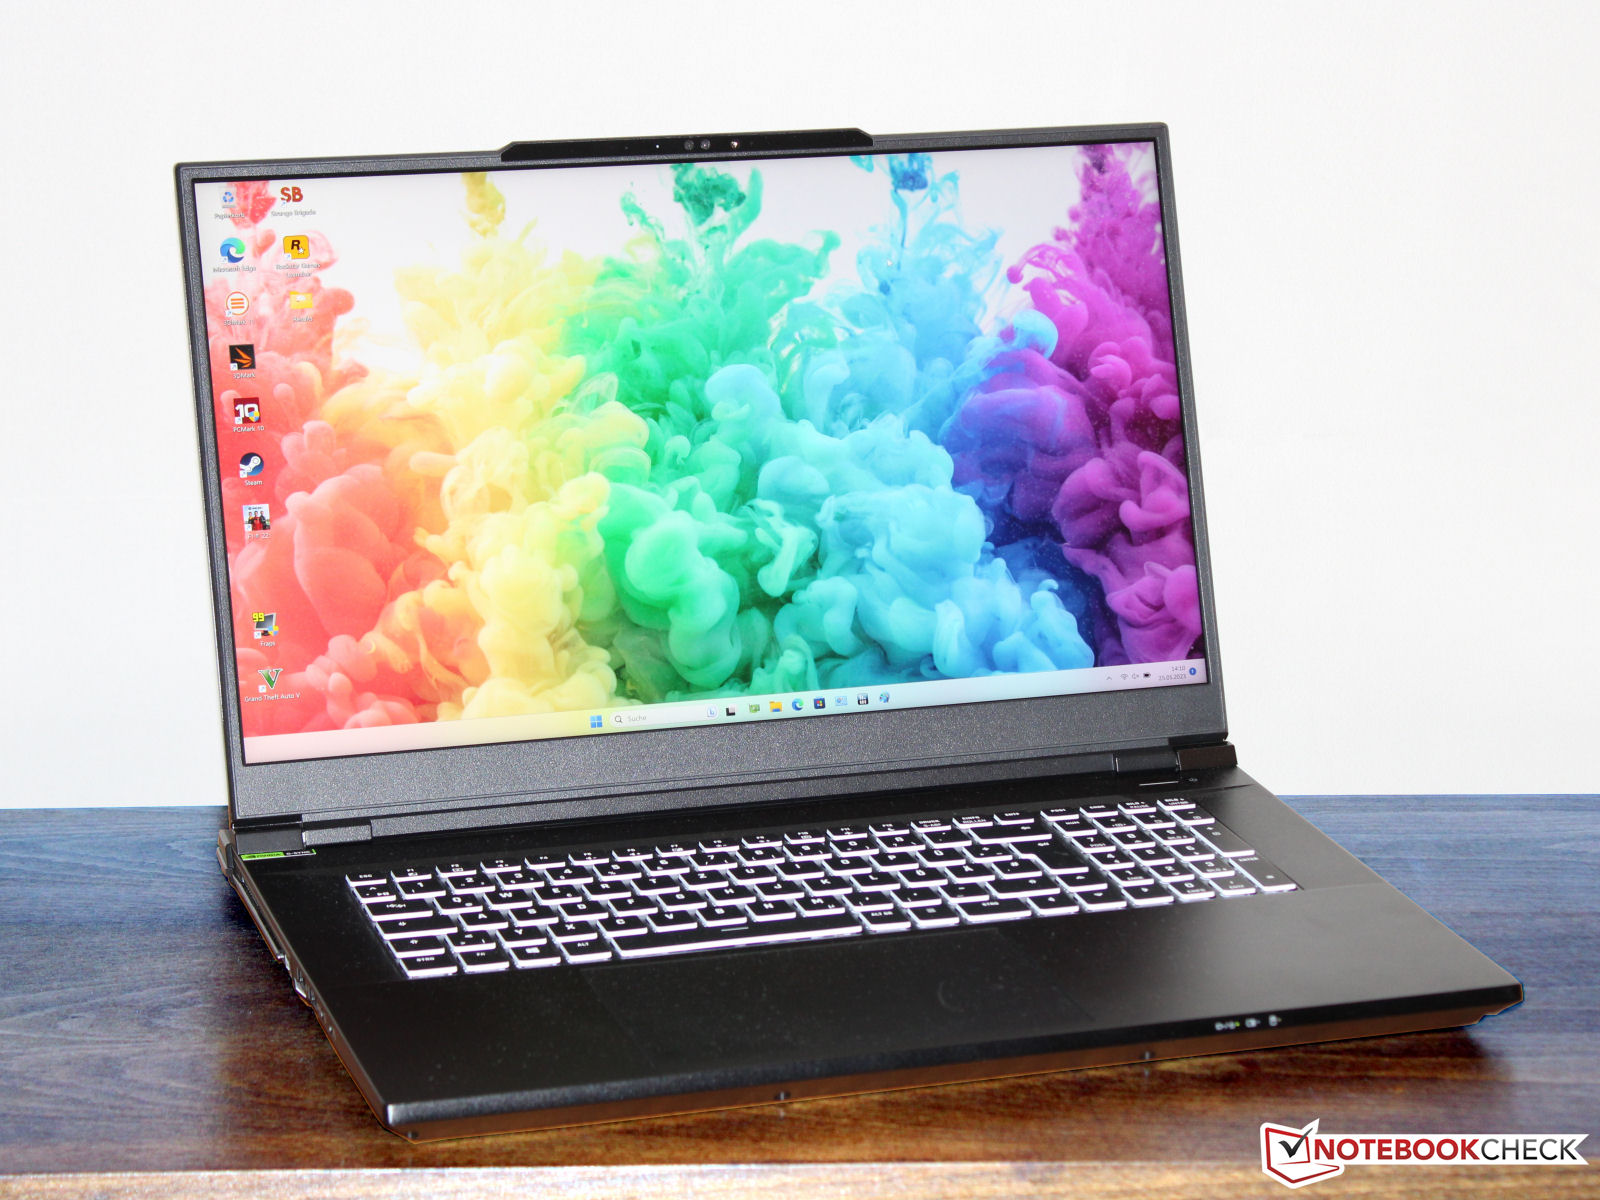
Recenzja Schenker Key 17 Pro (Early 23): notebook do gier 4K z Core i9 i RTX 4090
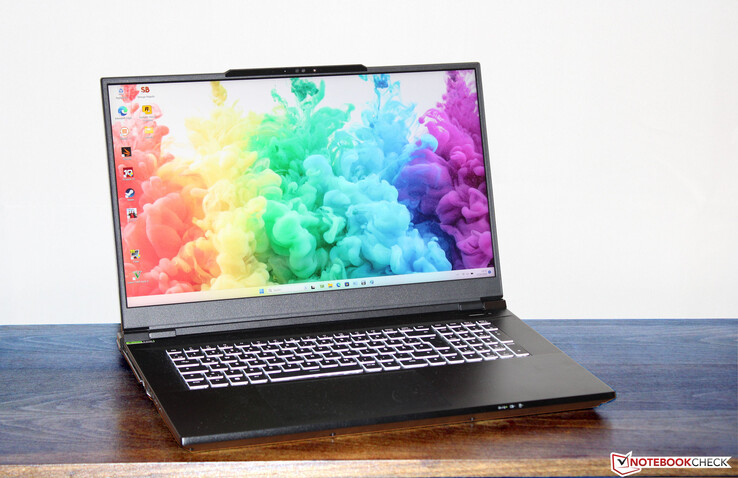
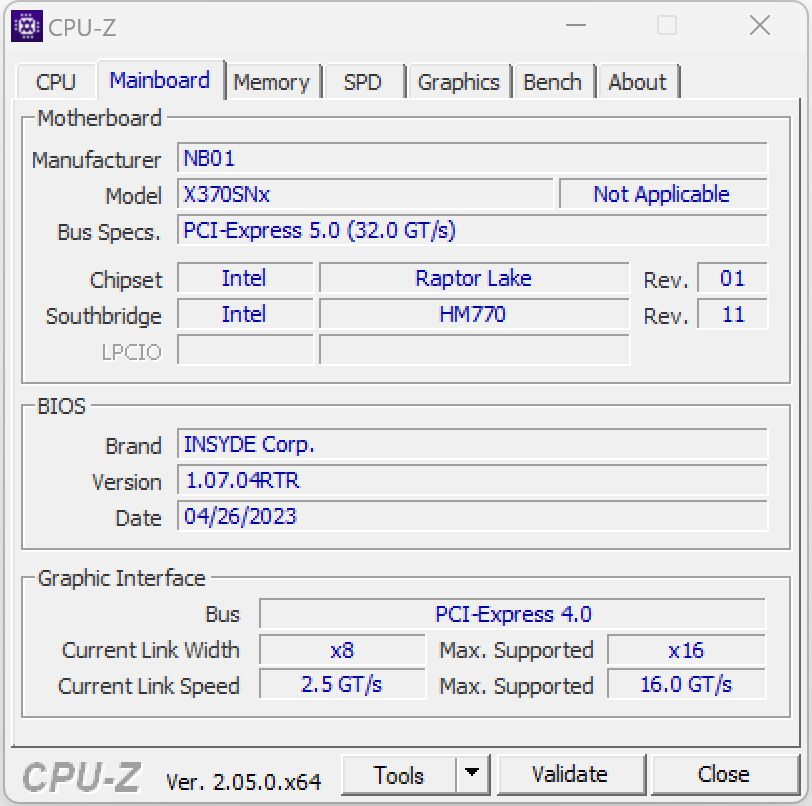
Potężny Key 17 Pro jest skierowany do twórców i graczy. Raptor Lake i Ada Lovelace zapewniają niezbędną moc obliczeniową w laptopie, który jest wyposażony w Core i9-13900HX iGeForce RTX 4090i bazuje na płycie głównej Clevo (X370SNW-G). Konkuruje on z takimi urządzeniami jak MSI Stealth 17 Studio A13VHi Asus ROG Strix Scar 17 G733PYasus ROG Strix Scar 17 G733PY Aorus 17X AZF oraz Medion Erazer Beast X40.
Potencjalni konkurenci w porównaniu
Ocena | Data | Model | Waga | Wysokość | Rozmiar | Rezolucja | Cena |
|---|---|---|---|---|---|---|---|
| 85.5 % v7 (old) | 06/2023 | Schenker Key 17 Pro (Early 23) i9-13900HX, GeForce RTX 4090 Laptop GPU | 3.4 kg | 24.9 mm | 17.30" | 3840x2160 | |
| 89.2 % v7 (old) | 04/2023 | MSI Stealth 17 Studio A13VH-014 i9-13900H, GeForce RTX 4080 Laptop GPU | 3 kg | 21.3 mm | 17.30" | 3840x2160 | |
| 88.3 % v7 (old) | 04/2023 | Asus ROG Strix Scar 17 G733PY-XS96 R9 7945HX, GeForce RTX 4090 Laptop GPU | 2.9 kg | 28.3 mm | 17.30" | 2560x1440 | |
| 86 % v7 (old) | 04/2023 | Aorus 17X AZF i9-13900HX, GeForce RTX 4090 Laptop GPU | 2.9 kg | 21.8 mm | 17.30" | 2560x1440 | |
| 88.4 % v7 (old) | 03/2023 | Medion Erazer Beast X40 i9-13900HX, GeForce RTX 4090 Laptop GPU | 2.9 kg | 33 mm | 17.00" | 2560x1600 |
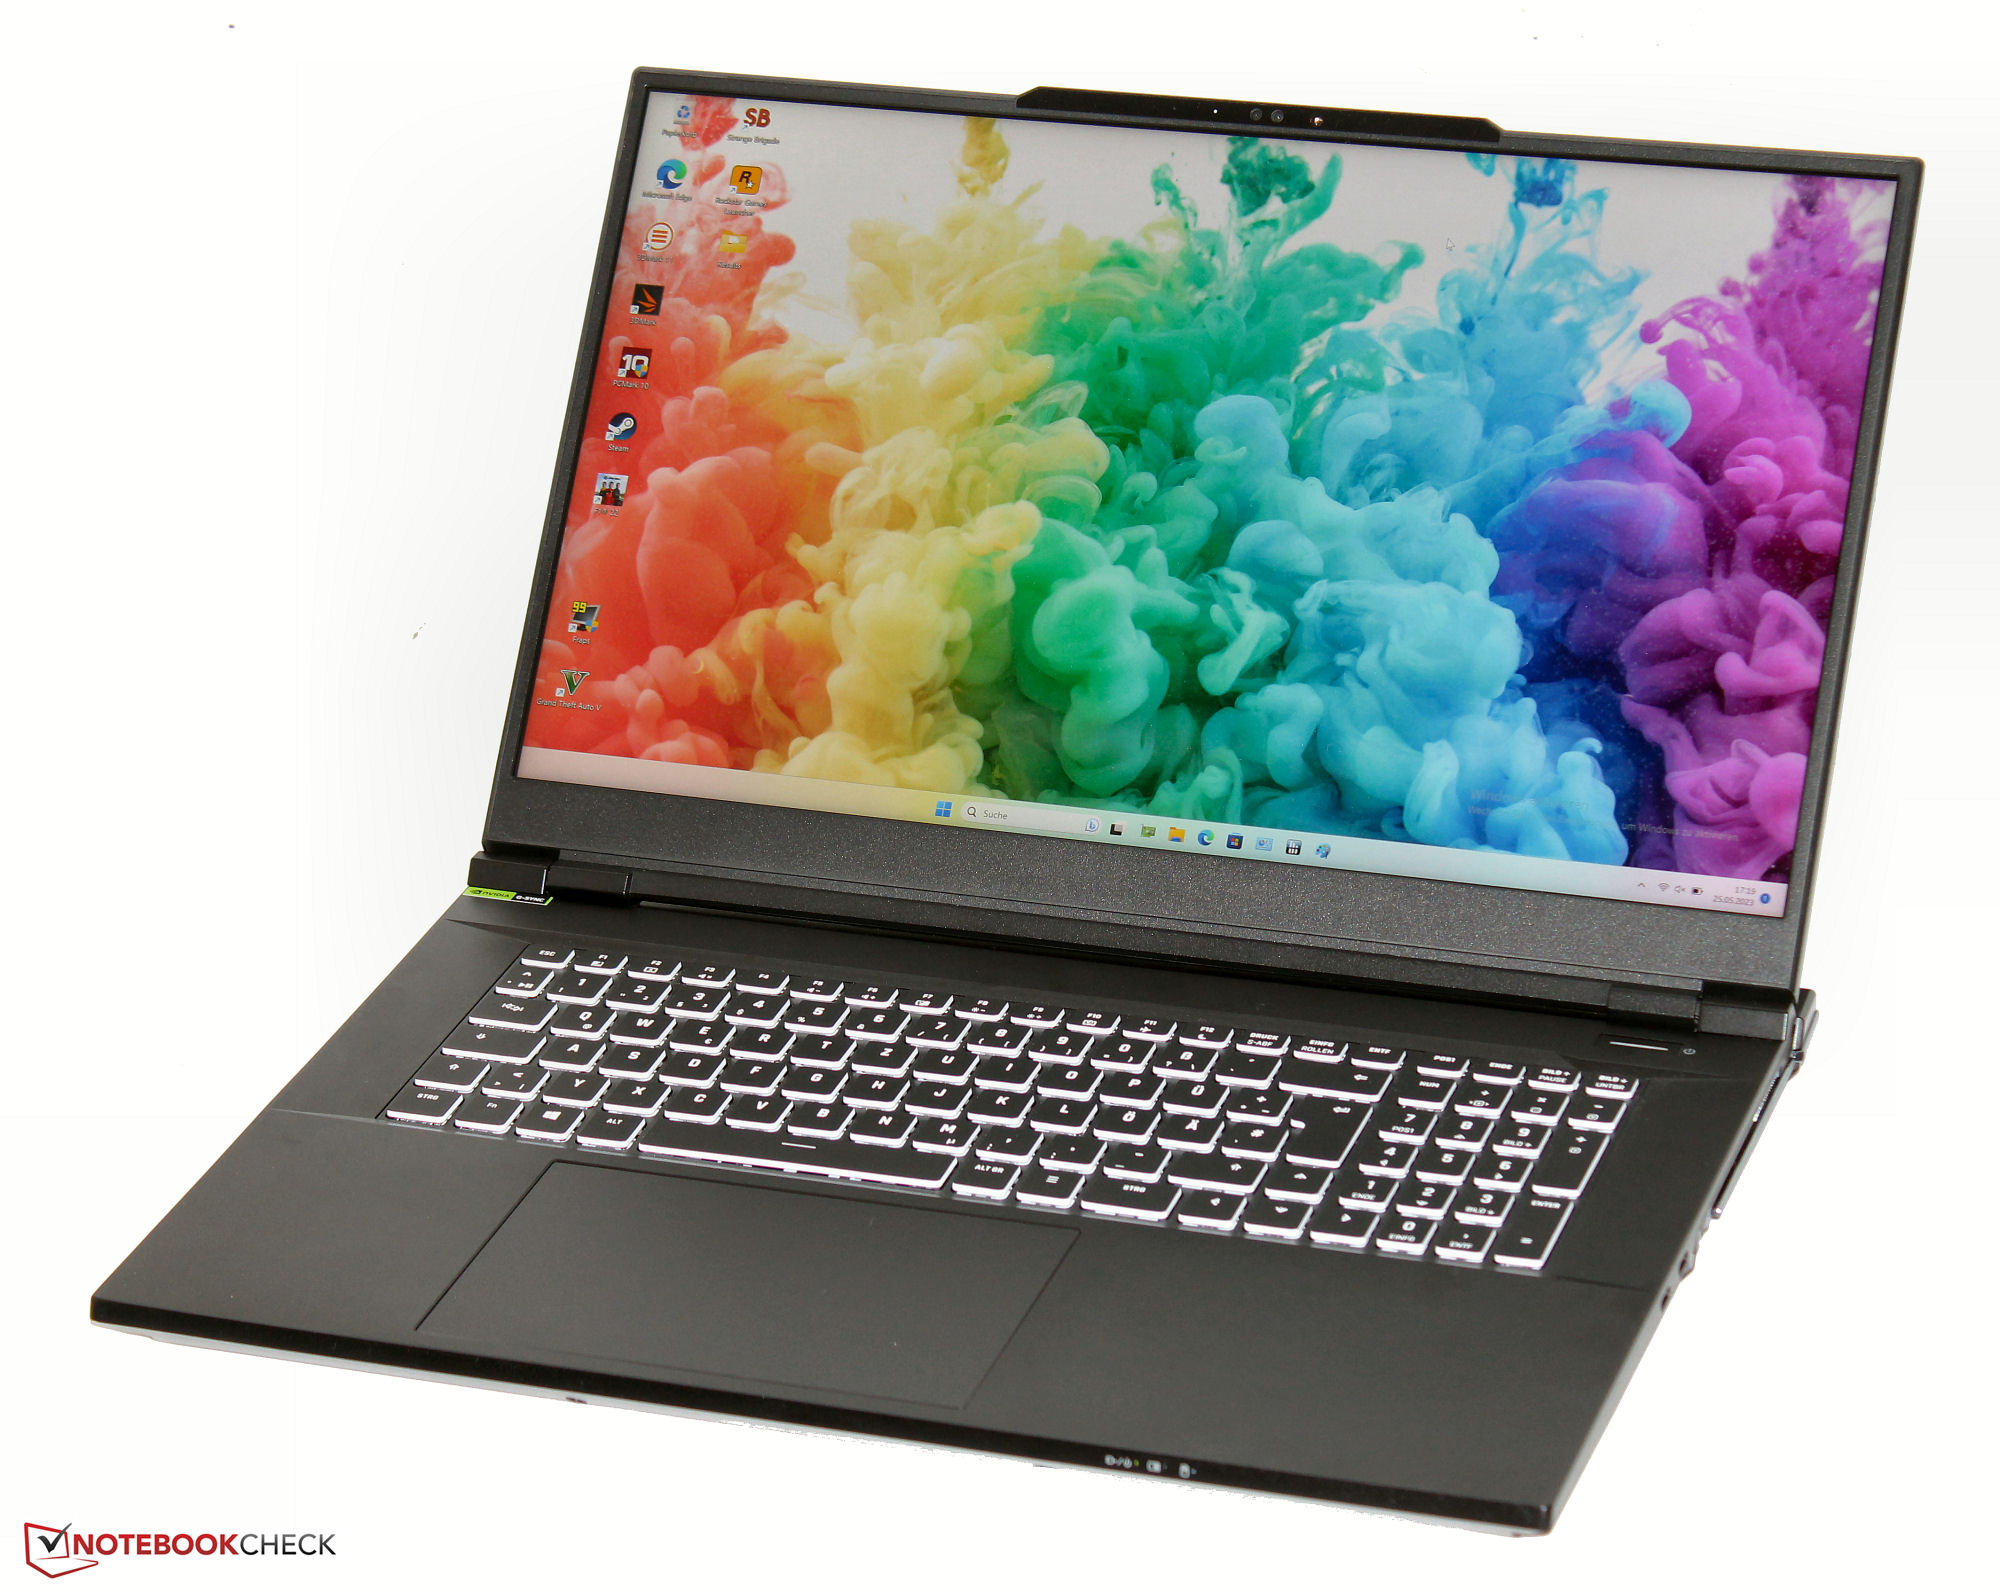
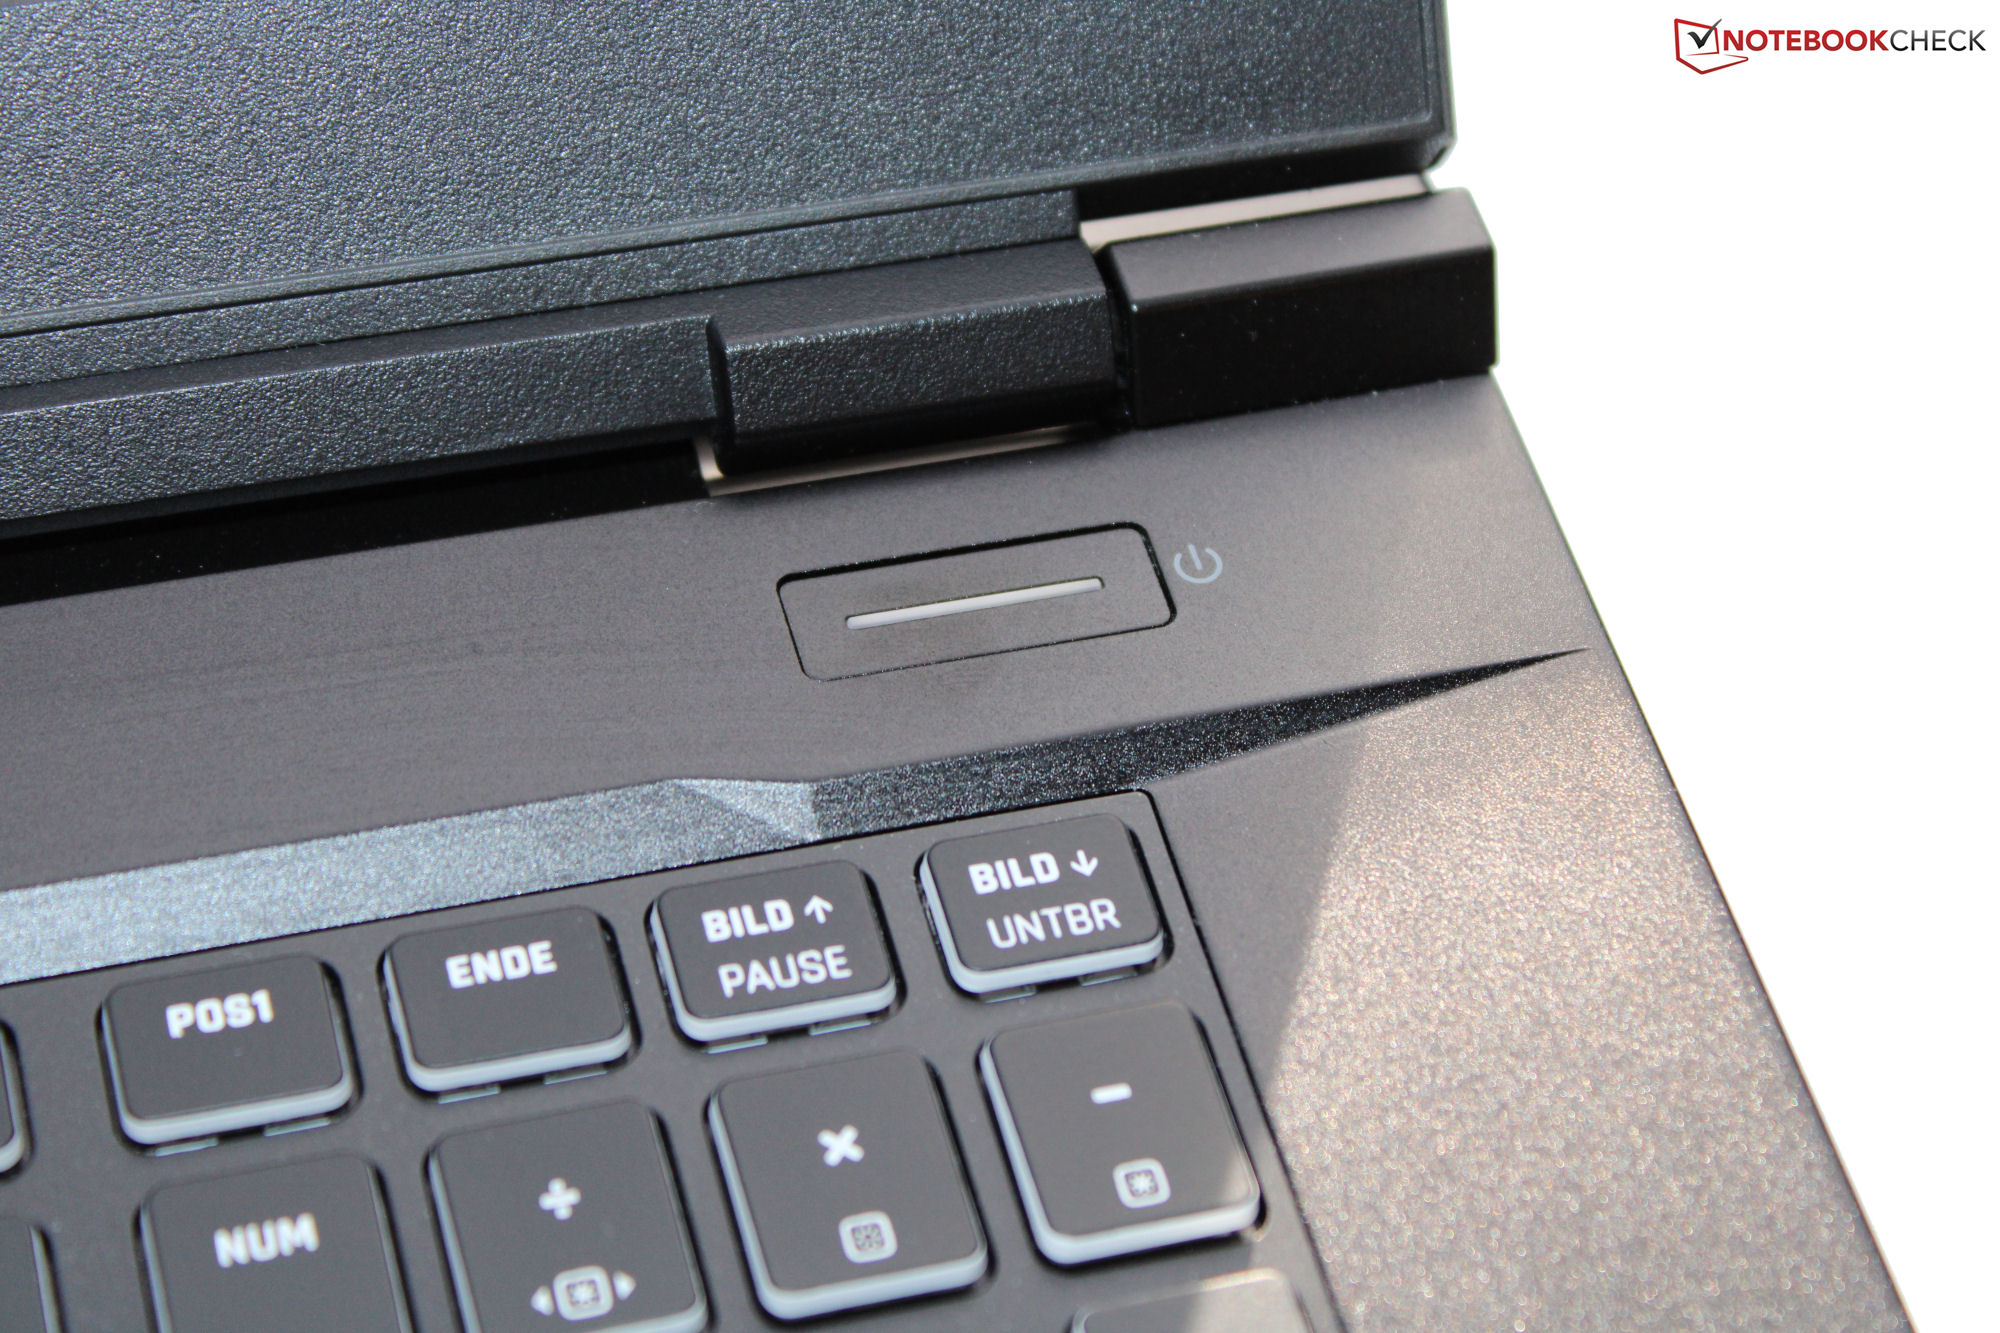
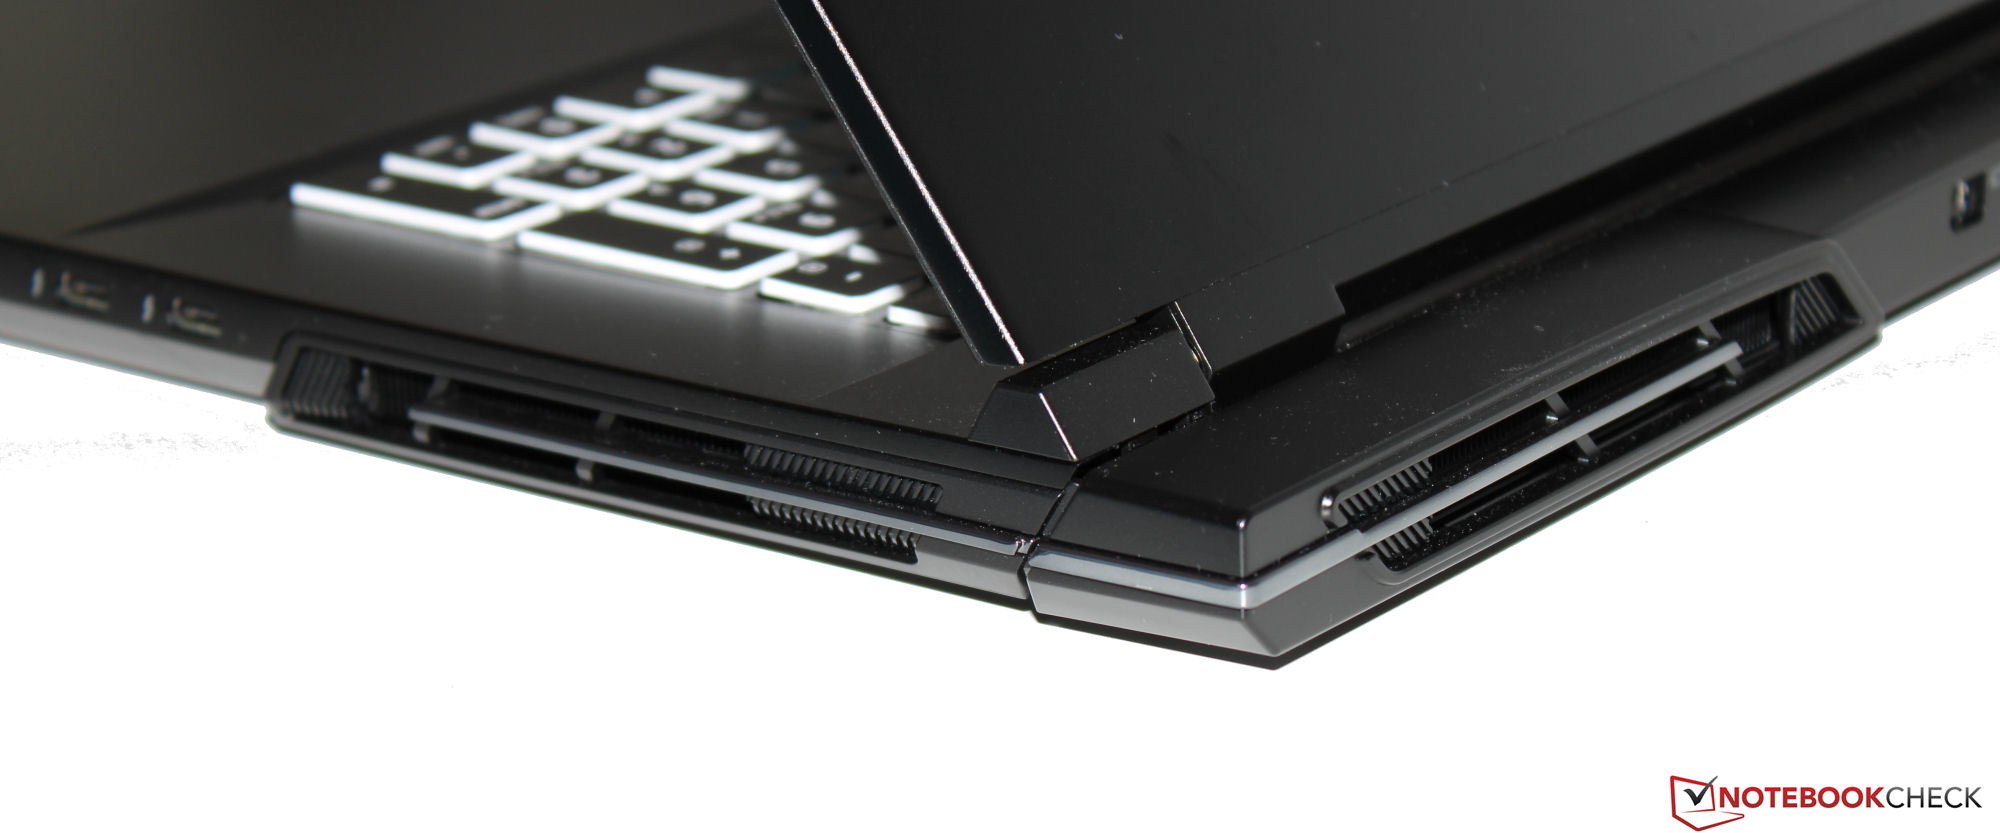
Obudowa i specyfikacja - Clevo barebone oferujący Thunderbolt 4
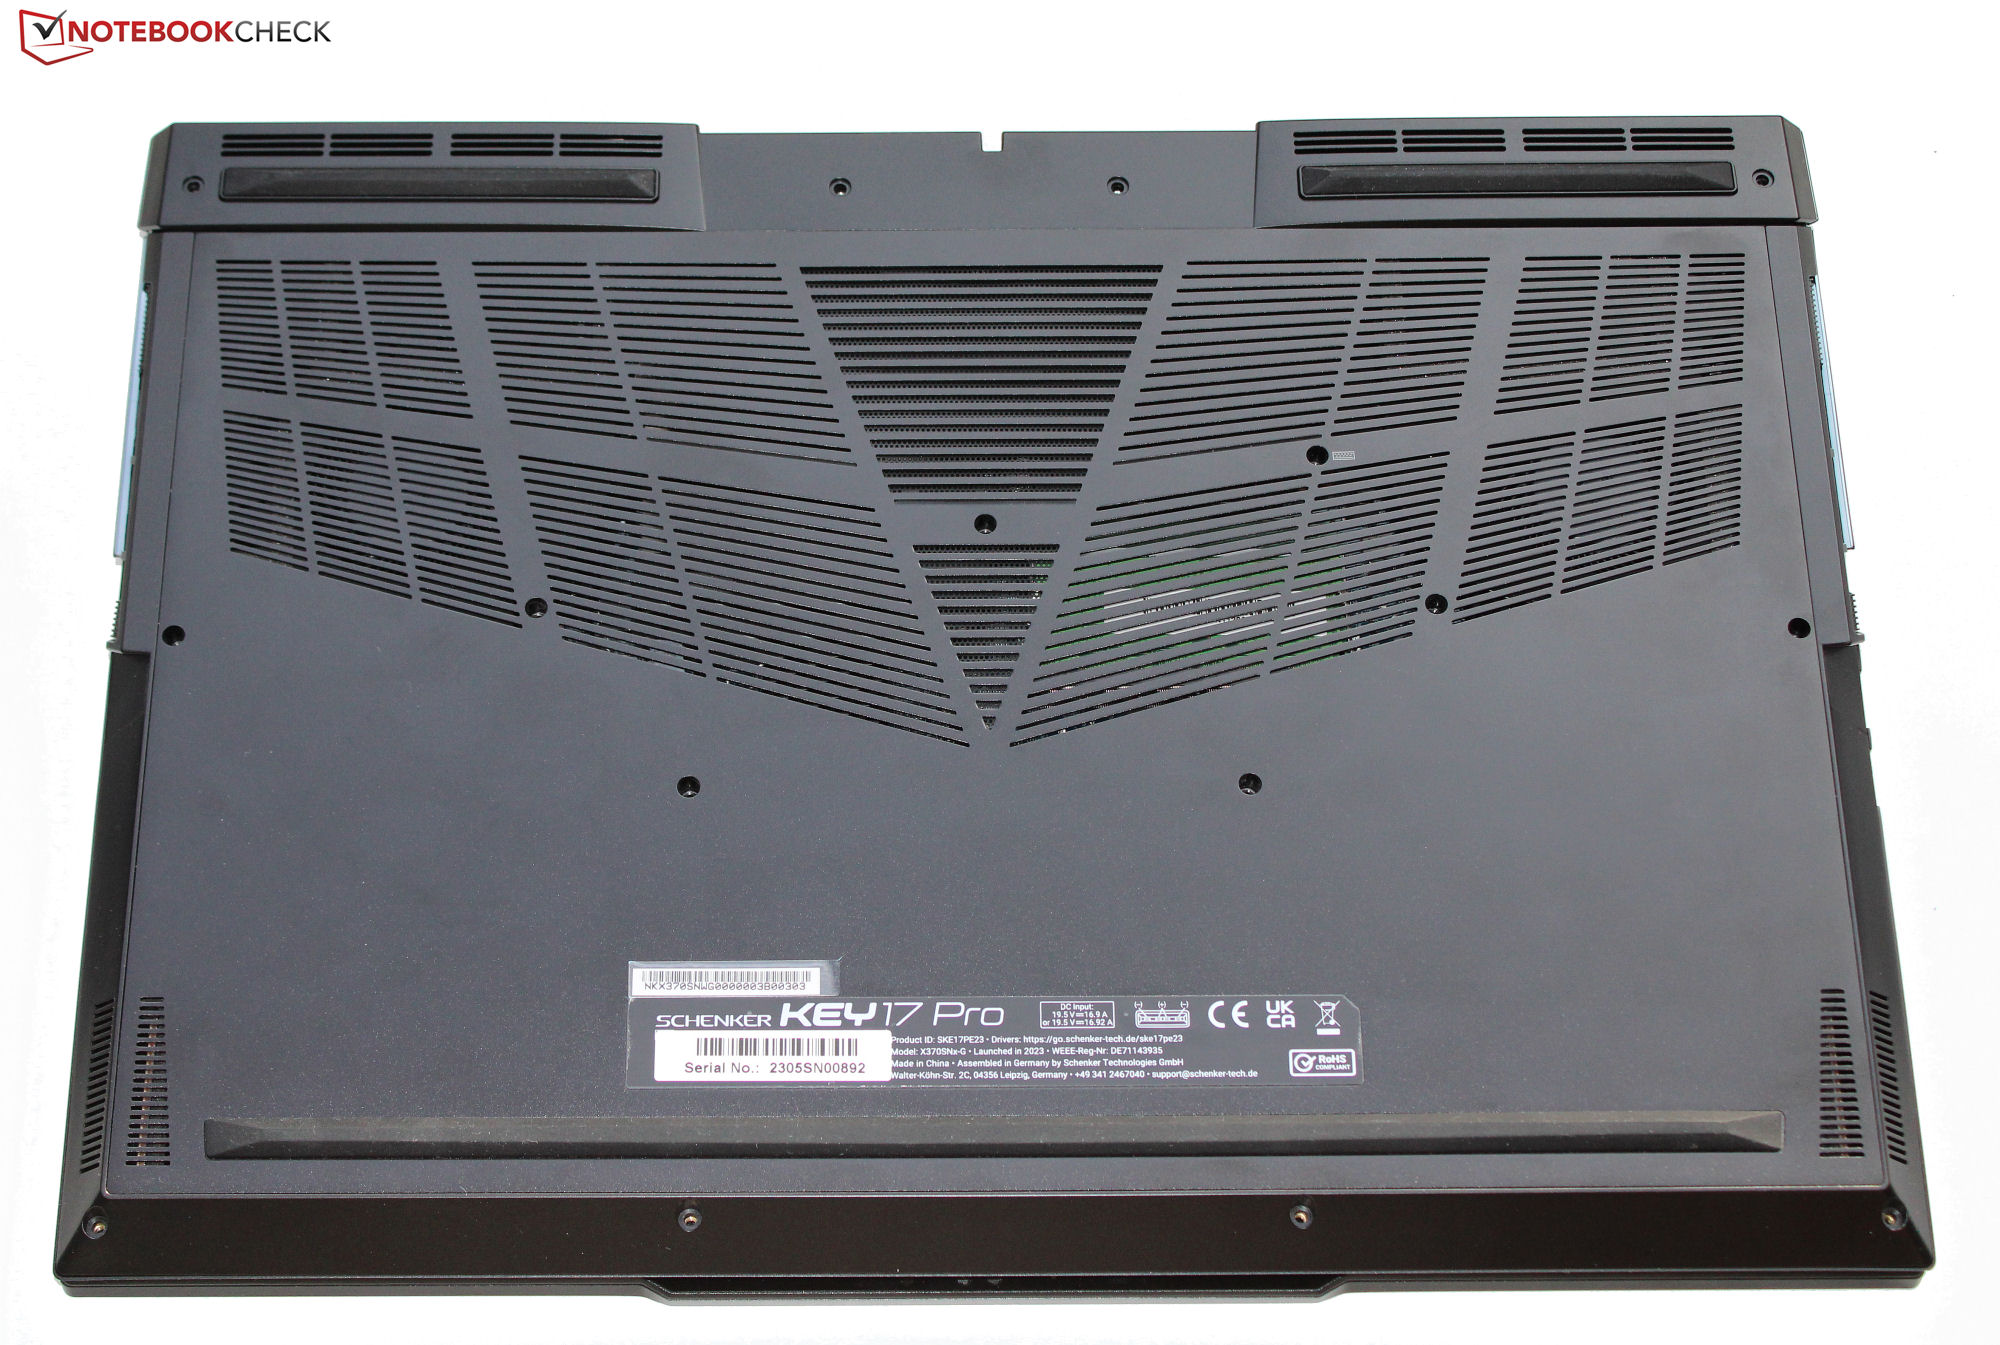
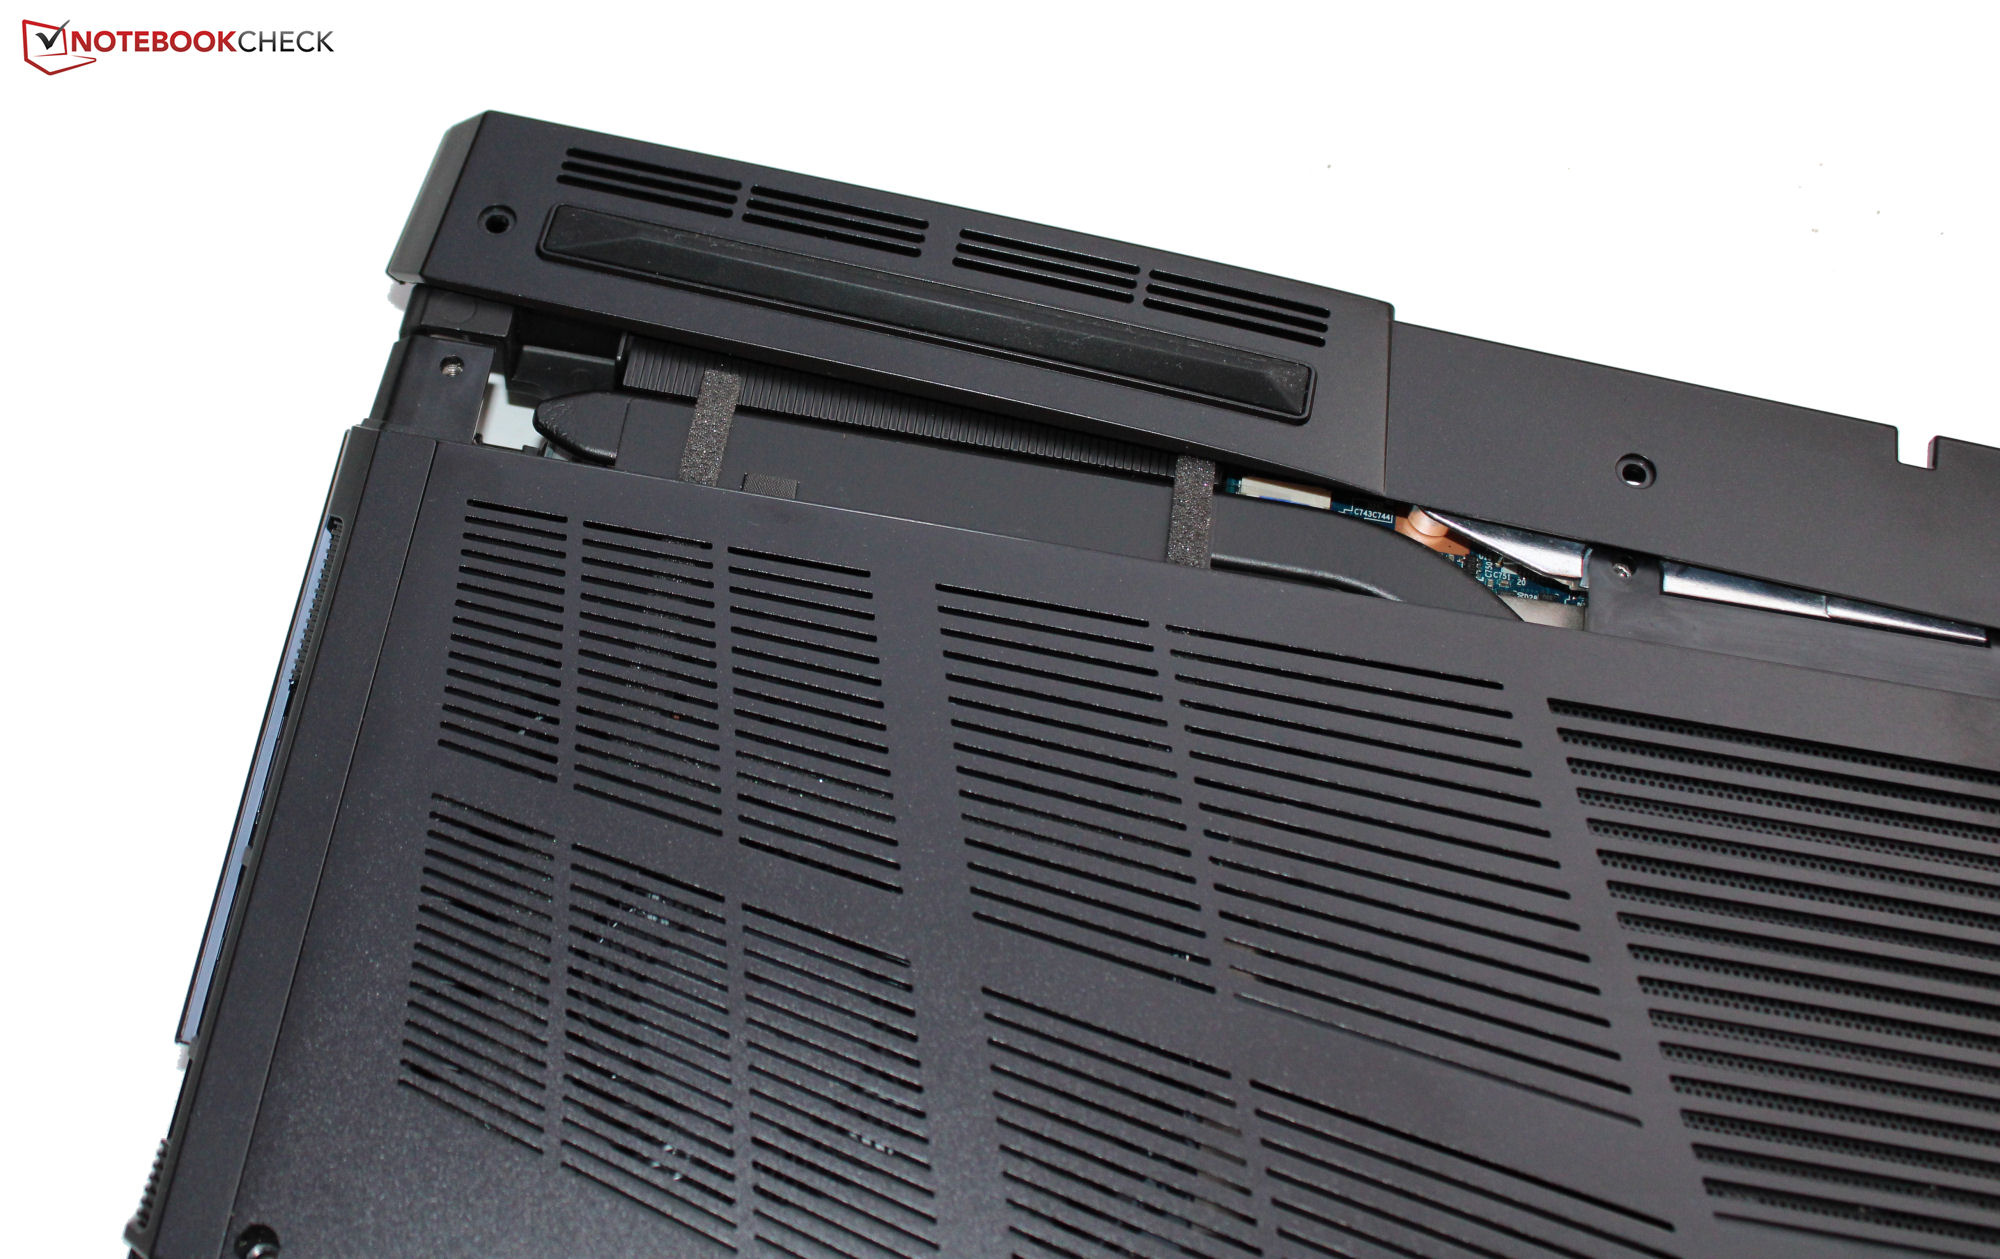
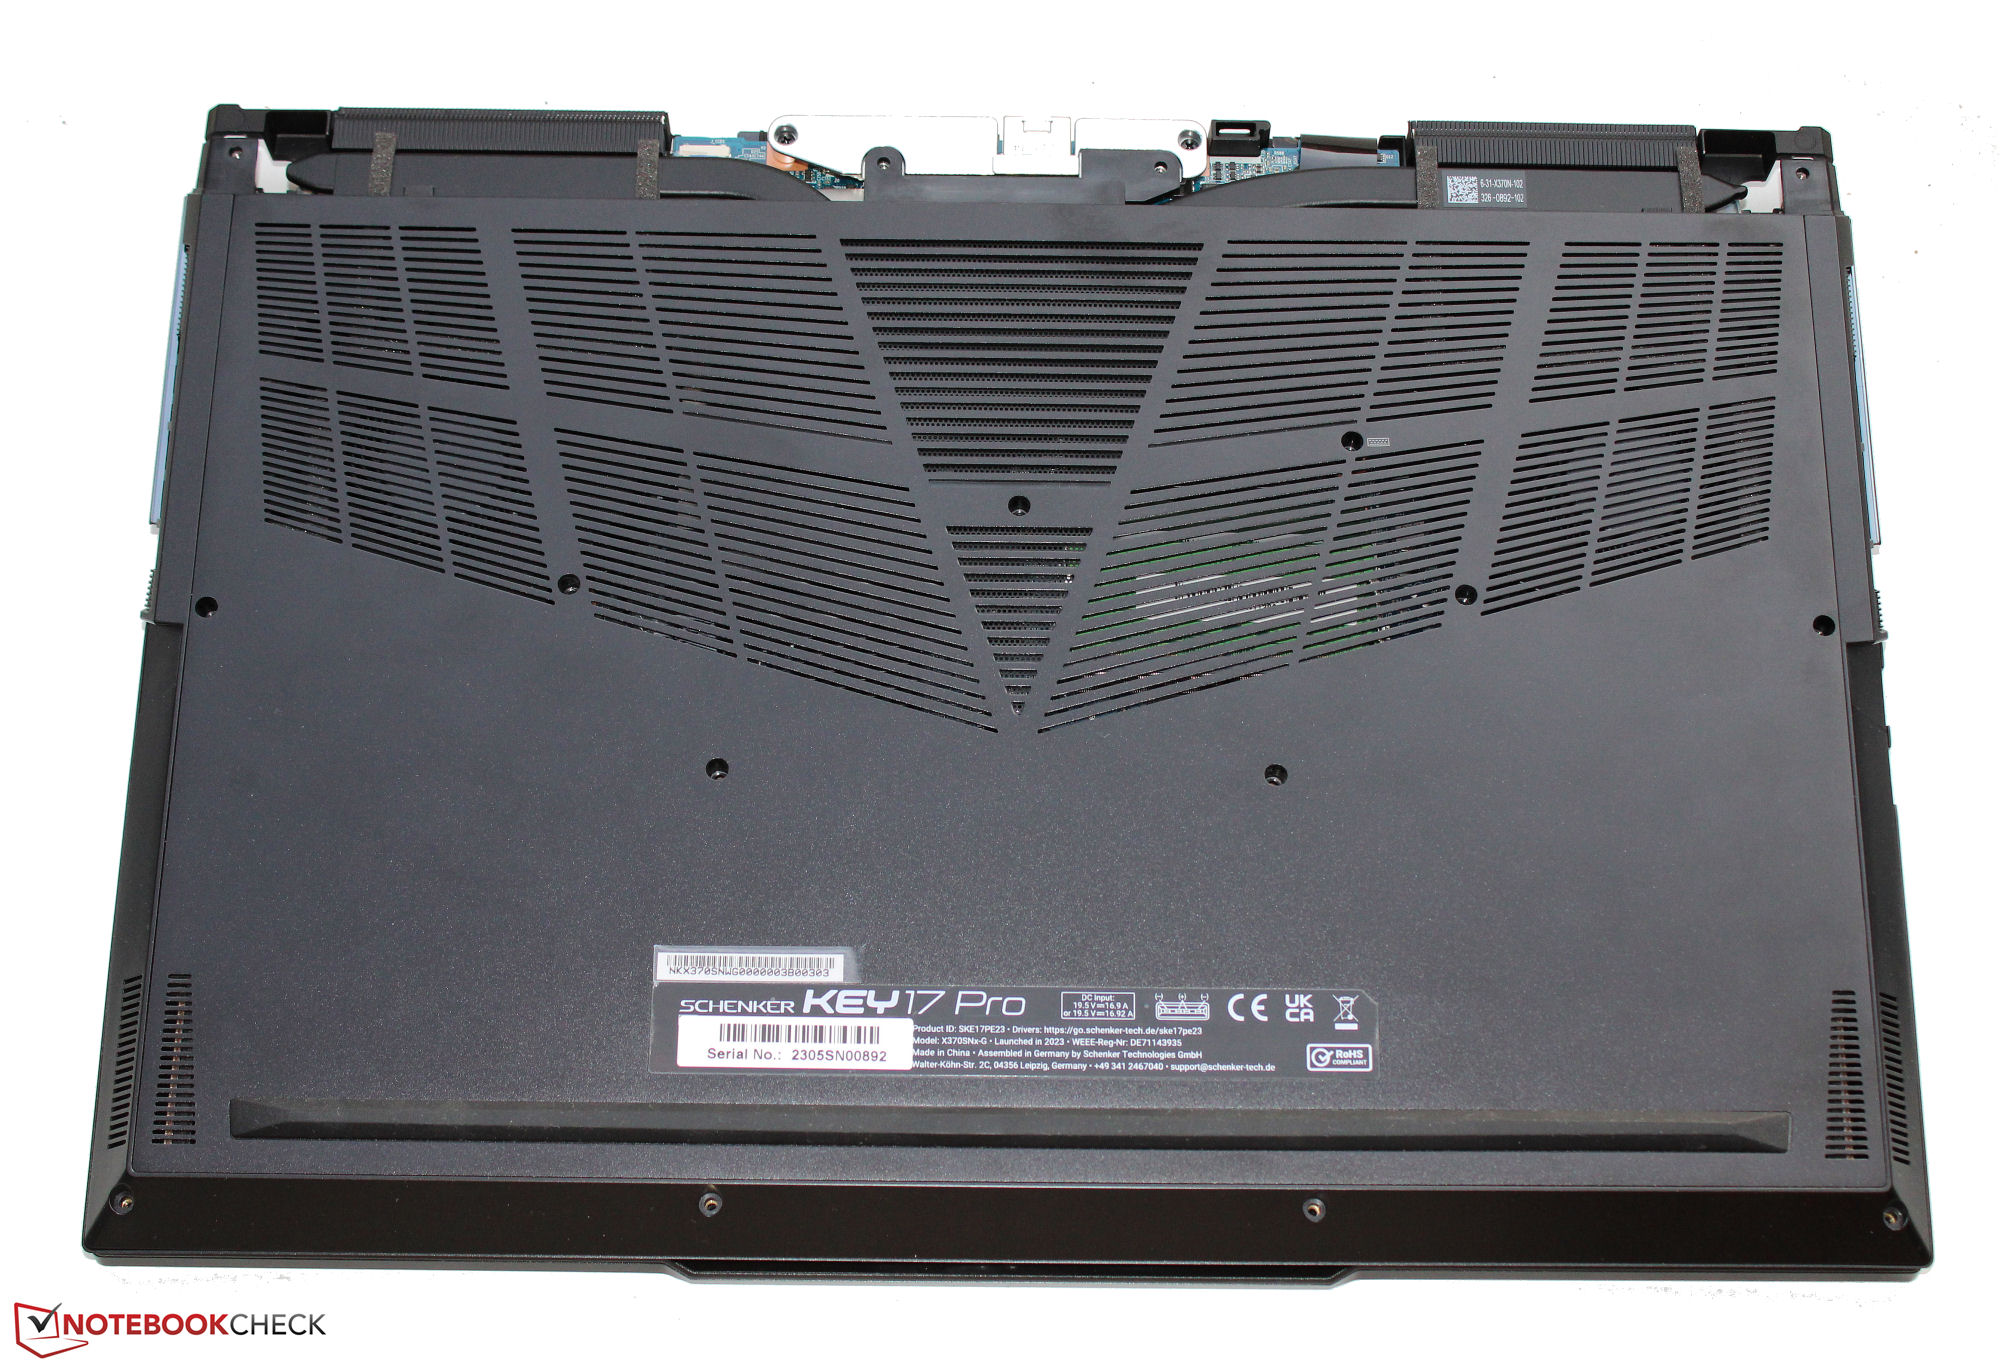
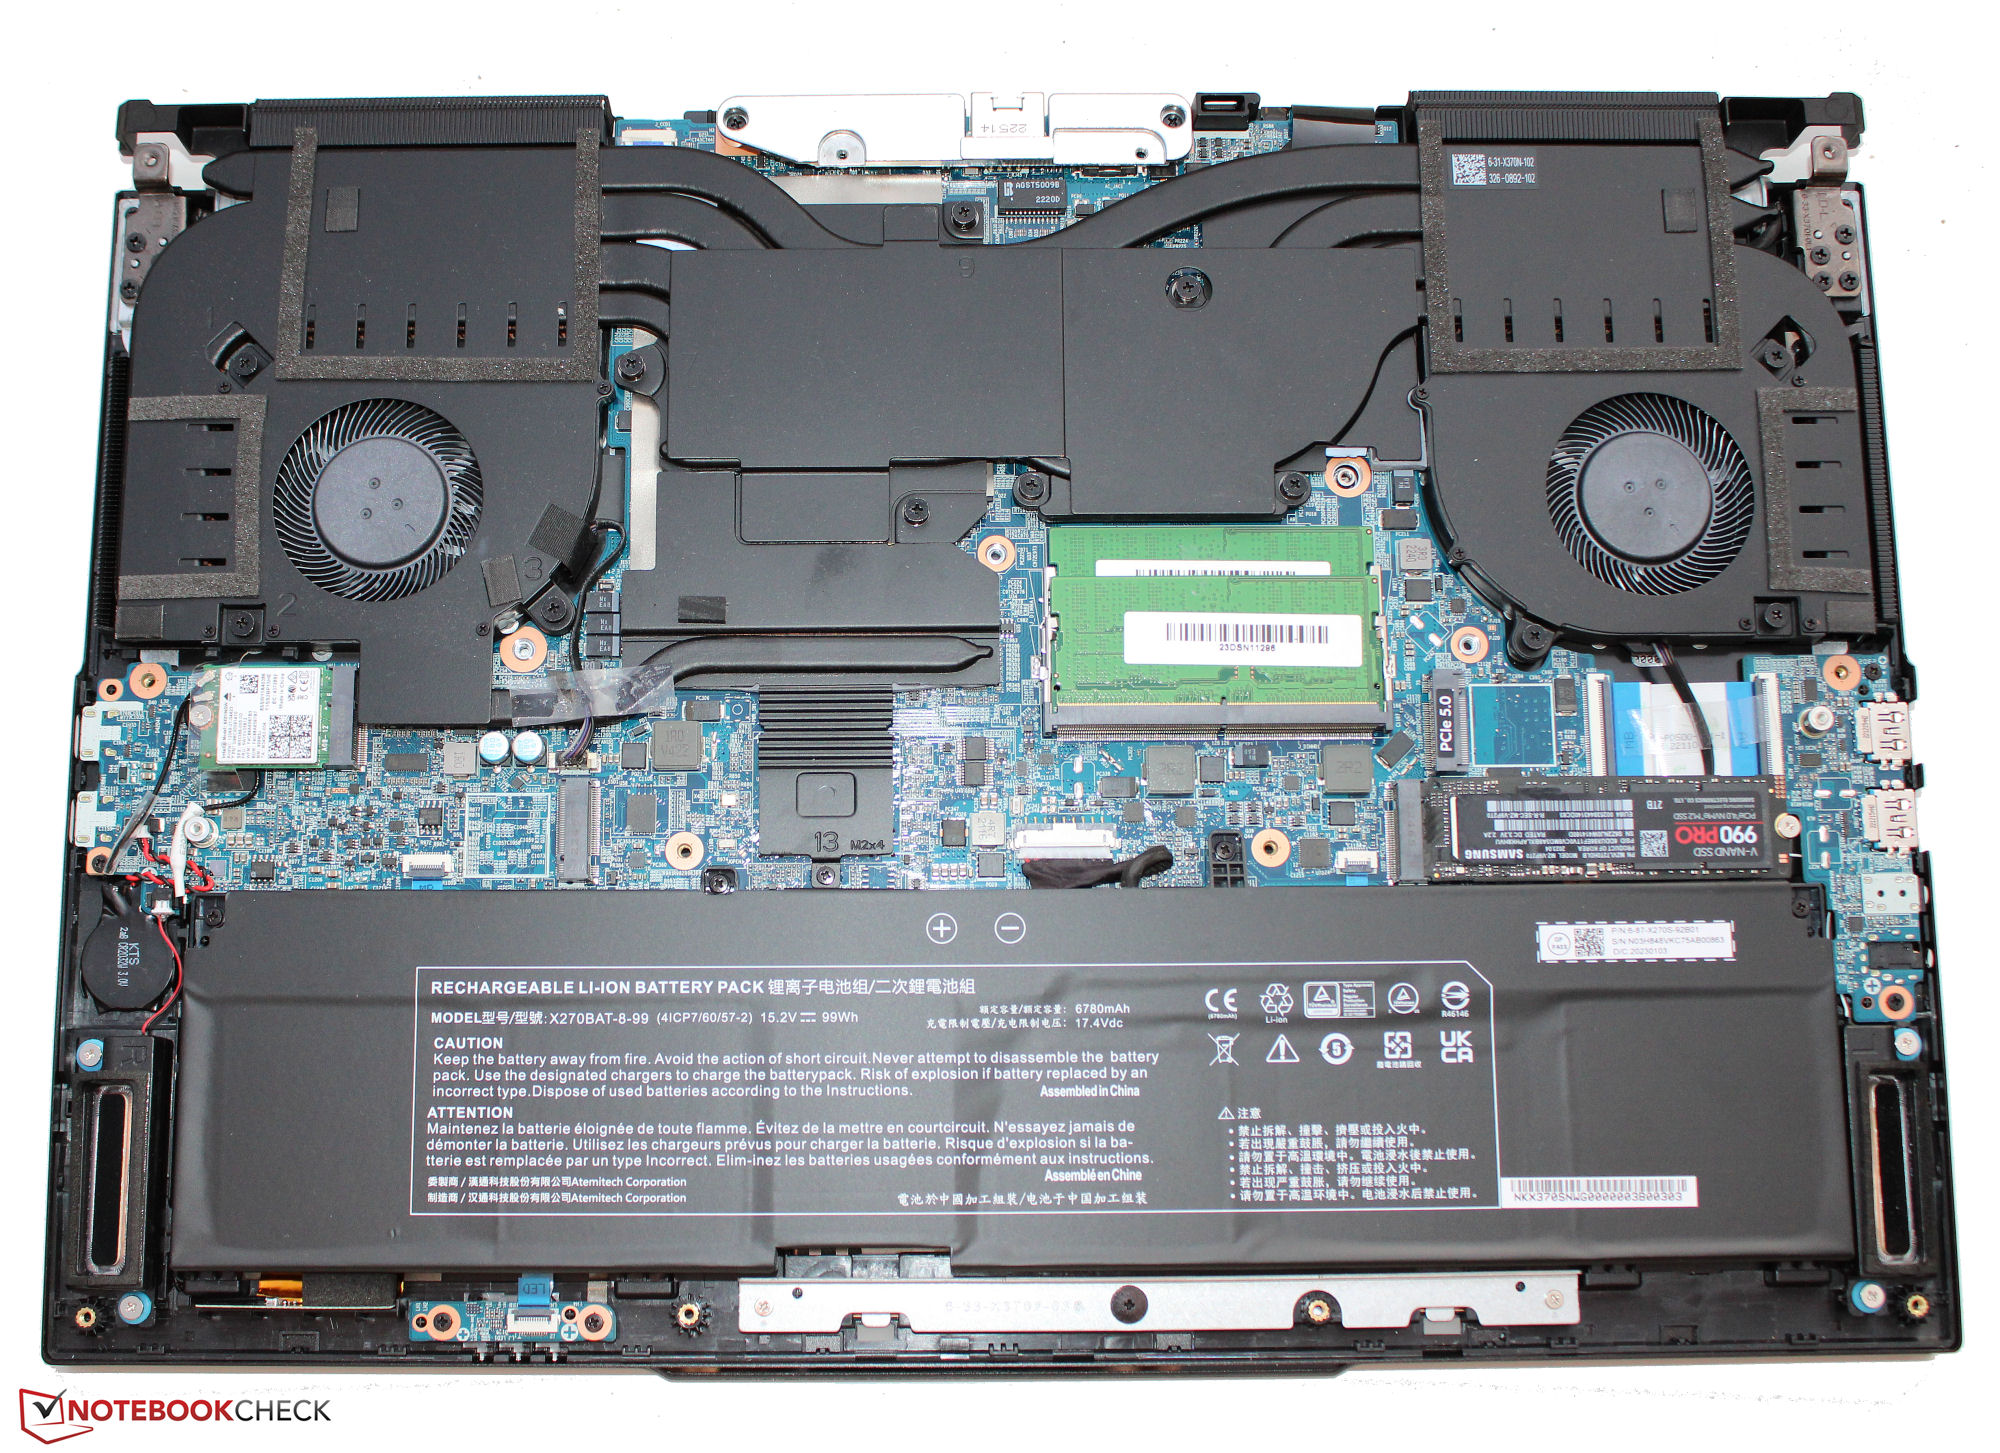
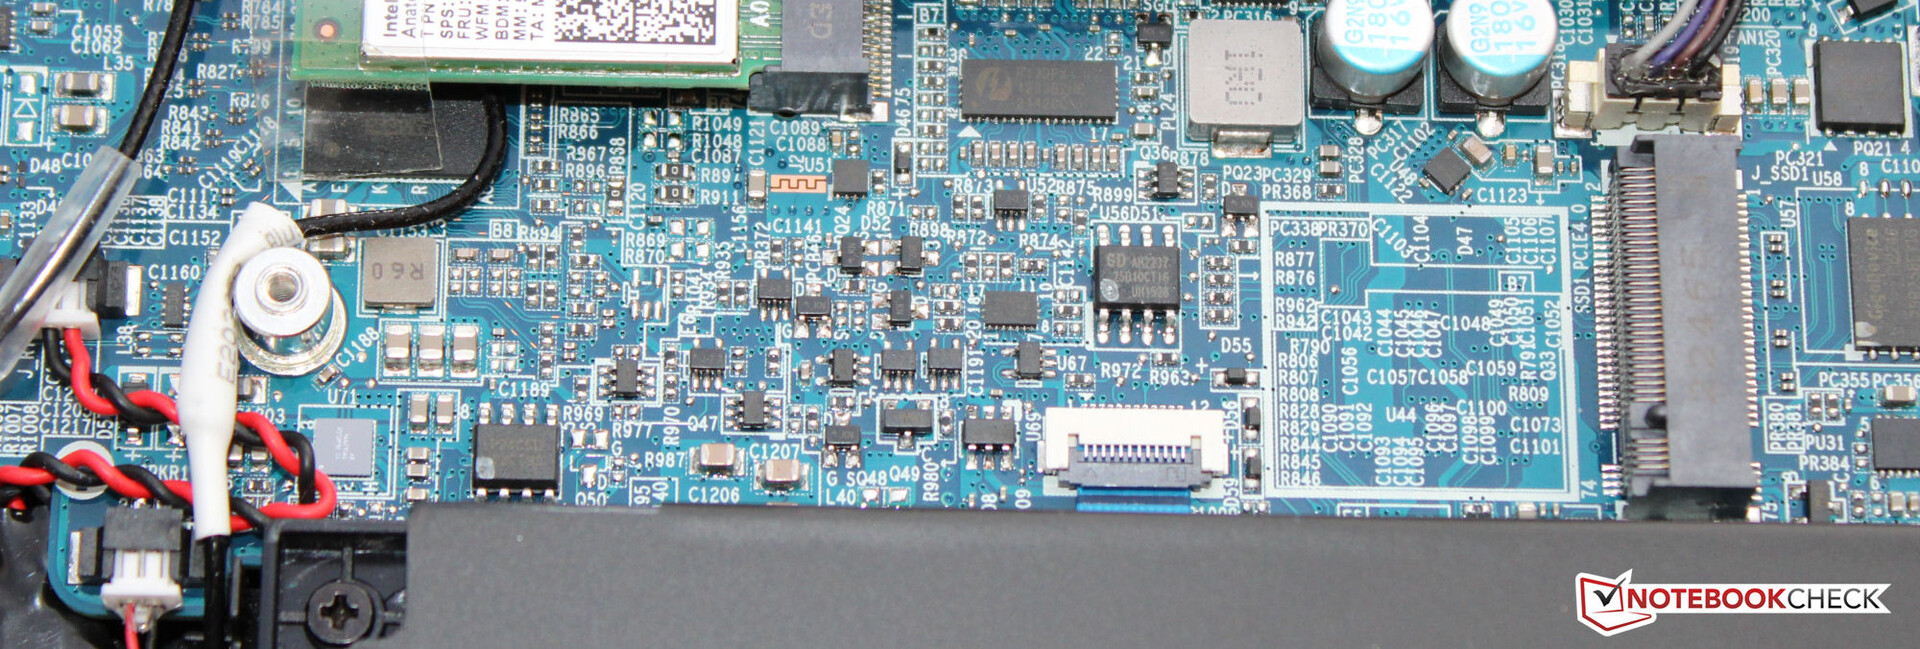
Subtelna, matowo-czarna metalowa obudowa w naszej jednostce testowej nie wykazuje żadnych problemów z wykonaniem. Podstawa prawie w ogóle się nie ugina, a pokrywa ma niewielki, ale bardzo akceptowalny luz. Bateria laptopa (przykręcona, a nie przyklejona) i inne elementy wewnętrzne są dostępne po zdjęciu dwuczęściowej dolnej pokrywy.
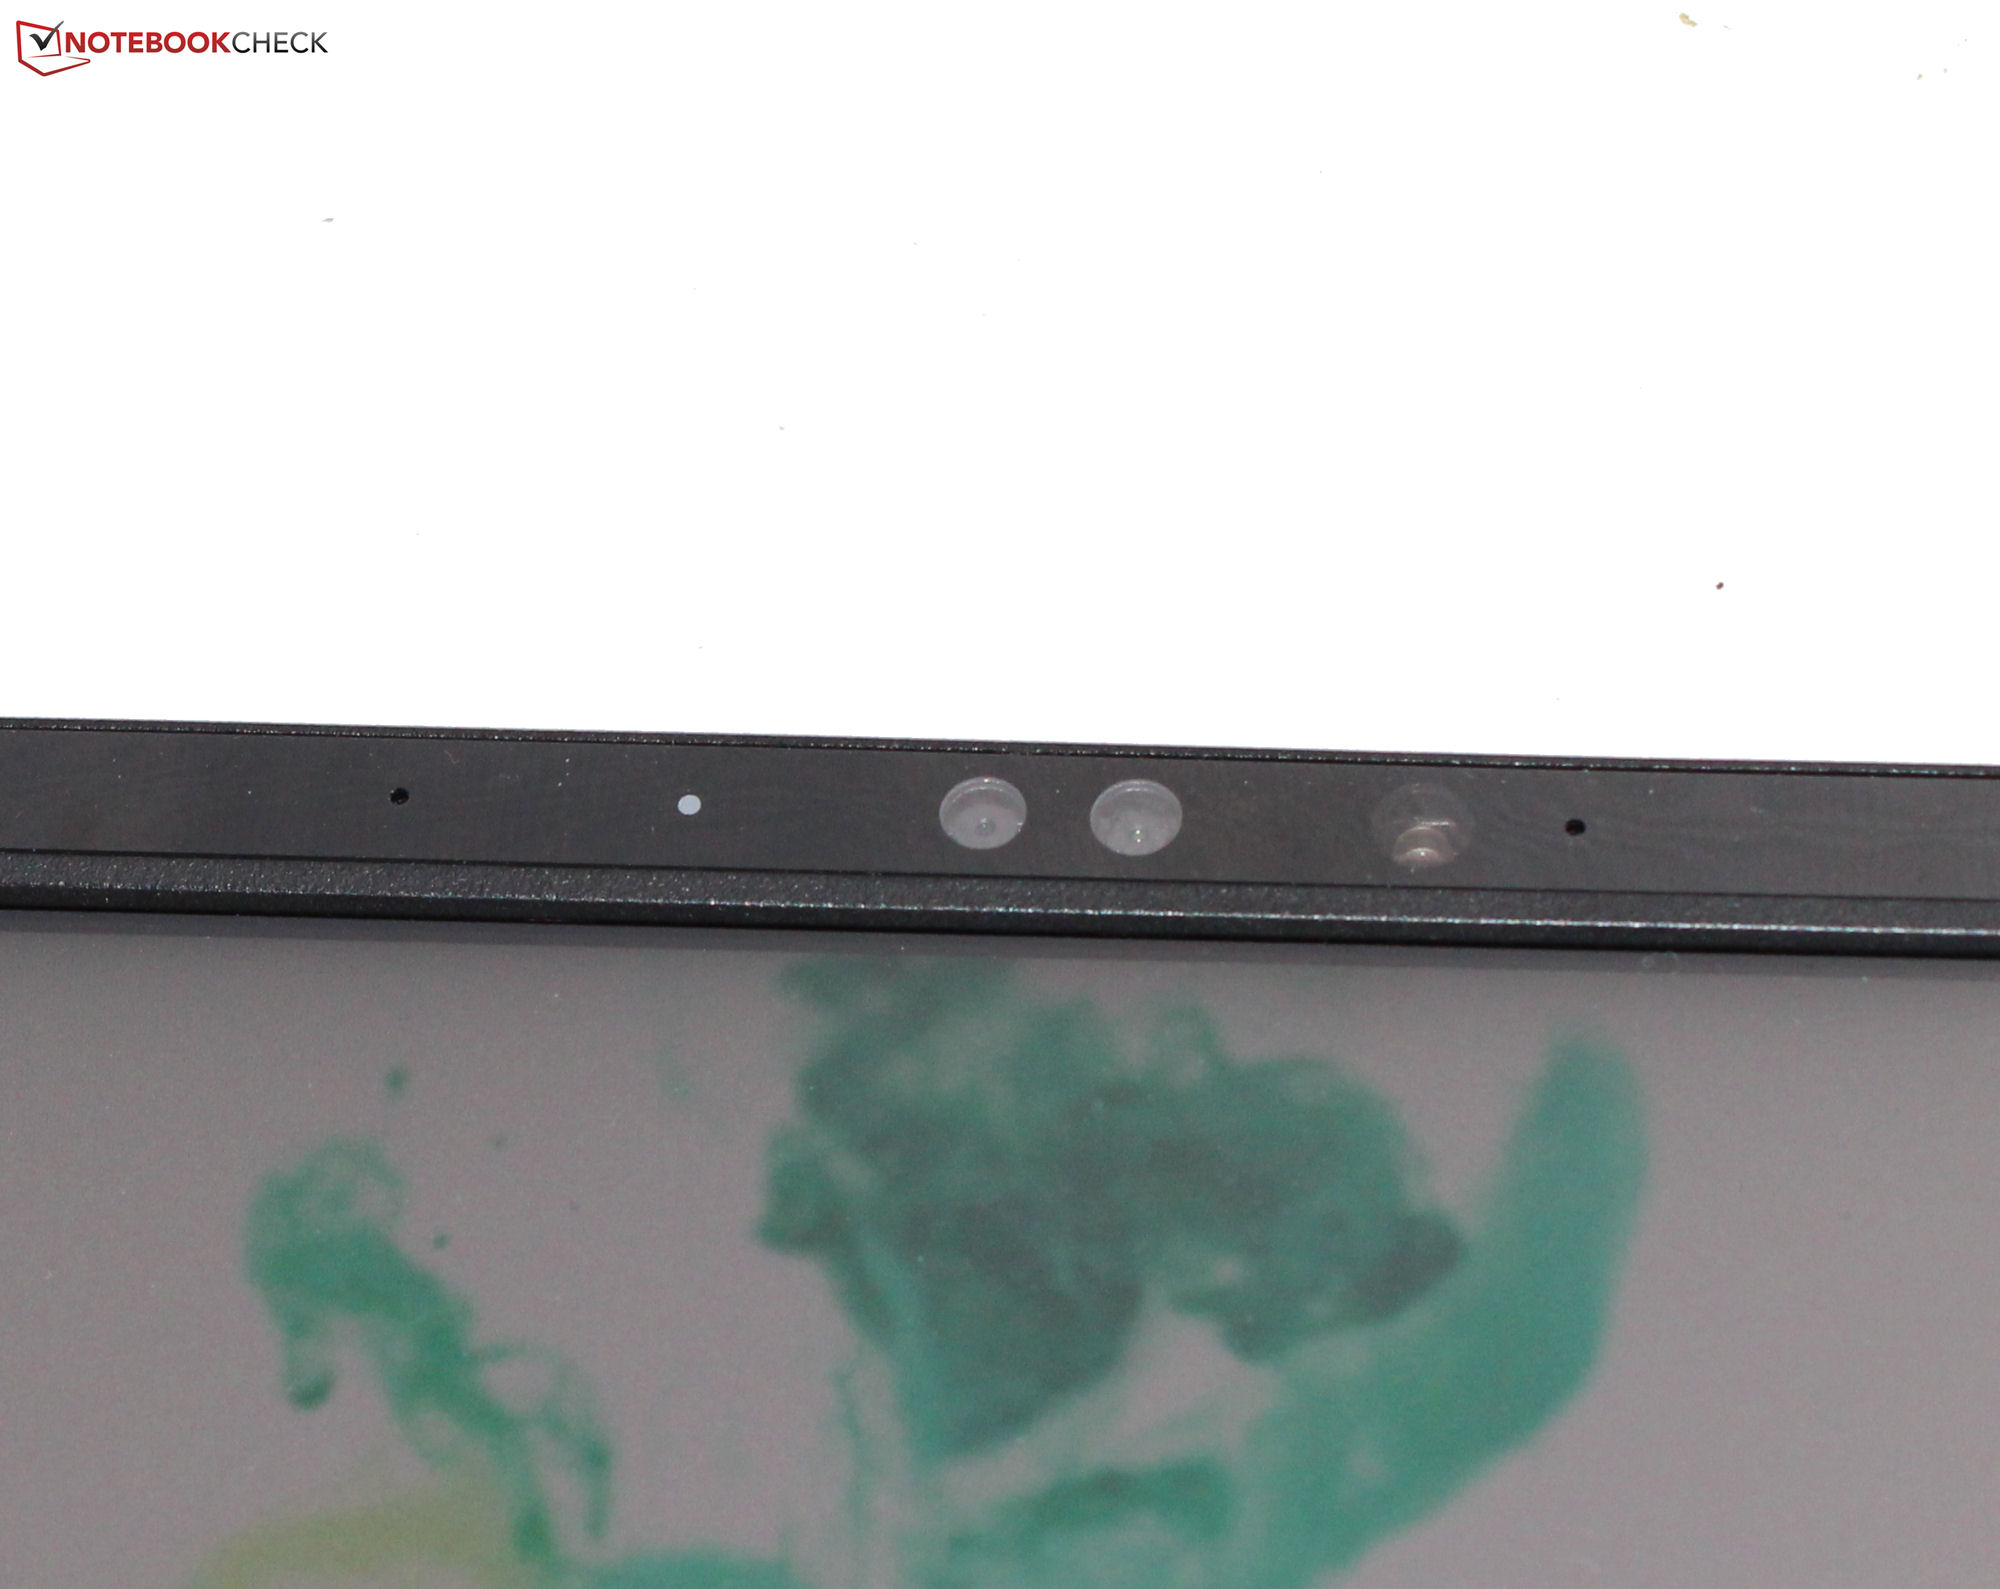
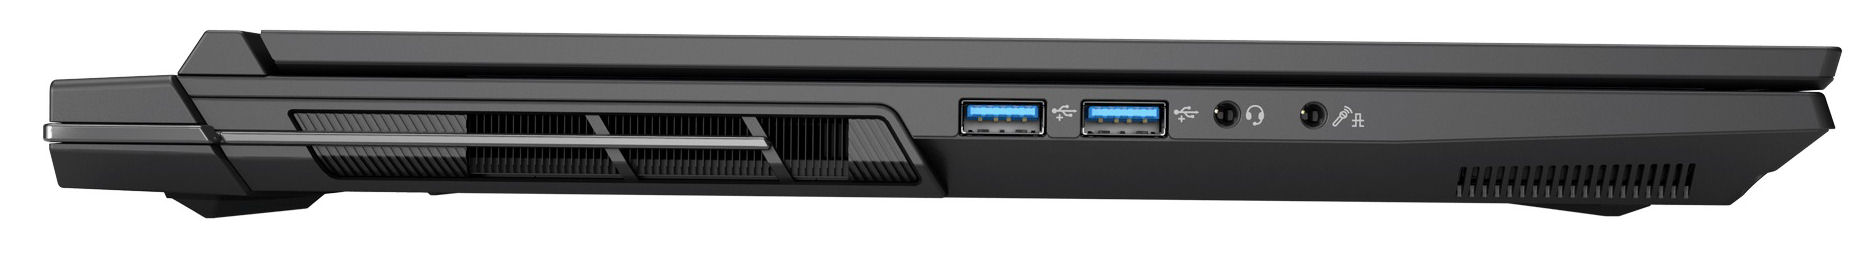
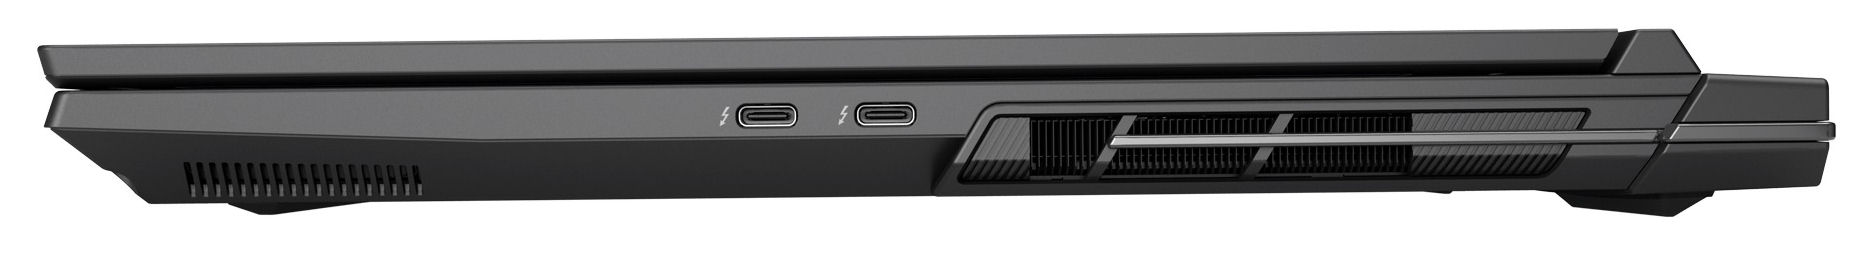
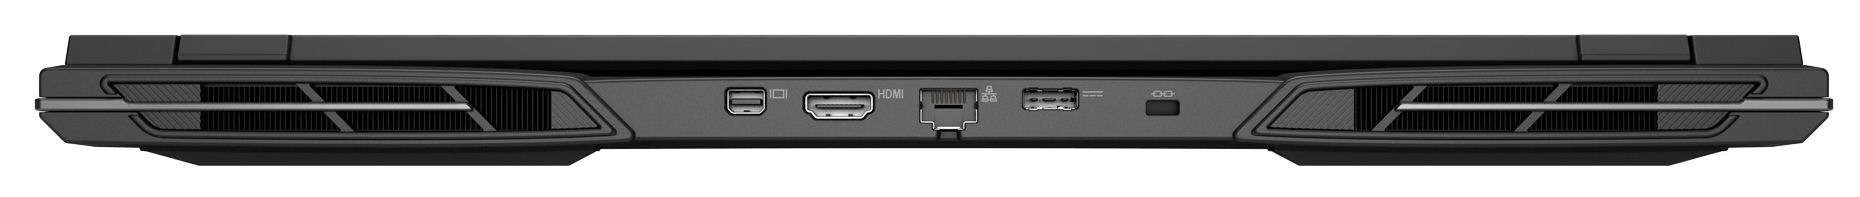
Key posiada dwa porty USB-A (USB 3.2 Gen 2) i dwa porty USB-C (Thunderbolt 4). Tylko jeden z portów Thunderbolt 4 obsługuje Power Delivery, ale oba są w stanie wyprowadzić sygnał DisplayPort. Laptop oferuje łącznie cztery wyjścia wideo (1x HDMI, 3x DP). Niestety, urządzenie nie jest wyposażone w czytnik kart pamięci, a kamera internetowa (2,1 MP, maksymalna rozdzielczość 1 920 x 1 080, brak migawki prywatności) nie jest niczym, o czym można by pisać.
Dzięki karcie Wi-Fi 6E (Intel AX211), Key 17 Pro jest w stanie osiągnąć doskonałe prędkości transmisji danych Wi-Fi w idealnych warunkach (tj. brak innych urządzeń Wi-Fi w pobliżu, niewielka odległość między laptopem a serwerem PC). Połączenia przewodowe obsługiwane są przez kontroler Killer E3100X (2,5 Gbit/s).

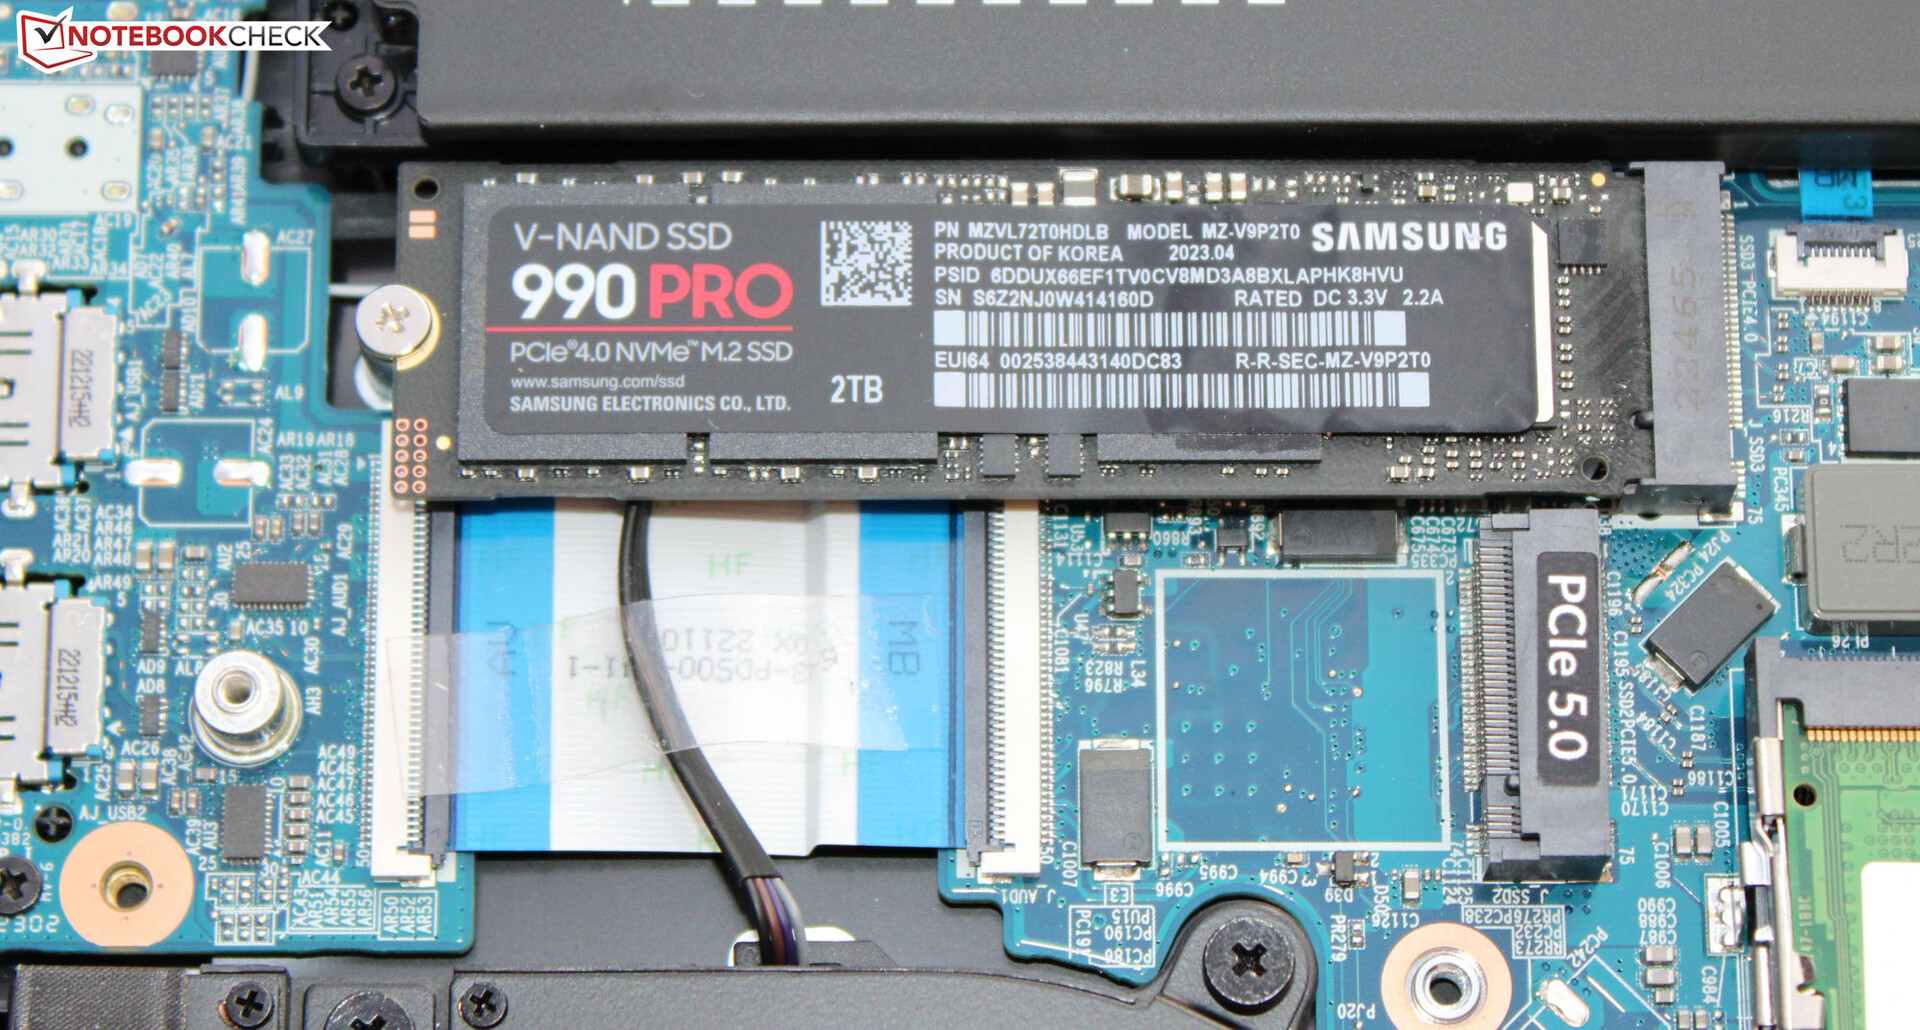
 GeForce RTX 4090 Laptop GPU, i9-13900HX, Samsung 990 Pro 2 TB MZVL72T0HDLB")
 GeForce RTX 4090 Laptop GPU, i9-13900HX, Samsung 990 Pro 2 TB MZVL72T0HDLB")
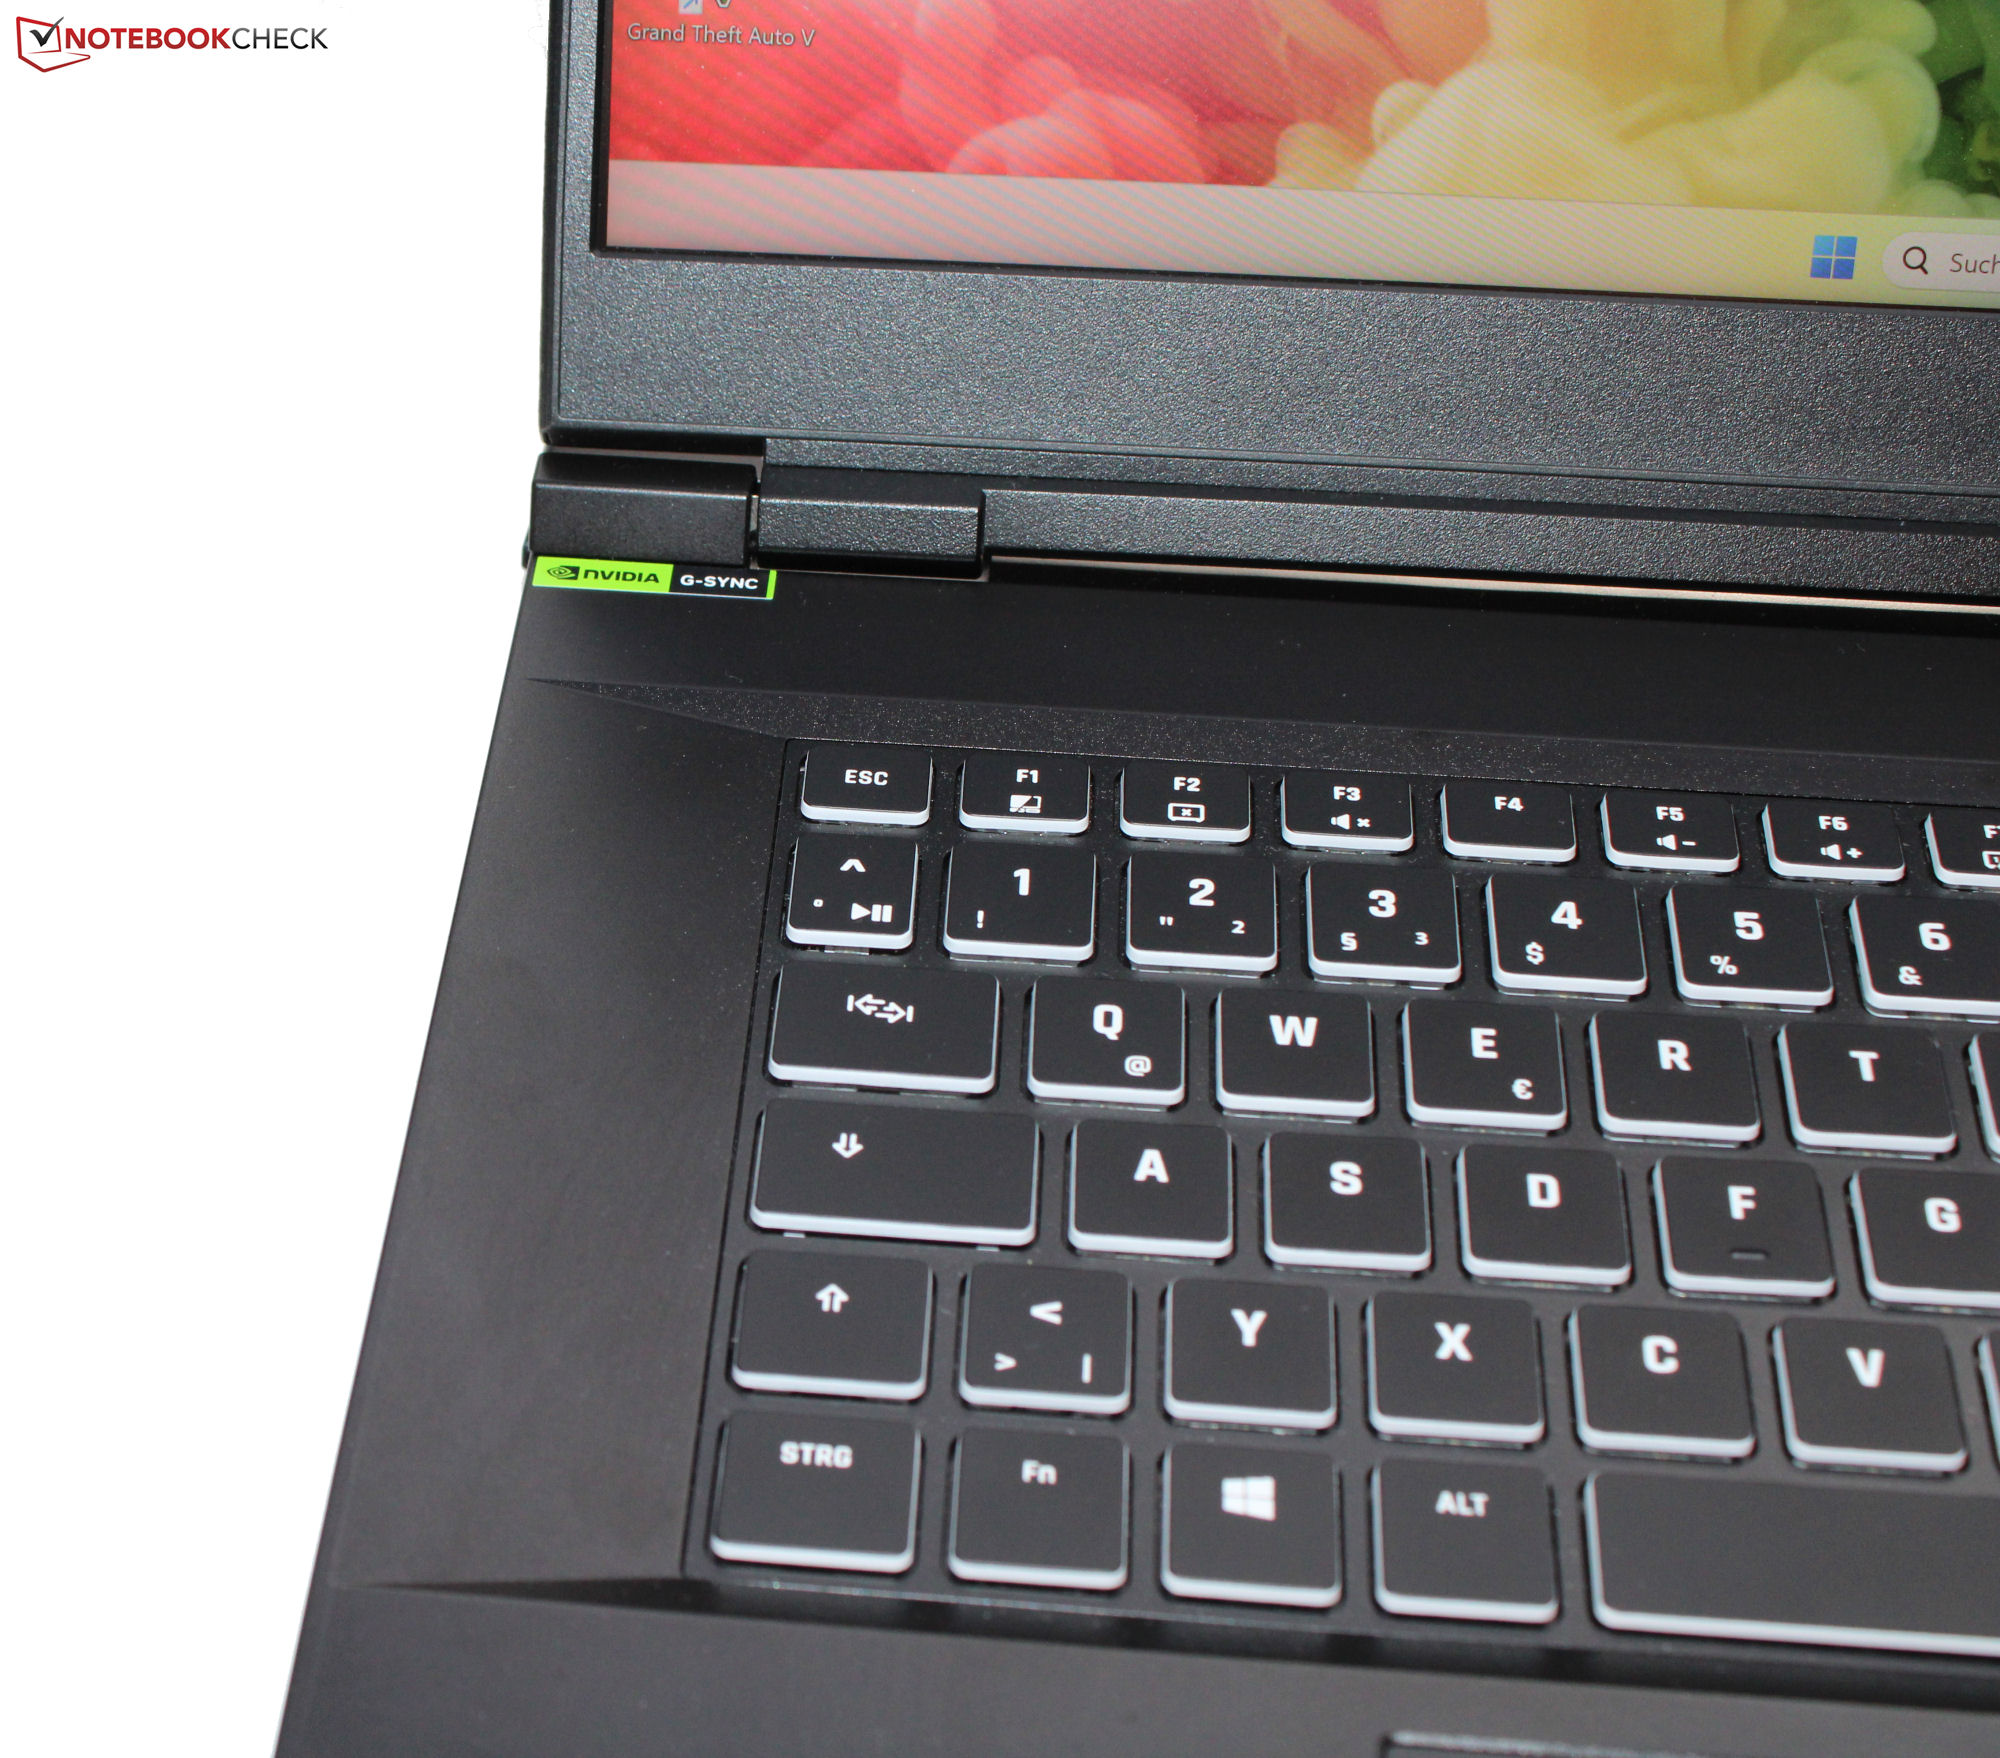
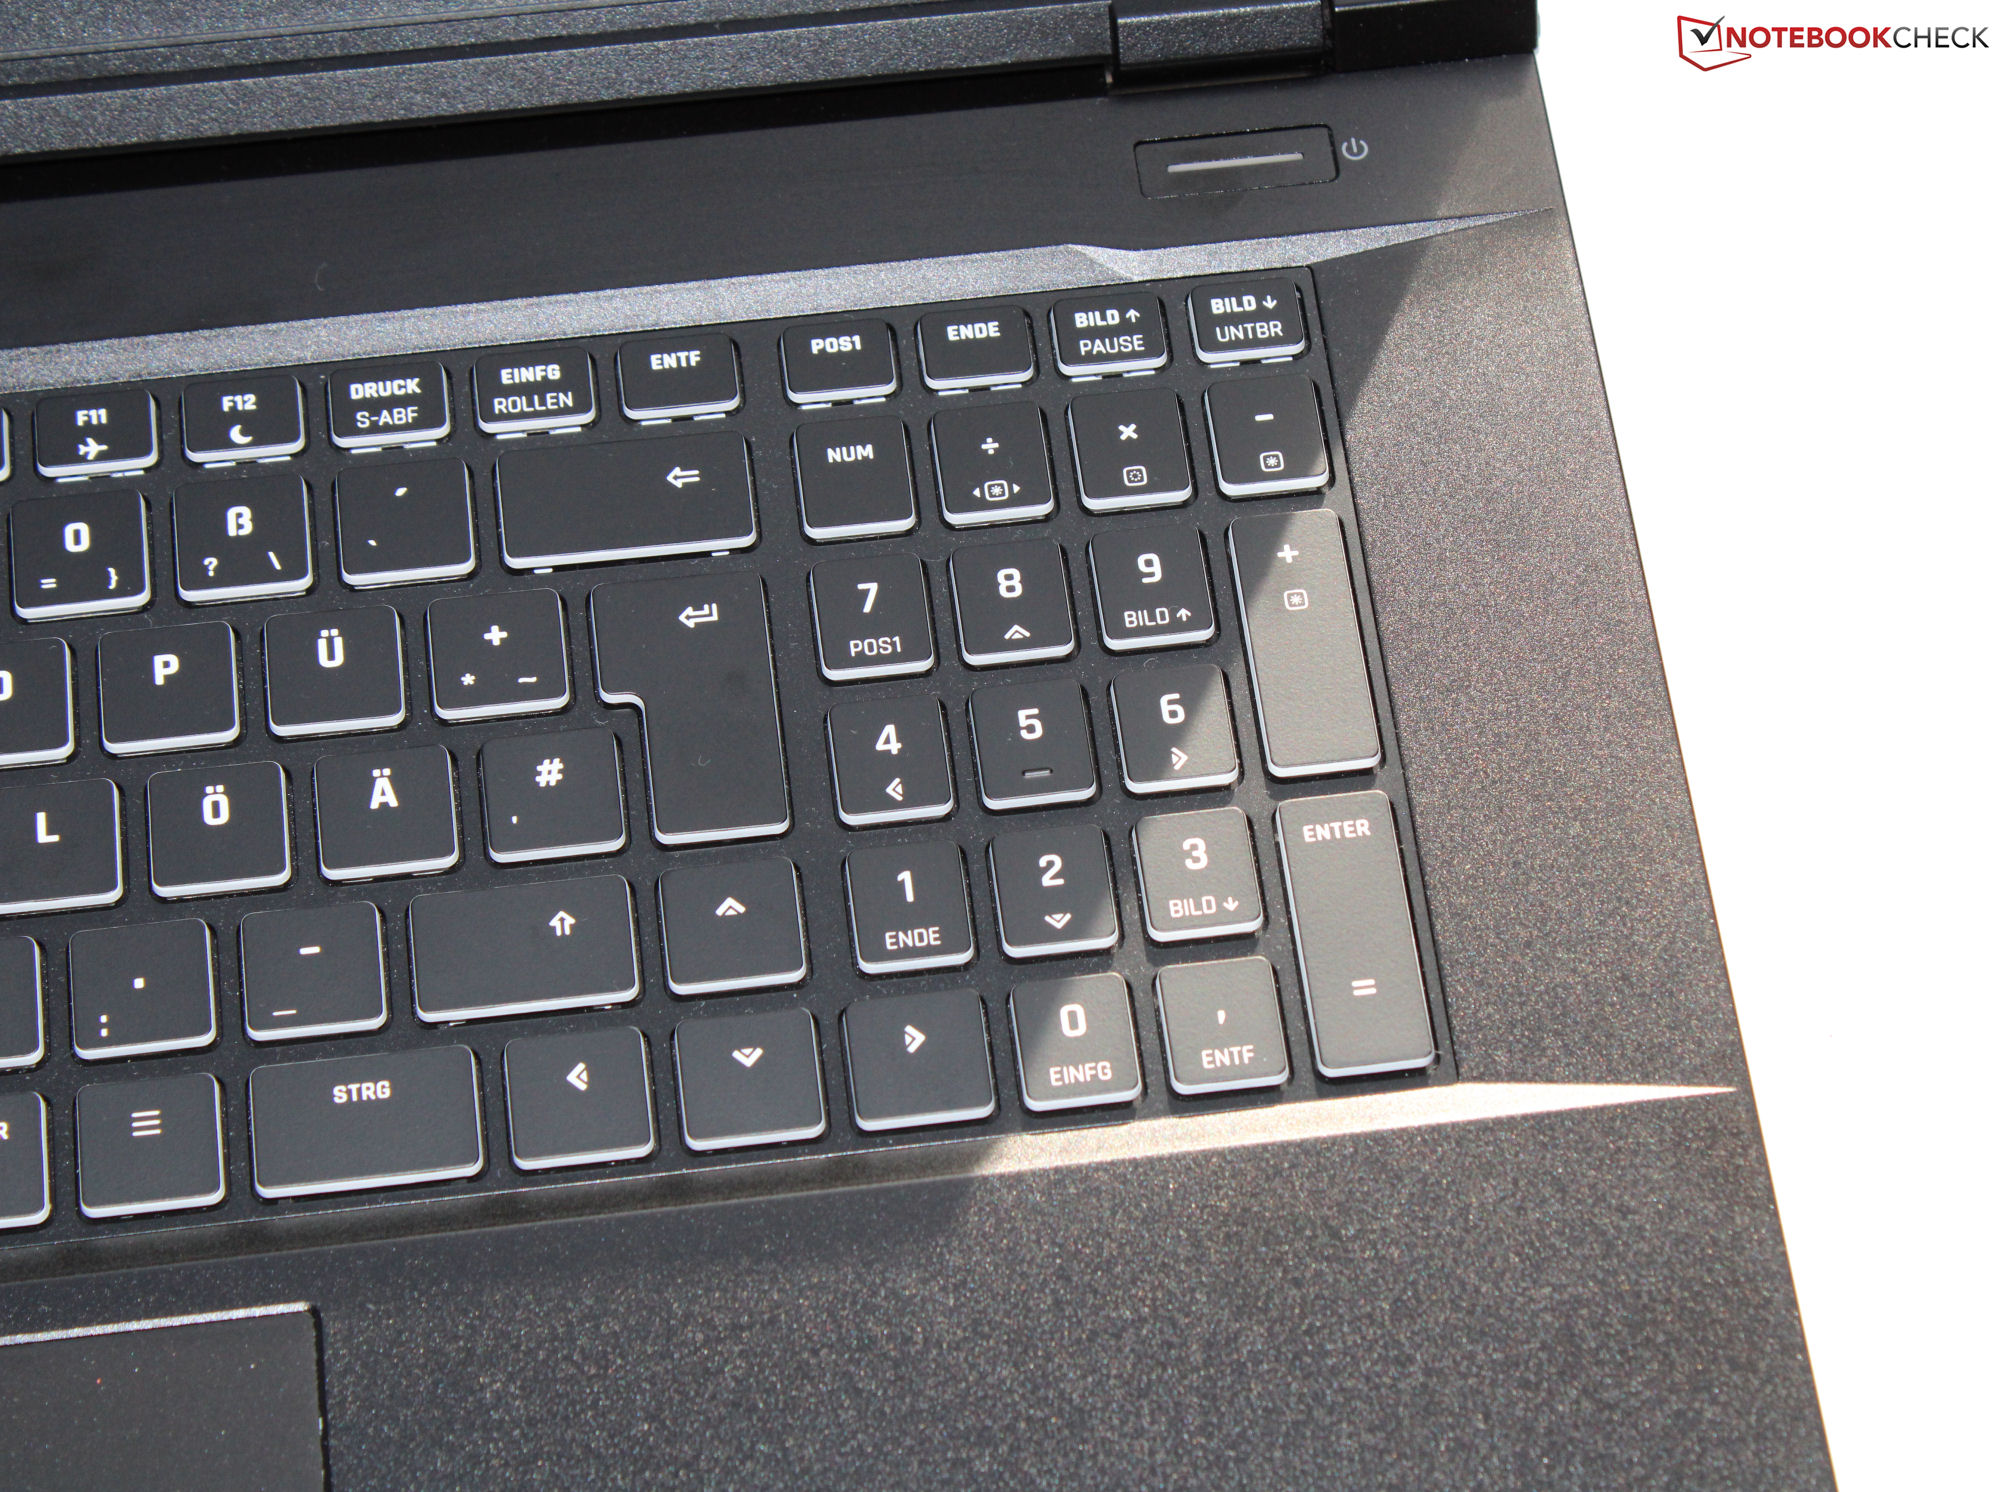
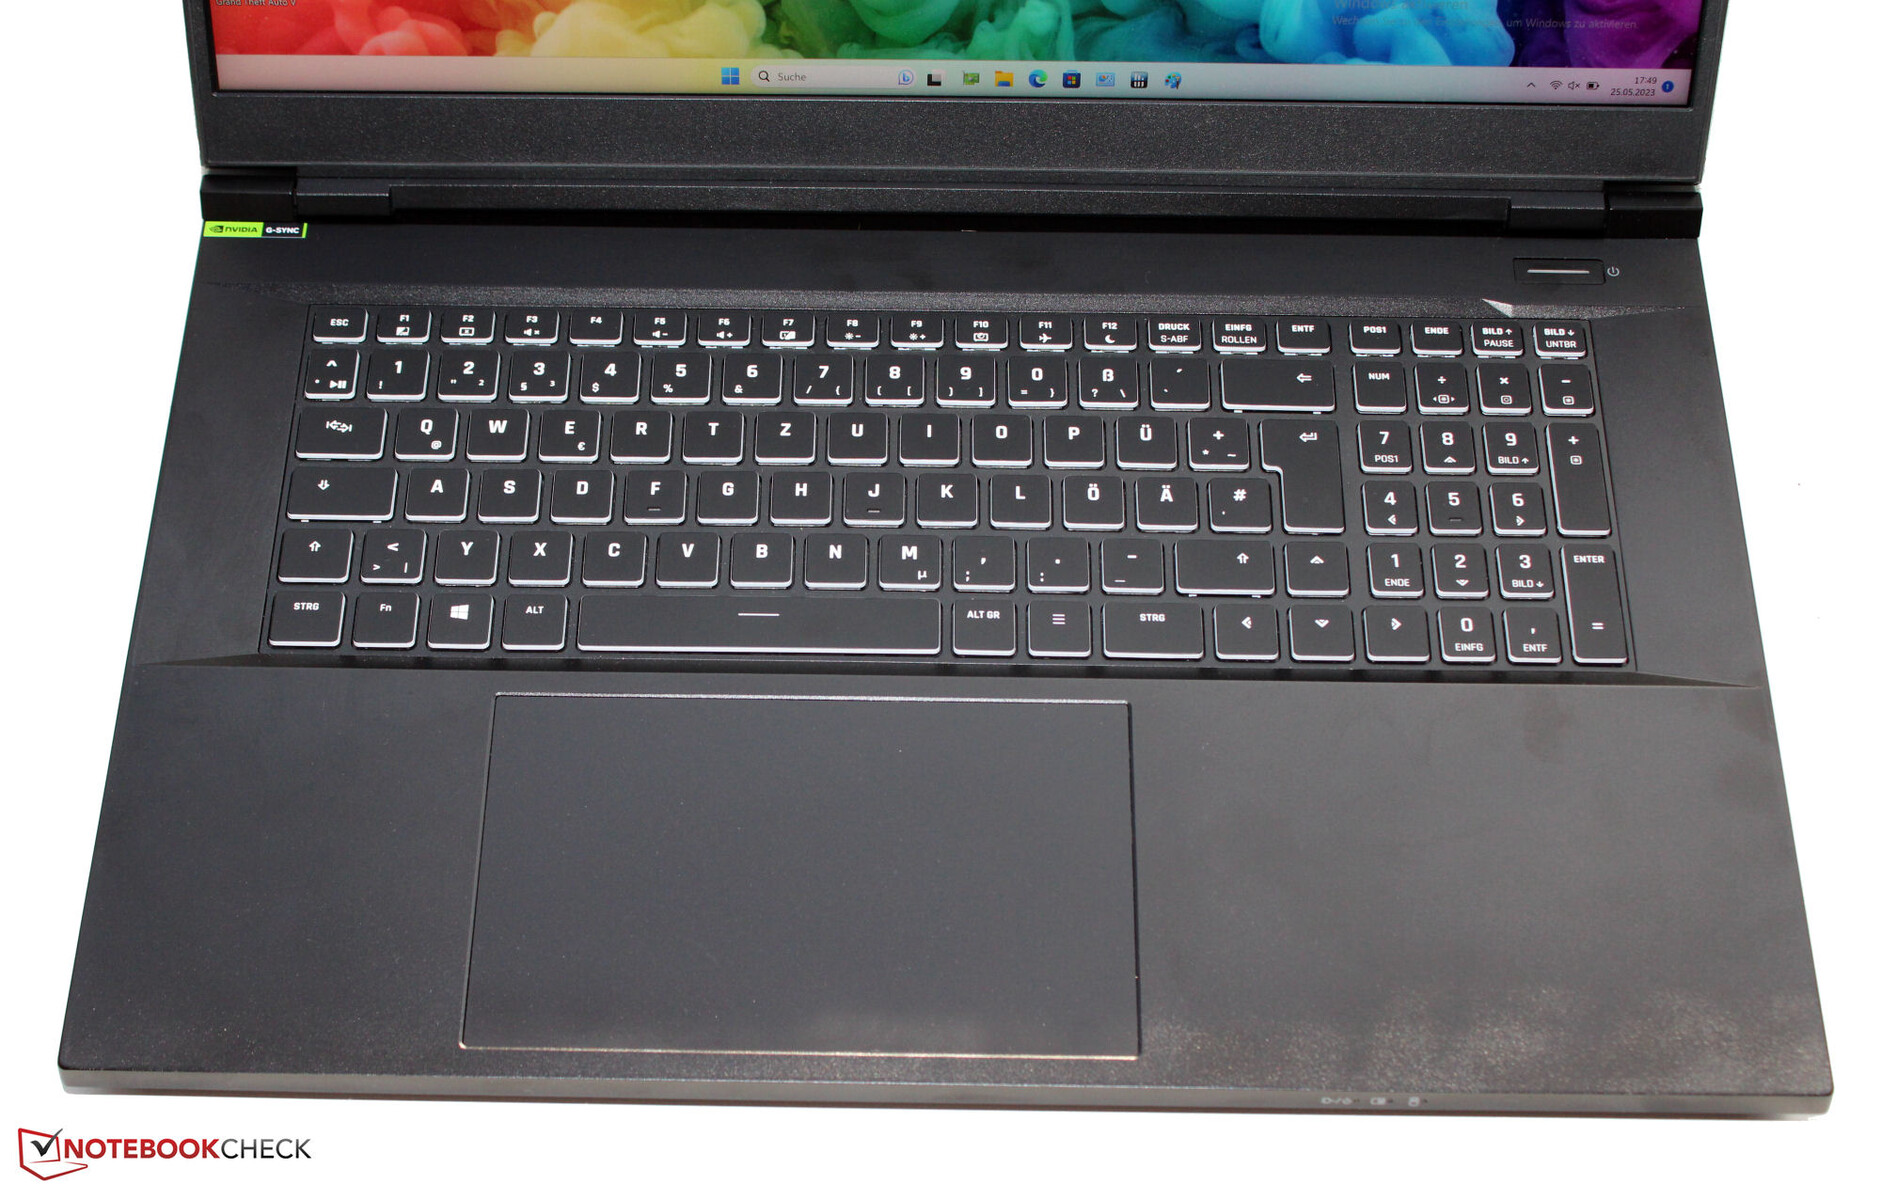
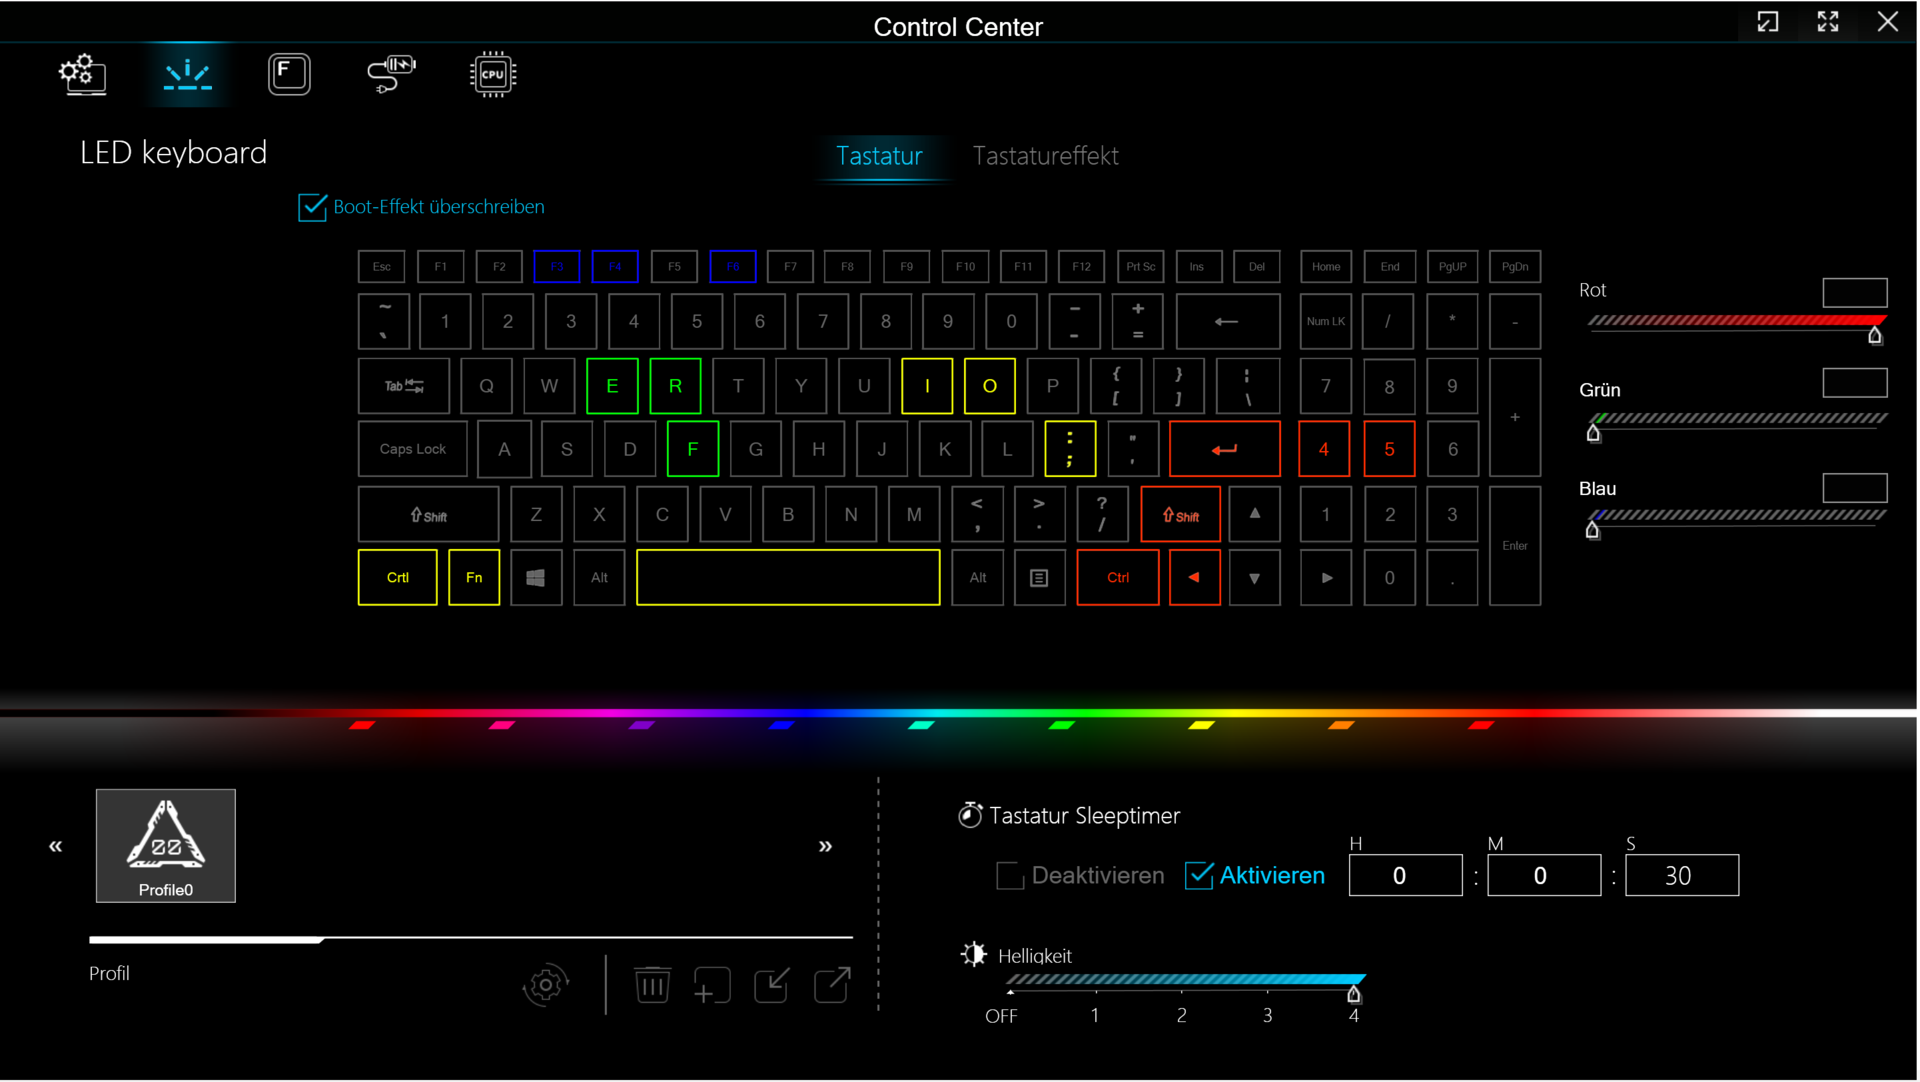
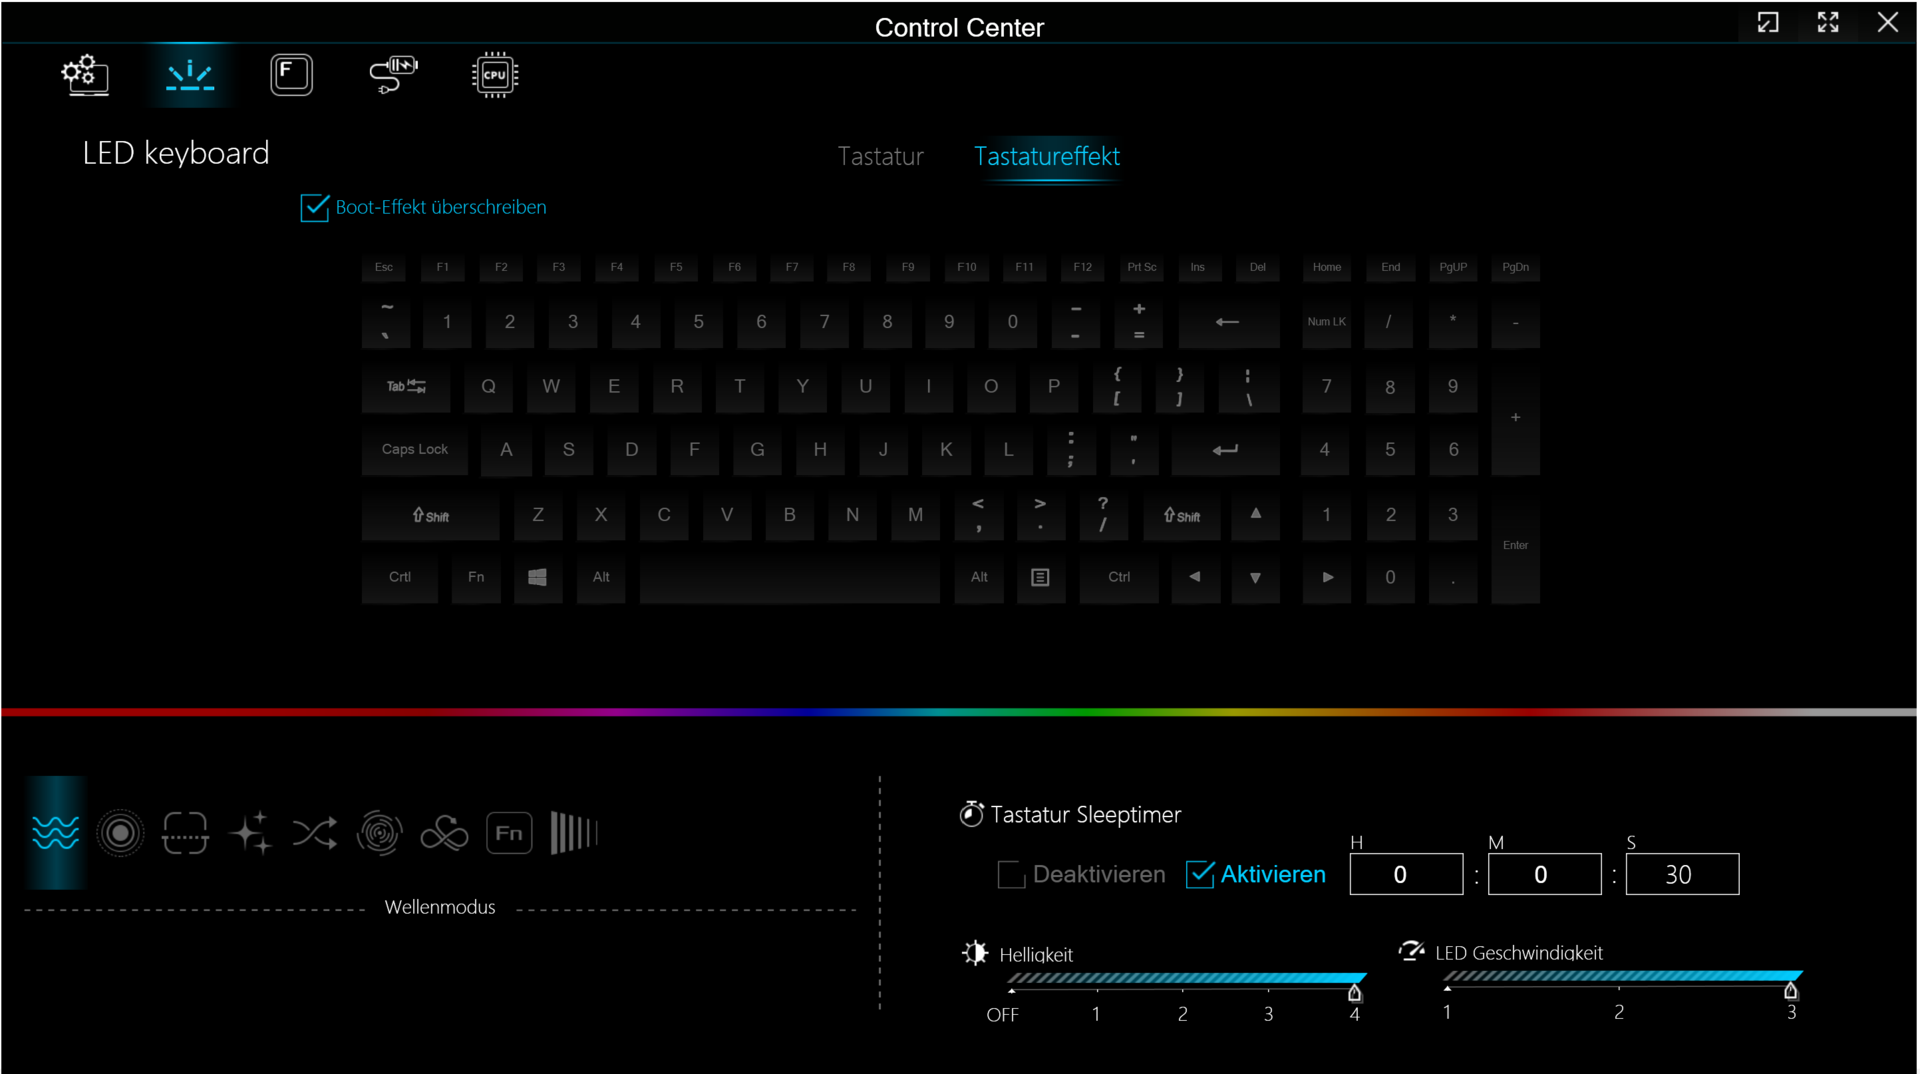
Urządzenia wejściowe - laptop Schenker z per-key RGB
Płaskie, gładkie klawisze na klawiaturze typu chiclet (z podświetleniem RGB dla każdego klawisza) mają umiarkowany skok i charakterystyczny punkt aktywacji. Opór klawiszy mógłby być jednak naszym zdaniem wyraźniejszy. Pokład klawiatury ugina się nieco podczas pisania, ale ogólnie Schenker dostarczył odpowiednią klawiaturę do codziennego użytku. Key 17 Pro posiada również touchpad (o wymiarach około 15 x 9,1 cm lub 5,9 x 3,6 cala) z krótkim skokiem i wyraźnym punktem kliknięcia.
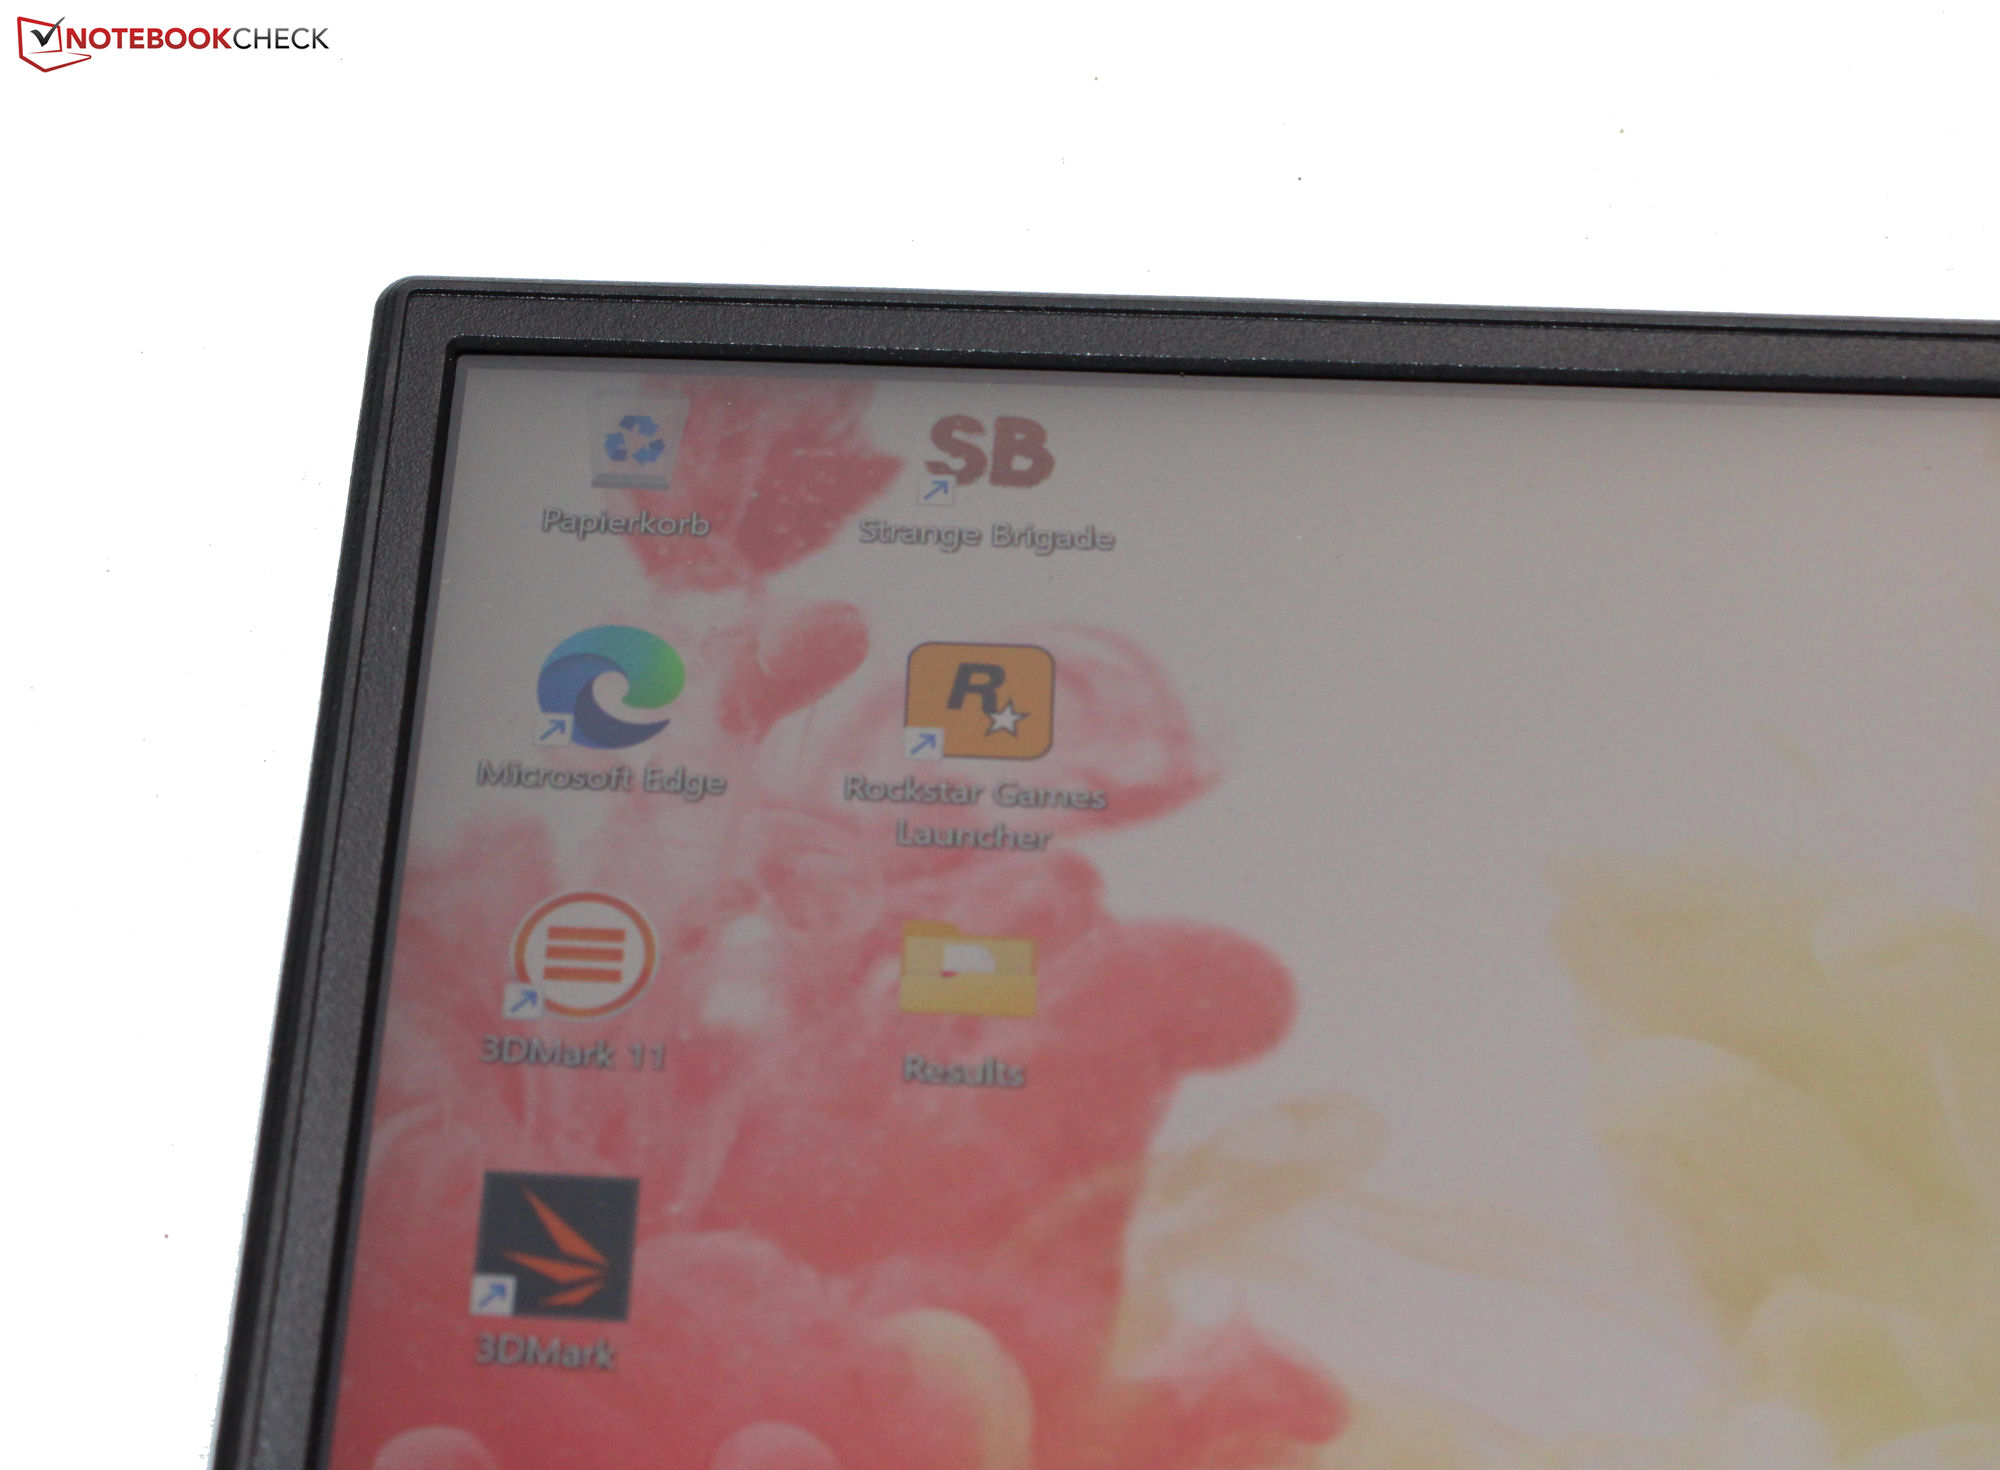
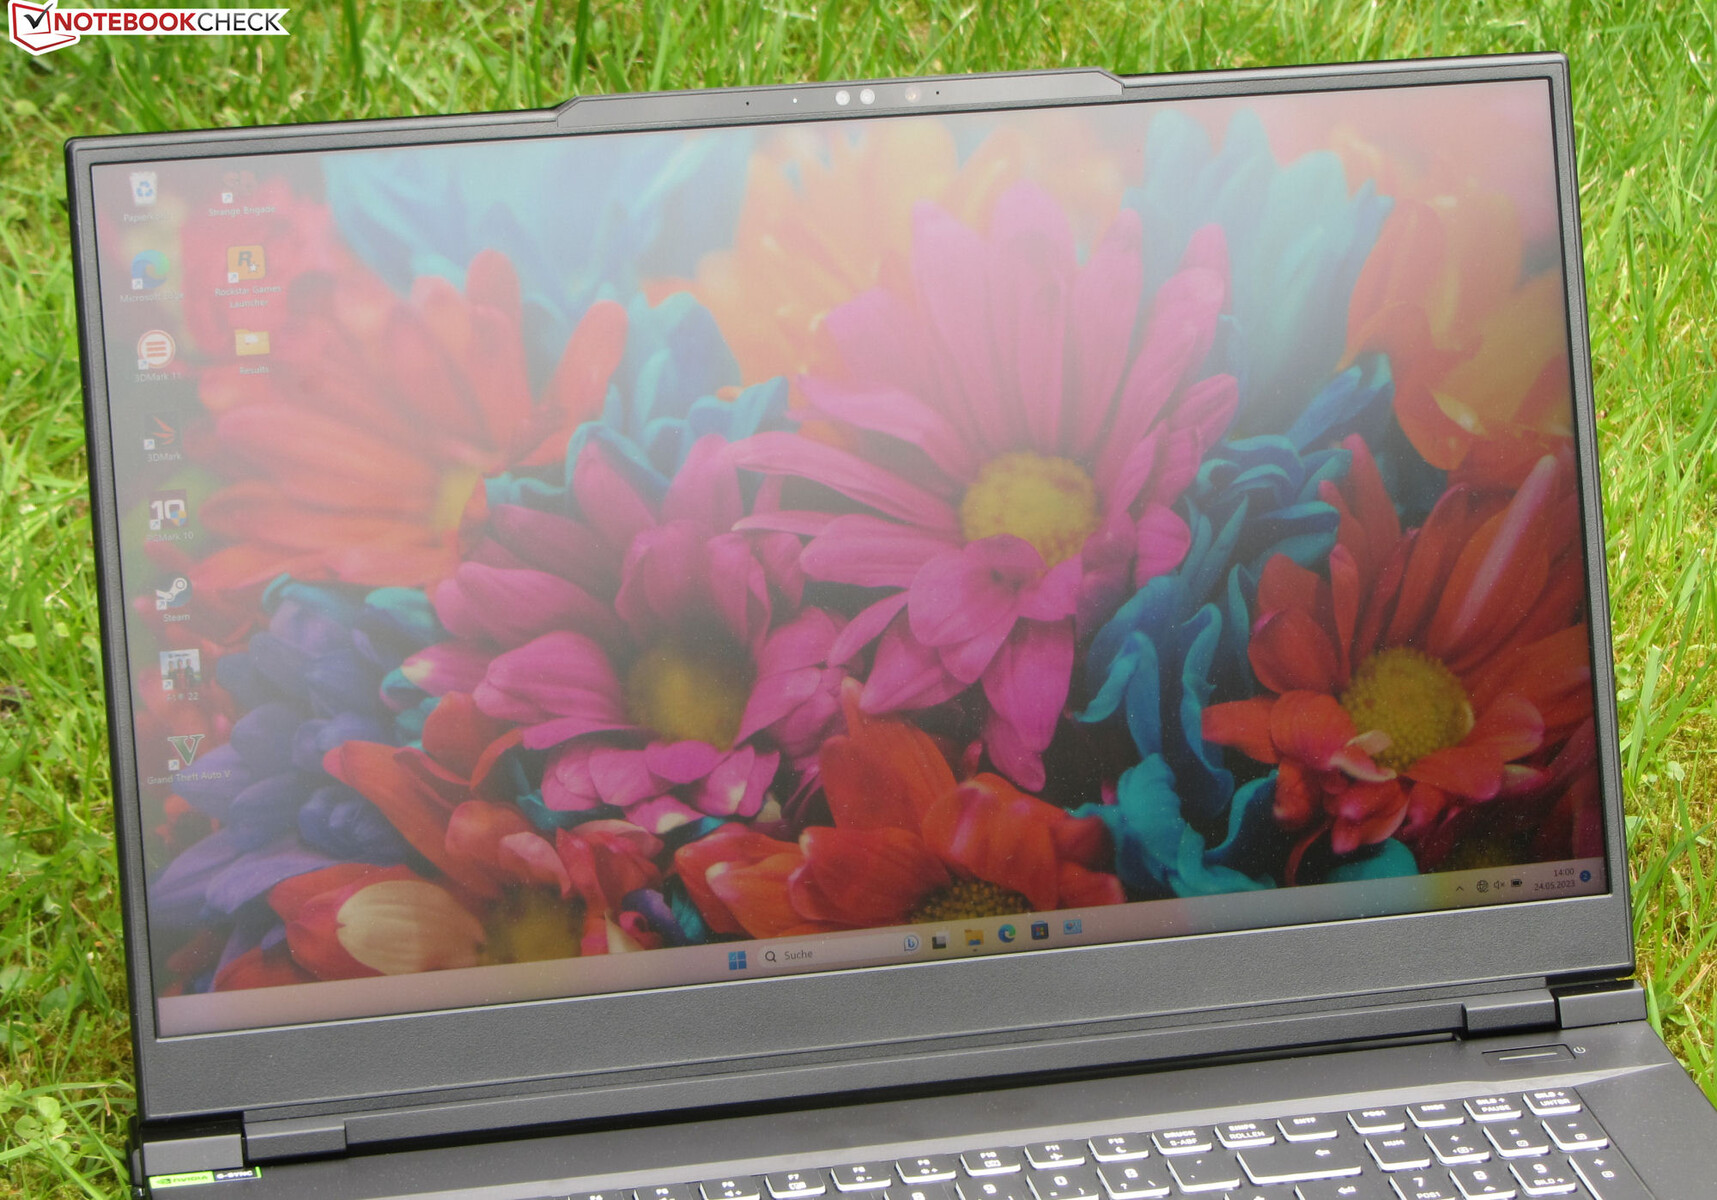
Wyświetlacz - panel UHD z pokryciem DCI-P3
Oprócz wyświetlacza 4K IPS (3,840 x 2,150 pikseli, 144 Hz) w recenzowanej jednostce, Schenker oferuje również Key 17 Pro z panelem QHD IPS (2,560 x 1,440 pikseli, 240 Hz) - oba 17,3-calowe ekrany obsługują G-Sync.
Panel 4K charakteryzuje się wysoką jasnością i brakiem migotania PWM, a także oferuje wysoką częstotliwość odświeżania (144 Hz) i krótki czas reakcji. Niemniej jednak, nie spełnia on oczekiwań (> 1000:1), jeśli chodzi o współczynnik kontrastu.
| |||||||||||||||||||||||||
rozświetlenie: 87 %
na akumulatorze: 487 cd/m²
kontrast: 955:1 (czerń: 0.51 cd/m²)
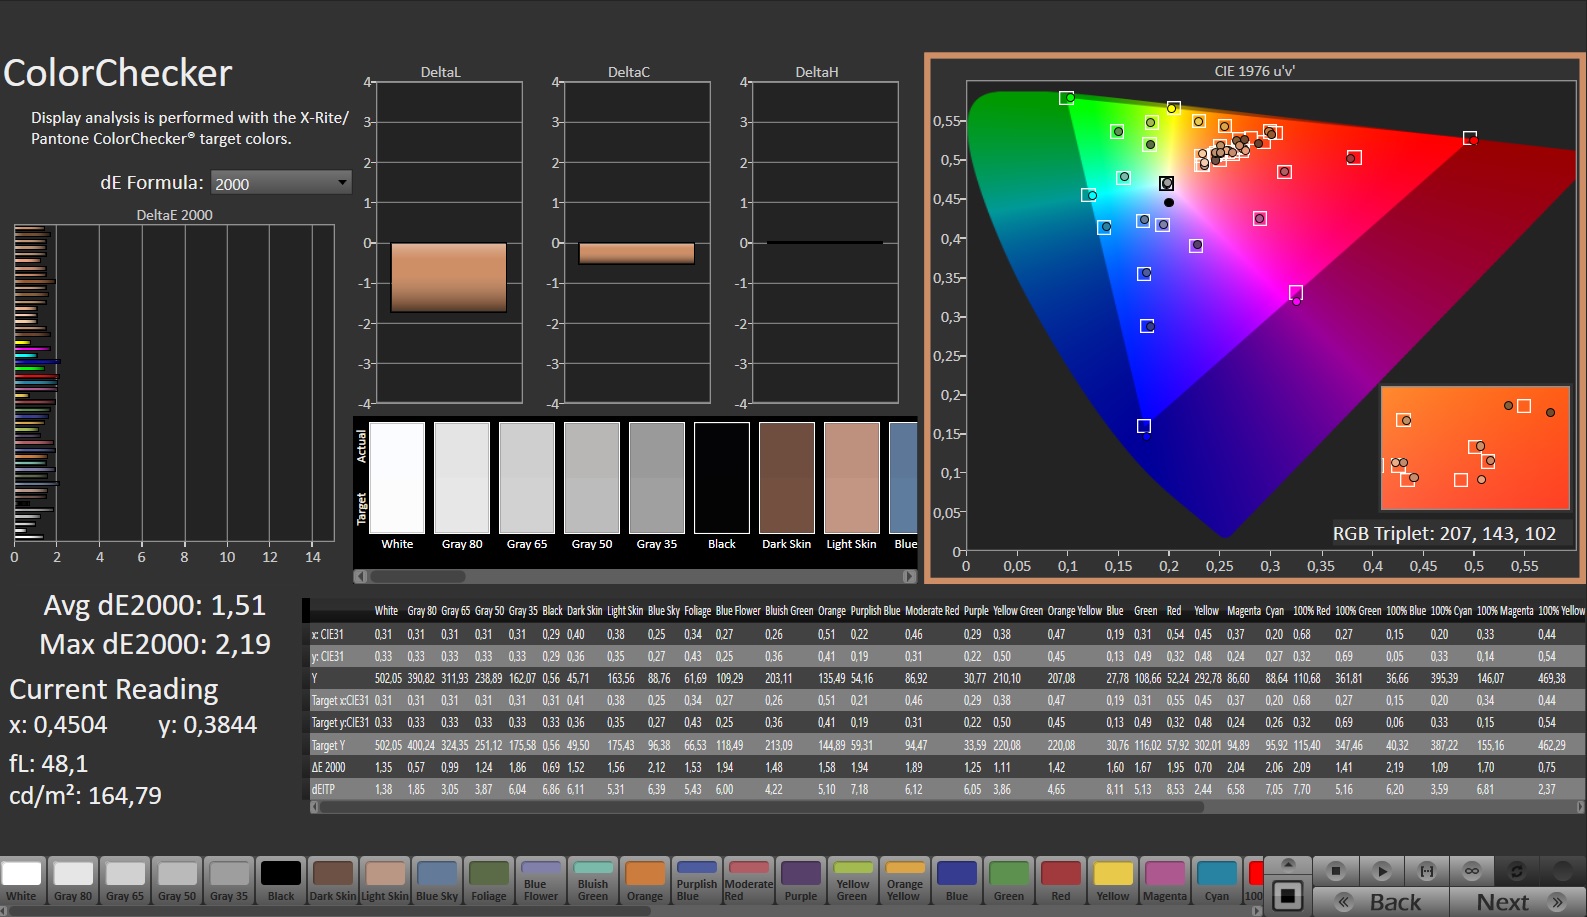
ΔE ColorChecker Calman: 1.51 | ∀{0.5-29.43 Ø4.72}
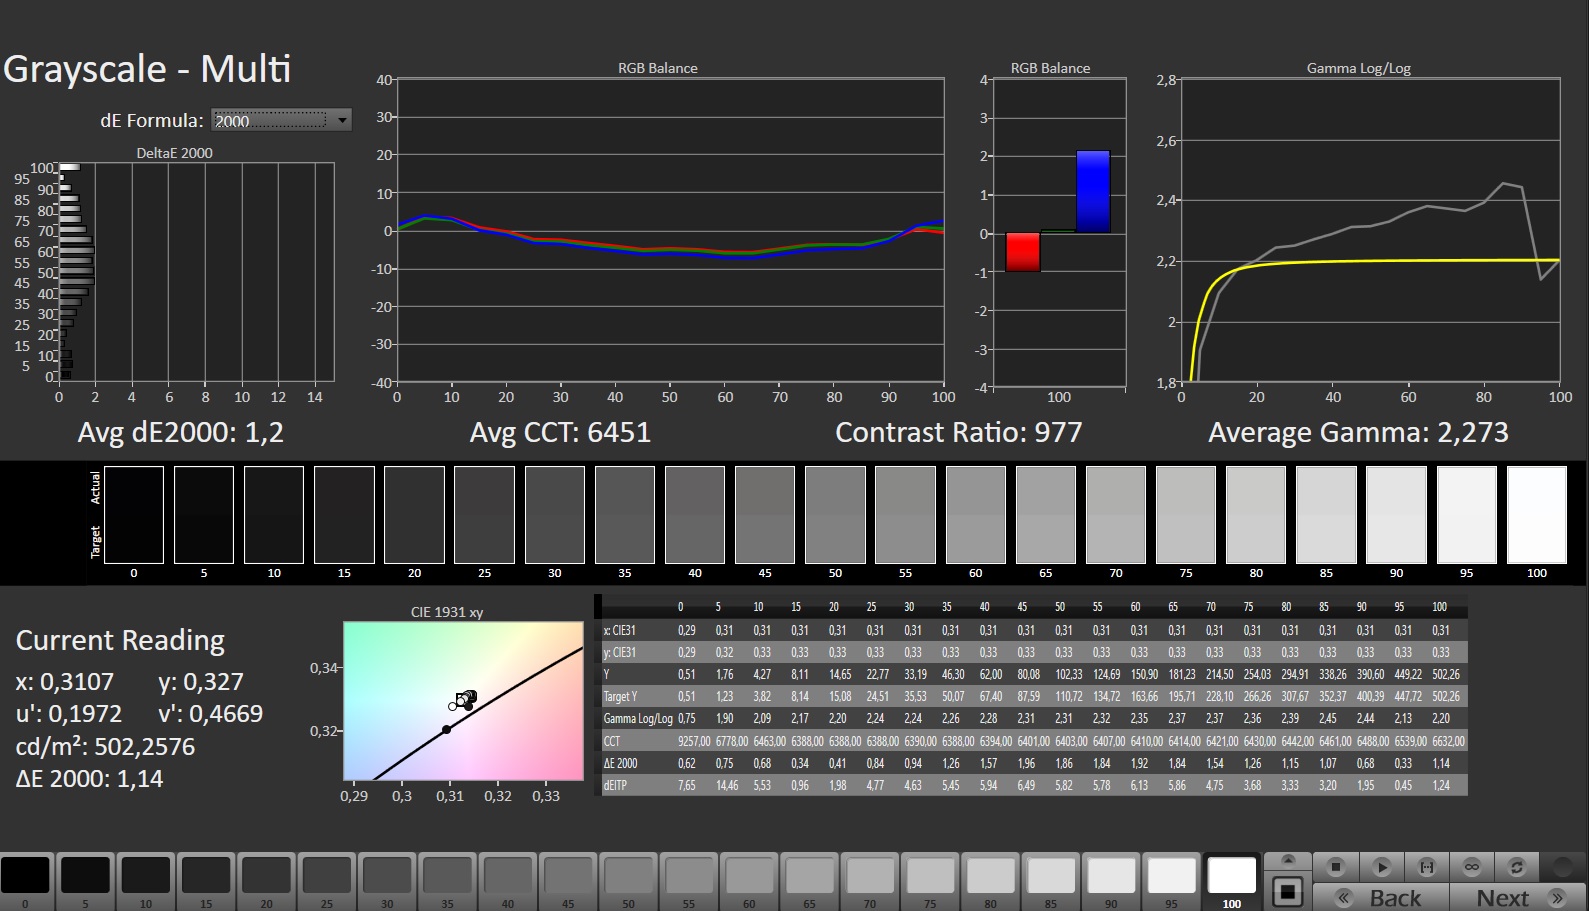
ΔE Greyscale Calman: 1.2 | ∀{0.09-98 Ø4.97}
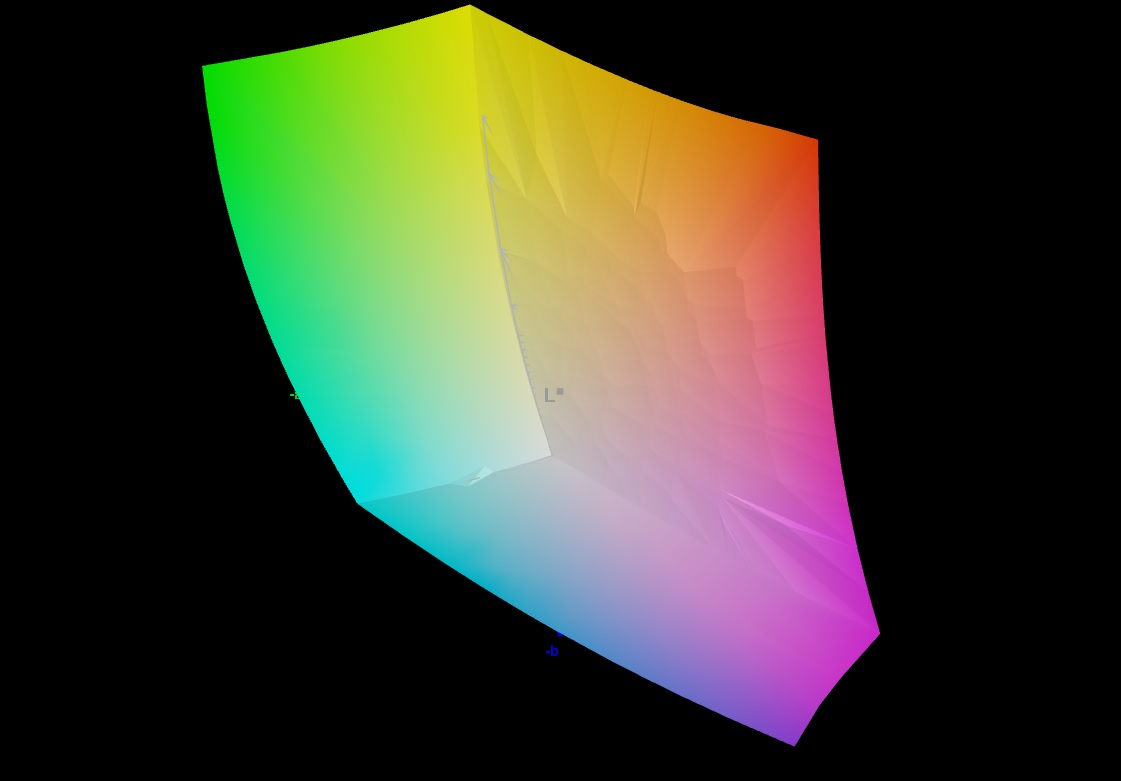
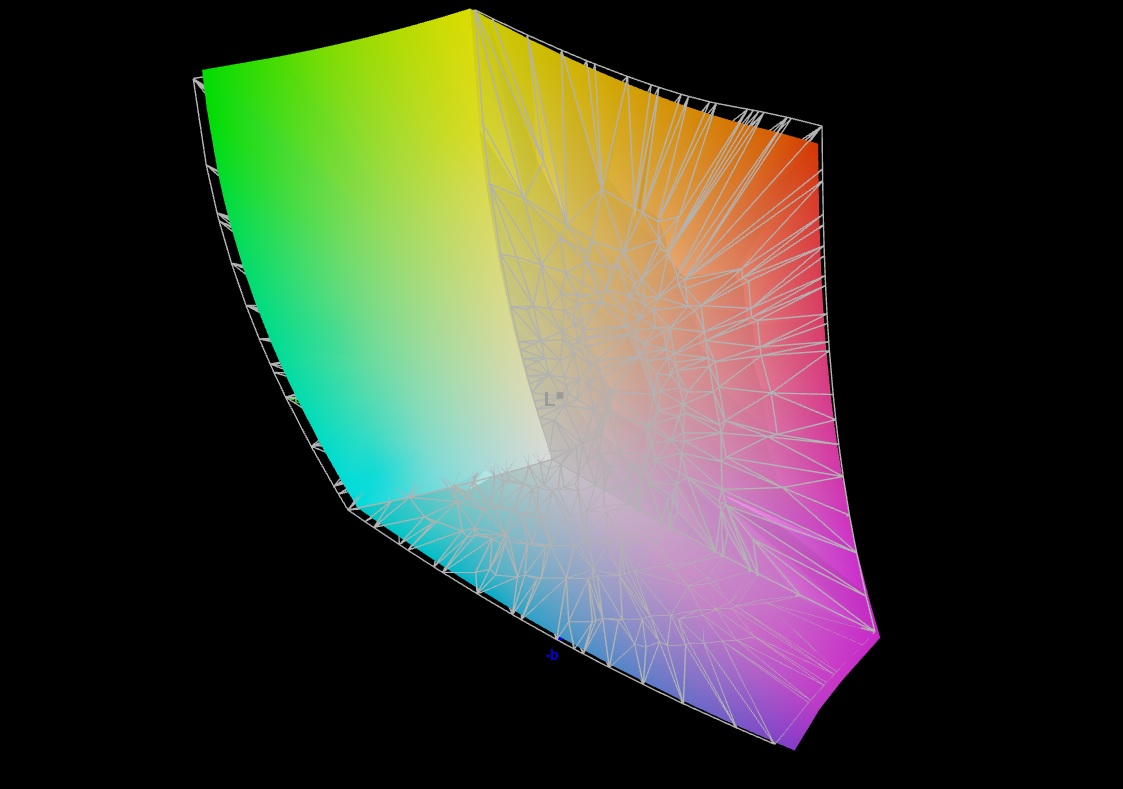
84.3% AdobeRGB 1998 (Argyll 3D)
99.9% sRGB (Argyll 3D)
96.4% Display P3 (Argyll 3D)
Gamma: 2.273
CCT: 6451 K
| Schenker Key 17 Pro (Early 23) BOE CQ NE173QUM-NY1, IPS, 3840x2160, 17.3" | MSI Stealth 17 Studio A13VH-014 AUO41A2 B173ZAN06.C, Mini LED, 3840x2160, 17.3" | Asus ROG Strix Scar 17 G733PY-XS96 NE173QHM-NZ2, IPS, 2560x1440, 17.3" | Aorus 17X AZF BOE09F9, IPS, 2560x1440, 17.3" | Medion Erazer Beast X40 BOE NE170QDM-NZ1, IPS, 2560x1600, 17" | |
|---|---|---|---|---|---|
| Display | 2% | 1% | 0% | -16% | |
| Display P3 Coverage (%) | 96.4 | 92 -5% | 98 2% | 96.7 0% | 68.6 -29% |
| sRGB Coverage (%) | 99.9 | 99.1 -1% | 100 0% | 99.9 0% | 99.8 0% |
| AdobeRGB 1998 Coverage (%) | 84.3 | 94.07 12% | 85.6 2% | 84.5 0% | 69.4 -18% |
| Response Times | -62% | 0% | -18% | 10% | |
| Response Time Grey 50% / Grey 80% * (ms) | 14.8 ? | 46.4 ? -214% | 6.2 ? 58% | 14 ? 5% | 11.3 ? 24% |
| Response Time Black / White * (ms) | 7.2 ? | 0.62 ? 91% | 11.4 ? -58% | 10.1 ? -40% | 7.5 ? -4% |
| PWM Frequency (Hz) | 2400 | ||||
| Screen | 221% | -8% | -57% | -29% | |
| Brightness middle (cd/m²) | 487 | 397.29 -18% | 322.5 -34% | 294 -40% | 384 -21% |
| Brightness (cd/m²) | 485 | 392 -19% | 317 -35% | 276 -43% | 377 -22% |
| Brightness Distribution (%) | 87 | 93 7% | 86 -1% | 90 3% | 90 3% |
| Black Level * (cd/m²) | 0.51 | 0.02 96% | 0.29 43% | 0.28 45% | 0.45 12% |
| Contrast (:1) | 955 | 19865 1980% | 1112 16% | 1050 10% | 853 -11% |
| Colorchecker dE 2000 * | 1.51 | 2.52 -67% | 1.15 24% | 2.81 -86% | 2.05 -36% |
| Colorchecker dE 2000 max. * | 2.19 | 3.91 -79% | 3.03 -38% | 5.7 -160% | 3.64 -66% |
| Greyscale dE 2000 * | 1.2 | 2.78 -132% | 1.7 -42% | 3.4 -183% | 2.3 -92% |
| Gamma | 2.273 97% | 2.63 84% | 2.27 97% | 2.301 96% | 2.017 109% |
| CCT | 6451 101% | 6412 101% | 6299 103% | 7389 88% | 6546 99% |
| Colorchecker dE 2000 calibrated * | 2.52 | 0.56 | 0.86 | 0.74 | |
| Całkowita średnia (program / ustawienia) | 54% /
127% | -2% /
-5% | -25% /
-38% | -12% /
-20% |
* ... im mniej tym lepiej
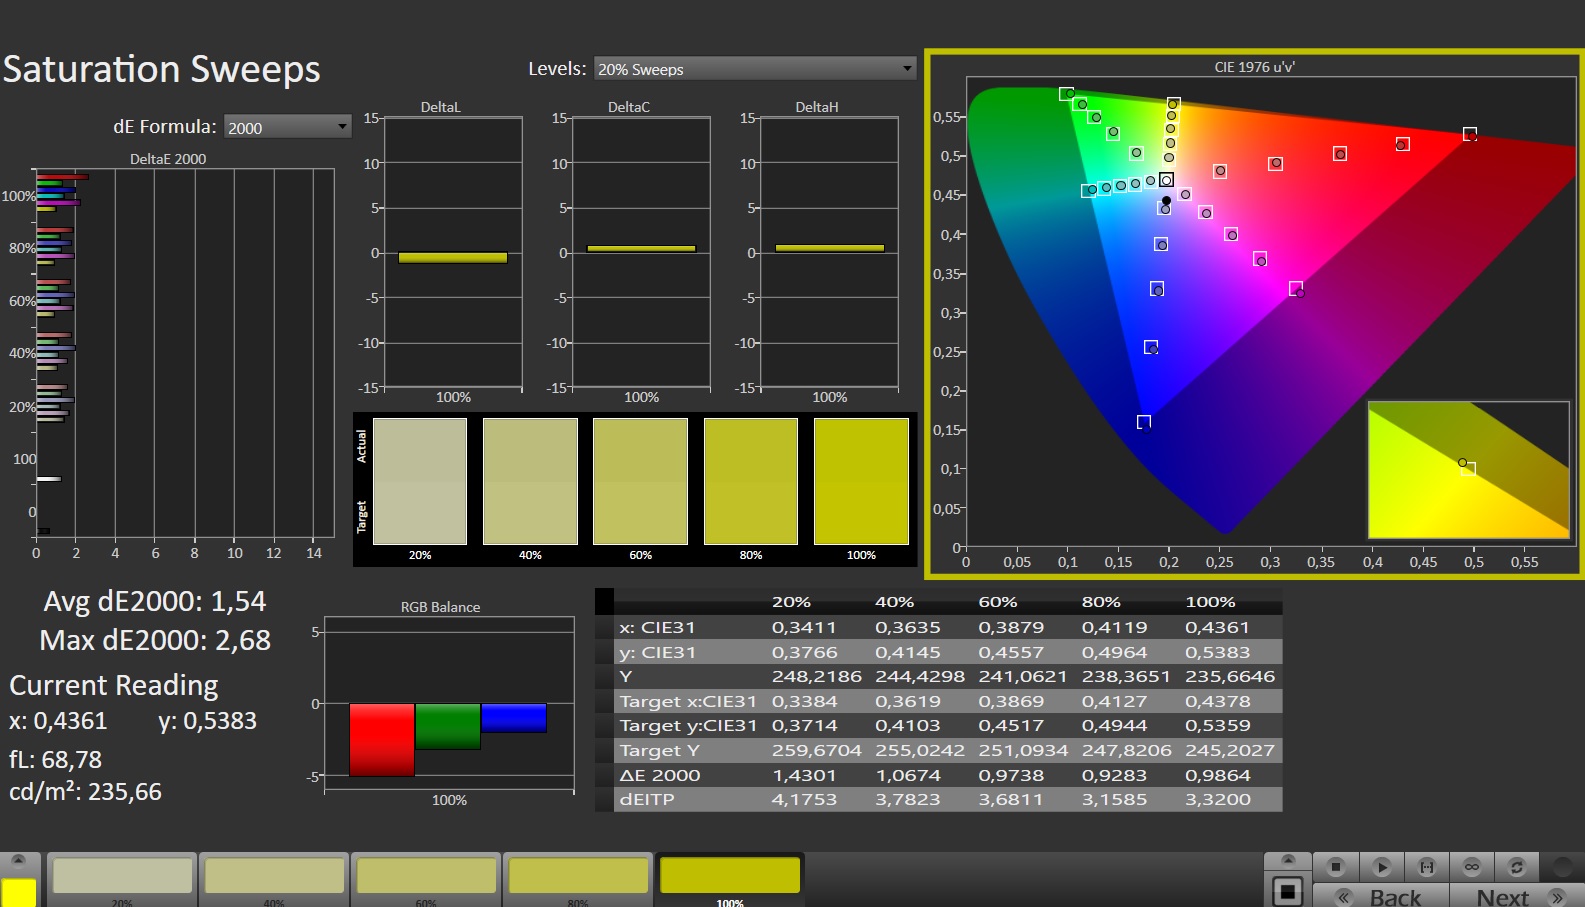
Wyświetlacz miał doskonałe odwzorowanie kolorów już po wyjęciu z pudełka. Przy około 1,5, jego średnia różnica kolorów z pewnością mieści się w tym, co uważamy za dobre (Delta E < 3). Dokładność kolorów jest oczywista: panel ma pełne pokrycie sRGB i może pokryć prawie całą przestrzeń DCI-P3; jest również w stanie odtworzyć do 84% gamy AdobeRGB.

Wyświetl czasy reakcji
| ↔ Czas reakcji od czerni do bieli | ||
|---|---|---|
| 7.2 ms ... wzrost ↗ i spadek ↘ łącznie | ↗ 2.2 ms wzrost | 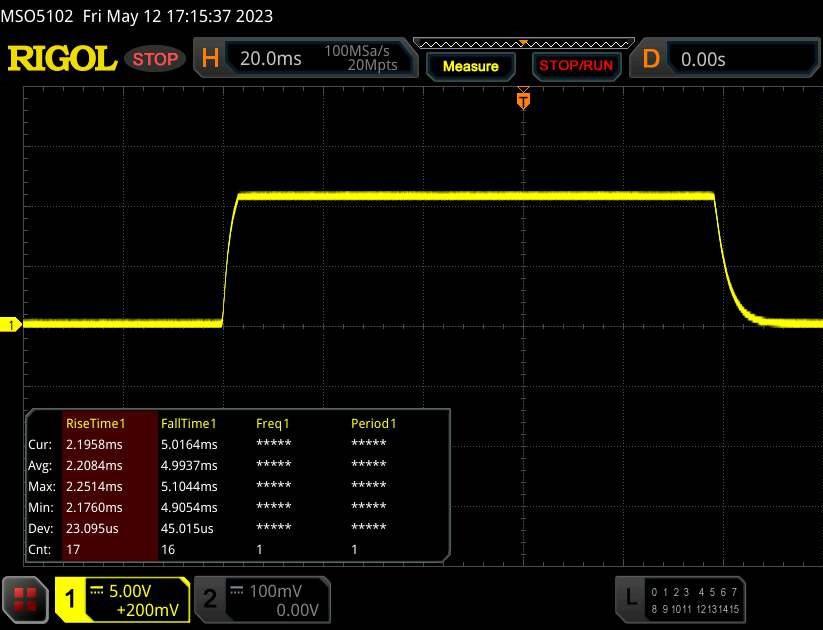 |
| ↘ 5 ms upadek | ||
| W naszych testach ekran wykazuje bardzo szybką reakcję i powinien bardzo dobrze nadawać się do szybkich gier. Dla porównania, wszystkie testowane urządzenia wahają się od 0.1 (minimum) do 240 (maksimum) ms. » 21 % wszystkich urządzeń jest lepszych. Oznacza to, że zmierzony czas reakcji jest lepszy od średniej wszystkich testowanych urządzeń (19.8 ms). | ||
| ↔ Czas reakcji 50% szarości do 80% szarości | ||
| 14.8 ms ... wzrost ↗ i spadek ↘ łącznie | ↗ 7.2 ms wzrost | 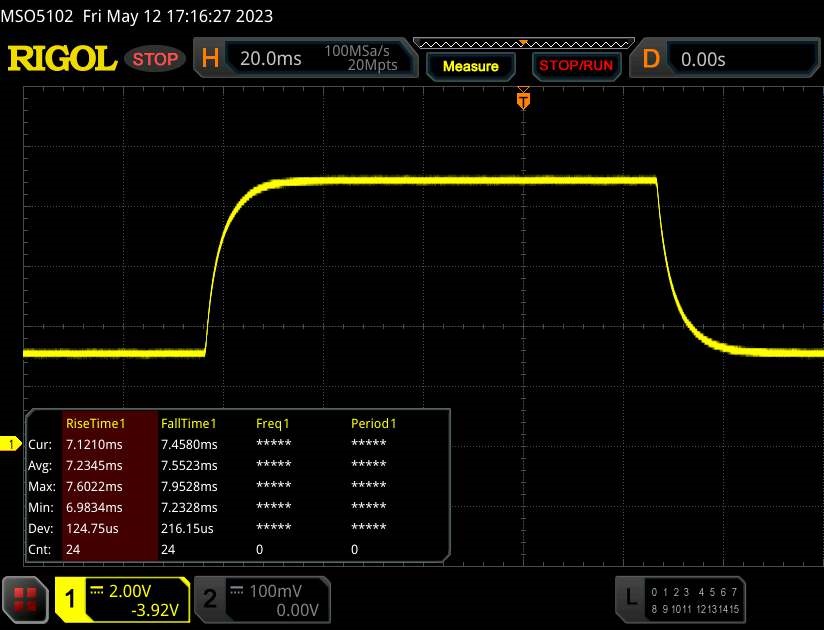 |
| ↘ 7.6 ms upadek | ||
| W naszych testach ekran wykazuje dobry współczynnik reakcji, ale może być zbyt wolny dla graczy rywalizujących ze sobą. Dla porównania, wszystkie testowane urządzenia wahają się od 0.165 (minimum) do 636 (maksimum) ms. » 29 % wszystkich urządzeń jest lepszych. Oznacza to, że zmierzony czas reakcji jest lepszy od średniej wszystkich testowanych urządzeń (31 ms). | ||
Migotanie ekranu / PWM (modulacja szerokości impulsu)
| Migotanie ekranu/nie wykryto PWM |  | ||
Dla porównania: 52 % wszystkich testowanych urządzeń nie używa PWM do przyciemniania wyświetlacza. Jeśli wykryto PWM, zmierzono średnio 7763 (minimum: 5 - maksimum: 343500) Hz. | |||
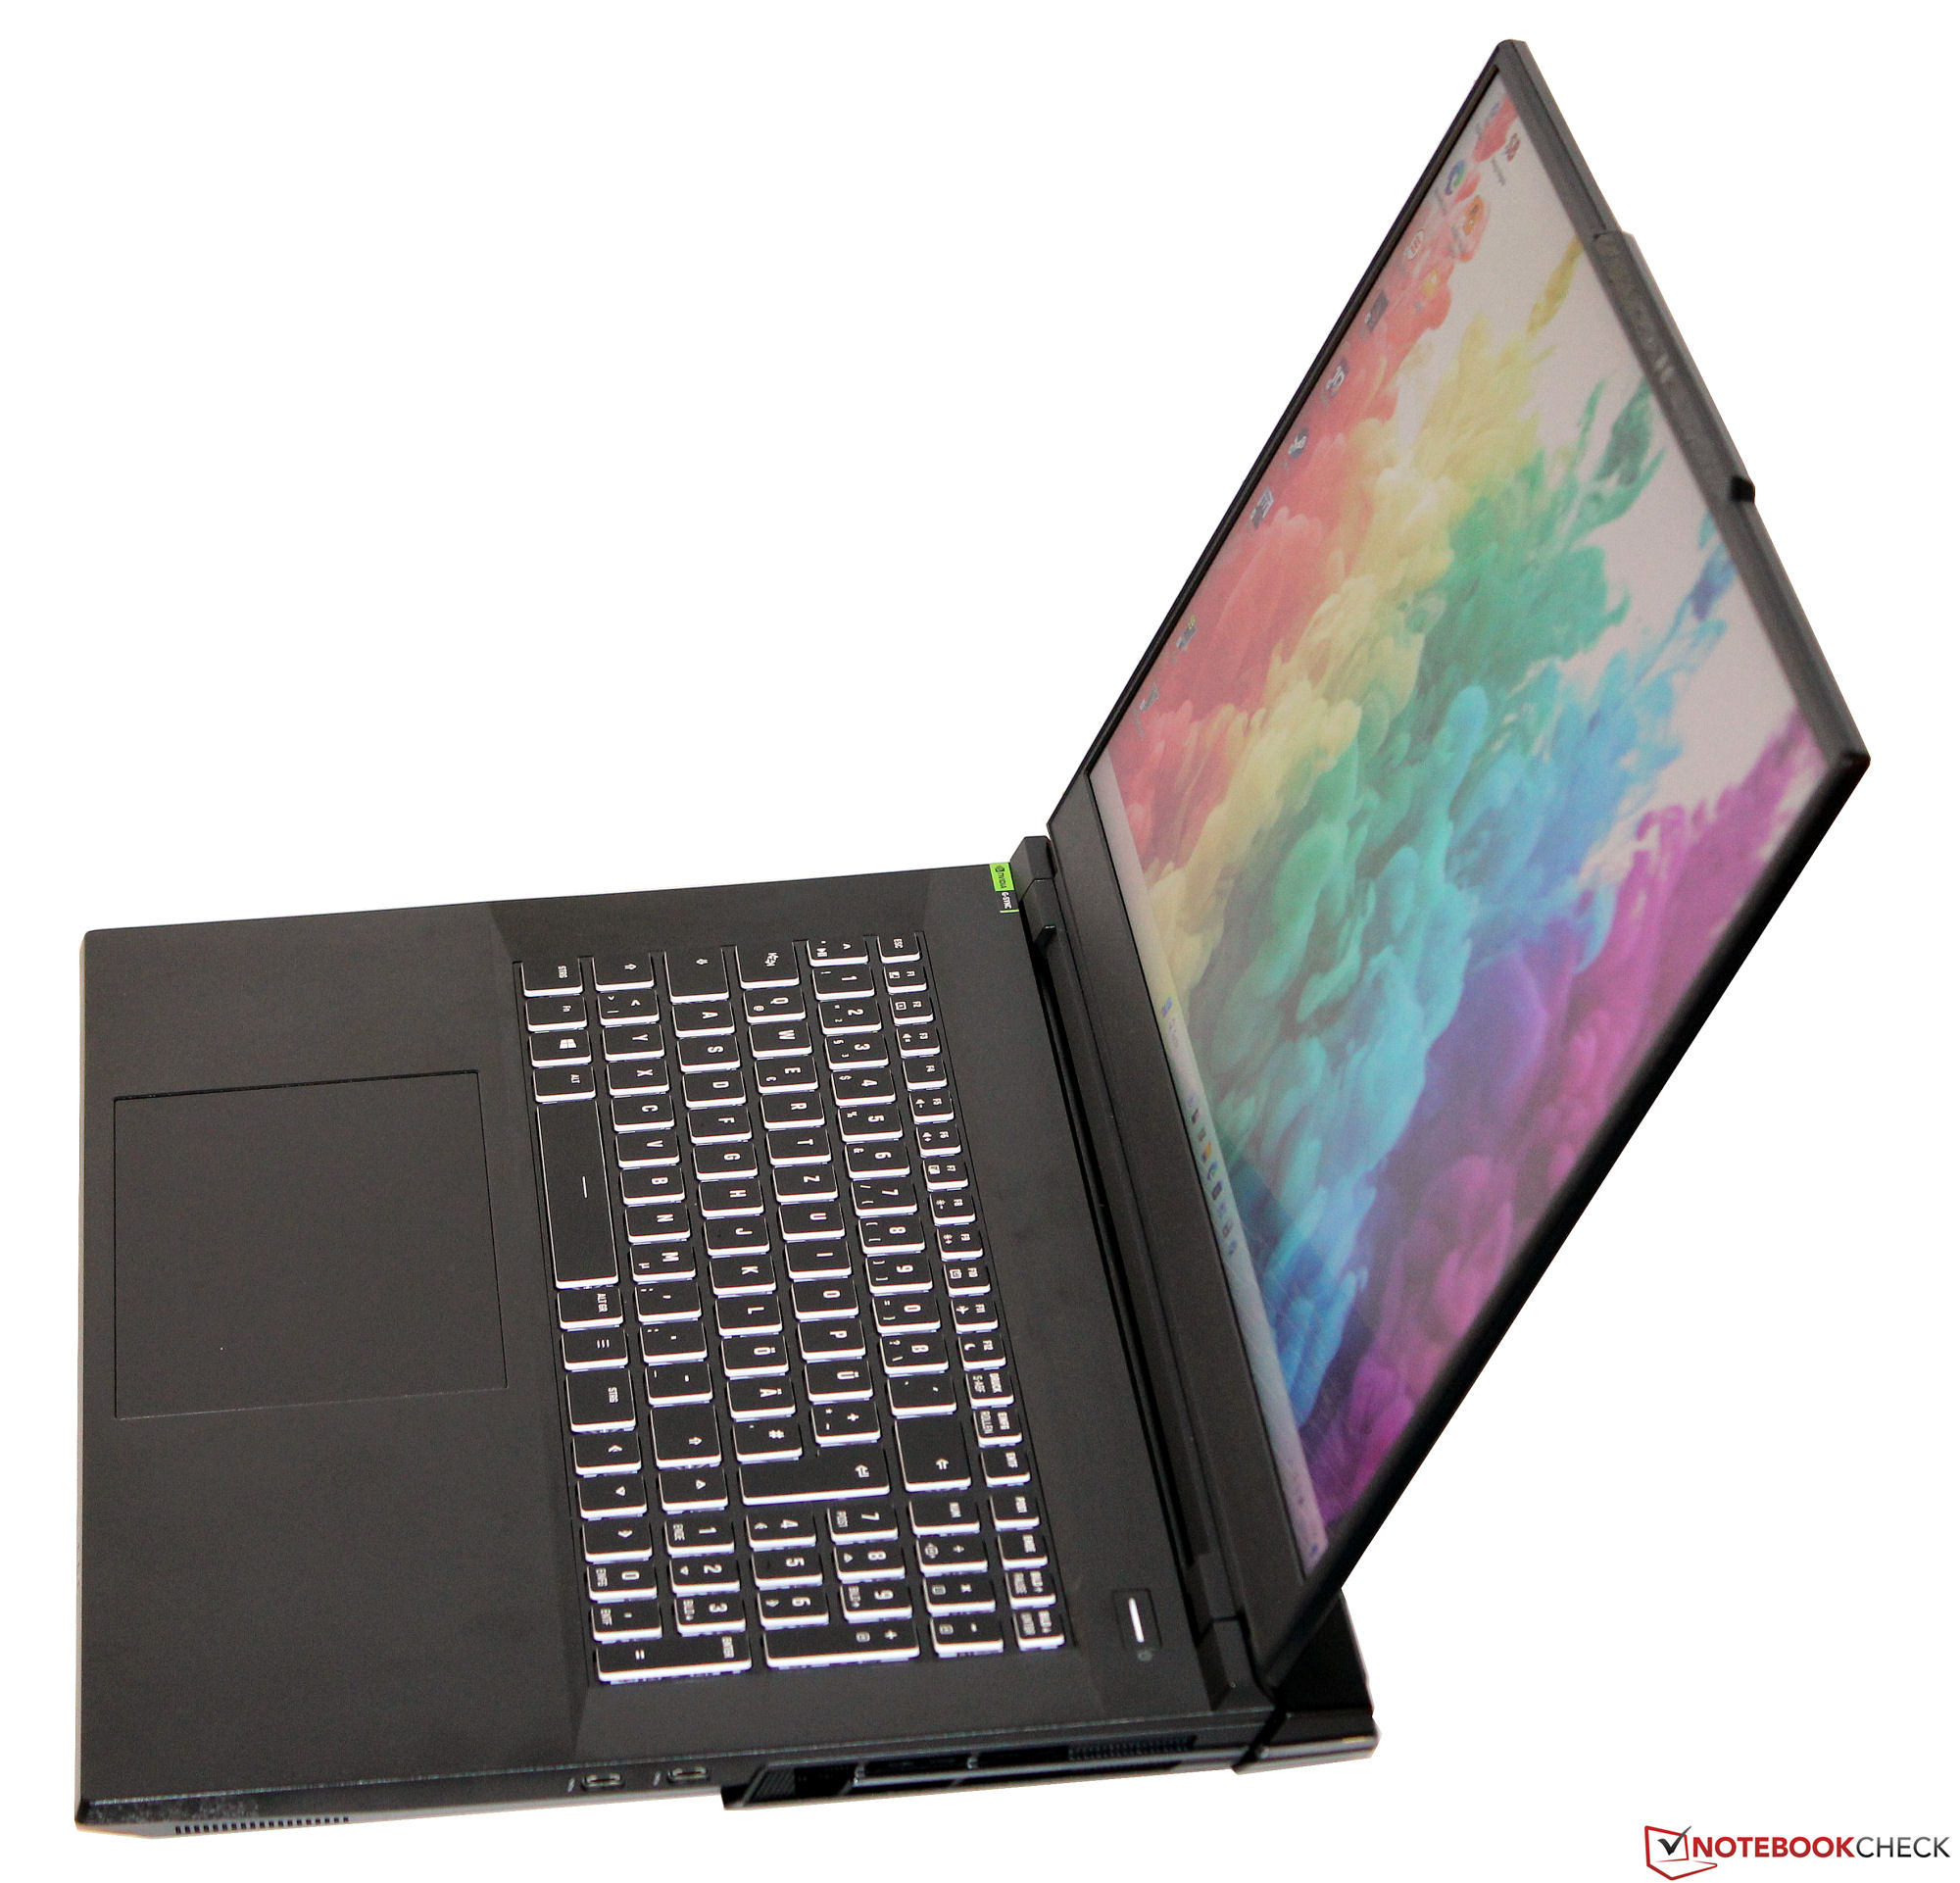
Wyświetlacz IPS jest czytelny z każdej pozycji dzięki szerokiemu kątowi widzenia. Z pewnością można dostrzec zawartość ekranu nawet na zewnątrz, pod warunkiem, że słońce nie świeci zbyt jasno.
Wydajność - Key 17 posiada wysokiej klasy sprzęt
Schenker Key 17 Pro to wysokiej klasy 17,3-calowy laptop, który wykorzystuje moc Raptor Lake i Ady Lovelace. Laptopa można skonfigurować do własnych potrzeb w sklepie internetowym Schenker. Nasza recenzja kosztowała około 4500 euro (4820 USD). Ceny zaczynają się od 3200 euro (3427 USD).
Warunki testowe
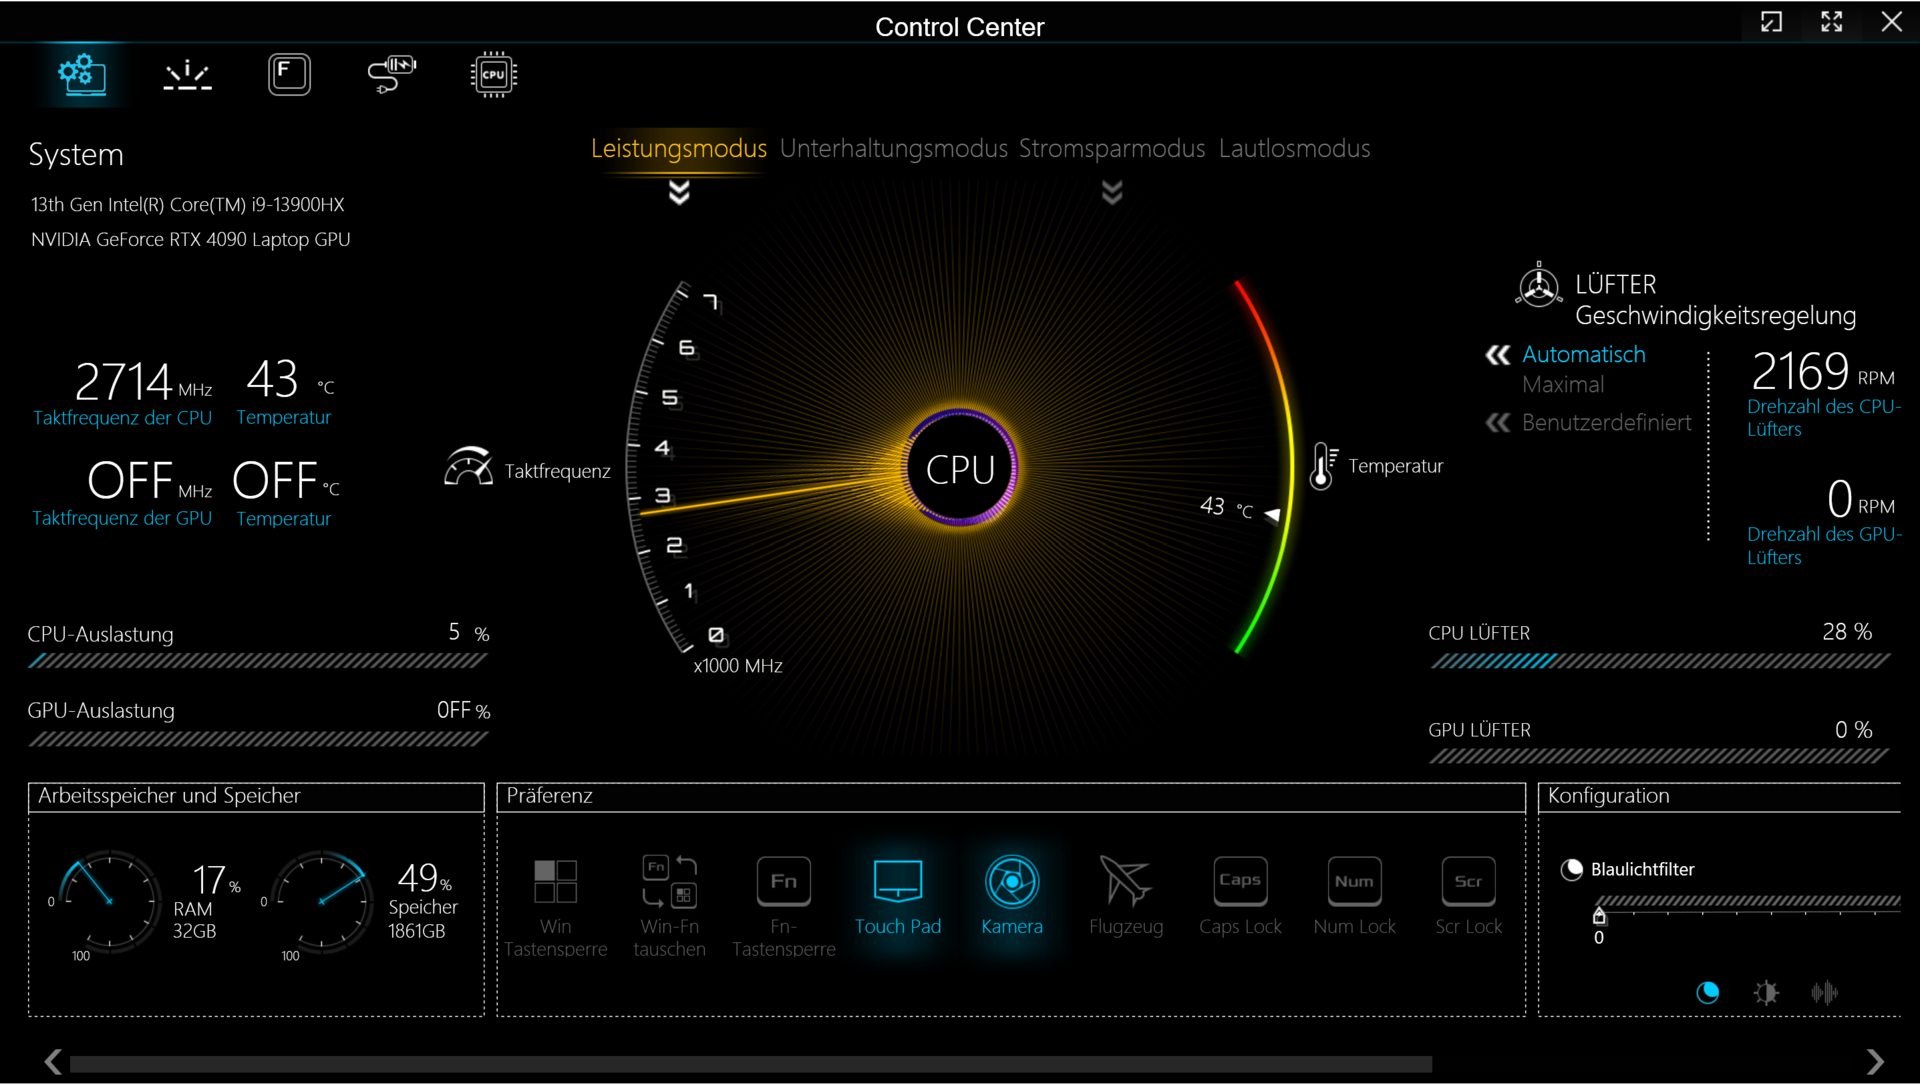
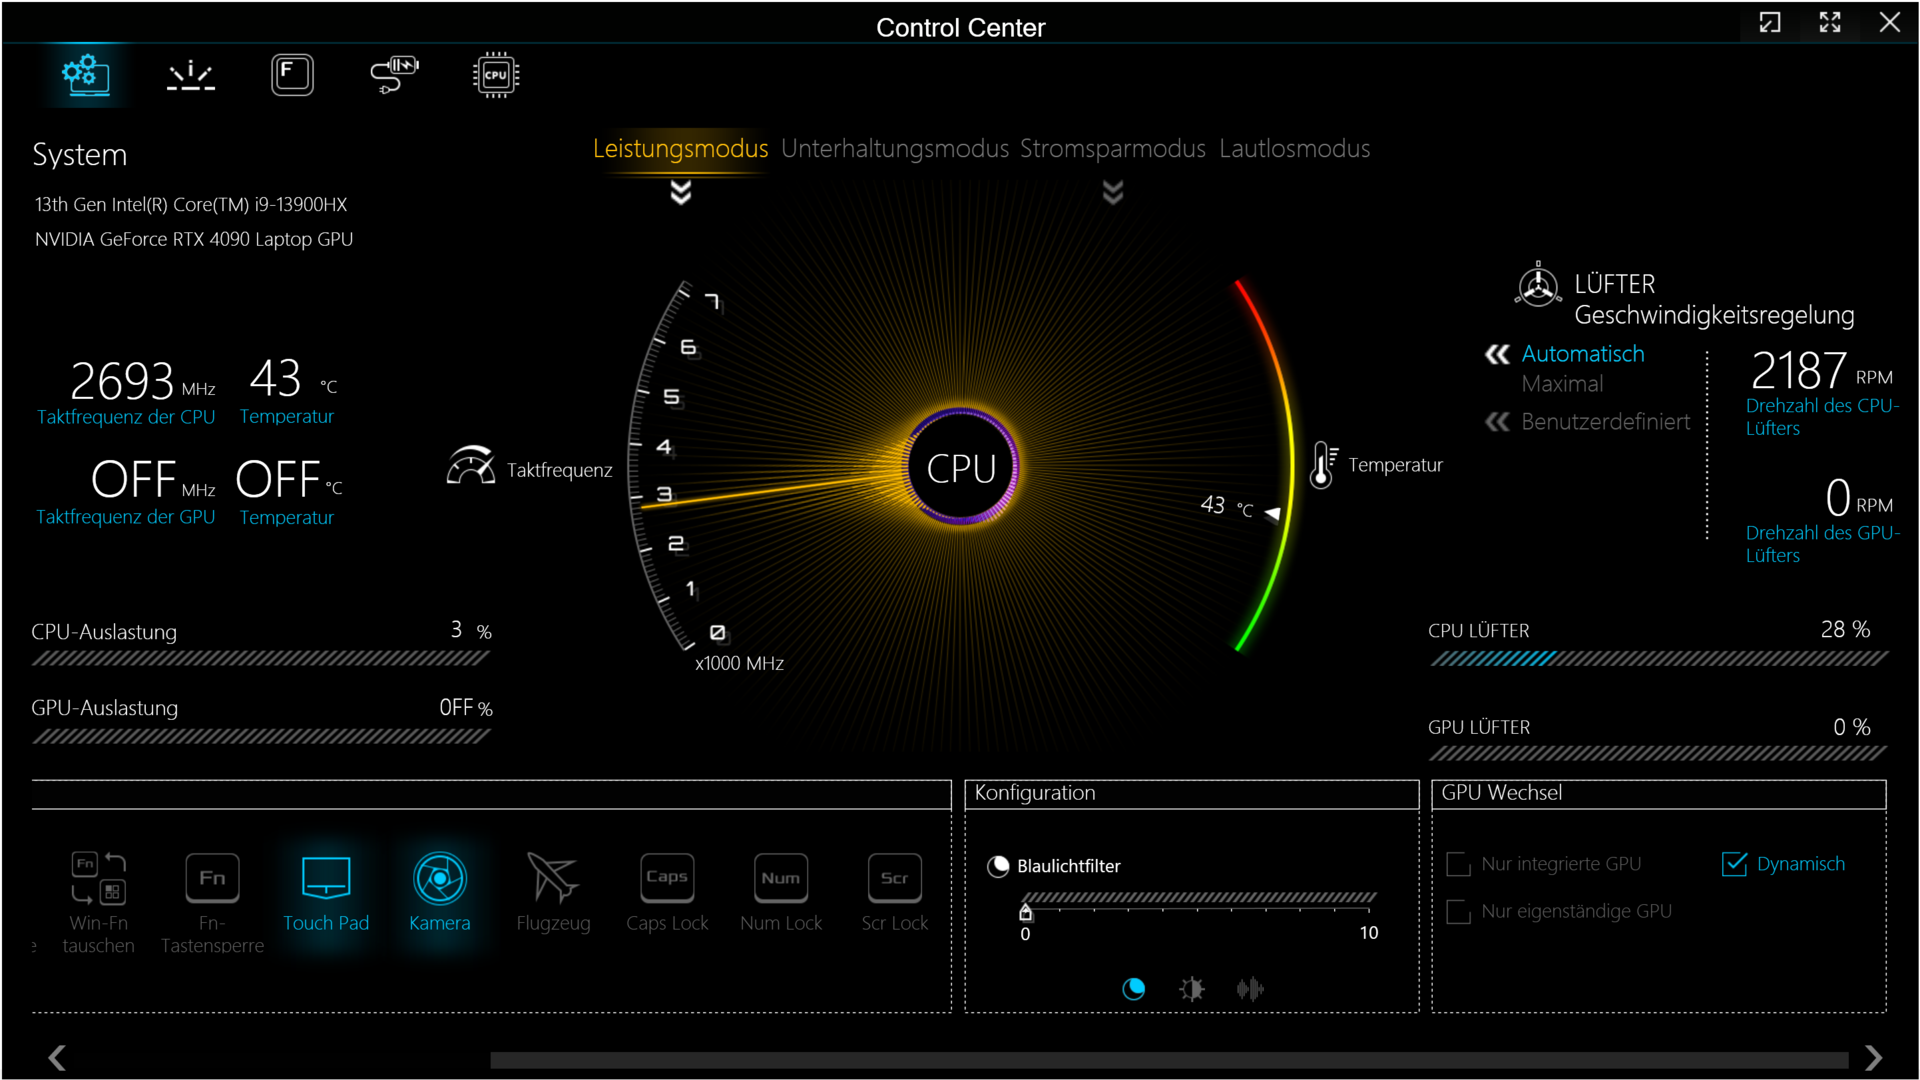
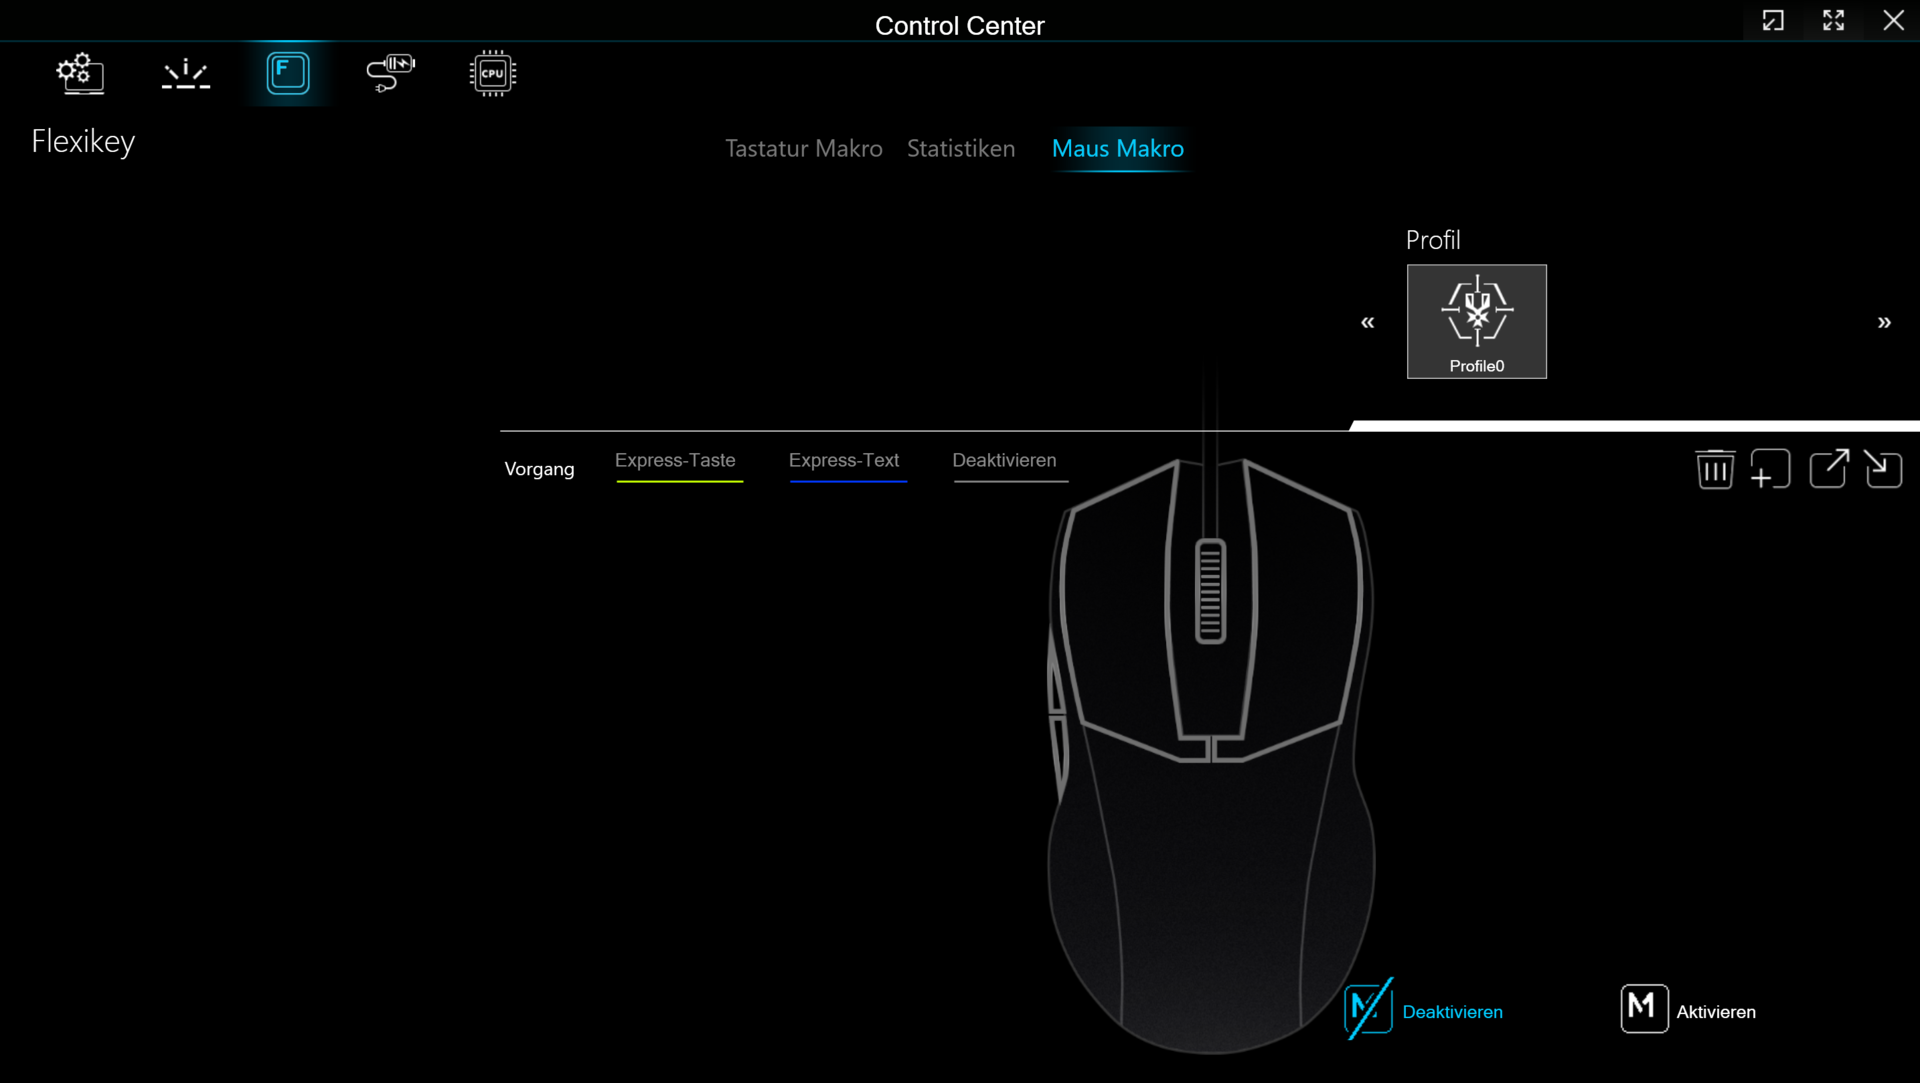
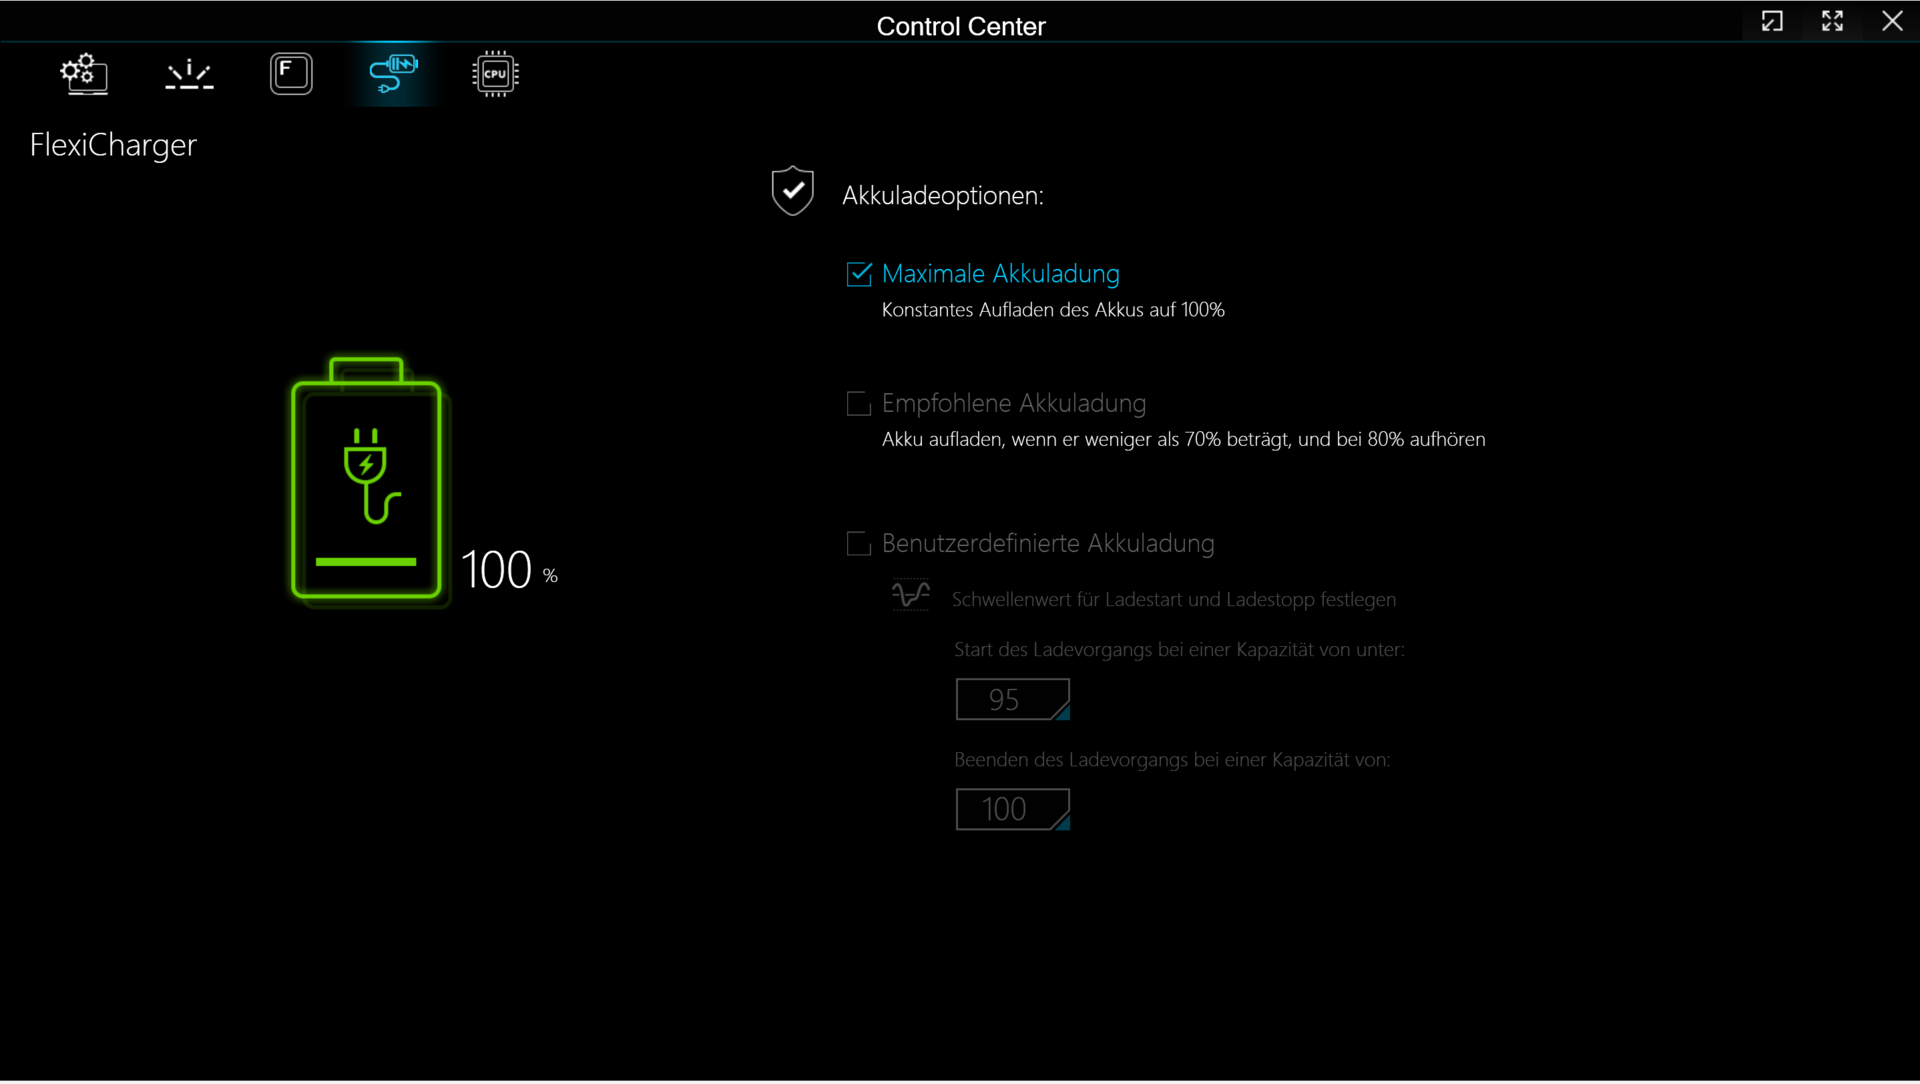
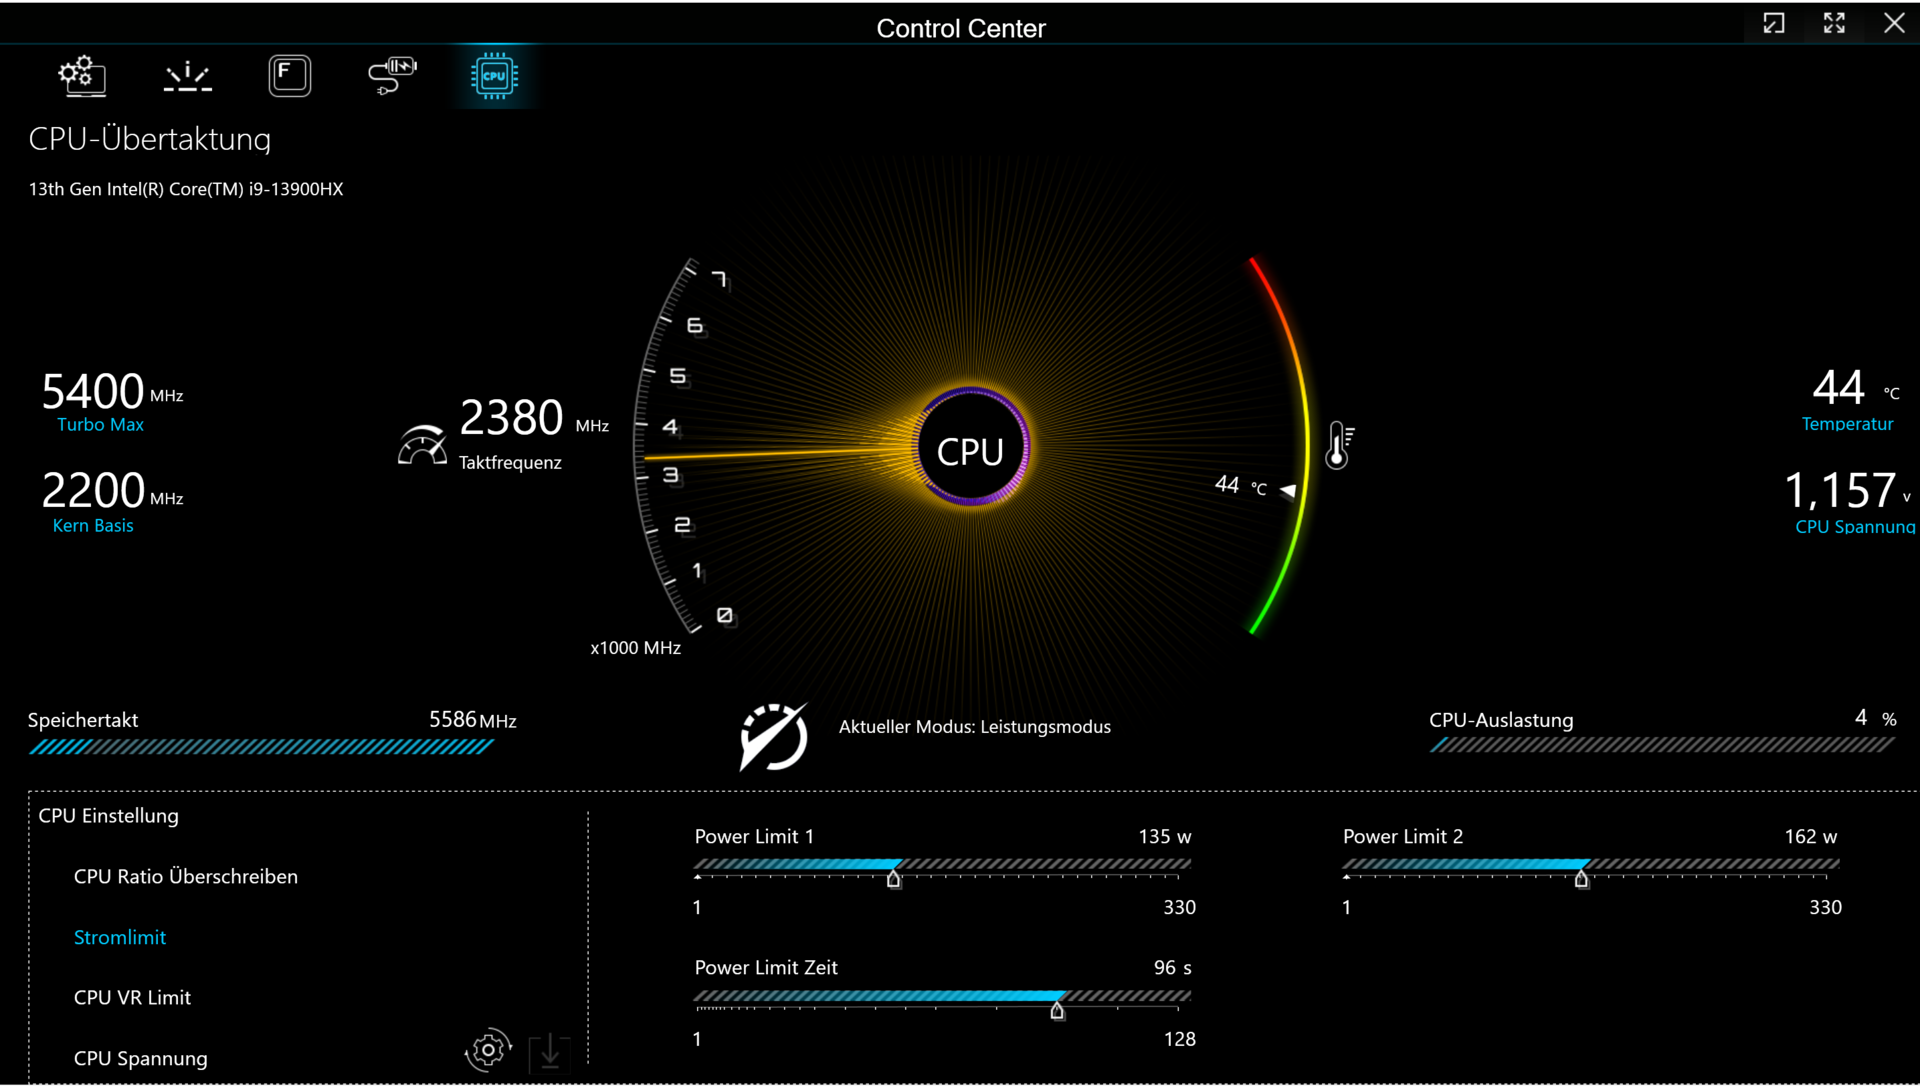
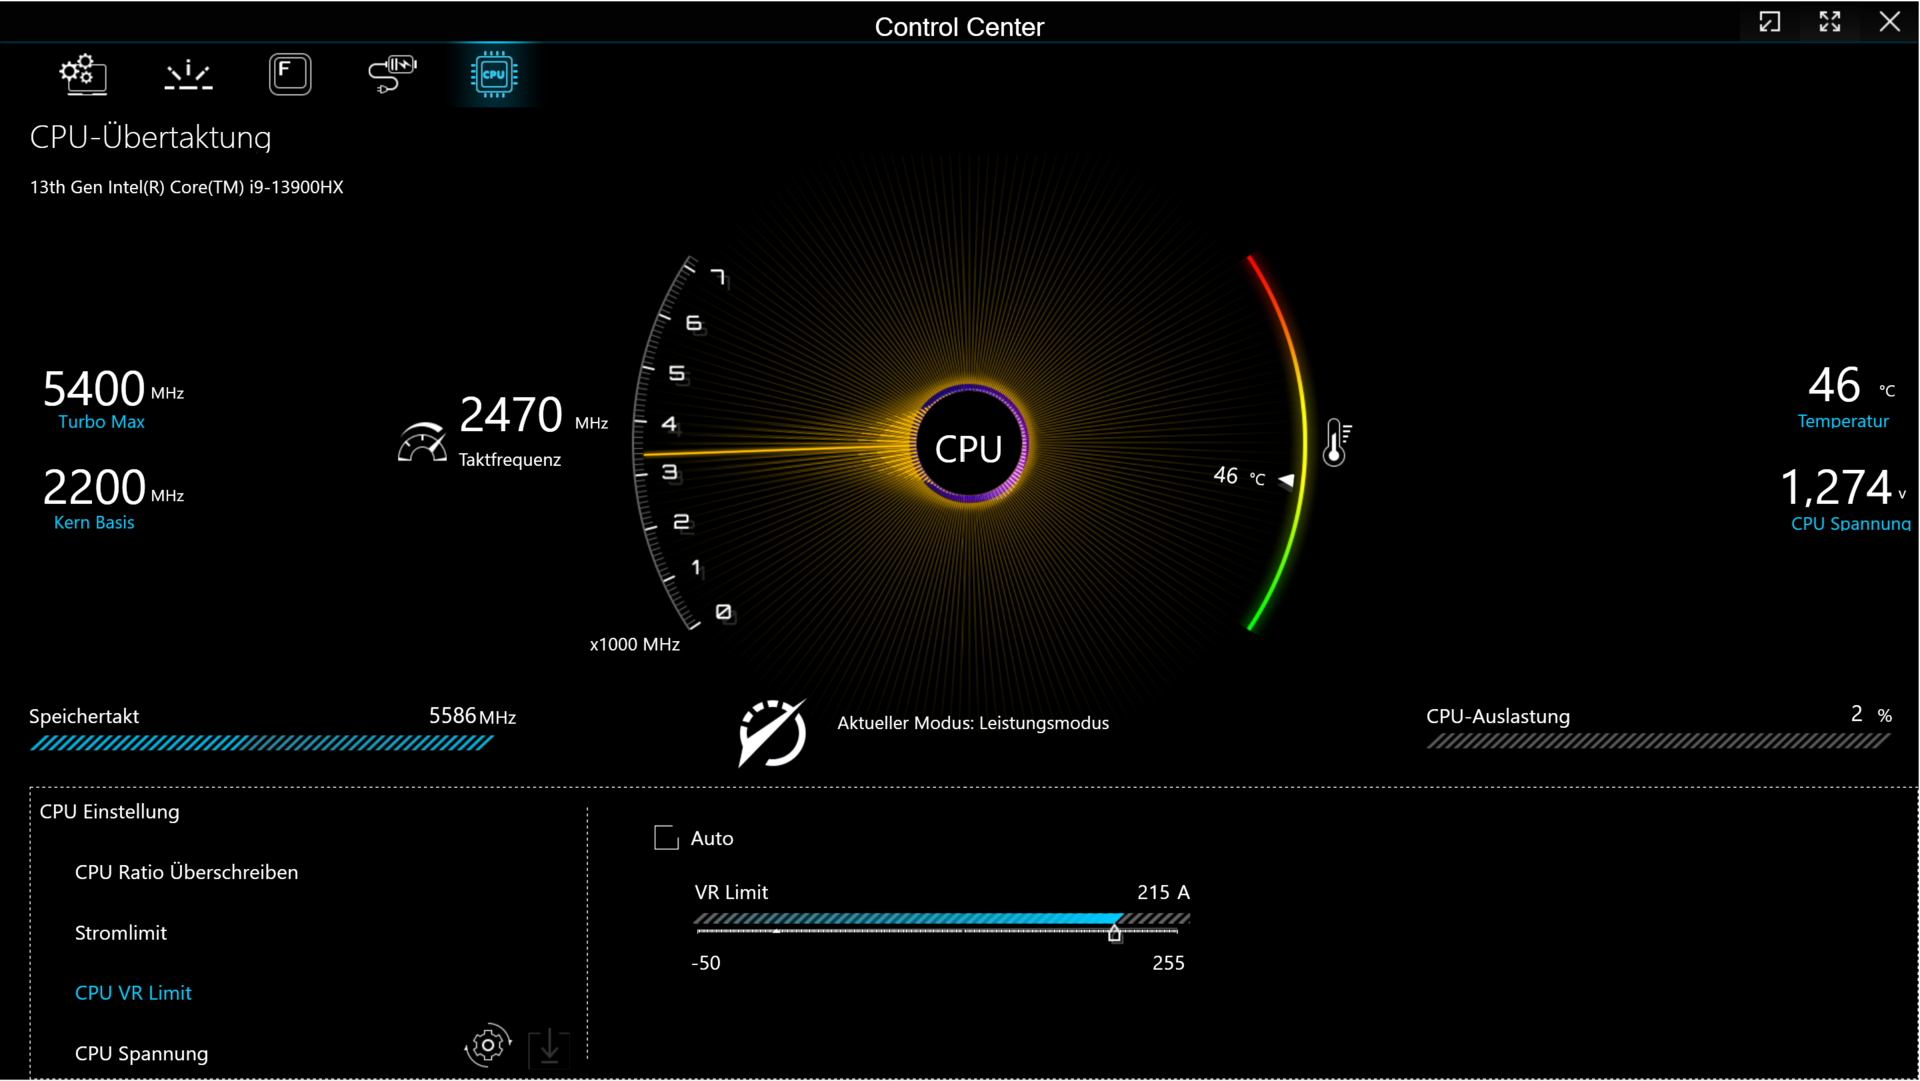
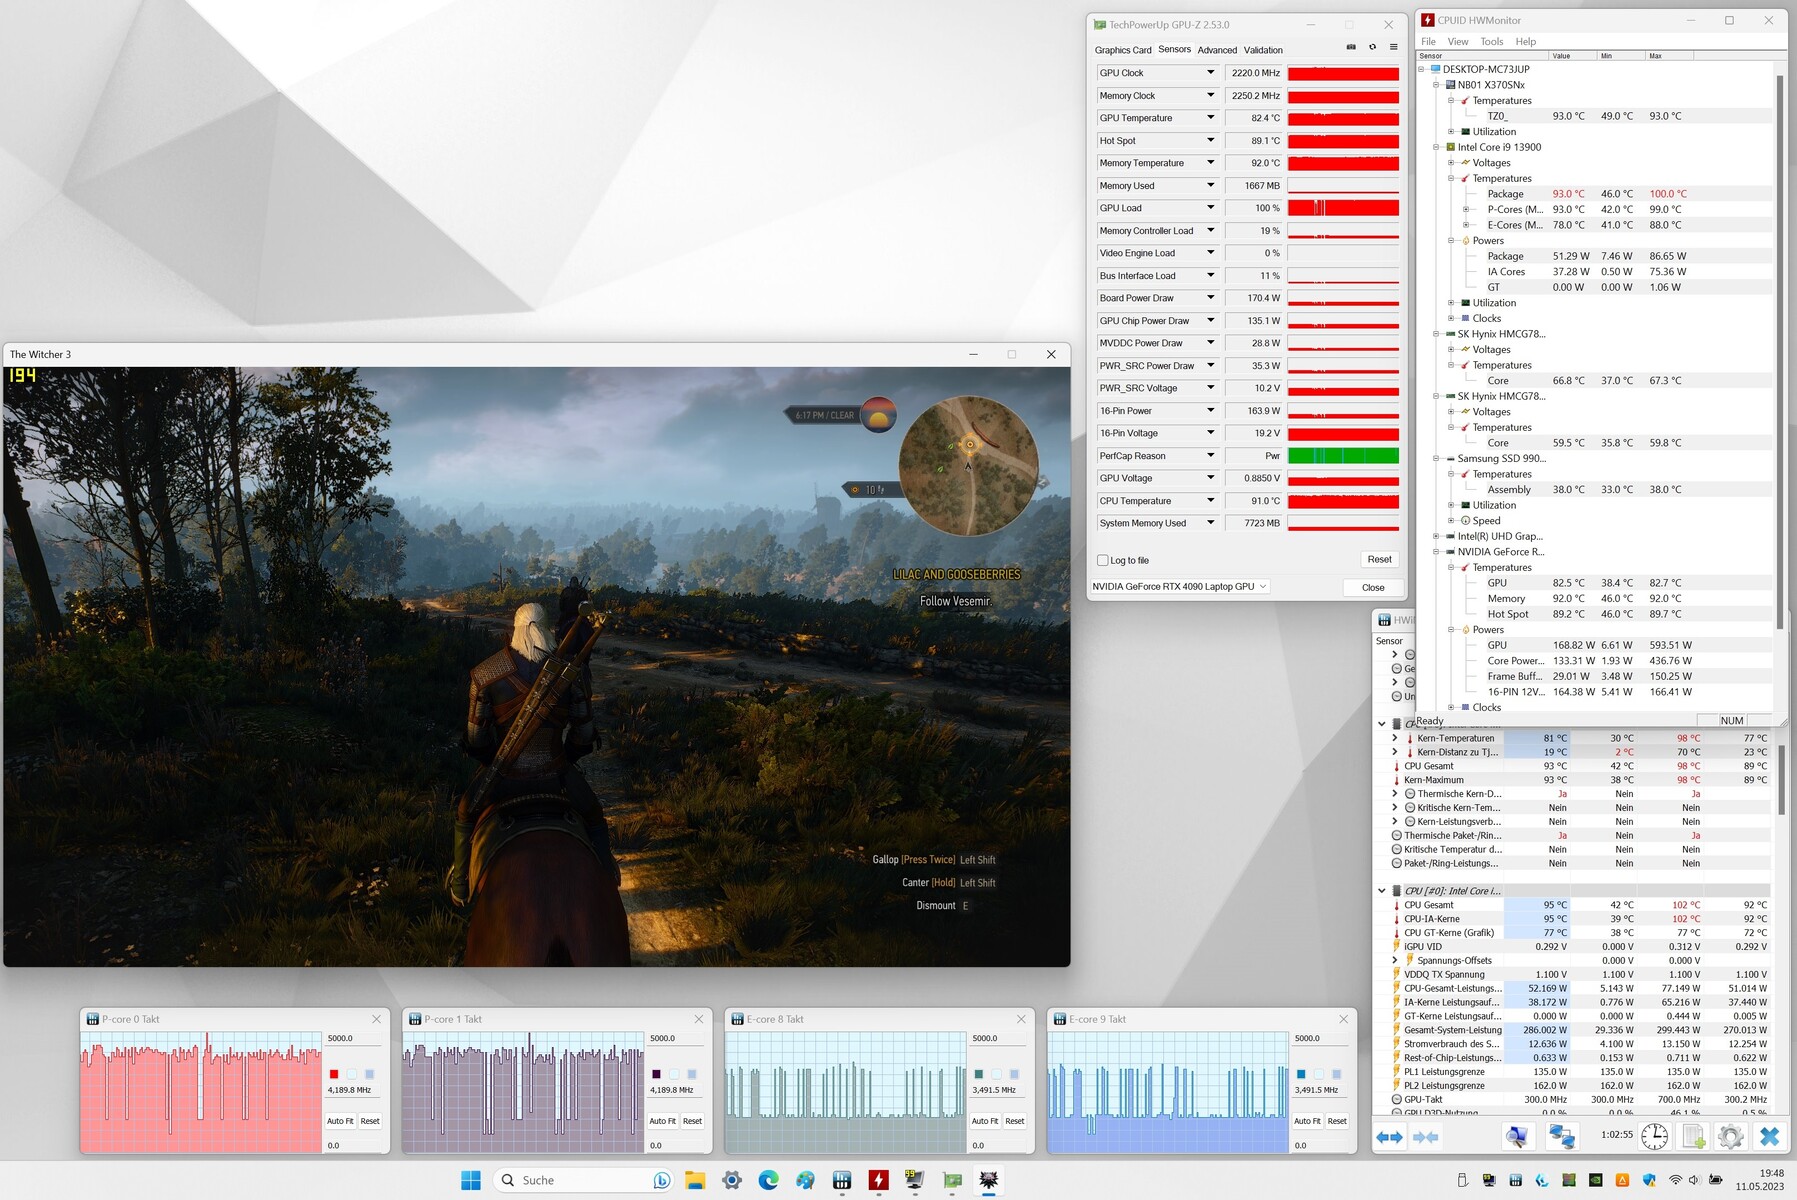
Key 17 Pro oferuje cztery tryby zasilania określone przez producenta (patrz tabela). Można przełączać się między nimi za pomocą oprogramowania Control Center zainstalowanego na laptopie. Przeprowadziliśmy nasze testy porównawcze w "trybie wydajności", a nasz test żywotności baterii w "trybie oszczędzania energii" (z wyłączonym RTX 4090. Optimus był włączony podczas naszych testów.
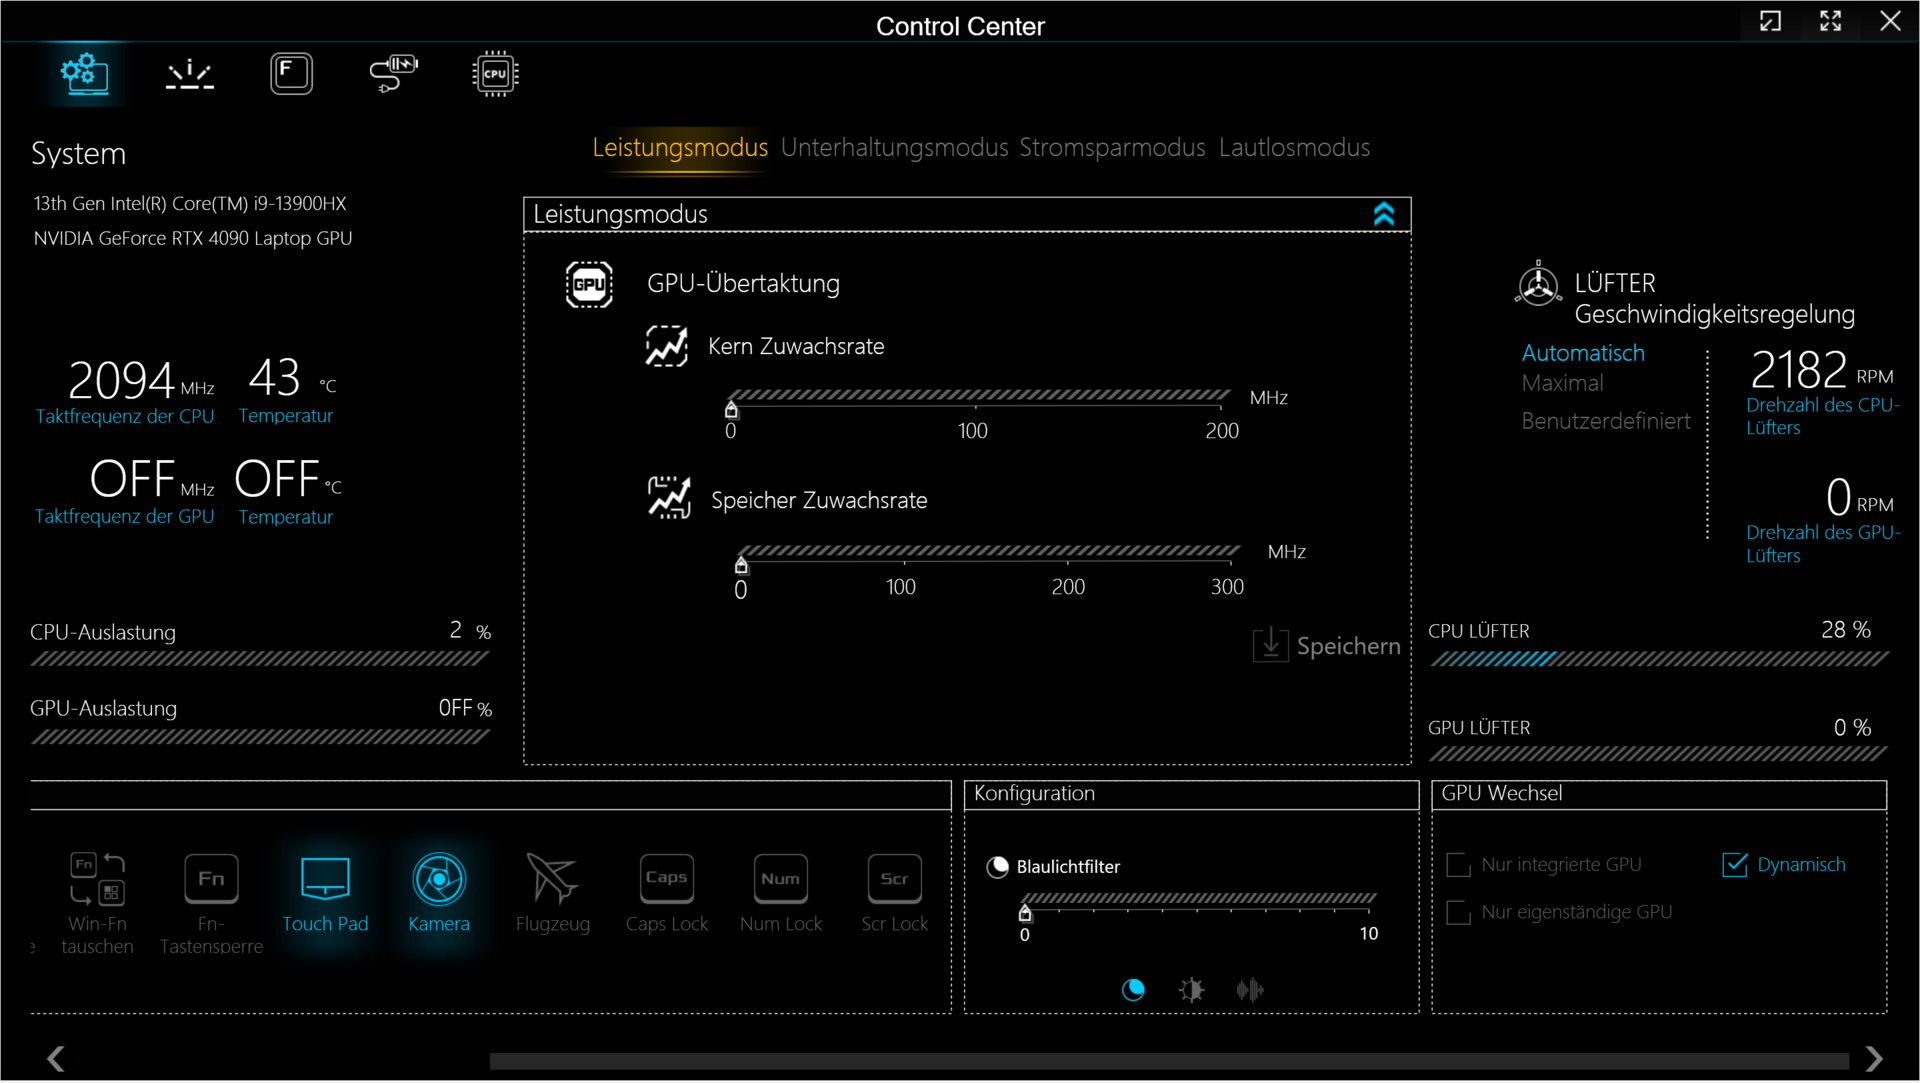
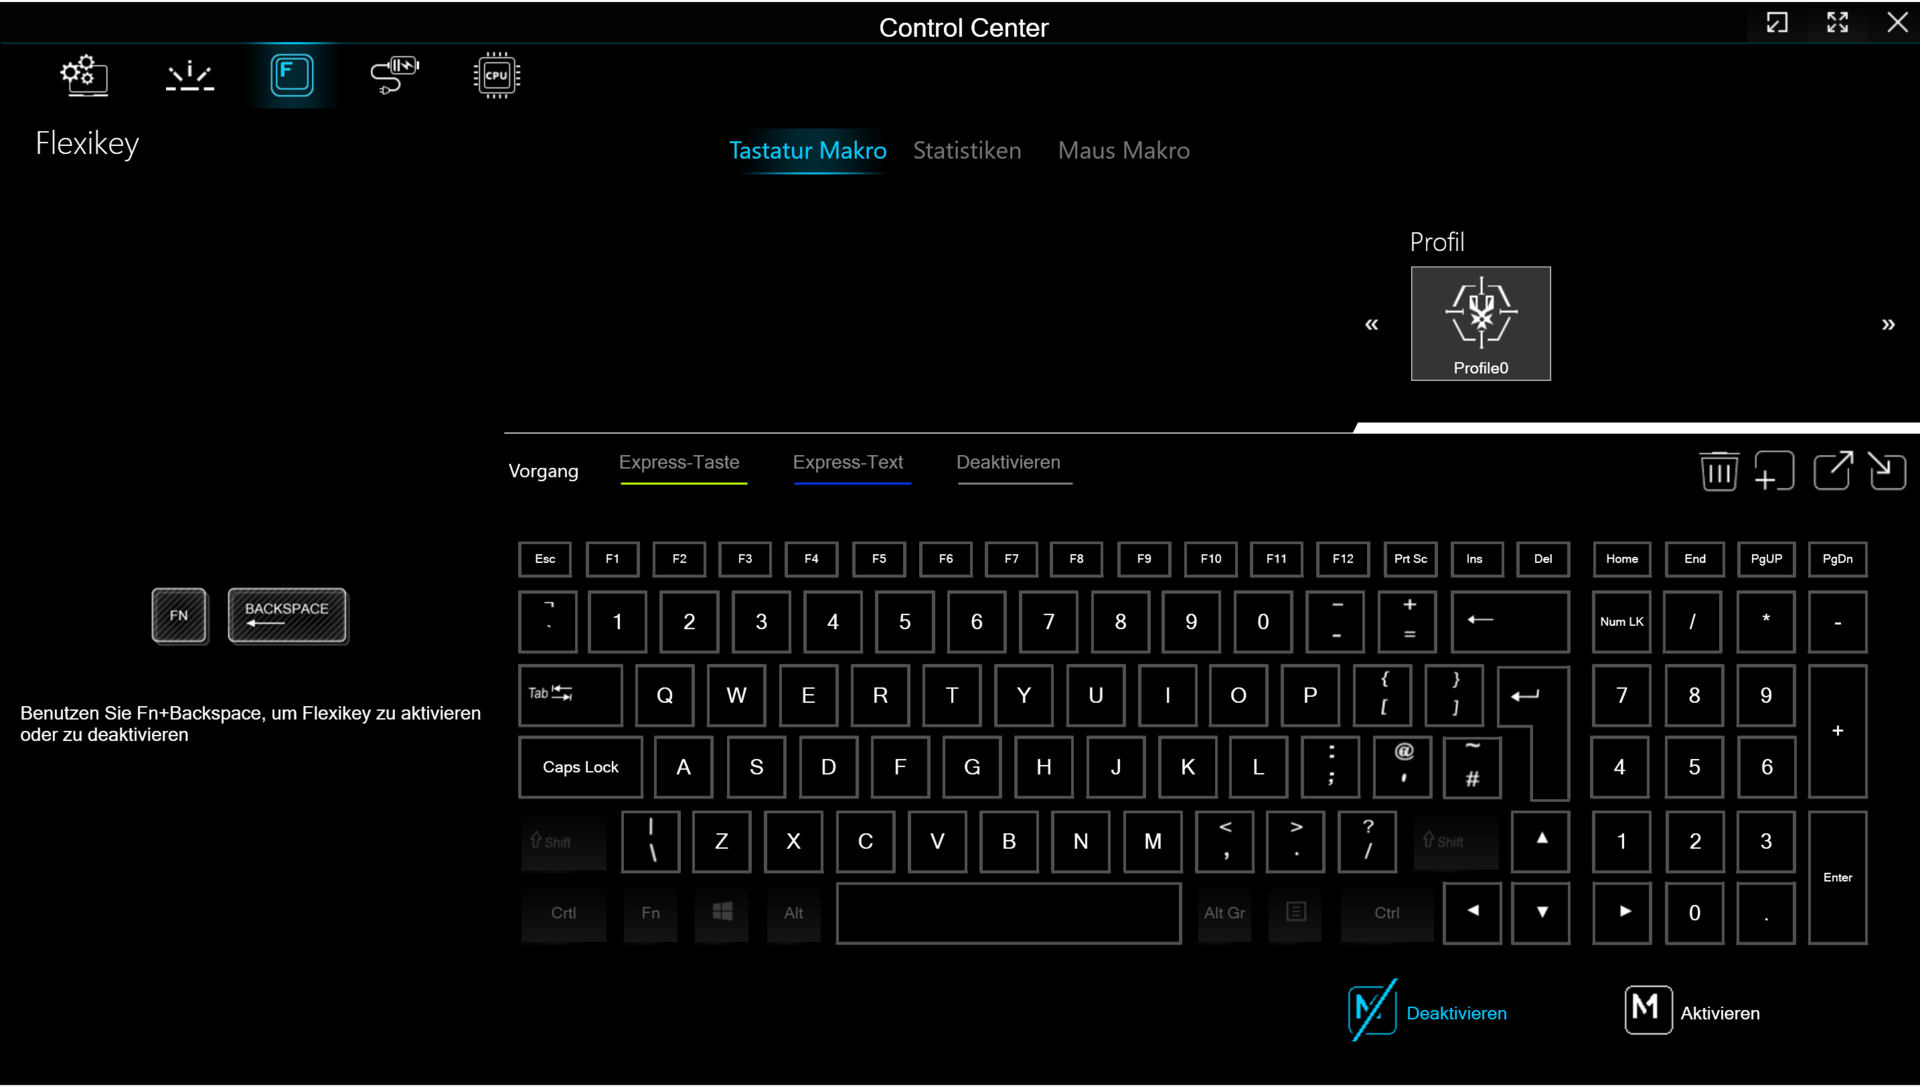
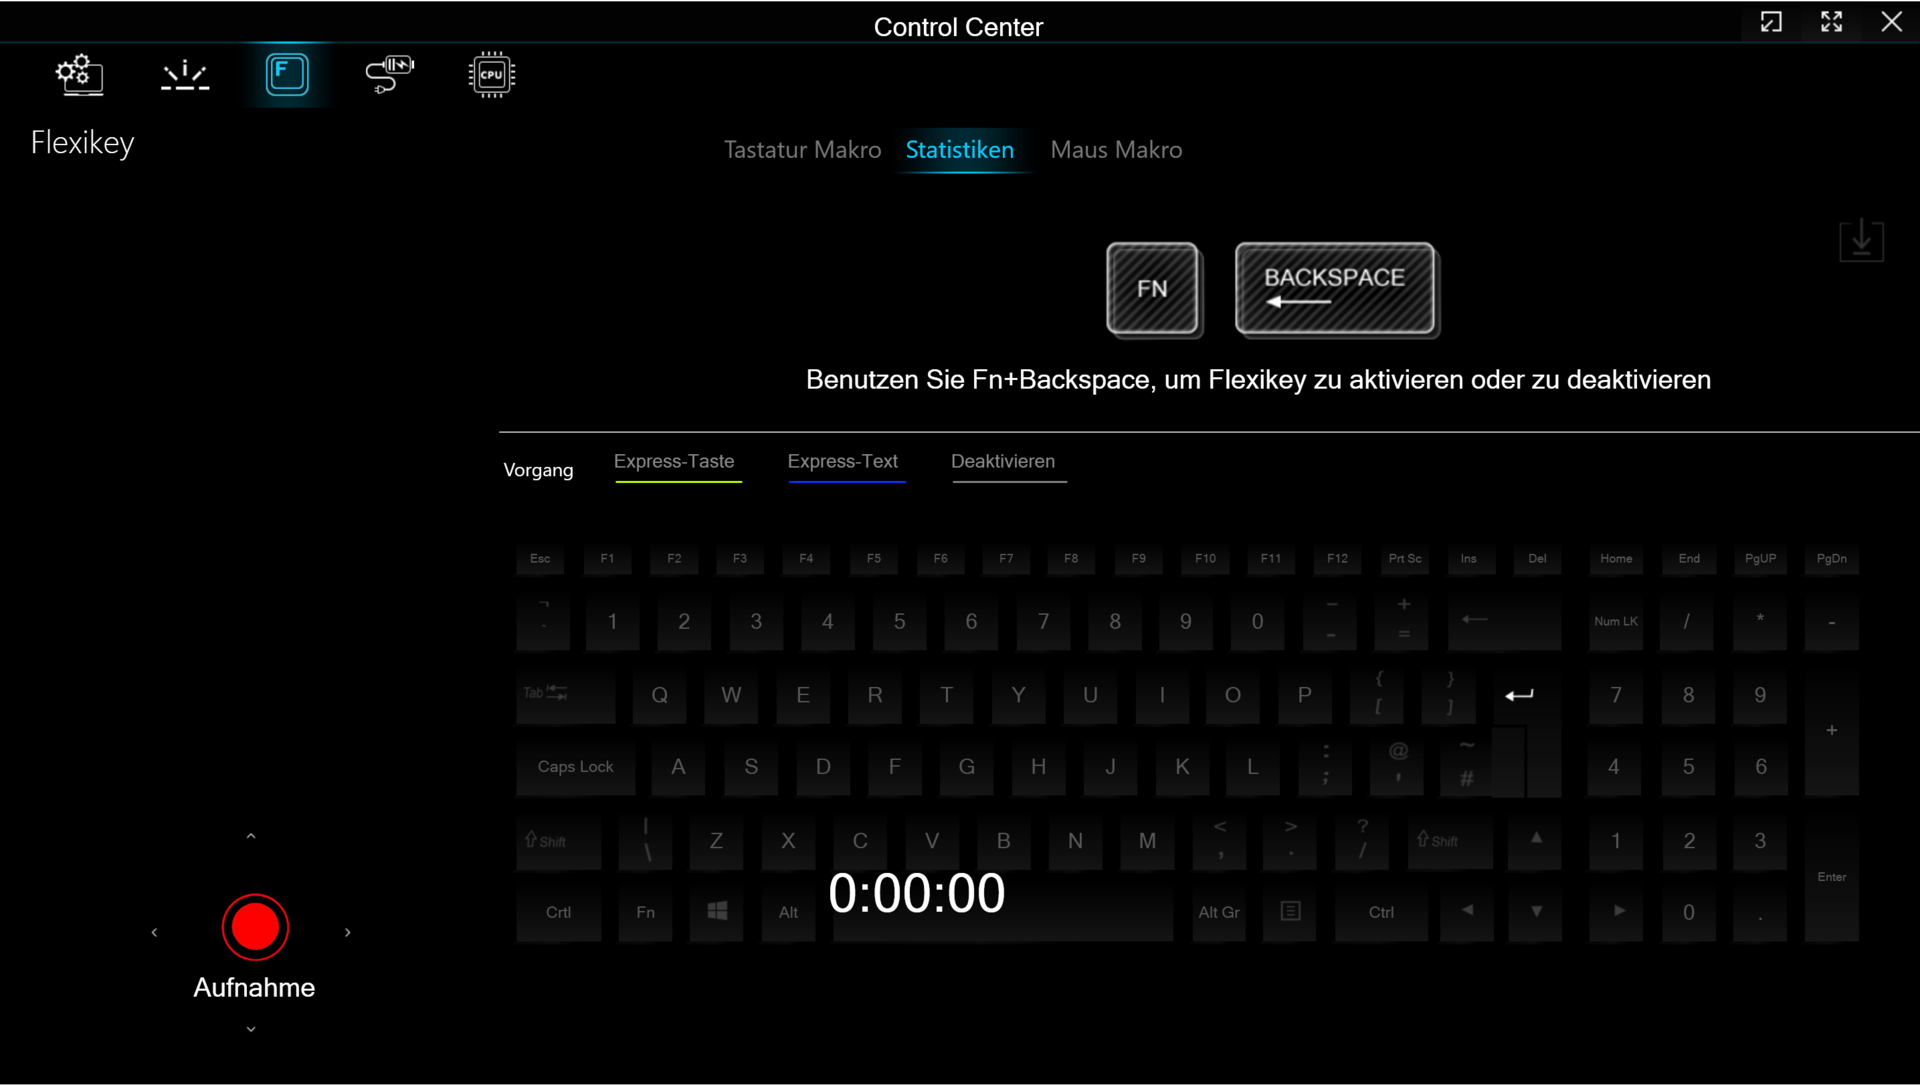
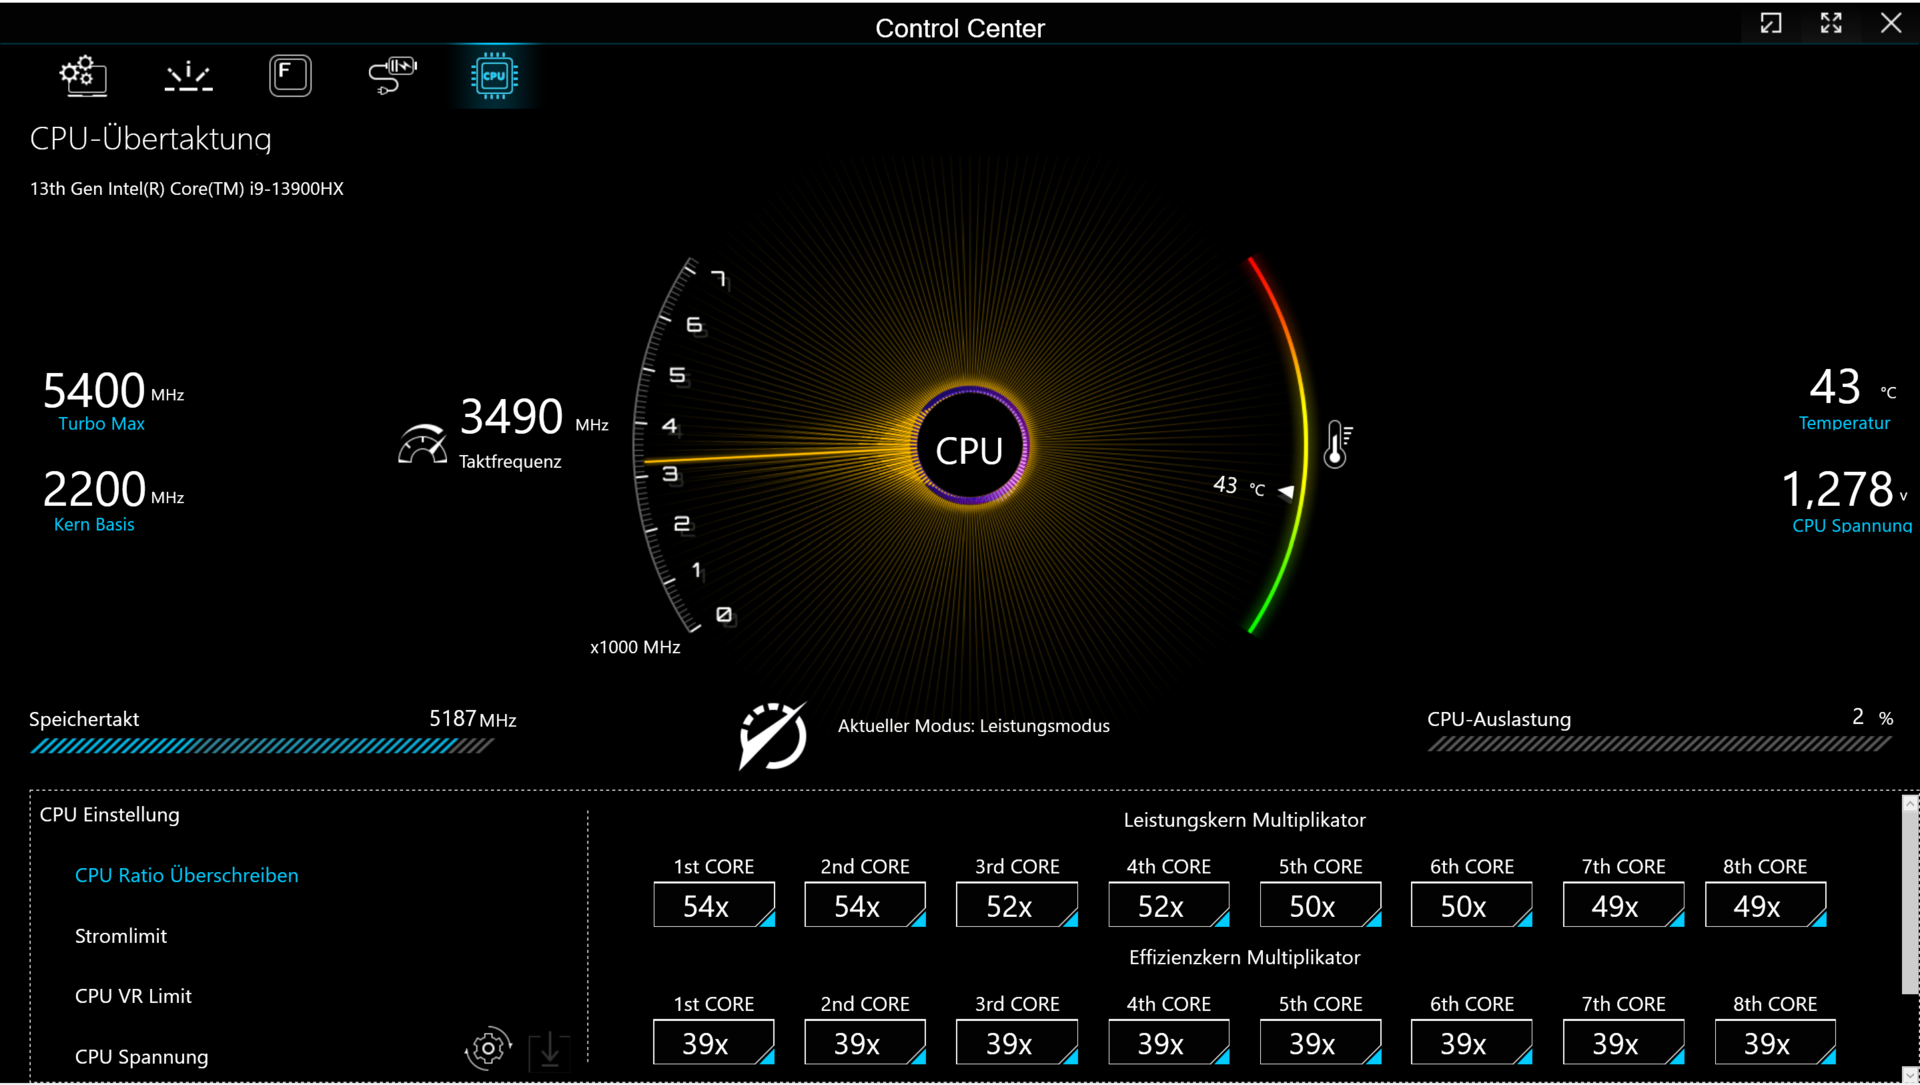
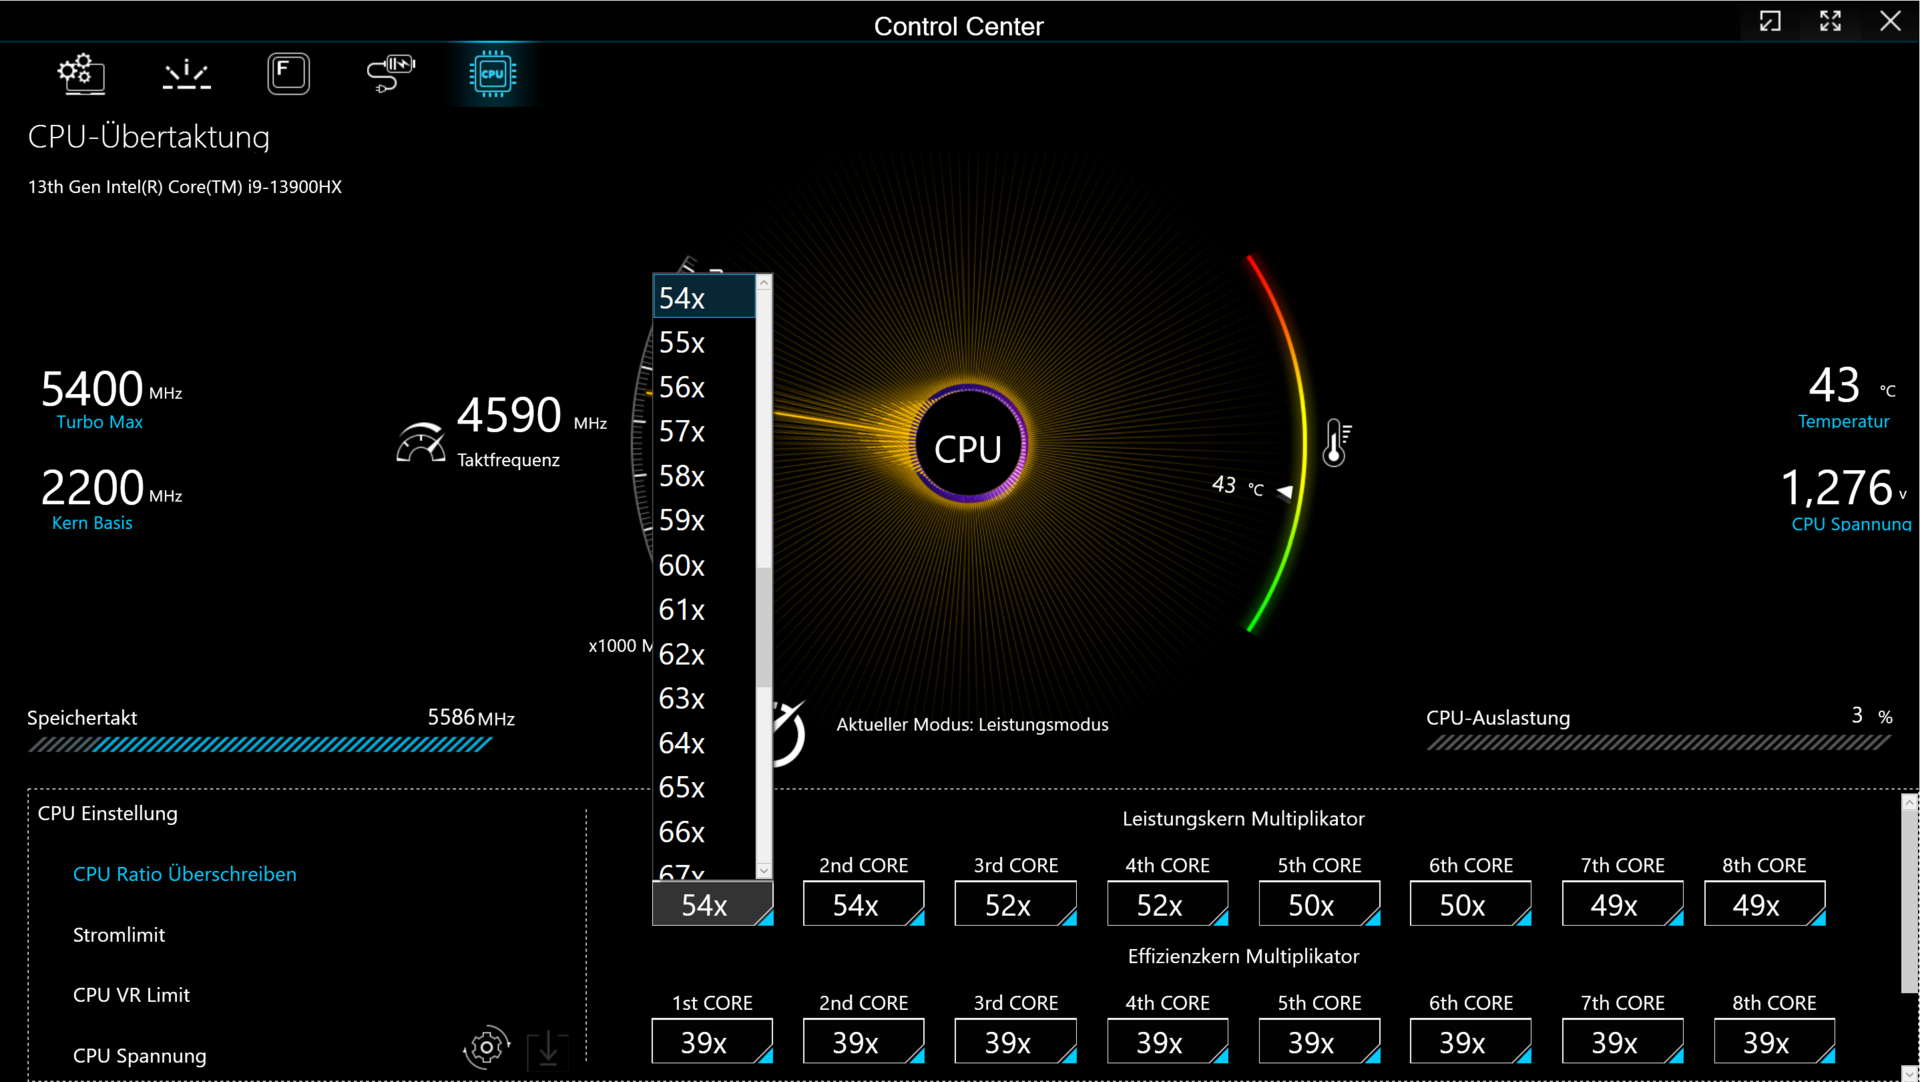
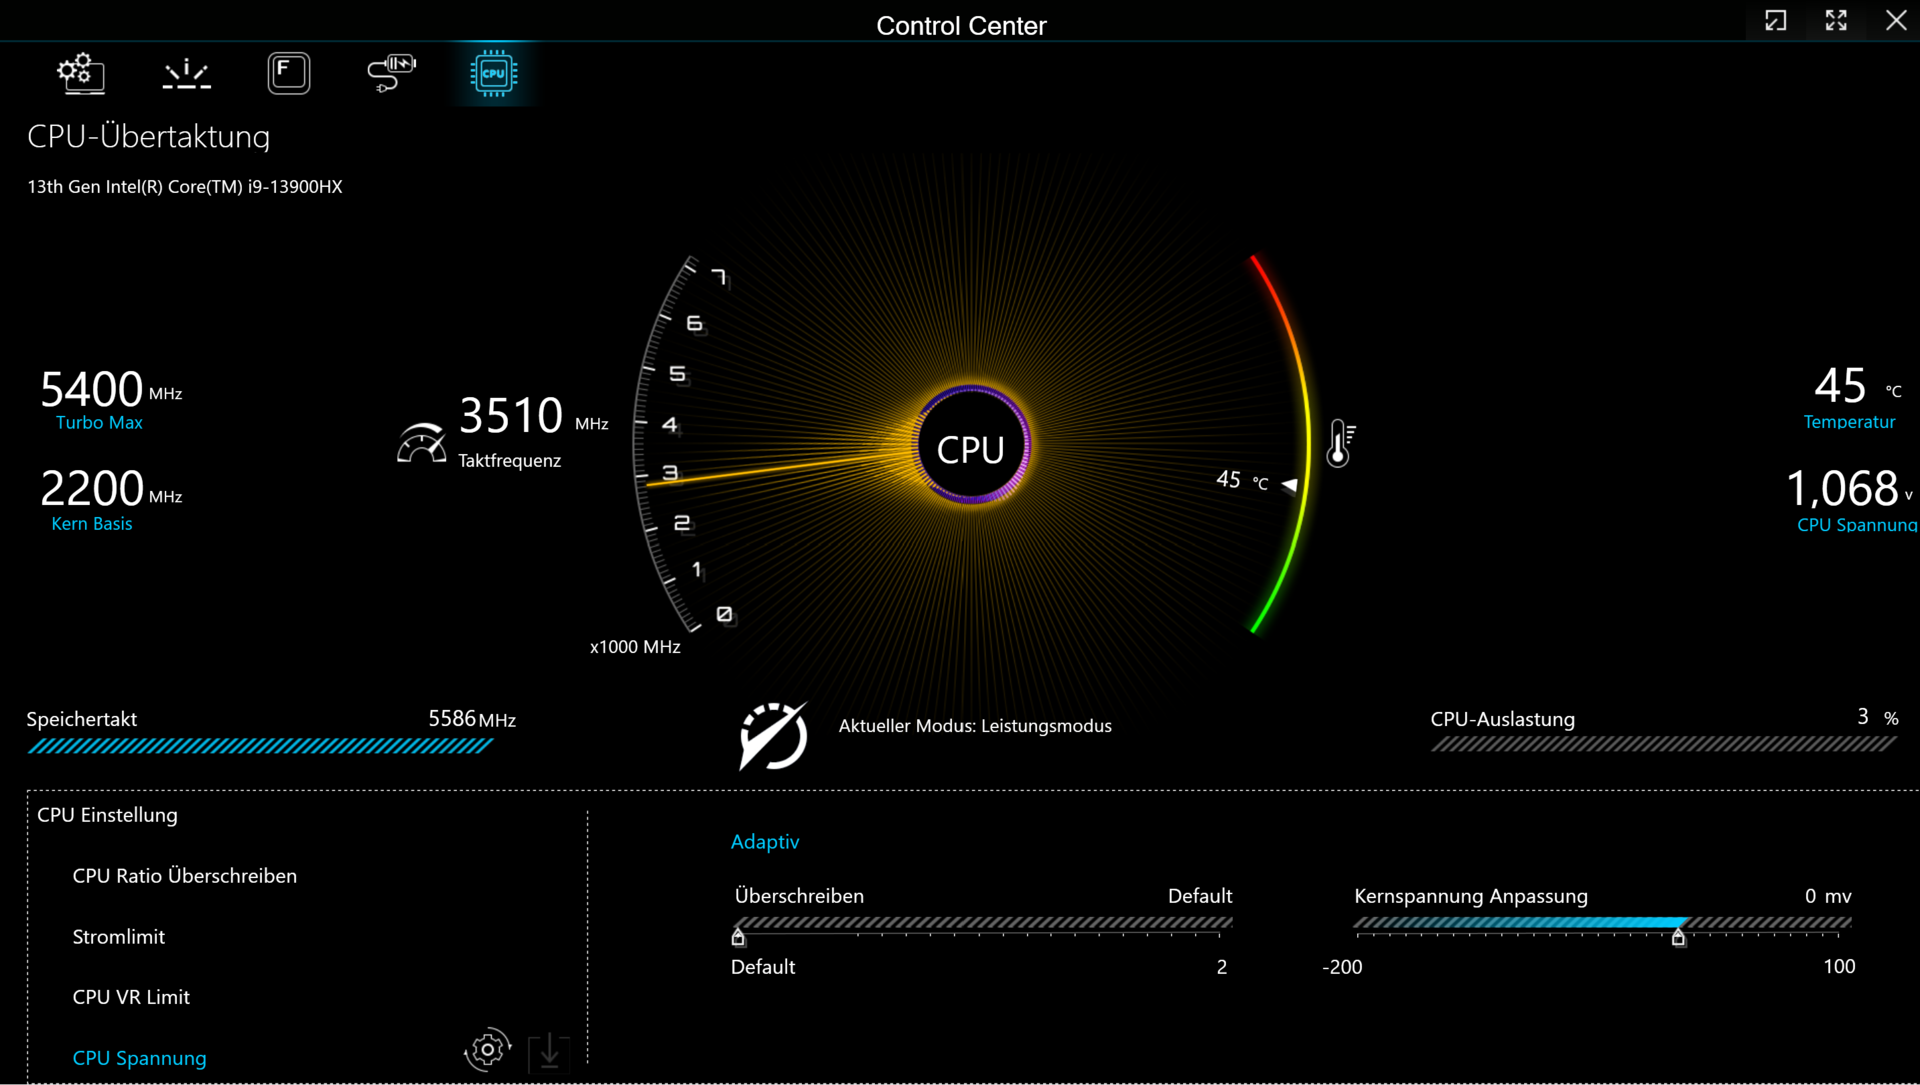
"Tryb wydajności" pozwala użytkownikom podkręcać GPU i VRAM w Centrum sterowania. Kliknięcie dwóch strzałek w dół otworzy odpowiednie menu (rysunek 3). Musisz włączyć podkręcanie procesora w BIOS-ie, zanim w Control Center pojawi się nowa zakładka (patrz rysunki od 12 do 16). Ale uwaga: podkręcasz sprzęt na własne ryzyko - jesteś odpowiedzialny za wszelkie szkody z tego wynikające.
| Tryb wydajności | Tryb rozrywki | Tryb oszczędzania energii | Tryb cichy | |
|---|---|---|---|---|
| CPU PL1 (HWInfo) | 135 Watt | 75 Watt | 15 Watt | 15 Watt |
| CPU PL2 (HWInfo) | 162 Watt | 130 Watt | 30 Watt | 30 Watt |
| Hałas (Witcher 3) | 62 dB(A) | 54 dB(A) | - | 42 dB(A) |
| Wydajność (Witcher 3) | ~204 fps | ~188 fps | - | 50 bis 60 fps |
Procesor
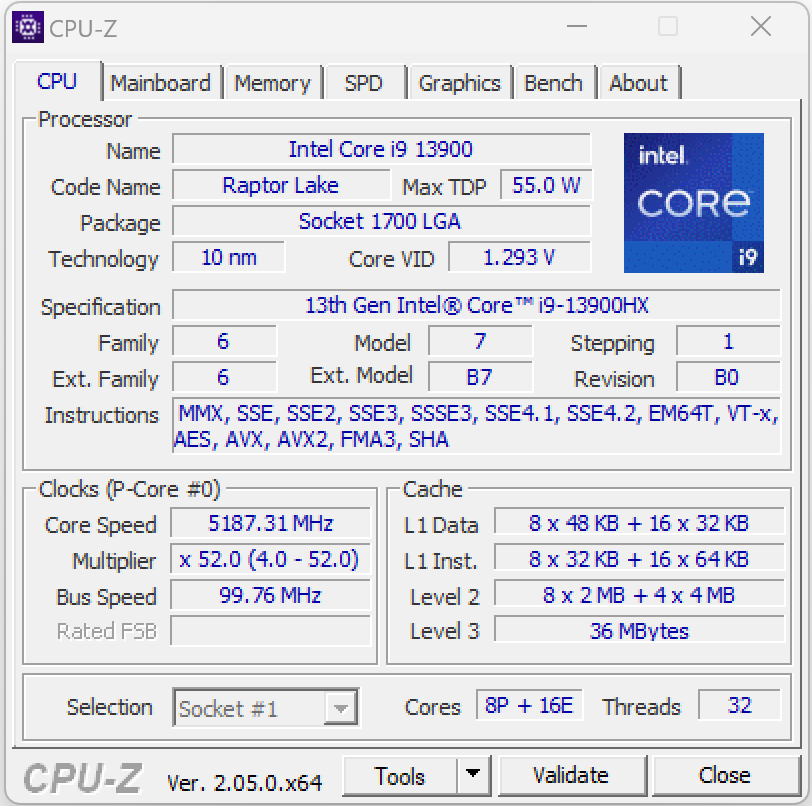
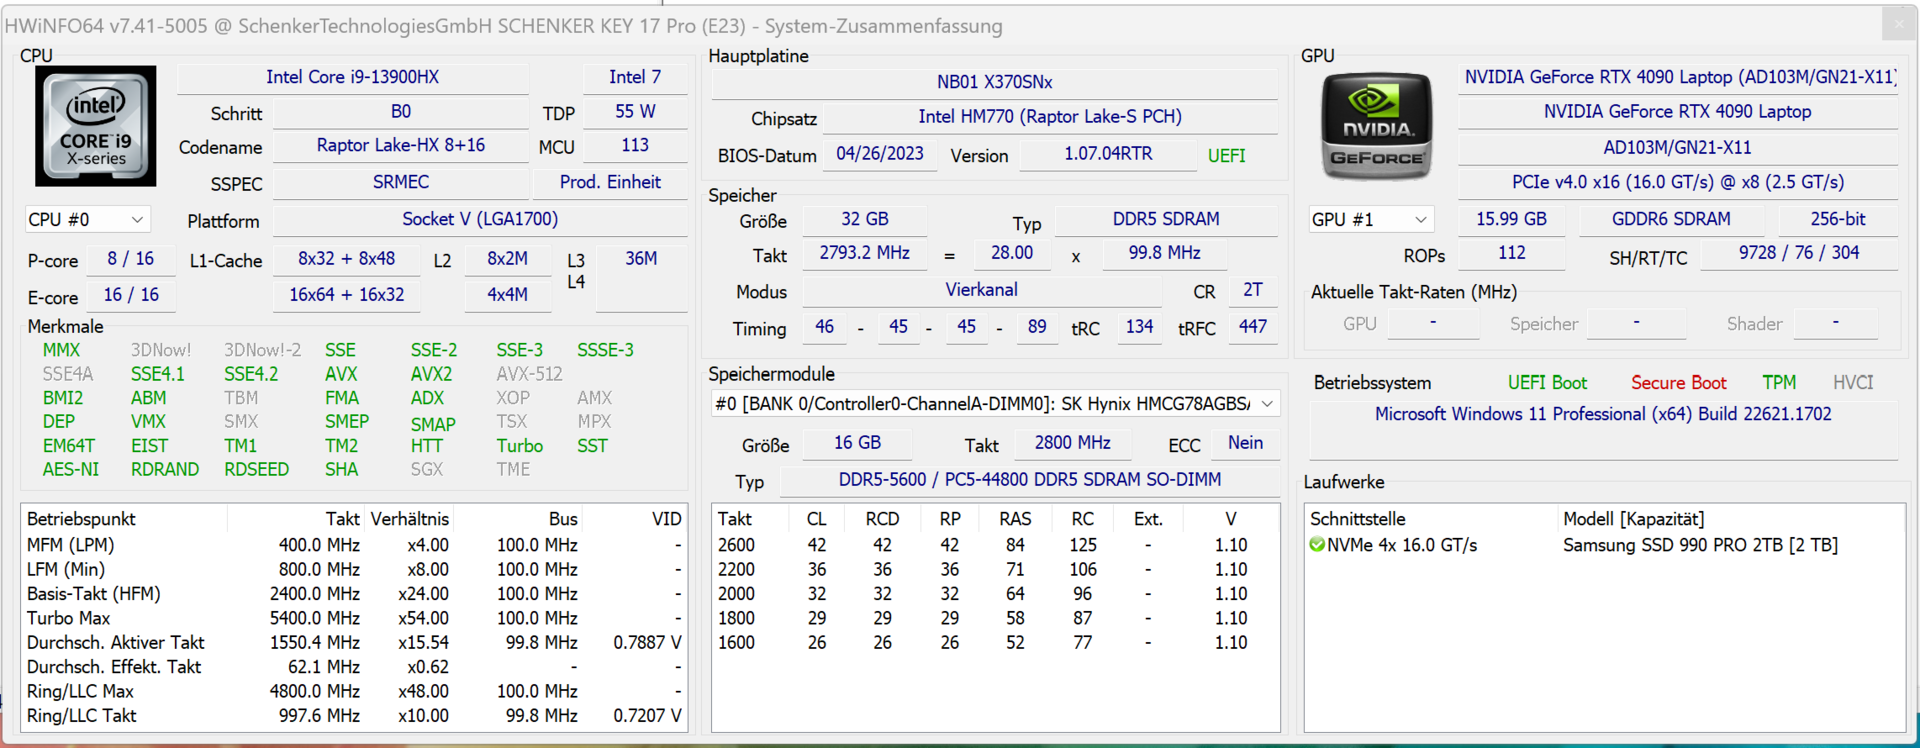
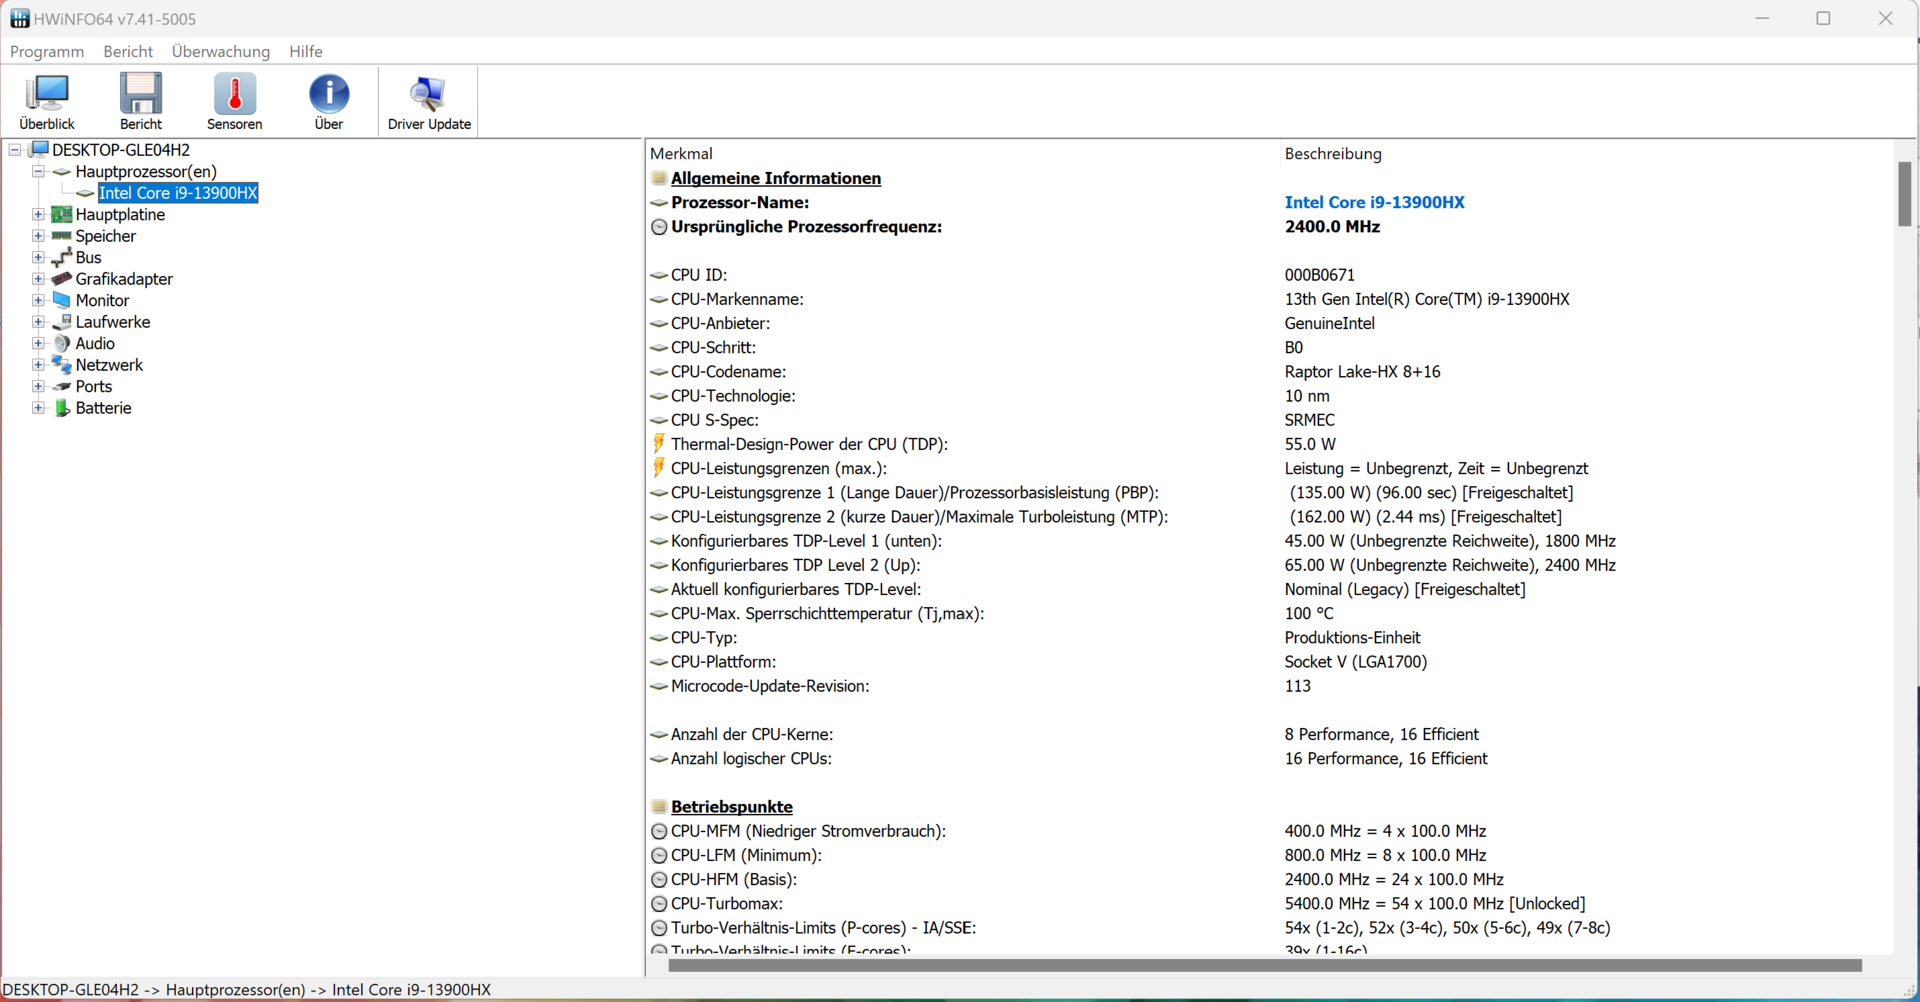
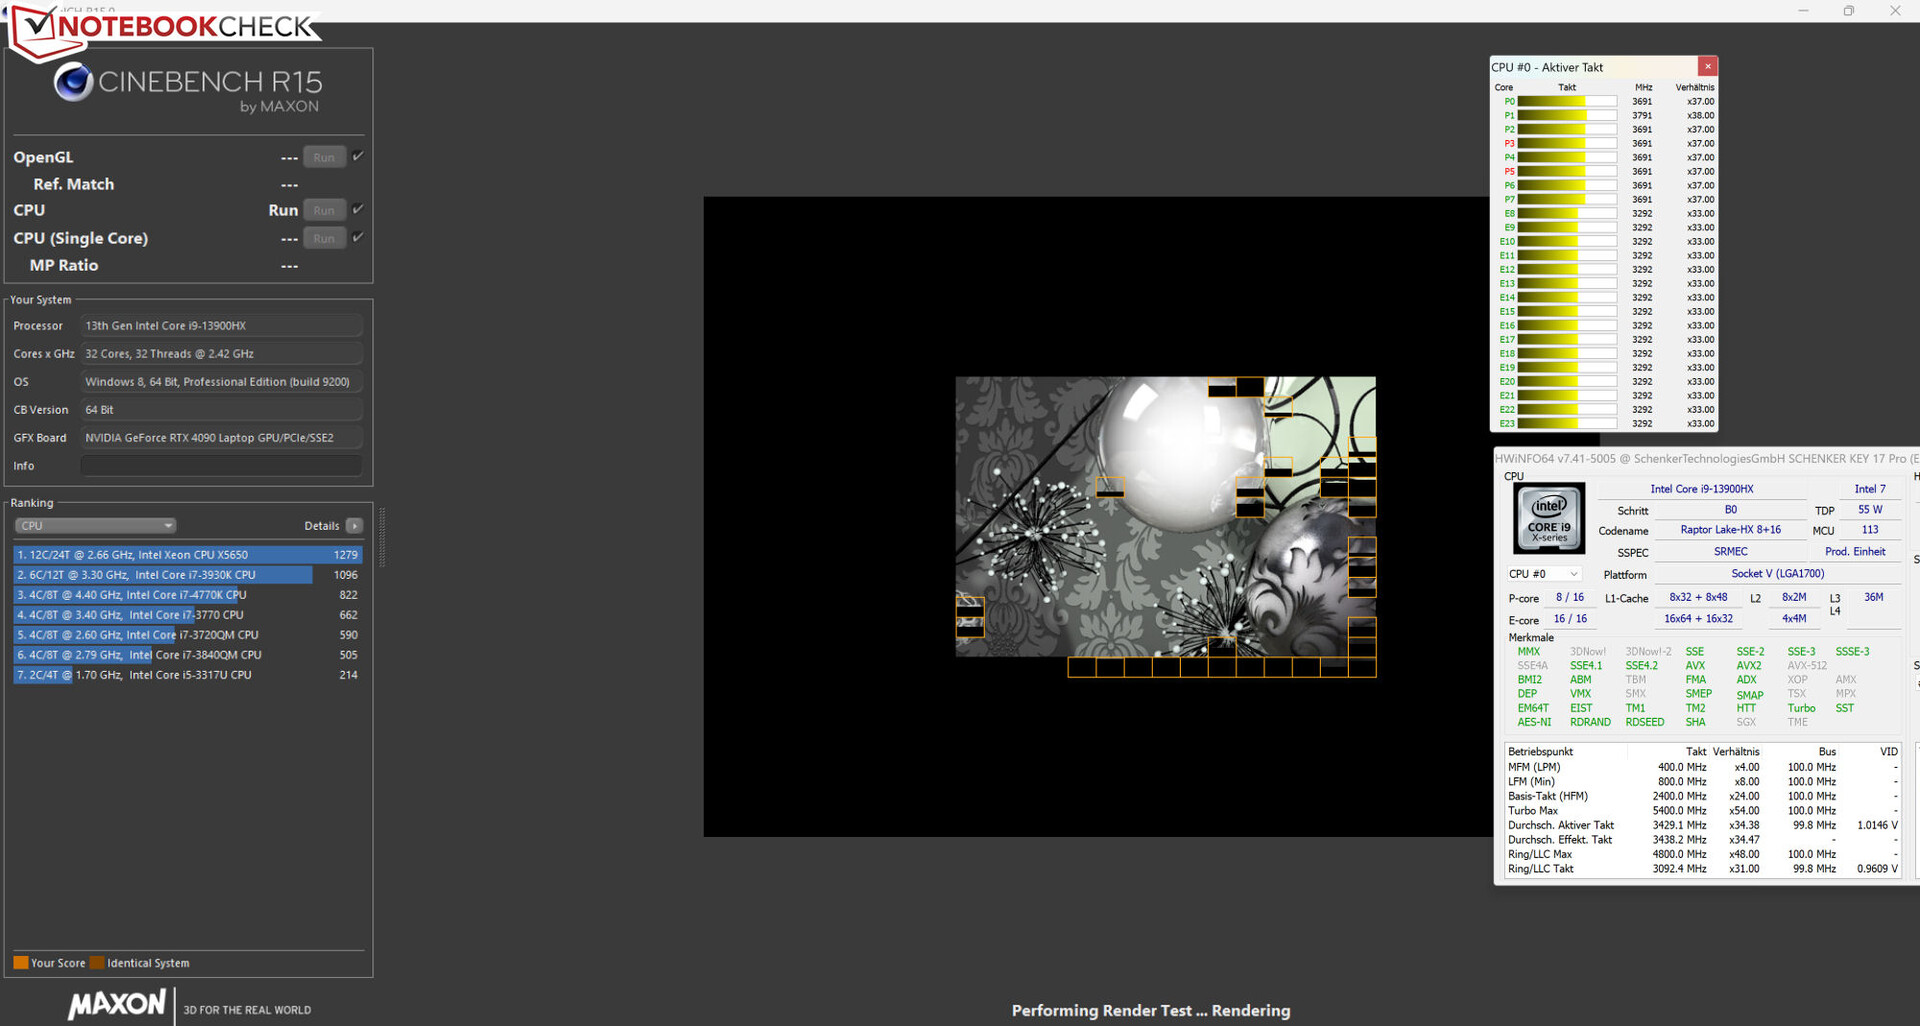
Procesor Core i9-13900HX Raptor Lake składa się z ośmiu rdzeni wydajnościowych (Hyperthreading, od 2,2 do 5,4 GHz) i szesnastu rdzeni wydajnościowych (bez Hyperthreading, od 1,6 do 3,9 GHz), co daje łącznie 32 logiczne rdzenie CPU.
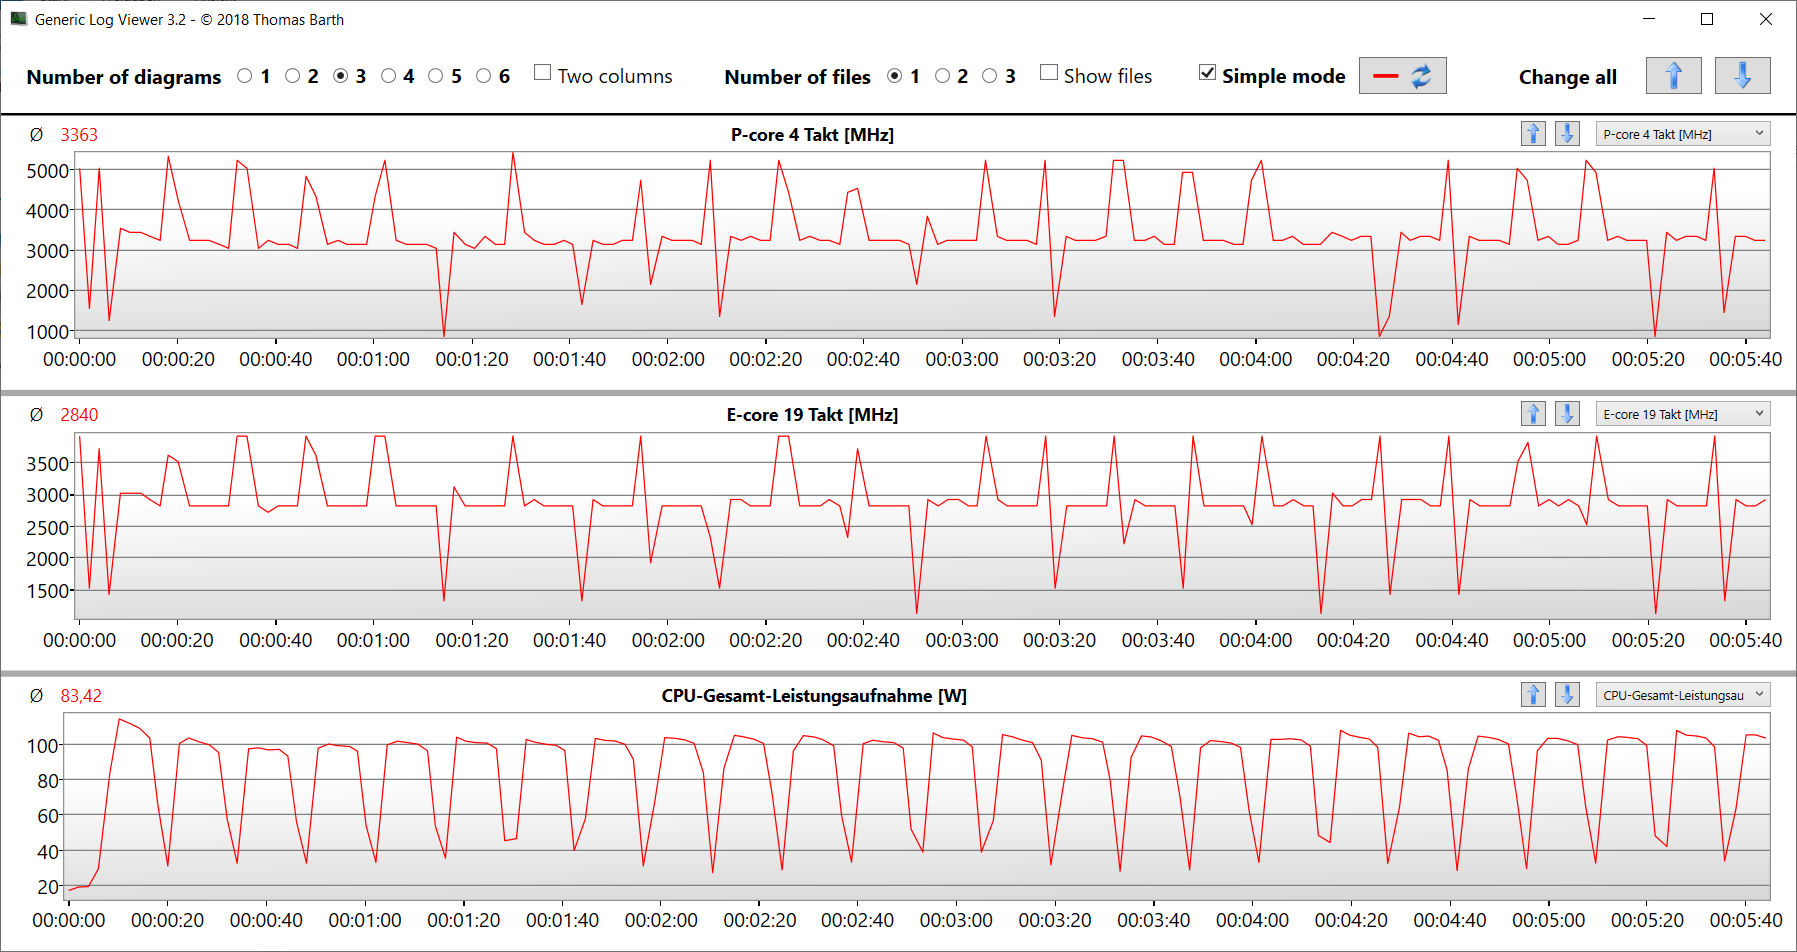
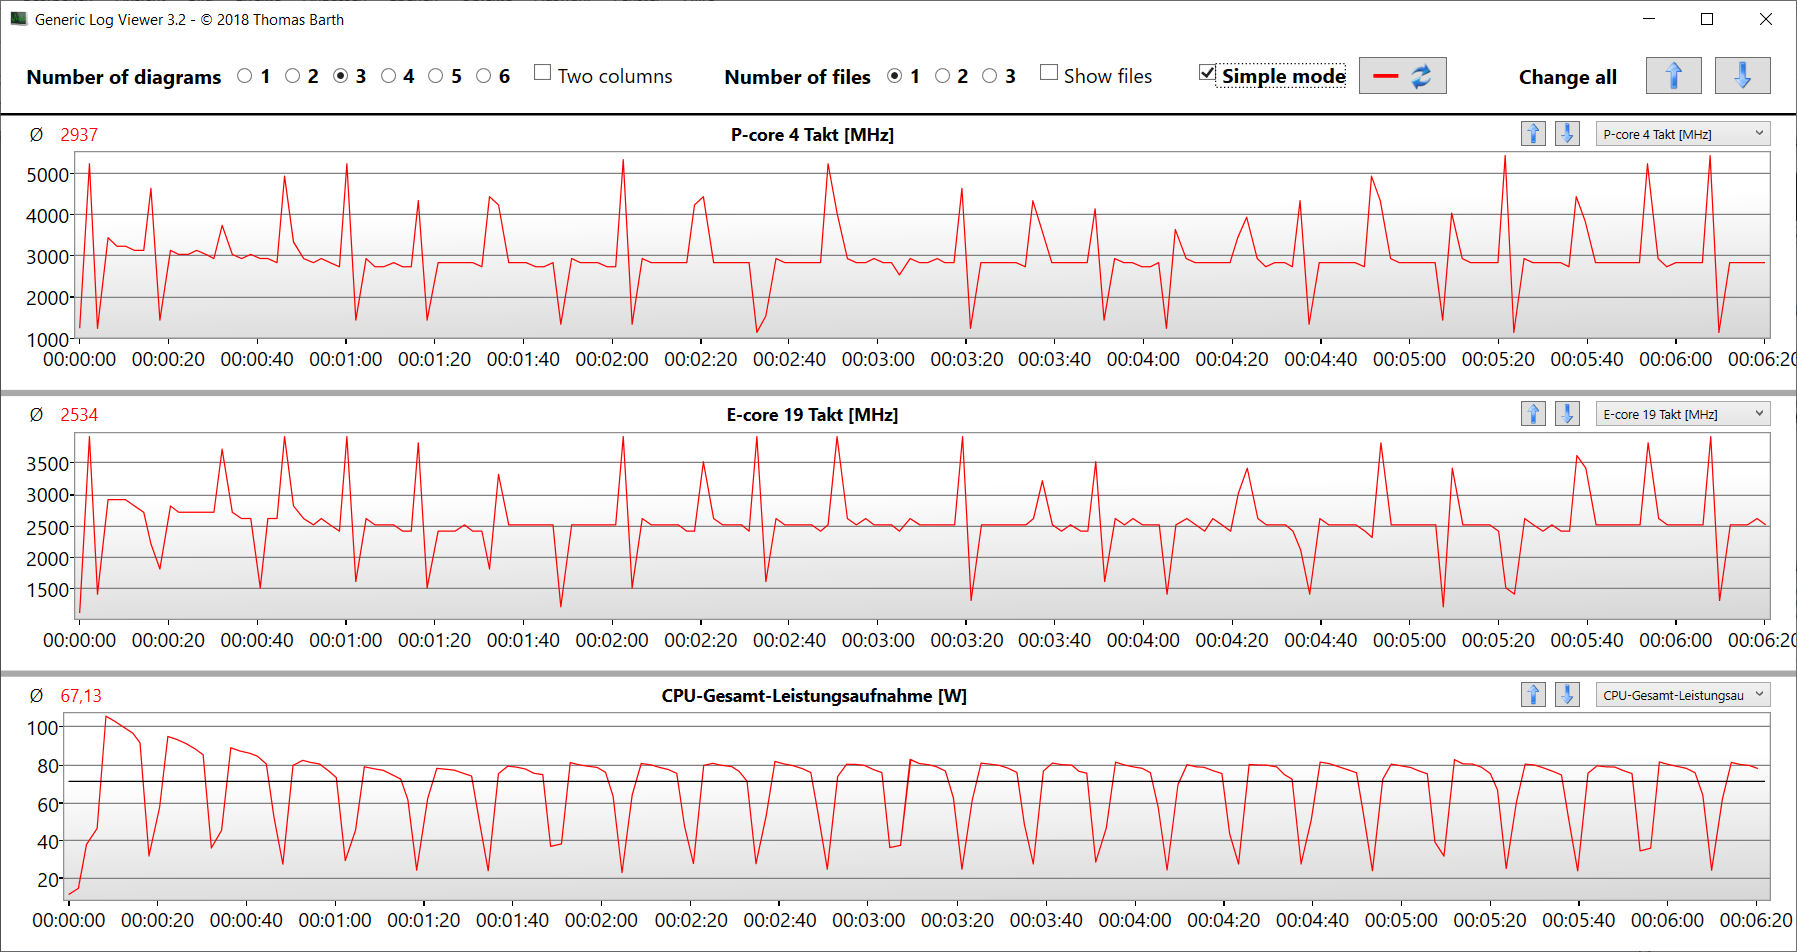
Wyniki testów porównawczych uzyskane przez Key 17 Pro są w przybliżeniu takie same jak te, które widzieliśmy w przypadku tego procesora. Podczas naszego testu w pętli Cinebench 15, długotrwałe obciążenie wielowątkowe spowodowało, że prędkość taktowania turbo procesora nieznacznie spadła w pierwszych dwóch przebiegach, zanim ostatecznie ustabilizowała się na stałym poziomie.
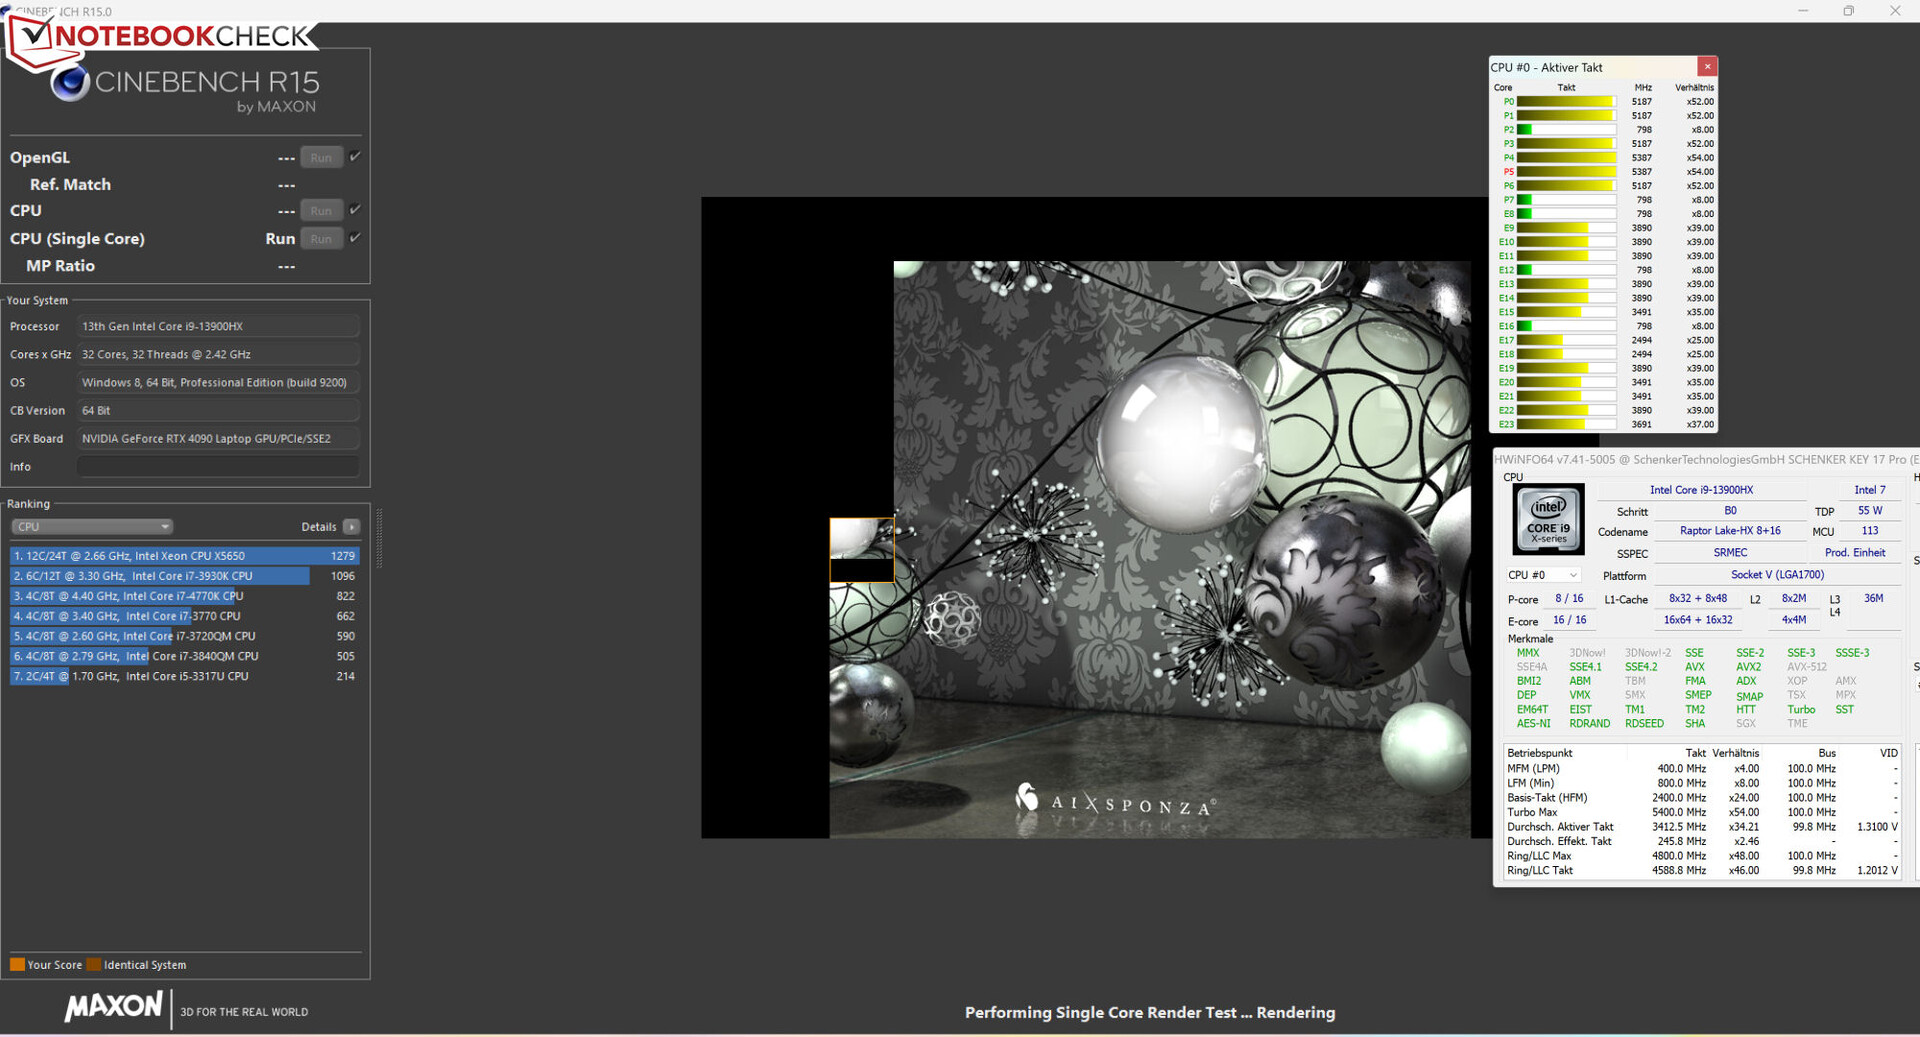
Cinebench R15 Multi sustained load
* ... im mniej tym lepiej
AIDA64: FP32 Ray-Trace | FPU Julia | CPU SHA3 | CPU Queen | FPU SinJulia | FPU Mandel | CPU AES | CPU ZLib | FP64 Ray-Trace | CPU PhotoWorxx
| Performance rating | |
| Asus ROG Strix Scar 17 G733PY-XS96 | |
| Schenker Key 17 Pro (Early 23) | |
| Medion Erazer Beast X40 | |
| Przeciętny Intel Core i9-13900HX | |
| Średnia w klasie Gaming | |
| Aorus 17X AZF | |
| MSI Stealth 17 Studio A13VH-014 | |
| AIDA64 / FP32 Ray-Trace | |
| Asus ROG Strix Scar 17 G733PY-XS96 | |
| Średnia w klasie Gaming (10227 - 85542, n=107, ostatnie 2 lata) | |
| Medion Erazer Beast X40 | |
| Przeciętny Intel Core i9-13900HX (17589 - 27615, n=22) | |
| Schenker Key 17 Pro (Early 23) | |
| MSI Stealth 17 Studio A13VH-014 | |
| Aorus 17X AZF | |
| AIDA64 / FPU Julia | |
| Asus ROG Strix Scar 17 G733PY-XS96 | |
| Średnia w klasie Gaming (51376 - 238426, n=107, ostatnie 2 lata) | |
| Medion Erazer Beast X40 | |
| Przeciętny Intel Core i9-13900HX (88686 - 137015, n=22) | |
| Schenker Key 17 Pro (Early 23) | |
| MSI Stealth 17 Studio A13VH-014 | |
| Aorus 17X AZF | |
| AIDA64 / CPU SHA3 | |
| Asus ROG Strix Scar 17 G733PY-XS96 | |
| Medion Erazer Beast X40 | |
| Średnia w klasie Gaming (2180 - 9817, n=107, ostatnie 2 lata) | |
| Przeciętny Intel Core i9-13900HX (4362 - 7029, n=22) | |
| Schenker Key 17 Pro (Early 23) | |
| Aorus 17X AZF | |
| MSI Stealth 17 Studio A13VH-014 | |
| AIDA64 / CPU Queen | |
| Asus ROG Strix Scar 17 G733PY-XS96 | |
| Schenker Key 17 Pro (Early 23) | |
| Przeciętny Intel Core i9-13900HX (125644 - 141385, n=22) | |
| Medion Erazer Beast X40 | |
| Aorus 17X AZF | |
| Średnia w klasie Gaming (49785 - 173351, n=94, ostatnie 2 lata) | |
| MSI Stealth 17 Studio A13VH-014 | |
| AIDA64 / FPU SinJulia | |
| Asus ROG Strix Scar 17 G733PY-XS96 | |
| Medion Erazer Beast X40 | |
| Przeciętny Intel Core i9-13900HX (12334 - 17179, n=22) | |
| Schenker Key 17 Pro (Early 23) | |
| Średnia w klasie Gaming (4424 - 33636, n=107, ostatnie 2 lata) | |
| Aorus 17X AZF | |
| MSI Stealth 17 Studio A13VH-014 | |
| AIDA64 / FPU Mandel | |
| Asus ROG Strix Scar 17 G733PY-XS96 | |
| Średnia w klasie Gaming (25115 - 128721, n=107, ostatnie 2 lata) | |
| Medion Erazer Beast X40 | |
| Przeciętny Intel Core i9-13900HX (43850 - 69202, n=22) | |
| Schenker Key 17 Pro (Early 23) | |
| MSI Stealth 17 Studio A13VH-014 | |
| Aorus 17X AZF | |
| AIDA64 / CPU AES | |
| Schenker Key 17 Pro (Early 23) | |
| Asus ROG Strix Scar 17 G733PY-XS96 | |
| Aorus 17X AZF | |
| Przeciętny Intel Core i9-13900HX (89413 - 237881, n=22) | |
| Medion Erazer Beast X40 | |
| Średnia w klasie Gaming (39258 - 247074, n=107, ostatnie 2 lata) | |
| MSI Stealth 17 Studio A13VH-014 | |
| AIDA64 / CPU ZLib | |
| Asus ROG Strix Scar 17 G733PY-XS96 | |
| Medion Erazer Beast X40 | |
| Przeciętny Intel Core i9-13900HX (1284 - 1958, n=22) | |
| Schenker Key 17 Pro (Early 23) | |
| Średnia w klasie Gaming (574 - 2531, n=107, ostatnie 2 lata) | |
| Aorus 17X AZF | |
| MSI Stealth 17 Studio A13VH-014 | |
| AIDA64 / FP64 Ray-Trace | |
| Asus ROG Strix Scar 17 G733PY-XS96 | |
| Średnia w klasie Gaming (5509 - 45446, n=107, ostatnie 2 lata) | |
| Medion Erazer Beast X40 | |
| Przeciętny Intel Core i9-13900HX (9481 - 15279, n=22) | |
| Schenker Key 17 Pro (Early 23) | |
| MSI Stealth 17 Studio A13VH-014 | |
| Aorus 17X AZF | |
| AIDA64 / CPU PhotoWorxx | |
| Schenker Key 17 Pro (Early 23) | |
| MSI Stealth 17 Studio A13VH-014 | |
| Aorus 17X AZF | |
| Przeciętny Intel Core i9-13900HX (42994 - 51994, n=22) | |
| Średnia w klasie Gaming (12271 - 89891, n=107, ostatnie 2 lata) | |
| Medion Erazer Beast X40 | |
| Asus ROG Strix Scar 17 G733PY-XS96 | |
Wydajność systemu
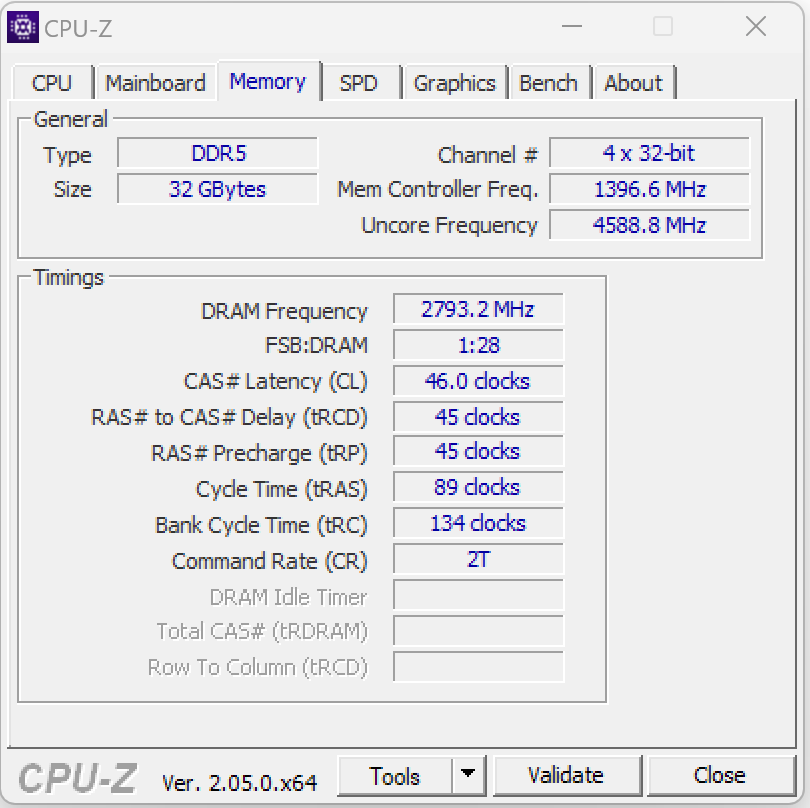
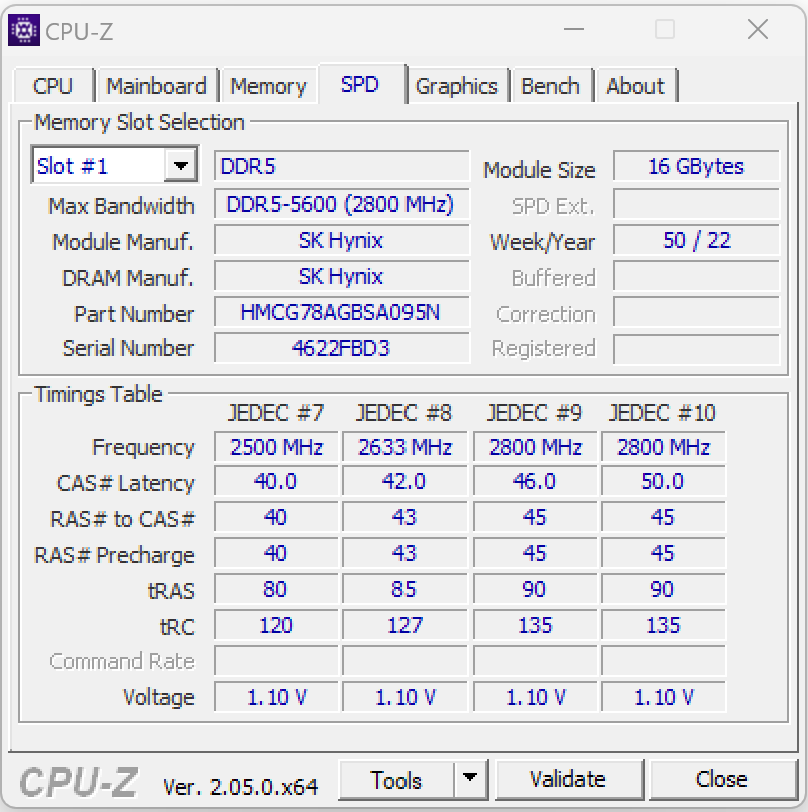
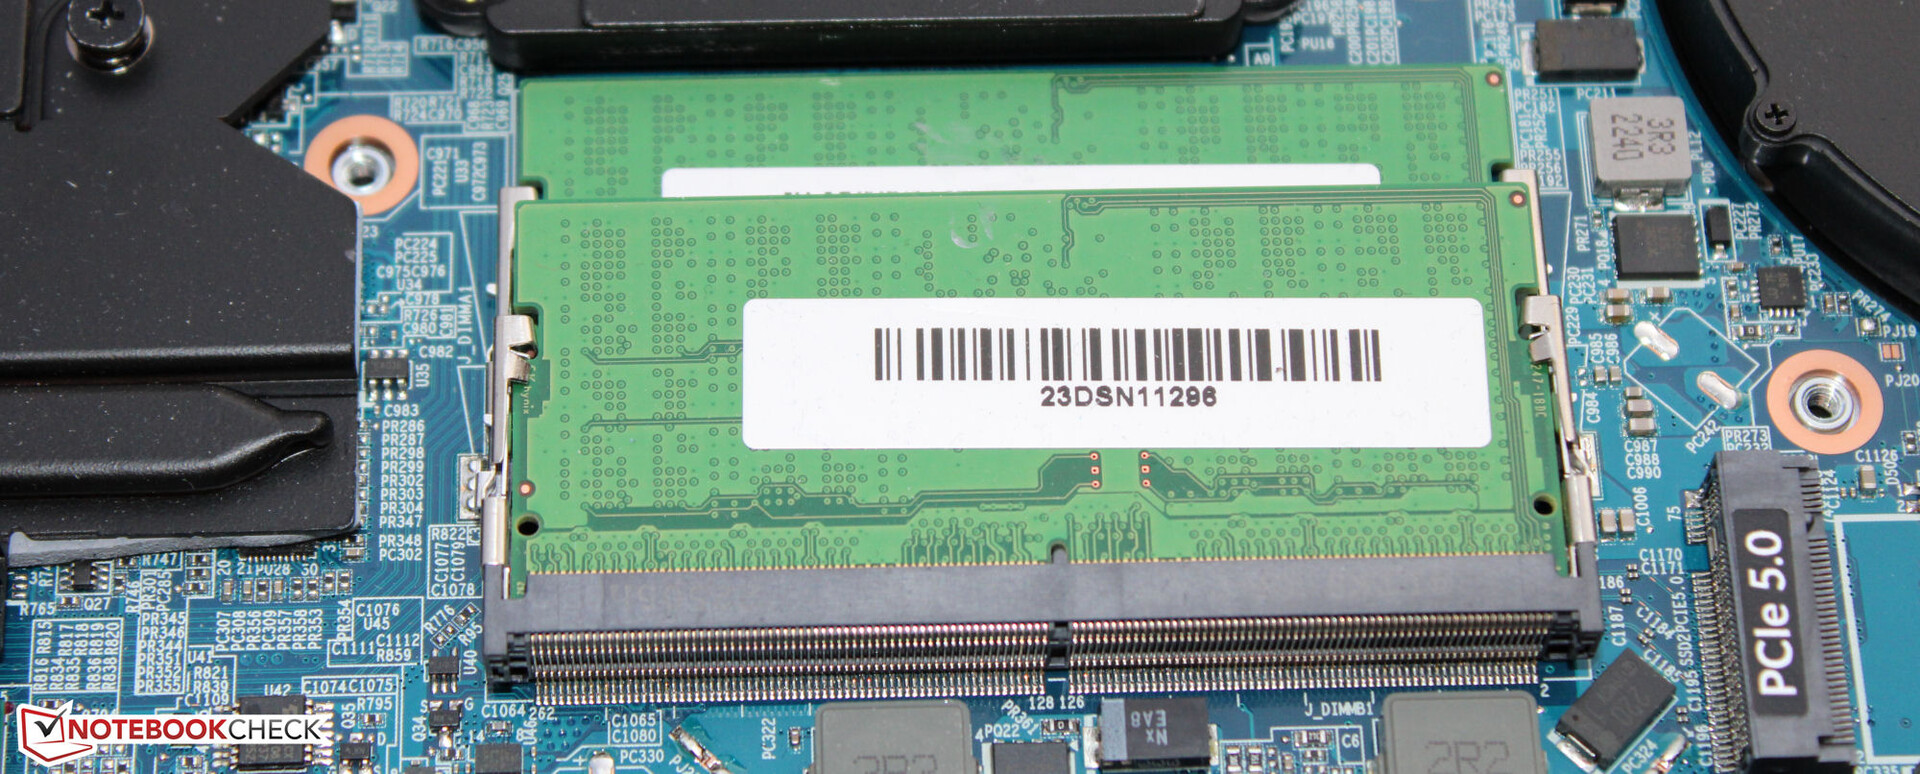
System działa płynnie i ma wystarczającą moc obliczeniową, aby wygodnie obsługiwać renderowanie, edycję wideo i gry. Szybkość transferu pamięci RAM jest dość standardowa dla pamięci DDR5-5600.
CrossMark: Overall | Productivity | Creativity | Responsiveness
| PCMark 10 / Score | |
| Schenker Key 17 Pro (Early 23) | |
| Asus ROG Strix Scar 17 G733PY-XS96 | |
| Przeciętny Intel Core i9-13900HX, NVIDIA GeForce RTX 4090 Laptop GPU (7690 - 9331, n=8) | |
| Średnia w klasie Gaming (5828 - 11574, n=95, ostatnie 2 lata) | |
| Medion Erazer Beast X40 | |
| Aorus 17X AZF | |
| MSI Stealth 17 Studio A13VH-014 | |
| PCMark 10 / Essentials | |
| Schenker Key 17 Pro (Early 23) | |
| Przeciętny Intel Core i9-13900HX, NVIDIA GeForce RTX 4090 Laptop GPU (10972 - 11983, n=8) | |
| Medion Erazer Beast X40 | |
| Aorus 17X AZF | |
| Asus ROG Strix Scar 17 G733PY-XS96 | |
| Średnia w klasie Gaming (8810 - 12600, n=99, ostatnie 2 lata) | |
| MSI Stealth 17 Studio A13VH-014 | |
| PCMark 10 / Productivity | |
| Medion Erazer Beast X40 | |
| Schenker Key 17 Pro (Early 23) | |
| Średnia w klasie Gaming (6845 - 21327, n=97, ostatnie 2 lata) | |
| Przeciętny Intel Core i9-13900HX, NVIDIA GeForce RTX 4090 Laptop GPU (9038 - 11680, n=8) | |
| Aorus 17X AZF | |
| Asus ROG Strix Scar 17 G733PY-XS96 | |
| MSI Stealth 17 Studio A13VH-014 | |
| PCMark 10 / Digital Content Creation | |
| Asus ROG Strix Scar 17 G733PY-XS96 | |
| Schenker Key 17 Pro (Early 23) | |
| Przeciętny Intel Core i9-13900HX, NVIDIA GeForce RTX 4090 Laptop GPU (10605 - 16395, n=8) | |
| Średnia w klasie Gaming (7602 - 19657, n=97, ostatnie 2 lata) | |
| MSI Stealth 17 Studio A13VH-014 | |
| Medion Erazer Beast X40 | |
| Aorus 17X AZF | |
| CrossMark / Overall | |
| Schenker Key 17 Pro (Early 23) | |
| Aorus 17X AZF | |
| Medion Erazer Beast X40 | |
| Przeciętny Intel Core i9-13900HX, NVIDIA GeForce RTX 4090 Laptop GPU (1825 - 2295, n=8) | |
| Asus ROG Strix Scar 17 G733PY-XS96 | |
| Średnia w klasie Gaming (1366 - 2409, n=96, ostatnie 2 lata) | |
| MSI Stealth 17 Studio A13VH-014 | |
| CrossMark / Productivity | |
| Schenker Key 17 Pro (Early 23) | |
| Aorus 17X AZF | |
| Medion Erazer Beast X40 | |
| Przeciętny Intel Core i9-13900HX, NVIDIA GeForce RTX 4090 Laptop GPU (1666 - 2166, n=8) | |
| Średnia w klasie Gaming (1386 - 2254, n=96, ostatnie 2 lata) | |
| Asus ROG Strix Scar 17 G733PY-XS96 | |
| MSI Stealth 17 Studio A13VH-014 | |
| CrossMark / Creativity | |
| Schenker Key 17 Pro (Early 23) | |
| Medion Erazer Beast X40 | |
| Przeciętny Intel Core i9-13900HX, NVIDIA GeForce RTX 4090 Laptop GPU (2162 - 2514, n=8) | |
| Asus ROG Strix Scar 17 G733PY-XS96 | |
| Aorus 17X AZF | |
| Średnia w klasie Gaming (1343 - 2729, n=96, ostatnie 2 lata) | |
| MSI Stealth 17 Studio A13VH-014 | |
| CrossMark / Responsiveness | |
| Schenker Key 17 Pro (Early 23) | |
| Aorus 17X AZF | |
| Medion Erazer Beast X40 | |
| Przeciętny Intel Core i9-13900HX, NVIDIA GeForce RTX 4090 Laptop GPU (1441 - 2275, n=8) | |
| Średnia w klasie Gaming (1226 - 2334, n=96, ostatnie 2 lata) | |
| Asus ROG Strix Scar 17 G733PY-XS96 | |
| MSI Stealth 17 Studio A13VH-014 | |
| PCMark 10 Score | 8913 pkt. | |
Pomoc | ||
| AIDA64 / Memory Copy | |
| Schenker Key 17 Pro (Early 23) | |
| Aorus 17X AZF | |
| Przeciętny Intel Core i9-13900HX (67716 - 79193, n=22) | |
| MSI Stealth 17 Studio A13VH-014 | |
| Średnia w klasie Gaming (21750 - 129946, n=107, ostatnie 2 lata) | |
| Medion Erazer Beast X40 | |
| Asus ROG Strix Scar 17 G733PY-XS96 | |
| AIDA64 / Memory Read | |
| Aorus 17X AZF | |
| Schenker Key 17 Pro (Early 23) | |
| Przeciętny Intel Core i9-13900HX (73998 - 88462, n=22) | |
| MSI Stealth 17 Studio A13VH-014 | |
| Medion Erazer Beast X40 | |
| Średnia w klasie Gaming (22956 - 118858, n=107, ostatnie 2 lata) | |
| Asus ROG Strix Scar 17 G733PY-XS96 | |
| AIDA64 / Memory Write | |
| Schenker Key 17 Pro (Early 23) | |
| Aorus 17X AZF | |
| Średnia w klasie Gaming (22297 - 135096, n=107, ostatnie 2 lata) | |
| MSI Stealth 17 Studio A13VH-014 | |
| Przeciętny Intel Core i9-13900HX (65472 - 77045, n=22) | |
| Medion Erazer Beast X40 | |
| Asus ROG Strix Scar 17 G733PY-XS96 | |
| AIDA64 / Memory Latency | |
| Średnia w klasie Gaming (75.3 - 259, n=107, ostatnie 2 lata) | |
| MSI Stealth 17 Studio A13VH-014 | |
| Schenker Key 17 Pro (Early 23) | |
| Medion Erazer Beast X40 | |
| Przeciętny Intel Core i9-13900HX (75.3 - 91.1, n=22) | |
| Asus ROG Strix Scar 17 G733PY-XS96 | |
| Aorus 17X AZF | |
* ... im mniej tym lepiej
Opóźnienie DPC
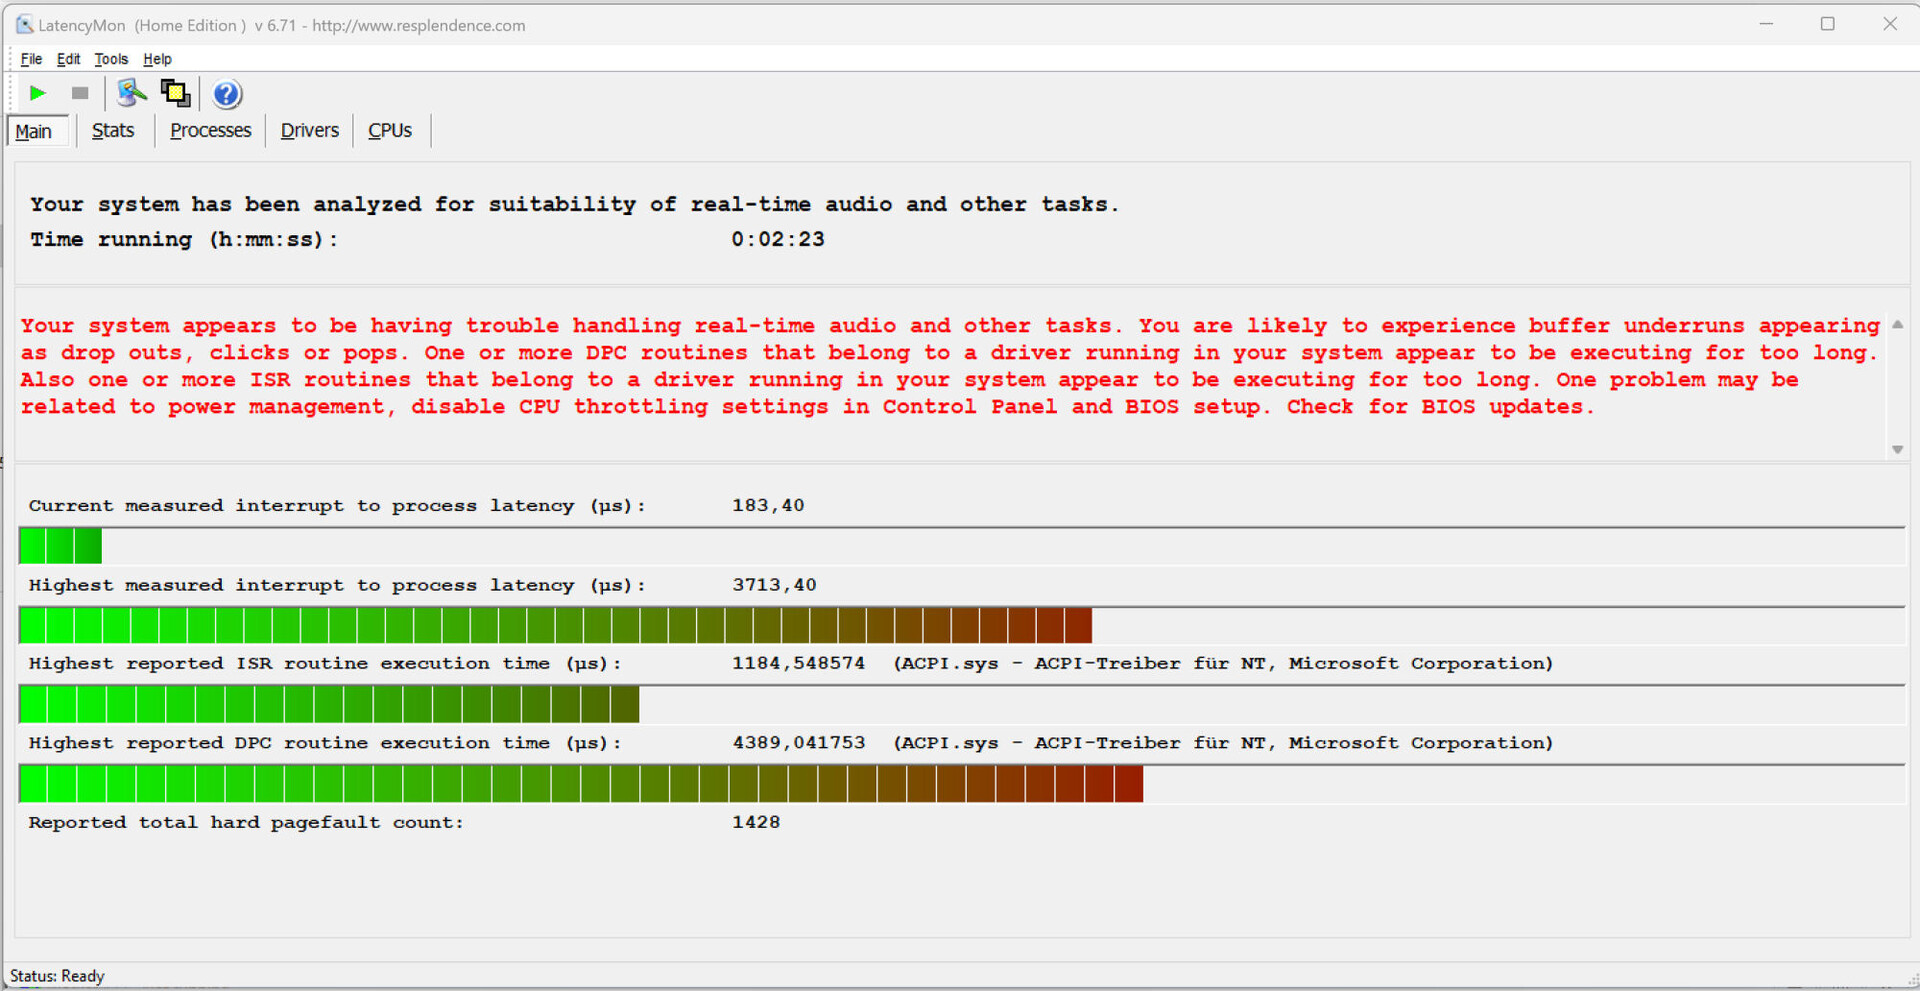
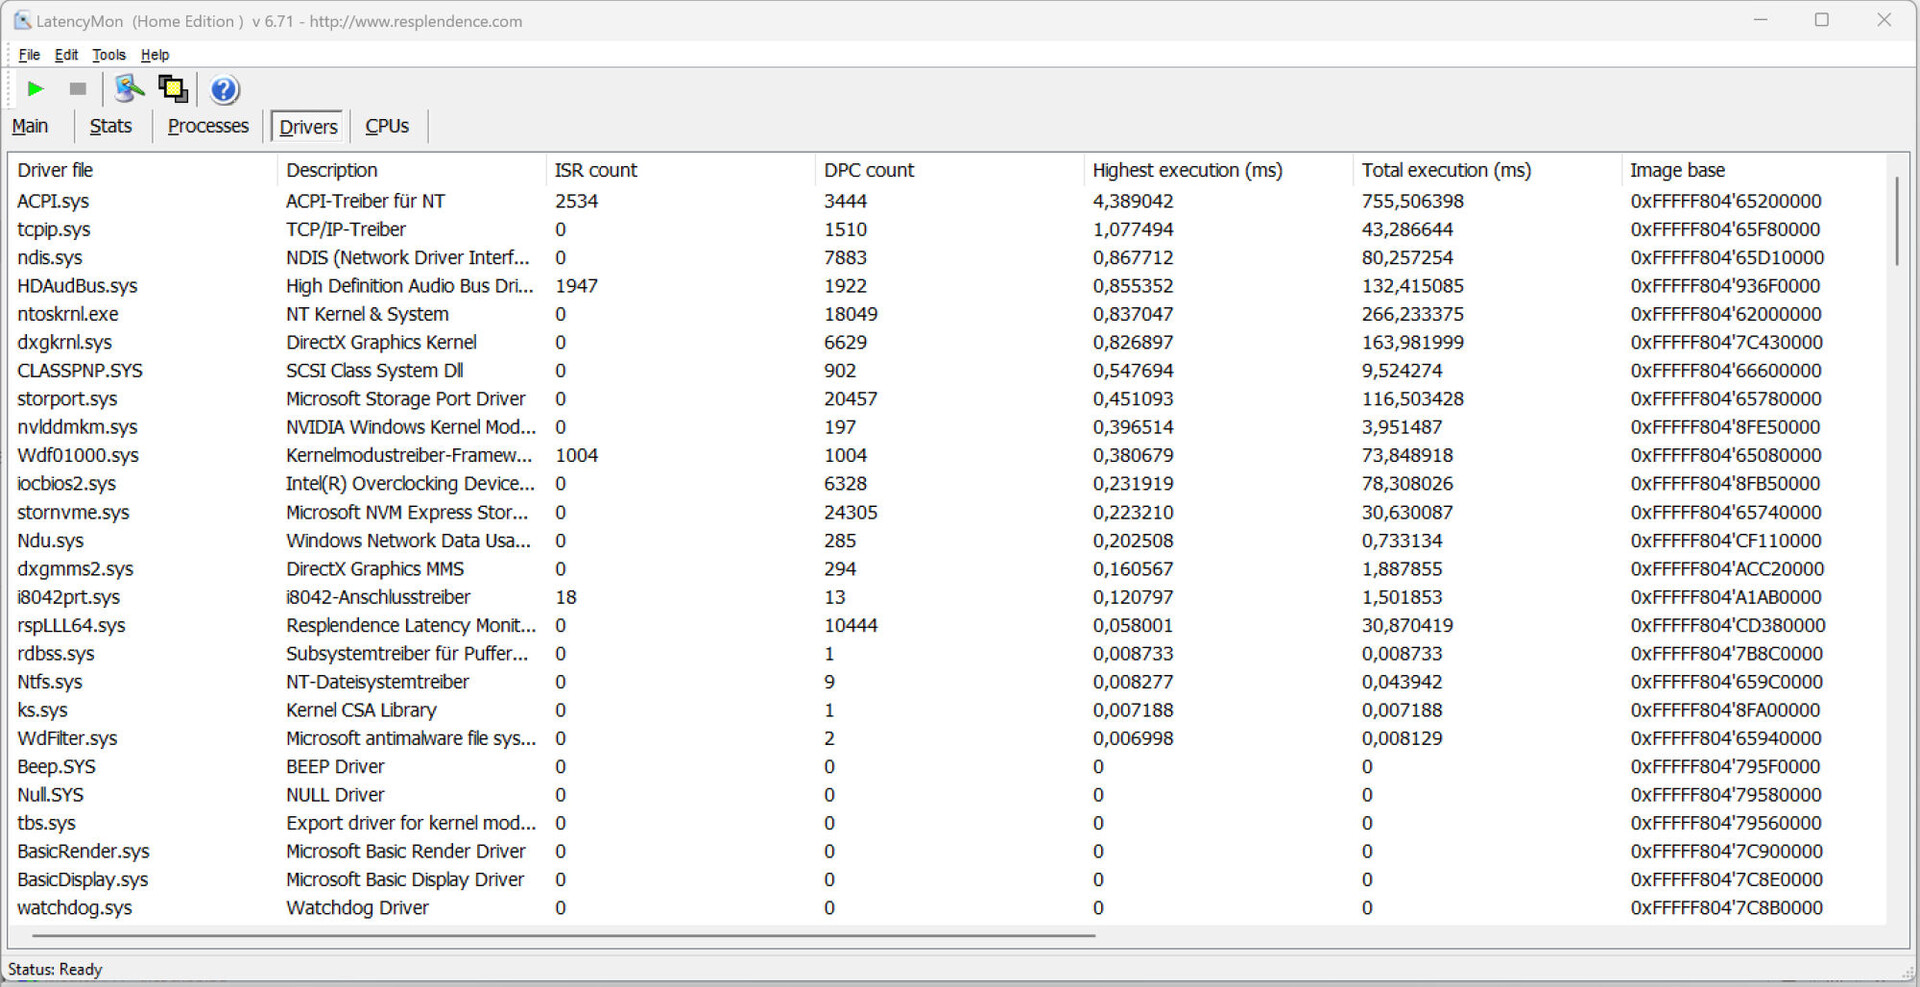
Nasz standardowy test monitora opóźnień (przeglądanie Internetu, odtwarzanie wideo 4K, wysokie obciążenie Prime95) ujawnił pewne problemy z opóźnieniami. System nie wydaje się być odpowiedni do obsługi zadań wideo i audio w czasie rzeczywistym. Miejmy nadzieję, że problemy te zostaną rozwiązane w przyszłych aktualizacjach oprogramowania.
| DPC Latencies / LatencyMon - interrupt to process latency (max), Web, Youtube, Prime95 | |
| Aorus 17X AZF | |
| Schenker Key 17 Pro (Early 23) | |
| MSI Stealth 17 Studio A13VH-014 | |
| Medion Erazer Beast X40 | |
| Asus ROG Strix Scar 17 G733PY-XS96 | |
* ... im mniej tym lepiej
Pamięć masowa
Schenker Key 17 Pro może pomieścić do trzech dysków SSD M.2-2280 (2x PCIe 4.0, 1x PCIe 5.0). Preinstalowany dysk PCIe 4.0 Samsung oferuje dużą ilość miejsca (2 TB) i zapewnia fantastyczne prędkości transferu. Nie zauważyliśmy żadnych spadków wydajności spowodowanych dławieniem termicznym.

* ... im mniej tym lepiej
Sustained load Read: DiskSpd Read Loop, Queue Depth 8
Karta graficzna
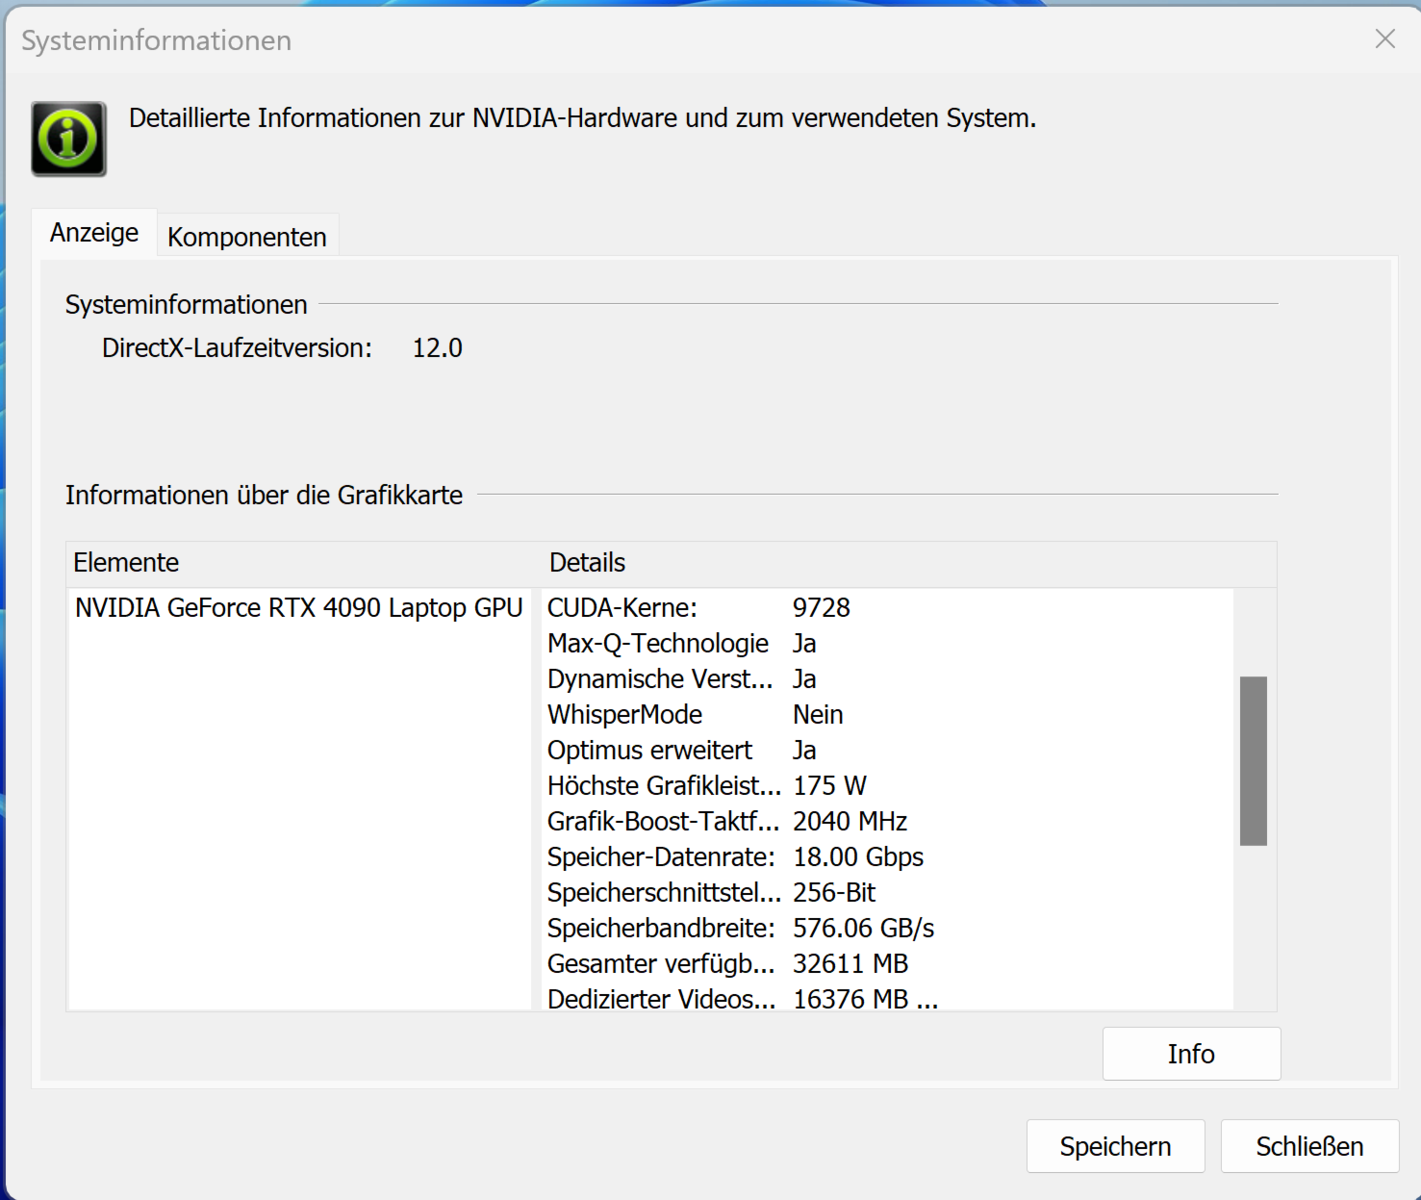
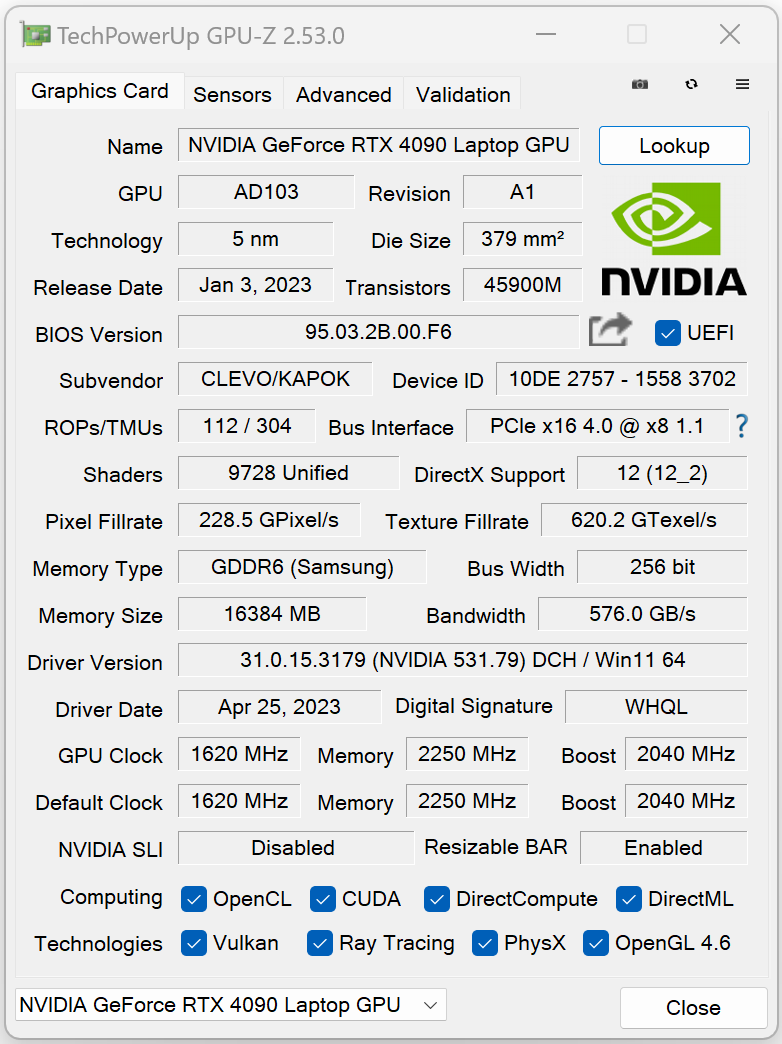
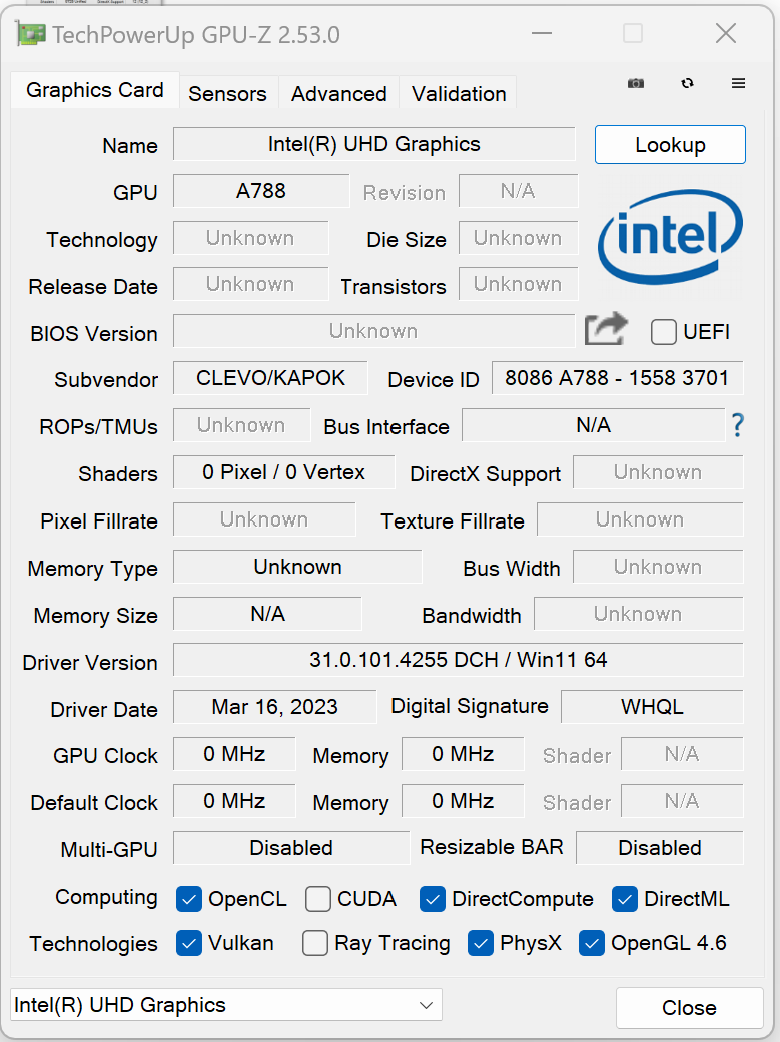
GeForce RTX 4090 Laptop to obecnie topowy mobilny procesor graficzny firmy Nvidia. Jest on wyposażony w 9 728 jednostek cieniujących, 256-bitową magistralę pamięci i 16 GB szybkiej pamięci RAM GDDR6. Karta graficzna ma maksymalne TGP wynoszące 175 watów (150 watów + 25 watów Dynamic Boost) - to tak dużo, jak to tylko możliwe. TGP nie było w pełni wykorzystywane podczas naszego testu Witcher 3
.
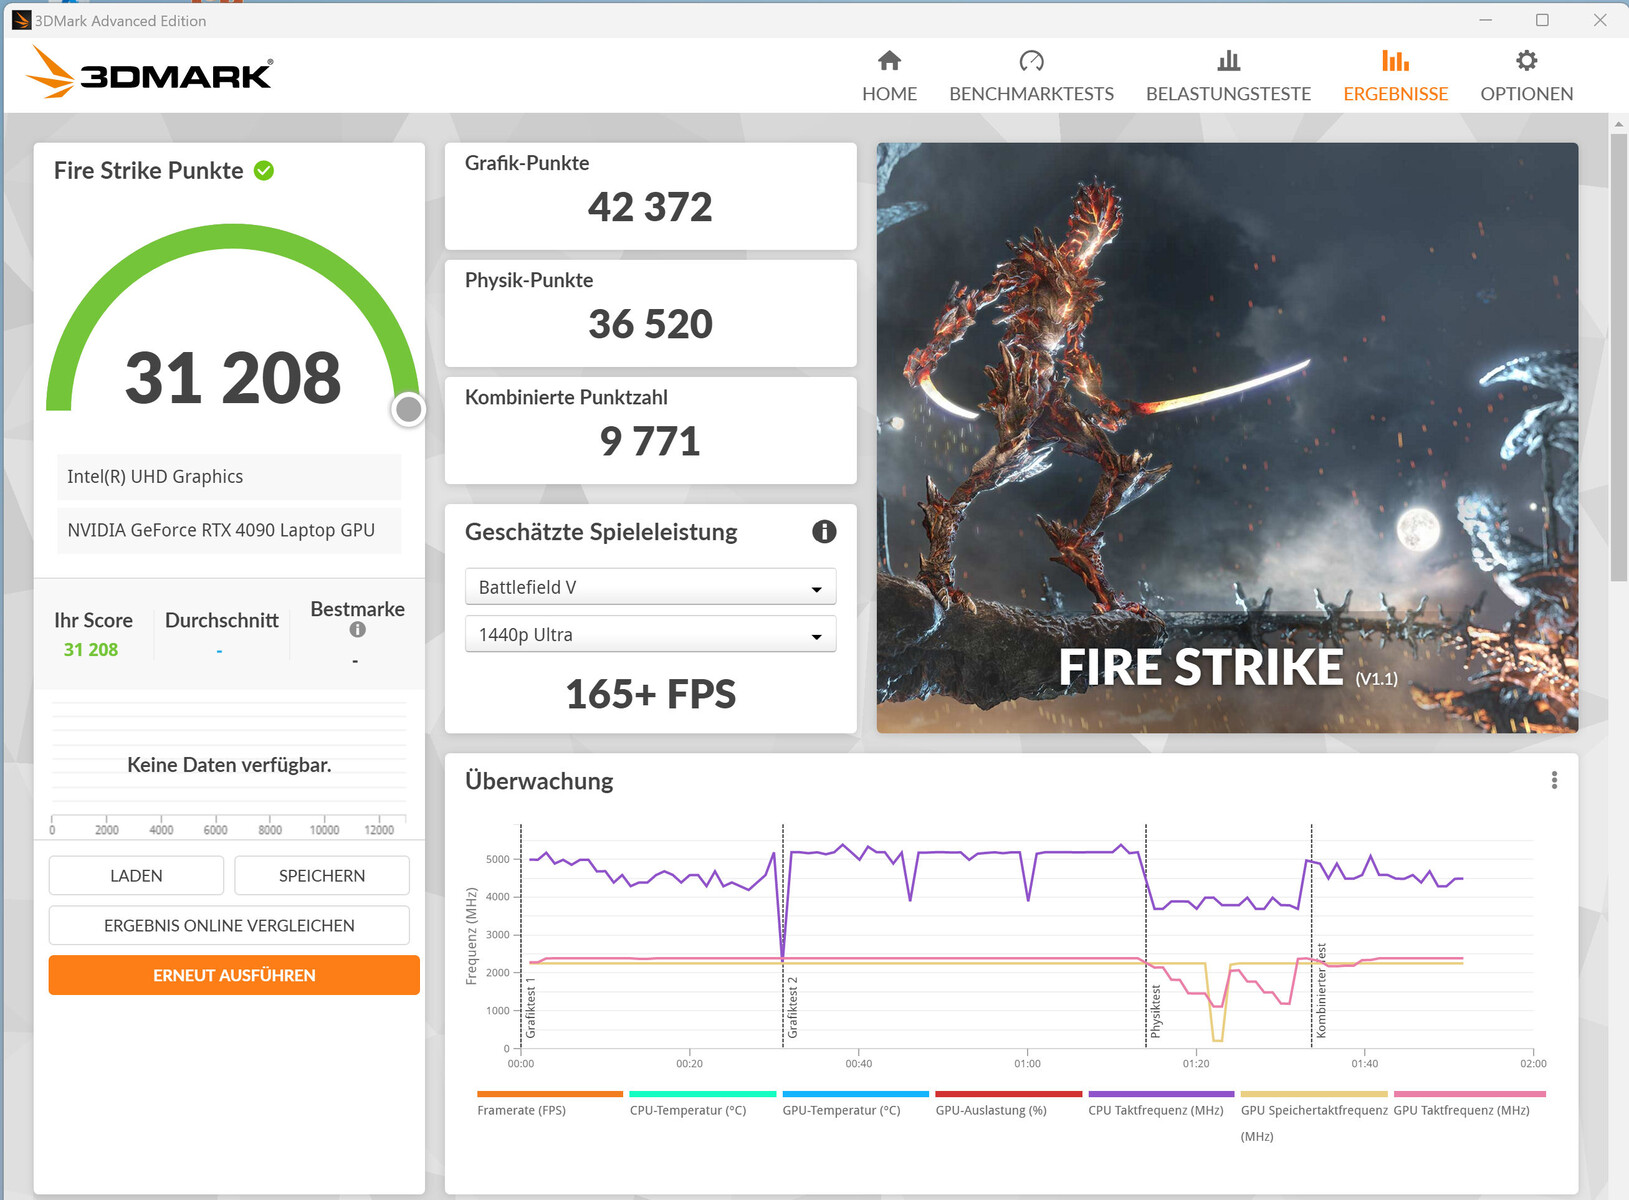
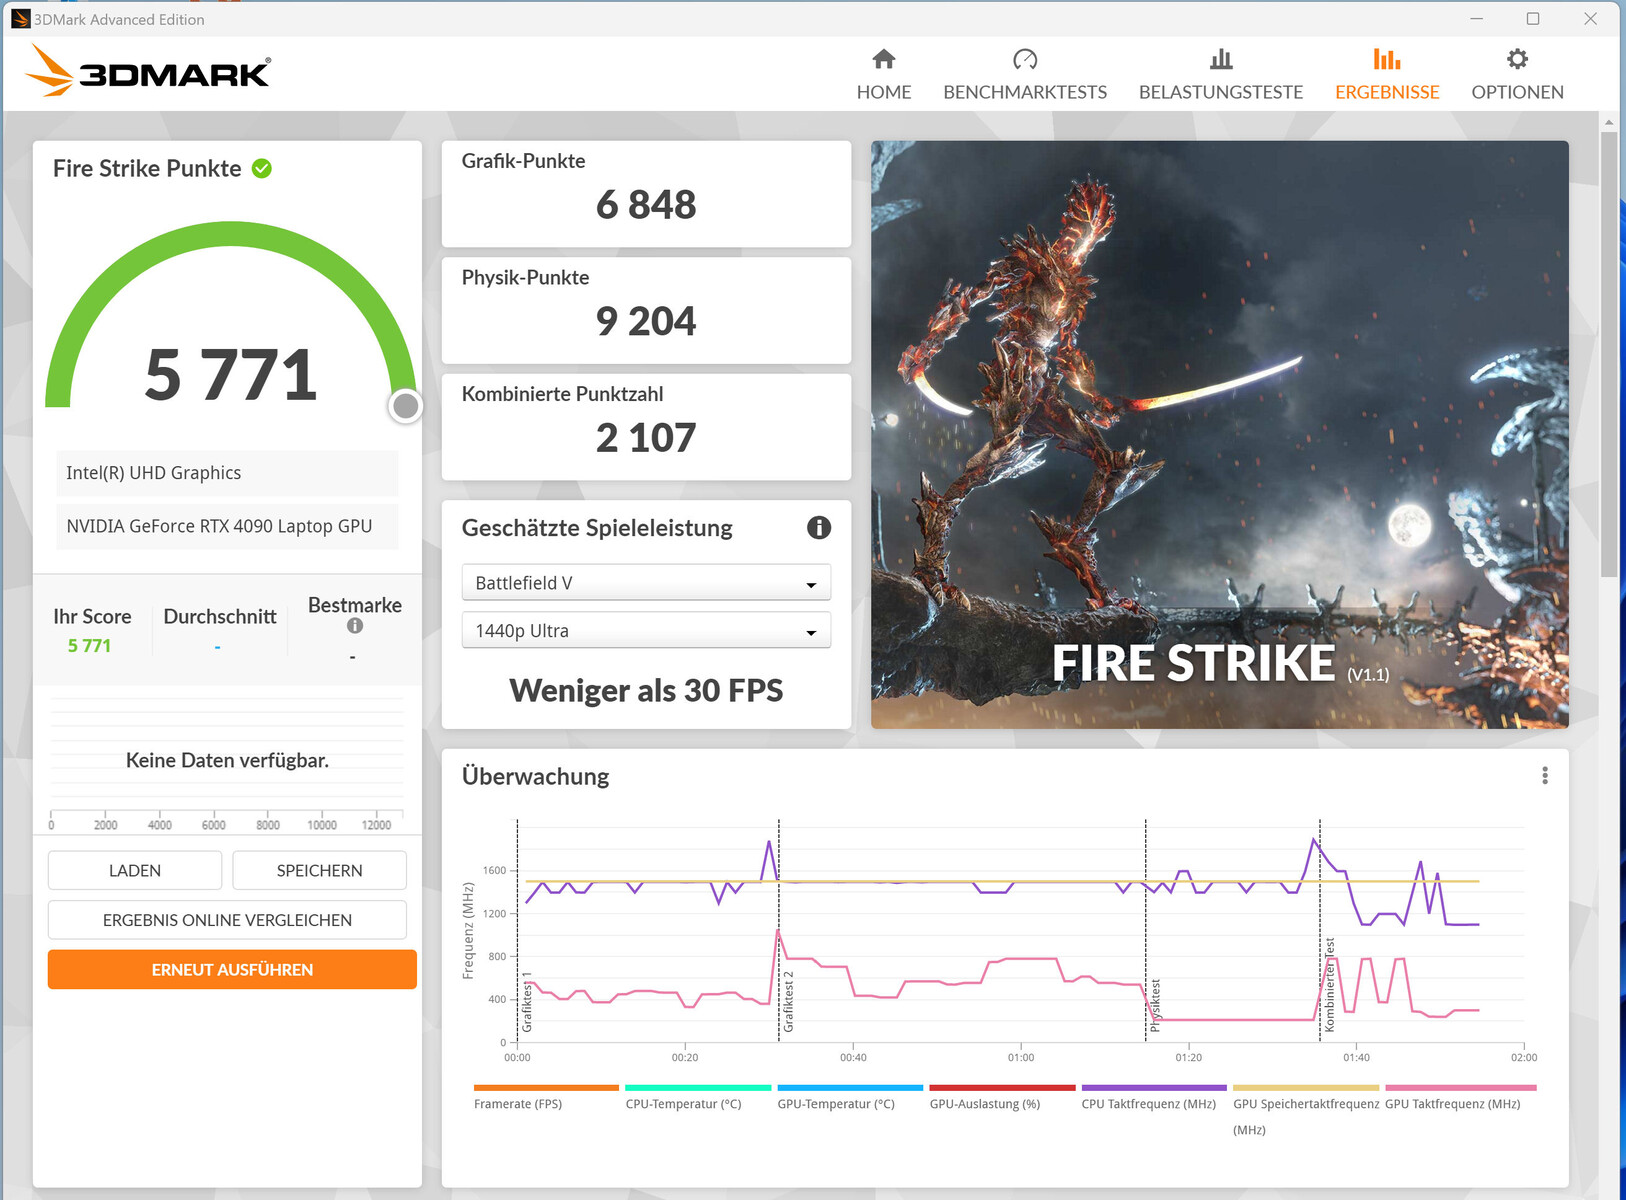
Pomimo tego, że GPU osiągnął wyniki poniżej średniej w syntetycznych benchmarkach GPU, jego wydajność w rzeczywistych grach była powyżej średniej. Przełączenie na tryb dGPU (poprzez Control Center) również zapewniło wzrost wydajności. Dzięki tak potężnemu sprzętowi laptop jest zdecydowanie zdolny do grania w rozdzielczości 4K przy ustawieniach od wysokich do maksymalnych.


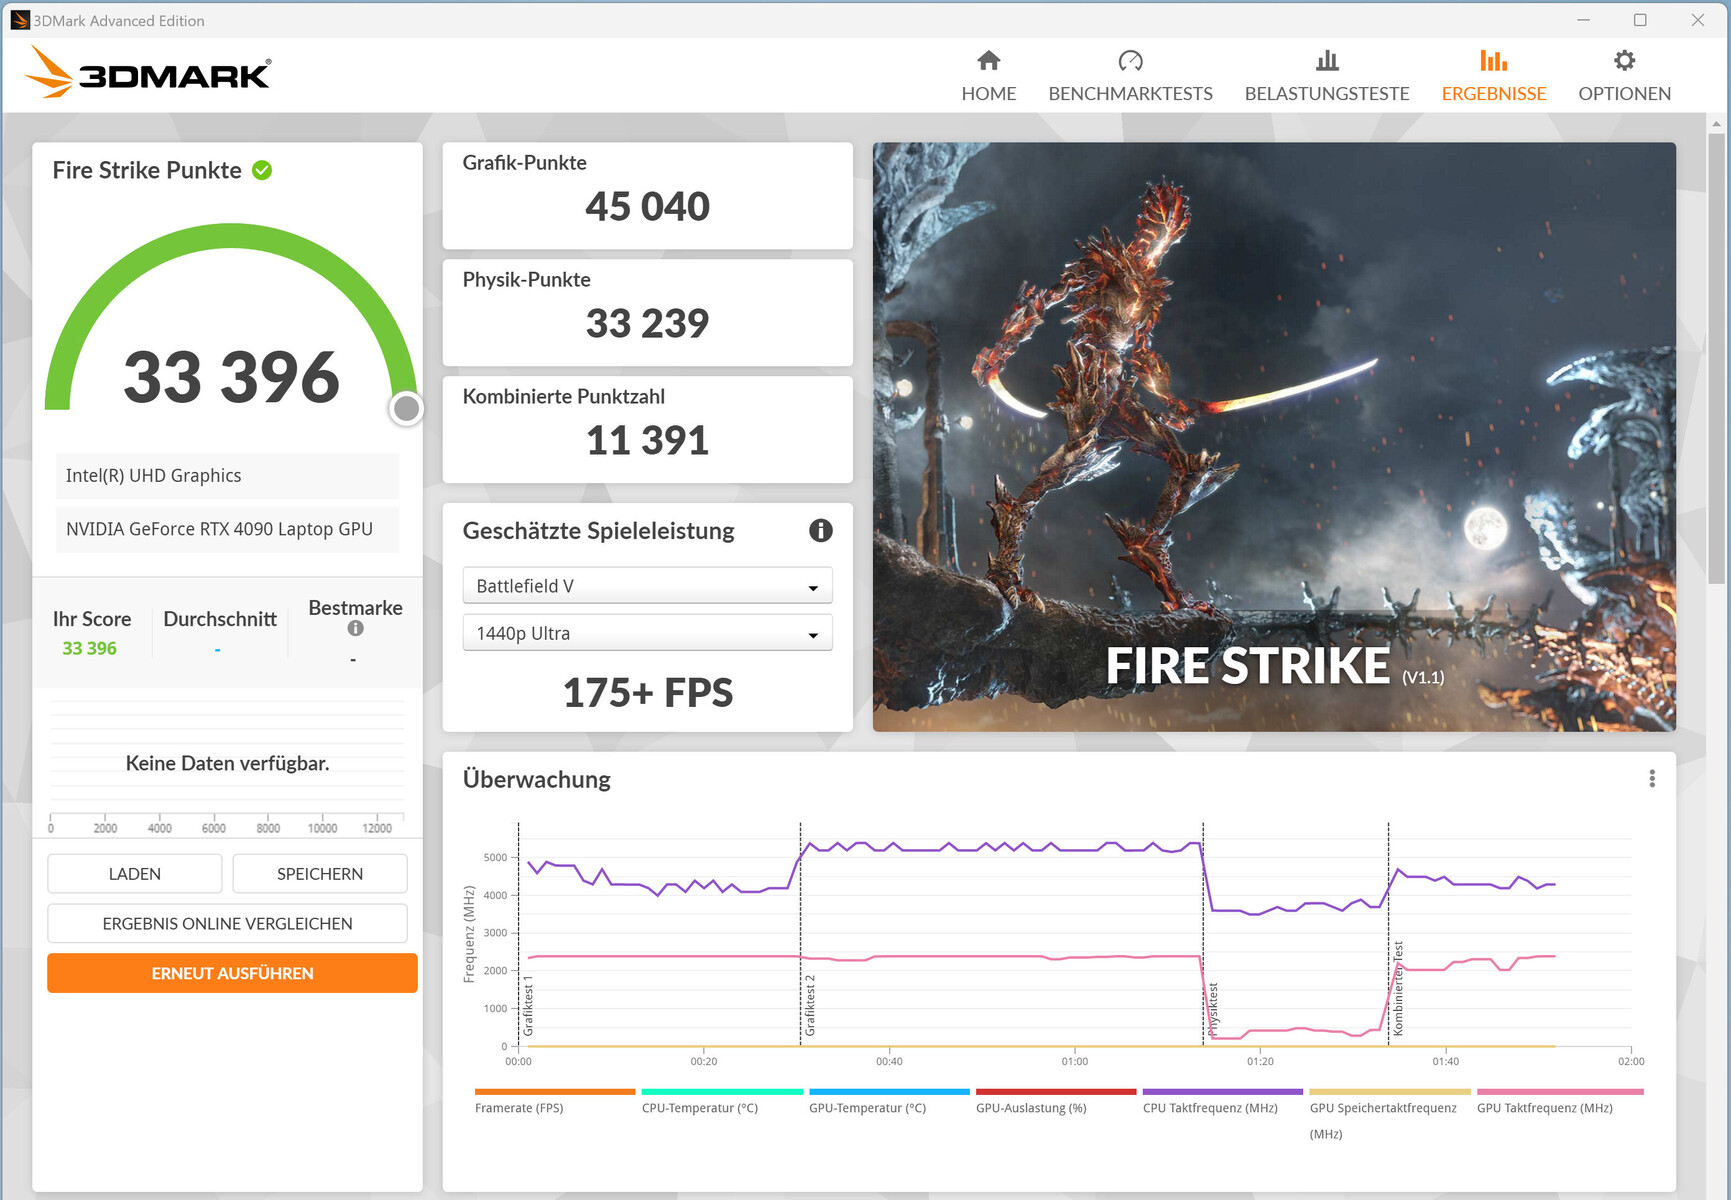
| 3DMark 11 Performance | 44742 pkt. | |
| 3DMark Cloud Gate Standard Score | 54257 pkt. | |
| 3DMark Fire Strike Score | 31208 pkt. | |
| 3DMark Time Spy Score | 19893 pkt. | |
Pomoc | ||
* ... im mniej tym lepiej
| The Witcher 3 - 1920x1080 Ultra Graphics & Postprocessing (HBAO+) | |
| Schenker Key 17 Pro (Early 23) | |
| Asus ROG Strix Scar 17 G733PY-XS96 | |
| Aorus 17X AZF | |
| Przeciętny NVIDIA GeForce RTX 4090 Laptop GPU (139.2 - 216, n=35) | |
| Medion Erazer Beast X40 | |
| Średnia w klasie Gaming (95 - 240, n=7, ostatnie 2 lata) | |
| MSI Stealth 17 Studio A13VH-014 | |
| Strange Brigade - 1920x1080 ultra AA:ultra AF:16 | |
| Aorus 17X AZF | |
| Schenker Key 17 Pro (Early 23) | |
| Medion Erazer Beast X40 | |
| Przeciętny NVIDIA GeForce RTX 4090 Laptop GPU (233 - 421, n=39) | |
| Średnia w klasie Gaming (76.3 - 456, n=88, ostatnie 2 lata) | |
| MSI Stealth 17 Studio A13VH-014 | |
| Sons of the Forest | |
| 1920x1080 Ultra Preset AA:T | |
| Schenker Key 17 Pro (Early 23) | |
| Przeciętny NVIDIA GeForce RTX 4090 Laptop GPU (85.7 - 93.9, n=2) | |
| Medion Erazer Beast X40 | |
| 3840x2160 Ultra Preset AA:T | |
| Schenker Key 17 Pro (Early 23) | |
| Przeciętny NVIDIA GeForce RTX 4090 Laptop GPU (n=1) | |
| Star Wars Jedi Survivor | |
| 1920x1080 Epic Preset | |
| Schenker Key 17 Pro (Early 23) | |
| Przeciętny NVIDIA GeForce RTX 4090 Laptop GPU (103 - 148, n=6) | |
| Asus ROG Strix Scar 17 G733PY-XS96 | |
| 3840x2160 Epic Preset | |
| Przeciętny NVIDIA GeForce RTX 4090 Laptop GPU (39 - 59, n=6) | |
| Asus ROG Strix Scar 17 G733PY-XS96 | |
| Schenker Key 17 Pro (Early 23) | |
| Resident Evil 4 Remake | |
| 1920x1080 Max Preset | |
| Schenker Key 17 Pro (Early 23) | |
| Przeciętny NVIDIA GeForce RTX 4090 Laptop GPU (136.3 - 143.2, n=2) | |
| Aorus 17X AZF | |
| 3840x2160 Max Preset | |
| Schenker Key 17 Pro (Early 23) | |
| Przeciętny NVIDIA GeForce RTX 4090 Laptop GPU (63.4 - 64.9, n=2) | |
| Aorus 17X AZF | |
| Dead Island 2 | |
| 1920x1080 Ultra Preset AA:High T | |
| Przeciętny NVIDIA GeForce RTX 4090 Laptop GPU (181.7 - 206, n=2) | |
| Schenker Key 17 Pro (Early 23) | |
| 3840x2160 Ultra Preset AA:High T | |
| Przeciętny NVIDIA GeForce RTX 4090 Laptop GPU (94.8 - 101.2, n=2) | |
| Schenker Key 17 Pro (Early 23) | |
| The Callisto Protocol | |
| 1920x1080 Ultra Preset (without FSR Upscaling) | |
| Schenker Key 17 Pro (Early 23) | |
| Aorus 17X AZF | |
| Przeciętny NVIDIA GeForce RTX 4090 Laptop GPU (102.6 - 150.7, n=6) | |
| 3840x2160 Ultra Preset (without FSR Upscaling) | |
| Schenker Key 17 Pro (Early 23) | |
| Przeciętny NVIDIA GeForce RTX 4090 Laptop GPU (48.1 - 81.4, n=6) | |
| Aorus 17X AZF | |
Witcher 3 FPS chart
| low | med. | high | ultra | QHD | 4K | |
|---|---|---|---|---|---|---|
| GTA V (2015) | 187.7 | 186.4 | 184.8 | 142.3 | 141.5 | 167.9 |
| The Witcher 3 (2015) | 474.4 | 382.6 | 299.2 | 206 | 96.3 | |
| Dota 2 Reborn (2015) | 231 | 207 | 195.3 | 182.5 | 141.9 | |
| Final Fantasy XV Benchmark (2018) | 230 | 217 | 183.1 | 156.4 | 91.9 | |
| X-Plane 11.11 (2018) | 180.8 | 171.7 | 136.6 | 109.7 | ||
| Strange Brigade (2018) | 558 | 437 | 410 | 378 | 291 | 153.4 |
| The Callisto Protocol (2022) | 194.5 | 182.6 | 175.5 | 150.7 | 126.7 | 81.4 |
| Sons of the Forest (2023) | 103.2 | 97.5 | 93.9 | 93.9 | 89.6 | 72.5 |
| Resident Evil 4 Remake (2023) | 203 | 194.6 | 173.1 | 143.2 | 113.2 | 64.9 |
| Dead Island 2 (2023) | 226 | 212 | 190.3 | 181.7 | 178.5 | 94.8 |
| Star Wars Jedi Survivor (2023) | 131.2 | 127.6 | 122.1 | 117.4 | 84.4 | 41.8 |
Emisje i zarządzanie energią - laptop Schenker może być dość głośny
Emisja hałasu
Potężny notebook, taki jak Key 17 Pro, może wytwarzać ogromną ilość hałasu pod obciążeniem: poziom hałasu osiągnął szczyt 62 dB(A), gdy laptop uruchamiał gry w "trybie wydajności". Nawet w trybie "Rozrywka" urządzenie nadal osiągało niezwykle głośny poziom 54 dB(A). Pozostałe dwa tryby zasilania pomagają Key 17 Pro pracować cicho przy znacznie zmniejszonej wydajności.
Notebook jest generalnie cichy, a czasem nawet bezgłośny, w trybie bezczynności lub podczas codziennego użytkowania (np. oprogramowanie biurowe, przeglądanie Internetu). Wentylatory jednak od czasu do czasu rozkręcają się bez powodu (zjawisko typowe dla barebone'ów Clevo).
Hałas
| luz |
| 26 / 33 / 46 dB |
| obciążenie |
| 56 / 64 dB |
 | ||
30 dB cichy 40 dB(A) słyszalny 50 dB(A) irytujący |
||
min: | ||
| Schenker Key 17 Pro (Early 23) i9-13900HX, GeForce RTX 4090 Laptop GPU | MSI Stealth 17 Studio A13VH-014 i9-13900H, GeForce RTX 4080 Laptop GPU | Asus ROG Strix Scar 17 G733PY-XS96 R9 7945HX, GeForce RTX 4090 Laptop GPU | Aorus 17X AZF i9-13900HX, GeForce RTX 4090 Laptop GPU | Medion Erazer Beast X40 i9-13900HX, GeForce RTX 4090 Laptop GPU | |
|---|---|---|---|---|---|
| Noise | 25% | 22% | 10% | 13% | |
| wyłączone / środowisko * (dB) | 26 | 24 8% | 22.7 13% | 25 4% | 24 8% |
| Idle Minimum * (dB) | 26 | 24 8% | 23.5 10% | 28 -8% | 25 4% |
| Idle Average * (dB) | 33 | 24 27% | 27.7 16% | 29 12% | 29 12% |
| Idle Maximum * (dB) | 46 | 24 48% | 27.7 40% | 34 26% | 35 24% |
| Load Average * (dB) | 56 | 34.49 38% | 30.5 46% | 51 9% | 51 9% |
| Witcher 3 ultra * (dB) | 62 | 48.29 22% | 51.4 17% | 57 8% | 51 18% |
| Load Maximum * (dB) | 64 | 49.66 22% | 54.1 15% | 54 16% | 53 17% |
* ... im mniej tym lepiej
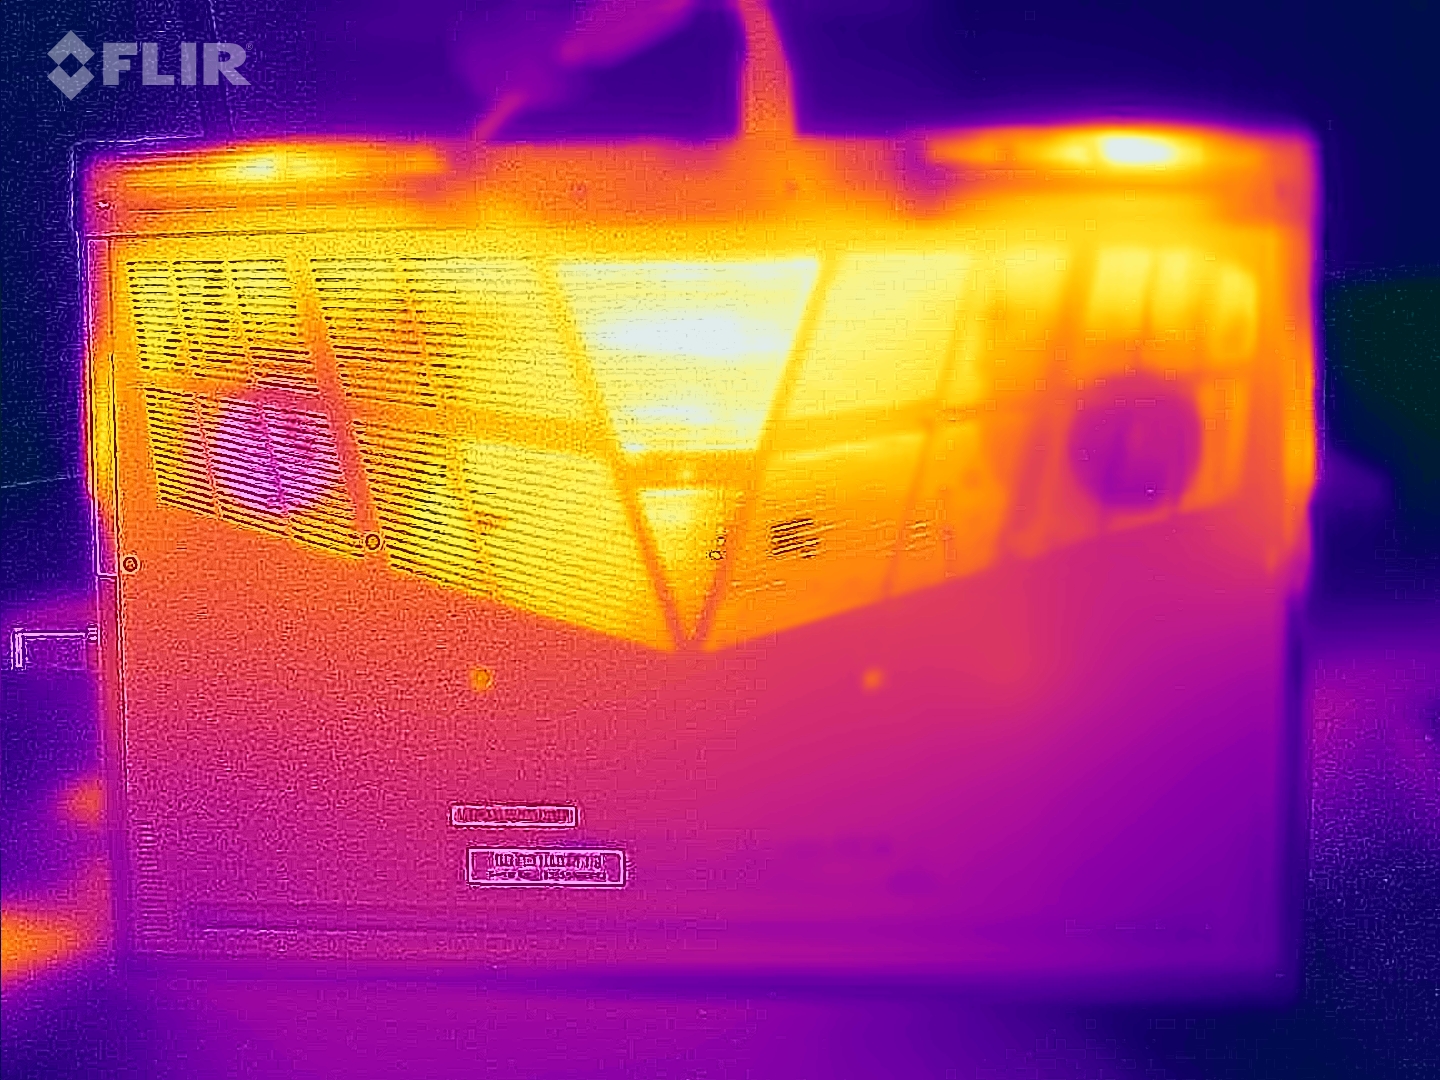
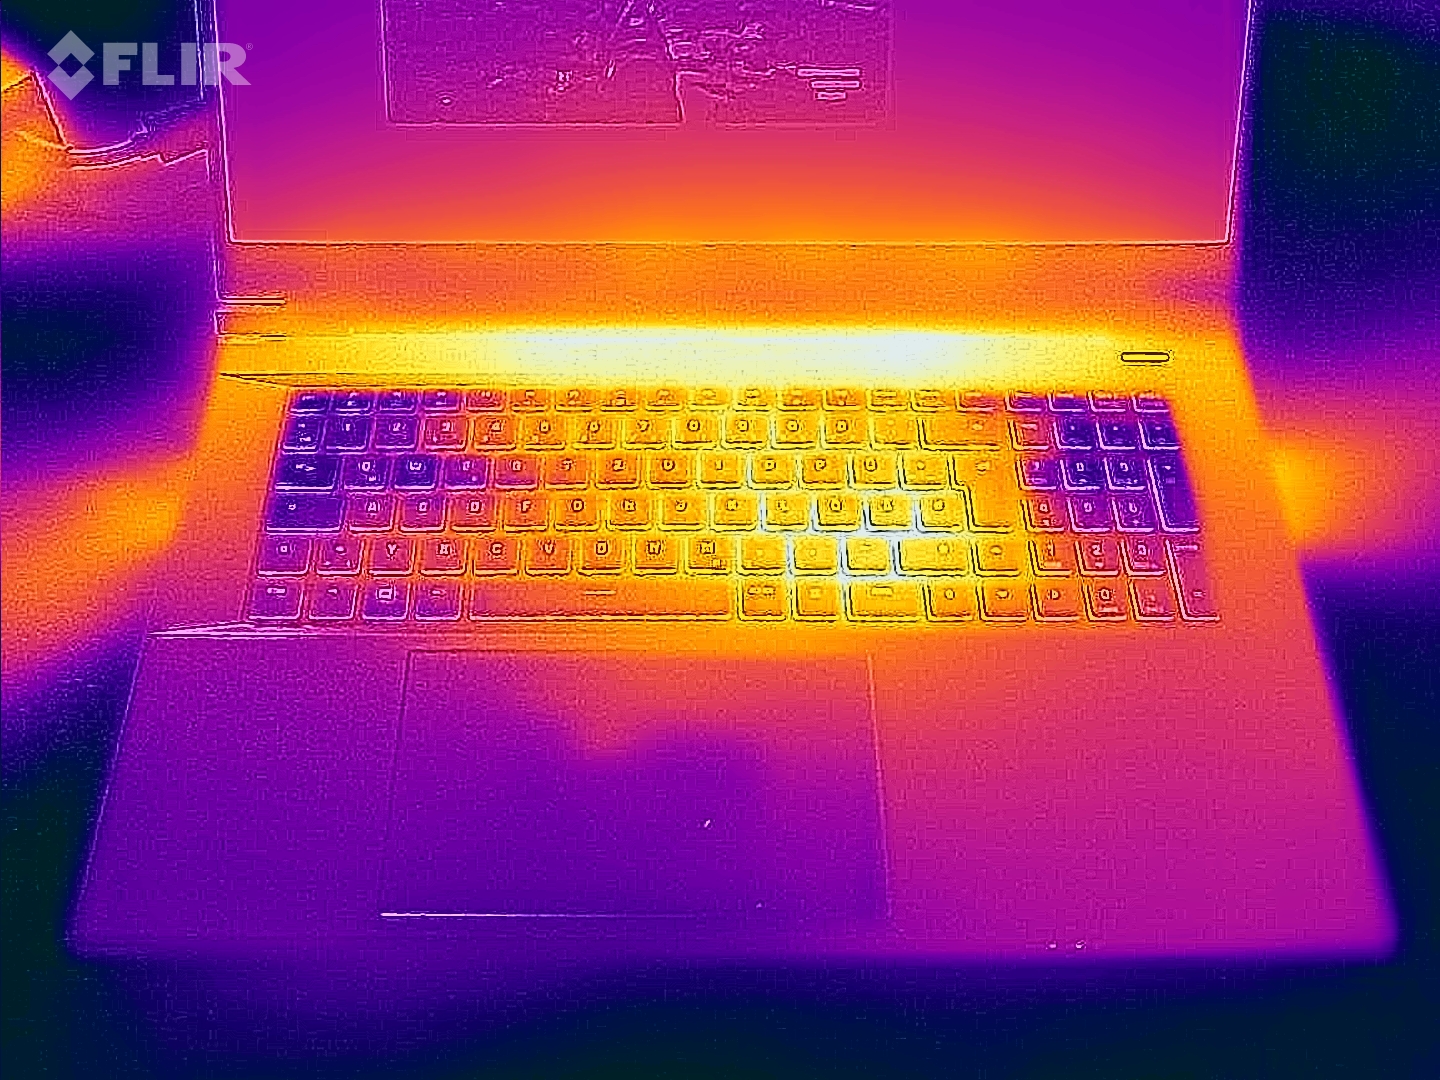
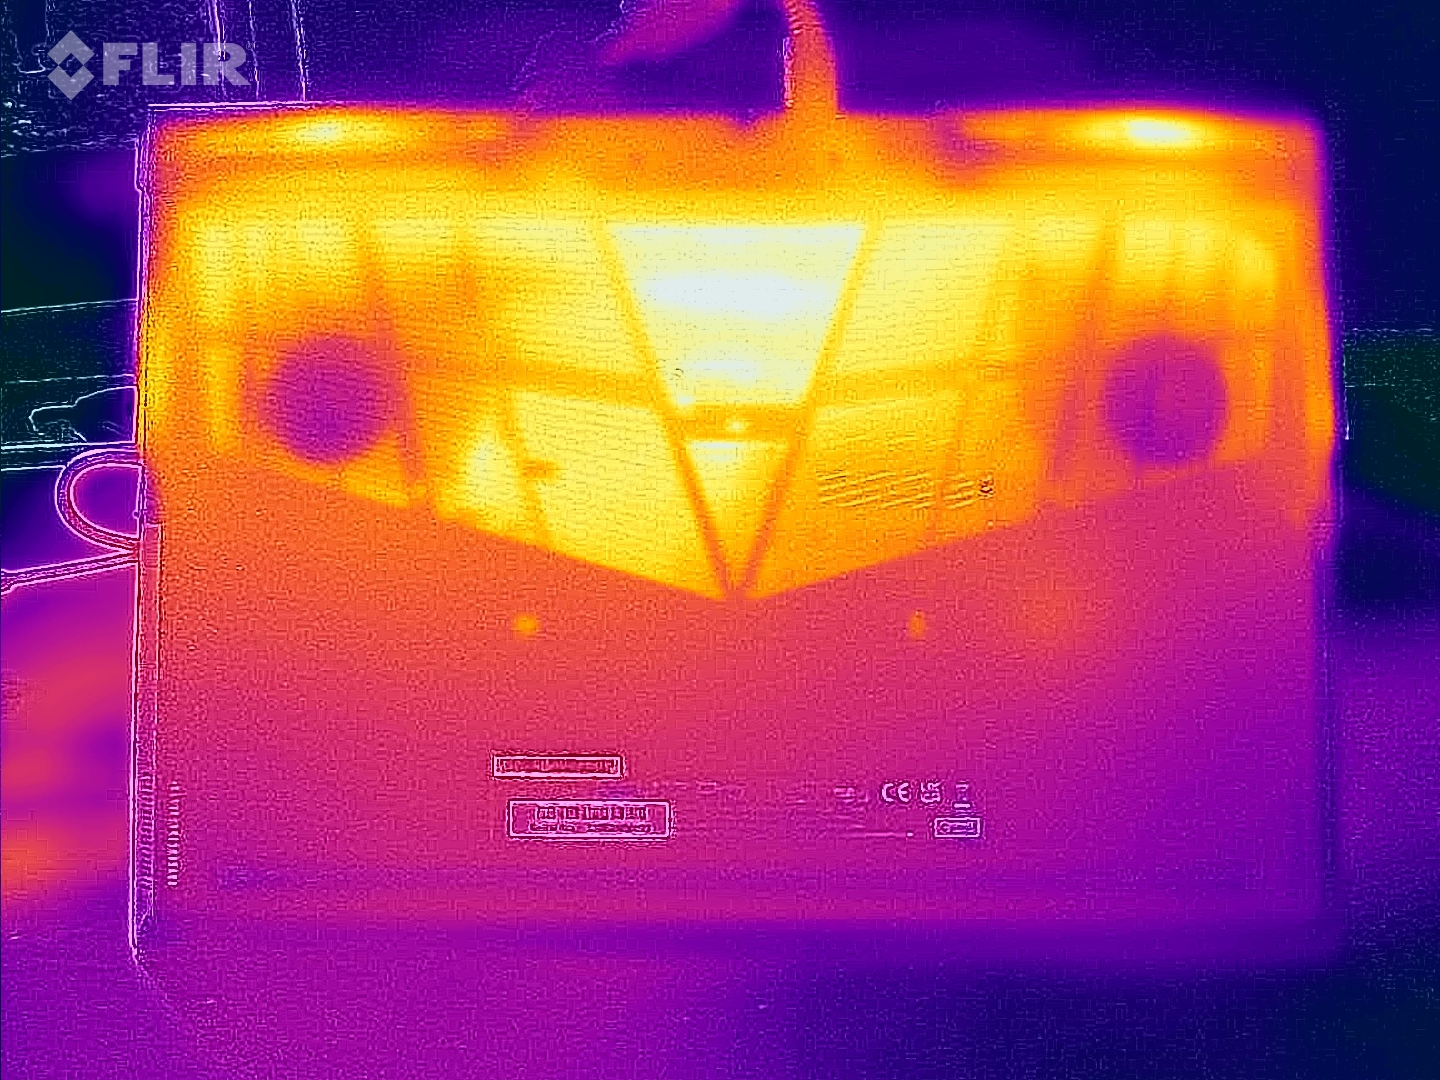
Temperatura
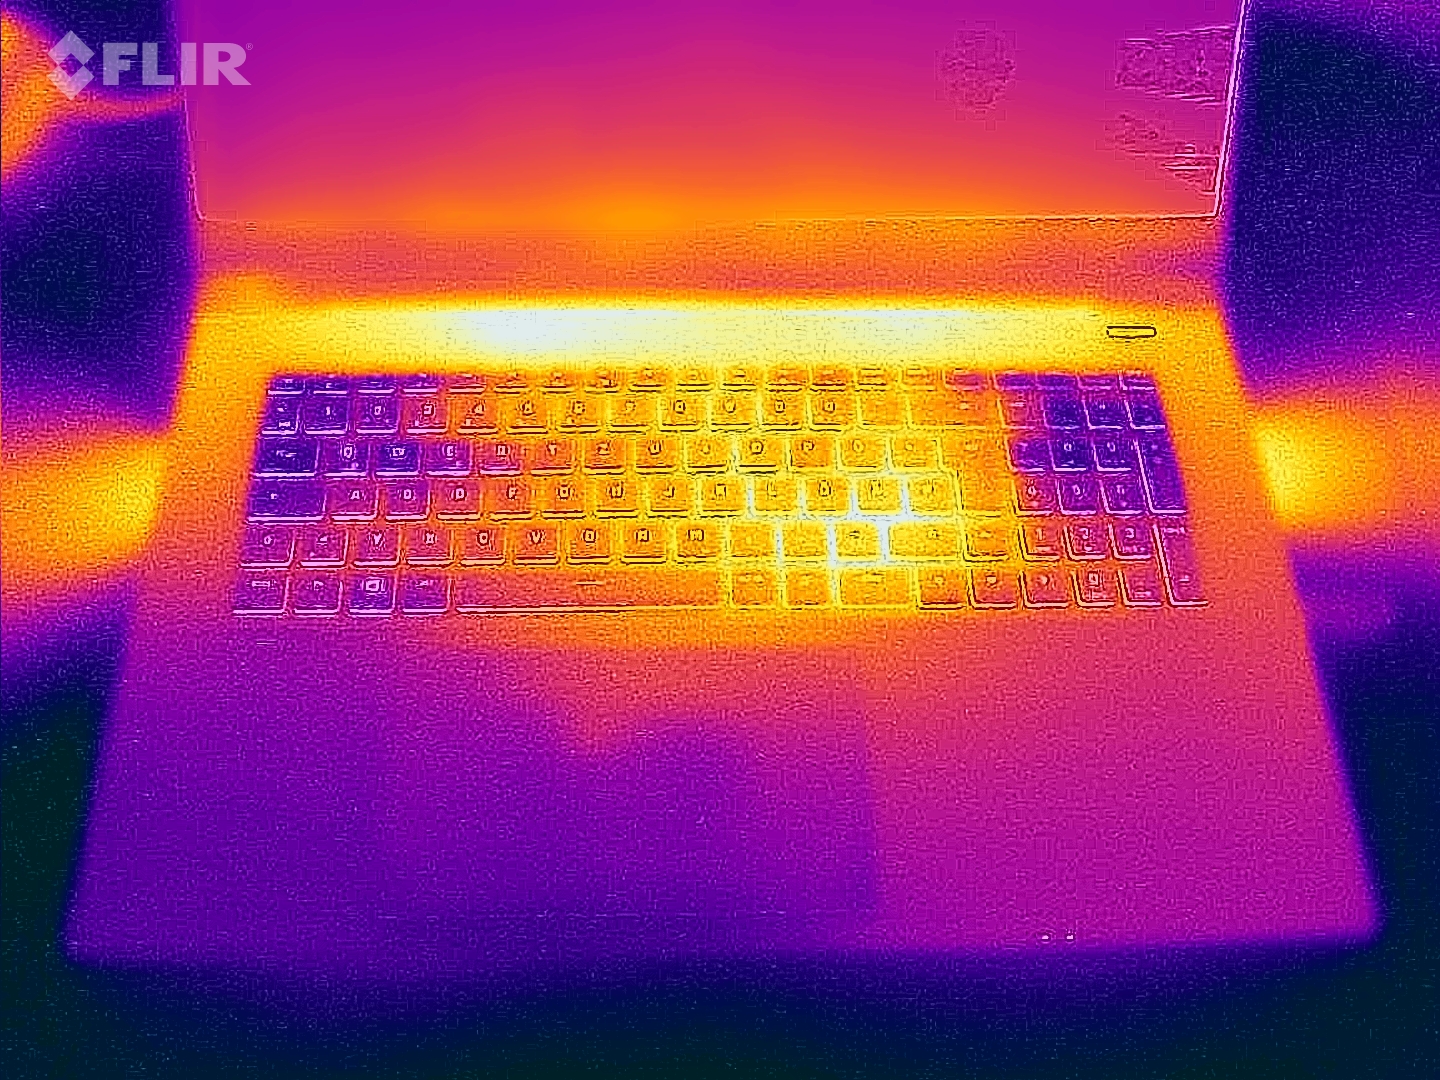
Laptop staje się zauważalnie ciepły pod obciążeniem: zmierzyliśmy temperatury między 55 a 60°C (131 a 140°F) w niektórych miejscach na obudowie. Podczas normalnego użytkowania temperatury obudowy utrzymywały się jednak w komfortowym zakresie
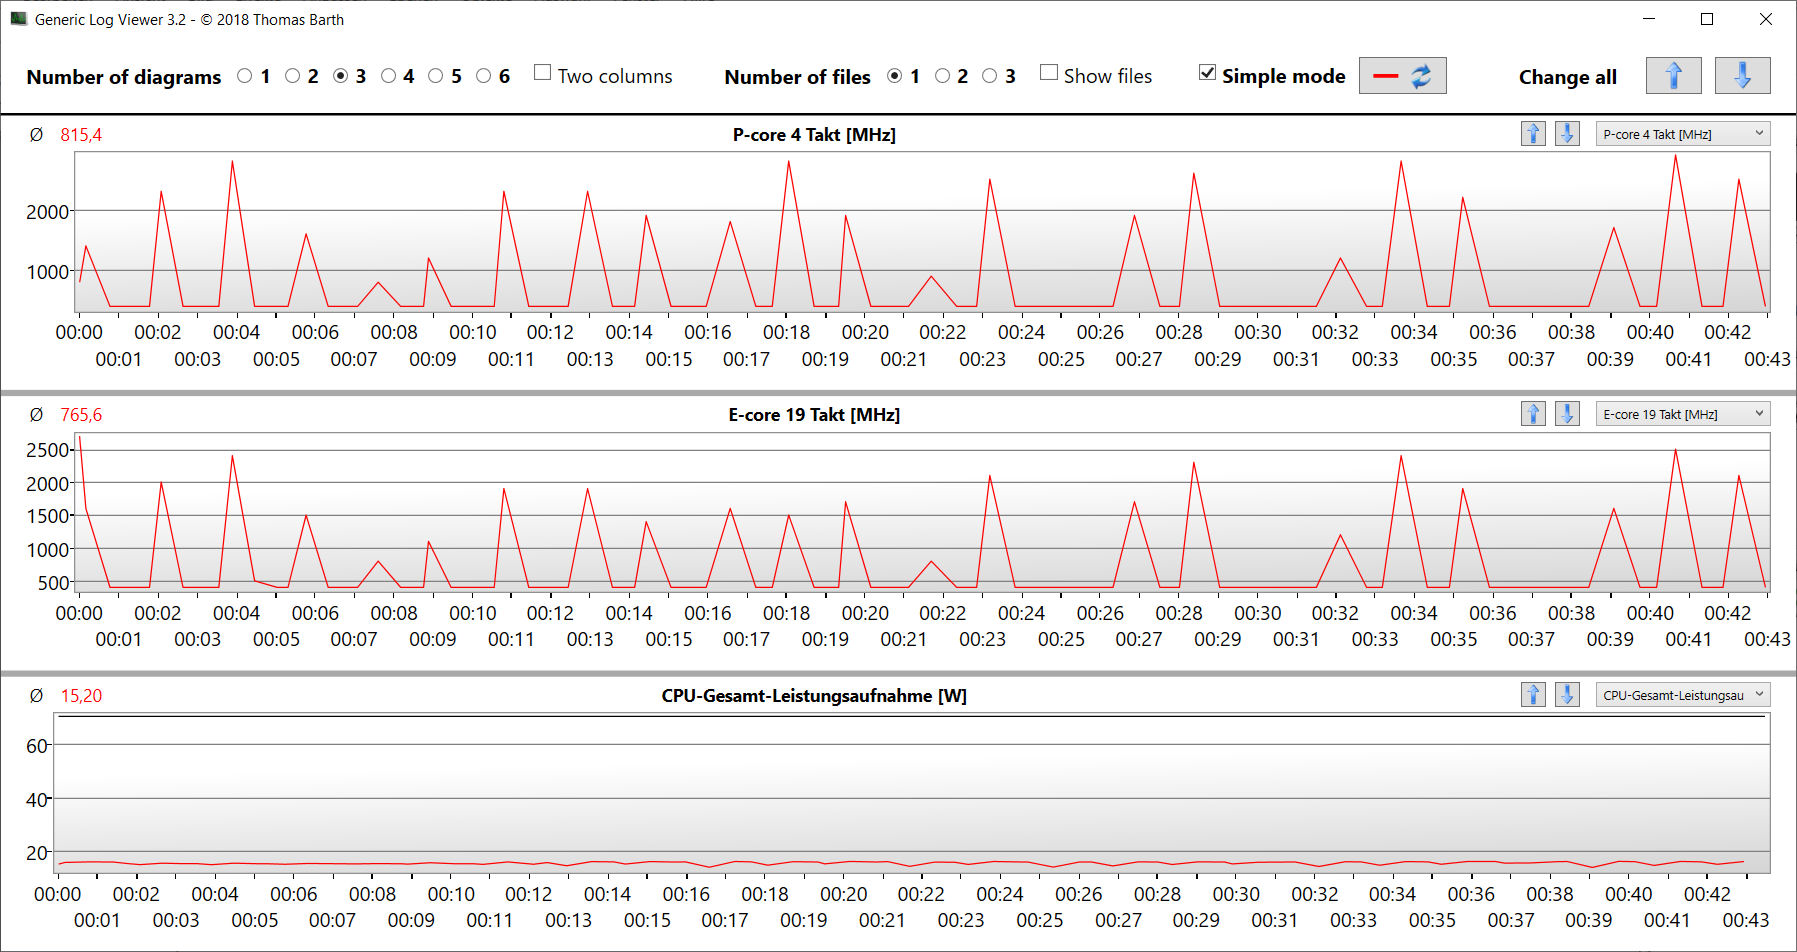
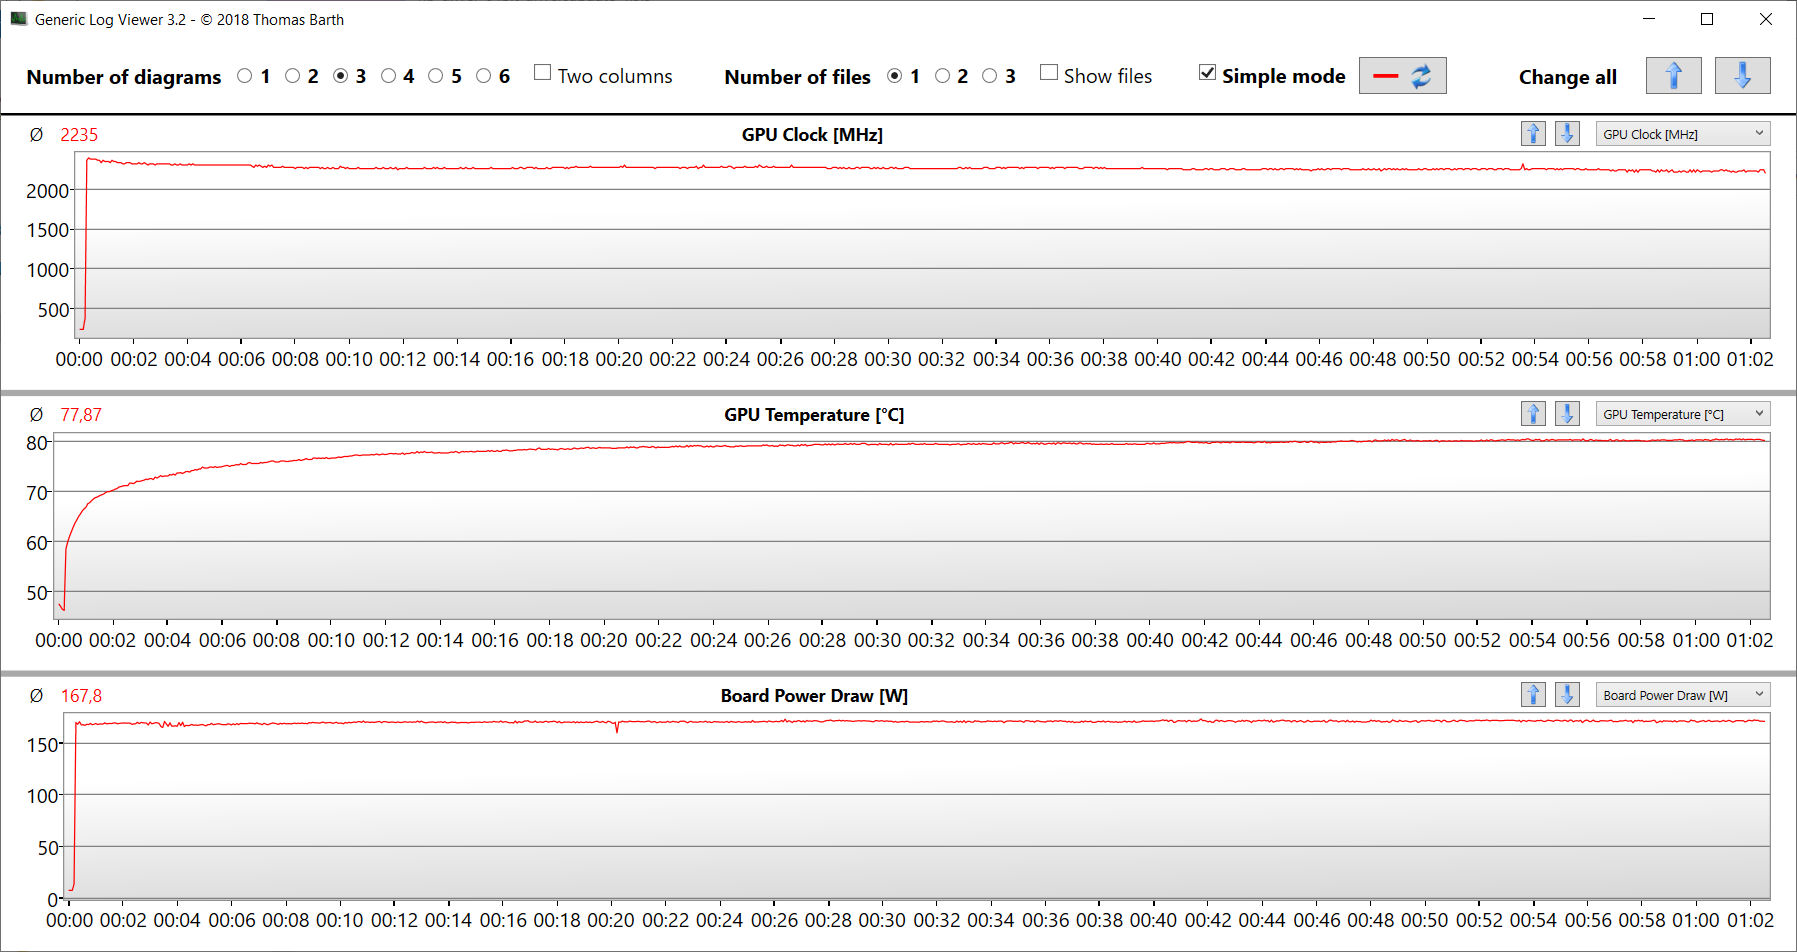
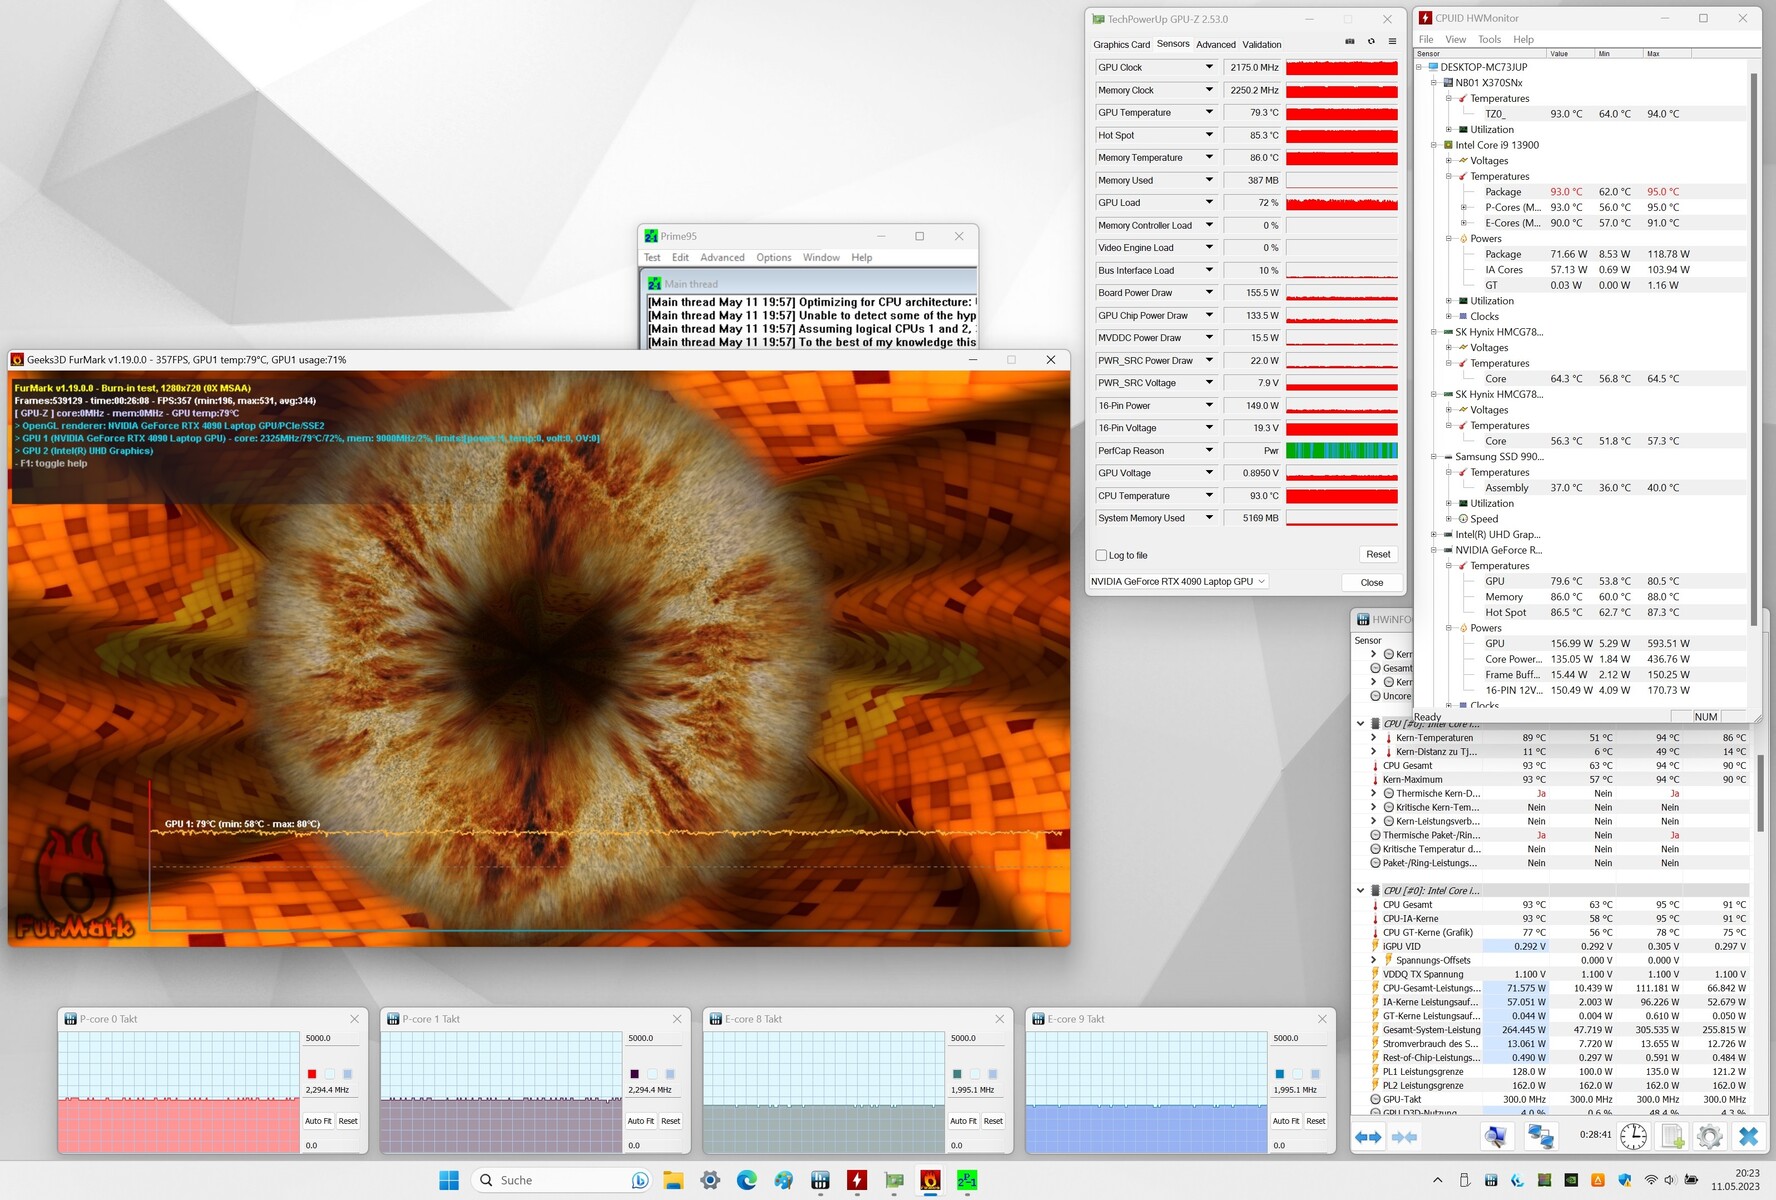
Nasz test warunków skrajnych (uruchomienie Prime95 i FurMark przez dłuższy czas) reprezentuje ekstremalny scenariusz mający na celu sprawdzenie stabilności systemu pod pełnym obciążeniem. Procesor pracował z wysokim taktowaniem (rdzenie P: od 3,4 do 3,5 GHz, rdzenie E: od 3,1 do 3,2 GHz) od samego początku, a karta graficzna tykała z częstotliwością od 1,0 do 1,6 GHz. Następnie taktowanie CPU spadło stosunkowo szybko, podczas gdy taktowanie GPU wzrosło powyżej 2 GHz.
(-) Maksymalna temperatura w górnej części wynosi 57 °C / 135 F, w porównaniu do średniej 40.4 °C / 105 F , począwszy od 21.2 do 68.8 °C dla klasy Gaming.
(-) Dno nagrzewa się maksymalnie do 60 °C / 140 F, w porównaniu do średniej 43.2 °C / 110 F
(+) W stanie bezczynności średnia temperatura górnej części wynosi 28.7 °C / 84 F, w porównaniu ze średnią temperaturą urządzenia wynoszącą 33.9 °C / ### class_avg_f### F.
(-) Podczas gry w Wiedźmina 3 średnia temperatura górnej części wynosi 47.3 °C / 117 F, w porównaniu do średniej temperatury urządzenia wynoszącej 33.9 °C / ## #class_avg_f### F.
(±) Podpórki pod nadgarstki i touchpad mogą się bardzo nagrzać w dotyku, maksymalnie do 38 °C / 100.4 F.
(-) Średnia temperatura obszaru podparcia dłoni w podobnych urządzeniach wynosiła 28.8 °C / 83.8 F (-9.2 °C / -16.6 F).
| Schenker Key 17 Pro (Early 23) Intel Core i9-13900HX, NVIDIA GeForce RTX 4090 Laptop GPU | MSI Stealth 17 Studio A13VH-014 Intel Core i9-13900H, NVIDIA GeForce RTX 4080 Laptop GPU | Asus ROG Strix Scar 17 G733PY-XS96 AMD Ryzen 9 7945HX, NVIDIA GeForce RTX 4090 Laptop GPU | Aorus 17X AZF Intel Core i9-13900HX, NVIDIA GeForce RTX 4090 Laptop GPU | Medion Erazer Beast X40 Intel Core i9-13900HX, NVIDIA GeForce RTX 4090 Laptop GPU | |
|---|---|---|---|---|---|
| Heat | 10% | 27% | 12% | 11% | |
| Maximum Upper Side * (°C) | 57 | 47 18% | 34.6 39% | 47 18% | 48 16% |
| Maximum Bottom * (°C) | 60 | 54 10% | 35.6 41% | 51 15% | 52 13% |
| Idle Upper Side * (°C) | 32 | 30 6% | 27.2 15% | 30 6% | 30 6% |
| Idle Bottom * (°C) | 34 | 32 6% | 30 12% | 31 9% | 31 9% |
* ... im mniej tym lepiej
Głośniki
Głośniki stereo brzmią całkiem przyzwoicie.
Schenker Key 17 Pro (Early 23) analiza dźwięku
(±) | głośność głośnika jest średnia, ale dobra (78 dB)
Bas 100 - 315 Hz
(±) | zredukowany bas - średnio 11.7% niższy od mediany
(±) | liniowość basu jest średnia (7.1% delta do poprzedniej częstotliwości)
Średnie 400 - 2000 Hz
(+) | zbalansowane środki średnie - tylko 2.1% od mediany
(+) | średnie są liniowe (3.5% delta do poprzedniej częstotliwości)
Wysokie 2–16 kHz
(+) | zrównoważone maksima - tylko 1.8% od mediany
(+) | wzloty są liniowe (6.4% delta do poprzedniej częstotliwości)
Ogólnie 100 - 16.000 Hz
(+) | ogólny dźwięk jest liniowy (11.9% różnicy w stosunku do mediany)
W porównaniu do tej samej klasy
» 12% wszystkich testowanych urządzeń w tej klasie było lepszych, 4% podobnych, 84% gorszych
» Najlepszy miał deltę 6%, średnia wynosiła ###średnia###%, najgorsza wynosiła 132%
W porównaniu do wszystkich testowanych urządzeń
» 9% wszystkich testowanych urządzeń było lepszych, 2% podobnych, 89% gorszych
» Najlepszy miał deltę 4%, średnia wynosiła ###średnia###%, najgorsza wynosiła 134%
MSI Stealth 17 Studio A13VH-014 analiza dźwięku
(+) | głośniki mogą odtwarzać stosunkowo głośno (82.44 dB)
Bas 100 - 315 Hz
(±) | zredukowany bas - średnio 8% niższy od mediany
(±) | liniowość basu jest średnia (8.8% delta do poprzedniej częstotliwości)
Średnie 400 - 2000 Hz
(±) | wyższe średnie - średnio 8.2% wyższe niż mediana
(+) | średnie są liniowe (6.8% delta do poprzedniej częstotliwości)
Wysokie 2–16 kHz
(+) | zrównoważone maksima - tylko 1% od mediany
(+) | wzloty są liniowe (4% delta do poprzedniej częstotliwości)
Ogólnie 100 - 16.000 Hz
(+) | ogólny dźwięk jest liniowy (11.6% różnicy w stosunku do mediany)
W porównaniu do tej samej klasy
» 10% wszystkich testowanych urządzeń w tej klasie było lepszych, 3% podobnych, 87% gorszych
» Najlepszy miał deltę 6%, średnia wynosiła ###średnia###%, najgorsza wynosiła 132%
W porównaniu do wszystkich testowanych urządzeń
» 8% wszystkich testowanych urządzeń było lepszych, 2% podobnych, 90% gorszych
» Najlepszy miał deltę 4%, średnia wynosiła ###średnia###%, najgorsza wynosiła 134%
Zużycie energii
Key 17 Pro nie wykazał żadnych problemów z zużyciem energii. Utrzymywał stały pobór mocy podczas testów obciążeniowych i testu Witcher 3. Dołączony zasilacz (330 W) jest wystarczająco mocny dla urządzenia.
| wyłączony / stan wstrzymania | |
| luz | |
| obciążenie |
|
Legenda:
min: | |
Power consumption Witcher 3 / Stresstest
Power consumption with external monitor
Żywotność baterii
Nasz test Wi-Fi ma na celu symulację rzeczywistego użytkowania i obejmuje dostęp do różnych stron internetowych za pomocą skryptu. 17,3-calowy laptop zdołał wytrzymać 6h 51m podczas testu - to bardzo przyzwoity wynik dla tak potężnego notebooka 4K.
Za
Przeciw
Werdykt - Potęga z możliwością dostosowania
Key 17 Pro został stworzony z myślą o scenariuszach wymagających dużej mocy obliczeniowej, takich jak edycja wideo, gry i renderowanie. Karta graficzna GeForce RTX 4090 Laptop i Core i9-13900HX zapewniają niezbędną siłę do obsługi tych zadań - oba komponenty są w stanie stale pracować z dużą prędkością. Laptop generuje normalną ilość ciepła i hałasu dla tej klasy urządzeń.
Firma Schenker dostarczyła potężny high-endowy notebook Key 17 Pro (Early 23).
Key 17 Pro jest wyposażony w trzy gniazda SSD (1x PCIe 5.0, 2x PCIe 4.0; M.2-2280), co oznacza, że można szybko dodać więcej dysków, jeśli kiedykolwiek zabraknie miejsca. Dwa gniazda PCIe 4.0 obsługują RAID 0/1. Instalacja dodatkowych dysków SSD nie jest zbyt skomplikowana. Dolny panel można zdjąć bez użycia narzędzi po odkręceniu wszystkich śrub.
Dwa porty USB-C (Thunderbolt 4) pozwalają bez wysiłku zintegrować laptopa z istniejącą konfiguracją biurkową i otworzyć opcje rozbudowy (np. zewnętrzne GPU). Jeden z portów obsługuje również Power Delivery. Czas pracy na baterii jest bardzo przyzwoity. Matowy wyświetlacz o przekątnej 17,3 cala (4K, IPS, 144 Hz, G-Sync i DCI-P3) pozostawił w większości pozytywne wrażenie podczas naszych testów, choć przydałby mu się wyższy kontrast.
Jedną z alternatyw dla Key 17 Pro jest MSI Stealth 17 Studio. Jest on wyposażony w ekran mini-LED i wytwarza znacznie mniej hałasu przy pełnym otwarciu przepustnicy. W momencie pisania tej recenzji, niemal identycznie wyposażony Aorus 17X AZF (choć z panelem QHD, a nie 4K) można kupić za znacznie mniej niż Key, a zatem jest to opcja bardziej przyjazna dla portfela.
Cena i dostępność
Schenker Key 17 Pro (Early 23) w specyfikacji opisanej w tej recenzji kosztuje około 4 479 € (4 820 USD). Alternatywnie można również skonfigurować urządzenie w oparciu o swoje potrzeby w sklepie internetowym Schenker. Ceny zaczynają się od €3,199 (US$3,445).
Schenker Key 17 Pro (Early 23)
- 30/05/2023 v7 (old)
Sascha Mölck
Przezroczystość
Wyboru urządzeń do recenzji dokonuje nasza redakcja. Próbka testowa została udostępniona autorowi jako pożyczka od producenta lub sprzedawcy detalicznego na potrzeby tej recenzji. Pożyczkodawca nie miał wpływu na tę recenzję, producent nie otrzymał też kopii tej recenzji przed publikacją. Nie było obowiązku publikowania tej recenzji. Jako niezależna firma medialna, Notebookcheck nie podlega władzy producentów, sprzedawców detalicznych ani wydawców.
Tak testuje Notebookcheck
Każdego roku Notebookcheck niezależnie sprawdza setki laptopów i smartfonów, stosując standardowe procedury, aby zapewnić porównywalność wszystkich wyników. Od około 20 lat stale rozwijamy nasze metody badawcze, ustanawiając przy tym standardy branżowe. W naszych laboratoriach testowych doświadczeni technicy i redaktorzy korzystają z wysokiej jakości sprzętu pomiarowego. Testy te obejmują wieloetapowy proces walidacji. Nasz kompleksowy system ocen opiera się na setkach uzasadnionych pomiarów i benchmarków, co pozwala zachować obiektywizm.Price comparison

