Recenzja Aorus 15 YE5: Wysokiej klasy laptop do gier dla oszczędzających pieniądze
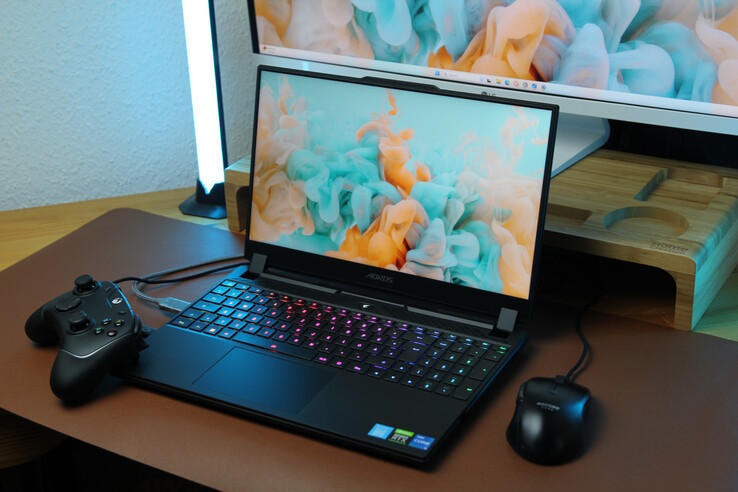
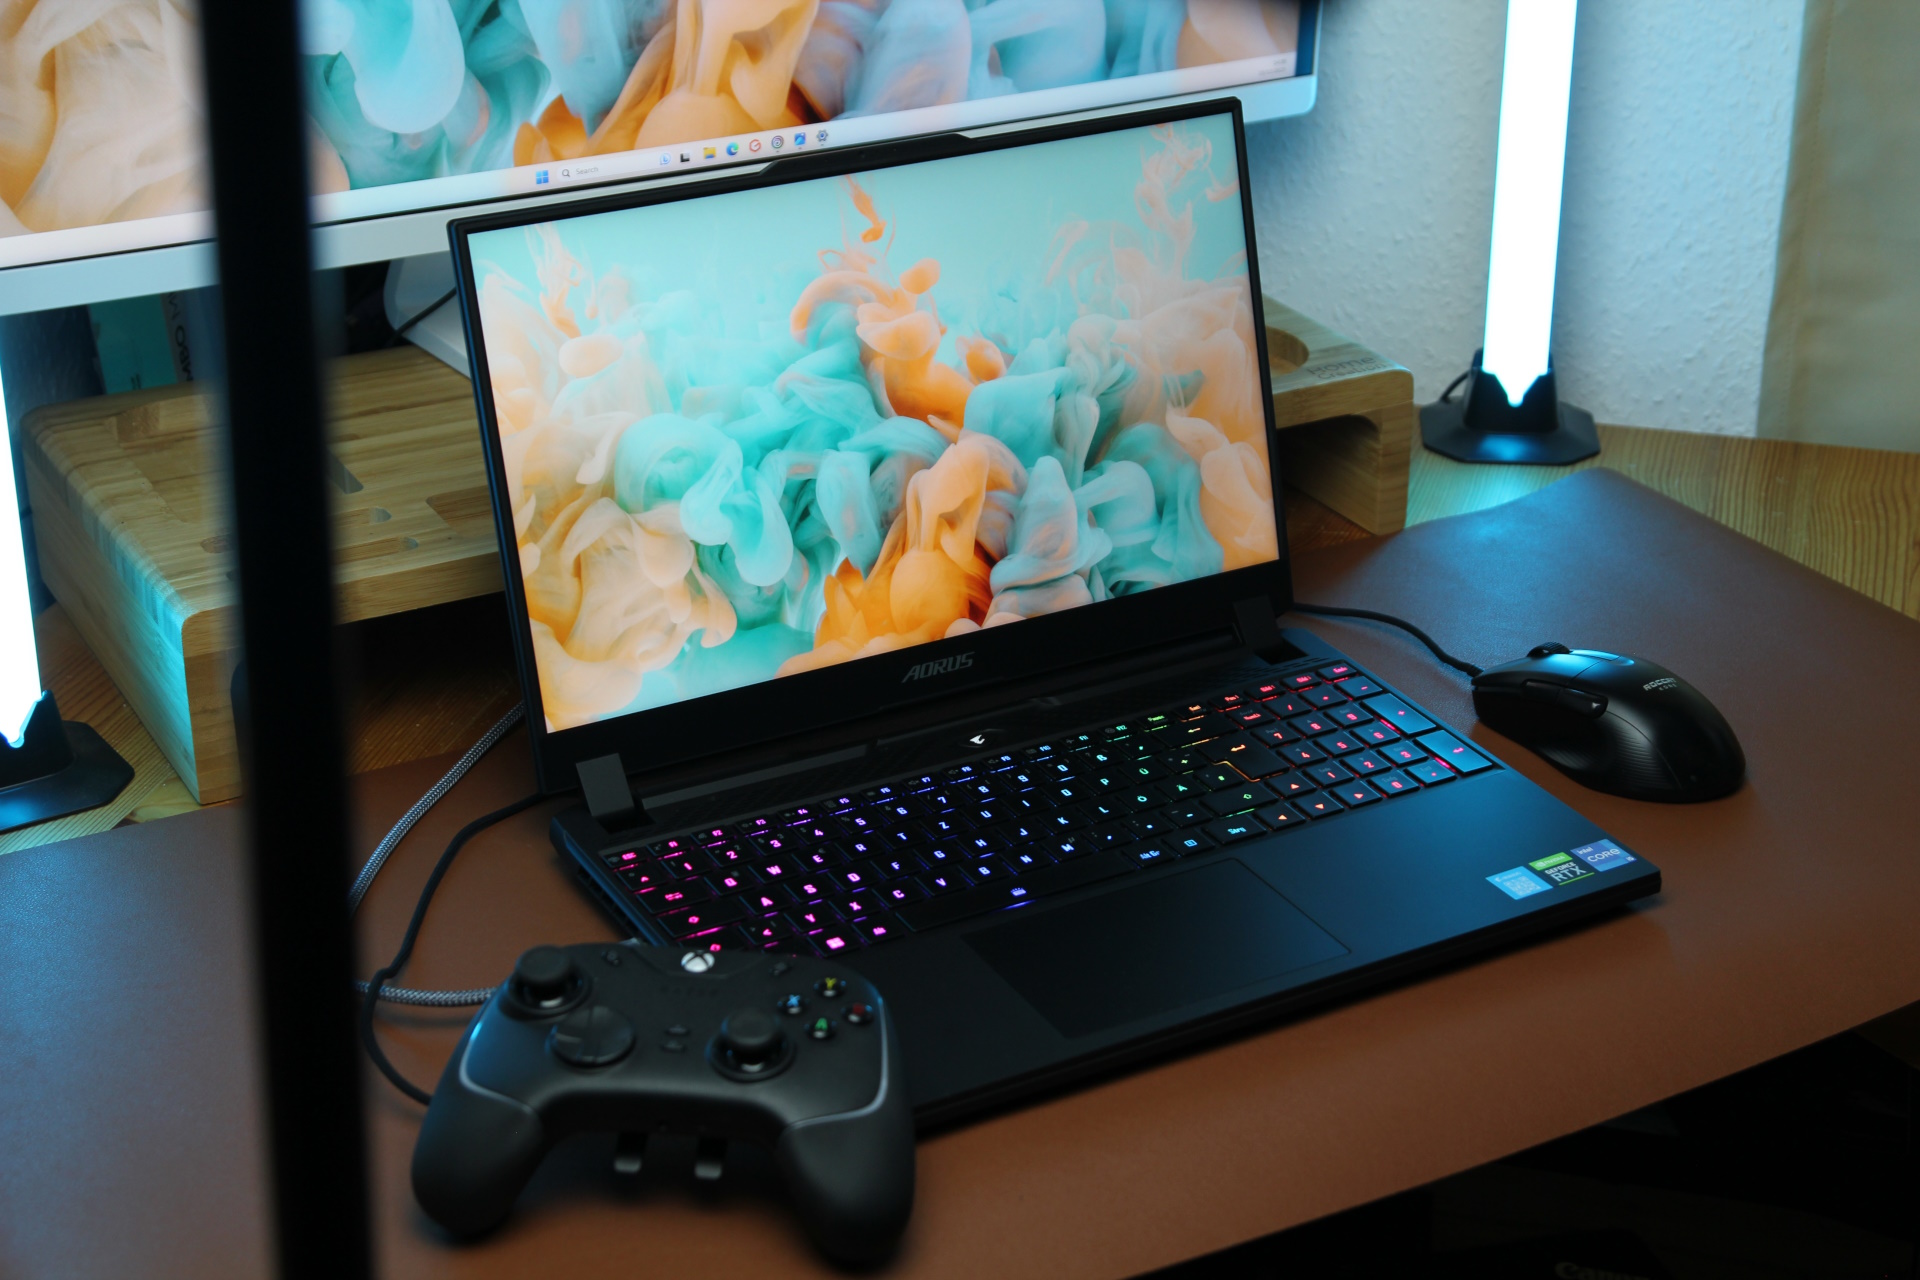
Już sama niska cena sprawia, że Aorus 15 YE jest interesującym laptopem do gier. Z zewnątrz wygląda nowocześnie i smukło - w przystępnej cenie znajdziemy nawet Thunderbolt 4 i DDR5. Z kolei wewnątrz zainstalowano (mocny) sprzęt ostatniej generacji, a mianowicie nie do końca high-endowy procesor Core i5-12500H i poprzedni flagowy model Nvidii RTX 3080 Ti. Wszystko to sprawia, że Aorus 15 YE5 jest jednym z najmocniejszych laptopów do gier, jakie można dostać za 1500 USD.
Pomimo tego, że jego CPU i GPU pochodzą z poprzedniej generacji, Aorus musi bronić się przed obecnymi konkurentami, aby pokazać, czy jest w stanie dotrzymać kroku i czy rzeczywiście udaje mu się zapewnić dobry stosunek jakości do ceny. W dalszej części zestawimy go z obecnymi laptopami wyposażonymi w RTX 4060 lub RTX 4070, takimi jak Aorus 15 BSF (RTX 4070), Captiva Advanced Gaming I74-121 (RTX 4060), HP Victus 16 (RTX 4070), HP Omen 16 (RTX 4080) i znacznie droższym Dell XPS 15 9530 (RTX 4070).
Potencjalni konkurenci w porównaniu
Ocena | Data | Model | Waga | Wysokość | Rozmiar | Rezolucja | Cena |
|---|---|---|---|---|---|---|---|
| 86.6 % v7 (old) | 12/2023 | Aorus 15 YE5-54DEB34SH i5-12500H, GeForce RTX 3080 Ti Laptop GPU | 2.3 kg | 27 mm | 15.60" | 2560x1440 | |
| 85.7 % v7 (old) | 08/2023 | Aorus 15 BSF i7-13700H, GeForce RTX 4070 Laptop GPU | 2.4 kg | 20.9 mm | 15.60" | 2560x1440 | |
| 85.7 % v7 (old) | 09/2023 | Captiva Advanced Gaming I74-121 i5-13500H, GeForce RTX 4060 Laptop GPU | 2.3 kg | 29 mm | 15.60" | 1920x1080 | |
| 85.1 % v7 (old) | 09/2023 | HP Victus 16-r0077ng i7-13700H, GeForce RTX 4070 Laptop GPU | 2.4 kg | 24 mm | 16.10" | 1920x1080 | |
| 90.3 % v7 (old) | 04/2023 | Dell XPS 15 9530 RTX 4070 i7-13700H, GeForce RTX 4070 Laptop GPU | 1.9 kg | 18 mm | 15.60" | 3456x2160 | |
| 87.4 % v7 (old) | 07/2023 | HP Omen 16-wf000 i7-13700HX, GeForce RTX 4080 Laptop GPU | 2.4 kg | 23.6 mm | 16.10" | 2560x1440 |
Obudowa i łączność: Nowoczesna, ale ograniczona do minimum
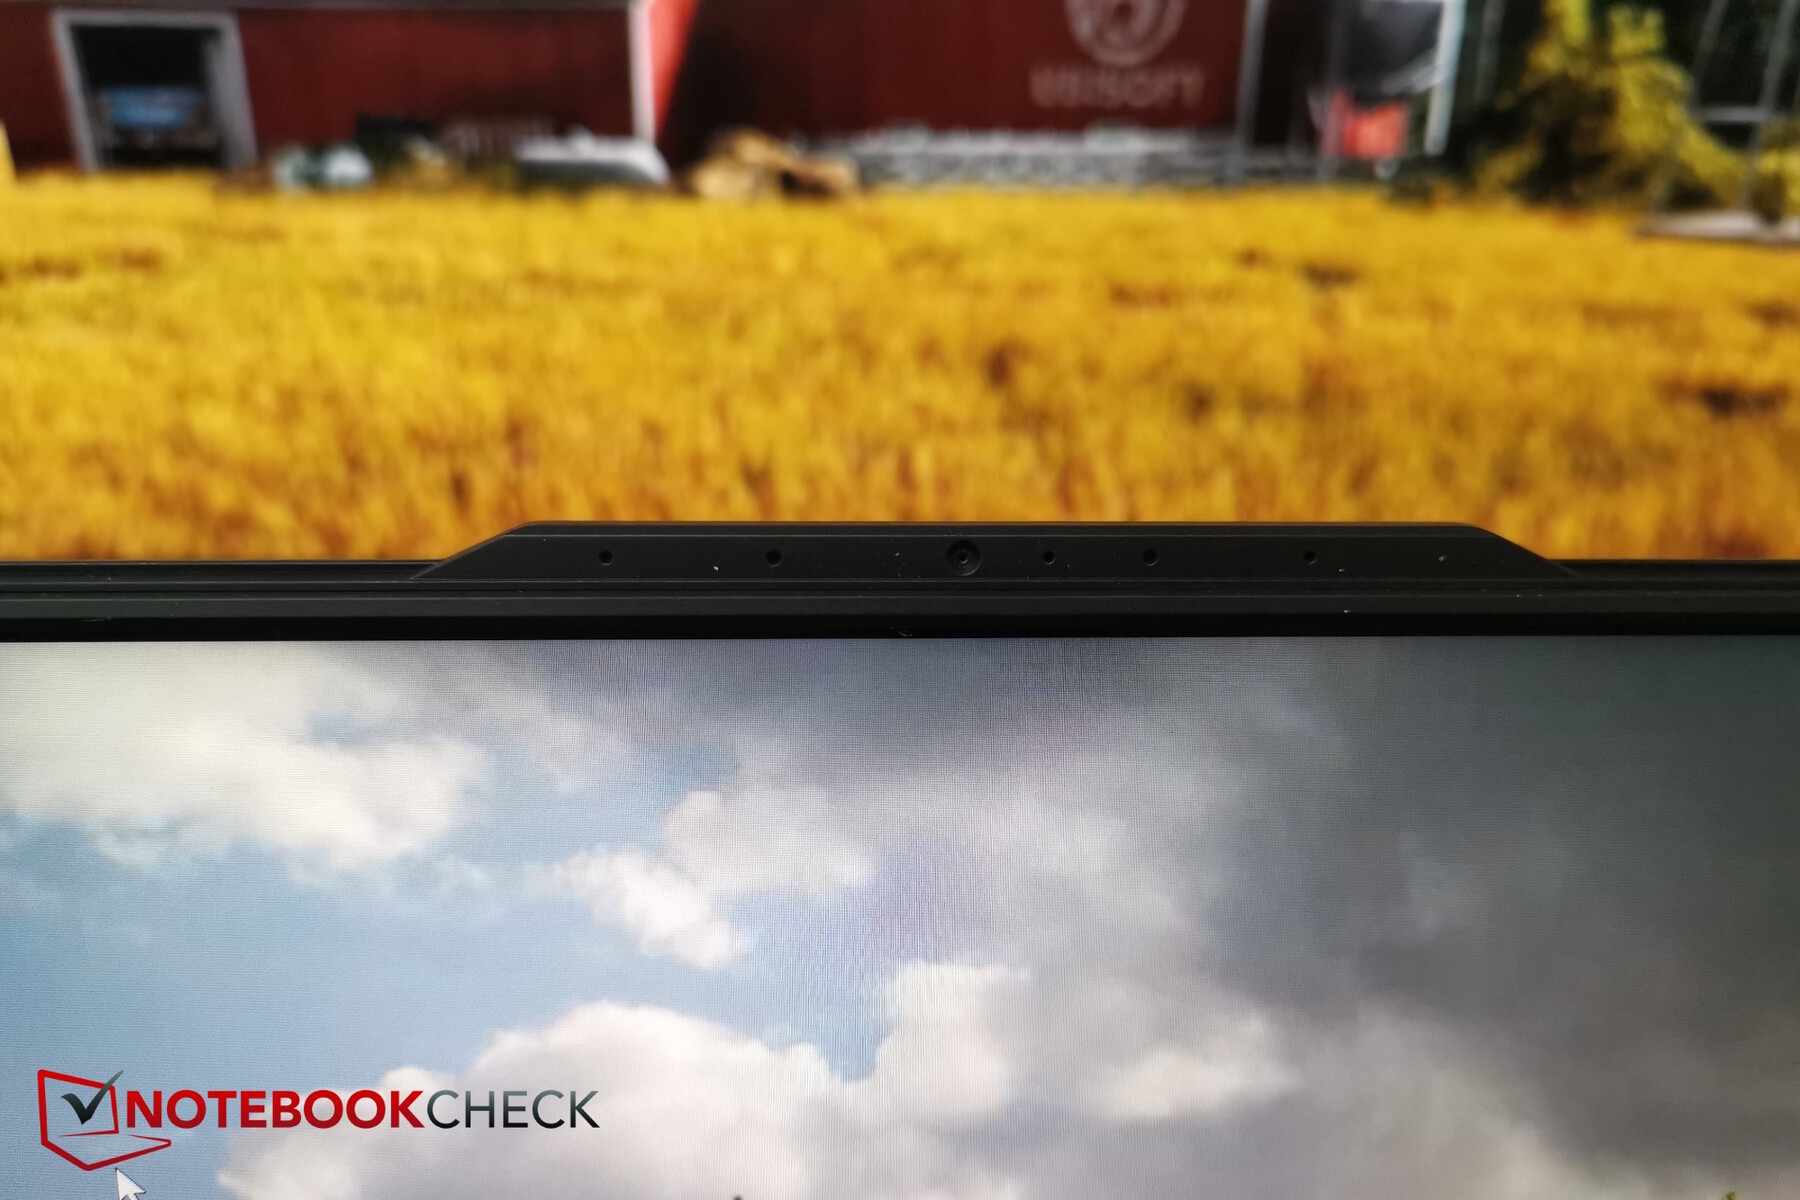
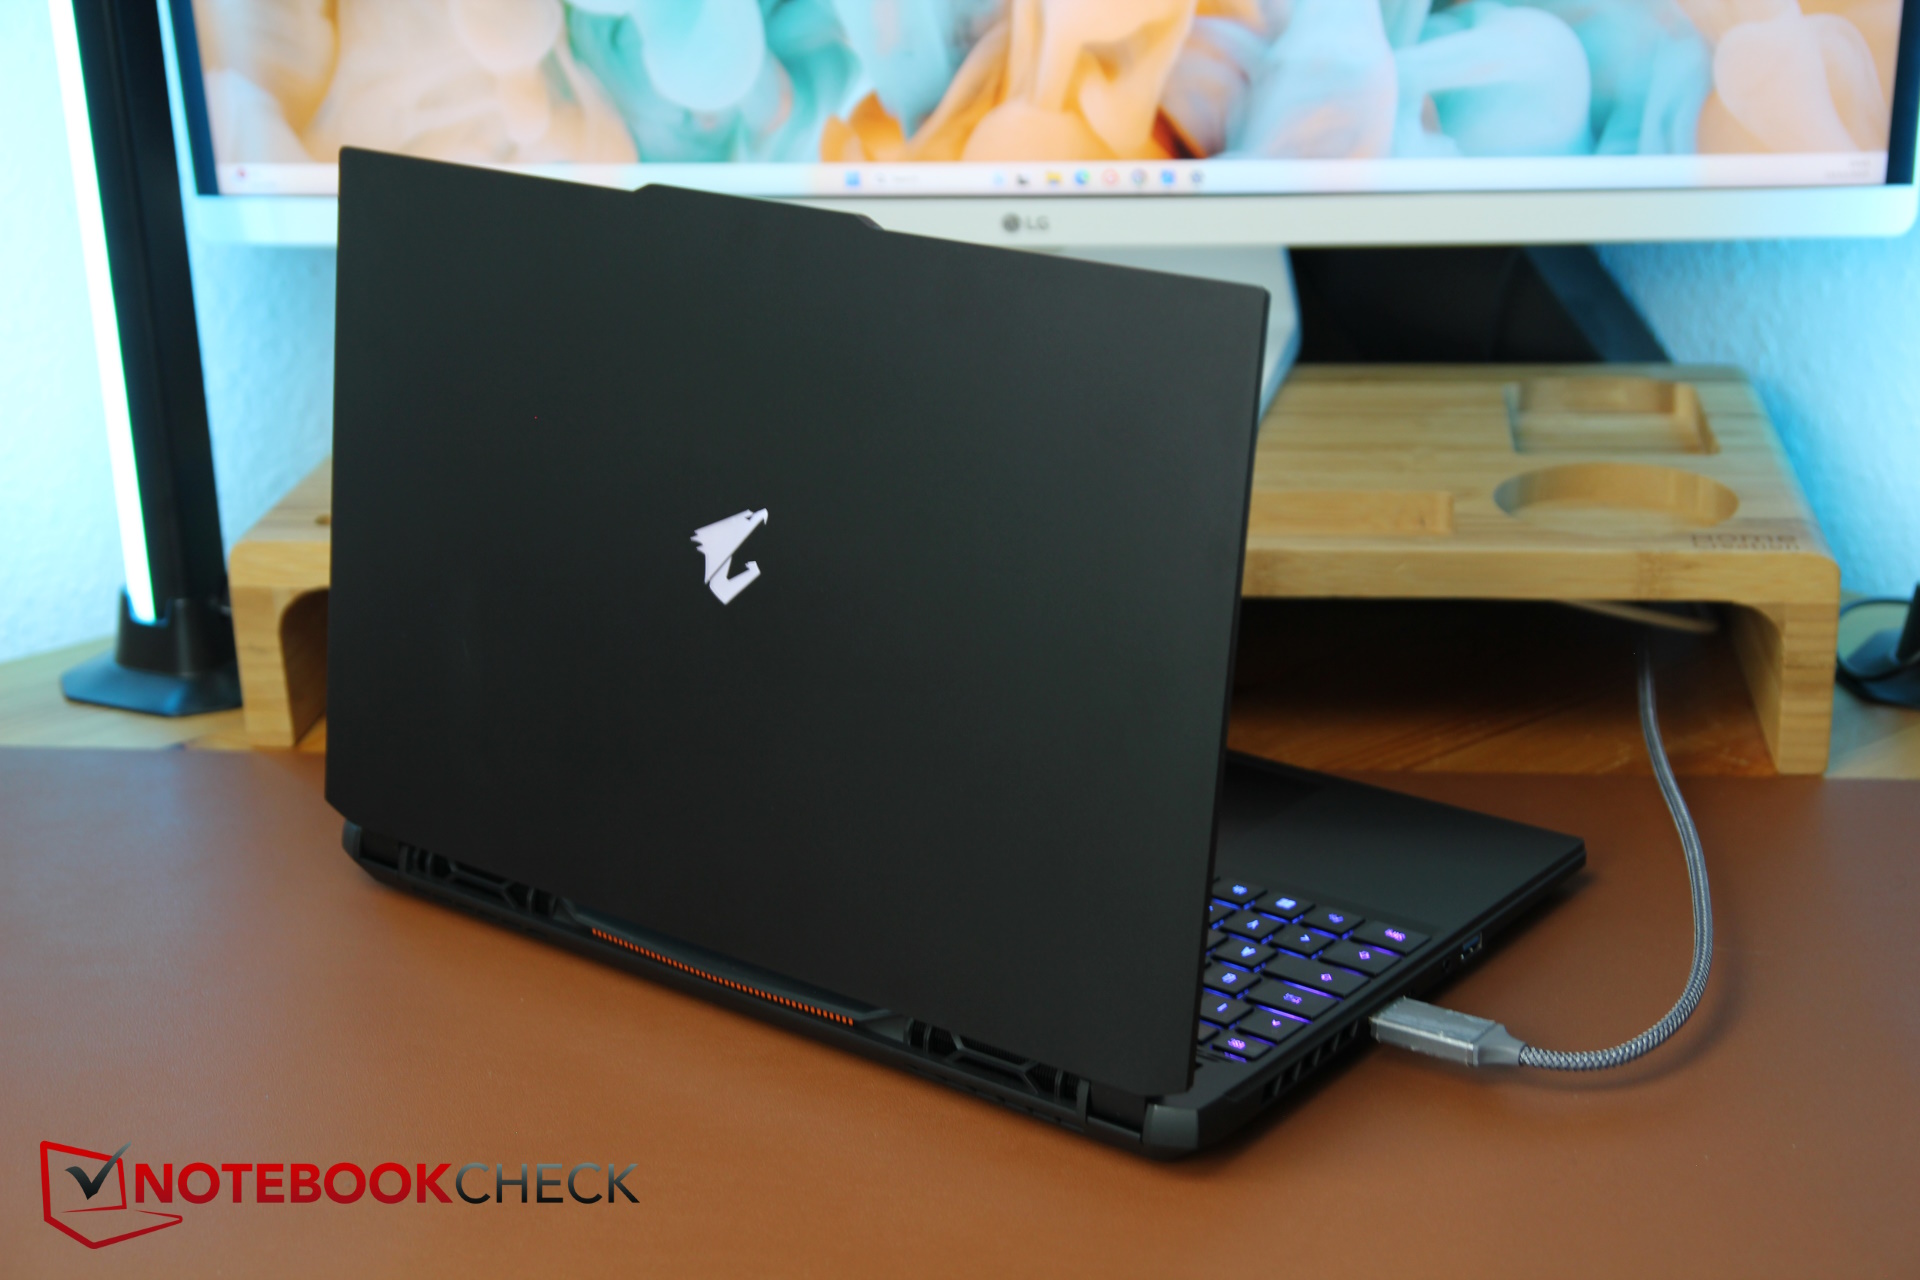
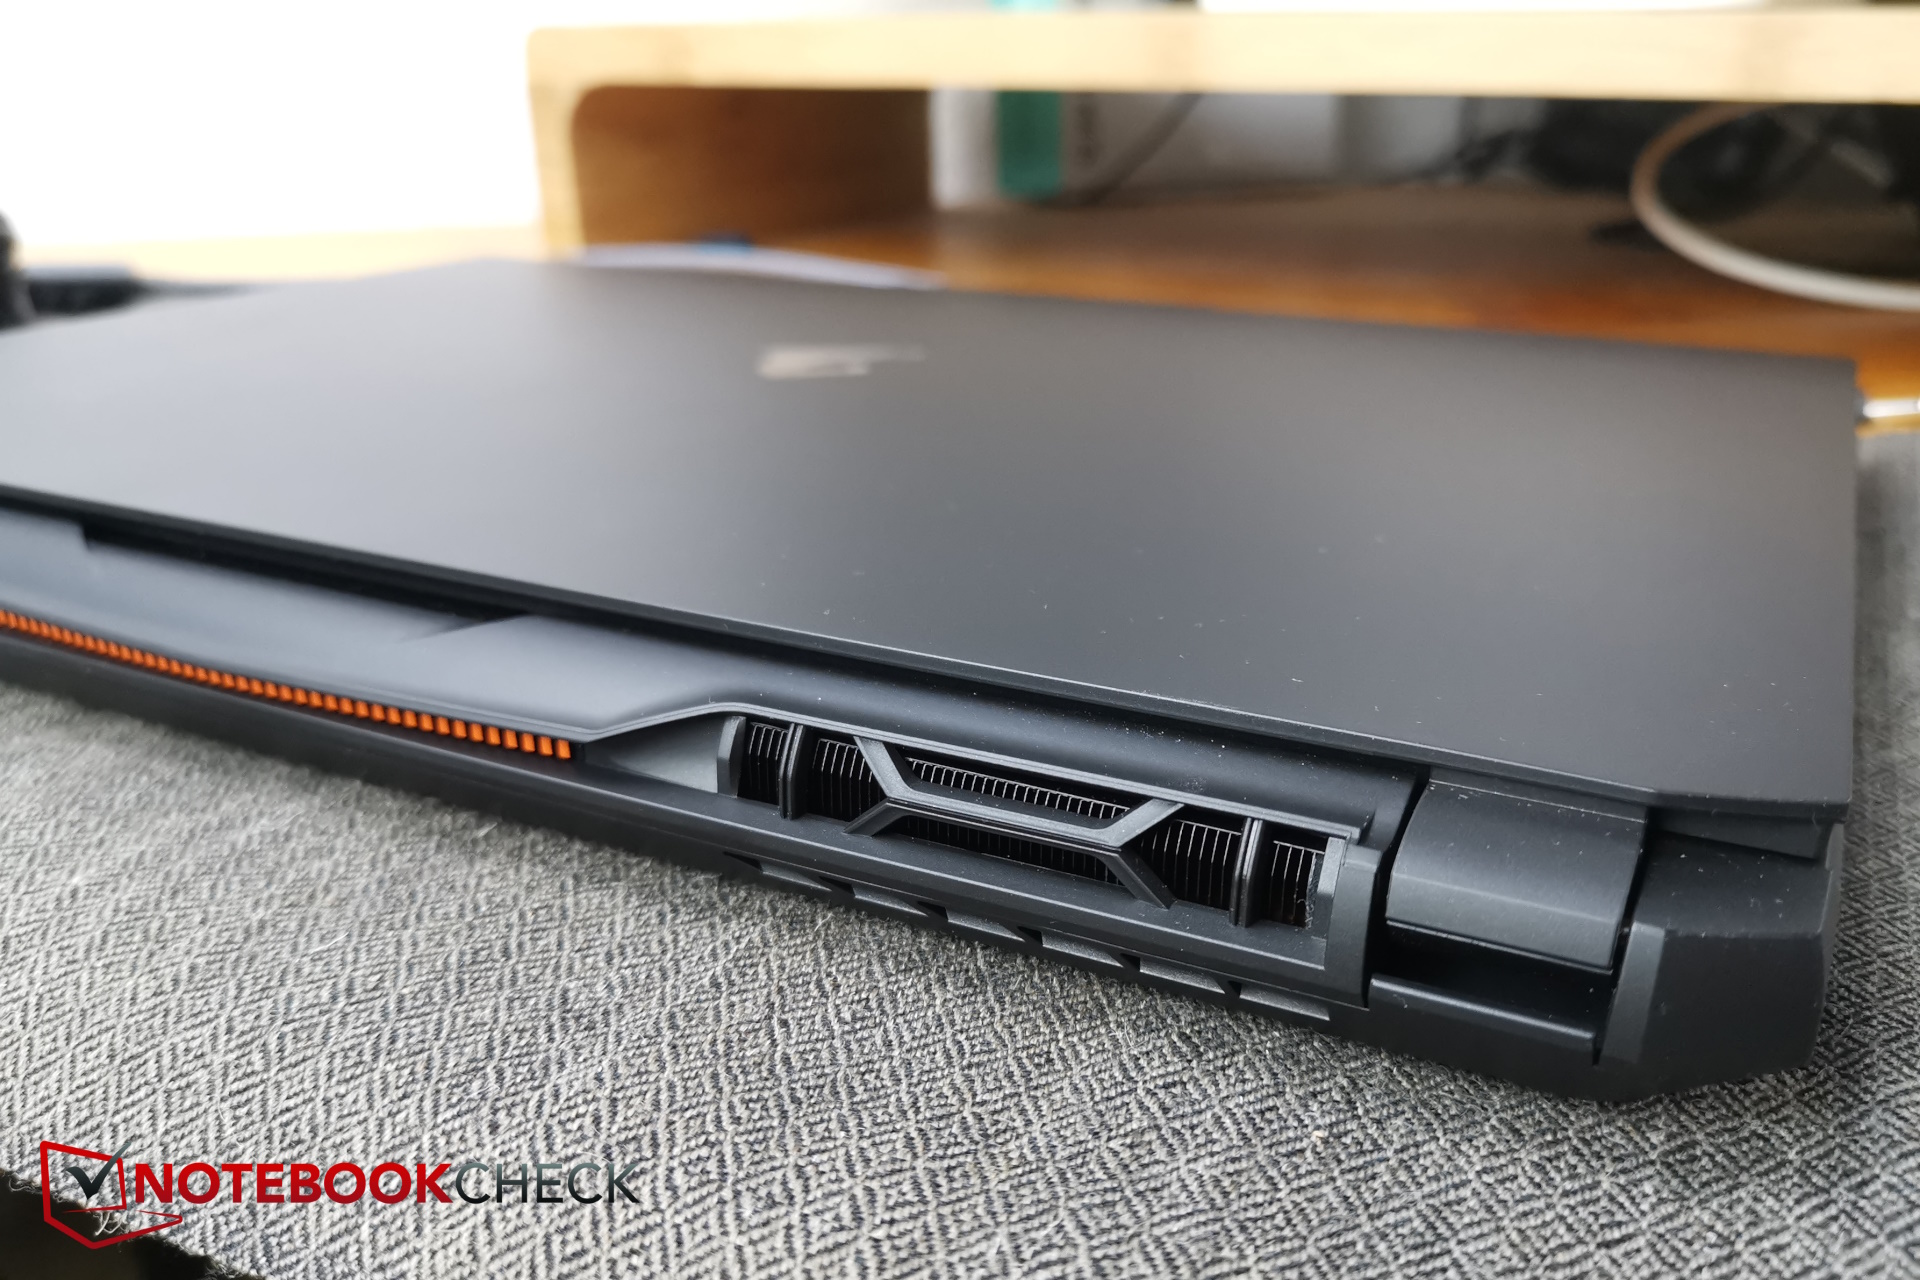
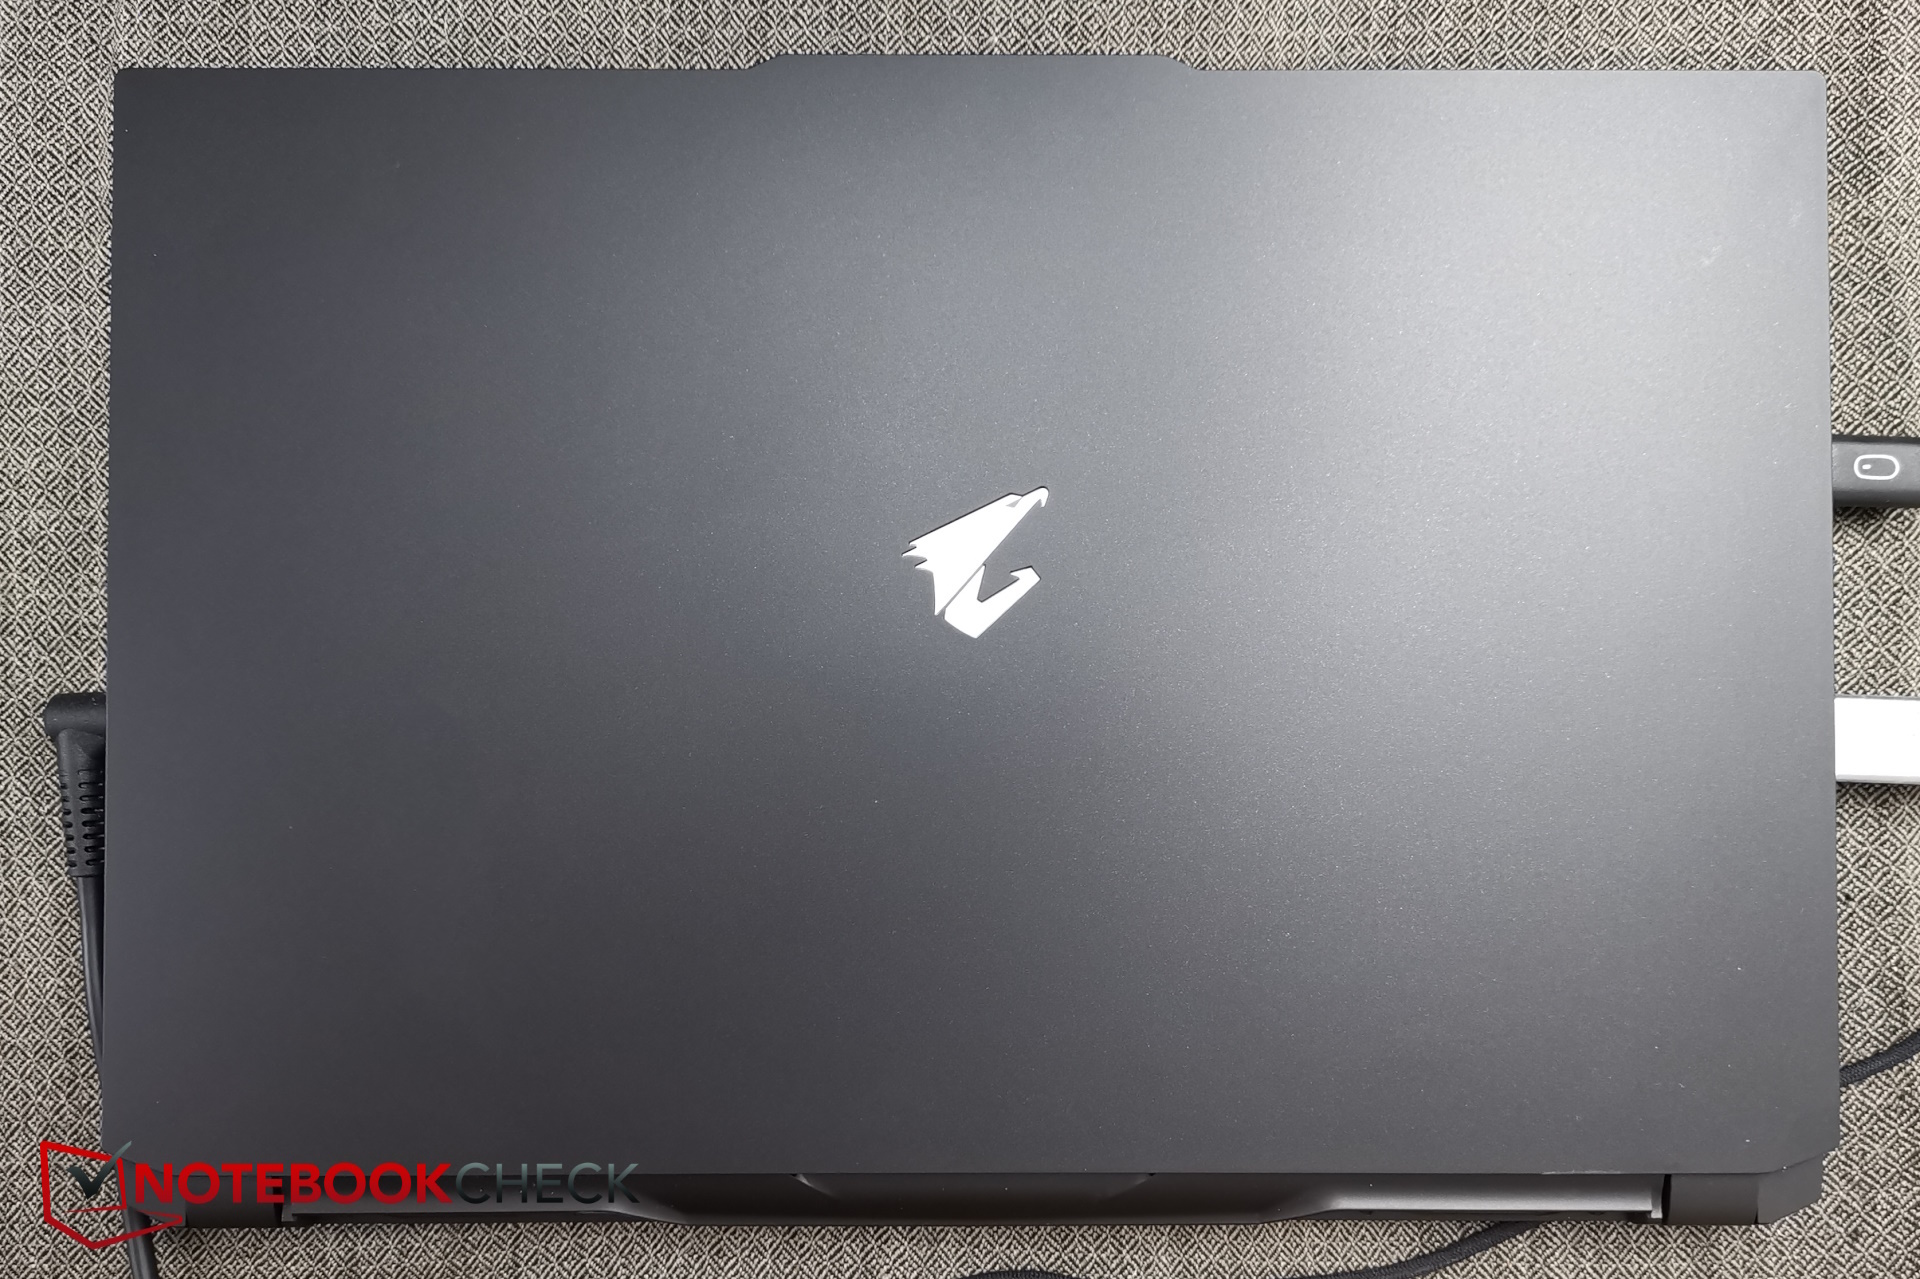
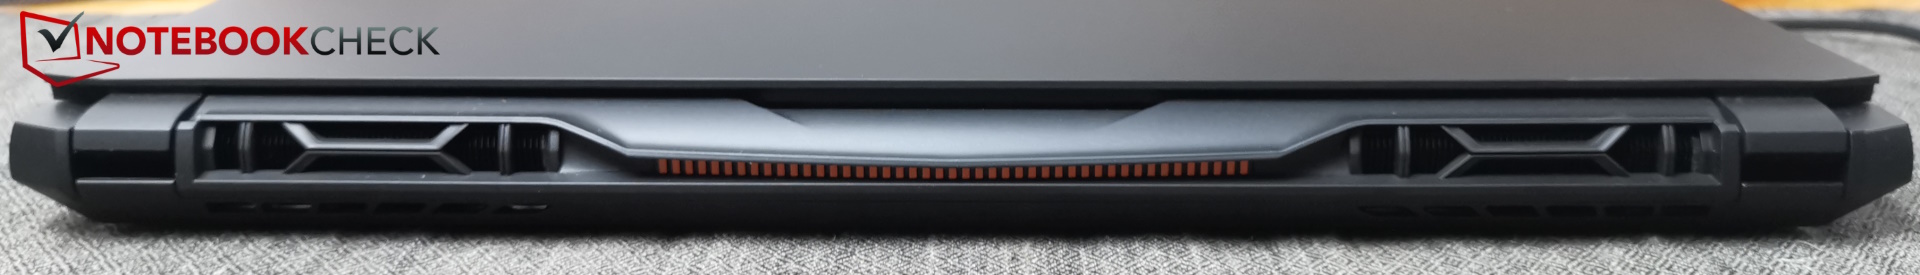
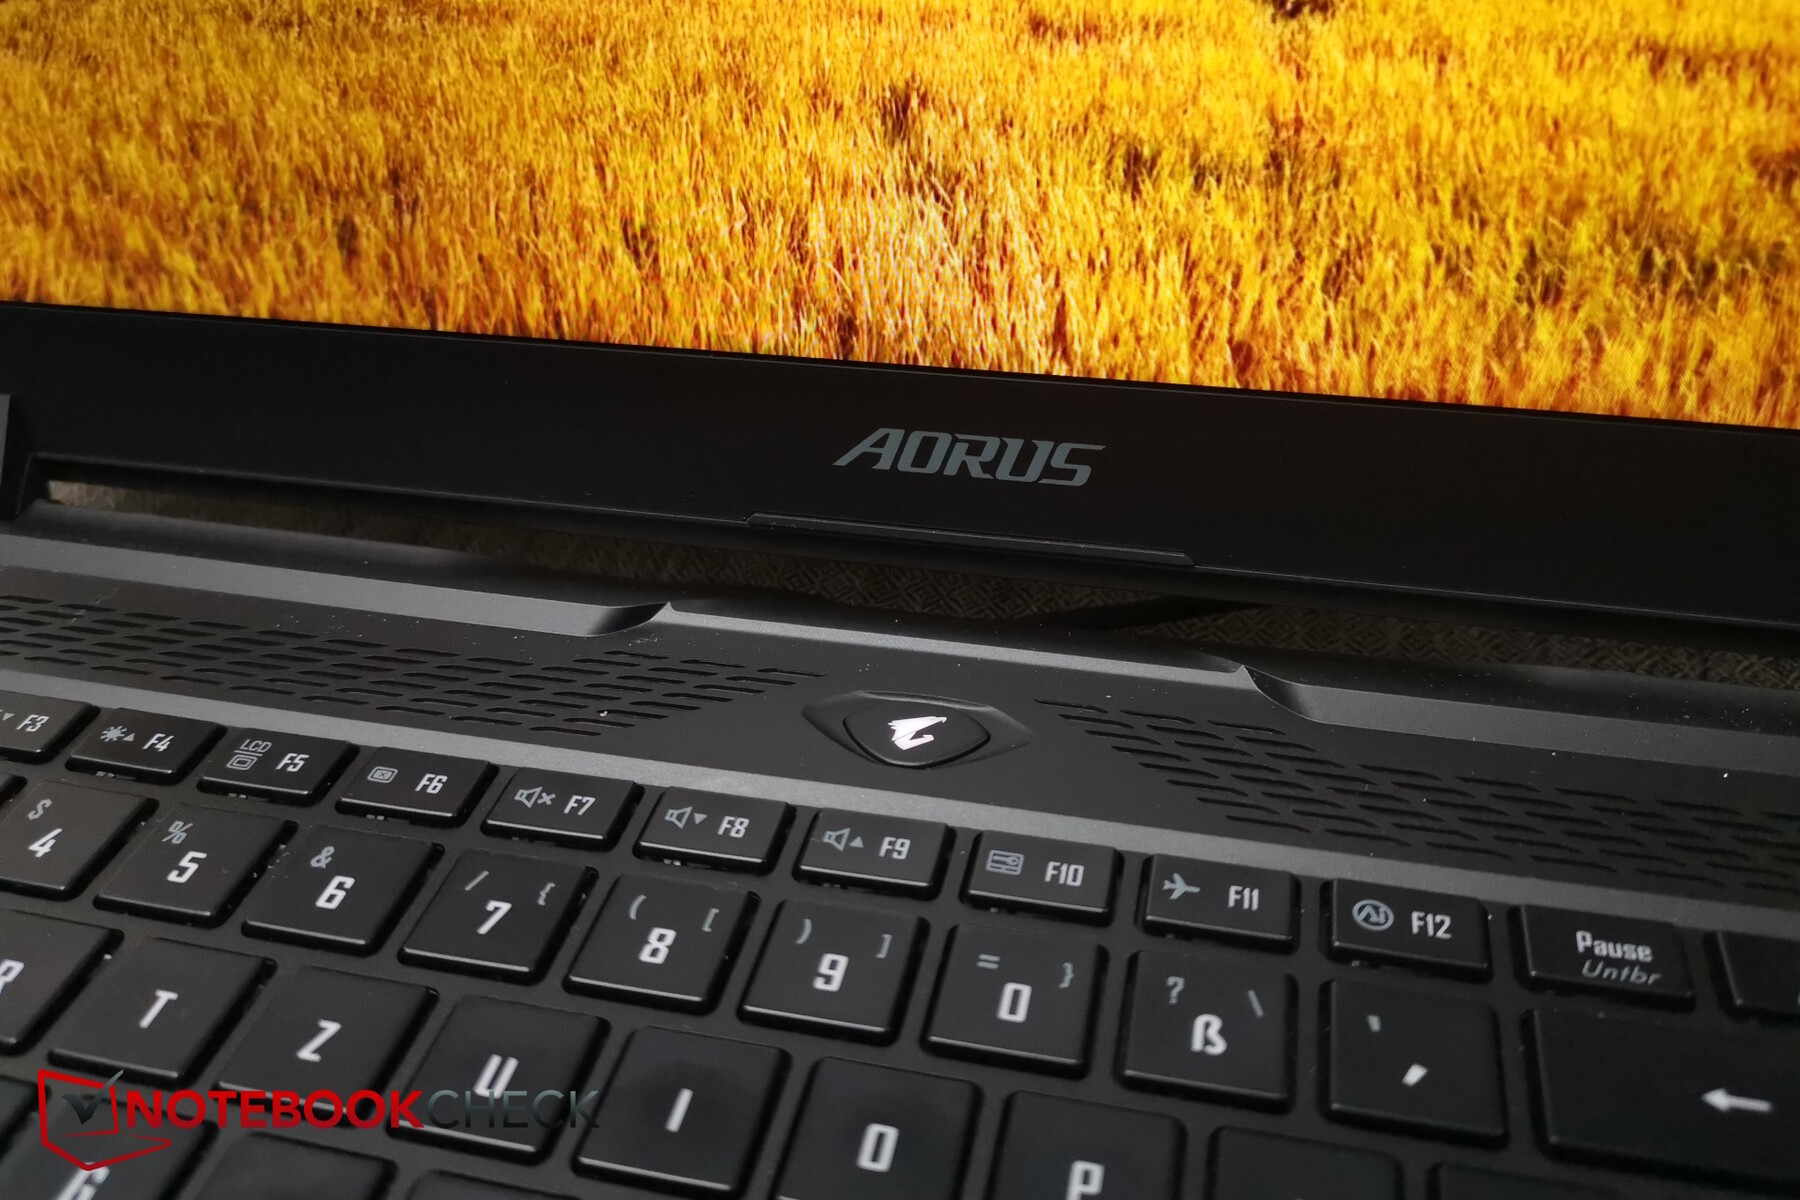
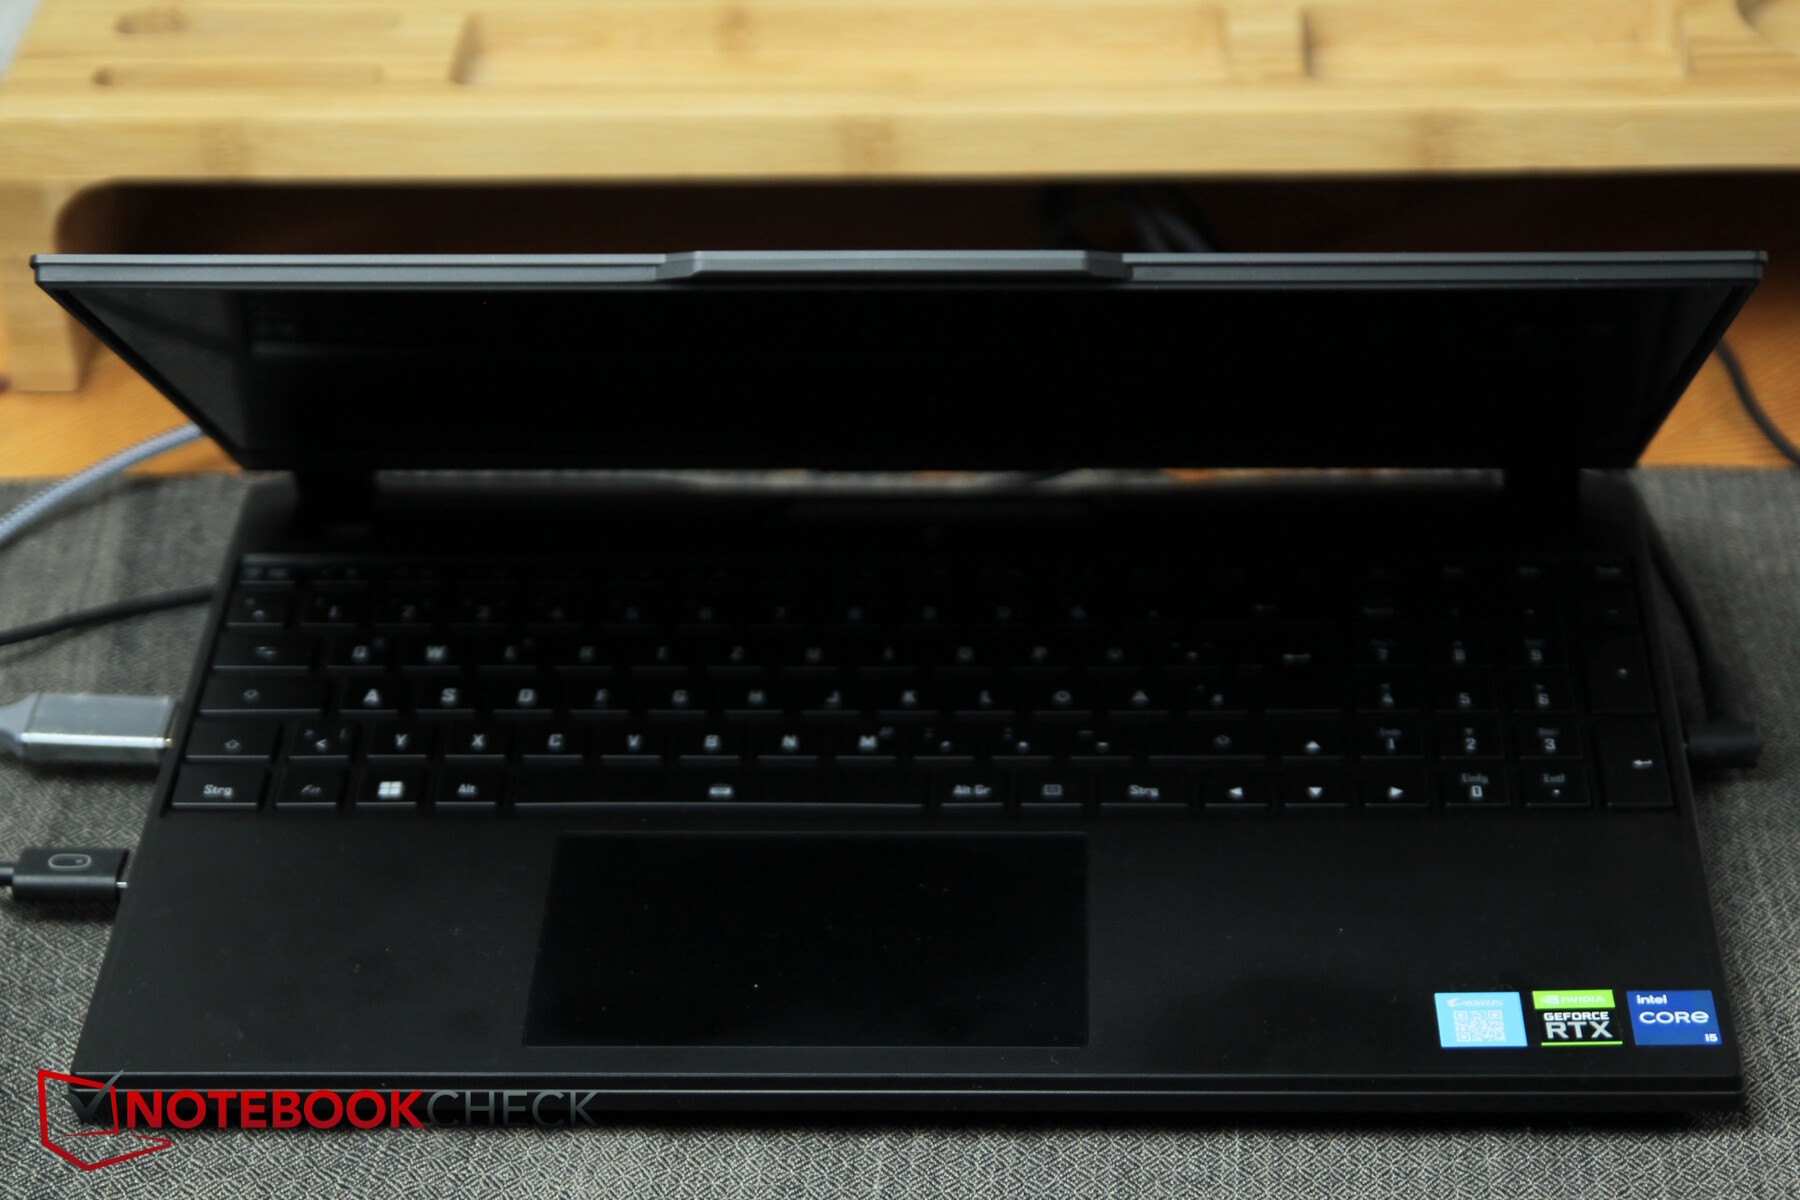
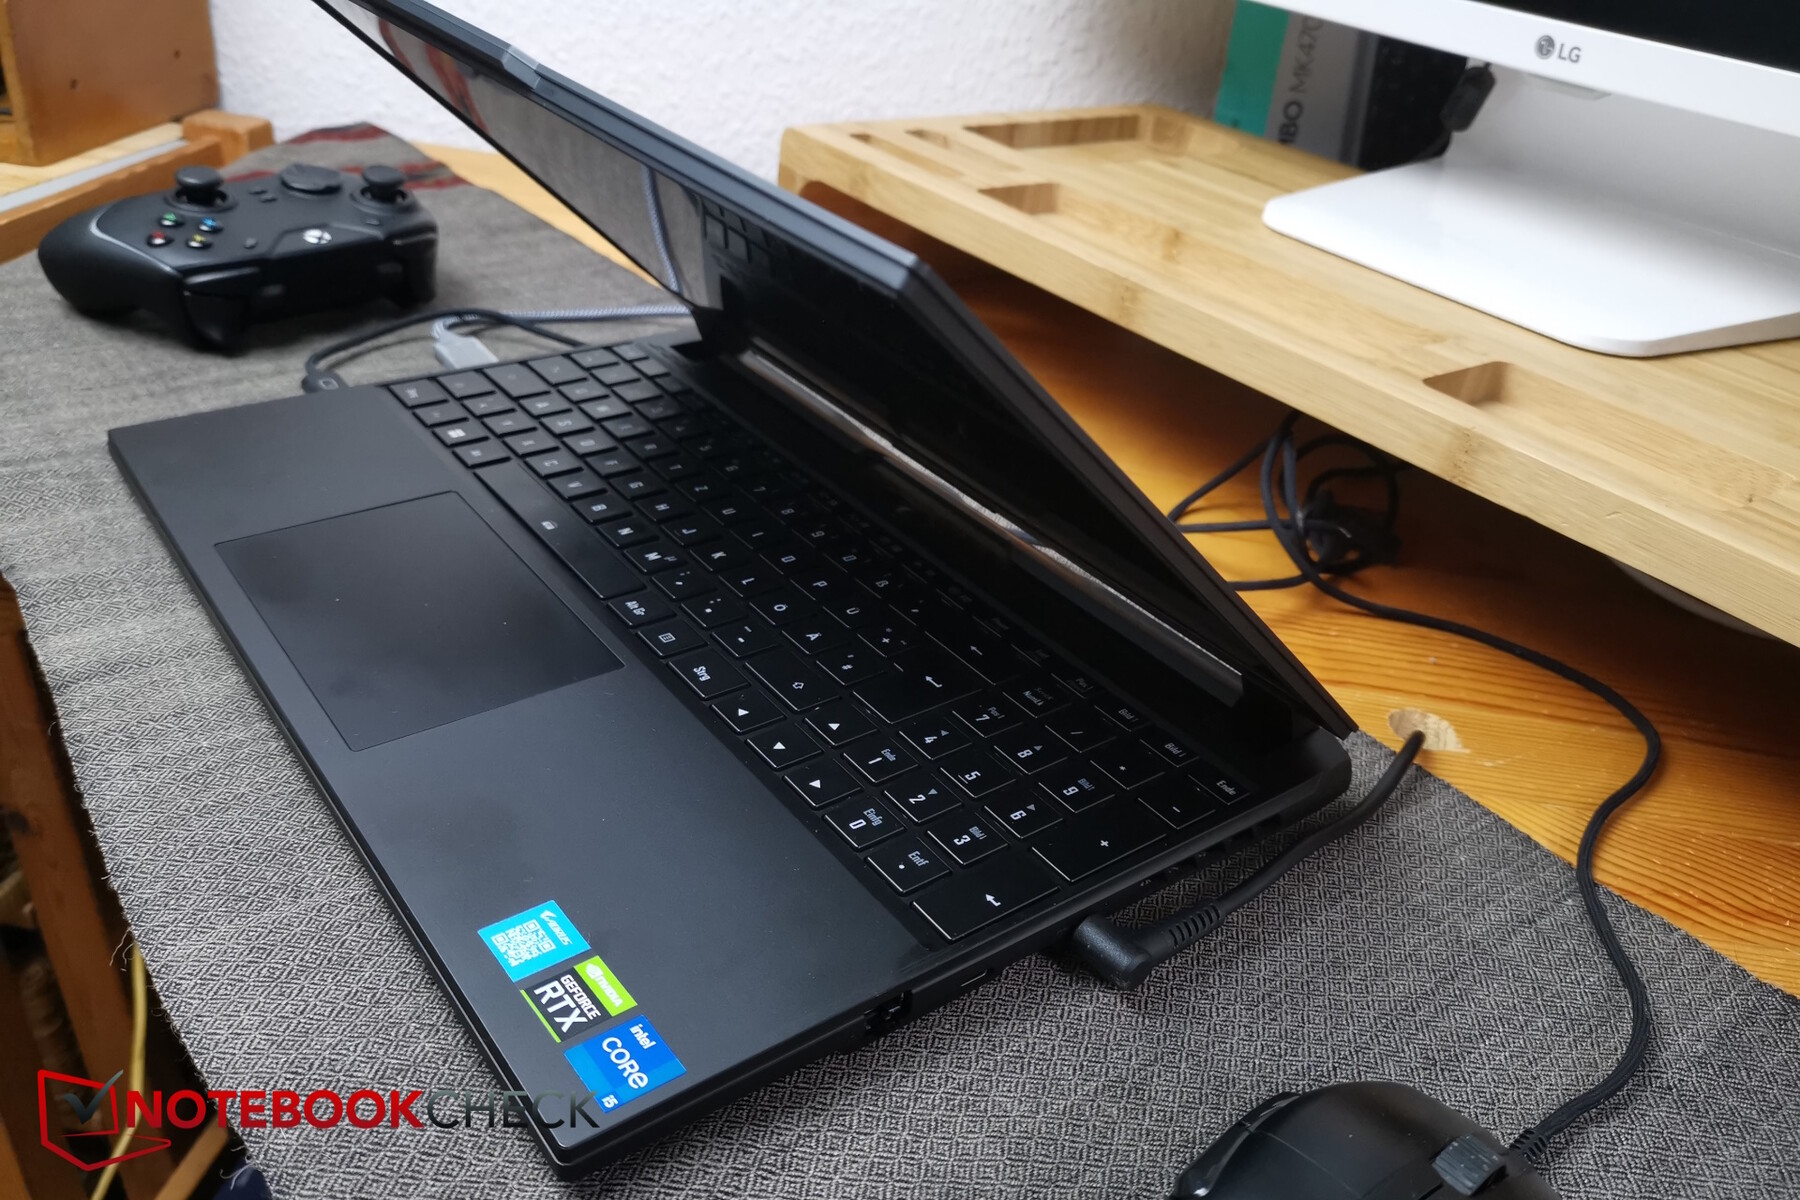
Wizualnie, Aorus wygląda całkiem nowocześnie i atrakcyjnie. Jest to zasługa matowej czerni i smukłej obudowy - choć w rzeczywistości laptop nie jest aż tak smukły (do 27 mm). Jednocześnie jest on elegancki, a jednocześnie zachowuje swój unikalny charakter, na przykład dzięki strukturze wzdłuż tylnej kratki wentylatora i pojawiającym się tam niewielkim, pomarańczowym zabarwieniom lub specjalnie zaprojektowanym, ściętym krawędziom. Srebrne logo Aorus zwraca uwagę na górną część urządzenia. Pokrywa posiada małe wycięcie wzdłuż przedniej górnej krawędzi, które mieści kamerkę internetową i głośniki - dodatkowo zapewnia naprawdę dobry chwyt podczas otwierania laptopa jedną ręką.
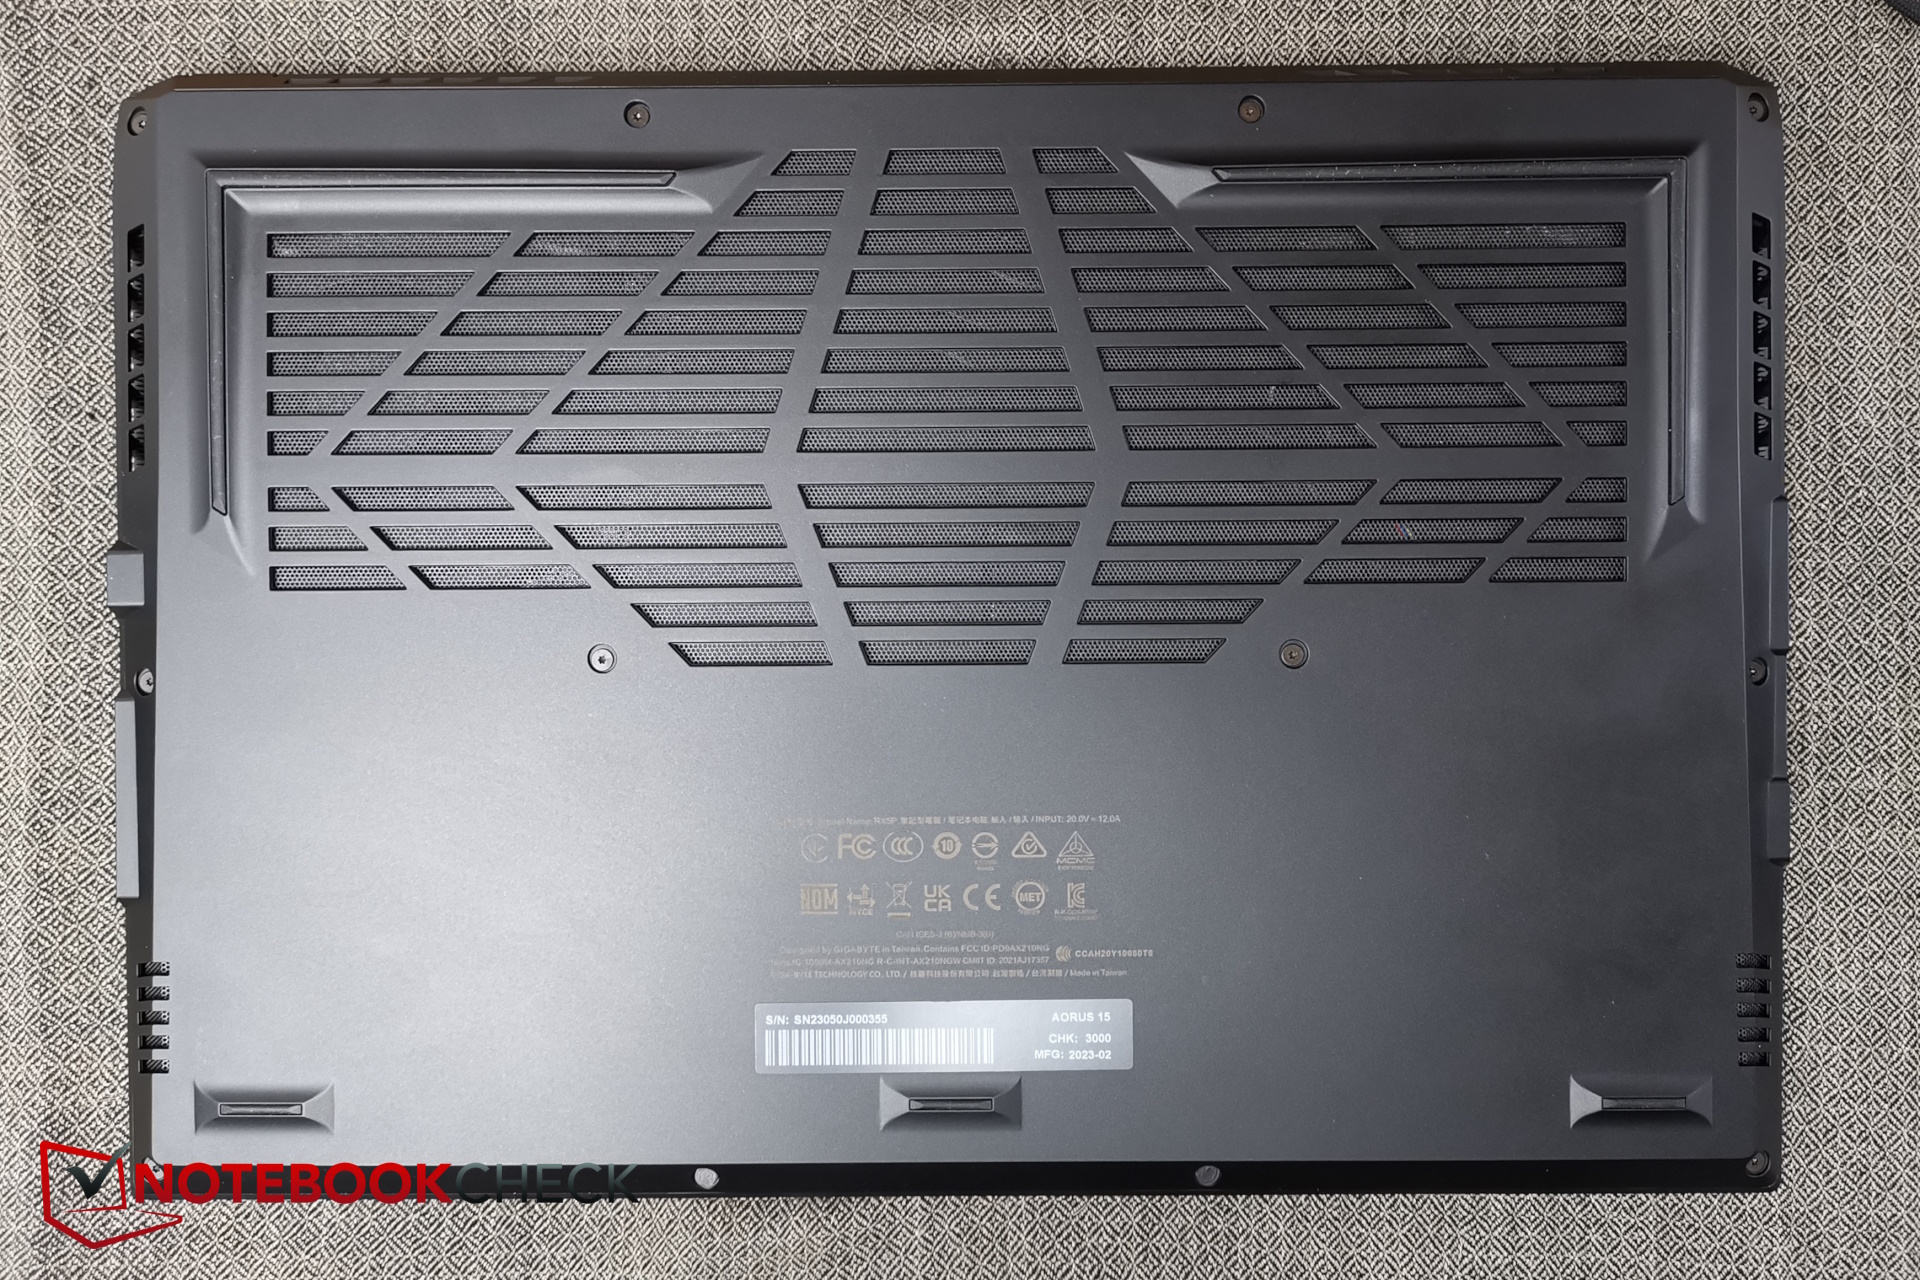
Wszystkie boki obudowy wykonane są z gładkiego plastiku. Wygląda to świetnie, ale nie jest tak odporne na skręcanie w porównaniu do niektórych konkurentów. Klawiatura nie ugina się podczas pisania na niej, co oznacza, że jej stabilność jest w porządku.
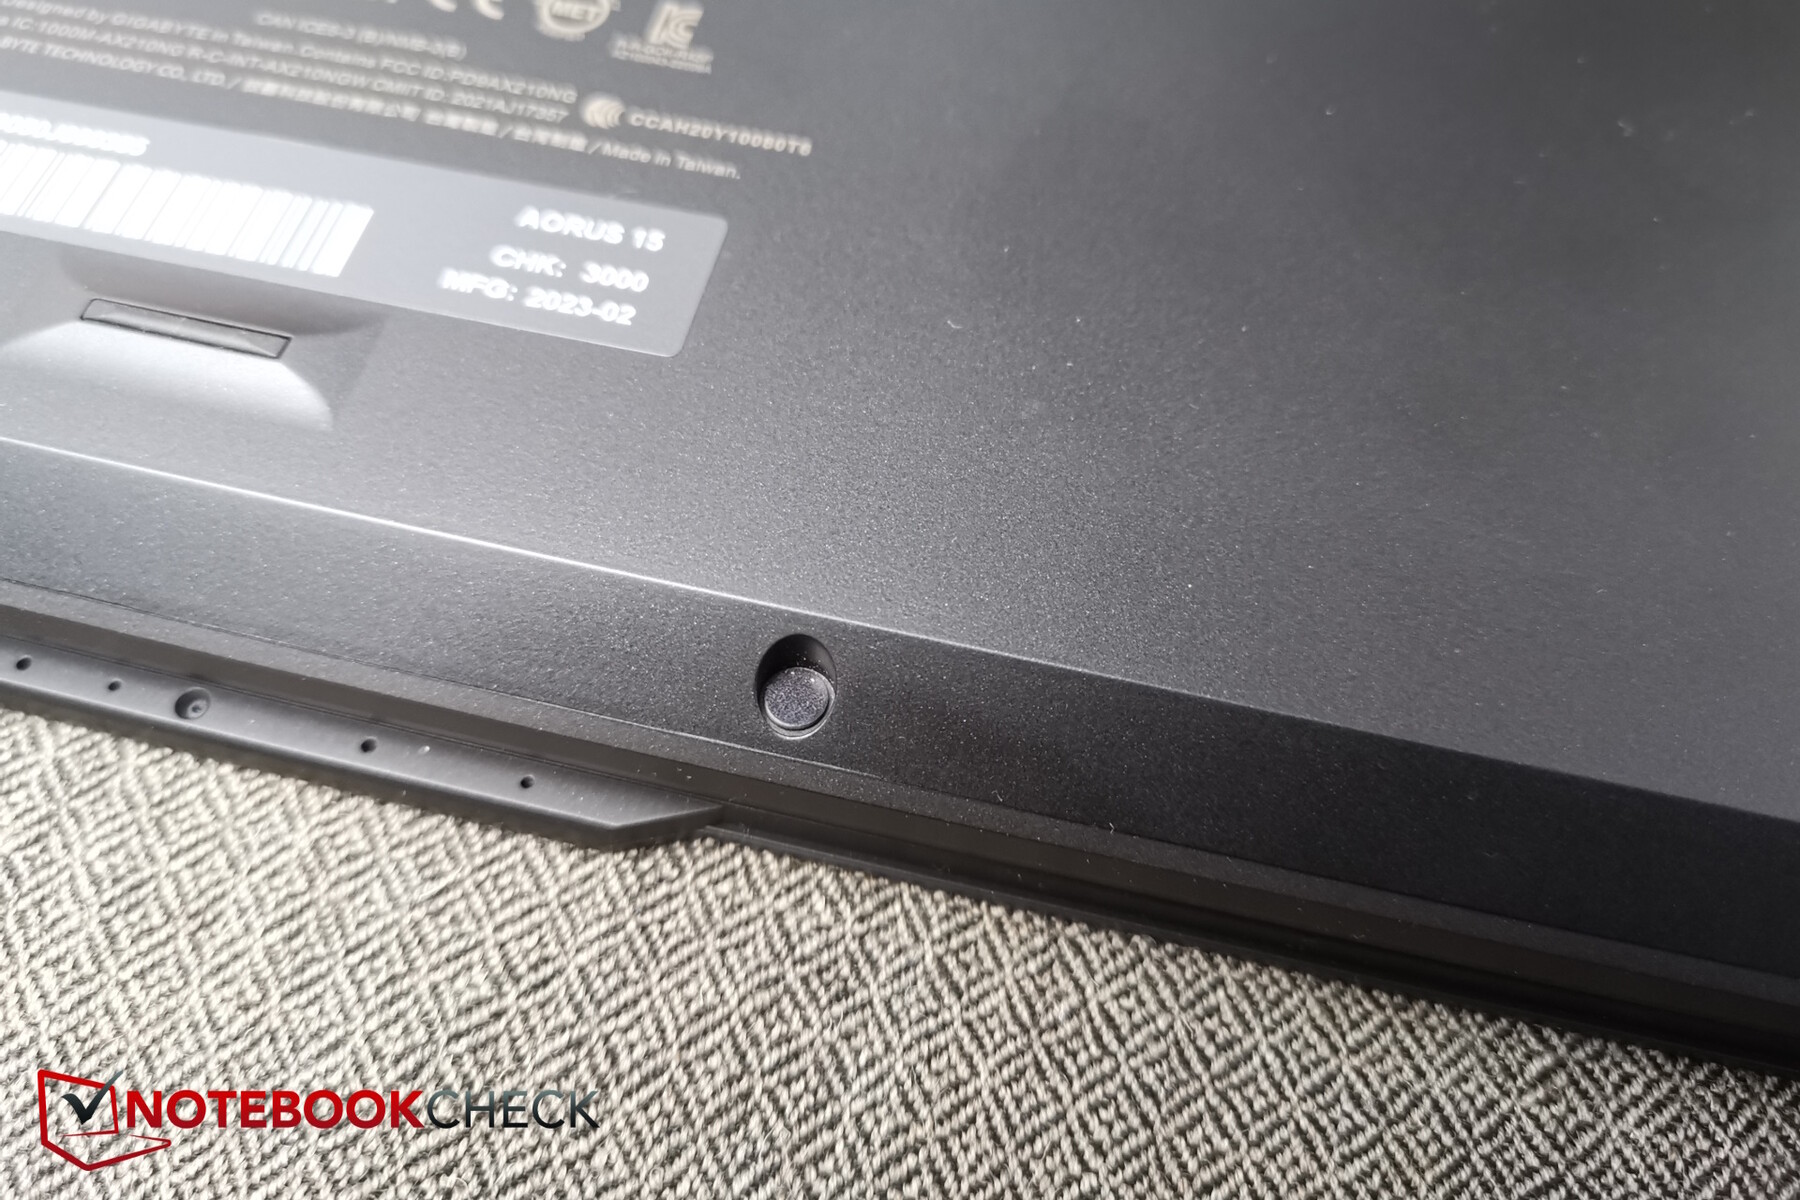
Nie otworzyliśmy Aorusa, ponieważ dwie śruby Torx są zakryte naklejką i nie chcieliśmy ich uszkodzić w interesie naszego pożyczonego Cyberportu.
Łączność
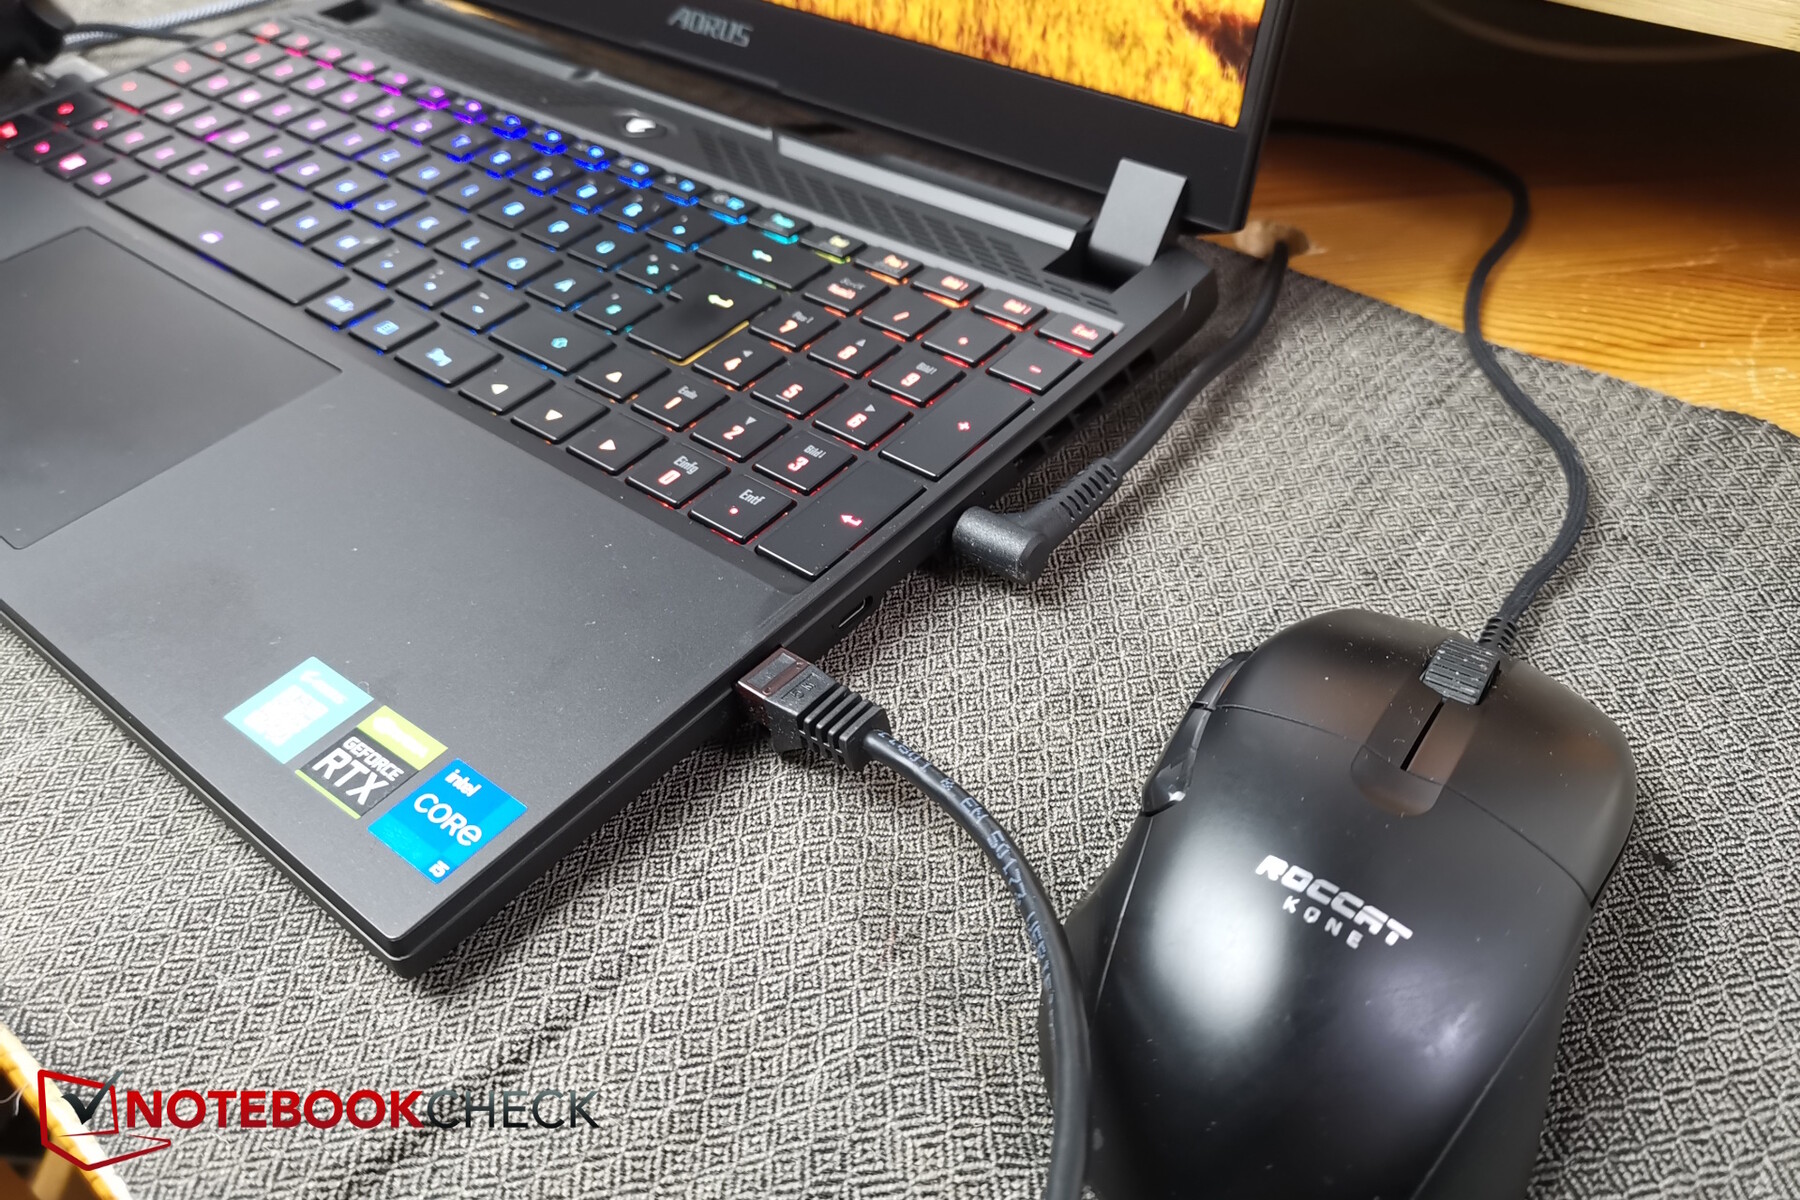
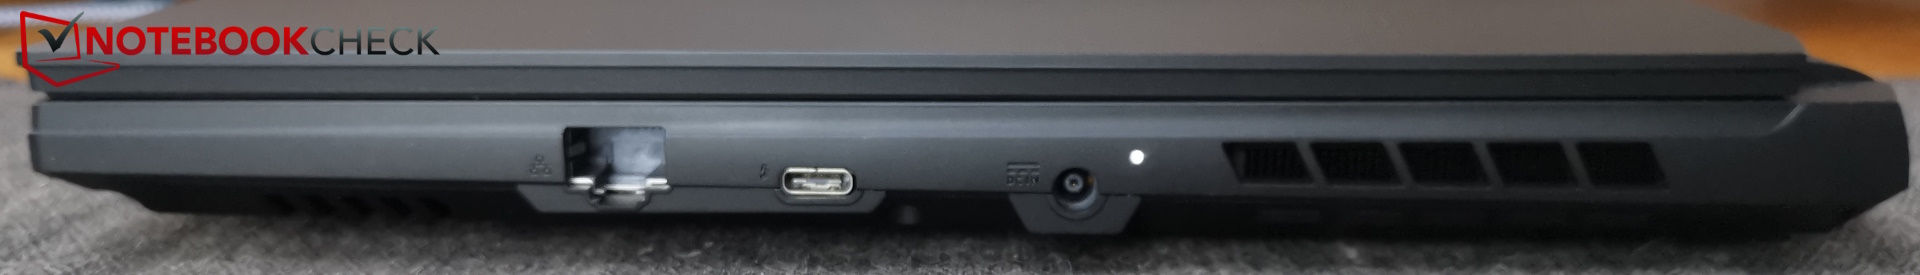
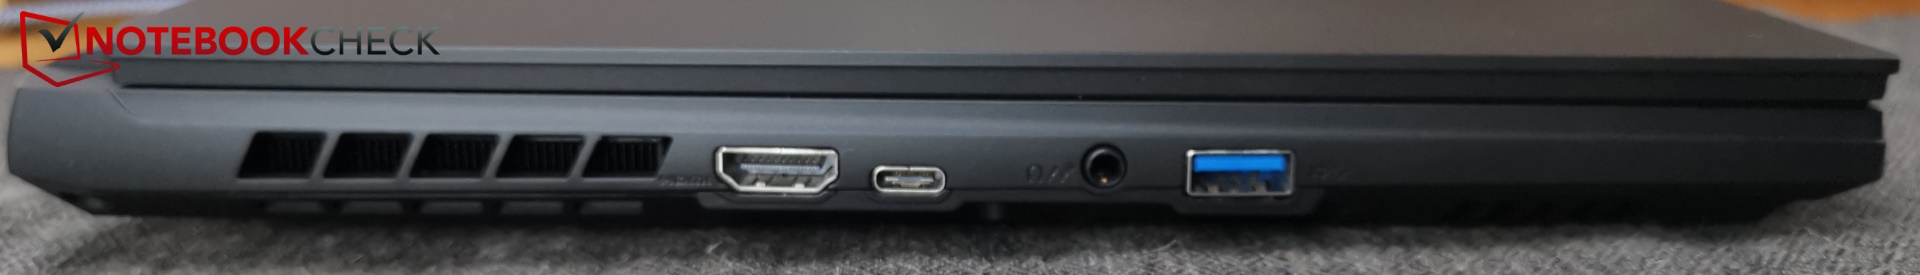
Opcje łączności laptopa Aorus są nowoczesne, a jednocześnie ograniczone do minimum. Z trzech portów USB tylko jeden jest typu A, co nie jest wystarczające. Z kolei jeden z dwóch portów typu C obsługuje Thunderbolt 4. Oprócz czwartego złącza USB, w urządzeniu brakuje również czytnika kart SD, blokady Kensington i dedykowanego portu DisplayPort (2x dostępnego przez USB-C).
Pomimo niewielkiej liczby portów, nie są one rozmieszczone zbyt dobrze - port RJ45 dla sztywnych kabli LAN znajduje się po prawej stronie i z przodu. Przestrzeń z tyłu Aorusa jest jak zwykle niewykorzystana. Znajdują się tam jedynie wyloty wentylatorów.
WiFi i kamera internetowa
Jego szybkość transmisji WLAN jest jedną z najwyższych w porównaniu zarówno w sieci 6 GHz (WiFi 6E), jak i 5 GHz.
Niestety, kamera internetowa urządzenia jest nadal ostatniej generacji: Ma tylko rozdzielczość 720p, jej odchylenia kolorów są dość wysokie i nie ma migawki w Centrum sterowania.


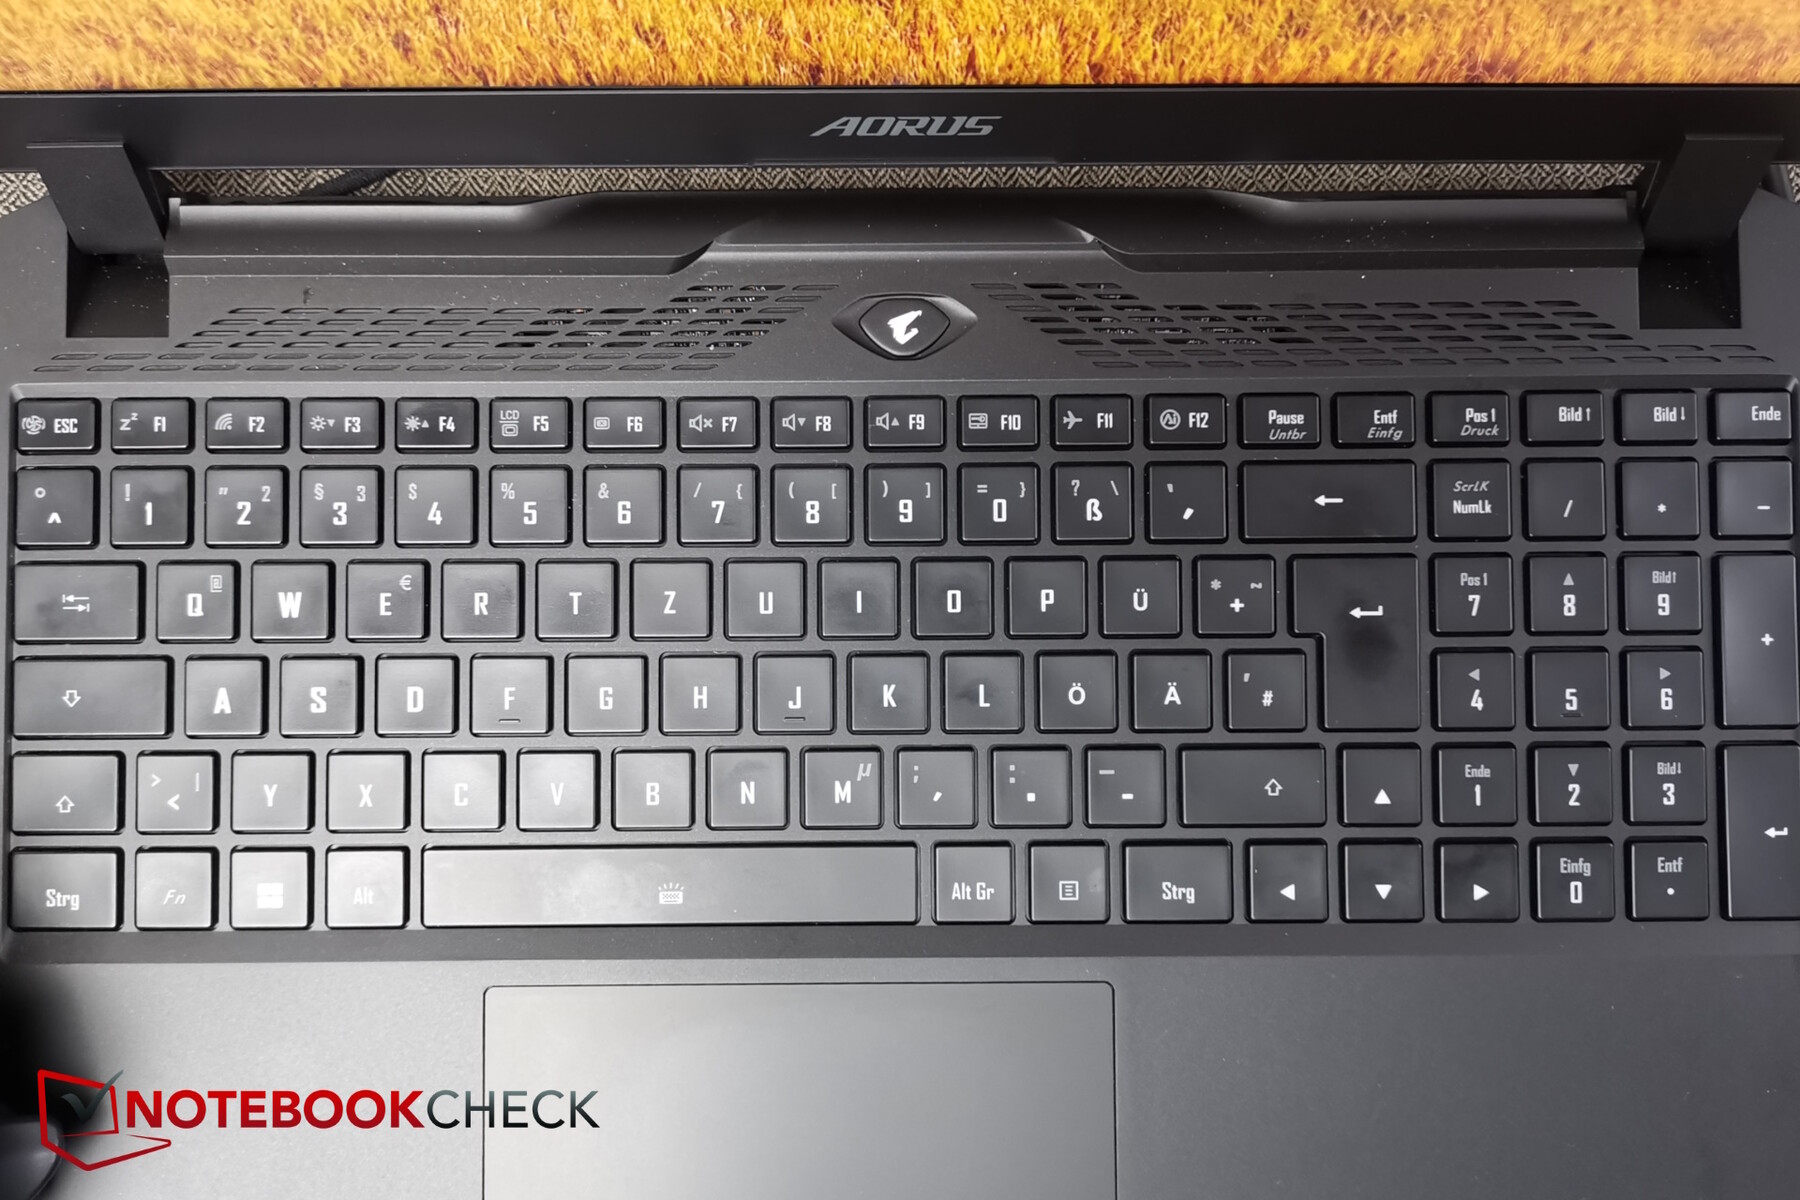
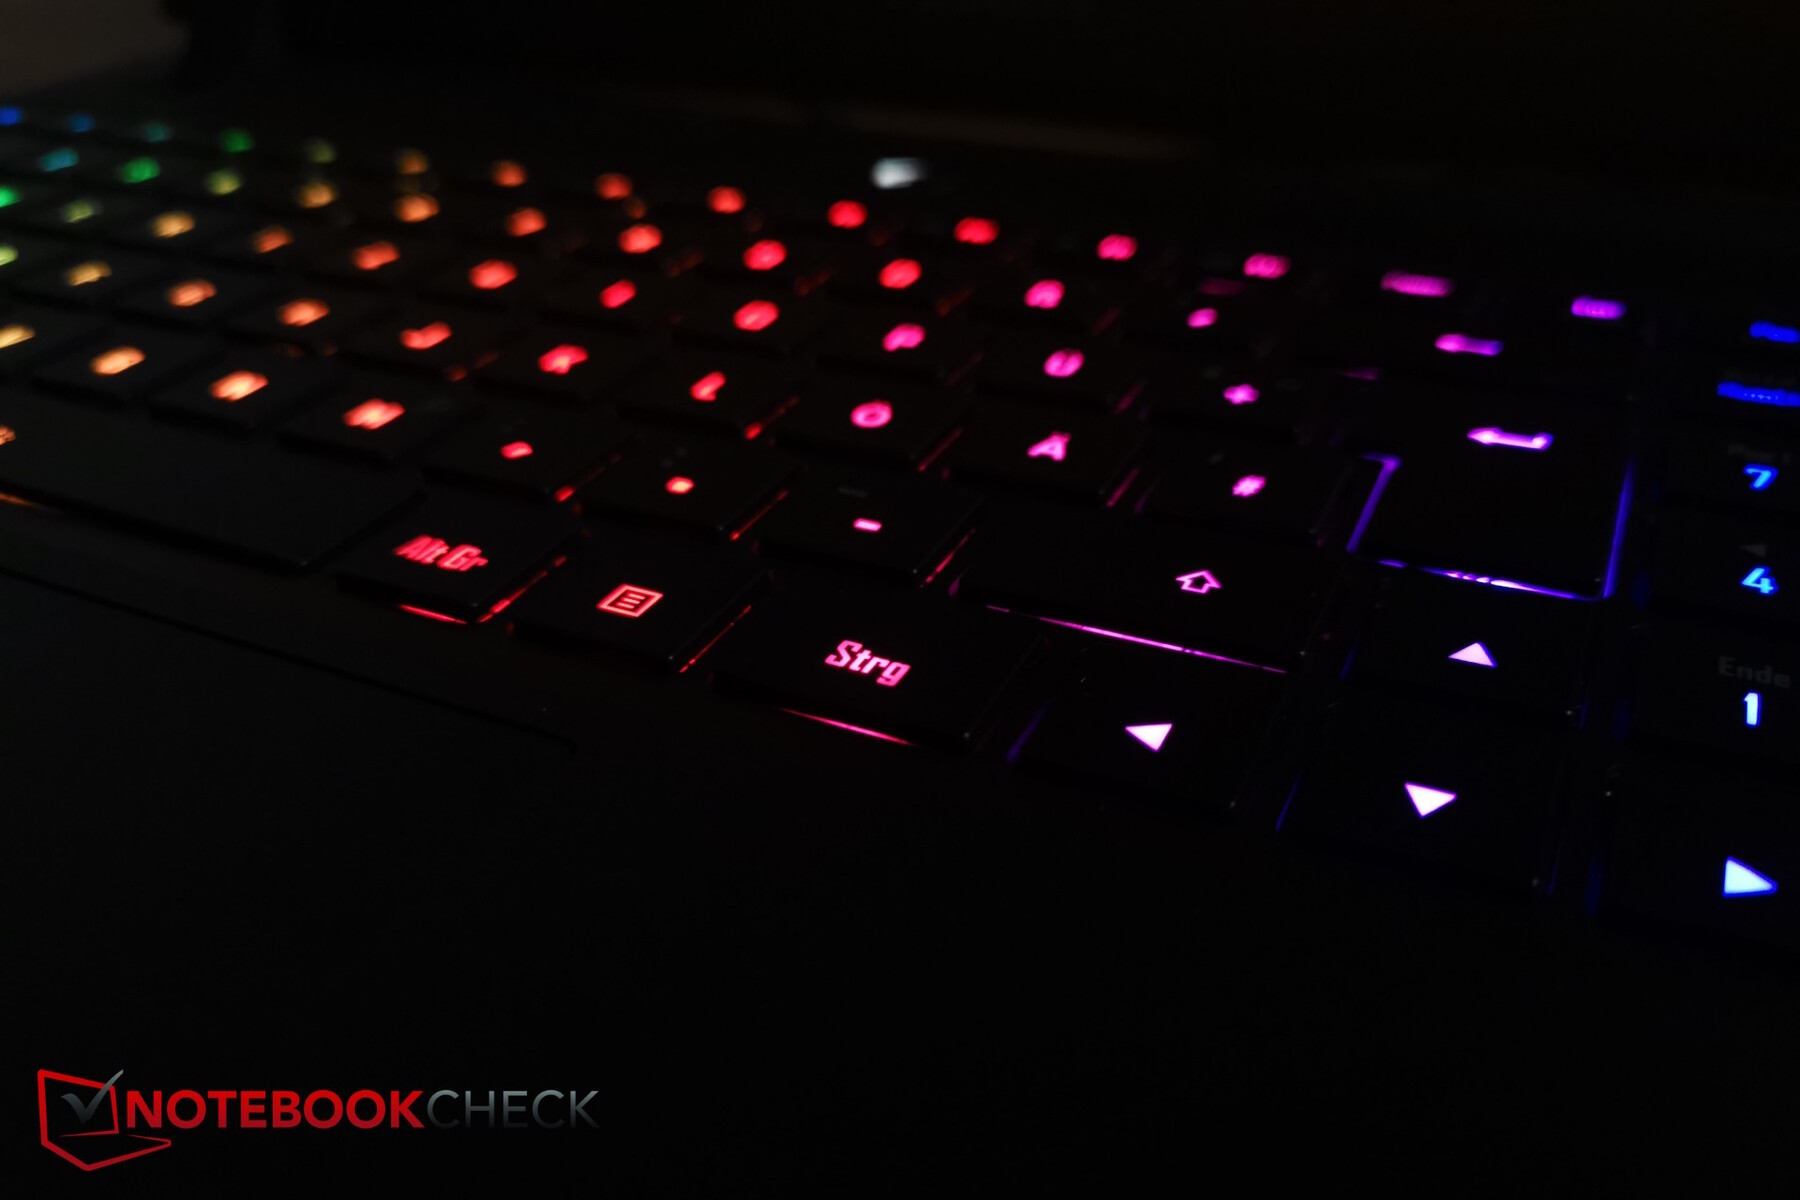
Urządzenia wejściowe - Więcej niż solidne, ale ciemne specjalne oznaczenie klawiszy
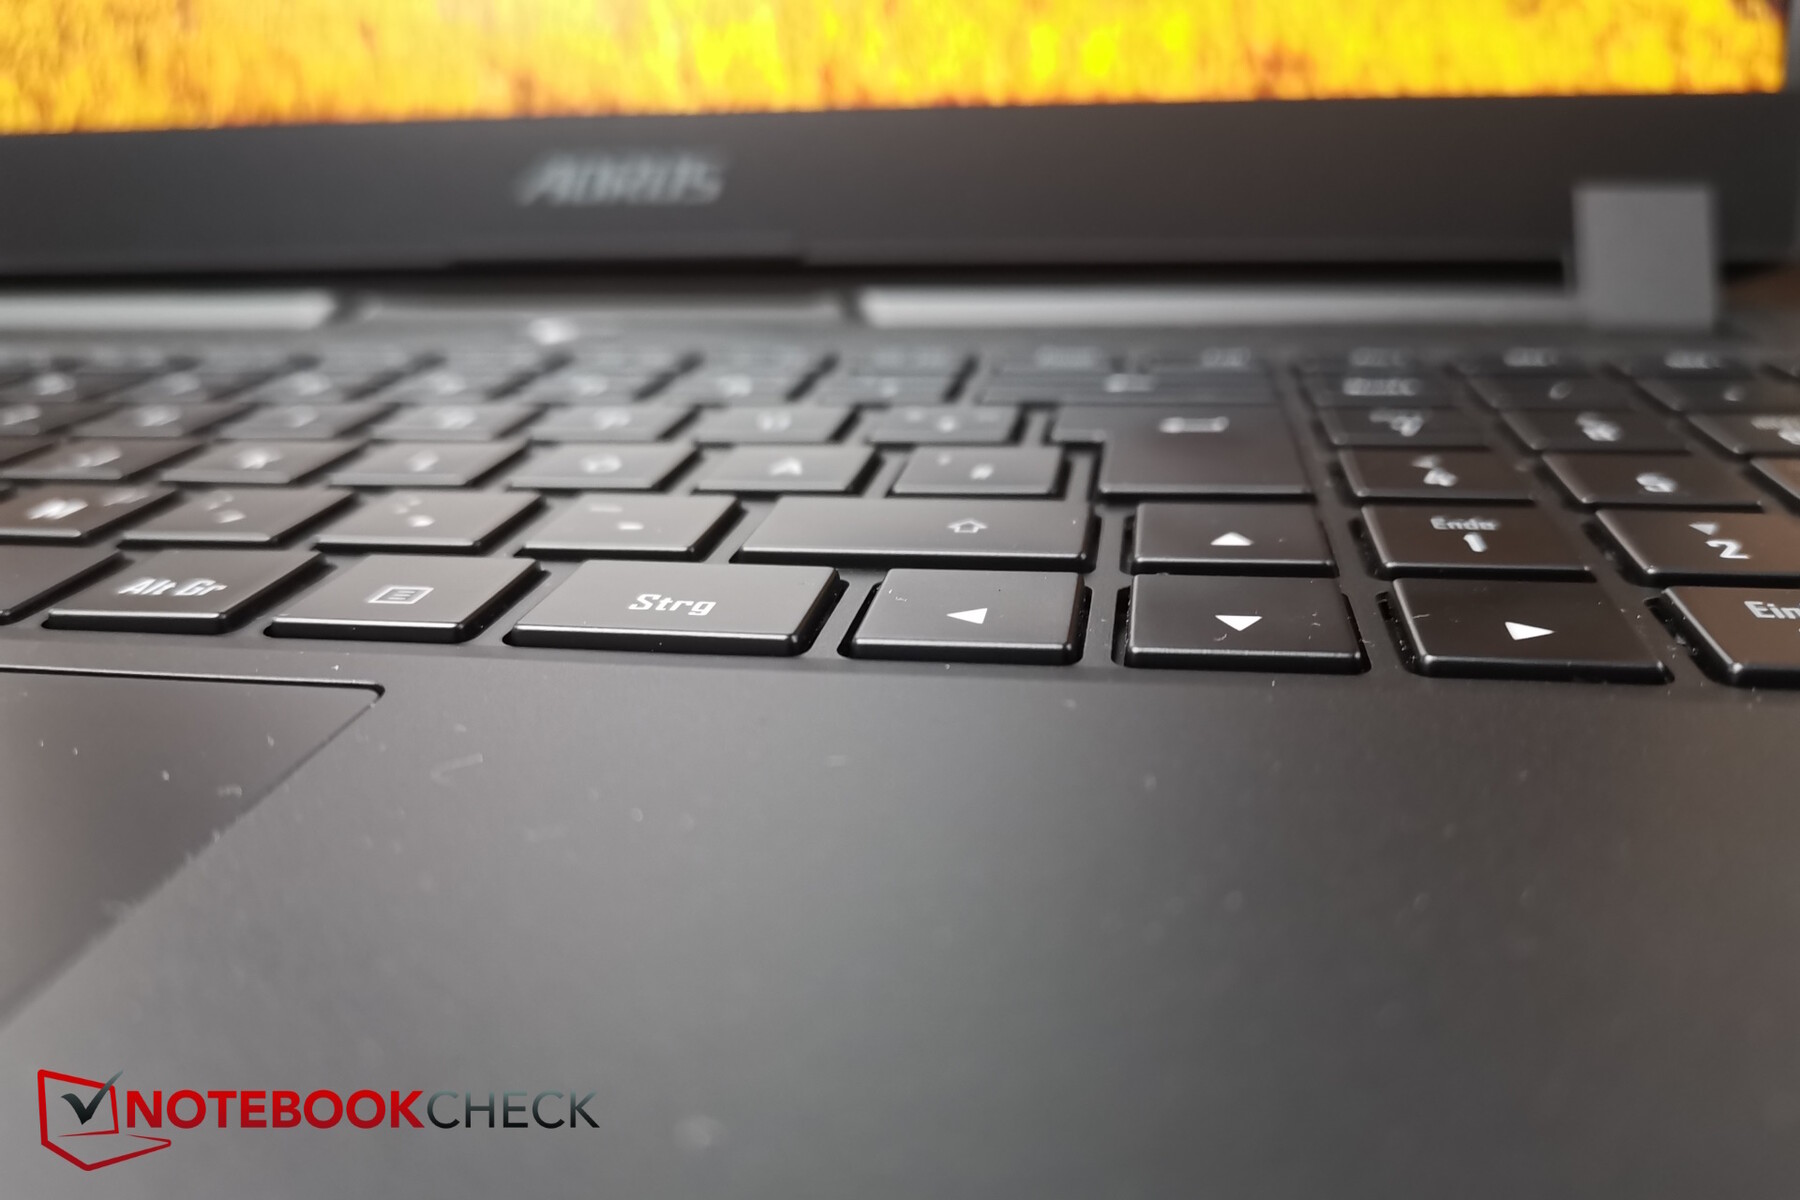
Układ klawiszy jest bardzo uporządkowany - klawiatura jest nieco obniżona w stosunku do podstawy laptopa. Klawisze strzałek są również normalnej wielkości, a bezpośrednio po prawej stronie znajduje się klawiatura numeryczna.
Klawisze mają tylko niski lub średni skok, ale mimo to są zaskakująco wygodne podczas pisania, co jest również zasługą przyzwoitego sprzężenia zwrotnego. Ich odgłosy podczas pisania są cichsze, więc nadają się również do cichych środowisk.
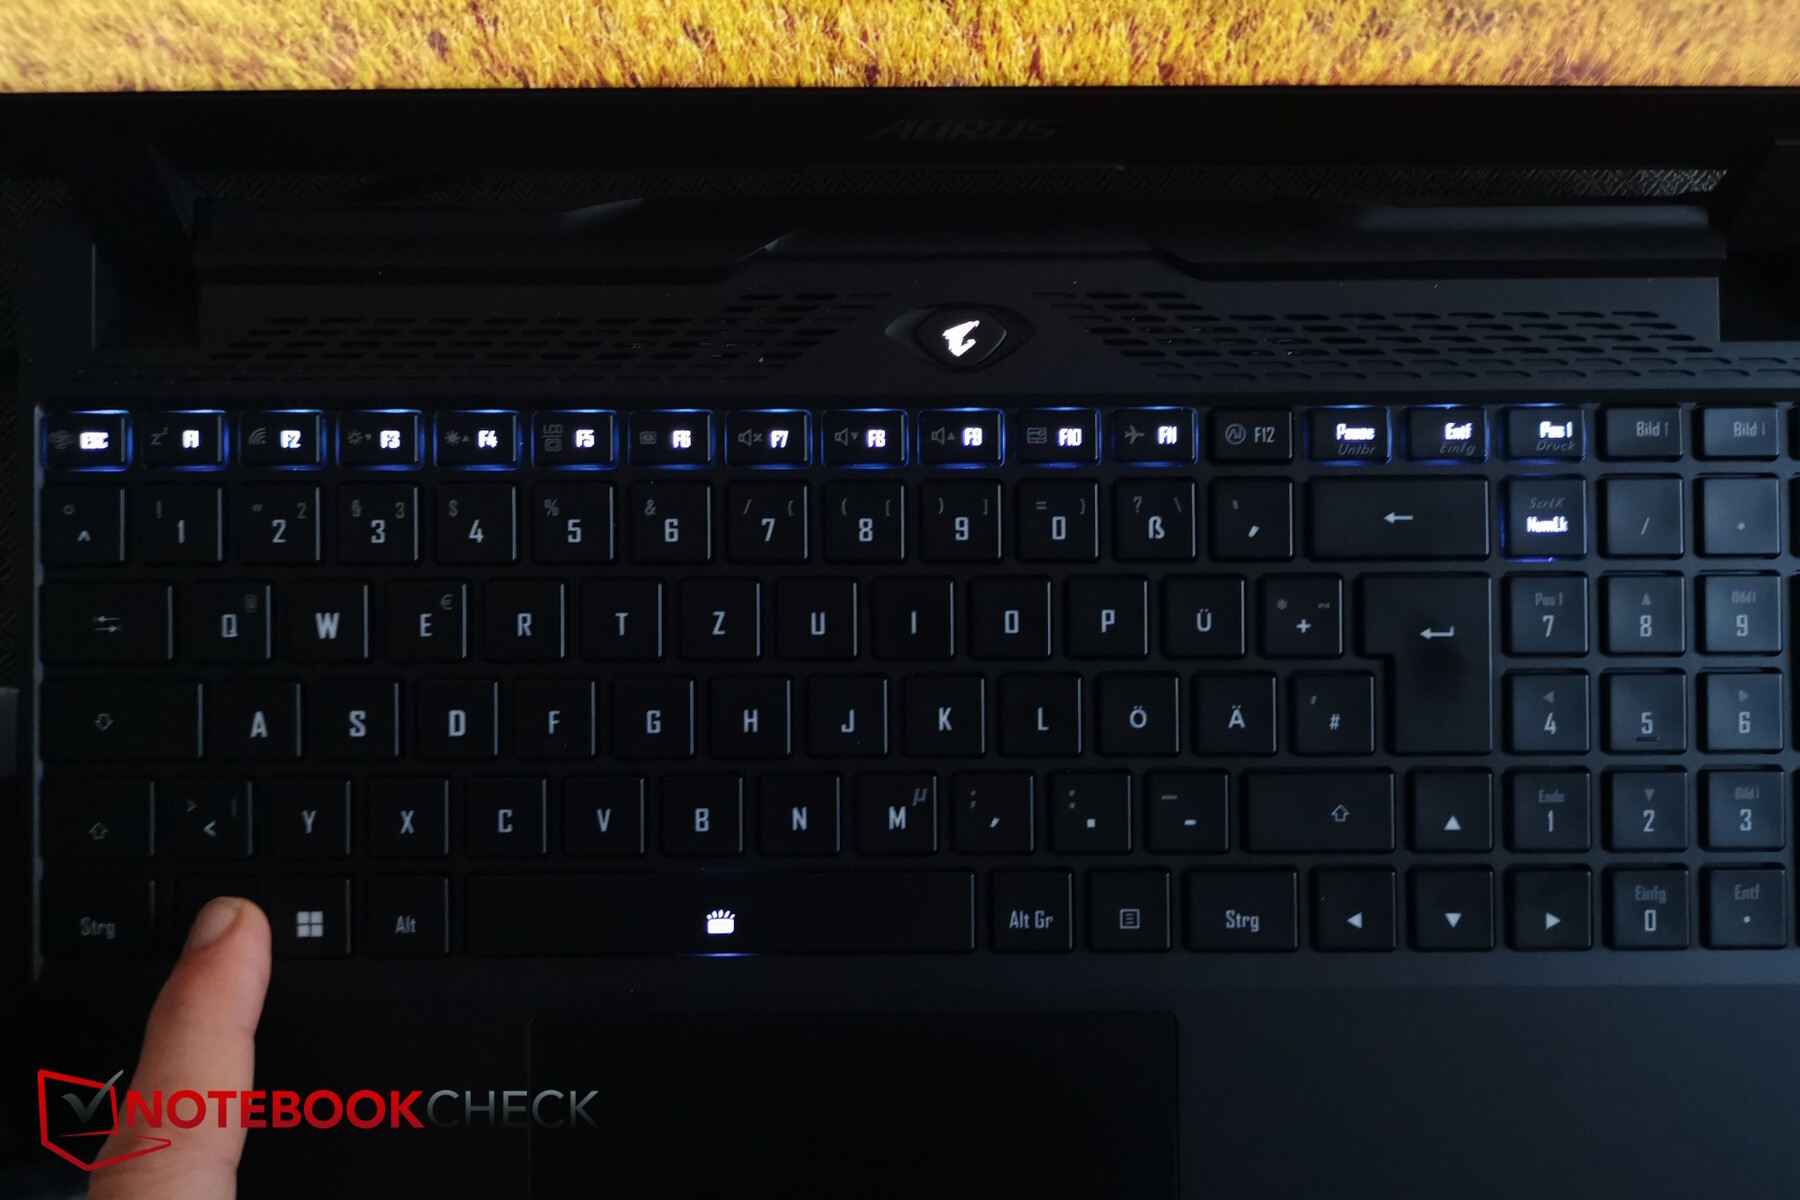
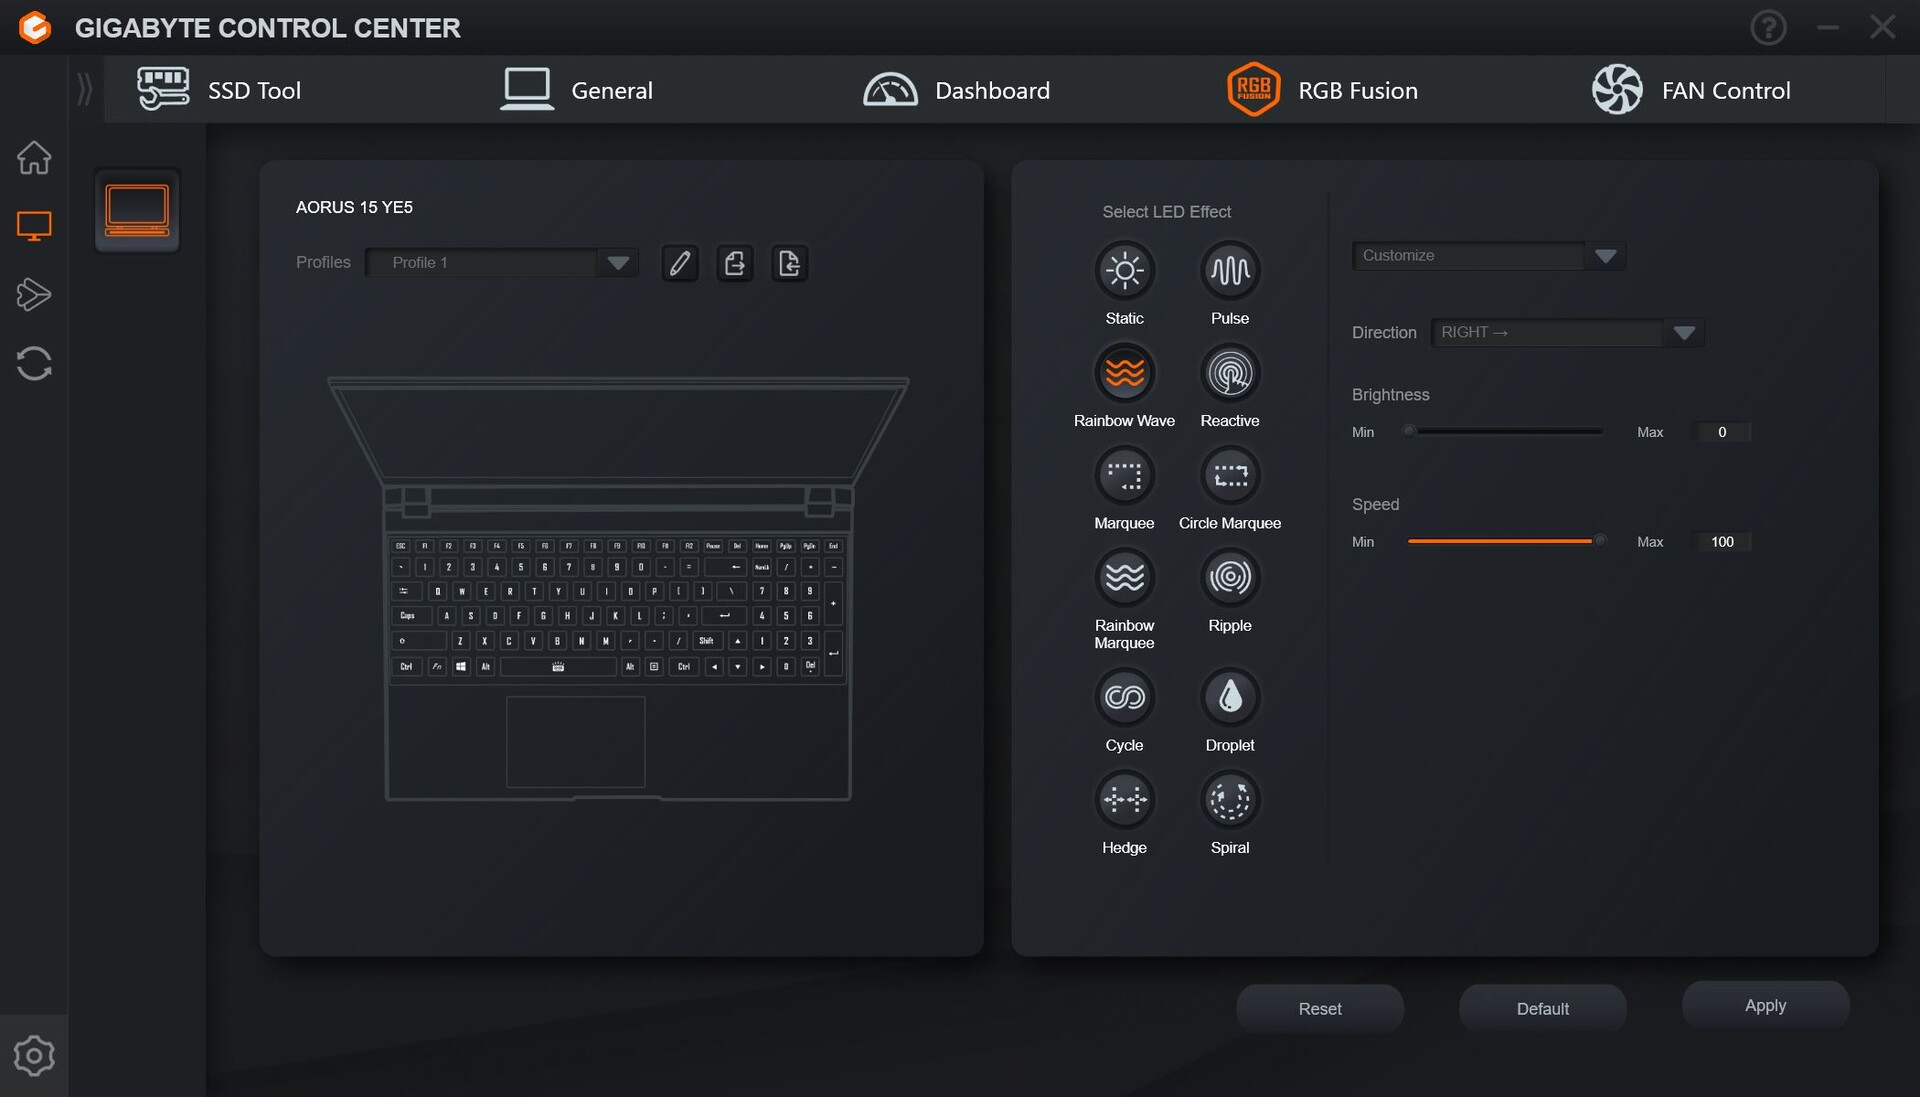
Podświetlenie klawiszy obsługuje różne efekty RGB, ale nie można go ustawić indywidualnie dla każdego klawisza - chociaż mogą one świecić w różnych kolorach dla niektórych efektów (Rain Drop). Praktyczne: Po naciśnięciu klawisza fn wszystkie klawisze, które można połączyć z fn w celu utworzenia funkcji specjalnych, zostaną podświetlone. Podświetlane są jednak tylko zwykłe etykiety klawiszy (np. "F7"), ale nie ich specjalne funkcje ("wyciszenie"), co prowadzi do tego, że specjalna funkcja klawisza F nie jest rozpoznawalna w ciemnym otoczeniu.
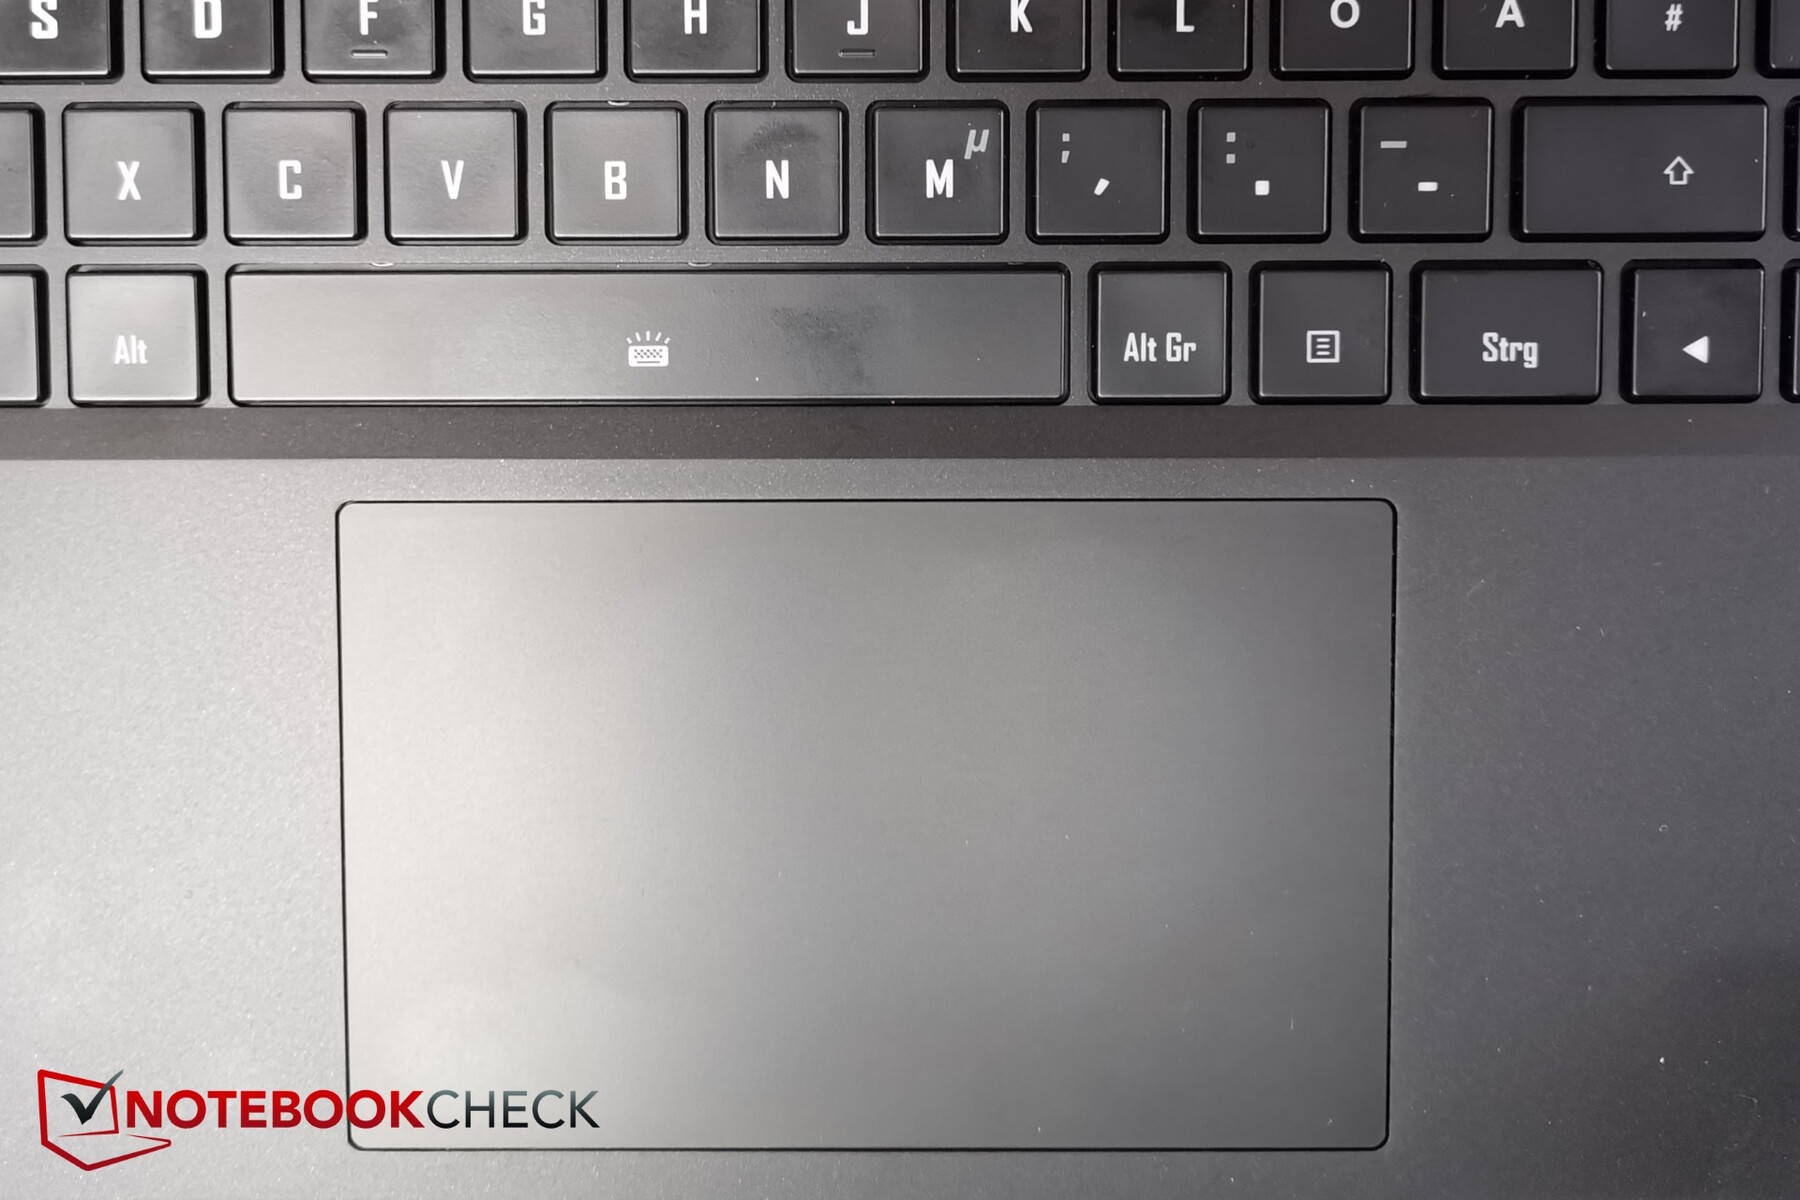
Wystarczająco duży touchpad (21,1 x 7,6 cm) jest przyjemny i gładki, nawet jeśli dłonie nie są całkowicie suche. Zintegrowane przyciski klikania wymagają dość dużej siły, co oznacza, że ich punkt nacisku jest wyraźny. Odgłosy klikania są umiarkowane.
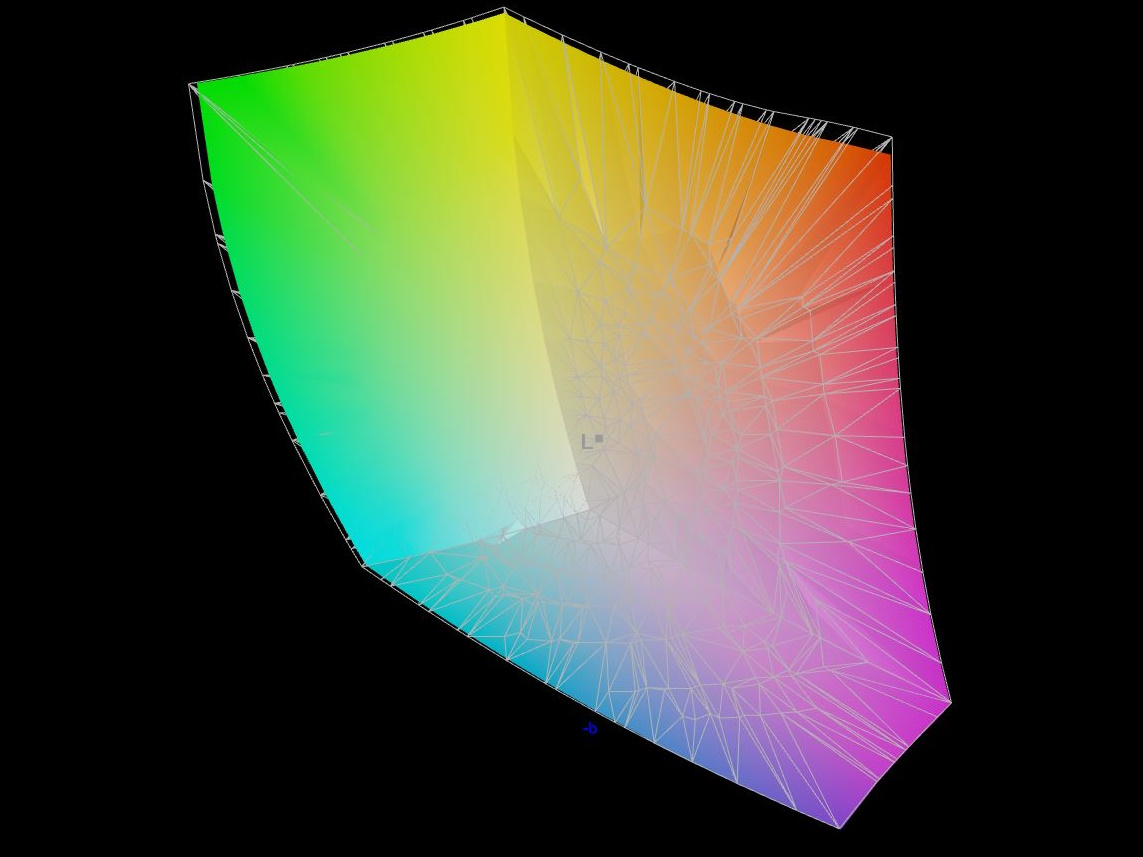
Wyświetlacz - 1440p z dobrą dokładnością kolorów
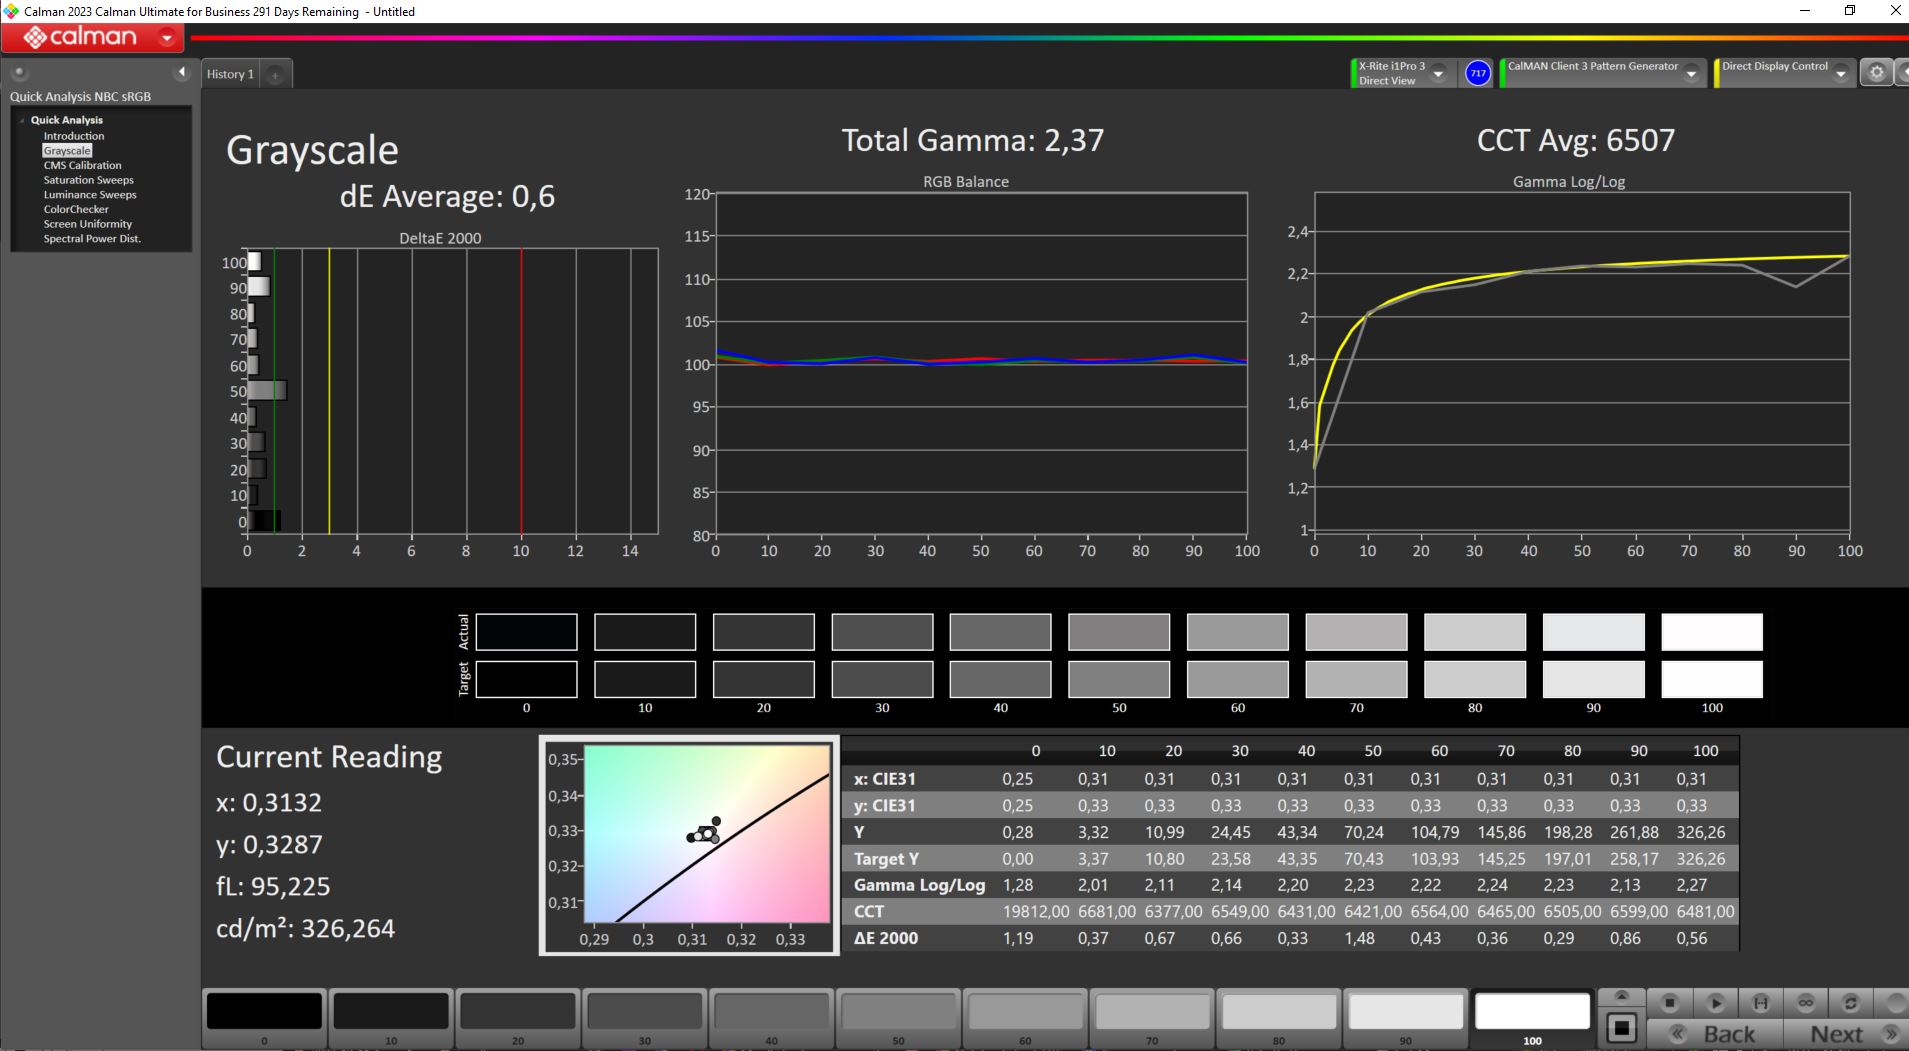
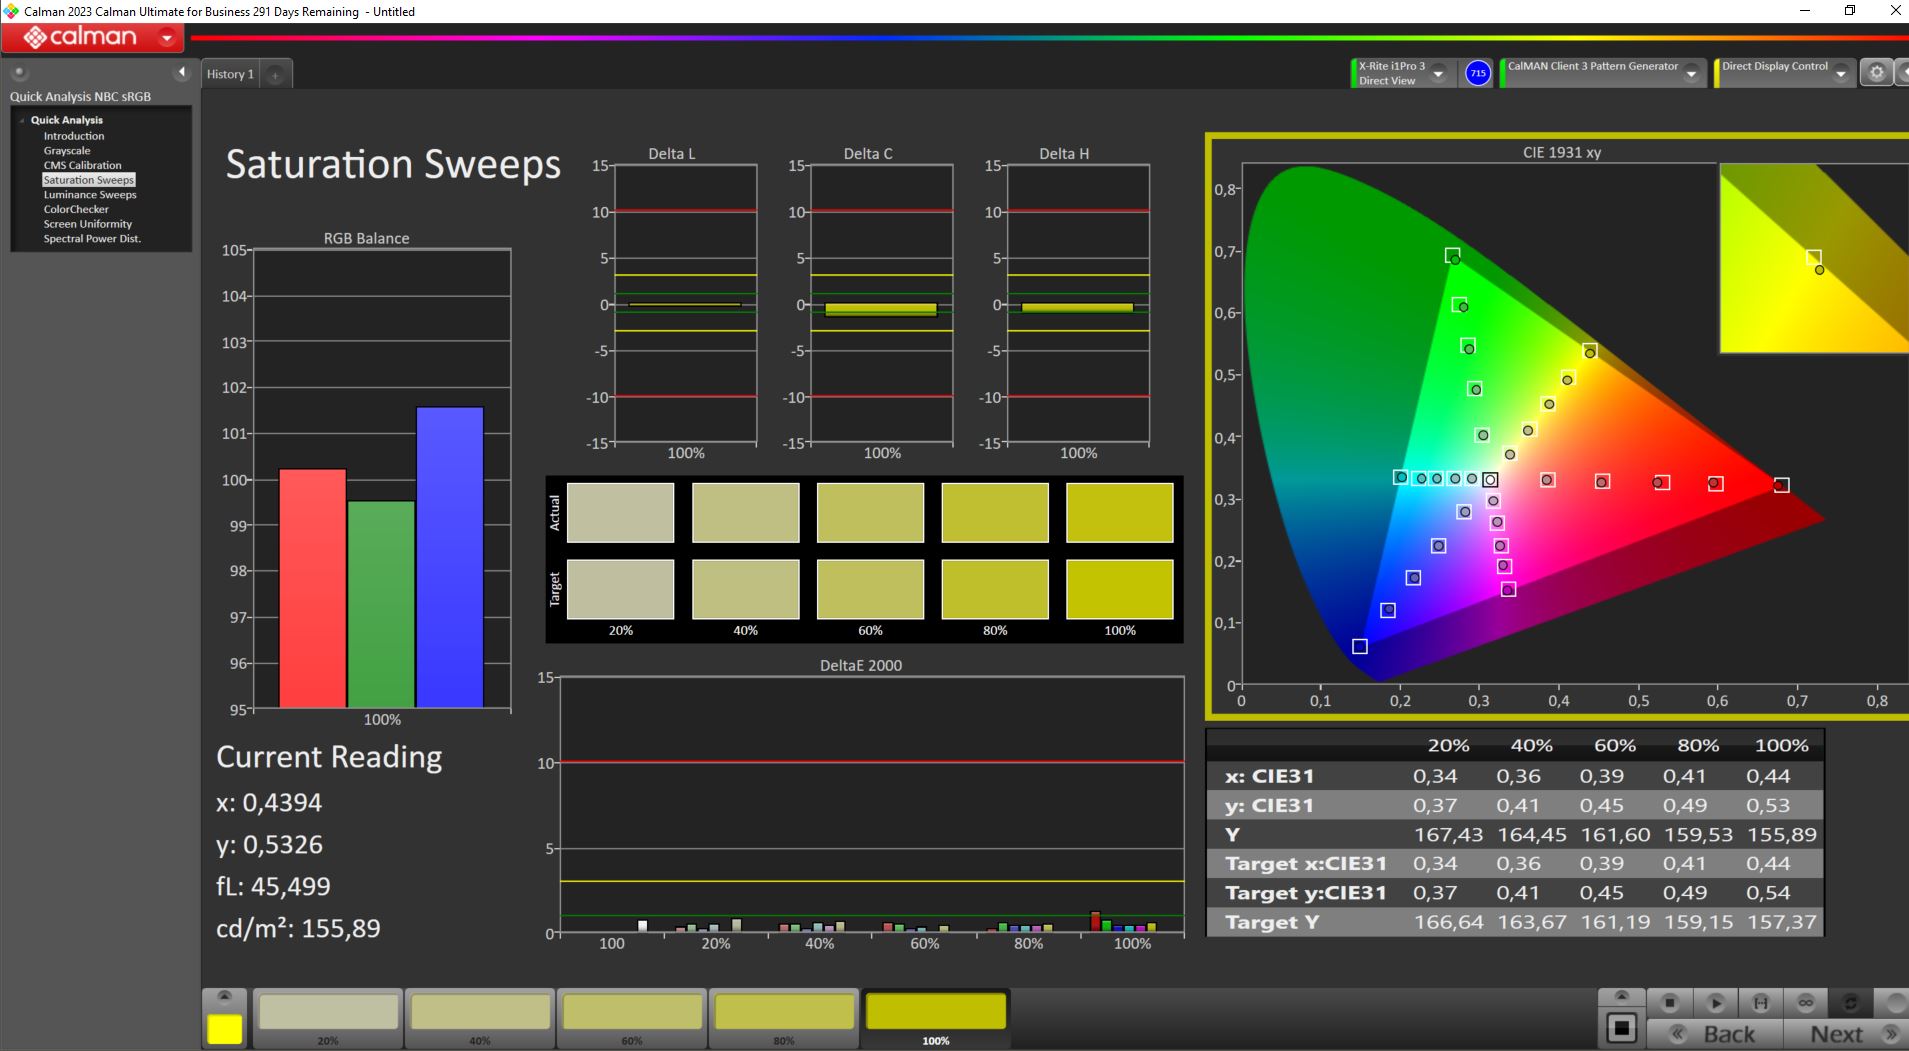
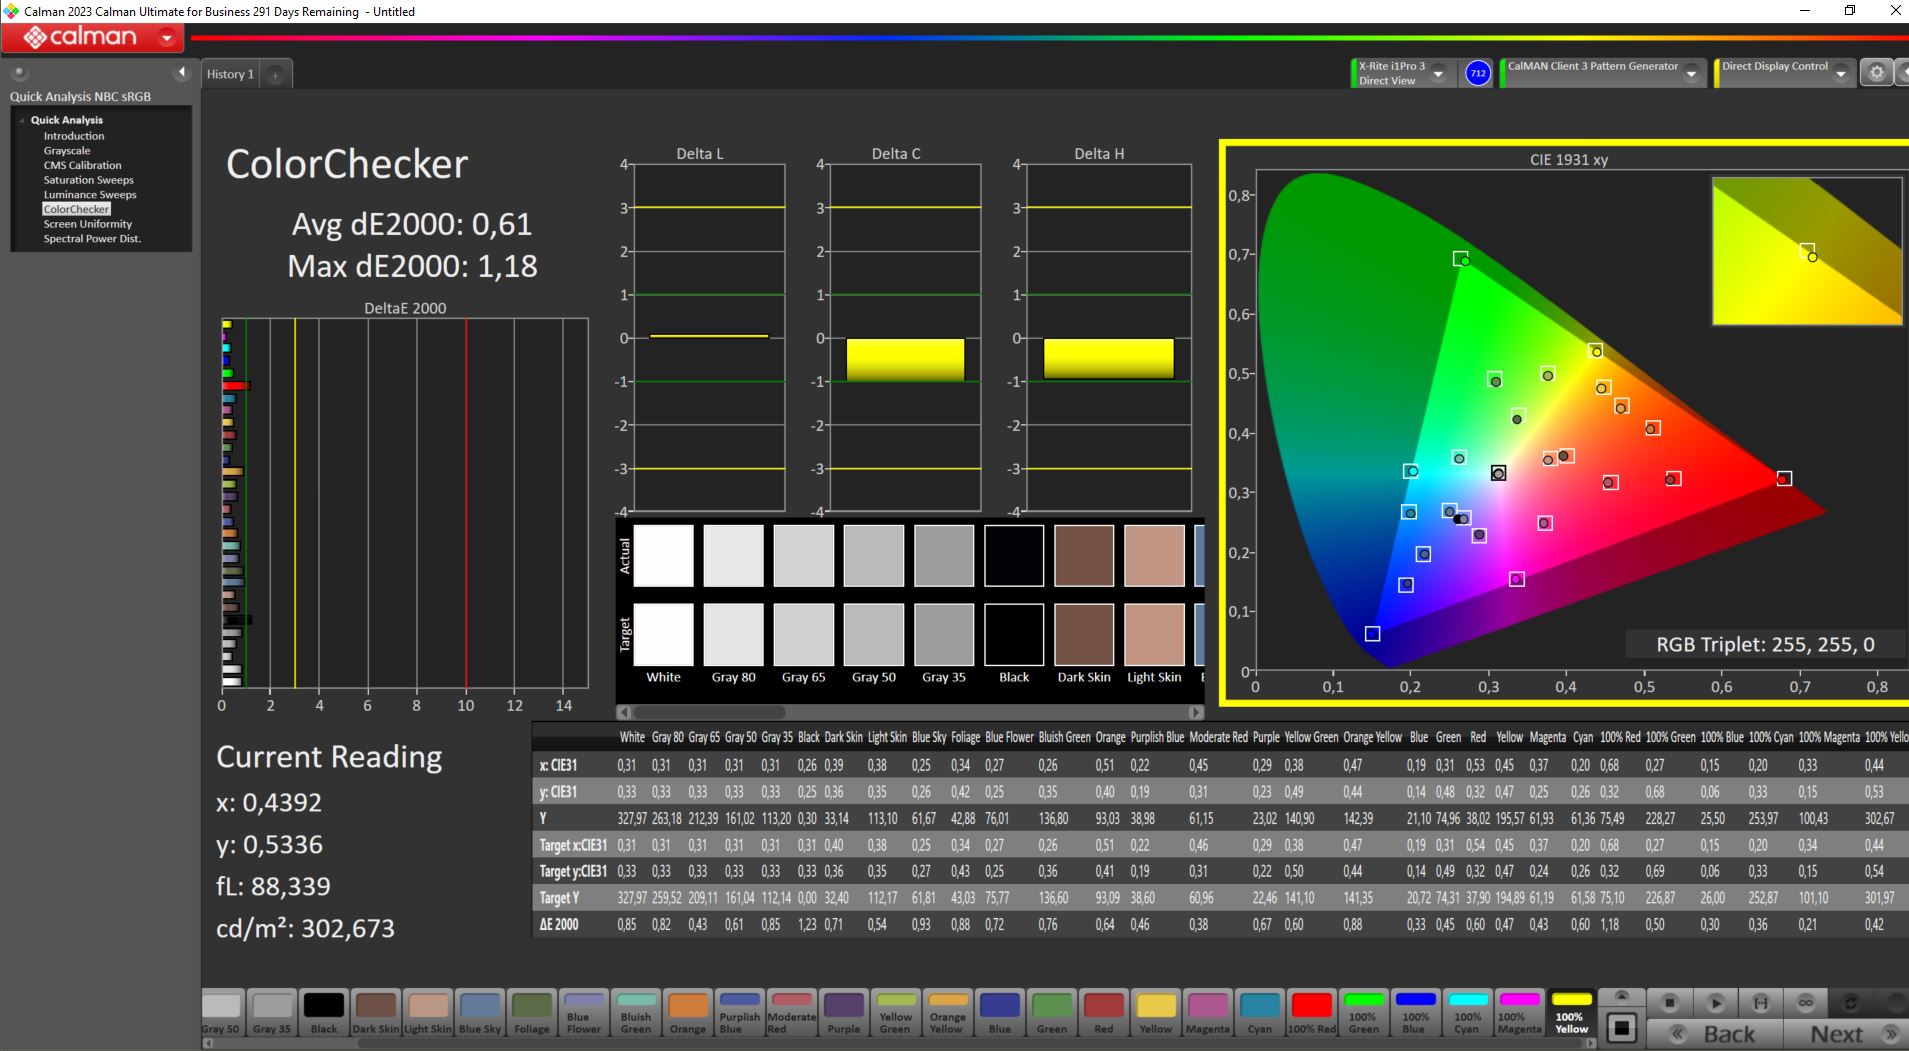
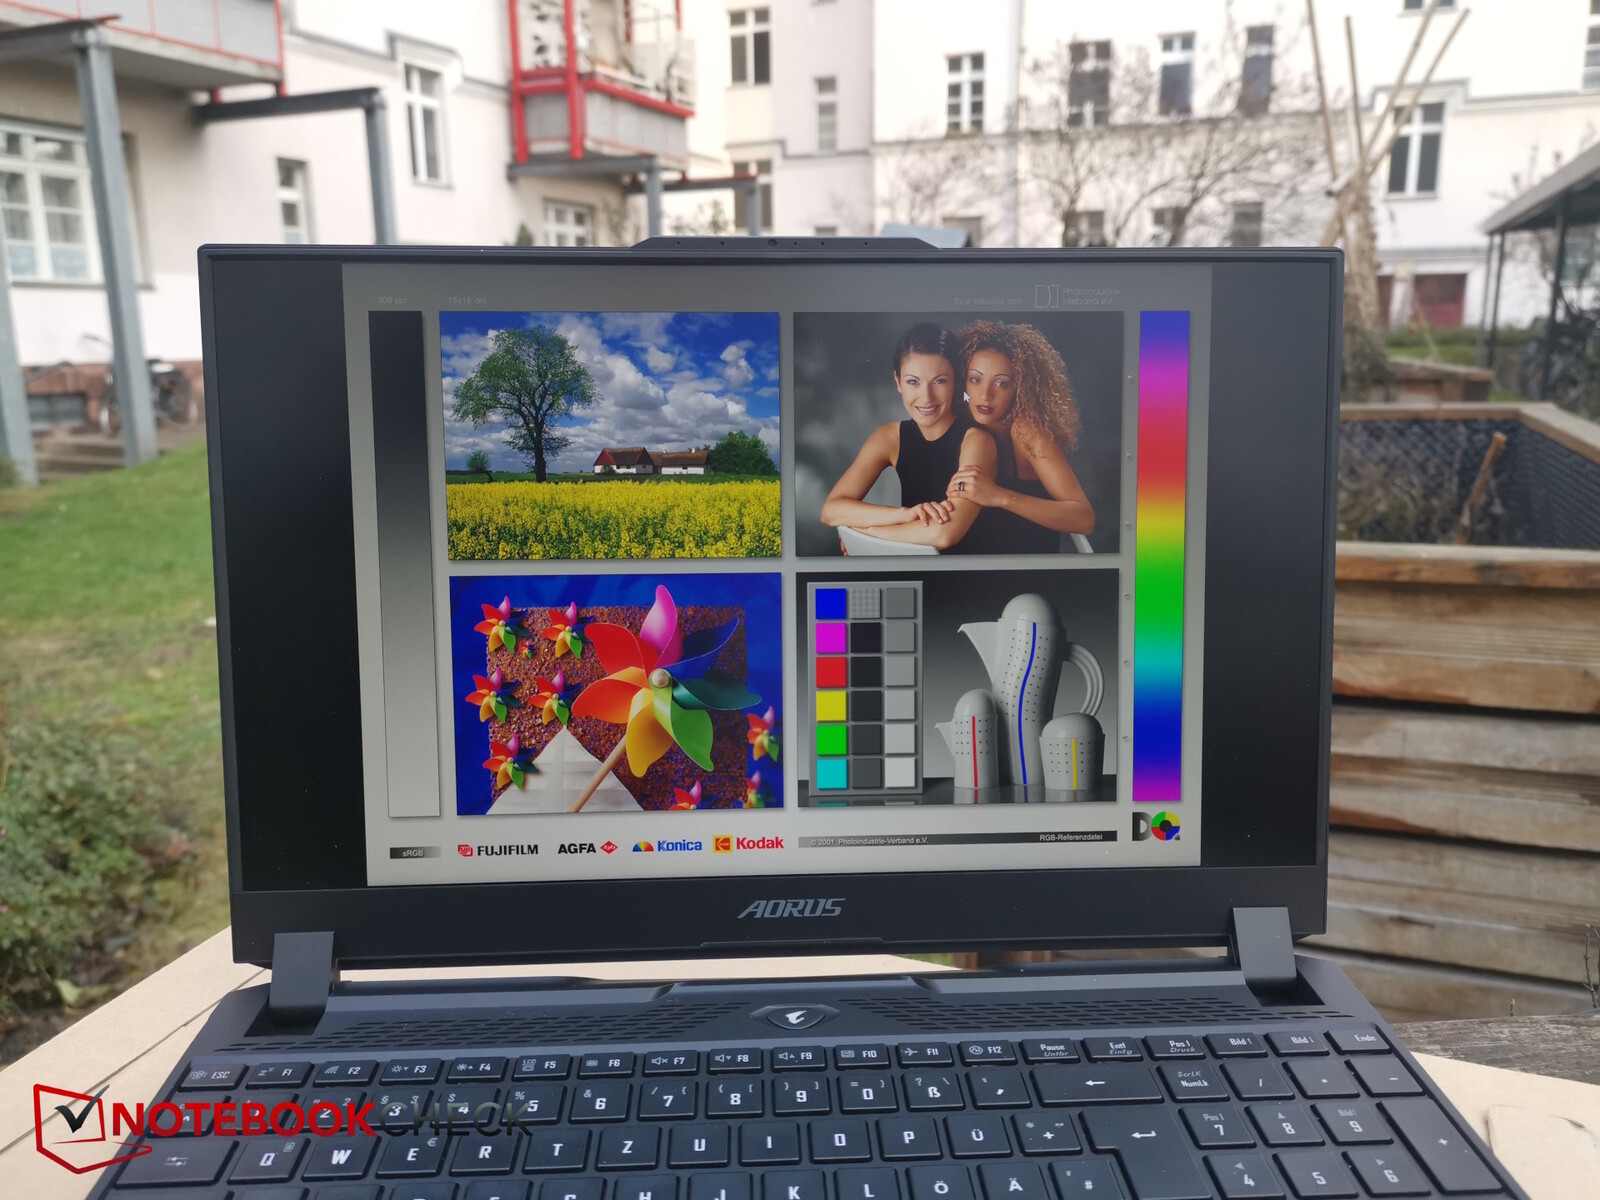
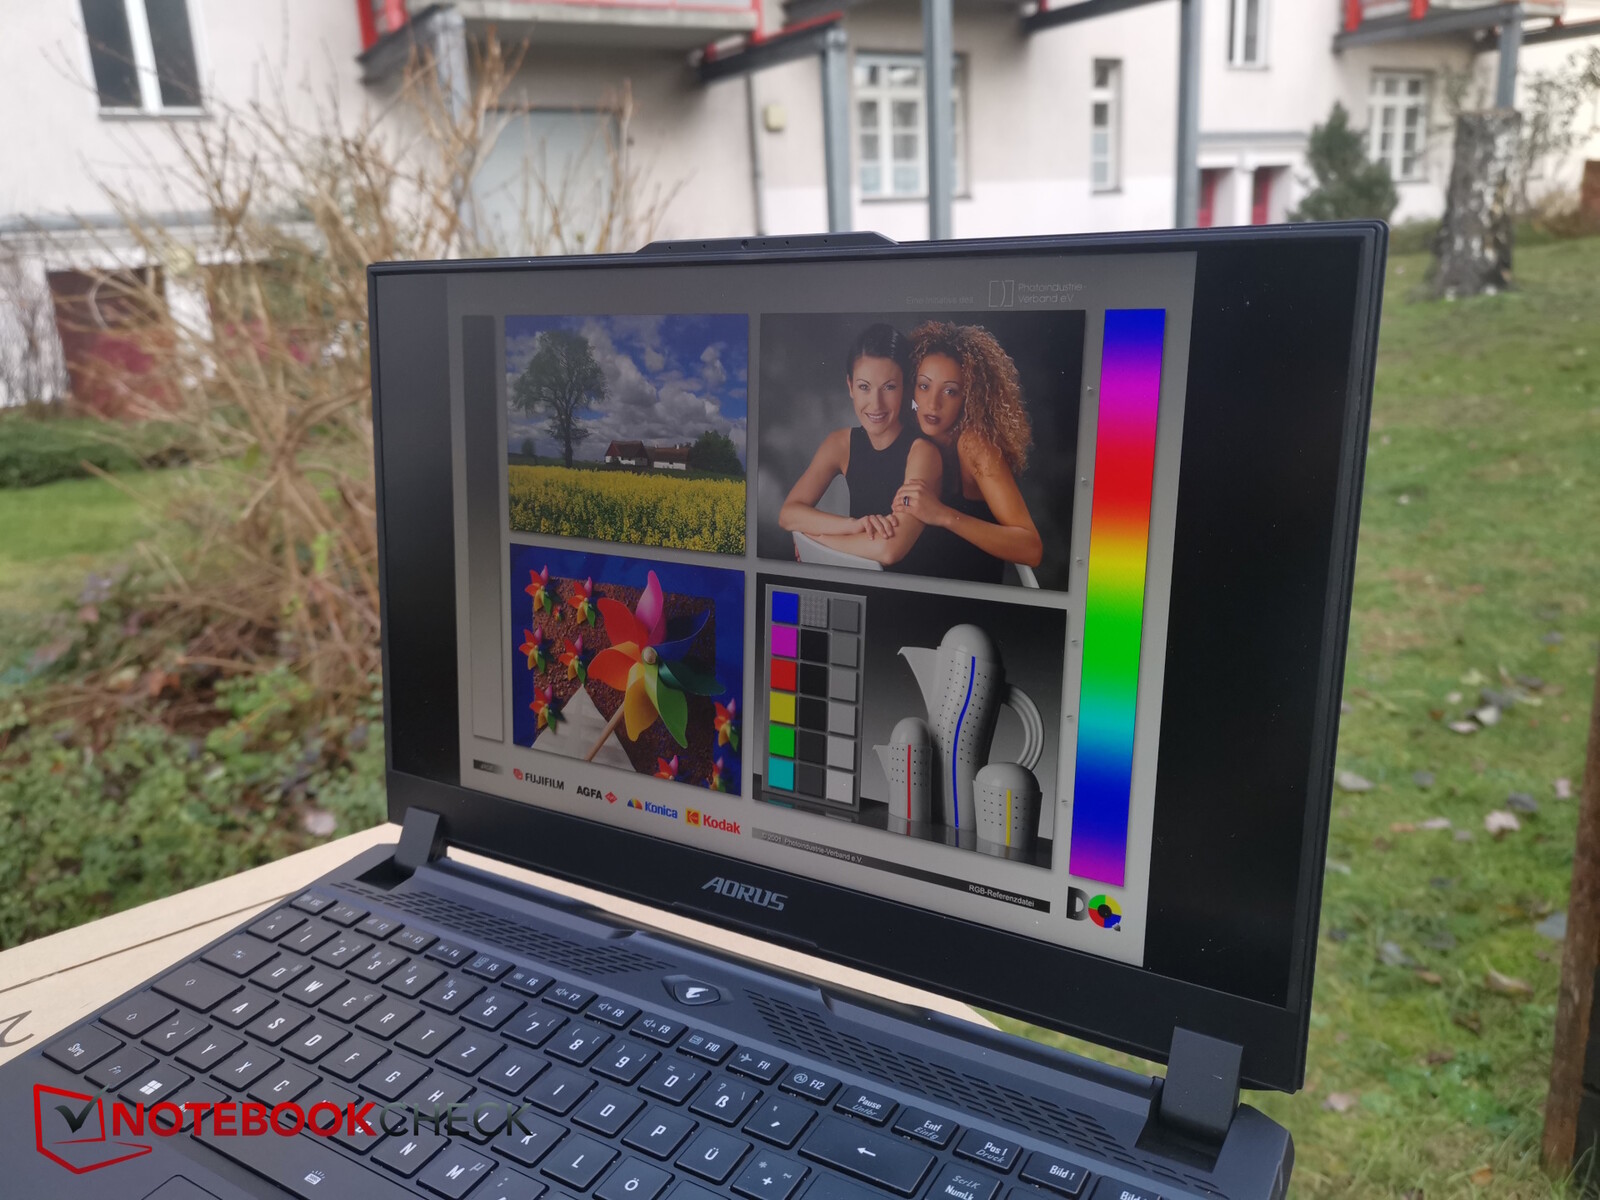
Matowy wyświetlacz WQHD laptopa Aorus jest produkowany przez Chi Mei i był już używany w Asus ROG Zephyrus G15 w 2021 roku. Był to sukces, więc w 2023 roku również nie wydaje się przestarzały. Rozdzielczość 2560 x 1440 pikseli jest równie imponująca, jak częstotliwość odświeżania 165 Hz, stosunkowo krótki czas reakcji i pokrycie przestrzeni kolorów (100% sRGB, 97% Display P3). Z drugiej strony, jasność i kontrast ekranu są przeciętne. Alternatywą jest również model Full HD z częstotliwością odświeżania 360 Hz.
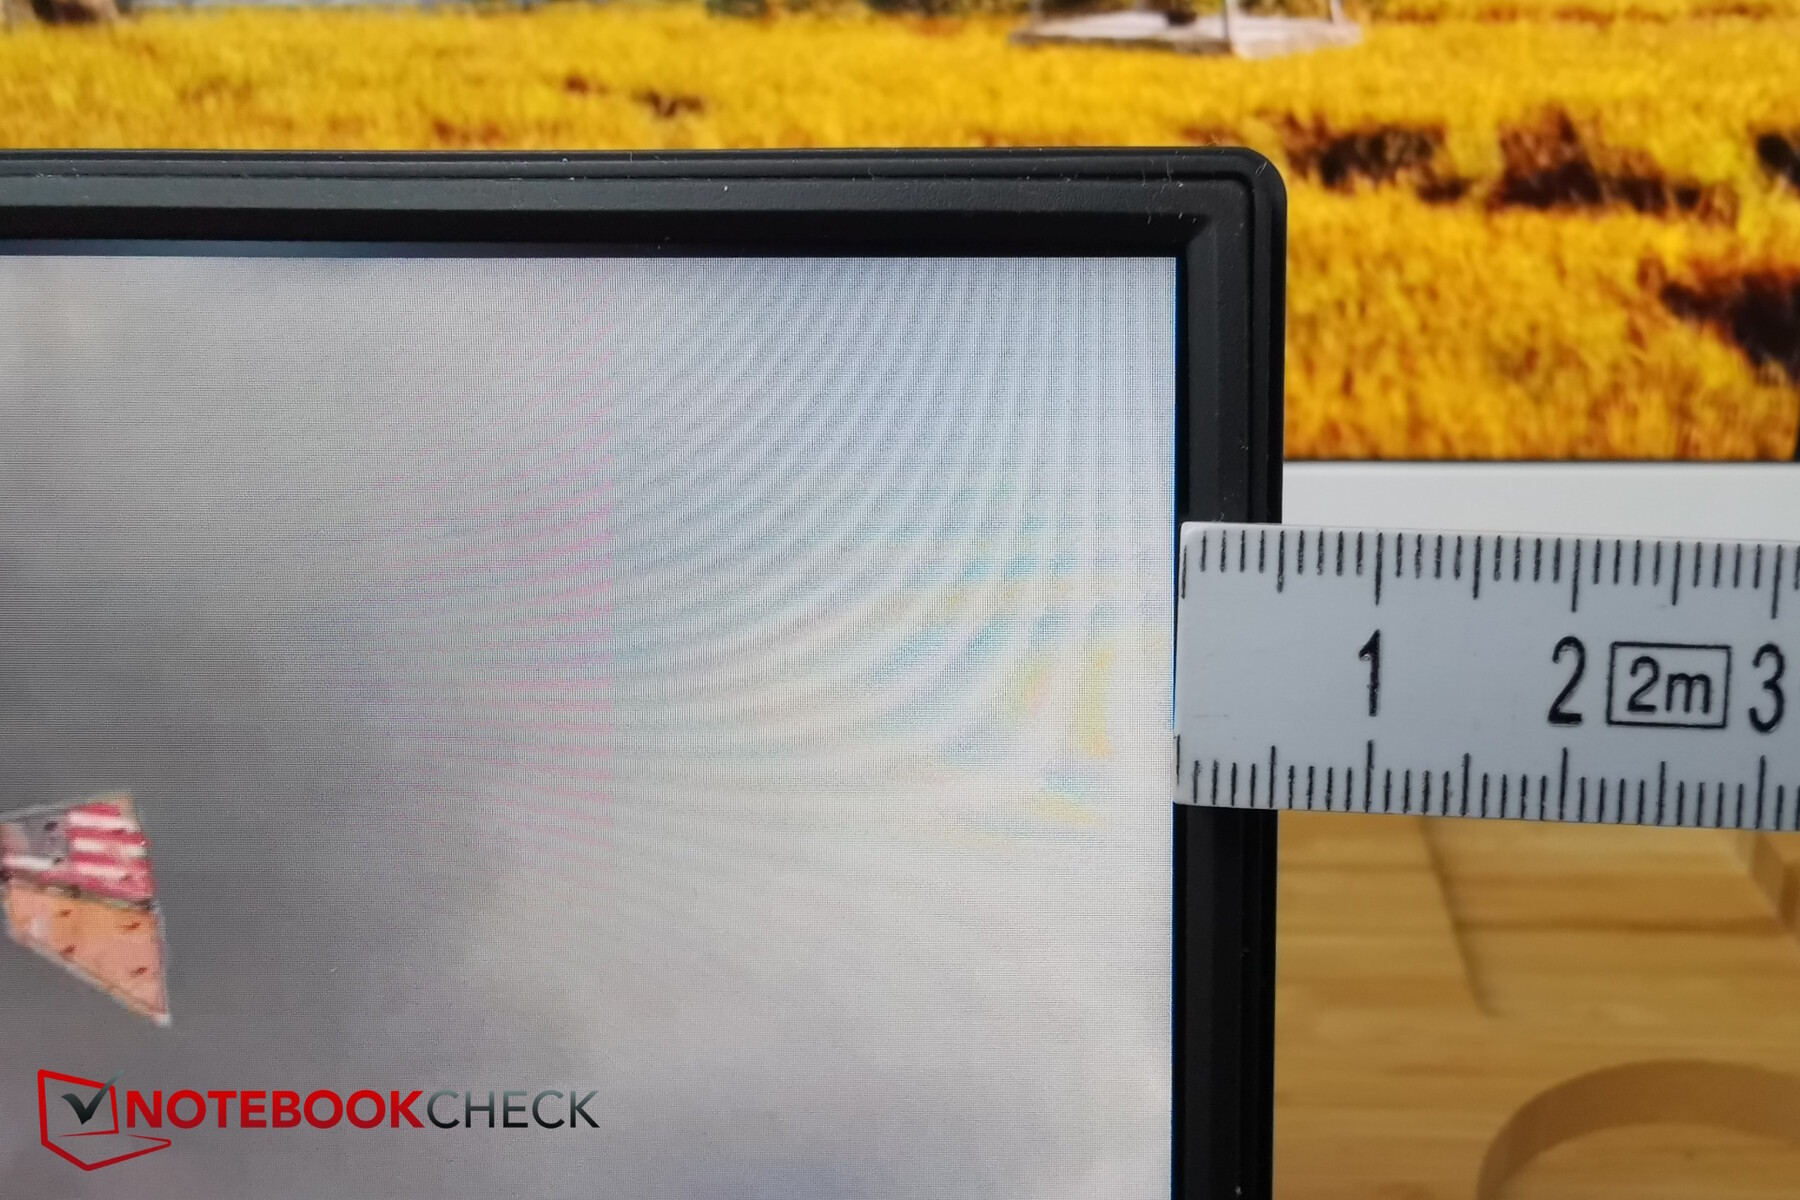
Słabiej wypada bardzo widoczny backlight bleeding w lewym dolnym rogu i wzdłuż prawej górnej krawędzi. PWM nie jest jednak wykorzystywany do regulacji jasności. Czasy reakcji są co najwyżej przeciętne.

| |||||||||||||||||||||||||
rozświetlenie: 81 %
na akumulatorze: 350 cd/m²
kontrast: 939:1 (czerń: 0.38 cd/m²)
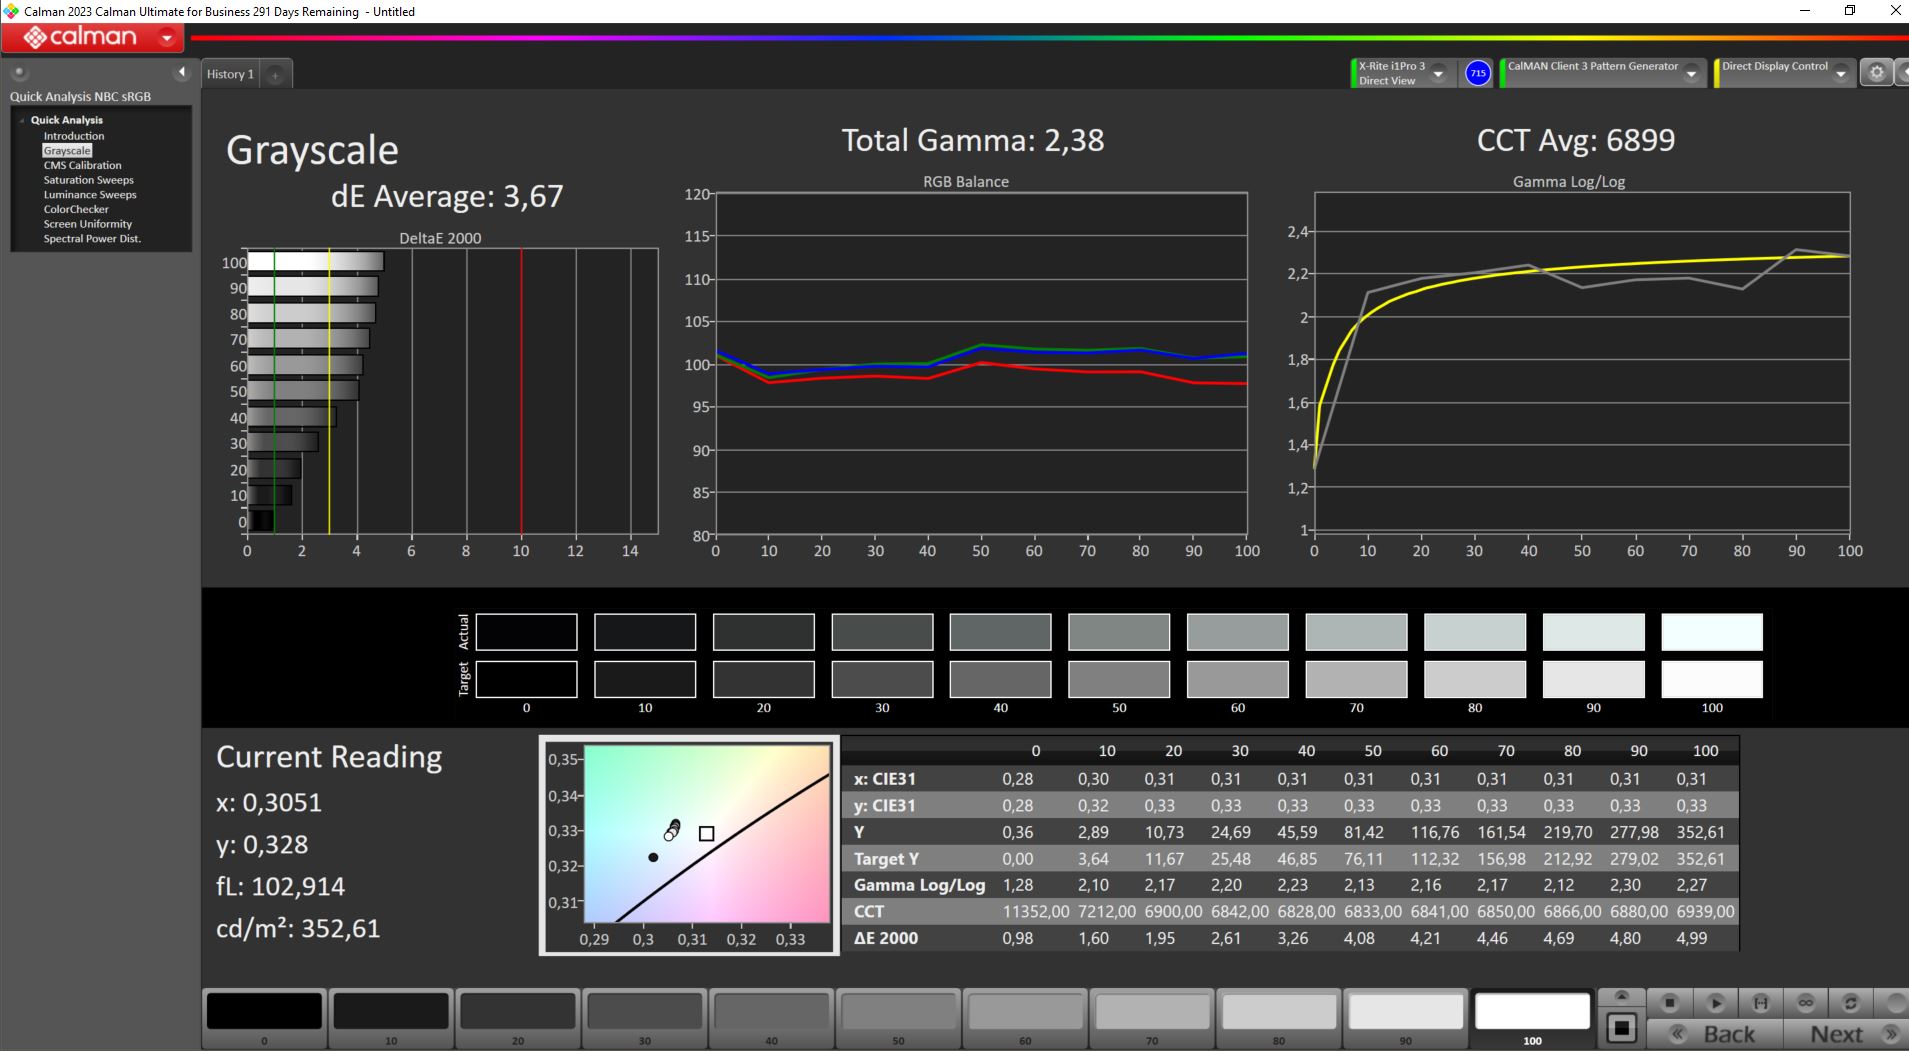
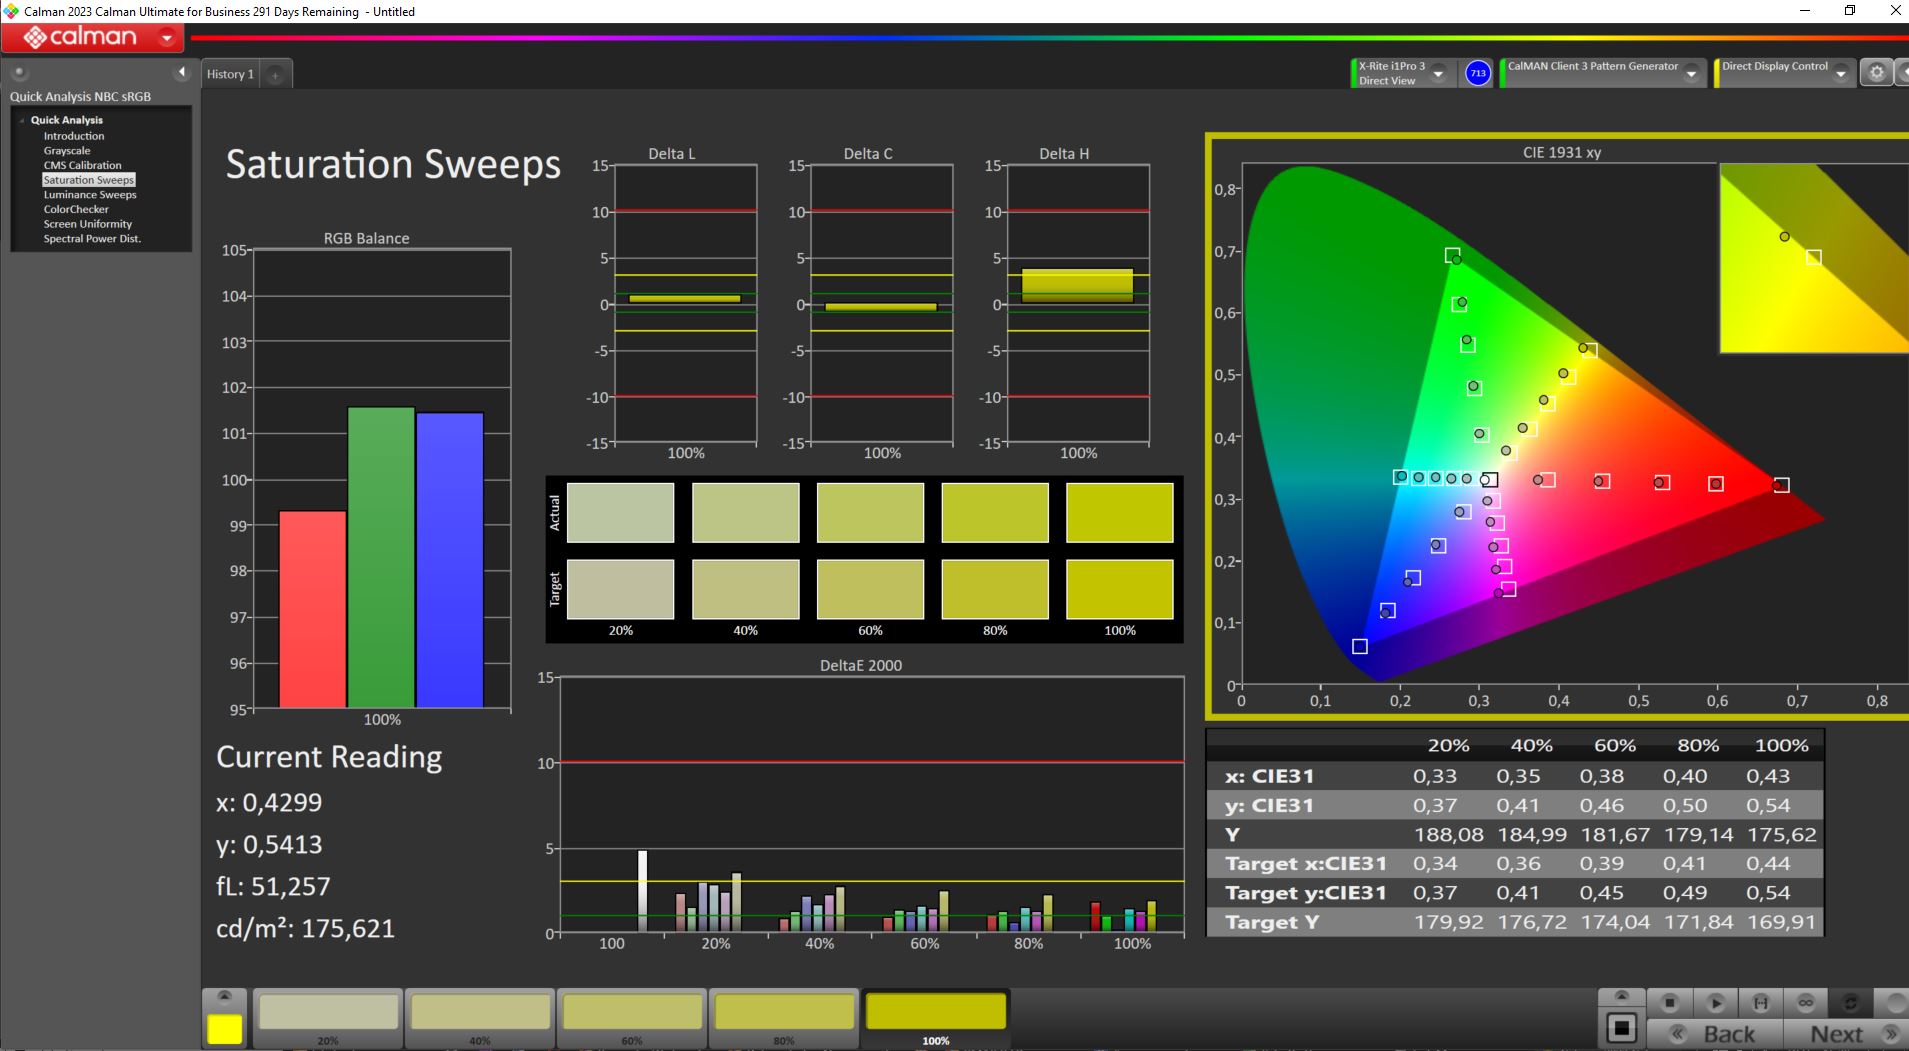
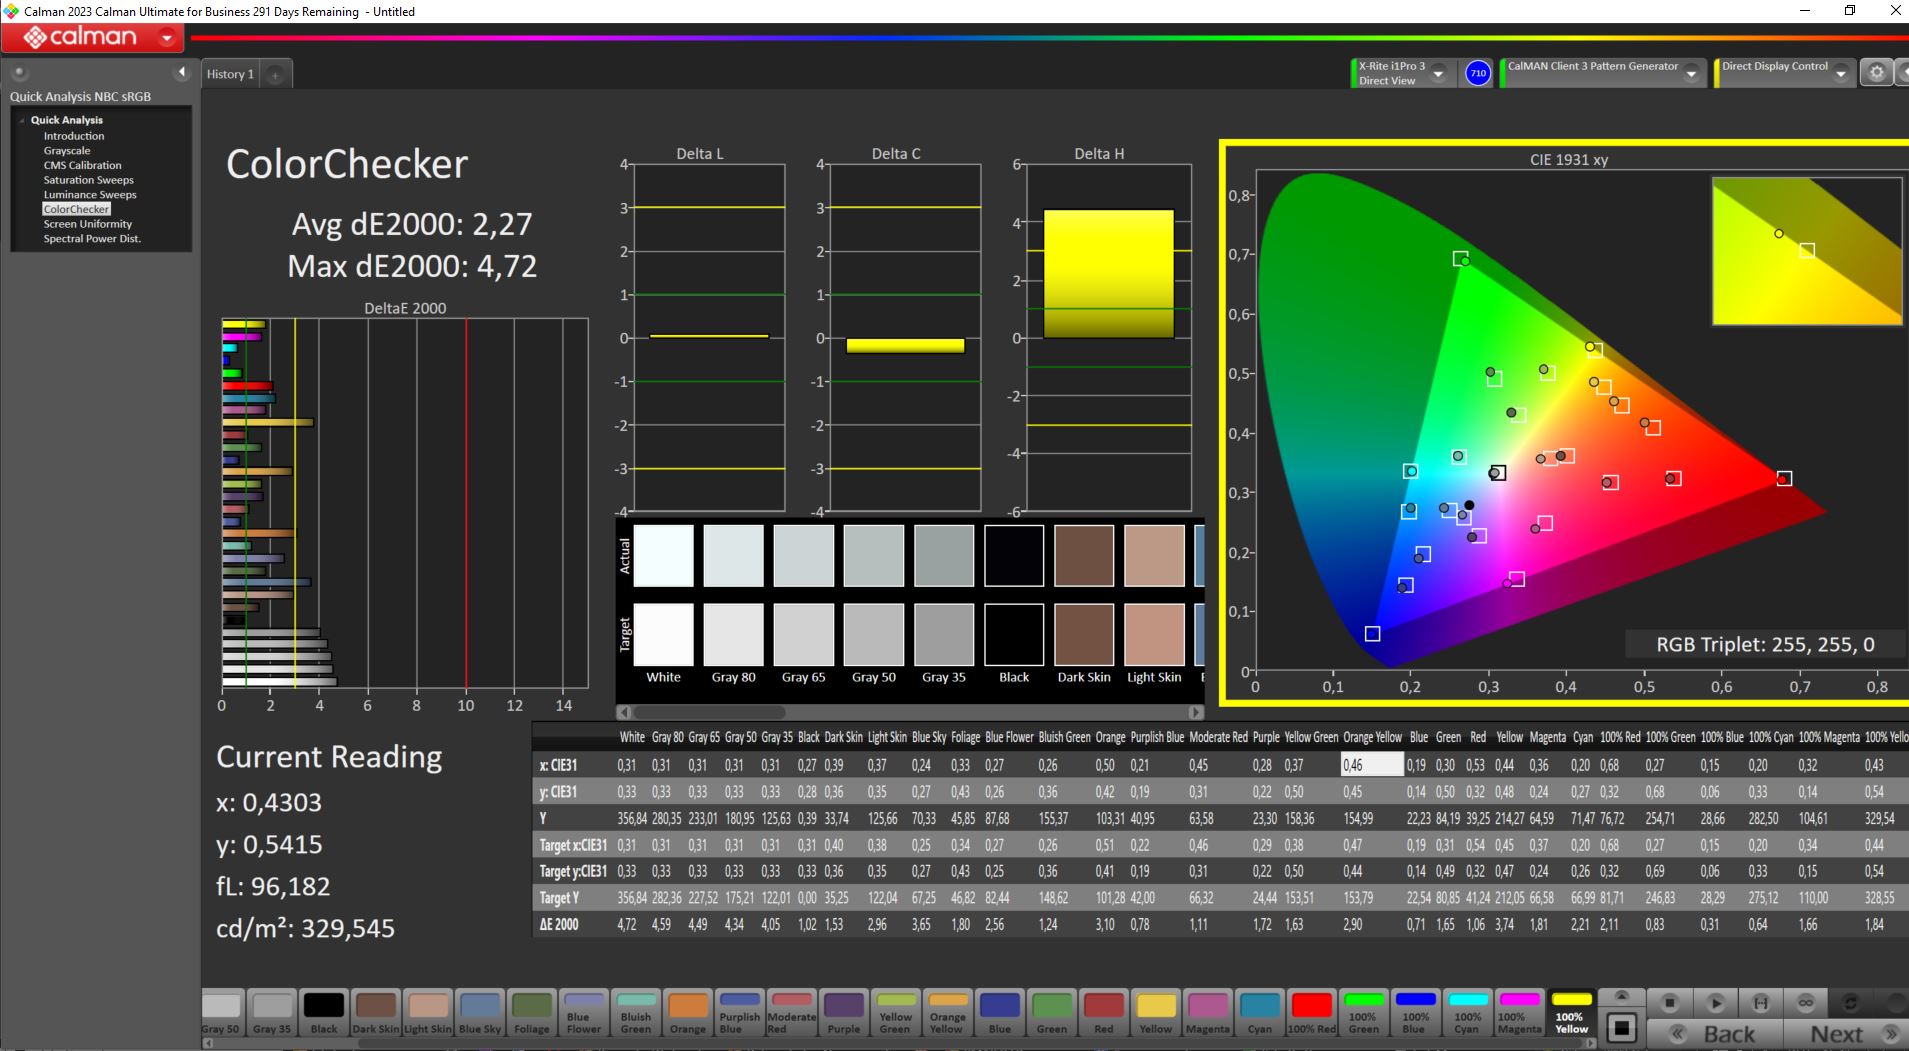
ΔE ColorChecker Calman: 2.27 | ∀{0.5-29.43 Ø4.72}
calibrated: 0.61
ΔE Greyscale Calman: 3.67 | ∀{0.09-98 Ø4.97}
85.9% AdobeRGB 1998 (Argyll 3D)
100% sRGB (Argyll 3D)
97.7% Display P3 (Argyll 3D)
Gamma: 2.38
CCT: 7899 K
| Aorus 15 YE5-54DEB34SH Chi Mei CMN1540 (CMN N156KME-GNA), IPS, 2560x1440, 15.6" | Aorus 15 BSF Sharp LQ156T1JW05, IPS, 2560x1440, 15.6" | Captiva Advanced Gaming I74-121 BOE08B3, IPS, 1920x1080, 15.6" | HP Victus 16-r0077ng CMN162D, IPS, 1920x1080, 16.1" | Dell XPS 15 9530 RTX 4070 Samsung 156XG01, OLED, 3456x2160, 15.6" | HP Omen 16-wf000 BOE0B7D, IPS, 2560x1440, 16.1" | |
|---|---|---|---|---|---|---|
| Display | 0% | -21% | -18% | 6% | -16% | |
| Display P3 Coverage (%) | 97.7 | 98.2 1% | 64 -34% | 66.7 -32% | 99.8 2% | 69 -29% |
| sRGB Coverage (%) | 100 | 99.9 0% | 93.2 -7% | 98 -2% | 100 0% | 99.2 -1% |
| AdobeRGB 1998 Coverage (%) | 85.9 | 85.7 0% | 66 -23% | 69 -20% | 98.4 15% | 71.2 -17% |
| Response Times | 40% | 55% | 30% | 87% | 47% | |
| Response Time Grey 50% / Grey 80% * (ms) | 18.9 ? | 11.3 ? 40% | 5 ? 74% | 13.3 ? 30% | 1.68 ? 91% | 4.6 ? 76% |
| Response Time Black / White * (ms) | 11.7 ? | 7 ? 40% | 7.55 ? 35% | 8.2 ? 30% | 1.94 ? 83% | 9.7 ? 17% |
| PWM Frequency (Hz) | 239 | |||||
| Screen | -34% | -28% | 15% | -36% | 7% | |
| Brightness middle (cd/m²) | 357 | 299 -16% | 346 -3% | 308 -14% | 389.5 9% | 310.9 -13% |
| Brightness (cd/m²) | 322 | 282 -12% | 324 1% | 285 -11% | 392 22% | 296 -8% |
| Brightness Distribution (%) | 81 | 82 1% | 90 11% | 85 5% | 98 21% | 91 12% |
| Black Level * (cd/m²) | 0.38 | 0.31 18% | 0.35 8% | 0.25 34% | 0.35 8% | |
| Contrast (:1) | 939 | 965 3% | 989 5% | 1232 31% | 888 -5% | |
| Colorchecker dE 2000 * | 2.27 | 2.24 1% | 4.12 -81% | 1.3 43% | 4.95 -118% | 2.18 4% |
| Colorchecker dE 2000 max. * | 4.72 | 4.29 9% | 7.78 -65% | 2.76 42% | 8.65 -83% | 3.58 24% |
| Colorchecker dE 2000 calibrated * | 0.61 | 2.62 -330% | 1.22 -100% | 0.92 -51% | 1.53 -151% | 0.52 15% |
| Greyscale dE 2000 * | 3.67 | 3 18% | 4.81 -31% | 1.7 54% | 2 46% | 2.8 24% |
| Gamma | 2.38 92% | 2.086 105% | 2.31 95% | 2.167 102% | 2.27 97% | 2.18 101% |
| CCT | 7899 82% | 6289 103% | 7633 85% | 6767 96% | 6265 104% | 6002 108% |
| Całkowita średnia (program / ustawienia) | 2% /
-16% | 2% /
-15% | 9% /
10% | 19% /
-5% | 13% /
8% |
* ... im mniej tym lepiej
Ex works, wyświetlacz nie jest optymalnie skalibrowany, ale nasza kalibracja przy użyciu urządzenia pomiarowego X-Rite Fab i oprogramowania Calman zmniejsza wartość DeltaE (znaczącą dla odchyleń (kolorów)) do znacznie poniżej 1 - zarówno dla skali szarości, jak i kolorów. W połączeniu z dobrym pokryciem przestrzeni barw (patrz ostatni rząd zdjęć poniżej), monitor nadaje się również do półprofesjonalnej edycji obrazów i wideo.

Wyświetl czasy reakcji
| ↔ Czas reakcji od czerni do bieli | ||
|---|---|---|
| 11.7 ms ... wzrost ↗ i spadek ↘ łącznie | ↗ 7.2 ms wzrost | 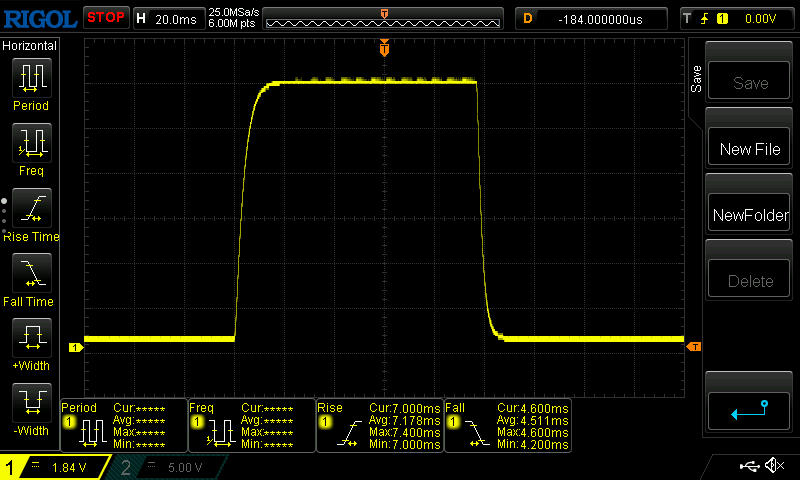 |
| ↘ 4.5 ms upadek | ||
| W naszych testach ekran wykazuje dobry współczynnik reakcji, ale może być zbyt wolny dla graczy rywalizujących ze sobą. Dla porównania, wszystkie testowane urządzenia wahają się od 0.1 (minimum) do 240 (maksimum) ms. » 31 % wszystkich urządzeń jest lepszych. Oznacza to, że zmierzony czas reakcji jest lepszy od średniej wszystkich testowanych urządzeń (19.8 ms). | ||
| ↔ Czas reakcji 50% szarości do 80% szarości | ||
| 18.9 ms ... wzrost ↗ i spadek ↘ łącznie | ↗ 9.4 ms wzrost | 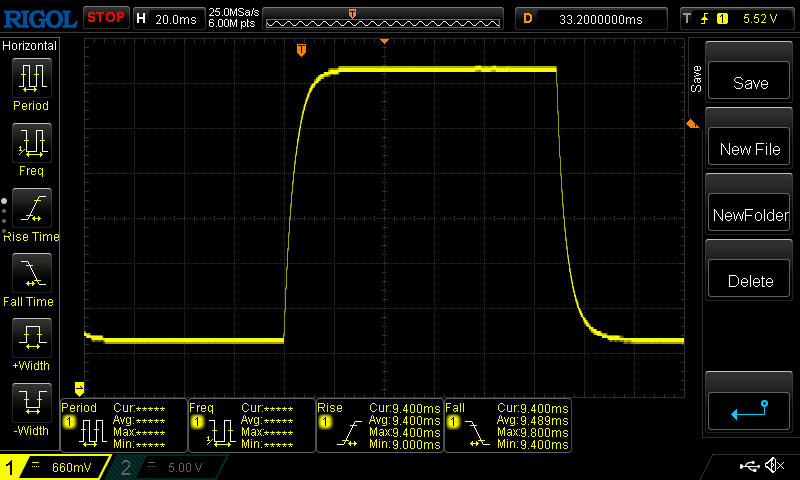 |
| ↘ 9.5 ms upadek | ||
| W naszych testach ekran wykazuje dobry współczynnik reakcji, ale może być zbyt wolny dla graczy rywalizujących ze sobą. Dla porównania, wszystkie testowane urządzenia wahają się od 0.165 (minimum) do 636 (maksimum) ms. » 32 % wszystkich urządzeń jest lepszych. Oznacza to, że zmierzony czas reakcji jest lepszy od średniej wszystkich testowanych urządzeń (31 ms). | ||
Migotanie ekranu / PWM (modulacja szerokości impulsu)
| Migotanie ekranu/nie wykryto PWM | 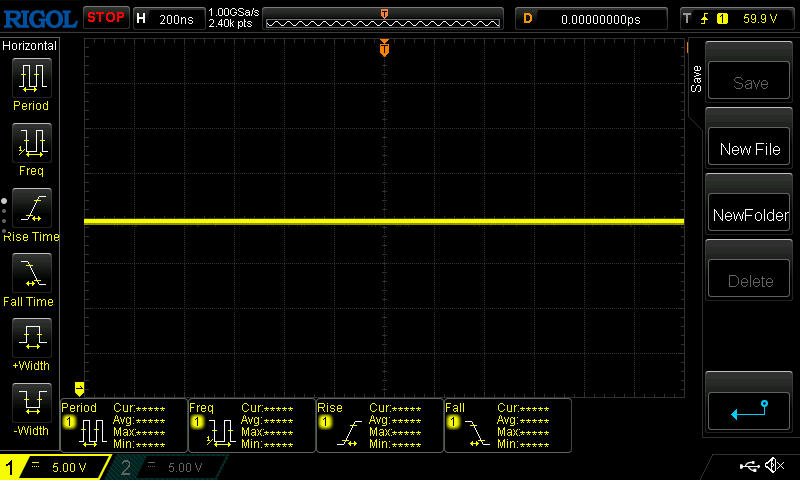 | ||
Dla porównania: 52 % wszystkich testowanych urządzeń nie używa PWM do przyciemniania wyświetlacza. Jeśli wykryto PWM, zmierzono średnio 7763 (minimum: 5 - maksimum: 343500) Hz. | |||
Dzięki akceptowalnej jasności ponad 300 nitów i matowej powierzchni, zawartość ekranu laptopa jest nadal dobrze widoczna w zacienionym otoczeniu.

Wydajność - poprzednia generacja wciąż daje radę
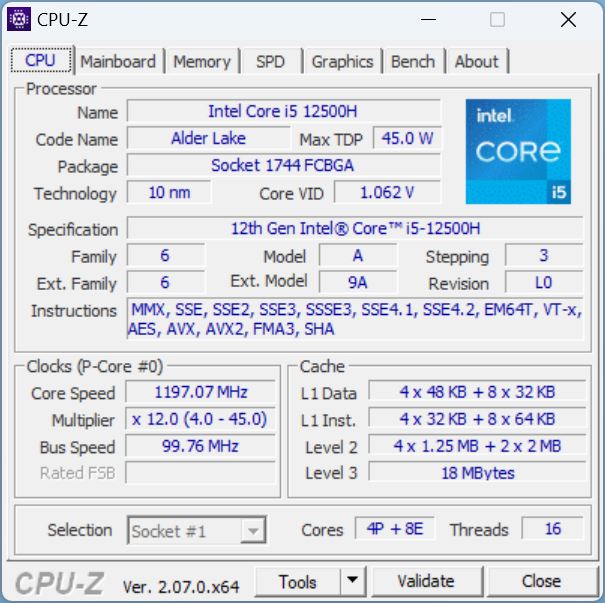
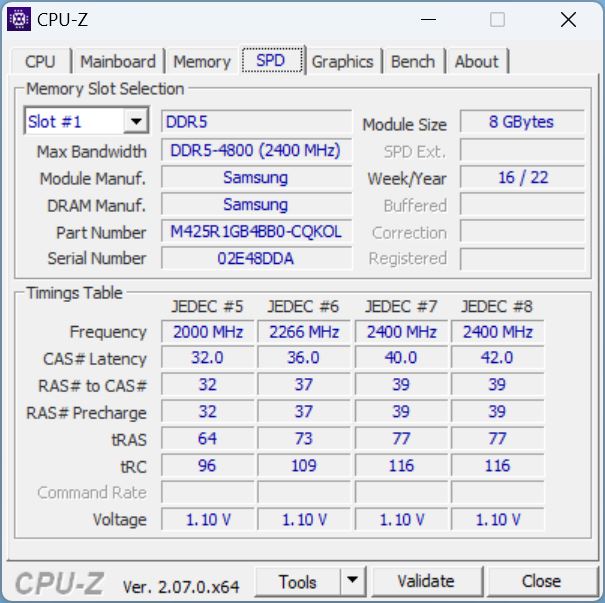
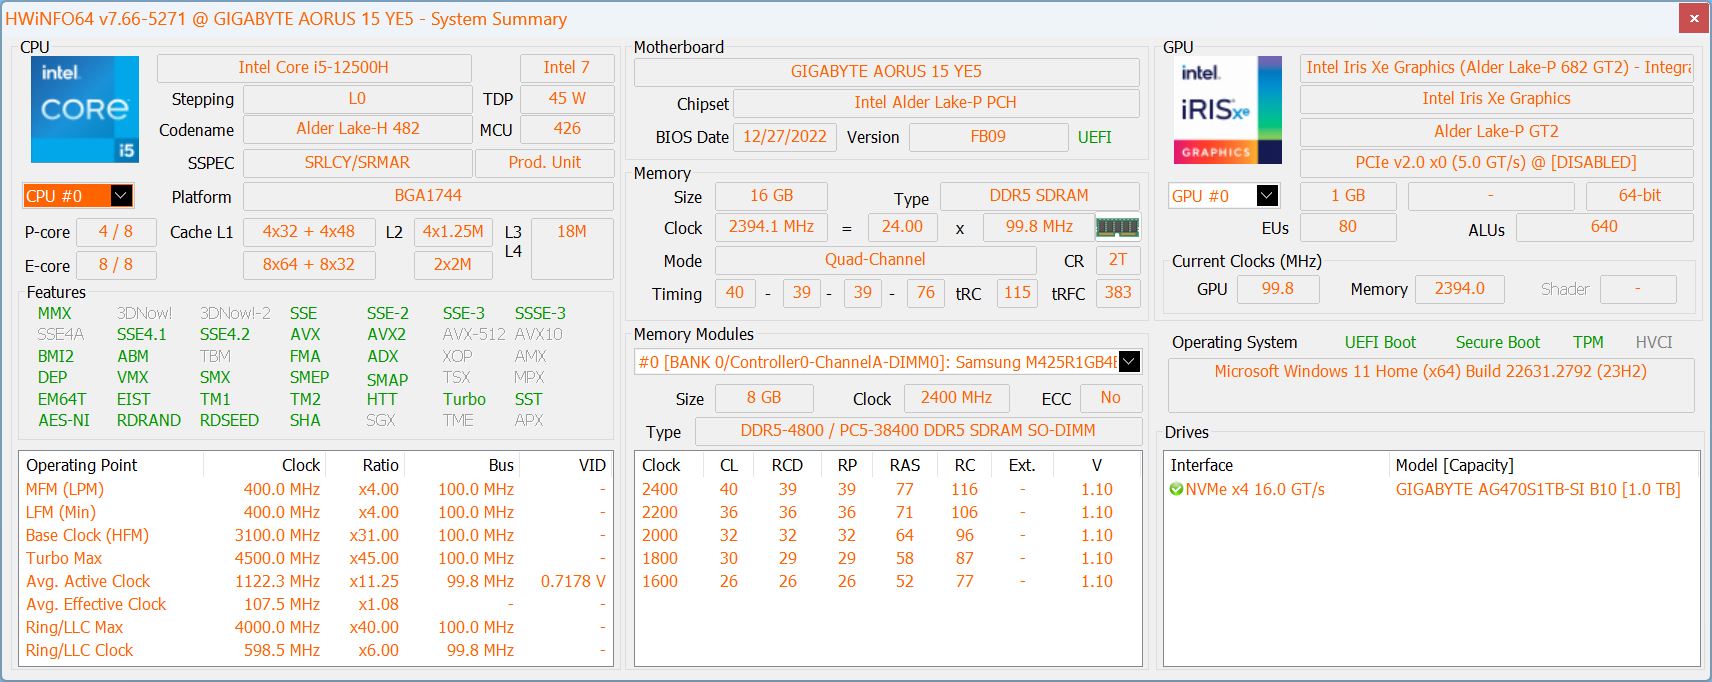
Procesor i karta graficzna ostatniej generacji zasilają system. Starszy Core i5-12500H ma dostęp do 16 GB nowoczesnej pamięci RAM DDR5 4800 i dysku SSD NVMe o pojemności 1 TB od Gigabyte. Wraz z kartą graficzną RTX 3080 Tiaorus 15 YE5 zdecydowanie można zaklasyfikować jako high-endowego gracza - pomimo procesora ostatniej generacji i średniej klasy.
Warunki testowania
Ex działa, laptop nie był dostarczany z preinstalowanym Control Center - powinien lub może być pobrany ze strony Gigabyte support website w razie potrzeby.
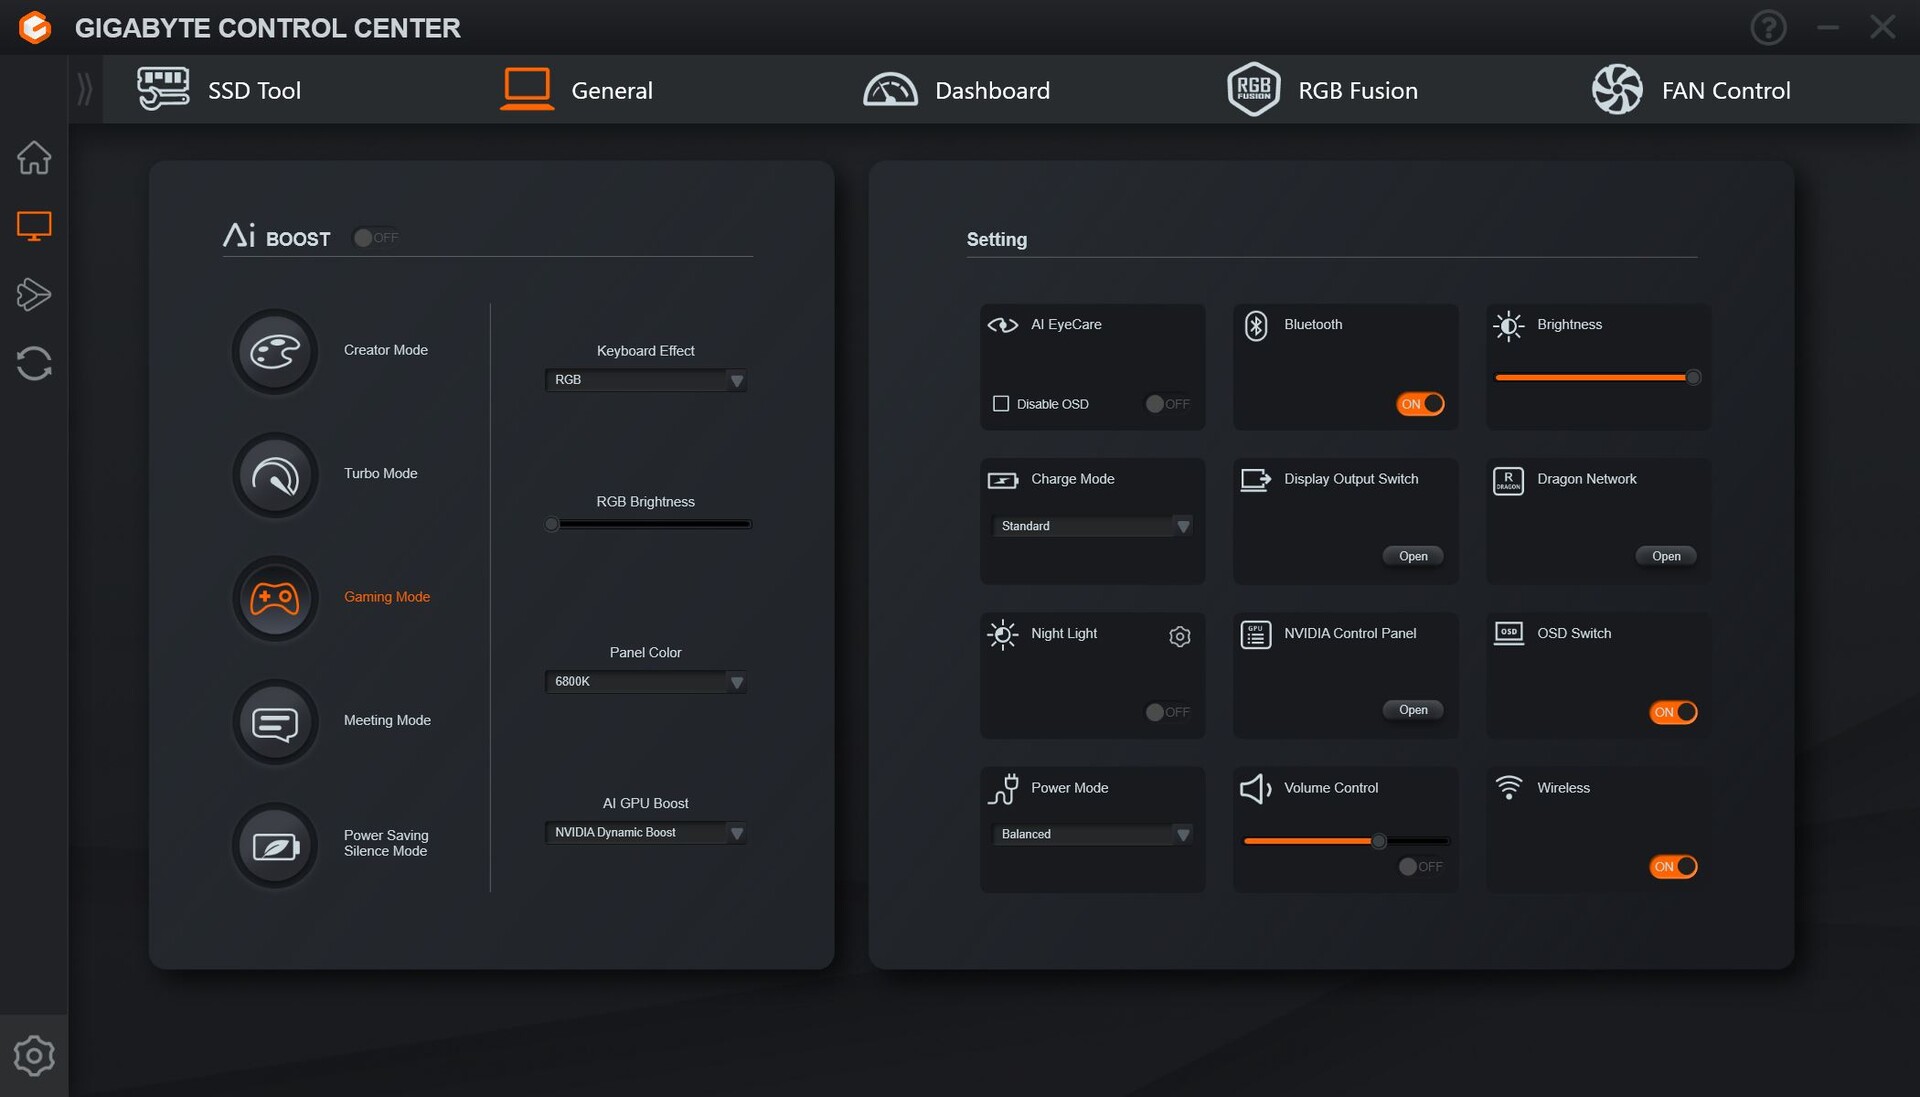
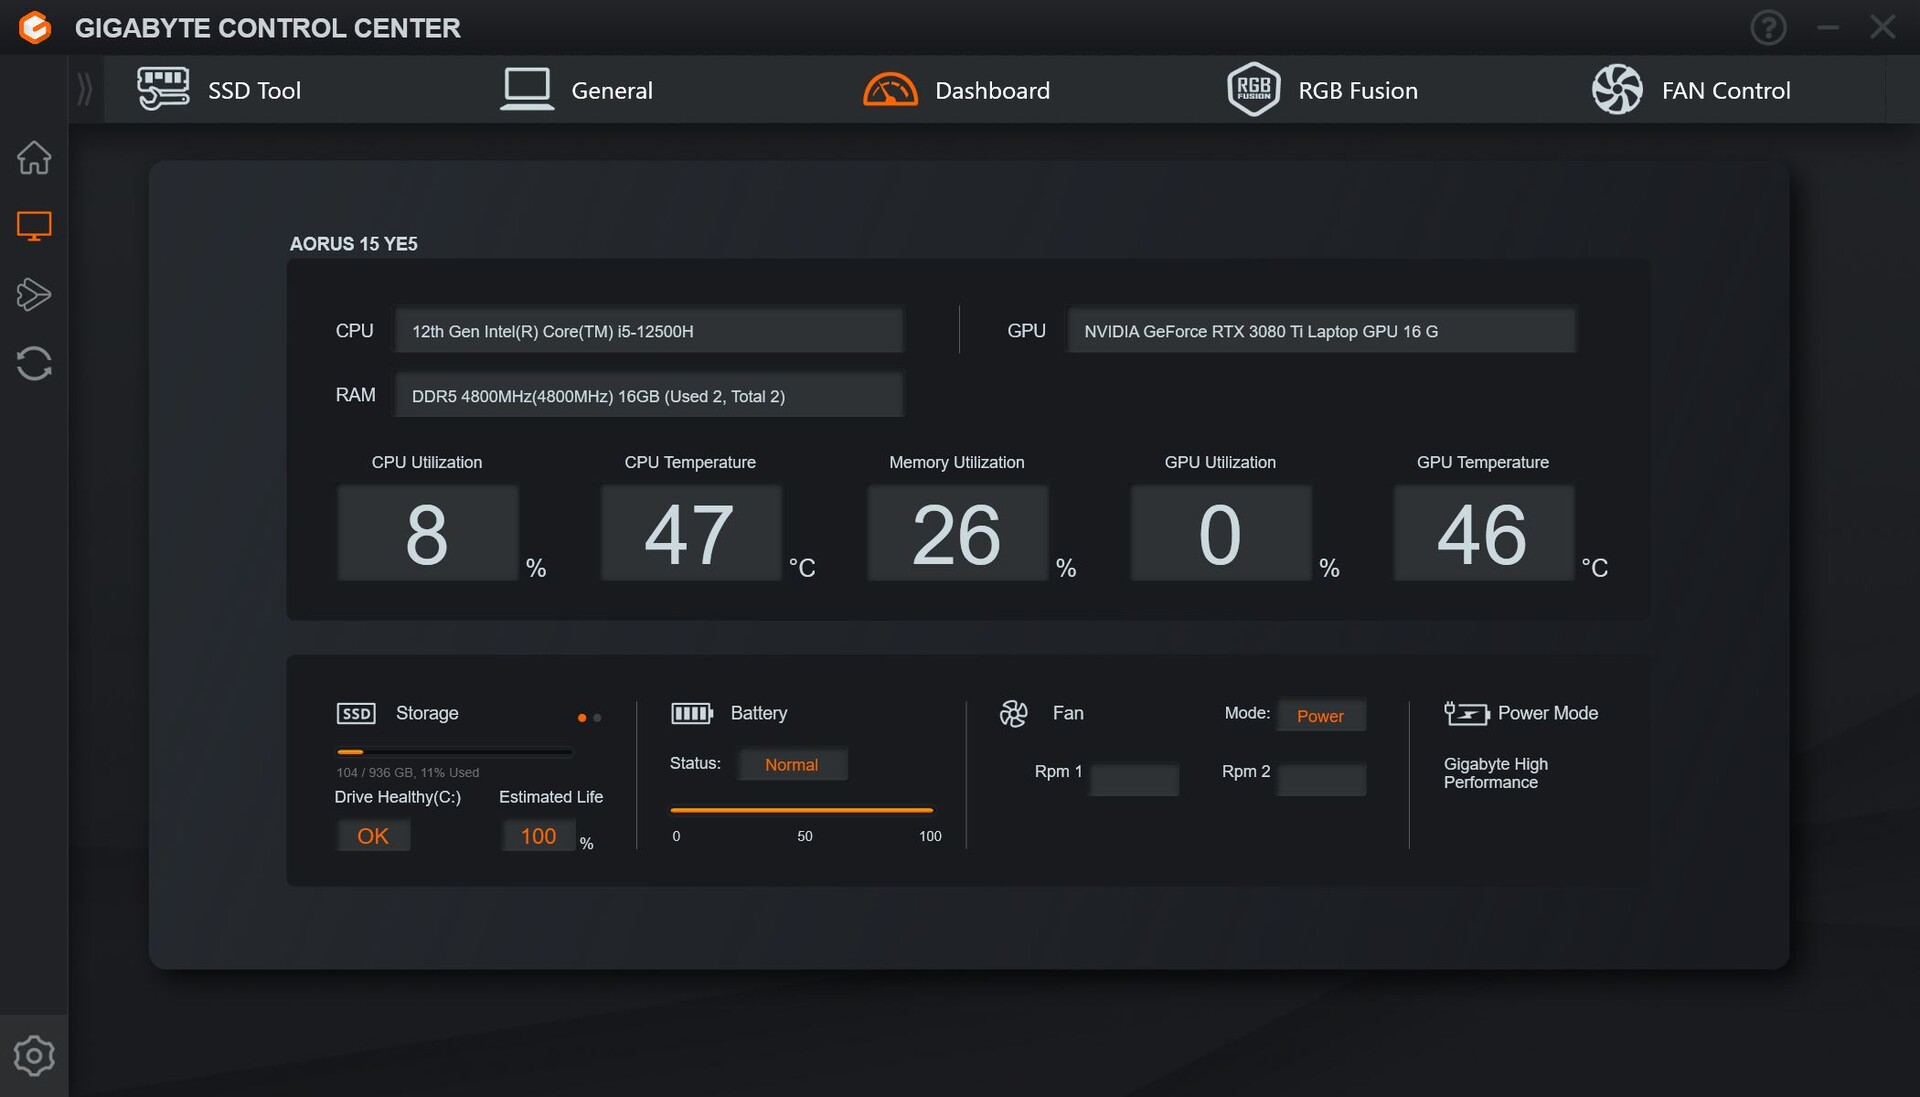
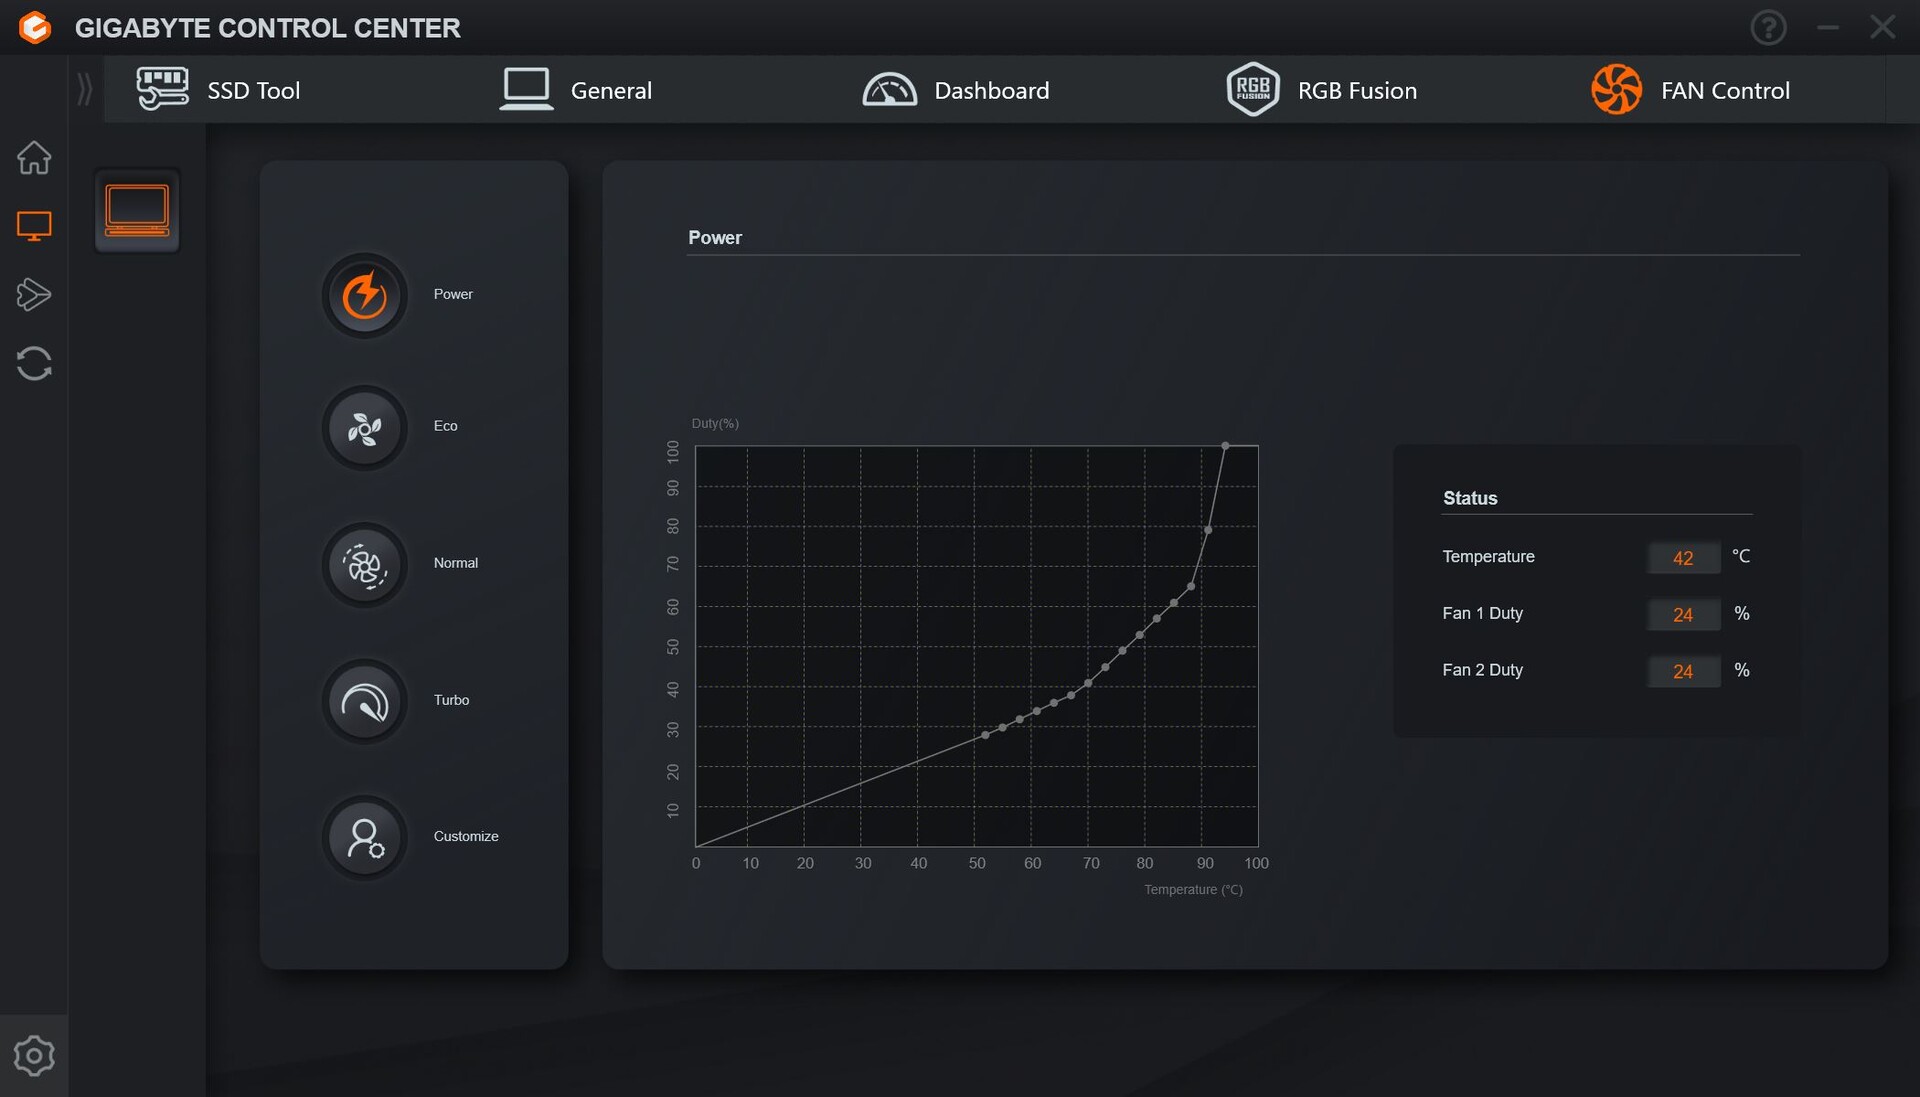
Centrum sterowania Gigabyte zawiera wiele ważnych ustawień, które kontrolują wydajność, podświetlenie klawiatury i dysk SSD. Menu mogłoby być nieco lepiej zorganizowane, ponieważ ekran główny nie wydaje się wyświetlać żadnych przydatnych informacji - najpierw należy wybrać sam laptop lub dysk SSD, aby uzyskać więcej informacji. To samo można jednak zrobić w odpowiednich menu, dlatego szczególnie ekran główny wydaje się bezsensowny. Brakowało nam również opcji przełączania GPU.
Poza tym dostępne są tryby wydajności, a także krzywe wentylatorów, oddzielnie regulowany tryb wydajności i różne inne opcje. W naszych testach porównawczych korzystaliśmy z trybu gamingowego. Podczas korzystania z jeszcze bardziej wydajnego trybu turbo, wentylatory zawsze pracują z pełną prędkością.
Kilka słów o trybie czuwania: W przypadku Aorus (w tym Aorus 15G), wydaje się, że laptop często przełącza się w tryb gotowości, gdy tylko pokrywa laptopa zostanie lekko zamknięta. Jest to niezwykle irytujące, na przykład w przypadku korzystania z zewnętrznego monitora i chęci lekkiego odchylenia pokrywy laptopa do przodu. System wyłącza się jednak przy około 40 do 45 stopniach, co jest naprawdę o wiele za wcześnie i działa na nerwy. Laptop powinien wyłączać się tylko wtedy, gdy jest rzeczywiście zamknięty, a nie w połowie drogi.
Procesor
Laptop jest wyposażony w procesor Alder Lake - model Core i5-12500H - z 4 rdzeniami P i 8 rdzeniami E. Łącznie daje to 8 rdzeni i 16 wątków. Stary procesor z wyższej średniej półki pozwolił producentowi zaoszczędzić pieniądze.
Podczas Cinebench R15 Loop jego wydajność nieco spadła w ciągu pierwszych dwóch przebiegów, a następnie pozostała stabilna.
Podczas wszystkich testów procesora stało się jasne, że Gen 13 oferuje znaczną (ale nie ogromną) przewagę szybkości nad Gen 12.
Procesor Captiva z procesorem i5-13500H uzyskała około 13 procent przewagi. Pozostali konkurenci z lepszym i7-13700H byli lepsi o 8 procent (HP Victus) do zauważalnie 22 procent lepszych (Aorus 15 BSF).
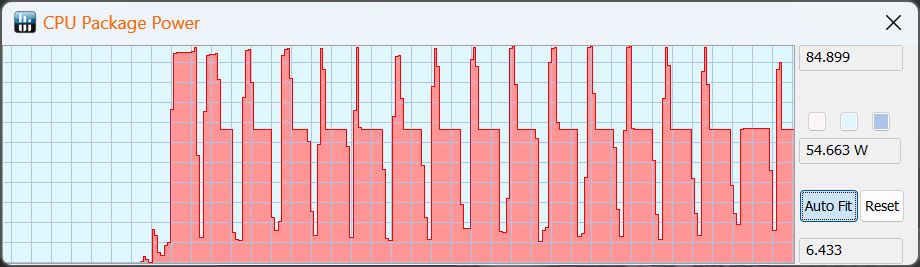
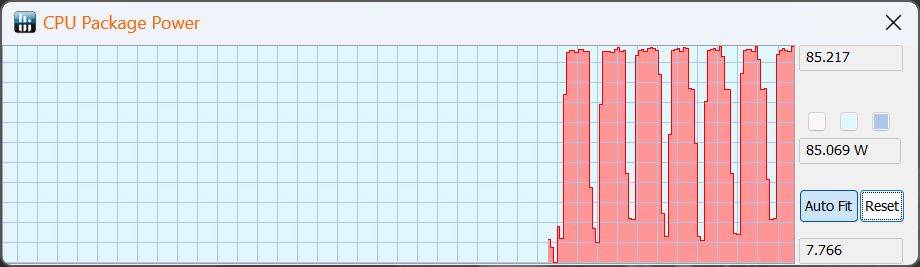
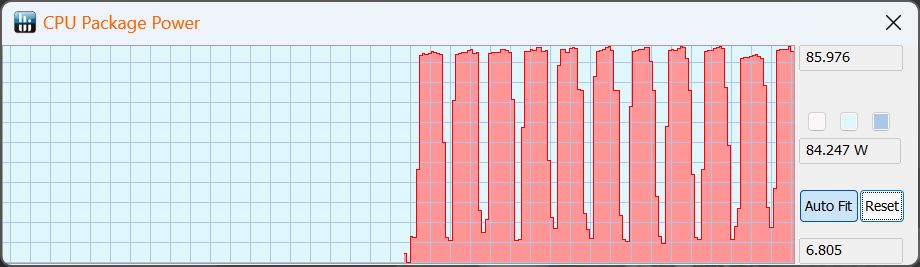
| Cinebench R15 | Wynik wielowątkowy (1. uruchomienie) | Pobór mocy procesora w watach |
|---|---|---|
| AI Boost | 2,277 | 85 |
| Turbo | 2,283 | 85 |
| Gaming | 2,283 | 85, spada do 55 |
| Creator | 2,239 | 85 |
| Spotkanie | 836 | 30, szybko spada do 15 |
| Oszczędzanie energii | 724 | 30, spada do 15 |
| Bateria | 1,670 | 45 |
Cinebench R15 Multi continuous test
Cinebench R23: Multi Core | Single Core
Cinebench R20: CPU (Multi Core) | CPU (Single Core)
Cinebench R15: CPU Multi 64Bit | CPU Single 64Bit
Blender: v2.79 BMW27 CPU
7-Zip 18.03: 7z b 4 | 7z b 4 -mmt1
Geekbench 5.5: Multi-Core | Single-Core
HWBOT x265 Benchmark v2.2: 4k Preset
LibreOffice : 20 Documents To PDF
R Benchmark 2.5: Overall mean
| CPU Performance rating | |
| Średnia w klasie Gaming | |
| HP Omen 16-wf000 -1! | |
| Aorus 15 BSF | |
| Dell XPS 15 9530 RTX 4070 | |
| Captiva Advanced Gaming I74-121 | |
| HP Victus 16-r0077ng | |
| Aorus 15 YE5-54DEB34SH | |
| Przeciętny Intel Core i5-12500H | |
| Cinebench R23 / Multi Core | |
| Średnia w klasie Gaming (10488 - 40970, n=109, ostatnie 2 lata) | |
| HP Omen 16-wf000 | |
| Aorus 15 BSF | |
| Captiva Advanced Gaming I74-121 | |
| Dell XPS 15 9530 RTX 4070 | |
| HP Victus 16-r0077ng | |
| Aorus 15 YE5-54DEB34SH | |
| Przeciętny Intel Core i5-12500H (11330 - 14686, n=9) | |
| Cinebench R23 / Single Core | |
| Średnia w klasie Gaming (1166 - 2356, n=109, ostatnie 2 lata) | |
| Aorus 15 BSF | |
| HP Omen 16-wf000 | |
| Dell XPS 15 9530 RTX 4070 | |
| Captiva Advanced Gaming I74-121 | |
| Aorus 15 YE5-54DEB34SH | |
| HP Victus 16-r0077ng | |
| Przeciętny Intel Core i5-12500H (1558 - 1701, n=9) | |
| Cinebench R20 / CPU (Multi Core) | |
| Średnia w klasie Gaming (4029 - 16108, n=108, ostatnie 2 lata) | |
| HP Omen 16-wf000 | |
| Aorus 15 BSF | |
| Captiva Advanced Gaming I74-121 | |
| Dell XPS 15 9530 RTX 4070 | |
| HP Victus 16-r0077ng | |
| Przeciętny Intel Core i5-12500H (4687 - 5640, n=9) | |
| Aorus 15 YE5-54DEB34SH | |
| Cinebench R20 / CPU (Single Core) | |
| Średnia w klasie Gaming (442 - 895, n=108, ostatnie 2 lata) | |
| Aorus 15 BSF | |
| HP Omen 16-wf000 | |
| Dell XPS 15 9530 RTX 4070 | |
| Captiva Advanced Gaming I74-121 | |
| Aorus 15 YE5-54DEB34SH | |
| HP Victus 16-r0077ng | |
| Przeciętny Intel Core i5-12500H (602 - 656, n=9) | |
| Cinebench R15 / CPU Multi 64Bit | |
| Średnia w klasie Gaming (1578 - 6271, n=107, ostatnie 2 lata) | |
| HP Omen 16-wf000 | |
| Aorus 15 BSF | |
| Dell XPS 15 9530 RTX 4070 | |
| Captiva Advanced Gaming I74-121 | |
| HP Victus 16-r0077ng | |
| Aorus 15 YE5-54DEB34SH | |
| Przeciętny Intel Core i5-12500H (1970 - 2283, n=10) | |
| Cinebench R15 / CPU Single 64Bit | |
| Średnia w klasie Gaming (188.8 - 343, n=108, ostatnie 2 lata) | |
| Aorus 15 BSF | |
| Dell XPS 15 9530 RTX 4070 | |
| HP Omen 16-wf000 | |
| Captiva Advanced Gaming I74-121 | |
| Aorus 15 YE5-54DEB34SH | |
| HP Victus 16-r0077ng | |
| Przeciętny Intel Core i5-12500H (220 - 250, n=9) | |
| Blender / v2.79 BMW27 CPU | |
| Aorus 15 YE5-54DEB34SH | |
| Przeciętny Intel Core i5-12500H (223 - 288, n=9) | |
| Aorus 15 BSF | |
| Dell XPS 15 9530 RTX 4070 | |
| HP Victus 16-r0077ng | |
| Captiva Advanced Gaming I74-121 | |
| Średnia w klasie Gaming (80 - 330, n=106, ostatnie 2 lata) | |
| 7-Zip 18.03 / 7z b 4 | |
| Średnia w klasie Gaming (33491 - 148086, n=107, ostatnie 2 lata) | |
| HP Omen 16-wf000 | |
| HP Victus 16-r0077ng | |
| Aorus 15 BSF | |
| Dell XPS 15 9530 RTX 4070 | |
| Captiva Advanced Gaming I74-121 | |
| Aorus 15 YE5-54DEB34SH | |
| Przeciętny Intel Core i5-12500H (44105 - 54380, n=9) | |
| 7-Zip 18.03 / 7z b 4 -mmt1 | |
| Średnia w klasie Gaming (4199 - 7436, n=107, ostatnie 2 lata) | |
| Aorus 15 BSF | |
| Dell XPS 15 9530 RTX 4070 | |
| HP Omen 16-wf000 | |
| Captiva Advanced Gaming I74-121 | |
| HP Victus 16-r0077ng | |
| Aorus 15 YE5-54DEB34SH | |
| Przeciętny Intel Core i5-12500H (5151 - 5563, n=9) | |
| Geekbench 5.5 / Multi-Core | |
| Średnia w klasie Gaming (6460 - 27010, n=107, ostatnie 2 lata) | |
| HP Omen 16-wf000 | |
| Aorus 15 BSF | |
| Dell XPS 15 9530 RTX 4070 | |
| HP Victus 16-r0077ng | |
| Aorus 15 YE5-54DEB34SH | |
| Captiva Advanced Gaming I74-121 | |
| Przeciętny Intel Core i5-12500H (7962 - 10828, n=9) | |
| Geekbench 5.5 / Single-Core | |
| Średnia w klasie Gaming (986 - 2474, n=107, ostatnie 2 lata) | |
| Dell XPS 15 9530 RTX 4070 | |
| HP Omen 16-wf000 | |
| Aorus 15 BSF | |
| Captiva Advanced Gaming I74-121 | |
| HP Victus 16-r0077ng | |
| Aorus 15 YE5-54DEB34SH | |
| Przeciętny Intel Core i5-12500H (1471 - 1693, n=9) | |
| HWBOT x265 Benchmark v2.2 / 4k Preset | |
| Średnia w klasie Gaming (11.5 - 44.3, n=107, ostatnie 2 lata) | |
| HP Omen 16-wf000 | |
| Captiva Advanced Gaming I74-121 | |
| Dell XPS 15 9530 RTX 4070 | |
| HP Victus 16-r0077ng | |
| Aorus 15 BSF | |
| Aorus 15 YE5-54DEB34SH | |
| Przeciętny Intel Core i5-12500H (12 - 16.6, n=9) | |
| LibreOffice / 20 Documents To PDF | |
| HP Victus 16-r0077ng | |
| Aorus 15 YE5-54DEB34SH | |
| Captiva Advanced Gaming I74-121 | |
| Średnia w klasie Gaming (33.2 - 88.8, n=107, ostatnie 2 lata) | |
| Przeciętny Intel Core i5-12500H (40.1 - 58.5, n=9) | |
| Aorus 15 BSF | |
| HP Omen 16-wf000 | |
| Dell XPS 15 9530 RTX 4070 | |
| R Benchmark 2.5 / Overall mean | |
| Aorus 15 YE5-54DEB34SH | |
| Przeciętny Intel Core i5-12500H (0.4748 - 0.535, n=9) | |
| HP Victus 16-r0077ng | |
| Captiva Advanced Gaming I74-121 | |
| HP Omen 16-wf000 | |
| Aorus 15 BSF | |
| Dell XPS 15 9530 RTX 4070 | |
| Średnia w klasie Gaming (0.3439 - 0.759, n=108, ostatnie 2 lata) | |
* ... im mniej tym lepiej
AIDA64: FP32 Ray-Trace | FPU Julia | CPU SHA3 | CPU Queen | FPU SinJulia | FPU Mandel | CPU AES | CPU ZLib | FP64 Ray-Trace | CPU PhotoWorxx
| Performance rating | |
| Średnia w klasie Gaming | |
| Aorus 15 BSF | |
| Captiva Advanced Gaming I74-121 | |
| Dell XPS 15 9530 RTX 4070 | |
| HP Victus 16-r0077ng | |
| Aorus 15 YE5-54DEB34SH | |
| Przeciętny Intel Core i5-12500H | |
| AIDA64 / FP32 Ray-Trace | |
| Średnia w klasie Gaming (10227 - 85542, n=106, ostatnie 2 lata) | |
| Captiva Advanced Gaming I74-121 | |
| HP Victus 16-r0077ng | |
| Dell XPS 15 9530 RTX 4070 | |
| Aorus 15 BSF | |
| Aorus 15 YE5-54DEB34SH | |
| Przeciętny Intel Core i5-12500H (6851 - 13947, n=9) | |
| AIDA64 / FPU Julia | |
| Średnia w klasie Gaming (51376 - 238426, n=106, ostatnie 2 lata) | |
| Captiva Advanced Gaming I74-121 | |
| HP Victus 16-r0077ng | |
| Aorus 15 BSF | |
| Dell XPS 15 9530 RTX 4070 | |
| Aorus 15 YE5-54DEB34SH | |
| Przeciętny Intel Core i5-12500H (29874 - 68178, n=9) | |
| AIDA64 / CPU SHA3 | |
| Średnia w klasie Gaming (2180 - 9817, n=106, ostatnie 2 lata) | |
| Captiva Advanced Gaming I74-121 | |
| HP Victus 16-r0077ng | |
| Aorus 15 BSF | |
| Dell XPS 15 9530 RTX 4070 | |
| Aorus 15 YE5-54DEB34SH | |
| Przeciętny Intel Core i5-12500H (2287 - 3337, n=9) | |
| AIDA64 / CPU Queen | |
| Średnia w klasie Gaming (49785 - 173351, n=93, ostatnie 2 lata) | |
| Aorus 15 BSF | |
| Dell XPS 15 9530 RTX 4070 | |
| HP Victus 16-r0077ng | |
| Captiva Advanced Gaming I74-121 | |
| Aorus 15 YE5-54DEB34SH | |
| Przeciętny Intel Core i5-12500H (77935 - 80703, n=9) | |
| AIDA64 / FPU SinJulia | |
| Średnia w klasie Gaming (4424 - 33636, n=106, ostatnie 2 lata) | |
| Aorus 15 BSF | |
| Dell XPS 15 9530 RTX 4070 | |
| HP Victus 16-r0077ng | |
| Captiva Advanced Gaming I74-121 | |
| Aorus 15 YE5-54DEB34SH | |
| Przeciętny Intel Core i5-12500H (6590 - 7431, n=9) | |
| AIDA64 / FPU Mandel | |
| Średnia w klasie Gaming (25115 - 128721, n=106, ostatnie 2 lata) | |
| Captiva Advanced Gaming I74-121 | |
| HP Victus 16-r0077ng | |
| Dell XPS 15 9530 RTX 4070 | |
| Aorus 15 BSF | |
| Aorus 15 YE5-54DEB34SH | |
| Przeciętny Intel Core i5-12500H (18252 - 34041, n=9) | |
| AIDA64 / CPU AES | |
| Captiva Advanced Gaming I74-121 | |
| Aorus 15 BSF | |
| Aorus 15 YE5-54DEB34SH | |
| Średnia w klasie Gaming (39258 - 247074, n=106, ostatnie 2 lata) | |
| Przeciętny Intel Core i5-12500H (50298 - 111567, n=9) | |
| HP Victus 16-r0077ng | |
| Dell XPS 15 9530 RTX 4070 | |
| AIDA64 / CPU ZLib | |
| Średnia w klasie Gaming (574 - 2531, n=106, ostatnie 2 lata) | |
| Captiva Advanced Gaming I74-121 | |
| HP Victus 16-r0077ng | |
| Aorus 15 YE5-54DEB34SH | |
| Dell XPS 15 9530 RTX 4070 | |
| Aorus 15 BSF | |
| Przeciętny Intel Core i5-12500H (746 - 924, n=9) | |
| AIDA64 / FP64 Ray-Trace | |
| Średnia w klasie Gaming (5509 - 45446, n=106, ostatnie 2 lata) | |
| Captiva Advanced Gaming I74-121 | |
| HP Victus 16-r0077ng | |
| Dell XPS 15 9530 RTX 4070 | |
| Aorus 15 BSF | |
| Aorus 15 YE5-54DEB34SH | |
| Przeciętny Intel Core i5-12500H (3848 - 7405, n=9) | |
| AIDA64 / CPU PhotoWorxx | |
| Dell XPS 15 9530 RTX 4070 | |
| Średnia w klasie Gaming (12271 - 89891, n=106, ostatnie 2 lata) | |
| HP Victus 16-r0077ng | |
| Aorus 15 BSF | |
| Aorus 15 YE5-54DEB34SH | |
| Przeciętny Intel Core i5-12500H (13686 - 43813, n=9) | |
| Captiva Advanced Gaming I74-121 | |
Wydajność systemu
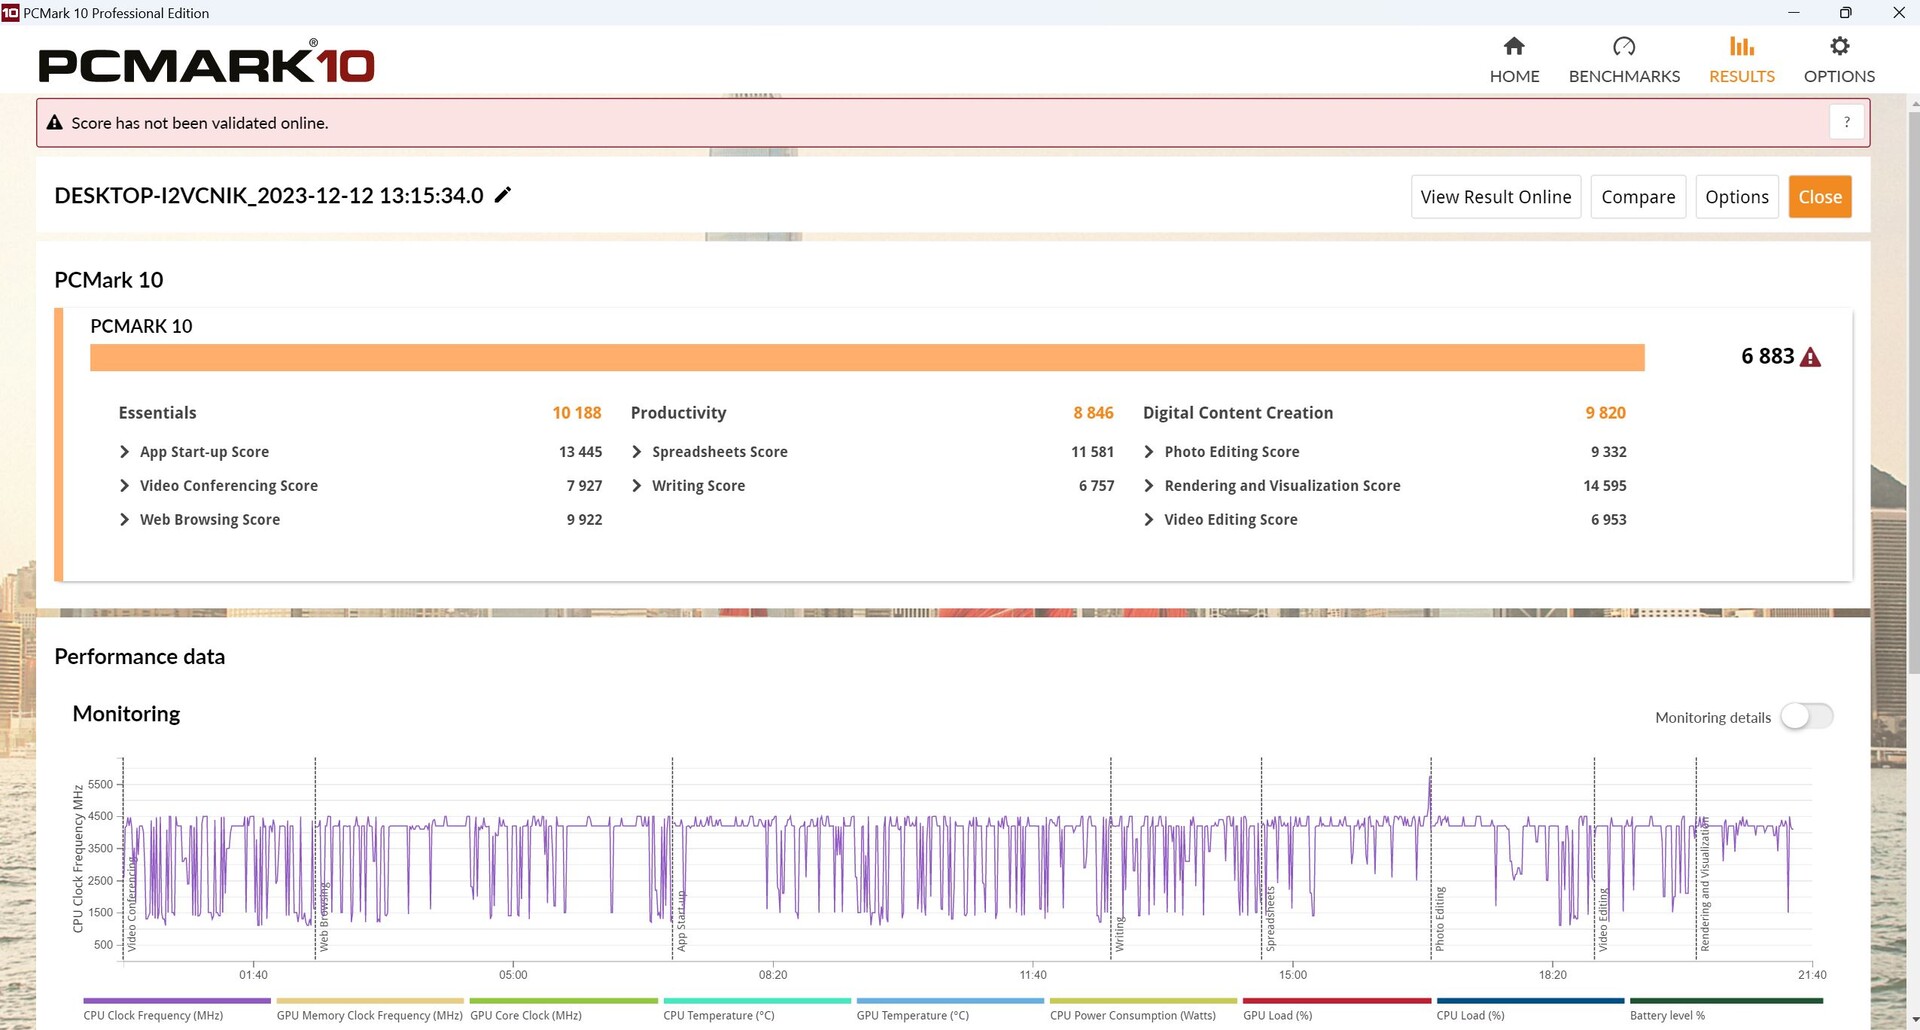
W teście PCMark 10, Captiva z następcą CPU uzyskała około 7% przewagę, podczas gdy oba urządzenia poradziły sobie tak samo w teście CrossMark.
CrossMark: Overall | Productivity | Creativity | Responsiveness
WebXPRT 3: Overall
WebXPRT 4: Overall
Mozilla Kraken 1.1: Total
| PCMark 10 / Score | |
| Średnia w klasie Gaming (5828 - 11574, n=94, ostatnie 2 lata) | |
| HP Omen 16-wf000 | |
| Captiva Advanced Gaming I74-121 | |
| Aorus 15 BSF | |
| Dell XPS 15 9530 RTX 4070 | |
| HP Victus 16-r0077ng | |
| Aorus 15 YE5-54DEB34SH | |
| Przeciętny Intel Core i5-12500H, NVIDIA GeForce RTX 3080 Ti Laptop GPU (n=1) | |
| PCMark 10 / Essentials | |
| Captiva Advanced Gaming I74-121 | |
| Dell XPS 15 9530 RTX 4070 | |
| Aorus 15 BSF | |
| HP Victus 16-r0077ng | |
| Średnia w klasie Gaming (8810 - 11935, n=98, ostatnie 2 lata) | |
| HP Omen 16-wf000 | |
| Aorus 15 YE5-54DEB34SH | |
| Przeciętny Intel Core i5-12500H, NVIDIA GeForce RTX 3080 Ti Laptop GPU (n=1) | |
| PCMark 10 / Productivity | |
| Średnia w klasie Gaming (6845 - 21327, n=96, ostatnie 2 lata) | |
| HP Omen 16-wf000 | |
| Captiva Advanced Gaming I74-121 | |
| Aorus 15 BSF | |
| HP Victus 16-r0077ng | |
| Aorus 15 YE5-54DEB34SH | |
| Przeciętny Intel Core i5-12500H, NVIDIA GeForce RTX 3080 Ti Laptop GPU (n=1) | |
| Dell XPS 15 9530 RTX 4070 | |
| PCMark 10 / Digital Content Creation | |
| Średnia w klasie Gaming (7602 - 19657, n=96, ostatnie 2 lata) | |
| HP Omen 16-wf000 | |
| Aorus 15 BSF | |
| Dell XPS 15 9530 RTX 4070 | |
| Captiva Advanced Gaming I74-121 | |
| HP Victus 16-r0077ng | |
| Aorus 15 YE5-54DEB34SH | |
| Przeciętny Intel Core i5-12500H, NVIDIA GeForce RTX 3080 Ti Laptop GPU (n=1) | |
| CrossMark / Overall | |
| Aorus 15 BSF | |
| Średnia w klasie Gaming (1366 - 2409, n=95, ostatnie 2 lata) | |
| Dell XPS 15 9530 RTX 4070 | |
| HP Omen 16-wf000 | |
| Captiva Advanced Gaming I74-121 | |
| Aorus 15 YE5-54DEB34SH | |
| Przeciętny Intel Core i5-12500H, NVIDIA GeForce RTX 3080 Ti Laptop GPU (n=1) | |
| CrossMark / Productivity | |
| Aorus 15 BSF | |
| Średnia w klasie Gaming (1386 - 2254, n=95, ostatnie 2 lata) | |
| Dell XPS 15 9530 RTX 4070 | |
| Captiva Advanced Gaming I74-121 | |
| Aorus 15 YE5-54DEB34SH | |
| Przeciętny Intel Core i5-12500H, NVIDIA GeForce RTX 3080 Ti Laptop GPU (n=1) | |
| HP Omen 16-wf000 | |
| CrossMark / Creativity | |
| Średnia w klasie Gaming (1343 - 2729, n=95, ostatnie 2 lata) | |
| Dell XPS 15 9530 RTX 4070 | |
| Aorus 15 BSF | |
| HP Omen 16-wf000 | |
| Aorus 15 YE5-54DEB34SH | |
| Przeciętny Intel Core i5-12500H, NVIDIA GeForce RTX 3080 Ti Laptop GPU (n=1) | |
| Captiva Advanced Gaming I74-121 | |
| CrossMark / Responsiveness | |
| Aorus 15 BSF | |
| Średnia w klasie Gaming (1226 - 2334, n=95, ostatnie 2 lata) | |
| Dell XPS 15 9530 RTX 4070 | |
| Captiva Advanced Gaming I74-121 | |
| Aorus 15 YE5-54DEB34SH | |
| Przeciętny Intel Core i5-12500H, NVIDIA GeForce RTX 3080 Ti Laptop GPU (n=1) | |
| HP Omen 16-wf000 | |
| WebXPRT 3 / Overall | |
| Dell XPS 15 9530 RTX 4070 | |
| Średnia w klasie Gaming (220 - 532, n=99, ostatnie 2 lata) | |
| Aorus 15 BSF | |
| HP Omen 16-wf000 | |
| HP Victus 16-r0077ng | |
| HP Victus 16-r0077ng | |
| Captiva Advanced Gaming I74-121 | |
| Captiva Advanced Gaming I74-121 | |
| Aorus 15 YE5-54DEB34SH | |
| Przeciętny Intel Core i5-12500H, NVIDIA GeForce RTX 3080 Ti Laptop GPU (n=1) | |
| WebXPRT 4 / Overall | |
| Średnia w klasie Gaming (165 - 354, n=100, ostatnie 2 lata) | |
| Dell XPS 15 9530 RTX 4070 | |
| Aorus 15 BSF | |
| HP Omen 16-wf000 | |
| HP Victus 16-r0077ng | |
| HP Victus 16-r0077ng | |
| Aorus 15 YE5-54DEB34SH | |
| Przeciętny Intel Core i5-12500H, NVIDIA GeForce RTX 3080 Ti Laptop GPU (n=1) | |
| Captiva Advanced Gaming I74-121 | |
| Captiva Advanced Gaming I74-121 | |
| Mozilla Kraken 1.1 / Total | |
| Aorus 15 YE5-54DEB34SH | |
| Przeciętny Intel Core i5-12500H, NVIDIA GeForce RTX 3080 Ti Laptop GPU (n=1) | |
| HP Victus 16-r0077ng | |
| HP Victus 16-r0077ng | |
| Captiva Advanced Gaming I74-121 | |
| Captiva Advanced Gaming I74-121 | |
| HP Omen 16-wf000 | |
| Dell XPS 15 9530 RTX 4070 | |
| Aorus 15 BSF | |
| Średnia w klasie Gaming (391 - 590, n=103, ostatnie 2 lata) | |
* ... im mniej tym lepiej
| PCMark 10 Score | 6883 pkt. | |
Pomoc | ||
| AIDA64 / Memory Copy | |
| Średnia w klasie Gaming (21750 - 129946, n=106, ostatnie 2 lata) | |
| Dell XPS 15 9530 RTX 4070 | |
| HP Victus 16-r0077ng | |
| Aorus 15 BSF | |
| Aorus 15 YE5-54DEB34SH | |
| Przeciętny Intel Core i5-12500H (23850 - 66598, n=9) | |
| Captiva Advanced Gaming I74-121 | |
| AIDA64 / Memory Read | |
| Średnia w klasie Gaming (22956 - 118858, n=106, ostatnie 2 lata) | |
| Dell XPS 15 9530 RTX 4070 | |
| HP Victus 16-r0077ng | |
| Aorus 15 BSF | |
| Aorus 15 YE5-54DEB34SH | |
| Przeciętny Intel Core i5-12500H (24879 - 68013, n=9) | |
| Captiva Advanced Gaming I74-121 | |
| AIDA64 / Memory Write | |
| Aorus 15 BSF | |
| Średnia w klasie Gaming (22297 - 135096, n=106, ostatnie 2 lata) | |
| Dell XPS 15 9530 RTX 4070 | |
| HP Victus 16-r0077ng | |
| Aorus 15 YE5-54DEB34SH | |
| Przeciętny Intel Core i5-12500H (23543 - 58797, n=9) | |
| Captiva Advanced Gaming I74-121 | |
| AIDA64 / Memory Latency | |
| Średnia w klasie Gaming (75.3 - 259, n=106, ostatnie 2 lata) | |
| Aorus 15 YE5-54DEB34SH | |
| Przeciętny Intel Core i5-12500H (83.8 - 114.7, n=9) | |
| HP Victus 16-r0077ng | |
| Aorus 15 BSF | |
| Dell XPS 15 9530 RTX 4070 | |
| Captiva Advanced Gaming I74-121 | |
* ... im mniej tym lepiej
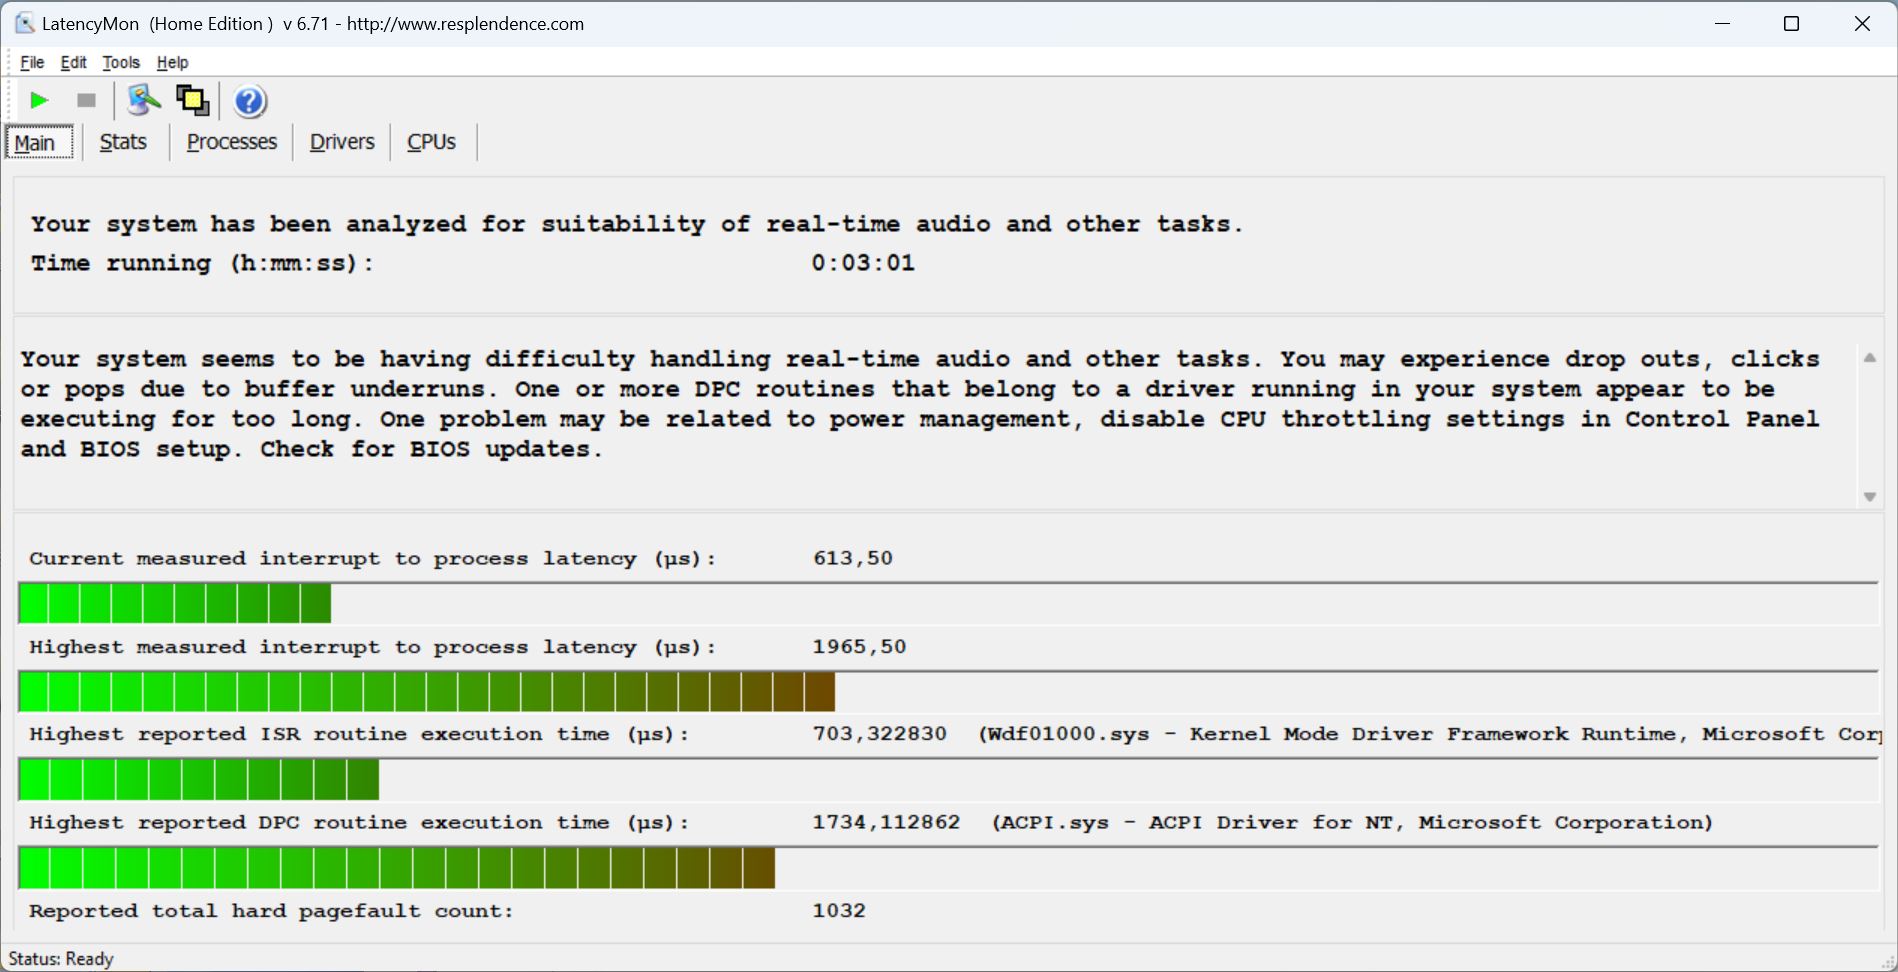
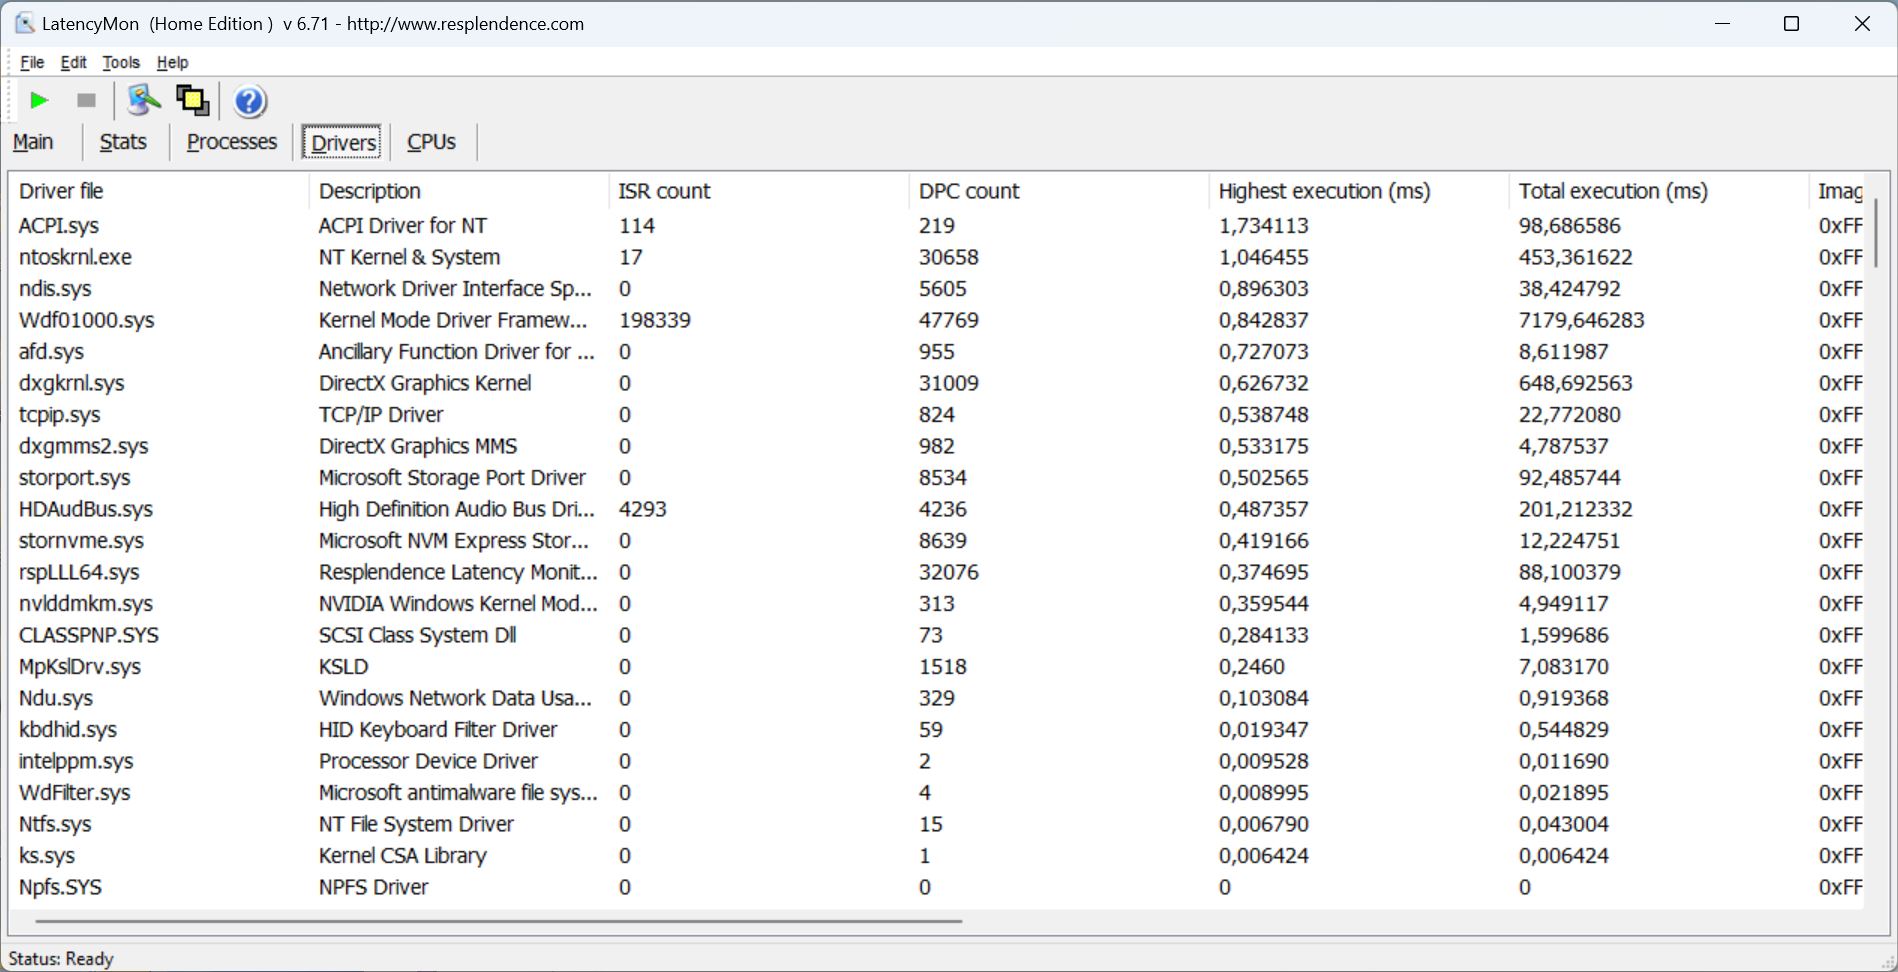
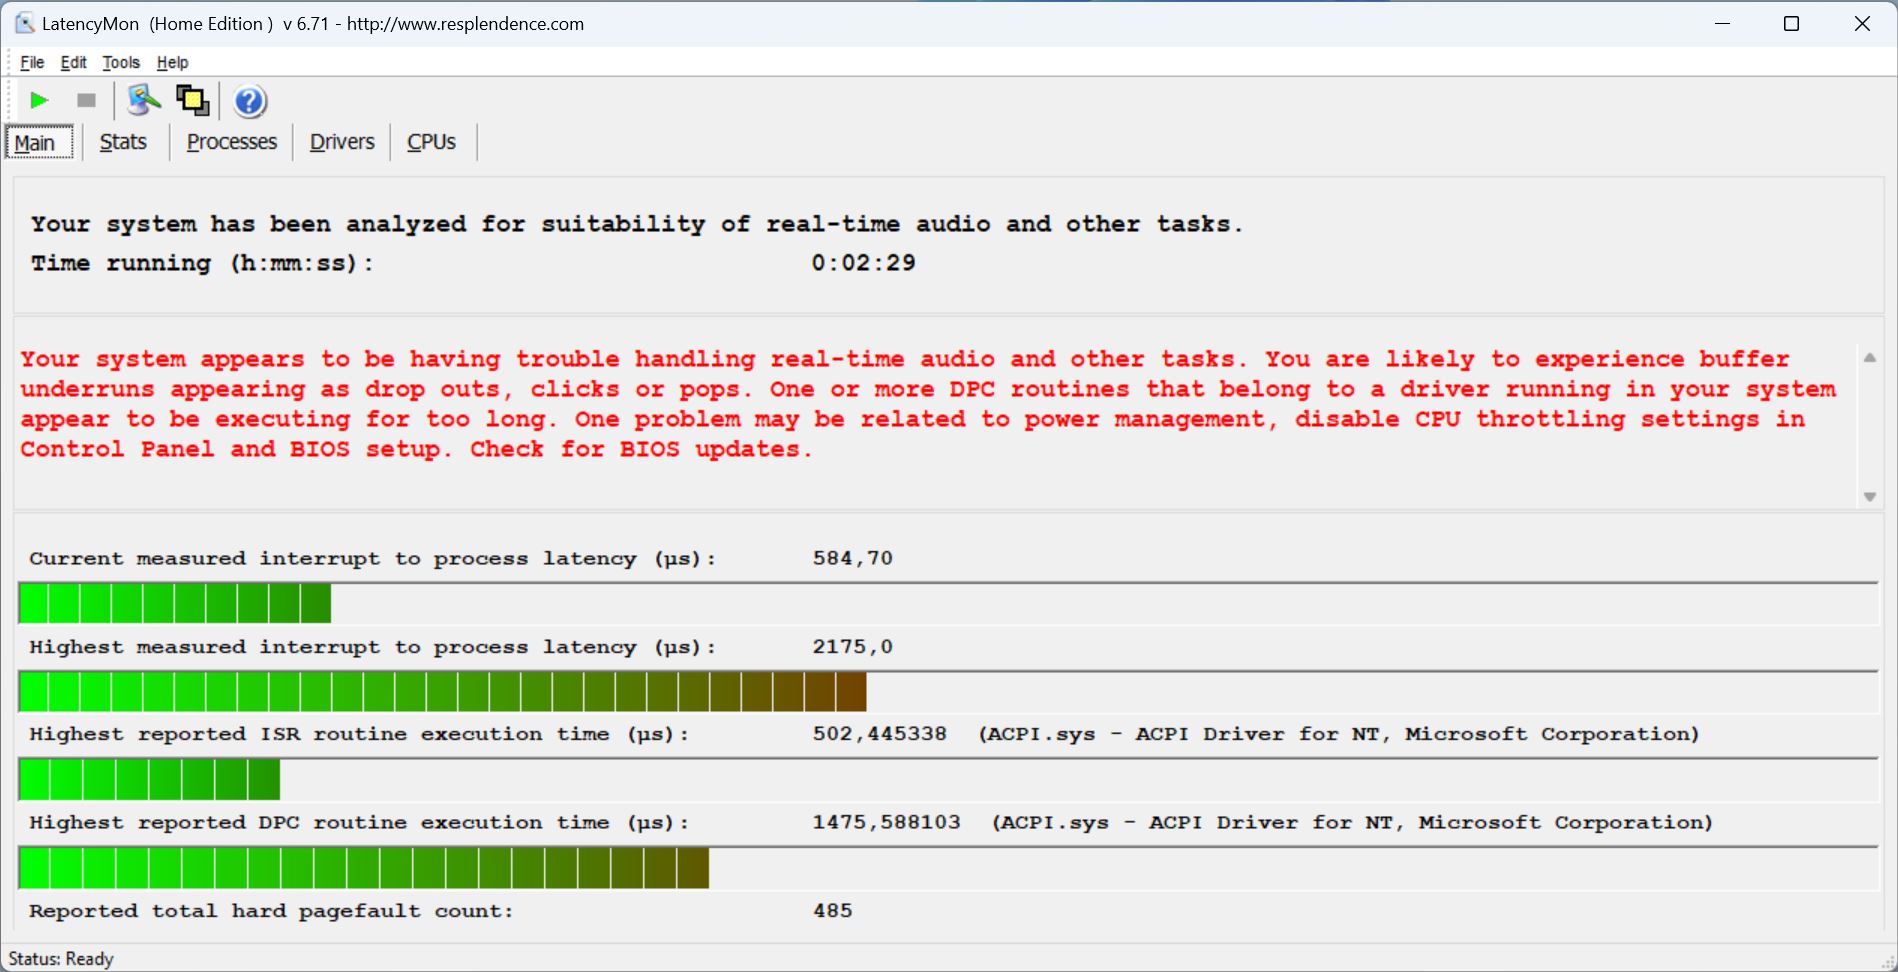
Opóźnienie DPC
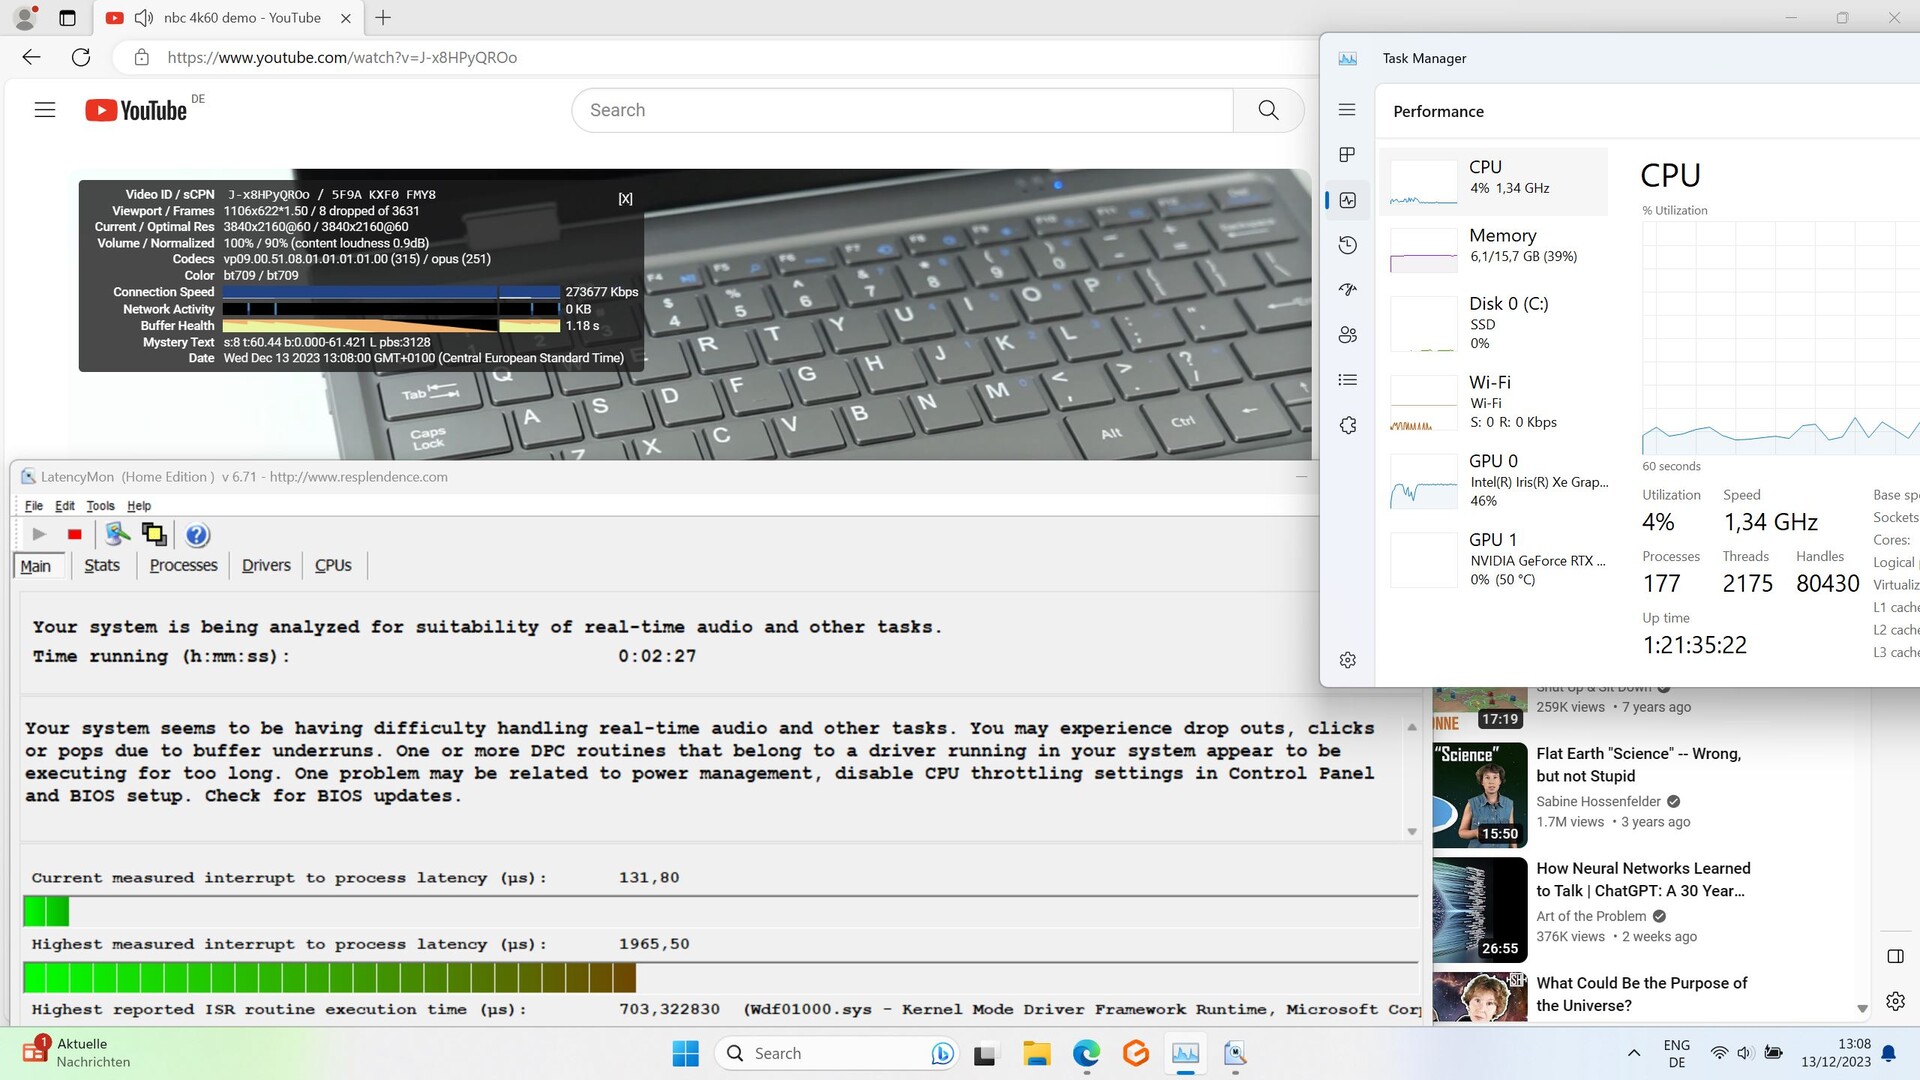
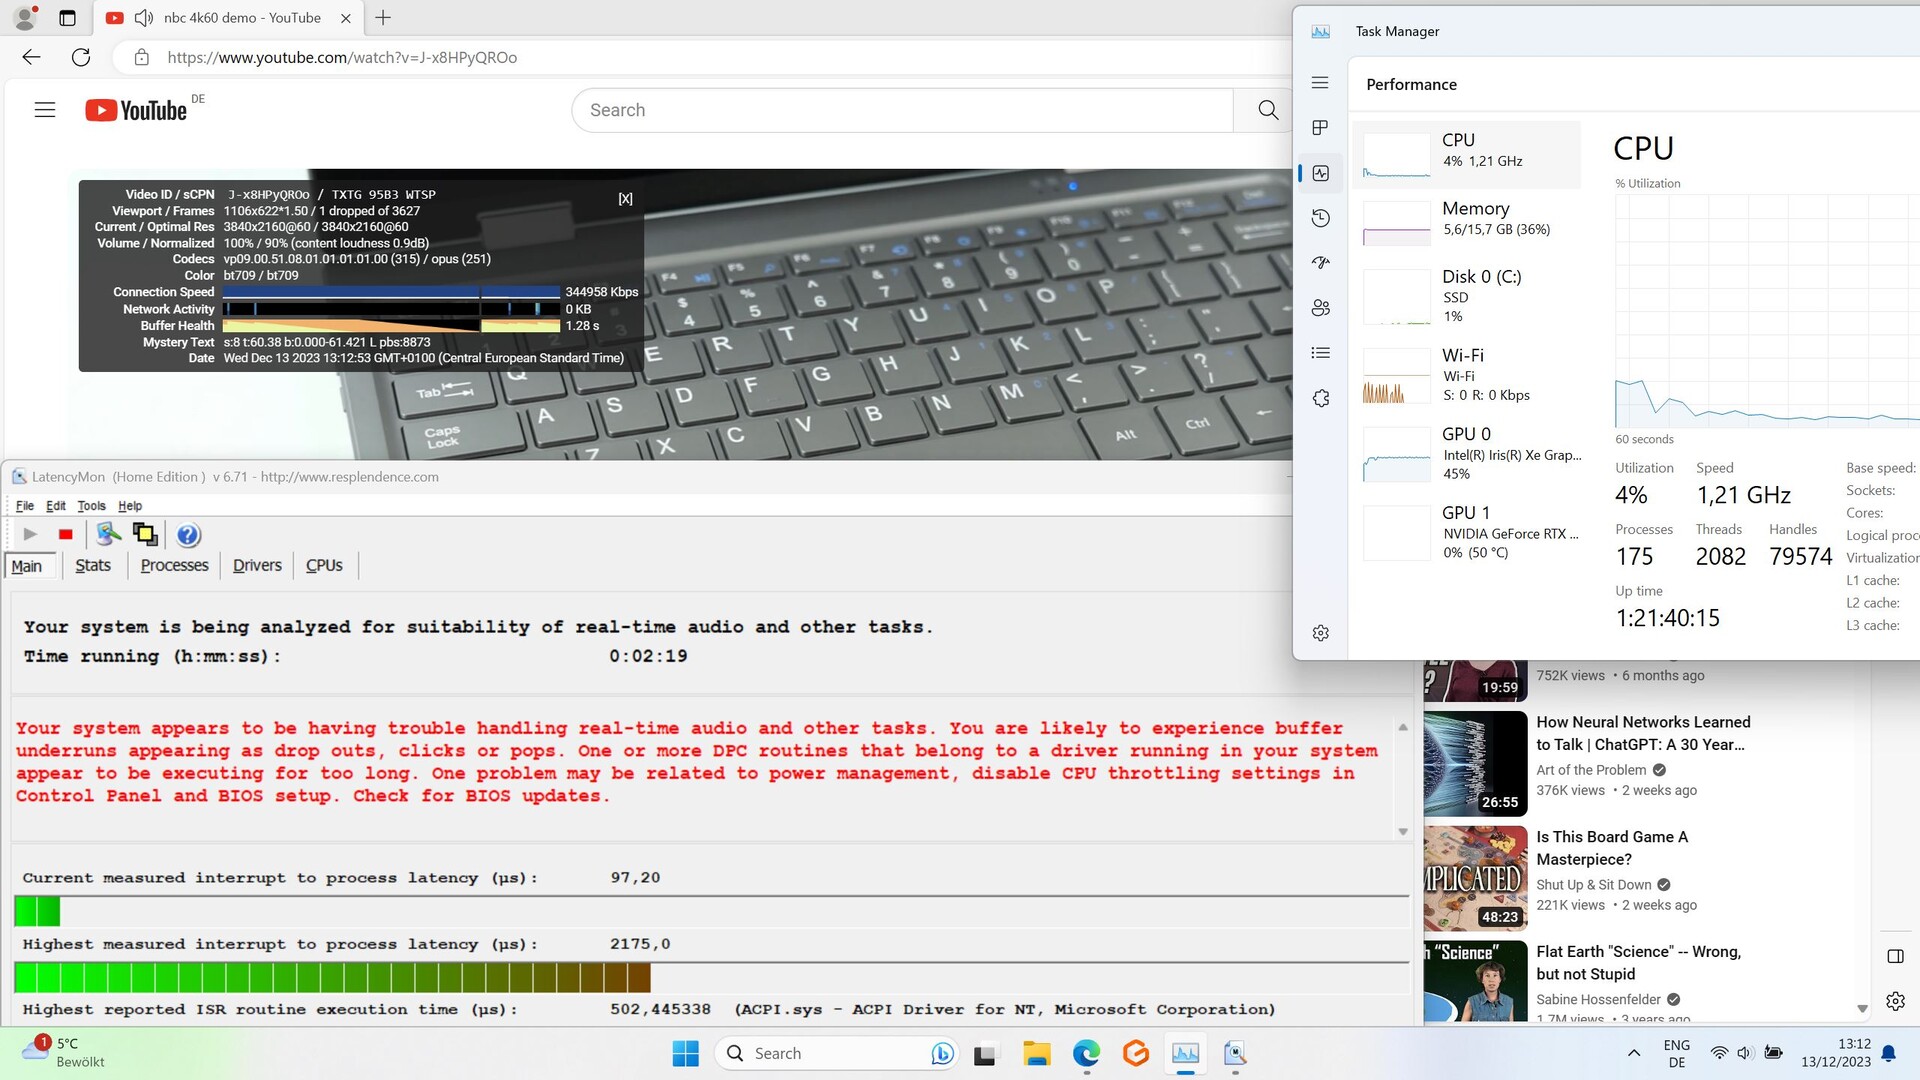
Ponieważ Centrum sterowania nie oferuje trybu zrównoważonego, przetestowaliśmy laptopa w trybach spotkania i twórcy. Ten pierwszy wykazał pewne problemy z opóźnieniami podczas otwierania wielu kart przeglądarki - stały się one jeszcze większe podczas oglądania wideo 4K/60 klatek na sekundę na YouTube, co skutkowało ośmioma utraconymi klatkami.
Jeśli sądzą Państwo, że sytuacja ta może ulec zmianie w bardziej wydajnym trybie twórcy, to niestety są Państwo w błędzie. Zauważyliśmy już zwiększone opóźnienia podczas otwierania przeglądarki. Z drugiej strony, wideo działało z tylko jedną zrzuconą klatką.
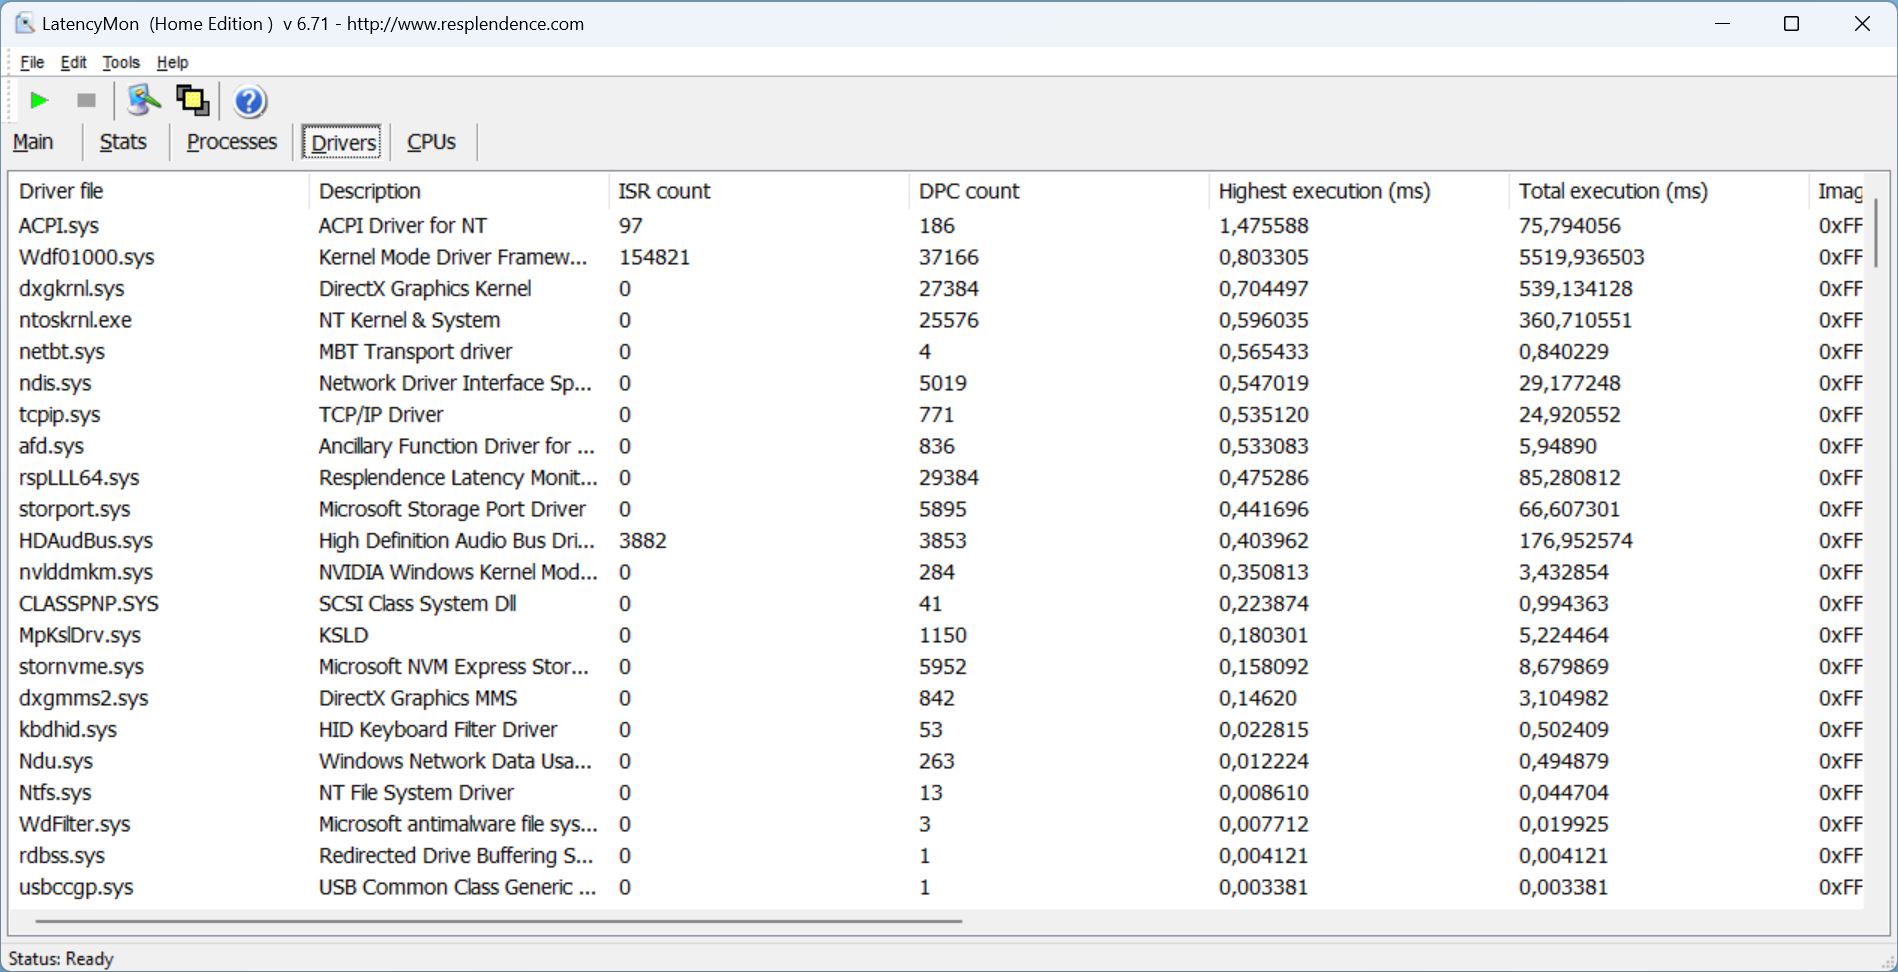
| DPC Latencies / LatencyMon - interrupt to process latency (max), Web, Youtube, Prime95 | |
| HP Omen 16-wf000 | |
| Aorus 15 YE5-54DEB34SH | |
| HP Victus 16-r0077ng | |
| Aorus 15 BSF | |
| Dell XPS 15 9530 RTX 4070 | |
| Captiva Advanced Gaming I74-121 | |
* ... im mniej tym lepiej
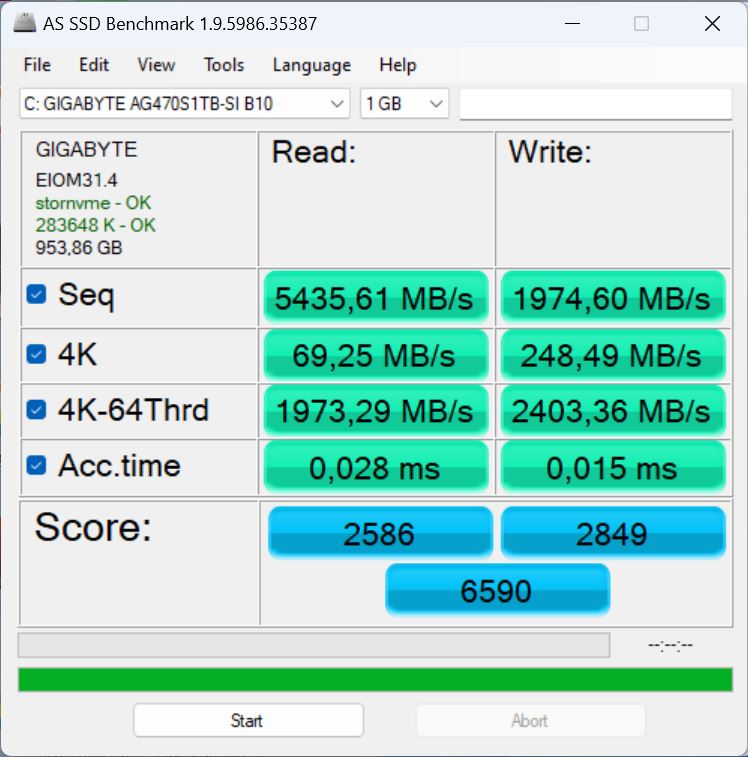
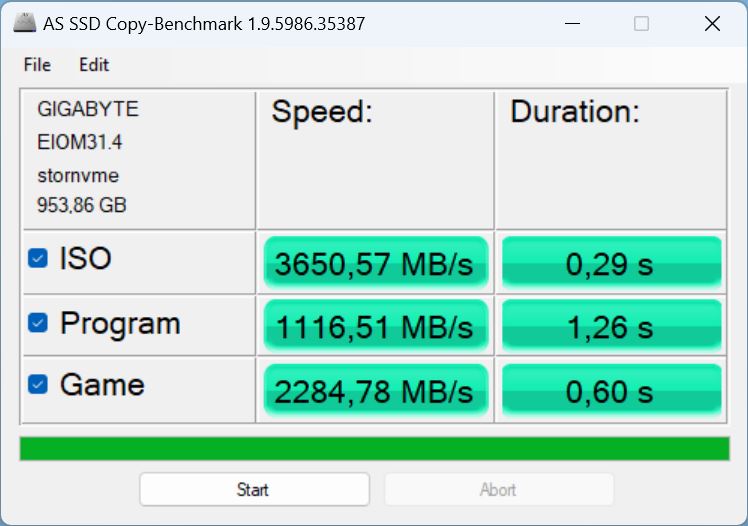
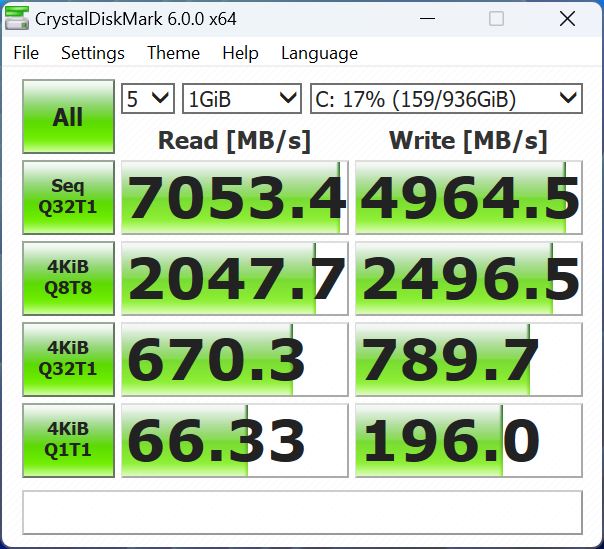
Urządzenia pamięci masowej
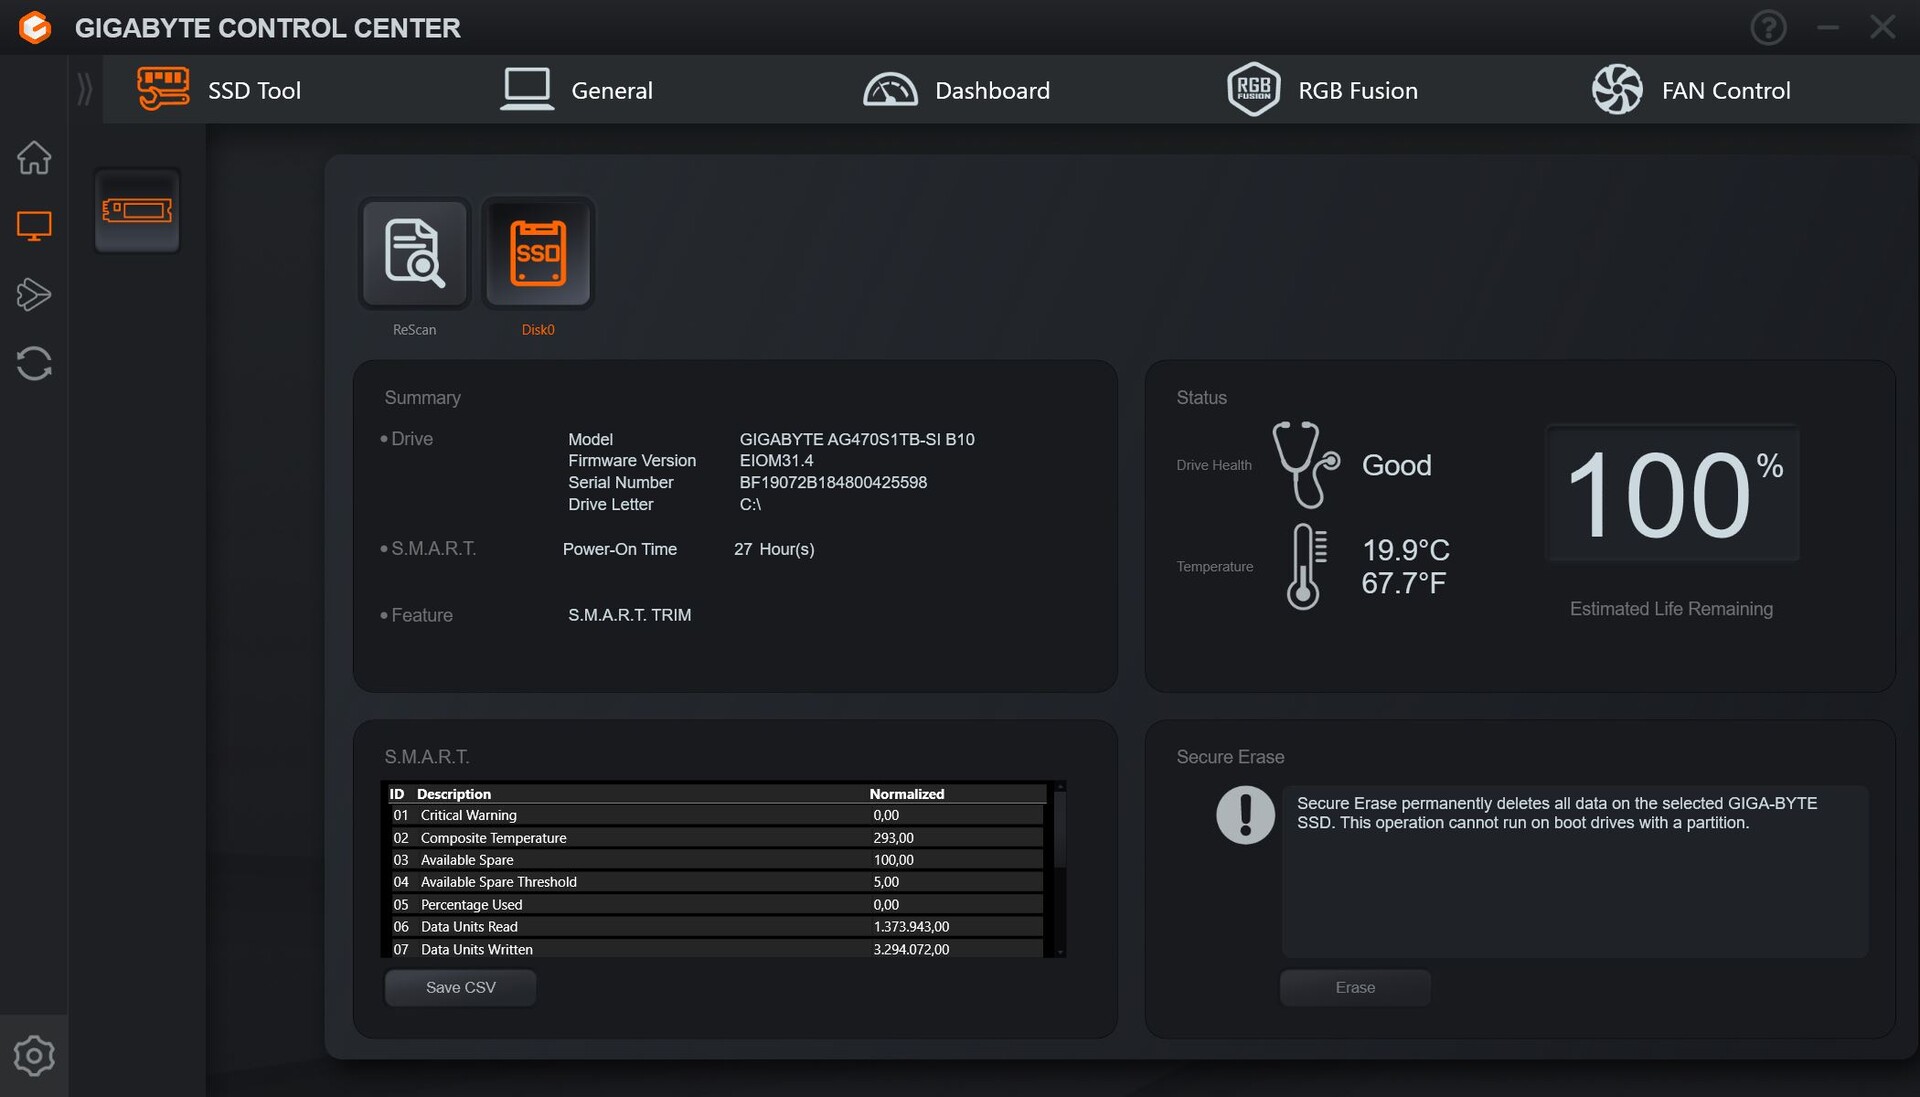
Zainstalowany dysk Gigabyte AG470S1TB-SI B10 z 1 TB pamięci masowej to szybki, wysokiej klasy dysk SSD PCIe Gen 4 NVMe. W naszym zestawieniu Liście najlepszych dysków SSDzajmuje obecnie pozycję 3, co jest doskonałym wynikiem.
W Aorus 15 YE5 może nie być w stanie wykorzystać swojego pełnego potencjału (plasując się 12 procent za modelem referencyjnym), jednak nadal jest szybszy niż dyski SSD konkurencji. Jedynym wyjątkiem jest Aorus 15 obecnej generacji. Wykorzystuje on ten sam dysk SSD, ale jest o 28 procent szybszy. Mimo to wydajność naszej próbki testowej jest nadal świetna, a przede wszystkim pozostała stała i nie wykazywała żadnych problemów z dławieniem podczas ciągłego użytkowania.

* ... im mniej tym lepiej
Reading continuous performance: DiskSpd Read Loop, Queue Depth 8
Karta graficzna
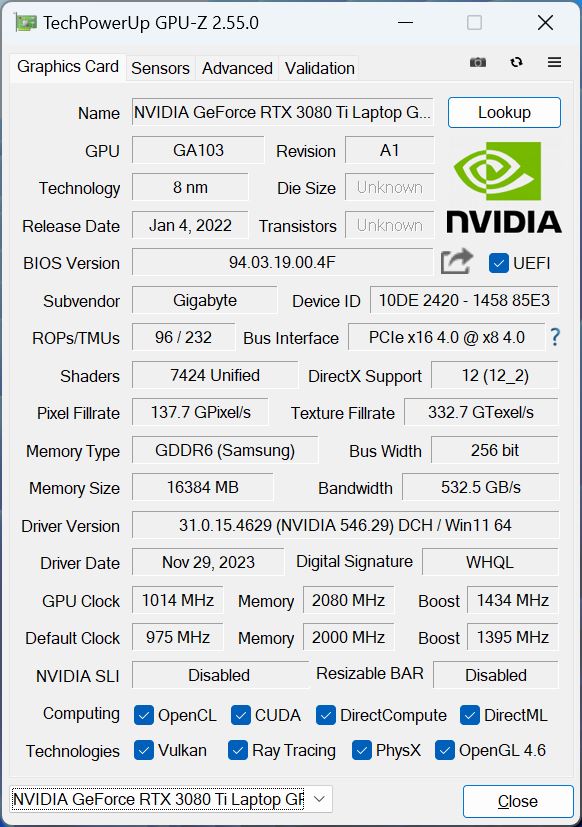
Poprzedni flagowy model Geforce RTX 3080 Ti z 16 GB pamięci RAM jest odpowiedzialny za obliczenia 3D jako karta graficzna laptopa. Ma ona jednak do dyspozycji tylko 130 W z maksymalnych możliwych 165 W. Potężny układ Ampere nie jest tak wydajny jak obecna architektura Ada Lovelace i prawdopodobnie będzie generował więcej ciepła.
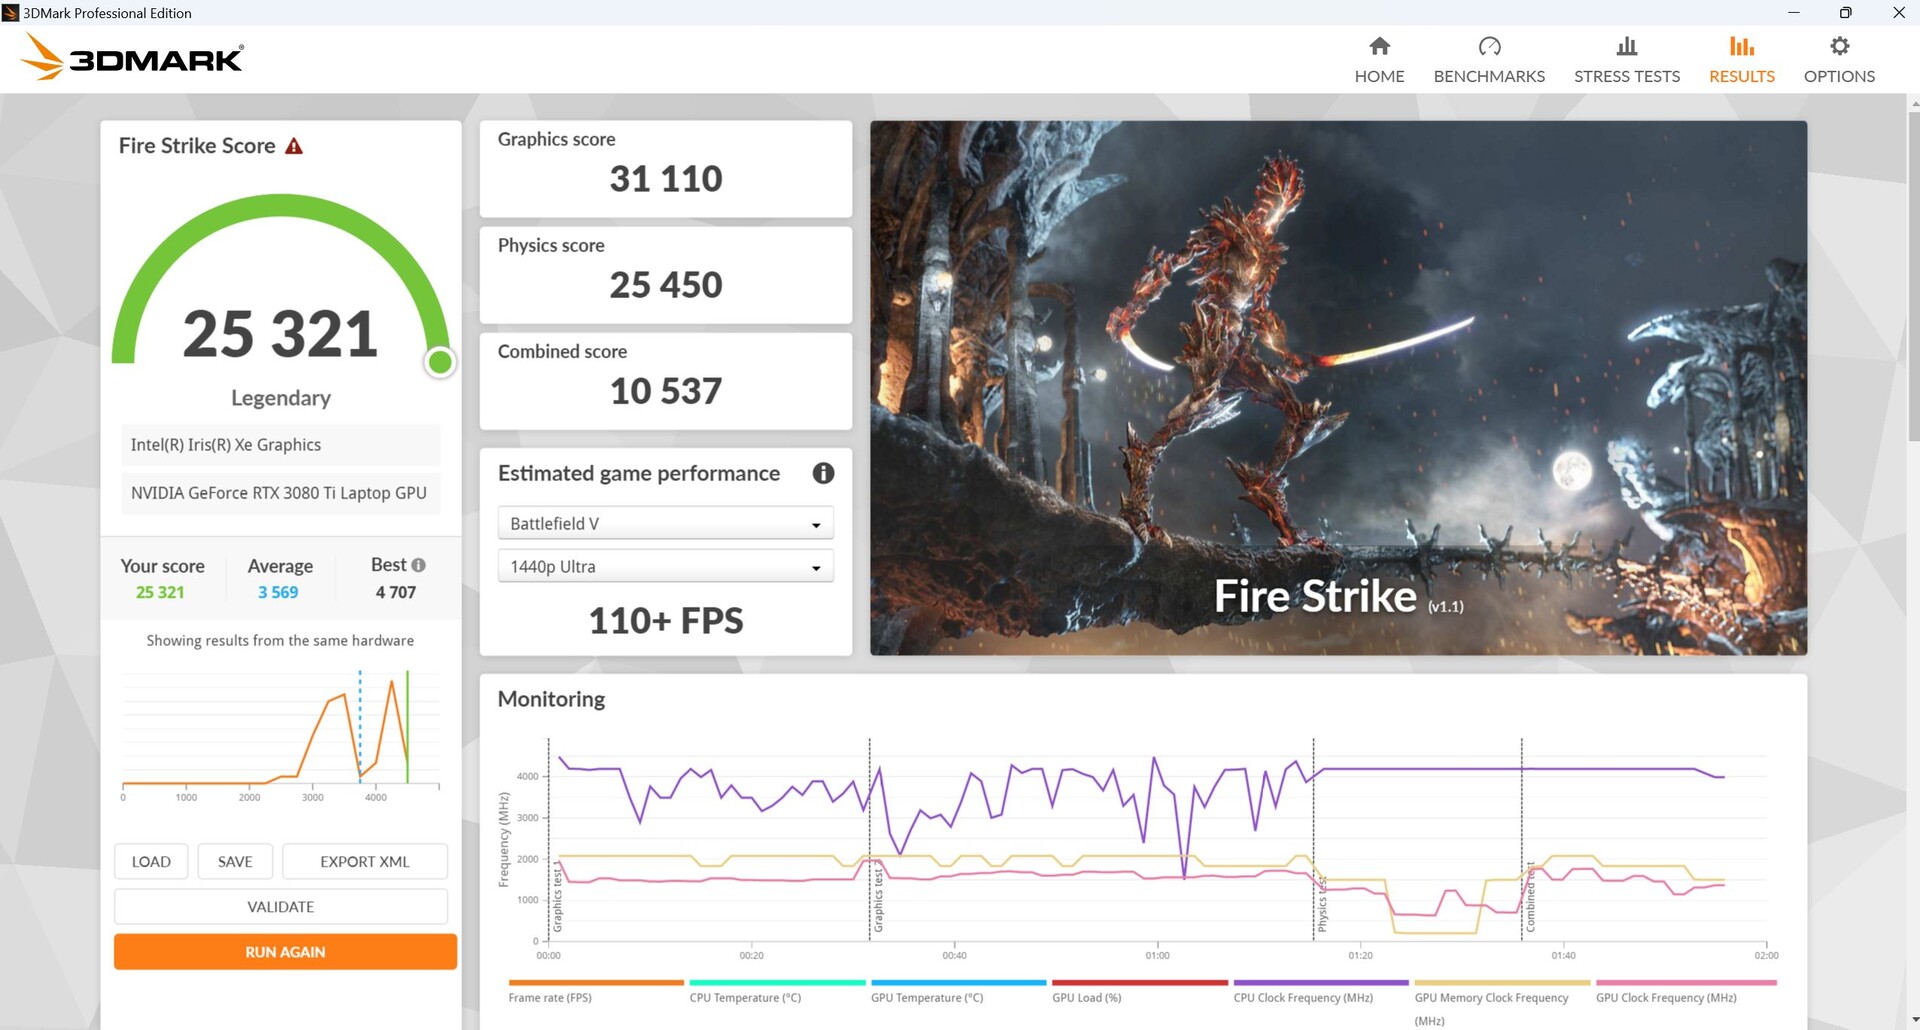
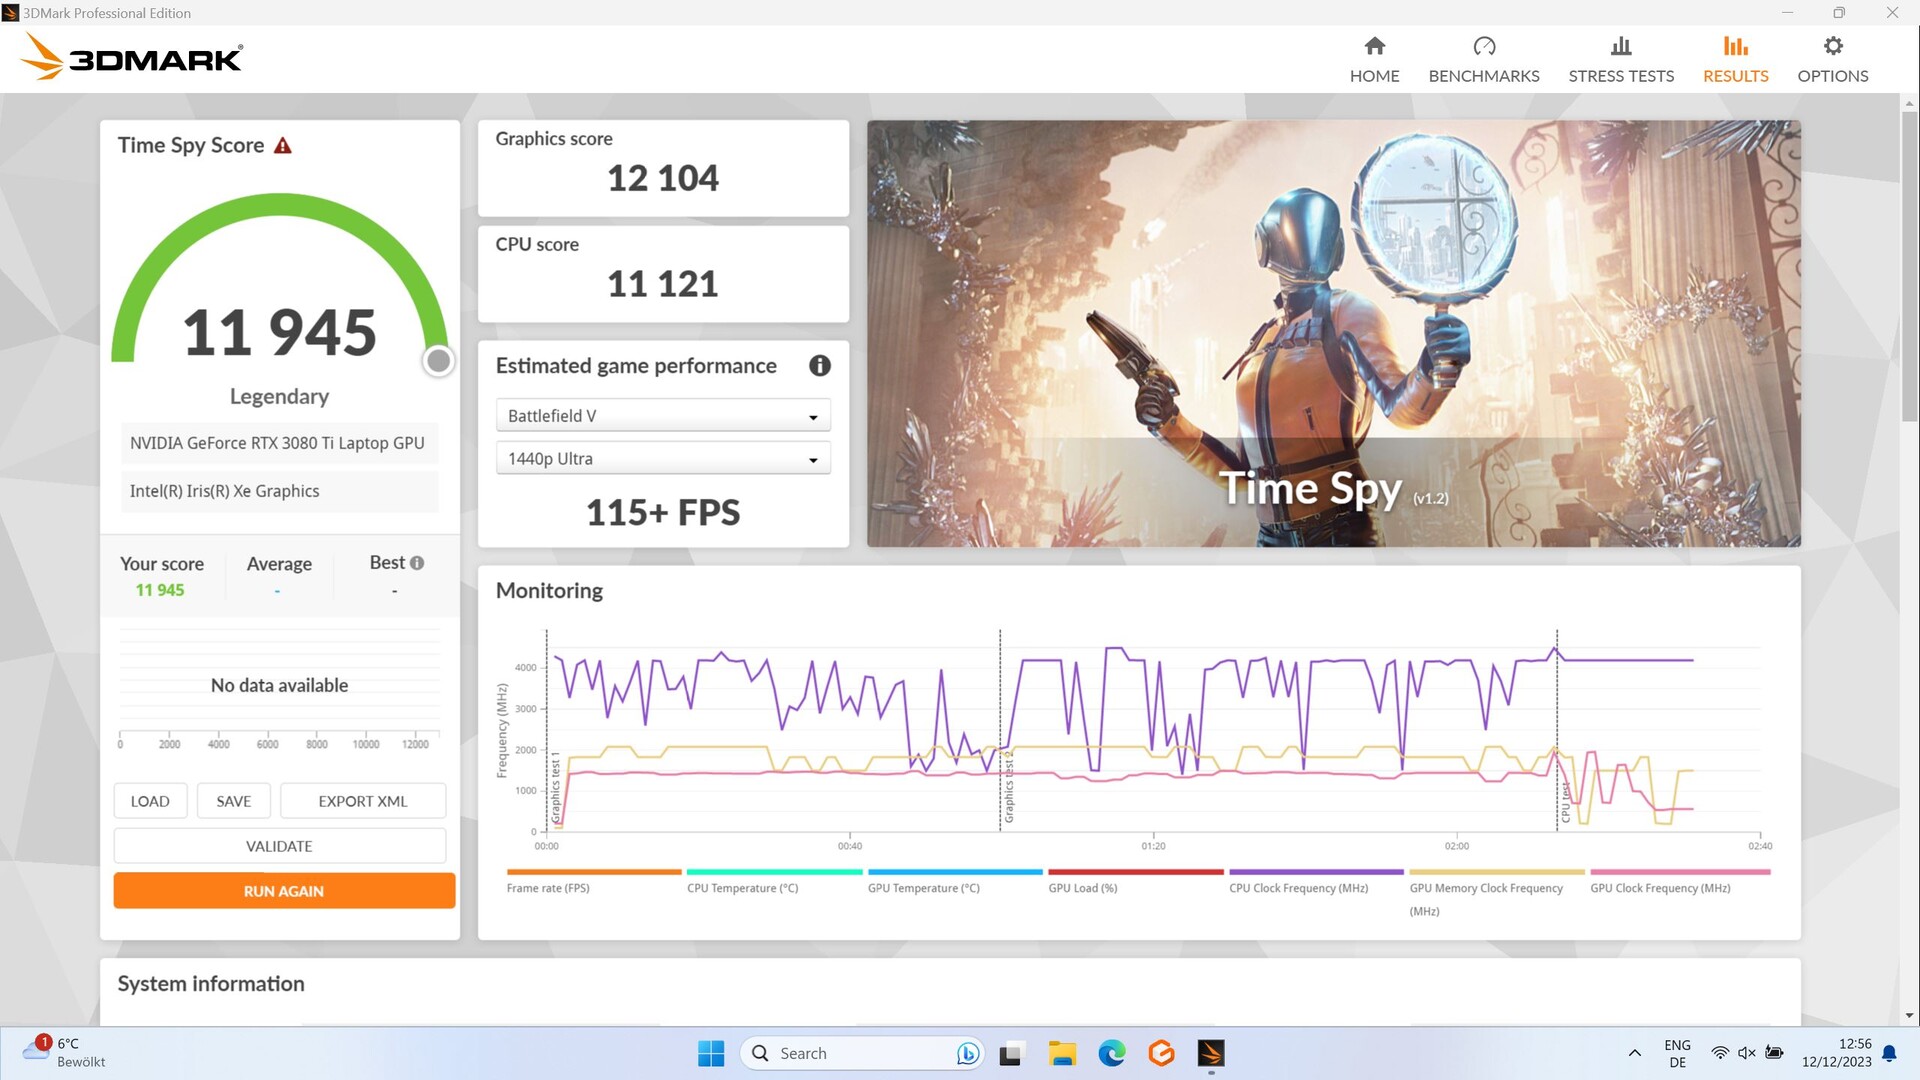
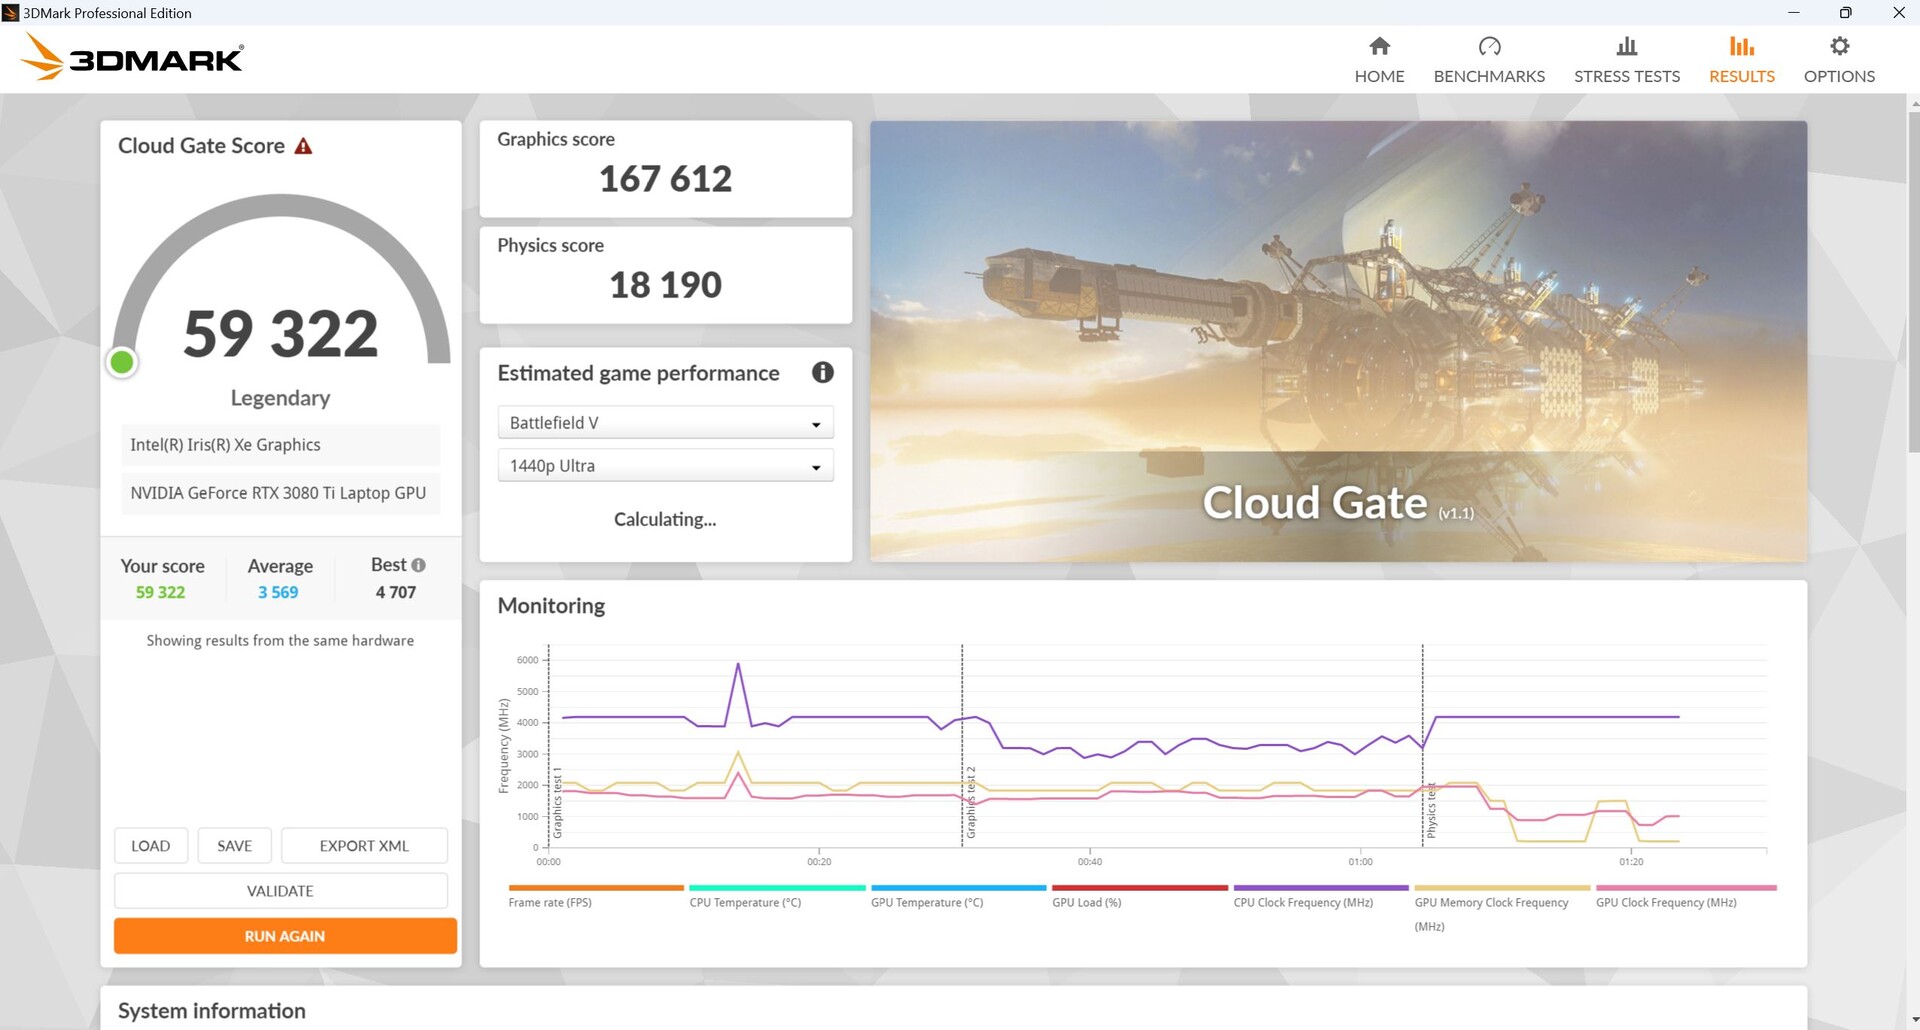
Podczas syntetycznych benchmarków 3DMark, nasz Aorus wyprzedził konkurencję obecnej generacji z kartą RTX 4060 i RTX 4070. Nasz RTX 3080 Ti wypadł lepiej w niemal wszystkich testach - nawet jeśli tylko o kilka punktów procentowych. Jednak różnice między nimi są dość niewielkie, ale stałe we wszystkich testach.
W trybie bateryjnym, jego wydajność w Fire Strike spadła z 31 110 do zaledwie 6 921 punktów, co stanowi spadek aż o 78 procent!
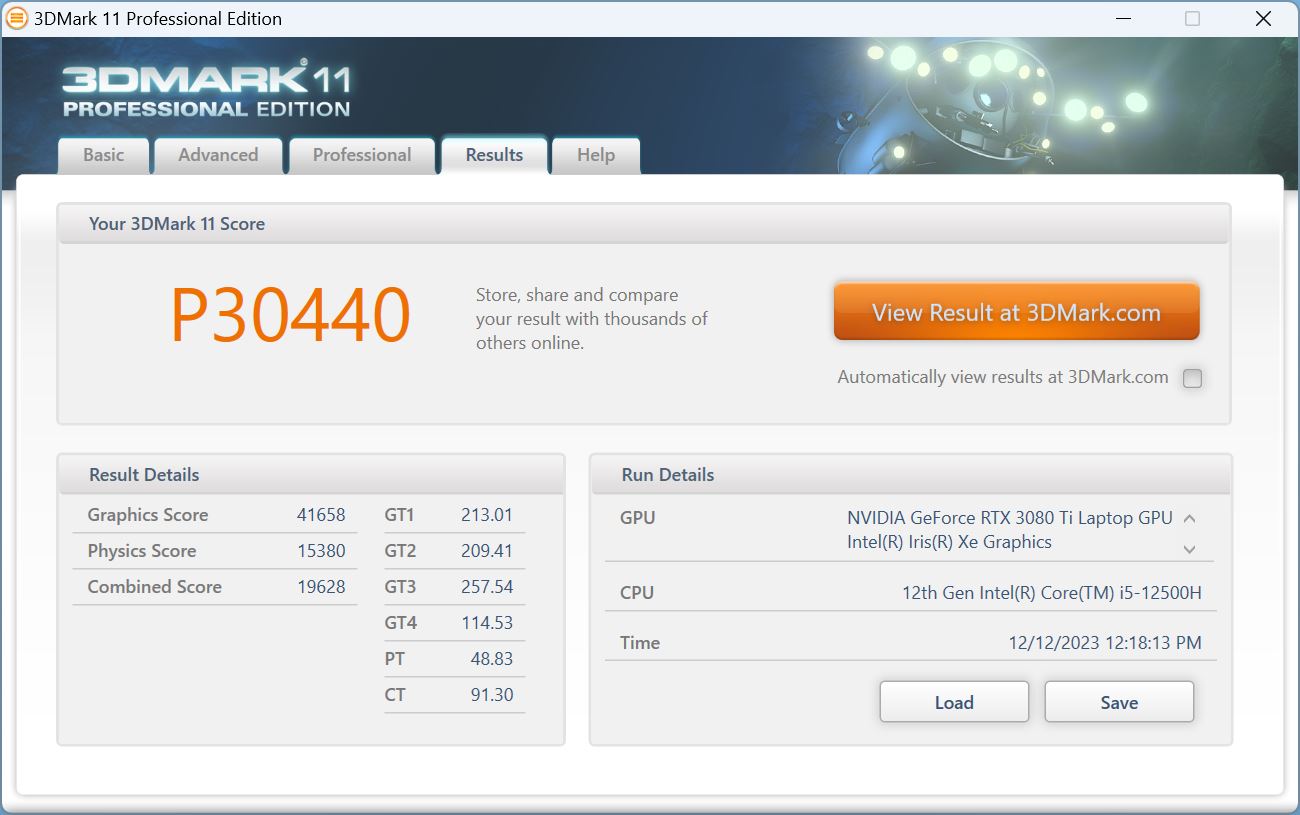
| 3DMark 11 Performance | 30440 pkt. | |
| 3DMark Cloud Gate Standard Score | 59322 pkt. | |
| 3DMark Fire Strike Score | 25321 pkt. | |
| 3DMark Time Spy Score | 11945 pkt. | |
Pomoc | ||
* ... im mniej tym lepiej
Gaming
Podczas grania nasz Aorus szedł łeb w łeb z aorus nowej generacji wyposażony w RTX 4070 a nawet zdołał go pokonać o niewielki margines. Wszyscy pozostali konkurenci z RTX 4070 również zostali nieznacznie pokonani. The Omen 16 z RTX 4080 pozostał nieosiągalny na szczycie i był o około 18 procent szybszy niż nasz zajmujący drugie miejsce Aorus we wszystkich testach gier. W grach, które koncentrują się na procesorze, jego wydajność pozostała w tyle za konkurencją z powodu miernego i5-12500H.
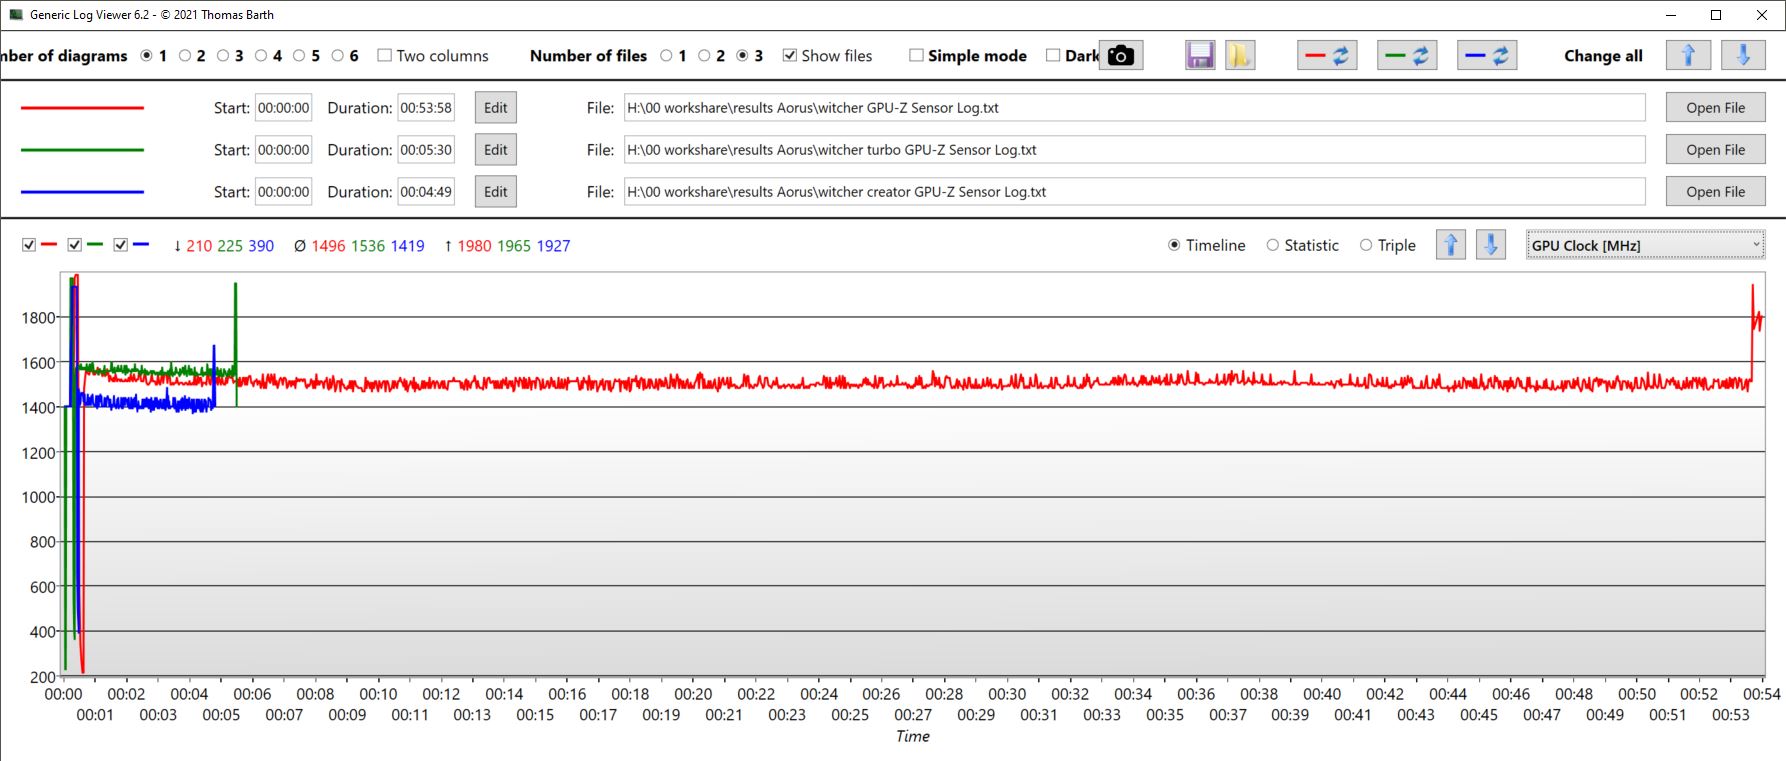
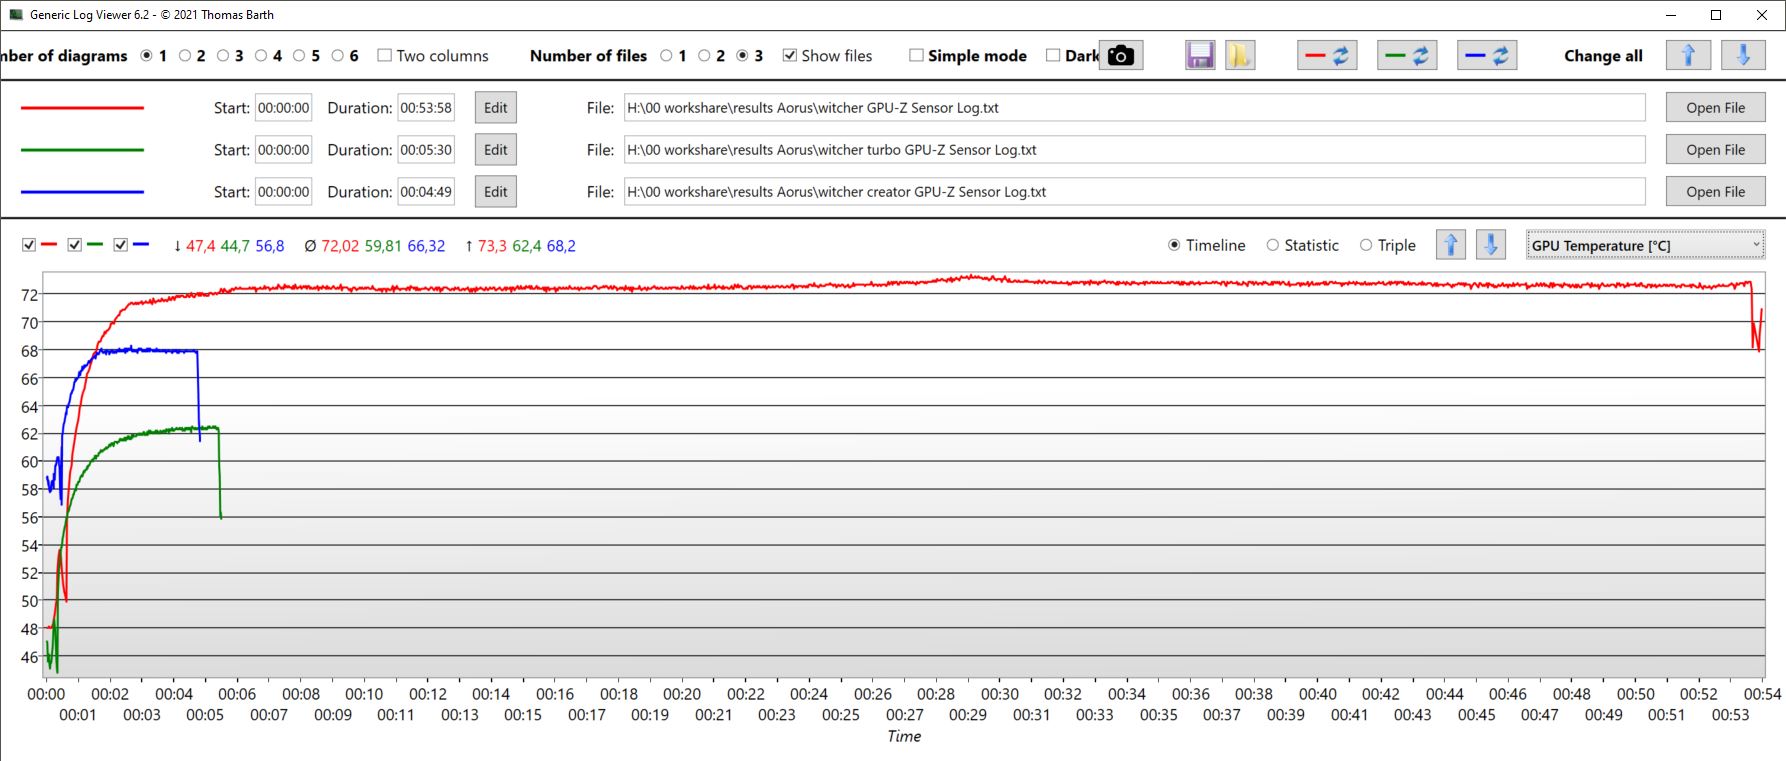
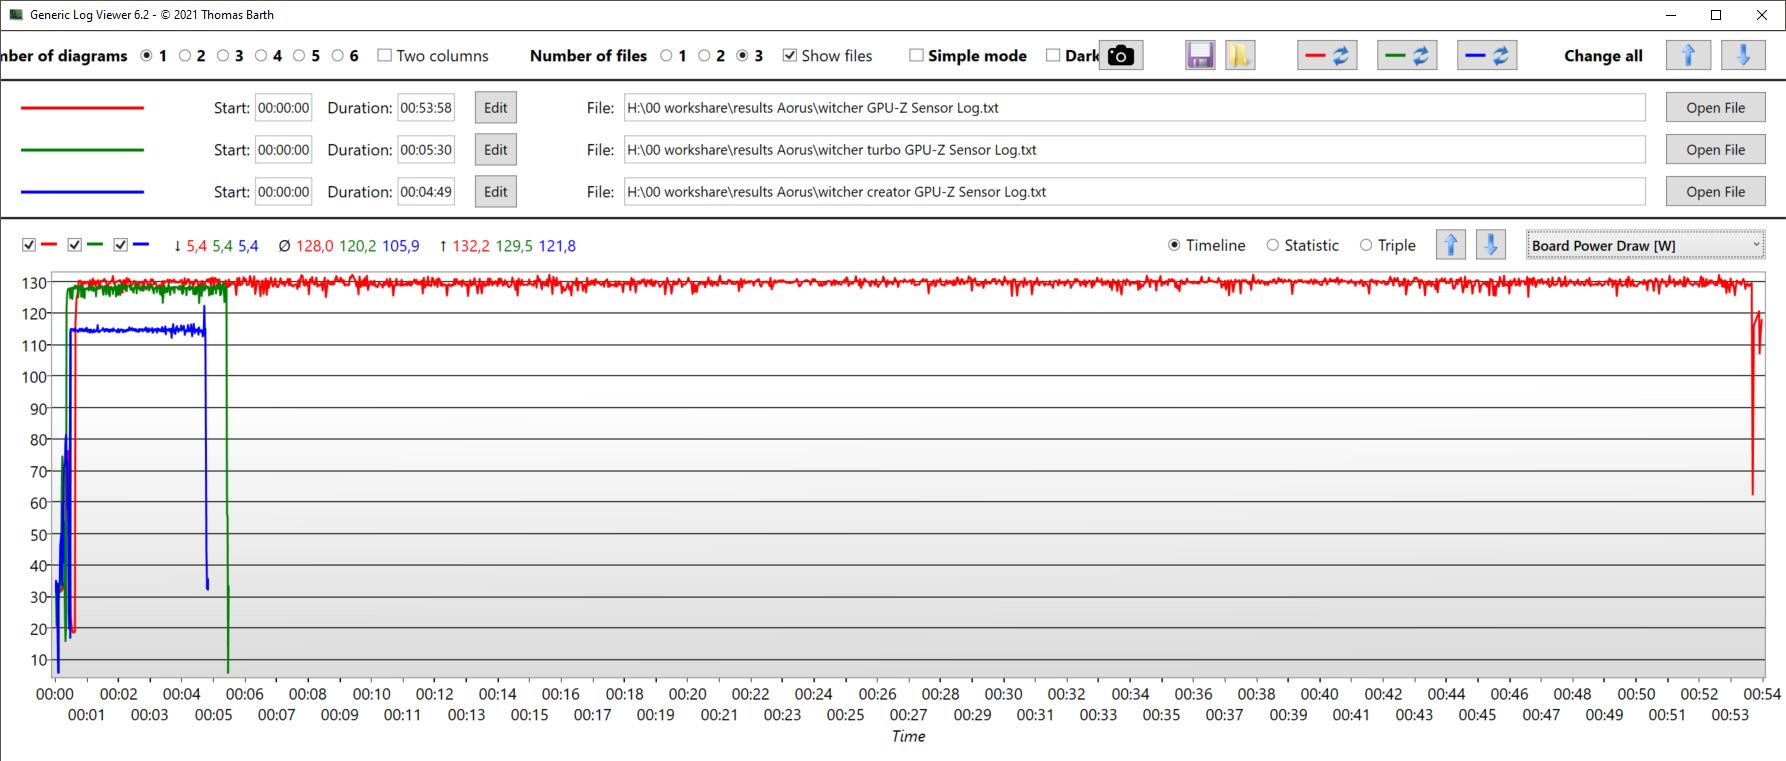
Porównując tryby, można zauważyć, że turbo, AI i gry zapewniały praktycznie taką samą wydajność GPU w The Witcher 3. Jedyną różnicą jest to, że GPU pozostawał znacznie chłodniejszy w trybie turbo, ale ten tryb był również znacznie głośniejszy.
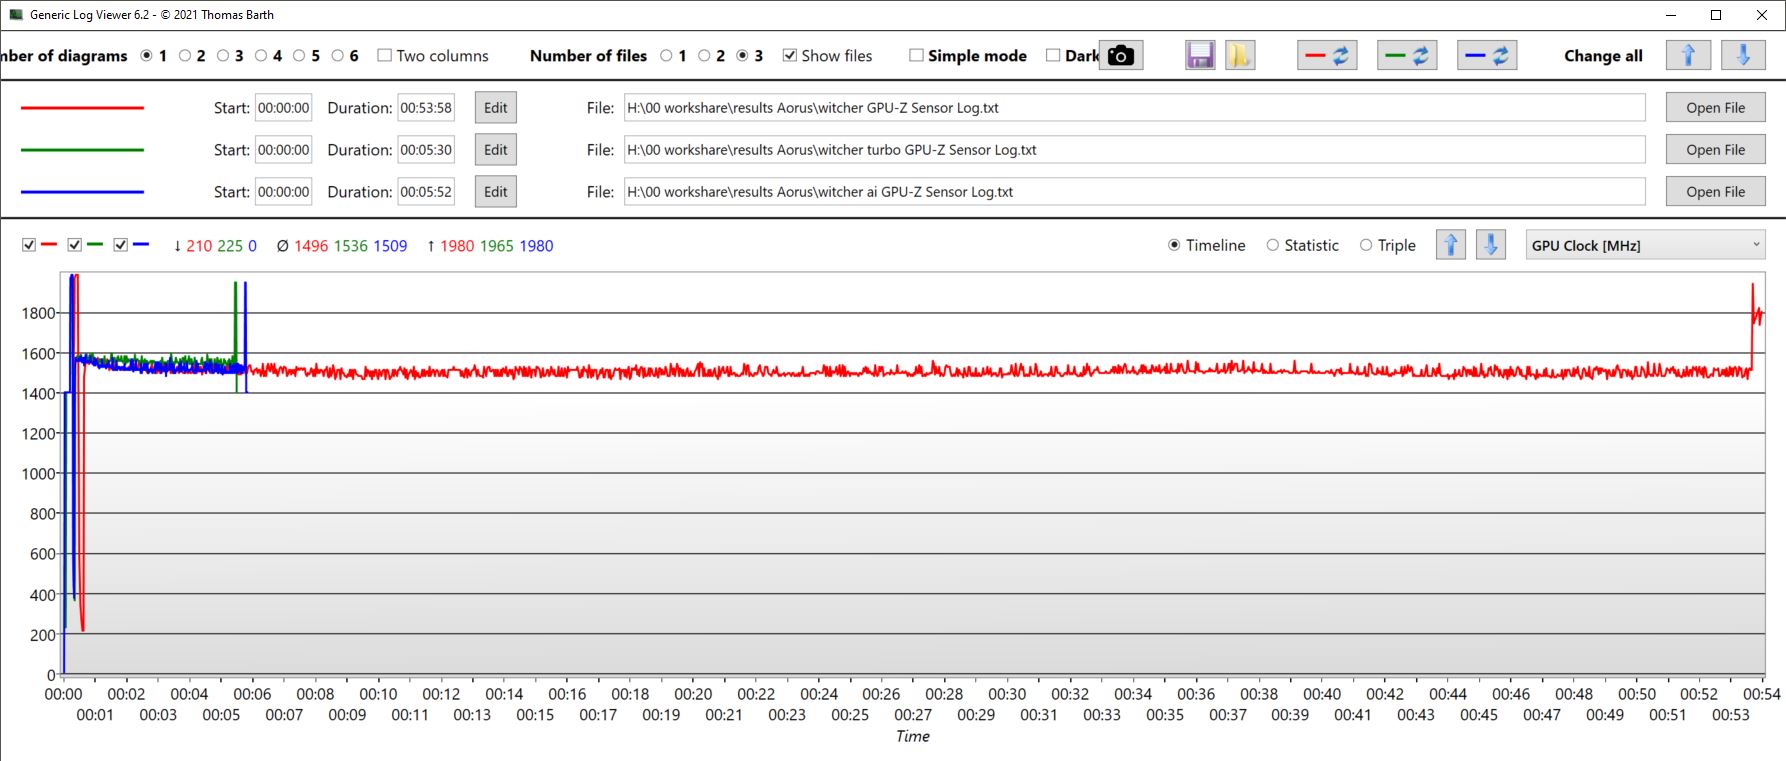
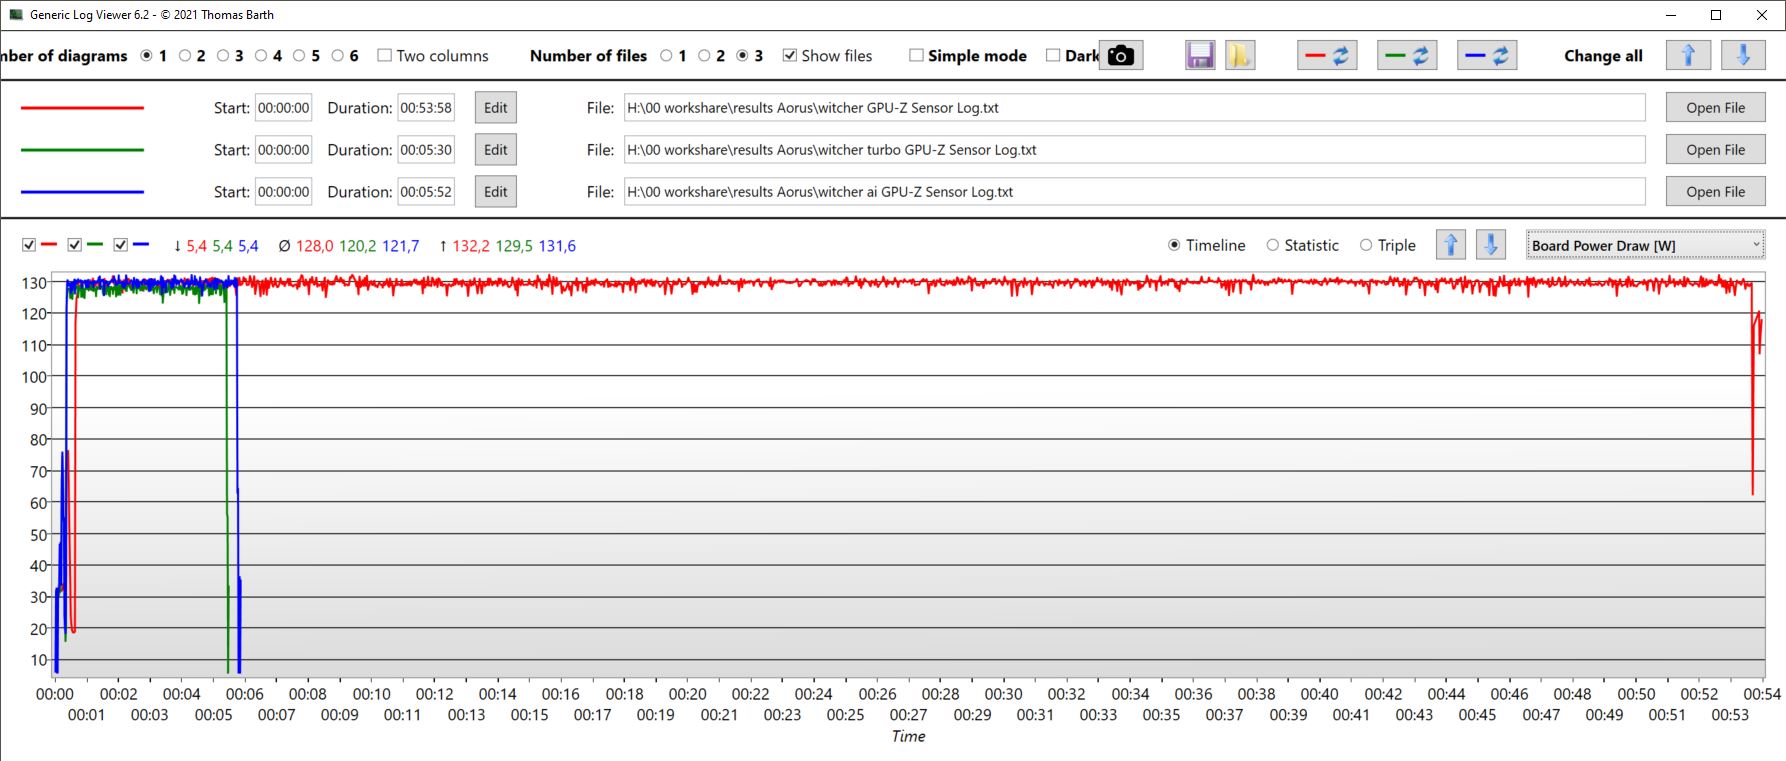
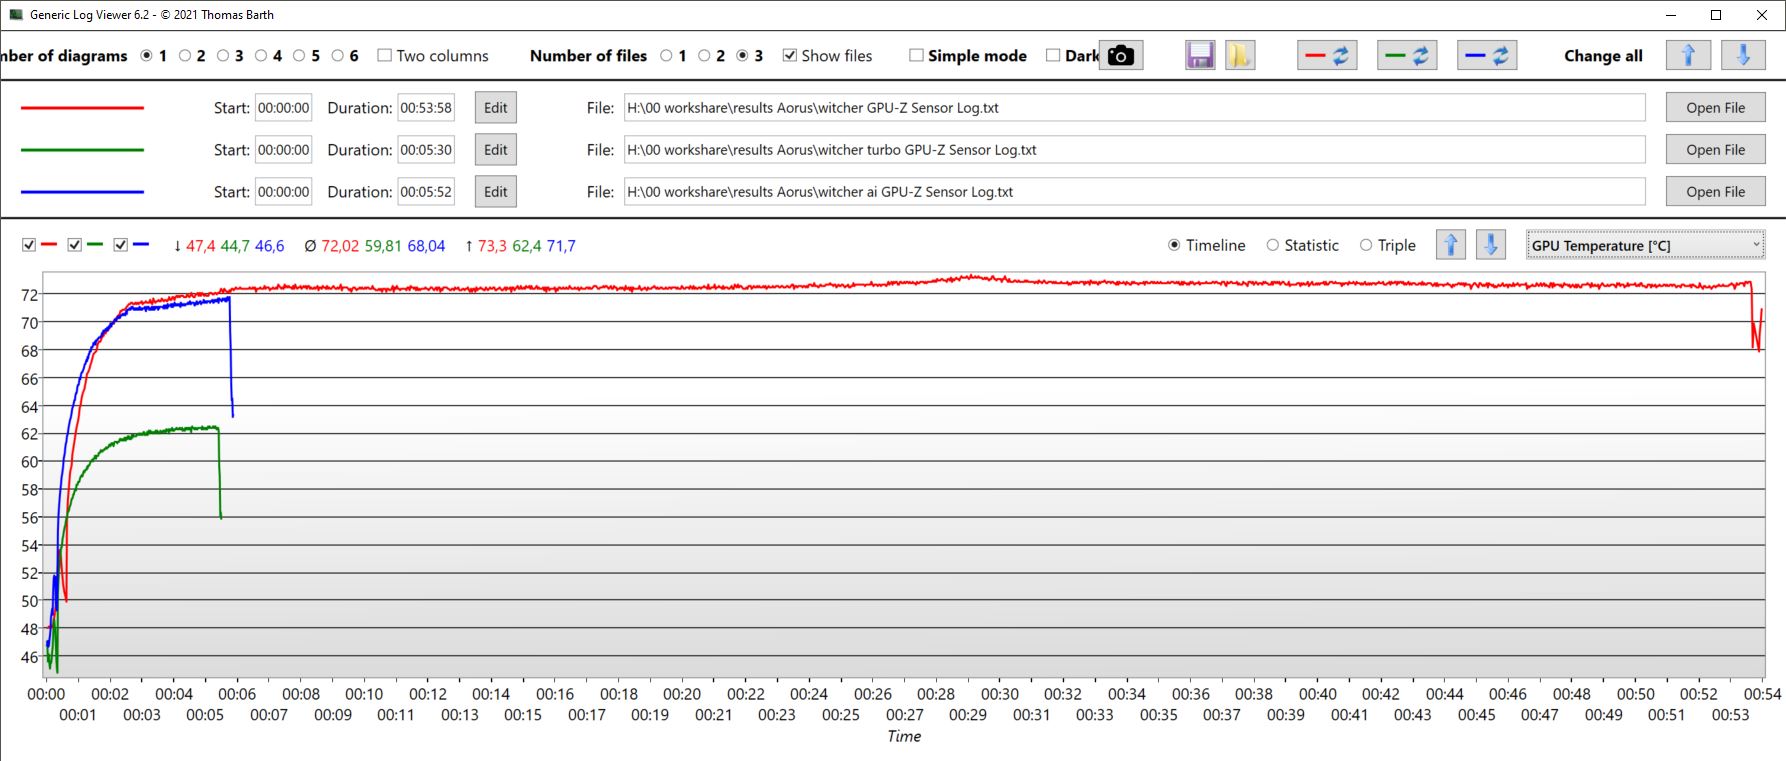
Tryb Creator (tym razem niebieska krzywa) działał nieco gorzej, nie pobierał tyle mocy i pozostawał nieco chłodniejszy. W sekcji dotyczącej emisji hałasu wymieniliśmy tryby i ich wpływ na liczbę klatek na sekundę i emisję hałasu podczas uruchamiania gry The Witcher 3.
| Performance rating - Percent | |
| HP Omen 16-wf000 | |
| Średnia w klasie Gaming | |
| Aorus 15 YE5-54DEB34SH -1! | |
| Aorus 15 BSF -1! | |
| HP Victus 16-r0077ng | |
| Captiva Advanced Gaming I74-121 | |
| Dell XPS 15 9530 RTX 4070 | |
| The Witcher 3 - 1920x1080 Ultra Graphics & Postprocessing (HBAO+) | |
| Średnia w klasie Gaming (95 - 240, n=7, ostatnie 2 lata) | |
| HP Omen 16-wf000 | |
| Aorus 15 YE5-54DEB34SH | |
| Aorus 15 BSF | |
| HP Victus 16-r0077ng | |
| Captiva Advanced Gaming I74-121 | |
| Dell XPS 15 9530 RTX 4070 | |
| GTA V - 1920x1080 Highest AA:4xMSAA + FX AF:16x | |
| Średnia w klasie Gaming (48.3 - 186.9, n=96, ostatnie 2 lata) | |
| Aorus 15 YE5-54DEB34SH | |
| Captiva Advanced Gaming I74-121 | |
| HP Omen 16-wf000 | |
| HP Victus 16-r0077ng | |
| Dell XPS 15 9530 RTX 4070 | |
| Final Fantasy XV Benchmark - 1920x1080 High Quality | |
| HP Omen 16-wf000 | |
| Średnia w klasie Gaming (41 - 215, n=97, ostatnie 2 lata) | |
| Aorus 15 YE5-54DEB34SH | |
| Aorus 15 BSF | |
| HP Victus 16-r0077ng | |
| Captiva Advanced Gaming I74-121 | |
| Dell XPS 15 9530 RTX 4070 | |
| Strange Brigade - 1920x1080 ultra AA:ultra AF:16 | |
| HP Omen 16-wf000 | |
| Średnia w klasie Gaming (76.3 - 456, n=87, ostatnie 2 lata) | |
| Aorus 15 BSF | |
| HP Victus 16-r0077ng | |
| Captiva Advanced Gaming I74-121 | |
| Dell XPS 15 9530 RTX 4070 | |
| Dota 2 Reborn - 1920x1080 ultra (3/3) best looking | |
| HP Omen 16-wf000 | |
| Średnia w klasie Gaming (84.8 - 248, n=109, ostatnie 2 lata) | |
| Aorus 15 BSF | |
| Captiva Advanced Gaming I74-121 | |
| Aorus 15 YE5-54DEB34SH | |
| Dell XPS 15 9530 RTX 4070 | |
| HP Victus 16-r0077ng | |
| X-Plane 11.11 - 1920x1080 high (fps_test=3) | |
| HP Omen 16-wf000 | |
| Aorus 15 BSF | |
| Captiva Advanced Gaming I74-121 | |
| Średnia w klasie Gaming (52.1 - 143.5, n=111, ostatnie 2 lata) | |
| HP Victus 16-r0077ng | |
| Aorus 15 YE5-54DEB34SH | |
| Dell XPS 15 9530 RTX 4070 | |
Witcher 3 FPS diagram
| low | med. | high | ultra | QHD | 4K | |
|---|---|---|---|---|---|---|
| GTA V (2015) | 184.4 | 180.8 | 176 | 118 | ||
| The Witcher 3 (2015) | 385 | 306 | 222 | 120 | 86 | |
| Dota 2 Reborn (2015) | 167.6 | 154.1 | 146.4 | 138.9 | 140.1 | |
| Final Fantasy XV Benchmark (2018) | 206 | 151.7 | 119.2 | 92.2 | ||
| X-Plane 11.11 (2018) | 134.1 | 121.3 | 94.9 | 85.4 | ||
| Far Cry 5 (2018) | 165 | 137 | 131 | 124 | 116 |
Emisje i moc - lepsze niż mogłoby to sugerować RTX 3080 Ti
Emisja hałasu
W trybie turbo wentylatory są zawsze blisko swojego limitu, czyli od 52 do 55 dB. W pozostałych trybach wentylatory pracują bardziej sytuacyjnie. Poniższa tabela zawiera poziomy emisji hałasu w różnych trybach po około 10 minutach grania w The Witcher 3. Ogólnie rzecz biorąc, emisje można określić jako umiarkowane w stosunku do wydajności i można je regulować w bardzo zmienny sposób dzięki wielu trybom. Zarówno Captiva i HP Victus działają gorzej w aplikacjach 3D, ale są podobnie głośne - Captiva jest nawet głośniejsza.
W trybie gry wentylatory są również aktywne, gdy laptop pracuje na biegu jałowym, aczkolwiek cicho. Zwykle są one ciche w trybie spotkania lub oszczędzania energii. Podczas symulowanego scenariusza średniego obciążenia (3DMark06) z wybranym trybem gry emisja hałasu stopniowo wzrastała do 43 dB. W trybie oszczędzania energii (Power Saver) ten sam test przebiegł przy zaledwie 27 dB.
| Tryb wydajności/Witcher 3 | Maksymalna liczba klatek na sekundę | Średnia liczba klatek na sekundę | Emisja hałasu w dB | Zużycie energii w watach |
|---|---|---|---|---|
| Turbo | 124 | 118 | 52.68 | 199 |
| AI | 122 | 116 | 44.78 | 197 |
| Gry | 125 | 116 | 46.77 | 196 |
| Twórca | 115 | 110 | 44.78 | 185 |
| Spotkanie | 111 | 105 | 36.53 | 163 |
| Oszczędzanie energii | 115 | 106 | 36.53 | 162 |
Hałas
| luz |
| 23 / 23 / 26.42 dB |
| obciążenie |
| 43.5 / 50.21 dB |
 | ||
30 dB cichy 40 dB(A) słyszalny 50 dB(A) irytujący |
||
min: | ||
| Aorus 15 YE5-54DEB34SH GeForce RTX 3080 Ti Laptop GPU, i5-12500H, Gigabyte AG470S1TB-SI B10 | Aorus 15 BSF GeForce RTX 4070 Laptop GPU, i7-13700H, Gigabyte AG470S1TB-SI B10 | Captiva Advanced Gaming I74-121 GeForce RTX 4060 Laptop GPU, i5-13500H, Samsung SSD 980 1TB MZ-V8V1T0BW | HP Victus 16-r0077ng GeForce RTX 4070 Laptop GPU, i7-13700H, Kioxia XG8 KXG80ZNV1T02 | Dell XPS 15 9530 RTX 4070 GeForce RTX 4070 Laptop GPU, i7-13700H, SK hynix PC801 HFS001TEJ9X101N | HP Omen 16-wf000 GeForce RTX 4080 Laptop GPU, i7-13700HX, SK hynix PC801 HFS002TEJ9X101N | |
|---|---|---|---|---|---|---|
| Noise | -20% | -3% | -9% | 10% | -13% | |
| wyłączone / środowisko * (dB) | 23 | 24 -4% | 23 -0% | 25 -9% | 23.1 -0% | 23 -0% |
| Idle Minimum * (dB) | 23 | 25 -9% | 23 -0% | 28 -22% | 23.1 -0% | 29.6 -29% |
| Idle Average * (dB) | 23 | 31 -35% | 25.67 -12% | 29 -26% | 23.1 -0% | 29.8 -30% |
| Idle Maximum * (dB) | 26.42 | 37 -40% | 25.67 3% | 30 -14% | 24.2 8% | 30.4 -15% |
| Load Average * (dB) | 43.5 | 51 -17% | 38.52 11% | 43 1% | 27.1 38% | 33.8 22% |
| Witcher 3 ultra * (dB) | 46.77 | 54.17 -16% | 46 2% | 40.1 14% | 57 -22% | |
| Load Maximum * (dB) | 50.21 | 57 -14% | 54.17 -8% | 48 4% | 44.6 11% | 58.3 -16% |
* ... im mniej tym lepiej
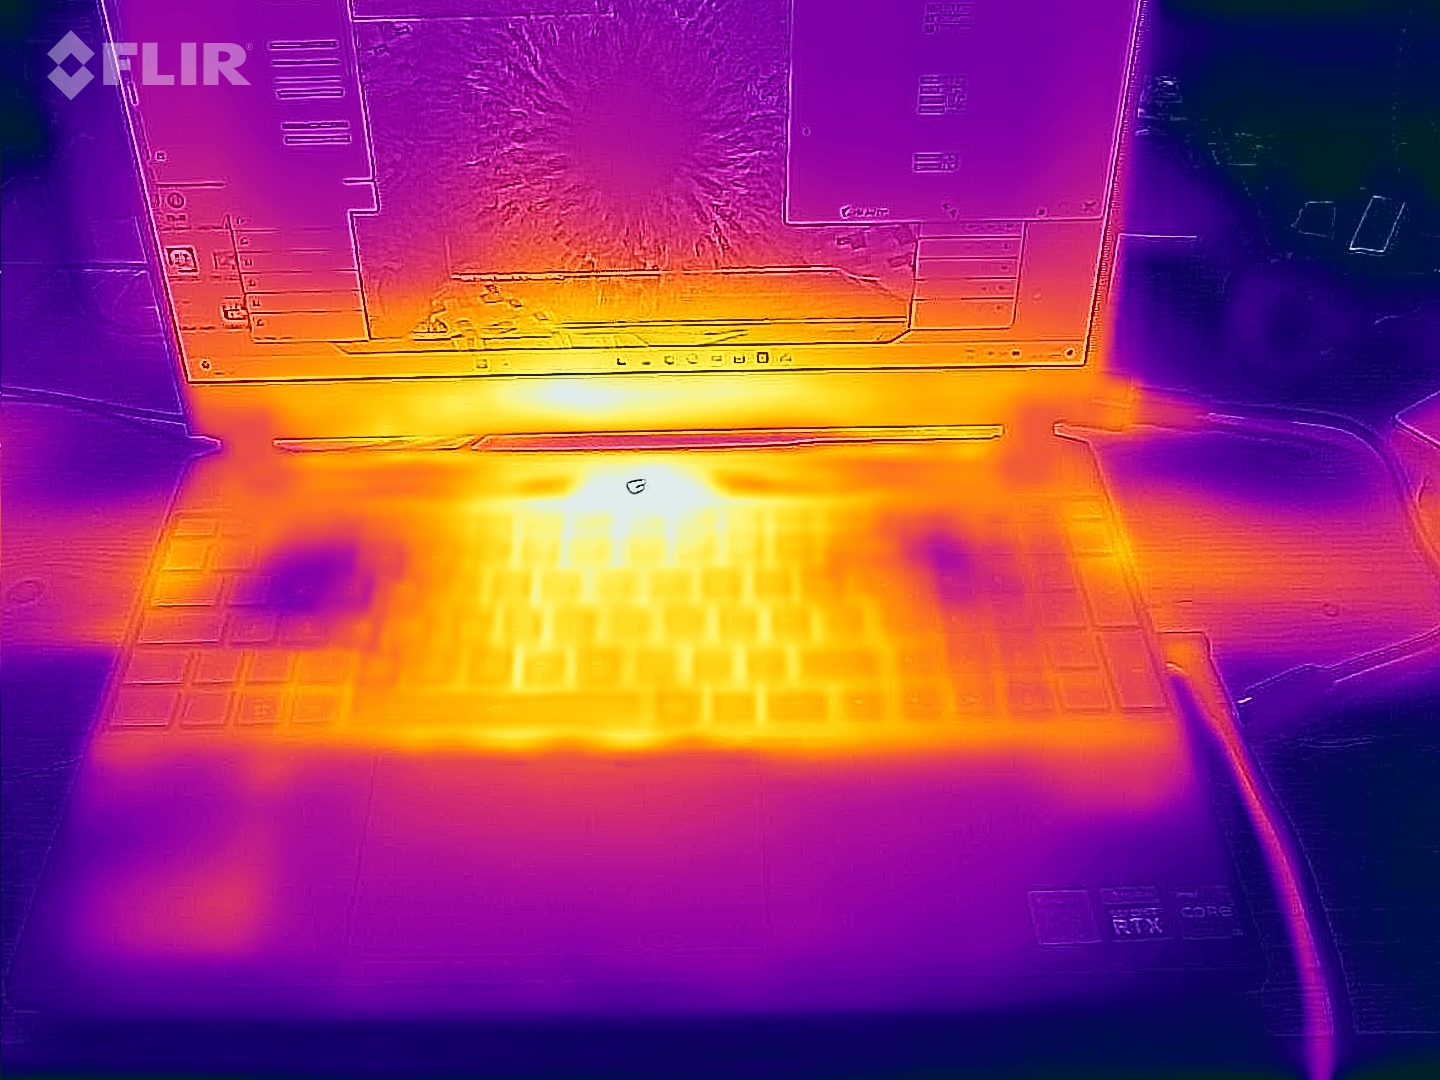
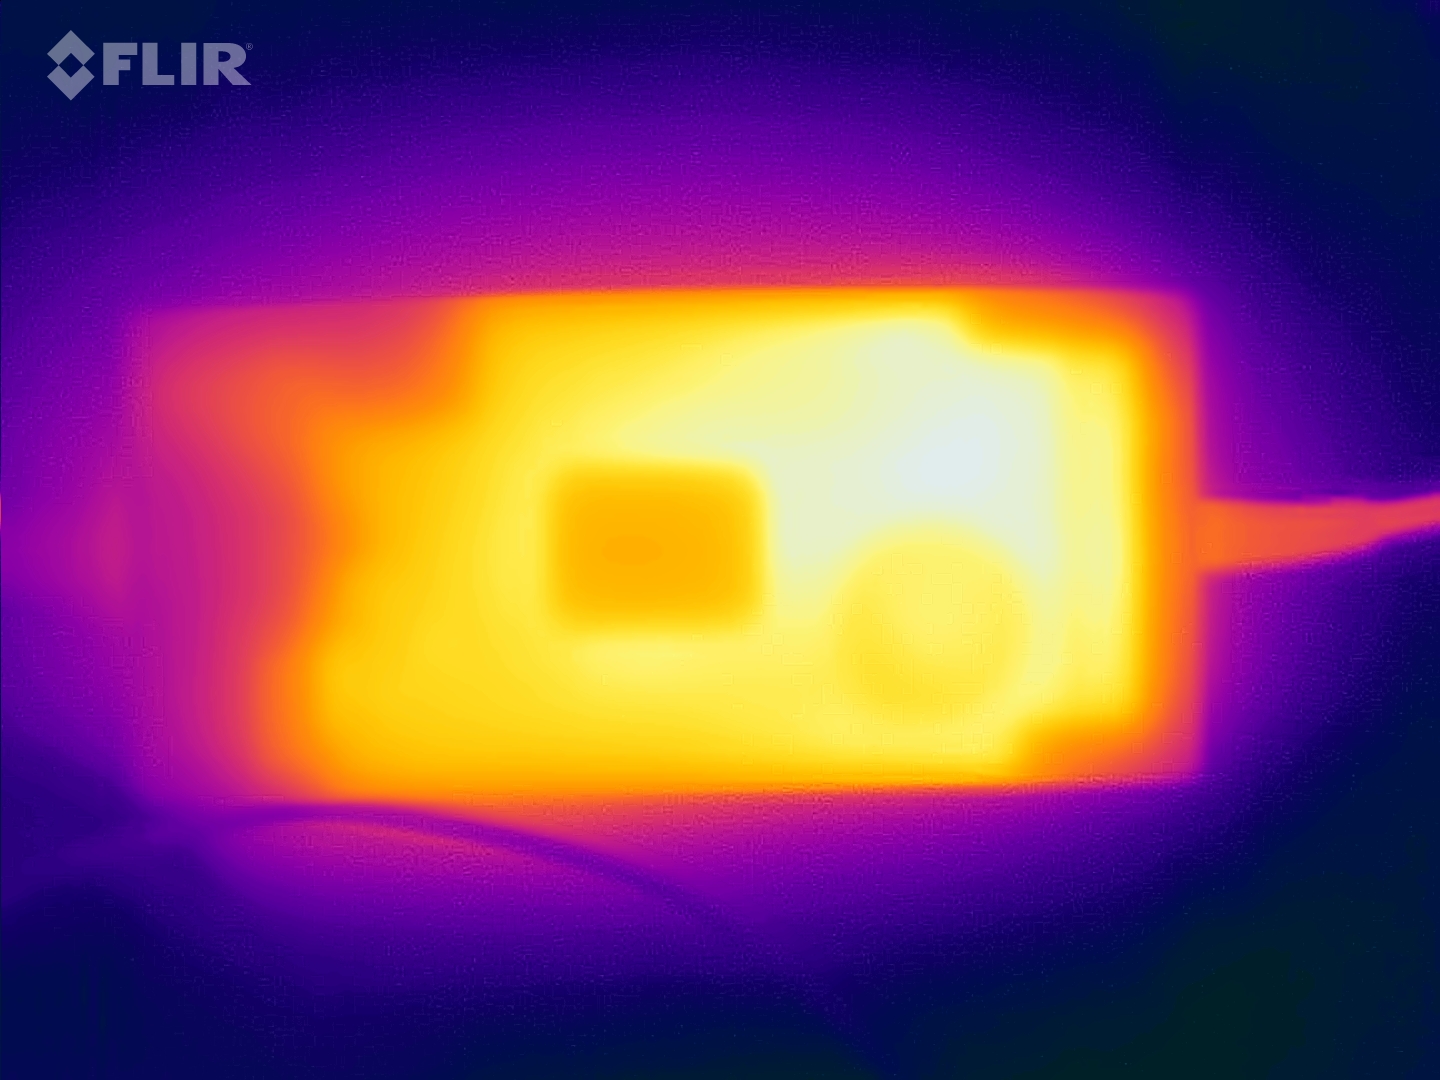
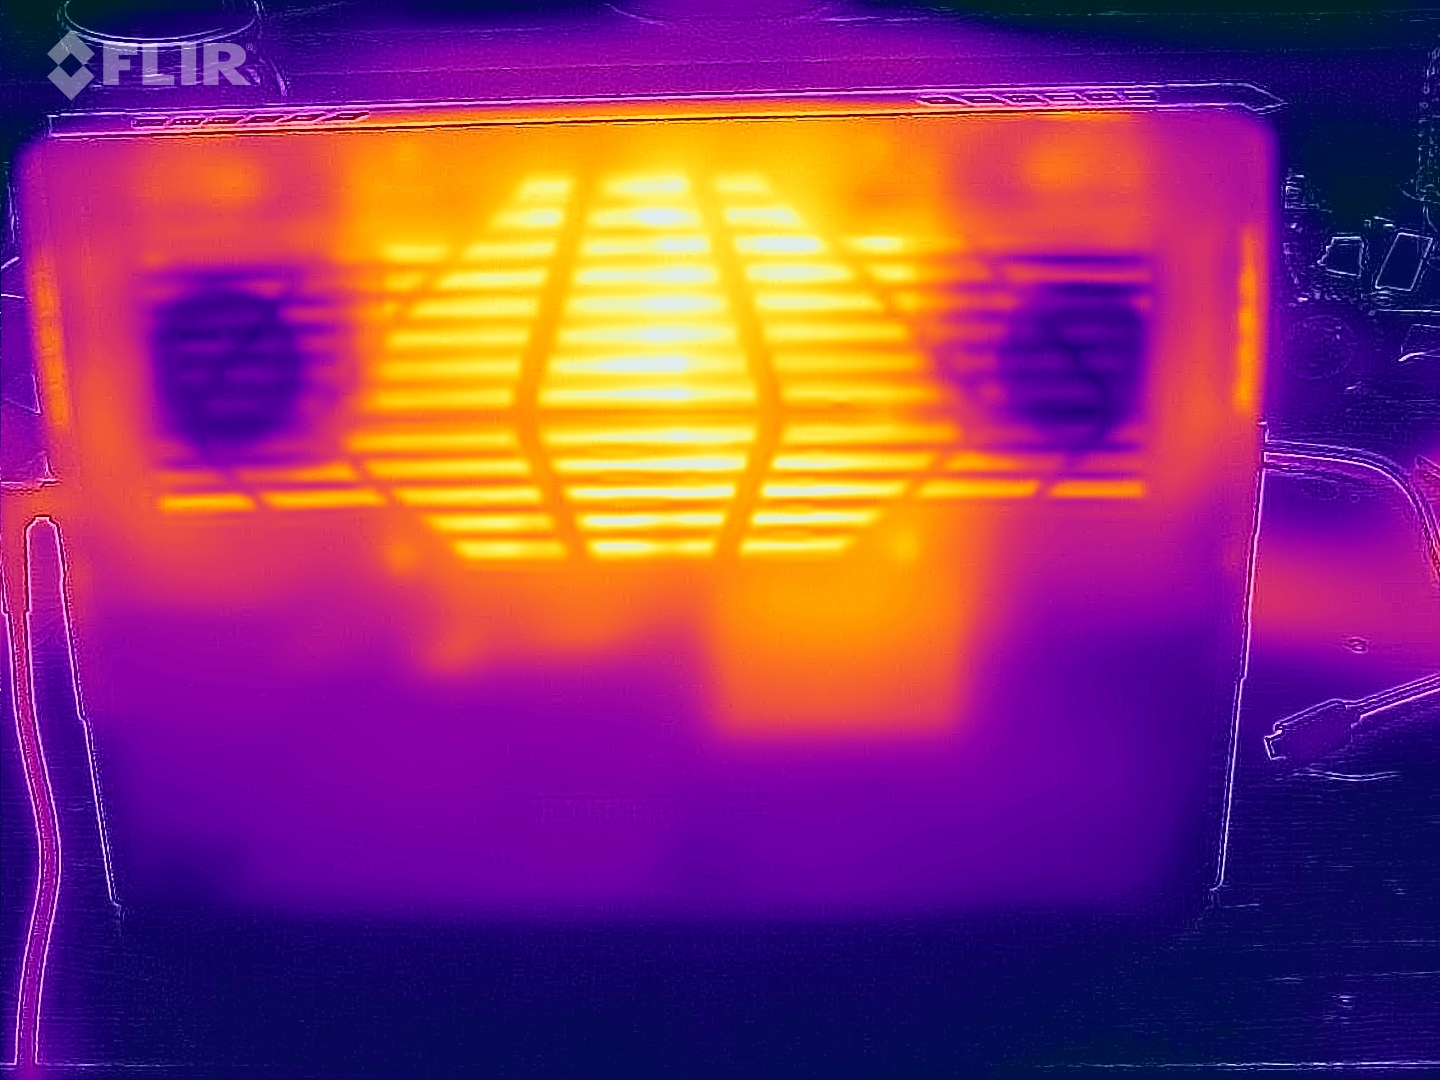
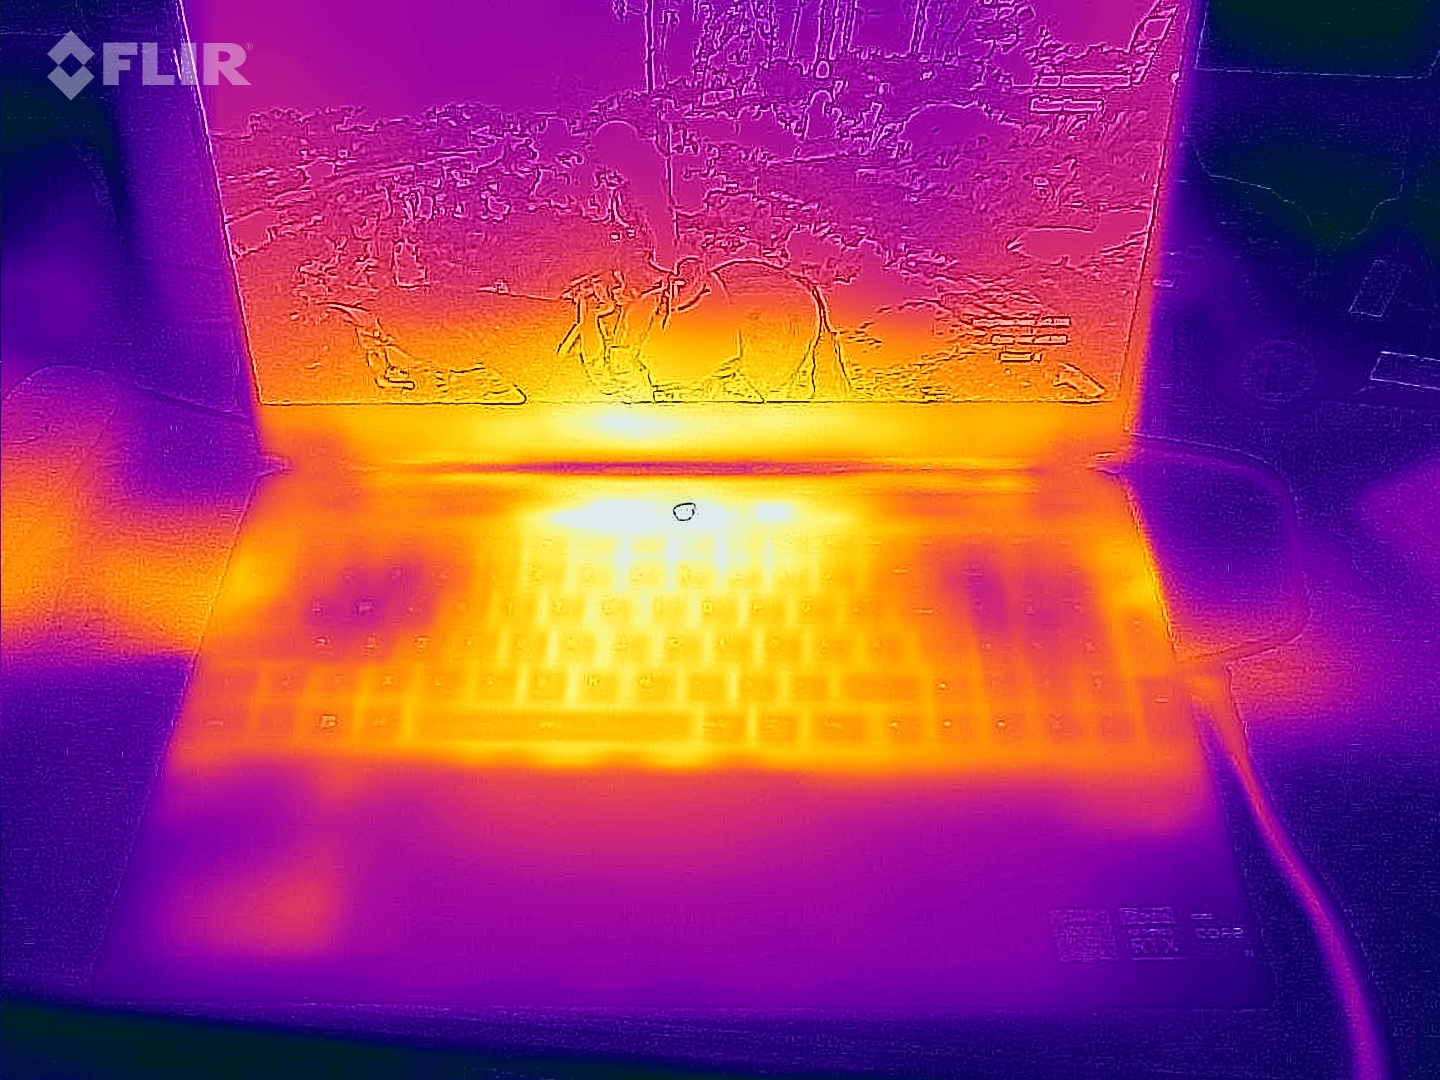
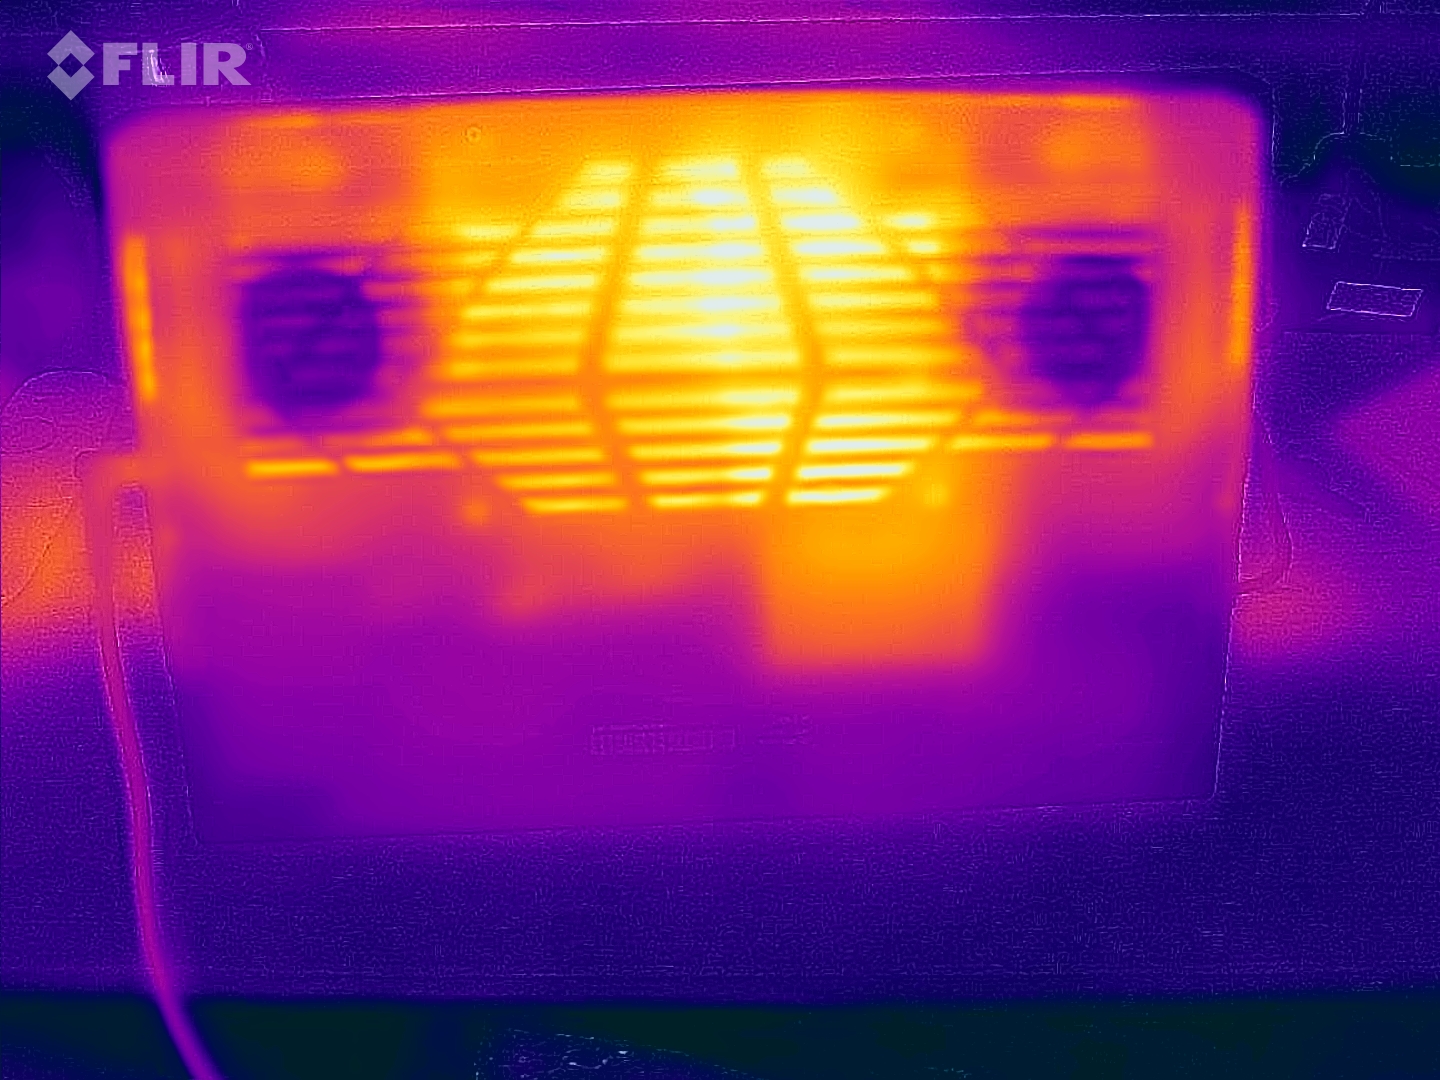
Temperatura
Pod dużym obciążeniem robi się gorący, szczególnie na spodzie w środkowej części urządzenia, w kierunku wyświetlacza. Jednak przy temperaturze do 50 °C mieści się w zakresie typowych laptopów do gier. Góra pozostaje nawet zaskakująco chłodna przy maksymalnie 43 °C. W trybie turbo temperatury są jeszcze niższe.
(±) Maksymalna temperatura w górnej części wynosi 43 °C / 109 F, w porównaniu do średniej 40.4 °C / 105 F , począwszy od 21.2 do 68.8 °C dla klasy Gaming.
(-) Dno nagrzewa się maksymalnie do 50 °C / 122 F, w porównaniu do średniej 43.2 °C / 110 F
(+) W stanie bezczynności średnia temperatura górnej części wynosi 27.3 °C / 81 F, w porównaniu ze średnią temperaturą urządzenia wynoszącą 33.9 °C / ### class_avg_f### F.
(+) Podczas gry w Wiedźmina 3 średnia temperatura górnej części wynosi 29.7 °C / 85 F, w porównaniu do średniej temperatury urządzenia wynoszącej 33.9 °C / ## #class_avg_f### F.
(+) Podpórki pod nadgarstki i touchpad są chłodniejsze niż temperatura skóry i maksymalnie 26 °C / 78.8 F i dlatego są chłodne w dotyku.
(+) Średnia temperatura obszaru podparcia dłoni w podobnych urządzeniach wynosiła 28.8 °C / 83.8 F (+2.8 °C / 5 F).
| Aorus 15 YE5-54DEB34SH Intel Core i5-12500H, NVIDIA GeForce RTX 3080 Ti Laptop GPU | Aorus 15 BSF Intel Core i7-13700H, NVIDIA GeForce RTX 4070 Laptop GPU | Captiva Advanced Gaming I74-121 Intel Core i5-13500H, NVIDIA GeForce RTX 4060 Laptop GPU | HP Victus 16-r0077ng Intel Core i7-13700H, NVIDIA GeForce RTX 4070 Laptop GPU | Dell XPS 15 9530 RTX 4070 Intel Core i7-13700H, NVIDIA GeForce RTX 4070 Laptop GPU | HP Omen 16-wf000 Intel Core i7-13700HX, NVIDIA GeForce RTX 4080 Laptop GPU | |
|---|---|---|---|---|---|---|
| Heat | -8% | 4% | -8% | 1% | 5% | |
| Maximum Upper Side * (°C) | 43 | 48 -12% | 41 5% | 51 -19% | 45.6 -6% | 45 -5% |
| Maximum Bottom * (°C) | 50 | 47 6% | 42 16% | 54 -8% | 42 16% | 48.8 2% |
| Idle Upper Side * (°C) | 33 | 39 -18% | 32 3% | 37 -12% | 34.4 -4% | 29.2 12% |
| Idle Bottom * (°C) | 32 | 35 -9% | 35 -9% | 29 9% | 33.2 -4% | 28.8 10% |
* ... im mniej tym lepiej
Głośniki
Pozytywnym aspektem jest przyzwoita głośność głośników. Jednak basy są słabo słyszalne, a średnie i wysokie tony nie są szczególnie zrównoważone.
Połączone gniazdo 3,5 mm dla mikrofonów i słuchawek jest dostępne do podłączania zewnętrznych urządzeń audio.
Aorus 15 YE5-54DEB34SH analiza dźwięku
(+) | głośniki mogą odtwarzać stosunkowo głośno (84.15 dB)
Bas 100 - 315 Hz
(-) | prawie brak basu - średnio 27.1% niższa od mediany
(±) | liniowość basu jest średnia (12.4% delta do poprzedniej częstotliwości)
Średnie 400 - 2000 Hz
(±) | wyższe średnie - średnio 6.2% wyższe niż mediana
(±) | liniowość środka jest średnia (7.7% delta do poprzedniej częstotliwości)
Wysokie 2–16 kHz
(±) | wyższe maksima - średnio 7.4% wyższe od mediany
(±) | liniowość wysokich wartości jest średnia (7.5% delta do poprzedniej częstotliwości)
Ogólnie 100 - 16.000 Hz
(±) | liniowość ogólnego dźwięku jest średnia (22.5% różnicy w stosunku do mediany)
W porównaniu do tej samej klasy
» 81% wszystkich testowanych urządzeń w tej klasie było lepszych, 5% podobnych, 14% gorszych
» Najlepszy miał deltę 6%, średnia wynosiła ###średnia###%, najgorsza wynosiła 132%
W porównaniu do wszystkich testowanych urządzeń
» 66% wszystkich testowanych urządzeń było lepszych, 6% podobnych, 28% gorszych
» Najlepszy miał deltę 4%, średnia wynosiła ###średnia###%, najgorsza wynosiła 134%
Apple MacBook Pro 16 2021 M1 Pro analiza dźwięku
(+) | głośniki mogą odtwarzać stosunkowo głośno (84.7 dB)
Bas 100 - 315 Hz
(+) | dobry bas - tylko 3.8% od mediany
(+) | bas jest liniowy (5.2% delta do poprzedniej częstotliwości)
Średnie 400 - 2000 Hz
(+) | zbalansowane środki średnie - tylko 1.3% od mediany
(+) | średnie są liniowe (2.1% delta do poprzedniej częstotliwości)
Wysokie 2–16 kHz
(+) | zrównoważone maksima - tylko 1.9% od mediany
(+) | wzloty są liniowe (2.7% delta do poprzedniej częstotliwości)
Ogólnie 100 - 16.000 Hz
(+) | ogólny dźwięk jest liniowy (4.6% różnicy w stosunku do mediany)
W porównaniu do tej samej klasy
» 0% wszystkich testowanych urządzeń w tej klasie było lepszych, 0% podobnych, 100% gorszych
» Najlepszy miał deltę 5%, średnia wynosiła ###średnia###%, najgorsza wynosiła 45%
W porównaniu do wszystkich testowanych urządzeń
» 0% wszystkich testowanych urządzeń było lepszych, 0% podobnych, 100% gorszych
» Najlepszy miał deltę 4%, średnia wynosiła ###średnia###%, najgorsza wynosiła 134%
Zużycie energii
No dobrze, RTX 3080 Ti nie jest do końca oszczędny - technicznie rzecz biorąc, obecna generacja CPU/GPU powinna być już bardziej wydajna.
Aby zużywać tak samo "mało" jak Captiva podczas grania w The Witcher 3, na przykład, musieliby Państwo ustawić naszego Aorusa na tryb spotkania lub oszczędzania energii. Jednakże, częstotliwość odświeżania w grze jest wtedy również na nieco zaskakującym poziomie (patrz tabela w sekcji emisji hałasu).
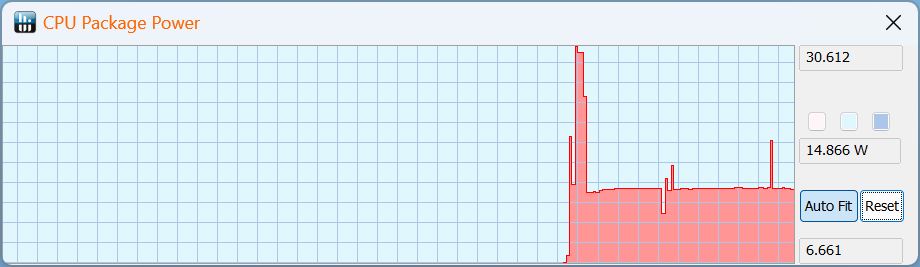
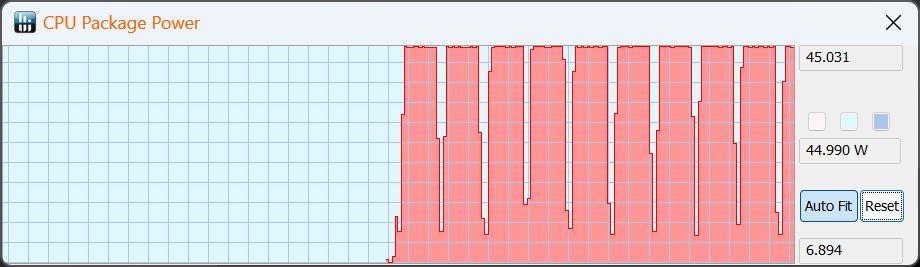
Przede wszystkim, 150 watów, które zmierzyliśmy w naszym teście 3DMark06 (średnie obciążenie) wyróżnia się negatywnie; w przeciwieństwie do tego, Captiva zużywa tylko 85 watów. Ogólnie rzecz biorąc, nawet w trybie bezczynności należy spodziewać się nieco wyższego zużycia energii, ale w grach nabiera to nowego znaczenia.
Zmierzyliśmy maksymalną i tymczasową wartość 204 watów, z którą 240-watowy zasilacz Delta z łatwością sobie poradzi.
| wyłączony / stan wstrzymania | |
| luz | |
| obciążenie |
|
Legenda:
min: | |
| Aorus 15 YE5-54DEB34SH GeForce RTX 3080 Ti Laptop GPU, i5-12500H, Gigabyte AG470S1TB-SI B10 | Aorus 15 BSF GeForce RTX 4070 Laptop GPU, i7-13700H, Gigabyte AG470S1TB-SI B10 | Captiva Advanced Gaming I74-121 GeForce RTX 4060 Laptop GPU, i5-13500H, Samsung SSD 980 1TB MZ-V8V1T0BW | HP Victus 16-r0077ng GeForce RTX 4070 Laptop GPU, i7-13700H, Kioxia XG8 KXG80ZNV1T02 | Dell XPS 15 9530 RTX 4070 GeForce RTX 4070 Laptop GPU, i7-13700H, SK hynix PC801 HFS001TEJ9X101N | HP Omen 16-wf000 GeForce RTX 4080 Laptop GPU, i7-13700HX, SK hynix PC801 HFS002TEJ9X101N | |
|---|---|---|---|---|---|---|
| Power Consumption | 10% | 15% | 23% | 23% | -24% | |
| Idle 150cd/m2 * (Watt) | 16 | 12.4 22% | 18 -13% | 12.8 20% | 20.1 -26% | 23.2 -45% |
| 3DMark06 Return To Proxycon * (Watt) | 150 | 85 43% | ||||
| Witcher 3 ultra * (Watt) | 196 | 175.8 10% | 164 16% | 141.8 28% | 95.4 51% | 214 -9% |
| 1280x720 Prime95 28.10 and Furmark 1.25 * (Watt) | 204 | 210 -3% | 179 12% | 164.1 20% | 117.2 43% | 240 -18% |
* ... im mniej tym lepiej
Power consumption Witcher 3 / stress test
Power consumption with external monitor
Czas trwania
Aorus rozczarowuje pod względem czasu pracy, prawdopodobnie ze względu na zwiększone zużycie energii w trybie bezczynności. Gigabyte zainstalował hojną baterię o pojemności 99 Wh, ale jej czas pracy był nadal na tym samym poziomie, co w przypadku Captiva z baterią 53 Wh! Obecna generacja Aorus BSF z i7-13700H i RTX 4070 działała o 65% dłużej z baterią 99 Wh i prawie dwa razy dłużej w teście WLAN! Działał przez ponad 10 godzin, podczas gdy nasz Aorus wytrzymał mniej niż 5,5 godziny.
| Aorus 15 YE5-54DEB34SH i5-12500H, GeForce RTX 3080 Ti Laptop GPU, 99 Wh | Aorus 15 BSF i7-13700H, GeForce RTX 4070 Laptop GPU, 99 Wh | Captiva Advanced Gaming I74-121 i5-13500H, GeForce RTX 4060 Laptop GPU, 53 Wh | HP Victus 16-r0077ng i7-13700H, GeForce RTX 4070 Laptop GPU, 83 Wh | Dell XPS 15 9530 RTX 4070 i7-13700H, GeForce RTX 4070 Laptop GPU, 86 Wh | HP Omen 16-wf000 i7-13700HX, GeForce RTX 4080 Laptop GPU, 83 Wh | Średnia w klasie Gaming | |
|---|---|---|---|---|---|---|---|
| Czasy pracy | 64% | -5% | 34% | 20% | -20% | 30% | |
| H.264 (h) | 5.3 | 9 70% | 4.9 -8% | 8.9 ? 68% | |||
| WiFi v1.3 (h) | 5.3 | 10.3 94% | 5.3 0% | 7.1 34% | 8 51% | 5.1 -4% | 7.09 ? 34% |
| Load (h) | 1.7 | 2.2 29% | 1.6 -6% | 1.5 -12% | 1.1 -35% | 1.51 ? -11% | |
| Reader / Idle (h) | 10.9 | 11.5 | 5.5 | 8.71 ? |
Za
Przeciw
Werdykt - Zdecydowanie konkurencyjny!


Połączenie procesora Gen-12 i RTX 3080 Ti w żadnym wypadku nie należy do przeszłości, zwłaszcza jeśli chodzi o wydajność (3D). Aorus 15 YE5 może pokonać większość innych laptopów do gier z RTX 4070, co czyni go wartym rozważenia - zwłaszcza w odniesieniu do jego niskiej ceny. Pomimo tego, Aorus nie zrezygnował z nowoczesnych funkcji, takich jak Thunderbolt 4, szybki dysk SSD czy dopracowana konstrukcja, jak wielu jego konkurentów.
Jego słaba wydajność nie jest już całkowicie aktualna, co znajduje odzwierciedlenie głównie w rozczarowujących czasach pracy laptopa pomimo dużej baterii. Jego stara kamera internetowa 720p może nie jest absolutnym no-go, jednak dla graczy jest to wyraźna wada. Irytującą cechą, która jest typowa dla Aorusa, jest to, że urządzenie bardzo szybko przełącza się w tryb gotowości, gdy tylko zamkniemy wyświetlacz o 45 stopni.
Aorus 15 YE5 oferuje bardzo wysoką wydajność w grach w niskiej cenie - bez wydawania się tanim, jak robią to niektórzy drożsi konkurenci. Jego procesor graficzny ostatniej generacji jest szczególnie imponujący, jeśli chodzi o wydajność 3D, podczas gdy jego wydajność i czasy pracy są niewystarczające.
Dostępnych jest kilka alternatyw w podobnej cenie, takich jak MSI Katana z RTX 4070. Jednak Aorus powinien być nieco szybszy w wielu grach. Co więcej, Katana nie jest wyposażona w Thunderbolt 4 ani nie sprawia wrażenia tak wysokiej jakości. Z kolei MSI korzysta z dłuższych czasów pracy. The HP Victus 16 zachowuje się podobnie - kosztuje nawet nieco więcej, ale nie jest tak szybki ani tak wysokiej jakości jak Aorus. Obecnie będą Państwo musieli wydać około 300 USD więcej, aby kupić Aorusa obecnej generacji.
Cena i dostępność
Aorus 15 YE5 kosztuje obecnie około 1500 USD. W chwili pisania tego tekstu nie mogliśmy znaleźć go w sprzedaży u żadnego sprzedawcy internetowego w USA.
Aorus 15 YE5-54DEB34SH
- 15/12/2023 v7 (old)
Christian Hintze
Przezroczystość
Wyboru urządzeń do recenzji dokonuje nasza redakcja. Próbka testowa została udostępniona autorowi jako pożyczka od producenta lub sprzedawcy detalicznego na potrzeby tej recenzji. Pożyczkodawca nie miał wpływu na tę recenzję, producent nie otrzymał też kopii tej recenzji przed publikacją. Nie było obowiązku publikowania tej recenzji. Jako niezależna firma medialna, Notebookcheck nie podlega władzy producentów, sprzedawców detalicznych ani wydawców.
Tak testuje Notebookcheck
Każdego roku Notebookcheck niezależnie sprawdza setki laptopów i smartfonów, stosując standardowe procedury, aby zapewnić porównywalność wszystkich wyników. Od około 20 lat stale rozwijamy nasze metody badawcze, ustanawiając przy tym standardy branżowe. W naszych laboratoriach testowych doświadczeni technicy i redaktorzy korzystają z wysokiej jakości sprzętu pomiarowego. Testy te obejmują wieloetapowy proces walidacji. Nasz kompleksowy system ocen opiera się na setkach uzasadnionych pomiarów i benchmarków, co pozwala zachować obiektywizm.Price comparison

