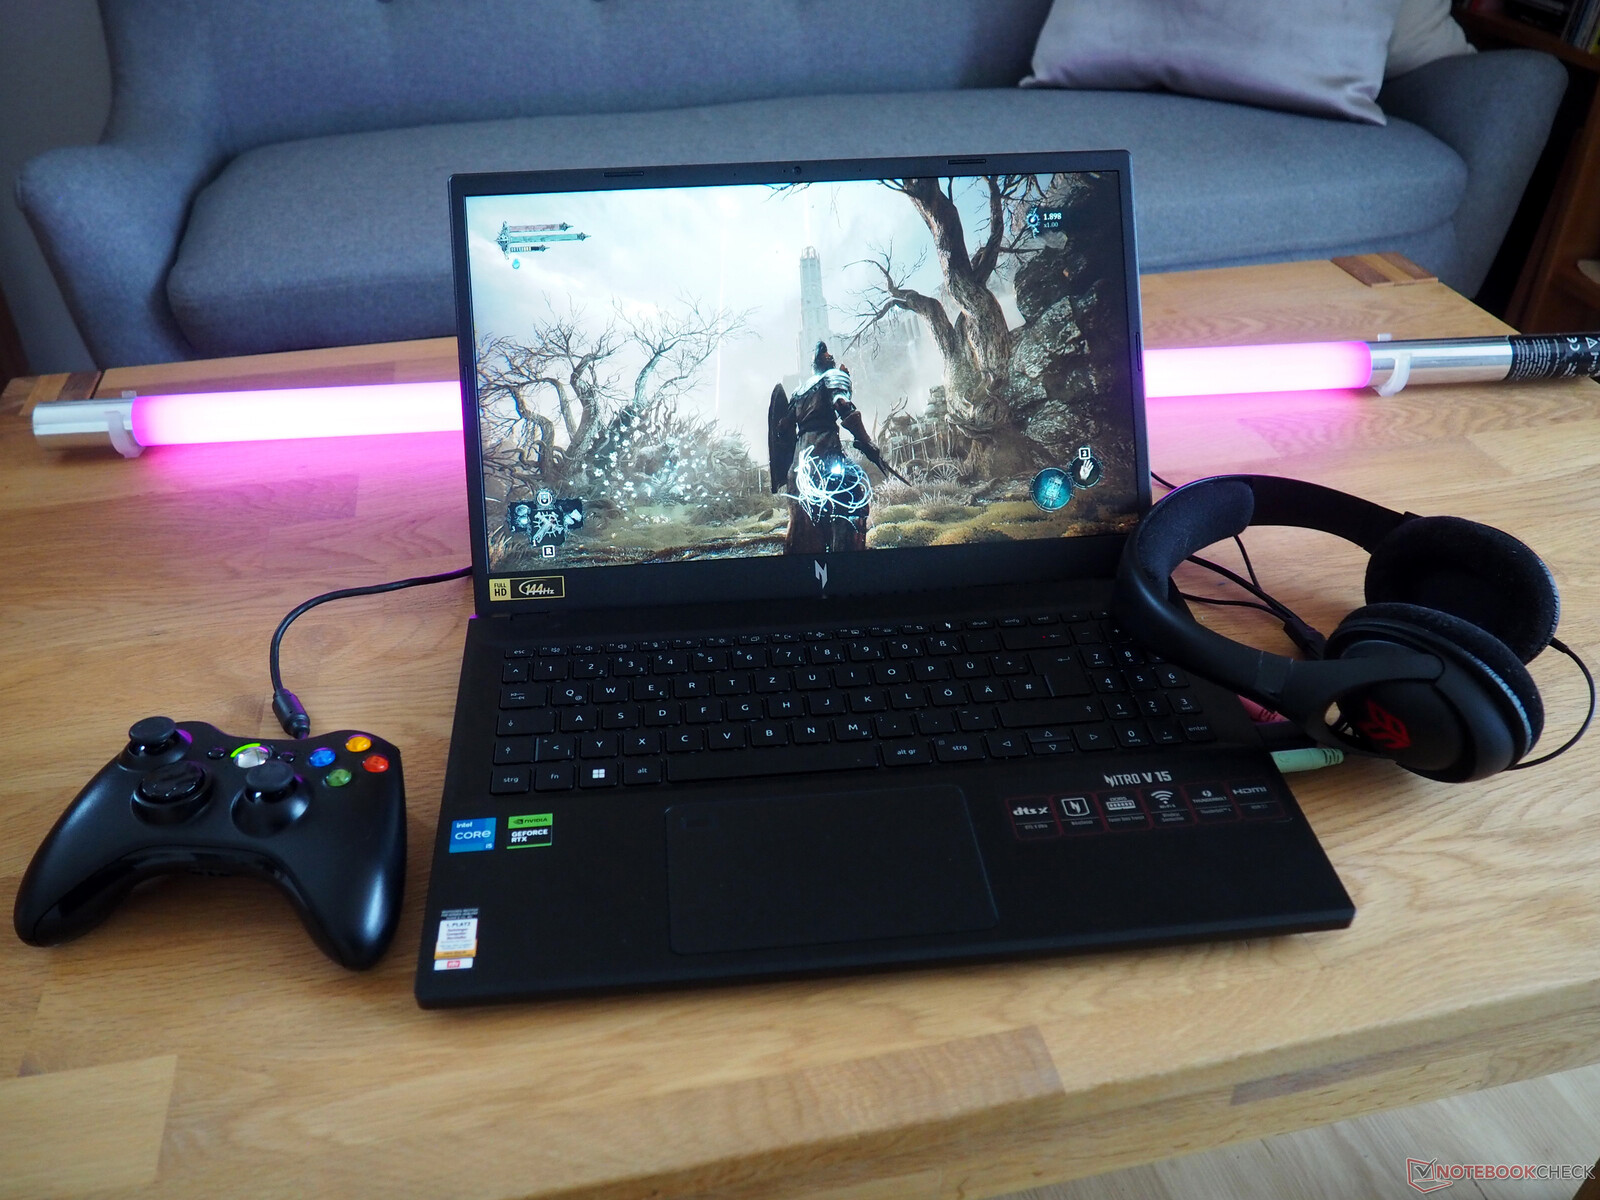
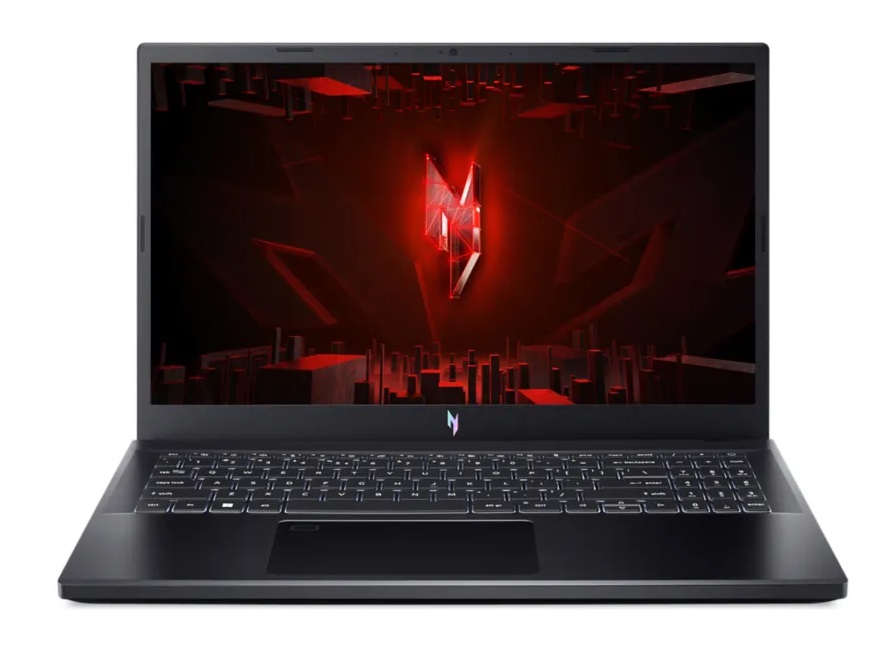
Recenzja Acer Nitro V 15 ANV15-51: Budżetowy laptop do gier z RTX 4050
W Niemczech dostępne są obecnie dwa główne warianty Nitro V 15. Podczas gdy podstawowy model przedstawiony w tej recenzji kosztuje około 900 euro (980 USD) i jest wyposażony w Core i5-13420H (12 wątków) i dysk SSD o pojemności 512 GB, droższy model kosztuje około 200 euro (218 USD) więcej i może pochwalić się procesorem Core i7-13620H (16 wątków) i dyskiem o pojemności 1 TB. Oba warianty są skonfigurowane z tymi samymi 16 GB pamięci RAM DDR5 i dedykowaną kartą graficzną GeForce RTX 4050. Wykorzystują również matowy wyświetlacz IPS o standardowej rozdzielczości Full HD (1920 x 1080) i 144 Hz.
Nitro V 15 konkuruje z innymi 15-calowymi budżetowymi laptopami do gier z GeForce RTX 4050, takimi jak Medion Erazer Crawler E40lenovo LOQ 15IRH8 Lenovo LOQ 15IRH8, Asus TUF A15 FA507 i Schenker XMG Apex 15 Late 23które zostały wymienione w poniższych tabelach w celach porównawczych.
Potencjalni konkurenci w porównaniu
Ocena | Data | Model | Waga | Wysokość | Rozmiar | Rezolucja | Cena |
|---|---|---|---|---|---|---|---|
| 82.8 % v7 (old) | 01/2024 | Acer Nitro V 15 ANV15-51-582S i5-13420H, GeForce RTX 4050 Laptop GPU | 2.1 kg | 23.5 mm | 15.60" | 1920x1080 | |
| 85.4 % v7 (old) | 12/2023 | Medion Erazer Crawler E40 - MD 62518 i5-13500H, GeForce RTX 4050 Laptop GPU | 2.3 kg | 28 mm | 15.60" | 1920x1080 | |
| 85.9 % v7 (old) | 10/2023 | Lenovo LOQ 15IRH8 Core i7 i7-13620H, GeForce RTX 4050 Laptop GPU | 2.4 kg | 25.2 mm | 15.60" | 2560x1440 | |
| 86.3 % v7 (old) | 06/2023 | Asus TUF A15 FA507 R7 7735HS, GeForce RTX 4050 Laptop GPU | 2.2 kg | 24.9 mm | 15.60" | 1920x1080 | |
| 86.2 % v7 (old) | 10/2023 | Schenker XMG Apex 15 (Late 23) R7 7840HS, GeForce RTX 4050 Laptop GPU | 2.2 kg | 26.7 mm | 15.60" | 2560x1440 |
Sprawa
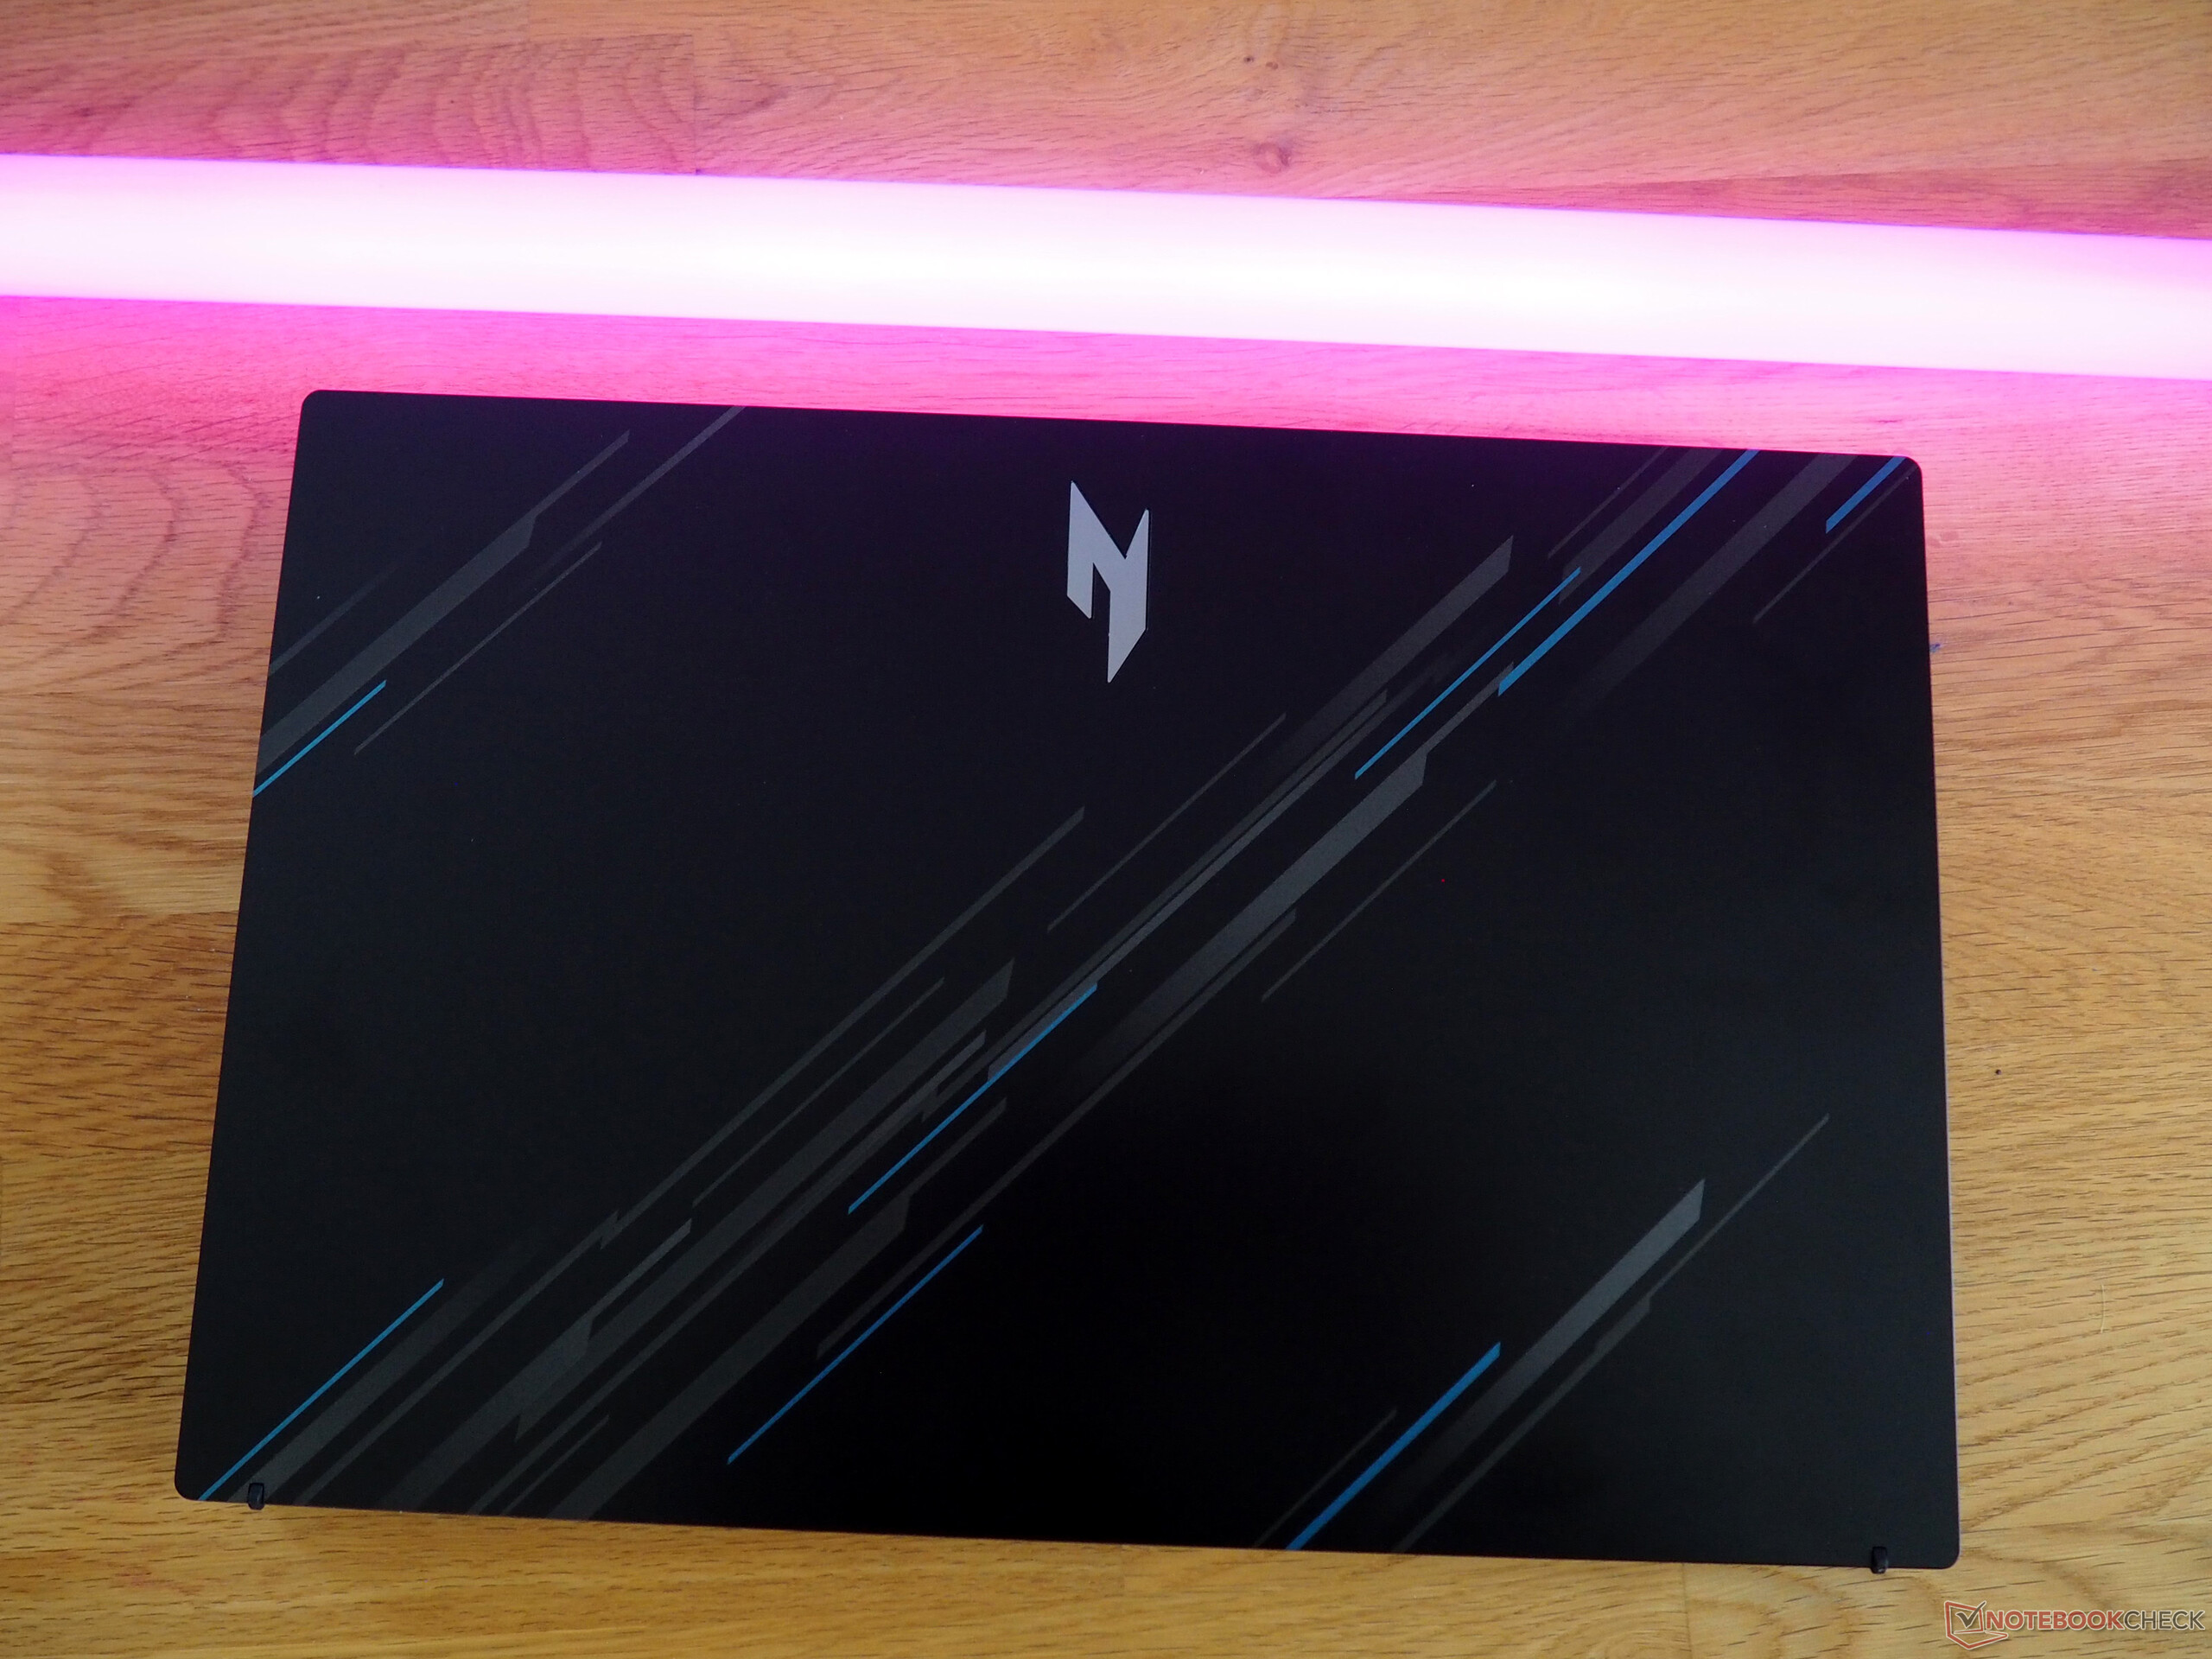
V 15 jest estetyczny. W szczególności szaro-niebieski wzór na pokrywie zapewnia powiew świeżości. Nie należy jednak oczekiwać zbyt wiele od obudowy pod względem jakości. Podobnie jak w przypadku wielu innych urządzeń w tym przedziale cenowym, nabywcy muszą zadowolić się nieco kruchą i niezbyt solidną plastikową obudową. Przynajmniej 15-calowy laptop ma czyste spasowanie i wykończenie, a także solidny maksymalny kąt otwarcia (około 140 °), chociaż jego zawiasy mogłyby być nieco sztywniejsze i mniej "chybotliwe".
Jedną z największych zalet Nitro jest jego umiarkowana waga: przy około 2,1 kg (4,6 funta) jest to najlżejsze urządzenie w naszym porównaniu (konkurenci ważą od 2,2 do 2,4 kg lub od 4,8 do 6,2 funta). Urządzenie nie wygląda też na nieporęczne dzięki smukłej sylwetce.
Specyfikacje
Interfejsy
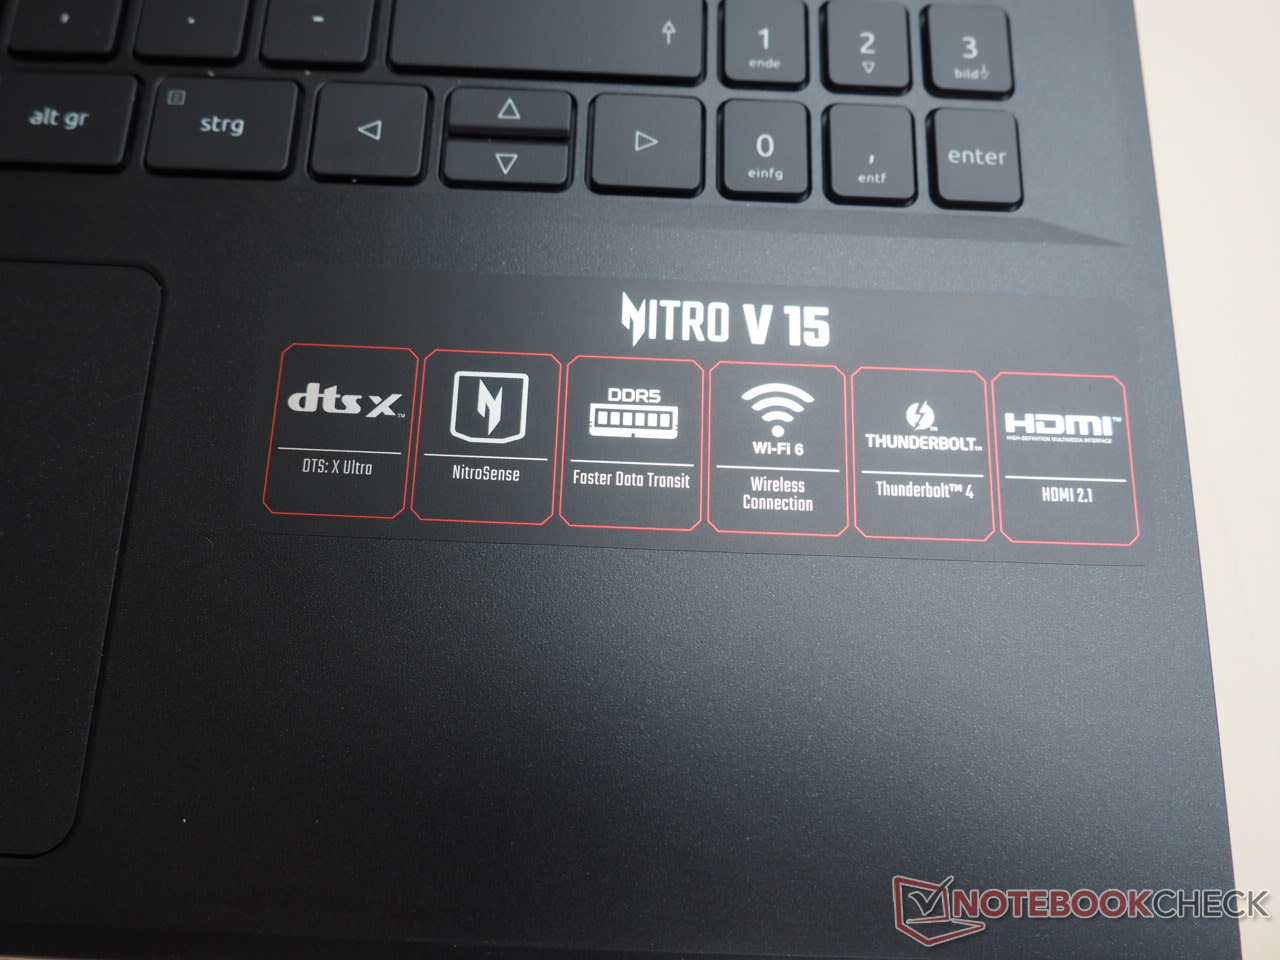
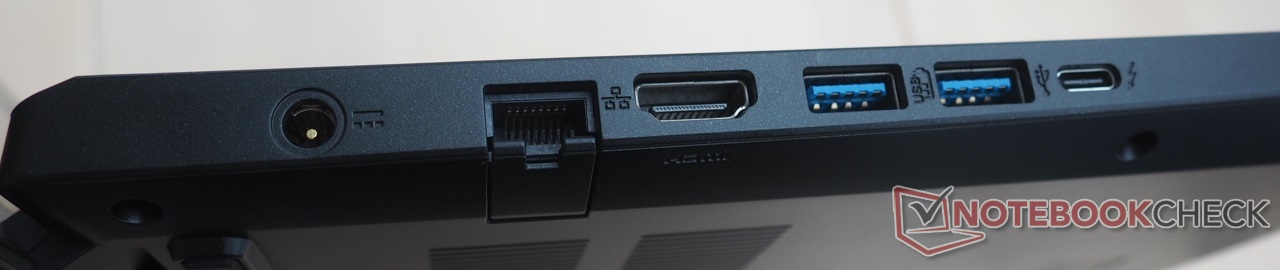
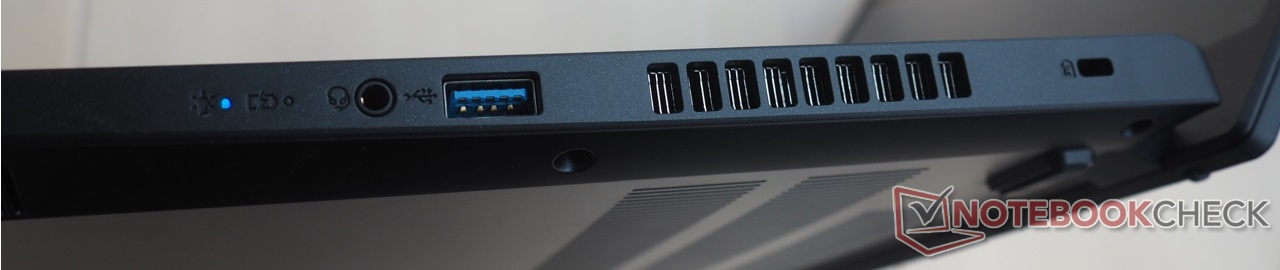
Jeśli zignorować brak czytnika kart, wybór portów można określić jako wystarczający. Chociaż chcielibyśmy zobaczyć jeszcze jeden port USB-C, trzy porty USB-A 3.0 i jeden port Thunderbolt 4 są nadal przyzwoite dla budżetowego laptopa do gier. Nitro V 15 posiada również rozkładany port Ethernet, wyjście HDMI 2.1, gniazdo audio i gniazdo Kensington. Interfejsy są dość dobrze rozmieszczone w całym urządzeniu. Niemniej jednak, niektóre z portów można było umieścić nieco dalej z tyłu, aby ułatwić korzystanie z myszy.
Łączność
Wydajność Wi-Fi jest w najlepszym razie przeciętna. Wbudowany moduł bezprzewodowy Intel (Wi-Fi 6 AX203) nie zapewnia najwyższej wydajności podczas wysyłania i odbierania danych, ale uzyskane prędkości są dość stabilne.
Kamera internetowa
Podobnie, wraz z laptopem otrzymają Państwo jedynie nie wyróżniającą się, standardową kamerę internetową. Jak to często bywa w przypadku kamer internetowych do laptopów, obrazom brakuje ostrości i dokładności kolorów.


Akcesoria
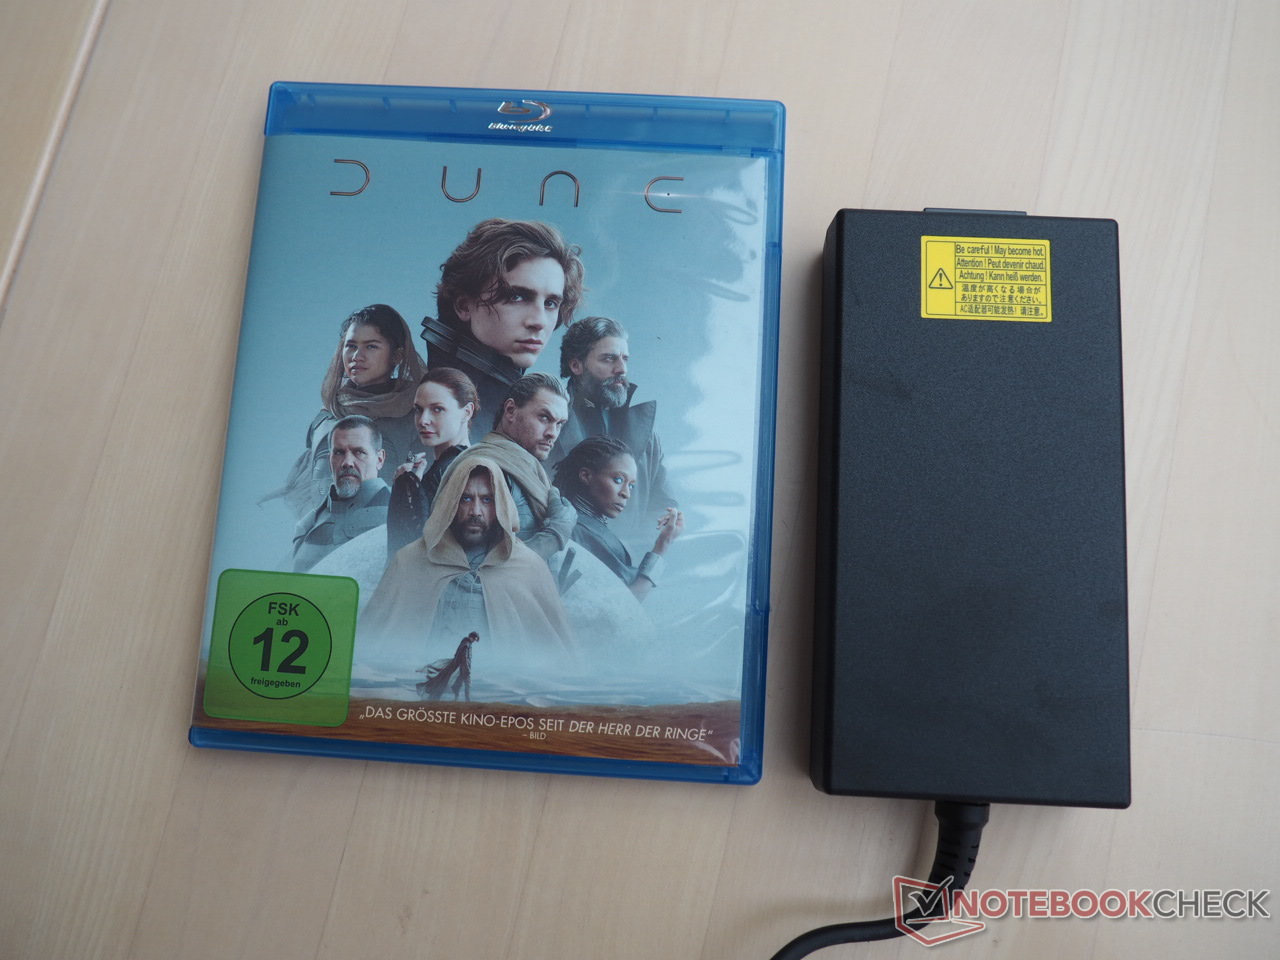
Oprócz kilku dokumentów, w pudełku znajdą Państwo również przyjemnie kompaktowy i lekki 135-watowy zasilacz sieciowy.
Konserwacja
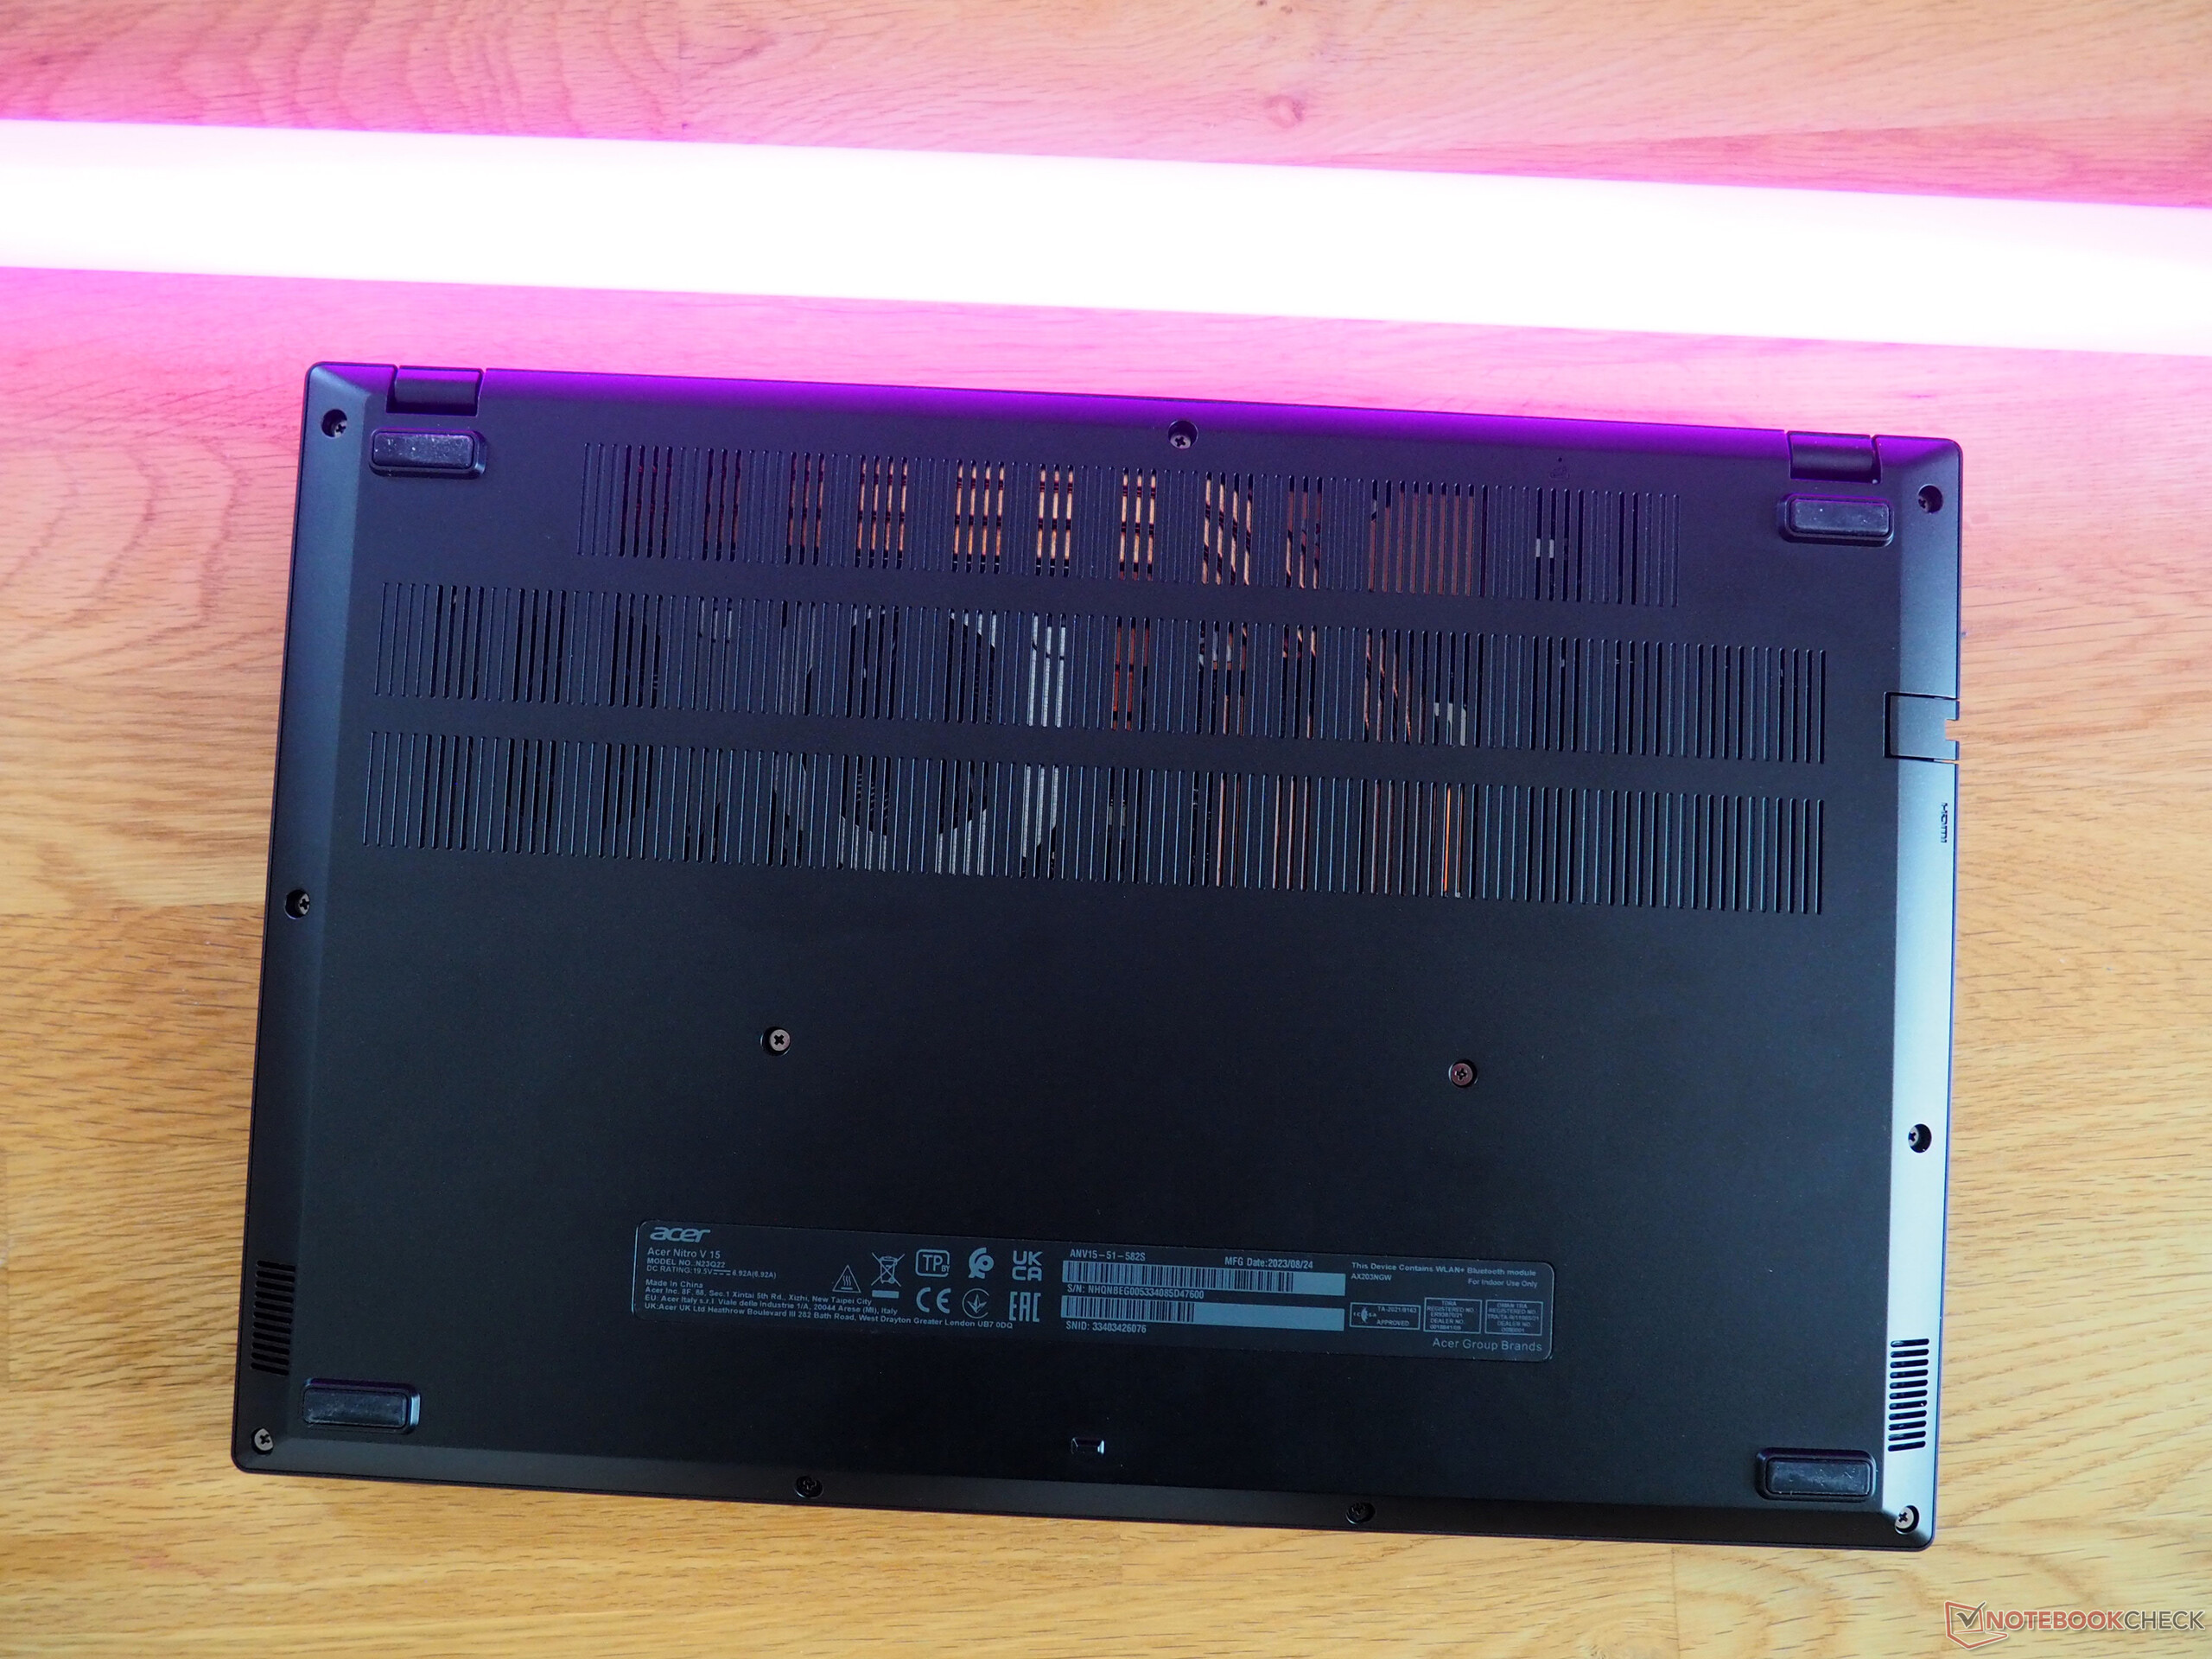
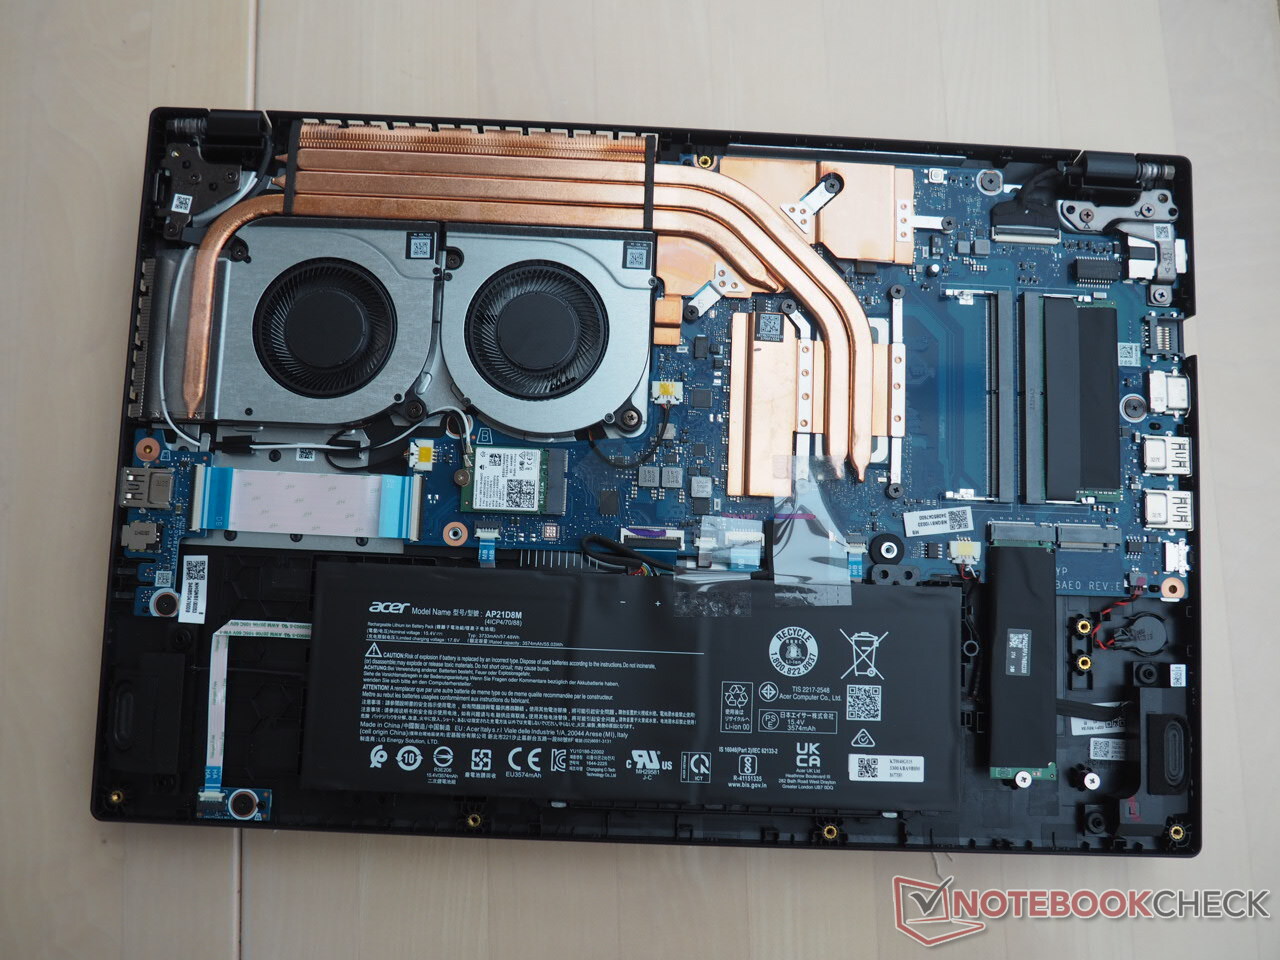
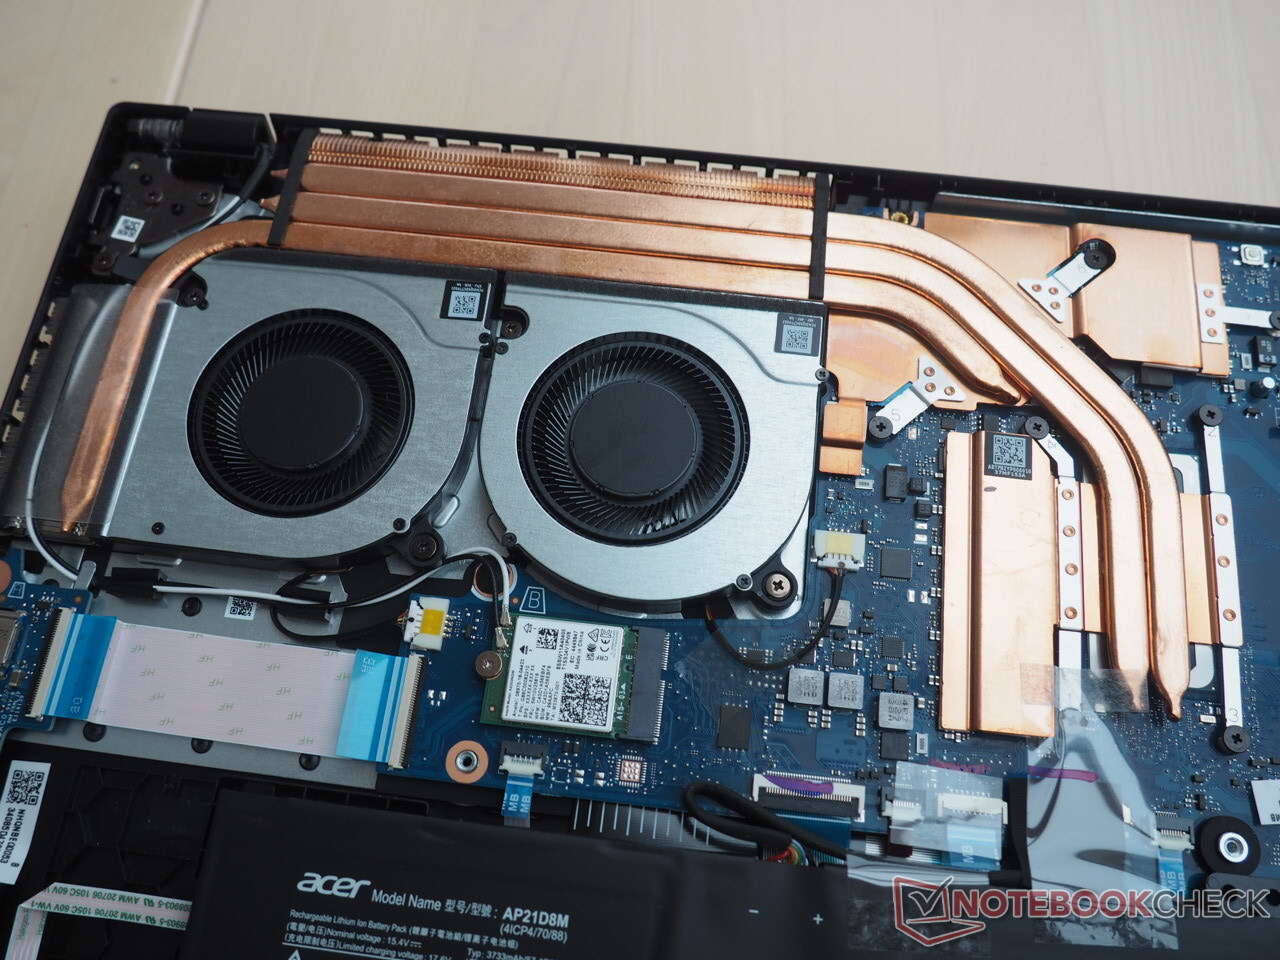
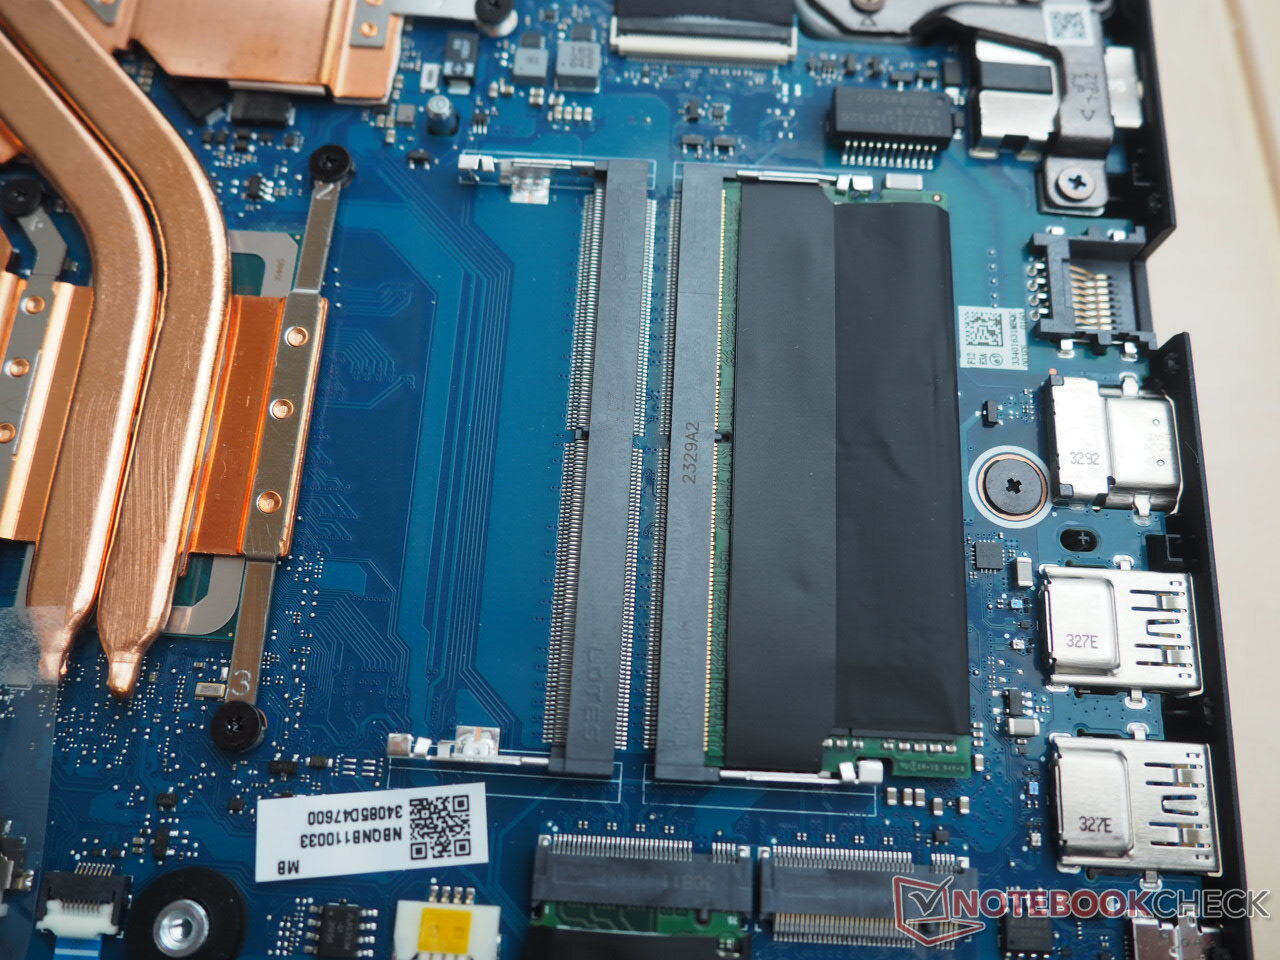
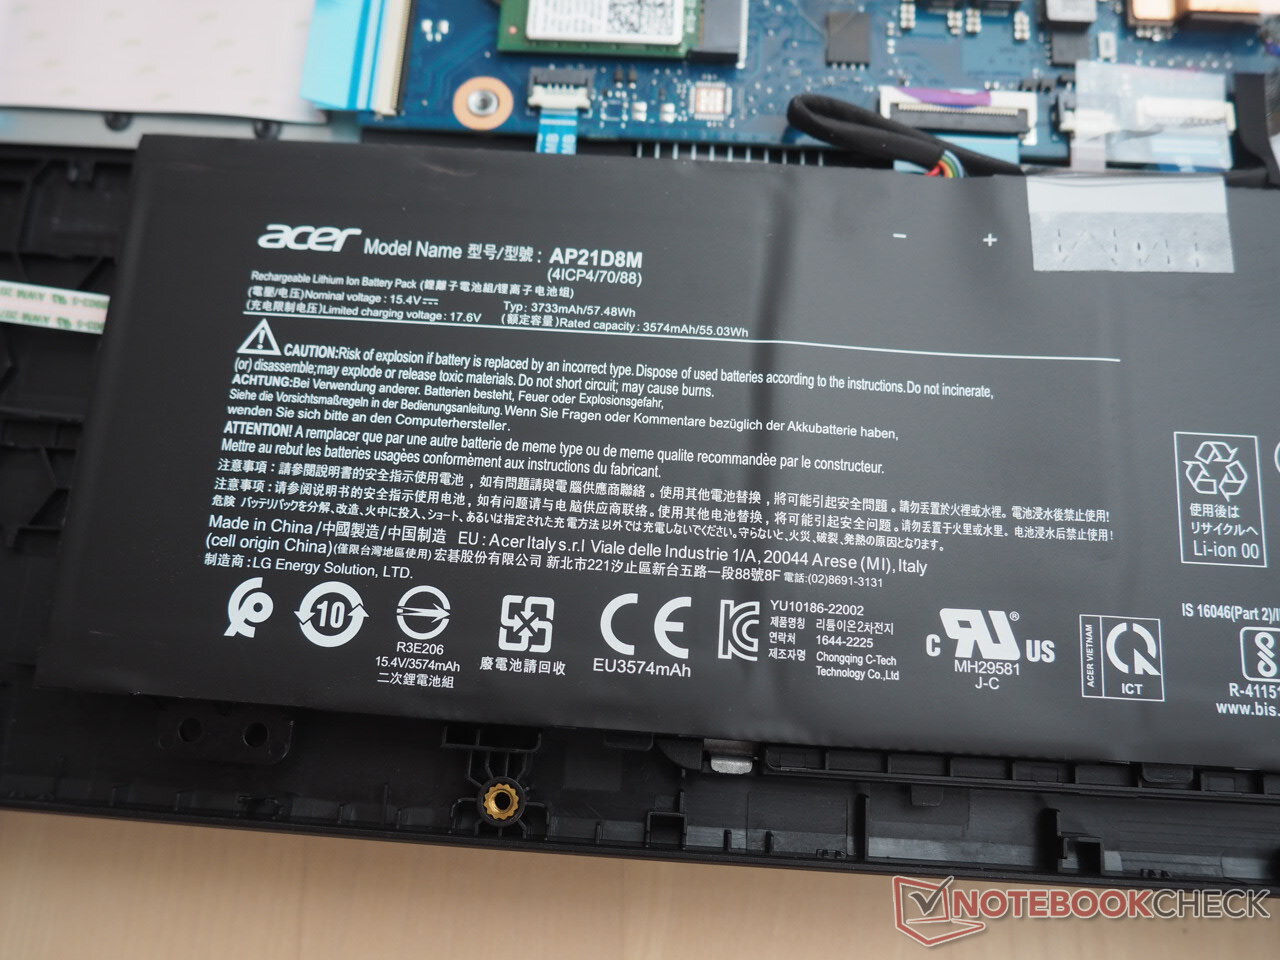
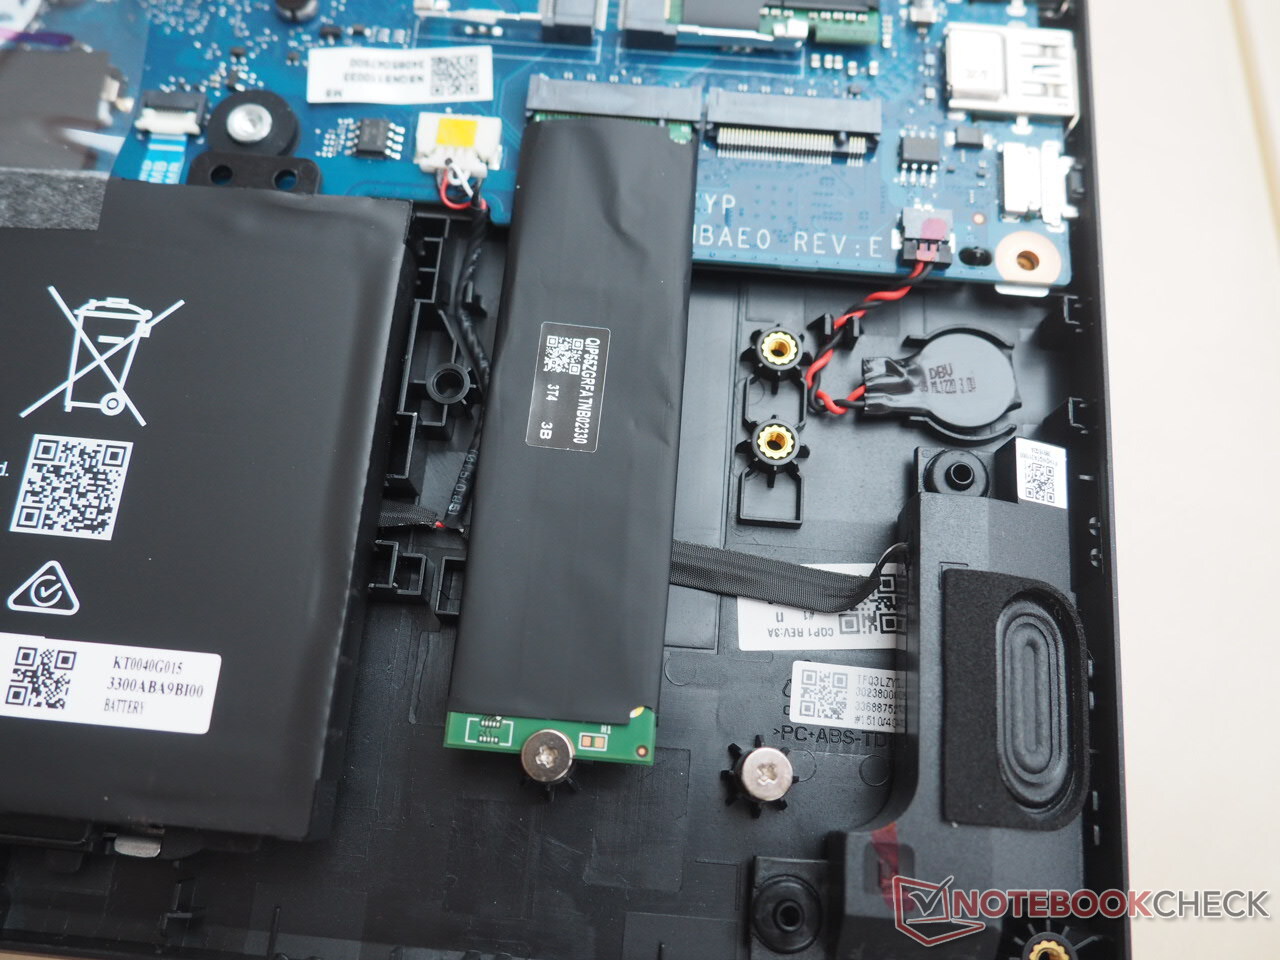
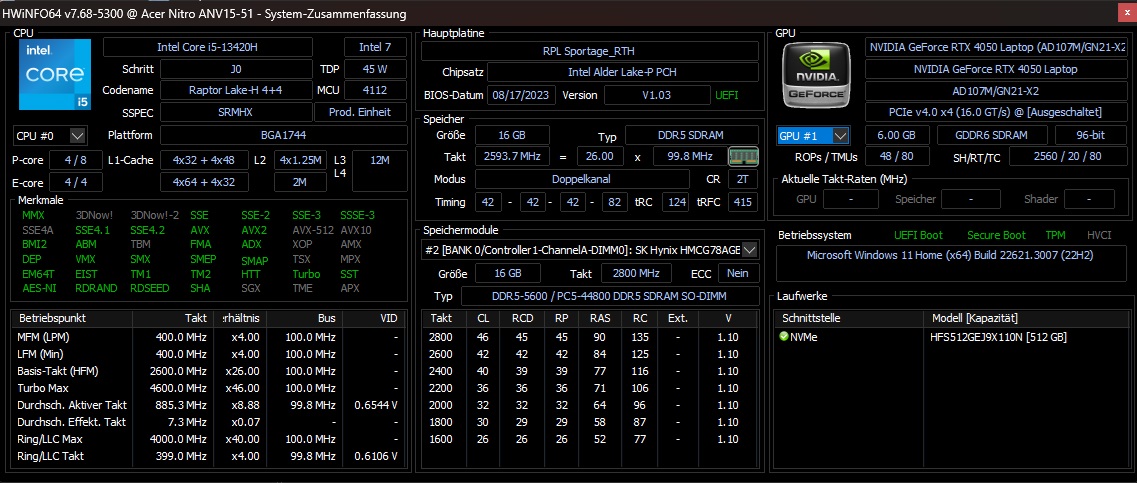
Jedną z zalet Nitro jest łatwość serwisowania. Pomimo faktu, że dolna pokrywa trzyma się dość mocno nawet po odkręceniu jedenastu śrub obudowy, po wejściu do wnętrza 15-calowego laptopa będziemy mieli dostęp do wolnego gniazda M.2 i pustego gniazda pamięci RAM (patrz zdjęcia). Chociaż konfiguracja z pojedynczą pamięcią RAM w naszej jednostce testowej może negatywnie wpływać na wydajność w niektórych sytuacjach. Proszę zwrócić uwagę na jedną rzecz: bateria nie jest przykręcona i teoretycznie może wypaść z obudowy podczas otwierania laptopa.
Gwarancja
Acer zapewnia dwuletnią gwarancję na Nitro V 15 w Niemczech. Okres gwarancji może się jednak różnić w zależności od regionu.
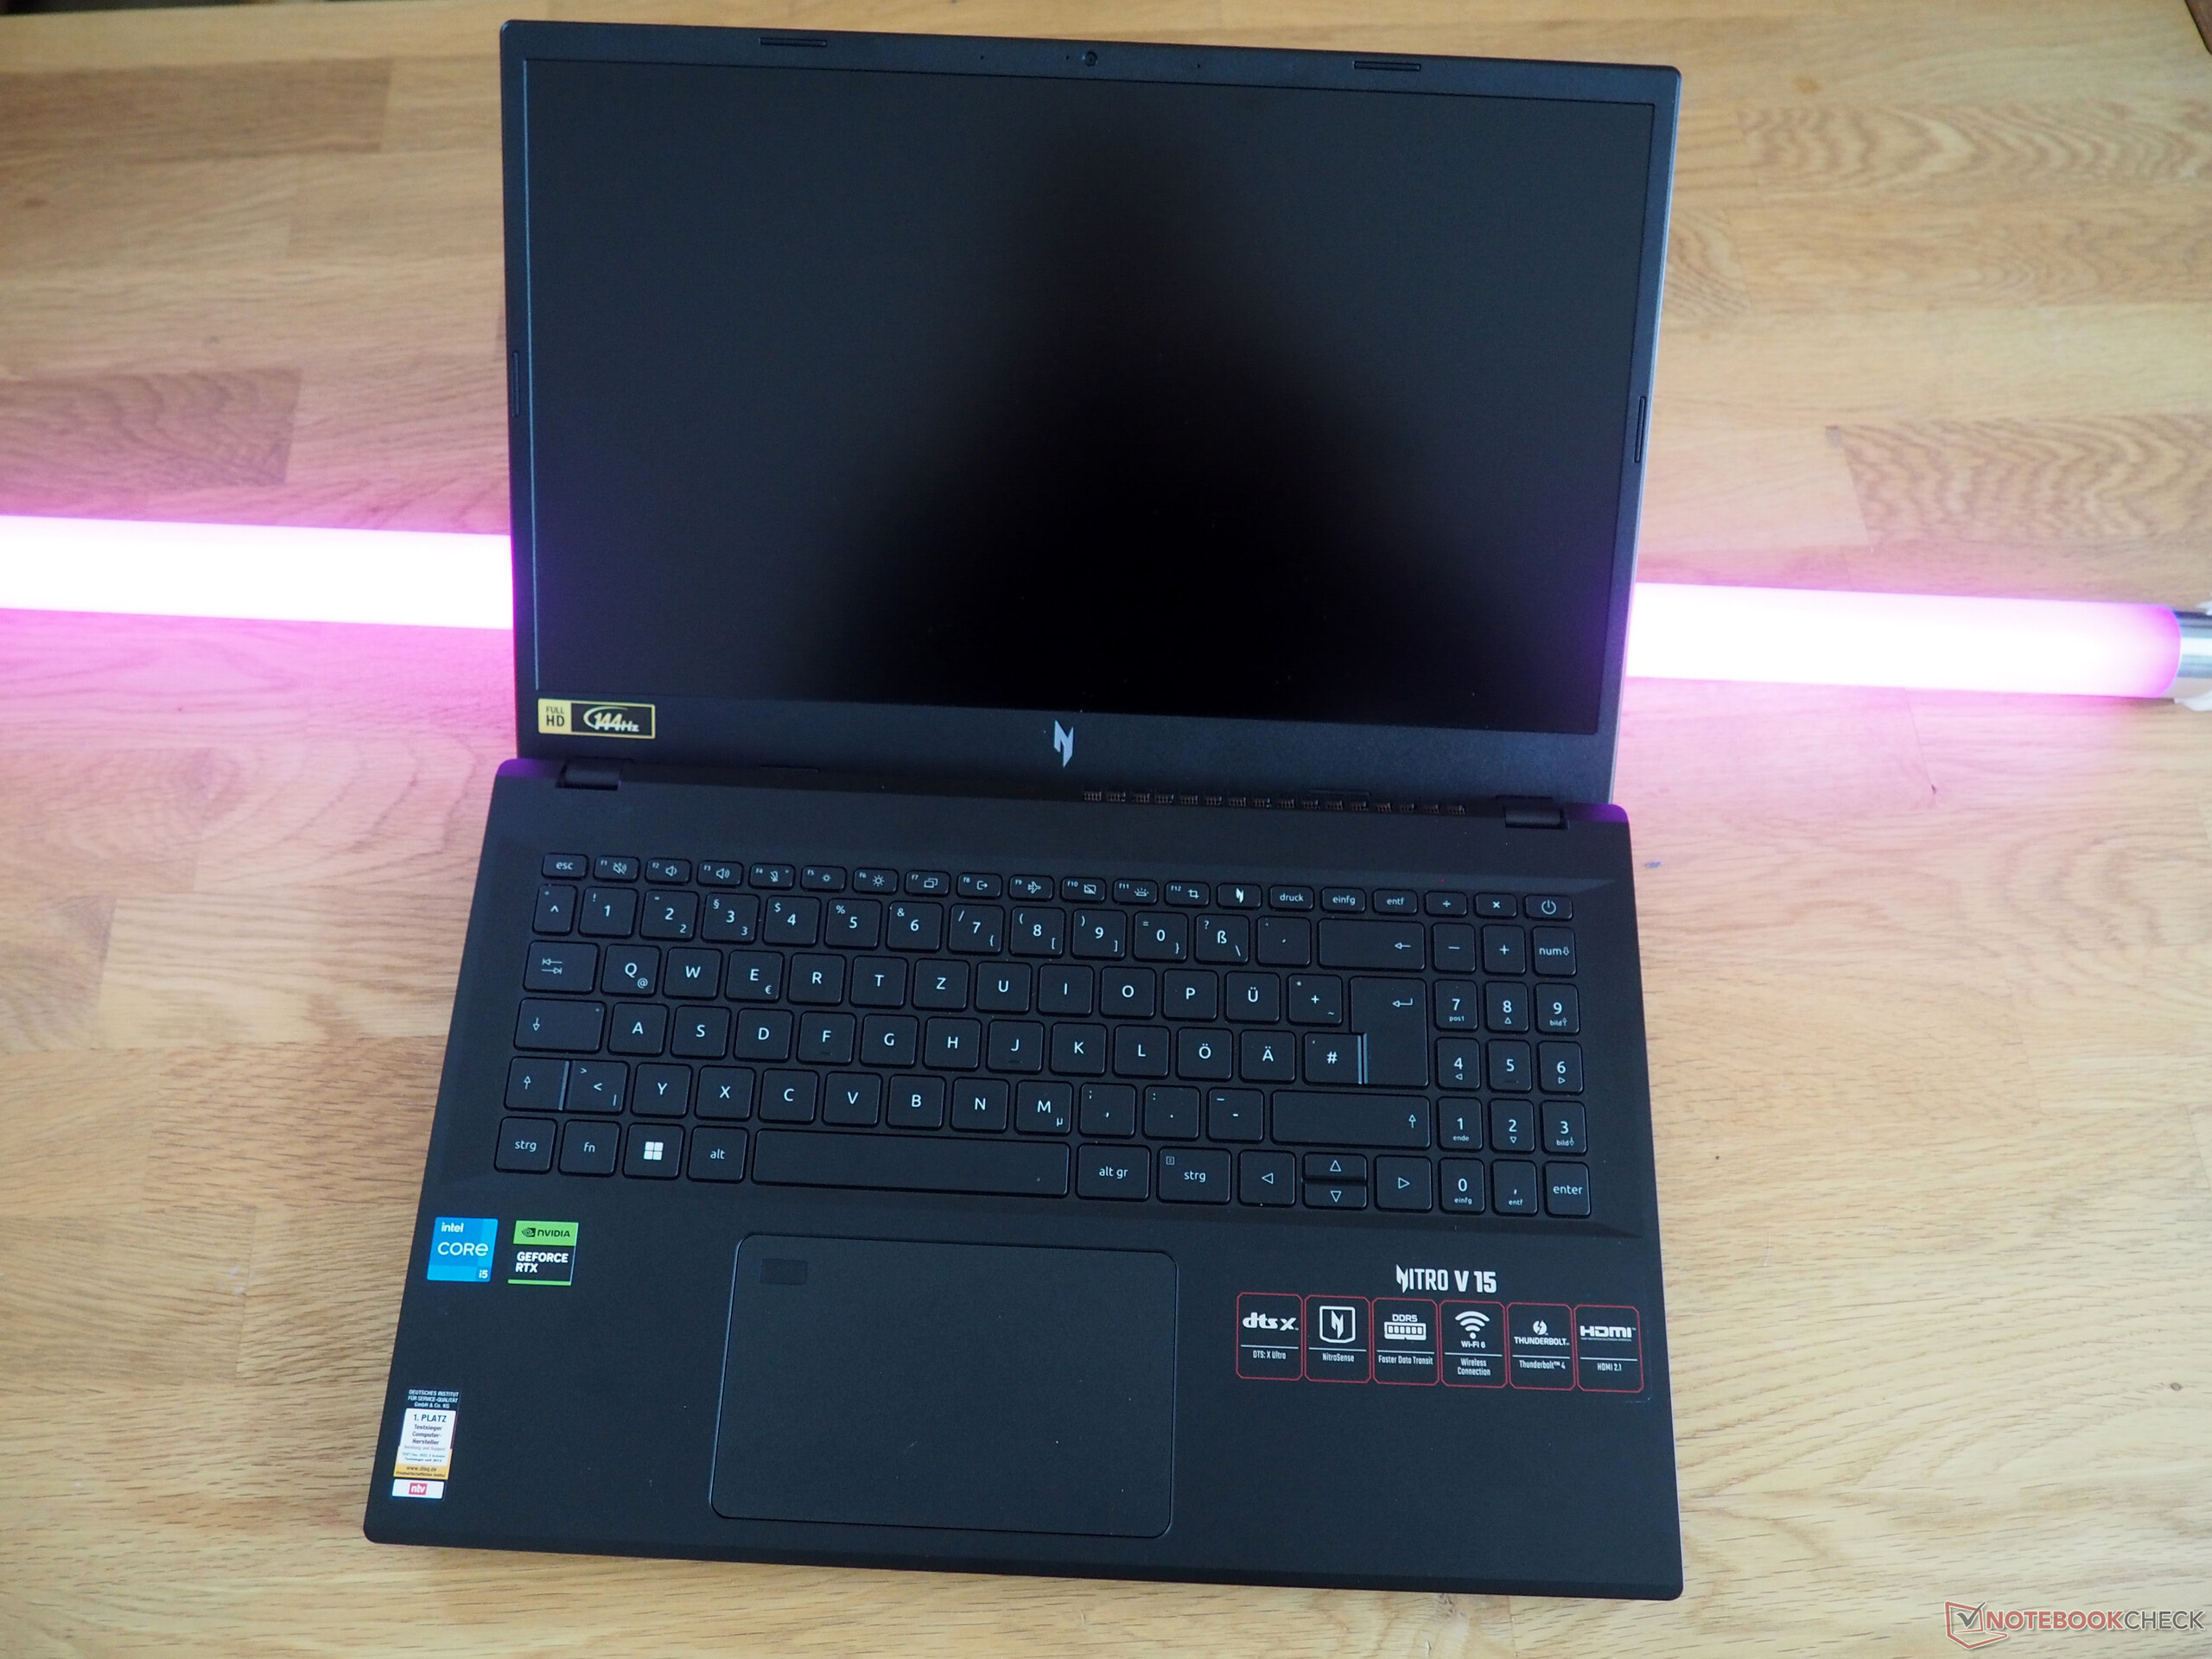
Urządzenia wejściowe
Klawiatura
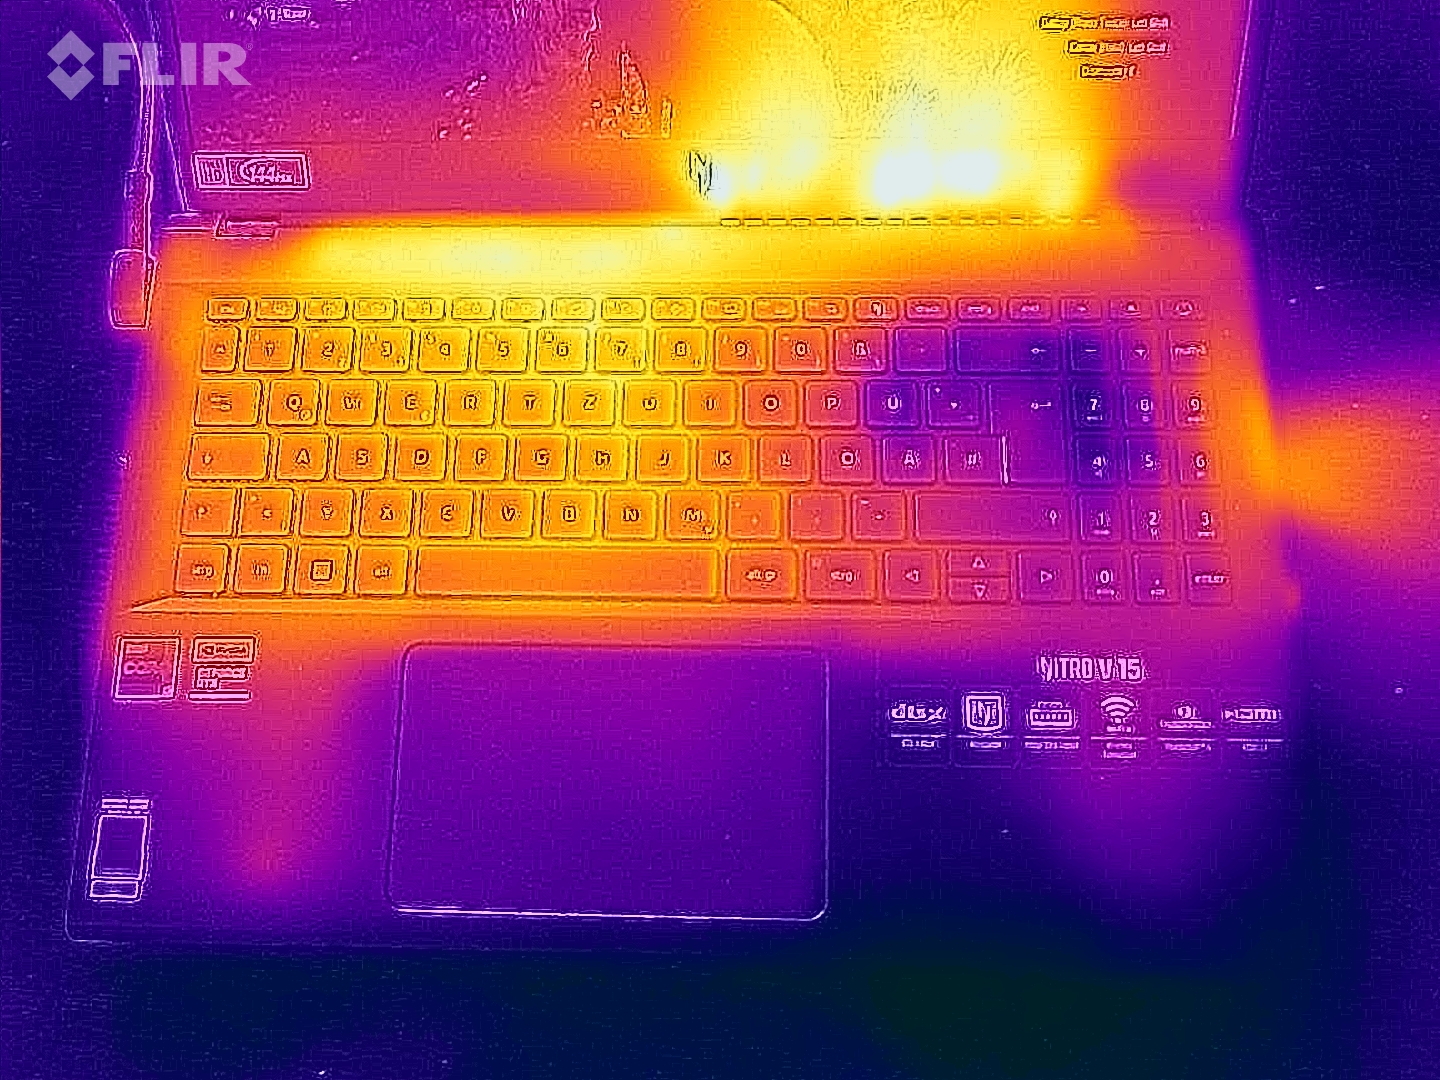
Urządzenia wejściowe nie są ani okropne, ani doskonałe. Podobnie jak w przypadku większości laptopów z konwencjonalnymi klawiaturami, pisanie na Nitro jest nieco miękkie z powodu braku dotykowego sprzężenia zwrotnego. Acer mógł również lepiej poradzić sobie z układem. Na przykład, jest wystarczająco dużo miejsca na standardową czterokolumnową klawiaturę numeryczną, a nie trzykolumnową. Szkoda również, że klawisze strzałek nie są świetne i ledwo nadają się do gier, a przycisk zasilania nie jest umieszczony osobno. Klawisze funkcyjne są prawie słabe, co również nie pomaga. Pozytywne aspekty, o których warto wspomnieć, to białe podświetlenie z regulowaną jasnością i dedykowany przycisk do otwierania oprogramowania tuningowego (NitroSense).
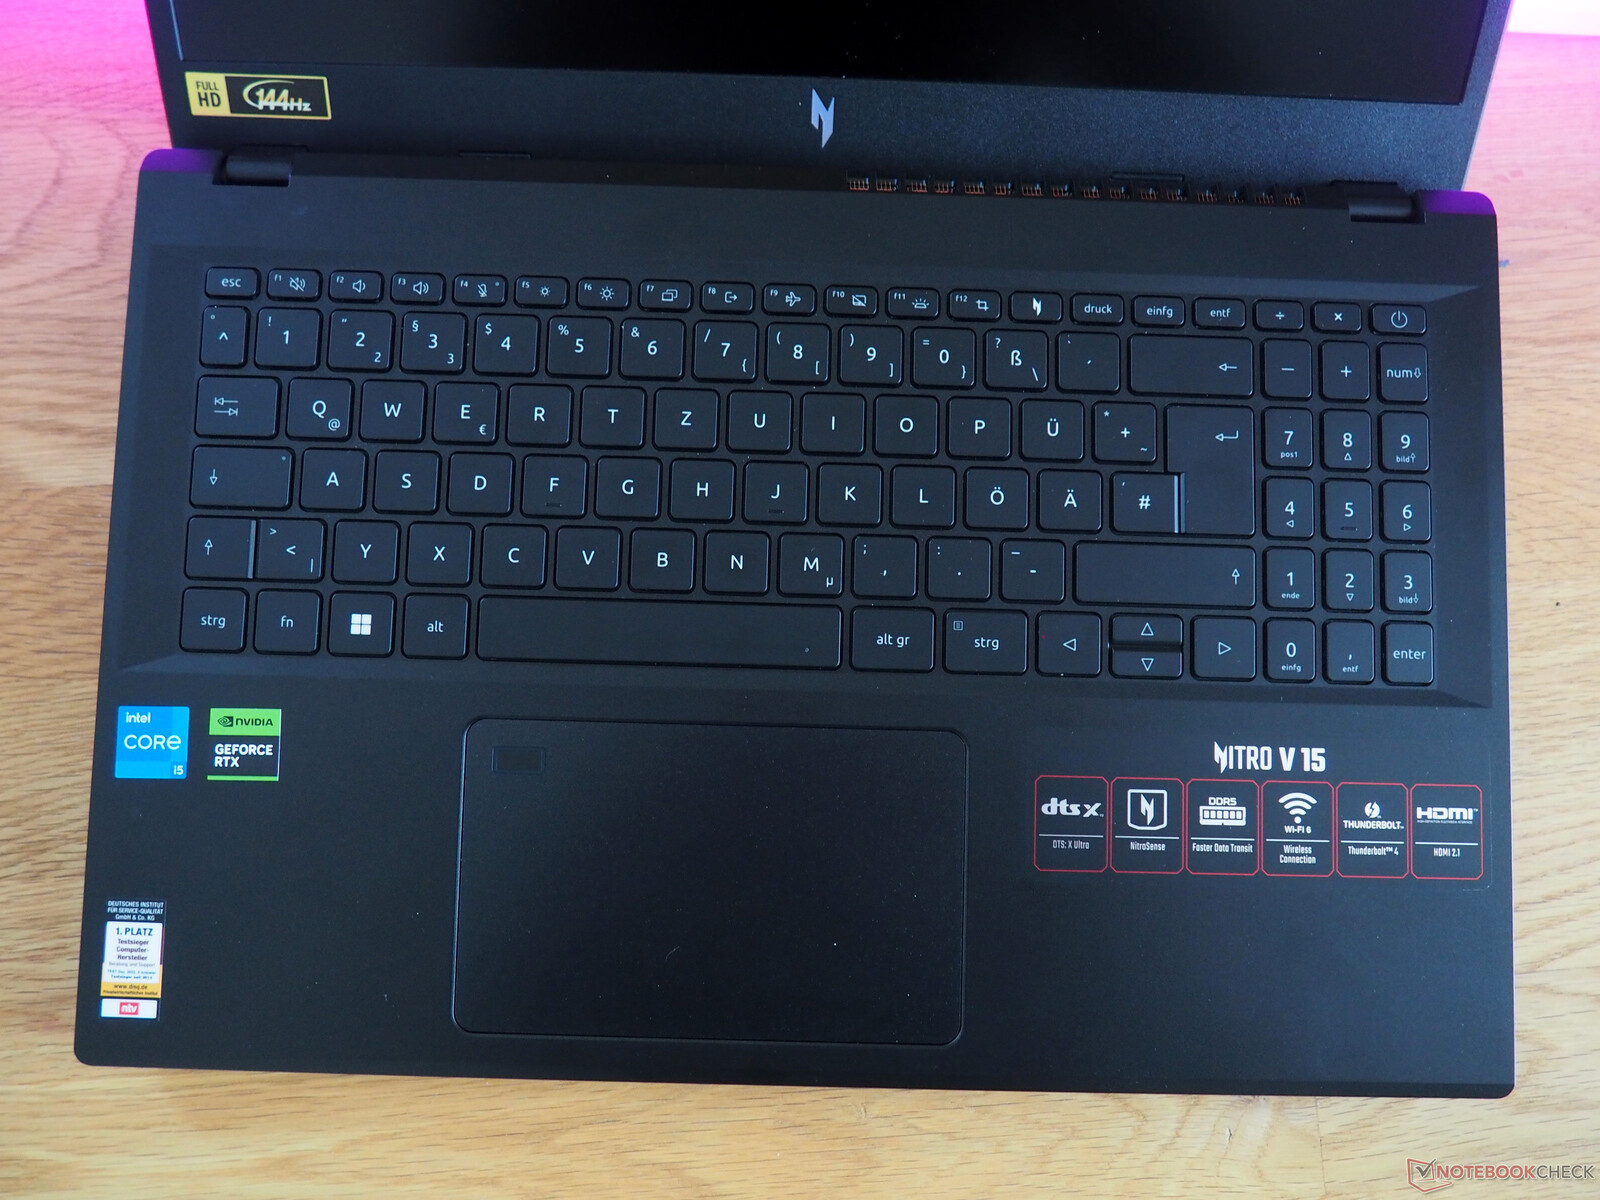
Panel dotykowy
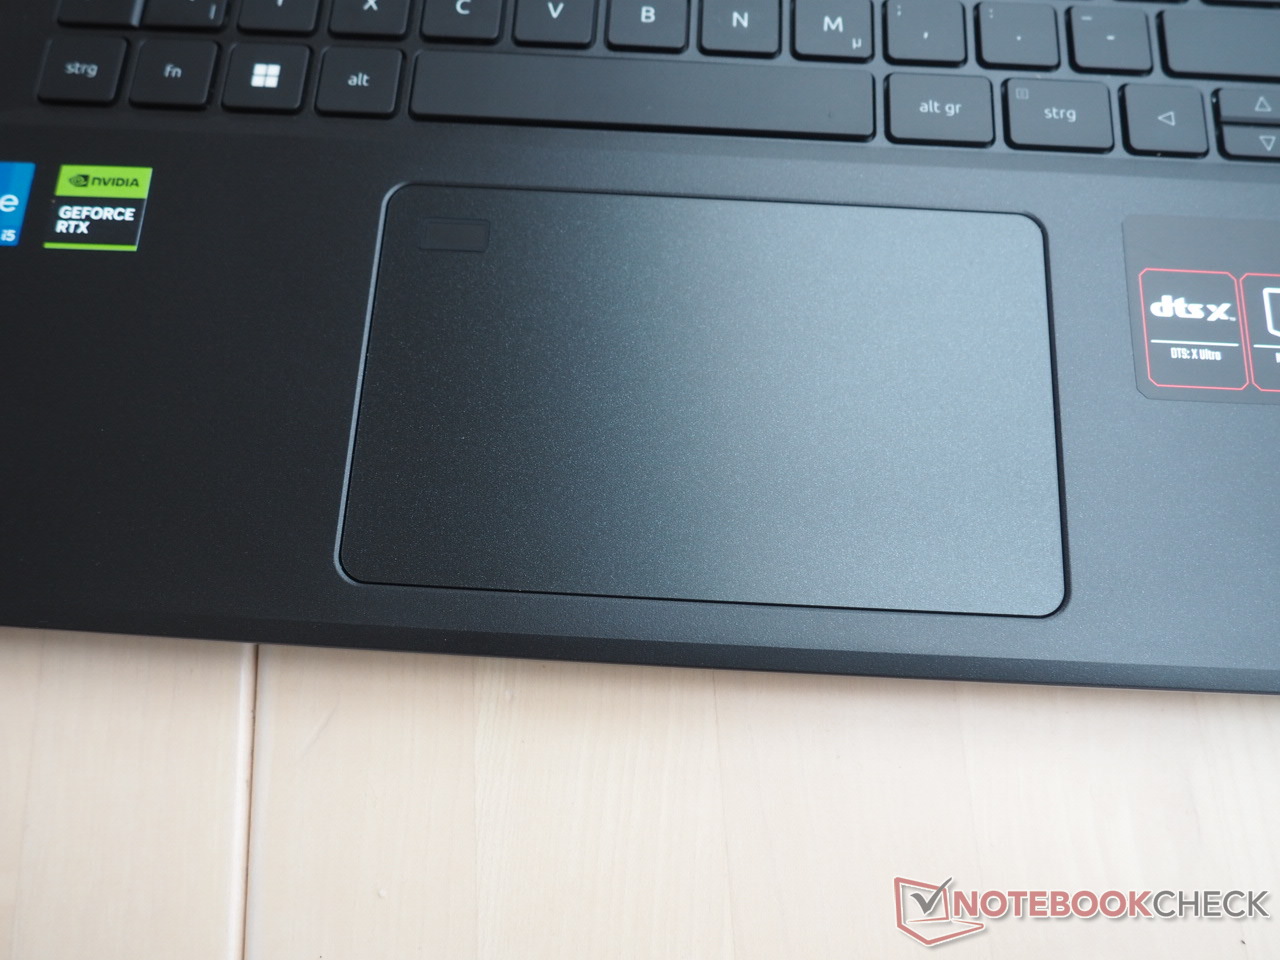
Touchpad wyróżnia się przede wszystkim wbudowanym skanerem linii papilarnych w lewym górnym rogu. Zamiennik myszy jest raczej przeciętny pod względem jakości. Poziom precyzji i płynności jest rozsądny, ale nie oszałamiający. Podobnie jest z obsługą multi-touch i wyczuciem powierzchni kliknięć. W zależności od siły nacisku touchpad ma niestety tendencję do grzechotania.
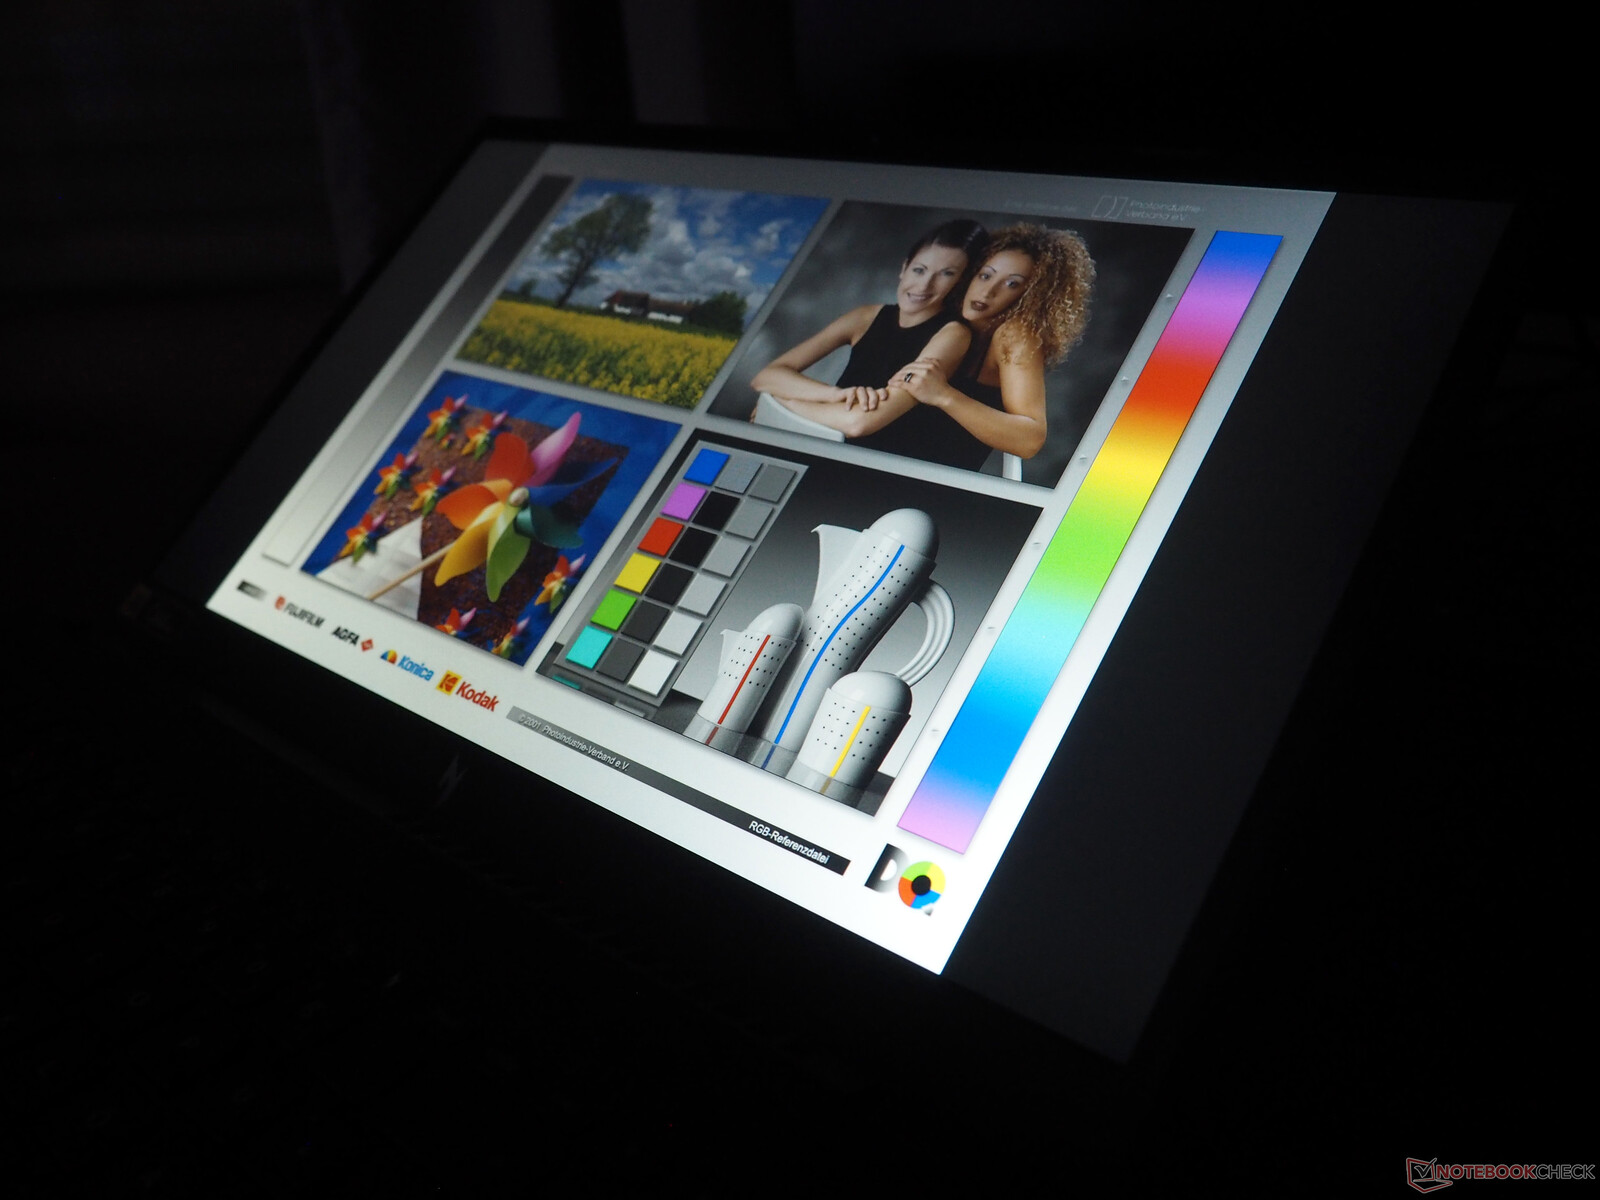
Wyświetlacz
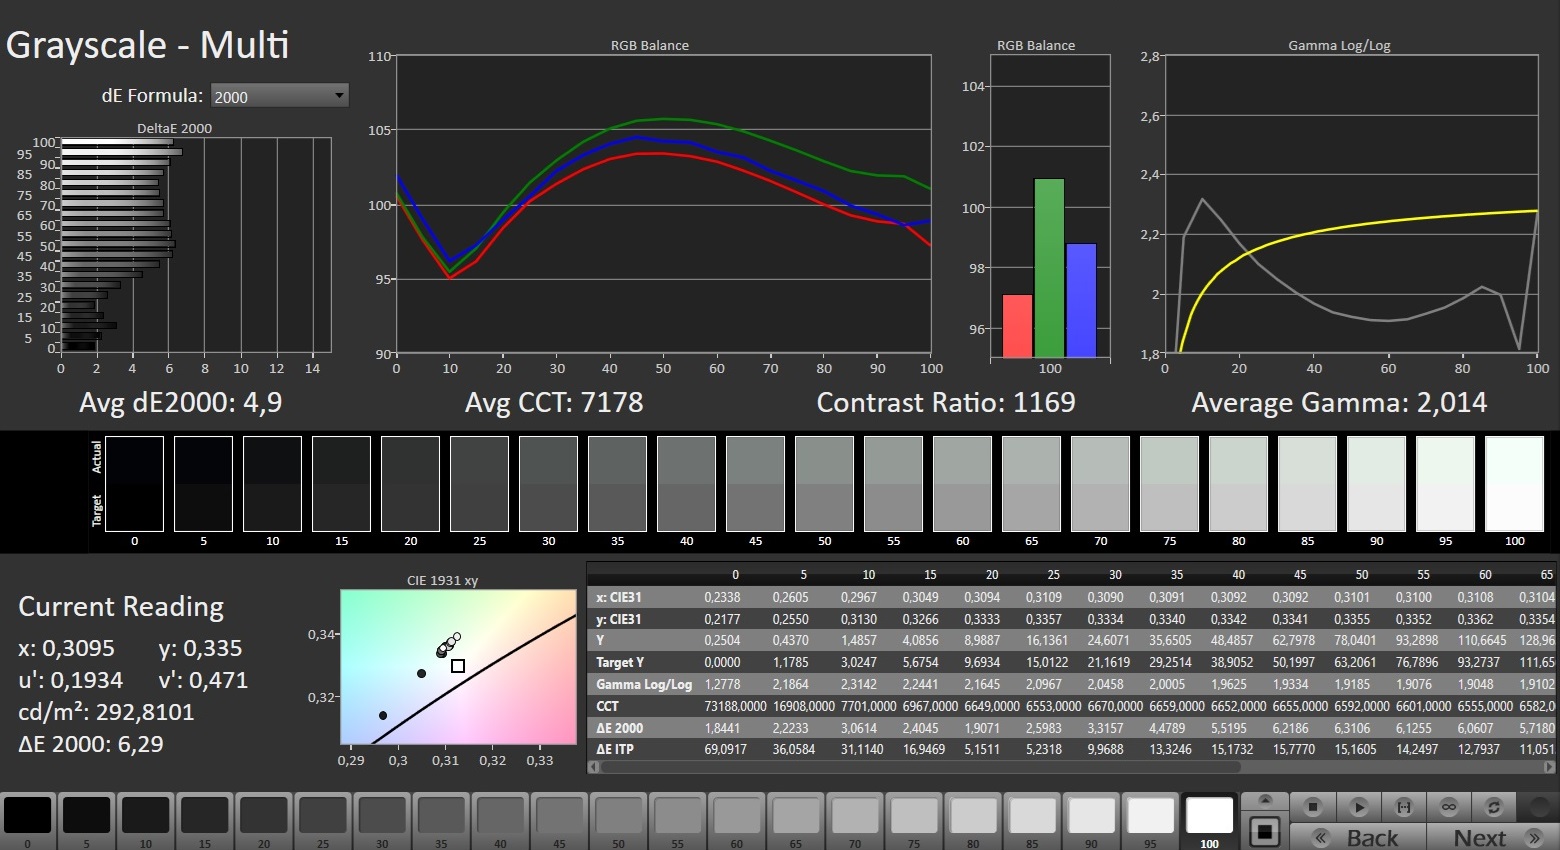
Niskiej jakości wyświetlacz Nitro V 15 to jedna z jego największych słabości. Na pierwszy rzut oka uzyskane wyniki nie wydają się zbyt rozczarowujące: poziom czerni wynoszący 0,25 cd/m² i współczynnik kontrastu 1168:1 są podobne do tego, co można uzyskać od konkurencji lub typowego panelu IPS. Dotyczy to również kąta widzenia.
| |||||||||||||||||||||||||
rozświetlenie: 80 %
na akumulatorze: 292 cd/m²
kontrast: 1168:1 (czerń: 0.25 cd/m²)
ΔE ColorChecker Calman: 7.15 | ∀{0.5-29.43 Ø4.72}
calibrated: 4.13
ΔE Greyscale Calman: 4.9 | ∀{0.09-98 Ø4.97}
41.4% AdobeRGB 1998 (Argyll 3D)
60% sRGB (Argyll 3D)
40% Display P3 (Argyll 3D)
Gamma: 2.014
CCT: 7178 K
| Acer Nitro V 15 ANV15-51-582S LG LP156WFJ-SPB4 (LGD0742), IPS, 1920x1080, 15.6" | Medion Erazer Crawler E40 - MD 62518 BOE HF NV156FHM-N4G, IPS, 1920x1080, 15.6" | Lenovo LOQ 15IRH8 Core i7 BOE CQ NE156QHM-NY4, IPS, 2560x1440, 15.6" | Asus TUF A15 FA507 N156HMA-GA1, IPS, 1920x1080, 15.6" | Schenker XMG Apex 15 (Late 23) BOE CQ NE156QHM-NY2, IPS, 2560x1440, 15.6" | |
|---|---|---|---|---|---|
| Display | 52% | 64% | 61% | 66% | |
| Display P3 Coverage (%) | 40 | 61.4 54% | 66.3 66% | 64.9 62% | 67.5 69% |
| sRGB Coverage (%) | 60 | 89.7 50% | 96.6 61% | 96.5 61% | 97.6 63% |
| AdobeRGB 1998 Coverage (%) | 41.4 | 63.2 53% | 67.7 64% | 66.6 61% | 68.9 66% |
| Response Times | 70% | 76% | 15% | 64% | |
| Response Time Grey 50% / Grey 80% * (ms) | 34.2 ? | 8 ? 77% | 5 ? 85% | 30.4 ? 11% | 13.2 ? 61% |
| Response Time Black / White * (ms) | 25.8 ? | 9.6 ? 63% | 8.41 ? 67% | 20.8 ? 19% | 8.8 ? 66% |
| PWM Frequency (Hz) | |||||
| Screen | 17% | 23% | 41% | 24% | |
| Brightness middle (cd/m²) | 292 | 364 25% | 373 28% | 288 -1% | 336 15% |
| Brightness (cd/m²) | 263 | 351 33% | 365 39% | 271 3% | 307 17% |
| Brightness Distribution (%) | 80 | 91 14% | 90 13% | 91 14% | 77 -4% |
| Black Level * (cd/m²) | 0.25 | 0.43 -72% | 0.33 -32% | 0.17 32% | 0.38 -52% |
| Contrast (:1) | 1168 | 847 -27% | 1130 -3% | 1694 45% | 884 -24% |
| Colorchecker dE 2000 * | 7.15 | 3.98 44% | 4.19 41% | 1.9 73% | 1.96 73% |
| Colorchecker dE 2000 max. * | 15.51 | 6.38 59% | 8.47 45% | 3.3 79% | 5.07 67% |
| Colorchecker dE 2000 calibrated * | 4.13 | 1.36 67% | 1.07 74% | 0.9 78% | 1.27 69% |
| Greyscale dE 2000 * | 4.9 | 4.39 10% | 5 -2% | 2.7 45% | 2.3 53% |
| Gamma | 2.014 109% | 2.58 85% | 1.93 114% | 2.32 95% | 2.017 109% |
| CCT | 7178 91% | 7316 89% | 7520 86% | 6535 99% | 6644 98% |
| Całkowita średnia (program / ustawienia) | 46% /
32% | 54% /
39% | 39% /
42% | 51% /
39% |
* ... im mniej tym lepiej
Po bliższym przyjrzeniu się można jednak zauważyć kilka niedociągnięć. Po pierwsze, średnia szczytowa jasność wynosząca 263 cd/m² jest odpowiednia tylko do użytku w pomieszczeniach; 15-calowy laptop w ogóle nie radzi sobie na zewnątrz.
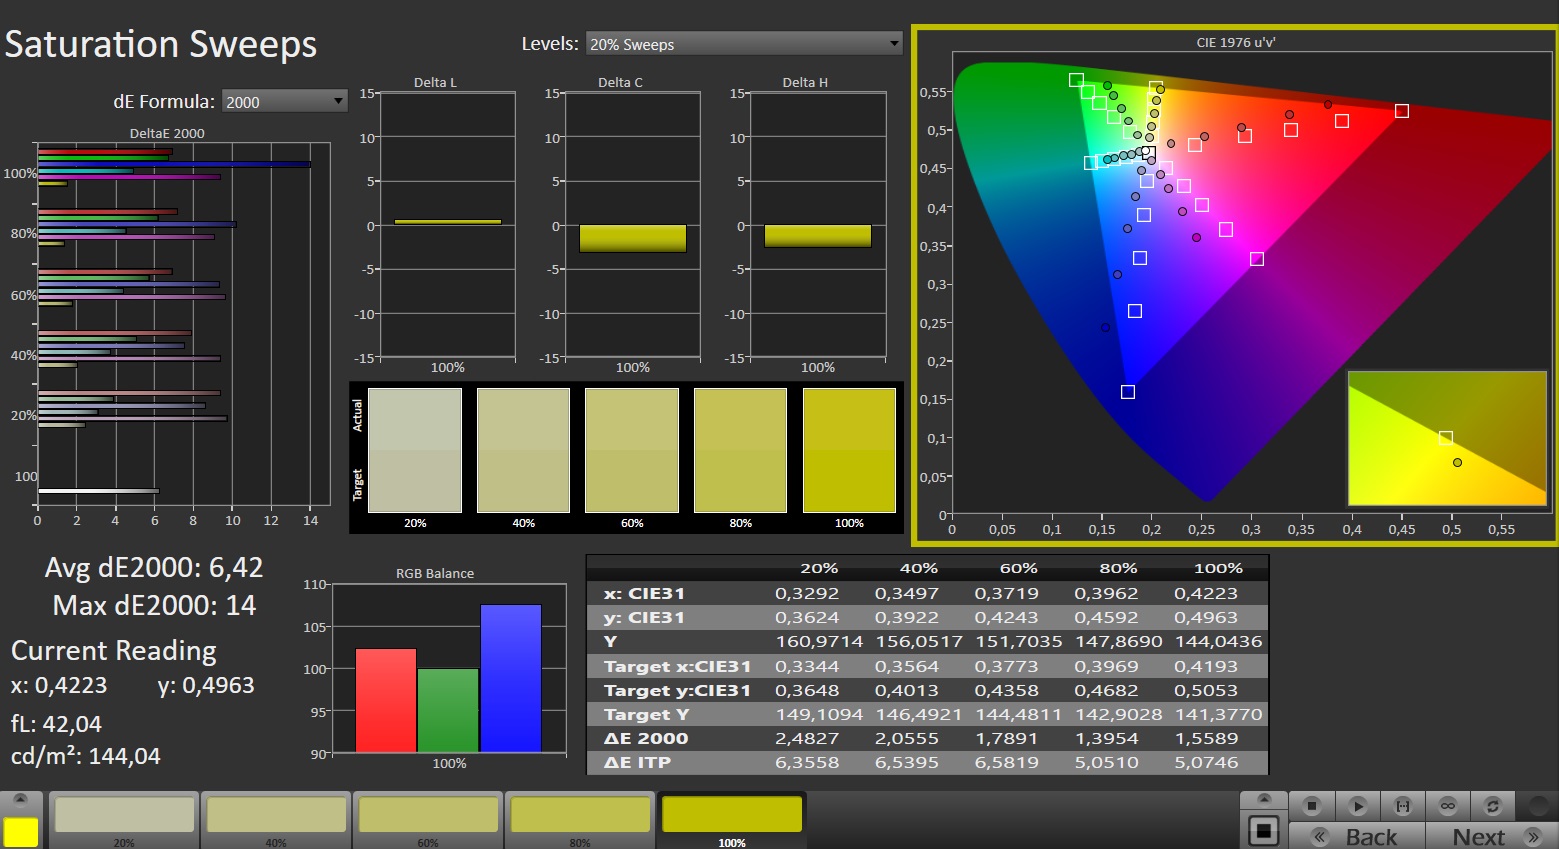
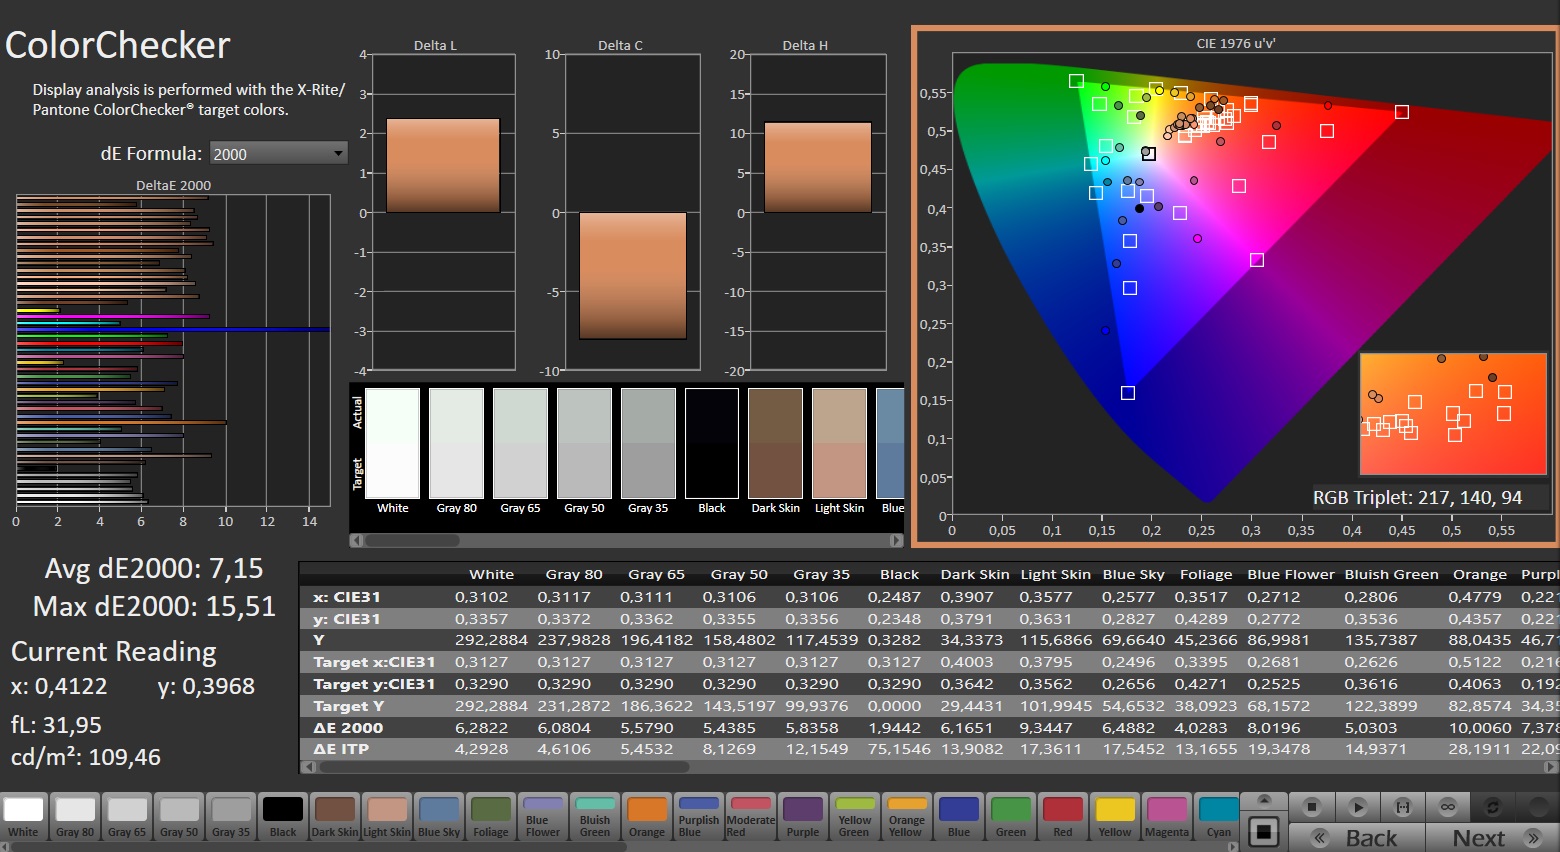
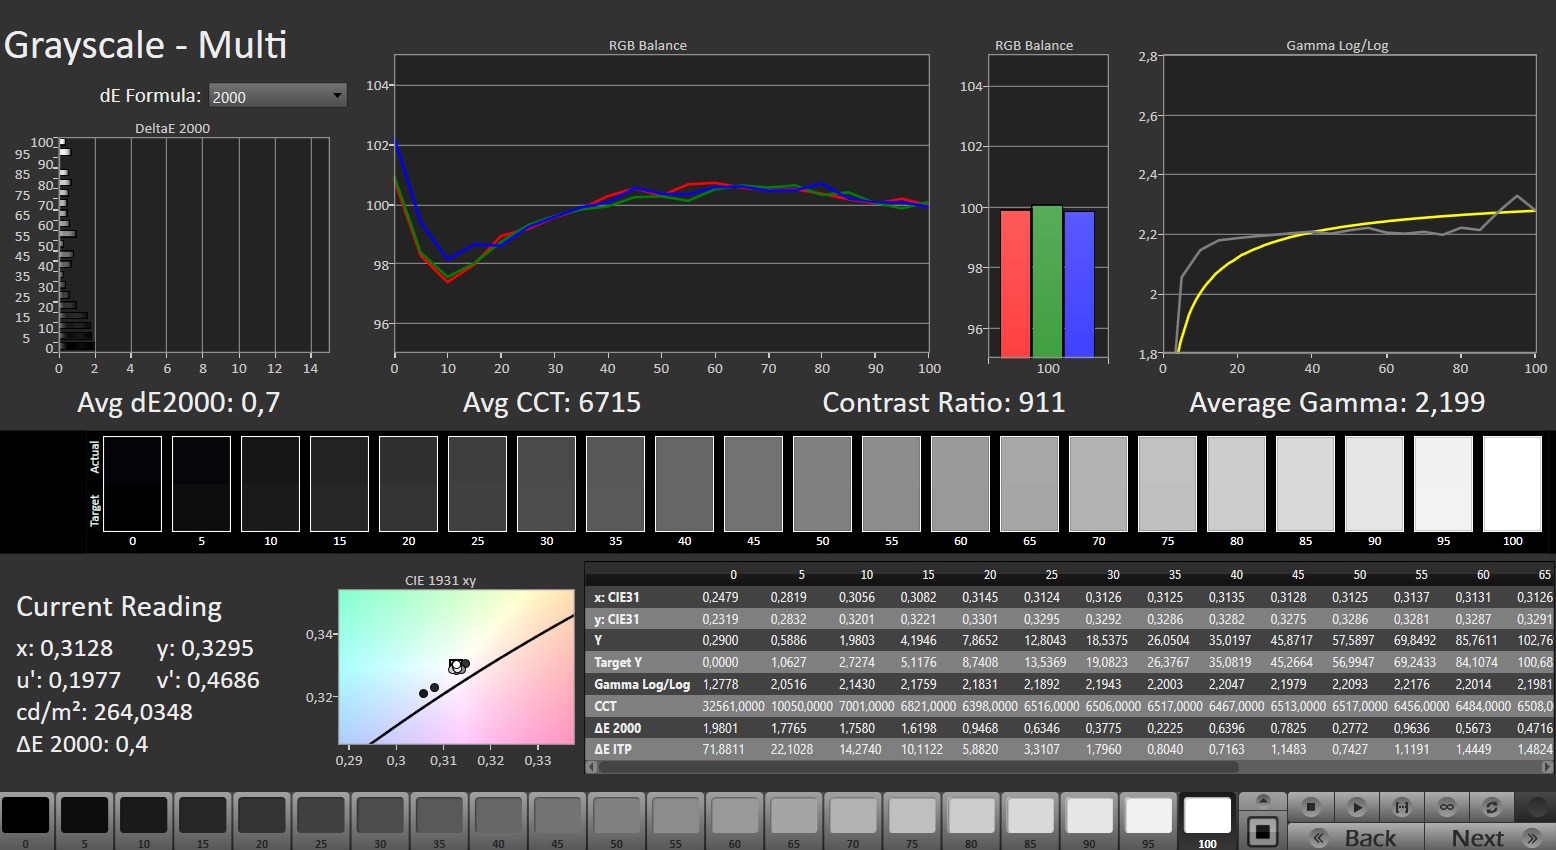
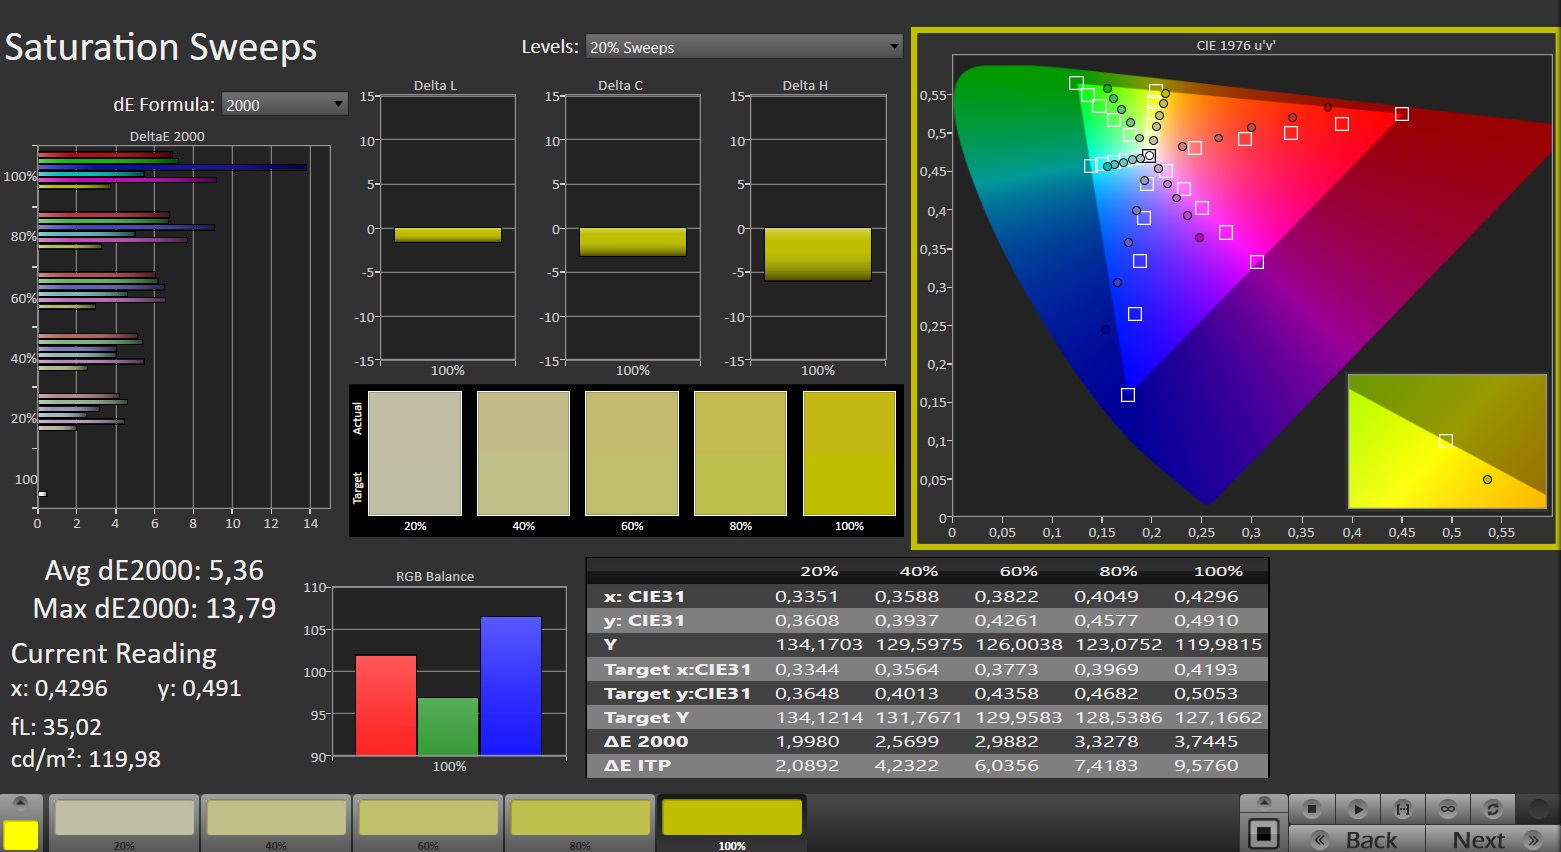
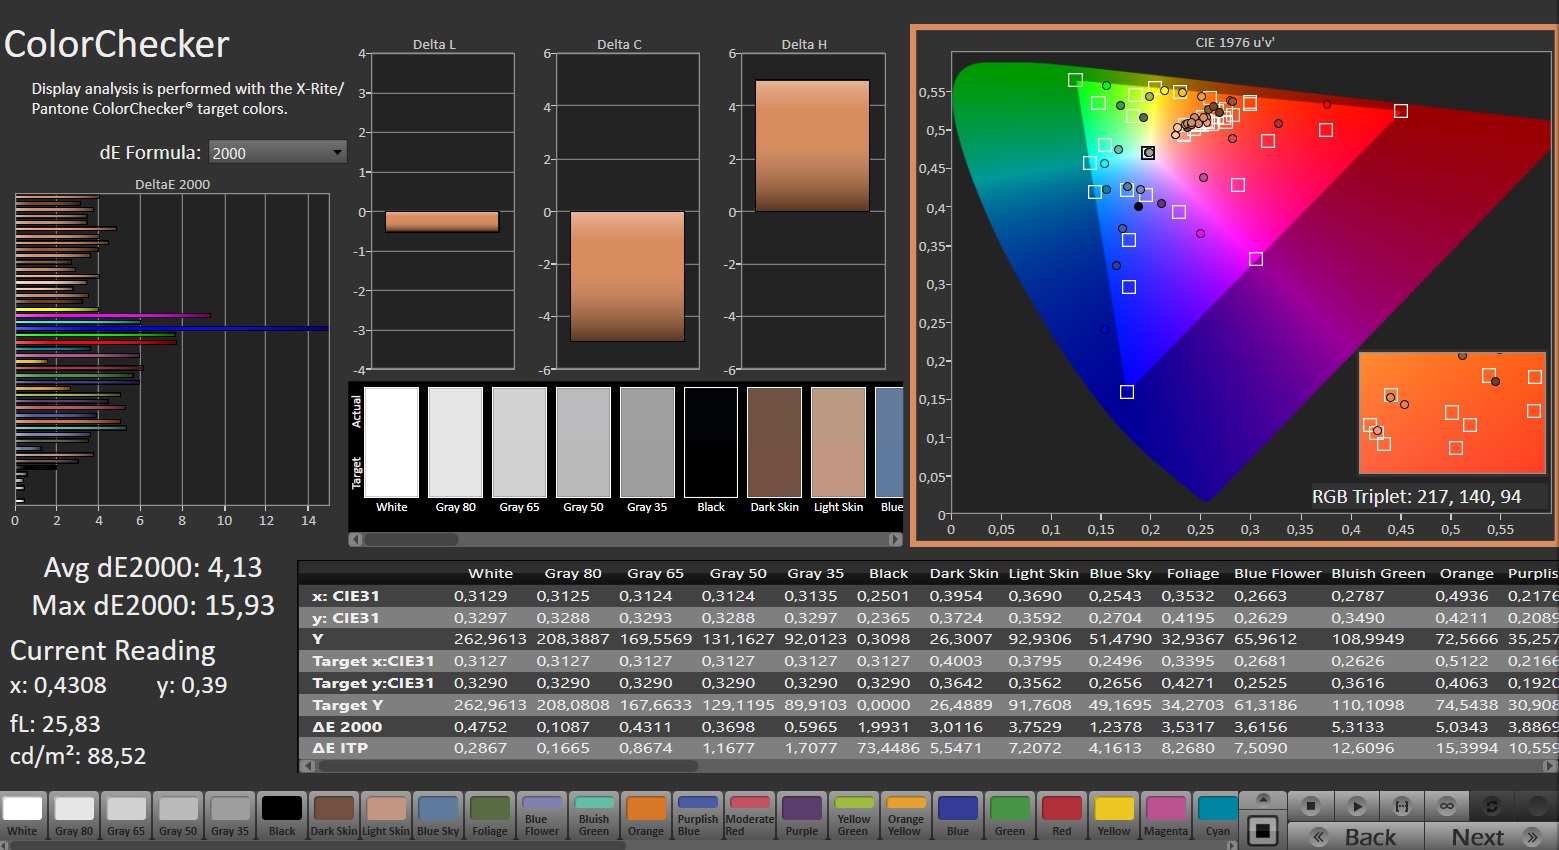
Nitro V 15 oferuje również bardzo ograniczone pokrycie kolorów: posiadanie 60% sRGB i około 40% AdobeRGB i DCI-P3 po prostu nie wystarczy w 2024 roku, nawet w przypadku budżetowego notebooka do gier.
Konkurenci pokazują, jak robić to znacznie lepiej. Acer Nitro zajął również ostatnie miejsce pod względem dokładności odwzorowania kolorów i czasu reakcji.
Wyświetl czasy reakcji
| ↔ Czas reakcji od czerni do bieli | ||
|---|---|---|
| 25.8 ms ... wzrost ↗ i spadek ↘ łącznie | ↗ 13.8 ms wzrost | 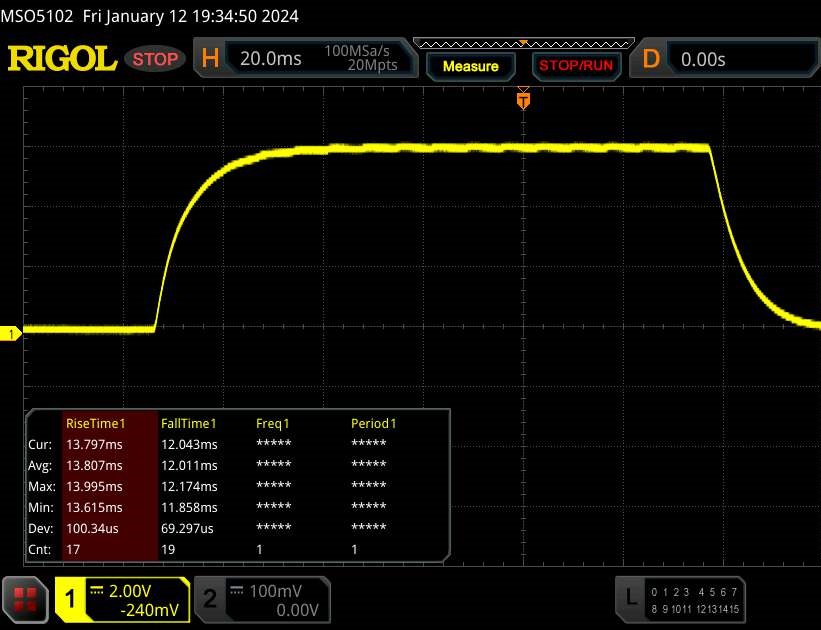 |
| ↘ 12 ms upadek | ||
| W naszych testach ekran wykazuje stosunkowo powolne tempo reakcji i może być zbyt wolny dla graczy. Dla porównania, wszystkie testowane urządzenia wahają się od 0.1 (minimum) do 240 (maksimum) ms. » 62 % wszystkich urządzeń jest lepszych. Oznacza to, że zmierzony czas reakcji jest gorszy od średniej wszystkich testowanych urządzeń (19.9 ms). | ||
| ↔ Czas reakcji 50% szarości do 80% szarości | ||
| 34.2 ms ... wzrost ↗ i spadek ↘ łącznie | ↗ 15.8 ms wzrost | 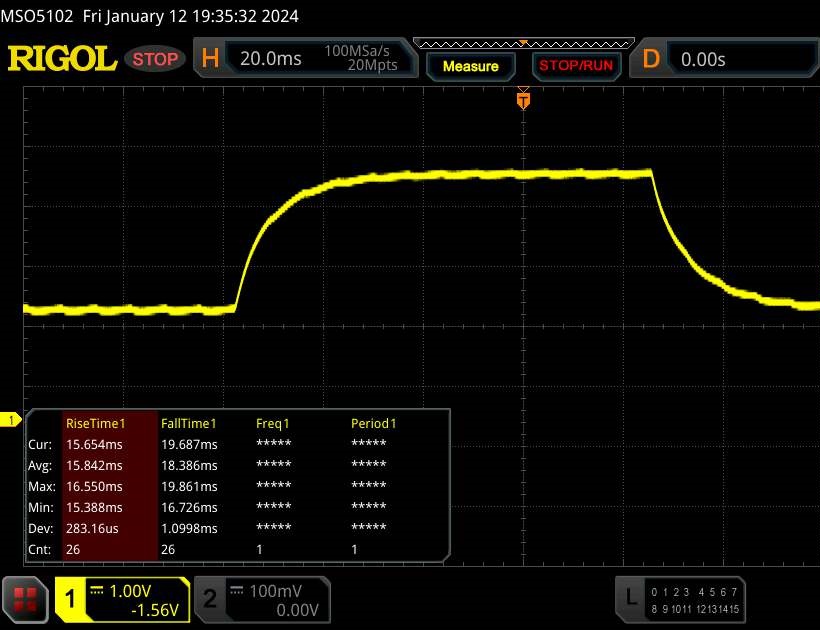 |
| ↘ 18.4 ms upadek | ||
| W naszych testach ekran wykazuje powolne tempo reakcji, co będzie niezadowalające dla graczy. Dla porównania, wszystkie testowane urządzenia wahają się od 0.165 (minimum) do 636 (maksimum) ms. » 48 % wszystkich urządzeń jest lepszych. Oznacza to, że zmierzony czas reakcji jest zbliżony do średniej wszystkich testowanych urządzeń (31.1 ms). | ||
Migotanie ekranu / PWM (modulacja szerokości impulsu)
| Migotanie ekranu/nie wykryto PWM |  | ||
Dla porównania: 52 % wszystkich testowanych urządzeń nie używa PWM do przyciemniania wyświetlacza. Jeśli wykryto PWM, zmierzono średnio 7784 (minimum: 5 - maksimum: 343500) Hz. | |||
Wydajność
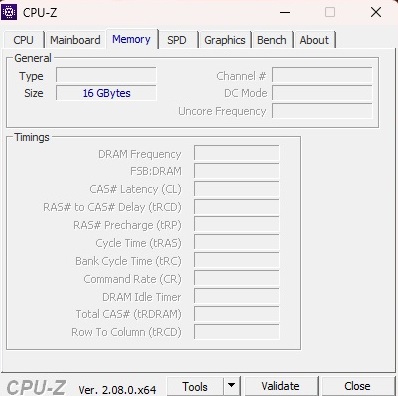
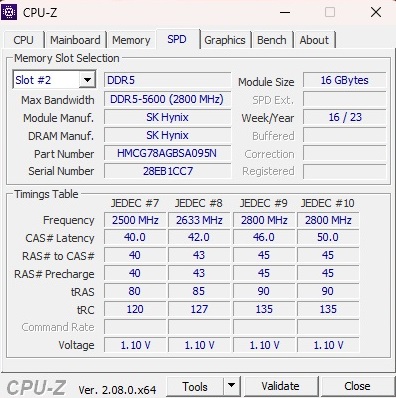
Nitro V 15 to urządzenie średniej klasy zarówno pod względem wydajności procesora, jak i karty graficznej. 16 GB pamięci RAM jest całkiem rozsądne, biorąc pod uwagę cenę laptopa, ale dysk SSD wypada nieco słabiej z pojemnością zaledwie 512 GB.
Warunki testu
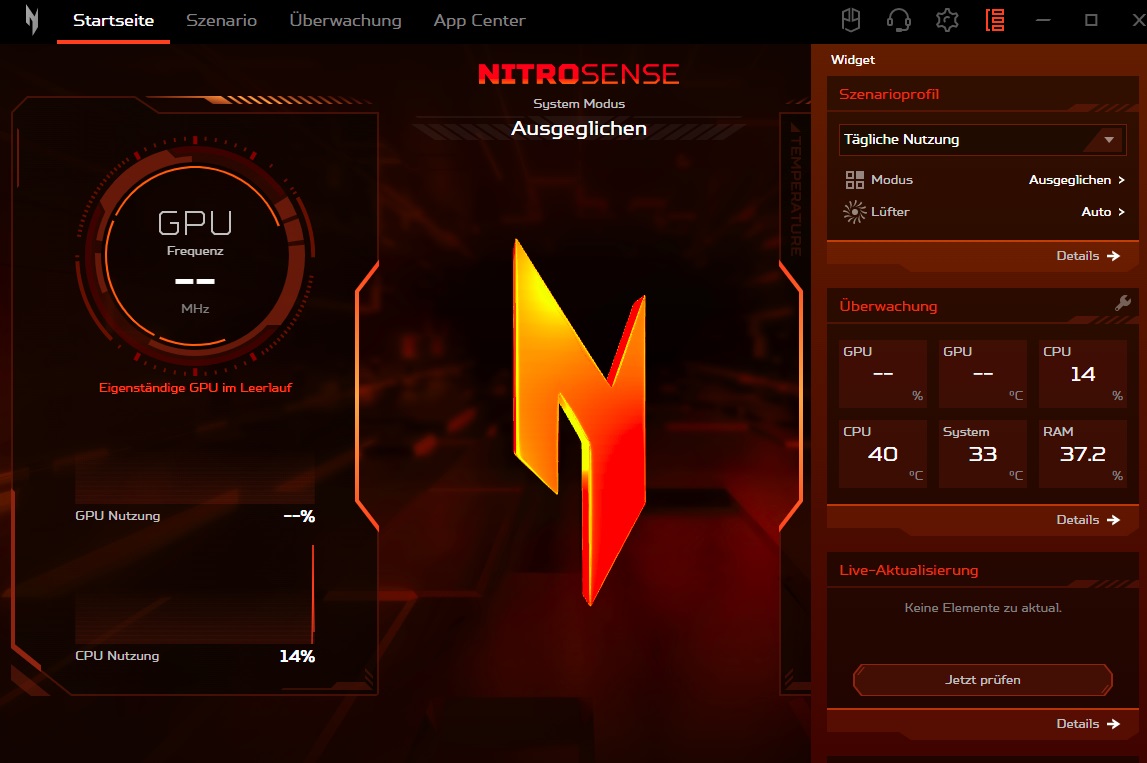
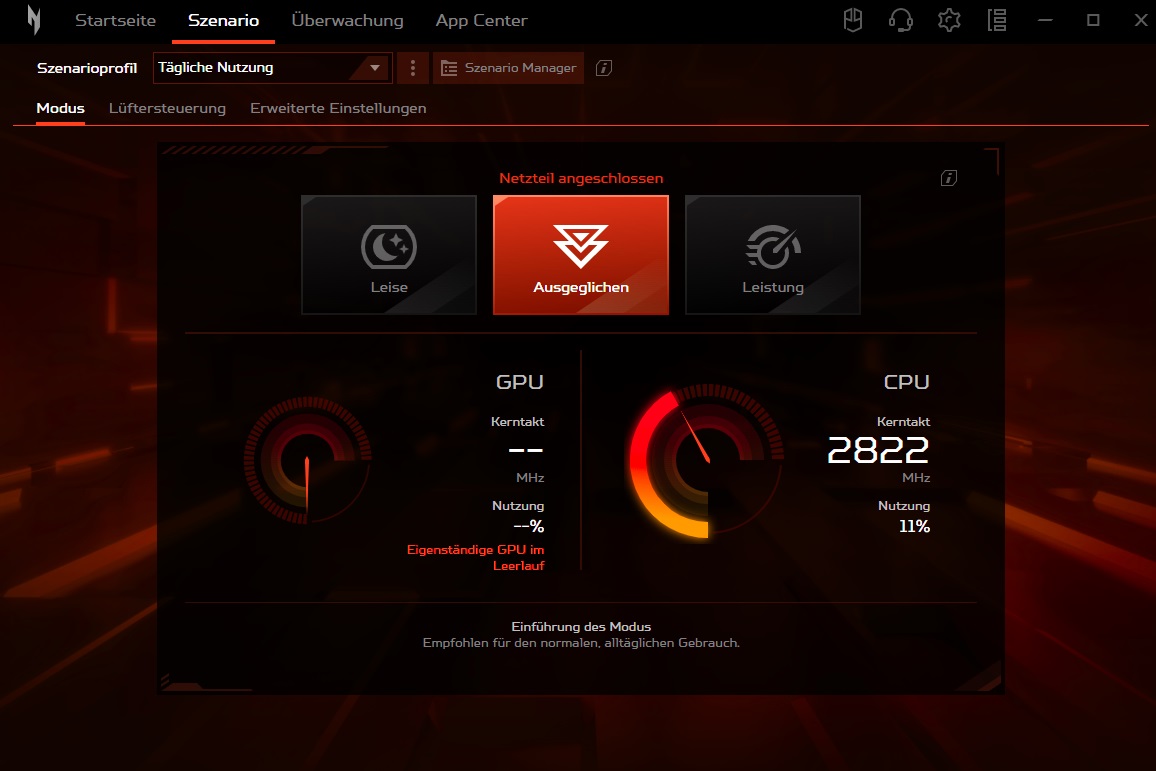
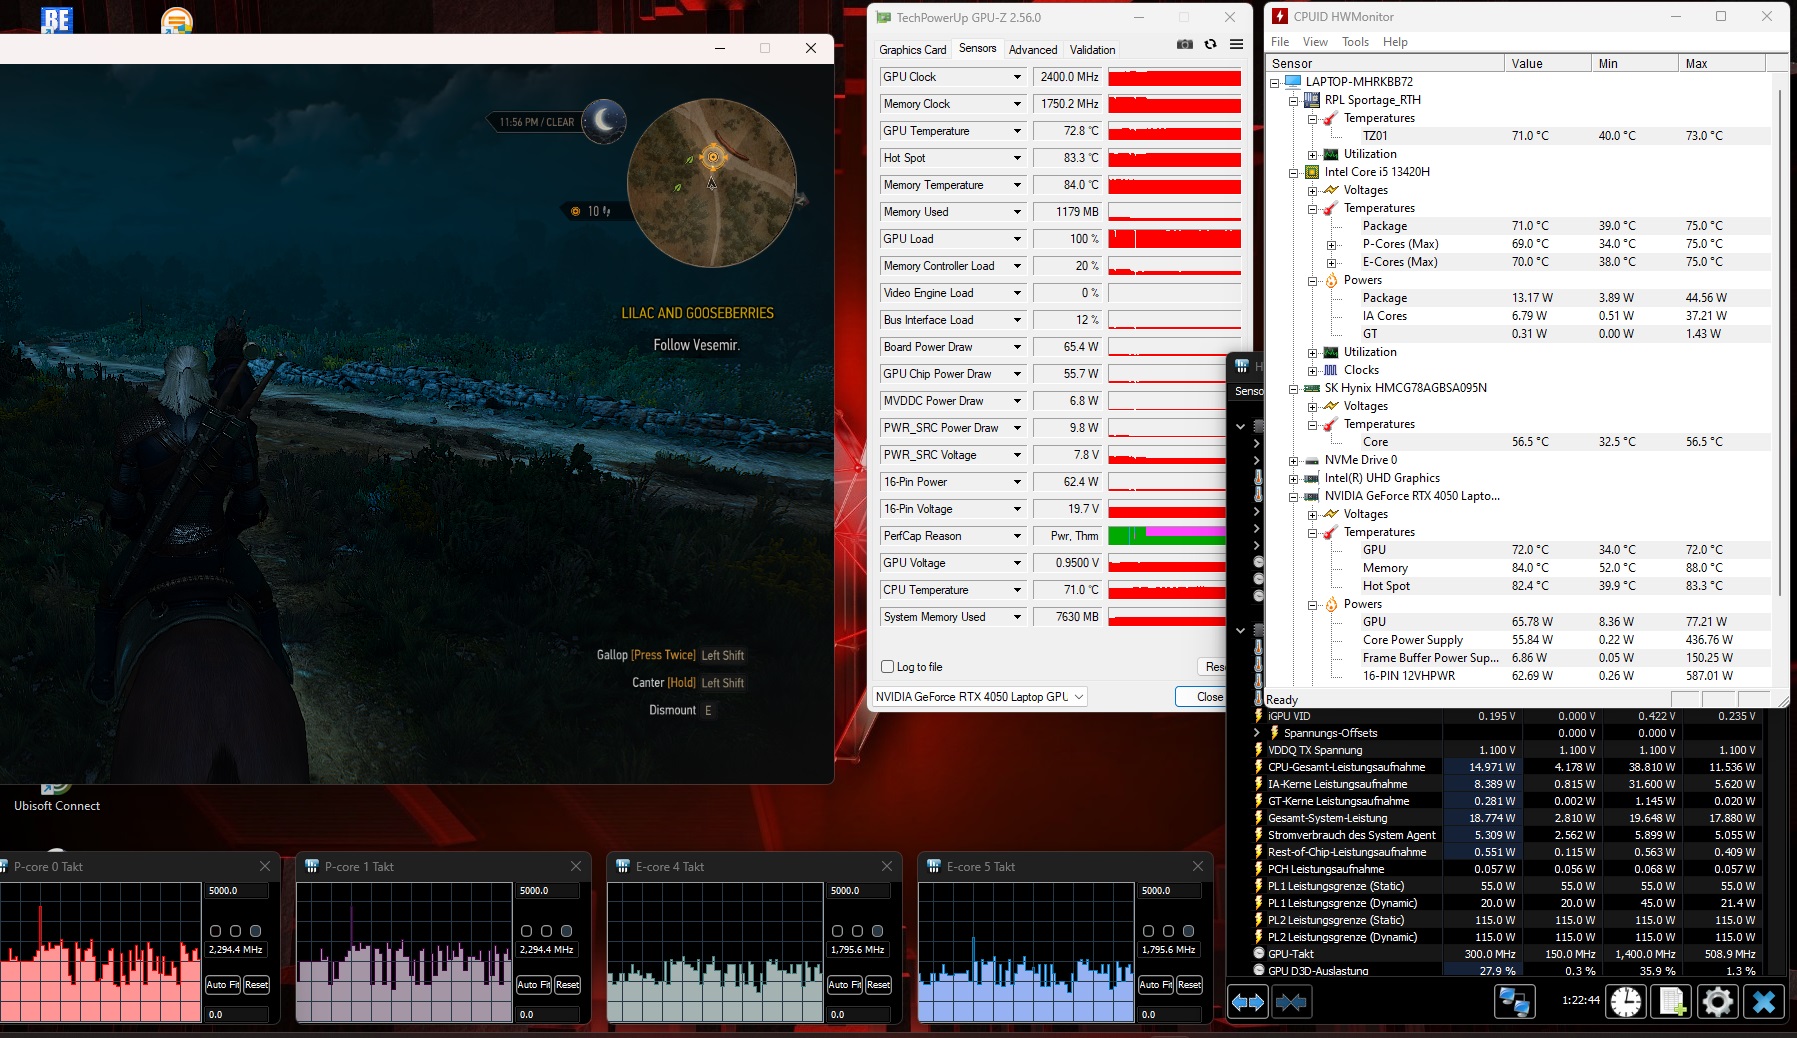
Preinstalowana aplikacja NitroSense pozwala użytkownikom dostosować różne ustawienia systemowe. Zakładka "Scenariusz" jest szczególnie interesująca dla rzeczywistych zastosowań. Pozwala ona majstrować przy planie zasilania (menu "Mode") i zachowaniu wentylatora (menu "Fan Control"). Nasze pomiary zostały przeprowadzone w trybie zrównoważonym i z automatycznym sterowaniem wentylatorem, ponieważ laptop działa znacznie głośniej, ale niewiele szybciej w trybie wydajności.
| NitroSense | Quiet | Balanced | Wydajność |
| CPU PL1 (HWiNFO) | 35 W | 45 W | 55 W |
| CPU PL2 (HWiNFO) | 64 W | 115 W | 115 W |
| Hałas (Witcher 3, FHD/Ultra) | 37 dB(A) | 49 dB(A) | 59 dB(A) |
| Wydajność (Witcher 3, FHD/Ultra) | ~62 FPS | ~78 FPS | ~82 FPS |
Procesor
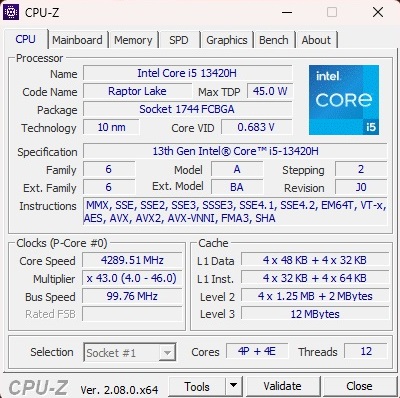
Core i5-13420H to procesor z linii Intel Raptor Lake (10 nm), który posiada cztery wydajne rdzenie (z Hyper-Threading) i cztery wydajne rdzenie (bez HT). W naszych testach porównawczych procesor ten nie tylko uzyskał lepsze wyniki niż jego droższe rodzeństwo Core i5-13500H i Core i7-13620H, ale także pokonał swoich konkurentów AMD Ryzen 7 7735HS i Ryzen 7 7840HS. To powiedziawszy, wydajność procesora jest więcej niż wystarczająca do gier, ponieważ większość gier jest, jak wiemy, związana z GPU.
Cinebench R15 Multi Sustained Load
* ... im mniej tym lepiej
AIDA64: FP32 Ray-Trace | FPU Julia | CPU SHA3 | CPU Queen | FPU SinJulia | FPU Mandel | CPU AES | CPU ZLib | FP64 Ray-Trace | CPU PhotoWorxx
| Performance rating | |
| Średnia w klasie Gaming | |
| Schenker XMG Apex 15 (Late 23) | |
| Asus TUF A15 FA507 | |
| Medion Erazer Crawler E40 - MD 62518 | |
| Lenovo LOQ 15IRH8 Core i7 | |
| Acer Nitro V 15 ANV15-51-582S | |
| Przeciętny Intel Core i5-13420H | |
| AIDA64 / FP32 Ray-Trace | |
| Średnia w klasie Gaming (10227 - 85542, n=107, ostatnie 2 lata) | |
| Schenker XMG Apex 15 (Late 23) | |
| Asus TUF A15 FA507 | |
| Medion Erazer Crawler E40 - MD 62518 | |
| Acer Nitro V 15 ANV15-51-582S | |
| Lenovo LOQ 15IRH8 Core i7 | |
| Przeciętny Intel Core i5-13420H (7922 - 12134, n=5) | |
| AIDA64 / FPU Julia | |
| Średnia w klasie Gaming (51376 - 238426, n=107, ostatnie 2 lata) | |
| Schenker XMG Apex 15 (Late 23) | |
| Asus TUF A15 FA507 | |
| Medion Erazer Crawler E40 - MD 62518 | |
| Lenovo LOQ 15IRH8 Core i7 | |
| Acer Nitro V 15 ANV15-51-582S | |
| Przeciętny Intel Core i5-13420H (40587 - 59715, n=5) | |
| AIDA64 / CPU SHA3 | |
| Średnia w klasie Gaming (2180 - 9817, n=107, ostatnie 2 lata) | |
| Schenker XMG Apex 15 (Late 23) | |
| Medion Erazer Crawler E40 - MD 62518 | |
| Asus TUF A15 FA507 | |
| Acer Nitro V 15 ANV15-51-582S | |
| Lenovo LOQ 15IRH8 Core i7 | |
| Przeciętny Intel Core i5-13420H (1724 - 2634, n=5) | |
| AIDA64 / CPU Queen | |
| Średnia w klasie Gaming (49785 - 173351, n=98, ostatnie 2 lata) | |
| Schenker XMG Apex 15 (Late 23) | |
| Asus TUF A15 FA507 | |
| Medion Erazer Crawler E40 - MD 62518 | |
| Lenovo LOQ 15IRH8 Core i7 | |
| Przeciętny Intel Core i5-13420H (69803 - 74956, n=5) | |
| Acer Nitro V 15 ANV15-51-582S | |
| AIDA64 / FPU SinJulia | |
| Schenker XMG Apex 15 (Late 23) | |
| Średnia w klasie Gaming (4424 - 33636, n=107, ostatnie 2 lata) | |
| Asus TUF A15 FA507 | |
| Medion Erazer Crawler E40 - MD 62518 | |
| Lenovo LOQ 15IRH8 Core i7 | |
| Acer Nitro V 15 ANV15-51-582S | |
| Przeciętny Intel Core i5-13420H (5485 - 6644, n=5) | |
| AIDA64 / FPU Mandel | |
| Średnia w klasie Gaming (25115 - 128721, n=107, ostatnie 2 lata) | |
| Schenker XMG Apex 15 (Late 23) | |
| Asus TUF A15 FA507 | |
| Medion Erazer Crawler E40 - MD 62518 | |
| Lenovo LOQ 15IRH8 Core i7 | |
| Acer Nitro V 15 ANV15-51-582S | |
| Przeciętny Intel Core i5-13420H (19684 - 30163, n=5) | |
| AIDA64 / CPU AES | |
| Schenker XMG Apex 15 (Late 23) | |
| Średnia w klasie Gaming (39258 - 247074, n=107, ostatnie 2 lata) | |
| Acer Nitro V 15 ANV15-51-582S | |
| Asus TUF A15 FA507 | |
| Medion Erazer Crawler E40 - MD 62518 | |
| Przeciętny Intel Core i5-13420H (35531 - 93100, n=5) | |
| Lenovo LOQ 15IRH8 Core i7 | |
| AIDA64 / CPU ZLib | |
| Średnia w klasie Gaming (574 - 2531, n=107, ostatnie 2 lata) | |
| Schenker XMG Apex 15 (Late 23) | |
| Medion Erazer Crawler E40 - MD 62518 | |
| Lenovo LOQ 15IRH8 Core i7 | |
| Acer Nitro V 15 ANV15-51-582S | |
| Przeciętny Intel Core i5-13420H (509 - 746, n=5) | |
| Asus TUF A15 FA507 | |
| AIDA64 / FP64 Ray-Trace | |
| Średnia w klasie Gaming (5509 - 45446, n=107, ostatnie 2 lata) | |
| Schenker XMG Apex 15 (Late 23) | |
| Asus TUF A15 FA507 | |
| Medion Erazer Crawler E40 - MD 62518 | |
| Lenovo LOQ 15IRH8 Core i7 | |
| Acer Nitro V 15 ANV15-51-582S | |
| Przeciętny Intel Core i5-13420H (4283 - 6627, n=5) | |
| AIDA64 / CPU PhotoWorxx | |
| Średnia w klasie Gaming (12271 - 89891, n=107, ostatnie 2 lata) | |
| Medion Erazer Crawler E40 - MD 62518 | |
| Schenker XMG Apex 15 (Late 23) | |
| Lenovo LOQ 15IRH8 Core i7 | |
| Asus TUF A15 FA507 | |
| Acer Nitro V 15 ANV15-51-582S | |
| Przeciętny Intel Core i5-13420H (12330 - 37044, n=5) | |
Wydajność systemu
Nitro V 15 nie dorównuje również swoim konkurentom pod względem wydajności systemu, choć różnice w PCMark 10 nie są tak duże, jak w testach procesora.
CrossMark: Overall | Productivity | Creativity | Responsiveness
WebXPRT 3: Overall
WebXPRT 4: Overall
Mozilla Kraken 1.1: Total
| PCMark 10 / Score | |
| Średnia w klasie Gaming (5828 - 11574, n=94, ostatnie 2 lata) | |
| Schenker XMG Apex 15 (Late 23) | |
| Lenovo LOQ 15IRH8 Core i7 | |
| Medion Erazer Crawler E40 - MD 62518 | |
| Asus TUF A15 FA507 | |
| Acer Nitro V 15 ANV15-51-582S | |
| Przeciętny Intel Core i5-13420H, NVIDIA GeForce RTX 4050 Laptop GPU (n=1) | |
| PCMark 10 / Essentials | |
| Lenovo LOQ 15IRH8 Core i7 | |
| Schenker XMG Apex 15 (Late 23) | |
| Średnia w klasie Gaming (8810 - 12600, n=98, ostatnie 2 lata) | |
| Asus TUF A15 FA507 | |
| Medion Erazer Crawler E40 - MD 62518 | |
| Acer Nitro V 15 ANV15-51-582S | |
| Przeciętny Intel Core i5-13420H, NVIDIA GeForce RTX 4050 Laptop GPU (n=1) | |
| PCMark 10 / Productivity | |
| Średnia w klasie Gaming (6845 - 18766, n=96, ostatnie 2 lata) | |
| Schenker XMG Apex 15 (Late 23) | |
| Lenovo LOQ 15IRH8 Core i7 | |
| Asus TUF A15 FA507 | |
| Medion Erazer Crawler E40 - MD 62518 | |
| Acer Nitro V 15 ANV15-51-582S | |
| Przeciętny Intel Core i5-13420H, NVIDIA GeForce RTX 4050 Laptop GPU (n=1) | |
| PCMark 10 / Digital Content Creation | |
| Średnia w klasie Gaming (7602 - 19657, n=96, ostatnie 2 lata) | |
| Lenovo LOQ 15IRH8 Core i7 | |
| Schenker XMG Apex 15 (Late 23) | |
| Medion Erazer Crawler E40 - MD 62518 | |
| Asus TUF A15 FA507 | |
| Acer Nitro V 15 ANV15-51-582S | |
| Przeciętny Intel Core i5-13420H, NVIDIA GeForce RTX 4050 Laptop GPU (n=1) | |
| CrossMark / Overall | |
| Średnia w klasie Gaming (1366 - 2409, n=96, ostatnie 2 lata) | |
| Lenovo LOQ 15IRH8 Core i7 | |
| Medion Erazer Crawler E40 - MD 62518 | |
| Schenker XMG Apex 15 (Late 23) | |
| Asus TUF A15 FA507 | |
| CrossMark / Productivity | |
| Średnia w klasie Gaming (1386 - 2254, n=96, ostatnie 2 lata) | |
| Lenovo LOQ 15IRH8 Core i7 | |
| Medion Erazer Crawler E40 - MD 62518 | |
| Schenker XMG Apex 15 (Late 23) | |
| Asus TUF A15 FA507 | |
| CrossMark / Creativity | |
| Średnia w klasie Gaming (1343 - 2729, n=96, ostatnie 2 lata) | |
| Lenovo LOQ 15IRH8 Core i7 | |
| Schenker XMG Apex 15 (Late 23) | |
| Medion Erazer Crawler E40 - MD 62518 | |
| Asus TUF A15 FA507 | |
| CrossMark / Responsiveness | |
| Lenovo LOQ 15IRH8 Core i7 | |
| Medion Erazer Crawler E40 - MD 62518 | |
| Średnia w klasie Gaming (1226 - 2334, n=96, ostatnie 2 lata) | |
| Schenker XMG Apex 15 (Late 23) | |
| Asus TUF A15 FA507 | |
| WebXPRT 3 / Overall | |
| Średnia w klasie Gaming (242 - 532, n=99, ostatnie 2 lata) | |
| Schenker XMG Apex 15 (Late 23) | |
| Asus TUF A15 FA507 | |
| Lenovo LOQ 15IRH8 Core i7 | |
| Medion Erazer Crawler E40 - MD 62518 | |
| Acer Nitro V 15 ANV15-51-582S | |
| Przeciętny Intel Core i5-13420H, NVIDIA GeForce RTX 4050 Laptop GPU (n=1) | |
| WebXPRT 4 / Overall | |
| Średnia w klasie Gaming (176.4 - 354, n=99, ostatnie 2 lata) | |
| Lenovo LOQ 15IRH8 Core i7 | |
| Acer Nitro V 15 ANV15-51-582S | |
| Przeciętny Intel Core i5-13420H, NVIDIA GeForce RTX 4050 Laptop GPU (n=1) | |
| Medion Erazer Crawler E40 - MD 62518 | |
| Asus TUF A15 FA507 | |
| Mozilla Kraken 1.1 / Total | |
| Asus TUF A15 FA507 | |
| Acer Nitro V 15 ANV15-51-582S | |
| Przeciętny Intel Core i5-13420H, NVIDIA GeForce RTX 4050 Laptop GPU (n=1) | |
| Medion Erazer Crawler E40 - MD 62518 | |
| Schenker XMG Apex 15 (Late 23) | |
| Lenovo LOQ 15IRH8 Core i7 | |
| Średnia w klasie Gaming (391 - 590, n=104, ostatnie 2 lata) | |
* ... im mniej tym lepiej
| PCMark 10 Score | 6569 pkt. | |
Pomoc | ||
| AIDA64 / Memory Copy | |
| Średnia w klasie Gaming (21750 - 129946, n=107, ostatnie 2 lata) | |
| Schenker XMG Apex 15 (Late 23) | |
| Medion Erazer Crawler E40 - MD 62518 | |
| Lenovo LOQ 15IRH8 Core i7 | |
| Asus TUF A15 FA507 | |
| Acer Nitro V 15 ANV15-51-582S | |
| Przeciętny Intel Core i5-13420H (22003 - 59609, n=5) | |
| AIDA64 / Memory Read | |
| Średnia w klasie Gaming (22956 - 118858, n=107, ostatnie 2 lata) | |
| Medion Erazer Crawler E40 - MD 62518 | |
| Lenovo LOQ 15IRH8 Core i7 | |
| Schenker XMG Apex 15 (Late 23) | |
| Asus TUF A15 FA507 | |
| Acer Nitro V 15 ANV15-51-582S | |
| Przeciętny Intel Core i5-13420H (23499 - 68085, n=5) | |
| AIDA64 / Memory Write | |
| Schenker XMG Apex 15 (Late 23) | |
| Średnia w klasie Gaming (22297 - 135096, n=107, ostatnie 2 lata) | |
| Medion Erazer Crawler E40 - MD 62518 | |
| Asus TUF A15 FA507 | |
| Lenovo LOQ 15IRH8 Core i7 | |
| Acer Nitro V 15 ANV15-51-582S | |
| Przeciętny Intel Core i5-13420H (21429 - 62529, n=5) | |
| AIDA64 / Memory Latency | |
| Lenovo LOQ 15IRH8 Core i7 | |
| Średnia w klasie Gaming (75.3 - 259, n=107, ostatnie 2 lata) | |
| Przeciętny Intel Core i5-13420H (90.2 - 103.6, n=5) | |
| Medion Erazer Crawler E40 - MD 62518 | |
| Acer Nitro V 15 ANV15-51-582S | |
| Schenker XMG Apex 15 (Late 23) | |
| Asus TUF A15 FA507 | |
* ... im mniej tym lepiej
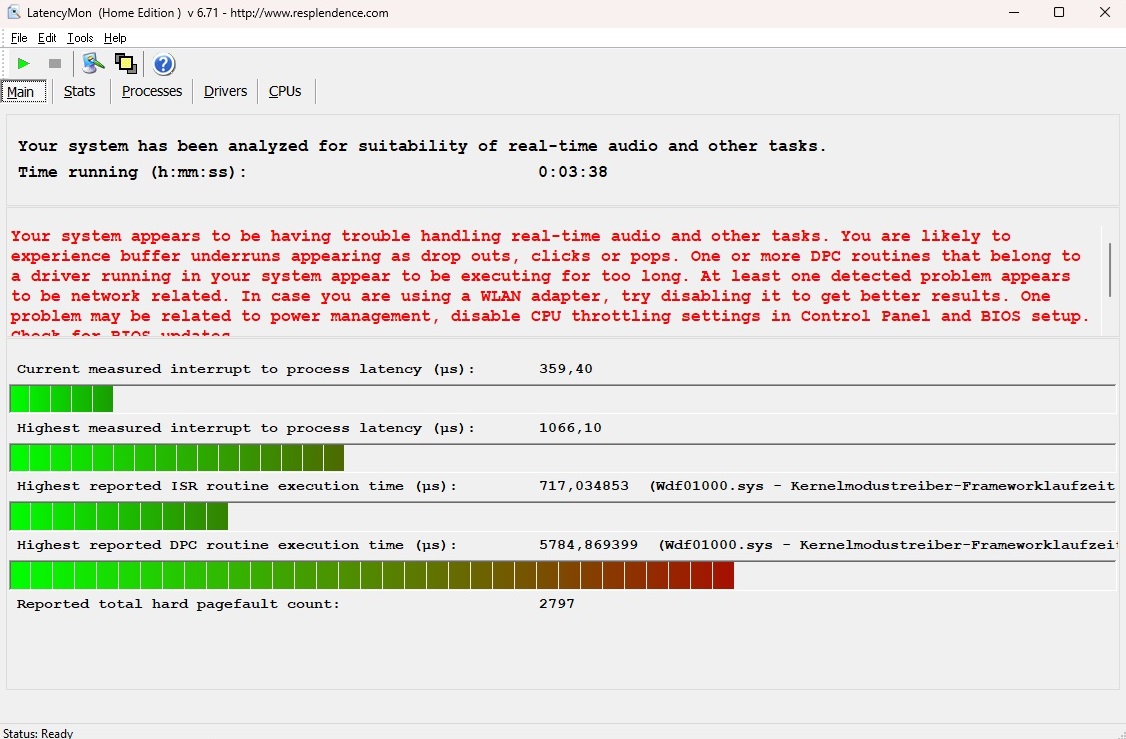
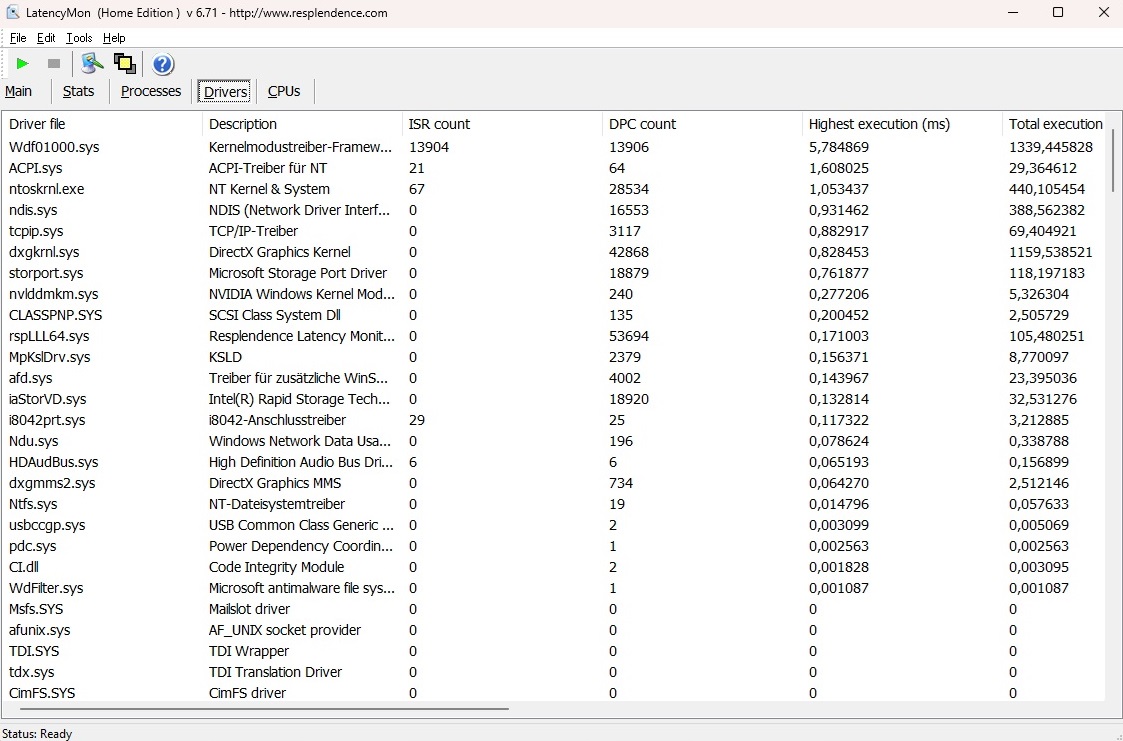
Opóźnienie DPC
Według LatencyMon, Nitro V 15 tylko częściowo nadaje się do aplikacji wrażliwych na opóźnienia, takich jak edycja audio i wideo w czasie rzeczywistym. Problem ten dotyczy jednak wielu laptopów i jest istotny tylko dla niektórych użytkowników.
| DPC Latencies / LatencyMon - interrupt to process latency (max), Web, Youtube, Prime95 | |
| Acer Nitro V 15 ANV15-51-582S | |
| Medion Erazer Crawler E40 - MD 62518 | |
| Lenovo LOQ 15IRH8 Core i7 | |
| Schenker XMG Apex 15 (Late 23) | |
* ... im mniej tym lepiej
Pamięć masowa
Dysk M.2 w naszej jednostce testowej został wyprodukowany przez SK hynix i zapewnia solidną wydajność odczytu i zapisu jak na urządzenie NVMe. Jednakże, podobnie jak dysk SSD w Lenovo LOQ LOQ 15IRH8, cierpi on na pewien poziom spadków wydajności i wahań przy stałym obciążeniu.

* ... im mniej tym lepiej
Sustained Load Read: DiskSpd Read Loop, Queue Depth 8
Karta graficzna
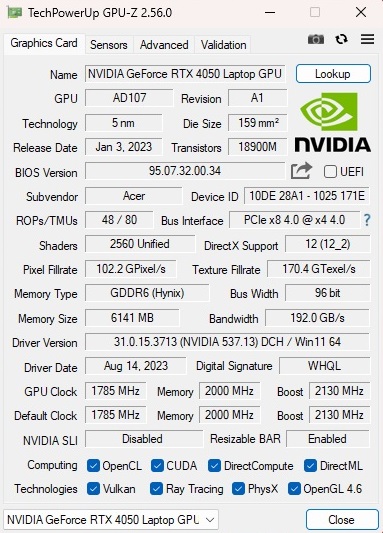
Choć konkurenci osiągnęli nieco lepsze wyniki w syntetycznych benchmarkach graficznych, RTX 4050 w Nitro V 15 nadal oferuje poziom wydajności zbliżony do tego, co średnio widzieliśmy w przypadku tego GPU. Średniej klasy model z generacji Ada Lovelace oferuje 2560 jednostek cieniujących, ale nie ma szczególnie hojnej konfiguracji pamięci, posiadając zaledwie 6 GB pamięci GDDR6 VRAM i 96-bitowy interfejs. Acer ustawił TGP na 75 W (60 W plus 15 W Dynamic Boost), co jest dość niską wartością jak na RTX 4050.
| 3DMark 11 Performance | 24506 pkt. | |
| 3DMark Ice Storm Standard Score | 133723 pkt. | |
| 3DMark Cloud Gate Standard Score | 50705 pkt. | |
| 3DMark Fire Strike Score | 18795 pkt. | |
| 3DMark Time Spy Score | 7944 pkt. | |
Pomoc | ||
* ... im mniej tym lepiej
Wydajność w grach
Tak długo, jak utrzymują Państwo rozdzielczość wewnętrzną na poziomie Full HD (tj. 1080p) i nie przesadzają z ustawieniami, RTX 4050 jest również w stanie poradzić sobie z nowoczesnymi grami. Średnie i wysokie ustawienia w większości przypadków nie powinny stanowić problemu; dopiero po przejściu do ustawień ultra może być momentami ciasno (np. w grze Lords of the Fallen lub Avatar: Frontiers of Pandora). Podobnie do tego, co widzieliśmy w benchmarkach graficznych, inne laptopy z RTX 4050 z wyższym TGP często radzą sobie lepiej niż Nitro.
| The Witcher 3 - 1920x1080 Ultra Graphics & Postprocessing (HBAO+) | |
| Średnia w klasie Gaming (95 - 240, n=8, ostatnie 2 lata) | |
| Lenovo LOQ 15IRH8 Core i7 | |
| Schenker XMG Apex 15 (Late 23) | |
| Asus TUF A15 FA507 | |
| Medion Erazer Crawler E40 - MD 62518 | |
| Acer Nitro V 15 ANV15-51-582S | |
| Przeciętny NVIDIA GeForce RTX 4050 Laptop GPU (18.5 - 94.7, n=40) | |
| Avatar Frontiers of Pandora - 1920x1080 Ultra Preset AA:T | |
| Średnia w klasie Gaming (n=1ostatnie 2 lata) | |
| Medion Erazer Scout E20 | |
| Acer Nitro V 15 ANV15-51-582S | |
| Przeciętny NVIDIA GeForce RTX 4050 Laptop GPU (35 - 35, n=2) | |
| The Finals - 1920x1080 Epic Preset | |
| Medion Erazer Scout E20 | |
| Przeciętny NVIDIA GeForce RTX 4050 Laptop GPU (91.8 - 99.2, n=2) | |
| Acer Nitro V 15 ANV15-51-582S | |
| Średnia w klasie Gaming (n=1ostatnie 2 lata) | |
| EA Sports WRC - 1920x1080 Ultra Preset AA:Epic AF:16x | |
| Medion Erazer Scout E20 | |
| Przeciętny NVIDIA GeForce RTX 4050 Laptop GPU (61 - 67.3, n=2) | |
| Acer Nitro V 15 ANV15-51-582S | |
| Średnia w klasie Gaming (n=1ostatnie 2 lata) | |
| Assassin's Creed Mirage - 1920x1080 Ultra High Preset (Adaptive Quality Off) | |
| XMG Focus 15 E23 | |
| Przeciętny NVIDIA GeForce RTX 4050 Laptop GPU (63 - 70, n=2) | |
| Acer Nitro V 15 ANV15-51-582S | |
| Ready or Not - 1920x1080 Epic Preset | |
| Medion Erazer Scout E20 | |
| Przeciętny NVIDIA GeForce RTX 4050 Laptop GPU (95.1 - 107.1, n=2) | |
| Acer Nitro V 15 ANV15-51-582S | |
| Lords of the Fallen - 1920x1080 Ultra Preset | |
| XMG Focus 15 E23 | |
| Przeciętny NVIDIA GeForce RTX 4050 Laptop GPU (27.3 - 32.1, n=2) | |
| Acer Nitro V 15 ANV15-51-582S | |
| Counter-Strike 2 - 1920x1080 Very High Preset | |
| Średnia w klasie Gaming (26.2 - 275, n=5, ostatnie 2 lata) | |
| Medion Erazer Scout E20 | |
| Przeciętny NVIDIA GeForce RTX 4050 Laptop GPU (80.9 - 110.2, n=2) | |
| Acer Nitro V 15 ANV15-51-582S | |
| Total War Pharaoh - 1920x1080 Ultra Preset | |
| Średnia w klasie Gaming (42.9 - 161.4, n=2, ostatnie 2 lata) | |
| XMG Focus 15 E23 | |
| Przeciętny NVIDIA GeForce RTX 4050 Laptop GPU (59.7 - 101, n=3) | |
| Acer Nitro V 15 ANV15-51-582S | |
Nie napotkaliśmy żadnych poważnych problemów podczas naszego testu stabilności (uruchomienie The Witcher 3 w rozdzielczości FHD/Ultra przez godzinę). Chociaż liczba klatek na sekundę nieznacznie spadła w trakcie testu, nie było żadnych niezwykłych spadków wydajności itp.
Witcher 3 FPS chart
| low | med. | high | ultra | |
|---|---|---|---|---|
| GTA V (2015) | 177.3 | 158.2 | 86.9 | |
| The Witcher 3 (2015) | 78 | |||
| Dota 2 Reborn (2015) | 153.7 | 143.6 | 136.5 | 120.3 |
| Final Fantasy XV Benchmark (2018) | 104.3 | 76.5 | ||
| X-Plane 11.11 (2018) | 114.3 | 94.5 | 77 | |
| Far Cry 5 (2018) | 128 | 118 | 102 | |
| Strange Brigade (2018) | 189.5 | 155.2 | 135.2 | |
| Counter-Strike 2 (2023) | 127 | 112.4 | 80.9 | |
| Assassin's Creed Mirage (2023) | 89 | 84 | 63 | |
| Total War Pharaoh (2023) | 147 | 84.1 | 59.7 | |
| Lords of the Fallen (2023) | 54.1 | 38.6 | 27.3 | |
| EA Sports WRC (2023) | 71.2 | 66.6 | 61 | |
| Avatar Frontiers of Pandora (2023) | 55 | 47 | 35 | |
| The Finals (2023) | 130.2 | 113.7 | 91.8 | |
| Ready or Not (2023) | 148.3 | 134.2 | 95.1 |
Emisje
Emisja hałasu
W stosunku do ilości generowanego ciepła, Nitro V 15 jest niepotrzebnie głośny podczas uruchamiania aplikacji 3D. Zmierzyliśmy około 49 dB(A) hałasu podczas grania (tryb zrównoważony), co jest wyraźnie słyszalne i może być wystarczająco głośne, aby przeszkadzać niektórym użytkownikom. Pod tym względem laptop nie różni się zbytnio od konkurencji. W trybie bezczynności dwa wentylatory wewnątrz są albo całkowicie nieruchome, albo pracują z umiarkowanym poziomem hałasu od 29 do 30 dB(A).
Hałas
| luz |
| 25 / 29 / 30 dB |
| obciążenie |
| 49 / 51 dB |
 | ||
30 dB cichy 40 dB(A) słyszalny 50 dB(A) irytujący |
||
min: | ||
| Acer Nitro V 15 ANV15-51-582S GeForce RTX 4050 Laptop GPU, i5-13420H | Medion Erazer Crawler E40 - MD 62518 GeForce RTX 4050 Laptop GPU, i5-13500H | Lenovo LOQ 15IRH8 Core i7 GeForce RTX 4050 Laptop GPU, i7-13620H | Asus TUF A15 FA507 GeForce RTX 4050 Laptop GPU, R7 7735HS | Schenker XMG Apex 15 (Late 23) GeForce RTX 4050 Laptop GPU, R7 7840HS | |
|---|---|---|---|---|---|
| Noise | 4% | -0% | 18% | 3% | |
| wyłączone / środowisko * (dB) | 25 | 23 8% | 23.69 5% | 23.3 7% | 24 4% |
| Idle Minimum * (dB) | 25 | 23 8% | 29.03 -16% | 23.3 7% | 25 -0% |
| Idle Average * (dB) | 29 | 23 21% | 29.03 -0% | 23.3 20% | 29 -0% |
| Idle Maximum * (dB) | 30 | 28.02 7% | 29.03 3% | 23.3 22% | 33 -10% |
| Load Average * (dB) | 49 | 50.21 -2% | 48.7 1% | 29.6 40% | 36 27% |
| Witcher 3 ultra * (dB) | 49 | 51.46 -5% | 48.5 1% | 43 12% | 48 2% |
| Load Maximum * (dB) | 51 | 56.79 -11% | 48.7 5% | 43 16% | 53 -4% |
* ... im mniej tym lepiej
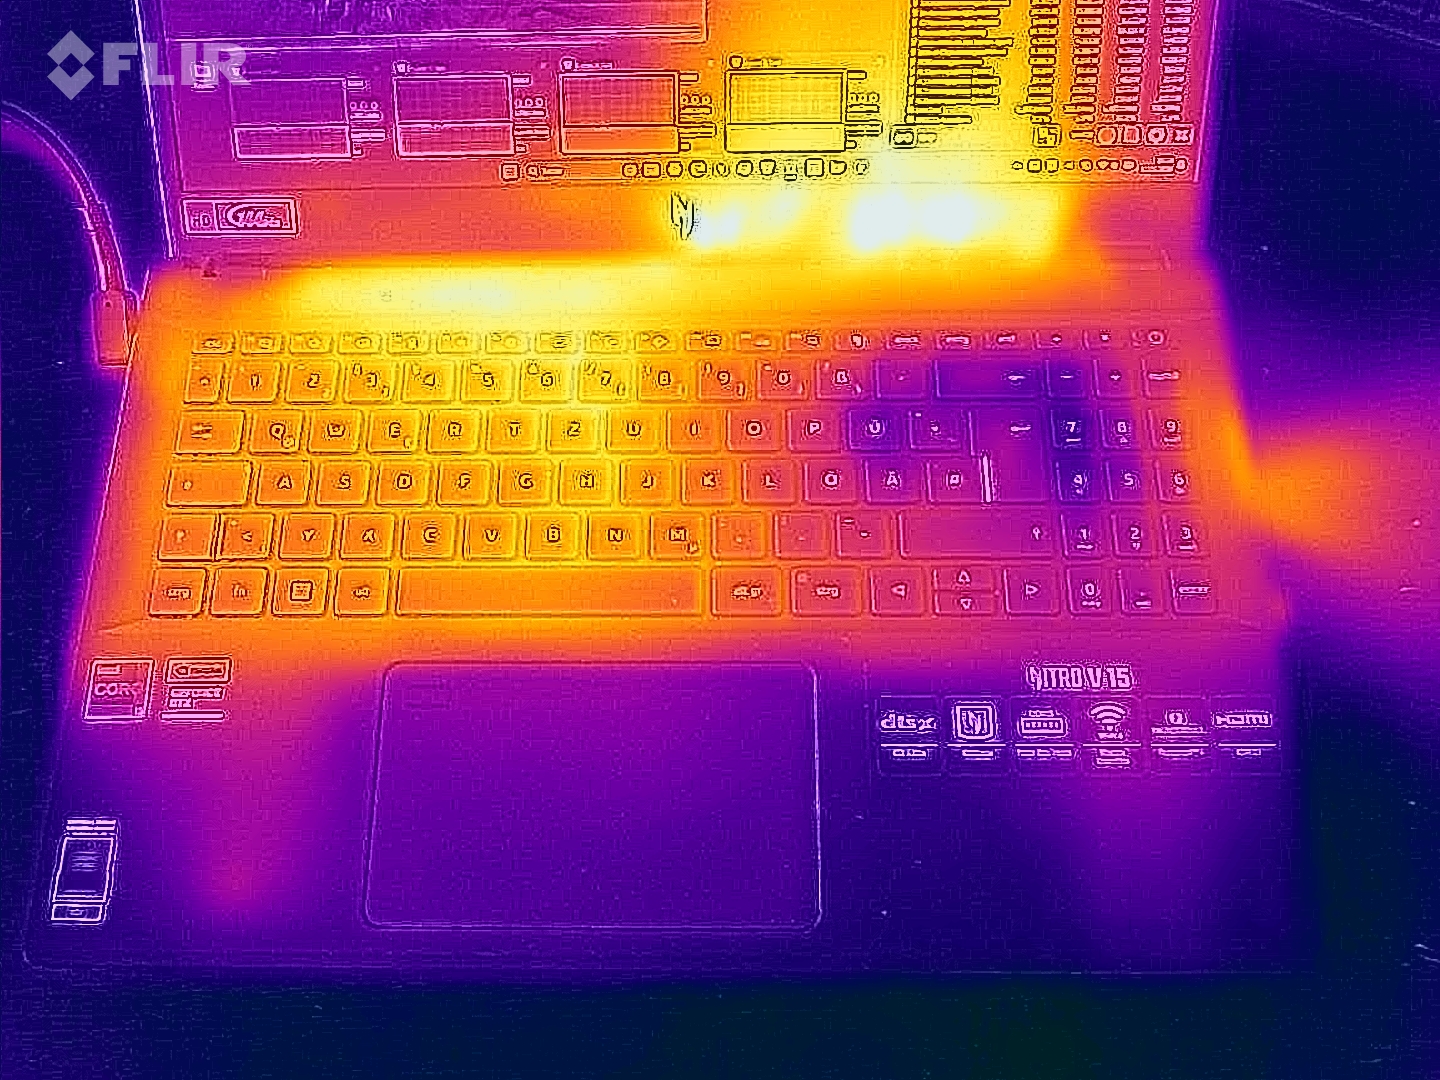
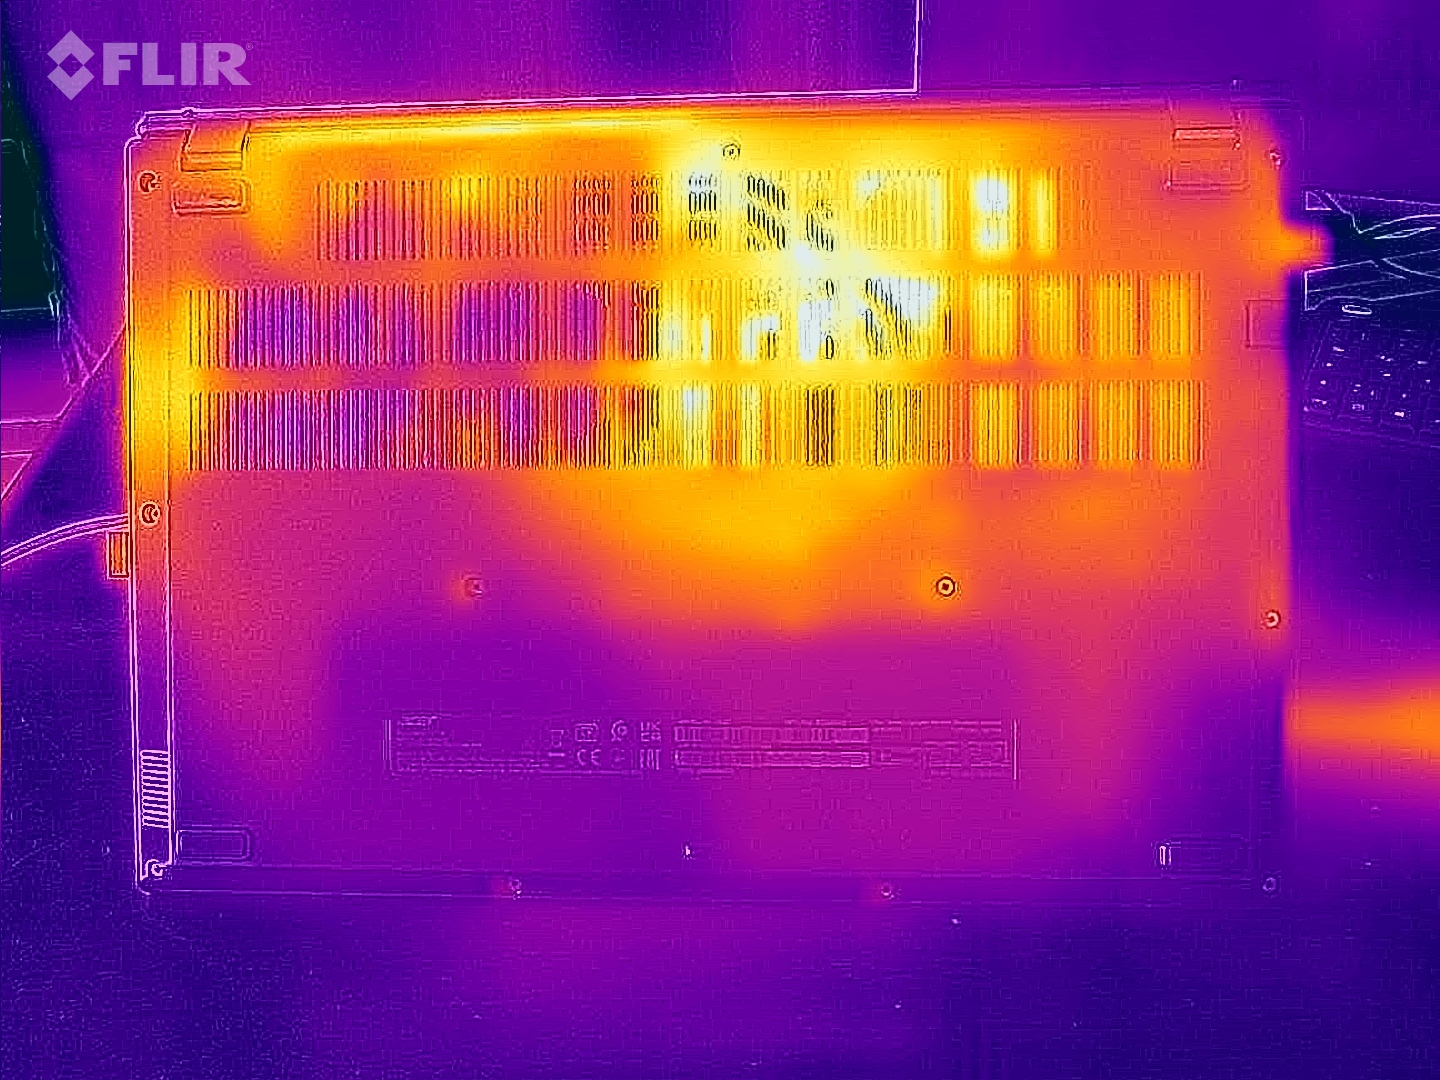
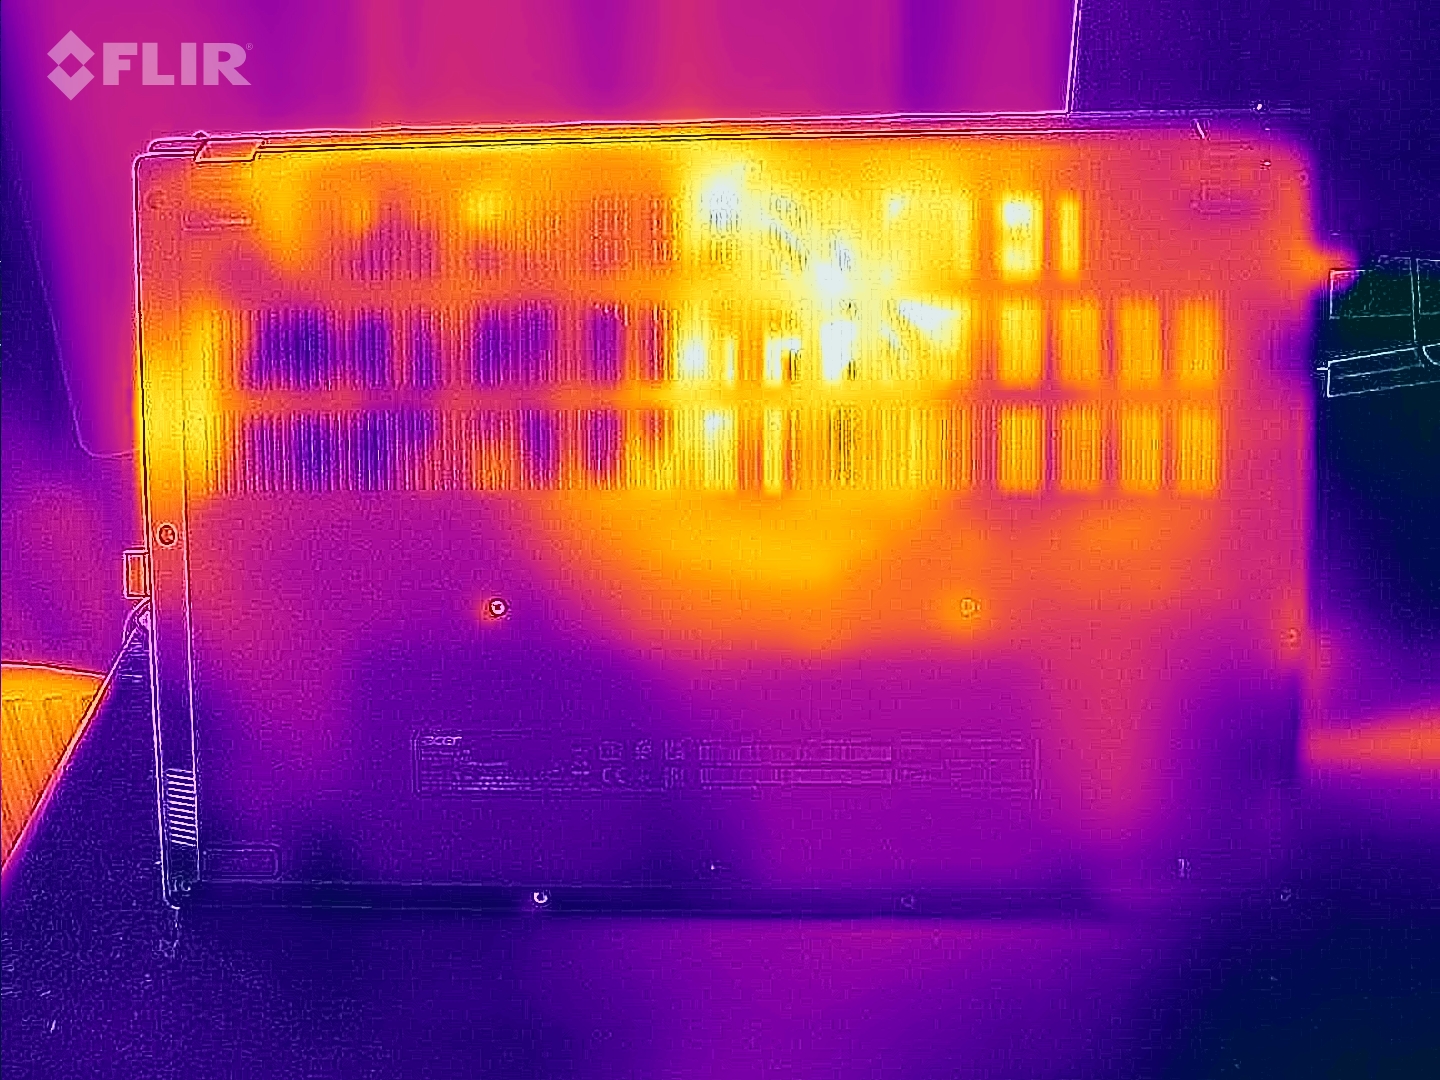
Temperatura
Nitro V 15 nie nagrzewa się do wysokich temperatur. Nawet po 60 minutach testów obciążeniowych (FurMark i Prime95), powierzchnia laptopa wciąż pozostawała poniżej 50°C (122°F). Cała obudowa jest utrzymywana w przyjemnym chłodzie w stanie spoczynku - nasz termometr odnotował tylko temperatury między 22 a 28°C (71,6 a 82,4°F).
(-) Maksymalna temperatura w górnej części wynosi 46 °C / 115 F, w porównaniu do średniej 40.4 °C / 105 F , począwszy od 21.2 do 68.8 °C dla klasy Gaming.
(-) Dno nagrzewa się maksymalnie do 48 °C / 118 F, w porównaniu do średniej 43.2 °C / 110 F
(+) W stanie bezczynności średnia temperatura górnej części wynosi 25.1 °C / 77 F, w porównaniu ze średnią temperaturą urządzenia wynoszącą 33.9 °C / ### class_avg_f### F.
(-) Podczas gry w Wiedźmina 3 średnia temperatura górnej części wynosi 39.4 °C / 103 F, w porównaniu do średniej temperatury urządzenia wynoszącej 33.9 °C / ## #class_avg_f### F.
(±) Podpórki pod nadgarstki i touchpad mogą się bardzo nagrzać w dotyku, maksymalnie do 36 °C / 96.8 F.
(-) Średnia temperatura obszaru podparcia dłoni w podobnych urządzeniach wynosiła 28.8 °C / 83.8 F (-7.2 °C / -13 F).
| Acer Nitro V 15 ANV15-51-582S GeForce RTX 4050 Laptop GPU, i5-13420H | Medion Erazer Crawler E40 - MD 62518 GeForce RTX 4050 Laptop GPU, i5-13500H | Lenovo LOQ 15IRH8 Core i7 GeForce RTX 4050 Laptop GPU, i7-13620H | Asus TUF A15 FA507 GeForce RTX 4050 Laptop GPU, R7 7735HS | Schenker XMG Apex 15 (Late 23) GeForce RTX 4050 Laptop GPU, R7 7840HS | |
|---|---|---|---|---|---|
| Heat | 14% | -20% | 1% | -13% | |
| Maximum Upper Side * (°C) | 46 | 36 22% | 46.4 -1% | 48.9 -6% | 52 -13% |
| Maximum Bottom * (°C) | 48 | 36 25% | 59.2 -23% | 44.6 7% | 47 2% |
| Idle Upper Side * (°C) | 27 | 26 4% | 34.4 -27% | 27.1 -0% | 33 -22% |
| Idle Bottom * (°C) | 28 | 27 4% | 36.2 -29% | 27.5 2% | 33 -18% |
* ... im mniej tym lepiej
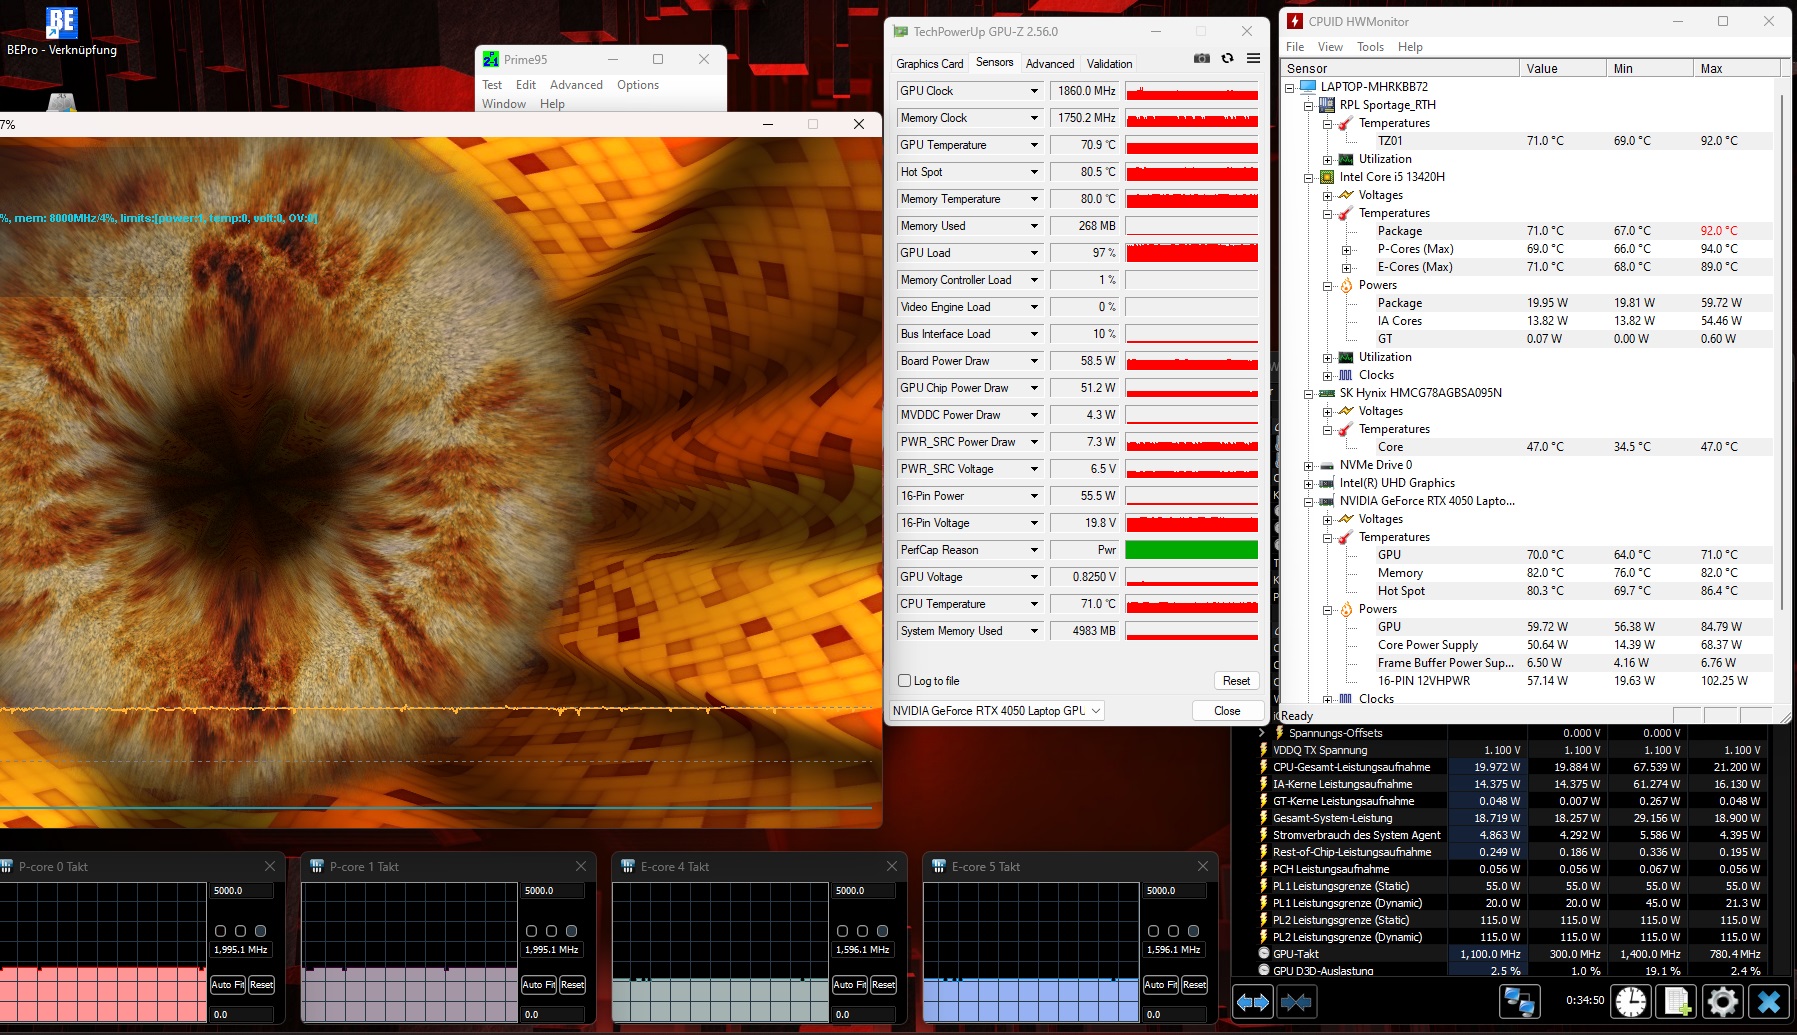
Test warunków skrajnych
Podzespoły laptopa nie przegrzewają się również przy pełnym obciążeniu. CPU i GPU pracowały w średniej temperaturze 71°C (159,8°F), co jest stosunkowo dobrą wartością, która nie daje powodów do obaw czy krytyki. 60-minutowy test Witcher 3 również przyniósł podobne wyniki.
Głośniki
Nitro V 15 oferuje przyzwoity lub dobry dźwięk jak na notebooka, ale jak to często bywa, brakuje basów. Maksymalna głośność 83 dB(A) jest jednak całkiem dobra.
Acer Nitro V 15 ANV15-51-582S analiza dźwięku
(+) | głośniki mogą odtwarzać stosunkowo głośno (83 dB)
Bas 100 - 315 Hz
(-) | prawie brak basu - średnio 26.5% niższa od mediany
(±) | liniowość basu jest średnia (13.9% delta do poprzedniej częstotliwości)
Średnie 400 - 2000 Hz
(+) | zbalansowane środki średnie - tylko 3.2% od mediany
(+) | średnie są liniowe (4.2% delta do poprzedniej częstotliwości)
Wysokie 2–16 kHz
(+) | zrównoważone maksima - tylko 1.6% od mediany
(+) | wzloty są liniowe (3.3% delta do poprzedniej częstotliwości)
Ogólnie 100 - 16.000 Hz
(±) | liniowość ogólnego dźwięku jest średnia (15.9% różnicy w stosunku do mediany)
W porównaniu do tej samej klasy
» 38% wszystkich testowanych urządzeń w tej klasie było lepszych, 7% podobnych, 56% gorszych
» Najlepszy miał deltę 6%, średnia wynosiła ###średnia###%, najgorsza wynosiła 132%
W porównaniu do wszystkich testowanych urządzeń
» 25% wszystkich testowanych urządzeń było lepszych, 5% podobnych, 70% gorszych
» Najlepszy miał deltę 4%, średnia wynosiła ###średnia###%, najgorsza wynosiła 134%
Asus TUF A15 FA507 analiza dźwięku
(±) | głośność głośnika jest średnia, ale dobra (79.3 dB)
Bas 100 - 315 Hz
(±) | zredukowany bas - średnio 13.7% niższy od mediany
(+) | bas jest liniowy (6.2% delta do poprzedniej częstotliwości)
Średnie 400 - 2000 Hz
(±) | wyższe średnie - średnio 7.6% wyższe niż mediana
(±) | liniowość środka jest średnia (7.3% delta do poprzedniej częstotliwości)
Wysokie 2–16 kHz
(+) | zrównoważone maksima - tylko 2.1% od mediany
(±) | liniowość wysokich wartości jest średnia (7.5% delta do poprzedniej częstotliwości)
Ogólnie 100 - 16.000 Hz
(±) | liniowość ogólnego dźwięku jest średnia (17.2% różnicy w stosunku do mediany)
W porównaniu do tej samej klasy
» 46% wszystkich testowanych urządzeń w tej klasie było lepszych, 11% podobnych, 42% gorszych
» Najlepszy miał deltę 6%, średnia wynosiła ###średnia###%, najgorsza wynosiła 132%
W porównaniu do wszystkich testowanych urządzeń
» 32% wszystkich testowanych urządzeń było lepszych, 8% podobnych, 60% gorszych
» Najlepszy miał deltę 4%, średnia wynosiła ###średnia###%, najgorsza wynosiła 134%
Zarządzanie energią
Zużycie energii
Po części dzięki przełączaniu grafiki, 15-calowy laptop wymaga dość niskiej ilości energii. Ma najniższe zużycie energii w naszym porównaniu, pobierając tylko od 7 do 11 watów w stanie bezczynności i od 76 do 136 watów w aplikacjach 3D. Niektóre z pozostałych urządzeń w porównaniu zużywają znacznie więcej energii.
| wyłączony / stan wstrzymania | |
| luz | |
| obciążenie |
|
Legenda:
min: | |
| Acer Nitro V 15 ANV15-51-582S GeForce RTX 4050 Laptop GPU, i5-13420H | Medion Erazer Crawler E40 - MD 62518 GeForce RTX 4050 Laptop GPU, i5-13500H | Lenovo LOQ 15IRH8 Core i7 GeForce RTX 4050 Laptop GPU, i7-13620H | Asus TUF A15 FA507 GeForce RTX 4050 Laptop GPU, R7 7735HS | Schenker XMG Apex 15 (Late 23) GeForce RTX 4050 Laptop GPU, R7 7840HS | Średnia w klasie Gaming | |
|---|---|---|---|---|---|---|
| Power Consumption | -50% | -107% | -26% | -20% | -95% | |
| Idle Minimum * (Watt) | 7 | 10 -43% | 18.52 -165% | 8 -14% | 6 14% | 13.2 ? -89% |
| Idle Average * (Watt) | 8 | 15.3 -91% | 22.54 -182% | 12.1 -51% | 11 -38% | 18.9 ? -136% |
| Idle Maximum * (Watt) | 11 | 15.5 -41% | 29.79 -171% | 12.5 -14% | 14 -27% | 24.3 ? -121% |
| Load Average * (Watt) | 76 | 88 -16% | 94.5 -24% | 74.9 1% | 65 14% | 108.3 ? -43% |
| Witcher 3 ultra * (Watt) | 98.2 | 155 -58% | 154.4 -57% | 136.6 -39% | 136.5 -39% | |
| Load Maximum * (Watt) | 136 | 202.47 -49% | 190.4 -40% | 185 -36% | 195 -43% | 254 ? -87% |
* ... im mniej tym lepiej
Power consumption Witcher 3 / Stresstest
Power consumption with external monitor
Żywotność baterii
Z drugiej strony, Nitro V 15 jest w stanie zapewnić świetny czas pracy na baterii i robi to pomimo tego, że jego bateria ma raczej skromną pojemność 57 Wh. W naszym teście Wi-Fi (jasność zredukowana do 150 cd/m²) notebook Acer działał około 9,5 godziny, co jest bardzo przyzwoitym wynikiem dla tej klasy laptopów.
| Acer Nitro V 15 ANV15-51-582S i5-13420H, GeForce RTX 4050 Laptop GPU, 57 Wh | Medion Erazer Crawler E40 - MD 62518 i5-13500H, GeForce RTX 4050 Laptop GPU, 54 Wh | Lenovo LOQ 15IRH8 Core i7 i7-13620H, GeForce RTX 4050 Laptop GPU, 60 Wh | Asus TUF A15 FA507 R7 7735HS, GeForce RTX 4050 Laptop GPU, 90 Wh | Schenker XMG Apex 15 (Late 23) R7 7840HS, GeForce RTX 4050 Laptop GPU, 62.32 Wh | Średnia w klasie Gaming | |
|---|---|---|---|---|---|---|
| Czasy pracy | -43% | -37% | -9% | -30% | -33% | |
| Reader / Idle (h) | 21.5 | 8.4 -61% | 8.71 ? -59% | |||
| WiFi v1.3 (h) | 9.4 | 4.1 -56% | 5.9 -37% | 11.7 24% | 7.1 -24% | 7.04 ? -25% |
| Load (h) | 1.7 | 1.2 -29% | 1 -41% | 1.6 -6% | 1.47 ? -14% | |
| H.264 (h) | 3.9 | 6.1 | 12.5 | 8.3 | 8.26 ? |
Za
Przeciw
Werdykt
Mocne i słabe strony Acer Nitro V 15 ujawniły się podczas naszych testów.
Podczas gdy laptop ma stylowy wygląd, stosunkowo kompaktową obudowę i imponujący czas pracy na baterii, wyświetlacz nie spełnia dzisiejszych standardów (szczególnie w odniesieniu do pokrycia kolorów i jasności).
Wydajność Core i5-13420H i GeForce RTX 4050 jest mniej więcej tym, czego można oczekiwać od laptopa kosztującego około 1000 euro (1085 USD).
Gracze zwracający uwagę na cenę otrzymują solidną platformę do gier, zdolną do generowania użytecznej liczby klatek na sekundę - przynajmniej w rozdzielczości Full HD.
Co wygodne, laptop ma wolne gniazdo pamięci RAM i drugie gniazdo M.2 gotowe do przyszłych aktualizacji. Wybór portów jest również aktualny dzięki Thunderbolt 4, choć w niektórych miejscach wciąż jest miejsce na poprawę.
Konkurenci wspomniani w recenzji, tacy jak Lenovo LOQ 15IRH8 i Asus TUF A15 FA507, otrzymali nieco wyższe oceny ogólne ze względu na ich lepsze wyświetlacze.
Cena i dostępność
Acer Nitro V 15 ANV15-51-582S z procesorem Core i5-13420H i GeForce RTX 4050 jest dostępny w różnych sklepach internetowych (np. notebooksbilliger.de) za około 900 euro. Na Amazon US model z szybszym Core i7-13620H można dostać za ok 950 USD.
Acer Nitro V 15 ANV15-51-582S
- 16/01/2024 v7 (old)
Florian Glaser
Przezroczystość
Wyboru urządzeń do recenzji dokonuje nasza redakcja. Próbka testowa została udostępniona autorowi jako pożyczka od producenta lub sprzedawcy detalicznego na potrzeby tej recenzji. Pożyczkodawca nie miał wpływu na tę recenzję, producent nie otrzymał też kopii tej recenzji przed publikacją. Nie było obowiązku publikowania tej recenzji. Jako niezależna firma medialna, Notebookcheck nie podlega władzy producentów, sprzedawców detalicznych ani wydawców.
Tak testuje Notebookcheck
Każdego roku Notebookcheck niezależnie sprawdza setki laptopów i smartfonów, stosując standardowe procedury, aby zapewnić porównywalność wszystkich wyników. Od około 20 lat stale rozwijamy nasze metody badawcze, ustanawiając przy tym standardy branżowe. W naszych laboratoriach testowych doświadczeni technicy i redaktorzy korzystają z wysokiej jakości sprzętu pomiarowego. Testy te obejmują wieloetapowy proces walidacji. Nasz kompleksowy system ocen opiera się na setkach uzasadnionych pomiarów i benchmarków, co pozwala zachować obiektywizm.Price comparison

