Recenzja laptopa Medion Erazer Crawler E40: Niedrogi gracz z dobrą wydajnością RTX 4050
Medion Erazer Crawler E40 zastępuje model E30 (wyposażony w Intel Gen12 i RTX 30xx) i podnosi serię do aktualnego stanu techniki dzięki Intel Gen 13 i RTX 4050. Ten podstawowy laptop do gier jest obecnie wyceniony na nieco poniżej ~ 1100 USD.
Konkurując z innymi budżetowymi laptopami do gier, Medion Erazer Crawler E40 musi stawić czoła takim rywalom jak Lenovo LOQ 15, Asus TUF Gaming A15 Asus TUF Gaming A15, XMG XMG Apex 15lub MSI Katana 15.
Medion obejmuje wiele modeli pod marką "Erazer", co sprawia, że śledzenie ich wszystkich jest wyzwaniem. Podczas gdy inni producenci organizują serie, w których łączą różne konfiguracje w tej samej obudowie, Medion wydaje się wierzyć, że każda konfiguracja uzasadnia nową nazwę serii. Erazer Crawler E40 jest dostępny tylko w tej konkretnej konfiguracji i dlatego jest sprzedawany tylko jako ten jeden model. Nie ma żadnych opcji dotyczących CPU, GPU czy wyświetlacza.
Inne modele Medion Erazer, które wcześniej testowaliśmy to:
Potencjalni konkurenci w porównaniu
Ocena | Data | Model | Waga | Wysokość | Rozmiar | Rezolucja | Cena |
|---|---|---|---|---|---|---|---|
| 85.4 % v7 (old) | 12/2023 | Medion Erazer Crawler E40 - MD 62518 i5-13500H, GeForce RTX 4050 Laptop GPU | 2.3 kg | 28 mm | 15.60" | 1920x1080 | |
| 85.9 % v7 (old) | 10/2023 | Lenovo LOQ 15IRH8 Core i7 i7-13620H, GeForce RTX 4050 Laptop GPU | 2.4 kg | 25.2 mm | 15.60" | 2560x1440 | |
| 86.3 % v7 (old) | 06/2023 | Asus TUF A15 FA507 R7 7735HS, GeForce RTX 4050 Laptop GPU | 2.2 kg | 24.9 mm | 15.60" | 1920x1080 | |
| 86.2 % v7 (old) | 10/2023 | Schenker XMG Apex 15 (Late 23) R7 7840HS, GeForce RTX 4050 Laptop GPU | 2.2 kg | 26.7 mm | 15.60" | 2560x1440 | |
| 82.9 % v7 (old) | 03/2023 | MSI Katana 15 B12VEK i7-12650H, GeForce RTX 4050 Laptop GPU | 2.3 kg | 24.9 mm | 15.60" | 1920x1080 |
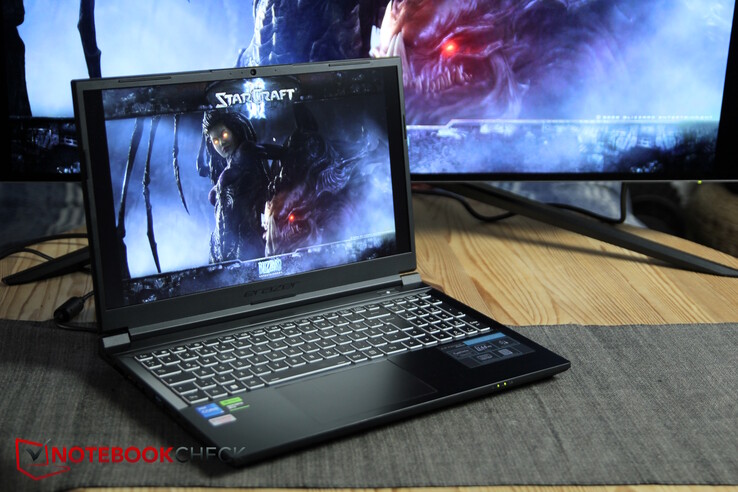
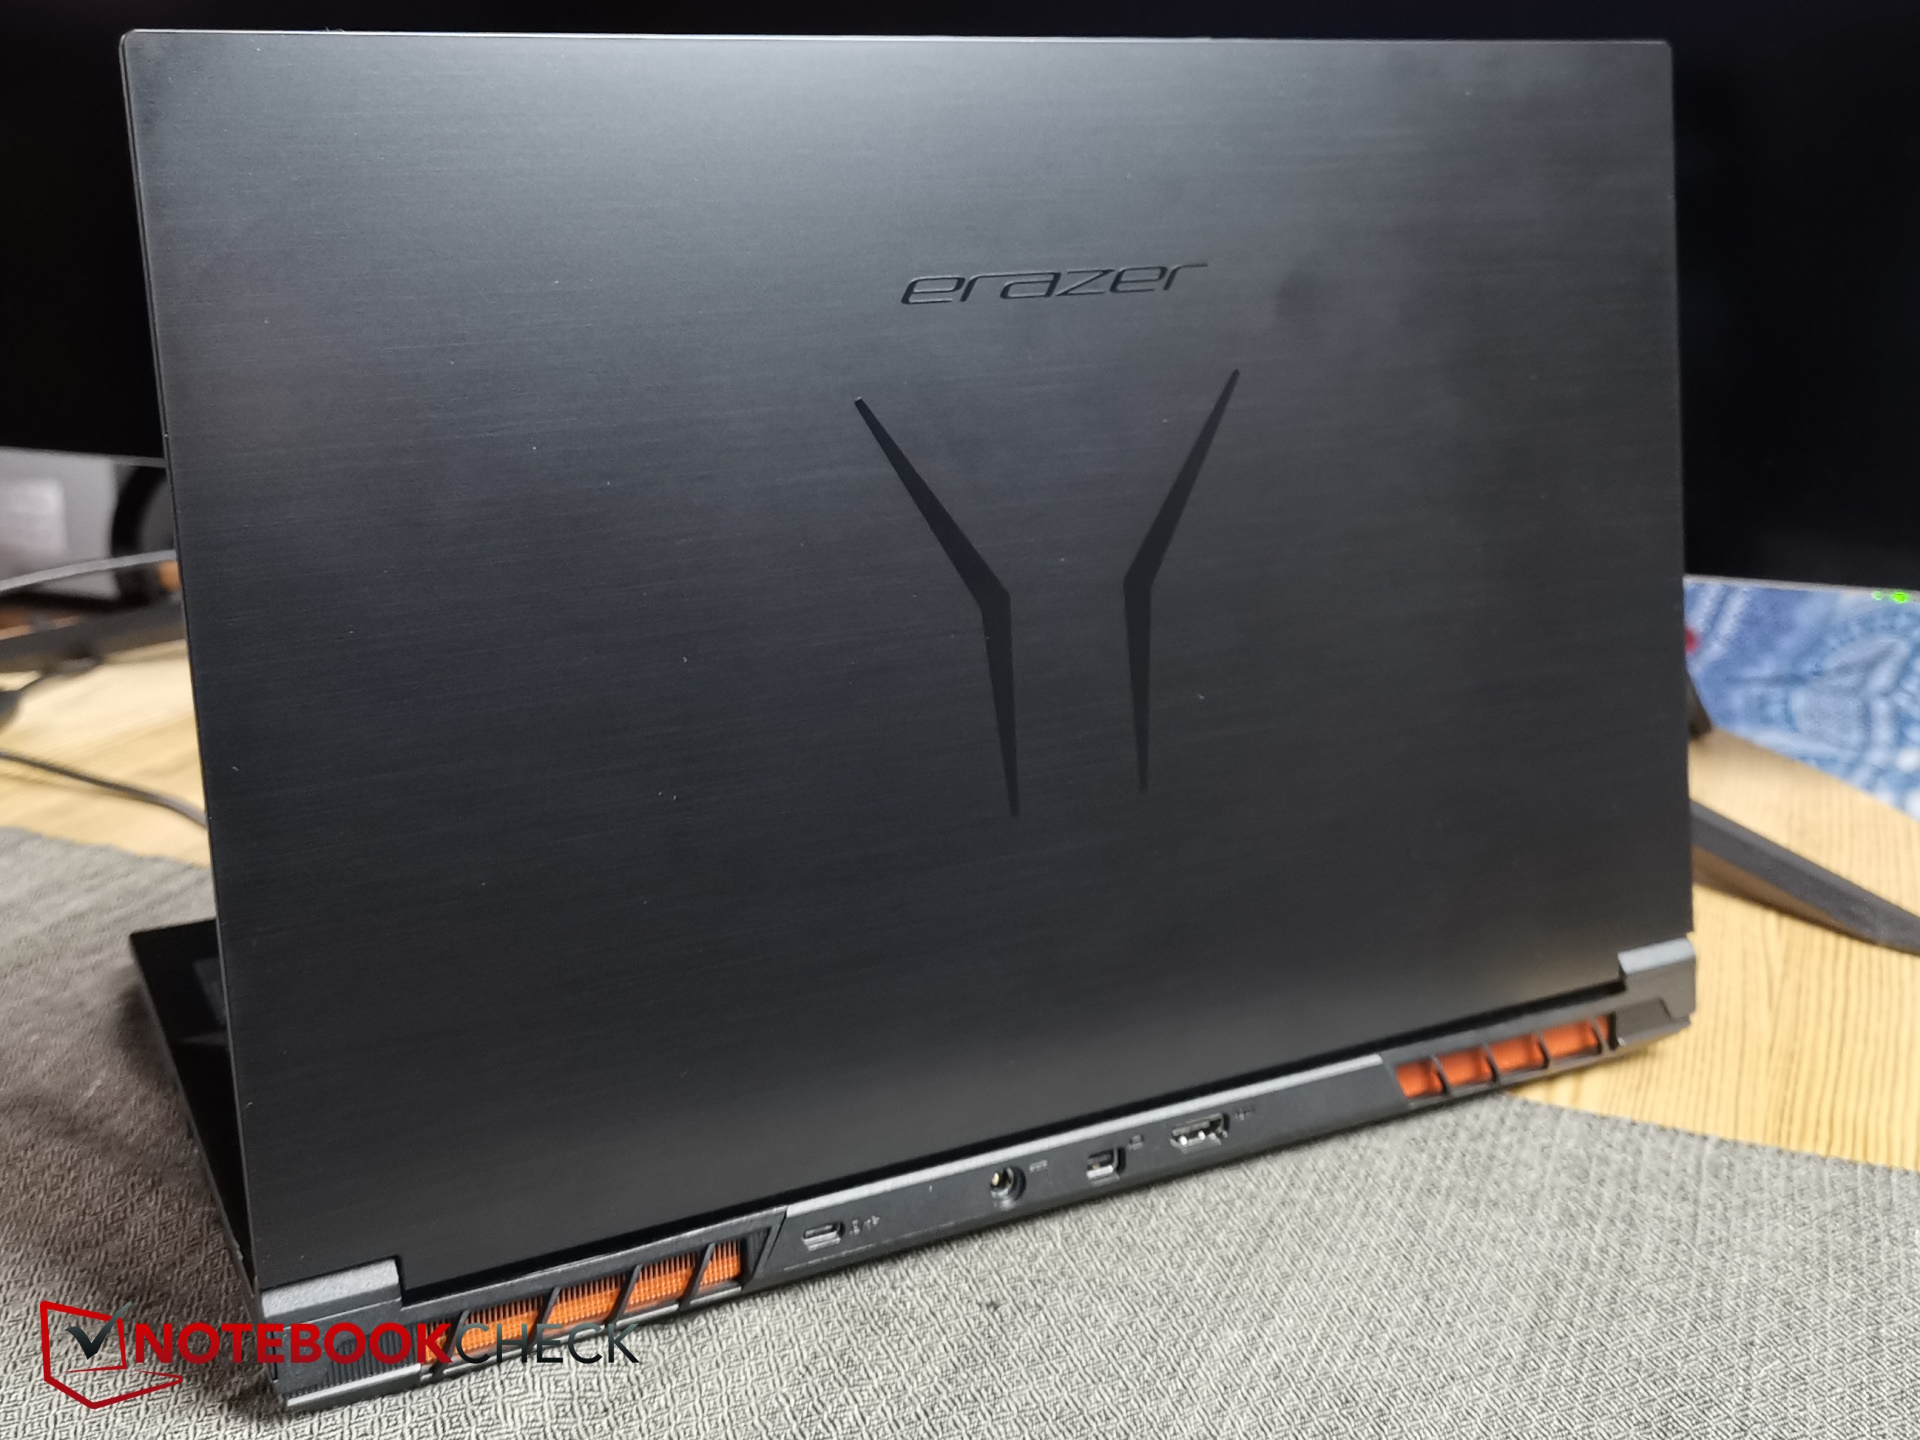
Obudowa i łączność - Crawler E40 w wykończeniu ze szczotkowanego plastiku
Pokrywa wyświetlacza i podstawa są wykonane z wytrzymałego tworzywa sztucznego, które bardzo przypomina aluminium, nadając mu zamierzony wygląd. Krawędzie wyświetlacza i spód laptopa są wykonane z miękkiego plastiku. Zarówno gładka pokrywa, jak i podstawa są podatne na przyciąganie odcisków palców.
Dzięki całkowicie czarnemu wzornictwu, w tym logo Erazer na pokrywie, laptop ma stosunkowo prostą estetykę. Podstawa wykazuje wysoki poziom odporności na skręcanie, podczas gdy pokrywa, choć w mniejszym stopniu, wydaje się szczególnie "miękka" i znacznie wygina się podczas skręcania, a wyświetlacz radzi sobie z tym ze stoickim spokojem. Ogólna jakość wykonania stoi na dobrym poziomie, a widoczne szczeliny nie występują.
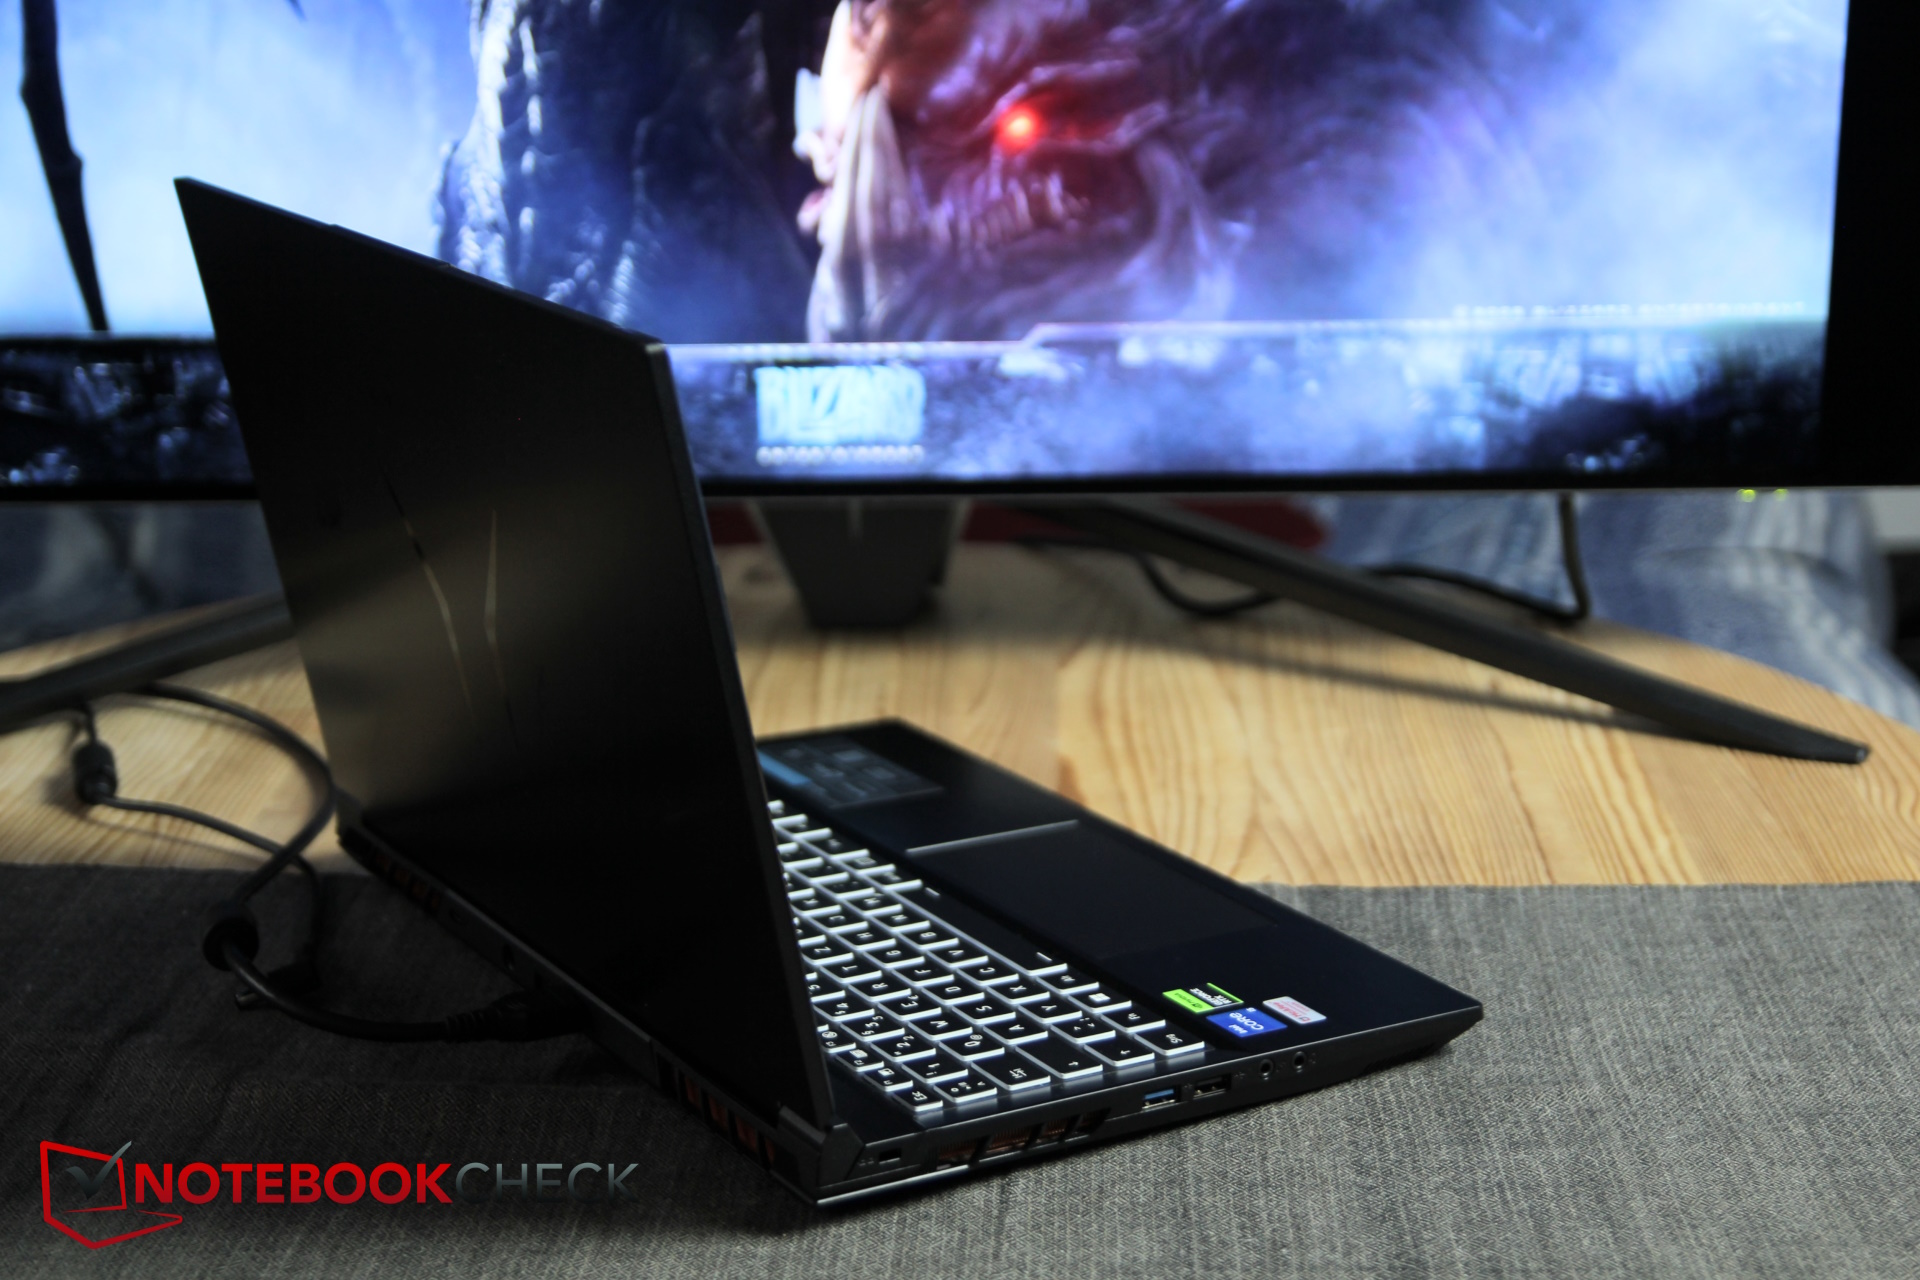
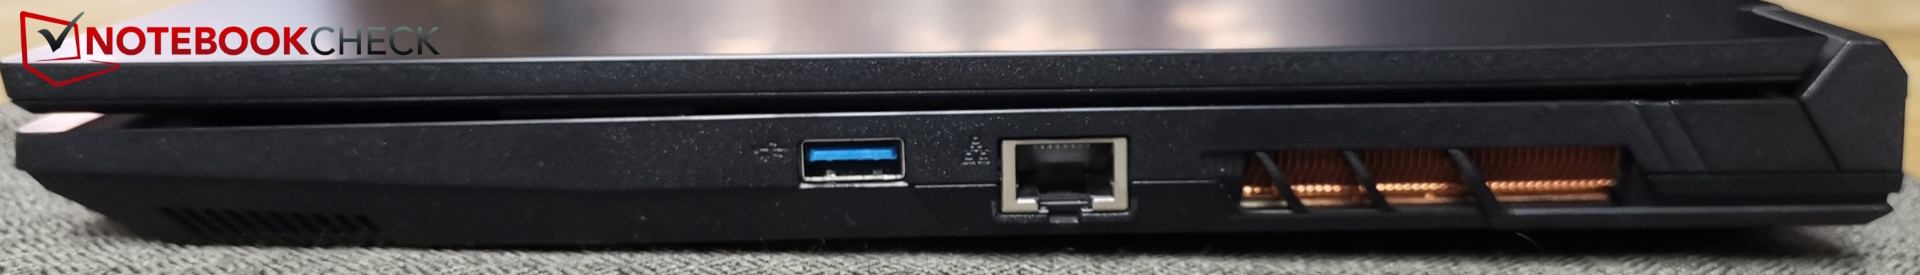
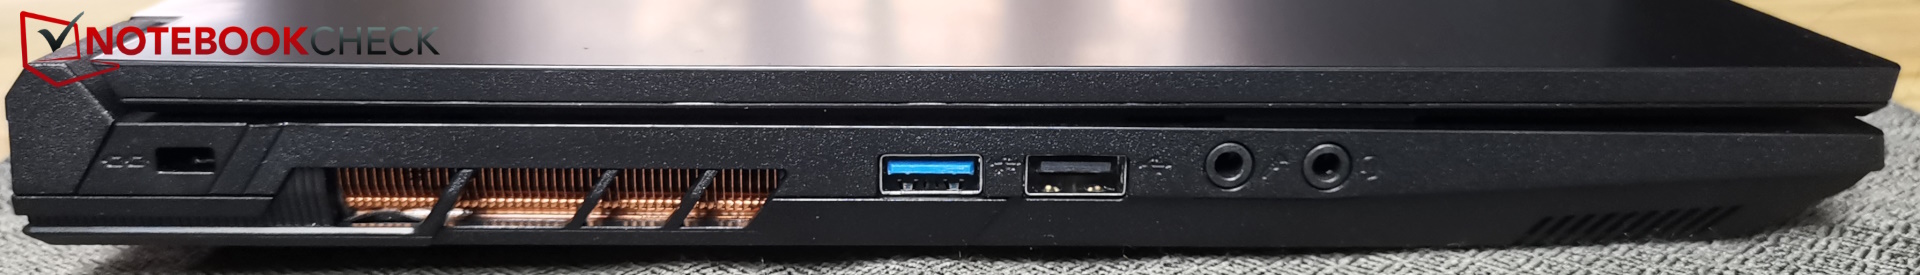
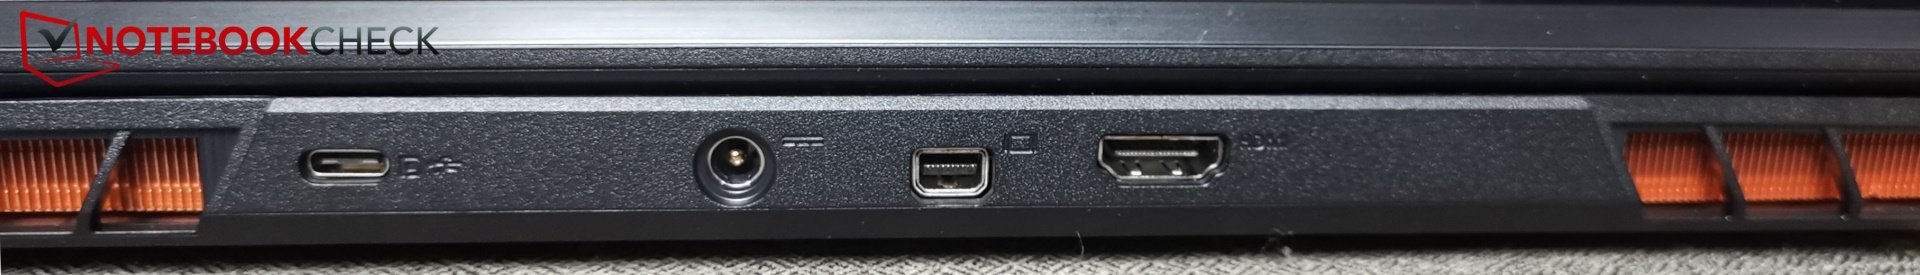
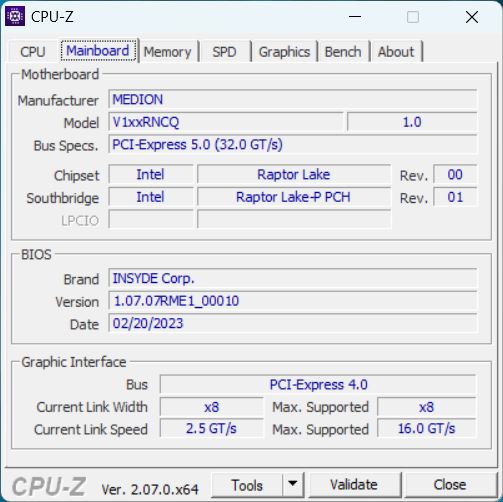
Złącza - Brak Thunderbolt, ale zamiast tego USB 2.0
Pomimo zastosowania procesora Intel, E40 nie obsługuje Thunderbolt. Posiada za to port USB-C o prędkości 10 Gb/s. Posiada jednak również przestarzały port USB-A 2.0, który można potencjalnie zaktualizować do szybszej alternatywy. Warto zauważyć, że nie ma czytnika kart.


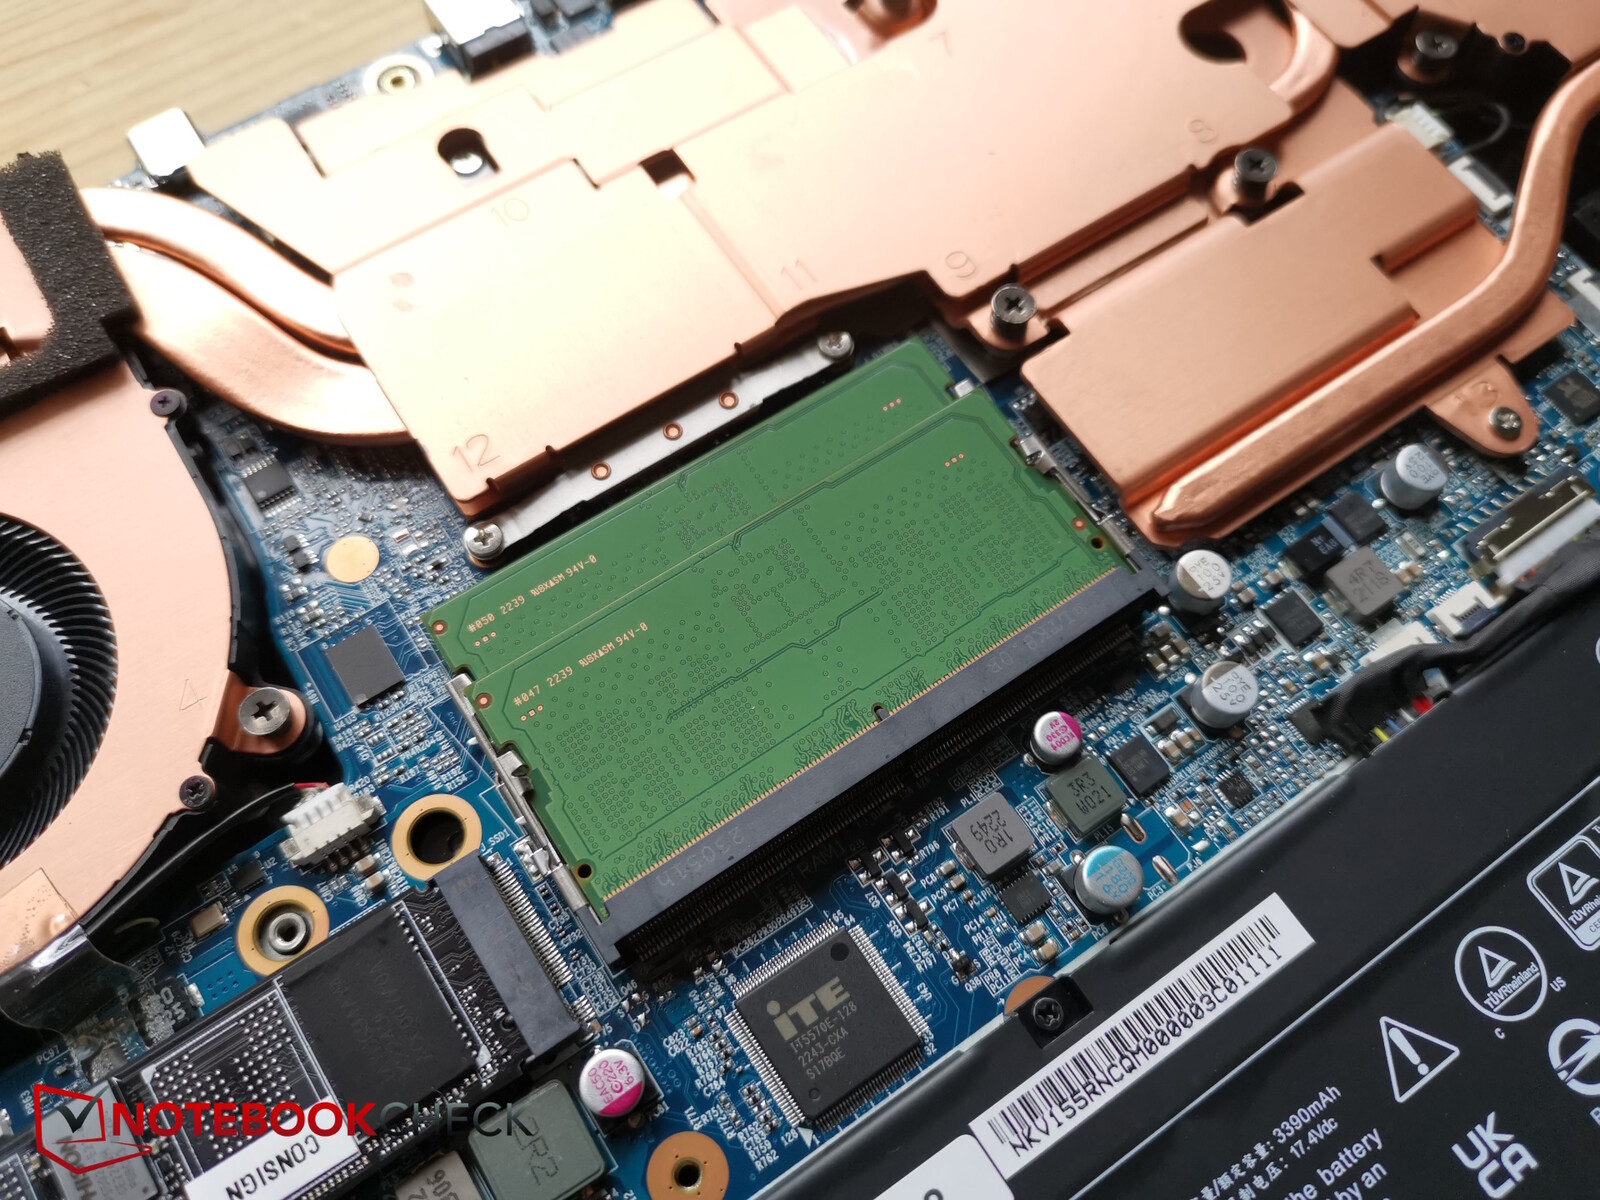
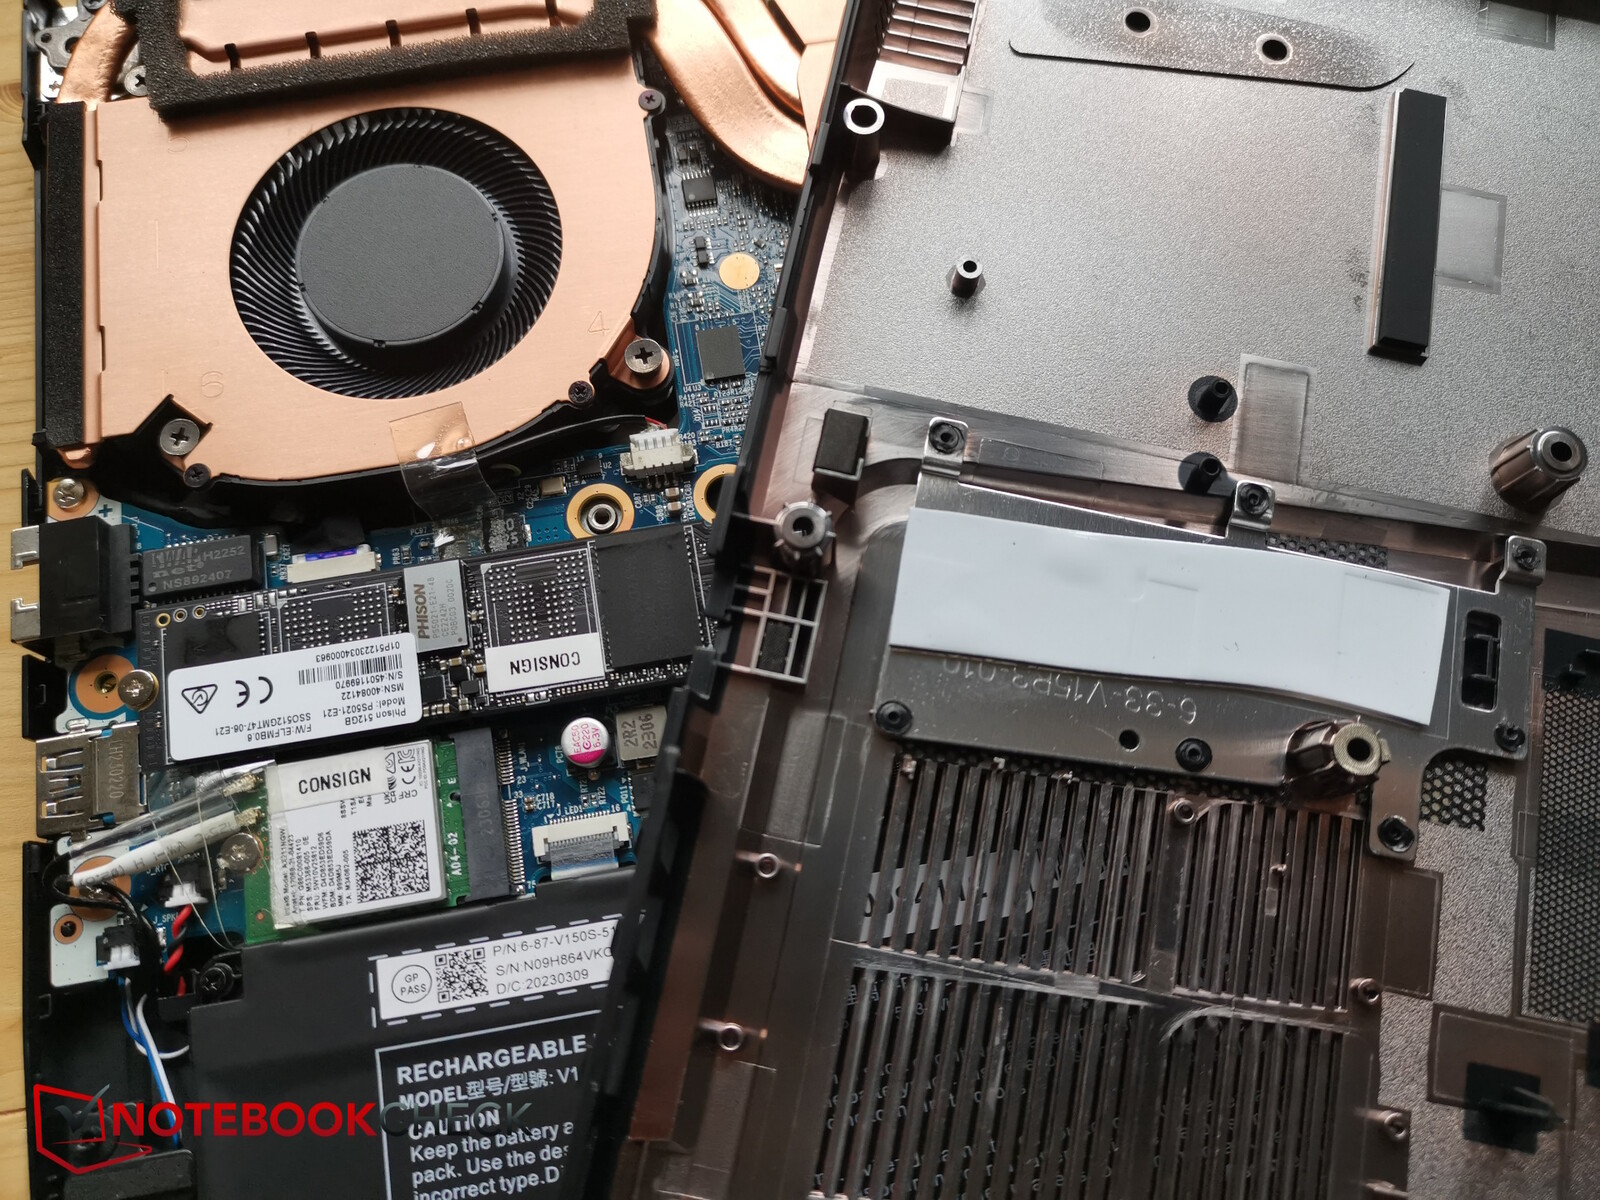
Konserwacja
Aby uzyskać dostęp do wewnętrznych komponentów, należy odkręcić 14 śrub krzyżakowych tego samego rozmiaru. Następnie można łatwo podważyć plastikową płytę bazową. Pod spodem znajdą Państwo układ chłodzenia z dużą ilością miedzi, przykręcaną baterię, dwa gniazda pamięci RAM, dysk SSD chłodzony dwoma podkładkami oraz wymienny moduł WiFi.

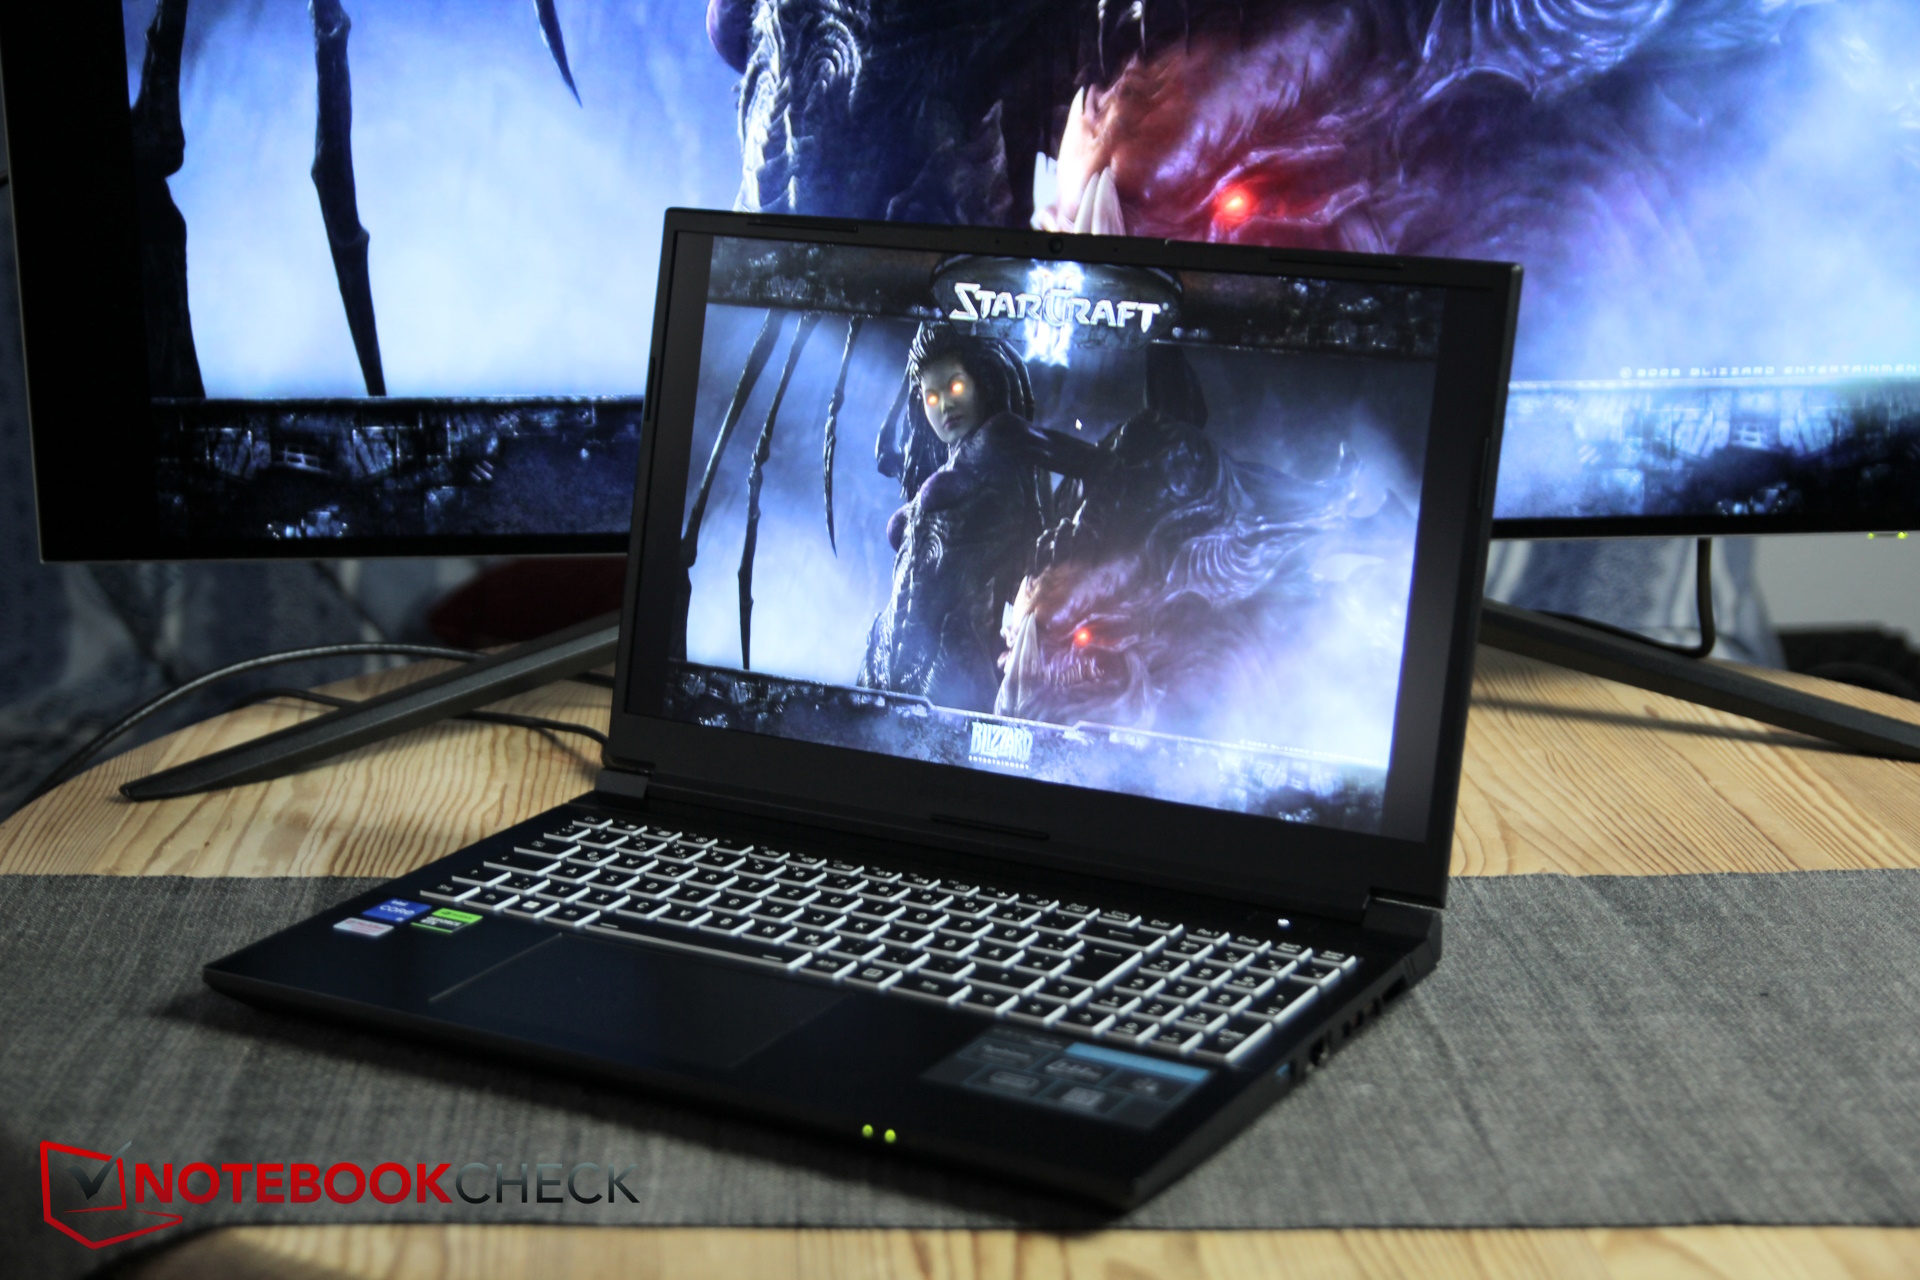
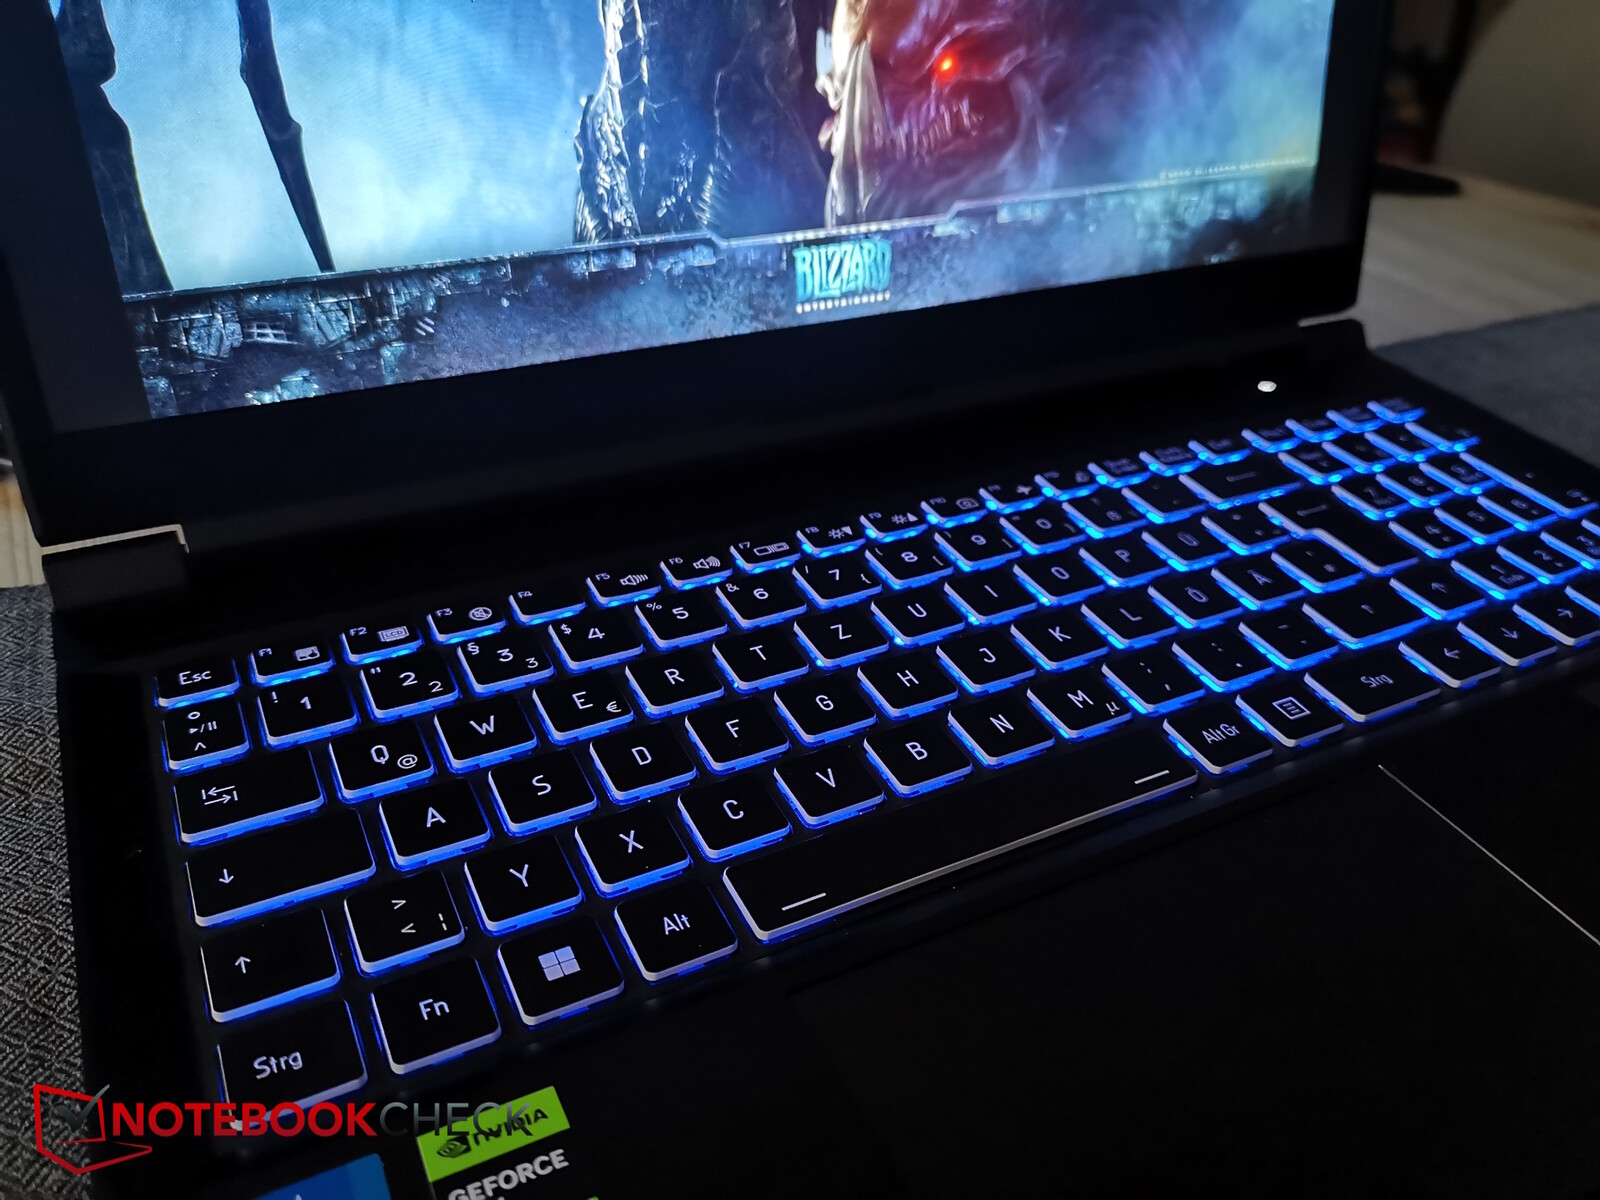
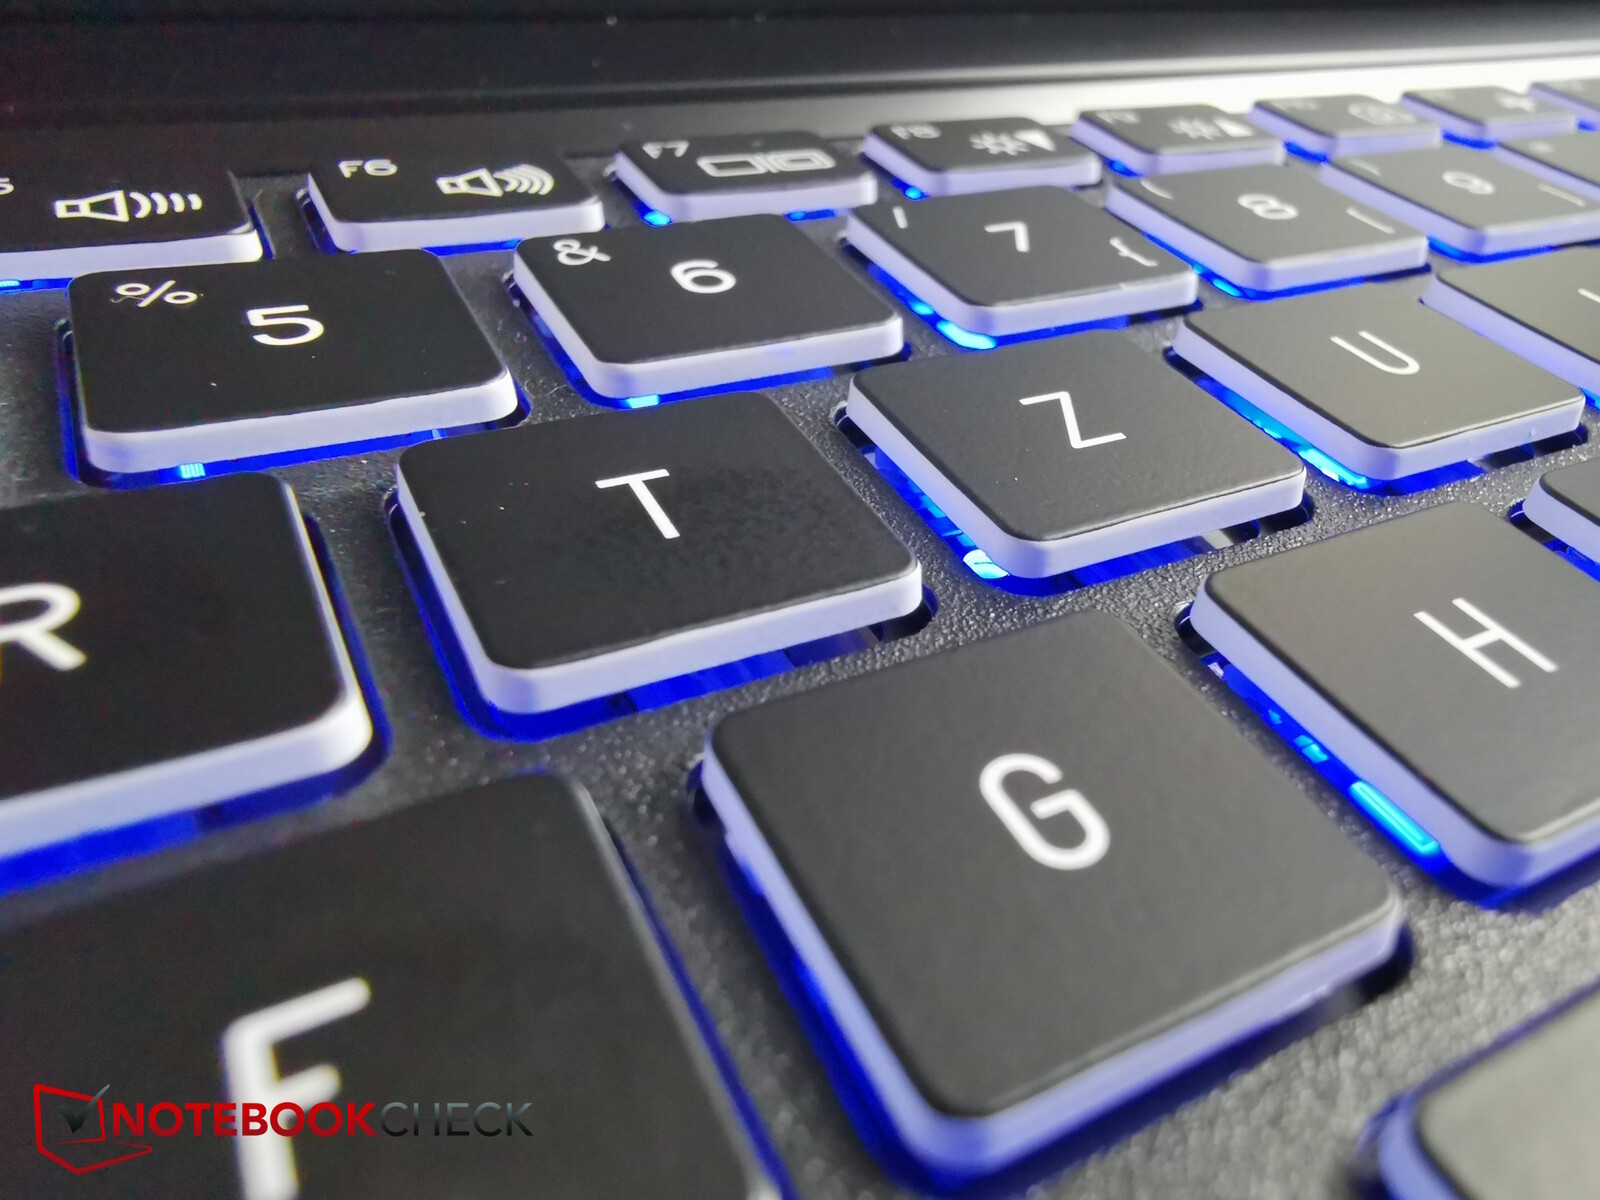
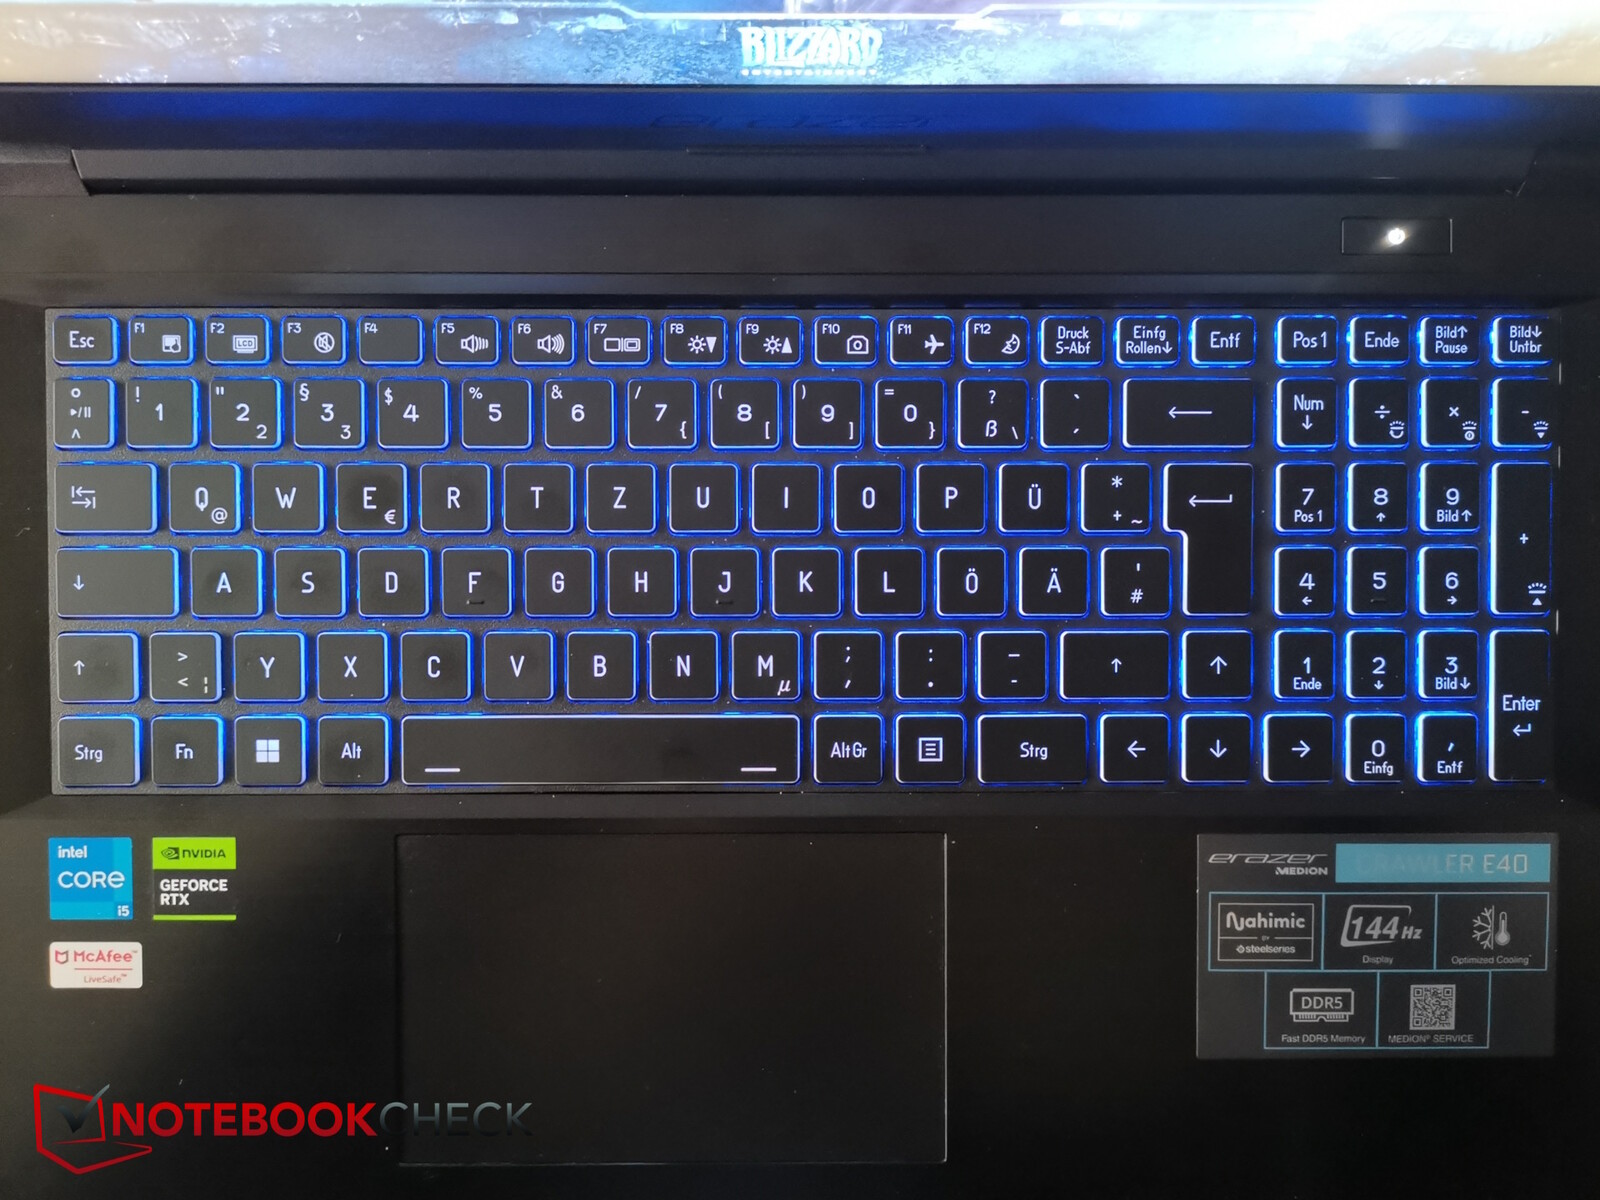
Urządzenia wejściowe - ogólnie solidne
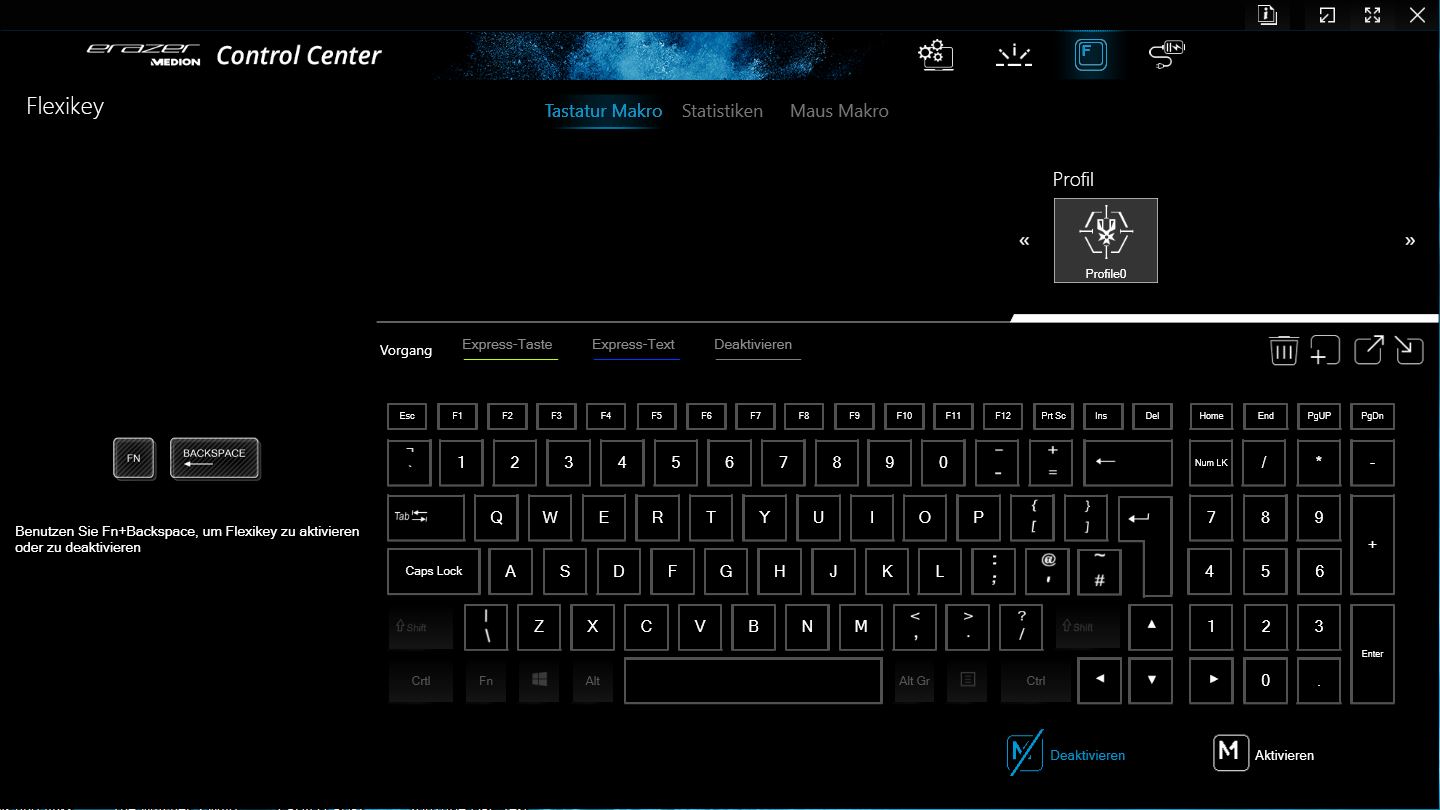
Układ klawiatury, podobnie jak w innych recenzowanych w tym roku urządzeniach Medion, jest dość czysty. Klawisze są jednak dość małe (1,4 cm), ale są odpowiednio rozmieszczone. Po prawej stronie znajduje się klawiatura numeryczna z jeszcze mniejszymi klawiszami.
Skok klawiszy jest przeciętny, a sprzężenie zwrotne nieco miękkie. Niemniej jednak pisze się na niej łatwo i szybko.
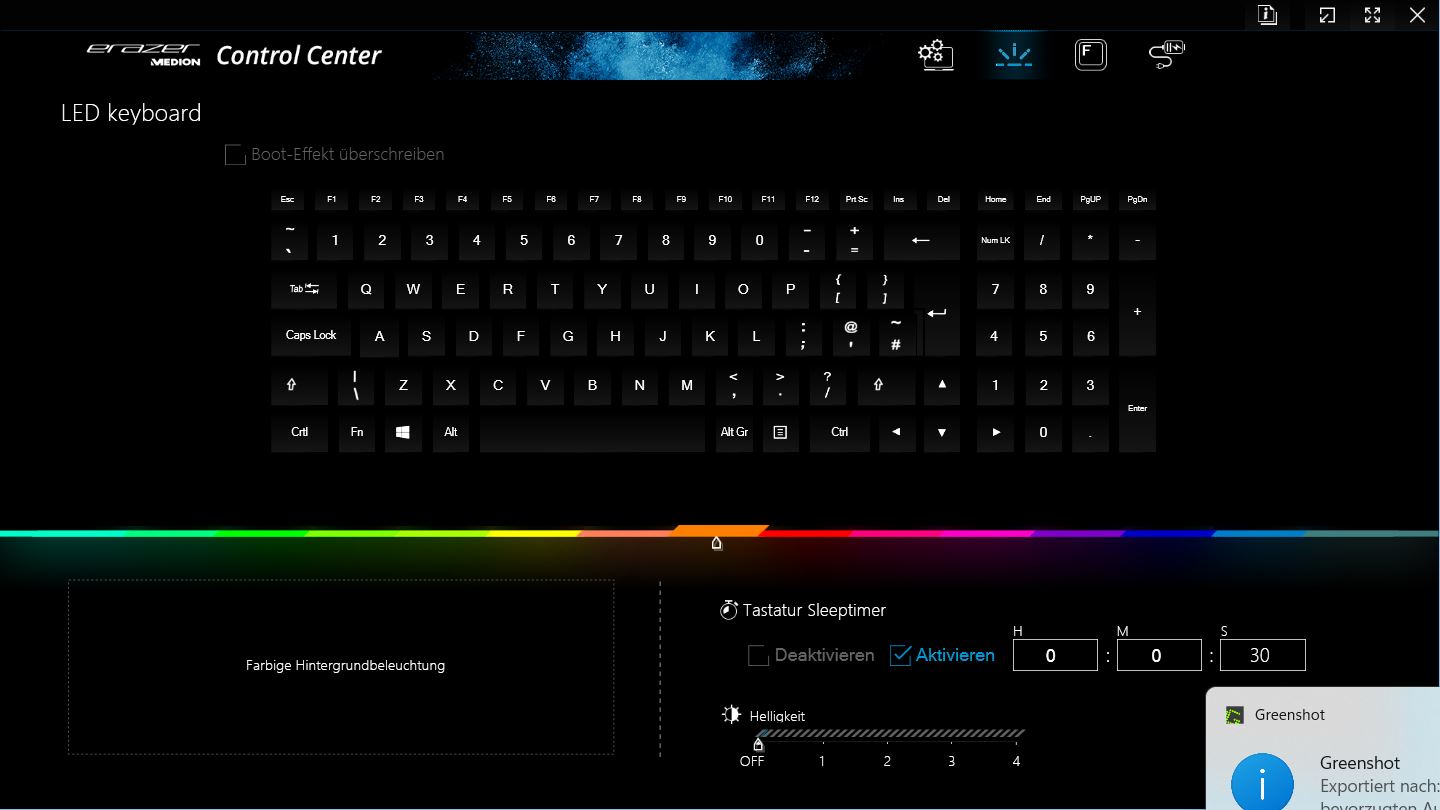
Dwustopniowe podświetlenie RGB, które można skonfigurować za pomocą Centrum sterowania (różne kolory) i kontrolować za pomocą specjalnych klawiszy, pomaga w ciemnym otoczeniu. Jest ono jednak tylko jednostrefowe.
Płytka dotykowa (ok. 12,1 x 7,3 cm) jest lekko przesunięta w lewo, aby znajdować się jak najbardziej centralnie pod innymi klawiszami, ze względu na klawiaturę numeryczną. Powierzchnia jest śliska, ale nie do końca ciche odgłosy klikania wydają się nieco tanie.
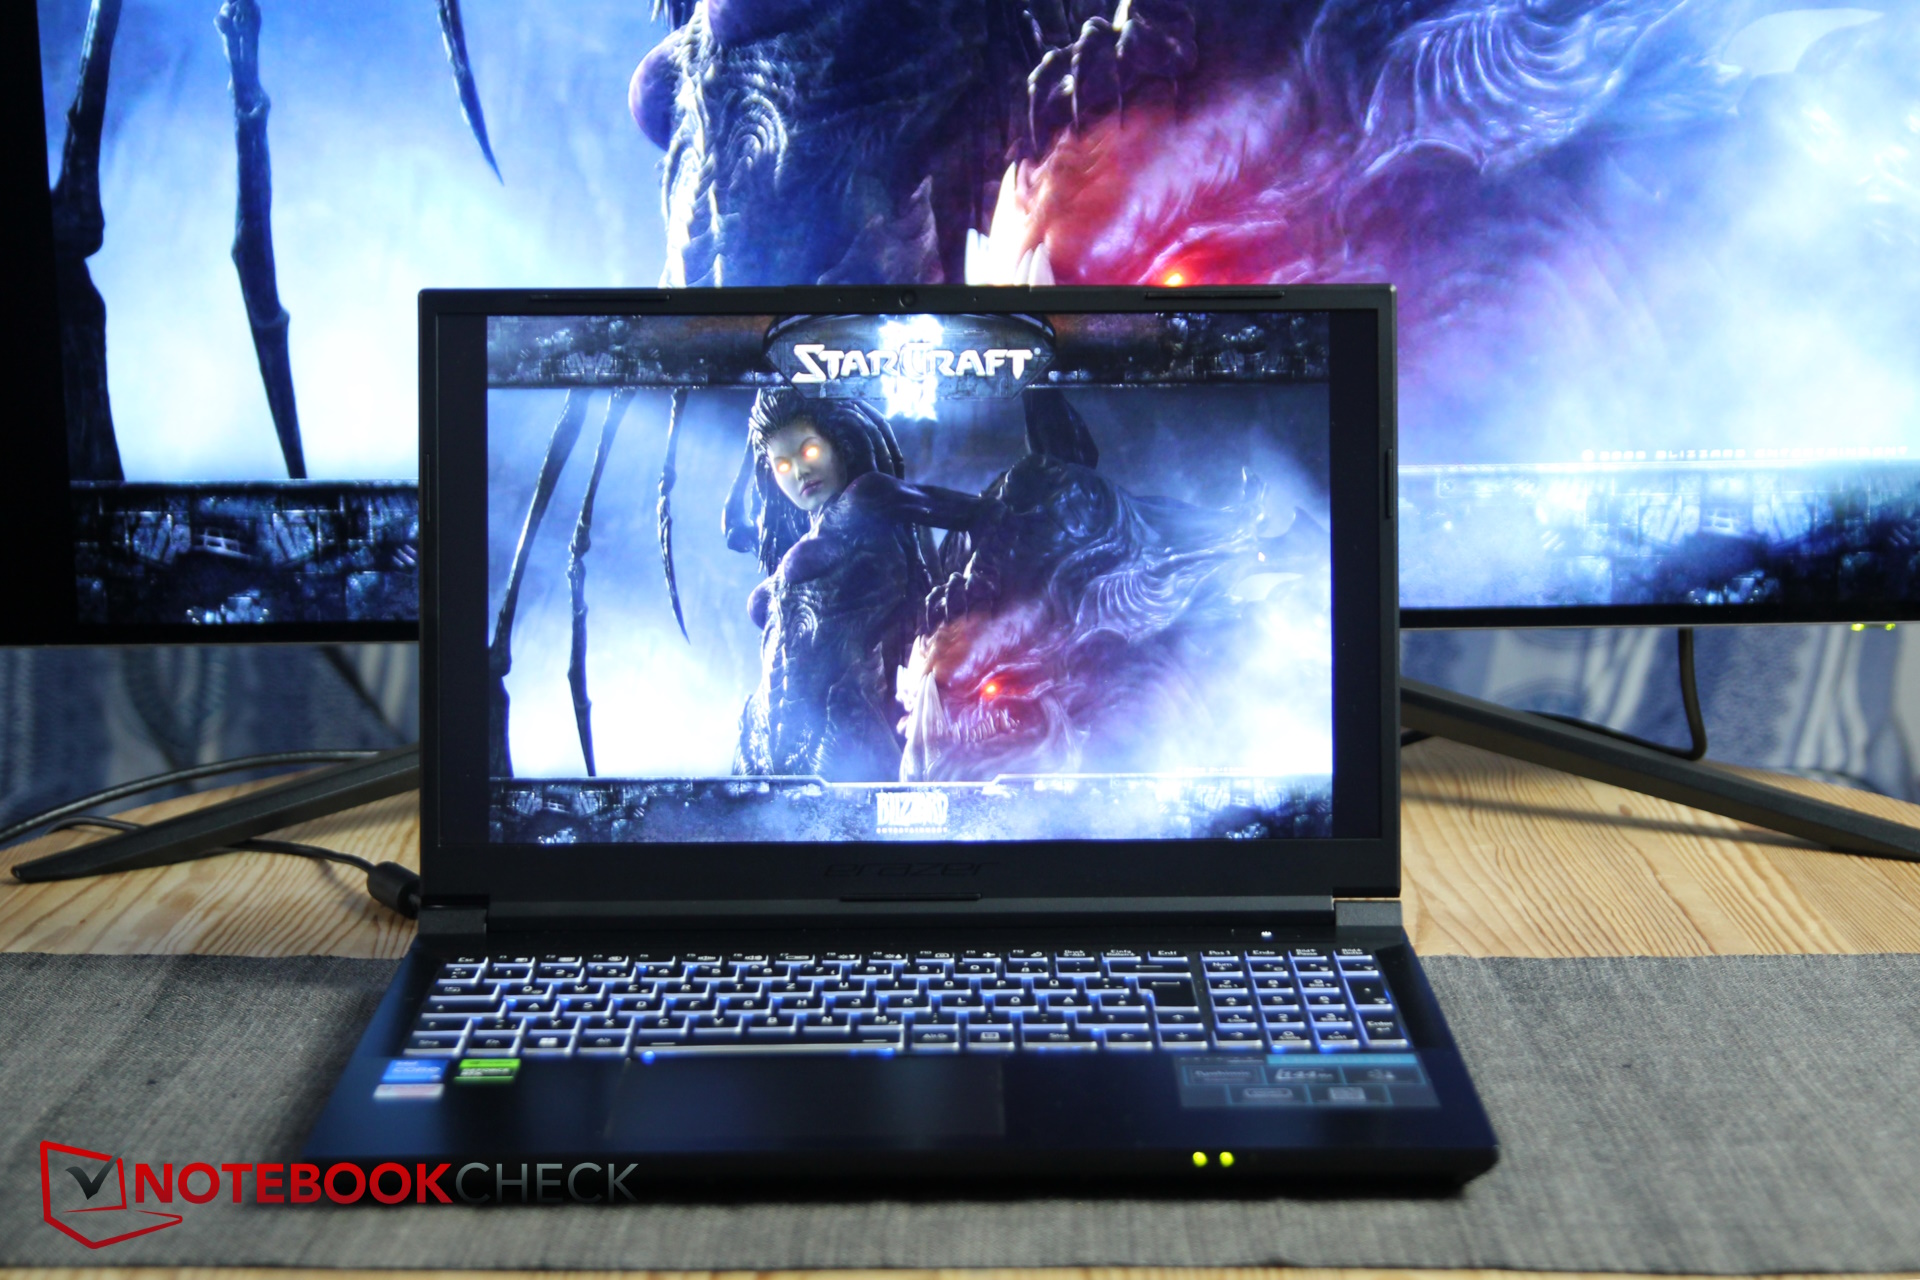
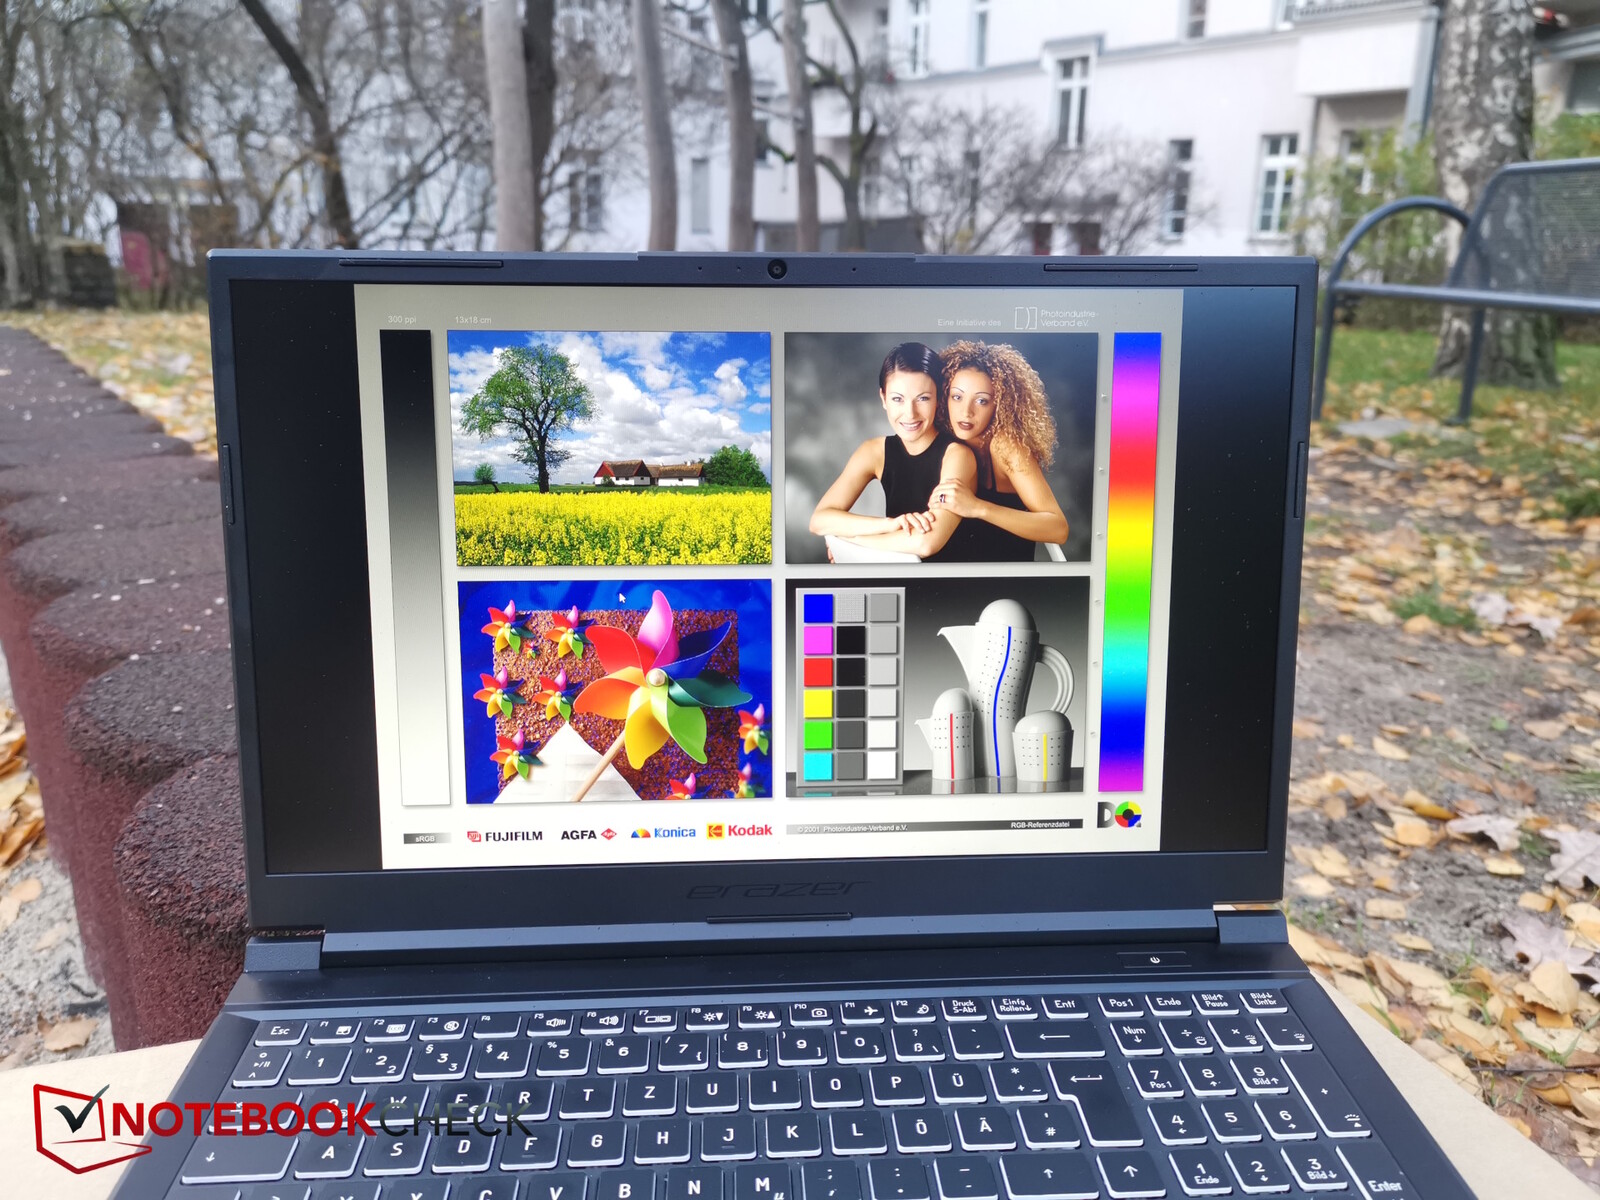
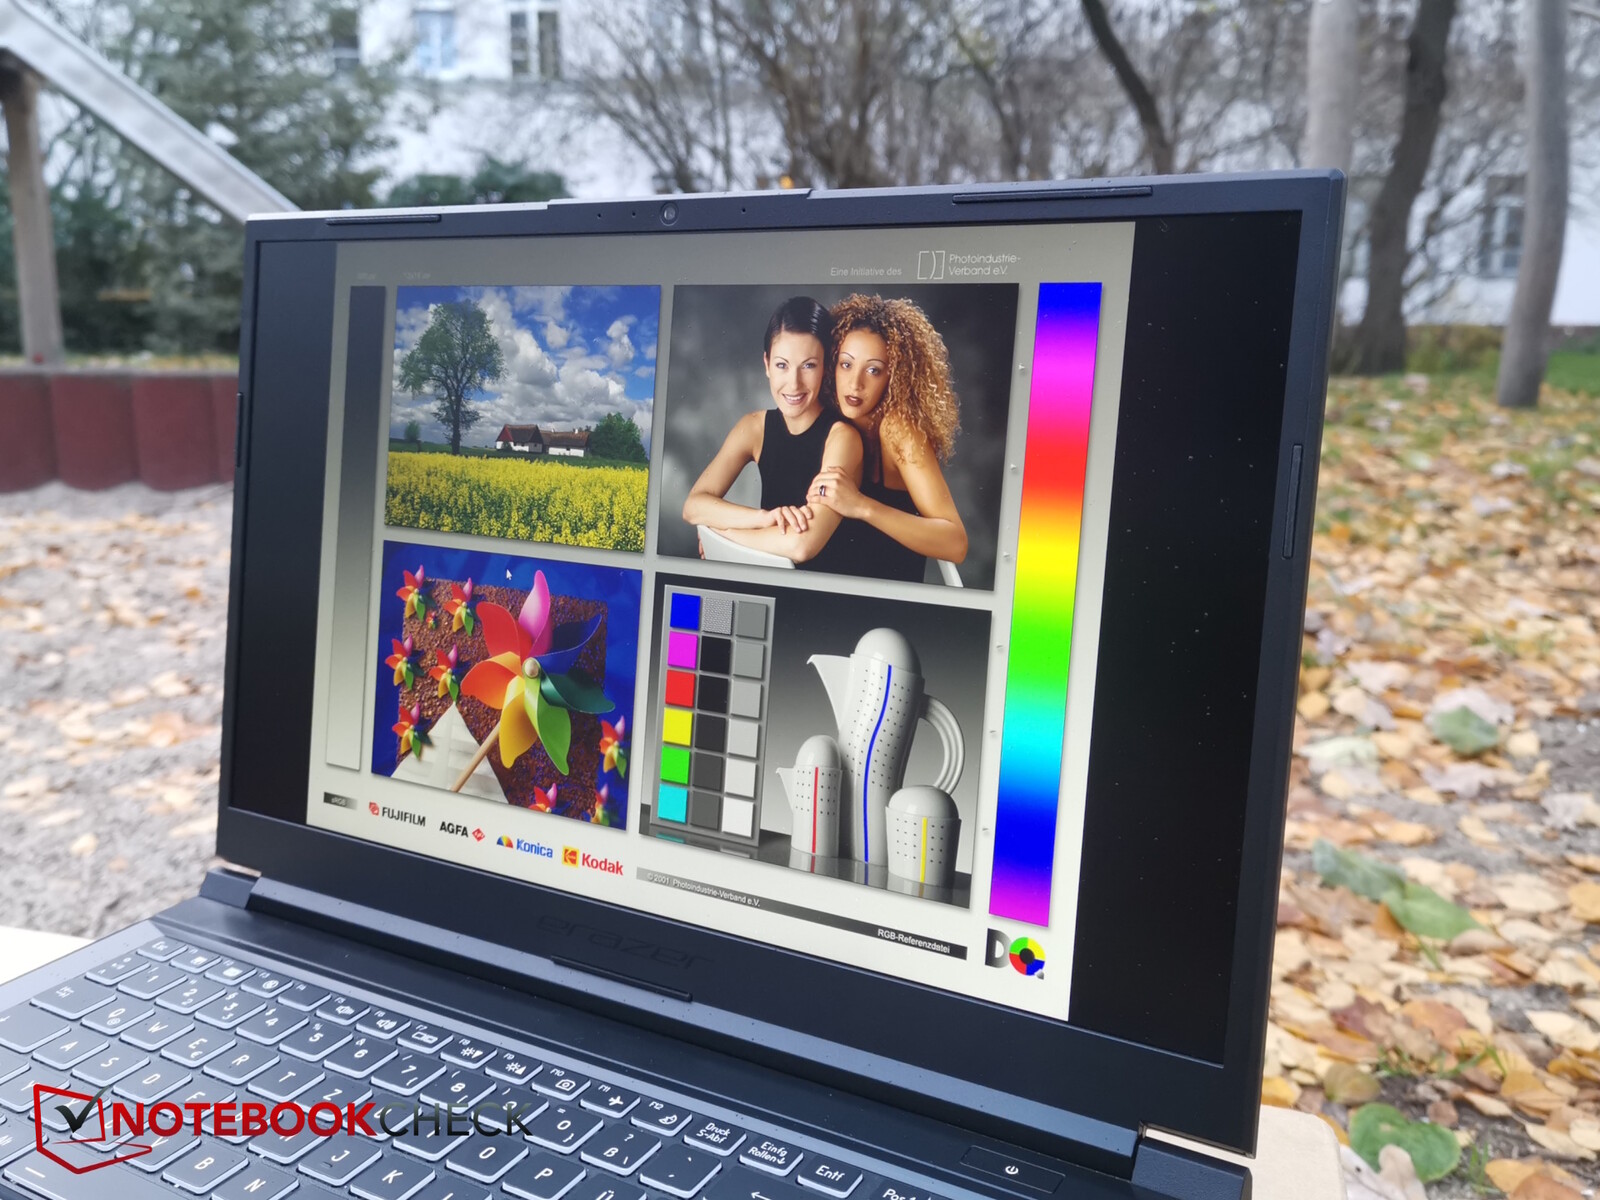
Wyświetlacz - stary znajomy z 2019 roku
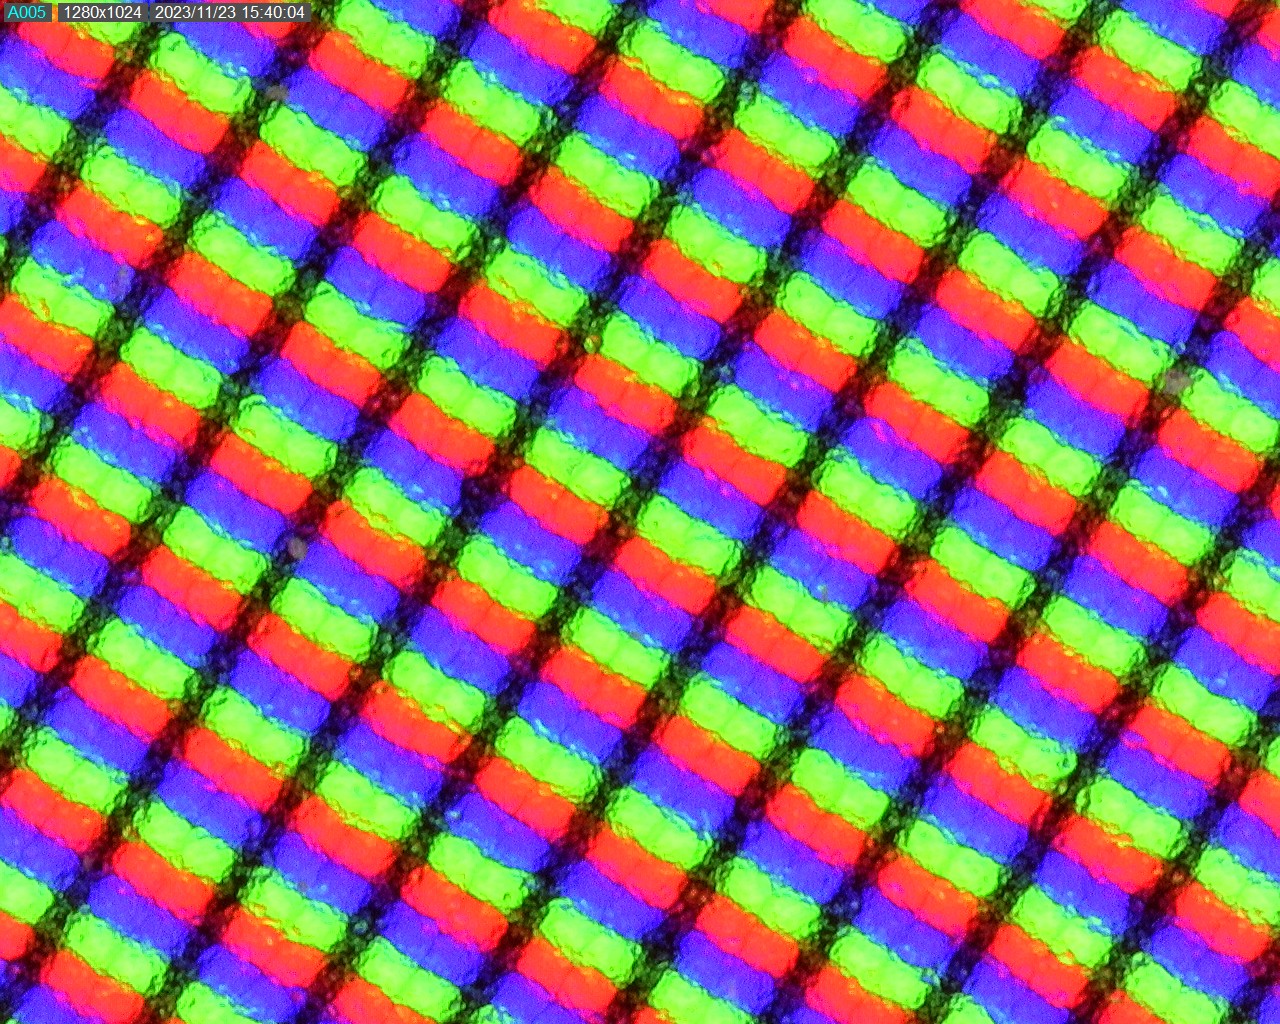
Medion Erazer Crawler E40 posiada dobrze znany wyświetlacz, który był już wcześniej stosowany w kilku laptopach. Matowy wyświetlacz IPS Full HD z częstotliwością odświeżania 144 Hz nie jest najnowszy, był już stosowany w laptopie XMG Fusion 15 już w 2019 roku.
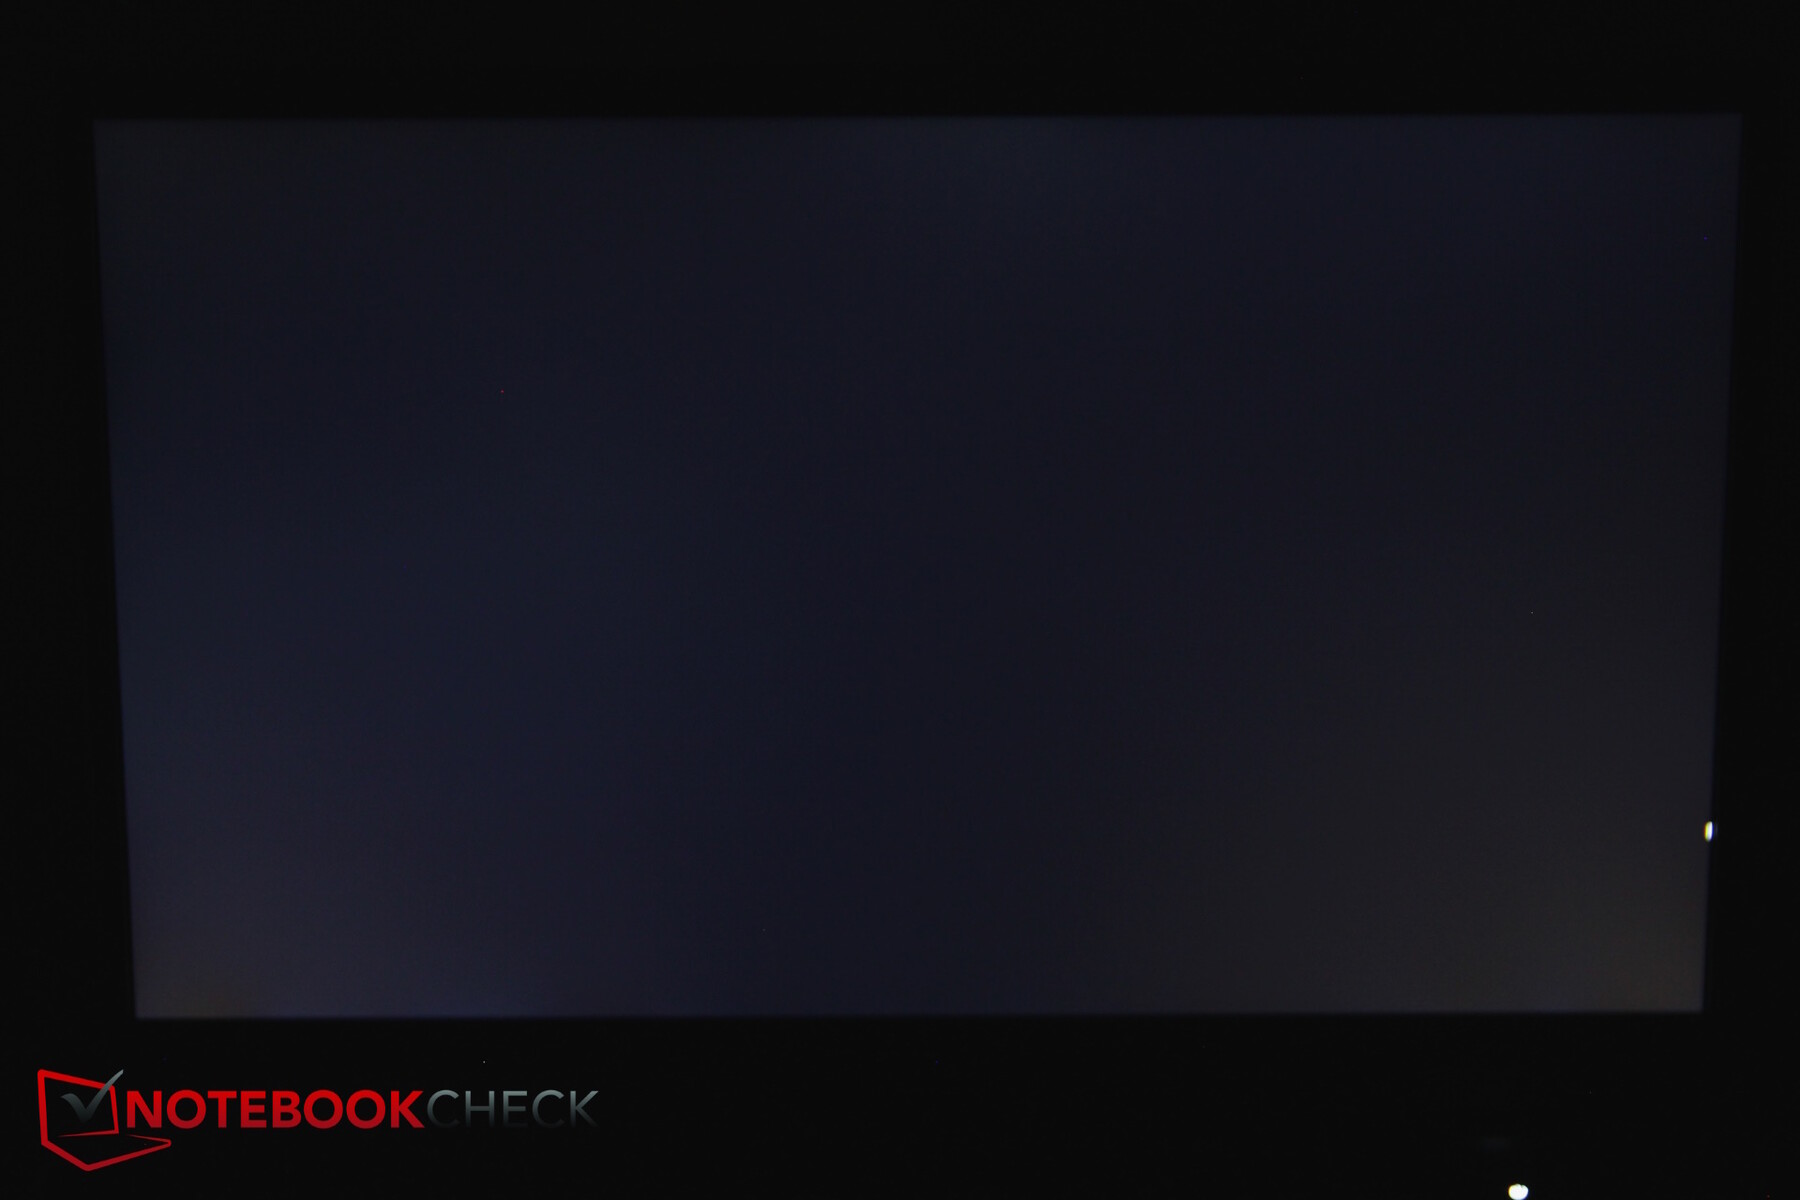
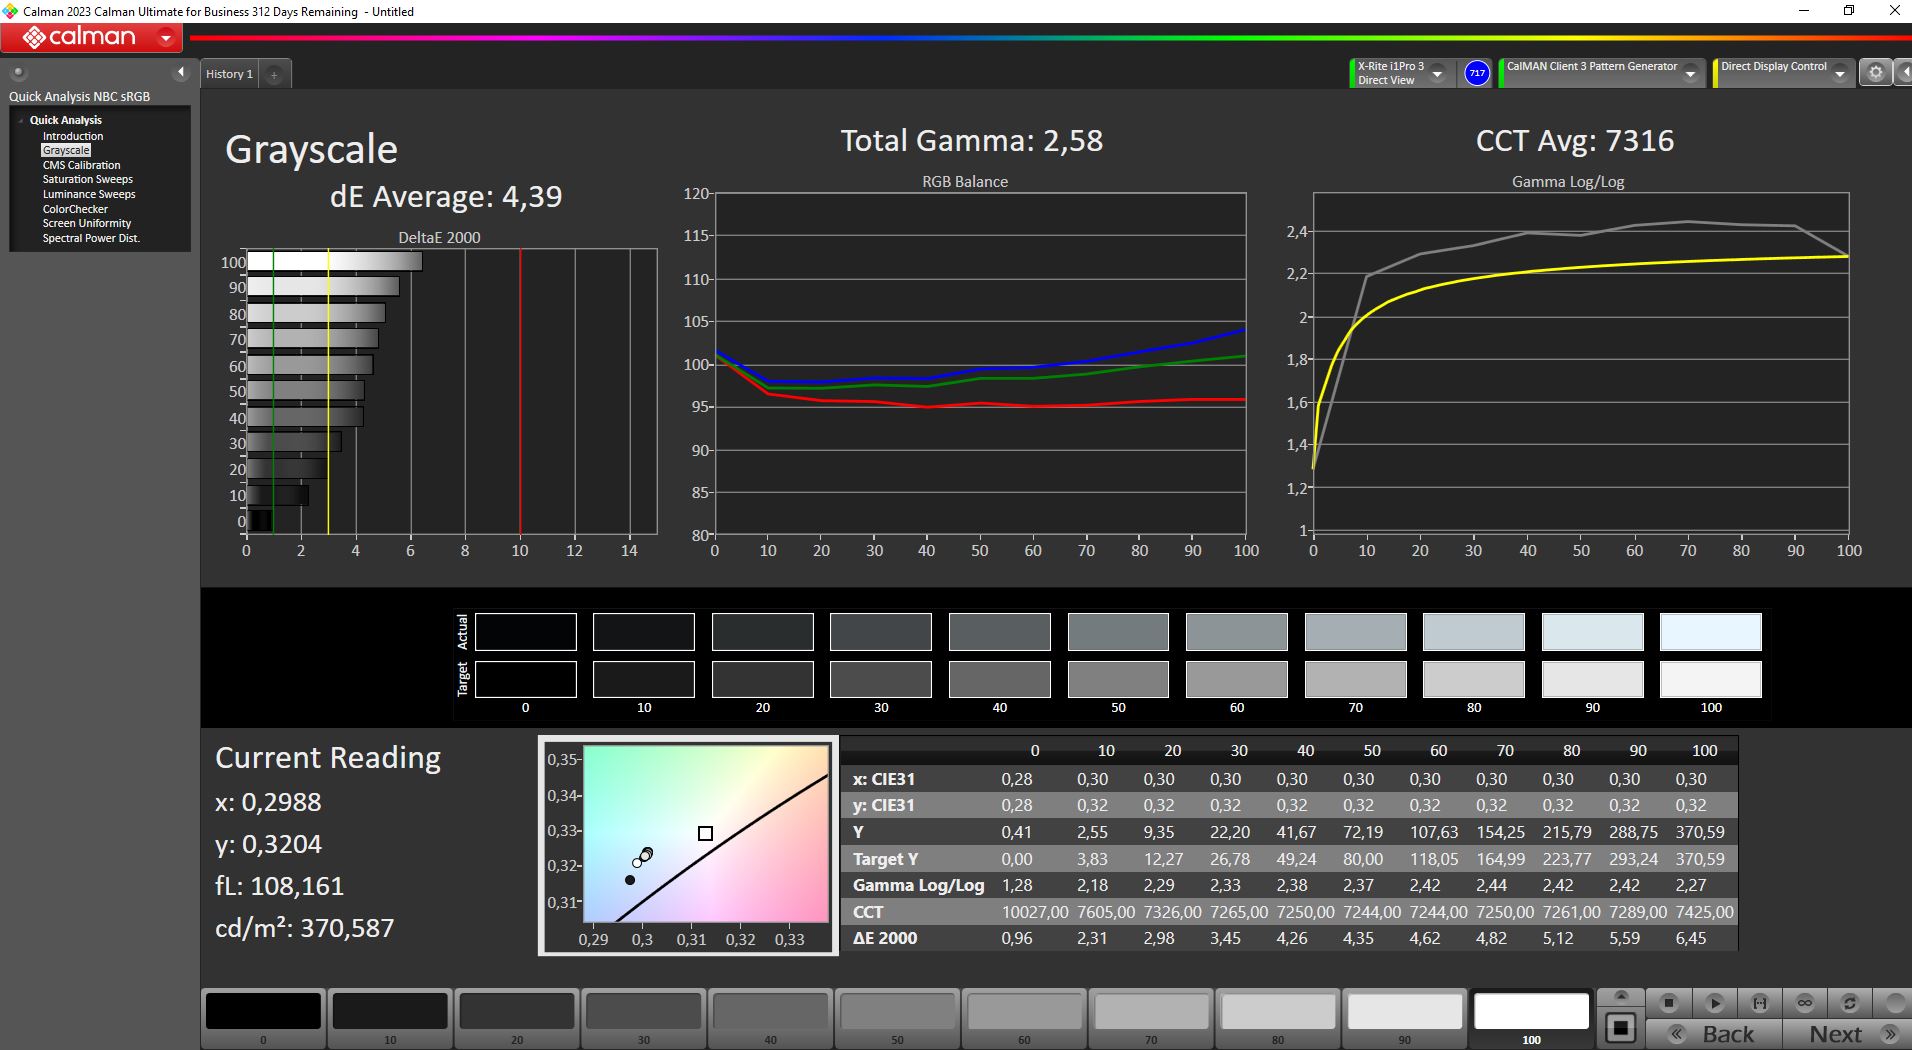
Średnia jasność wyświetlacza wynosząca 350 nitów jest akceptowalna, choć kontrast jest nieco osłabiony przez słabą wartość czerni.
Czasy reakcji są przyzwoite jak na laptopa do gier i występuje niewielkie krwawienie podświetlenia.
| |||||||||||||||||||||||||
rozświetlenie: 91 %
na akumulatorze: 356 cd/m²
kontrast: 847:1 (czerń: 0.43 cd/m²)
ΔE ColorChecker Calman: 3.98 | ∀{0.5-29.43 Ø4.72}
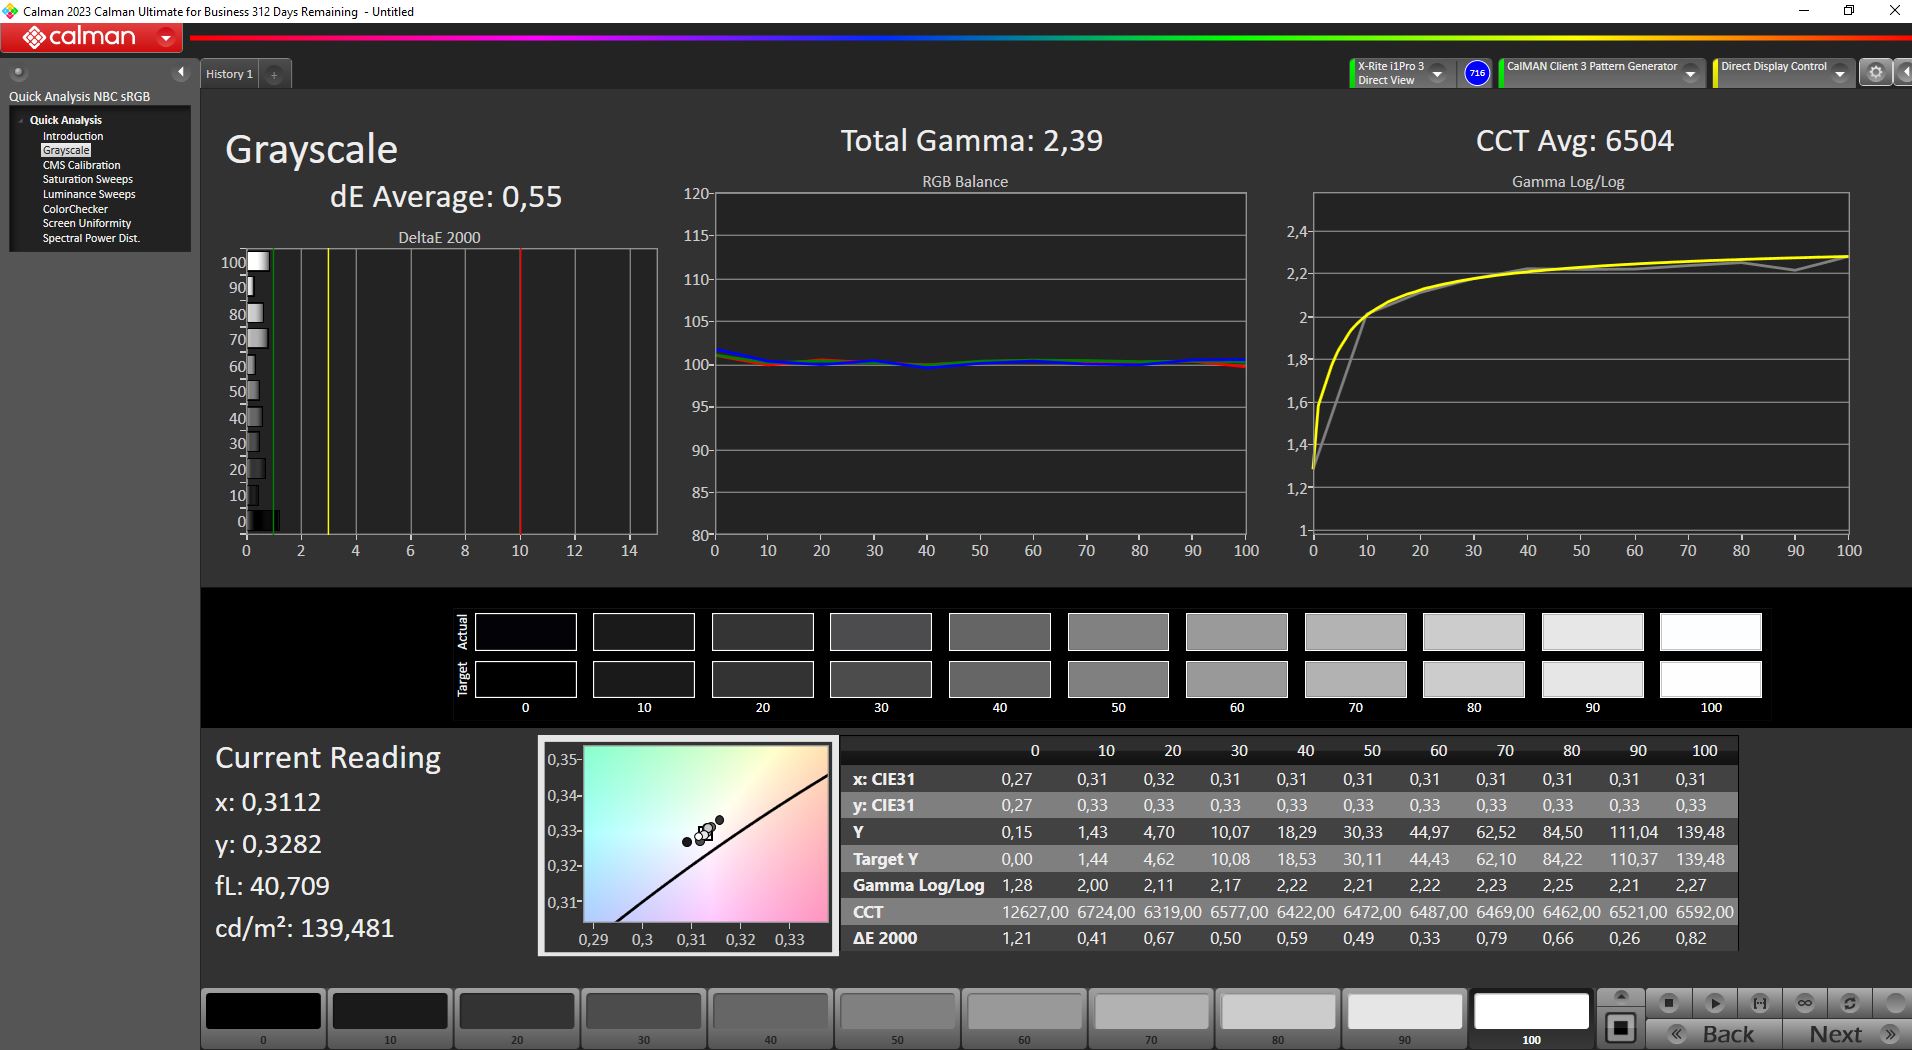
calibrated: 1.36
ΔE Greyscale Calman: 4.39 | ∀{0.09-98 Ø4.97}
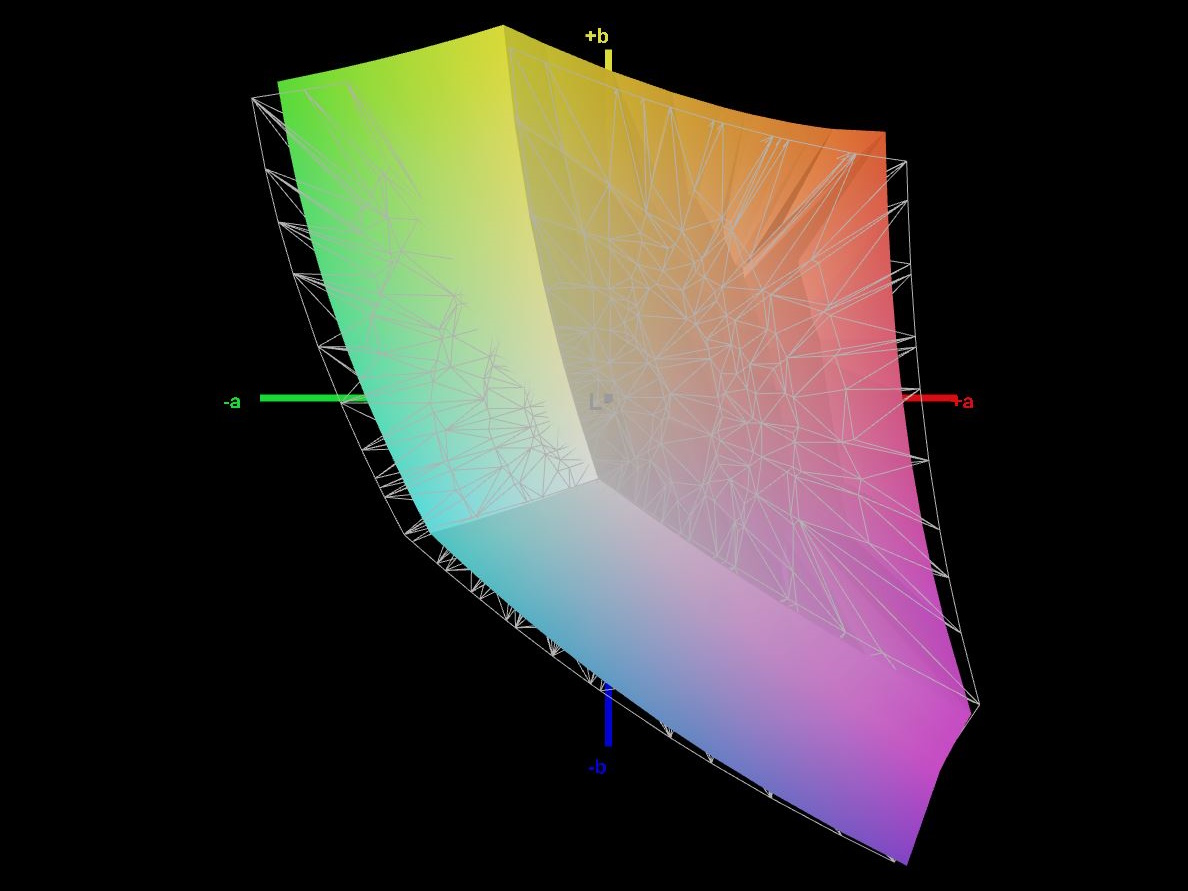
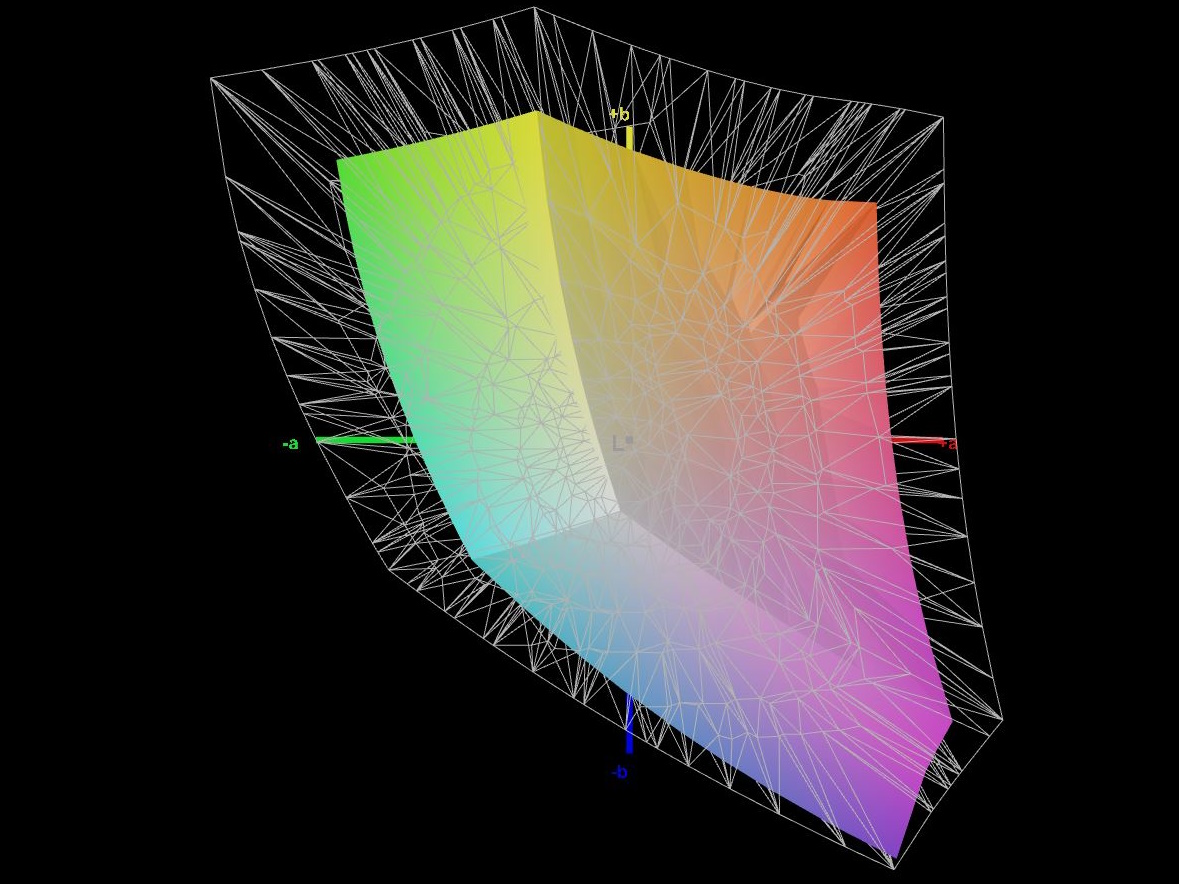
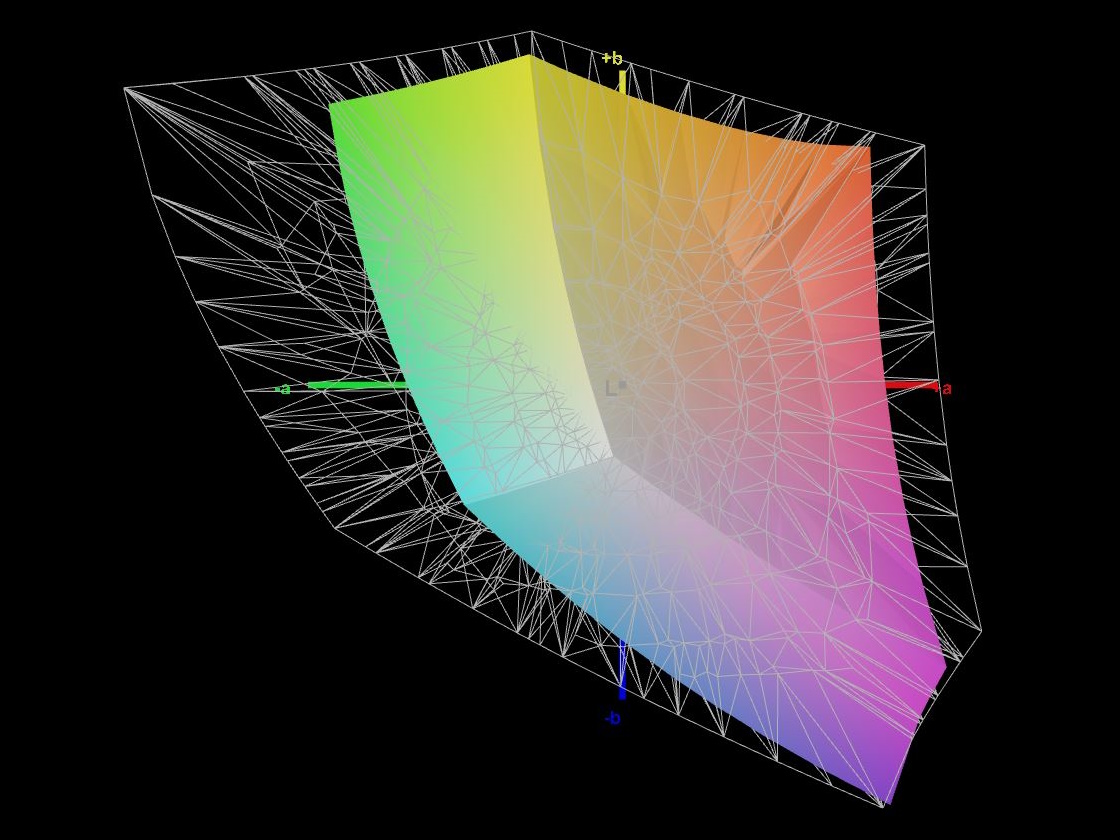
63.2% AdobeRGB 1998 (Argyll 3D)
89.7% sRGB (Argyll 3D)
61.4% Display P3 (Argyll 3D)
Gamma: 2.58
CCT: 7316 K
| Medion Erazer Crawler E40 - MD 62518 BOE HF NV156FHM-N4G, IPS, 1920x1080, 15.6" | Lenovo LOQ 15IRH8 Core i7 BOE CQ NE156QHM-NY4, IPS, 2560x1440, 15.6" | Asus TUF A15 FA507 N156HMA-GA1, IPS, 1920x1080, 15.6" | Schenker XMG Apex 15 (Late 23) BOE CQ NE156QHM-NY2, IPS, 2560x1440, 15.6" | MSI Katana 15 B12VEK AUOAF90 (B156HAN08.4), IPS, 1920x1080, 15.6" | |
|---|---|---|---|---|---|
| Display | 8% | 6% | 9% | -38% | |
| Display P3 Coverage (%) | 61.4 | 66.3 8% | 64.9 6% | 67.5 10% | 38.1 -38% |
| sRGB Coverage (%) | 89.7 | 96.6 8% | 96.5 8% | 97.6 9% | 56.8 -37% |
| AdobeRGB 1998 Coverage (%) | 63.2 | 67.7 7% | 66.6 5% | 68.9 9% | 39.3 -38% |
| Response Times | 25% | -199% | -29% | -282% | |
| Response Time Grey 50% / Grey 80% * (ms) | 8 ? | 5 ? 37% | 30.4 ? -280% | 13.2 ? -65% | 38.8 ? -385% |
| Response Time Black / White * (ms) | 9.6 ? | 8.41 ? 12% | 20.8 ? -117% | 8.8 ? 8% | 26.8 ? -179% |
| PWM Frequency (Hz) | |||||
| Screen | 3% | 32% | 12% | -46% | |
| Brightness middle (cd/m²) | 364 | 373 2% | 288 -21% | 336 -8% | 261 -28% |
| Brightness (cd/m²) | 351 | 365 4% | 271 -23% | 307 -13% | 258 -26% |
| Brightness Distribution (%) | 91 | 90 -1% | 91 0% | 77 -15% | 92 1% |
| Black Level * (cd/m²) | 0.43 | 0.33 23% | 0.17 60% | 0.38 12% | 0.19 56% |
| Contrast (:1) | 847 | 1130 33% | 1694 100% | 884 4% | 1374 62% |
| Colorchecker dE 2000 * | 3.98 | 4.19 -5% | 1.9 52% | 1.96 51% | 5.57 -40% |
| Colorchecker dE 2000 max. * | 6.38 | 8.47 -33% | 3.3 48% | 5.07 21% | 20.6 -223% |
| Colorchecker dE 2000 calibrated * | 1.36 | 1.07 21% | 0.9 34% | 1.27 7% | 4.63 -240% |
| Greyscale dE 2000 * | 4.39 | 5 -14% | 2.7 38% | 2.3 48% | 3.19 27% |
| Gamma | 2.58 85% | 1.93 114% | 2.32 95% | 2.017 109% | 2.45 90% |
| CCT | 7316 89% | 7520 86% | 6535 99% | 6644 98% | 6146 106% |
| Całkowita średnia (program / ustawienia) | 12% /
7% | -54% /
-6% | -3% /
6% | -122% /
-78% |
* ... im mniej tym lepiej
Wydajność wyświetlacza po wyjęciu z pudełka jest nieoptymalna, z wartościami DeltaE dla kolorów i skali szarości znacznie powyżej celu, a poziom czerni jest zbyt wysoki. Jednak kalibracja panelu i zmniejszenie jasności znacznie poprawia jakość wyświetlania. Po kalibracji, wartości DeltaE zostały zredukowane do godnego pochwały poziomu 0,55 dla skali szarości i 1,36 dla ColorChecker.
Nasz skalibrowany profil kolorów mogą Państwo pobrać bezpłatnie powyżej.
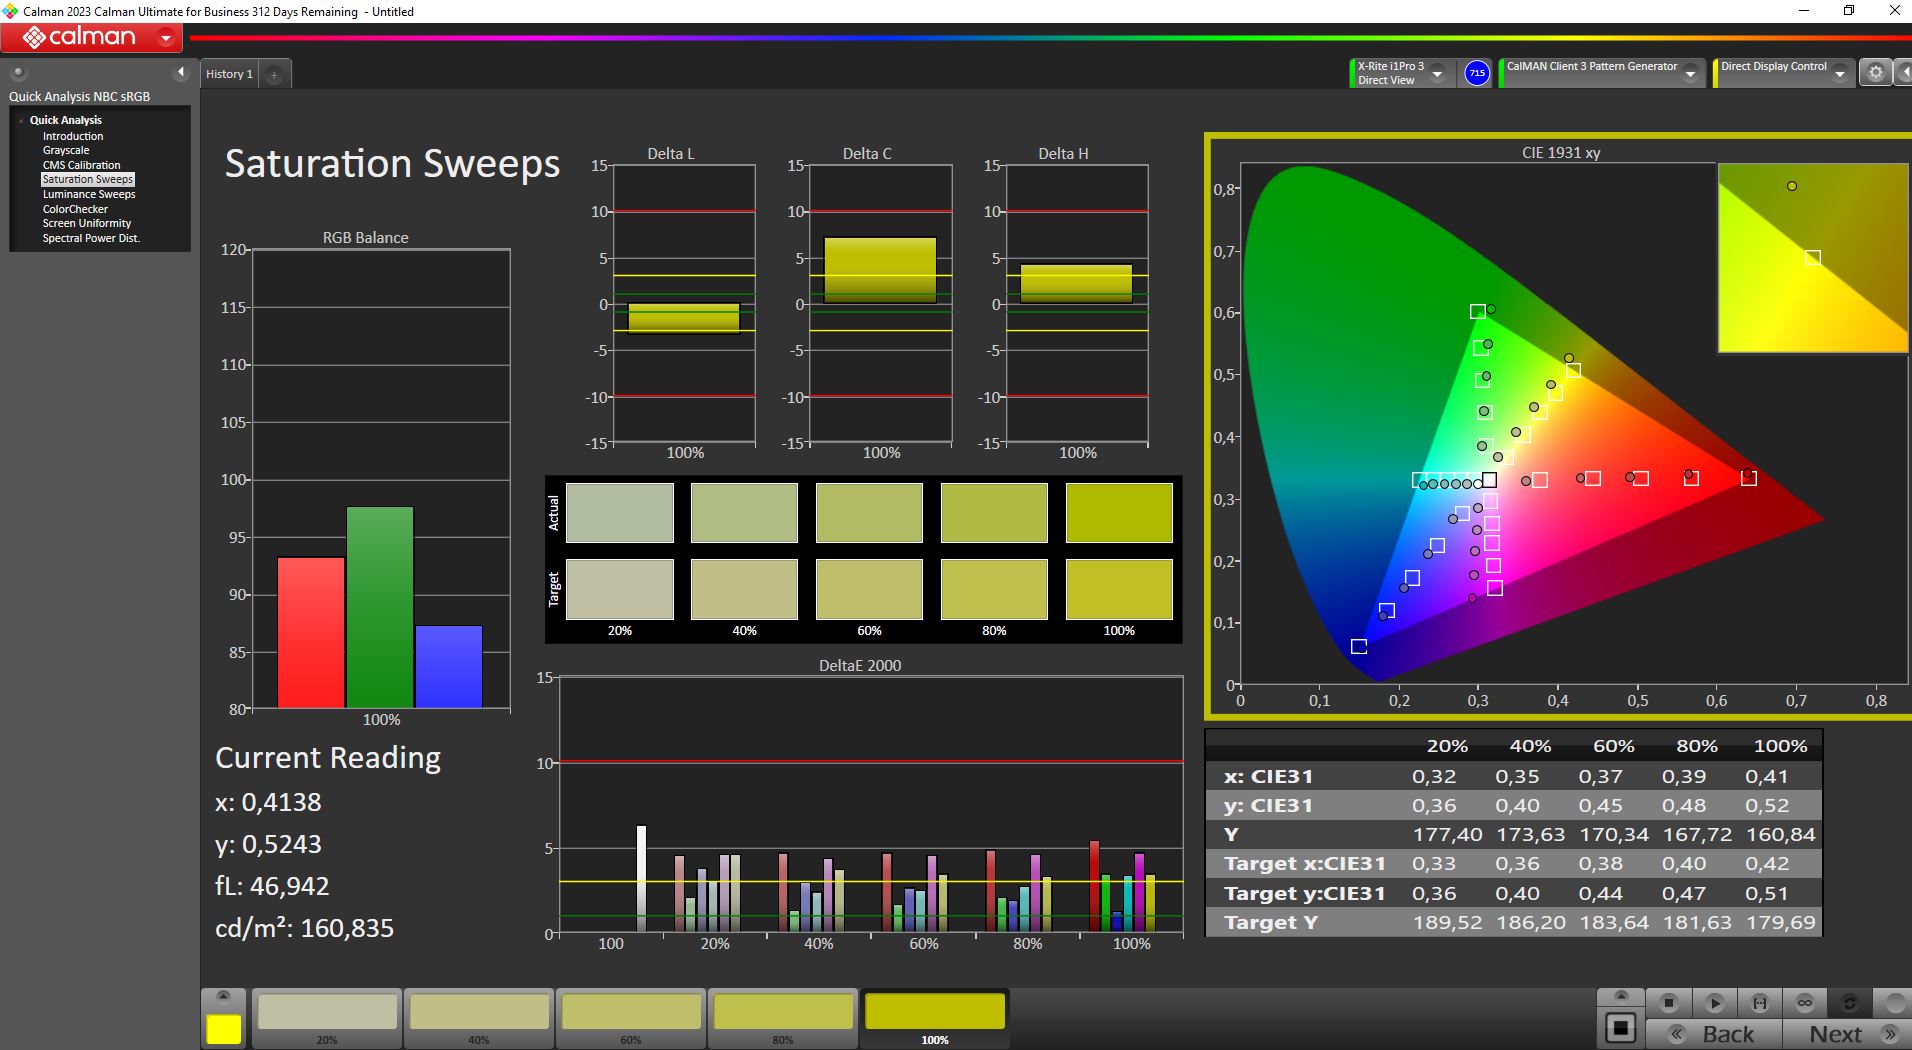
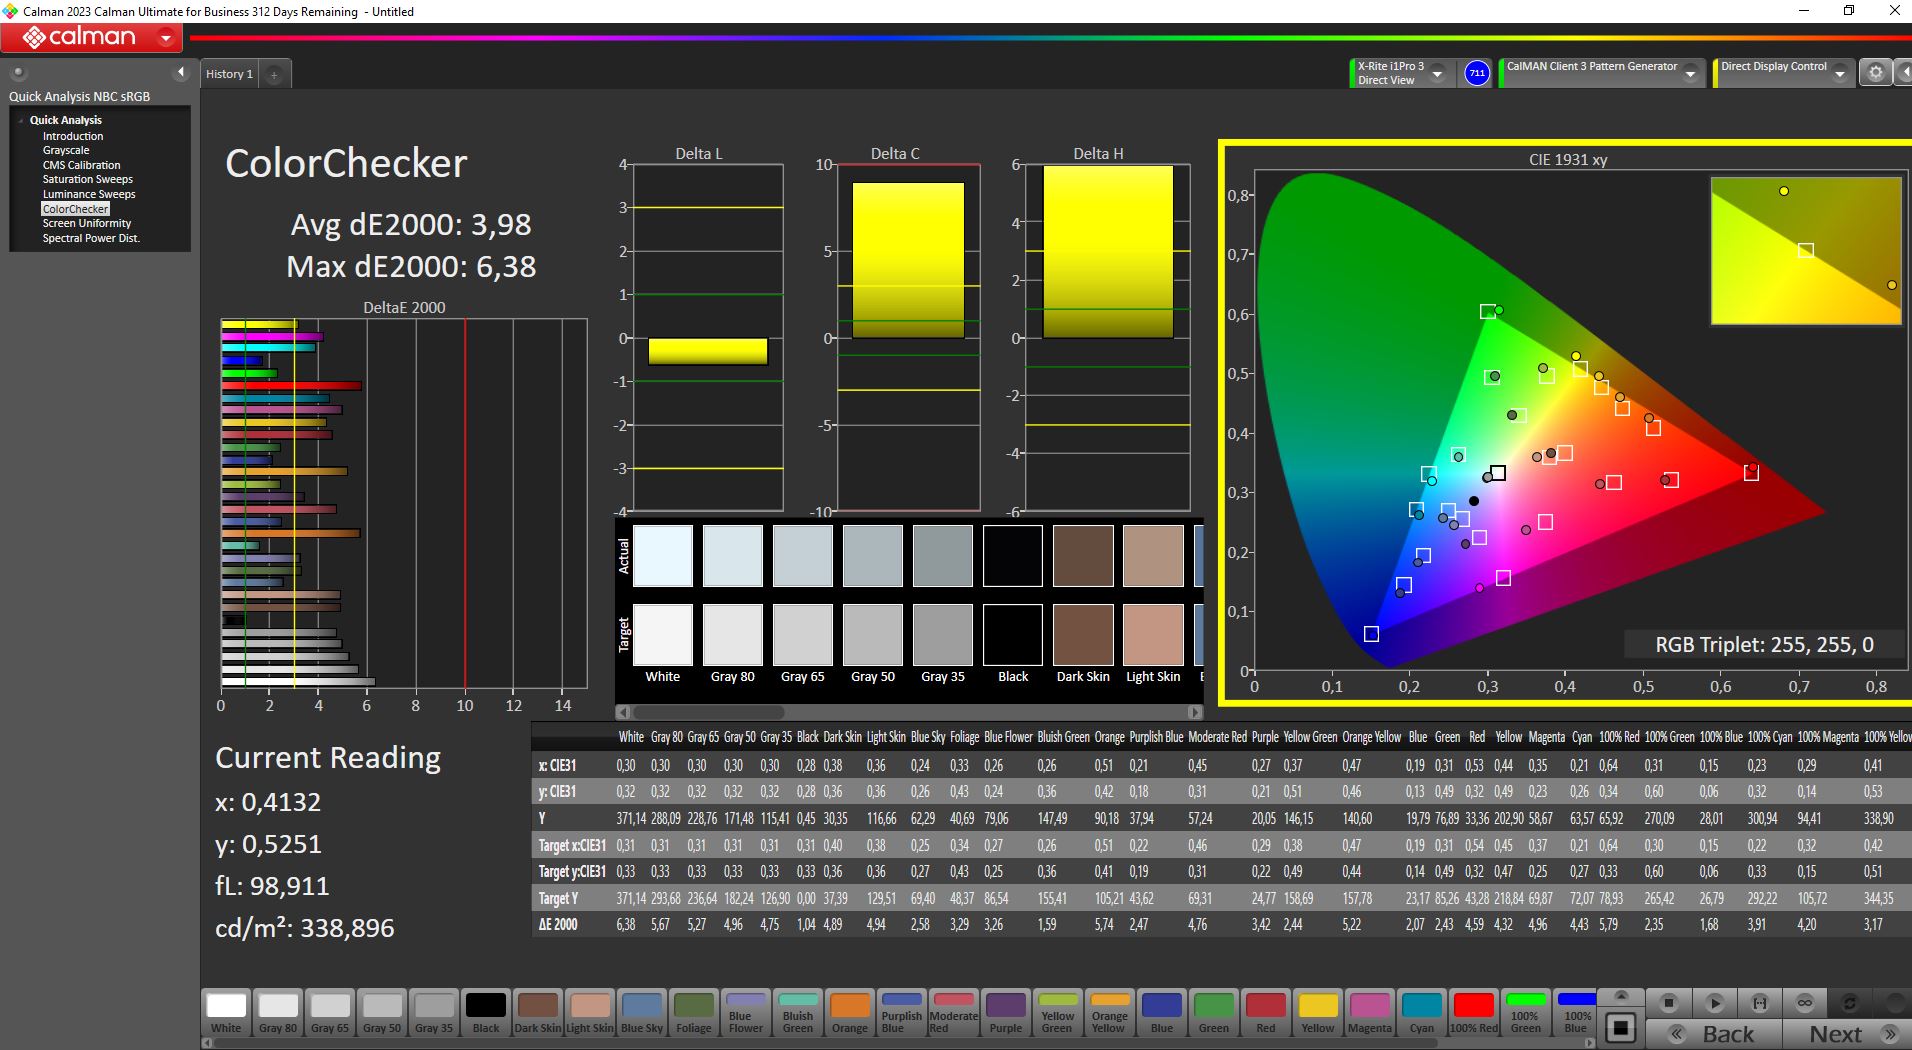
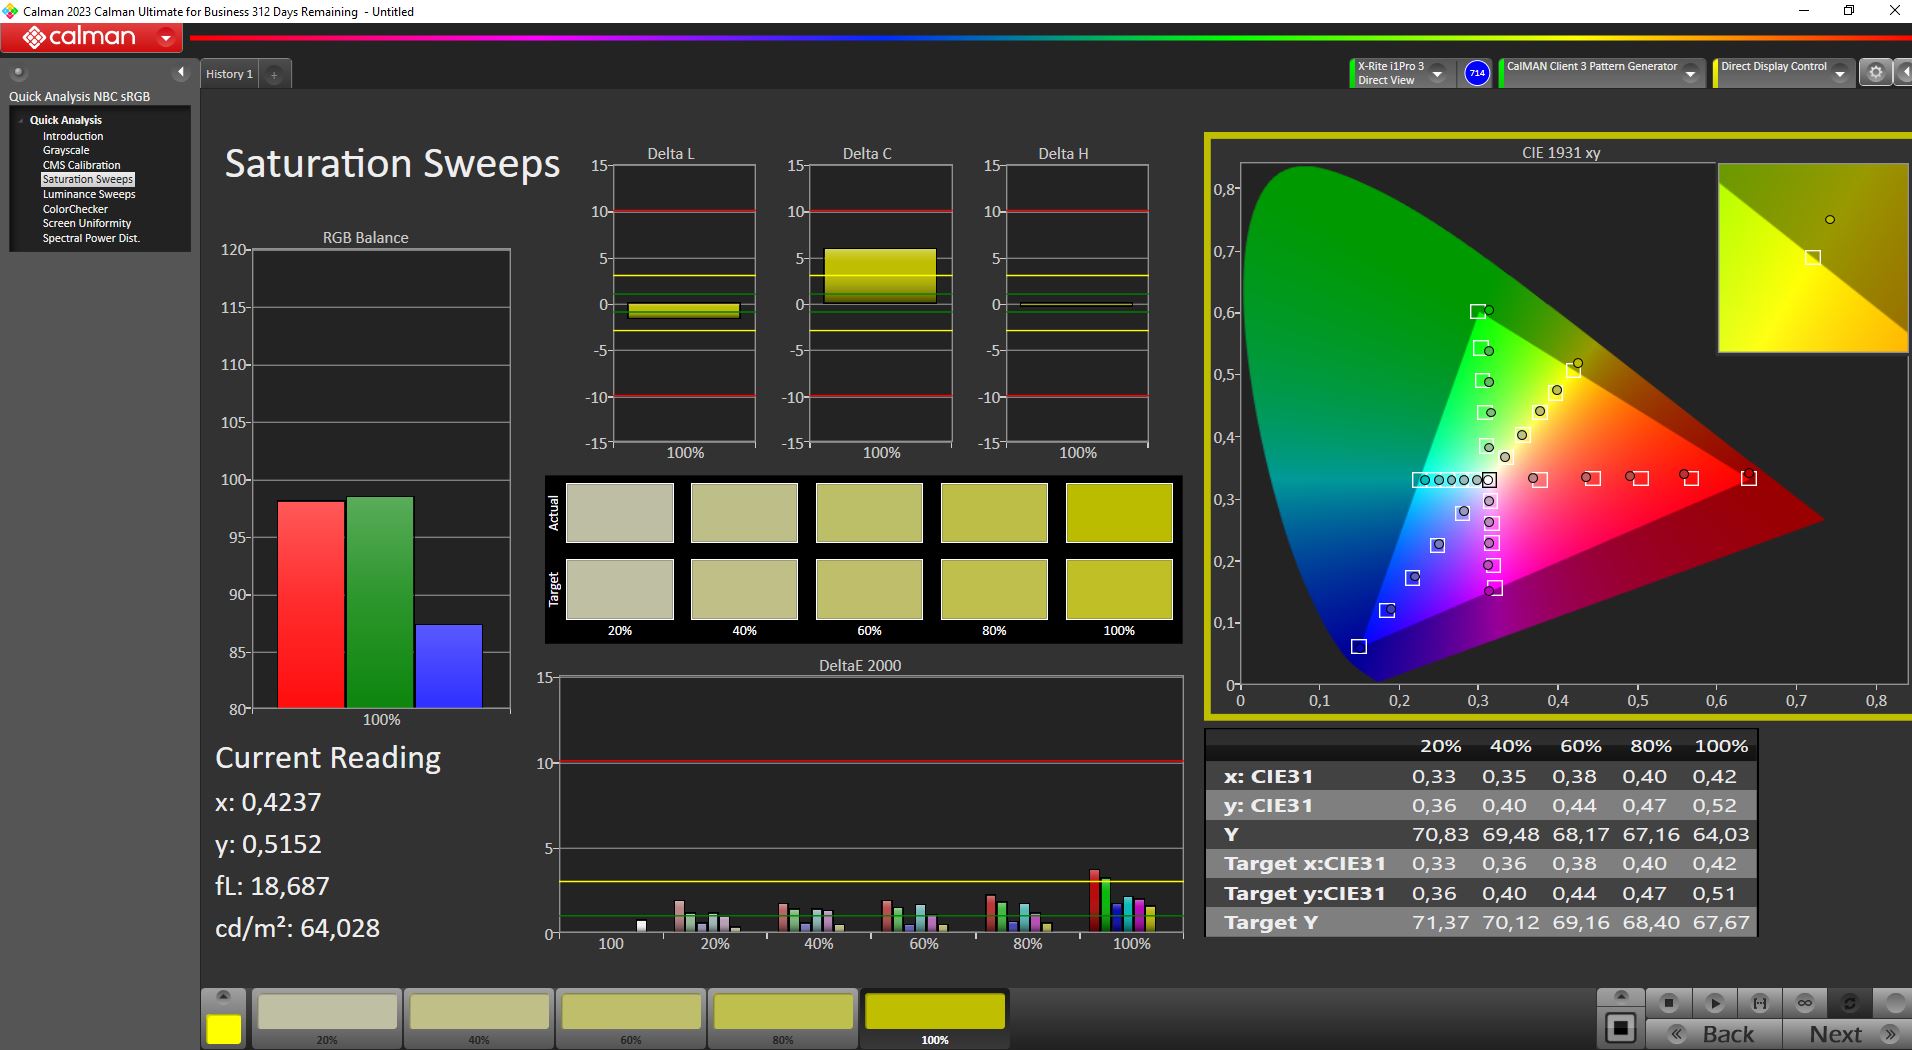
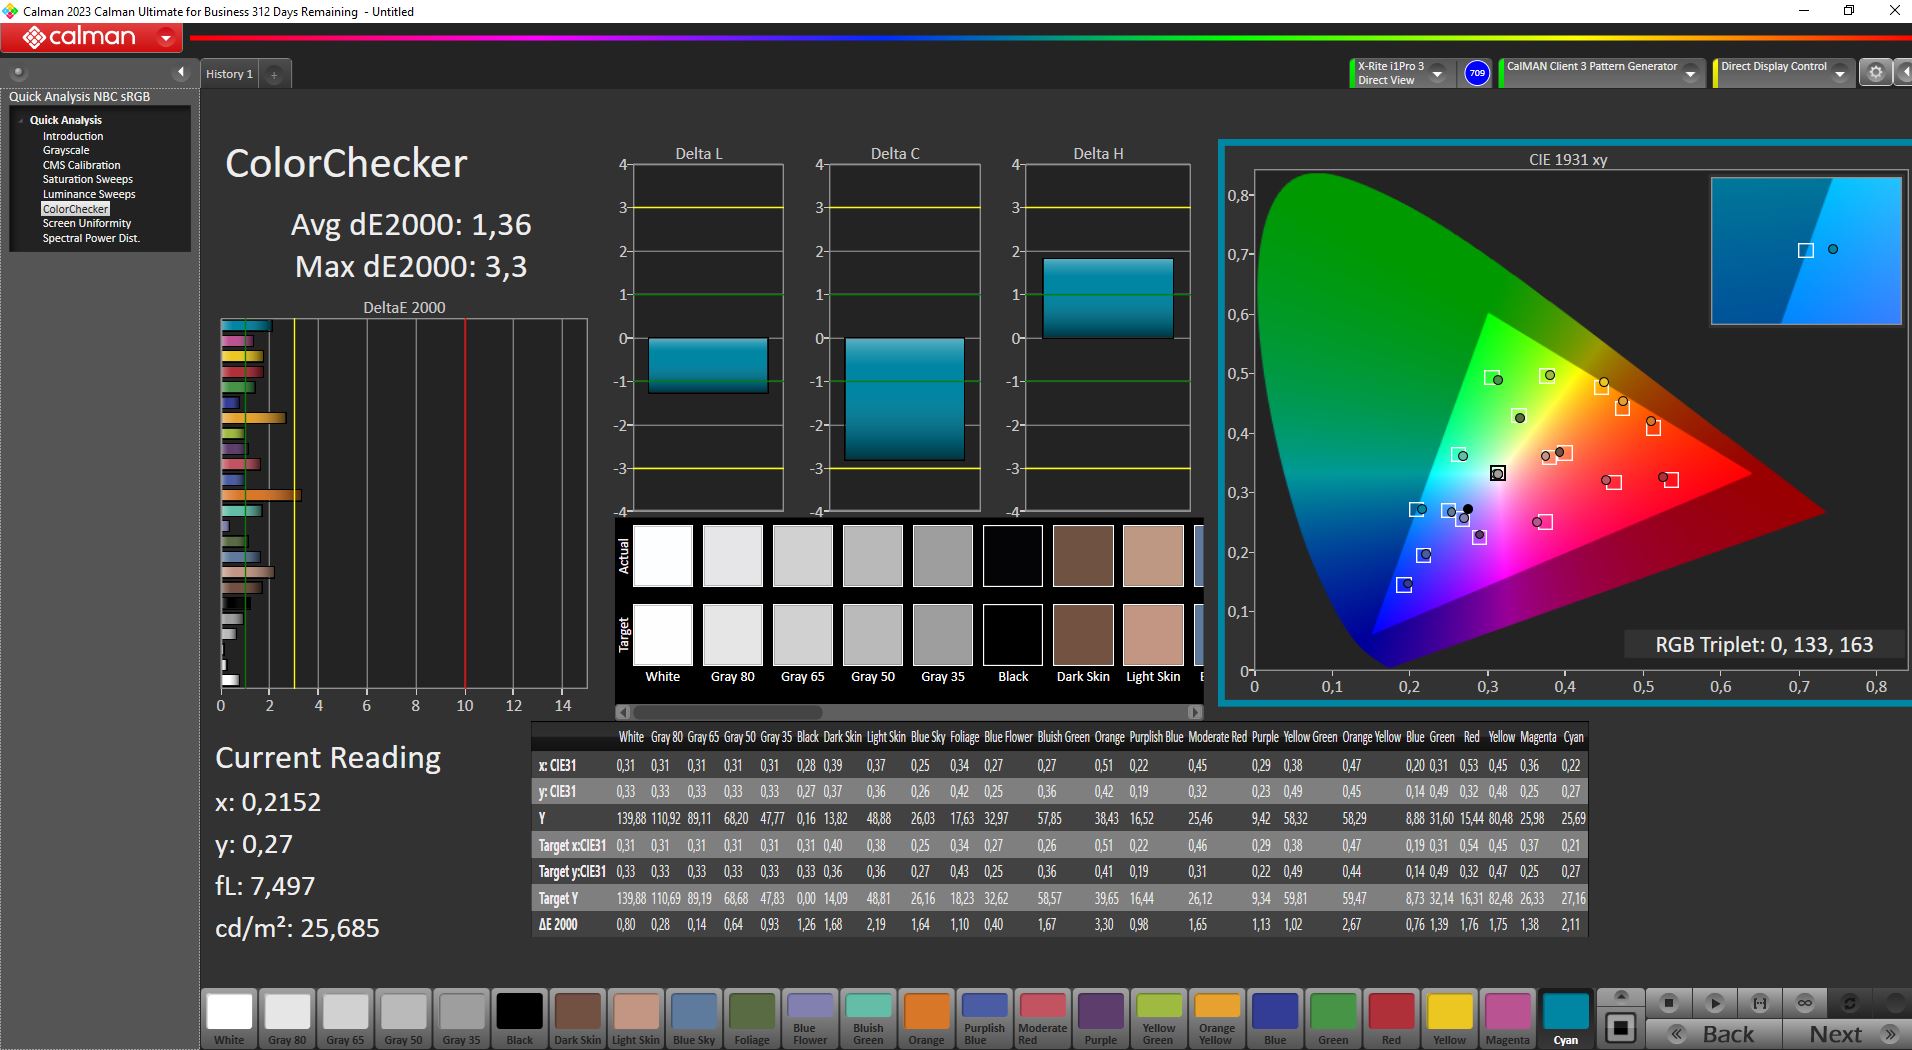
Starszy panel wykazuje wyraźne słabości pod względem pokrycia przestrzeni barw, przy czym nawet sRGB pokryte jest w najlepszym przypadku w zaledwie 90 procentach. Pomimo dobrych wartości DeltaE, panel może być mniej odpowiedni dla twórców treści.
Wyświetl czasy reakcji
| ↔ Czas reakcji od czerni do bieli | ||
|---|---|---|
| 9.6 ms ... wzrost ↗ i spadek ↘ łącznie | ↗ 5.4 ms wzrost | 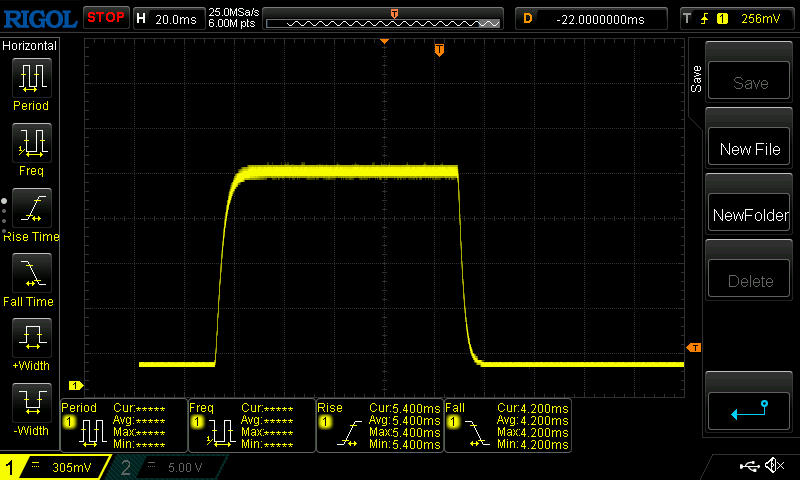 |
| ↘ 4.2 ms upadek | ||
| W naszych testach ekran wykazuje szybki czas reakcji i powinien nadawać się do gier. Dla porównania, wszystkie testowane urządzenia wahają się od 0.1 (minimum) do 240 (maksimum) ms. » 26 % wszystkich urządzeń jest lepszych. Oznacza to, że zmierzony czas reakcji jest lepszy od średniej wszystkich testowanych urządzeń (19.8 ms). | ||
| ↔ Czas reakcji 50% szarości do 80% szarości | ||
| 8 ms ... wzrost ↗ i spadek ↘ łącznie | ↗ 3.8 ms wzrost | 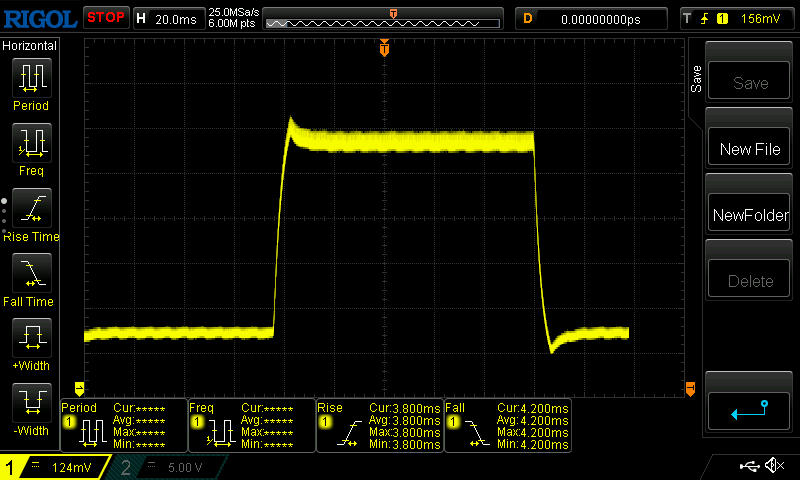 |
| ↘ 4.2 ms upadek | ||
| W naszych testach ekran wykazuje szybki czas reakcji i powinien nadawać się do gier. Dla porównania, wszystkie testowane urządzenia wahają się od 0.165 (minimum) do 636 (maksimum) ms. » 21 % wszystkich urządzeń jest lepszych. Oznacza to, że zmierzony czas reakcji jest lepszy od średniej wszystkich testowanych urządzeń (31 ms). | ||
Migotanie ekranu / PWM (modulacja szerokości impulsu)
| Migotanie ekranu/nie wykryto PWM | 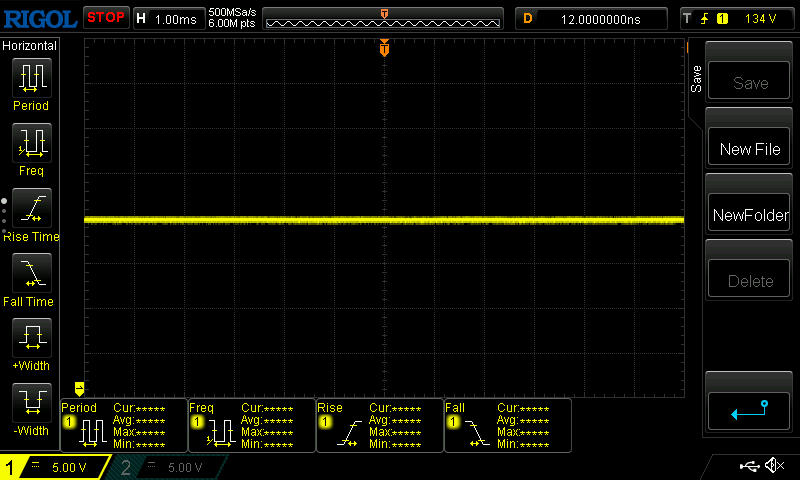 | ||
Dla porównania: 52 % wszystkich testowanych urządzeń nie używa PWM do przyciemniania wyświetlacza. Jeśli wykryto PWM, zmierzono średnio 7763 (minimum: 5 - maksimum: 343500) Hz. | |||
Matowa powierzchnia w połączeniu z jasnością 350 nitów sprawia, że praca na zewnątrz, przynajmniej w zacienionym miejscu, nie jest wyzwaniem.

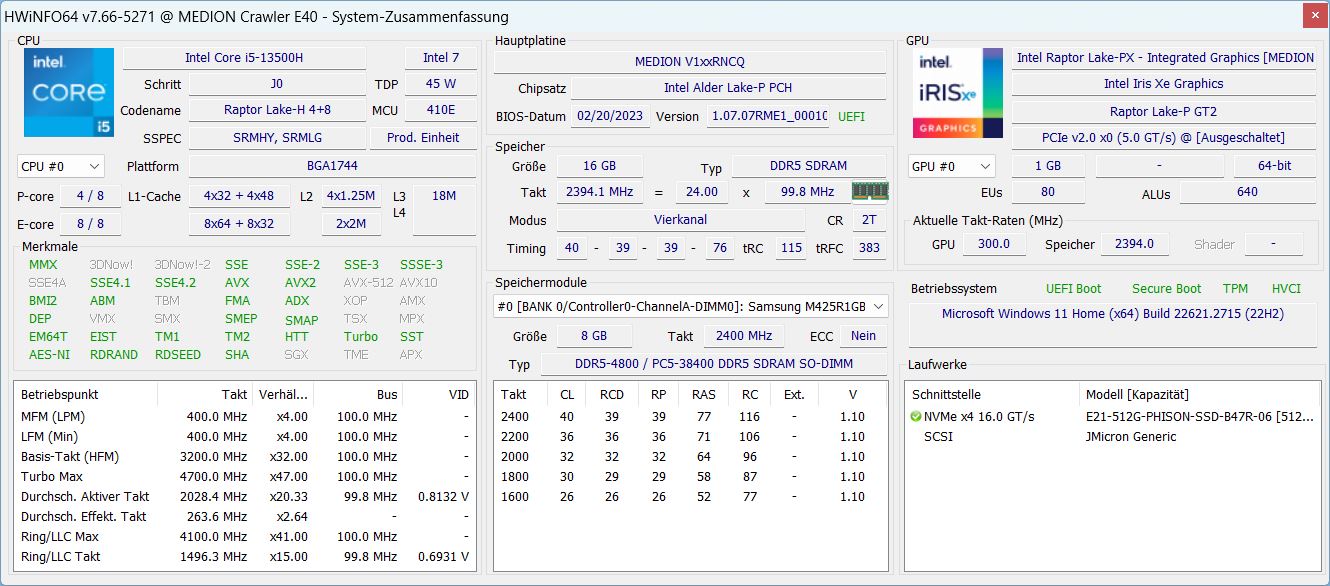
Wydajność - dobre połączenie i5-13500H i RTX 4050
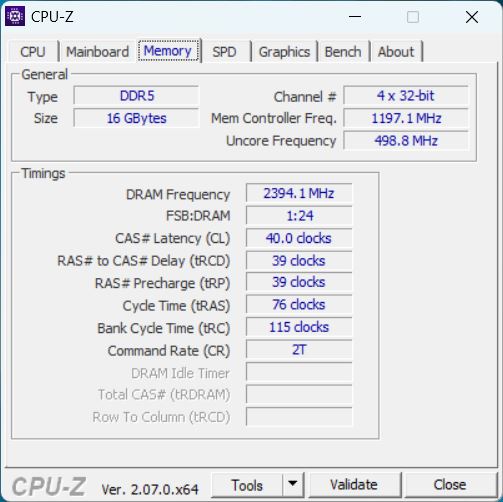
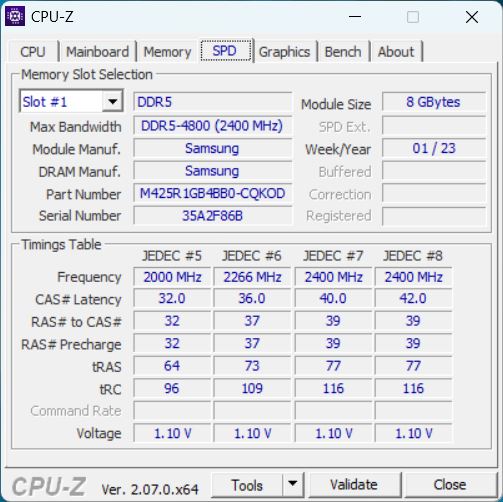
W przypadku Crawlera mamy do czynienia z podstawowym laptopem do gier, na co wskazuje Nvidia GeForce RTX 4050 i Intel Core i5-13500Hz których oba są solidnymi wariantami budżetowymi wśród komponentów do gier. Jest też 16 GB nowoczesnej pamięci RAM DDR5-4800 i dysk SSD NVMe o pojemności 512 GB, a przestrzeń dyskowa to również bardziej budżetowa opcja.
To sprawia, że laptop nadaje się dla każdego, kto niekoniecznie musi grać w każdą aktualną grę na maksymalnych detalach. W przypadku wielu gier wydajność w natywnej rozdzielczości 1080p powinna być jednak wystarczająca dla wysokich detali. Twórcy treści również mogą być zainteresowani wydajnością i prostym designem, ale wyświetlacz prawdopodobnie będzie powalającym kryterium dla prawdziwej pracy twórczej (zdjęcia, filmy).
Warunki testowania
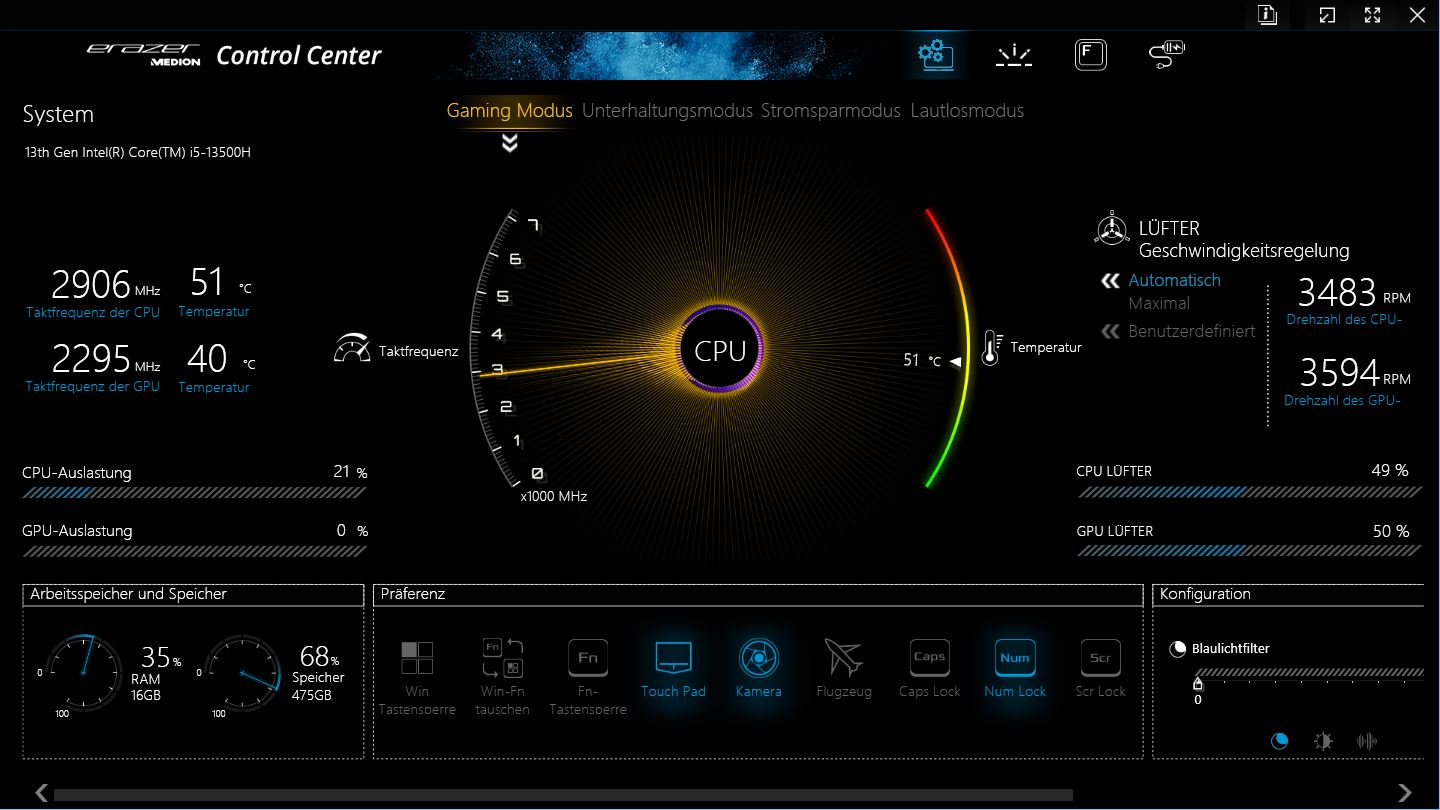
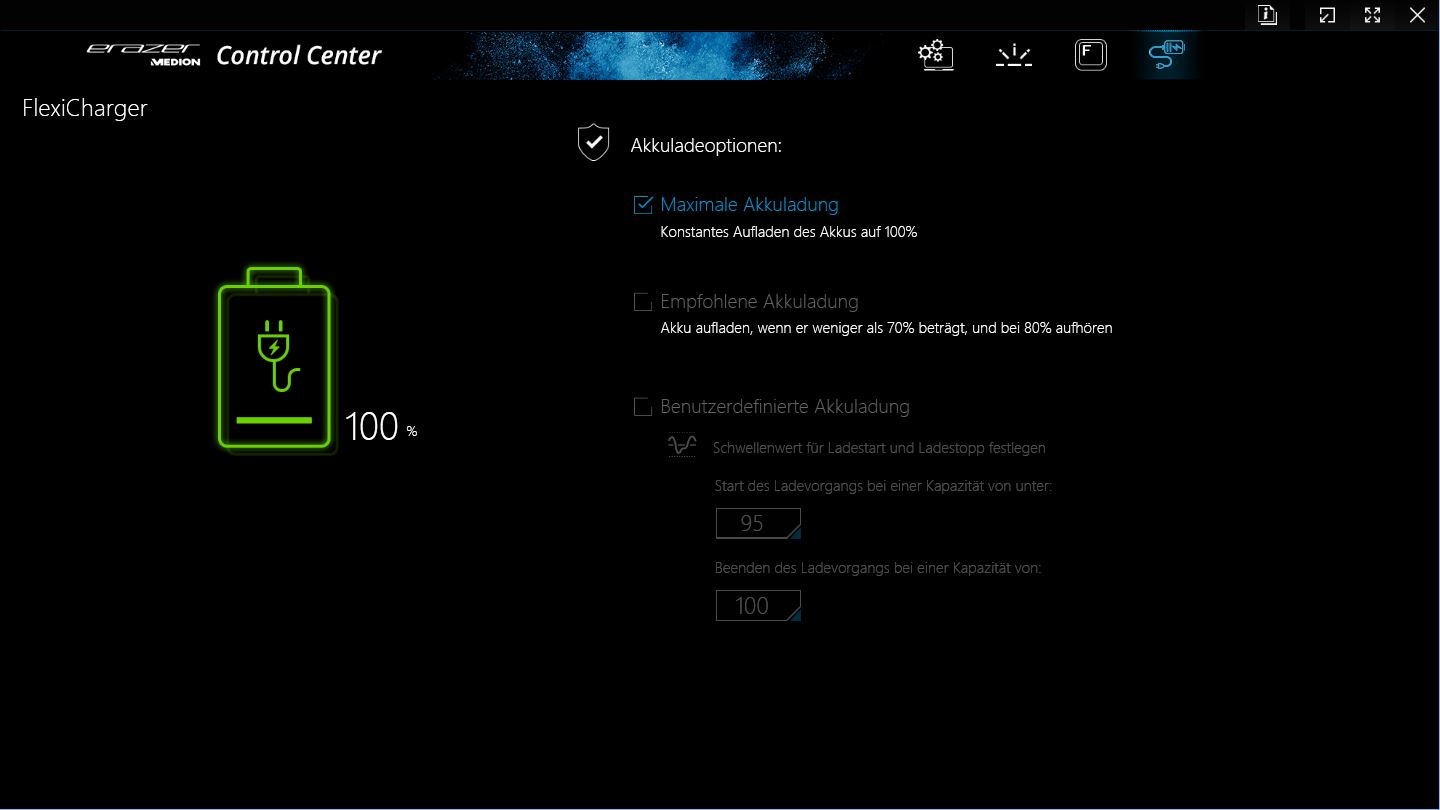
Medion preinstalował na Crawler E40 ogólne Centrum Sterowania, które zawiera profile wydajności, podświetlenie klawiatury i inne ustawienia. Aplikacja nie jest szczególnie szybka i często przetwarza dane wejściowe z niewielkim opóźnieniem.
Na ekranie głównym nieco irytujące jest również to, że trzeba przewijać w prawym dolnym rogu, aby uzyskać dostęp na przykład do przełącznika GPU (MSHybrid vs. dGPU, wymagany restart), który przy odrobinie wysiłku mógłby być zaprojektowany bardziej przejrzyście.
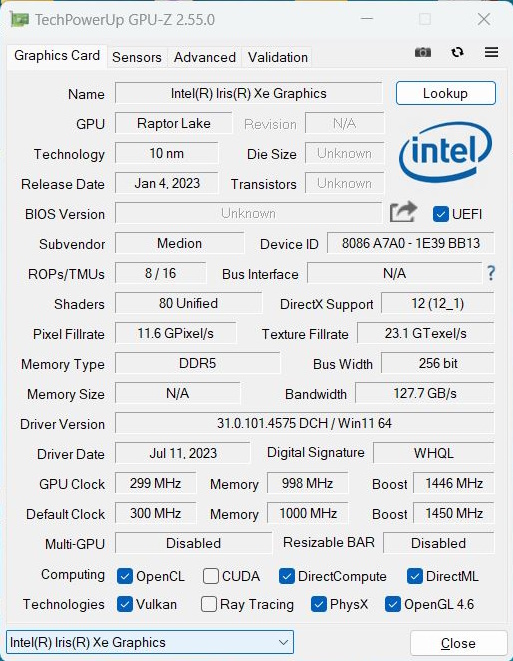
Użyliśmy trybu gier do testów wydajności i trybu oszczędzania energii do testów baterii, ponieważ dGPU jest tutaj dezaktywowany, a zintegrowany GPU przejmuje kontrolę.
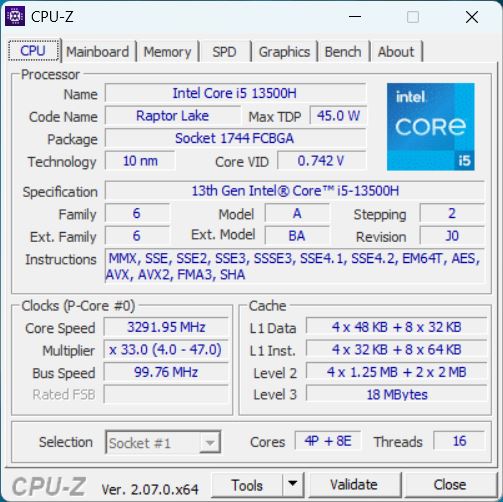
Procesor
Procesor Intel Core i5-13500H to średniej klasy procesor z obecnej serii Raptor Lake-H (Intel Gen13). Posiada on 4 z możliwych 6 rdzeni P i 8 rdzeni E. Razem ma 12 rdzeni i 16 wątków (tylko rdzenie P obsługują hyperthreading). Bazowy zegar E wynosi 1,9 GHz, rdzenie P mogą być taktowane indywidualnie do 4,7 GHz, a razem do 4,6 GHz.
Nawiasem mówiąc, istnieje Medion Erazer Crawler E50 z procesorem Intel Gen 12 i5-12450H. Schemat nazewnictwa Mediona jest naprawdę bardzo nieprzejrzysty i może wprowadzać kupujących w błąd, więc proszę uważać przy zakupie!
W naszych testach porównawczych procesor zapewnił dobrą wydajność i jest prawie na równi z przeciętnym i5-13500 z naszej bazy danych.
W pętli Cinebench R15 procesor wykazuje bardzo stałą wydajność od samego początku, bez spadku po kilku pierwszych uruchomieniach. Poniższa tabela przedstawia zachowanie w różnych trybach wydajności, w tym w trybie baterii.
| Tryb/Wartość | Wynik Cinebench R15 | Pobór mocy procesora Zakres | Typowy pobór mocy procesora |
|---|---|---|---|
| Gry | 2,331 | 60 - 110 W | 105 |
| Rozrywka | 2.135 | 50-105 | 51 |
| Cicha praca | 835 | 15-23 | 15 |
| Bateria | 1,065 | 19-21 | 21 |
Cinebench R15 Multi Loop
Cinebench R23: Multi Core | Single Core
Cinebench R20: CPU (Multi Core) | CPU (Single Core)
Cinebench R15: CPU Multi 64Bit | CPU Single 64Bit
Blender: v2.79 BMW27 CPU
7-Zip 18.03: 7z b 4 | 7z b 4 -mmt1
Geekbench 5.5: Multi-Core | Single-Core
HWBOT x265 Benchmark v2.2: 4k Preset
LibreOffice : 20 Documents To PDF
R Benchmark 2.5: Overall mean
| CPU Performance rating | |
| Średnia w klasie Gaming | |
| Schenker XMG Apex 15 (Late 23) | |
| Lenovo LOQ 15IRH8 Core i7 | |
| MSI Katana 15 B12VEK | |
| Medion Erazer Crawler E40 - MD 62518 | |
| Przeciętny Intel Core i5-13500H | |
| Asus TUF A15 FA507 | |
| Cinebench R23 / Multi Core | |
| Średnia w klasie Gaming (10488 - 40970, n=110, ostatnie 2 lata) | |
| Schenker XMG Apex 15 (Late 23) | |
| MSI Katana 15 B12VEK | |
| Lenovo LOQ 15IRH8 Core i7 | |
| Przeciętny Intel Core i5-13500H (13542 - 16335, n=5) | |
| Medion Erazer Crawler E40 - MD 62518 | |
| Asus TUF A15 FA507 | |
| Cinebench R23 / Single Core | |
| Średnia w klasie Gaming (1166 - 2356, n=110, ostatnie 2 lata) | |
| Lenovo LOQ 15IRH8 Core i7 | |
| Medion Erazer Crawler E40 - MD 62518 | |
| Schenker XMG Apex 15 (Late 23) | |
| Przeciętny Intel Core i5-13500H (1704 - 1799, n=5) | |
| MSI Katana 15 B12VEK | |
| Asus TUF A15 FA507 | |
| Cinebench R20 / CPU (Multi Core) | |
| Średnia w klasie Gaming (4029 - 16108, n=109, ostatnie 2 lata) | |
| Schenker XMG Apex 15 (Late 23) | |
| MSI Katana 15 B12VEK | |
| Lenovo LOQ 15IRH8 Core i7 | |
| Przeciętny Intel Core i5-13500H (5108 - 6212, n=5) | |
| Asus TUF A15 FA507 | |
| Medion Erazer Crawler E40 - MD 62518 | |
| Cinebench R20 / CPU (Single Core) | |
| Średnia w klasie Gaming (442 - 895, n=109, ostatnie 2 lata) | |
| Lenovo LOQ 15IRH8 Core i7 | |
| Schenker XMG Apex 15 (Late 23) | |
| Medion Erazer Crawler E40 - MD 62518 | |
| Przeciętny Intel Core i5-13500H (655 - 687, n=5) | |
| MSI Katana 15 B12VEK | |
| Asus TUF A15 FA507 | |
| Cinebench R15 / CPU Multi 64Bit | |
| Średnia w klasie Gaming (1578 - 6271, n=108, ostatnie 2 lata) | |
| Schenker XMG Apex 15 (Late 23) | |
| Medion Erazer Crawler E40 - MD 62518 | |
| Przeciętny Intel Core i5-13500H (2234 - 2475, n=5) | |
| Lenovo LOQ 15IRH8 Core i7 | |
| Asus TUF A15 FA507 | |
| MSI Katana 15 B12VEK | |
| Cinebench R15 / CPU Single 64Bit | |
| Średnia w klasie Gaming (188.8 - 343, n=109, ostatnie 2 lata) | |
| Schenker XMG Apex 15 (Late 23) | |
| Lenovo LOQ 15IRH8 Core i7 | |
| Przeciętny Intel Core i5-13500H (243 - 261, n=5) | |
| Asus TUF A15 FA507 | |
| Medion Erazer Crawler E40 - MD 62518 | |
| MSI Katana 15 B12VEK | |
| Blender / v2.79 BMW27 CPU | |
| Lenovo LOQ 15IRH8 Core i7 | |
| Przeciętny Intel Core i5-13500H (205 - 263, n=6) | |
| MSI Katana 15 B12VEK | |
| Asus TUF A15 FA507 | |
| Medion Erazer Crawler E40 - MD 62518 | |
| Schenker XMG Apex 15 (Late 23) | |
| Średnia w klasie Gaming (80 - 330, n=107, ostatnie 2 lata) | |
| 7-Zip 18.03 / 7z b 4 | |
| Średnia w klasie Gaming (33491 - 148086, n=108, ostatnie 2 lata) | |
| Schenker XMG Apex 15 (Late 23) | |
| Asus TUF A15 FA507 | |
| MSI Katana 15 B12VEK | |
| Medion Erazer Crawler E40 - MD 62518 | |
| Lenovo LOQ 15IRH8 Core i7 | |
| Przeciętny Intel Core i5-13500H (50846 - 58567, n=6) | |
| 7-Zip 18.03 / 7z b 4 -mmt1 | |
| Schenker XMG Apex 15 (Late 23) | |
| Średnia w klasie Gaming (4199 - 7436, n=108, ostatnie 2 lata) | |
| Lenovo LOQ 15IRH8 Core i7 | |
| Asus TUF A15 FA507 | |
| Przeciętny Intel Core i5-13500H (5500 - 5885, n=6) | |
| MSI Katana 15 B12VEK | |
| Medion Erazer Crawler E40 - MD 62518 | |
| Geekbench 5.5 / Multi-Core | |
| Średnia w klasie Gaming (6460 - 27010, n=108, ostatnie 2 lata) | |
| Schenker XMG Apex 15 (Late 23) | |
| Lenovo LOQ 15IRH8 Core i7 | |
| MSI Katana 15 B12VEK | |
| Medion Erazer Crawler E40 - MD 62518 | |
| Przeciętny Intel Core i5-13500H (9312 - 11465, n=5) | |
| Asus TUF A15 FA507 | |
| Geekbench 5.5 / Single-Core | |
| Średnia w klasie Gaming (986 - 2474, n=108, ostatnie 2 lata) | |
| Schenker XMG Apex 15 (Late 23) | |
| Lenovo LOQ 15IRH8 Core i7 | |
| Przeciętny Intel Core i5-13500H (1674 - 1762, n=5) | |
| Medion Erazer Crawler E40 - MD 62518 | |
| MSI Katana 15 B12VEK | |
| Asus TUF A15 FA507 | |
| HWBOT x265 Benchmark v2.2 / 4k Preset | |
| Średnia w klasie Gaming (11.5 - 44.3, n=108, ostatnie 2 lata) | |
| Schenker XMG Apex 15 (Late 23) | |
| Medion Erazer Crawler E40 - MD 62518 | |
| MSI Katana 15 B12VEK | |
| Asus TUF A15 FA507 | |
| Lenovo LOQ 15IRH8 Core i7 | |
| Przeciętny Intel Core i5-13500H (14.4 - 17.9, n=6) | |
| LibreOffice / 20 Documents To PDF | |
| Medion Erazer Crawler E40 - MD 62518 | |
| Przeciętny Intel Core i5-13500H (44 - 65.5, n=5) | |
| Asus TUF A15 FA507 | |
| Średnia w klasie Gaming (19 - 88.8, n=108, ostatnie 2 lata) | |
| MSI Katana 15 B12VEK | |
| Schenker XMG Apex 15 (Late 23) | |
| Lenovo LOQ 15IRH8 Core i7 | |
| R Benchmark 2.5 / Overall mean | |
| Asus TUF A15 FA507 | |
| MSI Katana 15 B12VEK | |
| Przeciętny Intel Core i5-13500H (0.471 - 0.51, n=6) | |
| Medion Erazer Crawler E40 - MD 62518 | |
| Lenovo LOQ 15IRH8 Core i7 | |
| Schenker XMG Apex 15 (Late 23) | |
| Średnia w klasie Gaming (0.3439 - 0.759, n=109, ostatnie 2 lata) | |
* ... im mniej tym lepiej
AIDA64: FP32 Ray-Trace | FPU Julia | CPU SHA3 | CPU Queen | FPU SinJulia | FPU Mandel | CPU AES | CPU ZLib | FP64 Ray-Trace | CPU PhotoWorxx
| Performance rating | |
| Średnia w klasie Gaming | |
| Schenker XMG Apex 15 (Late 23) | |
| Asus TUF A15 FA507 | |
| MSI Katana 15 B12VEK | |
| Medion Erazer Crawler E40 - MD 62518 | |
| Przeciętny Intel Core i5-13500H | |
| Lenovo LOQ 15IRH8 Core i7 | |
| AIDA64 / FP32 Ray-Trace | |
| Średnia w klasie Gaming (10227 - 85542, n=107, ostatnie 2 lata) | |
| Schenker XMG Apex 15 (Late 23) | |
| Asus TUF A15 FA507 | |
| MSI Katana 15 B12VEK | |
| Medion Erazer Crawler E40 - MD 62518 | |
| Przeciętny Intel Core i5-13500H (11081 - 15390, n=6) | |
| Lenovo LOQ 15IRH8 Core i7 | |
| AIDA64 / FPU Julia | |
| Średnia w klasie Gaming (51376 - 238426, n=107, ostatnie 2 lata) | |
| Schenker XMG Apex 15 (Late 23) | |
| Asus TUF A15 FA507 | |
| MSI Katana 15 B12VEK | |
| Medion Erazer Crawler E40 - MD 62518 | |
| Przeciętny Intel Core i5-13500H (56813 - 74251, n=6) | |
| Lenovo LOQ 15IRH8 Core i7 | |
| AIDA64 / CPU SHA3 | |
| Średnia w klasie Gaming (2180 - 9817, n=107, ostatnie 2 lata) | |
| Schenker XMG Apex 15 (Late 23) | |
| Medion Erazer Crawler E40 - MD 62518 | |
| Asus TUF A15 FA507 | |
| MSI Katana 15 B12VEK | |
| Przeciętny Intel Core i5-13500H (2621 - 3623, n=6) | |
| Lenovo LOQ 15IRH8 Core i7 | |
| AIDA64 / CPU Queen | |
| Średnia w klasie Gaming (49785 - 173351, n=95, ostatnie 2 lata) | |
| Schenker XMG Apex 15 (Late 23) | |
| Asus TUF A15 FA507 | |
| MSI Katana 15 B12VEK | |
| Medion Erazer Crawler E40 - MD 62518 | |
| Przeciętny Intel Core i5-13500H (77835 - 85727, n=6) | |
| Lenovo LOQ 15IRH8 Core i7 | |
| AIDA64 / FPU SinJulia | |
| Schenker XMG Apex 15 (Late 23) | |
| Średnia w klasie Gaming (4424 - 33636, n=107, ostatnie 2 lata) | |
| Asus TUF A15 FA507 | |
| MSI Katana 15 B12VEK | |
| Medion Erazer Crawler E40 - MD 62518 | |
| Przeciętny Intel Core i5-13500H (7249 - 8086, n=6) | |
| Lenovo LOQ 15IRH8 Core i7 | |
| AIDA64 / FPU Mandel | |
| Średnia w klasie Gaming (25115 - 128721, n=107, ostatnie 2 lata) | |
| Schenker XMG Apex 15 (Late 23) | |
| Asus TUF A15 FA507 | |
| MSI Katana 15 B12VEK | |
| Medion Erazer Crawler E40 - MD 62518 | |
| Przeciętny Intel Core i5-13500H (27820 - 38336, n=6) | |
| Lenovo LOQ 15IRH8 Core i7 | |
| AIDA64 / CPU AES | |
| Schenker XMG Apex 15 (Late 23) | |
| Średnia w klasie Gaming (39258 - 247074, n=107, ostatnie 2 lata) | |
| Przeciętny Intel Core i5-13500H (62657 - 120493, n=6) | |
| MSI Katana 15 B12VEK | |
| Asus TUF A15 FA507 | |
| Medion Erazer Crawler E40 - MD 62518 | |
| Lenovo LOQ 15IRH8 Core i7 | |
| AIDA64 / CPU ZLib | |
| Średnia w klasie Gaming (574 - 2531, n=107, ostatnie 2 lata) | |
| Schenker XMG Apex 15 (Late 23) | |
| Medion Erazer Crawler E40 - MD 62518 | |
| Przeciętny Intel Core i5-13500H (782 - 992, n=6) | |
| MSI Katana 15 B12VEK | |
| Lenovo LOQ 15IRH8 Core i7 | |
| Asus TUF A15 FA507 | |
| AIDA64 / FP64 Ray-Trace | |
| Średnia w klasie Gaming (5509 - 45446, n=107, ostatnie 2 lata) | |
| Schenker XMG Apex 15 (Late 23) | |
| Asus TUF A15 FA507 | |
| MSI Katana 15 B12VEK | |
| Medion Erazer Crawler E40 - MD 62518 | |
| Przeciętny Intel Core i5-13500H (5955 - 8495, n=6) | |
| Lenovo LOQ 15IRH8 Core i7 | |
| AIDA64 / CPU PhotoWorxx | |
| Średnia w klasie Gaming (12271 - 89891, n=107, ostatnie 2 lata) | |
| MSI Katana 15 B12VEK | |
| Medion Erazer Crawler E40 - MD 62518 | |
| Schenker XMG Apex 15 (Late 23) | |
| Lenovo LOQ 15IRH8 Core i7 | |
| Przeciętny Intel Core i5-13500H (20212 - 37618, n=6) | |
| Asus TUF A15 FA507 | |
Wydajność systemu
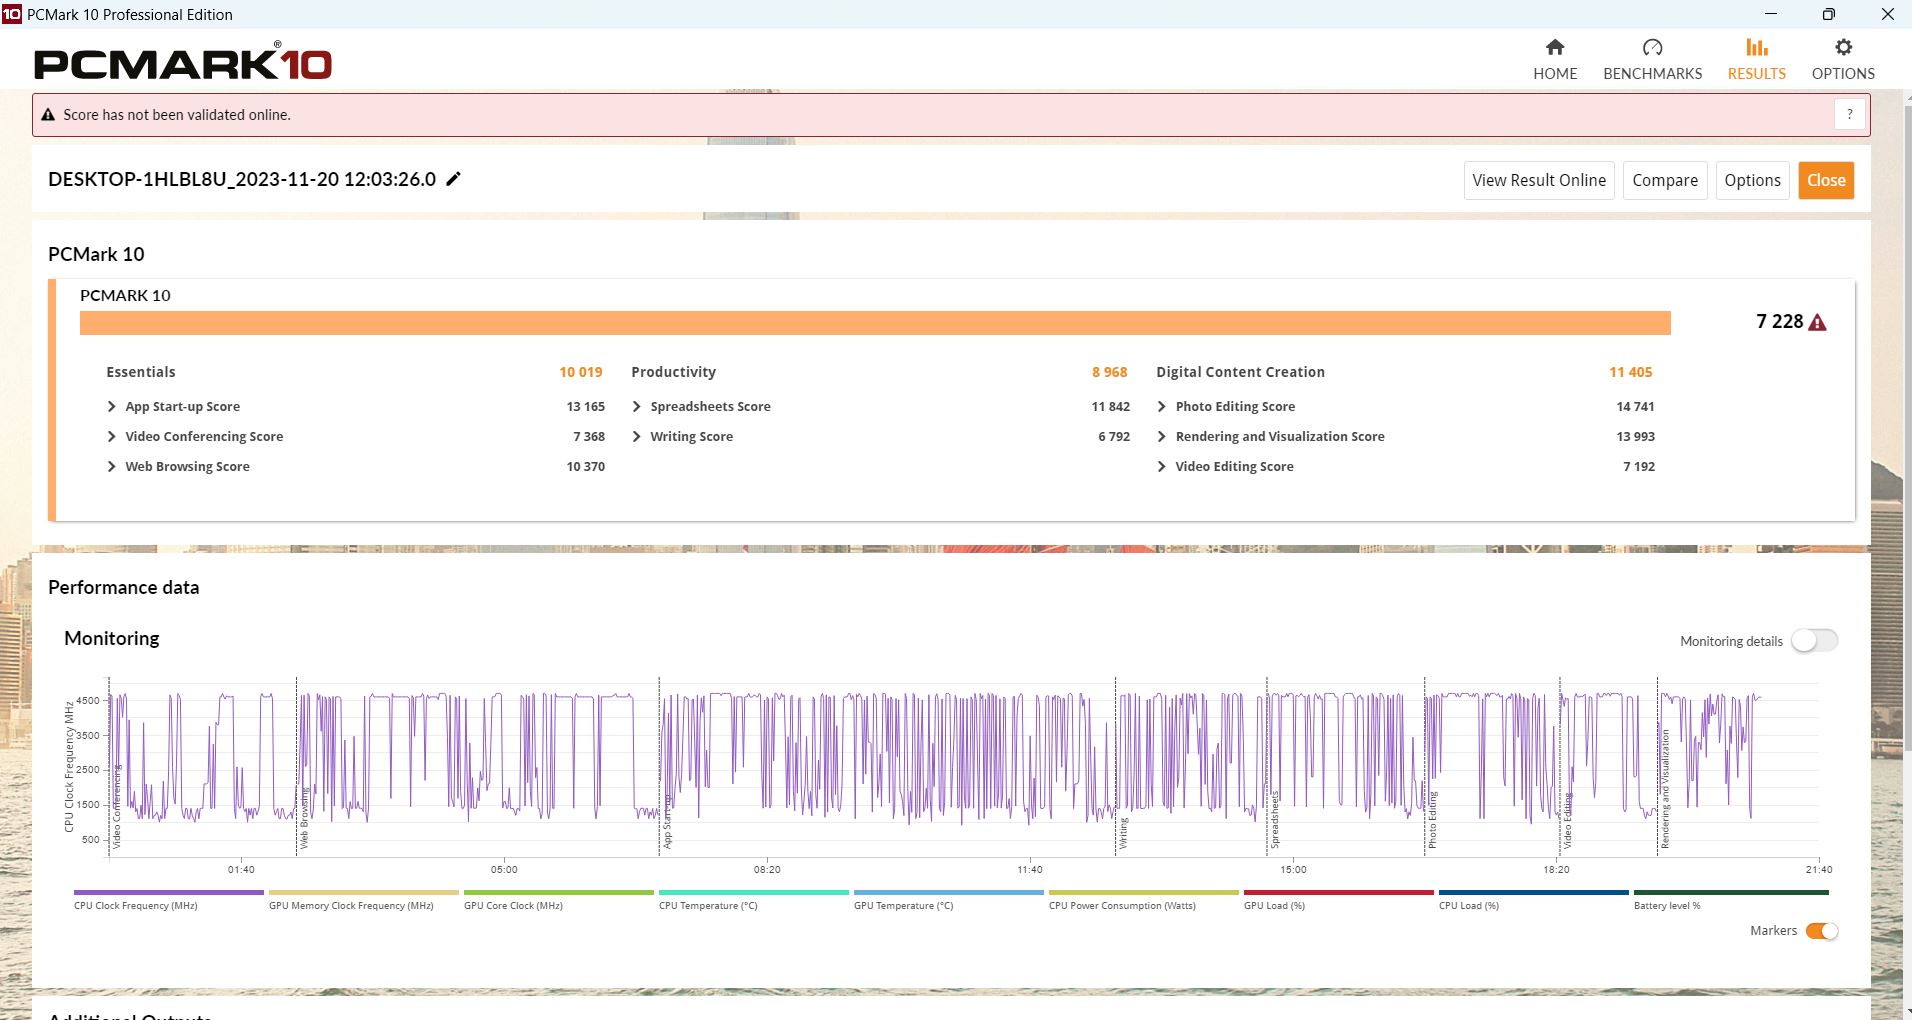
W teście PCMark 10 XMG Apex 15 i Lenovo LOQ 15 nieznacznie wyprzedzają się, zwłaszcza w kategoriach Productivity i Essentials. Crawler jest równy w Digital Content Creation. Tylko LOQ 15 jest nieco szybszy w Crossmark.
CrossMark: Overall | Productivity | Creativity | Responsiveness
| PCMark 10 / Score | |
| Średnia w klasie Gaming (5828 - 11574, n=95, ostatnie 2 lata) | |
| Schenker XMG Apex 15 (Late 23) | |
| Lenovo LOQ 15IRH8 Core i7 | |
| Medion Erazer Crawler E40 - MD 62518 | |
| Asus TUF A15 FA507 | |
| Przeciętny Intel Core i5-13500H, NVIDIA GeForce RTX 4050 Laptop GPU (6812 - 7228, n=2) | |
| MSI Katana 15 B12VEK | |
| PCMark 10 / Essentials | |
| Lenovo LOQ 15IRH8 Core i7 | |
| Schenker XMG Apex 15 (Late 23) | |
| Średnia w klasie Gaming (8810 - 12600, n=99, ostatnie 2 lata) | |
| Asus TUF A15 FA507 | |
| MSI Katana 15 B12VEK | |
| Medion Erazer Crawler E40 - MD 62518 | |
| Przeciętny Intel Core i5-13500H, NVIDIA GeForce RTX 4050 Laptop GPU (9521 - 10019, n=2) | |
| PCMark 10 / Productivity | |
| Średnia w klasie Gaming (6845 - 21327, n=97, ostatnie 2 lata) | |
| Schenker XMG Apex 15 (Late 23) | |
| MSI Katana 15 B12VEK | |
| Lenovo LOQ 15IRH8 Core i7 | |
| Asus TUF A15 FA507 | |
| Medion Erazer Crawler E40 - MD 62518 | |
| Przeciętny Intel Core i5-13500H, NVIDIA GeForce RTX 4050 Laptop GPU (8890 - 8968, n=2) | |
| PCMark 10 / Digital Content Creation | |
| Średnia w klasie Gaming (7602 - 19657, n=97, ostatnie 2 lata) | |
| Lenovo LOQ 15IRH8 Core i7 | |
| Schenker XMG Apex 15 (Late 23) | |
| Medion Erazer Crawler E40 - MD 62518 | |
| Przeciętny Intel Core i5-13500H, NVIDIA GeForce RTX 4050 Laptop GPU (10134 - 11405, n=2) | |
| Asus TUF A15 FA507 | |
| MSI Katana 15 B12VEK | |
| CrossMark / Overall | |
| Średnia w klasie Gaming (1366 - 2409, n=96, ostatnie 2 lata) | |
| Lenovo LOQ 15IRH8 Core i7 | |
| Medion Erazer Crawler E40 - MD 62518 | |
| Przeciętny Intel Core i5-13500H, NVIDIA GeForce RTX 4050 Laptop GPU (n=1) | |
| Schenker XMG Apex 15 (Late 23) | |
| MSI Katana 15 B12VEK | |
| Asus TUF A15 FA507 | |
| CrossMark / Productivity | |
| Średnia w klasie Gaming (1386 - 2254, n=96, ostatnie 2 lata) | |
| Lenovo LOQ 15IRH8 Core i7 | |
| Medion Erazer Crawler E40 - MD 62518 | |
| Przeciętny Intel Core i5-13500H, NVIDIA GeForce RTX 4050 Laptop GPU (n=1) | |
| Schenker XMG Apex 15 (Late 23) | |
| MSI Katana 15 B12VEK | |
| Asus TUF A15 FA507 | |
| CrossMark / Creativity | |
| Średnia w klasie Gaming (1343 - 2729, n=96, ostatnie 2 lata) | |
| Lenovo LOQ 15IRH8 Core i7 | |
| Schenker XMG Apex 15 (Late 23) | |
| Medion Erazer Crawler E40 - MD 62518 | |
| Przeciętny Intel Core i5-13500H, NVIDIA GeForce RTX 4050 Laptop GPU (n=1) | |
| MSI Katana 15 B12VEK | |
| Asus TUF A15 FA507 | |
| CrossMark / Responsiveness | |
| Lenovo LOQ 15IRH8 Core i7 | |
| Medion Erazer Crawler E40 - MD 62518 | |
| Przeciętny Intel Core i5-13500H, NVIDIA GeForce RTX 4050 Laptop GPU (n=1) | |
| Średnia w klasie Gaming (1226 - 2334, n=96, ostatnie 2 lata) | |
| MSI Katana 15 B12VEK | |
| Schenker XMG Apex 15 (Late 23) | |
| Asus TUF A15 FA507 | |
| PCMark 10 Score | 7228 pkt. | |
Pomoc | ||
| AIDA64 / Memory Copy | |
| Średnia w klasie Gaming (21750 - 129946, n=107, ostatnie 2 lata) | |
| Schenker XMG Apex 15 (Late 23) | |
| Medion Erazer Crawler E40 - MD 62518 | |
| MSI Katana 15 B12VEK | |
| Lenovo LOQ 15IRH8 Core i7 | |
| Przeciętny Intel Core i5-13500H (36916 - 57830, n=6) | |
| Asus TUF A15 FA507 | |
| AIDA64 / Memory Read | |
| Średnia w klasie Gaming (22956 - 118858, n=107, ostatnie 2 lata) | |
| MSI Katana 15 B12VEK | |
| Medion Erazer Crawler E40 - MD 62518 | |
| Lenovo LOQ 15IRH8 Core i7 | |
| Schenker XMG Apex 15 (Late 23) | |
| Przeciętny Intel Core i5-13500H (41676 - 65633, n=6) | |
| Asus TUF A15 FA507 | |
| AIDA64 / Memory Write | |
| Schenker XMG Apex 15 (Late 23) | |
| Średnia w klasie Gaming (22297 - 135096, n=107, ostatnie 2 lata) | |
| Medion Erazer Crawler E40 - MD 62518 | |
| MSI Katana 15 B12VEK | |
| Asus TUF A15 FA507 | |
| Lenovo LOQ 15IRH8 Core i7 | |
| Przeciętny Intel Core i5-13500H (36826 - 60523, n=6) | |
| AIDA64 / Memory Latency | |
| Lenovo LOQ 15IRH8 Core i7 | |
| Średnia w klasie Gaming (75.3 - 259, n=107, ostatnie 2 lata) | |
| Medion Erazer Crawler E40 - MD 62518 | |
| MSI Katana 15 B12VEK | |
| Przeciętny Intel Core i5-13500H (86.2 - 96.1, n=6) | |
| Schenker XMG Apex 15 (Late 23) | |
| Asus TUF A15 FA507 | |
* ... im mniej tym lepiej
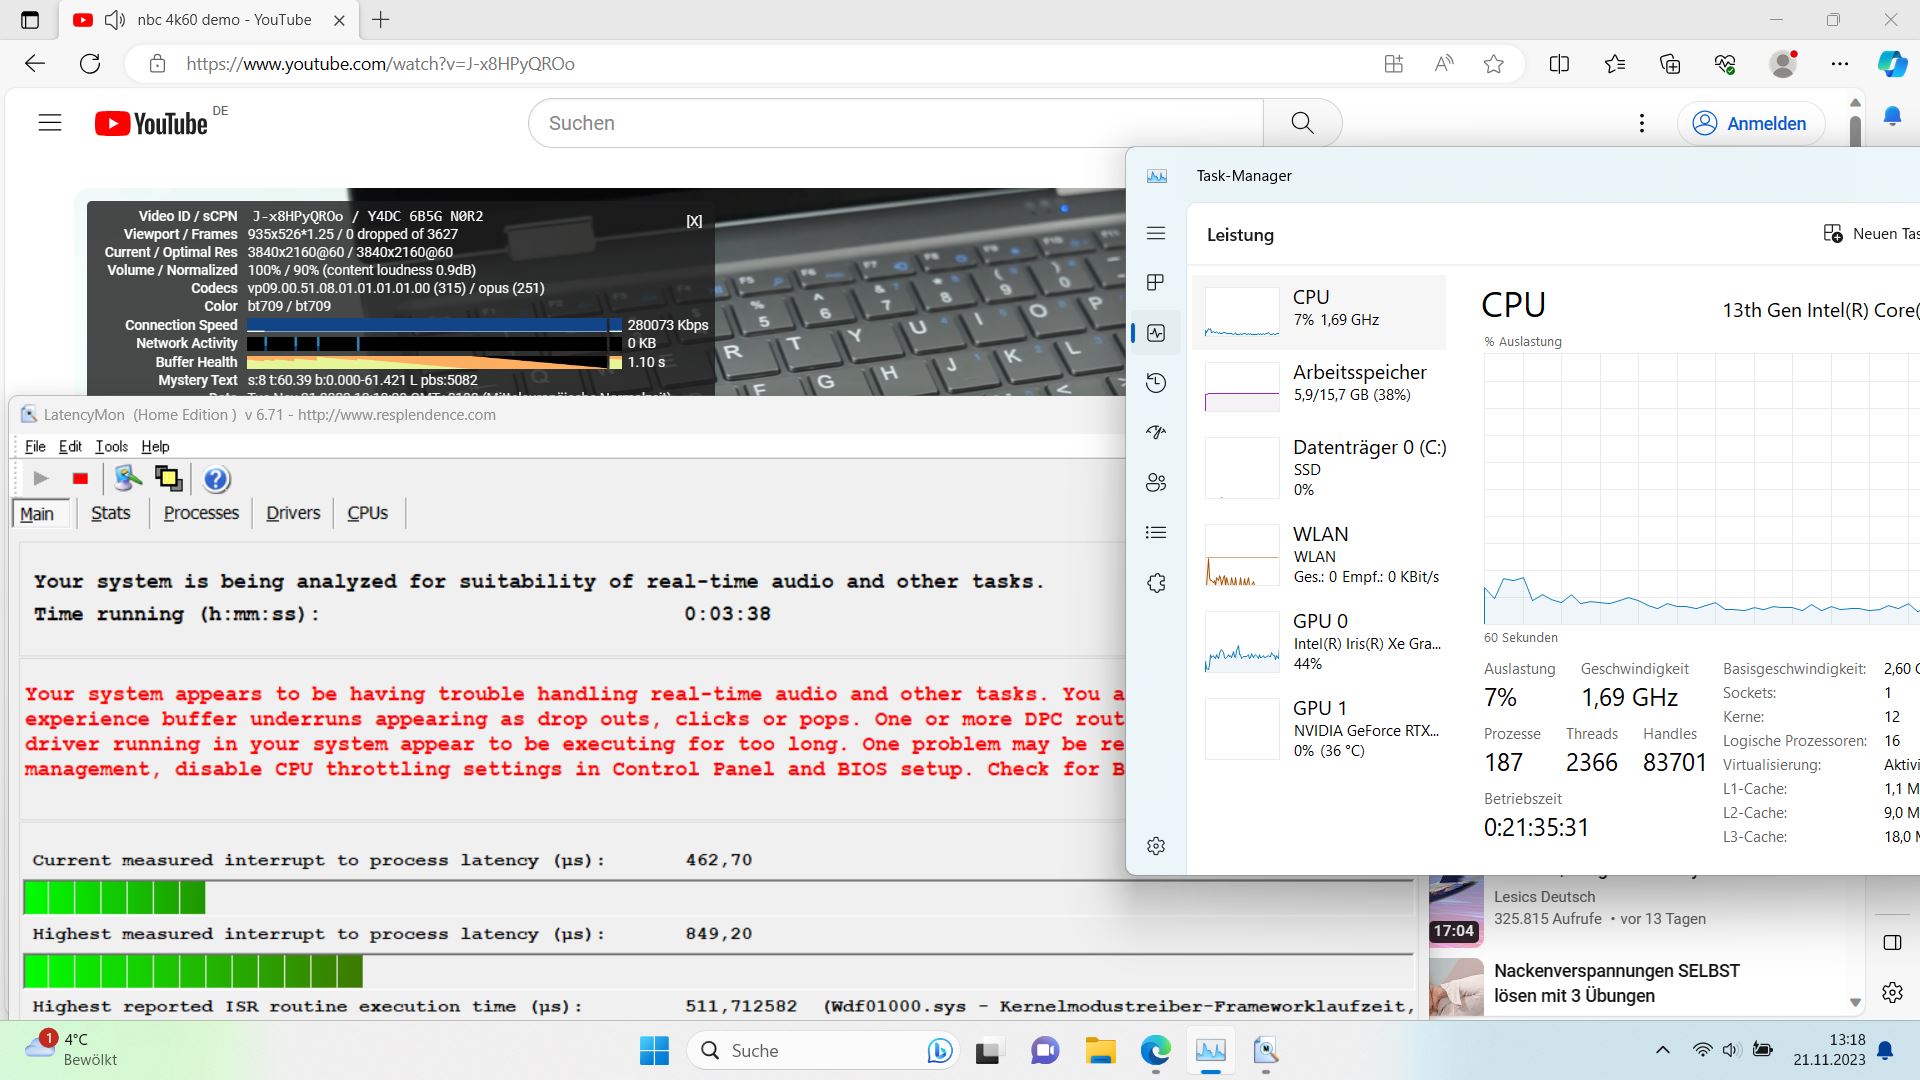
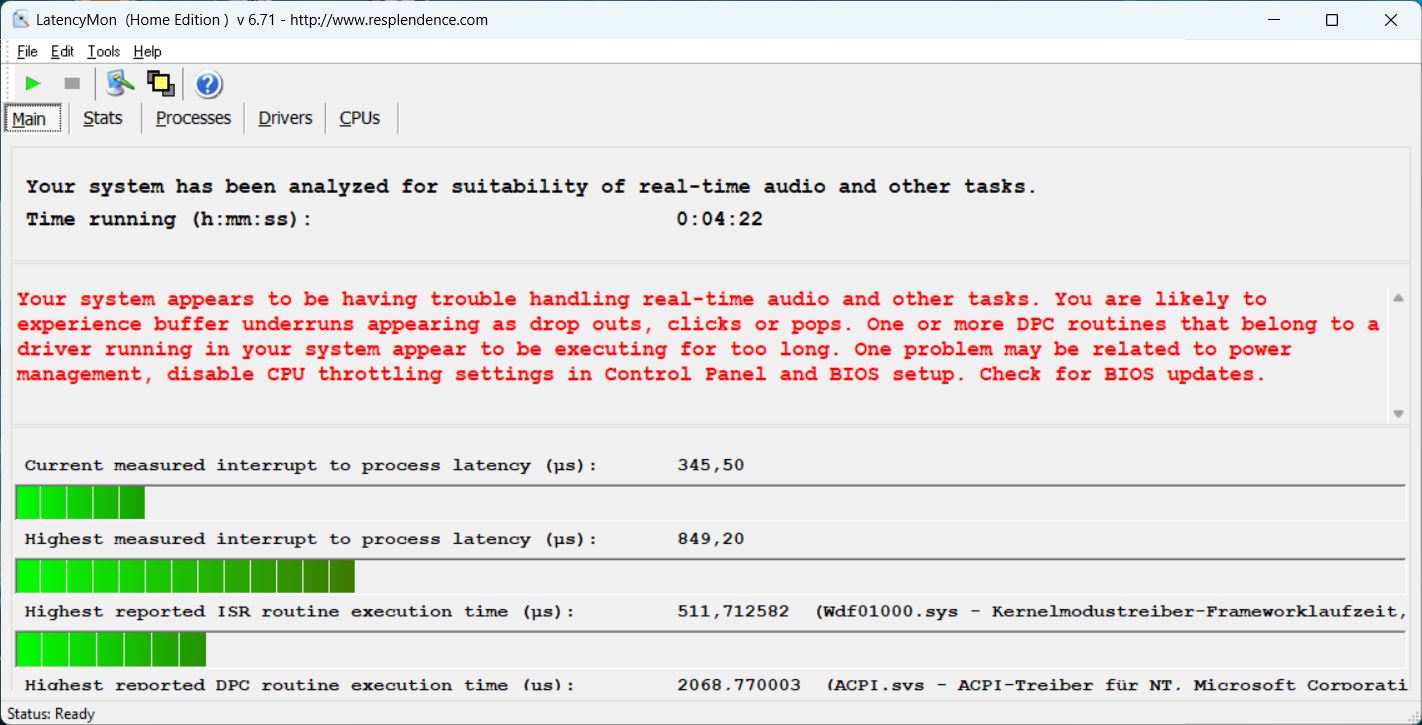
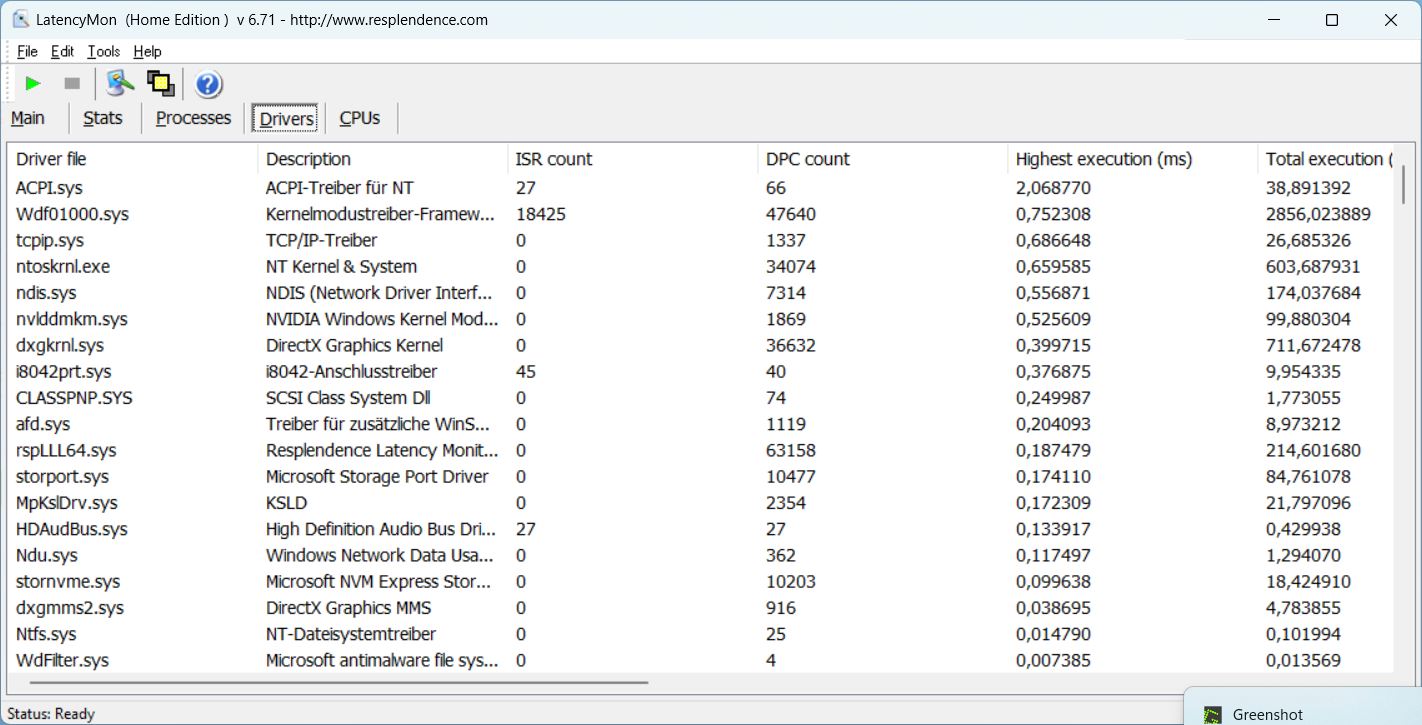
Opóźnienie DPC
Nie ma żadnych problemów podczas otwierania przeglądarki lub wielu kart. LatencyMon wykrywa jednak pewne problemy podczas odtwarzania naszego filmu 4K/60 fps z YouTube. Przynajmniej to jest odtwarzane bez żadnych spadków klatek. Wartość opóźnienia nieznacznie wzrasta pod Prime95.
| DPC Latencies / LatencyMon - interrupt to process latency (max), Web, Youtube, Prime95 | |
| MSI Katana 15 B12VEK | |
| Medion Erazer Crawler E40 - MD 62518 | |
| Lenovo LOQ 15IRH8 Core i7 | |
| Schenker XMG Apex 15 (Late 23) | |
* ... im mniej tym lepiej
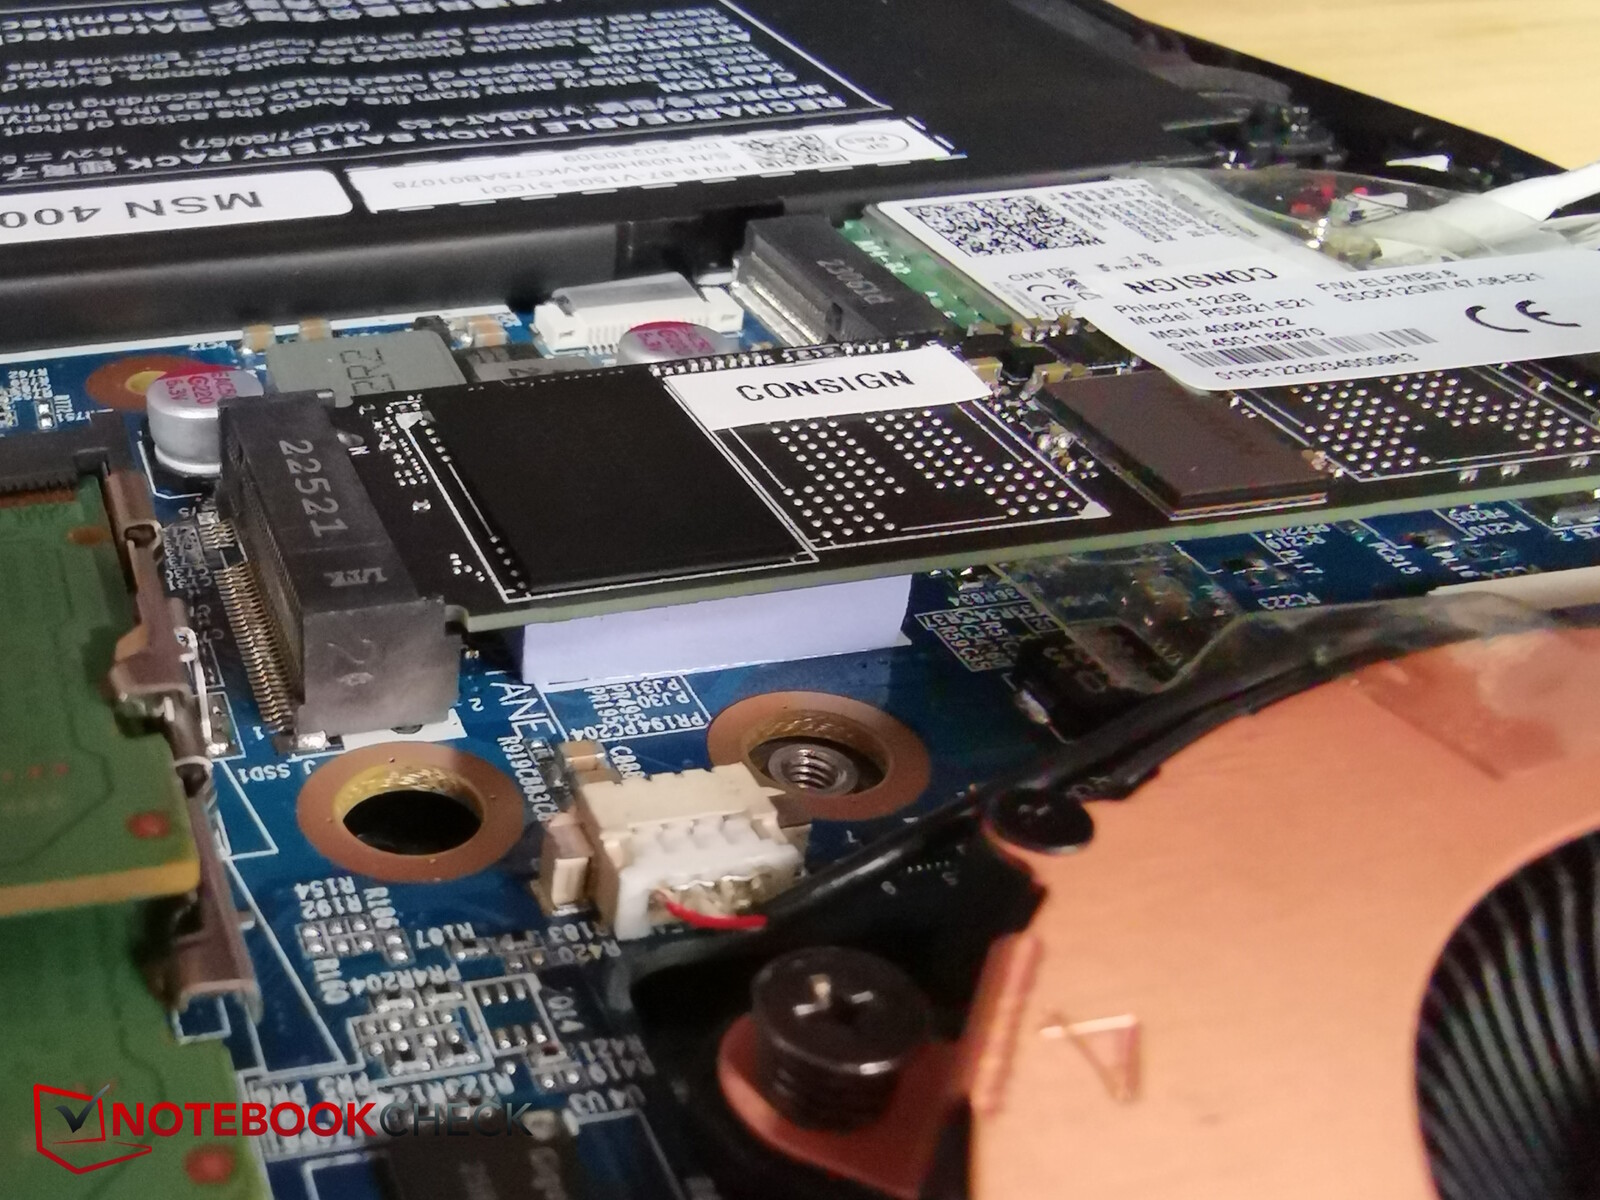
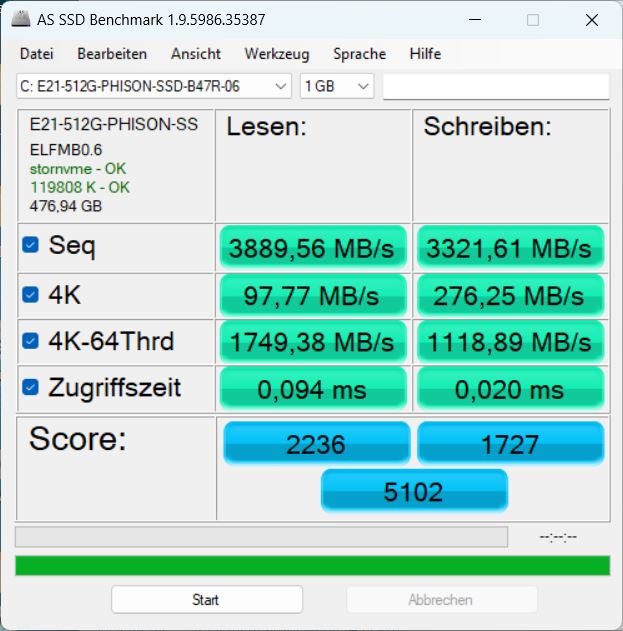
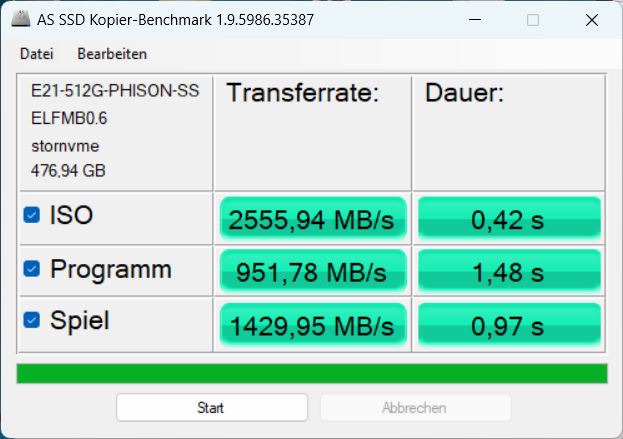
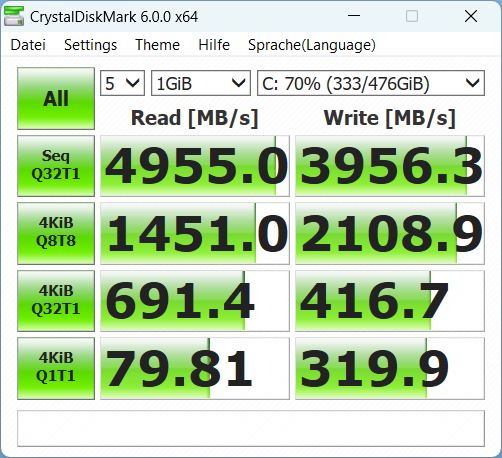
Urządzenia pamięci masowej
Medion wykorzystuje 512 GB NVMe SSD od Phison. Chociaż nie zbliża się on do szybkości Samsunga 990 Pro w XMG Apex 15, to przewyższa pamięć masową pozostałych trzech konkurentów, a jego wydajność jest również bardzo spójna w dłuższym okresie czasu. Więcej porównań dysków SSD znajdą Państwo w naszym zestawieniu najlepszych dysków SSD.

* ... im mniej tym lepiej
Continuous power read: DiskSpd Read Loop, Queue Depth 8
Karta graficzna
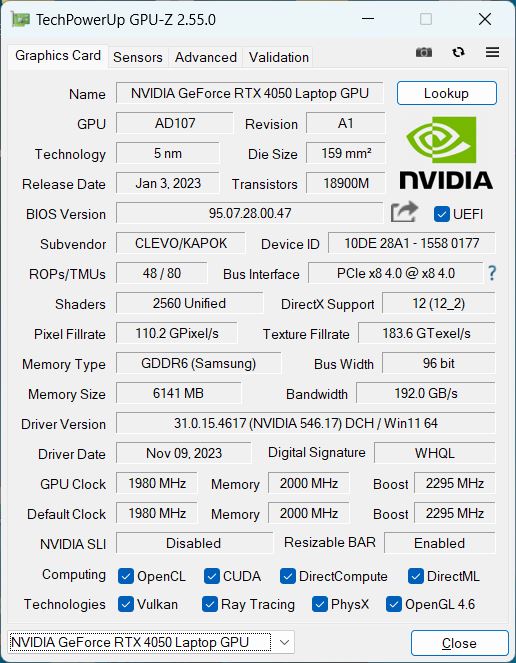
W naszym crawlerze E40 RTX 4050 o maksymalnej mocy znamionowej 100 W.
E40 osiąga naprawdę dobre wyniki w benchmarkach 3DMark, jest nieco powyżej średniej RTX 4050 i na równi z XMG Apex 15 i MSI Katana 15, które również są mocne w tej kategorii.
W trybie bateryjnym wydajność 3D w Fire Strike spada o całe 70 procent.
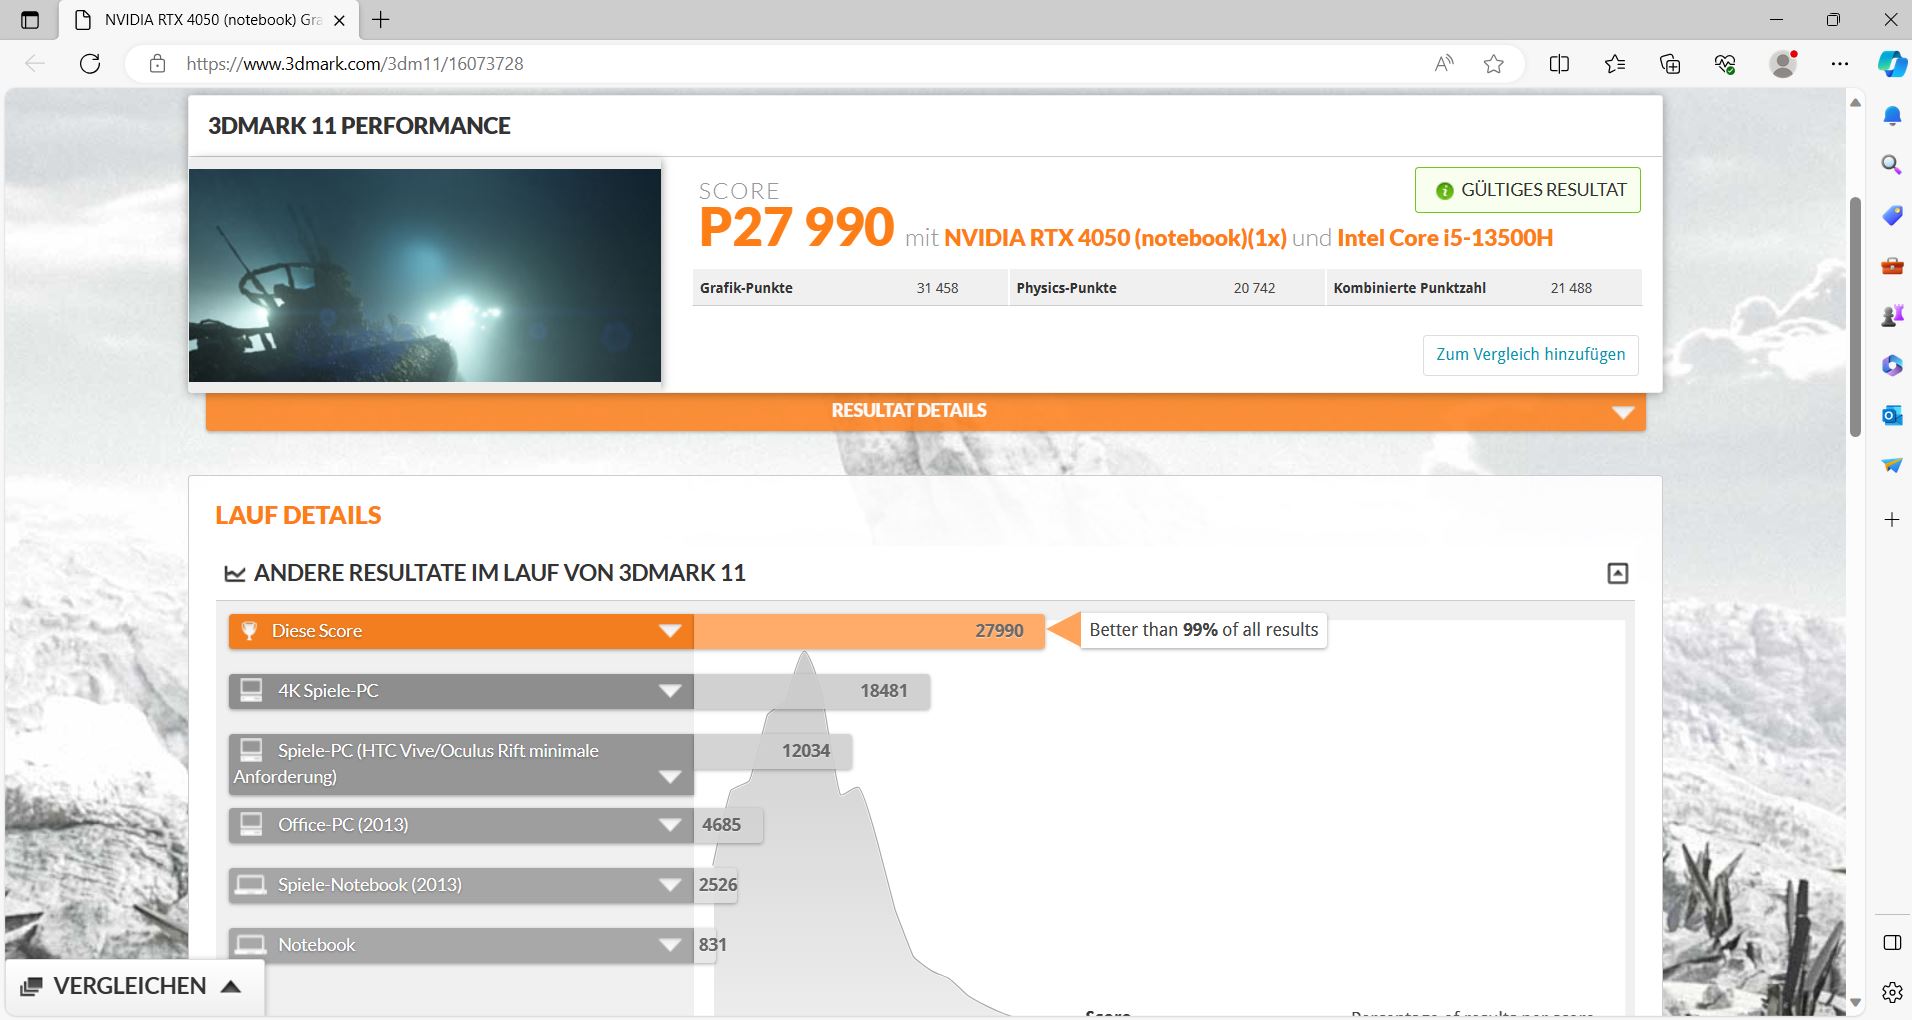
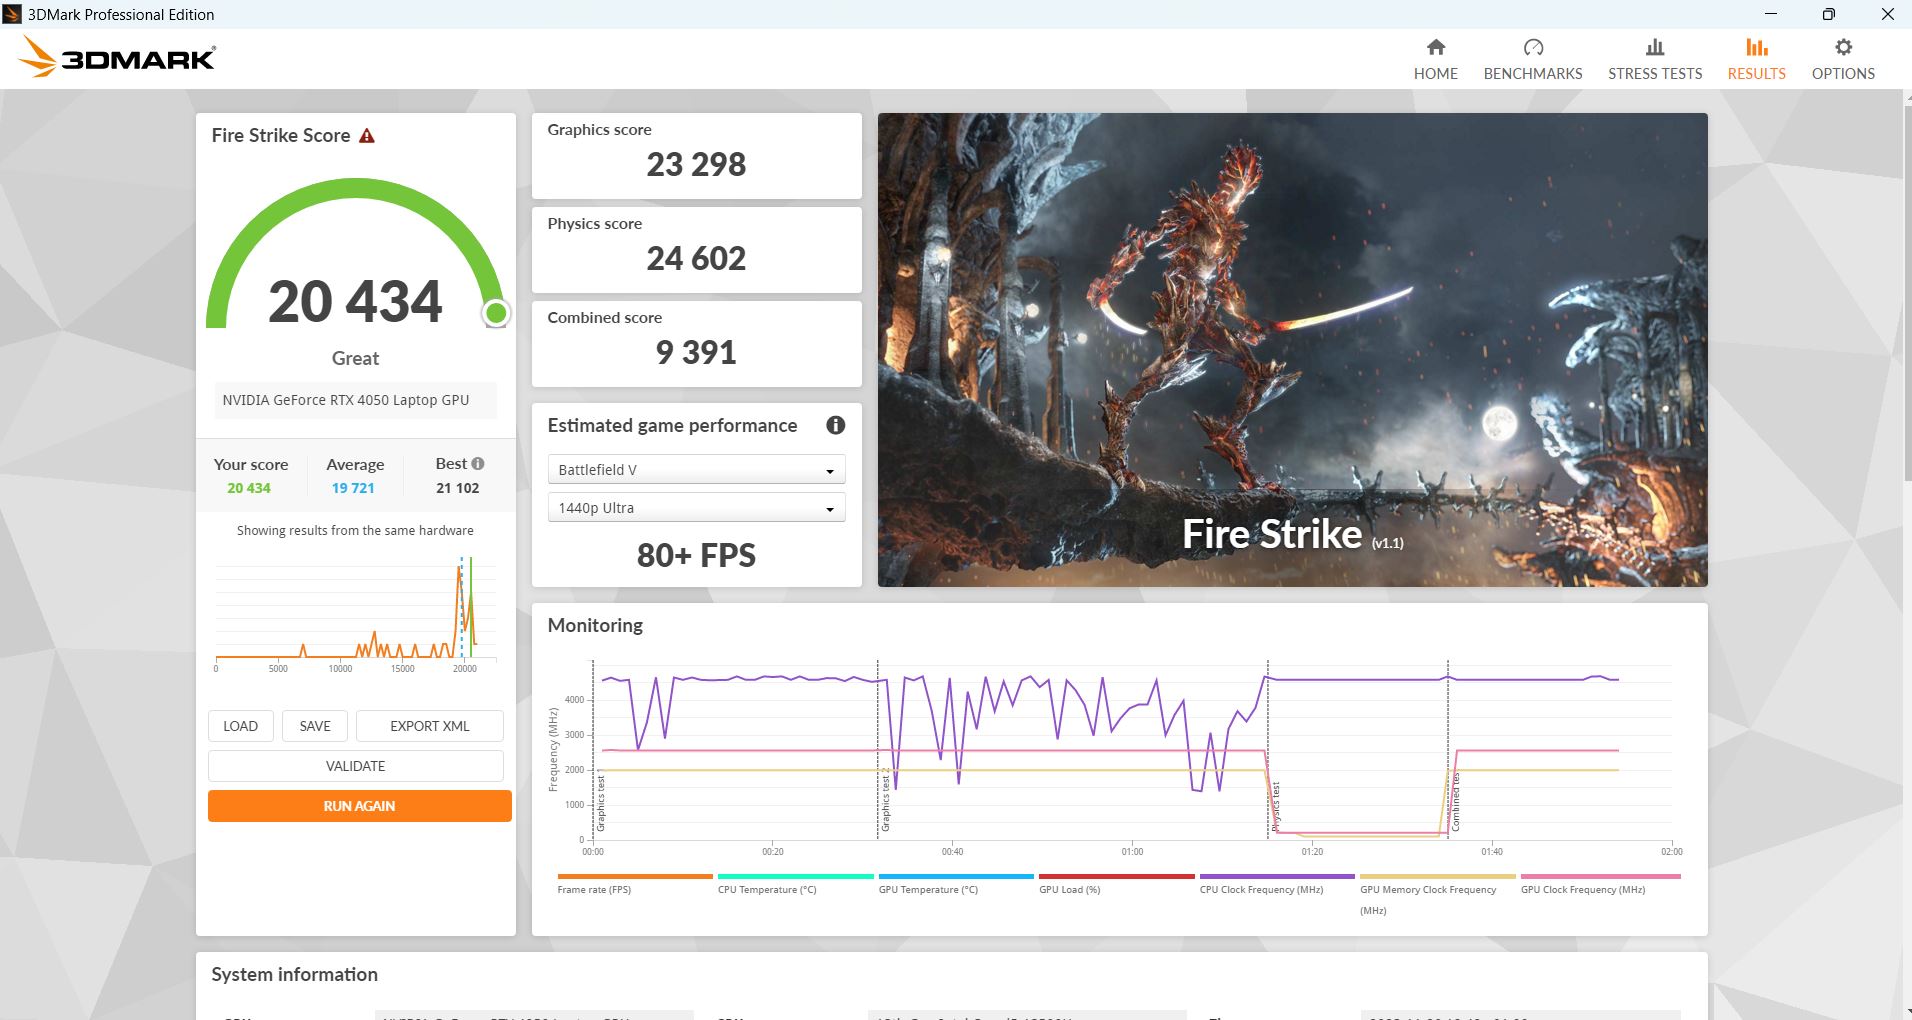
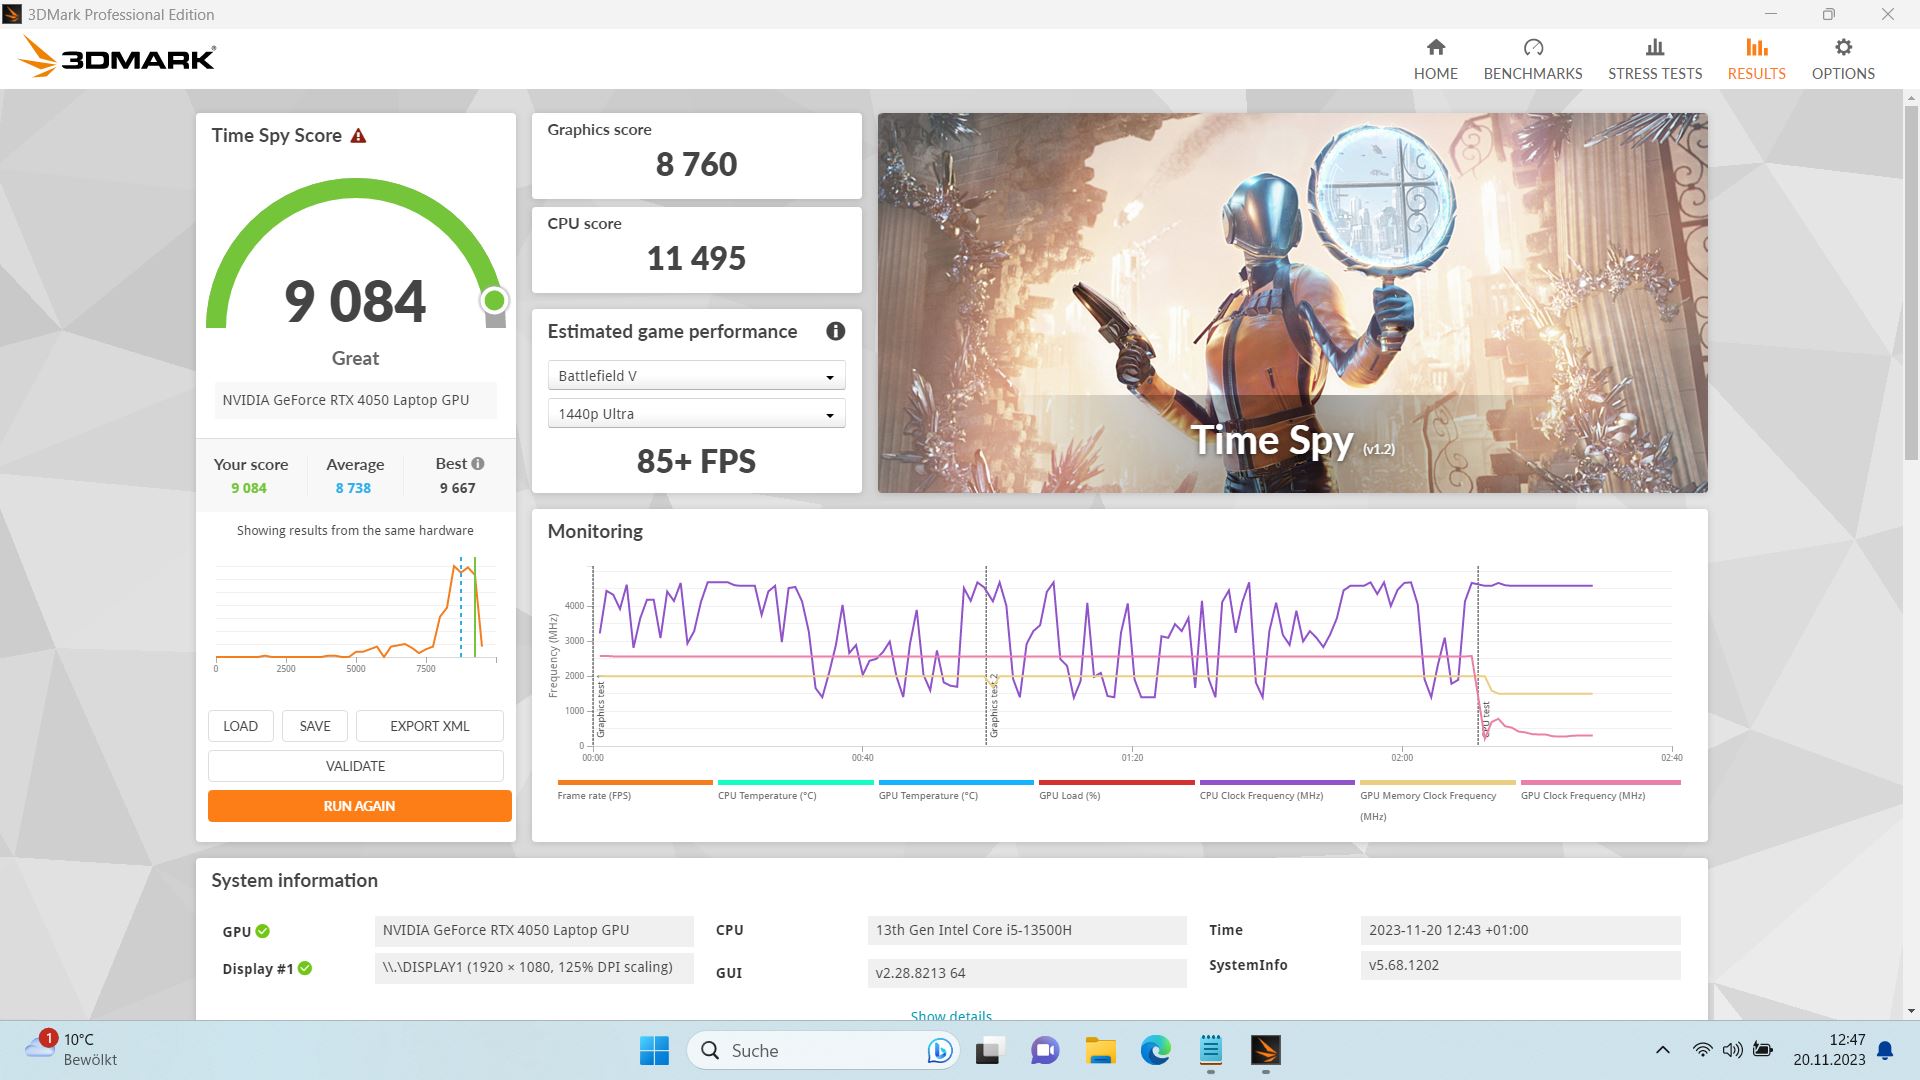
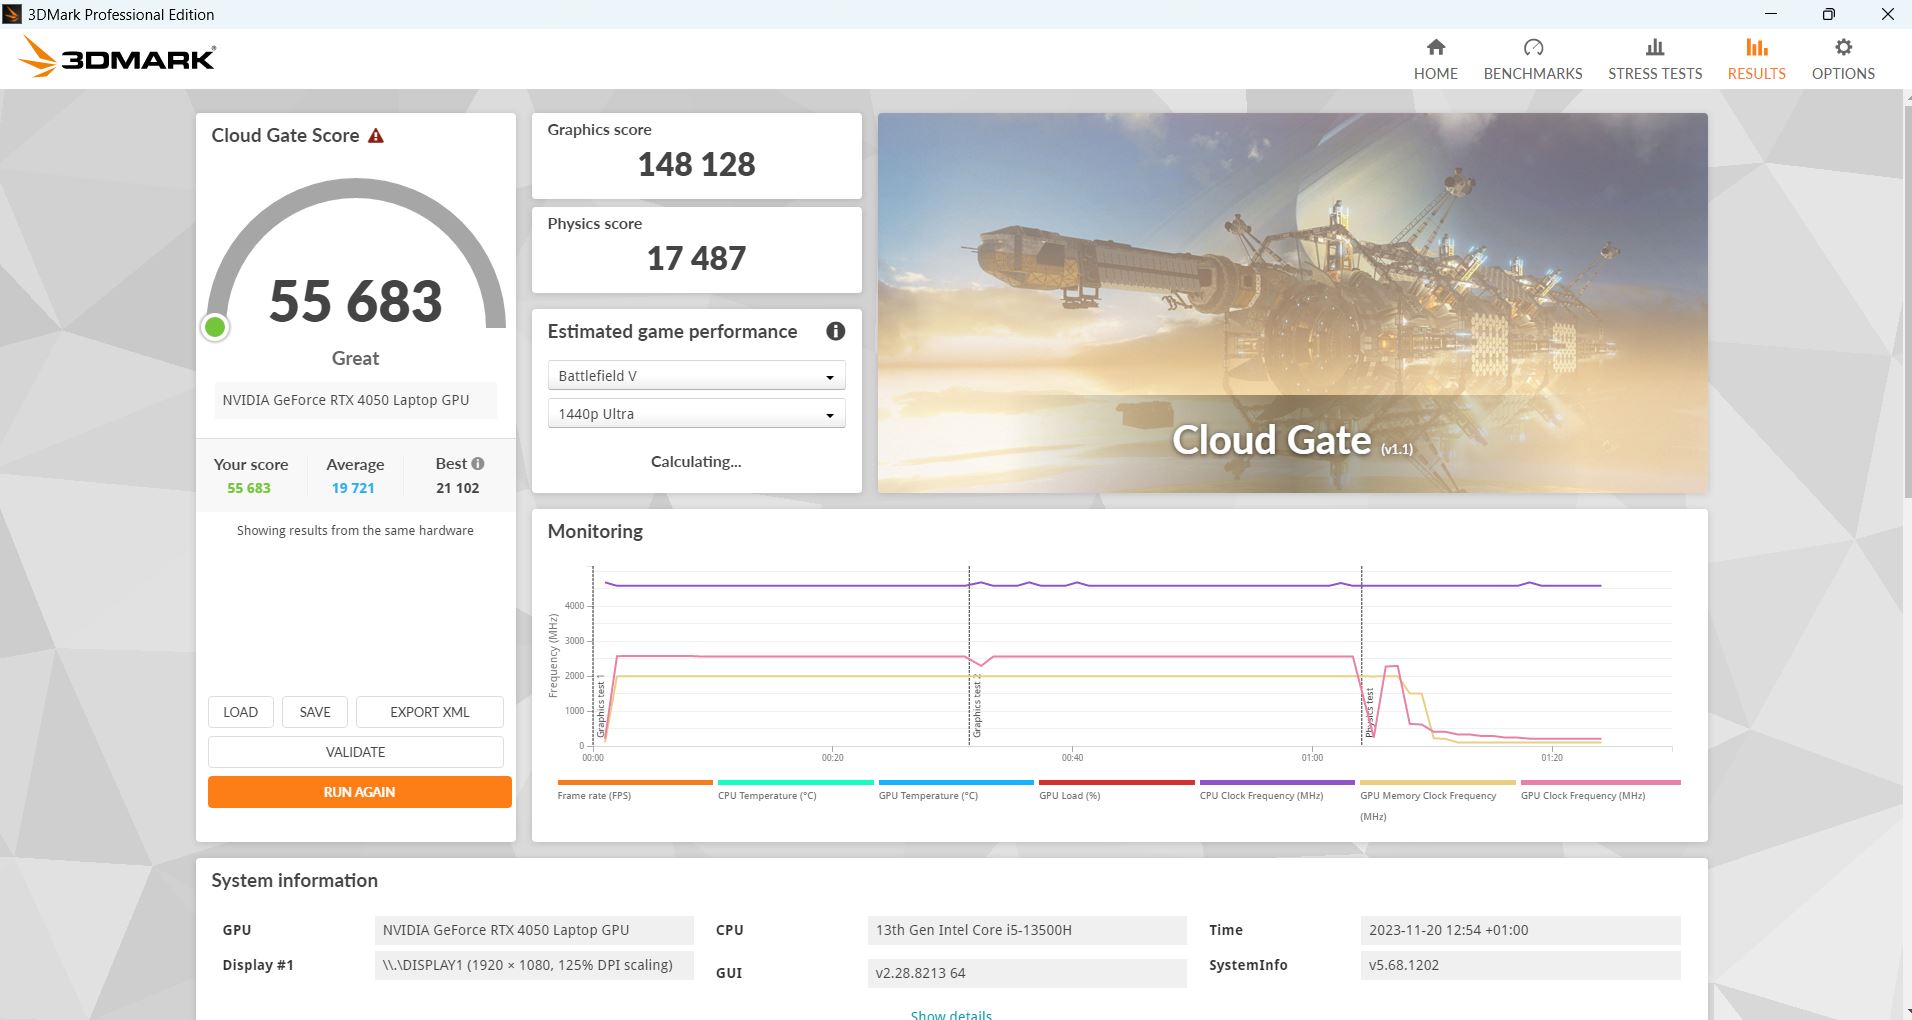
| 3DMark 11 Performance | 27990 pkt. | |
| 3DMark Cloud Gate Standard Score | 55683 pkt. | |
| 3DMark Fire Strike Score | 20434 pkt. | |
| 3DMark Time Spy Score | 9084 pkt. | |
Pomoc | ||
* ... im mniej tym lepiej
Gaming
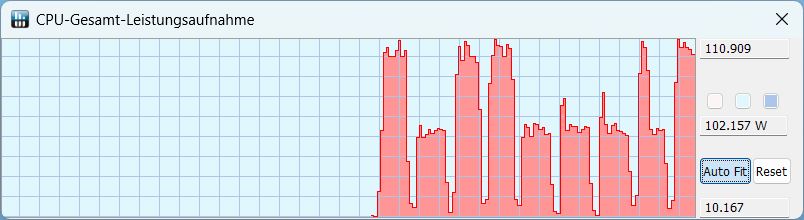
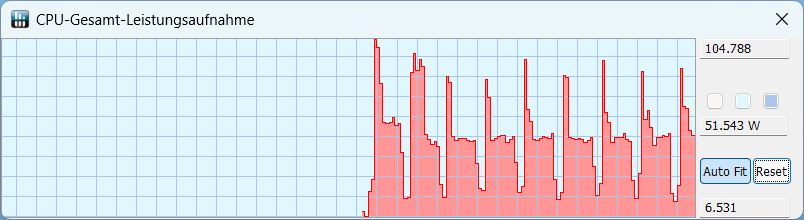
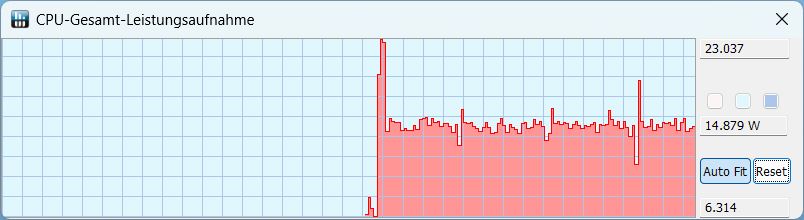
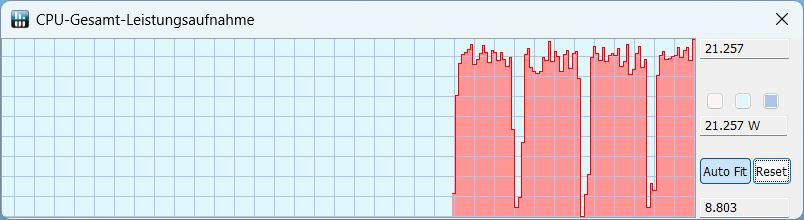
W naszych danych dziennika dla Witcher 3 (patrz zrzuty ekranu poniżej) można zauważyć, że taktowanie GPU i zużycie energii w trybie rozrywkowym i cichym są prawie dokładnie takie same i tylko nieznacznie niższe niż w trybie gry. W związku z tym liczba klatek na sekundę prawie się nie różni. Jedyną różnicą między trybami jest zachowanie wentylatora, które prowadzi do innego poziomu głośności i temperatury. W trybie cichym GPU nagrzewa się bardziej niż w pozostałych trybach. W trybie gry, liczba klatek na sekundę Witcher 3 jest bardzo stała.
W porównaniu do konkurencji, E40 wypada dobrze. W szczególności zajmuje czołowe miejsce w Far Cry 5. Z kolei w Witcher 3 zajmuje ostatnie miejsce, ale różnice są bardzo niewielkie. W ogólnym wyniku w grach konkurencja jest blisko siebie, LOQ 15 jest nieco lepszy od naszego crawlera, Katana 15 jest mniej więcej taka sama, a Apex 15, a zwłaszcza Asus TUF A15 są słabsze.
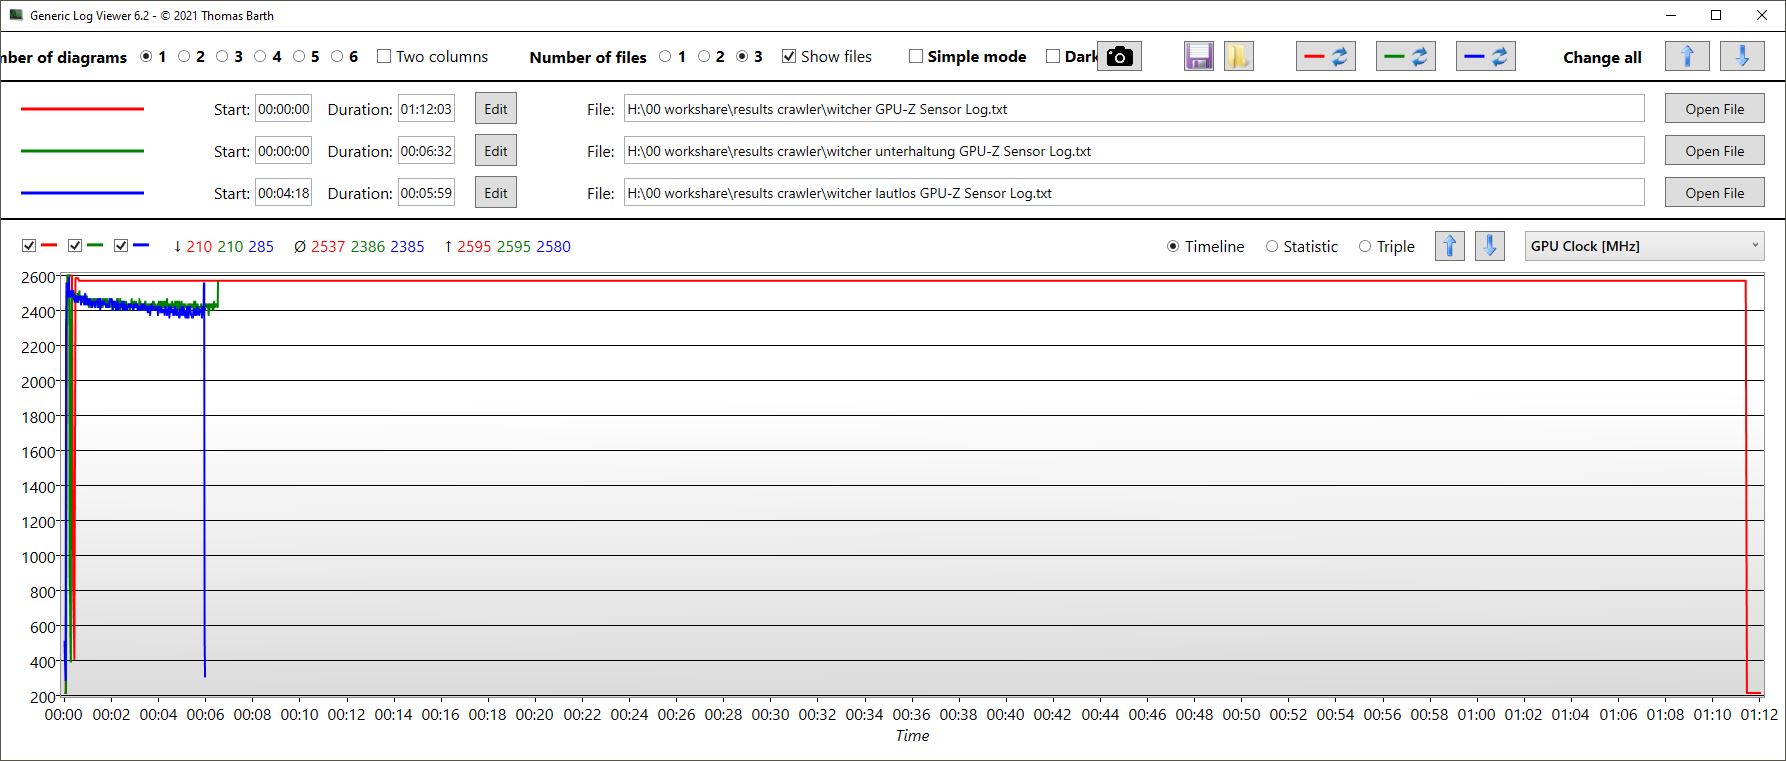
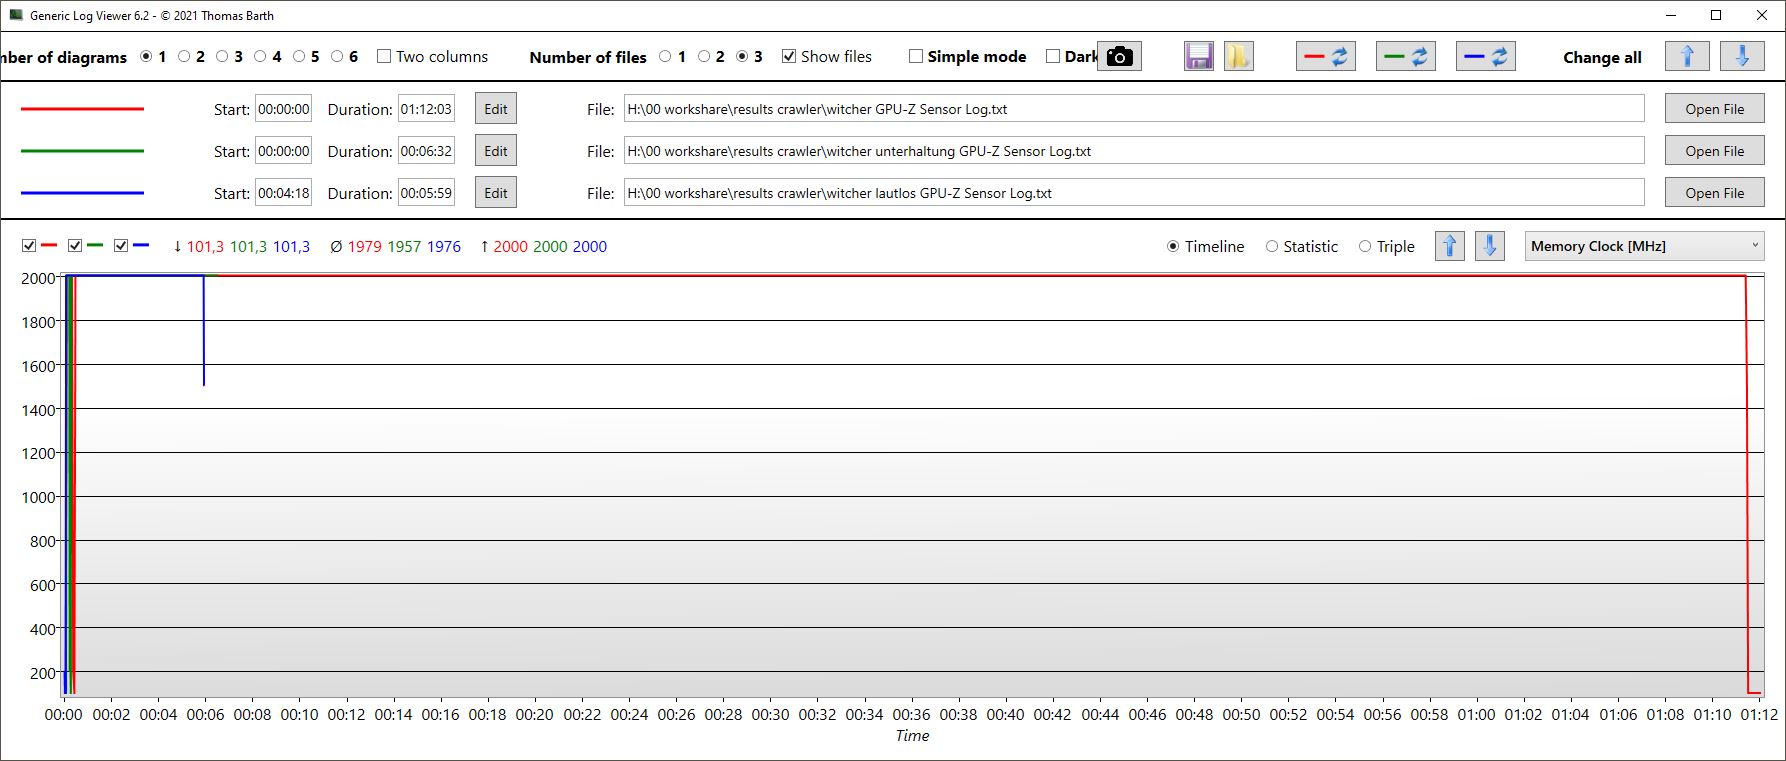
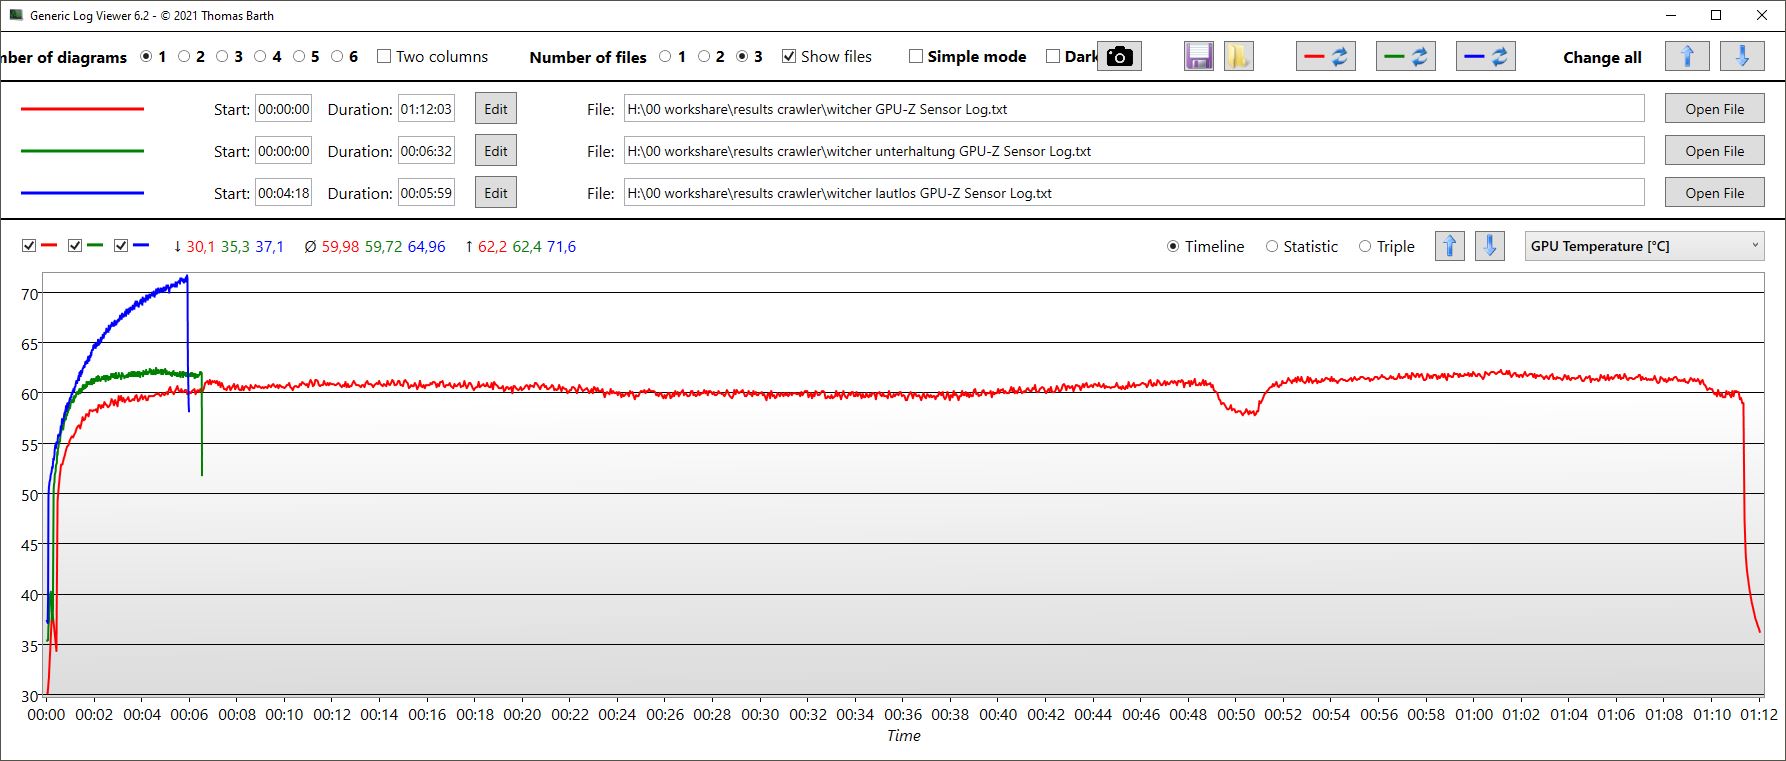
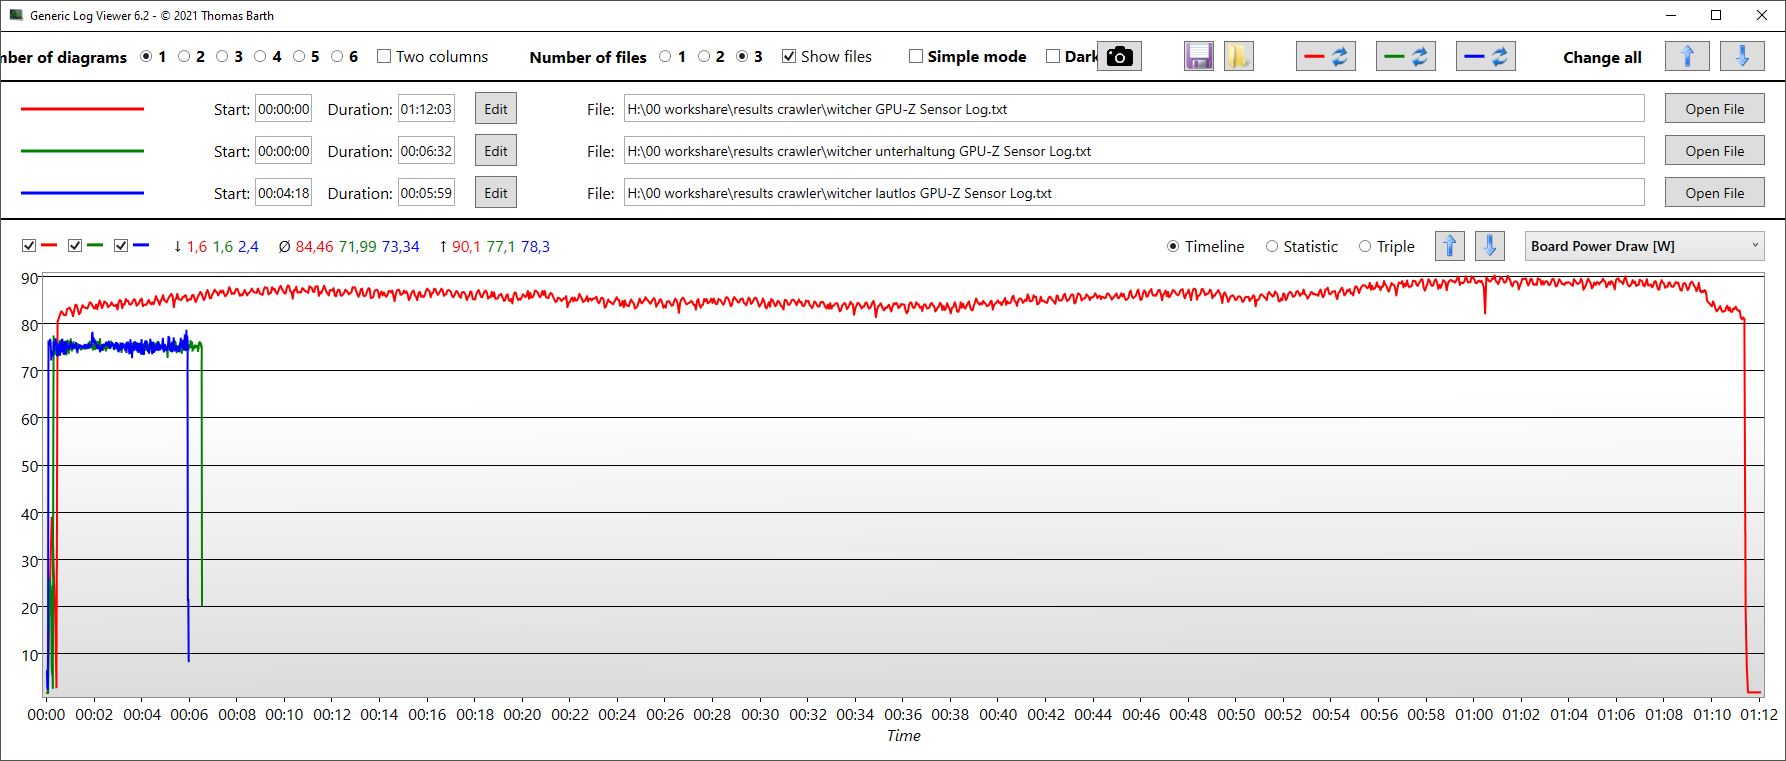
| Tryb/Witcher 3 Pomiar GPU | Średni FPS | Zegar GPU | Zegar pamięci | Średnia temperatura | Pobór mocy |
|---|---|---|---|---|---|
| Gry | 79.5 | 2.595 MHz | 2.000 MHz | 60 °C | 85 W |
| Rozrywka | 77 | 2,400 MHz | 2,000 MHz | ok. 62 °C | 72 W |
| Ciche | 78 | 2,400 MHz | 2,000 MHz | ok. 75 °C | 73 W |
| Performance rating - Percent | |
| Średnia w klasie Gaming | |
| Lenovo LOQ 15IRH8 Core i7 | |
| Medion Erazer Crawler E40 - MD 62518 | |
| MSI Katana 15 B12VEK | |
| Schenker XMG Apex 15 (Late 23) -1! | |
| Asus TUF A15 FA507 | |
| The Witcher 3 - 1920x1080 Ultra Graphics & Postprocessing (HBAO+) | |
| Średnia w klasie Gaming (95 - 240, n=8, ostatnie 2 lata) | |
| Lenovo LOQ 15IRH8 Core i7 | |
| Schenker XMG Apex 15 (Late 23) | |
| MSI Katana 15 B12VEK | |
| Asus TUF A15 FA507 | |
| Medion Erazer Crawler E40 - MD 62518 | |
| GTA V - 1920x1080 Highest AA:4xMSAA + FX AF:16x | |
| Średnia w klasie Gaming (48.3 - 186.9, n=98, ostatnie 2 lata) | |
| Medion Erazer Crawler E40 - MD 62518 | |
| Lenovo LOQ 15IRH8 Core i7 | |
| MSI Katana 15 B12VEK | |
| Asus TUF A15 FA507 | |
| Final Fantasy XV Benchmark - 1920x1080 High Quality | |
| Średnia w klasie Gaming (41 - 215, n=99, ostatnie 2 lata) | |
| Schenker XMG Apex 15 (Late 23) | |
| Medion Erazer Crawler E40 - MD 62518 | |
| Lenovo LOQ 15IRH8 Core i7 | |
| MSI Katana 15 B12VEK | |
| Asus TUF A15 FA507 | |
| Strange Brigade - 1920x1080 ultra AA:ultra AF:16 | |
| Średnia w klasie Gaming (76.3 - 456, n=89, ostatnie 2 lata) | |
| Lenovo LOQ 15IRH8 Core i7 | |
| MSI Katana 15 B12VEK | |
| Schenker XMG Apex 15 (Late 23) | |
| Asus TUF A15 FA507 | |
| Medion Erazer Crawler E40 - MD 62518 | |
| Dota 2 Reborn - 1920x1080 ultra (3/3) best looking | |
| Lenovo LOQ 15IRH8 Core i7 | |
| Średnia w klasie Gaming (84.8 - 248, n=110, ostatnie 2 lata) | |
| MSI Katana 15 B12VEK | |
| Medion Erazer Crawler E40 - MD 62518 | |
| Schenker XMG Apex 15 (Late 23) | |
| Asus TUF A15 FA507 | |
| X-Plane 11.11 - 1920x1080 high (fps_test=3) | |
| Lenovo LOQ 15IRH8 Core i7 | |
| Medion Erazer Crawler E40 - MD 62518 | |
| Średnia w klasie Gaming (52.1 - 143.5, n=113, ostatnie 2 lata) | |
| MSI Katana 15 B12VEK | |
| Schenker XMG Apex 15 (Late 23) | |
| Asus TUF A15 FA507 | |
Witcher 3 FPS chart
| low | med. | high | ultra | |
|---|---|---|---|---|
| GTA V (2015) | 182.2 | 176.4 | 169.1 | 97.7 |
| The Witcher 3 (2015) | 369 | 283 | 170 | 81 |
| Dota 2 Reborn (2015) | 162.7 | 152.7 | 147.9 | 140.2 |
| Final Fantasy XV Benchmark (2018) | 183.5 | 122.9 | 84.6 | |
| X-Plane 11.11 (2018) | 128.5 | 121.8 | 98.6 | |
| Far Cry 5 (2018) | 146 | 140 | 133 | 124 |
| Strange Brigade (2018) | 391 | 205 | 167.6 | 146.9 |
Emisje i energia - Agresywny i głośny układ chłodzenia
Hałas systemowy
Crawler nie jest bynajmniej cichym graczem. W porównaniu z konkurencją jest najgłośniejszym graczem, zmierzyliśmy do 56 dB w teście warunków skrajnych i nadal ponad 51 dB pod Witcher 3, konkurencja zwykle pozostaje tutaj znacznie poniżej 50 dB. To samo dotyczy testu 3DMark06: Podczas gdy inne laptopy pozostają tutaj całkowicie ciche w fazach i pozwalają wentylatorom obracać się dość cicho dopiero w drugiej połowie testu, w E40 obracają się one już przy 50 dB.
System chłodzenia jest dla nas zbyt agresywny i głośny. Jak widać w następnej sekcji, temperatury są tak niskie, że cichsze wentylatory byłyby tutaj z łatwością możliwe. Zalecamy granie w trybie rozrywkowym lub nawet cichym.
Przynajmniej w trybie bezczynności, E40 zwykle pozostaje cichy, tylko gdy procesy w tle generują większe obciążenie niż pożądane w trybie bezczynności, wentylatory się włączają. Ale nawet jeśli Crawler E40 został wystawiony na dłuższe obciążenie, wentylatory nie uspokajają się całkowicie. Nawet w trybie cichym wentylatory nie wyłączają się w przewidywalnej przyszłości.
| Tryb/Witcher 3 Pomiar | Głośność | Pobór mocy przez system |
|---|---|---|
| Gry | 51,46 dB | 155 W |
| Rozrywka | 48.21 | 139 W |
| Cichy | 31,37 dB | 117 W |
Hałas
| luz |
| 23 / 23 / 28.02 dB |
| obciążenie |
| 50.21 / 56.79 dB |
 | ||
30 dB cichy 40 dB(A) słyszalny 50 dB(A) irytujący |
||
min: | ||
| Medion Erazer Crawler E40 - MD 62518 GeForce RTX 4050 Laptop GPU, i5-13500H, Phison PS5021-E21 512GB | Lenovo LOQ 15IRH8 Core i7 GeForce RTX 4050 Laptop GPU, i7-13620H, Kioxia BG5 KBG50ZNT512G | Asus TUF A15 FA507 GeForce RTX 4050 Laptop GPU, R7 7735HS, Micron 2400 MTFDKBA512QFM | Schenker XMG Apex 15 (Late 23) GeForce RTX 4050 Laptop GPU, R7 7840HS, Samsung 990 Pro 1 TB | MSI Katana 15 B12VEK GeForce RTX 4050 Laptop GPU, i7-12650H, Micron 2400 MTFDKBA1T0QFM | |
|---|---|---|---|---|---|
| Noise | -5% | 14% | -2% | 6% | |
| wyłączone / środowisko * (dB) | 23 | 23.69 -3% | 23.3 -1% | 24 -4% | 24 -4% |
| Idle Minimum * (dB) | 23 | 29.03 -26% | 23.3 -1% | 25 -9% | 24 -4% |
| Idle Average * (dB) | 23 | 29.03 -26% | 23.3 -1% | 29 -26% | 24 -4% |
| Idle Maximum * (dB) | 28.02 | 29.03 -4% | 23.3 17% | 33 -18% | 24 14% |
| Load Average * (dB) | 50.21 | 48.7 3% | 29.6 41% | 36 28% | 37.71 25% |
| Witcher 3 ultra * (dB) | 51.46 | 48.5 6% | 43 16% | 48 7% | 45.75 11% |
| Load Maximum * (dB) | 56.79 | 48.7 14% | 43 24% | 53 7% | 54.55 4% |
* ... im mniej tym lepiej
Temperatura
Dzięki agresywnemu systemowi chłodzenia, temperatury powierzchni są niemal zadziwiająco niskie. Nawet przy maksymalnym obciążeniu, ledwo wzrastają one powyżej 96,8 °F w trybie gry (temperatura otoczenia 64,4 °F). Wciąż jest tu sporo miejsca na cichszy system chłodzenia.
(+) Maksymalna temperatura w górnej części wynosi 36 °C / 97 F, w porównaniu do średniej 40.4 °C / 105 F , począwszy od 21.2 do 68.8 °C dla klasy Gaming.
(+) Dno nagrzewa się maksymalnie do 36 °C / 97 F, w porównaniu do średniej 43.2 °C / 110 F
(+) W stanie bezczynności średnia temperatura górnej części wynosi 23.7 °C / 75 F, w porównaniu ze średnią temperaturą urządzenia wynoszącą 33.9 °C / ### class_avg_f### F.
(+) Podczas gry w Wiedźmina 3 średnia temperatura górnej części wynosi 27.4 °C / 81 F, w porównaniu do średniej temperatury urządzenia wynoszącej 33.9 °C / ## #class_avg_f### F.
(+) Podpórki pod nadgarstki i touchpad są chłodniejsze niż temperatura skóry i maksymalnie 24 °C / 75.2 F i dlatego są chłodne w dotyku.
(+) Średnia temperatura obszaru podparcia dłoni w podobnych urządzeniach wynosiła 28.8 °C / 83.8 F (+4.8 °C / 8.6 F).
| Medion Erazer Crawler E40 - MD 62518 Intel Core i5-13500H, NVIDIA GeForce RTX 4050 Laptop GPU | Lenovo LOQ 15IRH8 Core i7 Intel Core i7-13620H, NVIDIA GeForce RTX 4050 Laptop GPU | Asus TUF A15 FA507 AMD Ryzen 7 7735HS, NVIDIA GeForce RTX 4050 Laptop GPU | Schenker XMG Apex 15 (Late 23) AMD Ryzen 7 7840HS, NVIDIA GeForce RTX 4050 Laptop GPU | MSI Katana 15 B12VEK Intel Core i7-12650H, NVIDIA GeForce RTX 4050 Laptop GPU | |
|---|---|---|---|---|---|
| Heat | -40% | -17% | -31% | -35% | |
| Maximum Upper Side * (°C) | 36 | 46.4 -29% | 48.9 -36% | 52 -44% | 47 -31% |
| Maximum Bottom * (°C) | 36 | 59.2 -64% | 44.6 -24% | 47 -31% | 48 -33% |
| Idle Upper Side * (°C) | 26 | 34.4 -32% | 27.1 -4% | 33 -27% | 35 -35% |
| Idle Bottom * (°C) | 27 | 36.2 -34% | 27.5 -2% | 33 -22% | 38 -41% |
* ... im mniej tym lepiej
Głośniki
Głośniki stereo znajdują się w przednich rogach i promieniują w dół. Tony wysokie są zrównoważone, ale basów prawie nie ma. Zalecamy podłączenie słuchawek przez wyjście jack.
Medion Erazer Crawler E40 - MD 62518 analiza dźwięku
(±) | głośność głośnika jest średnia, ale dobra (81.47 dB)
Bas 100 - 315 Hz
(-) | prawie brak basu - średnio 32.7% niższa od mediany
(±) | liniowość basu jest średnia (11% delta do poprzedniej częstotliwości)
Średnie 400 - 2000 Hz
(+) | zbalansowane środki średnie - tylko 4.6% od mediany
(±) | liniowość środka jest średnia (7.1% delta do poprzedniej częstotliwości)
Wysokie 2–16 kHz
(+) | zrównoważone maksima - tylko 3.1% od mediany
(+) | wzloty są liniowe (5.7% delta do poprzedniej częstotliwości)
Ogólnie 100 - 16.000 Hz
(±) | liniowość ogólnego dźwięku jest średnia (21.8% różnicy w stosunku do mediany)
W porównaniu do tej samej klasy
» 78% wszystkich testowanych urządzeń w tej klasie było lepszych, 6% podobnych, 16% gorszych
» Najlepszy miał deltę 6%, średnia wynosiła ###średnia###%, najgorsza wynosiła 132%
W porównaniu do wszystkich testowanych urządzeń
» 62% wszystkich testowanych urządzeń było lepszych, 7% podobnych, 31% gorszych
» Najlepszy miał deltę 4%, średnia wynosiła ###średnia###%, najgorsza wynosiła 134%
Lenovo LOQ 15IRH8 Core i7 analiza dźwięku
(±) | głośność głośnika jest średnia, ale dobra (75.9 dB)
Bas 100 - 315 Hz
(-) | prawie brak basu - średnio 18.6% niższa od mediany
(±) | liniowość basu jest średnia (10.2% delta do poprzedniej częstotliwości)
Średnie 400 - 2000 Hz
(+) | zbalansowane środki średnie - tylko 2.2% od mediany
(+) | średnie są liniowe (3.1% delta do poprzedniej częstotliwości)
Wysokie 2–16 kHz
(+) | zrównoważone maksima - tylko 2.3% od mediany
(+) | wzloty są liniowe (4.4% delta do poprzedniej częstotliwości)
Ogólnie 100 - 16.000 Hz
(+) | ogólny dźwięk jest liniowy (13.7% różnicy w stosunku do mediany)
W porównaniu do tej samej klasy
» 21% wszystkich testowanych urządzeń w tej klasie było lepszych, 7% podobnych, 72% gorszych
» Najlepszy miał deltę 6%, średnia wynosiła ###średnia###%, najgorsza wynosiła 132%
W porównaniu do wszystkich testowanych urządzeń
» 15% wszystkich testowanych urządzeń było lepszych, 4% podobnych, 81% gorszych
» Najlepszy miał deltę 4%, średnia wynosiła ###średnia###%, najgorsza wynosiła 134%
Zużycie energii
Zużycie energii jest nieco wysokie w trybie bezczynności i w teście warunków skrajnych, ale tak naprawdę nie wyróżnia się. Pod normalnym obciążeniem zużycie energii mieści się w średniej konkurencji. W grach jest na równi z Lenovo LOQ 15, ale wyższy niż u innych konkurentów.
Zmierzyliśmy tymczasowe maksymalne zużycie 202,5 W podczas naszego jednoczesnego testu obciążeniowego CPU i GPU. Zasilacz LiteOn o mocy 230 W nie powinien mieć tutaj żadnych problemów.
| wyłączony / stan wstrzymania | |
| luz | |
| obciążenie |
|
Legenda:
min: | |
| Medion Erazer Crawler E40 - MD 62518 GeForce RTX 4050 Laptop GPU, i5-13500H, Phison PS5021-E21 512GB | Lenovo LOQ 15IRH8 Core i7 GeForce RTX 4050 Laptop GPU, i7-13620H, Kioxia BG5 KBG50ZNT512G | Asus TUF A15 FA507 GeForce RTX 4050 Laptop GPU, R7 7735HS, Micron 2400 MTFDKBA512QFM | Schenker XMG Apex 15 (Late 23) GeForce RTX 4050 Laptop GPU, R7 7840HS, Samsung 990 Pro 1 TB | MSI Katana 15 B12VEK GeForce RTX 4050 Laptop GPU, i7-12650H, Micron 2400 MTFDKBA1T0QFM | |
|---|---|---|---|---|---|
| Power Consumption | 1% | 23% | 15% | 18% | |
| Idle 150cd/m2 * (Watt) | 15.3 | 9.48 38% | 10.8 29% | 9.8 36% | |
| 3DMark06 Return To Proxycon * (Watt) | 88 | 94.5 -7% | 84 5% | ||
| Witcher 3 ultra * (Watt) | 155 | 154.4 -0% | 136.6 12% | 136.5 12% | 128 17% |
| 1280x720 Prime95 28.10 and Furmark 1.25 * (Watt) | 190 | 169.2 11% | 156.7 18% | 181 5% | 165 13% |
* ... im mniej tym lepiej
Power consumption Witcher 3 / stress test
Power consumption with external monitor
Żywotność baterii
Medion wykorzystuje baterię o pojemności 54 Wh. Tylko MSI Katana ma podobnie małą baterię, ale mimo to wytrzymuje nieco dłużej we wszystkich testach. Reszta konkurencji ma baterie o pojemności co najmniej 60 Wh, a Asus TUF A15 nawet 90 Wh. W skrócie: Medion ma najkrótszy czas pracy w bezpośrednim porównaniu. W naszym teście wideo lub przeglądania przy zmniejszonej jasności laptop osiąga czas pracy około 4 godzin - to nie jest porywające.
| Medion Erazer Crawler E40 - MD 62518 i5-13500H, GeForce RTX 4050 Laptop GPU, 54 Wh | Lenovo LOQ 15IRH8 Core i7 i7-13620H, GeForce RTX 4050 Laptop GPU, 60 Wh | Asus TUF A15 FA507 R7 7735HS, GeForce RTX 4050 Laptop GPU, 90 Wh | Schenker XMG Apex 15 (Late 23) R7 7840HS, GeForce RTX 4050 Laptop GPU, 62.32 Wh | MSI Katana 15 B12VEK i7-12650H, GeForce RTX 4050 Laptop GPU, 53.5 Wh | Średnia w klasie Gaming | |
|---|---|---|---|---|---|---|
| Czasy pracy | 50% | 130% | 73% | 14% | 68% | |
| H.264 (h) | 3.9 | 6.1 56% | 12.5 221% | 8.3 113% | 4.4 13% | 8.28 ? 112% |
| WiFi v1.3 (h) | 4.1 | 5.9 44% | 11.7 185% | 7.1 73% | 4.3 5% | 6.96 ? 70% |
| Load (h) | 1.2 | 1 -17% | 1.6 33% | 1.5 25% | 1.47 ? 23% | |
| Reader / Idle (h) | 8.4 | 8.71 ? |
Za
Przeciw
Werdykt - budżetowy gracz z kompromisami, ale dobrą wydajnością

Za ~1300 USD, Medion Crawler E40 oferuje przyjazną dla budżetu opcję laptopa do gier z RTX 4050. Chociaż mieści się w przedziale budżetowym, dostępne są jeszcze tańsze modele, co skłania do bliższego przyjrzenia się stosunkowi ceny do wydajności. Crawler E40 ujawnia swoje budżetowe pochodzenie dzięki takim cechom jak i5-13500H zamiast i7-13700H, wyświetlacz z 2019 roku, kamera internetowa 720p i gniazdo USB 2.0. W związku z tym może nie spełnić oczekiwań graczy o wysokich wymaganiach. Jednak wydajność CPU i GPU jest godna pochwały, a dysk SSD działa dobrze. Wyświetlacz, choć nie najnowszy, jest wystarczająco jasny na poziomie 350 nitów, responsywny i oferuje częstotliwość odświeżania 144 Hz, nawet jeśli nie w pełni pokrywa typowe przestrzenie kolorów.
Chociaż istnieją pewne punkty krytyki, wiele z nich jest akceptowalnych w budżetowym laptopie. Z drugiej strony, szczególnie słaby czas pracy na baterii i zbyt głośny system chłodzenia są bardziej istotnymi obawami. Optymalizacja oprogramowania mogłaby rozwiązać kwestię systemu chłodzenia, ponieważ wydaje się, że jest miejsce na poprawę, biorąc pod uwagę niskie temperatury.
Podsumowując, Medion Crawler E40 to niedrogi laptop do gier z pewnymi kompromisami, ale wydajność jego komponentów jest godna pochwały. Główne zarzuty dotyczą głośnego i agresywnego systemu chłodzenia, a także słabej żywotności baterii.
Każdy z konkurentów omawianych w teście ma swoje zalety, a różnice między nimi są stosunkowo niewielkie. Asus TUF A15, choć zapewnia nieco słabszą wydajność, wyróżnia się imponującymi czasami pracy na baterii. Jeśli priorytetem jest dłuższy czas pracy na baterii przy porównywalnej wydajności i są Państwo skłonni wydać nieco więcej, Lenovo LOQ 15 może być odpowiednim wyborem, pomimo pewnych wad. Należy zauważyć, że nie ma wyraźnego zwycięzcy, zwłaszcza biorąc pod uwagę, że XMG Apex 15 kosztuje prawie ~550 USD więcej.
Cena i dostępność
Medion Erazer Crawler E40 kosztuje około ~1300 USD bezpośrednio od Medion.
Medion Erazer Crawler E40 - MD 62518
- 28/11/2023 v7 (old)
Christian Hintze
Przezroczystość
Wyboru urządzeń do recenzji dokonuje nasza redakcja. Próbka testowa została udostępniona autorowi jako pożyczka od producenta lub sprzedawcy detalicznego na potrzeby tej recenzji. Pożyczkodawca nie miał wpływu na tę recenzję, producent nie otrzymał też kopii tej recenzji przed publikacją. Nie było obowiązku publikowania tej recenzji. Jako niezależna firma medialna, Notebookcheck nie podlega władzy producentów, sprzedawców detalicznych ani wydawców.
Tak testuje Notebookcheck
Każdego roku Notebookcheck niezależnie sprawdza setki laptopów i smartfonów, stosując standardowe procedury, aby zapewnić porównywalność wszystkich wyników. Od około 20 lat stale rozwijamy nasze metody badawcze, ustanawiając przy tym standardy branżowe. W naszych laboratoriach testowych doświadczeni technicy i redaktorzy korzystają z wysokiej jakości sprzętu pomiarowego. Testy te obejmują wieloetapowy proces walidacji. Nasz kompleksowy system ocen opiera się na setkach uzasadnionych pomiarów i benchmarków, co pozwala zachować obiektywizm.Price comparison

