Nvidia GeForce RTX 4090 Founders Edition Review: Bezkonkurencyjny behemot 4K 100 fps za 400 USD mniej niż RTX 3090 Ti
")
Kiedy pierwsze plotki o nowym układzie graficznym Nvidii opartym na architekturze Ada Lovelace pojawiły się pod koniec 2020 roku, ich specyfikacja była wręcz zdumiewająca. Dziś, RTX 4090 jest dostępny w ciele za 1599 USD MSRP i jest tak imponujący, jak tylko może być to możliwe w przypadku konsumenckiego procesora graficznego.
Procesor graficzny AD102 w RTX 4090 mieści 16 384 rdzenie CUDA, 512 rdzeni Tensor czwartej generacji i 128 rdzeni RT trzeciej generacji. To cięcie w stosunku do kompletnego krzemu AD102, który posiada 18 432 rdzenie CUDA, 568 rdzeni Tensor i 142 rdzenie RT. Nie trzeba więc dodawać, że w najbliższych miesiącach możemy spodziewać się czegoś w rodzaju "RTX 4090 Ti".
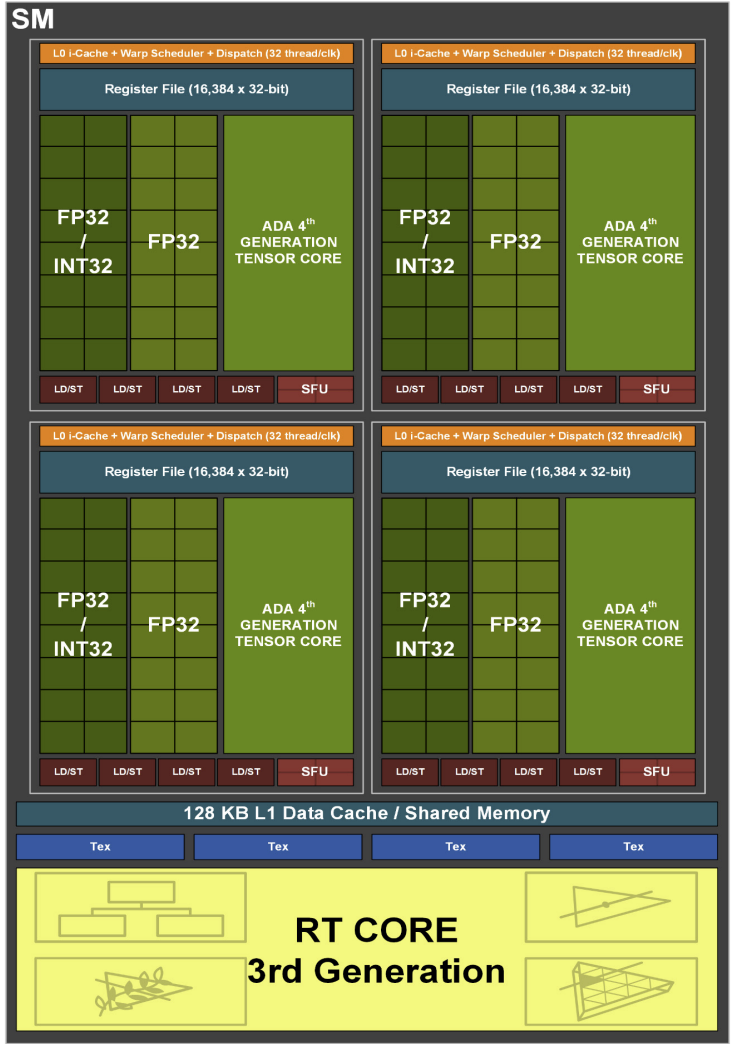
Klaster przetwarzania grafiki Ada (GPC) obejmuje silnik rastrowy, sześć klastrów procesorów teksturujących (TPC), 12 multiprocesorów strumieniowych (SM) i 16 potoków operacji rastrowych (ROP).
Każdy SM posiada z kolei 128 rdzeni CUDA, jeden rdzeń RT, cztery rdzenie Tensor, cztery jednostki teksturujące, rejestr o pojemności 256 KB oraz 128 KB konfigurowalnej pamięci podręcznej L1.

W tej recenzji przyglądamy się flagowej Adzie, czyli Nvidii GeForce RTX 4090 Founders Edition, i sprawdzamy, jak duży wzrost wydajności gen-to-gen oferuje nowa architektura w stosunku do flagowców Ampere i AMD RDNA 2.
Porównanie RTX 4090 z innymi układami GPU Nvidii
| Specyfikacja | RTX 4090 FE | RTX 3090 Ti FE | RTX 3090 FE | RTX 3080 Ti FE | RTX 3080 FE | RTX 3070 FE | RTX 3060 Ti FE | Titan RTX | Titan X Pascal |
| Chip | AD102 | GA102 | GA102 | GA102 | GA102 | GA104 | GA104 | TU102 | GP102 |
| Proces FinFET | Custom 4N | 8 nm | 8 nm | 8 nm | 8 nm | 8 nm | 8 nm | 12 nm | 16 nm |
| Rdzenie CUDA | 16,384 | 10,752 | 10,496 | 10,240 | 8,704 | 5,888 | 4,864 | 4,608 | 3,584 |
| Jednostki tekstury | 512 | 336 | 328 | 320 | 272 | 184 | 152 | 288 | 224 |
| Tensor Cores | 512 4th Gen. | 336 3rd Gen. | 328 3rd Gen. | 320 3rd Gen. | 272 3rd Gen. | 184 3rd Gen. | 152 3rd Gen. | 576 2nd Gen. | - |
| RT Cores | 128 3rd Gen. | 84 2nd Gen. | 82 2nd Gen. | 80 2nd Gen. | 68 2nd Gen. | 46 2nd Gen. | 38 2nd Gen. | 72 | - |
| Zegar podstawowy procesora graficznego | 2,235 MHz | 1,560 MHz | 1,395 MHz | 1,365 MHz | 1,440 MHz | 1,500 MHz | 1,410 MHz | 1,350 MHz | 1,417 MHz |
| Zegar zwiększający częstotliwość pracy układu GPU | 2,520 MHz | 1,860 MHz | 1,695 MHz | 1,665 MHz | 1,710 MHz | 1,750 MHz | 1,665 MHz | 1,770 MHz | 1,531 MHz |
| Szyna pamięci | 384-bit | 384-bit | 384-bit | 384-bit | 320-bit | 256-bit | 256-bit | 384-bit | 384-bit |
| Przepustowość pamięci | 1 008 GB/s | 1 008 GB/s | 936 GB/s | 912 GB/s | 760 GB/s | 448 GB/s | 448 GB/s | 672 GB/s | 480,4 GB/s |
| Pamięć wideo | 24 GB GDDR6X | 24 GB GDDR6X | 24 GB GDDR6X | 12 GB GDDR6X | 10 GB GDDR6X | 8 GB GDDR6 | 8 GB GDDR6 | 24 GB GDDR6 | 12 GB GDDR5X |
| Pobór mocy | 450 W | 450 W | 350 W | 350 W | 320 W | 220 W | 200 W | 280 W | 250 W |
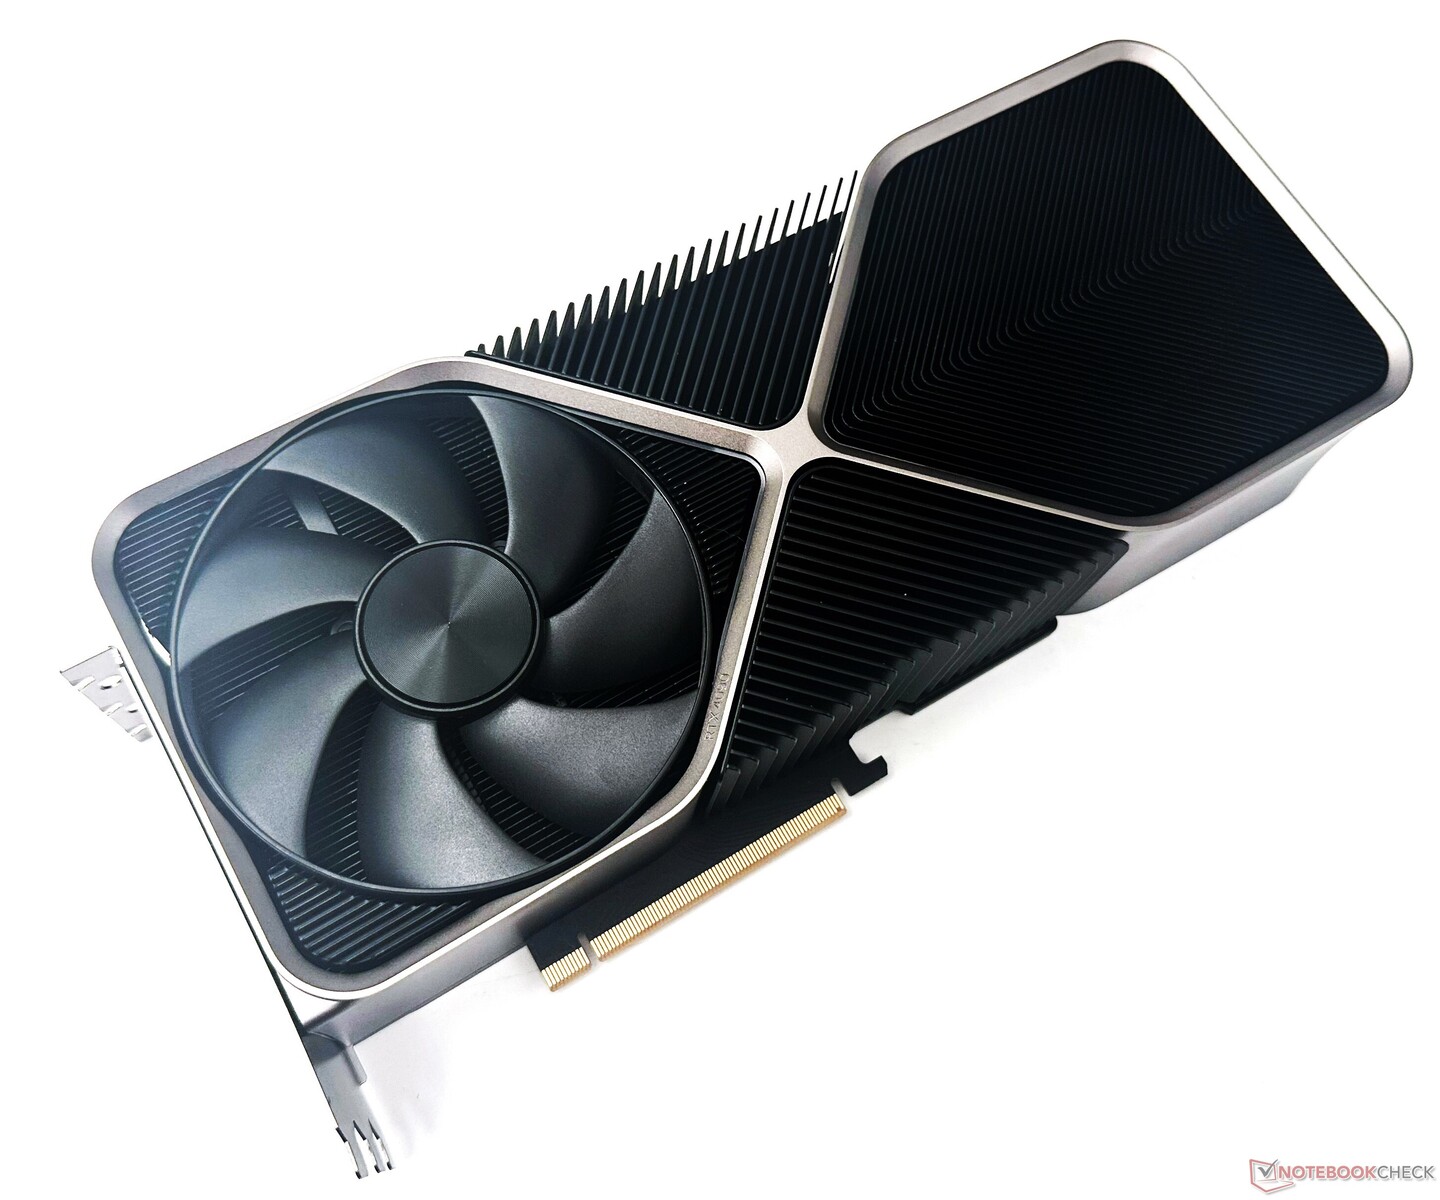
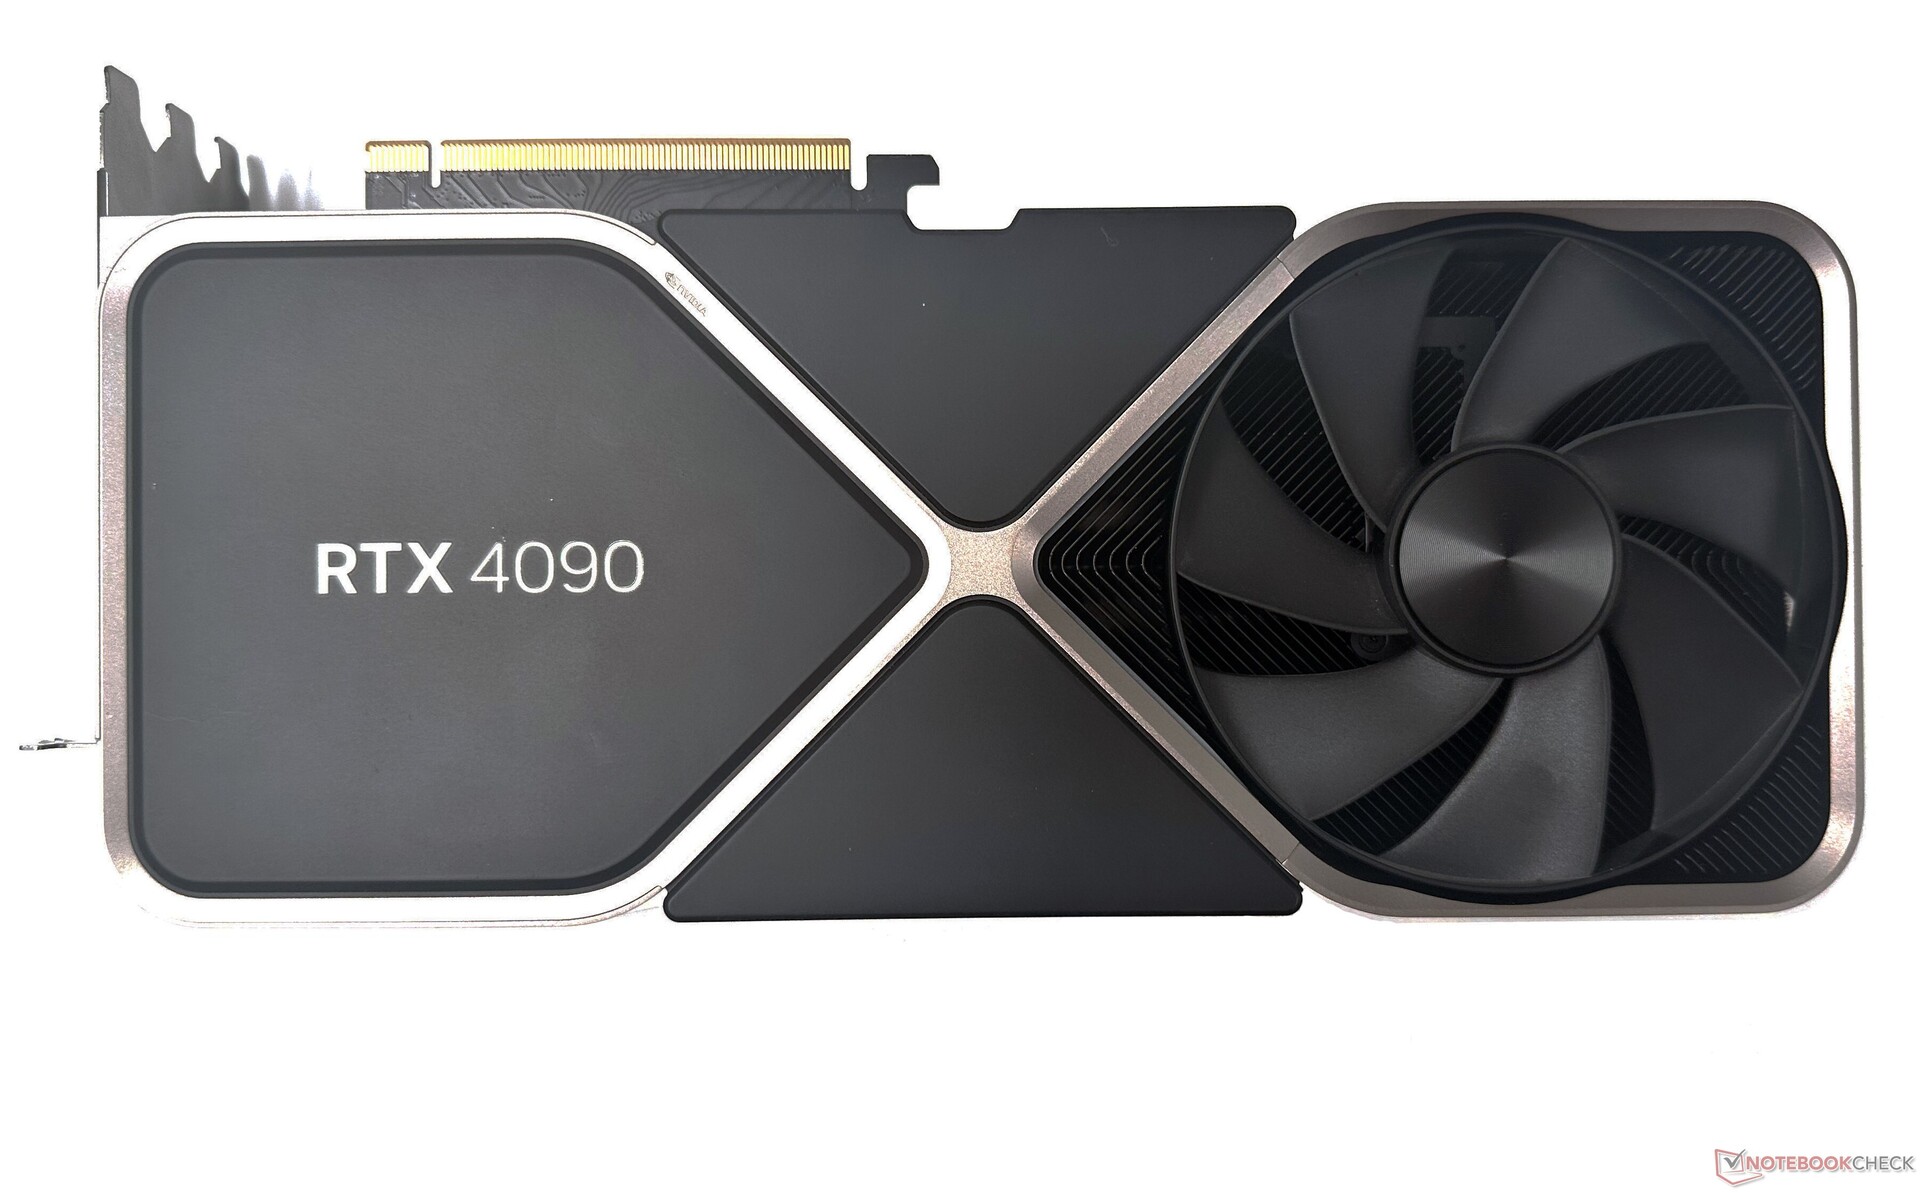
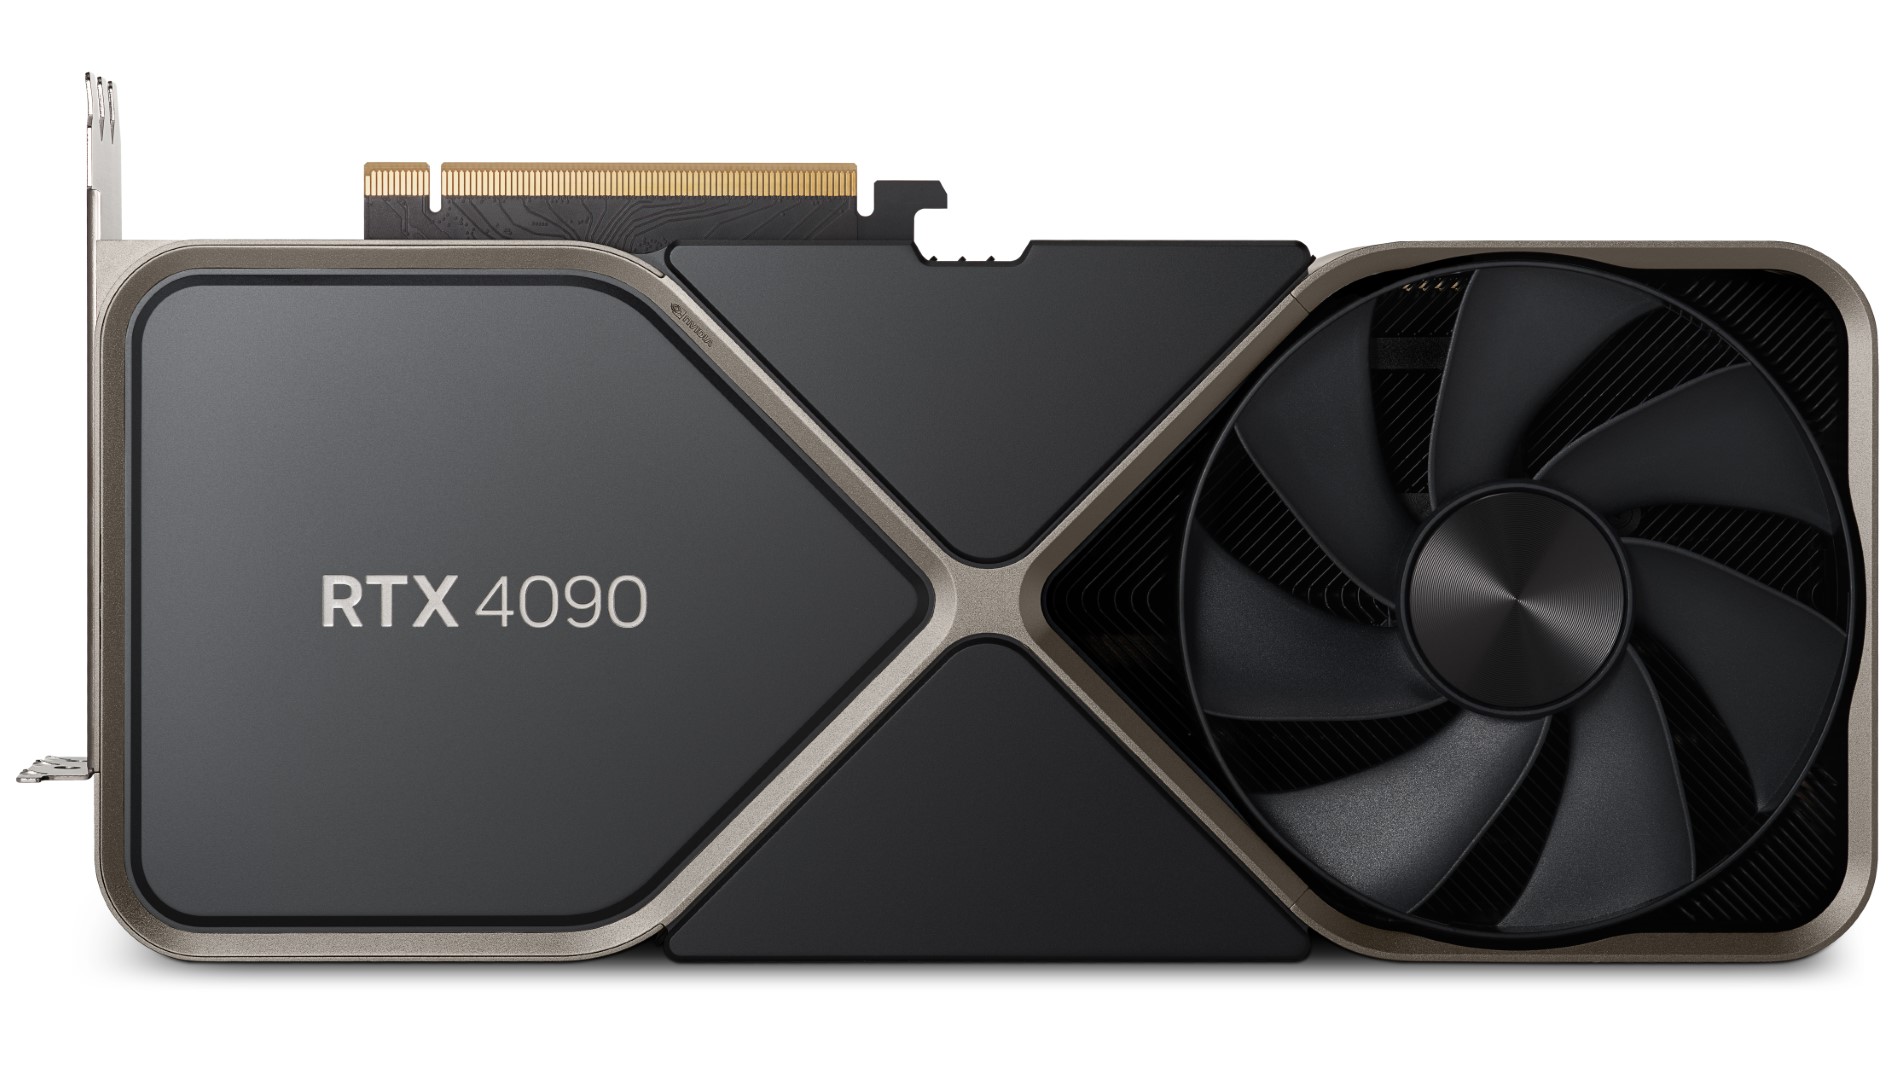
Bliższe spojrzenie na Nvidia GeForce RTX 4090 Founders Edition
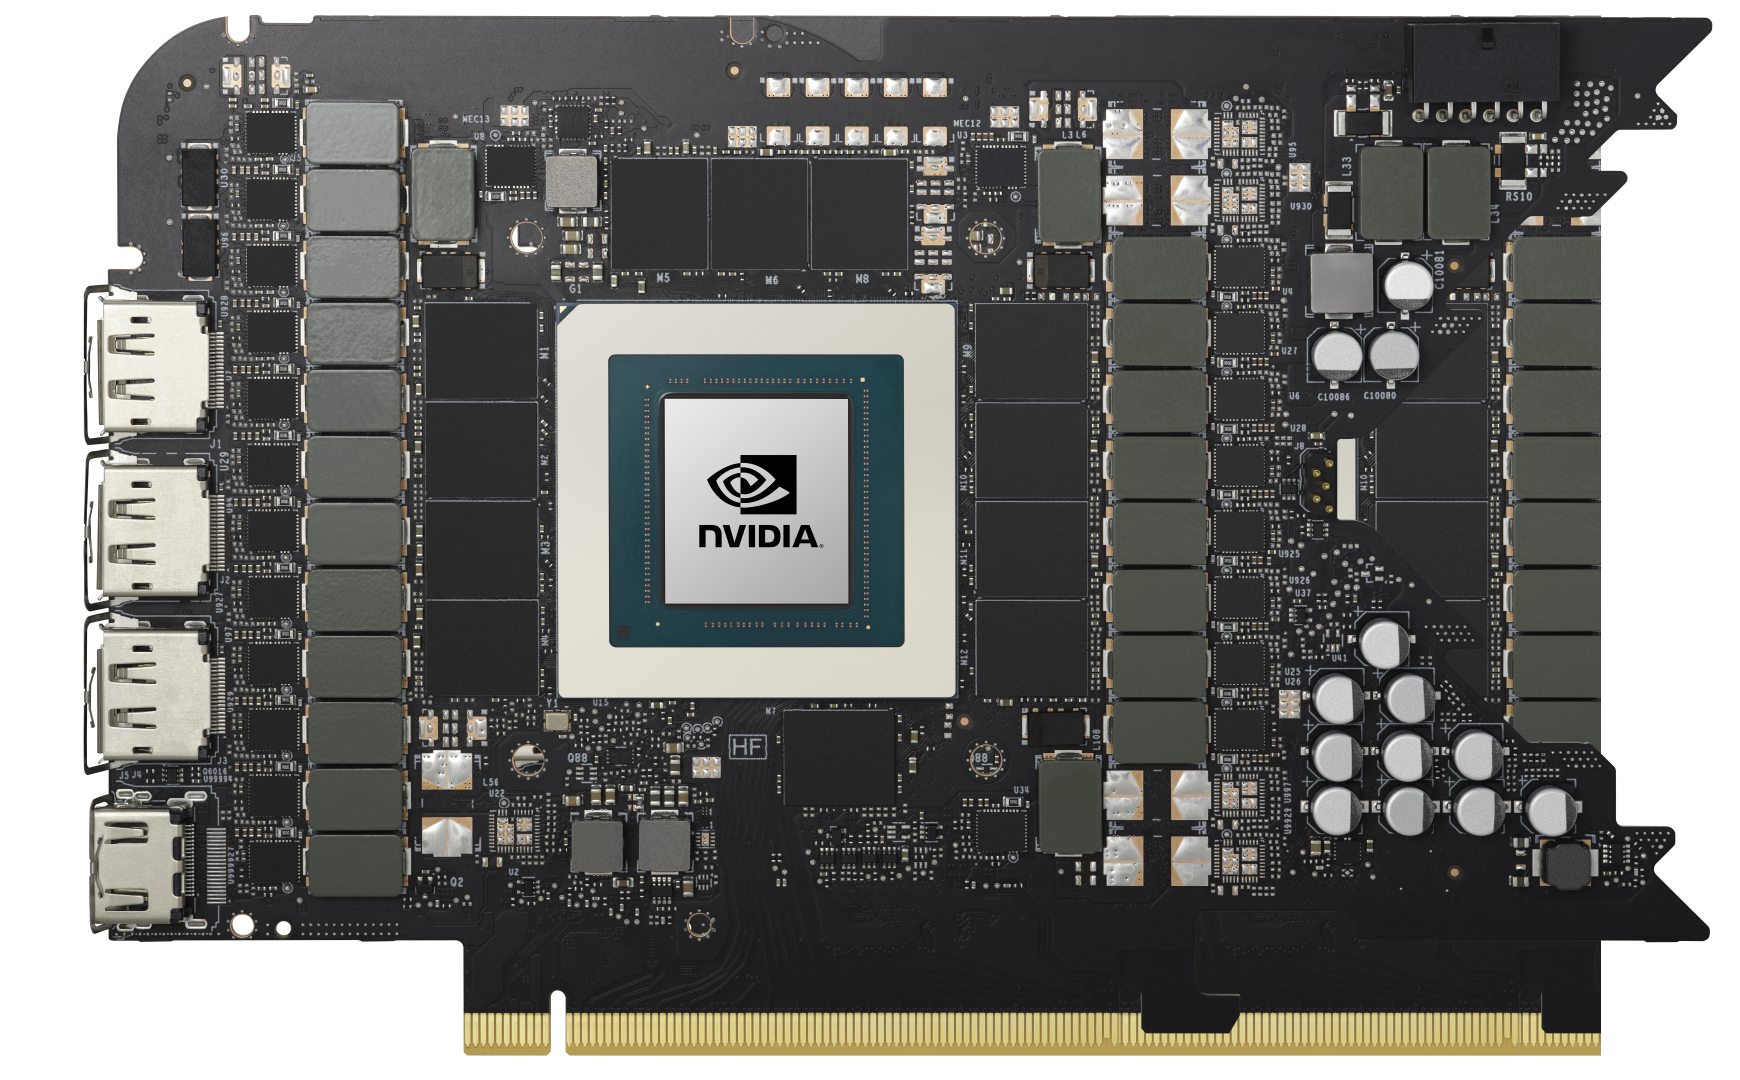
Mimo że nie jest to kompletny układ, obecna matryca AD102 w RTX 4090 mieści 76,3 miliarda tranzystorów - to blisko 170% wzrost liczby tranzystorów w porównaniu do RTX 3090 Ti - a jednocześnie udało się zmniejszyć matrycę o 3% do 608,5 mm2. AD102 faktycznie bazuje na procesie N5 firmy TSMC, ale Nvidia oznacza go jako "4N", wskazując na własne modyfikacje.
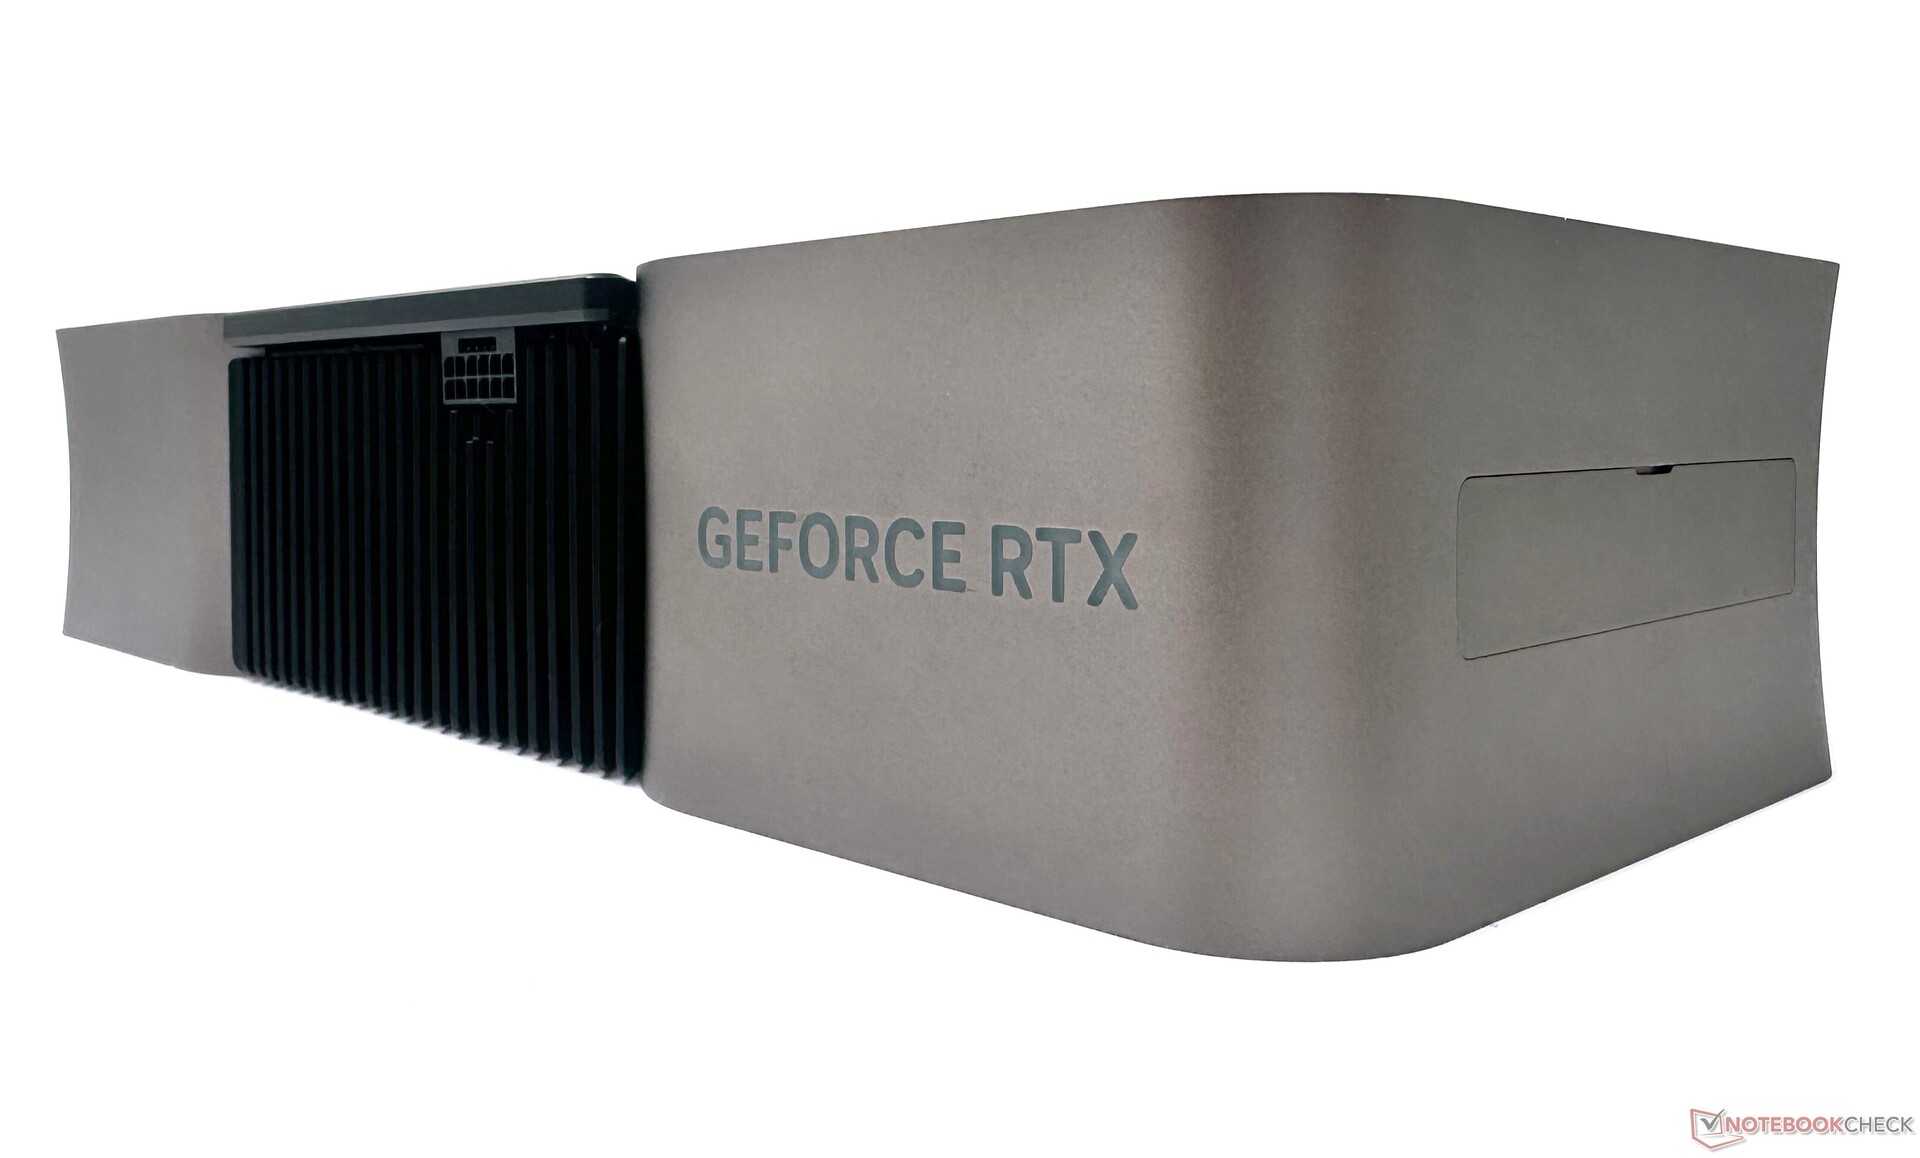
Zewnętrznie RTX 4090 FE na pierwszy rzut oka wygląda masywnie, ale pomiary stawiają go mniej więcej na równi z RTX 3090 FE. 4090 FE ma większą grubość (61 mm vs 57 mm w RTX 3090 FE), a RTX 3090 FE jest w rzeczywistości dłuższy - 313 mm w porównaniu z 304 mm długością 4090 FE.
RTX 4090 FE jest nieco dłuższy niż płyta główna E-ATX i zajmie miejsce trzech slotów PCIe, więc trzeba to uwzględnić podczas zakupu. Zalecamy zachowanie odpowiedniego odstępu między kartą a przednimi wentylatorami obudowy, aby zapewnić optymalny przepływ powietrza.
Poza pomiarami, nie ma zbyt wielu estetycznych różnic w stosunku do tego, co już widzieliśmy w RTX 3090 FE. Konstrukcja jest prosta, nierzucająca się w oczy, a jednocześnie niezwykle funkcjonalna.
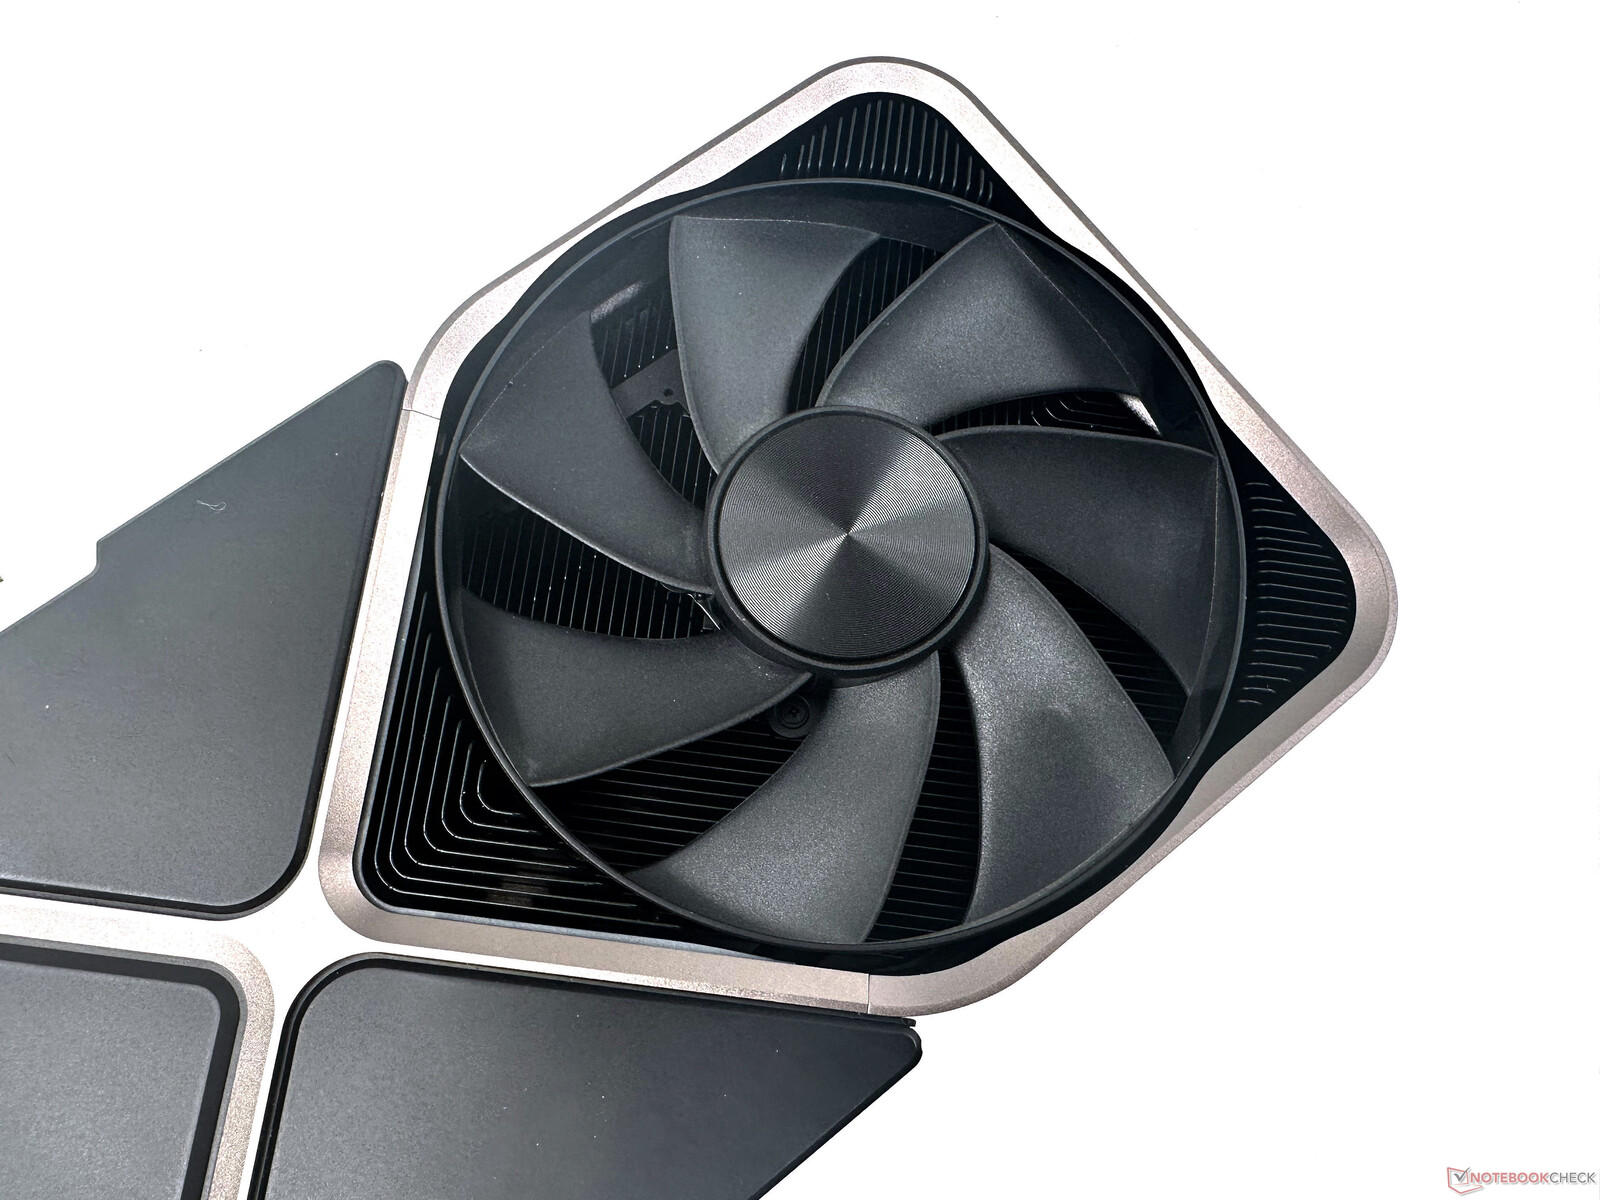
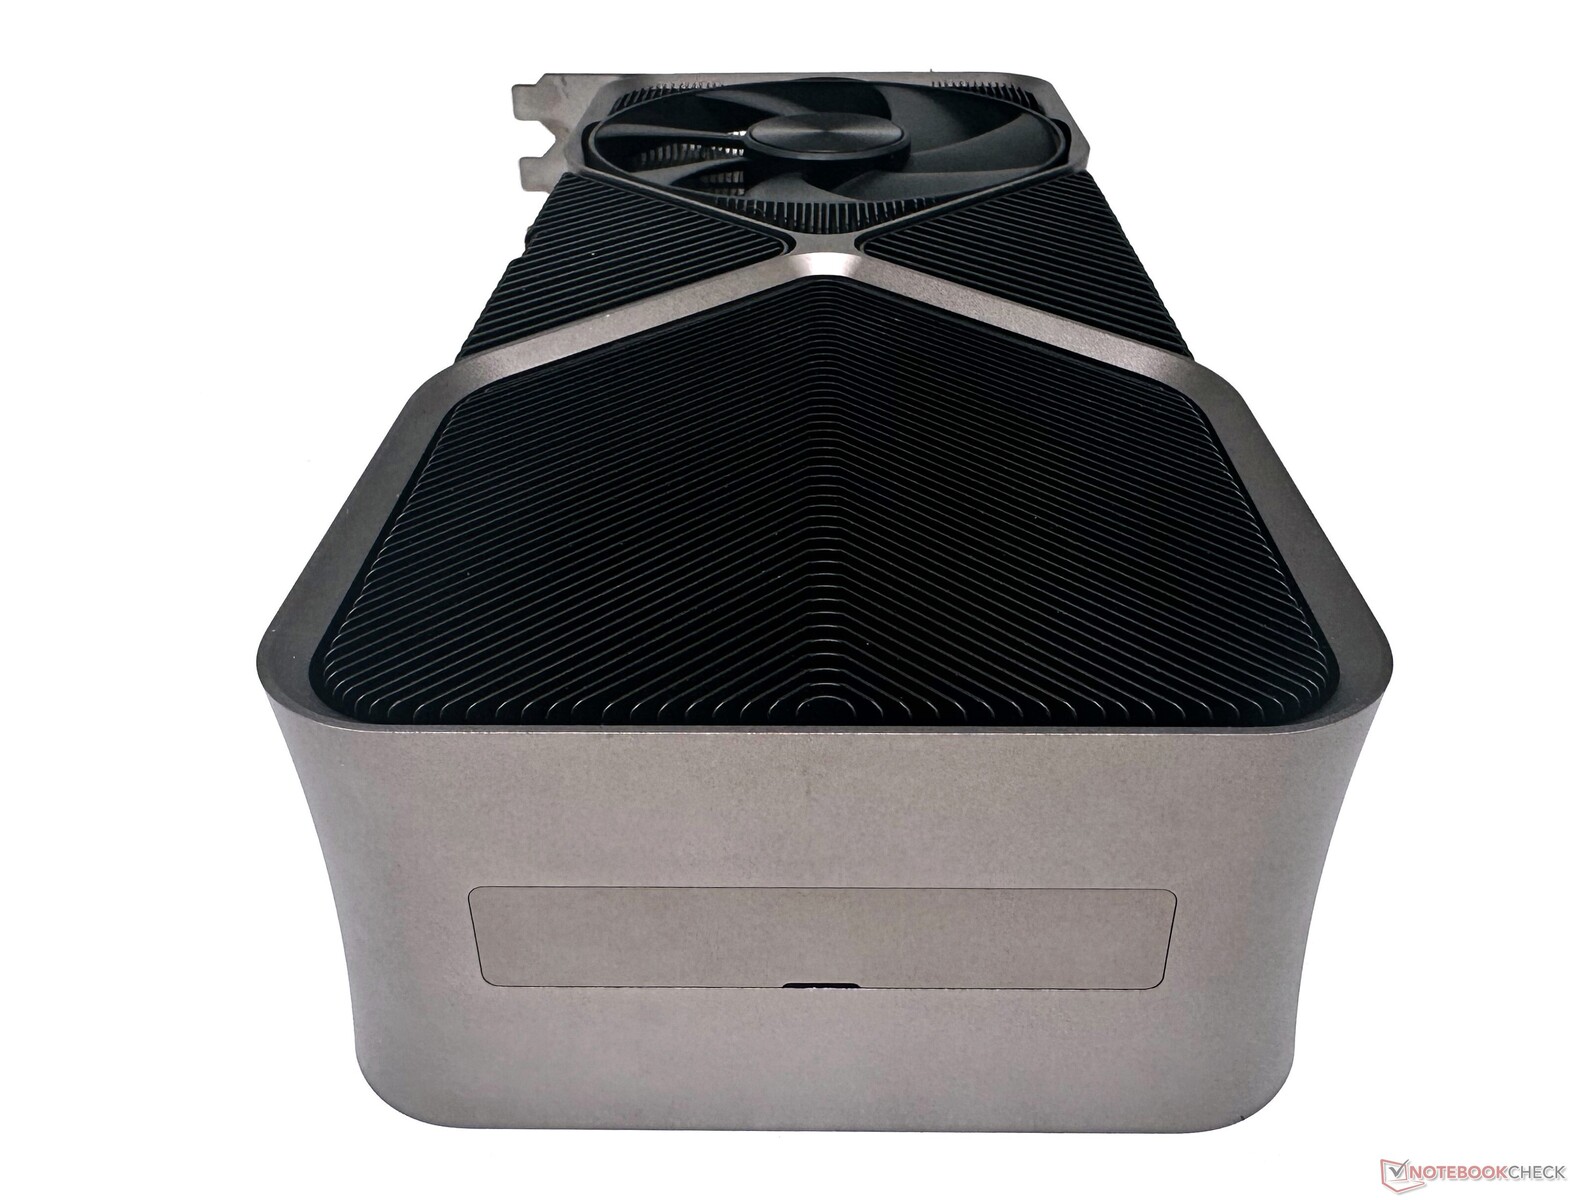
Podsystem termiczny również ma znany wygląd i funkcjonalność jak poprzednia generacja - jeden wentylator zasysa powietrze od spodu, podczas gdy drugi zasysa je z karty i wypycha na przeciwległy koniec, zazwyczaj w kierunku góry obudowy. Oznacza to, że jeśli umieścimy kartę w sposób konwencjonalny, to wentylatory radiatora lub "ciągnące" wentylatory wyciągowe powinny być idealnie zlokalizowane na górze obudowy, aby zapobiec potencjalnemu gromadzeniu się ciepła.
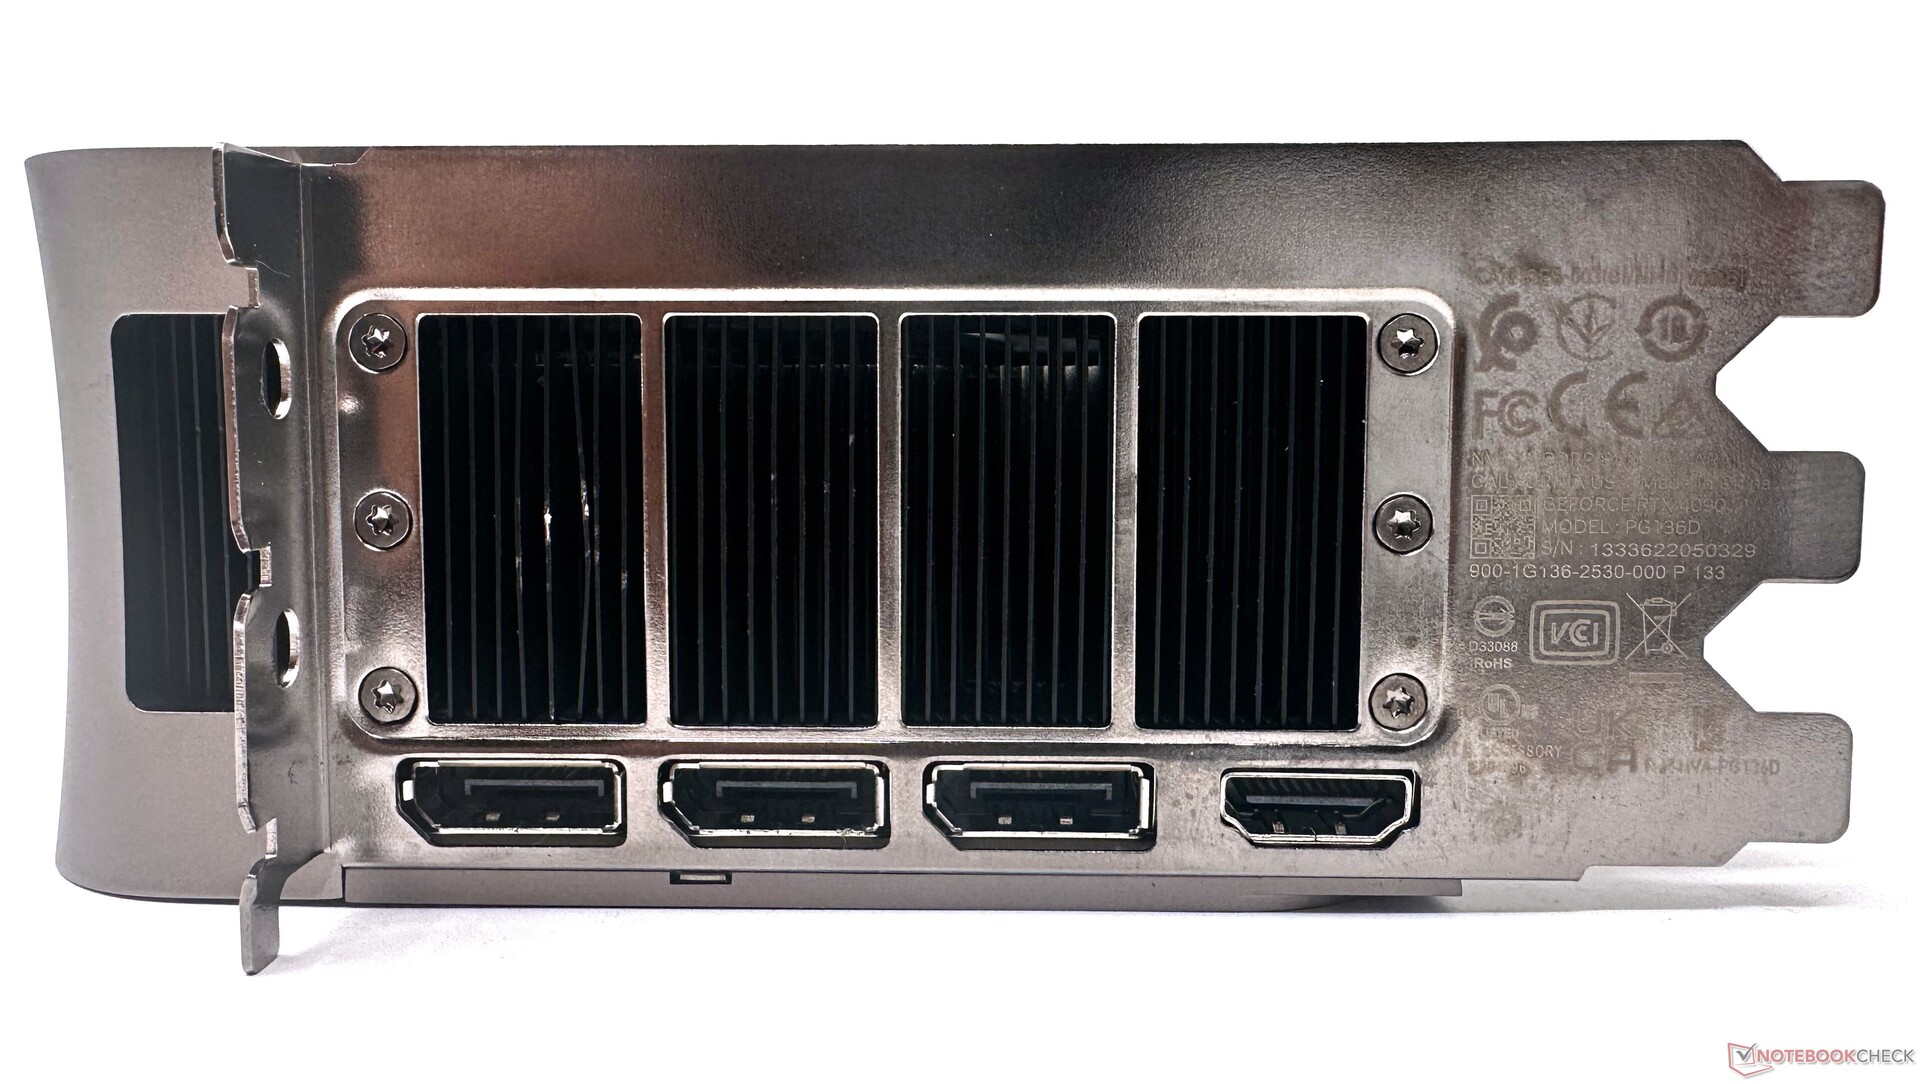
Opcje łączności są takie same jak to, co widzieliśmy wcześniej w przypadku kart Ampere, ale złącze NVLink, które było wcześniej oferowane z płytami RTX 3090 i RTX 3090 Ti, zostało teraz osierocone. Są trzy wyjścia DisplayPort 1.4a i jeden port HDMI 2.1a.
Nvidia uważa, że rynek nie jest jeszcze dojrzały do DisplayPort 2.1, podczas gdy nadchodzący AMD Radeon RX 7900 XT oraz RX 7900 XTXrDNA 3 chwalą się już posiadaniem DisplayPort 2.1 z obsługą UHBR 13.5.
Karty Turing oferowały jeszcze swego czasu obsługę USB Type-C, ale Nvidia usunęła ten port wraz z Amperem. Choć nie jest to raczej deal-breaker, to z drugiej strony nadchodzące karty AMD RDNA 3 będą oferować USB Type-C do bezpośredniego podpinania zestawów słuchawkowych VR i monitorów USB-C.
Nvidia po raz pierwszy wprowadziła złącze zasilające PCIe Gen 5 wraz z RTX 3090 Ti i nakazała jego umieszczenie nawet w modelach partnerskich typu add-in board (AiB). W tym roku złącze PCIe Gen 5, nazywane adapterem 12VHPWR, przyciągnęło sporo uwagiza rosnącą liczbę raportów o topnieniu.

Zarówno pierwsi, jak i przyszli nabywcy obawiają się zagrożeń związanych z topniejącym złączem zasilania, które może wyciągnąć 600 W pod obciążeniem.
Nvidia potwierdziła że aktywnie bada ten problem i powiedziała, że problem może pojawić się, jeśli złącze nie jest bezpiecznie podłączone. Niemniej jednak firma powiedziała, że będzie wspierać wszystkich dotkniętych klientów i przyspieszy proces RMA.
Nie mieliśmy pod ręką zasilacza ATX 3 ani modowanych kabli, więc musieliśmy się zadowolić dostarczoną przejściówką z 12VHPWR 16-pin na 4x 8-pin.
Na szczęście złącze w naszym egzemplarzu testowym nadal pozostaje nienaruszone, nawet po wielu godzinach ciągłej gry, testów obciążeniowych i podkręcania.

Jeśli jesteś zadowolony z pracy RTX 4090 przy 450 W, możesz technicznie rzecz biorąc poradzić sobie z użyciem tylko 3x 8-pinowych połączeń do zasilacza. Czwarte 8-pin będzie potrzebne tylko wtedy, gdy planujesz podkręcić lub zwiększyć docelową moc karty.
Piny sensoryczne w 12VHPWR informują GPU o liczbie podłączonych 8-pinów, aby odpowiednio dostosować moc. W przypadku mniej niż trzech połączeń 8-pinowych karta nie uruchomi się
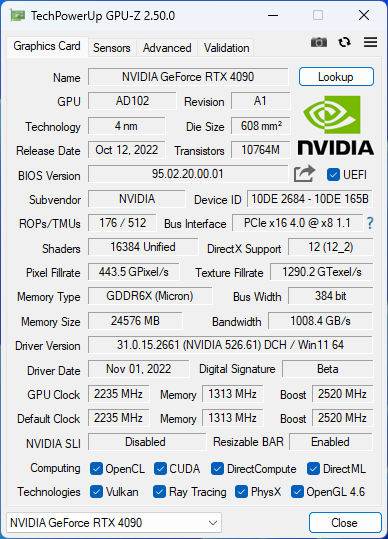
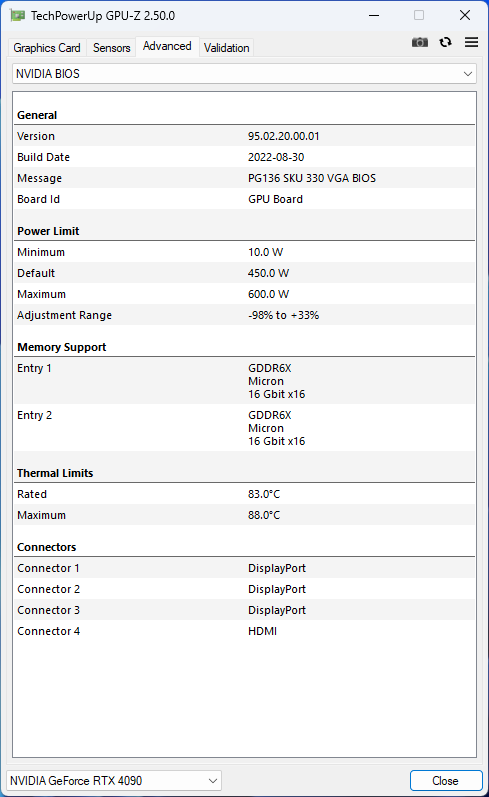
RTX 4090 FE pracuje z bazowym taktowaniem 2 235 MHz i może być podbity do 2 520 MHz w domyślnym profilu zasilania i napięcia. Możliwe jest zwiększenie docelowej mocy o dodatkowe 33% do 600 W.
Ławka testowa: Core i9-13900K spotyka się z RTX 4090 FE
Aby RTX 4090 mógł w pełni naprężyć swoje mięśnie, potrzebny będzie nowoczesny procesor pokroju AMD Zen 4 lub Intel Alder Lake/Raptor Lake - np.AMD Ryzen 9 7900X/7950X lubIntel Core i9-13900Ksą godnymi towarzyszami dla RTX 4090.
Na stronie Ryzen 7 5800X3D może być również dobrą opcją, jeśli chcesz na razie pozostać przy platformie AM4. Jednak inne procesory AM4, m.in Ryzen 9 5950Xmogą poważnie osłabić RTX 4090, zwłaszcza w rozdzielczościach poniżej QHD.
Podczas naszych wstępnych testów z Ryzenem 9 5950X stwierdziliśmy, że wydajność RTX 4090 w 1080p była tak wąska, że niektóre wyniki w różnych ustawieniach tej rozdzielczości często nie różniły się od wyników RTX 3090 Ti. Dlatego też obecna recenzja opiera się na platformie Core i9-13900K.
W naszej konstrukcji wykorzystano następujące komponenty:
- Stanowisko testowe Cooler Master MasterFrame 700
- Intel Core i9-13900K
- Płyta główna Gigabyte Z790 Aorus Master
- Dysk SSD Gigabyte Aorus Gen 4 2 TB NVMe do benchmarków i gier
- 2x 16 GB RAM Kingston Fury Beast DDR5-6000 z timingami 36-38-38-80 przy 1,35 V
- Monitor Gigabyte M28U 4K 144 Hz
- Chłodnica Cooler Master MasterLiquid ML360L V2 ARGB AIO
- W pełni modularny zasilacz Cooler Master MVE Gold 1250 V2
Świeża instalacja systemu Windows 11 22H2 z najnowszymi łatkami została użyta wraz ze sterownikiem Game Ready w wersji 526.47.
Dziękujemy firmie Cooler Master za dostarczenie stanowiska testowego, AIO i zasilacza, firmie Gigabyte za procesor Core i9-13900K, płytę główną Z790, monitor M28U i dysk SSD NVMe, a firmie AMD za pamięci Kingston DDR5.
Syntetyczne benchmarki: Niezłe uderzenie dla RTX 4090
Łącząc ze sobą wszystkie syntetyczne benchmarki, stwierdzamy, że RTX 4090 FE uzyskuje znaczącą przewagę 51% nad RTX 3090 Ti i 58% nad RTX 3090 FE, a także z Radeonem RX 6950 XT.
Radeon RX 6950 XT ma jednak odczuwalną przewagę nad RTX 3090 Ti w syntetycznych testach graficznych 3DMark. Nie wiadomo jeszcze, jak poradzą sobie nowe karty RDNA 3, gdy będą dostępne w przyszłym miesiącu, ale RTX 4090 FE jest w stanie zapewnić sobie na razie wystarczająco dużą przewagę. Co ciekawe, RX 6950 XT jest tylko o 9% gorszy od 4090 FE w Fire Strike Graphics, podczas gdy w innych testach, takich jak Time Spy Graphics, traci nawet 40%.
Testy Unigine pokazują, że karty Nvidii prowadzą ogólnie, a RTX 4090 FE w szczególności. Widzimy ponad 50% poprawę zarówno w testach Heaven 4.0, jak i w teście OpenGL Valley 1.0 w porównaniu do RTX 3090 Ti
Superpozycja, szczególnie w wyższych rozdzielczościach, pokazuje RTX 4090 FE całkowicie dziesiątkującego RX 6950 XT aż o 93%, jednocześnie wykazując przewagę do 79% nad RTX 3090 Ti.
| Performance rating - Percent | |
| Nvidia GeForce RTX 4090 FE | |
| Średnia w klasie Desktop | |
| NVIDIA GeForce RTX 3090 Ti | |
| NVIDIA GeForce RTX 3090 | |
| AMD Radeon RX 6950 XT | |
| Przeciętny NVIDIA GeForce RTX 3090 | |
| Przeciętny NVIDIA GeForce RTX 3080 Ti | |
| AMD Radeon RX 6900 XT | |
| AMD Radeon RX 6800 XT | |
| Przeciętny NVIDIA GeForce RTX 3080 | |
| Przeciętny NVIDIA Titan RTX | |
| 3DMark 11 - 1280x720 Performance GPU | |
| Nvidia GeForce RTX 4090 FE | |
| Średnia w klasie Desktop (3175 - 130697, n=34, ostatnie 2 lata) | |
| AMD Radeon RX 6950 XT | |
| NVIDIA GeForce RTX 3090 Ti | |
| Przeciętny NVIDIA GeForce RTX 3080 Ti (59799 - 62189, n=4) | |
| Przeciętny NVIDIA GeForce RTX 3090 (55144 - 66934, n=18) | |
| NVIDIA GeForce RTX 3090 | |
| AMD Radeon RX 6900 XT | |
| Przeciętny NVIDIA GeForce RTX 3080 (47287 - 57662, n=4) | |
| AMD Radeon RX 6800 XT | |
| Przeciętny NVIDIA Titan RTX (43461 - 51863, n=31) | |
| Unigine Heaven 4.0 | |
| Extreme Preset DX11 | |
| Nvidia GeForce RTX 4090 FE | |
| Średnia w klasie Desktop (10.9 - 545, n=44, ostatnie 2 lata) | |
| NVIDIA GeForce RTX 3090 | |
| NVIDIA GeForce RTX 3090 Ti | |
| Przeciętny NVIDIA GeForce RTX 3090 (272 - 315, n=12) | |
| Przeciętny NVIDIA GeForce RTX 3080 Ti (290 - 312, n=4) | |
| AMD Radeon RX 6950 XT | |
| AMD Radeon RX 6900 XT | |
| AMD Radeon RX 6800 XT | |
| Przeciętny NVIDIA GeForce RTX 3080 (233 - 253, n=2) | |
| Przeciętny NVIDIA Titan RTX (207 - 248, n=12) | |
| Extreme Preset OpenGL | |
| Nvidia GeForce RTX 4090 FE | |
| Średnia w klasie Desktop (11.7 - 551, n=30, ostatnie 2 lata) | |
| NVIDIA GeForce RTX 3090 Ti | |
| NVIDIA GeForce RTX 3090 | |
| Przeciętny NVIDIA GeForce RTX 3080 Ti (264 - 282, n=4) | |
| Przeciętny NVIDIA GeForce RTX 3090 (188.2 - 284, n=11) | |
| Przeciętny NVIDIA GeForce RTX 3080 (232 - 243, n=2) | |
| Przeciętny NVIDIA Titan RTX (203 - 299, n=12) | |
| AMD Radeon RX 6950 XT | |
| AMD Radeon RX 6900 XT | |
| AMD Radeon RX 6800 XT | |
| Unigine Valley 1.0 | |
| 1920x1080 Extreme HD DirectX AA:x8 | |
| Nvidia GeForce RTX 4090 FE | |
| NVIDIA GeForce RTX 3090 | |
| Przeciętny NVIDIA GeForce RTX 3080 Ti (206 - 240, n=4) | |
| Przeciętny NVIDIA GeForce RTX 3090 (184.2 - 247, n=12) | |
| AMD Radeon RX 6950 XT | |
| Średnia w klasie Desktop (9.8 - 295, n=44, ostatnie 2 lata) | |
| NVIDIA GeForce RTX 3090 Ti | |
| AMD Radeon RX 6900 XT | |
| AMD Radeon RX 6800 XT | |
| Przeciętny NVIDIA GeForce RTX 3080 (176.2 - 181.8, n=2) | |
| Przeciętny NVIDIA Titan RTX (135 - 191.4, n=12) | |
| 1920x1080 Extreme HD Preset OpenGL AA:x8 | |
| Nvidia GeForce RTX 4090 FE | |
| NVIDIA GeForce RTX 3090 | |
| NVIDIA GeForce RTX 3090 Ti | |
| Przeciętny NVIDIA GeForce RTX 3090 (158.8 - 226, n=11) | |
| Przeciętny NVIDIA GeForce RTX 3080 Ti (195.1 - 210, n=4) | |
| Średnia w klasie Desktop (9.1 - 313, n=30, ostatnie 2 lata) | |
| AMD Radeon RX 6950 XT | |
| Przeciętny NVIDIA GeForce RTX 3080 (163.8 - 172, n=2) | |
| AMD Radeon RX 6900 XT | |
| AMD Radeon RX 6800 XT | |
| Przeciętny NVIDIA Titan RTX (139.2 - 181.2, n=12) | |
| 3DMark 11 Performance | 64966 pkt. | |
| 3DMark Ice Storm Standard Score | 300753 pkt. | |
| 3DMark Cloud Gate Standard Score | 85501 pkt. | |
| 3DMark Fire Strike Score | 47404 pkt. | |
| 3DMark Fire Strike Extreme Score | 37848 pkt. | |
| 3DMark Time Spy Score | 32177 pkt. | |
Pomoc | ||
Benchmarki obliczeniowe: Wydajność jak z rękawa
Hegemonia RTX 4090 FE trwa również w benchmarkach obliczeniowych. W ogólnym zestawieniu ComputeMark flagowy produkt Nvidii Ada uzyskał 93% przewagę nad RX 6950XT i znaczące 66% nad RTX 3090 Ti.
LuxMark prezentuje jednak ciekawy paradygmat. Podczas gdy RTX 4090 FE prowadzi nad RX 6950XT w teście Room o niebotyczne 150%, karty AMD generalnie wykazują się lepszą wydajnością w Sali.
| LuxMark v2.0 64Bit | |
| Room GPUs-only | |
| Nvidia GeForce RTX 4090 FE | |
| Średnia w klasie Desktop (370 - 14722, n=40, ostatnie 2 lata) | |
| NVIDIA GeForce RTX 3090 Ti | |
| Przeciętny NVIDIA GeForce RTX 3080 Ti (5772 - 6464, n=4) | |
| NVIDIA GeForce RTX 3090 | |
| Przeciętny NVIDIA GeForce RTX 3090 (5727 - 5985, n=10) | |
| Przeciętny NVIDIA GeForce RTX 3080 (5112 - 5198, n=2) | |
| AMD Radeon RX 6950 XT | |
| AMD Radeon RX 6900 XT | |
| AMD Radeon RX 6800 XT | |
| Przeciętny NVIDIA Titan RTX (4643 - 4703, n=2) | |
| Sala GPUs-only | |
| AMD Radeon RX 6950 XT | |
| AMD Radeon RX 6900 XT | |
| AMD Radeon RX 6800 XT | |
| Nvidia GeForce RTX 4090 FE | |
| Średnia w klasie Desktop (600 - 33461, n=40, ostatnie 2 lata) | |
| NVIDIA GeForce RTX 3090 Ti | |
| Przeciętny NVIDIA GeForce RTX 3080 Ti (14871 - 16438, n=4) | |
| NVIDIA GeForce RTX 3090 | |
| Przeciętny NVIDIA GeForce RTX 3090 (14590 - 15242, n=10) | |
| Przeciętny NVIDIA GeForce RTX 3080 (12797 - 12980, n=2) | |
| Przeciętny NVIDIA Titan RTX (10799 - 10996, n=2) | |
| V-Ray Benchmark Next 4.10 - GPU | |
| Nvidia GeForce RTX 4090 FE | |
| Średnia w klasie Desktop (122 - 2403, n=48, ostatnie 2 lata) | |
| NVIDIA GeForce RTX 3090 Ti | |
| NVIDIA GeForce RTX 3090 | |
| Przeciętny NVIDIA GeForce RTX 3090 (781 - 883, n=18) | |
| Przeciętny NVIDIA GeForce RTX 3080 Ti (854 - 855, n=3) | |
| Przeciętny NVIDIA GeForce RTX 3080 (636 - 643, n=2) | |
| Przeciętny NVIDIA Titan RTX (386 - 439, n=16) | |
| AMD Radeon RX 6800 XT | |
| AMD Radeon RX 6950 XT | |
| V-Ray 5 Benchmark | |
| GPU CUDA | |
| Nvidia GeForce RTX 4090 FE | |
| Średnia w klasie Desktop (356 - 5824, n=40, ostatnie 2 lata) | |
| NVIDIA GeForce RTX 3090 Ti | |
| NVIDIA GeForce RTX 3090 | |
| Przeciętny NVIDIA GeForce RTX 3080 Ti (2045 - 2070, n=3) | |
| Przeciętny NVIDIA GeForce RTX 3090 (1616 - 2131, n=15) | |
| Przeciętny NVIDIA Titan RTX (668 - 1052, n=7) | |
| AMD Radeon RX 6950 XT | |
| GPU RTX | |
| Nvidia GeForce RTX 4090 FE | |
| Średnia w klasie Desktop (1408 - 7496, n=35, ostatnie 2 lata) | |
| NVIDIA GeForce RTX 3090 | |
| NVIDIA GeForce RTX 3090 Ti | |
| Przeciętny NVIDIA GeForce RTX 3090 (2551 - 2979, n=15) | |
| Przeciętny NVIDIA GeForce RTX 3080 Ti (2727 - 2883, n=3) | |
| Przeciętny NVIDIA Titan RTX (1246 - 1348, n=7) | |
* ... im mniej tym lepiej
Profesjonalne aplikacje: Potężny sprzęt upośledzony przez sterowniki
RTX 4090 jest w stanie zaoferować znacznie lepszą wydajność w aplikacjach profesjonalnych niż inne konsumenckie układy GPU ostatniej generacji wyłącznie dzięki swojej potężnej mocy sprzętowej. W końcu to wciąż karta GeForce, więc wydajność w tych aplikacjach jest sztucznie ograniczona przez sterownik
Karta oparta na GA102RTX A6000 ma 109% zysku w testach SPECviewperf wyłącznie dzięki optymalizacji sterowników. Z tego samego powodu nawet mobilny, oparty na Turingu Quadro RTX 5000 jest w stanie zaoferować znacznie lepszą wydajność w Solidworks i Siemens NX, choć pozostaje w tyle w takich obciążeniach jak 3Ds Max i Maya.
Nvidia umożliwia zmianę stanu VRAM ECC nawet w przypadku zwykłych sterowników Game Ready. Opcja ta nie przyda się graczom, ponieważ może zmniejszyć prędkość pamięci. Może jednak przydać się profesjonalistom prowadzącym długie symulacje, którzy mogą wykorzystać ogromną pamięć VRAM RTX 4090, ale nie chcą wydawać mnóstwa pieniędzy na Quadro.
| Nvidia GeForce RTX 4090 FE i9-13900K | NVIDIA GeForce RTX 3090 Ti R7 5800X3D | AMD Radeon RX 6950 XT R9 5900X | AMD Radeon RX 6900 XT R9 5950X | AMD Radeon RX 6800 XT R9 5950X | NVIDIA GeForce RTX 3090 i9-13900K | 4x NVIDIA RTX A6000 TR Pro 3975WX | NVIDIA RTX A6000 TR Pro 3975WX | Przeciętny NVIDIA GeForce RTX 3090 | Przeciętny NVIDIA GeForce RTX 3080 | Przeciętny NVIDIA GeForce RTX 3080 Ti | Przeciętny NVIDIA Titan RTX | Przeciętny NVIDIA RTX A5000 Laptop GPU | Przeciętny NVIDIA Quadro RTX 5000 (Laptop) | Średnia w klasie Desktop | |
|---|---|---|---|---|---|---|---|---|---|---|---|---|---|---|---|
| SPECviewperf 12 | -43% | -20% | -16% | -27% | -34% | 96% | 109% | -38% | -56% | -34% | 67% | 27% | 24% | 16% | |
| 1900x1060 Solidworks (sw-03) (fps) | 119 | 85.7 -28% | 157 32% | 167 40% | 150 26% | 106 -11% | 208 75% | 225 89% | 95.9 ? -19% | 68.6 ? -42% | 103.7 ? -13% | 164.8 ? 38% | 168.2 ? 41% | 156.7 ? 32% | 138.5 ? 16% |
| 1900x1060 Siemens NX (snx-02) (fps) | 28.8 | 15.6 -46% | 49.4 72% | 47.7 66% | 45.07 56% | 17.1 -41% | 333 1056% | 351 1119% | 16.3 ? -43% | 13.1 ? -55% | 16.7 ? -42% | 264 ? 817% | 167.3 ? 481% | 184 ? 539% | 98.6 ? 242% |
| 1900x1060 Showcase (showcase-01) (fps) | 410 | 265 -35% | 308 -25% | 241 -41% | 223 -46% | 263 -36% | 237 -42% | 255 -38% | 257 ? -37% | 190 ? -54% | 256 ? -38% | 193.8 ? -53% | 110.3 ? -73% | 104.3 ? -75% | 306 ? -25% |
| 1900x1060 Medical (medical-01) (fps) | 288 | 87.1 -70% | 58.3 -80% | 88.4 -69% | 77.3 -73% | 90 -69% | 156 -46% | 159 -45% | 97.5 ? -66% | 43.9 ? -85% | 124.8 ? -57% | 94.6 ? -67% | 69.8 ? -76% | 109.3 ? -62% | 180.3 ? -37% |
| 1900x1060 Maya (maya-04) (fps) | 324 | 197 -39% | 90.7 -72% | 151 -53% | 118 -64% | 306 -6% | 147 -55% | 144 -56% | 270 ? -17% | 165.3 ? -49% | 294 ? -9% | 184 ? -43% | 113.8 ? -65% | 121.4 ? -63% | 271 ? -16% |
| 1900x1060 Energy (energy-01) (fps) | 82.6 | 27.6 -67% | 23 -72% | 30.8 -63% | 28.39 -66% | 26 -69% | 39.3 -52% | 39.8 -52% | 25.3 ? -69% | 17.4 ? -79% | 26.7 ? -68% | 28.7 ? -65% | 16.9 ? -80% | 26 ? -69% | 59.7 ? -28% |
| 1900x1060 Creo (creo-01) (fps) | 122 | 76.4 -37% | 115 -6% | 127 4% | 119 -2% | 101 -17% | 127 4% | 136 11% | 90.2 ? -26% | 69.9 ? -43% | 96.3 ? -21% | 153.8 ? 26% | 151.3 ? 24% | 144.4 ? 18% | 114.1 ? -6% |
| 1900x1060 Catia (catia-04) (fps) | 274 | 150 -45% | 199 -27% | 292 7% | 238 -13% | 177 -35% | 208 -24% | 229 -16% | 162.5 ? -41% | 121.1 ? -56% | 172 ? -37% | 239 ? -13% | 177.3 ? -35% | 159 ? -42% | 277 ? 1% |
| 1900x1060 3ds Max (3dsmax-05) (fps) | 473 | 371 -22% | 484 2% | 318 -33% | 167 -65% | 369 -22% | 245 -48% | 336 -29% | 361 ? -24% | 276 ? -42% | 373 ? -21% | 284 ? -40% | 193.9 ? -59% | 450 ? -5% | |
| SPECviewperf 13 | -40% | -10% | -17% | -24% | -36% | 98% | 110% | -40% | -52% | -37% | 58% | 9% | 8% | 20% | |
| Solidworks (sw-04) (fps) | 190 | 118 -38% | 210 11% | 214 13% | 193 2% | 154 -19% | 191 1% | 192 1% | 136.6 ? -28% | 94.5 ? -50% | 150.7 ? -21% | 169.6 ? -11% | 151.3 ? -20% | 144.1 ? -24% | 179 ? -6% |
| Siemens NX (snx-03) (fps) | 51.4 | 28 -46% | 89.7 75% | 85.8 67% | 81.4 58% | 30.7 -40% | 604 1075% | 638 1141% | 28.5 ? -45% | 23.7 ? -54% | 30.1 ? -41% | 477 ? 828% | 298 ? 480% | 307 ? 497% | 178.2 ? 247% |
| Showcase (showcase-02) (fps) | 412 | 265 -36% | 312 -24% | 241 -42% | 232 -44% | 262 -36% | 239 -42% | 255 -38% | 247 ? -40% | 204 ? -50% | 257 ? -38% | 192.8 ? -53% | 117.9 ? -71% | 104.7 ? -75% | 305 ? -26% |
| Medical (medical-02) (fps) | 182 | 113 -38% | 157 -14% | 148 -19% | 130 -29% | 107 -41% | 180 -1% | 184 1% | 100.3 ? -45% | 95.4 ? -48% | 106.3 ? -42% | 90.1 ? -50% | 114.3 ? -37% | 116.1 ? -36% | 224 ? 23% |
| Maya (maya-05) (fps) | 838 | 493 -41% | 372 -56% | 395 -53% | 348 -58% | 580 -31% | 405 -52% | 415 -50% | 525 ? -37% | 400 ? -52% | 574 ? -32% | 425 ? -49% | 235 ? -72% | 235 ? -72% | 611 ? -27% |
| Energy (energy-02) (fps) | 119 | 48.4 -59% | 60.3 -49% | 60.6 -49% | 58.4 -51% | 45.1 -62% | 128 8% | 132 11% | 42.9 ? -64% | 37 ? -69% | 41.4 ? -65% | 52.7 ? -56% | 63.8 ? -46% | 51.7 ? -57% | 102.2 ? -14% |
| Creo (creo-02) (fps) | 580 | 353 -39% | 323 -44% | 292 -50% | 276 -52% | 397 -32% | 292 -50% | 366 -37% | 369 ? -36% | 288 ? -50% | 398 ? -31% | 344 ? -41% | 233 ? -60% | 231 ? -60% | 491 ? -15% |
| Catia (catia-05) (fps) | 406 | 230 -43% | 450 11% | 468 15% | 412 1% | 252 -38% | 359 -12% | 371 -9% | 234 ? -42% | 190.2 ? -53% | 251 ? -38% | 374 ? -8% | 262 ? -35% | 239 ? -41% | 410 ? 1% |
| 3ds Max (3dsmax-06) (fps) | 474 | 373 -21% | 483 2% | 317 -33% | 284 -40% | 369 -22% | 247 -48% | 338 -29% | 347 ? -27% | 266 ? -44% | 372 ? -22% | 283 ? -40% | 196 ? -59% | 187.5 ? -60% | 443 ? -7% |
| SPECviewperf 2020 | -40% | -21% | -30% | -28% | -24% | 57% | 104% | -34% | -46% | -32% | 64% | -6% | 12% | ||
| 3840x2160 Solidworks (solidworks-05) (fps) | 305 | 197 -35% | 125 -59% | 112 -63% | 108 -65% | 192 -37% | 141 -54% | 169 -45% | 178 ? -42% | 158 ? -48% | 184 ? -40% | 171.2 ? -44% | 82.6 ? -73% | 372 ? 22% | |
| 3840x2160 Siemens NX (snx-04) (fps) | 44 | 23.7 -46% | 88.6 101% | 85 93% | 81.7 86% | 25.6 -42% | 367 734% | 481 993% | 24 ? -45% | 19.8 ? -55% | 25.2 ? -43% | 372 ? 745% | 152.3 ? 246% | 86.2 ? 96% | |
| 3840x2160 Medical (medical-03) (fps) | 39.3 | 22.2 -44% | 34.4 -12% | 30.4 -23% | 27.84 -29% | 20.3 -48% | 32.1 -18% | 37.9 -4% | 19.9 ? -49% | 18.5 ? -53% | 21.8 ? -45% | 18.6 ? -53% | 22.8 ? -42% | 44.1 ? 12% | |
| 3840x2160 Maya (maya-06) (fps) | 508 | 353 -31% | 296 -42% | 266 -48% | 224 -56% | 356 -30% | 262 -48% | 329 -35% | 341 ? -33% | 293 ? -42% | 356 ? -30% | 278 ? -45% | 127.7 ? -75% | 441 ? -13% | |
| 3840x2160 Energy (energy-03) (fps) | 65.3 | 31.6 -52% | 47.6 -27% | 32.6 -50% | 60.8 -7% | 101 55% | 46.1 -29% | 63 -4% | 62.4 ? -4% | 51.7 ? -21% | 64.3 ? -2% | 50.1 ? -23% | 87.1 ? 33% | 87.2 ? 34% | |
| 3840x2160 Creo (creo-03) (fps) | 142 | 84.5 -40% | 73.1 -49% | 65.4 -54% | 65 -54% | 118 -17% | 75.6 -47% | 111 -22% | 107.7 ? -24% | 77.6 ? -45% | 113 ? -20% | 127.5 ? -10% | 93.3 ? -34% | 117.5 ? -17% | |
| 3840x2160 CATIA (catia-06) (fps) | 95.6 | 58.6 -39% | 53 -45% | 44.6 -53% | 42.4 -56% | 60.4 -37% | 67.5 -29% | 82.4 -14% | 57 ? -40% | 50 ? -48% | 59.6 ? -38% | 83.8 ? -12% | 58.4 ? -39% | 76.6 ? -20% | |
| 3840x2160 3ds Max (3dsmax-07) (fps) | 213 | 145 -32% | 144 -32% | 121 -43% | 114 -46% | 143 -33% | 95.7 -55% | 137 -36% | 134.7 ? -37% | 100 ? -53% | 139.3 ? -35% | 119.4 ? -44% | 83.9 ? -61% | 167.9 ? -21% | |
| Całkowita średnia (program / ustawienia) | -41% /
-41% | -17% /
-17% | -21% /
-21% | -26% /
-26% | -31% /
-31% | 84% /
85% | 108% /
108% | -37% /
-38% | -51% /
-52% | -34% /
-34% | 63% /
63% | 10% /
10% | 16% /
16% | 16% /
16% |
Benchmarki gier: Najwyższa wydajność rastrowa i RT
Gracze decydujący się na zakup RTX 4090 będą ogólnie zadowoleni z oferowanego wzrostu wydajności rastrowej w porównaniu z RTX 3090 Ti lub RX 6950 XT. Dokładne zyski będą zależeć od samej gry i możliwe, że nie wszystkie gry będą skalować się liniowo ze zwiększoną liczbą shaderów. W zależności od silnika gry możesz również napotkać ograniczenia maksymalnej liczby klatek na sekundę.
Ogólnie rzecz biorąc, RTX 4090 może być nawet o 39%, 59% i 63% szybszy niż RTX 3090 Ti, RX 6950 XT i średni RTX 3090
| Performance rating - Percent | |
| Nvidia GeForce RTX 4090 FE | |
| Średnia w klasie Desktop -6! | |
| NVIDIA GeForce RTX 3090 Ti | |
| AMD Radeon RX 6950 XT | |
| Przeciętny NVIDIA GeForce RTX 3080 Ti | |
| Przeciętny NVIDIA GeForce RTX 3090 | |
| AMD Radeon RX 6900 XT | |
| Przeciętny NVIDIA GeForce RTX 3080 | |
| AMD Radeon RX 6800 XT | |
| Przeciętny NVIDIA Titan RTX | |
| The Witcher 3 | |
| 3840x2160 High Graphics & Postprocessing (Nvidia HairWorks Off) | |
| Nvidia GeForce RTX 4090 FE | |
| Średnia w klasie Desktop (41.7 - 388, n=44, ostatnie 2 lata) | |
| NVIDIA GeForce RTX 3090 Ti | |
| Przeciętny NVIDIA GeForce RTX 3080 Ti (149 - 156.8, n=4) | |
| Przeciętny NVIDIA GeForce RTX 3090 (128 - 160.2, n=14) | |
| AMD Radeon RX 6950 XT | |
| AMD Radeon RX 6900 XT | |
| Przeciętny NVIDIA GeForce RTX 3080 (114 - 115, n=2) | |
| AMD Radeon RX 6800 XT | |
| Przeciętny NVIDIA Titan RTX (94 - 107.1, n=28) | |
| 1920x1080 Ultra Graphics & Postprocessing (HBAO+) | |
| Nvidia GeForce RTX 4090 FE | |
| Średnia w klasie Desktop (7.8 - 369, n=48, ostatnie 2 lata) | |
| AMD Radeon RX 6950 XT | |
| NVIDIA GeForce RTX 3090 Ti (110% PT) | |
| NVIDIA GeForce RTX 3090 Ti (100% PT) | |
| Przeciętny NVIDIA GeForce RTX 3090 (160 - 192.6, n=18) | |
| Przeciętny NVIDIA GeForce RTX 3080 Ti (174 - 184.6, n=4) | |
| AMD Radeon RX 6900 XT | |
| AMD Radeon RX 6800 XT | |
| Przeciętny NVIDIA GeForce RTX 3080 (145 - 152, n=2) | |
| Przeciętny NVIDIA Titan RTX (124 - 150, n=28) | |
| Mafia Definitive Edition | |
| 3840x2160 High Preset | |
| Nvidia GeForce RTX 4090 FE | |
| NVIDIA GeForce RTX 3090 Ti | |
| Przeciętny NVIDIA GeForce RTX 3090 (84.5 - 89.1, n=2) | |
| Przeciętny NVIDIA GeForce RTX 3080 Ti (n=1) | |
| AMD Radeon RX 6950 XT | |
| Przeciętny NVIDIA GeForce RTX 3080 (78.1 - 78.2, n=2) | |
| AMD Radeon RX 6900 XT | |
| Przeciętny NVIDIA Titan RTX (n=1) | |
| AMD Radeon RX 6800 XT | |
| 2560x1440 High Preset | |
| Nvidia GeForce RTX 4090 FE | |
| NVIDIA GeForce RTX 3090 Ti | |
| AMD Radeon RX 6950 XT | |
| Przeciętny NVIDIA GeForce RTX 3090 (142.3 - 149, n=2) | |
| Przeciętny NVIDIA GeForce RTX 3080 Ti (n=1) | |
| Przeciętny NVIDIA GeForce RTX 3080 (127 - 137, n=2) | |
| AMD Radeon RX 6900 XT | |
| AMD Radeon RX 6800 XT | |
| Przeciętny NVIDIA Titan RTX (n=1) | |
| 1920x1080 High Preset | |
| Nvidia GeForce RTX 4090 FE | |
| NVIDIA GeForce RTX 3090 Ti | |
| AMD Radeon RX 6950 XT | |
| Przeciętny NVIDIA GeForce RTX 3080 Ti (n=1) | |
| Przeciętny NVIDIA GeForce RTX 3090 (157 - 158.8, n=2) | |
| Przeciętny NVIDIA GeForce RTX 3080 (144 - 169, n=2) | |
| AMD Radeon RX 6900 XT | |
| Przeciętny NVIDIA Titan RTX (n=1) | |
| AMD Radeon RX 6800 XT | |
Wydajność śledzenia promieni
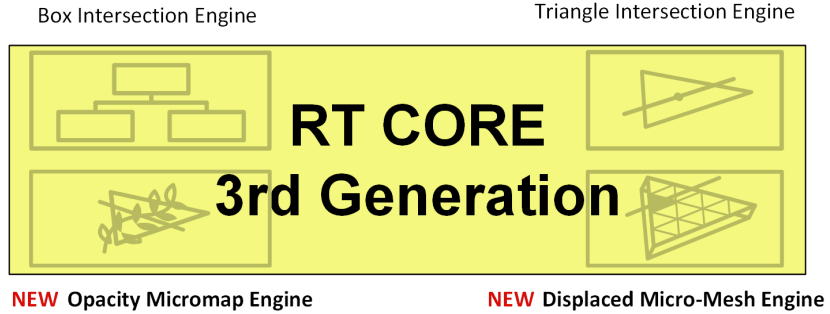
Nowa architektura Ada przynosi ze sobą 128 rdzeni RT trzeciej generacji, co stanowi 52% wzrost liczby rdzeni RT w Ampere. Zasadniczą zmianą w rdzeniach RT Ady jest dodanie dwóch nowych funkcji - Opacity Micromap Engine i Displaced Micro-mesh Engine - oprócz Box Intersection Engine i Triangle Intersection Engine, które pierwotnie były częścią Ampere.
Rdzenie RT Ada posiadają również nowy system planowania Shader Execution Reordering (SER), który efektywnie zmienia kolejność wątków dla promieni wtórnych w celu uzyskania takich efektów jak path tracing, odbicia, oświetlenie pośrednie i półprzezroczystość. Jednak programiści będą musieli skorzystać z SER poprzez API, aby zobaczyć korzyści.
Silnik Box Intersection Engine (przedstawiony w postaci pól po lewej stronie diagramu) wykonuje trawersowanie Bounding Volume Hierarchy (BVH), podczas gdy Triangle Intersection Engine oblicza testy przecięcia promienia z trójkątem.
Nvidia twierdzi, że rdzeń RT Ada może śledzić złożoną geometrię dzięki silnikowi Displaced Micro-mesh Engine, który generuje siatki mikro-trójkątów, oraz przyspieszonym trawersom alfa, wykonywanym przez silnik Opacity Micromap Engine.

Choć dobrze jest widzieć, że Nvidia inwestuje w rozwój technologii renderingu RT, to wyniki w świecie rzeczywistym nie zawsze mogą reprezentować skok wydajności o całą generację. Na przykład Metro Exodus (nie Enhanced Edition) wykazuje tylko 5% wzrost w przypadku RTX 4090 w porównaniu do RTX 3090 Ti w benchmarku Taiga w grze
Korzyści z RT zaczynają być widoczne w przypadku Control i Dying Light 2, które zyskują 42% w porównaniu do RTX 3090 Ti w 1080p bez DLSS. Far Cry 6 i Watch Dogs: Legion to kolejne gry, w których można dostrzec zauważalne korzyści z możliwości RTX 4090 w zakresie ray tracingu.
Prawdopodobnie największe zyski widać w przypadku gier Cyberpunk 2077 i Ghostwire: Tokyo, które obficie wykorzystują odbicia i cienie RT. W grze Cyberpunk 2077 wydajność RT wzrosła o 75% w porównaniu do RTX 3090 Ti w rozdzielczości 4K Ultra bez DLSS i jakości RT ustawionej na Ultra. Jednak liczby te są nadal poniżej 60 klatek na sekundę
wydajność RT w 1080p w grach Cyberpunk 2077 i Ghostwire: Tokyo widzi znaczny wzrost w porównaniu do poprzedniego flagowca Ampere.
| Metro Exodus - 1920x1080 Ultra Quality DXR AF:16x | |
| Średnia w klasie Desktop (159 - 198.2, n=8, ostatnie 2 lata) | |
| Nvidia GeForce RTX 4090 FE | |
| NVIDIA GeForce RTX 3090 Ti | |
| NVIDIA GeForce RTX 3090 | |
| Przeciętny NVIDIA GeForce RTX 3080 Ti (110 - 121.2, n=4) | |
| Przeciętny NVIDIA GeForce RTX 3090 (68.6 - 122.2, n=12) | |
| Przeciętny NVIDIA GeForce RTX 3080 (91.5 - 102, n=2) | |
| AMD Radeon RX 6900 XT | |
| Przeciętny NVIDIA Titan RTX (69 - 95.5, n=23) | |
| AMD Radeon RX 6800 XT | |
| Control - 1920x1080 High Quality Preset & High Ray Tracing Preset (DX12) | |
| Nvidia GeForce RTX 4090 FE | |
| Średnia w klasie Desktop (163.1 - 170.5, n=2, ostatnie 2 lata) | |
| NVIDIA GeForce RTX 3090 Ti | |
| Przeciętny NVIDIA GeForce RTX 3080 Ti (111 - 120.6, n=3) | |
| Przeciętny NVIDIA GeForce RTX 3090 (91.4 - 122.6, n=5) | |
| Przeciętny NVIDIA GeForce RTX 3080 (98.1 - 103, n=2) | |
| AMD Radeon RX 6950 XT | |
| Przeciętny NVIDIA Titan RTX (63 - 120, n=3) | |
| AMD Radeon RX 6900 XT (SAM ENABLED) | |
| AMD Radeon RX 6900 XT | |
| AMD Radeon RX 6800 XT | |
| Watch Dogs Legion - 1920x1080 Ultra Preset + Ultra Ray Tracing (DX12) | |
| Nvidia GeForce RTX 4090 FE | |
| NVIDIA GeForce RTX 3090 Ti | |
| Przeciętny NVIDIA GeForce RTX 3090 (75.7 - 110, n=3) | |
| Przeciętny NVIDIA GeForce RTX 3080 Ti (n=1) | |
| AMD Radeon RX 6800 XT | |
| Przeciętny NVIDIA GeForce RTX 3080 (70.9 - 71.3, n=2) | |
| AMD Radeon RX 6950 XT | |
| AMD Radeon RX 6900 XT | |
| AMD Radeon RX 6900 XT (SAM ENABLED) | |
| Przeciętny NVIDIA Titan RTX (n=1) | |
| Far Cry 6 - 1920x1080 Ultra Graphics Quality + HD Textures + DXR AA:T | |
| Średnia w klasie Desktop (62.2 - 207, n=12, ostatnie 2 lata) | |
| Nvidia GeForce RTX 4090 FE | |
| NVIDIA GeForce RTX 3090 Ti | |
| Przeciętny NVIDIA GeForce RTX 3080 Ti (112 - 128.6, n=2) | |
| Przeciętny NVIDIA GeForce RTX 3090 (76 - 138.2, n=8) | |
| Przeciętny NVIDIA Titan RTX (97 - 109.3, n=2) | |
| AMD Radeon RX 6950 XT | |
| Przeciętny NVIDIA GeForce RTX 3080 (n=1) | |
| Dying Light 2 - 1920x1080 High Quality Raytracing | |
| Nvidia GeForce RTX 4090 FE | |
| Przeciętny NVIDIA GeForce RTX 3090 (67.9 - 109.9, n=3) | |
| Przeciętny NVIDIA GeForce RTX 3080 Ti (n=1) | |
| Przeciętny NVIDIA Titan RTX (n=1) | |
| NVIDIA GeForce RTX 3090 Ti | |
| Przeciętny NVIDIA GeForce RTX 3080 (n=1) | |
| Cyberpunk 2077 1.6 | |
| 3840x2160 Ray Tracing Ultra Preset (DLSS off) | |
| Nvidia GeForce RTX 4090 FE (1.6) | |
| NVIDIA GeForce RTX 3090 Ti (1.52) | |
| Przeciętny NVIDIA GeForce RTX 3090 (19.8 - 22.1, n=6) | |
| Przeciętny NVIDIA GeForce RTX 3080 Ti (n=1) | |
| Przeciętny NVIDIA Titan RTX (n=1) | |
| Przeciętny NVIDIA GeForce RTX 3080 (n=1) | |
| 1920x1080 Ray Tracing Ultra Preset (DLSS off) | |
| Nvidia GeForce RTX 4090 FE (1.6) | |
| NVIDIA GeForce RTX 3090 Ti (1.52) | |
| Przeciętny NVIDIA GeForce RTX 3080 Ti (n=1) | |
| Przeciętny NVIDIA GeForce RTX 3090 (61.3 - 70.4, n=6) | |
| Przeciętny NVIDIA GeForce RTX 3080 (n=1) | |
| Przeciętny NVIDIA Titan RTX (n=1) | |
| Ghostwire Tokyo - 1920x1080 Highest Settings + Maximum Ray Tracing | |
| Średnia w klasie Desktop (n=1ostatnie 2 lata) | |
| Nvidia GeForce RTX 4090 FE | |
| NVIDIA GeForce RTX 3090 Ti | |
| Przeciętny NVIDIA GeForce RTX 3080 Ti (n=1) | |
| Przeciętny NVIDIA GeForce RTX 3090 (106 - 122, n=4) | |
| Przeciętny NVIDIA GeForce RTX 3080 (n=1) | |
| Przeciętny NVIDIA Titan RTX (74.5 - 79, n=2) | |
| low | med. | high | ultra | QHD | 4K | |
|---|---|---|---|---|---|---|
| GTA V (2015) | 188 | 187.9 | 187.4 | 168.6 | 167.9 | 187.6 |
| The Witcher 3 (2015) | 747 | 666 | 606 | 297 | 274 | |
| Dota 2 Reborn (2015) | 292.4 | 268.3 | 252.6 | 239.8 | 228.9 | |
| Final Fantasy XV Benchmark (2018) | 236 | 233 | 230 | 220 | 151.5 | |
| X-Plane 11.11 (2018) | 251 | 216 | 164.8 | 138.6 | ||
| Far Cry 5 (2018) | 239 | 222 | 215 | 203 | 207 | 176 |
| Shadow of the Tomb Raider (2018) | 324 | 316 | 315 | 306 | 282 | 182 |
| Metro Exodus (2019) | 273 | 250 | 215 | 191.2 | 176 | 135 |
| Total War: Three Kingdoms (2019) | 642 | 422 | 332 | 268 | 188 | 100 |
| Control (2019) | 233 | 238 | 238 | 201 | 107.7 | |
| Borderlands 3 (2019) | 242 | 217 | 203 | 201 | 190 | 133.4 |
| Doom Eternal (2020) | 855 | 826 | 679 | 680 | 572 | 364 |
| Mafia Definitive Edition (2020) | 291 | 267 | 255 | 238 | 160.2 | |
| Watch Dogs Legion (2020) | 189.5 | 187.7 | 172.5 | 160.3 | 151.9 | 111.6 |
| Assassin´s Creed Valhalla (2020) | 303 | 274 | 235 | 206 | 173 | 120 |
| F1 2021 (2021) | 663 | 616 | 573 | 289 | 273 | 192 |
| Far Cry 6 (2021) | 234 | 214 | 193 | 182 | 175 | 132 |
| Call of Duty Vanguard (2021) | 286 | 329 | 301 | 239 | 161.4 | |
| Forza Horizon 5 (2021) | 388 | 275 | 266 | 198 | 186 | 151 |
| Rainbow Six Extraction (2022) | 530 | 489 | 468 | 446 | 343 | 198 |
| Dying Light 2 (2022) | 363 | 315 | 276 | 204 | 105.2 | |
| Cyberpunk 2077 1.6 (2022) | 241 | 233 | 222 | 210 | 147 | 77.8 |
| Ghostwire Tokyo (2022) | 301 | 300 | 302 | 301 | 299 | 167.2 |
| F1 22 (2022) | 387 | 411 | 381 | 199.2 | 149.6 | 80.5 |
| Call of Duty Modern Warfare 2 2022 (2022) | 364 | 335 | 291 | 285 | 216 | 139 |
Uwaga dotycząca generowania ramki DLSS 3
Nvidia chce, aby gracze wykorzystali ich nową technologię generowania klatek DLSS 3 z ray tracingiem, aby uzyskać trzycyfrową liczbę klatek. DLSS 3 generuje klatki pośrednie pomiędzy klatką 1 i 2, teoretycznie podwajając liczbę klatek. Jednakże nie wszystkie gry obsługują tę funkcję, a ponadto wiąże się ona z dodatkowym opóźnieniem, co wymaga nieuchronnego włączenia funkcji Nvidia Reflex.
DLSS 3 jest wstecznie kompatybilny z DLSS 2 i może być włączony niezależnie lub w połączeniu z innymi upscalerami, takimi jak Intel XeSS czy AMD FSR. Aspekt super rozdzielczości nie uległ zmianie, ale tutaj pojawiają się zasłony dla posiadaczy RTX 30. Ampere posiada co prawda samodzielny akcelerator przepływów optycznych (OFA), ale ten w Adzie jest 2x mocniejszy i może zapewnić wydajność 300 TOPS według Nvidii. W konsekwencji generowanie klatek DLSS 3 nie będzie obsługiwane przez układy GPU Ampere i na razie jest wyłączne dla Ady.
Generowanie klatek może być dobrodziejstwem dla gier ograniczonych przez CPU. Trzeba tu jednak zaznaczyć, że generowanie klatek nie odbywa się u źródła, więc w ostatecznym rozrachunku nadal można mieć do czynienia z grą z ograniczeniem CPU. To, czy będziesz w stanie dostrzec przerywane klatki, czy nie, zależy od tego, jak szybka jest akcja w grze i ogólna implementacja.
Większość narzędzi opartych na PresentMon, takich jak CapFrameX, których regularnie używamy do naszych pomiarów w grach, może nie zawsze widzieć pośrednie klatki. Dlatego uchwycenie dokładnych fps-ów przy włączonym generowaniu klatek wymaga użycia narzędzia FrameView 1.4 firmy Nvidia.
AMD zaoferuje również własną technikę generowania klatek zwaną Fluid Motion Frame w nadchodzącej aktualizacji FSR 3 w przyszłym roku, miejmy nadzieję, że z odrobiną uczenia maszynowego. Porównania pomiędzy DLSS 3 i FSR 3 będą interesujące.
Emisje: Lepsze termiki i hałas wentylatora w porównaniu z konstrukcją referencyjną
Nvidia już od jakiegoś czasu przybija gwoździem konstrukcję termiczną w przypadku kart Founders Edition i nie inaczej jest w przypadku RTX 4090 FE. Ta flagowa karta referencyjna Ada jest w większości chłodnym klientem, ze znośnym szumem wentylatora nawet pod obciążeniem.
Chcielibyśmy tutaj wspomnieć, że podkręcanie działa inaczej z Adą w porównaniu do Ampere. Algorytmy boost w Ampere polegały na limitach mocy, aby zwiększyć zegary. Nvidia twierdzi, że ponieważ Ada jest znacznie bardziej energooszczędna, procesor graficzny najpierw patrzy na maksymalne zegary i limity napięcia, aby zwiększyć zegary oportunistycznie, zanim dojdzie do limitów mocy. Dlatego teoretycznie powinno być możliwe uzyskanie lepszej krzywej napięcie-częstotliwość przy tej samej mocy
W naszych testach udało nam się uzyskać około +205 MHz na rdzeniu, +1650 MHz na pamięci i 133% mocy przy maksymalnym napięciu rdzenia w MSI Afterburner. To było maksimum, jakie mogliśmy osiągnąć, zanim zauważyliśmy artefakt w benchmarku Heaven 4.0. Należy pamiętać, że nie wszystkie obciążenia tolerują te ustawienia. Dla przykładu, FurMark w rozdzielczości 1080p spowodowałby awarię sterownika przy tych ustawieniach, podczas gdy nie mieliśmy żadnych problemów z uruchomieniem 3DMark Port Royal.
Testy warunków skrajnych
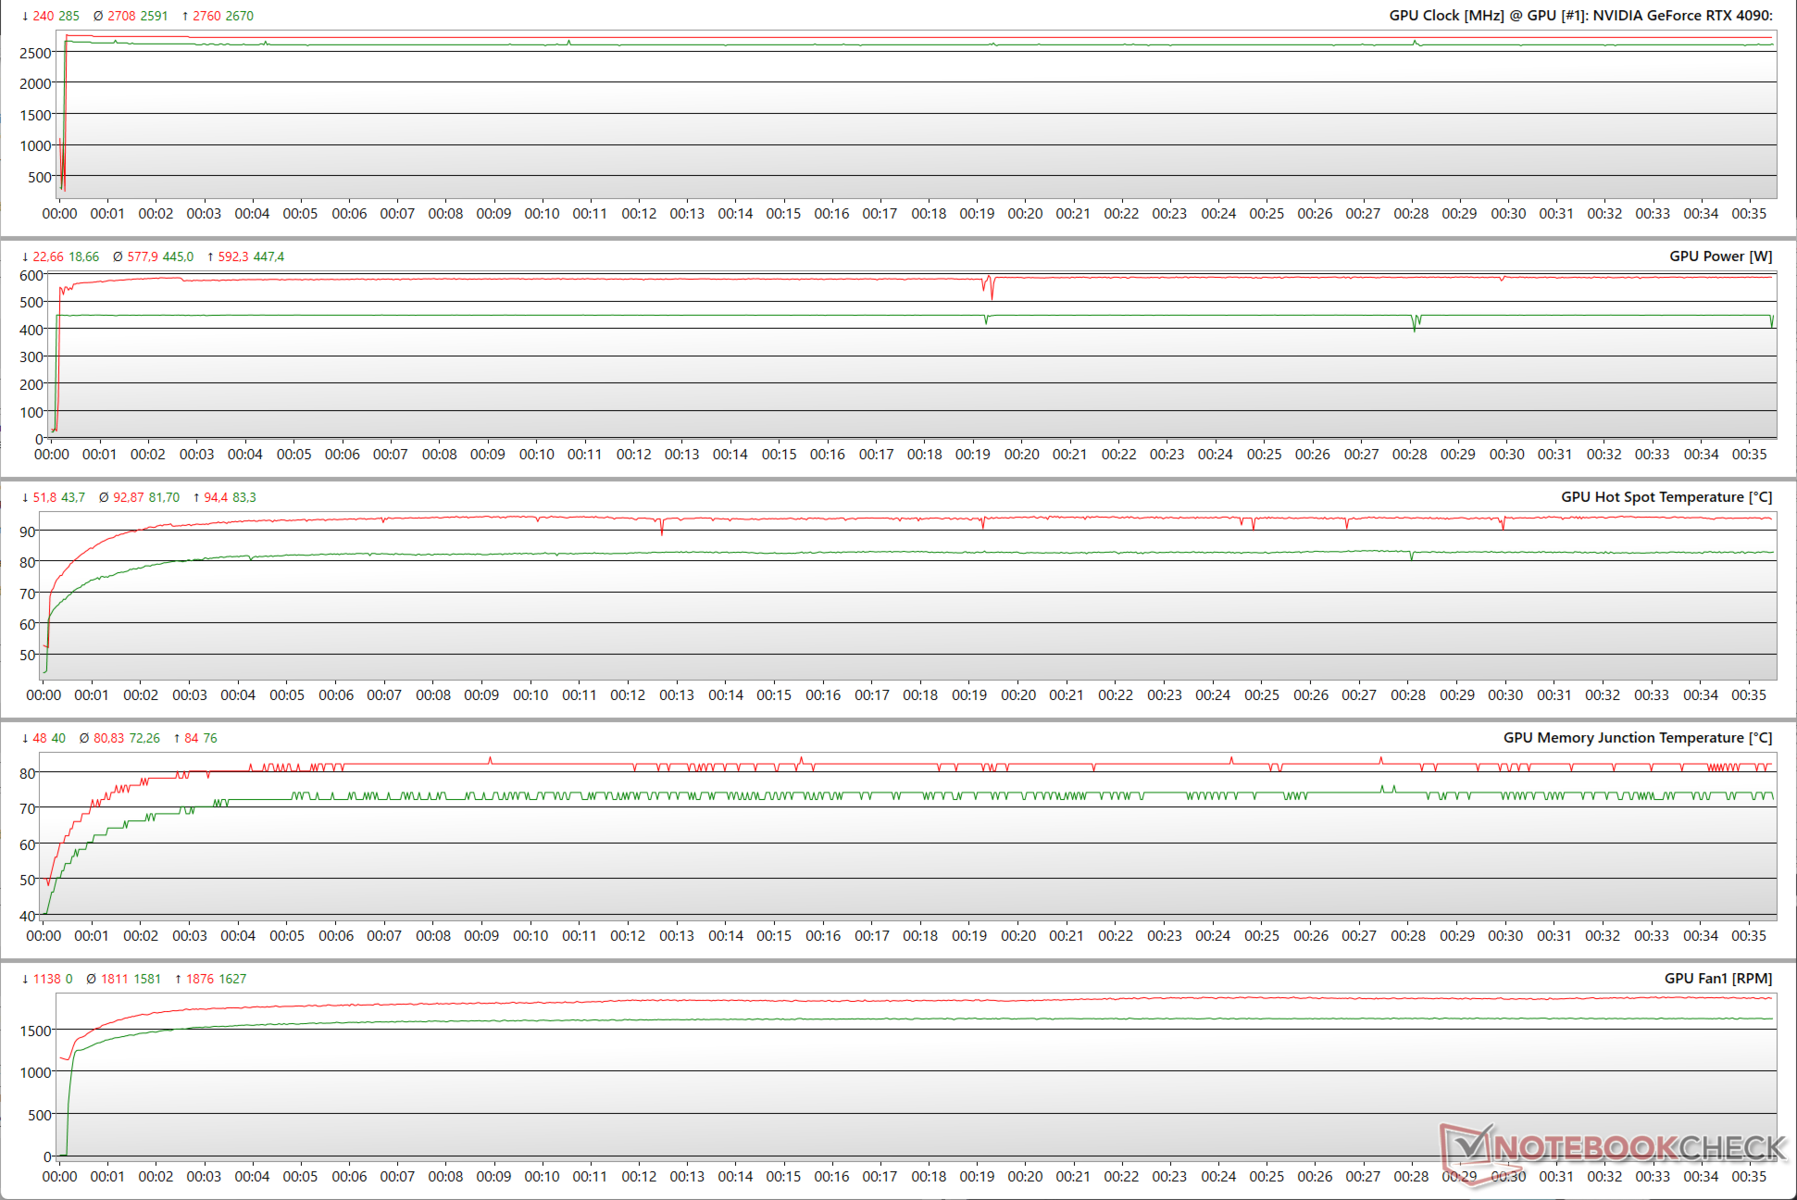
Testy obciążeniowe z użyciem FurMark 1.19 w rozdzielczości 1280x720 z wyłączonym AA pokazują, że taktowanie GPU stabilizuje się na poziomie 2 591 MHz przy 100% poborze mocy (cel energetyczny), a przy 133% poborze mocy może wzrosnąć do szczytowego poziomu 2 760 MHz, przy czym TGP wzrasta do 592 W
Prędkość obrotowa wentylatora osiąga maksymalnie 65% wartości znamionowej przy 1,876 RPM przy wyższym PT, a poza tym pozostaje dość stabilna przy 1,581 RPM w ustawieniu domyślnym. W ustawieniach domyślnych temperatura gorącego punktu procesora graficznego oscyluje wokół 82°C, natomiast po podkręceniu może wzrosnąć do 93°C.
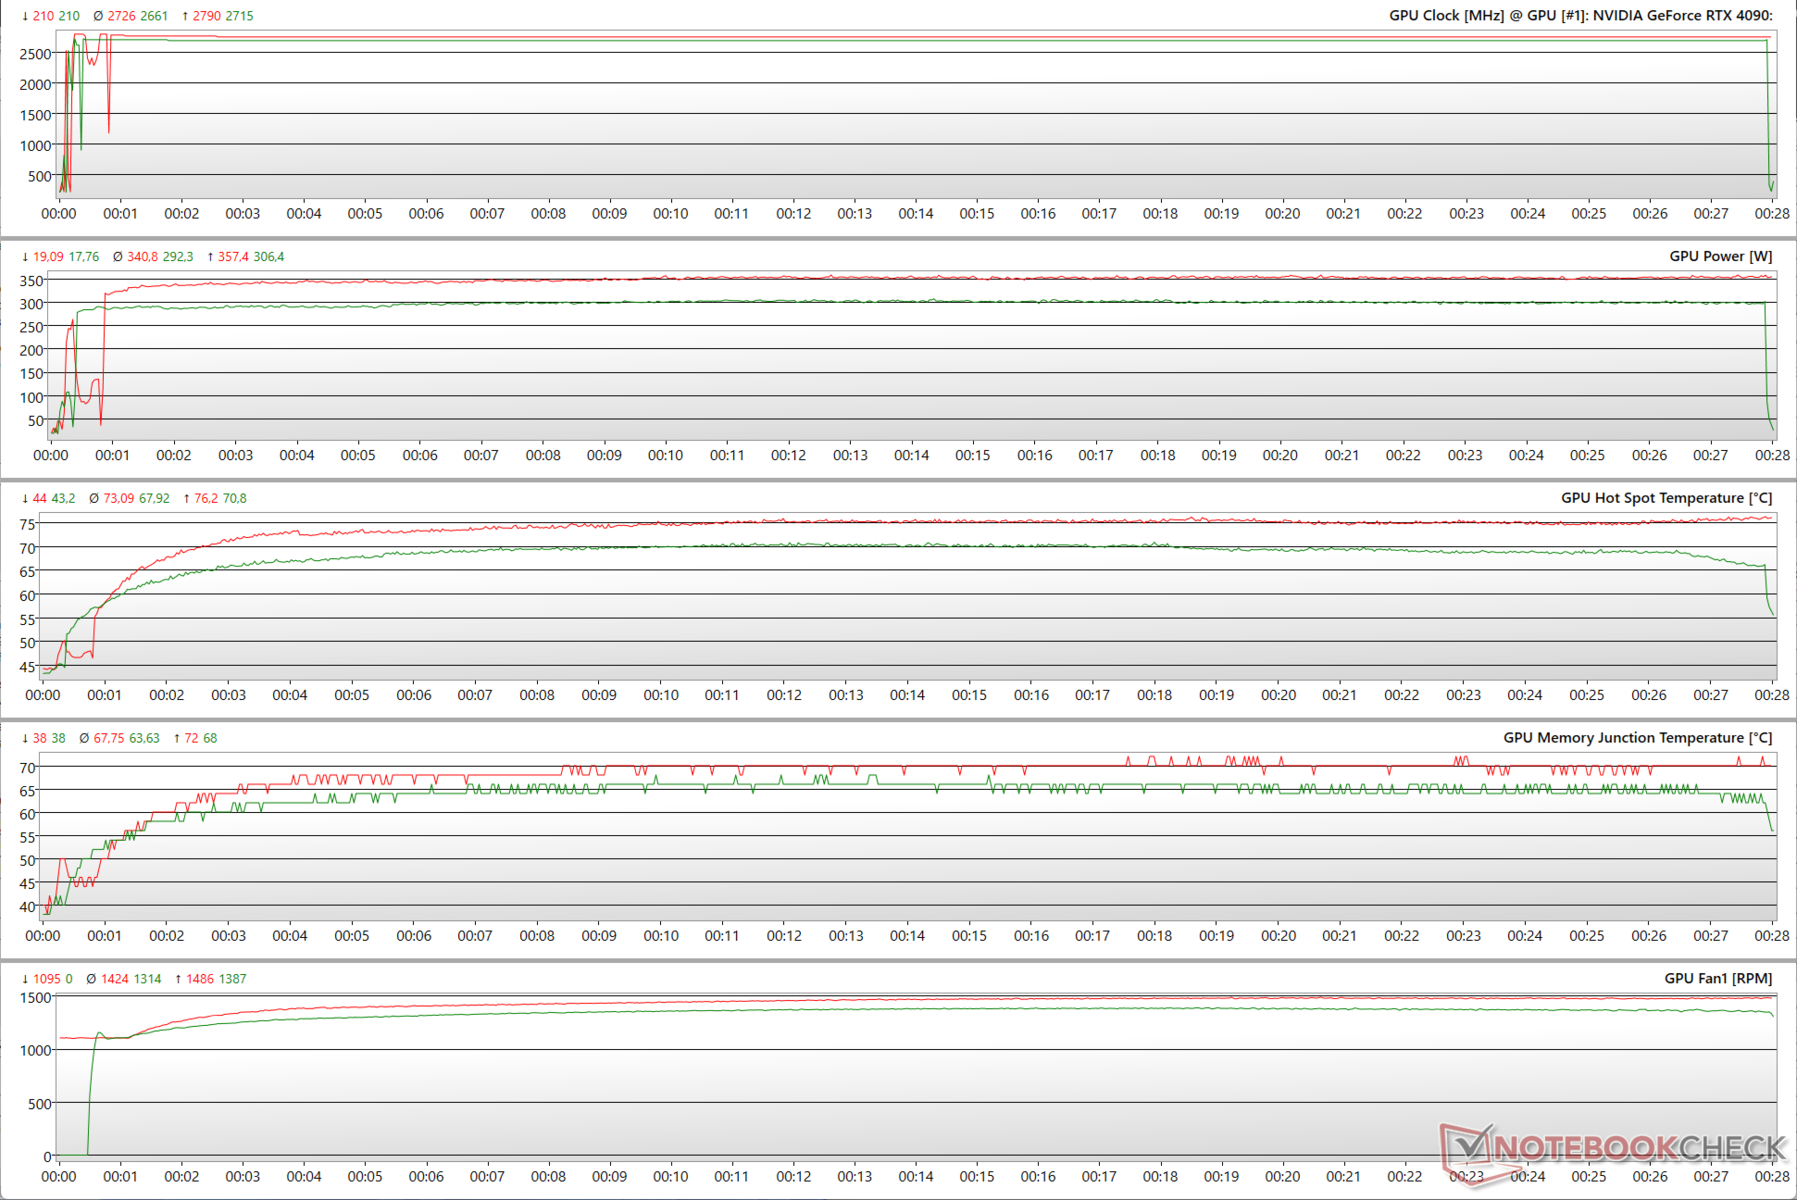
Podobny schemat można zaobserwować podczas testów The Witcher 3 w rozdzielczości 1080p Ultra, ale w tym przypadku obserwujemy chłodniejszą pracę - temperatura punktu gorącego nawet przy podkręceniu wynosi około 73 °C. Prędkości wentylatorów są również stosunkowo niższe.
Wynika to z dużo niższego maksymalnego poboru mocy, który wynosi zaledwie 306 W w ustawieniach domyślnych i około 357 W w OC, co jest faktycznie dużo bardziej wydajne niż to, co obserwowaliśmy w przypadku modelu Zotac RTX 3090 Ti AMP Extreme Holo który w tym stress teście zużywał 416 W nawet bez OC.
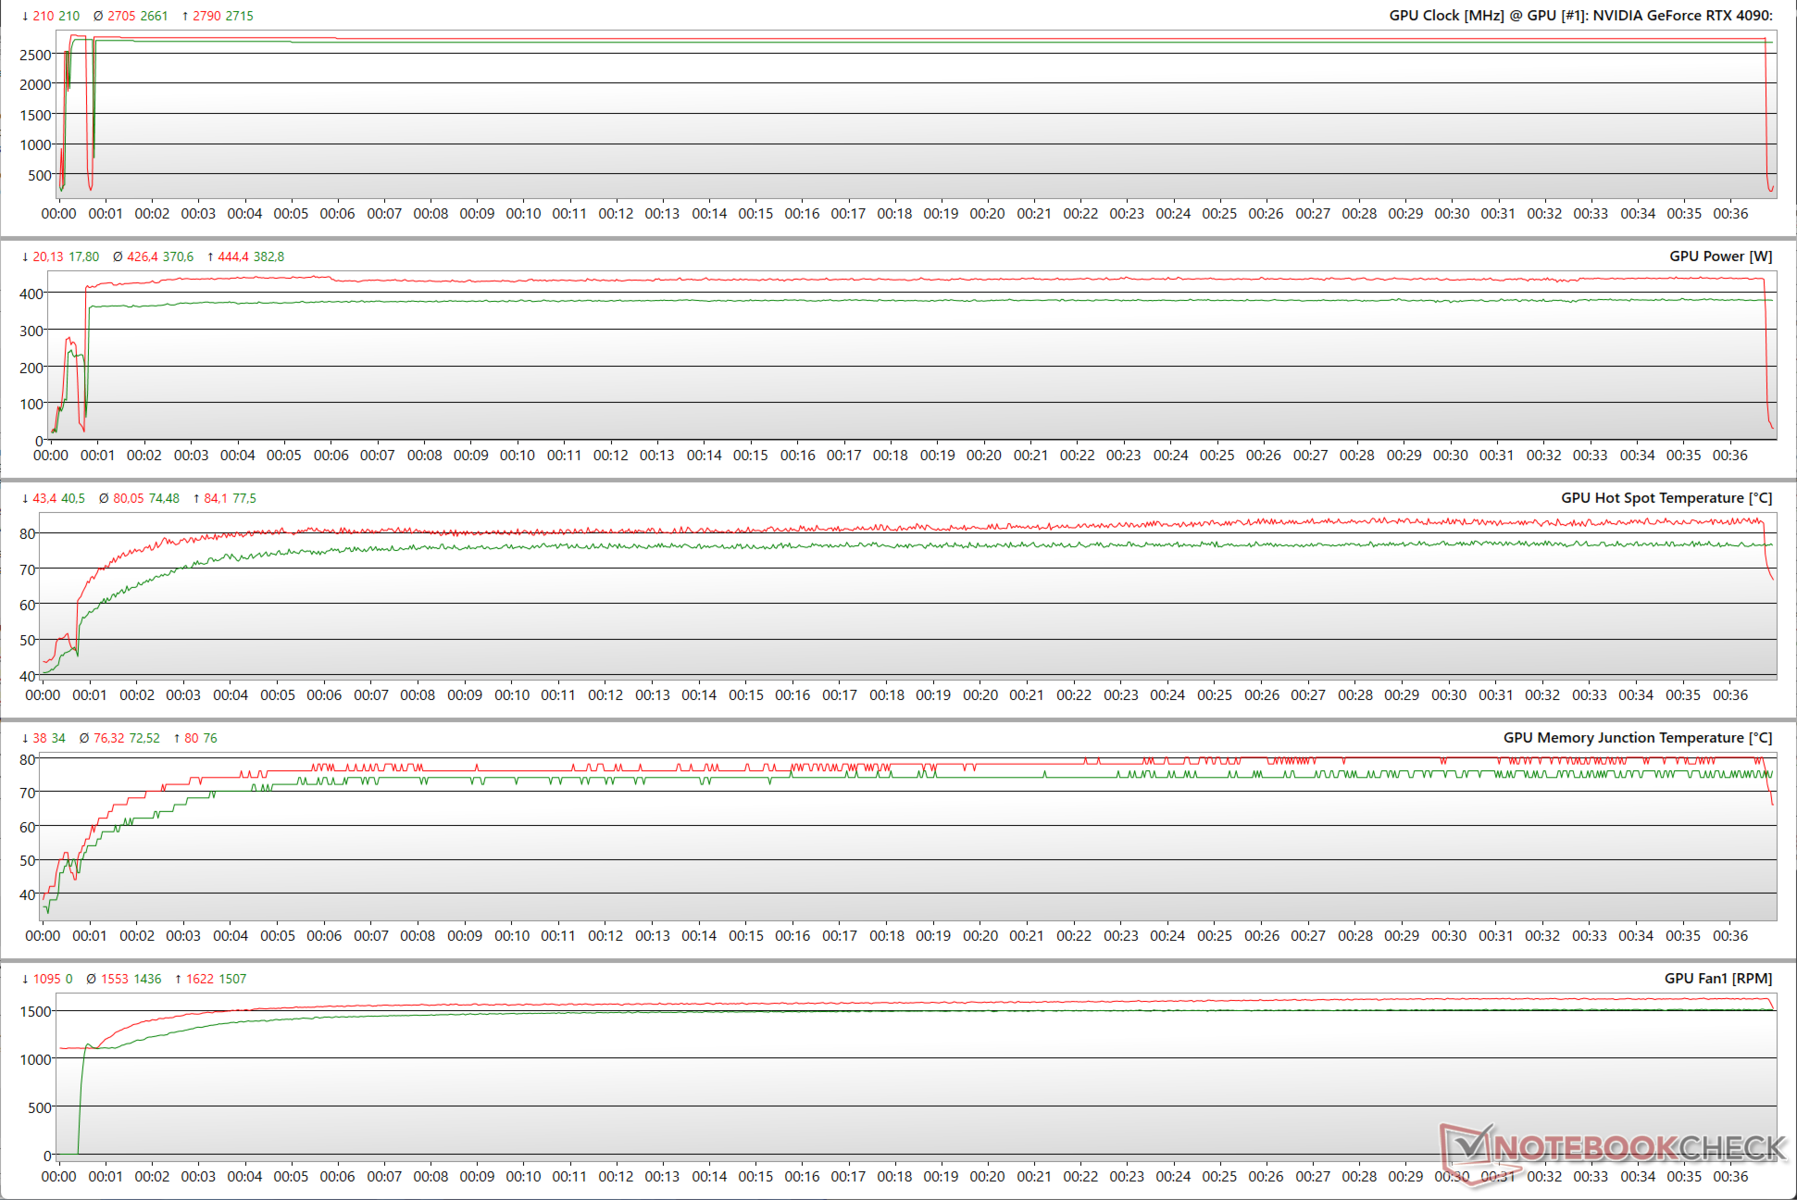
Stresowanie z The Witcher 3 w 4K Ultra powoduje, że TGP wzrasta do 382 W maksimum w trybie domyślnym i blisko 445 W w OC. Nie zaobserwowaliśmy dużej różnicy w zegarach w obu ustawieniach. Temperatura w gorącym punkcie w tym stresie osiągnęła jednak maksymalnie 77,5°C bez OC.
Wykres Witcher 3 FPS
Na stronie Witcher 3 widać ogólnie stabilną liczbę klatek na sekundę zarówno w 1080p Ultra, jak i 4K Ultra, co wskazuje, że system chłodzenia karty pozwala jej działać z pełnym potencjałem bez throttlingu.
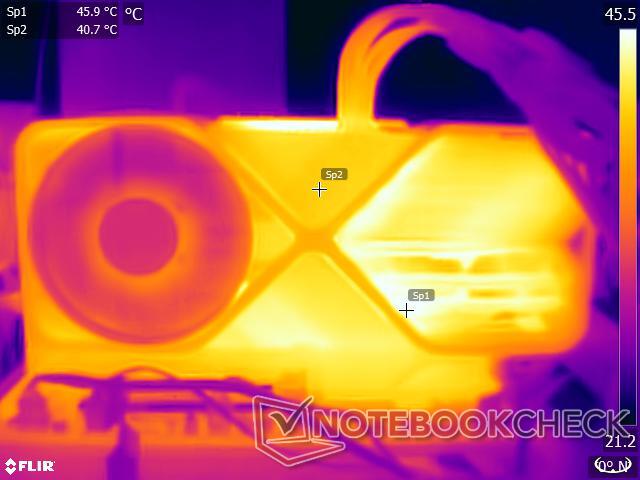
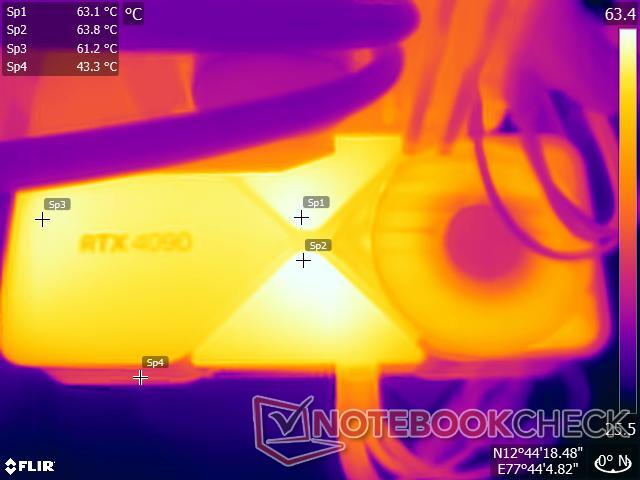
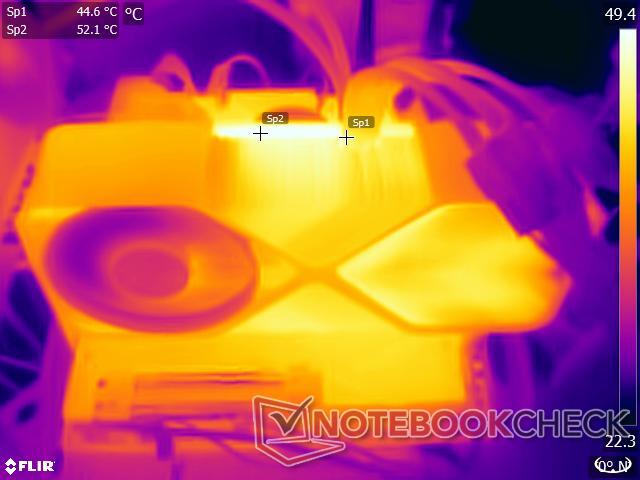
Temperatury powierzchniowe
Dzięki wydajnemu chłodzeniu i odprowadzaniu ciepła, temperatury powierzchni na RTX 4090 FE są bardzo znośne. Odnotowaliśmy blisko zaledwie 64 °C jako maksymalną temperaturę powierzchni w stresie przy temperaturze otoczenia wynoszącej około 23 °C. Temperatura w pobliżu zasilacza była stosunkowo chłodna, blisko 45 °C, co wskazuje na brak niepożądanych oznak topnienia.
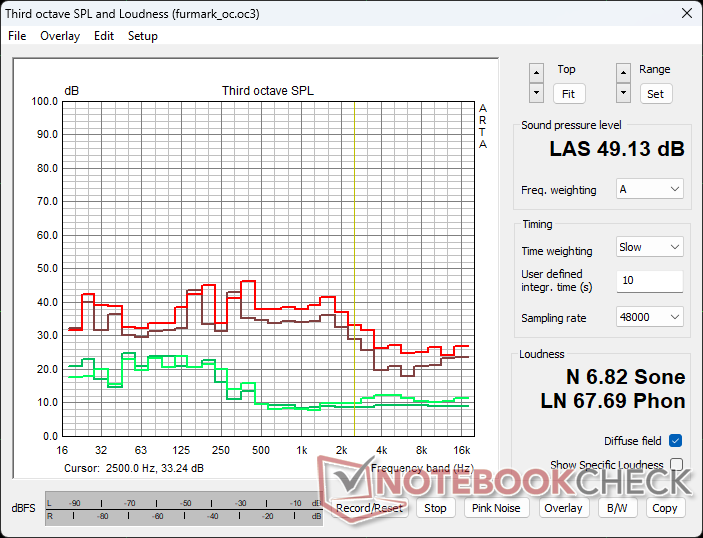
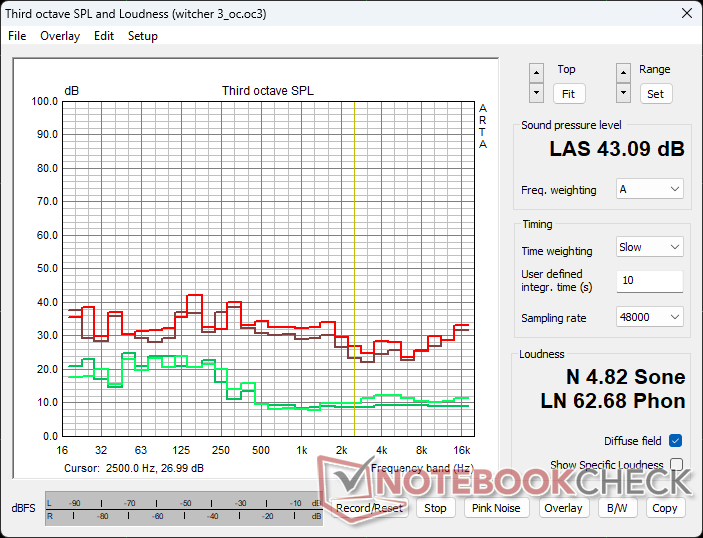
Poziomy hałasu
Zmierzyliśmy hałas wentylatorów w odległości 20 cm od stanowiska testowego, przy wyłączonych wszystkich wentylatorach oprócz pompki Cooler Master AIO. Odnotowaliśmy odpowiednio 22,1 dB(A) i 23,47 dB(A) jako szum otoczenia i szum systemu w stanie spoczynku
Przy 100% mocy FurMark stress powoduje, że wentylatory kręcą się z maksymalną prędkością 53% swojej prędkości znamionowej. Skutkuje to emisją hałasu na poziomie 44,42 dB(A). Po podkręceniu do 133% mocy wentylatory kręcą się teraz z prędkością 65%, co skutkuje wyższym poziomem ciśnienia akustycznego (SPL) o 49,13 dB(A)
Podobnie przy 100% mocy, Wiedźmin 3 w 1080p Ultra skutkuje tylko 43% obrotów wentylatorów i SPL na poziomie 40,79 dB(A). Po podkręceniu do 133% mocy obserwujemy 47% maksymalnych obrotów wentylatora i emisję hałasu na poziomie 43,09 dB(A).
Nvidia implementuje całkowite zatrzymanie wentylatora, gdy karta nie jest opodatkowana. Podsumowując, RTX 4090 FE ma stonowany profil hałasu w ustawieniach domyślnych i jest to jeden z obszarów, w którym karty Nvidia Founders Edition mogą mieć znaczną przewagę nad swoimi odpowiednikami z serii AiB.
Zużycie prądu: Szykują się wysokie rachunki za energię
Przy ustawieniach stockowych całkowity pobór mocy ze ściany w FurMark jest mniej więcej na liniach tego, co wcześniej widzieliśmy z RTX 3090 Ti i RX 6950 XT. Po podkręceniu, RTX 4090 FE może zużywać nawet 25% więcej energii niż RX 6950 XT. W porównaniu z OC'd Zotac RTX 3090 Ti AMP Extreme Holo, całkowity pobór mocy przy OC RTX 4090 FE jest o około 9% wyższy
Na stronie Witcher 3 w rozdzielczości 1080p Ultra, RTX 4090 FE okazuje się być bardziej oszczędną kartą w porównaniu do RX 6950 XT, który ma o 18% wyższe zużycie energii w ustawieniach fabrycznych, co jest również o 7% wyższe w porównaniu do nawet podkręconego RTX 4090 FE
Choć Ada obiecuje większą wydajność przy tym samym TGP, co Ampere, to nadal powinieneś być przygotowany na rozdęte rachunki za energię w przypadku RTX 4090 FE.
Power Consumption: External Monitor
| Power Consumption | |
| 1280x720 FurMark 1.19 GPU Stress Test (external Monitor) | |
| Nvidia GeForce RTX 4090 FE (133% PT OC, Idle: 81.25 W) | |
| Nvidia GeForce RTX 4090 FE (100% PT, Idle: 81.25 W) | |
| NVIDIA GeForce RTX 3090 Ti (110% PT, Idle: 102 W) | |
| NVIDIA GeForce RTX 3090 Ti (100% PT; Quiet BIOS, Idle: 102 W) | |
| NVIDIA GeForce RTX 3090 Ti (100% PT; Amplify BIOS, Idle: 102 W) | |
| AMD Radeon RX 6950 XT | |
| Przeciętny NVIDIA GeForce RTX 3080 (Idle: 492 - 505, n=2 W) | |
| Przeciętny NVIDIA GeForce RTX 3090 (Idle: 281 - 551, n=9 W) | |
| Przeciętny NVIDIA GeForce RTX 3080 Ti (Idle: 427 - 513, n=3 W) | |
| AMD Radeon RX 6900 XT (Idle: 99.15 W) | |
| AMD Radeon RX 6800 XT (Idle: 99.5 W) | |
| Przeciętny NVIDIA Titan RTX (Idle: n=1 W) | |
| Średnia w klasie Desktop (Idle: 70 - 743, n=38, ostatnie 2 lata W) | |
| 1920x1080 The Witcher 3 ultra (external Monitor) | |
| AMD Radeon RX 6950 XT | |
| NVIDIA GeForce RTX 3090 Ti (110% PT, Idle: 102 W) | |
| NVIDIA GeForce RTX 3090 Ti (100% PT, Idle: 102 W) | |
| Nvidia GeForce RTX 4090 FE (133% PT OC, Idle: 81.25 W) | |
| Nvidia GeForce RTX 4090 FE (100% PT, Idle: 81.25 W) | |
| NVIDIA GeForce RTX 3090 | |
| Przeciętny NVIDIA GeForce RTX 3090 (Idle: 464 - 597, n=18 W) | |
| Przeciętny NVIDIA GeForce RTX 3080 Ti (Idle: 490 - 528, n=3 W) | |
| AMD Radeon RX 6800 XT (Idle: 99.5 W) | |
| Przeciętny NVIDIA GeForce RTX 3080 (Idle: 498 - 505, n=2 W) | |
| AMD Radeon RX 6900 XT (Idle: 99.15 W) | |
| Średnia w klasie Desktop (Idle: 69 - 692, n=44, ostatnie 2 lata W) | |
| Przeciętny NVIDIA Titan RTX (Idle: 371 - 463, n=27 W) | |
* ... im mniej tym lepiej
Za
Przeciw
Werdykt: Jeden układ GPU, który rządzi nimi wszystkimi
Wypuszczając RTX 4090 wcześniej niż karty z głównego nurtu, takie jak RTX 4080 i niższe, Nvidia chce pokazać światu, jak potężna może być jej nowa architektura Ada Lovelace. Oprócz ogromnego wzrostu liczby rdzeni CUDA, Tensor i RT w połączeniu z korzyściami płynącymi z wydajności niestandardowego procesu 4N firmy TSMC, Ada przynosi ze sobą nowe potoki graficzne, takie jak zmiana kolejności wykonywania shaderów, ulepszona akceleracja przepływów optycznych i nowe funkcje rdzenia RT nieobecne w Ampere.
RTX 4090 Founders Edition charakteryzuje się tym samym językiem projektowania, który wcześniej dobrze wróżył Nvidii w przypadku RTX 3090 Founders Edition. Dzięki temu Nvidia może zaoferować doskonałą wydajność termiczną i akustyczną, która wyznacza punkt odniesienia dla kart partnerów AiB
RTX 4090 FE sprawia, że liczby mówią same za siebie. To bezsprzecznie upragniony heroiczny procesor graficzny tej generacji, który jeszcze przez długi czas pozostanie niekwestionowany."
Choć problemy związane z nowym złączem 12VHPWR są niepokojące, dobrze jest widzieć, że Nvidia w końcu oferuje jakieś wytchnienie dla poszkodowanych użytkowników. Liczby dotyczące wydajności nie wymagają dalszych wyjaśnień, ale zaleca się sprawdzenie, jak wiele korzyści zyska Twój specyficzny tok pracy, zanim wydasz pieniądze na tę kartę.
Aby w pełni wykorzystać możliwości RTX 4090, należy upewnić się, że w systemie nie ma absolutnie żadnych wąskich gardeł. Nawet najnowsze układy Intel 13. generacji i AMD Ryzen 7000 mogą nie poradzić sobie z zasileniem RTX 4090 w zależności od gry i ustawień rozdzielczości.
Wszystkie te wzrosty wydajności nie są jednak tanie. Może się okazać, że zainwestujesz w kompletny przegląd specyfikacji, jeśli Twój komputer ma już kilka lat. Pobór mocy jest podobny do RTX 3090 Ti i RX 6950 XT w ustawieniach stockowych, ale mimo wszystko są one po wyższej stronie.
RTX 4090 to karta klasy Titan i lepiej nadaje się dla profesjonalistów, którzy również grają. Mainstreamowi gracze lepiej poradzą sobie z GPU z serii RTX 4080 i niższych. Pewność siebie firmy AMD , która chce prześcignąć RTX 4080 w znacznie niższej cenie, jest również pozytywnym znakiem, ale wstrzymamy się z osądem, gdy przetestujemy RX 7900 XT i RX 7900 XTX.
Nie poruszyliśmy w tej recenzji takich aspektów jak porównanie jakości obrazu DLSS 3 i wydajności podwójnych koderów NVENC. Na razie jednak nie jest hiperbolą stwierdzenie, że na RTX 4090 będą spoglądać inne GPU zarówno własne, jak i konkurencji
Za cenę 1 599 USD MSRP, która jest w rzeczywistości o 400 USD niższa niż to, co RTX 3090 Ti FE kosztował w tamtych czasach, jest to dość znaczące osiągnięcie.
Cena i dostępność
Nvidia GeForce RTX 4090 można kupić we wszystkich głównych e-tailerach PC i sklepach murowanych na całym świecie w formatach Founders Edition i AiB, ale zapasy są nadal problemem. Obecnie Best Buyoferuje RTX 4090 Founders Edition w cenie 1 599 USD MSRP, ale w chwili pisania tego tekstu zapasy są wyprzedane.
W Indiach, RTX 4090 FE kosztuje ₹1,55,000 MSRP. Jednakże, RP Tech oferuje kartę za ₹1,58,000 i jest jedynym dystrybutorem kart Founders Edition w tym kraju. Karty są obecnie niedostępne w magazynie, ale potencjalni nabywcy mogą złożyć wniosek online i cierpliwie czekać na e-mail z linkiem do zakupu.
Price comparison

