Recenzja komputera stacjonarnego Minisforum NUCXi7: Ultra płaski komputer do gier z GeForce RTX 3070 i Core i7-11800H

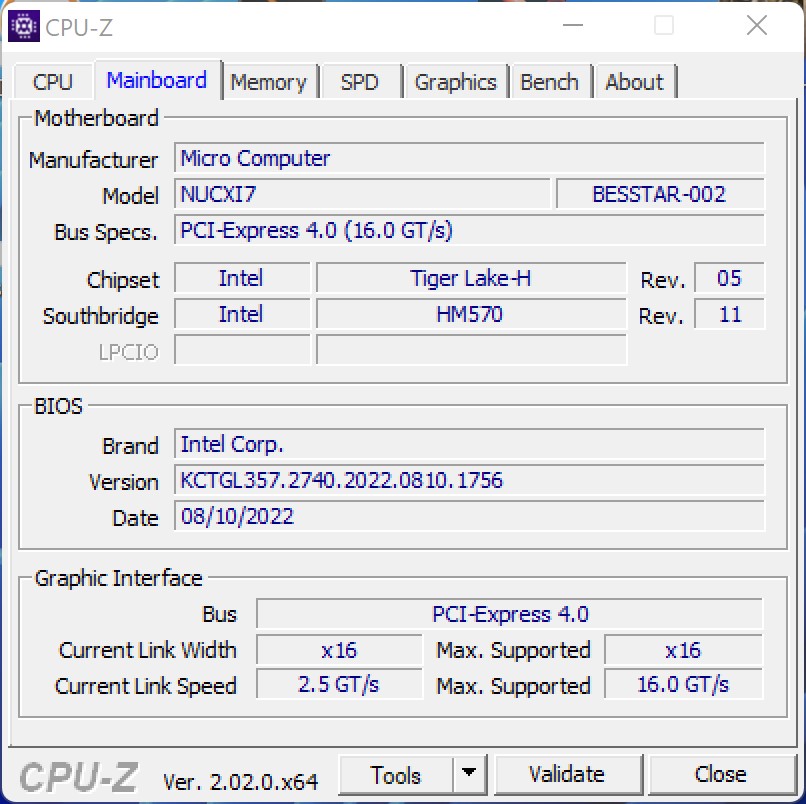
Firma Minisforum znana jest w tym kraju (Niemcy) jako producent systemów dla mini PC. Jednak z serią NUCX producent celuje w nieco inną grupę docelową użytkowników, oferując w tym modelu w pełni funkcjonalny komputer do gier. Nie jest to zwykły komputer stacjonarny, a ultra smukły PC o przyzwoitej mocy. Bazuje on na płycie głównej Intel NUC-XI5, która jest wykorzystywana również w laptopach.
NUCX jest obecnie dostępny w dwóch podstawowych konfiguracjach, które różnią się zarówno procesorami jak i układami graficznymi. Z jednej strony mamy Minisforum NUCXi5, który bazuje na Intel Core i5-11400Hw połączeniu zGPU Nvidia GeForce RTX 3060 "Laptop, a z drugiej strony MinisForum NUCXi7 z.Intel Core i7-11800Hw połączeniu z Nvidia GeForce RTX 3070 Laptop GPU. Jeśli chodzi o ich cenę, modele zaczynają się jako systemy barebone odpowiednio od 1 199 euro (~1 195 dolarów) i 1 449 euro (~1 444 dolarów). Nasza jednostka testowa, NUCXi7 z 16 GB pamięci RAM i 512-GB dyskiem SSD, kosztuje 1 629 euro (~1 623 dolarów) z preinstalowanym już systemem Windows 11 w wersji Pro.
W tej recenzji inne kompaktowe komputery stacjonarne służą jako urządzenia porównawcze. Aby odzwierciedlić bezpośrednie porównanie wydajności GPU, do grona naszych testowych konkurentów włączyliśmy również podobnie wyposażony laptop do gier.
Potencjalni konkurenci w porównaniu
Ocena | Data | Model | Waga | Wysokość | Cena |
|---|---|---|---|---|---|
v7 (old) | 10/2022 | Minisforum NUCX i7 i7-11800H, GeForce RTX 3070 Laptop GPU | 2.4 kg | 393 mm | |
v (old) | Intel Beast Canyon NUC i9-11900KB, GeForce RTX 3060 | 189 mm | |||
v (old) | Zotac Magnus One (ECM73070C) i7-10700, GeForce RTX 3070 | ||||
v (old) | Zotac ZBOX Magnus EN173070C i7-11800H, GeForce RTX 3070 Laptop GPU | 1.8 kg | 62.2 mm | ||
v (old) | Intel Dragon Canyon NUC - RTX 3060 i9-12900, GeForce RTX 3060 | 189 mm | |||
v (old) | Zotac MEK Mini (RTX 2070 Super) i7-9700, GeForce RTX 2070 Super (Desktop) | ||||
| 83.2 % v7 (old) | Gigabyte A7 X1 R9 5900HX, GeForce RTX 3070 Laptop GPU | 2.5 kg | 34 mm |
Minisforum NUCXi7 w szczegółach

Sprawa
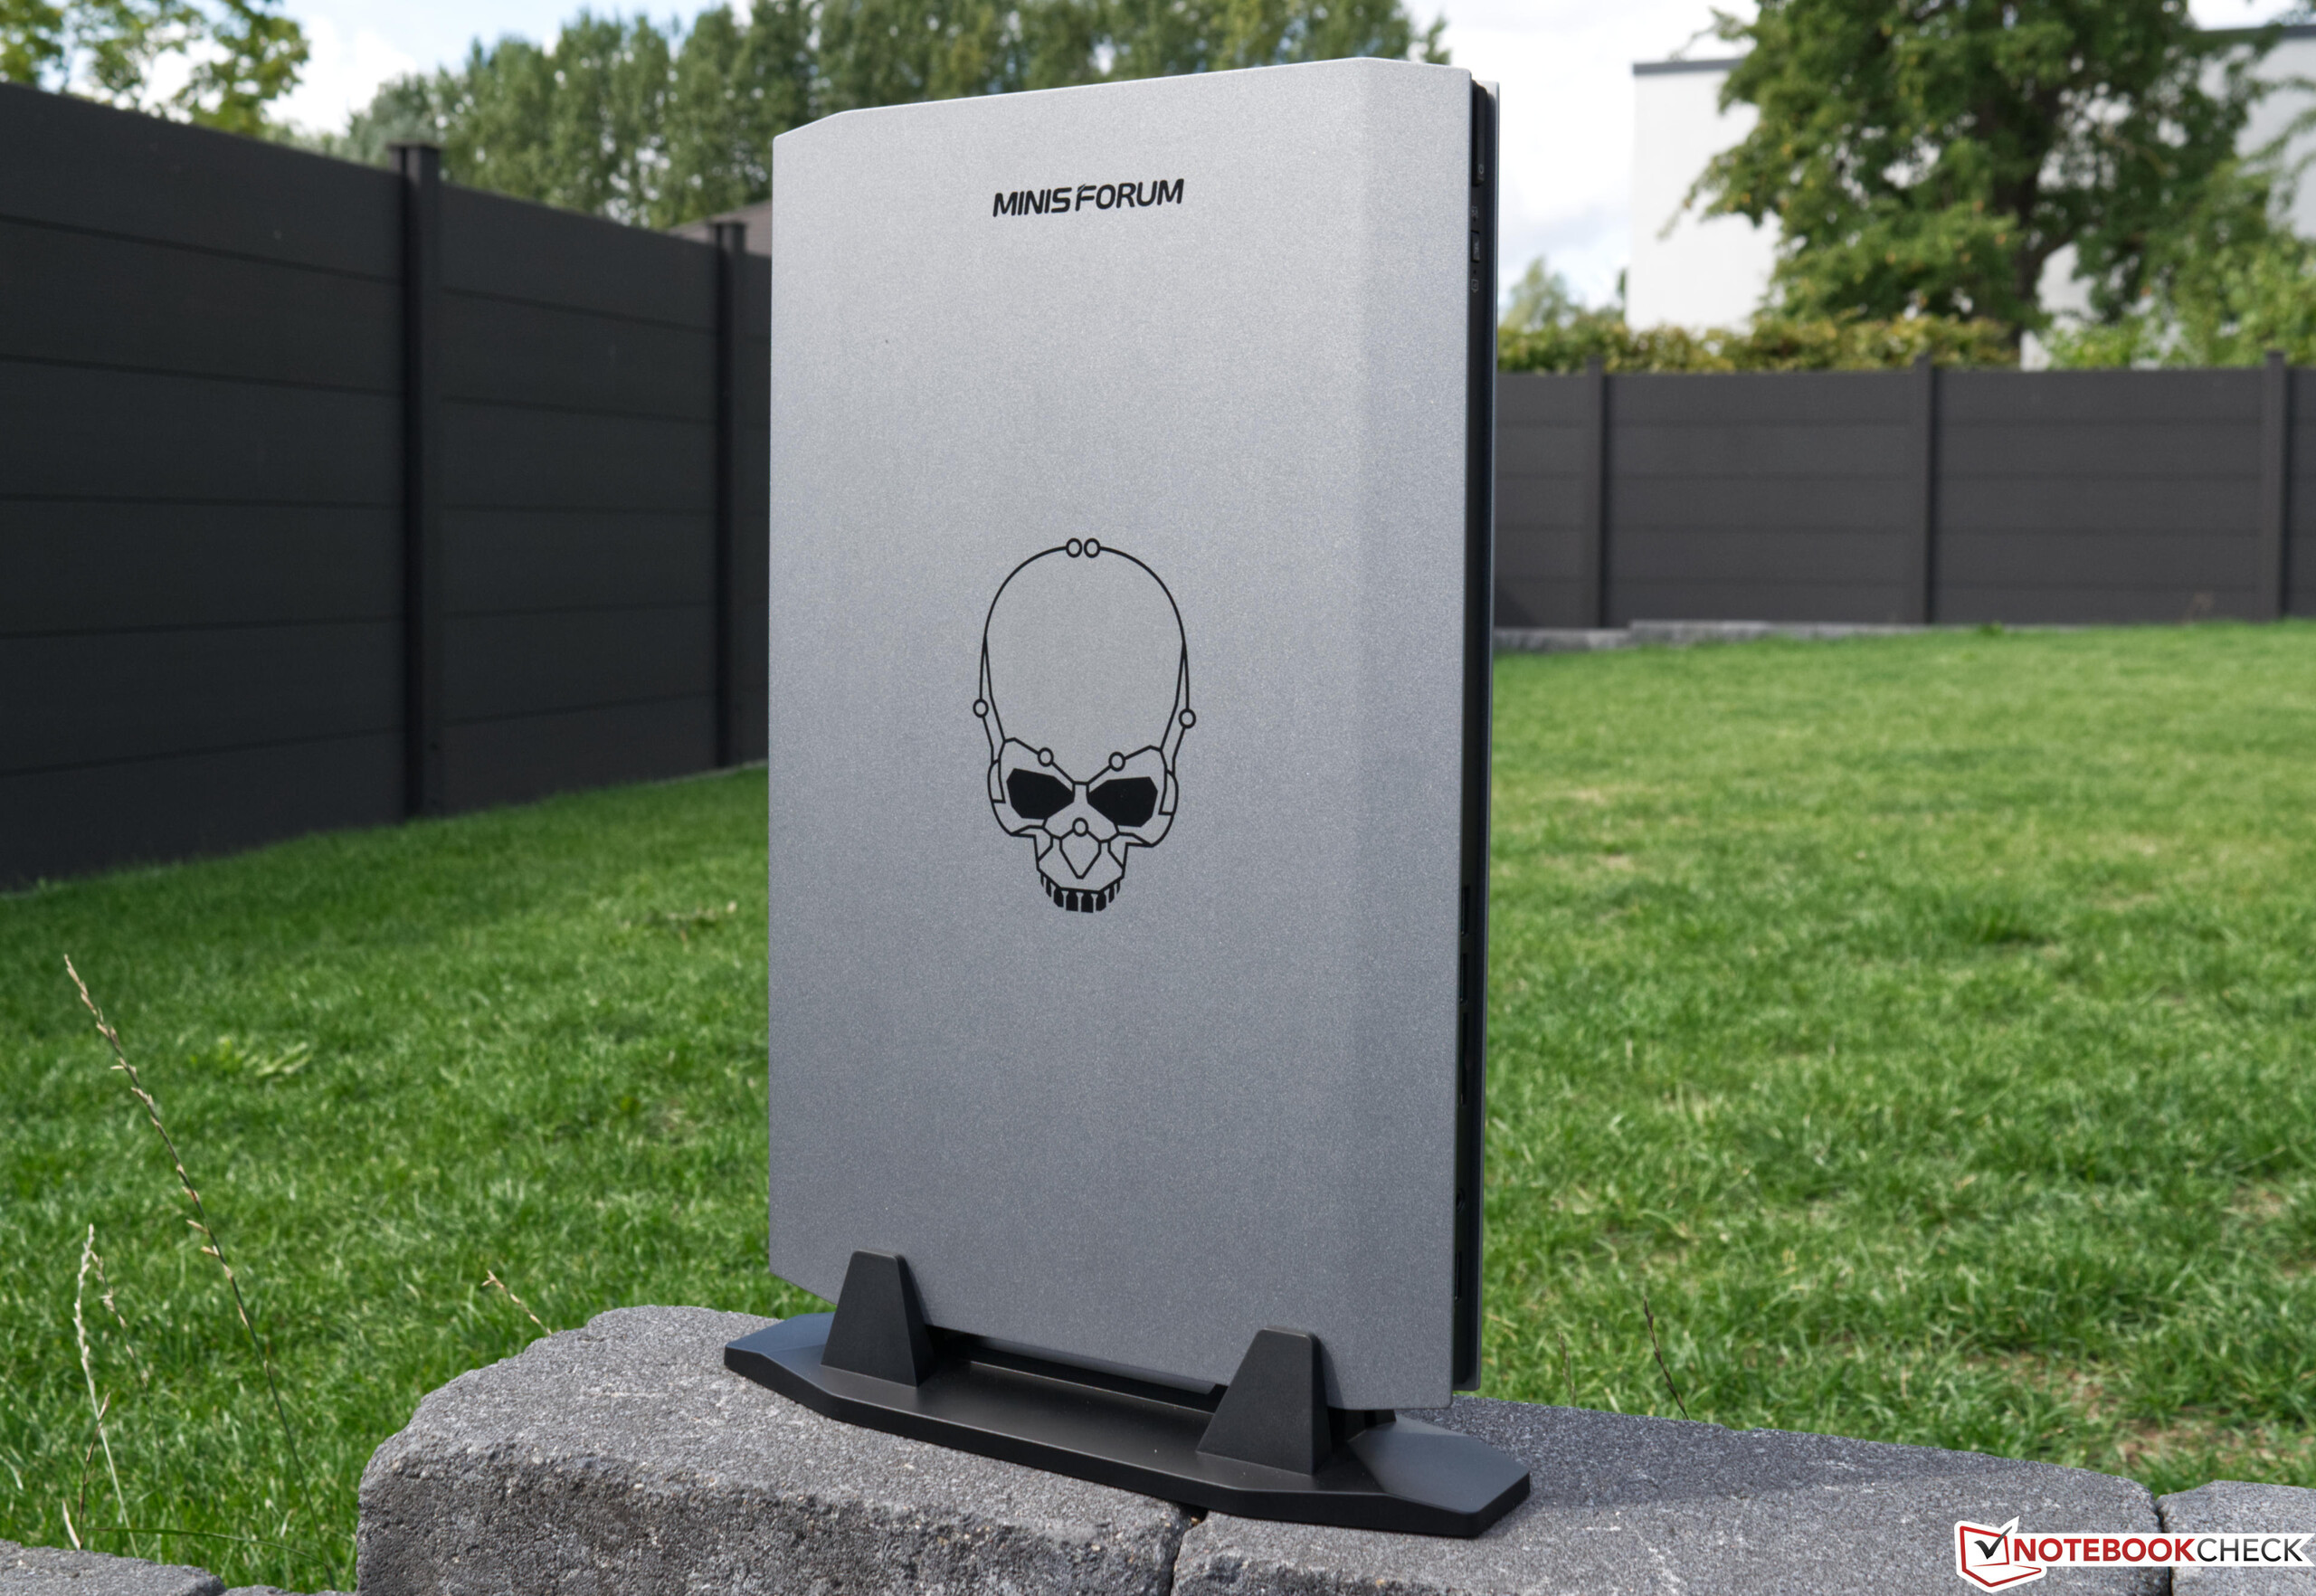
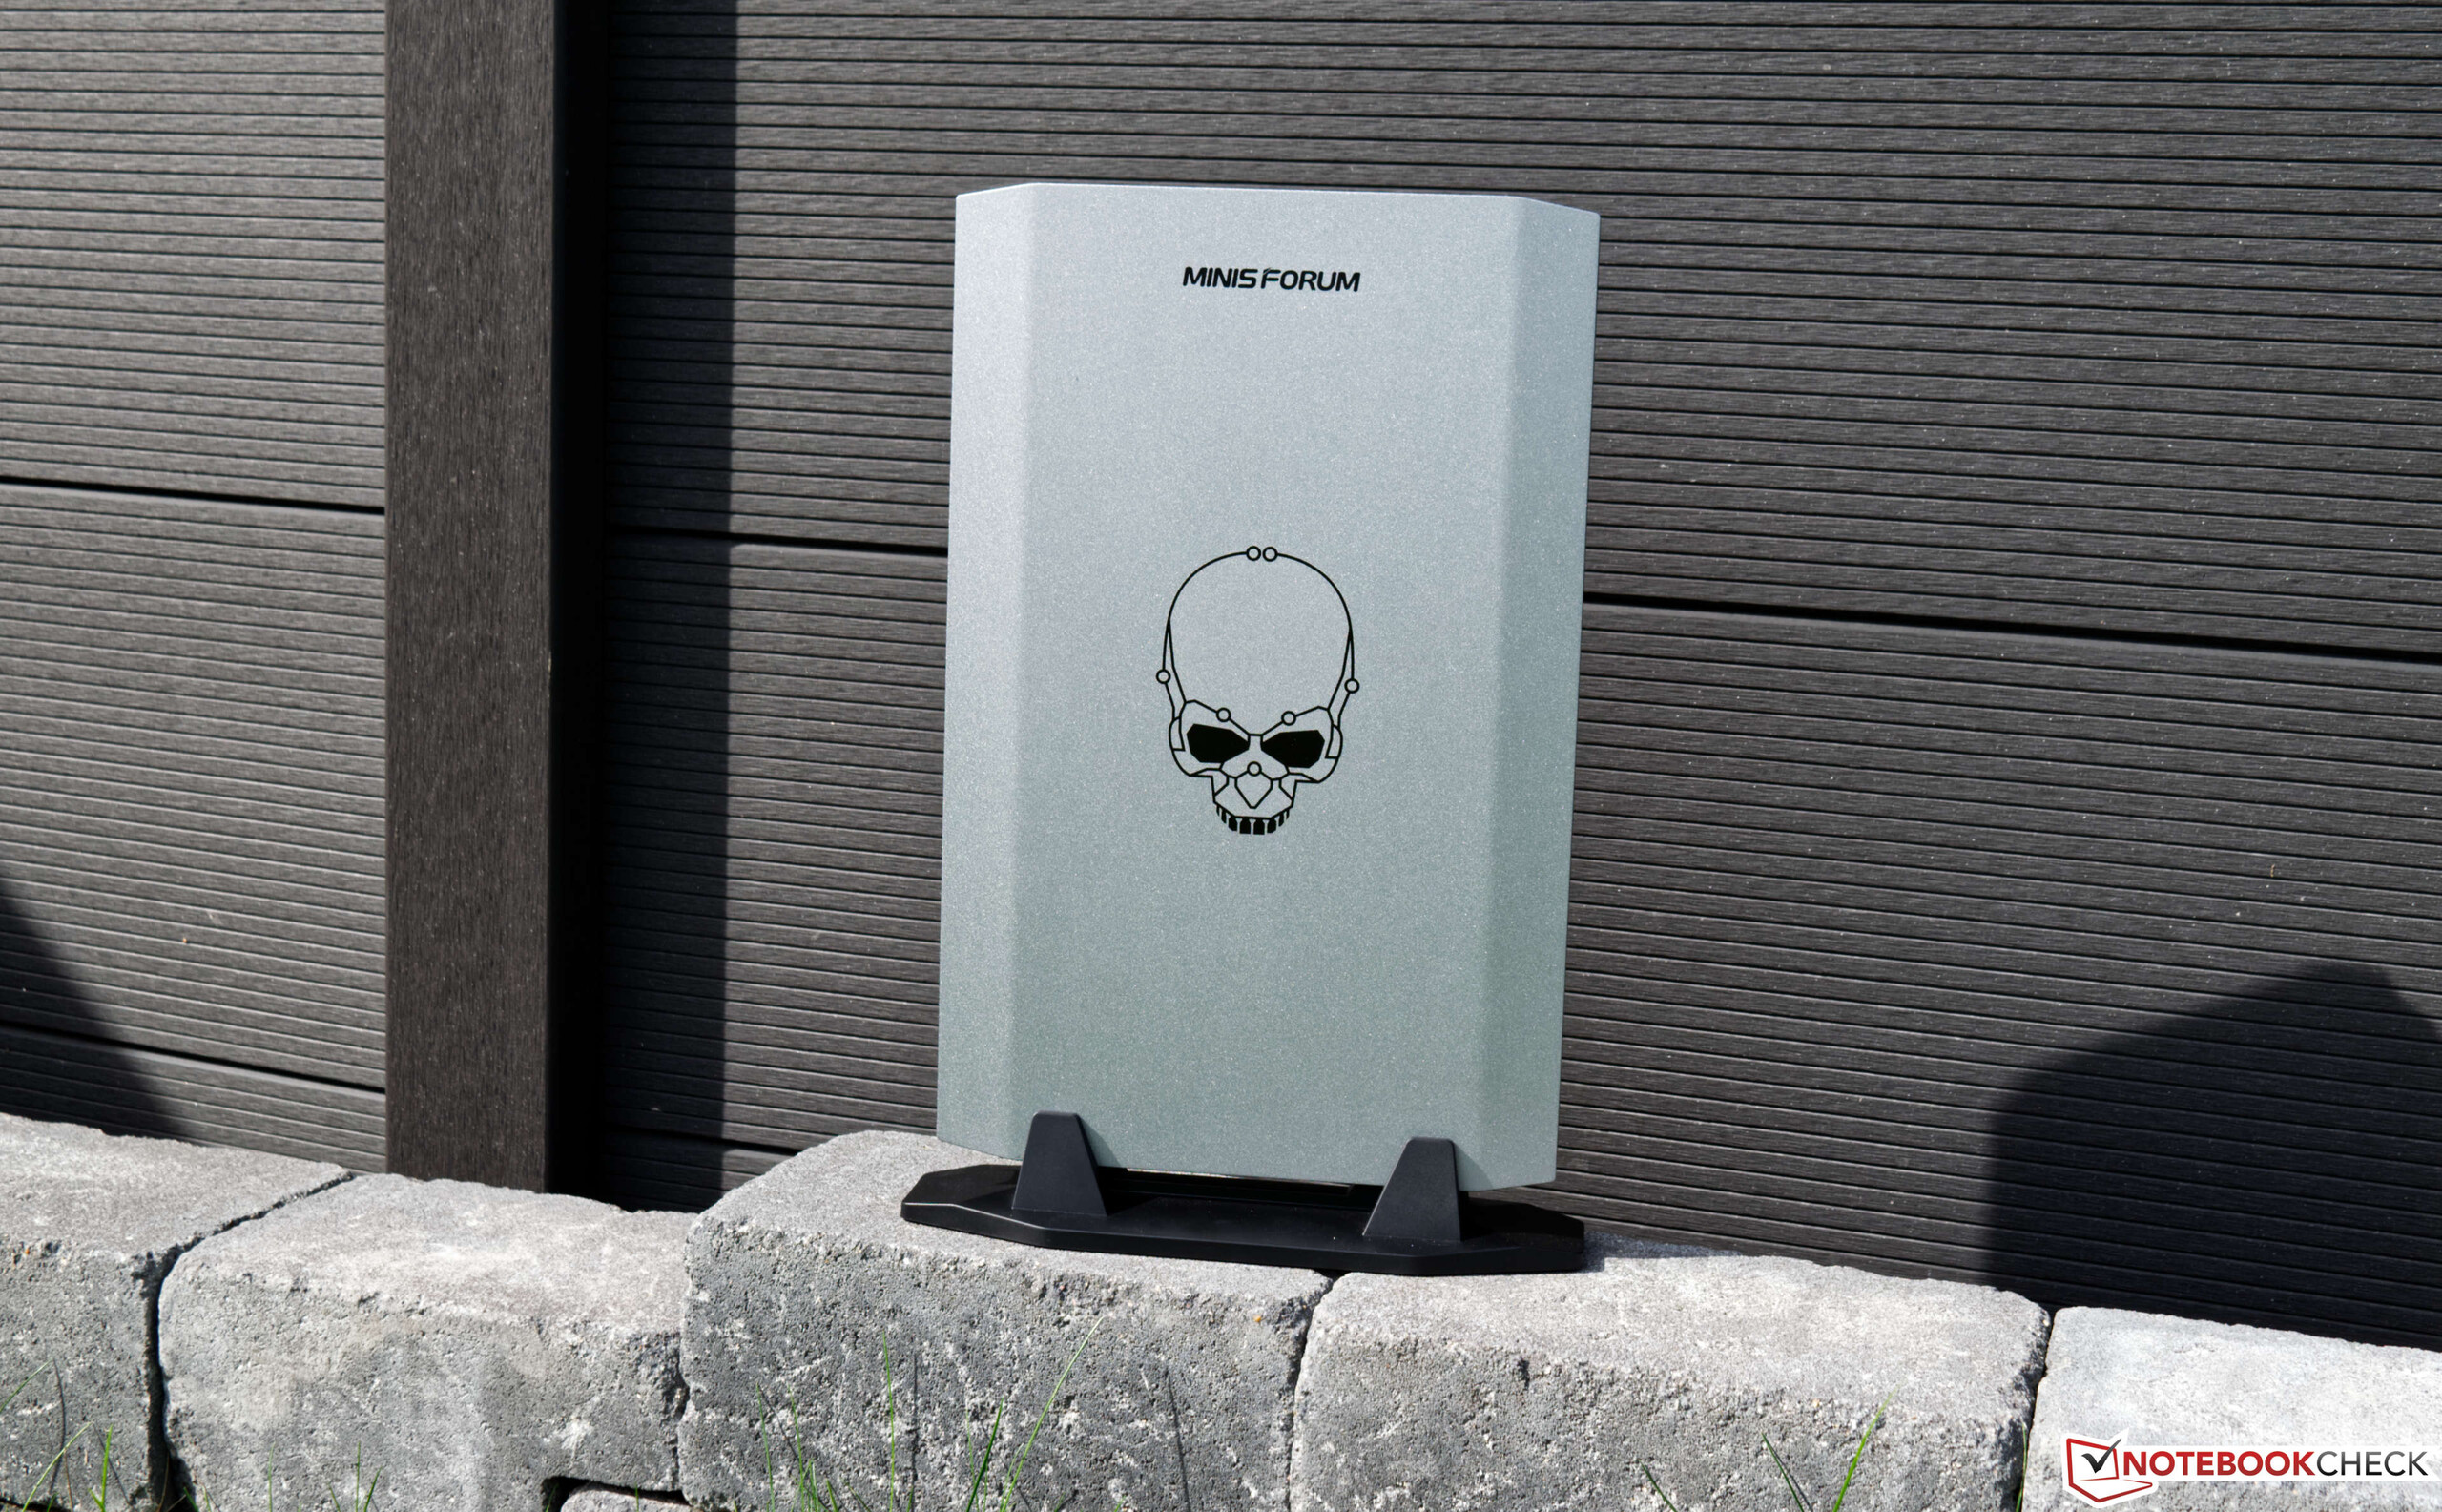
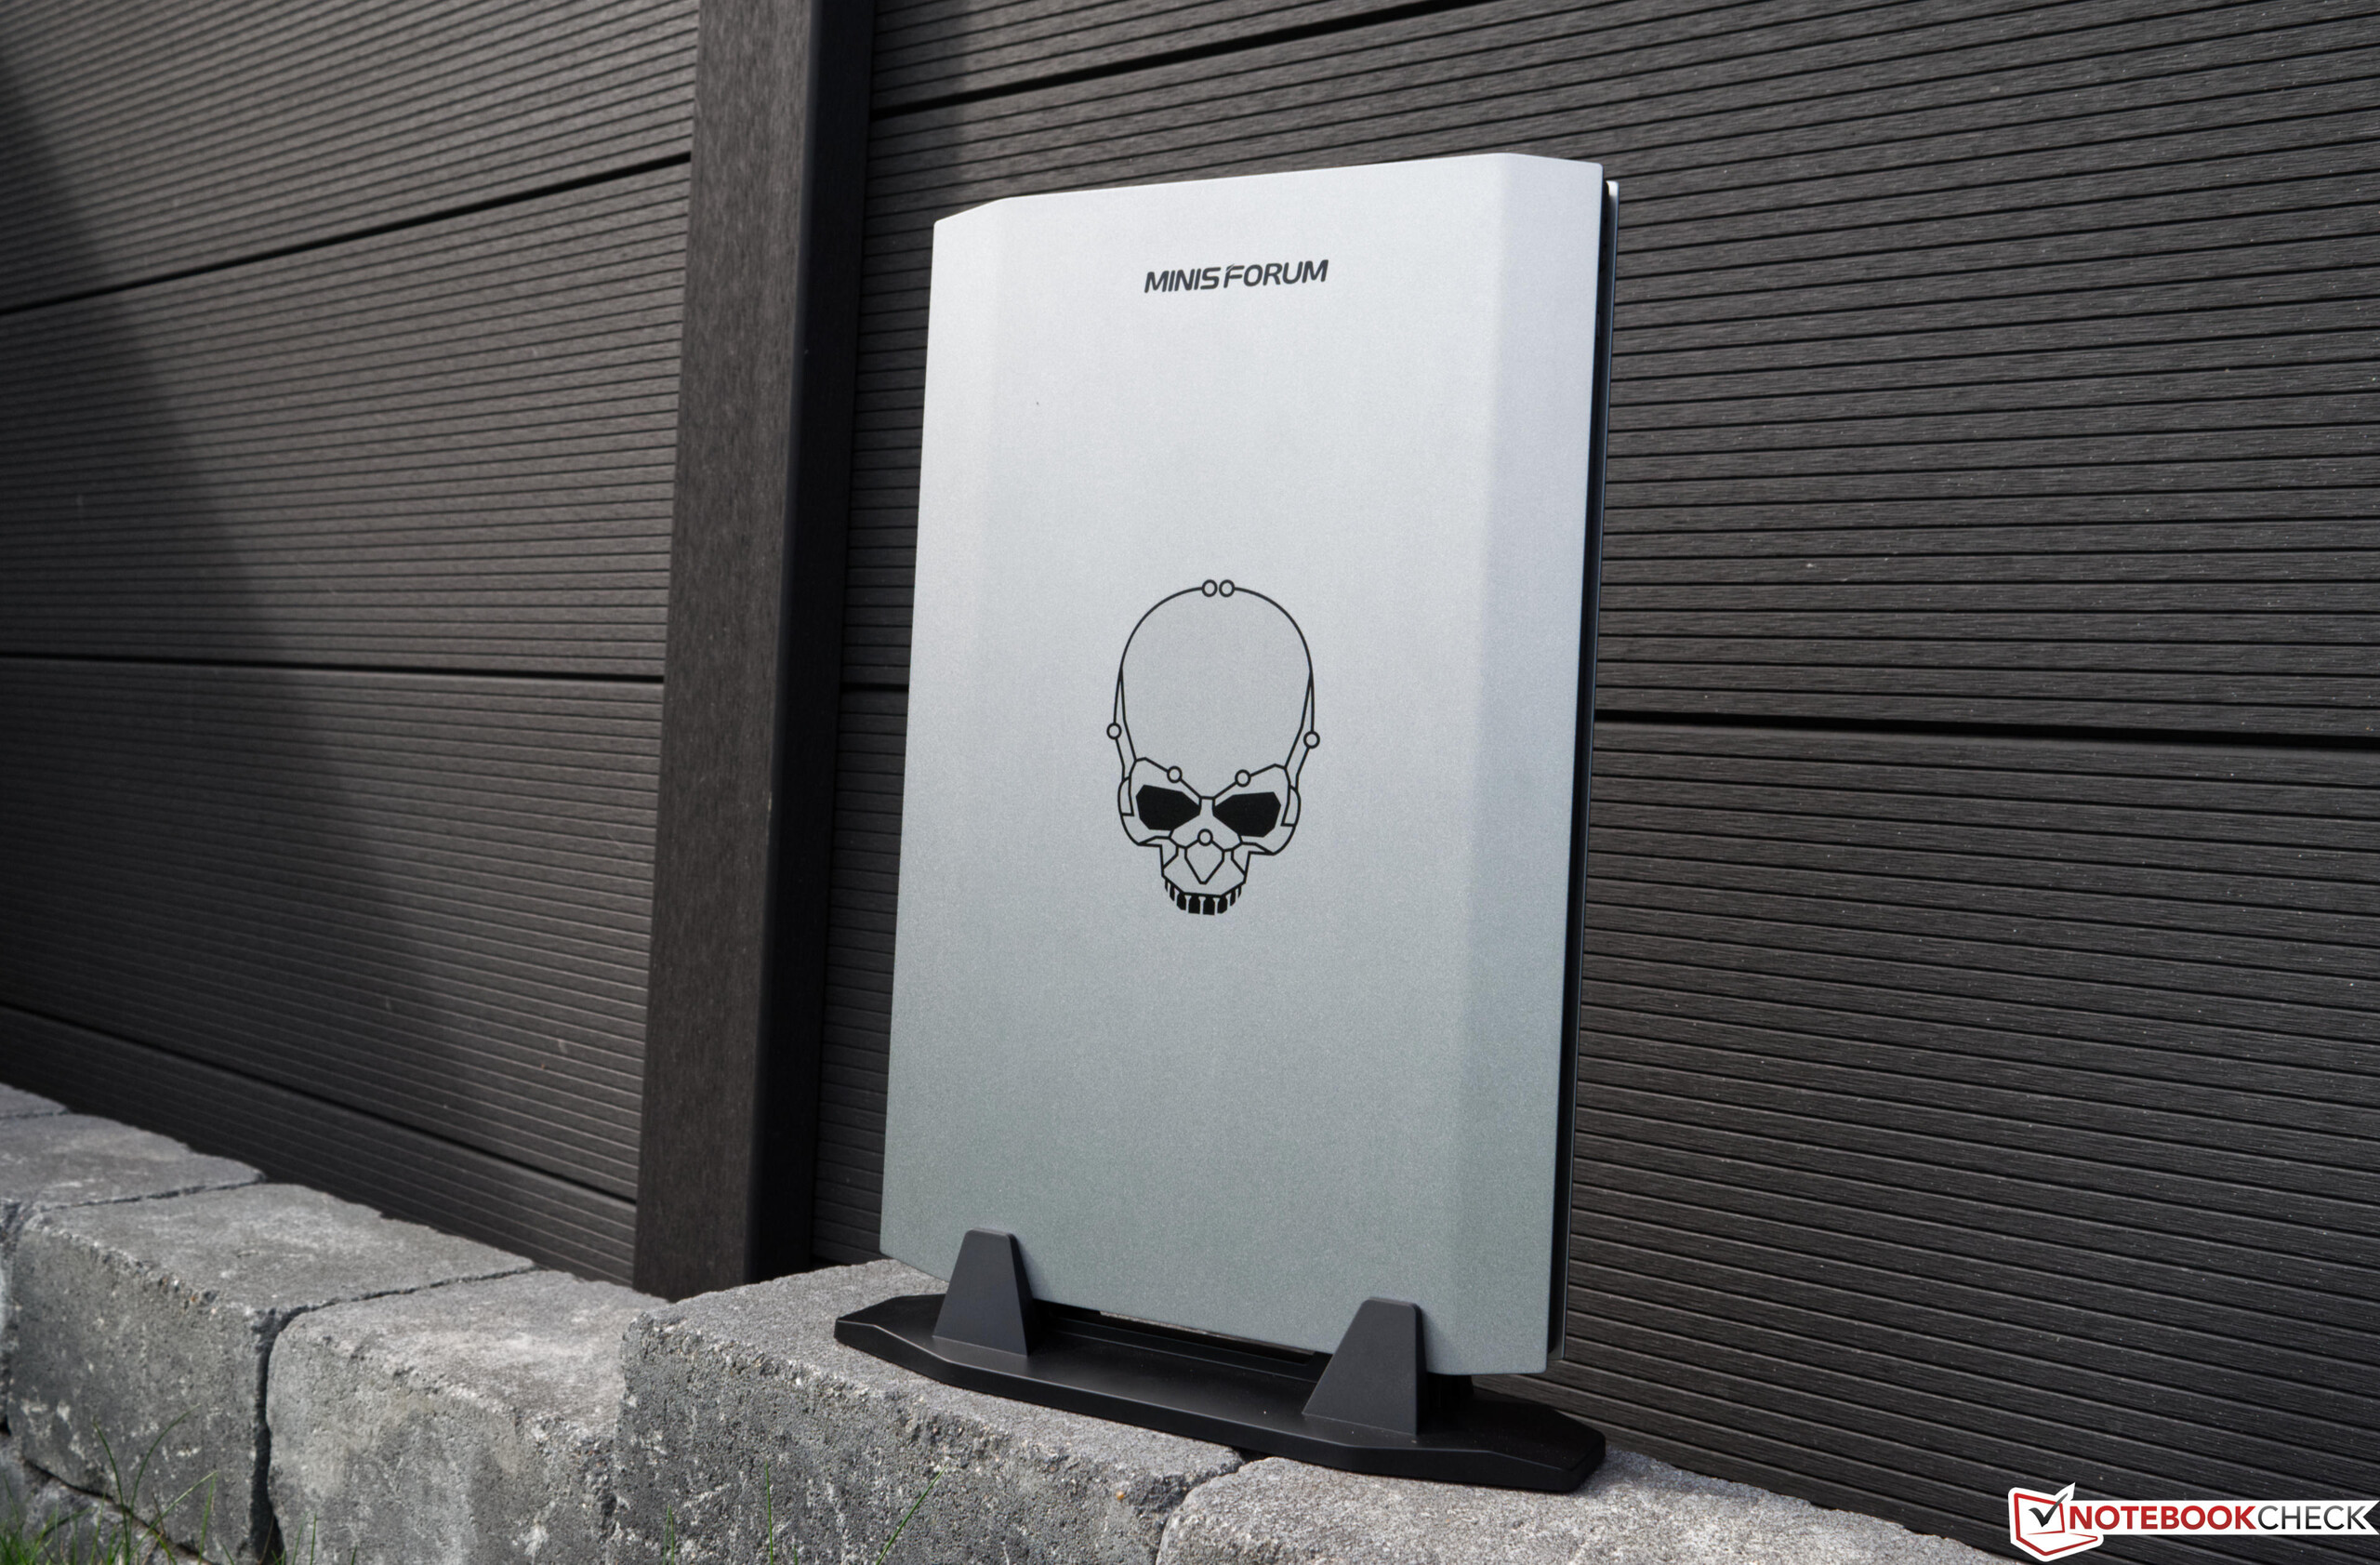
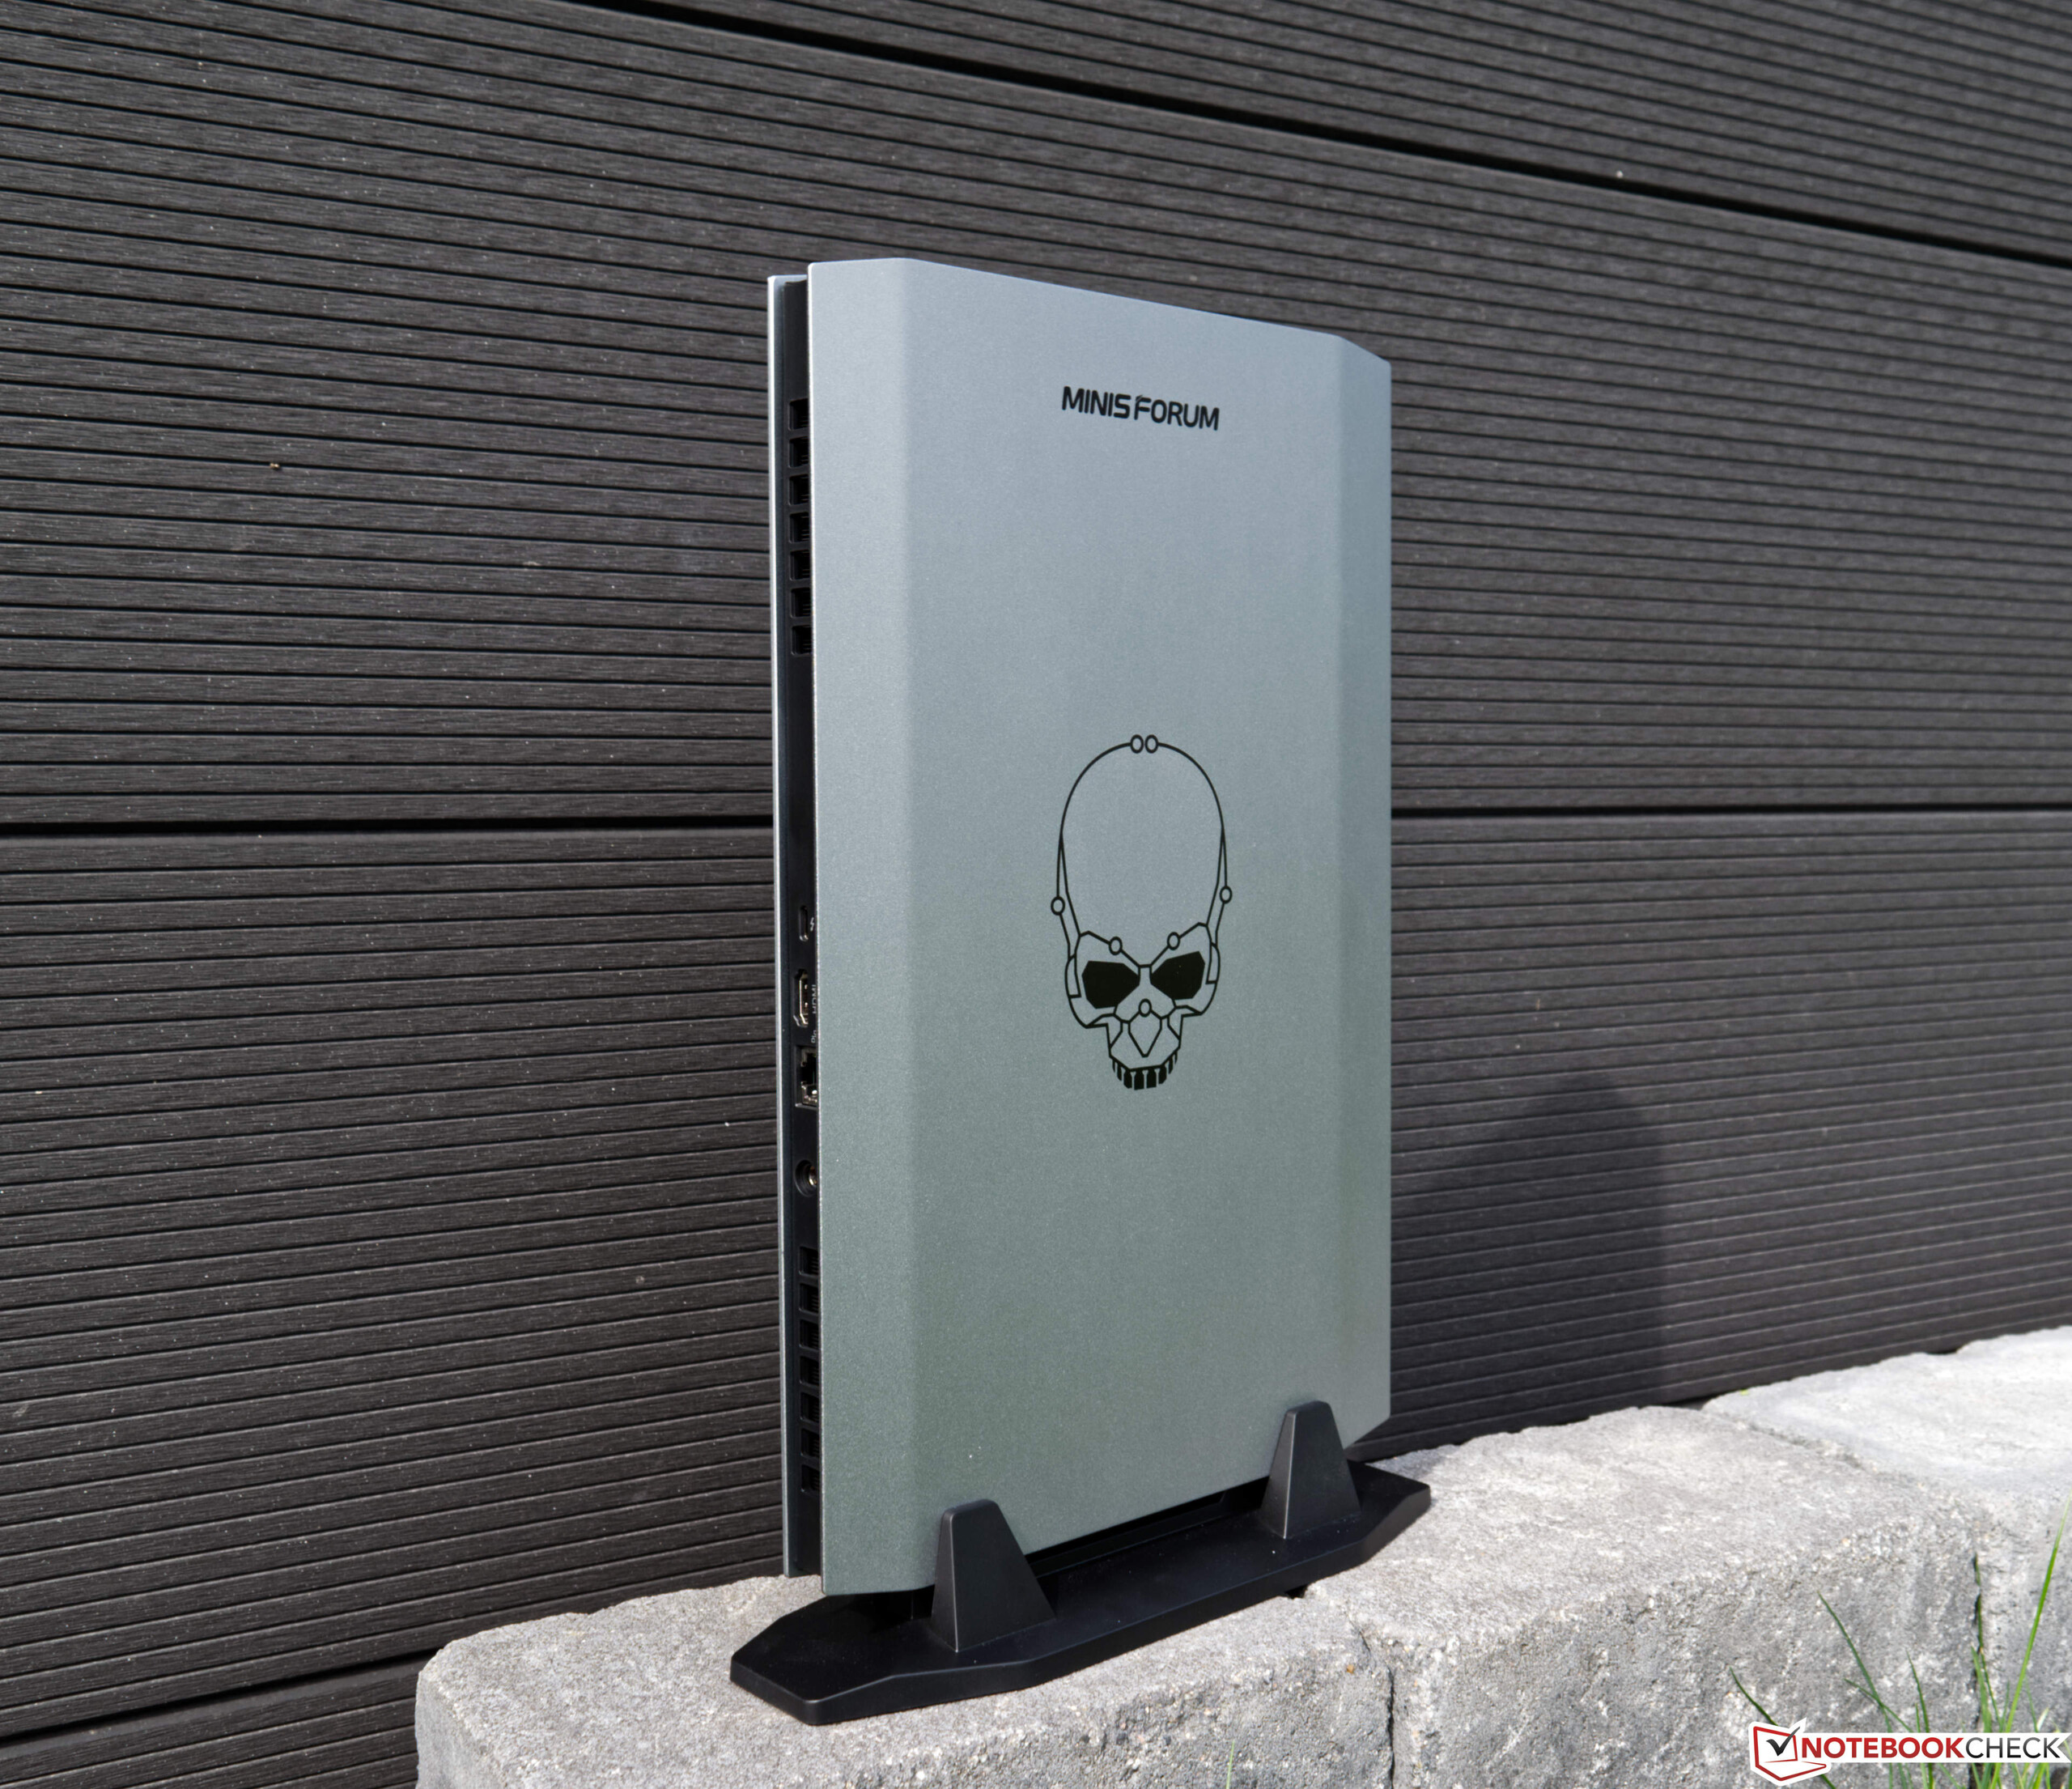
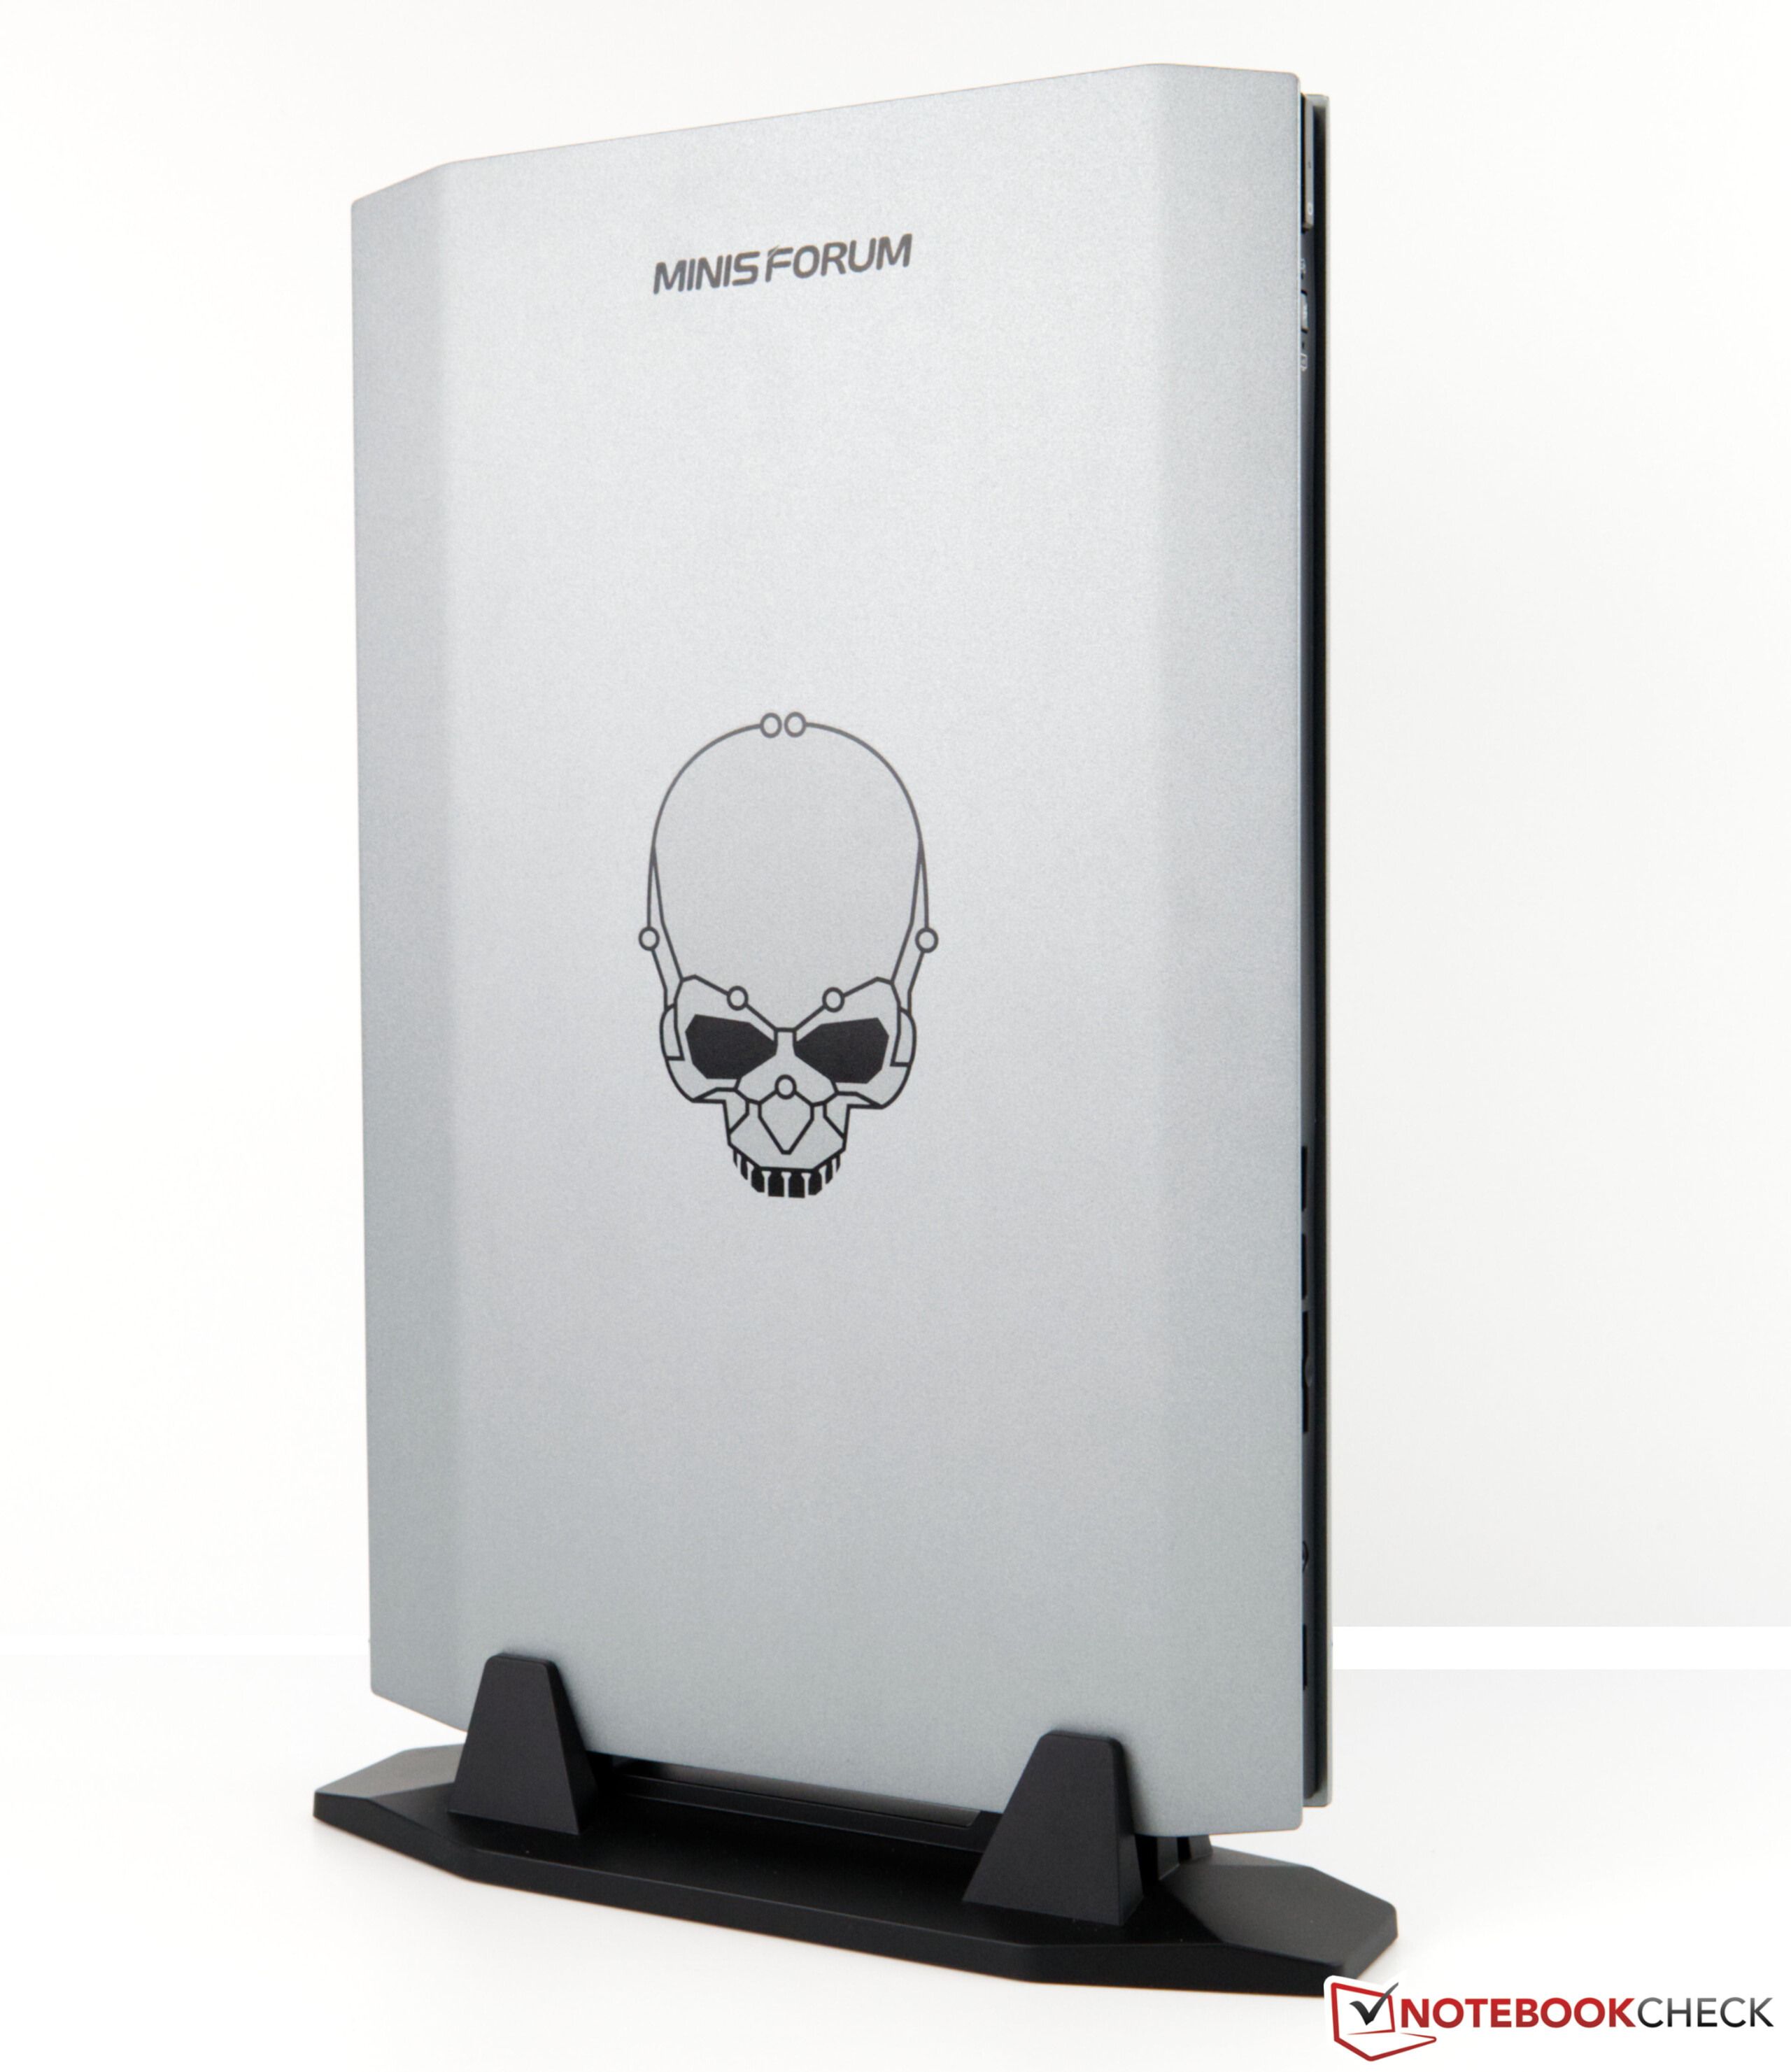
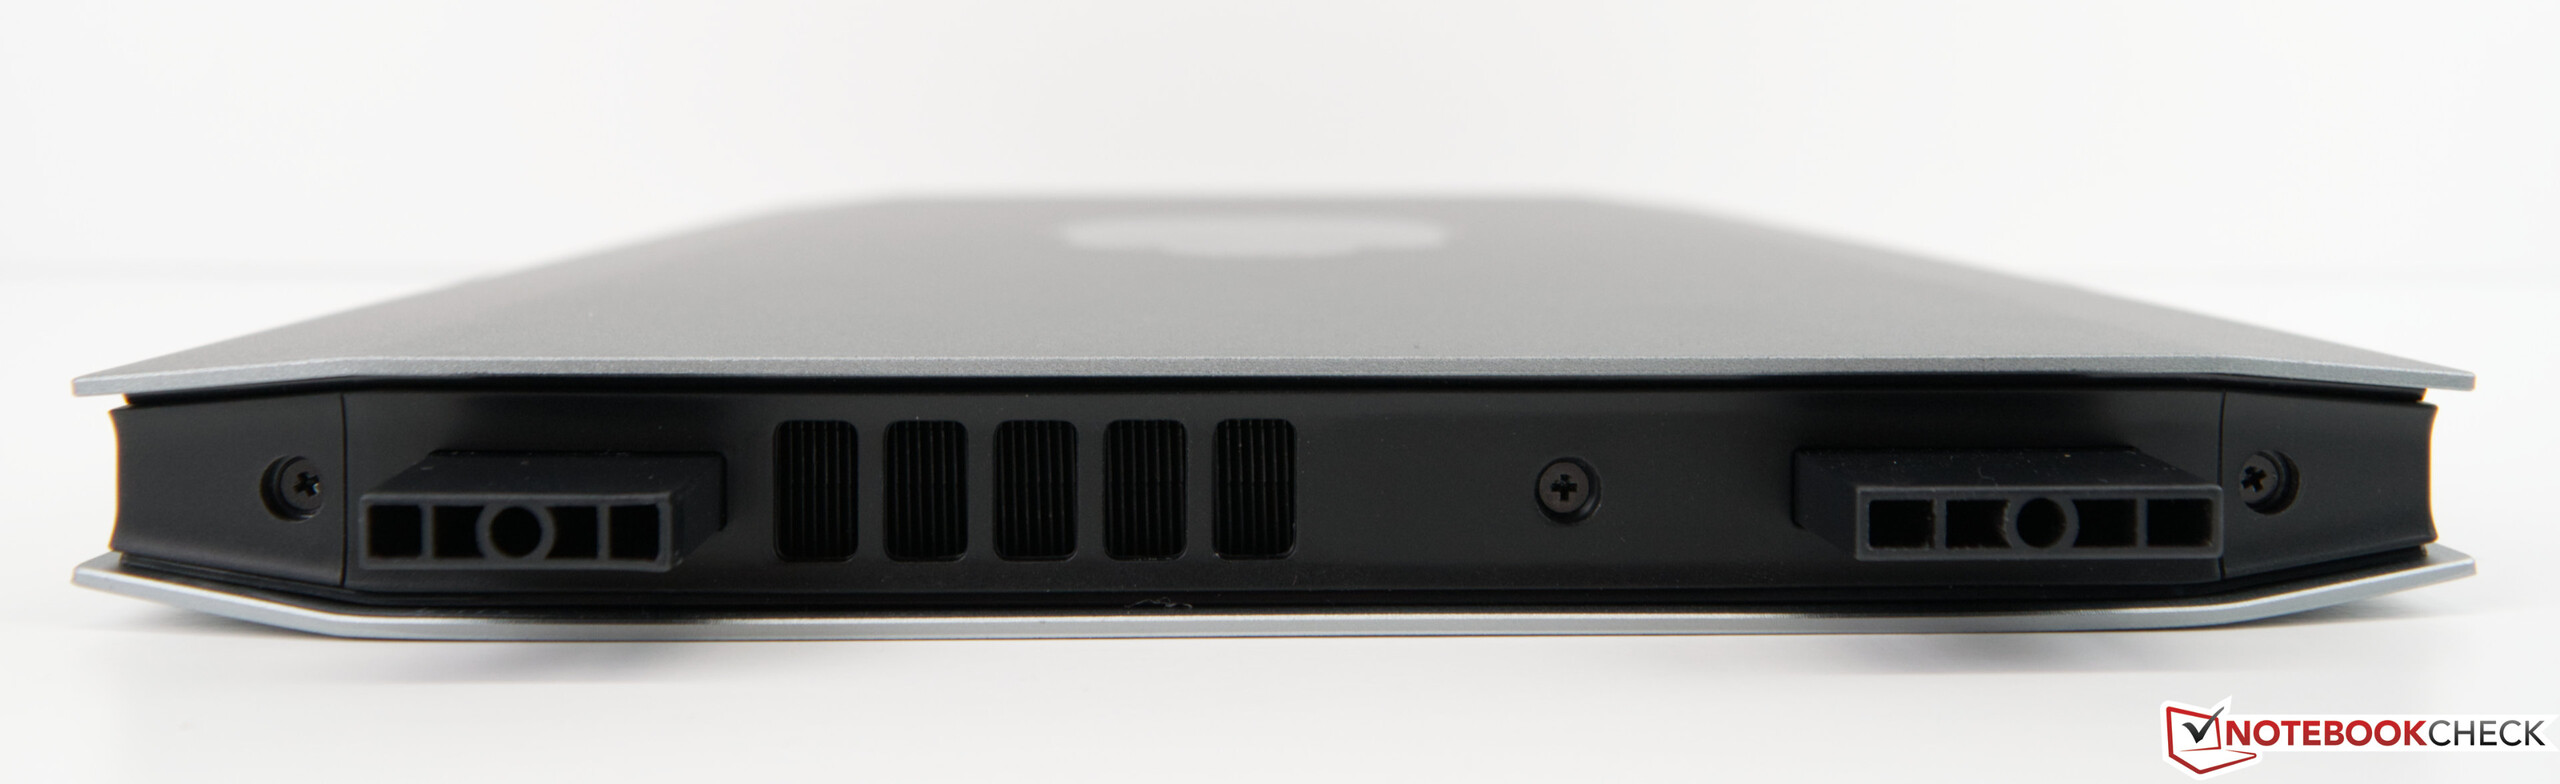
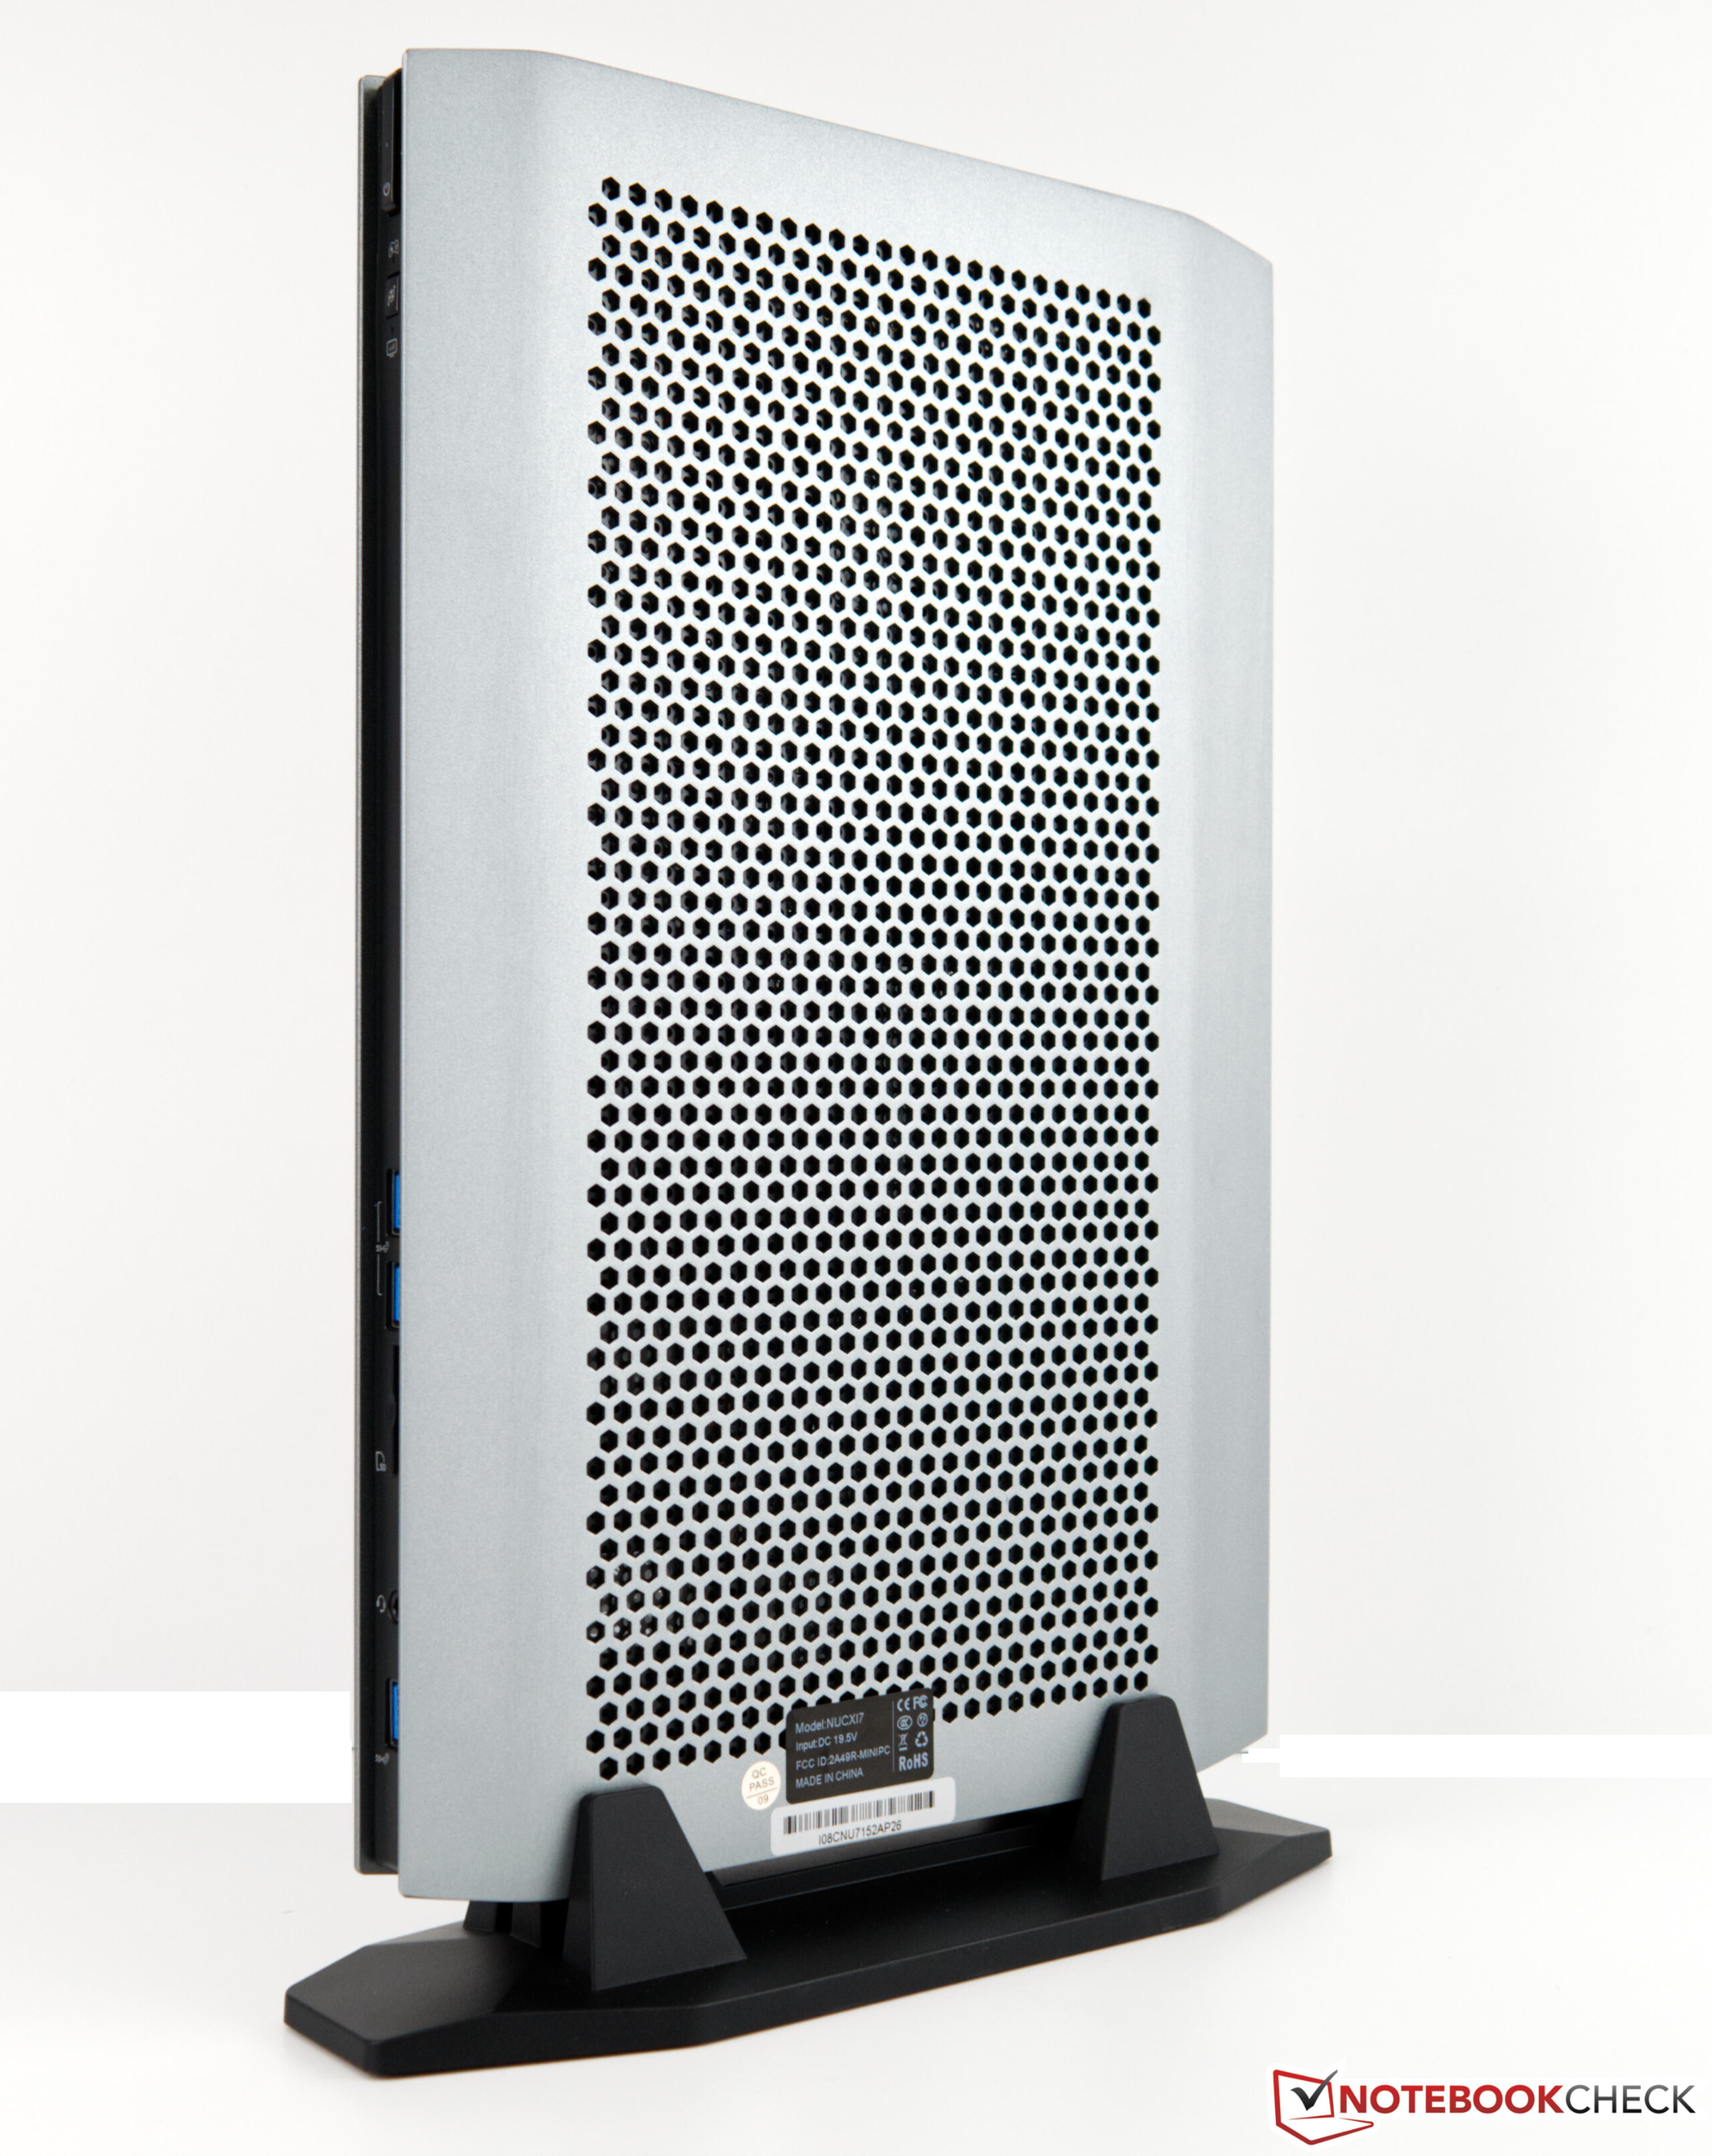
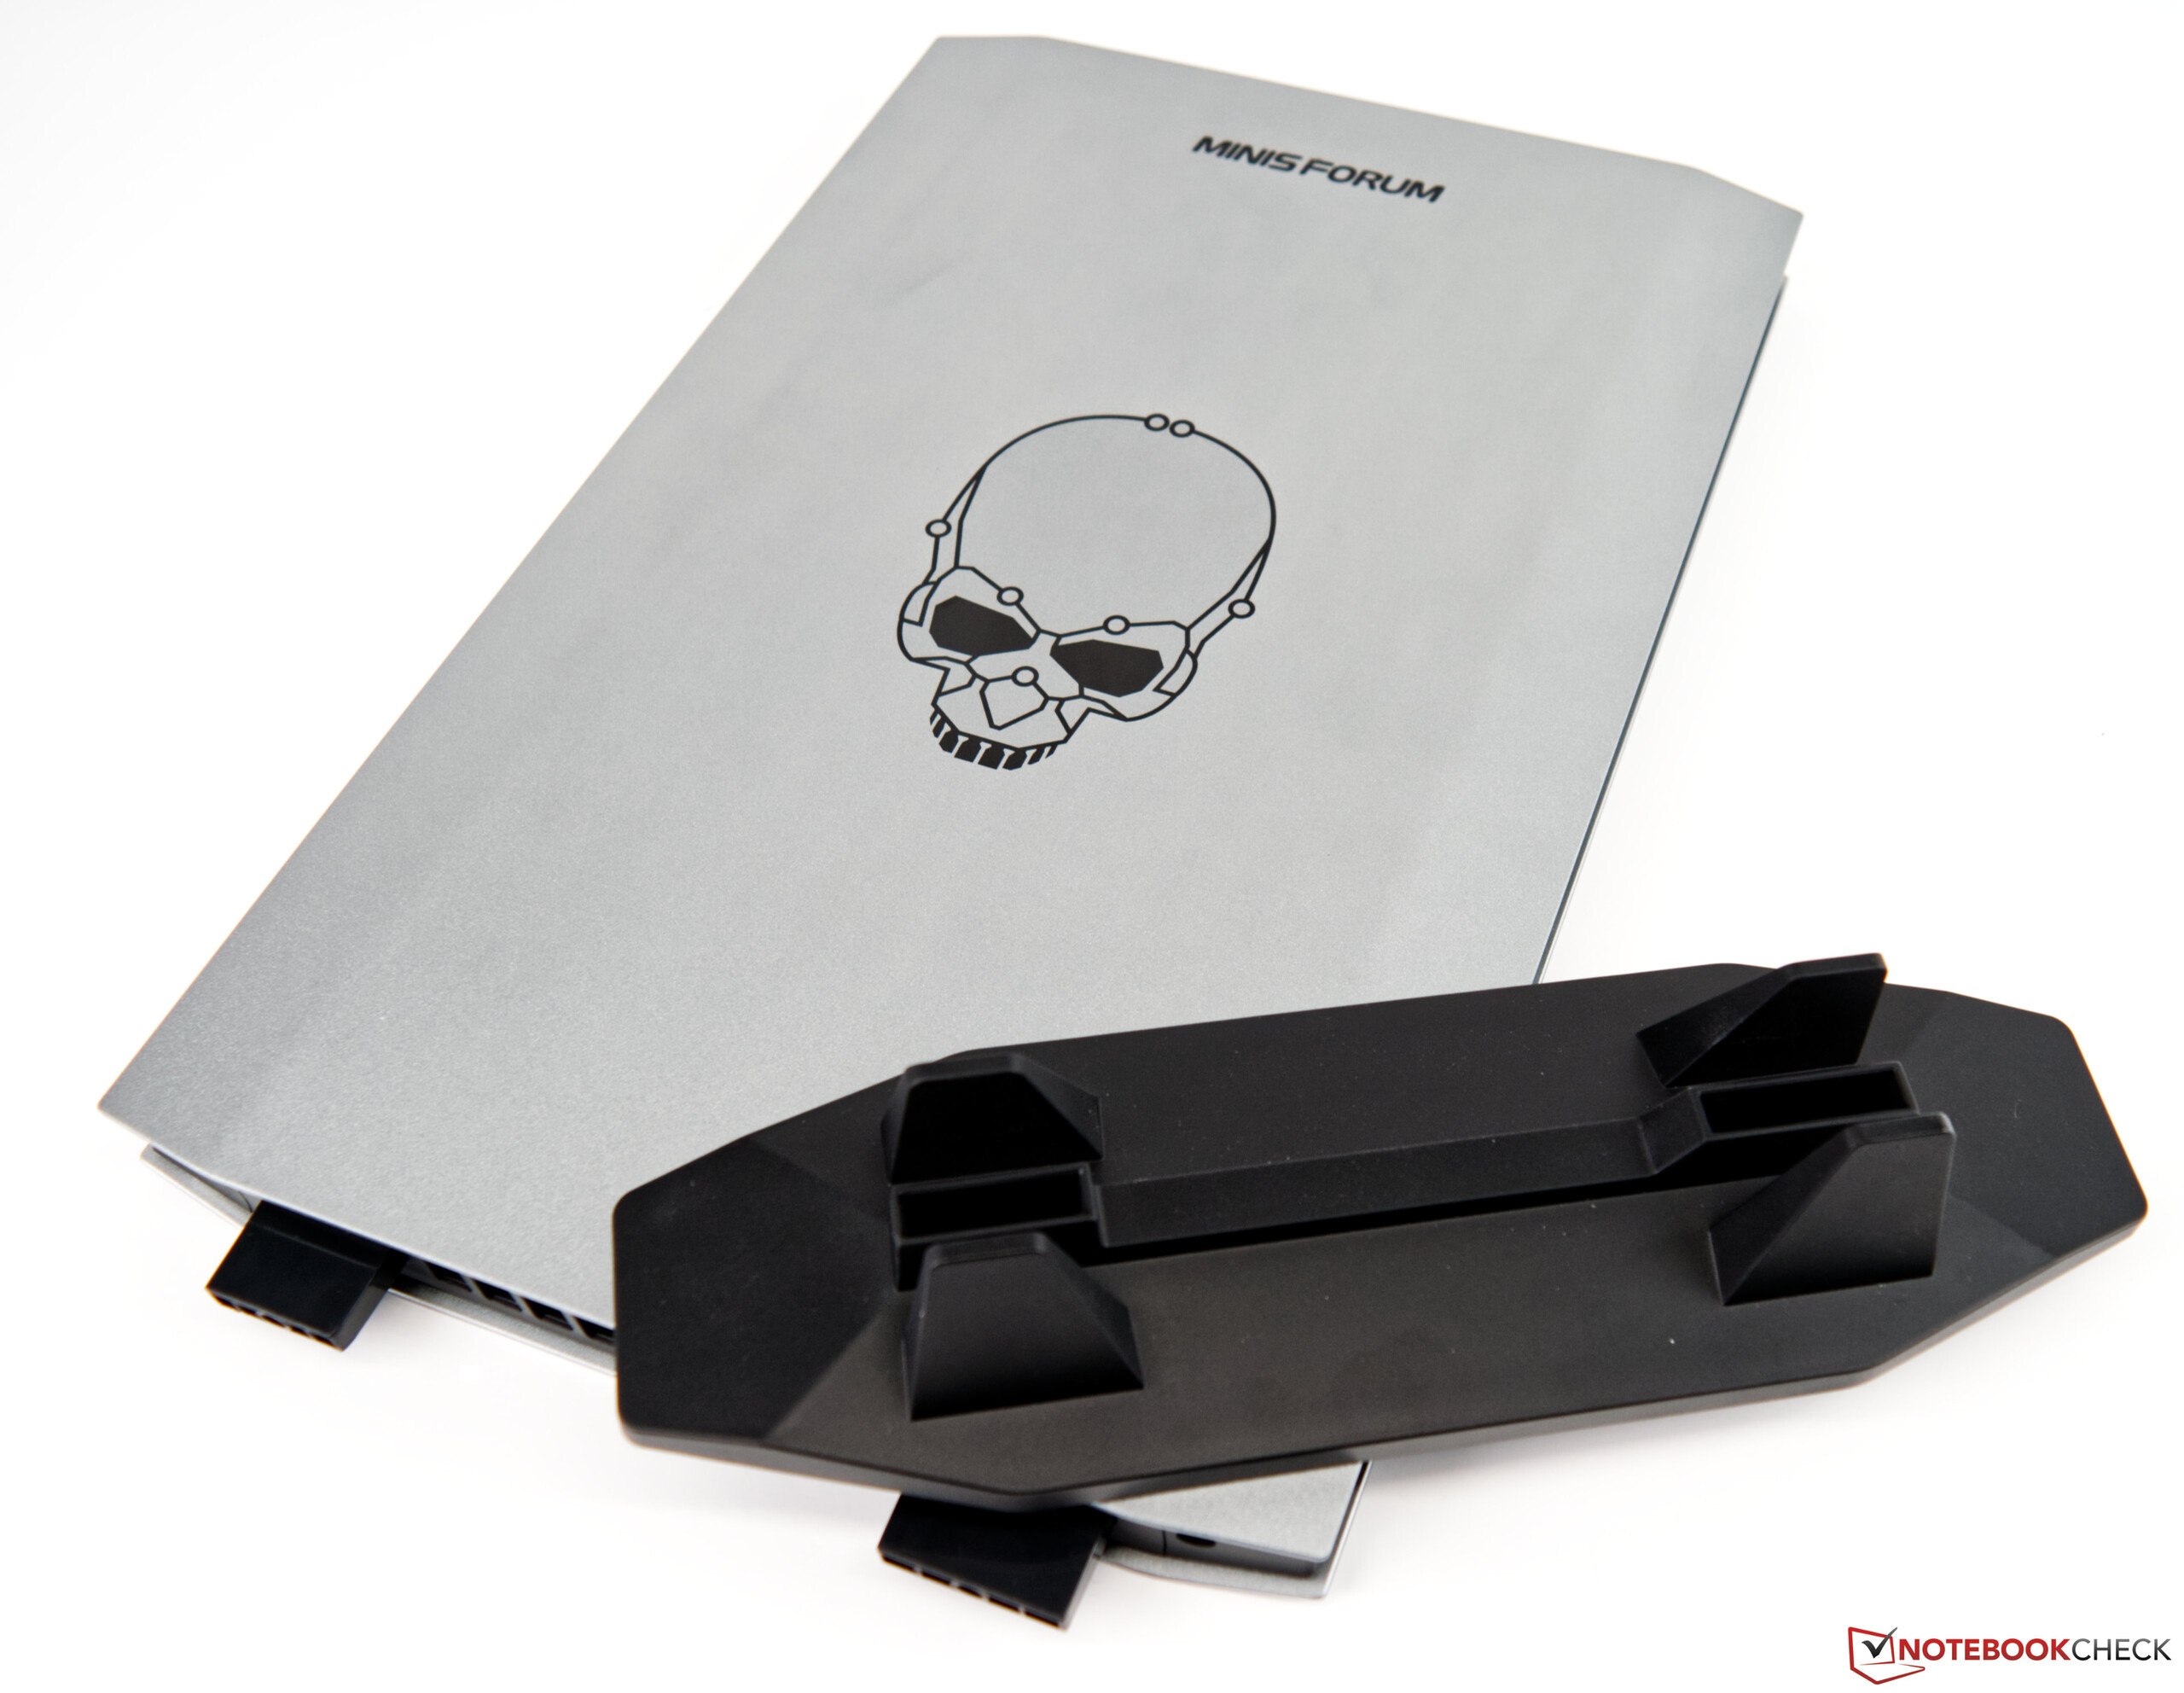
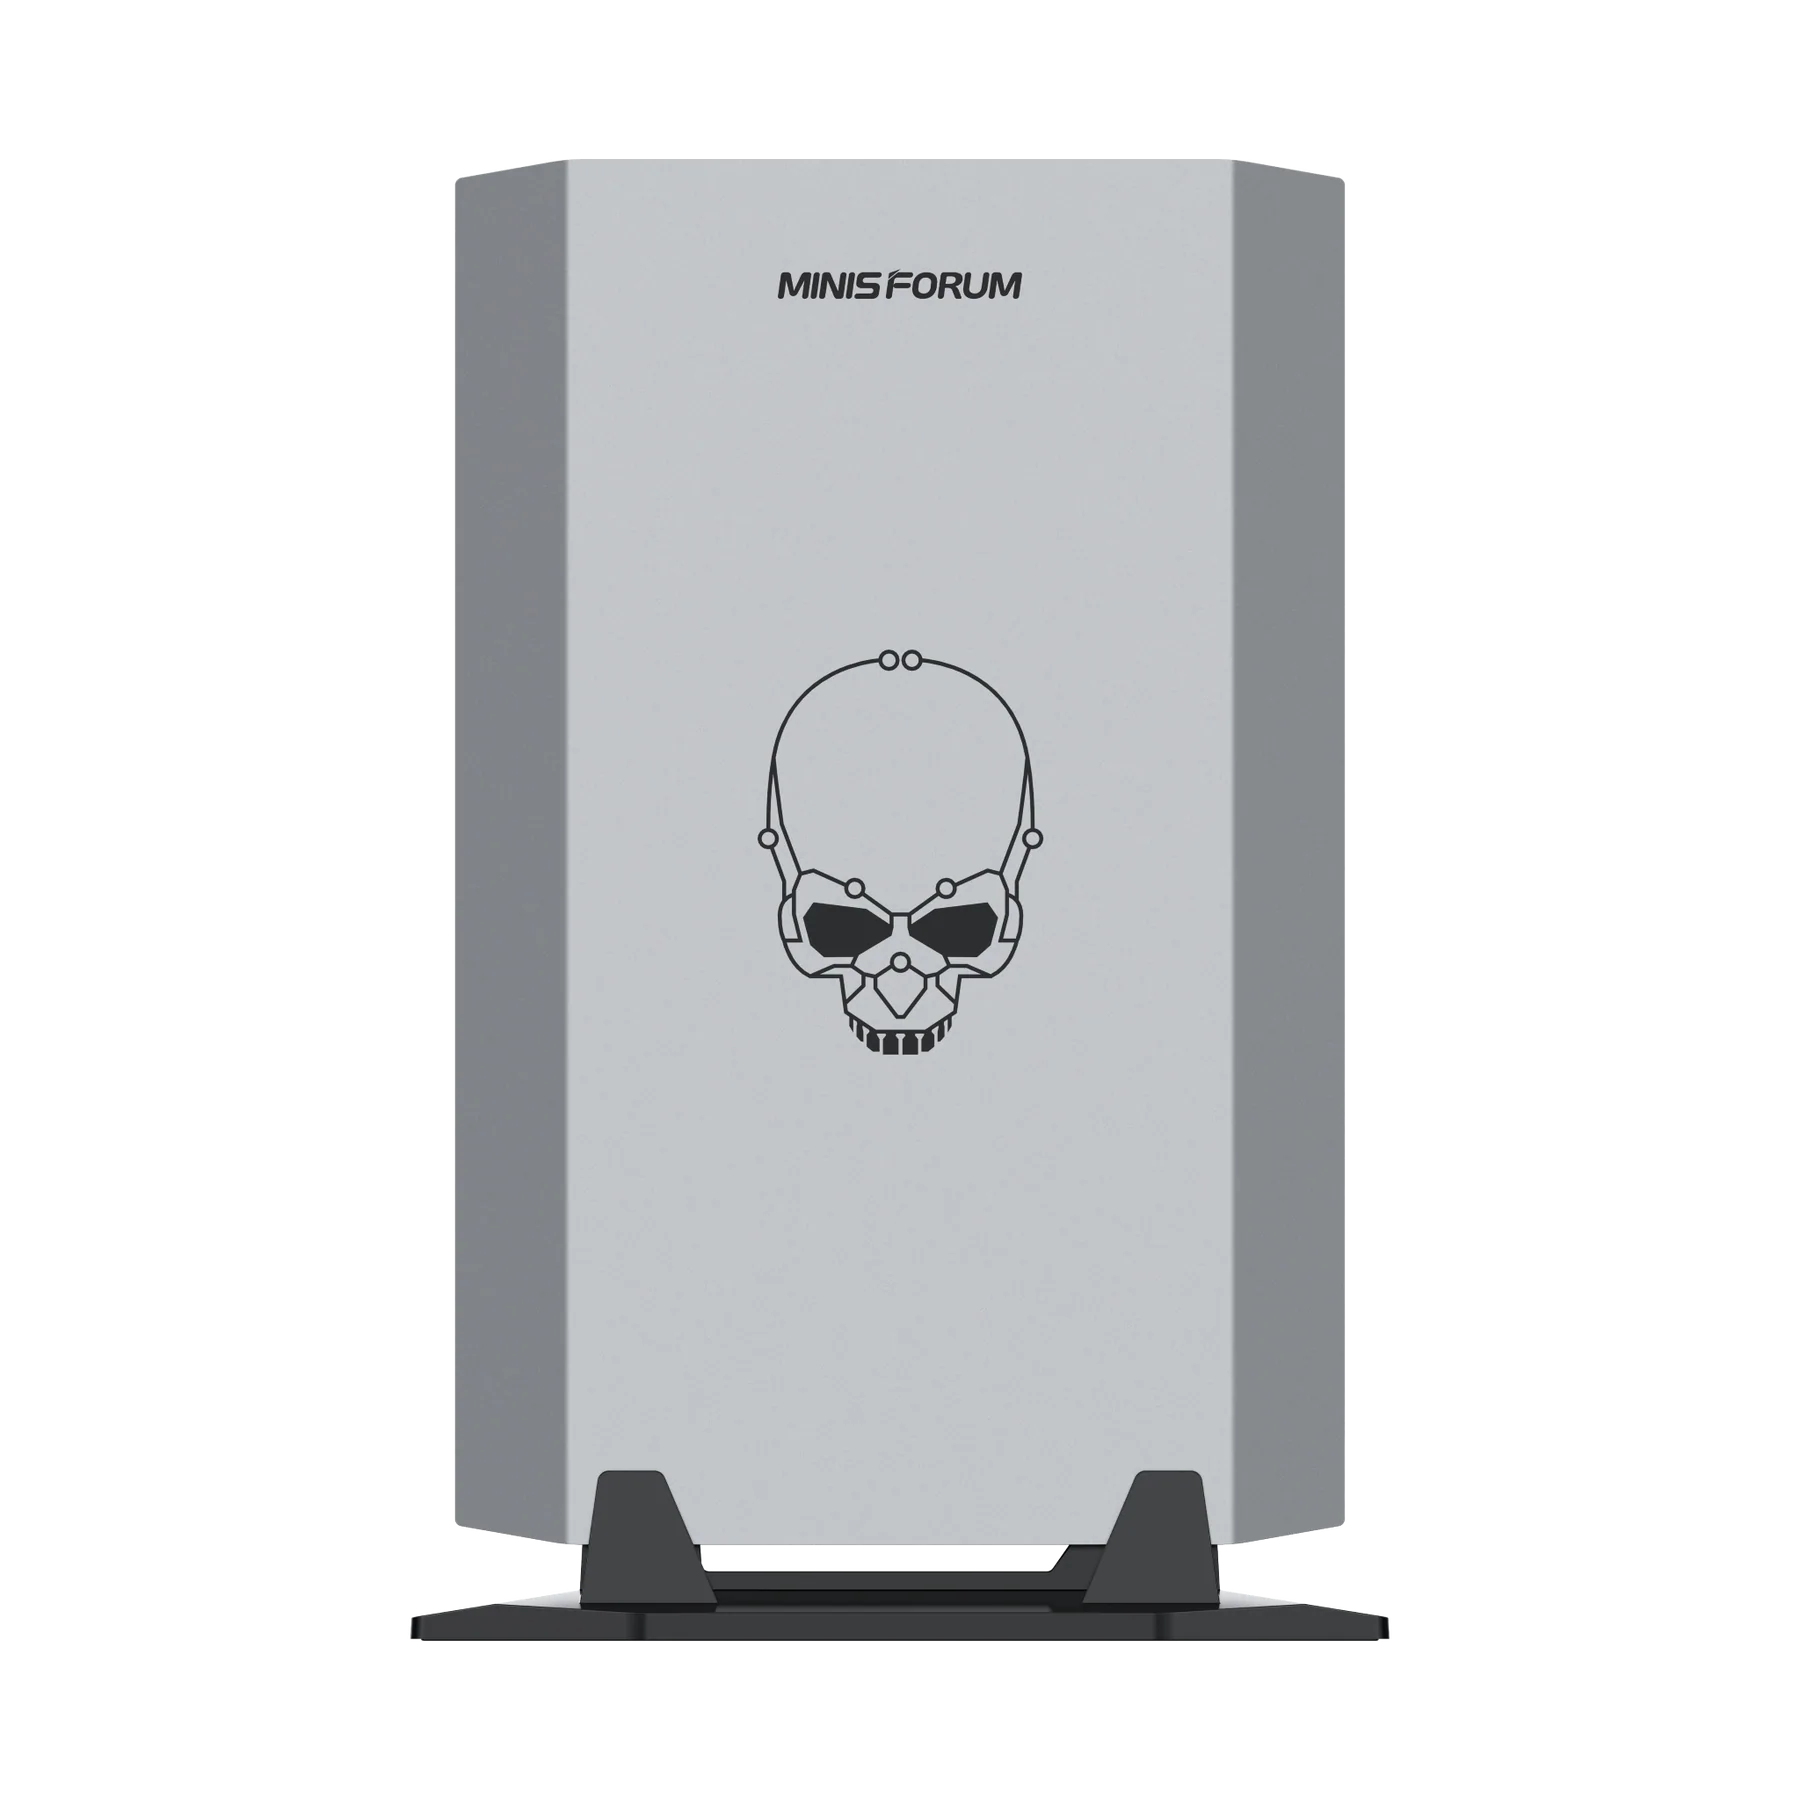
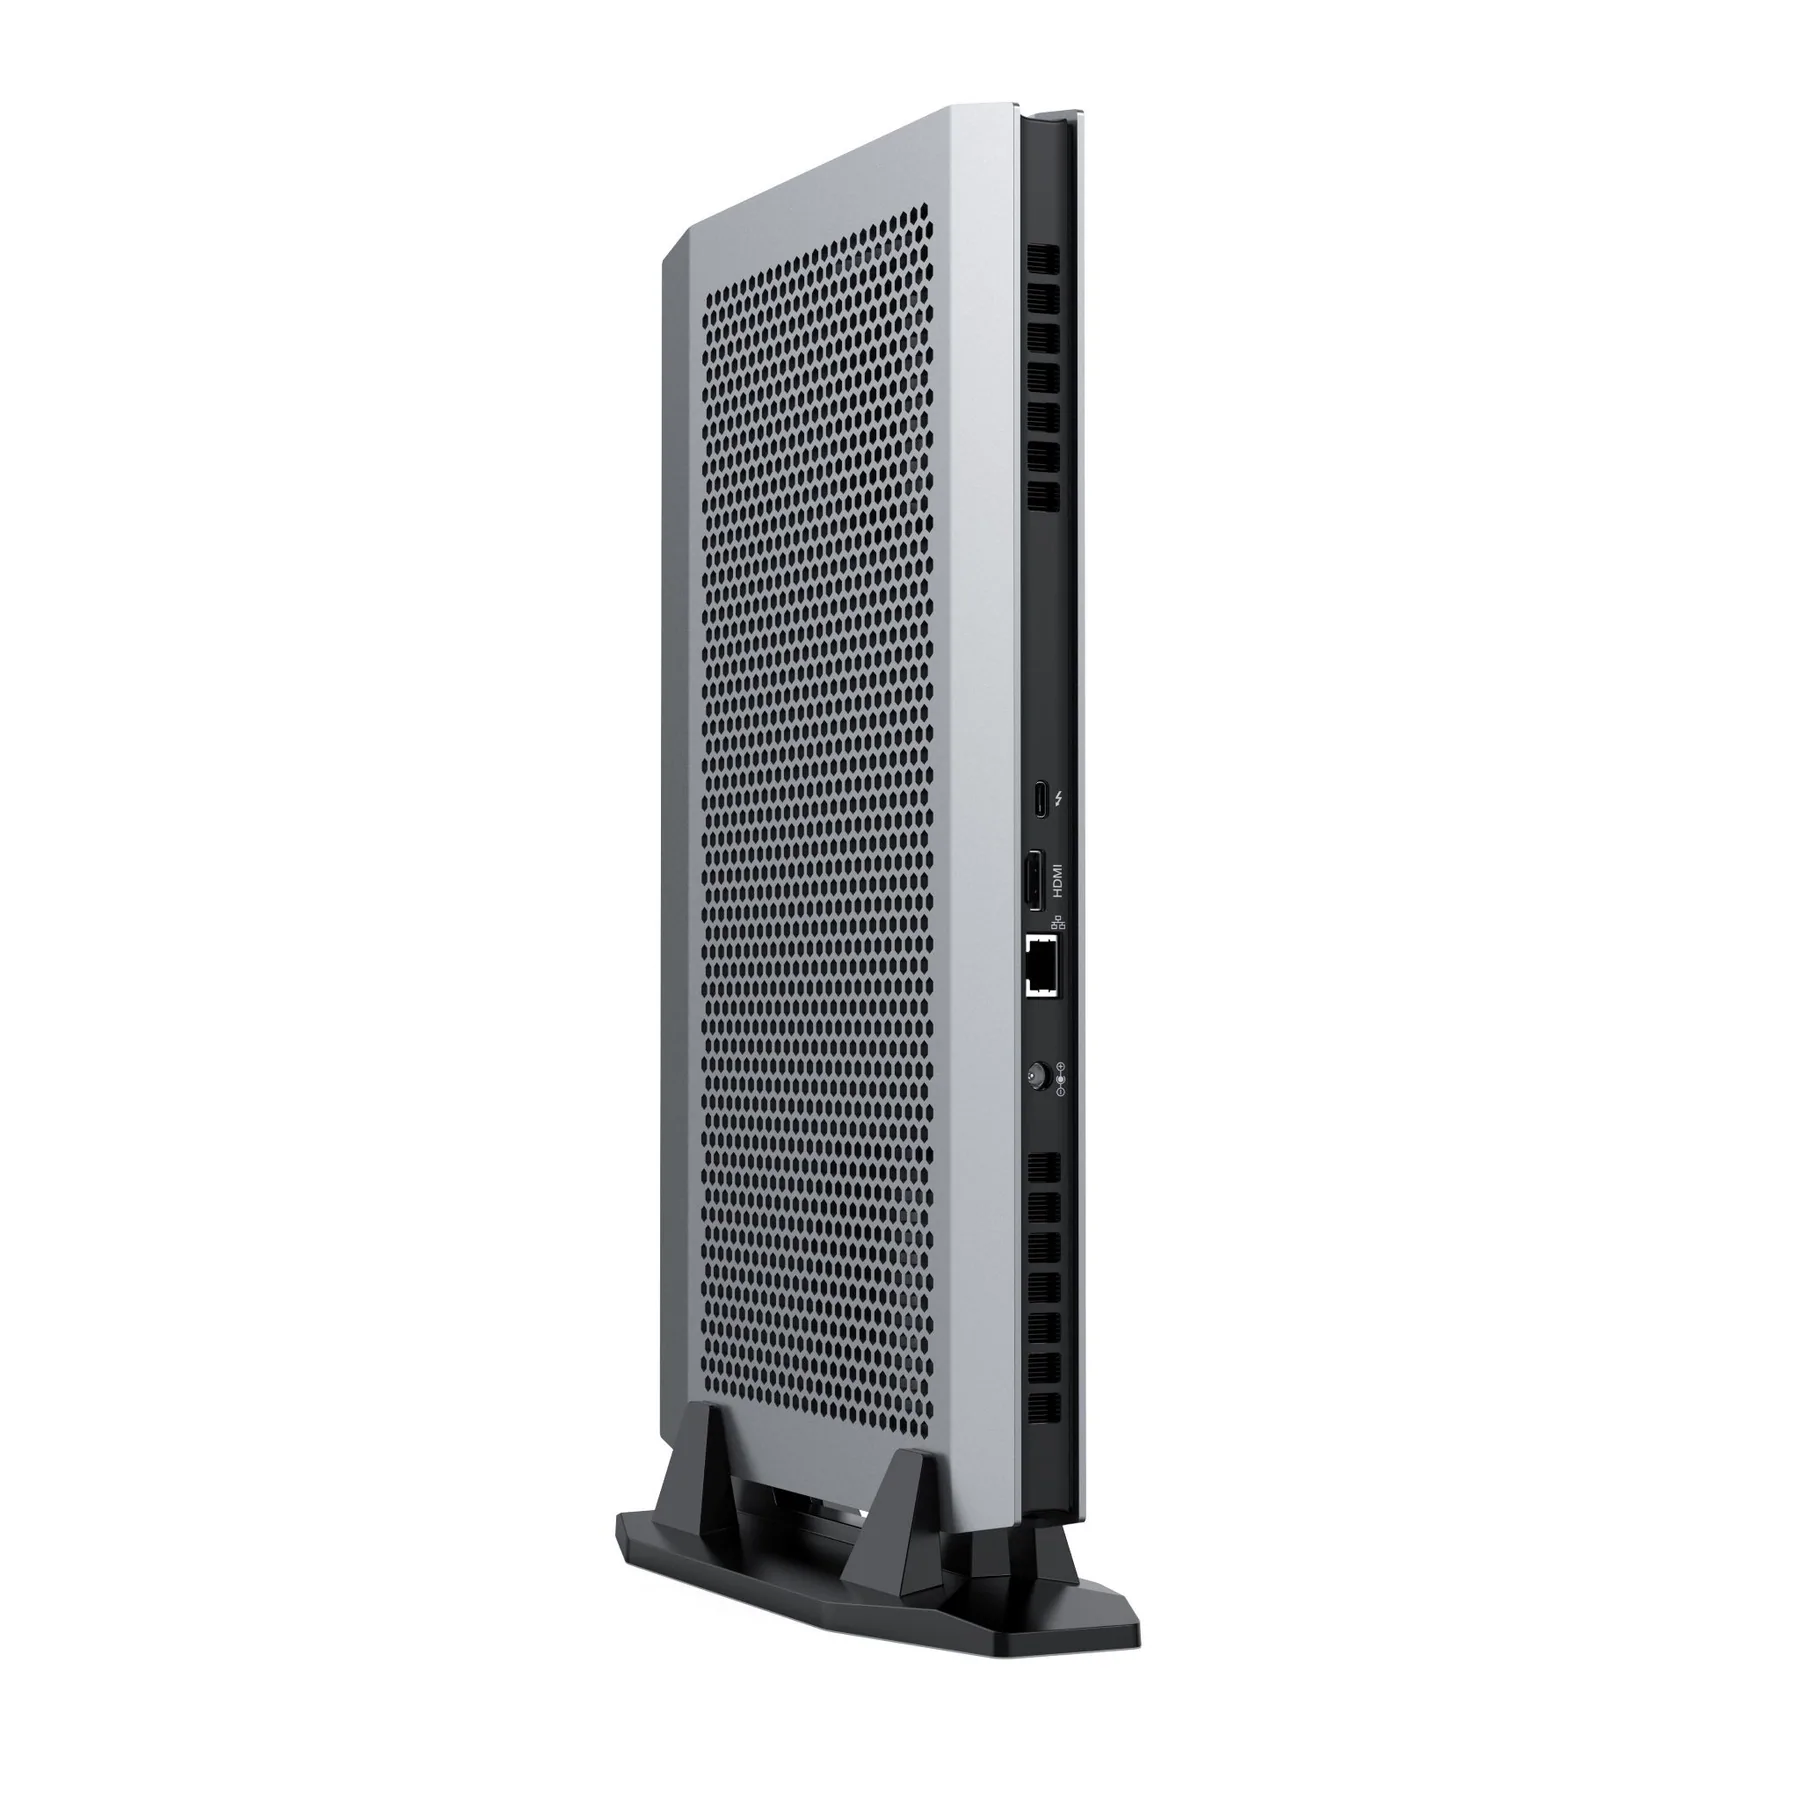
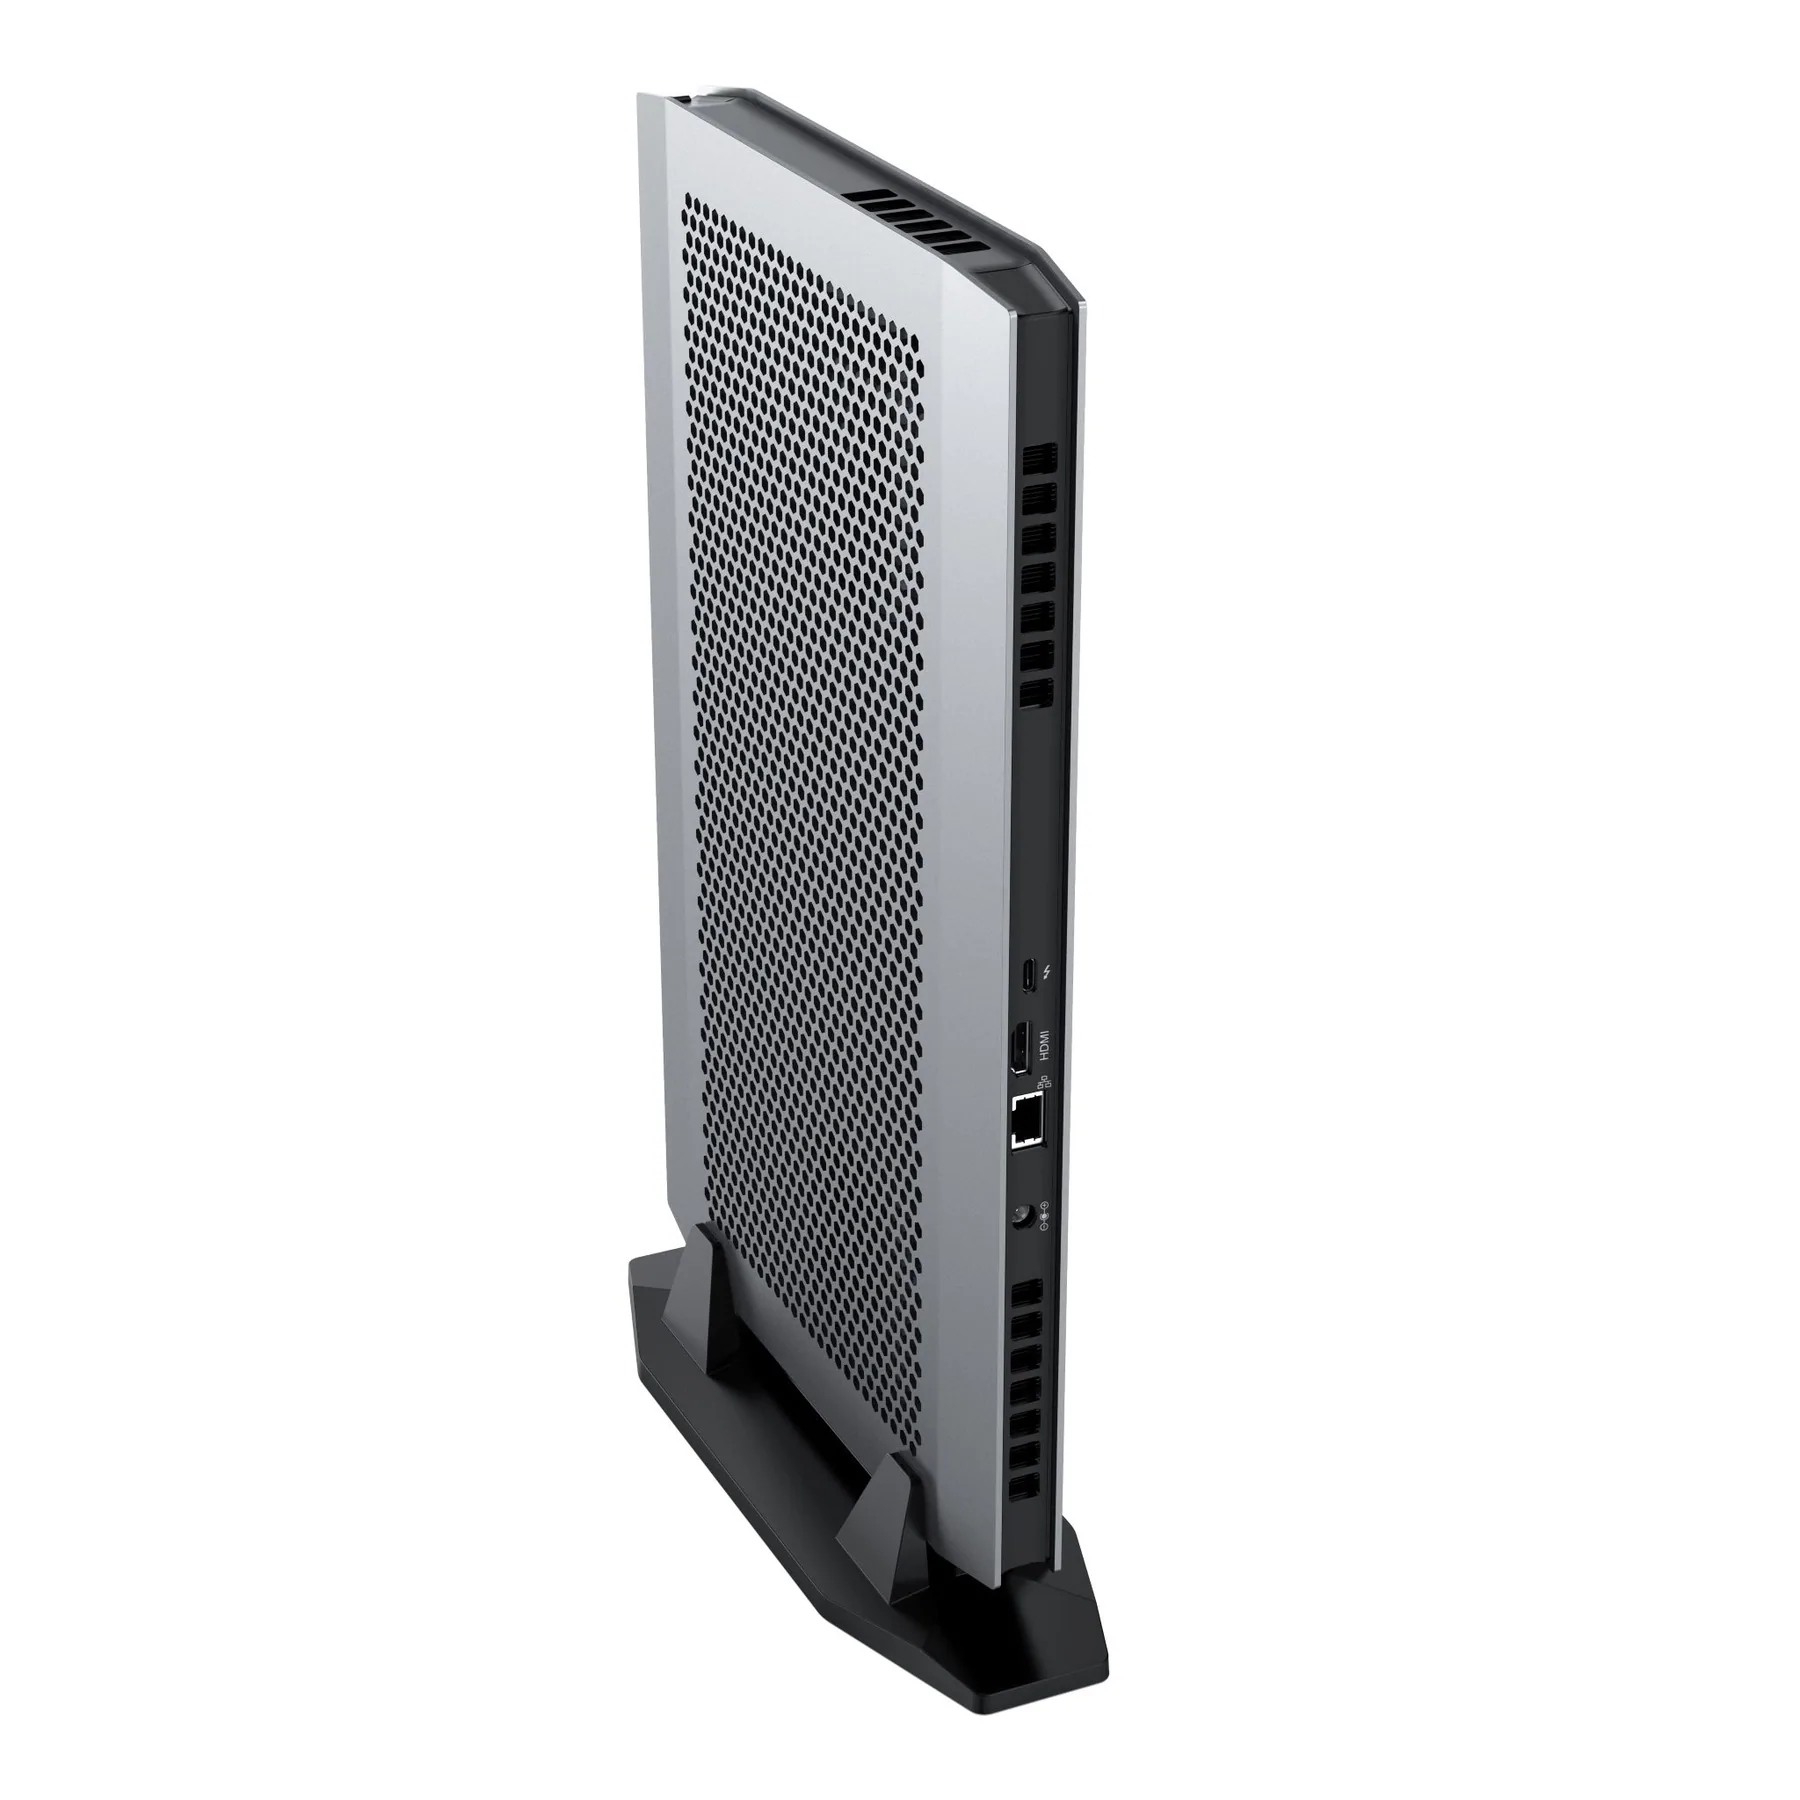
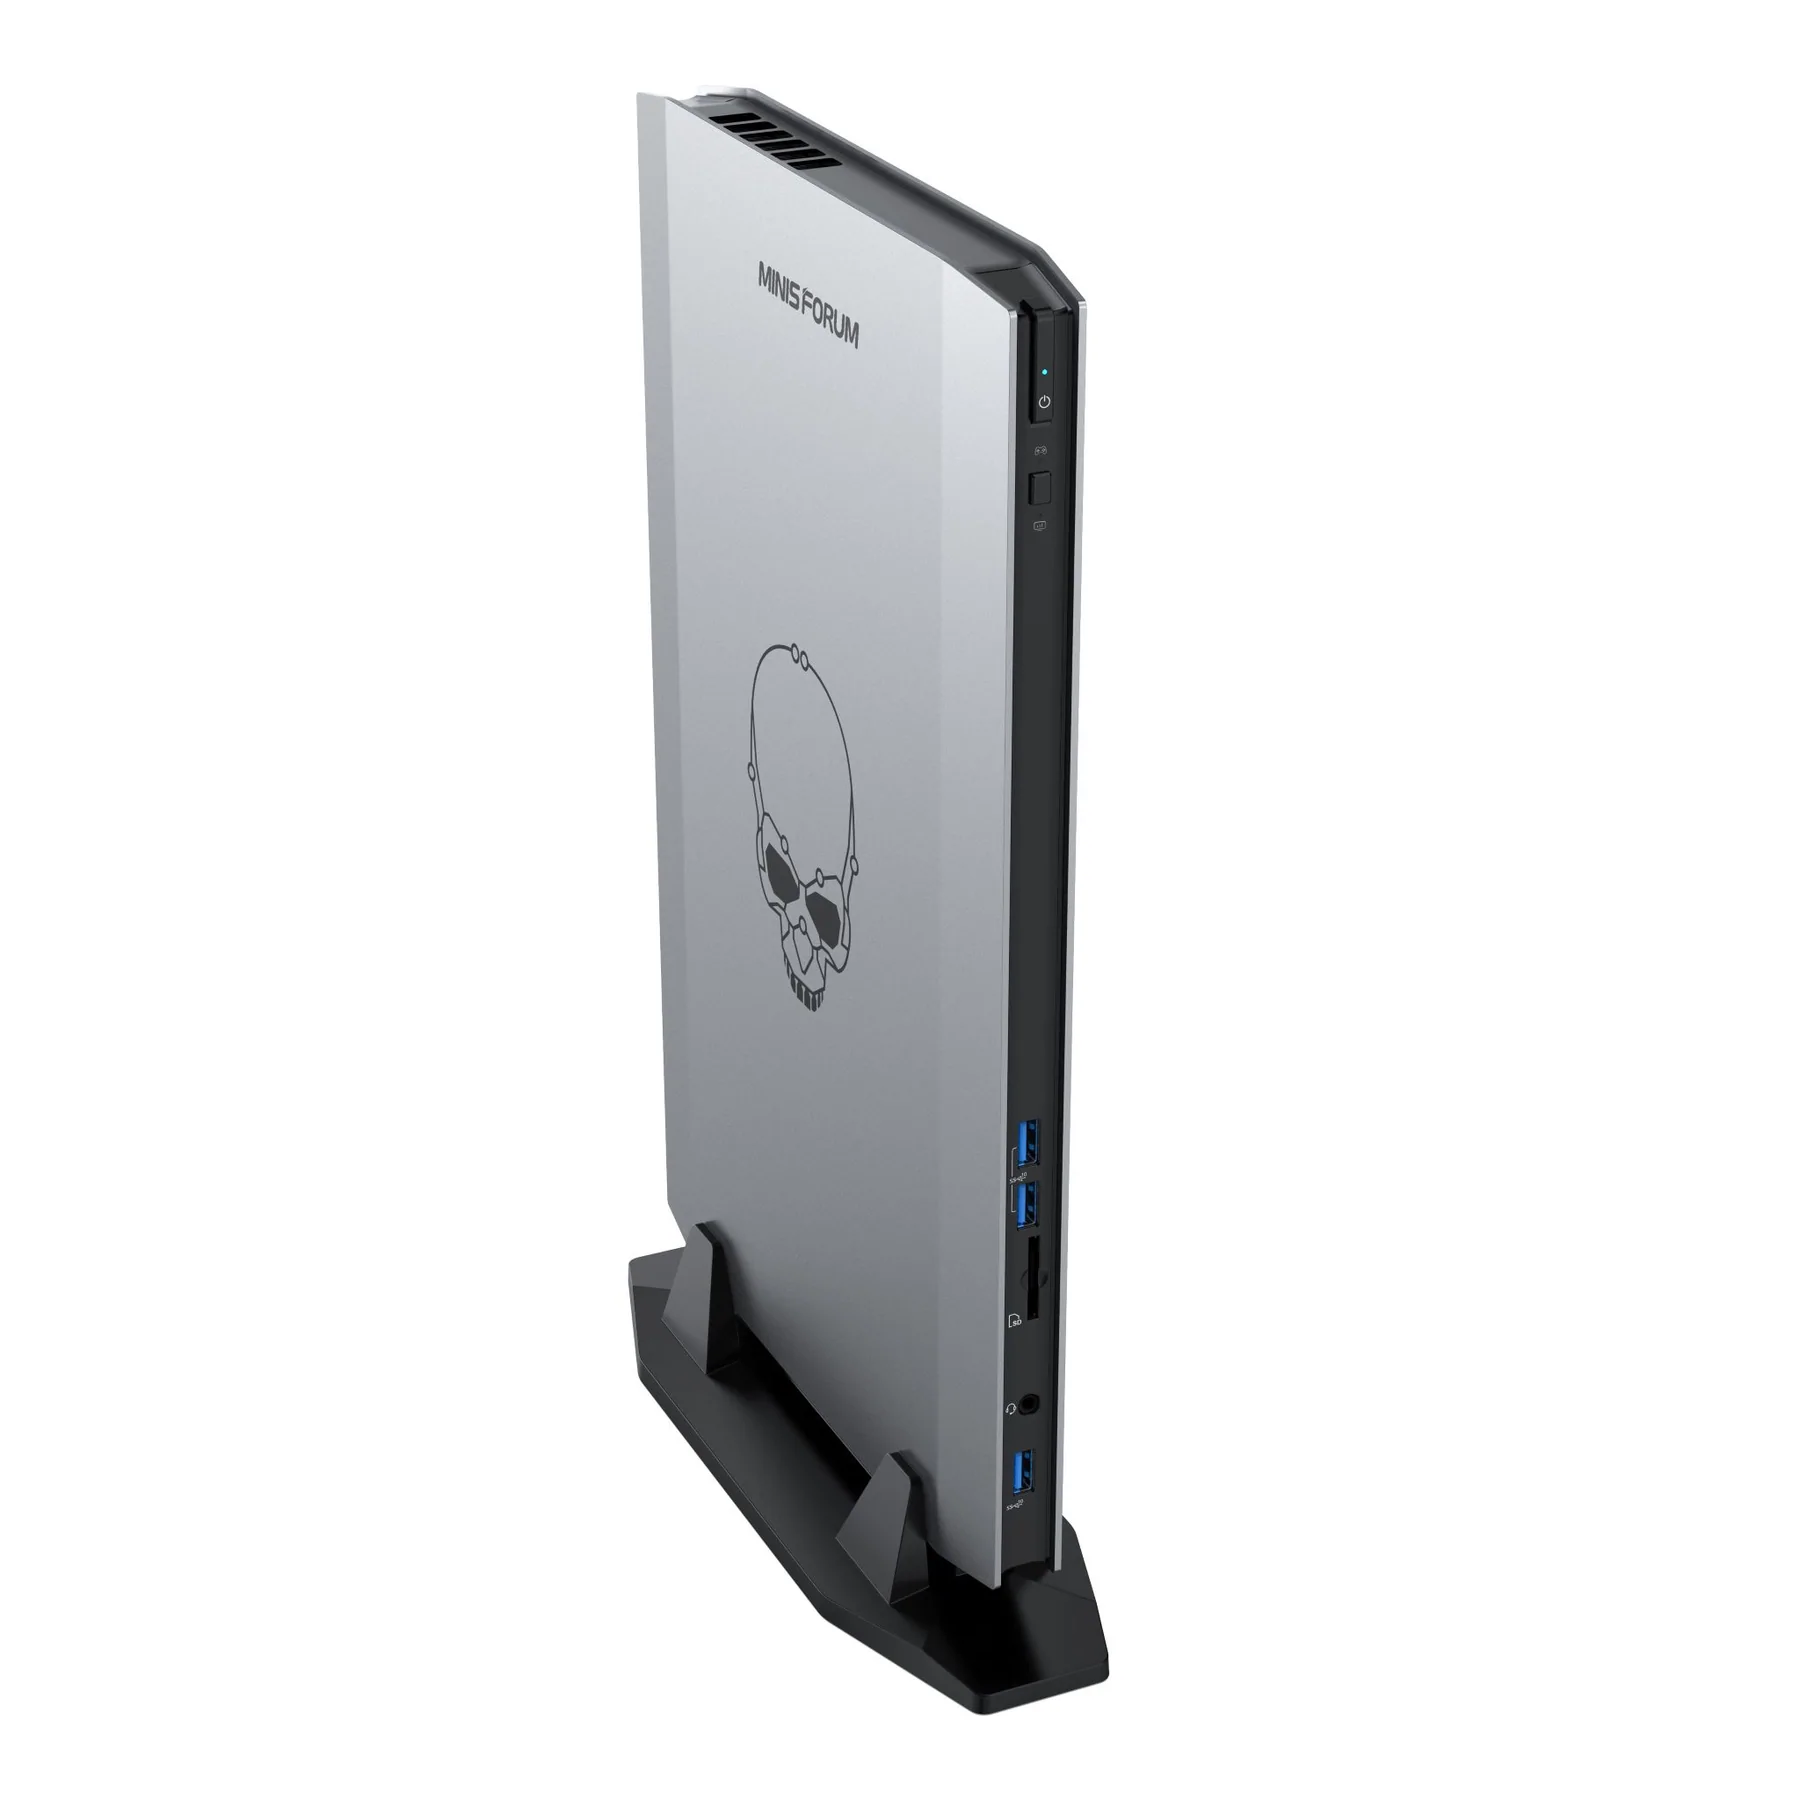
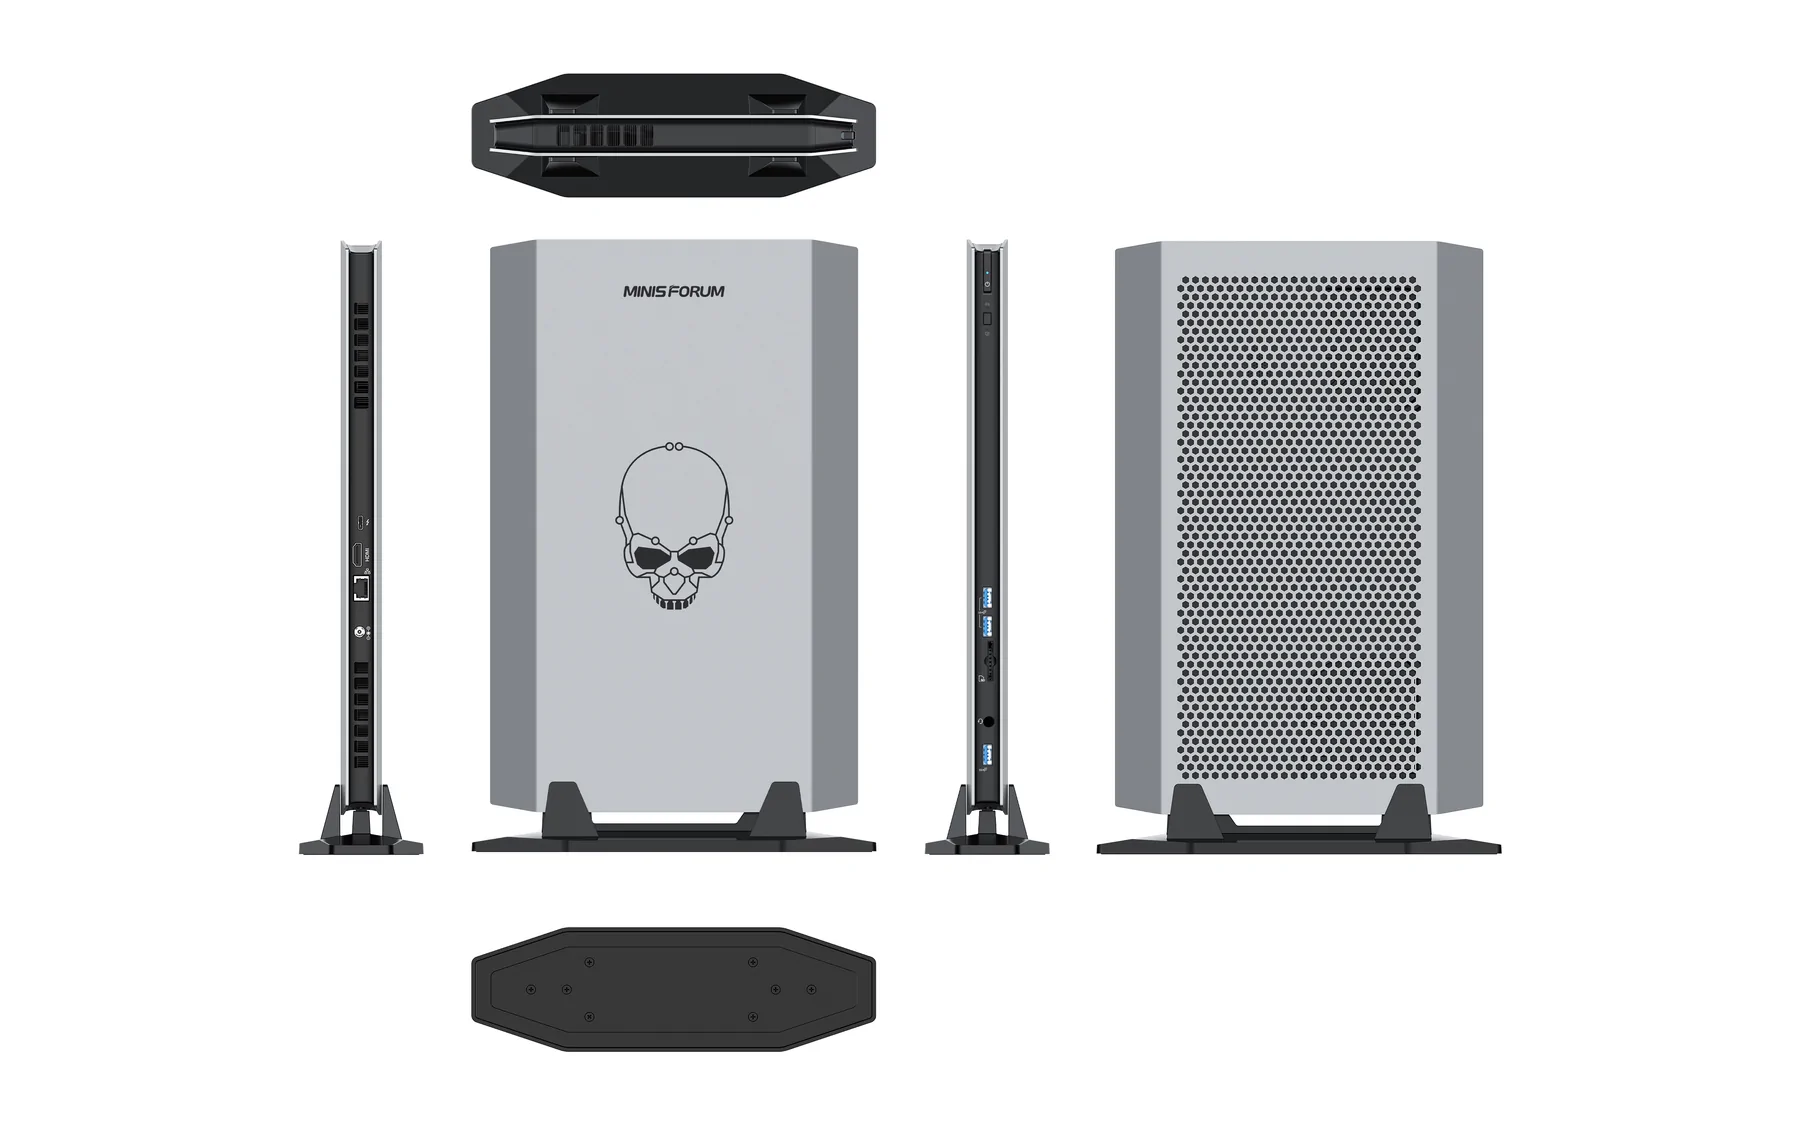
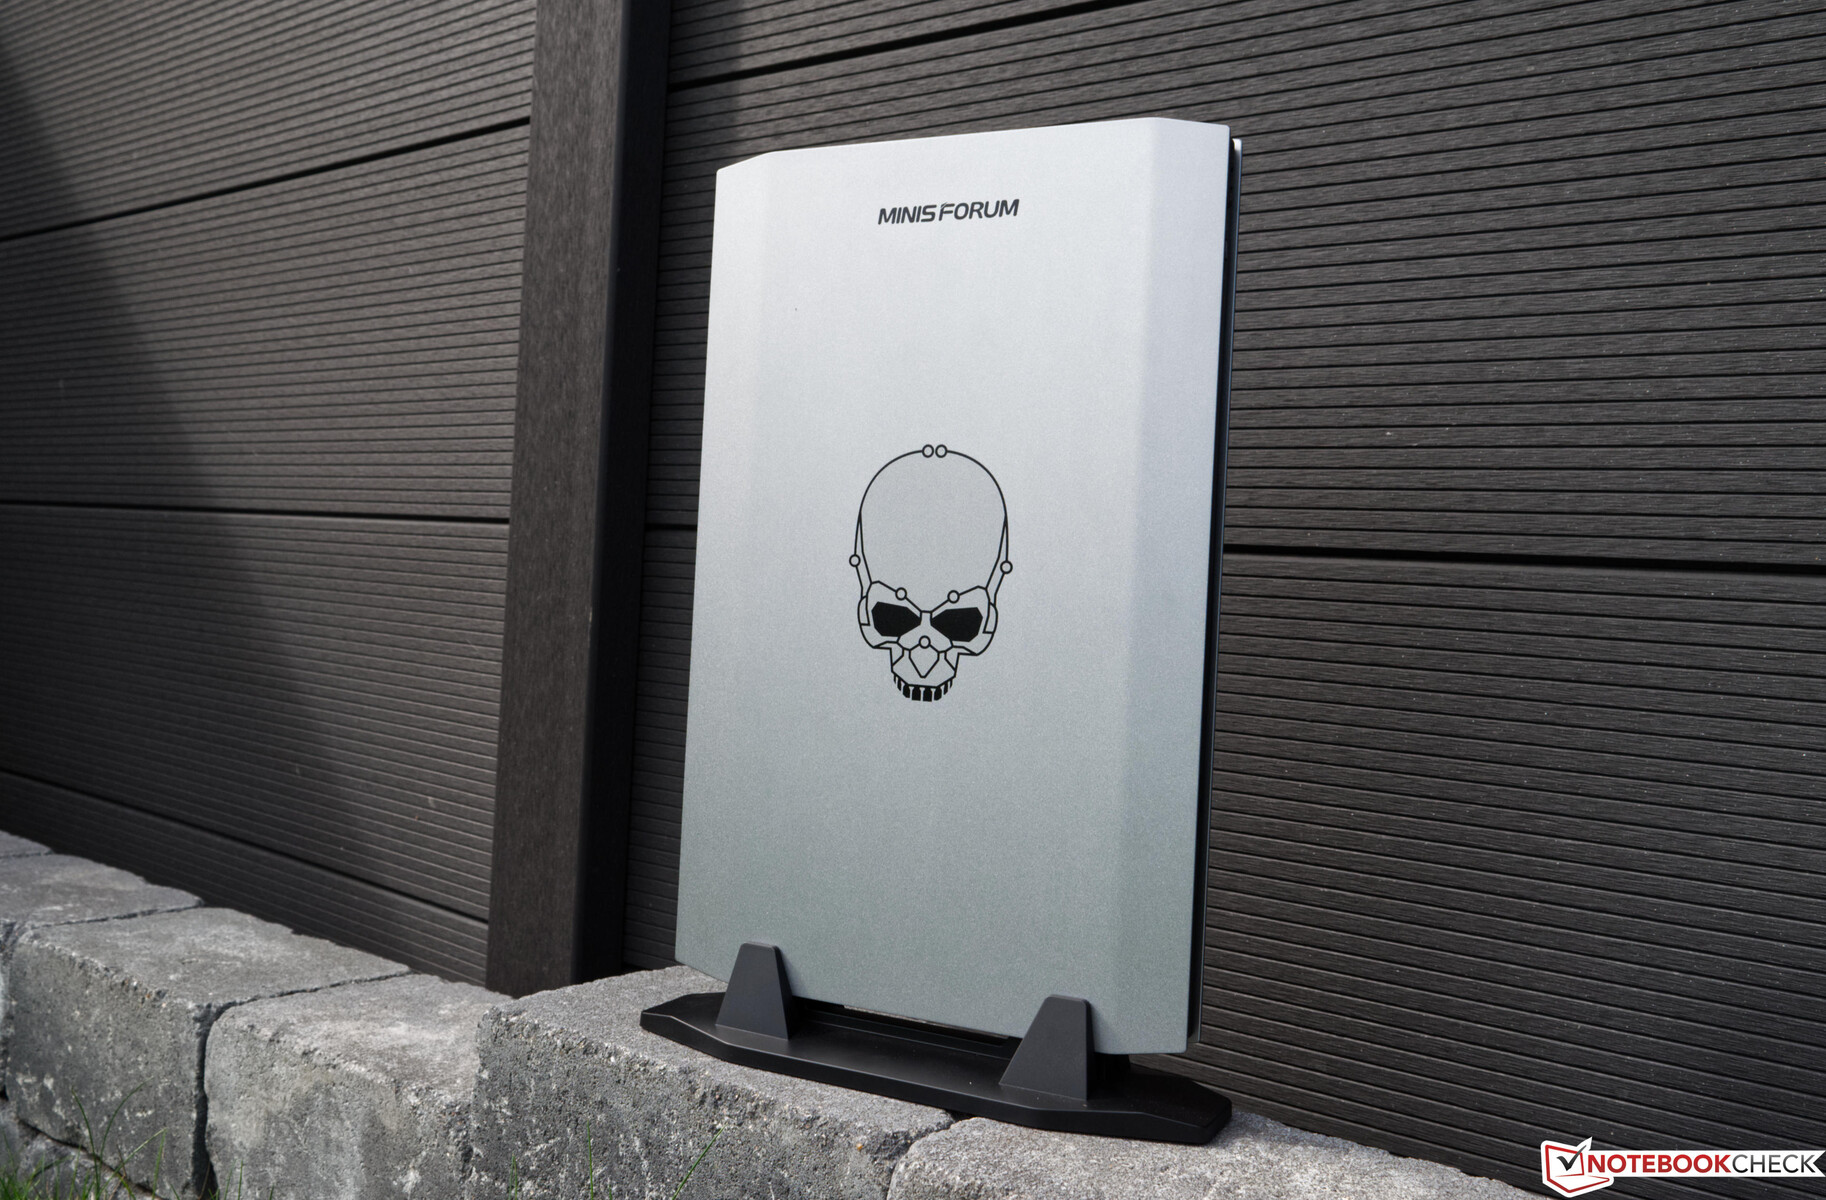
Minisforum NUCXi7 nie jest mały i naszym zdaniem nie jest klasycznym mini PC. Urządzenie jest jednak nadal bardzo smukłe, przypominając laptopa bez wyświetlacza i urządzeń wejściowych. Większość obudowy wykonana jest z plastiku, jednocześnie dając wysokiej jakości wrażenia haptyczne. Choć aluminiowa podstawa byłaby zapewne cięższa, urządzenie zyskałoby znacząco na wrażeniach jakościowych. Wizualnie lewy bok zdobi czaszka, która ożywia skądinąd gładki srebrny bok. Tył pokryty jest dużym wzorem plastra miodu, który ma zapewnić dobre chłodzenie. Urządzenie jest przykręcone do stabilnej podstawki i może być uruchamiane tylko w pozycji pionowej. Minisforum NUCXi7 nie jest przeznaczony do pracy w poziomie, gdyż prawdopodobnie byłoby to również z wyraźną szkodą dla właściwości chłodzenia.
Łącznie z podstawką, Minisforum NUCXi7 wnosi na wagę zaledwie 2,4 kg (~5,3 lb), czyli bardzo mało. Z drugiej strony, waga podstawki zapobiega łatwemu przewróceniu się. W przypadku zewnętrznego zasilacza trzeba też dodać do wagi około kolejne 0,5 kg (~1,1 lb).
Sprzęt
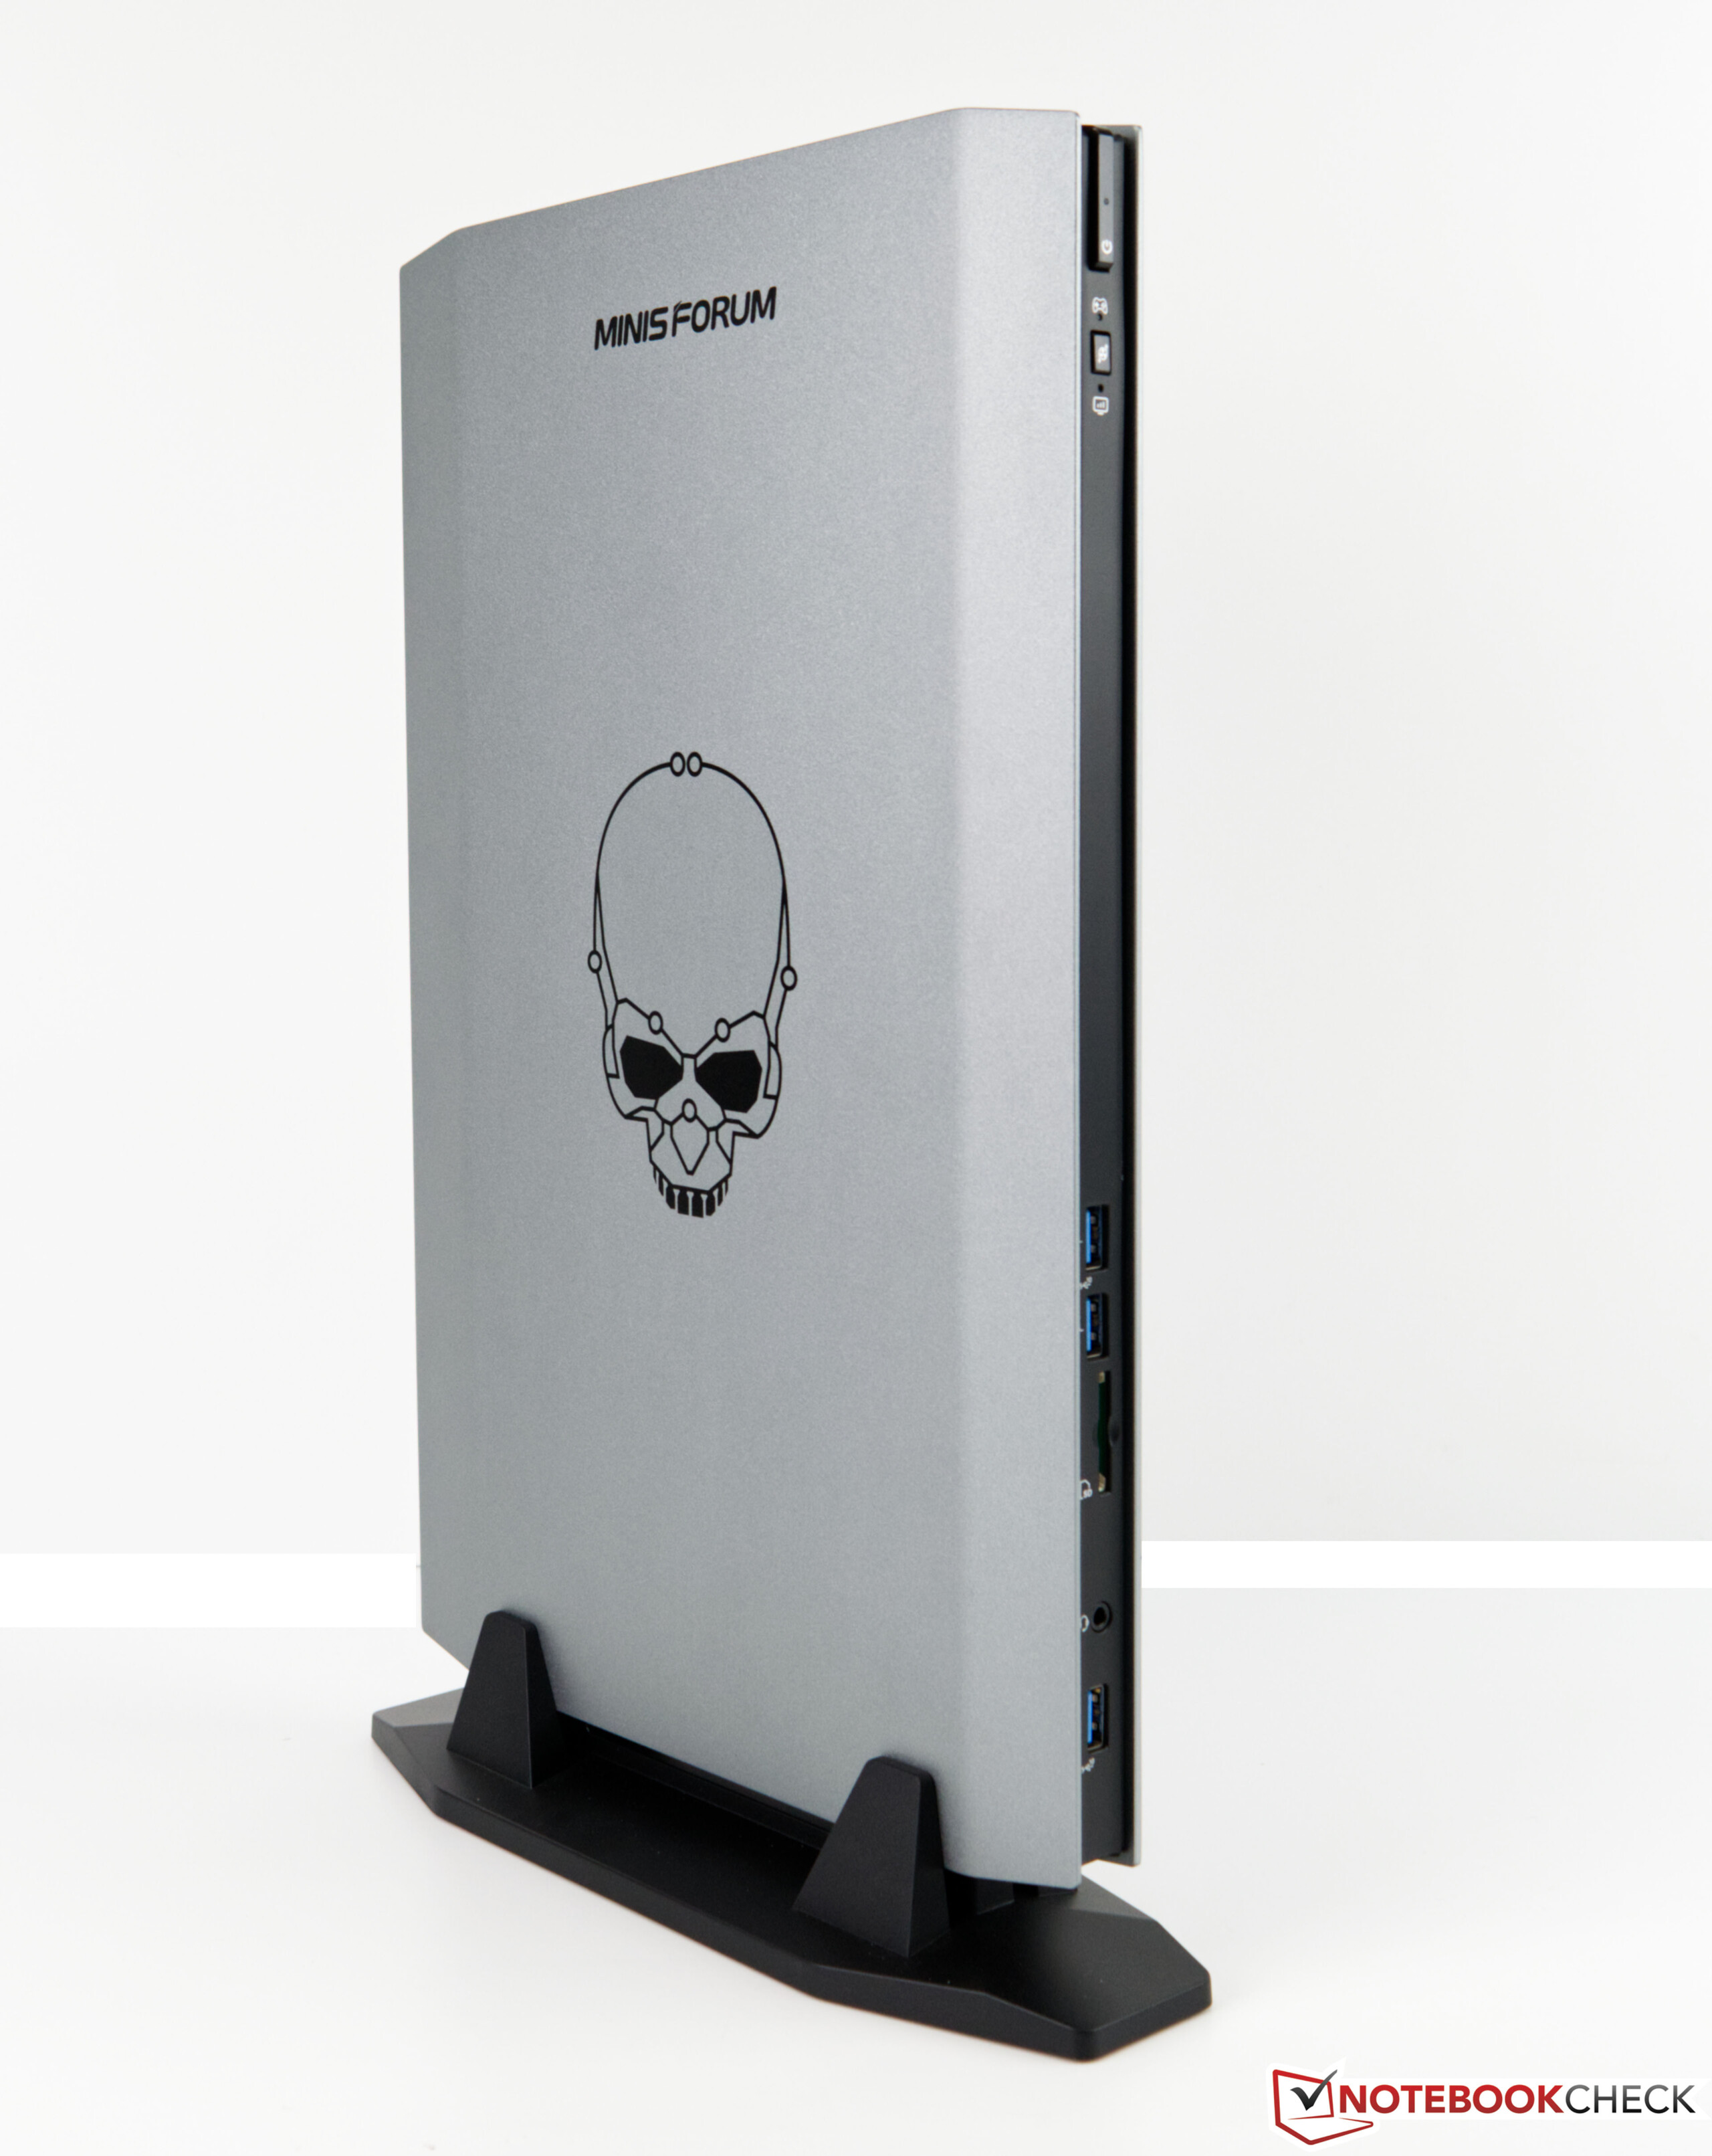
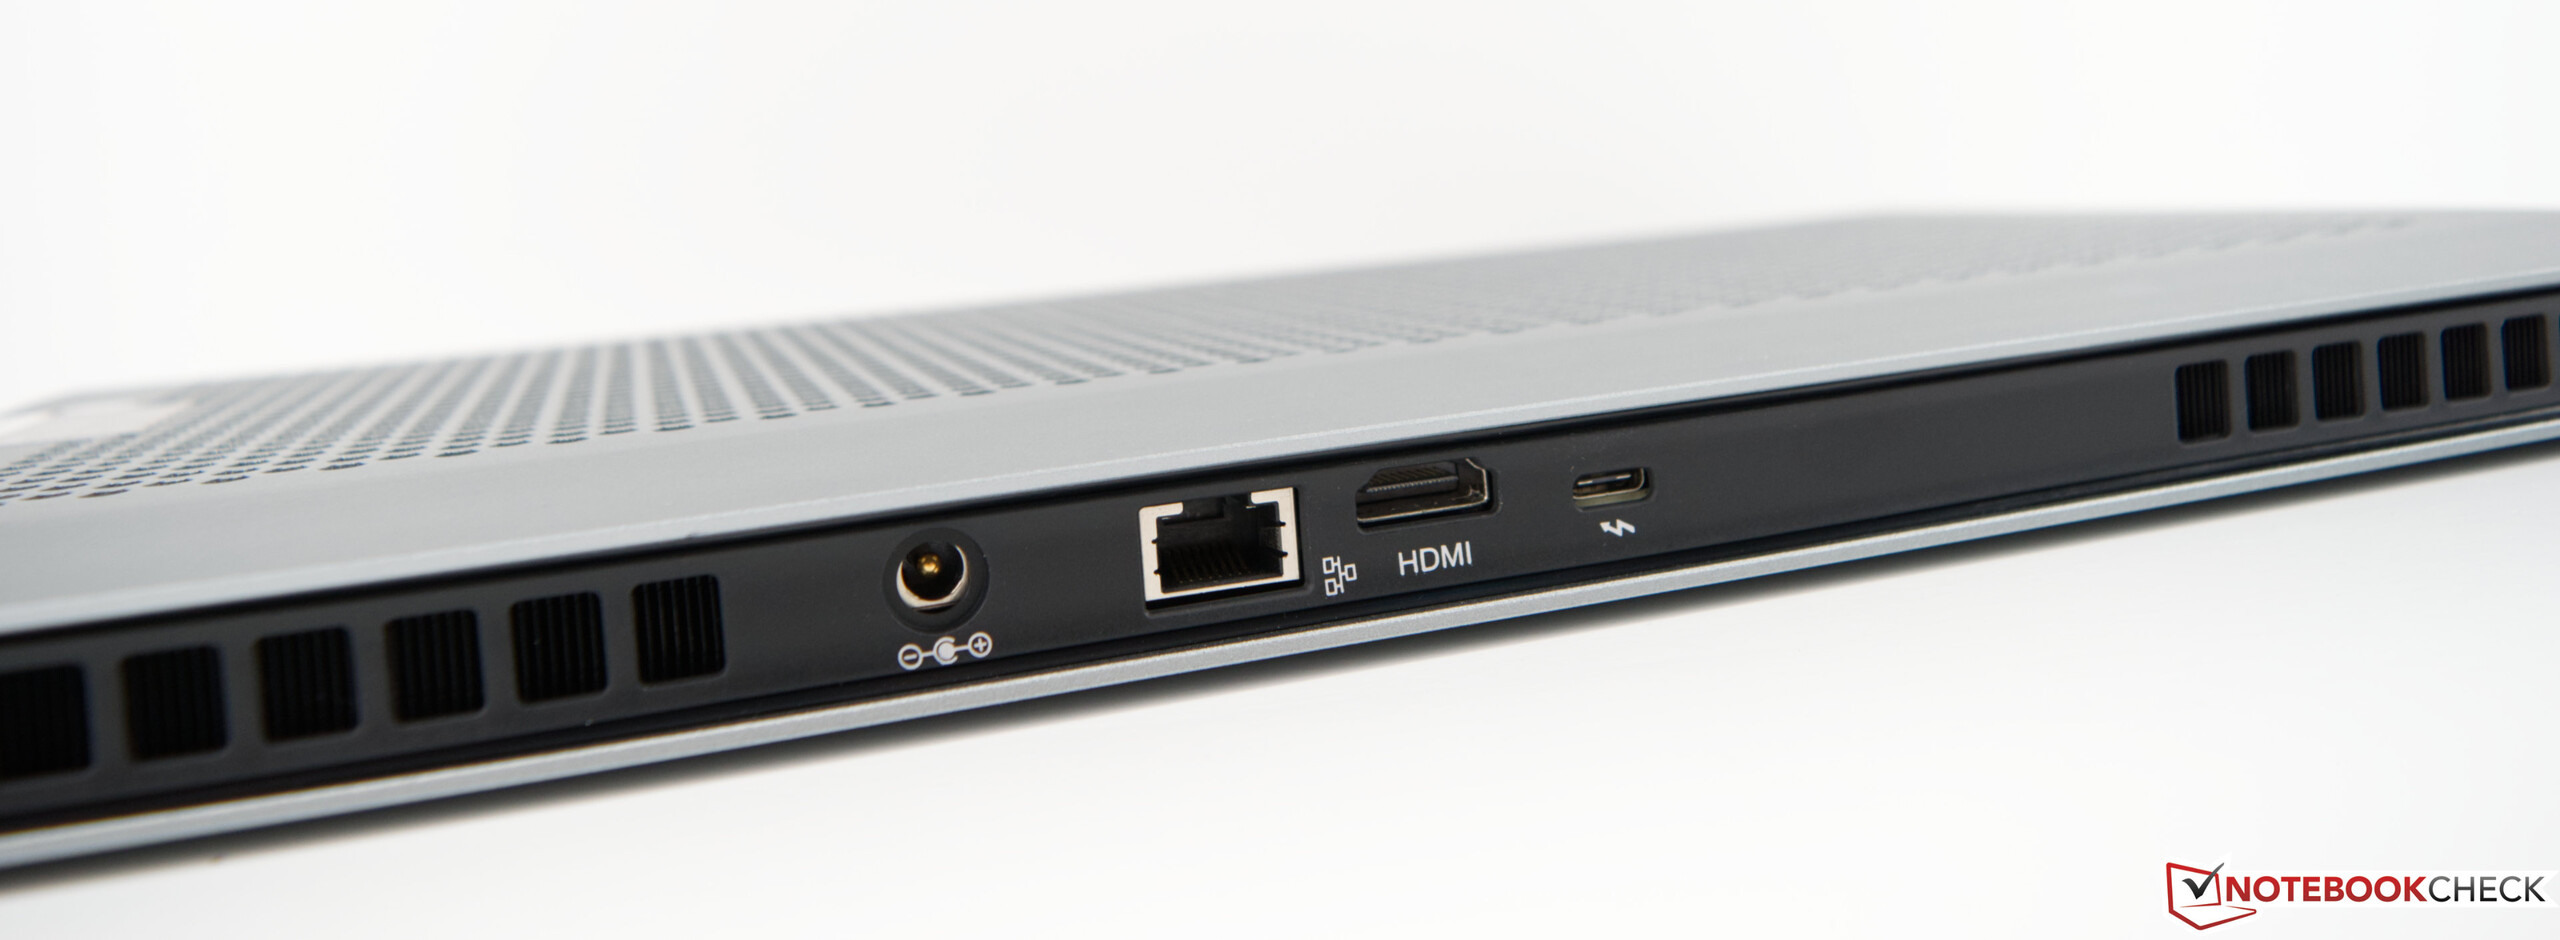
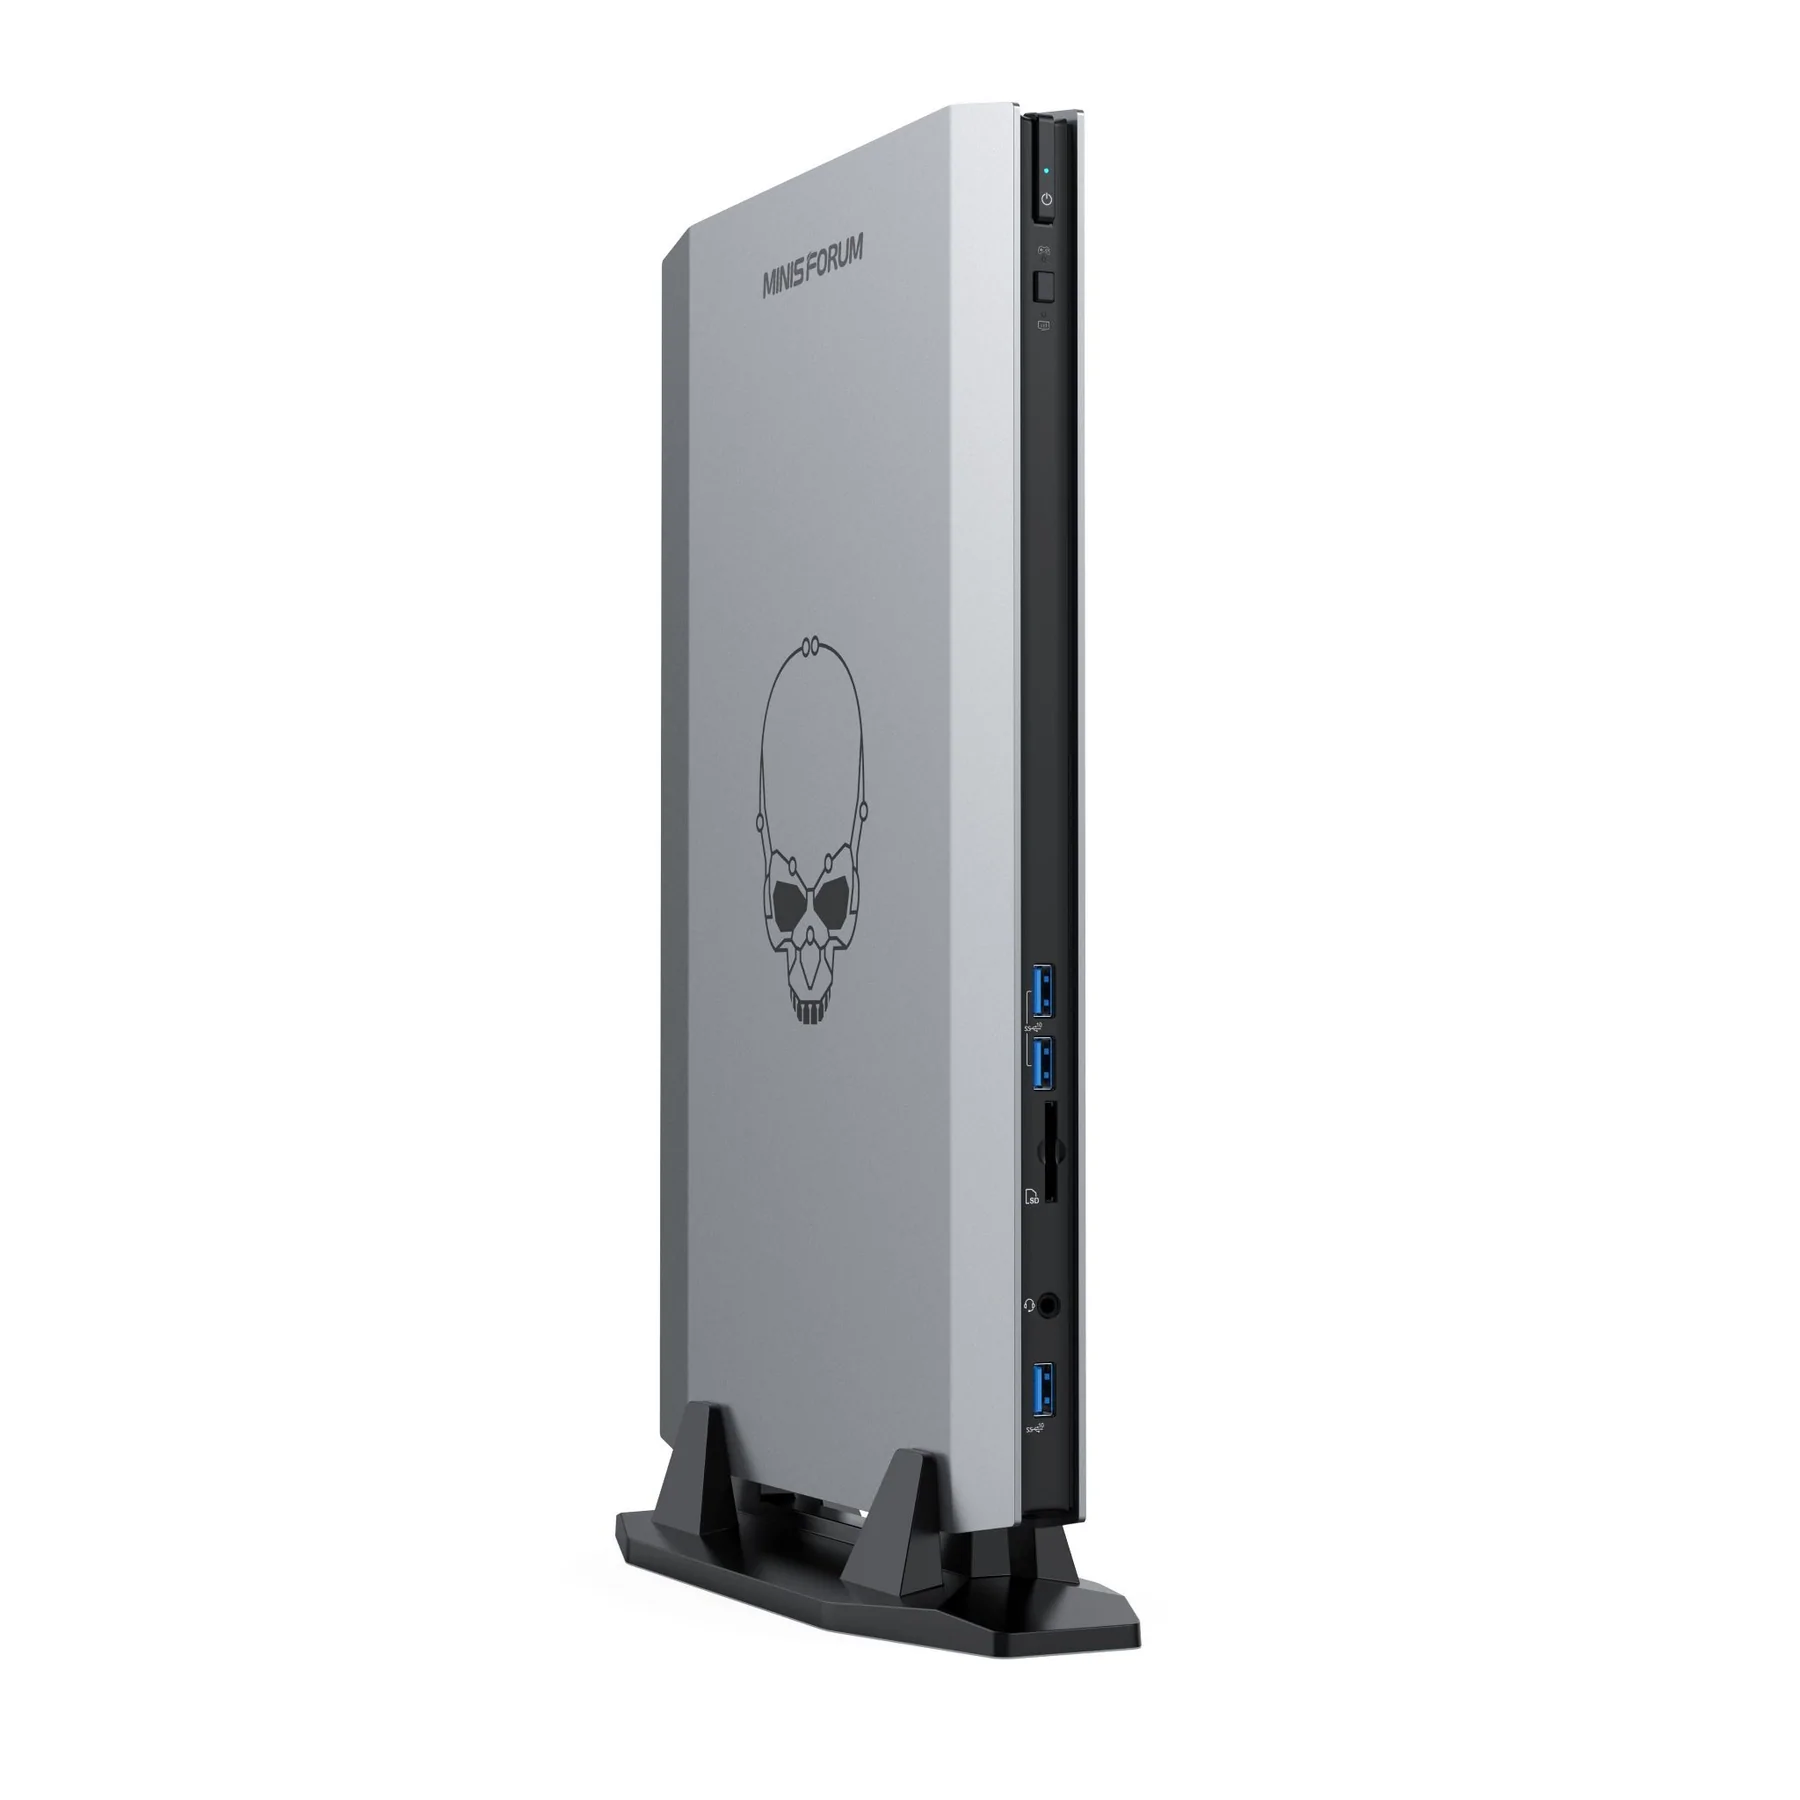
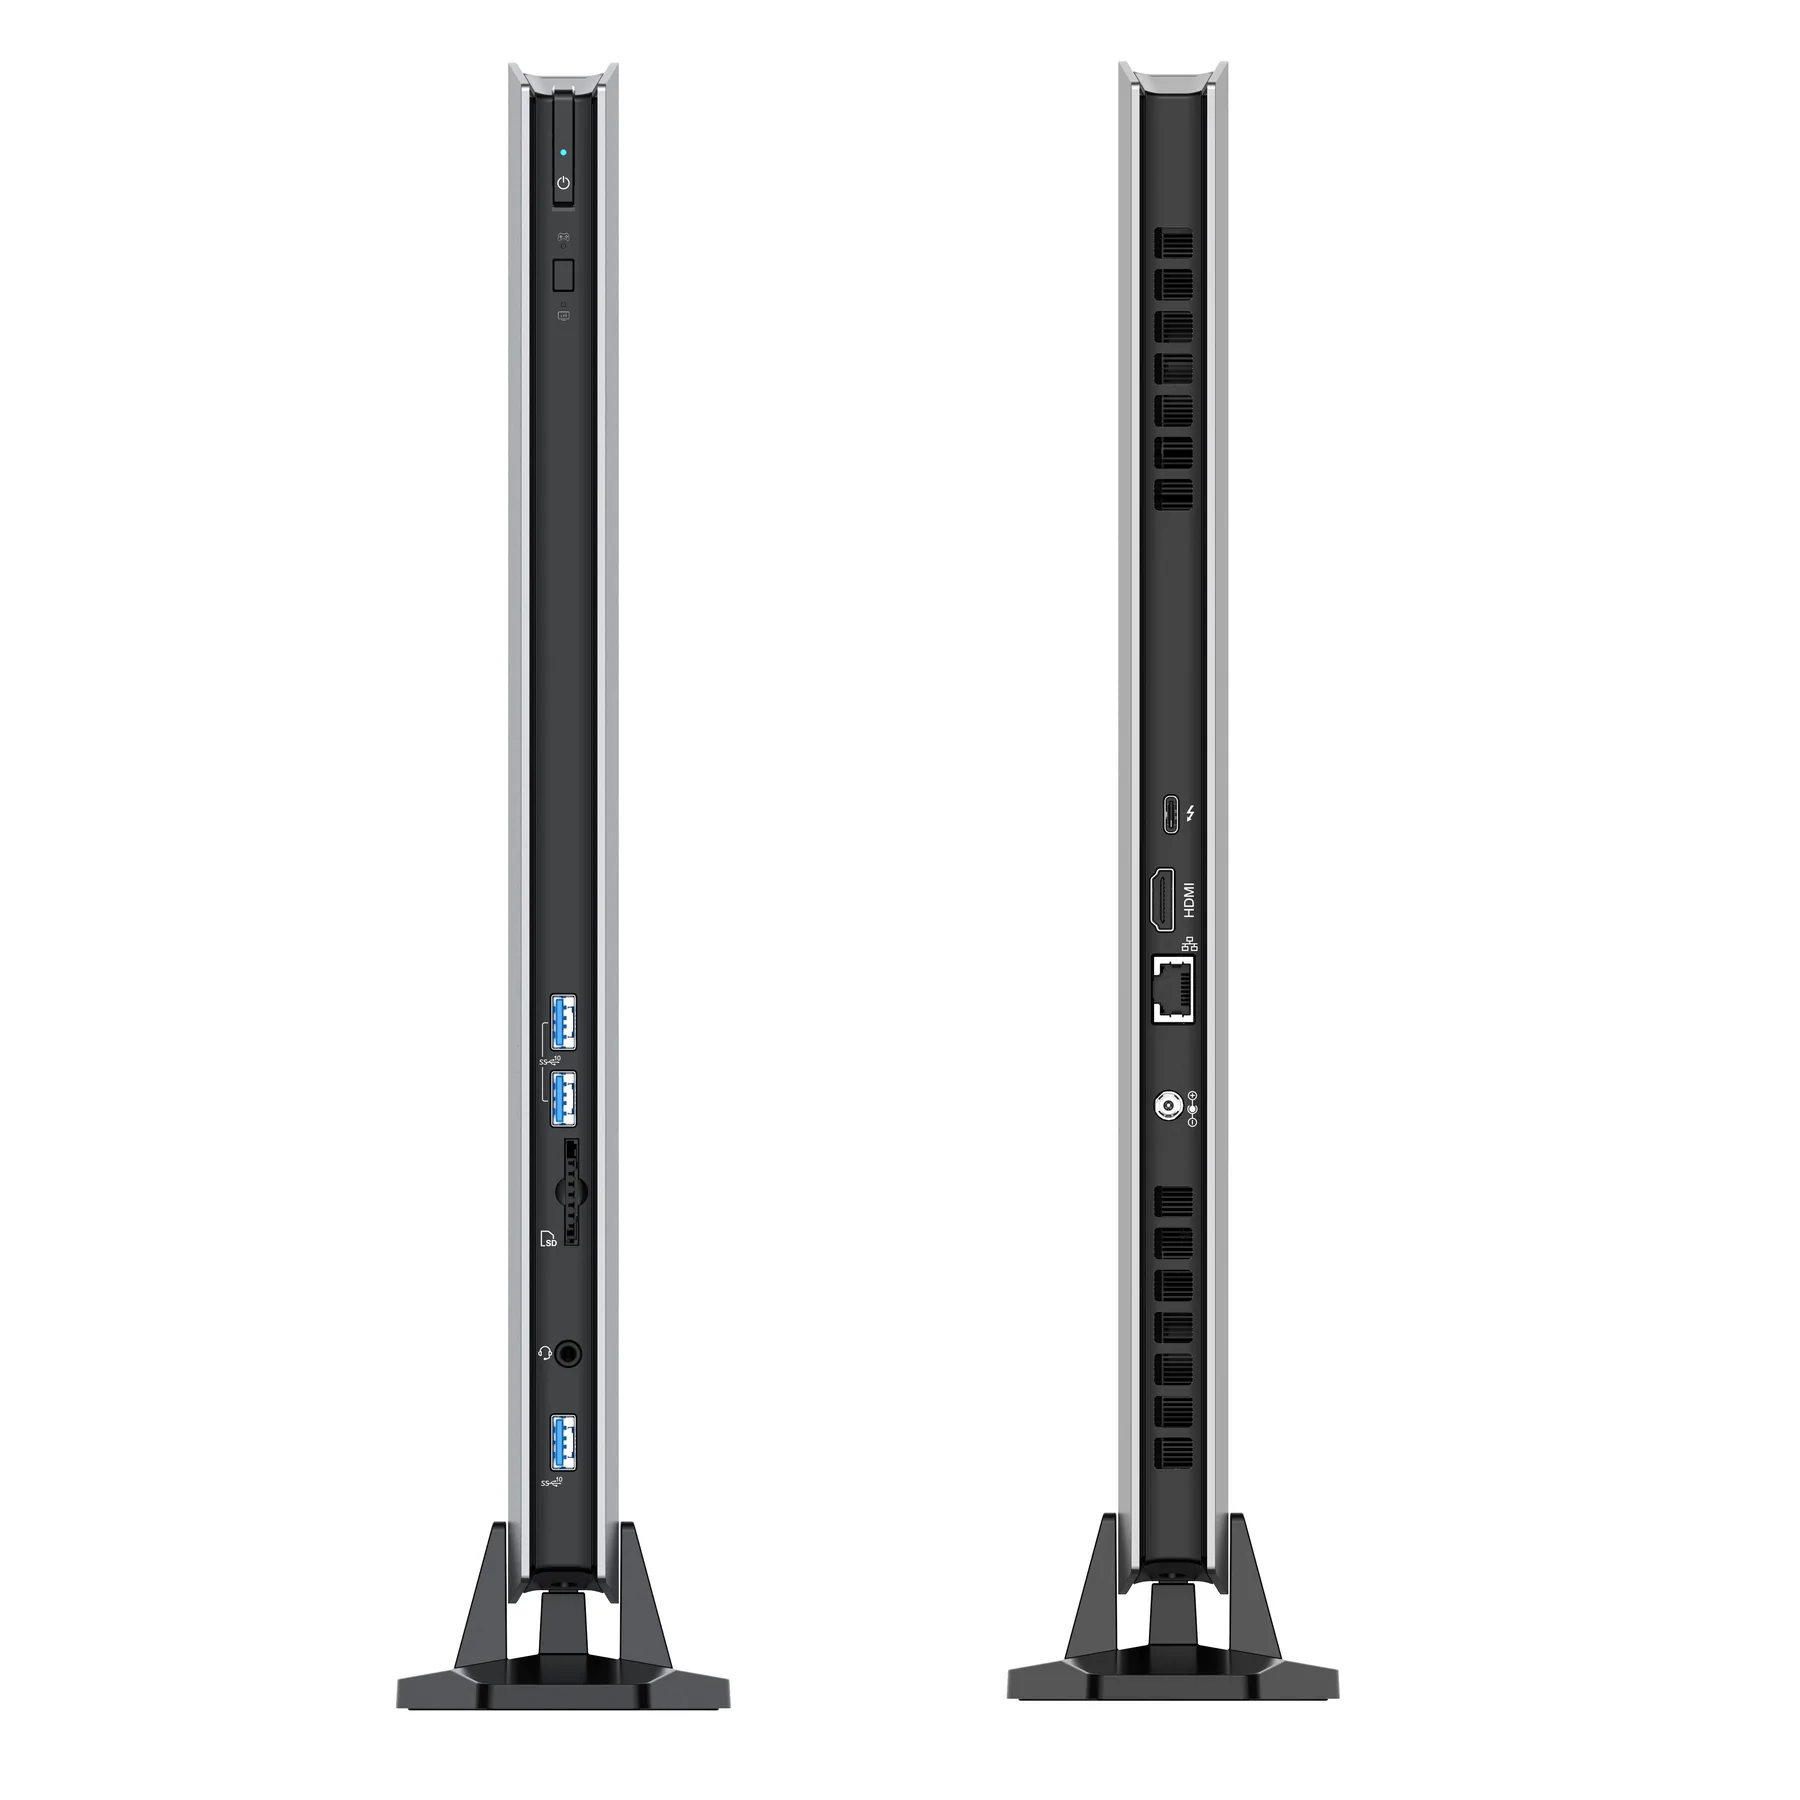
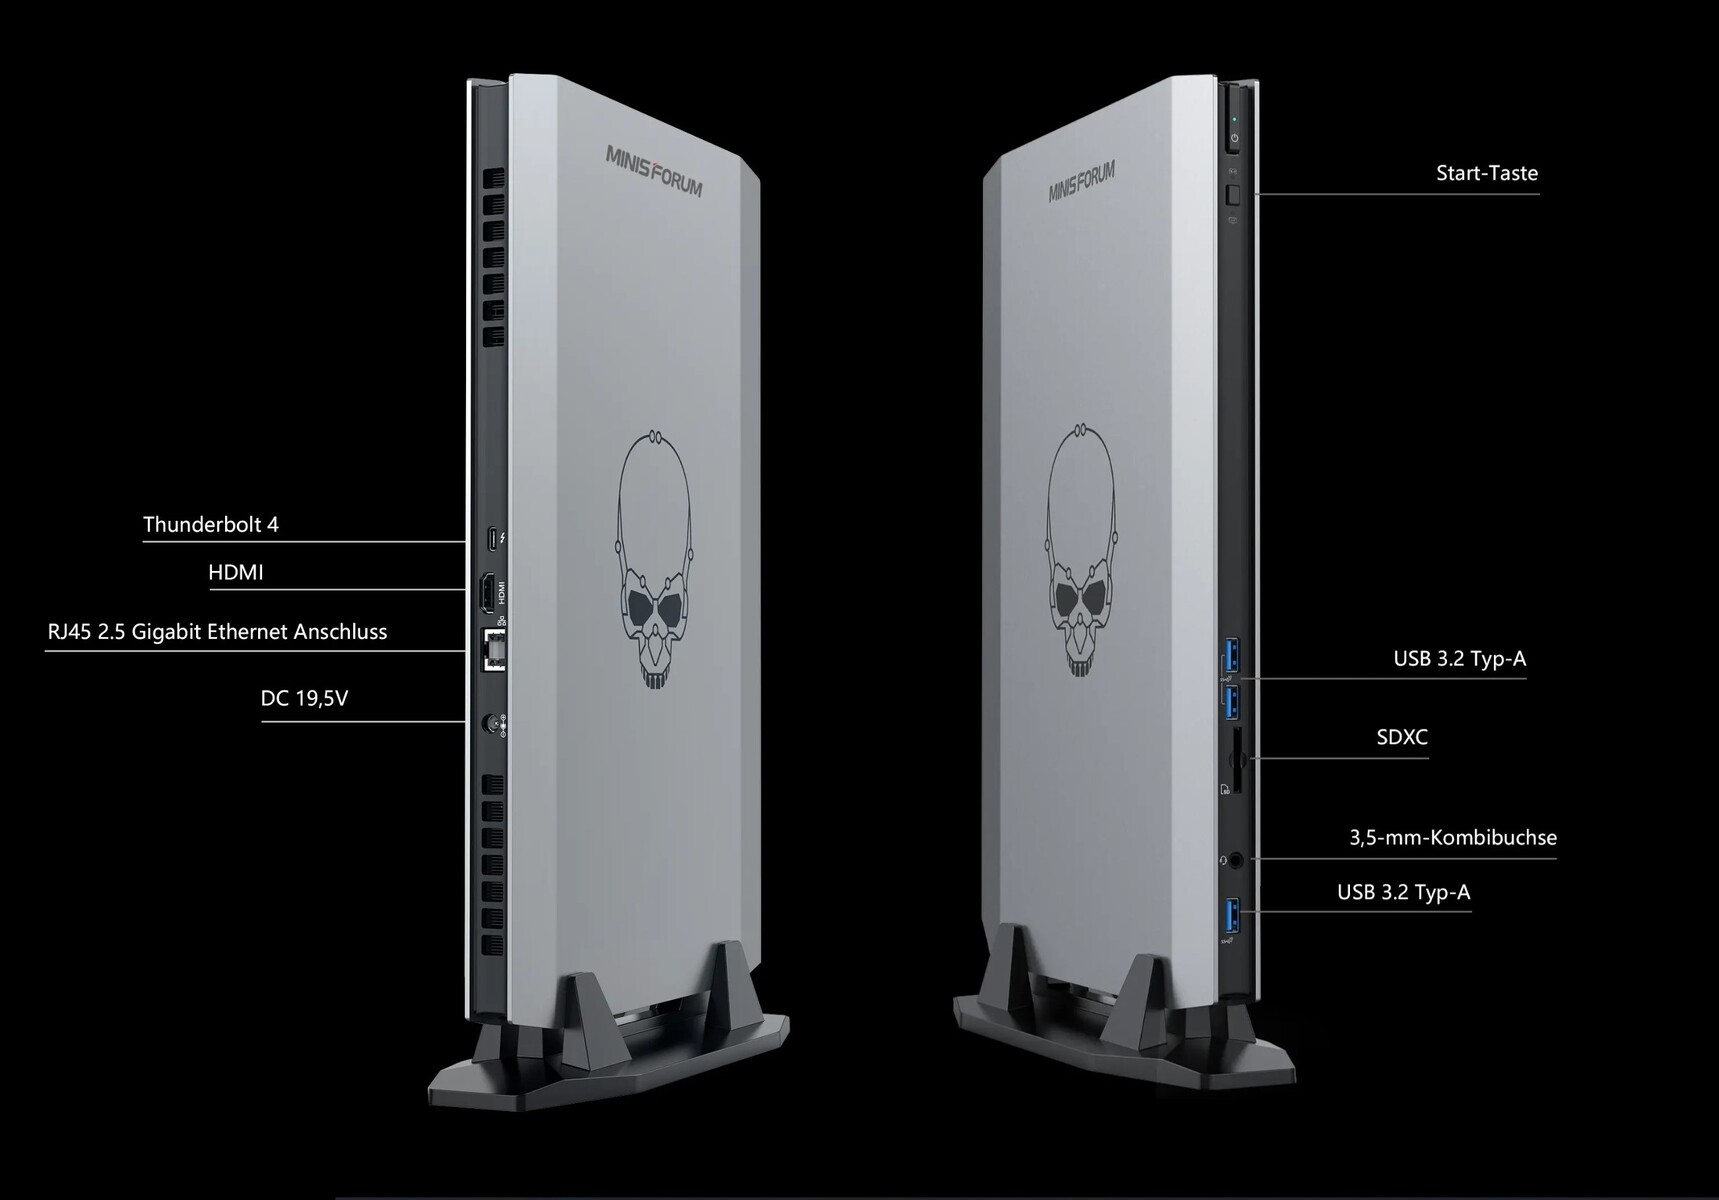
Na pierwszy rzut oka widać, że wszystkie ważne złącza są dostępne. Jest nawet nowoczesny port Thunderbolt. Jednocześnie można mieć różne opinie na temat liczby dostępnych portów USB 3.2 Type-A. Urządzenie oferuje ich tylko trzy i wszystkie są umieszczone z przodu. Nam przydałby się jeszcze przynajmniej jeden port USB z tyłu. Ale niestety producent jest przywiązany do układu płyty głównej, co utrudniłoby sprawę. Wyświetlacze można podłączyć za pomocą HDMI lub Thunderbolt, przy czym obie te opcje działały bez problemów w naszym teście. Nie trzeba też tutaj żyć bez czytnika kart SD.
Czytnik kart SD
Minisforum NUCXi7 jest wyposażony w czytnik kart SD, który działa z prędkością USB 3. Zmierzone w naszym teście 76 MB/s przy użyciu naszej karty referencyjnej (Angelbird AV Pro V60) z połączeniem UHS-II również potwierdza szybkość USB 3. Wydajność ta jest jednak wciąż gorsza od średniej w klasie.
| SD Card Reader - average JPG Copy Test (av. of 3 runs) | |
| Asus ROG Zephyrus Duo 16 GX650RX (AV PRO microSD 128 GB V60) | |
| Razer Blade 17 Early 2022 (AV PRO microSD 128 GB V60) | |
| Minisforum NUCX i7 (AV Pro SD microSD 128 GB V60) | |
| MSI Titan GT77 12UHS (AV PRO microSD 128 GB V60) | |
| Acer Predator Triton 500 SE PT516-52s-70KX (AV PRO microSD 128 GB V60) | |
| MSI Raider GE77 HX 12UHS (AV PRO microSD 128 GB V60) | |
Komunikacja
Minisforum wykorzystuje w NUCXi7 moduł Intel Wi-Fi 6E-AX210. W teście z naszym routerem ASUS ROG Rapture GT-AXE11000 nie udało nam się osiągnąć dobrych wyników urządzeń porównawczych. Minisforum NUCXi7 plasuje się na końcu pola porównawczego, wyraźnie zostając tu w tyle. Zintegrowany port LAN stanowi dobrą alternatywę dla połączenia bezprzewodowego, obsługując do 2,5 Gbit/s.
| Networking | |
| iperf3 receive AXE11000 6GHz | |
| Intel Dragon Canyon NUC - RTX 3060 | |
| Zotac ZBOX Magnus EN173070C | |
| Przeciętny Intel Wi-Fi 6E AX210 (729 - 1827, n=29) | |
| Minipc Union Ace Magician AMR5 | |
| Minisforum NUCX i7 | |
| Średnia w klasie Desktop (n=1ostatnie 2 lata) | |
| iperf3 transmit AXE11000 6GHz | |
| Intel Dragon Canyon NUC - RTX 3060 | |
| Zotac ZBOX Magnus EN173070C | |
| Przeciętny Intel Wi-Fi 6E AX210 (712 - 1991, n=28) | |
| Minisforum NUCX i7 | |
| Średnia w klasie Desktop (n=1ostatnie 2 lata) | |
| Minipc Union Ace Magician AMR5 | |
Akcesoria
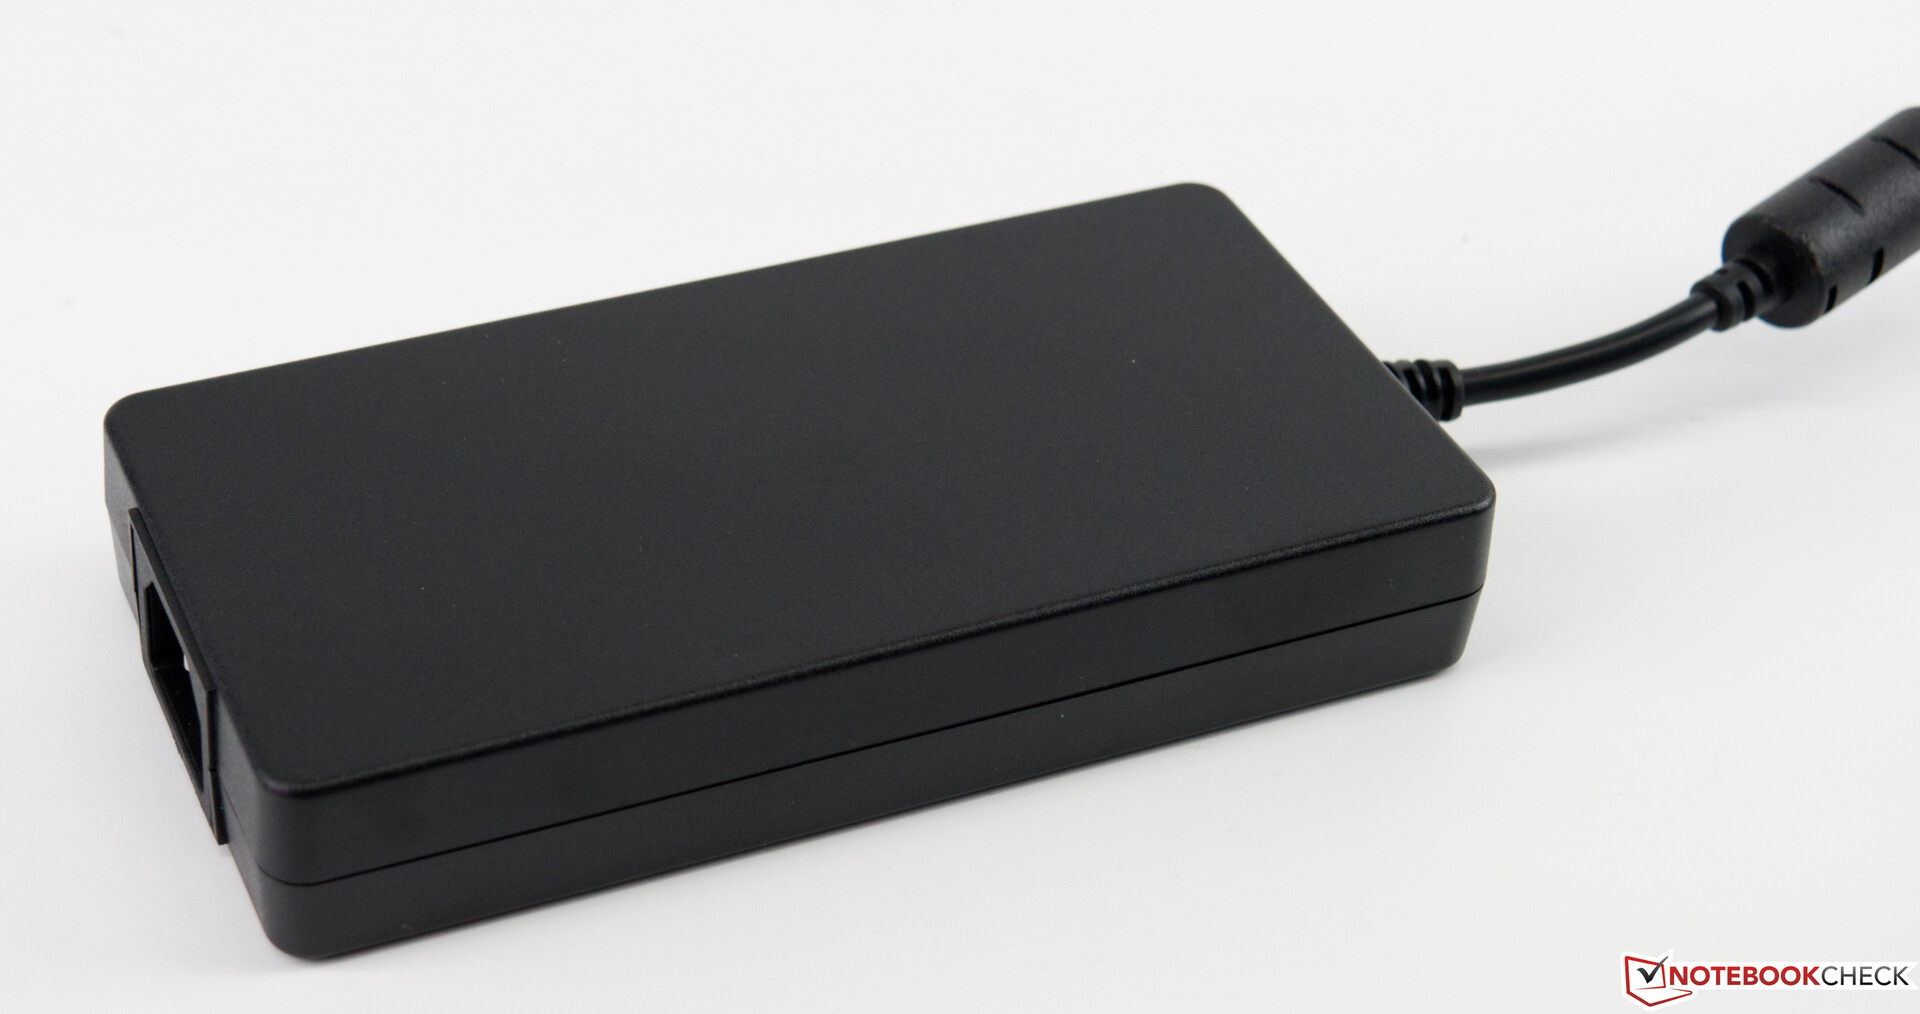
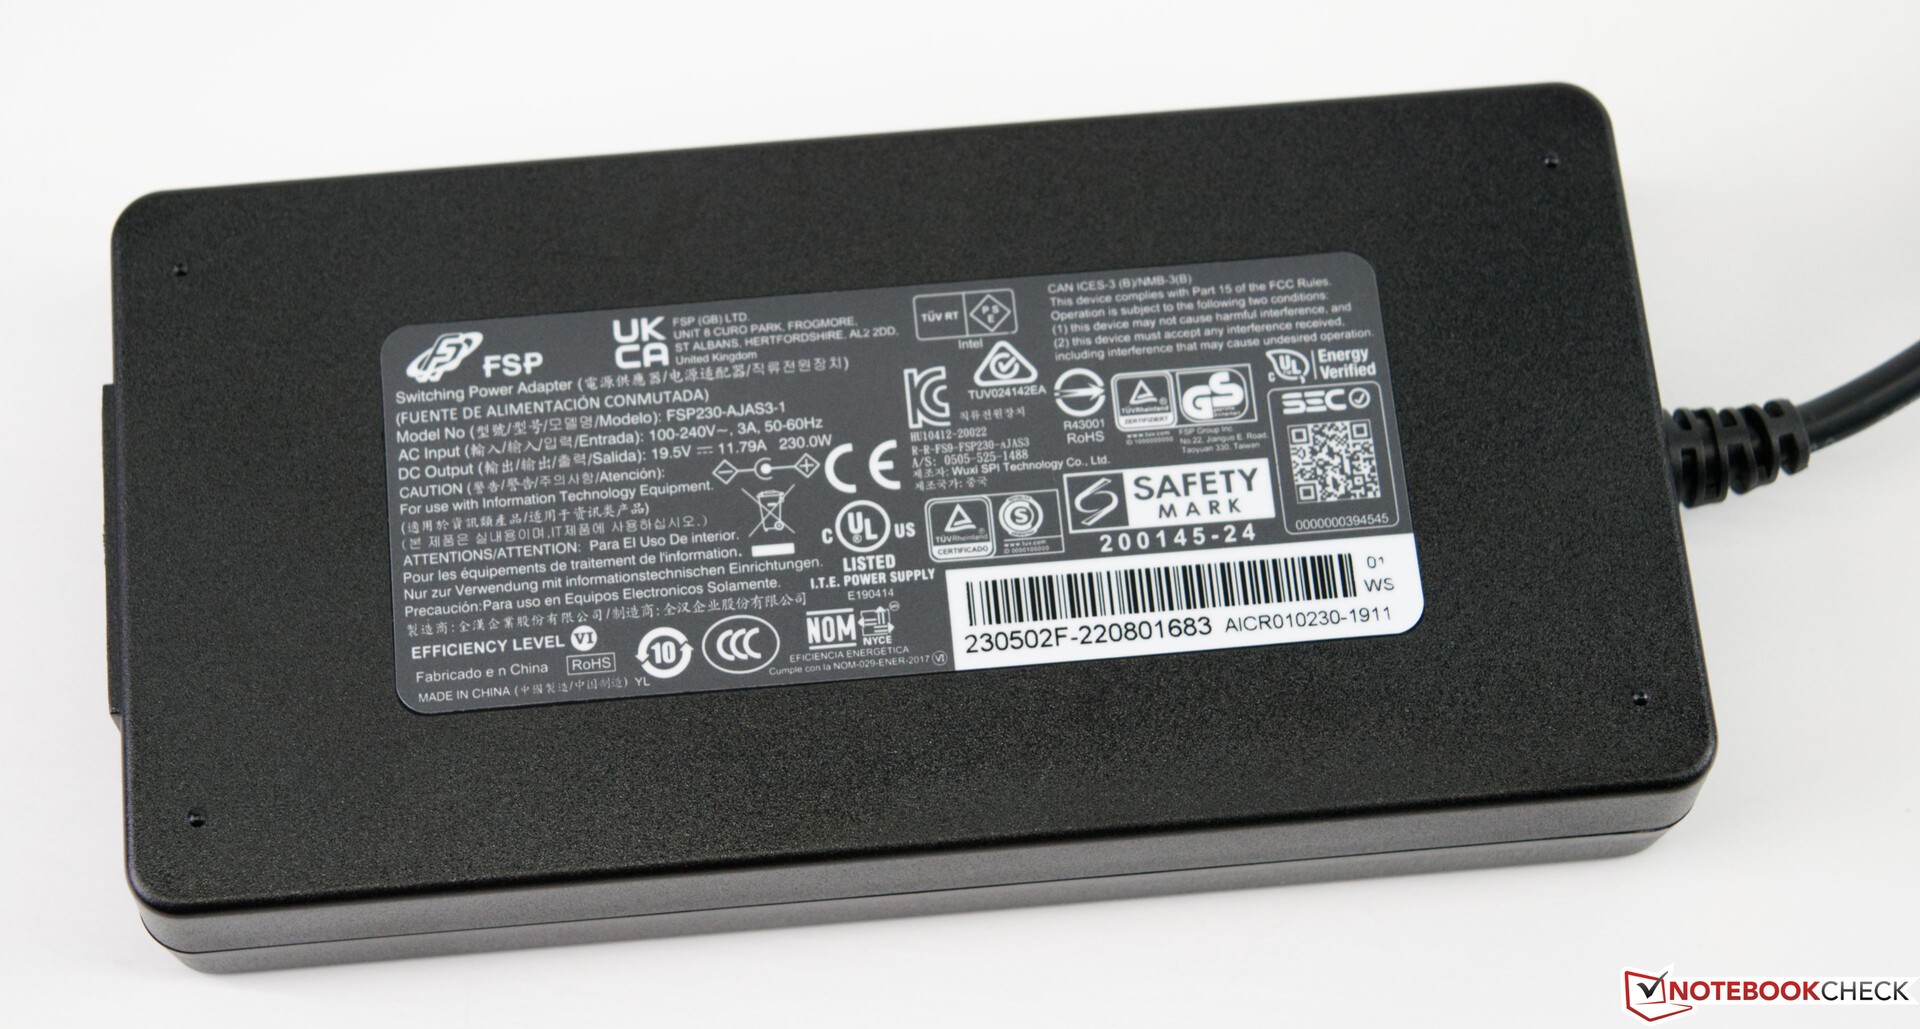
Oprócz samego komputera w pudełku znajdziemy również 230-watowy zasilacz oraz podstawkę, pozwalającą na ustawienie urządzenia w poziomie.
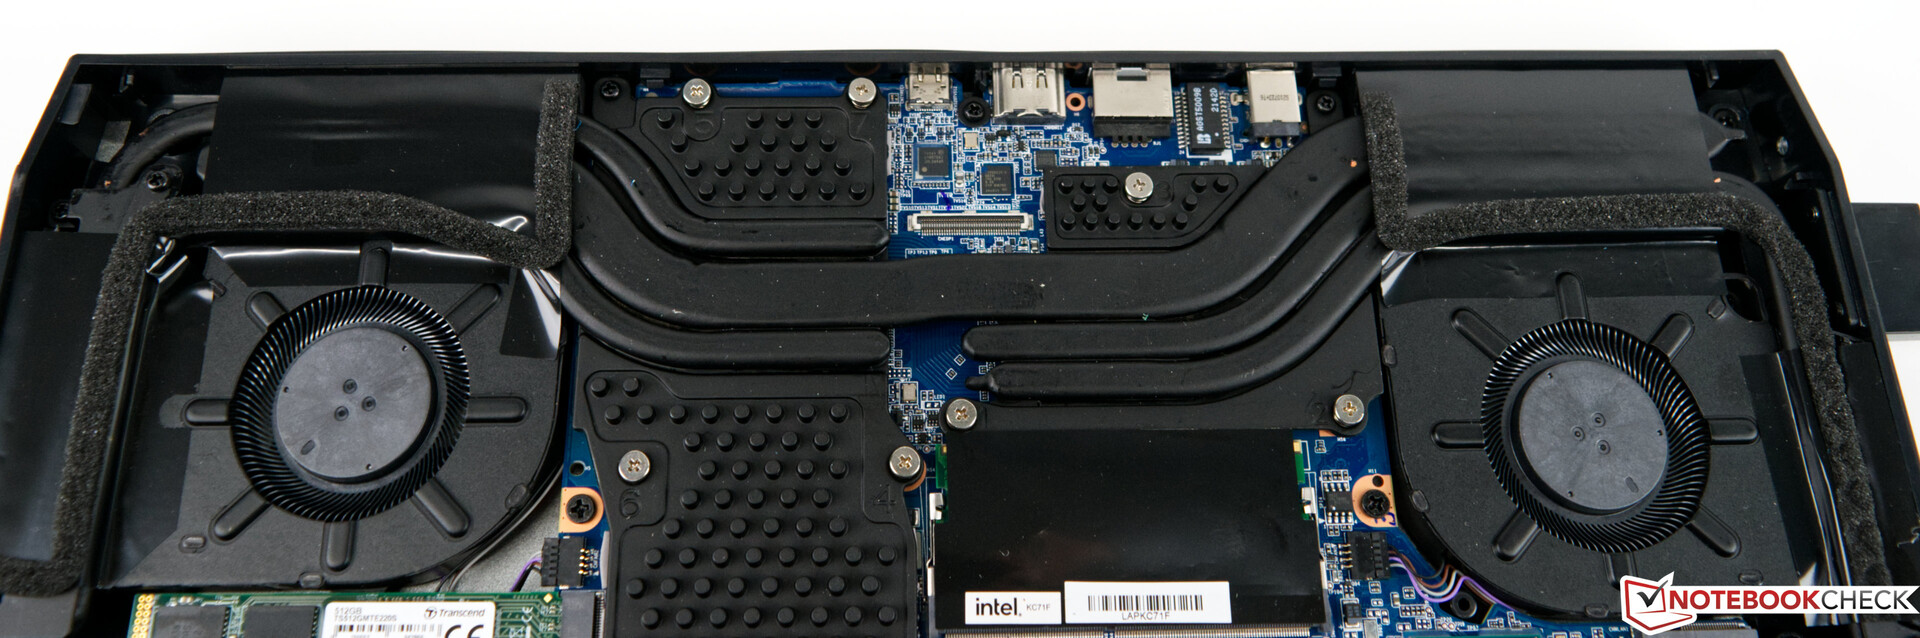
Konserwacja
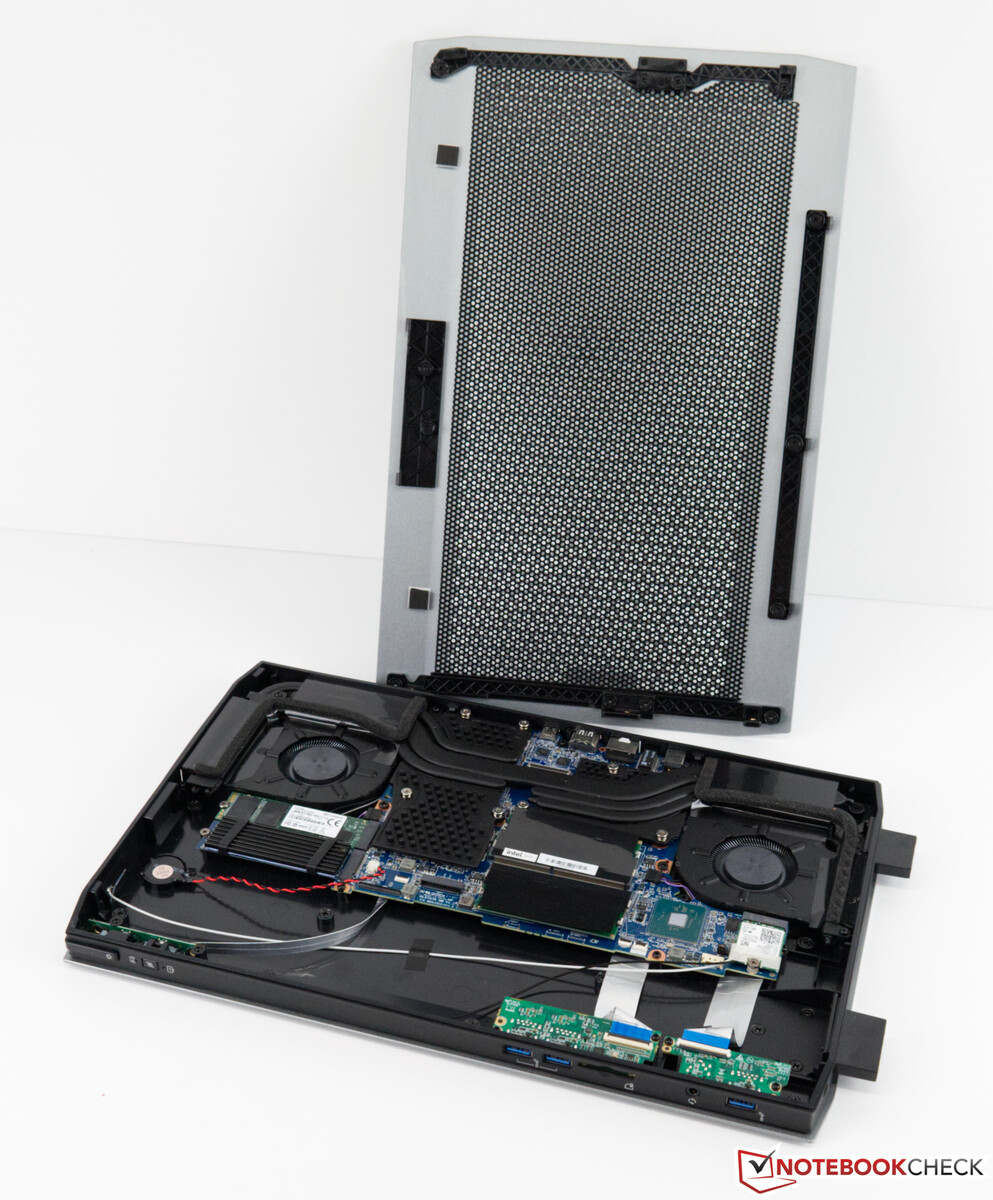
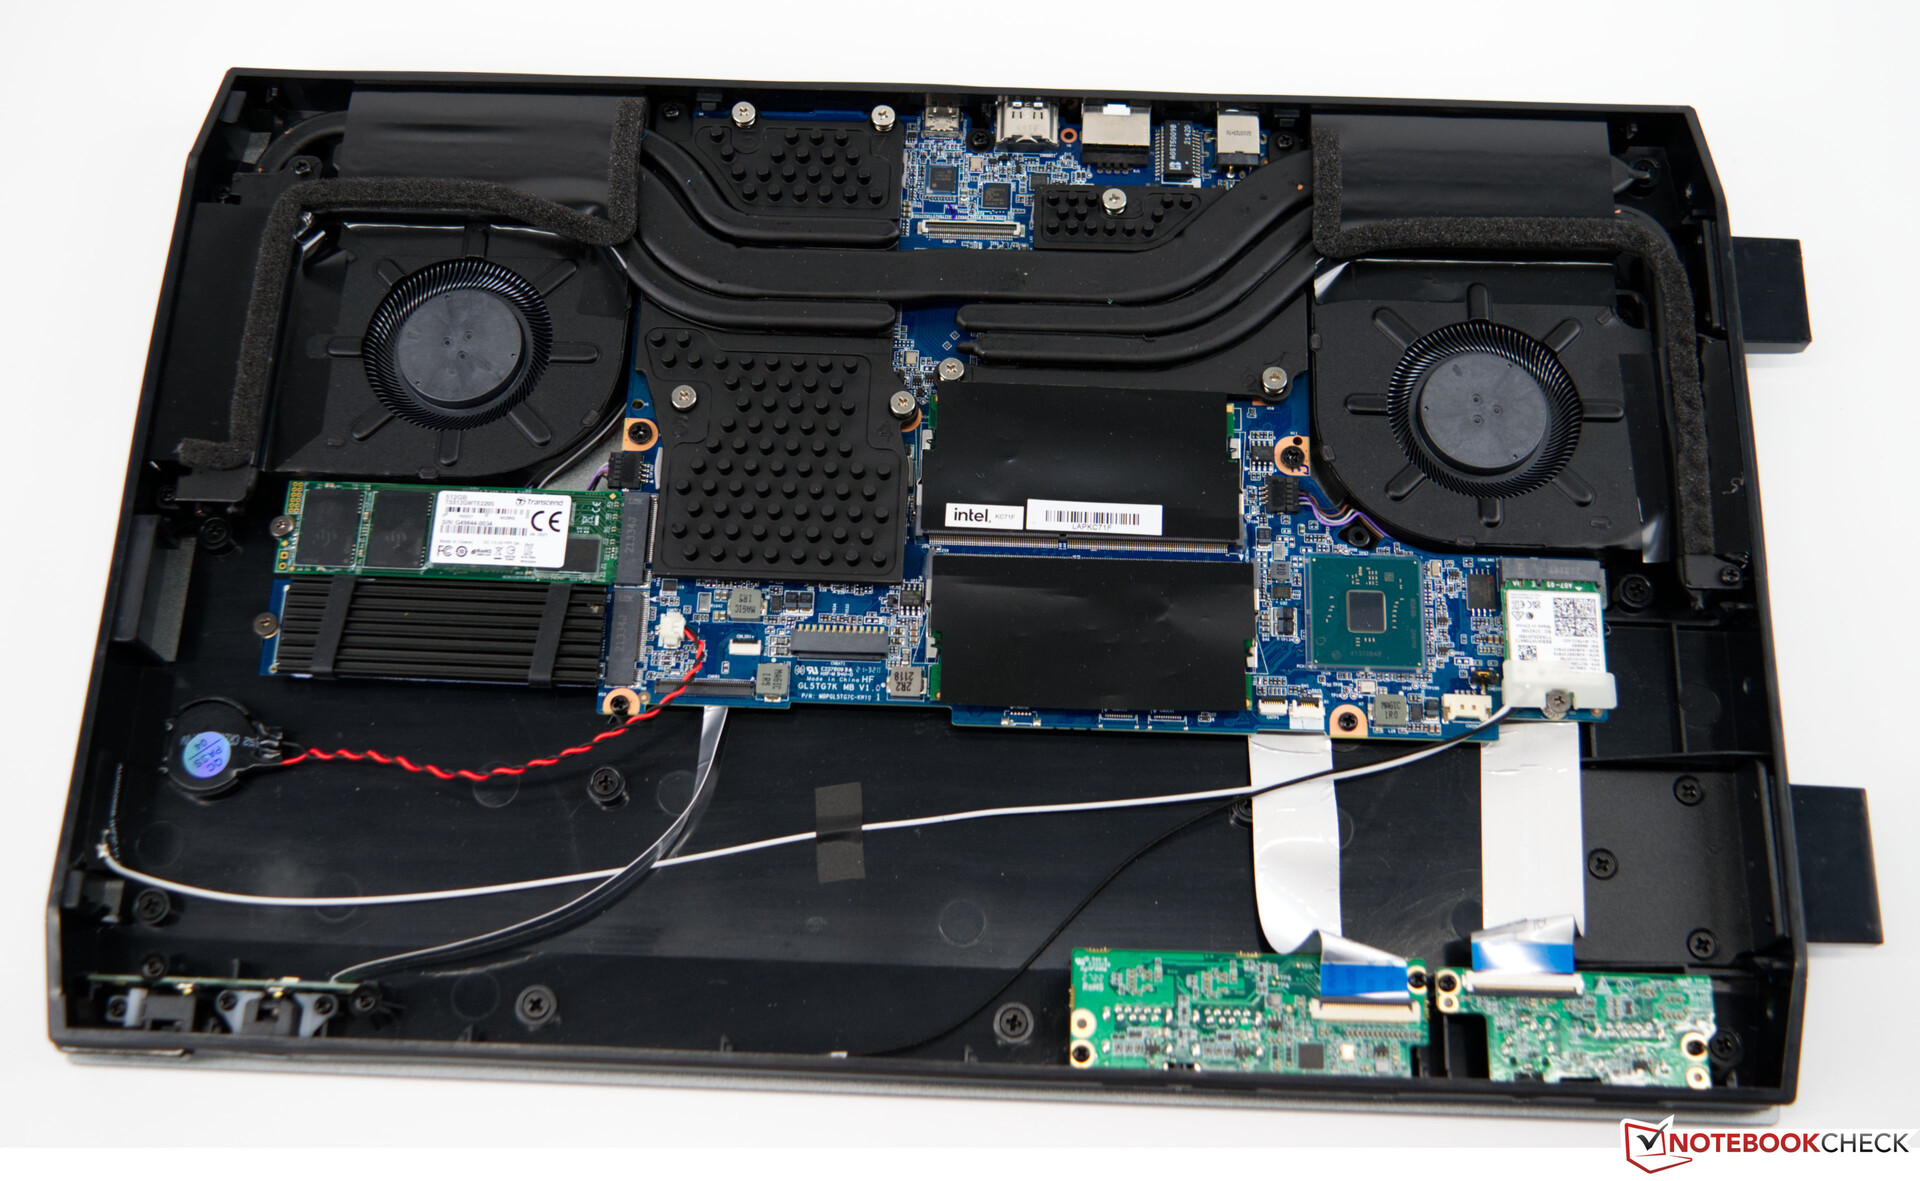
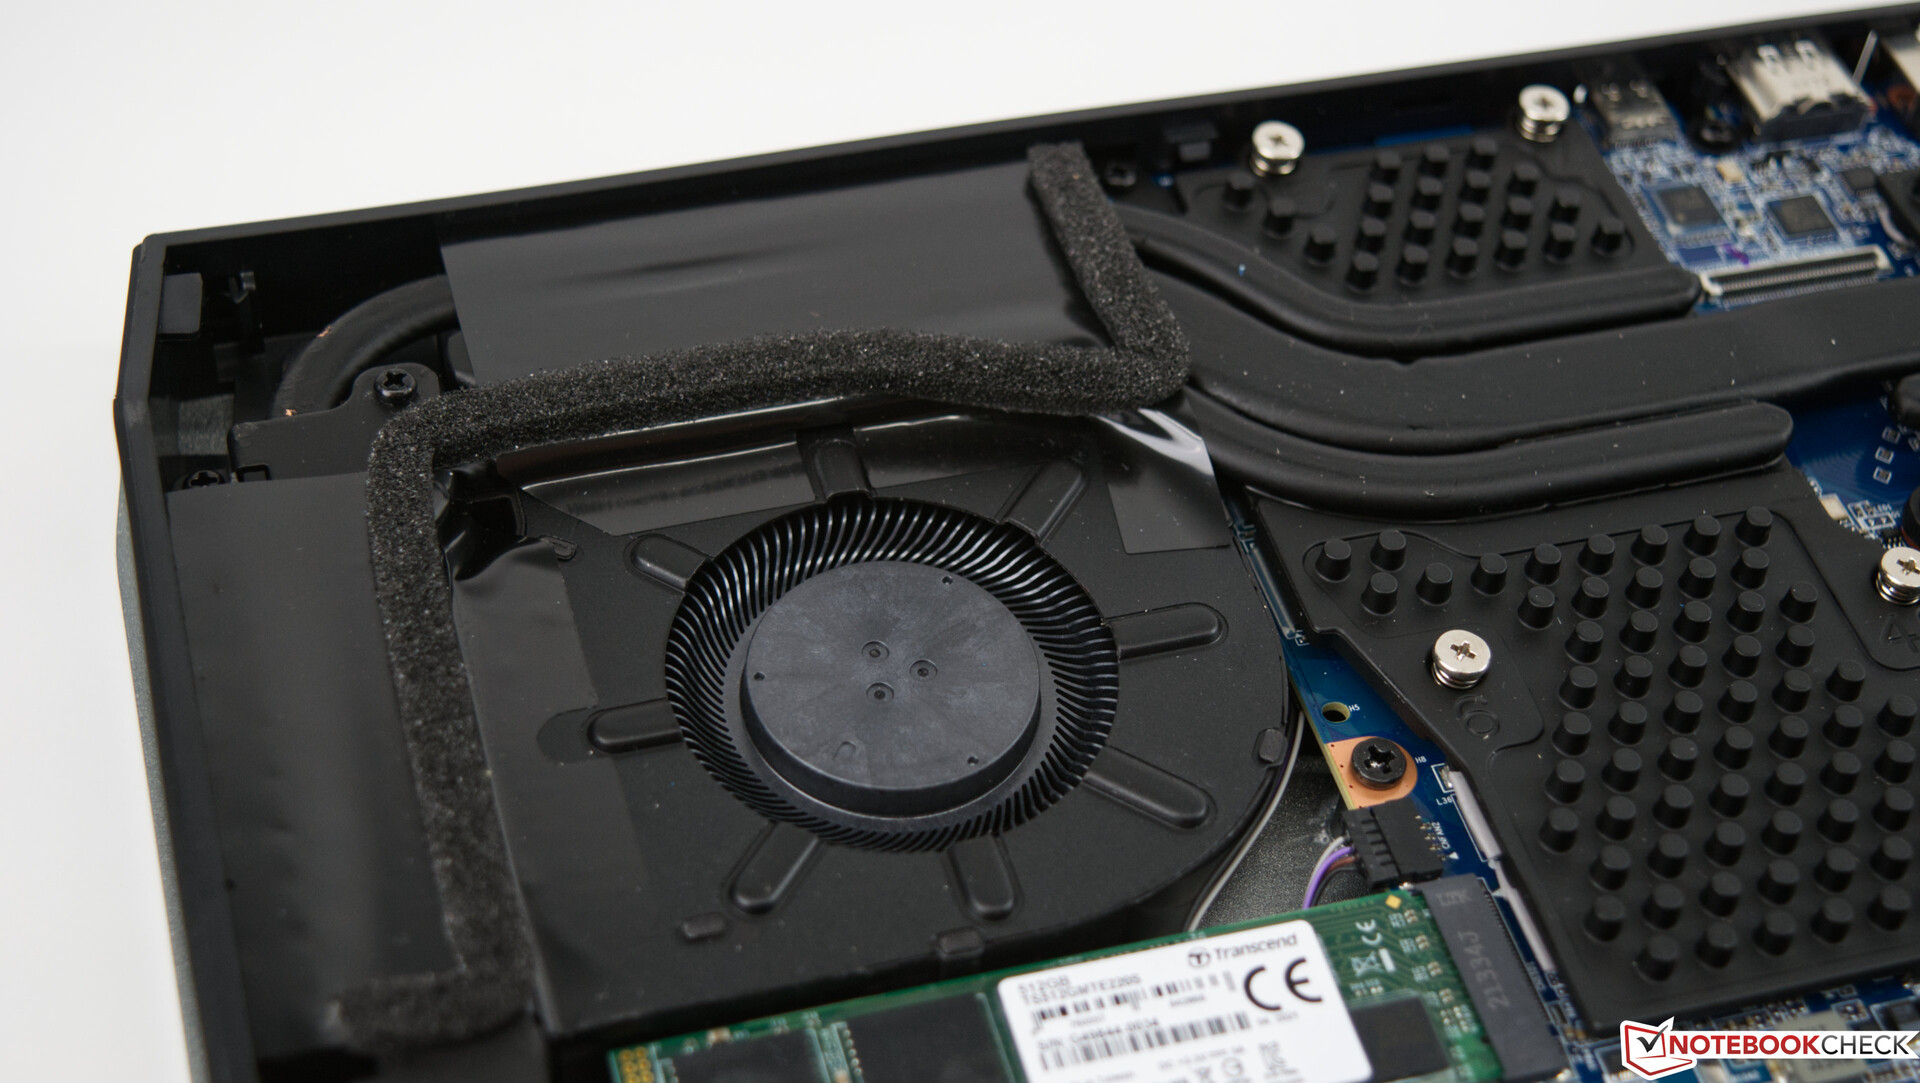
Na potrzeby rozbudowy lub czynności konserwacyjnych można zdjąć boczną pokrywę urządzenia. Jest ona przymocowana na dole trzema śrubami, a po ich odkręceniu można bez większych problemów zdjąć pokrywę. Dołączona broszura również wyjaśnia, jak to zrobić. Po zdjęciu pokrywy można pomylić się, myśląc, że patrzy się na laptop. Wciąż jednak pozostaje sporo niewykorzystanej przestrzeni, która zwykle byłaby zarezerwowana dla akumulatora. Widać też, dlaczego nie można było po prostu łatwo dodać kilku portów USB z tyłu. Jedyne miejsce na jakieś dodatkowe złącza byłoby z przodu.
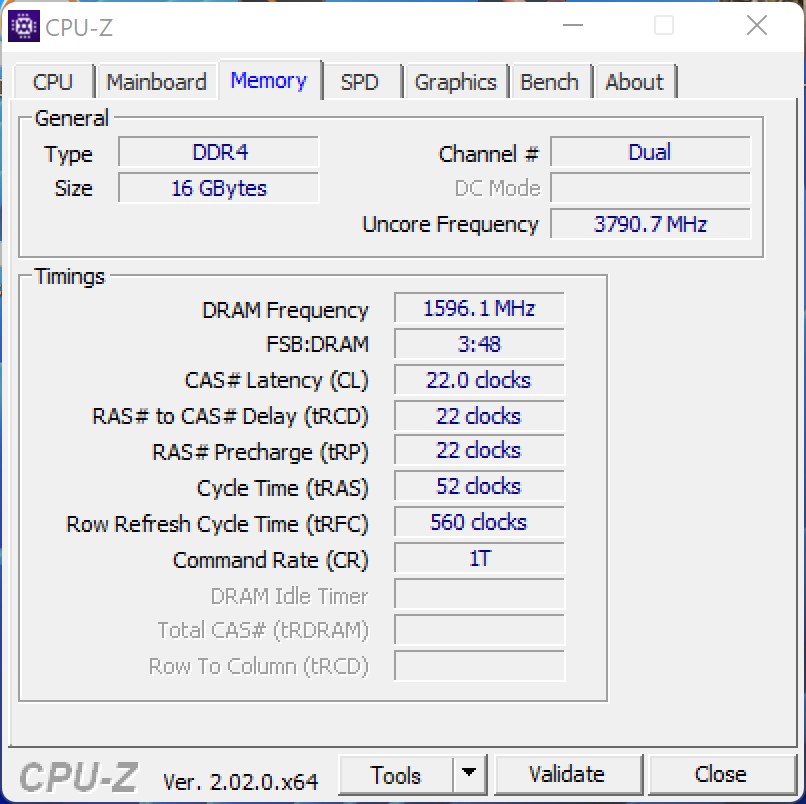
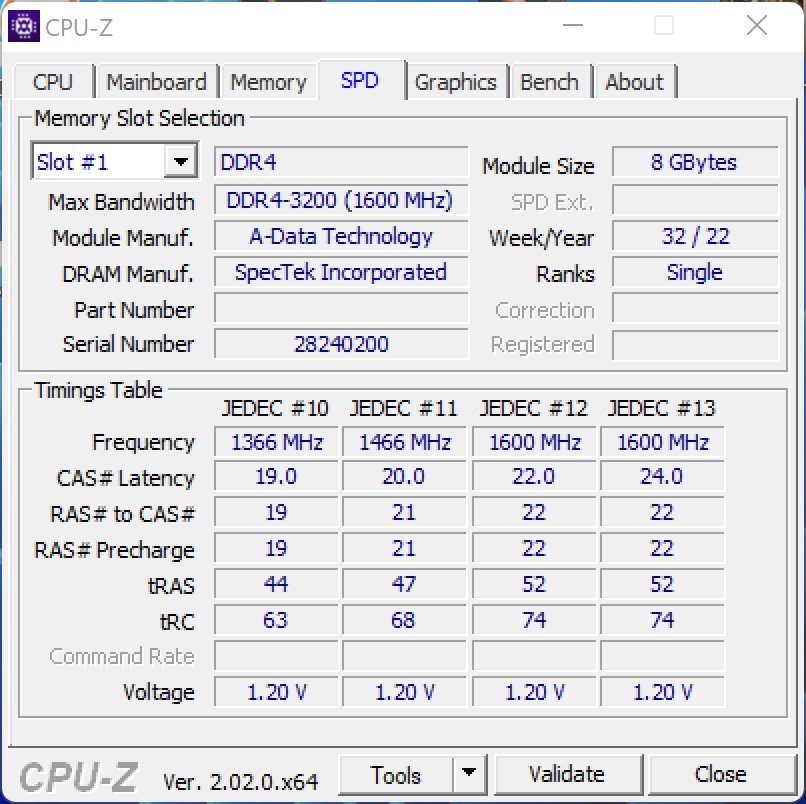
W urządzeniu można zmieścić łącznie dwa dyski SSD M.2, co też zrobiliśmy na potrzeby tego testu. Aby rozszerzyć pamięć roboczą, masz jedynie możliwość wymiany modułów, gdyż oba sloty SO-Dimm są już zajęte przez moduły 8-GB.
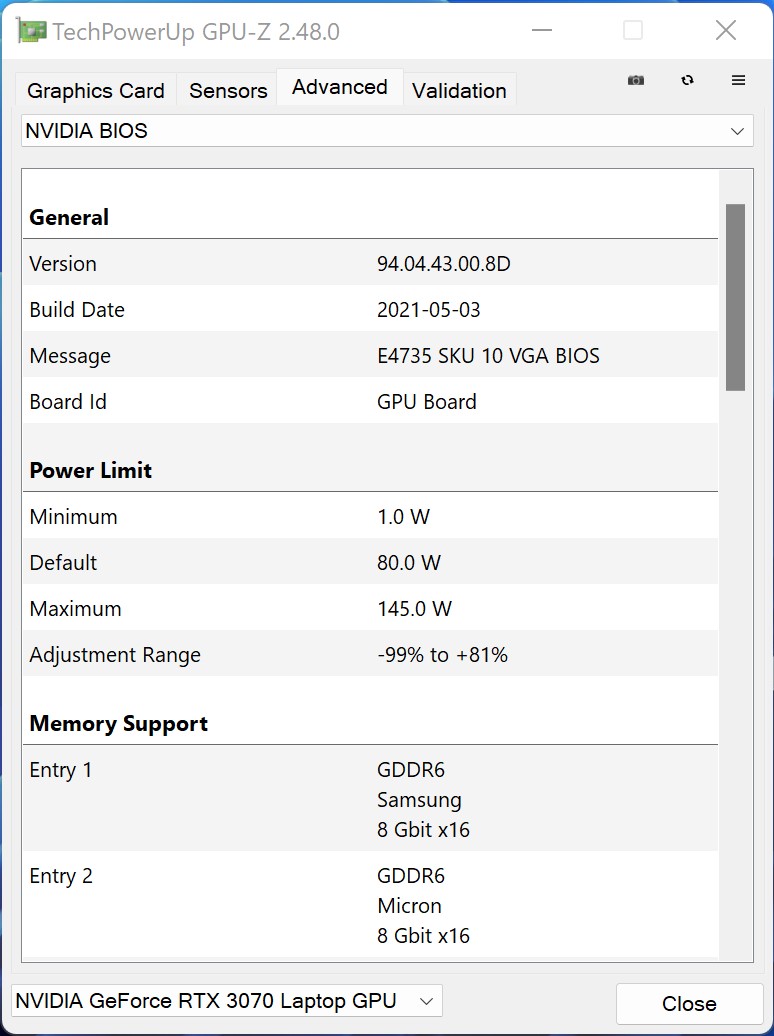
Wydajność - szybki Core i7-11800H
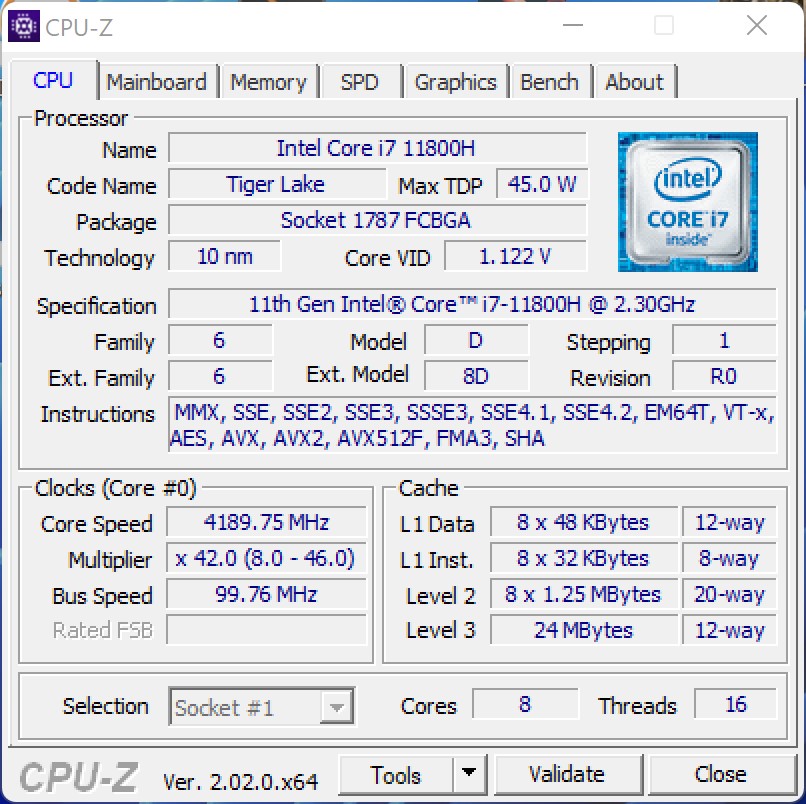
Z Intel Core i7-11800Hnasz testowy egzemplarz oferuje dobrą podstawę do obsługi wymagających aplikacji. W połączeniu z Nvidia GeForce RTX 3070 Laptop GPU, Minisforum NUCXi7 wygląda jak dobrze wyposażony laptop do gier. 16 GB pamięci RAM wystarcza zwykle do wszystkich aktualnych gier, chociaż miejsce może stać się nieco ciasne przy 512 GB dysku SSD. Dzięki temu sprzętowi można również cieszyć się aktualnymi grami w rozdzielczości 1 440p. Ci, którzy chcą grać tylko w gry w 1,080p powinni przyjrzeć się bliżej Minisforum NUCXi5.
Warunki badania
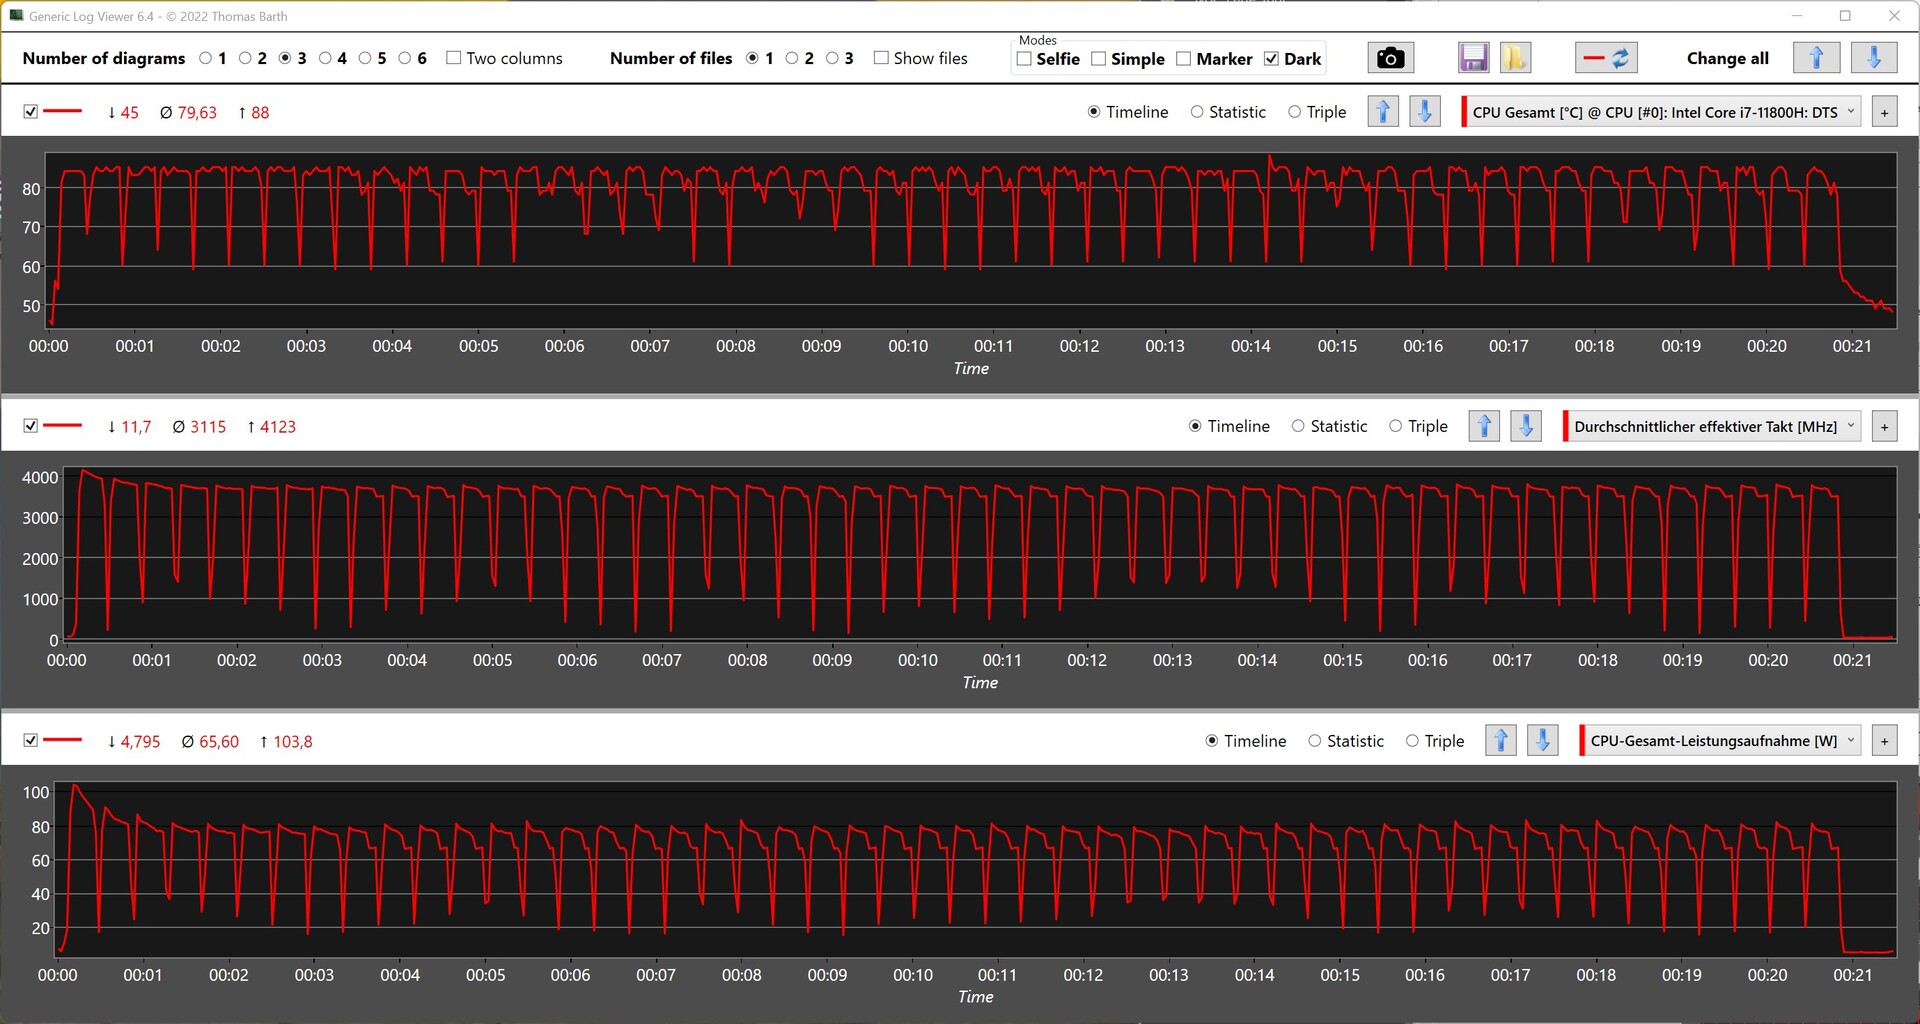
Wszystkie testy wydajnościowe przeprowadziliśmy w trybie Gaming. Można go aktywować poprzez naciśnięcie przycisku z przodu, przyznając GPU wyższy pobór mocy pod obciążeniem. Dokładnie rzecz ujmując, odpowiada to zwiększeniu poboru mocy GPU do 125 W.
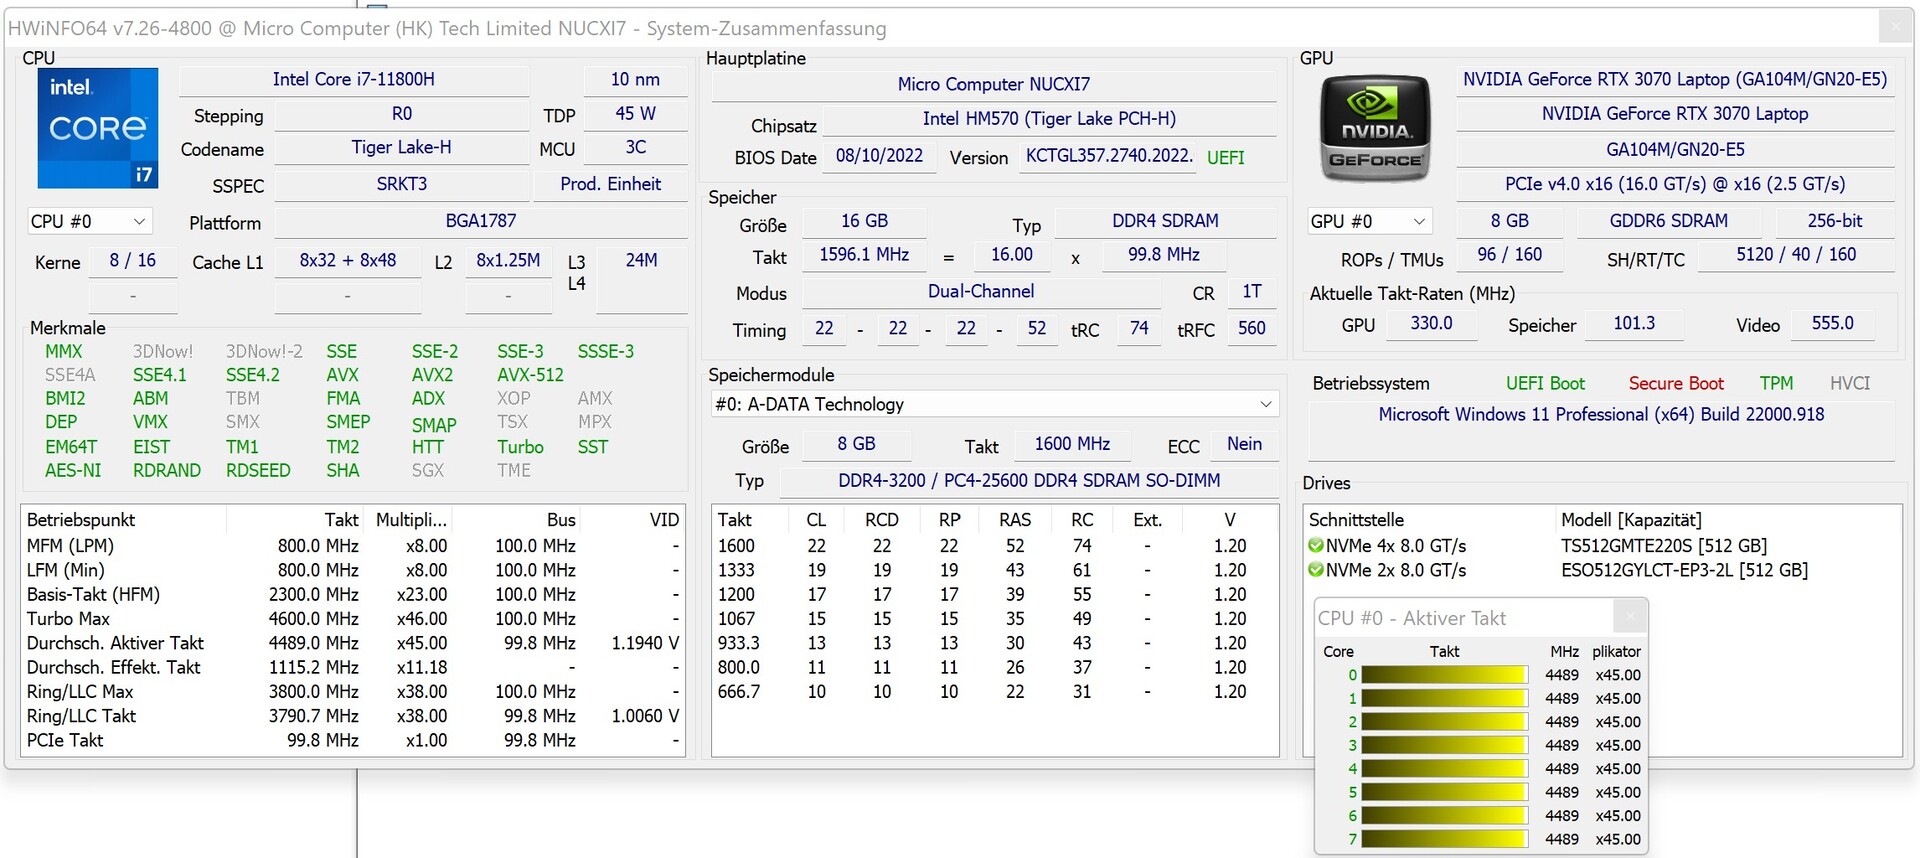
Procesor
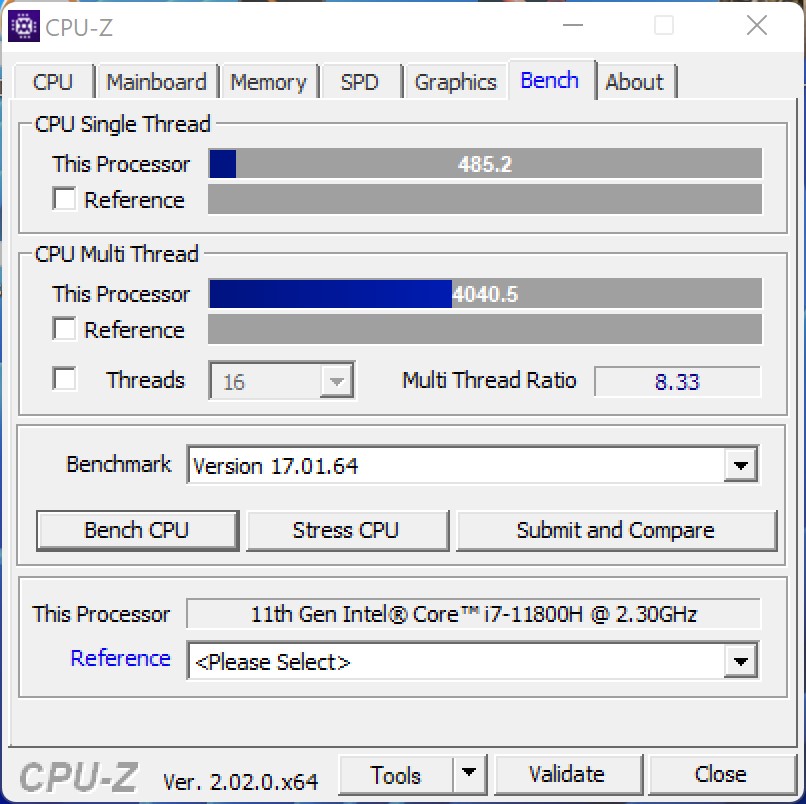
StronaIntel Core i7-11800Hoferuje osiem natywnych rdzeni obliczeniowych i jest oparty na architekturze Tiger Lake firmy Intel. Jeśli chodzi o pobór mocy, Minisforum daje pewną przestrzeń na głowę, sięgającą 110 watów (PL2), choć przy 68 watach PL1 to wciąż bardzo dobra wartość, pozwalająca osiągnąć wysoką wydajność. I tak rzeczywiście jest, bo nasz testowy egzemplarz jest w stanie zapewnić sobie dobre miejsce w środku pola z wydajnością osiągniętą w naszym teście. Wada za szybszymi urządzeniami porównawczymi jest niewielka i subiektywnie niezauważalna.
Dodatkowe benchmarki procesorów można znaleźć m.in tutaj.
| Performance rating - Percent | |
| Intel Dragon Canyon NUC - RTX 3060 | |
| Gigabyte A7 X1 -17! | |
| Intel Beast Canyon NUC | |
| Minisforum NUCX i7 | |
| Przeciętny Intel Core i7-11800H | |
| Zotac ZBOX Magnus EN173070C | |
| Zotac Magnus One (ECM73070C) -2! | |
| Zotac MEK Mini (RTX 2070 Super) | |
| Cinebench R15 | |
| CPU Single 64Bit | |
| Intel Dragon Canyon NUC - RTX 3060 | |
| Intel Beast Canyon NUC | |
| Gigabyte A7 X1 | |
| Minisforum NUCX i7 | |
| Przeciętny Intel Core i7-11800H (201 - 231, n=46) | |
| Zotac ZBOX Magnus EN173070C | |
| Zotac MEK Mini (RTX 2070 Super) | |
| Zotac Magnus One (ECM73070C) | |
| CPU Multi 64Bit | |
| Intel Dragon Canyon NUC - RTX 3060 | |
| Gigabyte A7 X1 | |
| Minisforum NUCX i7 | |
| Intel Beast Canyon NUC | |
| Przeciętny Intel Core i7-11800H (1342 - 2173, n=50) | |
| Zotac ZBOX Magnus EN173070C | |
| Zotac Magnus One (ECM73070C) | |
| Zotac MEK Mini (RTX 2070 Super) | |
| Cinebench R20 | |
| CPU (Single Core) | |
| Intel Dragon Canyon NUC - RTX 3060 | |
| Intel Beast Canyon NUC | |
| Gigabyte A7 X1 | |
| Minisforum NUCX i7 | |
| Przeciętny Intel Core i7-11800H (520 - 586, n=47) | |
| Zotac ZBOX Magnus EN173070C | |
| Zotac MEK Mini (RTX 2070 Super) | |
| CPU (Multi Core) | |
| Intel Dragon Canyon NUC - RTX 3060 | |
| Gigabyte A7 X1 | |
| Minisforum NUCX i7 | |
| Intel Beast Canyon NUC | |
| Przeciętny Intel Core i7-11800H (2498 - 5408, n=50) | |
| Zotac ZBOX Magnus EN173070C | |
| Zotac MEK Mini (RTX 2070 Super) | |
| Cinebench R11.5 | |
| CPU Single 64Bit | |
| Intel Dragon Canyon NUC - RTX 3060 | |
| Intel Beast Canyon NUC | |
| Minisforum NUCX i7 | |
| Zotac ZBOX Magnus EN173070C | |
| Przeciętny Intel Core i7-11800H (2.45 - 2.62, n=4) | |
| Zotac Magnus One (ECM73070C) | |
| Zotac MEK Mini (RTX 2070 Super) | |
| CPU Multi 64Bit | |
| Intel Dragon Canyon NUC - RTX 3060 | |
| Intel Beast Canyon NUC | |
| Minisforum NUCX i7 | |
| Zotac ZBOX Magnus EN173070C | |
| Przeciętny Intel Core i7-11800H (16 - 21.9, n=4) | |
| Zotac Magnus One (ECM73070C) | |
| Zotac MEK Mini (RTX 2070 Super) | |
| Cinebench R10 | |
| Rendering Single CPUs 64Bit | |
| Intel Dragon Canyon NUC - RTX 3060 | |
| Intel Beast Canyon NUC | |
| Minisforum NUCX i7 | |
| Zotac ZBOX Magnus EN173070C | |
| Przeciętny Intel Core i7-11800H (10903 - 11957, n=4) | |
| Zotac Magnus One (ECM73070C) | |
| Zotac MEK Mini (RTX 2070 Super) | |
| Rendering Multiple CPUs 64Bit | |
| Intel Dragon Canyon NUC - RTX 3060 | |
| Minisforum NUCX i7 | |
| Intel Beast Canyon NUC | |
| Zotac ZBOX Magnus EN173070C | |
| Przeciętny Intel Core i7-11800H (49232 - 67486, n=4) | |
| Zotac Magnus One (ECM73070C) | |
| Zotac MEK Mini (RTX 2070 Super) | |
| Blender - v2.79 BMW27 CPU | |
| Zotac MEK Mini (RTX 2070 Super) | |
| Zotac Magnus One (ECM73070C) | |
| Zotac ZBOX Magnus EN173070C | |
| Przeciętny Intel Core i7-11800H (217 - 454, n=46) | |
| Intel Beast Canyon NUC | |
| Intel Dragon Canyon NUC - RTX 3060 | |
| Minisforum NUCX i7 | |
| Gigabyte A7 X1 | |
| wPrime 2.10 | |
| 32m | |
| Zotac MEK Mini (RTX 2070 Super) | |
| Zotac ZBOX Magnus EN173070C | |
| Przeciętny Intel Core i7-11800H (3.41 - 4.19, n=3) | |
| Intel Beast Canyon NUC | |
| Minisforum NUCX i7 | |
| Zotac Magnus One (ECM73070C) | |
| Intel Dragon Canyon NUC - RTX 3060 | |
| 1024m | |
| Intel Dragon Canyon NUC - RTX 3060 | |
| Zotac MEK Mini (RTX 2070 Super) | |
| Zotac ZBOX Magnus EN173070C | |
| Zotac Magnus One (ECM73070C) | |
| Przeciętny Intel Core i7-11800H (98.3 - 121.1, n=3) | |
| Intel Beast Canyon NUC | |
| Minisforum NUCX i7 | |
| X264 HD Benchmark 4.0 | |
| Pass 1 | |
| Intel Dragon Canyon NUC - RTX 3060 | |
| Intel Beast Canyon NUC | |
| Minisforum NUCX i7 | |
| Przeciętny Intel Core i7-11800H (242 - 258, n=3) | |
| Zotac MEK Mini (RTX 2070 Super) | |
| Zotac ZBOX Magnus EN173070C | |
| Zotac Magnus One (ECM73070C) | |
| Pass 2 | |
| Intel Dragon Canyon NUC - RTX 3060 | |
| Minisforum NUCX i7 | |
| Intel Beast Canyon NUC | |
| Przeciętny Intel Core i7-11800H (86.3 - 109.3, n=3) | |
| Zotac ZBOX Magnus EN173070C | |
| Zotac Magnus One (ECM73070C) | |
| Zotac MEK Mini (RTX 2070 Super) | |
| WinRAR - Result | |
| Intel Dragon Canyon NUC - RTX 3060 | |
| Intel Beast Canyon NUC | |
| Przeciętny Intel Core i7-11800H (7925 - 8569, n=3) | |
| Minisforum NUCX i7 | |
| Zotac ZBOX Magnus EN173070C | |
| Zotac MEK Mini (RTX 2070 Super) | |
| Zotac Magnus One (ECM73070C) | |
| TrueCrypt | |
| AES Mean 100MB | |
| Intel Dragon Canyon NUC - RTX 3060 | |
| Intel Beast Canyon NUC | |
| Minisforum NUCX i7 | |
| Zotac Magnus One (ECM73070C) | |
| Zotac ZBOX Magnus EN173070C | |
| Przeciętny Intel Core i7-11800H (6.5 - 11.6, n=4) | |
| Zotac MEK Mini (RTX 2070 Super) | |
| Twofish Mean 100MB | |
| Intel Dragon Canyon NUC - RTX 3060 | |
| Zotac Magnus One (ECM73070C) | |
| Intel Beast Canyon NUC | |
| Minisforum NUCX i7 | |
| Przeciętny Intel Core i7-11800H (1.5 - 1.7, n=4) | |
| Zotac ZBOX Magnus EN173070C | |
| Zotac MEK Mini (RTX 2070 Super) | |
| Serpent Mean 100MB | |
| Intel Dragon Canyon NUC - RTX 3060 | |
| Zotac Magnus One (ECM73070C) | |
| Intel Beast Canyon NUC | |
| Minisforum NUCX i7 | |
| Przeciętny Intel Core i7-11800H (0.9 - 1.1, n=4) | |
| Zotac ZBOX Magnus EN173070C | |
| Zotac MEK Mini (RTX 2070 Super) | |
| Geekbench 5.5 | |
| Multi-Core | |
| Minisforum NUCX i7 | |
| Intel Beast Canyon NUC | |
| Intel Dragon Canyon NUC - RTX 3060 | |
| Przeciętny Intel Core i7-11800H (4655 - 9851, n=40) | |
| Zotac ZBOX Magnus EN173070C | |
| Zotac Magnus One (ECM73070C) | |
| Gigabyte A7 X1 | |
| Zotac MEK Mini (RTX 2070 Super) | |
| Single-Core | |
| Intel Beast Canyon NUC | |
| Intel Dragon Canyon NUC - RTX 3060 | |
| Zotac ZBOX Magnus EN173070C | |
| Minisforum NUCX i7 | |
| Przeciętny Intel Core i7-11800H (1429 - 1625, n=40) | |
| Gigabyte A7 X1 | |
| Zotac MEK Mini (RTX 2070 Super) | |
| Zotac Magnus One (ECM73070C) | |
| Geekbench 5.0 | |
| 5.0 Multi-Core | |
| Minisforum NUCX i7 | |
| Intel Beast Canyon NUC | |
| Intel Dragon Canyon NUC - RTX 3060 | |
| Zotac Magnus One (ECM73070C) | |
| Zotac ZBOX Magnus EN173070C | |
| Przeciętny Intel Core i7-11800H (6340 - 9103, n=8) | |
| Zotac MEK Mini (RTX 2070 Super) | |
| 5.0 Single-Core | |
| Intel Beast Canyon NUC | |
| Intel Dragon Canyon NUC - RTX 3060 | |
| Zotac ZBOX Magnus EN173070C | |
| Minisforum NUCX i7 | |
| Przeciętny Intel Core i7-11800H (1436 - 1571, n=8) | |
| Zotac Magnus One (ECM73070C) | |
| Zotac MEK Mini (RTX 2070 Super) | |
| Geekbench 4.4 | |
| 64 Bit Single-Core Score | |
| Intel Beast Canyon NUC | |
| Intel Dragon Canyon NUC - RTX 3060 | |
| Zotac ZBOX Magnus EN173070C | |
| Minisforum NUCX i7 | |
| Przeciętny Intel Core i7-11800H (6104 - 6747, n=7) | |
| Zotac MEK Mini (RTX 2070 Super) | |
| Zotac Magnus One (ECM73070C) | |
| 64 Bit Multi-Core Score | |
| Minisforum NUCX i7 | |
| Intel Beast Canyon NUC | |
| Intel Dragon Canyon NUC - RTX 3060 | |
| Przeciętny Intel Core i7-11800H (27454 - 36706, n=7) | |
| Zotac ZBOX Magnus EN173070C | |
| Zotac Magnus One (ECM73070C) | |
| Zotac MEK Mini (RTX 2070 Super) | |
| 3DMark 11 - 1280x720 Performance Physics | |
| Intel Dragon Canyon NUC - RTX 3060 | |
| Intel Beast Canyon NUC | |
| Minisforum NUCX i7 | |
| Przeciętny Intel Core i7-11800H (10590 - 19167, n=46) | |
| Zotac ZBOX Magnus EN173070C | |
| Zotac Magnus One (ECM73070C) | |
| Gigabyte A7 X1 | |
| Zotac MEK Mini (RTX 2070 Super) | |
| 7-Zip 18.03 | |
| 7z b 4 | |
| Gigabyte A7 X1 | |
| Minisforum NUCX i7 | |
| Intel Beast Canyon NUC | |
| Intel Dragon Canyon NUC - RTX 3060 | |
| Przeciętny Intel Core i7-11800H (33718 - 56758, n=46) | |
| Zotac ZBOX Magnus EN173070C | |
| Zotac Magnus One (ECM73070C) | |
| Zotac MEK Mini (RTX 2070 Super) | |
| 7z b 4 -mmt1 | |
| Intel Beast Canyon NUC | |
| Intel Dragon Canyon NUC - RTX 3060 | |
| Gigabyte A7 X1 | |
| Zotac ZBOX Magnus EN173070C | |
| Przeciętny Intel Core i7-11800H (5138 - 5732, n=46) | |
| Minisforum NUCX i7 | |
| Zotac Magnus One (ECM73070C) | |
| Zotac MEK Mini (RTX 2070 Super) | |
| HWBOT x265 Benchmark v2.2 - 4k Preset | |
| Gigabyte A7 X1 | |
| Minisforum NUCX i7 | |
| Intel Beast Canyon NUC | |
| Intel Dragon Canyon NUC - RTX 3060 | |
| Przeciętny Intel Core i7-11800H (7.38 - 17.4, n=46) | |
| Zotac ZBOX Magnus EN173070C | |
| Zotac Magnus One (ECM73070C) | |
| Zotac MEK Mini (RTX 2070 Super) | |
| R Benchmark 2.5 - Overall mean | |
| Zotac MEK Mini (RTX 2070 Super) | |
| Zotac Magnus One (ECM73070C) | |
| Przeciętny Intel Core i7-11800H (0.548 - 0.615, n=46) | |
| Minisforum NUCX i7 | |
| Zotac ZBOX Magnus EN173070C | |
| Intel Beast Canyon NUC | |
| Intel Dragon Canyon NUC - RTX 3060 | |
| Gigabyte A7 X1 | |
| LibreOffice - 20 Documents To PDF | |
| Zotac Magnus One (ECM73070C) | |
| Gigabyte A7 X1 | |
| Minisforum NUCX i7 | |
| Zotac MEK Mini (RTX 2070 Super) | |
| Zotac ZBOX Magnus EN173070C | |
| Przeciętny Intel Core i7-11800H (38.6 - 59.9, n=45) | |
| Intel Beast Canyon NUC | |
| Intel Dragon Canyon NUC - RTX 3060 | |
| WebXPRT 3 - Overall | |
| Gigabyte A7 X1 | |
| Intel Beast Canyon NUC | |
| Intel Dragon Canyon NUC - RTX 3060 | |
| Zotac ZBOX Magnus EN173070C | |
| Przeciętny Intel Core i7-11800H (251 - 280, n=40) | |
| Minisforum NUCX i7 | |
| Zotac Magnus One (ECM73070C) | |
| Zotac MEK Mini (RTX 2070 Super) | |
| Mozilla Kraken 1.1 - Total | |
| Zotac MEK Mini (RTX 2070 Super) | |
| Zotac Magnus One (ECM73070C) | |
| Przeciętny Intel Core i7-11800H (600 - 690, n=45) | |
| Zotac ZBOX Magnus EN173070C | |
| Minisforum NUCX i7 | |
| Gigabyte A7 X1 | |
| Intel Beast Canyon NUC | |
| Intel Dragon Canyon NUC - RTX 3060 | |
| 3DMark | |
| 3840x2160 Fire Strike Ultra Physics | |
| Intel Dragon Canyon NUC - RTX 3060 | |
| Intel Beast Canyon NUC | |
| Przeciętny Intel Core i7-11800H (21176 - 25203, n=16) | |
| Minisforum NUCX i7 | |
| Zotac ZBOX Magnus EN173070C | |
| Zotac Magnus One (ECM73070C) | |
| Zotac MEK Mini (RTX 2070 Super) | |
| 1920x1080 Fire Strike Physics | |
| Intel Dragon Canyon NUC - RTX 3060 | |
| Gigabyte A7 X1 | |
| Minisforum NUCX i7 | |
| Intel Beast Canyon NUC | |
| Zotac ZBOX Magnus EN173070C | |
| Przeciętny Intel Core i7-11800H (12843 - 25145, n=47) | |
| Zotac Magnus One (ECM73070C) | |
| Zotac MEK Mini (RTX 2070 Super) | |
| 2560x1440 Time Spy CPU | |
| Intel Dragon Canyon NUC - RTX 3060 | |
| Minisforum NUCX i7 | |
| Intel Beast Canyon NUC | |
| Zotac ZBOX Magnus EN173070C | |
| Przeciętny Intel Core i7-11800H (5086 - 11076, n=47) | |
| Gigabyte A7 X1 | |
| Zotac Magnus One (ECM73070C) | |
| Zotac MEK Mini (RTX 2070 Super) | |
* ... im mniej tym lepiej
AIDA64: FP32 Ray-Trace | FPU Julia | CPU SHA3 | CPU Queen | FPU SinJulia | FPU Mandel | CPU AES | CPU ZLib | FP64 Ray-Trace | CPU PhotoWorxx
| Performance rating | |
| Średnia w klasie Desktop | |
| Gigabyte A7 X1 | |
| Intel Beast Canyon NUC | |
| Intel Dragon Canyon NUC - RTX 3060 | |
| Minisforum NUCX i7 | |
| Zotac ZBOX Magnus EN173070C | |
| Zotac MEK Mini (RTX 2070 Super) | |
| AIDA64 / FP32 Ray-Trace | |
| Średnia w klasie Desktop (12248 - 84577, n=21, ostatnie 2 lata) | |
| Gigabyte A7 X1 | |
| Intel Beast Canyon NUC | |
| Intel Dragon Canyon NUC - RTX 3060 | |
| Zotac ZBOX Magnus EN173070C | |
| Minisforum NUCX i7 | |
| Zotac MEK Mini (RTX 2070 Super) | |
| AIDA64 / FPU Julia | |
| Średnia w klasie Desktop (65152 - 246125, n=21, ostatnie 2 lata) | |
| Gigabyte A7 X1 | |
| Intel Beast Canyon NUC | |
| Intel Dragon Canyon NUC - RTX 3060 | |
| Zotac ZBOX Magnus EN173070C | |
| Minisforum NUCX i7 | |
| Zotac MEK Mini (RTX 2070 Super) | |
| AIDA64 / CPU SHA3 | |
| Średnia w klasie Desktop (2982 - 10804, n=21, ostatnie 2 lata) | |
| Intel Beast Canyon NUC | |
| Intel Dragon Canyon NUC - RTX 3060 | |
| Zotac ZBOX Magnus EN173070C | |
| Minisforum NUCX i7 | |
| Gigabyte A7 X1 | |
| Zotac MEK Mini (RTX 2070 Super) | |
| AIDA64 / CPU Queen | |
| Średnia w klasie Desktop (76512 - 187912, n=18, ostatnie 2 lata) | |
| Gigabyte A7 X1 | |
| Intel Beast Canyon NUC | |
| Intel Dragon Canyon NUC - RTX 3060 | |
| Minisforum NUCX i7 | |
| Zotac ZBOX Magnus EN173070C | |
| Zotac MEK Mini (RTX 2070 Super) | |
| AIDA64 / FPU SinJulia | |
| Średnia w klasie Desktop (6443 - 35251, n=21, ostatnie 2 lata) | |
| Gigabyte A7 X1 | |
| Intel Beast Canyon NUC | |
| Intel Dragon Canyon NUC - RTX 3060 | |
| Minisforum NUCX i7 | |
| Zotac ZBOX Magnus EN173070C | |
| Zotac MEK Mini (RTX 2070 Super) | |
| AIDA64 / FPU Mandel | |
| Średnia w klasie Desktop (31697 - 129745, n=21, ostatnie 2 lata) | |
| Gigabyte A7 X1 | |
| Intel Beast Canyon NUC | |
| Intel Dragon Canyon NUC - RTX 3060 | |
| Zotac ZBOX Magnus EN173070C | |
| Minisforum NUCX i7 | |
| Zotac MEK Mini (RTX 2070 Super) | |
| AIDA64 / CPU AES | |
| Średnia w klasie Desktop (57777 - 513073, n=21, ostatnie 2 lata) | |
| Intel Beast Canyon NUC | |
| Intel Dragon Canyon NUC - RTX 3060 | |
| Minisforum NUCX i7 | |
| Zotac ZBOX Magnus EN173070C | |
| Gigabyte A7 X1 | |
| Zotac MEK Mini (RTX 2070 Super) | |
| AIDA64 / CPU ZLib | |
| Średnia w klasie Desktop (887 - 2674, n=21, ostatnie 2 lata) | |
| Gigabyte A7 X1 | |
| Minisforum NUCX i7 | |
| Intel Beast Canyon NUC | |
| Intel Dragon Canyon NUC - RTX 3060 | |
| Zotac ZBOX Magnus EN173070C | |
| Zotac MEK Mini (RTX 2070 Super) | |
| AIDA64 / FP64 Ray-Trace | |
| Średnia w klasie Desktop (6471 - 44013, n=21, ostatnie 2 lata) | |
| Gigabyte A7 X1 | |
| Intel Beast Canyon NUC | |
| Intel Dragon Canyon NUC - RTX 3060 | |
| Zotac ZBOX Magnus EN173070C | |
| Minisforum NUCX i7 | |
| Zotac MEK Mini (RTX 2070 Super) | |
| AIDA64 / CPU PhotoWorxx | |
| Średnia w klasie Desktop (38071 - 63949, n=21, ostatnie 2 lata) | |
| Zotac ZBOX Magnus EN173070C | |
| Minisforum NUCX i7 | |
| Intel Beast Canyon NUC | |
| Intel Dragon Canyon NUC - RTX 3060 | |
| Zotac MEK Mini (RTX 2070 Super) | |
| Gigabyte A7 X1 | |
Minisforum NUCXi7 w pętli Cinebench R15 Multi Loop
Pętla testu stałego obciążenia Cinebench R15 daje dobre wrażenie co do wydajności wbudowanego układu chłodzenia. Po pierwszych przebiegach wydajność spada tylko minimalnie, po czym dalej wyrównuje się na średnim poziomie 1 828 pkt.
Wydajność systemu
Minisforum NUCXi7 pozostawia dobre wrażenie w benchmarkach systemowych. Minus za Intel Dragon Canyon NUC z procesorem Intel Core i9-12900 wynosi 17%. W tym samym czasie Intel Core i7-11800H, który w tym momencie ma już ponad rok, również pokazuje, że jeszcze przez dłuższy czas nie będzie należał do sterty złomu. Niemniej jednak, Minisforum mogłoby również otrzymać kilka znaczących ulepszeń dzięki aktualizacji do SoC Intela z serii Alder Lake. W obecnej konfiguracji sprzętowej Minisforum NUCXi7 zapewnia jednak solidną wydajność, która przekonuje także w codziennej pracy.
| Performance rating - Percent | |
| Intel Dragon Canyon NUC - RTX 3060, Intel Core i9-12900 | |
| Intel Beast Canyon NUC, Intel Core i9-11900KB | |
| Gigabyte A7 X1, AMD Ryzen 9 5900HX | |
| Zotac ZBOX Magnus EN173070C, Intel Core i7-11800H | |
| Minisforum NUCX i7, Intel Core i7-11800H | |
| Zotac Magnus One (ECM73070C), Intel Core i7-10700 | |
| Zotac MEK Mini (RTX 2070 Super), Intel Core i7-9700 | |
| PCMark 10 | |
| Score | |
| Intel Dragon Canyon NUC - RTX 3060, Intel Core i9-12900 | |
| Intel Beast Canyon NUC, Intel Core i9-11900KB | |
| Zotac ZBOX Magnus EN173070C, Intel Core i7-11800H | |
| Gigabyte A7 X1, AMD Ryzen 9 5900HX | |
| Minisforum NUCX i7, Intel Core i7-11800H | |
| Zotac Magnus One (ECM73070C), Intel Core i7-10700 | |
| Zotac MEK Mini (RTX 2070 Super), Intel Core i7-9700 | |
| Essentials | |
| Intel Dragon Canyon NUC - RTX 3060, Intel Core i9-12900 | |
| Intel Beast Canyon NUC, Intel Core i9-11900KB | |
| Zotac ZBOX Magnus EN173070C, Intel Core i7-11800H | |
| Gigabyte A7 X1, AMD Ryzen 9 5900HX | |
| Minisforum NUCX i7, Intel Core i7-11800H | |
| Zotac Magnus One (ECM73070C), Intel Core i7-10700 | |
| Zotac MEK Mini (RTX 2070 Super), Intel Core i7-9700 | |
| Productivity | |
| Intel Dragon Canyon NUC - RTX 3060, Intel Core i9-12900 | |
| Intel Beast Canyon NUC, Intel Core i9-11900KB | |
| Gigabyte A7 X1, AMD Ryzen 9 5900HX | |
| Zotac ZBOX Magnus EN173070C, Intel Core i7-11800H | |
| Minisforum NUCX i7, Intel Core i7-11800H | |
| Zotac MEK Mini (RTX 2070 Super), Intel Core i7-9700 | |
| Zotac Magnus One (ECM73070C), Intel Core i7-10700 | |
| CrossMark / Responsiveness | |
| Intel Beast Canyon NUC, Intel Core i9-11900KB | |
| Intel Dragon Canyon NUC - RTX 3060, Intel Core i9-12900 | |
| Minisforum NUCX i7, Intel Core i7-11800H | |
| Zotac ZBOX Magnus EN173070C, Intel Core i7-11800H | |
| CrossMark / Creativity | |
| Intel Beast Canyon NUC, Intel Core i9-11900KB | |
| Intel Dragon Canyon NUC - RTX 3060, Intel Core i9-12900 | |
| Minisforum NUCX i7, Intel Core i7-11800H | |
| Zotac ZBOX Magnus EN173070C, Intel Core i7-11800H | |
| CrossMark / Productivity | |
| Intel Beast Canyon NUC, Intel Core i9-11900KB | |
| Intel Dragon Canyon NUC - RTX 3060, Intel Core i9-12900 | |
| Minisforum NUCX i7, Intel Core i7-11800H | |
| Zotac ZBOX Magnus EN173070C, Intel Core i7-11800H | |
| CrossMark / Overall | |
| Intel Beast Canyon NUC, Intel Core i9-11900KB | |
| Intel Dragon Canyon NUC - RTX 3060, Intel Core i9-12900 | |
| Minisforum NUCX i7, Intel Core i7-11800H | |
| Zotac ZBOX Magnus EN173070C, Intel Core i7-11800H | |
| AIDA64 / Memory Copy | |
| Średnia w klasie Desktop (54743 - 98416, n=21, ostatnie 2 lata) | |
| Intel Beast Canyon NUC | |
| Intel Dragon Canyon NUC - RTX 3060 | |
| Minisforum NUCX i7 | |
| Zotac ZBOX Magnus EN173070C | |
| Przeciętny Intel Core i7-11800H (24508 - 48144, n=21) | |
| Gigabyte A7 X1 | |
| Zotac MEK Mini (RTX 2070 Super) | |
| AIDA64 / Memory Read | |
| Średnia w klasie Desktop (58375 - 110448, n=21, ostatnie 2 lata) | |
| Zotac ZBOX Magnus EN173070C | |
| Intel Beast Canyon NUC | |
| Intel Dragon Canyon NUC - RTX 3060 | |
| Minisforum NUCX i7 | |
| Przeciętny Intel Core i7-11800H (25882 - 50365, n=20) | |
| Gigabyte A7 X1 | |
| Zotac MEK Mini (RTX 2070 Super) | |
| AIDA64 / Memory Write | |
| Średnia w klasie Desktop (60635 - 93889, n=21, ostatnie 2 lata) | |
| Zotac ZBOX Magnus EN173070C | |
| Minisforum NUCX i7 | |
| Intel Beast Canyon NUC | |
| Intel Dragon Canyon NUC - RTX 3060 | |
| Przeciętny Intel Core i7-11800H (22240 - 46214, n=20) | |
| Zotac MEK Mini (RTX 2070 Super) | |
| Gigabyte A7 X1 | |
| AIDA64 / Memory Latency | |
| Minisforum NUCX i7 | |
| Średnia w klasie Desktop (68.5 - 168, n=21, ostatnie 2 lata) | |
| Intel Beast Canyon NUC | |
| Intel Dragon Canyon NUC - RTX 3060 | |
| Zotac ZBOX Magnus EN173070C | |
| Gigabyte A7 X1 | |
| Zotac MEK Mini (RTX 2070 Super) | |
| Przeciętny Intel Core i7-11800H (71.9 - 104.1, n=44) | |
* ... im mniej tym lepiej
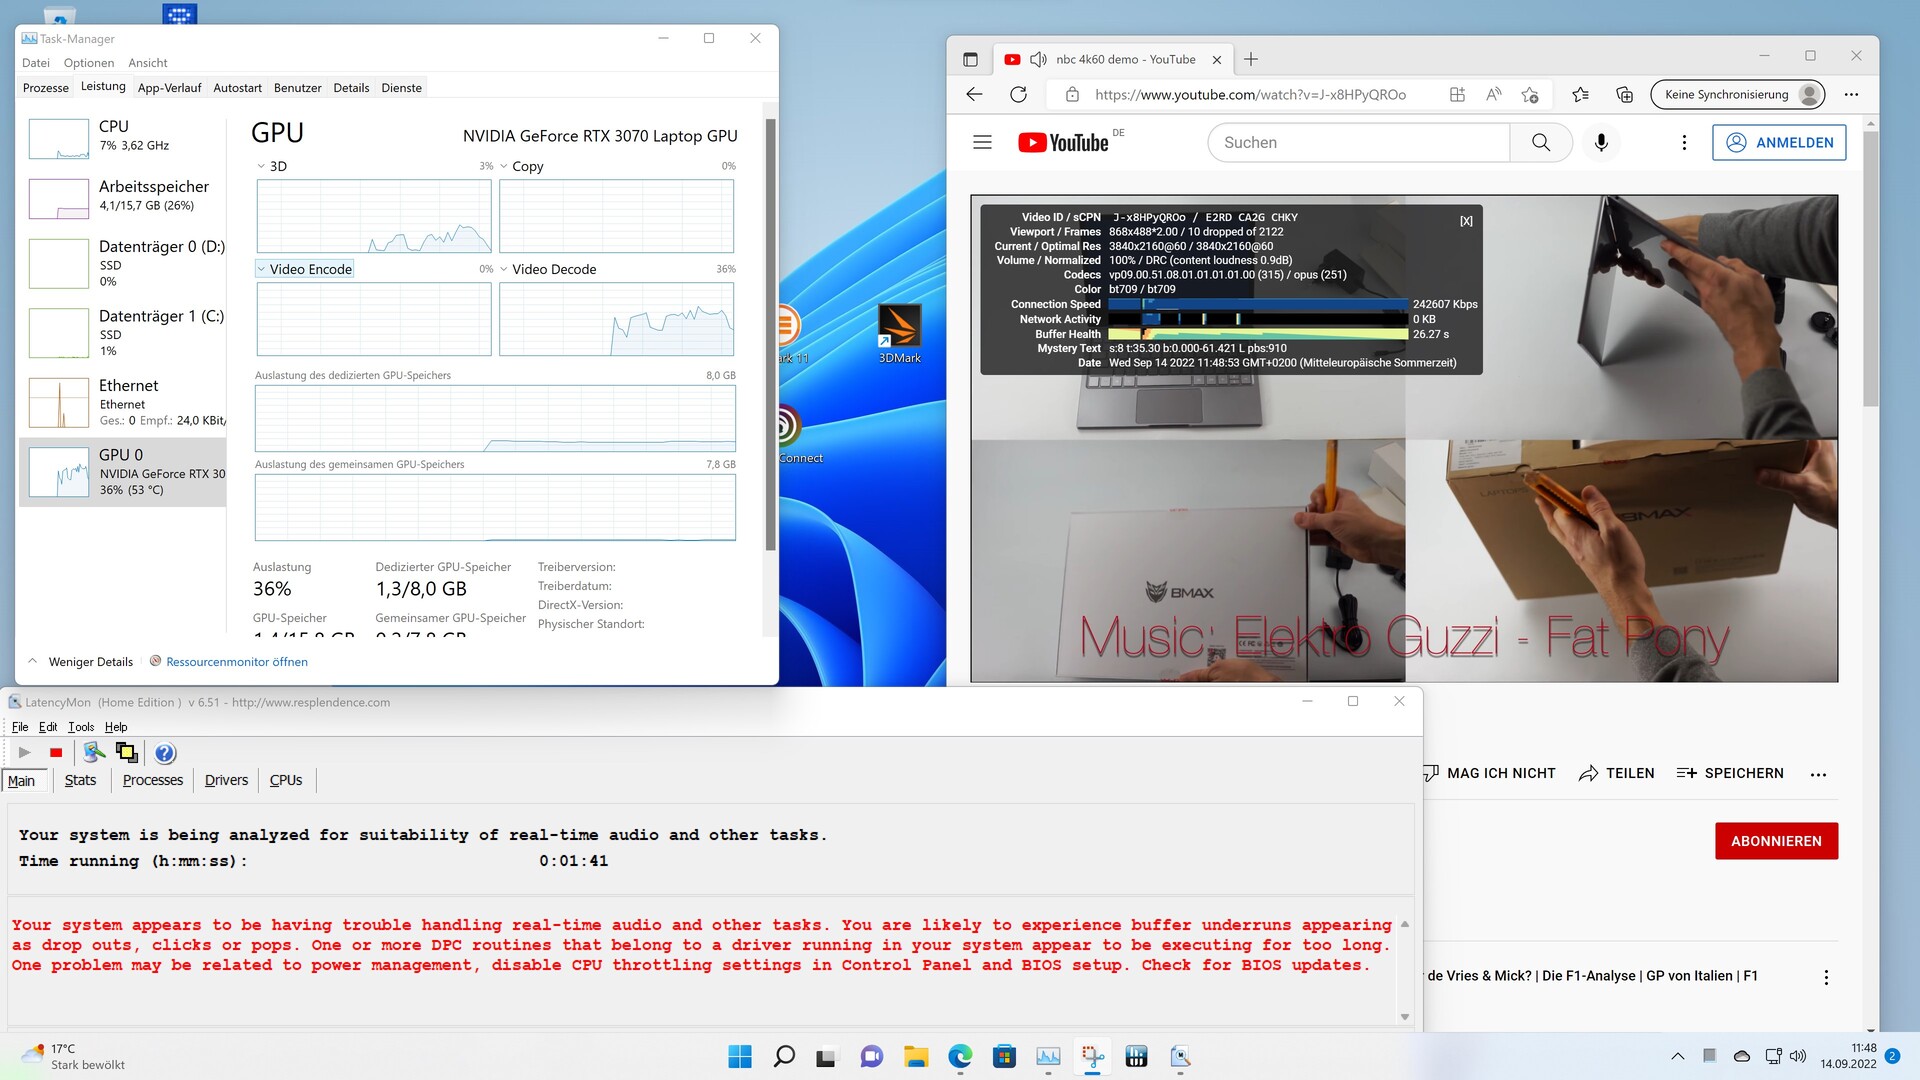
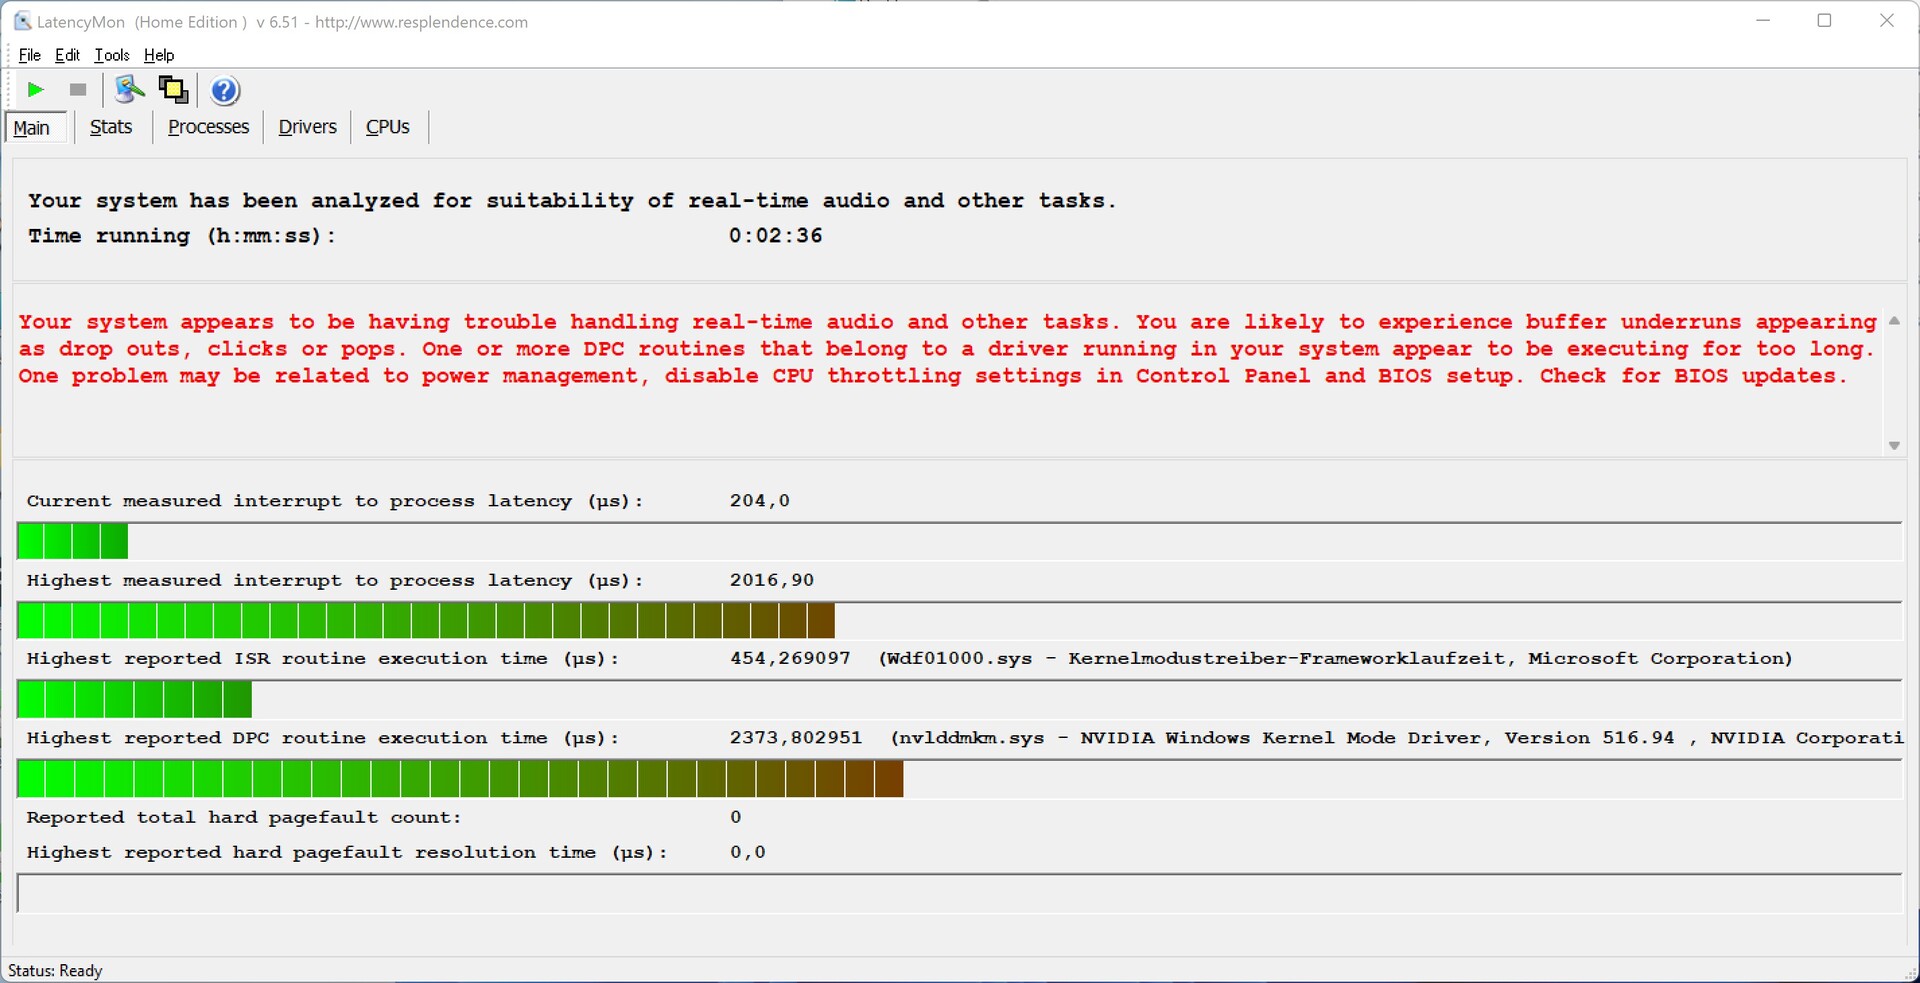
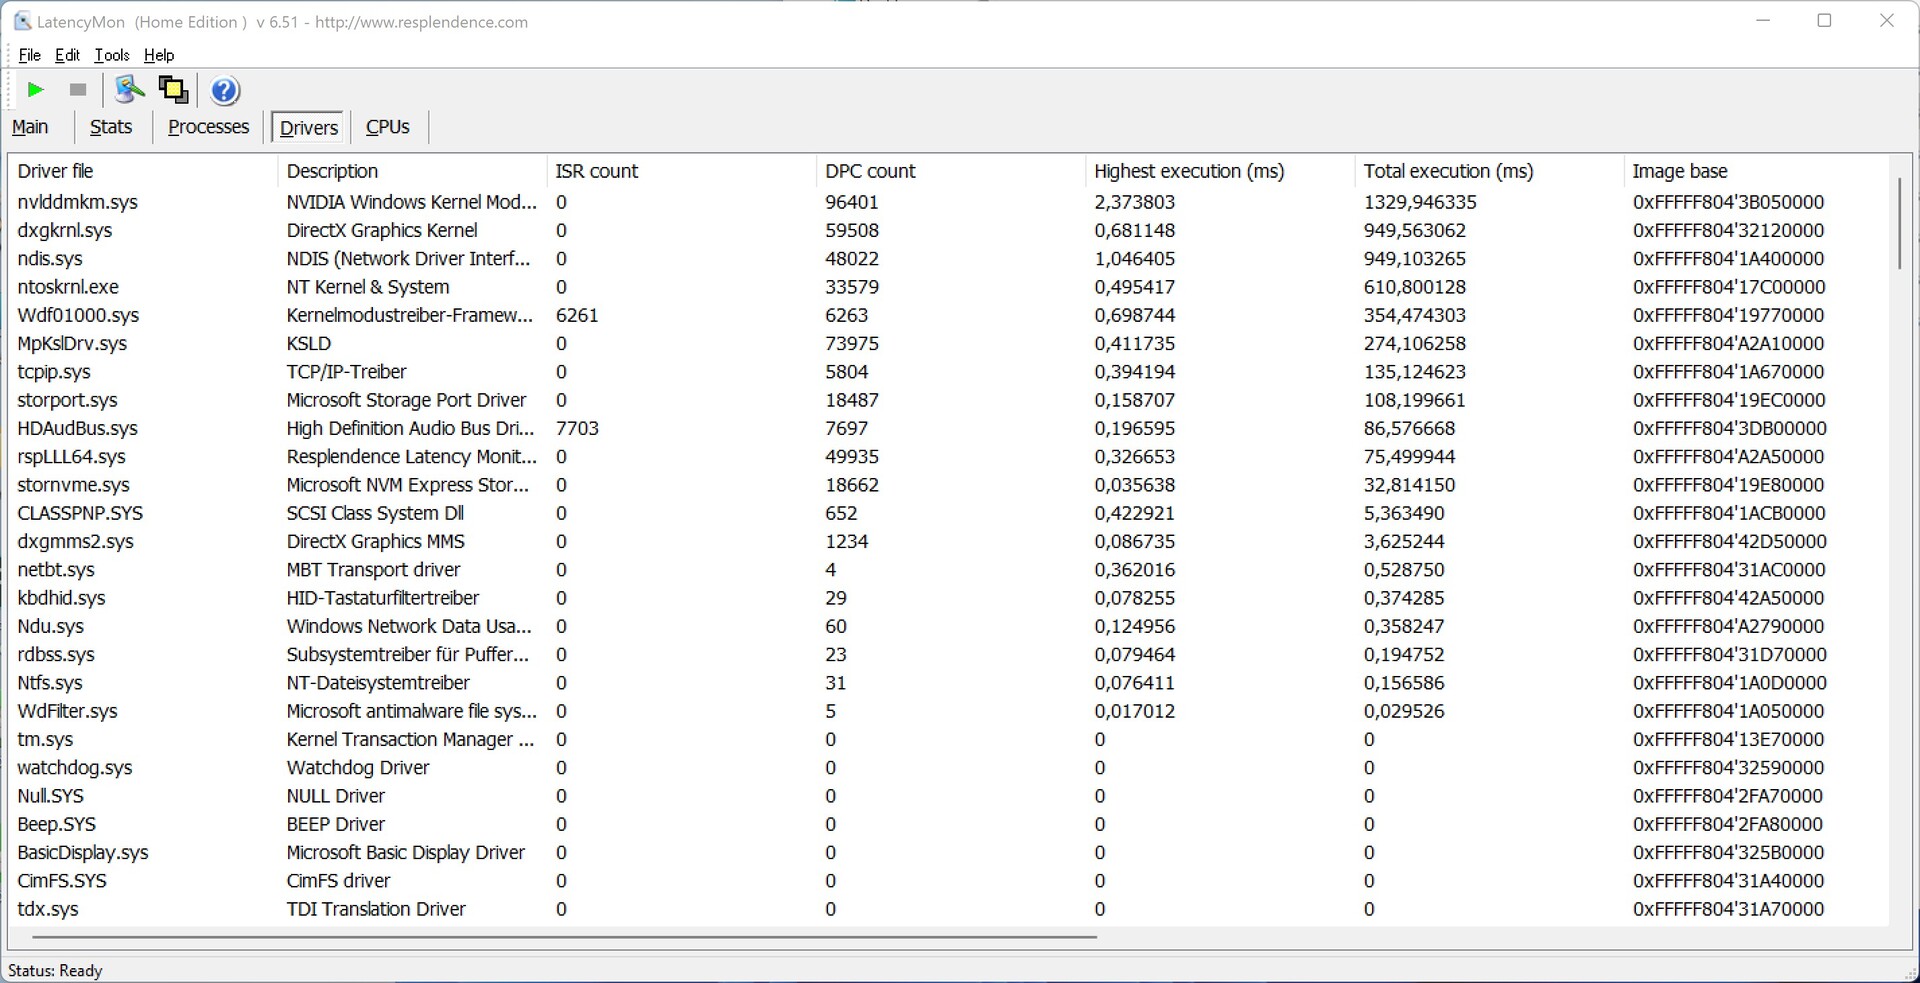
Opóźnienia DPC
Minisforum NUCXi7 zmaga się z podwyższonymi latencjami już podczas otwierania kilku kart w przeglądarce Edge. Podczas odtwarzania naszego testowego wideo w rozdzielczości 4K Nvidia GeForce RTX 3070 Laptop GPUjest obciążony w około 36%.
| DPC Latencies / LatencyMon - interrupt to process latency (max), Web, Youtube, Prime95 | |
| Minisforum NUCX i7, Intel Core i7-11800H | |
| Zotac ZBOX Magnus EN173070C, Intel Core i7-11800H | |
| Gigabyte A7 X1, AMD Ryzen 9 5900HX | |
* ... im mniej tym lepiej
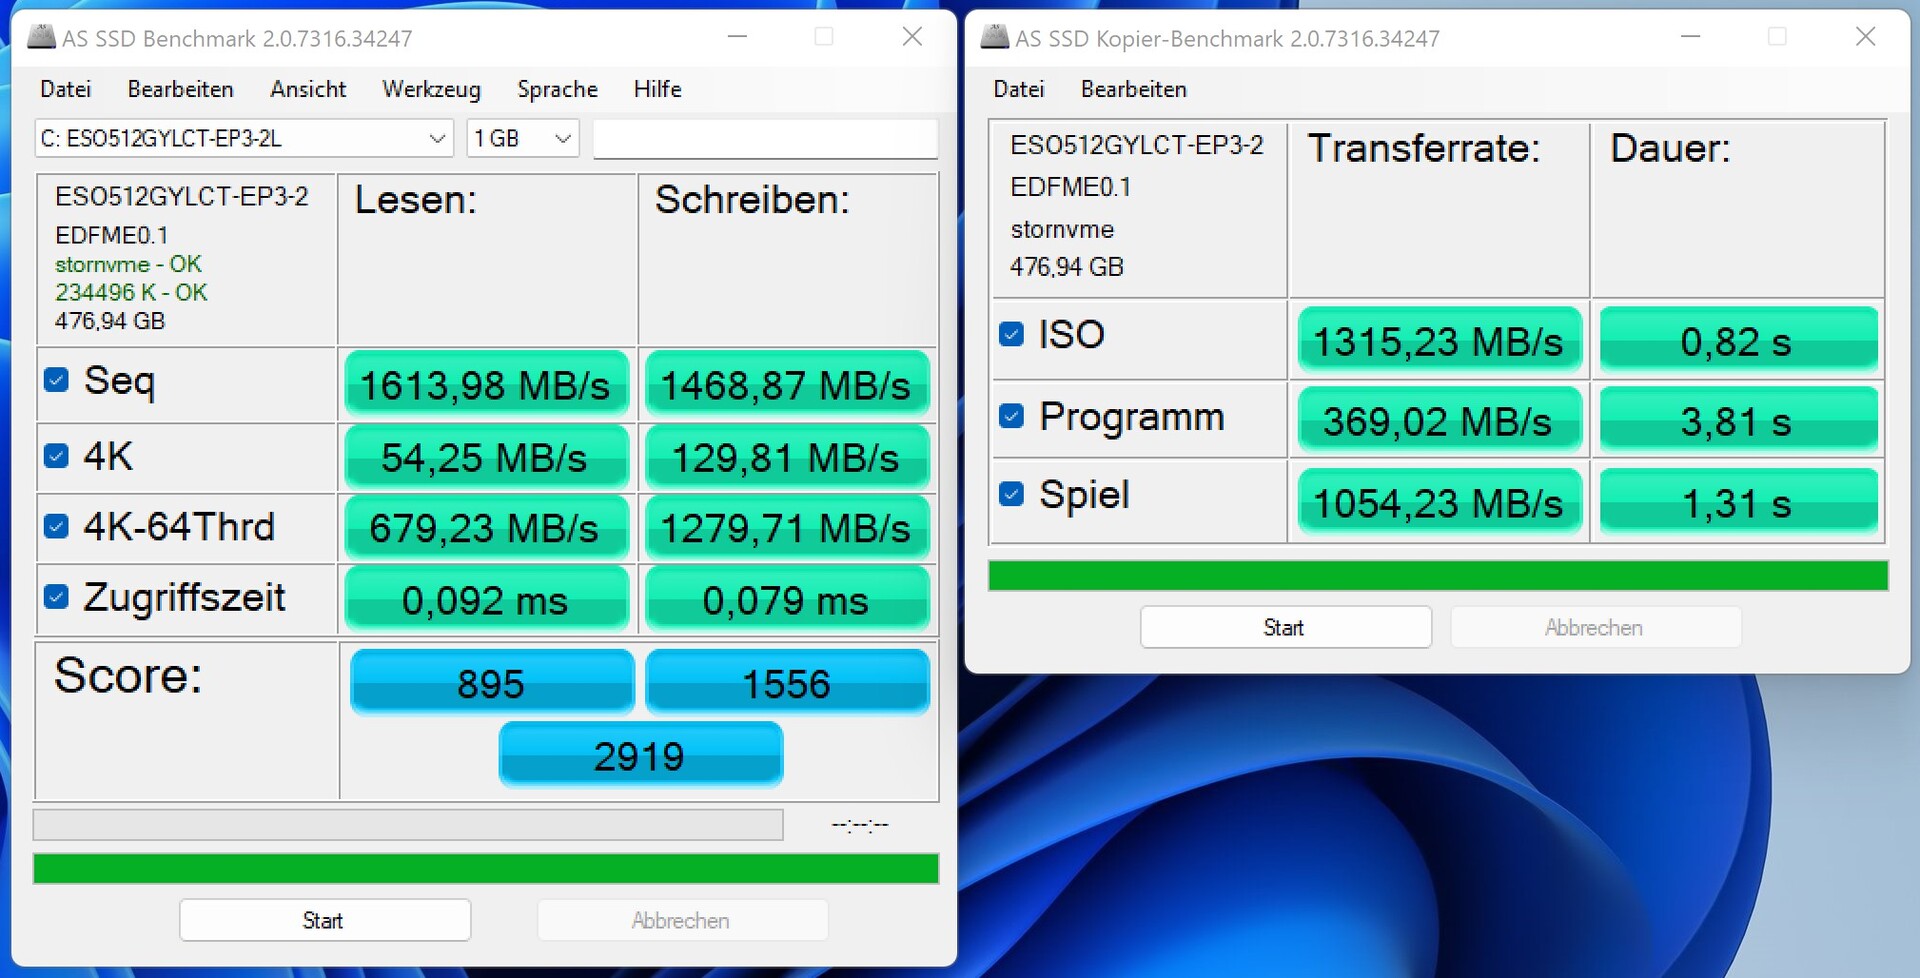
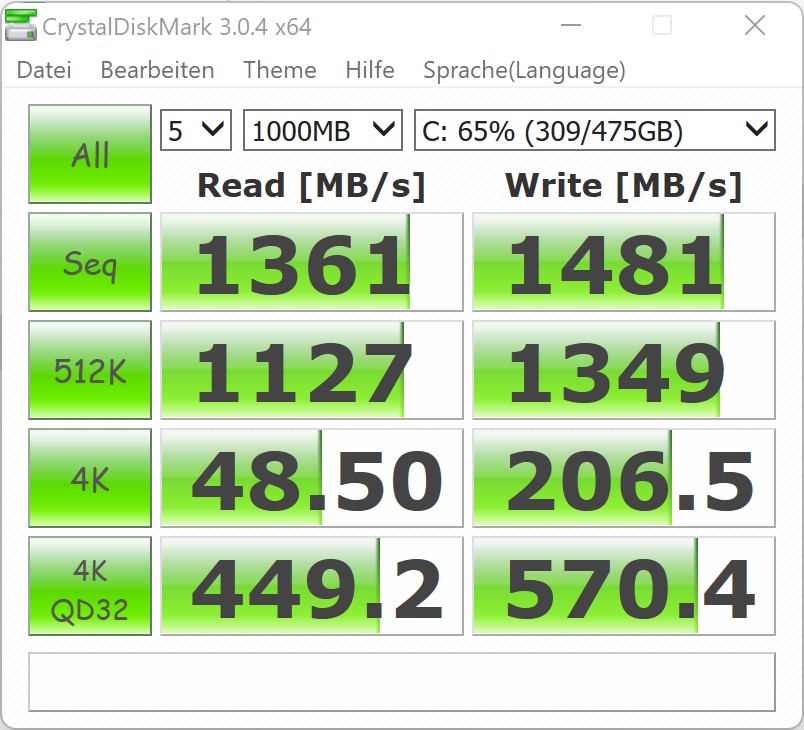
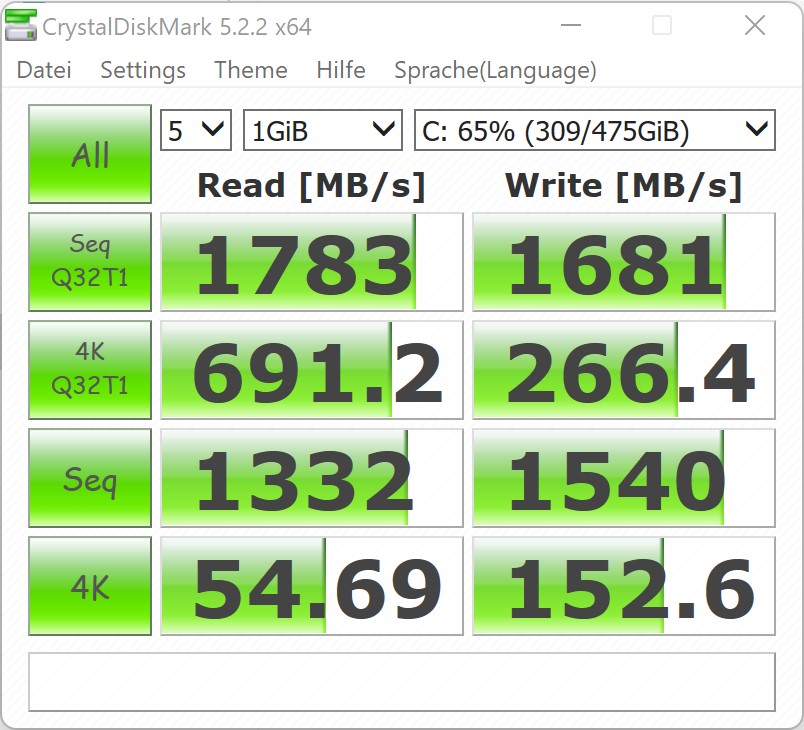
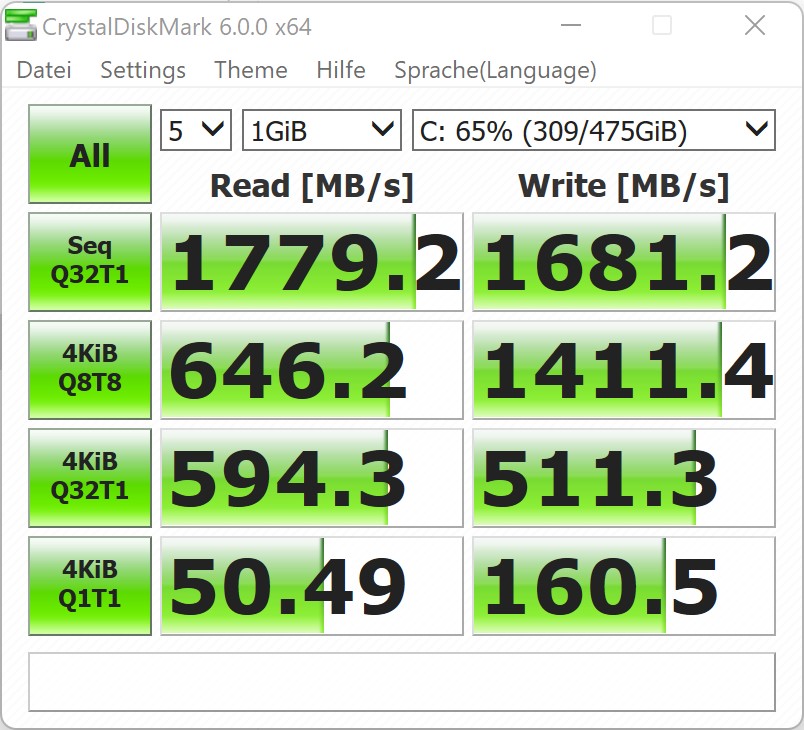
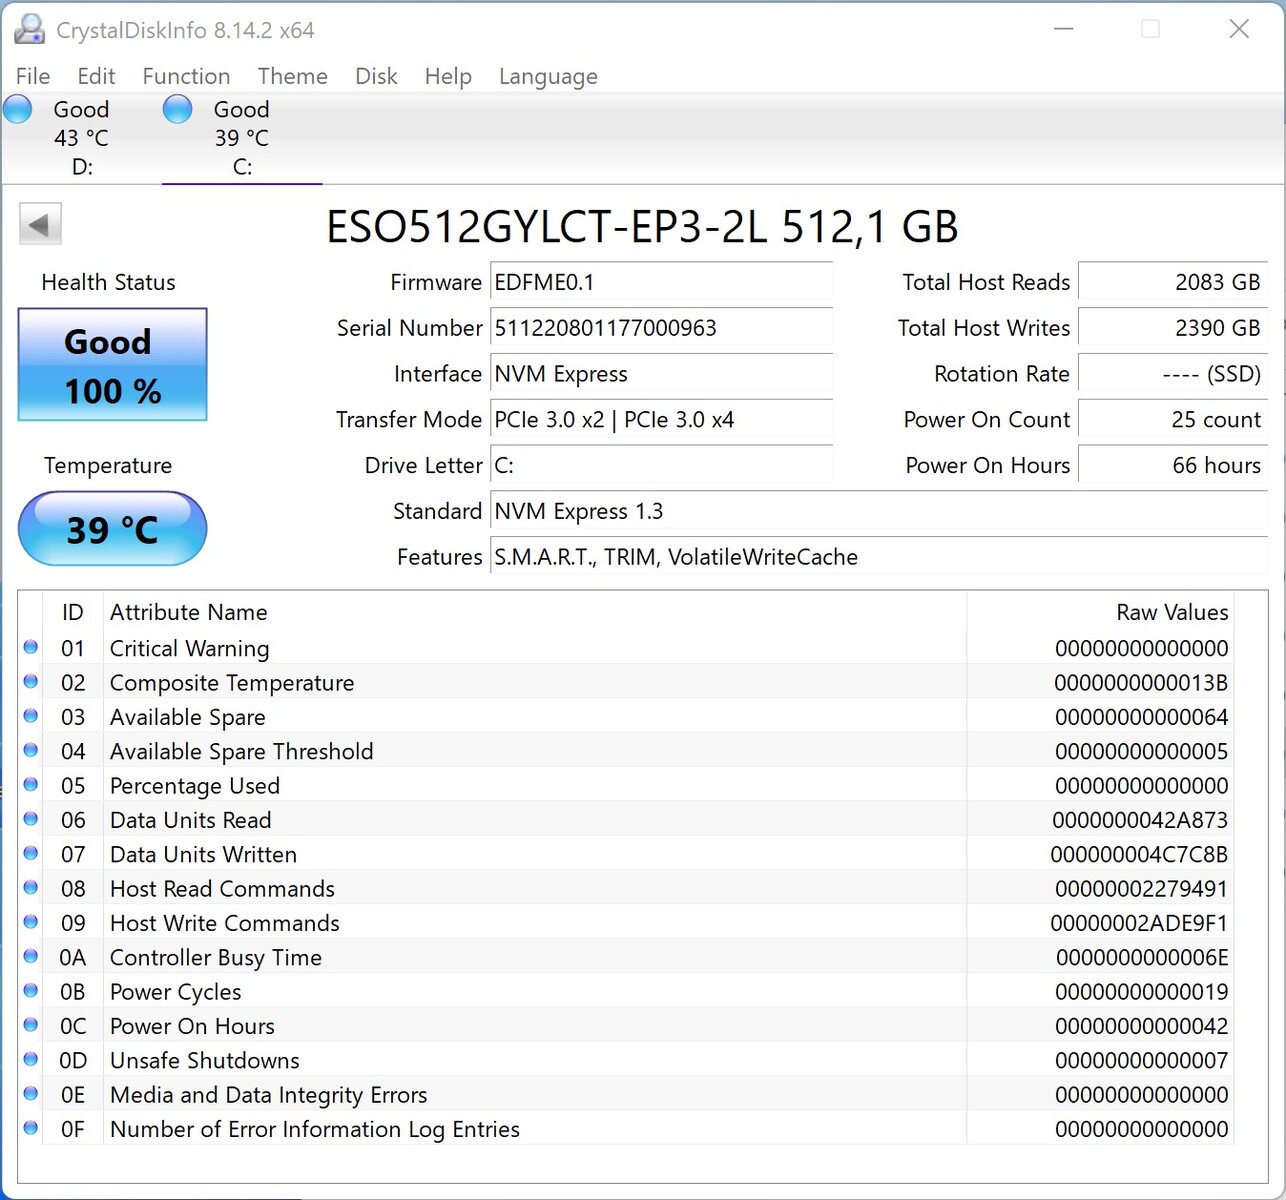
Rozwiązanie w zakresie przechowywania
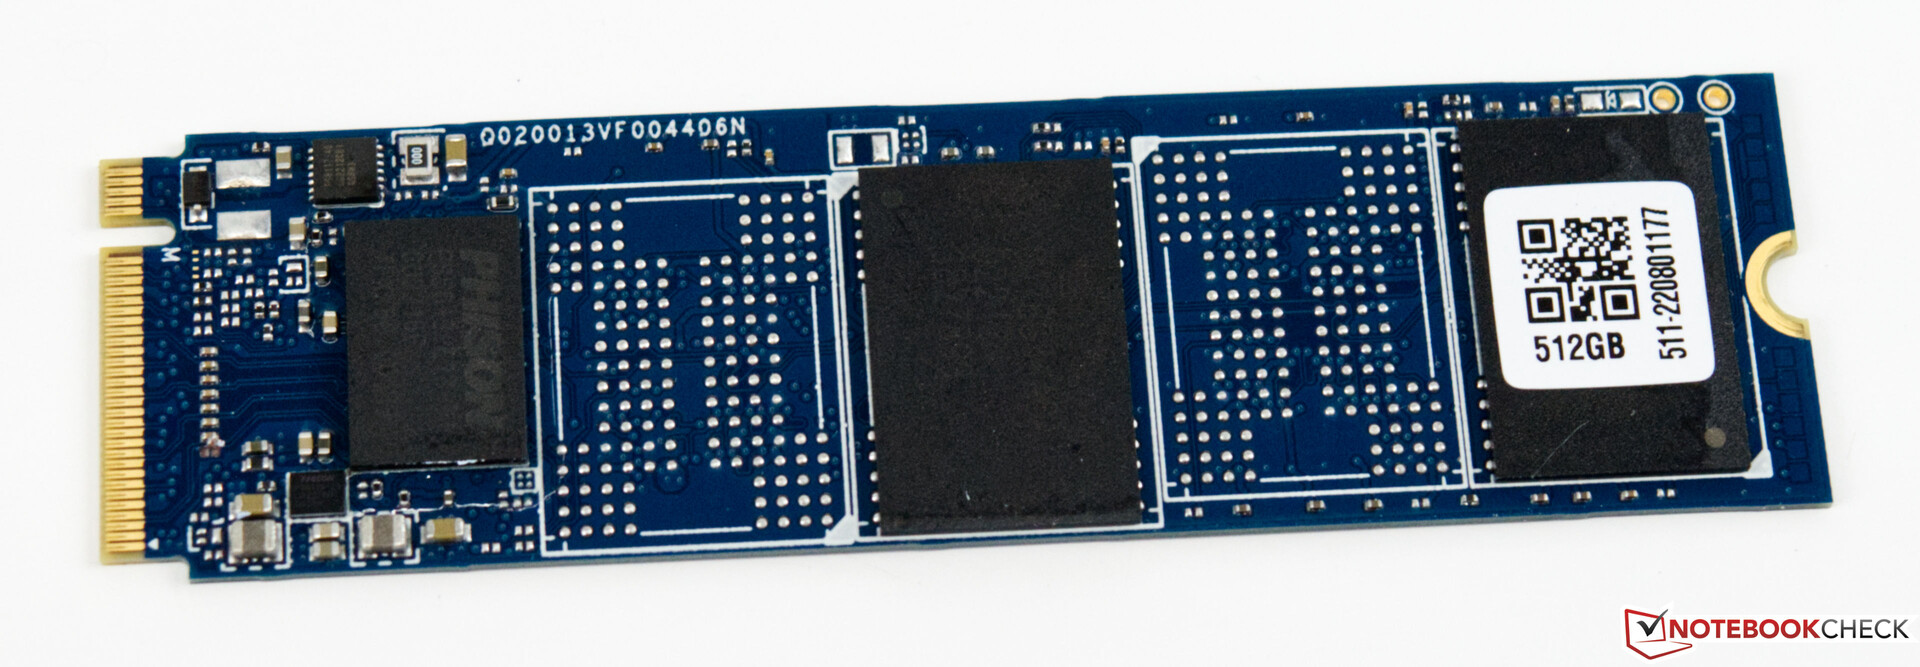
W naszej konfiguracji pamięć masowa to dysk SSD NVMe o pojemności 512 GB. Choć zastosowany model jest szybki, nie do końca jest w stanie dotrzymać kroku wydajności naszych urządzeń porównawczych. Wydajność jest jednak nadal wystarczająca do wszystkich typowych zastosowań. Dodatkowo nie udało nam się zauważyć żadnych niepotrzebnych opóźnień wynikających z wydajności dysku SSD. Z drugiej strony, biorąc pod uwagę docelową grupę użytkowników, przestrzeń dyskowa okazuje się bardzo niska na poziomie zaledwie 512 GB. W przypadku urządzenia do gier oczekujemy co najmniej 1 TB pamięci masowej. Jednocześnie można rozszerzyć pamięć masową w późniejszym czasie, korzystając z drugiego gniazda M.2.
Dodatkowe porównania i benchmarki znajdziecie w naszym tabela porównawcza.

| Drive Performance rating - Percent | |
| Średnia w klasie Desktop | |
| Intel Beast Canyon NUC | |
| Intel Dragon Canyon NUC - RTX 3060 -11! | |
| Gigabyte A7 X1 | |
| Zotac ZBOX Magnus EN173070C | |
| Zotac Magnus One (ECM73070C) | |
| Minisforum NUCX i7 | |
| Global Average -3 | |
| Zotac MEK Mini (RTX 2070 Super) | |
| DiskSpd | |
| seq read | |
| Średnia w klasie Desktop (2076 - 7350, n=13, ostatnie 2 lata) | |
| Global Average -3 (113.3 - 9494, n=2110) | |
| Zotac ZBOX Magnus EN173070C | |
| Gigabyte A7 X1 | |
| Intel Beast Canyon NUC | |
| Intel Dragon Canyon NUC - RTX 3060 | |
| Minisforum NUCX i7 | |
| Zotac Magnus One (ECM73070C) | |
| Zotac MEK Mini (RTX 2070 Super) | |
| seq write | |
| Średnia w klasie Desktop (1481 - 10361, n=13, ostatnie 2 lata) | |
| Global Average -3 (43 - 10361, n=2110) | |
| Gigabyte A7 X1 | |
| Intel Beast Canyon NUC | |
| Intel Dragon Canyon NUC - RTX 3060 | |
| Minisforum NUCX i7 | |
| Zotac ZBOX Magnus EN173070C | |
| Zotac Magnus One (ECM73070C) | |
| Zotac MEK Mini (RTX 2070 Super) | |
| seq q8 t1 read | |
| Średnia w klasie Desktop (3170 - 14590, n=13, ostatnie 2 lata) | |
| Intel Beast Canyon NUC | |
| Intel Dragon Canyon NUC - RTX 3060 | |
| Global Average -3 (114.5 - 16102, n=2110) | |
| Gigabyte A7 X1 | |
| Zotac Magnus One (ECM73070C) | |
| Zotac ZBOX Magnus EN173070C | |
| Minisforum NUCX i7 | |
| Zotac MEK Mini (RTX 2070 Super) | |
| seq q8 t1 write | |
| Średnia w klasie Desktop (1482 - 14206, n=13, ostatnie 2 lata) | |
| Global Average -3 (46.7 - 14571, n=2110) | |
| Intel Beast Canyon NUC | |
| Intel Dragon Canyon NUC - RTX 3060 | |
| Gigabyte A7 X1 | |
| Zotac Magnus One (ECM73070C) | |
| Zotac ZBOX Magnus EN173070C | |
| Minisforum NUCX i7 | |
| Zotac MEK Mini (RTX 2070 Super) | |
| 4k q1 t1 read | |
| Średnia w klasie Desktop (51.4 - 101.6, n=13, ostatnie 2 lata) | |
| Zotac ZBOX Magnus EN173070C | |
| Global Average -3 (0.67 - 361, n=2110) | |
| Intel Beast Canyon NUC | |
| Intel Dragon Canyon NUC - RTX 3060 | |
| Gigabyte A7 X1 | |
| Zotac Magnus One (ECM73070C) | |
| Minisforum NUCX i7 | |
| Zotac MEK Mini (RTX 2070 Super) | |
| 4k q1 t1 write | |
| Intel Beast Canyon NUC | |
| Intel Dragon Canyon NUC - RTX 3060 | |
| Średnia w klasie Desktop (135.2 - 318, n=13, ostatnie 2 lata) | |
| Zotac ZBOX Magnus EN173070C | |
| Minisforum NUCX i7 | |
| Global Average -3 (1.23 - 435, n=2109) | |
| Gigabyte A7 X1 | |
| Zotac Magnus One (ECM73070C) | |
| Zotac MEK Mini (RTX 2070 Super) | |
| 4k q32 t16 read | |
| Średnia w klasie Desktop (757 - 8156, n=13, ostatnie 2 lata) | |
| Global Average -3 (1.03 - 8156, n=2109) | |
| Gigabyte A7 X1 | |
| Zotac Magnus One (ECM73070C) | |
| Intel Beast Canyon NUC | |
| Intel Dragon Canyon NUC - RTX 3060 | |
| Minisforum NUCX i7 | |
| Zotac ZBOX Magnus EN173070C | |
| Zotac MEK Mini (RTX 2070 Super) | |
| 4k q32 t16 write | |
| Średnia w klasie Desktop (469 - 6217, n=13, ostatnie 2 lata) | |
| Global Average -3 (1.5 - 6738, n=2109) | |
| Intel Beast Canyon NUC | |
| Intel Dragon Canyon NUC - RTX 3060 | |
| Minisforum NUCX i7 | |
| Zotac Magnus One (ECM73070C) | |
| Zotac ZBOX Magnus EN173070C | |
| Gigabyte A7 X1 | |
| Zotac MEK Mini (RTX 2070 Super) | |
| AS SSD | |
| Score Total | |
| Średnia w klasie Desktop (4432 - 16295, n=8, ostatnie 2 lata) | |
| Intel Beast Canyon NUC | |
| Zotac Magnus One (ECM73070C) | |
| Gigabyte A7 X1 | |
| Global Average -3 (19 - 16295, n=3767) | |
| Zotac MEK Mini (RTX 2070 Super) | |
| Zotac ZBOX Magnus EN173070C | |
| Minisforum NUCX i7 | |
| Score Read | |
| Średnia w klasie Desktop (1358 - 6261, n=8, ostatnie 2 lata) | |
| Intel Beast Canyon NUC | |
| Zotac Magnus One (ECM73070C) | |
| Gigabyte A7 X1 | |
| Zotac MEK Mini (RTX 2070 Super) | |
| Global Average -3 (6 - 6261, n=3768) | |
| Minisforum NUCX i7 | |
| Zotac ZBOX Magnus EN173070C | |
| Score Write | |
| Średnia w klasie Desktop (2441 - 6844, n=8, ostatnie 2 lata) | |
| Intel Beast Canyon NUC | |
| Gigabyte A7 X1 | |
| Zotac Magnus One (ECM73070C) | |
| Minisforum NUCX i7 | |
| Global Average -3 (4 - 7208, n=3768) | |
| Zotac MEK Mini (RTX 2070 Super) | |
| Zotac ZBOX Magnus EN173070C | |
| Seq Read | |
| Średnia w klasie Desktop (3054 - 10753, n=8, ostatnie 2 lata) | |
| Intel Beast Canyon NUC | |
| Gigabyte A7 X1 | |
| Zotac ZBOX Magnus EN173070C | |
| Zotac Magnus One (ECM73070C) | |
| Zotac MEK Mini (RTX 2070 Super) | |
| Global Average -3 (193.2 - 12763, n=3985) | |
| Minisforum NUCX i7 | |
| Seq Write | |
| Średnia w klasie Desktop (2867 - 10950, n=8, ostatnie 2 lata) | |
| Intel Beast Canyon NUC | |
| Zotac ZBOX Magnus EN173070C | |
| Zotac Magnus One (ECM73070C) | |
| Gigabyte A7 X1 | |
| Global Average -3 (52.2 - 11316, n=3988) | |
| Minisforum NUCX i7 | |
| Zotac MEK Mini (RTX 2070 Super) | |
| 4K Read | |
| Średnia w klasie Desktop (68 - 100.5, n=8, ostatnie 2 lata) | |
| Intel Beast Canyon NUC | |
| Minisforum NUCX i7 | |
| Global Average -3 (6.08 - 314, n=3977) | |
| Gigabyte A7 X1 | |
| Zotac Magnus One (ECM73070C) | |
| Zotac ZBOX Magnus EN173070C | |
| Zotac MEK Mini (RTX 2070 Super) | |
| 4K Write | |
| Intel Beast Canyon NUC | |
| Średnia w klasie Desktop (159.6 - 275, n=8, ostatnie 2 lata) | |
| Zotac ZBOX Magnus EN173070C | |
| Gigabyte A7 X1 | |
| Minisforum NUCX i7 | |
| Global Average -3 (13.3 - 512, n=3977) | |
| Zotac Magnus One (ECM73070C) | |
| Zotac MEK Mini (RTX 2070 Super) | |
| 4K-64 Read | |
| Średnia w klasie Desktop (802 - 5086, n=8, ostatnie 2 lata) | |
| Intel Beast Canyon NUC | |
| Zotac Magnus One (ECM73070C) | |
| Gigabyte A7 X1 | |
| Zotac MEK Mini (RTX 2070 Super) | |
| Global Average -3 (13.1 - 5086, n=3976) | |
| Minisforum NUCX i7 | |
| Zotac ZBOX Magnus EN173070C | |
| 4K-64 Write | |
| Średnia w klasie Desktop (1956 - 5519, n=8, ostatnie 2 lata) | |
| Intel Beast Canyon NUC | |
| Gigabyte A7 X1 | |
| Zotac Magnus One (ECM73070C) | |
| Minisforum NUCX i7 | |
| Global Average -3 (13.7 - 5909, n=3974) | |
| Zotac MEK Mini (RTX 2070 Super) | |
| Zotac ZBOX Magnus EN173070C | |
| Access Time Read | |
| Global Average -3 (0.012 - 33, n=3907) | |
| Zotac MEK Mini (RTX 2070 Super) | |
| Zotac Magnus One (ECM73070C) | |
| Gigabyte A7 X1 | |
| Minisforum NUCX i7 | |
| Intel Beast Canyon NUC | |
| Zotac ZBOX Magnus EN173070C | |
| Średnia w klasie Desktop (0.015 - 0.111, n=8, ostatnie 2 lata) | |
| Access Time Write | |
| Global Average -3 (0.011 - 60.7, n=3950) | |
| Minisforum NUCX i7 | |
| Zotac MEK Mini (RTX 2070 Super) | |
| Zotac Magnus One (ECM73070C) | |
| Gigabyte A7 X1 | |
| Zotac ZBOX Magnus EN173070C | |
| Średnia w klasie Desktop (0.014 - 0.032, n=8, ostatnie 2 lata) | |
| Intel Beast Canyon NUC | |
* ... im mniej tym lepiej
Constant Performance Reading: DiskSpd Read Loop, Queue Depth 8
Karta graficzna
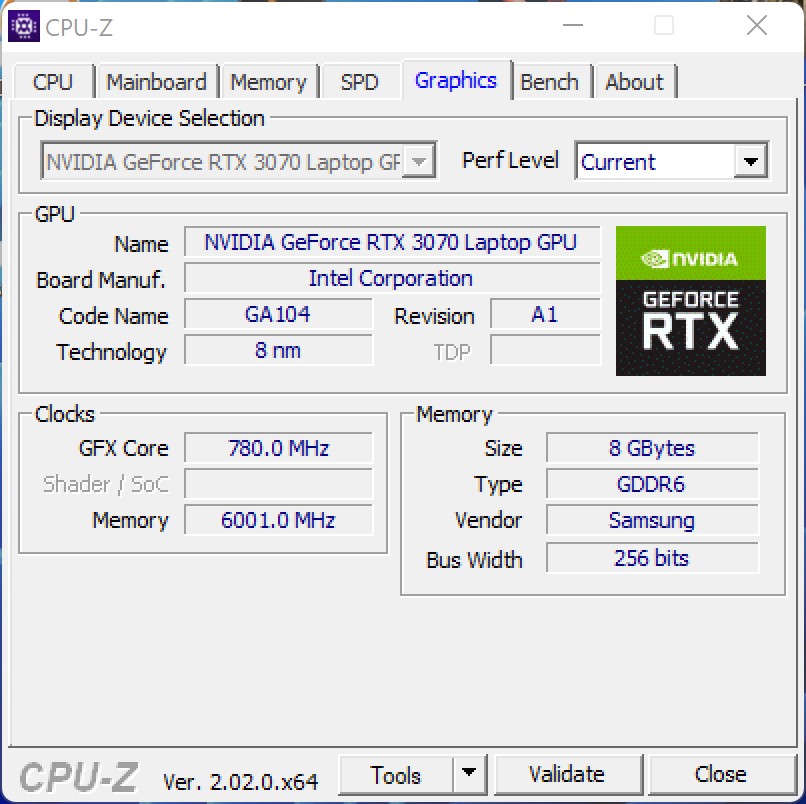
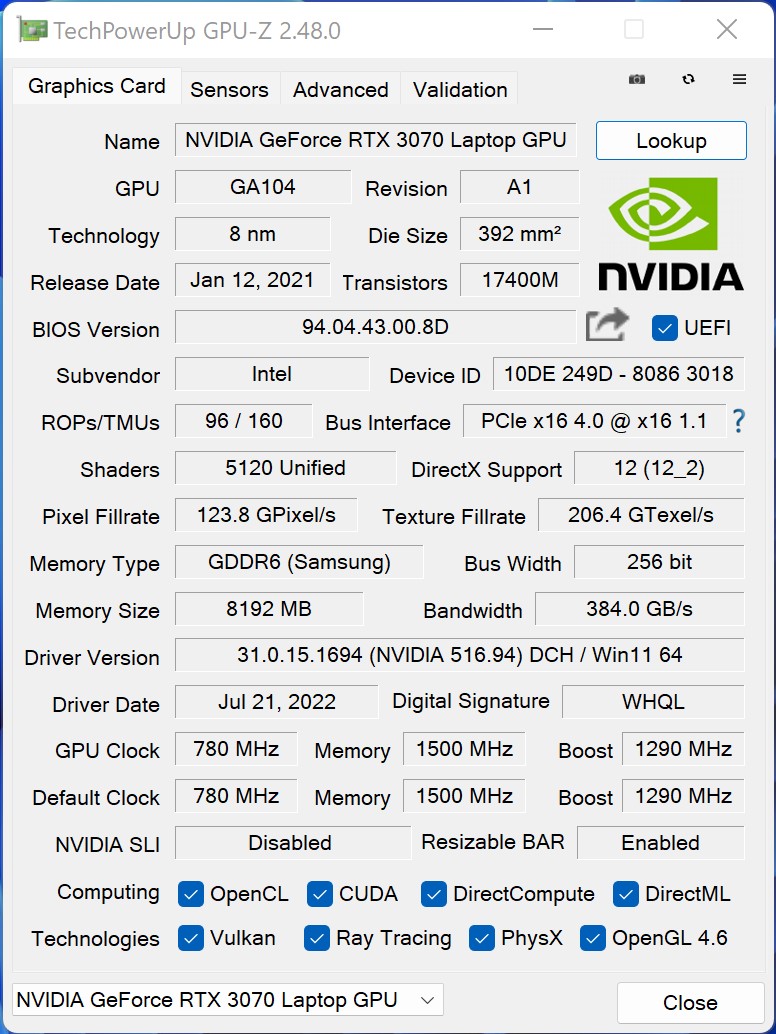
Na stronieNvidia GeForce RTX 3070 Laptop GPUuruchomiony w Minisforum NUCXi7 jest w stanie wykorzystać swoją pełną wydajność 125 W w trybie Gaming. Nadal jednak trzeba mieć świadomość, że jest to mobilna wersja GeForce RTX 3070, której wydajność nie zbliża się do tej z wersji desktopowej. Procesor graficzny Nvidia GeForce RTX 3070 do laptopa jest o około 25 do 30% wolniejszy od.Nvidia GeForce RTX 3070 Desktop GPU. Jednak nasza jednostka testowa z łatwością utrzymuje w ryzach konkurentów, którzy bazują na procesorze graficznym Nvidia GeForce RTX 3060 Desktop. Aby ocenić przybliżoną wydajność Minisforum NUCXi5, zamieszczamy również średnie wartości wydajności Nvidia GeForce RTX 3060 Laptop GPUna naszym wykresie.
Dodatkowe benchmarki dotyczące Nvidia GeForce RTX 3070 można znaleźć tutaj.
| 3DMark Performance rating - Percent | |
| MSI GeForce RTX 3070 Ventus 3X | |
| Zotac Magnus One (ECM73070C) | |
| Zotac ZBOX Magnus EN173070C | |
| Minisforum NUCX i7 | |
| Przeciętny NVIDIA GeForce RTX 3070 Laptop GPU | |
| Zotac MEK Mini (RTX 2070 Super) | |
| Intel Dragon Canyon NUC - RTX 3060 | |
| Intel Beast Canyon NUC | |
| Przeciętny NVIDIA GeForce RTX 3060 Laptop GPU | |
| 3DMark 11 - 1280x720 Performance GPU | |
| MSI GeForce RTX 3070 Ventus 3X | |
| Zotac Magnus One (ECM73070C) | |
| Minisforum NUCX i7 | |
| Zotac ZBOX Magnus EN173070C | |
| Zotac MEK Mini (RTX 2070 Super) | |
| Przeciętny NVIDIA GeForce RTX 3070 Laptop GPU (12535 - 38275, n=54) | |
| Intel Dragon Canyon NUC - RTX 3060 | |
| Intel Beast Canyon NUC | |
| Przeciętny NVIDIA GeForce RTX 3060 Laptop GPU (13799 - 30772, n=43) | |
| 3DMark | |
| 1280x720 Cloud Gate Standard Graphics | |
| Zotac Magnus One (ECM73070C) | |
| Zotac ZBOX Magnus EN173070C | |
| MSI GeForce RTX 3070 Ventus 3X | |
| Minisforum NUCX i7 | |
| Intel Beast Canyon NUC | |
| Zotac MEK Mini (RTX 2070 Super) | |
| Przeciętny NVIDIA GeForce RTX 3070 Laptop GPU (45531 - 179716, n=33) | |
| Intel Dragon Canyon NUC - RTX 3060 | |
| Przeciętny NVIDIA GeForce RTX 3060 Laptop GPU (33126 - 136826, n=38) | |
| 1920x1080 Fire Strike Graphics | |
| MSI GeForce RTX 3070 Ventus 3X | |
| Zotac Magnus One (ECM73070C) | |
| Zotac ZBOX Magnus EN173070C | |
| Minisforum NUCX i7 | |
| Przeciętny NVIDIA GeForce RTX 3070 Laptop GPU (7178 - 29128, n=52) | |
| Zotac MEK Mini (RTX 2070 Super) | |
| Intel Dragon Canyon NUC - RTX 3060 | |
| Intel Beast Canyon NUC | |
| Przeciętny NVIDIA GeForce RTX 3060 Laptop GPU (16354 - 23109, n=49) | |
| 2560x1440 Time Spy Graphics | |
| MSI GeForce RTX 3070 Ventus 3X | |
| Zotac Magnus One (ECM73070C) | |
| Zotac ZBOX Magnus EN173070C | |
| Zotac MEK Mini (RTX 2070 Super) | |
| Przeciętny NVIDIA GeForce RTX 3070 Laptop GPU (2644 - 11019, n=53) | |
| Minisforum NUCX i7 | |
| Intel Dragon Canyon NUC - RTX 3060 | |
| Intel Beast Canyon NUC | |
| Przeciętny NVIDIA GeForce RTX 3060 Laptop GPU (6285 - 9235, n=49) | |
| Fire Strike Extreme Graphics | |
| MSI GeForce RTX 3070 Ventus 3X | |
| Zotac Magnus One (ECM73070C) | |
| Przeciętny NVIDIA GeForce RTX 3070 Laptop GPU (11757 - 13506, n=4) | |
| Zotac ZBOX Magnus EN173070C | |
| Minisforum NUCX i7 | |
| Zotac MEK Mini (RTX 2070 Super) | |
| Przeciętny NVIDIA GeForce RTX 3060 Laptop GPU (10110 - 10623, n=4) | |
| Intel Dragon Canyon NUC - RTX 3060 | |
| Intel Beast Canyon NUC | |
| Performance rating - Percent | |
| Zotac Magnus One (ECM73070C) | |
| Zotac ZBOX Magnus EN173070C | |
| Przeciętny NVIDIA GeForce RTX 3070 Laptop GPU | |
| Minisforum NUCX i7 | |
| Intel Dragon Canyon NUC - RTX 3060 | |
| Intel Beast Canyon NUC | |
| Przeciętny NVIDIA GeForce RTX 3060 Laptop GPU | |
| Unigine Heaven 4.0 | |
| Extreme Preset OpenGL | |
| Zotac Magnus One (ECM73070C) | |
| Zotac ZBOX Magnus EN173070C | |
| Przeciętny NVIDIA GeForce RTX 3070 Laptop GPU (139.4 - 152.9, n=2) | |
| Minisforum NUCX i7 | |
| Intel Dragon Canyon NUC - RTX 3060 | |
| Intel Beast Canyon NUC | |
| Przeciętny NVIDIA GeForce RTX 3060 Laptop GPU (n=1) | |
| Extreme Preset DX11 | |
| Zotac Magnus One (ECM73070C) | |
| Zotac ZBOX Magnus EN173070C | |
| Przeciętny NVIDIA GeForce RTX 3070 Laptop GPU (152.9 - 165.1, n=2) | |
| Minisforum NUCX i7 | |
| Intel Dragon Canyon NUC - RTX 3060 | |
| Intel Beast Canyon NUC | |
| Przeciętny NVIDIA GeForce RTX 3060 Laptop GPU (n=1) | |
| Unigine Valley 1.0 | |
| 1920x1080 Extreme HD DirectX AA:x8 | |
| Zotac Magnus One (ECM73070C) | |
| Zotac ZBOX Magnus EN173070C | |
| Przeciętny NVIDIA GeForce RTX 3070 Laptop GPU (120.9 - 131.6, n=2) | |
| Minisforum NUCX i7 | |
| Intel Dragon Canyon NUC - RTX 3060 | |
| Intel Beast Canyon NUC | |
| Przeciętny NVIDIA GeForce RTX 3060 Laptop GPU (n=1) | |
| 1920x1080 Extreme HD Preset OpenGL AA:x8 | |
| Zotac Magnus One (ECM73070C) | |
| Zotac ZBOX Magnus EN173070C | |
| Przeciętny NVIDIA GeForce RTX 3070 Laptop GPU (104.8 - 115.3, n=2) | |
| Minisforum NUCX i7 | |
| Intel Dragon Canyon NUC - RTX 3060 | |
| Intel Beast Canyon NUC | |
| Przeciętny NVIDIA GeForce RTX 3060 Laptop GPU (n=1) | |
| Unigine Superposition | |
| 1920x1080 1080p High | |
| Zotac Magnus One (ECM73070C) | |
| Zotac ZBOX Magnus EN173070C | |
| Przeciętny NVIDIA GeForce RTX 3070 Laptop GPU (12667 - 13502, n=2) | |
| Minisforum NUCX i7 | |
| Przeciętny NVIDIA GeForce RTX 3060 Laptop GPU (n=1) | |
| Intel Beast Canyon NUC | |
| Intel Dragon Canyon NUC - RTX 3060 | |
| 1920x1080 1080p Extreme | |
| Zotac Magnus One (ECM73070C) | |
| Zotac ZBOX Magnus EN173070C | |
| Przeciętny NVIDIA GeForce RTX 3070 Laptop GPU (5847 - 6259, n=2) | |
| Minisforum NUCX i7 | |
| Intel Dragon Canyon NUC - RTX 3060 | |
| Intel Beast Canyon NUC | |
| Przeciętny NVIDIA GeForce RTX 3060 Laptop GPU (n=1) | |
| 3840x2160 4k Optimized | |
| Zotac Magnus One (ECM73070C) | |
| Zotac ZBOX Magnus EN173070C | |
| Przeciętny NVIDIA GeForce RTX 3070 Laptop GPU (7574 - 7997, n=2) | |
| Minisforum NUCX i7 | |
| Intel Beast Canyon NUC | |
| Przeciętny NVIDIA GeForce RTX 3060 Laptop GPU (n=1) | |
| Intel Dragon Canyon NUC - RTX 3060 | |
| 3DMark 05 Standard | 46264 pkt. | |
| 3DMark 06 Standard Score | 47138 pkt. | |
| 3DMark Vantage P Result | 76594 pkt. | |
| 3DMark 11 Performance | 27592 pkt. | |
| 3DMark Ice Storm Standard Score | 218821 pkt. | |
| 3DMark Cloud Gate Standard Score | 53894 pkt. | |
| 3DMark Fire Strike Score | 21258 pkt. | |
| 3DMark Fire Strike Extreme Score | 11291 pkt. | |
| 3DMark Time Spy Score | 9337 pkt. | |
| 3DMark Steel Nomad Score | 2368 pkt. | |
| 3DMark Steel Nomad Light Score | 10548 pkt. | |
Pomoc | ||
Wydajność w grach
Minisforum NUCXi7 zaskakująco dobrze sprawdza się jako komputer do gier. Wydajność systemu w większości przypadków wystarcza do grania w 1,440p. Od czasu do czasu można też uzyskać 2,160p z Nvidia GeForce RTX 3070 Laptop GPU, o ile gra nie stawia zbyt wysokich wymagań sprzętowi. Udokumentowana wydajność w grach jest tu jednak w porównaniu z nimi zdumiewająca. Często nasza jednostka testowa jest w stanie dotrzymać kroku urządzeniom porównawczym opartym na szybszych desktopowych GPU, a nawet je przewyższyć.
Przegląd wydajności wszystkich testowanych przez nas gier w porównaniu z innymi modelami można znaleźć w naszym Lista gier na GPU.
| GTA V | |
| 1920x1080 Highest AA:4xMSAA + FX AF:16x | |
| Minisforum NUCX i7 | |
| Zotac ZBOX Magnus EN173070C | |
| Intel Beast Canyon NUC | |
| Intel Dragon Canyon NUC - RTX 3060 | |
| Zotac Magnus One (ECM73070C) | |
| Przeciętny NVIDIA GeForce RTX 3070 Laptop GPU (21.7 - 125.8, n=50) | |
| Gigabyte A7 X1 | |
| 1920x1080 High/On (Advanced Graphics Off) AA:2xMSAA + FX AF:8x | |
| Intel Beast Canyon NUC | |
| Intel Dragon Canyon NUC - RTX 3060 | |
| Minisforum NUCX i7 | |
| Zotac ZBOX Magnus EN173070C | |
| Zotac Magnus One (ECM73070C) | |
| Przeciętny NVIDIA GeForce RTX 3070 Laptop GPU (58.2 - 181.4, n=38) | |
| Gigabyte A7 X1 | |
| The Witcher 3 | |
| 1920x1080 High Graphics & Postprocessing (Nvidia HairWorks Off) | |
| Zotac Magnus One (ECM73070C) | |
| Minisforum NUCX i7 | |
| Zotac ZBOX Magnus EN173070C | |
| Intel Dragon Canyon NUC - RTX 3060 | |
| Zotac MEK Mini (RTX 2070 Super) | |
| Przeciętny NVIDIA GeForce RTX 3070 Laptop GPU (122.1 - 207, n=34) | |
| 1920x1080 Ultra Graphics & Postprocessing (HBAO+) | |
| Zotac Magnus One (ECM73070C) | |
| Zotac ZBOX Magnus EN173070C | |
| Minisforum NUCX i7 | |
| Gigabyte A7 X1 | |
| Zotac MEK Mini (RTX 2070 Super) | |
| Przeciętny NVIDIA GeForce RTX 3070 Laptop GPU (34.9 - 109, n=52) | |
| Intel Dragon Canyon NUC - RTX 3060 | |
| Far Cry 5 | |
| 1920x1080 Ultra Preset AA:T | |
| Intel Dragon Canyon NUC - RTX 3060 | |
| Intel Beast Canyon NUC | |
| Zotac ZBOX Magnus EN173070C | |
| Minisforum NUCX i7 | |
| Zotac Magnus One (ECM73070C) | |
| Zotac MEK Mini (RTX 2070 Super) | |
| Przeciętny NVIDIA GeForce RTX 3070 Laptop GPU (89 - 140, n=36) | |
| 2560x1440 Ultra Preset AA:T | |
| Zotac Magnus One (ECM73070C) | |
| Zotac ZBOX Magnus EN173070C | |
| Minisforum NUCX i7 | |
| Intel Beast Canyon NUC | |
| Intel Dragon Canyon NUC - RTX 3060 | |
| Zotac MEK Mini (RTX 2070 Super) | |
| Przeciętny NVIDIA GeForce RTX 3070 Laptop GPU (81 - 101, n=18) | |
| Far Cry New Dawn | |
| 2560x1440 Ultra Preset | |
| Zotac Magnus One (ECM73070C) | |
| Intel Dragon Canyon NUC - RTX 3060 | |
| Zotac ZBOX Magnus EN173070C | |
| Minisforum NUCX i7 | |
| Intel Beast Canyon NUC | |
| Przeciętny NVIDIA GeForce RTX 3070 Laptop GPU (62 - 91, n=5) | |
| Zotac MEK Mini (RTX 2070 Super) | |
| 1920x1080 Ultra Preset | |
| Intel Dragon Canyon NUC - RTX 3060 | |
| Intel Beast Canyon NUC | |
| Zotac ZBOX Magnus EN173070C | |
| Minisforum NUCX i7 | |
| Zotac Magnus One (ECM73070C) | |
| Przeciętny NVIDIA GeForce RTX 3070 Laptop GPU (70 - 101, n=6) | |
| Zotac MEK Mini (RTX 2070 Super) | |
| F1 2020 | |
| 2560x1440 Ultra High Preset AA:T AF:16x | |
| Minisforum NUCX i7 | |
| Zotac ZBOX Magnus EN173070C | |
| Intel Beast Canyon NUC | |
| Intel Dragon Canyon NUC - RTX 3060 | |
| Przeciętny NVIDIA GeForce RTX 3070 Laptop GPU (74 - 123.7, n=4) | |
| 1920x1080 Ultra High Preset AA:T AF:16x | |
| Minisforum NUCX i7 | |
| Zotac ZBOX Magnus EN173070C | |
| Intel Beast Canyon NUC | |
| Intel Dragon Canyon NUC - RTX 3060 | |
| Przeciętny NVIDIA GeForce RTX 3070 Laptop GPU (97 - 173, n=7) | |
| Strange Brigade | |
| 2560x1440 ultra AA:ultra AF:16 | |
| Zotac Magnus One (ECM73070C) | |
| Zotac ZBOX Magnus EN173070C | |
| Minisforum NUCX i7 | |
| Przeciętny NVIDIA GeForce RTX 3070 Laptop GPU (82.3 - 140.5, n=18) | |
| Intel Beast Canyon NUC | |
| Intel Dragon Canyon NUC - RTX 3060 | |
| 1920x1080 ultra AA:ultra AF:16 | |
| Zotac Magnus One (ECM73070C) | |
| Zotac ZBOX Magnus EN173070C | |
| Gigabyte A7 X1 | |
| Minisforum NUCX i7 | |
| Przeciętny NVIDIA GeForce RTX 3070 Laptop GPU (36.2 - 194, n=46) | |
| Intel Beast Canyon NUC | |
| Intel Dragon Canyon NUC - RTX 3060 | |
| Borderlands 3 | |
| 2560x1440 Badass Overall Quality (DX11) | |
| Zotac Magnus One (ECM73070C) | |
| Intel Beast Canyon NUC | |
| Minisforum NUCX i7 | |
| Zotac ZBOX Magnus EN173070C | |
| Intel Dragon Canyon NUC - RTX 3060 | |
| Przeciętny NVIDIA GeForce RTX 3070 Laptop GPU (47.2 - 64.3, n=4) | |
| Zotac MEK Mini (RTX 2070 Super) | |
| 1920x1080 Badass Overall Quality (DX11) | |
| Intel Beast Canyon NUC | |
| Zotac Magnus One (ECM73070C) | |
| Intel Dragon Canyon NUC - RTX 3060 | |
| Minisforum NUCX i7 | |
| Zotac ZBOX Magnus EN173070C | |
| Przeciętny NVIDIA GeForce RTX 3070 Laptop GPU (65.4 - 88.3, n=4) | |
| Zotac MEK Mini (RTX 2070 Super) | |
| Metro Exodus | |
| 1920x1080 Ultra Quality AF:16x | |
| Zotac Magnus One (ECM73070C) | |
| Zotac ZBOX Magnus EN173070C | |
| Minisforum NUCX i7 | |
| Przeciętny NVIDIA GeForce RTX 3070 Laptop GPU (57.1 - 77.2, n=4) | |
| Zotac MEK Mini (RTX 2070 Super) | |
| Intel Dragon Canyon NUC - RTX 3060 | |
| Intel Beast Canyon NUC | |
| 2560x1440 Ultra Quality AF:16x | |
| Zotac Magnus One (ECM73070C) | |
| Minisforum NUCX i7 | |
| Zotac ZBOX Magnus EN173070C | |
| Przeciętny NVIDIA GeForce RTX 3070 Laptop GPU (45.3 - 61.6, n=4) | |
| Zotac MEK Mini (RTX 2070 Super) | |
| Intel Dragon Canyon NUC - RTX 3060 | |
| Intel Beast Canyon NUC | |
| low | med. | high | ultra | QHD DLSS | QHD | 4K DLSS | 4K FSR | 4K | |
|---|---|---|---|---|---|---|---|---|---|
| GTA V (2015) | 184.7 | 179.4 | 171.5 | 106 | 90.6 | 85.6 | |||
| The Witcher 3 (2015) | 417 | 315 | 204 | 104.1 | 71.6 | ||||
| Dota 2 Reborn (2015) | 169.9 | 151.2 | 145.8 | 135.6 | 124.3 | ||||
| Rise of the Tomb Raider (2016) | 293 | 206 | 138.7 | 122 | 56.9 | ||||
| Final Fantasy XV Benchmark (2018) | 187.3 | 135.9 | 103.3 | 76.7 | 45.6 | ||||
| X-Plane 11.11 (2018) | 143.2 | 125.9 | 94.8 | 81.5 | |||||
| Far Cry 5 (2018) | 157 | 134 | 127 | 119 | 99 | 55 | |||
| Strange Brigade (2018) | 501 | 265 | 213 | 184.7 | 137.3 | 78.6 | |||
| Shadow of the Tomb Raider (2018) | 167.7 | 143.5 | 134.3 | 123.1 | 88.6 | 48 | |||
| Forza Horizon 4 (2018) | 211 | 189 | 188 | 167 | 140 | 93 | |||
| Far Cry New Dawn (2019) | 133 | 115 | 112 | 100 | 91 | 58 | |||
| Metro Exodus (2019) | 185 | 120.8 | 93.1 | 74.6 | 59.9 | 37.6 | |||
| Anno 1800 (2019) | 143.6 | 132.6 | 109.8 | 56.7 | 48.2 | 32.1 | |||
| Control (2019) | 240 | 131.7 | 96.1 | 61 | 30.3 | ||||
| Borderlands 3 (2019) | 141.9 | 124.9 | 101 | 84.7 | 62.6 | 34.8 | |||
| F1 2020 (2020) | 333 | 273 | 230 | 166.2 | 123.7 | 69.7 | |||
| Watch Dogs Legion (2020) | 114 | 106 | 96 | 73 | 64 | 27 | |||
| Dirt 5 (2020) | 210 | 147 | 114 | 91 | 73 | 49 | |||
| F1 2021 (2021) | 381 | 303 | 244 | 123.1 | 90.2 | 51.1 | |||
| New World (2021) | 115.7 | 95.2 | 89.1 | 84.2 | 67.5 | 35.7 | |||
| Far Cry 6 (2021) | 139.1 | 120 | 106.5 | 102.3 | 78.6 | ||||
| Forza Horizon 5 (2021) | 206 | 145 | 132 | 81 | 70 | 50 | |||
| God of War (2022) | 128.1 | 111 | 91.5 | 67.7 | 57.4 | 37 | |||
| GRID Legends (2022) | 147 | 163 | 153 | 122 | 81 | 56 | |||
| Cyberpunk 2077 1.6 (2022) | 145.6 | 129.2 | 113.9 | 72.3 | 47.3 | 22.3 | |||
| Tiny Tina's Wonderlands (2022) | 194.1 | 158.8 | 111.6 | 88.3 | 62.1 | 33.6 | |||
| F1 22 (2022) | 239 | 208 | 172.1 | 61.9 | 39.7 | 19.1 | |||
| A Plague Tale Requiem (2022) | 107.9 | 84.8 | 66.2 | 50.1 | 36.3 | 20.4 | |||
| Uncharted Legacy of Thieves Collection (2022) | 83.4 | 80.6 | 76.8 | 73.7 | 56.4 | 21.9 | |||
| Call of Duty Modern Warfare 2 2022 (2022) | 129 | 117 | 90 | 87 | 62 | 58 | 37 | ||
| Spider-Man Miles Morales (2022) | 124.8 | 114.7 | 111.3 | 100.4 | 66.6 | 44.6 | |||
| The Callisto Protocol (2022) | 124.9 | 105.2 | 100.2 | 72.5 | 53.2 | 30.8 | |||
| Need for Speed Unbound (2022) | 116.8 | 108.2 | 92.7 | 89.7 | 78.1 | 44.8 | |||
| High On Life (2023) | 216 | 157 | 124.3 | 103 | 65.5 | 27.6 | |||
| The Witcher 3 v4 (2023) | 161.1 | 151.2 | 128.4 | 112.6 | 81.9 | 46.5 | |||
| Dead Space Remake (2023) | 87.7 | 83.9 | 73.3 | 73.6 | 53.8 | 27.5 | |||
| Hogwarts Legacy (2023) | 97.1 | 88.4 | 72.4 | 59.1 | 47 | 26.7 | |||
| Returnal (2023) | 104 | 101 | 93 | 79 | 59 | 34 | |||
| Atomic Heart (2023) | 186.7 | 143.9 | 88.5 | 69.8 | 53.8 | 32.5 | |||
| Company of Heroes 3 (2023) | 193.5 | 167.4 | 134.3 | 133.9 | 100.8 | 58.4 | |||
| Sons of the Forest (2023) | 80.4 | 75.8 | 72.8 | 72.5 | 57.7 | 37.8 | |||
| Resident Evil 4 Remake (2023) | 140 | 103.1 | 96.7 | 67.6 | 52.6 | 30.5 | |||
| The Last of Us (2023) | 96.6 | 82.2 | 71.6 | 56.9 | 36.6 | 31 | 16.5 | ||
| Dead Island 2 (2023) | 209 | 205 | 164.3 | 126.1 | 89.9 | 45.1 | |||
| Star Wars Jedi Survivor (2023) | 81.1 | 72.3 | 67.4 | 64.2 | 40.5 | 19.8 | |||
| Diablo 4 (2023) | 250 | 197.9 | 164.1 | 155.6 | 111.2 | 57.3 | |||
| Ratchet & Clank Rift Apart (2023) | 87.6 | 75.7 | 66.8 | 63.5 | 61.7 | 51.3 | |||
| Atlas Fallen (2023) | 144.5 | 135 | 127 | 106.8 | 42.6 | 75.9 | |||
| Immortals of Aveum (2023) | 62.4 | 51.2 | 41.7 | 28.2 | 15.9 | ||||
| Armored Core 6 (2023) | 104.3 | 102.4 | 101.1 | 96.3 | 76.6 | 44.6 | |||
| Starfield (2023) | 73.5 | 64 | 51.6 | 47.1 | 32.5 | 23.1 | |||
| Lies of P (2023) | 160.7 | 152 | 130.2 | 117.1 | 80.2 | 65 | 41.6 | ||
| Baldur's Gate 3 (2023) | 163.1 | 121.6 | 102 | 86.7 | 84.7 | 30.3 | |||
| Cyberpunk 2077 (2023) | 122.9 | 99.3 | 84.8 | 75 | 46.9 | 20.9 | |||
| Counter-Strike 2 (2023) | 241 | 230 | 193.8 | 149.5 | 105.9 | 63.3 | |||
| EA Sports FC 24 (2023) | 249 | 199.3 | 161.7 | 151.4 | 129 | 79.5 | |||
| Assassin's Creed Mirage (2023) | 114 | 106 | 101 | 79 | 64 | 52 | 41 | ||
| Total War Pharaoh (2023) | 329.3 | 205.4 | 127.1 | 99.1 | 78.3 | 42.5 | |||
| Lords of the Fallen (2023) | 68 | 68.1 | 65.2 | 53.9 | 54.6 | 26.1 | 34 | ||
| Alan Wake 2 (2023) | 67 | 61.2 | 53.2 | 33.6 | 14.1 | ||||
| EA Sports WRC (2023) | 130.8 | 98.1 | 90.7 | 83.4 | 63.2 | 52.5 | 35.5 | ||
| Call of Duty Modern Warfare 3 2023 (2023) | 146 | 129 | 101 | 83 | 67 | 46 | 43 | ||
| Avatar Frontiers of Pandora (2023) | 76 | 72 | 61 | 46 | 31 | 28 | 16 | ||
| The Finals (2023) | 222 | 181.7 | 160.6 | 127.2 | 80.2 | 37.6 | |||
| Ready or Not (2023) | 210 | 189.1 | 174.8 | 131.3 | 82 | 75.1 | 37.2 | ||
| Prince of Persia The Lost Crown (2024) | 356 | 356 | 356 | 340 | 178 | ||||
| Palworld (2024) | 116.7 | 106.1 | 103 | 102.1 | 72.9 | 54.9 | 38.7 | ||
| Enshrouded (2024) | 80.3 | 68.8 | 58.8 | 49.2 | 38 | 34 | 32.8 | 22.8 | |
| Helldivers 2 (2024) | 130 | 101 | 91.3 | 89.5 | 65.6 | 35.3 | |||
| Skull & Bones (2024) | 112 | 103 | 84 | 63 | 50 | 46 | 43 | 31 | |
| Last Epoch (2024) | 192.2 | 184.2 | 167.2 | 127.3 | 83.6 | 40.7 | |||
| Alone in the Dark (2024) | 172.9 | 156.8 | 149.9 | 102.4 | 51.5 | 36.7 | 53.1 | 16.1 | |
| Dragon's Dogma 2 (2024) | 54.2 | 52.7 | 49.3 | 38.7 | 37.5 | 33.9 | |||
| Horizon Forbidden West (2024) | 104.2 | 96.2 | 62.7 | 60.5 | 47 | 42.2 | 38.8 | 29.3 | |
| Ghost of Tsushima (2024) | 88.6 | 80.7 | 74.5 | 60.3 | 63 | 48.3 | 8.5 | 4.8 | |
| Senua's Saga Hellblade 2 (2024) | 60.9 | 52.5 | 38.4 | 39.2 | 26.1 | 24.8 | 9.4 | ||
| F1 24 (2024) | 248 | 234 | 181.7 | 60 | 61.7 | 38.1 | 33 | 18.3 | |
| The First Descendant (2024) | 151.7 | 96.9 | 78.4 | 66.1 | 43.6 | 23.3 | 23.8 | ||
| Once Human (2024) | 184.4 | 126.1 | 108.6 | 99 | 68.2 | 35.6 | |||
| Black Myth: Wukong (2024) | 80 | 60 | 46 | 24 | 27 | 18 | 19 | 10 | |
| Star Wars Outlaws (2024) | 50.2 | 44.9 | 38.1 | 30.9 | 30.8 | 22.2 | |||
| Space Marine 2 (2024) | 77.3 | 71 | 68 | 62 | 61.8 | 46.4 | 38.8 | 24.2 | |
| Final Fantasy XVI (2024) | 69.4 | 66.7 | 56.5 | 49.6 | 40.8 | 36.2 | 17.9 | ||
| God of War Ragnarök (2024) | 127.7 | 107 | 91.4 | 83.1 | 90.6 | 63.2 | 35.6 | ||
| Until Dawn (2024) | 65.3 | 51.5 | 39.1 | 28.1 | 16.1 | ||||
| Call of Duty Black Ops 6 (2024) | 111 | 99 | 72 | 69 | 50 | 31 | |||
| Stalker 2 (2024) | 77.7 | 66.7 | 53.3 | 43.9 | 36.1 | ||||
| Indiana Jones and the Great Circle (2024) | 93.5 | 63 | |||||||
| Kingdom Come Deliverance 2 (2025) | 109 | 84.3 | 69.2 | 50.2 | 49.1 | 35.9 | 23 | 20.1 | |
| Monster Hunter Wilds (2025) | 60.2 | 51.1 | 30.5 | 31.1 | 24.6 | ||||
| Civilization 7 (2025) | 292 | 174.7 | 122.3 | 79.9 | 34.9 | ||||
| Assassin's Creed Shadows (2025) | 54 | 45 | 39 | 24 | 23 | ||||
| The Elder Scrolls IV Oblivion Remastered (2025) | 80.4 | 70.4 | 47.9 | 23.7 | 25.8 | 14.2 | |||
| Doom: The Dark Ages (2025) | 68 | 60.2 | 54.7 | 52.6 | 49.9 | 33.1 | |||
| F1 25 (2025) | 185.3 | 167.5 | 138.1 | 14.9 | 15.2 | 8.48 | 6.36 | 3.44 | |
| Borderlands 4 (2025) | 56.4 | 49.4 | 40 | 26.9 | 31.1 | 18.5 | |||
| Battlefield 6 (2025) | 104.7 | 94.3 | 80.5 | 60.2 | 38.4 | 39.1 | 23 | 17.7 | |
| The Outer Worlds 2 (2025) | 86.3 | 80.4 | 64.6 | 36.5 | 31 | 23 | |||
| ARC Raiders (2025) | 181.7 | 114.9 | 92.4 | 57.5 | 58.1 | 40.2 | 36.4 | 22.7 | |
| Anno 117: Pax Romana (2025) | 95.6 | 73.5 | 55.9 | 30 | 30.6 | 21.5 | |||
| Resident Evil Requiem (2026) | 112.5 | 85.2 | 79.5 | 42.2 | 13.3 | ||||
| Death Stranding 2 (2026) | 71.4 | 61.8 | 56.8 | 44.4 | 47.9 | 33.3 | 29.6 | 20.6 | |
| Crimson Desert (2026) | 90.9 | 57.4 | 53.9 | 46.2 | 37.6 | 35.9 | 22.2 | 20.5 | |
| Pragmata (2026) | 114.4 | 86.2 | 69.2 | 67.4 | 50.6 | 42.7 | 27.7 | ||
| Forza Horizon 6 (2026) | 142 | 90 | 48 | 21 | 18 | 17 | |||
| 007 First Light (2026) | 63.7 | 52.9 | 57.8 | 49.3 | 6.93 |
Emisja - Dobre chłodzenie i cicha praca pod obciążeniem
Emisja hałasu
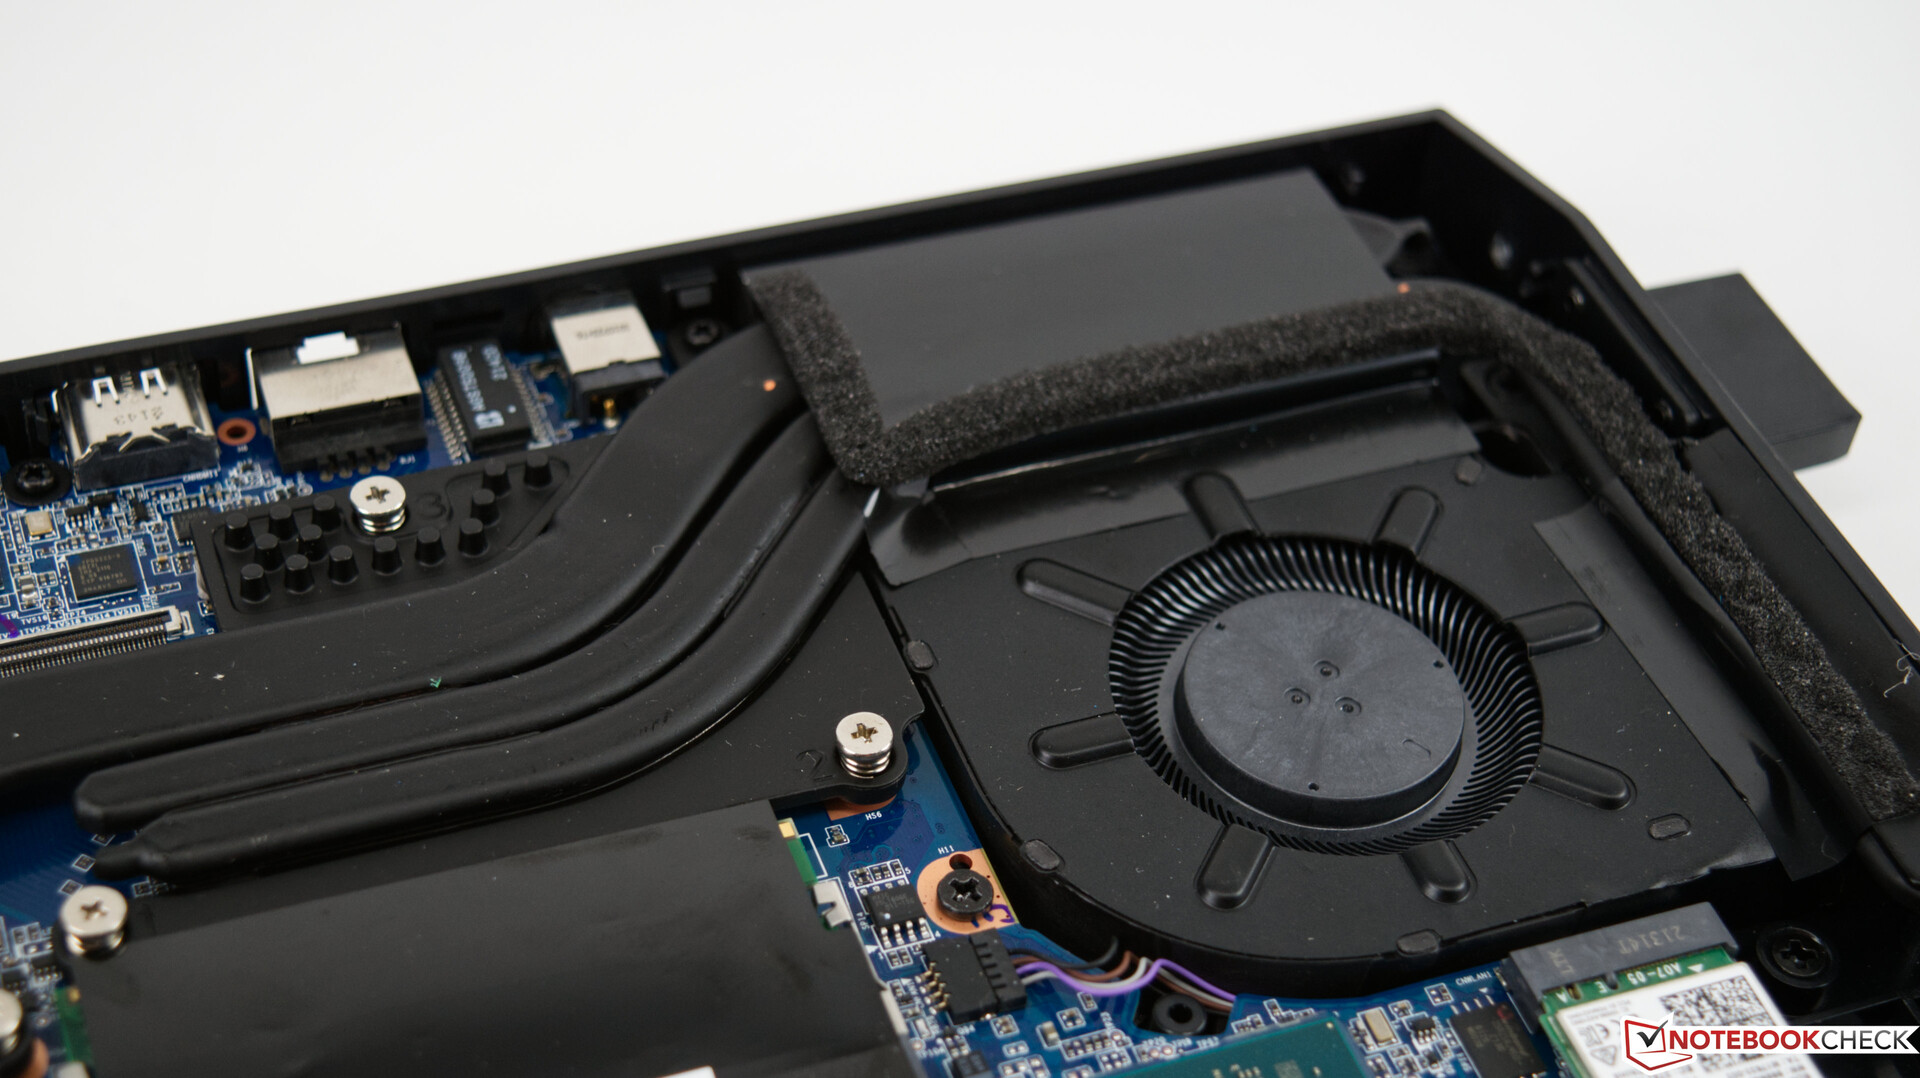
Układ chłodzenia Minisforum NUCXi7 składa się z pięciu ciepłowodów i dwóch wentylatorów, które podczas pracy jałowej są ledwo słyszalne, a nawet zupełnie bezgłośne. Jednak nawet pod obciążeniem urządzenie nigdy nie staje się naprawdę głośne, a maksymalny poziom hałasu mierzymy na poziomie 40,8 dB(A).
Hałas
| luz |
| 29.5 / 29.5 / 29.5 dB |
| obciążenie |
| 32.8 / 40.8 dB |
 | ||
30 dB cichy 40 dB(A) słyszalny 50 dB(A) irytujący |
||
min: | ||
| Minisforum NUCX i7 i7-11800H, GeForce RTX 3070 Laptop GPU | Zotac Magnus One (ECM73070C) i7-10700, GeForce RTX 3070 | Zotac ZBOX Magnus EN173070C i7-11800H, GeForce RTX 3070 Laptop GPU | Intel Dragon Canyon NUC - RTX 3060 i9-12900, GeForce RTX 3060 | |
|---|---|---|---|---|
| Noise | -18% | -13% | -4% | |
| wyłączone / środowisko * (dB) | 29.5 | 30 -2% | 30.7 -4% | 30.2 -2% |
| Idle Minimum * (dB) | 29.5 | 33.58 -14% | 32.7 -11% | 30.2 -2% |
| Idle Average * (dB) | 29.5 | 32.8 -11% | 30.4 -3% | |
| Idle Maximum * (dB) | 29.5 | 32.8 -11% | 30.8 -4% | |
| Load Average * (dB) | 32.8 | 44.25 -35% | 41.7 -27% | |
| Load Maximum * (dB) | 40.8 | 48.72 -19% | 45.4 -11% | 45.1 -11% |
* ... im mniej tym lepiej
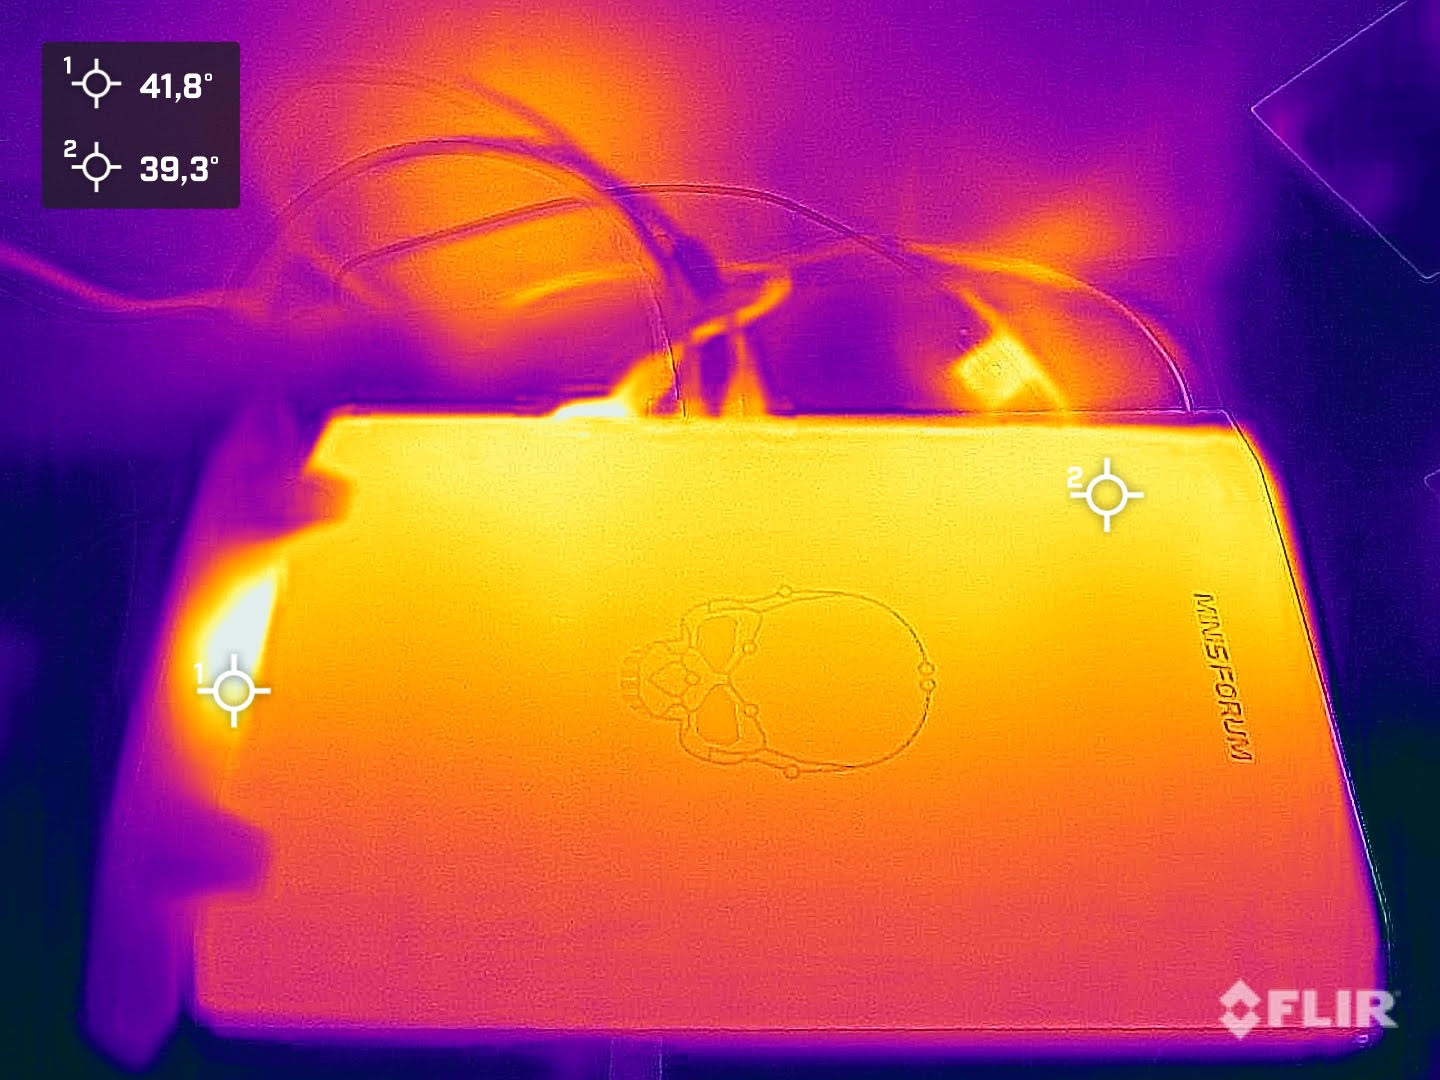
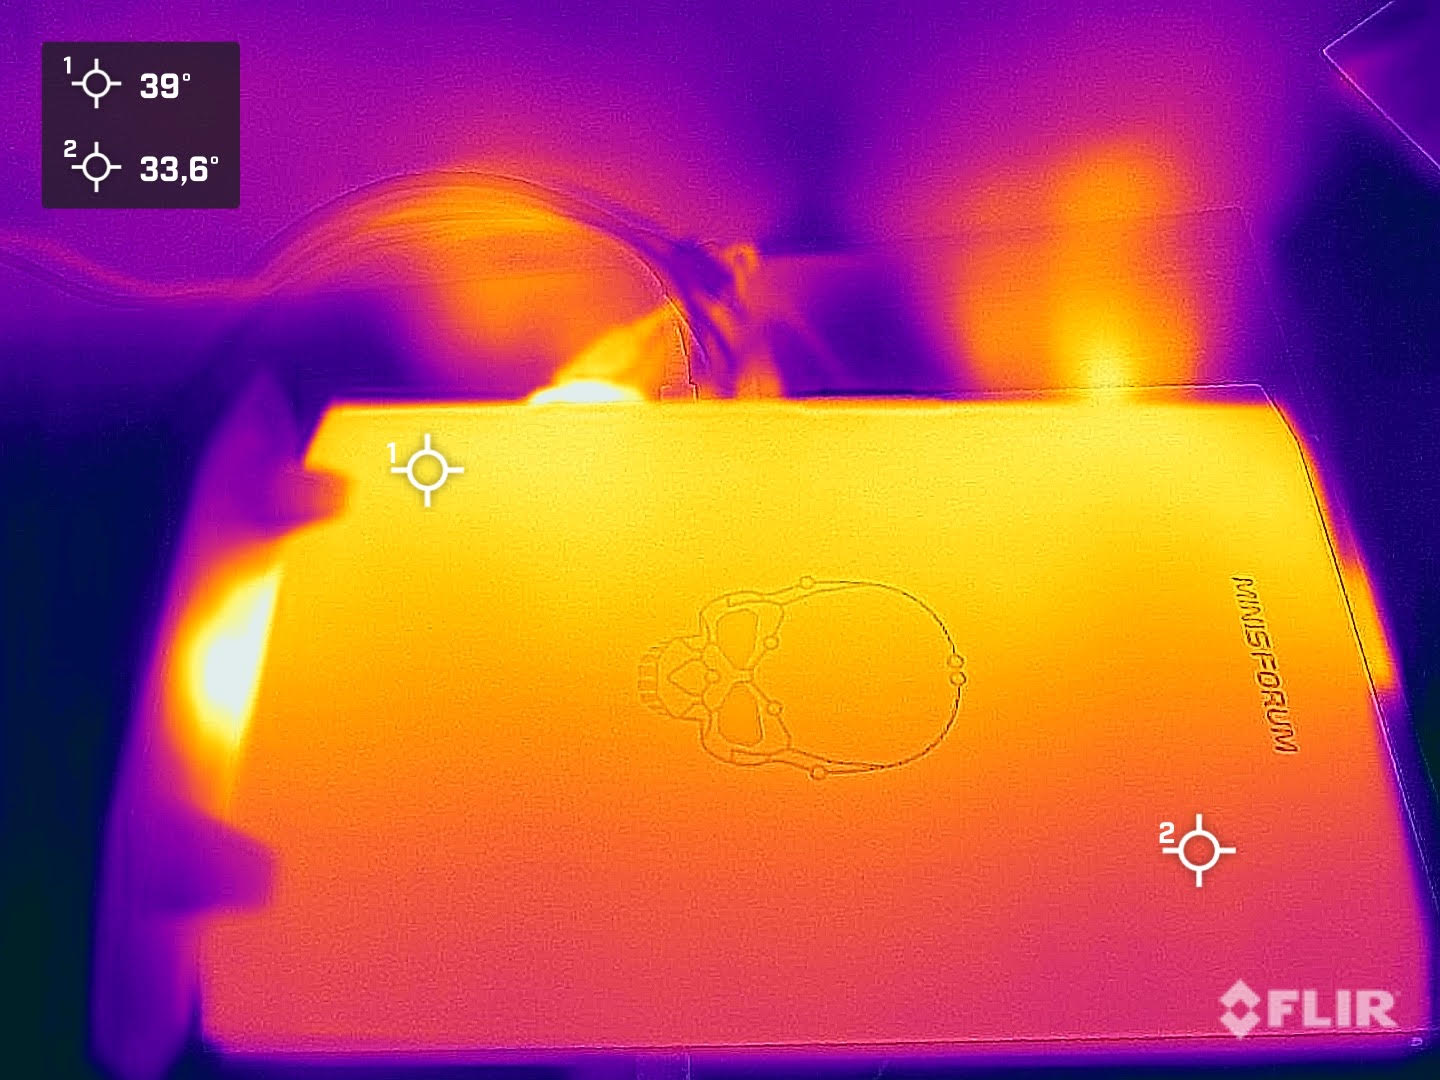
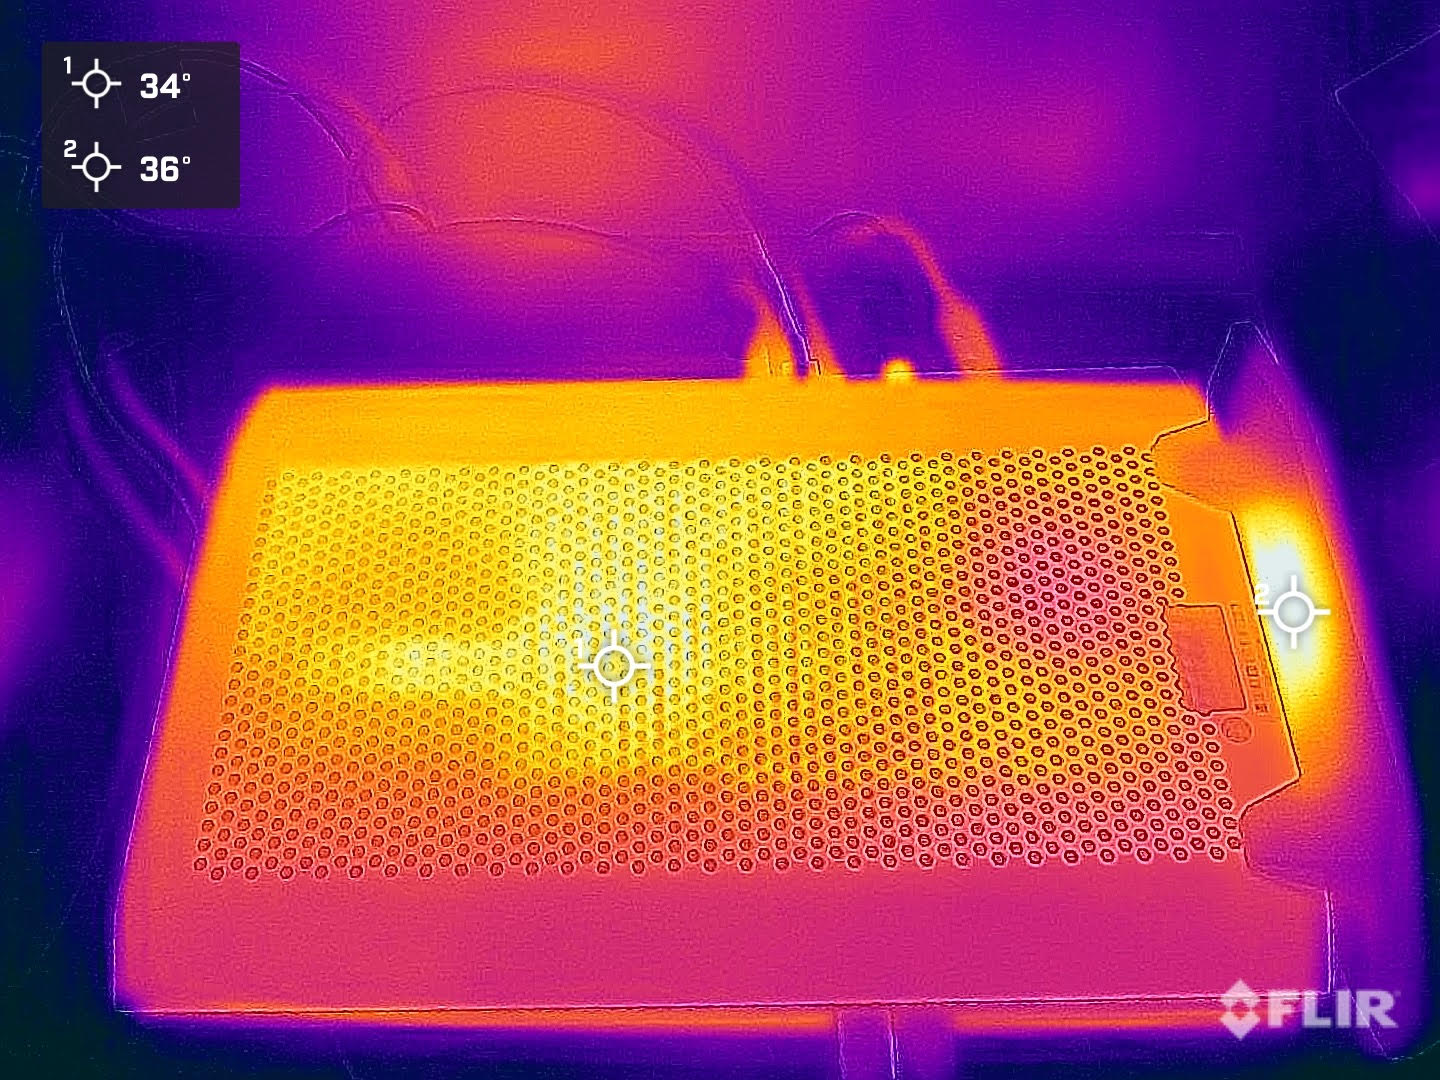
Temperatury
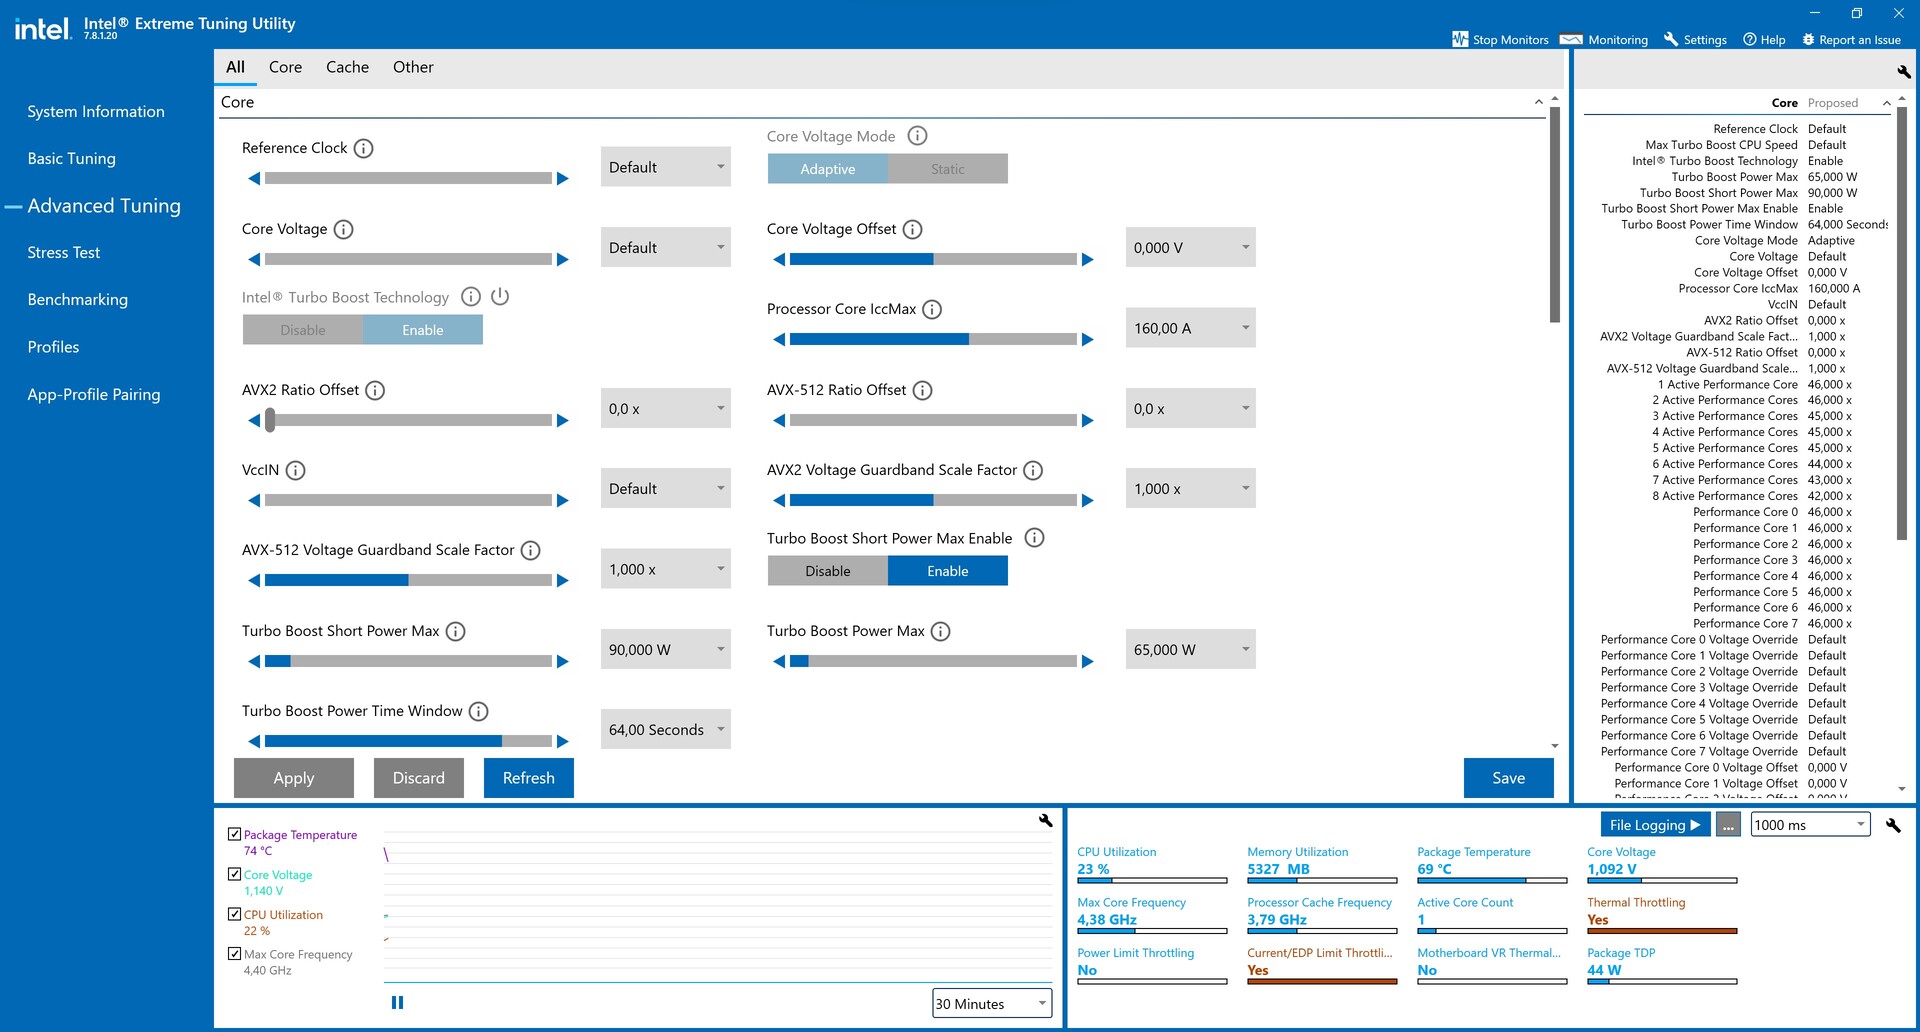
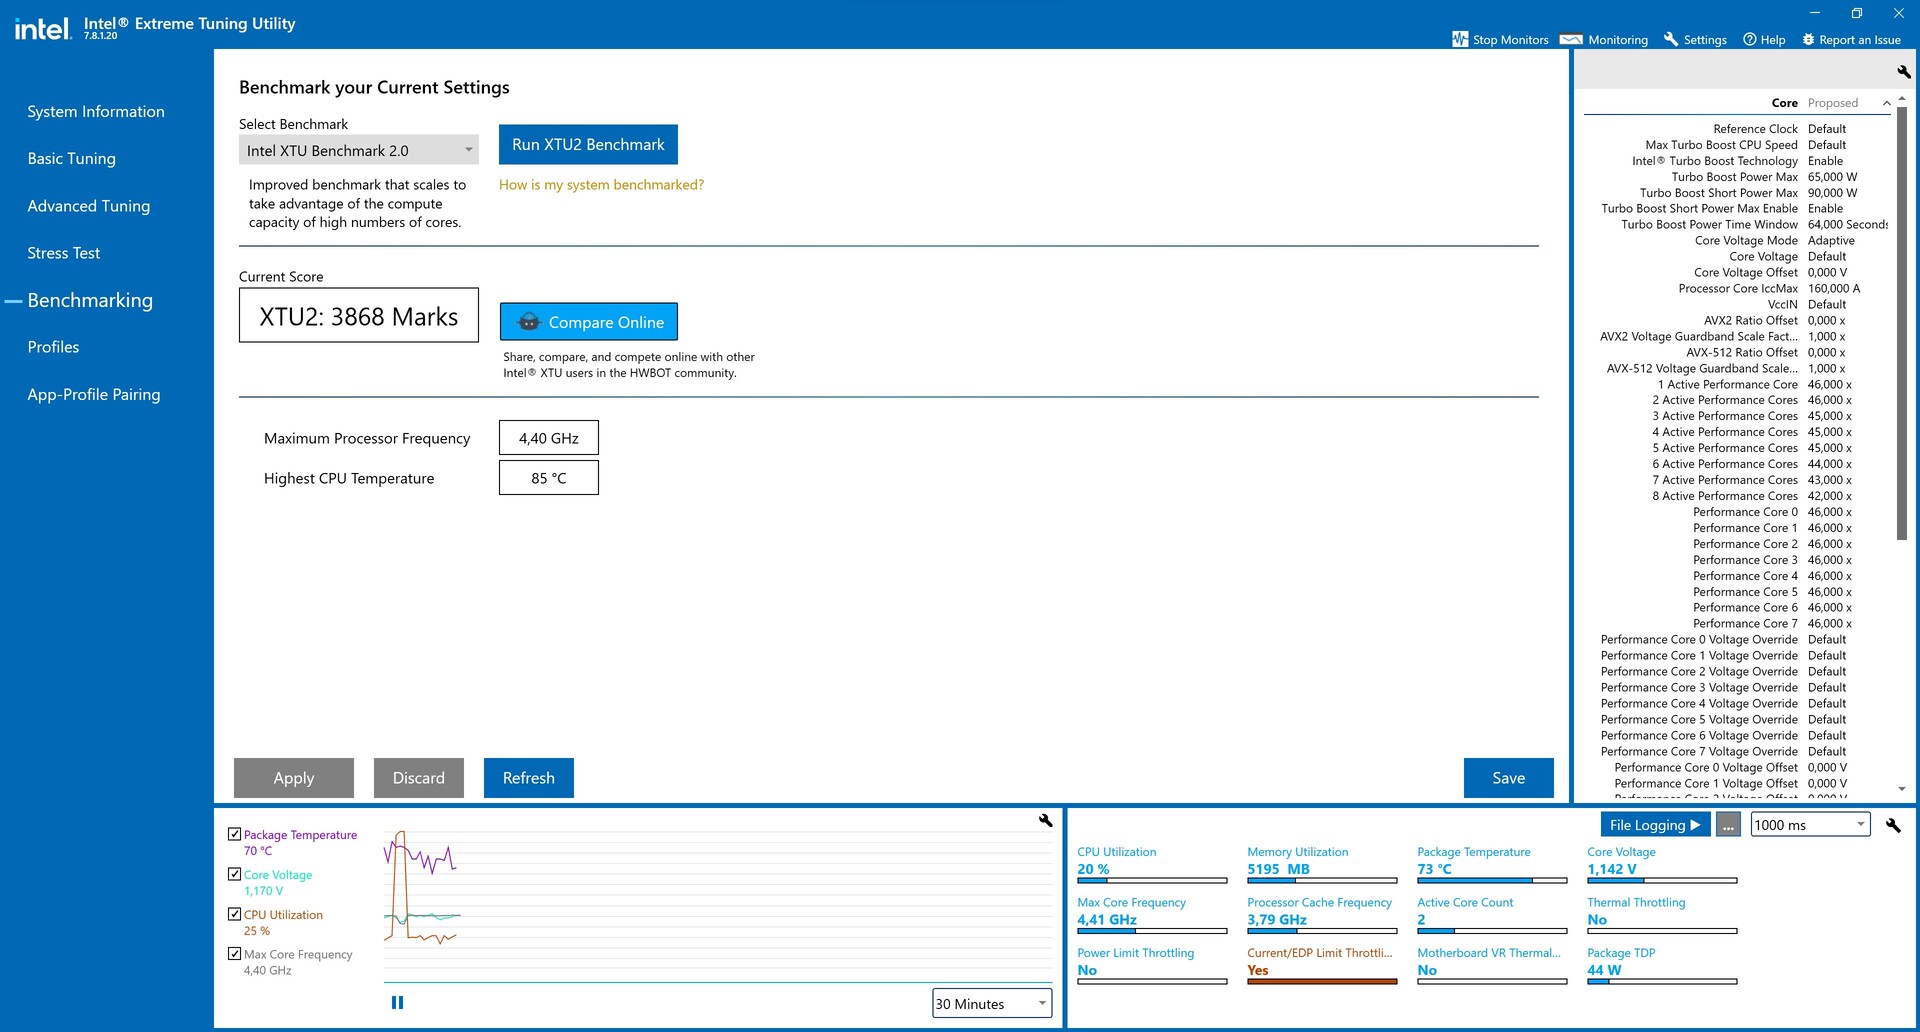
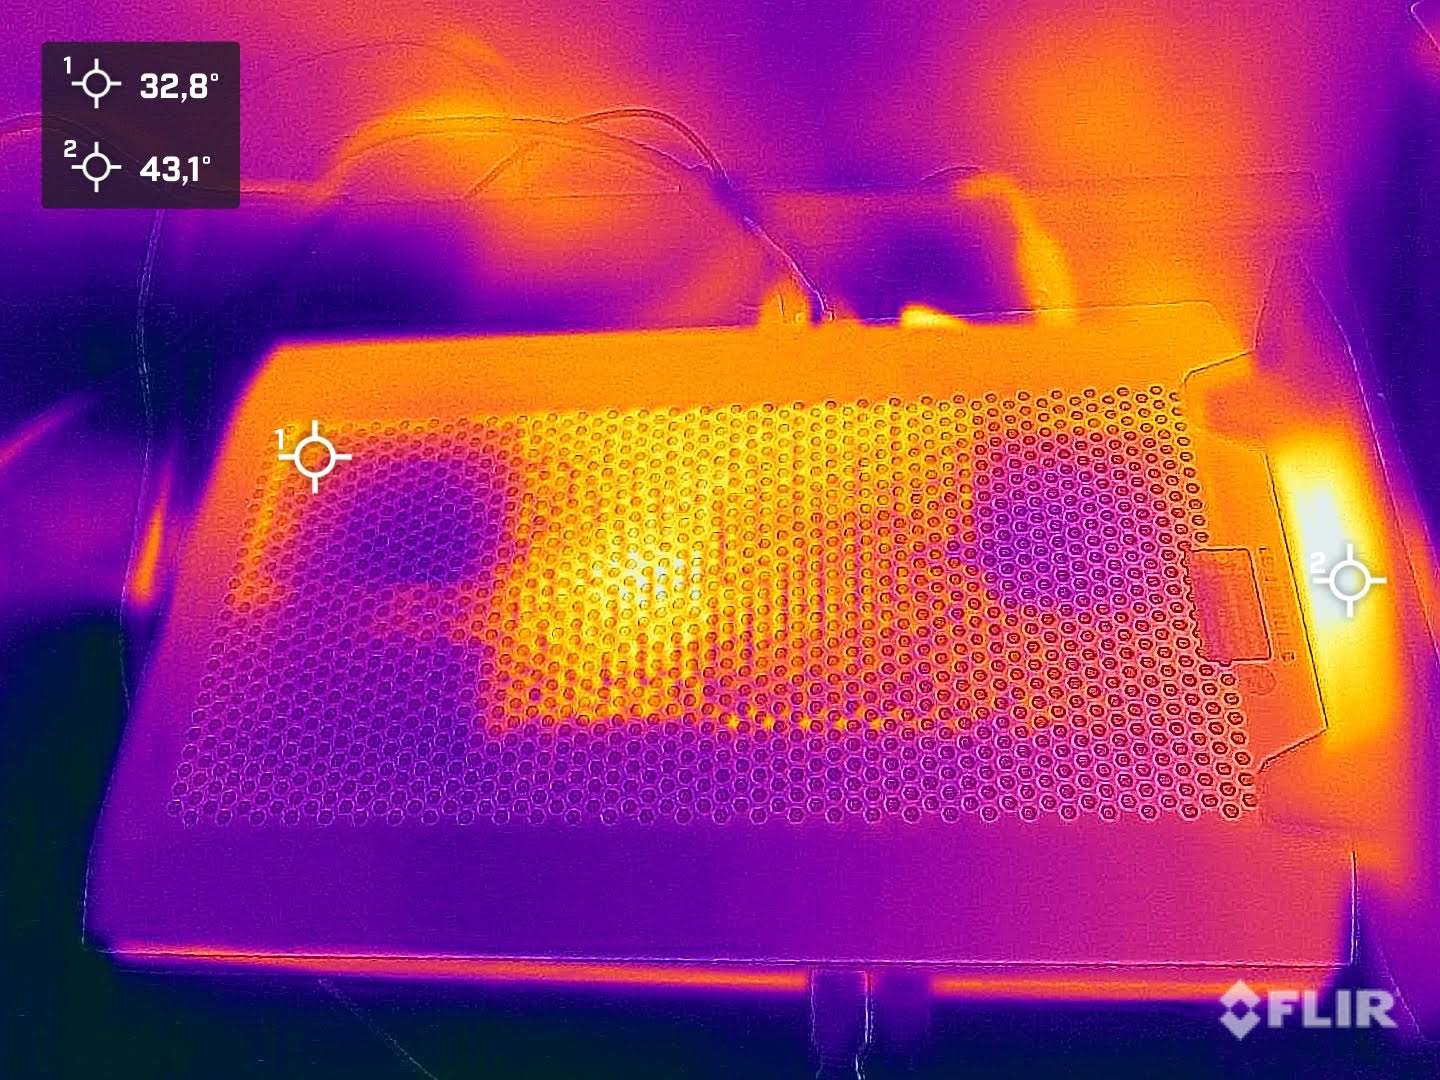
Ze względu na konstrukcję, temperatury obudowy są bardzo zbliżone do temperatur laptopa gamingowego. Podczas testu obciążeniowego mierzymy 45,9 °C (114,6 °F) w najcieplejszym miejscu na widocznej stronie, na której widać też logo i etykietę. Temperatury obudowy, które zmierzyliśmy podczas grania, są nieco niższe.
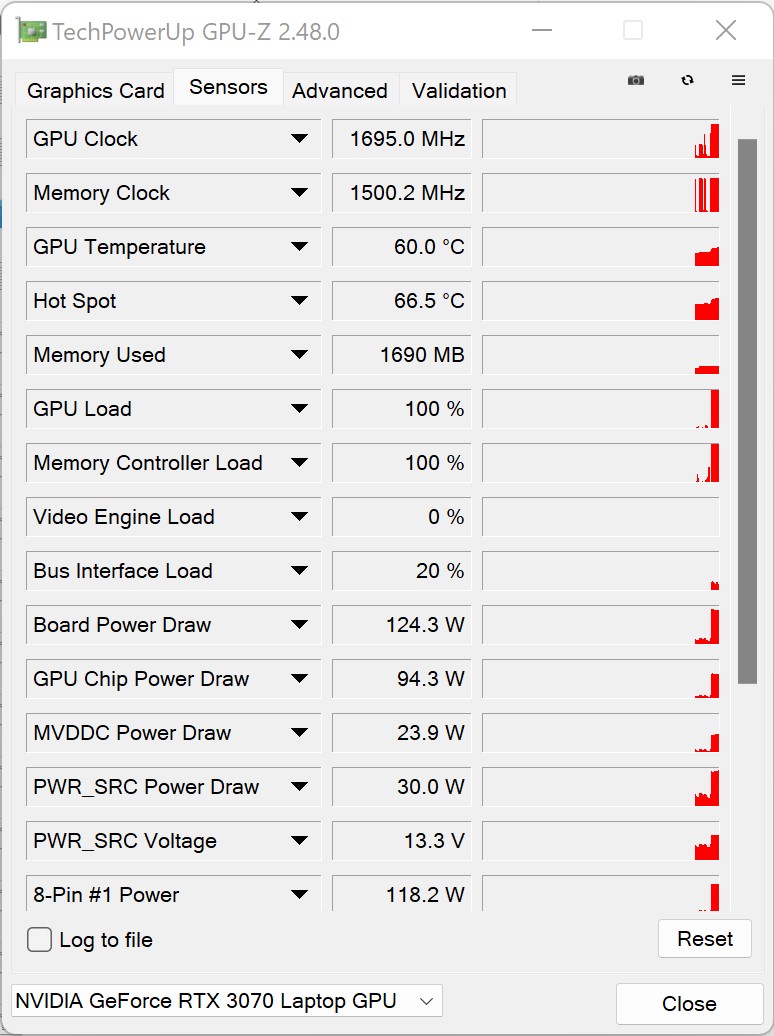
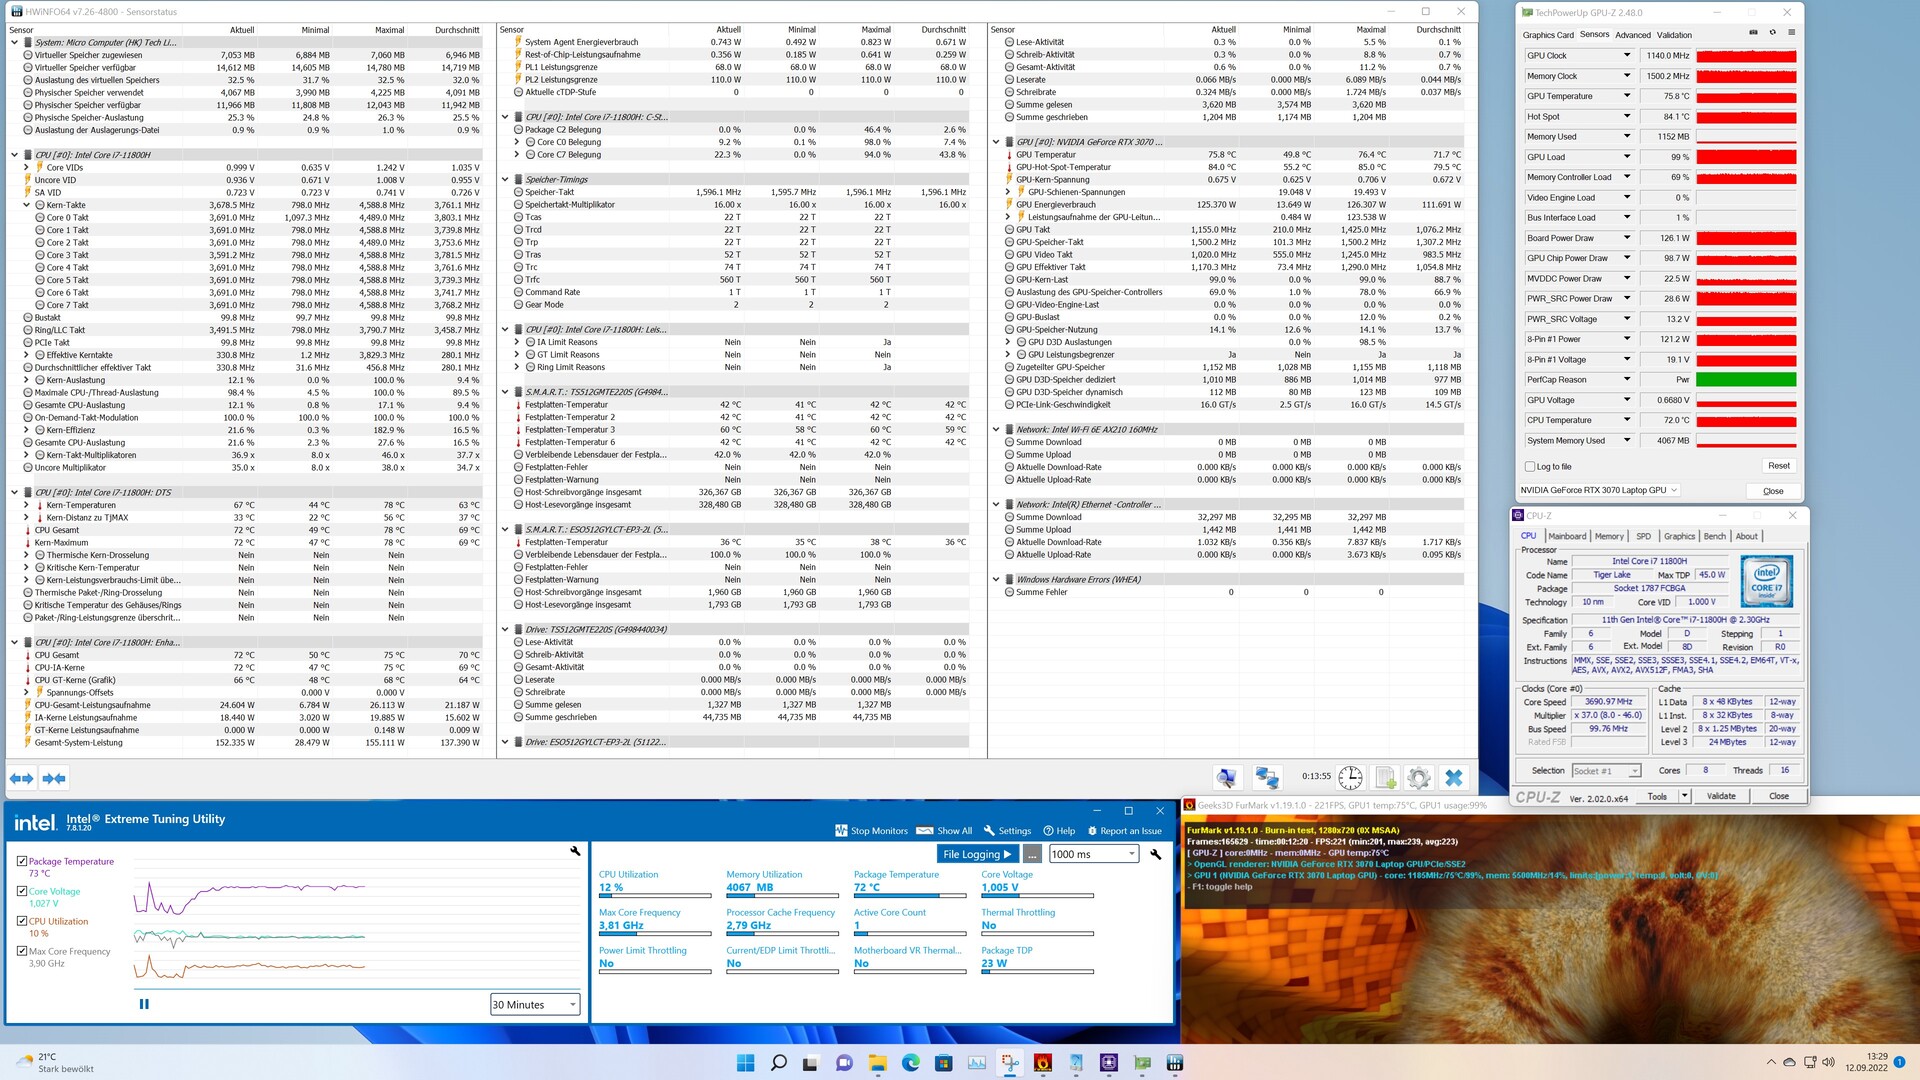
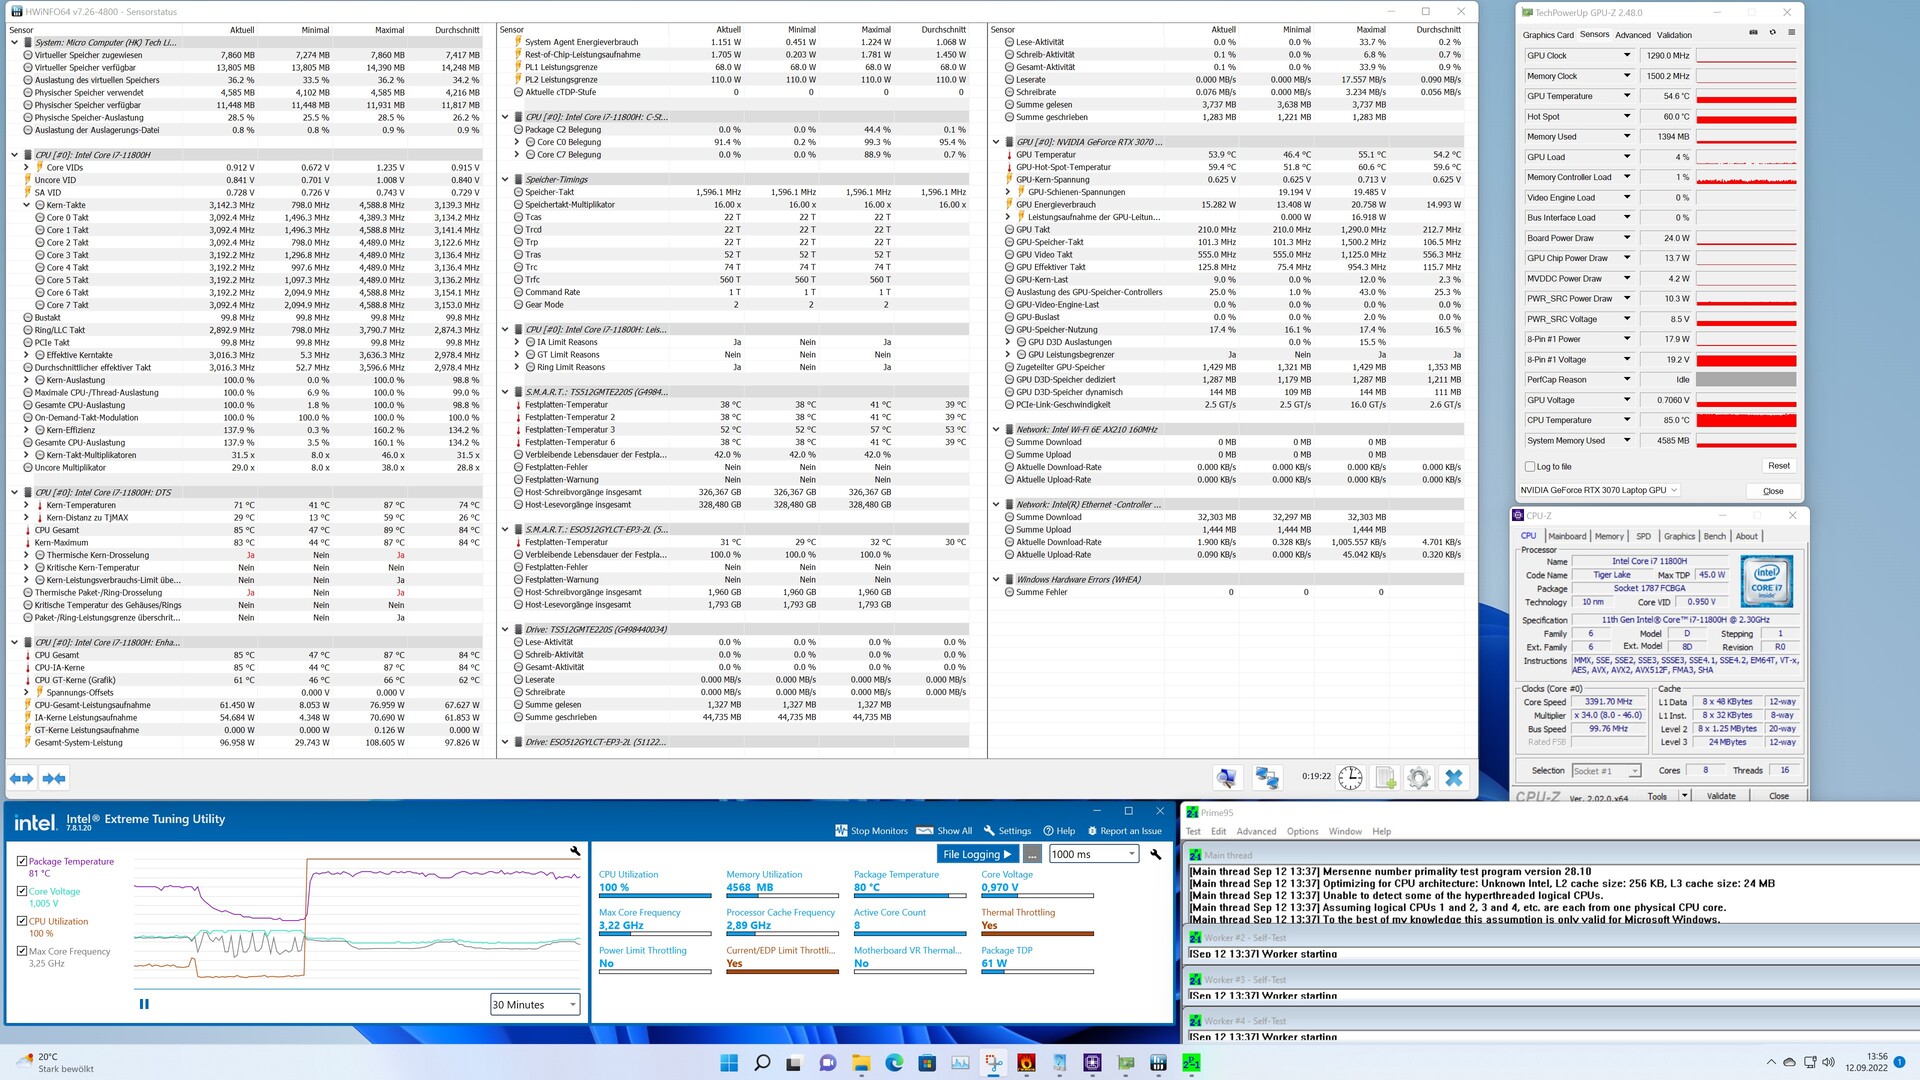
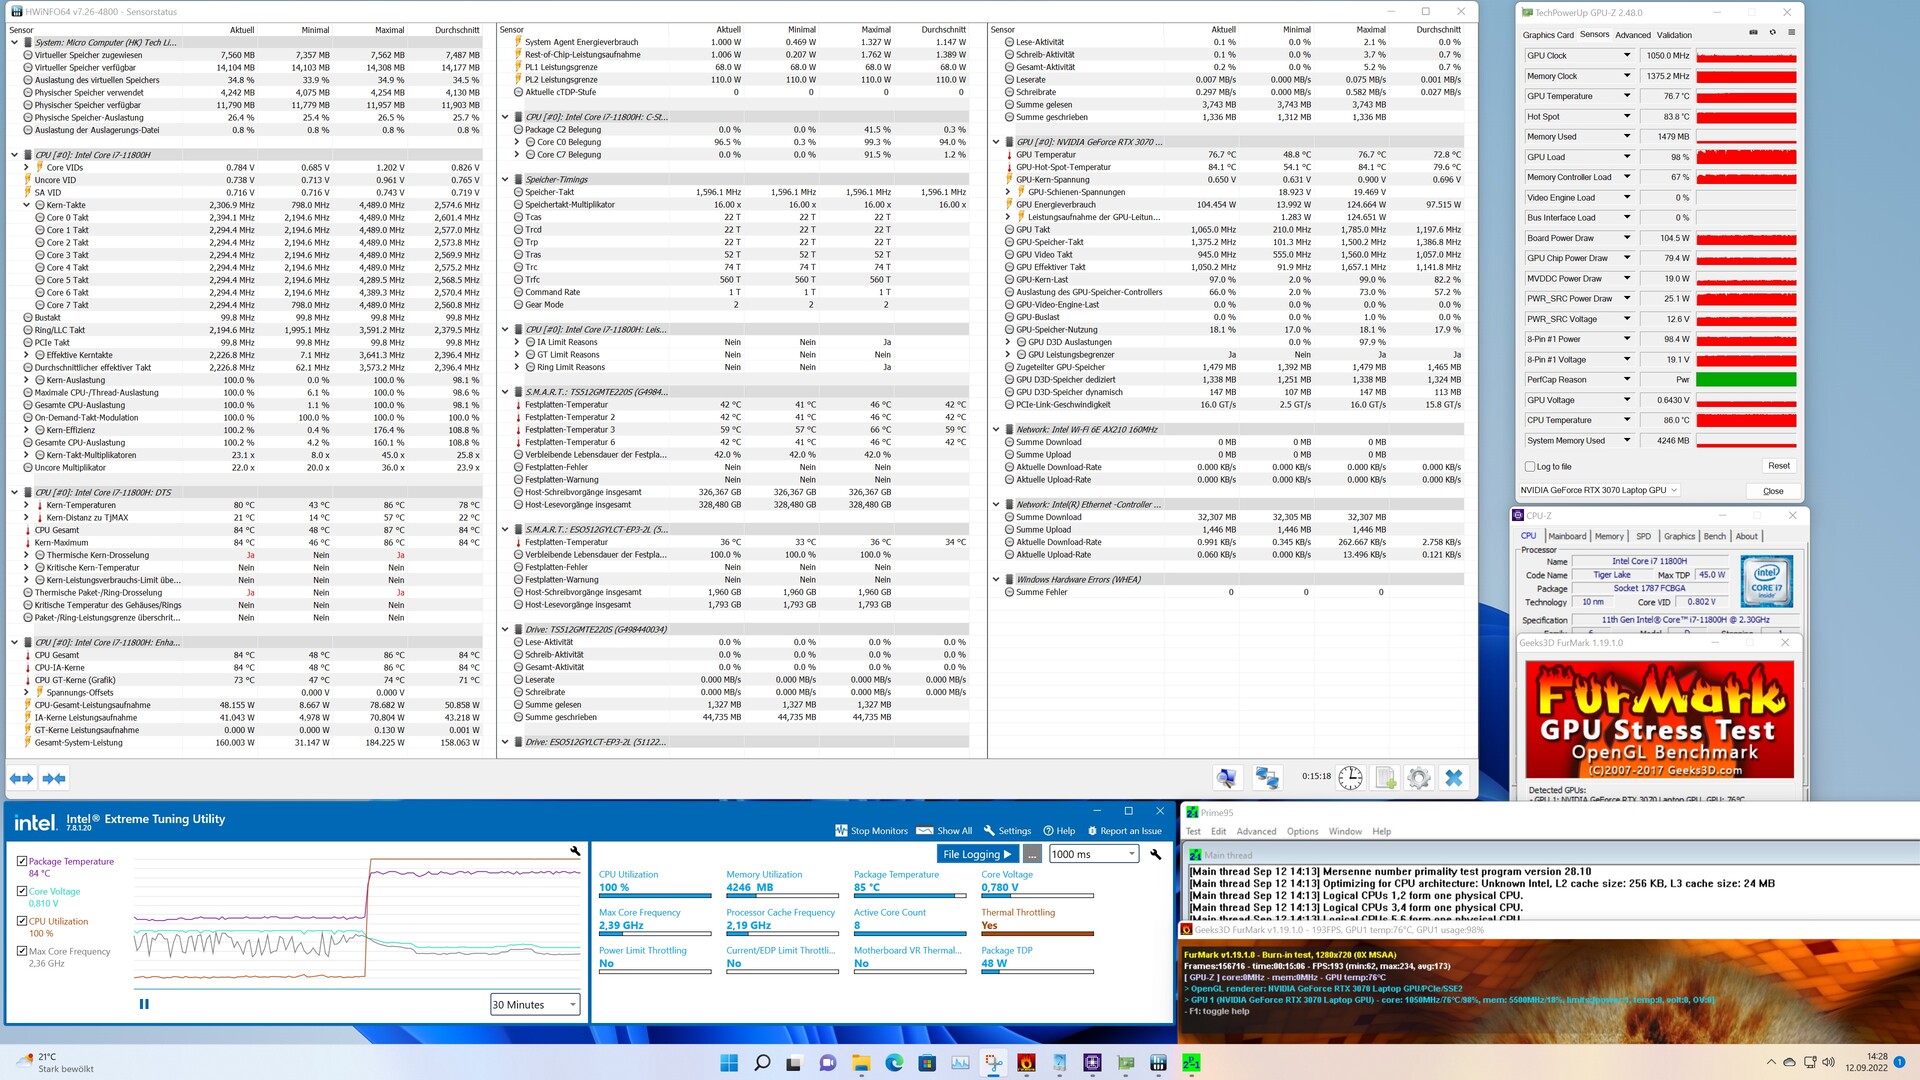
Podobnie dobrze wygląda sprawa z podzespołami: Procesor Intel Core i7-11800H osiąga 86 °C (187 °F) pod obciążeniem, choć procesor graficzny Nvidia GeForce RTX 3070 Laptop pozostaje nieco chłodniejszy podczas testu obciążeniowego przy 77 °C (°F). Intel XTU a także HWiNFO zgłaszają dławienie termiczne pod obciążeniem, co potwierdza, że producent zdefiniował limit termiczny procesora na poziomie 85 °C (185 °F). W BIOS-ie można zwiększyć ten limit procesora do 94 °C (201 °F). Z kolei dla karty graficznej limit 87 °C (189 °F) pozostaje zawsze stały.
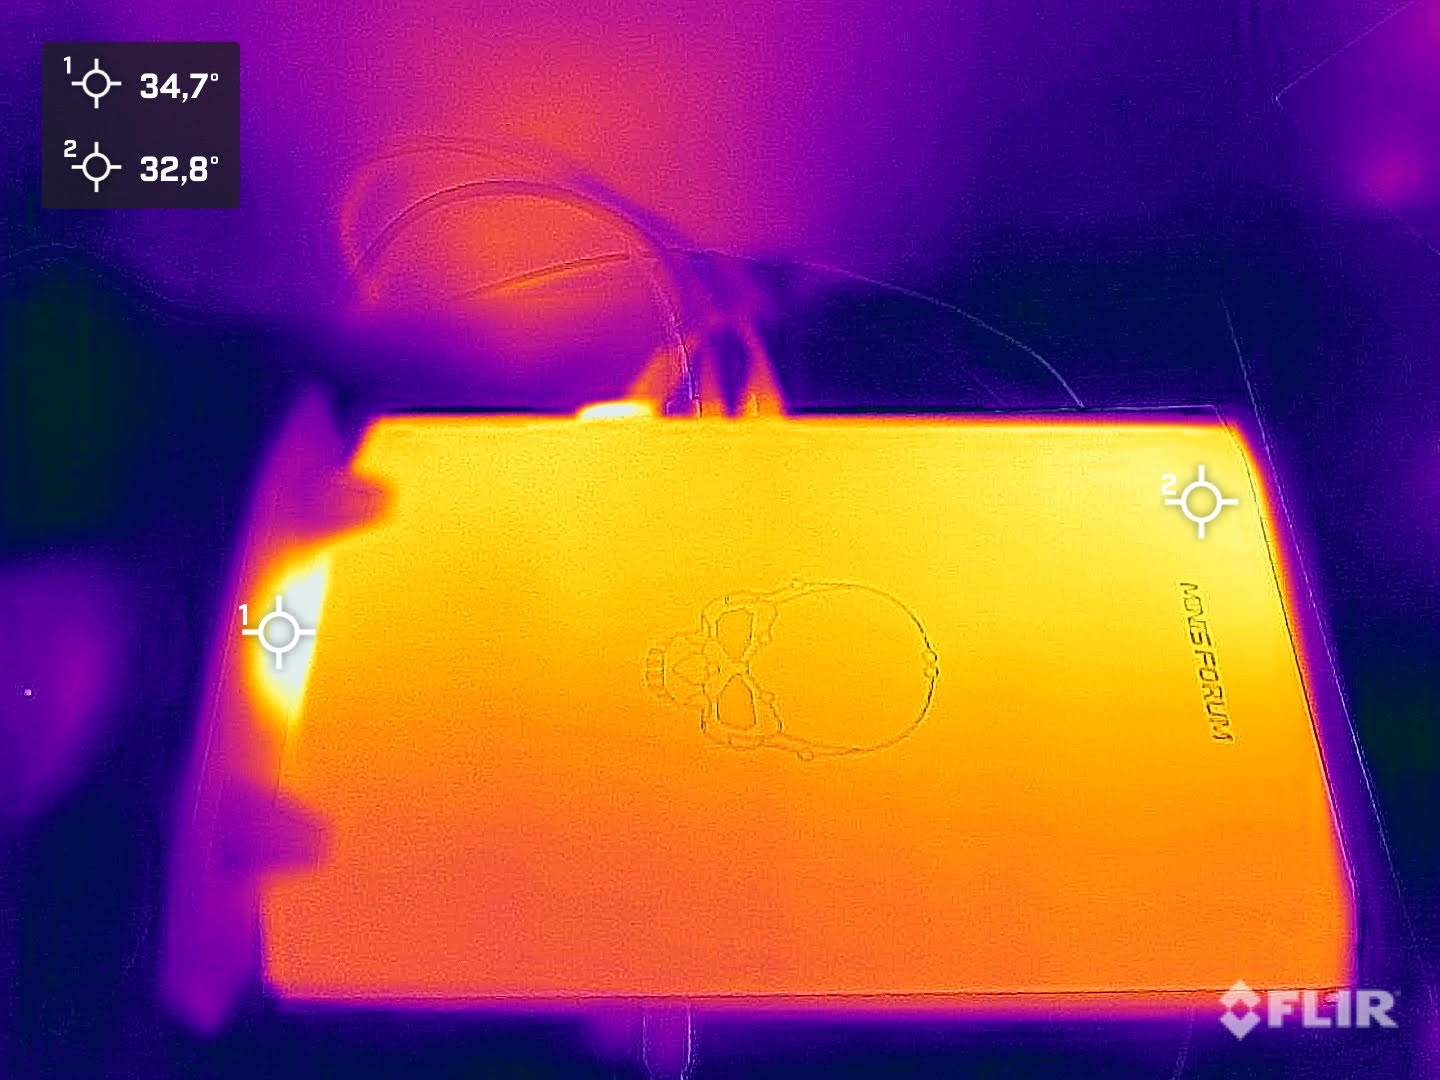
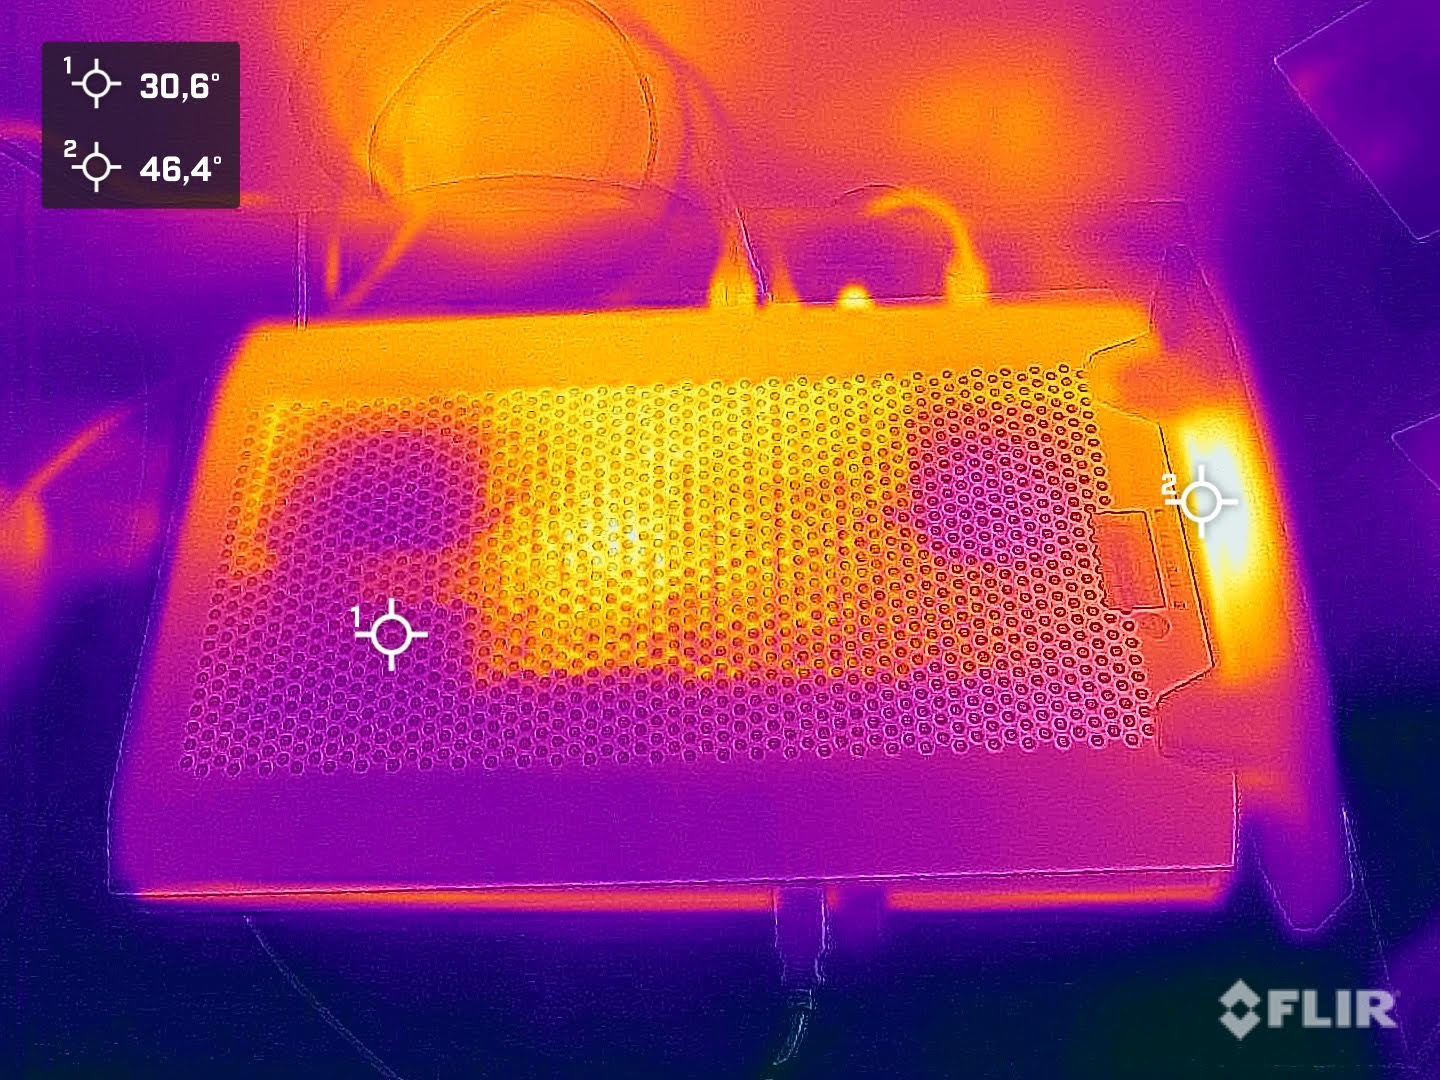
(-) Maksymalna temperatura w górnej części wynosi 45.9 °C / 115 F, w porównaniu do średniej 33.9 °C / 93 F , począwszy od 25 do 47 °C dla klasy Desktop.
(+) Dno nagrzewa się maksymalnie do 39.3 °C / 103 F, w porównaniu do średniej 33.6 °C / 92 F
(±) W stanie bezczynności średnia temperatura górnej części wynosi 35.7 °C / 96 F, w porównaniu ze średnią temperaturą urządzenia wynoszącą 29.5 °C / ### class_avg_f### F.
(-) Podczas gry w Wiedźmina 3 średnia temperatura górnej części wynosi 40.2 °C / 104 F, w porównaniu do średniej temperatury urządzenia wynoszącej 29.5 °C / ## #class_avg_f### F.
Pobór mocy
W porównaniu ze zwykłym komputerem stacjonarnym Minisforum NUCXi7 ma wyraźną przewagę dzięki wydajnym komponentom. Nawet w porównaniu do Zotac ZBOX Magnus EN1730C, nasz testowy egzemplarz wyraźnie wyprzedza, będąc znacznie wydajniejszym pomimo niemal identycznego sprzętu, nie tracąc przy tym nic z wydajności. Przy 28-36 watach, zużycie energii jest niskie bez obciążenia, ale nadal znacznie wyższe w porównaniu z Gigabyte A7 X1. Pod obciążeniem Minisforum NUCXi7 zużywa wtedy średnio 83 waty, choć podczas gry mierzymy 167 watów. Odnotowujemy też krótkie szczyty do 215 watów, które nie osiągną limitów 230-watowego zasilacza.
| wyłączony / stan wstrzymania | |
| luz | |
| obciążenie |
|
Legenda:
min: | |
| Minisforum NUCX i7 i7-11800H, GeForce RTX 3070 Laptop GPU | Zotac ZBOX Magnus EN173070C i7-11800H, GeForce RTX 3070 Laptop GPU | Gigabyte A7 X1 R9 5900HX, GeForce RTX 3070 Laptop GPU | Przeciętny NVIDIA GeForce RTX 3070 Laptop GPU | Średnia w klasie Desktop | |
|---|---|---|---|---|---|
| Power Consumption | -37% | 15% | 13% | 3% | |
| Idle Minimum * (Watt) | 28.2 | 31.3 -11% | 12 57% | 15.6 ? 45% | 17.9 ? 37% |
| Idle Average * (Watt) | 29.9 | 35.1 -17% | 14 53% | 20.1 ? 33% | 37.2 ? -24% |
| Idle Maximum * (Watt) | 36.2 | 41.6 -15% | 19 48% | 29.4 ? 19% | 41.3 ? -14% |
| Load Average * (Watt) | 83.2 | 214 -157% | 118 -42% | 110.8 ? -33% | 96.7 ? -16% |
| Witcher 3 ultra * (Watt) | 167 | 193.5 -16% | 205 -23% | ||
| Cyberpunk 2077 ultra external monitor * (Watt) | 177 | ||||
| Load Maximum * (Watt) | 215.7 | 231 -7% | 229 -6% | 214 ? 1% | 141.6 ? 34% |
* ... im mniej tym lepiej
Power Consumption With External Monitor
Za
Przeciw
Werdykt - Ultra płaski komputer do gier
Wraz z Minisforum NUCXi7 producent oferuje bardzo ciekawy komputer do gier, wykorzystujący sprawdzoną technologię laptopów. Połączenie procesora Intel Core i7-11800Horaz GPU Nvidia GeForce RTX 3070 Laptopsprawdza się bardzo dobrze i zapewnia szybko działający system. Bardzo smukła obudowa sprawia wrażenie wysokiej jakości i jednocześnie nowoczesnej. Ze względu na chłodzenie, Minisforum NUCXi7 powinien być uruchamiany tylko w pozycji pionowej. Jest to coś, z czym trzeba się pogodzić decydując się na to urządzenie. Trzeba też żyć z drobnymi kompromisami w kwestii różnorodności połączeń, gdyż porty USB-A, które zwykle służą do podłączenia myszy i klawiatury, umieszczono z przodu urządzenia. Dzięki 512-GB dyskowi SSD użytkownik jest dość dobrze wyposażony na początek. Biorąc jednak pod uwagę docelowych użytkowników, graczy, może on szybko trafić w swoje granice, dlatego zalecamy przynajmniej 1 TB jako standard.
Minisforum NUCXi7 to cichy komputer gamingowy w ultra płaskiej obudowie, który został zaprojektowany do gier w rozdzielczości 1 440p.
Bardzo spodobały nam się wartości niskiej emisji Minisforum NUCXi7: urządzenie jest nie tylko ciche, ale także wydajne, zawsze utrzymując temperatury pod kontrolą. Jednocześnie nie trzeba żyć ze zmniejszoną wydajnością CPU i GPU. Ponadto nasz testowy egzemplarz w żadnym momencie nie popełnił żadnych złych błędów. Wydajność systemu jest dobra podczas pracy lub podczas grania. W niektórych częściach Minisforum NUCXi7 jest nawet w stanie dotrzymać kroku zwykłym komputerom stacjonarnym.
Jako ewentualną alternatywę dla Minisforum NUCXi7 można też spojrzeć na laptopa gamingowego. Na pewno jest dodatkowa wartość, choć przy podobnym wyposażeniu jest też niewielka dodatkowa premia: Gigabyte A7 X1 kosztuje ok.
Cena i dostępność
Minisforum NUCXi7jest wymieniony w sklepie Minisforum z zamówieniami, które mają być wysłane w połowie października. Obecnie jest jeszcze kilka atrakcyjnych rabatów "przedsprzedażowych". Na przykład nasza jednostka testowa kosztuje obecnie 1169 dolarów. Cena regularna wynosiłaby 1,339$ bez rabatu. Bardziej przystępny NUCXi5 obecnie kosztuje $979 z tym samym wyposażeniem w RAM i SSD (regularnie $1129).
Minisforum NUCX i7
- 14/09/2022 v7 (old)
Sebastian Bade

