Werdykt - profesjonalny wygląd do biura lub domu
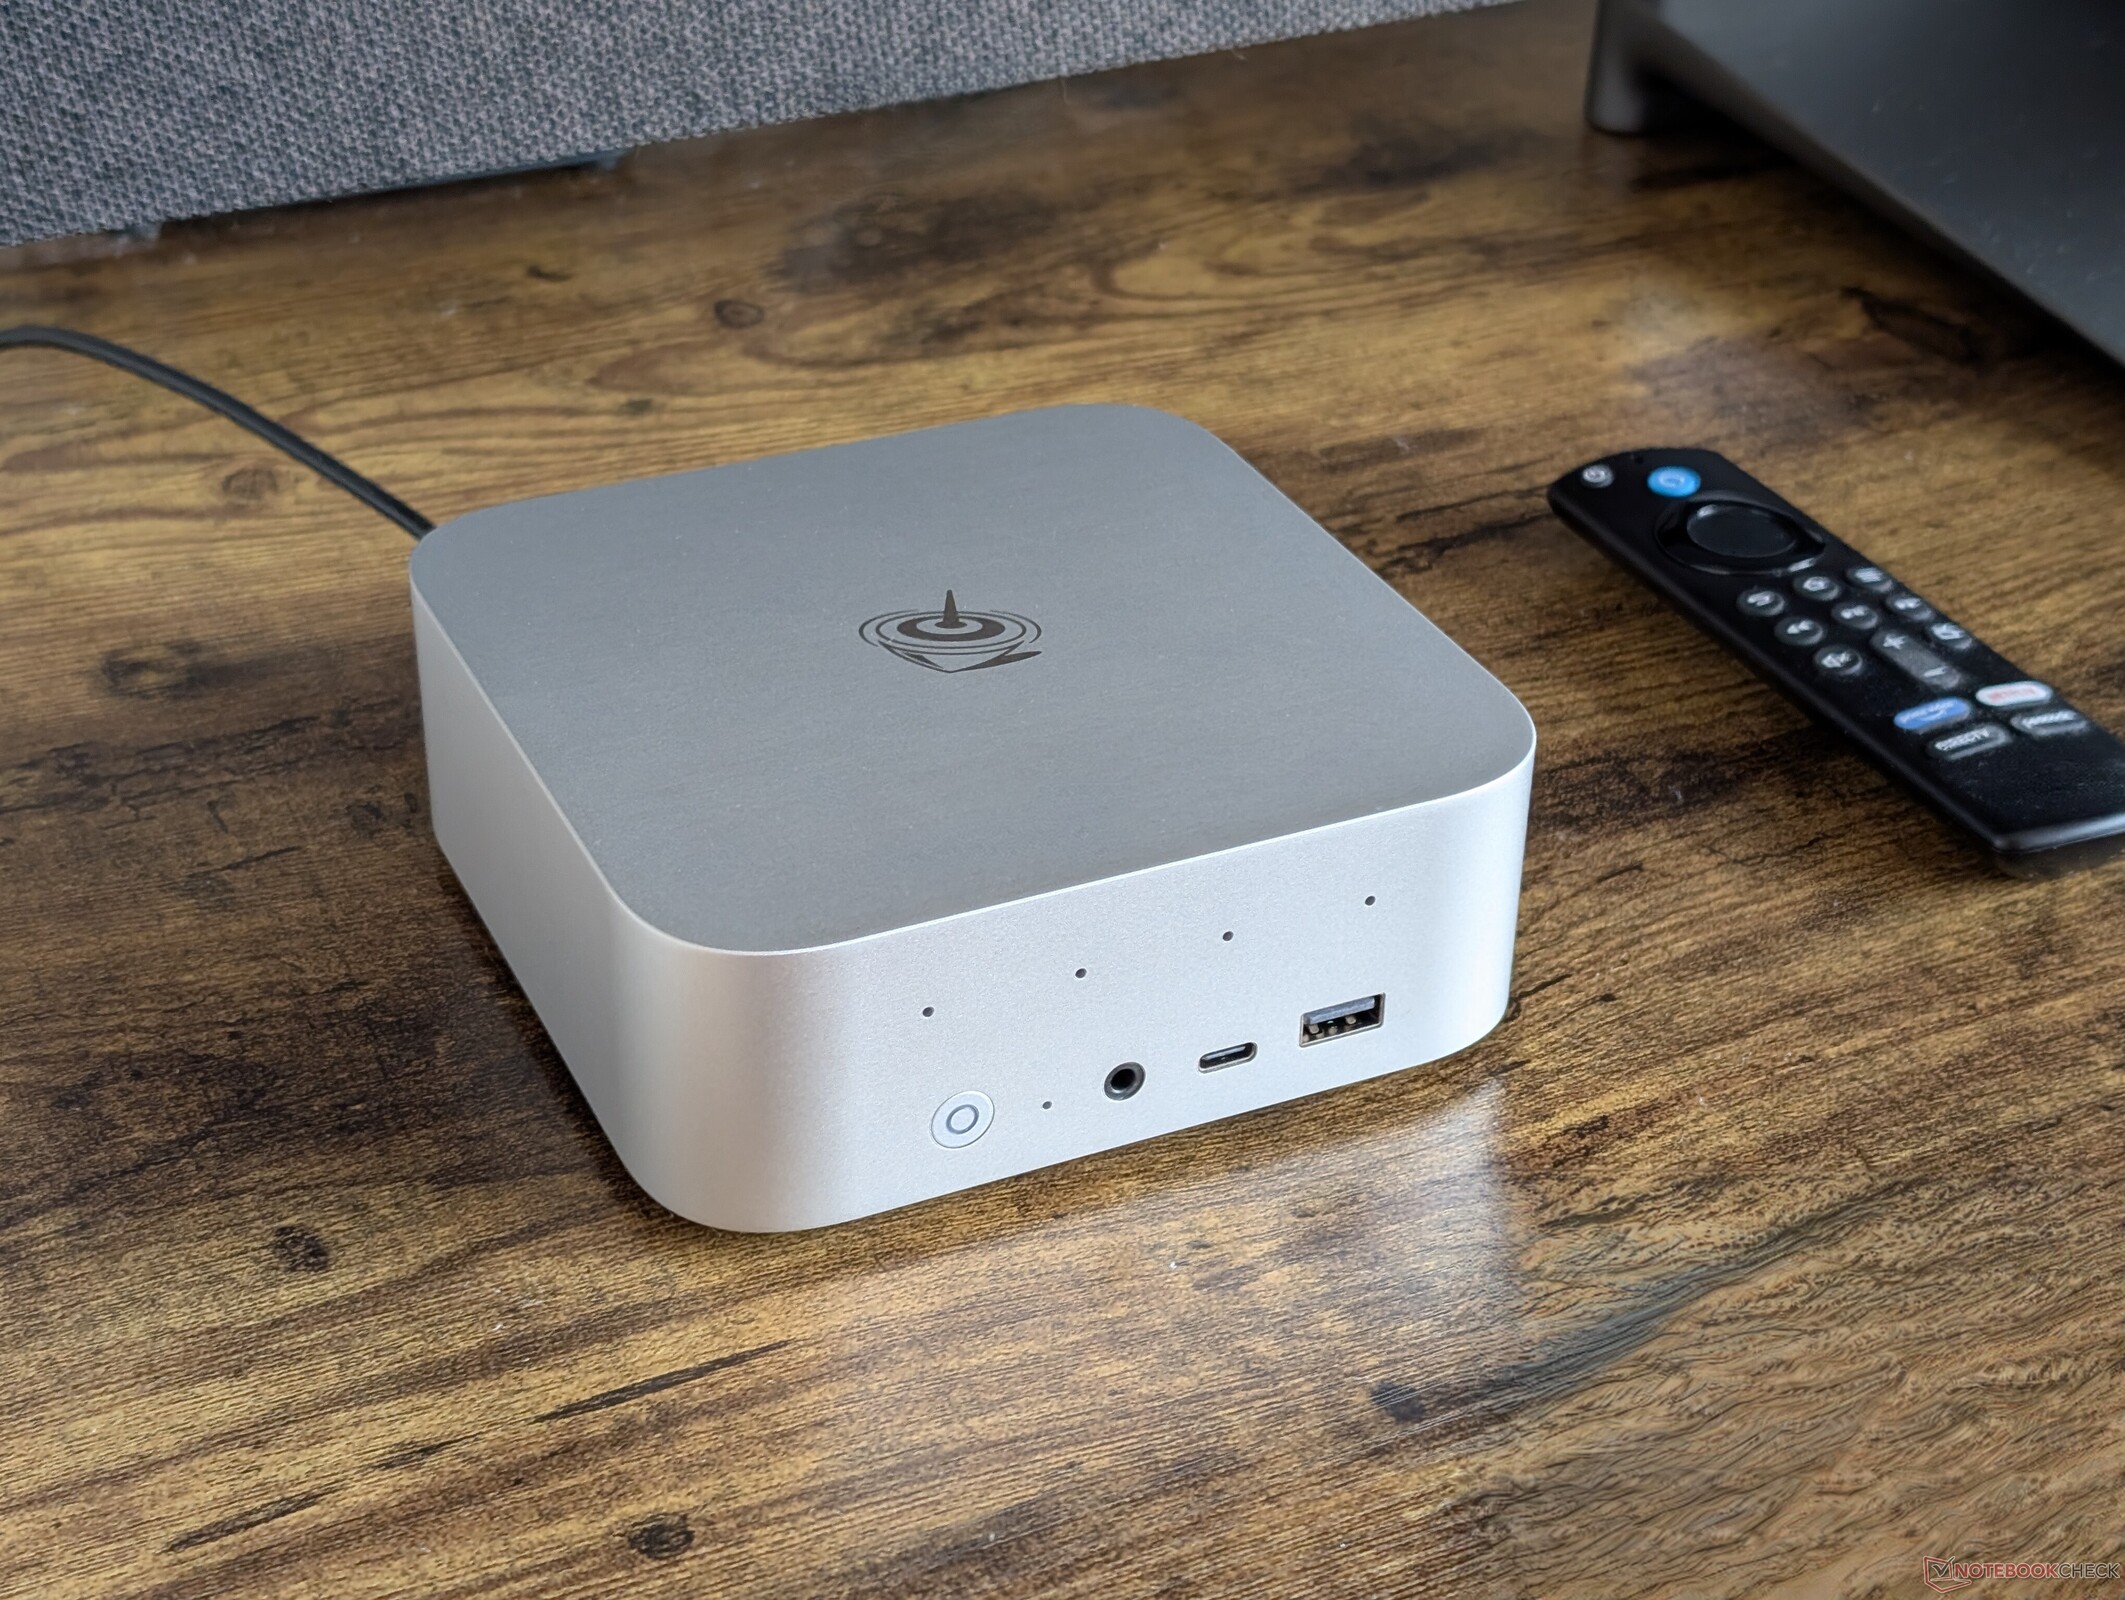
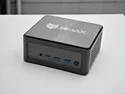
Jednym z najbardziej atrakcyjnych aspektów Beelink SEi13 Pro jest jego design inspirowany Apple, ponieważ system łatwiej wtapia się w środowisko biurowe lub domowe niż starsze, ciężkie plastikowe konstrukcje SER7 lub SEi12 sEi12. Wyższa jakość wykonania i materiałów nie pociągnęła za sobą znacznie wyższych cen, co oznacza, że SEi13 Pro pozostaje stosunkowo przystępny cenowo w przedziale od 500 do 600 USD.
Wydajność procesora i porty również pozostają na wysokim poziomie, a procesor Core i9-13900HK i trzy rodzaje portów wideo są więcej niż wystarczające dla większości konfiguracji biurowych lub multimedialnych. Doceniamy również jego cichą pracę i bardziej kompaktowe wymiary w porównaniu do większego i droższego GTi13 Ultra który jest wyposażony w dokładnie ten sam procesor Intel, zapewniający niemal ten sam poziom wydajności.
Podczas gdy większość użytkowników uzna SEi13 Pro za wystarczający, zaawansowani użytkownicy mogą narzekać na brak akceleracji sztucznej inteligencji procesora i ogólnie słabą wydajność graficzną, nawet w przypadku zintegrowanego GPU. Zintegrowane głośniki stereo, choć dobre na papierze, nie są wystarczająco głośne, aby wypełnić sale konferencyjne lub salony. Brakujące funkcje, takie jak obsługa VESA, Thunderbolt, a nawet czytnik kart SD, mogą ograniczać opcje łączności i negatywnie wpływać na wrażenia użytkownika. Aktualizacja do GTi13 Ultra rozwiązuje niektóre z tych problemów, podczas gdy alternatywy AMD, takie jak SER8 mogą zapewnić większą moc graficzną za mniej więcej tę samą cenę.
Za
Przeciw
Cena i dostępność
Amazon wysyła teraz Beelink SEi13 Pro za 540 USD. Użytkownicy mogą również zakupić bezpośrednio od producenta w tej samej cenie.
SEi13 Pro to multimedialny mini PC inspirowany komputerami Apple Mac Mini dla domu lub biura. Na uwagę zasługują zintegrowane głośniki stereo i chłodzenie komorą parową, które są niespotykane w innych mini PC w tym samym przedziale cenowym.
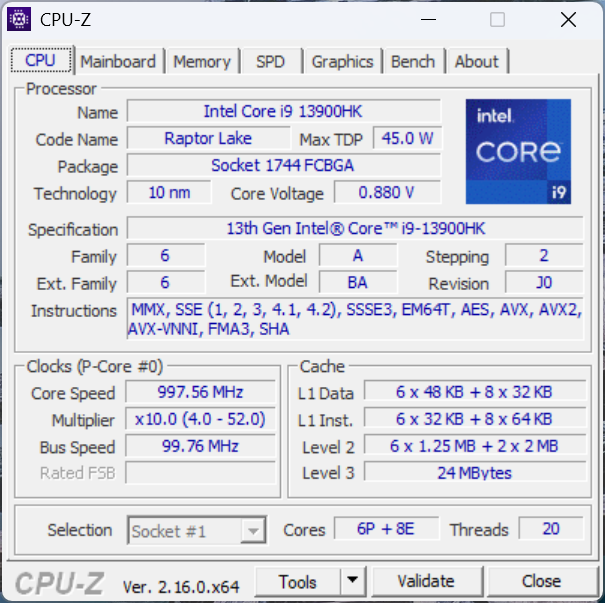
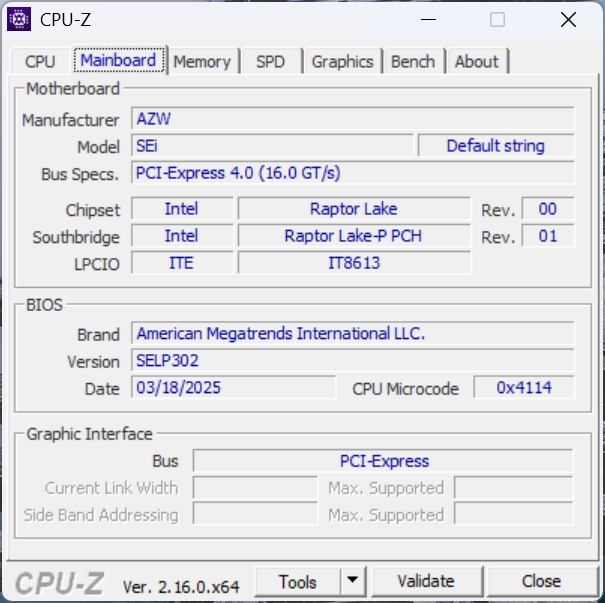
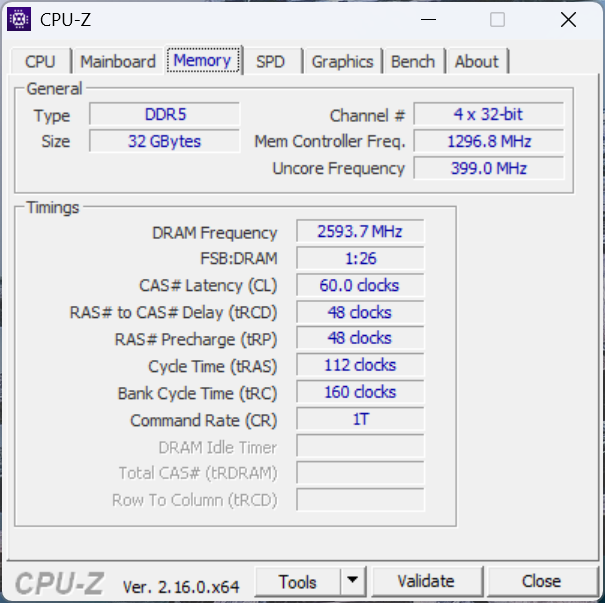
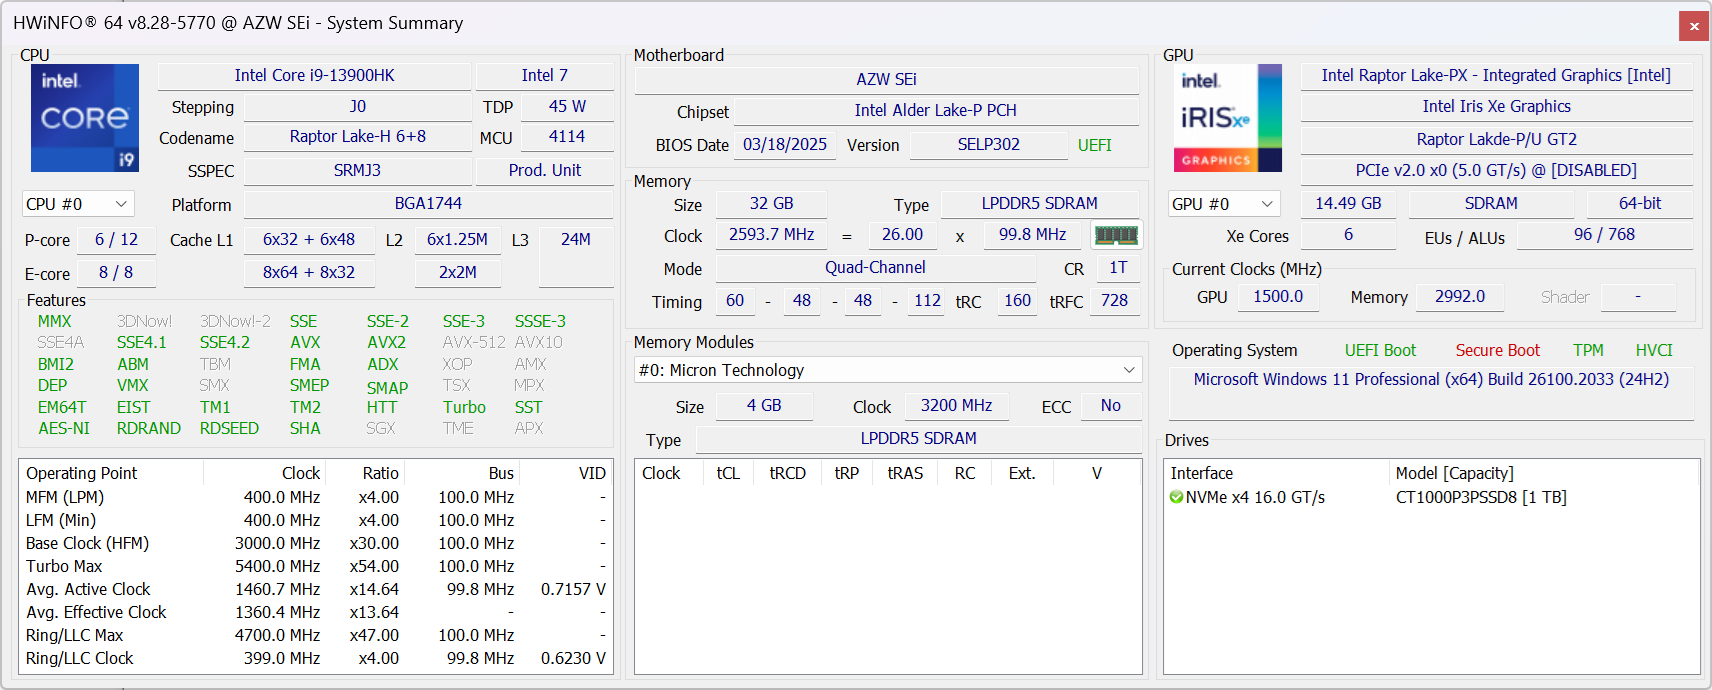
Nasza jednostka testowa jest dostarczana z procesorem Raptor Lake Core i9-13900HK, 32 GB pamięci RAM i dyskiem SSD o pojemności 1 TB w cenie 540 USD. Dostępne są szare i srebrne wersje kolorystyczne.
Więcej recenzji Beelink:
Specyfikacje
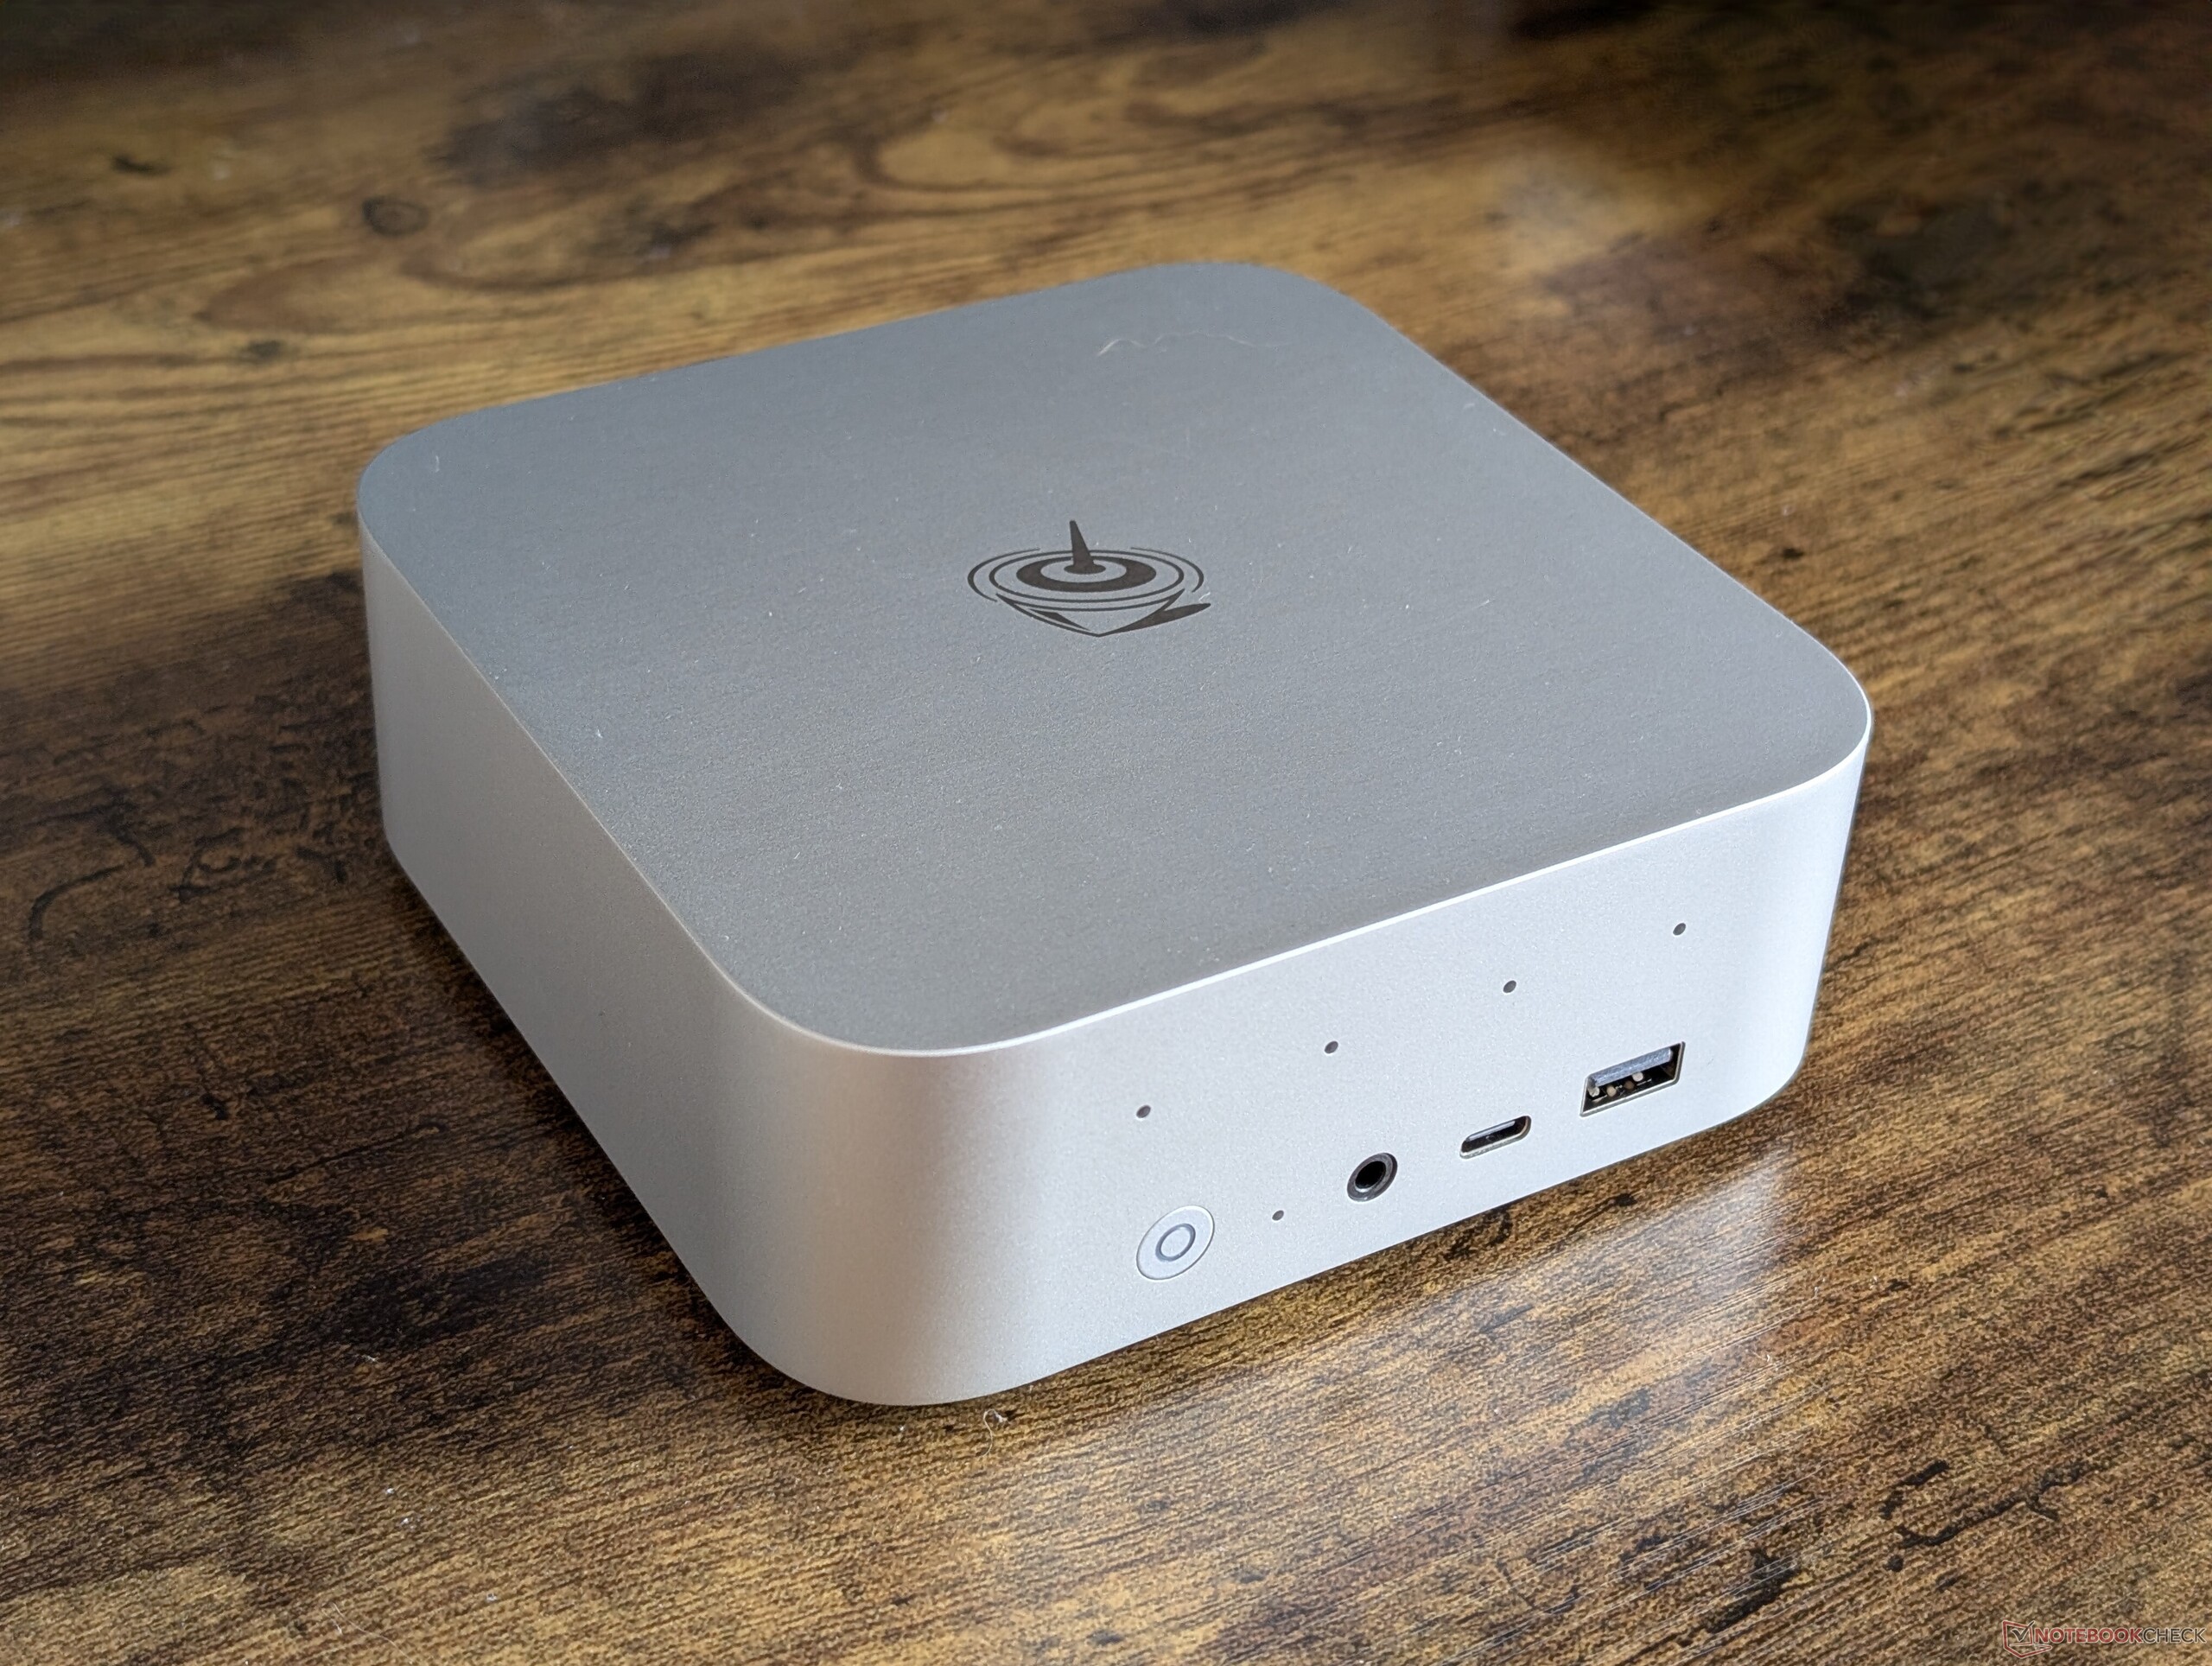
Przypadek
SEi13 Pro jest zasadniczo mniejszą i lżejszą wersją GTi13 Ultra. Metalowy materiał obudowy pozostaje taki sam, aby zapewnić podobne wrażenia jak w przypadku Maca Mini.
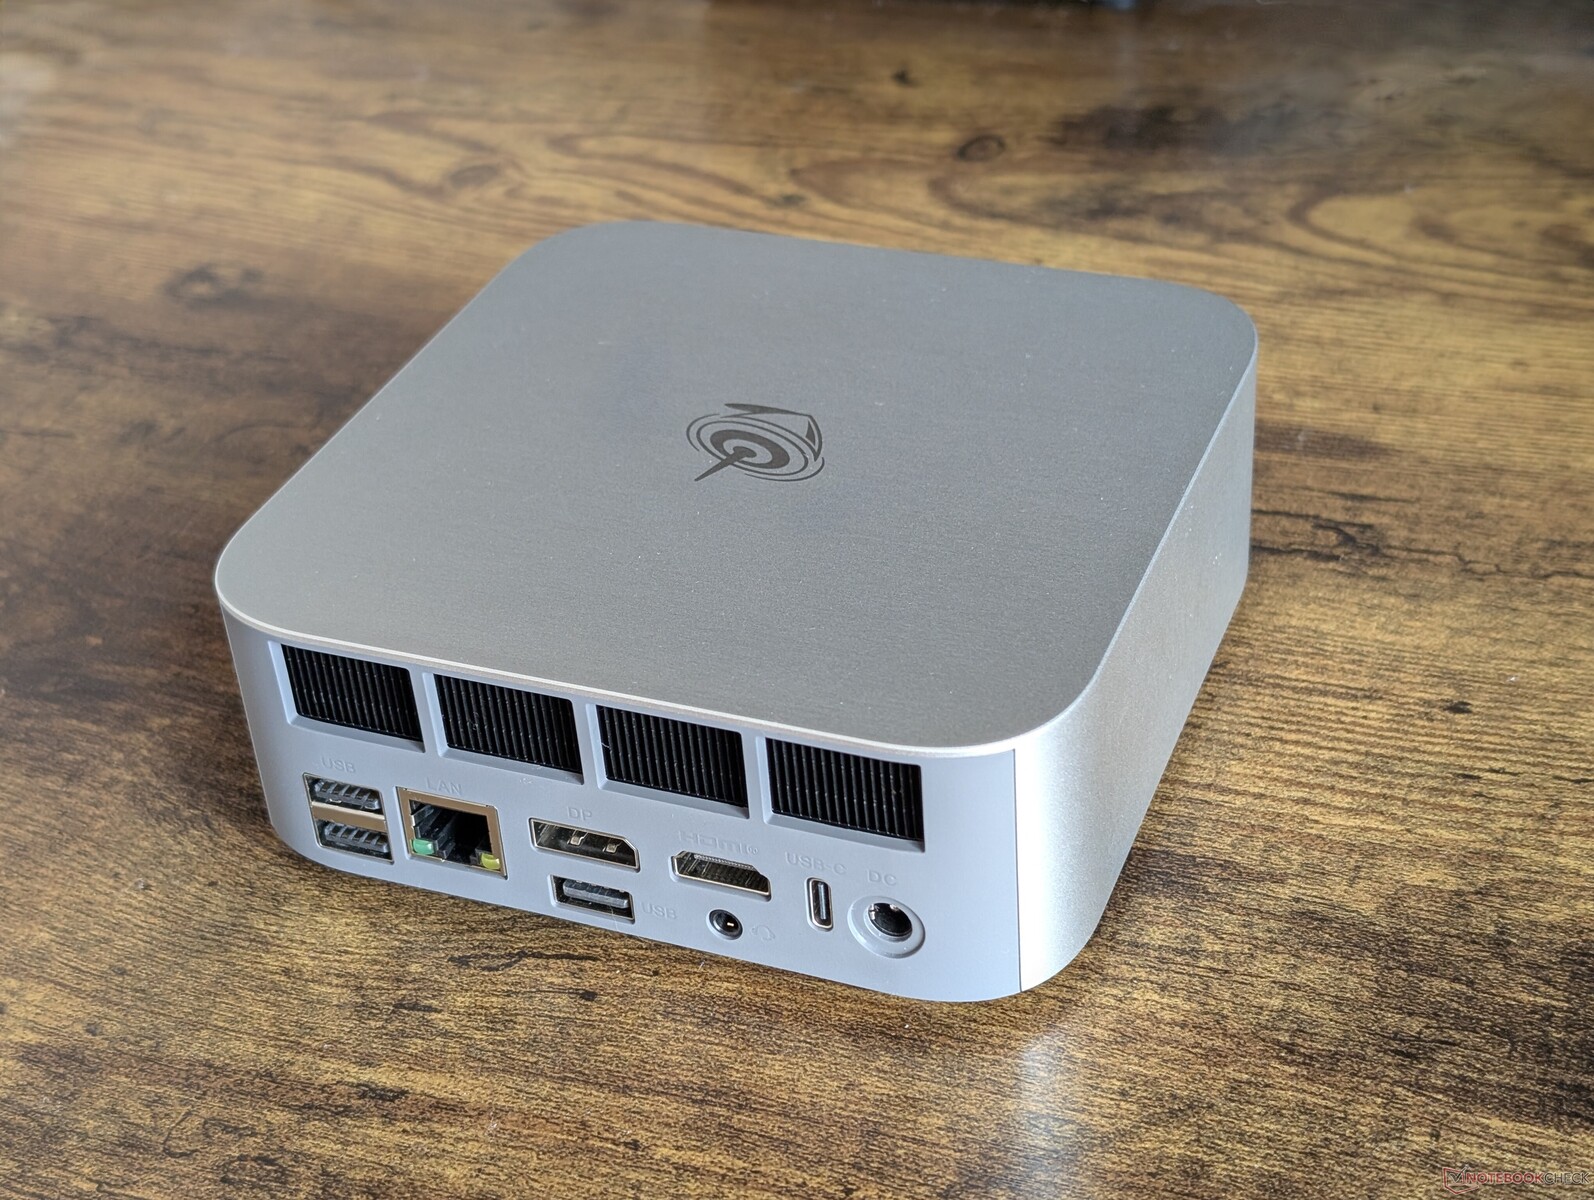
Łączność
Zintegrowane porty są prawie takie same jak w SEi13 Ultra, z wyjątkiem innego portu zasilacza sieciowego i mniejszej liczby portów USB-A i RJ-45 z tyłu. Zrezygnowano również z czytnika kart SD.
Proszę zauważyć, że system może być zasilany za pomocą ogólnego zasilacza sieciowego USB-C, jeśli kiedykolwiek zgubią Państwo 100 W zasilacz sieciowy dostarczany wraz z urządzeniem.
Komunikacja
| Networking | |
| iperf3 transmit AXE11000 | |
| BOSGAME M4 Neo | |
| Beelink SEi12 Core i5-1235U | |
| HP Z2 Mini G1a | |
| Beelink GTI13 Ultra | |
| Beelink SEi13 Pro | |
| iperf3 receive AXE11000 | |
| BOSGAME M4 Neo | |
| Beelink SEi12 Core i5-1235U | |
| HP Z2 Mini G1a | |
| Beelink GTI13 Ultra | |
| Beelink SEi13 Pro | |
| iperf3 transmit AXE11000 6GHz | |
| HP Z2 Mini G1a | |
| BOSGAME M4 Neo | |
| iperf3 receive AXE11000 6GHz | |
| HP Z2 Mini G1a | |
| BOSGAME M4 Neo | |
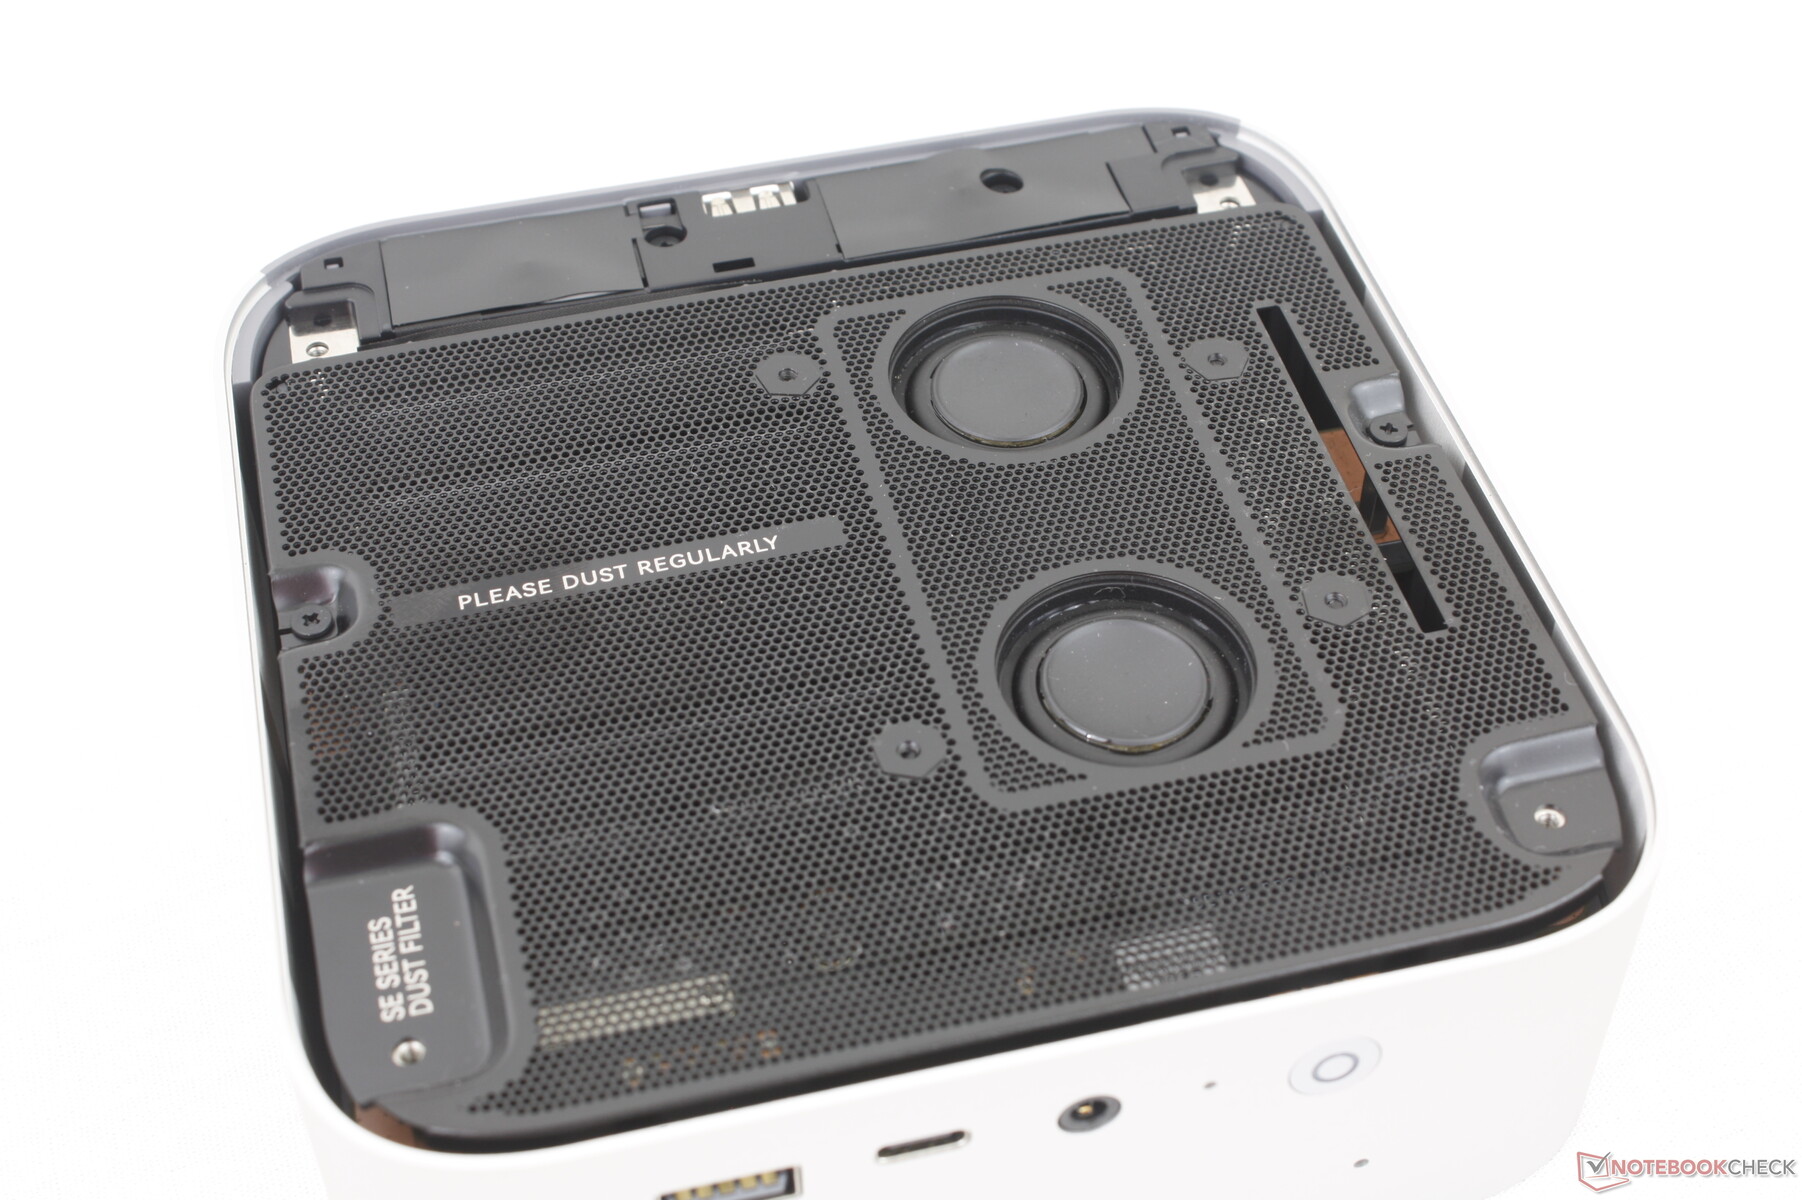
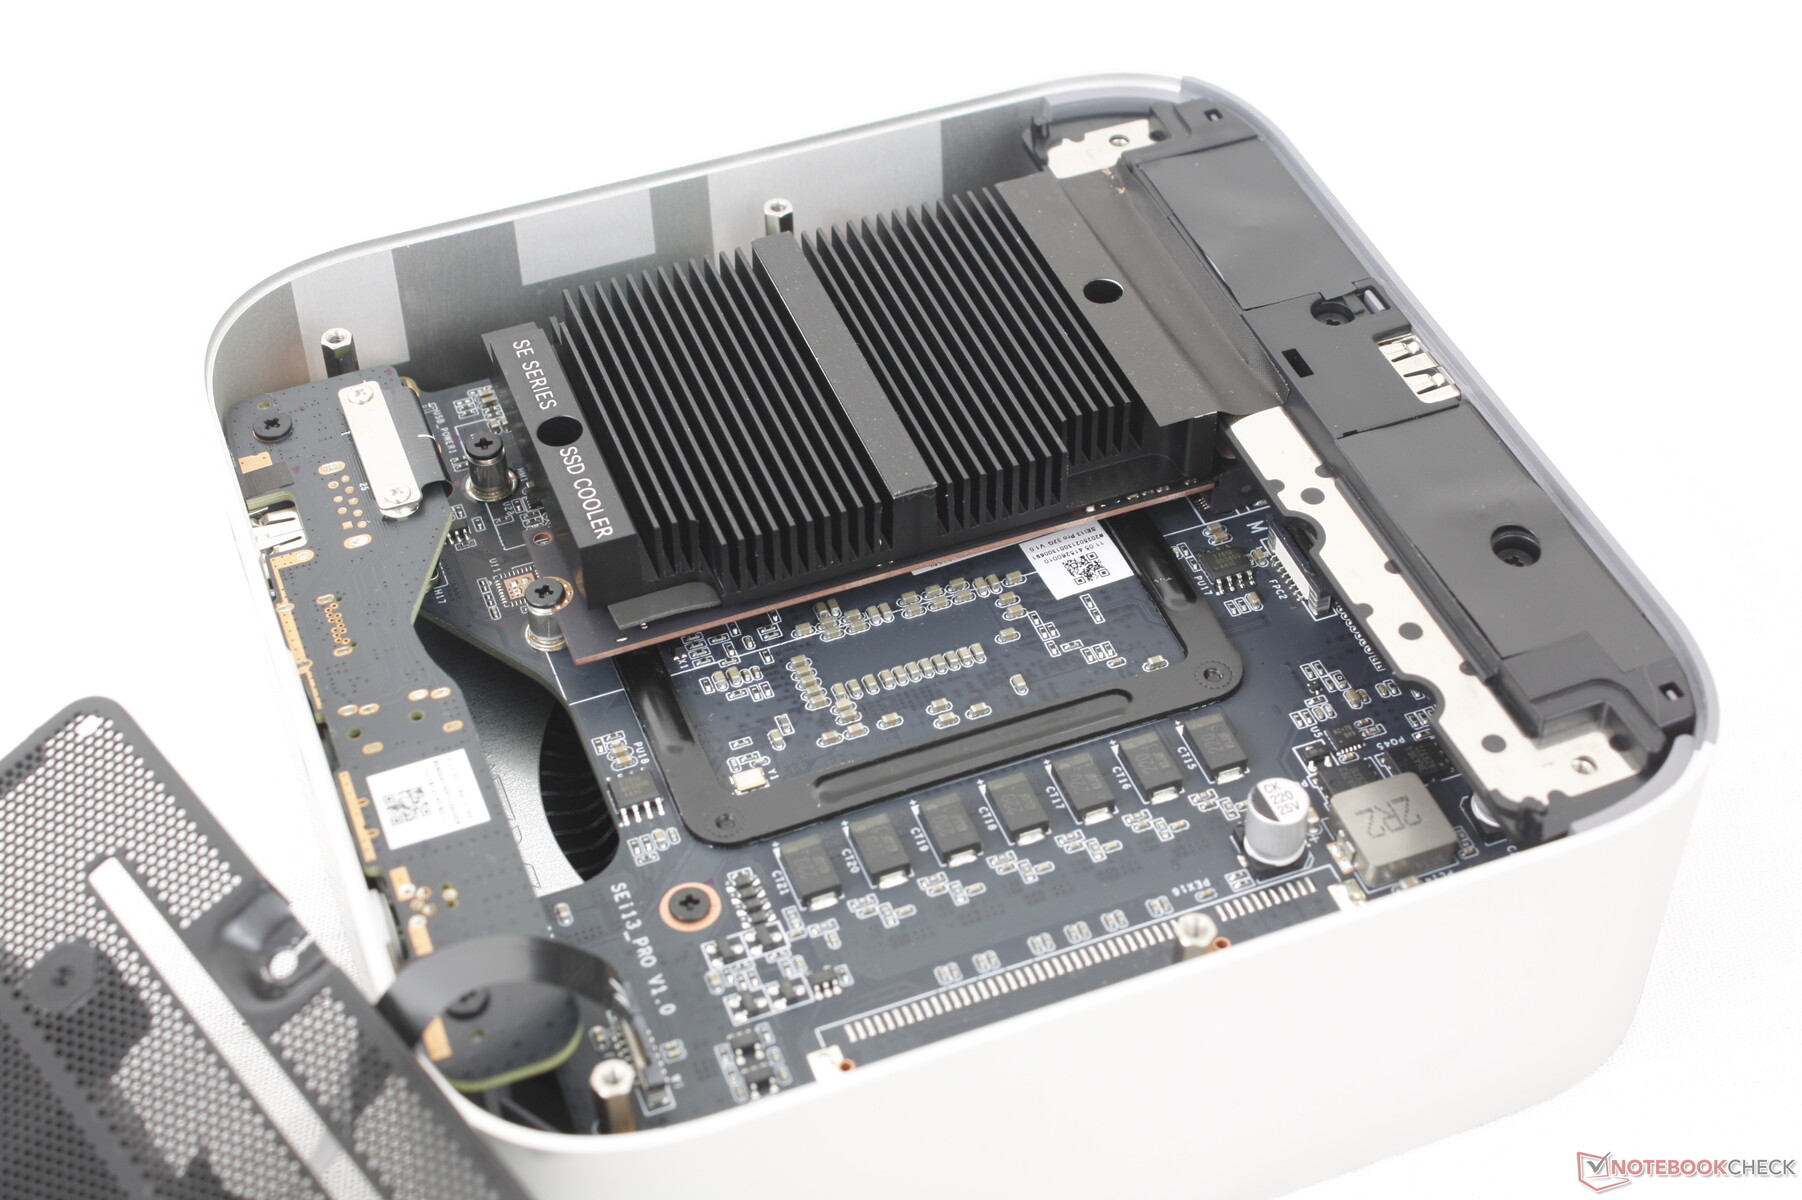
Konserwacja
Modernizacja jest łatwiejsza niż w przypadku GTi13 Ultra, ponieważ konstrukcja SEi13 nie ma zintegrowanego zasilacza na płycie głównej. Niemniej jednak modernizacja jest ograniczona do zaledwie dwóch dysków SSD M.2, ponieważ pamięć RAM jest przylutowana, w przeciwieństwie do wspomnianego wcześniej GTi13 Ultra.
Zrównoważony rozwój
Producent nie wspomina o materiałach pochodzących z recyklingu użytych podczas produkcji. Samo opakowanie jest w całości kartonowe i papierowe z plastikowym opakowaniem.
Akcesoria i gwarancja
Pudełko detaliczne zawiera kabel HDMI i zasilacz sieciowy z instrukcją obsługi. W przypadku zakupu w Stanach Zjednoczonych obowiązuje standardowa roczna ograniczona gwarancja producenta.
Wydajność
Warunki testowania
Przed uruchomieniem poniższych testów porównawczych ustawiliśmy system Windows w tryb wydajności.
Procesor
Choć nadal dość szybki jak na swoją cenę Core i9-13900HK nie posiada zintegrowanej jednostki NPU do akceleracji AI.
Cinebench R15 Multi Loop
Cinebench R23: Multi Core | Single Core
Cinebench R20: CPU (Multi Core) | CPU (Single Core)
Cinebench R15: CPU Multi 64Bit | CPU Single 64Bit
Blender: v2.79 BMW27 CPU
7-Zip 18.03: 7z b 4 | 7z b 4 -mmt1
Geekbench 6.7: Multi-Core | Single-Core
Geekbench 5.5: Multi-Core | Single-Core
HWBOT x265 Benchmark v2.2: 4k Preset
LibreOffice : 20 Documents To PDF
R Benchmark 2.5: Overall mean
| CPU Performance rating | |
| Minisforum MS-A2 | |
| HP Z2 Mini G1a | |
| Acemagic F3A | |
| Geekom Mini IT15, Ultra 9 285H | |
| Khadas Mind 2s | |
| Beelink GTI13 Ultra | |
| BOSGAME M4 Neo | |
| Przeciętny Intel Core i9-13900HK | |
| Geekom Mini IT13 | |
| Beelink SEi13 Pro | |
| Minix Elite EU512-AI -2! | |
| BMAX B9 Power | |
| Beelink SEi12 Core i5-1235U -2! | |
| NiPoGi AM06 Pro | |
| Cinebench R23 / Multi Core | |
| HP Z2 Mini G1a | |
| Minisforum MS-A2 | |
| Acemagic F3A | |
| Geekom Mini IT15, Ultra 9 285H | |
| Khadas Mind 2s | |
| Beelink GTI13 Ultra | |
| Przeciętny Intel Core i9-13900HK (12799 - 19704, n=4) | |
| Beelink SEi13 Pro | |
| BOSGAME M4 Neo | |
| Minix Elite EU512-AI | |
| BMAX B9 Power | |
| Geekom Mini IT13 | |
| Beelink SEi12 Core i5-1235U | |
| NiPoGi AM06 Pro | |
| Cinebench R23 / Single Core | |
| Minisforum MS-A2 | |
| Geekom Mini IT15, Ultra 9 285H | |
| Khadas Mind 2s | |
| Beelink GTI13 Ultra | |
| Acemagic F3A | |
| HP Z2 Mini G1a | |
| Przeciętny Intel Core i9-13900HK (1426 - 2089, n=4) | |
| BOSGAME M4 Neo | |
| Geekom Mini IT13 | |
| Minix Elite EU512-AI | |
| Beelink SEi12 Core i5-1235U | |
| Beelink SEi13 Pro | |
| BMAX B9 Power | |
| NiPoGi AM06 Pro | |
| Cinebench R20 / CPU (Multi Core) | |
| HP Z2 Mini G1a | |
| Minisforum MS-A2 | |
| Acemagic F3A | |
| Geekom Mini IT15, Ultra 9 285H | |
| Khadas Mind 2s | |
| BOSGAME M4 Neo | |
| Beelink GTI13 Ultra | |
| Przeciętny Intel Core i9-13900HK (4968 - 7542, n=4) | |
| Beelink SEi13 Pro | |
| Minix Elite EU512-AI | |
| BMAX B9 Power | |
| Geekom Mini IT13 | |
| Beelink SEi12 Core i5-1235U | |
| NiPoGi AM06 Pro | |
| Cinebench R20 / CPU (Single Core) | |
| Minisforum MS-A2 | |
| Geekom Mini IT15, Ultra 9 285H | |
| Khadas Mind 2s | |
| Acemagic F3A | |
| Beelink GTI13 Ultra | |
| HP Z2 Mini G1a | |
| Przeciętny Intel Core i9-13900HK (549 - 798, n=4) | |
| BOSGAME M4 Neo | |
| Geekom Mini IT13 | |
| Minix Elite EU512-AI | |
| Beelink SEi12 Core i5-1235U | |
| Beelink SEi13 Pro | |
| BMAX B9 Power | |
| NiPoGi AM06 Pro | |
| Cinebench R15 / CPU Multi 64Bit | |
| HP Z2 Mini G1a | |
| Minisforum MS-A2 | |
| Acemagic F3A | |
| Geekom Mini IT15, Ultra 9 285H | |
| Khadas Mind 2s | |
| BOSGAME M4 Neo | |
| Przeciętny Intel Core i9-13900HK (2004 - 2950, n=4) | |
| Beelink GTI13 Ultra | |
| Beelink SEi13 Pro | |
| BMAX B9 Power | |
| Minix Elite EU512-AI | |
| Geekom Mini IT13 | |
| Beelink SEi12 Core i5-1235U | |
| NiPoGi AM06 Pro | |
| Cinebench R15 / CPU Single 64Bit | |
| Minisforum MS-A2 | |
| Acemagic F3A | |
| Khadas Mind 2s | |
| Geekom Mini IT15, Ultra 9 285H | |
| HP Z2 Mini G1a | |
| Beelink GTI13 Ultra | |
| BOSGAME M4 Neo | |
| Przeciętny Intel Core i9-13900HK (204 - 296, n=4) | |
| Geekom Mini IT13 | |
| Minix Elite EU512-AI | |
| Beelink SEi12 Core i5-1235U | |
| Beelink SEi13 Pro | |
| BMAX B9 Power | |
| NiPoGi AM06 Pro | |
| Blender / v2.79 BMW27 CPU | |
| NiPoGi AM06 Pro | |
| Beelink SEi12 Core i5-1235U | |
| Geekom Mini IT13 | |
| BMAX B9 Power | |
| Minix Elite EU512-AI | |
| Przeciętny Intel Core i9-13900HK (197 - 253, n=3) | |
| Khadas Mind 2s | |
| Geekom Mini IT15, Ultra 9 285H | |
| BOSGAME M4 Neo | |
| Beelink SEi13 Pro | |
| Beelink GTI13 Ultra | |
| Acemagic F3A | |
| Minisforum MS-A2 | |
| HP Z2 Mini G1a | |
| 7-Zip 18.03 / 7z b 4 -mmt1 | |
| Minisforum MS-A2 | |
| Beelink GTI13 Ultra | |
| Acemagic F3A | |
| BOSGAME M4 Neo | |
| Geekom Mini IT15, Ultra 9 285H | |
| HP Z2 Mini G1a | |
| Khadas Mind 2s | |
| Geekom Mini IT13 | |
| Przeciętny Intel Core i9-13900HK (4461 - 6516, n=4) | |
| Beelink SEi12 Core i5-1235U | |
| Minix Elite EU512-AI | |
| Beelink SEi13 Pro | |
| NiPoGi AM06 Pro | |
| BMAX B9 Power | |
| Geekbench 6.7 / Multi-Core | |
| Minisforum MS-A2 | |
| HP Z2 Mini G1a | |
| Geekom Mini IT15, Ultra 9 285H | |
| Khadas Mind 2s | |
| Beelink GTI13 Ultra | |
| BOSGAME M4 Neo | |
| Acemagic F3A | |
| Geekom Mini IT13 | |
| Przeciętny Intel Core i9-13900HK (7103 - 13309, n=4) | |
| BMAX B9 Power | |
| Beelink SEi13 Pro | |
| NiPoGi AM06 Pro | |
| Geekbench 6.7 / Single-Core | |
| Minisforum MS-A2 | |
| Geekom Mini IT15, Ultra 9 285H | |
| Acemagic F3A | |
| Khadas Mind 2s | |
| HP Z2 Mini G1a | |
| Beelink GTI13 Ultra | |
| BOSGAME M4 Neo | |
| Geekom Mini IT13 | |
| Przeciętny Intel Core i9-13900HK (1849 - 2883, n=4) | |
| Beelink SEi13 Pro | |
| BMAX B9 Power | |
| NiPoGi AM06 Pro | |
| Geekbench 5.5 / Multi-Core | |
| Minisforum MS-A2 | |
| HP Z2 Mini G1a | |
| Geekom Mini IT15, Ultra 9 285H | |
| Khadas Mind 2s | |
| Acemagic F3A | |
| Beelink GTI13 Ultra | |
| BOSGAME M4 Neo | |
| Przeciętny Intel Core i9-13900HK (7927 - 14985, n=5) | |
| Geekom Mini IT13 | |
| BMAX B9 Power | |
| Minix Elite EU512-AI | |
| Beelink SEi13 Pro | |
| Beelink SEi12 Core i5-1235U | |
| NiPoGi AM06 Pro | |
| Geekbench 5.5 / Single-Core | |
| Minisforum MS-A2 | |
| Geekom Mini IT15, Ultra 9 285H | |
| HP Z2 Mini G1a | |
| Khadas Mind 2s | |
| Acemagic F3A | |
| Beelink GTI13 Ultra | |
| BOSGAME M4 Neo | |
| Przeciętny Intel Core i9-13900HK (1315 - 1996, n=5) | |
| Geekom Mini IT13 | |
| Minix Elite EU512-AI | |
| Beelink SEi12 Core i5-1235U | |
| Beelink SEi13 Pro | |
| BMAX B9 Power | |
| NiPoGi AM06 Pro | |
| HWBOT x265 Benchmark v2.2 / 4k Preset | |
| Minisforum MS-A2 | |
| HP Z2 Mini G1a | |
| Acemagic F3A | |
| Geekom Mini IT15, Ultra 9 285H | |
| BOSGAME M4 Neo | |
| Khadas Mind 2s | |
| Beelink GTI13 Ultra | |
| Przeciętny Intel Core i9-13900HK (14.2 - 21.9, n=4) | |
| Beelink SEi13 Pro | |
| BMAX B9 Power | |
| Minix Elite EU512-AI | |
| Geekom Mini IT13 | |
| Beelink SEi12 Core i5-1235U | |
| NiPoGi AM06 Pro | |
| LibreOffice / 20 Documents To PDF | |
| NiPoGi AM06 Pro | |
| Minix Elite EU512-AI | |
| Acemagic F3A | |
| BMAX B9 Power | |
| HP Z2 Mini G1a | |
| Beelink SEi13 Pro | |
| Geekom Mini IT13 | |
| Beelink SEi12 Core i5-1235U | |
| BOSGAME M4 Neo | |
| Przeciętny Intel Core i9-13900HK (37.3 - 56, n=4) | |
| Khadas Mind 2s | |
| Minisforum MS-A2 | |
| Geekom Mini IT15, Ultra 9 285H | |
| Beelink GTI13 Ultra | |
| R Benchmark 2.5 / Overall mean | |
| Beelink SEi13 Pro | |
| BMAX B9 Power | |
| NiPoGi AM06 Pro | |
| Minix Elite EU512-AI | |
| Beelink SEi12 Core i5-1235U | |
| Przeciętny Intel Core i9-13900HK (0.4119 - 0.653, n=4) | |
| Geekom Mini IT13 | |
| BOSGAME M4 Neo | |
| Khadas Mind 2s | |
| Beelink GTI13 Ultra | |
| Geekom Mini IT15, Ultra 9 285H | |
| HP Z2 Mini G1a | |
| Acemagic F3A | |
| Minisforum MS-A2 | |
Cinebench R23: Multi Core | Single Core
Cinebench R20: CPU (Multi Core) | CPU (Single Core)
Cinebench R15: CPU Multi 64Bit | CPU Single 64Bit
Blender: v2.79 BMW27 CPU
7-Zip 18.03: 7z b 4 | 7z b 4 -mmt1
Geekbench 6.7: Multi-Core | Single-Core
Geekbench 5.5: Multi-Core | Single-Core
HWBOT x265 Benchmark v2.2: 4k Preset
LibreOffice : 20 Documents To PDF
R Benchmark 2.5: Overall mean
* ... im mniej tym lepiej
AIDA64: FP32 Ray-Trace | FPU Julia | CPU SHA3 | CPU Queen | FPU SinJulia | FPU Mandel | CPU AES | CPU ZLib | FP64 Ray-Trace | CPU PhotoWorxx
| Performance rating | |
| HP Z2 Mini G1a | |
| BOSGAME M4 Neo | |
| Beelink GTI13 Ultra | |
| Przeciętny Intel Core i9-13900HK | |
| BMAX B9 Power | |
| Beelink SEi13 Pro | |
| Beelink SEi12 Core i5-1235U | |
| AIDA64 / FP32 Ray-Trace | |
| HP Z2 Mini G1a | |
| BOSGAME M4 Neo | |
| Beelink SEi13 Pro | |
| Przeciętny Intel Core i9-13900HK (12351 - 18326, n=4) | |
| Beelink GTI13 Ultra | |
| BMAX B9 Power | |
| Beelink SEi12 Core i5-1235U | |
| AIDA64 / FPU Julia | |
| HP Z2 Mini G1a | |
| BOSGAME M4 Neo | |
| Beelink GTI13 Ultra | |
| Przeciętny Intel Core i9-13900HK (61409 - 92925, n=4) | |
| Beelink SEi13 Pro | |
| BMAX B9 Power | |
| Beelink SEi12 Core i5-1235U | |
| AIDA64 / CPU SHA3 | |
| HP Z2 Mini G1a | |
| BOSGAME M4 Neo | |
| Przeciętny Intel Core i9-13900HK (2923 - 4190, n=4) | |
| Beelink GTI13 Ultra | |
| Beelink SEi13 Pro | |
| BMAX B9 Power | |
| Beelink SEi12 Core i5-1235U | |
| AIDA64 / CPU Queen | |
| HP Z2 Mini G1a | |
| BOSGAME M4 Neo | |
| Beelink GTI13 Ultra | |
| Przeciętny Intel Core i9-13900HK (75615 - 118166, n=4) | |
| Beelink SEi13 Pro | |
| BMAX B9 Power | |
| Beelink SEi12 Core i5-1235U | |
| AIDA64 / FPU SinJulia | |
| HP Z2 Mini G1a | |
| BOSGAME M4 Neo | |
| Beelink GTI13 Ultra | |
| Przeciętny Intel Core i9-13900HK (7427 - 11249, n=4) | |
| Beelink SEi13 Pro | |
| BMAX B9 Power | |
| Beelink SEi12 Core i5-1235U | |
| AIDA64 / FPU Mandel | |
| HP Z2 Mini G1a | |
| BOSGAME M4 Neo | |
| Beelink SEi13 Pro | |
| Beelink GTI13 Ultra | |
| Przeciętny Intel Core i9-13900HK (30549 - 45616, n=4) | |
| BMAX B9 Power | |
| Beelink SEi12 Core i5-1235U | |
| AIDA64 / CPU AES | |
| HP Z2 Mini G1a | |
| BMAX B9 Power | |
| BOSGAME M4 Neo | |
| Przeciętny Intel Core i9-13900HK (68508 - 100891, n=4) | |
| Beelink GTI13 Ultra | |
| Beelink SEi13 Pro | |
| Beelink SEi12 Core i5-1235U | |
| AIDA64 / CPU ZLib | |
| HP Z2 Mini G1a | |
| Beelink GTI13 Ultra | |
| Przeciętny Intel Core i9-13900HK (797 - 1249, n=4) | |
| BOSGAME M4 Neo | |
| Beelink SEi13 Pro | |
| BMAX B9 Power | |
| Beelink SEi12 Core i5-1235U | |
| AIDA64 / FP64 Ray-Trace | |
| HP Z2 Mini G1a | |
| BOSGAME M4 Neo | |
| Przeciętny Intel Core i9-13900HK (6839 - 10018, n=4) | |
| Beelink SEi13 Pro | |
| Beelink GTI13 Ultra | |
| BMAX B9 Power | |
| Beelink SEi12 Core i5-1235U | |
| AIDA64 / CPU PhotoWorxx | |
| HP Z2 Mini G1a | |
| Beelink GTI13 Ultra | |
| BOSGAME M4 Neo | |
| Przeciętny Intel Core i9-13900HK (15421 - 49539, n=4) | |
| Beelink SEi12 Core i5-1235U | |
| BMAX B9 Power | |
| Beelink SEi13 Pro | |
Wydajność systemu
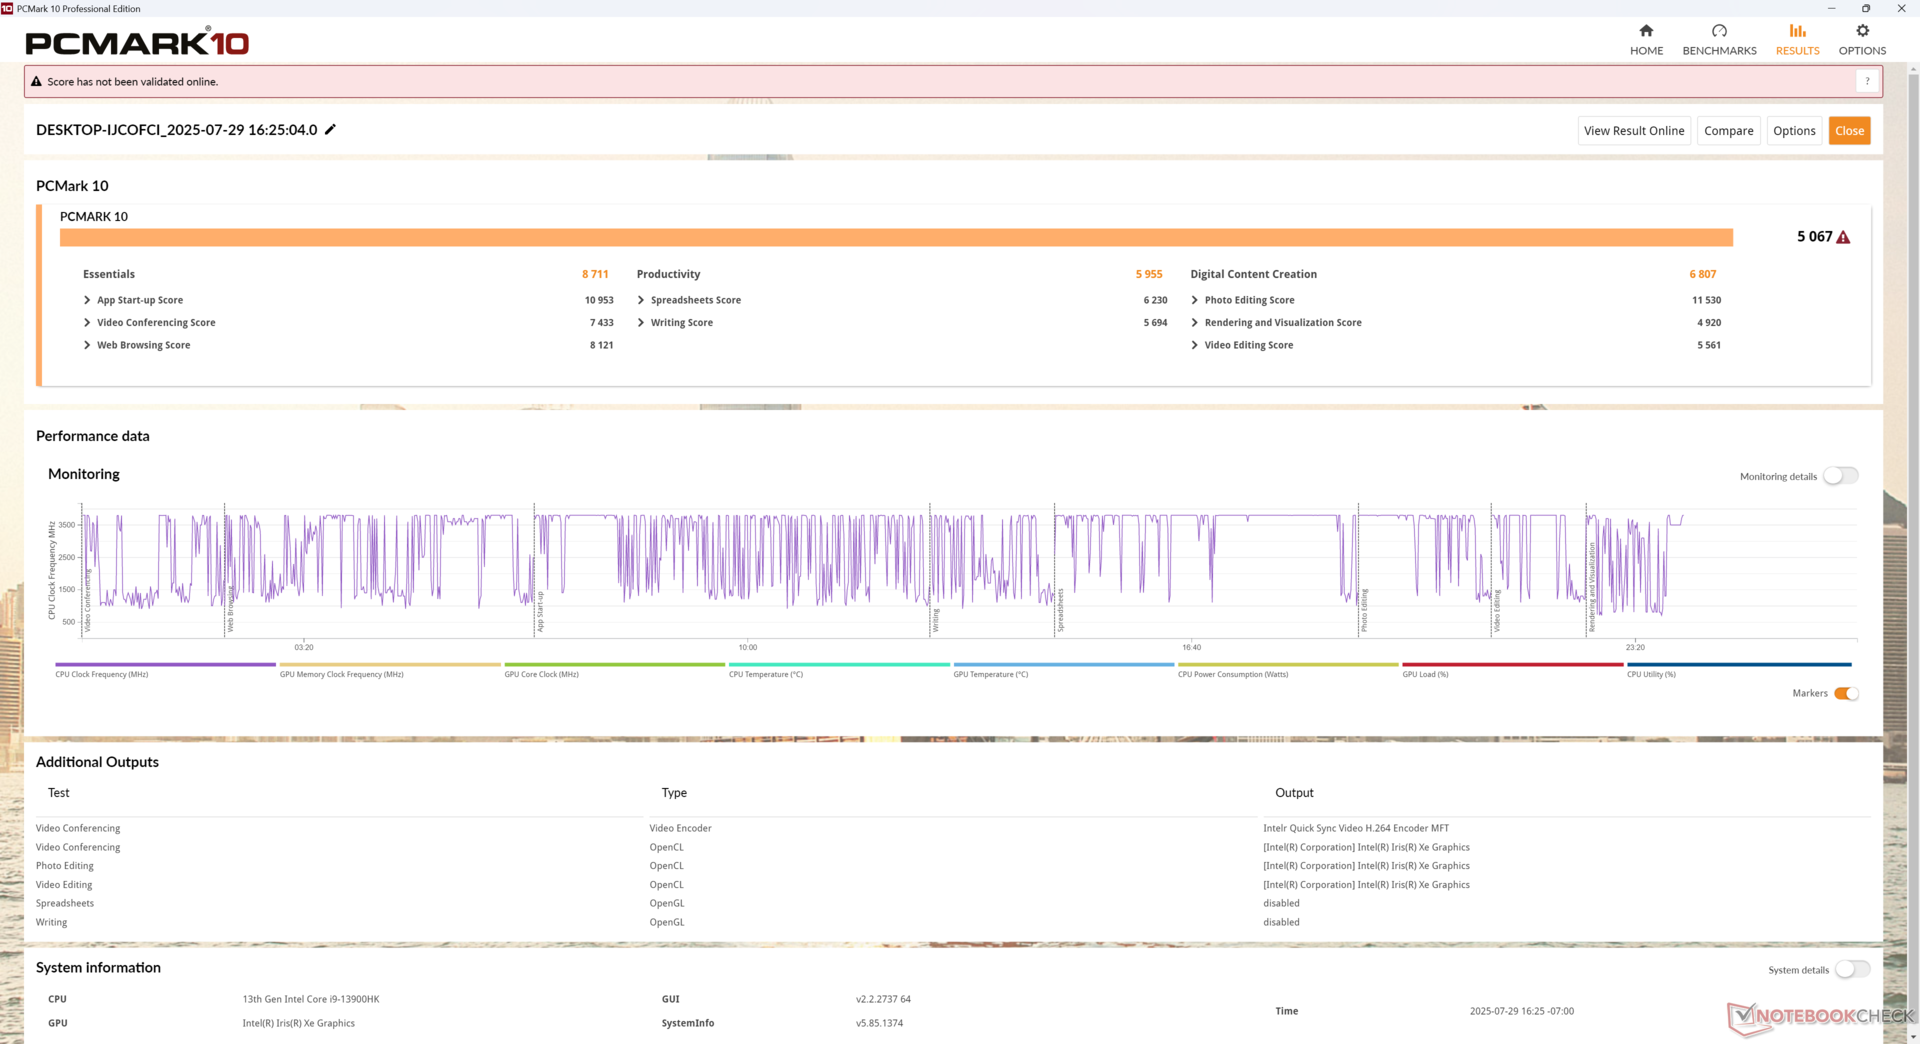
PCMark 10: Score | Essentials | Productivity | Digital Content Creation
CrossMark: Overall | Productivity | Creativity | Responsiveness
WebXPRT 3: Overall
WebXPRT 4: Overall
Mozilla Kraken 1.1: Total
| Performance rating | |
| HP Z2 Mini G1a | |
| Beelink GTI13 Ultra | |
| BOSGAME M4 Neo | |
| Beelink SEi12 Core i5-1235U | |
| Beelink SEi13 Pro -4! | |
| BMAX B9 Power -4! | |
| PCMark 10 / Score | |
| HP Z2 Mini G1a | |
| BOSGAME M4 Neo | |
| Beelink GTI13 Ultra | |
| Beelink SEi12 Core i5-1235U | |
| PCMark 10 / Essentials | |
| Beelink GTI13 Ultra | |
| Beelink SEi12 Core i5-1235U | |
| HP Z2 Mini G1a | |
| BOSGAME M4 Neo | |
| PCMark 10 / Productivity | |
| HP Z2 Mini G1a | |
| BOSGAME M4 Neo | |
| Beelink GTI13 Ultra | |
| Beelink SEi12 Core i5-1235U | |
| PCMark 10 / Digital Content Creation | |
| HP Z2 Mini G1a | |
| BOSGAME M4 Neo | |
| Beelink GTI13 Ultra | |
| Beelink SEi12 Core i5-1235U | |
| CrossMark / Overall | |
| Beelink GTI13 Ultra | |
| HP Z2 Mini G1a | |
| BOSGAME M4 Neo | |
| Beelink SEi12 Core i5-1235U | |
| Beelink SEi13 Pro | |
| BMAX B9 Power | |
| CrossMark / Productivity | |
| Beelink GTI13 Ultra | |
| BOSGAME M4 Neo | |
| Beelink SEi12 Core i5-1235U | |
| HP Z2 Mini G1a | |
| Beelink SEi13 Pro | |
| BMAX B9 Power | |
| CrossMark / Creativity | |
| HP Z2 Mini G1a | |
| Beelink GTI13 Ultra | |
| BOSGAME M4 Neo | |
| Beelink SEi12 Core i5-1235U | |
| BMAX B9 Power | |
| Beelink SEi13 Pro | |
| CrossMark / Responsiveness | |
| Beelink GTI13 Ultra | |
| Beelink SEi12 Core i5-1235U | |
| BOSGAME M4 Neo | |
| Beelink SEi13 Pro | |
| HP Z2 Mini G1a | |
| BMAX B9 Power | |
| WebXPRT 3 / Overall | |
| Beelink GTI13 Ultra | |
| HP Z2 Mini G1a | |
| BOSGAME M4 Neo | |
| Beelink SEi12 Core i5-1235U | |
| BMAX B9 Power | |
| Beelink SEi13 Pro | |
| WebXPRT 4 / Overall | |
| Beelink GTI13 Ultra | |
| HP Z2 Mini G1a | |
| BOSGAME M4 Neo | |
| Beelink SEi12 Core i5-1235U | |
| Beelink SEi13 Pro | |
| BMAX B9 Power | |
| Mozilla Kraken 1.1 / Total | |
| BMAX B9 Power | |
| Beelink SEi13 Pro | |
| Beelink SEi12 Core i5-1235U | |
| BOSGAME M4 Neo | |
| Beelink GTI13 Ultra | |
| HP Z2 Mini G1a | |
* ... im mniej tym lepiej
» No benchmarks for this notebook found!
| AIDA64 / Memory Copy | |
| HP Z2 Mini G1a | |
| Beelink GTI13 Ultra | |
| BOSGAME M4 Neo | |
| Beelink SEi13 Pro | |
| Przeciętny Intel Core i9-13900HK (45935 - 74460, n=4) | |
| Beelink SEi12 Core i5-1235U | |
| BMAX B9 Power | |
| AIDA64 / Memory Read | |
| HP Z2 Mini G1a | |
| Beelink GTI13 Ultra | |
| BOSGAME M4 Neo | |
| Przeciętny Intel Core i9-13900HK (34298 - 74896, n=4) | |
| Beelink SEi12 Core i5-1235U | |
| BMAX B9 Power | |
| Beelink SEi13 Pro | |
| AIDA64 / Memory Write | |
| HP Z2 Mini G1a | |
| BOSGAME M4 Neo | |
| Beelink SEi13 Pro | |
| Beelink GTI13 Ultra | |
| Przeciętny Intel Core i9-13900HK (47347 - 85917, n=4) | |
| Beelink SEi12 Core i5-1235U | |
| BMAX B9 Power | |
| AIDA64 / Memory Latency | |
| HP Z2 Mini G1a | |
| Beelink SEi13 Pro | |
| BMAX B9 Power | |
| Przeciętny Intel Core i9-13900HK (83 - 115.3, n=4) | |
| Beelink SEi12 Core i5-1235U | |
| BOSGAME M4 Neo | |
| Beelink GTI13 Ultra | |
* ... im mniej tym lepiej
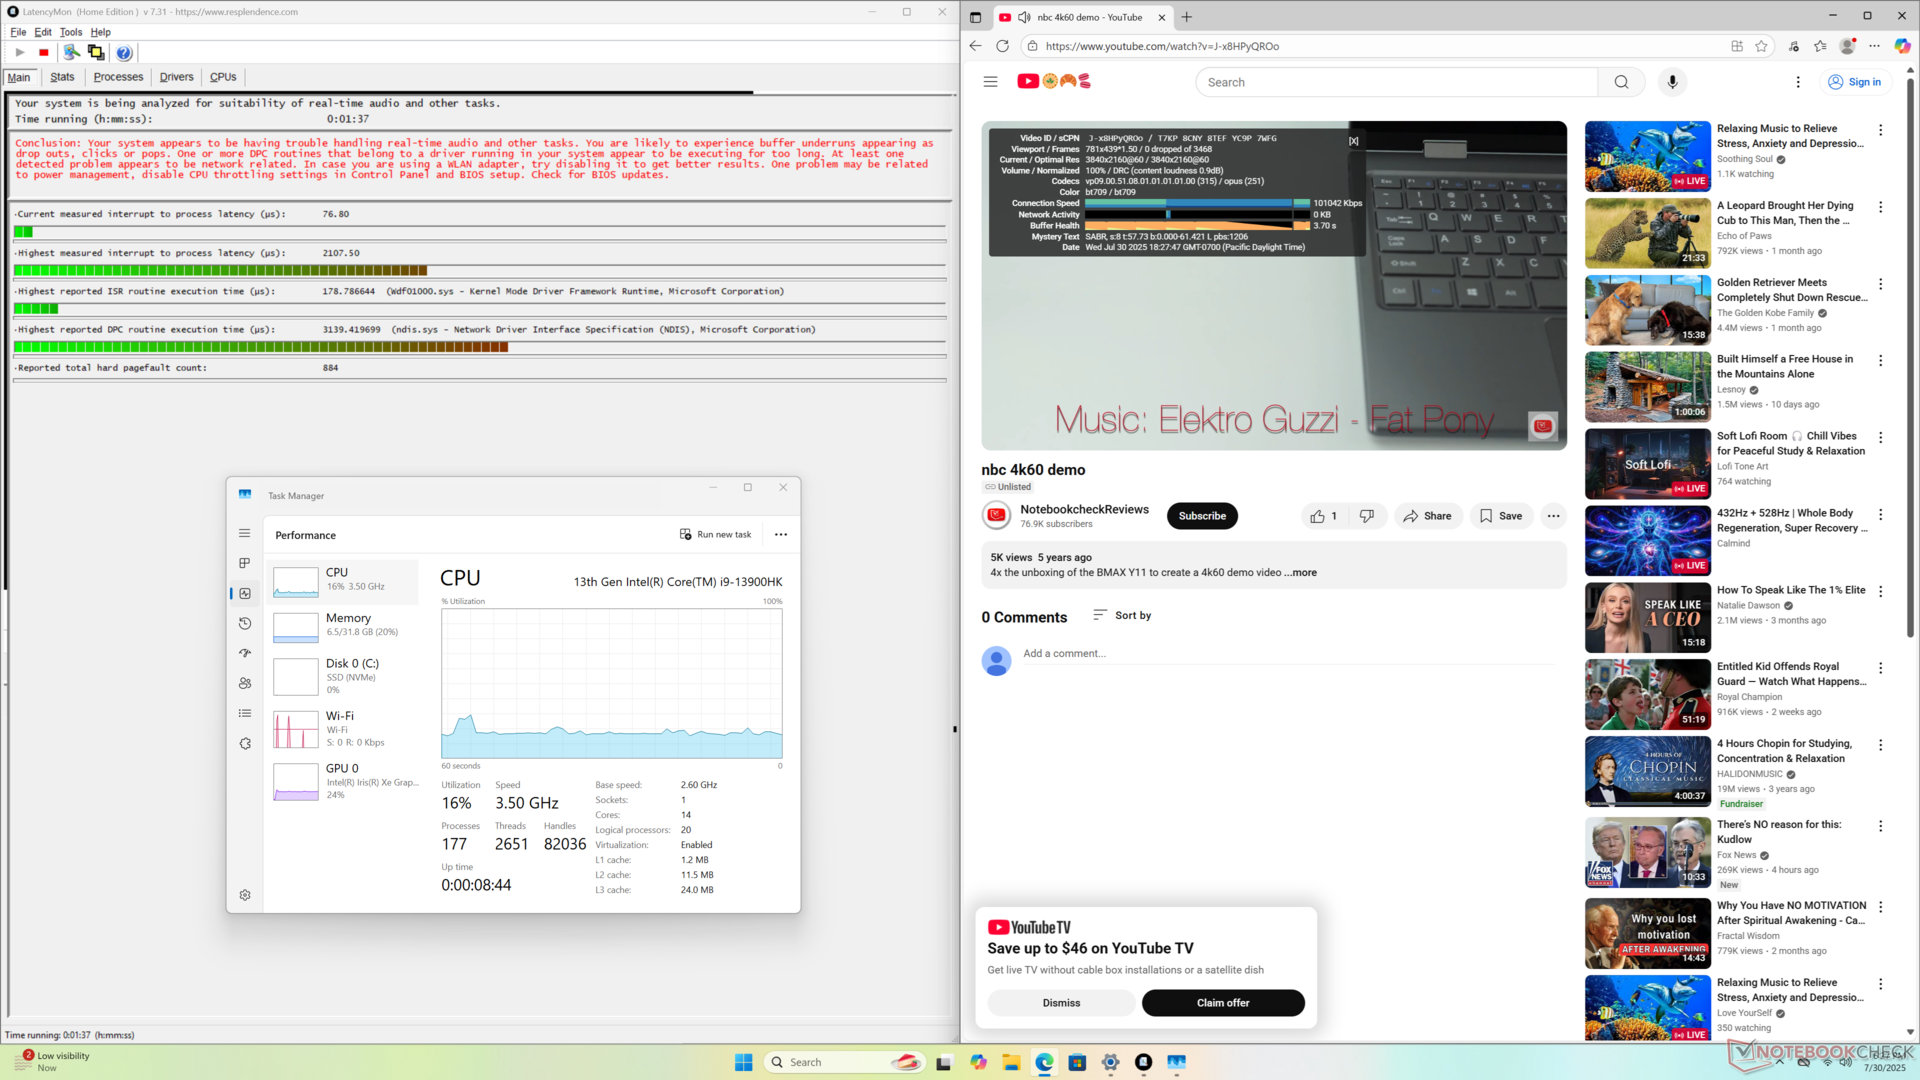
Opóźnienie DPC
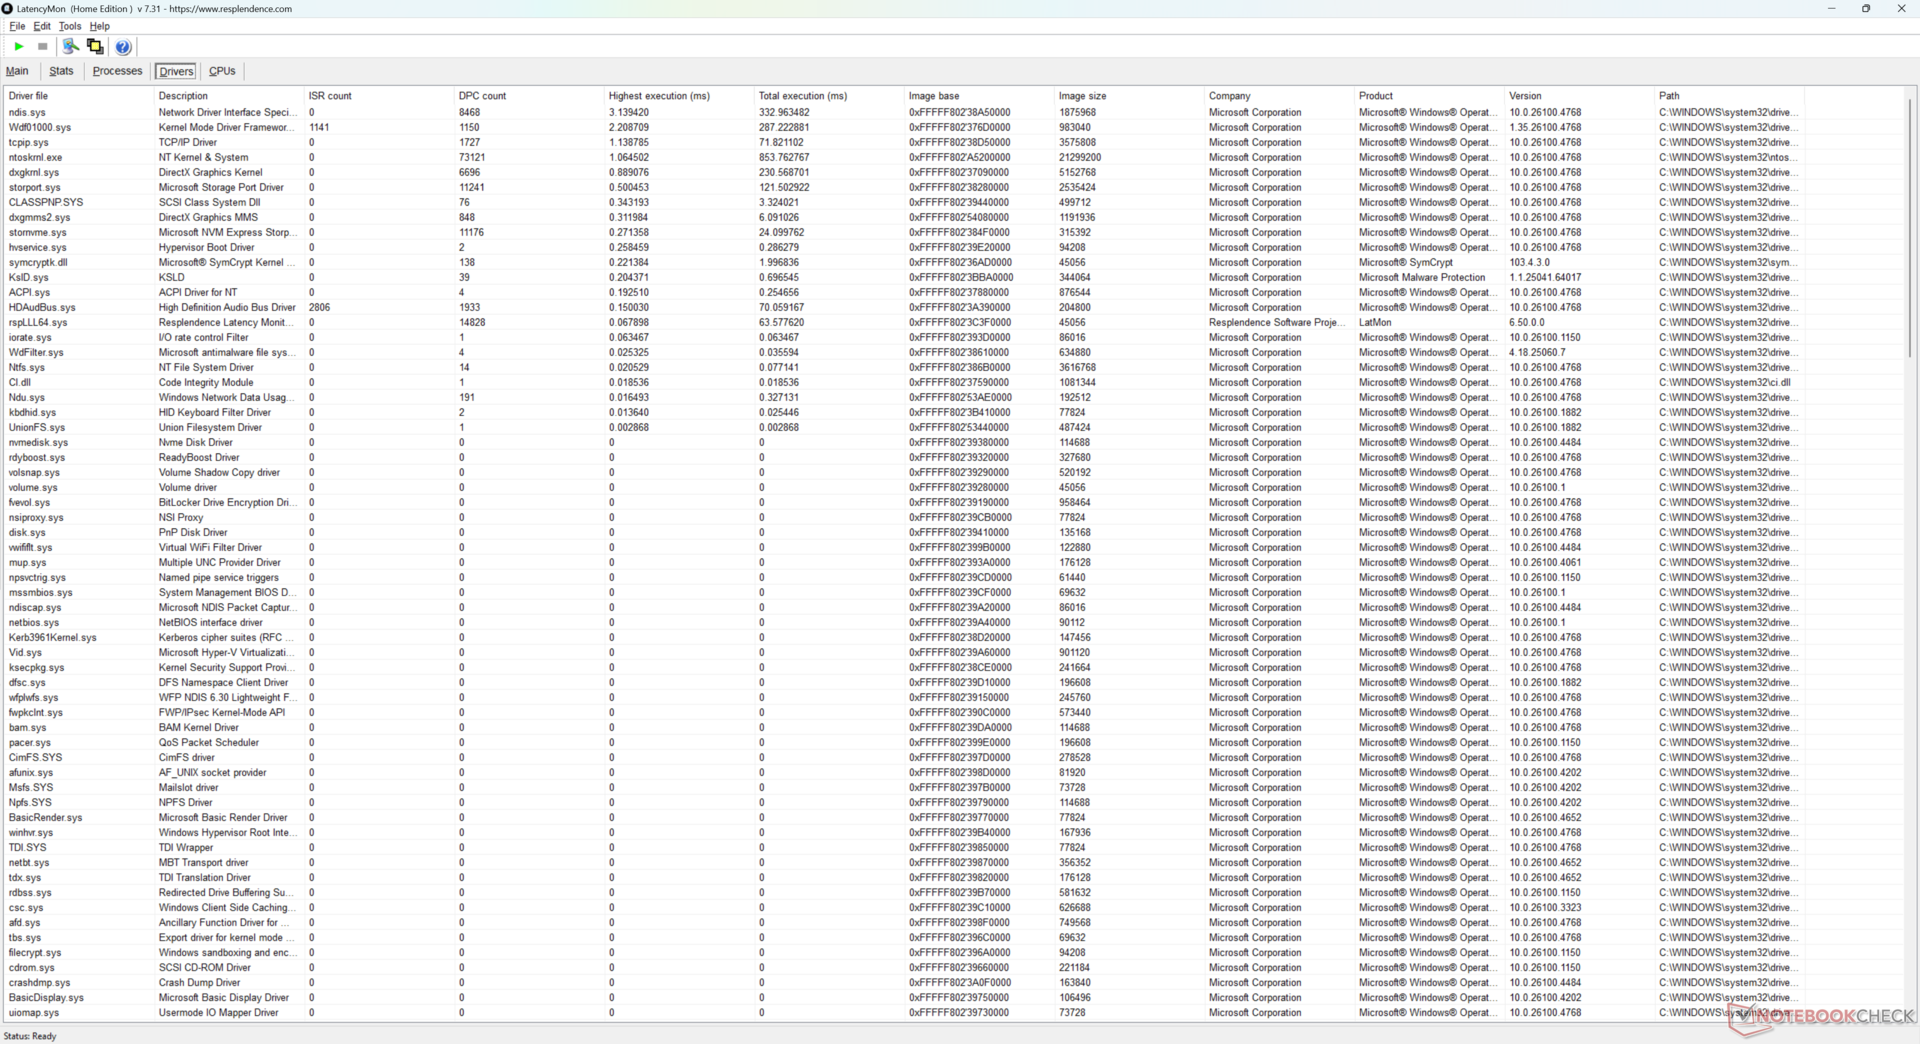
| DPC Latencies / LatencyMon - interrupt to process latency (max), Web, Youtube, Prime95 | |
| HP Z2 Mini G1a | |
| Beelink SEi13 Pro | |
| Beelink GTI13 Ultra | |
| Beelink SEi12 Core i5-1235U | |
| BOSGAME M4 Neo | |
* ... im mniej tym lepiej
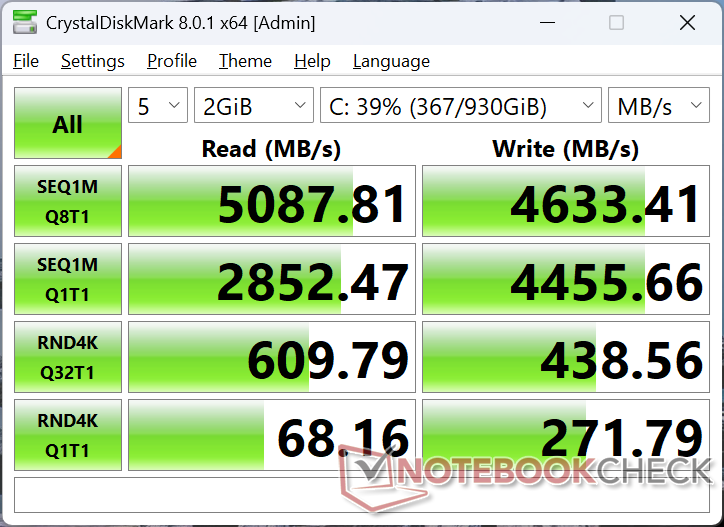
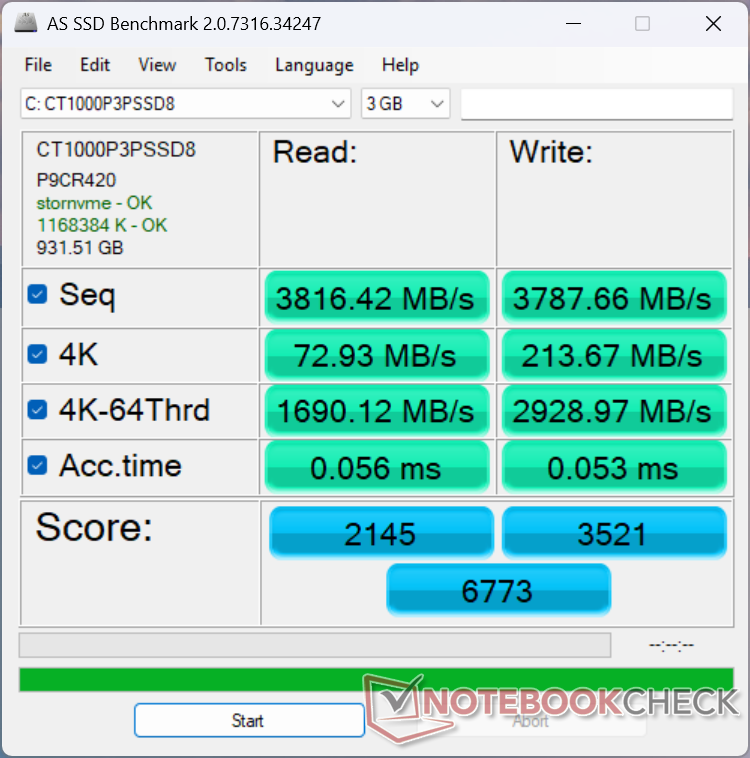
Urządzenia pamięci masowej
Do chłodzenia obu gniazd SSD dołączono duży rozpraszacz ciepła.

| Drive Performance rating - Percent | |
| Beelink GTI13 Ultra | |
| Beelink SEi13 Pro | |
| HP Z2 Mini G1a | |
| BOSGAME M4 Neo | |
| Beelink SEi12 Core i5-1235U | |
| BMAX B9 Power | |
* ... im mniej tym lepiej
Disk Throttling: DiskSpd Read Loop, Queue Depth 8
Wydajność GPU
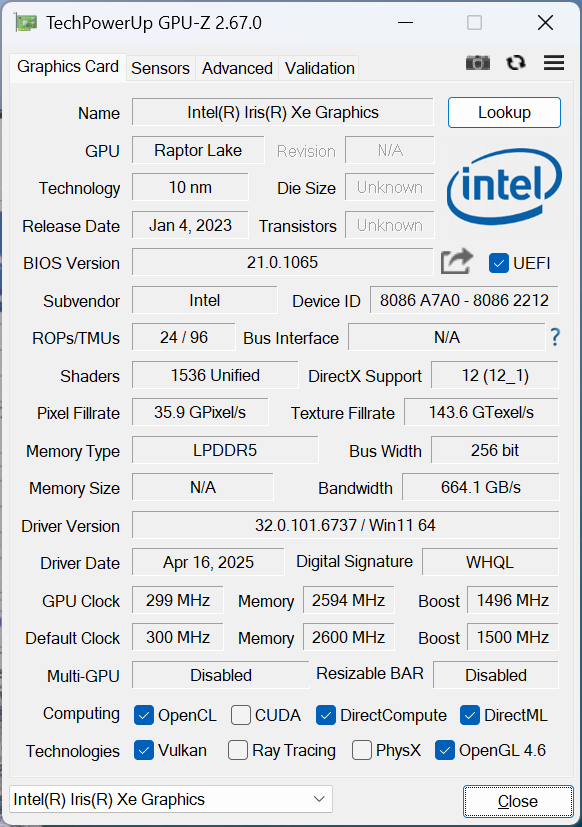
Karta graficzna Iris Xe Graphics G7 96 EUs jest teraz kilka generacji za obecną serią Arc, aby być jednym z wolniejszych zintegrowanych procesorów graficznych dostępnych na rynku. Choć nie nadaje się on do gier, to wciąż jest wystarczająco wydajny do płynnego streamowania w rozdzielczości 4K.
Warto wspomnieć, że zarówno X-Plane 11.11, jak i benchmark Cyberpunk 2077 zawsze ulegały awarii, nawet po wielu próbach i resetach.
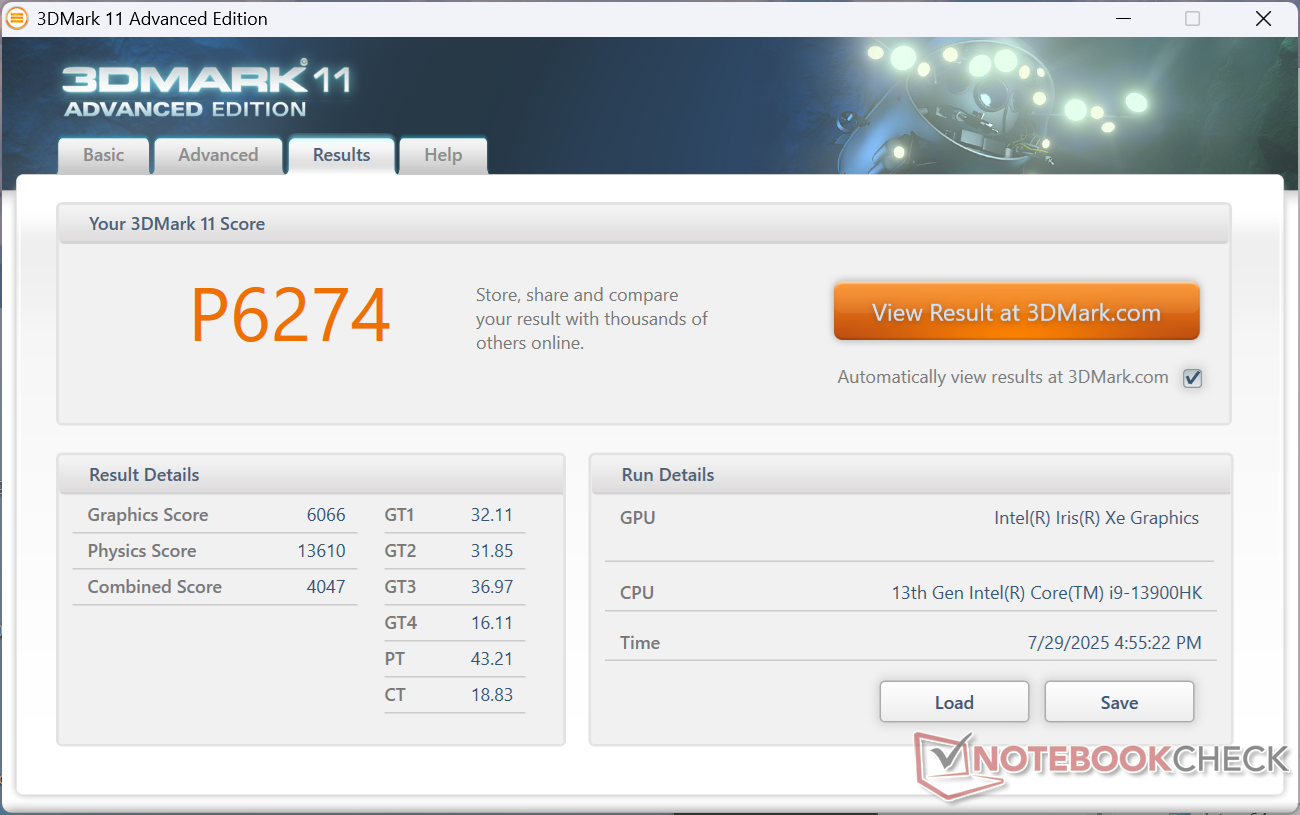
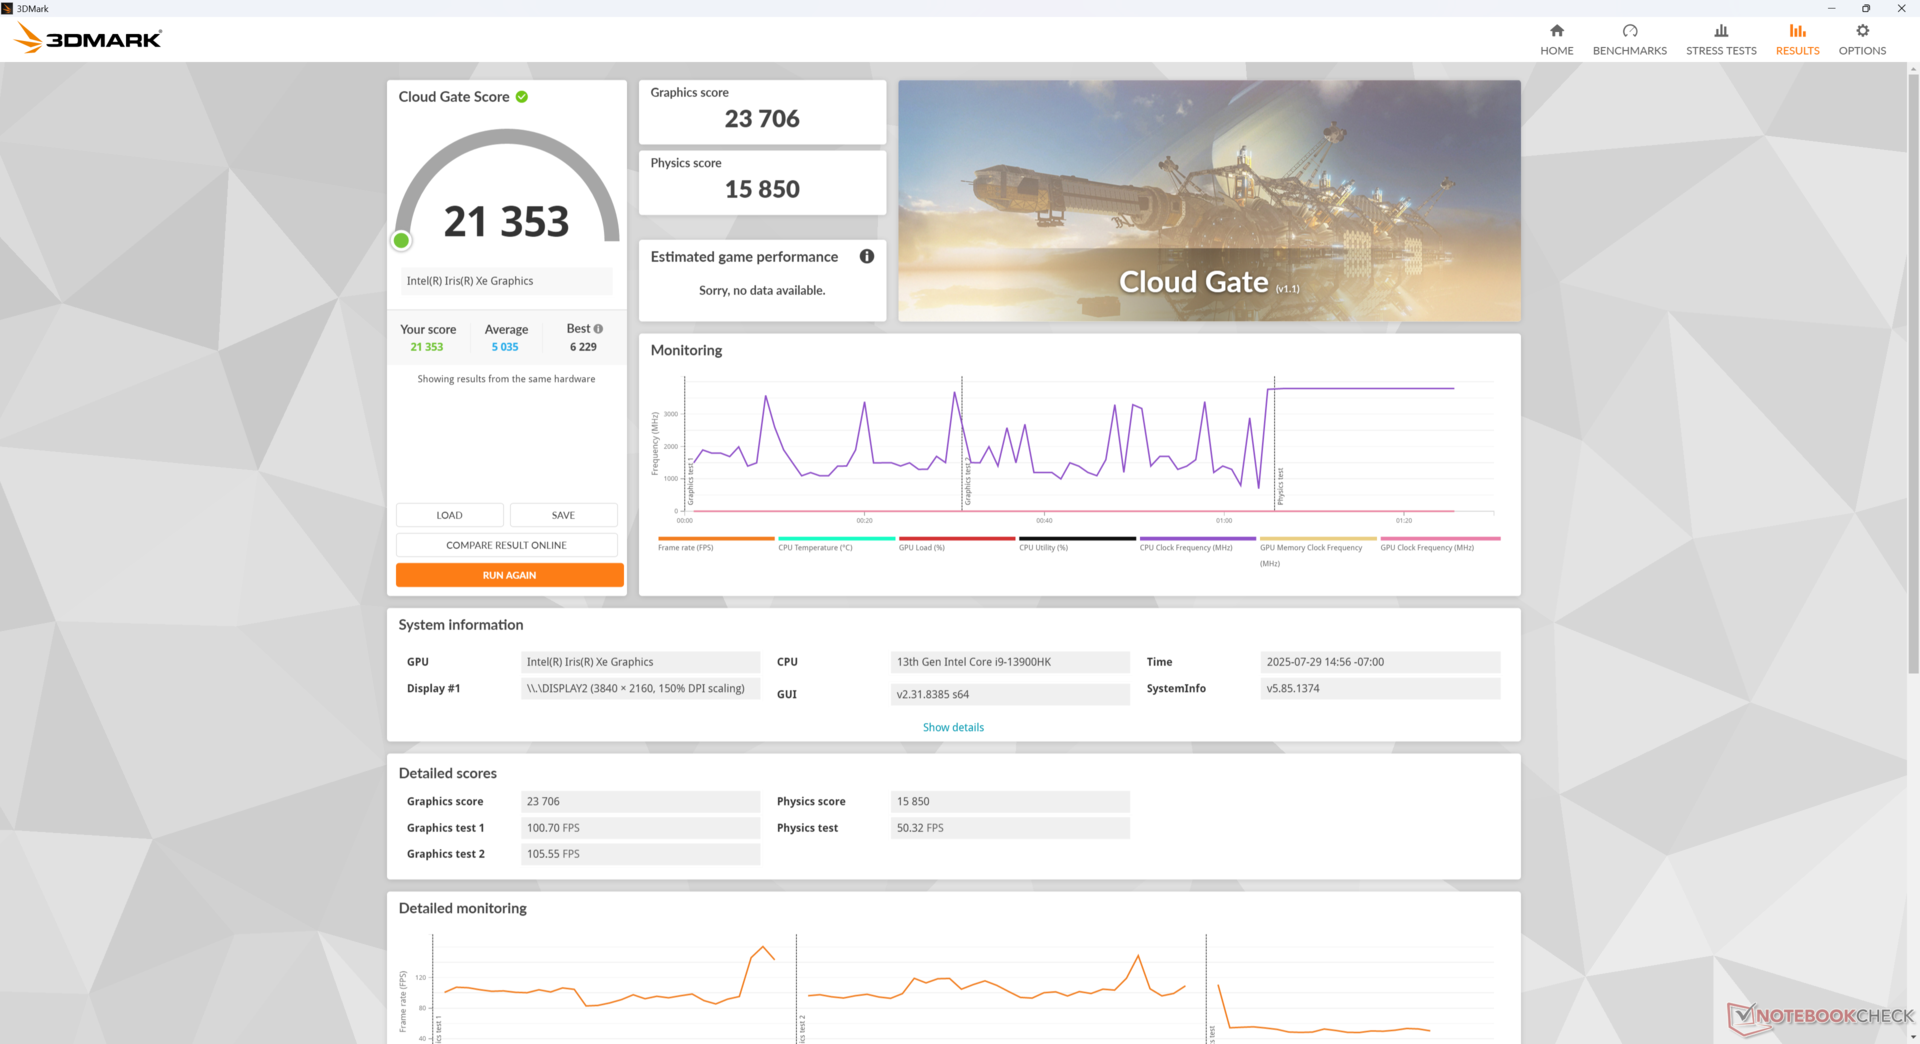
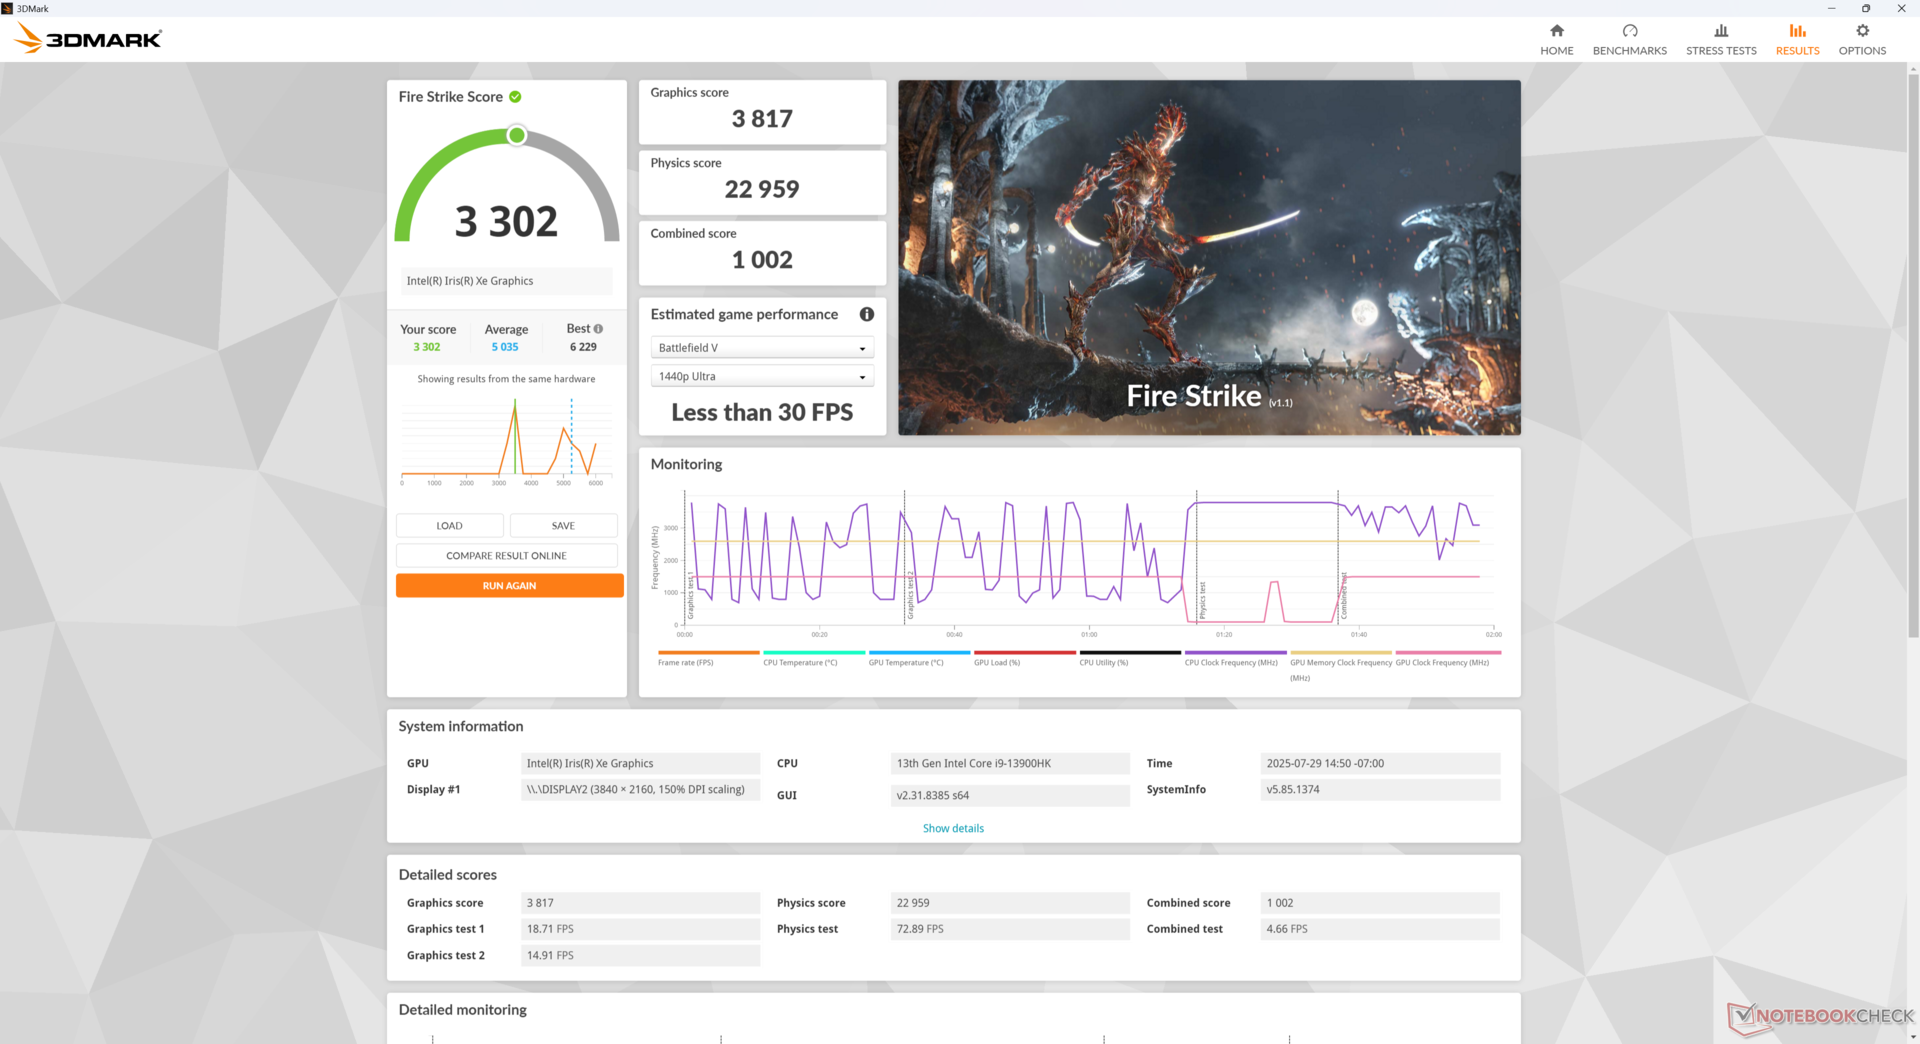
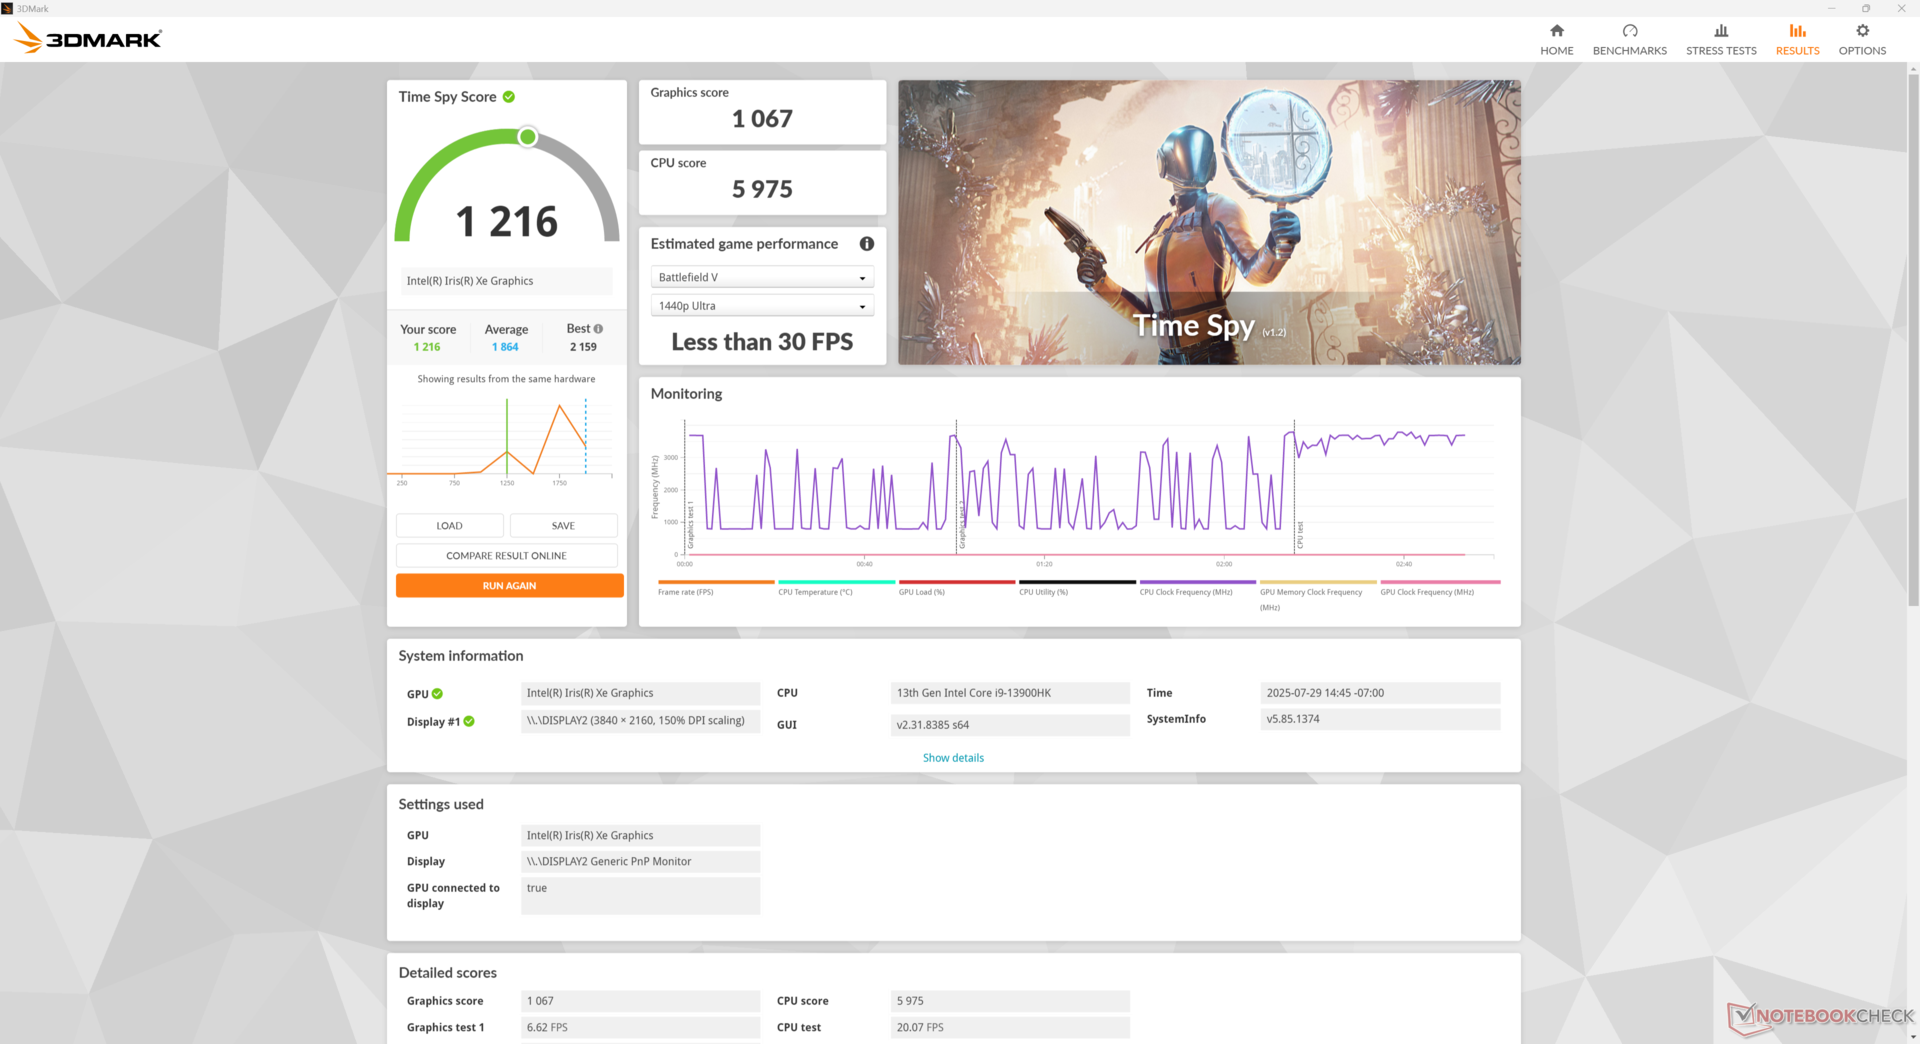
| 3DMark 11 Performance | 6274 pkt. | |
| 3DMark Cloud Gate Standard Score | 21353 pkt. | |
| 3DMark Fire Strike Score | 3302 pkt. | |
| 3DMark Time Spy Score | 1216 pkt. | |
Pomoc | ||
* ... im mniej tym lepiej
Cyberpunk 2077 ultra FPS Chart
| low | med. | high | ultra | |
|---|---|---|---|---|
| GTA V (2015) | 67.2 | 56.2 | 11.7 | 4.79 |
| Dota 2 Reborn (2015) | 84.4 | 68 | 46.1 | 44 |
| Final Fantasy XV Benchmark (2018) | 30.2 | 14.9 | 10.7 | |
| Strange Brigade (2018) | 67 | 23.4 | 20.1 | 17 |
| Baldur's Gate 3 (2023) | 12.9 | 10.7 | 9.2 | 9.2 |
| Cyberpunk 2077 (2023) | ||||
| F1 24 (2024) | 25.7 | 23.8 | 18 | 14.8 |
Emisje
Hałas systemowy
Poziom hałasu wentylatora jest nieco głośniejszy niż w większym GTi13 Ultra. Mimo to, pułap jest zauważalnie niższy niż w przypadku alternatyw, takich jak BOSGAME M4 Neo lub starszym i wolniejszym SEi12.
Hałas
| luz |
| 28 / 28 / 28 dB |
| obciążenie |
| 32.6 / 36.3 dB |
 | ||
30 dB cichy 40 dB(A) słyszalny 50 dB(A) irytujący |
||
min: | ||
| Beelink SEi13 Pro Iris Xe G7 96EUs, i9-13900HK, Crucial P3 Plus CT1000P3PSSD8 | Beelink GTI13 Ultra Iris Xe G7 96EUs, i9-13900HK, Crucial P5 Plus 1TB CT1000P5PSSD8 | Beelink SEi12 Core i5-1235U Iris Xe G7 80EUs, i5-1235U, Kingston NV1 SNVS/500GCN | HP Z2 Mini G1a Radeon 8060S, Ryzen AI Max+ PRO 395, Samsung PM9A1 MZVL22T0HBLB | BOSGAME M4 Neo Radeon 780M, R7 7840HS, Kingston OM8PGP41024N-A0 | |
|---|---|---|---|---|---|
| Noise | 5% | -1% | -37% | -23% | |
| wyłączone / środowisko * (dB) | 23.1 | 23.4 -1% | 23.3 -1% | 24.9 -8% | 24.3 -5% |
| Idle Minimum * (dB) | 28 | 26.5 5% | 27.8 1% | 32.1 -15% | 37.6 -34% |
| Idle Average * (dB) | 28 | 26.7 5% | 27.8 1% | 32.4 -16% | 37.9 -35% |
| Idle Maximum * (dB) | 28 | 28.5 -2% | 27.8 1% | 32.6 -16% | 38 -36% |
| Load Average * (dB) | 32.6 | 30.6 6% | 32 2% | 41.1 -26% | 40.8 -25% |
| Cyberpunk 2077 ultra * (dB) | 34.3 | 32.5 5% | 67 -95% | 40.18 -17% | |
| Load Maximum * (dB) | 36.3 | 30.8 15% | 39.2 -8% | 67.3 -85% | 40.2 -11% |
| Witcher 3 ultra * (dB) | 34.1 | 70 |
* ... im mniej tym lepiej
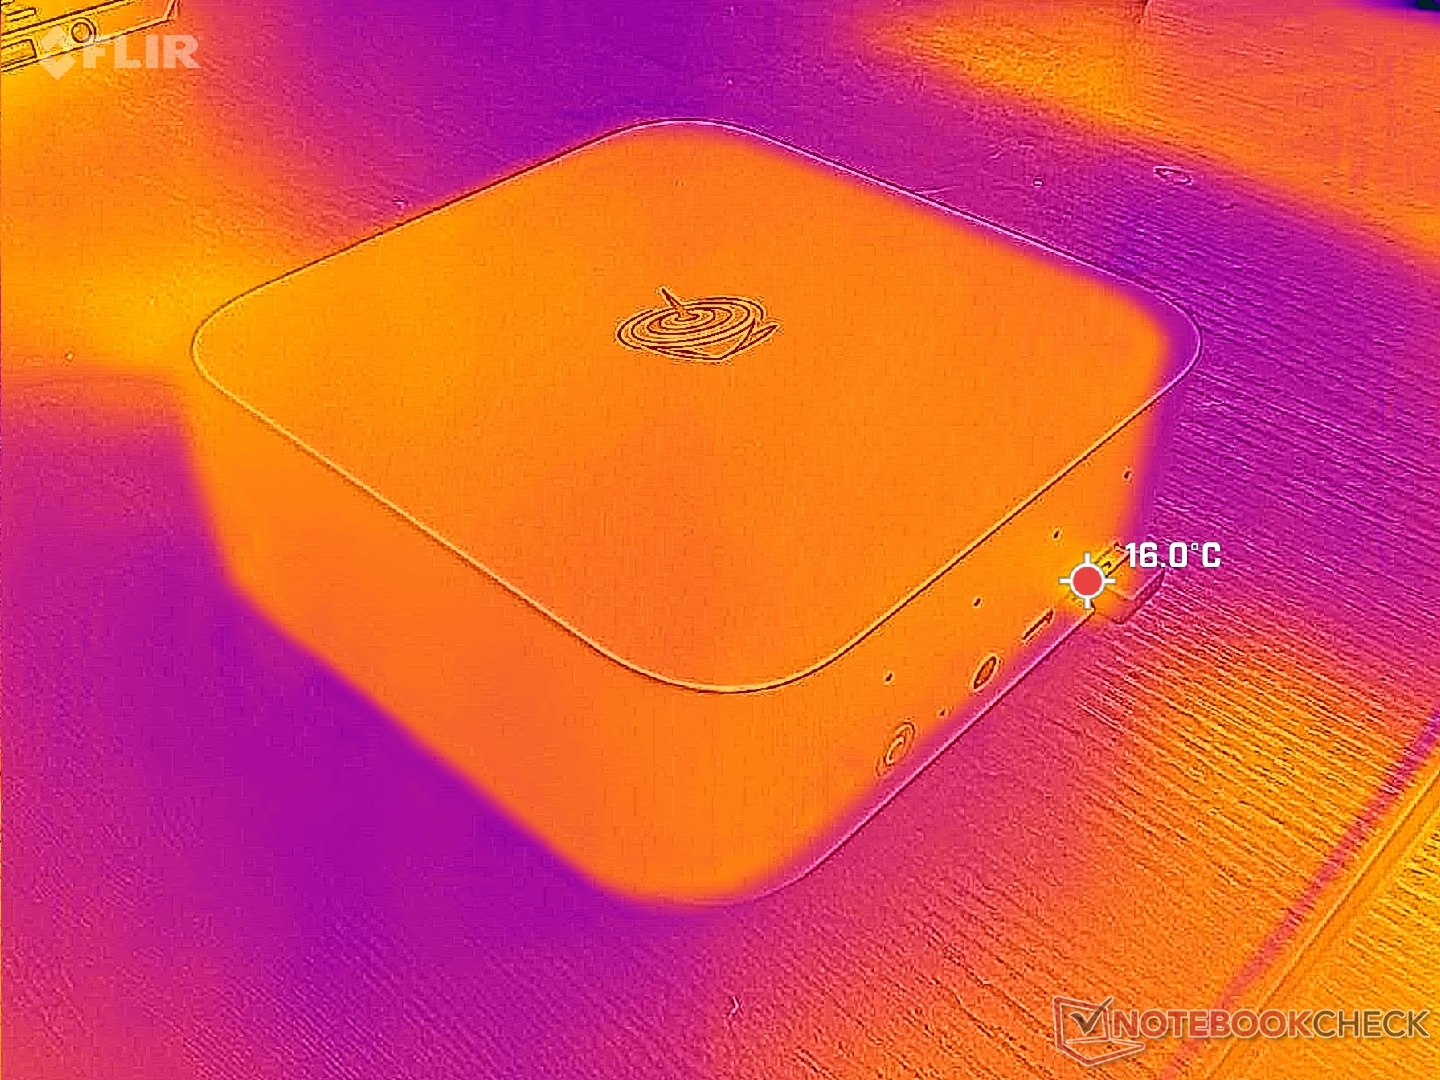
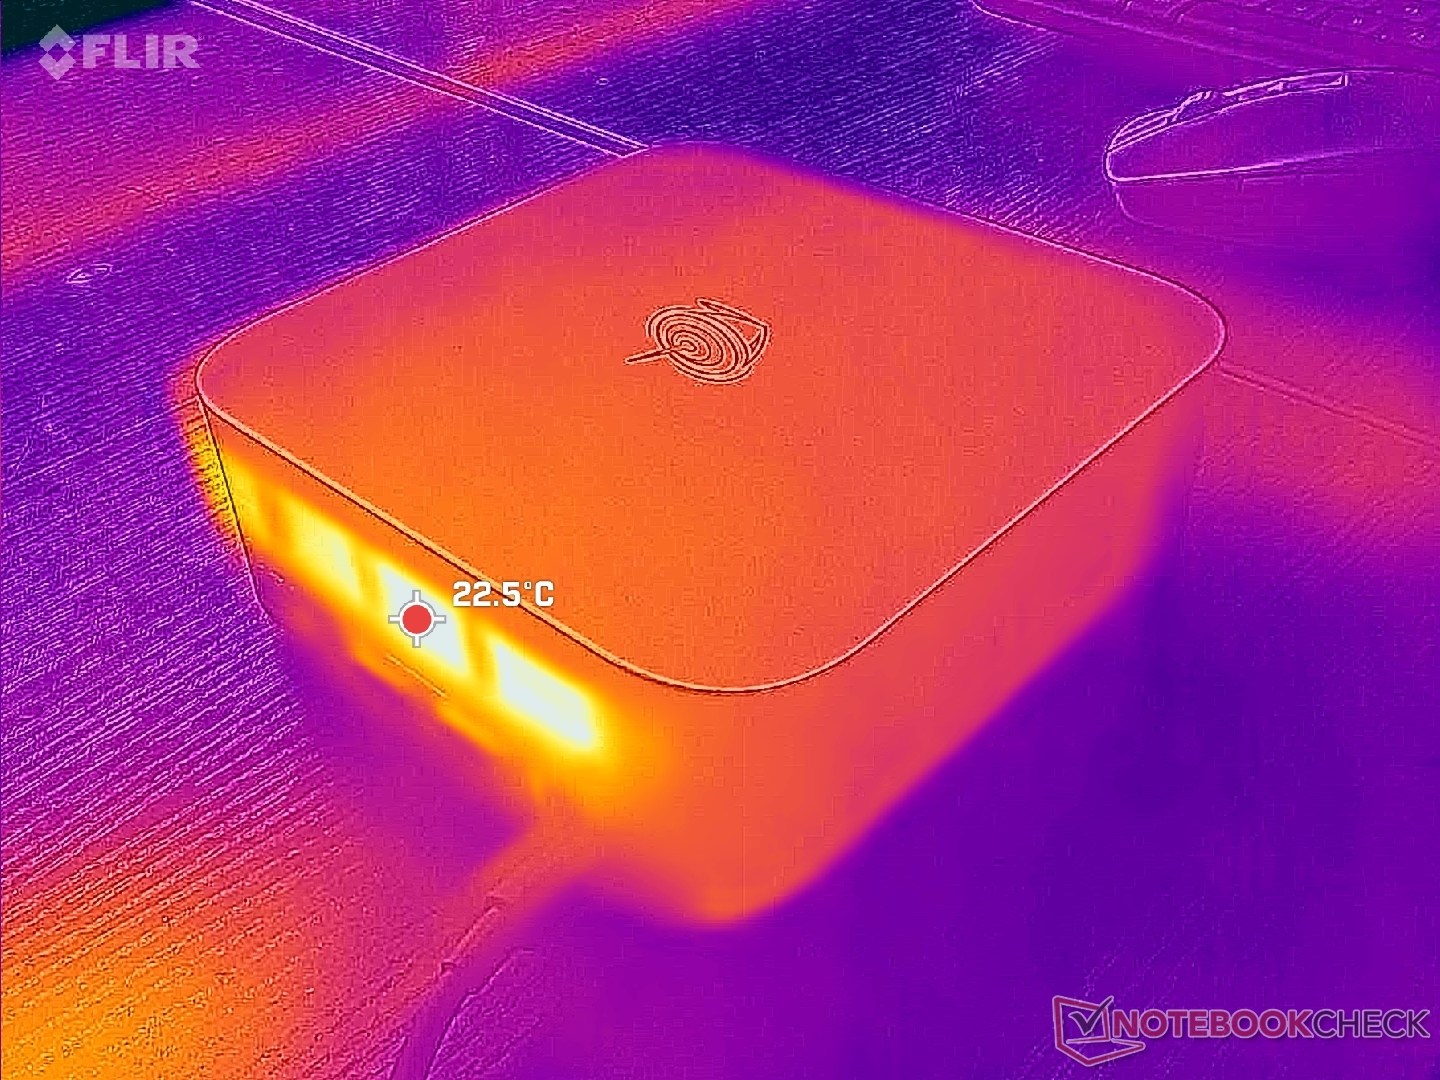
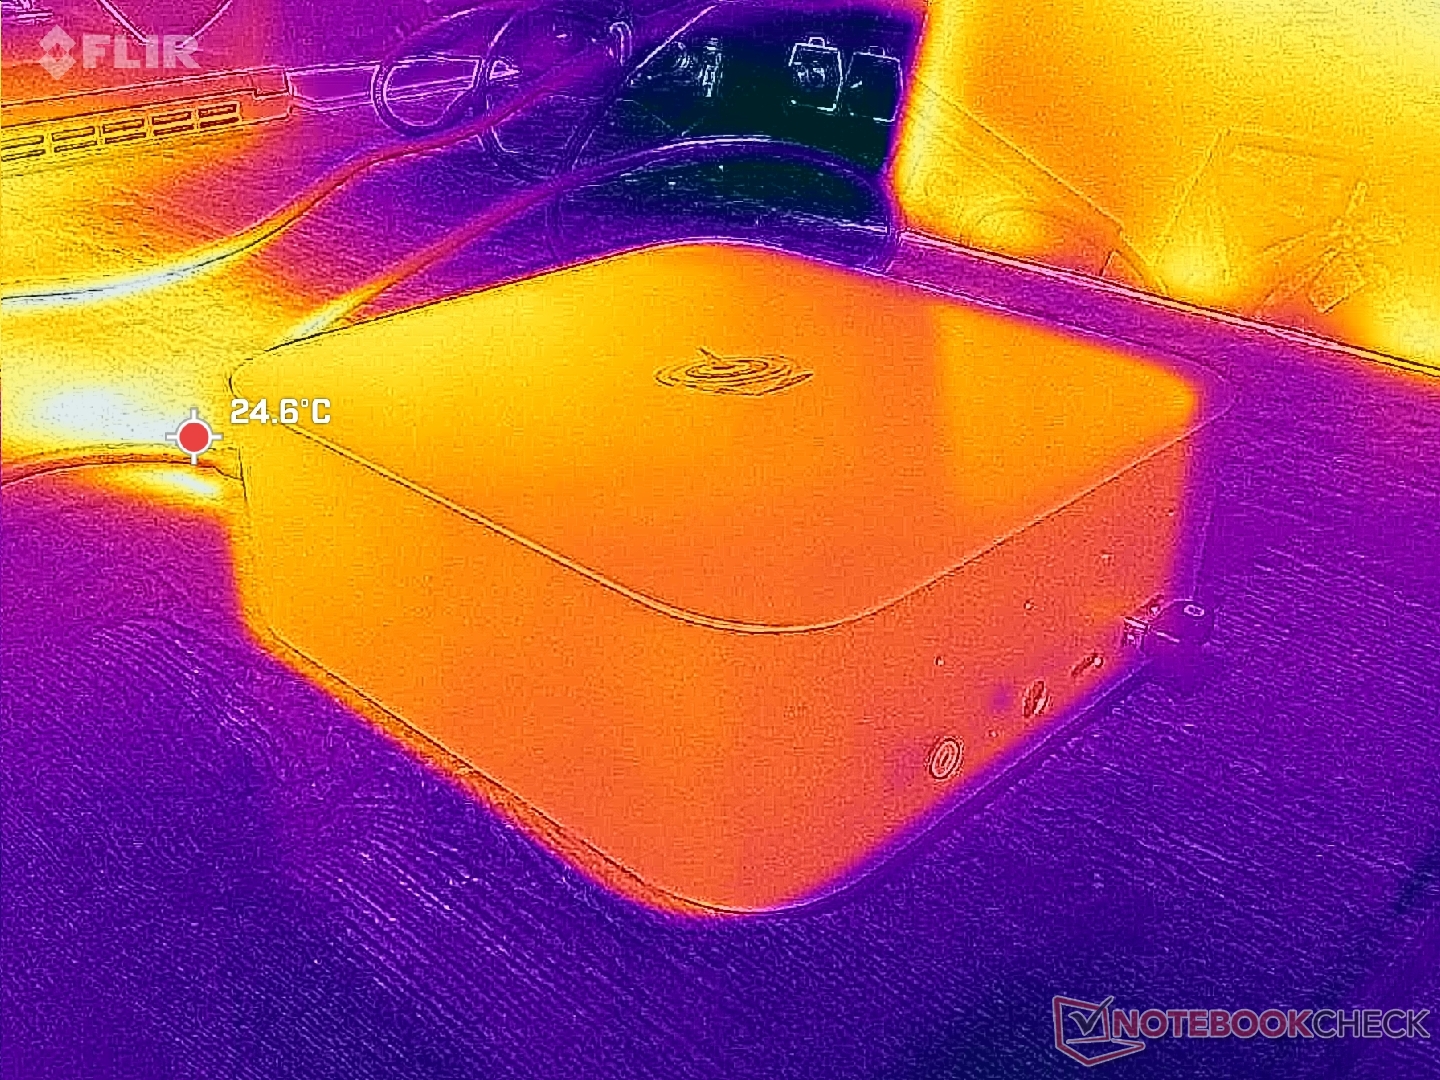
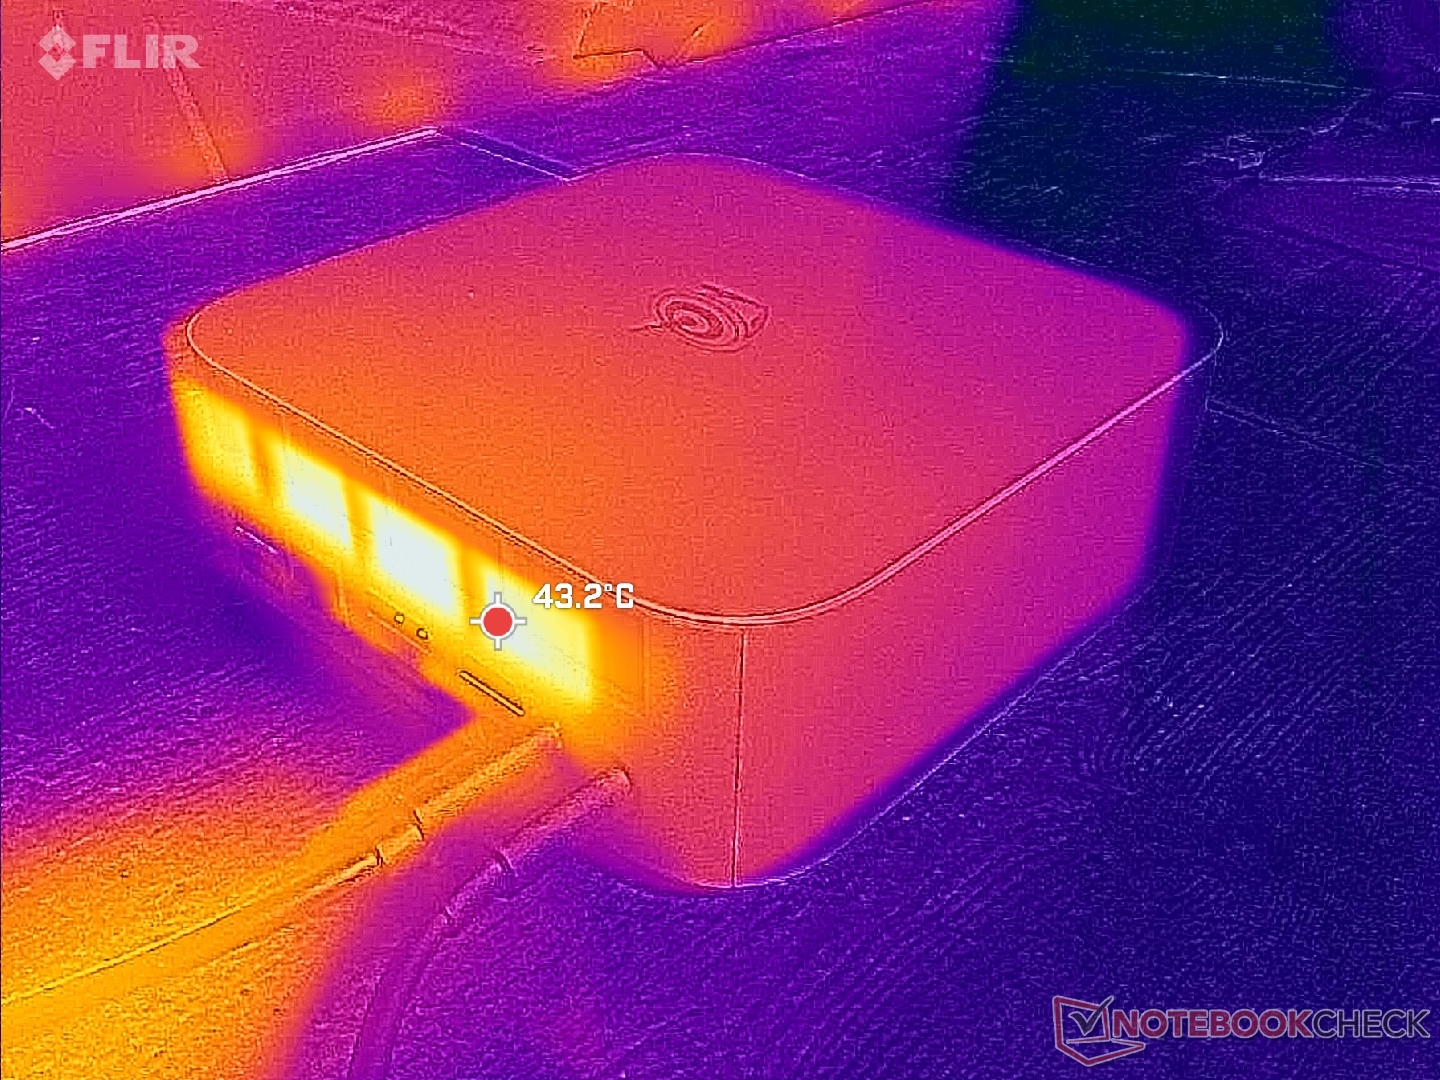
Temperatura
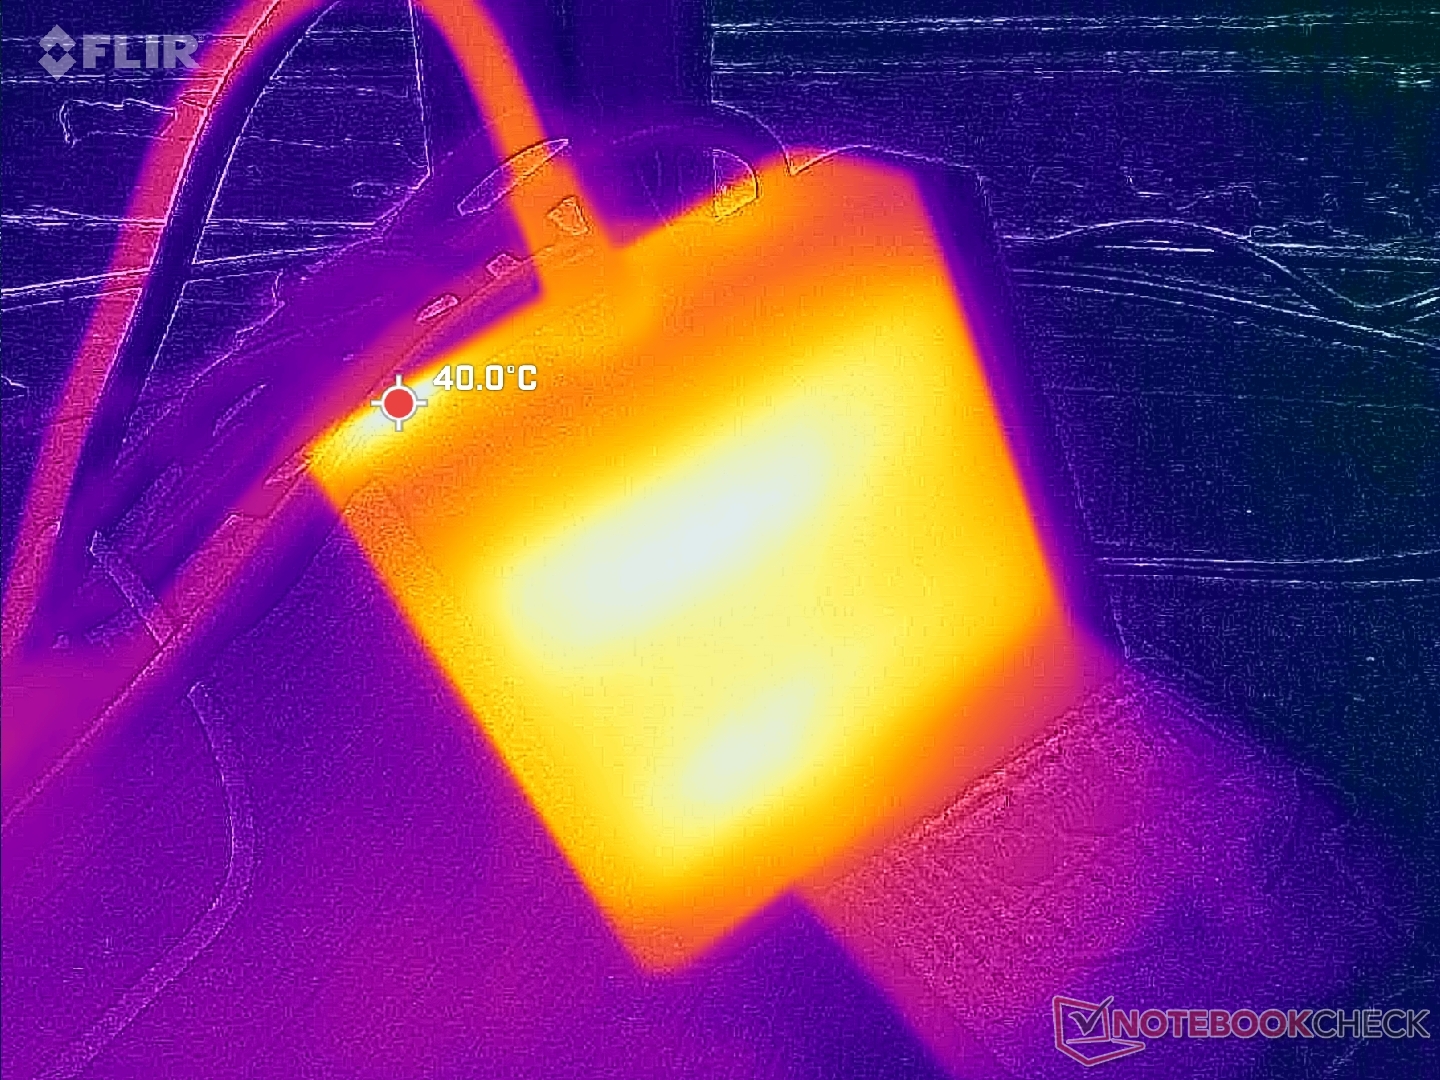
Ciepło odpadowe ucieka z tyłu, podczas gdy świeże powietrze dostaje się od dołu. Górna powierzchnia staje się ciepła, ale nigdy nie jest nieprzyjemnie gorąca, pomimo kilku kratek wentylacyjnych.
Test warunków skrajnych
Procesor stabilizuje się na poziomie 3,5 GHz, 44 W i 60 C podczas stresu Prime95, co jest w rzeczywistości chłodniejsze niż to, co zaobserwowaliśmy na GTI13 Ultra o kilka stopni.
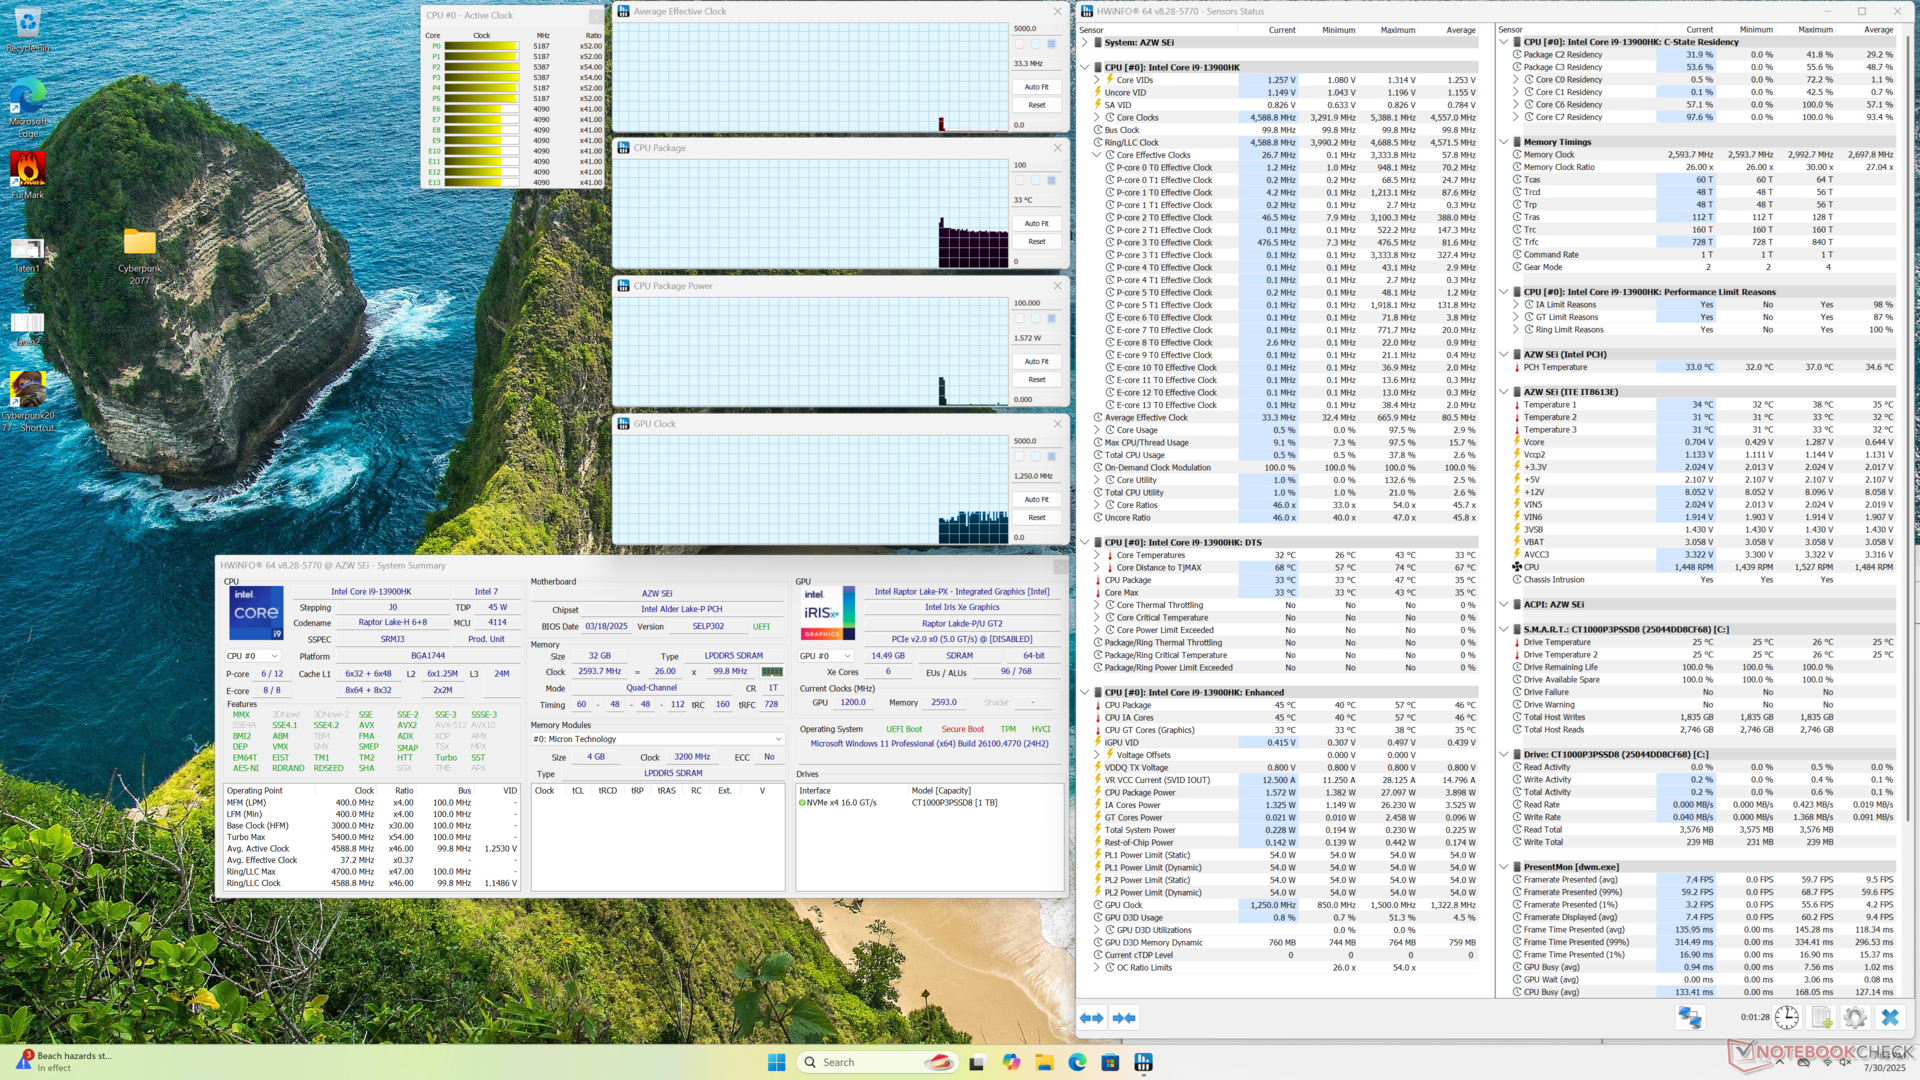
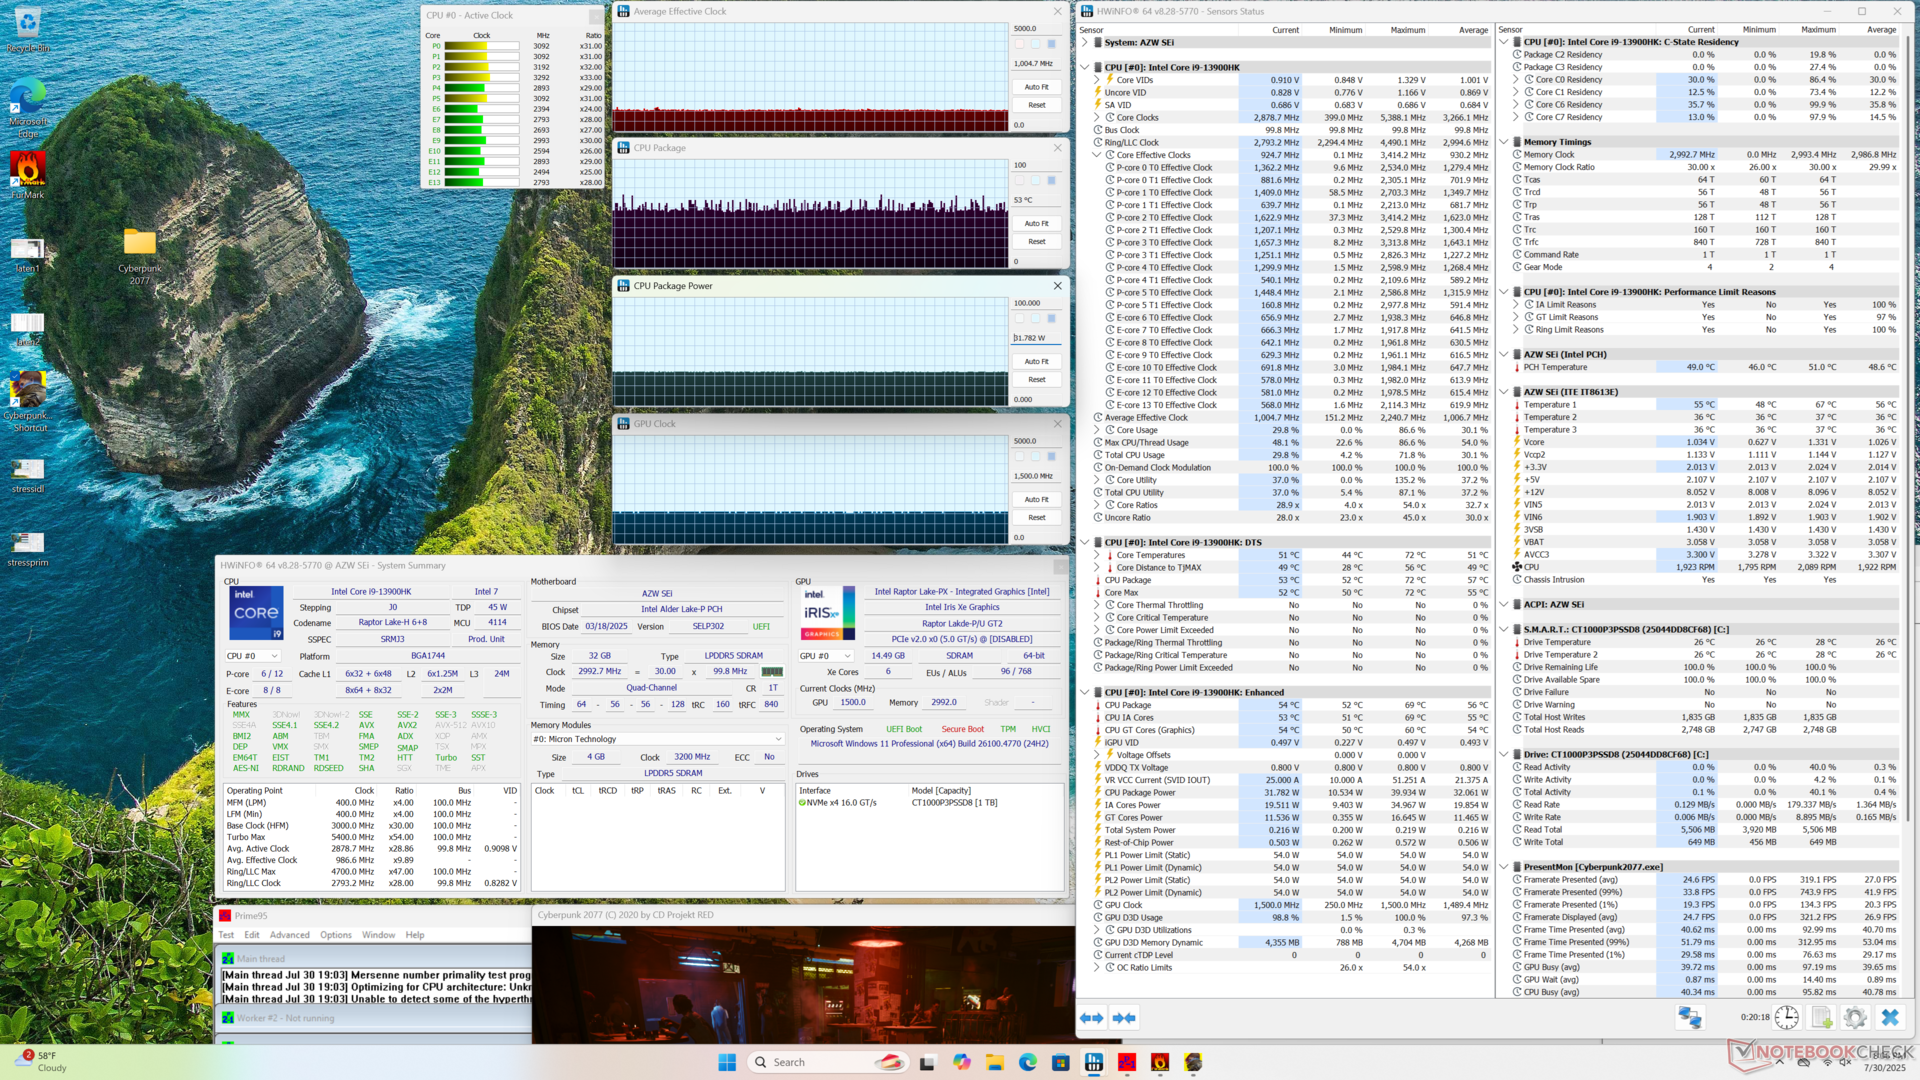

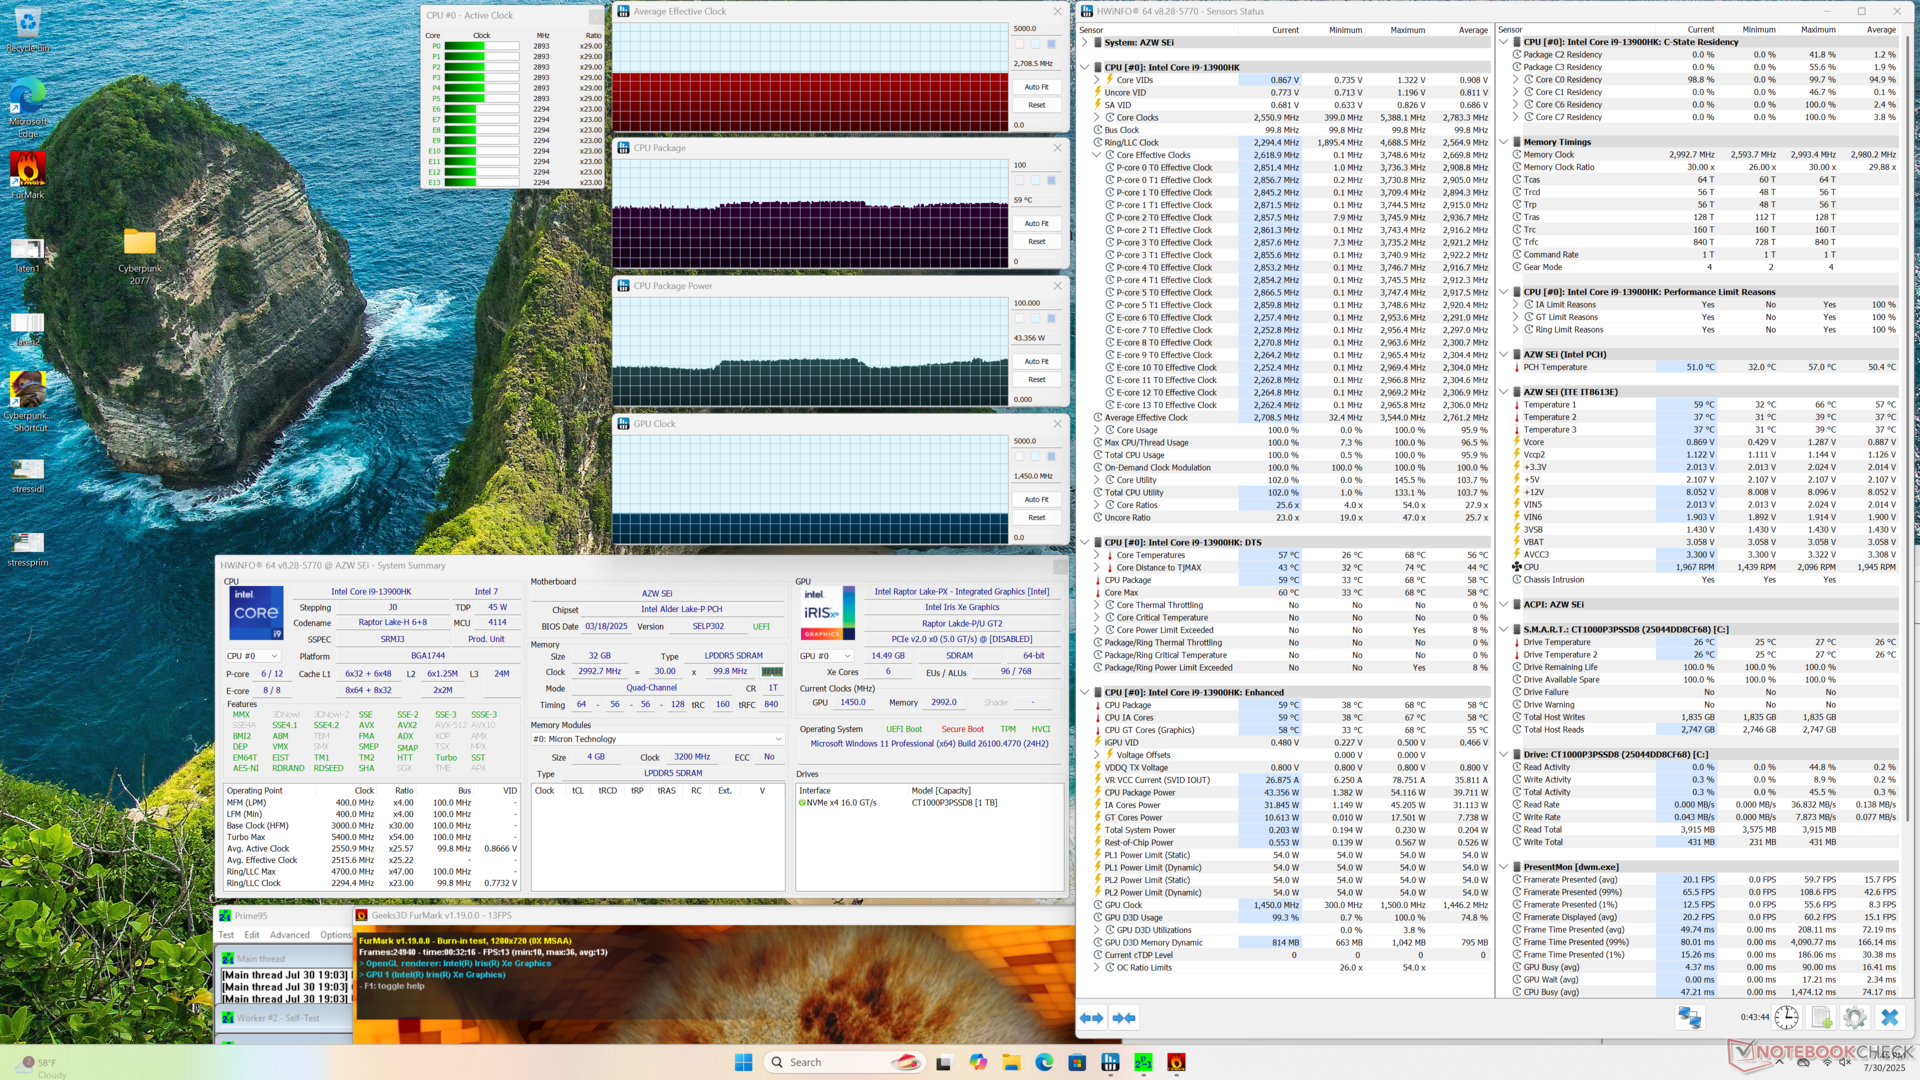
| Średnie taktowanie CPU (GHz) | Taktowanie GPU (MHz) | Średnia temperatura CPU (°C) | |
| System bezczynności | -- | -- | 33 |
| Prime95 Stress | 3.5 | -- | 60 |
| Prime95 + FurMark Stress | 2.7 | 1450 | 59 |
| Cyberpunk 2077 Stress | 1.0 | 1500 | 53 |
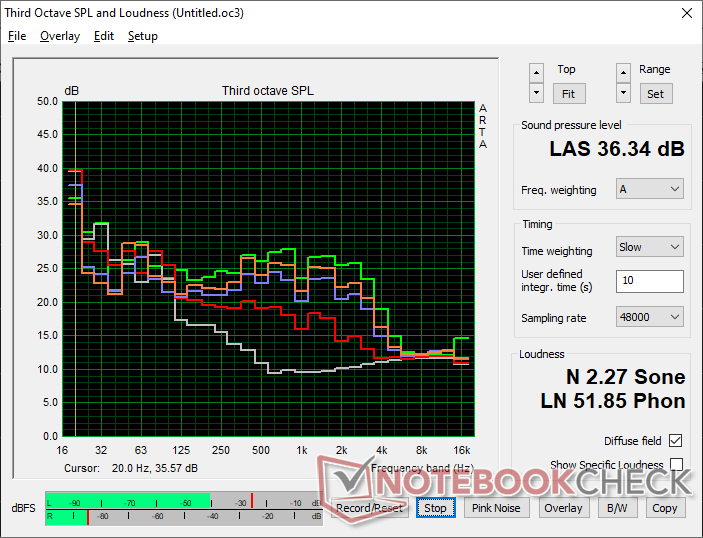
Głośniki
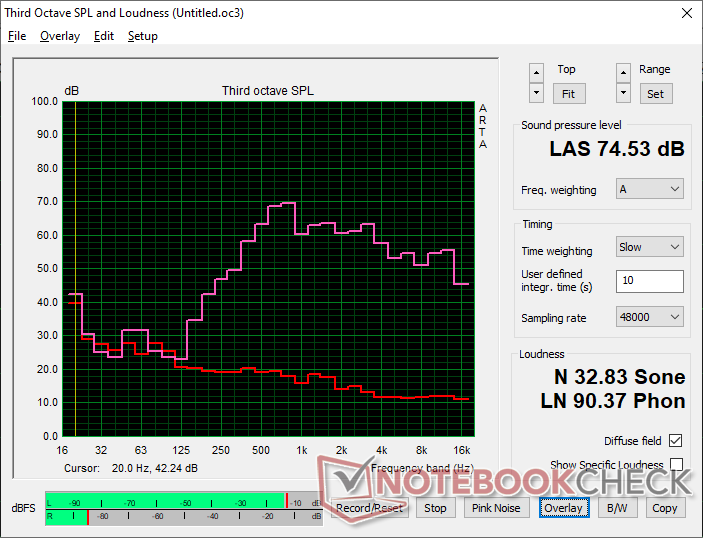
Beelink SEi13 Pro analiza dźwięku
(±) | głośność głośnika jest średnia, ale dobra (74.5 dB)
Bas 100 - 315 Hz
(-) | prawie brak basu - średnio 18.9% niższa od mediany
(±) | liniowość basu jest średnia (12.7% delta do poprzedniej częstotliwości)
Średnie 400 - 2000 Hz
(±) | wyższe średnie - średnio 7.9% wyższe niż mediana
(±) | liniowość środka jest średnia (11.9% delta do poprzedniej częstotliwości)
Wysokie 2–16 kHz
(+) | zrównoważone maksima - tylko 3.5% od mediany
(±) | liniowość wysokich wartości jest średnia (8.1% delta do poprzedniej częstotliwości)
Ogólnie 100 - 16.000 Hz
(±) | liniowość ogólnego dźwięku jest średnia (26.7% różnicy w stosunku do mediany)
W porównaniu do tej samej klasy
» 71% wszystkich testowanych urządzeń w tej klasie było lepszych, 4% podobnych, 25% gorszych
» Najlepszy miał deltę 13%, średnia wynosiła ###średnia###%, najgorsza wynosiła 64%
W porównaniu do wszystkich testowanych urządzeń
» 82% wszystkich testowanych urządzeń było lepszych, 4% podobnych, 14% gorszych
» Najlepszy miał deltę 4%, średnia wynosiła ###średnia###%, najgorsza wynosiła 134%
Apple MacBook Pro 16 2021 M1 Pro analiza dźwięku
(+) | głośniki mogą odtwarzać stosunkowo głośno (84.7 dB)
Bas 100 - 315 Hz
(+) | dobry bas - tylko 3.8% od mediany
(+) | bas jest liniowy (5.2% delta do poprzedniej częstotliwości)
Średnie 400 - 2000 Hz
(+) | zbalansowane środki średnie - tylko 1.3% od mediany
(+) | średnie są liniowe (2.1% delta do poprzedniej częstotliwości)
Wysokie 2–16 kHz
(+) | zrównoważone maksima - tylko 1.9% od mediany
(+) | wzloty są liniowe (2.7% delta do poprzedniej częstotliwości)
Ogólnie 100 - 16.000 Hz
(+) | ogólny dźwięk jest liniowy (4.6% różnicy w stosunku do mediany)
W porównaniu do tej samej klasy
» 0% wszystkich testowanych urządzeń w tej klasie było lepszych, 0% podobnych, 100% gorszych
» Najlepszy miał deltę 5%, średnia wynosiła ###średnia###%, najgorsza wynosiła 45%
W porównaniu do wszystkich testowanych urządzeń
» 0% wszystkich testowanych urządzeń było lepszych, 0% podobnych, 100% gorszych
» Najlepszy miał deltę 4%, średnia wynosiła ###średnia###%, najgorsza wynosiła 134%
Zarządzanie energią
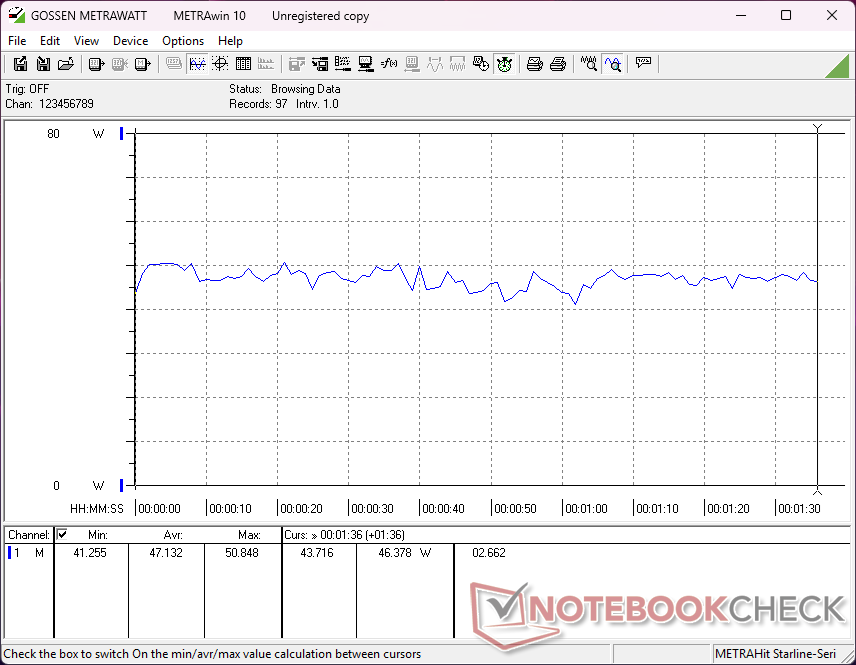
Zużycie energii
System wymaga mniej energii niż GTi13 Ultra pod obciążeniem, ponieważ procesor domyślnie osiąga maksymalną moc 44 W w porównaniu do 55 W w tym drugim przypadku. Zużycie energii jest również niższe niż w przypadku BOSGAME M4ale ten drugi oferuje szybszą wydajność graficzną, aby to zrekompensować.

| wyłączony / stan wstrzymania | |
| luz | |
| obciążenie |
|
Legenda:
min: | |
| Beelink SEi13 Pro i9-13900HK, Iris Xe G7 96EUs, Crucial P3 Plus CT1000P3PSSD8, , x, | Beelink GTI13 Ultra i9-13900HK, Iris Xe G7 96EUs, Crucial P5 Plus 1TB CT1000P5PSSD8, , x, | Beelink SEi12 Core i5-1235U i5-1235U, Iris Xe G7 80EUs, Kingston NV1 SNVS/500GCN, , x, | HP Z2 Mini G1a Ryzen AI Max+ PRO 395, Radeon 8060S, Samsung PM9A1 MZVL22T0HBLB, , x, | BOSGAME M4 Neo R7 7840HS, Radeon 780M, Kingston OM8PGP41024N-A0, , x, | |
|---|---|---|---|---|---|
| Power Consumption | -31% | -17% | -69% | 1% | |
| Idle Minimum * (Watt) | 14.5 | 15.7 -8% | 15.8 -9% | 7.1 51% | 7.6 48% |
| Idle Average * (Watt) | 14.9 | 16.5 -11% | 16.8 -13% | 9.5 36% | 9.1 39% |
| Idle Maximum * (Watt) | 15.8 | 16.5 -4% | 17 -8% | 13.8 13% | 11.1 30% |
| Load Average * (Watt) | 47.1 | 77.3 -64% | 54.4 -15% | 76.7 -63% | 67.2 -43% |
| Cyberpunk 2077 ultra external monitor * (Watt) | 53.4 | 91.9 -72% | 195.1 -265% | 81.3 -52% | |
| Load Maximum * (Watt) | 85.7 | 106 -24% | 119.1 -39% | 245.4 -186% | 98.4 -15% |
| Witcher 3 ultra * (Watt) | 50.7 |
* ... im mniej tym lepiej
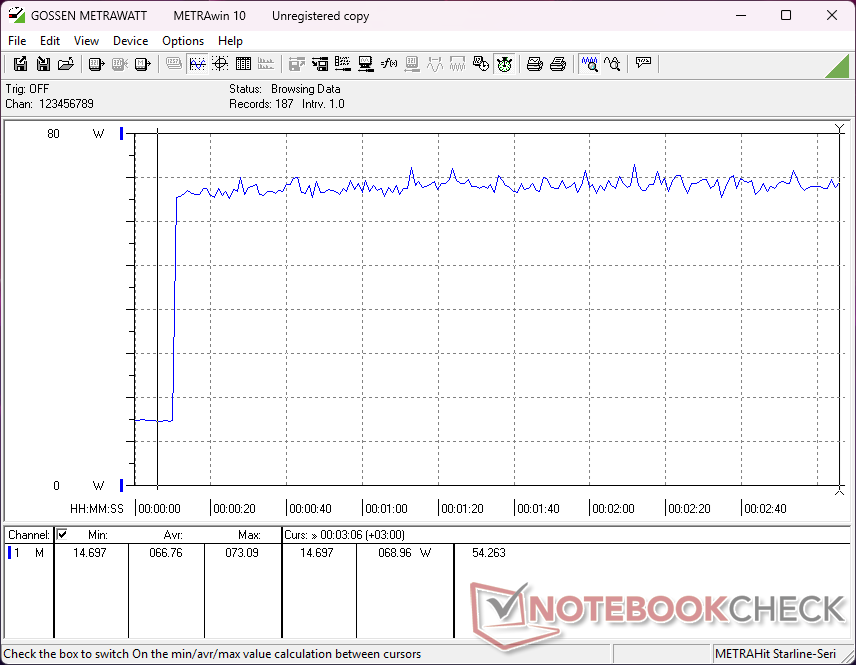
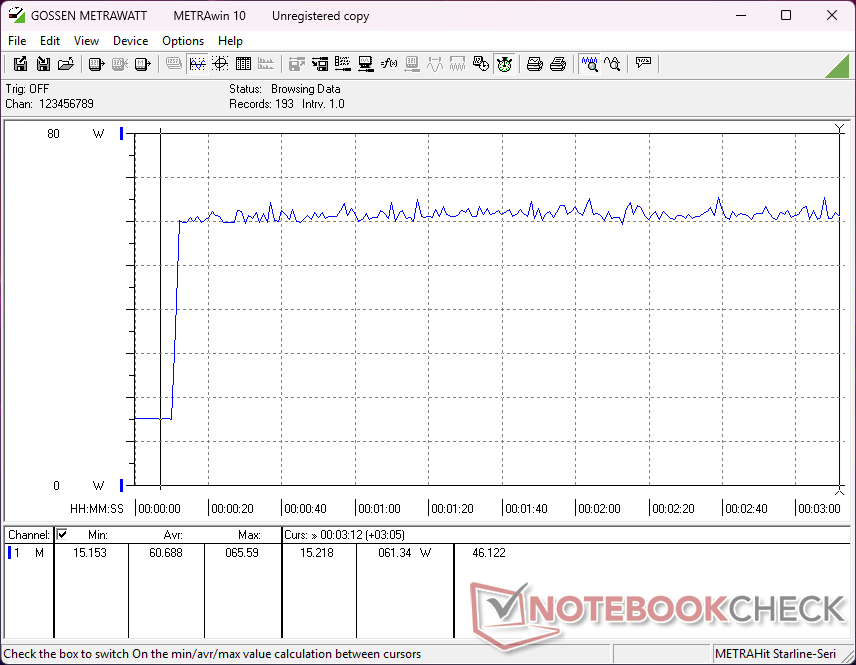
Power Consumption Cyberpunk / Stress Test
Power Consumption external Monitor
Ocena Notebookcheck
Beelink SEi13 Pro
- 01/08/2025 v8
Allen Ngo
 Total Sustainability Score:
 Potencjalni konkurenci w porównaniu
Obraz | Model / recenzja | Cena | Waga | Wysokość | Ekran |
|---|---|---|---|---|---|
1. 71% 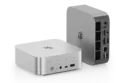 | Beelink SEi13 Pro Intel Core i9-13900HK ⎘ Intel Iris Xe Graphics G7 96EUs ⎘ 32 GB Pamięć, 1024 GB SSD | Amazon: 1. $699.00 Beelink SEi13 Pro Mini PC, I... 2. $799.00 Beelink SEi13 Pro Mini PC W-... 3. $799.00 Beelink SEi13 Pro Mini PC, I... Cena katalogowa: 540 USD | 808 g | 44.7 mm | x |
2. 79.9% 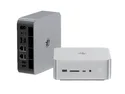 | Beelink GTI13 Ultra Intel Core i9-13900HK ⎘ Intel Iris Xe Graphics G7 96EUs ⎘ 32 GB Pamięć, 1024 GB SSD | Amazon: Cena katalogowa: 600 USD | 1.3 kg | 55.8 mm | x |
3.  | Beelink SEi12 Core i5-1235U Intel Core i5-1235U ⎘ Intel Iris Xe Graphics G7 80EUs ⎘ 16 GB Pamięć, 500 GB SSD | Amazon: 1. $559.00 Beelink EQI12 Mini PC with I... 2. $509.00 Beelink EQI12 Mini PC,Intel ... 3. $529.00 Beelink EQI13 Mini PC,Intel ... Cena katalogowa: 460 USD | 465 g | 42 mm | x |
4. 78.7%  | HP Z2 Mini G1a AMD Ryzen AI Max+ PRO 395 ⎘ AMD Radeon 8060S ⎘ 64 GB Pamięć, 2048 GB SSD | Amazon: 1. $1,792.05 HP Z2 Mini G1a Workstation -... 2. $2,299.99 HP Z2 Mini G1a Workstation B... 3. $5,399.00 HP Z2 Mini G1a Workstation -... Cena katalogowa: 3175 EUR | 2.6 kg | 85.5 mm | x |
5. 74% 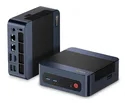 | BOSGAME M4 Neo AMD Ryzen 7 7840HS ⎘ AMD Radeon 780M ⎘ 32 GB Pamięć, 1024 GB SSD | Amazon: Cena katalogowa: 389 EUR | 560 g | 42 mm | x |
6.  | BMAX B9 Power Intel Core i9-12900HK ⎘ Intel Iris Xe Graphics G7 96EUs ⎘ 32 GB Pamięć, 1024 GB SSD | Amazon: Cena katalogowa: 540 EUR | 427 g | 52 mm | x |
Przezroczystość
Wyboru urządzeń do recenzji dokonuje nasza redakcja. Próbka testowa została udostępniona autorowi jako pożyczka od producenta lub sprzedawcy detalicznego na potrzeby tej recenzji. Pożyczkodawca nie miał wpływu na tę recenzję, producent nie otrzymał też kopii tej recenzji przed publikacją. Nie było obowiązku publikowania tej recenzji. Jako niezależna firma medialna, Notebookcheck nie podlega władzy producentów, sprzedawców detalicznych ani wydawców.
Tak testuje Notebookcheck
Każdego roku Notebookcheck niezależnie sprawdza setki laptopów i smartfonów, stosując standardowe procedury, aby zapewnić porównywalność wszystkich wyników. Od około 20 lat stale rozwijamy nasze metody badawcze, ustanawiając przy tym standardy branżowe. W naszych laboratoriach testowych doświadczeni technicy i redaktorzy korzystają z wysokiej jakości sprzętu pomiarowego. Testy te obejmują wieloetapowy proces walidacji. Nasz kompleksowy system ocen opiera się na setkach uzasadnionych pomiarów i benchmarków, co pozwala zachować obiektywizm.
