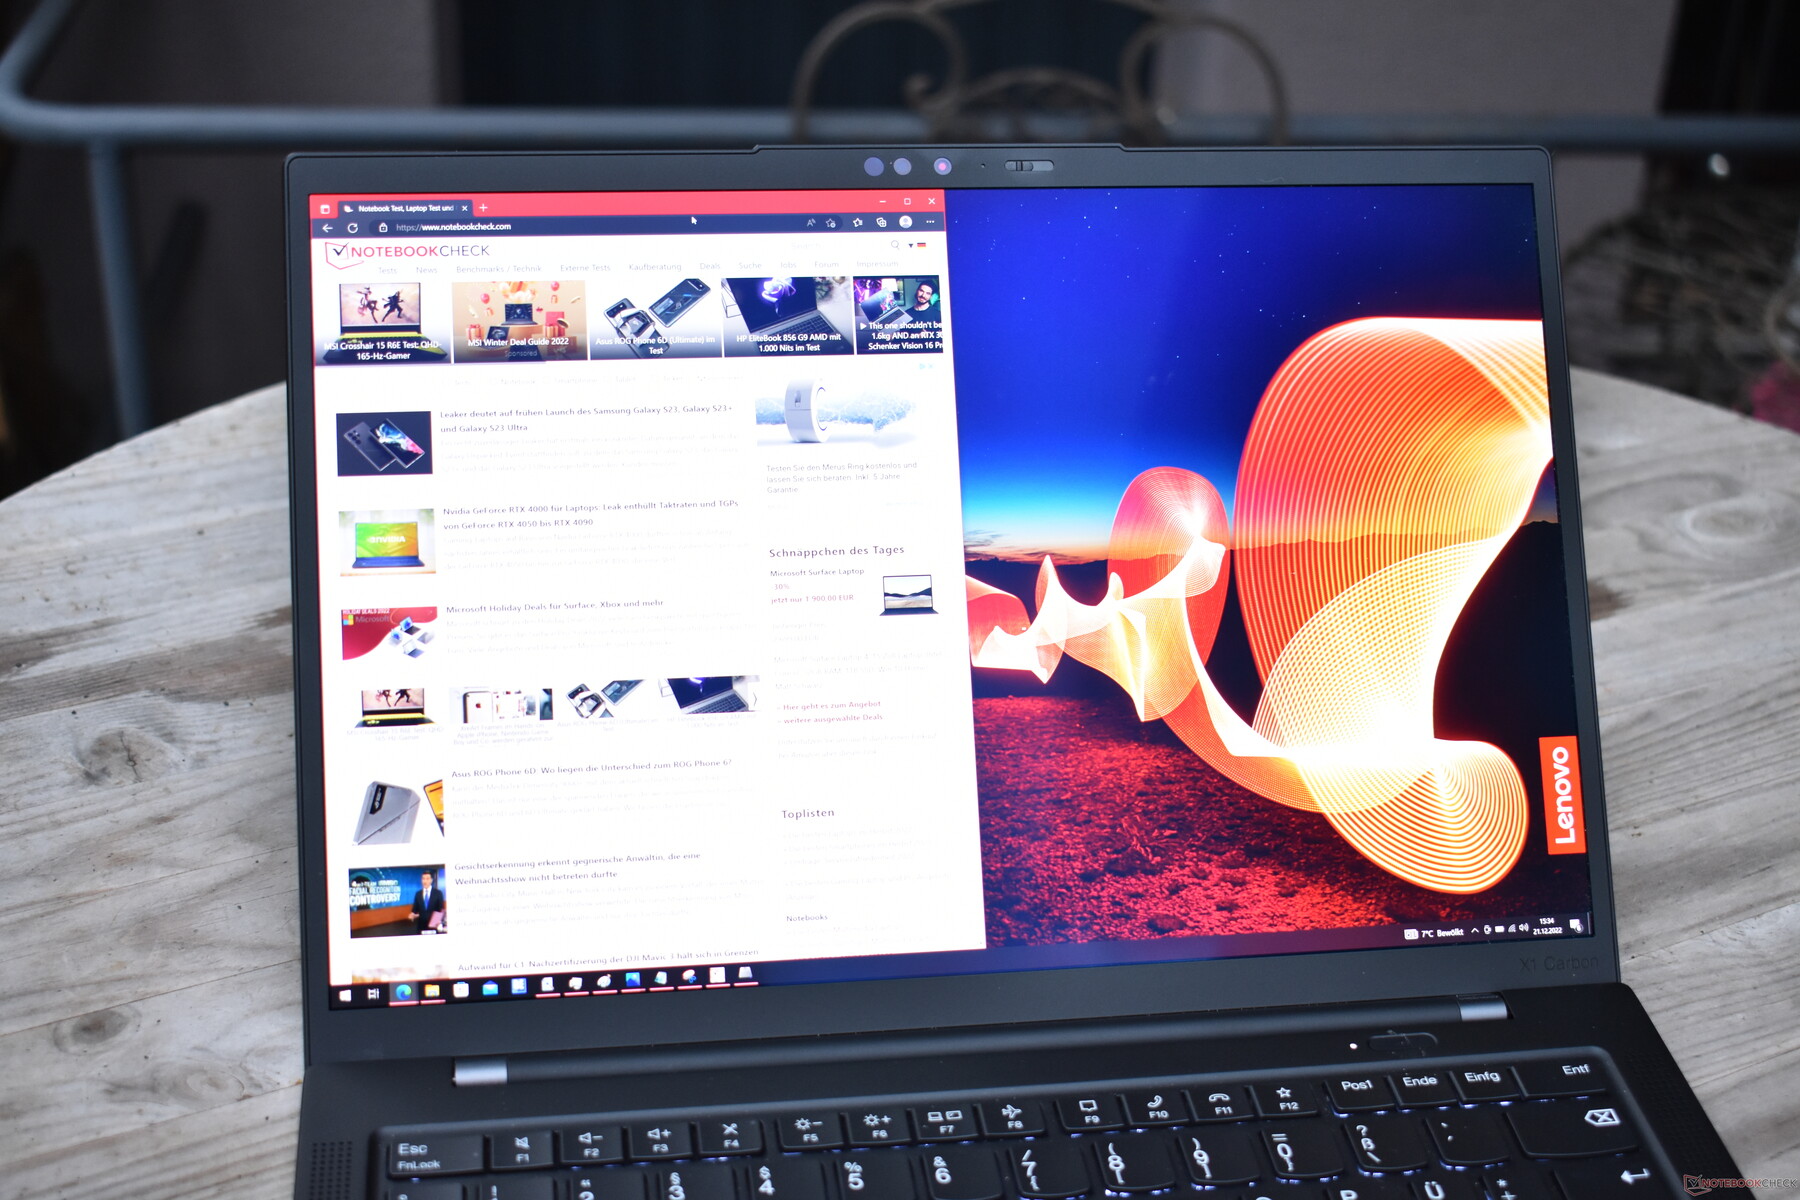
Recenzja laptopa Lenovo ThinkPad X1 Carbon G10 30th Anniversary: Edycja OLED z problemami z wytrzymałością
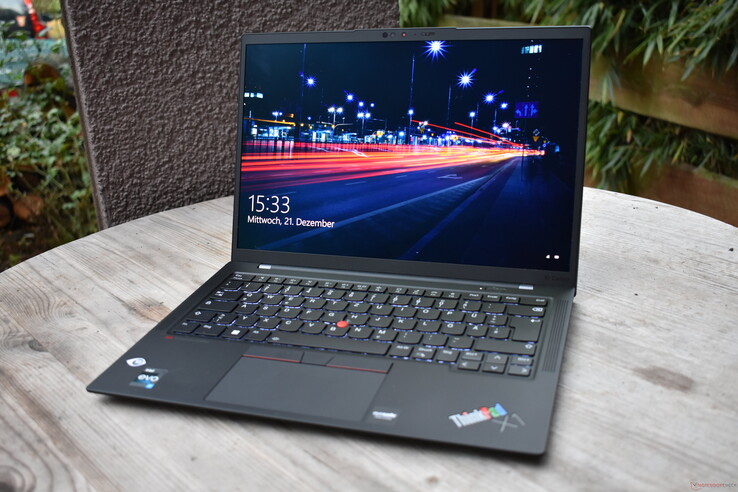
30 lat to wieczność w branży technologicznej, a także długi okres w życiu człowieka. Lenovo świętuje ten kamień milowy specjalnym modelem: Lenovo ThinkPad X1 Carbon G10 30th Anniversary Edition, który jest przedmiotem dzisiejszej recenzji.
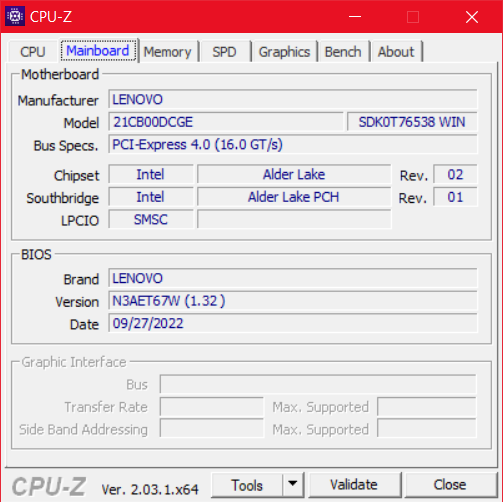
Oczywiście nie jest to pierwszy ThinkPad X1 Carbon Gen 10, który trafił pod naszą lupę, dlatego też jest to aktualizacja testów. Pod względem specyfikacji, omawiany model jest szczególnie interesujący ze względu na ekran OLED. Interesujące będzie również to, czy Lenovo poprawiło wydajność procesorów Intel Alder Lake P28od czasu pierwszej recenzji ThinkPada X1 Carbon G10, wtedy z procesorem i5.
Potencjalni konkurenci w porównaniu
Ocena | Data | Model | Waga | Wysokość | Rozmiar | Rezolucja | Cena |
|---|---|---|---|---|---|---|---|
| 88.9 % v7 (old) | 12/2022 | Lenovo ThinkPad X1 Carbon G10 21CB00DCGE i7-1260P, Iris Xe G7 96EUs | 1.2 kg | 15.36 mm | 14.00" | 2880x1800 | |
| 90.2 % v7 (old) | Lenovo ThinkPad X1 Carbon G10 21CC001RGE i5-1250P, Iris Xe G7 80EUs | 1.2 kg | 15.36 mm | 14.00" | 1920x1200 | ||
| 90.3 % v7 (old) | Lenovo ThinkPad X1 Carbon G9-20XWCTO1WW i7-1165G7, Iris Xe G7 96EUs | 1.2 kg | 14.9 mm | 14.00" | 3840x2400 | ||
| 88.8 % v7 (old) | 10/2022 | Lenovo ThinkPad Z13 G1-21D20016GE R7 PRO 6860Z, Radeon 680M | 1.3 kg | 14 mm | 13.30" | 2880x1800 | |
| 91 % v7 (old) | HP Elite Dragonfly G3 i7-1265U, Iris Xe G7 96EUs | 1.2 kg | 16.3 mm | 13.50" | 1920x1280 | ||
| 89.8 % v7 (old) | Dell Latitude 9430 2-in-1 i7-1265U, Iris Xe G7 96EUs | 1.5 kg | 13.94 mm | 14.00" | 2560x1600 |
Różnice w stosunku do modelu zwykłego
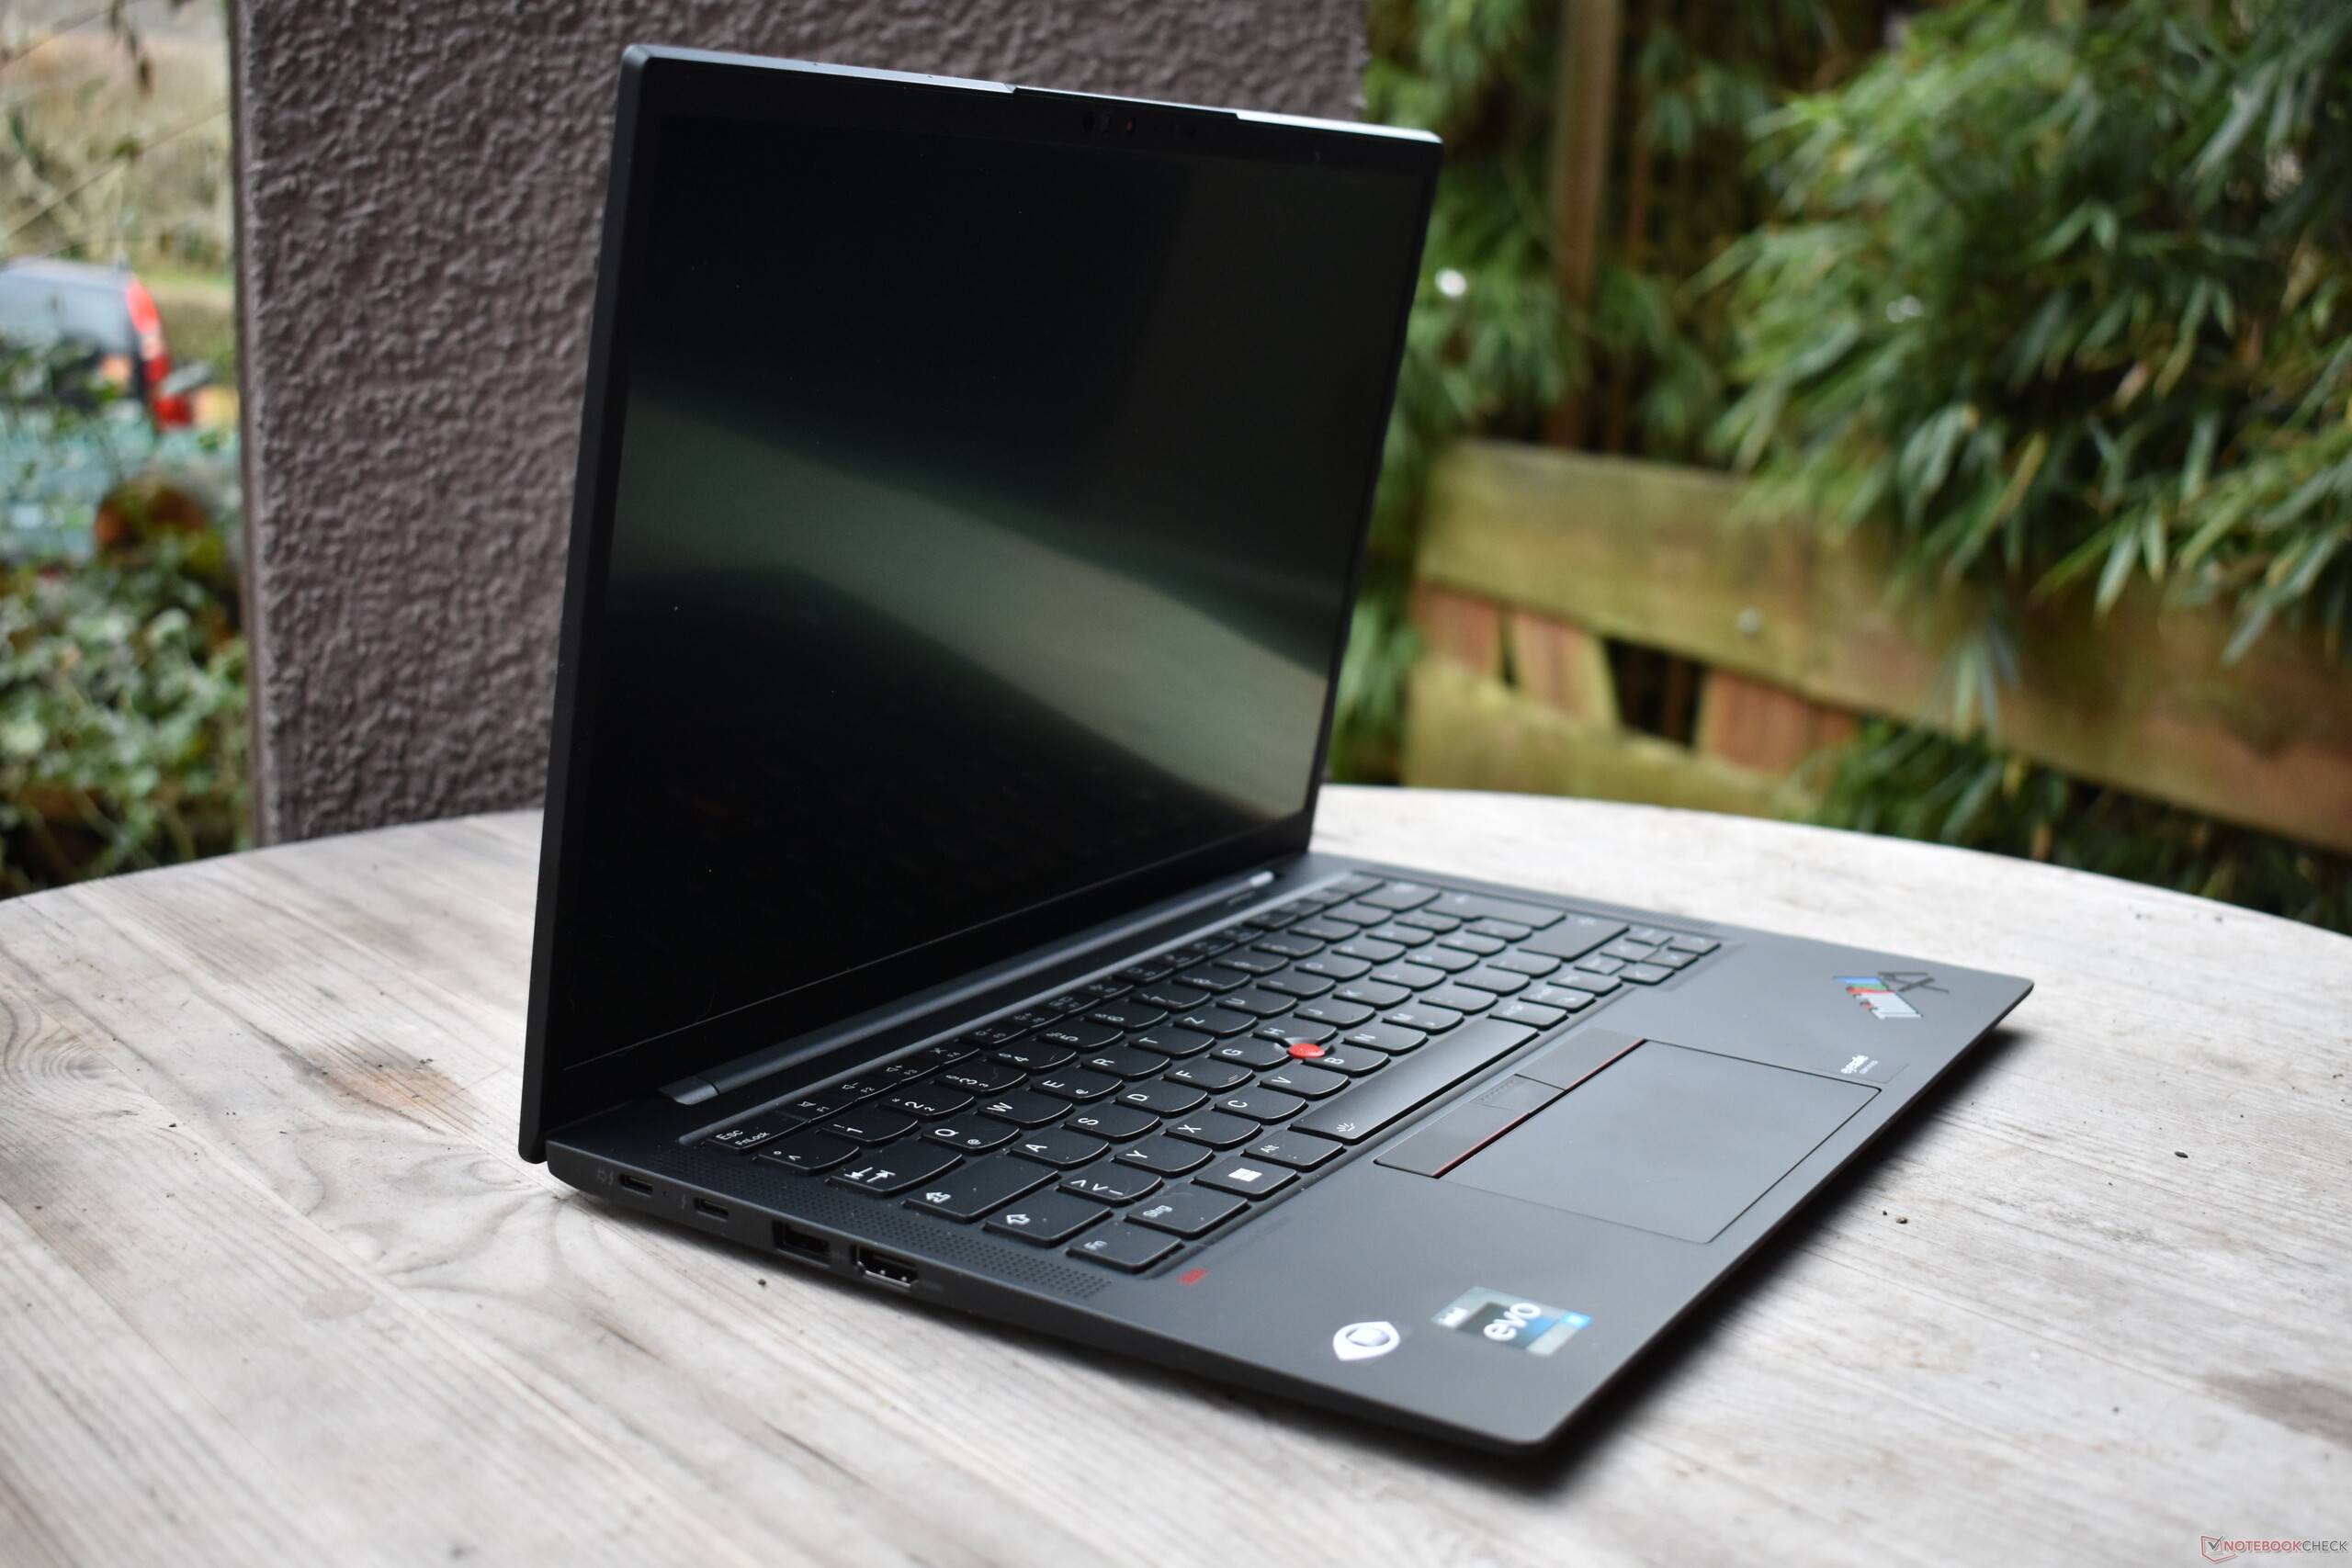
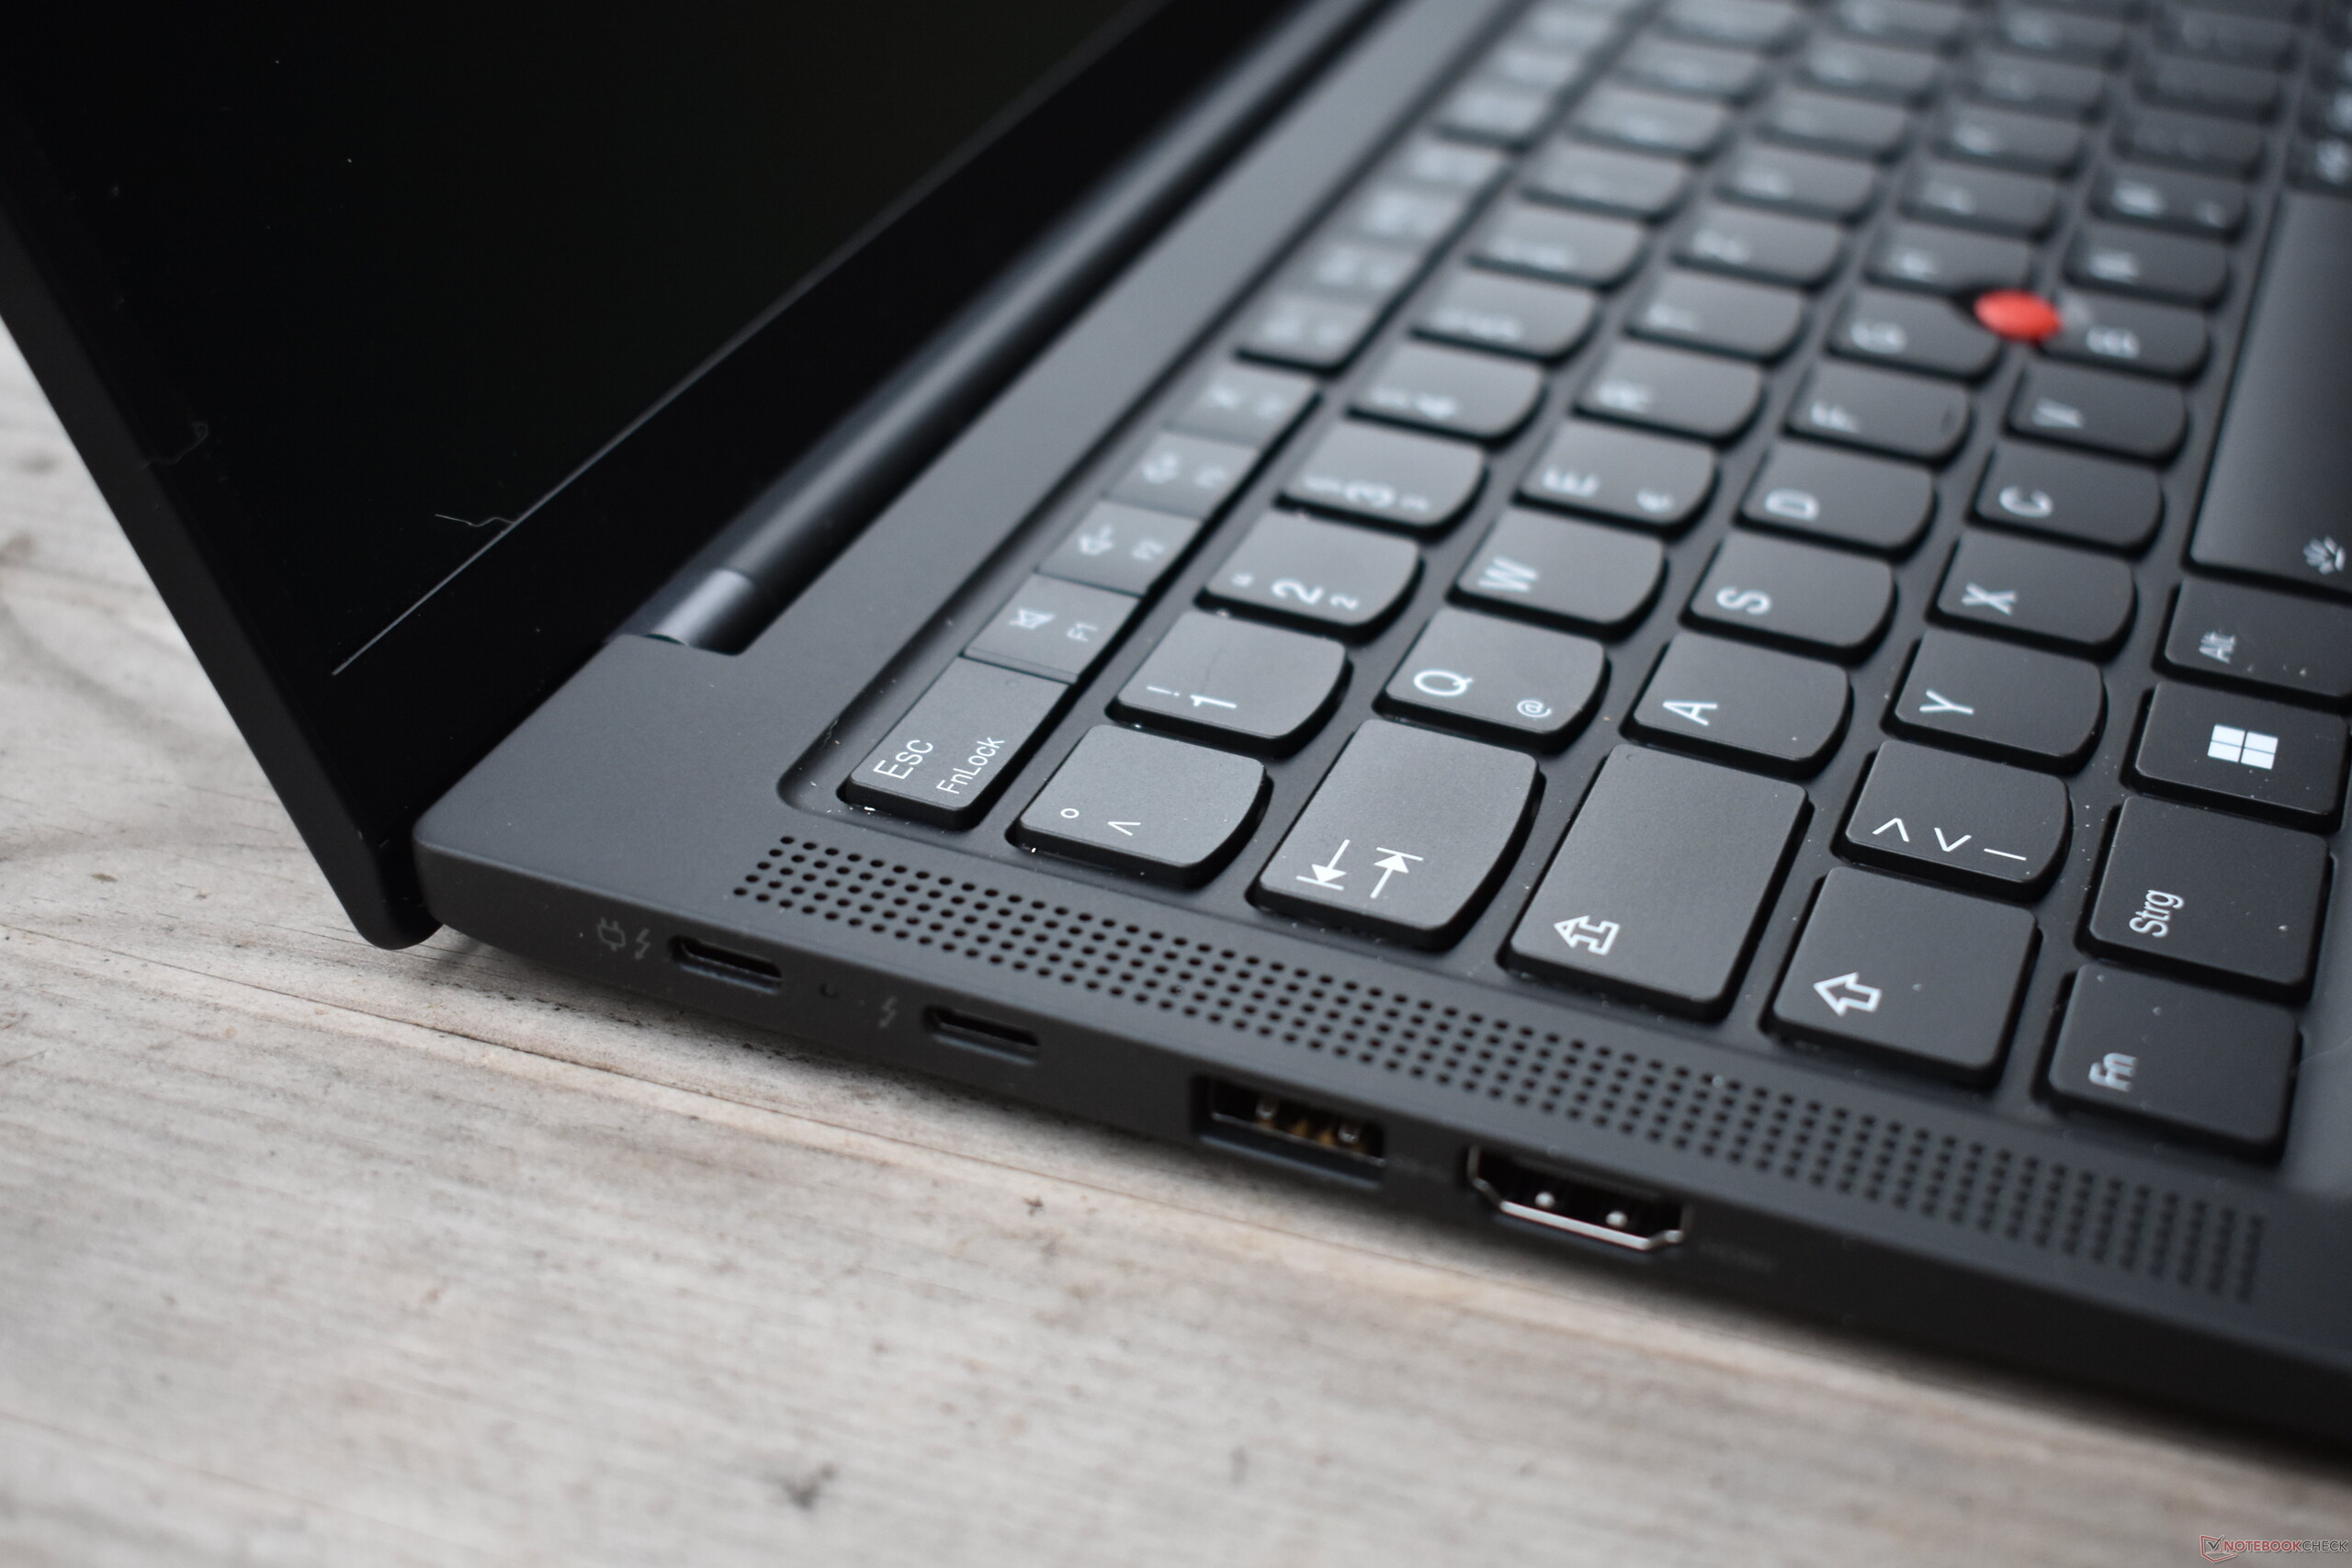
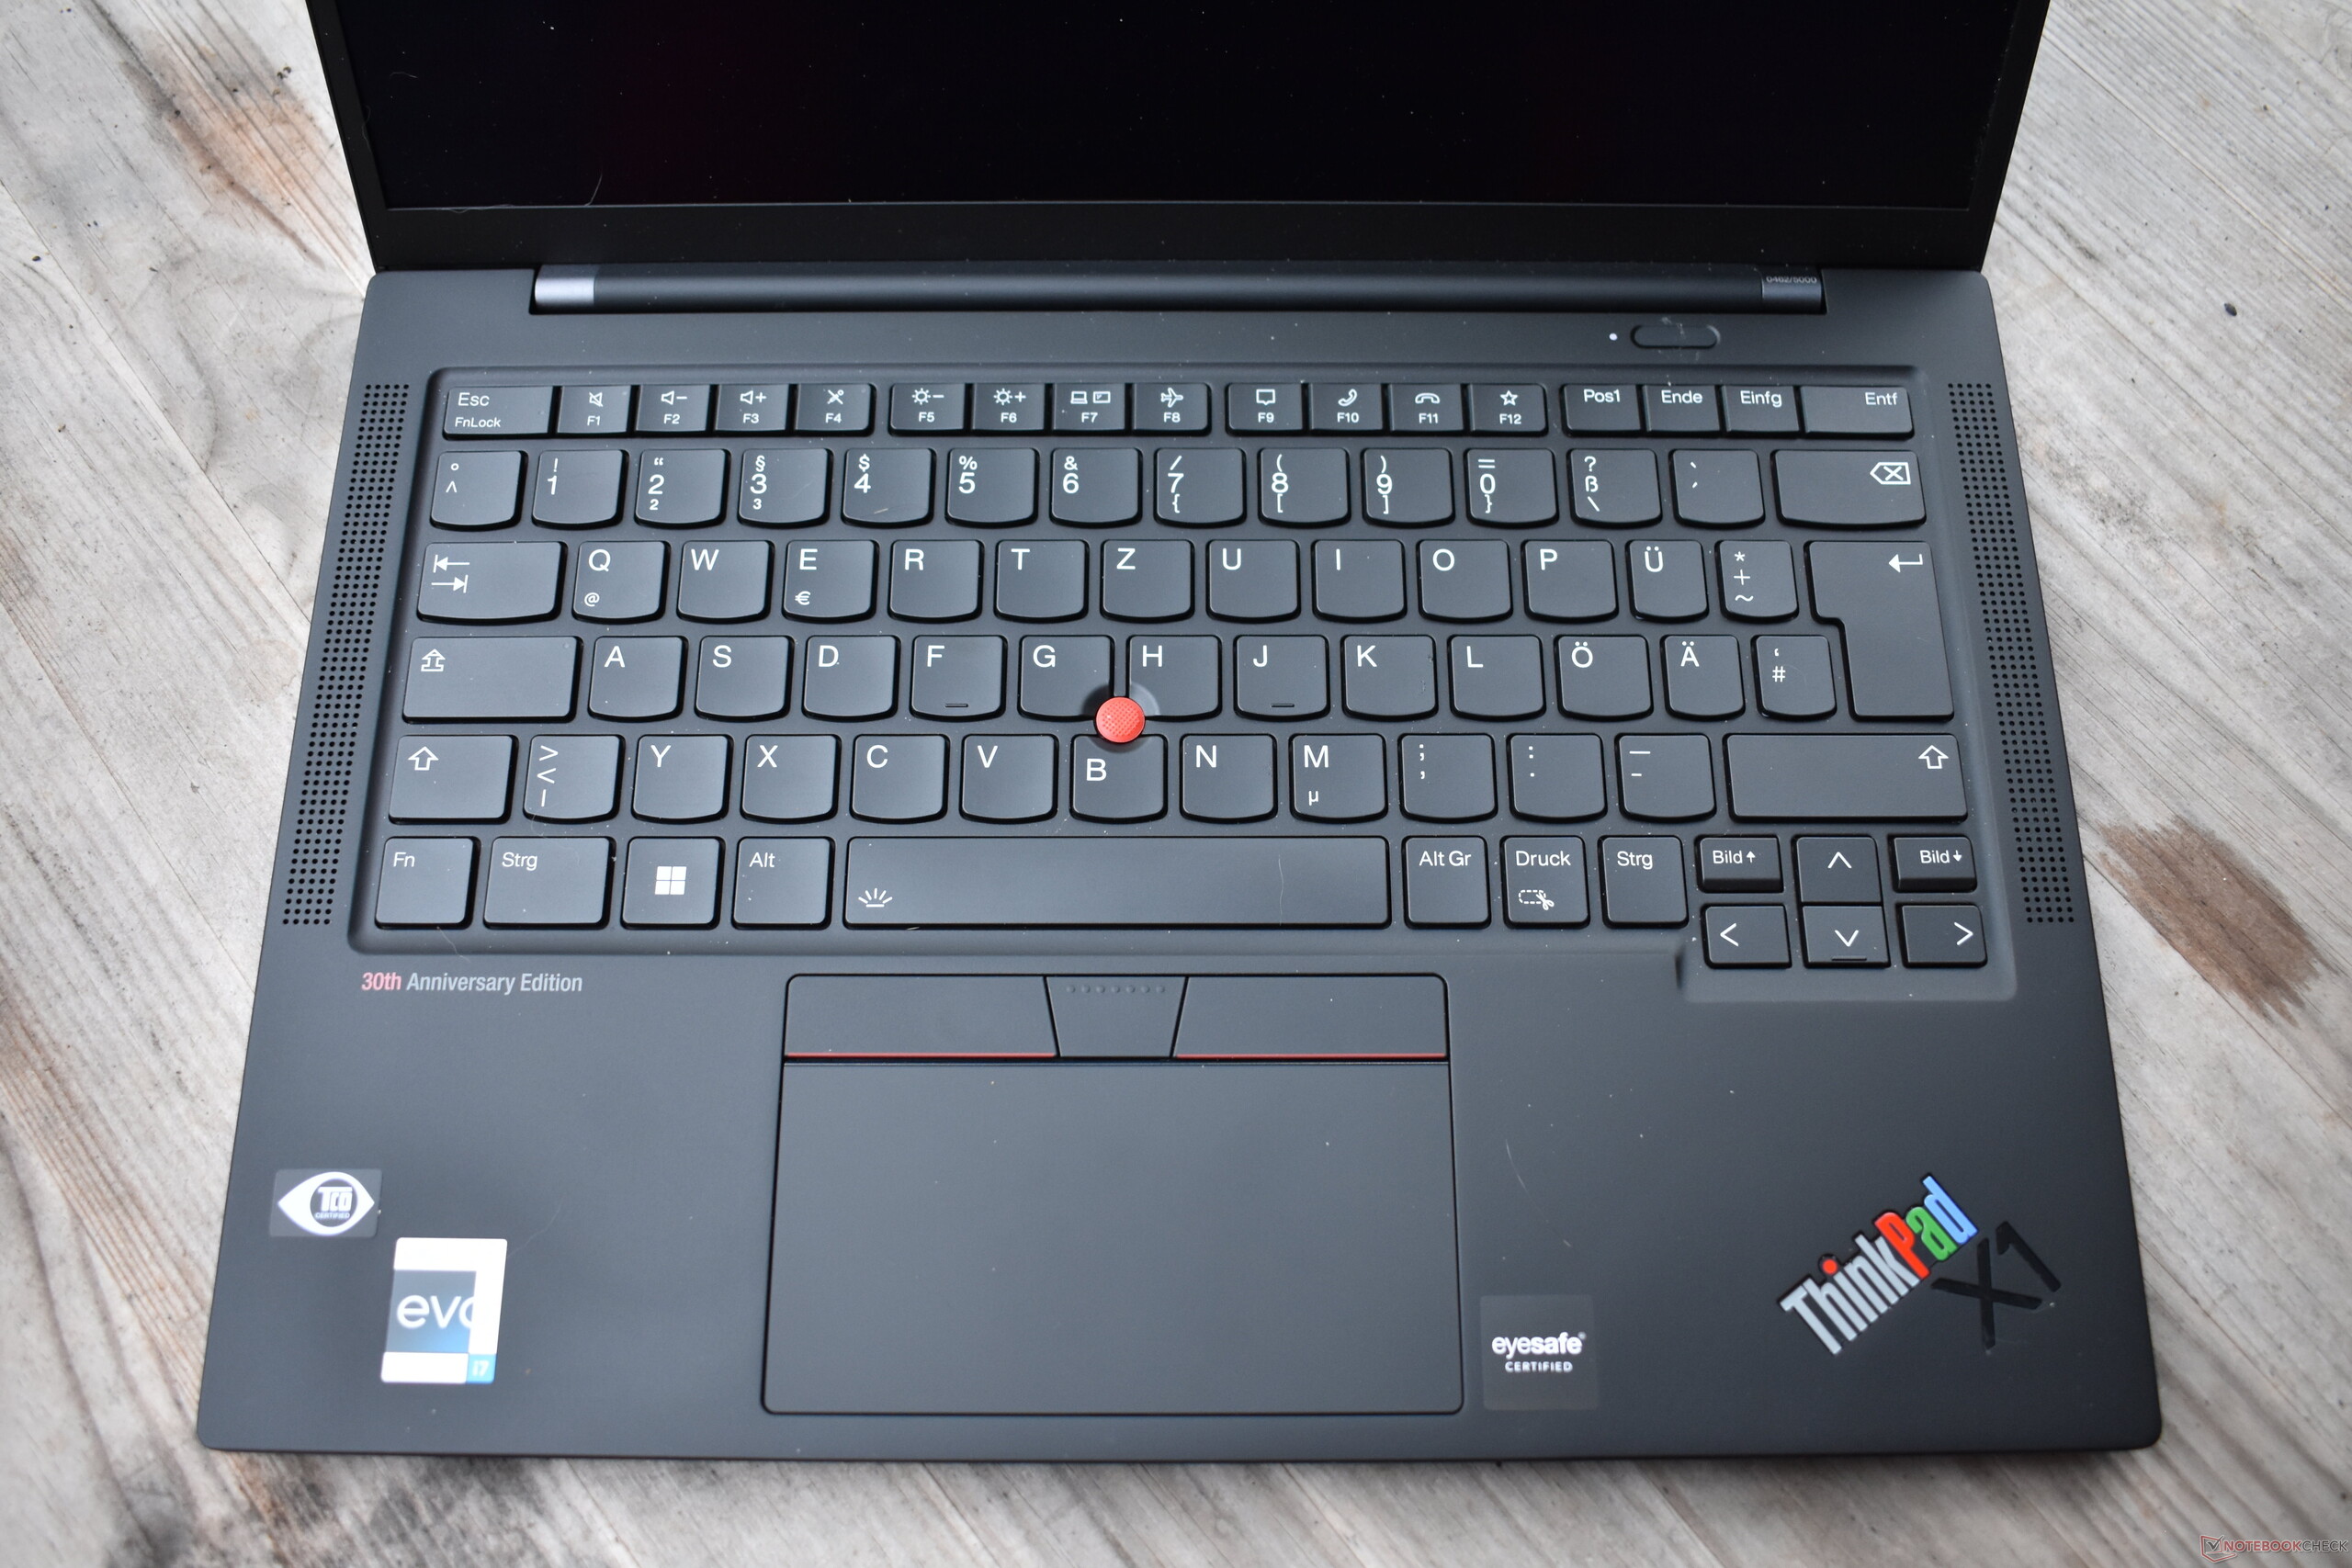
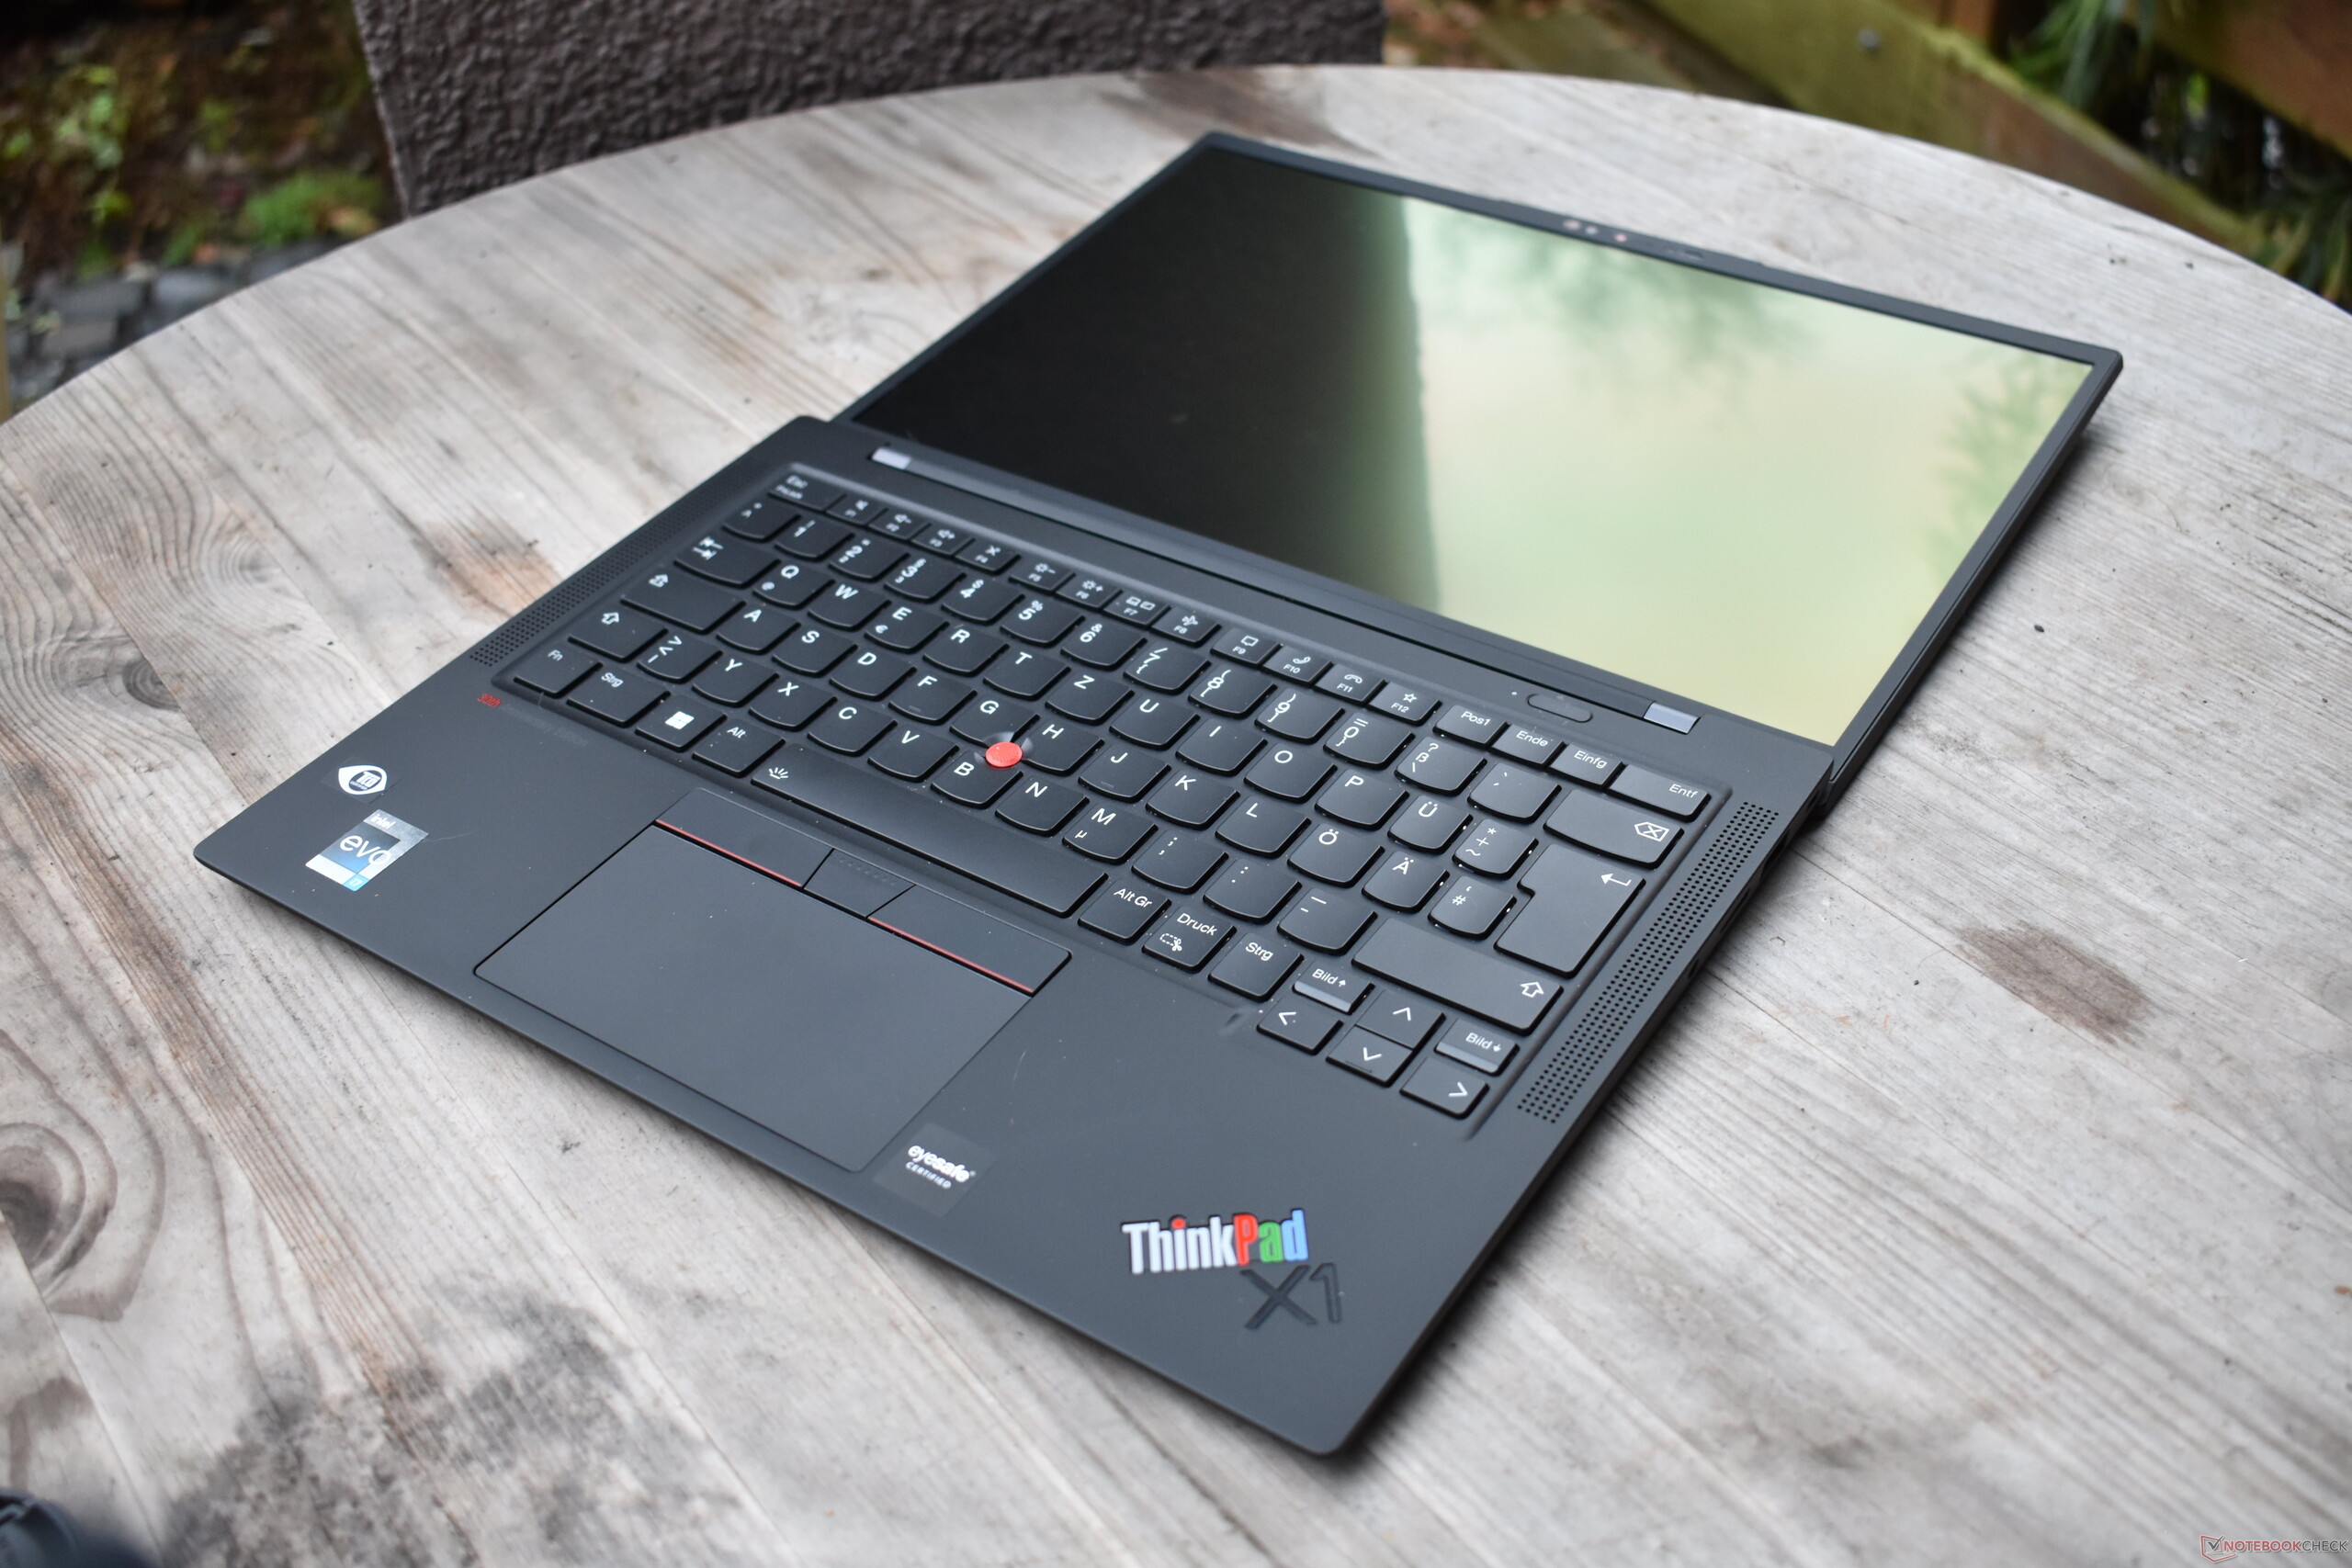
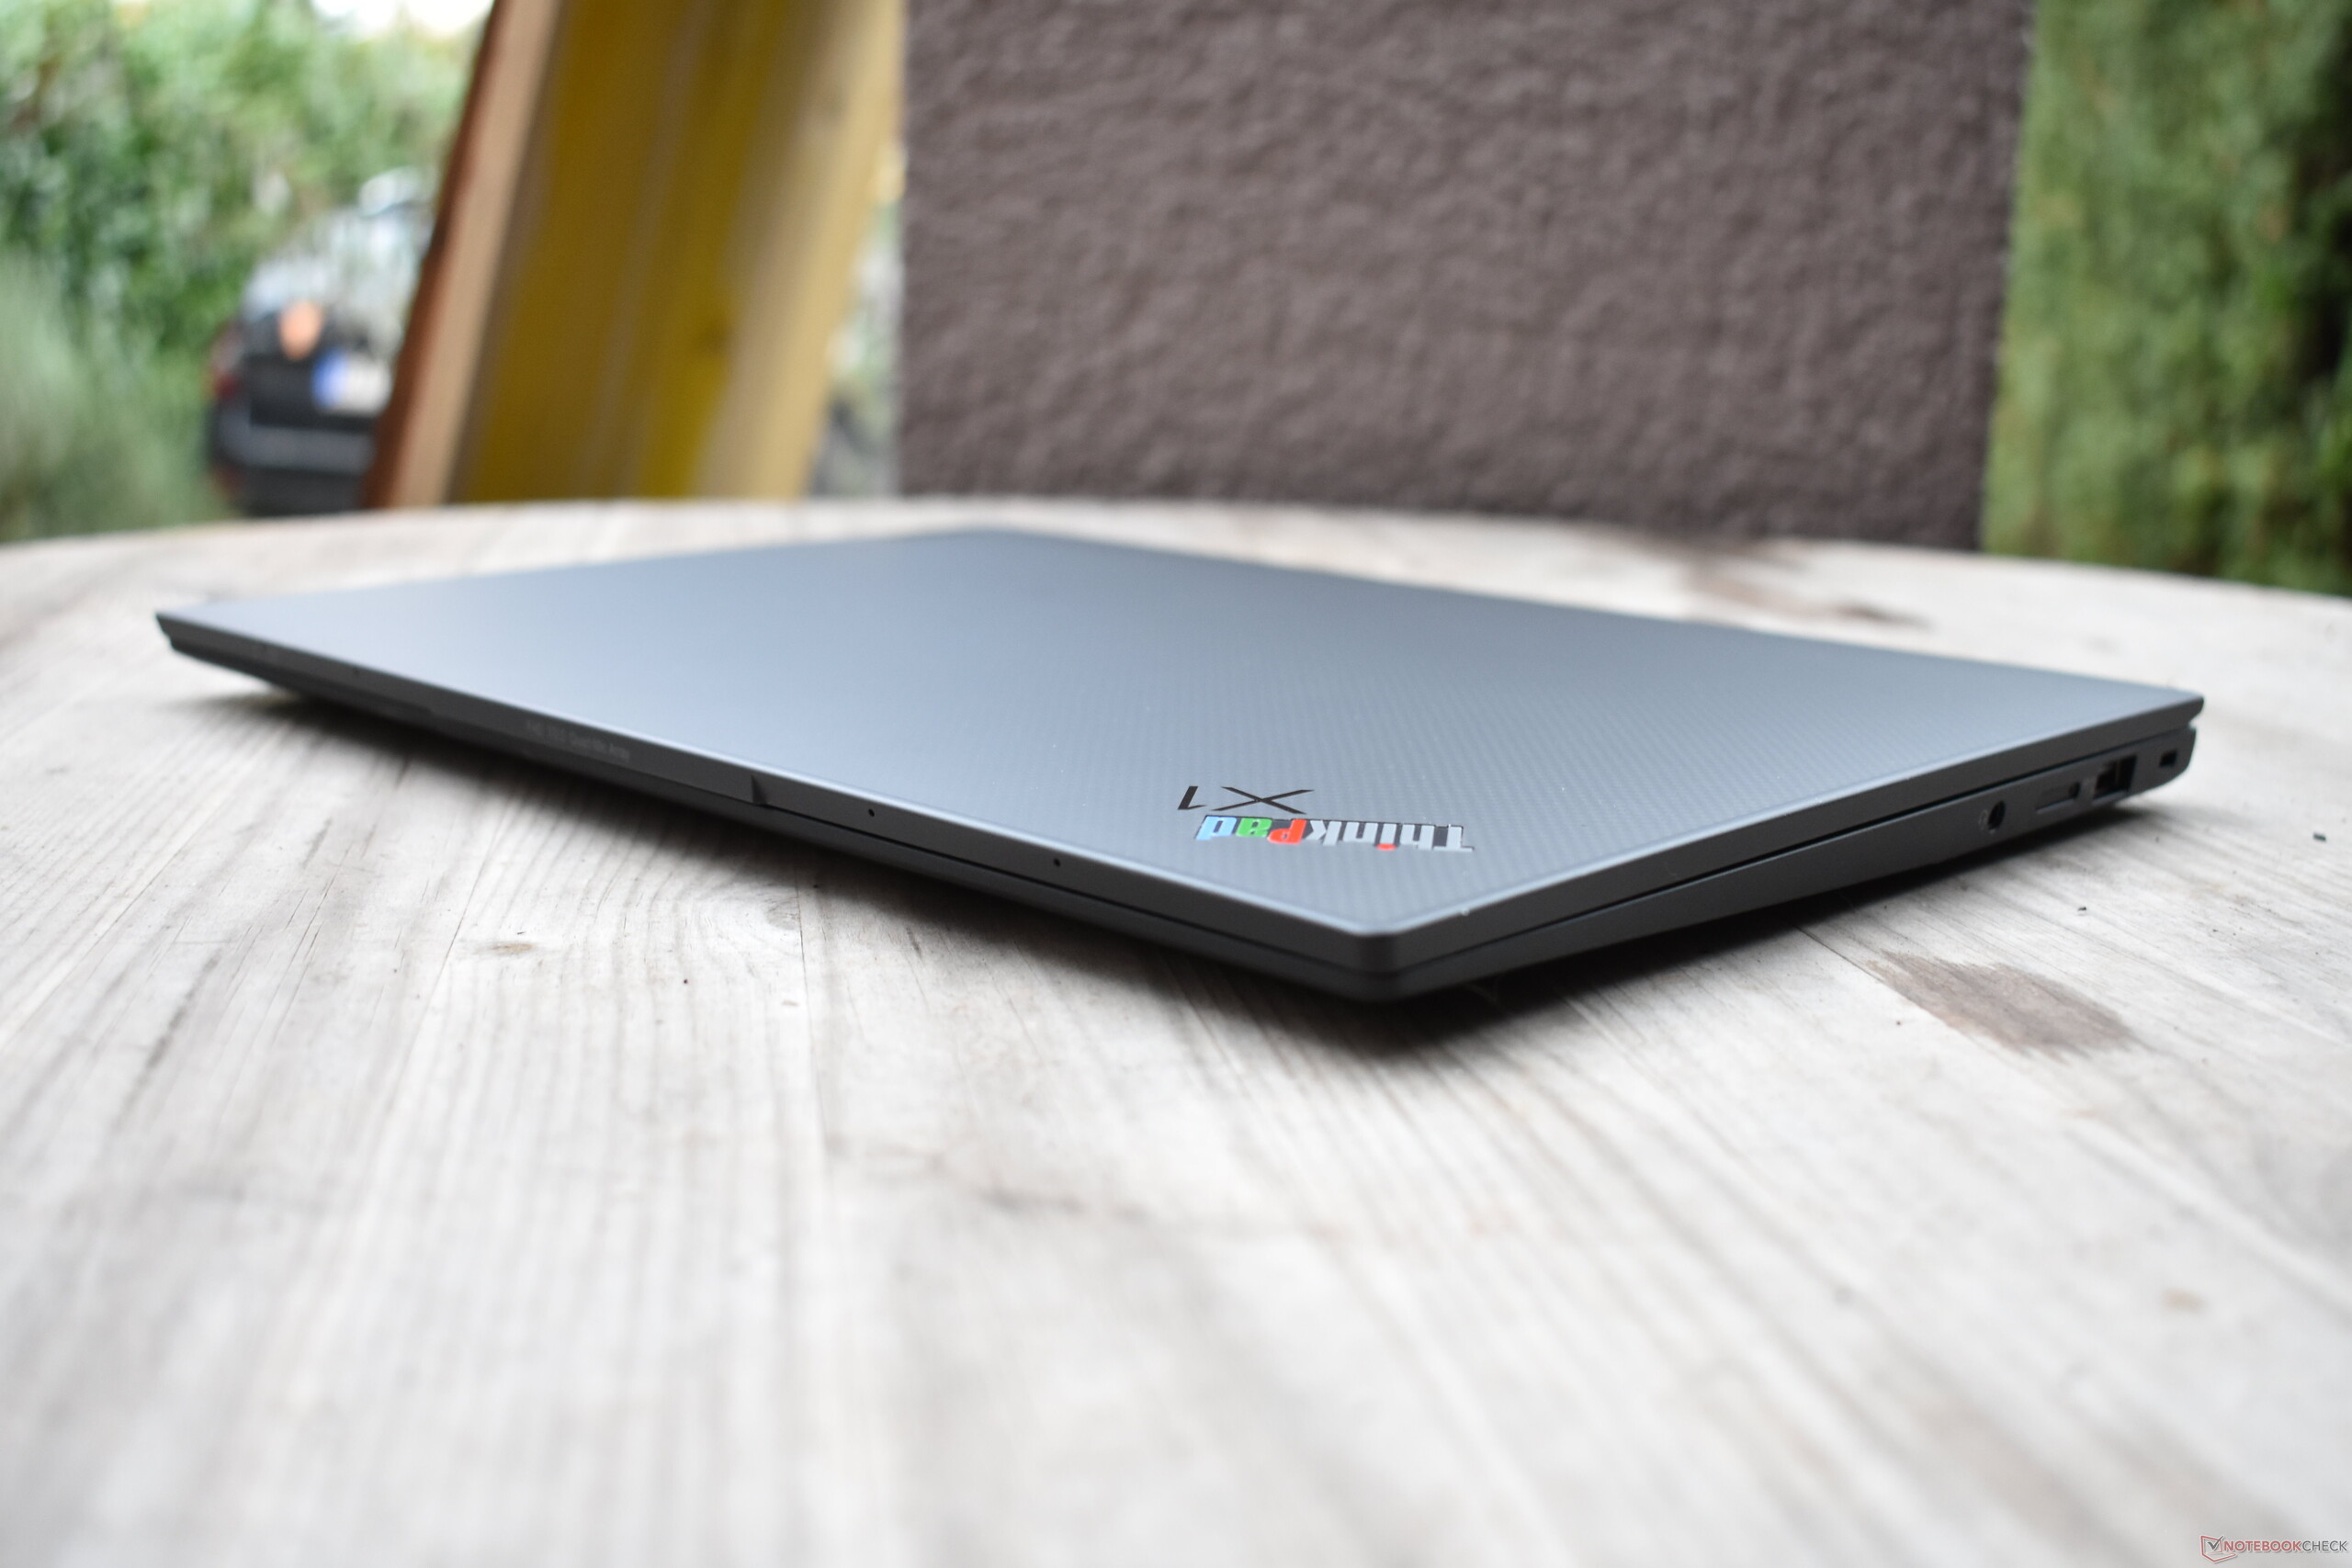
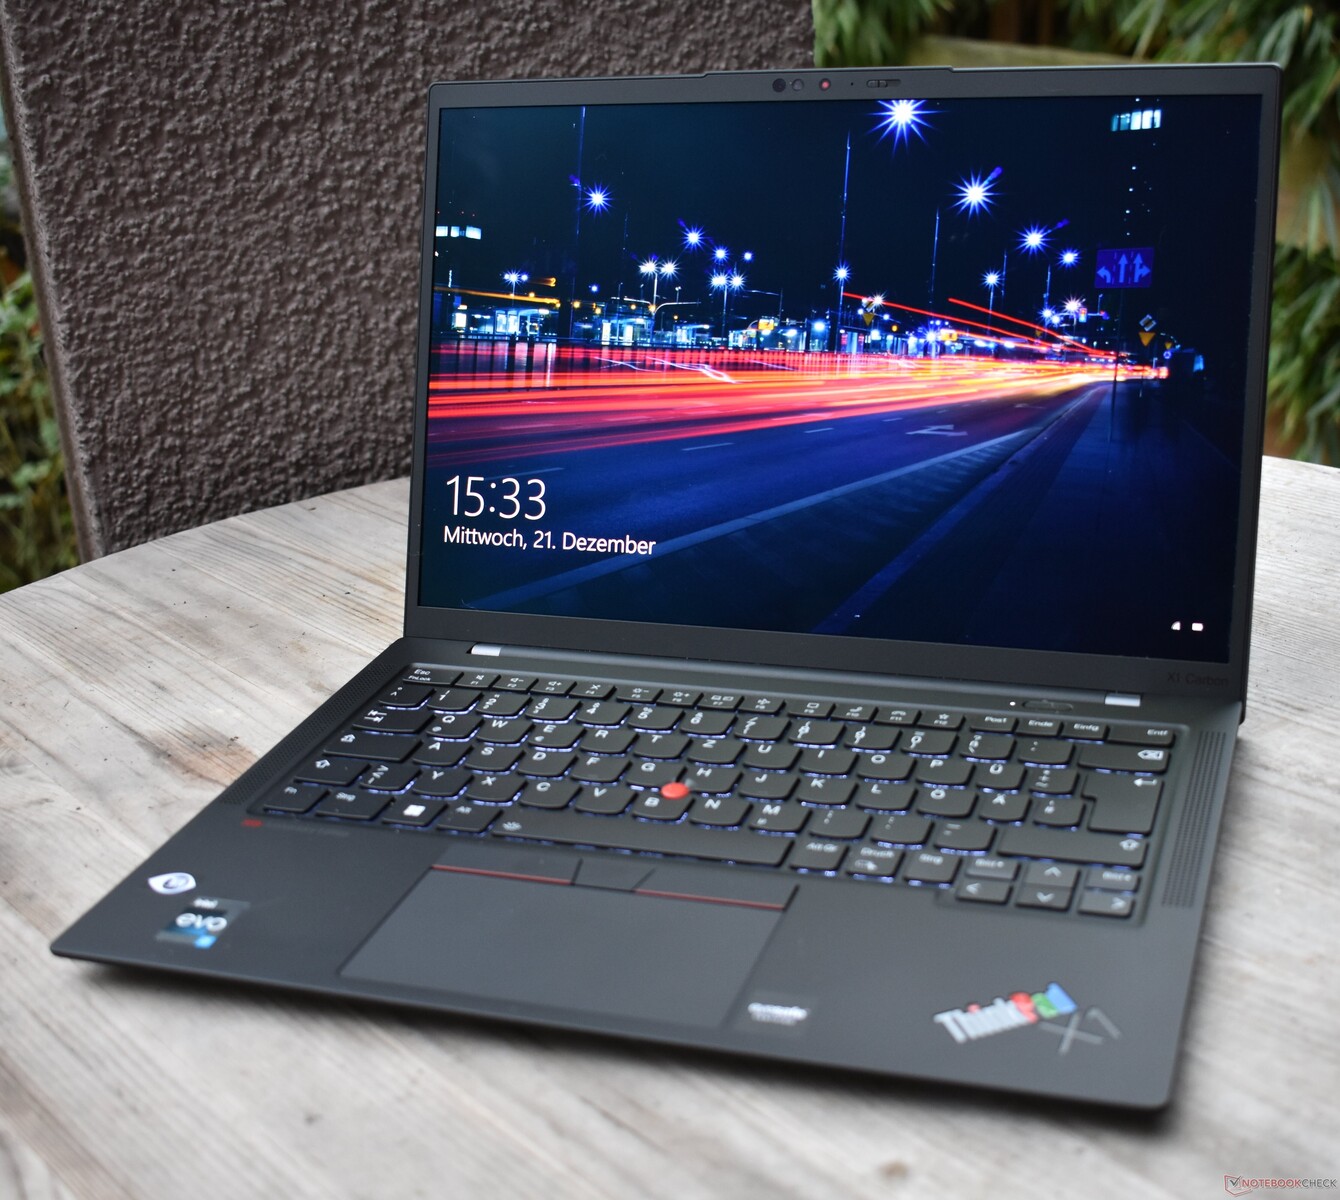
W przeciwieństwie do ThinkPad 25sprzed pięciu lat, Lenovo rezygnuje z większych zmian w sprzęcie modelu X1 Carbon Gen 10 30th Anniversary Edition. Zamiast tego wprowadzono kilka kosmetycznych modyfikacji, takich jak logo "30th Anniversary Edition" na podpórce pod nadgarstki, laserowo wygrawerowany numer jednostki na zawiasie (w sumie jest 5000 modeli) oraz specjalne rocznicowe logo ThinkPad z częścią "Pad" w schemacie kolorów IBM RGB Tricolor - inspirowane starym Logo IBM ThinkPad. Dodatkowo w zakres dostawy wchodzi opakowanie z edycji specjalnej oraz trzy dodatkowe nakładki TrackPoint, przy czym każda z nich jest czerwona, zielona i niebieska. W pozostałych przypadkach jest to zwykły ThinkPad X1 Carbon G10. Lenovo nie próbuje tym razem wskrzesić klasycznej klawiatury ThinkPad z siedmioma rzędami.


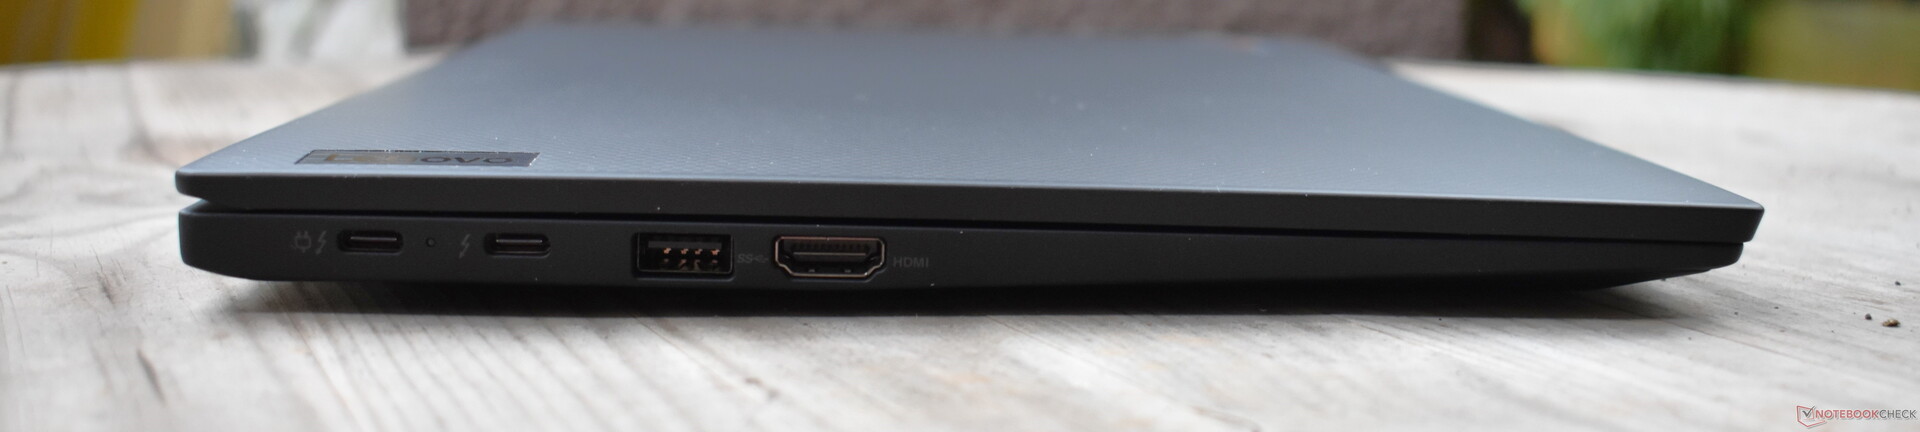
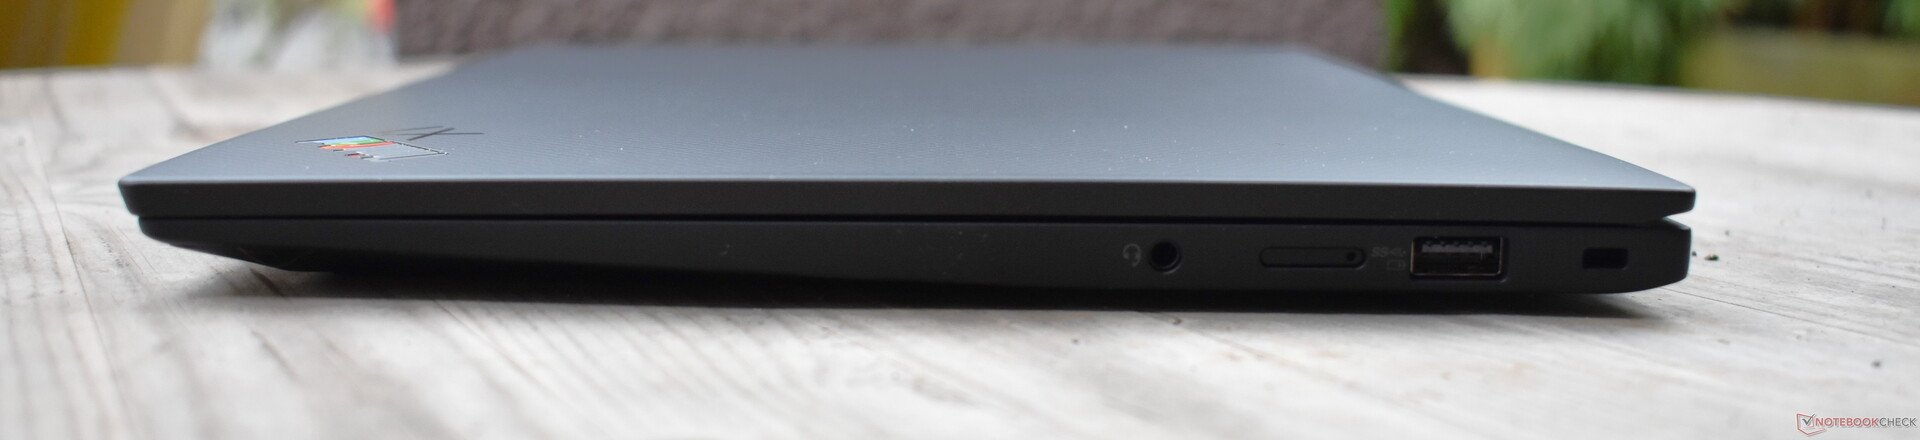
Nie wprowadzono żadnych zmian w wyposażeniu, a wyniki dotyczące WiFi i kamerki internetowej są praktycznie identyczne jak w pierwszej recenzji ThinkPada X1 Carbon G10. Wyjątek: Testowana tu wersja działa pod kontrolą systemu Windows 10, dlatego nie mogliśmy przetestować WiFi 6E.
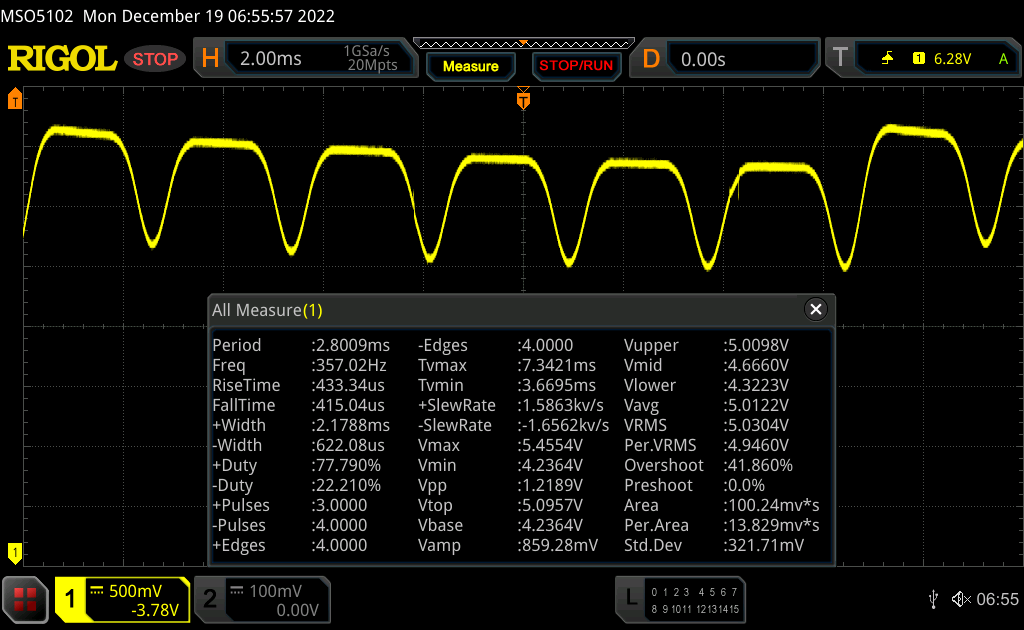
| Networking | |
| iperf3 transmit AXE11000 | |
| Lenovo ThinkPad X1 Carbon G10 21CB00DCGE | |
| Przeciętny Intel Wi-Fi 6E AX211 (64 - 1921, n=276) | |
| Średnia w klasie Office (507 - 1911, n=60, ostatnie 2 lata) | |
| iperf3 receive AXE11000 | |
| Lenovo ThinkPad X1 Carbon G10 21CB00DCGE | |
| Przeciętny Intel Wi-Fi 6E AX211 (582 - 1890, n=276) | |
| Średnia w klasie Office (530 - 1775, n=61, ostatnie 2 lata) | |
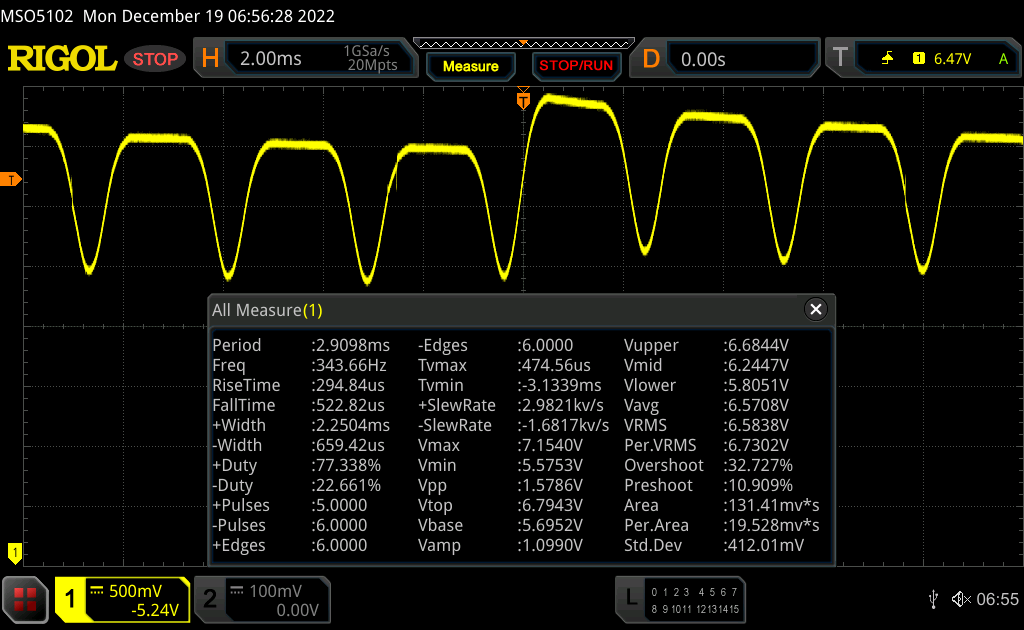
| iperf3 receive AXE11000 6GHz | |
| Lenovo ThinkPad Z13 G1-21D20016GE | |
| Średnia w klasie Office (508 - 2328, n=40, ostatnie 2 lata) | |
| Lenovo ThinkPad X1 Carbon G10 21CC001RGE | |
| Przeciętny Intel Wi-Fi 6E AX211 (700 - 1857, n=226) | |
| Dell Latitude 9430 2-in-1 | |
| HP Elite Dragonfly G3 | |
| iperf3 transmit AXE11000 6GHz | |
| Lenovo ThinkPad Z13 G1-21D20016GE | |
| Lenovo ThinkPad X1 Carbon G10 21CC001RGE | |
| Przeciętny Intel Wi-Fi 6E AX211 (385 - 1851, n=226) | |
| Średnia w klasie Office (417 - 2341, n=38, ostatnie 2 lata) | |
| HP Elite Dragonfly G3 | |
| Dell Latitude 9430 2-in-1 | |


Wyświetlacz OLED w X1 Carbon jest niemal matowy

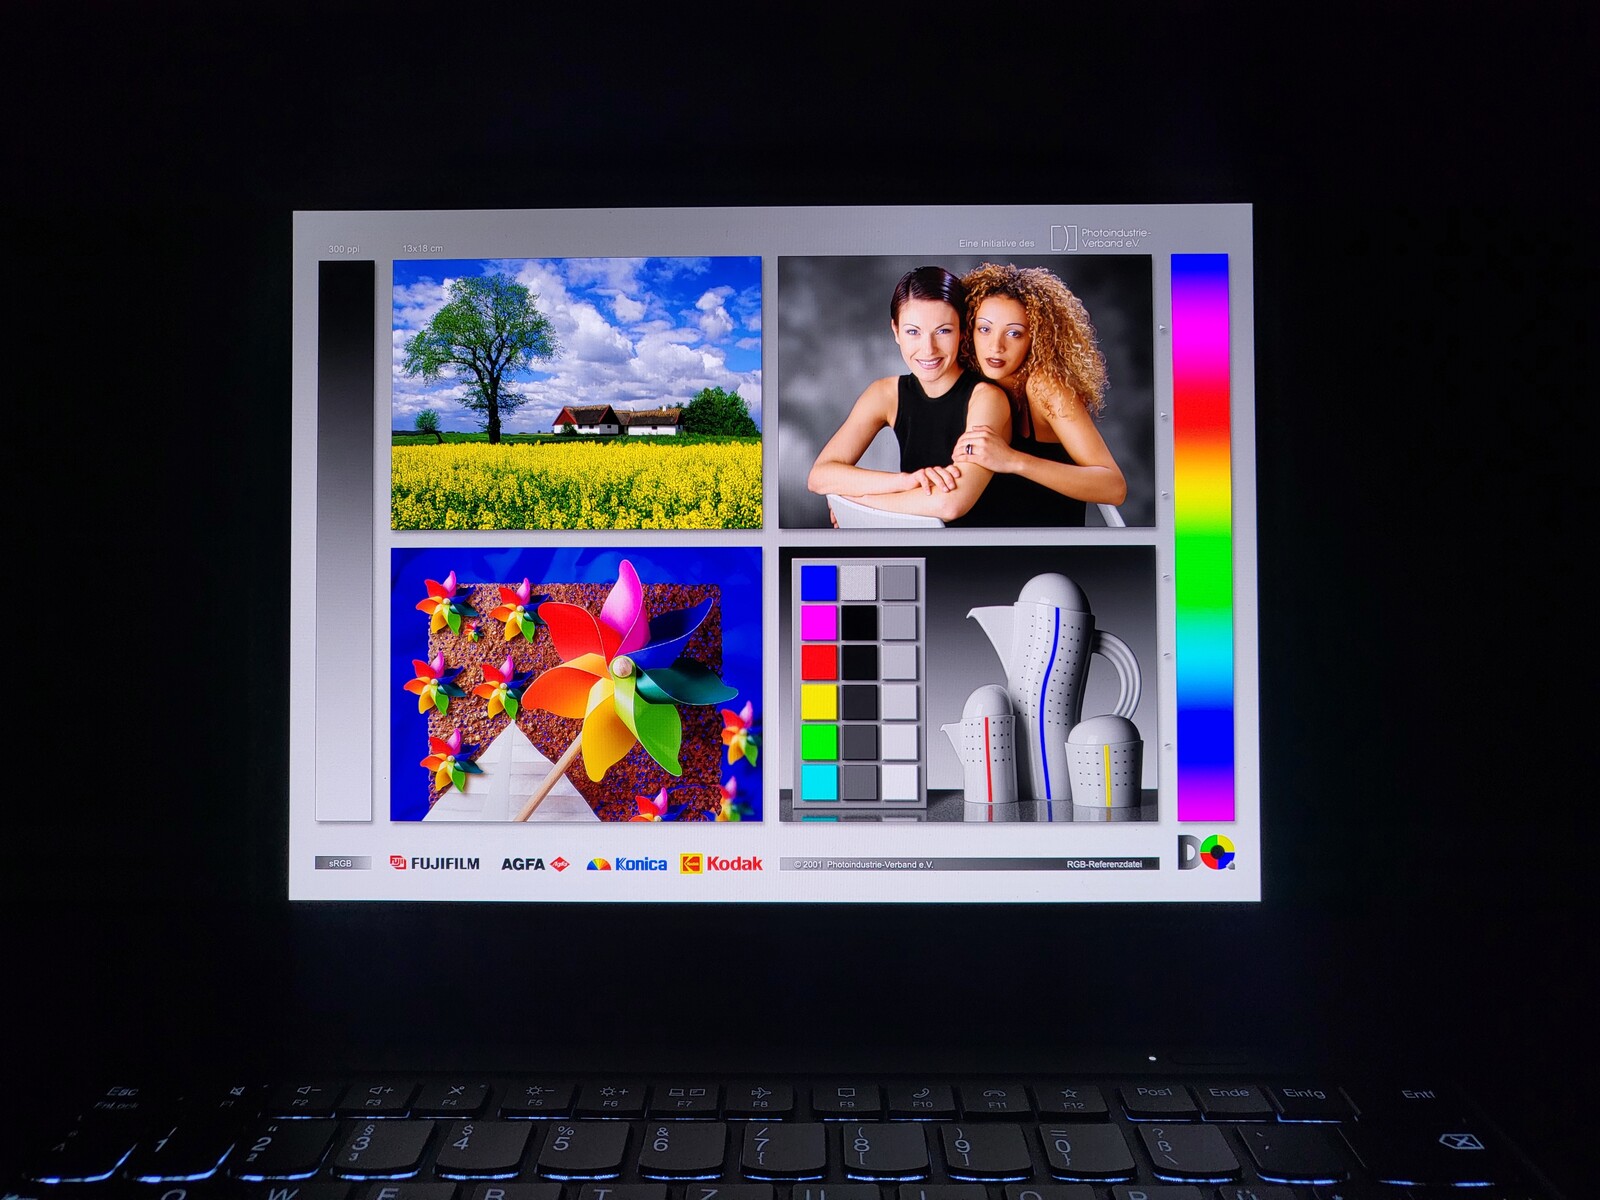
Centralnym punktem tej wersji Lenovo ThinkPad X1 Carbon Gen 10 jest bez wątpienia ekran. Jak w przypadku niemal każdego ThinkPada, dostępne są różne opcje, które wymieniliśmy również w naszej pierwszej recenzji X1 Carbon G10. Dzisiejszy egzemplarz recenzencki mieści 14-calowy wyświetlacz 2,8K (2 880 x 1 800) - panel (numer modelu ATNA40YK01-1) pochodzi od Samsunga i jest wyświetlaczem OLED.
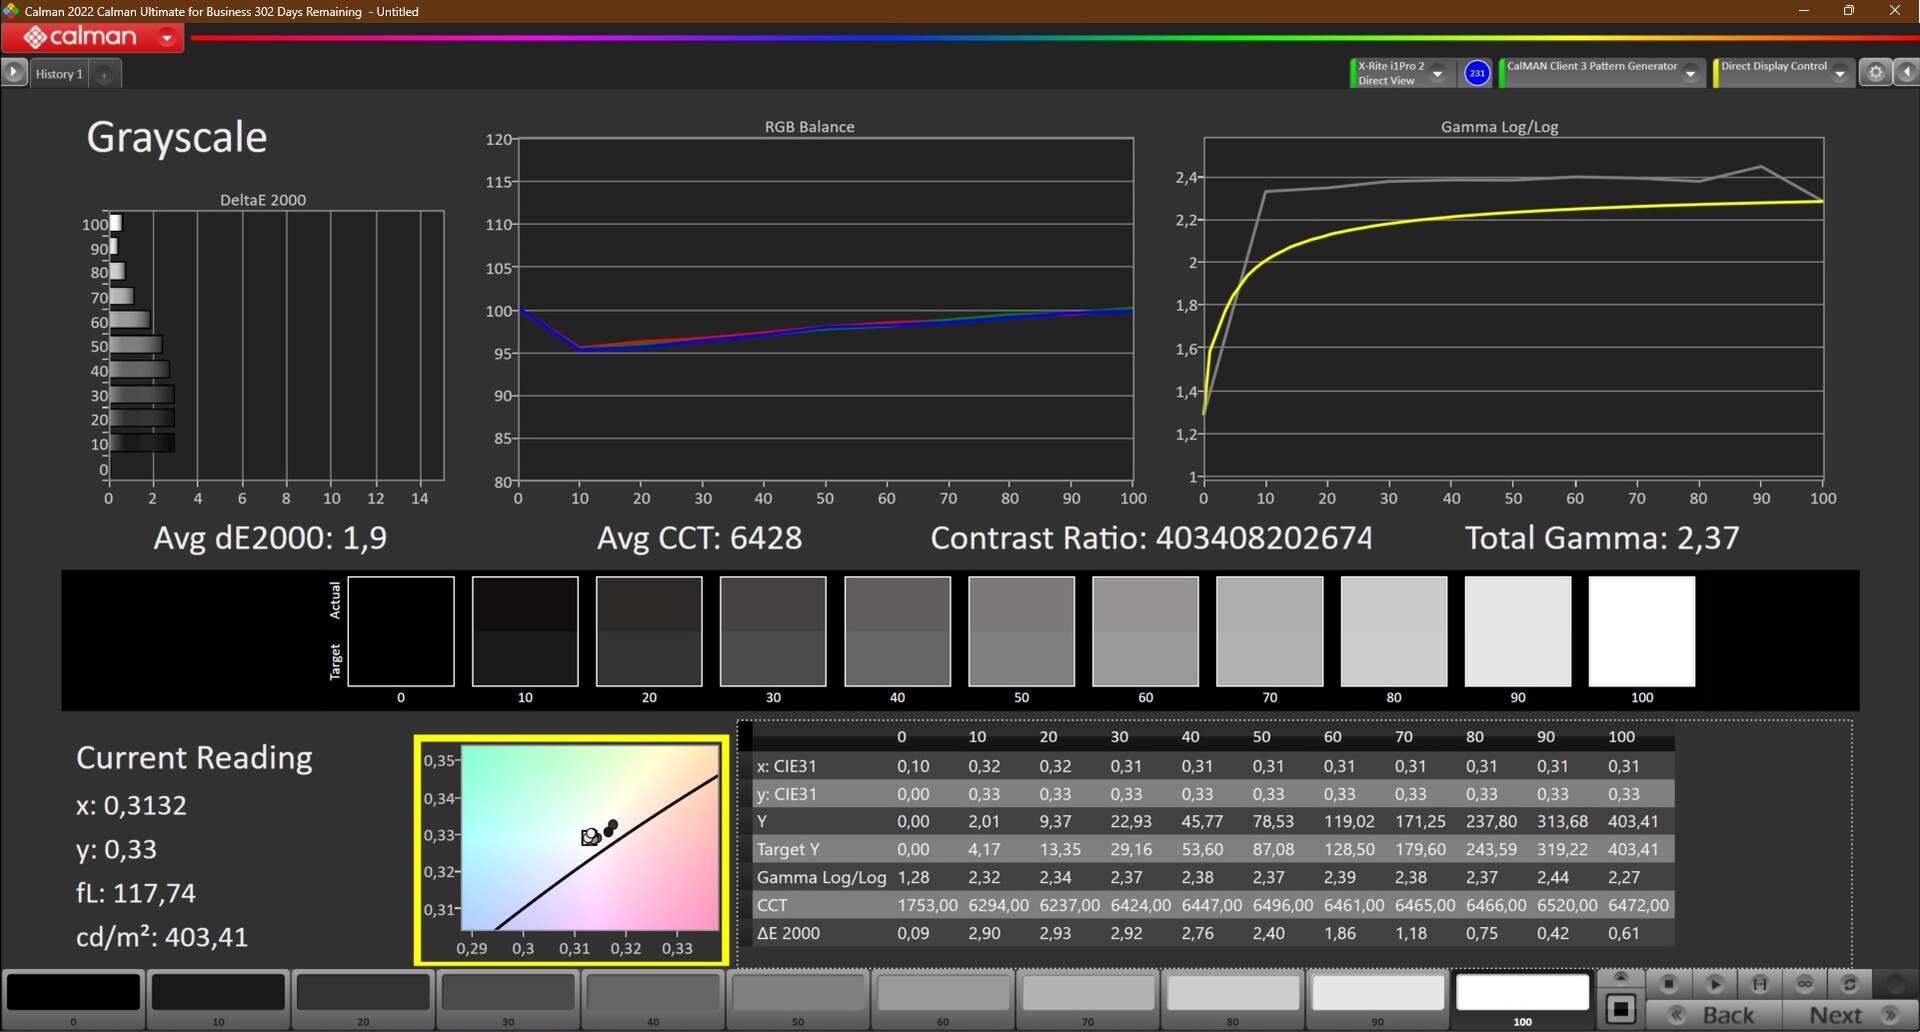
Według Lenovo, ekran jest podobno w stanie wyświetlać treści SDR przy 400 cd/m² i HDR przy 500 cd/m². O ile tego ostatniego nie mierzyliśmy, o tyle wartość SDR możemy zdecydowanie potwierdzić. Dzięki temu ekran jest ciemniejszy od wyświetlacza 4K UHD w modeluX1 Carbon G9 i 2,5K LCD w Dell Latitude 9430. W zamian jednak wyświetlacz OLED ma inne zalety: Jasność jest bardzo równomiernie rozłożona, nie występuje backlight bleeding, a czasy reakcji są znacznie lepsze niż u rywali z matrycą IPS. Szkoda jednak, że Lenovo pozostawiło częstotliwość odświeżania na poziomie 60 Hz, bo 90 Hz byłoby dobrym krokiem naprzód.
Jedna wada technologii OLED: PWM jest zawsze obecny. Częstotliwość PWM wynosząca około 342 Hz na wszystkich poziomach jasności może powodować bóle głowy u osób wrażliwych, nawet jeśli gołym okiem nie widać migotania.
| |||||||||||||||||||||||||
rozświetlenie: 97 %
na akumulatorze: 400 cd/m²
kontrast: ∞:1 (czerń: 0 cd/m²)
ΔE ColorChecker Calman: 2.2 | ∀{0.5-29.43 Ø4.72}
calibrated: 2.6
ΔE Greyscale Calman: 1.2 | ∀{0.09-98 Ø4.97}
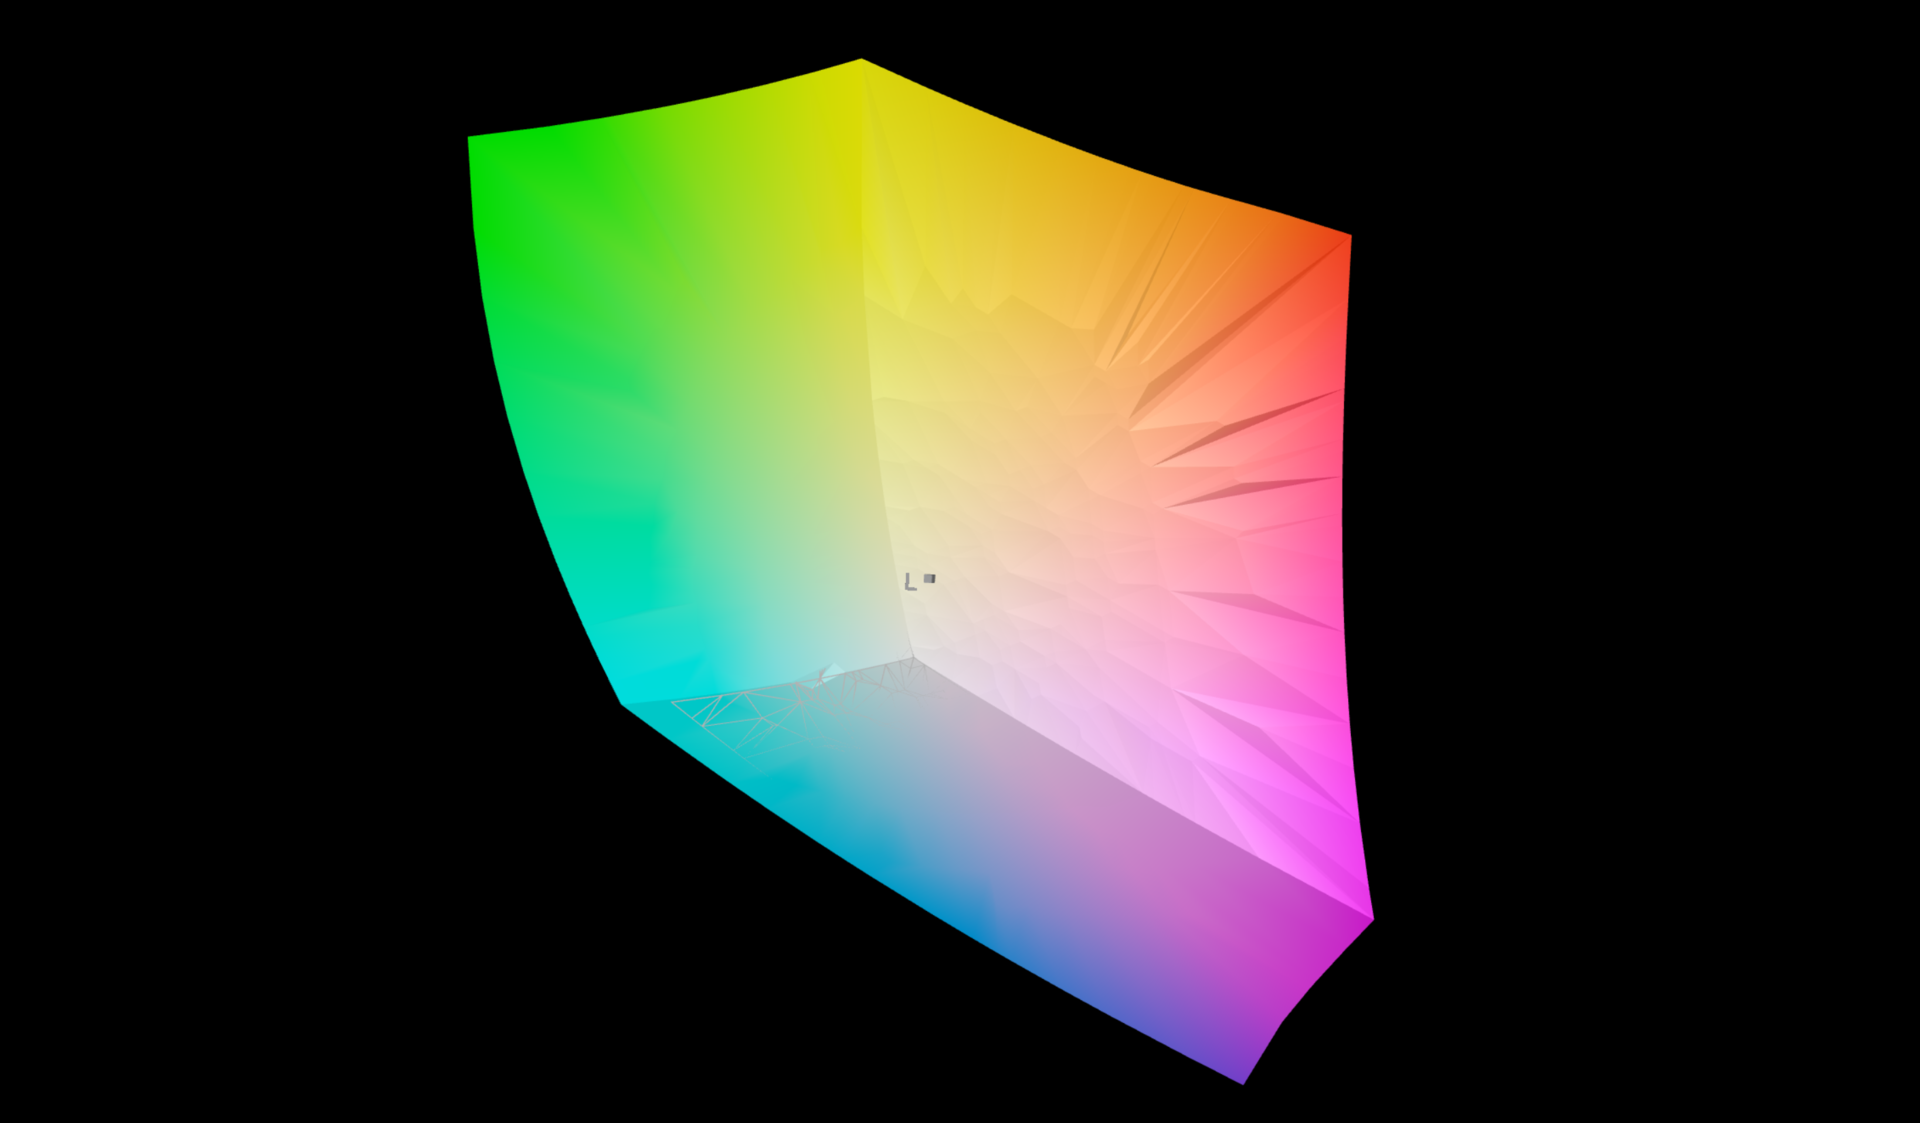
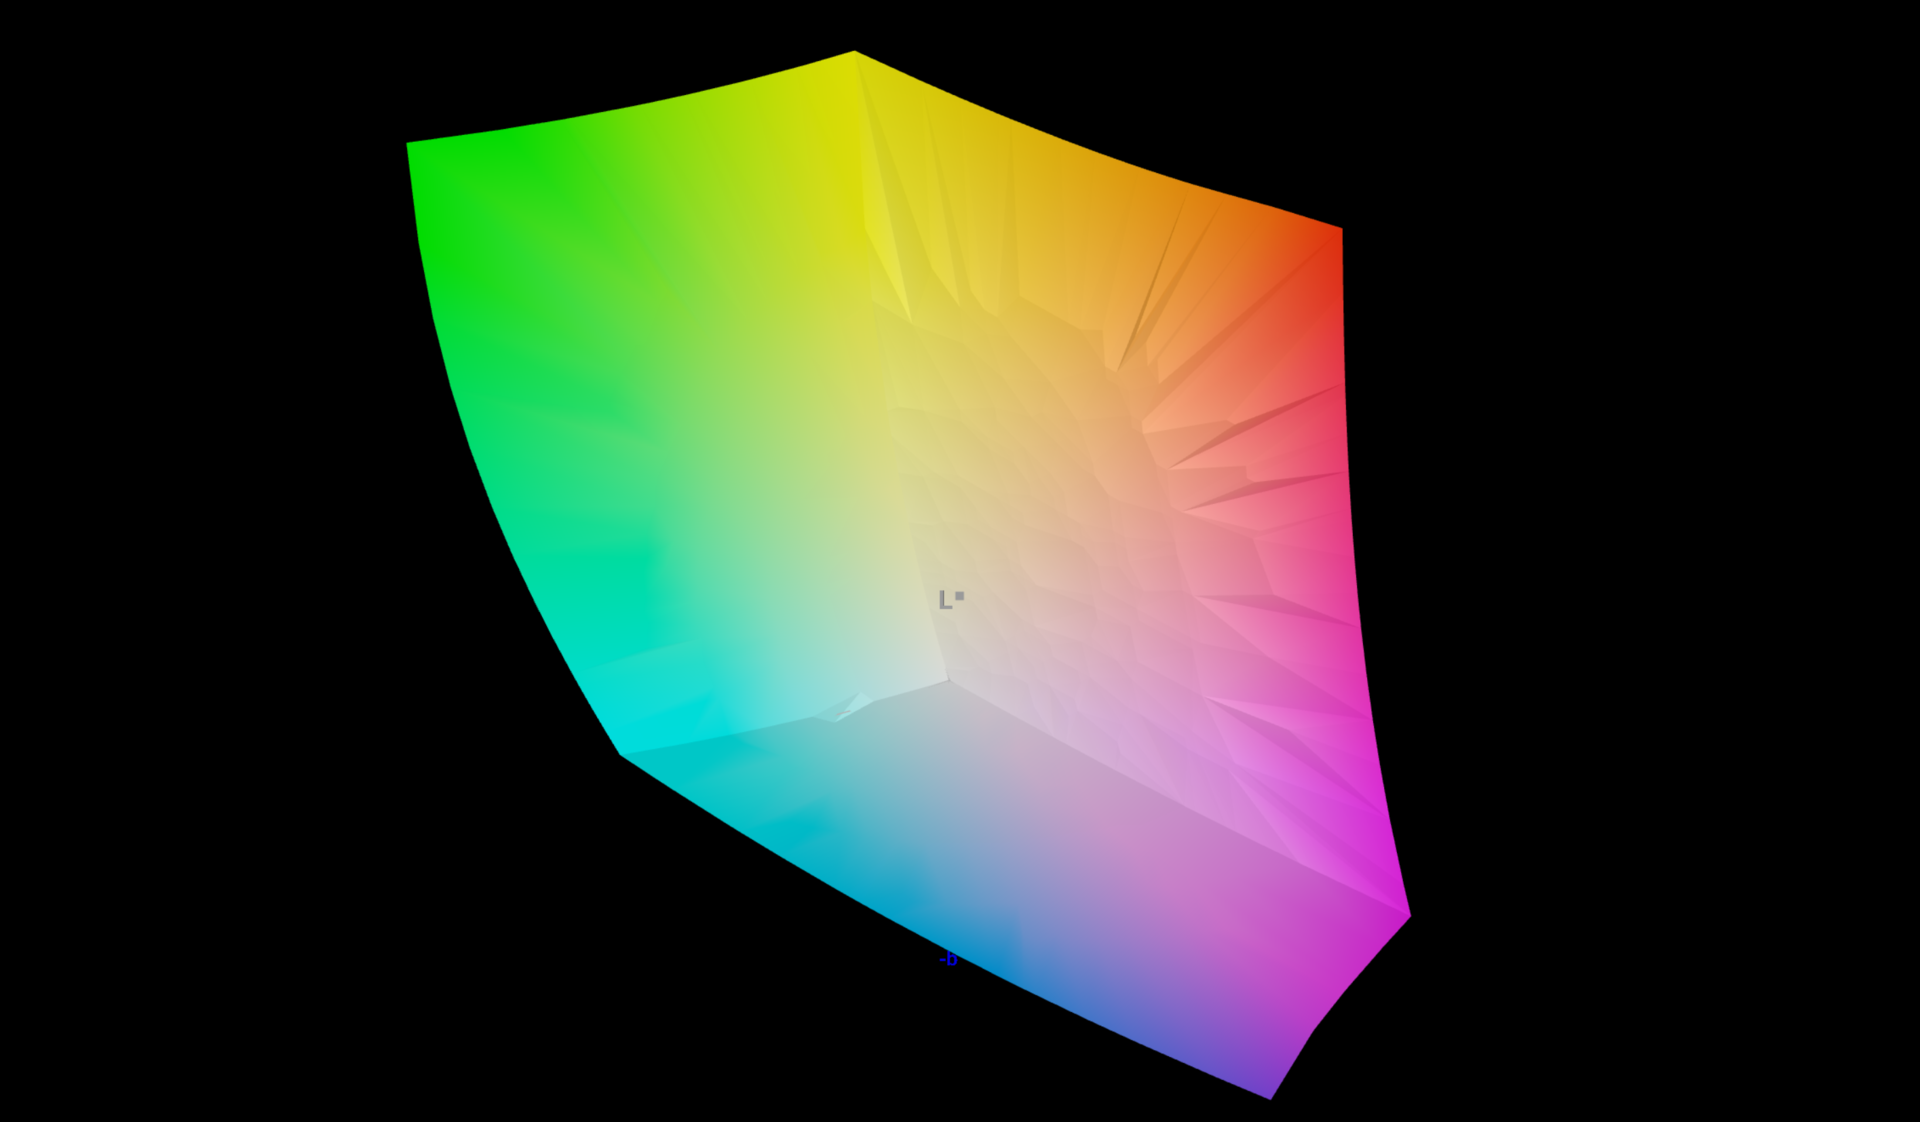
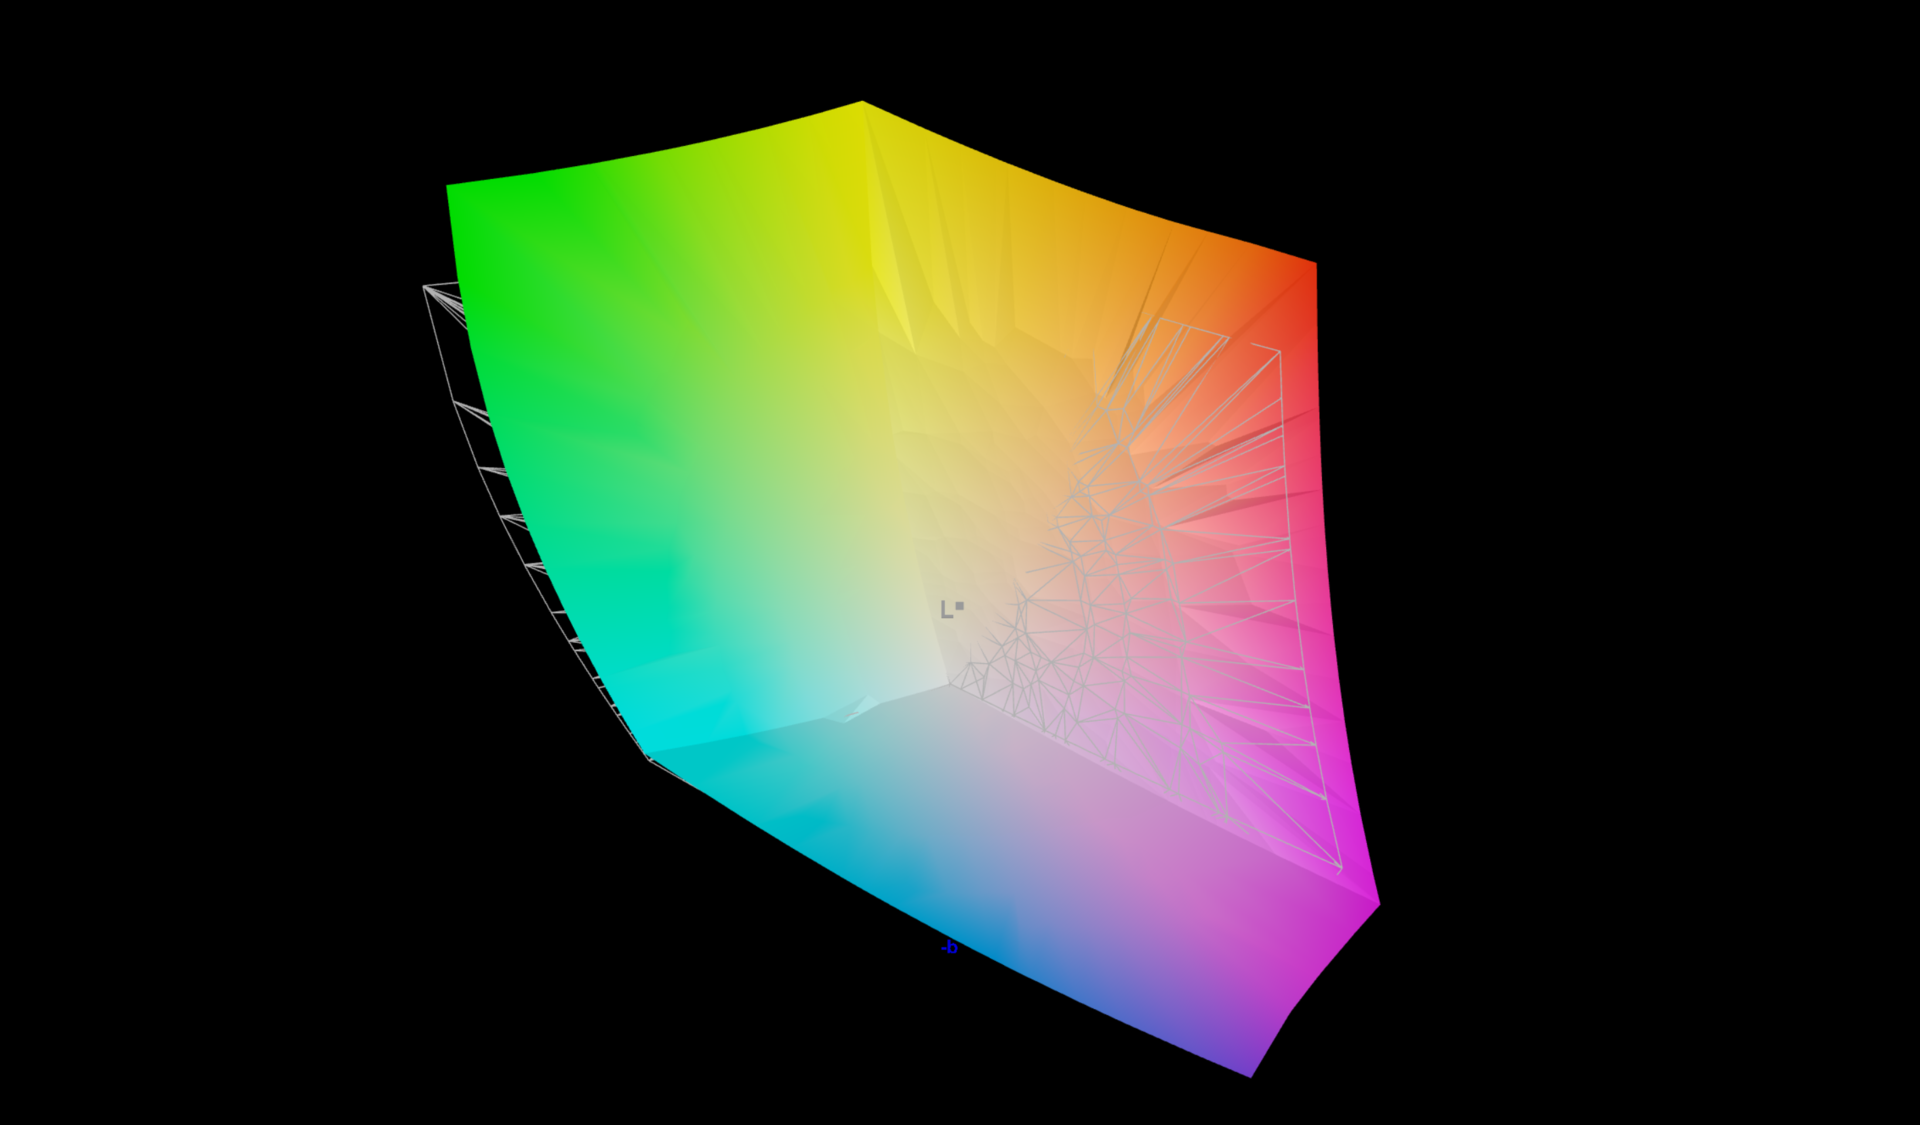
96.5% AdobeRGB 1998 (Argyll 3D)
100% sRGB (Argyll 3D)
99.7% Display P3 (Argyll 3D)
Gamma: 2.22
CCT: 6364 K
| Lenovo ThinkPad X1 Carbon G10 21CB00DCGE ATNA40YK01-1, OLED, 2880x1800, 14" | Lenovo ThinkPad X1 Carbon G10 21CC001RGE B140UAN02.1, IPS LED, 1920x1200, 14" | Lenovo ThinkPad X1 Carbon G9-20XWCTO1WW MNE007A1-2, IPS LED, 3840x2400, 14" | Lenovo ThinkPad Z13 G1-21D20016GE ATNA33AA02-0, OLED, 2880x1800, 13.3" | HP Elite Dragonfly G3 Chi Mei CMN13C0, IPS, 1920x1280, 13.5" | Dell Latitude 9430 2-in-1 AU Optronics B140QAN, IPS, 2560x1600, 14" | |
|---|---|---|---|---|---|---|
| Display | -16% | -4% | 0% | -21% | -13% | |
| Display P3 Coverage (%) | 99.7 | 74.6 -25% | 95.2 -5% | 99.9 0% | 68 -32% | 79.4 -20% |
| sRGB Coverage (%) | 100 | 98.6 -1% | 99.8 0% | 100 0% | 98.3 -2% | 100 0% |
| AdobeRGB 1998 Coverage (%) | 96.5 | 76.5 -21% | 89.2 -8% | 97.5 1% | 69.9 -28% | 79.4 -18% |
| Response Times | -2546% | -2754% | -29% | -3117% | -3600% | |
| Response Time Grey 50% / Grey 80% * (ms) | 1.2 ? | 45.5 ? -3692% | 46 ? -3733% | 1.9 ? -58% | 50.8 ? -4133% | 63.6 ? -5200% |
| Response Time Black / White * (ms) | 1.6 ? | 24 ? -1400% | 30 ? -1775% | 1.6 ? -0% | 35.2 ? -2100% | 33.6 ? -2000% |
| PWM Frequency (Hz) | 342 ? | 53050 ? | 240 ? | |||
| Screen | -51% | 27% | -10% | -18% | -29% | |
| Brightness middle (cd/m²) | 400 | 372 -7% | 497 24% | 371 -7% | 387.2 -3% | 517.7 29% |
| Brightness (cd/m²) | 401 | 362 -10% | 488 22% | 378 -6% | 360 -10% | 493 23% |
| Brightness Distribution (%) | 97 | 94 -3% | 87 -10% | 98 1% | 80 -18% | 90 -7% |
| Black Level * (cd/m²) | 0.18 | 0.35 | 0.04 | 0.26 | 0.33 | |
| Colorchecker dE 2000 * | 2.2 | 3.4 -55% | 1.2 45% | 2.5 -14% | 2.36 -7% | 3.38 -54% |
| Colorchecker dE 2000 max. * | 4.3 | 6.7 -56% | 2.1 51% | 4.4 -2% | 4.79 -11% | 6.25 -45% |
| Colorchecker dE 2000 calibrated * | 2.6 | 1.8 31% | 0.9 65% | 1.9 27% | 0.63 76% | 0.41 84% |
| Greyscale dE 2000 * | 1.2 | 4.3 -258% | 1.3 -8% | 2 -67% | 3 -150% | 4 -233% |
| Gamma | 2.22 99% | 2.13 103% | 2.16 102% | 2.17 101% | 2.17 101% | 2.13 103% |
| CCT | 6364 102% | 6158 106% | 6690 97% | 6228 104% | 6137 106% | 6186 105% |
| Contrast (:1) | 2067 | 1420 | 9275 | 1489 | 1569 | |
| Color Space (Percent of AdobeRGB 1998) (%) | 79.37 | |||||
| Color Space (Percent of sRGB) (%) | 99.78 | |||||
| Całkowita średnia (program / ustawienia) | -871% /
-458% | -910% /
-444% | -13% /
-10% | -1052% /
-535% | -1214% /
-620% |
* ... im mniej tym lepiej
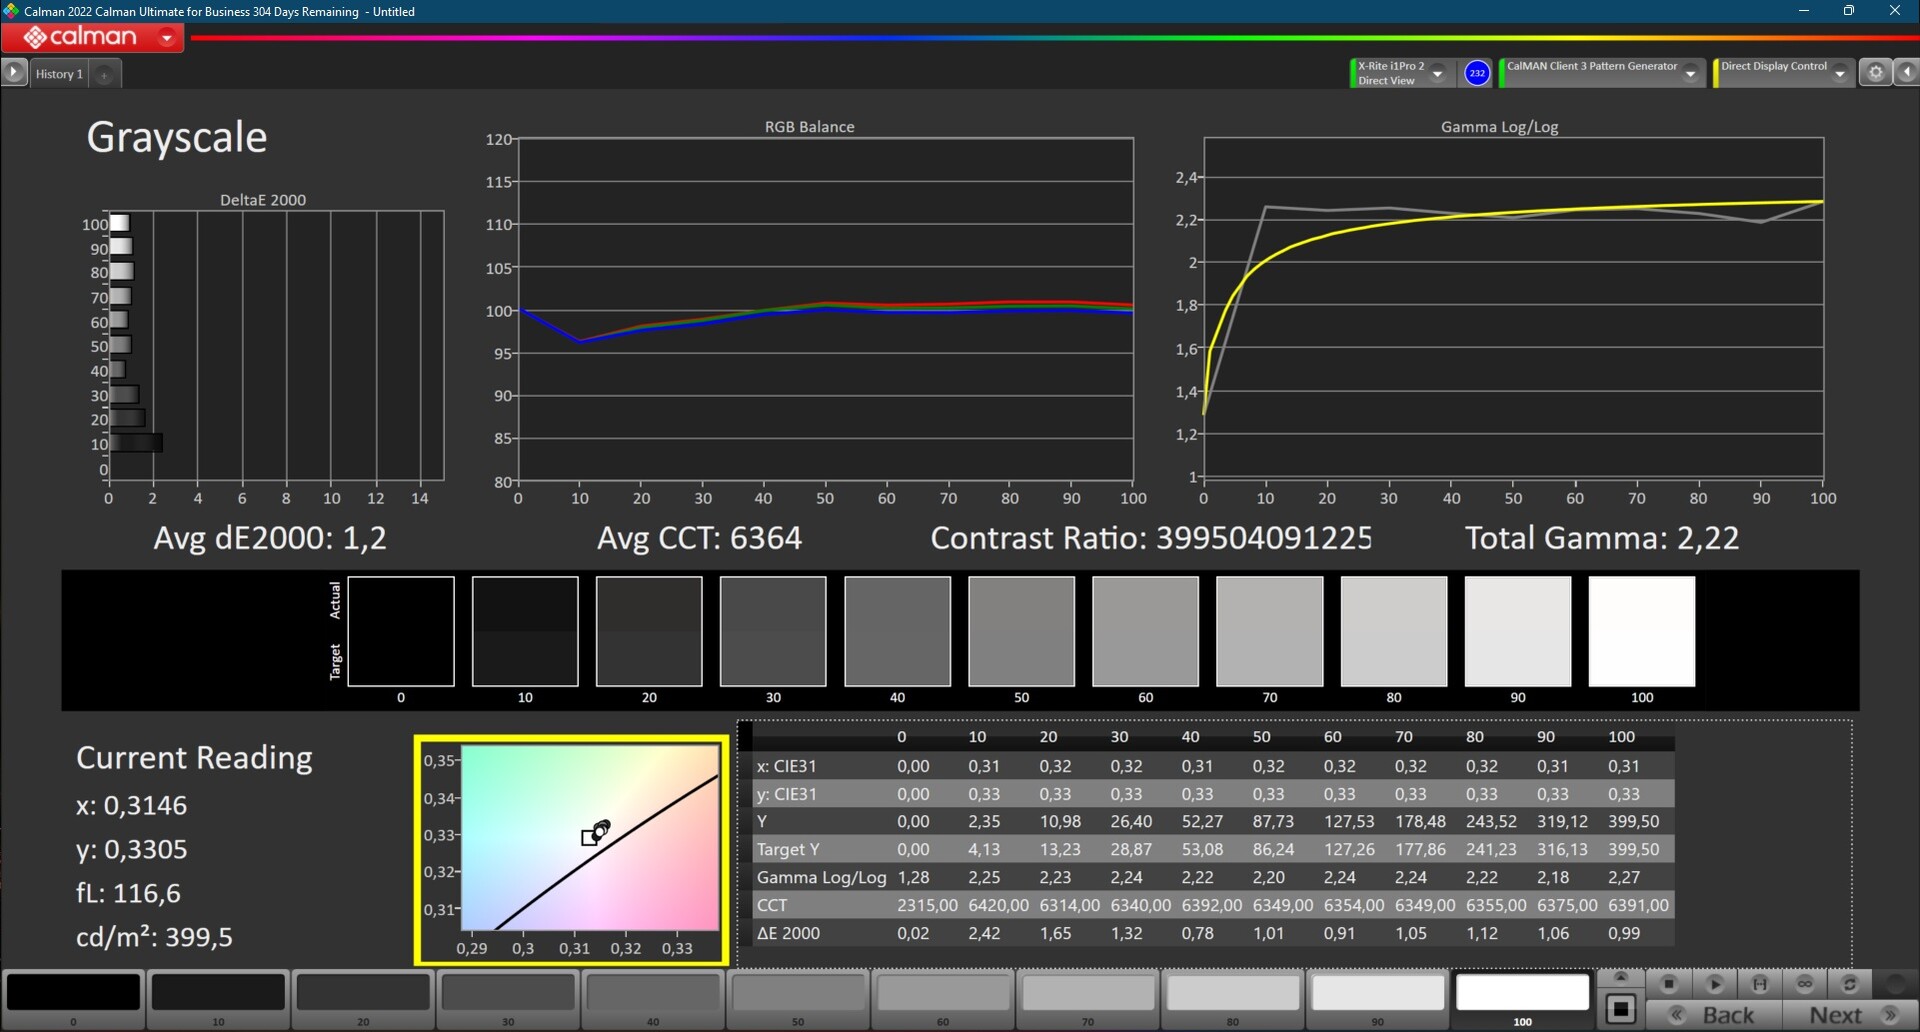
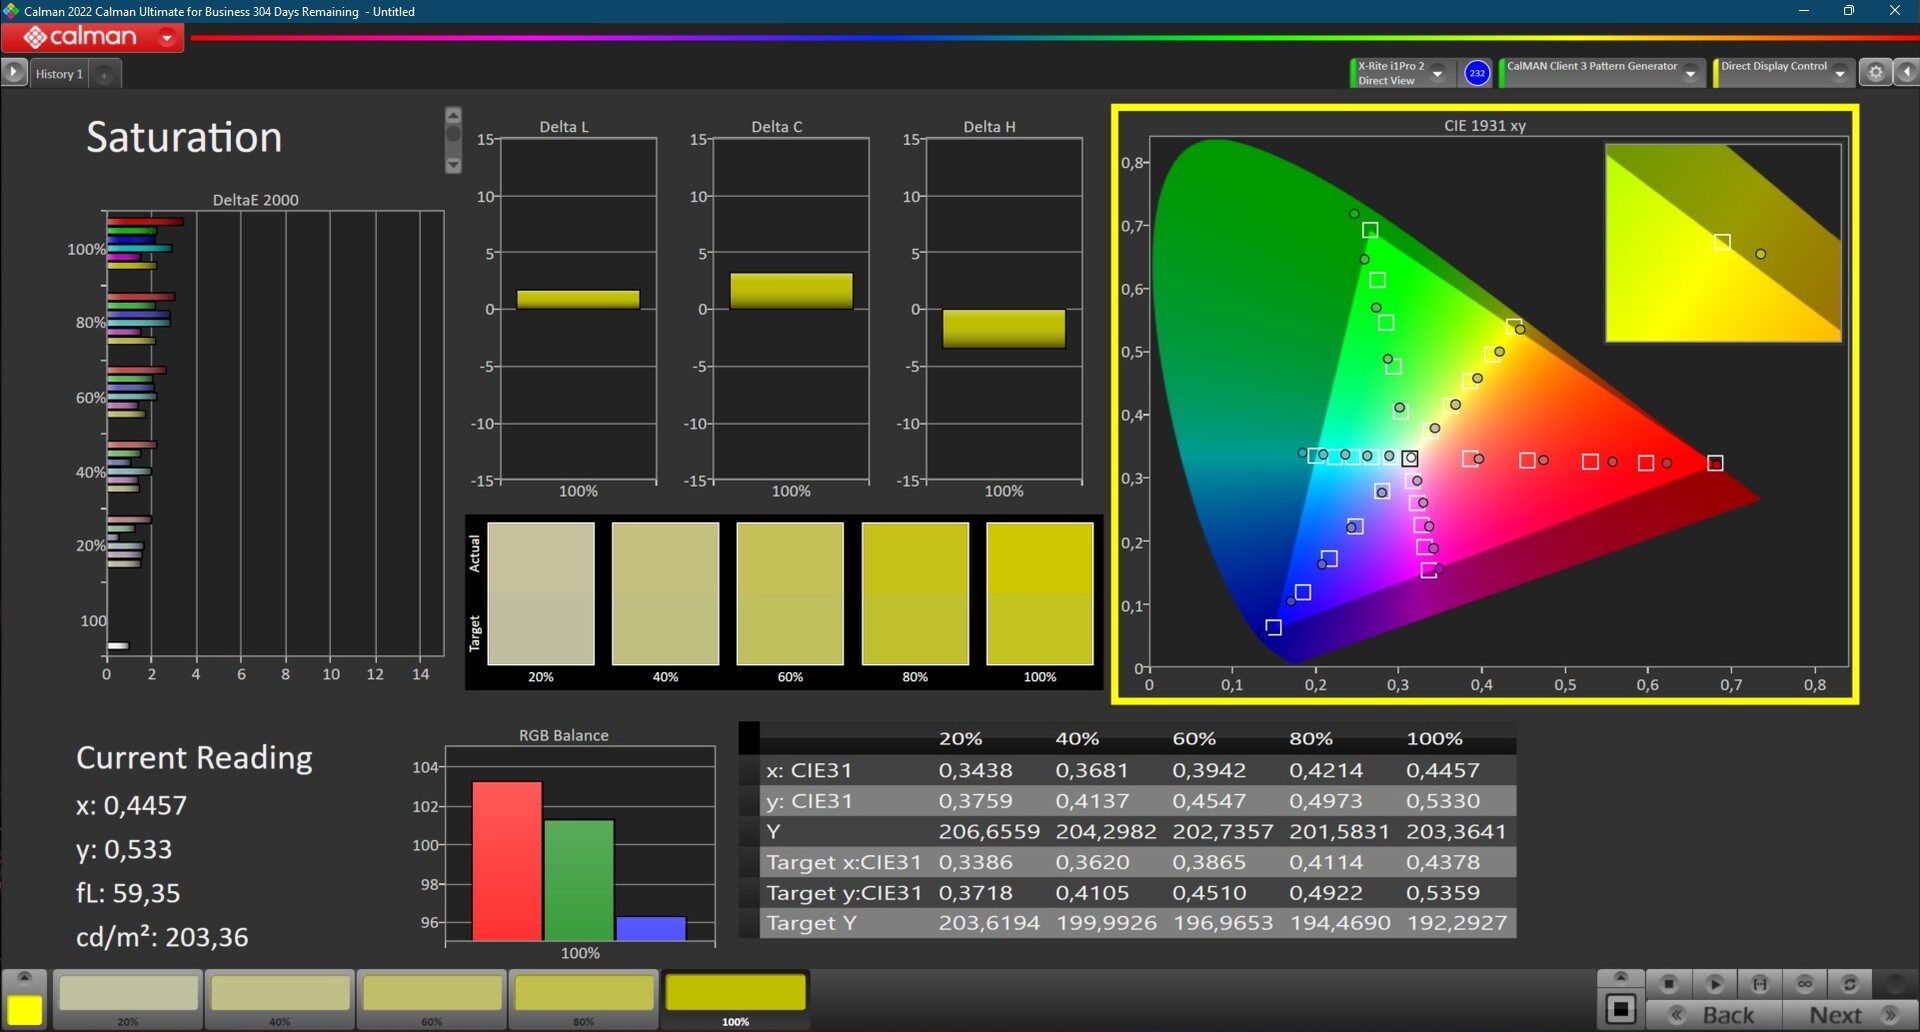
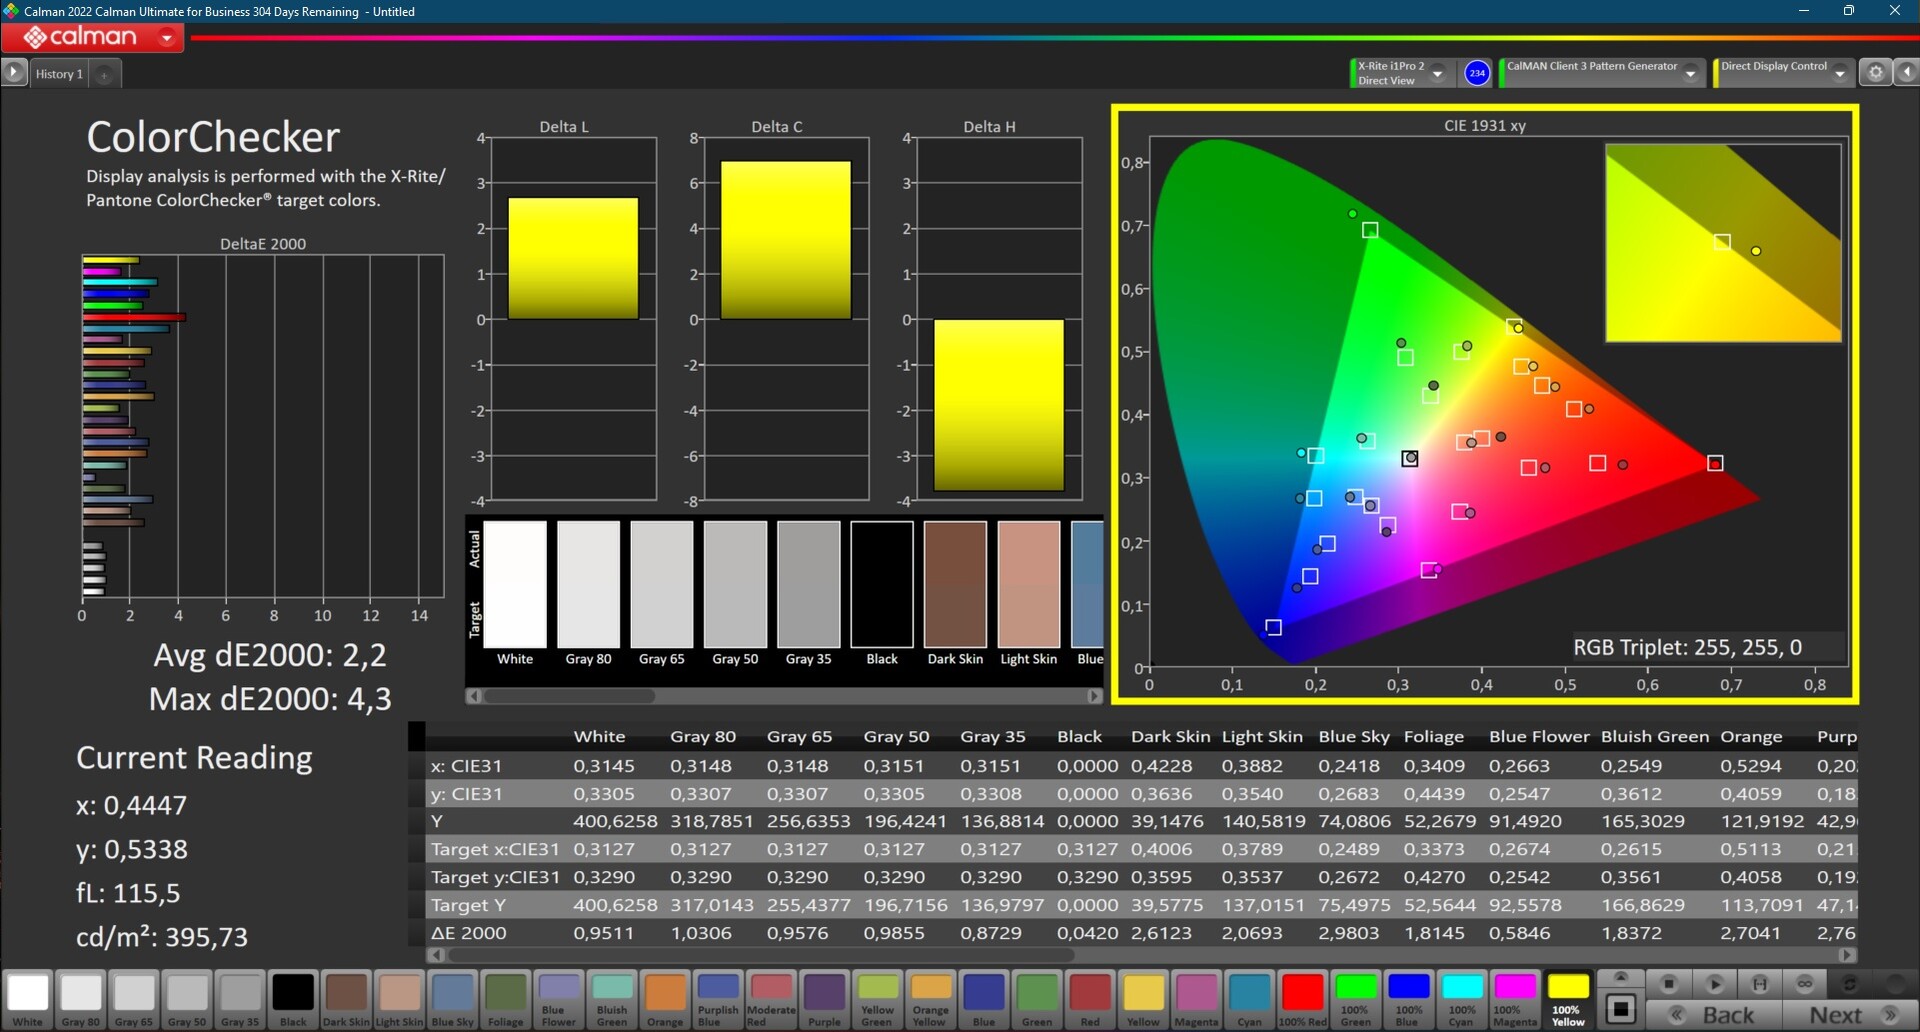
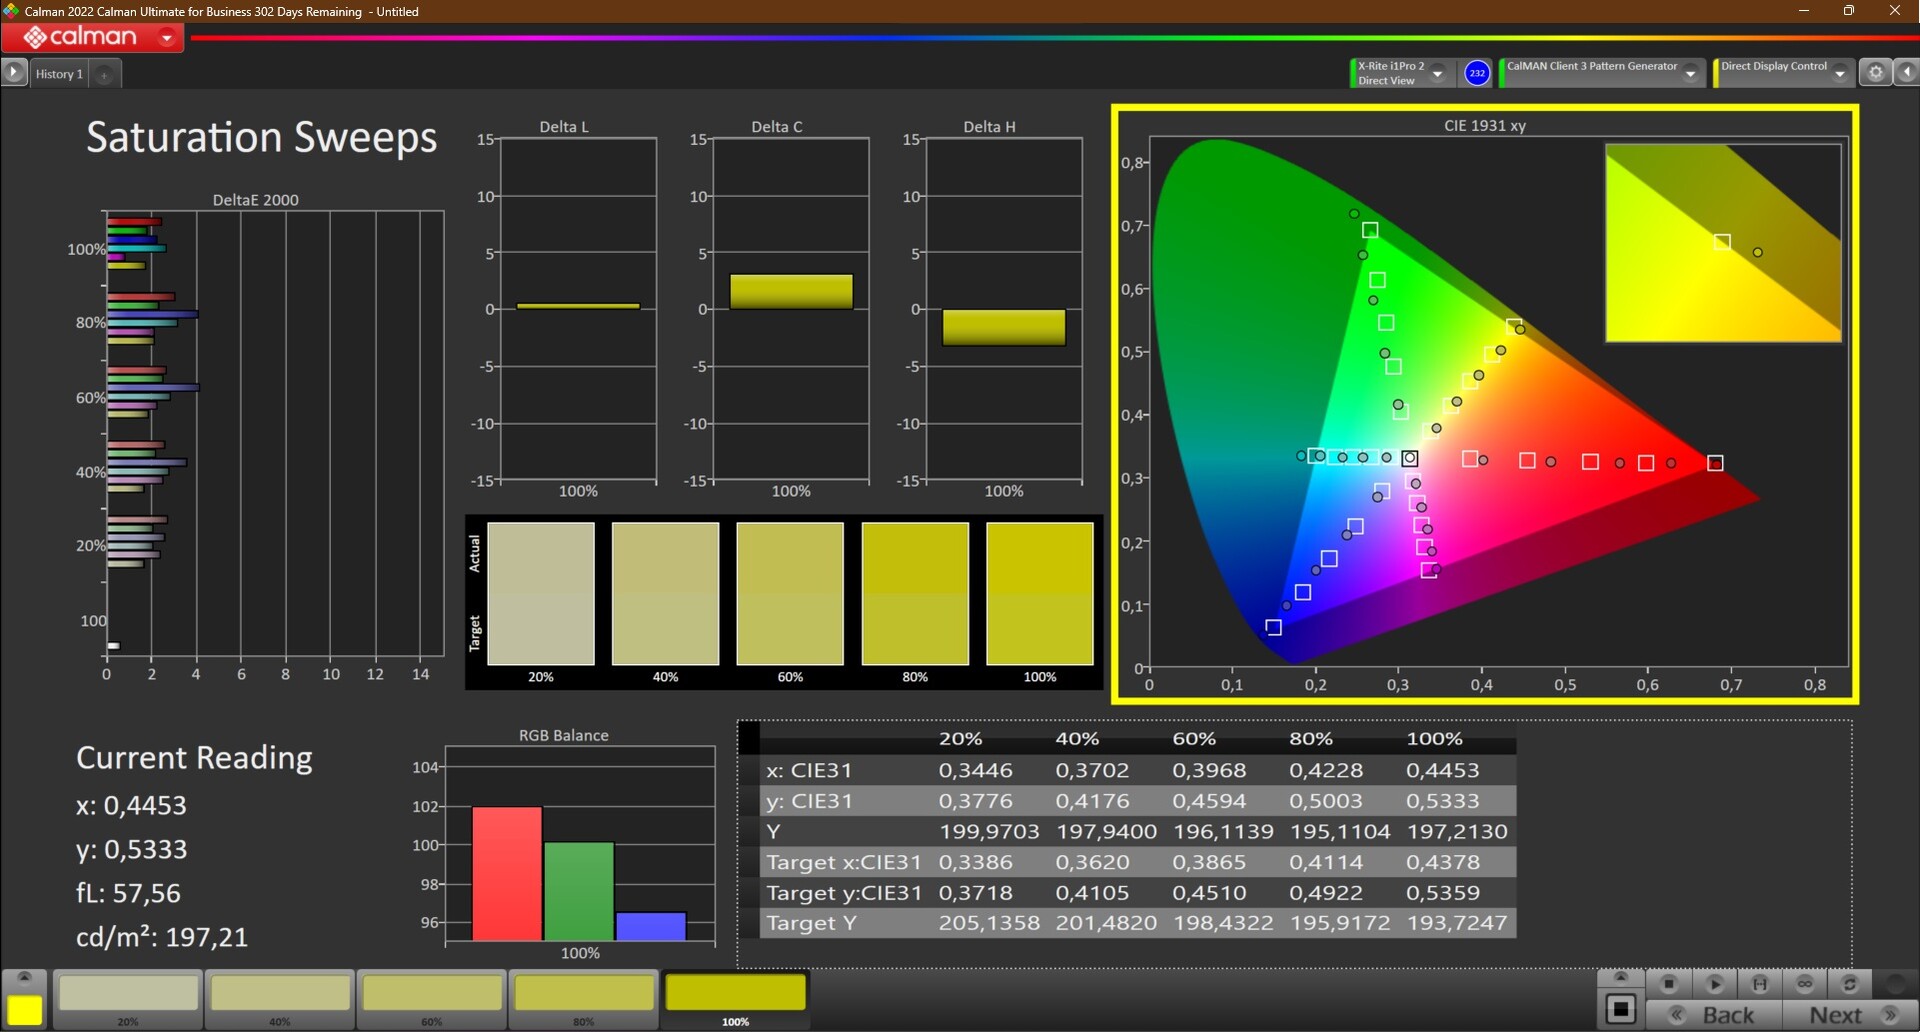
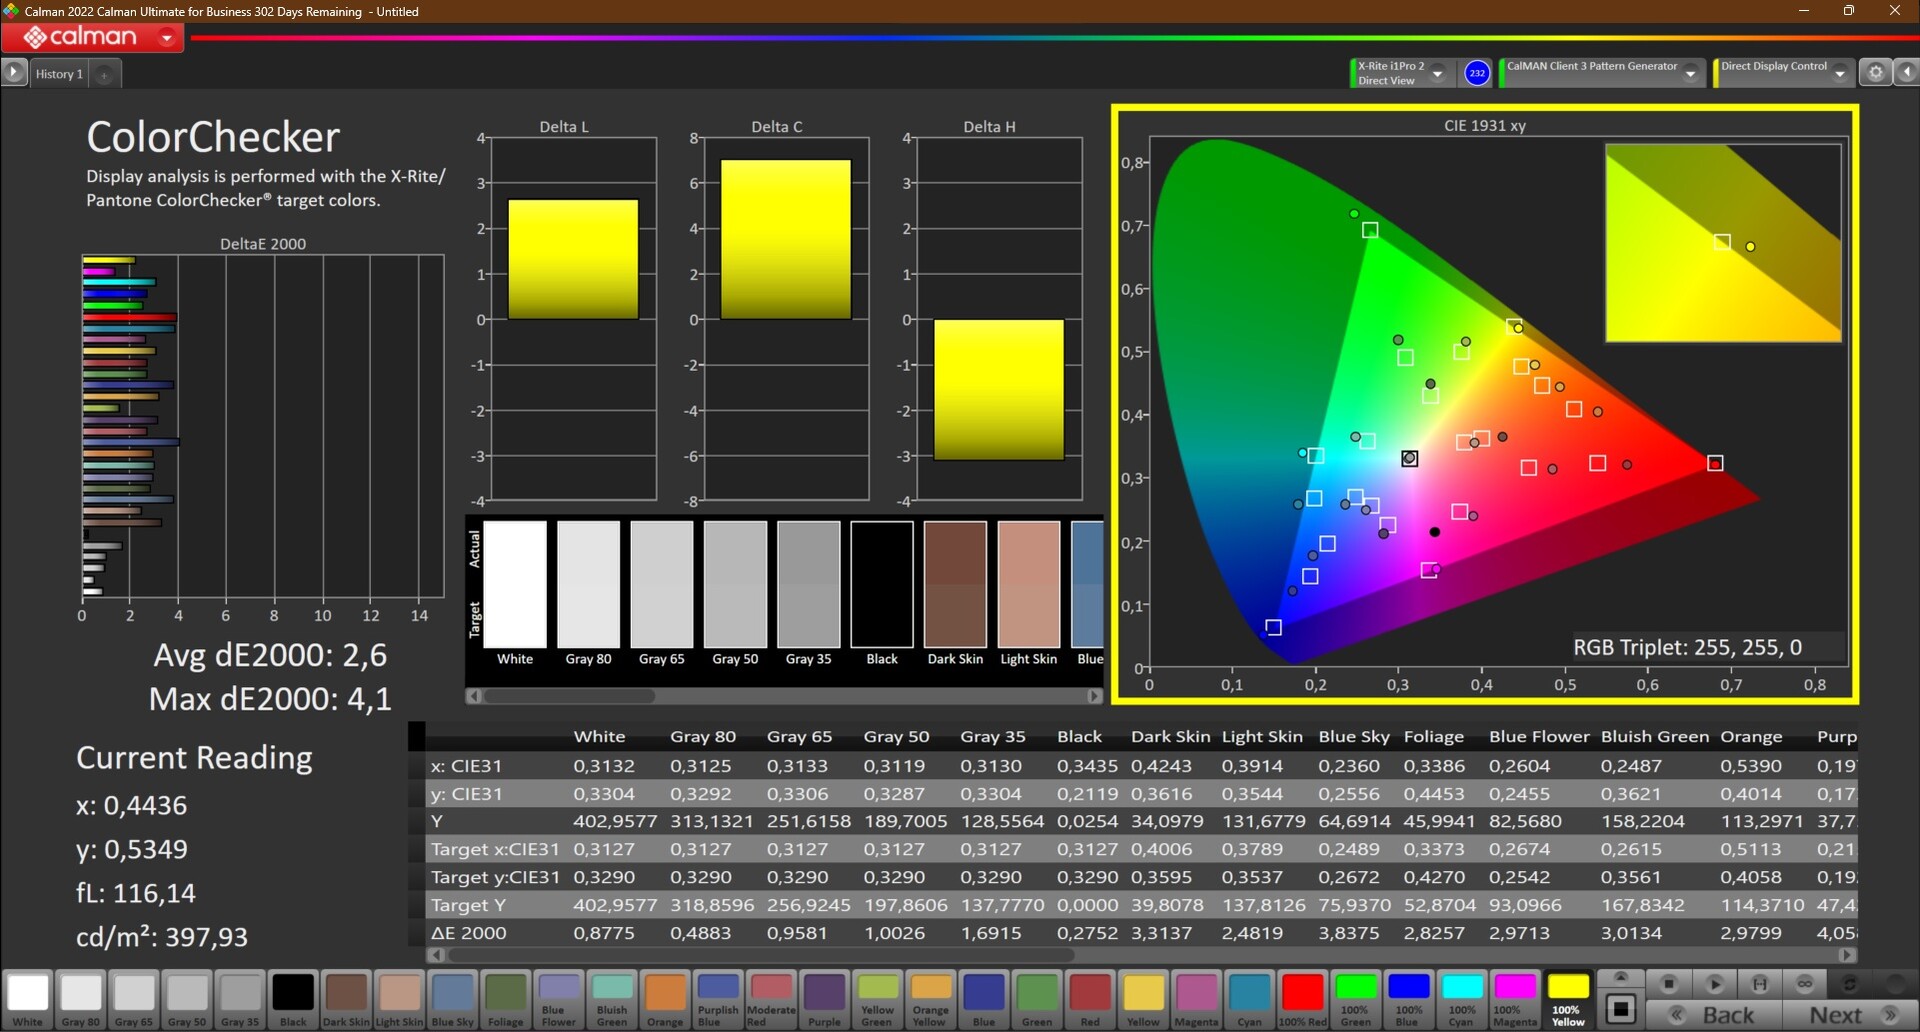
Jakość kolorów ekranu jest już w stanie fabrycznym bardzo wysoka; praktycznie nieskończenie wysoka wartość kontrastu skutkuje żywymi, uwypuklonymi kolorami. Odchylenia od ideału są już stosunkowo niewielkie dla większości kolorów ex works - i praktycznie nie byliśmy w stanie poprawić jakości poprzez kalibrację.
Mocną stroną ekranu OLED jest bardzo dobre pokrycie przestrzeni barw. Lenovo obiecuje 100% DCI-P3, co w rzeczywistości okazuje się być 99,7%. Panel jest w stanie w pełni odwzorować niewielką przestrzeń barw sRGB, a nawet AdobeRGB nie brakuje wiele przy 96,5%.
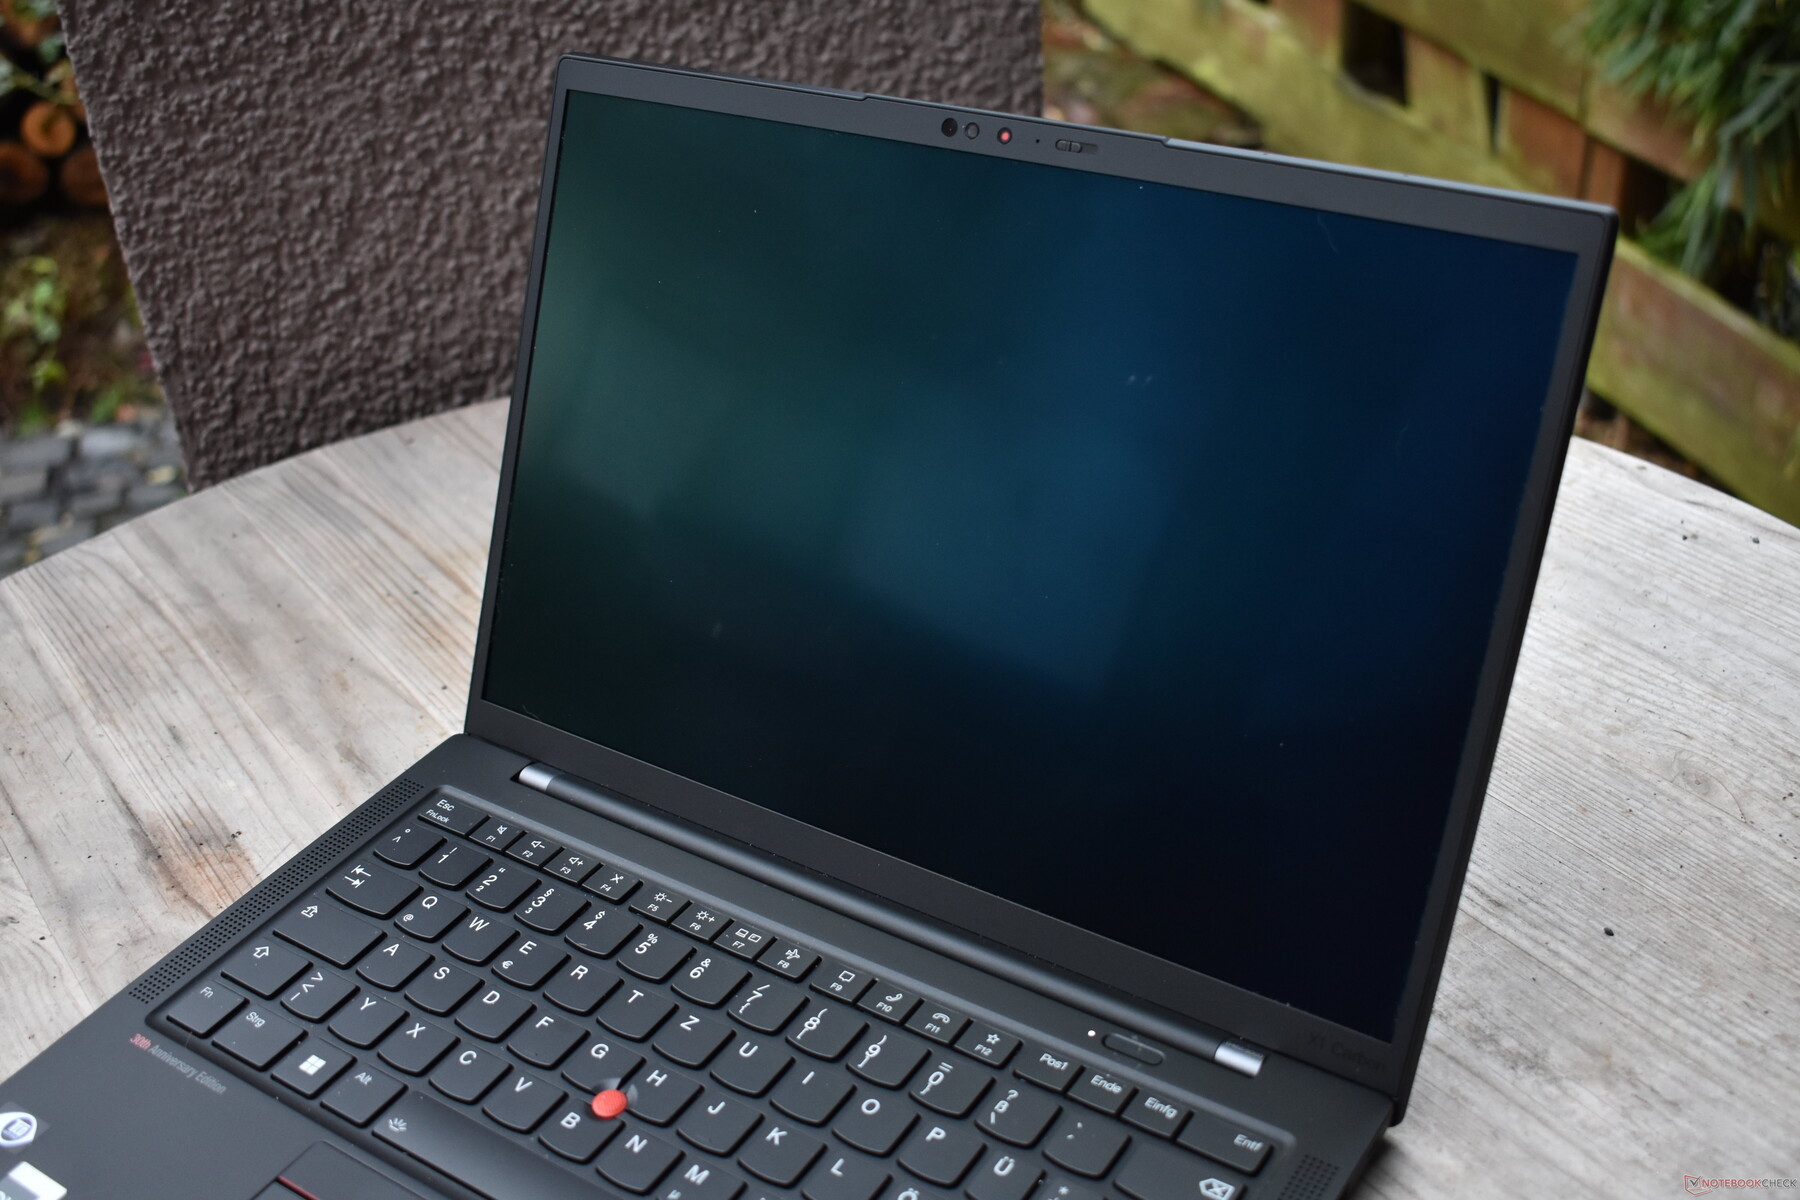
Wyświetlacze OLED są zazwyczaj błyszczące - ekran ThinkPada X1 Carbon G10 firmy Lenovo również jest błyszczący, ale tylko w bardzo niewielkim stopniu, a ponadto jest to panel antyrefleksyjny. W połączeniu z jasnością około 400 cd/m² i wysokim współczynnikiem kontrastu ekran może być bez problemu używany na zewnątrz.
Wyświetl czasy reakcji
| ↔ Czas reakcji od czerni do bieli | ||
|---|---|---|
| 1.6 ms ... wzrost ↗ i spadek ↘ łącznie | ↗ 0.9 ms wzrost |  |
| ↘ 0.7 ms upadek | ||
| W naszych testach ekran wykazuje bardzo szybką reakcję i powinien bardzo dobrze nadawać się do szybkich gier. Dla porównania, wszystkie testowane urządzenia wahają się od 0.1 (minimum) do 240 (maksimum) ms. » 9 % wszystkich urządzeń jest lepszych. Oznacza to, że zmierzony czas reakcji jest lepszy od średniej wszystkich testowanych urządzeń (19.8 ms). | ||
| ↔ Czas reakcji 50% szarości do 80% szarości | ||
| 1.2 ms ... wzrost ↗ i spadek ↘ łącznie | ↗ 0.6 ms wzrost |  |
| ↘ 0.6 ms upadek | ||
| W naszych testach ekran wykazuje bardzo szybką reakcję i powinien bardzo dobrze nadawać się do szybkich gier. Dla porównania, wszystkie testowane urządzenia wahają się od 0.165 (minimum) do 636 (maksimum) ms. » 5 % wszystkich urządzeń jest lepszych. Oznacza to, że zmierzony czas reakcji jest lepszy od średniej wszystkich testowanych urządzeń (31 ms). | ||
Migotanie ekranu / PWM (modulacja szerokości impulsu)
| Wykryto migotanie ekranu/wykryto PWM | 342 Hz | ≤ 100 % ustawienia jasności |  |
Podświetlenie wyświetlacza miga z częstotliwością 342 Hz (najgorszy przypadek, np. przy użyciu PWM) Wykryto migotanie przy ustawieniu jasności 100 % i poniżej. Powyżej tego ustawienia jasności nie powinno być żadnego migotania ani PWM. Częstotliwość 342 Hz jest stosunkowo wysoka, więc większość użytkowników wrażliwych na PWM nie powinna zauważyć żadnego migotania. Istnieją jednak doniesienia, że niektórzy użytkownicy są nadal wrażliwi na PWM przy częstotliwości 500 Hz i wyższej, więc należy zachować ostrożność. Dla porównania: 52 % wszystkich testowanych urządzeń nie używa PWM do przyciemniania wyświetlacza. Jeśli wykryto PWM, zmierzono średnio 7769 (minimum: 5 - maksimum: 343500) Hz. | |||


Wydajność: Lenovo tym razem ustala limit TDP wyżej
Opis opcji podzespołów można znaleźć w naszej pierwszej recenzji dot Lenovo ThinkPad X1 Carbon G10.
Warunki badania
Jak zawsze w przypadku ThinkPadów, Lenovo korzysta z trybów wydajnościowych Windows, które można ustawić w ustawieniach systemu Windows. Tryb "Longest Battery Life" na stałe ogranicza procesor do 11 watów. W środkowym poziomie "Better Performance" możliwe jest zwiększenie mocy do 50 watów, a procesor jest ograniczony do 19 watów na długi czas. Ten długoterminowy limit dotyczy również ustawienia "Best Performance", przy czym w krótkich zrywach możliwe jest uzyskanie do 56 watów, a w etapach pośrednich - 28 watów.
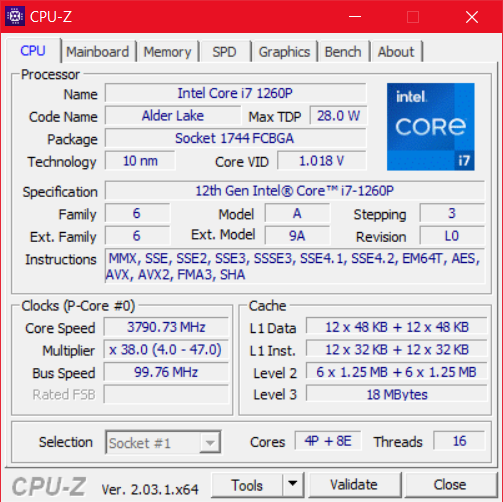
Procesor
Strona Intel Core i7-1260Pto procesor z serii "Alder-Lake-P28". Jak sama nazwa wskazuje, przy zużyciu 28 watów ma on łącznie dwanaście rdzeni, w tym cztery wydajnościowe i osiem efektywnościowych. Nasze lista procesorów można wykorzystać do szerszych porównań benchmarkowych z innymi procesorami.
Stałe zużycie 19 watów jest znacznie poniżej granicy 28 watów, do której ten procesor jest rzeczywiście przeznaczony. Z drugiej strony jest to i tak poprawa w porównaniu znaszej pierwszej próbki recenzenckiej X1 Carbon G10, którego Intel Core i5-1250P był na stałe ograniczony do zaledwie 15 W. Ponadto procesor może utrzymać 28 W jako etap pośredni dłużej niż w naszej pierwszej recenzji. Pod względem wydajności procesora X1 Carbon Gen 10 jest więc znacznie bardziej konkurencyjny. Nadal jednak jest wyraźnie gorszy od Lenovo ThinkPad Z13 z procesorem AMD.
Wydajność procesora jest też w pełni dostępna w trybie akumulatorowym.
Cinebench R15 Multi Sustained Load
Cinebench R23: Multi Core | Single Core
Cinebench R20: CPU (Multi Core) | CPU (Single Core)
Cinebench R15: CPU Multi 64Bit | CPU Single 64Bit
Blender: v2.79 BMW27 CPU
7-Zip 18.03: 7z b 4 | 7z b 4 -mmt1
Geekbench 5.5: Multi-Core | Single-Core
HWBOT x265 Benchmark v2.2: 4k Preset
LibreOffice : 20 Documents To PDF
R Benchmark 2.5: Overall mean
| CPU Performance rating | |
| Lenovo ThinkPad Z13 G1-21D20016GE | |
| Dell Latitude 9430 2-in-1 -1! | |
| Średnia w klasie Office | |
| Przeciętny Intel Core i7-1260P | |
| Lenovo ThinkPad X1 Carbon G10 21CB00DCGE | |
| HP Elite Dragonfly G3 | |
| Lenovo ThinkPad X1 Carbon G10 21CC001RGE | |
| Lenovo ThinkPad X1 Carbon G9-20XWCTO1WW | |
| Cinebench R23 / Multi Core | |
| Lenovo ThinkPad Z13 G1-21D20016GE | |
| Średnia w klasie Office (1673 - 22808, n=74, ostatnie 2 lata) | |
| Lenovo ThinkPad X1 Carbon G10 21CB00DCGE | |
| Przeciętny Intel Core i7-1260P (3173 - 12150, n=27) | |
| Dell Latitude 9430 2-in-1 | |
| Lenovo ThinkPad X1 Carbon G10 21CC001RGE | |
| HP Elite Dragonfly G3 | |
| Lenovo ThinkPad X1 Carbon G9-20XWCTO1WW | |
| Cinebench R23 / Single Core | |
| Dell Latitude 9430 2-in-1 | |
| Przeciętny Intel Core i7-1260P (1155 - 1812, n=25) | |
| Średnia w klasie Office (708 - 2130, n=74, ostatnie 2 lata) | |
| Lenovo ThinkPad X1 Carbon G10 21CB00DCGE | |
| HP Elite Dragonfly G3 | |
| Lenovo ThinkPad X1 Carbon G10 21CC001RGE | |
| Lenovo ThinkPad X1 Carbon G9-20XWCTO1WW | |
| Lenovo ThinkPad Z13 G1-21D20016GE | |
| Cinebench R20 / CPU (Multi Core) | |
| Lenovo ThinkPad Z13 G1-21D20016GE | |
| Średnia w klasie Office (648 - 8840, n=73, ostatnie 2 lata) | |
| Lenovo ThinkPad X1 Carbon G10 21CB00DCGE | |
| Przeciętny Intel Core i7-1260P (1234 - 4748, n=25) | |
| Dell Latitude 9430 2-in-1 | |
| HP Elite Dragonfly G3 | |
| Lenovo ThinkPad X1 Carbon G10 21CC001RGE | |
| Lenovo ThinkPad X1 Carbon G9-20XWCTO1WW | |
| Cinebench R20 / CPU (Single Core) | |
| Dell Latitude 9430 2-in-1 | |
| Średnia w klasie Office (345 - 816, n=73, ostatnie 2 lata) | |
| Przeciętny Intel Core i7-1260P (448 - 698, n=25) | |
| Lenovo ThinkPad X1 Carbon G10 21CB00DCGE | |
| Lenovo ThinkPad Z13 G1-21D20016GE | |
| HP Elite Dragonfly G3 | |
| Lenovo ThinkPad X1 Carbon G9-20XWCTO1WW | |
| Lenovo ThinkPad X1 Carbon G10 21CC001RGE | |
| Cinebench R15 / CPU Multi 64Bit | |
| Lenovo ThinkPad Z13 G1-21D20016GE | |
| Średnia w klasie Office (250 - 3380, n=75, ostatnie 2 lata) | |
| Lenovo ThinkPad X1 Carbon G10 21CB00DCGE | |
| Dell Latitude 9430 2-in-1 | |
| Przeciętny Intel Core i7-1260P (549 - 2034, n=29) | |
| Lenovo ThinkPad X1 Carbon G10 21CC001RGE | |
| HP Elite Dragonfly G3 | |
| Lenovo ThinkPad X1 Carbon G9-20XWCTO1WW | |
| Cinebench R15 / CPU Single 64Bit | |
| Dell Latitude 9430 2-in-1 | |
| Średnia w klasie Office (99.5 - 312, n=75, ostatnie 2 lata) | |
| Lenovo ThinkPad Z13 G1-21D20016GE | |
| Przeciętny Intel Core i7-1260P (165.4 - 260, n=27) | |
| HP Elite Dragonfly G3 | |
| Lenovo ThinkPad X1 Carbon G9-20XWCTO1WW | |
| Lenovo ThinkPad X1 Carbon G10 21CC001RGE | |
| Lenovo ThinkPad X1 Carbon G10 21CB00DCGE | |
| Blender / v2.79 BMW27 CPU | |
| Lenovo ThinkPad X1 Carbon G9-20XWCTO1WW | |
| Lenovo ThinkPad X1 Carbon G10 21CC001RGE | |
| HP Elite Dragonfly G3 | |
| Przeciętny Intel Core i7-1260P (264 - 906, n=26) | |
| Średnia w klasie Office (158 - 1940, n=74, ostatnie 2 lata) | |
| Lenovo ThinkPad X1 Carbon G10 21CB00DCGE | |
| Lenovo ThinkPad Z13 G1-21D20016GE | |
| 7-Zip 18.03 / 7z b 4 | |
| Lenovo ThinkPad Z13 G1-21D20016GE | |
| Średnia w klasie Office (7098 - 76886, n=75, ostatnie 2 lata) | |
| Lenovo ThinkPad X1 Carbon G10 21CB00DCGE | |
| Przeciętny Intel Core i7-1260P (16146 - 47064, n=25) | |
| Dell Latitude 9430 2-in-1 | |
| HP Elite Dragonfly G3 | |
| Lenovo ThinkPad X1 Carbon G10 21CC001RGE | |
| Lenovo ThinkPad X1 Carbon G9-20XWCTO1WW | |
| 7-Zip 18.03 / 7z b 4 -mmt1 | |
| Dell Latitude 9430 2-in-1 | |
| Średnia w klasie Office (3387 - 6469, n=75, ostatnie 2 lata) | |
| Lenovo ThinkPad Z13 G1-21D20016GE | |
| Przeciętny Intel Core i7-1260P (4064 - 5791, n=25) | |
| Lenovo ThinkPad X1 Carbon G10 21CB00DCGE | |
| Lenovo ThinkPad X1 Carbon G9-20XWCTO1WW | |
| HP Elite Dragonfly G3 | |
| Lenovo ThinkPad X1 Carbon G10 21CC001RGE | |
| Geekbench 5.5 / Multi-Core | |
| Średnia w klasie Office (1483 - 16999, n=71, ostatnie 2 lata) | |
| Dell Latitude 9430 2-in-1 | |
| Przeciętny Intel Core i7-1260P (3866 - 10570, n=25) | |
| Lenovo ThinkPad X1 Carbon G10 21CB00DCGE | |
| Lenovo ThinkPad Z13 G1-21D20016GE | |
| HP Elite Dragonfly G3 | |
| Lenovo ThinkPad X1 Carbon G10 21CC001RGE | |
| Lenovo ThinkPad X1 Carbon G9-20XWCTO1WW | |
| Geekbench 5.5 / Single-Core | |
| Średnia w klasie Office (811 - 2128, n=71, ostatnie 2 lata) | |
| Dell Latitude 9430 2-in-1 | |
| Lenovo ThinkPad X1 Carbon G10 21CB00DCGE | |
| Przeciętny Intel Core i7-1260P (1436 - 1786, n=25) | |
| Lenovo ThinkPad X1 Carbon G10 21CC001RGE | |
| Lenovo ThinkPad X1 Carbon G9-20XWCTO1WW | |
| HP Elite Dragonfly G3 | |
| Lenovo ThinkPad Z13 G1-21D20016GE | |
| HWBOT x265 Benchmark v2.2 / 4k Preset | |
| Lenovo ThinkPad Z13 G1-21D20016GE | |
| Średnia w klasie Office (2.21 - 26, n=74, ostatnie 2 lata) | |
| Przeciętny Intel Core i7-1260P (3.45 - 13.6, n=26) | |
| Dell Latitude 9430 2-in-1 | |
| Lenovo ThinkPad X1 Carbon G10 21CB00DCGE | |
| HP Elite Dragonfly G3 | |
| Lenovo ThinkPad X1 Carbon G10 21CC001RGE | |
| Lenovo ThinkPad X1 Carbon G9-20XWCTO1WW | |
| LibreOffice / 20 Documents To PDF | |
| HP Elite Dragonfly G3 | |
| Średnia w klasie Office (39.9 - 102.3, n=74, ostatnie 2 lata) | |
| Lenovo ThinkPad X1 Carbon G10 21CC001RGE | |
| Lenovo ThinkPad Z13 G1-21D20016GE | |
| Przeciętny Intel Core i7-1260P (40.2 - 65.7, n=25) | |
| Lenovo ThinkPad X1 Carbon G10 21CB00DCGE | |
| Dell Latitude 9430 2-in-1 | |
| Lenovo ThinkPad X1 Carbon G9-20XWCTO1WW | |
| R Benchmark 2.5 / Overall mean | |
| Lenovo ThinkPad X1 Carbon G9-20XWCTO1WW | |
| Lenovo ThinkPad X1 Carbon G10 21CC001RGE | |
| HP Elite Dragonfly G3 | |
| Średnia w klasie Office (0.4098 - 0.888, n=74, ostatnie 2 lata) | |
| Lenovo ThinkPad X1 Carbon G10 21CB00DCGE | |
| Lenovo ThinkPad Z13 G1-21D20016GE | |
| Przeciętny Intel Core i7-1260P (0.4559 - 0.727, n=25) | |
| Dell Latitude 9430 2-in-1 | |
* ... im mniej tym lepiej
AIDA64: FP32 Ray-Trace | FPU Julia | CPU SHA3 | CPU Queen | FPU SinJulia | FPU Mandel | CPU AES | CPU ZLib | FP64 Ray-Trace | CPU PhotoWorxx
| Performance rating | |
| Lenovo ThinkPad Z13 G1-21D20016GE | |
| Średnia w klasie Office | |
| Dell Latitude 9430 2-in-1 | |
| Przeciętny Intel Core i7-1260P | |
| Lenovo ThinkPad X1 Carbon G9-20XWCTO1WW | |
| Lenovo ThinkPad X1 Carbon G10 21CB00DCGE | |
| HP Elite Dragonfly G3 | |
| Lenovo ThinkPad X1 Carbon G10 21CC001RGE | |
| AIDA64 / FP32 Ray-Trace | |
| Średnia w klasie Office (2083 - 31245, n=80, ostatnie 2 lata) | |
| Lenovo ThinkPad Z13 G1-21D20016GE | |
| Dell Latitude 9430 2-in-1 | |
| Lenovo ThinkPad X1 Carbon G9-20XWCTO1WW | |
| Lenovo ThinkPad X1 Carbon G10 21CB00DCGE | |
| Przeciętny Intel Core i7-1260P (2176 - 10898, n=26) | |
| HP Elite Dragonfly G3 | |
| Lenovo ThinkPad X1 Carbon G10 21CC001RGE | |
| AIDA64 / FPU Julia | |
| Lenovo ThinkPad Z13 G1-21D20016GE | |
| Średnia w klasie Office (8191 - 125394, n=80, ostatnie 2 lata) | |
| Dell Latitude 9430 2-in-1 | |
| Lenovo ThinkPad X1 Carbon G10 21CB00DCGE | |
| Przeciętny Intel Core i7-1260P (11015 - 56906, n=26) | |
| HP Elite Dragonfly G3 | |
| Lenovo ThinkPad X1 Carbon G9-20XWCTO1WW | |
| Lenovo ThinkPad X1 Carbon G10 21CC001RGE | |
| AIDA64 / CPU SHA3 | |
| Lenovo ThinkPad Z13 G1-21D20016GE | |
| Średnia w klasie Office (433 - 5755, n=80, ostatnie 2 lata) | |
| Dell Latitude 9430 2-in-1 | |
| Lenovo ThinkPad X1 Carbon G9-20XWCTO1WW | |
| Przeciętny Intel Core i7-1260P (669 - 2709, n=26) | |
| HP Elite Dragonfly G3 | |
| Lenovo ThinkPad X1 Carbon G10 21CB00DCGE | |
| Lenovo ThinkPad X1 Carbon G10 21CC001RGE | |
| AIDA64 / CPU Queen | |
| Lenovo ThinkPad Z13 G1-21D20016GE | |
| Lenovo ThinkPad X1 Carbon G10 21CB00DCGE | |
| Przeciętny Intel Core i7-1260P (42571 - 82493, n=26) | |
| Lenovo ThinkPad X1 Carbon G10 21CC001RGE | |
| Dell Latitude 9430 2-in-1 | |
| Średnia w klasie Office (22784 - 115197, n=69, ostatnie 2 lata) | |
| HP Elite Dragonfly G3 | |
| Lenovo ThinkPad X1 Carbon G9-20XWCTO1WW | |
| AIDA64 / FPU SinJulia | |
| Lenovo ThinkPad Z13 G1-21D20016GE | |
| Średnia w klasie Office (1378 - 18321, n=80, ostatnie 2 lata) | |
| Przeciętny Intel Core i7-1260P (2901 - 6975, n=26) | |
| Dell Latitude 9430 2-in-1 | |
| Lenovo ThinkPad X1 Carbon G10 21CB00DCGE | |
| Lenovo ThinkPad X1 Carbon G10 21CC001RGE | |
| Lenovo ThinkPad X1 Carbon G9-20XWCTO1WW | |
| HP Elite Dragonfly G3 | |
| AIDA64 / FPU Mandel | |
| Lenovo ThinkPad Z13 G1-21D20016GE | |
| Średnia w klasie Office (4601 - 66922, n=80, ostatnie 2 lata) | |
| Dell Latitude 9430 2-in-1 | |
| Lenovo ThinkPad X1 Carbon G9-20XWCTO1WW | |
| Lenovo ThinkPad X1 Carbon G10 21CB00DCGE | |
| Przeciętny Intel Core i7-1260P (5950 - 26376, n=26) | |
| HP Elite Dragonfly G3 | |
| Lenovo ThinkPad X1 Carbon G10 21CC001RGE | |
| AIDA64 / CPU AES | |
| Lenovo ThinkPad X1 Carbon G9-20XWCTO1WW | |
| Lenovo ThinkPad Z13 G1-21D20016GE | |
| Średnia w klasie Office (4854 - 155900, n=80, ostatnie 2 lata) | |
| Przeciętny Intel Core i7-1260P (16041 - 92356, n=26) | |
| Dell Latitude 9430 2-in-1 | |
| Lenovo ThinkPad X1 Carbon G10 21CB00DCGE | |
| HP Elite Dragonfly G3 | |
| Lenovo ThinkPad X1 Carbon G10 21CC001RGE | |
| AIDA64 / CPU ZLib | |
| Średnia w klasie Office (114.6 - 1366, n=80, ostatnie 2 lata) | |
| Lenovo ThinkPad Z13 G1-21D20016GE | |
| Dell Latitude 9430 2-in-1 | |
| Przeciętny Intel Core i7-1260P (259 - 771, n=26) | |
| Lenovo ThinkPad X1 Carbon G10 21CC001RGE | |
| HP Elite Dragonfly G3 | |
| Lenovo ThinkPad X1 Carbon G10 21CB00DCGE | |
| Lenovo ThinkPad X1 Carbon G9-20XWCTO1WW | |
| AIDA64 / FP64 Ray-Trace | |
| Średnia w klasie Office (1109 - 17834, n=80, ostatnie 2 lata) | |
| Lenovo ThinkPad Z13 G1-21D20016GE | |
| Dell Latitude 9430 2-in-1 | |
| Lenovo ThinkPad X1 Carbon G9-20XWCTO1WW | |
| Przeciętny Intel Core i7-1260P (1237 - 5858, n=26) | |
| Lenovo ThinkPad X1 Carbon G10 21CB00DCGE | |
| HP Elite Dragonfly G3 | |
| Lenovo ThinkPad X1 Carbon G10 21CC001RGE | |
| AIDA64 / CPU PhotoWorxx | |
| Dell Latitude 9430 2-in-1 | |
| HP Elite Dragonfly G3 | |
| Lenovo ThinkPad X1 Carbon G9-20XWCTO1WW | |
| Lenovo ThinkPad X1 Carbon G10 21CB00DCGE | |
| Średnia w klasie Office (11090 - 65229, n=80, ostatnie 2 lata) | |
| Lenovo ThinkPad X1 Carbon G10 21CC001RGE | |
| Przeciętny Intel Core i7-1260P (13261 - 43652, n=26) | |
| Lenovo ThinkPad Z13 G1-21D20016GE | |
Wydajność systemu
Benchmarki syntetycznej wydajności systemu wypadają podobnie jak testy procesora. Lenovo ThinkPad X1 Carbon Gen 10 30th Anniversary Edition działa szybko, ale nie zajmuje pole position. W codziennym użytkowaniu okazuje się urządzeniem bardzo responsywnym.
CrossMark: Overall | Productivity | Creativity | Responsiveness
| PCMark 10 / Score | |
| Średnia w klasie Office (2601 - 9298, n=64, ostatnie 2 lata) | |
| Lenovo ThinkPad Z13 G1-21D20016GE | |
| Przeciętny Intel Core i7-1260P, Intel Iris Xe Graphics G7 96EUs (4796 - 6068, n=17) | |
| Dell Latitude 9430 2-in-1 | |
| Lenovo ThinkPad X1 Carbon G10 21CB00DCGE | |
| Lenovo ThinkPad X1 Carbon G10 21CC001RGE | |
| Lenovo ThinkPad X1 Carbon G9-20XWCTO1WW | |
| HP Elite Dragonfly G3 | |
| PCMark 10 / Essentials | |
| Dell Latitude 9430 2-in-1 | |
| Przeciętny Intel Core i7-1260P, Intel Iris Xe Graphics G7 96EUs (9260 - 11251, n=17) | |
| Lenovo ThinkPad Z13 G1-21D20016GE | |
| Lenovo ThinkPad X1 Carbon G10 21CC001RGE | |
| Lenovo ThinkPad X1 Carbon G9-20XWCTO1WW | |
| Średnia w klasie Office (3245 - 11594, n=64, ostatnie 2 lata) | |
| Lenovo ThinkPad X1 Carbon G10 21CB00DCGE | |
| HP Elite Dragonfly G3 | |
| PCMark 10 / Productivity | |
| Średnia w klasie Office (5336 - 17243, n=64, ostatnie 2 lata) | |
| Lenovo ThinkPad Z13 G1-21D20016GE | |
| Dell Latitude 9430 2-in-1 | |
| Przeciętny Intel Core i7-1260P, Intel Iris Xe Graphics G7 96EUs (6167 - 8629, n=17) | |
| Lenovo ThinkPad X1 Carbon G9-20XWCTO1WW | |
| Lenovo ThinkPad X1 Carbon G10 21CB00DCGE | |
| Lenovo ThinkPad X1 Carbon G10 21CC001RGE | |
| HP Elite Dragonfly G3 | |
| PCMark 10 / Digital Content Creation | |
| Średnia w klasie Office (2049 - 13541, n=64, ostatnie 2 lata) | |
| Lenovo ThinkPad Z13 G1-21D20016GE | |
| Lenovo ThinkPad X1 Carbon G10 21CB00DCGE | |
| Przeciętny Intel Core i7-1260P, Intel Iris Xe Graphics G7 96EUs (5231 - 6908, n=17) | |
| Dell Latitude 9430 2-in-1 | |
| HP Elite Dragonfly G3 | |
| Lenovo ThinkPad X1 Carbon G10 21CC001RGE | |
| Lenovo ThinkPad X1 Carbon G9-20XWCTO1WW | |
| CrossMark / Overall | |
| Przeciętny Intel Core i7-1260P, Intel Iris Xe Graphics G7 96EUs (1484 - 1811, n=16) | |
| Dell Latitude 9430 2-in-1 | |
| Lenovo ThinkPad X1 Carbon G10 21CB00DCGE | |
| Lenovo ThinkPad X1 Carbon G10 21CC001RGE | |
| Lenovo ThinkPad Z13 G1-21D20016GE | |
| Średnia w klasie Office (381 - 2010, n=73, ostatnie 2 lata) | |
| HP Elite Dragonfly G3 | |
| CrossMark / Productivity | |
| Przeciętny Intel Core i7-1260P, Intel Iris Xe Graphics G7 96EUs (1486 - 1755, n=16) | |
| Dell Latitude 9430 2-in-1 | |
| Lenovo ThinkPad Z13 G1-21D20016GE | |
| Lenovo ThinkPad X1 Carbon G10 21CB00DCGE | |
| Lenovo ThinkPad X1 Carbon G10 21CC001RGE | |
| Średnia w klasie Office (464 - 1880, n=73, ostatnie 2 lata) | |
| HP Elite Dragonfly G3 | |
| CrossMark / Creativity | |
| Przeciętny Intel Core i7-1260P, Intel Iris Xe Graphics G7 96EUs (1451 - 1872, n=16) | |
| Lenovo ThinkPad X1 Carbon G10 21CB00DCGE | |
| Dell Latitude 9430 2-in-1 | |
| Lenovo ThinkPad X1 Carbon G10 21CC001RGE | |
| Średnia w klasie Office (319 - 2361, n=73, ostatnie 2 lata) | |
| Lenovo ThinkPad Z13 G1-21D20016GE | |
| HP Elite Dragonfly G3 | |
| CrossMark / Responsiveness | |
| Przeciętny Intel Core i7-1260P, Intel Iris Xe Graphics G7 96EUs (1253 - 1807, n=16) | |
| Dell Latitude 9430 2-in-1 | |
| Lenovo ThinkPad X1 Carbon G10 21CC001RGE | |
| Lenovo ThinkPad X1 Carbon G10 21CB00DCGE | |
| Lenovo ThinkPad Z13 G1-21D20016GE | |
| Średnia w klasie Office (360 - 1690, n=73, ostatnie 2 lata) | |
| HP Elite Dragonfly G3 | |
| PCMark 10 Score | 5411 pkt. | |
Pomoc | ||
| AIDA64 / Memory Copy | |
| Dell Latitude 9430 2-in-1 | |
| HP Elite Dragonfly G3 | |
| Średnia w klasie Office (20075 - 110930, n=77, ostatnie 2 lata) | |
| Lenovo ThinkPad X1 Carbon G10 21CC001RGE | |
| Lenovo ThinkPad X1 Carbon G10 21CB00DCGE | |
| Lenovo ThinkPad X1 Carbon G9-20XWCTO1WW | |
| Przeciętny Intel Core i7-1260P (25125 - 71544, n=25) | |
| Lenovo ThinkPad Z13 G1-21D20016GE | |
| AIDA64 / Memory Read | |
| Lenovo ThinkPad X1 Carbon G10 21CC001RGE | |
| Lenovo ThinkPad X1 Carbon G10 21CB00DCGE | |
| Średnia w klasie Office (10084 - 128030, n=78, ostatnie 2 lata) | |
| HP Elite Dragonfly G3 | |
| Dell Latitude 9430 2-in-1 | |
| Lenovo ThinkPad X1 Carbon G9-20XWCTO1WW | |
| Przeciętny Intel Core i7-1260P (24983 - 72065, n=25) | |
| Lenovo ThinkPad Z13 G1-21D20016GE | |
| AIDA64 / Memory Write | |
| Średnia w klasie Office (20073 - 119858, n=78, ostatnie 2 lata) | |
| Dell Latitude 9430 2-in-1 | |
| Lenovo ThinkPad X1 Carbon G10 21CB00DCGE | |
| Lenovo ThinkPad X1 Carbon G9-20XWCTO1WW | |
| Lenovo ThinkPad X1 Carbon G10 21CC001RGE | |
| HP Elite Dragonfly G3 | |
| Przeciętny Intel Core i7-1260P (23512 - 66799, n=25) | |
| Lenovo ThinkPad Z13 G1-21D20016GE | |
| AIDA64 / Memory Latency | |
| Lenovo ThinkPad Z13 G1-21D20016GE | |
| HP Elite Dragonfly G3 | |
| Dell Latitude 9430 2-in-1 | |
| Średnia w klasie Office (7.6 - 162.9, n=73, ostatnie 2 lata) | |
| Lenovo ThinkPad X1 Carbon G10 21CB00DCGE | |
| Lenovo ThinkPad X1 Carbon G9-20XWCTO1WW | |
| Przeciętny Intel Core i7-1260P (77.9 - 118.4, n=21) | |
| Lenovo ThinkPad X1 Carbon G10 21CC001RGE | |
| Lenovo ThinkPad X1 Carbon G10 21CC001RGE | |
* ... im mniej tym lepiej
Opóźnienie DPC
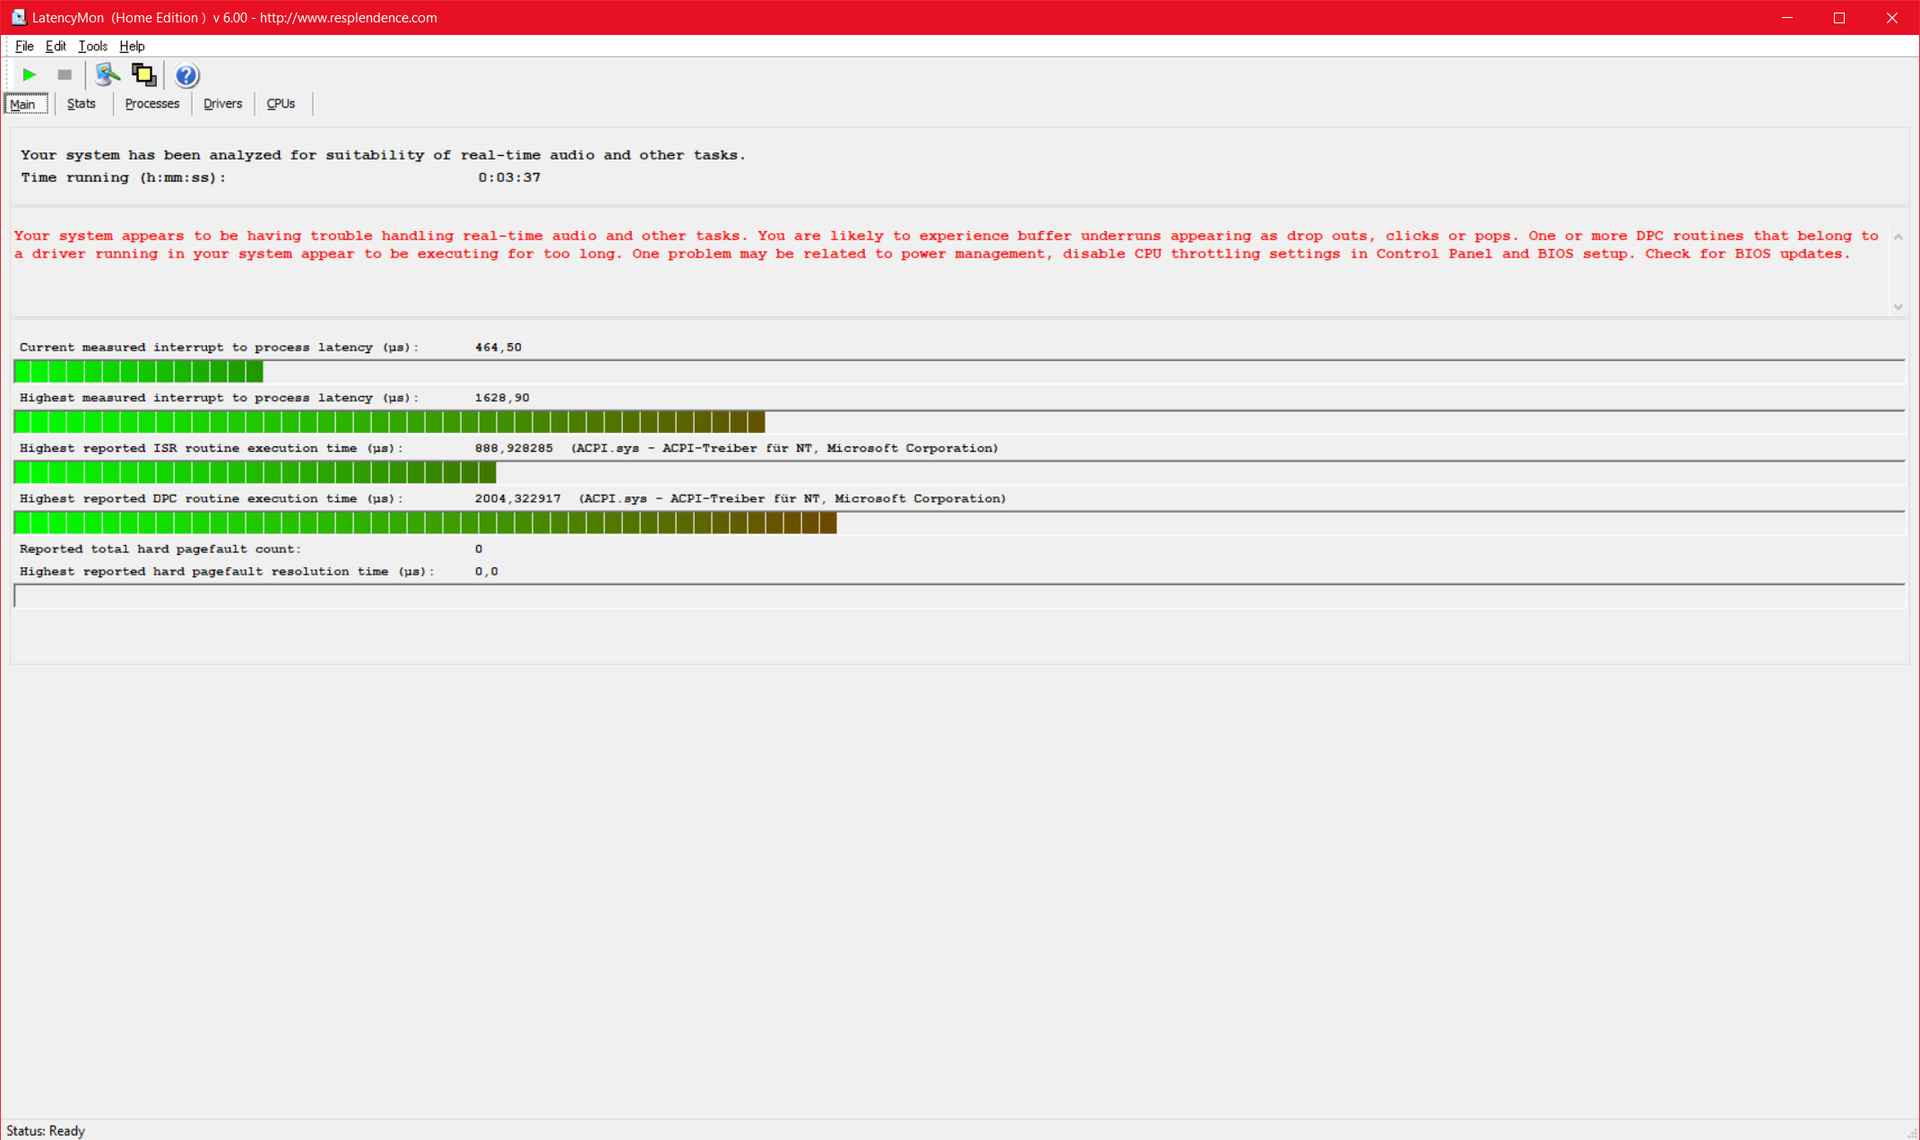

| DPC Latencies / LatencyMon - interrupt to process latency (max), Web, Youtube, Prime95 | |
| Lenovo ThinkPad X1 Carbon G10 21CC001RGE | |
| Lenovo ThinkPad X1 Carbon G10 21CB00DCGE | |
| HP Elite Dragonfly G3 | |
| Dell Latitude 9430 2-in-1 | |
| Lenovo ThinkPad Z13 G1-21D20016GE | |
| Lenovo ThinkPad X1 Carbon G9-20XWCTO1WW | |
* ... im mniej tym lepiej
Urządzenia do przechowywania danych
Dysk M.2 SSD PM91A o pojemności 512 GB pochodzi od firmy Samsung. Jest on połączony ze standardem NVMe PCIe 4.0 i działa szybko, choć nieco poniżej średniej dla tego dysku SSD. Przynajmniej wydajność jest w pełni stabilna, nawet pod stałym obciążeniem.

| Drive Performance rating - Percent | |
| Przeciętny Samsung PM9A1 MZVL2512HCJQ | |
| Lenovo ThinkPad X1 Carbon G10 21CC001RGE | |
| Lenovo ThinkPad X1 Carbon G9-20XWCTO1WW | |
| Lenovo ThinkPad X1 Carbon G10 21CB00DCGE | |
| Średnia w klasie Office | |
| HP Elite Dragonfly G3 | |
| Lenovo ThinkPad Z13 G1-21D20016GE | |
| Dell Latitude 9430 2-in-1 | |
* ... im mniej tym lepiej
Sustained Read Performance: DiskSpd Read Loop, Queue Depth 8
Karta graficzna
W porównaniu do naszej pierwszej próbki recenzenckiej X1 Carbon 2022, nastąpiła również zmiana w GPU, ponieważ IntelIris Xe zainstalowany tutaj ma 96 zamiast 80 jednostek wykonawczych. Skutkuje to niewielkim wzrostem wydajności, ale tak naprawdę nie robi dużej różnicy. GPU jest wystarczające do prostych zadań, ale X1 Carbon G10 jest złym notebookiem do wszystkiego innego, w tym zarówno do gier jak i CAD.
| 3DMark Performance rating - Percent | |
| Lenovo ThinkPad Z13 G1-21D20016GE | |
| Średnia w klasie Office | |
| Lenovo ThinkPad X1 Carbon G9-20XWCTO1WW -1! | |
| Dell Latitude 9430 2-in-1 | |
| HP Elite Dragonfly G3 | |
| Przeciętny Intel Iris Xe Graphics G7 96EUs | |
| Lenovo ThinkPad X1 Carbon G10 21CB00DCGE | |
| Lenovo ThinkPad X1 Carbon G10 21CC001RGE | |
| 3DMark 11 - 1280x720 Performance GPU | |
| Lenovo ThinkPad Z13 G1-21D20016GE | |
| Średnia w klasie Office (2551 - 18313, n=69, ostatnie 2 lata) | |
| Lenovo ThinkPad X1 Carbon G9-20XWCTO1WW | |
| Przeciętny Intel Iris Xe Graphics G7 96EUs (2867 - 7676, n=209) | |
| Dell Latitude 9430 2-in-1 | |
| HP Elite Dragonfly G3 | |
| Lenovo ThinkPad X1 Carbon G10 21CB00DCGE | |
| Lenovo ThinkPad X1 Carbon G10 21CC001RGE | |
| 3DMark 11 Performance | 5769 pkt. | |
| 3DMark Cloud Gate Standard Score | 14688 pkt. | |
| 3DMark Fire Strike Score | 4154 pkt. | |
| 3DMark Time Spy Score | 1722 pkt. | |
Pomoc | ||
| Blender | |
| v3.3 Classroom HIP/AMD | |
| Lenovo ThinkPad Z13 G1-21D20016GE | |
| Średnia w klasie Office (296 - 507, n=5, ostatnie 2 lata) | |
| v3.3 Classroom CPU | |
| HP Elite Dragonfly G3 | |
| Dell Latitude 9430 2-in-1 | |
| Lenovo ThinkPad X1 Carbon G10 21CB00DCGE | |
| Przeciętny Intel Iris Xe Graphics G7 96EUs (336 - 1259, n=109) | |
| Średnia w klasie Office (245 - 3219, n=72, ostatnie 2 lata) | |
| Lenovo ThinkPad Z13 G1-21D20016GE | |
* ... im mniej tym lepiej
| Performance rating - Percent | |
| Lenovo ThinkPad Z13 G1-21D20016GE | |
| Średnia w klasie Office | |
| Dell Latitude 9430 2-in-1 | |
| HP Elite Dragonfly G3 | |
| Lenovo ThinkPad X1 Carbon G10 21CB00DCGE | |
| Lenovo ThinkPad X1 Carbon G10 21CC001RGE -1! | |
| The Witcher 3 - 1920x1080 Ultra Graphics & Postprocessing (HBAO+) | |
| Lenovo ThinkPad Z13 G1-21D20016GE | |
| Średnia w klasie Office (14.8 - 18.1, n=4, ostatnie 2 lata) | |
| Dell Latitude 9430 2-in-1 | |
| HP Elite Dragonfly G3 | |
| Lenovo ThinkPad X1 Carbon G10 21CB00DCGE | |
| Lenovo ThinkPad X1 Carbon G10 21CC001RGE | |
| Final Fantasy XV Benchmark - 1920x1080 High Quality | |
| Średnia w klasie Office (8.09 - 79.5, n=69, ostatnie 2 lata) | |
| Lenovo ThinkPad Z13 G1-21D20016GE | |
| Dell Latitude 9430 2-in-1 | |
| HP Elite Dragonfly G3 | |
| Lenovo ThinkPad X1 Carbon G10 21CB00DCGE | |
| Lenovo ThinkPad X1 Carbon G10 21CC001RGE | |
| Strange Brigade - 1920x1080 ultra AA:ultra AF:16 | |
| Lenovo ThinkPad Z13 G1-21D20016GE | |
| Średnia w klasie Office (12.9 - 142.1, n=51, ostatnie 2 lata) | |
| Dell Latitude 9430 2-in-1 | |
| HP Elite Dragonfly G3 | |
| Lenovo ThinkPad X1 Carbon G10 21CB00DCGE | |
| Dota 2 Reborn - 1920x1080 ultra (3/3) best looking | |
| Lenovo ThinkPad Z13 G1-21D20016GE | |
| Dell Latitude 9430 2-in-1 | |
| Średnia w klasie Office (14.6 - 135, n=75, ostatnie 2 lata) | |
| HP Elite Dragonfly G3 | |
| Lenovo ThinkPad X1 Carbon G10 21CB00DCGE | |
| Lenovo ThinkPad X1 Carbon G10 21CC001RGE | |
| X-Plane 11.11 - 1920x1080 high (fps_test=3) | |
| Dell Latitude 9430 2-in-1 | |
| Lenovo ThinkPad Z13 G1-21D20016GE | |
| Lenovo ThinkPad X1 Carbon G10 21CB00DCGE | |
| Średnia w klasie Office (12 - 82.4, n=66, ostatnie 2 lata) | |
| HP Elite Dragonfly G3 | |
| Lenovo ThinkPad X1 Carbon G10 21CC001RGE | |
Witcher 3 FPS Chart
| low | med. | high | ultra | QHD | |
|---|---|---|---|---|---|
| The Witcher 3 (2015) | 83.3 | 51 | 27.2 | 12.9 | |
| Dota 2 Reborn (2015) | 99.8 | 74.7 | 50.3 | 43.5 | |
| Final Fantasy XV Benchmark (2018) | 39.8 | 18.6 | 13 | 9.59 | |
| X-Plane 11.11 (2018) | 38.1 | 38.2 | 34.2 | ||
| Strange Brigade (2018) | 79.2 | 34.2 | 25.8 | 19.8 |
Emisje: Większa wydajność oznacza większy hałas wentylatora
Hałas
O ile wartości wydajnościowe uległy poprawie, to z szumem wentylatorów jest odwrotnie - są one głośniejsze niż w naszym pierwszym egzemplarzu recenzenckim, a ponadto uruchamiają się częściej. Nawet w trybie bezczynności układ chłodzenia od czasu do czasu daje o sobie znać. Dla porównania tylko Lenovo ThinkPad Z13 ma głośniejsze chłodzenie pod obciążeniem. ThinkPad X1 Carbon G10 niekoniecznie jest więc dobrym wyborem dla miłośników ciszy, zwłaszcza że wentylatory są też stosunkowo wysoko ustawione.
Nie wykryto żadnego wycieku cewek.
Hałas
| luz |
| 22.8 / 22.8 / 24.6 dB |
| obciążenie |
| 38.2 / 38.2 dB |
 | ||
30 dB cichy 40 dB(A) słyszalny 50 dB(A) irytujący |
||
min: | ||
| Lenovo ThinkPad X1 Carbon G10 21CB00DCGE Iris Xe G7 96EUs, i7-1260P, Samsung PM9A1 MZVL2512HCJQ | Lenovo ThinkPad X1 Carbon G10 21CC001RGE Iris Xe G7 80EUs, i5-1250P, Samsung PM9A1 MZVL2512HCJQ | Lenovo ThinkPad X1 Carbon G9-20XWCTO1WW Iris Xe G7 96EUs, i7-1165G7, Samsung PM9A1 MZVL21T0HCLR | Lenovo ThinkPad Z13 G1-21D20016GE Radeon 680M, R7 PRO 6860Z, Micron 2450 1TB MTFDKCD1T0TFK | HP Elite Dragonfly G3 Iris Xe G7 96EUs, i7-1265U, Micron 3400 MTFDKBA512TFH 512GB | Dell Latitude 9430 2-in-1 Iris Xe G7 96EUs, i7-1265U | |
|---|---|---|---|---|---|---|
| Noise | 5% | 2% | -6% | 9% | -4% | |
| wyłączone / środowisko * (dB) | 22.8 | 22.81 -0% | 23.66 -4% | 24.3 -7% | 22.8 -0% | 23.7 -4% |
| Idle Minimum * (dB) | 22.8 | 22.81 -0% | 23.6 -4% | 24.3 -7% | 23.2 -2% | 23.7 -4% |
| Idle Average * (dB) | 22.8 | 22.81 -0% | 23.6 -4% | 24.3 -7% | 23.2 -2% | 23.7 -4% |
| Idle Maximum * (dB) | 24.6 | 22.81 7% | 23.6 4% | 24.3 1% | 23.2 6% | 23.7 4% |
| Load Average * (dB) | 38.2 | 31.59 17% | 33.5 12% | 41 -7% | 25.1 34% | 35.1 8% |
| Witcher 3 ultra * (dB) | 38.1 | 35.59 7% | 41 -8% | 32 16% | 43.3 -14% | |
| Load Maximum * (dB) | 38.2 | 35.47 7% | 34.3 10% | 41 -7% | 35.2 8% | 43 -13% |
* ... im mniej tym lepiej
Temperatura
Większość rozwoju ciepła koncentruje się w lewym górnym rogu obudowy. Pod obciążeniem osiąga się tu około 50 stopni Celsjusza, zarówno na górze, jak i na dole, a nawet nieco więcej w teście Witcher 3. Na szczęście są to obszary, które nie są zazwyczaj dotykane podczas użytkowania, ale Lenovo ThinkPad X1 Carbon G10 30th Anniversary Edition z pewnością nie można określić mianem laptopa chłodno pracującego.
Podczas testów stresowych, czyli jednoczesnego obciążenia GPU i CPU, procesor jest na stałe ograniczony do zaledwie 17 W. Ten związany z TDP throttling nie ma większego wpływu na codzienne użytkowanie, poza już istniejącym ograniczeniem wydajności CPU. W tym przypadku GPU zużywa dodatkową część budżetu TDP.
(-) Maksymalna temperatura w górnej części wynosi 50 °C / 122 F, w porównaniu do średniej 34.3 °C / 94 F , począwszy od 21.2 do 62.5 °C dla klasy Office.
(-) Dno nagrzewa się maksymalnie do 49.7 °C / 121 F, w porównaniu do średniej 36.8 °C / 98 F
(+) W stanie bezczynności średnia temperatura górnej części wynosi 27.1 °C / 81 F, w porównaniu ze średnią temperaturą urządzenia wynoszącą 29.5 °C / ### class_avg_f### F.
(±) Podczas gry w Wiedźmina 3 średnia temperatura górnej części wynosi 35.7 °C / 96 F, w porównaniu do średniej temperatury urządzenia wynoszącej 29.5 °C / ## #class_avg_f### F.
(+) Podpórki pod nadgarstki i touchpad są chłodniejsze niż temperatura skóry i maksymalnie 28.8 °C / 83.8 F i dlatego są chłodne w dotyku.
(±) Średnia temperatura obszaru podparcia dłoni w podobnych urządzeniach wynosiła 27.5 °C / 81.5 F (-1.3 °C / -2.3 F).
| Lenovo ThinkPad X1 Carbon G10 21CB00DCGE Intel Core i7-1260P, Intel Iris Xe Graphics G7 96EUs | Lenovo ThinkPad X1 Carbon G10 21CC001RGE Intel Core i5-1250P, Intel Iris Xe Graphics G7 80EUs | Lenovo ThinkPad X1 Carbon G9-20XWCTO1WW Intel Core i7-1165G7, Intel Iris Xe Graphics G7 96EUs | Lenovo ThinkPad Z13 G1-21D20016GE AMD Ryzen 7 PRO 6860Z, AMD Radeon 680M | HP Elite Dragonfly G3 Intel Core i7-1265U, Intel Iris Xe Graphics G7 96EUs | Dell Latitude 9430 2-in-1 Intel Core i7-1265U, Intel Iris Xe Graphics G7 96EUs | |
|---|---|---|---|---|---|---|
| Heat | 6% | 6% | 9% | 17% | 24% | |
| Maximum Upper Side * (°C) | 50 | 45 10% | 51.5 -3% | 45.6 9% | 39 22% | 39.2 22% |
| Maximum Bottom * (°C) | 49.7 | 44 11% | 45.3 9% | 51 -3% | 42.2 15% | 44.8 10% |
| Idle Upper Side * (°C) | 32.4 | 31.2 4% | 29.6 9% | 27 17% | 26.8 17% | 21.4 34% |
| Idle Bottom * (°C) | 32.3 | 33.2 -3% | 30 7% | 27.9 14% | 28.2 13% | 22.4 31% |
* ... im mniej tym lepiej
Mówcy
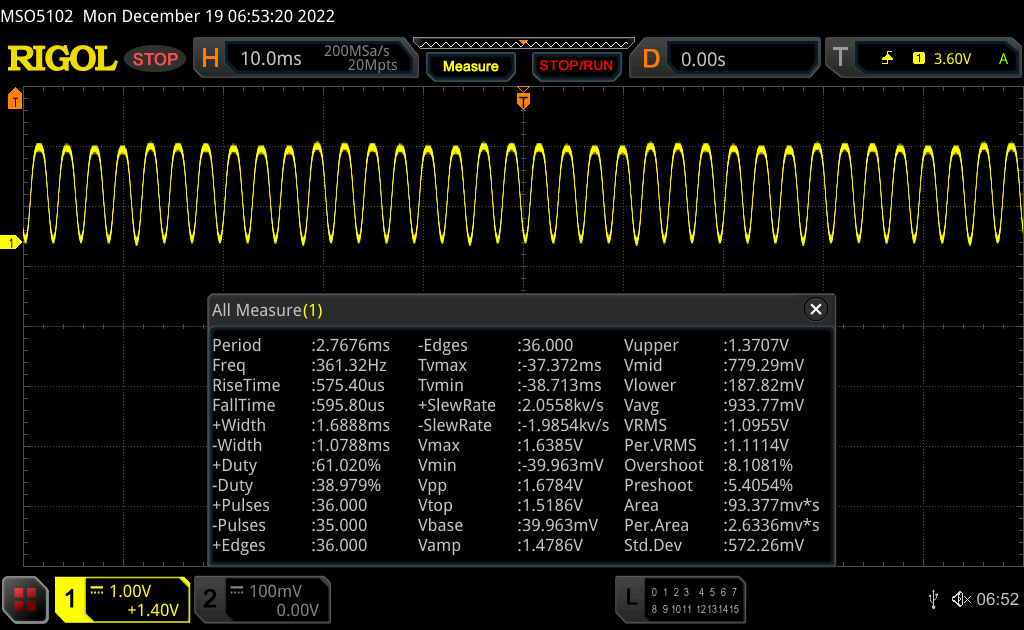
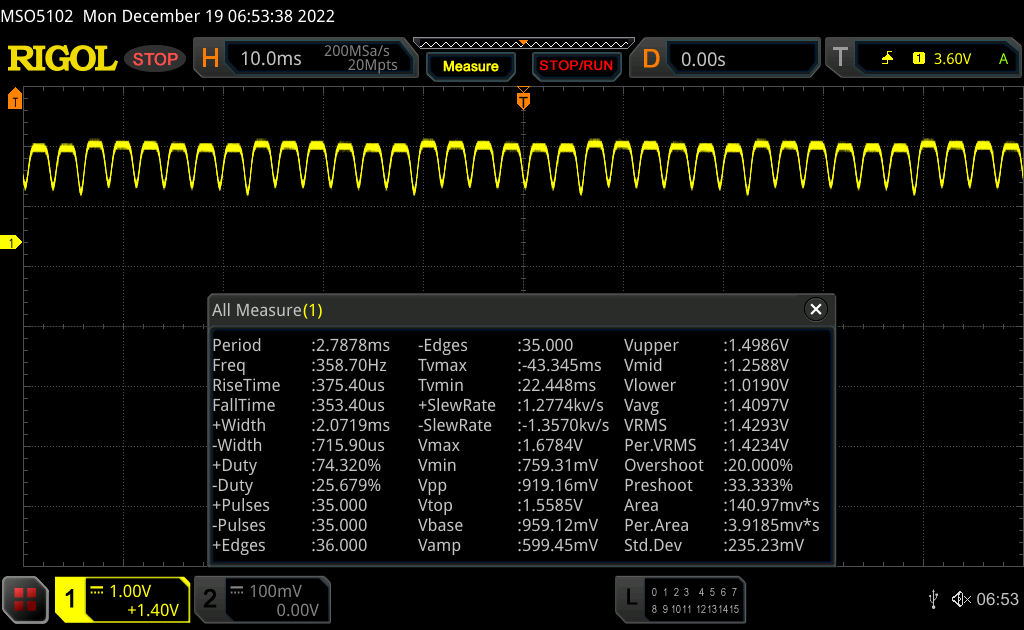
W porównaniu z głośnikami wDell Latitude 9430, cztery głośniki w Lenovo ThinkPad X1 Carbon G10 są znacznie cichsze, ale nieco bardziej zrównoważone. Połączenie dwóch głośników niskotonowych na dole i dwóch wysokotonowych na górze jest wystarczająco mocne, by wypełnić dźwiękiem niewielkie pomieszczenie.
Lenovo ThinkPad X1 Carbon G10 21CB00DCGE analiza dźwięku
(±) | głośność głośnika jest średnia, ale dobra (75.2 dB)
Bas 100 - 315 Hz
(±) | zredukowany bas - średnio 12.8% niższy od mediany
(±) | liniowość basu jest średnia (14.9% delta do poprzedniej częstotliwości)
Średnie 400 - 2000 Hz
(+) | zbalansowane środki średnie - tylko 2.5% od mediany
(+) | średnie są liniowe (4.8% delta do poprzedniej częstotliwości)
Wysokie 2–16 kHz
(+) | zrównoważone maksima - tylko 1.1% od mediany
(+) | wzloty są liniowe (2.8% delta do poprzedniej częstotliwości)
Ogólnie 100 - 16.000 Hz
(+) | ogólny dźwięk jest liniowy (12.2% różnicy w stosunku do mediany)
W porównaniu do tej samej klasy
» 5% wszystkich testowanych urządzeń w tej klasie było lepszych, 2% podobnych, 94% gorszych
» Najlepszy miał deltę 7%, średnia wynosiła ###średnia###%, najgorsza wynosiła 53%
W porównaniu do wszystkich testowanych urządzeń
» 10% wszystkich testowanych urządzeń było lepszych, 2% podobnych, 88% gorszych
» Najlepszy miał deltę 4%, średnia wynosiła ###średnia###%, najgorsza wynosiła 134%
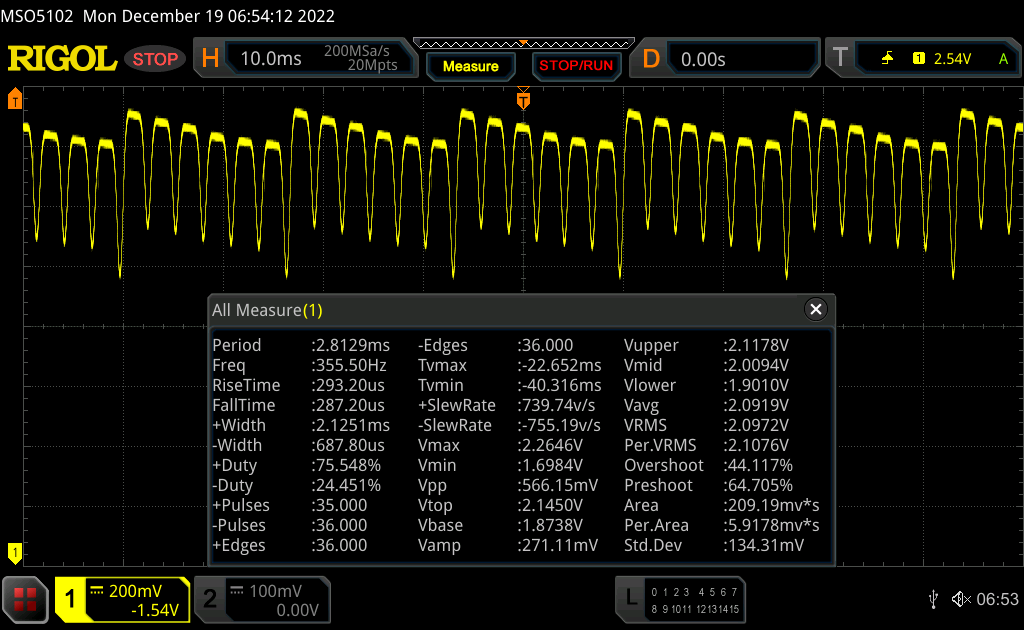
Dell Latitude 9430 2-in-1 analiza dźwięku
(+) | głośniki mogą odtwarzać stosunkowo głośno (94.3 dB)
Bas 100 - 315 Hz
(±) | zredukowany bas - średnio 12.3% niższy od mediany
(+) | bas jest liniowy (5.3% delta do poprzedniej częstotliwości)
Średnie 400 - 2000 Hz
(+) | zbalansowane środki średnie - tylko 2% od mediany
(+) | średnie są liniowe (4.7% delta do poprzedniej częstotliwości)
Wysokie 2–16 kHz
(±) | wyższe maksima - średnio 5.4% wyższe od mediany
(+) | wzloty są liniowe (3% delta do poprzedniej częstotliwości)
Ogólnie 100 - 16.000 Hz
(+) | ogólny dźwięk jest liniowy (11.6% różnicy w stosunku do mediany)
W porównaniu do tej samej klasy
» 10% wszystkich testowanych urządzeń w tej klasie było lepszych, 4% podobnych, 86% gorszych
» Najlepszy miał deltę 6%, średnia wynosiła ###średnia###%, najgorsza wynosiła 57%
W porównaniu do wszystkich testowanych urządzeń
» 8% wszystkich testowanych urządzeń było lepszych, 2% podobnych, 90% gorszych
» Najlepszy miał deltę 4%, średnia wynosiła ###średnia###%, najgorsza wynosiła 134%
Zarządzanie energią: OLED skraca czas pracy na baterii X1 Carbon G10
Pobór mocy
Wpływ ekranu OLED o wyższej rozdzielczości na zużycie energii jest wyraźnie negatywnym aspektem. Minimalne zużycie w stanie spoczynku jest ponad dwukrotnie wyższe, niż w pierwszym modelu ThinkPad X1 Carbon G10, który był wyposażony w panel IPS WUXGA. Przynajmniej X1 Carbon jest prawie na równi z ThinkPadem Z13, który również posiada ekran OLED.
Zasilacz jest więcej niż odpowiedni do maksymalnego zużycia 62,5 W, co również stanowi tylko szczytowe obciążenie.
| wyłączony / stan wstrzymania | |
| luz | |
| obciążenie |
|
Legenda:
min: | |
| Lenovo ThinkPad X1 Carbon G10 21CB00DCGE i7-1260P, Iris Xe G7 96EUs, Samsung PM9A1 MZVL2512HCJQ, OLED, 2880x1800, 14" | Lenovo ThinkPad X1 Carbon G10 21CC001RGE i5-1250P, Iris Xe G7 80EUs, Samsung PM9A1 MZVL2512HCJQ, IPS LED, 1920x1200, 14" | Lenovo ThinkPad X1 Carbon G9-20XWCTO1WW i7-1165G7, Iris Xe G7 96EUs, Samsung PM9A1 MZVL21T0HCLR, IPS LED, 3840x2400, 14" | Lenovo ThinkPad Z13 G1-21D20016GE R7 PRO 6860Z, Radeon 680M, Micron 2450 1TB MTFDKCD1T0TFK, OLED, 2880x1800, 13.3" | HP Elite Dragonfly G3 i7-1265U, Iris Xe G7 96EUs, Micron 3400 MTFDKBA512TFH 512GB, IPS, 1920x1280, 13.5" | Dell Latitude 9430 2-in-1 i7-1265U, Iris Xe G7 96EUs, , IPS, 2560x1600, 14" | Przeciętny Intel Iris Xe Graphics G7 96EUs | Średnia w klasie Office | |
|---|---|---|---|---|---|---|---|---|
| Power Consumption | 28% | -10% | -3% | 16% | 19% | -5% | 10% | |
| Idle Minimum * (Watt) | 6.4 | 2.9 55% | 5 22% | 5.7 11% | 3.4 47% | 2.9 55% | 5.51 ? 14% | 4.41 ? 31% |
| Idle Average * (Watt) | 7.4 | 4.9 34% | 10.2 -38% | 7.6 -3% | 5.6 24% | 5.8 22% | 8.66 ? -17% | 7.37 ? -0% |
| Idle Maximum * (Watt) | 8.3 | 6 28% | 11 -33% | 8.4 -1% | 8.4 -1% | 6.6 20% | 10.9 ? -31% | 8.58 ? -3% |
| Load Average * (Watt) | 56.5 | 29.3 48% | 51.7 8% | 54.4 4% | 40.8 28% | 49.2 13% | 45.6 ? 19% | 43 ? 24% |
| Witcher 3 ultra * (Watt) | 37.5 | 36.6 2% | 48.1 -28% | 35.5 5% | 35.3 6% | |||
| Load Maximum * (Watt) | 62.5 | 63.3 -1% | 67.5 -8% | 62.7 -0% | 68.4 -9% | 63.1 -1% | 67.8 ? -8% | 64.6 ? -3% |
* ... im mniej tym lepiej
Power consumption Witcher 3 / Stress test
Power Consumption with an external monitor
Czas pracy na baterii
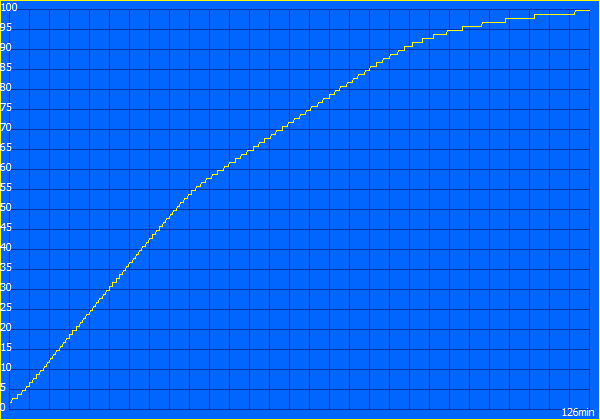
Pojemność baterii wynosząca 57 watogodzin pozostaje bez zmian. Większe zużycie ekranu OLED znacząco wpływa na czasy pracy na akumulatorze: Lenovo ThinkPad X1 Carbon G10 30th Anniversary Edition wyczerpał się po zaledwie pięciu godzinach w naszym teście Wi-Fi (jasność 150 cd/m²). Jest to wynik bardzo słaby. Dla porównania: ThinkPad Z13, również z energochłonnym wyświetlaczem OLED, osiągnął w tym samym teście ponad siedem godzin.
Jednym ze sposobów na uzyskanie dłuższych czasów pracy na akumulatorze w laptopach z ekranem OLED jest tryb ciemny. Nasz test WiFi składa się głównie ze stron internetowych z jasnym tłem, co oznacza większe zużycie energii przez część samoświecących pikseli. Nowoczesne przeglądarki internetowe można ustawić tak, by wszystkie strony internetowe były wyświetlane w trybie ciemnym. Powtórzyliśmy test Wi-Fi w tych warunkach. W trybie ciemnym w teście Wi-Fi Lenovo ThinkPad X1 Carbon G10 OLED uzyskał czas pracy około siedmiu godzin. Nabywcy tego modelu i innych laptopów z matrycą OLED powinni w miarę możliwości korzystać z trybu ciemnego.
| Czasy pracy - WiFi v1.3 | |
| Średnia w klasie Office (3.83 - 31.5, n=75, ostatnie 2 lata) | |
| Lenovo ThinkPad X1 Carbon G10 21CB00DCGE | |
| Lenovo ThinkPad X1 Carbon G10 21CC001RGE | |
| Lenovo ThinkPad X1 Carbon G9-20XWCTO1WW | |
| Lenovo ThinkPad Z13 G1-21D20016GE | |
| HP Elite Dragonfly G3 | |
| Dell Latitude 9430 2-in-1 | |
Za
Przeciw
Werdykt: Wysokiej jakości wyświetlacz OLED skraca czas pracy na baterii
Nawet bez wyświetlacza OLED Lenovo ThinkPad X1 Carbon Gen 10 to bardzo dobry notebook biznesowy. Nasze pierwsze urządzenie recenzenckie, z panelem IPS, uzyskało ocenę ogólną na poziomie 90 procent. Dzięki OLED jakość wyświetlania znacznie wzrasta, ale w innych miejscach trzeba iść na kompromisy: Czas pracy na baterii cierpi znacznie z powodu większego zużycia, a X1 Carbon G10 OLED trudno używać w podróży przez dłuższy czas bez aktywowanego trybu ciemnego dla wszystkich aplikacji i stron internetowych. Szkoda, bo antyrefleksyjny panel OLED faktycznie bardzo dobrze nadaje się do pracy na zewnątrz.
Innym ekscytującym aspektem tej aktualizacji recenzji była wydajność procesora, która została uznana za słabą w naszej pierwszej recenzji X1 Carbon G10 mit i5-CPU. Na szczęście uległa ona poprawie, a Lenovo rozwiązało ten problem dzięki aktualizacji oprogramowania sprzętowego. Wentylator działa jednak nieco głośniej pod obciążeniem niż wcześniej.
Mało jubileuszowy duch, ale bardzo dobry wyświetlacz OLED: Lenovo ThinkPad X1 Carbon Gen 10 30th Anniversary Edition
W codziennym użytkowaniu prawie nie zauważa się, że jest to edycja rocznicowa, poza kolorowym logo jako przypomnieniem. Lenovo zmarnowało szansę na stworzenie tutaj czegoś wyjątkowego, co oznacza, że w tym modelu na pierwszy plan wysuwa się wyświetlacz OLED. To właściwie wciąż dość rzadka cecha wśród laptopów biznesowych, a wysoka jakość obrazu to bardzo dobry argument za X1 Carbon Gen 10 30th Anniversary Edition. Nie jest on może tak praktyczny jak inne modele biznesowe ze względu na krótszy czas pracy na baterii, ale korzystanie z monitora OLED to czysta przyjemność.
Jeśli porty i bardziej klasyczny design ThinkPada nie są tak ważne, to Lenovo ThinkPad Z13 OLED może być dobrą alternatywą. Jest jeszcze wydajniejszy i ma dłuższe czasy pracy na baterii. Biznesowa konkurencja pozostałych producentów nie oferuje OLED, ale np HP Elite Dragonfly G3 ma bardzo dobry IPS LCD w formacie 3:2, co może być interesujące dla niektórych czytelników. Na stronie Dell Latitude 9430 2-in-1 jest znacznie cięższy, ale w zamian ma jaśniejszy wyświetlacz. Zarówno laptopy Della jak i HP mają też znacznie lepszy czas pracy na baterii.
Cena i dostępność
W zależności od lokalizacji, Lenovo ThinkPad X1 Carbon Gen 10 30th Anniversary Edition jest dostępny za pośrednictwem oficjalnej strony internetowej Lenovo jako dowolnie konfigurowany laptop. Ceny w serwisie USA zaczynają się od 1 397,40 USD. Ceny początkowe w Wielkiej Brytanii i Singapurze wynoszą odpowiednio 2 310,00 GBP i 2 303,74 SG$ (nie jest to wyczerpująca lista).
Ceny są aktualne na dzień 22.12.2022 i mogą ulec zmianie.
Lenovo ThinkPad X1 Carbon G10 21CB00DCGE
- 21/12/2022 v7 (old)
Benjamin Herzig
Price comparison

