Acer Swift X SFX16-52G w recenzji: laptop, który równoważy efektywność i wydajność

W modelu Swift X SFX16-52G firma Acer oferuje ultrabook nastawiony na pracę twórczą. Zarówno karta graficzna Intel Arc A370M, jak i dostępnyi5-1240Plub i7-1260Psą przeznaczone raczej do wydajnej pracy, a niekoniecznie do najwyższej wydajności. W obliczu ceny katalogowej 1300 euro notebook wydaje się być optymalnie wyposażony i dlatego powinien zadowolić także bardziej wymagających użytkowników. Do tego dochodzi jeszcze wyświetlacz w formacie 16:10 o rozdzielczości 4 mln pikseli - nie zapominając o trzech wyjściach wideo.
Wśród konkurentów znajdują się podobnie zaprojektowane laptopy multimedialne o dobrej, ale nie wybitnej wydajności graficznej, takie jak Lenovo ThinkBook 16 G4+ czy rzeczywiście Asus ZenBook Flip 15 z tym samym GPU
.
Potencjalni konkurenci w porównaniu
Ocena | Data | Model | Waga | Wysokość | Rozmiar | Rezolucja | Cena |
|---|---|---|---|---|---|---|---|
| 86.2 % v7 (old) | 11/2022 | Acer Swift X SFX16-52G-52VE i5-1240P, A370M | 1.8 kg | 21.3 mm | 16.00" | 2560x1600 | |
| 80.7 % v7 (old) | 09/2022 | Acer Aspire 5 A515-57G-53N8 i5-1240P, GeForce RTX 2050 Mobile | 1.8 kg | 18 mm | 15.60" | 1920x1080 | |
| 89.3 % v7 (old) | 09/2022 | Lenovo ThinkPad T16 G1 21BWS00200 i5-1240P, Iris Xe G7 80EUs | 1.9 kg | 20.5 mm | 16.00" | 1920x1200 | |
| 88 % v7 (old) | Asus ZenBook Flip 15 Q539ZD i7-12700H, A370M | 1.8 kg | 18.9 mm | 15.60" | 2880x1620 | ||
| 82.8 % v7 (old) | 10/2022 | Lenovo IdeaPad Gaming 3 15IAH7 i5-12500H, GeForce RTX 3050 Ti Laptop GPU | 2.4 kg | 26 mm | 15.60" | 1920x1080 | |
| 86 % v7 (old) | HP Omen 16-c0077ng R7 5800H, Radeon RX 6600M | 2.3 kg | 26 mm | 16.10" | 2560x1440 | ||
| 88.4 % v7 (old) | 10/2022 | Lenovo ThinkBook 16 G4+ IAP i7-12700H, GeForce RTX 2050 Mobile | 1.8 kg | 16.5 mm | 16.00" | 2560x1600 |
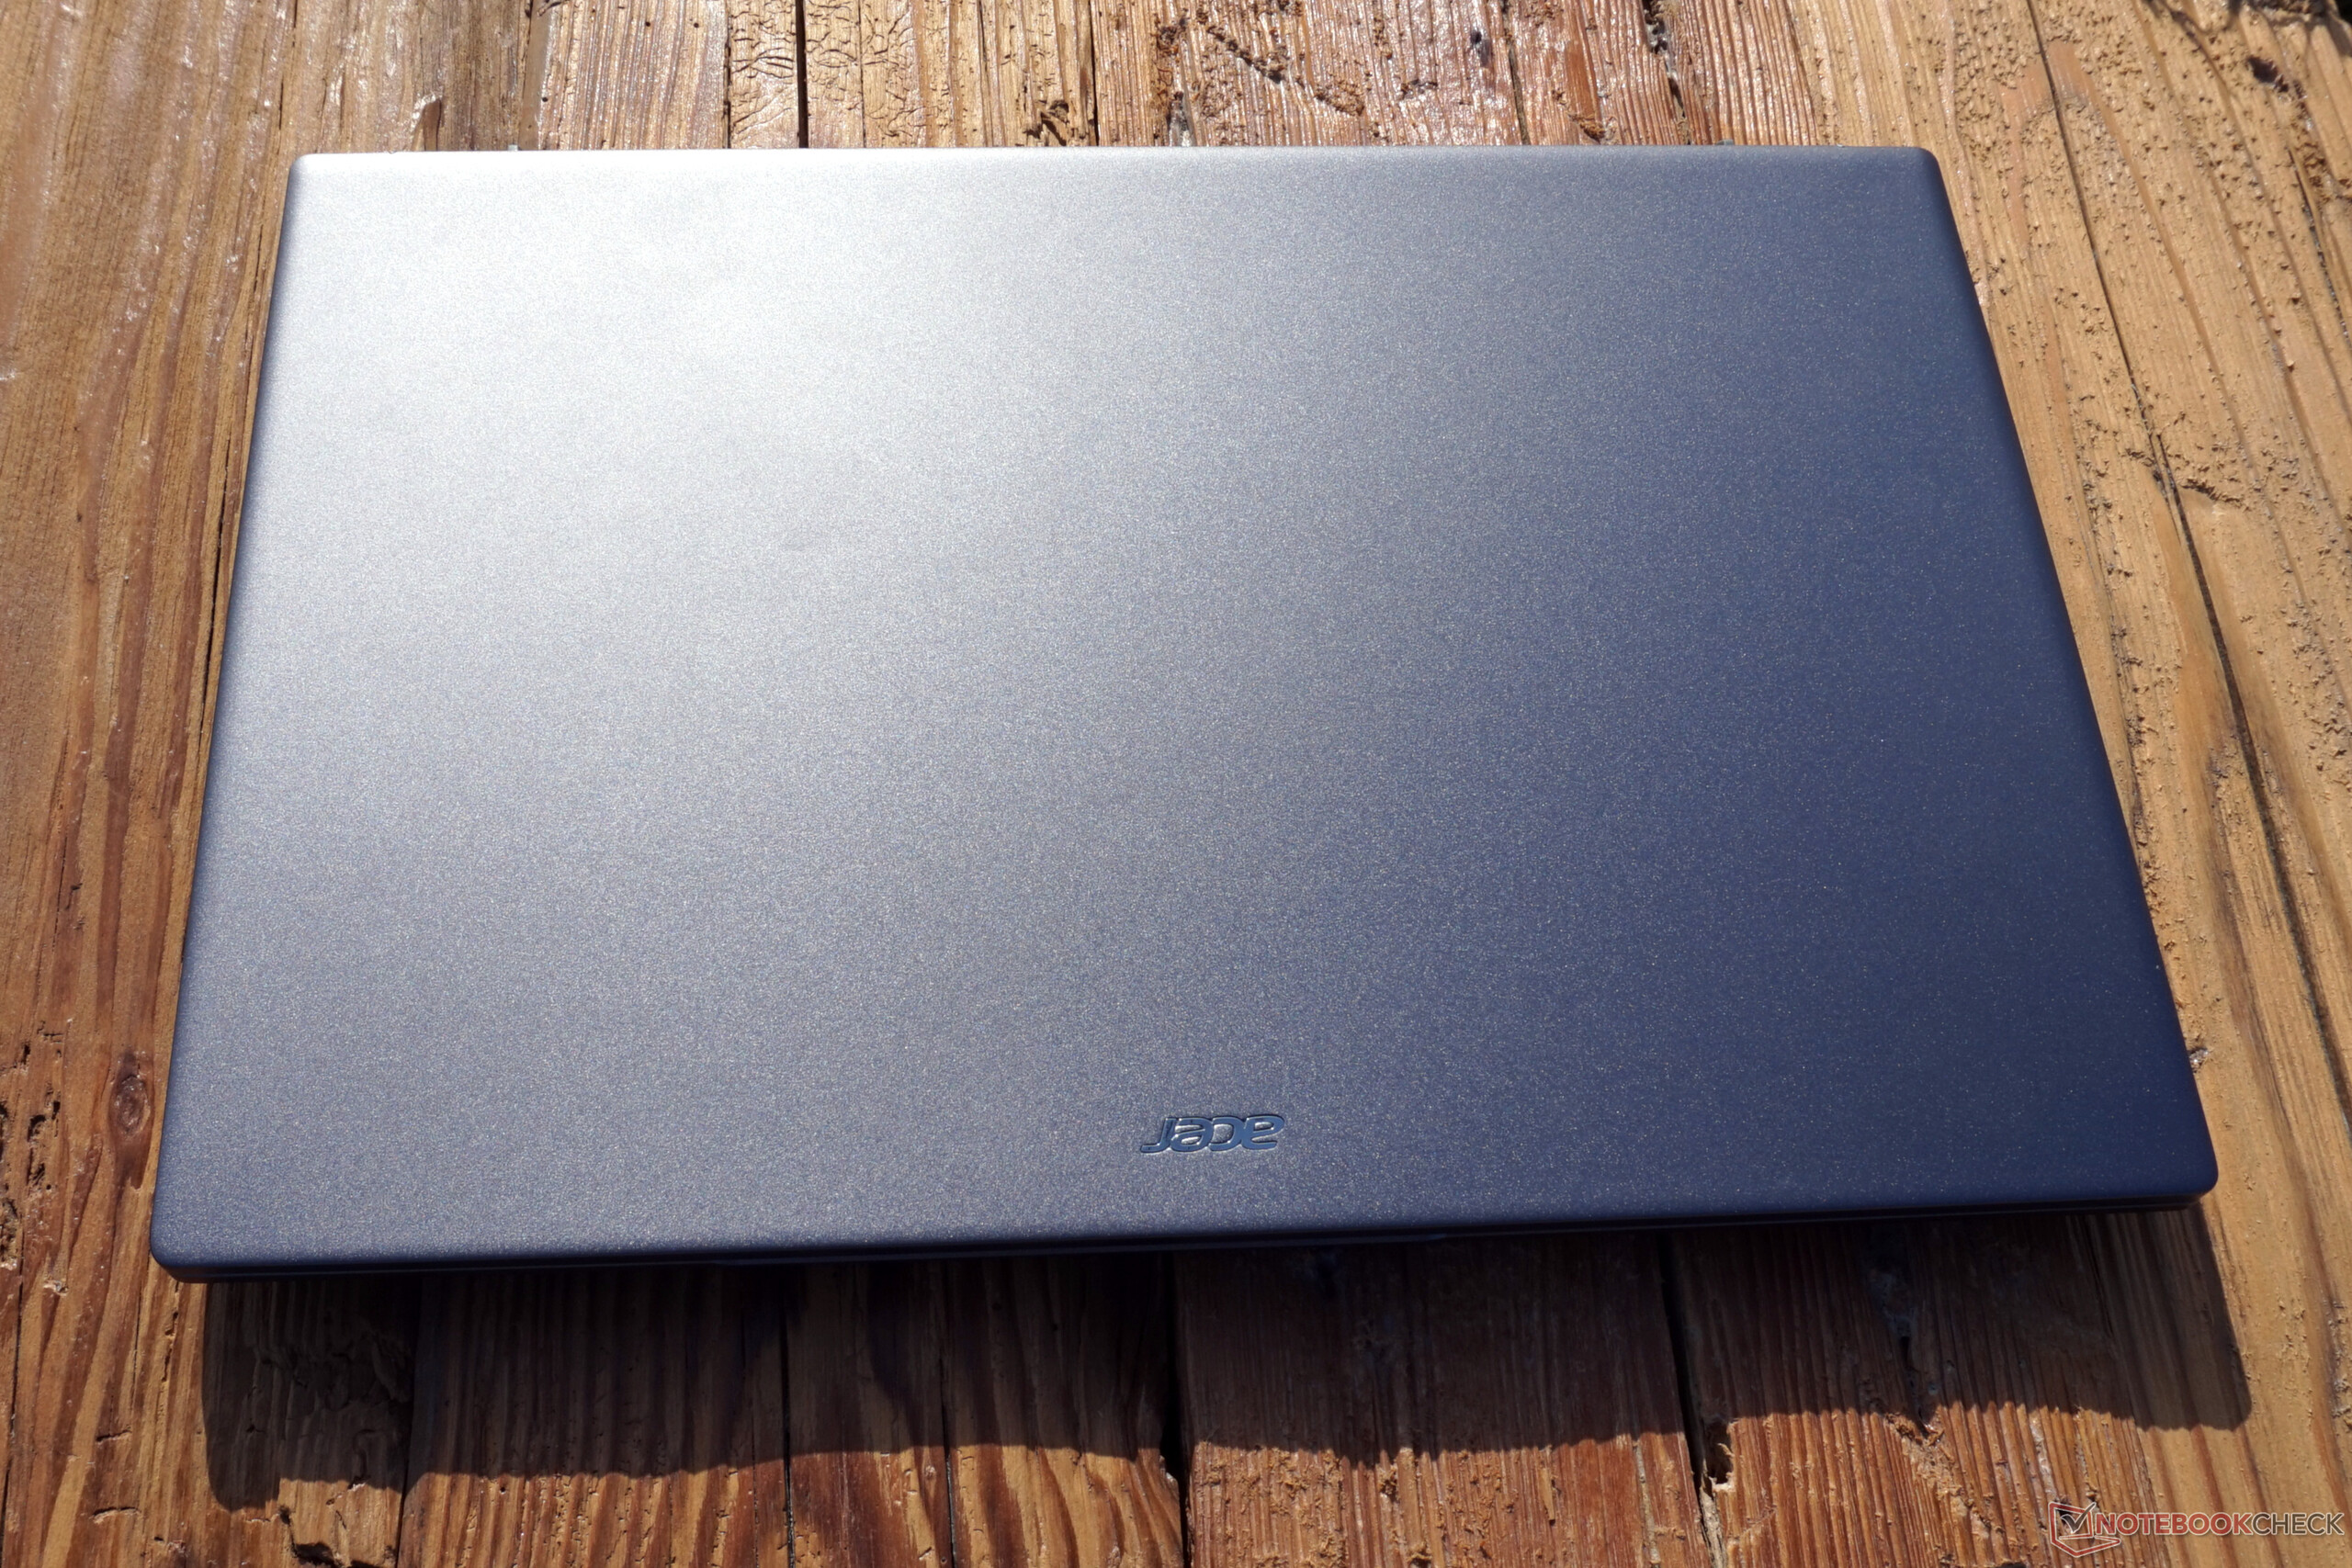
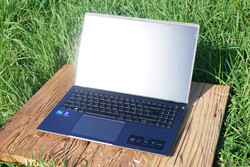
Obudowa - Swift X jest raczej dyskretny
Swift X sprawia wrażenie wyrafinowanego, a przede wszystkim solidnego w rękach. Ramka klawiatury i metalowa pokrywa wyświetlacza zapewniają dobre wrażenie. Górę można jednak wcisnąć trochę zbyt łatwo jak na nasz gust. Od razu rzuca się też w oczy fakt, że podstawa jest wykonana z tworzywa sztucznego. Wadą jest też ramka ekranu, gdyż jej czarny plastik zupełnie nie pasuje do skądinąd dość eleganckiego wyglądu.
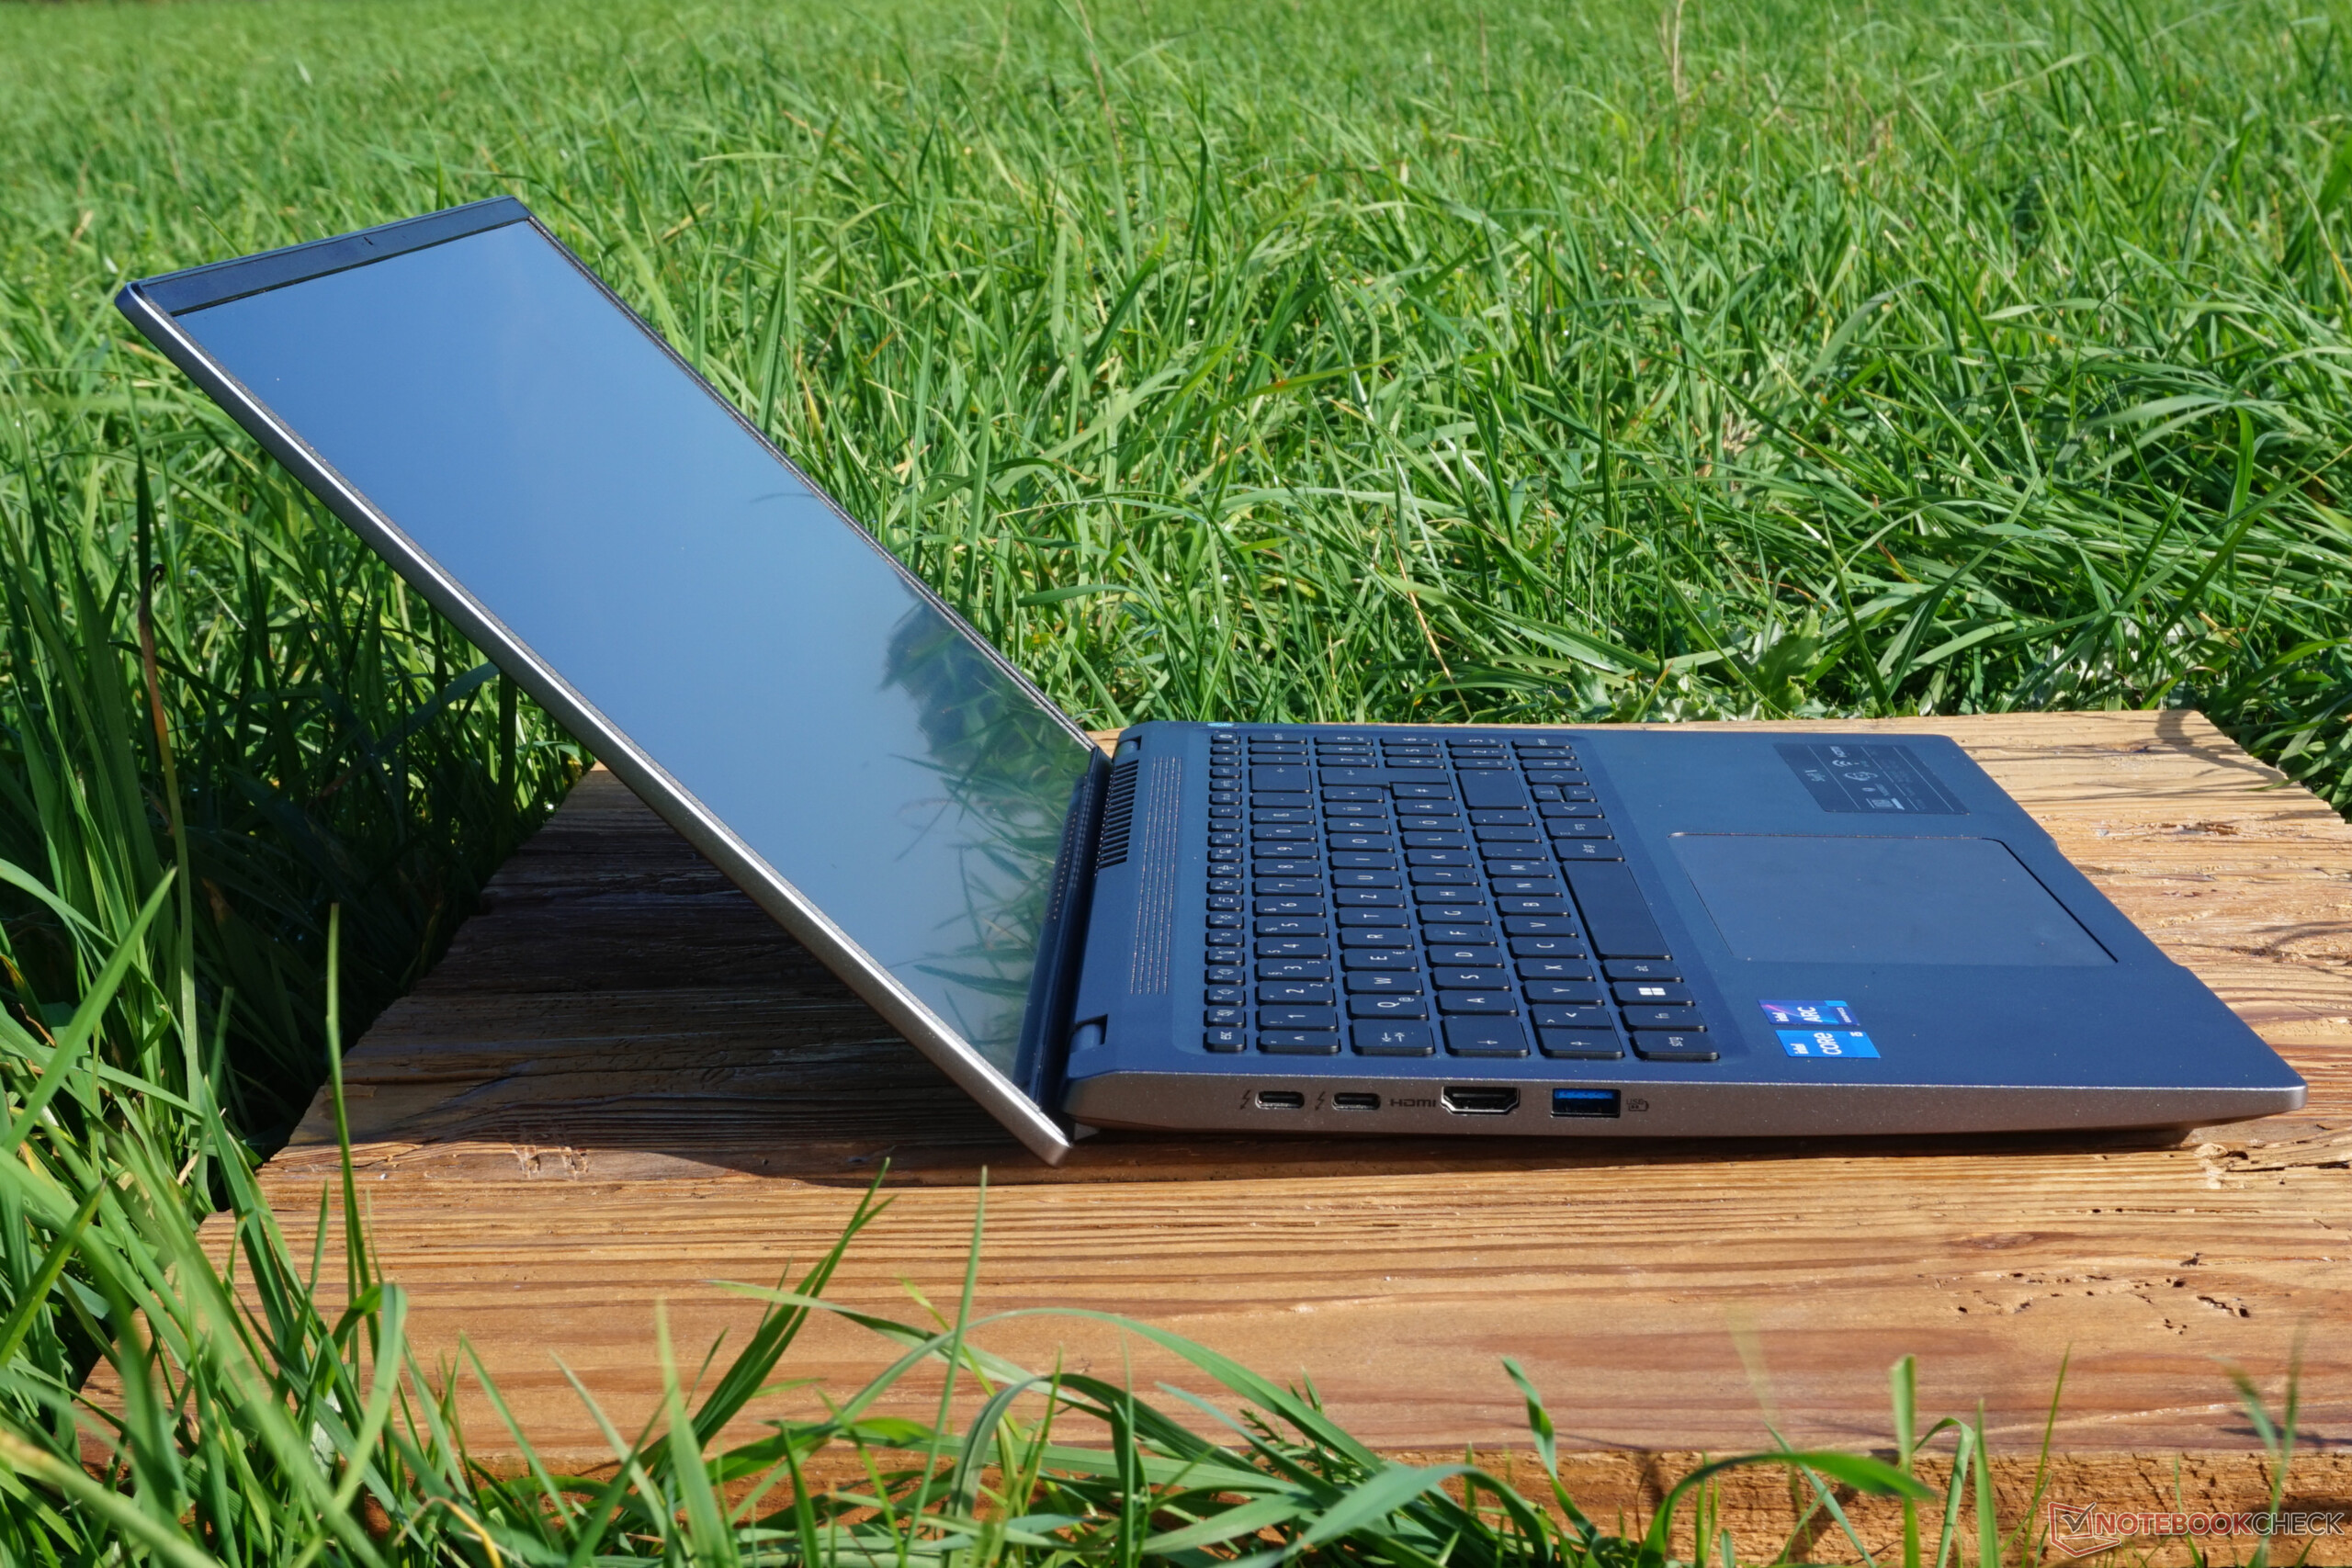
Ogólnie rzecz biorąc, obudowa jest przyjemnie twarda. Wyświetlacz otwiera się z lekkim oporem nawet jedną ręką i trudno go odkształcić. Od kąta otwarcia 90° krawędź ekranu, który ma też dwie nóżki, opiera się na biurku, co oprócz stabilnej podstawy stwarza też lepsze warunki dla dopływu powietrza.

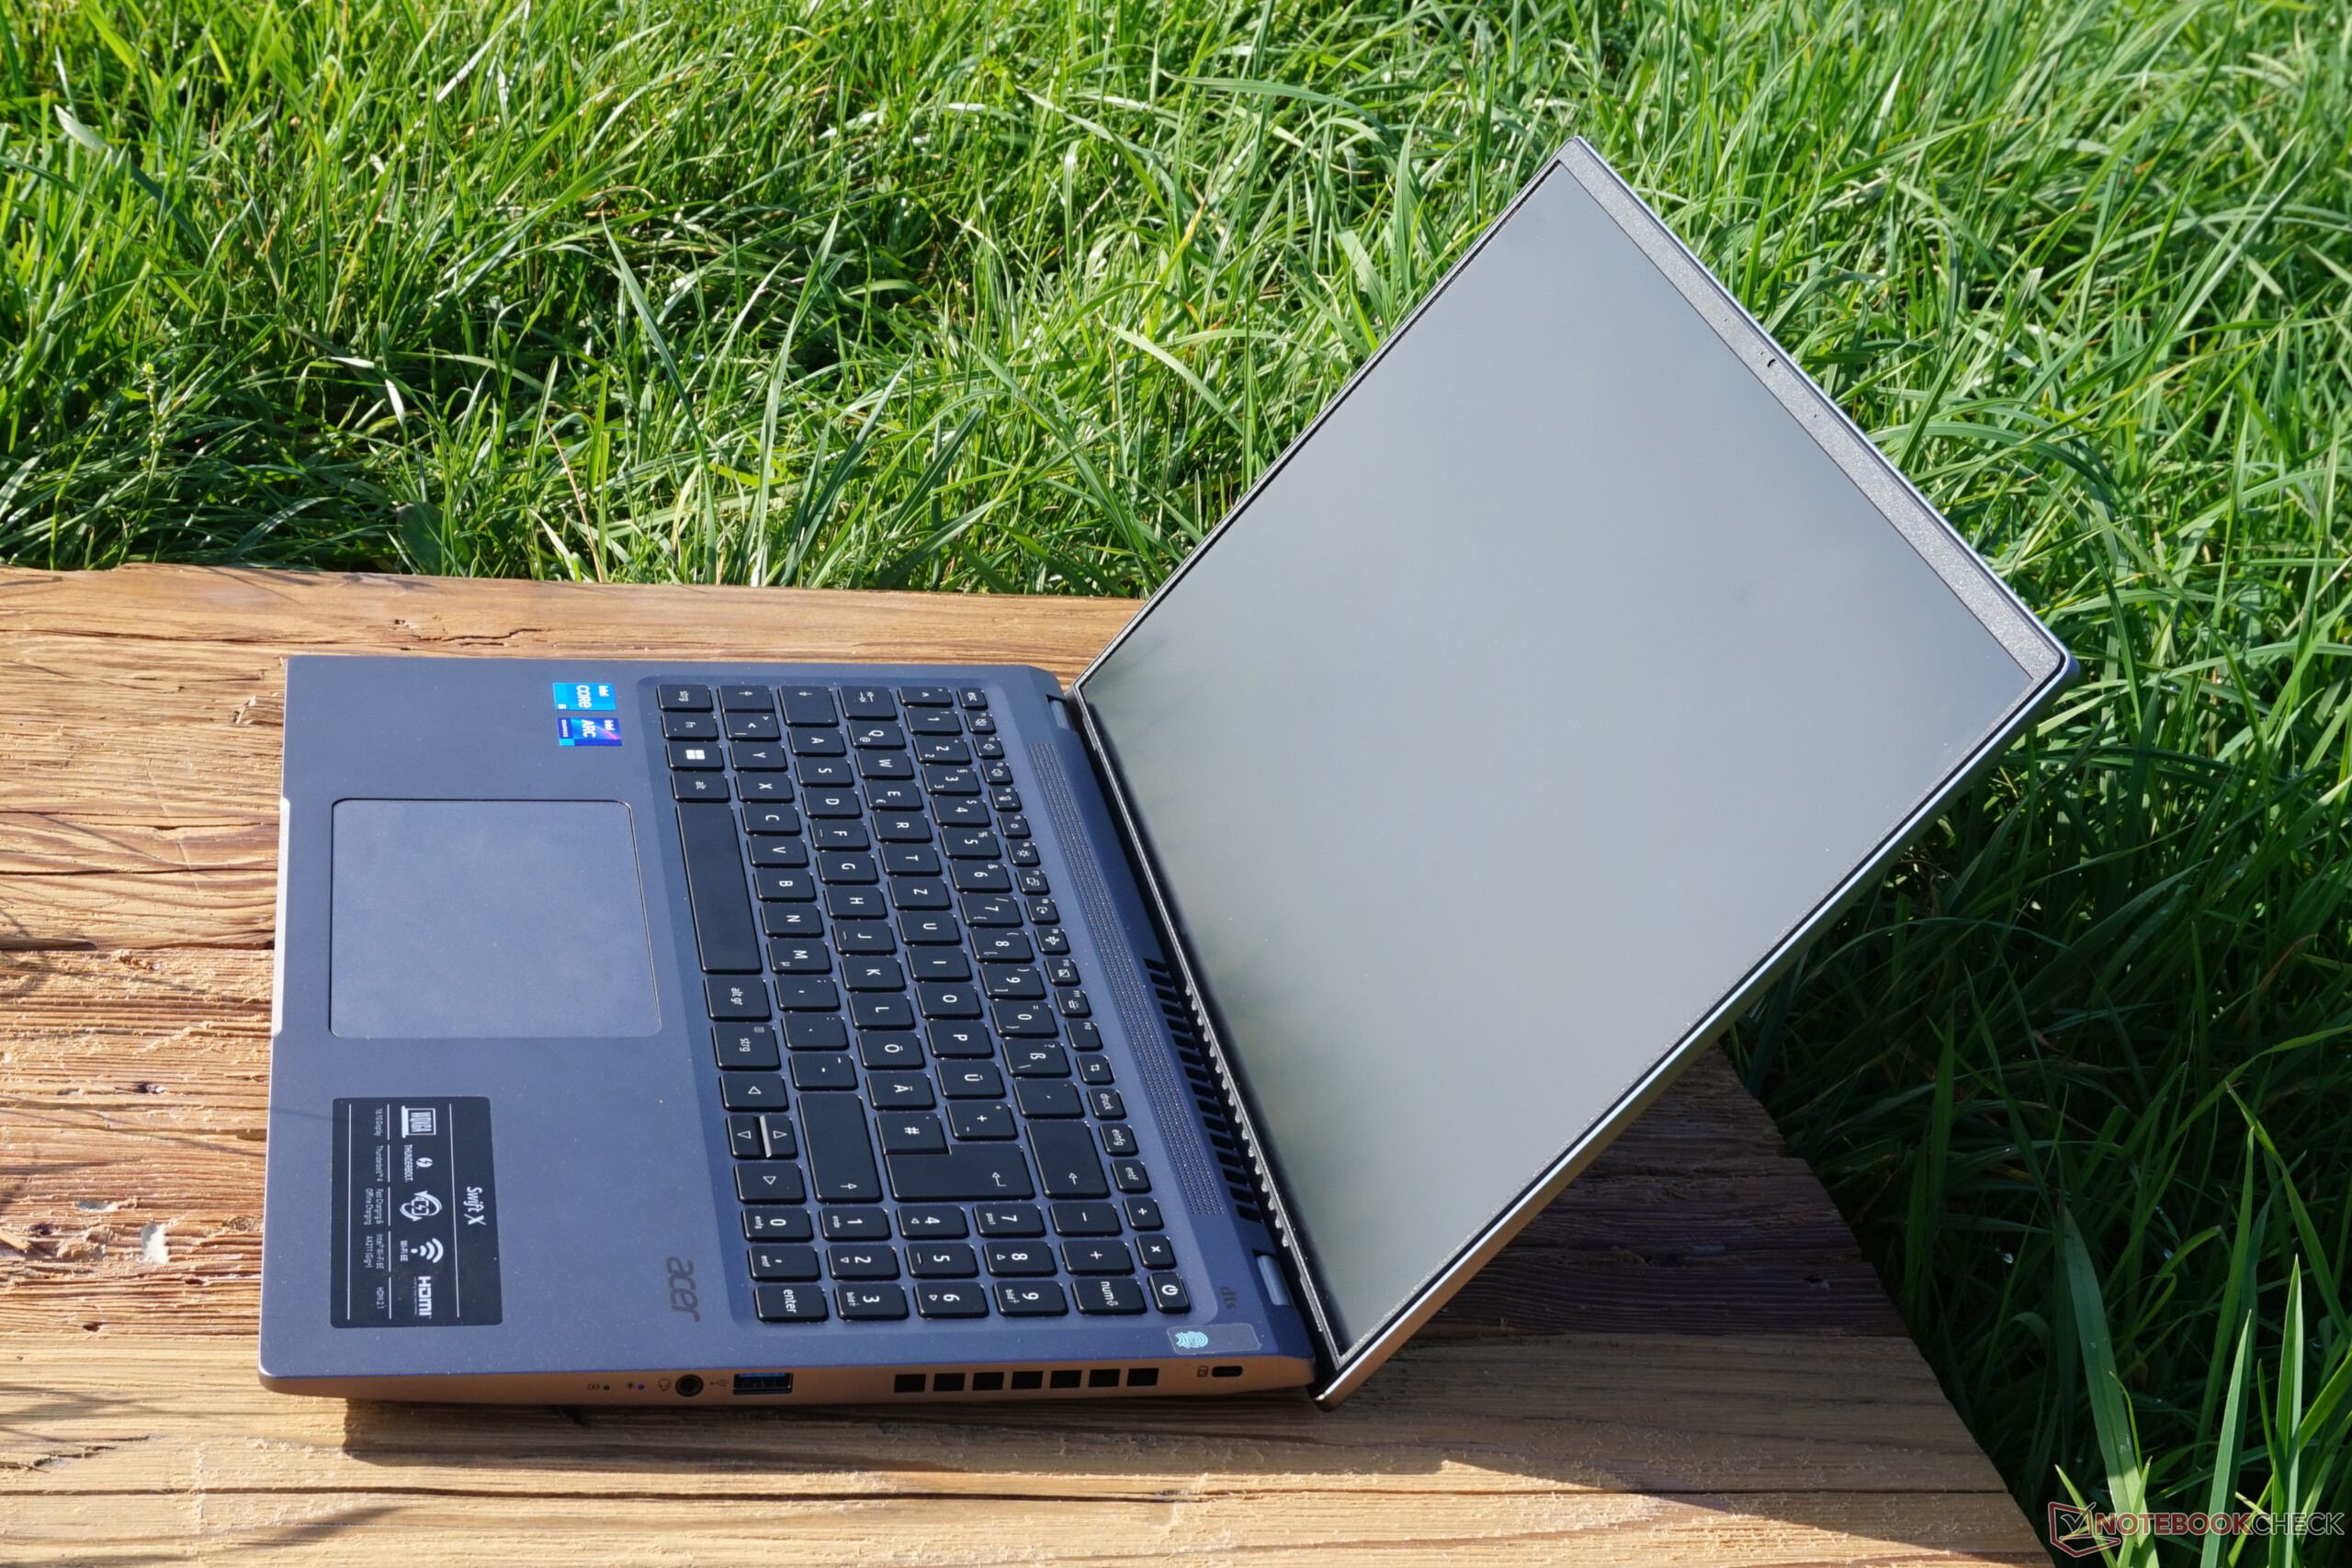
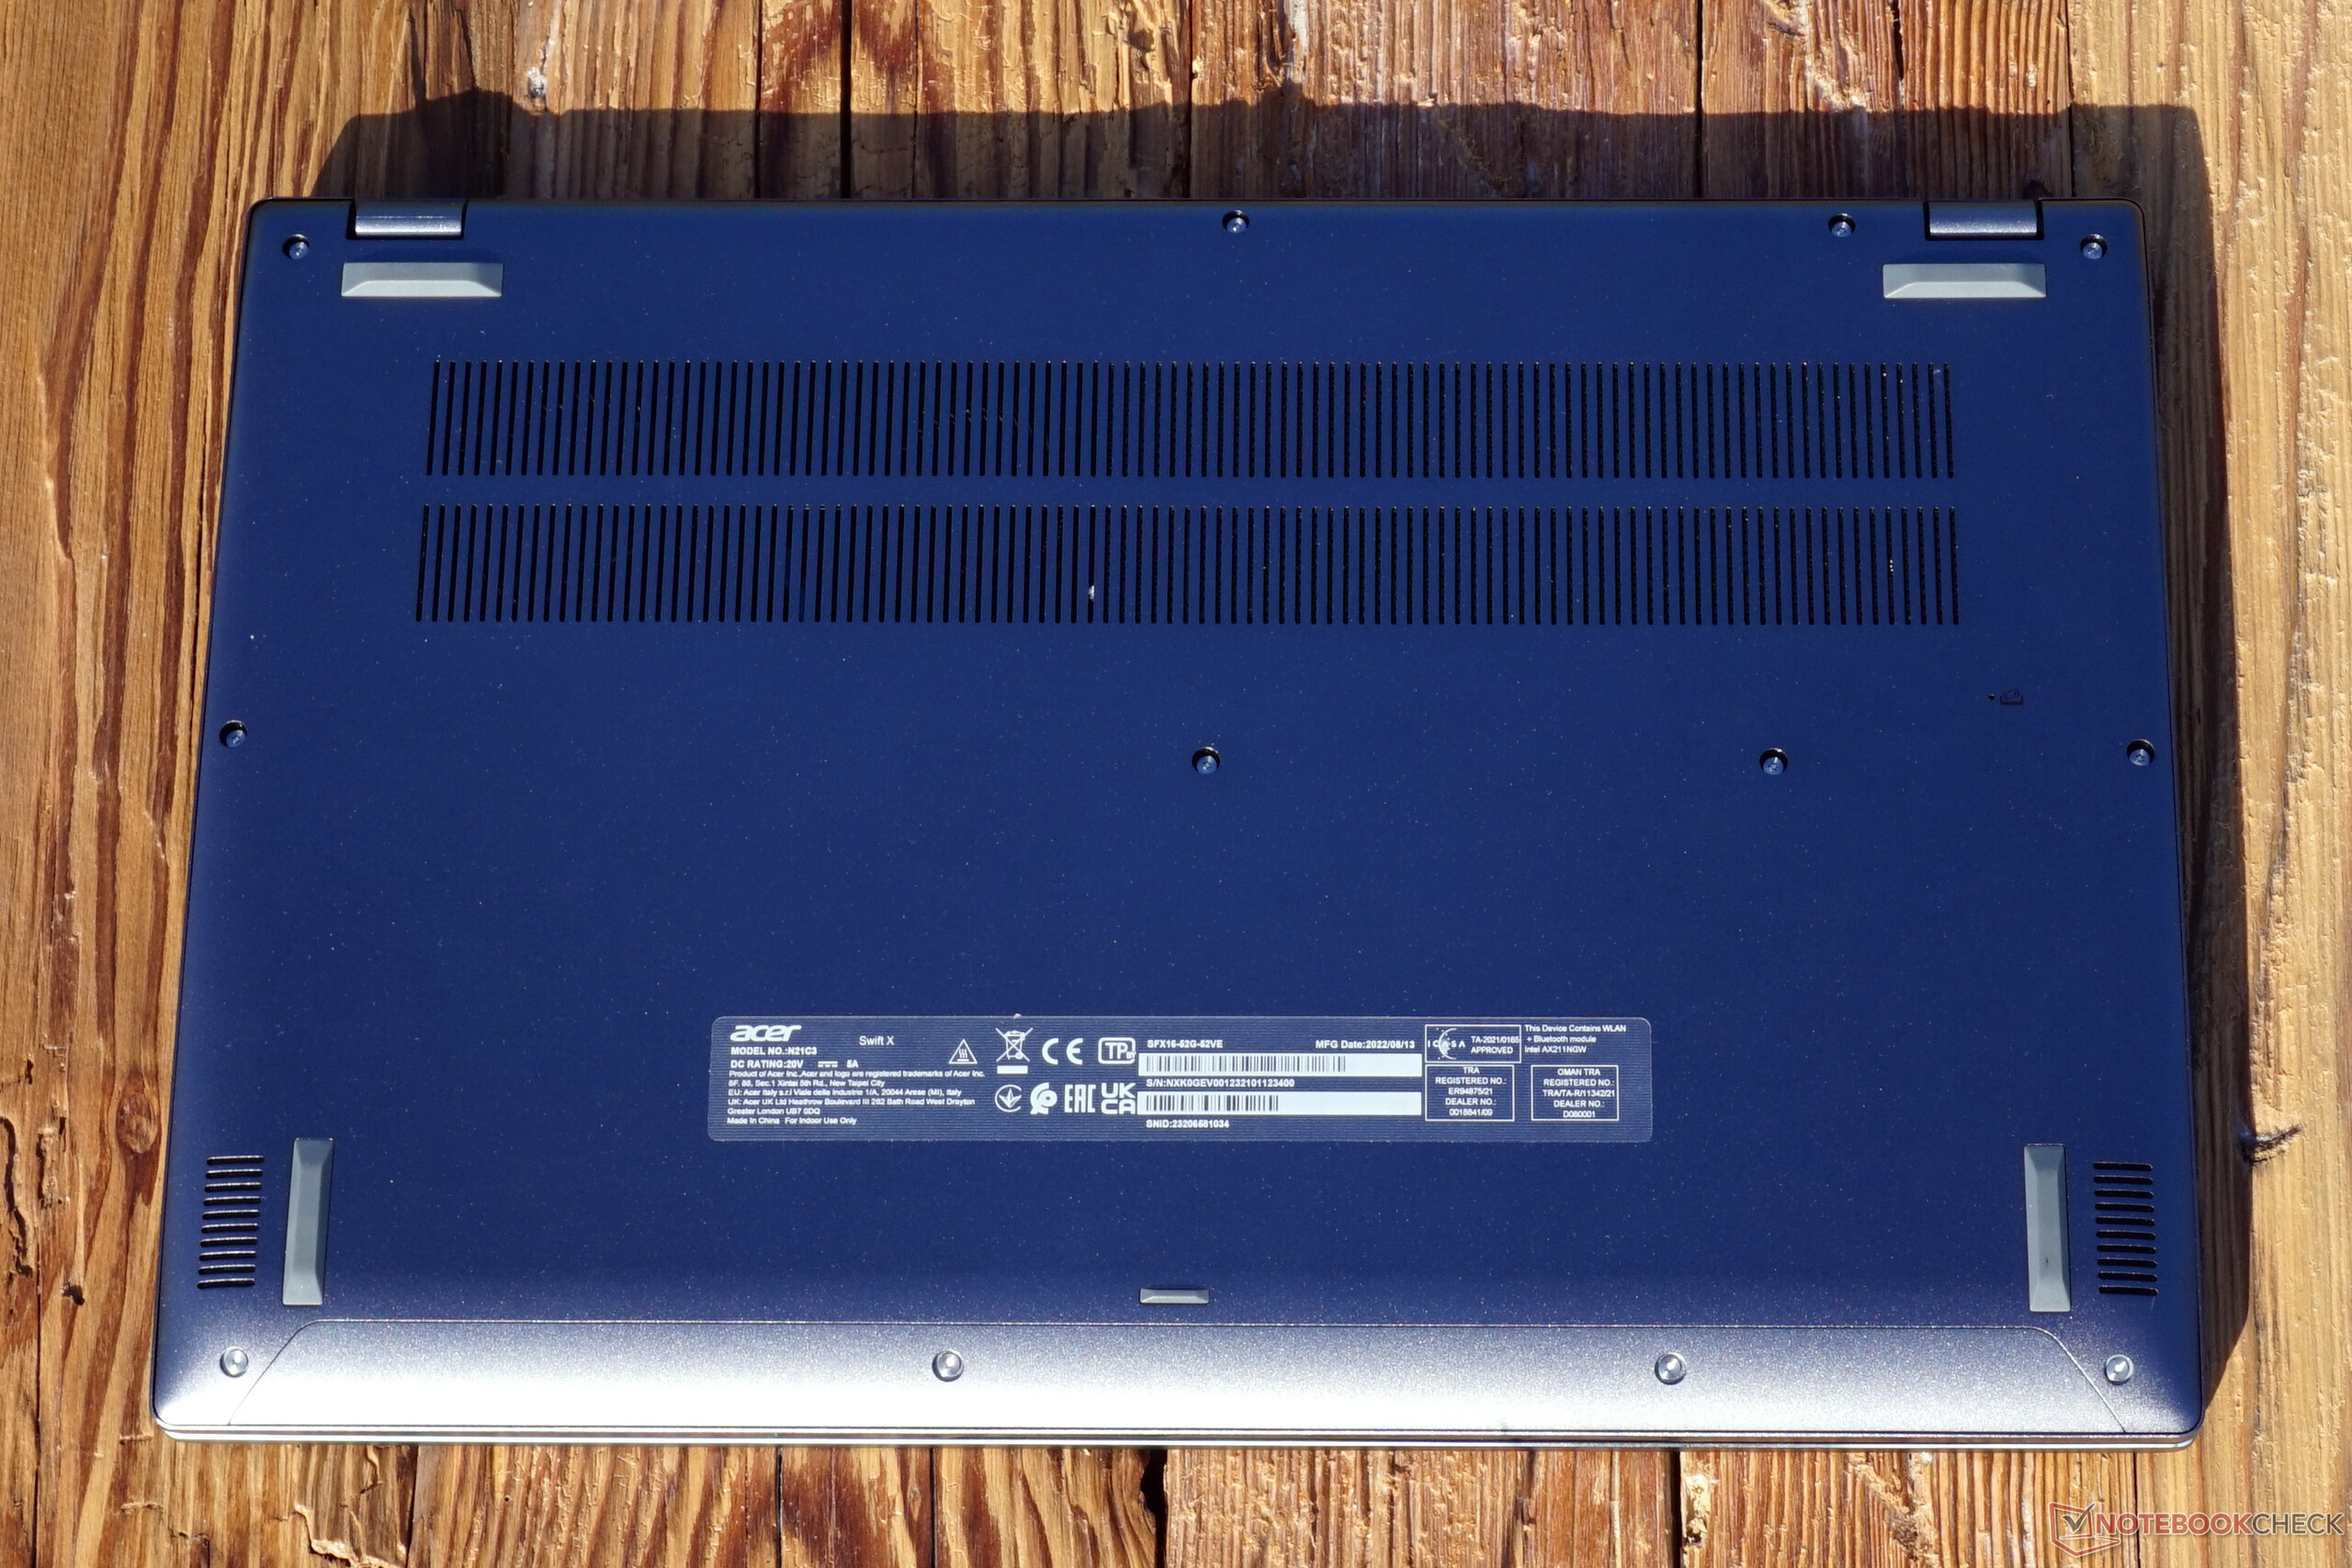
Biorąc pod uwagę cechy i przekątną ekranu 16 cali, waga jest powściągliwa i wynosi 1,8 kg, co jest również zasługą kilku zbyt dużych elementów plastikowych. Dzięki przyjemnie wąskim krawędziom ekranu obudowa laptopa jest kompaktowa i powinna bez problemu zmieścić się w wielu obudowach notebooków 15-calowych.
Na papierze Acer Swift X jest jednym z cieńszych urządzeń w swojej klasie. Właśnie dlatego musieliśmy go kilkakrotnie mierzyć. Zamiast podanych przez Acer 17,9 mm, mierzymy 21,3 mm z tyłu i 20,1 mm z przodu. Znacznie lepszej wartości, którą deklaruje Acer, nigdzie nie znajdziemy. Ale może to tylko błąd w bazie danych na ich stronie.
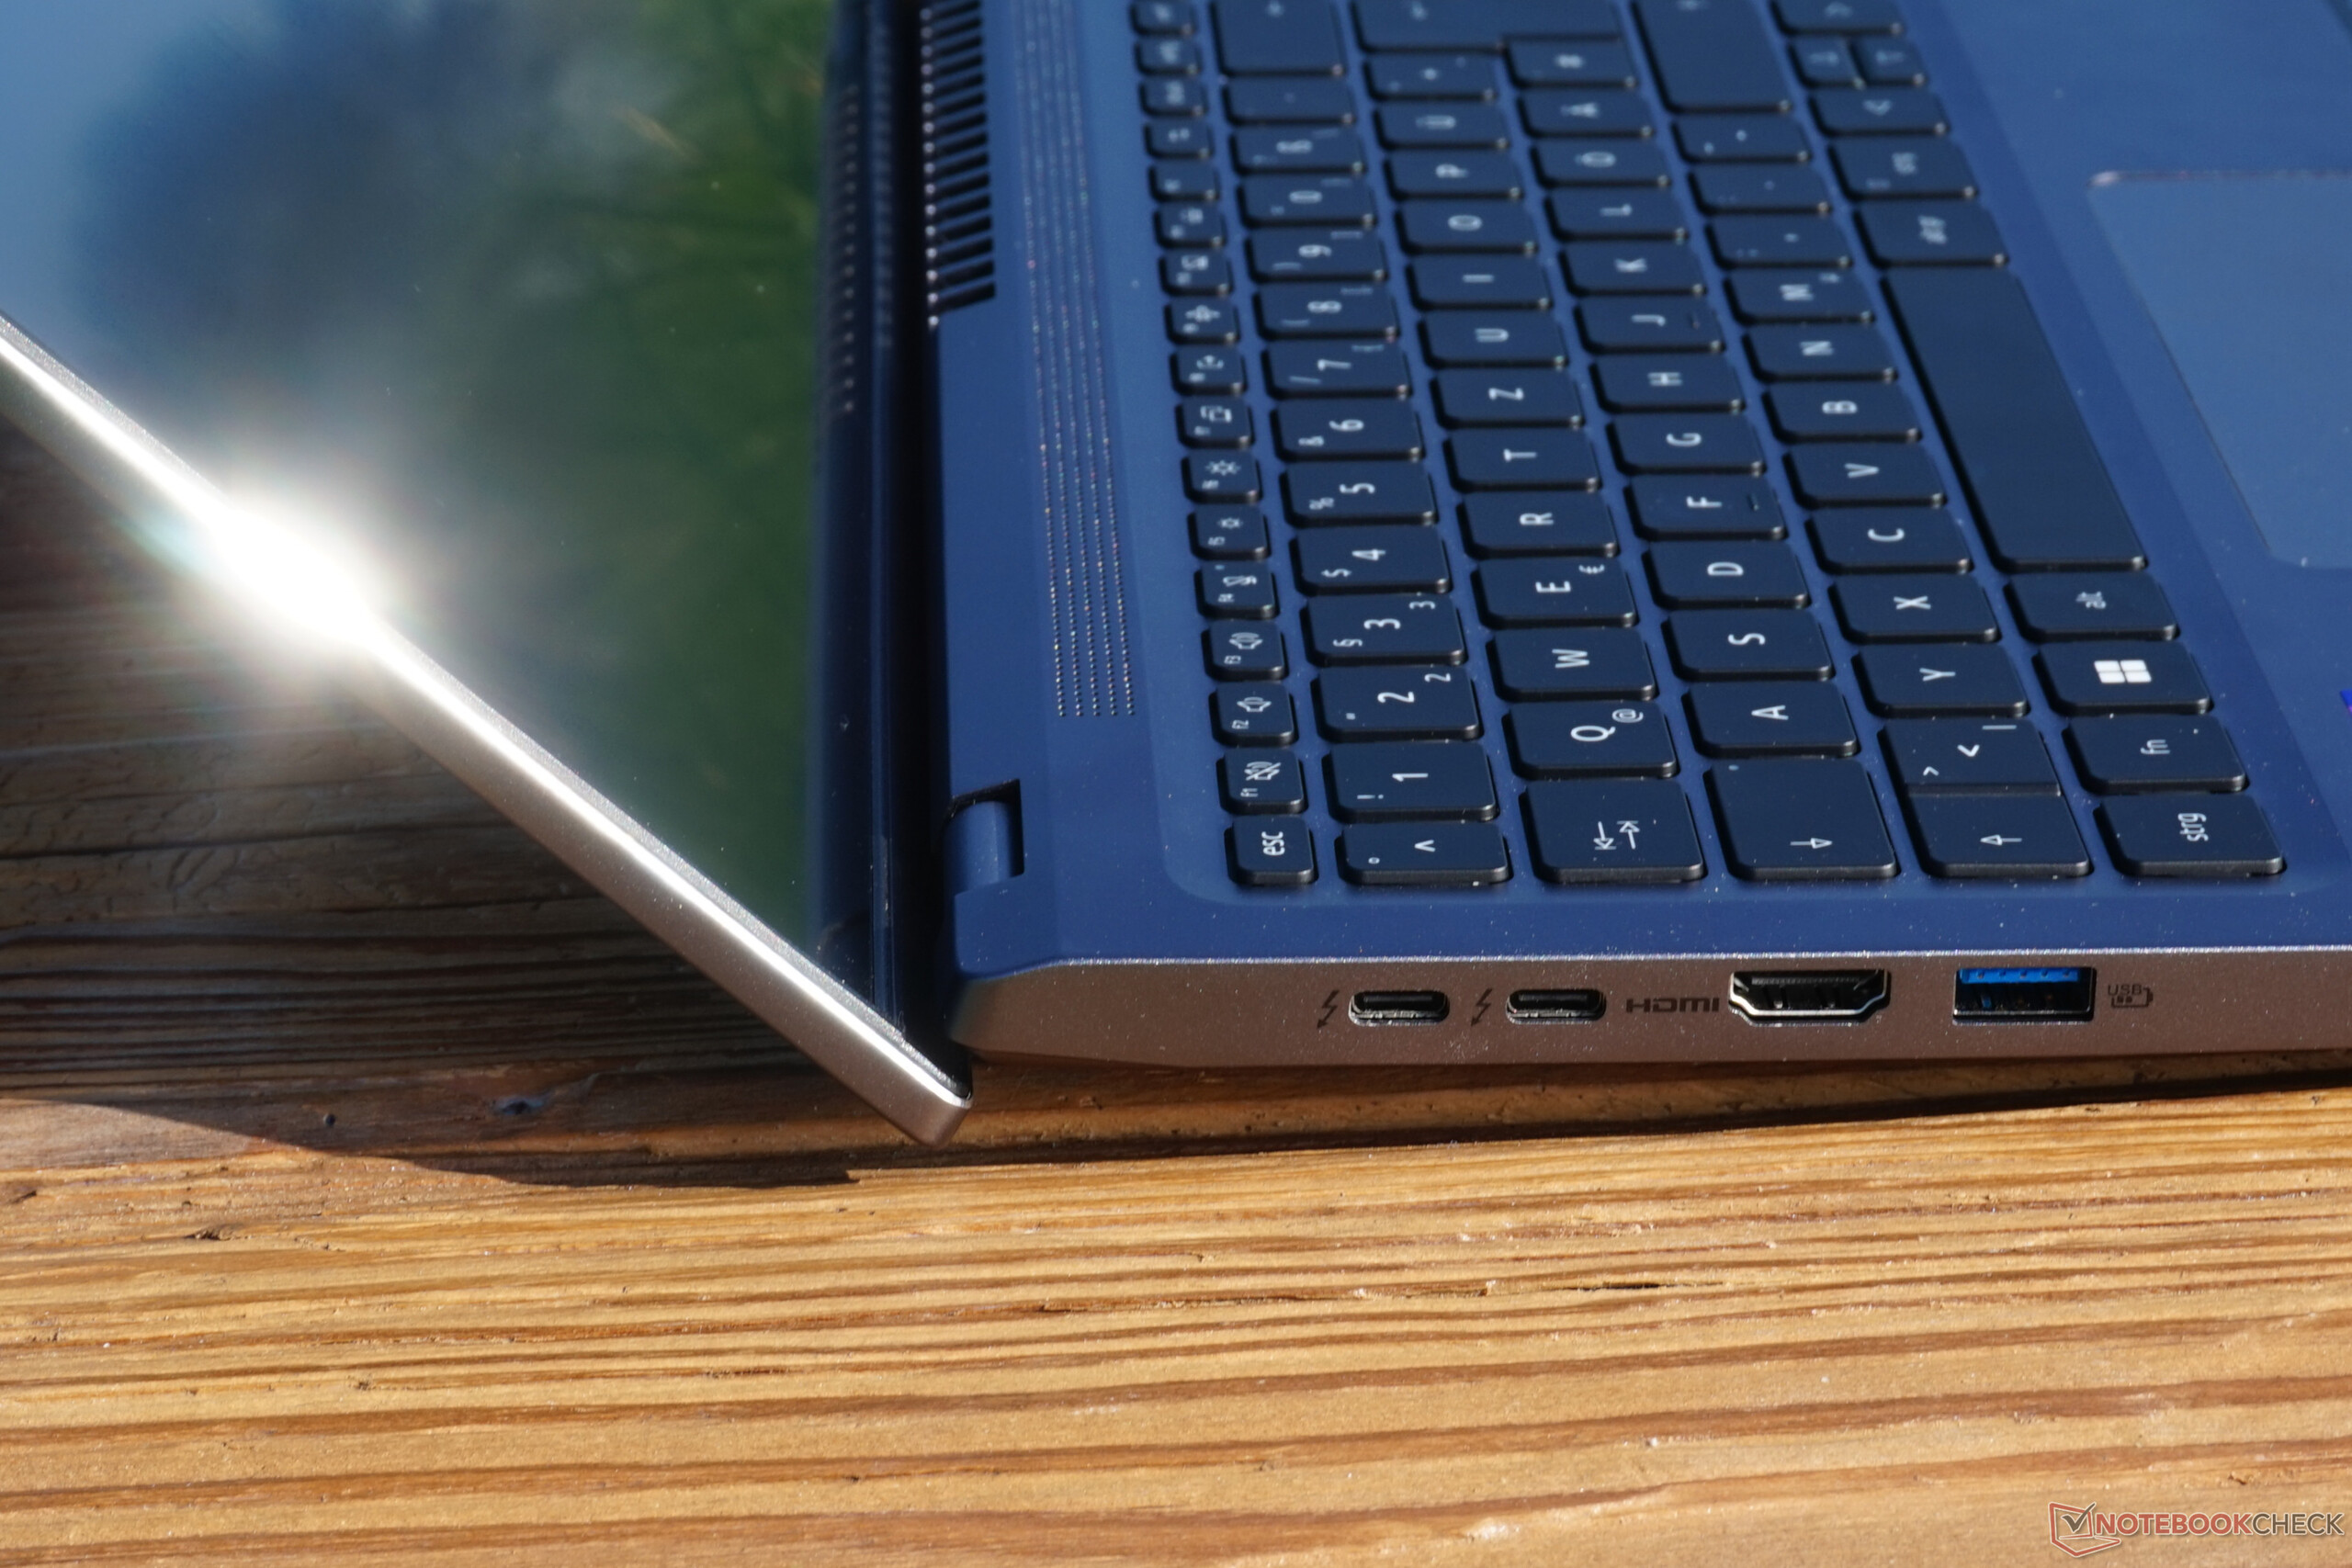
Cechy - Multimedialny notebook z TB4, ale niewiele więcej
Thunderbolt 4 x 2 może być w każdym przypadku wyróżniony. Laptop może być ładowany przy użyciu obu portów. Maksymalny transfer na poziomie 40 Gbit/s pozwala również na podłączenie wysokowydajnych urządzeń peryferyjnych. Do tego dochodzi jeszcze jedna cecha szczególna: port USB-A po lewej stronie jest zawsze zasilany. Nawet gdy laptop jest całkowicie wyłączony, port ten można wykorzystać np. do ładowania smartfona.
W przeciwnym razie przeważa raczej oszczędność. Kolejne złącze USB-A po prawej stronie, a także HDMI do podłączenia telewizora i analogowy port słuchawkowy, to wszystko, co dostajemy. Nie ma slotu na karty pamięci ani portu LAN.


Komunikacja
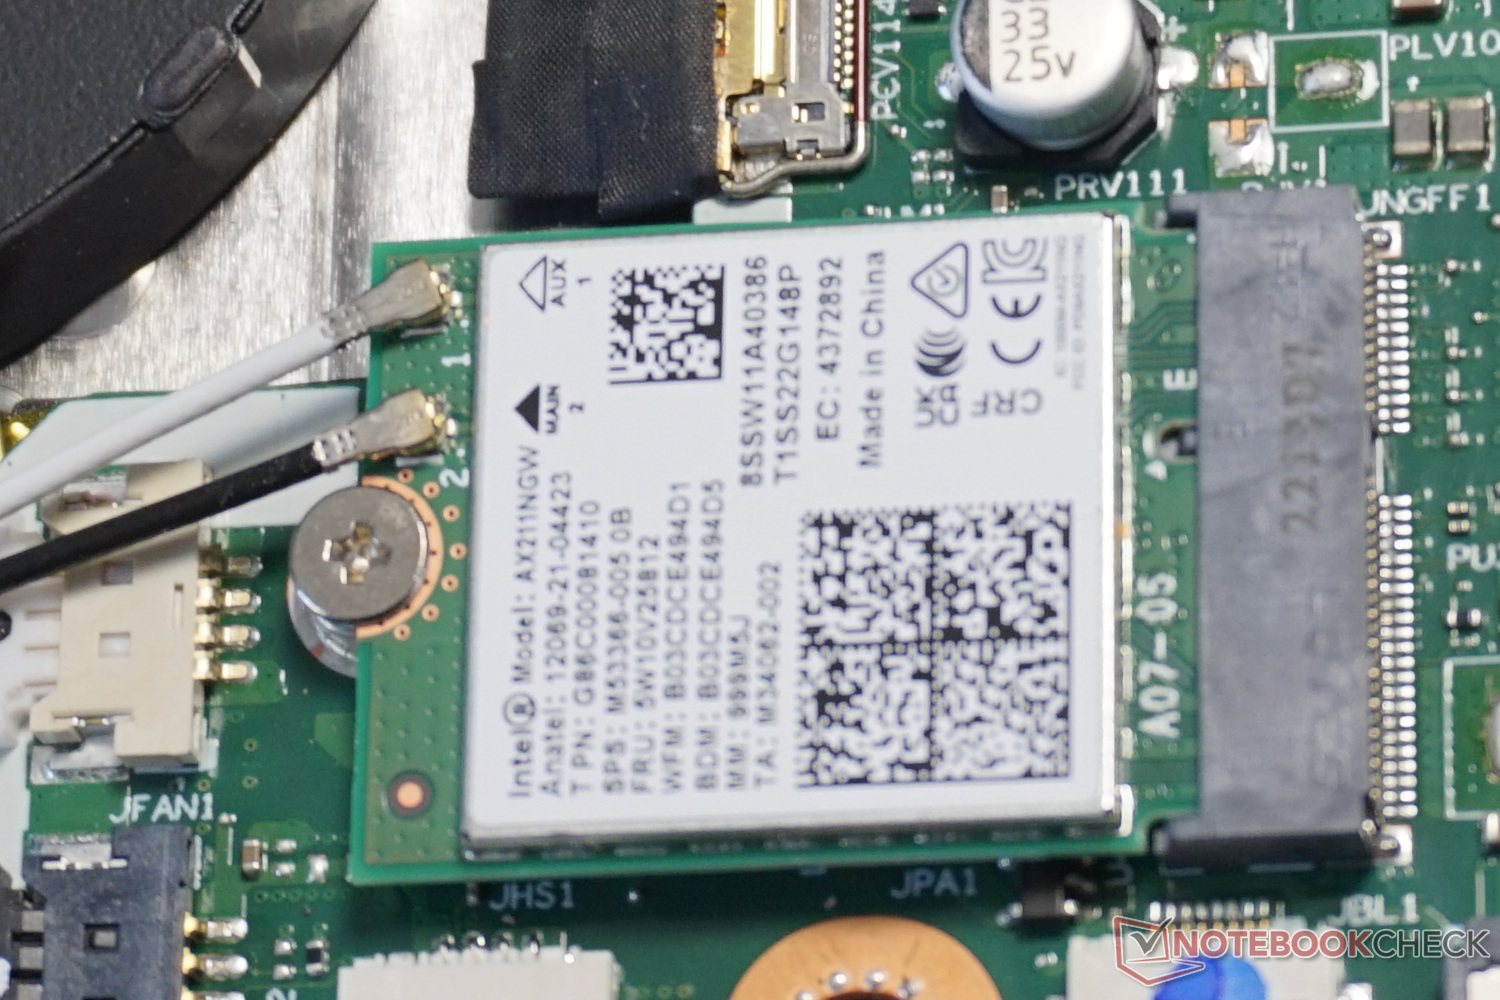
Wymienny moduł WLAN Intel AX211 zachowuje się zgodnie z oczekiwaniami. Szybkość transmisji pozostaje podczas testów na niezmiennie wysokim poziomie i można ją również zaliczyć do nieco ponadprzeciętnych. Przy dostatecznie dobrym sygnale WLAN brak portu LAN raczej nie stanowi problemu.
Kamera internetowa
Stosunkowo wysokiej jakości wideorozmowy są możliwe dzięki rozdzielczości Full HD. To co jednak rzuca się w oczy, to mimowolny efekt rozjaśnienia, nawet przy niewielkich zmianach oświetlenia. Wystarczy chmura lub włączenie lampy w pobliżu, by wywołać nieprzyjemne migotanie. Łatwo to zauważyć na naszym wykresie porównawczym kolorów. Pola o szczególnie znacznym odchyleniu kolorów są po prostu rozjaśniane przez aparat, bo faktycznie robi on przyzwoite zdjęcia.
Przynajmniej mikrofon jest w pełni przekonujący. W teście odebrał on głos z niewielkimi zniekształceniami, niemal niezależnie od tego, z którego kierunku głos dochodził i jak daleko znajdował się notebook.


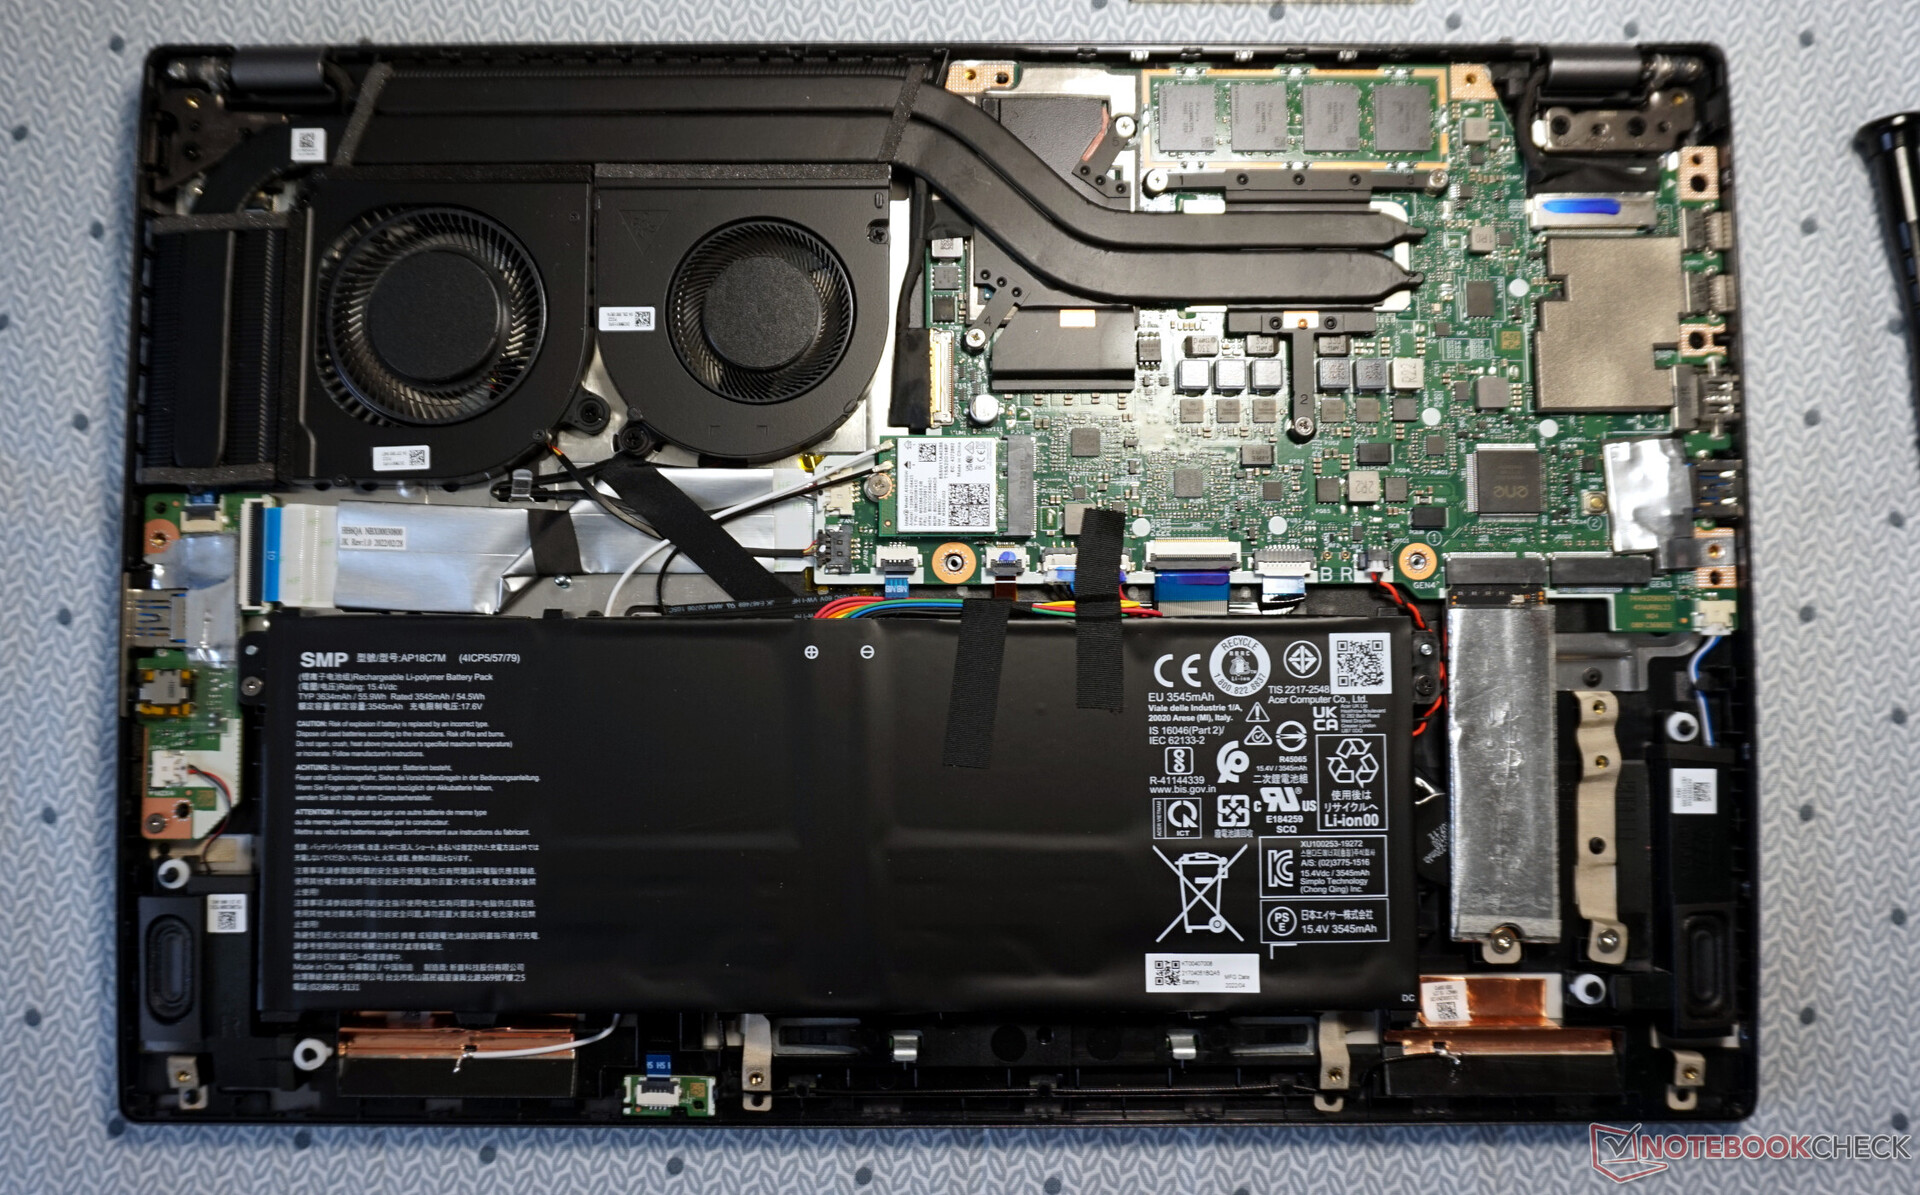
Konserwacja
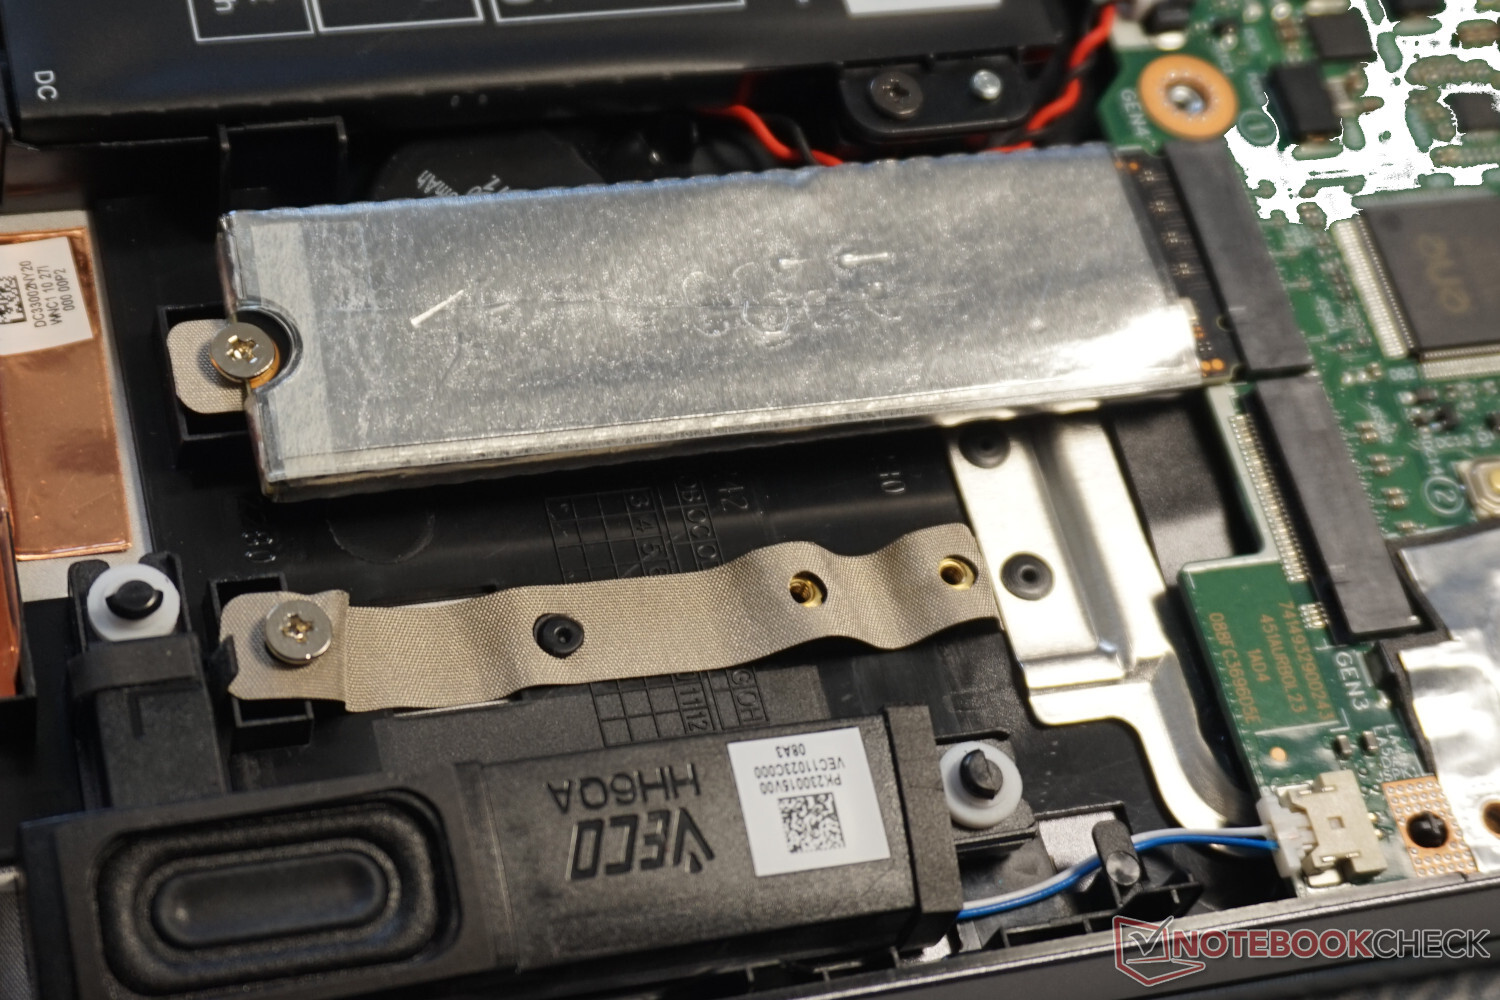
Po odkręceniu dwunastu śrub Torx wystarczy ostrożne poluzowanie płyty bazowej. Jest ona zablokowana dookoła za pomocą plastikowych klipsów, ale bardzo równo i nie za mocno.
Można wymienić akumulator, dysk SSD M.2 i moduł WLAN. Uaktualnienie pamięci operacyjnej jest jeszcze prostsze. Oprócz standardowego dysku SSD wolny jest dodatkowy slot, co w połączeniu ze stosunkowo łatwym dostępem sprawia, że taki upgrade wydaje się realny nawet dla nieprofesjonalistów. Pamięć RAM jest natomiast lutowana do płyty głównej, dlatego dostępne wyłącznie 16 GB jest niezmienne.
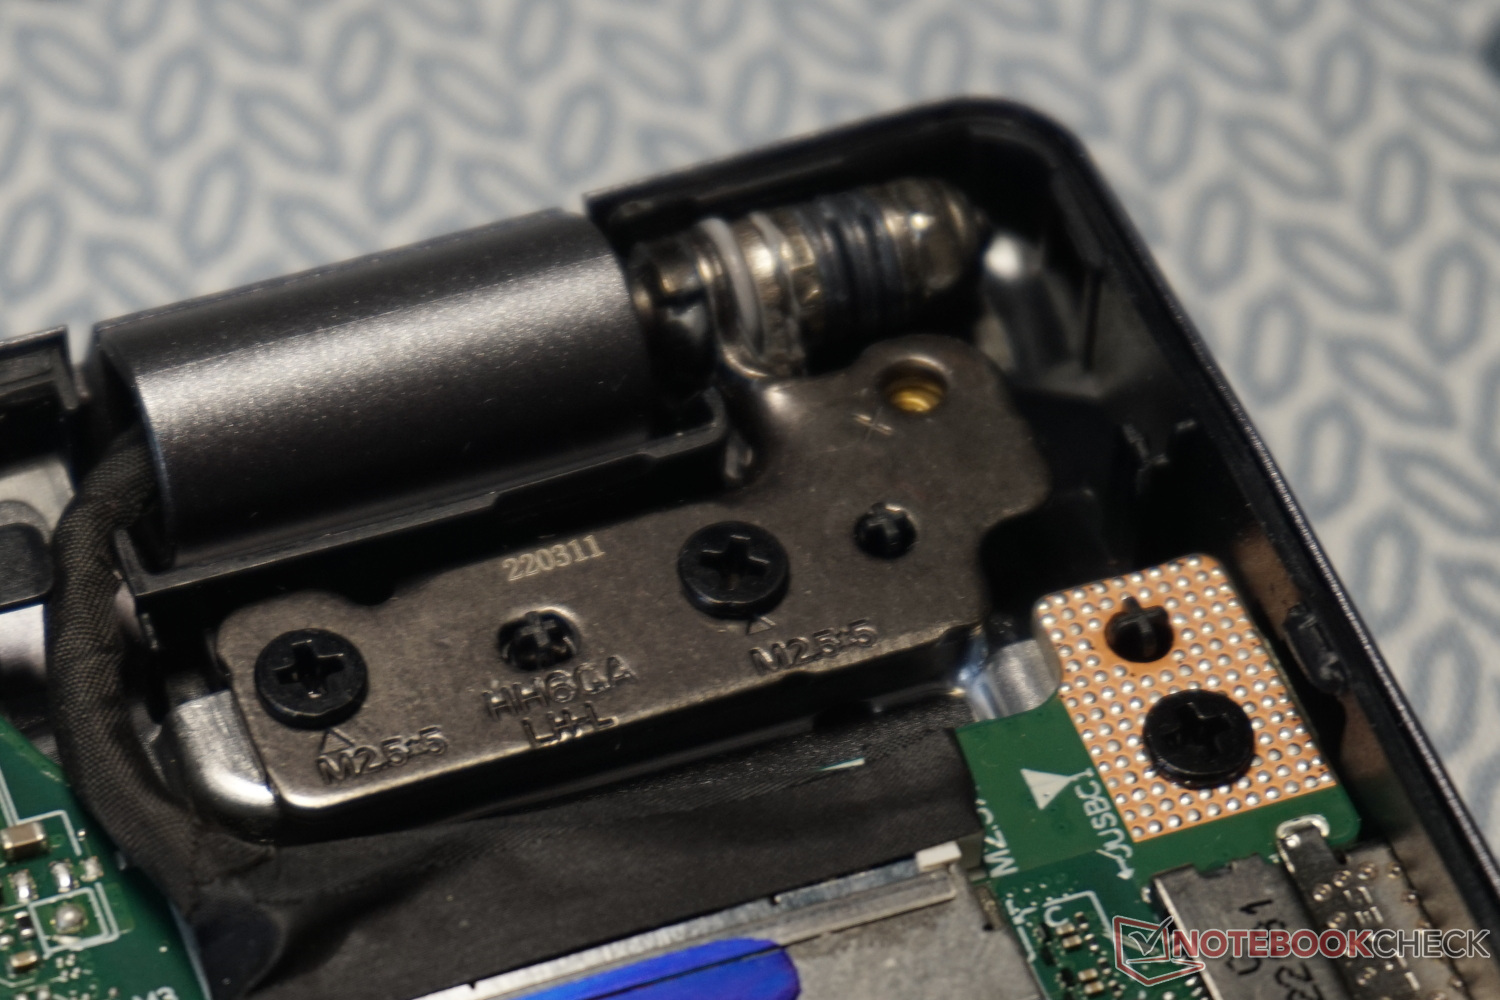
Zawiasy i ich połączenia śrubowe są trochę zbyt delikatne. W innych, ale z reguły także droższych laptopach, kwestia ta jest rozwiązana w sposób bardziej rozbudowany, a więc i stabilniejszy.
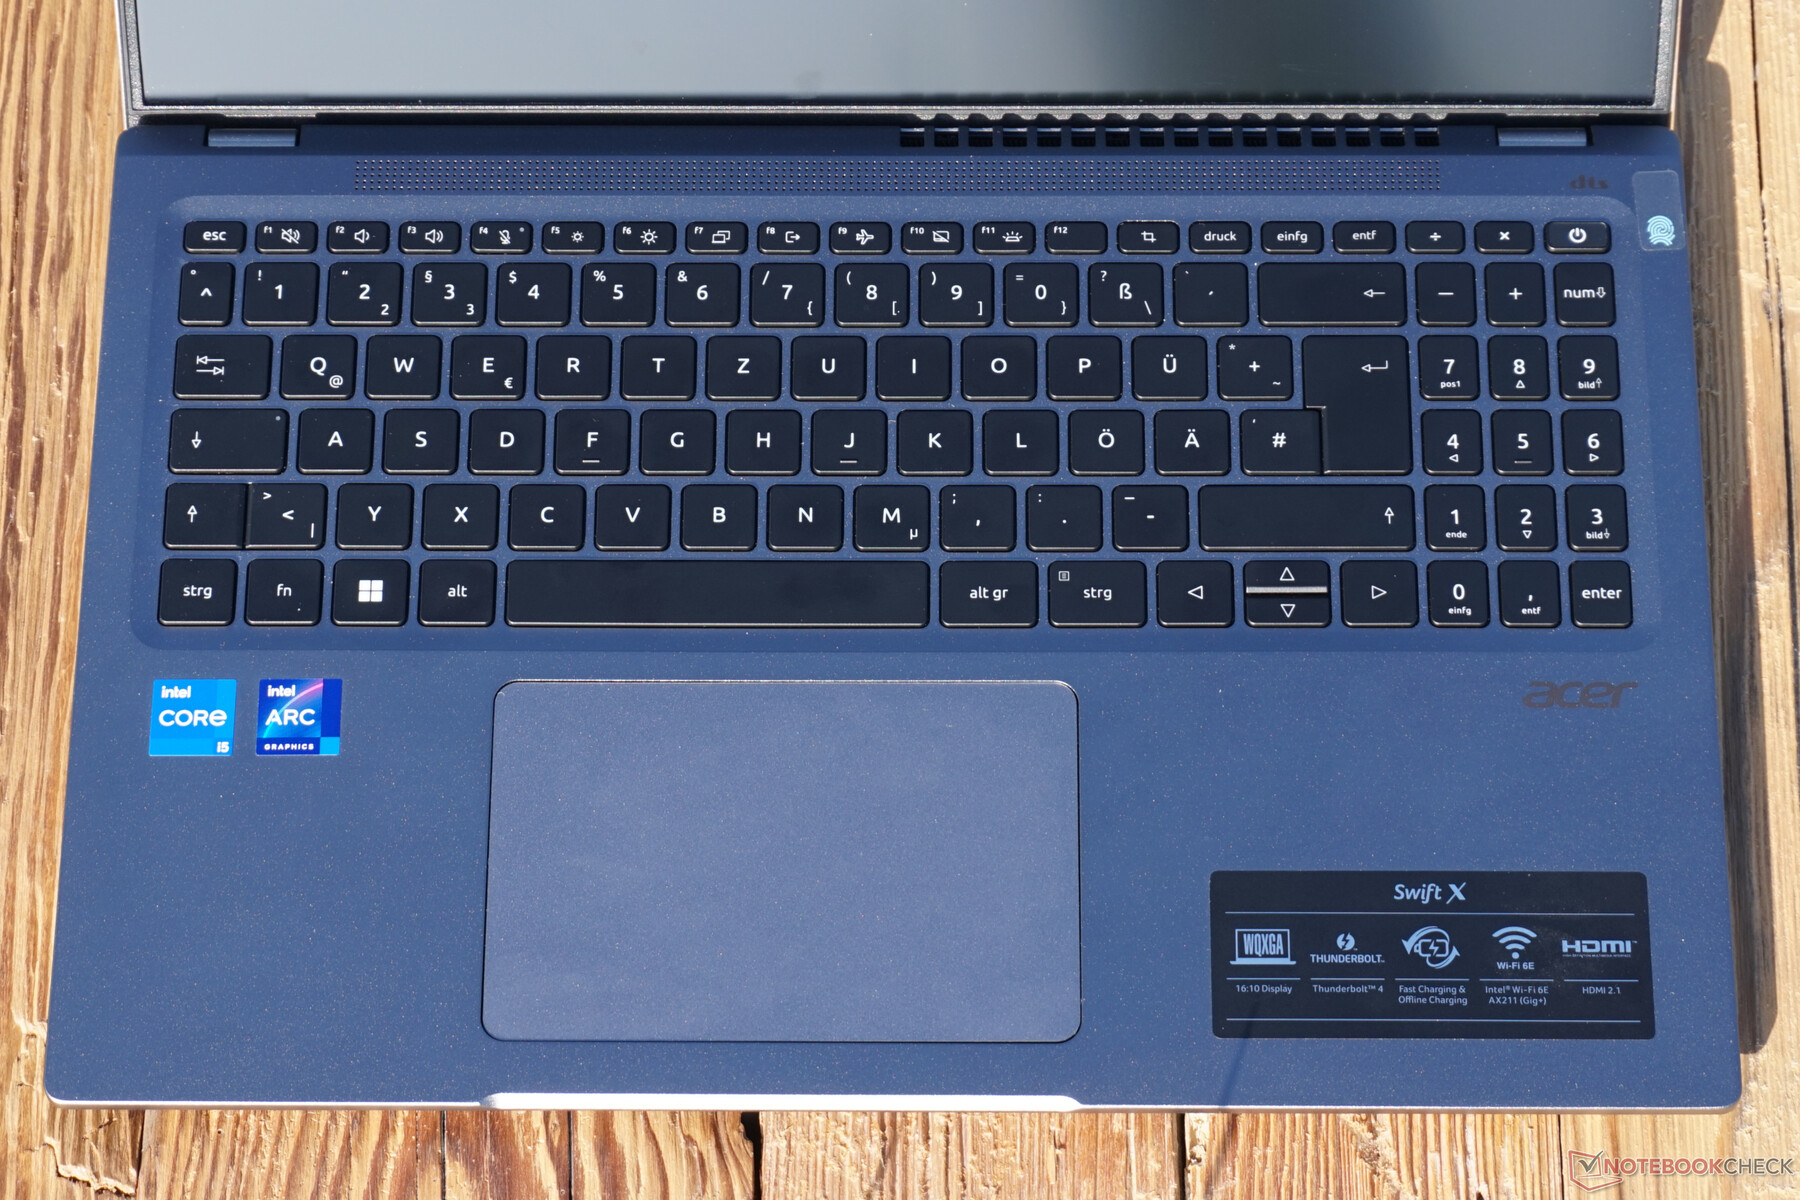
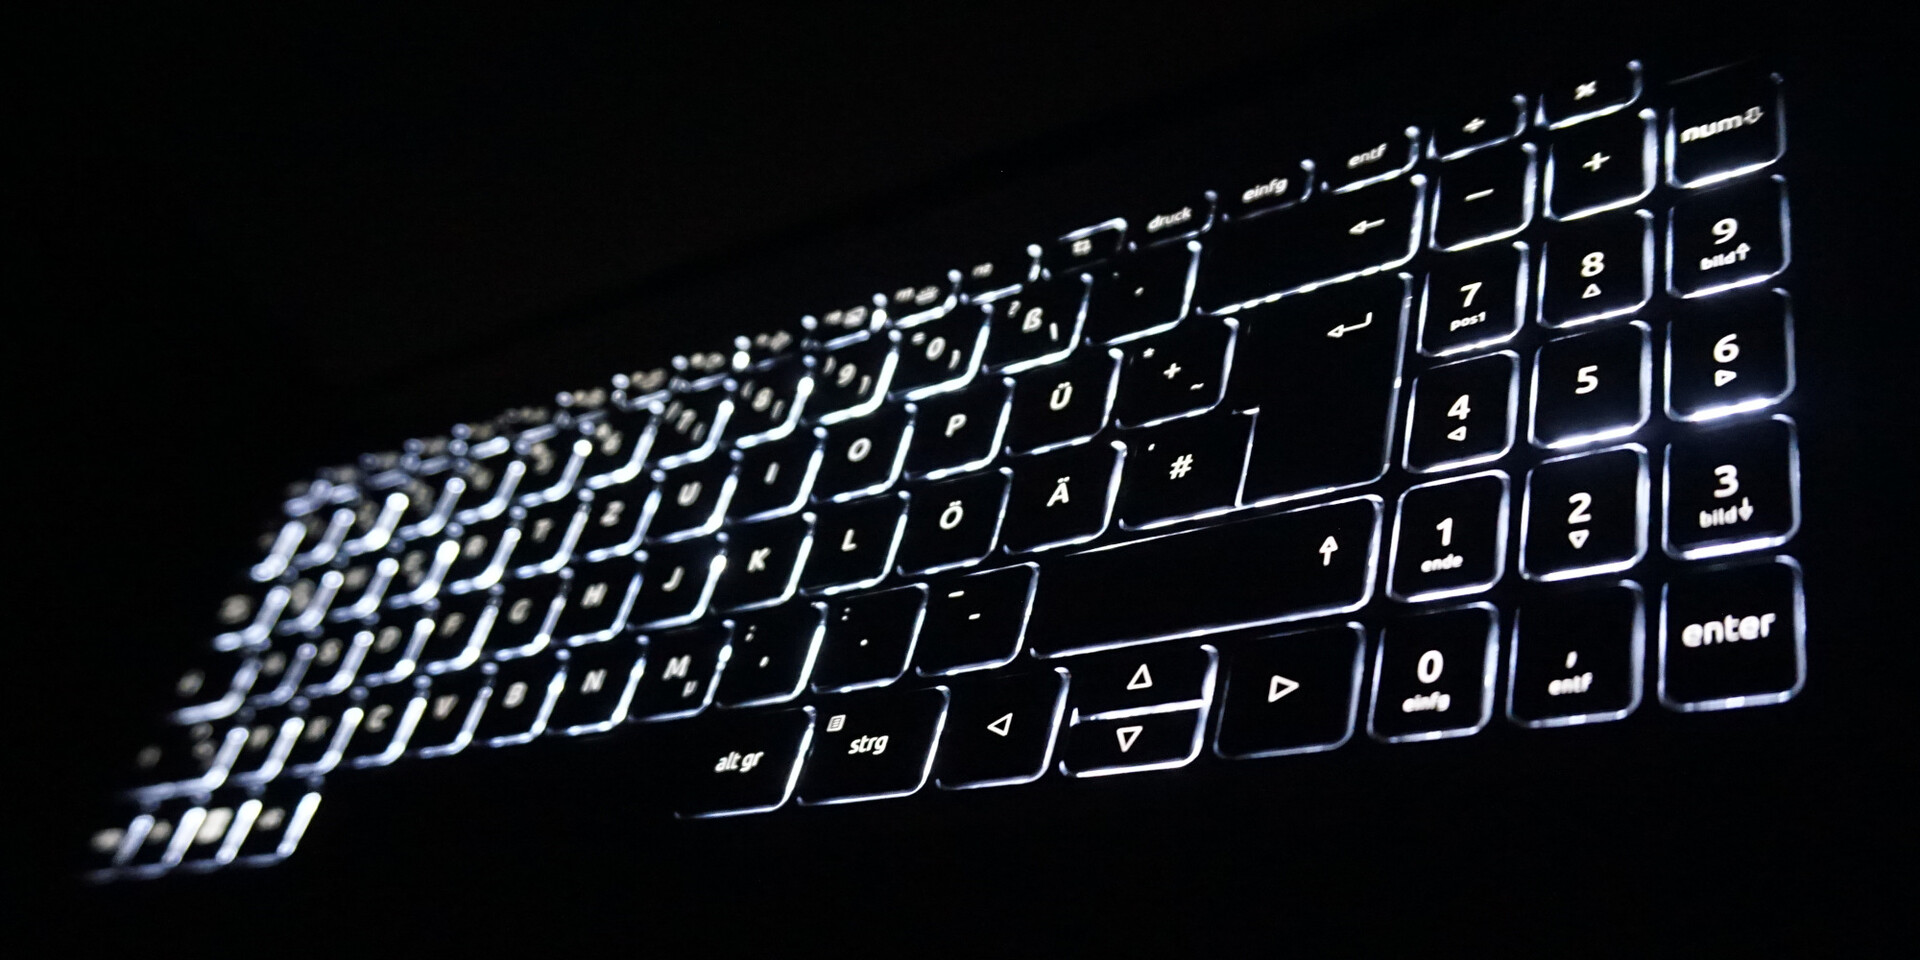
Urządzenia wejściowe - notebook Acer stawia na prostotę
Standardowej wielkości klawiatura typu chiclet jest łatwa do pisania i odpowiednio szybka. Przyjemnie kontroluje się również nacisk przeciwny. Skok natomiast okazuje się krótki i wynosi dokładnie 1 mm. Z czasem może to stać się niewygodne, jeśli jesteśmy przyzwyczajeni do pisania na dużej klawiaturze.
Touchpad pod spodem jest praktycznych rozmiarów i można go obsługiwać precyzyjnie i płynnie, nawet kilkoma palcami. Z kolei klawisze ukryte w dolnej części wydają się sztywne.
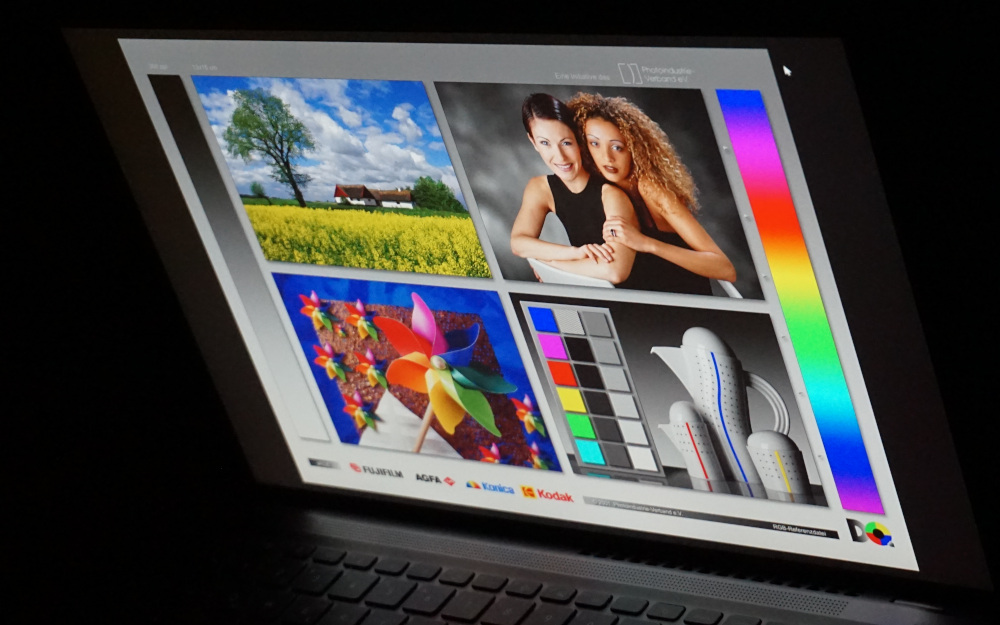
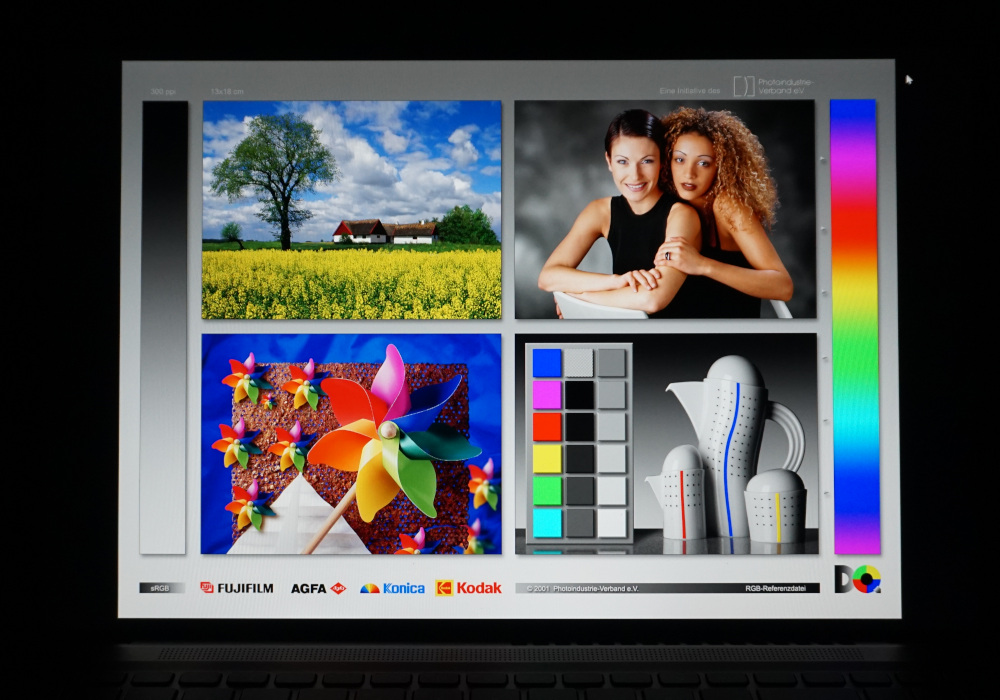
Wyświetlacz - wysoka rozdzielczość i precyzyjny wyświetlacz w Acer Swift X


Matowy ekran oferuje spójną rozdzielczość 2 560 na 1 600 pikseli, która najlepiej nadaje się m.in. do edycji zdjęć cyfrowych. Z kolei do normalnego czytania, pisania i przeglądania stron internetowych należy trzymać się zalecanego powiększenia 150%. W przeciwnym razie prawie nic nie będzie widać. Proporcje 16:10 są również nastawione na projektowanie multimediów. Pozostawia to miejsce na przyciski powyżej i poniżej typowych ujęć 16:9.
Maksymalna jasność 400 cd/m² jest osiągana tylko w centrum wyświetlacza, ale ogólnie obraz jest jasny i ma też przyzwoitą wartość kontrastu. Ogólnie rzecz biorąc, wartości obrazu odpowiadają dość dokładnie temu, czego można oczekiwać od solidnego, bynajmniej nie wybitnego notebooka multimedialnego.
Screen bleeding jest minimalnie odczuwalny we wszystkich czterech narożnikach, ale jest dokuczliwy tylko wtedy, gdy zawartość wyświetlacza jest wyjątkowo ciemna, a otoczenie również ciemne.
| |||||||||||||||||||||||||
rozświetlenie: 81 %
na akumulatorze: 316 cd/m²
kontrast: 1393:1 (czerń: 0.295 cd/m²)
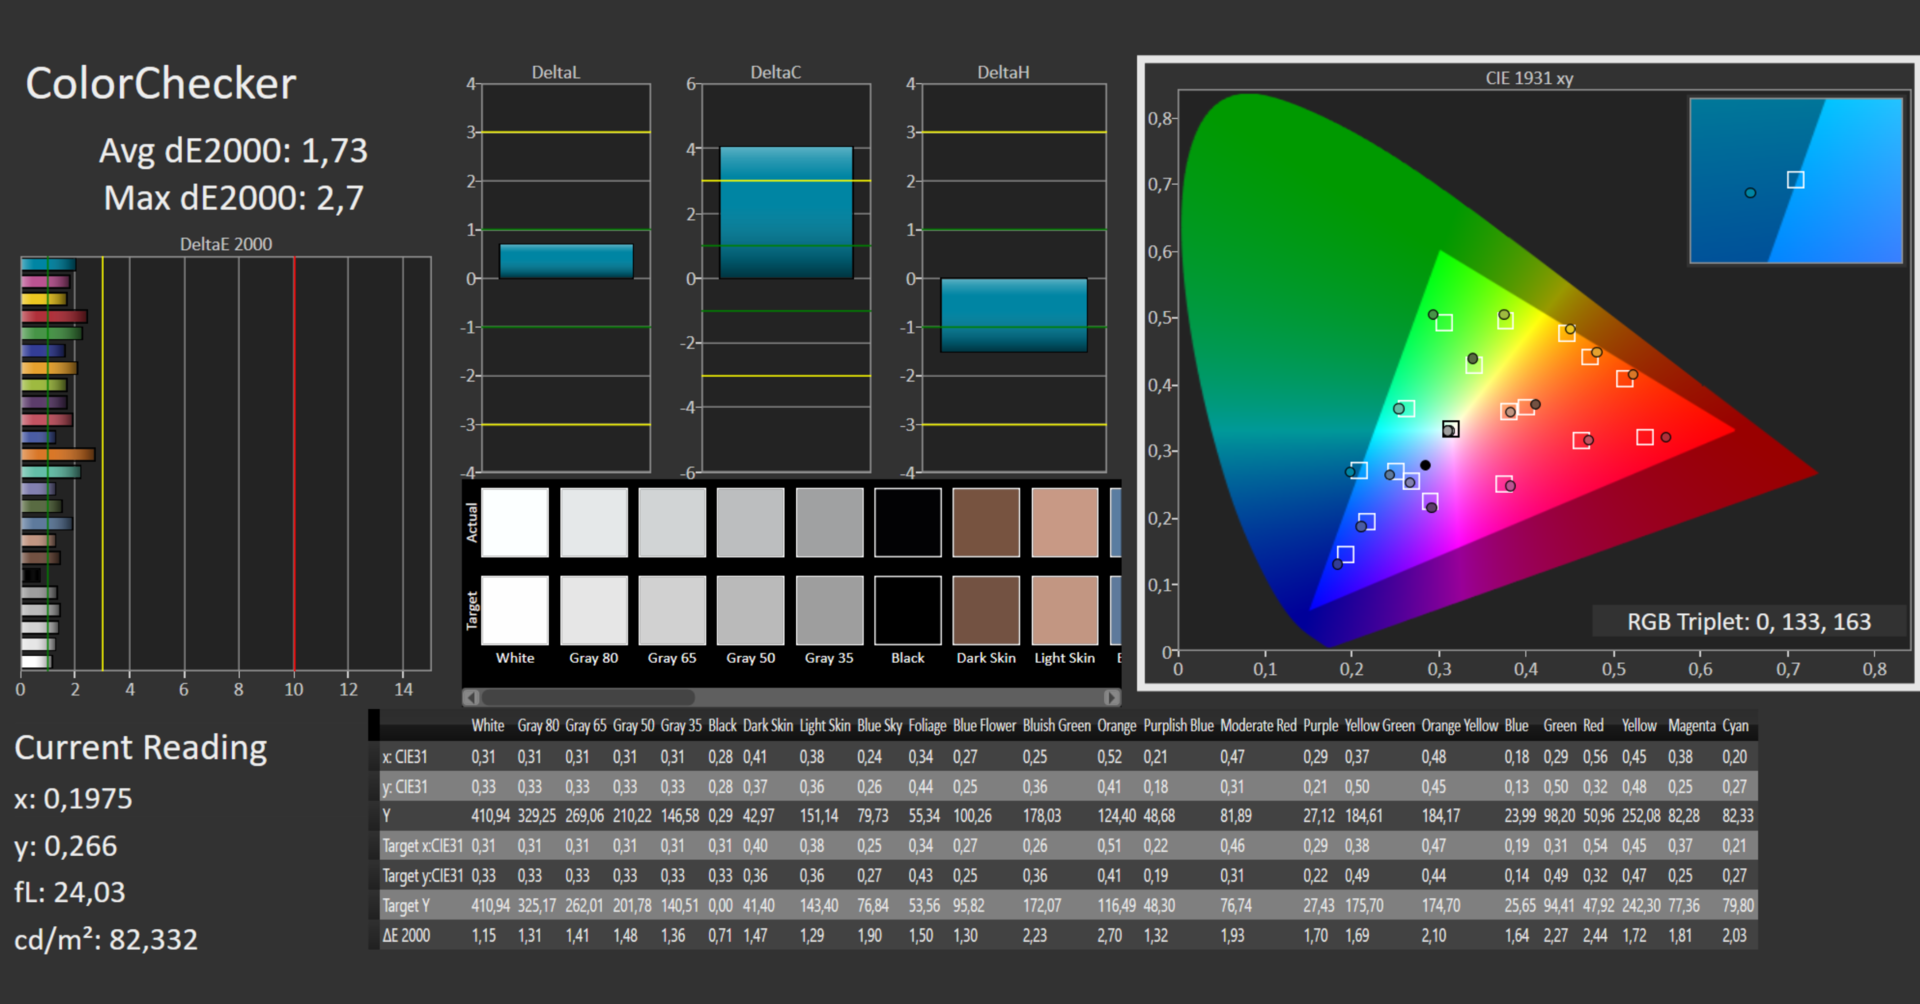
ΔE ColorChecker Calman: 1.73 | ∀{0.5-29.43 Ø4.72}
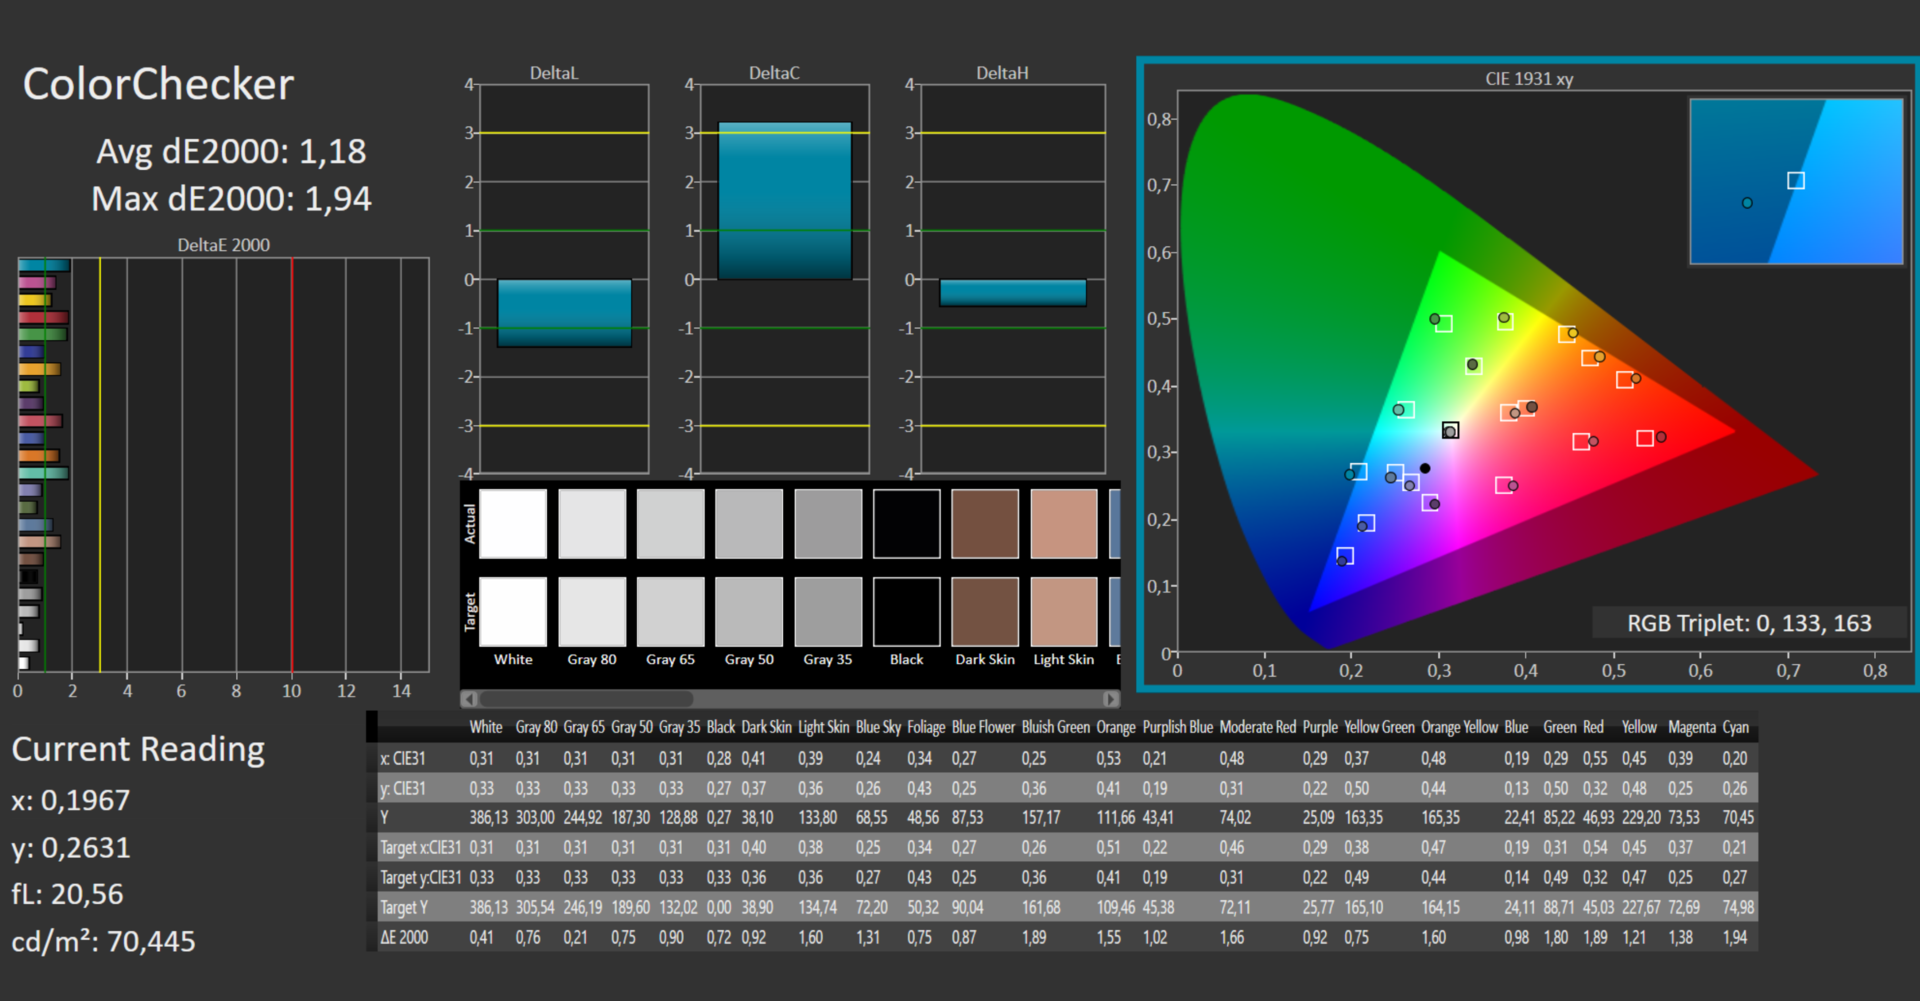
calibrated: 1.18
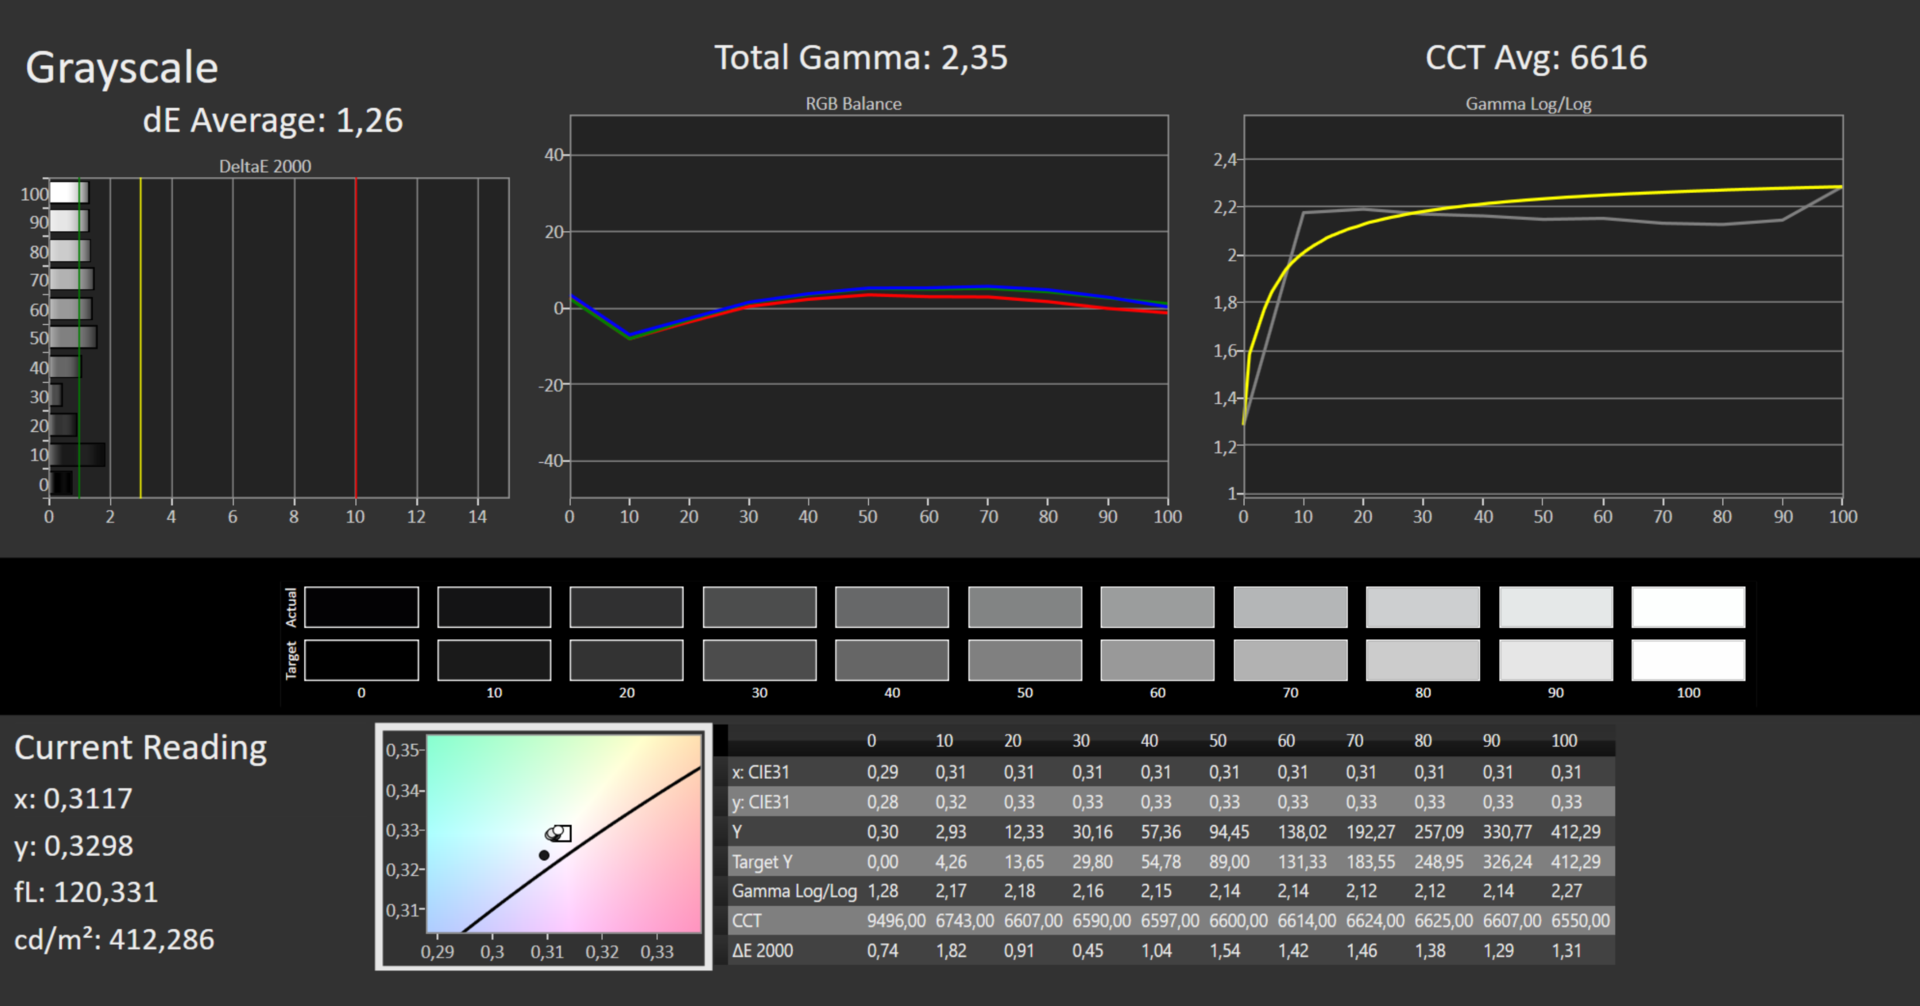
ΔE Greyscale Calman: 1.26 | ∀{0.09-98 Ø4.97}
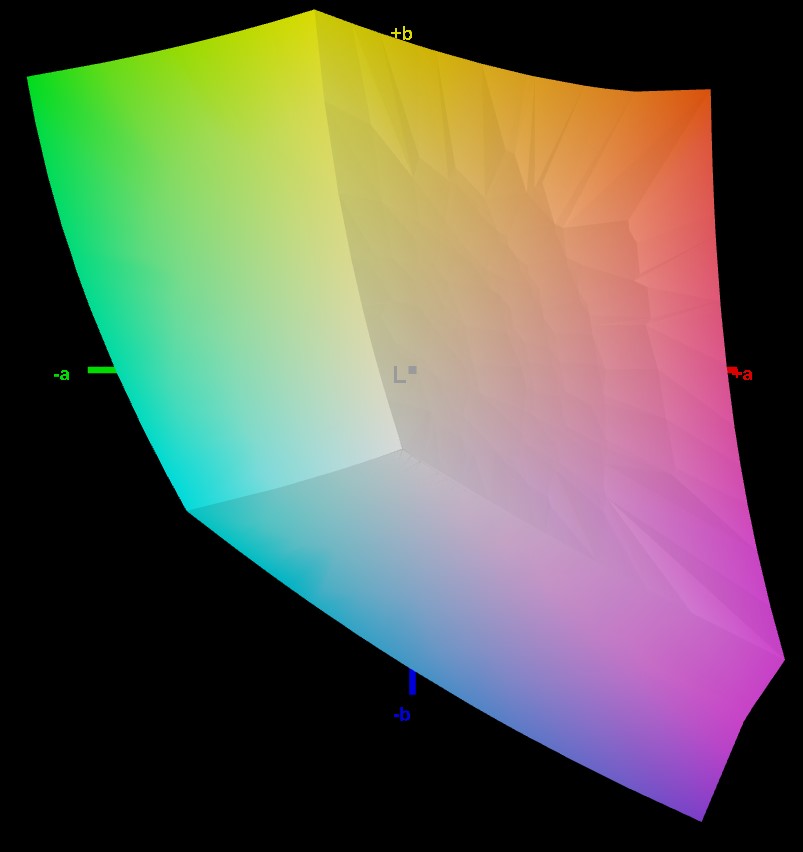
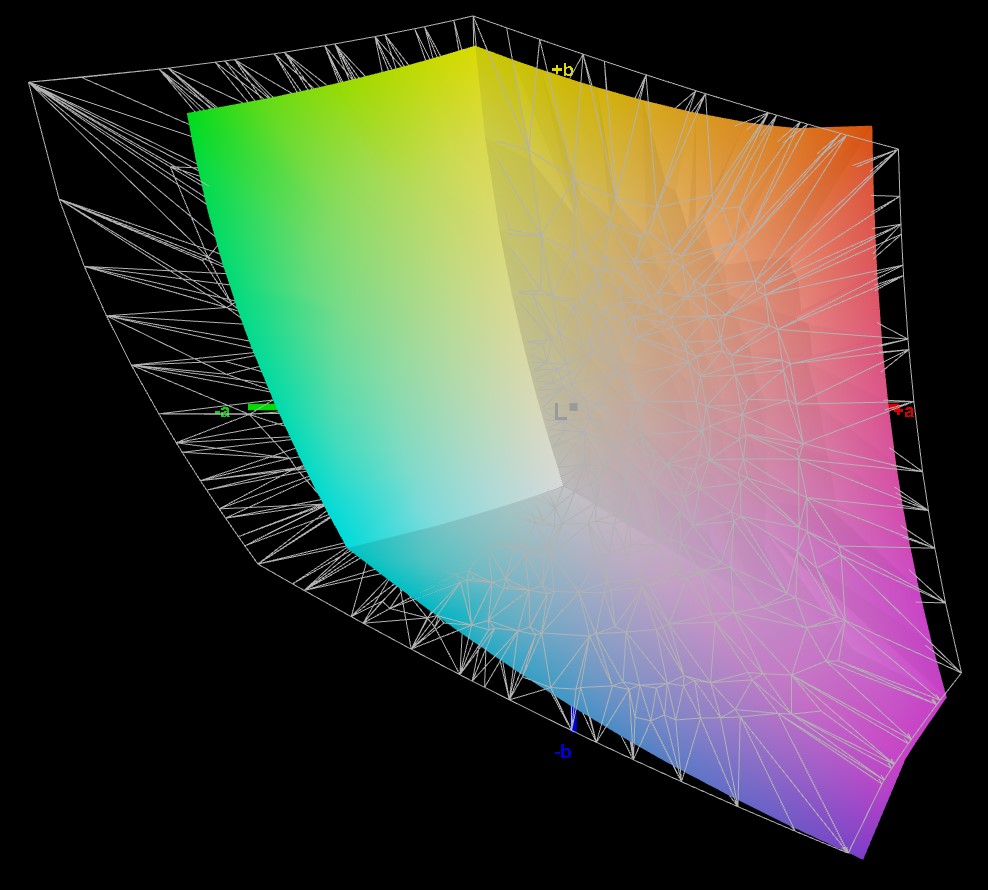
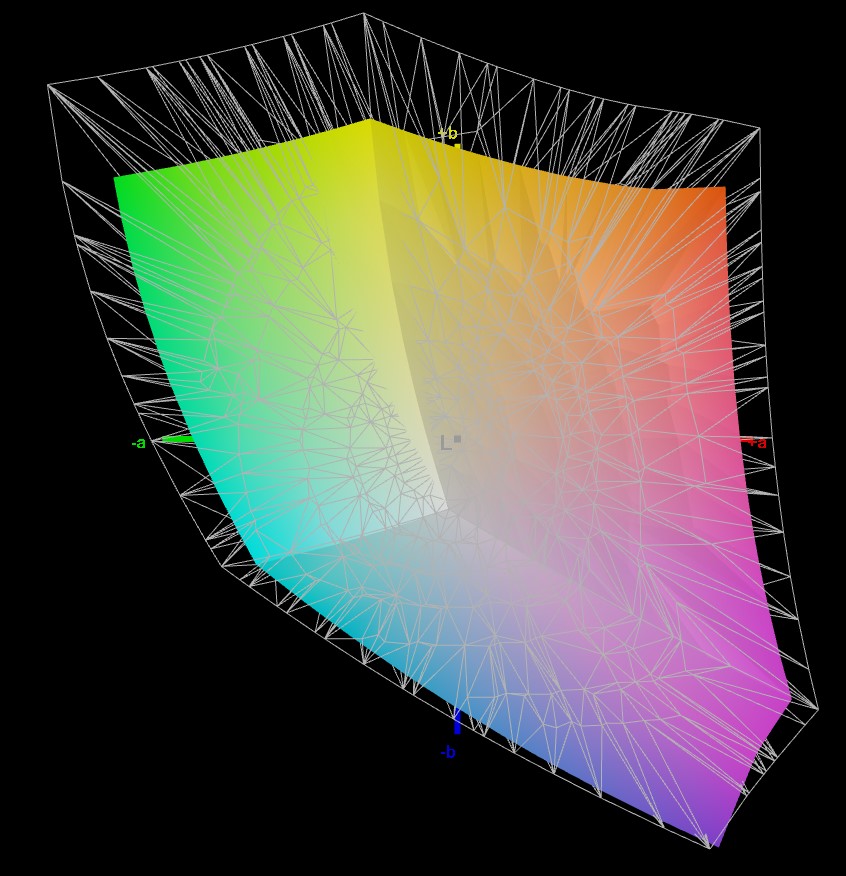
76.51% AdobeRGB 1998 (Argyll 3D)
100% sRGB (Argyll 3D)
75.75% Display P3 (Argyll 3D)
Gamma: 2.35
CCT: 6616 K
| Acer Swift X SFX16-52G-52VE AU Optronics AUOBD9E, , 2560x1600, 16" | Acer Aspire 5 A515-57G-53N8 CMN N156HCA-EAB, IPS, 1920x1080, 15.6" | Lenovo ThinkPad T16 G1 21BWS00200 B160UAN01.K, IPS, 1920x1200, 16" | Asus ZenBook Flip 15 Q539ZD Samsung ATNA56AC01-0, OLED, 2880x1620, 15.6" | Lenovo IdeaPad Gaming 3 15IAH7 Lenovo LEN156FHD, IPS, 1920x1080, 15.6" | HP Omen 16-c0077ng BOE09E5, IPS, 2560x1440, 16.1" | Lenovo ThinkBook 16 G4+ IAP LEN160WQXGA, IPS, 2560x1600, 16" | |
|---|---|---|---|---|---|---|---|
| Display | -40% | 4% | 20% | -6% | -6% | -5% | |
| Display P3 Coverage (%) | 75.75 | 43.3 -43% | 80.1 6% | 99.8 32% | 69.1 -9% | 68.8 -9% | 69.6 -8% |
| sRGB Coverage (%) | 100 | 65 -35% | 100 0% | 100 0% | 99.2 -1% | 96.9 -3% | 97.5 -2% |
| AdobeRGB 1998 Coverage (%) | 76.51 | 44.8 -41% | 80.5 5% | 97.5 27% | 69.9 -9% | 71.1 -7% | 71.7 -6% |
| Response Times | -25% | 11% | 96% | 56% | 51% | 4% | |
| Response Time Grey 50% / Grey 80% * (ms) | 37 ? | 35.6 ? 4% | 27 ? 27% | 0.8 ? 98% | 13 ? 65% | 13 ? 65% | 32.7 ? 12% |
| Response Time Black / White * (ms) | 16 ? | 24.5 ? -53% | 17 ? -6% | 1.1 ? 93% | 8.4 ? 47% | 10 ? 37% | 16.8 ? -5% |
| PWM Frequency (Hz) | 240.4 ? | ||||||
| Screen | -116% | -79% | -35% | -70% | -76% | -31% | |
| Brightness middle (cd/m²) | 411 | 250 -39% | 404 -2% | 340.1 -17% | 338 -18% | 297 -28% | 371 -10% |
| Brightness (cd/m²) | 364 | 234 -36% | 391 7% | 344 -5% | 329 -10% | 283 -22% | 357 -2% |
| Brightness Distribution (%) | 81 | 79 -2% | 80 -1% | 97 20% | 92 14% | 91 12% | 91 12% |
| Black Level * (cd/m²) | 0.295 | 0.19 36% | 0.29 2% | 0.27 8% | 0.22 25% | 0.23 22% | |
| Contrast (:1) | 1393 | 1316 -6% | 1393 0% | 1252 -10% | 1350 -3% | 1613 16% | |
| Colorchecker dE 2000 * | 1.73 | 3.94 -128% | 3.9 -125% | 2.47 -43% | 2.88 -66% | 3.25 -88% | 2.6 -50% |
| Colorchecker dE 2000 max. * | 2.7 | 16.73 -520% | 8.5 -215% | 5.96 -121% | 9.35 -246% | 6.33 -134% | 4.4 -63% |
| Colorchecker dE 2000 calibrated * | 1.18 | 3.09 -162% | 1.7 -44% | 1.22 -3% | 1.11 6% | 1.3 -10% | |
| Greyscale dE 2000 * | 1.26 | 3.6 -186% | 5.4 -329% | 1.8 -43% | 5 -297% | 6.97 -453% | 3.7 -194% |
| Gamma | 2.35 94% | 2.081 106% | 2.21 100% | 2.2 100% | 2.162 102% | 2.3 96% | 2.32 95% |
| CCT | 6616 98% | 6476 100% | 6242 104% | 6346 102% | 7497 87% | 6050 107% | 7271 89% |
| Całkowita średnia (program / ustawienia) | -60% /
-87% | -21% /
-48% | 27% /
4% | -7% /
-38% | -10% /
-43% | -11% /
-21% |
* ... im mniej tym lepiej
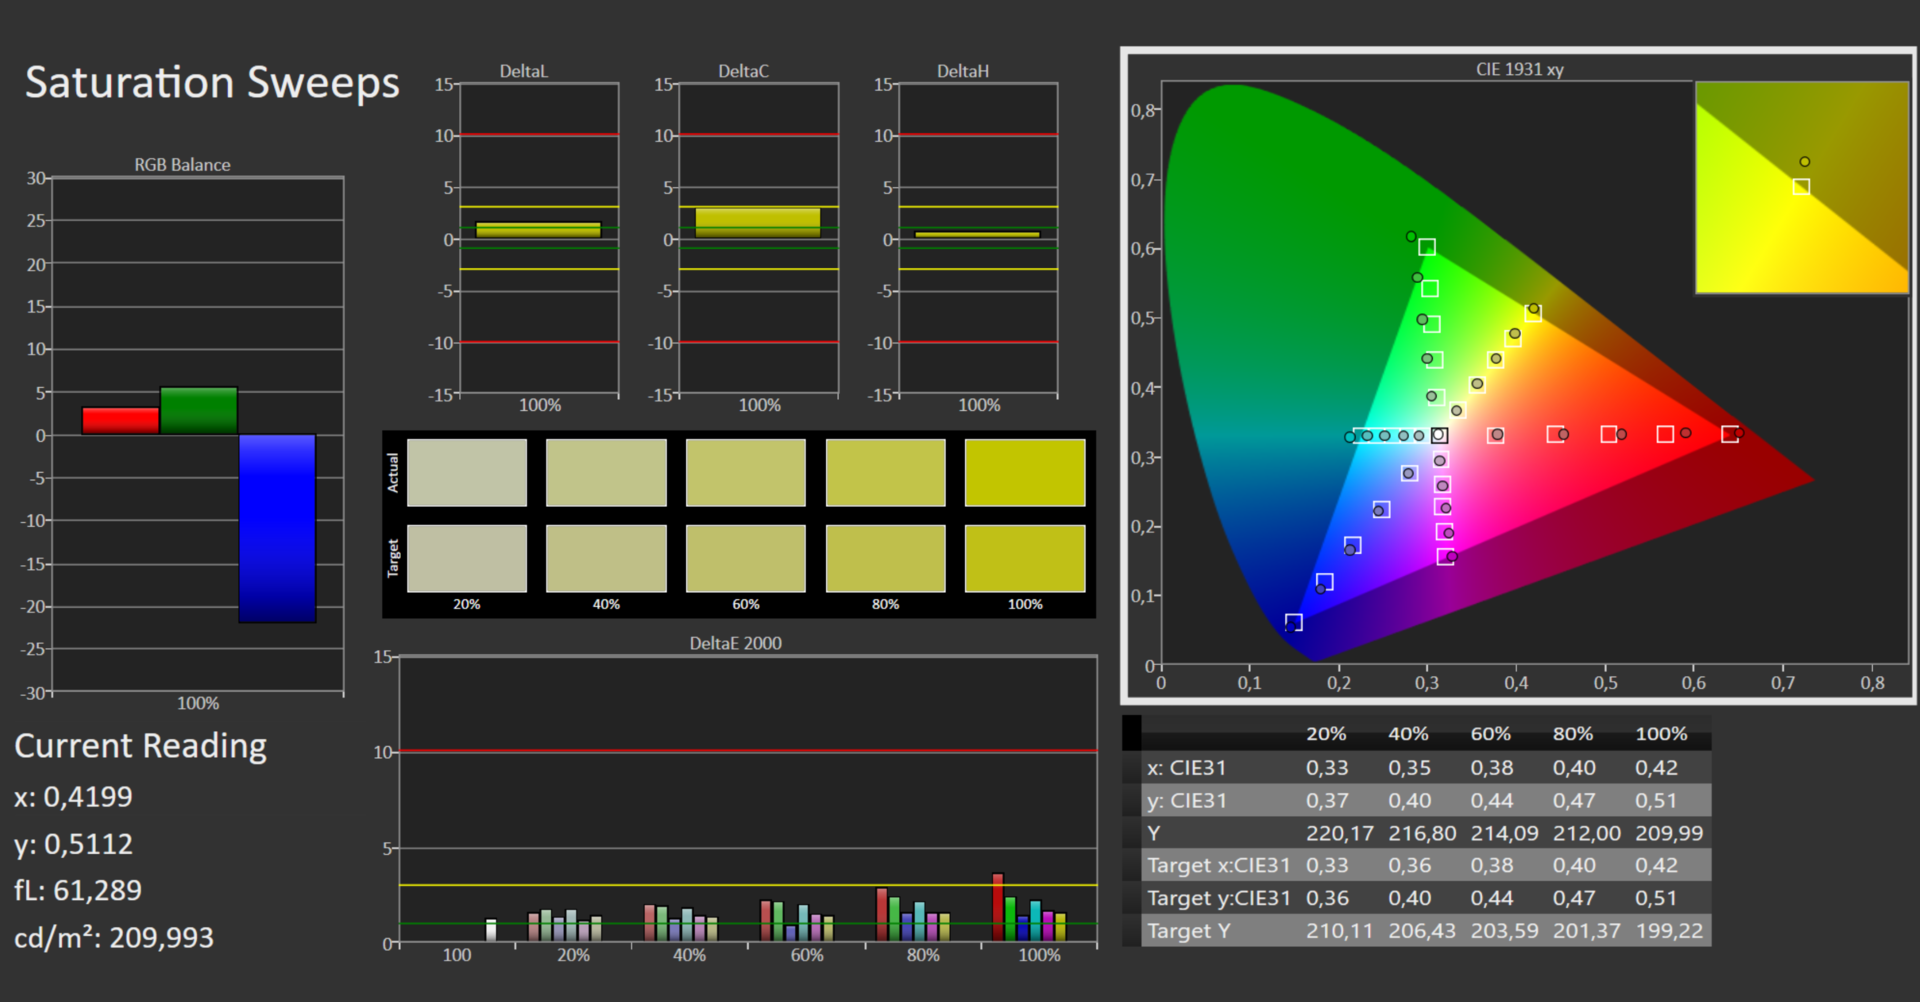
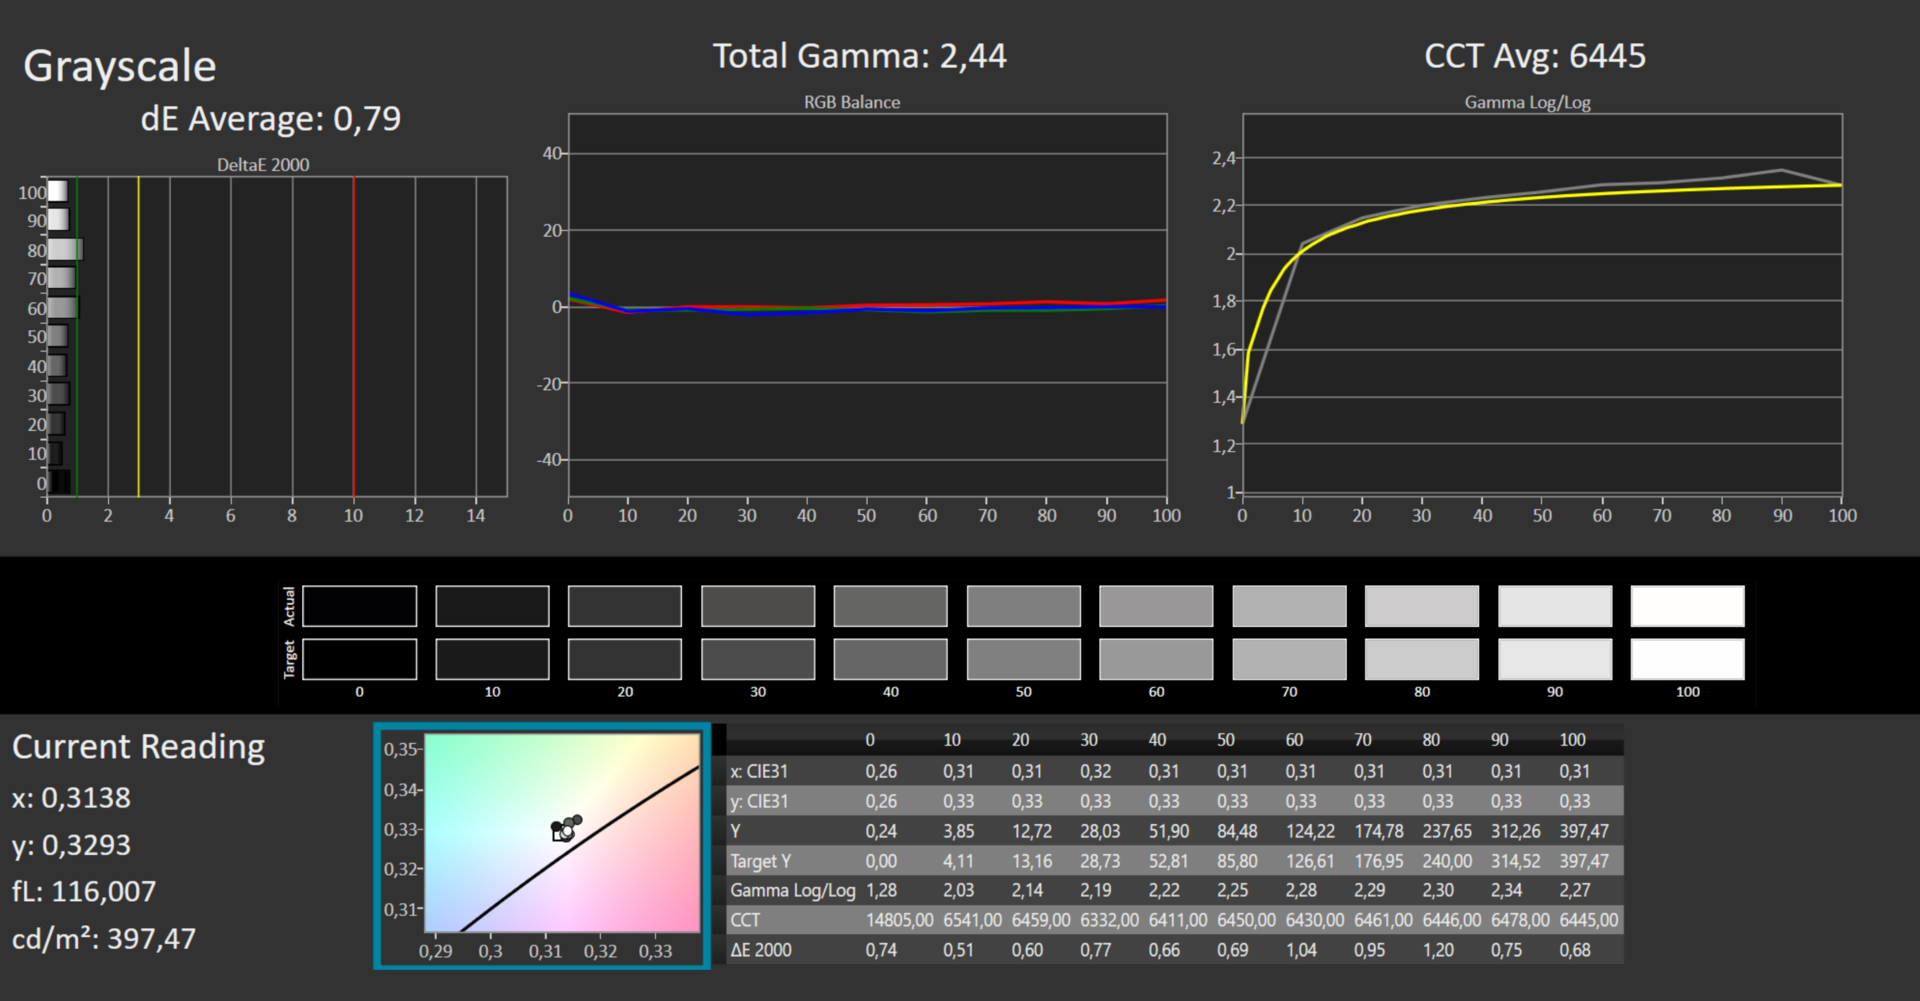
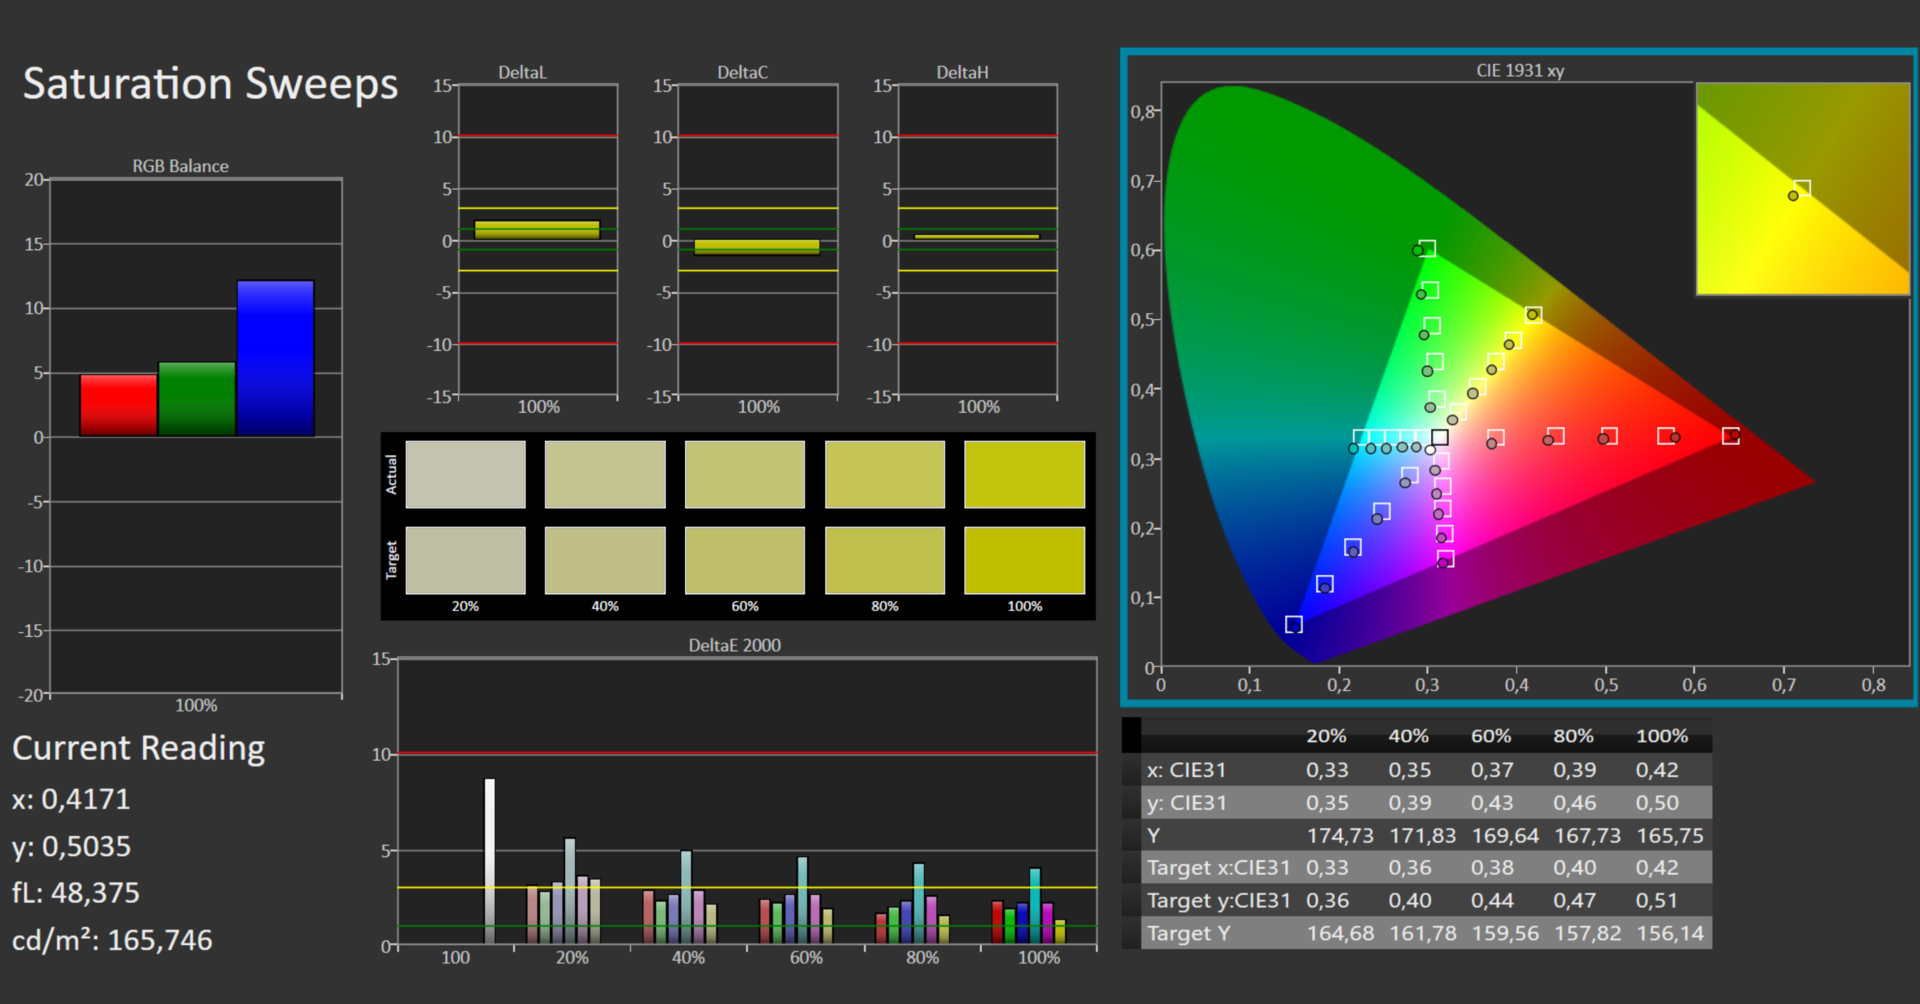
Acer reklamuje Swift X ze 100% pokryciem przestrzeni sRGB i może się z tej obietnicy wywiązać. Z kolei większe przestrzenie kolorów, jak AdobeRGB czy DCI-P3, nie są pokryte w całości. Nie będzie to wystarczające na przykład dla profesjonalnych fotografów. Powinno jednak zadowolić wszystkich innych użytkowników.
Nawet na oryginalnym wyświetlaczu nie widać prawie żadnych odchyleń kolorystycznych. Zmierzonego DeltaE na poziomie maksymalnie 2,7 nie da się tak naprawdę określić gołym okiem. W rzeczywistości kalibracja obniża tę wartość do mniej niż 2. W związku z tym ocena odwzorowania kolorów jest doskonała. Odpowiedni profil można pobrać poniżej pola z wartościami wyświetlania
Wyświetl czasy reakcji
| ↔ Czas reakcji od czerni do bieli | ||
|---|---|---|
| 16 ms ... wzrost ↗ i spadek ↘ łącznie | ↗ 6 ms wzrost |  |
| ↘ 10 ms upadek | ||
| W naszych testach ekran wykazuje dobry współczynnik reakcji, ale może być zbyt wolny dla graczy rywalizujących ze sobą. Dla porównania, wszystkie testowane urządzenia wahają się od 0.1 (minimum) do 240 (maksimum) ms. » 37 % wszystkich urządzeń jest lepszych. Oznacza to, że zmierzony czas reakcji jest lepszy od średniej wszystkich testowanych urządzeń (19.9 ms). | ||
| ↔ Czas reakcji 50% szarości do 80% szarości | ||
| 37 ms ... wzrost ↗ i spadek ↘ łącznie | ↗ 17 ms wzrost |  |
| ↘ 20 ms upadek | ||
| W naszych testach ekran wykazuje powolne tempo reakcji, co będzie niezadowalające dla graczy. Dla porównania, wszystkie testowane urządzenia wahają się od 0.165 (minimum) do 636 (maksimum) ms. » 53 % wszystkich urządzeń jest lepszych. Oznacza to, że zmierzony czas reakcji jest gorszy od średniej wszystkich testowanych urządzeń (31.1 ms). | ||
Migotanie ekranu / PWM (modulacja szerokości impulsu)
| Migotanie ekranu/nie wykryto PWM |  | ||
Dla porównania: 52 % wszystkich testowanych urządzeń nie używa PWM do przyciemniania wyświetlacza. Jeśli wykryto PWM, zmierzono średnio 7784 (minimum: 5 - maksimum: 343500) Hz. | |||
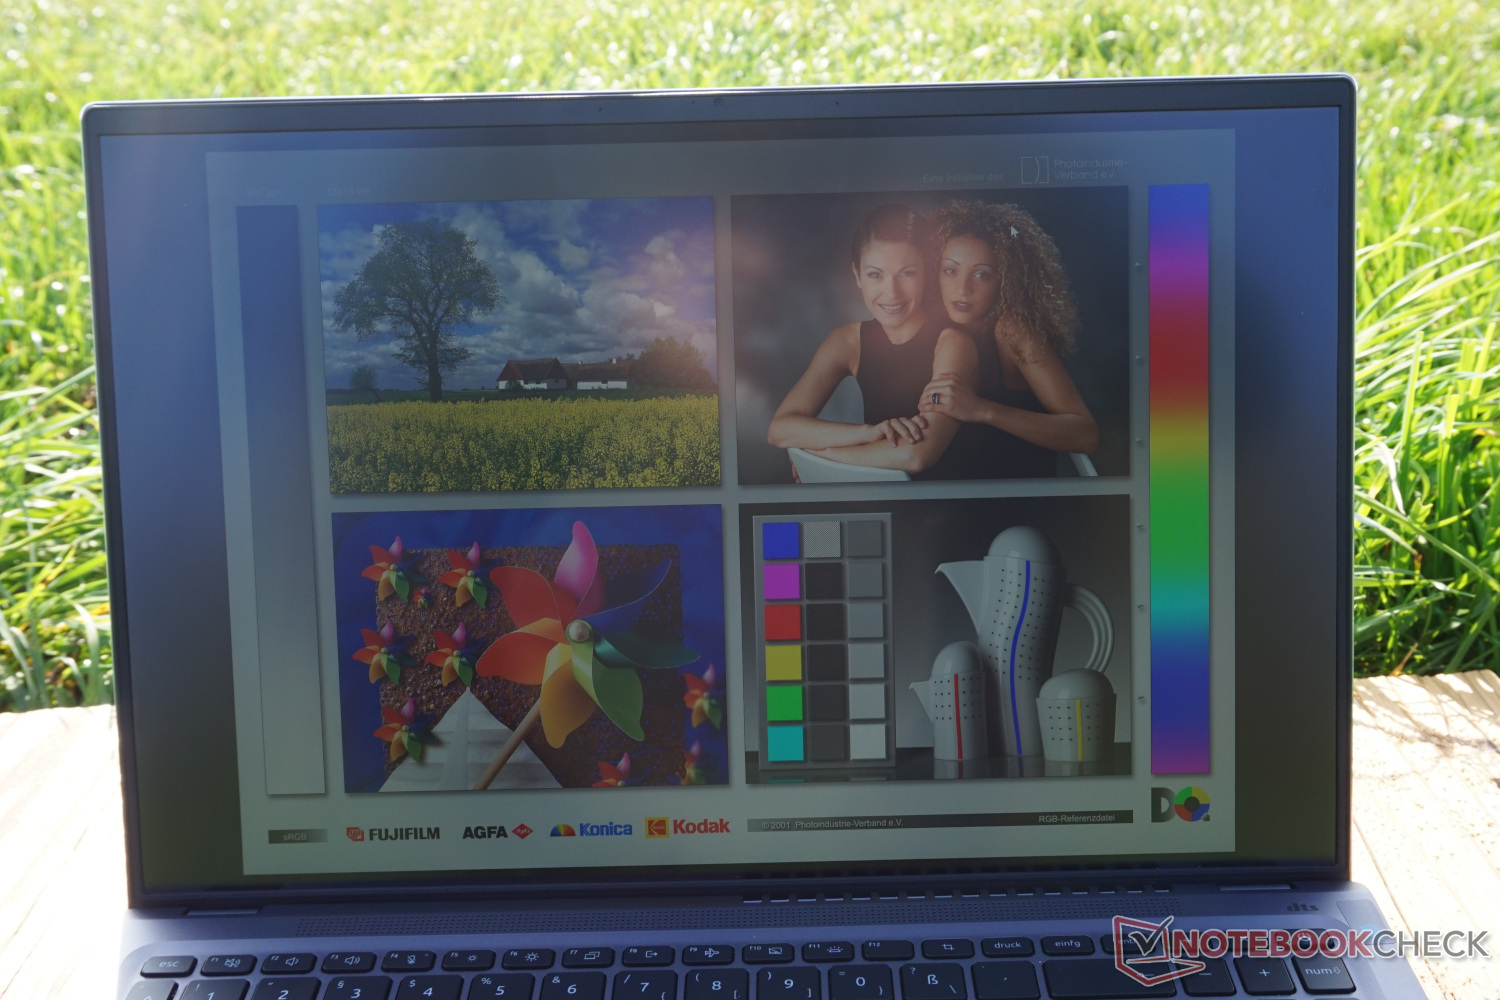
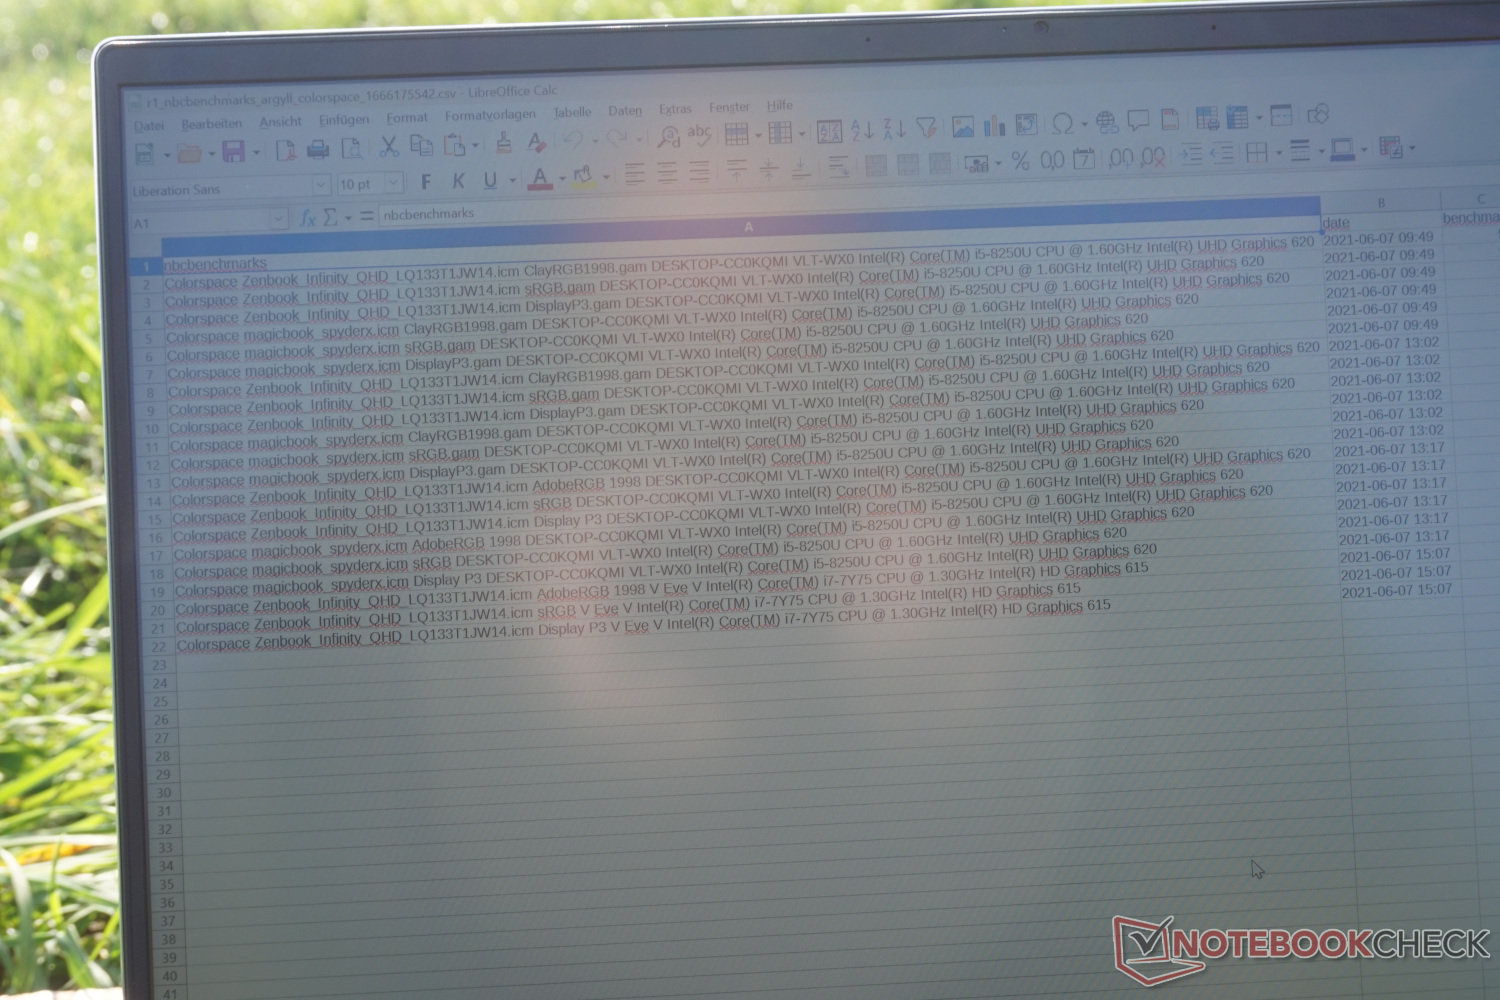
Jasność ekranu jest przyzwoita, ale wciąż niewystarczająca do korzystania z laptopa w świetle słonecznym. Jedną z przyczyn może być dość znaczne zmniejszenie jasności z 400 do 300 cd/m². Pod słońce nadal widać dość dobrze zawartość ekranu. Kolory również nie wyglądają blado ani nie są przekłamane. Jeżeli chcemy pracować w zacienionym miejscu na dworze, nie powinniśmy napotkać żadnych problemów.
Istnieje opcja narzucenia wyższej jasności wyświetlacza w ustawieniach systemu Windows, ale odbywa się to kosztem czasu pracy na baterii i z naszego punktu widzenia z niewielkim zyskiem.
Panel IPS nie wykazuje ani zmian kolorów, ani pogorszenia jasności, niezależnie od wybranych kątów widzenia. Biorąc jednak pod uwagę technologię obrazu, można by się tego spodziewać.

Wydajność - Intel Arc i i-Core dobrze dostosowane
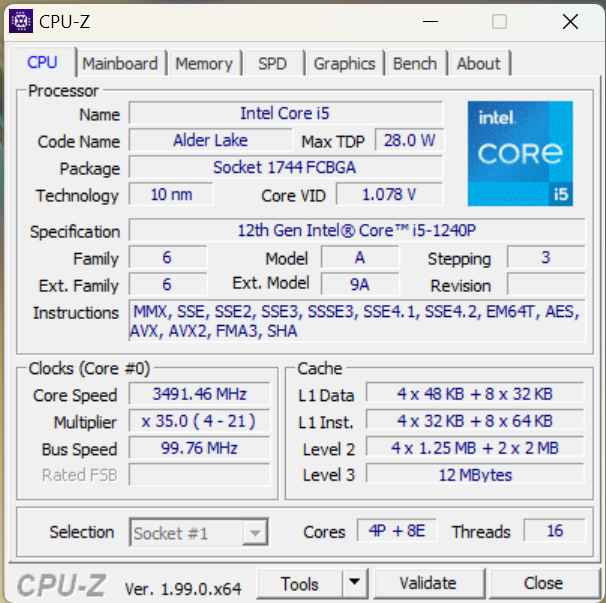
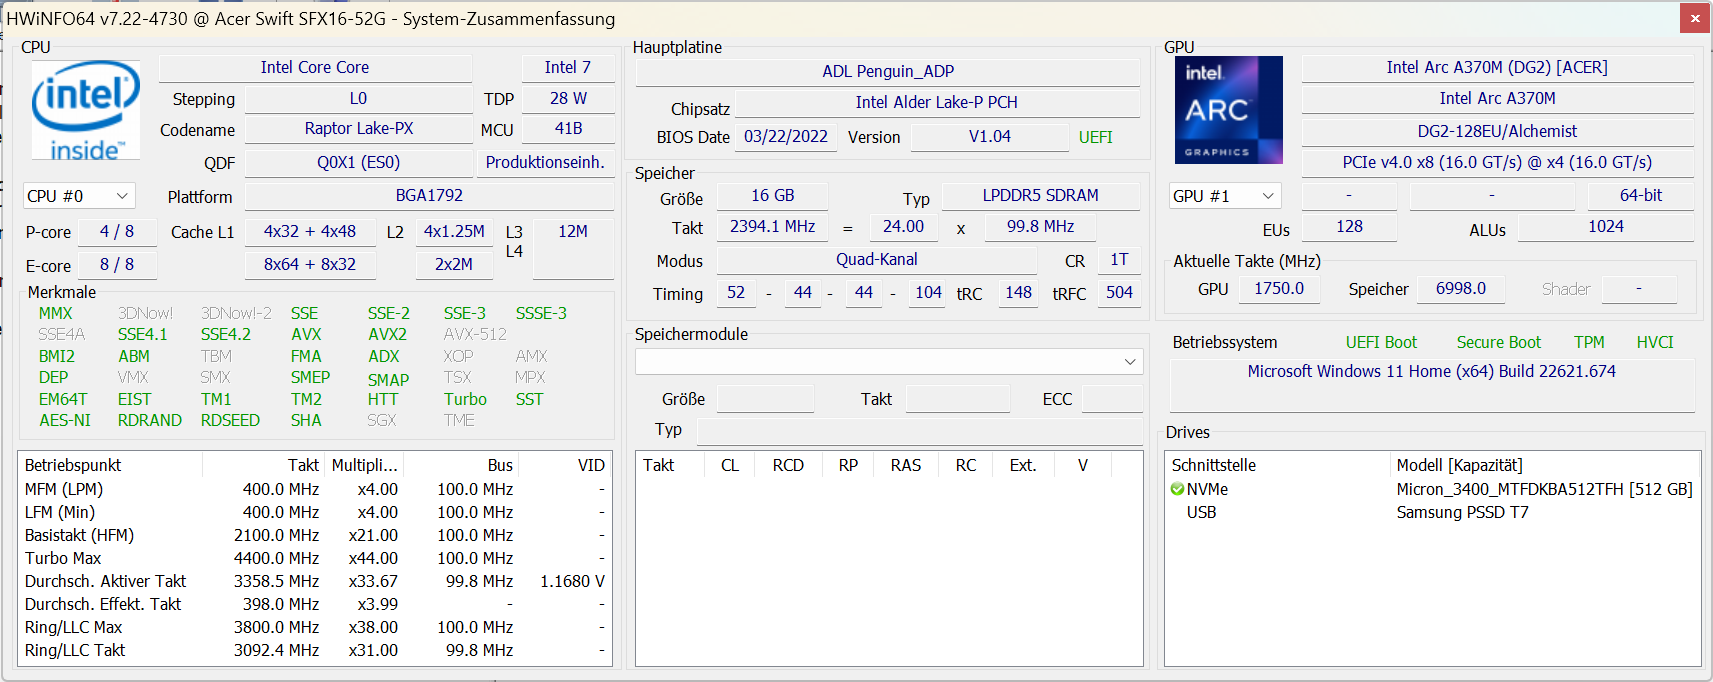
StronaIntel Core i5-1240Poraz Intel Arc A370Msą najnowocześniejsze. Cechą wspólną obu jest to, że charakteryzują się bardziej efektywnością niż szczególnie wysokimi wartościami wydajności.
Dzięki temu laptop będzie głównie obsługiwał codzienne zadania na wysokich obrotach przy niskim zużyciu energii. Wydajność grafiki jest nastawiona przede wszystkim na edycję zdjęć i filmów. W gry również można grać, ale z poważnymi ograniczeniami w zakresie detali i rozdzielczości.
Warunki badania
Jeśli szukasz wszechstronnych opcji personalizacji, to na próżno będziesz szukać. Pobór mocy procesora nie jest ograniczony ani w trybie oszczędzania energii, ani w trybie bateryjnym. Jak zwykle jednak przy braku podłączenia do prądu spada maksymalna częstotliwość taktowania, co obniża nieco wydajność.
Wszystkie testy wydajnościowe i benchmarkowe przeprowadziliśmy przy ustawieniu "najlepsza wydajność". Z kolei czas pracy na baterii testowaliśmy przy "najlepszej efektywności energetycznej". Z reguły Windows wybiera te ustawienia automatycznie.
Procesor
StronaIntel Core i5-1240P, z 12 rdzeniami i 16 wątkami, to procesor ze średniej półki. Nie obiecuje on nadmiernej mocy obliczeniowej, ale pozostaje oszczędny w działaniu. W przypadku konieczności dłuższego działania Acer Swift X SFX16-52G ma zużywać 35 W przez maksymalnie minutę. Przez ułamki sekund jest to nawet 64 W. Spora część mocy jest też dostępna w trybie bateryjnym. Świadczy o tym spojrzenie na PCMark10. Wartości są tylko o niecałe 20% niższe od najwyższej wydajności z podłączonym zasilaczem.
Ogólnie rzecz biorąc, wydajność ledwo odstaje od podobnie wyposażonych notebooków. Niewielka przewaga nad m.in.Lenovo ThinkPad T16 G1z identycznym procesorem jest najprawdopodobniej tłumaczona przez oddzielną kartę grafiki. Skok wydajnościowy w porównaniu z procesorami Intela poprzedniej generacji można wyraźnie zaobserwować w pętli Cinebench, która odzwierciedla czystą moc obliczeniową, przy wykorzystaniu m.in i7-1165G7jako przykład.
Dodatkowe benchmarki i wartości wydajności można znaleźć w naszymLista benchmarków dla procesorów.

Cinebench R15 Multi endurance test
Cinebench R23: Multi Core | Single Core
Cinebench R20: CPU (Multi Core) | CPU (Single Core)
Cinebench R15: CPU Multi 64Bit | CPU Single 64Bit
Blender: v2.79 BMW27 CPU
7-Zip 18.03: 7z b 4 | 7z b 4 -mmt1
Geekbench 5.5: Multi-Core | Single-Core
HWBOT x265 Benchmark v2.2: 4k Preset
LibreOffice : 20 Documents To PDF
R Benchmark 2.5: Overall mean
| CPU Performance rating | |
| Średnia w klasie Multimedia | |
| Lenovo ThinkBook 16 G4+ IAP | |
| Asus ZenBook Flip 15 Q539ZD | |
| Lenovo IdeaPad Gaming 3 15IAH7 | |
| Acer Swift X SFX16-52G-52VE | |
| Acer Aspire 5 A515-57G-53N8 | |
| HP Omen 16-c0077ng -1! | |
| Lenovo ThinkPad T16 G1 21BWS00200 | |
| Przeciętny Intel Core i5-1240P | |
| Cinebench R23 / Multi Core | |
| Średnia w klasie Multimedia (4861 - 33362, n=80, ostatnie 2 lata) | |
| Lenovo ThinkBook 16 G4+ IAP | |
| Asus ZenBook Flip 15 Q539ZD | |
| Lenovo IdeaPad Gaming 3 15IAH7 | |
| HP Omen 16-c0077ng | |
| Acer Swift X SFX16-52G-52VE | |
| Acer Aspire 5 A515-57G-53N8 | |
| Przeciętny Intel Core i5-1240P (277 - 11556, n=20) | |
| Lenovo ThinkPad T16 G1 21BWS00200 | |
| Cinebench R23 / Single Core | |
| Średnia w klasie Multimedia (1128 - 2459, n=72, ostatnie 2 lata) | |
| Lenovo ThinkBook 16 G4+ IAP | |
| Asus ZenBook Flip 15 Q539ZD | |
| Acer Aspire 5 A515-57G-53N8 | |
| Lenovo IdeaPad Gaming 3 15IAH7 | |
| Lenovo ThinkPad T16 G1 21BWS00200 | |
| Acer Swift X SFX16-52G-52VE | |
| Przeciętny Intel Core i5-1240P (640 - 1689, n=18) | |
| HP Omen 16-c0077ng | |
| Cinebench R20 / CPU (Multi Core) | |
| Średnia w klasie Multimedia (1887 - 12912, n=63, ostatnie 2 lata) | |
| Lenovo ThinkBook 16 G4+ IAP | |
| Asus ZenBook Flip 15 Q539ZD | |
| Lenovo IdeaPad Gaming 3 15IAH7 | |
| HP Omen 16-c0077ng | |
| Acer Swift X SFX16-52G-52VE | |
| Acer Aspire 5 A515-57G-53N8 | |
| Przeciętny Intel Core i5-1240P (763 - 4456, n=16) | |
| Lenovo ThinkPad T16 G1 21BWS00200 | |
| Cinebench R20 / CPU (Single Core) | |
| Średnia w klasie Multimedia (425 - 853, n=63, ostatnie 2 lata) | |
| Lenovo ThinkBook 16 G4+ IAP | |
| Asus ZenBook Flip 15 Q539ZD | |
| Lenovo IdeaPad Gaming 3 15IAH7 | |
| Acer Aspire 5 A515-57G-53N8 | |
| Acer Swift X SFX16-52G-52VE | |
| Lenovo ThinkPad T16 G1 21BWS00200 | |
| HP Omen 16-c0077ng | |
| Przeciętny Intel Core i5-1240P (251 - 653, n=16) | |
| Cinebench R15 / CPU Multi 64Bit | |
| Średnia w klasie Multimedia (856 - 5224, n=67, ostatnie 2 lata) | |
| Lenovo ThinkBook 16 G4+ IAP | |
| Lenovo IdeaPad Gaming 3 15IAH7 | |
| Asus ZenBook Flip 15 Q539ZD | |
| HP Omen 16-c0077ng | |
| Acer Swift X SFX16-52G-52VE | |
| Lenovo ThinkPad T16 G1 21BWS00200 | |
| Lenovo ThinkPad T16 G1 21BWS00200 | |
| Acer Aspire 5 A515-57G-53N8 | |
| Przeciętny Intel Core i5-1240P (407 - 2007, n=19) | |
| Cinebench R15 / CPU Single 64Bit | |
| Średnia w klasie Multimedia (184.8 - 326, n=65, ostatnie 2 lata) | |
| Lenovo ThinkBook 16 G4+ IAP | |
| Asus ZenBook Flip 15 Q539ZD | |
| Lenovo IdeaPad Gaming 3 15IAH7 | |
| Acer Aspire 5 A515-57G-53N8 | |
| Acer Swift X SFX16-52G-52VE | |
| HP Omen 16-c0077ng | |
| Lenovo ThinkPad T16 G1 21BWS00200 | |
| Przeciętny Intel Core i5-1240P (91.8 - 243, n=18) | |
| Blender / v2.79 BMW27 CPU | |
| Przeciętny Intel Core i5-1240P (285 - 1926, n=16) | |
| Lenovo ThinkPad T16 G1 21BWS00200 | |
| Acer Aspire 5 A515-57G-53N8 | |
| Acer Swift X SFX16-52G-52VE | |
| HP Omen 16-c0077ng | |
| Średnia w klasie Multimedia (100 - 557, n=64, ostatnie 2 lata) | |
| Lenovo IdeaPad Gaming 3 15IAH7 | |
| Lenovo ThinkBook 16 G4+ IAP | |
| Asus ZenBook Flip 15 Q539ZD | |
| 7-Zip 18.03 / 7z b 4 | |
| Lenovo ThinkBook 16 G4+ IAP | |
| Asus ZenBook Flip 15 Q539ZD | |
| Średnia w klasie Multimedia (29095 - 130368, n=61, ostatnie 2 lata) | |
| Acer Swift X SFX16-52G-52VE | |
| Lenovo IdeaPad Gaming 3 15IAH7 | |
| Acer Aspire 5 A515-57G-53N8 | |
| Przeciętny Intel Core i5-1240P (7254 - 47002, n=16) | |
| Lenovo ThinkPad T16 G1 21BWS00200 | |
| 7-Zip 18.03 / 7z b 4 -mmt1 | |
| Średnia w klasie Multimedia (3666 - 7545, n=62, ostatnie 2 lata) | |
| Lenovo ThinkBook 16 G4+ IAP | |
| Asus ZenBook Flip 15 Q539ZD | |
| Lenovo IdeaPad Gaming 3 15IAH7 | |
| HP Omen 16-c0077ng | |
| Acer Aspire 5 A515-57G-53N8 | |
| Acer Swift X SFX16-52G-52VE | |
| Lenovo ThinkPad T16 G1 21BWS00200 | |
| Przeciętny Intel Core i5-1240P (2197 - 5320, n=16) | |
| Geekbench 5.5 / Multi-Core | |
| Średnia w klasie Multimedia (4652 - 20422, n=61, ostatnie 2 lata) | |
| Asus ZenBook Flip 15 Q539ZD | |
| Lenovo ThinkBook 16 G4+ IAP | |
| Acer Swift X SFX16-52G-52VE | |
| Acer Aspire 5 A515-57G-53N8 | |
| Lenovo IdeaPad Gaming 3 15IAH7 | |
| Przeciętny Intel Core i5-1240P (1763 - 10112, n=15) | |
| HP Omen 16-c0077ng | |
| Lenovo ThinkPad T16 G1 21BWS00200 | |
| Geekbench 5.5 / Single-Core | |
| Średnia w klasie Multimedia (805 - 2974, n=61, ostatnie 2 lata) | |
| Lenovo ThinkBook 16 G4+ IAP | |
| Asus ZenBook Flip 15 Q539ZD | |
| Acer Swift X SFX16-52G-52VE | |
| Acer Aspire 5 A515-57G-53N8 | |
| Lenovo IdeaPad Gaming 3 15IAH7 | |
| Lenovo ThinkPad T16 G1 21BWS00200 | |
| Przeciętny Intel Core i5-1240P (672 - 1658, n=15) | |
| HP Omen 16-c0077ng | |
| HWBOT x265 Benchmark v2.2 / 4k Preset | |
| Średnia w klasie Multimedia (5.26 - 36.1, n=62, ostatnie 2 lata) | |
| Lenovo ThinkBook 16 G4+ IAP | |
| Asus ZenBook Flip 15 Q539ZD | |
| Lenovo IdeaPad Gaming 3 15IAH7 | |
| HP Omen 16-c0077ng | |
| Acer Swift X SFX16-52G-52VE | |
| Acer Aspire 5 A515-57G-53N8 | |
| Przeciętny Intel Core i5-1240P (1.99 - 12.9, n=16) | |
| Lenovo ThinkPad T16 G1 21BWS00200 | |
| LibreOffice / 20 Documents To PDF | |
| HP Omen 16-c0077ng | |
| Przeciętny Intel Core i5-1240P (46.4 - 120.5, n=16) | |
| Acer Aspire 5 A515-57G-53N8 | |
| Średnia w klasie Multimedia (23.9 - 146.7, n=63, ostatnie 2 lata) | |
| Lenovo IdeaPad Gaming 3 15IAH7 | |
| Lenovo ThinkPad T16 G1 21BWS00200 | |
| Acer Swift X SFX16-52G-52VE | |
| Asus ZenBook Flip 15 Q539ZD | |
| Lenovo ThinkBook 16 G4+ IAP | |
| R Benchmark 2.5 / Overall mean | |
| Przeciętny Intel Core i5-1240P (0.4987 - 1.236, n=16) | |
| Acer Swift X SFX16-52G-52VE | |
| Lenovo ThinkPad T16 G1 21BWS00200 | |
| HP Omen 16-c0077ng | |
| Lenovo IdeaPad Gaming 3 15IAH7 | |
| Acer Aspire 5 A515-57G-53N8 | |
| Średnia w klasie Multimedia (0.3604 - 0.947, n=62, ostatnie 2 lata) | |
| Lenovo ThinkBook 16 G4+ IAP | |
| Asus ZenBook Flip 15 Q539ZD | |
* ... im mniej tym lepiej
AIDA64: FP32 Ray-Trace | FPU Julia | CPU SHA3 | CPU Queen | FPU SinJulia | FPU Mandel | CPU AES | CPU ZLib | FP64 Ray-Trace | CPU PhotoWorxx
| Performance rating | |
| Średnia w klasie Multimedia | |
| HP Omen 16-c0077ng | |
| Lenovo ThinkBook 16 G4+ IAP | |
| Lenovo IdeaPad Gaming 3 15IAH7 | |
| Asus ZenBook Flip 15 Q539ZD | |
| Acer Swift X SFX16-52G-52VE | |
| Lenovo ThinkPad T16 G1 21BWS00200 | |
| Acer Aspire 5 A515-57G-53N8 | |
| Przeciętny Intel Core i5-1240P | |
| AIDA64 / FP32 Ray-Trace | |
| Średnia w klasie Multimedia (2214 - 50388, n=59, ostatnie 2 lata) | |
| HP Omen 16-c0077ng | |
| Lenovo ThinkBook 16 G4+ IAP | |
| Lenovo IdeaPad Gaming 3 15IAH7 | |
| Acer Swift X SFX16-52G-52VE | |
| Asus ZenBook Flip 15 Q539ZD | |
| Lenovo ThinkPad T16 G1 21BWS00200 | |
| Przeciętny Intel Core i5-1240P (2405 - 9694, n=16) | |
| Acer Aspire 5 A515-57G-53N8 | |
| AIDA64 / FPU Julia | |
| HP Omen 16-c0077ng | |
| Średnia w klasie Multimedia (12867 - 201874, n=60, ostatnie 2 lata) | |
| Lenovo ThinkBook 16 G4+ IAP | |
| Lenovo IdeaPad Gaming 3 15IAH7 | |
| Acer Swift X SFX16-52G-52VE | |
| Lenovo ThinkPad T16 G1 21BWS00200 | |
| Asus ZenBook Flip 15 Q539ZD | |
| Przeciętny Intel Core i5-1240P (7407 - 49934, n=16) | |
| Acer Aspire 5 A515-57G-53N8 | |
| AIDA64 / CPU SHA3 | |
| Średnia w klasie Multimedia (653 - 8623, n=60, ostatnie 2 lata) | |
| Lenovo ThinkBook 16 G4+ IAP | |
| Lenovo IdeaPad Gaming 3 15IAH7 | |
| HP Omen 16-c0077ng | |
| Asus ZenBook Flip 15 Q539ZD | |
| Acer Swift X SFX16-52G-52VE | |
| Acer Aspire 5 A515-57G-53N8 | |
| Lenovo ThinkPad T16 G1 21BWS00200 | |
| Przeciętny Intel Core i5-1240P (415 - 2462, n=16) | |
| AIDA64 / CPU Queen | |
| Lenovo ThinkBook 16 G4+ IAP | |
| HP Omen 16-c0077ng | |
| Asus ZenBook Flip 15 Q539ZD | |
| Lenovo IdeaPad Gaming 3 15IAH7 | |
| Lenovo ThinkPad T16 G1 21BWS00200 | |
| Acer Aspire 5 A515-57G-53N8 | |
| Średnia w klasie Multimedia (13483 - 181505, n=48, ostatnie 2 lata) | |
| Przeciętny Intel Core i5-1240P (29405 - 76736, n=16) | |
| Acer Swift X SFX16-52G-52VE | |
| AIDA64 / FPU SinJulia | |
| HP Omen 16-c0077ng | |
| Lenovo ThinkBook 16 G4+ IAP | |
| Średnia w klasie Multimedia (1240 - 28794, n=60, ostatnie 2 lata) | |
| Asus ZenBook Flip 15 Q539ZD | |
| Lenovo IdeaPad Gaming 3 15IAH7 | |
| Acer Swift X SFX16-52G-52VE | |
| Acer Aspire 5 A515-57G-53N8 | |
| Lenovo ThinkPad T16 G1 21BWS00200 | |
| Przeciętny Intel Core i5-1240P (2135 - 6540, n=16) | |
| AIDA64 / FPU Mandel | |
| HP Omen 16-c0077ng | |
| Średnia w klasie Multimedia (6395 - 105740, n=59, ostatnie 2 lata) | |
| Lenovo ThinkBook 16 G4+ IAP | |
| Lenovo IdeaPad Gaming 3 15IAH7 | |
| Acer Swift X SFX16-52G-52VE | |
| Asus ZenBook Flip 15 Q539ZD | |
| Lenovo ThinkPad T16 G1 21BWS00200 | |
| Przeciętny Intel Core i5-1240P (5113 - 23992, n=16) | |
| Acer Aspire 5 A515-57G-53N8 | |
| AIDA64 / CPU AES | |
| HP Omen 16-c0077ng | |
| Lenovo IdeaPad Gaming 3 15IAH7 | |
| Lenovo ThinkBook 16 G4+ IAP | |
| Średnia w klasie Multimedia (13243 - 126790, n=60, ostatnie 2 lata) | |
| Asus ZenBook Flip 15 Q539ZD | |
| Acer Swift X SFX16-52G-52VE | |
| Lenovo ThinkPad T16 G1 21BWS00200 | |
| Przeciętny Intel Core i5-1240P (8849 - 90370, n=16) | |
| Acer Aspire 5 A515-57G-53N8 | |
| AIDA64 / CPU ZLib | |
| Lenovo ThinkBook 16 G4+ IAP | |
| Średnia w klasie Multimedia (167.2 - 2022, n=60, ostatnie 2 lata) | |
| Asus ZenBook Flip 15 Q539ZD | |
| Lenovo IdeaPad Gaming 3 15IAH7 | |
| HP Omen 16-c0077ng | |
| Acer Swift X SFX16-52G-52VE | |
| Acer Aspire 5 A515-57G-53N8 | |
| Lenovo ThinkPad T16 G1 21BWS00200 | |
| Przeciętny Intel Core i5-1240P (101.6 - 812, n=16) | |
| AIDA64 / FP64 Ray-Trace | |
| Średnia w klasie Multimedia (1014 - 26875, n=60, ostatnie 2 lata) | |
| HP Omen 16-c0077ng | |
| Lenovo ThinkBook 16 G4+ IAP | |
| Lenovo IdeaPad Gaming 3 15IAH7 | |
| Acer Swift X SFX16-52G-52VE | |
| Asus ZenBook Flip 15 Q539ZD | |
| Lenovo ThinkPad T16 G1 21BWS00200 | |
| Przeciętny Intel Core i5-1240P (1154 - 5258, n=16) | |
| Acer Aspire 5 A515-57G-53N8 | |
| AIDA64 / CPU PhotoWorxx | |
| Średnia w klasie Multimedia (12860 - 88154, n=60, ostatnie 2 lata) | |
| Acer Swift X SFX16-52G-52VE | |
| Lenovo ThinkBook 16 G4+ IAP | |
| Asus ZenBook Flip 15 Q539ZD | |
| Przeciętny Intel Core i5-1240P (11873 - 43661, n=16) | |
| Acer Aspire 5 A515-57G-53N8 | |
| HP Omen 16-c0077ng | |
| Lenovo ThinkPad T16 G1 21BWS00200 | |
| Lenovo IdeaPad Gaming 3 15IAH7 | |
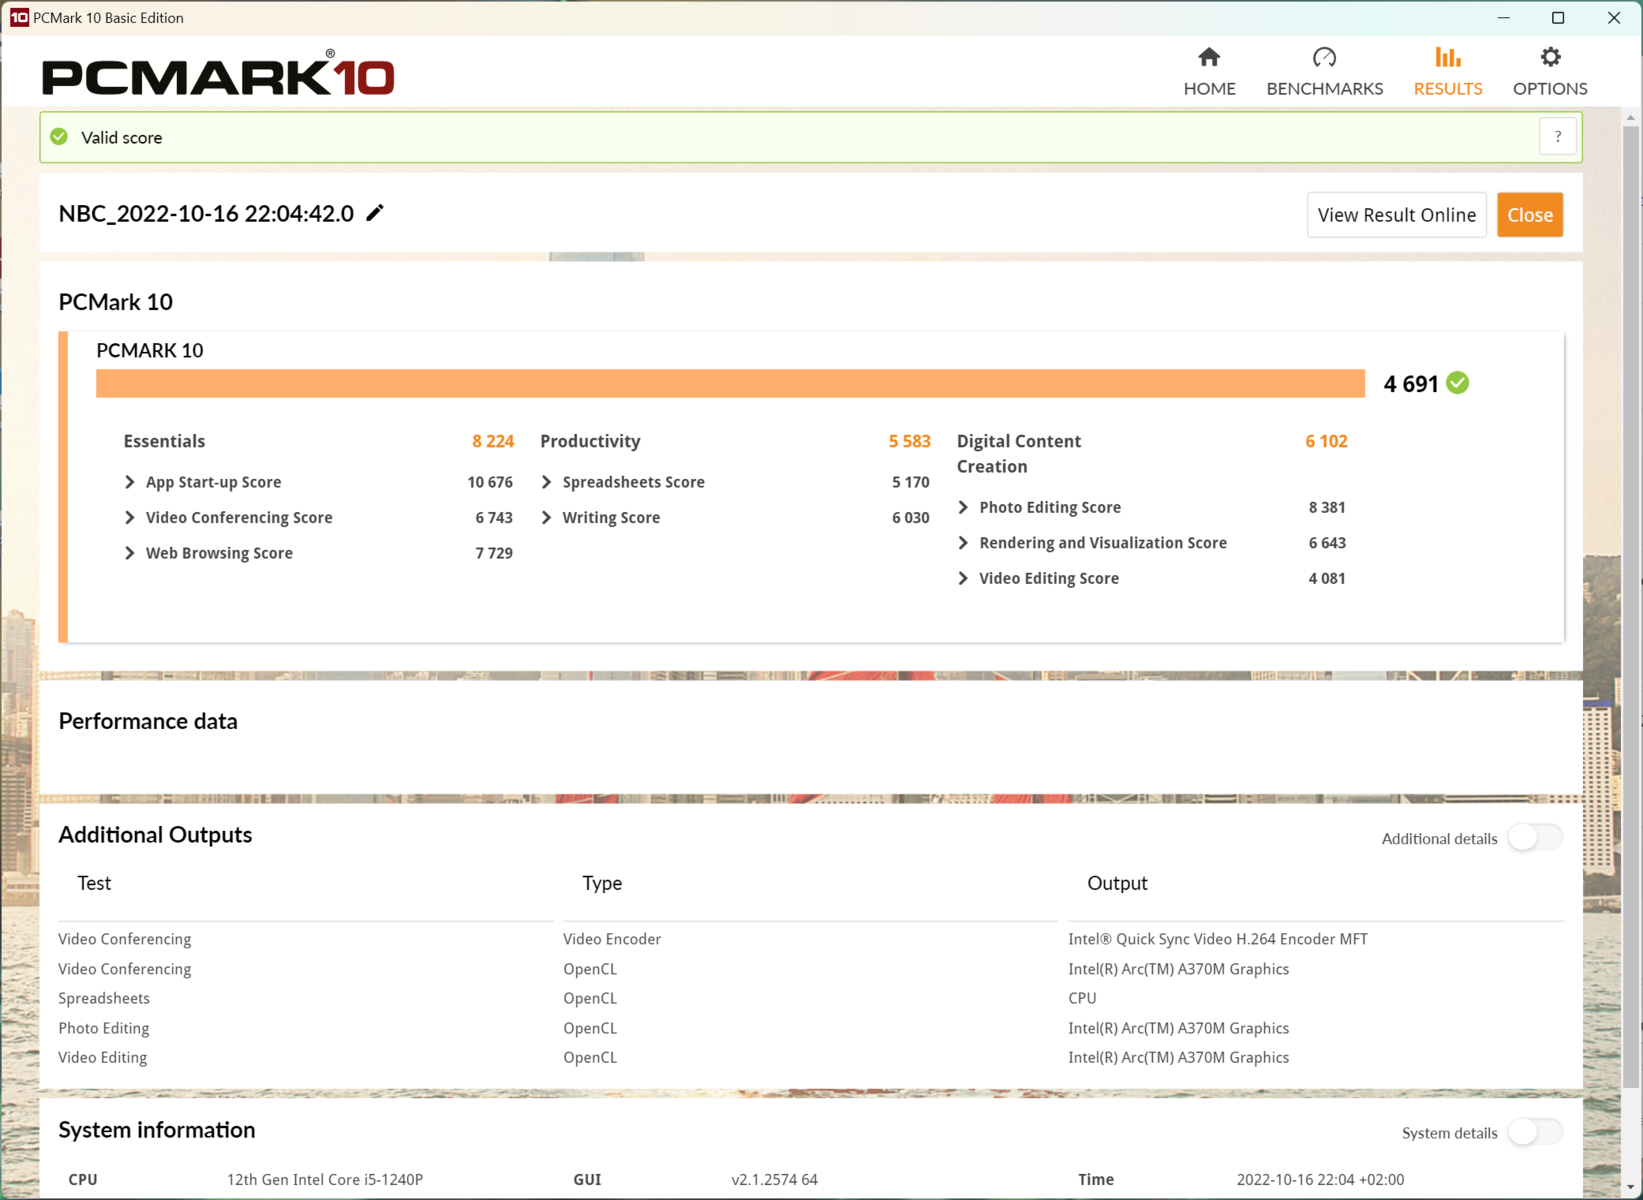
Wydajność systemu
Od codziennych zadań takich jak przeglądanie stron internetowych, streaming czy pisanie po ambitną edycję zdjęć i filmów, system nie prezentuje żadnych słabych punktów. Dzięki wystarczającej ilości rdzeni, procesor nie stroni od wielozadaniowości. Co najwyżej Swift X robi sobie przerwę teraz i wtedy podczas skomplikowanych zadań, w tym procesów instalacyjnych. Z kolei podczas obcowania z programami nie zauważa się żadnych opóźnień.
Z kolei zadania wymagające graficznie stosunkowo szybko doprowadzają do granic możliwości dość małą jednostkę graficzną Intel Arc A370M. Wyniki w grach są odpowiednio słabe, natomiast syntetyczne benchmarki do tworzenia treści, czyli np. edycji multimediów, są niemal na równi z innymi notebookami multimedialnymi. Z reguły jednak zastosowano w nich szybsze procesory graficzne, które zawsze odpowiadają za nieco wyższe oceny. W każdym razie, ogólnie rzecz biorąc, solidny notebook biznesowy, jak np.Lenovo ThinkPad T16 G1 z identycznym procesorem może zostać wyraźnie prześcignięty.
Korzystanie z notebooka w trybie bateryjnym praktycznie nie powoduje spadku wydajności. Przy dużym obciążeniu bateria jest jednak dość szybko drenowana mimo dość oszczędnych podzespołów.
CrossMark: Overall | Productivity | Creativity | Responsiveness
| PCMark 10 / Score | |
| Średnia w klasie Multimedia (4325 - 10386, n=57, ostatnie 2 lata) | |
| HP Omen 16-c0077ng | |
| Lenovo IdeaPad Gaming 3 15IAH7 | |
| Asus ZenBook Flip 15 Q539ZD | |
| Acer Swift X SFX16-52G-52VE | |
| Przeciętny Intel Core i5-1240P, Intel Arc A370M (n=1) | |
| Acer Aspire 5 A515-57G-53N8 | |
| Lenovo ThinkPad T16 G1 21BWS00200 | |
| PCMark 10 / Essentials | |
| Asus ZenBook Flip 15 Q539ZD | |
| Średnia w klasie Multimedia (8025 - 11664, n=56, ostatnie 2 lata) | |
| HP Omen 16-c0077ng | |
| Lenovo IdeaPad Gaming 3 15IAH7 | |
| Acer Swift X SFX16-52G-52VE | |
| Przeciętny Intel Core i5-1240P, Intel Arc A370M (n=1) | |
| Lenovo ThinkPad T16 G1 21BWS00200 | |
| Acer Aspire 5 A515-57G-53N8 | |
| PCMark 10 / Productivity | |
| Średnia w klasie Multimedia (7323 - 18233, n=56, ostatnie 2 lata) | |
| Lenovo IdeaPad Gaming 3 15IAH7 | |
| HP Omen 16-c0077ng | |
| Acer Aspire 5 A515-57G-53N8 | |
| Acer Swift X SFX16-52G-52VE | |
| Przeciętny Intel Core i5-1240P, Intel Arc A370M (n=1) | |
| Asus ZenBook Flip 15 Q539ZD | |
| Lenovo ThinkPad T16 G1 21BWS00200 | |
| PCMark 10 / Digital Content Creation | |
| Średnia w klasie Multimedia (3651 - 16240, n=56, ostatnie 2 lata) | |
| HP Omen 16-c0077ng | |
| Lenovo IdeaPad Gaming 3 15IAH7 | |
| Asus ZenBook Flip 15 Q539ZD | |
| Acer Swift X SFX16-52G-52VE | |
| Przeciętny Intel Core i5-1240P, Intel Arc A370M (n=1) | |
| Acer Aspire 5 A515-57G-53N8 | |
| Lenovo ThinkPad T16 G1 21BWS00200 | |
| CrossMark / Overall | |
| Średnia w klasie Multimedia (866 - 2728, n=66, ostatnie 2 lata) | |
| Lenovo ThinkBook 16 G4+ IAP | |
| Asus ZenBook Flip 15 Q539ZD | |
| Acer Swift X SFX16-52G-52VE | |
| Przeciętny Intel Core i5-1240P, Intel Arc A370M (n=1) | |
| Lenovo ThinkPad T16 G1 21BWS00200 | |
| CrossMark / Productivity | |
| Średnia w klasie Multimedia (931 - 2489, n=66, ostatnie 2 lata) | |
| Lenovo ThinkBook 16 G4+ IAP | |
| Asus ZenBook Flip 15 Q539ZD | |
| Lenovo ThinkPad T16 G1 21BWS00200 | |
| Acer Swift X SFX16-52G-52VE | |
| Przeciętny Intel Core i5-1240P, Intel Arc A370M (n=1) | |
| CrossMark / Creativity | |
| Średnia w klasie Multimedia (907 - 3465, n=66, ostatnie 2 lata) | |
| Asus ZenBook Flip 15 Q539ZD | |
| Lenovo ThinkBook 16 G4+ IAP | |
| Acer Swift X SFX16-52G-52VE | |
| Przeciętny Intel Core i5-1240P, Intel Arc A370M (n=1) | |
| Lenovo ThinkPad T16 G1 21BWS00200 | |
| CrossMark / Responsiveness | |
| Lenovo ThinkBook 16 G4+ IAP | |
| Średnia w klasie Multimedia (605 - 2024, n=66, ostatnie 2 lata) | |
| Asus ZenBook Flip 15 Q539ZD | |
| Lenovo ThinkPad T16 G1 21BWS00200 | |
| Acer Swift X SFX16-52G-52VE | |
| Przeciętny Intel Core i5-1240P, Intel Arc A370M (n=1) | |
| PCMark 10 Score | 5898 pkt. | |
Pomoc | ||
| AIDA64 / Memory Copy | |
| Średnia w klasie Multimedia (21158 - 132135, n=60, ostatnie 2 lata) | |
| Acer Swift X SFX16-52G-52VE | |
| Asus ZenBook Flip 15 Q539ZD | |
| Lenovo ThinkBook 16 G4+ IAP | |
| Przeciętny Intel Core i5-1240P (23312 - 70537, n=16) | |
| Acer Aspire 5 A515-57G-53N8 | |
| HP Omen 16-c0077ng | |
| Lenovo IdeaPad Gaming 3 15IAH7 | |
| Lenovo ThinkPad T16 G1 21BWS00200 | |
| AIDA64 / Memory Read | |
| Średnia w klasie Multimedia (19699 - 174586, n=60, ostatnie 2 lata) | |
| Lenovo ThinkBook 16 G4+ IAP | |
| Asus ZenBook Flip 15 Q539ZD | |
| Acer Swift X SFX16-52G-52VE | |
| Przeciętny Intel Core i5-1240P (18989 - 70553, n=16) | |
| Acer Aspire 5 A515-57G-53N8 | |
| HP Omen 16-c0077ng | |
| Lenovo IdeaPad Gaming 3 15IAH7 | |
| Lenovo ThinkPad T16 G1 21BWS00200 | |
| AIDA64 / Memory Write | |
| Średnia w klasie Multimedia (17733 - 134998, n=60, ostatnie 2 lata) | |
| Asus ZenBook Flip 15 Q539ZD | |
| Acer Swift X SFX16-52G-52VE | |
| Lenovo ThinkBook 16 G4+ IAP | |
| Przeciętny Intel Core i5-1240P (23454 - 62496, n=16) | |
| Acer Aspire 5 A515-57G-53N8 | |
| HP Omen 16-c0077ng | |
| Lenovo IdeaPad Gaming 3 15IAH7 | |
| Lenovo ThinkPad T16 G1 21BWS00200 | |
| AIDA64 / Memory Latency | |
| Średnia w klasie Multimedia (7 - 535, n=59, ostatnie 2 lata) | |
| Przeciętny Intel Core i5-1240P (85.1 - 188.3, n=11) | |
| Lenovo ThinkBook 16 G4+ IAP | |
| Acer Swift X SFX16-52G-52VE | |
| Lenovo IdeaPad Gaming 3 15IAH7 | |
| Lenovo ThinkPad T16 G1 21BWS00200 | |
| HP Omen 16-c0077ng | |
| Asus ZenBook Flip 15 Q539ZD | |
* ... im mniej tym lepiej
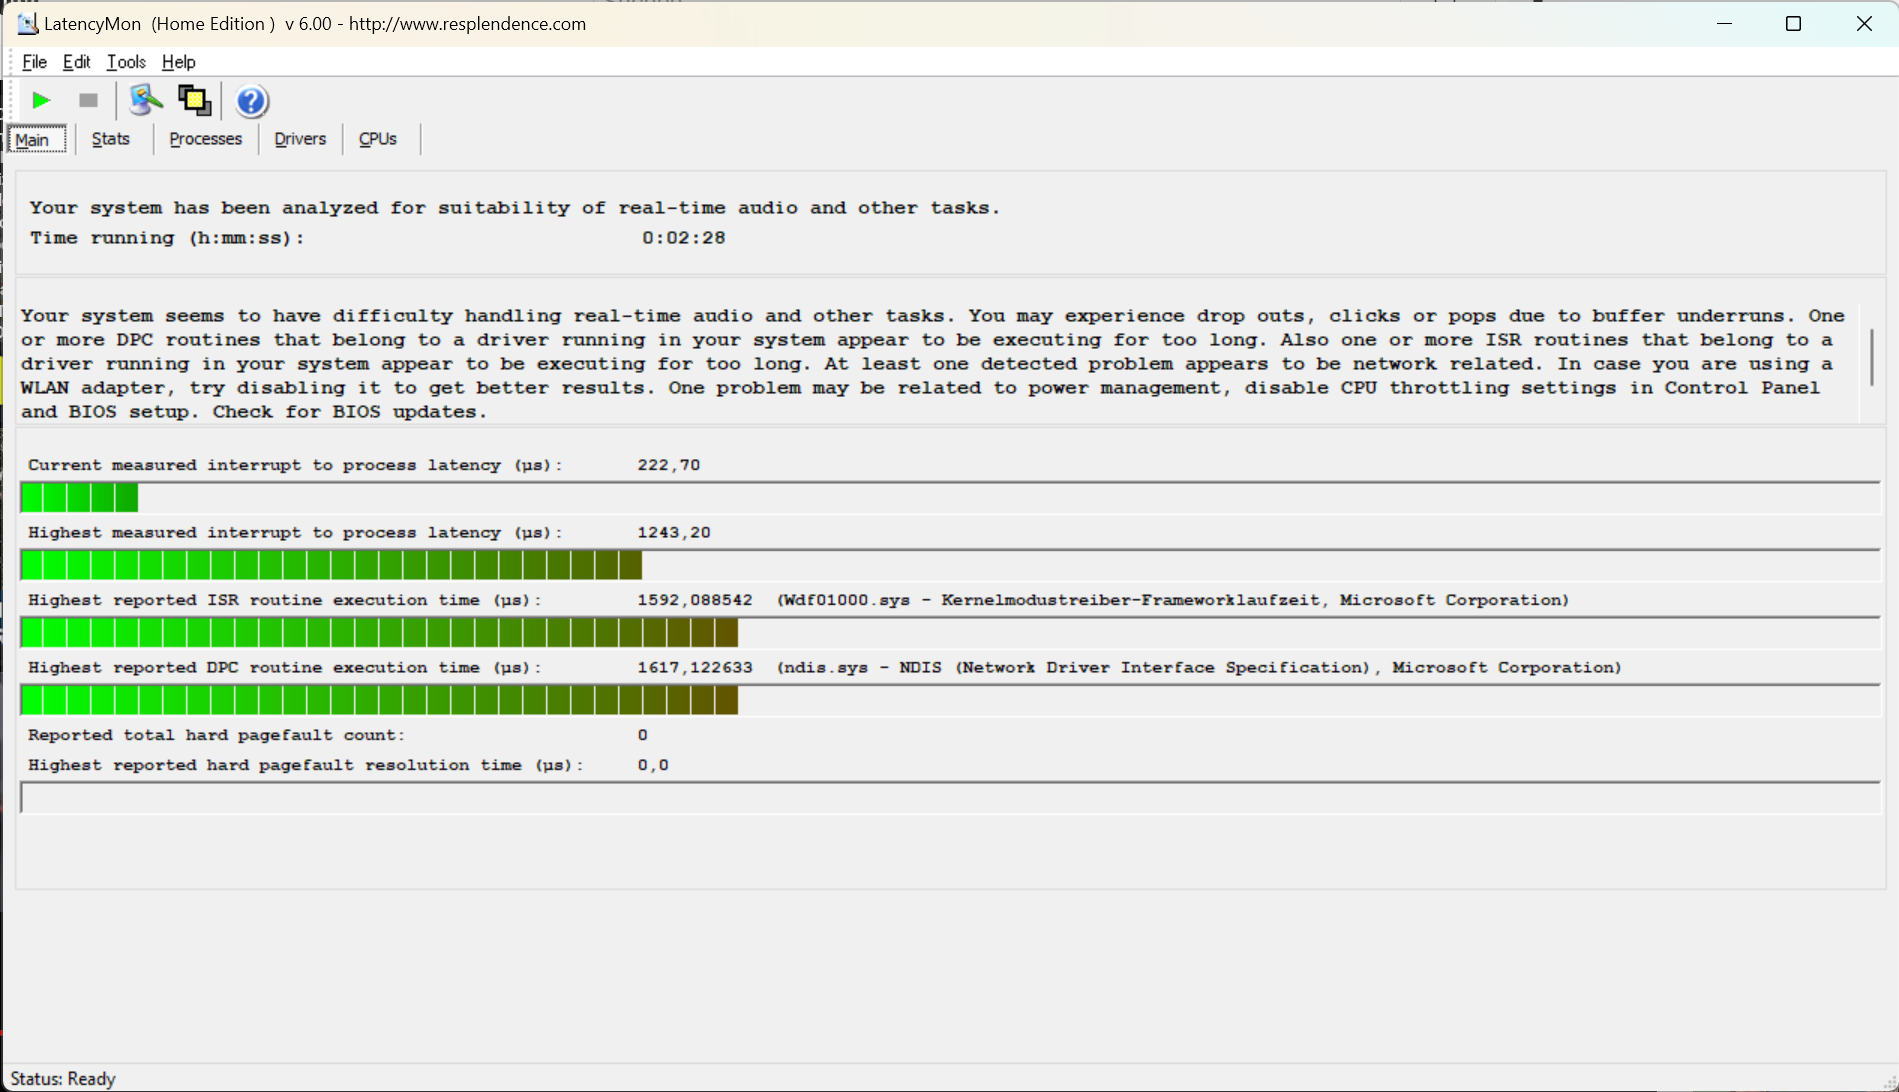
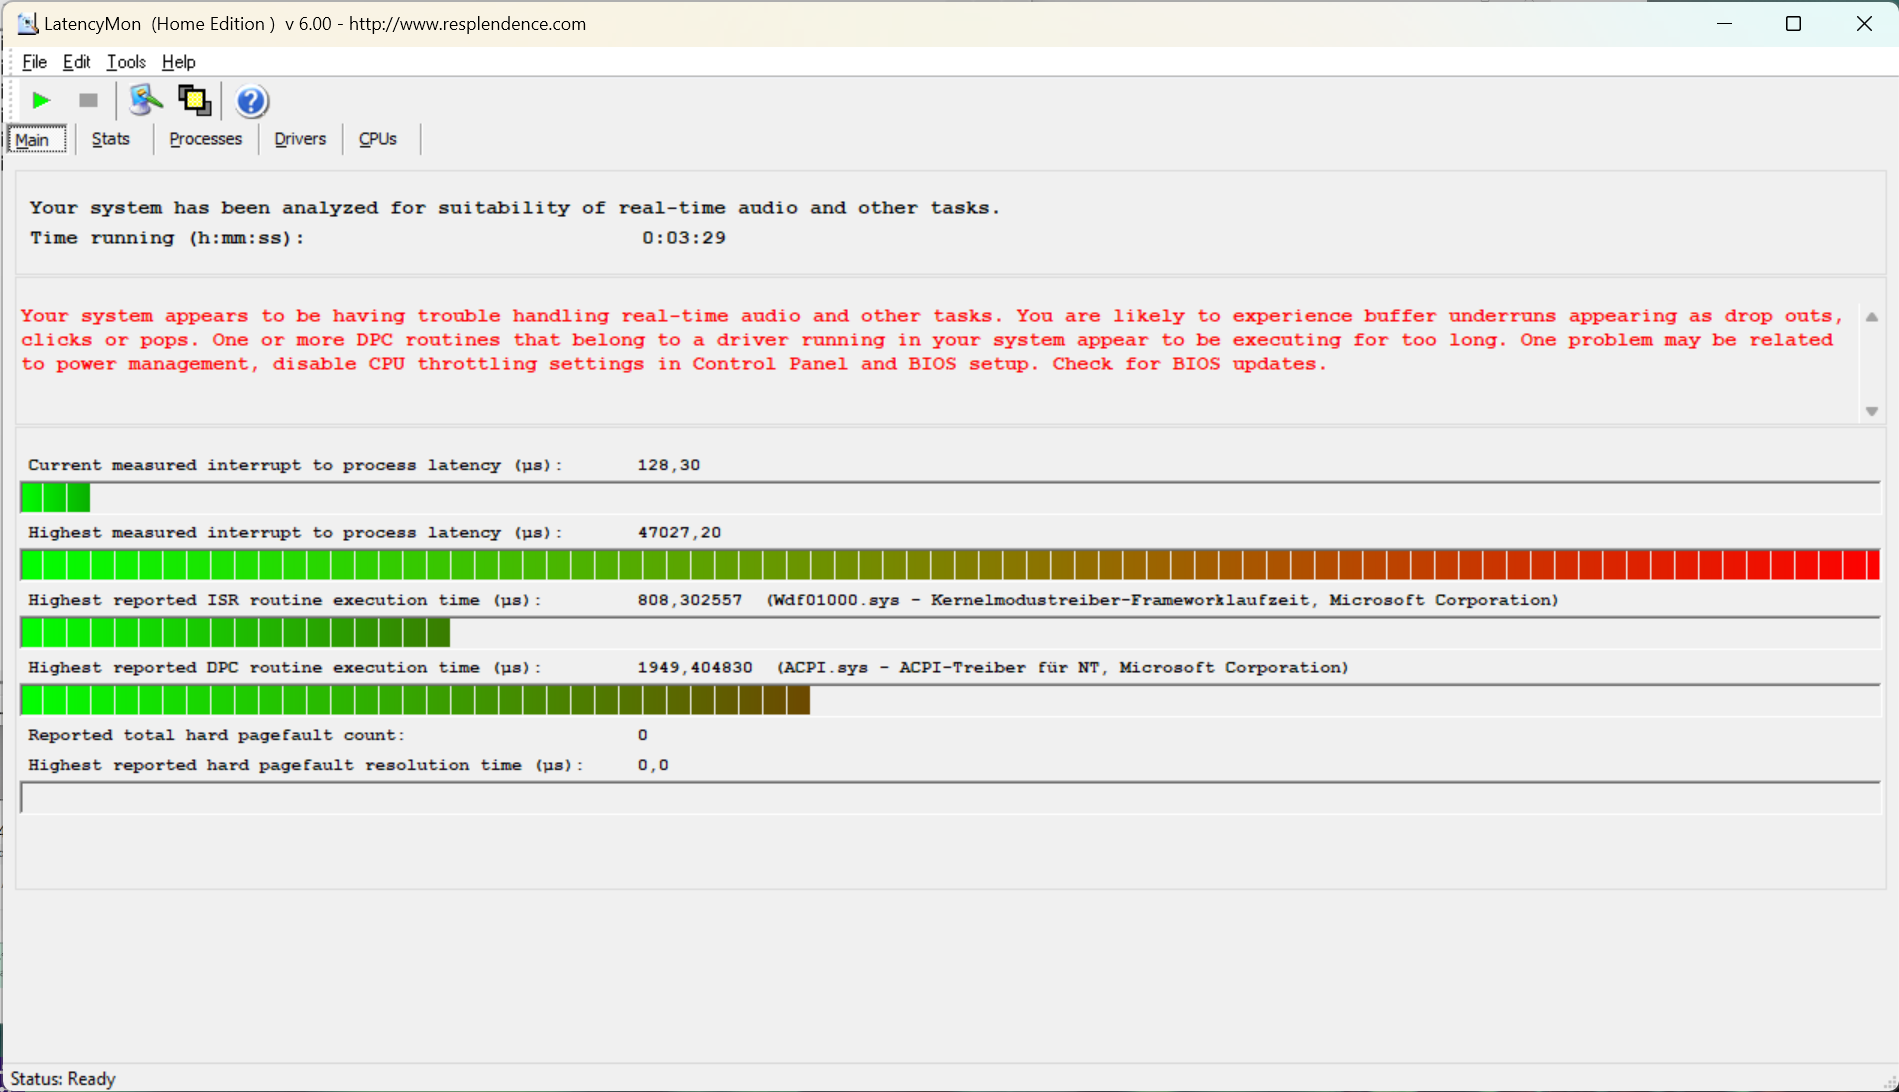
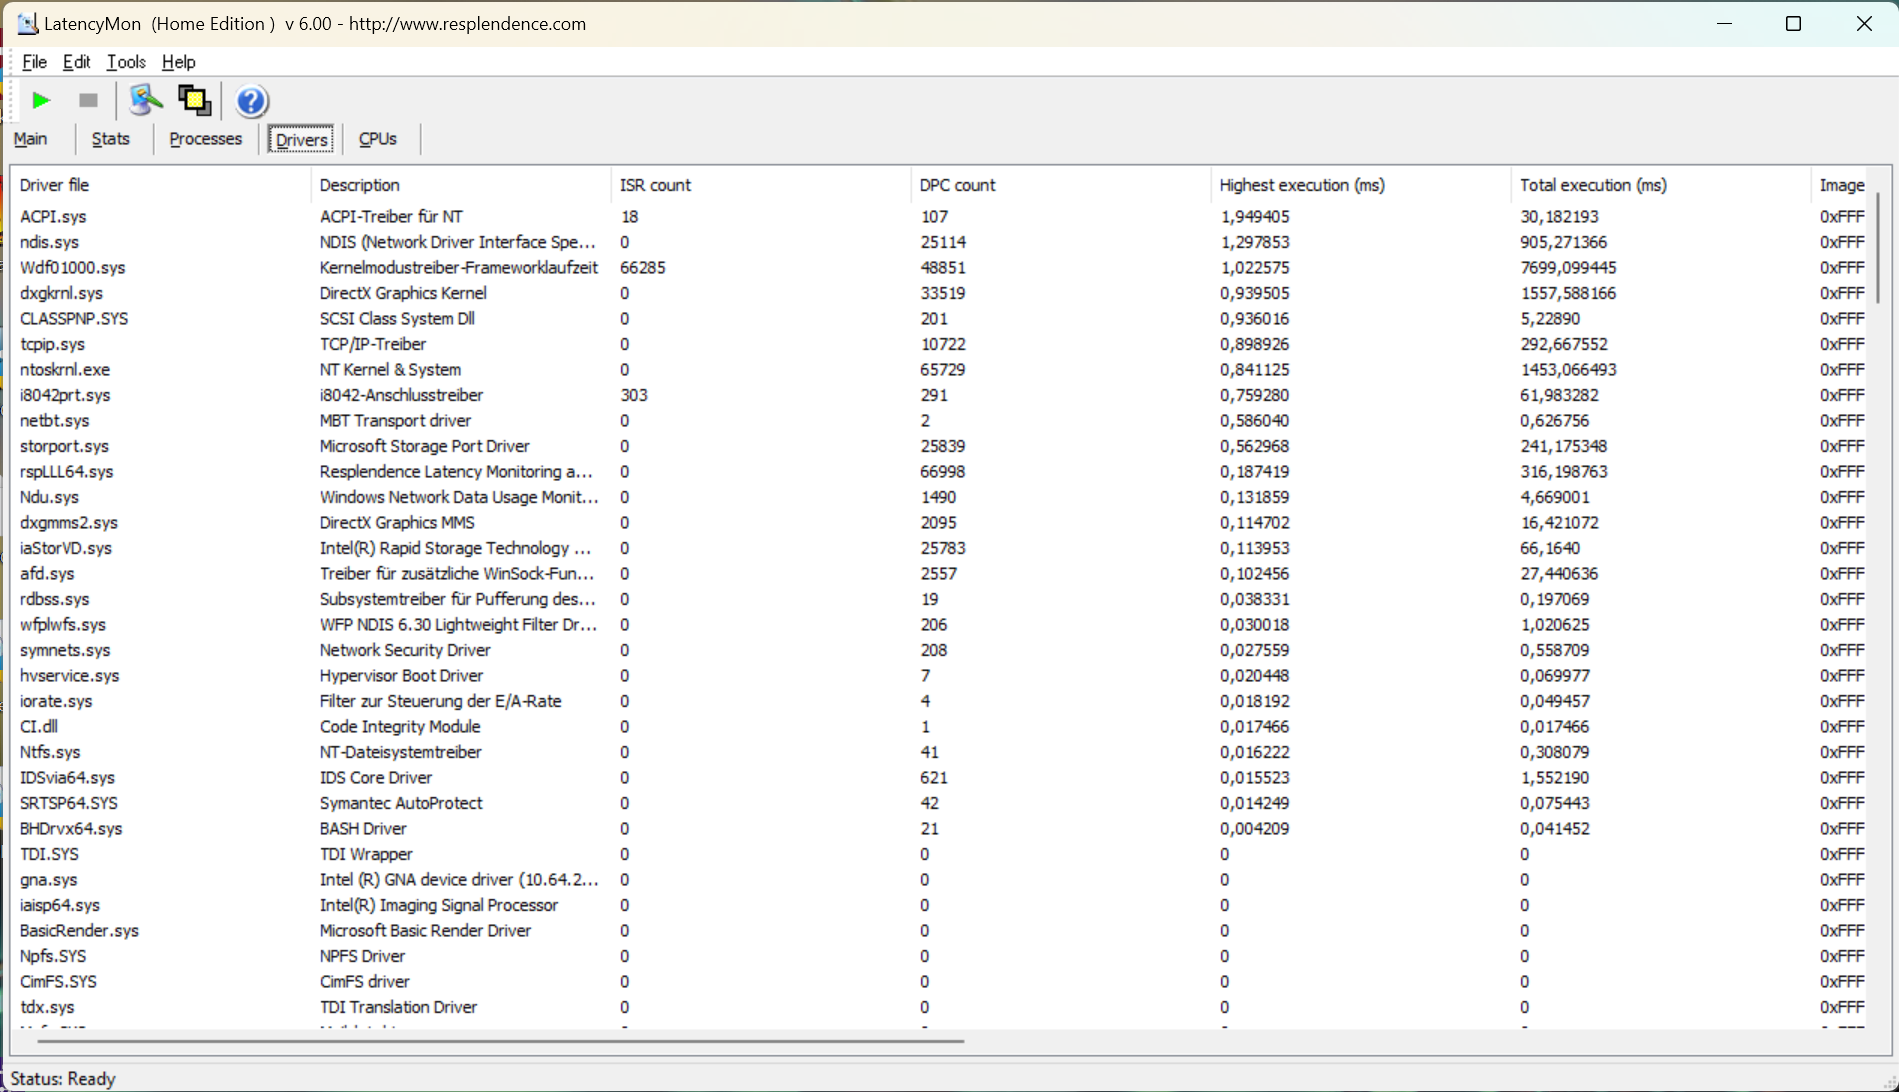
Opóźnienia DPC
Notebook Acer raczej nie nadaje się do obróbki audio i wideo w czasie rzeczywistym, choć nieco ponad 1 ms to wynik przyzwoity na tle konkurencji. Występują jednak podobne problemy jak u bezpośredniego poprzednika, tjacer Swift X SFX16-51G, kiedy w planie oszczędzania energii wybrana jest opcja "zrównoważona". Wówczas opóźnienia są poza akceptowalnym poziomem i zauważalne przerwy mogą być odbierane w obie strony. Aktualizacja BIOS-u lub zmienione sterowniki mogą jednak naprawić problem.
| DPC Latencies / LatencyMon - interrupt to process latency (max), Web, Youtube, Prime95 | |
| Lenovo ThinkBook 16 G4+ IAP | |
| HP Omen 16-c0077ng | |
| Acer Aspire 5 A515-57G-53N8 | |
| Lenovo ThinkPad T16 G1 21BWS00200 | |
| Lenovo IdeaPad Gaming 3 15IAH7 | |
| Acer Swift X SFX16-52G-52VE | |
| Asus ZenBook Flip 15 Q539ZD | |
* ... im mniej tym lepiej
Przechowywanie
Dysk SSD M.2 od Microna zapewnia imponującą wydajność. To przede wszystkim zasługa standardu PCIe 4.0, co oznacza, że prędkości transferu sekwencyjnego są bardzo wysokie. Nie ma też na co narzekać w kwestii czasów wyszukiwania, więc pamięć nie będzie miała negatywnego wpływu na wydajność systemu.
Podczas testu wytrzymałościowego ujawniają się jednak problemy z chłodzeniem. Dlatego nawet przy większych ilościach zapisów szybkość transmisji danych znacznie spadnie. Taki scenariusz jest w praktyce raczej rzadki, ale świadczy o tym, że temperatura dysku twardego jest wyższa, niż w notebookach osiągających stałą wydajność. Może to mieć negatywny wpływ na żywotność.

| Acer Swift X SFX16-52G-52VE Micron 3400 MTFDKBA512TFH 512GB | Acer Aspire 5 A515-57G-53N8 Micron 2450 512GB MTFDKBA512TFK | Lenovo ThinkPad T16 G1 21BWS00200 Samsung PM9A1 MZVL2512HCJQ | Asus ZenBook Flip 15 Q539ZD SK Hynix HFM001TD3JX013N | Lenovo IdeaPad Gaming 3 15IAH7 Intel SSD 660p SSDPEKNW512G8 | HP Omen 16-c0077ng Samsung PM981a MZVLB1T0HBLR | Lenovo ThinkBook 16 G4+ IAP Micron 2450 1TB MTFDKCD1T0TFK | Przeciętny Micron 3400 MTFDKBA512TFH 512GB | Średnia w klasie Multimedia | |
|---|---|---|---|---|---|---|---|---|---|
| Drive Performance rating | |||||||||
| Percent (pt) | 79.3 | 50.9 -36% | 69.8 -12% | 58.2 -27% | 52 -34% | 74.2 -6% | 64.1 -19% | 72.5 -9% | 74.7 -6% |
| DiskSpd | -64% | -17% | -39% | -42% | -18% | -31% | -17% | -13% | |
| seq read (MB/s) | 2619 | 756 -71% | 3645 39% | 2216 -15% | 2168 -17% | 2746 5% | 2124 -19% | 2722 ? 4% | 2928 ? 12% |
| seq write (MB/s) | 3900 | 830 -79% | 2809 -28% | 2029 -48% | 1607 -59% | 2786 -29% | 2677 -31% | 3356 ? -14% | 3087 ? -21% |
| seq q8 t1 read (MB/s) | 6439 | 1023 -84% | 6524 1% | 3554 -45% | 2660 -59% | 3503 -46% | 3377 -48% | 6014 ? -7% | 5666 ? -12% |
| seq q8 t1 write (MB/s) | 3911 | 934 -76% | 4812 23% | 2969 -24% | 1671 -57% | 3016 -23% | 3241 -17% | 3698 ? -5% | 4543 ? 16% |
| 4k q1 t1 read (MB/s) | 65.3 | 18.6 -72% | 68.2 4% | 62.7 -4% | 72.3 11% | 48.8 -25% | 61.2 -6% | 54.8 ? -16% | 62.1 ? -5% |
| 4k q1 t1 write (MB/s) | 208 | 221 6% | 134.8 -35% | 138.2 -34% | 194.3 -7% | 144 -31% | 187.8 -10% | 161.6 ? -22% | 157.1 ? -24% |
| 4k q32 t16 read (MB/s) | 1522 | 416 -73% | 683 -55% | 628 -59% | 474 -69% | 1798 18% | 923 -39% | 1020 ? -33% | 1392 ? -9% |
| 4k q32 t16 write (MB/s) | 2390 | 923 -61% | 293 -88% | 405 -83% | 609 -75% | 2142 -10% | 501 -79% | 1356 ? -43% | 971 ? -59% |
| AS SSD | -47% | -1% | -27% | -24% | 5% | -32% | -3% | -10% | |
| Score Total (Points) | 4936 | 4707 -5% | 4630 -6% | 4202 -15% | 2702 -45% | 5866 19% | 4750 -4% | 4778 ? -3% | 5035 ? 2% |
| Score Read (Points) | 1737 | 1763 1% | 1112 -36% | 1221 -30% | 760 -56% | 2363 36% | 1296 -25% | 1588 ? -9% | 1577 ? -9% |
| Score Write (Points) | 2287 | 2024 -11% | 3010 32% | 2393 5% | 1584 -31% | 2325 2% | 2826 24% | 2443 ? 7% | 2709 ? 18% |
| Seq Read (MB/s) | 3200 | 3123.89 -2% | 3225 1% | 2906.11 -9% | 2432.02 -24% | 3148 -2% | 2825 -12% | 4340 ? 36% | 4468 ? 40% |
| Seq Write (MB/s) | 3430 | 3008.29 -12% | 1567 -54% | 1889.69 -45% | 1229.14 -64% | 2565 -25% | 1852 -46% | 2806 ? -18% | 3062 ? -11% |
| 4K Read (MB/s) | 63.1 | 89.47 42% | 69.7 10% | 57.61 -9% | 75.66 20% | 52.1 -17% | 58.44 -7% | 58.6 ? -7% | 61.1 ? -3% |
| 4K Write (MB/s) | 141.6 | 277.46 96% | 170.9 21% | 135.2 -5% | 242.19 71% | 136.8 -3% | 227.47 61% | 163.1 ? 15% | 185.7 ? 31% |
| 4K-64 Read (MB/s) | 1354 | 1360.83 1% | 720 -47% | 872.52 -36% | 441.63 -67% | 1996 47% | 954.65 -29% | 1096 ? -19% | 1069 ? -21% |
| 4K-64 Write (MB/s) | 1802 | 1446.04 -20% | 2682 49% | 2069.03 15% | 1218.61 -32% | 1931 7% | 2413.44 34% | 1999 ? 11% | 2217 ? 23% |
| Access Time Read * (ms) | 0.064 | 0.106 -66% | 0.059 8% | 0.035 45% | 0.073 -14% | 0.066 -3% | 0.026 59% | 0.0568 ? 11% | 0.05738 ? 10% |
| Access Time Write * (ms) | 0.026 | 0.168 -546% | 0.024 8% | 0.082 -215% | 0.033 -27% | 0.027 -4% | 0.131 -404% | 0.0402 ? -55% | 0.07592 ? -192% |
| Całkowita średnia (program / ustawienia) | -49% /
-53% | -10% /
-8% | -31% /
-32% | -33% /
-32% | -6% /
-5% | -27% /
-31% | -10% /
-9% | -10% /
-11% |
* ... im mniej tym lepiej
Continuous load read: DiskSpd Read Loop, Queue Depth 8
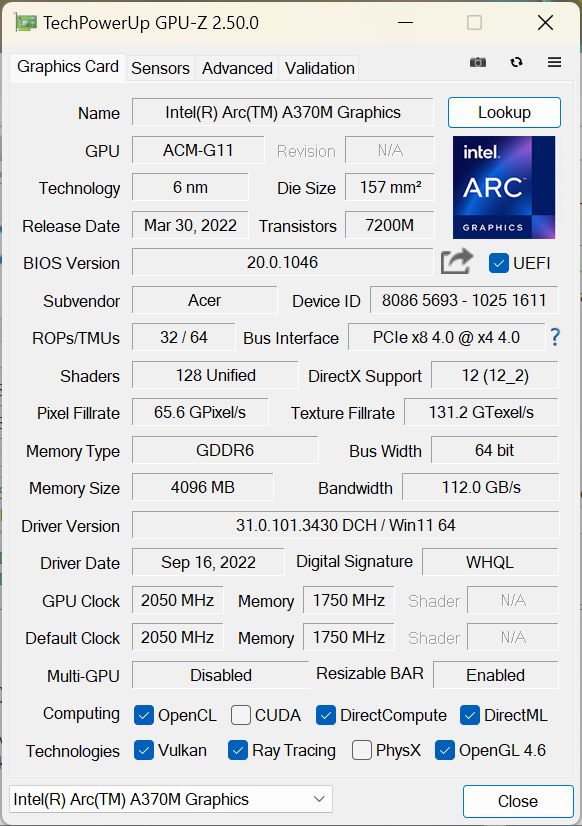
Karta graficzna
StronaIntel Arc A370M, którego premiera odbyła się dopiero wiosną 2022 roku, wykorzystuje jednostkę obliczeniową układu graficznego Iris Xe. Do dyspozycji jest łącznie 8 rdzeni i 8 jednostek ray-tracingu. 4 GB pamięci wideo jest hojne, biorąc pod uwagę niską wydajność. Dla karty dostępne jest maksymalnie 45 W. W dłuższym okresie czasu wartość ta zmniejsza się najpierw do 35 W, a w końcu do 25 W. Zasilanie jest więc co najwyżej połową tego, co zazwyczaj przyznaje się karcie graficznej do gier.
Dlatego też trudno ją porównywać z prostymi mobilnymi GPU od konkurencji. Zarówno w przypadku.AMD Radeon RX 6500Mjak i Nvidia GeForce RTX 3050są wyraźnie lepsze. Nawet Acer Aspire 5 A515-57Gz wiekową Nvidia GeForce RTX 2050i TGP o mocy 35 W jest szybszy, zwłaszcza w grach.
I odwrotnie, A370M może wyraźnie przewyższać np. modele GeForce MX. W przypadku laptopa multimedialnego, jakim jest Acer Swift X SFX16, jest to spartański, ale wystarczająco wydajny wybór. Wydajność jest tu najważniejsza. Wyniki w naszych testach w 3DMarku, Blenderze i innych testach są odpowiednio słabe. Swift X jest zawsze na dole skali wydajności, ale i tak wyraźnie wyprzedza notebooki bez oddzielnego GPU. W Blenderze Intel Arc również wypada lepiej niż średnia laptopów multimedialnych z ostatnich dwóch lat.
Dalsze benchmarki i wartości wydajności można znaleźć w naszym zestawieniu benchmarków GPU https://www.notebookcheck.net/Mobile-Graphics-Cards-Benchmark-List.844.0.html
| 3DMark Performance rating - Percent | |
| HP Omen 16-c0077ng | |
| Lenovo IdeaPad Gaming 3 15IAH7 | |
| Średnia w klasie Multimedia | |
| Lenovo ThinkBook 16 G4+ IAP | |
| Acer Aspire 5 A515-57G-53N8 | |
| Asus ZenBook Flip 15 Q539ZD | |
| Przeciętny Intel Arc A370M | |
| Acer Swift X SFX16-52G-52VE | |
| Lenovo ThinkPad T16 G1 21BWS00200 | |
| 3DMark 11 - 1280x720 Performance GPU | |
| HP Omen 16-c0077ng | |
| Lenovo IdeaPad Gaming 3 15IAH7 | |
| Średnia w klasie Multimedia (3765 - 60002, n=61, ostatnie 2 lata) | |
| Lenovo ThinkBook 16 G4+ IAP | |
| Asus ZenBook Flip 15 Q539ZD | |
| Przeciętny Intel Arc A370M (11748 - 12338, n=4) | |
| Acer Aspire 5 A515-57G-53N8 | |
| Acer Swift X SFX16-52G-52VE | |
| Lenovo ThinkPad T16 G1 21BWS00200 | |
| 3DMark 11 Performance | 12308 pkt. | |
| 3DMark Cloud Gate Standard Score | 27250 pkt. | |
| 3DMark Fire Strike Score | 7717 pkt. | |
| 3DMark Time Spy Score | 3505 pkt. | |
Pomoc | ||
* ... im mniej tym lepiej
Wydajność w grach
Generalnie da się grać także przy stosunkowo niskiej wydajności Acer Swift X. Od wciąż wymagającego Witcher 3 z 2015 roku po całkiem niedawne Grid Legends, są ustawienia, które zapewniają grywalną liczbę klatek na sekundę. Można osiągnąć średnie detale i rozdzielczość Full HD.
Jednak nawetGeForce RTX 2050wyprzedza zastosowany tu Intel Arc A370M w niemal wszystkich benchmarkach. Ponieważ jest to dość nowy sprzęt, różnica w benchmarku zmniejsza się zauważalnie przy bardziej aktualnych tytułach gier. W Strange Brigade z 2018 roku można czasem zagrać płynniej niż przy użyciu RTX 2050. W przypadku Grid Legends obie karty graficzne są na mniej więcej tym samym poziomie. Im starsze gry, a co za tym idzie, stojąca za nimi technologia, tym więcej kłopotów sprawia Intel Arc z ich obsługą.
Kilka problemów można jeszcze zaobserwować ze sterownikiem Intel Arc. W tym przypadku wystąpiły awarie w GTA V. Liczba klatek na sekundę wielokrotnie zauważalnie spadała w Fifie 23 na najniższych ustawieniach jakościowych urządzenia. Z kolei wysokie ustawienia skutkowały stosunkowo przyjemną rozgrywką. Generalnie w przypadku nowszych tytułów należy spodziewać się komplikacji, ale zazwyczaj tylko przy określonych ustawieniach. Wskazana jest ciągła aktualizacja do najnowszej wersji sterowników.
Z kolei notebooki do gier klasy podstawowej, takie jak Lenovo IdeaPad Gaming 3, mogą niemal konsekwentnie generować dwa razy więcej klatek na sekundę.
| The Witcher 3 | |
| 1920x1080 High Graphics & Postprocessing (Nvidia HairWorks Off) | |
| HP Omen 16-c0077ng | |
| Lenovo IdeaPad Gaming 3 15IAH7 | |
| Średnia w klasie Multimedia (22 - 224, n=13, ostatnie 2 lata) | |
| Lenovo ThinkBook 16 G4+ IAP | |
| Acer Aspire 5 A515-57G-53N8 | |
| Asus ZenBook Flip 15 Q539ZD | |
| Przeciętny Intel Arc A370M (45 - 55.9, n=3) | |
| Acer Swift X SFX16-52G-52VE | |
| Lenovo ThinkPad T16 G1 21BWS00200 | |
| 1920x1080 Ultra Graphics & Postprocessing (HBAO+) | |
| HP Omen 16-c0077ng | |
| Lenovo IdeaPad Gaming 3 15IAH7 | |
| Średnia w klasie Multimedia (11 - 121, n=13, ostatnie 2 lata) | |
| Lenovo ThinkBook 16 G4+ IAP | |
| Acer Aspire 5 A515-57G-53N8 | |
| Asus ZenBook Flip 15 Q539ZD | |
| Przeciętny Intel Arc A370M (25 - 26.3, n=3) | |
| Acer Swift X SFX16-52G-52VE | |
| Lenovo ThinkPad T16 G1 21BWS00200 | |
| GTA V - 1920x1080 High/On (Advanced Graphics Off) AA:2xMSAA + FX AF:8x | |
| HP Omen 16-c0077ng | |
| Lenovo IdeaPad Gaming 3 15IAH7 | |
| Lenovo ThinkBook 16 G4+ IAP | |
| Średnia w klasie Multimedia (19.5 - 186.1, n=55, ostatnie 2 lata) | |
| Acer Aspire 5 A515-57G-53N8 | |
| Przeciętny Intel Arc A370M (40.5 - 41.4, n=3) | |
| Asus ZenBook Flip 15 Q539ZD | |
| Acer Swift X SFX16-52G-52VE | |
| Lenovo ThinkPad T16 G1 21BWS00200 | |
| Dota 2 Reborn | |
| 1920x1080 high (2/3) | |
| Lenovo ThinkBook 16 G4+ IAP | |
| HP Omen 16-c0077ng | |
| Lenovo IdeaPad Gaming 3 15IAH7 | |
| Acer Aspire 5 A515-57G-53N8 | |
| Średnia w klasie Multimedia (31.1 - 196.9, n=67, ostatnie 2 lata) | |
| Asus ZenBook Flip 15 Q539ZD | |
| Przeciętny Intel Arc A370M (62.2 - 72.8, n=3) | |
| Acer Swift X SFX16-52G-52VE | |
| Lenovo ThinkPad T16 G1 21BWS00200 | |
| 1920x1080 ultra (3/3) best looking | |
| Lenovo ThinkBook 16 G4+ IAP | |
| Lenovo IdeaPad Gaming 3 15IAH7 | |
| HP Omen 16-c0077ng | |
| Acer Aspire 5 A515-57G-53N8 | |
| Średnia w klasie Multimedia (29 - 179.9, n=67, ostatnie 2 lata) | |
| Asus ZenBook Flip 15 Q539ZD | |
| Przeciętny Intel Arc A370M (57.7 - 68.3, n=3) | |
| Acer Swift X SFX16-52G-52VE | |
| Lenovo ThinkPad T16 G1 21BWS00200 | |
| Final Fantasy XV Benchmark | |
| 1920x1080 Standard Quality | |
| Lenovo IdeaPad Gaming 3 15IAH7 | |
| Średnia w klasie Multimedia (11.4 - 181.1, n=65, ostatnie 2 lata) | |
| Lenovo ThinkBook 16 G4+ IAP | |
| Acer Aspire 5 A515-57G-53N8 | |
| Asus ZenBook Flip 15 Q539ZD | |
| Przeciętny Intel Arc A370M (34.4 - 38.4, n=3) | |
| Acer Swift X SFX16-52G-52VE | |
| Lenovo ThinkPad T16 G1 21BWS00200 | |
| 1920x1080 High Quality | |
| HP Omen 16-c0077ng | |
| Lenovo IdeaPad Gaming 3 15IAH7 | |
| Średnia w klasie Multimedia (7.61 - 144.4, n=65, ostatnie 2 lata) | |
| Lenovo ThinkBook 16 G4+ IAP | |
| Acer Aspire 5 A515-57G-53N8 | |
| Asus ZenBook Flip 15 Q539ZD | |
| Przeciętny Intel Arc A370M (19.6 - 26.7, n=3) | |
| Acer Swift X SFX16-52G-52VE | |
| X-Plane 11.11 | |
| 1920x1080 med (fps_test=2) | |
| Lenovo ThinkBook 16 G4+ IAP | |
| Lenovo IdeaPad Gaming 3 15IAH7 | |
| Acer Aspire 5 A515-57G-53N8 | |
| Średnia w klasie Multimedia (18.7 - 177.4, n=62, ostatnie 2 lata) | |
| Asus ZenBook Flip 15 Q539ZD | |
| Przeciętny Intel Arc A370M (27.4 - 34.2, n=3) | |
| Lenovo ThinkPad T16 G1 21BWS00200 | |
| Acer Swift X SFX16-52G-52VE | |
| 1920x1080 high (fps_test=3) | |
| Lenovo ThinkBook 16 G4+ IAP | |
| Lenovo IdeaPad Gaming 3 15IAH7 | |
| Acer Aspire 5 A515-57G-53N8 | |
| Średnia w klasie Multimedia (16.9 - 141.1, n=61, ostatnie 2 lata) | |
| HP Omen 16-c0077ng | |
| Asus ZenBook Flip 15 Q539ZD | |
| Lenovo ThinkPad T16 G1 21BWS00200 | |
| Przeciętny Intel Arc A370M (23.9 - 29.9, n=3) | |
| Acer Swift X SFX16-52G-52VE | |
| Far Cry 5 | |
| 1920x1080 Ultra Preset AA:T | |
| HP Omen 16-c0077ng | |
| Lenovo ThinkBook 16 G4+ IAP | |
| Średnia w klasie Multimedia (17 - 145, n=23, ostatnie 2 lata) | |
| Acer Aspire 5 A515-57G-53N8 | |
| Przeciętny Intel Arc A370M (42 - 43, n=2) | |
| Acer Swift X SFX16-52G-52VE | |
| Lenovo ThinkPad T16 G1 21BWS00200 | |
| 1920x1080 High Preset AA:T | |
| HP Omen 16-c0077ng | |
| Średnia w klasie Multimedia (19 - 150, n=23, ostatnie 2 lata) | |
| Lenovo ThinkBook 16 G4+ IAP | |
| Acer Aspire 5 A515-57G-53N8 | |
| Przeciętny Intel Arc A370M (45 - 46, n=2) | |
| Acer Swift X SFX16-52G-52VE | |
| Lenovo ThinkPad T16 G1 21BWS00200 | |
| Strange Brigade | |
| 1920x1080 ultra AA:ultra AF:16 | |
| HP Omen 16-c0077ng | |
| Lenovo IdeaPad Gaming 3 15IAH7 | |
| Średnia w klasie Multimedia (13.3 - 303, n=65, ostatnie 2 lata) | |
| Lenovo ThinkBook 16 G4+ IAP | |
| Acer Swift X SFX16-52G-52VE | |
| Przeciętny Intel Arc A370M (52.1 - 54.3, n=3) | |
| Asus ZenBook Flip 15 Q539ZD | |
| Lenovo ThinkPad T16 G1 21BWS00200 | |
| 1920x1080 high AA:high AF:8 | |
| HP Omen 16-c0077ng | |
| Lenovo IdeaPad Gaming 3 15IAH7 | |
| Średnia w klasie Multimedia (15.7 - 321, n=65, ostatnie 2 lata) | |
| Lenovo ThinkBook 16 G4+ IAP | |
| Acer Swift X SFX16-52G-52VE | |
| Przeciętny Intel Arc A370M (61.4 - 64.2, n=3) | |
| Asus ZenBook Flip 15 Q539ZD | |
| Acer Aspire 5 A515-57G-53N8 | |
| Lenovo ThinkPad T16 G1 21BWS00200 | |
| GRID Legends | |
| 1920x1080 High Preset | |
| HP Omen 16-c0077ng | |
| Acer Aspire 5 A515-57G-53N8 | |
| Acer Swift X SFX16-52G-52VE | |
| Przeciętny Intel Arc A370M (55 - 57.6, n=2) | |
| Lenovo ThinkPad T16 G1 21BWS00200 | |
| 1920x1080 Ultra Preset | |
| HP Omen 16-c0077ng | |
| Acer Aspire 5 A515-57G-53N8 | |
| Przeciętny Intel Arc A370M (41.7 - 41.9, n=2) | |
| Acer Swift X SFX16-52G-52VE | |
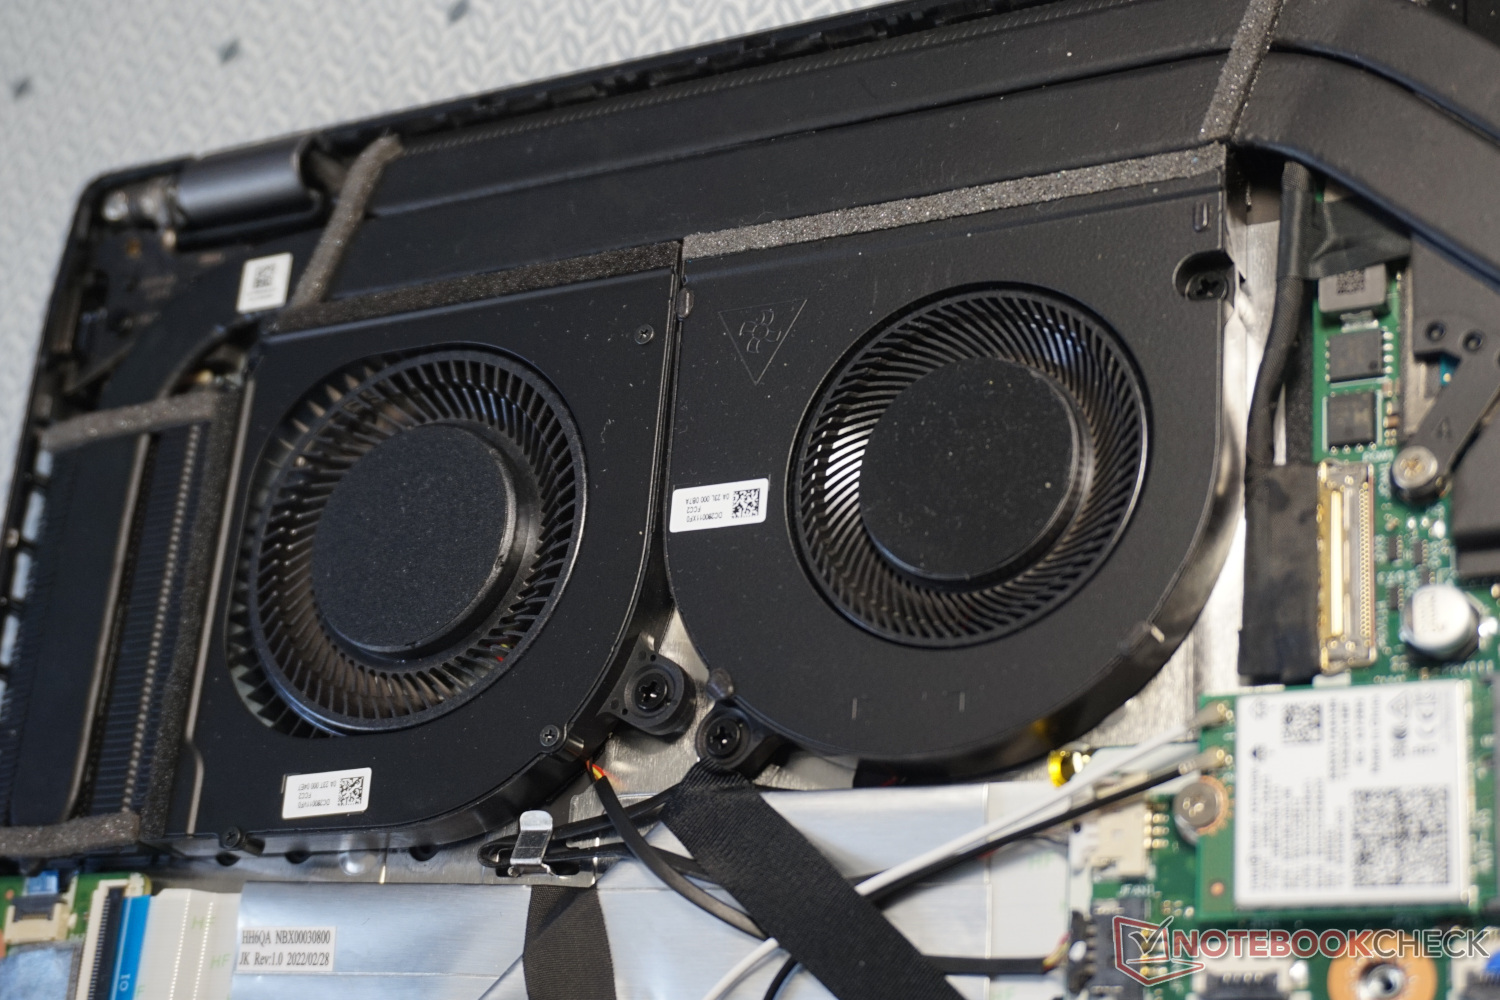
W stress teście z Witcher 3 na najwyższych ustawieniach widać stabilne zachowanie. Tuż po uruchomieniu częstotliwość odświeżania minimalnie spada, ale potem pozostaje absolutnie stabilna. Oznacza to, że podwójny wentylator jest w stanie wystarczająco schłodzić GPU i CPU, a dalsze zmniejszanie poboru mocy nie jest konieczne nawet w wyjątkowych sytuacjach.
Witcher 3 FPS-Diagramm
| low | med. | high | ultra | QHD | |
|---|---|---|---|---|---|
| GTA V (2015) | 145.4 | 135.1 | 40.5 | 0 | 9.67 |
| The Witcher 3 (2015) | 121 | 87 | 45 | 25 | |
| Dota 2 Reborn (2015) | 82.6 | 69.2 | 62.2 | 57.7 | |
| Final Fantasy XV Benchmark (2018) | 66.9 | 34.4 | 19.6 | 14.4 | |
| X-Plane 11.11 (2018) | 36.9 | 27.4 | 23.9 | ||
| Far Cry 5 (2018) | 87 | 48 | 45 | 42 | 28 |
| Strange Brigade (2018) | 184.8 | 76.7 | 64.2 | 54.3 | |
| God of War (2022) | 35 | 30 | 24 | 18 | 12 |
| GRID Legends (2022) | 97.5 | 68.3 | 57.6 | 41.7 | 31.3 |
| Vampire Bloodhunt (2022) | 127 | 87 | 62 | 55 | 34 |
| F1 22 (2022) | 127.2 | 49.5 | 46.3 | 33 | 2.85 |
| FIFA 23 (2022) | 70 (visible stuttering) | 62 | 40 | 41 | 30 |
Emisja - laptop multimedialny w niskiej cenie
Emisja hałasu
Więcej niż szum tła nie jest słyszalne poza maksymalną wydajnością. Z reguły notebook Acer jest niemal bezgłośny.
Podczas intensywnego użytkowania prędkość obrotowa wentylatora przyspiesza regularnie, ale w akceptowalnym tempie. Krzyczące wentylatory nie stanowią tutaj problemu. Nawet przy najwyższej wydajności chłodzenia poziom hałasu pozostaje w znośnym zakresie. Swift X jest wtedy zdecydowanie słyszalny, ale cichy w porównaniu z pełnoprawnym notebookiem dla graczy czy laptopem dla twórców z segmentu premium.
Niestety, nasze urządzenie testowe wytwarza nieprzyjemny szum elektroniczny. Przypuszczalnie jest to związane z nieprawidłowo wykonanym tranzystorem. Nie udało nam się wskazać dokładnego źródła. Dało się jednak zauważyć, że występował on tylko podczas niskich obciążeń roboczych i początkowo milkł po przetworzeniu większego obciążenia. Po każdym ponownym uruchomieniu komputera pojawiał się jednak ponownie.
Hałas
| luz |
| 25 / 25 / 26.4 dB |
| obciążenie |
| 36.5 / 43 dB |
 | ||
30 dB cichy 40 dB(A) słyszalny 50 dB(A) irytujący |
||
min: | ||
| Acer Swift X SFX16-52G-52VE A370M, i5-1240P, Micron 3400 MTFDKBA512TFH 512GB | Acer Aspire 5 A515-57G-53N8 GeForce RTX 2050 Mobile, i5-1240P, Micron 2450 512GB MTFDKBA512TFK | Lenovo ThinkPad T16 G1 21BWS00200 Iris Xe G7 80EUs, i5-1240P, Samsung PM9A1 MZVL2512HCJQ | Asus ZenBook Flip 15 Q539ZD A370M, i7-12700H, SK Hynix HFM001TD3JX013N | Lenovo IdeaPad Gaming 3 15IAH7 GeForce RTX 3050 Ti Laptop GPU, i5-12500H, Intel SSD 660p SSDPEKNW512G8 | HP Omen 16-c0077ng Radeon RX 6600M, R7 5800H, Samsung PM981a MZVLB1T0HBLR | Lenovo ThinkBook 16 G4+ IAP GeForce RTX 2050 Mobile, i7-12700H, Micron 2450 1TB MTFDKCD1T0TFK | |
|---|---|---|---|---|---|---|---|
| Noise | -11% | 14% | 6% | -16% | -23% | -4% | |
| wyłączone / środowisko * (dB) | 25 | 25 -0% | 23.3 7% | 23 8% | 25 -0% | 25 -0% | 24.2 3% |
| Idle Minimum * (dB) | 25 | 25 -0% | 23.3 7% | 23 8% | 29 -16% | 25 -0% | 24.2 3% |
| Idle Average * (dB) | 25 | 29 -16% | 23.3 7% | 23 8% | 30 -20% | 31.2 -25% | 24.2 3% |
| Idle Maximum * (dB) | 26.4 | 31 -17% | 23.3 12% | 24.7 6% | 32 -21% | 33.8 -28% | 24.2 8% |
| Load Average * (dB) | 36.5 | 46 -26% | 25.1 31% | 31.7 13% | 42 -15% | 55.4 -52% | 47 -29% |
| Load Maximum * (dB) | 43 | 47 -9% | 34 21% | 45.2 -5% | 54 -26% | 56 -30% | 47 -9% |
| Witcher 3 ultra * (dB) | 42 | 32.1 | 45.2 | 46 | 47 |
* ... im mniej tym lepiej
Temperatura
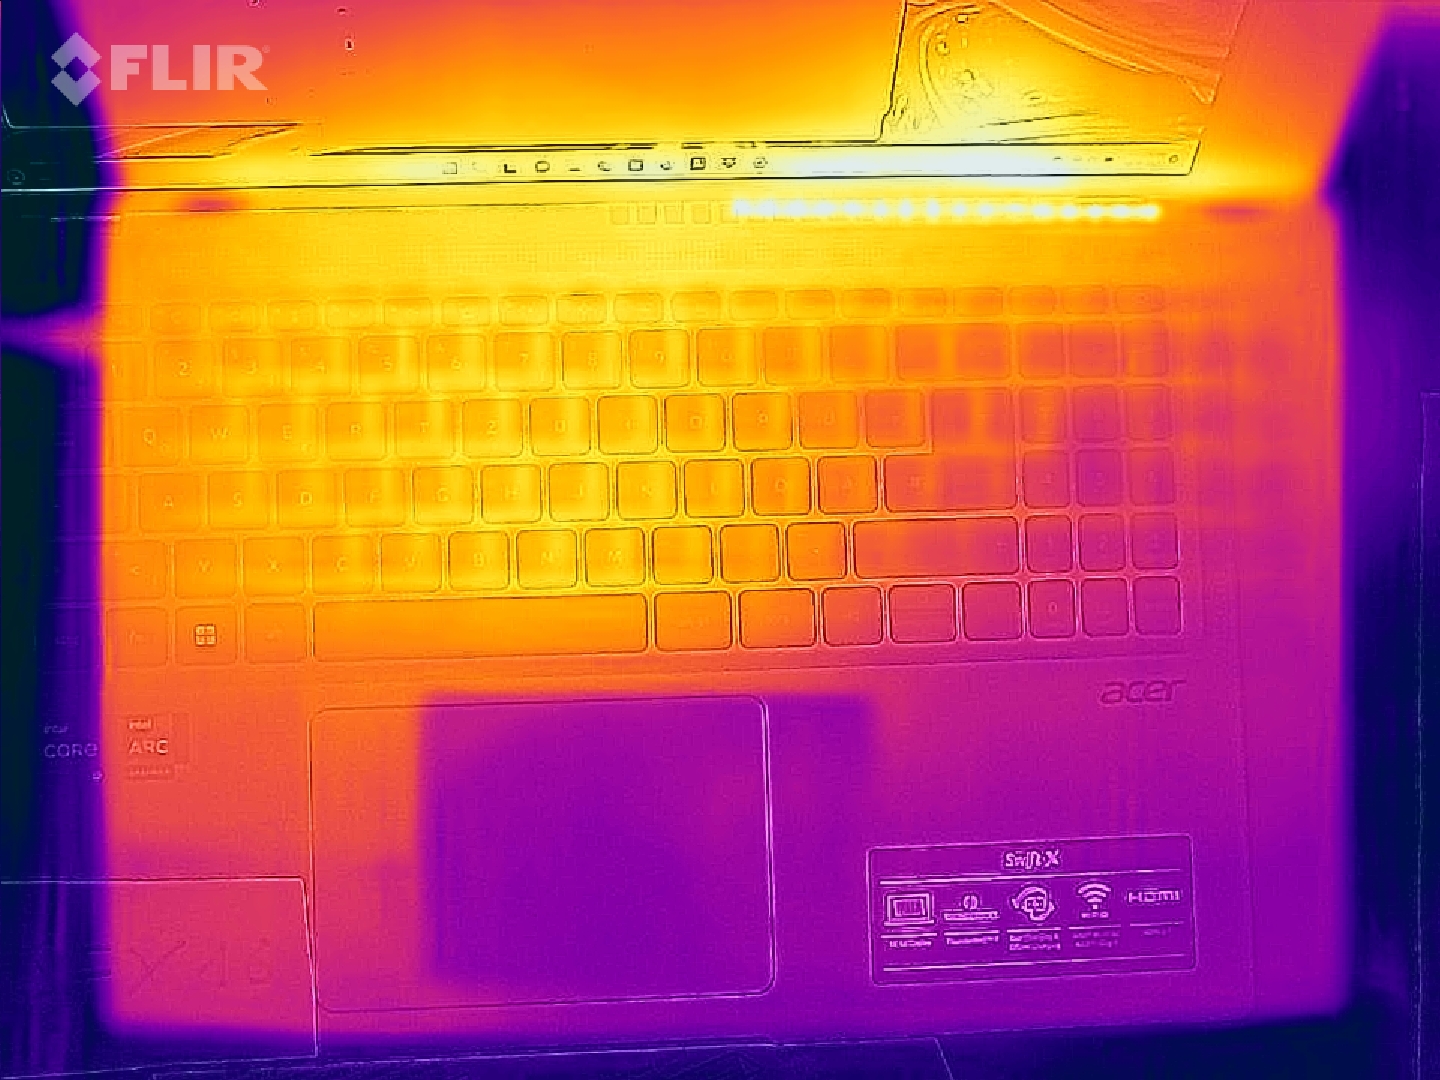
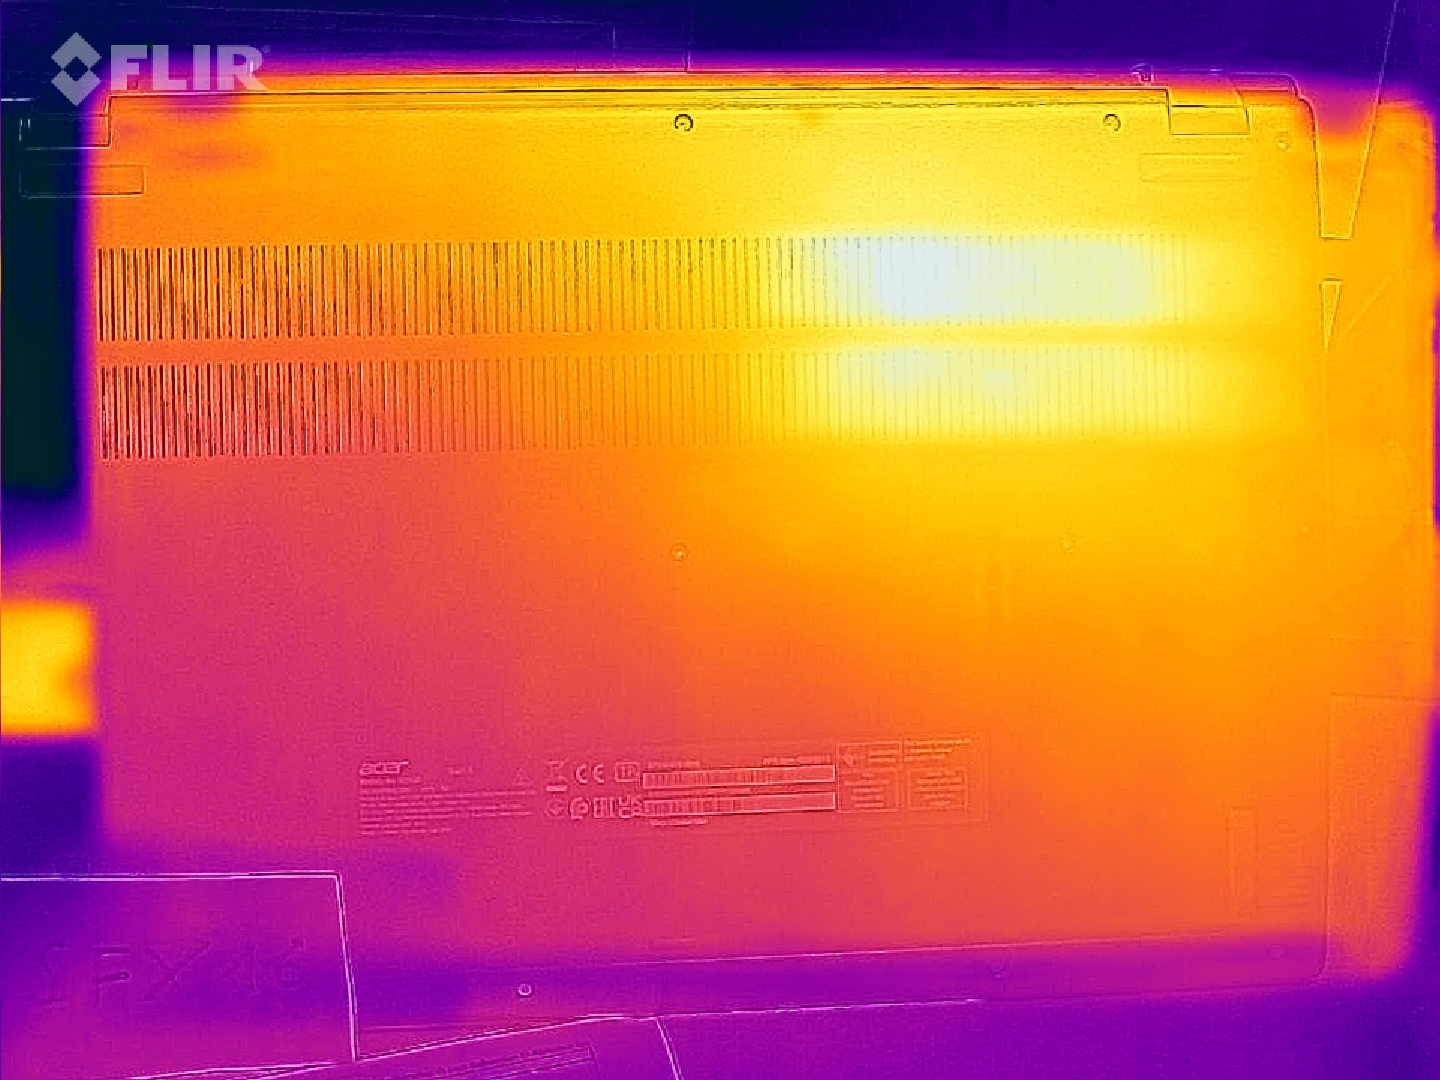
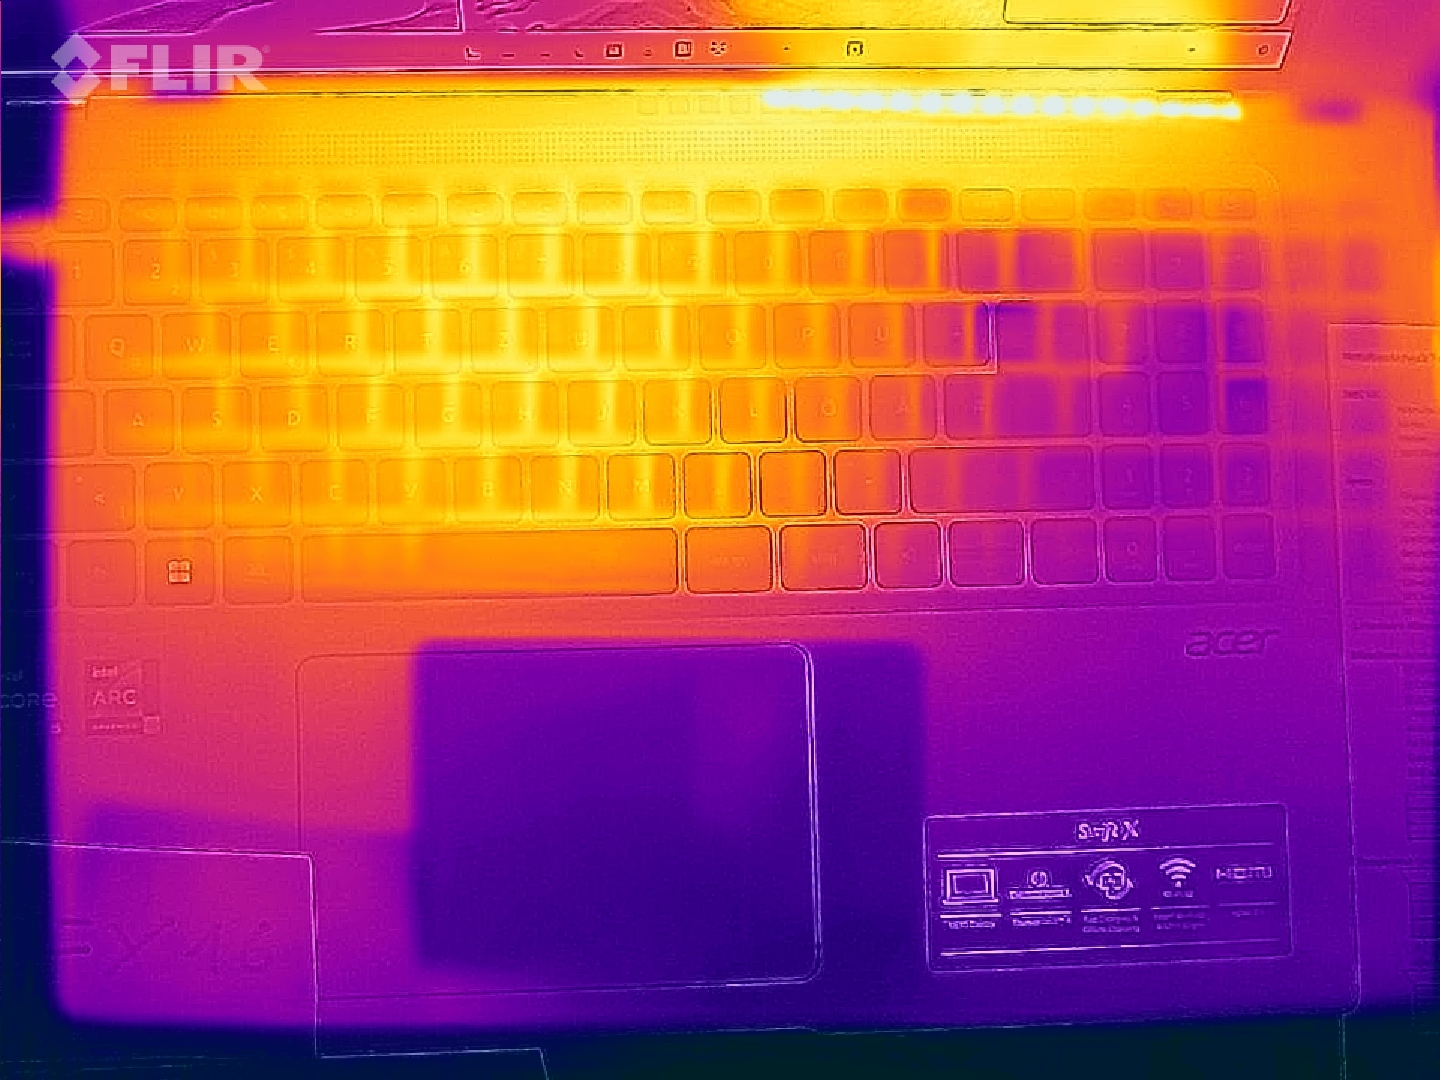
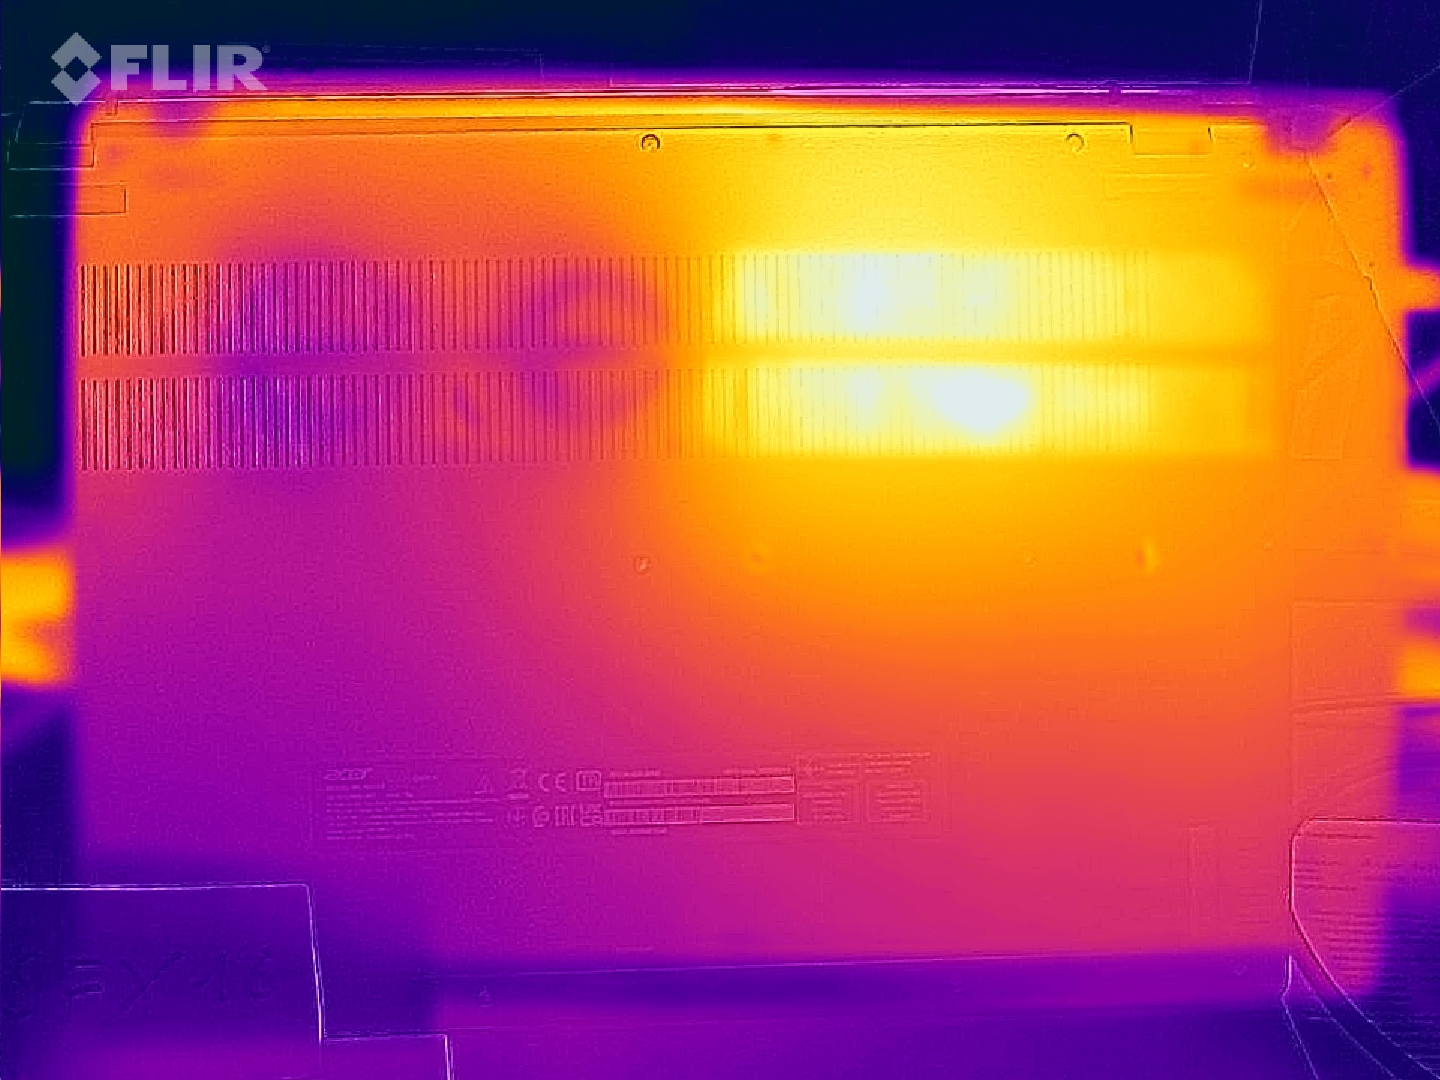
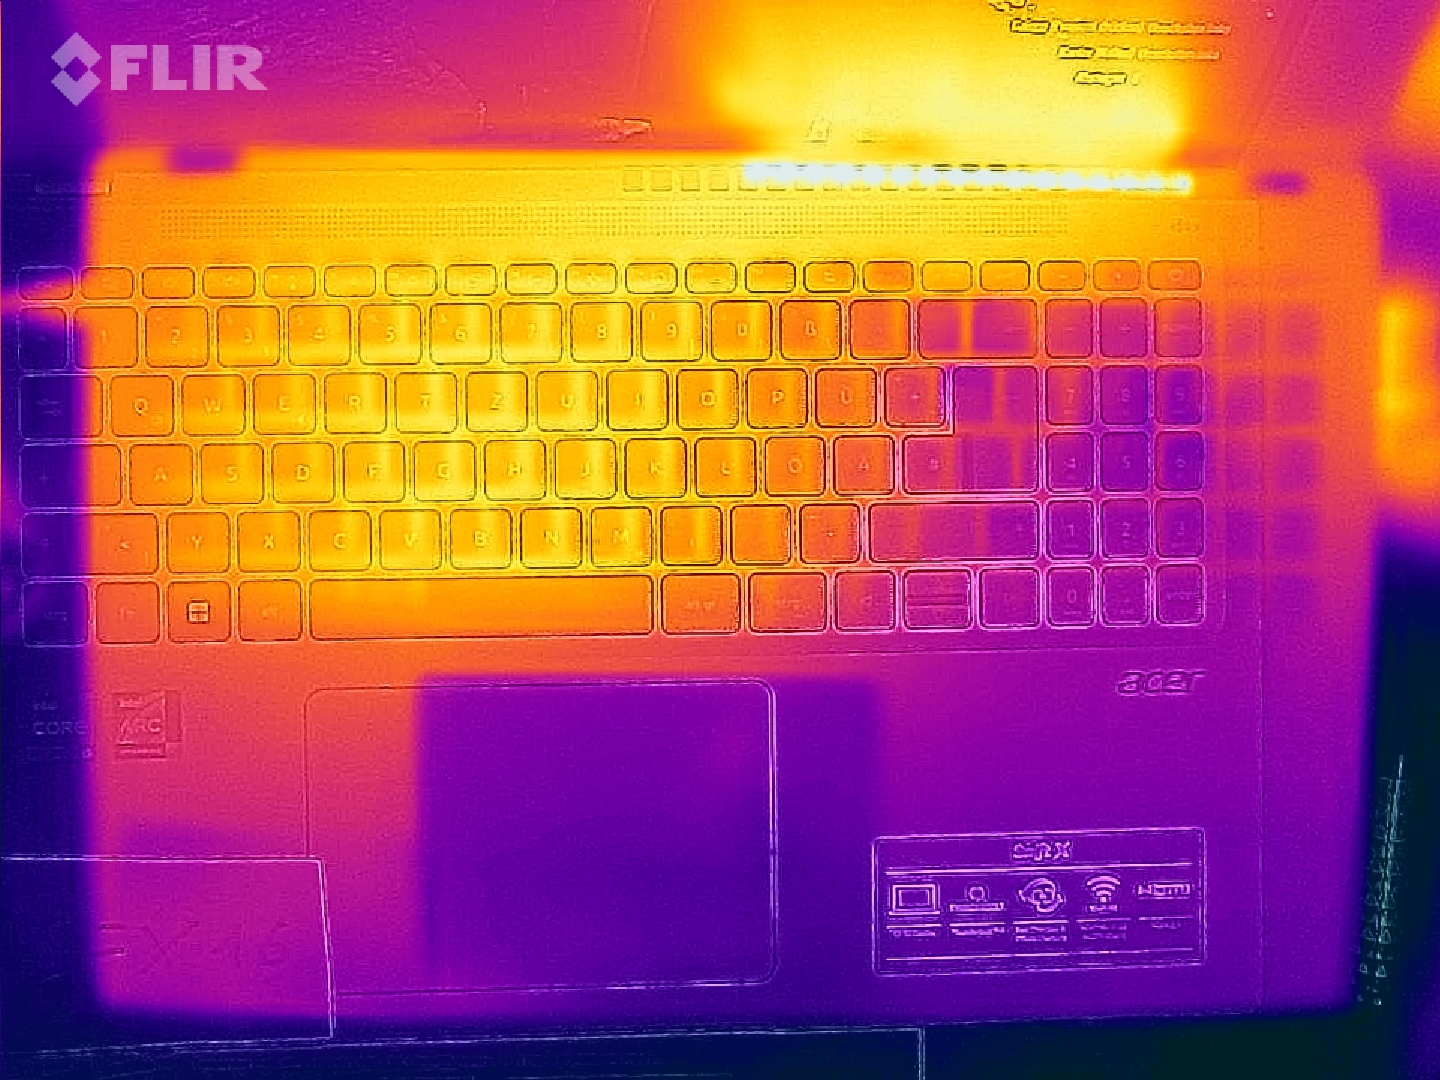
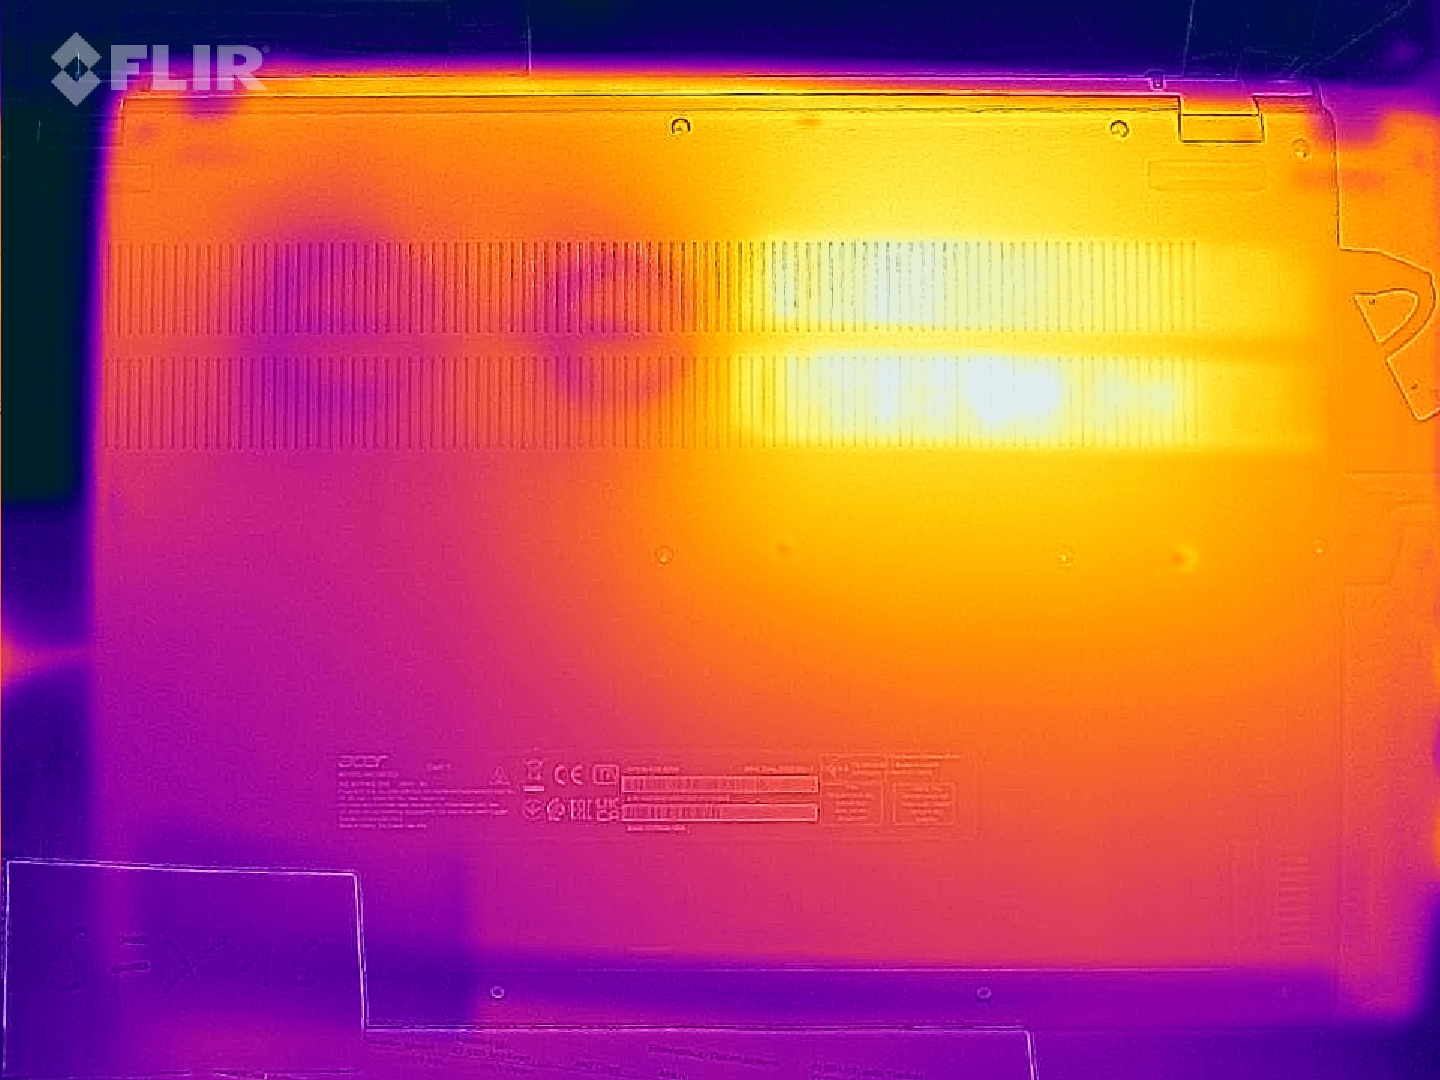
Nawet podczas wykonywania prostych zadań Acer Swift X SFX16 trochę się nagrzewa. Klawiatura zaczyna być stosunkowo szybko odczuwalna jako ciepła. Przy intensywnym użytkowaniu temperatura wzrasta i w okolicy podwójnego wentylatora osiąga ponad 50°C. Położenie wentylatora widać wyraźnie na obrazie termicznym wierzchu i spodu. Dotyczy to jednak tylko sytuacji ekstremalnych. Tylko 43°C jest osiągane w Witcher 3, co również doprowadza laptop do granic możliwości.
Cechą szczególną jest tu klawiatura przepuszczająca powietrze. W efekcie, w przeciwieństwie do większości konkurentów, góra nagrzewa się bardziej niż spód. Niestety zmierzone temperatury wydają się zbyt wysokie jak na faktycznie ograniczony pobór mocy, a co za tym idzie, również rozwój ciepła. W tym kontekście obiecujące wydaje się podejście polegające na tym, by pozwolić ogrzanemu powietrzu obrać naturalną drogę.
(-) Maksymalna temperatura w górnej części wynosi 52 °C / 126 F, w porównaniu do średniej 36.8 °C / 98 F , począwszy od 21 do 71 °C dla klasy Multimedia.
(-) Dno nagrzewa się maksymalnie do 50.4 °C / 123 F, w porównaniu do średniej 39.1 °C / 102 F
(+) W stanie bezczynności średnia temperatura górnej części wynosi 28.1 °C / 83 F, w porównaniu ze średnią temperaturą urządzenia wynoszącą 31.3 °C / ### class_avg_f### F.
(±) Podczas gry w Wiedźmina 3 średnia temperatura górnej części wynosi 33.5 °C / 92 F, w porównaniu do średniej temperatury urządzenia wynoszącej 31.3 °C / ## #class_avg_f### F.
(-) Podpórki pod nadgarstki i touchpad mogą się bardzo nagrzać w dotyku, maksymalnie do 41.4 °C / 106.5 F.
(-) Średnia temperatura obszaru podparcia dłoni w podobnych urządzeniach wynosiła 28.7 °C / 83.7 F (-12.7 °C / -22.8 F).
| Acer Swift X SFX16-52G-52VE Intel Core i5-1240P, Intel Arc A370M | Acer Aspire 5 A515-57G-53N8 Intel Core i5-1240P, NVIDIA GeForce RTX 2050 Mobile | Lenovo ThinkPad T16 G1 21BWS00200 Intel Core i5-1240P, Intel Iris Xe Graphics G7 80EUs | Asus ZenBook Flip 15 Q539ZD Intel Core i7-12700H, Intel Arc A370M | Lenovo IdeaPad Gaming 3 15IAH7 Intel Core i5-12500H, NVIDIA GeForce RTX 3050 Ti Laptop GPU | HP Omen 16-c0077ng AMD Ryzen 7 5800H, AMD Radeon RX 6600M | Lenovo ThinkBook 16 G4+ IAP Intel Core i7-12700H, NVIDIA GeForce RTX 2050 Mobile | |
|---|---|---|---|---|---|---|---|
| Heat | 13% | 4% | 18% | 13% | 9% | 12% | |
| Maximum Upper Side * (°C) | 52 | 43 17% | 45 13% | 36.4 30% | 47 10% | 40.6 22% | 42.9 17% |
| Maximum Bottom * (°C) | 50.4 | 48 5% | 42.8 15% | 40.4 20% | 52 -3% | 36 29% | 50.6 -0% |
| Idle Upper Side * (°C) | 30 | 26 13% | 33 -10% | 26.2 13% | 25 17% | 31.3 -4% | 26 13% |
| Idle Bottom * (°C) | 32.4 | 27 17% | 33.6 -4% | 29.2 10% | 24 26% | 36 -11% | 26.5 18% |
* ... im mniej tym lepiej
Test na stres
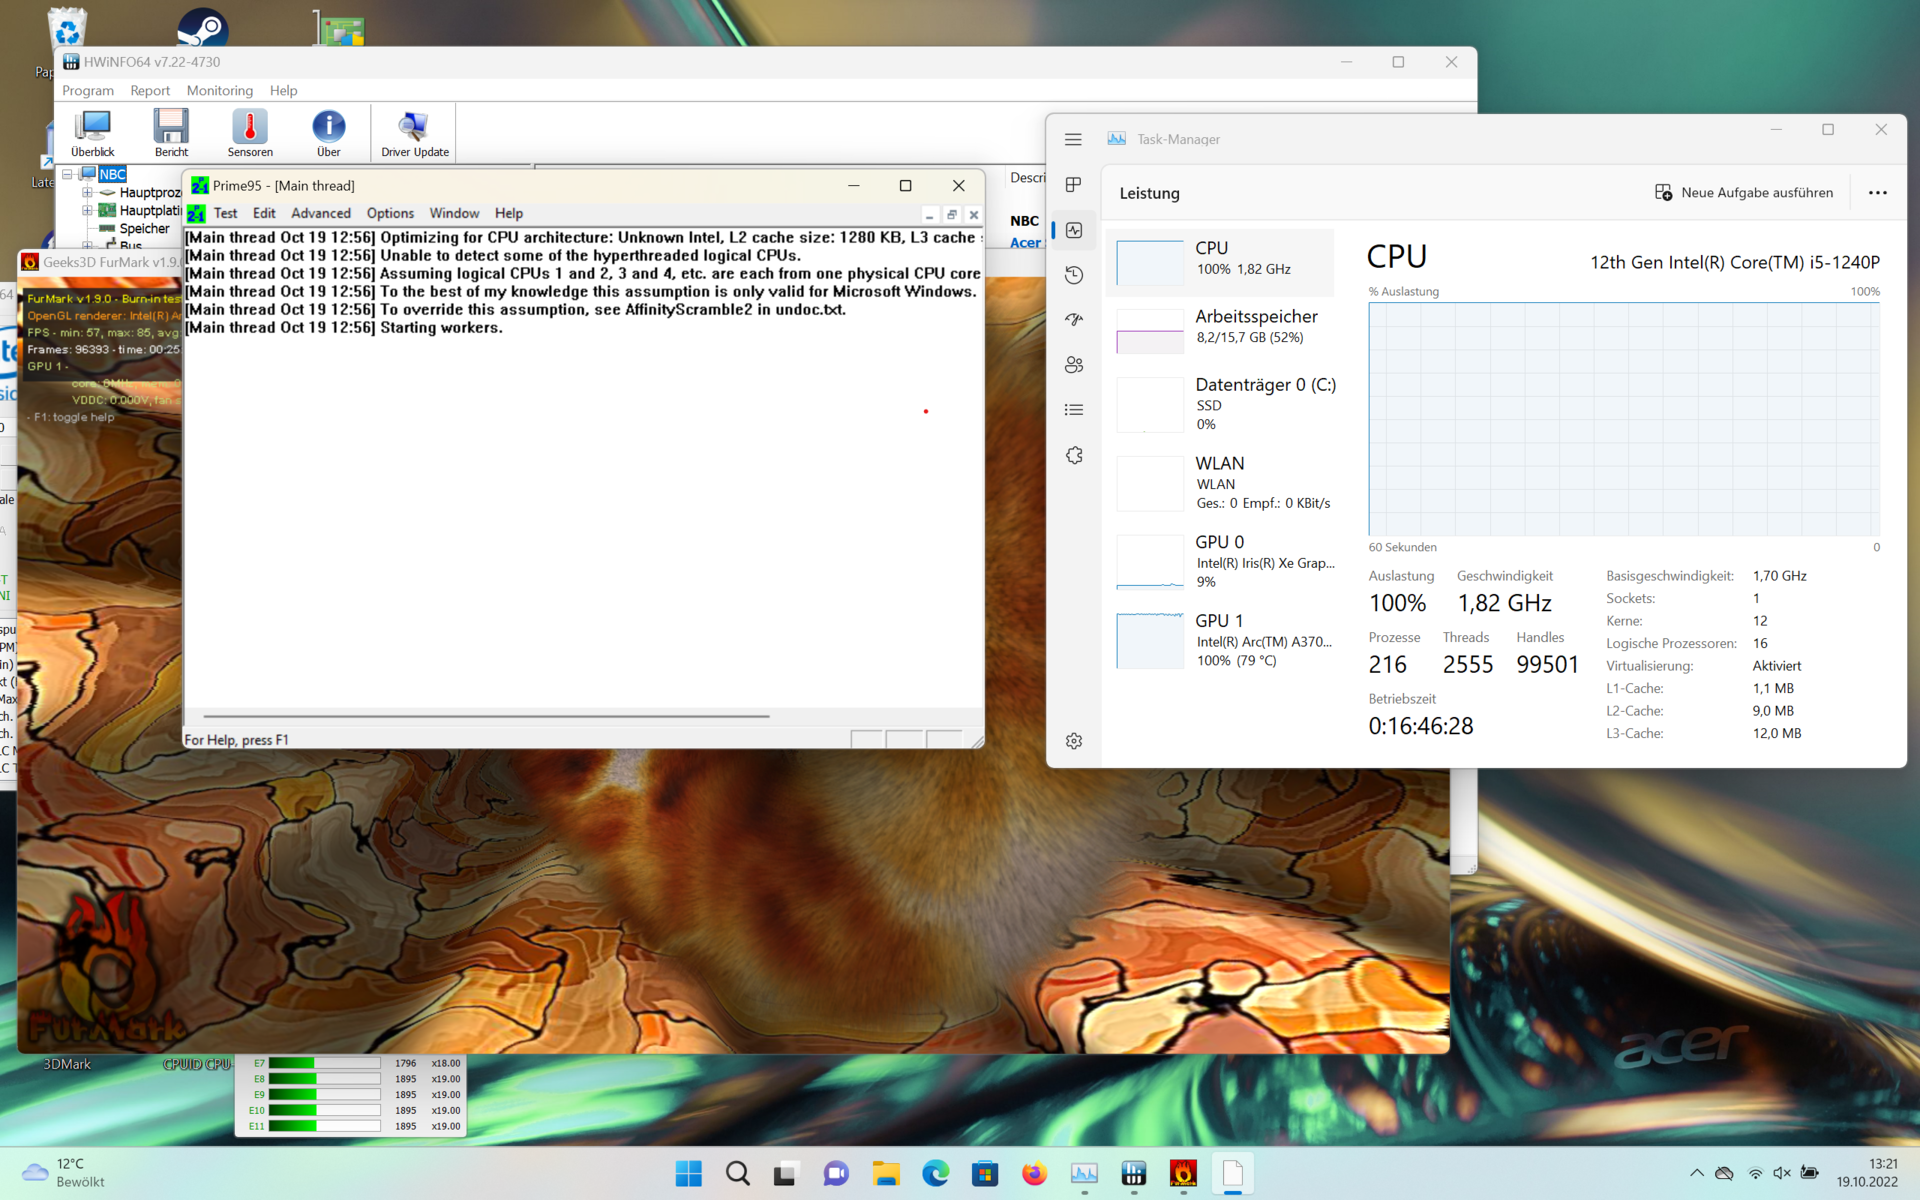
Przy maksymalnym obciążeniu, którym zarządzamy za pomocą Prime95 i Furmarka, temperatura procesora może na krótko osiągnąć krytyczną granicę 100°C. Dotyczy to jednak tylko poszczególnych rdzeni, nigdy całego procesora.
Każdy inny wynik byłby zaskakujący - maksymalny pobór mocy wynosi 100 W, a typowo 70 W. Chłodzenie z dwoma wentylatorami obok siebie działa więc niezawodnie.
Wydajność chłodzenia widać wyraźnie w poborze mocy przez procesor. Granica mocy 1 wynosząca 35 W, która określa maksymalne obciążenie przez niespełna 1 min, jest osiągana raz po raz po dłuższym czasie. Procesor może pobierać przez cały czas około 30 W, więc podczas stress testu utrzymywał prawie pełną wydajność.
Mówcy
Przynajmniej do muzyki dwa małe głośniki stereo nadają się tylko w ograniczonym stopniu. Basu nie ma prawie wcale, a niższe tony średnie, w których słychać np. gitary, są również bardzo słabe.
Głosy natomiast brzmią przyjemnie, bogato w szczegóły i równo. Jest to wystarczające do wideotelefonii, podcastów i oglądania strumieni na żywo. Wszystko inne wymaga zewnętrznych głośników lub słuchawek.
Acer Swift X SFX16-52G-52VE analiza dźwięku
(±) | głośność głośnika jest średnia, ale dobra (80.1 dB)
Bas 100 - 315 Hz
(-) | prawie brak basu - średnio 27.6% niższa od mediany
(±) | liniowość basu jest średnia (14.1% delta do poprzedniej częstotliwości)
Średnie 400 - 2000 Hz
(+) | zbalansowane środki średnie - tylko 1.8% od mediany
(+) | średnie są liniowe (5.6% delta do poprzedniej częstotliwości)
Wysokie 2–16 kHz
(+) | zrównoważone maksima - tylko 2.9% od mediany
(+) | wzloty są liniowe (5.7% delta do poprzedniej częstotliwości)
Ogólnie 100 - 16.000 Hz
(±) | liniowość ogólnego dźwięku jest średnia (18.3% różnicy w stosunku do mediany)
W porównaniu do tej samej klasy
» 56% wszystkich testowanych urządzeń w tej klasie było lepszych, 7% podobnych, 38% gorszych
» Najlepszy miał deltę 5%, średnia wynosiła ###średnia###%, najgorsza wynosiła 45%
W porównaniu do wszystkich testowanych urządzeń
» 40% wszystkich testowanych urządzeń było lepszych, 8% podobnych, 52% gorszych
» Najlepszy miał deltę 4%, średnia wynosiła ###średnia###%, najgorsza wynosiła 134%
Apple MacBook Pro 16 2021 M1 Pro analiza dźwięku
(+) | głośniki mogą odtwarzać stosunkowo głośno (84.7 dB)
Bas 100 - 315 Hz
(+) | dobry bas - tylko 3.8% od mediany
(+) | bas jest liniowy (5.2% delta do poprzedniej częstotliwości)
Średnie 400 - 2000 Hz
(+) | zbalansowane środki średnie - tylko 1.3% od mediany
(+) | średnie są liniowe (2.1% delta do poprzedniej częstotliwości)
Wysokie 2–16 kHz
(+) | zrównoważone maksima - tylko 1.9% od mediany
(+) | wzloty są liniowe (2.7% delta do poprzedniej częstotliwości)
Ogólnie 100 - 16.000 Hz
(+) | ogólny dźwięk jest liniowy (4.6% różnicy w stosunku do mediany)
W porównaniu do tej samej klasy
» 0% wszystkich testowanych urządzeń w tej klasie było lepszych, 0% podobnych, 100% gorszych
» Najlepszy miał deltę 5%, średnia wynosiła ###średnia###%, najgorsza wynosiła 45%
W porównaniu do wszystkich testowanych urządzeń
» 0% wszystkich testowanych urządzeń było lepszych, 0% podobnych, 100% gorszych
» Najlepszy miał deltę 4%, średnia wynosiła ###średnia###%, najgorsza wynosiła 134%
Zarządzanie energią - niskie zużycie, wysoka wytrzymałość
Pobór mocy
Podczas przeglądania stron internetowych, oglądania filmów i podobnych zadań układ graficzny pozostaje wyłączony. Pobór mocy jest odpowiednio niski jak na klasę multimedialną. Zazwyczaj 8 W podcinają jedynie notebooki biznesowe i biurowe.
Ponieważ CPU i GPU pobierają zwykle tylko skromne ilości energii nawet pod obciążeniem, pobór mocy Swifta X na poziomie nieco poniżej 70 W jest znacznie niższy od większości laptopów z dodatkową kartą grafiki.
Przy szczytowych wartościach powyżej 100 W życzylibyśmy sobie nieco większego zasilacza. Nie pozwoliłoby na to jednak prawdopodobnie Thunderbolt 4, więc rozbieżność jest do zniesienia. Krótkie skoki mocy powinny w każdym razie zostać zaabsorbowane przez elektronikę.
| wyłączony / stan wstrzymania | |
| luz | |
| obciążenie |
|
Legenda:
min: | |
| Acer Swift X SFX16-52G-52VE i5-1240P, A370M, Micron 3400 MTFDKBA512TFH 512GB, , 2560x1600, 16" | Acer Aspire 5 A515-57G-53N8 i5-1240P, GeForce RTX 2050 Mobile, Micron 2450 512GB MTFDKBA512TFK, IPS, 1920x1080, 15.6" | Lenovo ThinkPad T16 G1 21BWS00200 i5-1240P, Iris Xe G7 80EUs, Samsung PM9A1 MZVL2512HCJQ, IPS, 1920x1200, 16" | Asus ZenBook Flip 15 Q539ZD i7-12700H, A370M, SK Hynix HFM001TD3JX013N, OLED, 2880x1620, 15.6" | Lenovo IdeaPad Gaming 3 15IAH7 i5-12500H, GeForce RTX 3050 Ti Laptop GPU, Intel SSD 660p SSDPEKNW512G8, IPS, 1920x1080, 15.6" | Lenovo ThinkBook 16 G4+ IAP i7-12700H, GeForce RTX 2050 Mobile, Micron 2450 1TB MTFDKCD1T0TFK, IPS, 2560x1600, 16" | Przeciętny Intel Arc A370M | Średnia w klasie Multimedia | |
|---|---|---|---|---|---|---|---|---|
| Power Consumption | 11% | 38% | -40% | -55% | -14% | -11% | -7% | |
| Idle Minimum * (Watt) | 5.7 | 4 30% | 2.9 49% | 9.1 -60% | 8 -40% | 5 12% | 6.17 ? -8% | 5.69 ? -0% |
| Idle Average * (Watt) | 8 | 8 -0% | 6 25% | 11.9 -49% | 10 -25% | 11.2 -40% | 9.17 ? -15% | 10.1 ? -26% |
| Idle Maximum * (Watt) | 10.4 | 13 -25% | 6.9 34% | 12.4 -19% | 16 -54% | 11.6 -12% | 11.3 ? -9% | 12.3 ? -18% |
| Load Average * (Watt) | 74 | 62 16% | 27.3 63% | 101.3 -37% | 99 -34% | 89.3 -21% | 81.8 ? -11% | 65.3 ? 12% |
| Witcher 3 ultra * (Watt) | 65 | 60 8% | 42.6 34% | 85.6 -32% | 144.6 -122% | 83 -28% | ||
| Load Maximum * (Watt) | 108.5 | 70 35% | 81.53 25% | 155.7 -44% | 168 -55% | 102 6% | 124.1 ? -14% | 112.5 ? -4% |
* ... im mniej tym lepiej
Power consumption - The Witcher 3 / Stress test
Power consumption with external monitor
Żywotność baterii
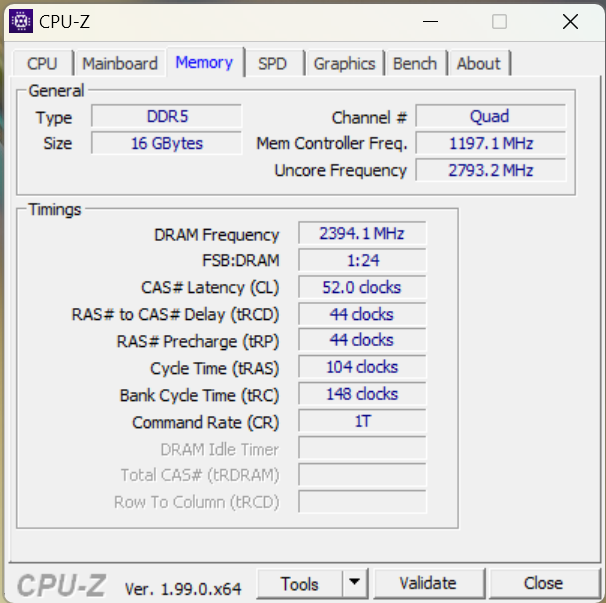
Wysoka wydajność m.in.Intel Core i5-1240Pjest widoczna w teście czasu pracy na akumulatorze. Akumulator wytrzymał prawie 10 godzin podczas symulowanego surfowania, a także podczas odtwarzania filmu Full HD w ciągłej pętli. Co najwyżej pojemność akumulatora 56 Wh jest nieco powyżej średniej.
Brak redukcji poboru mocy w trybie akumulatorowym przekłada się na czas pracy podczas dużych obciążeń. Niecała godzina nie jest zadowalająca. W końcu do dyspozycji jest sporo mocy, nawet jeśli tylko na krótko.
| Acer Swift X SFX16-52G-52VE i5-1240P, A370M, 56 Wh | Acer Aspire 5 A515-57G-53N8 i5-1240P, GeForce RTX 2050 Mobile, 50 Wh | Asus ZenBook Flip 15 Q539ZD i7-12700H, A370M, 96 Wh | Lenovo IdeaPad Gaming 3 15IAH7 i5-12500H, GeForce RTX 3050 Ti Laptop GPU, 60 Wh | HP Omen 16-c0077ng R7 5800H, Radeon RX 6600M, 70 Wh | Lenovo ThinkBook 16 G4+ IAP i7-12700H, GeForce RTX 2050 Mobile, 71 Wh | Średnia w klasie Multimedia | |
|---|---|---|---|---|---|---|---|
| Czasy pracy | 15% | 99% | -39% | -33% | 27% | 59% | |
| H.264 (h) | 9.8 | 7 -29% | 12.6 29% | 16.4 ? 67% | |||
| WiFi v1.3 (h) | 9.7 | 7.1 -27% | 9.4 -3% | 5.9 -39% | 6.1 -37% | 8.2 -15% | 12 ? 24% |
| Load (h) | 0.9 | 1.4 56% | 2.7 200% | 1.5 67% | 1.675 ? 86% | ||
| Witcher 3 ultra (h) | 1.4 |
Za
Przeciw
Werdykt - dość przeciętne oceny dla Acer Swift X
Po karcie graficznej w Acerze SFX16-52G nie należy się spodziewać poważnej wydajności w grach. Niemniej jednak podstawowe oczekiwania są spełnione nawet w przypadku skomplikowanych aplikacji 3D. Ponadto, procesor graficzny doskonale współgra z procesorem i5-1240P. W efekcie otrzymujemy notebooka, który szybko poradzi sobie z większością zadań, a także wykona intensywne graficznie obliczenia.
Szczytowych wartości na próżno szukać. Słabości, które idą w parze z rozbudowaną, czasem nadmierną wydajnością, są w tym przypadku równie nieobecne. Laptop nie robi się zbyt głośny ani zbyt gorący, a czasy pracy na akumulatorze są również znakomite mimo przeciętnej pojemności. Poza tym spodobała nam się opcja łatwej rozbudowy przestrzeni dyskowej i ogólnie dobra łatwość utrzymania.
Mocne wrażenie z odpowiednimi dla notebooka multimedialnego wskaźnikami wydajności i dobrym wyświetlaczem jest w Acerze Swift X SFX16 szargane przez liczne, w niektórych przypadkach niepotrzebne, niedociągnięcia.
Acer poczynił oszczędności w innych obszarach, by móc zaimplementować przekonujące cechy podstawowe, w tym dobry wyświetlacz. Obudowa ustępuje zbyt mocno w obszarze pokrywy wyświetlacza. Również urządzenia wejścia mogłyby być wyższej jakości, zwłaszcza touchpad
Poza tym system chłodzenia nie jest do końca przekonujący; wysoka wydajność komponentów mogłaby zostać podkreślona nieco lepszym wykonaniem. Wadliwe głośniki i brak gniazda kart pamięci odbierają nieco to, co w gruncie rzeczy jest bardzo dobrym wrażeniem ogólnym
Mimo to Swift X pozostaje dobrym wyborem, jeśli edycja zdjęć i filmów jest najbardziej wymagającym graficznie zadaniem. W końcu sama wydajność jest dokładnie na poziomie, który jest wymagany tuż poniżej notebooków dla graczy. Z drugiej strony, jeśli chcesz od czasu do czasu pograć, Lenovo ThinkBook 16 G4+ lub, jeszcze lepiej, HP Omen 16-c0077ng są bardziej odpowiednim wyborem. Jeśli na biurku mamy do dyspozycji wysokiej jakości monitor, można by polecić także Acer Aspire 5 A515, którego wyświetlacz tak rozczarowująco wypadł w naszym teście.
Cena i dostępność
Testowany przez nas Acer Swift X SFX16-52G-52VE jest obecnie dostępny na stronie notebooksbilliger.de za 1 299 EUR (~1 291 USD). Wariant z szybszym procesorem i7 oraz dyskiem SSD 1 TB kosztuje 1 499 EUR (~1 490 USD) i 1 TB dyskiem SSD kosztuje 1 499 euro (~1 490 dolarów).
Acer Swift X SFX16-52G-52VE
- 21/10/2022 v7 (old)
Translated
Price comparison

