Werdykt - Niezwykle lekki, ale nie bez pewnych poświęceń
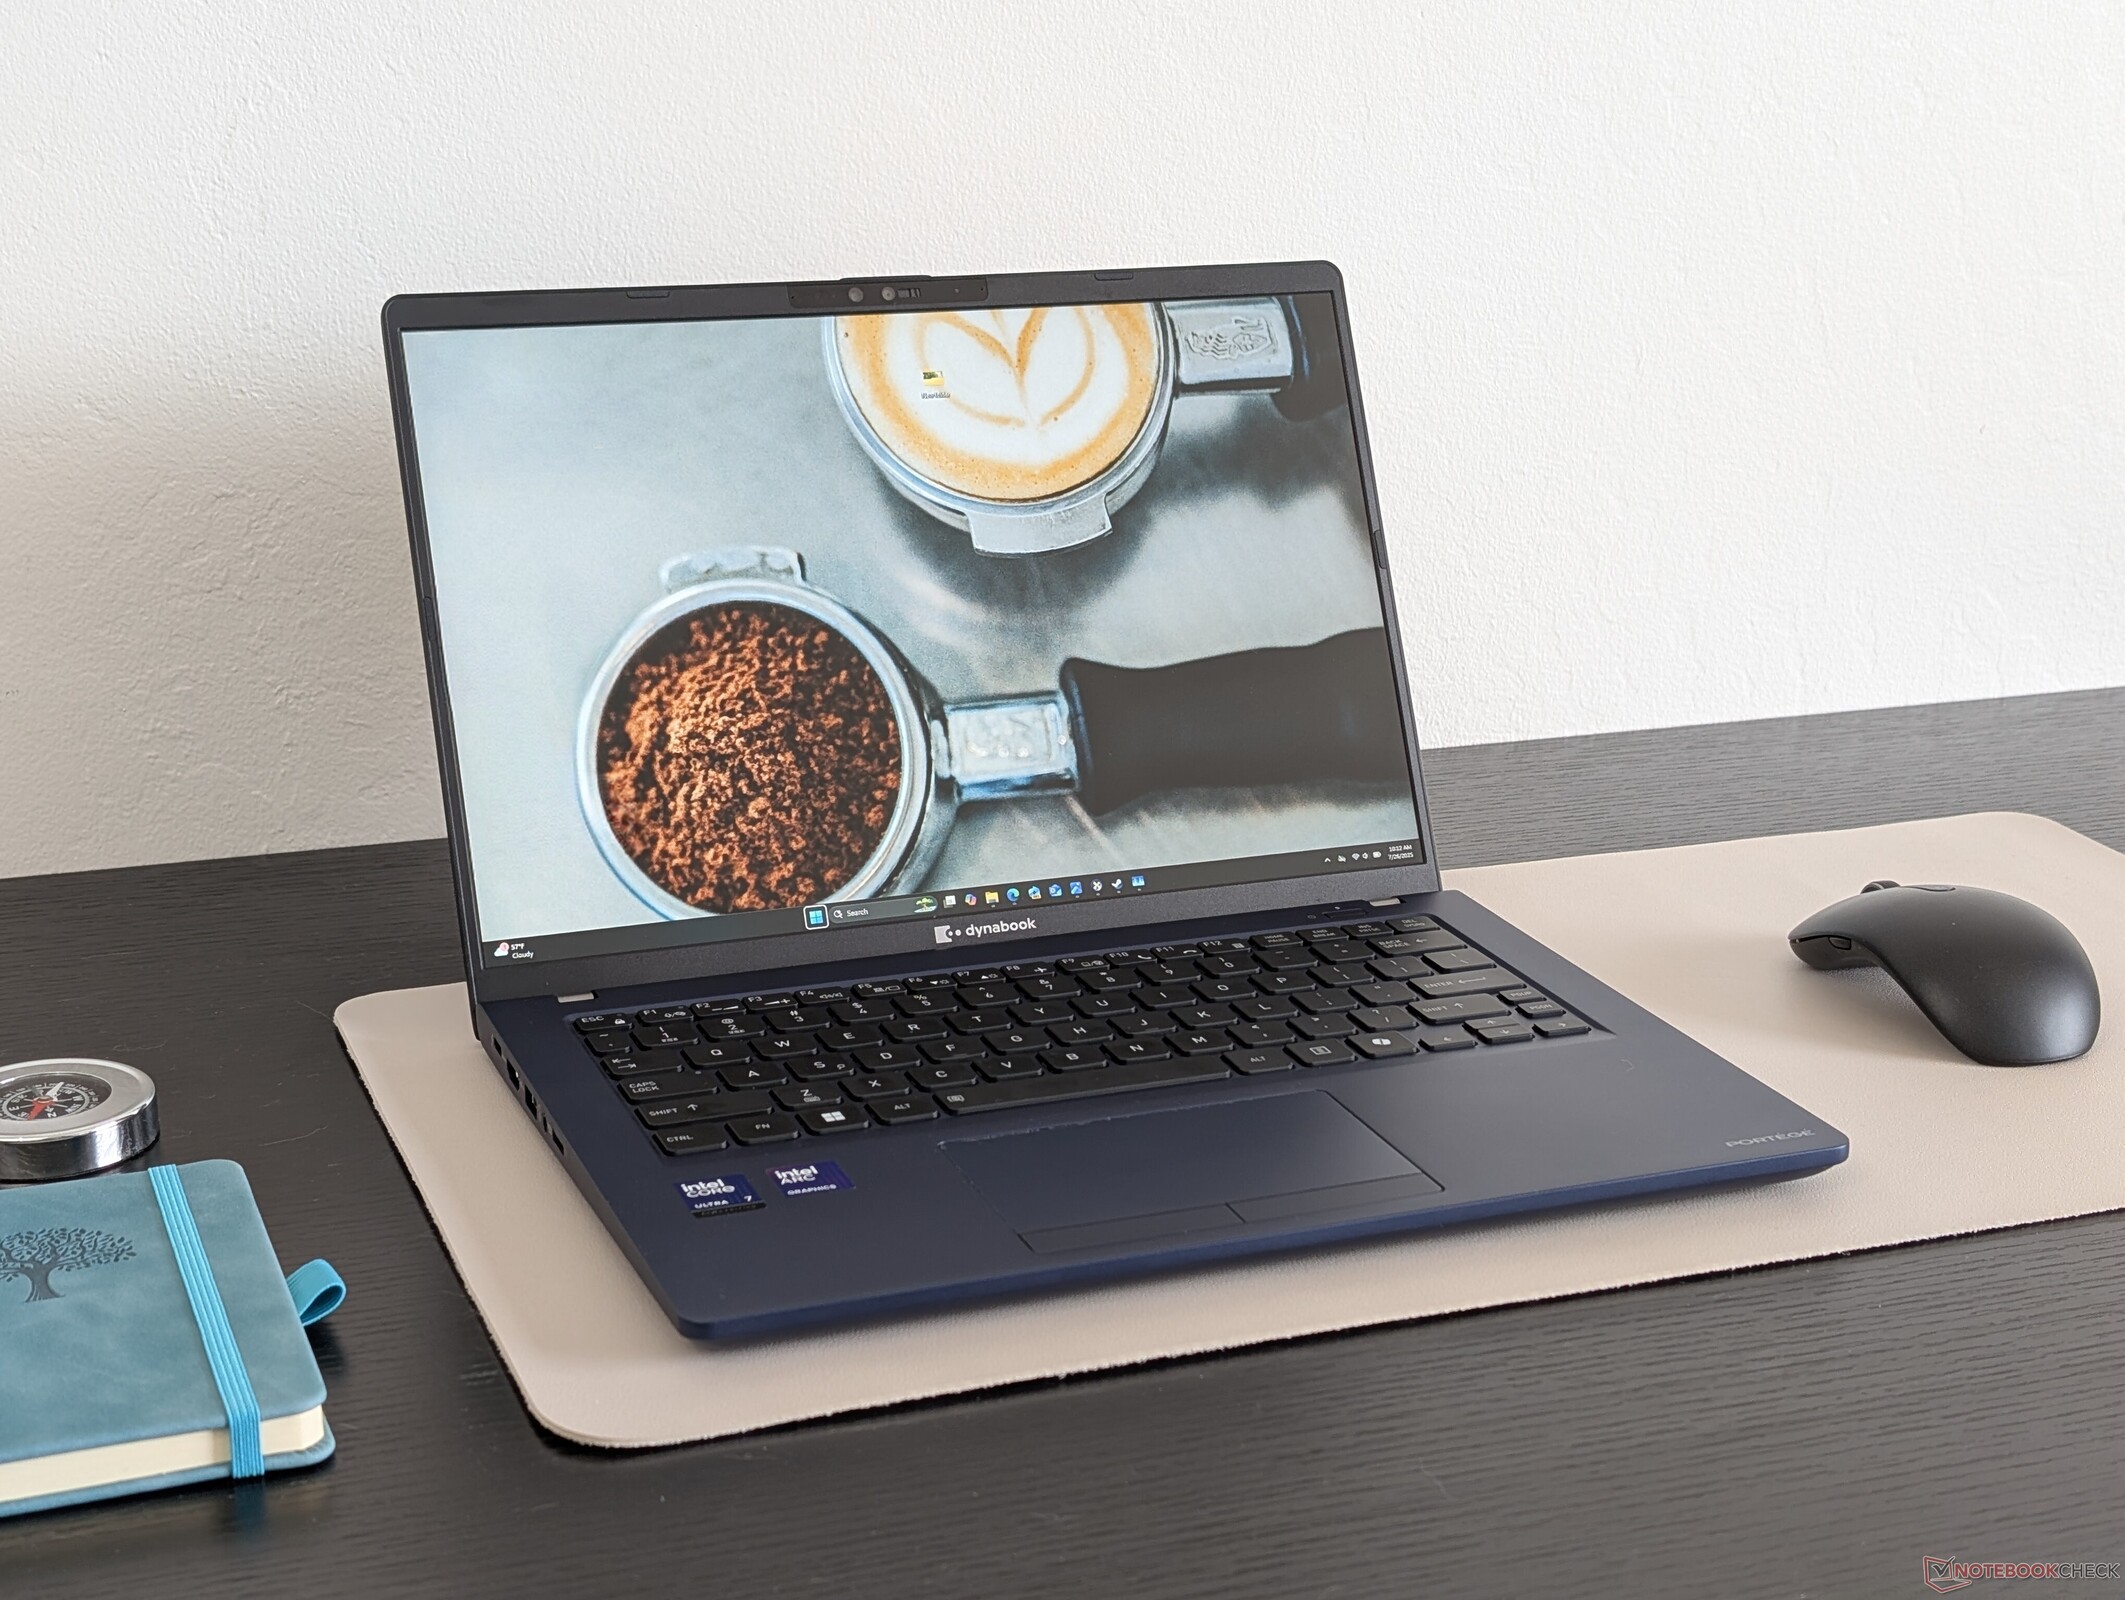
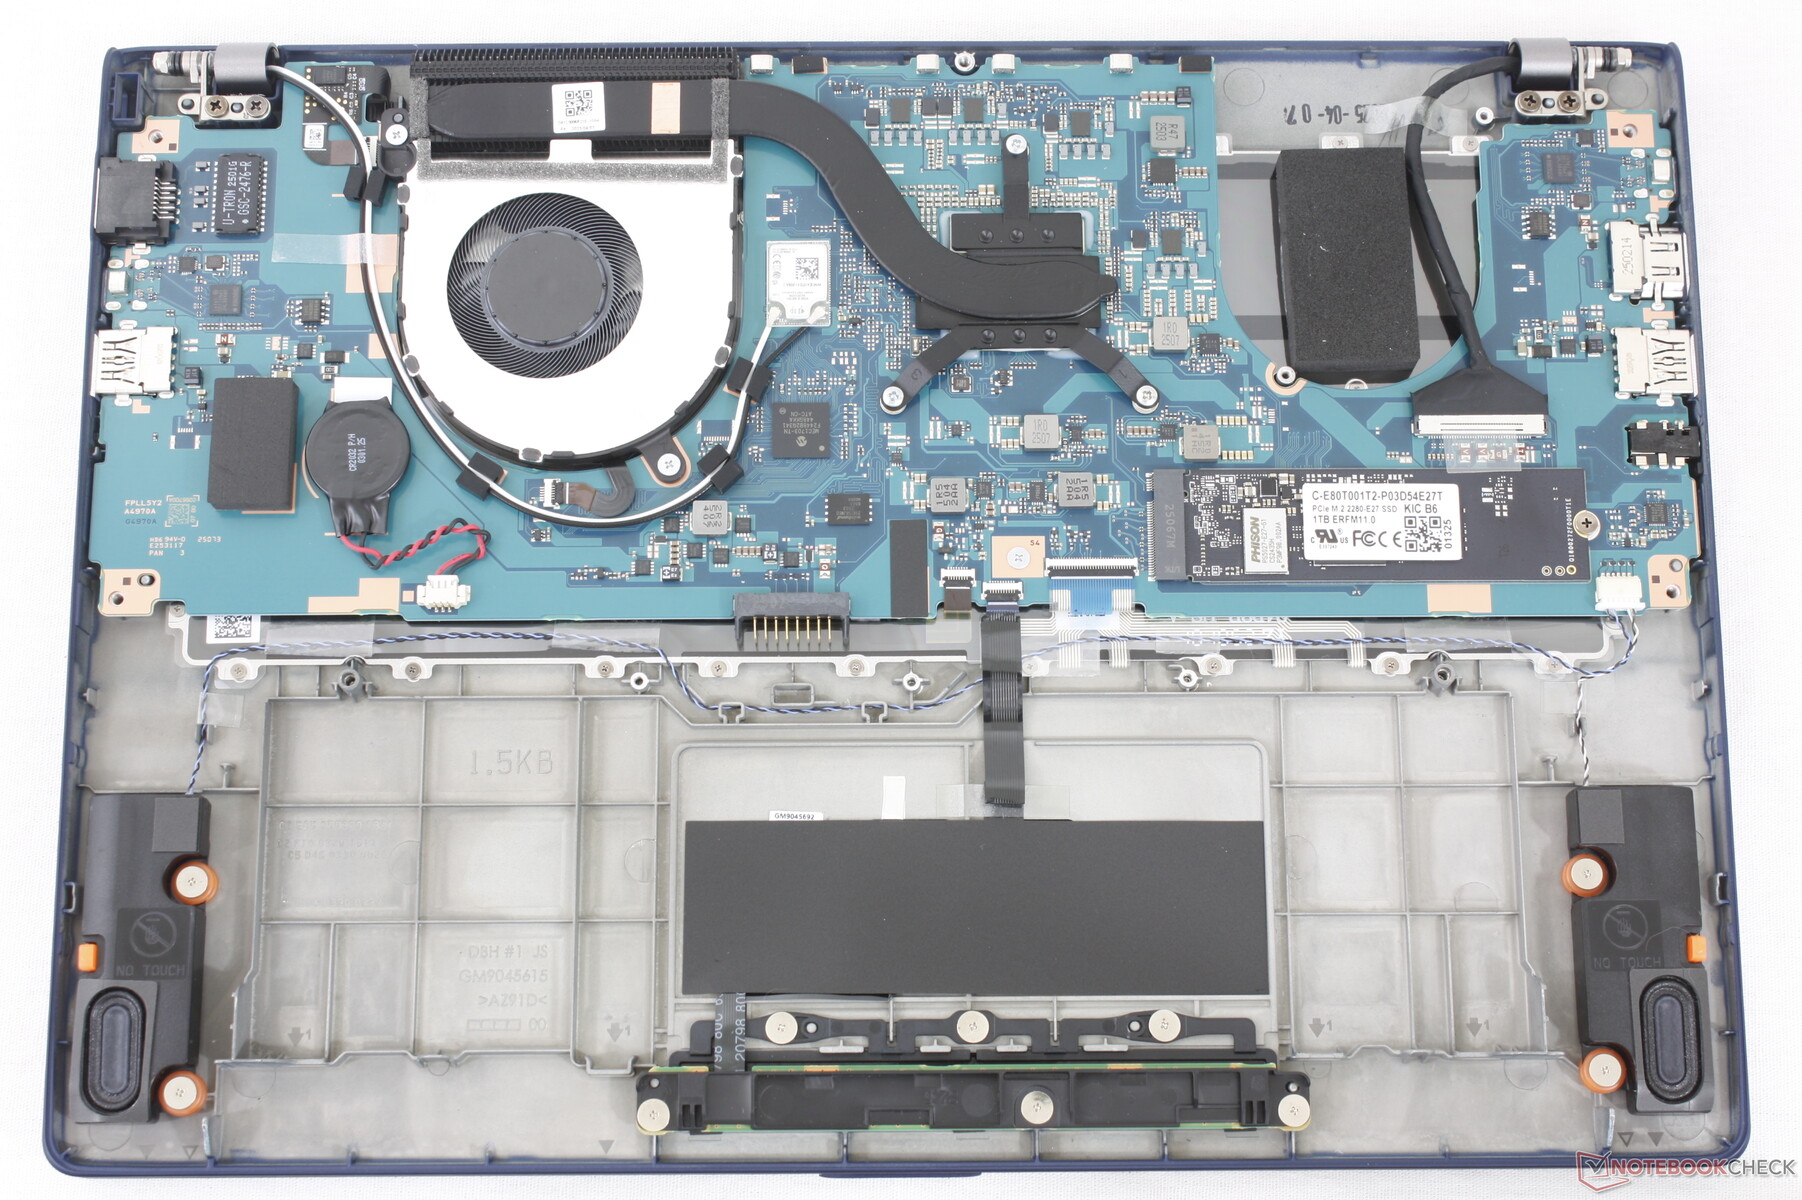
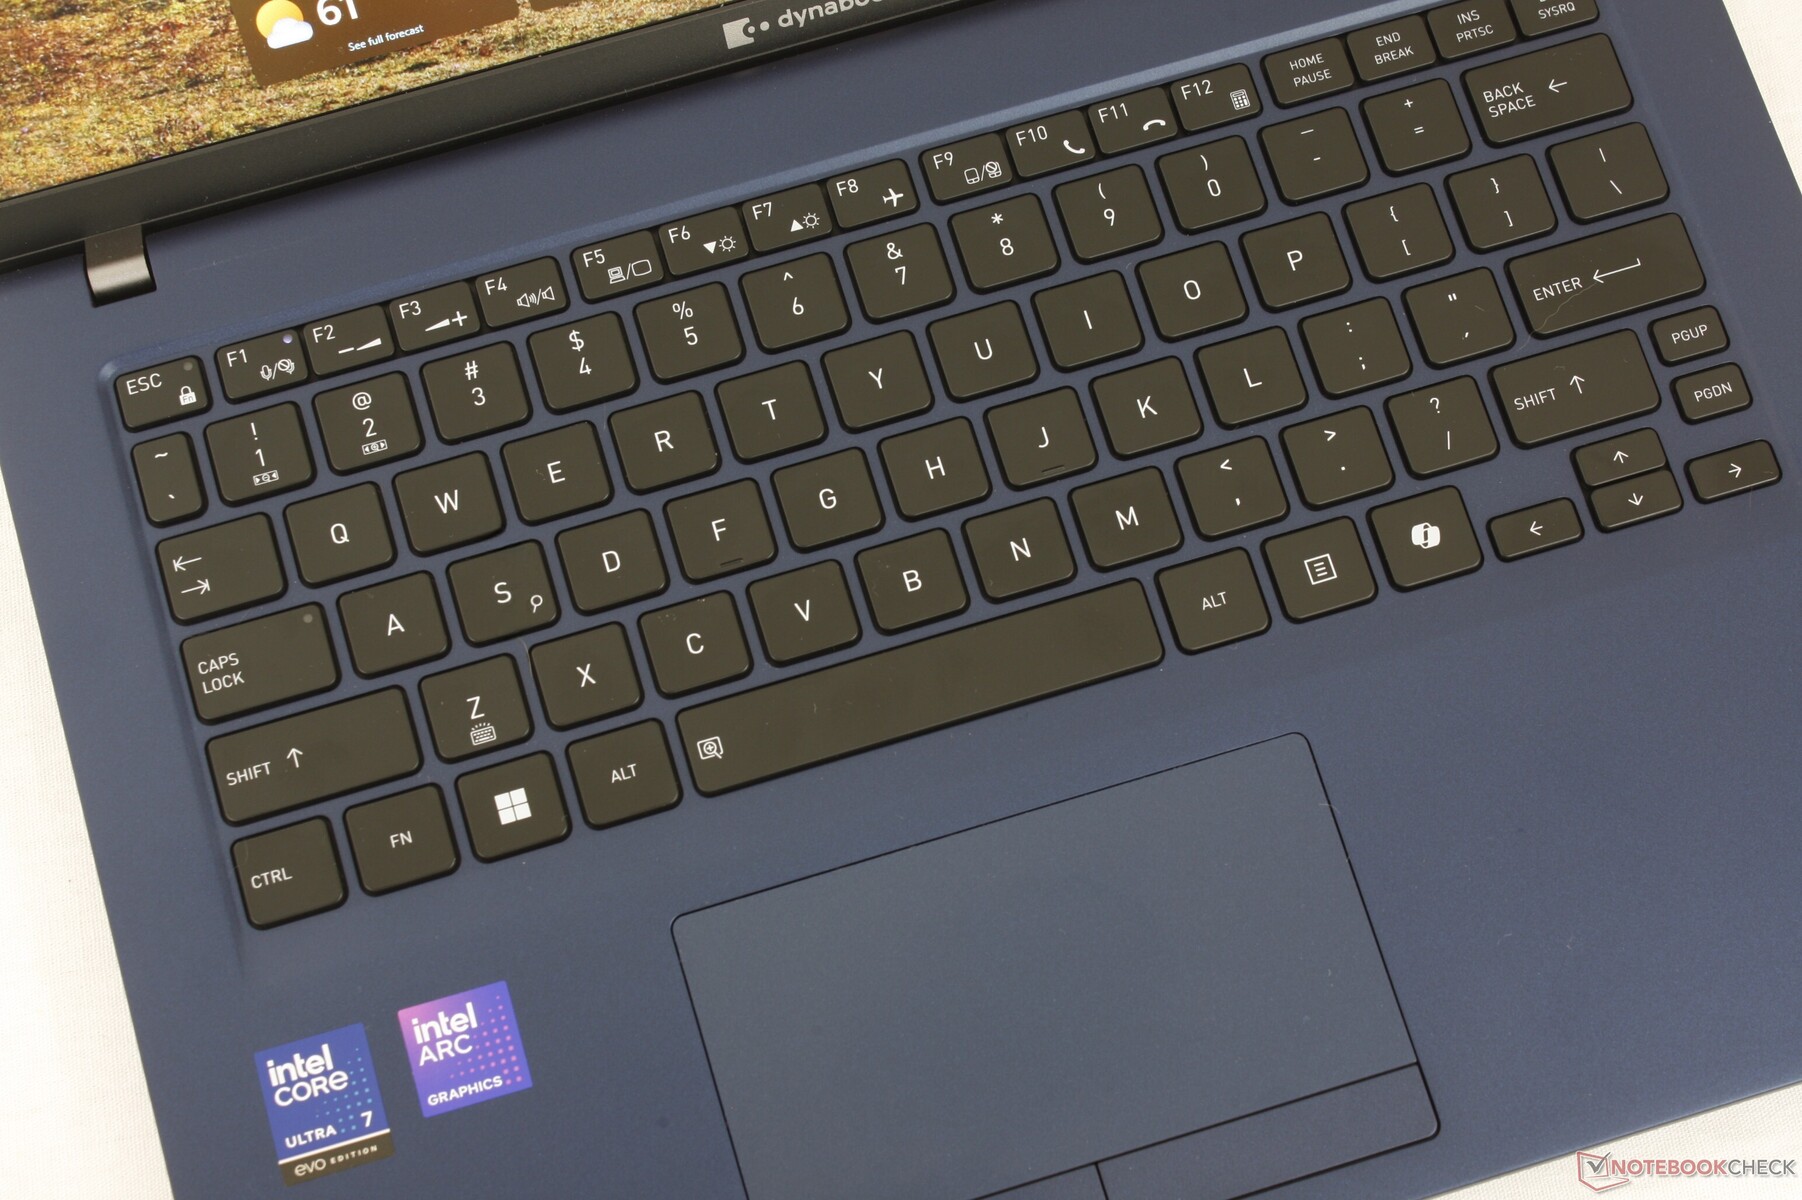
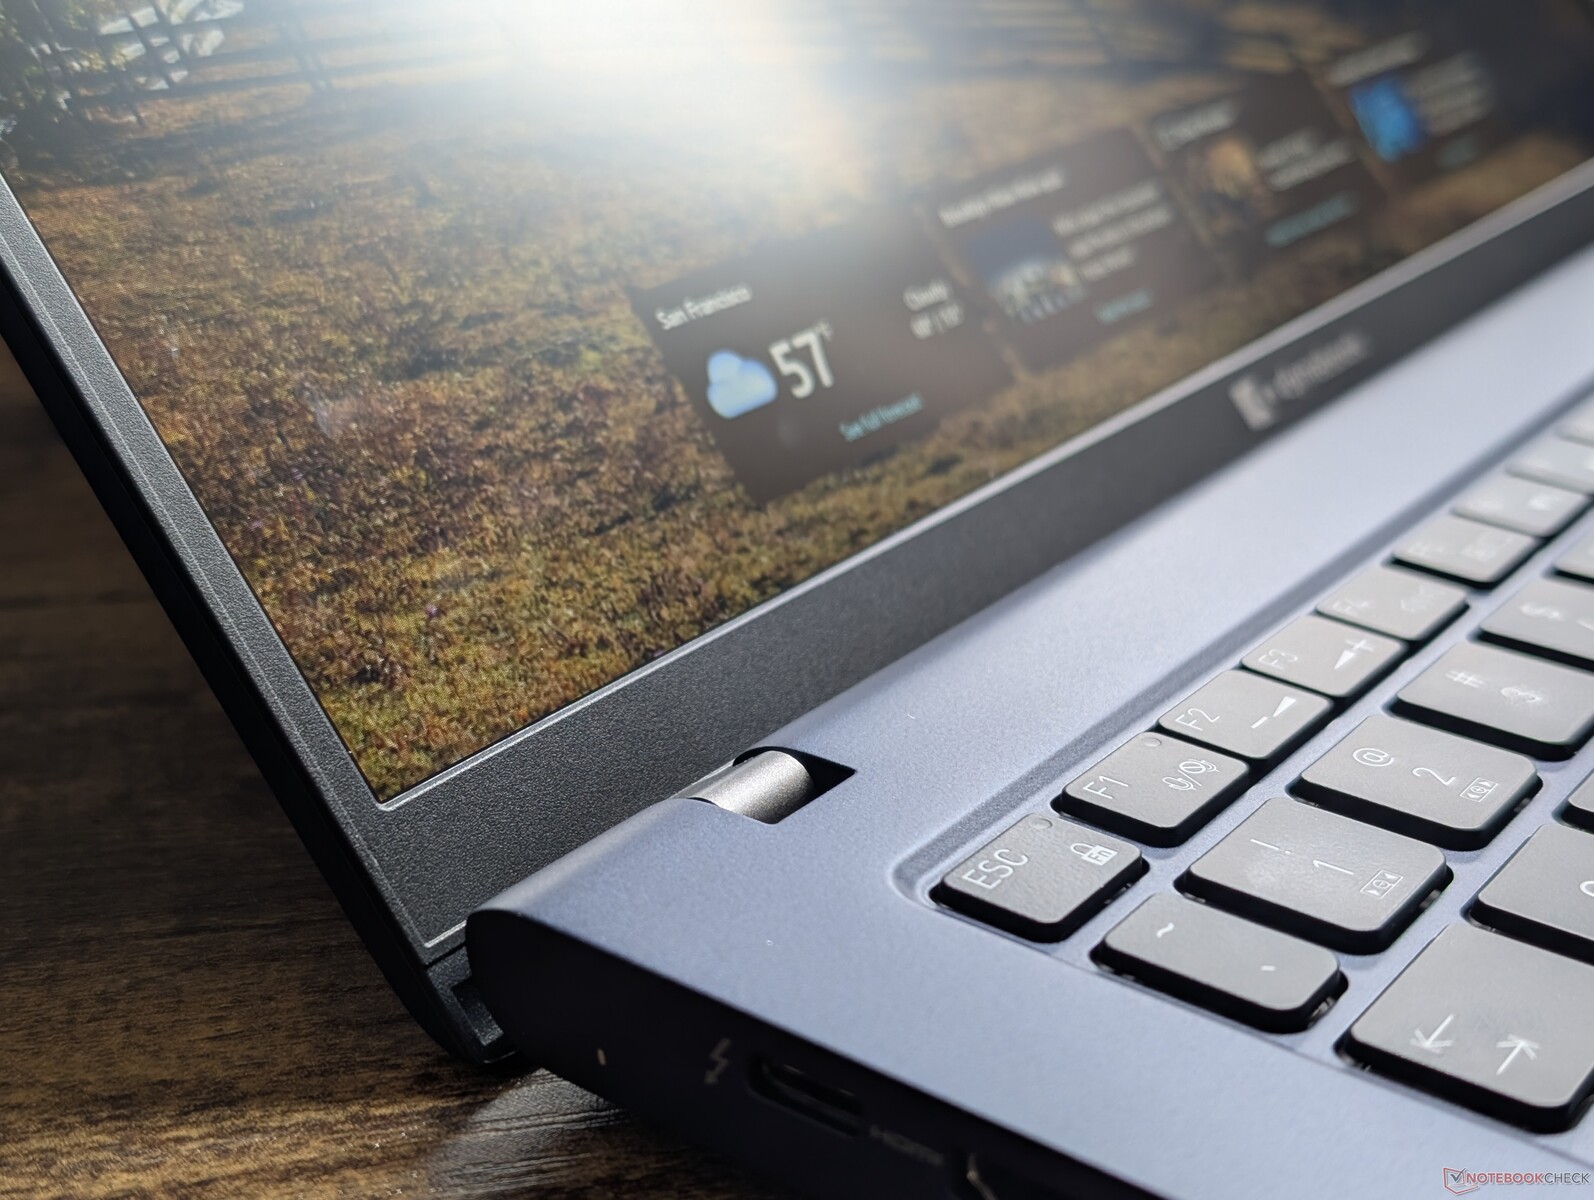
Dynabook Portege Z40L-N wyróżnia się tym, że jest jednym z najlżejszych 14-calowych laptopów z systemem Windows na rynku. Podczas gdy takie osiągnięcie zwykle wiąże się z poważnymi wadami, Dynabookowi udało się zintegrować zdrową liczbę portów, wymienny dysk SSD M.2 2280, pełne kolory sRGB oraz wygodną klawiaturę i touchpad pomimo niskiej wagi. Nie możemy przecenić tego, o ile łatwiej jest korzystać z Dynabooka w podróży w porównaniu do cięższych 14-calowych laptopów, takich jak Samsung Galaxy Book Pro 14 lub HP EliteBook X G1i 14 AI.
Wady są jednak obecne. Oprócz jawnego braku obsługi sieci WAN, procesor i dysk SSD są bardziej podatne na dławienie wydajności niż w wielu innych subnotebookach z podobnymi opcjami konfiguracji. Obudowa lub szkielet również wygina się i skręca łatwiej niż sztywniejszy MacBook Air lub Dell XPS. Bardziej wymagający użytkownicy mogą zatem rozważyć cięższe laptopy ze względu na dodatkową moc i sztywność.
Za
Przeciw
Cena i dostępność
Dynabook Z40L-N nie jest powszechnie dostępny za pośrednictwem zewnętrznych sprzedawców lub sklepów. Systemy można nabyć bezpośrednio od producenta tutaj ceny zaczynają się od 1700 USD za konfigurację Core Ultra 5 do 2200 USD za naszą konfigurację testową.
- $2,130.95dynabook Portégé Z40L-N 14" WUXGA Touchscreen Ultra-Light Business Laptop, Intel Core Ultra 5 226V, 16GB LPDDR5X, 512GB PCIe SSD, Windows 11 Pro, Wi-Fi 7, Thunderbolt 4, 5MP Webcam, 2.11lb
- $1,059.00dynabook Satellite Pro C50-K 15.6" FHD Business Laptop, Intel Core 5 120U, 16GB DDR4 RAM, 512GB PCIe NVMe SSD, Windows 11 Pro, Wi-Fi 6E, USB-C, HDMI, RJ-45, Spill-Resistant Keyboard
- $1,779.00dynabook Tecra A40-M 14" WUXGA Business Laptop, Intel Core Ultra 7 155U, 32GB DDR5, 1TB PCIe SSD, Windows 11 Pro, Wi-Fi 6E, Thunderbolt 4, 5MP AI Webcam, Fingerprint
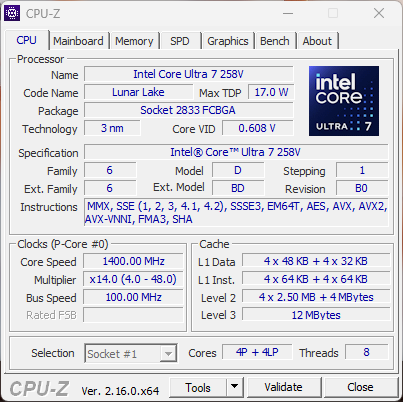
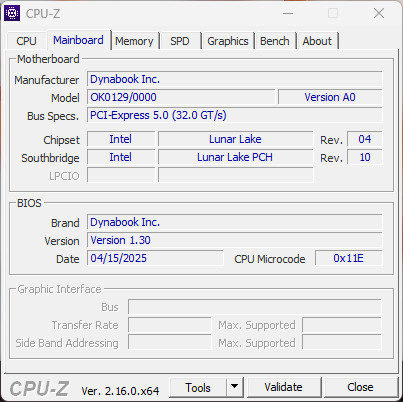
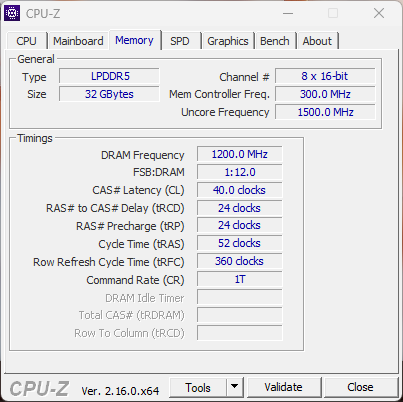
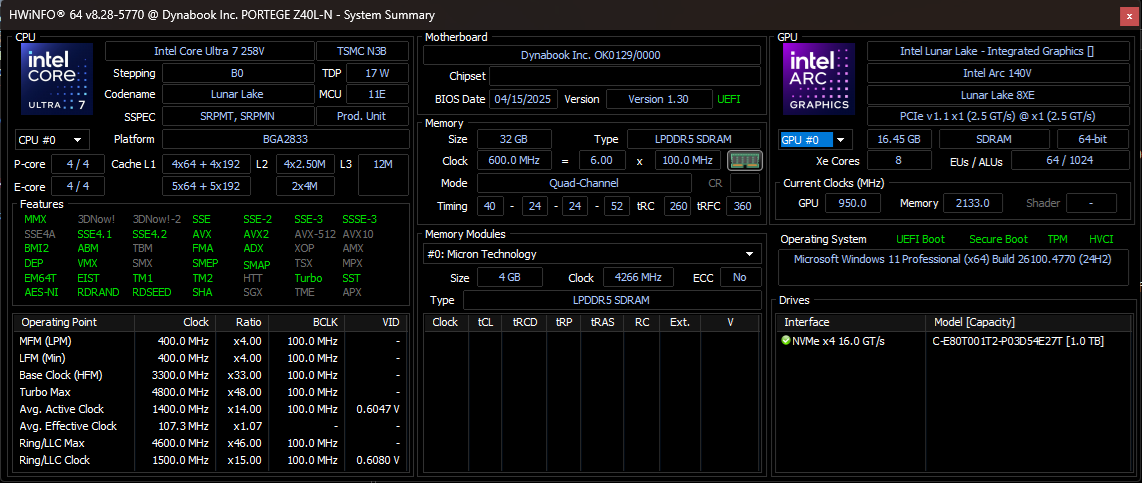
Seria Portege Z koncentruje się na ultralekkich laptopach biznesowych, a 14-calowy Portege Z40L-N jest najnowszym modelem w rodzinie. Nasza jednostka testowa to konfiguracja z wyższej półki z procesorem Lunar Lake Core Ultra 7 258V za około 2200 USD, podczas gdy opcja Core Ultra 5 z połową pamięci RAM jest dostępna za 1700 USD. Wszystkie opcje są standardowo wyposażone w ten sam wyświetlacz IPS 1200p i 3-letnią gwarancję.
Alternatywy dla Portege Z40L-N obejmują inne ultralekkie 14-calowe laptopy biznesowe, takie jak Seria LG Gram lub Samsung Galaxy Book series.
Więcej recenzji Dynabook:
Specyfikacje
Przypadek
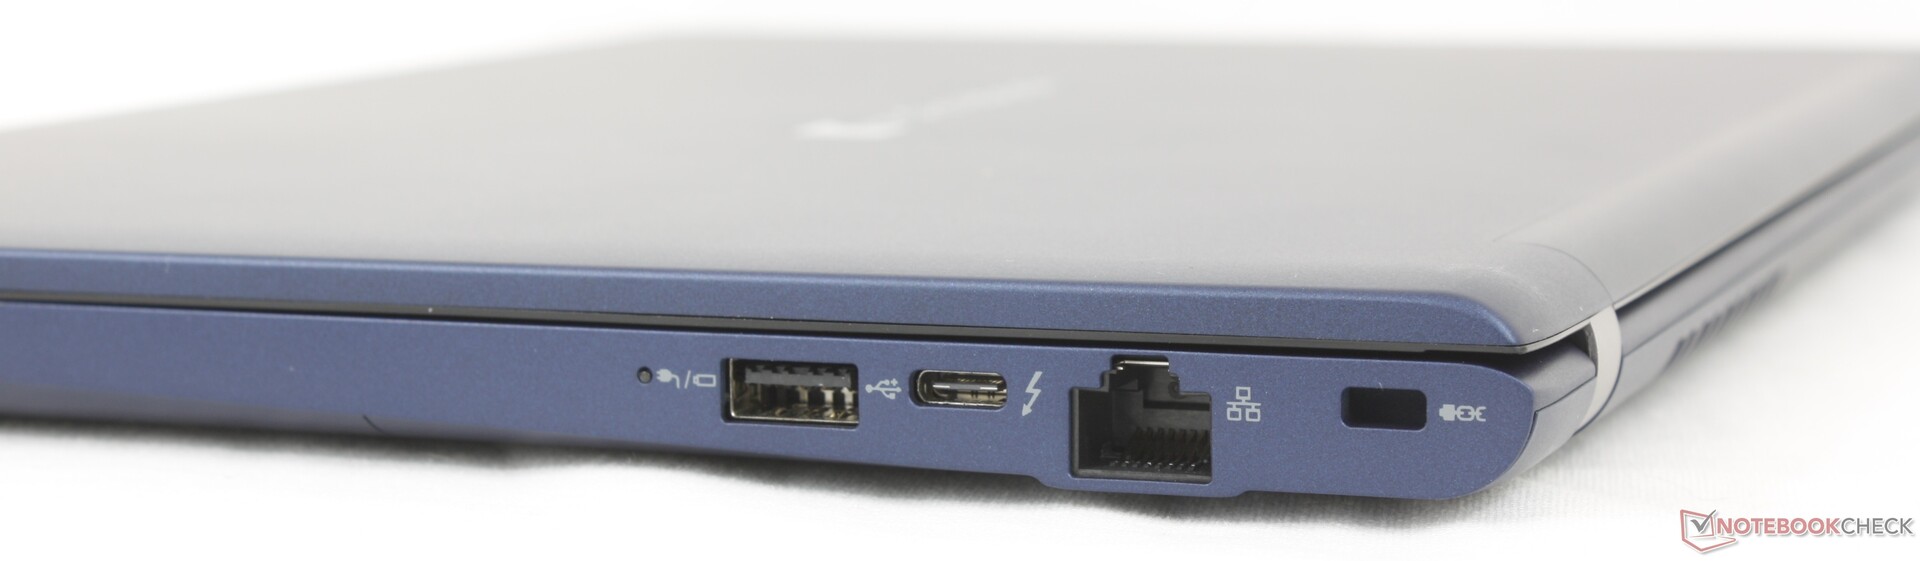
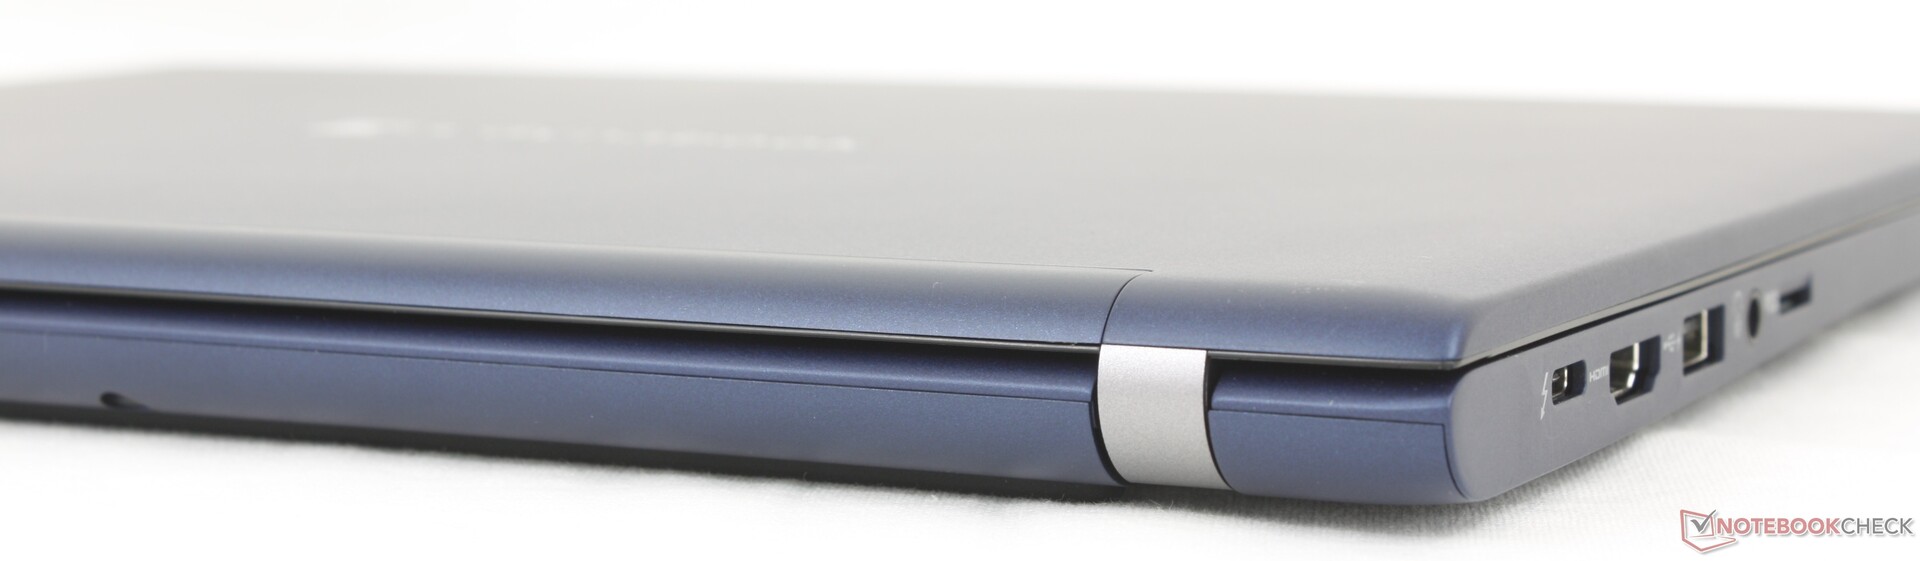
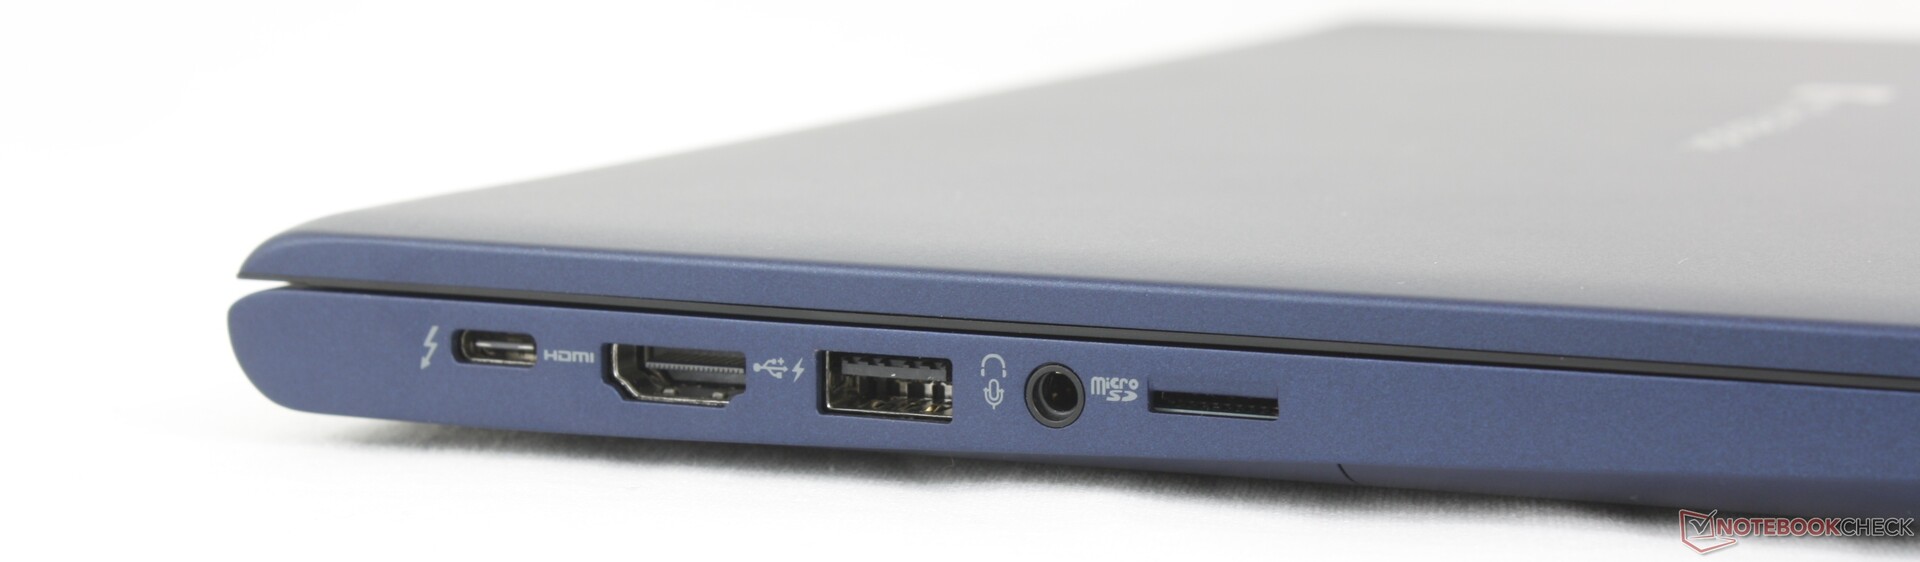
Łączność
Czytnik kart SD
| SD Card Reader | |
| average JPG Copy Test (av. of 3 runs) | |
| LG Gram Style 14Z90RS-G.AD7AG (AV PRO microSD 128 GB V60) | |
| Dynabook Portégé X40-K (AV Pro SD microSD V60) | |
| Lenovo ThinkBook 14 Gen 8 21SJ007SGE | |
| Dynabook Portege Z40L-N (AV PRO microSD 128 GB V60) | |
| maximum AS SSD Seq Read Test (1GB) | |
| Lenovo ThinkBook 14 Gen 8 21SJ007SGE | |
| Dynabook Portege Z40L-N (AV PRO microSD 128 GB V60) | |
| LG Gram Style 14Z90RS-G.AD7AG (AV PRO microSD 128 GB V60) | |
| Dynabook Portégé X40-K (AV Pro SD microSD V60) | |
Komunikacja
| Networking | |
| iperf3 transmit AXE11000 | |
| HP EliteBook X G1i 14 AI | |
| LG Gram Style 14Z90RS-G.AD7AG | |
| Dell Pro 14 Premium | |
| Lenovo ThinkBook 14 Gen 8 21SJ007SGE | |
| Dynabook Portege Z40L-N | |
| iperf3 receive AXE11000 | |
| HP EliteBook X G1i 14 AI | |
| Lenovo ThinkBook 14 Gen 8 21SJ007SGE | |
| Dell Pro 14 Premium | |
| LG Gram Style 14Z90RS-G.AD7AG | |
| Dynabook Portege Z40L-N | |
| iperf3 transmit AXE11000 6GHz | |
| LG Gram Style 14Z90RS-G.AD7AG | |
| Dynabook Portégé X40-K | |
| Dell Pro 14 Premium | |
| HP EliteBook X G1i 14 AI | |
| Dynabook Portege Z40L-N | |
| Lenovo ThinkBook 14 Gen 8 21SJ007SGE | |
| iperf3 receive AXE11000 6GHz | |
| LG Gram Style 14Z90RS-G.AD7AG | |
| HP EliteBook X G1i 14 AI | |
| Dell Pro 14 Premium | |
| Lenovo ThinkBook 14 Gen 8 21SJ007SGE | |
| Dynabook Portégé X40-K | |
| Dynabook Portege Z40L-N | |
Kamera internetowa


Konserwacja
Urządzenia wejściowe
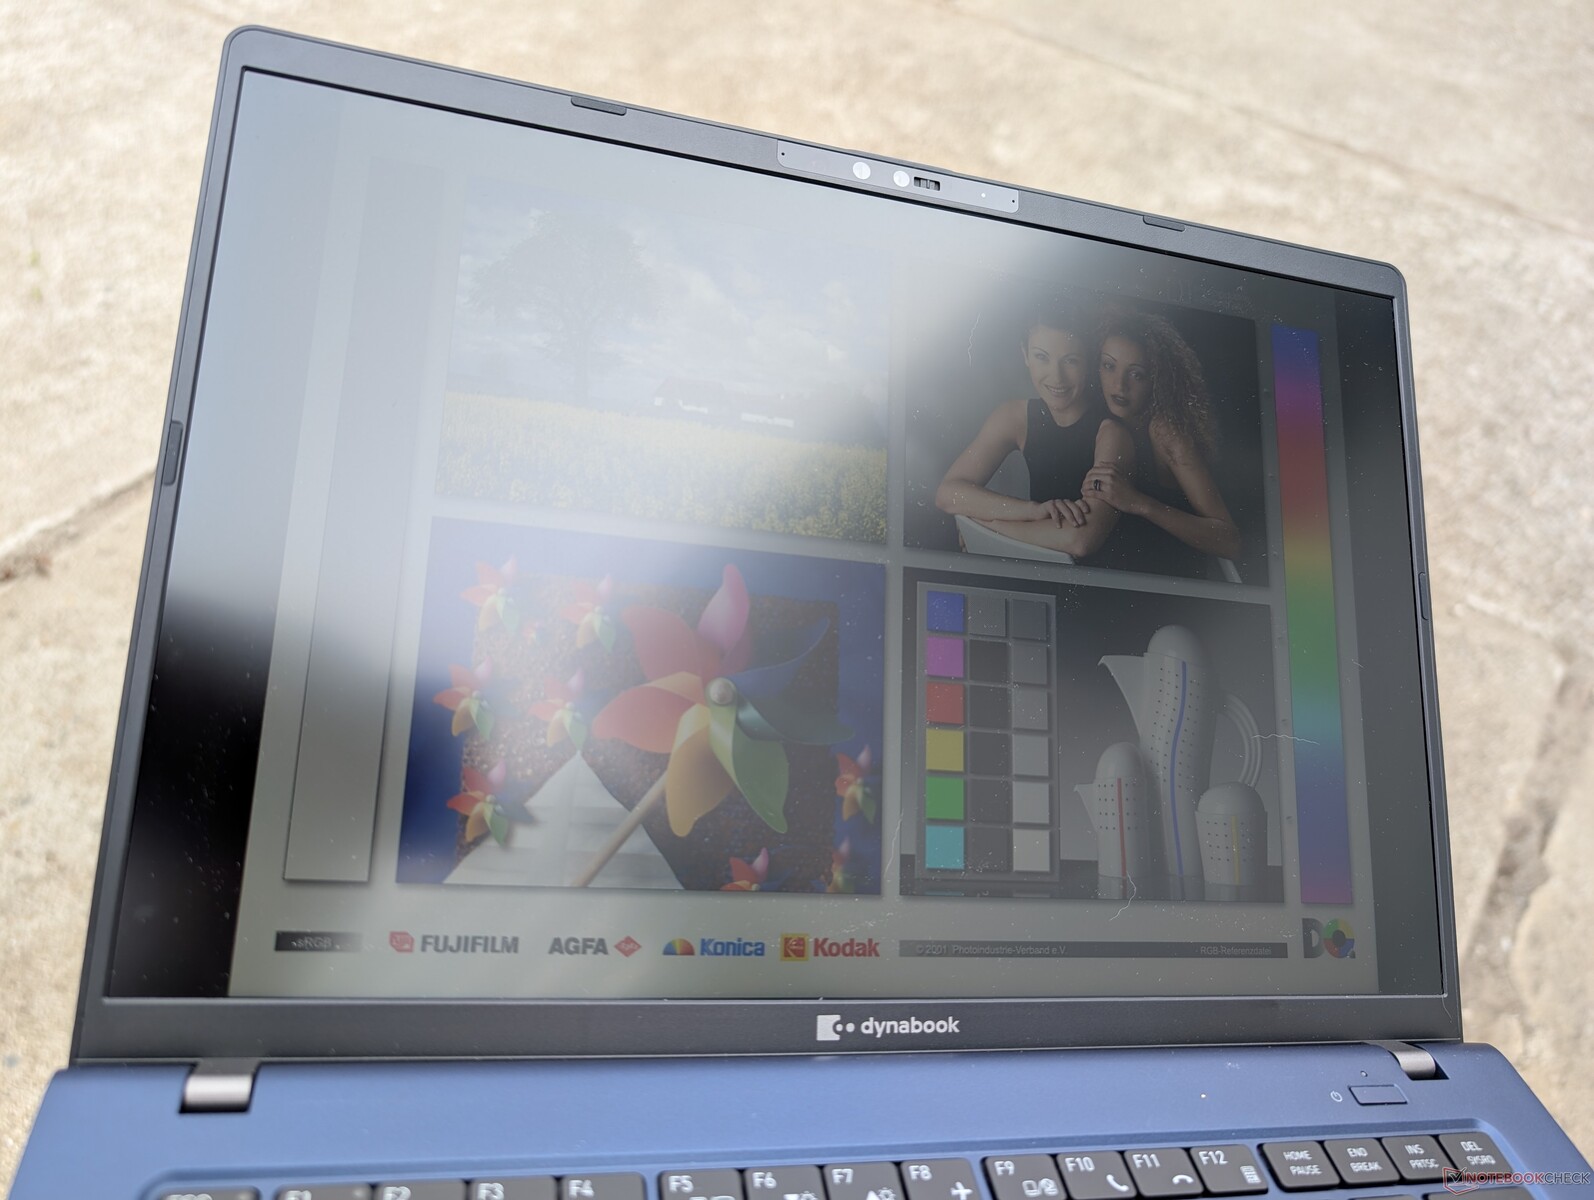
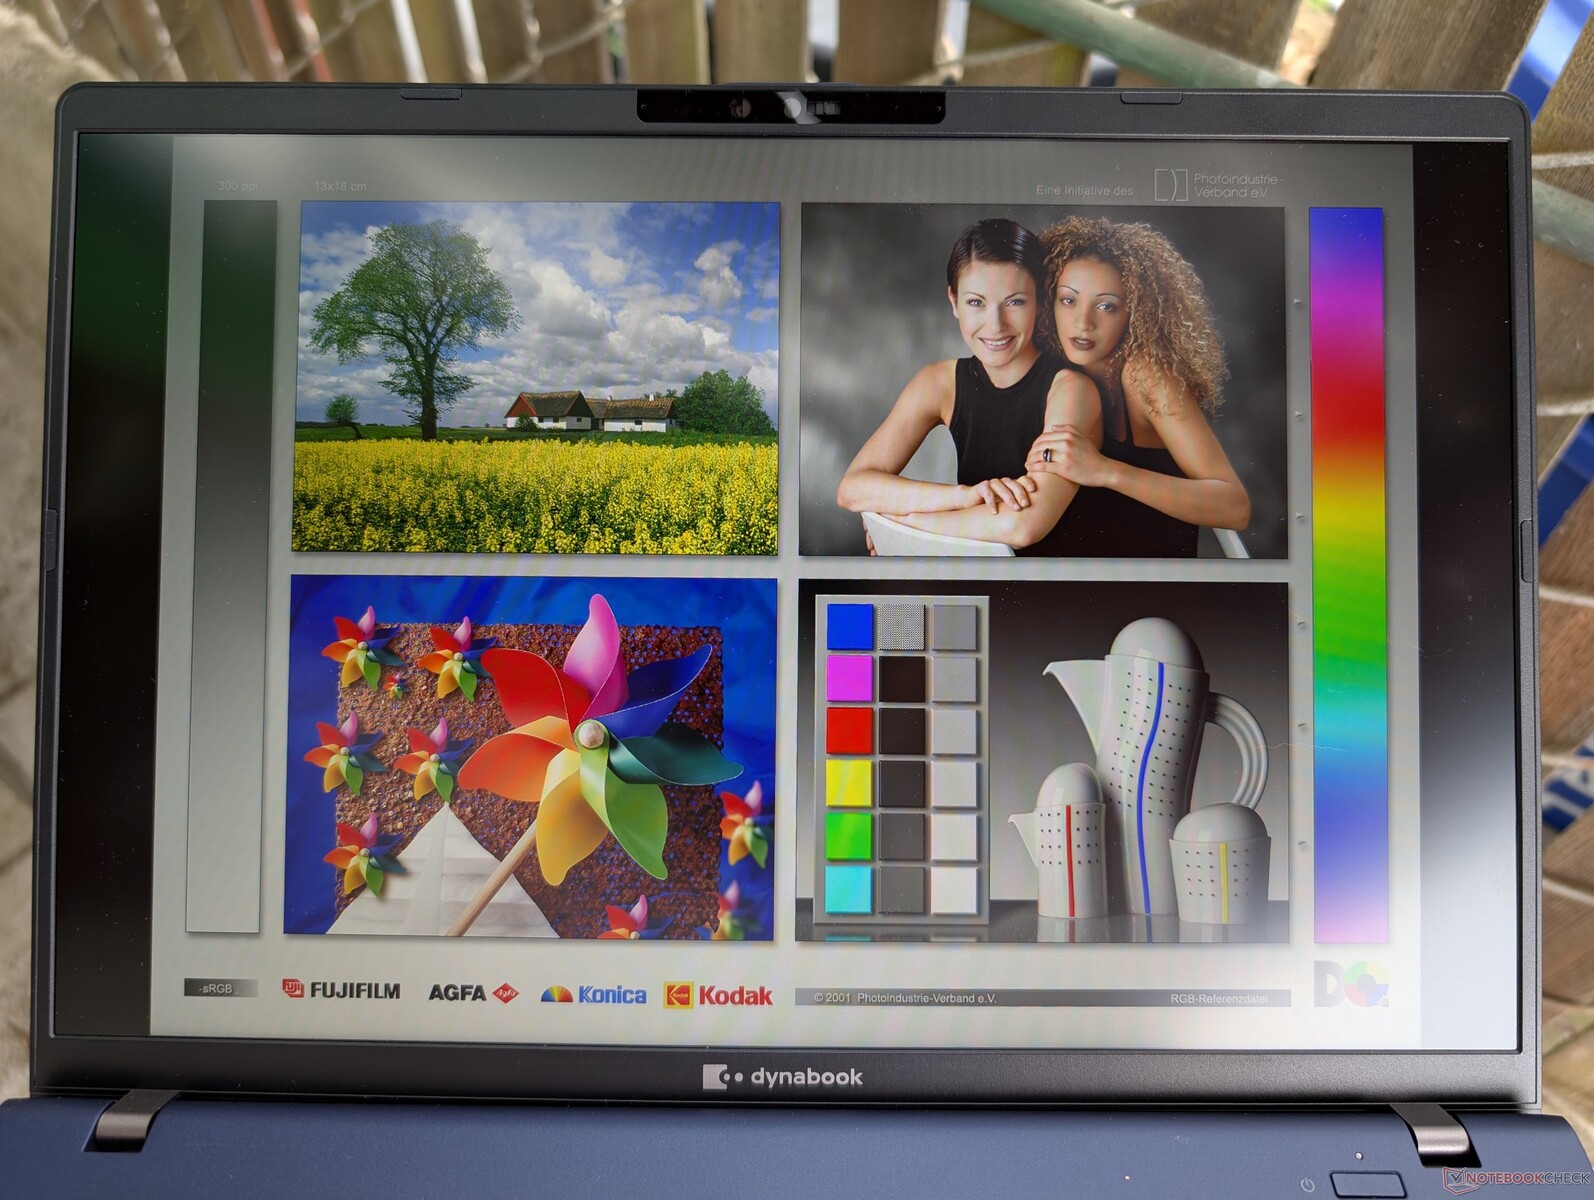
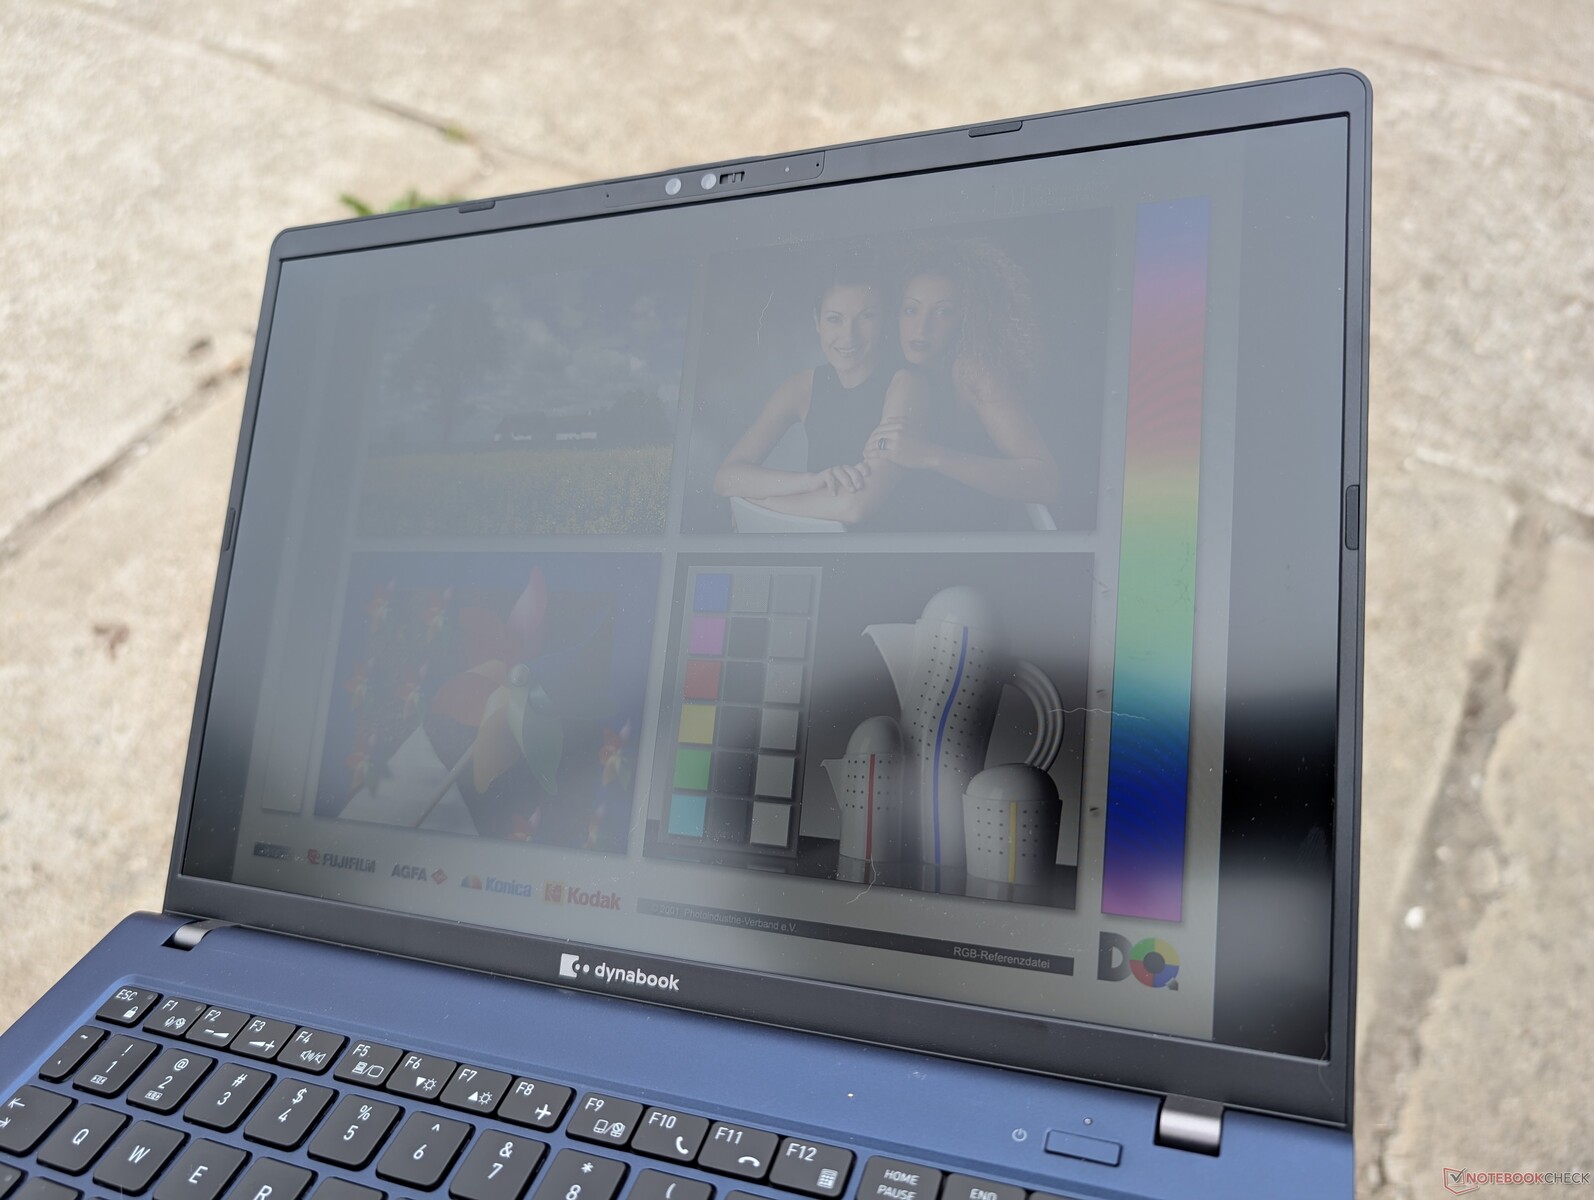
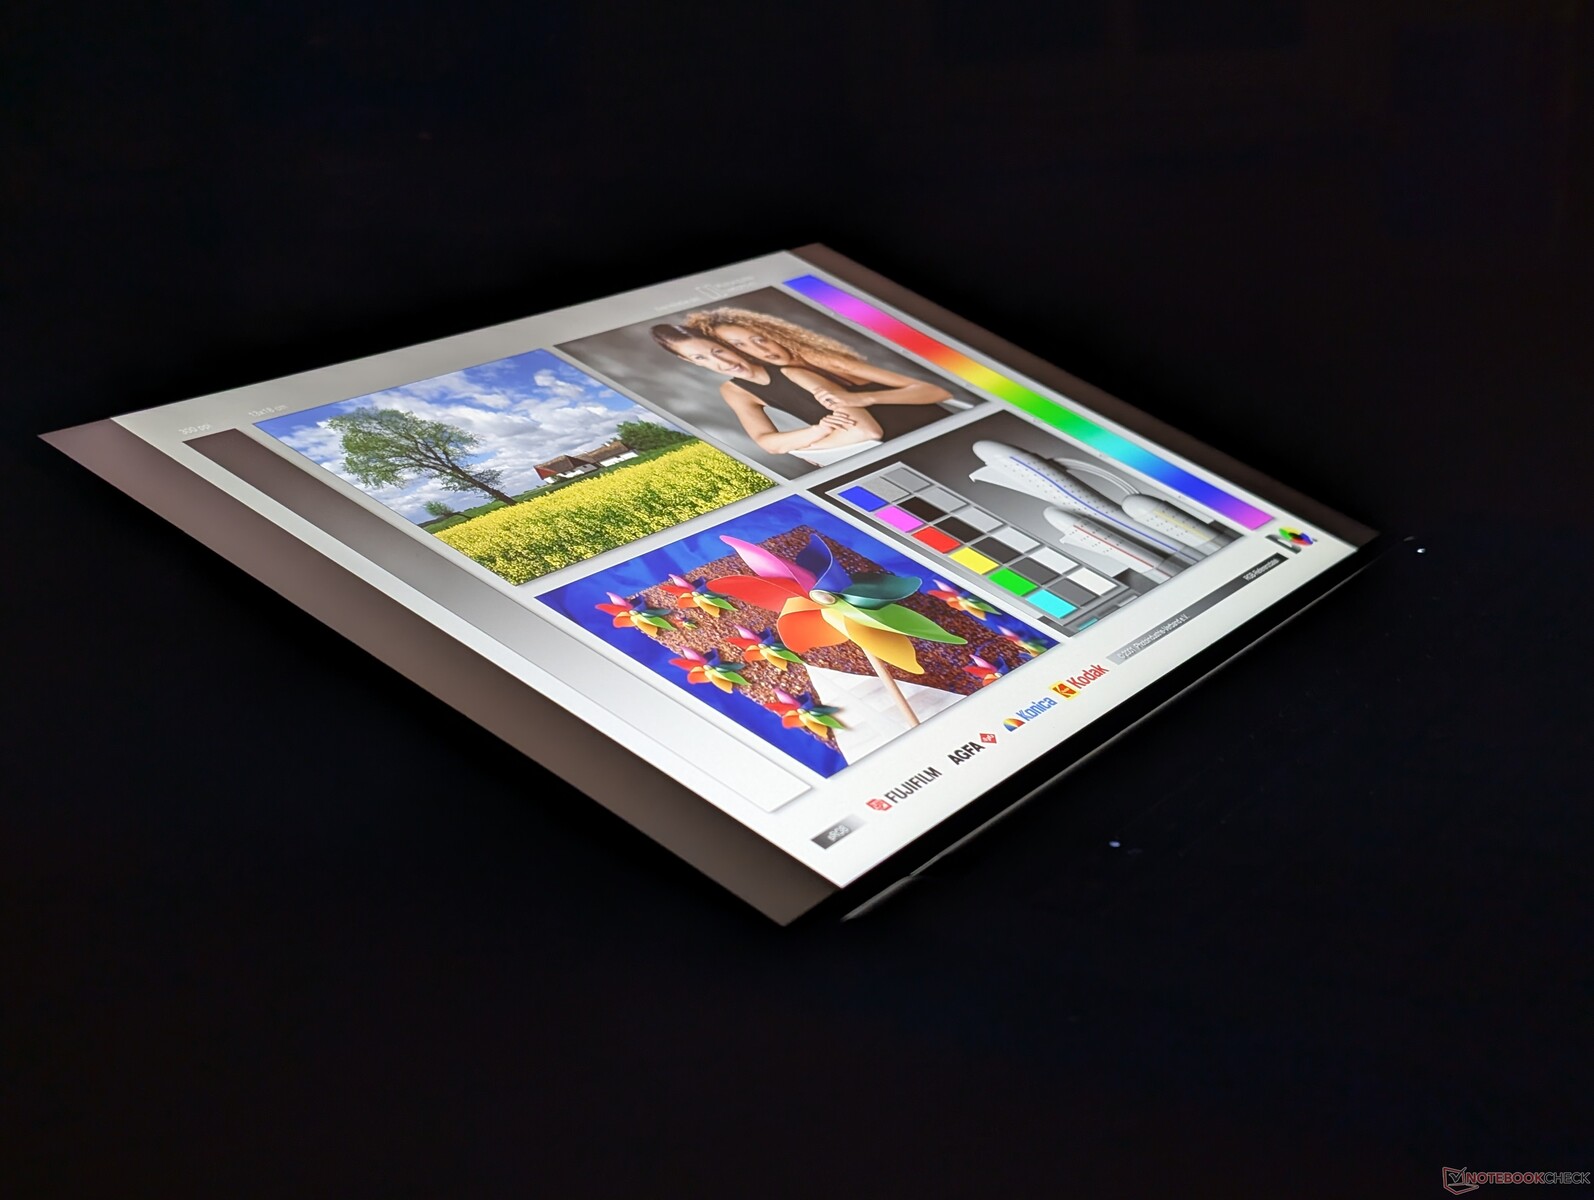
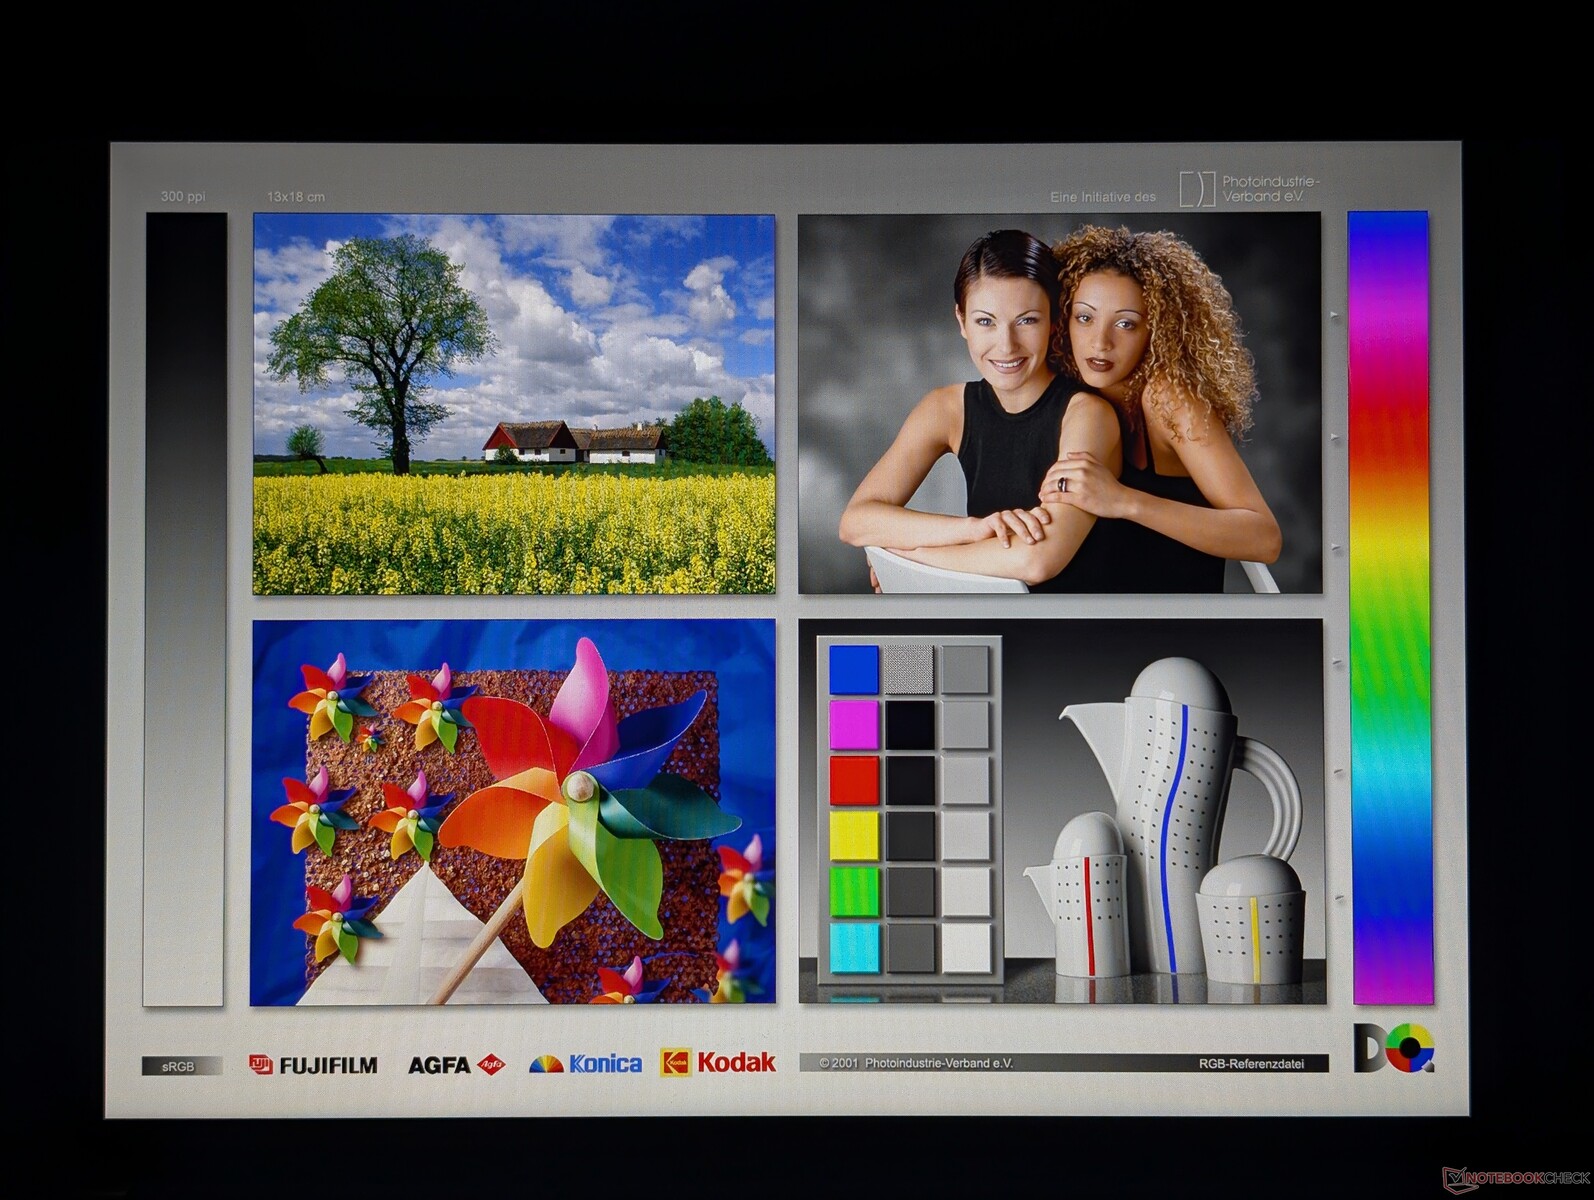
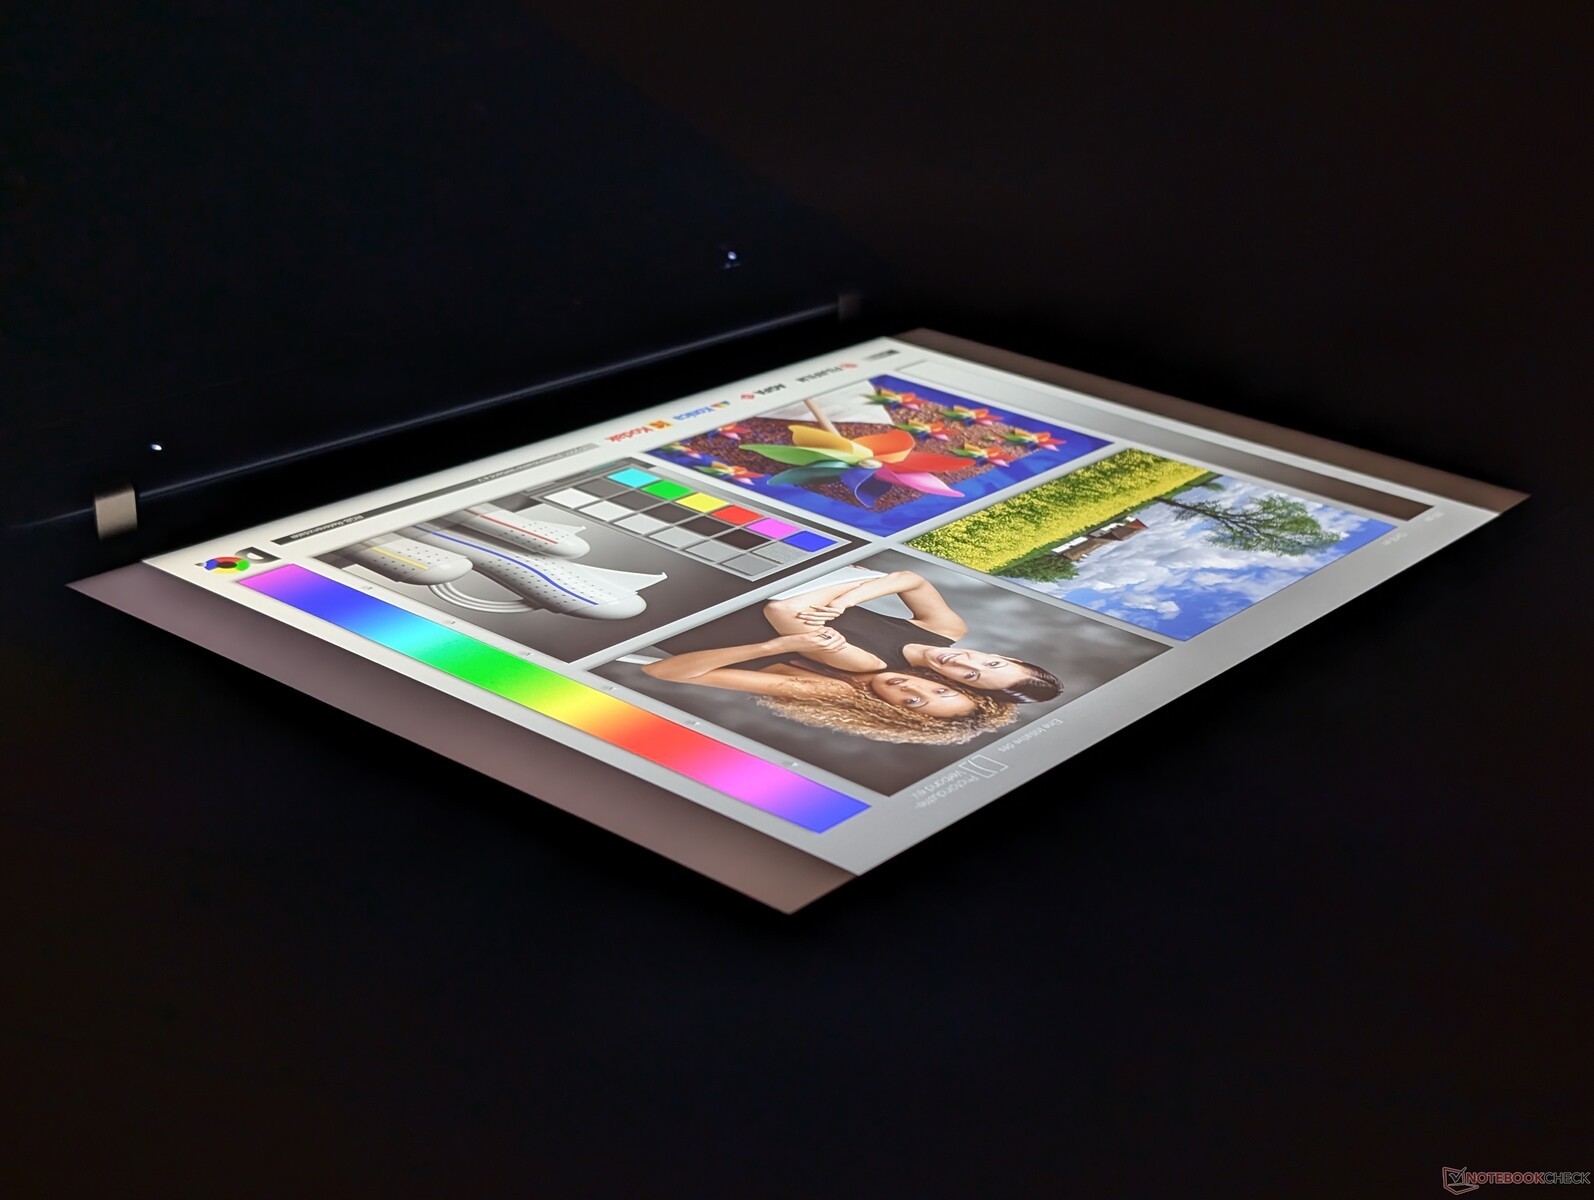
Wyświetlacz


| |||||||||||||||||||||||||
rozświetlenie: 91 %
na akumulatorze: 445.4 cd/m²
kontrast: 1937:1 (czerń: 0.23 cd/m²)
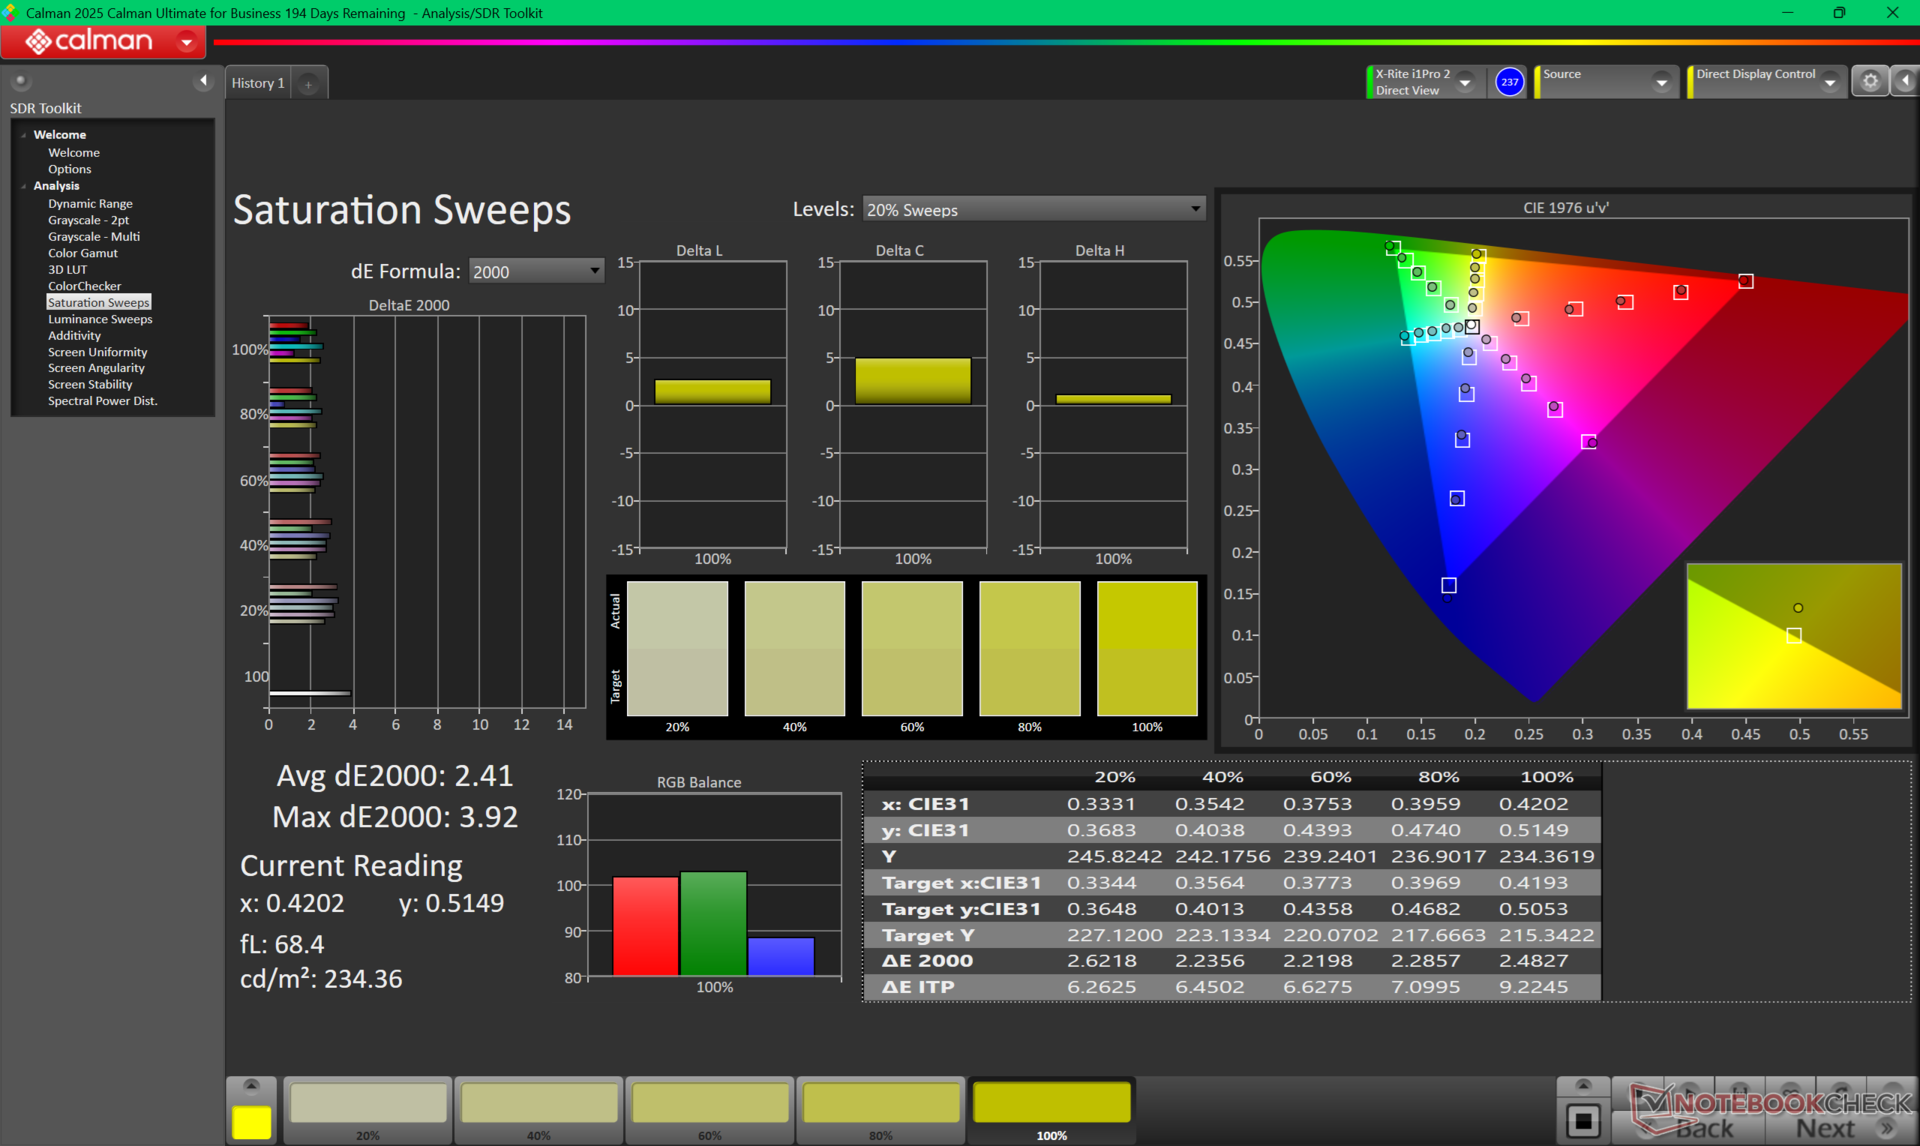
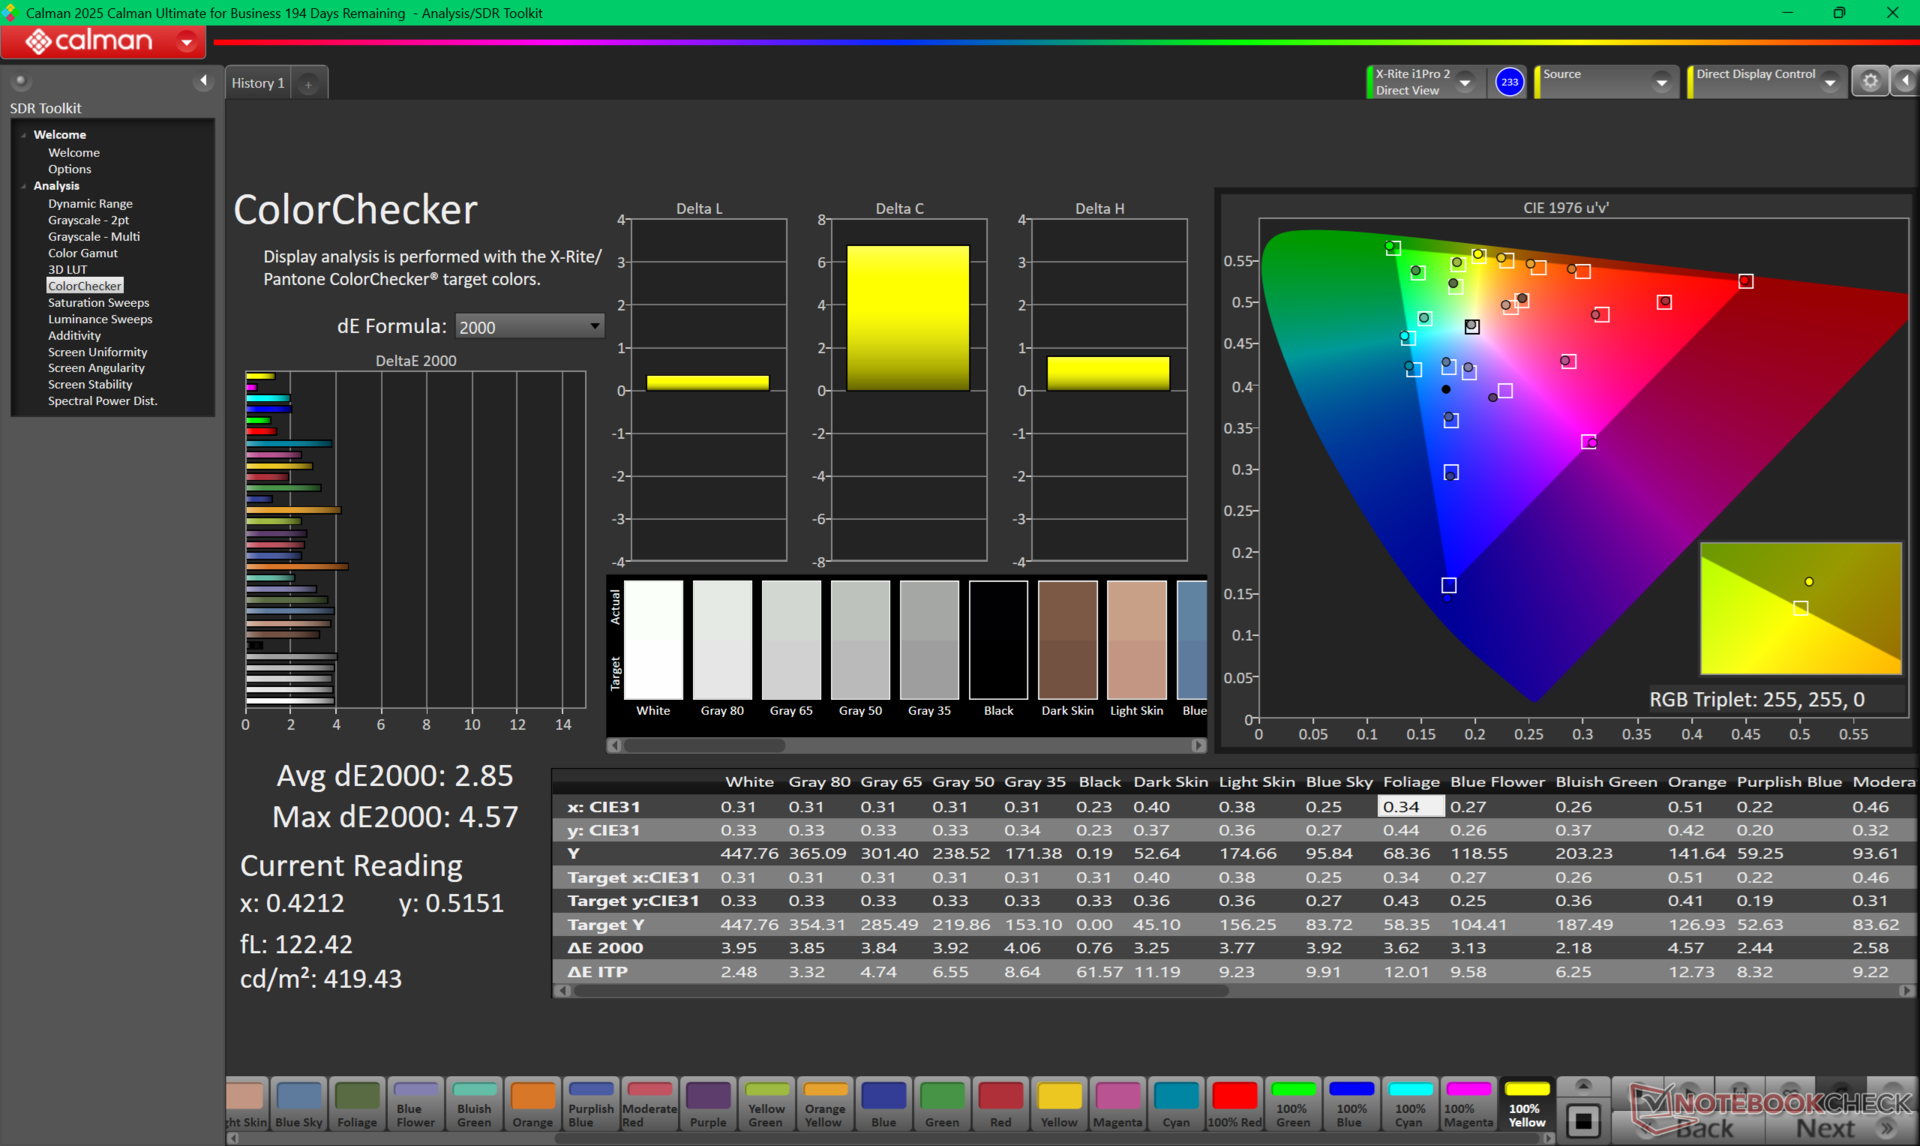
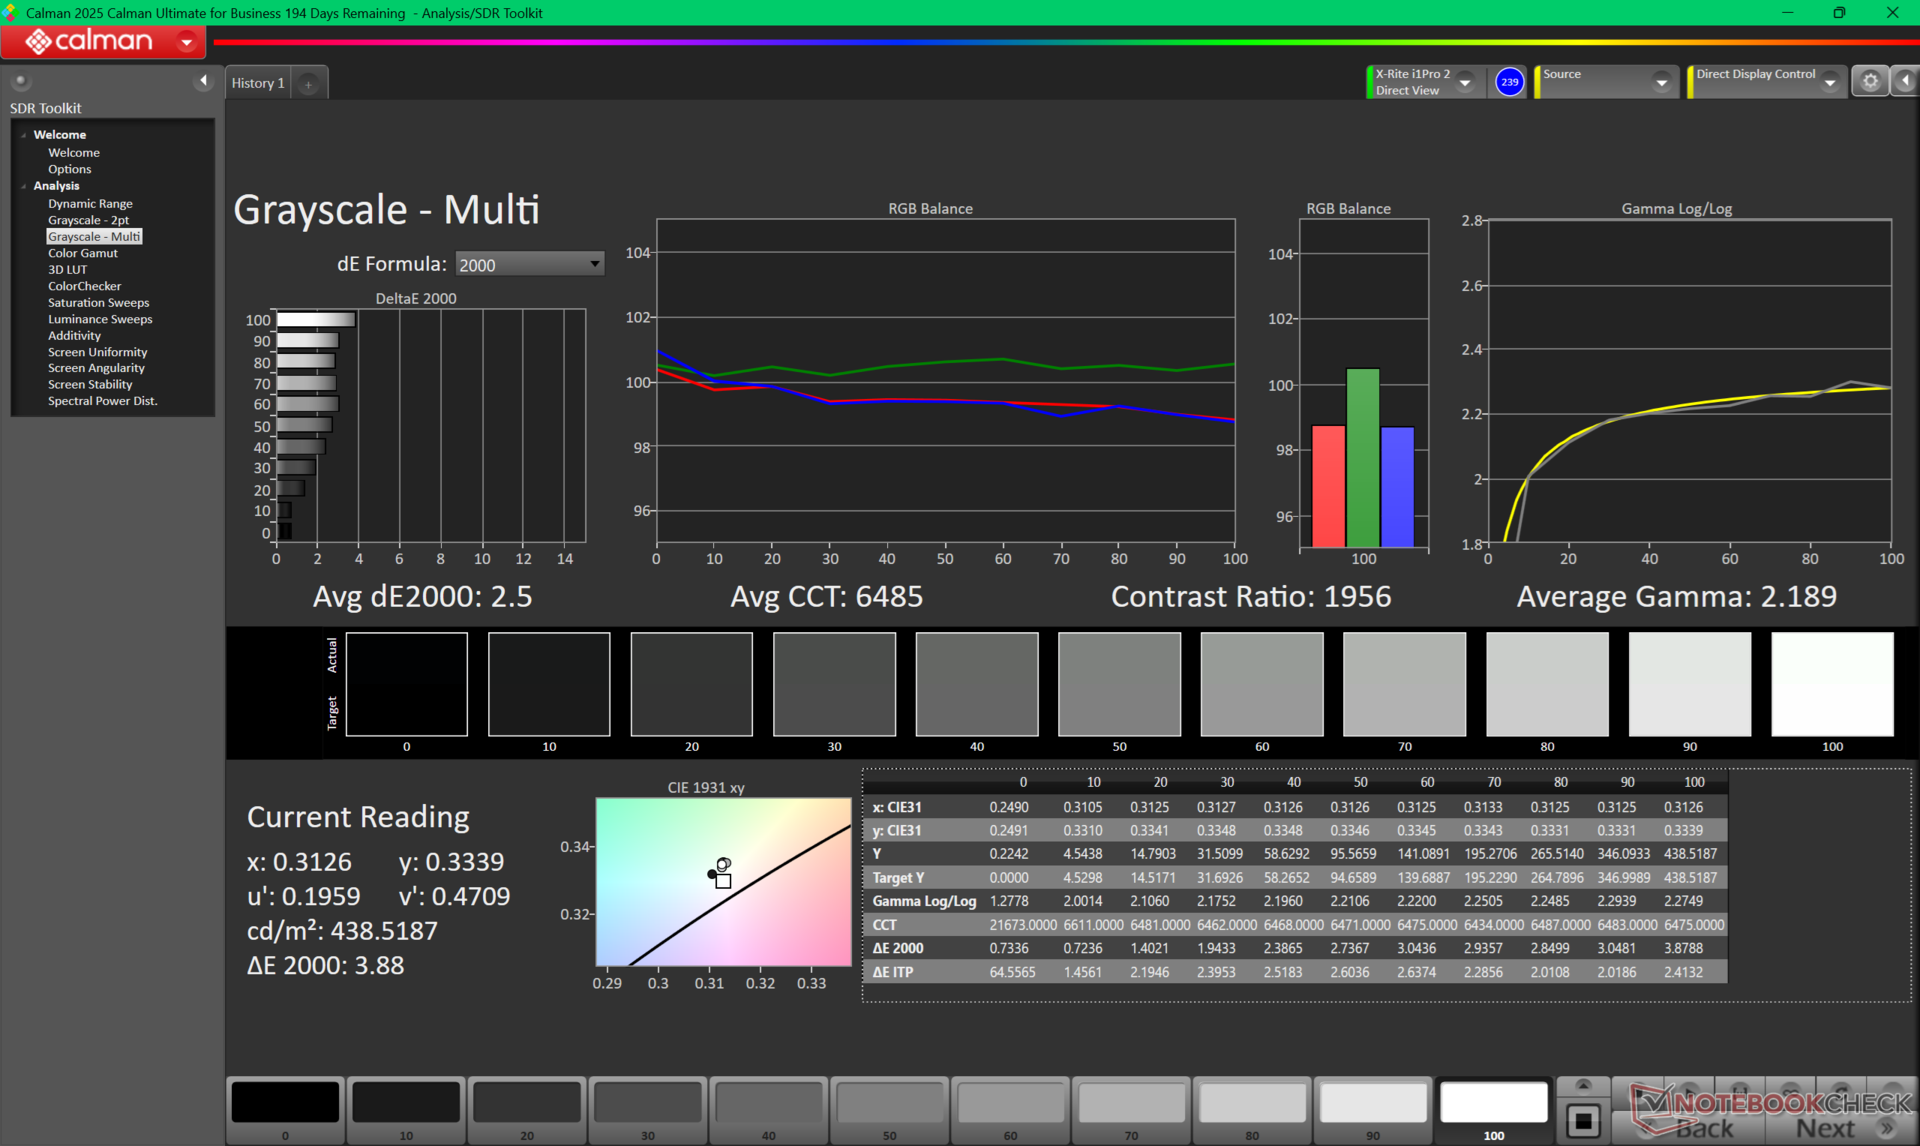
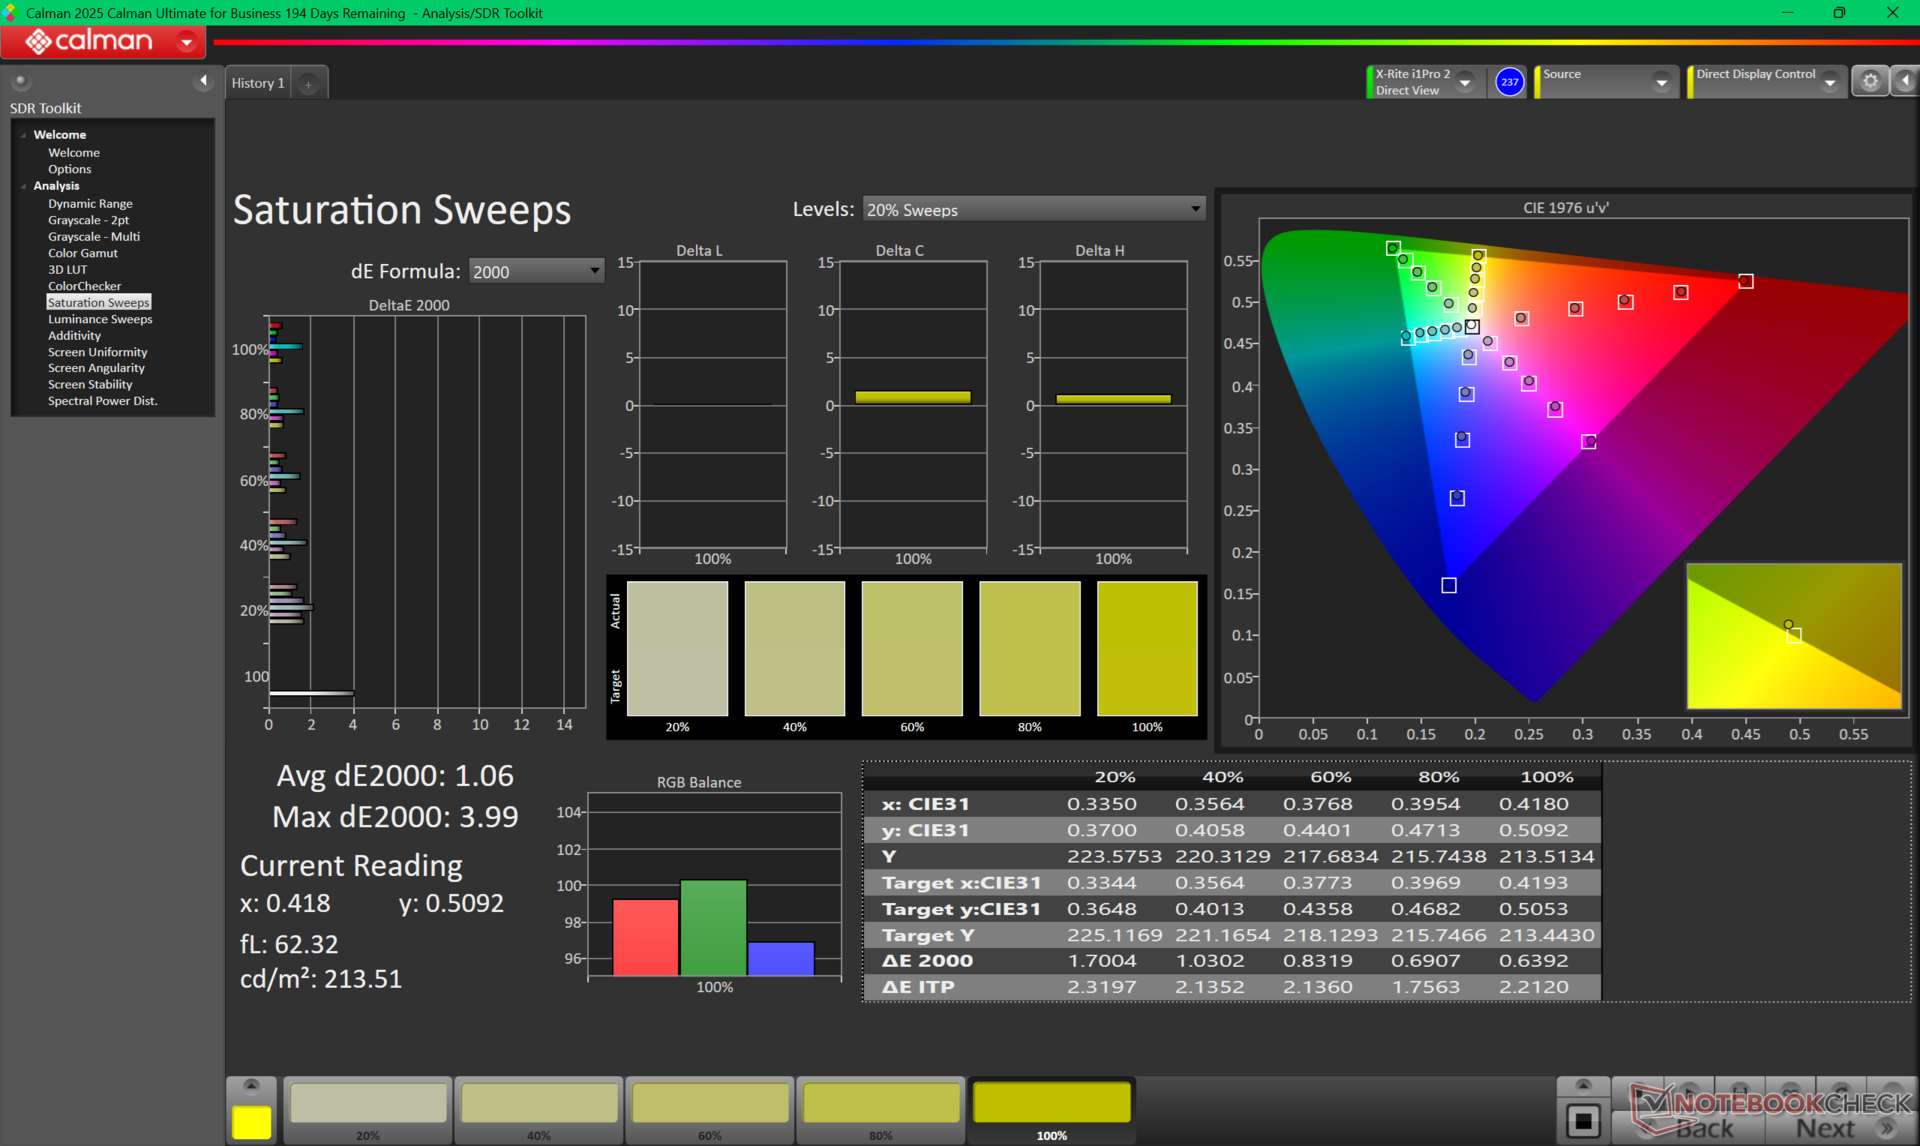
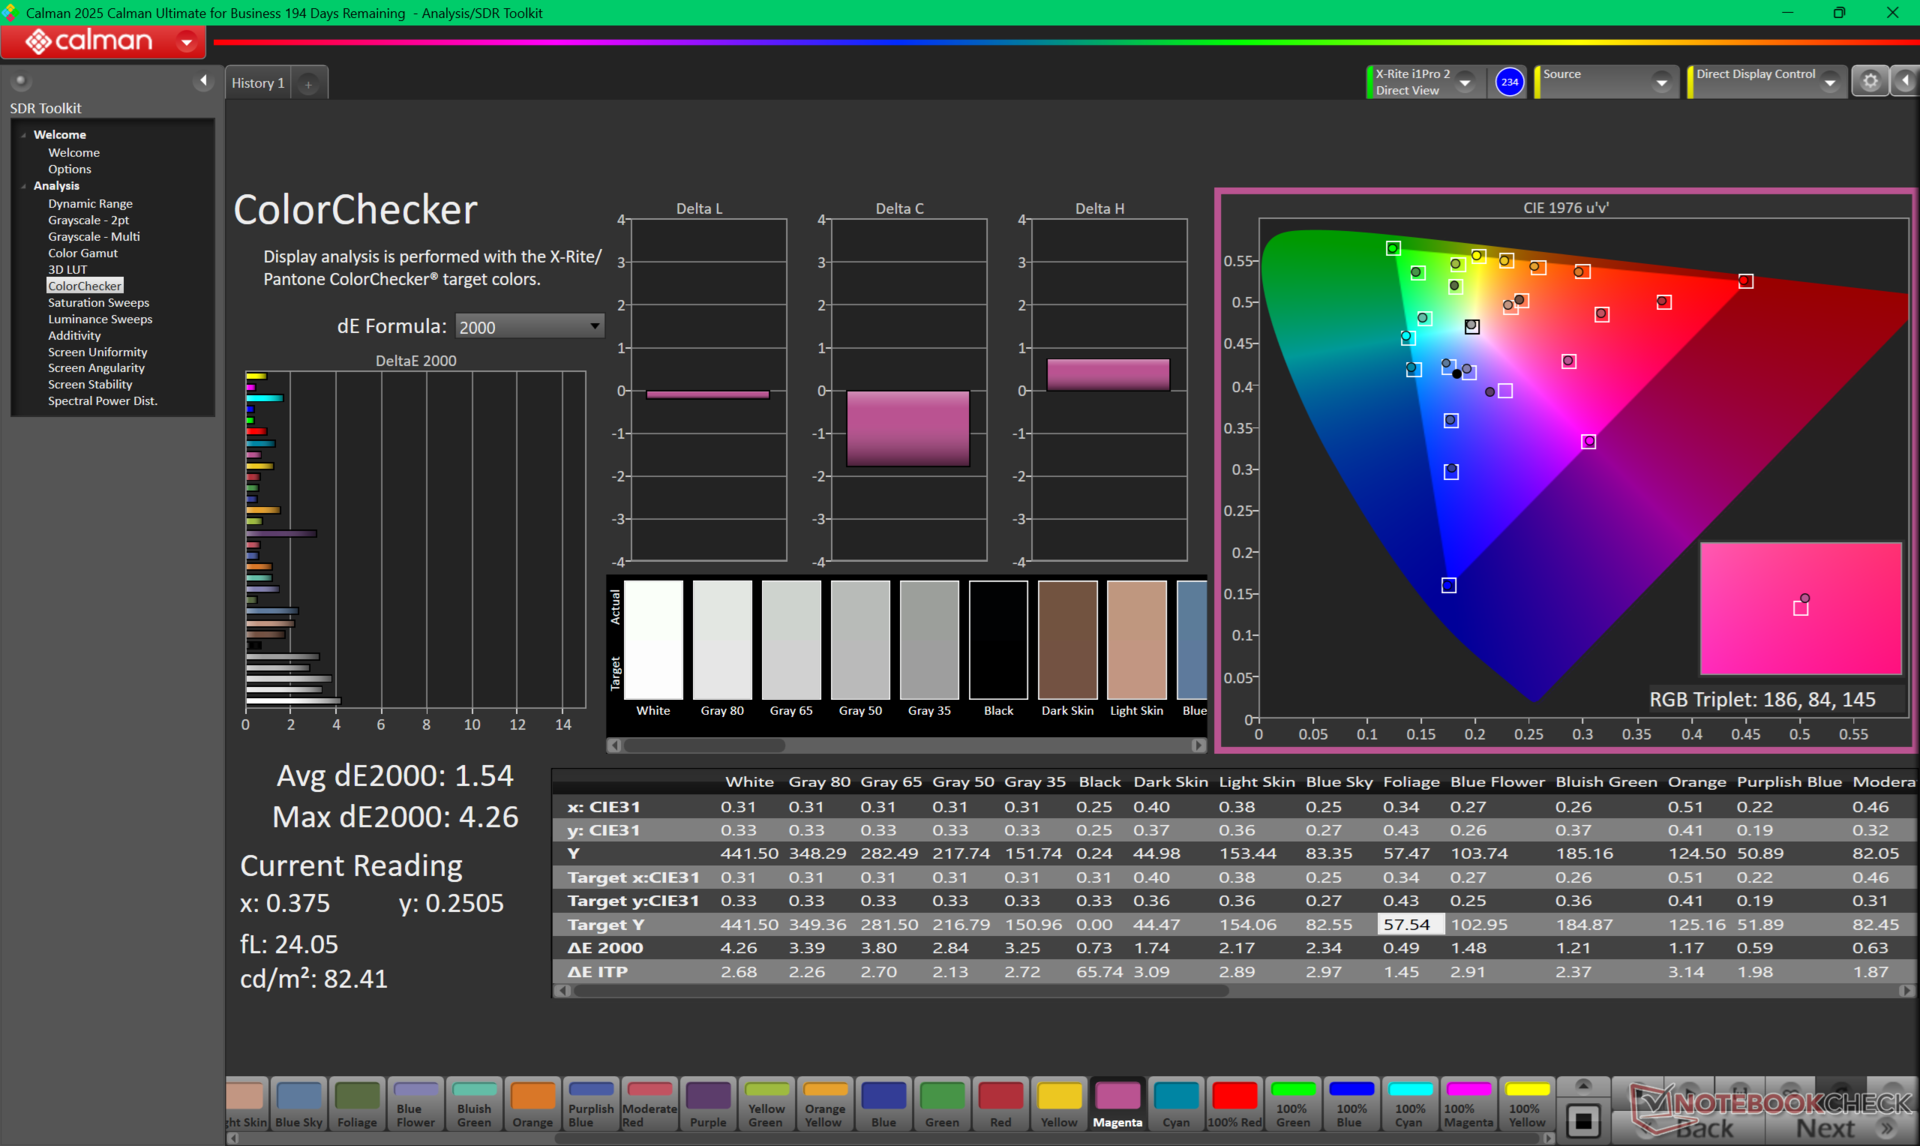
ΔE ColorChecker Calman: 2.85 | ∀{0.5-29.43 Ø4.71}
calibrated: 1.54
ΔE Greyscale Calman: 3.3 | ∀{0.09-98 Ø4.96}
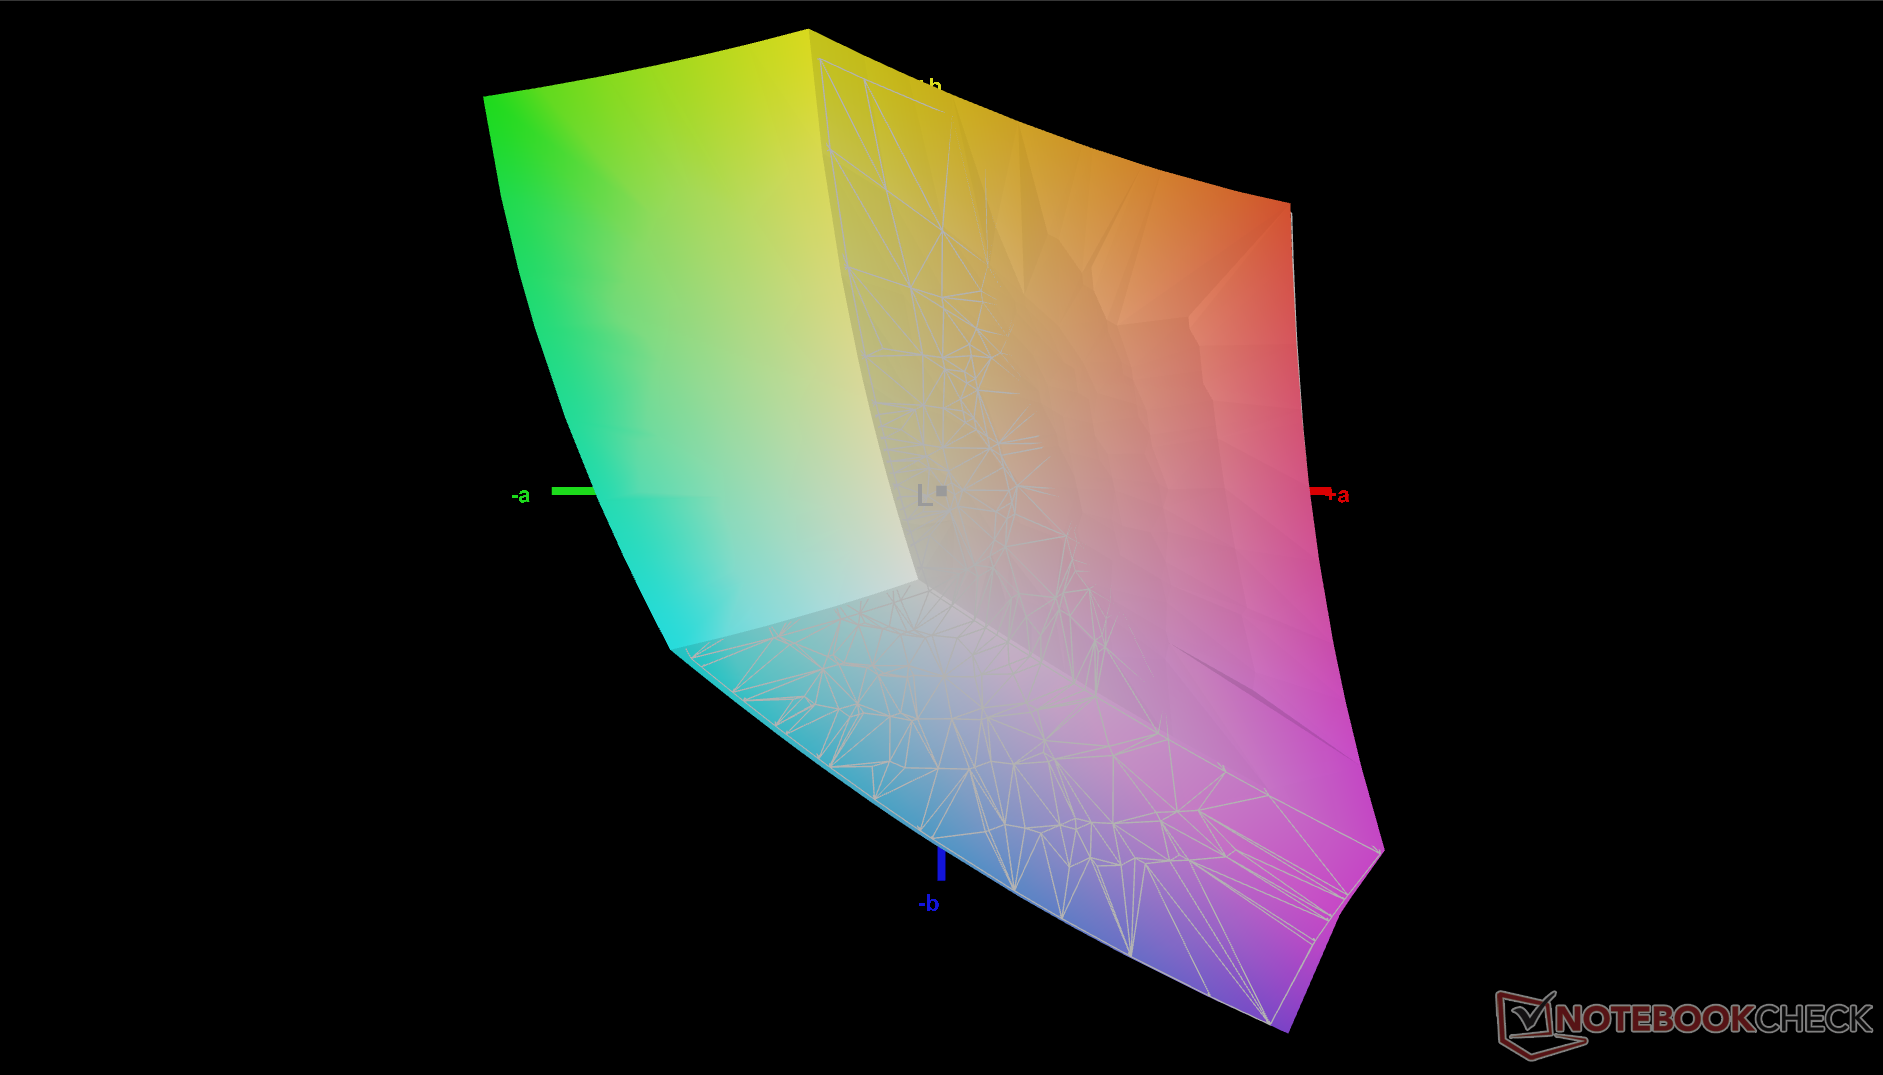
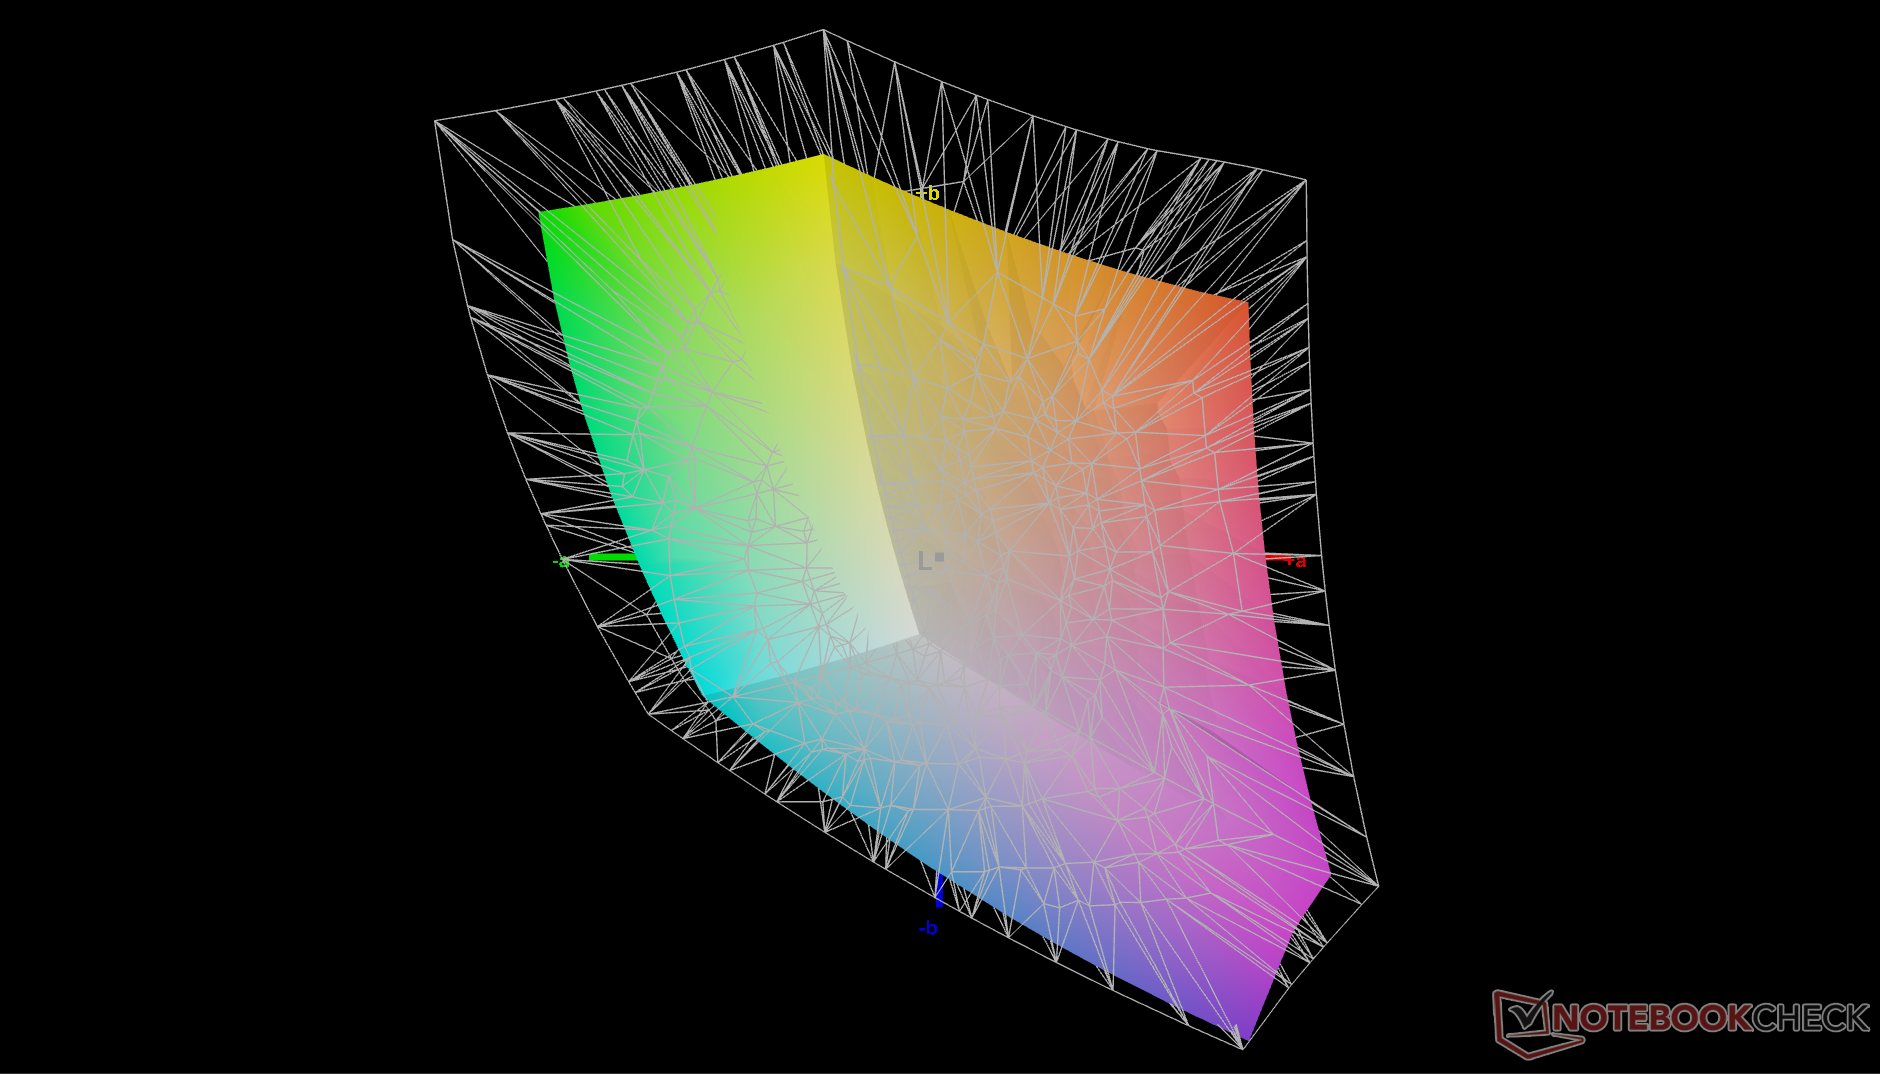
71.8% AdobeRGB 1998 (Argyll 3D)
99% sRGB (Argyll 3D)
70.1% Display P3 (Argyll 3D)
Gamma: 2.03
CCT: 6497 K
| Dynabook Portege Z40L-N BOE NE140WUM-N6K, IPS, 1920x1200, 14", 60 Hz | Dynabook Portégé X40-K Chi Mei N140HCA-EAC, IPS, 1920x1080, 14", 60 Hz | LG Gram Style 14Z90RS-G.AD7AG Samsung SDC417F ATNA40YK10-1, OLED, 2880x1800, 14", 90 Hz | Lenovo ThinkBook 14 Gen 8 21SJ007SGE LEN140WUXGA, IPS LED, 1920x1200, 14", 60 Hz | Dell Pro 14 Premium LG Phillips 140WT1, OLED, 2880x1800, 14", 60 Hz | HP EliteBook X G1i 14 AI IPS, 1920x1200, 14", 60 Hz | |
|---|---|---|---|---|---|---|
| Display | -37% | 25% | -40% | 25% | -0% | |
| Display P3 Coverage (%) | 70.1 | 43.4 -38% | 99.92 43% | 41.5 -41% | 99 41% | 69.9 0% |
| sRGB Coverage (%) | 99 | 64.6 -35% | 100 1% | 60.3 -39% | 100 1% | 98.4 -1% |
| AdobeRGB 1998 Coverage (%) | 71.8 | 44.9 -37% | 94.71 32% | 42.9 -40% | 95.8 33% | 71.6 0% |
| Response Times | 22% | 94% | 48% | 85% | -3% | |
| Response Time Grey 50% / Grey 80% * (ms) | 42.1 ? | 33.6 ? 20% | 2 ? 95% | 19.3 ? 54% | 1.4 ? 97% | 42.3 ? -0% |
| Response Time Black / White * (ms) | 26.7 ? | 20.4 ? 24% | 2 ? 93% | 15.8 ? 41% | 2.7 ? 90% | 28 ? -5% |
| PWM Frequency (Hz) | 350 | 241.1 ? | ||||
| PWM Amplitude * (%) | 100 | 32 68% | ||||
| Screen | -92% | 32% | -97% | 4% | 3% | |
| Brightness middle (cd/m²) | 445.4 | 246.4 -45% | 384 -14% | 271 -39% | 392.3 -12% | 487.5 9% |
| Brightness (cd/m²) | 424 | 237 -44% | 388 -8% | 276 -35% | 392 -8% | 469 11% |
| Brightness Distribution (%) | 91 | 88 -3% | 97 7% | 89 -2% | 95 4% | 91 0% |
| Black Level * (cd/m²) | 0.23 | 0.41 -78% | 0.054 77% | 0.29 -26% | 0.26 -13% | |
| Contrast (:1) | 1937 | 601 -69% | 7111 267% | 934 -52% | 1875 -3% | |
| Colorchecker dE 2000 * | 2.85 | 6 -111% | 2.47 13% | 6.4 -125% | 3.39 -19% | 2.37 17% |
| Colorchecker dE 2000 max. * | 4.57 | 21.16 -363% | 4.33 5% | 20.7 -353% | 6.53 -43% | 5.77 -26% |
| Colorchecker dE 2000 calibrated * | 1.54 | 1.86 -21% | 2.81 -82% | 5.1 -231% | 0.99 36% | 0.86 44% |
| Greyscale dE 2000 * | 3.3 | 6.4 -94% | 2.63 20% | 3.6 -9% | 1.1 67% | 3.8 -15% |
| Gamma | 2.03 108% | 2.01 109% | 2.18 101% | 1.99 111% | 2.23 99% | 2.14 103% |
| CCT | 6497 100% | 6738 96% | 6279 104% | 6576 99% | 6502 100% | 6540 99% |
| Całkowita średnia (program / ustawienia) | -36% /
-64% | 50% /
39% | -30% /
-64% | 38% /
27% | 0% /
1% |
* ... im mniej tym lepiej

Wyświetl czasy reakcji
| ↔ Czas reakcji od czerni do bieli | ||
|---|---|---|
| 26.7 ms ... wzrost ↗ i spadek ↘ łącznie | ↗ 12 ms wzrost | 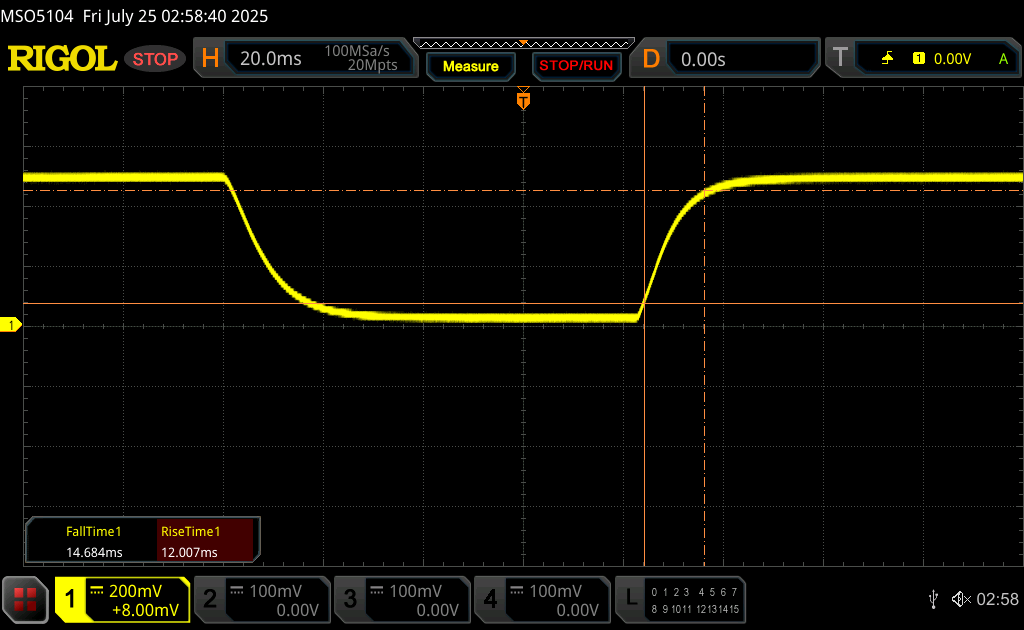 |
| ↘ 14.7 ms upadek | ||
| W naszych testach ekran wykazuje stosunkowo powolne tempo reakcji i może być zbyt wolny dla graczy. Dla porównania, wszystkie testowane urządzenia wahają się od 0.1 (minimum) do 240 (maksimum) ms. » 67 % wszystkich urządzeń jest lepszych. Oznacza to, że zmierzony czas reakcji jest gorszy od średniej wszystkich testowanych urządzeń (19.8 ms). | ||
| ↔ Czas reakcji 50% szarości do 80% szarości | ||
| 42.1 ms ... wzrost ↗ i spadek ↘ łącznie | ↗ 19.6 ms wzrost | 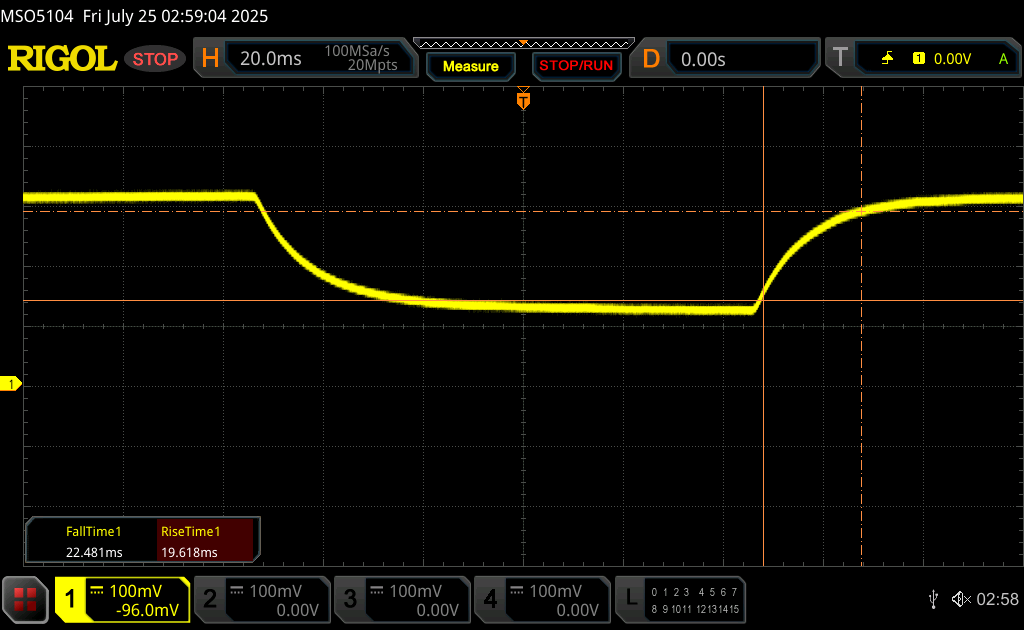 |
| ↘ 22.5 ms upadek | ||
| W naszych testach ekran wykazuje powolne tempo reakcji, co będzie niezadowalające dla graczy. Dla porównania, wszystkie testowane urządzenia wahają się od 0.165 (minimum) do 636 (maksimum) ms. » 70 % wszystkich urządzeń jest lepszych. Oznacza to, że zmierzony czas reakcji jest gorszy od średniej wszystkich testowanych urządzeń (30.9 ms). | ||
Migotanie ekranu / PWM (modulacja szerokości impulsu)
| Migotanie ekranu/nie wykryto PWM |  | ||
Dla porównania: 52 % wszystkich testowanych urządzeń nie używa PWM do przyciemniania wyświetlacza. Jeśli wykryto PWM, zmierzono średnio 7748 (minimum: 5 - maksimum: 343500) Hz. | |||
Wydajność
Warunki testowania
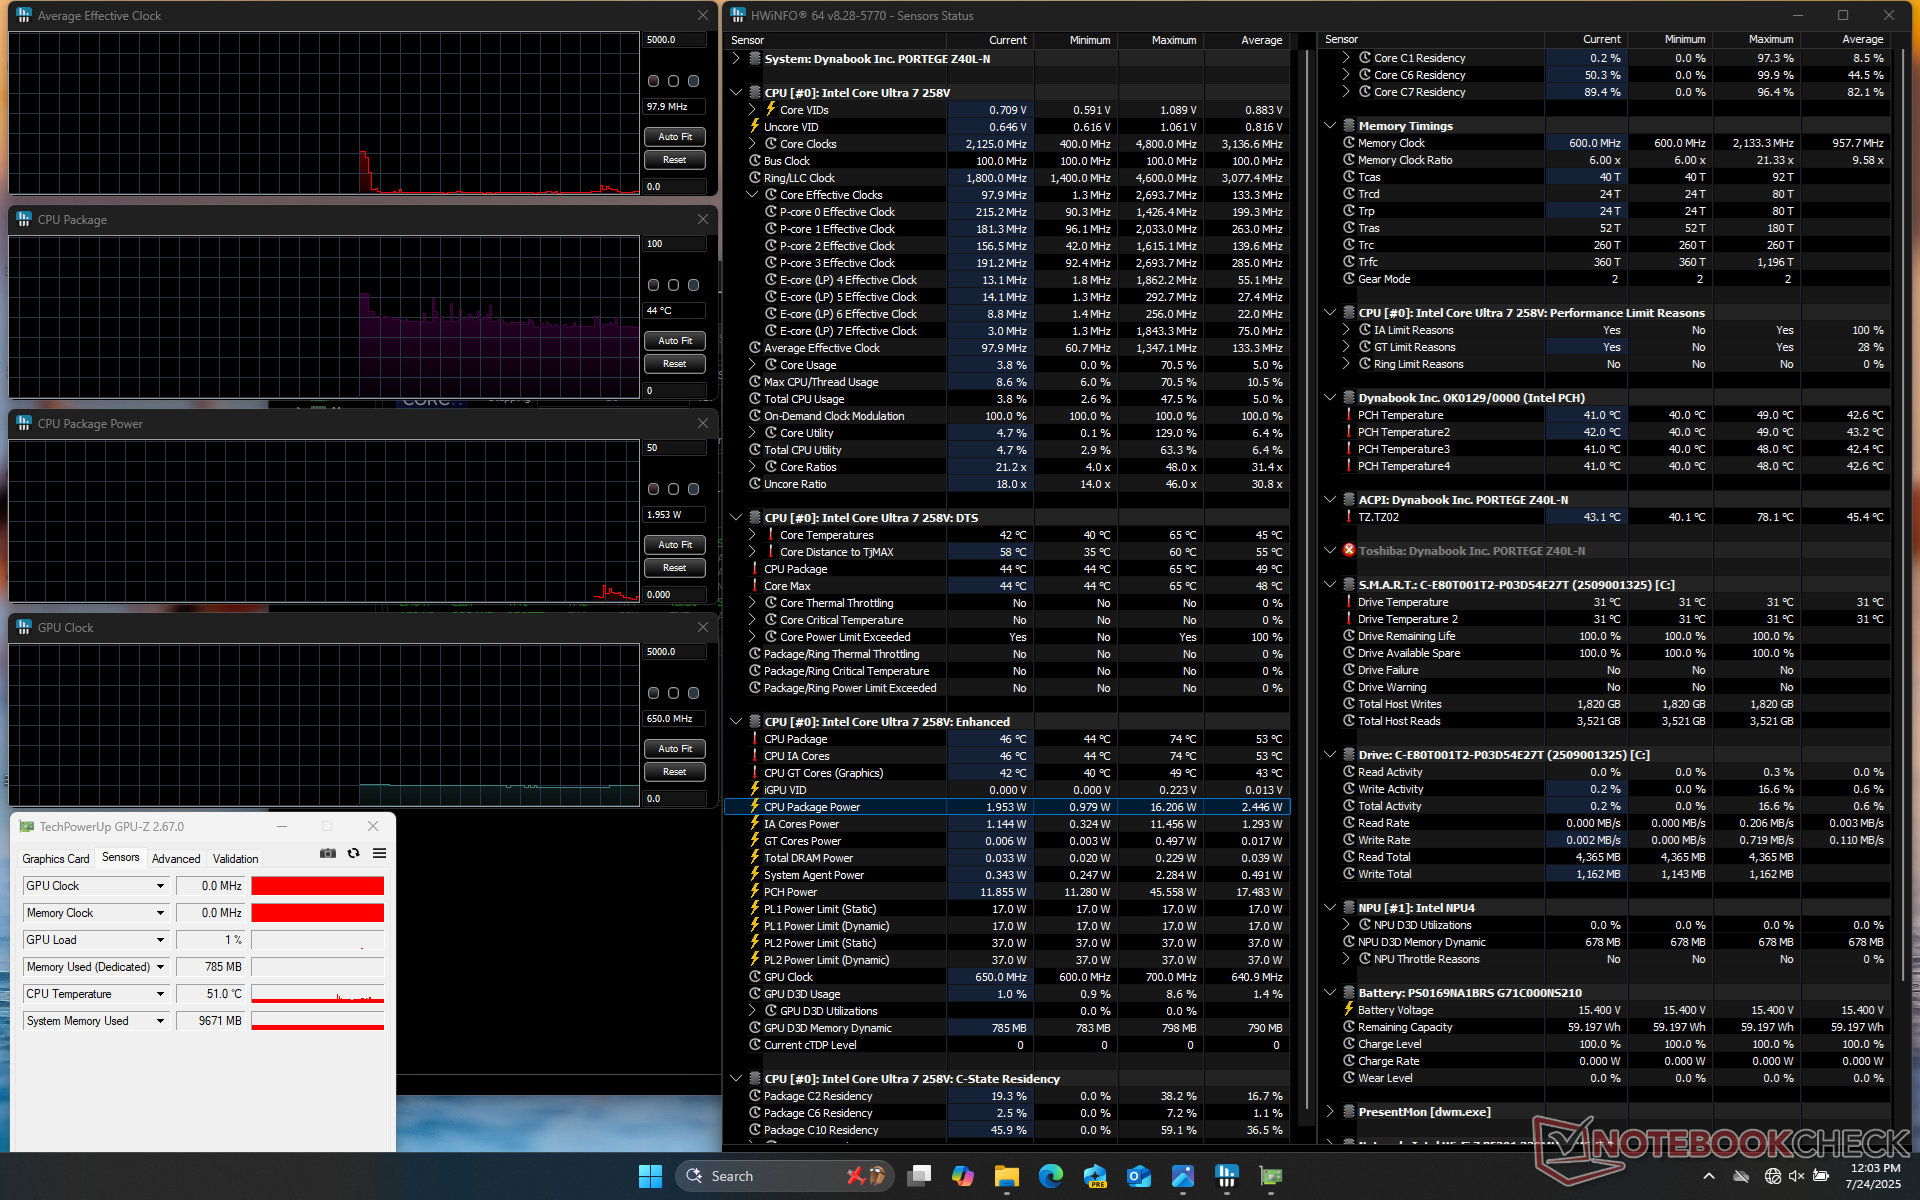
Przed uruchomieniem poniższych testów porównawczych ustawiliśmy system Windows w tryb wydajności.
Procesor
Cinebench R15 Multi Loop
Cinebench R23: Multi Core | Single Core
Cinebench R20: CPU (Multi Core) | CPU (Single Core)
Cinebench R15: CPU Multi 64Bit | CPU Single 64Bit
Blender: v2.79 BMW27 CPU
7-Zip 18.03: 7z b 4 | 7z b 4 -mmt1
Geekbench 6.7: Multi-Core | Single-Core
Geekbench 5.5: Multi-Core | Single-Core
HWBOT x265 Benchmark v2.2: 4k Preset
LibreOffice : 20 Documents To PDF
R Benchmark 2.5: Overall mean
| CPU Performance rating | |
| Lenovo ThinkBook 14 Gen 8 21SJ007SGE | |
| Dell Inspiron 14 7445 2-in-1 | |
| Lenovo Yoga 7 2-in-1 14AKP10 | |
| HP EliteBook X G1i 14 AI | |
| Dell Pro 14 Premium | |
| Lenovo Yoga 7 2-in-1 14AHP9 Arctic Grey | |
| Przeciętny Intel Core Ultra 7 258V | |
| Dell 14 Plus | |
| Asus Vivobook S 14 OLED S5406SA | |
| Acer TravelMate P4 14 TMP414-42-TCO-R6KG | |
| Dynabook Portege Z40L-N | |
| Dynabook Portégé X40-K -4! | |
| LG Gram Style 14Z90RS-G.AD7AG | |
| Cinebench R23 / Multi Core | |
| Lenovo ThinkBook 14 Gen 8 21SJ007SGE | |
| Dell Inspiron 14 7445 2-in-1 | |
| Lenovo Yoga 7 2-in-1 14AKP10 | |
| Lenovo Yoga 7 2-in-1 14AHP9 Arctic Grey | |
| HP EliteBook X G1i 14 AI | |
| Dell Pro 14 Premium | |
| Dynabook Portégé X40-K | |
| Przeciętny Intel Core Ultra 7 258V (7920 - 11097, n=25) | |
| Dell 14 Plus | |
| Asus Vivobook S 14 OLED S5406SA | |
| Acer TravelMate P4 14 TMP414-42-TCO-R6KG | |
| LG Gram Style 14Z90RS-G.AD7AG | |
| Dynabook Portege Z40L-N | |
| Cinebench R23 / Single Core | |
| Lenovo ThinkBook 14 Gen 8 21SJ007SGE | |
| Dell Pro 14 Premium | |
| Lenovo Yoga 7 2-in-1 14AKP10 | |
| HP EliteBook X G1i 14 AI | |
| Przeciętny Intel Core Ultra 7 258V (1664 - 1957, n=25) | |
| Dynabook Portege Z40L-N | |
| Dell 14 Plus | |
| Dynabook Portégé X40-K | |
| Dell Inspiron 14 7445 2-in-1 | |
| Asus Vivobook S 14 OLED S5406SA | |
| Lenovo Yoga 7 2-in-1 14AHP9 Arctic Grey | |
| Acer TravelMate P4 14 TMP414-42-TCO-R6KG | |
| LG Gram Style 14Z90RS-G.AD7AG | |
| Cinebench R20 / CPU (Multi Core) | |
| Lenovo ThinkBook 14 Gen 8 21SJ007SGE | |
| Dell Inspiron 14 7445 2-in-1 | |
| Lenovo Yoga 7 2-in-1 14AKP10 | |
| Lenovo Yoga 7 2-in-1 14AHP9 Arctic Grey | |
| HP EliteBook X G1i 14 AI | |
| Dell Pro 14 Premium | |
| Dynabook Portégé X40-K | |
| Przeciętny Intel Core Ultra 7 258V (3130 - 4314, n=24) | |
| Dell 14 Plus | |
| Asus Vivobook S 14 OLED S5406SA | |
| Acer TravelMate P4 14 TMP414-42-TCO-R6KG | |
| LG Gram Style 14Z90RS-G.AD7AG | |
| Dynabook Portege Z40L-N | |
| Cinebench R20 / CPU (Single Core) | |
| Lenovo ThinkBook 14 Gen 8 21SJ007SGE | |
| Lenovo Yoga 7 2-in-1 14AKP10 | |
| Dell Pro 14 Premium | |
| HP EliteBook X G1i 14 AI | |
| Dynabook Portege Z40L-N | |
| Przeciętny Intel Core Ultra 7 258V (643 - 749, n=24) | |
| Dell 14 Plus | |
| Dynabook Portégé X40-K | |
| Dell Inspiron 14 7445 2-in-1 | |
| Acer TravelMate P4 14 TMP414-42-TCO-R6KG | |
| Lenovo Yoga 7 2-in-1 14AHP9 Arctic Grey | |
| Asus Vivobook S 14 OLED S5406SA | |
| LG Gram Style 14Z90RS-G.AD7AG | |
| Cinebench R15 / CPU Multi 64Bit | |
| Lenovo ThinkBook 14 Gen 8 21SJ007SGE | |
| Dell Inspiron 14 7445 2-in-1 | |
| Dynabook Portégé X40-K | |
| Lenovo Yoga 7 2-in-1 14AKP10 | |
| Lenovo Yoga 7 2-in-1 14AHP9 Arctic Grey | |
| HP EliteBook X G1i 14 AI | |
| Dell Pro 14 Premium | |
| Przeciętny Intel Core Ultra 7 258V (1280 - 1656, n=24) | |
| Acer TravelMate P4 14 TMP414-42-TCO-R6KG | |
| Asus Vivobook S 14 OLED S5406SA | |
| Dell 14 Plus | |
| LG Gram Style 14Z90RS-G.AD7AG | |
| Dynabook Portege Z40L-N | |
| Cinebench R15 / CPU Single 64Bit | |
| Lenovo ThinkBook 14 Gen 8 21SJ007SGE | |
| Lenovo Yoga 7 2-in-1 14AKP10 | |
| Dell Pro 14 Premium | |
| HP EliteBook X G1i 14 AI | |
| Przeciętny Intel Core Ultra 7 258V (258 - 298, n=24) | |
| Dynabook Portege Z40L-N | |
| Dell 14 Plus | |
| Dell Inspiron 14 7445 2-in-1 | |
| Lenovo Yoga 7 2-in-1 14AHP9 Arctic Grey | |
| Asus Vivobook S 14 OLED S5406SA | |
| Dynabook Portégé X40-K | |
| Acer TravelMate P4 14 TMP414-42-TCO-R6KG | |
| LG Gram Style 14Z90RS-G.AD7AG | |
| Blender / v2.79 BMW27 CPU | |
| Dynabook Portege Z40L-N | |
| LG Gram Style 14Z90RS-G.AD7AG | |
| Dell 14 Plus | |
| Przeciętny Intel Core Ultra 7 258V (315 - 484, n=24) | |
| Asus Vivobook S 14 OLED S5406SA | |
| Acer TravelMate P4 14 TMP414-42-TCO-R6KG | |
| Dynabook Portégé X40-K | |
| Dell Pro 14 Premium | |
| HP EliteBook X G1i 14 AI | |
| Lenovo Yoga 7 2-in-1 14AHP9 Arctic Grey | |
| Lenovo Yoga 7 2-in-1 14AKP10 | |
| Dell Inspiron 14 7445 2-in-1 | |
| Lenovo ThinkBook 14 Gen 8 21SJ007SGE | |
| 7-Zip 18.03 / 7z b 4 -mmt1 | |
| Dell Inspiron 14 7445 2-in-1 | |
| Acer TravelMate P4 14 TMP414-42-TCO-R6KG | |
| Lenovo ThinkBook 14 Gen 8 21SJ007SGE | |
| Lenovo Yoga 7 2-in-1 14AHP9 Arctic Grey | |
| Lenovo Yoga 7 2-in-1 14AKP10 | |
| Dynabook Portégé X40-K | |
| HP EliteBook X G1i 14 AI | |
| Dell Pro 14 Premium | |
| Dynabook Portege Z40L-N | |
| Przeciętny Intel Core Ultra 7 258V (4769 - 5869, n=24) | |
| Dell 14 Plus | |
| Asus Vivobook S 14 OLED S5406SA | |
| LG Gram Style 14Z90RS-G.AD7AG | |
| HWBOT x265 Benchmark v2.2 / 4k Preset | |
| Lenovo ThinkBook 14 Gen 8 21SJ007SGE | |
| Dell Inspiron 14 7445 2-in-1 | |
| Lenovo Yoga 7 2-in-1 14AHP9 Arctic Grey | |
| HP EliteBook X G1i 14 AI | |
| Lenovo Yoga 7 2-in-1 14AKP10 | |
| Dell Pro 14 Premium | |
| Asus Vivobook S 14 OLED S5406SA | |
| Dell 14 Plus | |
| Przeciętny Intel Core Ultra 7 258V (7.11 - 14.2, n=24) | |
| Acer TravelMate P4 14 TMP414-42-TCO-R6KG | |
| Dynabook Portégé X40-K | |
| LG Gram Style 14Z90RS-G.AD7AG | |
| Dynabook Portege Z40L-N | |
| LibreOffice / 20 Documents To PDF | |
| Lenovo Yoga 7 2-in-1 14AHP9 Arctic Grey | |
| Asus Vivobook S 14 OLED S5406SA | |
| Lenovo Yoga 7 2-in-1 14AKP10 | |
| Acer TravelMate P4 14 TMP414-42-TCO-R6KG | |
| Dell 14 Plus | |
| LG Gram Style 14Z90RS-G.AD7AG | |
| Przeciętny Intel Core Ultra 7 258V (41.1 - 62.8, n=24) | |
| Dynabook Portégé X40-K | |
| HP EliteBook X G1i 14 AI | |
| Dell Inspiron 14 7445 2-in-1 | |
| Dell Pro 14 Premium | |
| Dynabook Portege Z40L-N | |
| Lenovo ThinkBook 14 Gen 8 21SJ007SGE | |
| R Benchmark 2.5 / Overall mean | |
| LG Gram Style 14Z90RS-G.AD7AG | |
| Lenovo Yoga 7 2-in-1 14AHP9 Arctic Grey | |
| Asus Vivobook S 14 OLED S5406SA | |
| Dynabook Portege Z40L-N | |
| Dynabook Portégé X40-K | |
| Przeciętny Intel Core Ultra 7 258V (0.443 - 0.542, n=24) | |
| Acer TravelMate P4 14 TMP414-42-TCO-R6KG | |
| Dell 14 Plus | |
| HP EliteBook X G1i 14 AI | |
| Dell Inspiron 14 7445 2-in-1 | |
| Dell Pro 14 Premium | |
| Lenovo ThinkBook 14 Gen 8 21SJ007SGE | |
| Lenovo Yoga 7 2-in-1 14AKP10 | |
Cinebench R23: Multi Core | Single Core
Cinebench R20: CPU (Multi Core) | CPU (Single Core)
Cinebench R15: CPU Multi 64Bit | CPU Single 64Bit
Blender: v2.79 BMW27 CPU
7-Zip 18.03: 7z b 4 | 7z b 4 -mmt1
Geekbench 6.7: Multi-Core | Single-Core
Geekbench 5.5: Multi-Core | Single-Core
HWBOT x265 Benchmark v2.2: 4k Preset
LibreOffice : 20 Documents To PDF
R Benchmark 2.5: Overall mean
* ... im mniej tym lepiej
AIDA64: FP32 Ray-Trace | FPU Julia | CPU SHA3 | CPU Queen | FPU SinJulia | FPU Mandel | CPU AES | CPU ZLib | FP64 Ray-Trace | CPU PhotoWorxx
| Performance rating | |
| Lenovo ThinkBook 14 Gen 8 21SJ007SGE | |
| HP EliteBook X G1i 14 AI | |
| Dell Pro 14 Premium | |
| Przeciętny Intel Core Ultra 7 258V | |
| Dynabook Portégé X40-K | |
| LG Gram Style 14Z90RS-G.AD7AG | |
| Dynabook Portege Z40L-N | |
| AIDA64 / FP32 Ray-Trace | |
| Lenovo ThinkBook 14 Gen 8 21SJ007SGE | |
| HP EliteBook X G1i 14 AI | |
| Dell Pro 14 Premium | |
| Przeciętny Intel Core Ultra 7 258V (8454 - 12781, n=26) | |
| Dynabook Portégé X40-K | |
| Dynabook Portege Z40L-N | |
| LG Gram Style 14Z90RS-G.AD7AG | |
| AIDA64 / FPU Julia | |
| Lenovo ThinkBook 14 Gen 8 21SJ007SGE | |
| HP EliteBook X G1i 14 AI | |
| Dell Pro 14 Premium | |
| Przeciętny Intel Core Ultra 7 258V (40875 - 63401, n=26) | |
| Dynabook Portégé X40-K | |
| Dynabook Portege Z40L-N | |
| LG Gram Style 14Z90RS-G.AD7AG | |
| AIDA64 / CPU SHA3 | |
| Lenovo ThinkBook 14 Gen 8 21SJ007SGE | |
| HP EliteBook X G1i 14 AI | |
| Dell Pro 14 Premium | |
| Przeciętny Intel Core Ultra 7 258V (1930 - 2817, n=26) | |
| Dynabook Portégé X40-K | |
| Dynabook Portege Z40L-N | |
| LG Gram Style 14Z90RS-G.AD7AG | |
| AIDA64 / CPU Queen | |
| Dynabook Portégé X40-K | |
| LG Gram Style 14Z90RS-G.AD7AG | |
| Lenovo ThinkBook 14 Gen 8 21SJ007SGE | |
| Dell Pro 14 Premium | |
| Przeciętny Intel Core Ultra 7 258V (48816 - 49818, n=24) | |
| HP EliteBook X G1i 14 AI | |
| Dynabook Portege Z40L-N | |
| AIDA64 / FPU SinJulia | |
| Lenovo ThinkBook 14 Gen 8 21SJ007SGE | |
| Dynabook Portégé X40-K | |
| LG Gram Style 14Z90RS-G.AD7AG | |
| Dell Pro 14 Premium | |
| HP EliteBook X G1i 14 AI | |
| Przeciętny Intel Core Ultra 7 258V (3817 - 4440, n=26) | |
| Dynabook Portege Z40L-N | |
| AIDA64 / FPU Mandel | |
| Lenovo ThinkBook 14 Gen 8 21SJ007SGE | |
| HP EliteBook X G1i 14 AI | |
| Dell Pro 14 Premium | |
| Przeciętny Intel Core Ultra 7 258V (21670 - 33565, n=26) | |
| Dynabook Portege Z40L-N | |
| Dynabook Portégé X40-K | |
| LG Gram Style 14Z90RS-G.AD7AG | |
| AIDA64 / CPU AES | |
| Lenovo ThinkBook 14 Gen 8 21SJ007SGE | |
| Dynabook Portégé X40-K | |
| Dell Pro 14 Premium | |
| HP EliteBook X G1i 14 AI | |
| Przeciętny Intel Core Ultra 7 258V (30957 - 40753, n=26) | |
| LG Gram Style 14Z90RS-G.AD7AG | |
| Dynabook Portege Z40L-N | |
| AIDA64 / CPU ZLib | |
| Lenovo ThinkBook 14 Gen 8 21SJ007SGE | |
| Dynabook Portégé X40-K | |
| HP EliteBook X G1i 14 AI | |
| Dell Pro 14 Premium | |
| Przeciętny Intel Core Ultra 7 258V (422 - 632, n=26) | |
| LG Gram Style 14Z90RS-G.AD7AG | |
| Dynabook Portege Z40L-N | |
| AIDA64 / FP64 Ray-Trace | |
| Lenovo ThinkBook 14 Gen 8 21SJ007SGE | |
| HP EliteBook X G1i 14 AI | |
| Dell Pro 14 Premium | |
| Przeciętny Intel Core Ultra 7 258V (4258 - 6930, n=26) | |
| Dynabook Portege Z40L-N | |
| Dynabook Portégé X40-K | |
| LG Gram Style 14Z90RS-G.AD7AG | |
| AIDA64 / CPU PhotoWorxx | |
| HP EliteBook X G1i 14 AI | |
| Dell Pro 14 Premium | |
| Przeciętny Intel Core Ultra 7 258V (44223 - 59245, n=26) | |
| Lenovo ThinkBook 14 Gen 8 21SJ007SGE | |
| Dynabook Portege Z40L-N | |
| LG Gram Style 14Z90RS-G.AD7AG | |
| Dynabook Portégé X40-K | |
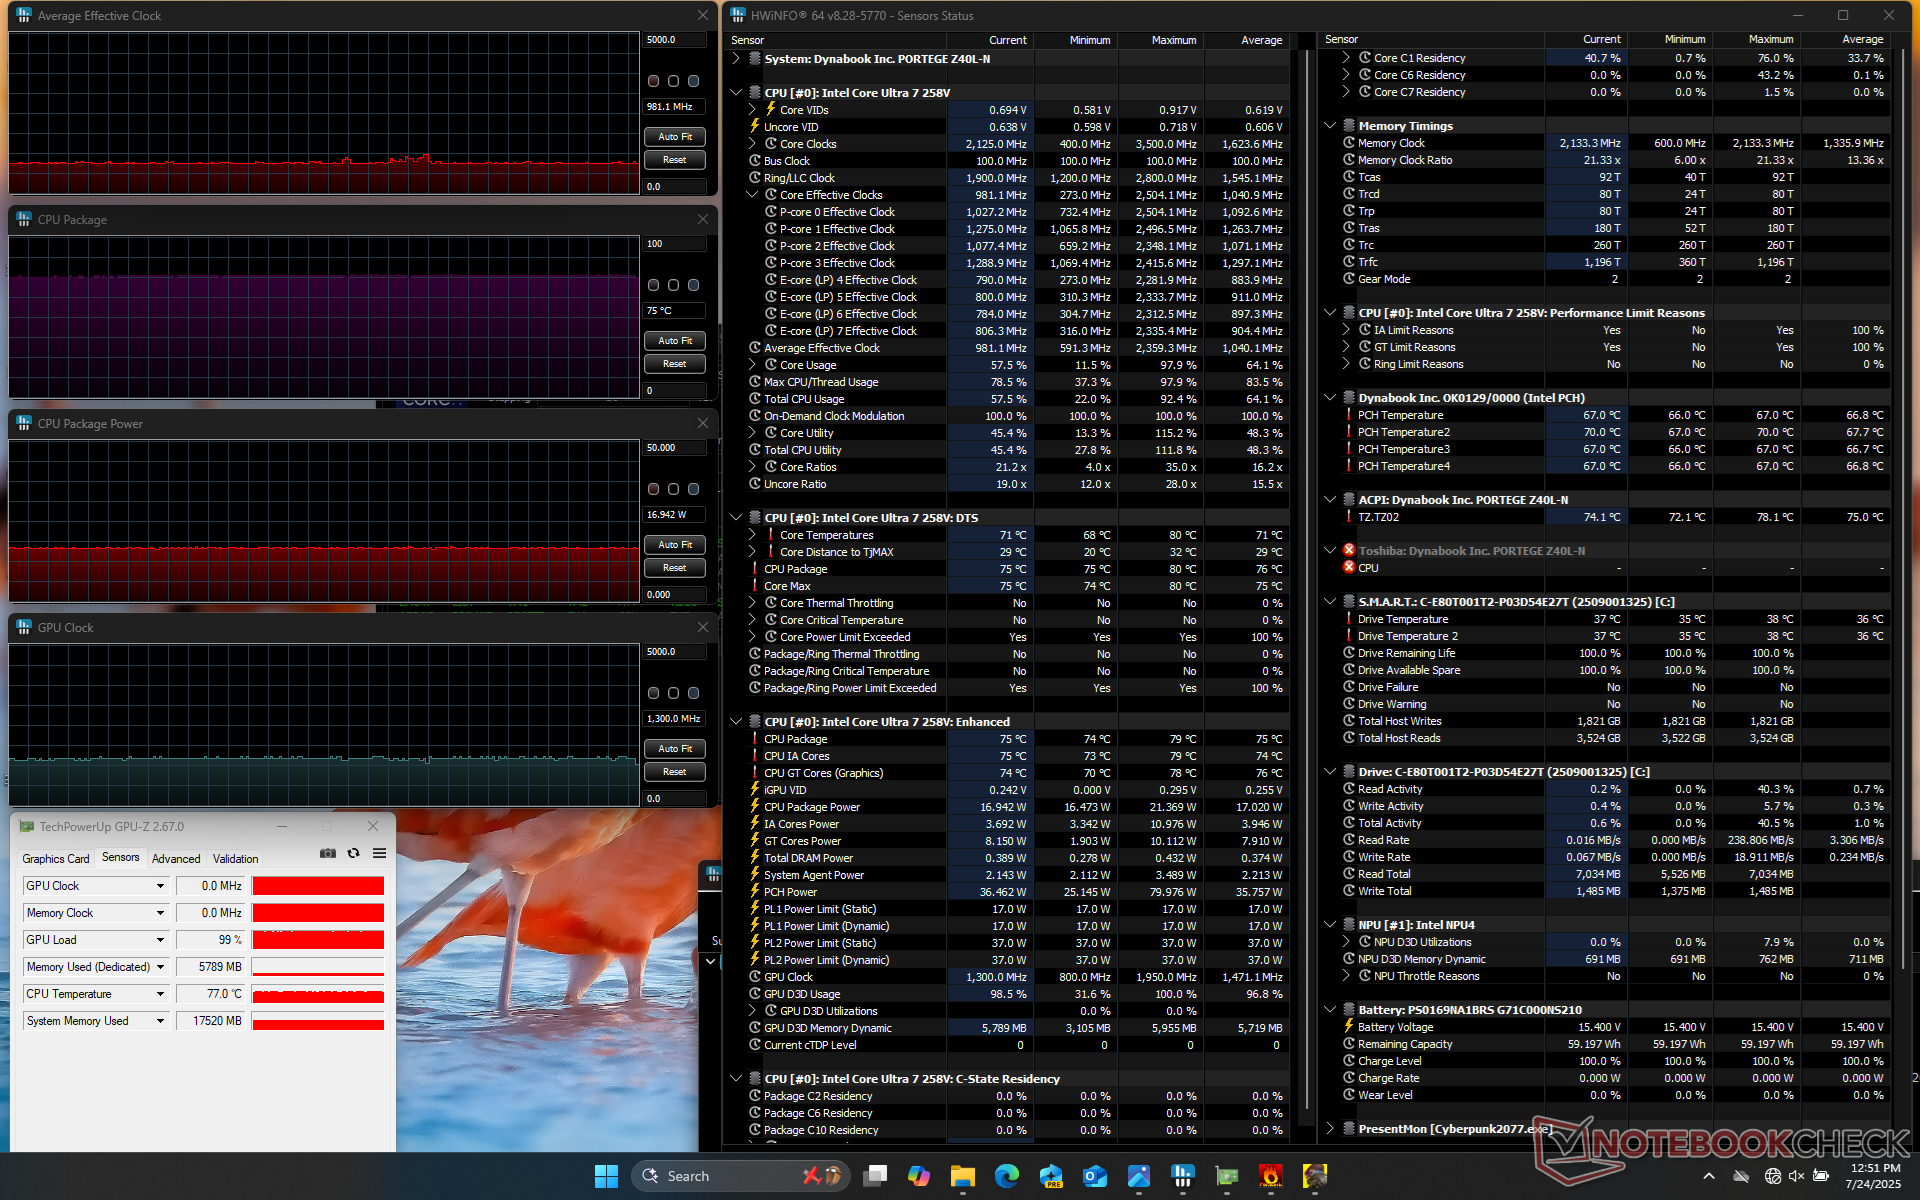
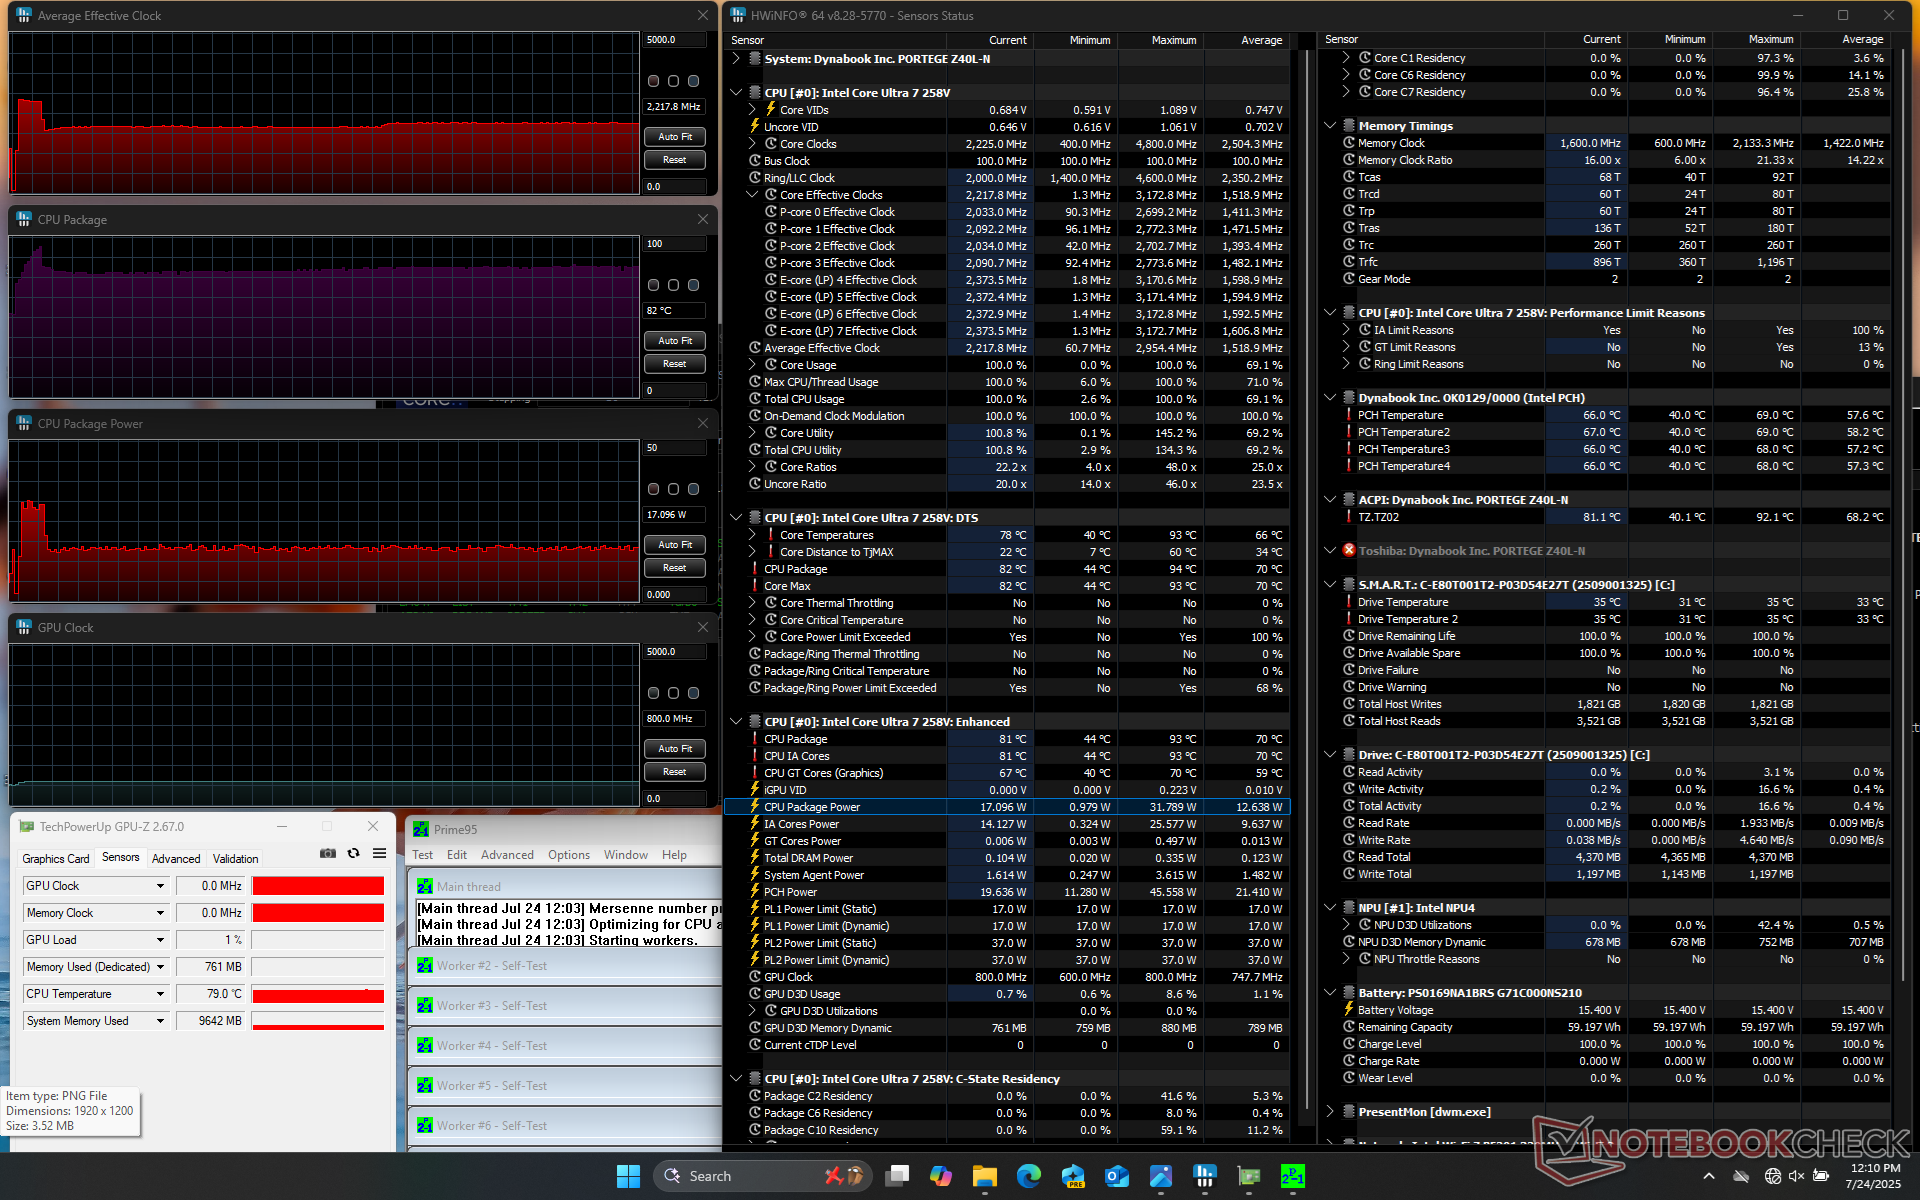
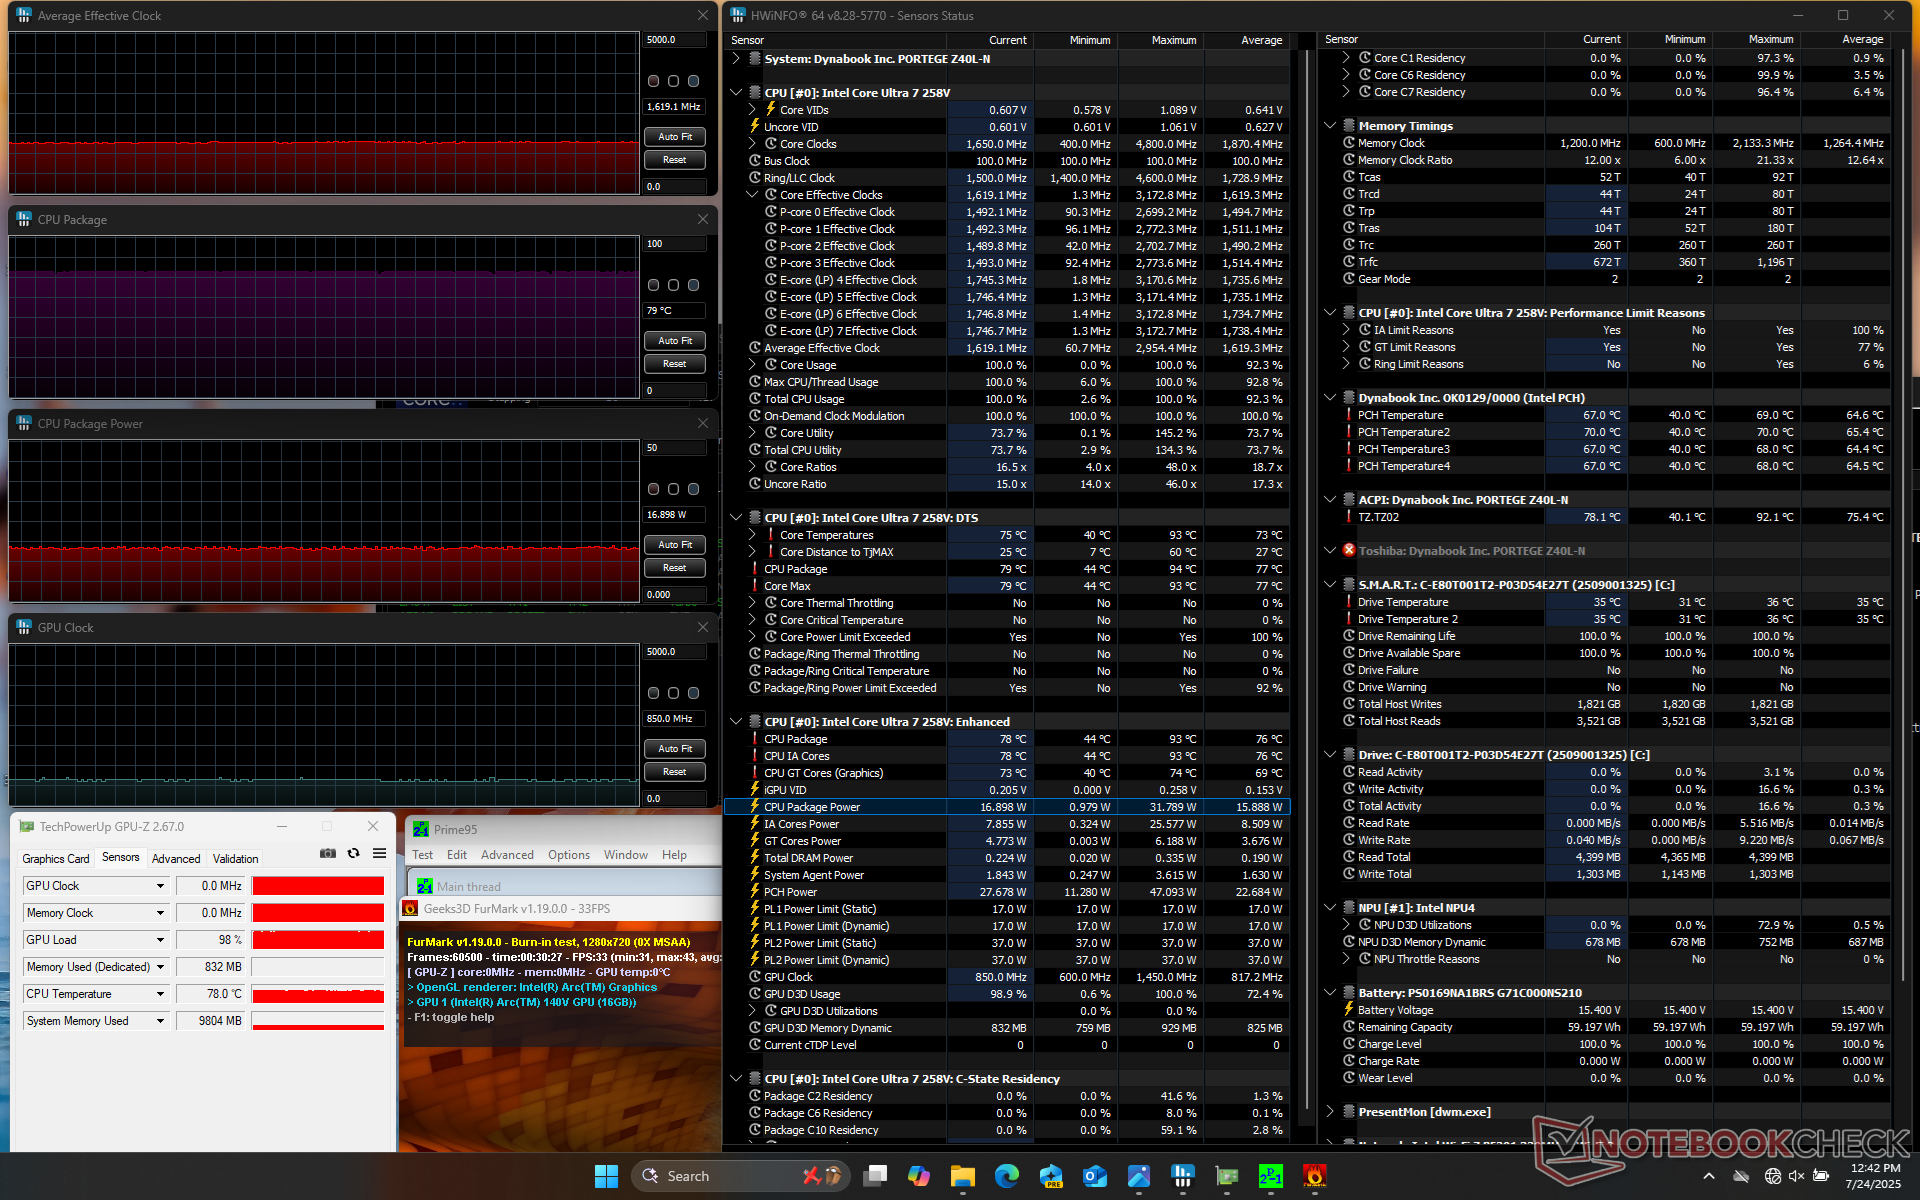
Test warunków skrajnych
| Średnie taktowanie CPU (GHz) | Taktowanie GPU (MHz) | Średnia temperatura CPU (°C) | |
| System bezczynności | -- | -- | 44 |
| Prime95 Stress | 2.2 | 800 | 82 |
| Prime95 + FurMark Stress | 1.6 | 850 | 79 |
| Cyberpunk 2077 Stress | 0.98 | 1300 | 75 |
Wydajność systemu
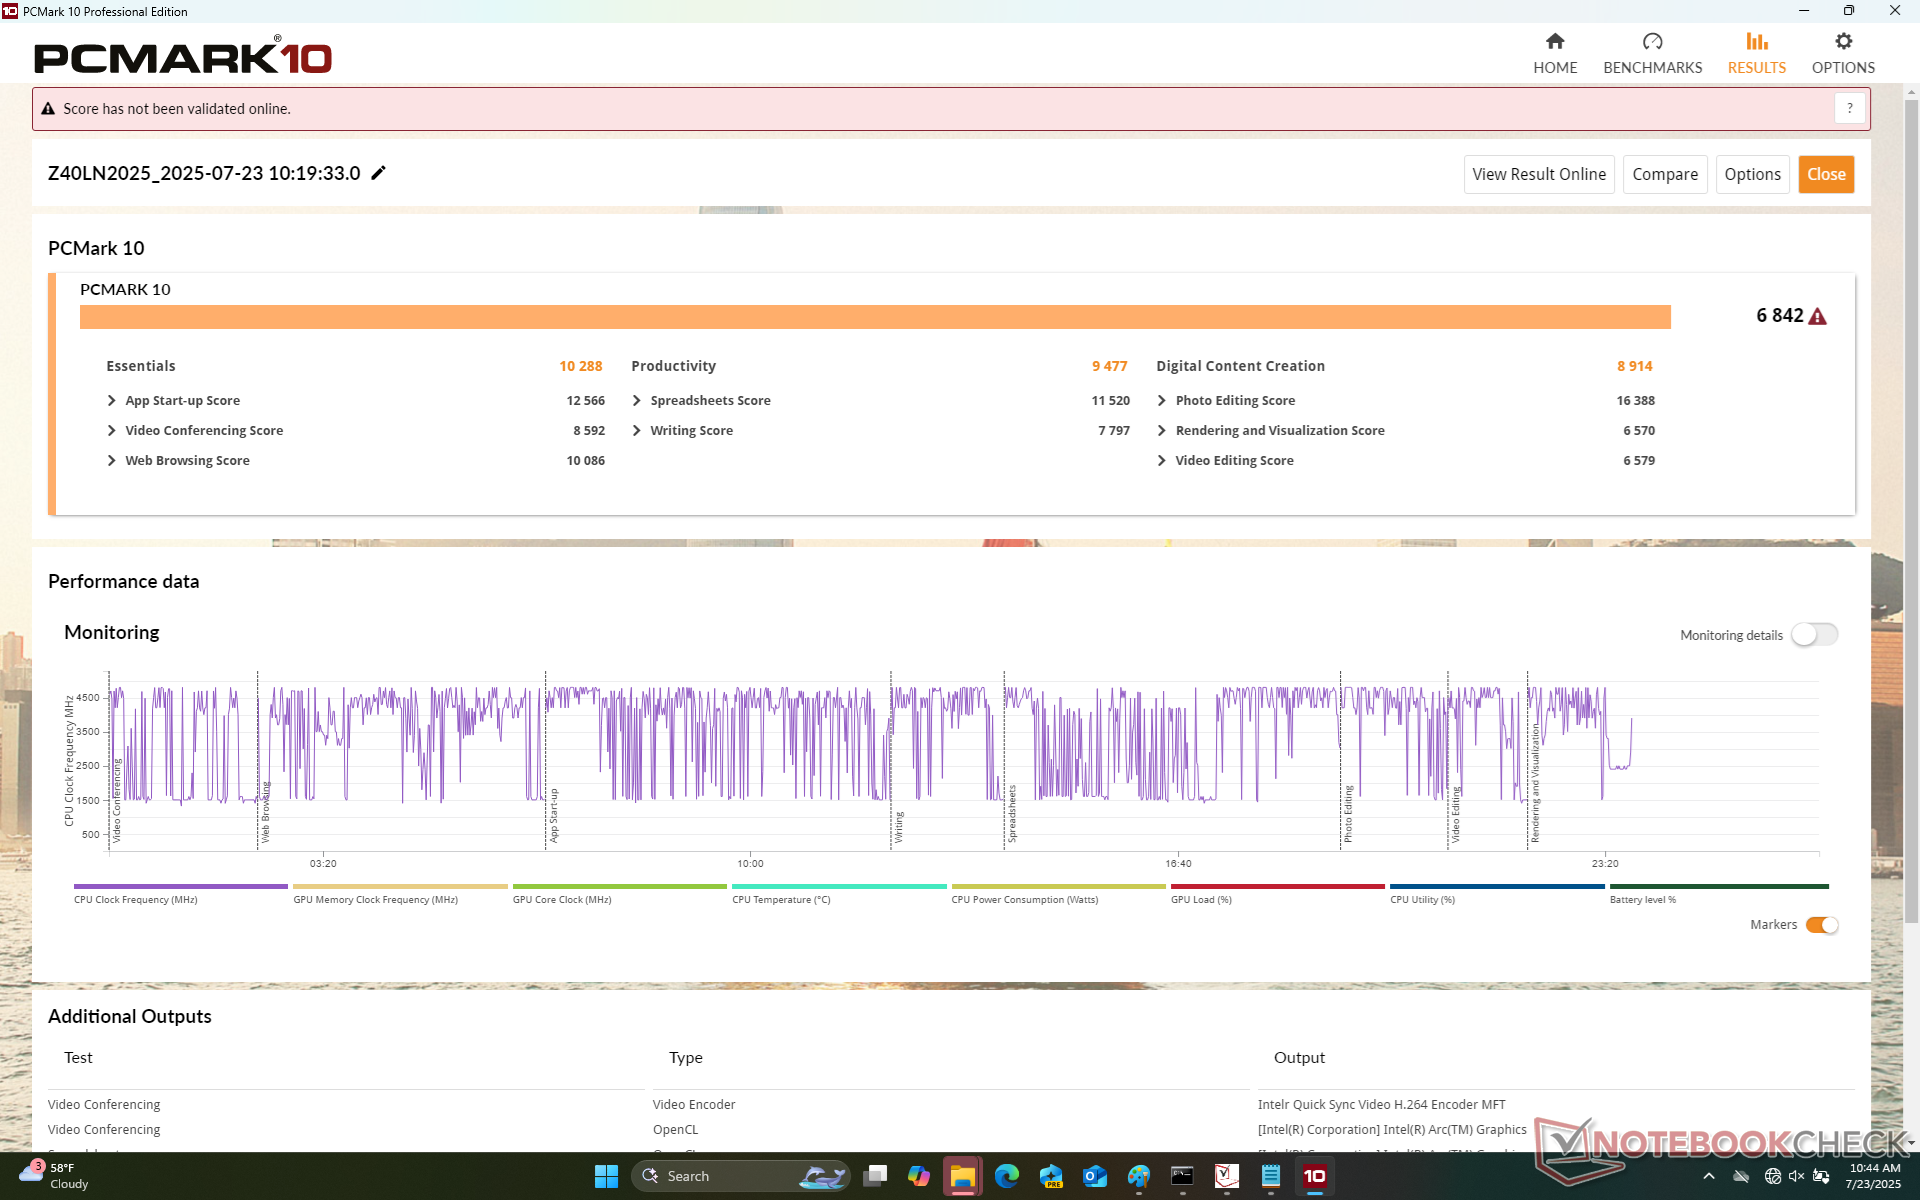
PCMark 10: Score | Essentials | Productivity | Digital Content Creation
CrossMark: Overall | Productivity | Creativity | Responsiveness
WebXPRT 3: Overall
WebXPRT 4: Overall
Mozilla Kraken 1.1: Total
| Performance rating | |
| Lenovo ThinkBook 14 Gen 8 21SJ007SGE | |
| Dell Pro 14 Premium | |
| HP EliteBook X G1i 14 AI | |
| Przeciętny Intel Core Ultra 7 258V, Intel Arc Graphics 140V | |
| Dynabook Portege Z40L-N | |
| LG Gram Style 14Z90RS-G.AD7AG | |
| Dynabook Portégé X40-K | |
| PCMark 10 / Score | |
| Lenovo ThinkBook 14 Gen 8 21SJ007SGE | |
| Dell Pro 14 Premium | |
| HP EliteBook X G1i 14 AI | |
| Przeciętny Intel Core Ultra 7 258V, Intel Arc Graphics 140V (6265 - 7420, n=23) | |
| Dynabook Portege Z40L-N | |
| LG Gram Style 14Z90RS-G.AD7AG | |
| Dynabook Portégé X40-K | |
| PCMark 10 / Essentials | |
| Lenovo ThinkBook 14 Gen 8 21SJ007SGE | |
| LG Gram Style 14Z90RS-G.AD7AG | |
| Dell Pro 14 Premium | |
| HP EliteBook X G1i 14 AI | |
| Przeciętny Intel Core Ultra 7 258V, Intel Arc Graphics 140V (9295 - 11467, n=23) | |
| Dynabook Portege Z40L-N | |
| Dynabook Portégé X40-K | |
| PCMark 10 / Productivity | |
| Lenovo ThinkBook 14 Gen 8 21SJ007SGE | |
| Dynabook Portege Z40L-N | |
| Dell Pro 14 Premium | |
| HP EliteBook X G1i 14 AI | |
| Przeciętny Intel Core Ultra 7 258V, Intel Arc Graphics 140V (7357 - 13600, n=23) | |
| LG Gram Style 14Z90RS-G.AD7AG | |
| Dynabook Portégé X40-K | |
| PCMark 10 / Digital Content Creation | |
| Lenovo ThinkBook 14 Gen 8 21SJ007SGE | |
| HP EliteBook X G1i 14 AI | |
| Dell Pro 14 Premium | |
| Przeciętny Intel Core Ultra 7 258V, Intel Arc Graphics 140V (8160 - 10308, n=23) | |
| Dynabook Portege Z40L-N | |
| Dynabook Portégé X40-K | |
| LG Gram Style 14Z90RS-G.AD7AG | |
| CrossMark / Overall | |
| Lenovo ThinkBook 14 Gen 8 21SJ007SGE | |
| Dell Pro 14 Premium | |
| Przeciętny Intel Core Ultra 7 258V, Intel Arc Graphics 140V (1275 - 1742, n=22) | |
| HP EliteBook X G1i 14 AI | |
| LG Gram Style 14Z90RS-G.AD7AG | |
| Dynabook Portege Z40L-N | |
| Dynabook Portégé X40-K | |
| CrossMark / Productivity | |
| Lenovo ThinkBook 14 Gen 8 21SJ007SGE | |
| Dell Pro 14 Premium | |
| HP EliteBook X G1i 14 AI | |
| Przeciętny Intel Core Ultra 7 258V, Intel Arc Graphics 140V (1267 - 1684, n=22) | |
| Dynabook Portege Z40L-N | |
| LG Gram Style 14Z90RS-G.AD7AG | |
| Dynabook Portégé X40-K | |
| CrossMark / Creativity | |
| Lenovo ThinkBook 14 Gen 8 21SJ007SGE | |
| Dell Pro 14 Premium | |
| HP EliteBook X G1i 14 AI | |
| Przeciętny Intel Core Ultra 7 258V, Intel Arc Graphics 140V (1393 - 1977, n=22) | |
| Dynabook Portege Z40L-N | |
| LG Gram Style 14Z90RS-G.AD7AG | |
| Dynabook Portégé X40-K | |
| CrossMark / Responsiveness | |
| Lenovo ThinkBook 14 Gen 8 21SJ007SGE | |
| LG Gram Style 14Z90RS-G.AD7AG | |
| Dell Pro 14 Premium | |
| Przeciętny Intel Core Ultra 7 258V, Intel Arc Graphics 140V (999 - 1411, n=22) | |
| Dynabook Portege Z40L-N | |
| Dynabook Portégé X40-K | |
| HP EliteBook X G1i 14 AI | |
| WebXPRT 3 / Overall | |
| Lenovo ThinkBook 14 Gen 8 21SJ007SGE | |
| Dell Pro 14 Premium | |
| HP EliteBook X G1i 14 AI | |
| Dynabook Portege Z40L-N | |
| Przeciętny Intel Core Ultra 7 258V, Intel Arc Graphics 140V (219 - 317, n=22) | |
| Dynabook Portégé X40-K | |
| LG Gram Style 14Z90RS-G.AD7AG | |
| WebXPRT 4 / Overall | |
| Lenovo ThinkBook 14 Gen 8 21SJ007SGE | |
| Dell Pro 14 Premium | |
| HP EliteBook X G1i 14 AI | |
| Dynabook Portege Z40L-N | |
| Przeciętny Intel Core Ultra 7 258V, Intel Arc Graphics 140V (199.5 - 291, n=22) | |
| Dynabook Portégé X40-K | |
| LG Gram Style 14Z90RS-G.AD7AG | |
| Mozilla Kraken 1.1 / Total | |
| LG Gram Style 14Z90RS-G.AD7AG | |
| Dynabook Portégé X40-K | |
| Przeciętny Intel Core Ultra 7 258V, Intel Arc Graphics 140V (468 - 559, n=24) | |
| Dynabook Portege Z40L-N | |
| HP EliteBook X G1i 14 AI | |
| Dell Pro 14 Premium | |
| Lenovo ThinkBook 14 Gen 8 21SJ007SGE | |
* ... im mniej tym lepiej
| PCMark 10 Score | 6842 pkt. | |
Pomoc | ||
| AIDA64 / Memory Copy | |
| Przeciętny Intel Core Ultra 7 258V (104408 - 114336, n=24) | |
| Dell Pro 14 Premium | |
| HP EliteBook X G1i 14 AI | |
| Dynabook Portege Z40L-N | |
| Lenovo ThinkBook 14 Gen 8 21SJ007SGE | |
| LG Gram Style 14Z90RS-G.AD7AG | |
| Dynabook Portégé X40-K | |
| AIDA64 / Memory Read | |
| Dell Pro 14 Premium | |
| Przeciętny Intel Core Ultra 7 258V (82846 - 89417, n=24) | |
| Dynabook Portege Z40L-N | |
| HP EliteBook X G1i 14 AI | |
| Lenovo ThinkBook 14 Gen 8 21SJ007SGE | |
| LG Gram Style 14Z90RS-G.AD7AG | |
| Dynabook Portégé X40-K | |
| AIDA64 / Memory Write | |
| Dell Pro 14 Premium | |
| Przeciętny Intel Core Ultra 7 258V (108824 - 117989, n=24) | |
| Dynabook Portege Z40L-N | |
| HP EliteBook X G1i 14 AI | |
| LG Gram Style 14Z90RS-G.AD7AG | |
| Lenovo ThinkBook 14 Gen 8 21SJ007SGE | |
| Dynabook Portégé X40-K | |
| AIDA64 / Memory Latency | |
| Lenovo ThinkBook 14 Gen 8 21SJ007SGE | |
| Dell Pro 14 Premium | |
| Dynabook Portege Z40L-N | |
| HP EliteBook X G1i 14 AI | |
| Przeciętny Intel Core Ultra 7 258V (95 - 101.7, n=24) | |
| LG Gram Style 14Z90RS-G.AD7AG | |
| Dynabook Portégé X40-K | |
* ... im mniej tym lepiej
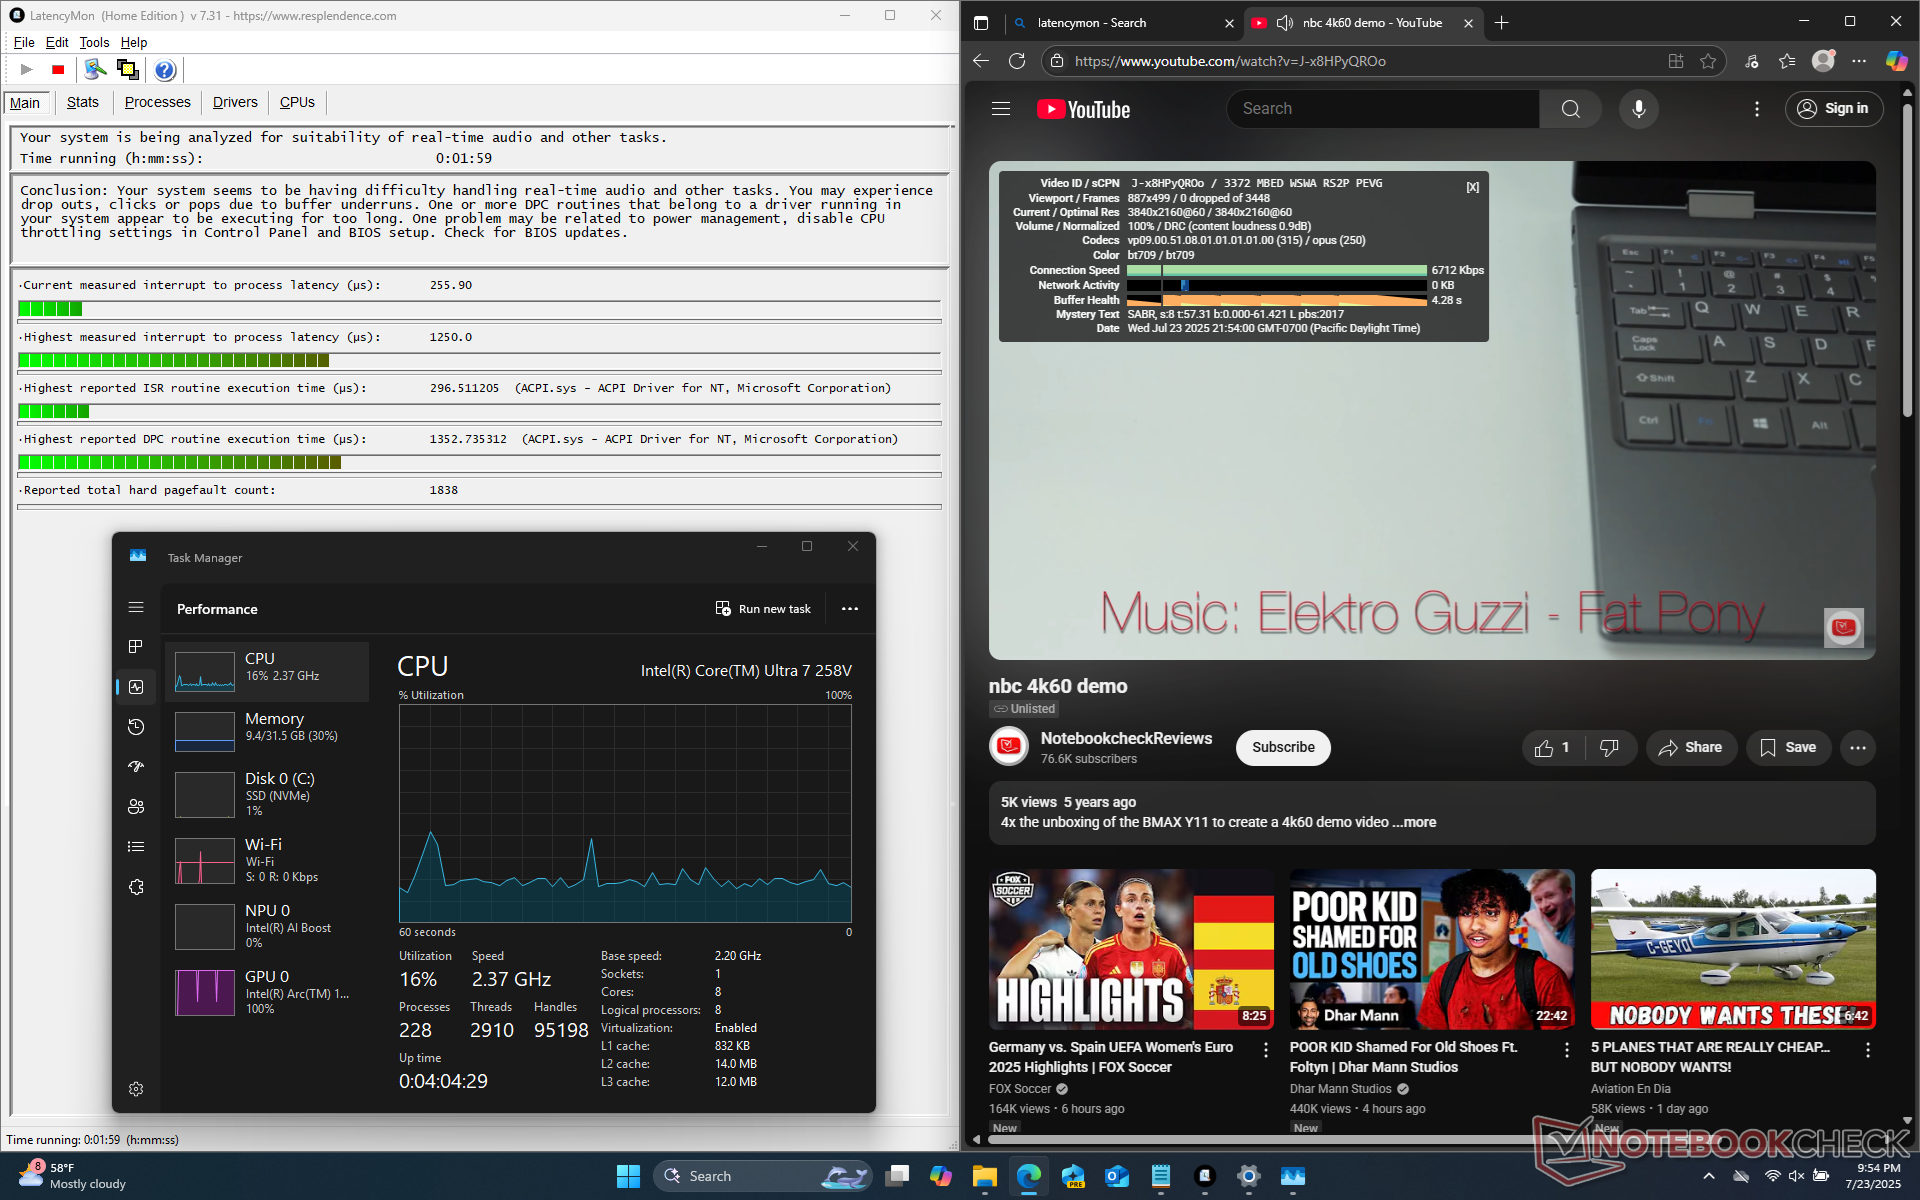
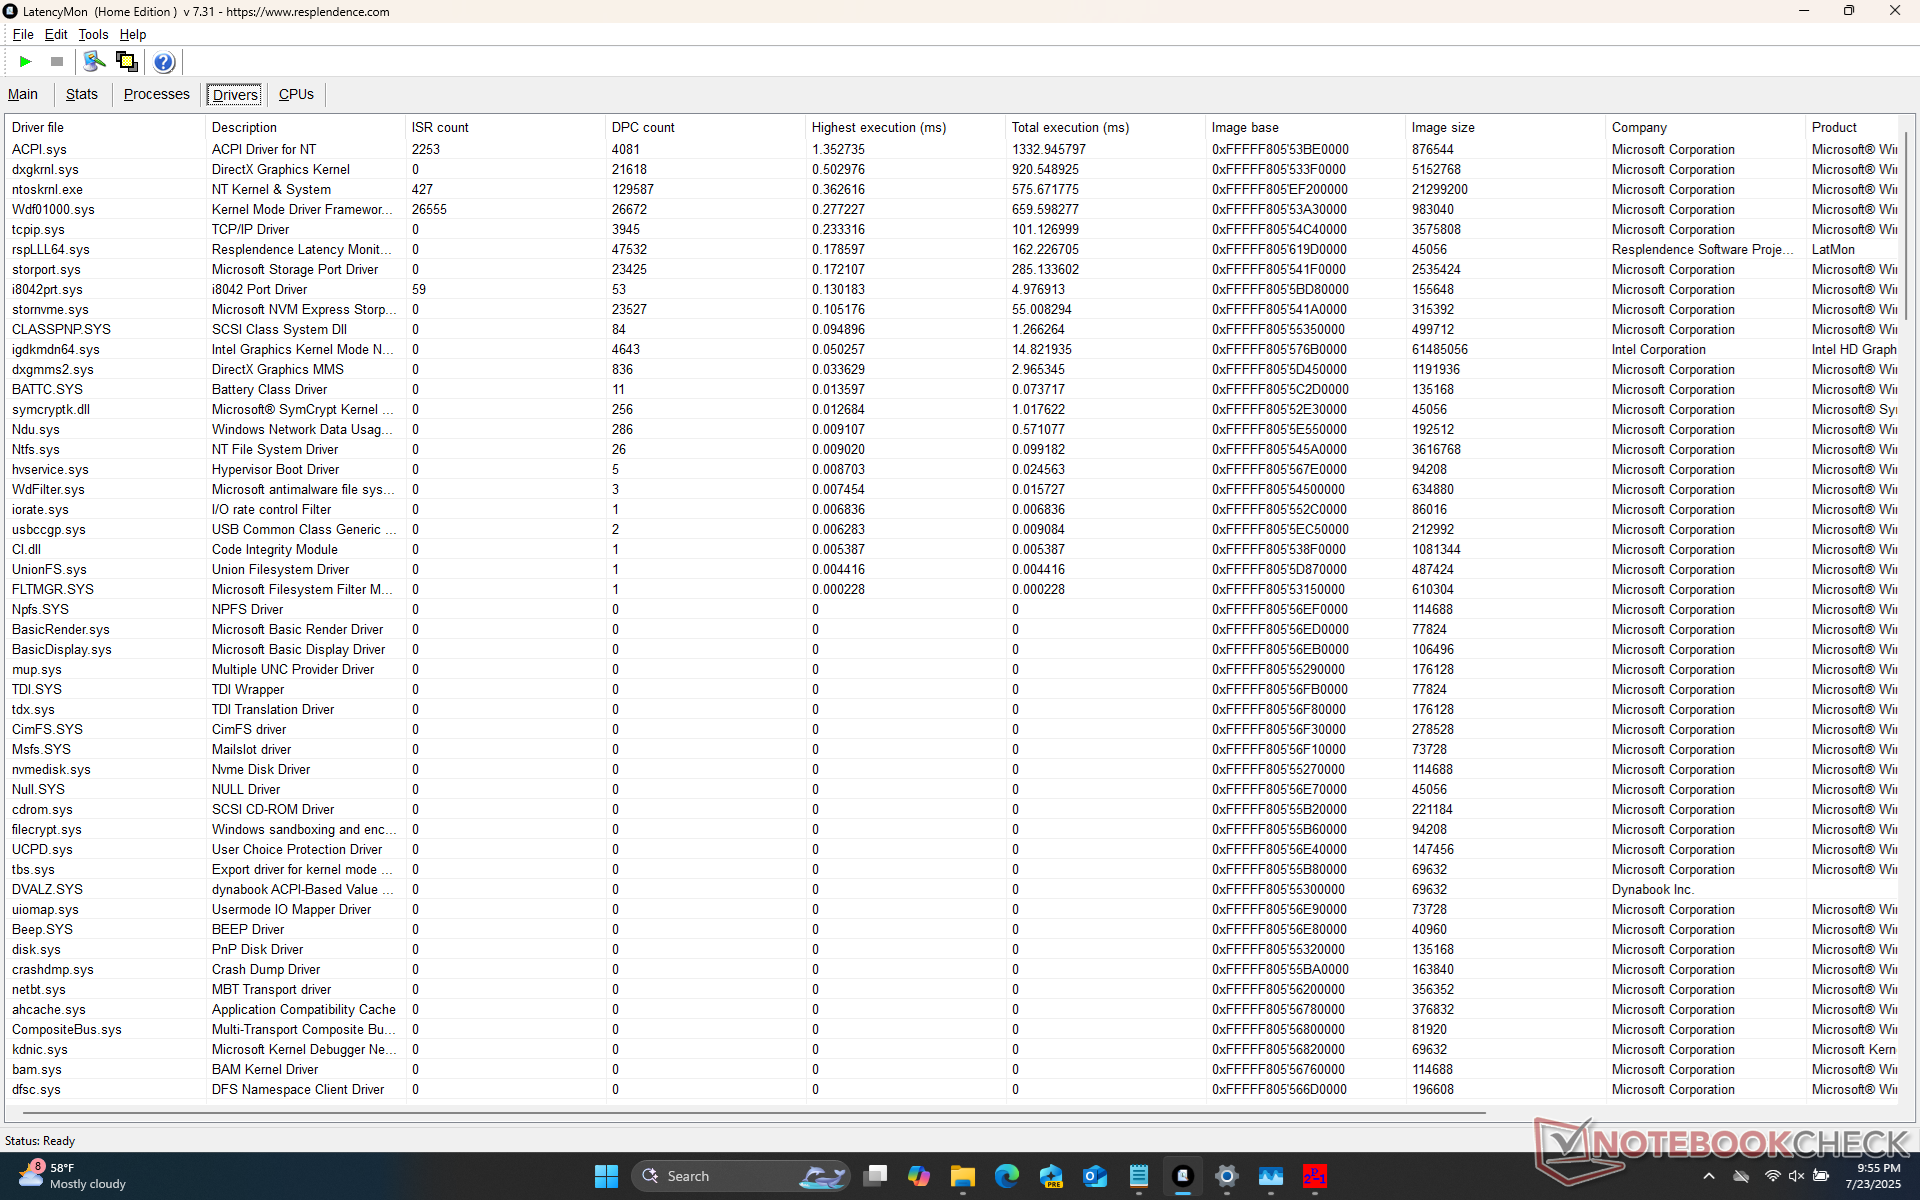
Opóźnienie DPC
| DPC Latencies / LatencyMon - interrupt to process latency (max), Web, Youtube, Prime95 | |
| Dell Pro 14 Premium | |
| LG Gram Style 14Z90RS-G.AD7AG | |
| Dynabook Portégé X40-K | |
| Dynabook Portege Z40L-N | |
| Lenovo ThinkBook 14 Gen 8 21SJ007SGE | |
| HP EliteBook X G1i 14 AI | |
* ... im mniej tym lepiej
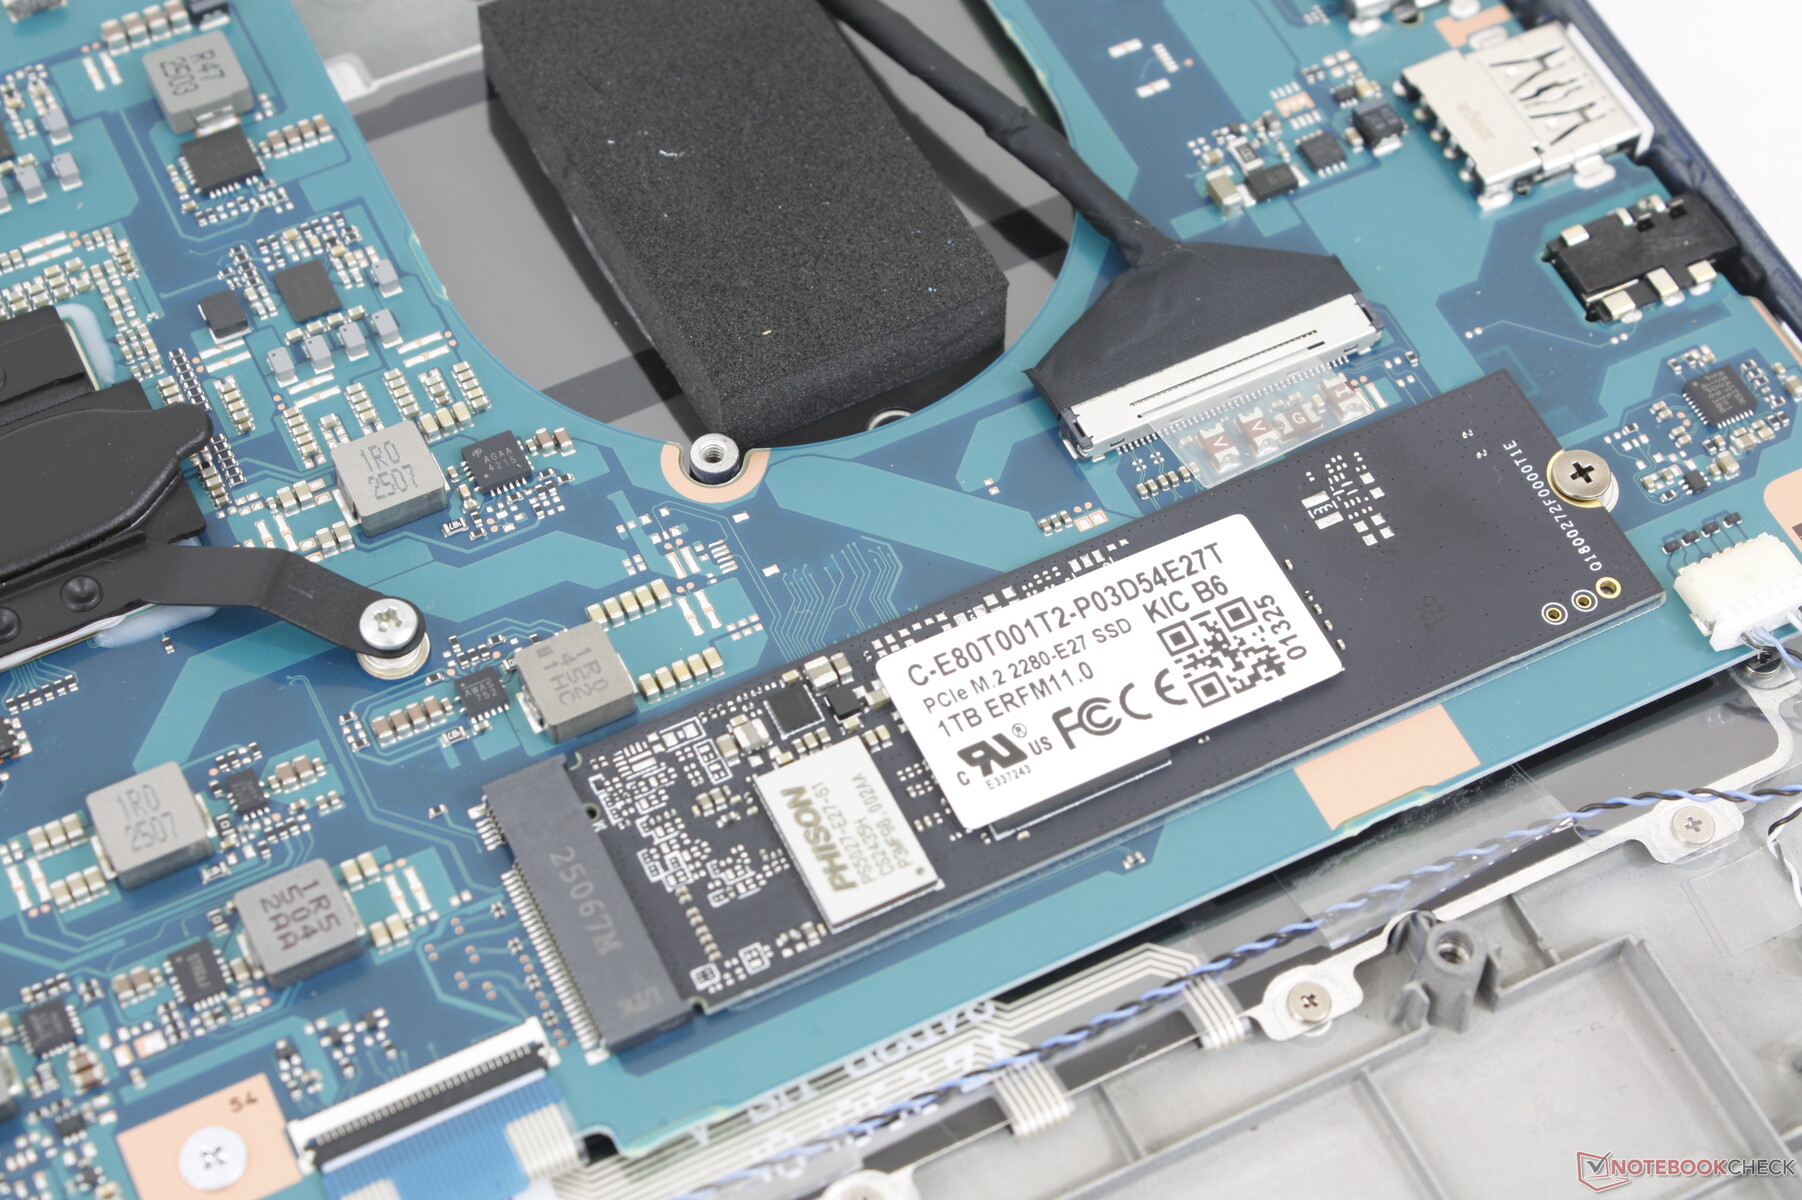
Urządzenia pamięci masowej
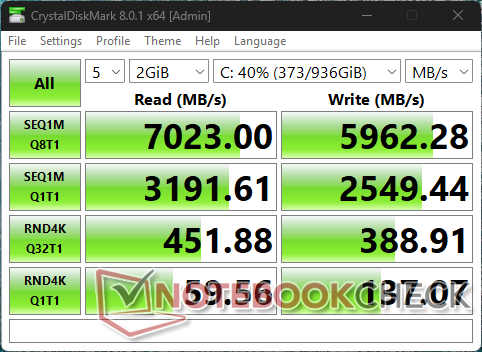
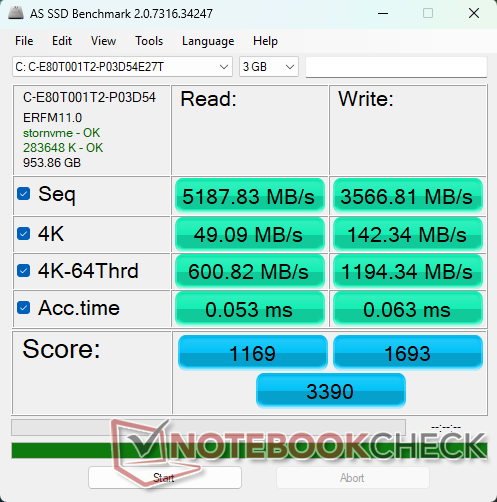

| Drive Performance rating - Percent | |
| LG Gram Style 14Z90RS-G.AD7AG | |
| Lenovo ThinkBook 14 Gen 8 21SJ007SGE | |
| Dynabook Portege Z40L-N | |
| HP EliteBook X G1i 14 AI | |
| Dell Pro 14 Premium | |
| Dynabook Portégé X40-K | |
* ... im mniej tym lepiej
Disk Throttling: DiskSpd Read Loop, Queue Depth 8
Wydajność GPU
| Profil zasilania | Wynik w dziedzinie grafiki | Wynik fizyki | Wynik łączny |
| Tryb wydajności | 7713 | 15893 | 2480 |
| Tryb zrównoważony | 8155 (+6%) | 15924 (+0%) | 2569 (+4%) |
| Zasilanie bateryjne | 8982 (+16%) | 16230 (+2%) | 2638 (+6%) |
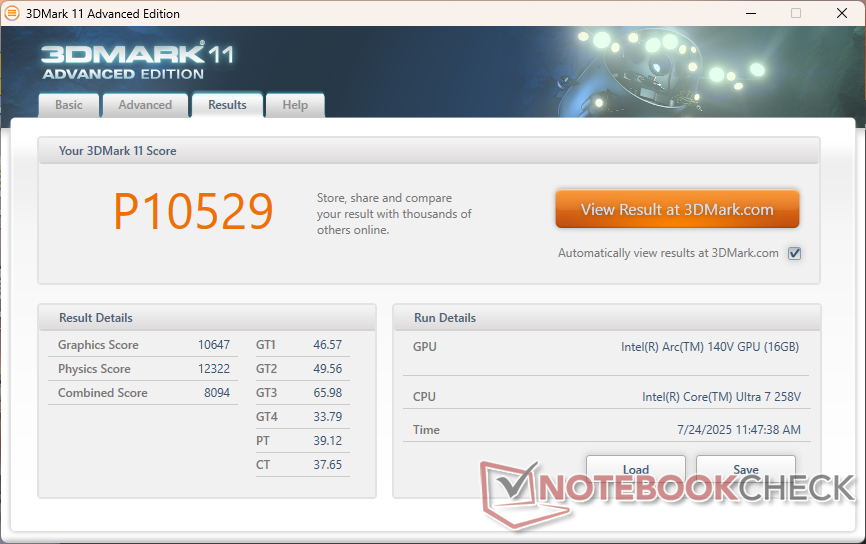
| 3DMark 11 Performance | 10529 pkt. | |
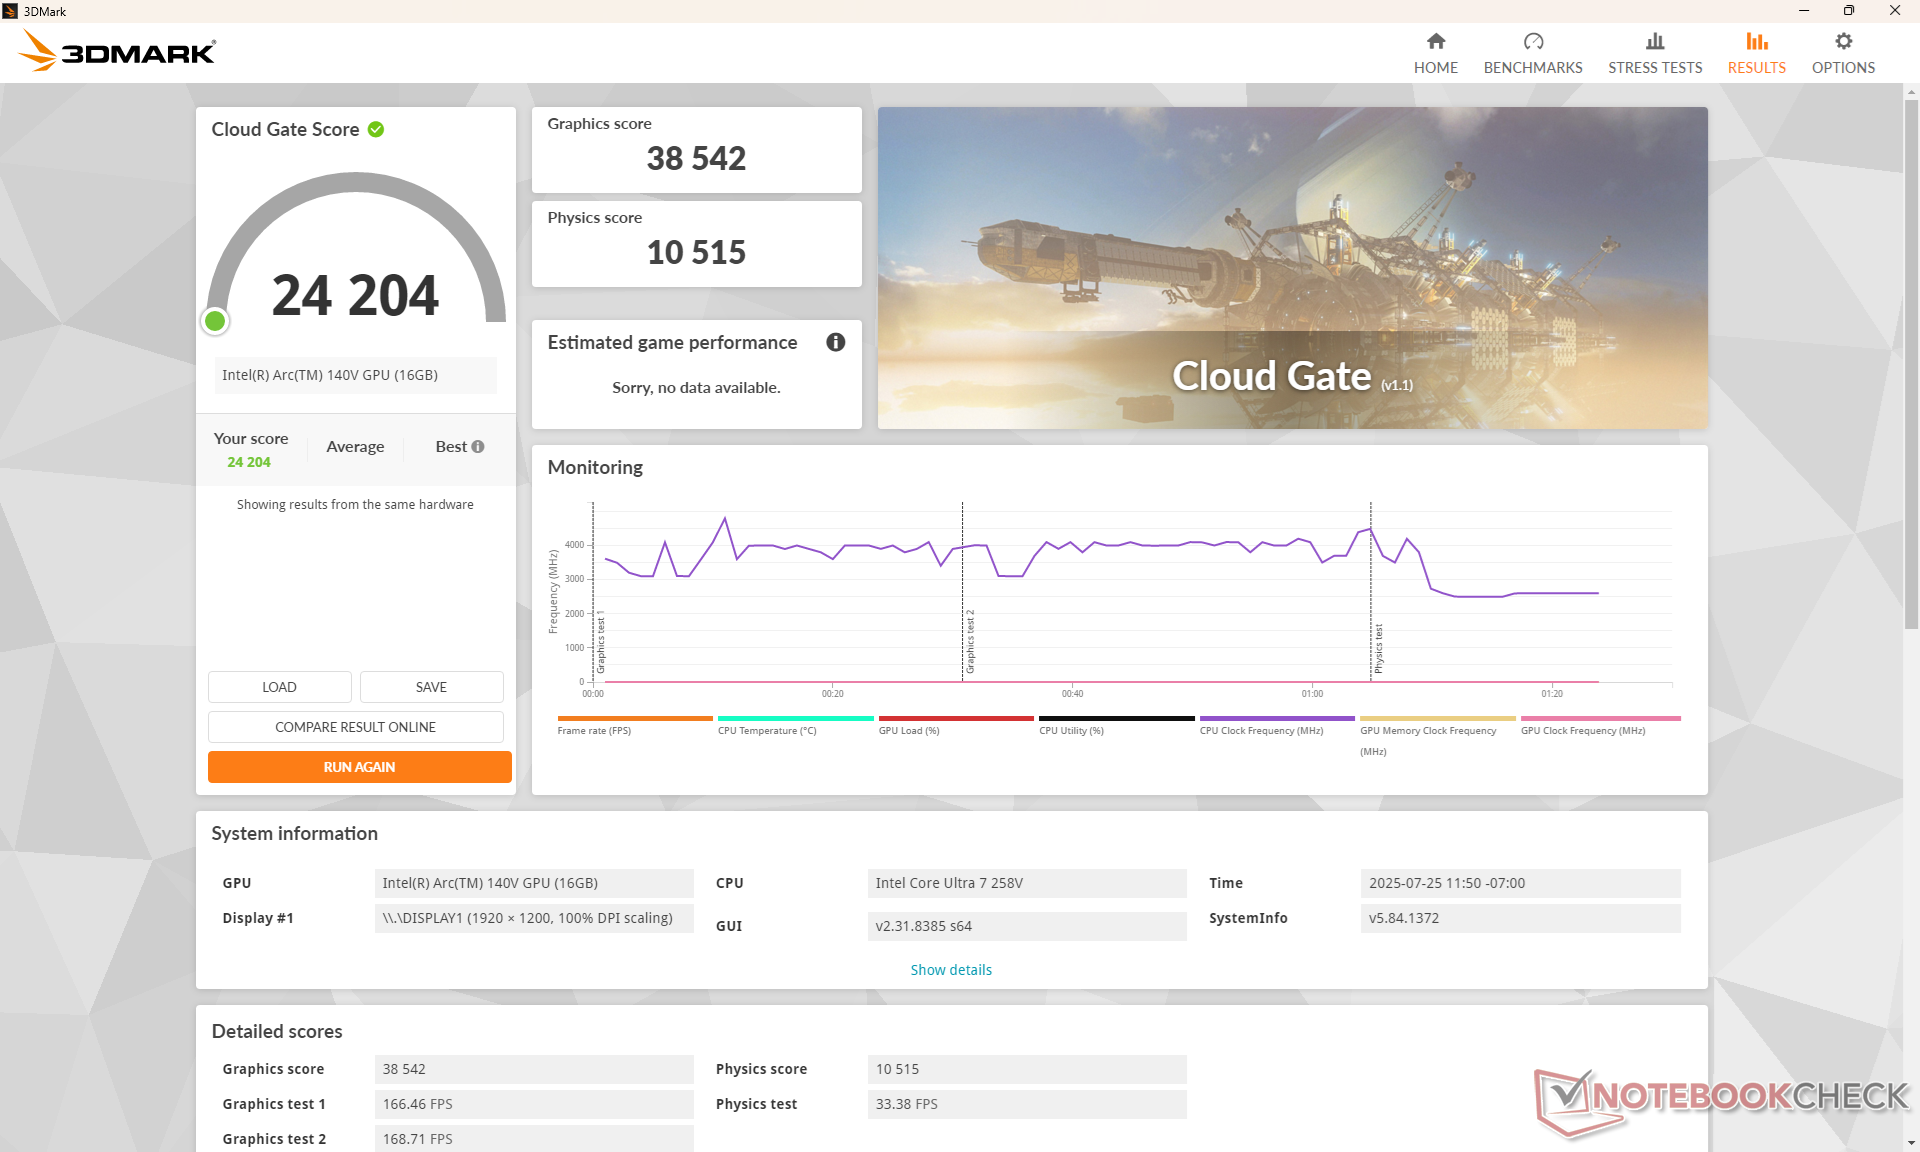
| 3DMark Cloud Gate Standard Score | 24204 pkt. | |
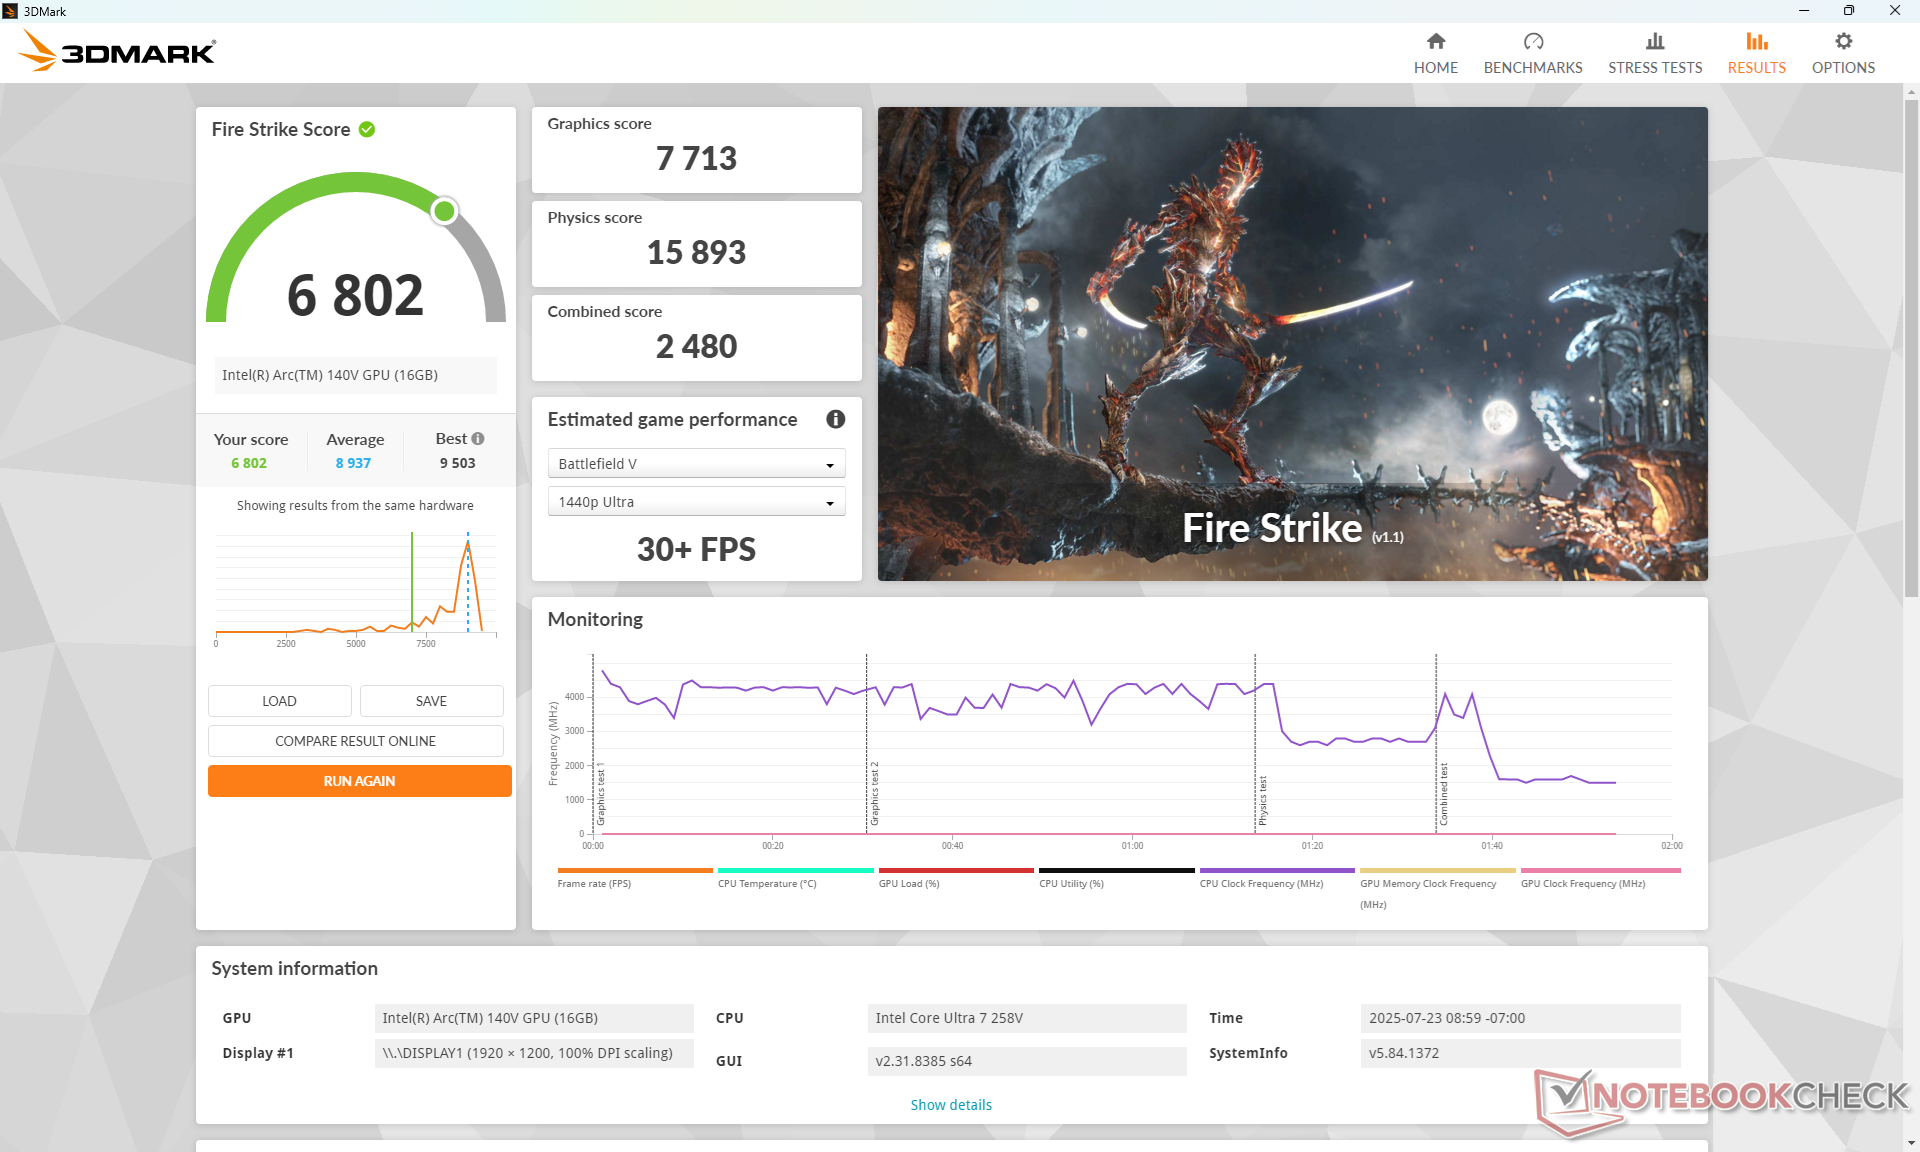
| 3DMark Fire Strike Score | 6802 pkt. | |
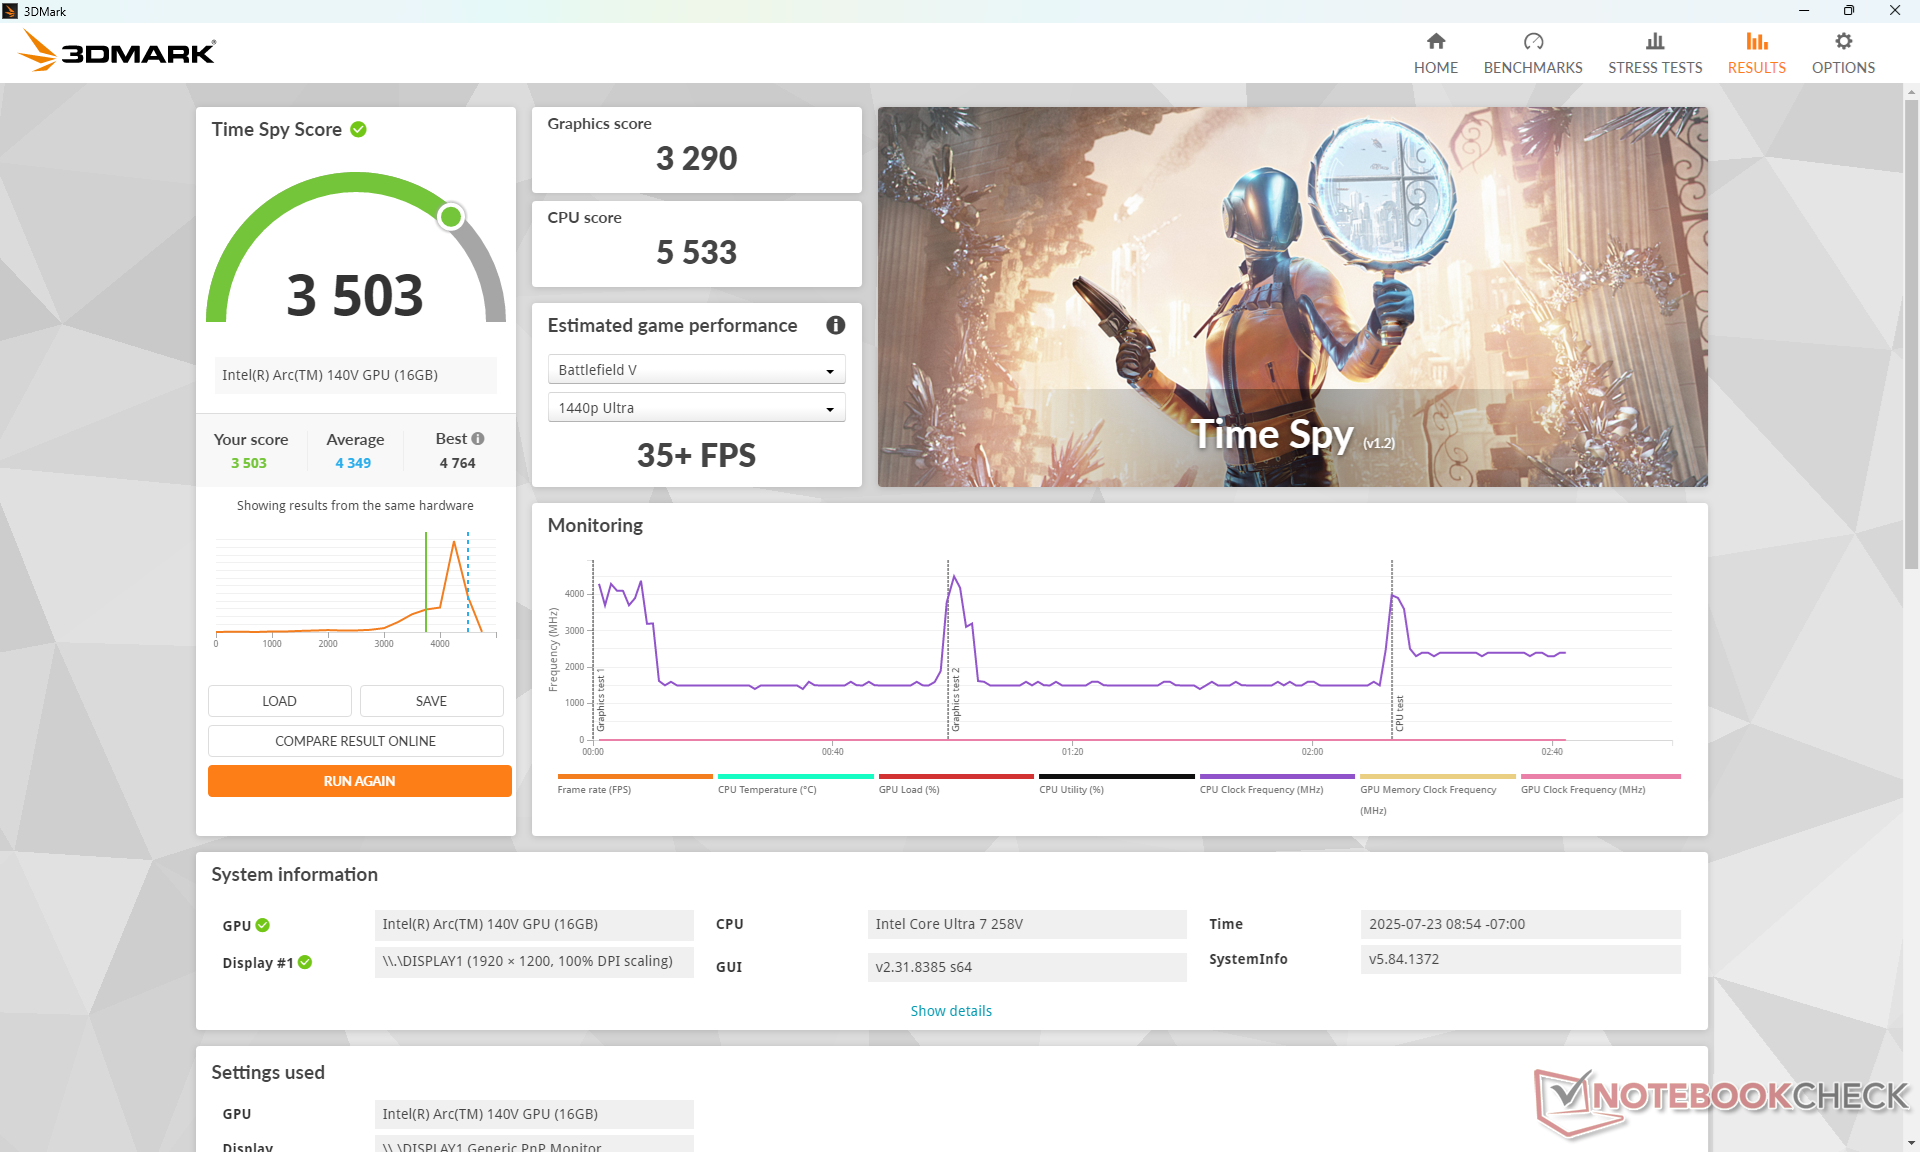
| 3DMark Time Spy Score | 3503 pkt. | |
Pomoc | ||
* ... im mniej tym lepiej
| GTA V | |
| 1920x1080 High/On (Advanced Graphics Off) AA:2xMSAA + FX AF:8x | |
| HP EliteBook X G1i 14 AI | |
| Przeciętny Intel Arc Graphics 140V (32 - 76.3, n=32) | |
| Asus Vivobook S 14 OLED S5406SA | |
| Lenovo Yoga 7 2-in-1 14AHP9 Arctic Grey | |
| Dynabook Portege Z40L-N | |
| Lenovo Yoga 7 2-in-1 14AKP10 | |
| Lenovo ThinkBook 14 Gen 8 21SJ007SGE | |
| Acer TravelMate P4 14 TMP414-42-TCO-R6KG | |
| LG Gram Style 14Z90RS-G.AD7AG | |
| Dynabook Portégé X40-K | |
| 1920x1080 Highest AA:4xMSAA + FX AF:16x | |
| HP EliteBook X G1i 14 AI | |
| Przeciętny Intel Arc Graphics 140V (15.4 - 29, n=33) | |
| Lenovo Yoga 7 2-in-1 14AHP9 Arctic Grey | |
| Dynabook Portege Z40L-N | |
| Asus Vivobook S 14 OLED S5406SA | |
| Lenovo Yoga 7 2-in-1 14AKP10 | |
| Lenovo ThinkBook 14 Gen 8 21SJ007SGE | |
| LG Gram Style 14Z90RS-G.AD7AG | |
| Acer TravelMate P4 14 TMP414-42-TCO-R6KG | |
| Dynabook Portégé X40-K | |
Cyberpunk 2077 ultra FPS Chart
| low | med. | high | ultra | |
|---|---|---|---|---|
| GTA V (2015) | 123.9 | 115.7 | 50.5 | 21.8 |
| Dota 2 Reborn (2015) | 92.4 | 68.9 | 51.4 | 58.2 |
| Final Fantasy XV Benchmark (2018) | 67.7 | 37.1 | 28.2 | |
| X-Plane 11.11 (2018) | 46.8 | 37 | 32.6 | |
| Strange Brigade (2018) | 179.5 | 56.3 | 49 | 46.3 |
| Baldur's Gate 3 (2023) | 34.3 | 29 | 25.6 | 25 |
| Cyberpunk 2077 (2023) | 35.1 | 28.3 | 24.1 | 21 |
| F1 24 (2024) | 67.4 | 63 | 48.1 | 15.3 |
Emisje
Hałas systemowy
Hałas
| luz |
| 23.6 / 23.6 / 23.6 dB |
| obciążenie |
| 37 / 39 dB |
 | ||
30 dB cichy 40 dB(A) słyszalny 50 dB(A) irytujący |
||
min: | ||
| Dynabook Portege Z40L-N Arc 140V, Core Ultra 7 258V, Phison C-E80T001T2-P03D54E27T | Dynabook Portégé X40-K Iris Xe G7 96EUs, i7-1260P, Samsung PM991 MZVLQ512HBLU | LG Gram Style 14Z90RS-G.AD7AG Iris Xe G7 96EUs, i7-1360P, SK hynix PC801 HFS001TEJ9X101N | Lenovo ThinkBook 14 Gen 8 21SJ007SGE Arc 140T, Ultra 7 255H, Western Digital PCSN5000S SDEPMSJ-1T00-1101 | Dell Pro 14 Premium Arc 140V, Core Ultra 7 268V, Kioxia BG6 KBG6AZNV1T02 | HP EliteBook X G1i 14 AI Arc 140V, Core Ultra 7 268V, Kioxia XG8 KXG80ZNV512G | |
|---|---|---|---|---|---|---|
| Noise | 3% | -5% | -7% | -4% | -11% | |
| wyłączone / środowisko * (dB) | 23.5 | 22.8 3% | 25 -6% | 25.2 -7% | 23.1 2% | 28.2 -20% |
| Idle Minimum * (dB) | 23.6 | 23.4 1% | 25 -6% | 25.2 -7% | 23.1 2% | 28.4 -20% |
| Idle Average * (dB) | 23.6 | 23.4 1% | 25 -6% | 25.2 -7% | 23.1 2% | 28.4 -20% |
| Idle Maximum * (dB) | 23.6 | 23.4 1% | 25 -6% | 25.2 -7% | 23.1 2% | 28.8 -22% |
| Load Average * (dB) | 37 | 31.2 16% | 37 -0% | 32.9 11% | 38.2 -3% | 33.5 9% |
| Cyberpunk 2077 ultra * (dB) | 37.8 | 44.1 -17% | 44.2 -17% | 39.1 -3% | ||
| Load Maximum * (dB) | 39 | 40.5 -4% | 40.62 -4% | 43.9 -13% | 44.2 -13% | 40.4 -4% |
| Witcher 3 ultra * (dB) | 27.1 | 37 |
* ... im mniej tym lepiej
Temperatura
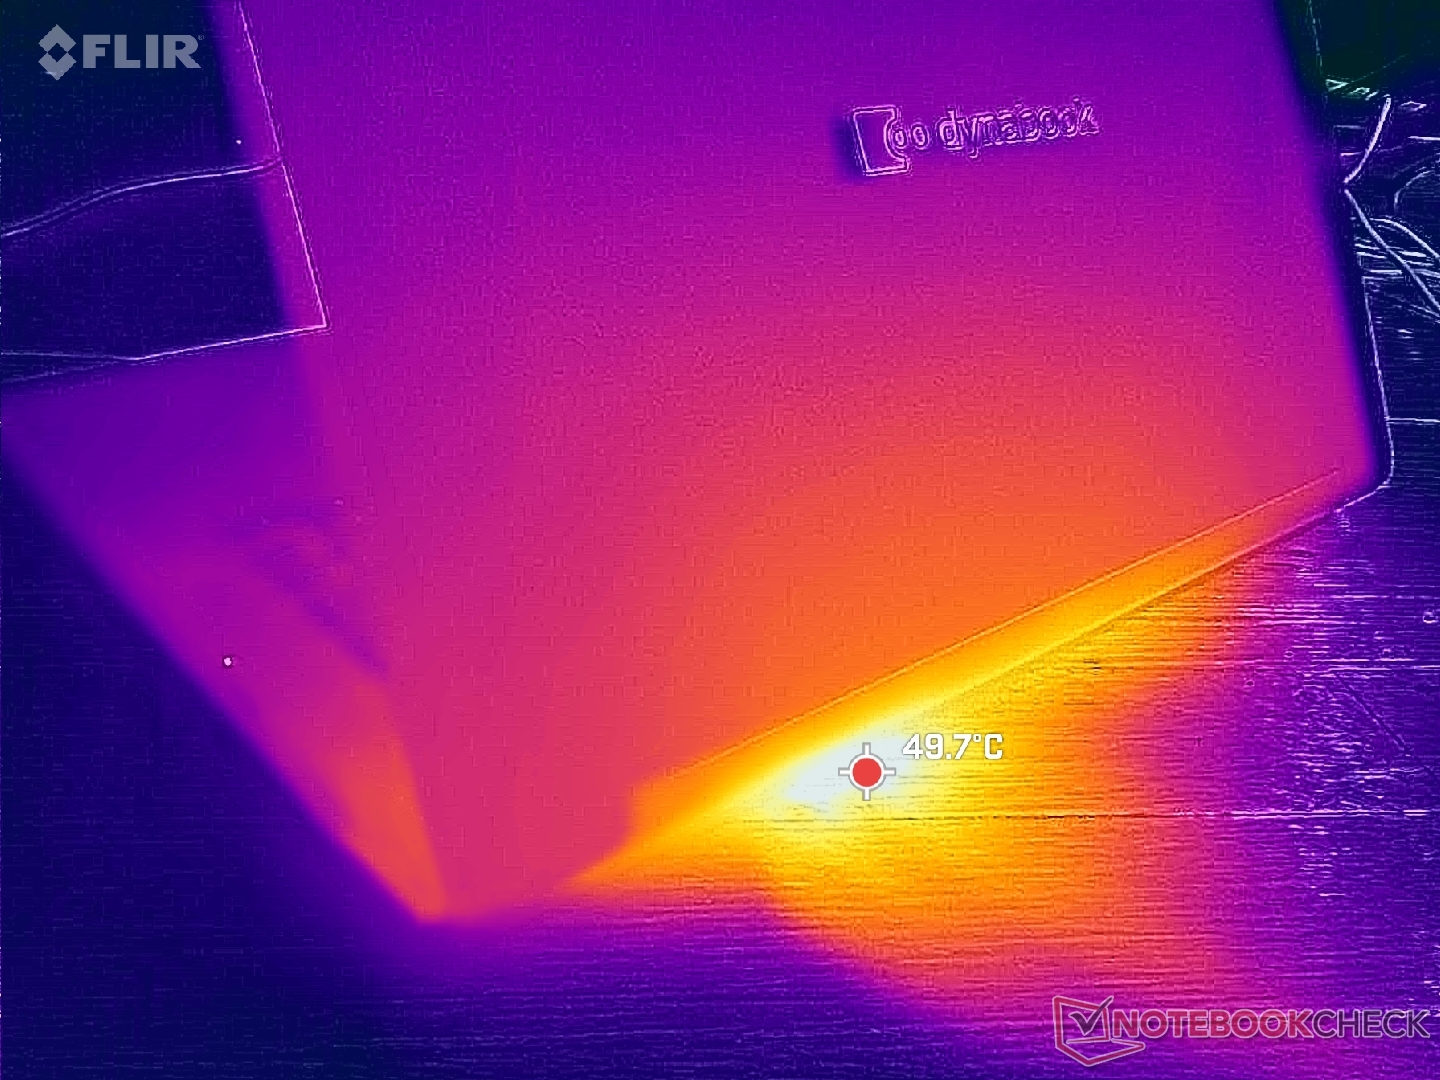
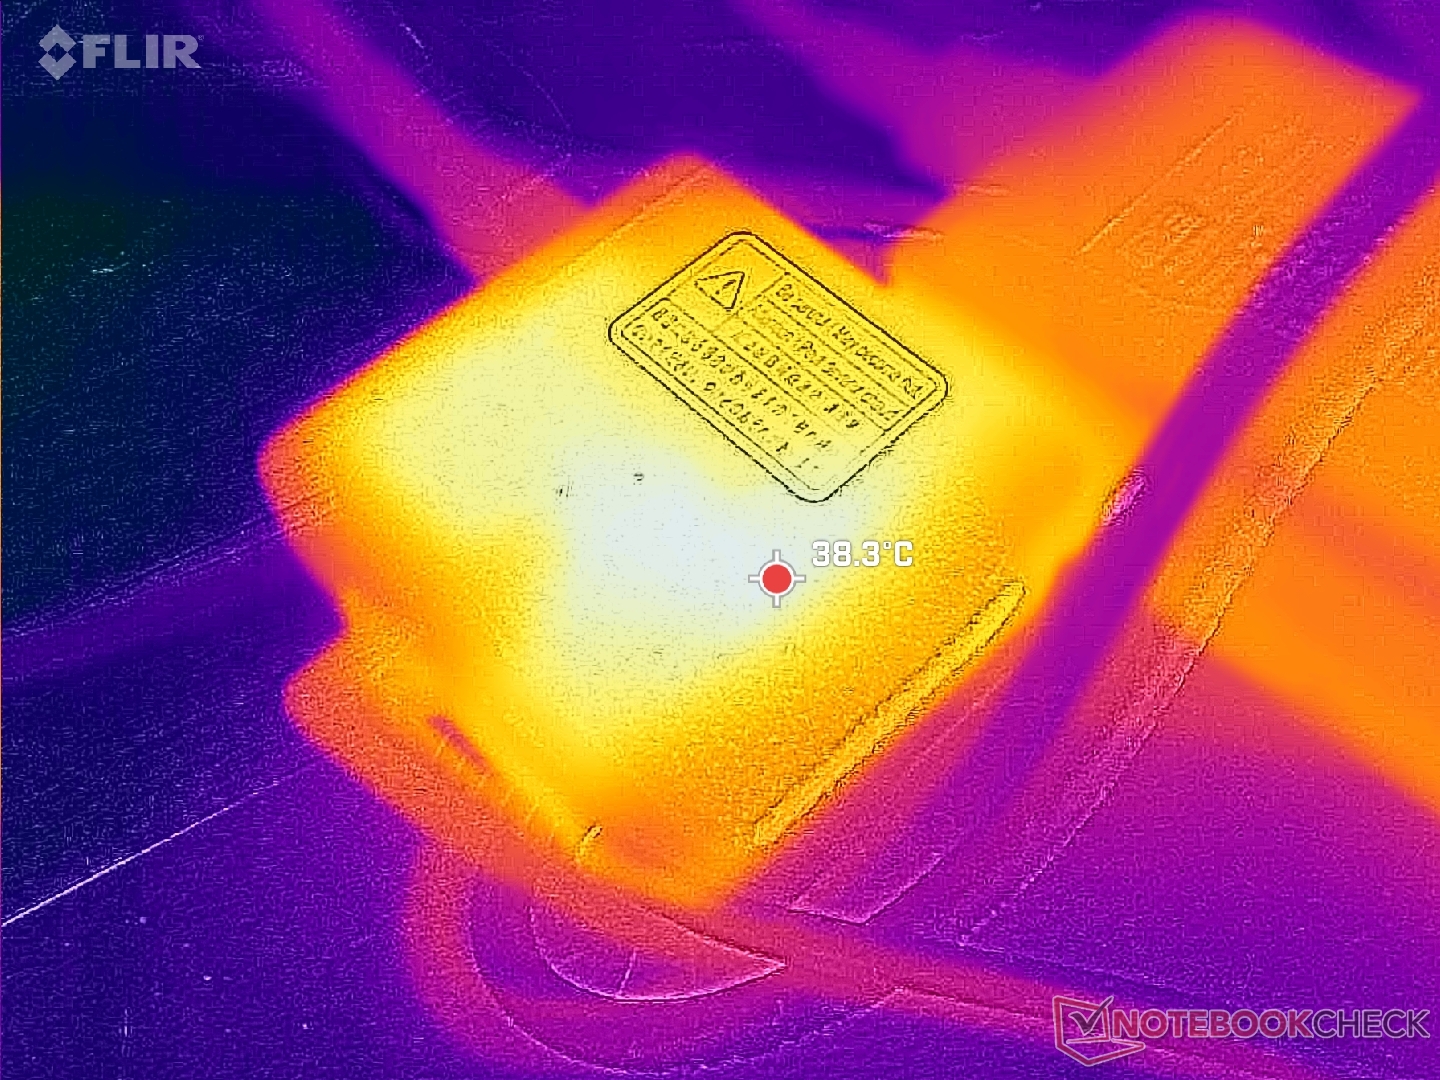
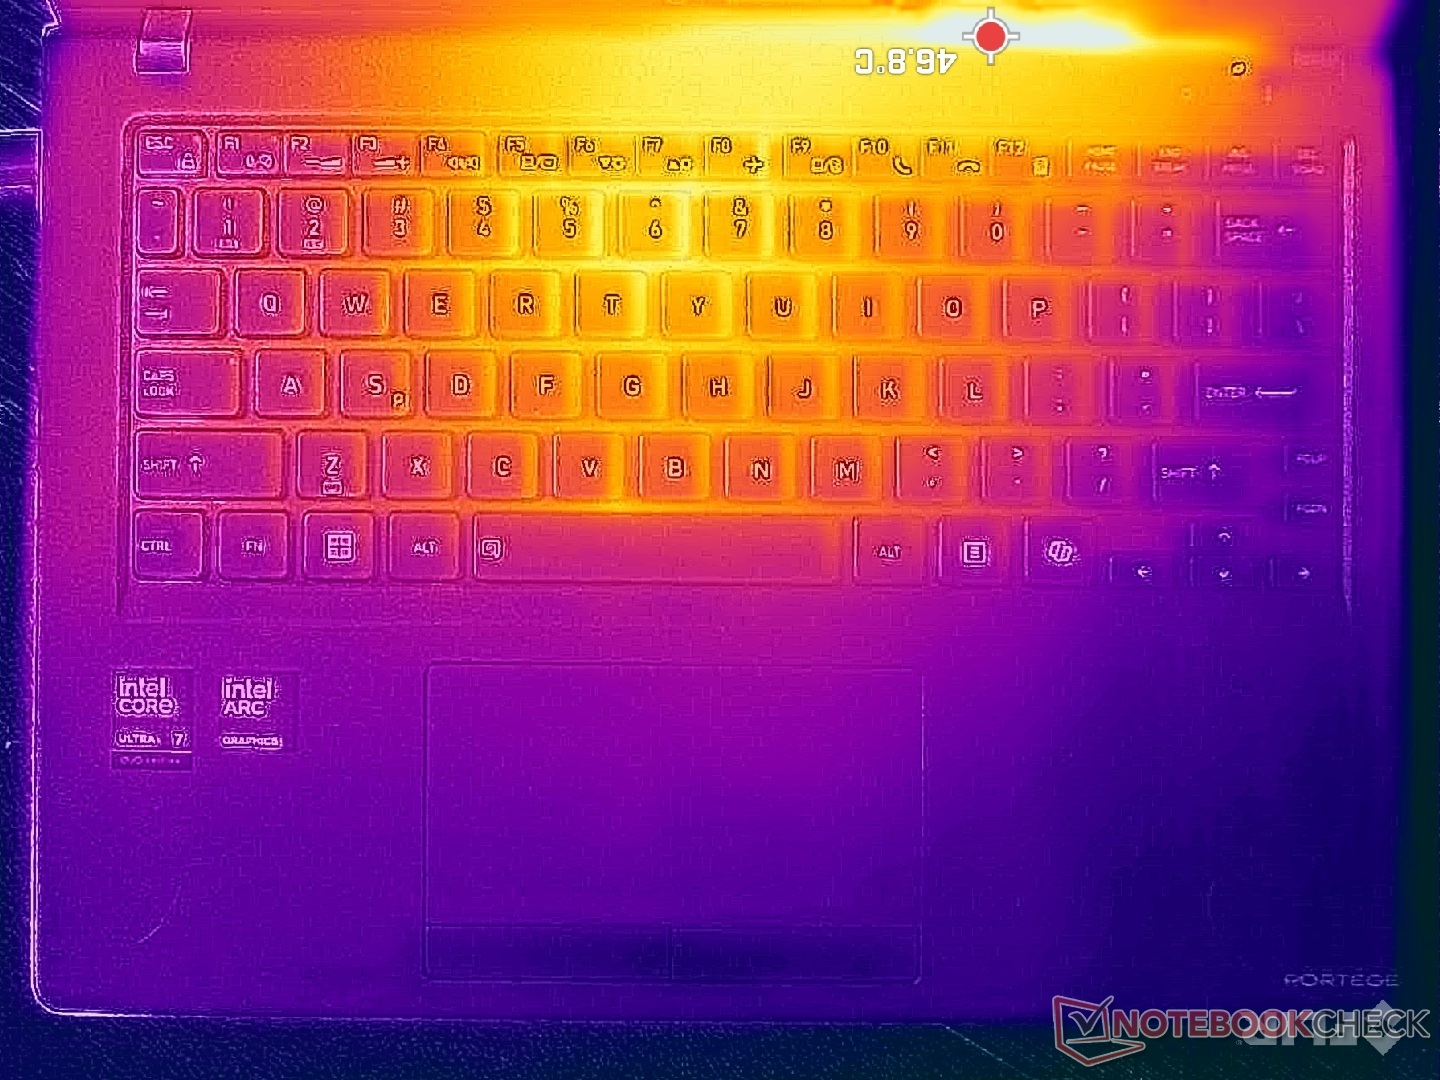
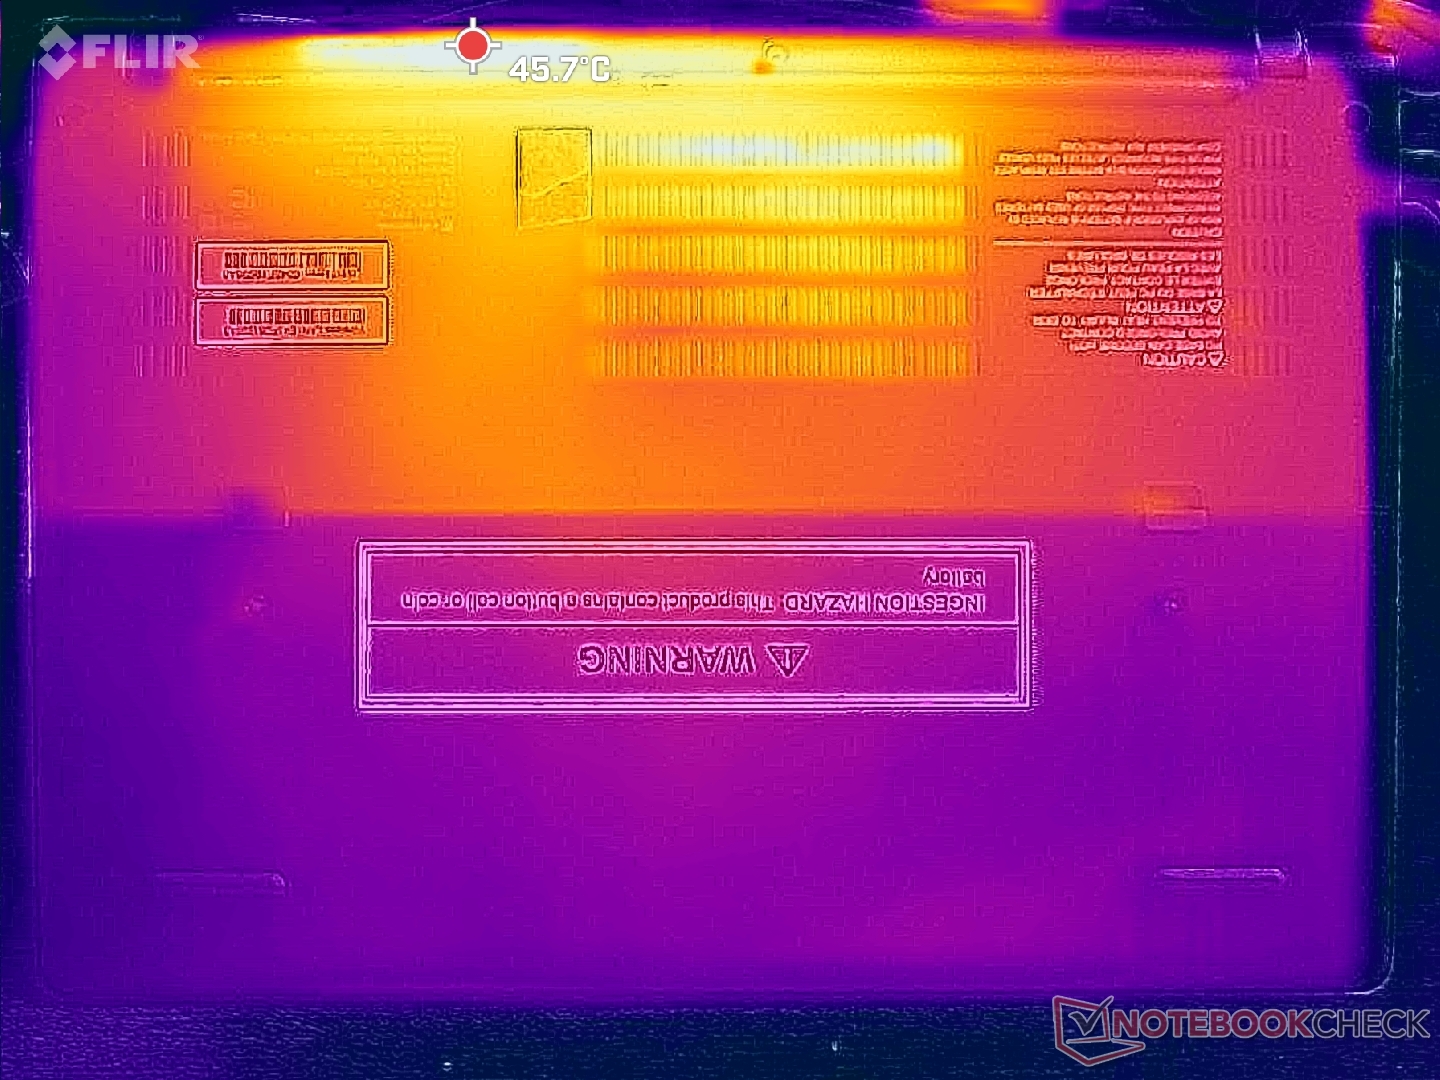
(±) Maksymalna temperatura w górnej części wynosi 41.2 °C / 106 F, w porównaniu do średniej 34.3 °C / 94 F , począwszy od 21.2 do 62.5 °C dla klasy Office.
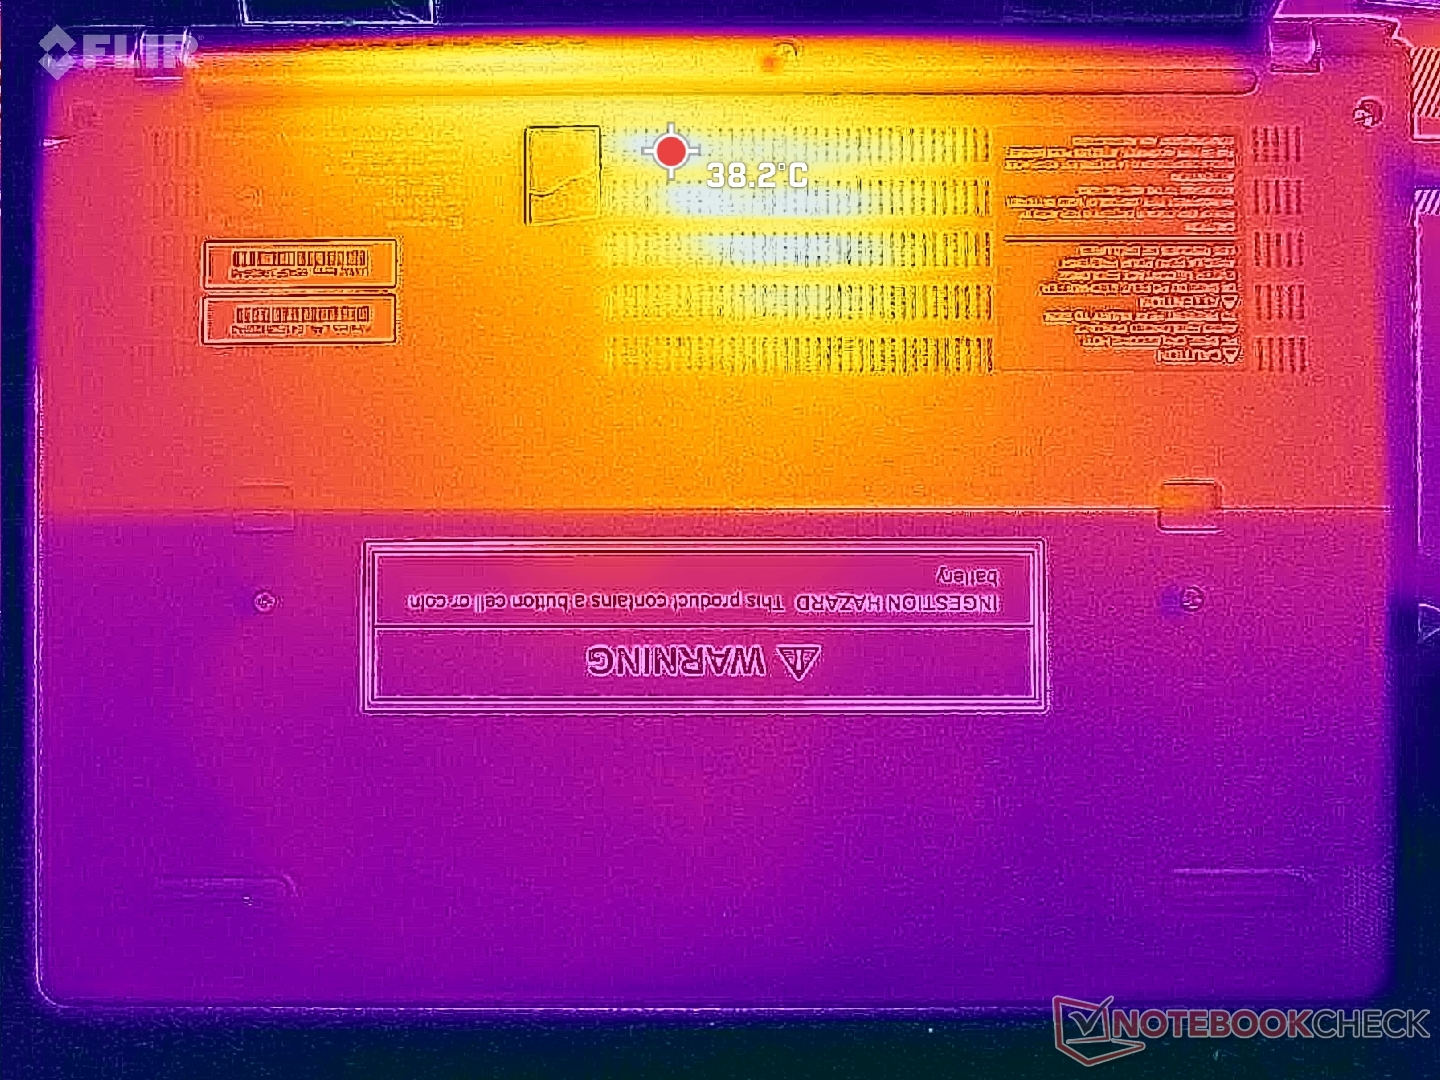
(+) Dno nagrzewa się maksymalnie do 38 °C / 100 F, w porównaniu do średniej 36.8 °C / 98 F
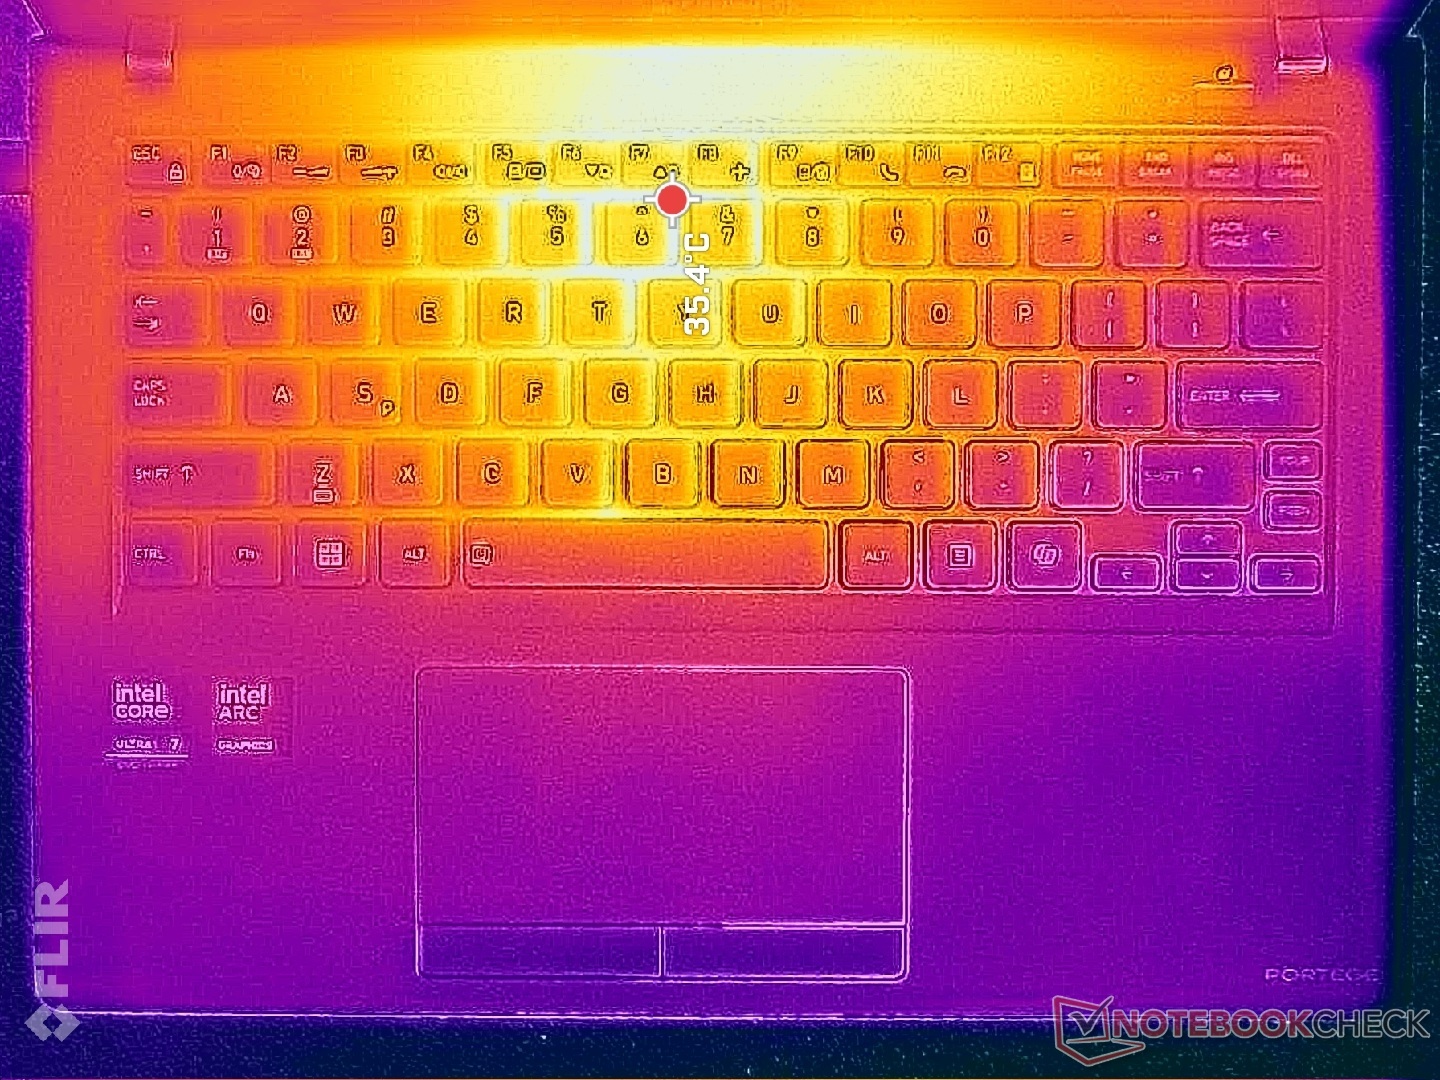
(+) W stanie bezczynności średnia temperatura górnej części wynosi 30 °C / 86 F, w porównaniu ze średnią temperaturą urządzenia wynoszącą 29.5 °C / ### class_avg_f### F.
(+) Podpórki pod nadgarstki i touchpad są chłodniejsze niż temperatura skóry i maksymalnie 27.6 °C / 81.7 F i dlatego są chłodne w dotyku.
(±) Średnia temperatura obszaru podparcia dłoni w podobnych urządzeniach wynosiła 27.6 °C / 81.7 F (0 °C / 0 F).
| Dynabook Portege Z40L-N Intel Core Ultra 7 258V, Intel Arc Graphics 140V | Dynabook Portégé X40-K Intel Core i7-1260P, Intel Iris Xe Graphics G7 96EUs | LG Gram Style 14Z90RS-G.AD7AG Intel Core i7-1360P, Intel Iris Xe Graphics G7 96EUs | Lenovo ThinkBook 14 Gen 8 21SJ007SGE Intel Core Ultra 7 255H, Intel Arc Graphics 140T | Dell Pro 14 Premium Intel Core Ultra 7 268V, Intel Arc Graphics 140V | HP EliteBook X G1i 14 AI Intel Core Ultra 7 268V, Intel Arc Graphics 140V | |
|---|---|---|---|---|---|---|
| Heat | 27% | 16% | -1% | 24% | 25% | |
| Maximum Upper Side * (°C) | 41.2 | 31.6 23% | 36.3 12% | 44.1 -7% | 33 20% | 35 15% |
| Maximum Bottom * (°C) | 38 | 32.8 14% | 36.8 3% | 44.6 -17% | 28 26% | 33.4 12% |
| Idle Upper Side * (°C) | 35.4 | 24 32% | 29.2 18% | 31.6 11% | 28 21% | 23.8 33% |
| Idle Bottom * (°C) | 39.8 | 24.8 38% | 27.4 31% | 35.4 11% | 28.8 28% | 24.2 39% |
* ... im mniej tym lepiej
Głośniki
Dynabook Portege Z40L-N analiza dźwięku
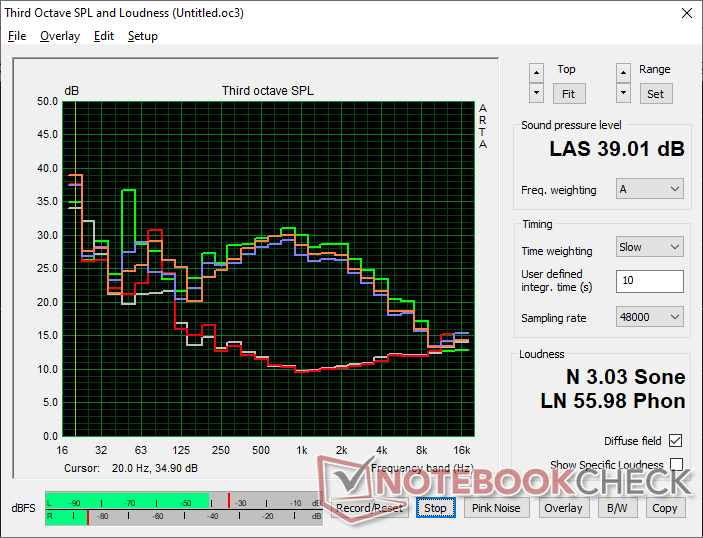
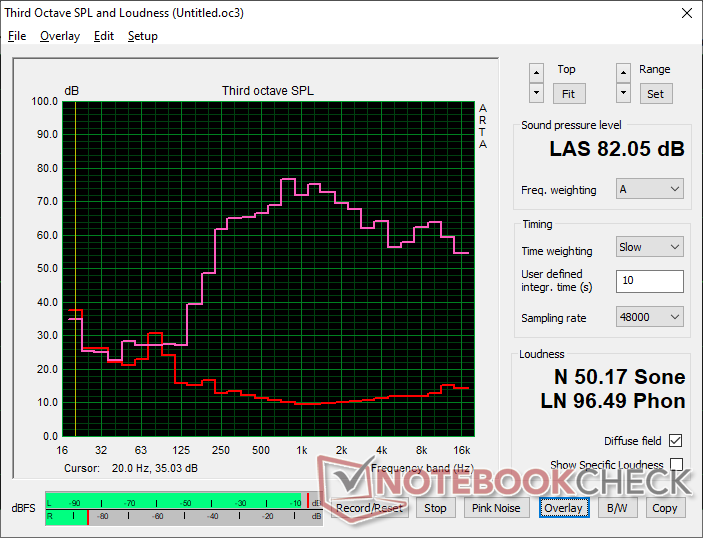
(+) | głośniki mogą odtwarzać stosunkowo głośno (82.1 dB)
Bas 100 - 315 Hz
(-) | prawie brak basu - średnio 19.3% niższa od mediany
(±) | liniowość basu jest średnia (12.3% delta do poprzedniej częstotliwości)
Średnie 400 - 2000 Hz
(±) | wyższe średnie - średnio 6.9% wyższe niż mediana
(+) | średnie są liniowe (6.1% delta do poprzedniej częstotliwości)
Wysokie 2–16 kHz
(+) | zrównoważone maksima - tylko 3% od mediany
(+) | wzloty są liniowe (6.8% delta do poprzedniej częstotliwości)
Ogólnie 100 - 16.000 Hz
(±) | liniowość ogólnego dźwięku jest średnia (18.3% różnicy w stosunku do mediany)
W porównaniu do tej samej klasy
» 33% wszystkich testowanych urządzeń w tej klasie było lepszych, 6% podobnych, 61% gorszych
» Najlepszy miał deltę 7%, średnia wynosiła ###średnia###%, najgorsza wynosiła 53%
W porównaniu do wszystkich testowanych urządzeń
» 40% wszystkich testowanych urządzeń było lepszych, 8% podobnych, 52% gorszych
» Najlepszy miał deltę 4%, średnia wynosiła ###średnia###%, najgorsza wynosiła 134%
Apple MacBook Pro 16 2021 M1 Pro analiza dźwięku
(+) | głośniki mogą odtwarzać stosunkowo głośno (84.7 dB)
Bas 100 - 315 Hz
(+) | dobry bas - tylko 3.8% od mediany
(+) | bas jest liniowy (5.2% delta do poprzedniej częstotliwości)
Średnie 400 - 2000 Hz
(+) | zbalansowane środki średnie - tylko 1.3% od mediany
(+) | średnie są liniowe (2.1% delta do poprzedniej częstotliwości)
Wysokie 2–16 kHz
(+) | zrównoważone maksima - tylko 1.9% od mediany
(+) | wzloty są liniowe (2.7% delta do poprzedniej częstotliwości)
Ogólnie 100 - 16.000 Hz
(+) | ogólny dźwięk jest liniowy (4.6% różnicy w stosunku do mediany)
W porównaniu do tej samej klasy
» 0% wszystkich testowanych urządzeń w tej klasie było lepszych, 0% podobnych, 100% gorszych
» Najlepszy miał deltę 5%, średnia wynosiła ###średnia###%, najgorsza wynosiła 45%
W porównaniu do wszystkich testowanych urządzeń
» 0% wszystkich testowanych urządzeń było lepszych, 0% podobnych, 100% gorszych
» Najlepszy miał deltę 4%, średnia wynosiła ###średnia###%, najgorsza wynosiła 134%
Zarządzanie energią
Zużycie energii
| wyłączony / stan wstrzymania | |
| luz | |
| obciążenie |
|
Legenda:
min: | |
| Dynabook Portege Z40L-N Core Ultra 7 258V, Arc 140V, Phison C-E80T001T2-P03D54E27T, IPS, 1920x1200, 14" | Dynabook Portégé X40-K i7-1260P, Iris Xe G7 96EUs, Samsung PM991 MZVLQ512HBLU, IPS, 1920x1080, 14" | LG Gram Style 14Z90RS-G.AD7AG i7-1360P, Iris Xe G7 96EUs, SK hynix PC801 HFS001TEJ9X101N, OLED, 2880x1800, 14" | Lenovo ThinkBook 14 Gen 8 21SJ007SGE Ultra 7 255H, Arc 140T, Western Digital PCSN5000S SDEPMSJ-1T00-1101, IPS LED, 1920x1200, 14" | Dell Pro 14 Premium Core Ultra 7 268V, Arc 140V, Kioxia BG6 KBG6AZNV1T02, OLED, 2880x1800, 14" | HP EliteBook X G1i 14 AI Core Ultra 7 268V, Arc 140V, Kioxia XG8 KXG80ZNV512G, IPS, 1920x1200, 14" | Przeciętny Intel Arc Graphics 140V | Średnia w klasie Office | |
|---|---|---|---|---|---|---|---|---|
| Power Consumption | -103% | -89% | -102% | -49% | -42% | -66% | -85% | |
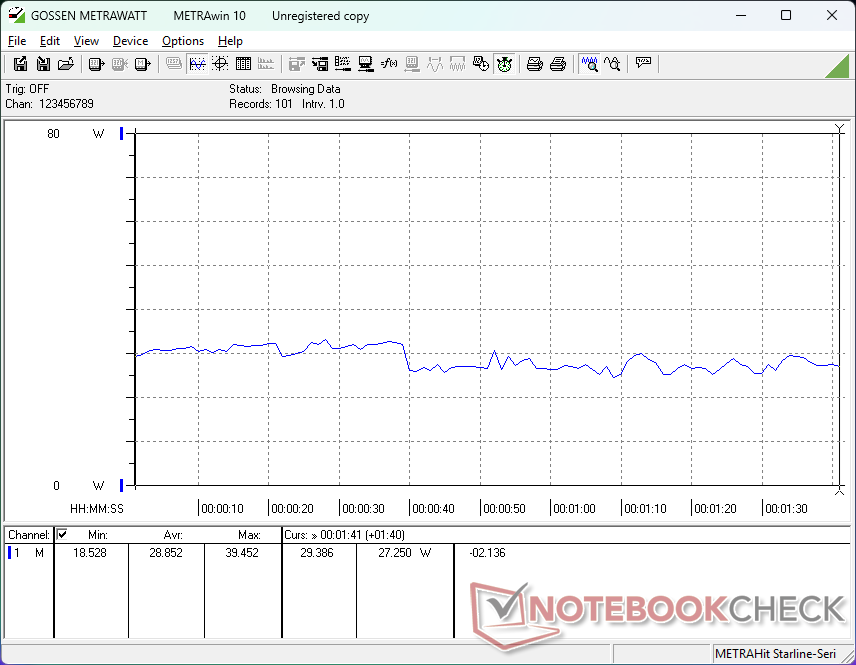
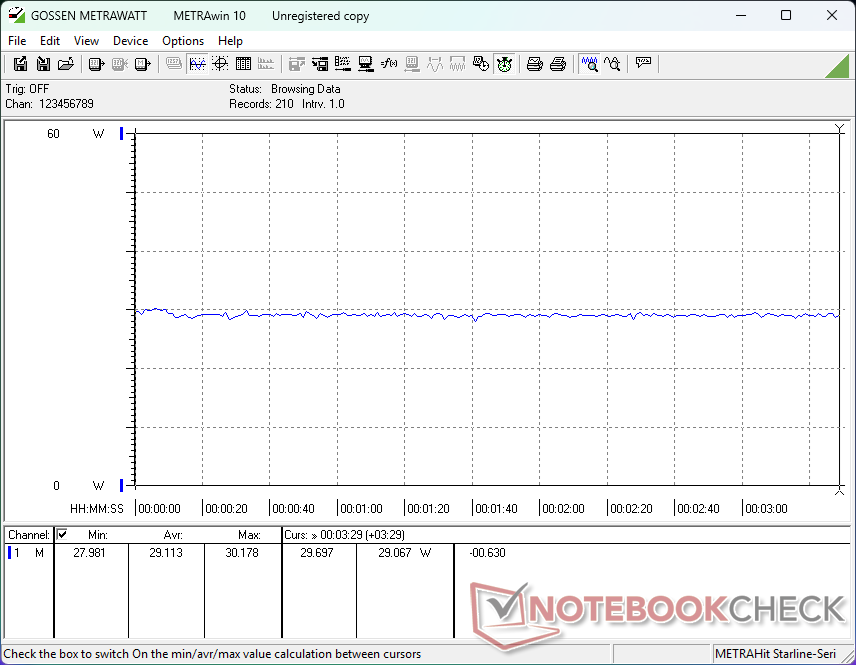
| Idle Minimum * (Watt) | 1.5 | 5.5 -267% | 3.58 -139% | 4.1 -173% | 3.5 -133% | 2.5 -67% | 3.72 ? -148% | 4.25 ? -183% |
| Idle Average * (Watt) | 4.3 | 6 -40% | 7.125 -66% | 7.8 -81% | 4.3 -0% | 5.4 -26% | 6.2 ? -44% | 7.3 ? -70% |
| Idle Maximum * (Watt) | 4.4 | 8.5 -93% | 12.1 -175% | 10.7 -143% | 7.9 -80% | 5.8 -32% | 8.14 ? -85% | 8.57 ? -95% |
| Load Average * (Watt) | 28.9 | 51.8 -79% | 40.67 -41% | 53.1 -84% | 38.9 -35% | 36.9 -28% | 39.2 ? -36% | 43.8 ? -52% |
| Cyberpunk 2077 ultra external monitor * (Watt) | 27 | 56.7 -110% | 38.7 -43% | 44.9 -66% | ||||
| Cyberpunk 2077 ultra * (Watt) | 29.1 | 56.9 -96% | 39 -34% | 48.5 -67% | ||||
| Load Maximum * (Watt) | 51 | 68.7 -35% | 64.2 -26% | 65.7 -29% | 60.7 -19% | 54.6 -7% | 60.3 ? -18% | 64.5 ? -26% |
| Witcher 3 ultra * (Watt) | 41 |
* ... im mniej tym lepiej
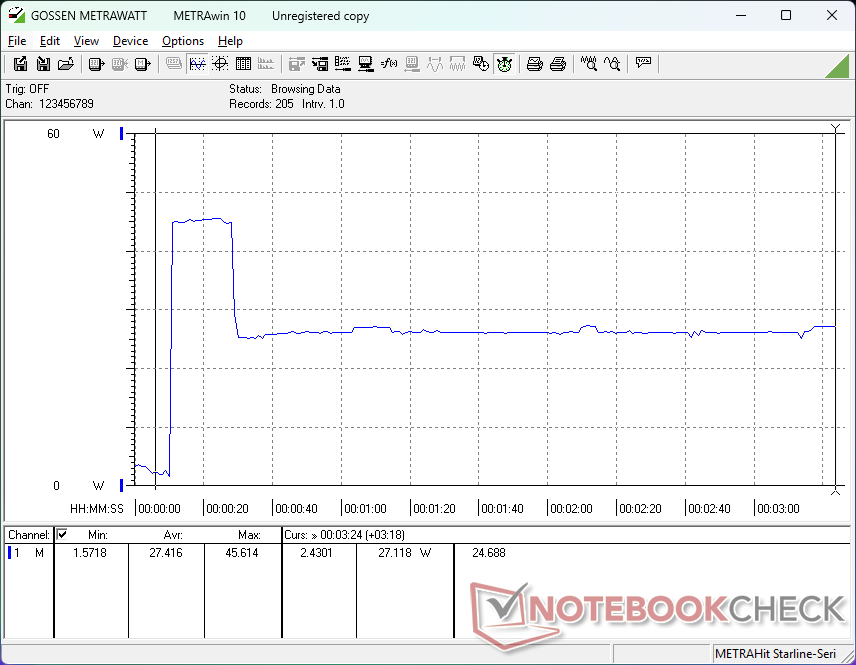
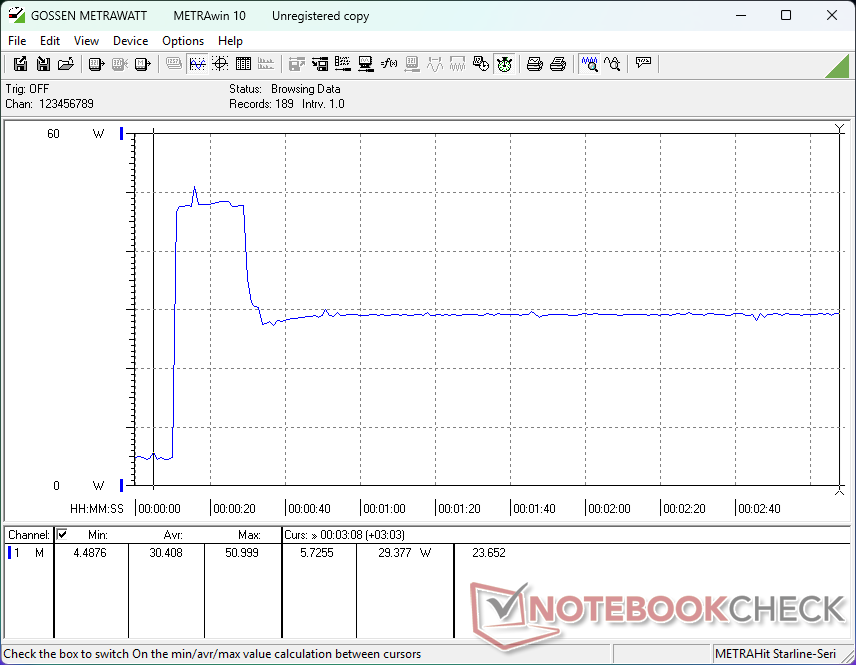
Power Consumption Cyberpunk / Stress Test
Power Consumption external Monitor
Żywotność baterii
| Dynabook Portege Z40L-N Core Ultra 7 258V, Arc 140V, 56 Wh | Dynabook Portégé X40-K i7-1260P, Iris Xe G7 96EUs, 53 Wh | LG Gram Style 14Z90RS-G.AD7AG i7-1360P, Iris Xe G7 96EUs, 72 Wh | Lenovo ThinkBook 14 Gen 8 21SJ007SGE Ultra 7 255H, Arc 140T, 45 Wh | Dell Pro 14 Premium Core Ultra 7 268V, Arc 140V, 60 Wh | HP EliteBook X G1i 14 AI Core Ultra 7 268V, Arc 140V, 68 Wh | |
|---|---|---|---|---|---|---|
| Czasy pracy | -52% | -39% | -62% | -20% | -3% | |
| WiFi v1.3 (h) | 19.1 | 9.2 -52% | 11.7 -39% | 7.3 -62% | 15.2 -20% | 18.5 -3% |
| H.264 (h) | 10.1 | |||||
| Load (h) | 2.4 | 0.8 |
Ocena Notebookcheck
Dynabook Portege Z40L-N
- 29/07/2025 v8
Allen Ngo
 Total Sustainability Score:
 Potencjalni konkurenci w porównaniu
Obraz | Model / recenzja | Cena | Waga | Wysokość | Ekran |
|---|---|---|---|---|---|
1. 86.2%  | Dynabook Portege Z40L-N Intel Core Ultra 7 258V ⎘ Intel Arc Graphics 140V ⎘ 32 GB Pamięć, 1024 GB | Amazon: 1. $2,130.95 dynabook Portégé Z40L-N 14... 2. $1,059.00 dynabook Satellite Pro C50-K... 3. $1,779.00 dynabook Tecra A40-M 14" WUX... Cena katalogowa: 2200 USD | 961 g | 18.9 mm | 14.00" 1920x1200 162 PPI IPS |
2. 84.3% v7 (old)  | Dynabook Portégé X40-K Intel Core i7-1260P ⎘ Intel Iris Xe Graphics G7 96EUs ⎘ 16 GB Pamięć, 512 GB SSD | Amazon: 1. $1,359.00 dynabook Portégé X40-M 14�... 2. $1,020.00 dynabook Portégé X40-M 14"... 3. $1,479.00 dynabook Portégé X40-M 14"... Cena katalogowa: 1450 USD | 1.5 kg | 17.9 mm | 14.00" 1920x1080 157 PPI IPS |
3. 90% v7 (old)  | LG Gram Style 14Z90RS-G.AD7AG Intel Core i7-1360P ⎘ Intel Iris Xe Graphics G7 96EUs ⎘ 32 GB Pamięć, 1024 GB SSD | Amazon: 1. $498.99 LG gram Book 15-inch Lightwe... 2. $1,166.78 LG Gram 17" Touchscreen Lapt... 3. $2,199.99 LG gram 14-inch Thin and Lig... Cena katalogowa: 1700€ | 987 g | 16.5 mm | 14.00" 2880x1800 243 PPI OLED |
4. 83.9%  | Lenovo ThinkBook 14 Gen 8 21SJ007SGE Intel Core Ultra 7 255H ⎘ Intel Arc Graphics 140T ⎘ 32 GB Pamięć, 1024 GB SSD | Amazon: Cena katalogowa: 1090 Euro | 1.5 kg | 20.8 mm | 14.00" 1920x1200 162 PPI IPS LED |
5. 86.4%  | Dell Pro 14 Premium Intel Core Ultra 7 268V ⎘ Intel Arc Graphics 140V ⎘ 32 GB Pamięć, 1024 GB SSD | Cena katalogowa: 2500 USD | 1.3 kg | 17.95 mm | 14.00" 2880x1800 243 PPI OLED |
6. 85.1% 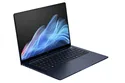 | HP EliteBook X G1i 14 AI Intel Core Ultra 7 268V ⎘ Intel Arc Graphics 140V ⎘ 32 GB Pamięć, 512 GB SSD | Amazon: Cena katalogowa: 3300 USD | 1.2 kg | 15 mm | 14.00" 1920x1200 162 PPI IPS |
Przezroczystość
Wyboru urządzeń do recenzji dokonuje nasza redakcja. Próbka testowa została udostępniona autorowi jako pożyczka od producenta lub sprzedawcy detalicznego na potrzeby tej recenzji. Pożyczkodawca nie miał wpływu na tę recenzję, producent nie otrzymał też kopii tej recenzji przed publikacją. Nie było obowiązku publikowania tej recenzji. Jako niezależna firma medialna, Notebookcheck nie podlega władzy producentów, sprzedawców detalicznych ani wydawców.
Tak testuje Notebookcheck
Każdego roku Notebookcheck niezależnie sprawdza setki laptopów i smartfonów, stosując standardowe procedury, aby zapewnić porównywalność wszystkich wyników. Od około 20 lat stale rozwijamy nasze metody badawcze, ustanawiając przy tym standardy branżowe. W naszych laboratoriach testowych doświadczeni technicy i redaktorzy korzystają z wysokiej jakości sprzętu pomiarowego. Testy te obejmują wieloetapowy proces walidacji. Nasz kompleksowy system ocen opiera się na setkach uzasadnionych pomiarów i benchmarków, co pozwala zachować obiektywizm.
