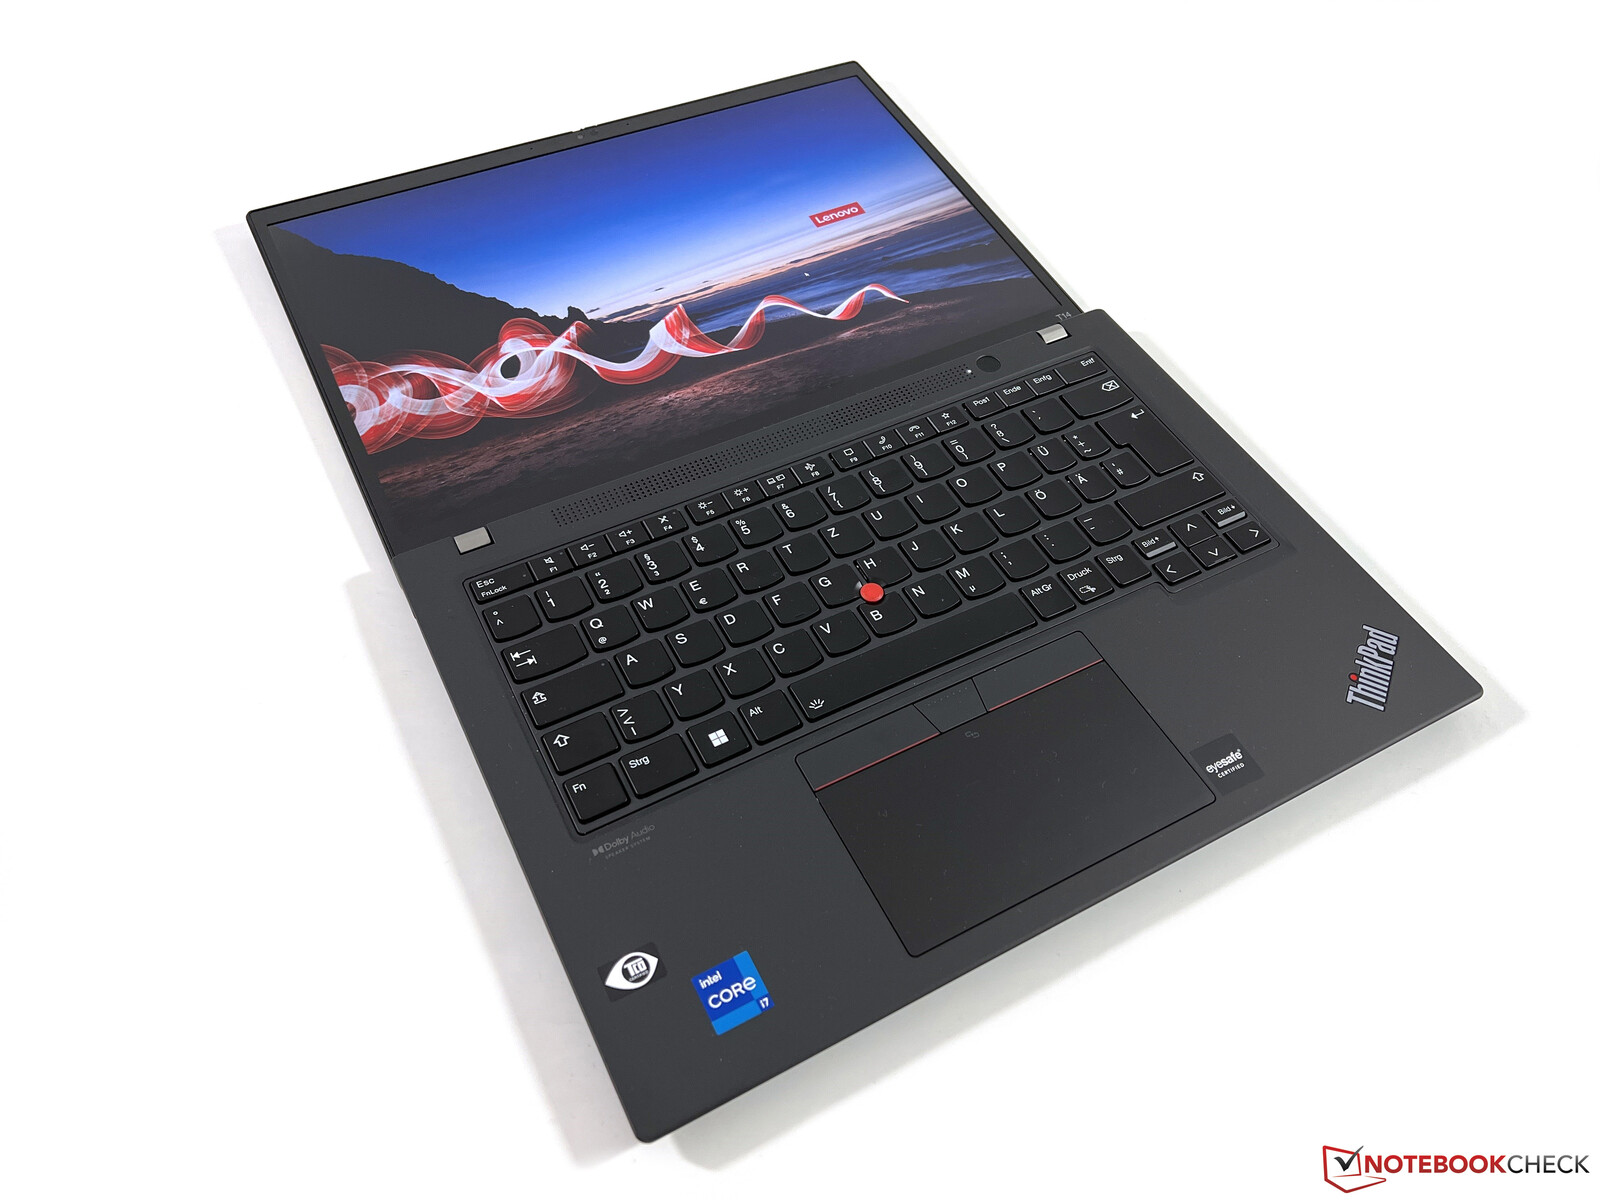
Recenzja Lenovo ThinkPad T14 G3 - biznesowy laptop jest gorszy dzięki Intelowi i Nvidii
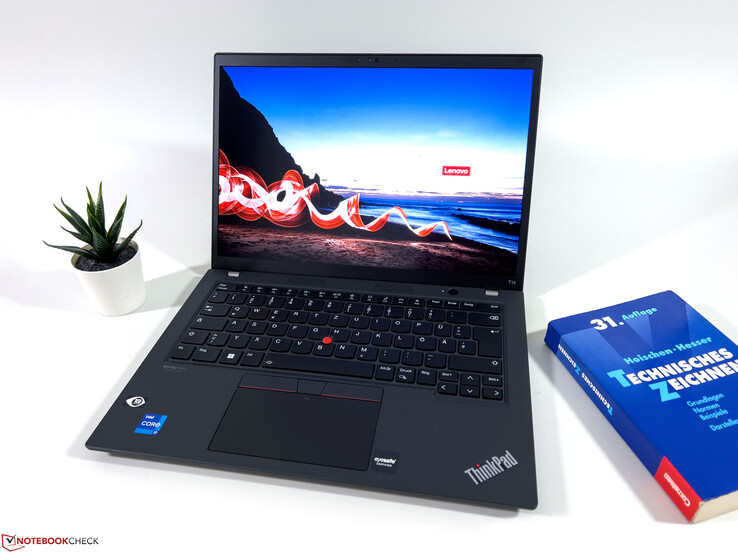
Testowaliśmy już m.in.ThinkPad T14 G3 w wersji z procesorem AMD Ryzen 7 Prowraz z szybkim Radeonem 680M iGPU obszernie, ale Lenovo kontynuuje również ofertę 14-calowego laptopa biznesowego z procesorami Intela i opcjonalnym układem graficznym Nvidia GeForce. W przypadku modelu 21AJS00400 mamy obecnie takiego przedstawiciela łączącego m.in Alder Lake Core i7-1260Pz GeForce MX550 na naszej ławce testowej. Możemy pominąć fakt, że nie zastosowano tu jeszcze procesora Raptor Lake, gdyż wzrost wydajności byłby tylko niewielki, o czym mogliśmy już już mogliśmy zobaczyć.
Zasadniczo model AMD i Intel mają tę samą obudowę i urządzenia wejściowe, kamerę internetową i głośniki. W poniższym teście skupimy się więc głównie na kwestii, która wersja jest lepsza i czy rzeczywiście dodatkowa karta graficzna jest jeszcze opłacalna.
Potencjalni konkurenci w porównaniu
Ocena | Data | Model | Waga | Wysokość | Rozmiar | Rezolucja | Cena |
|---|---|---|---|---|---|---|---|
| 86.4 % v7 (old) | 03/2023 | Lenovo ThinkPad T14 G3-21AJS00400 i7-1260P, GeForce MX550 | 1.5 kg | 17.9 mm | 14.00" | 1920x1200 | |
| 88.8 % v7 (old) | 09/2022 | Lenovo ThinkPad T14 G3-21CF004NGE R7 PRO 6850U, Radeon 680M | 1.4 kg | 17.9 mm | 14.00" | 1920x1200 | |
| 88.7 % v7 (old) | 12/2022 | HP EliteBook 840 G9 i7-1280P, Iris Xe G7 96EUs | 1.5 kg | 19 mm | 14.00" | 1920x1200 | |
| 88.8 % v7 (old) | 10/2022 | Schenker Vision 14 2022 RTX 3050 Ti i7-12700H, GeForce RTX 3050 Ti Laptop GPU | 1.3 kg | 16.6 mm | 14.00" | 2880x1800 | |
| 90.3 % v7 (old) | 10/2022 | Huawei MateBook X Pro 2022 i7-1260P, Iris Xe G7 96EUs | 1.3 kg | 15.6 mm | 14.20" | 3120x2080 |
Różnice w stosunku do ThinkPada T14 G3 AMD
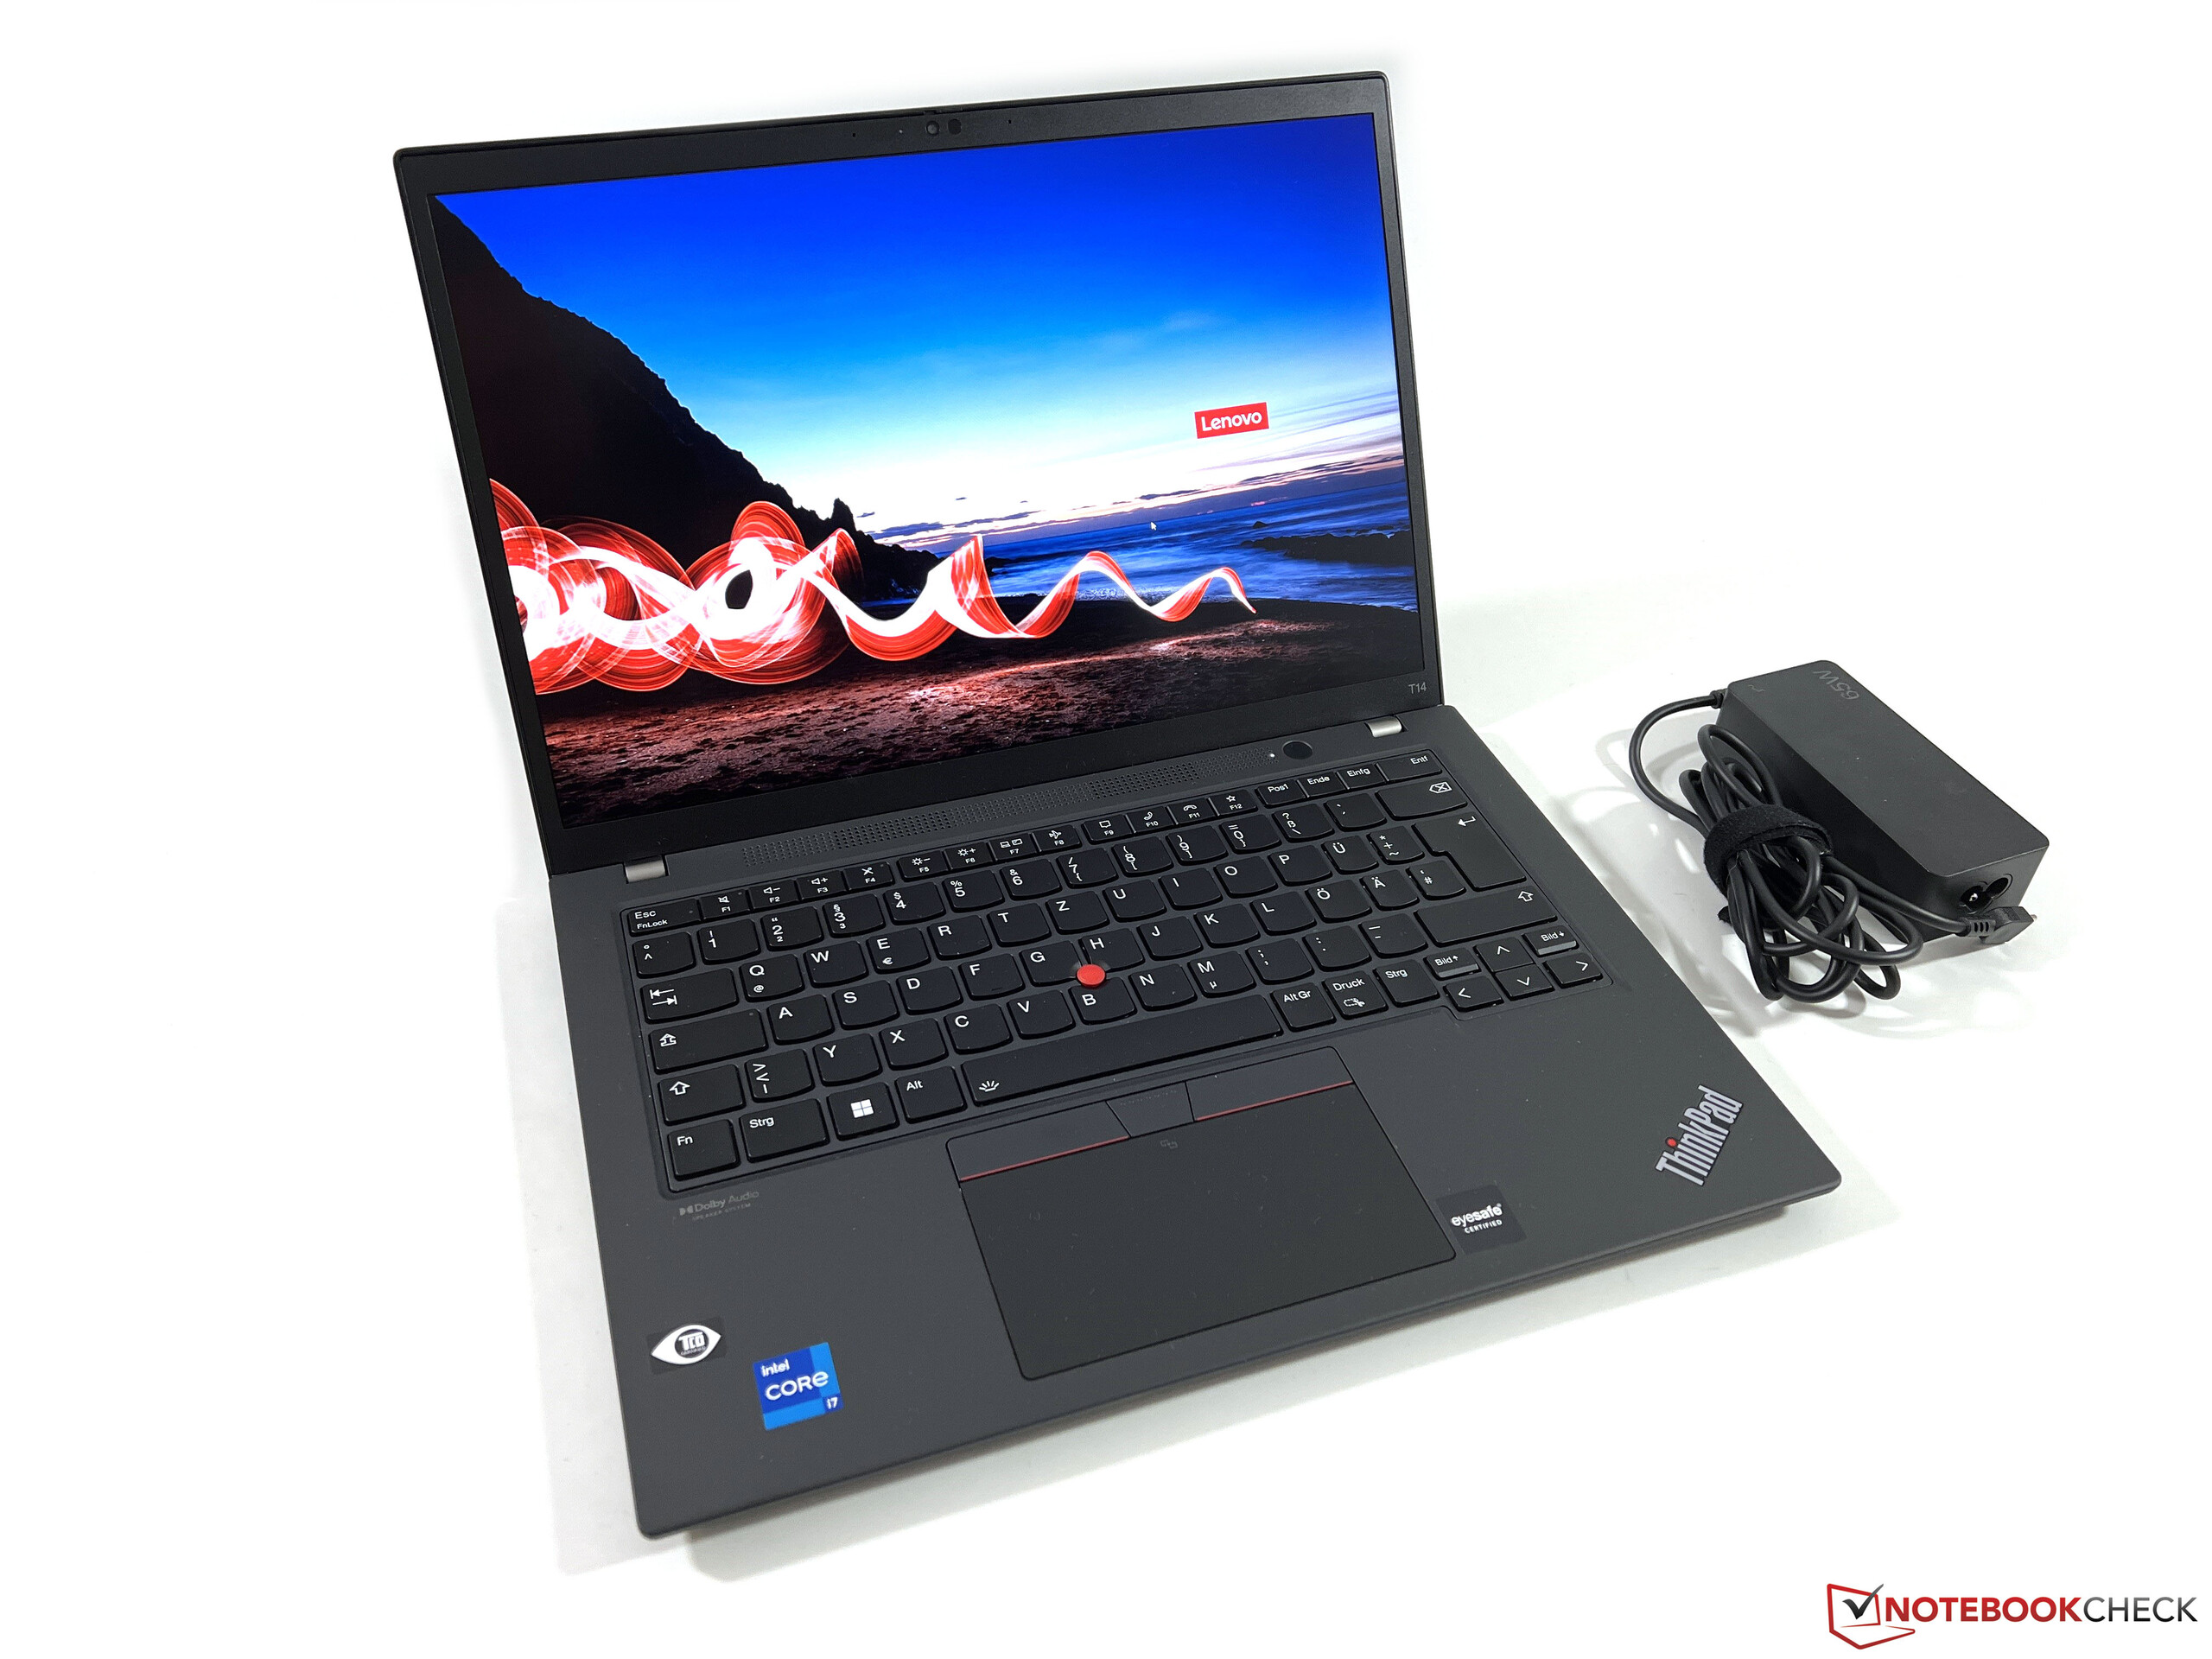
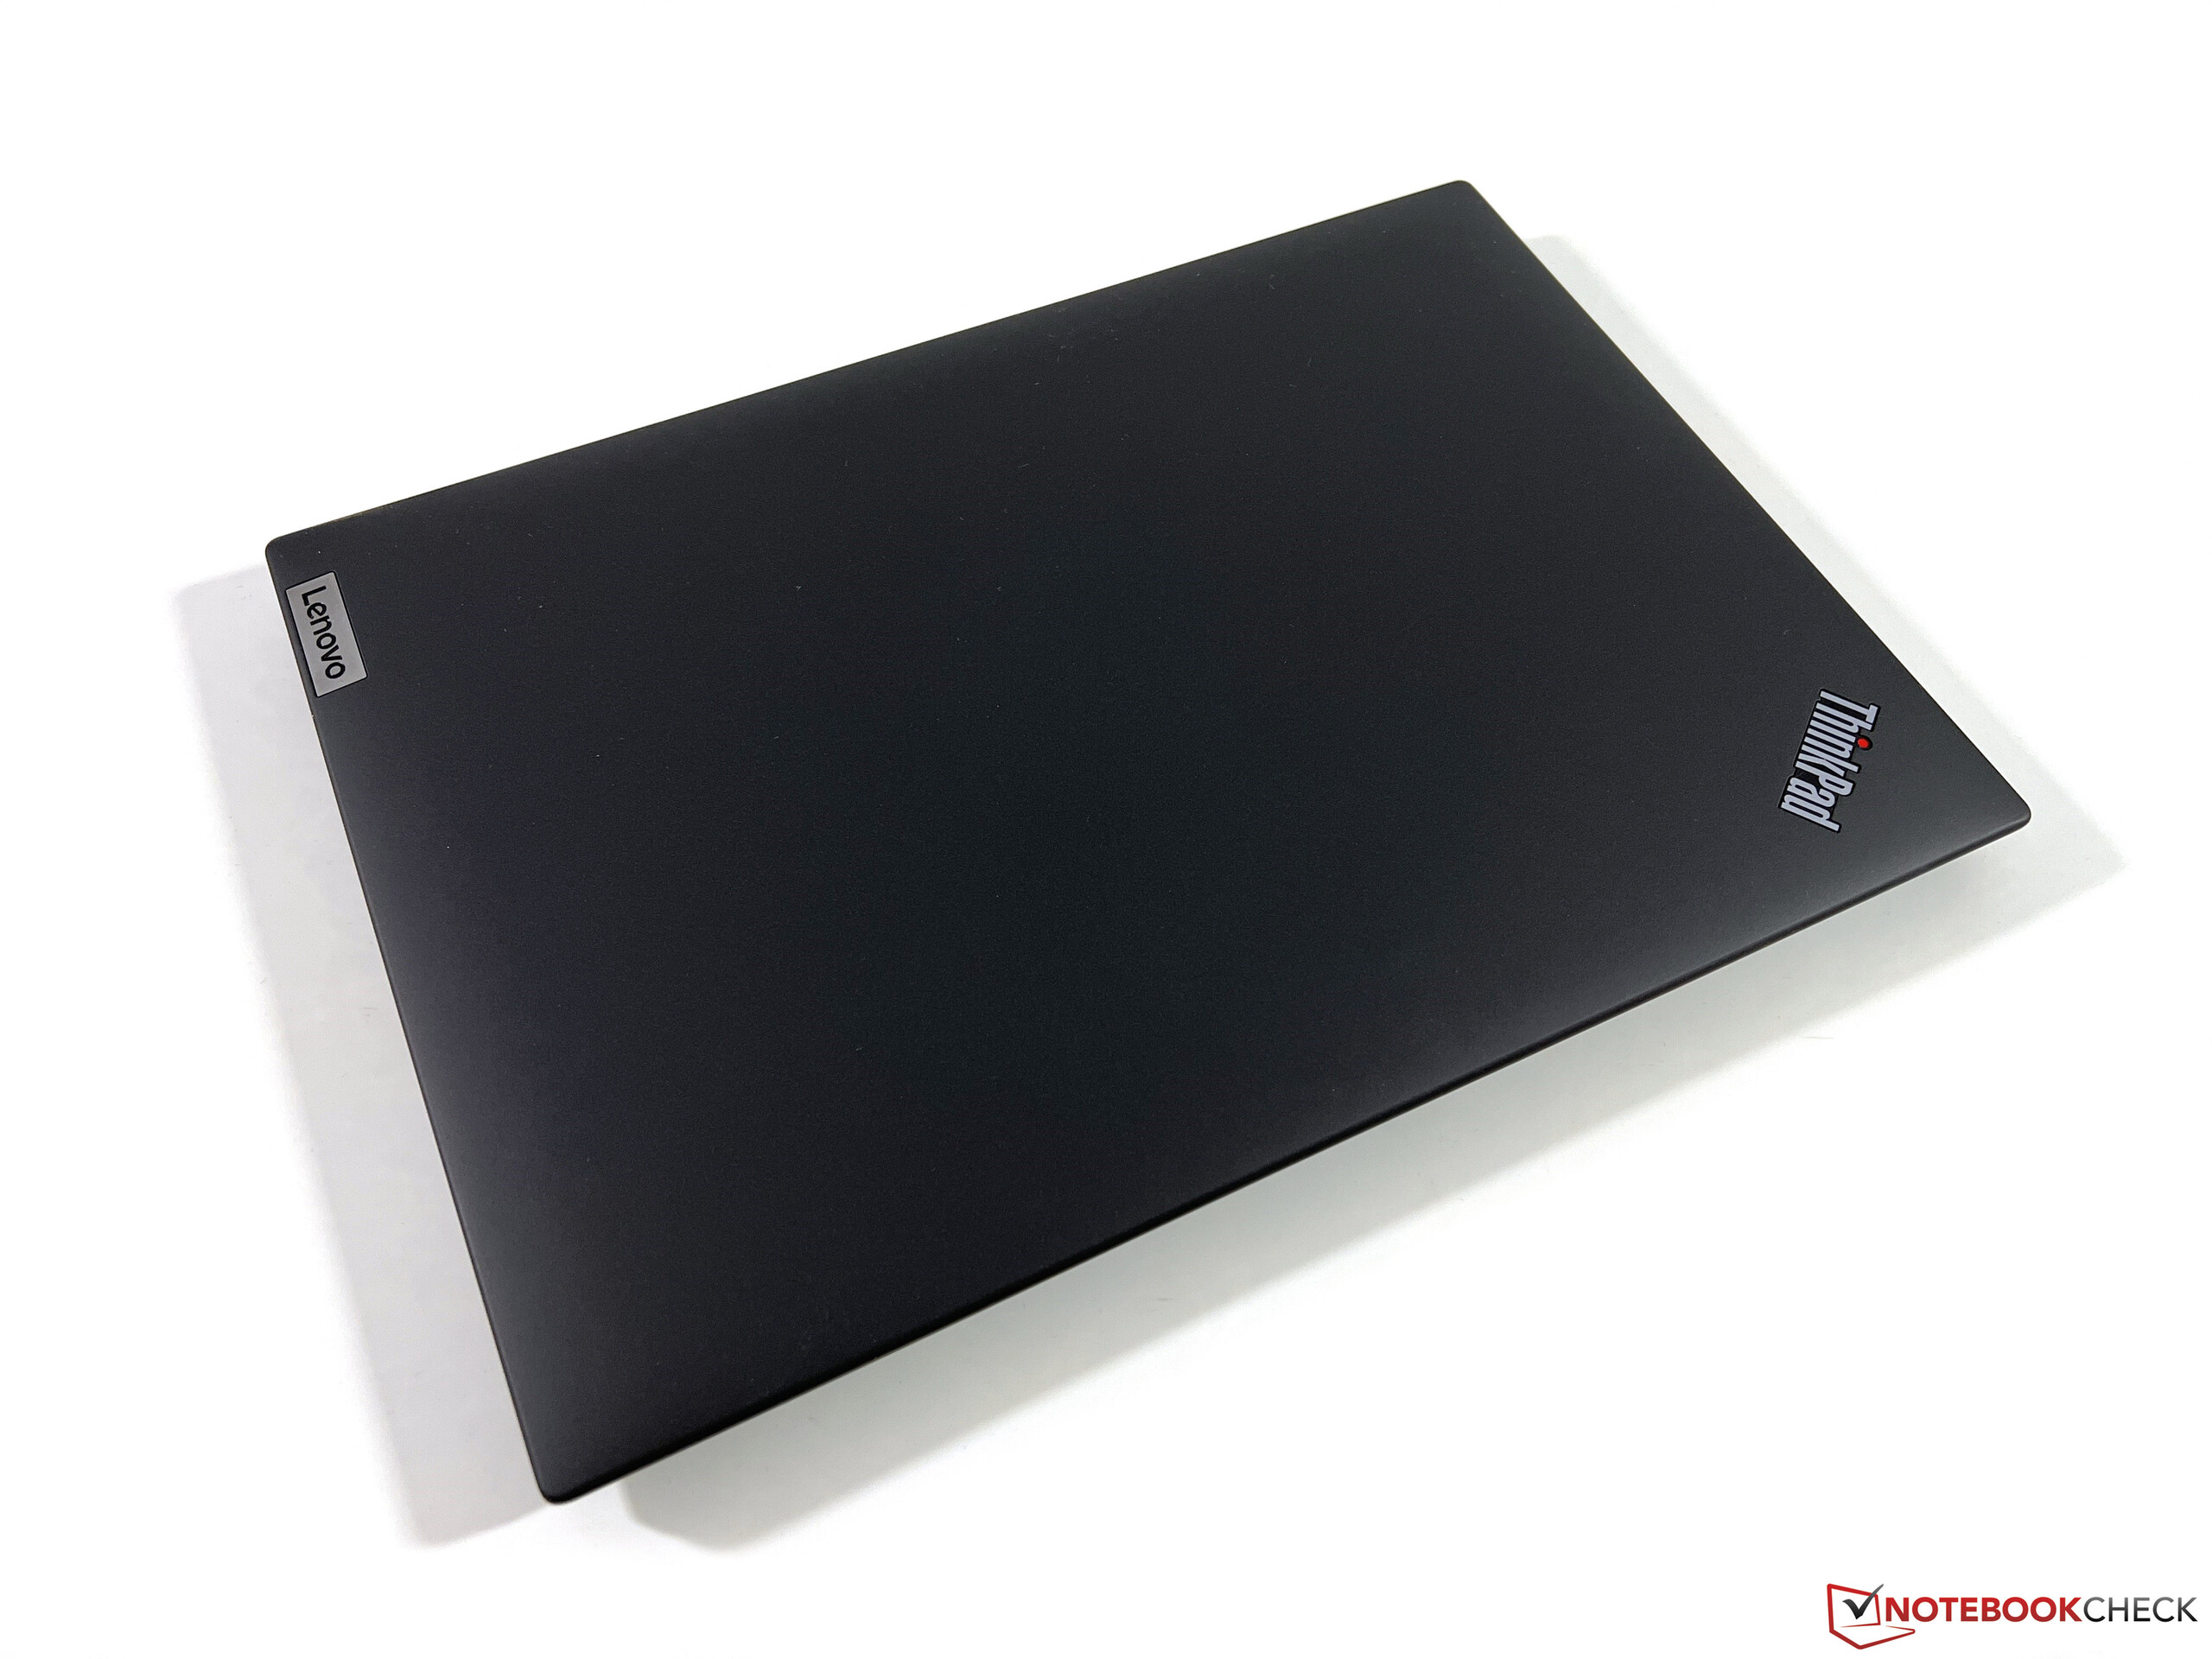
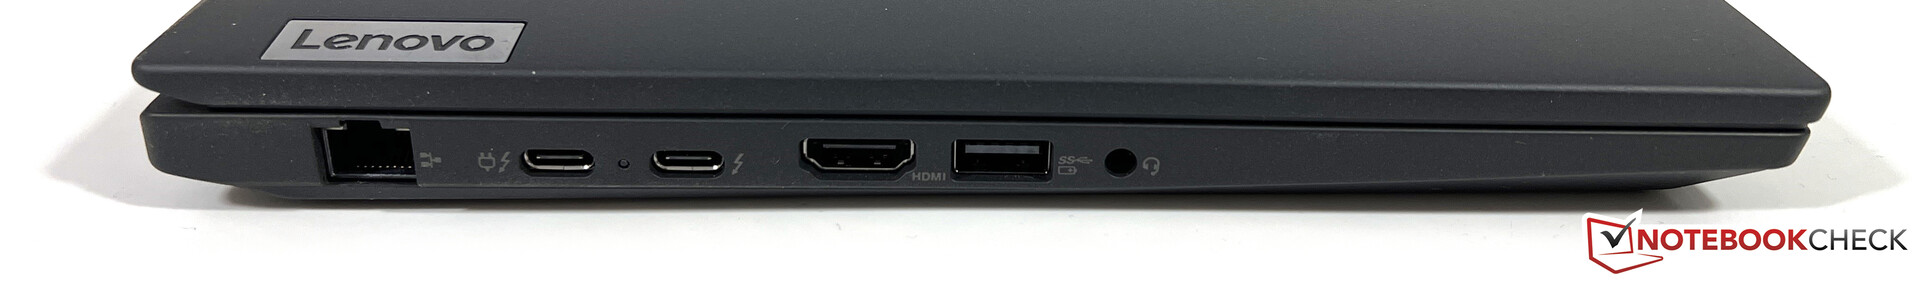
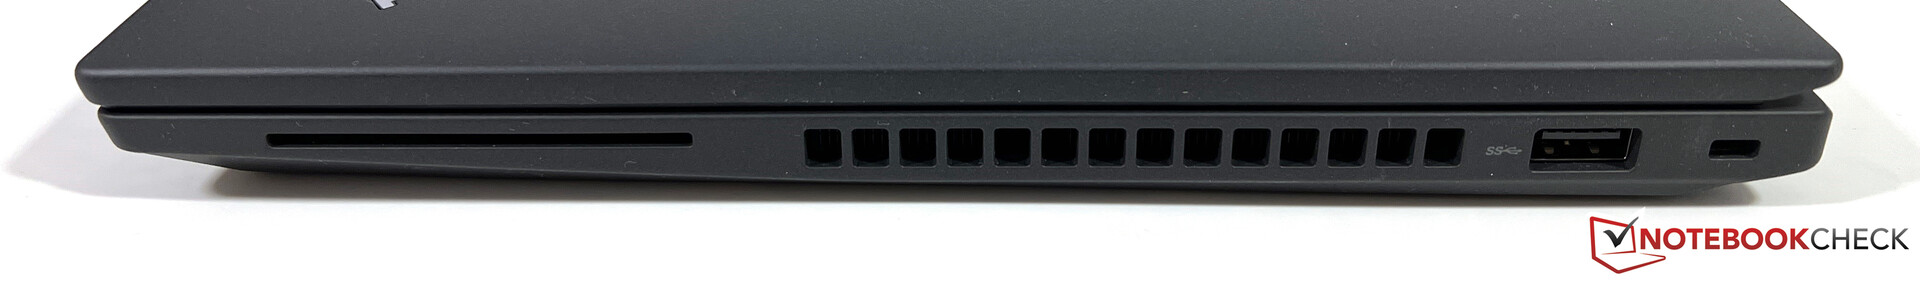
Poza różnymi naklejkami na podpórce pod dłonie nie ma żadnych różnic w wyglądzie zewnętrznym obu wersji ThinkPada T14, więc odsyłamy Was do naszego obszernego testu modelu AMDna ten temat. Podstawowe złącza również są takie same, ale podczas gdy Lenovo odpuszcza sobie USB 4.0 w modelu AMD, wersja z procesorem Intela jest wyposażona w dwa złącza USB-C obsługujące Thunderbolt 4.
Dzięki karcie WLAN AX211 model Intela obsługuje również nowoczesną sieć 6 GHz, ale podczas testu nie udało nam się połączyć z odpowiednią siecią za pomocą naszego referencyjnego routera sieciowego. Wydajność w zwykłej sieci 5G była jednak również bardzo dobra. Nasz testowy egzemplarz jest gotowy do obsługi sieci WWAN, a slot Nano-SIM z tyłu, jak również niezbędne anteny dla modułu LTE są już na swoim miejscu.

| Networking | |
| Lenovo ThinkPad T14 G3-21AJS00400 | |
| iperf3 receive AXE11000 | |
| iperf3 transmit AXE11000 | |
| Lenovo ThinkPad T14 G3-21CF004NGE | |
| iperf3 receive AXE11000 6GHz | |
| iperf3 transmit AXE11000 6GHz | |
| HP EliteBook 840 G9 | |
| iperf3 receive AXE11000 6GHz | |
| iperf3 receive AXE11000 | |
| iperf3 transmit AXE11000 6GHz | |
| iperf3 transmit AXE11000 | |
| Schenker Vision 14 2022 RTX 3050 Ti | |
| iperf3 receive AXE11000 | |
| iperf3 transmit AXE11000 | |
| Huawei MateBook X Pro 2022 | |
| iperf3 receive AXE11000 6GHz | |
| iperf3 transmit AXE11000 6GHz | |


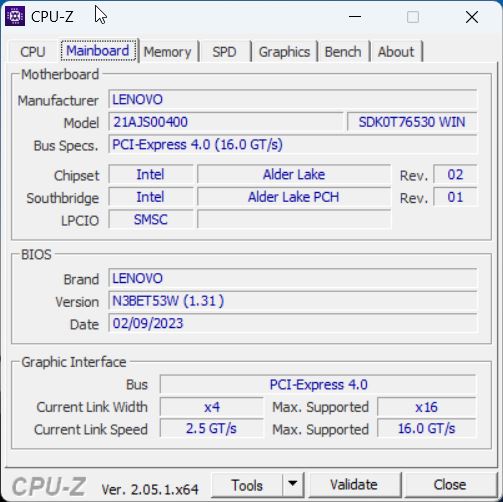
Konserwacja
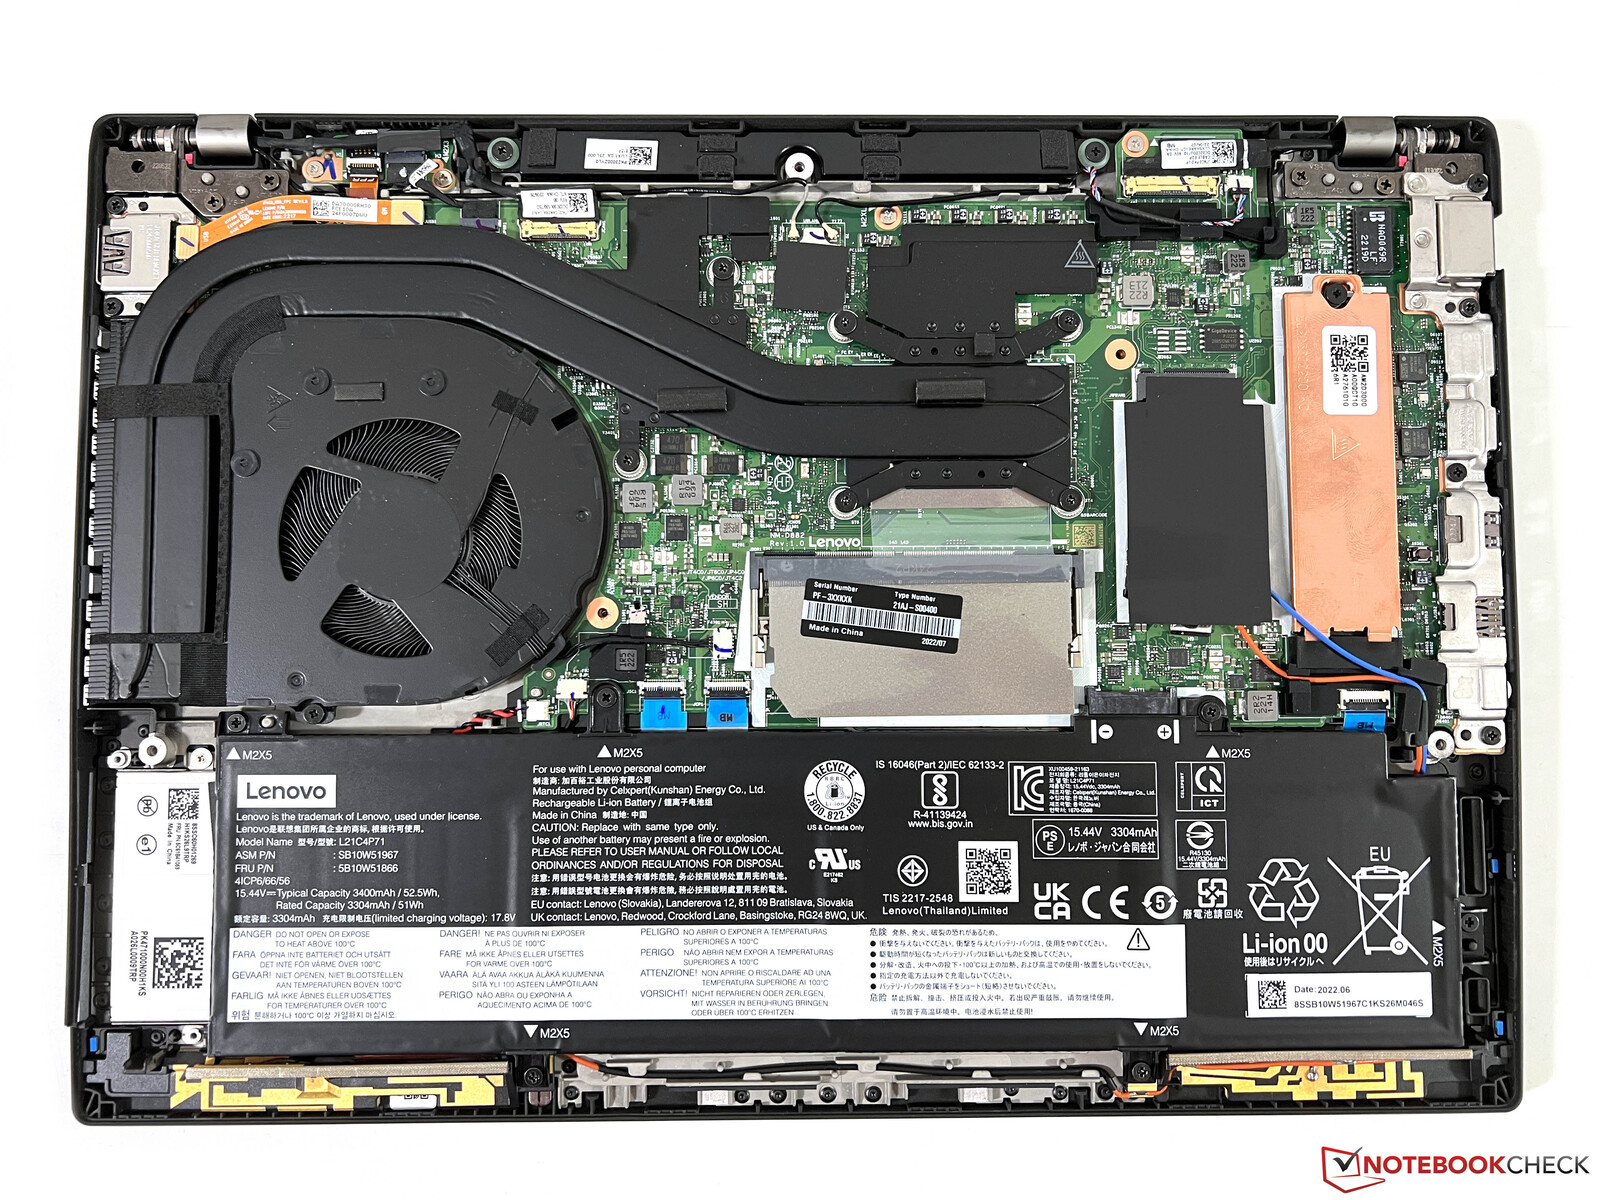
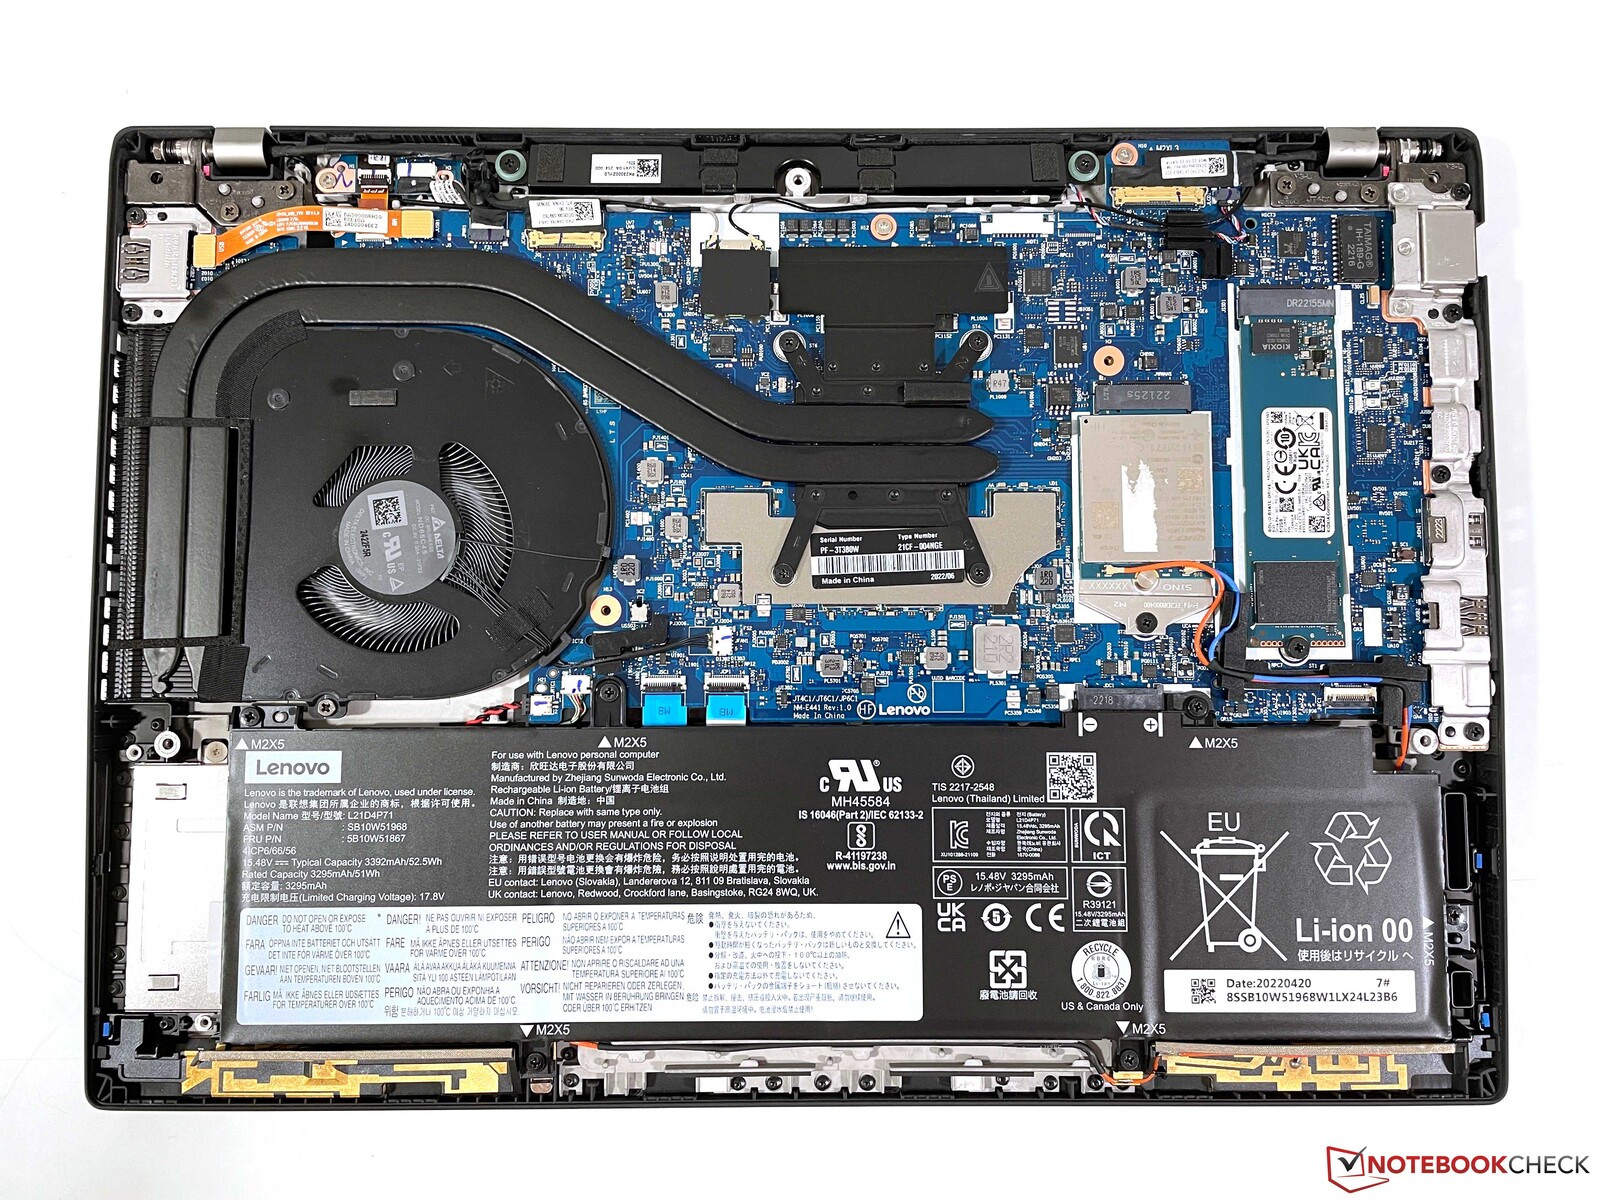
Różnica jest także w układzie wewnętrznym. Podczas gdy Lenovo dostarcza na rynek m.in Model AMDwyłącznie z wlutowaną pamięcią RAM, nie oferując użytkownikowi żadnych możliwości rozbudowy, w przypadku modelu Intela sytuacja wygląda inaczej. Oprócz wlutowanego modułu (w naszym przypadku 16 GB) jest też wolne gniazdo SO-DIMM, dzięki czemu możliwa łączna ilość pamięci RAM wzrasta do 48 GB.
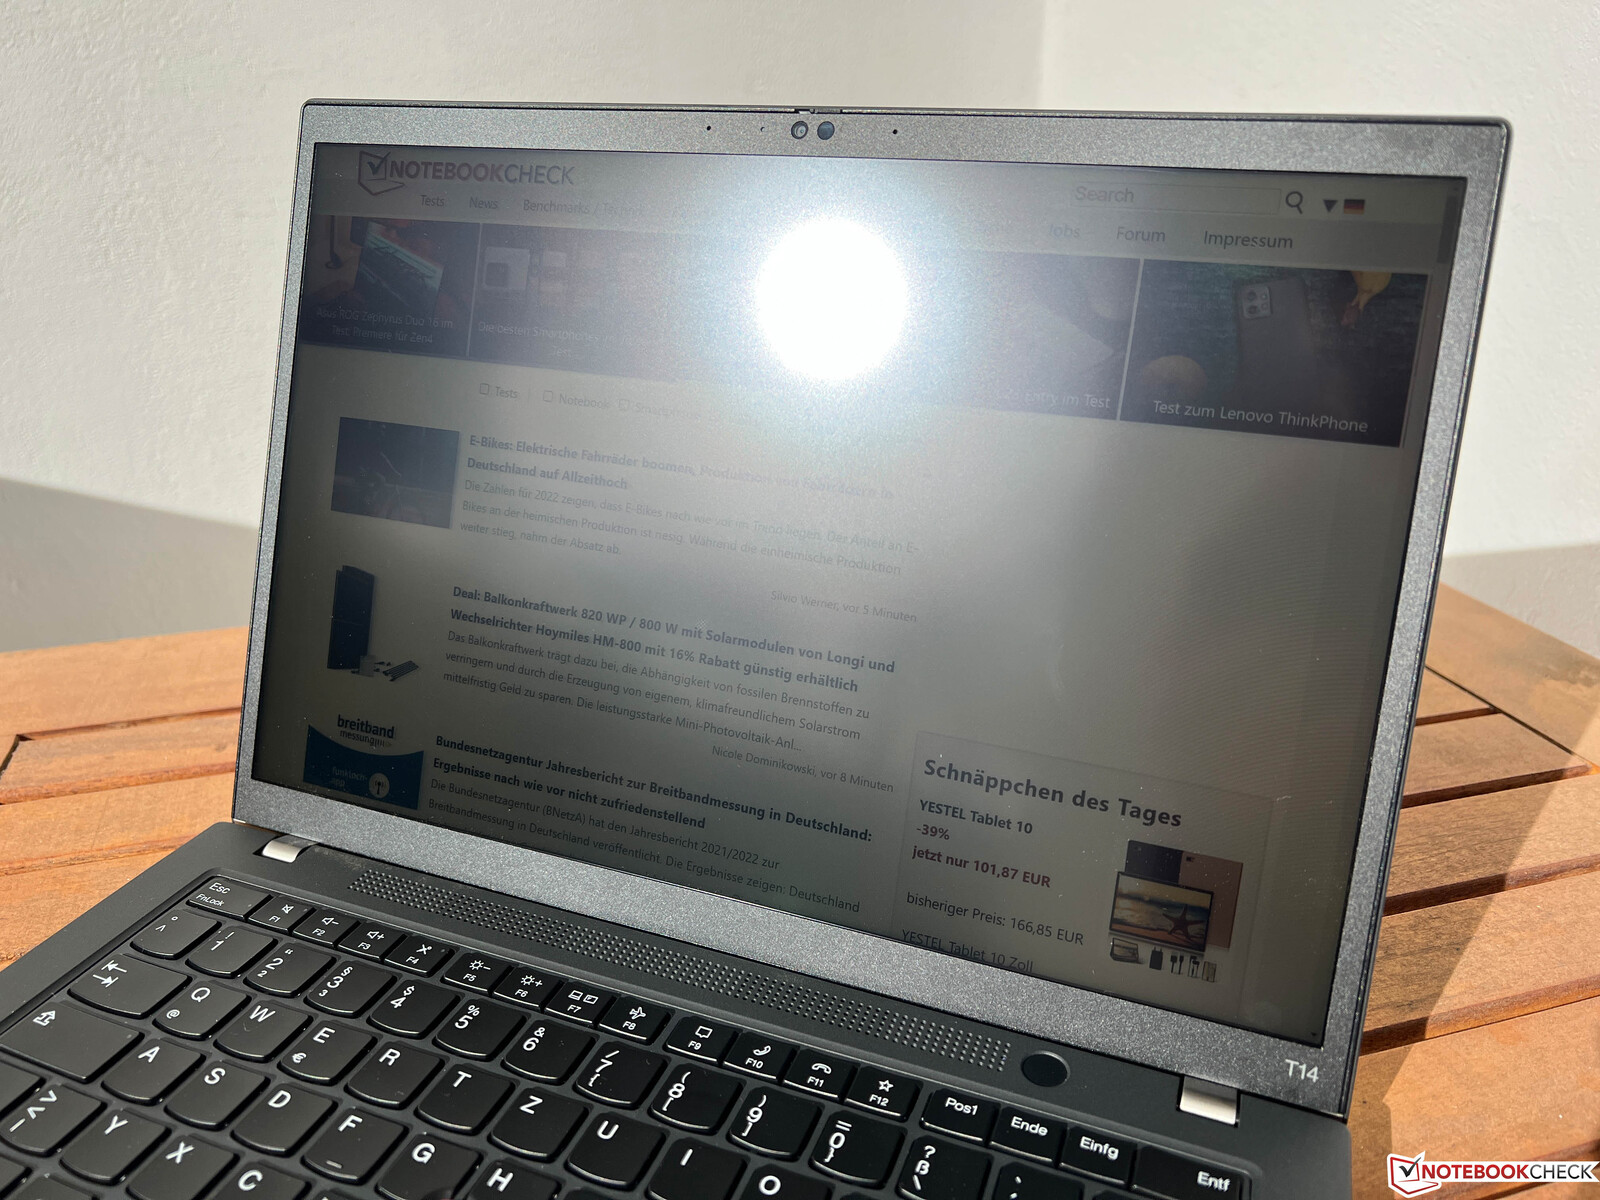
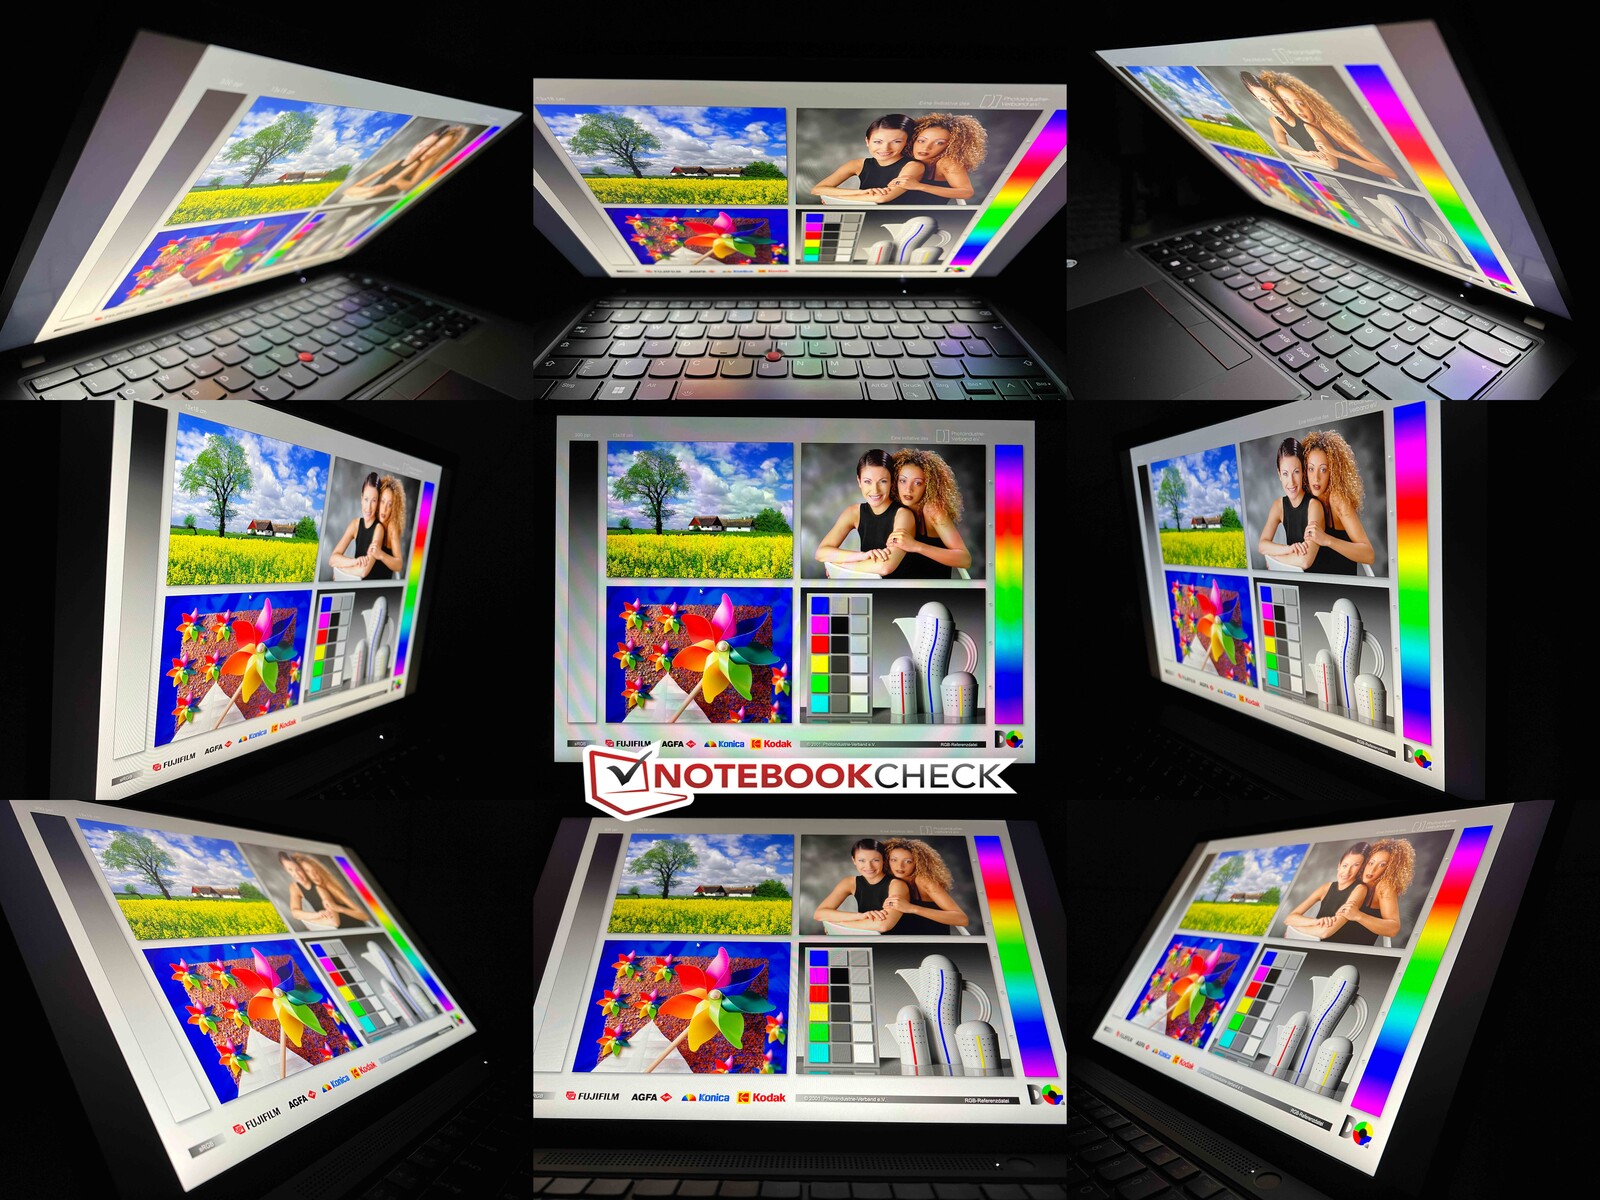
Wyświetlacz - loteria panelu trwa
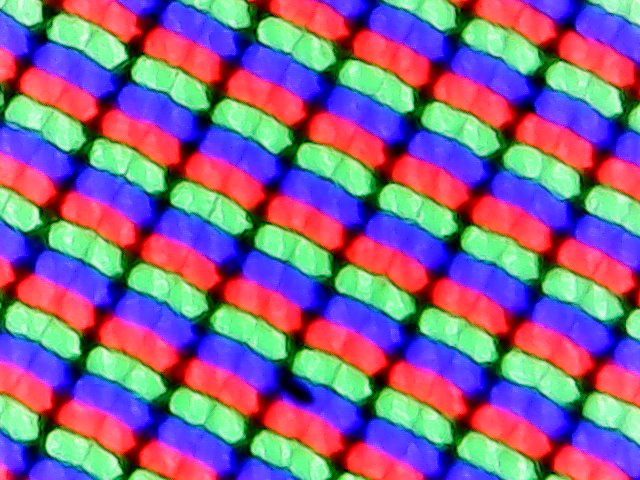
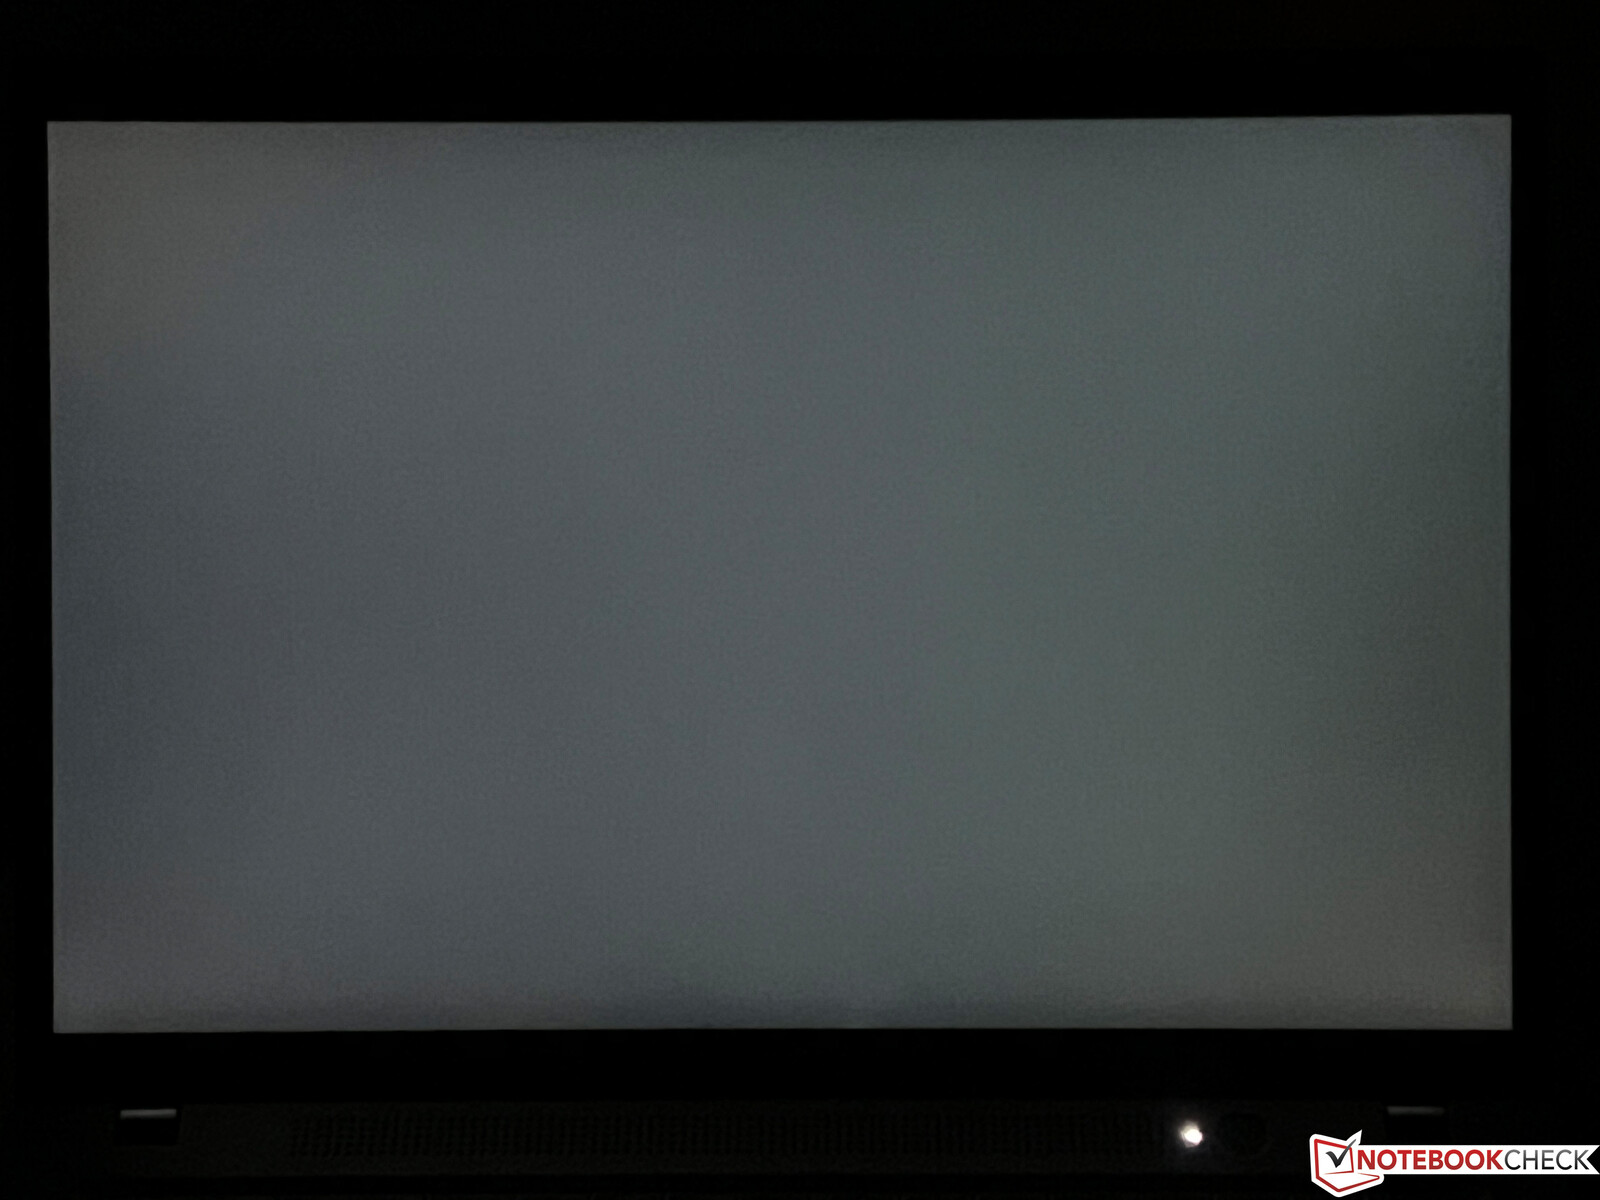
Podobnie jak już w poprzednich modelach ThinkPadów, także w obecnych Lenovo korzysta z usług różnych producentów paneli. Choć oba nasze egzemplarze testowe są wyposażone w 14-calowy panel LowPower Full-HD, występują tu różnice, nawet jeśli zachowana jest podstawowa specyfikacja techniczna obu wersji (a nawet więcej, gdyż w przeszłości były aż 4 wersje). W przeciwieństwie do np.LG w naszej poprzedniej jednostce testowej AMD, nasz obecny egzemplarz testowy Intela wykorzystuje panel od AUO, który subiektywnie nie jest do końca przekonujący, gdyż jasne obszary wydają się nieco ziarniste. Czasy reakcji są tu także wyraźnie wolniejsze, a do tego dochodzi kilka widocznych efektów smużenia, na przykład przy przesuwaniu wskaźnika myszy. PWM nie jest tu jednak również wykorzystywany.
Podobnie jest z jasnością, która okazuje się niższa niż w modelu LG. Nadal jednak osiąga ona reklamowane 400 cd/m². Dzięki niskiej wartości czerni współczynnik kontrastu nie daje powodów do narzekań. Nasz testowy egzemplarz nie ma żadnych problemów z cloudingiem czy krwawieniem ekranu, nawet na najwyższym poziomie jasności.
| |||||||||||||||||||||||||
rozświetlenie: 91 %
na akumulatorze: 399 cd/m²
kontrast: 2105:1 (czerń: 0.19 cd/m²)
ΔE ColorChecker Calman: 3.5 | ∀{0.5-29.43 Ø4.72}
calibrated: 1.6
ΔE Greyscale Calman: 4.8 | ∀{0.09-98 Ø4.97}
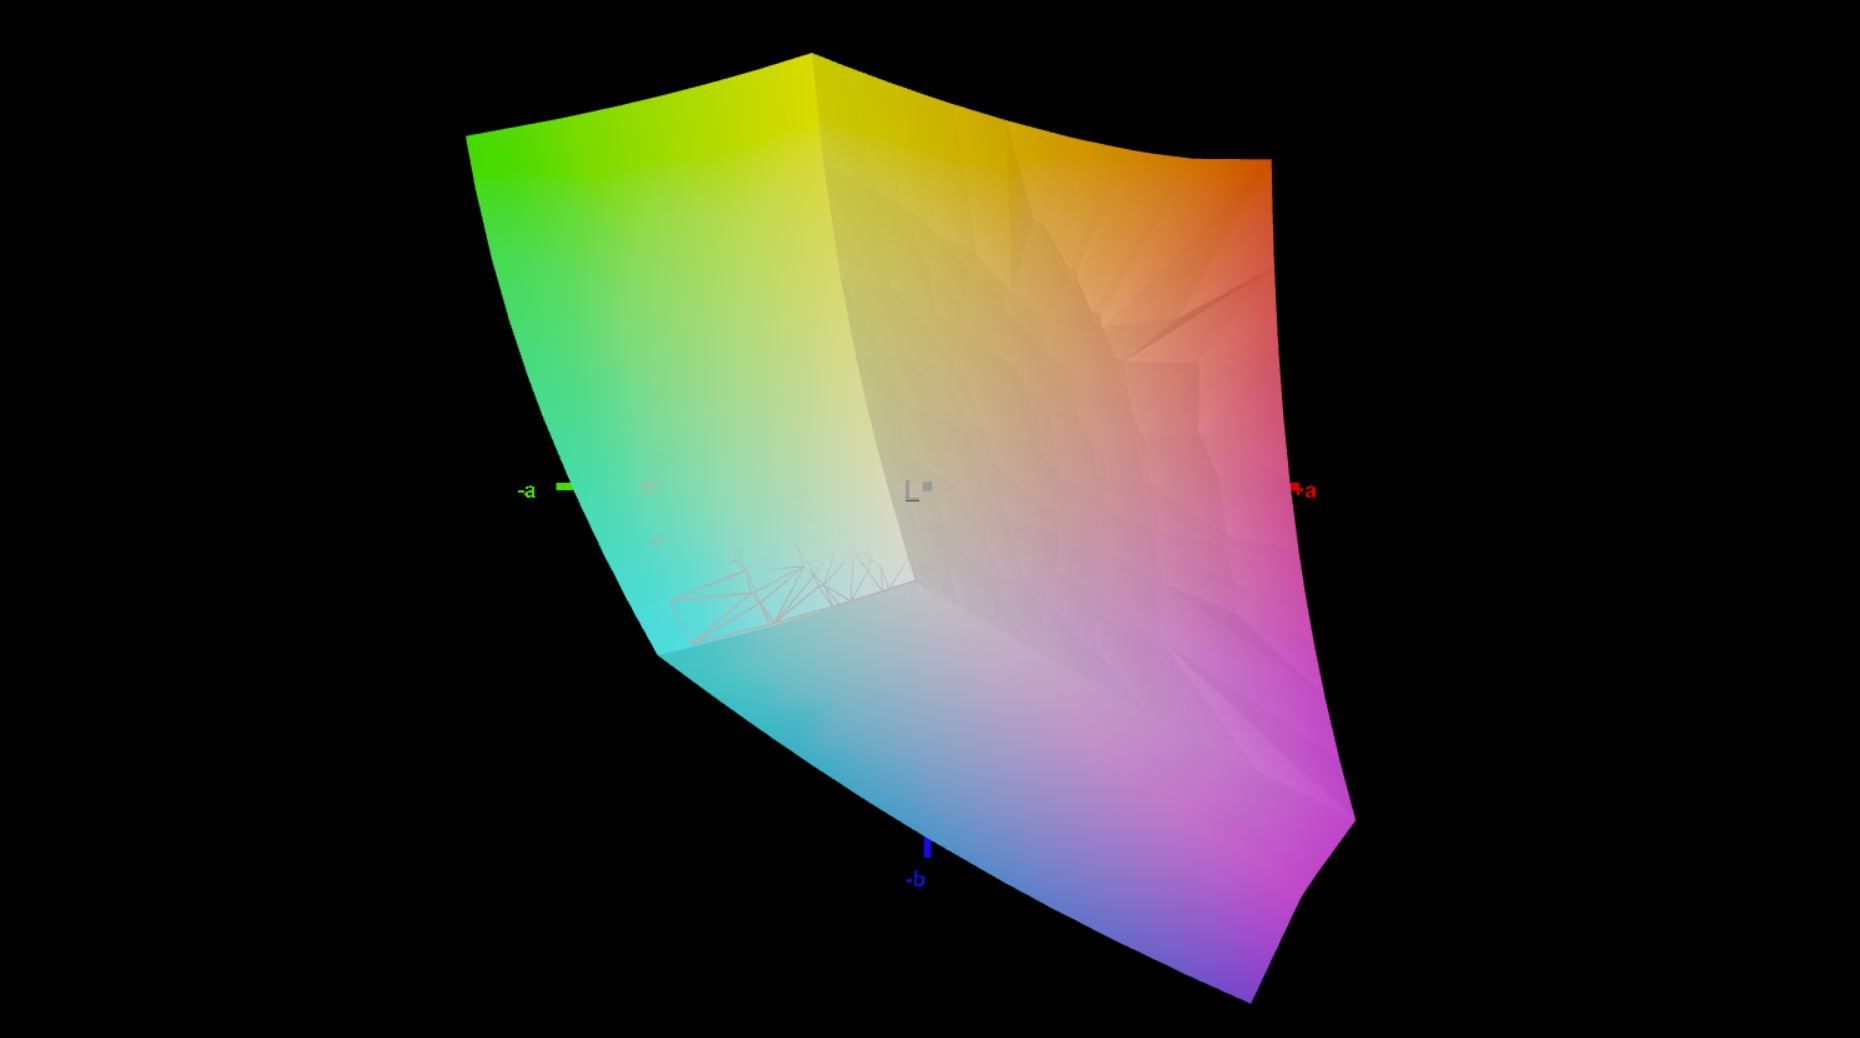
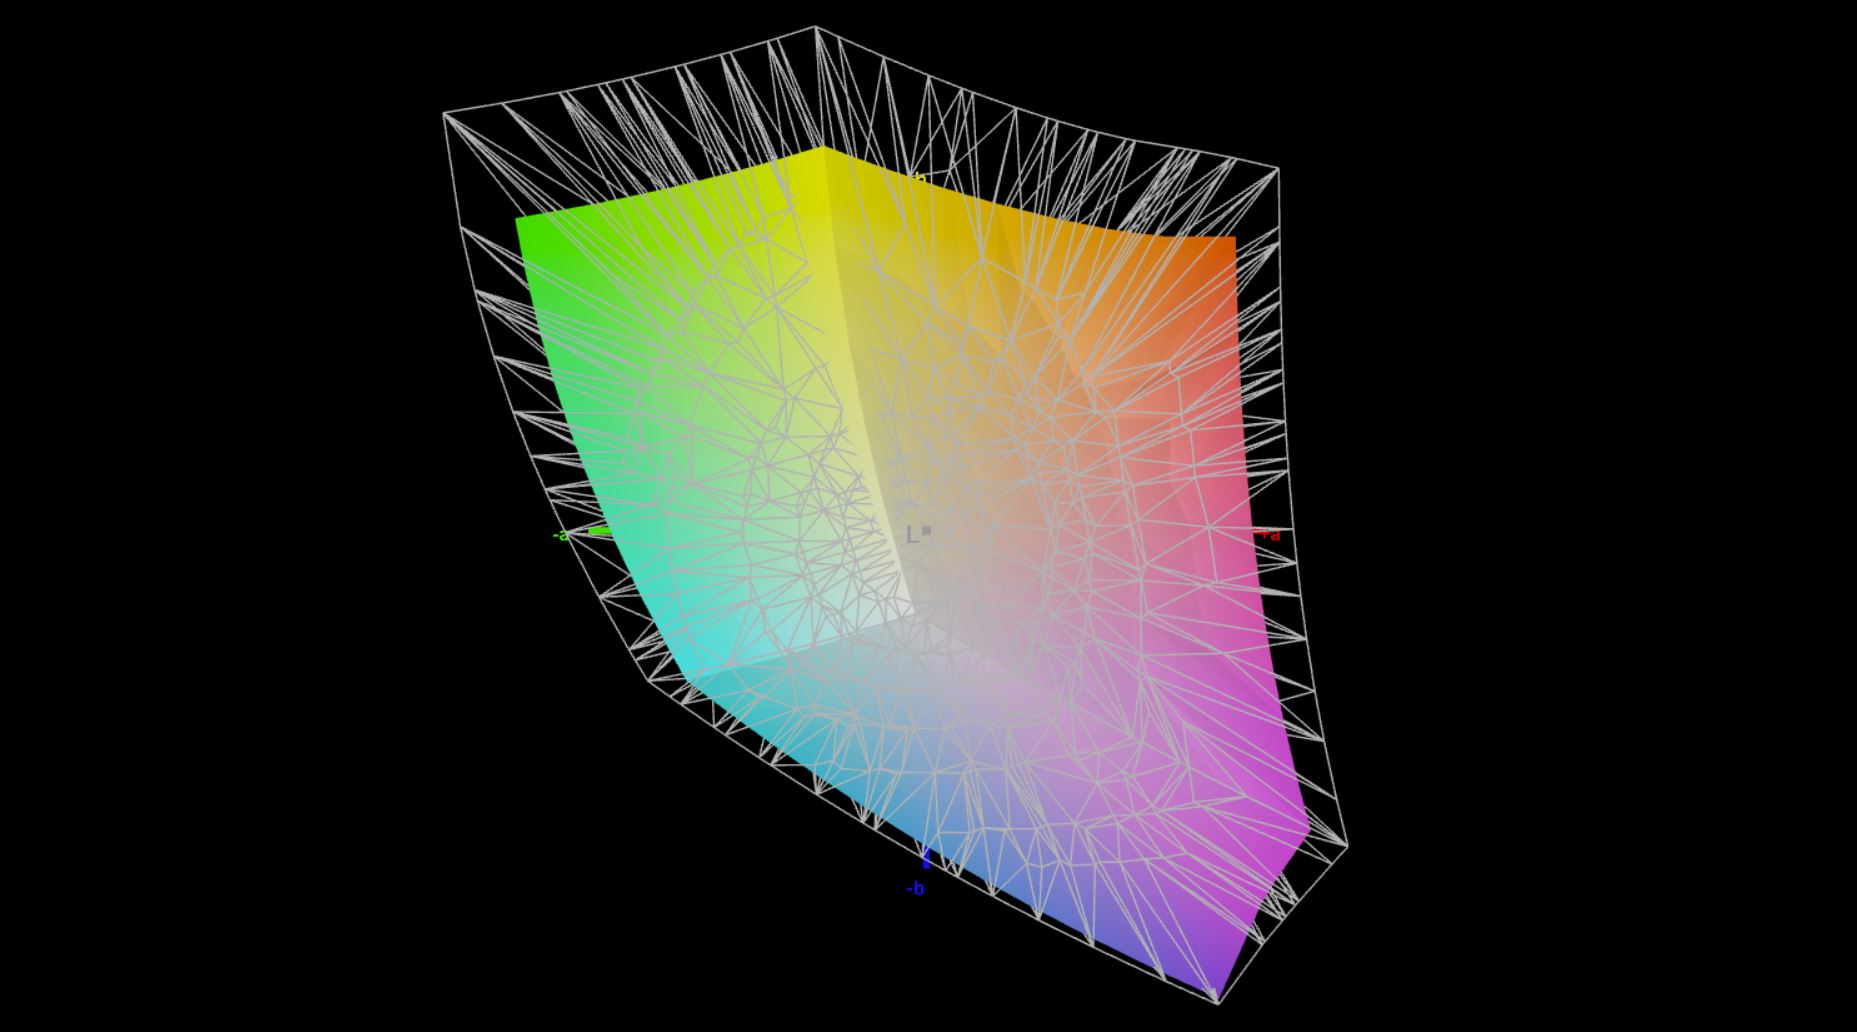
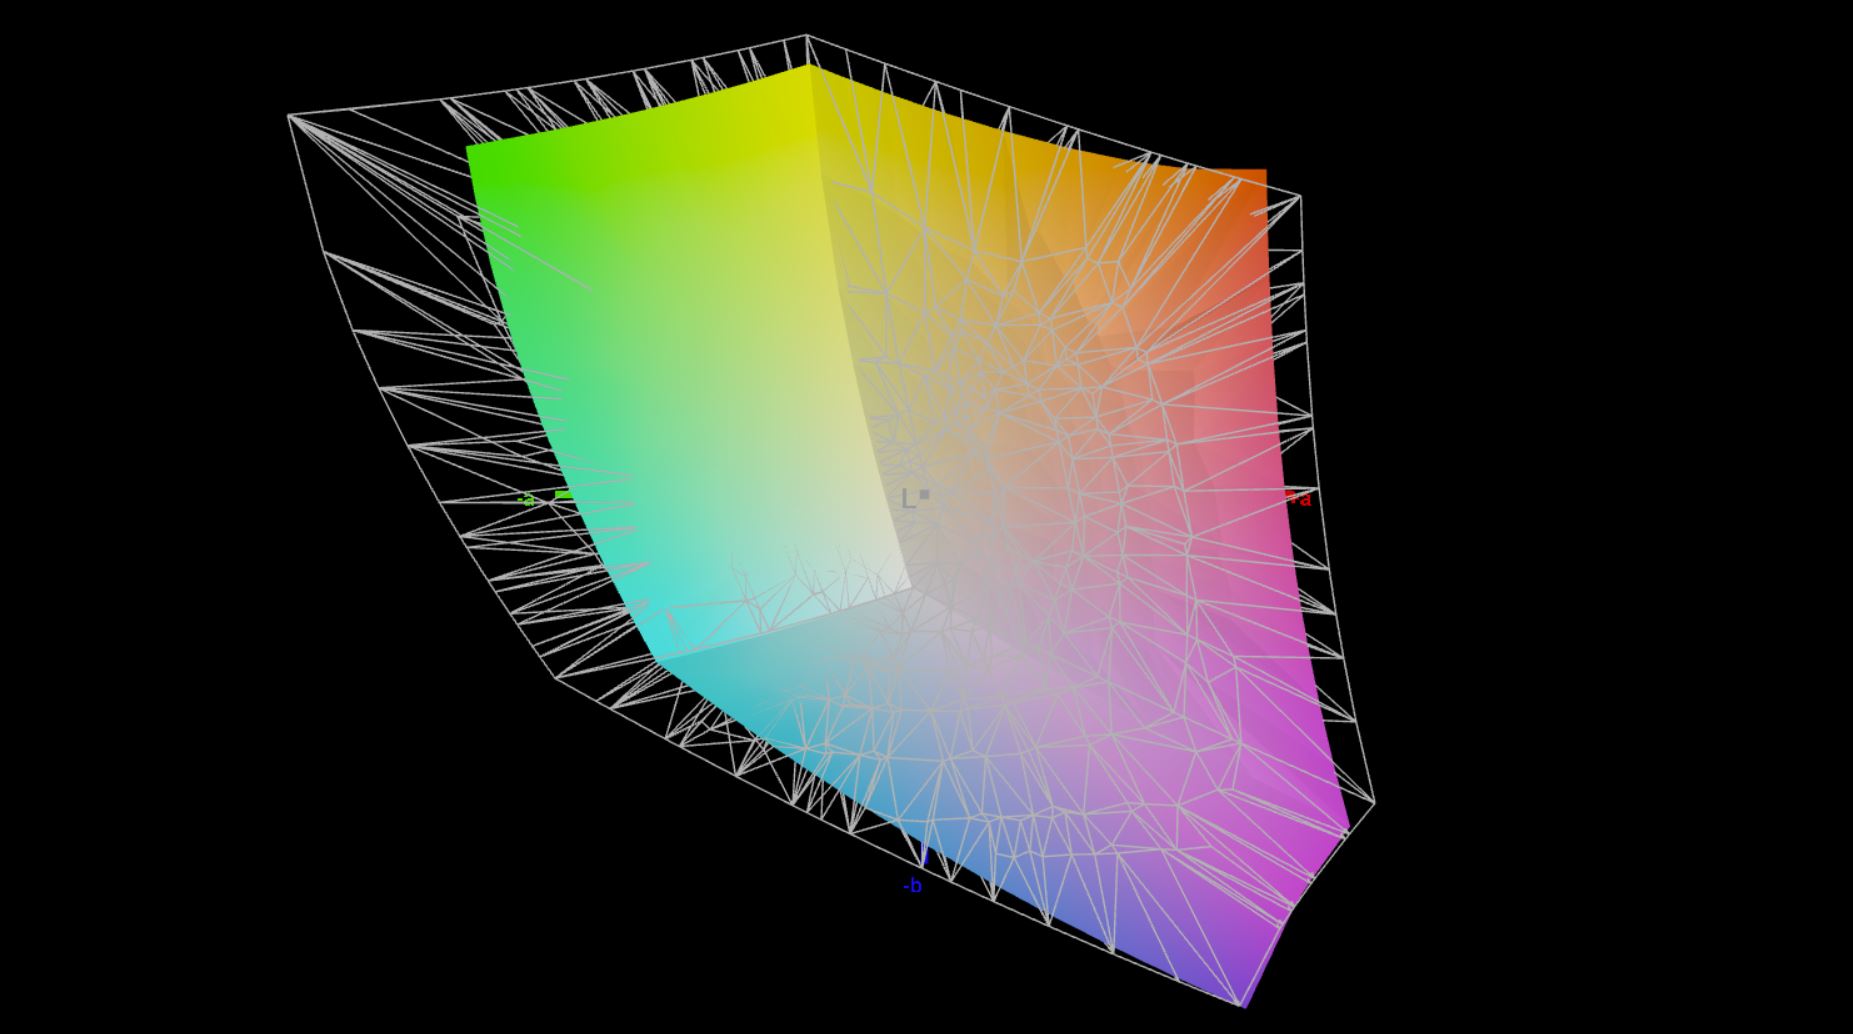
77.9% AdobeRGB 1998 (Argyll 3D)
100% sRGB (Argyll 3D)
76.3% Display P3 (Argyll 3D)
Gamma: 2.11
CCT: 6662 K
| Lenovo ThinkPad T14 G3-21AJS00400 B140UAN02.1, IPS, 1920x1200, 14" | Lenovo ThinkPad T14 G3-21CF004NGE LP140WU1-SPB2, IPS, 1920x1200, 14" | HP EliteBook 840 G9 Chi Mei CMN1435, IPS, 1920x1200, 14" | Schenker Vision 14 2022 RTX 3050 Ti MNE007ZA1-1, IPS, 2880x1800, 14" | Huawei MateBook X Pro 2022 TMX1422, IPS, 3120x2080, 14.2" | |
|---|---|---|---|---|---|
| Display | -7% | -8% | -3% | 12% | |
| Display P3 Coverage (%) | 76.3 | 69.2 -9% | 67.6 -11% | 74.1 -3% | 94.6 24% |
| sRGB Coverage (%) | 100 | 97.4 -3% | 98.7 -1% | 97.4 -3% | 99.5 0% |
| AdobeRGB 1998 Coverage (%) | 77.9 | 71.5 -8% | 69.7 -11% | 75.3 -3% | 86.5 11% |
| Response Times | 40% | -19% | 54% | 55% | |
| Response Time Grey 50% / Grey 80% * (ms) | 62.6 ? | 41.4 ? 34% | 66 ? -5% | 31.5 ? 50% | 25.4 ? 59% |
| Response Time Black / White * (ms) | 34.9 ? | 19.2 ? 45% | 46.4 ? -33% | 14.5 ? 58% | 17.1 ? 51% |
| PWM Frequency (Hz) | |||||
| Screen | 16% | 14% | -6% | 22% | |
| Brightness middle (cd/m²) | 400 | 451 13% | 391.3 -2% | 421 5% | 603 51% |
| Brightness (cd/m²) | 395 | 435 10% | 368 -7% | 416 5% | 586 48% |
| Brightness Distribution (%) | 91 | 94 3% | 86 -5% | 89 -2% | 91 0% |
| Black Level * (cd/m²) | 0.19 | 0.21 -11% | 0.32 -68% | 0.28 -47% | 0.39 -105% |
| Contrast (:1) | 2105 | 2148 2% | 1223 -42% | 1504 -29% | 1546 -27% |
| Colorchecker dE 2000 * | 3.5 | 2.4 31% | 1.49 57% | 3.2 9% | 1.1 69% |
| Colorchecker dE 2000 max. * | 7.2 | 4.1 43% | 3.29 54% | 5.5 24% | 2.2 69% |
| Colorchecker dE 2000 calibrated * | 1.6 | 1.3 19% | 0.44 73% | 2 -25% | 1.2 25% |
| Greyscale dE 2000 * | 4.8 | 3.3 31% | 1.7 65% | 4.4 8% | 1.5 69% |
| Gamma | 2.11 104% | 2.13 103% | 2.12 104% | 2.22 99% | 2.17 101% |
| CCT | 6662 98% | 6848 95% | 6488 100% | 6384 102% | 6549 99% |
| Całkowita średnia (program / ustawienia) | 16% /
14% | -4% /
5% | 15% /
3% | 30% /
25% |
* ... im mniej tym lepiej
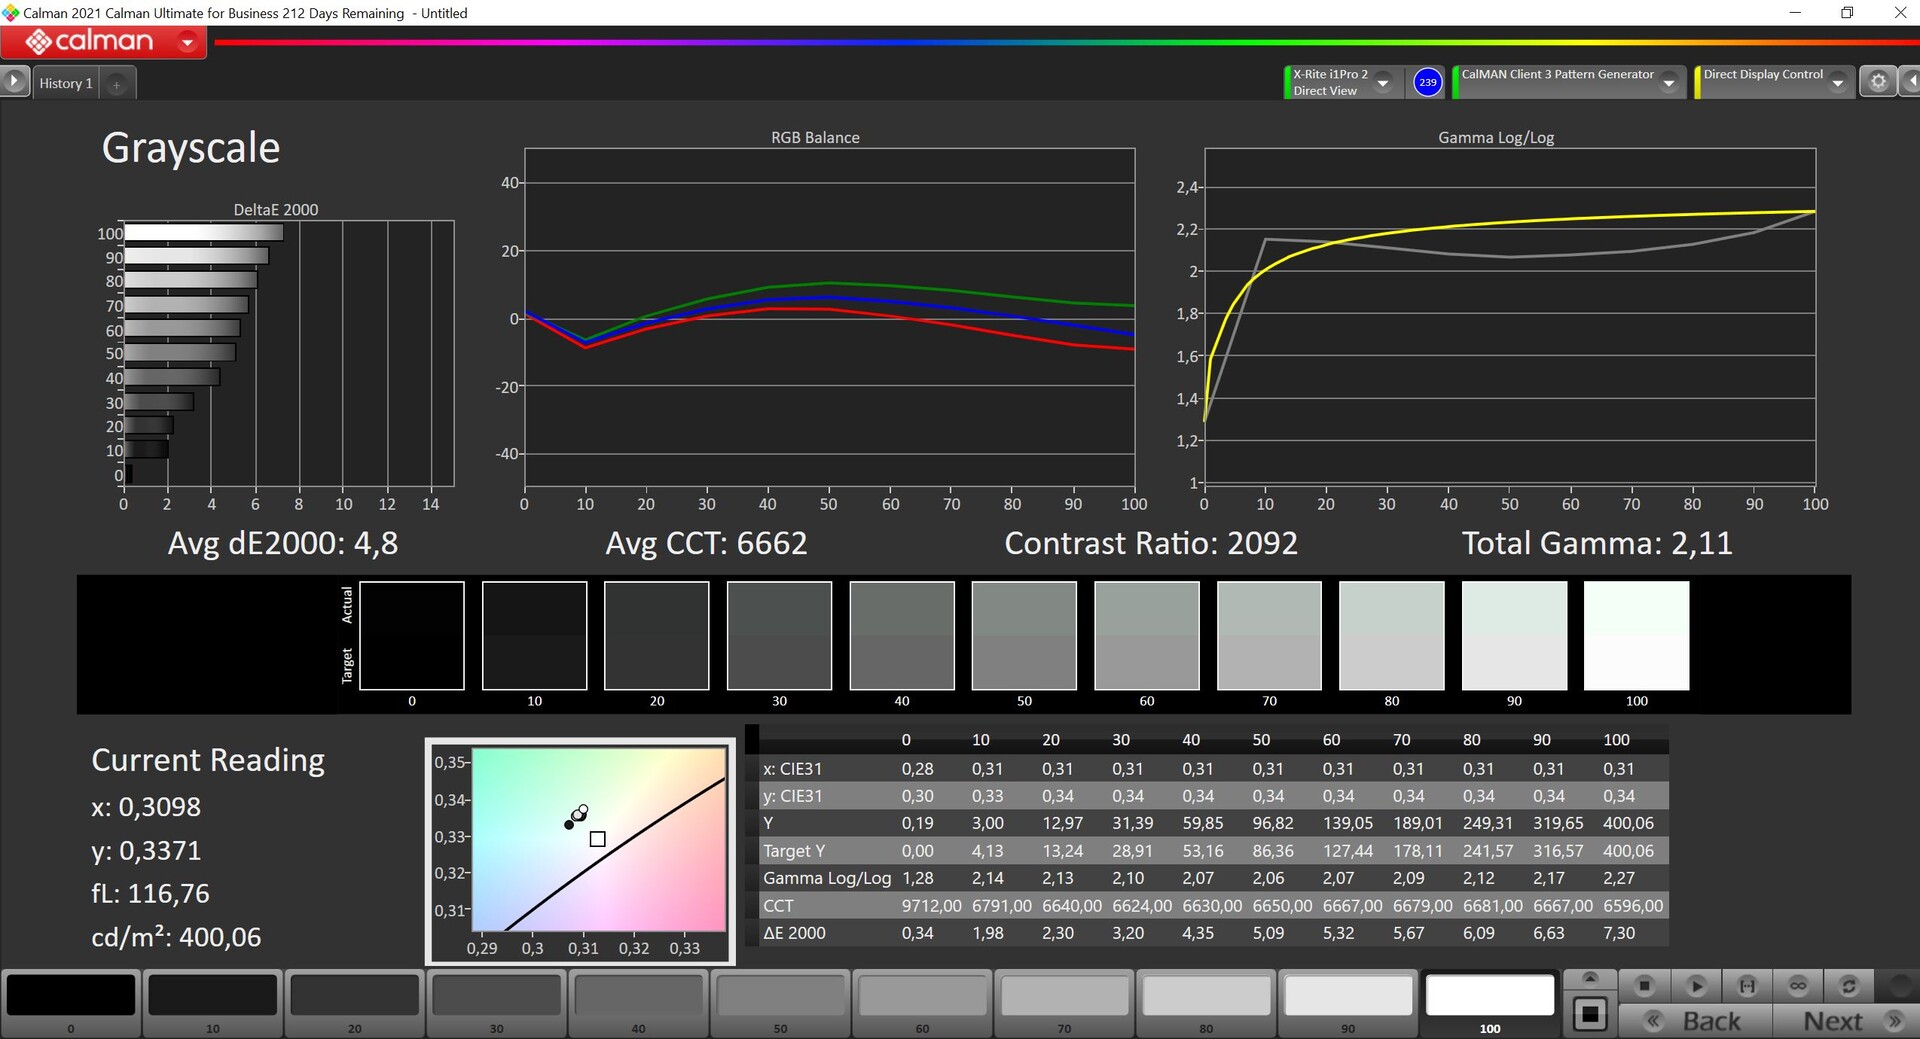
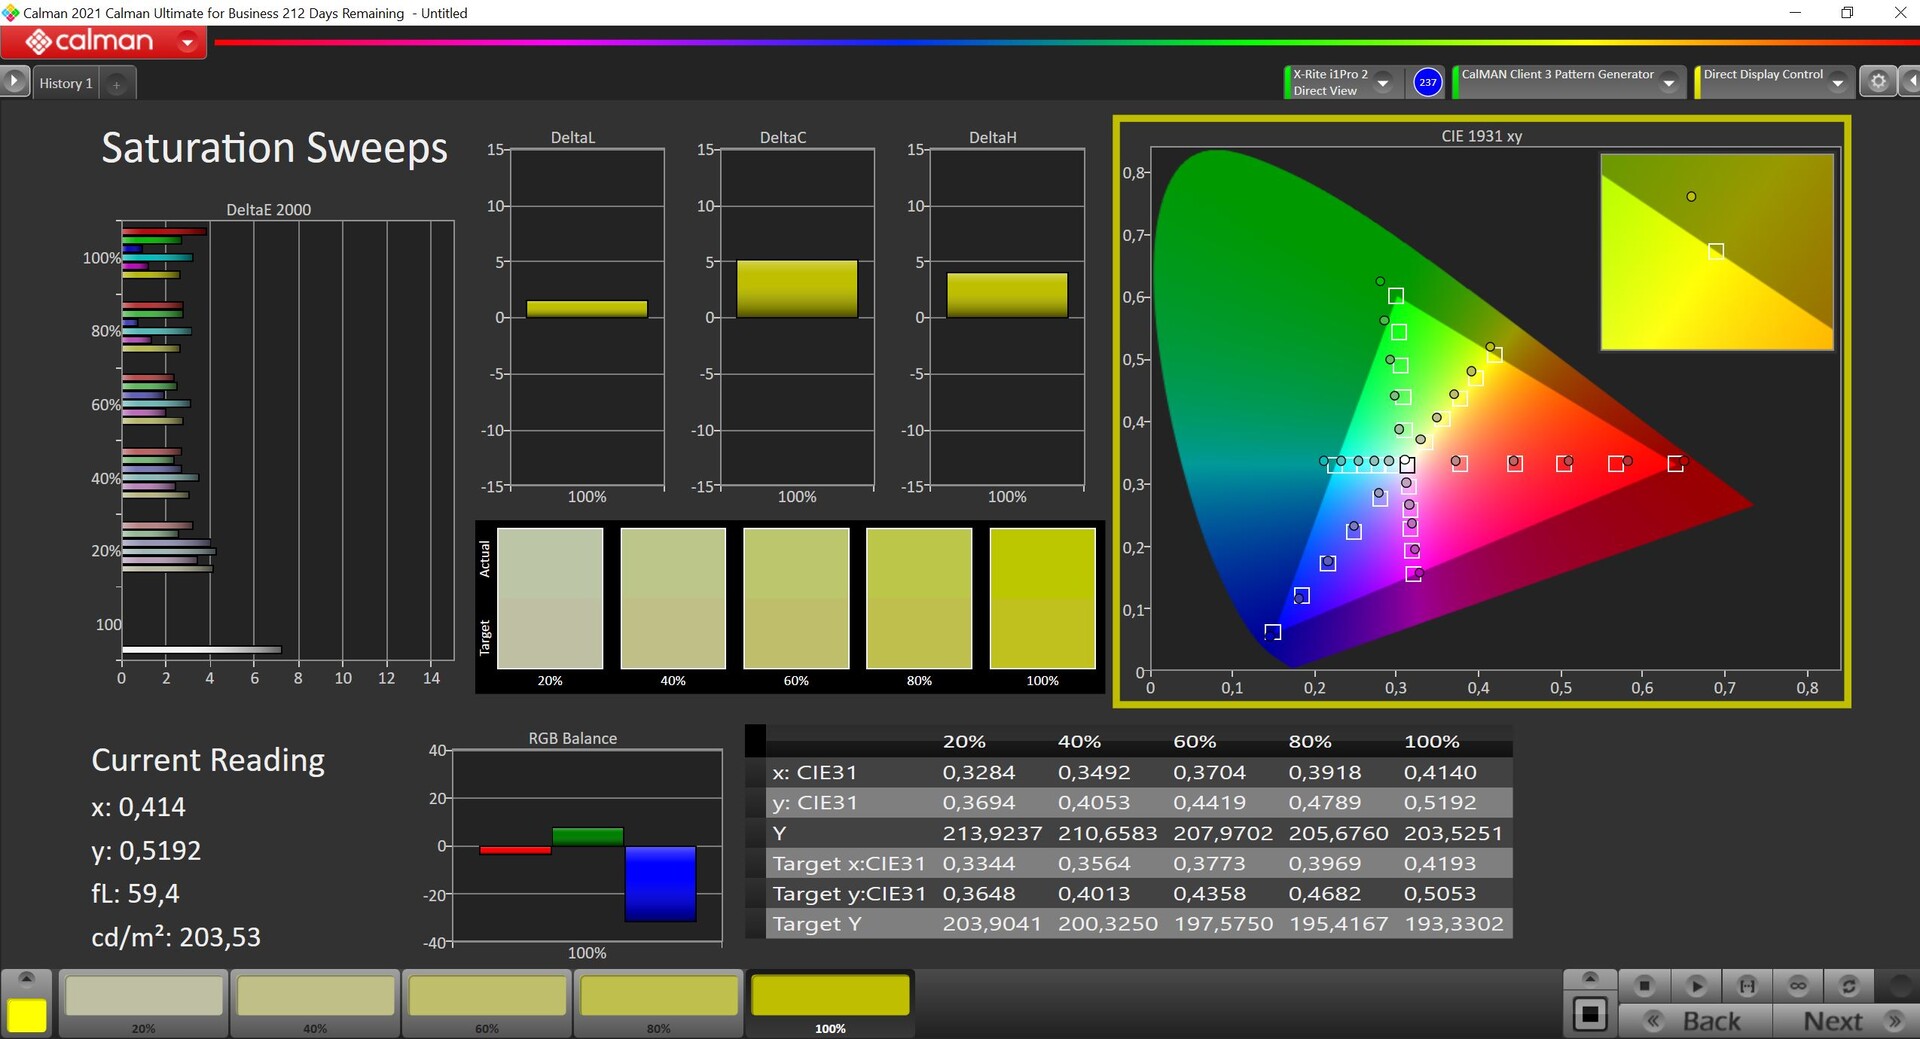
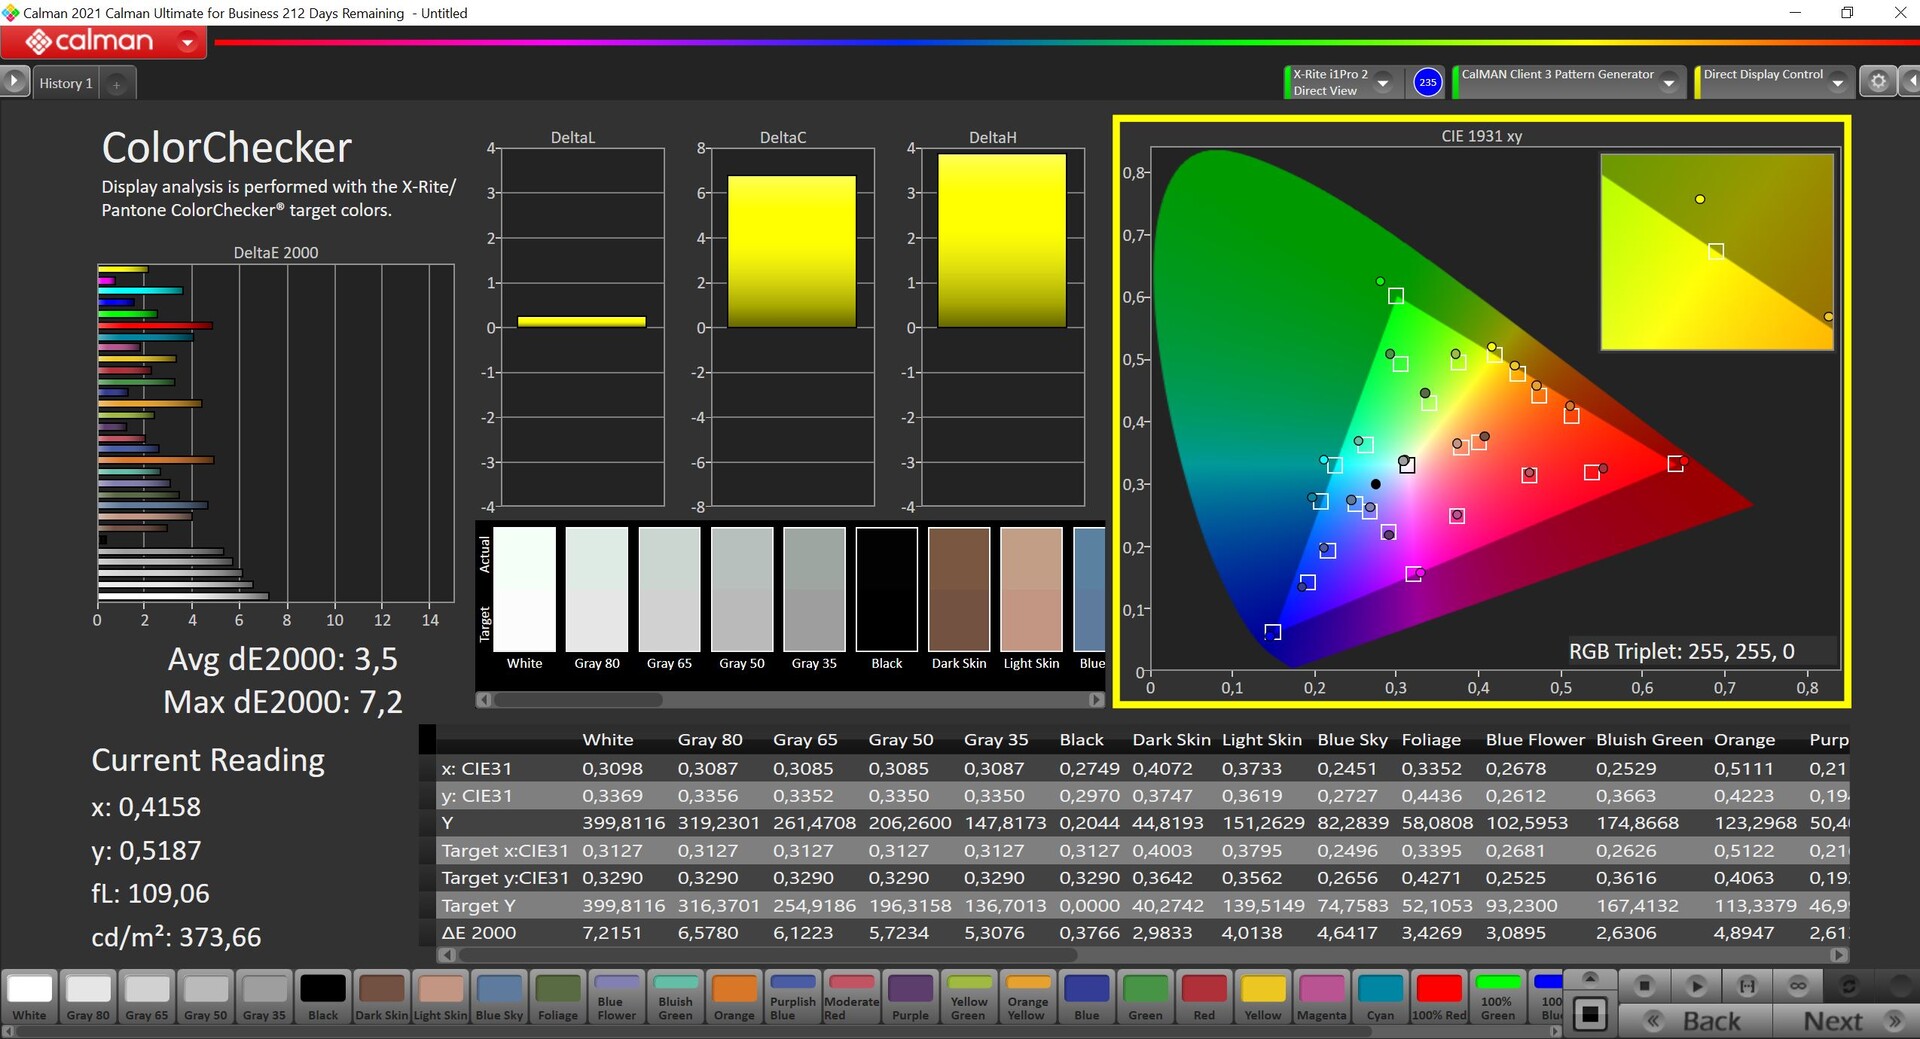
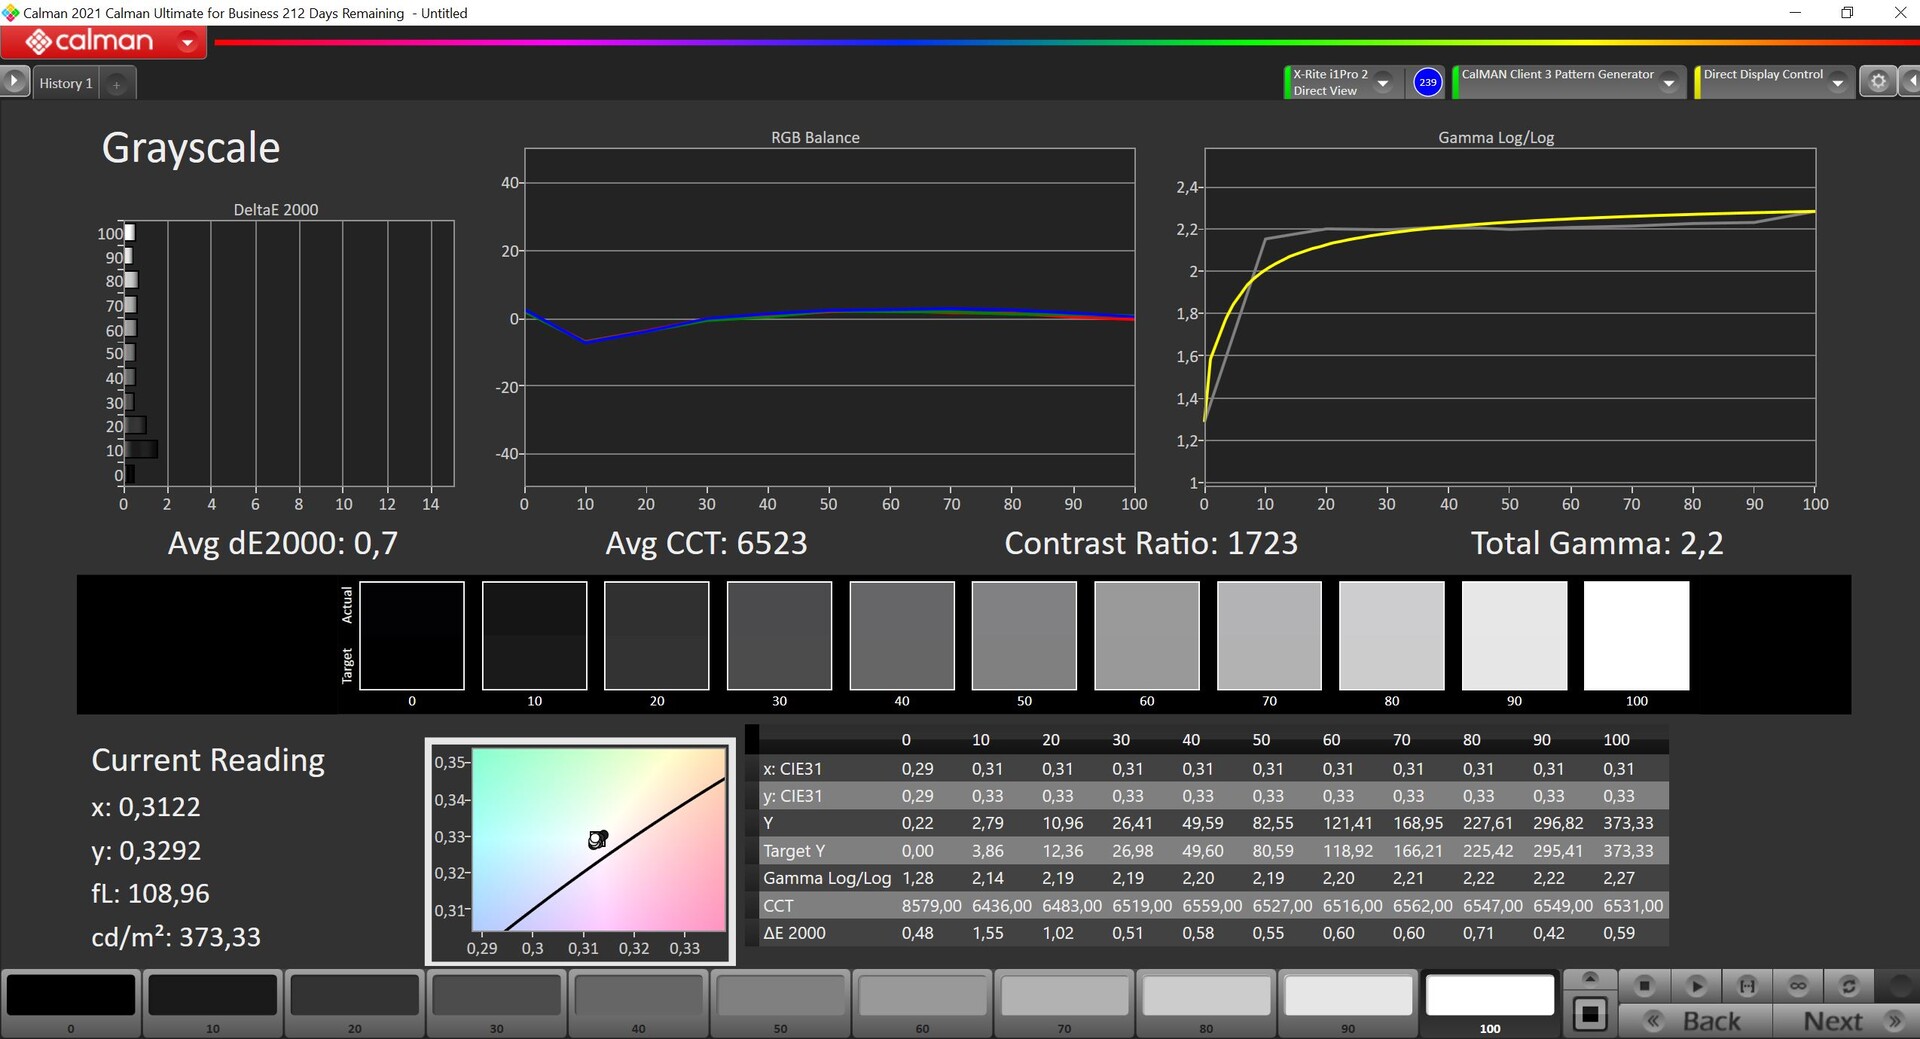
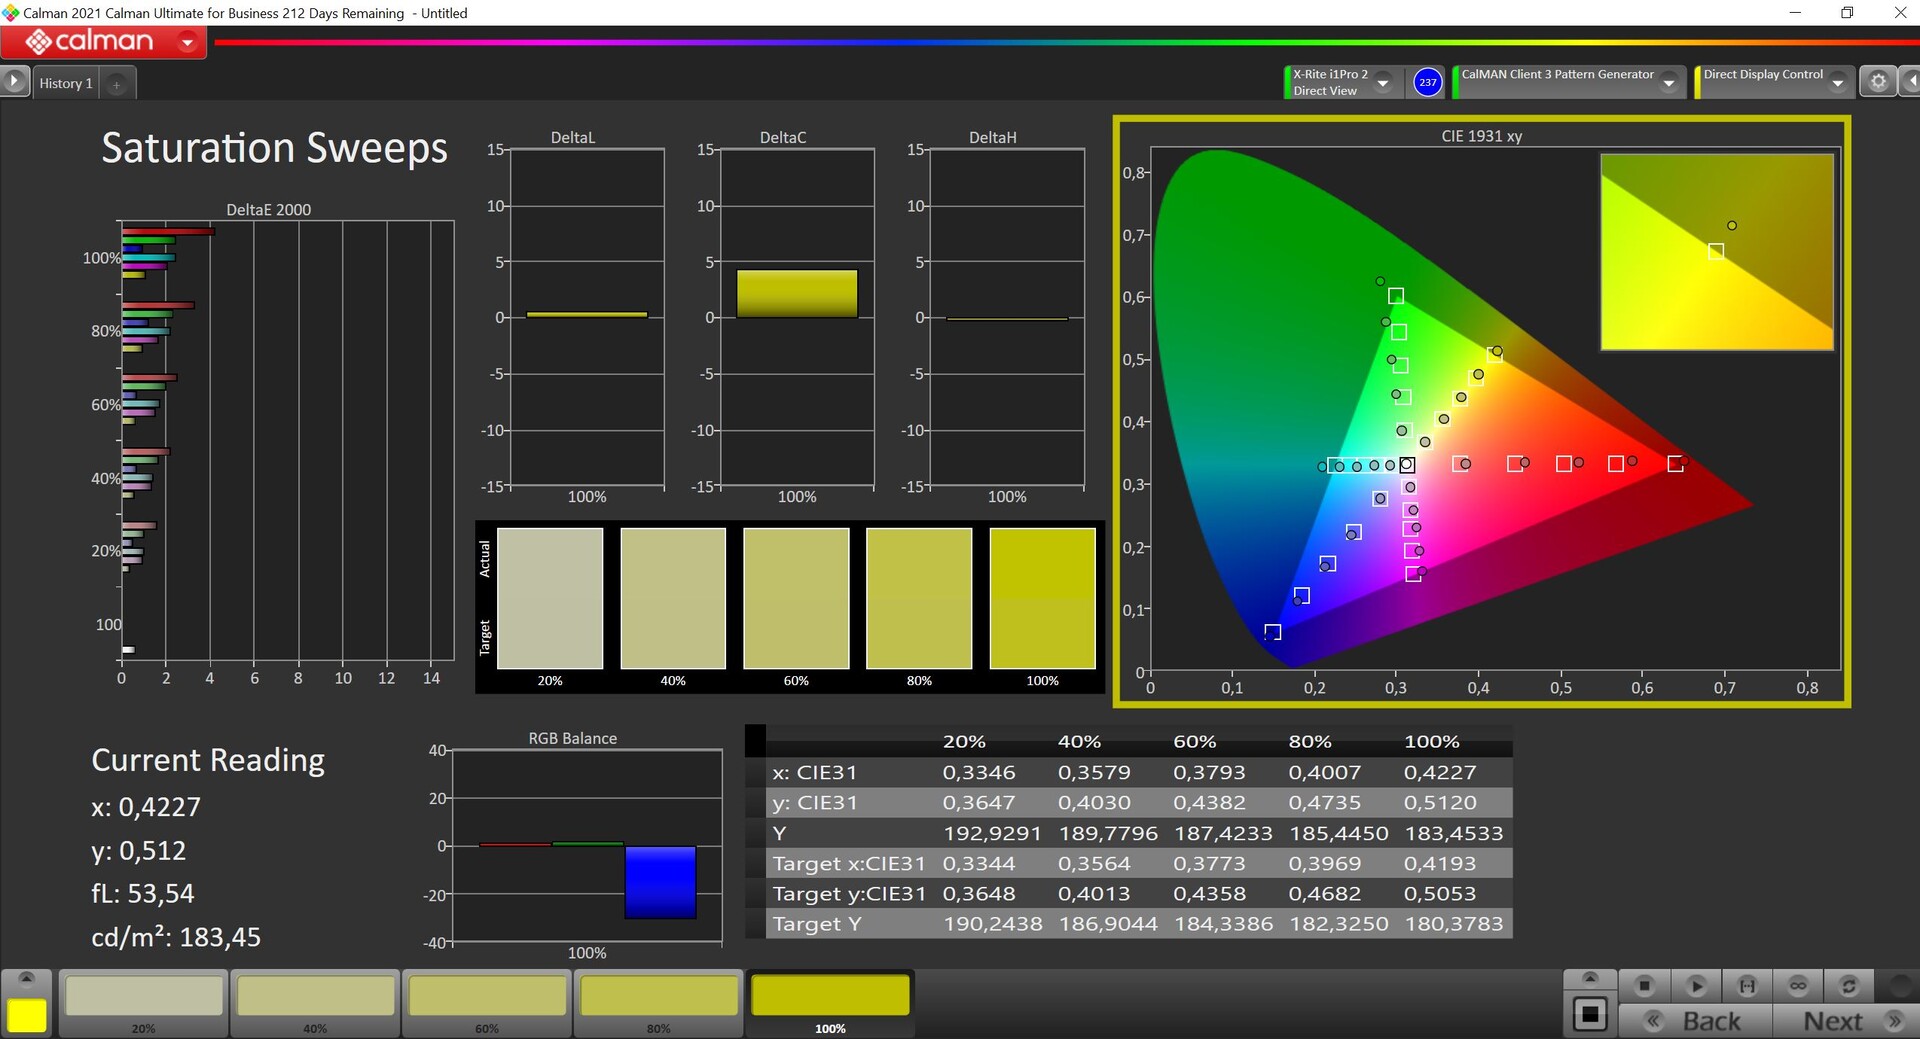
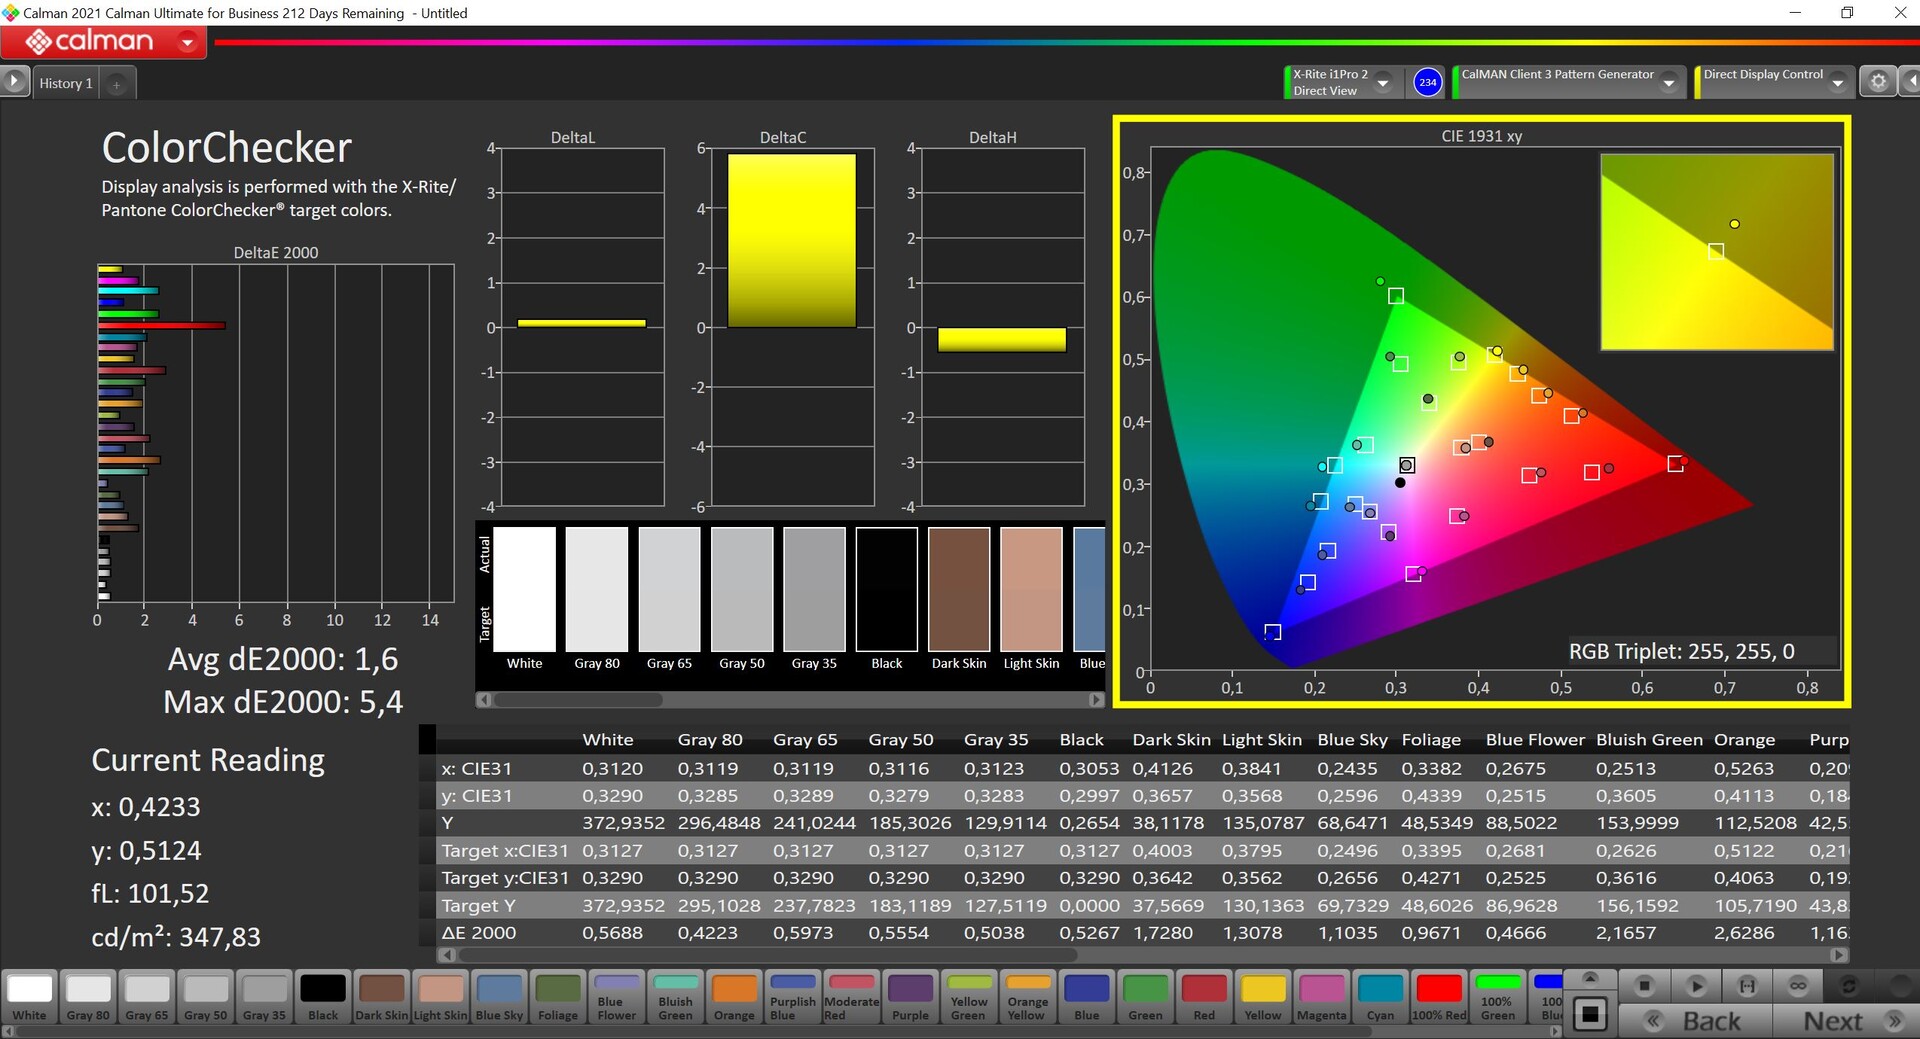
Panel zmierzyliśmy za pomocą profesjonalnego oprogramowania CalMAN (X-Rite i1 Pro 2). Mimo że w stanie dostawy występuje lekkie zabarwienie w kierunku zielonego/niebieskiego, w codziennej eksploatacji nie jest to bardzo widoczne, a wyniki są już przyzwoite jak na laptop biznesowy. Dzięki własnej kalibracji (profil kolorów dostępny do pobrania za darmo z linku powyżej) jesteśmy w stanie jeszcze bardziej poprawić odwzorowanie barw. W połączeniu z pełnym pokryciem przestrzeni barwnej sRGB panel nadaje się całkiem nieźle do sporadycznych zadań związanych z obróbką zdjęć czy filmów.
Wyświetl czasy reakcji
| ↔ Czas reakcji od czerni do bieli | ||
|---|---|---|
| 34.9 ms ... wzrost ↗ i spadek ↘ łącznie | ↗ 16.5 ms wzrost | 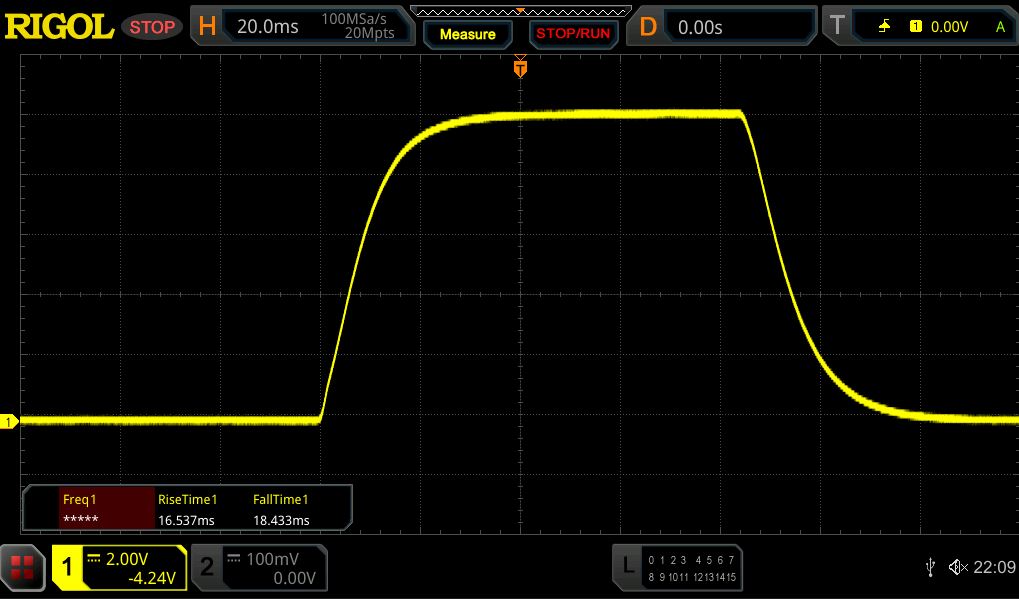 |
| ↘ 18.4 ms upadek | ||
| W naszych testach ekran wykazuje powolne tempo reakcji, co będzie niezadowalające dla graczy. Dla porównania, wszystkie testowane urządzenia wahają się od 0.1 (minimum) do 240 (maksimum) ms. » 92 % wszystkich urządzeń jest lepszych. Oznacza to, że zmierzony czas reakcji jest gorszy od średniej wszystkich testowanych urządzeń (19.8 ms). | ||
| ↔ Czas reakcji 50% szarości do 80% szarości | ||
| 62.6 ms ... wzrost ↗ i spadek ↘ łącznie | ↗ 28.2 ms wzrost | 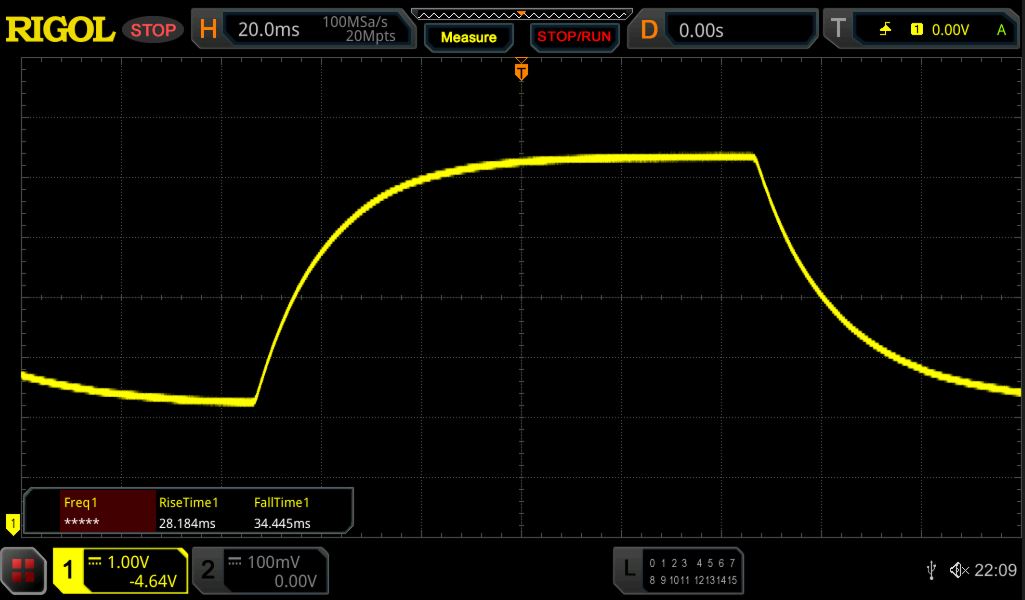 |
| ↘ 34.4 ms upadek | ||
| W naszych testach ekran wykazuje powolne tempo reakcji, co będzie niezadowalające dla graczy. Dla porównania, wszystkie testowane urządzenia wahają się od 0.165 (minimum) do 636 (maksimum) ms. » 97 % wszystkich urządzeń jest lepszych. Oznacza to, że zmierzony czas reakcji jest gorszy od średniej wszystkich testowanych urządzeń (31 ms). | ||
Migotanie ekranu / PWM (modulacja szerokości impulsu)
| Migotanie ekranu/nie wykryto PWM | 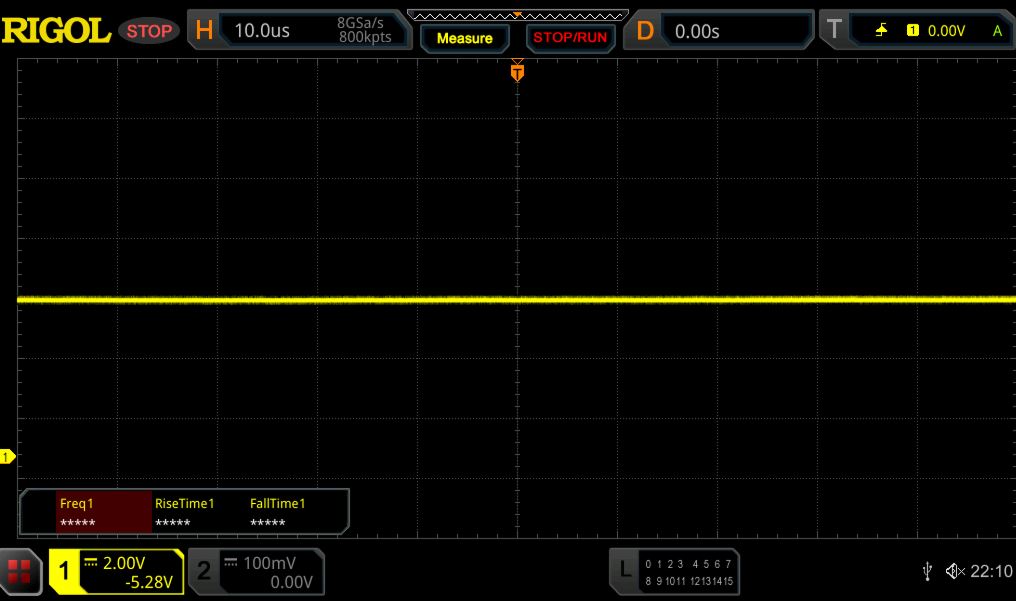 | ||
Dla porównania: 52 % wszystkich testowanych urządzeń nie używa PWM do przyciemniania wyświetlacza. Jeśli wykryto PWM, zmierzono średnio 7781 (minimum: 5 - maksimum: 343500) Hz. | |||
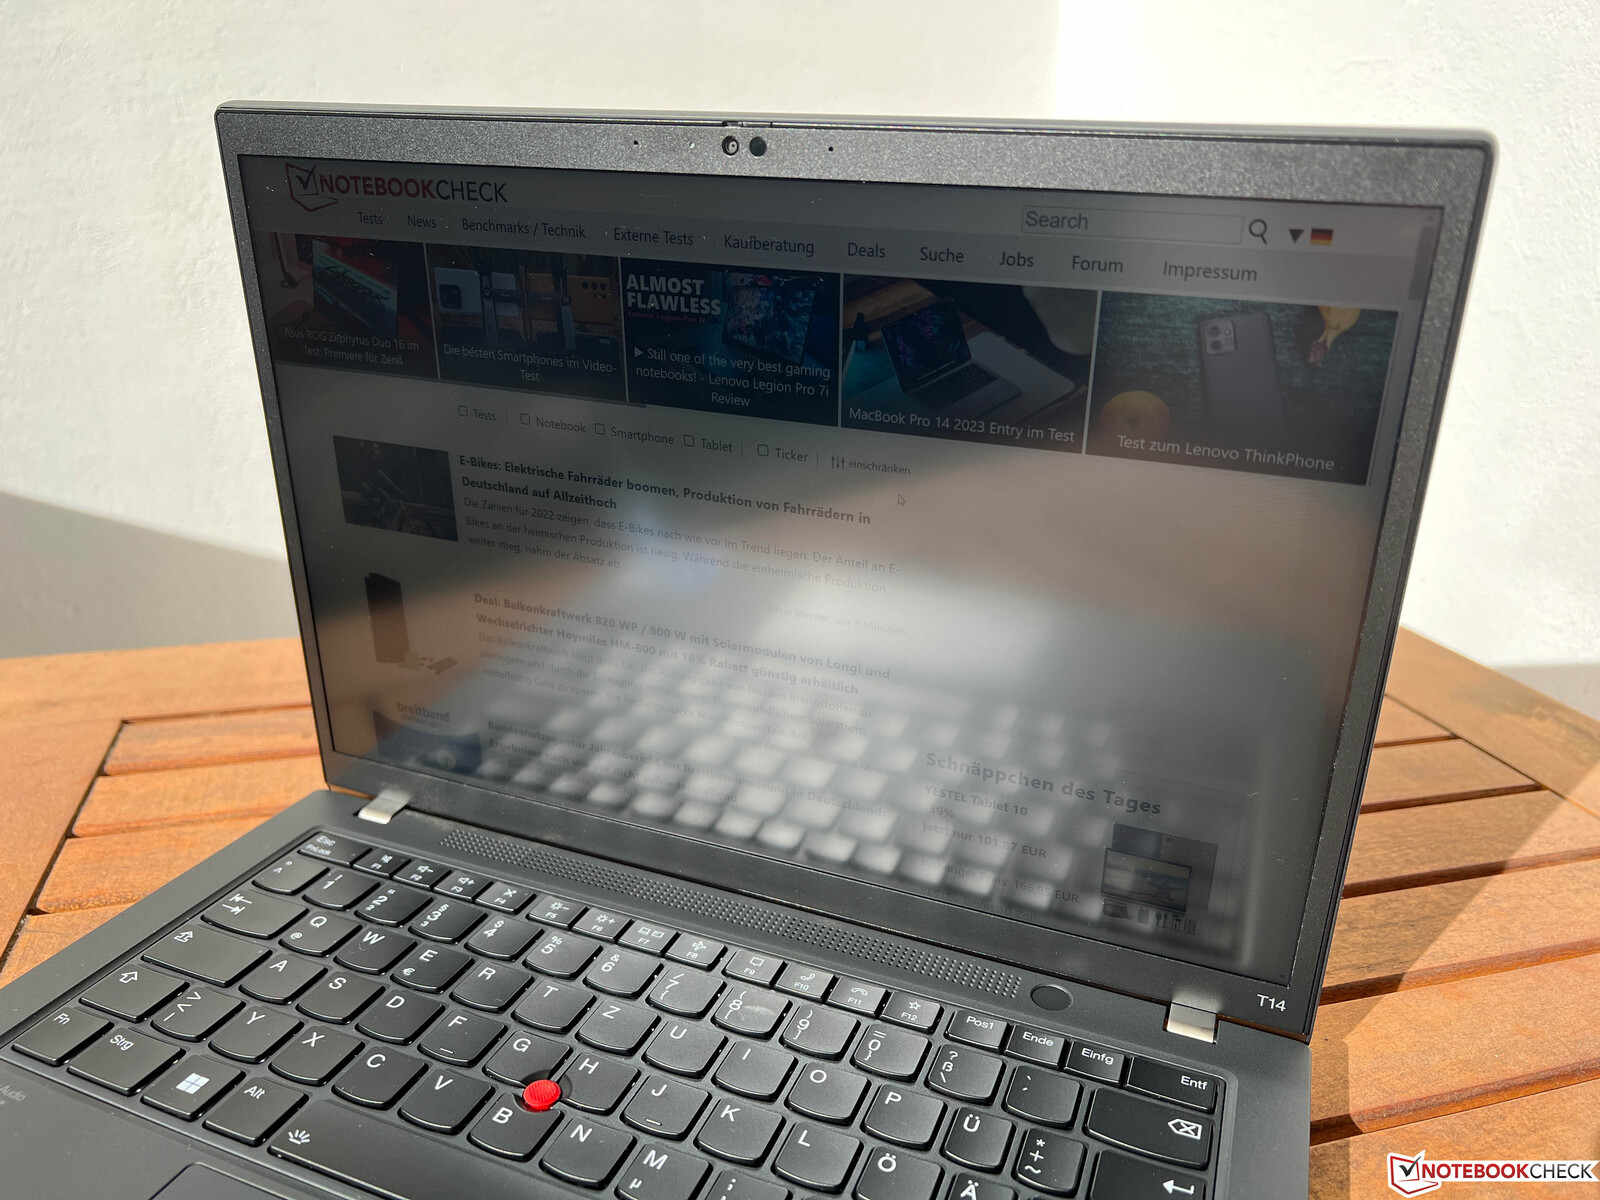
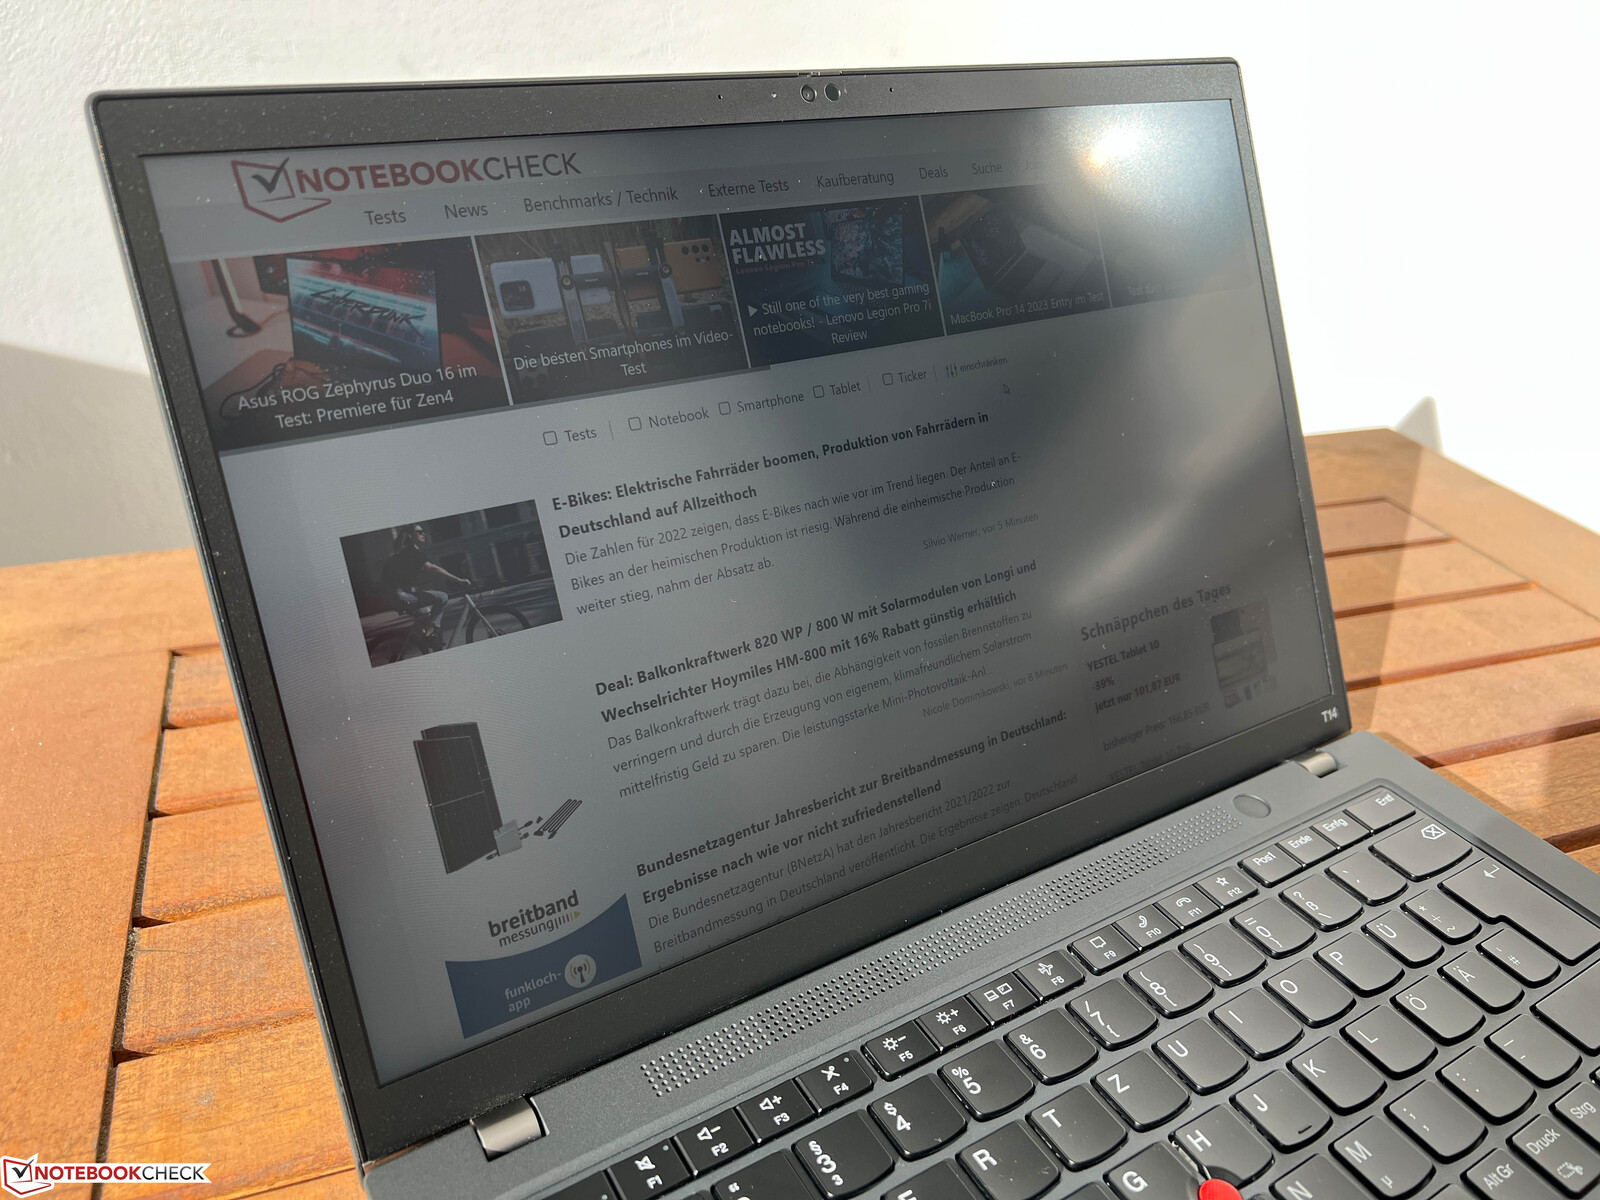
Na dworze panel radzi sobie ok, ale mimo wszystko należy unikać odbić bezpośrednich źródeł światła. Stabilność kątów widzenia panelu IPS jest bardzo dobra.
Wydajność - Alder Lake i GeForce MX550
Warunki badania
Aplikacja Lenovo Vantage App oferuje tryb "Intelligent Cooling", ale w naszym teście po krótkim czasie miało to negatywny wpływ na wydajność. Dlatego wyłączyliśmy ten tryb na potrzeby naszych benchmarków i pomiarów (za pomocą aplikacji lub kombinacji klawiszy Fn+T).
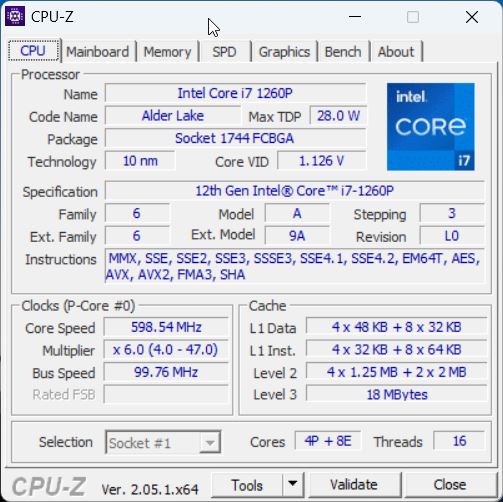
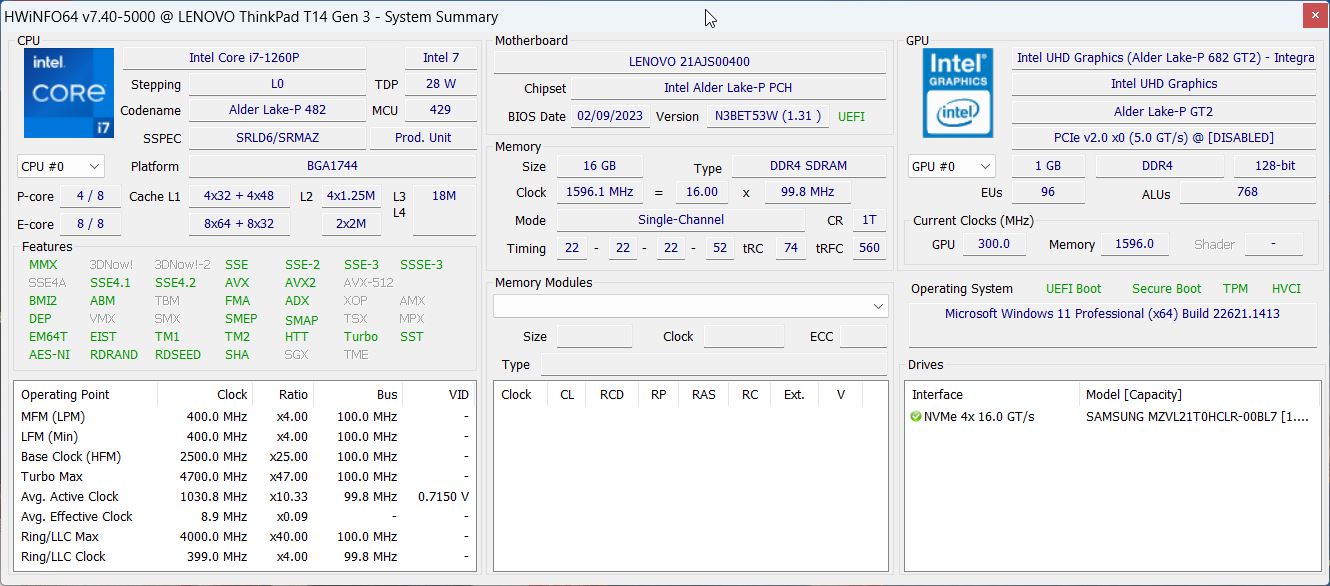
Procesor - Core i7-1260P
Znamy już m.in.Core i7-1260Pz generacji Alder Lake, a dzięki 4 szybkim rdzeniom wydajnościowym i 8 wydajnym wydajność jest bardzo dobra, ale przy tym procesor Intela zużywa też sporo energii. W ThinkPadzie T14 G3 procesor może pobierać maksymalnie do 58 W, a stale 42 W. Wydajność jednordzeniowa jest lepsza od modelu AMD, natomiast wydajność wielordzeniowa jest porównywalna.
Cinebench R15 Multi Constant Load Test
W pętli Cinebench wydajność ogólnie pozostaje względnie stabilna. Ciekawe jest tu również porównanie z nowym Raptor Lake Core i7-1360P, który ma przewagę w pierwszym przebiegu, ale potem spada do poziomu starszych procesorów Alder Lake. Jedynie wydajność jednordzeniowa pozostaje nieco lepsza, ale w sumie bez obaw można wybrać także Core i7-1260P.
Podczas pracy na baterii procesor może pobierać maksymalnie 32 W, co prowadzi do spadku wydajności o ~30% w testach wielordzeniowych. Dodatkowe benchmarki znajdziecie w m.in naszym dziale technicznym.
Cinebench R23: Multi Core | Single Core
Cinebench R20: CPU (Multi Core) | CPU (Single Core)
Cinebench R15: CPU Multi 64Bit | CPU Single 64Bit
Blender: v2.79 BMW27 CPU
7-Zip 18.03: 7z b 4 | 7z b 4 -mmt1
Geekbench 5.5: Multi-Core | Single-Core
HWBOT x265 Benchmark v2.2: 4k Preset
LibreOffice : 20 Documents To PDF
R Benchmark 2.5: Overall mean
| CPU Performance rating | |
| Schenker Vision 14 2022 RTX 3050 Ti | |
| Lenovo Yoga 9 14IRP G8 | |
| HP EliteBook 840 G9 | |
| Lenovo ThinkPad T14 G3-21AJS00400 | |
| Huawei MateBook X Pro 2022 | |
| Średnia w klasie Office | |
| Lenovo ThinkPad T14 G3-21CF004NGE | |
| Przeciętny Intel Core i7-1260P | |
| Cinebench R23 / Multi Core | |
| Schenker Vision 14 2022 RTX 3050 Ti | |
| Lenovo ThinkPad T14 G3-21AJS00400 | |
| Lenovo Yoga 9 14IRP G8 | |
| Średnia w klasie Office (1673 - 22808, n=74, ostatnie 2 lata) | |
| Lenovo ThinkPad T14 G3-21CF004NGE | |
| HP EliteBook 840 G9 | |
| Przeciętny Intel Core i7-1260P (3173 - 12150, n=27) | |
| Huawei MateBook X Pro 2022 | |
| Cinebench R23 / Single Core | |
| Lenovo Yoga 9 14IRP G8 | |
| Lenovo ThinkPad T14 G3-21AJS00400 | |
| HP EliteBook 840 G9 | |
| Schenker Vision 14 2022 RTX 3050 Ti | |
| Przeciętny Intel Core i7-1260P (1155 - 1812, n=25) | |
| Średnia w klasie Office (708 - 2130, n=74, ostatnie 2 lata) | |
| Huawei MateBook X Pro 2022 | |
| Lenovo ThinkPad T14 G3-21CF004NGE | |
| Cinebench R20 / CPU (Multi Core) | |
| Schenker Vision 14 2022 RTX 3050 Ti | |
| Lenovo ThinkPad T14 G3-21AJS00400 | |
| Lenovo Yoga 9 14IRP G8 | |
| Średnia w klasie Office (648 - 8840, n=73, ostatnie 2 lata) | |
| HP EliteBook 840 G9 | |
| Lenovo ThinkPad T14 G3-21CF004NGE | |
| Huawei MateBook X Pro 2022 | |
| Przeciętny Intel Core i7-1260P (1234 - 4748, n=25) | |
| Cinebench R20 / CPU (Single Core) | |
| Lenovo Yoga 9 14IRP G8 | |
| Schenker Vision 14 2022 RTX 3050 Ti | |
| Lenovo ThinkPad T14 G3-21AJS00400 | |
| Huawei MateBook X Pro 2022 | |
| Średnia w klasie Office (345 - 816, n=73, ostatnie 2 lata) | |
| Przeciętny Intel Core i7-1260P (448 - 698, n=25) | |
| HP EliteBook 840 G9 | |
| Lenovo ThinkPad T14 G3-21CF004NGE | |
| Cinebench R15 / CPU Multi 64Bit | |
| Schenker Vision 14 2022 RTX 3050 Ti | |
| Lenovo Yoga 9 14IRP G8 | |
| HP EliteBook 840 G9 | |
| Huawei MateBook X Pro 2022 | |
| Huawei MateBook X Pro 2022 | |
| Lenovo ThinkPad T14 G3-21AJS00400 | |
| Średnia w klasie Office (250 - 3380, n=75, ostatnie 2 lata) | |
| Lenovo ThinkPad T14 G3-21CF004NGE | |
| Przeciętny Intel Core i7-1260P (549 - 2034, n=29) | |
| Cinebench R15 / CPU Single 64Bit | |
| Lenovo Yoga 9 14IRP G8 | |
| Schenker Vision 14 2022 RTX 3050 Ti | |
| HP EliteBook 840 G9 | |
| Średnia w klasie Office (99.5 - 312, n=75, ostatnie 2 lata) | |
| Huawei MateBook X Pro 2022 | |
| Lenovo ThinkPad T14 G3-21AJS00400 | |
| Lenovo ThinkPad T14 G3-21CF004NGE | |
| Przeciętny Intel Core i7-1260P (165.4 - 260, n=27) | |
| Blender / v2.79 BMW27 CPU | |
| Przeciętny Intel Core i7-1260P (264 - 906, n=26) | |
| Średnia w klasie Office (158 - 1940, n=74, ostatnie 2 lata) | |
| Huawei MateBook X Pro 2022 | |
| Lenovo ThinkPad T14 G3-21AJS00400 | |
| Lenovo ThinkPad T14 G3-21CF004NGE | |
| Lenovo Yoga 9 14IRP G8 | |
| HP EliteBook 840 G9 | |
| Schenker Vision 14 2022 RTX 3050 Ti | |
| 7-Zip 18.03 / 7z b 4 | |
| Schenker Vision 14 2022 RTX 3050 Ti | |
| Lenovo ThinkPad T14 G3-21CF004NGE | |
| HP EliteBook 840 G9 | |
| Lenovo Yoga 9 14IRP G8 | |
| Średnia w klasie Office (7098 - 76886, n=75, ostatnie 2 lata) | |
| Huawei MateBook X Pro 2022 | |
| Lenovo ThinkPad T14 G3-21AJS00400 | |
| Przeciętny Intel Core i7-1260P (16146 - 47064, n=25) | |
| 7-Zip 18.03 / 7z b 4 -mmt1 | |
| HP EliteBook 840 G9 | |
| Lenovo Yoga 9 14IRP G8 | |
| Schenker Vision 14 2022 RTX 3050 Ti | |
| Lenovo ThinkPad T14 G3-21AJS00400 | |
| Średnia w klasie Office (3387 - 6469, n=75, ostatnie 2 lata) | |
| Huawei MateBook X Pro 2022 | |
| Lenovo ThinkPad T14 G3-21CF004NGE | |
| Przeciętny Intel Core i7-1260P (4064 - 5791, n=25) | |
| Geekbench 5.5 / Multi-Core | |
| HP EliteBook 840 G9 | |
| Schenker Vision 14 2022 RTX 3050 Ti | |
| Lenovo Yoga 9 14IRP G8 | |
| Huawei MateBook X Pro 2022 | |
| Średnia w klasie Office (1483 - 16999, n=71, ostatnie 2 lata) | |
| Przeciętny Intel Core i7-1260P (3866 - 10570, n=25) | |
| Lenovo ThinkPad T14 G3-21CF004NGE | |
| Lenovo ThinkPad T14 G3-21AJS00400 | |
| Geekbench 5.5 / Single-Core | |
| Średnia w klasie Office (811 - 2128, n=71, ostatnie 2 lata) | |
| Lenovo Yoga 9 14IRP G8 | |
| Schenker Vision 14 2022 RTX 3050 Ti | |
| HP EliteBook 840 G9 | |
| Huawei MateBook X Pro 2022 | |
| Przeciętny Intel Core i7-1260P (1436 - 1786, n=25) | |
| Lenovo ThinkPad T14 G3-21AJS00400 | |
| Lenovo ThinkPad T14 G3-21CF004NGE | |
| HWBOT x265 Benchmark v2.2 / 4k Preset | |
| Schenker Vision 14 2022 RTX 3050 Ti | |
| Lenovo ThinkPad T14 G3-21AJS00400 | |
| Lenovo ThinkPad T14 G3-21CF004NGE | |
| Lenovo Yoga 9 14IRP G8 | |
| HP EliteBook 840 G9 | |
| Średnia w klasie Office (2.21 - 26, n=74, ostatnie 2 lata) | |
| Huawei MateBook X Pro 2022 | |
| Przeciętny Intel Core i7-1260P (3.45 - 13.6, n=26) | |
| LibreOffice / 20 Documents To PDF | |
| Średnia w klasie Office (39.9 - 102.3, n=74, ostatnie 2 lata) | |
| Lenovo ThinkPad T14 G3-21CF004NGE | |
| Przeciętny Intel Core i7-1260P (40.2 - 65.7, n=25) | |
| Lenovo Yoga 9 14IRP G8 | |
| HP EliteBook 840 G9 | |
| Schenker Vision 14 2022 RTX 3050 Ti | |
| Lenovo ThinkPad T14 G3-21AJS00400 | |
| Huawei MateBook X Pro 2022 | |
| R Benchmark 2.5 / Overall mean | |
| Średnia w klasie Office (0.4098 - 0.888, n=74, ostatnie 2 lata) | |
| Lenovo ThinkPad T14 G3-21CF004NGE | |
| Przeciętny Intel Core i7-1260P (0.4559 - 0.727, n=25) | |
| Huawei MateBook X Pro 2022 | |
| Lenovo ThinkPad T14 G3-21AJS00400 | |
| HP EliteBook 840 G9 | |
| Lenovo Yoga 9 14IRP G8 | |
| Schenker Vision 14 2022 RTX 3050 Ti | |
* ... im mniej tym lepiej
AIDA64: FP32 Ray-Trace | FPU Julia | CPU SHA3 | CPU Queen | FPU SinJulia | FPU Mandel | CPU AES | CPU ZLib | FP64 Ray-Trace | CPU PhotoWorxx
| Performance rating | |
| Schenker Vision 14 2022 RTX 3050 Ti | |
| Lenovo ThinkPad T14 G3-21CF004NGE | |
| Średnia w klasie Office | |
| HP EliteBook 840 G9 | |
| Lenovo ThinkPad T14 G3-21AJS00400 | |
| Huawei MateBook X Pro 2022 | |
| Przeciętny Intel Core i7-1260P | |
| AIDA64 / FP32 Ray-Trace | |
| Średnia w klasie Office (2083 - 31245, n=80, ostatnie 2 lata) | |
| Schenker Vision 14 2022 RTX 3050 Ti | |
| Lenovo ThinkPad T14 G3-21CF004NGE | |
| Lenovo ThinkPad T14 G3-21AJS00400 | |
| HP EliteBook 840 G9 | |
| Przeciętny Intel Core i7-1260P (2176 - 10898, n=26) | |
| Huawei MateBook X Pro 2022 | |
| AIDA64 / FPU Julia | |
| Lenovo ThinkPad T14 G3-21CF004NGE | |
| Schenker Vision 14 2022 RTX 3050 Ti | |
| Średnia w klasie Office (8191 - 125394, n=80, ostatnie 2 lata) | |
| Lenovo ThinkPad T14 G3-21AJS00400 | |
| HP EliteBook 840 G9 | |
| Przeciętny Intel Core i7-1260P (11015 - 56906, n=26) | |
| Huawei MateBook X Pro 2022 | |
| AIDA64 / CPU SHA3 | |
| Średnia w klasie Office (433 - 5755, n=80, ostatnie 2 lata) | |
| Schenker Vision 14 2022 RTX 3050 Ti | |
| Lenovo ThinkPad T14 G3-21AJS00400 | |
| Lenovo ThinkPad T14 G3-21CF004NGE | |
| HP EliteBook 840 G9 | |
| Przeciętny Intel Core i7-1260P (669 - 2709, n=26) | |
| Huawei MateBook X Pro 2022 | |
| AIDA64 / CPU Queen | |
| HP EliteBook 840 G9 | |
| Schenker Vision 14 2022 RTX 3050 Ti | |
| Lenovo ThinkPad T14 G3-21CF004NGE | |
| Lenovo ThinkPad T14 G3-21AJS00400 | |
| Huawei MateBook X Pro 2022 | |
| Przeciętny Intel Core i7-1260P (42571 - 82493, n=26) | |
| Średnia w klasie Office (22784 - 115197, n=69, ostatnie 2 lata) | |
| AIDA64 / FPU SinJulia | |
| Lenovo ThinkPad T14 G3-21CF004NGE | |
| Schenker Vision 14 2022 RTX 3050 Ti | |
| Średnia w klasie Office (1378 - 18321, n=80, ostatnie 2 lata) | |
| HP EliteBook 840 G9 | |
| Lenovo ThinkPad T14 G3-21AJS00400 | |
| Huawei MateBook X Pro 2022 | |
| Przeciętny Intel Core i7-1260P (2901 - 6975, n=26) | |
| AIDA64 / FPU Mandel | |
| Lenovo ThinkPad T14 G3-21CF004NGE | |
| Średnia w klasie Office (4601 - 66922, n=80, ostatnie 2 lata) | |
| Schenker Vision 14 2022 RTX 3050 Ti | |
| Lenovo ThinkPad T14 G3-21AJS00400 | |
| HP EliteBook 840 G9 | |
| Przeciętny Intel Core i7-1260P (5950 - 26376, n=26) | |
| Huawei MateBook X Pro 2022 | |
| AIDA64 / CPU AES | |
| Schenker Vision 14 2022 RTX 3050 Ti | |
| Huawei MateBook X Pro 2022 | |
| Lenovo ThinkPad T14 G3-21AJS00400 | |
| HP EliteBook 840 G9 | |
| Średnia w klasie Office (4854 - 155900, n=80, ostatnie 2 lata) | |
| Lenovo ThinkPad T14 G3-21CF004NGE | |
| Przeciętny Intel Core i7-1260P (16041 - 92356, n=26) | |
| AIDA64 / CPU ZLib | |
| Schenker Vision 14 2022 RTX 3050 Ti | |
| Lenovo ThinkPad T14 G3-21AJS00400 | |
| HP EliteBook 840 G9 | |
| Średnia w klasie Office (114.6 - 1366, n=80, ostatnie 2 lata) | |
| Lenovo ThinkPad T14 G3-21CF004NGE | |
| Huawei MateBook X Pro 2022 | |
| Przeciętny Intel Core i7-1260P (259 - 771, n=26) | |
| AIDA64 / FP64 Ray-Trace | |
| Średnia w klasie Office (1109 - 17834, n=80, ostatnie 2 lata) | |
| Schenker Vision 14 2022 RTX 3050 Ti | |
| Lenovo ThinkPad T14 G3-21CF004NGE | |
| Lenovo ThinkPad T14 G3-21AJS00400 | |
| HP EliteBook 840 G9 | |
| Przeciętny Intel Core i7-1260P (1237 - 5858, n=26) | |
| Huawei MateBook X Pro 2022 | |
| AIDA64 / CPU PhotoWorxx | |
| Średnia w klasie Office (11090 - 65229, n=80, ostatnie 2 lata) | |
| Huawei MateBook X Pro 2022 | |
| HP EliteBook 840 G9 | |
| Przeciętny Intel Core i7-1260P (13261 - 43652, n=26) | |
| Schenker Vision 14 2022 RTX 3050 Ti | |
| Lenovo ThinkPad T14 G3-21CF004NGE | |
| Lenovo ThinkPad T14 G3-21AJS00400 | |
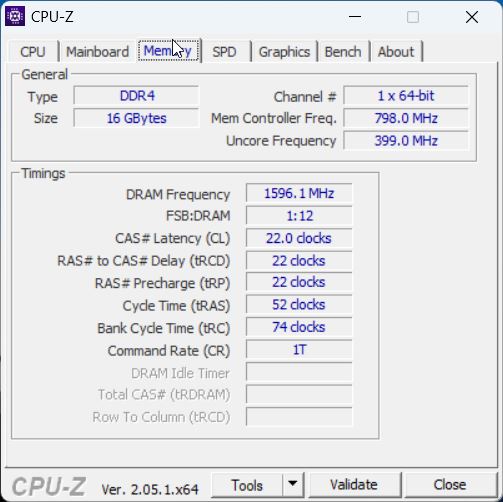
Wydajność systemu
W praktyce ThinkPad T14 G3 w wersji z procesorem Intela jest również laptopem bardzo responsywnym i nie udało nam się zauważyć żadnych problemów. W benchmarkach syntetycznych nasz testowany egzemplarz wykazuje się jednak tylko przeciętną wydajnością. Wynika to głównie z kiepskiej wydajności pamięci masowej, gdyż pamięć robocza działa tylko w konfiguracji jednokanałowej.
CrossMark: Overall | Productivity | Creativity | Responsiveness
| PCMark 10 / Score | |
| Schenker Vision 14 2022 RTX 3050 Ti | |
| Średnia w klasie Office (2601 - 9298, n=64, ostatnie 2 lata) | |
| Huawei MateBook X Pro 2022 | |
| Lenovo ThinkPad T14 G3-21CF004NGE | |
| Przeciętny Intel Core i7-1260P, NVIDIA GeForce MX550 (5870 - 6235, n=2) | |
| HP EliteBook 840 G9 | |
| Lenovo ThinkPad T14 G3-21AJS00400 | |
| PCMark 10 / Essentials | |
| HP EliteBook 840 G9 | |
| Huawei MateBook X Pro 2022 | |
| Schenker Vision 14 2022 RTX 3050 Ti | |
| Średnia w klasie Office (3245 - 11594, n=64, ostatnie 2 lata) | |
| Przeciętny Intel Core i7-1260P, NVIDIA GeForce MX550 (9729 - 10132, n=2) | |
| Lenovo ThinkPad T14 G3-21CF004NGE | |
| Lenovo ThinkPad T14 G3-21AJS00400 | |
| PCMark 10 / Productivity | |
| Średnia w klasie Office (5336 - 17243, n=64, ostatnie 2 lata) | |
| Przeciętny Intel Core i7-1260P, NVIDIA GeForce MX550 (8189 - 9245, n=2) | |
| Huawei MateBook X Pro 2022 | |
| Schenker Vision 14 2022 RTX 3050 Ti | |
| Lenovo ThinkPad T14 G3-21CF004NGE | |
| Lenovo ThinkPad T14 G3-21AJS00400 | |
| HP EliteBook 840 G9 | |
| PCMark 10 / Digital Content Creation | |
| Schenker Vision 14 2022 RTX 3050 Ti | |
| Średnia w klasie Office (2049 - 13541, n=64, ostatnie 2 lata) | |
| Lenovo ThinkPad T14 G3-21CF004NGE | |
| HP EliteBook 840 G9 | |
| Przeciętny Intel Core i7-1260P, NVIDIA GeForce MX550 (6891 - 7021, n=2) | |
| Lenovo ThinkPad T14 G3-21AJS00400 | |
| Huawei MateBook X Pro 2022 | |
| CrossMark / Overall | |
| Huawei MateBook X Pro 2022 | |
| HP EliteBook 840 G9 | |
| Schenker Vision 14 2022 RTX 3050 Ti | |
| Lenovo ThinkPad T14 G3-21AJS00400 | |
| Przeciętny Intel Core i7-1260P, NVIDIA GeForce MX550 (n=1) | |
| Średnia w klasie Office (381 - 2010, n=73, ostatnie 2 lata) | |
| Lenovo ThinkPad T14 G3-21CF004NGE | |
| CrossMark / Productivity | |
| Huawei MateBook X Pro 2022 | |
| HP EliteBook 840 G9 | |
| Schenker Vision 14 2022 RTX 3050 Ti | |
| Lenovo ThinkPad T14 G3-21AJS00400 | |
| Przeciętny Intel Core i7-1260P, NVIDIA GeForce MX550 (n=1) | |
| Średnia w klasie Office (464 - 1880, n=73, ostatnie 2 lata) | |
| Lenovo ThinkPad T14 G3-21CF004NGE | |
| CrossMark / Creativity | |
| Huawei MateBook X Pro 2022 | |
| HP EliteBook 840 G9 | |
| Schenker Vision 14 2022 RTX 3050 Ti | |
| Średnia w klasie Office (319 - 2361, n=73, ostatnie 2 lata) | |
| Lenovo ThinkPad T14 G3-21AJS00400 | |
| Przeciętny Intel Core i7-1260P, NVIDIA GeForce MX550 (n=1) | |
| Lenovo ThinkPad T14 G3-21CF004NGE | |
| CrossMark / Responsiveness | |
| Huawei MateBook X Pro 2022 | |
| HP EliteBook 840 G9 | |
| Schenker Vision 14 2022 RTX 3050 Ti | |
| Lenovo ThinkPad T14 G3-21AJS00400 | |
| Przeciętny Intel Core i7-1260P, NVIDIA GeForce MX550 (n=1) | |
| Średnia w klasie Office (360 - 1690, n=73, ostatnie 2 lata) | |
| Lenovo ThinkPad T14 G3-21CF004NGE | |
| PCMark 10 Score | 5870 pkt. | |
Pomoc | ||
| AIDA64 / Memory Copy | |
| Średnia w klasie Office (20075 - 110930, n=77, ostatnie 2 lata) | |
| Huawei MateBook X Pro 2022 | |
| HP EliteBook 840 G9 | |
| Przeciętny Intel Core i7-1260P (25125 - 71544, n=25) | |
| Lenovo ThinkPad T14 G3-21CF004NGE | |
| Schenker Vision 14 2022 RTX 3050 Ti | |
| Lenovo ThinkPad T14 G3-21AJS00400 | |
| AIDA64 / Memory Read | |
| Huawei MateBook X Pro 2022 | |
| Średnia w klasie Office (10084 - 128030, n=78, ostatnie 2 lata) | |
| HP EliteBook 840 G9 | |
| Przeciętny Intel Core i7-1260P (24983 - 72065, n=25) | |
| Lenovo ThinkPad T14 G3-21CF004NGE | |
| Schenker Vision 14 2022 RTX 3050 Ti | |
| Lenovo ThinkPad T14 G3-21AJS00400 | |
| AIDA64 / Memory Write | |
| Średnia w klasie Office (20073 - 119858, n=78, ostatnie 2 lata) | |
| Huawei MateBook X Pro 2022 | |
| HP EliteBook 840 G9 | |
| Przeciętny Intel Core i7-1260P (23512 - 66799, n=25) | |
| Lenovo ThinkPad T14 G3-21CF004NGE | |
| Schenker Vision 14 2022 RTX 3050 Ti | |
| Lenovo ThinkPad T14 G3-21AJS00400 | |
| AIDA64 / Memory Latency | |
| Lenovo ThinkPad T14 G3-21CF004NGE | |
| Huawei MateBook X Pro 2022 | |
| Średnia w klasie Office (7.6 - 162.9, n=73, ostatnie 2 lata) | |
| HP EliteBook 840 G9 | |
| Lenovo ThinkPad T14 G3-21AJS00400 | |
| Schenker Vision 14 2022 RTX 3050 Ti | |
| Przeciętny Intel Core i7-1260P (77.9 - 118.4, n=21) | |
* ... im mniej tym lepiej
Opóźnienia DPC
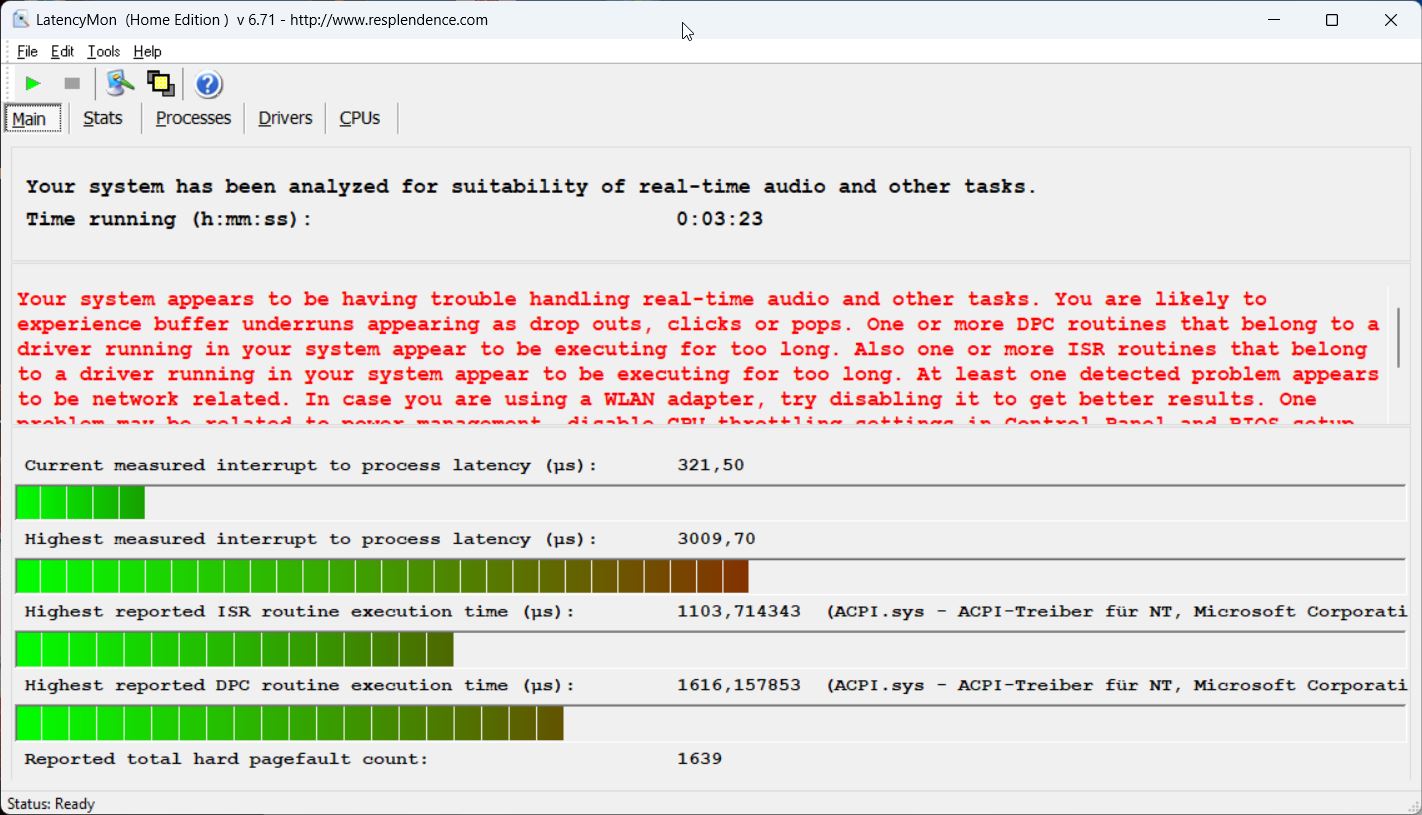
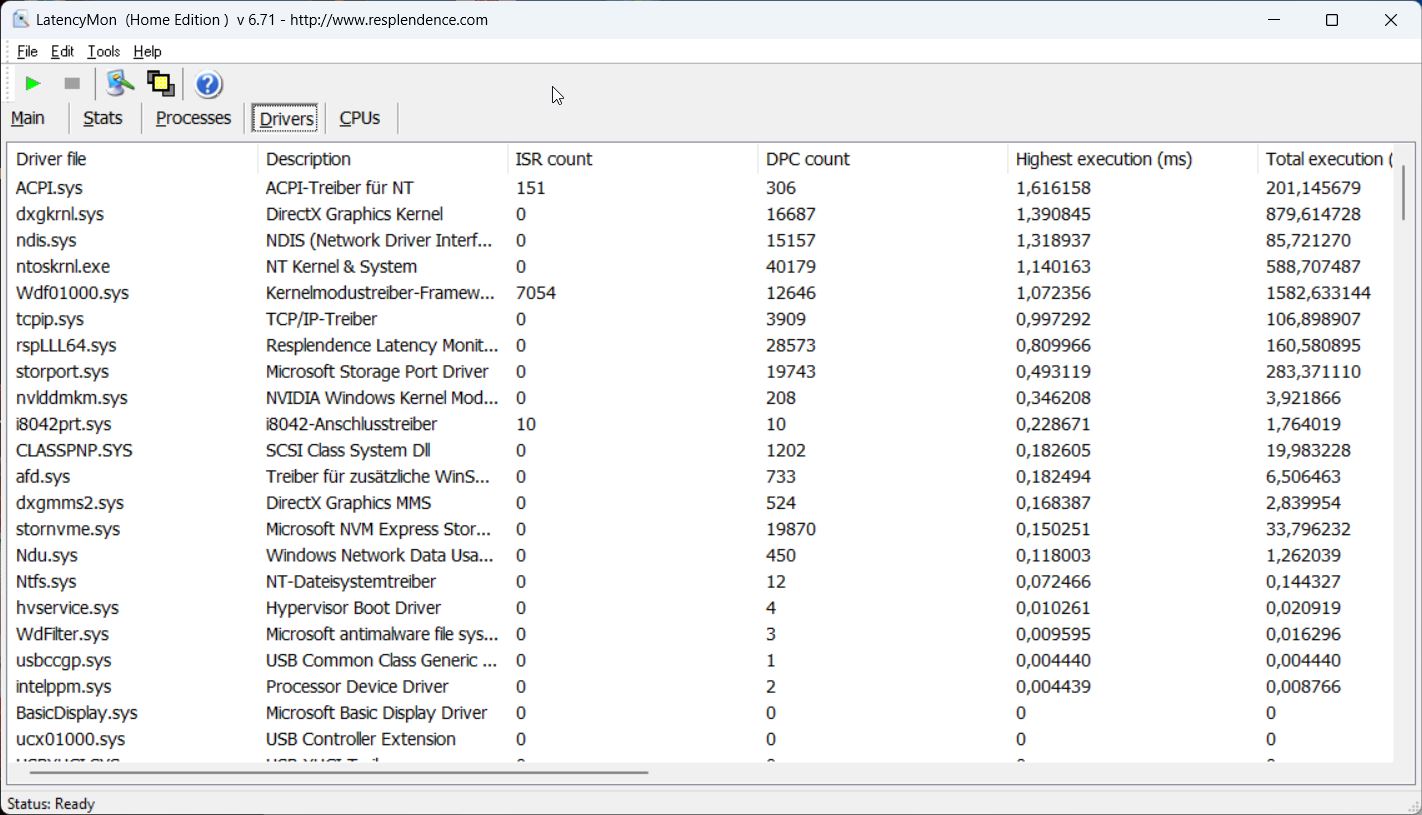
W naszym standaryzowanym teście opóźnień (surfowanie po internecie, odtwarzanie filmów 4K z YouTube i obciążenie procesora) jednostka testowa z aktualną wersją BIOS-u wykazuje pewne znaczące ograniczenia w użytkowaniu w aplikacjach audio czasu rzeczywistego. Mogą to być jednak również ograniczenia spowodowane przez sterownik Nvidii, ponieważ w przypadku kilku wersji sterowników występowały problemy w tym zakresie. Strona Model AMD T14 G3nie miał tutaj żadnych problemów.
| DPC Latencies / LatencyMon - interrupt to process latency (max), Web, Youtube, Prime95 | |
| HP EliteBook 840 G9 | |
| Lenovo ThinkPad T14 G3-21AJS00400 | |
| Huawei MateBook X Pro 2022 | |
| Schenker Vision 14 2022 RTX 3050 Ti | |
| Lenovo ThinkPad T14 G3-21CF004NGE | |
* ... im mniej tym lepiej
Rozwiązanie w zakresie przechowywania
W naszym egzemplarzu testowym zastosowano 1-TB wersję Samsunga PM9A1, który jest wariantem OEM modelu 980 Pro. Dysk SSD PCIe 4.0 oferuje wprawdzie bardzo dobre transfery, ale po pewnym czasie pod stałym obciążeniem szybkości te spadają. Nie ma to jednak żadnego wpływu w codziennej pracy biznesowej. Po pierwszym uruchomieniu do dyspozycji użytkownika jest 904 GB przestrzeni dyskowej. Dodatkowe benchmarki dysków SSD można znaleźć m.in tutaj.

* ... im mniej tym lepiej
Disk Throttling: DiskSpd Read Loop, Queue Depth 8
Karta graficzna
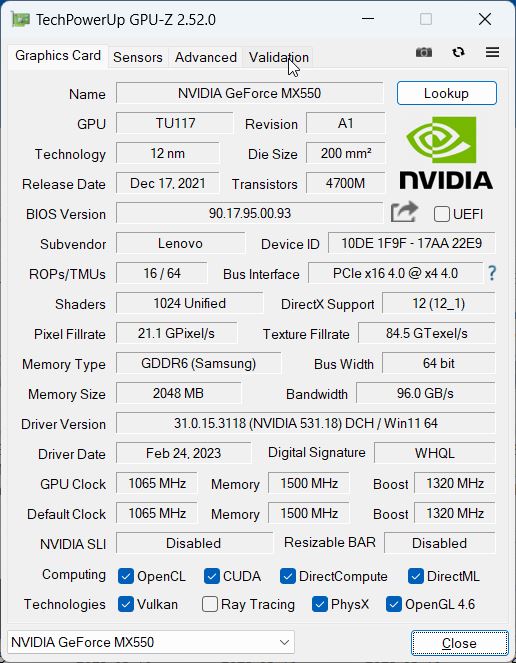
Oprócz zintegrowanego Iris Xe Graphics G7procesora, Lenovo wyposażyło naszą konfigurację testową również w dedykowaną GeForce MX550od Nvidii z 2 GB pamięci VRAM. Karta graficzna może pobierać maksymalnie 30 W i również oferuje zauważalną przewagę w benchmarkach w porównaniu z nieco przestarzałym iGPU od Intela. Jednak zintegrowany Radeon 680M w modelu AMD wypada na tym samym poziomie, przynajmniej w testach syntetycznych. Musimy więc już teraz zadać pytanie, po co tu dodatkowa karta graficzna.
Z drugiej strony GPU GeForce ma niewielką przewagę w stosunku do zintegrowanego Radeona 680M w rzeczywistych benchmarkach gamingowych, ale przewaga ta nie jest naprawdę ogromna. Dla osób, które po skończonej pracy lubią rozegrać rundkę gier na swoim laptopie służbowym, znacznie lepszym rozwiązaniem jest Schenker Vision 14i der RTX 3050 Ti, na przykład.
Pod stałym obciążeniem i w pracy na baterii wydajność graficzna pozostaje stabilna. Dodatkowe benchmarki GPU można znaleźć w naszej sekcji technicznej.
| 3DMark 11 Performance | 10068 pkt. | |
| 3DMark Fire Strike Score | 5764 pkt. | |
| 3DMark Time Spy Score | 2695 pkt. | |
Pomoc | ||
| Blender / v3.3 Classroom OPTIX/RTX | |
| Lenovo ThinkPad T14 G3-21AJS00400 | |
| Przeciętny NVIDIA GeForce MX550 (n=1) | |
| Średnia w klasie Office (29 - 242, n=2, ostatnie 2 lata) | |
| Schenker Vision 14 2022 RTX 3050 Ti | |
| Blender / v3.3 Classroom CUDA | |
| Lenovo ThinkPad T14 G3-21AJS00400 | |
| Przeciętny NVIDIA GeForce MX550 (n=1) | |
| Średnia w klasie Office (53 - 214, n=3, ostatnie 2 lata) | |
| Schenker Vision 14 2022 RTX 3050 Ti | |
| Blender / v3.3 Classroom CPU | |
| HP EliteBook 840 G9 | |
| Lenovo ThinkPad T14 G3-21AJS00400 | |
| Przeciętny NVIDIA GeForce MX550 (n=1) | |
| Huawei MateBook X Pro 2022 | |
| Średnia w klasie Office (245 - 3219, n=72, ostatnie 2 lata) | |
| Lenovo ThinkPad T14 G3-21CF004NGE | |
| Schenker Vision 14 2022 RTX 3050 Ti | |
| Blender / v3.3 Classroom HIP/AMD | |
| Średnia w klasie Office (296 - 507, n=5, ostatnie 2 lata) | |
| Lenovo ThinkPad T14 G3-21CF004NGE | |
* ... im mniej tym lepiej
| Performance rating - Percent | |
| Schenker Vision 14 2022 RTX 3050 Ti | |
| Lenovo ThinkPad T14 G3-21AJS00400 | |
| Lenovo ThinkPad T14 G3-21CF004NGE | |
| Średnia w klasie Office | |
| HP EliteBook 840 G9 | |
| Huawei MateBook X Pro 2022 | |
| The Witcher 3 - 1920x1080 Ultra Graphics & Postprocessing (HBAO+) | |
| Schenker Vision 14 2022 RTX 3050 Ti | |
| Lenovo ThinkPad T14 G3-21AJS00400 | |
| Lenovo ThinkPad T14 G3-21CF004NGE | |
| HP EliteBook 840 G9 | |
| Średnia w klasie Office (14.8 - 18.1, n=4, ostatnie 2 lata) | |
| Huawei MateBook X Pro 2022 | |
| GTA V - 1920x1080 Highest AA:4xMSAA + FX AF:16x | |
| Schenker Vision 14 2022 RTX 3050 Ti | |
| Lenovo ThinkPad T14 G3-21AJS00400 | |
| Lenovo ThinkPad T14 G3-21CF004NGE | |
| Średnia w klasie Office (5.77 - 45.3, n=66, ostatnie 2 lata) | |
| Huawei MateBook X Pro 2022 | |
| HP EliteBook 840 G9 | |
| Final Fantasy XV Benchmark - 1920x1080 High Quality | |
| Schenker Vision 14 2022 RTX 3050 Ti | |
| Lenovo ThinkPad T14 G3-21CF004NGE | |
| Średnia w klasie Office (8.09 - 79.5, n=69, ostatnie 2 lata) | |
| Lenovo ThinkPad T14 G3-21AJS00400 | |
| Huawei MateBook X Pro 2022 | |
| HP EliteBook 840 G9 | |
| Strange Brigade - 1920x1080 ultra AA:ultra AF:16 | |
| Schenker Vision 14 2022 RTX 3050 Ti | |
| Lenovo ThinkPad T14 G3-21AJS00400 | |
| Lenovo ThinkPad T14 G3-21CF004NGE | |
| Średnia w klasie Office (12.9 - 142.1, n=51, ostatnie 2 lata) | |
| Huawei MateBook X Pro 2022 | |
| HP EliteBook 840 G9 | |
| Dota 2 Reborn - 1920x1080 ultra (3/3) best looking | |
| Schenker Vision 14 2022 RTX 3050 Ti | |
| Lenovo ThinkPad T14 G3-21AJS00400 | |
| Lenovo ThinkPad T14 G3-21CF004NGE | |
| HP EliteBook 840 G9 | |
| Huawei MateBook X Pro 2022 | |
| Średnia w klasie Office (14.6 - 135, n=75, ostatnie 2 lata) | |
The Witcher 3 FPS Chart
| low | med. | high | ultra | 4K | |
|---|---|---|---|---|---|
| GTA V (2015) | 159.9 | 152.3 | 73.4 | 33.7 | |
| The Witcher 3 (2015) | 149 | 89 | 48 | 24 | |
| Dota 2 Reborn (2015) | 142.1 | 127 | 110.4 | 101.1 | |
| Final Fantasy XV Benchmark (2018) | 69.2 | 34.3 | 20.8 | ||
| X-Plane 11.11 (2018) | 109.9 | 95.2 | 73.4 | ||
| Far Cry 5 (2018) | 95 | 40 | 32 | 30 | |
| Strange Brigade (2018) | 147 | 59 | 51 | 45 | |
| F1 2021 (2021) | 152.7 | 53.5 | 47.4 | 25.7 | |
| F1 22 (2022) | 59.4 | 51.3 | 41.2 | 28.1 |
Emisje i zarządzanie energią
Poziomy hałasu
Model Intela z ThinkPada T14 G3 jest bardzo cichym towarzyszem pod małym obciążeniem, ale szybkie obroty wentylatora są nieco irytujące. Nawet pomimo szybkiego zmniejszenia prędkości obrotowej wentylator początkowo obraca się bardzo zauważalnie. Pod większym obciążeniem urządzenie staje się również nieco głośniejsze niż wersja AMD, a podczas gry i w teście obciążeniowym mierzymy maksymalnie prawie 40 dB(A). Nasz egzemplarz testowy nie wytwarza żadnych innych elektronicznych odgłosów.
Hałas
| luz |
| 23.6 / 23.6 / 23.6 dB |
| obciążenie |
| 35.1 / 39.6 dB |
 | ||
30 dB cichy 40 dB(A) słyszalny 50 dB(A) irytujący |
||
min: | ||
| Lenovo ThinkPad T14 G3-21AJS00400 GeForce MX550, i7-1260P, Samsung PM9A1 MZVL21T0HCLR | Lenovo ThinkPad T14 G3-21CF004NGE Radeon 680M, R7 PRO 6850U, Kioxia BG5 KBG5AZNV512G | HP EliteBook 840 G9 Iris Xe G7 96EUs, i7-1280P, SK hynix PC801 HFS512GEJ9X101N BF | Schenker Vision 14 2022 RTX 3050 Ti GeForce RTX 3050 Ti Laptop GPU, i7-12700H, Samsung SSD 980 Pro 1TB MZ-V8P1T0BW | Huawei MateBook X Pro 2022 Iris Xe G7 96EUs, i7-1260P, Silicon Motion PCIe-8 SSD 1TB | |
|---|---|---|---|---|---|
| Noise | 1% | -3% | -14% | 0% | |
| wyłączone / środowisko * (dB) | 23.6 | 24.2 -3% | 24.3 -3% | 24.4 -3% | 23.5 -0% |
| Idle Minimum * (dB) | 23.6 | 24.2 -3% | 24.5 -4% | 24.4 -3% | 23.5 -0% |
| Idle Average * (dB) | 23.6 | 24.2 -3% | 24.5 -4% | 24.4 -3% | 23.5 -0% |
| Idle Maximum * (dB) | 23.6 | 25.8 -9% | 26 -10% | 27.8 -18% | 25.9 -10% |
| Load Average * (dB) | 35.1 | 32.2 8% | 32.3 8% | 43.3 -23% | 33.8 4% |
| Witcher 3 ultra * (dB) | 39.6 | 34.1 14% | 39 2% | 48.2 -22% | 35.4 11% |
| Load Maximum * (dB) | 39.6 | 38.8 2% | 44.7 -13% | 48.8 -23% | 40.6 -3% |
* ... im mniej tym lepiej
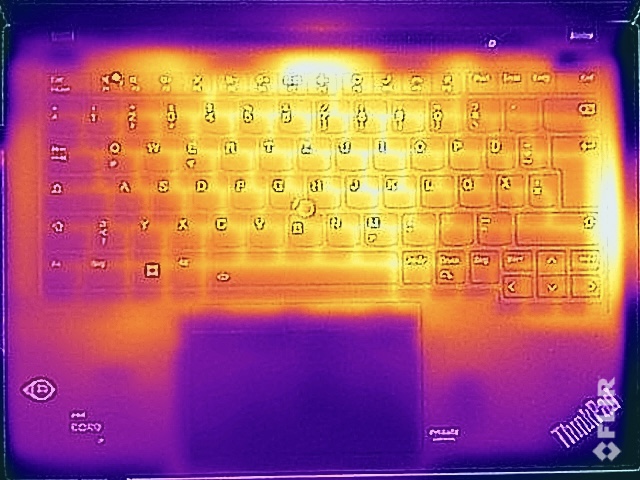
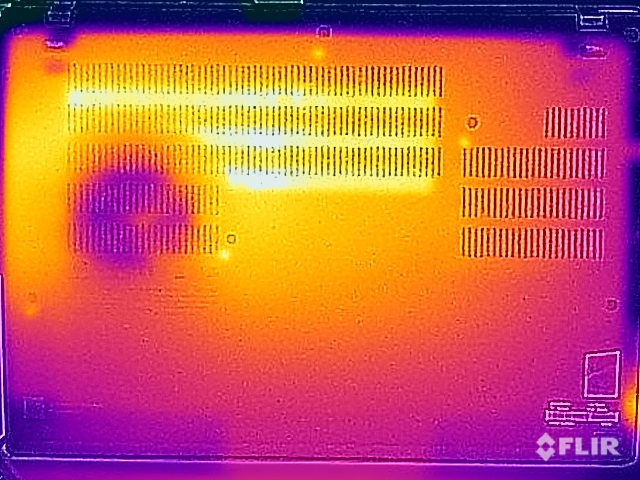
Temperatury
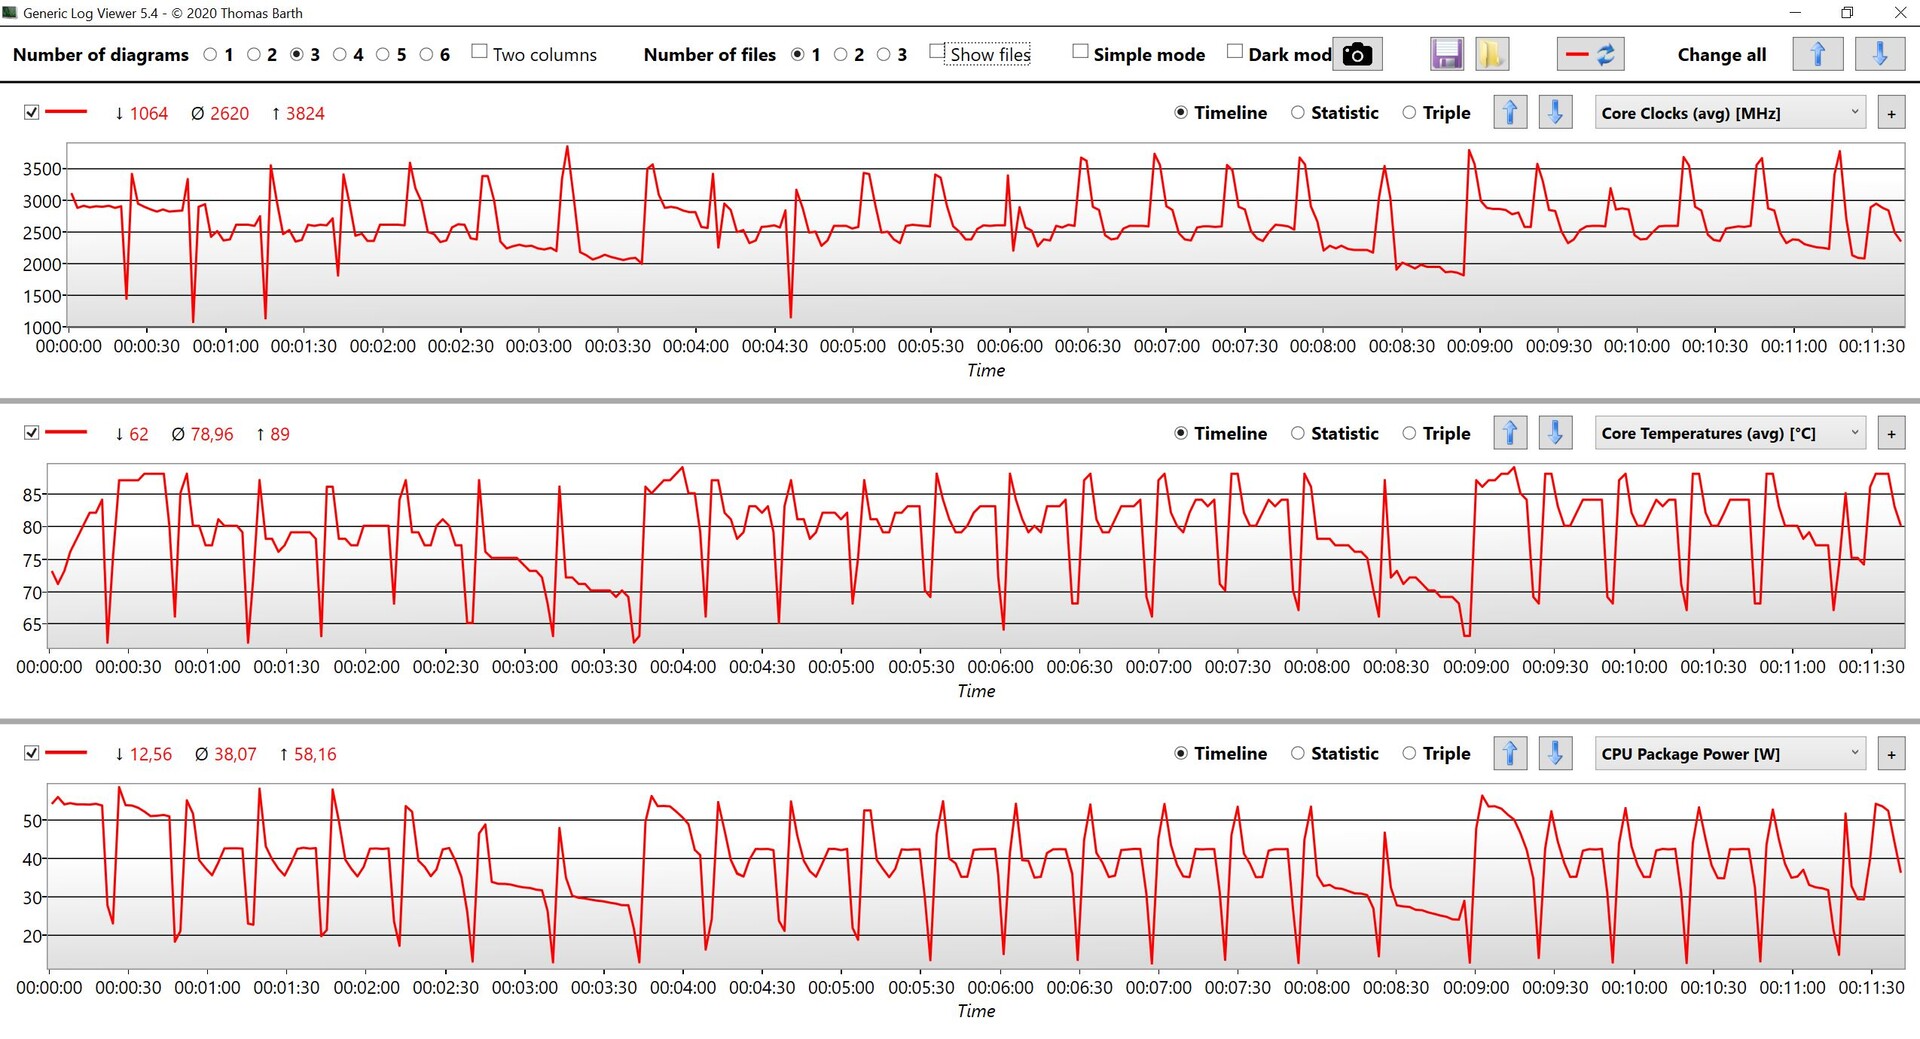
Lenovo dobrze trzyma się temperatur powierzchni ThinkPada T14 G3 ogólnie, ale pod małym obciążeniem urządzenie niestety robi się już nieco cieplejsze od modelu AMD. Pod większym obciążeniem mierzymy maksymalną temperaturę nieco wyższą niż 40°C (104°F), więc nie powoduje to tutaj żadnych ograniczeń i nadal można komfortowo pisać, a także trzymać urządzenie na kolanach.
Podczas testu stresu wydajność GPU pozostaje stabilna na poziomie około 30 W, ale procesor po kilku minutach musi masowo dławić swoją wydajność, spadając z maksymalnych 50 W do zaledwie 15 W. Jeśli spojrzymy na zużycie energii, od razu widać też, że 65-watowy zasilacz nigdy nie będzie w stanie zapewnić tutaj wystarczającej mocy, ale o tym więcej później.

(-) Maksymalna temperatura w górnej części wynosi 46.4 °C / 116 F, w porównaniu do średniej 34.3 °C / 94 F , począwszy od 21.2 do 62.5 °C dla klasy Office.
(±) Dno nagrzewa się maksymalnie do 43.1 °C / 110 F, w porównaniu do średniej 36.8 °C / 98 F
(+) W stanie bezczynności średnia temperatura górnej części wynosi 29.9 °C / 86 F, w porównaniu ze średnią temperaturą urządzenia wynoszącą 29.5 °C / ### class_avg_f### F.
(±) Podczas gry w Wiedźmina 3 średnia temperatura górnej części wynosi 37.5 °C / 100 F, w porównaniu do średniej temperatury urządzenia wynoszącej 29.5 °C / ## #class_avg_f### F.
(+) Podparcia dłoni i touchpad osiągają maksymalną temperaturę skóry (34.5 °C / 94.1 F) i dlatego nie są gorące.
(-) Średnia temperatura obszaru podparcia dłoni w podobnych urządzeniach wynosiła 27.5 °C / 81.5 F (-7 °C / -12.6 F).
| Lenovo ThinkPad T14 G3-21AJS00400 Intel Core i7-1260P, NVIDIA GeForce MX550 | Lenovo ThinkPad T14 G3-21CF004NGE AMD Ryzen 7 PRO 6850U, AMD Radeon 680M | HP EliteBook 840 G9 Intel Core i7-1280P, Intel Iris Xe Graphics G7 96EUs | Schenker Vision 14 2022 RTX 3050 Ti Intel Core i7-12700H, NVIDIA GeForce RTX 3050 Ti Laptop GPU | Huawei MateBook X Pro 2022 Intel Core i7-1260P, Intel Iris Xe Graphics G7 96EUs | |
|---|---|---|---|---|---|
| Heat | 6% | 27% | -3% | 7% | |
| Maximum Upper Side * (°C) | 46.4 | 48.2 -4% | 32.8 29% | 48.4 -4% | 43.1 7% |
| Maximum Bottom * (°C) | 43.1 | 52.8 -23% | 36.6 15% | 57.1 -32% | 42 3% |
| Idle Upper Side * (°C) | 33.9 | 24.4 28% | 21.6 36% | 28.1 17% | 29.4 13% |
| Idle Bottom * (°C) | 31.4 | 24.5 22% | 22.2 29% | 29 8% | 29.4 6% |
* ... im mniej tym lepiej
Mówcy
Lenovo ThinkPad T14 G3-21AJS00400 analiza dźwięku
(±) | głośność głośnika jest średnia, ale dobra (77.8 dB)
Bas 100 - 315 Hz
(-) | prawie brak basu - średnio 24.9% niższa od mediany
(±) | liniowość basu jest średnia (11.7% delta do poprzedniej częstotliwości)
Średnie 400 - 2000 Hz
(+) | zbalansowane środki średnie - tylko 2.4% od mediany
(+) | średnie są liniowe (4% delta do poprzedniej częstotliwości)
Wysokie 2–16 kHz
(+) | zrównoważone maksima - tylko 2.5% od mediany
(+) | wzloty są liniowe (3.8% delta do poprzedniej częstotliwości)
Ogólnie 100 - 16.000 Hz
(±) | liniowość ogólnego dźwięku jest średnia (18% różnicy w stosunku do mediany)
W porównaniu do tej samej klasy
» 30% wszystkich testowanych urządzeń w tej klasie było lepszych, 7% podobnych, 63% gorszych
» Najlepszy miał deltę 7%, średnia wynosiła ###średnia###%, najgorsza wynosiła 53%
W porównaniu do wszystkich testowanych urządzeń
» 38% wszystkich testowanych urządzeń było lepszych, 8% podobnych, 54% gorszych
» Najlepszy miał deltę 4%, średnia wynosiła ###średnia###%, najgorsza wynosiła 134%
Huawei MateBook X Pro 2022 analiza dźwięku
(+) | głośniki mogą odtwarzać stosunkowo głośno (85.5 dB)
Bas 100 - 315 Hz
(±) | zredukowany bas - średnio 5% niższy od mediany
(+) | bas jest liniowy (5.3% delta do poprzedniej częstotliwości)
Średnie 400 - 2000 Hz
(+) | zbalansowane środki średnie - tylko 1.5% od mediany
(+) | średnie są liniowe (2.5% delta do poprzedniej częstotliwości)
Wysokie 2–16 kHz
(+) | zrównoważone maksima - tylko 2.1% od mediany
(+) | wzloty są liniowe (5.3% delta do poprzedniej częstotliwości)
Ogólnie 100 - 16.000 Hz
(+) | ogólny dźwięk jest liniowy (5% różnicy w stosunku do mediany)
W porównaniu do tej samej klasy
» 0% wszystkich testowanych urządzeń w tej klasie było lepszych, 0% podobnych, 100% gorszych
» Najlepszy miał deltę 5%, średnia wynosiła ###średnia###%, najgorsza wynosiła 53%
W porównaniu do wszystkich testowanych urządzeń
» 0% wszystkich testowanych urządzeń było lepszych, 0% podobnych, 100% gorszych
» Najlepszy miał deltę 4%, średnia wynosiła ###średnia###%, najgorsza wynosiła 134%
Pobór mocy
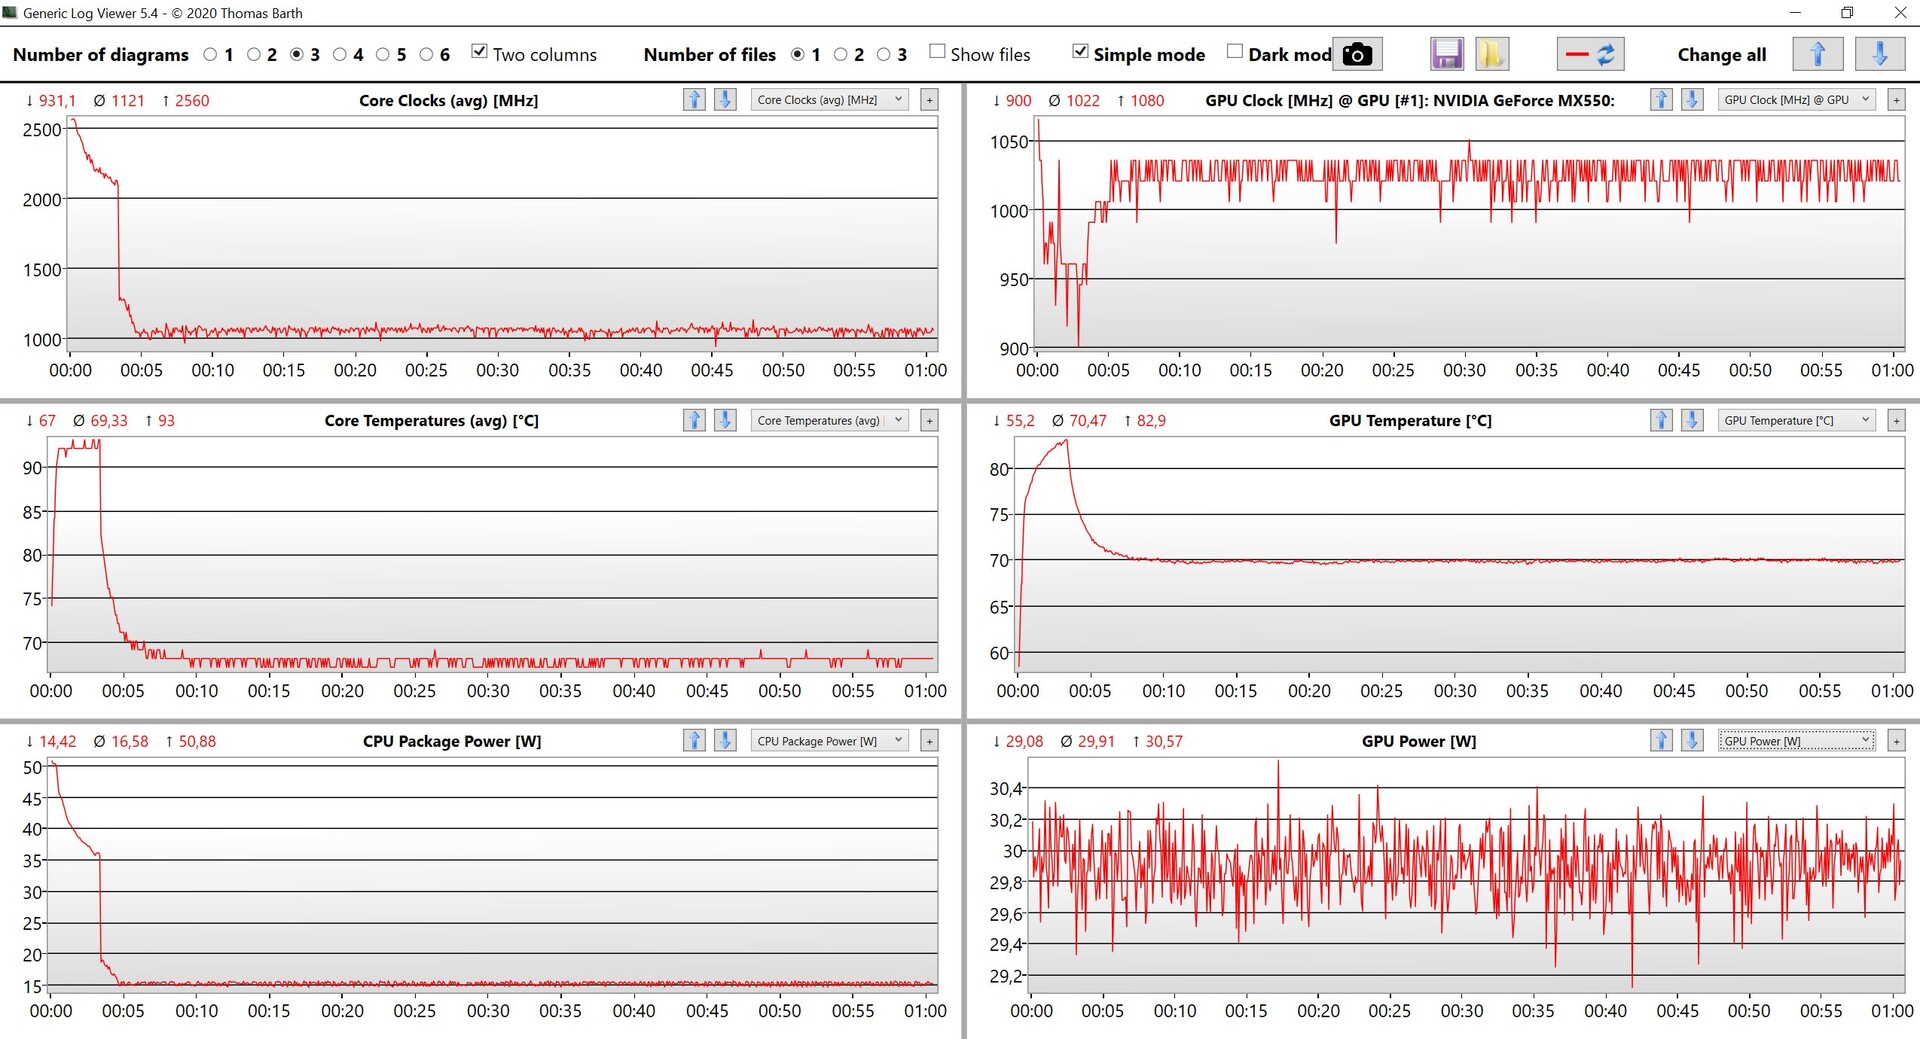
Model Intela zużywa więcej energii niż Wersja AMDwe wszystkich scenariuszach, nawet podczas pracy w spoczynku (ale inny panel może tu również odgrywać rolę). Ponadto 65-watowy zasilacz nie jest wystarczająco duży pod obciążeniem, gdyż w pierwszych trzech minutach urządzenie musi pobierać energię z akumulatora, przy czym pojemność baterii również spada do ~95%. Dopiero gdy procesor zrówna się z 15 W (patrz wyżej), zasilacz jest w stanie zapewnić wystarczającą moc podczas stress testu.
Musimy powiedzieć, że Lenovo wyraźnie ogranicza wydajność w tym scenariuszu. Używając 100-watowego zasilacza, byliśmy w stanie zmierzyć maksymalne zużycie 101 watów na początku testu warunków skrajnych, zanim następnie wyrównało się ono do ~85 watów. Dzięki temu wydajność procesora byłaby również lepsza, ale z drugiej strony miałoby to również wpływ na hałas wentylatora i temperatury powierzchni.
| wyłączony / stan wstrzymania | |
| luz | |
| obciążenie |
|
Legenda:
min: | |
| Lenovo ThinkPad T14 G3-21AJS00400 GeForce MX550, i7-1260P, Samsung PM9A1 MZVL21T0HCLR | Lenovo ThinkPad T14 G3-21CF004NGE Radeon 680M, R7 PRO 6850U, Kioxia BG5 KBG5AZNV512G | HP EliteBook 840 G9 Iris Xe G7 96EUs, i7-1280P, SK hynix PC801 HFS512GEJ9X101N BF | Schenker Vision 14 2022 RTX 3050 Ti GeForce RTX 3050 Ti Laptop GPU, i7-12700H, Samsung SSD 980 Pro 1TB MZ-V8P1T0BW | Huawei MateBook X Pro 2022 Iris Xe G7 96EUs, i7-1260P, Silicon Motion PCIe-8 SSD 1TB | |
|---|---|---|---|---|---|
| Power Consumption | 26% | 10% | -63% | -55% | |
| Idle Minimum * (Watt) | 4.3 | 2.4 44% | 2.2 49% | 7.5 -74% | 6.5 -51% |
| Idle Average * (Watt) | 6.2 | 5.3 15% | 5.3 15% | 10.4 -68% | 13.7 -121% |
| Idle Maximum * (Watt) | 7 | 5.6 20% | 8.5 -21% | 11.4 -63% | 14.4 -106% |
| Load Average * (Watt) | 63.5 | 39.7 37% | 54.3 14% | 83.3 -31% | 64.6 -2% |
| Witcher 3 ultra * (Watt) | 52.5 | 42.8 18% | 51 3% | 92.7 -77% | 57.2 -9% |
| Load Maximum * (Watt) | 66.1 | 50.6 23% | 67.3 -2% | 110.3 -67% | 90.9 -38% |
* ... im mniej tym lepiej
Power Consumption The Witcher 3 / Stress Test
Power Consumption with External Monitor
Czas pracy na baterii
To samo zachowanie utrzymuje się w testach baterii, a model Intela wyraźnie ustępuje wersji AMD w naszych dwóch testach WLAN (raz przy pełnej jasności, a następnie przy 150 cd/m²). Podczas surfowania mierzymy między 7-8 godzin, podczas gdy model AMD wytrzymał ~9,5-13 godzin.
Za
Przeciw
Werdykt - ThinkPad T14 G3 jest lepszy dzięki AMD
Patrząc na ThinkPada T14 G3 samodzielnie, jest to dobry laptop biznesowy także z połączeniem Intel/Nvidia o nieco większej wydajności graficznej od wiekowego iGPU od Intela. W porównaniu z Wersji "AMD, jest kilka zalet, takich jak wyższa wydajność jednordzeniowa procesora Intela i nieco lepsza wydajność w grach dzięki dedykowanemu układowi GeForce MX550. Ponadto model Intela oferuje także Thunderbolt 4 oraz jest slot SO-DIMM, co pozwala na rozbudowę pamięci roboczej.
Z drugiej strony są też wady, takie jak znacznie wyższy pobór mocy pod obciążeniem - dołączony 65-watowy zasilacz jest zdecydowanie za słaby, co skutkuje sztucznym dławieniem wydajności przy łącznym obciążeniu CPU/GPU. Głośniejszy staje się też wentylator, a czas pracy na baterii okazuje się krótszy. Jednocześnie procesor AMD osiąga w testach wielordzeniowych wyniki na tym samym poziomie, pobierając przy tym mniej energii.
Ze względu na dodatkową kartę grafiki ThinkPad T14 G3 pobiera też więcej energii, a dodatkowa wydajność w porównaniu z wersją z procesorem AMD jest bardzo niewielka. Dodatkowy moduł jest więc mało opłacalny, a osoby, które mogą się obejść bez Thunderbolt 4, otrzymają lepszy laptop biznesowy o dłuższych czasach pracy na akumulatorze, jeżeli wybiorą ThinkPada T14 G3 w wersji z AMD.
Kolejnym problemem jest sytuacja z panelem, ale to również dotyczy wszystkich modeli ThinkPada T14 G3. Na przykład panel LG pozostawił w teście lepsze wrażenie niż model od AU Optronics, mimo że w obu przypadkach był to 14-calowy wyświetlacz LowPower. Loterię tego panelu widzieliśmy już we wcześniejszych modelach i niestety nigdy nie wiadomo z góry, jaki panel zostanie zastosowany.
Mimo że T14 G3 jest już na rynku od jakiegoś czasu, nowe mobilne procesory Intel Raptor Lake są ogólnie dość rozczarowującą aktualizacją i w tym momencie nie wiemy, kiedy pojawią się nowe modele AMD. Przynajmniej, nie spodziewamy się aktualizacji w ciągu najbliższych kilku miesięcy.
Cena i dostępność
Lenovo ThinkPad T14 G3 w wersji z Intelem dostępny jest w ofercie Lenovo od 1012,32 USD, a konfiguracja z Nvidią od 1067,52 USD.
Lenovo ThinkPad T14 G3-21AJS00400
- 21/03/2023 v7 (old)
Andreas Osthoff
Przezroczystość
Wyboru urządzeń do recenzji dokonuje nasza redakcja. Próbka testowa została udostępniona autorowi jako pożyczka od producenta lub sprzedawcy detalicznego na potrzeby tej recenzji. Pożyczkodawca nie miał wpływu na tę recenzję, producent nie otrzymał też kopii tej recenzji przed publikacją. Nie było obowiązku publikowania tej recenzji. Jako niezależna firma medialna, Notebookcheck nie podlega władzy producentów, sprzedawców detalicznych ani wydawców.
Tak testuje Notebookcheck
Każdego roku Notebookcheck niezależnie sprawdza setki laptopów i smartfonów, stosując standardowe procedury, aby zapewnić porównywalność wszystkich wyników. Od około 20 lat stale rozwijamy nasze metody badawcze, ustanawiając przy tym standardy branżowe. W naszych laboratoriach testowych doświadczeni technicy i redaktorzy korzystają z wysokiej jakości sprzętu pomiarowego. Testy te obejmują wieloetapowy proces walidacji. Nasz kompleksowy system ocen opiera się na setkach uzasadnionych pomiarów i benchmarków, co pozwala zachować obiektywizm.Price comparison

