Recenzja laptopa Lenovo ThinkPad E14 G5 Intel: Core i7-1355U vs. Ryzen 7 7730U

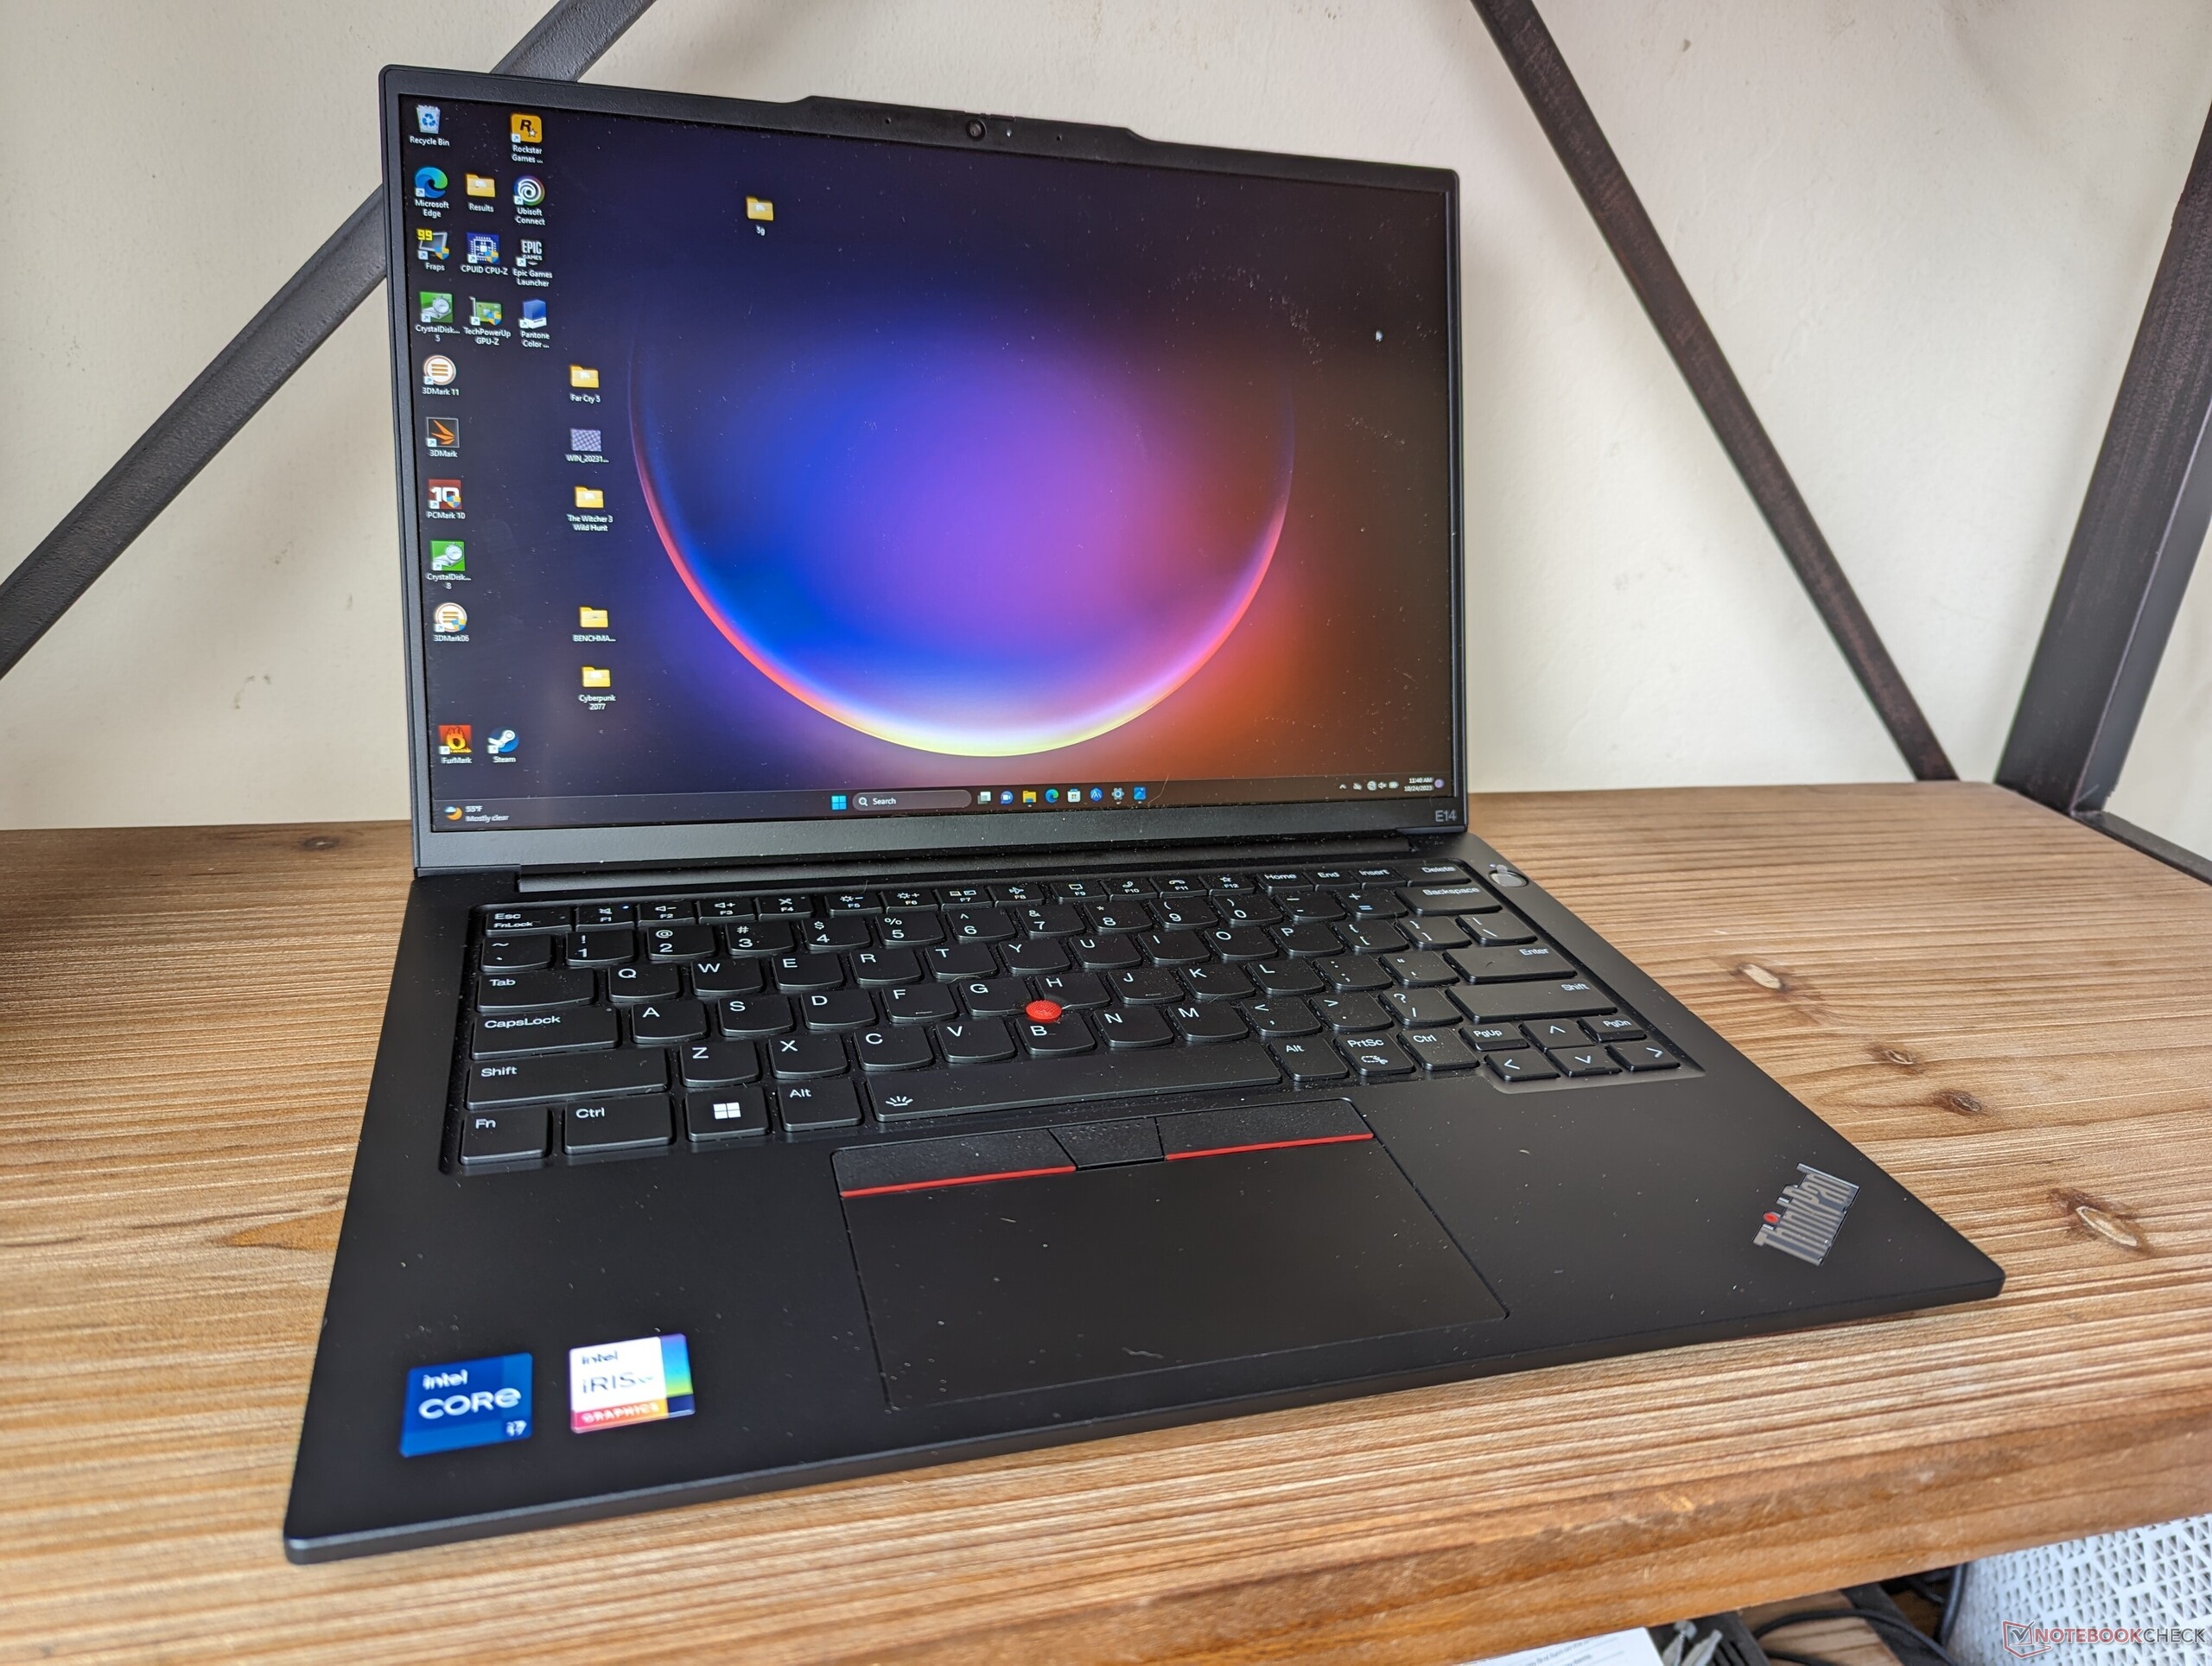
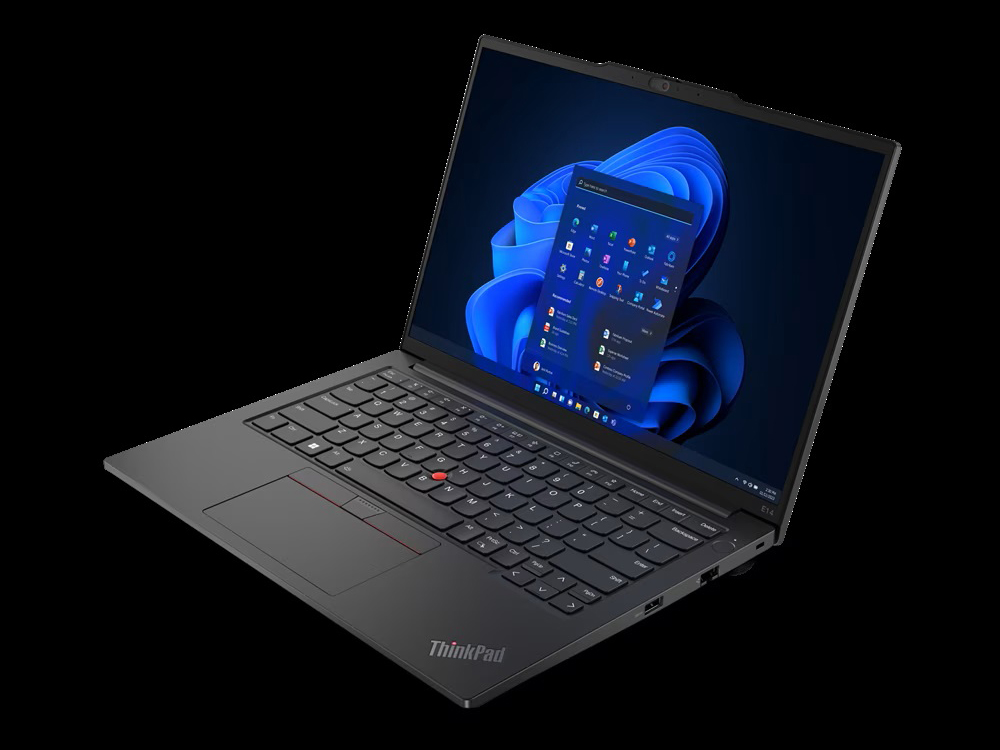
Po niedawnej recenzji ThinkPada E14 G5 w wersji AMD, jesteśmy teraz gotowi zająć się ThinkPadem E14 G5 w wersji Intel. Obie wersje mają tę samą konstrukcję obudowy, dlatego zalecamy sprawdzenie naszą recenzję wersji AMD aby dowiedzieć się więcej o fizycznych cechach tego modelu. Niemniej jednak istnieje kilka wewnętrznych różnic między nimi, o których wspomnimy w poniższej recenzji.
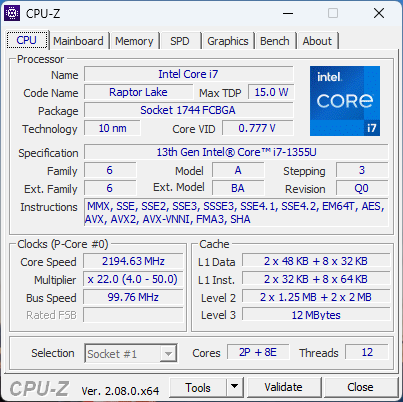
Nasza jednostka testowa to środkowa konfiguracja Intela z procesorem Core i7-1355U 13. generacji Raptor Lake i wyświetlaczem 1200p FHD+ za około 915 USD. Inne SKU zaczynają się od Core i3-1315U do Core i7-13700H z opcjonalną grafiką GeForce MX550 i wyświetlaczem IPS o wyższej rozdzielczości 2240 x 1400. Zakres konfiguracji jest szerszy niż oczekiwano, zwłaszcza w przypadku 14-calowego subnotebooka.
Alternatywy dla ThinkPada E14 G5 obejmują inne subnotebooki biznesowe z wyższej półki, takie jak HP EliteBook 845 lub Dell Latitude 7440.
Więcej recenzji Lenovo:
Potencjalni konkurenci w porównaniu
Ocena | Data | Model | Waga | Wysokość | Rozmiar | Rezolucja | Cena |
|---|---|---|---|---|---|---|---|
| 86 % v7 (old) | 10/2023 | Lenovo ThinkPad E14 G5 i7-1355U i7-1355U, Iris Xe G7 96EUs | 1.5 kg | 17.99 mm | 14.00" | 1920x1200 | |
| 88.3 % v7 (old) | 08/2023 | Lenovo ThinkPad E14 G5-21JSS05C00 R7 7730U, Vega 8 | 1.4 kg | 18 mm | 14.00" | 2240x1400 | |
| 90.1 % v7 (old) | 08/2023 | HP EliteBook 845 G10 818N0EA R9 PRO 7940HS, Radeon 780M | 1.5 kg | 17.9 mm | 14.00" | 2560x1600 | |
| 85.3 % v7 (old) | 06/2023 | Asus ZenBook 14 UM3402Y R7 7730U, Vega 8 | 1.4 kg | 16.9 mm | 14.00" | 2880x1800 | |
| 86.6 % v7 (old) | 10/2022 | LG Gram 14Z90Q i5-1240P, Iris Xe G7 80EUs | 980 g | 16.8 mm | 14.00" | 1920x1200 | |
| 90.3 % v7 (old) | 07/2023 | Dell Latitude 7440 i5-1345U, Iris Xe G7 80EUs | 1.2 kg | 17.95 mm | 14.00" | 2560x1600 |
Sprawa
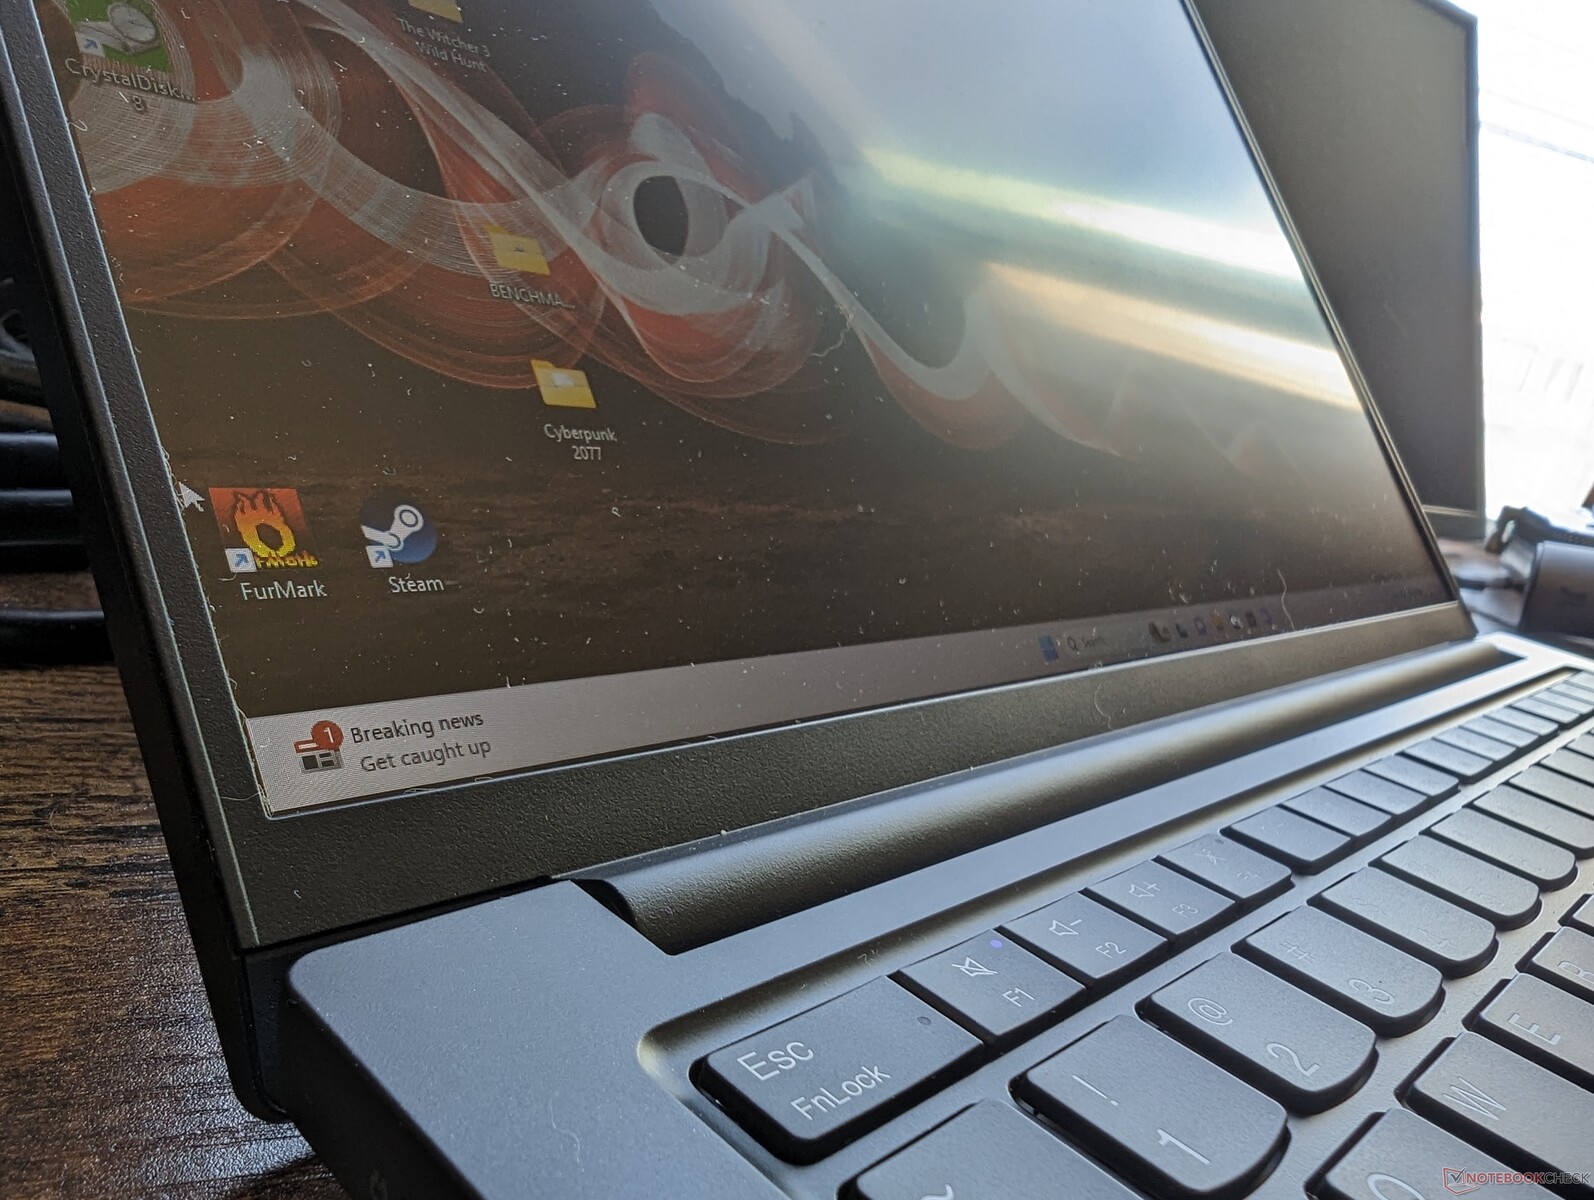
Być może najłatwiejszym sposobem na rozróżnienie ThinkPada E14 G5 w wersji Intel i AMD jest wypatrzenie logo Thunderbolt wzdłuż lewej krawędzi. Wersje AMD nie obsługują zarówno Thunderbolt, jak i USB4, co daje wersjom Intela przewagę, jeśli chodzi o możliwości dokowania.
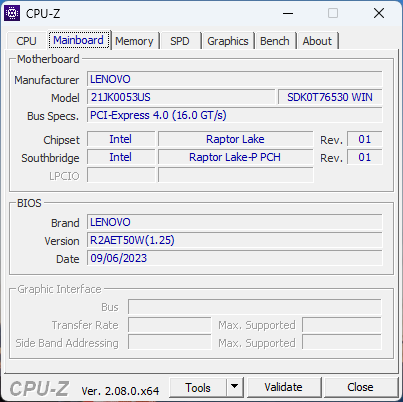
Komunikacja
W zestawie znajduje się karta Intel AX201 zapewniająca obsługę Wi-Fi 6 i Bluetooth 5.1. Droższy AX211 jest opcjonalny dla użytkowników, którzy chcą łączności Wi-Fi 6E.
| Networking | |
| iperf3 transmit AXE11000 | |
| Lenovo ThinkPad E14 G5-21JSS05C00 | |
| Lenovo ThinkPad E14 G5 i7-1355U | |
| Dell Latitude 7440 | |
| Asus ZenBook 14 UM3402Y | |
| iperf3 receive AXE11000 | |
| Lenovo ThinkPad E14 G5-21JSS05C00 | |
| Lenovo ThinkPad E14 G5 i7-1355U | |
| Asus ZenBook 14 UM3402Y | |
| Dell Latitude 7440 | |
| iperf3 transmit AXE11000 6GHz | |
| HP EliteBook 845 G10 818N0EA | |
| Asus ZenBook 14 UM3402Y | |
| Dell Latitude 7440 | |
| iperf3 receive AXE11000 6GHz | |
| HP EliteBook 845 G10 818N0EA | |
| LG Gram 14Z90Q | |
| Asus ZenBook 14 UM3402Y | |
| Dell Latitude 7440 | |
Kamera internetowa
Podczas gdy migawka prywatności jest standardem we wszystkich jednostkach SKU, rozdzielczość 1080p i czujnik podczerwieni są opcjonalne. Niższe jednostki SKU mogą być dostarczane z czujnikiem 720p.


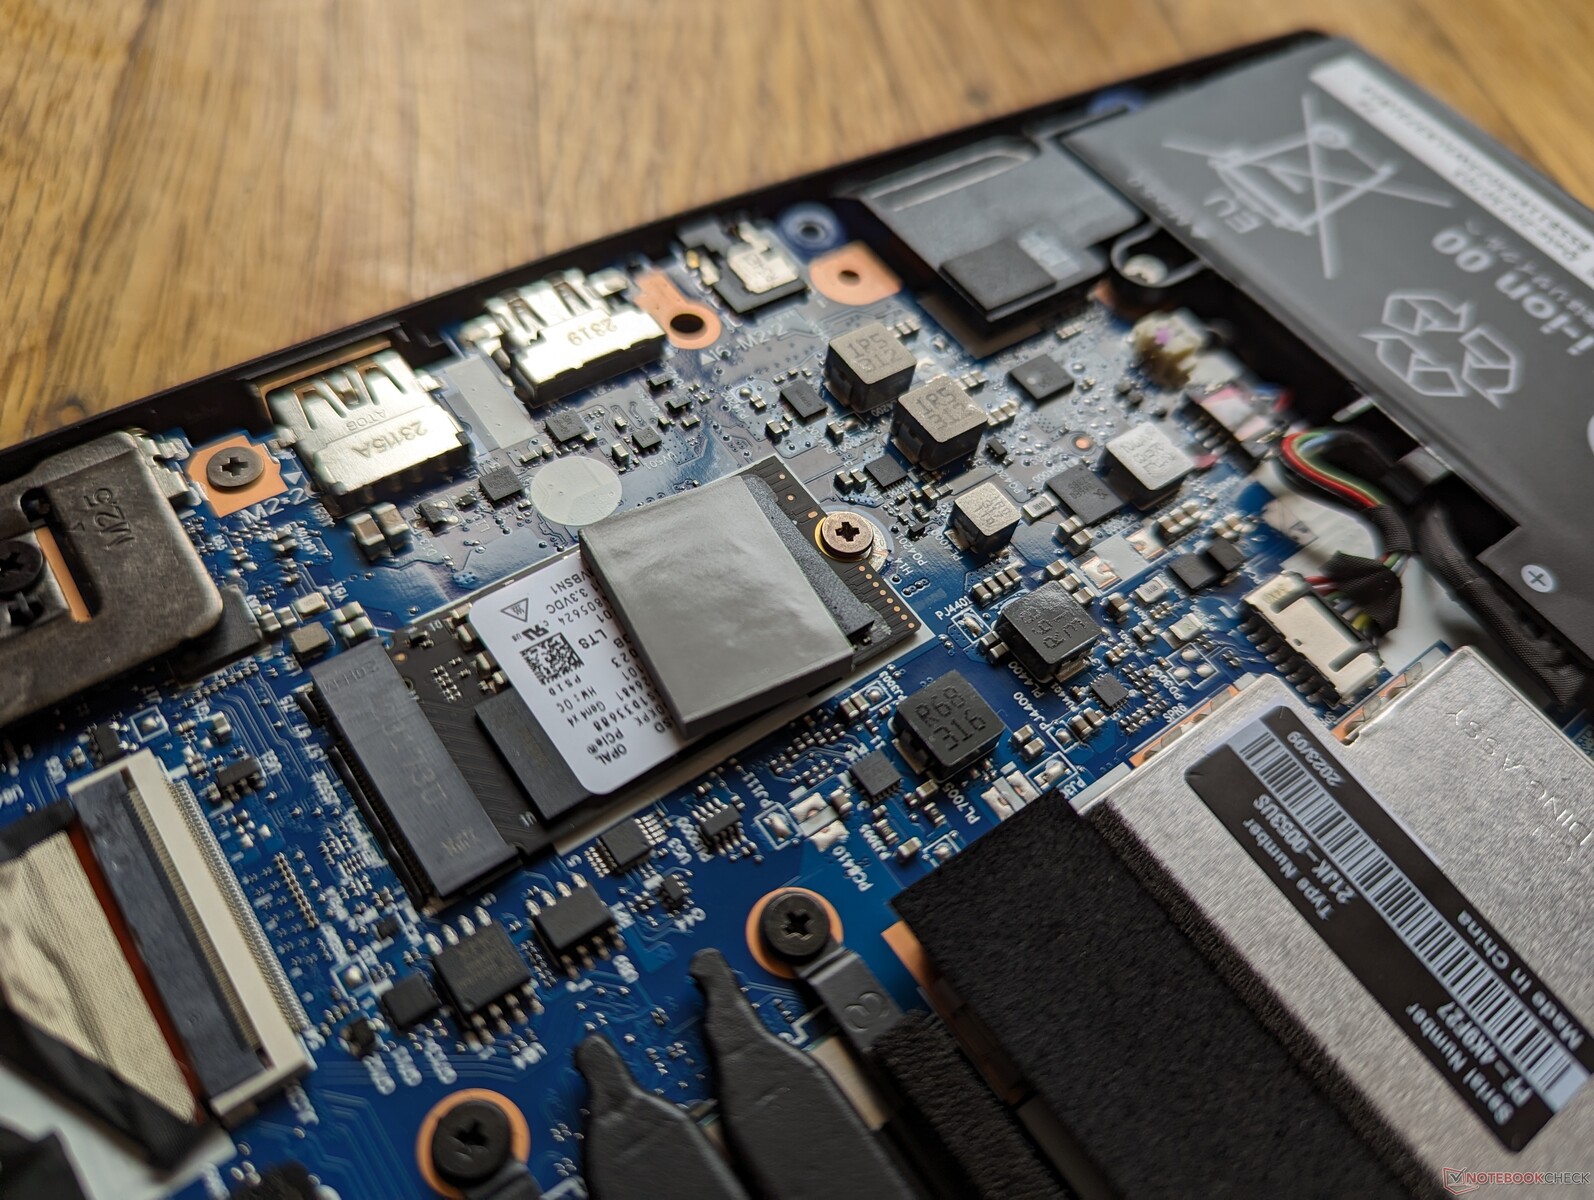
Konserwacja
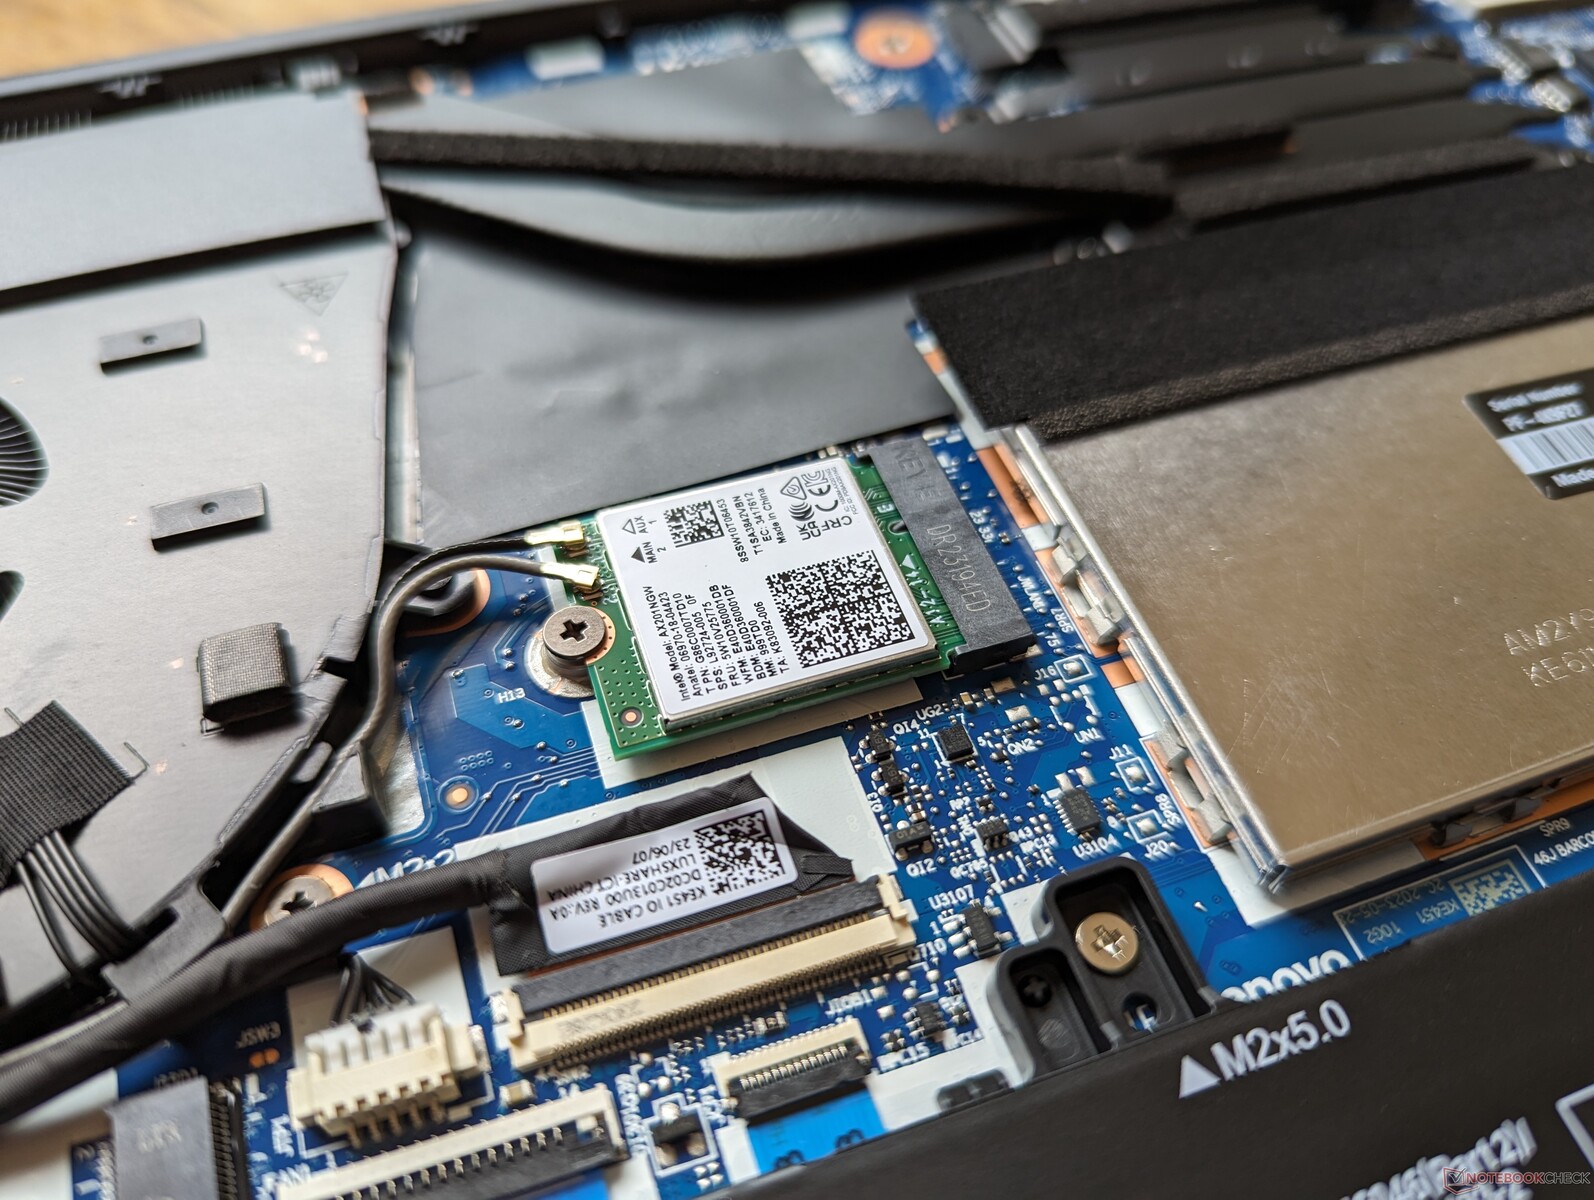
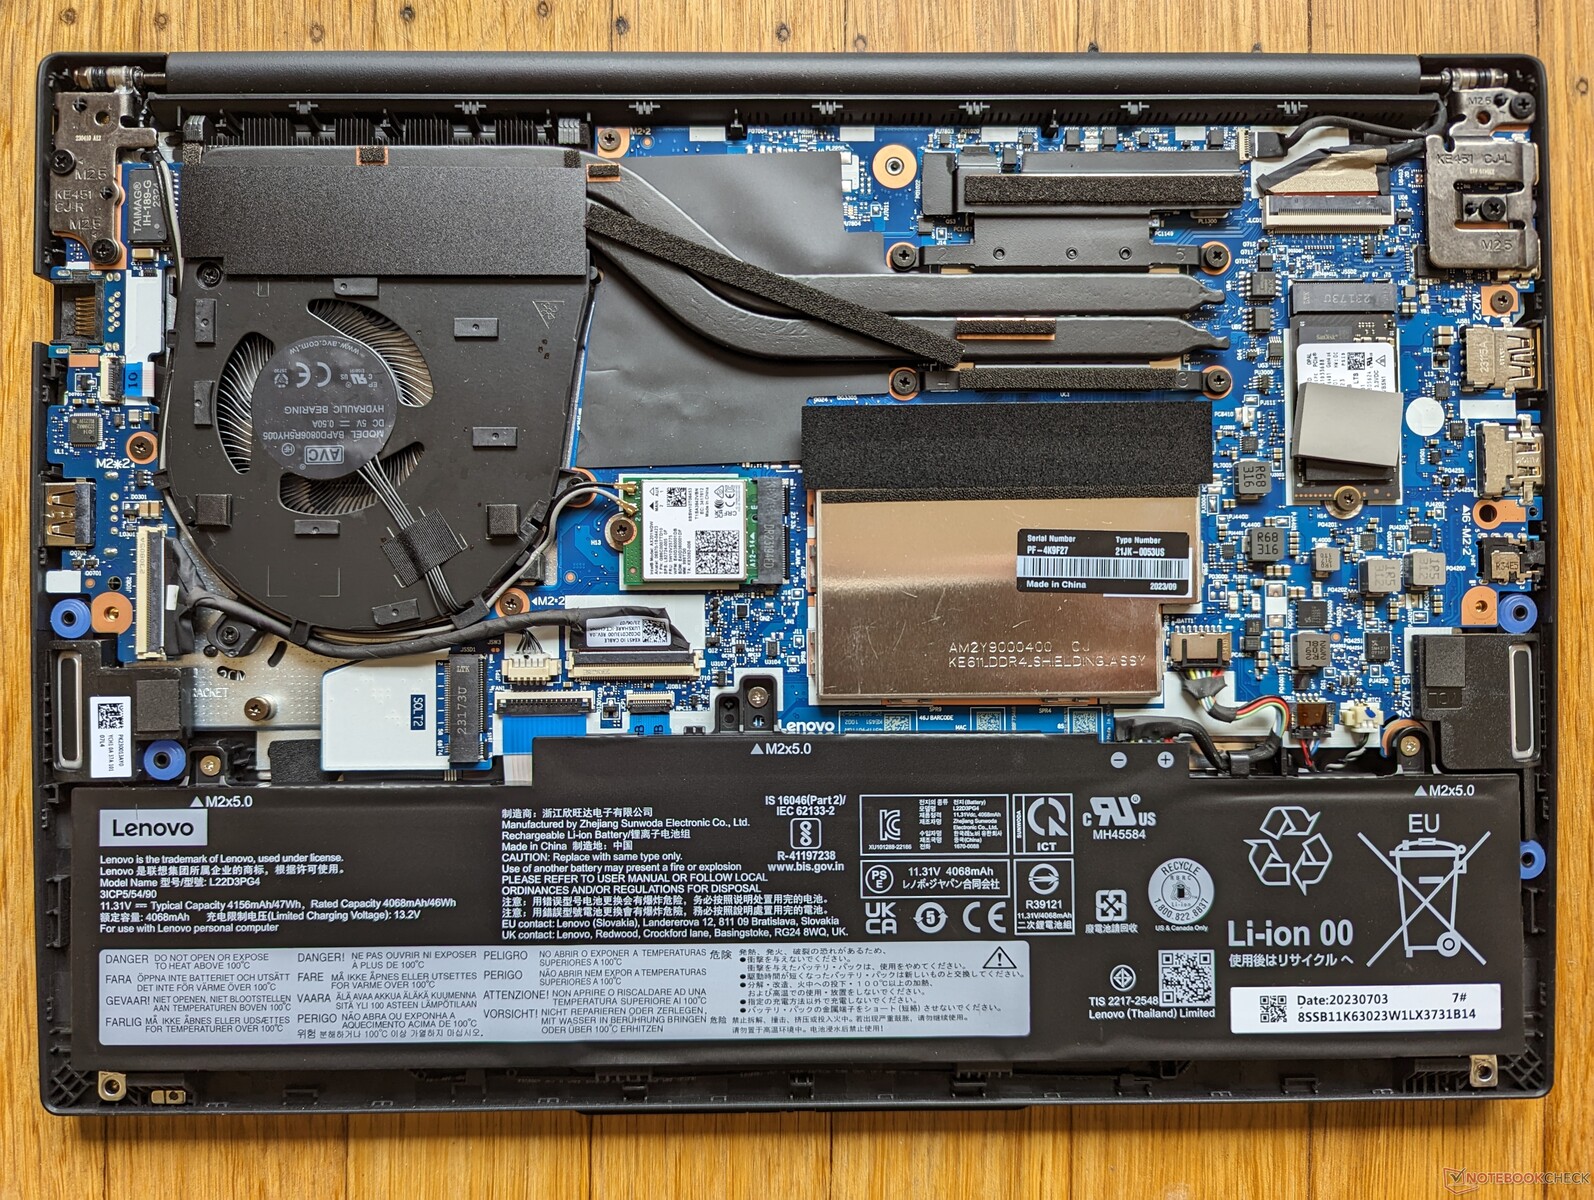
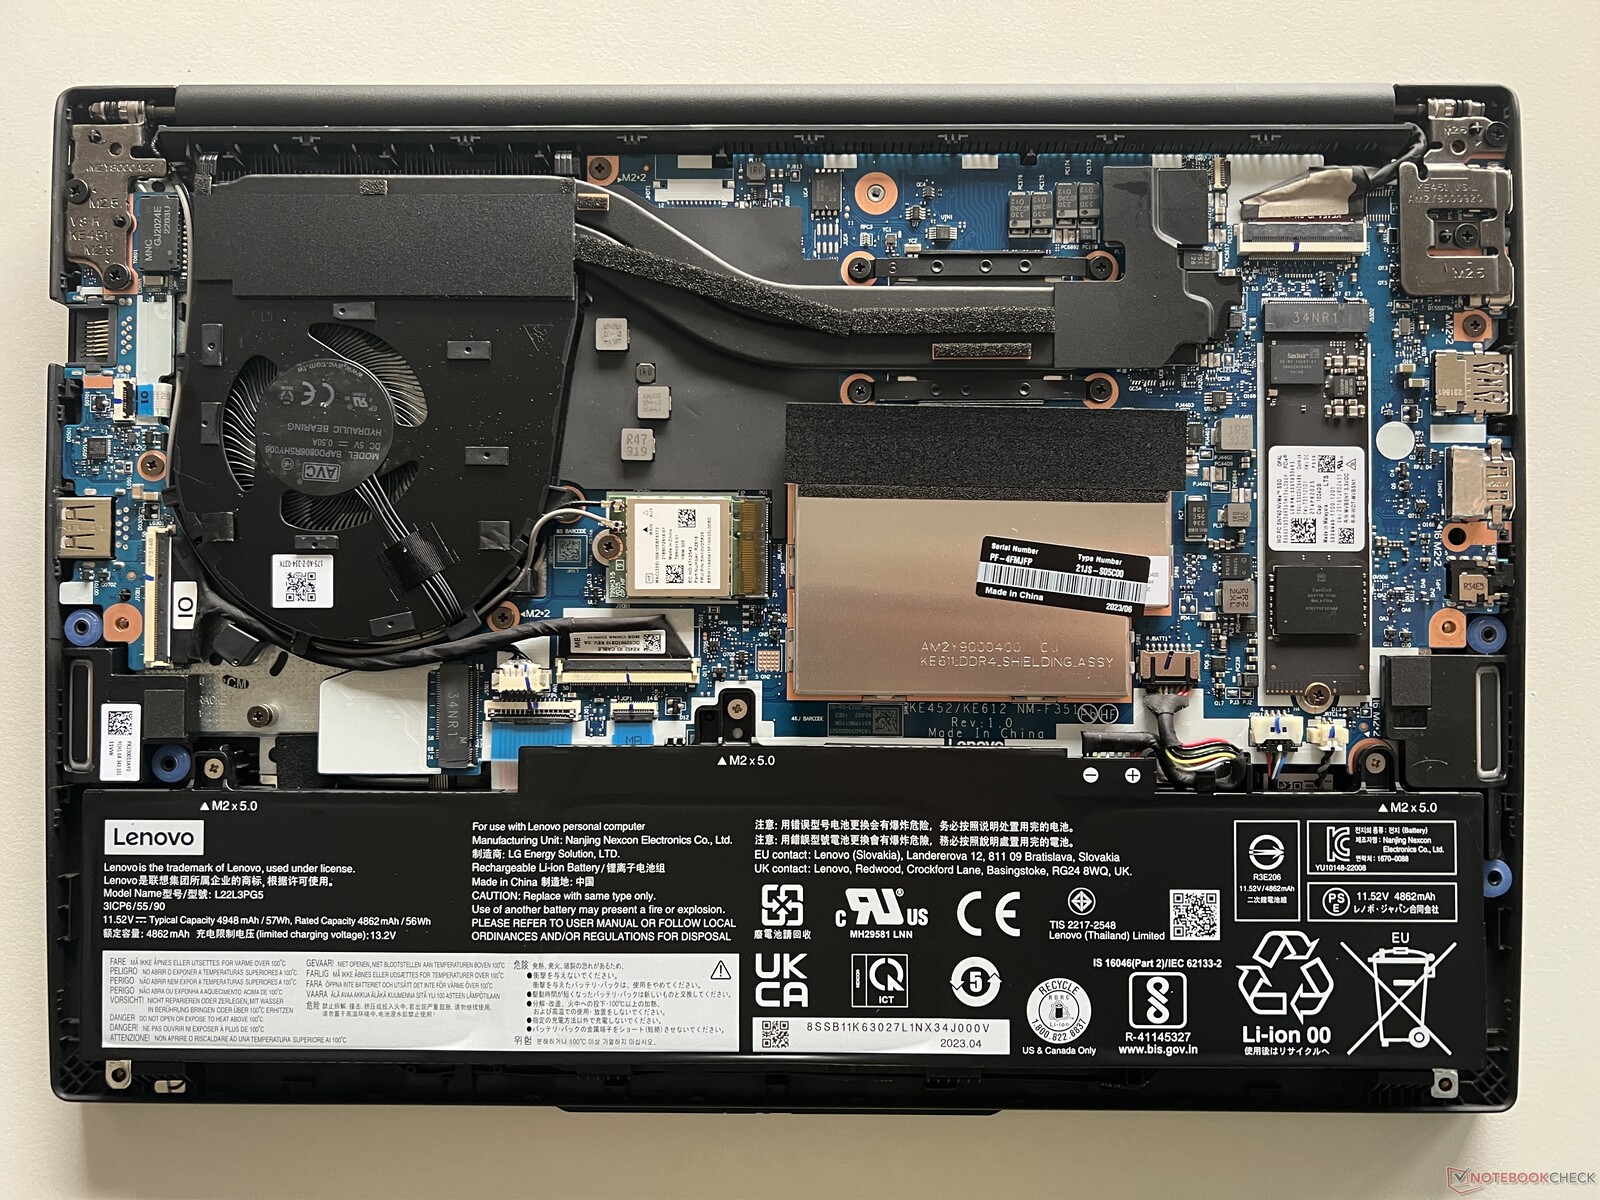
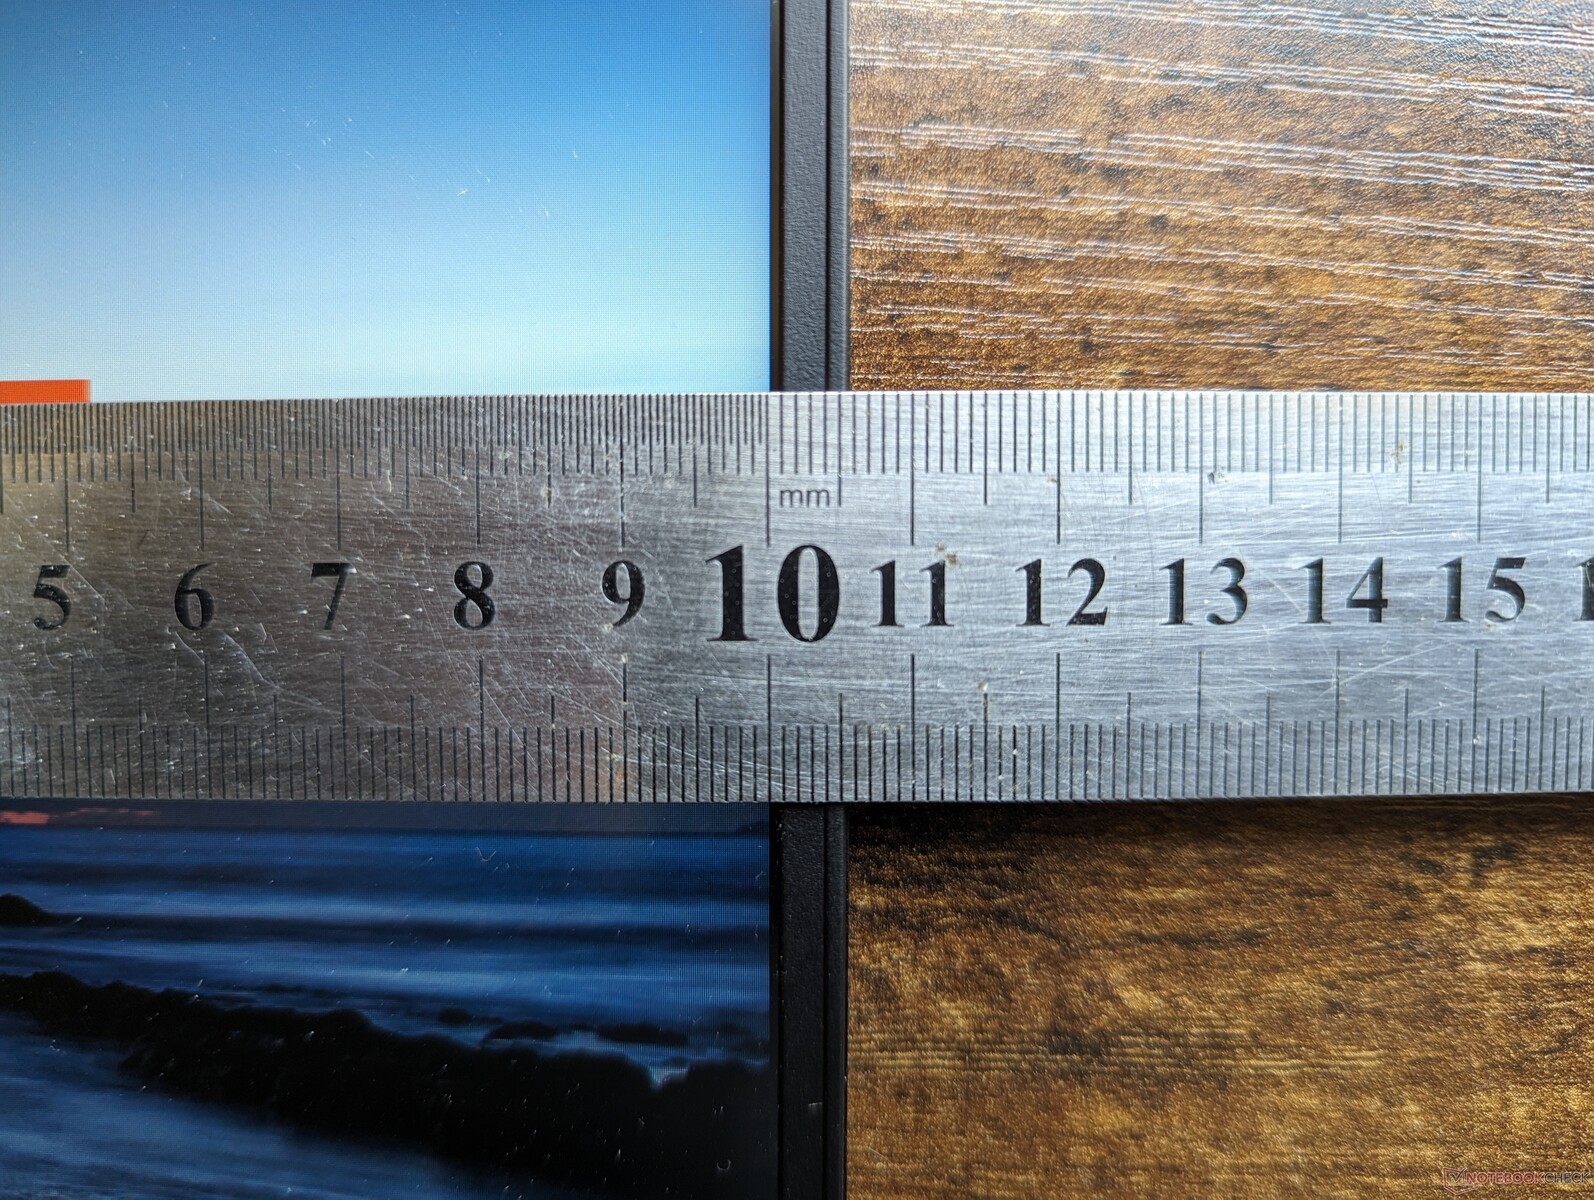
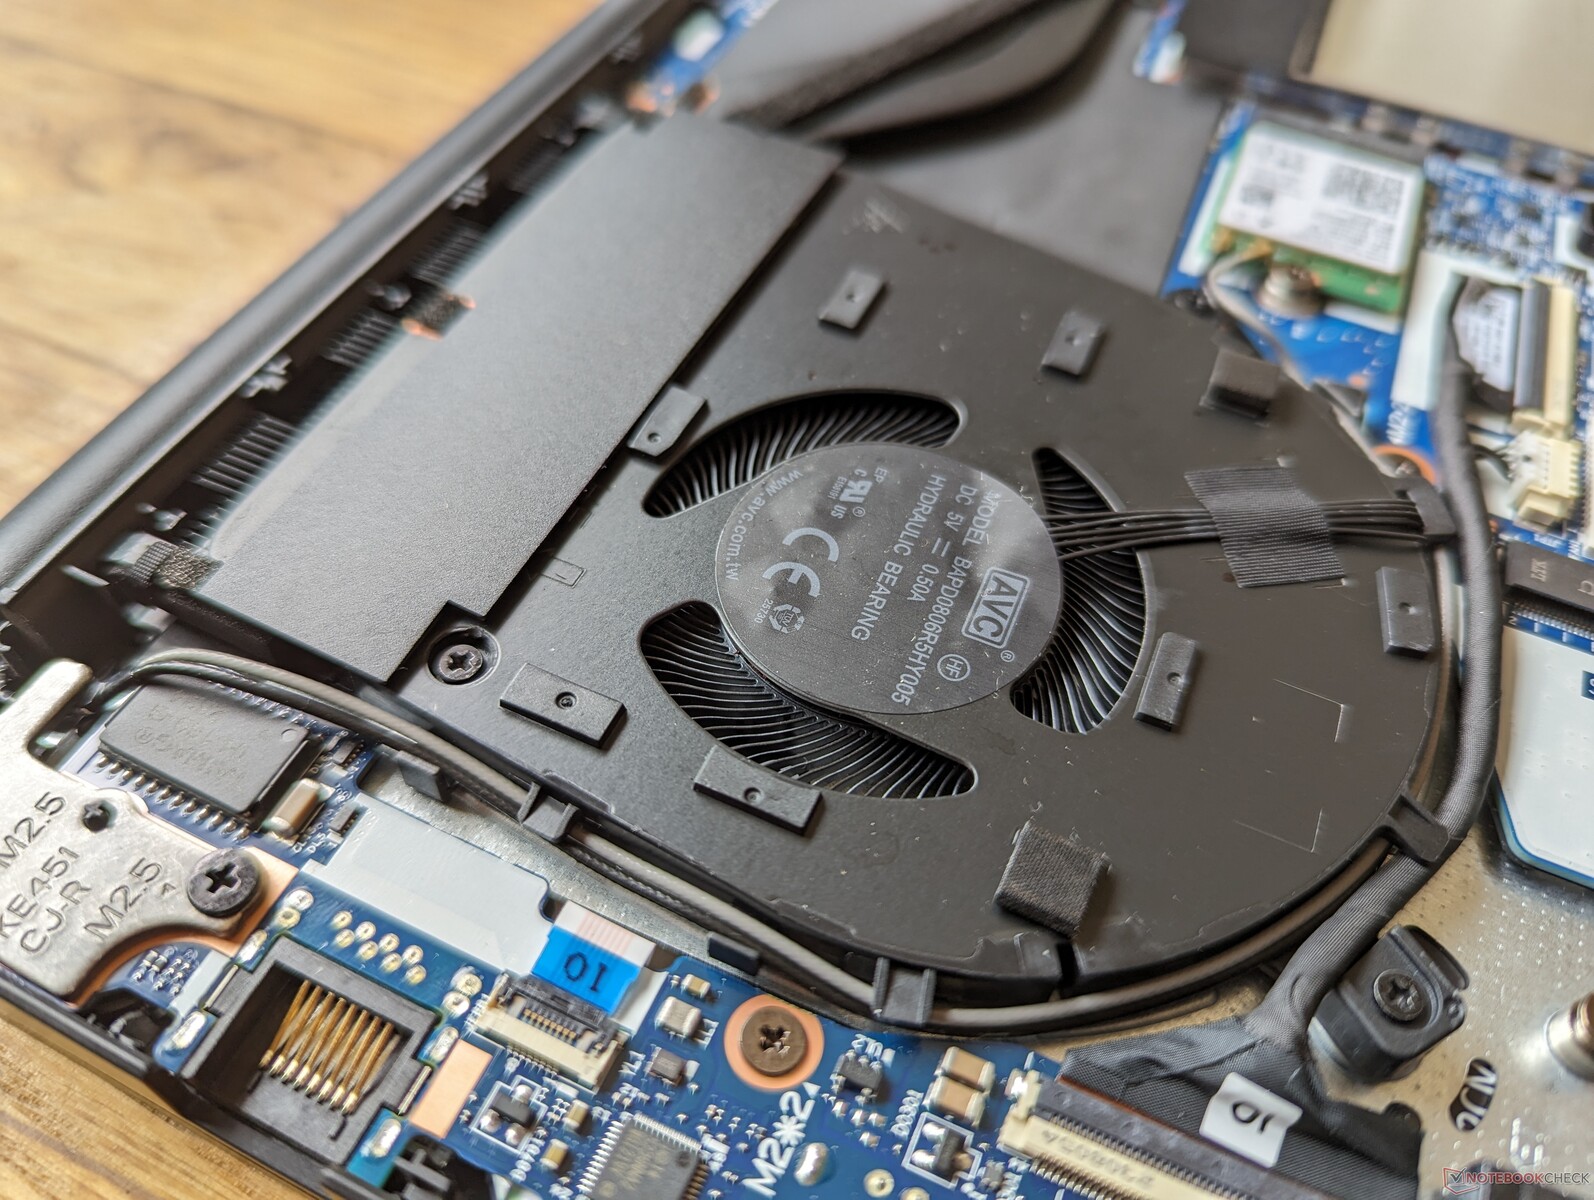
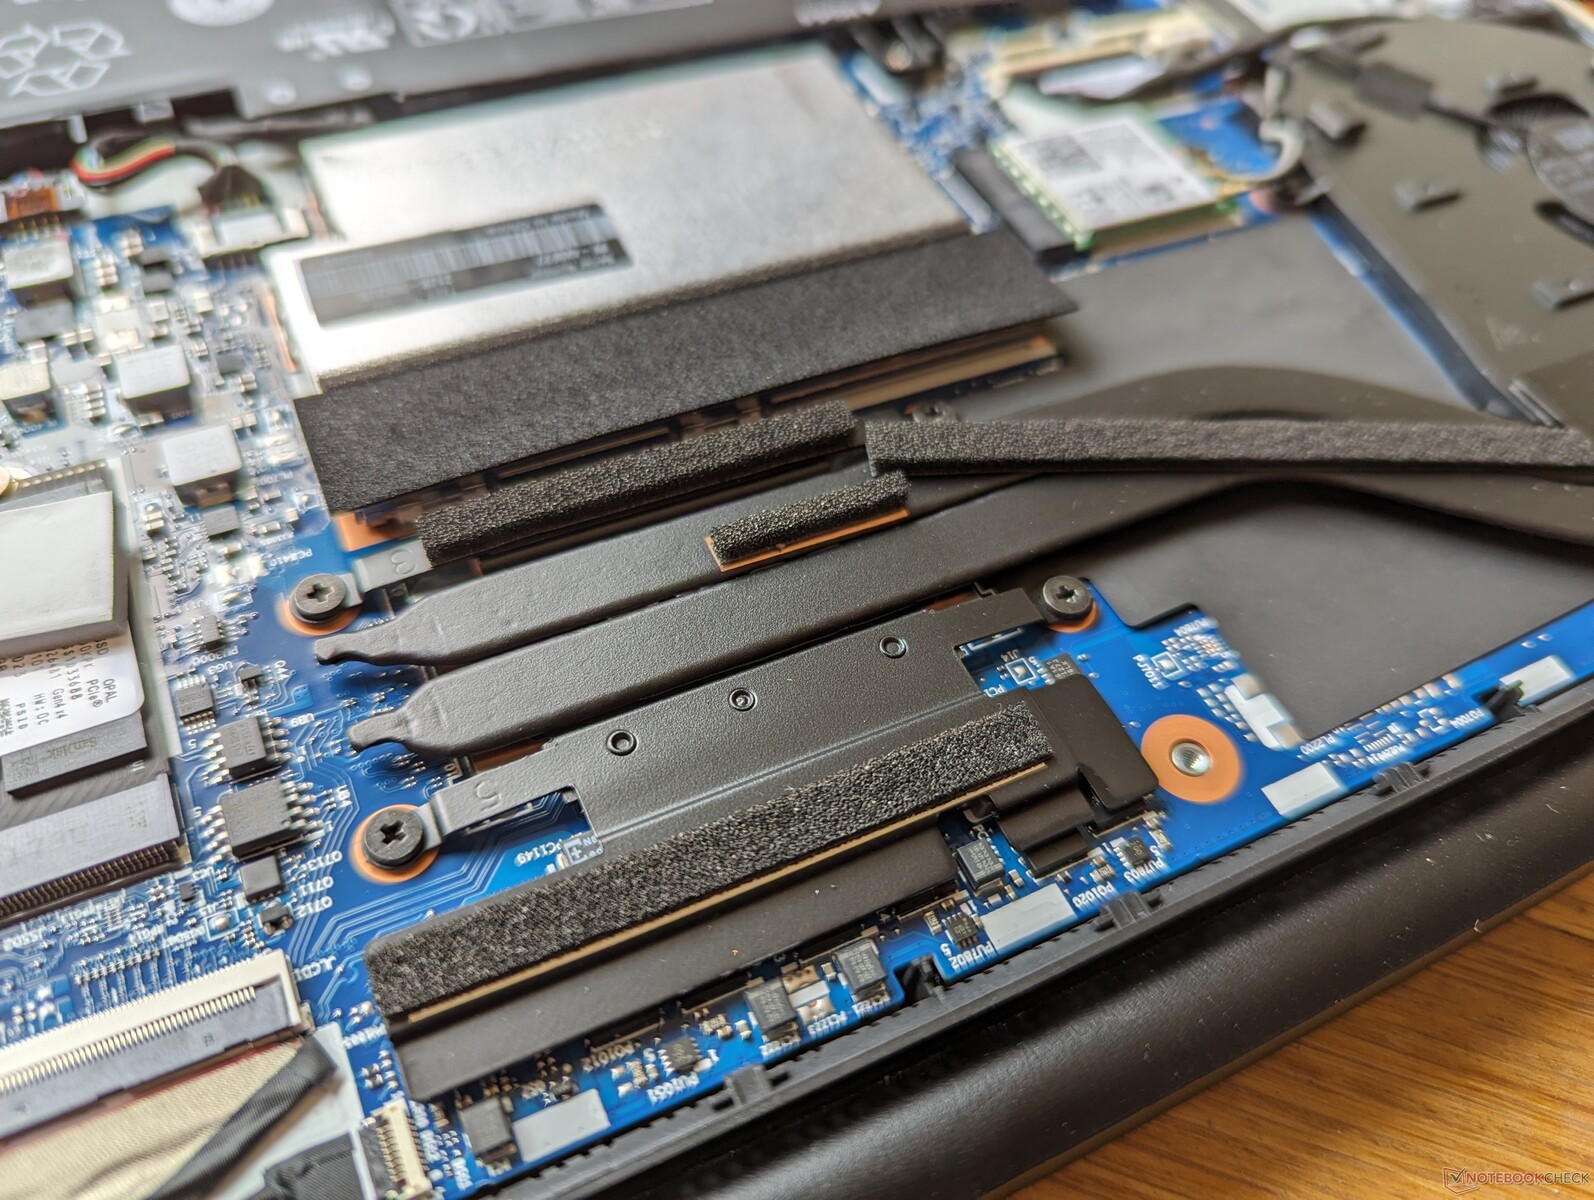
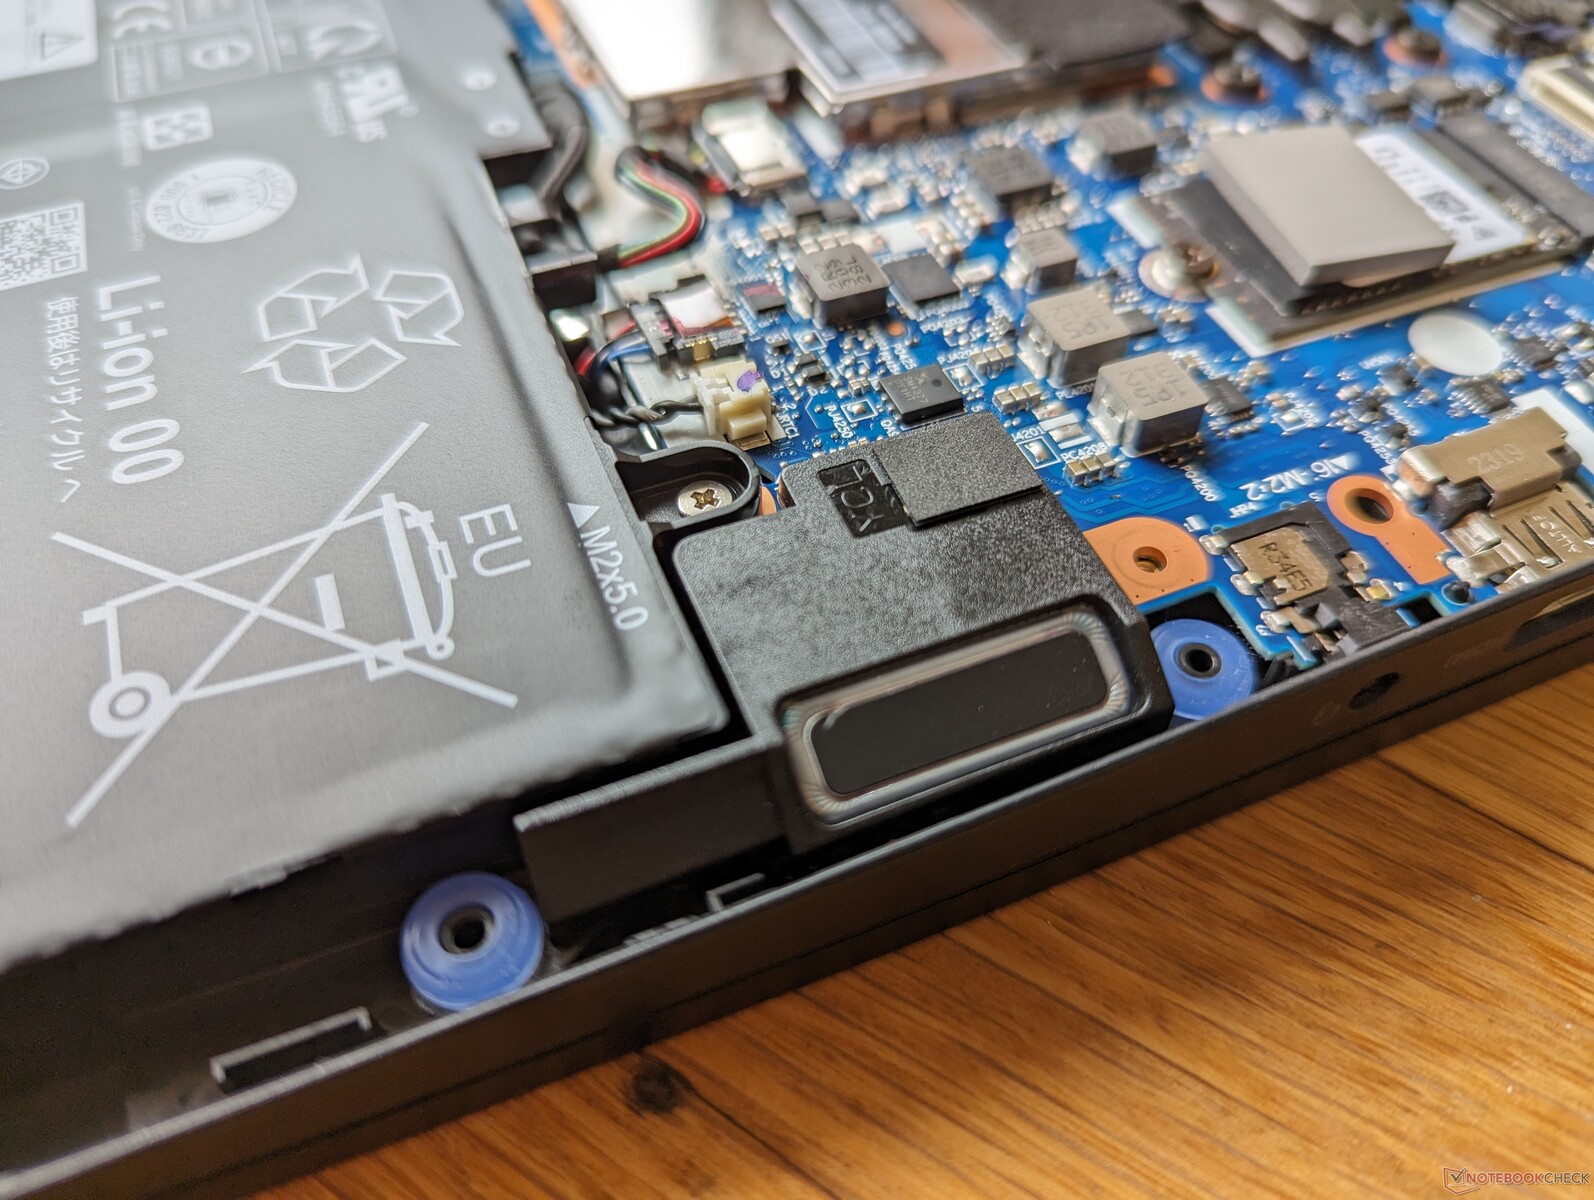
Jedną z interesujących różnic między wersjami Intel i AMD jest to, że wersja Intel nie obsługuje dysków SSD M.2 2280 o pełnej długości, co pokazują poniższe zdjęcia porównawcze. Nadal można zainstalować do dwóch dysków (PCIe4 x4 + PCIe3 x4), ale każdy z nich musi mieć długość do 42 mm (2242).
Akcesoria i gwarancja
W pudełku nie ma żadnych dodatków poza zasilaczem sieciowym i dokumentacją. W przypadku zakupu w Stanach Zjednoczonych obowiązuje roczna ograniczona gwarancja producenta.
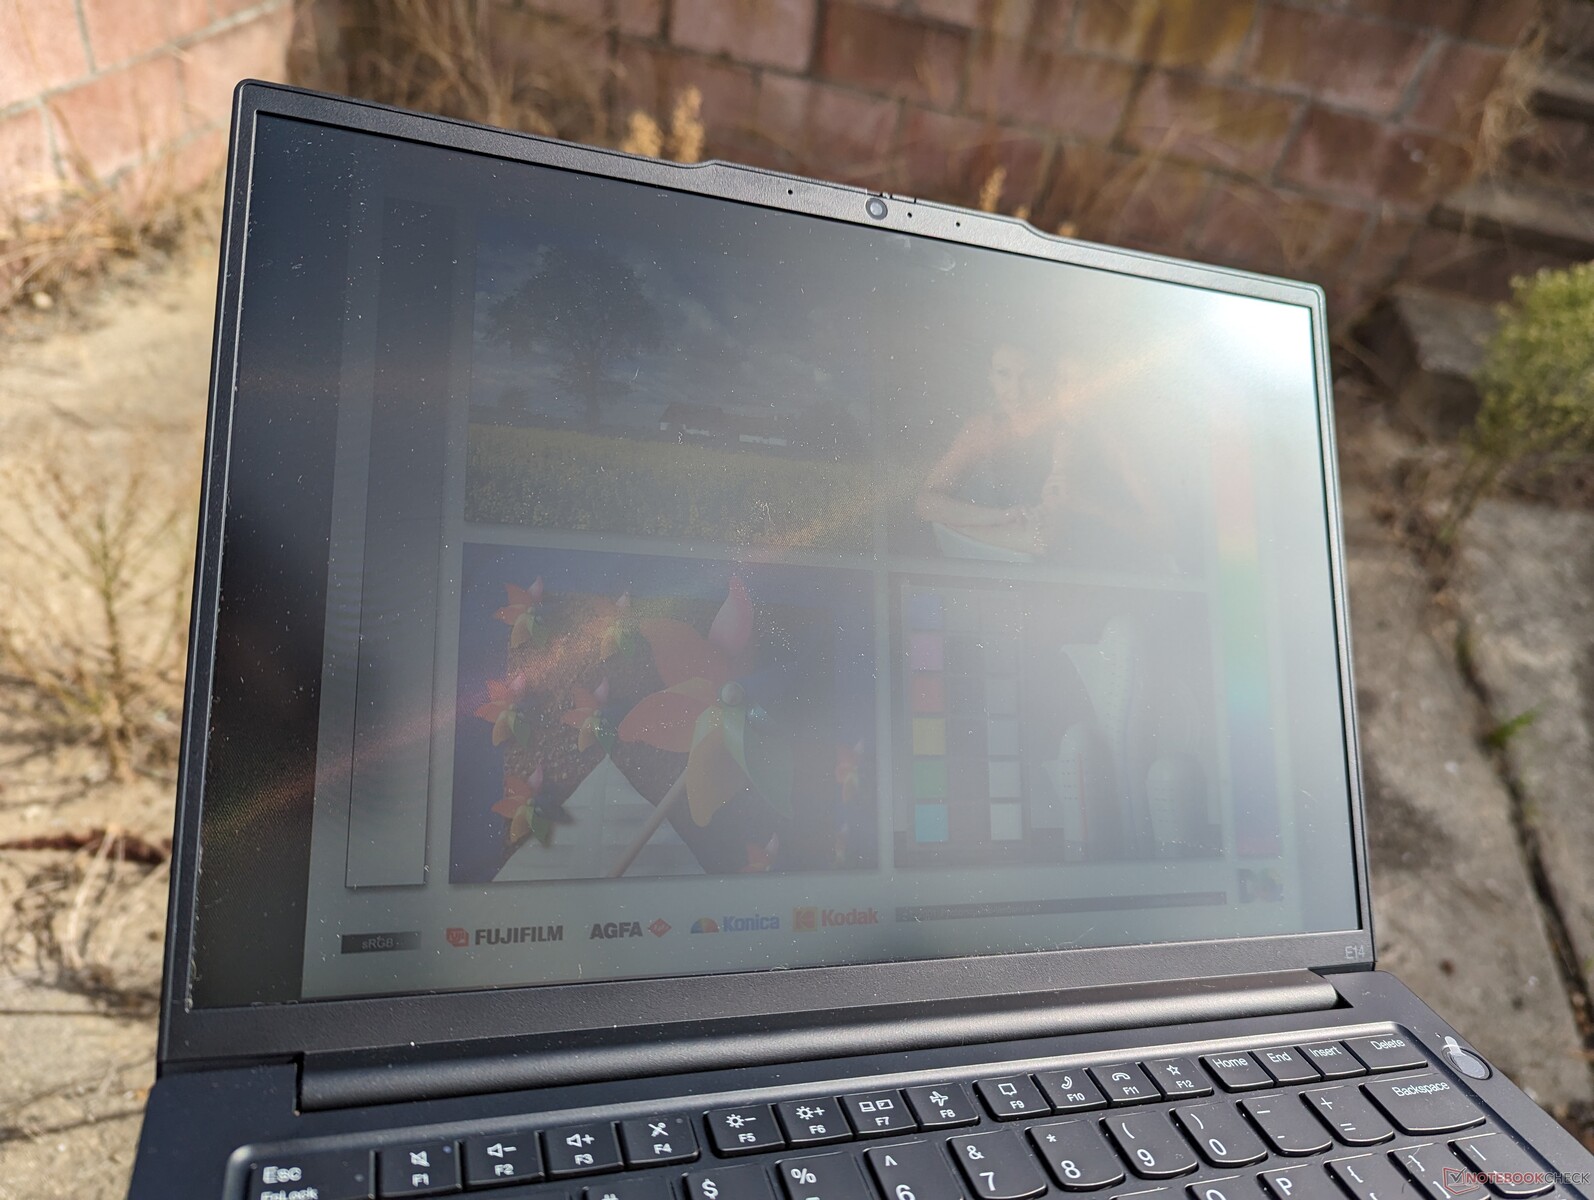
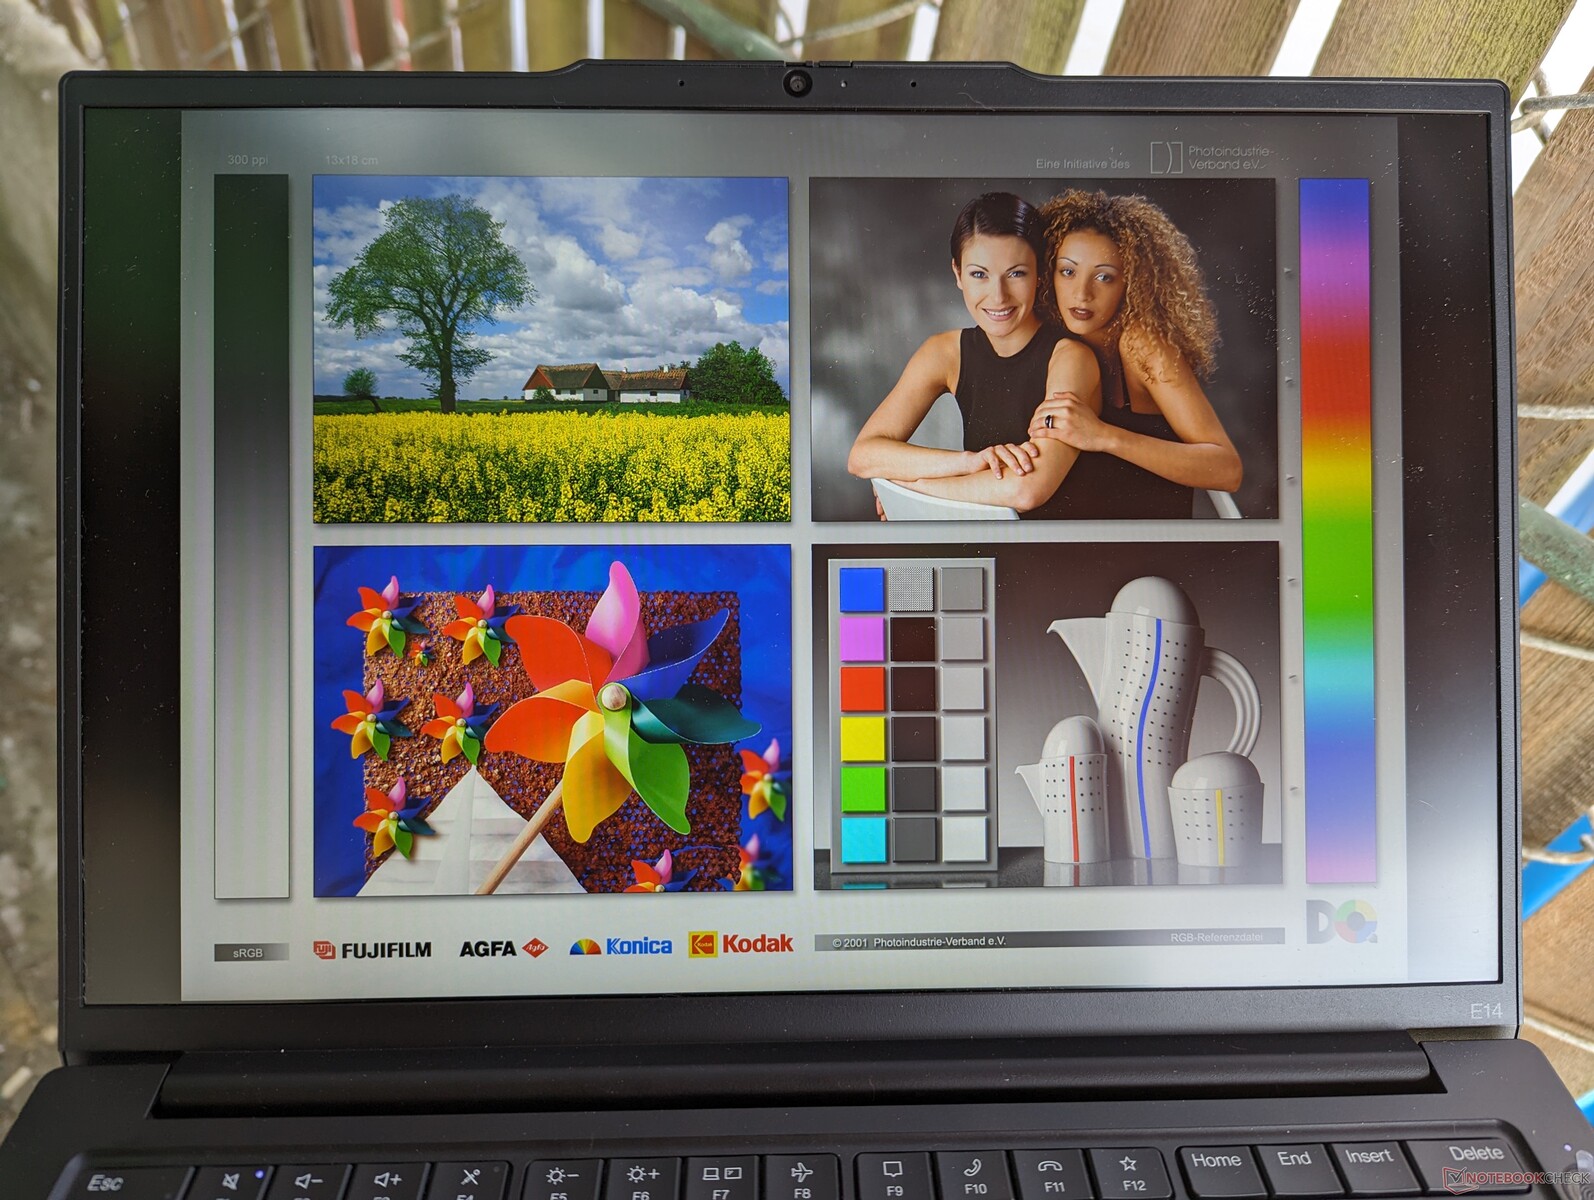
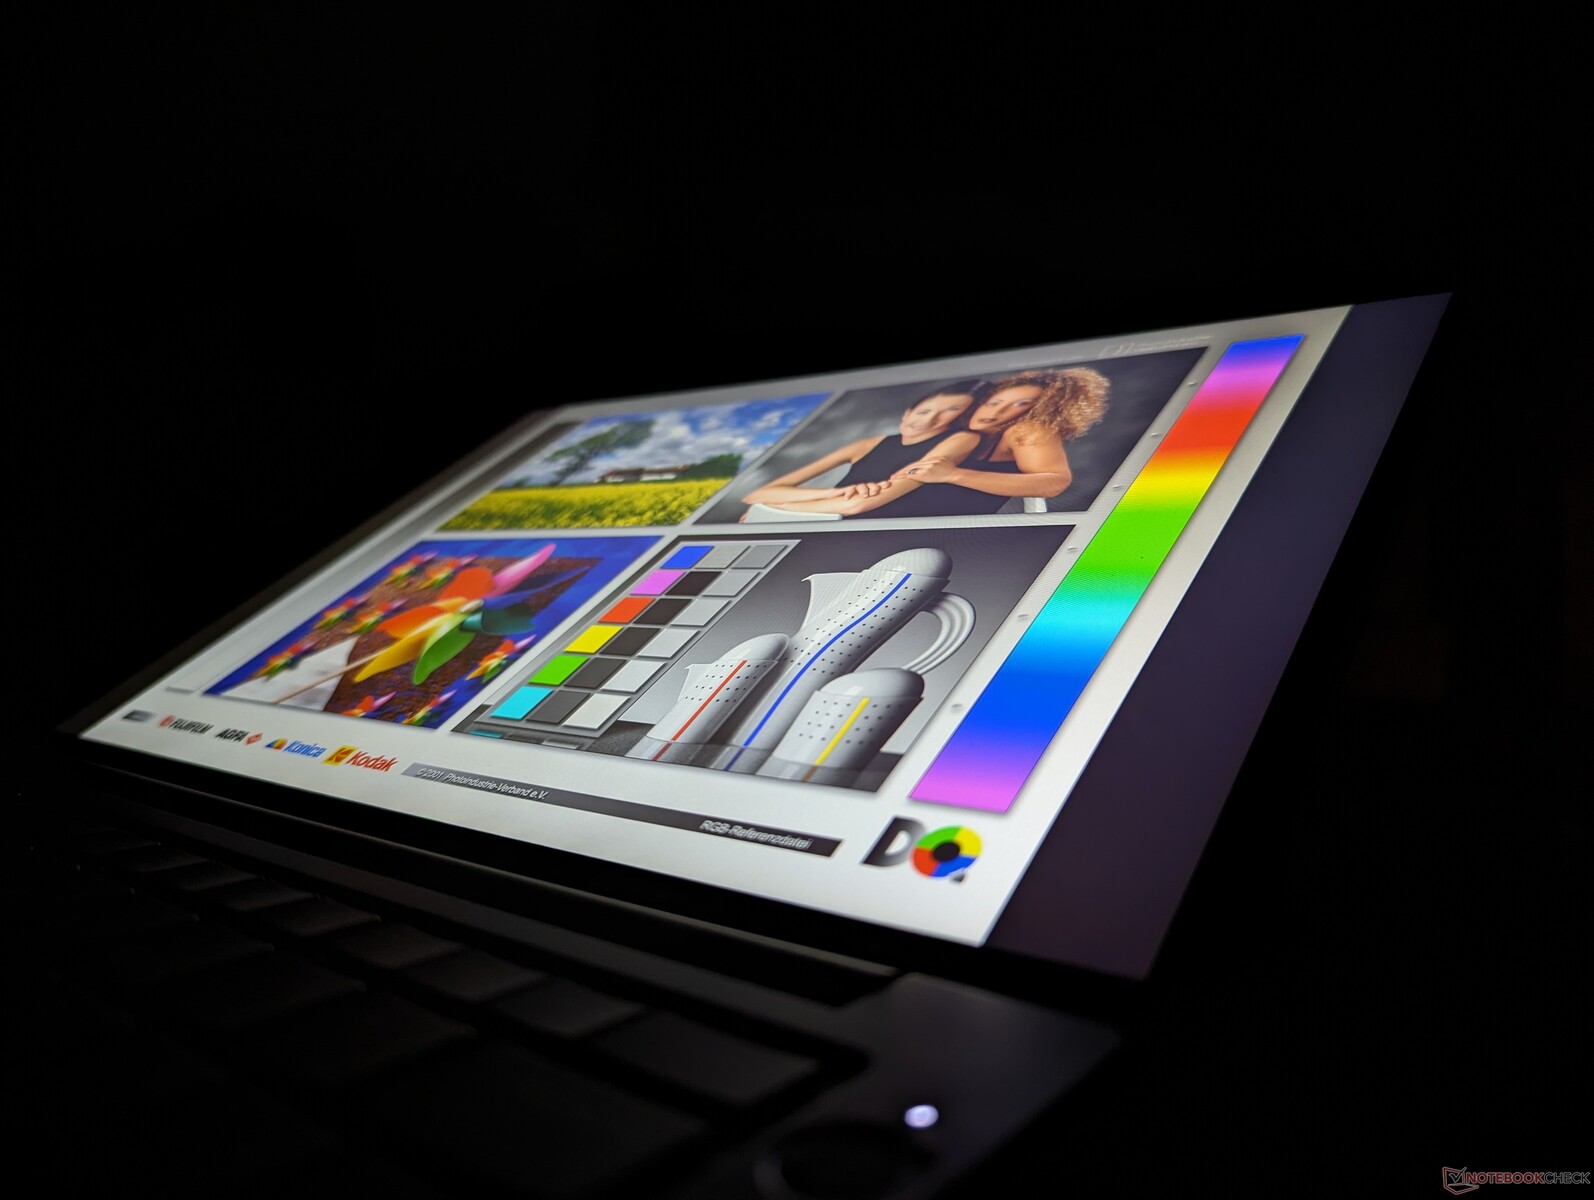
Wyświetlacz
Dostępne są trzy następujące opcje wyświetlania:
- 1920 x 1200, IPS, 60% sRGB, 60 Hz, 300 nitów, bezdotykowy, matowy
- 1920 x 1200, IPS, 60% sRGB, 60 Hz, 300 nitów, dotykowy, matowy
- 2240 x 1400, IPS, 100% sRGB, 60 Hz, 300 nitów, bezdotykowy, matowy
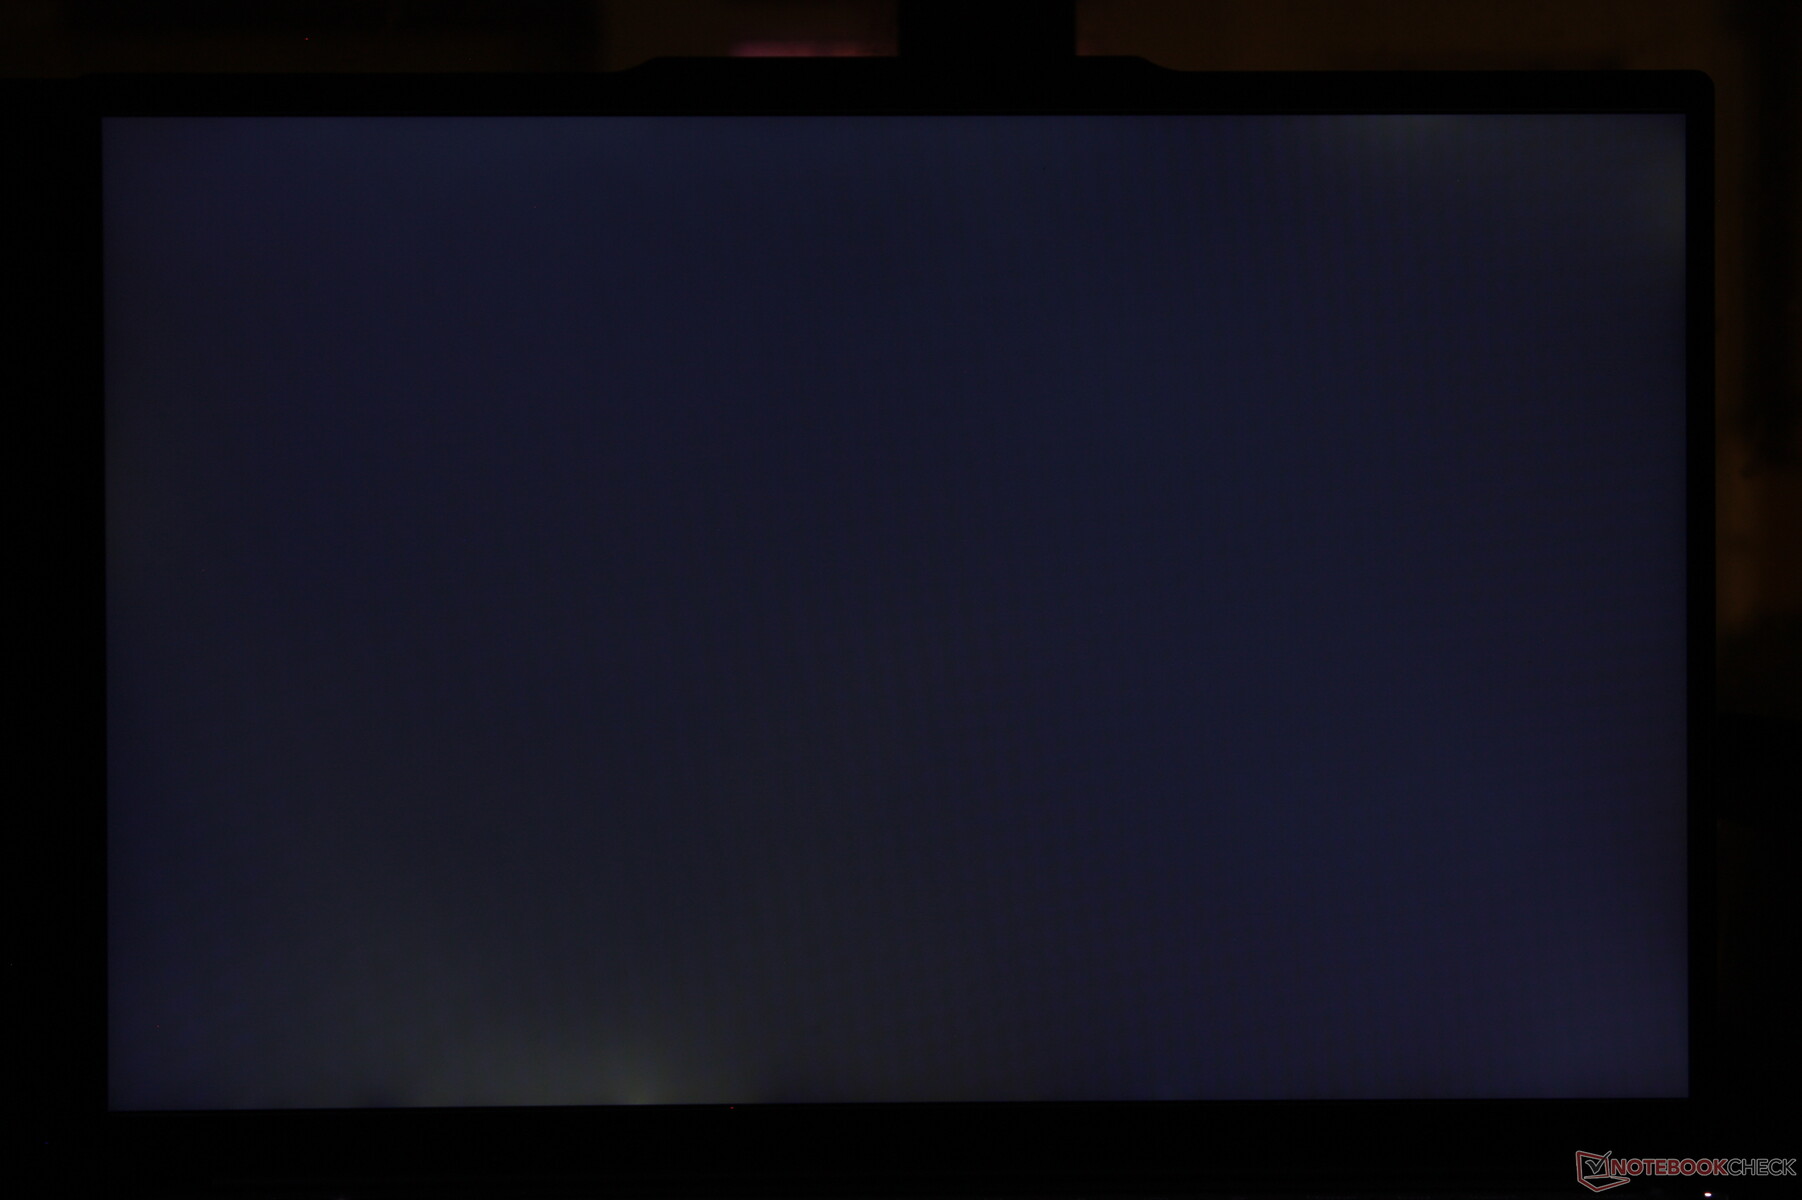
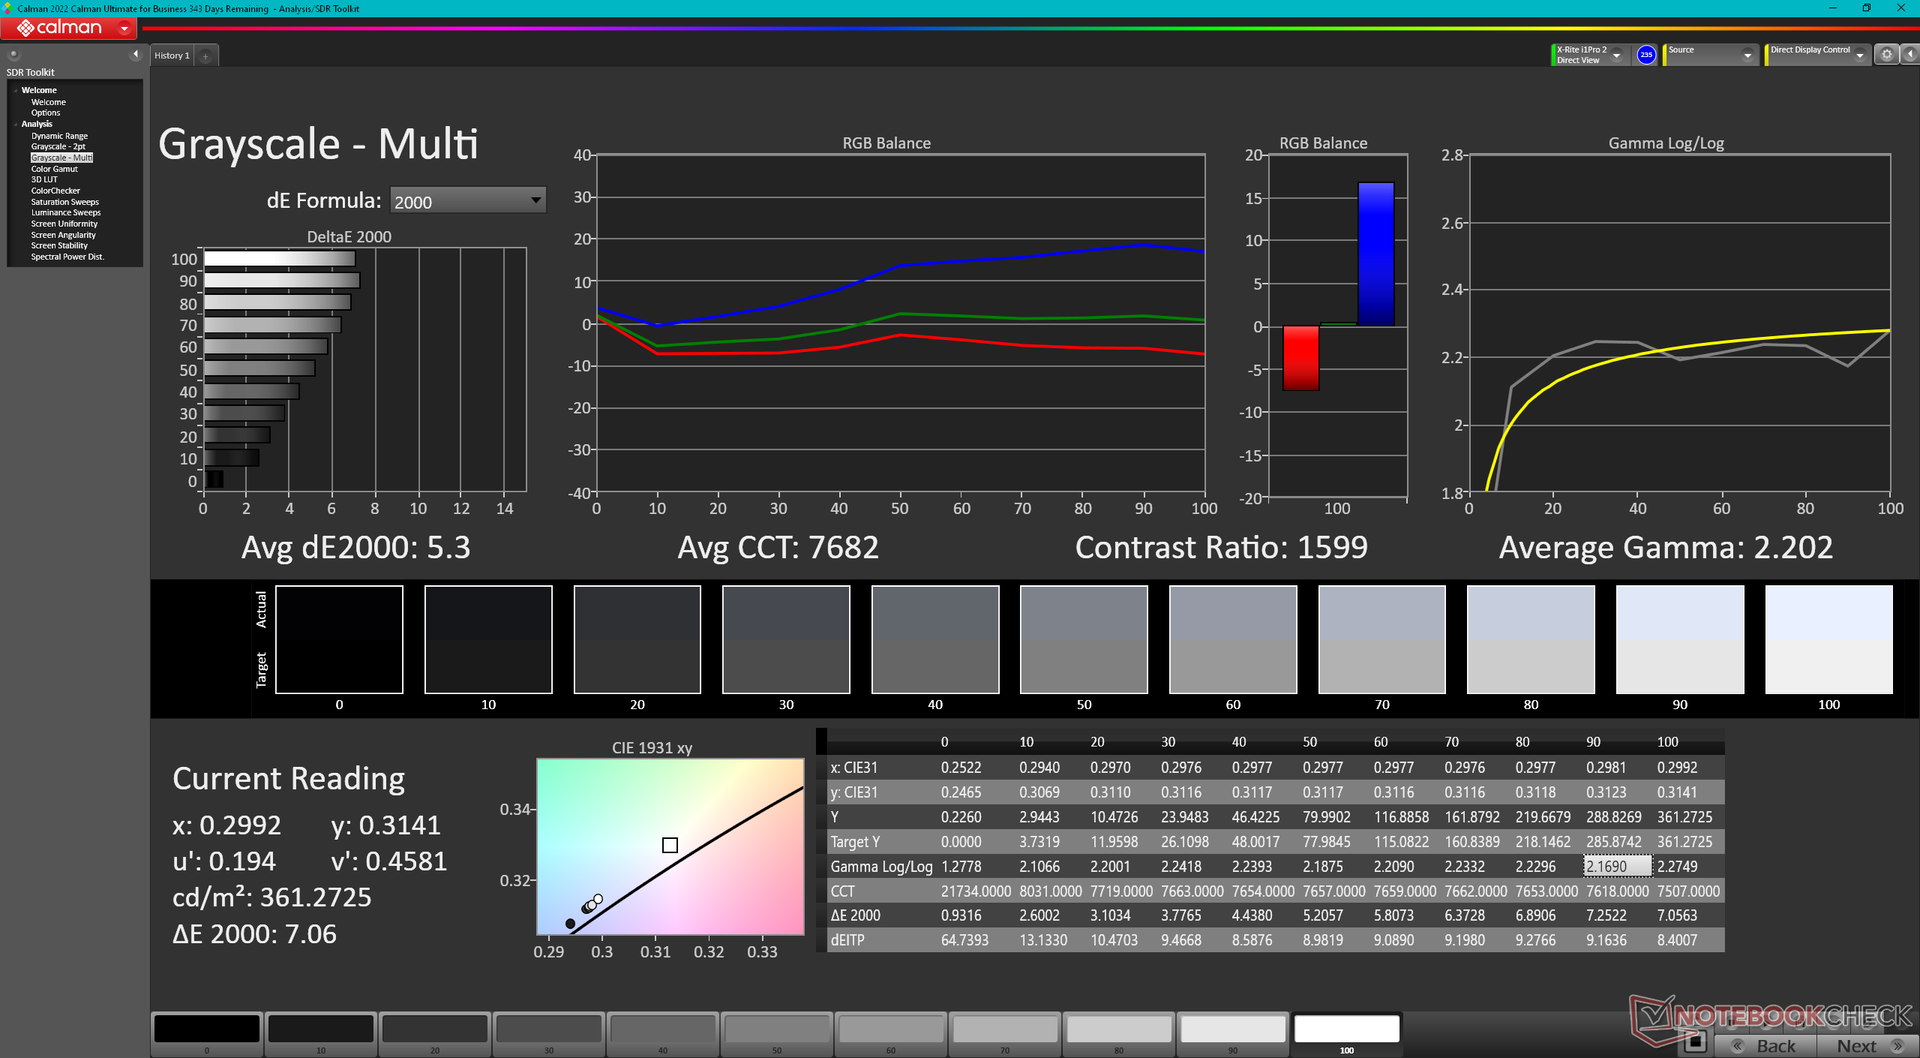
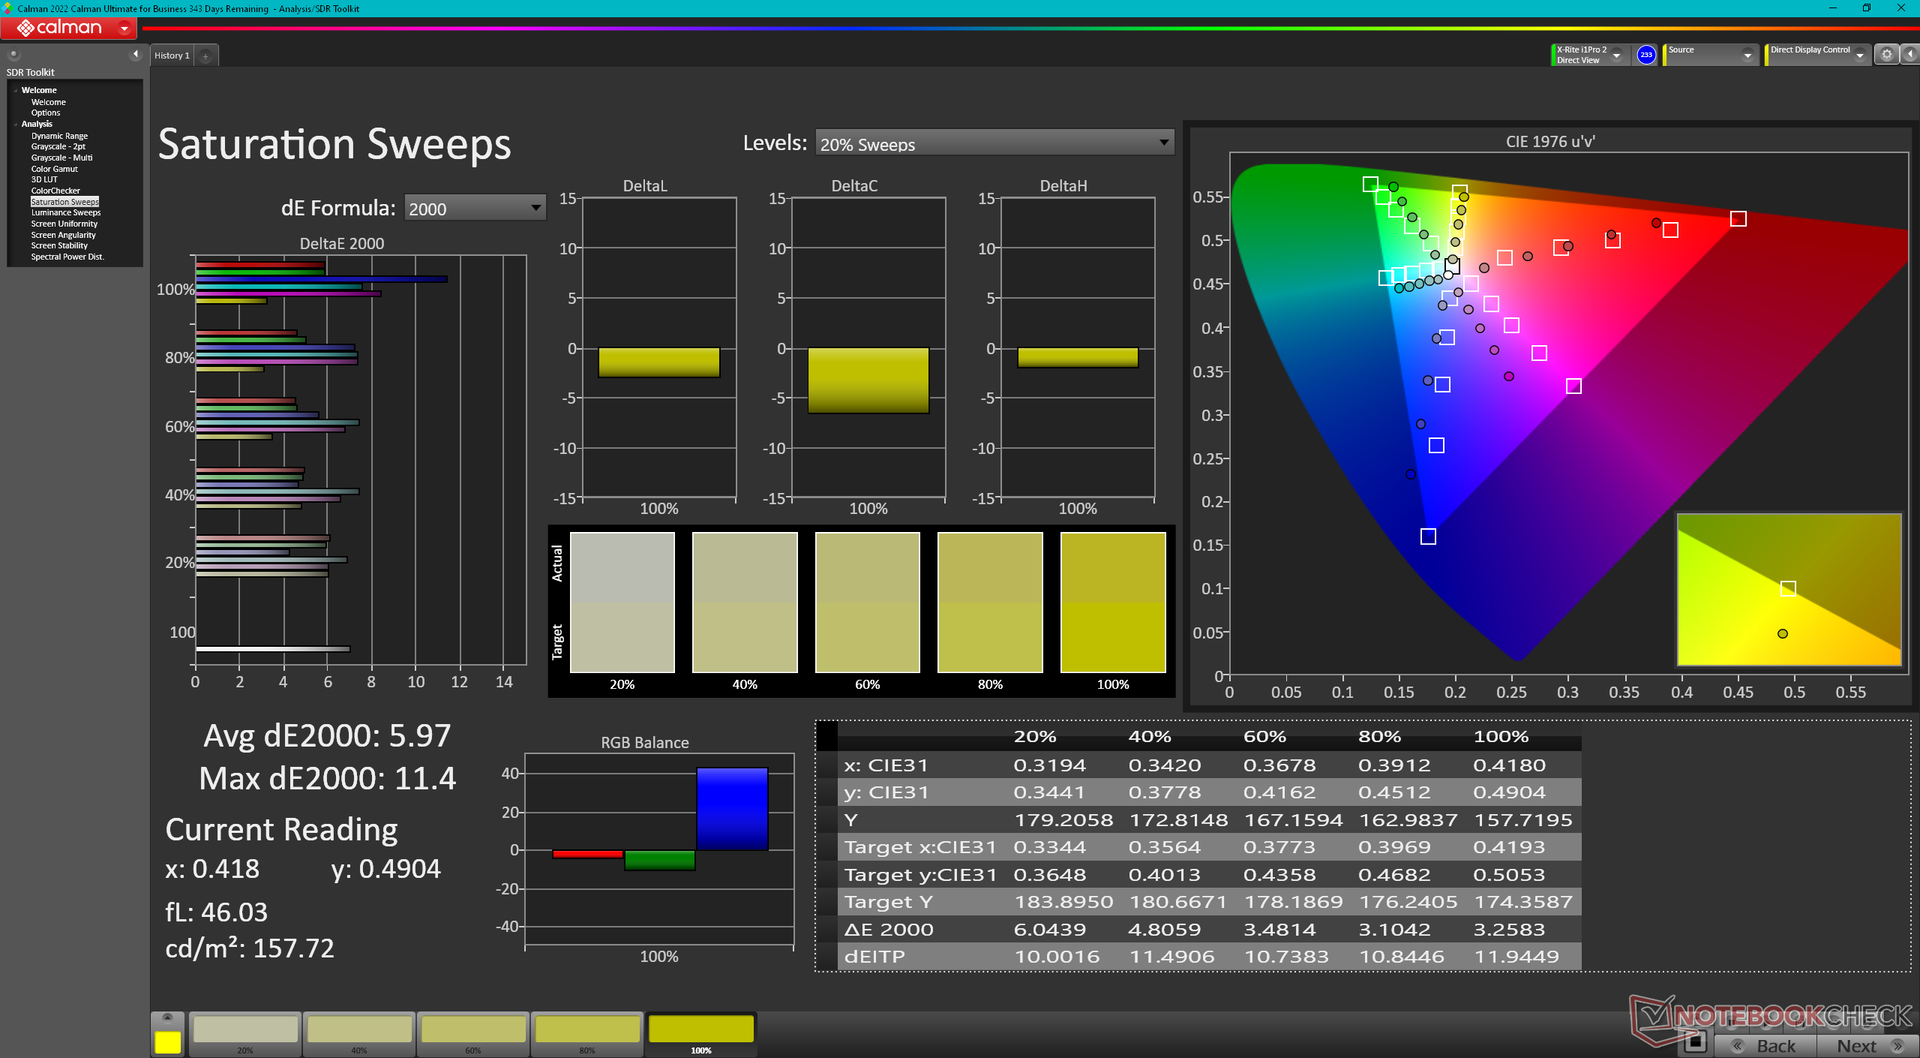
Podczas gdy nasza jednostka AMD została skonfigurowana z panelem 1400p, nasza jednostka Intel jest wyposażona w pogrubioną opcję. Zalecamy panel 1400p, jeśli Państwa zadania wymagają dokładniejszych kolorów i wyższego współczynnika kontrastu. W przeciwnym razie inne atrybuty, takie jak jasność i czas reakcji czerni i bieli, wydają się być spójne między wszystkimi opcjami.
| |||||||||||||||||||||||||
rozświetlenie: 86 %
na akumulatorze: 352.3 cd/m²
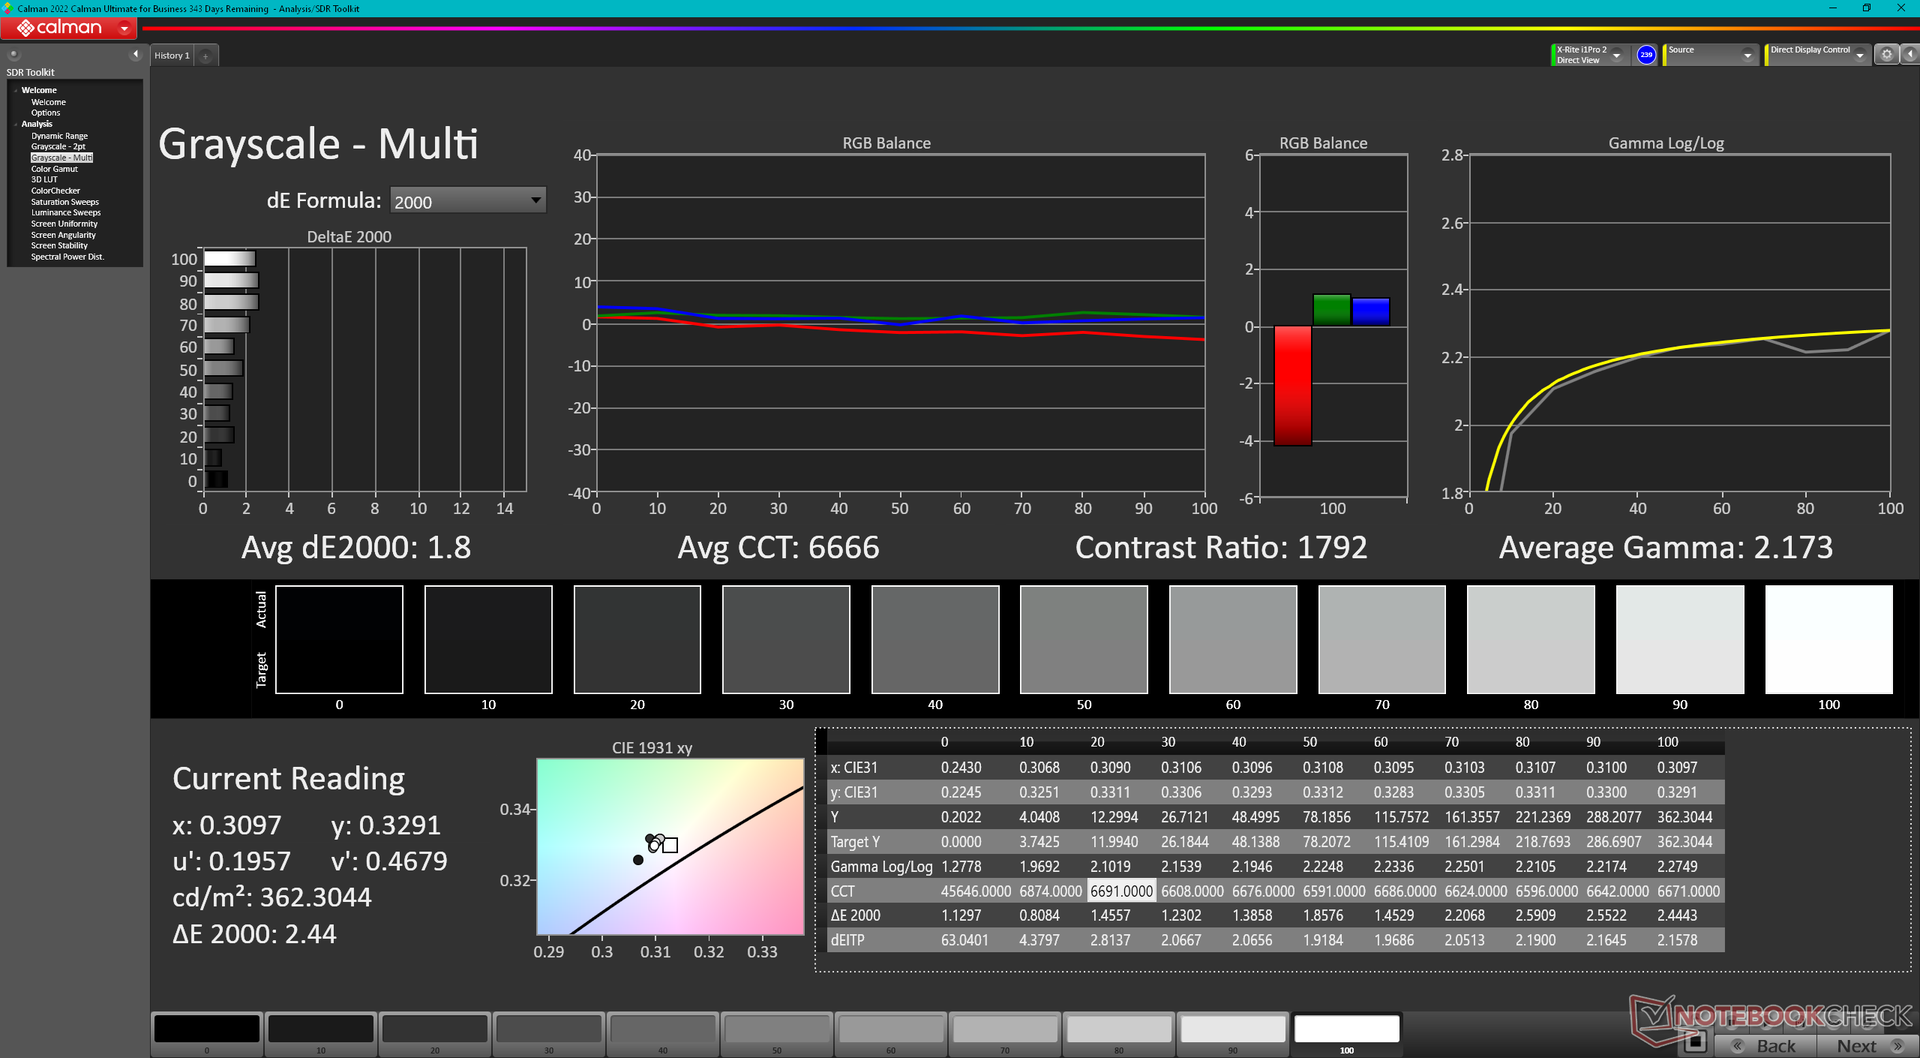
kontrast: 1305:1 (czerń: 0.27 cd/m²)
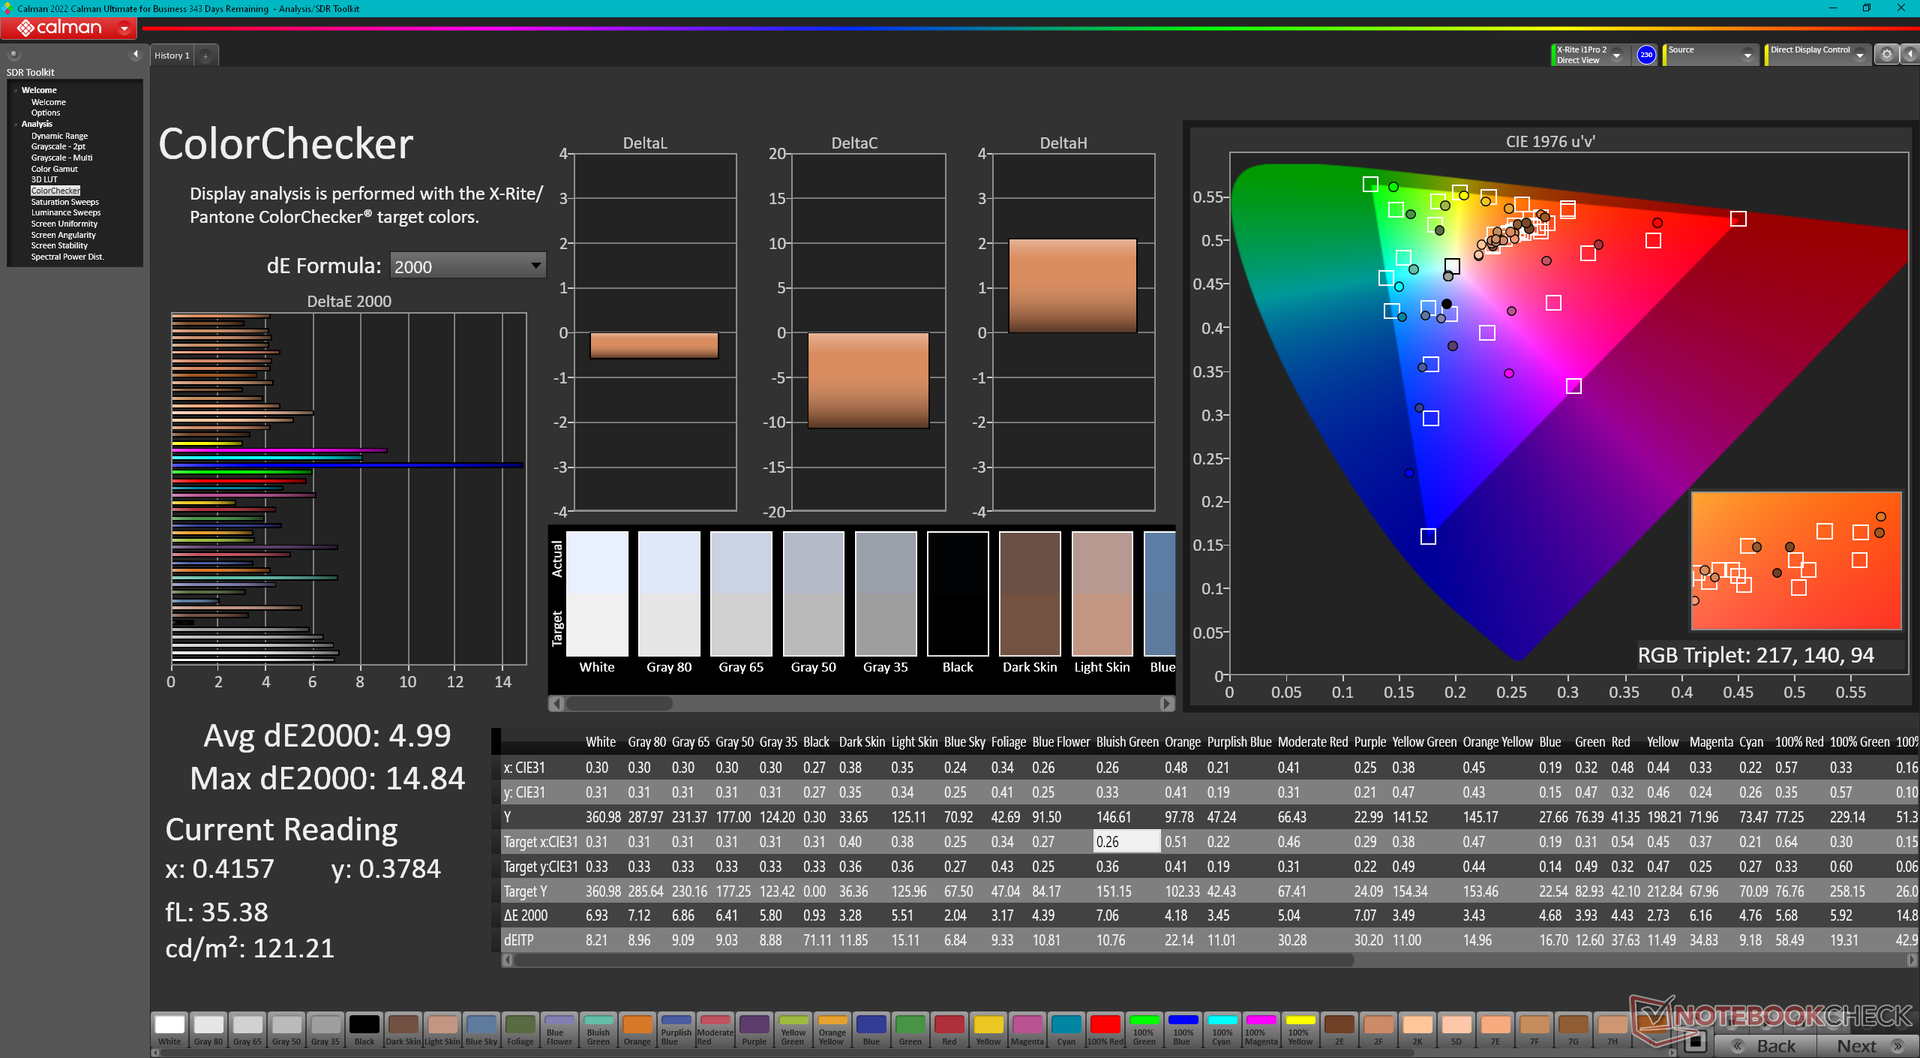
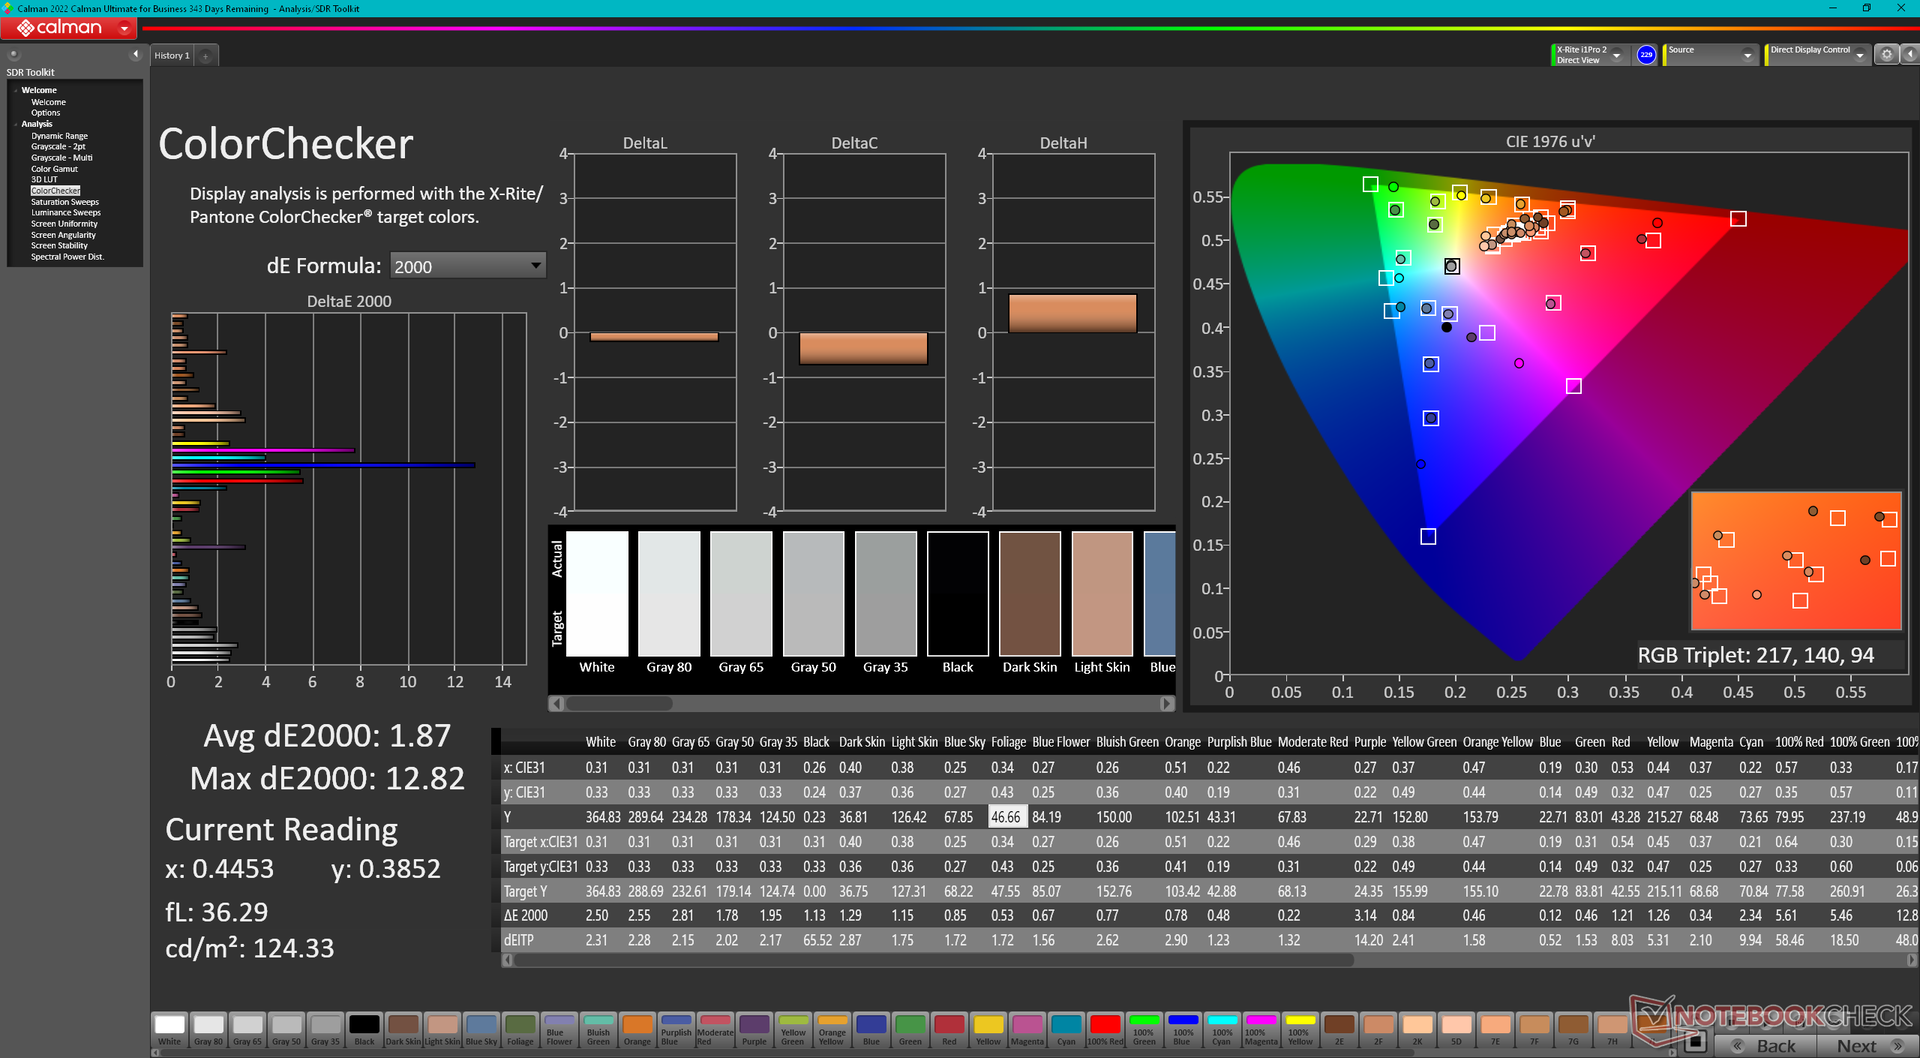
ΔE ColorChecker Calman: 4.99 | ∀{0.5-29.43 Ø4.71}
calibrated: 1.87
ΔE Greyscale Calman: 5.3 | ∀{0.09-98 Ø4.96}
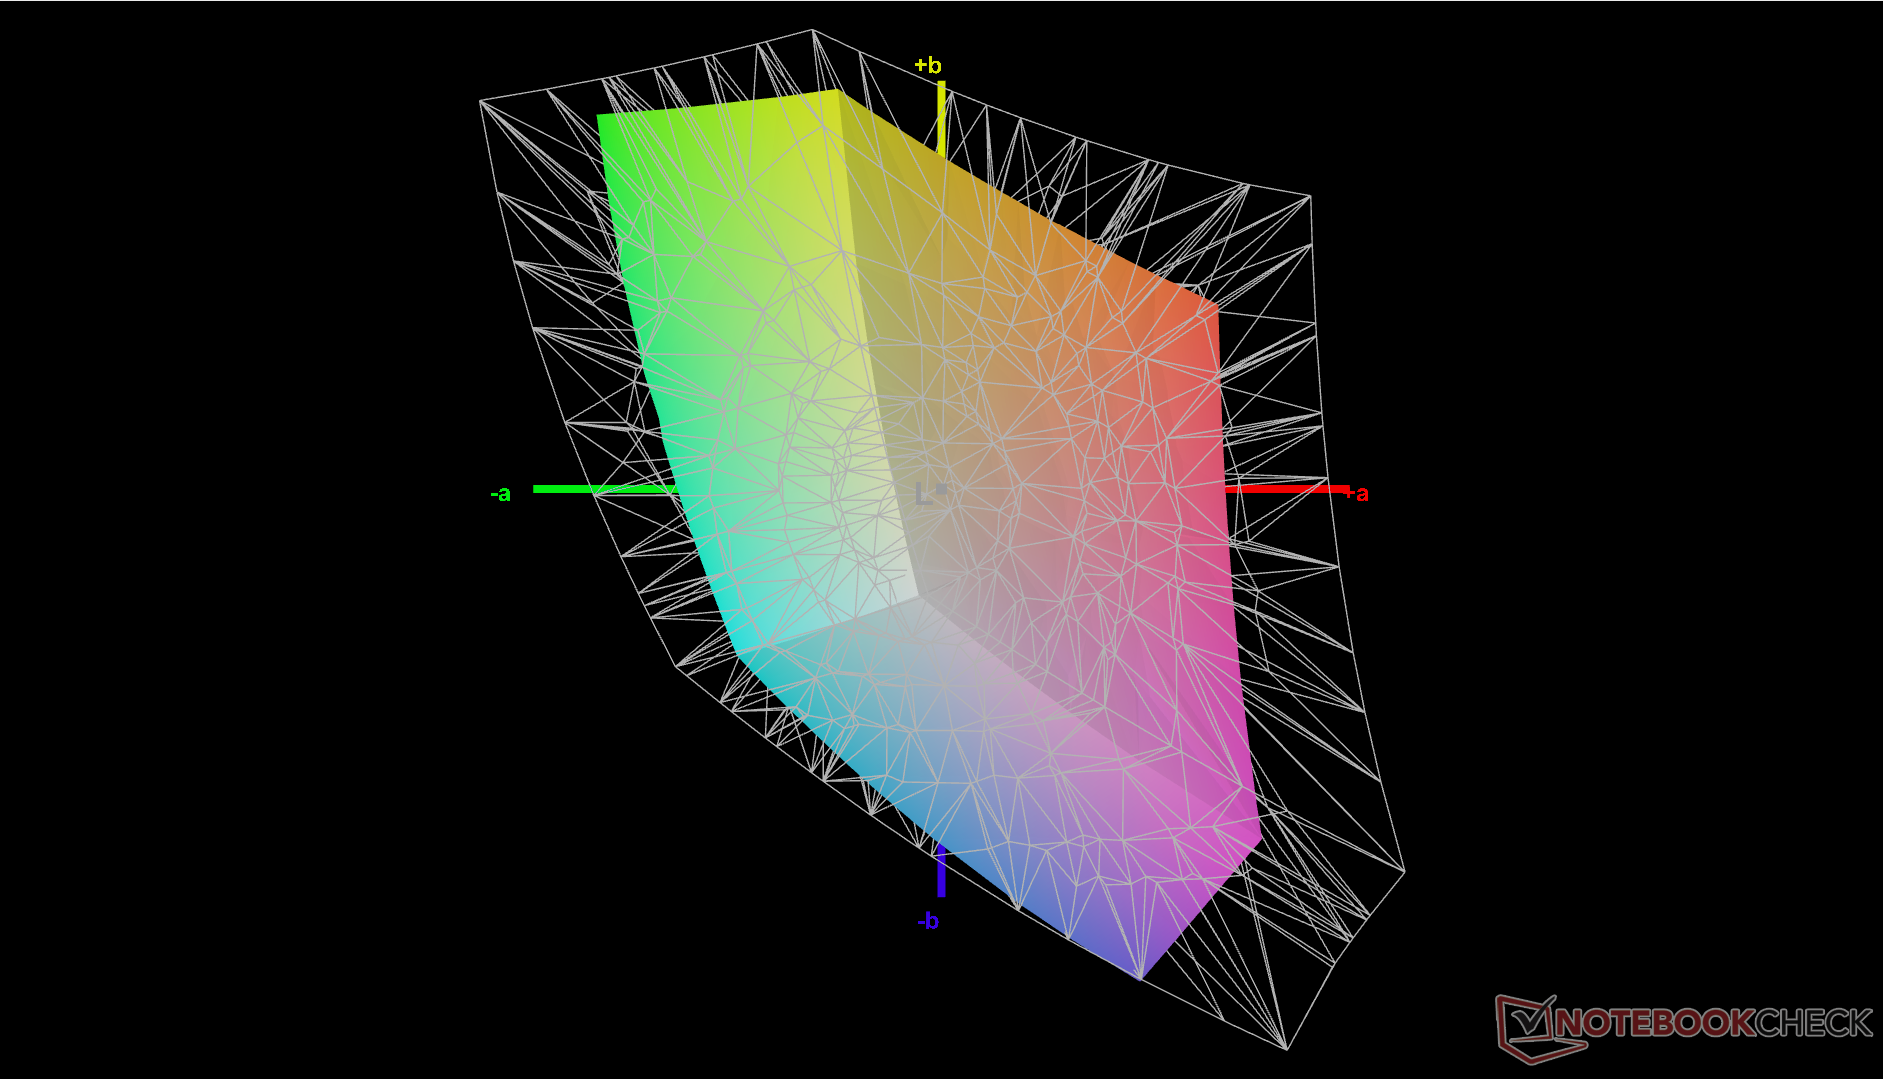
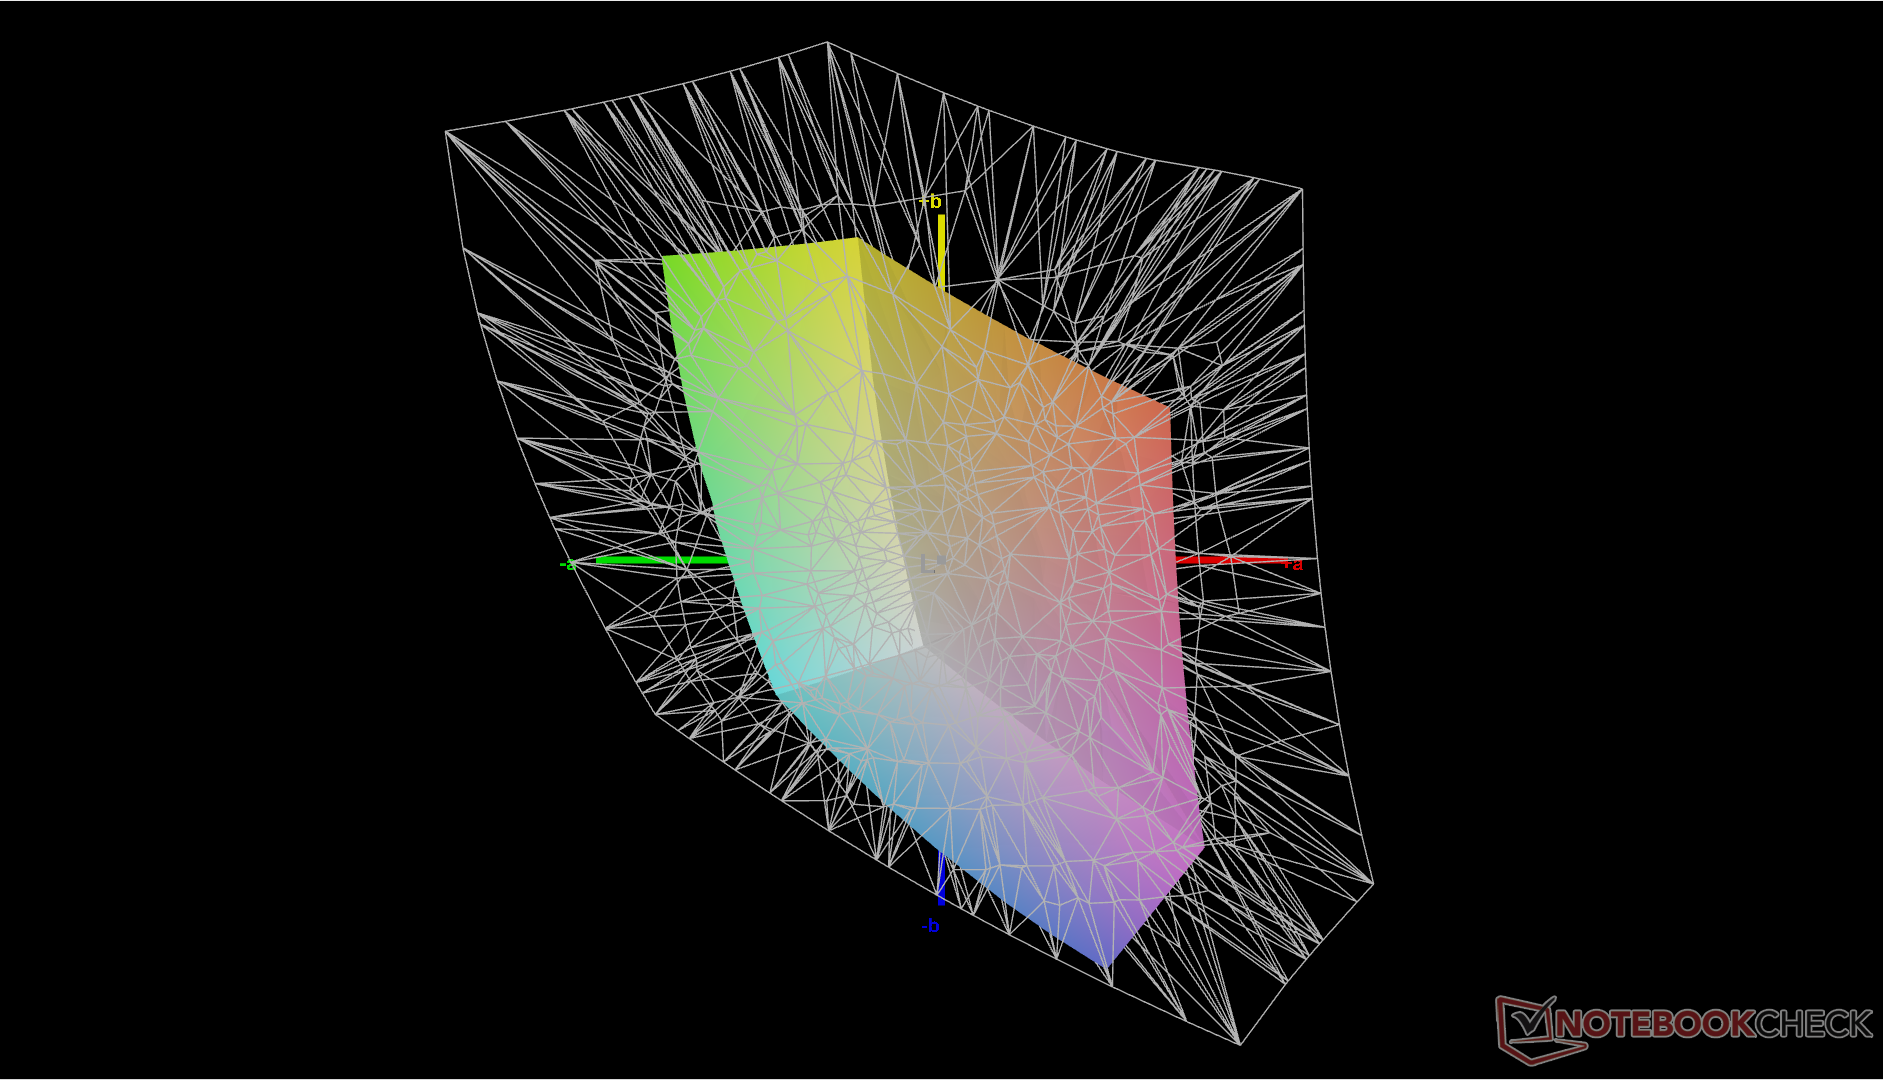
43.3% AdobeRGB 1998 (Argyll 3D)
63% sRGB (Argyll 3D)
41.9% Display P3 (Argyll 3D)
Gamma: 2.2
CCT: 7682 K
| Lenovo ThinkPad E14 G5 i7-1355U R140NW4D R5, IPS, 1920x1200, 14" | Lenovo ThinkPad E14 G5-21JSS05C00 M140NWHE R1, IPS, 2240x1400, 14" | HP EliteBook 845 G10 818N0EA AUO6DA8, IPS, 2560x1600, 14" | Asus ZenBook 14 UM3402Y Samsung ATNA40YK07-1, OLED, 2880x1800, 14" | LG Gram 14Z90Q LG LP140WU1-SPF1, IPS, 1920x1200, 14" | Dell Latitude 7440 AU Optronics B140QAX, IPS, 2560x1600, 14" | |
|---|---|---|---|---|---|---|
| Display | 61% | 97% | 108% | 97% | 72% | |
| Display P3 Coverage (%) | 41.9 | 69.3 65% | 98.3 135% | 99.9 138% | 98.4 135% | 75.4 80% |
| sRGB Coverage (%) | 63 | 97.6 55% | 99.8 58% | 100 59% | 99.9 59% | 99.9 59% |
| AdobeRGB 1998 Coverage (%) | 43.3 | 70.4 63% | 86.2 99% | 98.3 127% | 85.9 98% | 76.2 76% |
| Response Times | -9% | 60% | 94% | -40% | -70% | |
| Response Time Grey 50% / Grey 80% * (ms) | 30.7 ? | 36.3 ? -18% | 12.7 ? 59% | 1.19 ? 96% | 47.5 ? -55% | 56 ? -82% |
| Response Time Black / White * (ms) | 19.6 ? | 19.5 ? 1% | 7.9 ? 60% | 1.62 ? 92% | 24.5 ? -25% | 30.8 ? -57% |
| PWM Frequency (Hz) | 362.3 ? | |||||
| Screen | 33% | 38% | 41% | 14% | 22% | |
| Brightness middle (cd/m²) | 352.3 | 362 3% | 546 55% | 336.6 -4% | 341 -3% | 517.3 47% |
| Brightness (cd/m²) | 344 | 354 3% | 564 64% | 339 -1% | 305 -11% | 488 42% |
| Brightness Distribution (%) | 86 | 91 6% | 86 0% | 98 14% | 87 1% | 88 2% |
| Black Level * (cd/m²) | 0.27 | 0.18 33% | 0.38 -41% | 0.26 4% | 0.34 -26% | |
| Contrast (:1) | 1305 | 2011 54% | 1437 10% | 1312 1% | 1521 17% | |
| Colorchecker dE 2000 * | 4.99 | 2.6 48% | 1.3 74% | 0.84 83% | 3.11 38% | 3.3 34% |
| Colorchecker dE 2000 max. * | 14.84 | 3.7 75% | 5.3 64% | 3.1 79% | 8.29 44% | 7.81 47% |
| Colorchecker dE 2000 calibrated * | 1.87 | 1.1 41% | 1.2 36% | 0.83 56% | 1.02 45% | |
| Greyscale dE 2000 * | 5.3 | 3.3 38% | 1.1 79% | 1.4 74% | 5.3 -0% | 5.6 -6% |
| Gamma | 2.2 100% | 2.28 96% | 2.27 97% | 2.24 98% | 2.037 108% | 2.37 93% |
| CCT | 7682 85% | 6761 96% | 6463 101% | 6439 101% | 7571 86% | 6804 96% |
| Całkowita średnia (program / ustawienia) | 28% /
33% | 65% /
54% | 81% /
69% | 24% /
24% | 8% /
20% |
* ... im mniej tym lepiej
Wyświetlacz nie jest fabrycznie skalibrowany. Samodzielna kalibracja panelu za pomocą kolorymetru X-Rite poprawiłaby średnie wartości deltaE skali szarości i kolorów z odpowiednio 5,3 i 4,99 do zaledwie 1,8 i 1,87. Nasz profil ICM można pobrać bezpłatnie powyżej.
Wyświetl czasy reakcji
| ↔ Czas reakcji od czerni do bieli | ||
|---|---|---|
| 19.6 ms ... wzrost ↗ i spadek ↘ łącznie | ↗ 9.8 ms wzrost | 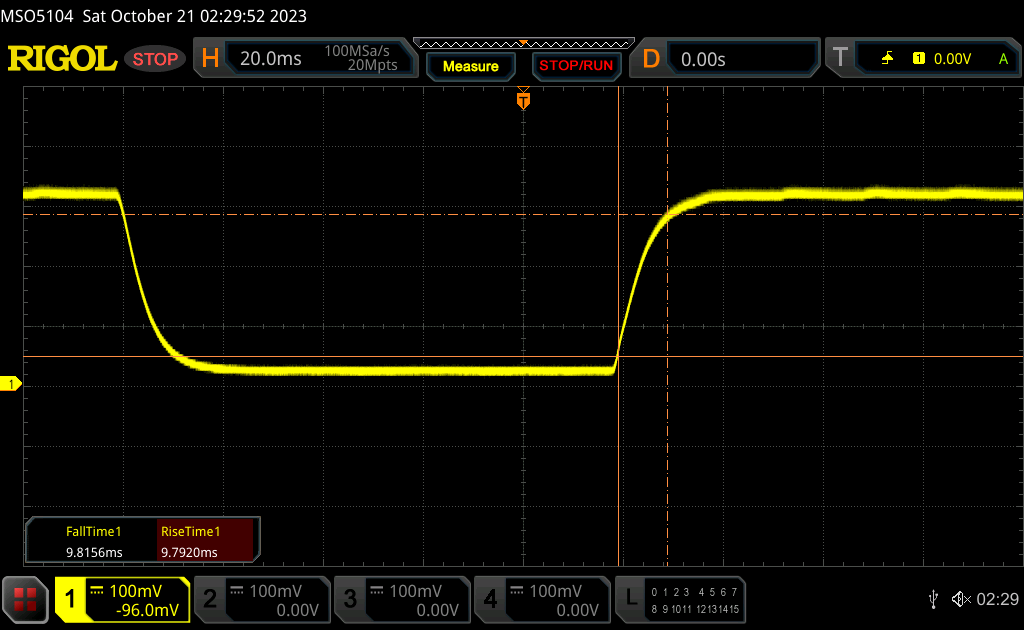 |
| ↘ 9.8 ms upadek | ||
| W naszych testach ekran wykazuje dobry współczynnik reakcji, ale może być zbyt wolny dla graczy rywalizujących ze sobą. Dla porównania, wszystkie testowane urządzenia wahają się od 0.1 (minimum) do 240 (maksimum) ms. » 43 % wszystkich urządzeń jest lepszych. Oznacza to, że zmierzony czas reakcji jest zbliżony do średniej wszystkich testowanych urządzeń (19.8 ms). | ||
| ↔ Czas reakcji 50% szarości do 80% szarości | ||
| 30.7 ms ... wzrost ↗ i spadek ↘ łącznie | ↗ 14.7 ms wzrost | 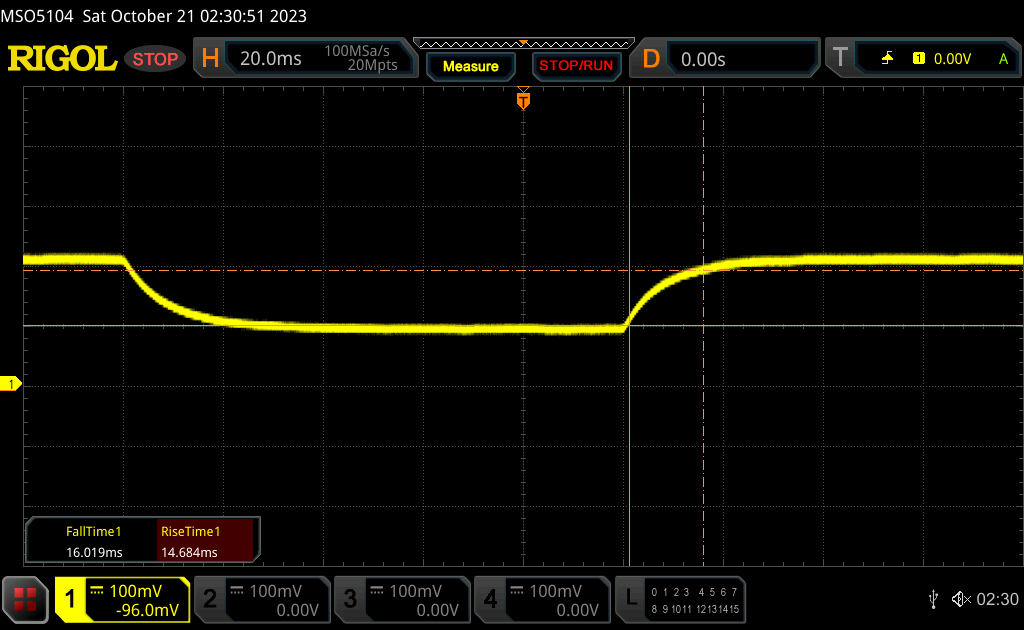 |
| ↘ 16 ms upadek | ||
| W naszych testach ekran wykazuje powolne tempo reakcji, co będzie niezadowalające dla graczy. Dla porównania, wszystkie testowane urządzenia wahają się od 0.165 (minimum) do 636 (maksimum) ms. » 41 % wszystkich urządzeń jest lepszych. Oznacza to, że zmierzony czas reakcji jest zbliżony do średniej wszystkich testowanych urządzeń (31 ms). | ||
Migotanie ekranu / PWM (modulacja szerokości impulsu)
| Migotanie ekranu/nie wykryto PWM | 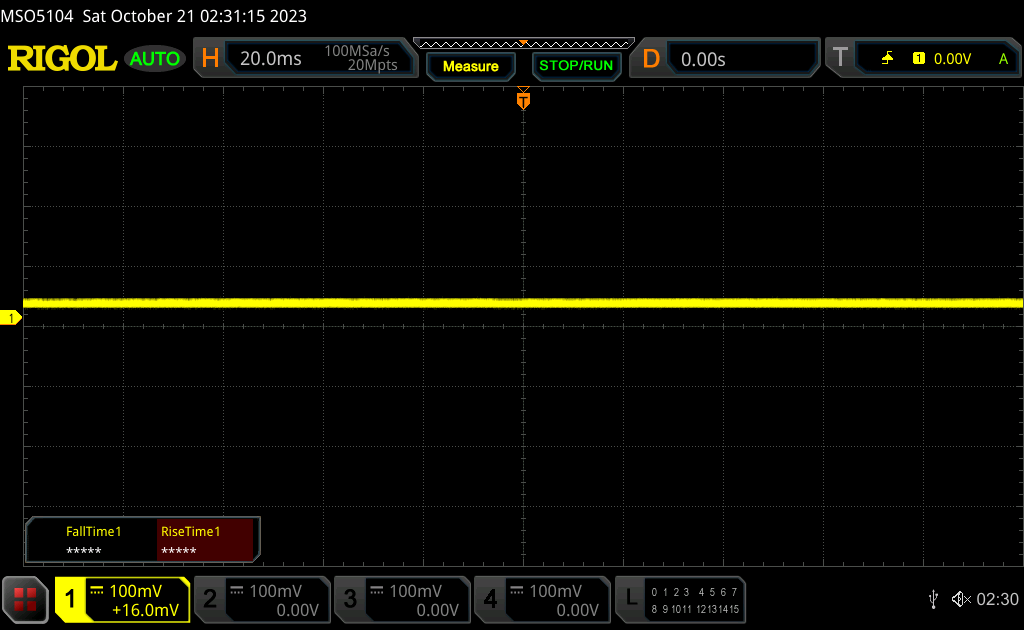 | ||
Dla porównania: 52 % wszystkich testowanych urządzeń nie używa PWM do przyciemniania wyświetlacza. Jeśli wykryto PWM, zmierzono średnio 7757 (minimum: 5 - maksimum: 343500) Hz. | |||
Wydajność
Warunki testowania
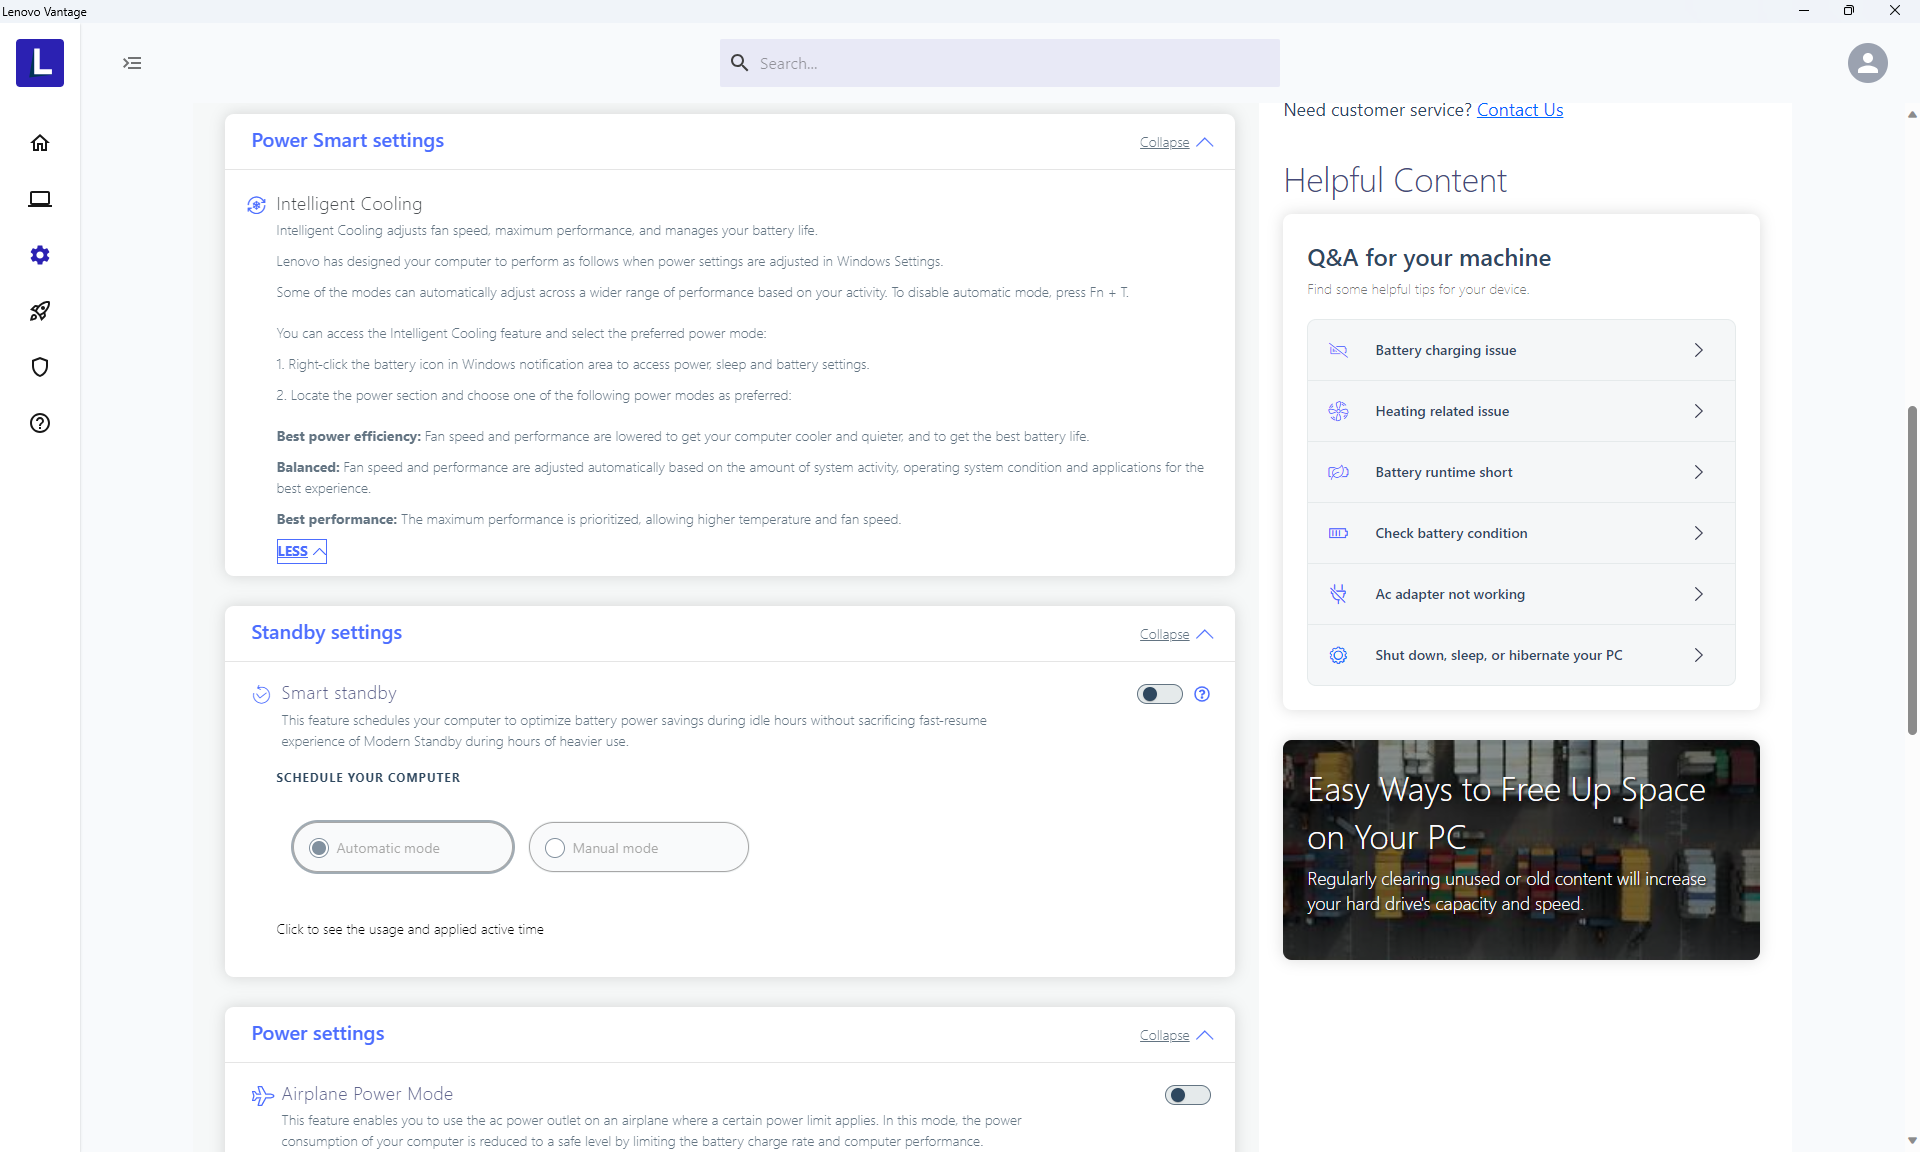
Przed testami ustawiliśmy system Windows na tryb wydajności. Lenovo nie zawiera żadnych specjalistycznych profili zasilania i zamiast tego opiera się na profilach zasilania systemu Windows, aby zmniejszyć zamieszanie.

Procesor
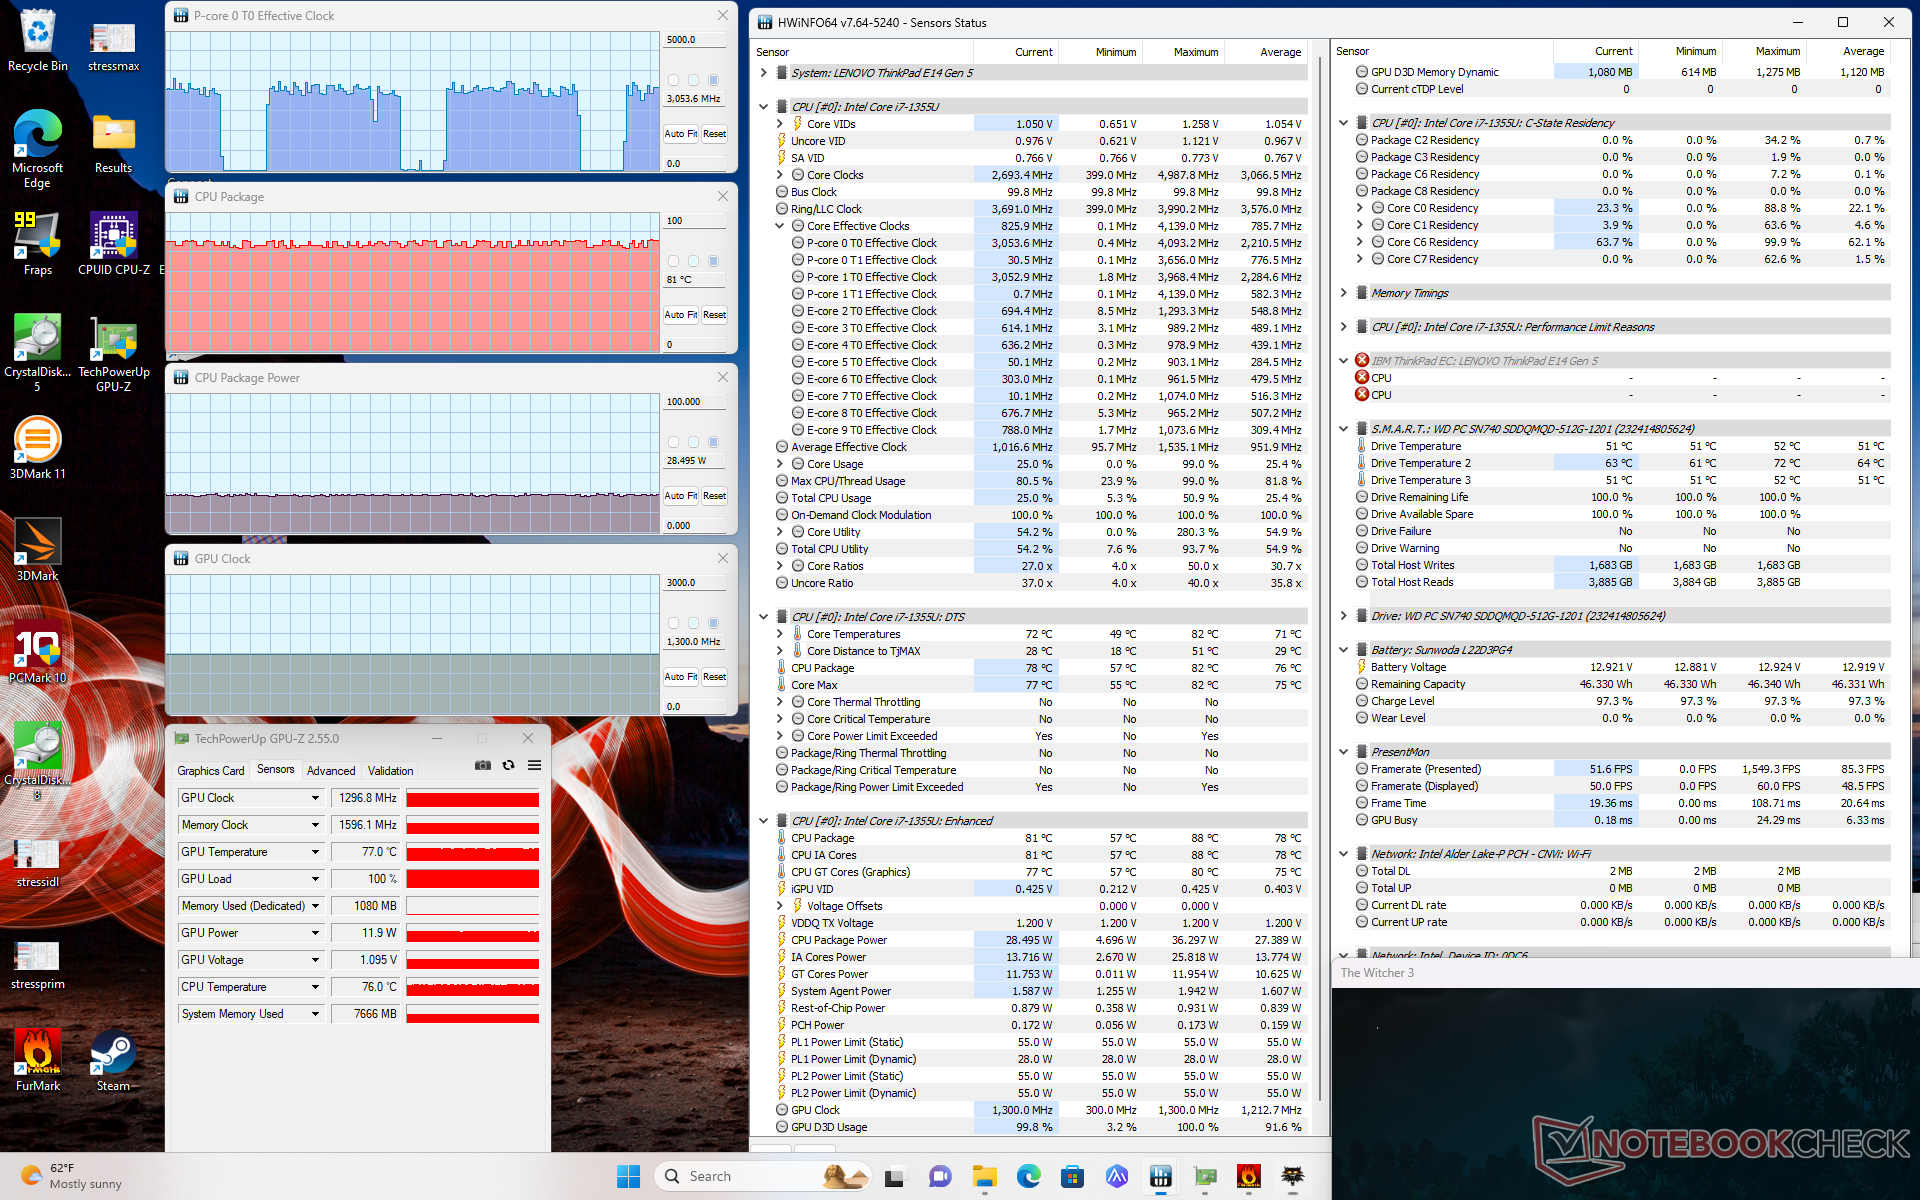
Wydajność procesora jest niższa niż oczekiwano i o około 10 do 15 procent wolniejsza niż w przeciętnym laptopie w naszej bazie danych wyposażonym w ten sam procesor Core i7-1355U. Deficyt można przypisać słabej stabilności Turbo Boost systemu. Podczas uruchamiania CineBench R15 xT w pętli, na przykład, początkowy wynik 1539 punktów spadłby nawet o 35 do 40 procent w drugiej pętli, jak pokazano na poniższym wykresie.
W porównaniu do Ryzen 7 7730U w ThinkPadzie E14 G5 z procesorem AMD, nasz Core i7-1355U oferuje od 25 do 30 procent wyższą wydajność jednowątkową, ale od 25 do 30 procent niższą wydajność wielowątkową po uwzględnieniu dławienia.
Cinebench R15 Multi Loop
Cinebench R23: Multi Core | Single Core
Cinebench R20: CPU (Multi Core) | CPU (Single Core)
Cinebench R15: CPU Multi 64Bit | CPU Single 64Bit
Blender: v2.79 BMW27 CPU
7-Zip 18.03: 7z b 4 | 7z b 4 -mmt1
Geekbench 5.5: Multi-Core | Single-Core
HWBOT x265 Benchmark v2.2: 4k Preset
LibreOffice : 20 Documents To PDF
R Benchmark 2.5: Overall mean
| CPU Performance rating | |
| HP EliteBook 845 G10 818N0EA | |
| Lenovo Yoga Pro 7 14ARP G8 | |
| HP EliteBook 845 G10 5Z4X0ES | |
| HP EliteBook 840 G9 | |
| Dell Latitude 7440 | |
| Lenovo ThinkPad E14 G5-21JSS05C00 | |
| Samsung Galaxy Book3 Pro 14 | |
| Przeciętny Intel Core i7-1355U | |
| Dell Inspiron 14 7435 2-in-1 | |
| HP EliteBook 1040 G10 818N7EA | |
| Lenovo ThinkPad E14 G5 i7-1355U | |
| Asus ExpertBook B3 Flip B3402FEA | |
| LG Gram 14Z90Q | |
| HP Envy 14-eb0252ng | |
| Cinebench R23 / Multi Core | |
| HP EliteBook 845 G10 818N0EA | |
| Lenovo Yoga Pro 7 14ARP G8 | |
| HP EliteBook 845 G10 5Z4X0ES | |
| Lenovo ThinkPad E14 G5-21JSS05C00 | |
| HP EliteBook 840 G9 | |
| Dell Latitude 7440 | |
| Przeciętny Intel Core i7-1355U (6936 - 10252, n=18) | |
| Dell Inspiron 14 7435 2-in-1 | |
| Samsung Galaxy Book3 Pro 14 | |
| Lenovo ThinkPad E14 G5 i7-1355U | |
| HP EliteBook 1040 G10 818N7EA | |
| HP Envy 14-eb0252ng | |
| Asus ExpertBook B3 Flip B3402FEA | |
| LG Gram 14Z90Q | |
| Cinebench R23 / Single Core | |
| Lenovo ThinkPad E14 G5 i7-1355U | |
| Przeciętny Intel Core i7-1355U (1687 - 1889, n=18) | |
| Dell Latitude 7440 | |
| HP EliteBook 840 G9 | |
| HP EliteBook 1040 G10 818N7EA | |
| Samsung Galaxy Book3 Pro 14 | |
| HP EliteBook 845 G10 5Z4X0ES | |
| HP EliteBook 845 G10 818N0EA | |
| Lenovo Yoga Pro 7 14ARP G8 | |
| Asus ExpertBook B3 Flip B3402FEA | |
| Lenovo ThinkPad E14 G5-21JSS05C00 | |
| Dell Inspiron 14 7435 2-in-1 | |
| HP Envy 14-eb0252ng | |
| LG Gram 14Z90Q | |
| Cinebench R20 / CPU (Multi Core) | |
| HP EliteBook 845 G10 818N0EA | |
| Lenovo Yoga Pro 7 14ARP G8 | |
| HP EliteBook 845 G10 5Z4X0ES | |
| HP EliteBook 840 G9 | |
| Lenovo ThinkPad E14 G5-21JSS05C00 | |
| Dell Latitude 7440 | |
| Przeciętny Intel Core i7-1355U (2849 - 3907, n=18) | |
| Samsung Galaxy Book3 Pro 14 | |
| Dell Inspiron 14 7435 2-in-1 | |
| Lenovo ThinkPad E14 G5 i7-1355U | |
| HP EliteBook 1040 G10 818N7EA | |
| HP Envy 14-eb0252ng | |
| Asus ExpertBook B3 Flip B3402FEA | |
| LG Gram 14Z90Q | |
| Cinebench R20 / CPU (Single Core) | |
| Lenovo ThinkPad E14 G5 i7-1355U | |
| Przeciętny Intel Core i7-1355U (654 - 725, n=18) | |
| Dell Latitude 7440 | |
| HP EliteBook 1040 G10 818N7EA | |
| Samsung Galaxy Book3 Pro 14 | |
| HP EliteBook 840 G9 | |
| HP EliteBook 845 G10 818N0EA | |
| HP EliteBook 845 G10 5Z4X0ES | |
| Lenovo Yoga Pro 7 14ARP G8 | |
| Lenovo ThinkPad E14 G5-21JSS05C00 | |
| Asus ExpertBook B3 Flip B3402FEA | |
| Dell Inspiron 14 7435 2-in-1 | |
| HP Envy 14-eb0252ng | |
| LG Gram 14Z90Q | |
| Cinebench R15 / CPU Multi 64Bit | |
| HP EliteBook 845 G10 818N0EA | |
| Lenovo Yoga Pro 7 14ARP G8 | |
| HP EliteBook 845 G10 5Z4X0ES | |
| HP EliteBook 840 G9 | |
| Lenovo ThinkPad E14 G5-21JSS05C00 | |
| Samsung Galaxy Book3 Pro 14 | |
| Dell Latitude 7440 | |
| Lenovo ThinkPad E14 G5 i7-1355U | |
| HP EliteBook 1040 G10 818N7EA | |
| Przeciętny Intel Core i7-1355U (1206 - 1735, n=18) | |
| Dell Inspiron 14 7435 2-in-1 | |
| LG Gram 14Z90Q | |
| HP Envy 14-eb0252ng | |
| Asus ExpertBook B3 Flip B3402FEA | |
| Cinebench R15 / CPU Single 64Bit | |
| Lenovo ThinkPad E14 G5 i7-1355U | |
| HP EliteBook 840 G9 | |
| Przeciętny Intel Core i7-1355U (237 - 267, n=18) | |
| HP EliteBook 845 G10 5Z4X0ES | |
| Lenovo Yoga Pro 7 14ARP G8 | |
| HP EliteBook 1040 G10 818N7EA | |
| HP EliteBook 845 G10 818N0EA | |
| Dell Latitude 7440 | |
| Samsung Galaxy Book3 Pro 14 | |
| Lenovo ThinkPad E14 G5-21JSS05C00 | |
| Dell Inspiron 14 7435 2-in-1 | |
| LG Gram 14Z90Q | |
| Asus ExpertBook B3 Flip B3402FEA | |
| HP Envy 14-eb0252ng | |
| Blender / v2.79 BMW27 CPU | |
| HP Envy 14-eb0252ng | |
| Asus ExpertBook B3 Flip B3402FEA | |
| LG Gram 14Z90Q | |
| HP EliteBook 1040 G10 818N7EA | |
| Lenovo ThinkPad E14 G5 i7-1355U | |
| Przeciętny Intel Core i7-1355U (328 - 503, n=18) | |
| Dell Inspiron 14 7435 2-in-1 | |
| Samsung Galaxy Book3 Pro 14 | |
| Dell Latitude 7440 | |
| HP EliteBook 840 G9 | |
| Lenovo ThinkPad E14 G5-21JSS05C00 | |
| HP EliteBook 845 G10 5Z4X0ES | |
| Lenovo Yoga Pro 7 14ARP G8 | |
| HP EliteBook 845 G10 818N0EA | |
| 7-Zip 18.03 / 7z b 4 | |
| HP EliteBook 845 G10 818N0EA | |
| Lenovo Yoga Pro 7 14ARP G8 | |
| HP EliteBook 845 G10 5Z4X0ES | |
| Lenovo ThinkPad E14 G5-21JSS05C00 | |
| HP EliteBook 840 G9 | |
| Dell Latitude 7440 | |
| Samsung Galaxy Book3 Pro 14 | |
| Dell Inspiron 14 7435 2-in-1 | |
| Przeciętny Intel Core i7-1355U (30255 - 42092, n=18) | |
| Lenovo ThinkPad E14 G5 i7-1355U | |
| HP EliteBook 1040 G10 818N7EA | |
| LG Gram 14Z90Q | |
| Asus ExpertBook B3 Flip B3402FEA | |
| HP Envy 14-eb0252ng | |
| 7-Zip 18.03 / 7z b 4 -mmt1 | |
| HP EliteBook 845 G10 5Z4X0ES | |
| HP EliteBook 840 G9 | |
| HP EliteBook 845 G10 818N0EA | |
| Samsung Galaxy Book3 Pro 14 | |
| Lenovo ThinkPad E14 G5 i7-1355U | |
| Przeciętny Intel Core i7-1355U (5301 - 5911, n=18) | |
| Lenovo Yoga Pro 7 14ARP G8 | |
| Lenovo ThinkPad E14 G5-21JSS05C00 | |
| HP EliteBook 1040 G10 818N7EA | |
| Dell Latitude 7440 | |
| Dell Inspiron 14 7435 2-in-1 | |
| Asus ExpertBook B3 Flip B3402FEA | |
| HP Envy 14-eb0252ng | |
| LG Gram 14Z90Q | |
| Geekbench 5.5 / Multi-Core | |
| HP EliteBook 840 G9 | |
| HP EliteBook 845 G10 818N0EA | |
| HP EliteBook 845 G10 5Z4X0ES | |
| Lenovo Yoga Pro 7 14ARP G8 | |
| Samsung Galaxy Book3 Pro 14 | |
| HP EliteBook 1040 G10 818N7EA | |
| Dell Latitude 7440 | |
| Przeciętny Intel Core i7-1355U (7507 - 9328, n=18) | |
| LG Gram 14Z90Q | |
| Lenovo ThinkPad E14 G5 i7-1355U | |
| Lenovo ThinkPad E14 G5-21JSS05C00 | |
| Dell Inspiron 14 7435 2-in-1 | |
| Asus ExpertBook B3 Flip B3402FEA | |
| HP Envy 14-eb0252ng | |
| Geekbench 5.5 / Single-Core | |
| Samsung Galaxy Book3 Pro 14 | |
| Przeciętny Intel Core i7-1355U (1678 - 1872, n=18) | |
| Lenovo ThinkPad E14 G5 i7-1355U | |
| HP EliteBook 840 G9 | |
| HP EliteBook 845 G10 818N0EA | |
| HP EliteBook 845 G10 5Z4X0ES | |
| Dell Latitude 7440 | |
| HP EliteBook 1040 G10 818N7EA | |
| LG Gram 14Z90Q | |
| Lenovo Yoga Pro 7 14ARP G8 | |
| Asus ExpertBook B3 Flip B3402FEA | |
| Lenovo ThinkPad E14 G5-21JSS05C00 | |
| Dell Inspiron 14 7435 2-in-1 | |
| HP Envy 14-eb0252ng | |
| HWBOT x265 Benchmark v2.2 / 4k Preset | |
| HP EliteBook 845 G10 818N0EA | |
| Lenovo Yoga Pro 7 14ARP G8 | |
| HP EliteBook 845 G10 5Z4X0ES | |
| Lenovo ThinkPad E14 G5-21JSS05C00 | |
| HP EliteBook 840 G9 | |
| Dell Inspiron 14 7435 2-in-1 | |
| Dell Latitude 7440 | |
| Przeciętny Intel Core i7-1355U (7.83 - 11.4, n=18) | |
| Samsung Galaxy Book3 Pro 14 | |
| Lenovo ThinkPad E14 G5 i7-1355U | |
| LG Gram 14Z90Q | |
| HP Envy 14-eb0252ng | |
| HP EliteBook 1040 G10 818N7EA | |
| Asus ExpertBook B3 Flip B3402FEA | |
| LibreOffice / 20 Documents To PDF | |
| Lenovo ThinkPad E14 G5 i7-1355U | |
| HP Envy 14-eb0252ng | |
| HP EliteBook 1040 G10 818N7EA | |
| LG Gram 14Z90Q | |
| Lenovo Yoga Pro 7 14ARP G8 | |
| Przeciętny Intel Core i7-1355U (41.1 - 108.6, n=18) | |
| Lenovo ThinkPad E14 G5-21JSS05C00 | |
| HP EliteBook 845 G10 818N0EA | |
| Dell Inspiron 14 7435 2-in-1 | |
| Asus ExpertBook B3 Flip B3402FEA | |
| HP EliteBook 845 G10 5Z4X0ES | |
| Samsung Galaxy Book3 Pro 14 | |
| Dell Latitude 7440 | |
| HP EliteBook 840 G9 | |
| R Benchmark 2.5 / Overall mean | |
| Lenovo ThinkPad E14 G5 i7-1355U | |
| HP Envy 14-eb0252ng | |
| Asus ExpertBook B3 Flip B3402FEA | |
| LG Gram 14Z90Q | |
| Dell Inspiron 14 7435 2-in-1 | |
| Lenovo ThinkPad E14 G5-21JSS05C00 | |
| HP EliteBook 1040 G10 818N7EA | |
| Lenovo Yoga Pro 7 14ARP G8 | |
| Dell Latitude 7440 | |
| Przeciętny Intel Core i7-1355U (0.4481 - 0.832, n=18) | |
| Samsung Galaxy Book3 Pro 14 | |
| HP EliteBook 845 G10 818N0EA | |
| HP EliteBook 845 G10 5Z4X0ES | |
| HP EliteBook 840 G9 | |
Cinebench R23: Multi Core | Single Core
Cinebench R20: CPU (Multi Core) | CPU (Single Core)
Cinebench R15: CPU Multi 64Bit | CPU Single 64Bit
Blender: v2.79 BMW27 CPU
7-Zip 18.03: 7z b 4 | 7z b 4 -mmt1
Geekbench 5.5: Multi-Core | Single-Core
HWBOT x265 Benchmark v2.2: 4k Preset
LibreOffice : 20 Documents To PDF
R Benchmark 2.5: Overall mean
* ... im mniej tym lepiej
AIDA64: FP32 Ray-Trace | FPU Julia | CPU SHA3 | CPU Queen | FPU SinJulia | FPU Mandel | CPU AES | CPU ZLib | FP64 Ray-Trace | CPU PhotoWorxx
| Performance rating | |
| HP EliteBook 845 G10 818N0EA | |
| Asus ZenBook 14 UM3402Y | |
| Lenovo ThinkPad E14 G5-21JSS05C00 | |
| Dell Latitude 7440 | |
| Przeciętny Intel Core i7-1355U | |
| Lenovo ThinkPad E14 G5 i7-1355U | |
| LG Gram 14Z90Q | |
| AIDA64 / FP32 Ray-Trace | |
| HP EliteBook 845 G10 818N0EA | |
| Asus ZenBook 14 UM3402Y | |
| Lenovo ThinkPad E14 G5-21JSS05C00 | |
| Dell Latitude 7440 | |
| Przeciętny Intel Core i7-1355U (5673 - 8424, n=18) | |
| Lenovo ThinkPad E14 G5 i7-1355U | |
| LG Gram 14Z90Q | |
| AIDA64 / FPU Julia | |
| HP EliteBook 845 G10 818N0EA | |
| Asus ZenBook 14 UM3402Y | |
| Lenovo ThinkPad E14 G5-21JSS05C00 | |
| Dell Latitude 7440 | |
| Przeciętny Intel Core i7-1355U (29580 - 42706, n=18) | |
| Lenovo ThinkPad E14 G5 i7-1355U | |
| LG Gram 14Z90Q | |
| AIDA64 / CPU SHA3 | |
| HP EliteBook 845 G10 818N0EA | |
| Asus ZenBook 14 UM3402Y | |
| Lenovo ThinkPad E14 G5-21JSS05C00 | |
| Dell Latitude 7440 | |
| Przeciętny Intel Core i7-1355U (1529 - 2200, n=18) | |
| Lenovo ThinkPad E14 G5 i7-1355U | |
| LG Gram 14Z90Q | |
| AIDA64 / CPU Queen | |
| HP EliteBook 845 G10 818N0EA | |
| Asus ZenBook 14 UM3402Y | |
| Lenovo ThinkPad E14 G5-21JSS05C00 | |
| LG Gram 14Z90Q | |
| Lenovo ThinkPad E14 G5 i7-1355U | |
| Dell Latitude 7440 | |
| Przeciętny Intel Core i7-1355U (21547 - 66907, n=18) | |
| AIDA64 / FPU SinJulia | |
| HP EliteBook 845 G10 818N0EA | |
| Asus ZenBook 14 UM3402Y | |
| Lenovo ThinkPad E14 G5-21JSS05C00 | |
| Dell Latitude 7440 | |
| Lenovo ThinkPad E14 G5 i7-1355U | |
| Przeciętny Intel Core i7-1355U (4045 - 5426, n=18) | |
| LG Gram 14Z90Q | |
| AIDA64 / FPU Mandel | |
| HP EliteBook 845 G10 818N0EA | |
| Asus ZenBook 14 UM3402Y | |
| Lenovo ThinkPad E14 G5-21JSS05C00 | |
| Dell Latitude 7440 | |
| Przeciętny Intel Core i7-1355U (14596 - 21627, n=18) | |
| Lenovo ThinkPad E14 G5 i7-1355U | |
| LG Gram 14Z90Q | |
| AIDA64 / CPU AES | |
| HP EliteBook 845 G10 818N0EA | |
| Asus ZenBook 14 UM3402Y | |
| Lenovo ThinkPad E14 G5-21JSS05C00 | |
| Dell Latitude 7440 | |
| Przeciętny Intel Core i7-1355U (31432 - 75408, n=18) | |
| Lenovo ThinkPad E14 G5 i7-1355U | |
| LG Gram 14Z90Q | |
| AIDA64 / CPU ZLib | |
| HP EliteBook 845 G10 818N0EA | |
| Asus ZenBook 14 UM3402Y | |
| Lenovo ThinkPad E14 G5-21JSS05C00 | |
| Dell Latitude 7440 | |
| Przeciętny Intel Core i7-1355U (454 - 684, n=18) | |
| Lenovo ThinkPad E14 G5 i7-1355U | |
| LG Gram 14Z90Q | |
| AIDA64 / FP64 Ray-Trace | |
| HP EliteBook 845 G10 818N0EA | |
| Asus ZenBook 14 UM3402Y | |
| Lenovo ThinkPad E14 G5-21JSS05C00 | |
| Dell Latitude 7440 | |
| Przeciętny Intel Core i7-1355U (2991 - 4453, n=18) | |
| LG Gram 14Z90Q | |
| Lenovo ThinkPad E14 G5 i7-1355U | |
| AIDA64 / CPU PhotoWorxx | |
| Dell Latitude 7440 | |
| Przeciętny Intel Core i7-1355U (21800 - 46154, n=18) | |
| HP EliteBook 845 G10 818N0EA | |
| LG Gram 14Z90Q | |
| Lenovo ThinkPad E14 G5 i7-1355U | |
| Asus ZenBook 14 UM3402Y | |
| Lenovo ThinkPad E14 G5-21JSS05C00 | |
Wydajność systemu
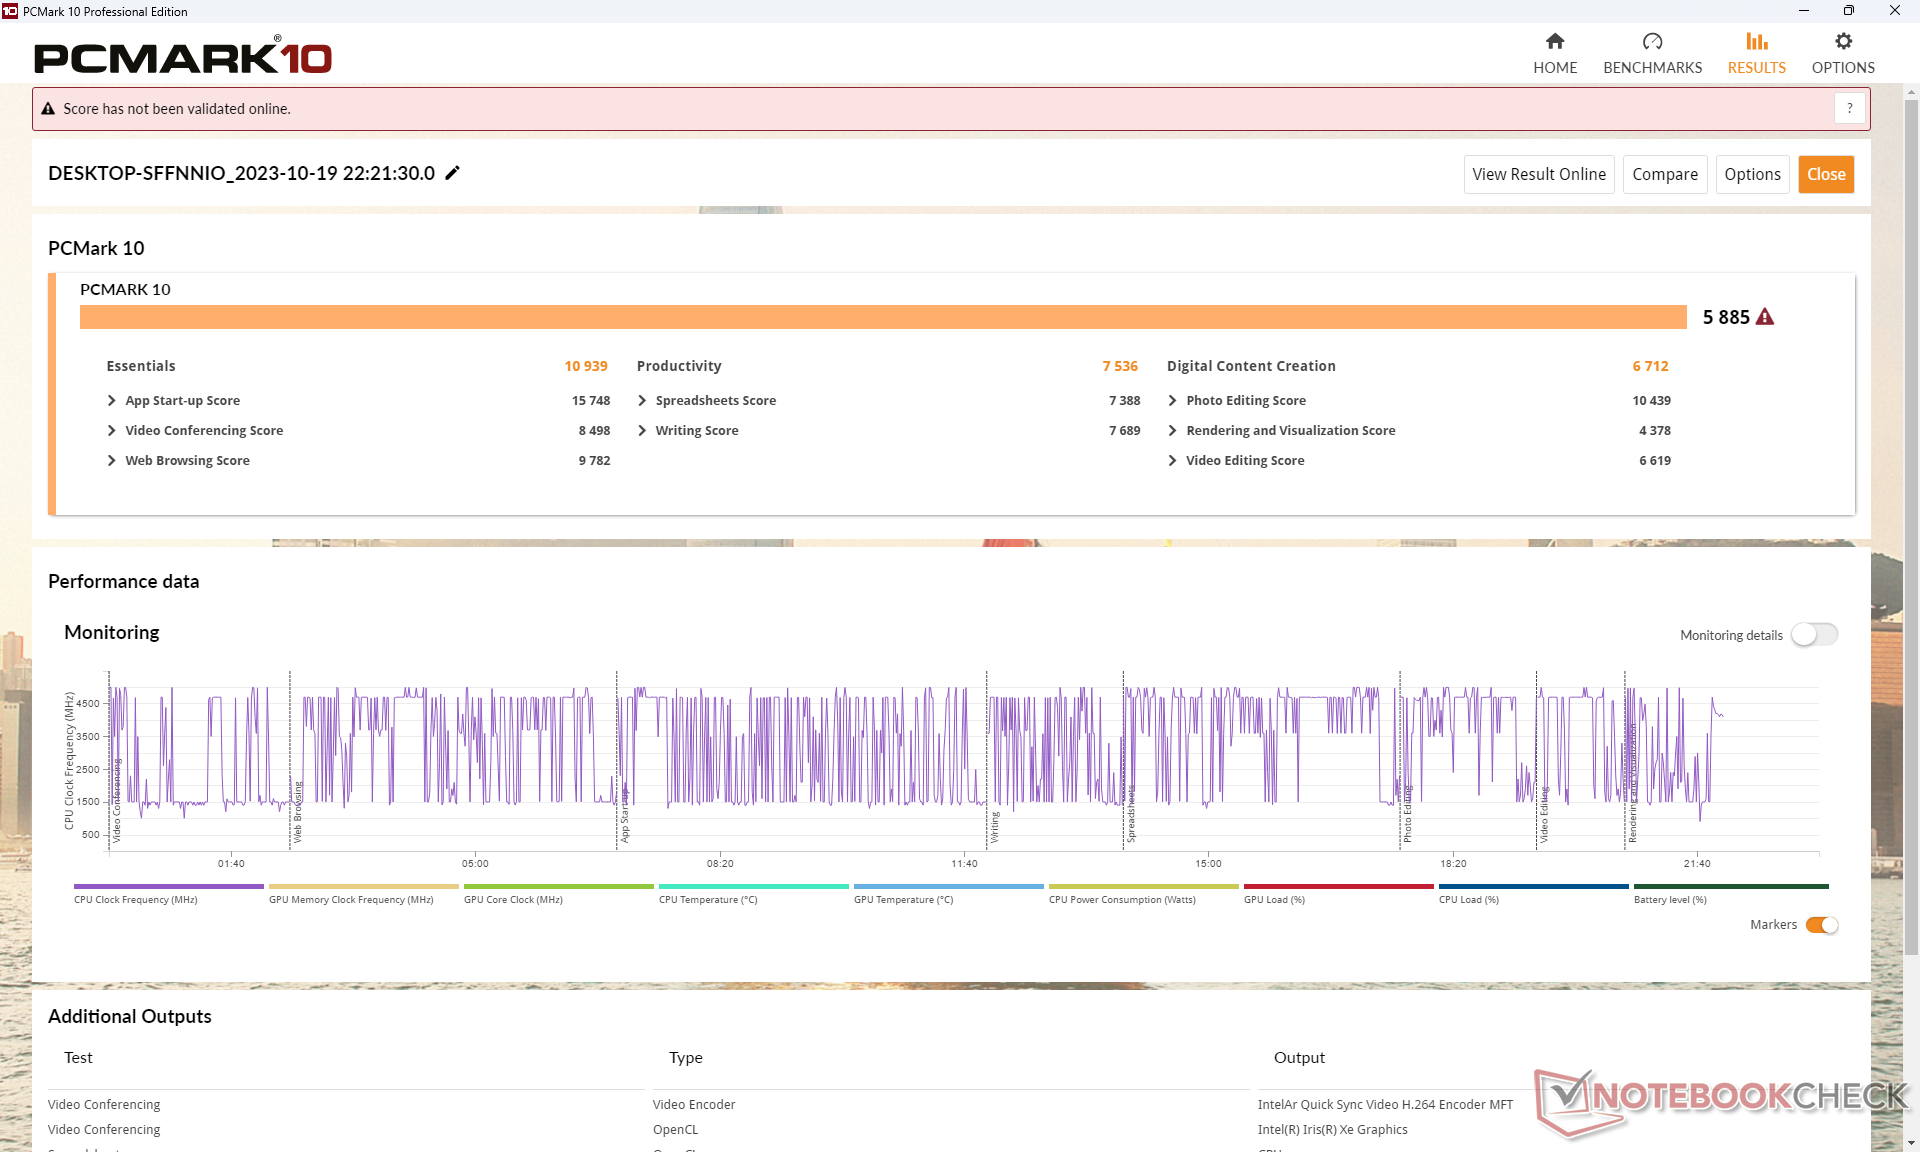
Wyniki PCMark są generalnie niższe niż w przypadku konfiguracji AMD, zwłaszcza w podteście Productivity, gdzie wydajność wielowątkowa ma największe znaczenie.
CrossMark: Overall | Productivity | Creativity | Responsiveness
| PCMark 10 / Score | |
| HP EliteBook 845 G10 818N0EA | |
| Lenovo ThinkPad E14 G5-21JSS05C00 | |
| Asus ZenBook 14 UM3402Y | |
| Lenovo ThinkPad E14 G5 i7-1355U | |
| Przeciętny Intel Core i7-1355U, Intel Iris Xe Graphics G7 96EUs (5455 - 5933, n=15) | |
| Dell Latitude 7440 | |
| LG Gram 14Z90Q | |
| PCMark 10 / Essentials | |
| Przeciętny Intel Core i7-1355U, Intel Iris Xe Graphics G7 96EUs (10203 - 11822, n=15) | |
| Lenovo ThinkPad E14 G5 i7-1355U | |
| Dell Latitude 7440 | |
| Lenovo ThinkPad E14 G5-21JSS05C00 | |
| Asus ZenBook 14 UM3402Y | |
| HP EliteBook 845 G10 818N0EA | |
| LG Gram 14Z90Q | |
| PCMark 10 / Productivity | |
| Asus ZenBook 14 UM3402Y | |
| Lenovo ThinkPad E14 G5-21JSS05C00 | |
| HP EliteBook 845 G10 818N0EA | |
| Lenovo ThinkPad E14 G5 i7-1355U | |
| Przeciętny Intel Core i7-1355U, Intel Iris Xe Graphics G7 96EUs (6763 - 7536, n=15) | |
| Dell Latitude 7440 | |
| LG Gram 14Z90Q | |
| PCMark 10 / Digital Content Creation | |
| HP EliteBook 845 G10 818N0EA | |
| Lenovo ThinkPad E14 G5 i7-1355U | |
| Przeciętny Intel Core i7-1355U, Intel Iris Xe Graphics G7 96EUs (5723 - 6712, n=15) | |
| Lenovo ThinkPad E14 G5-21JSS05C00 | |
| Asus ZenBook 14 UM3402Y | |
| Dell Latitude 7440 | |
| LG Gram 14Z90Q | |
| CrossMark / Overall | |
| Przeciętny Intel Core i7-1355U, Intel Iris Xe Graphics G7 96EUs (1478 - 1643, n=15) | |
| Lenovo ThinkPad E14 G5 i7-1355U | |
| HP EliteBook 845 G10 818N0EA | |
| Asus ZenBook 14 UM3402Y | |
| Lenovo ThinkPad E14 G5-21JSS05C00 | |
| CrossMark / Productivity | |
| Przeciętny Intel Core i7-1355U, Intel Iris Xe Graphics G7 96EUs (1444 - 1665, n=15) | |
| Lenovo ThinkPad E14 G5 i7-1355U | |
| HP EliteBook 845 G10 818N0EA | |
| Asus ZenBook 14 UM3402Y | |
| Lenovo ThinkPad E14 G5-21JSS05C00 | |
| CrossMark / Creativity | |
| Przeciętny Intel Core i7-1355U, Intel Iris Xe Graphics G7 96EUs (1563 - 1732, n=15) | |
| Lenovo ThinkPad E14 G5 i7-1355U | |
| HP EliteBook 845 G10 818N0EA | |
| Asus ZenBook 14 UM3402Y | |
| Lenovo ThinkPad E14 G5-21JSS05C00 | |
| CrossMark / Responsiveness | |
| Przeciętny Intel Core i7-1355U, Intel Iris Xe Graphics G7 96EUs (1217 - 1681, n=15) | |
| Lenovo ThinkPad E14 G5 i7-1355U | |
| HP EliteBook 845 G10 818N0EA | |
| Asus ZenBook 14 UM3402Y | |
| Lenovo ThinkPad E14 G5-21JSS05C00 | |
| PCMark 10 Score | 5885 pkt. | |
Pomoc | ||
| AIDA64 / Memory Copy | |
| Dell Latitude 7440 | |
| Przeciętny Intel Core i7-1355U (35017 - 71600, n=18) | |
| LG Gram 14Z90Q | |
| Asus ZenBook 14 UM3402Y | |
| Lenovo ThinkPad E14 G5 i7-1355U | |
| HP EliteBook 845 G10 818N0EA | |
| Lenovo ThinkPad E14 G5-21JSS05C00 | |
| AIDA64 / Memory Read | |
| LG Gram 14Z90Q | |
| Przeciętny Intel Core i7-1355U (38551 - 73377, n=18) | |
| Dell Latitude 7440 | |
| Asus ZenBook 14 UM3402Y | |
| Lenovo ThinkPad E14 G5-21JSS05C00 | |
| Lenovo ThinkPad E14 G5 i7-1355U | |
| HP EliteBook 845 G10 818N0EA | |
| AIDA64 / Memory Write | |
| Dell Latitude 7440 | |
| Przeciętny Intel Core i7-1355U (35910 - 93342, n=18) | |
| LG Gram 14Z90Q | |
| Lenovo ThinkPad E14 G5 i7-1355U | |
| Asus ZenBook 14 UM3402Y | |
| HP EliteBook 845 G10 818N0EA | |
| Lenovo ThinkPad E14 G5-21JSS05C00 | |
| AIDA64 / Memory Latency | |
| LG Gram 14Z90Q | |
| Przeciętny Intel Core i7-1355U (72.2 - 346, n=18) | |
| Asus ZenBook 14 UM3402Y | |
| HP EliteBook 845 G10 818N0EA | |
| Dell Latitude 7440 | |
| Lenovo ThinkPad E14 G5-21JSS05C00 | |
| Lenovo ThinkPad E14 G5 i7-1355U | |
* ... im mniej tym lepiej
Opóźnienie DPC
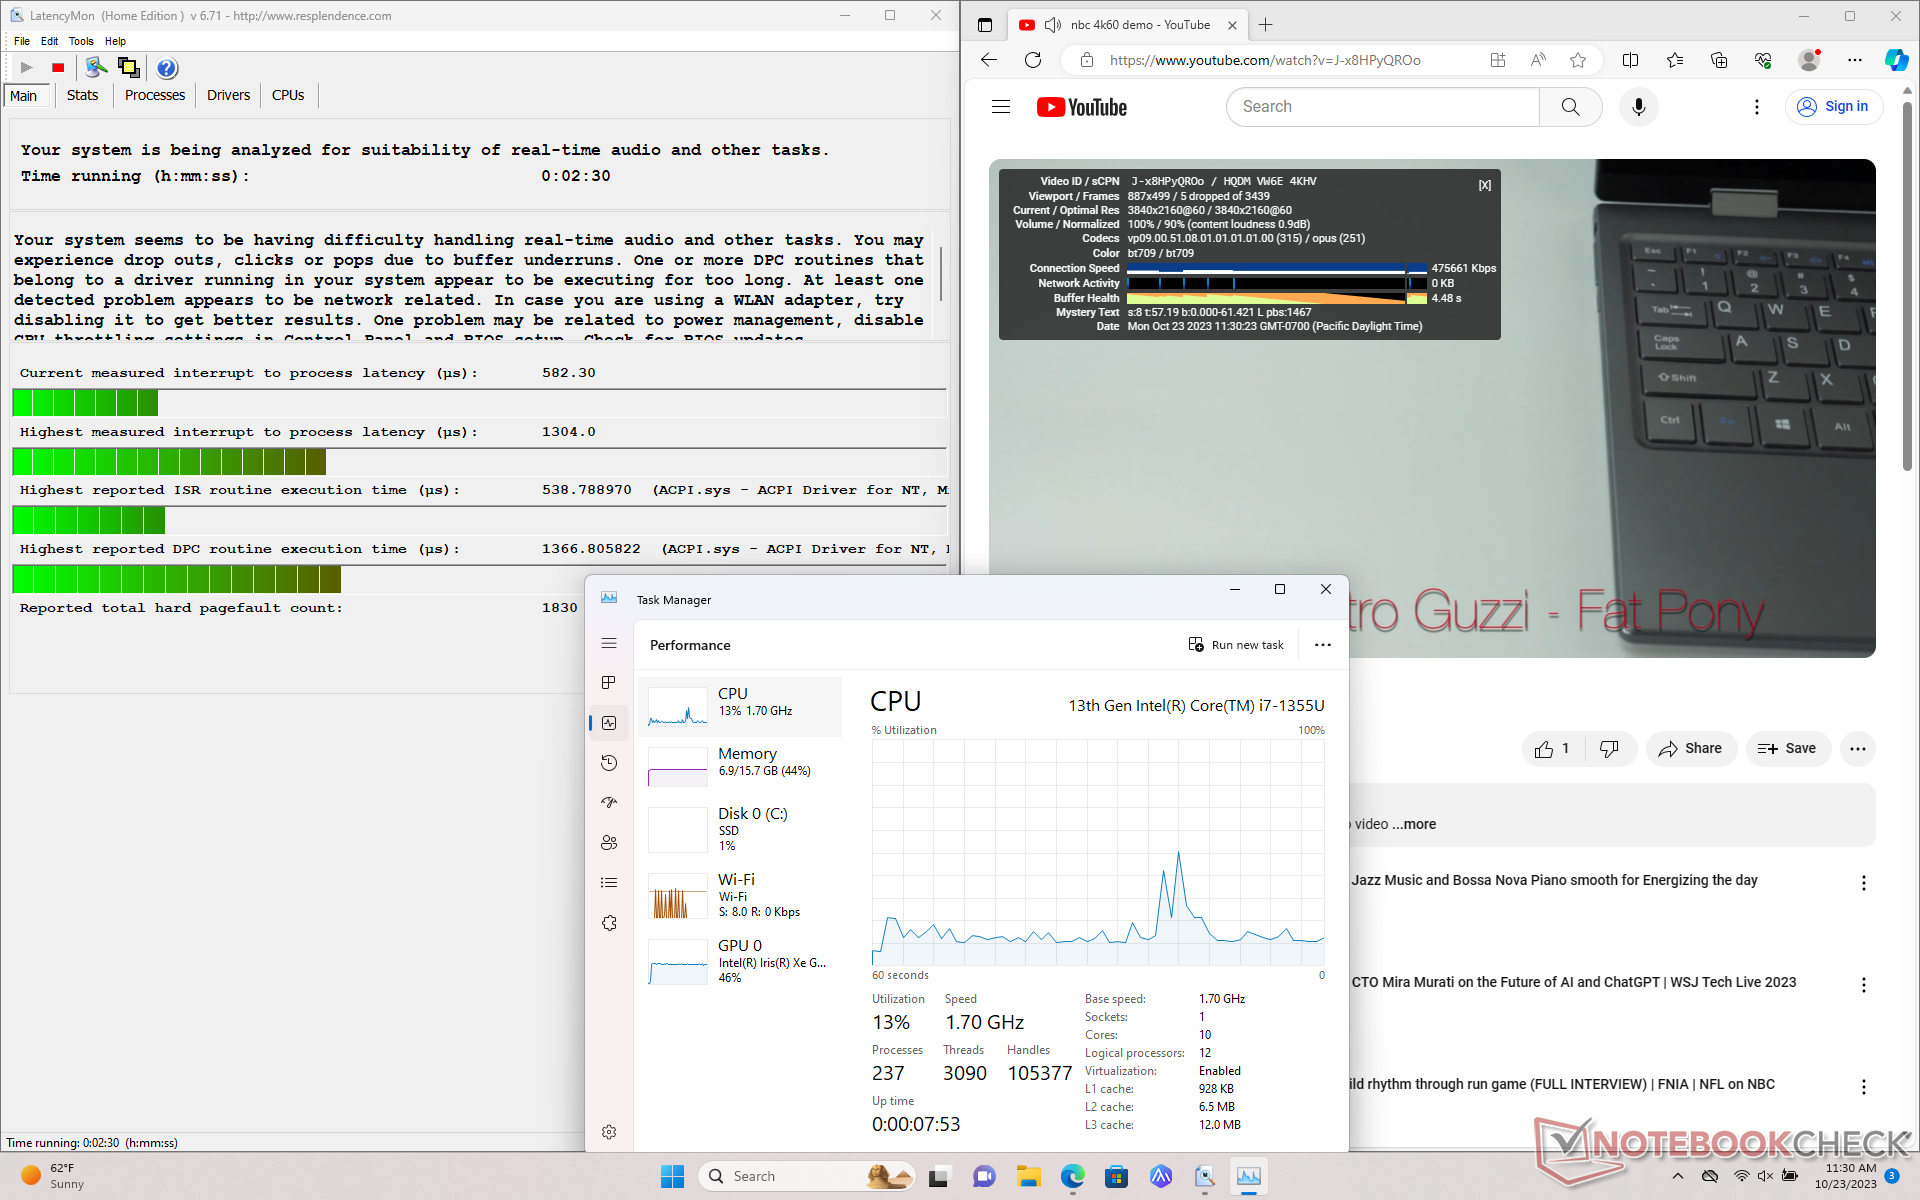
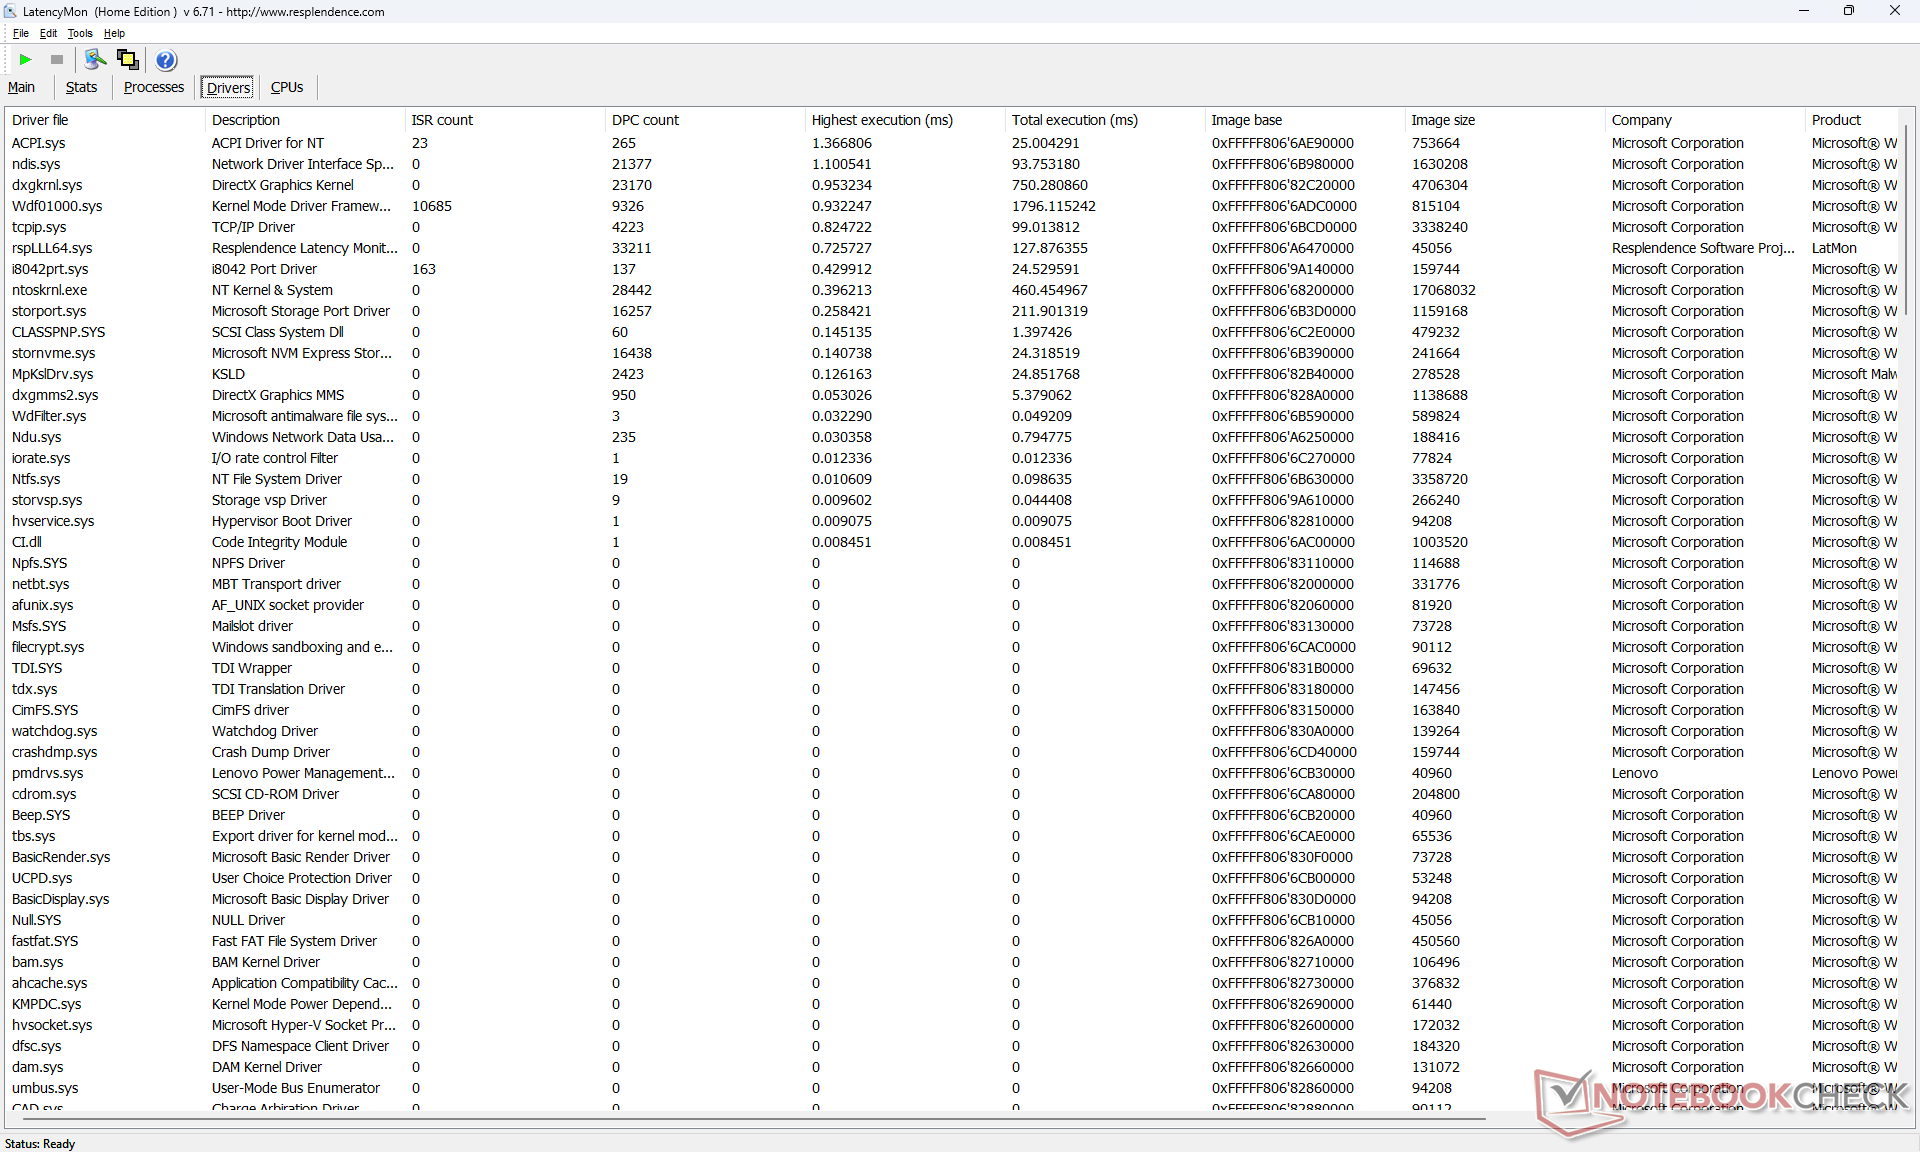
LatencyMon pokazuje problemy z DPC podczas otwierania wielu kart przeglądarki na naszej stronie głównej. odtwarzanie wideo 4K przy 60 FPS jest również niedoskonałe z 5 utraconymi klatkami zarejestrowanymi podczas 60-sekundowego okresu.
| DPC Latencies / LatencyMon - interrupt to process latency (max), Web, Youtube, Prime95 | |
| Asus ZenBook 14 UM3402Y | |
| Lenovo ThinkPad E14 G5-21JSS05C00 | |
| Lenovo ThinkPad E14 G5 i7-1355U | |
| Dell Latitude 7440 | |
| LG Gram 14Z90Q | |
| HP EliteBook 845 G10 818N0EA | |
* ... im mniej tym lepiej
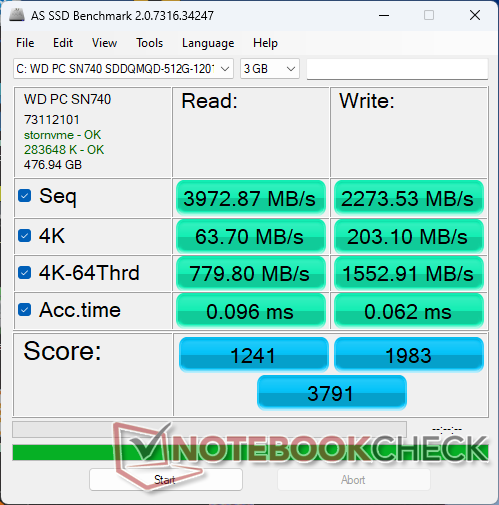
Urządzenia pamięci masowej
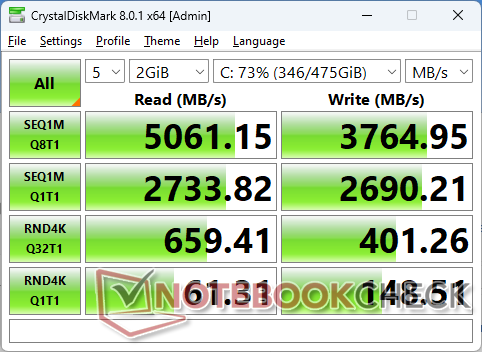
Nasze urządzenie jest dostarczane z wersją 42 mmWD PC SN740 podczas gdy konfiguracja AMD jest dostarczana z 80 mm WD PC SN740. Ten średniej klasy dysk SSD PCIe4 x4 NVMe oferuje prędkość odczytu do 5000 MB/s, ale tylko przez kilka minut, zanim zacznie się dławienie, jak pokazuje poniższy wykres.

| Drive Performance rating - Percent | |
| LG Gram 14Z90Q | |
| HP EliteBook 845 G10 818N0EA | |
| Lenovo ThinkPad E14 G5 i7-1355U | |
| Dell Latitude 7440 | |
| Lenovo ThinkPad E14 G5-21JSS05C00 | |
| Asus ZenBook 14 UM3402Y | |
* ... im mniej tym lepiej
Disk Throttling: DiskSpd Read Loop, Queue Depth 8
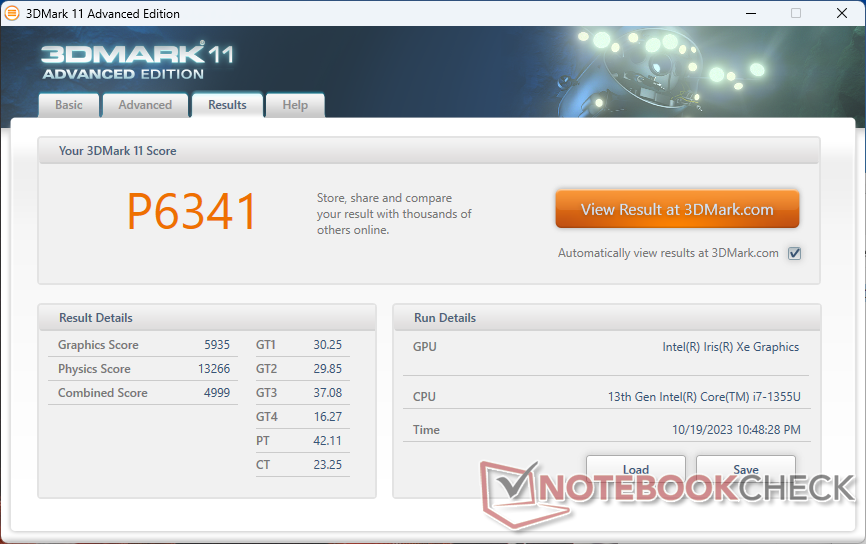
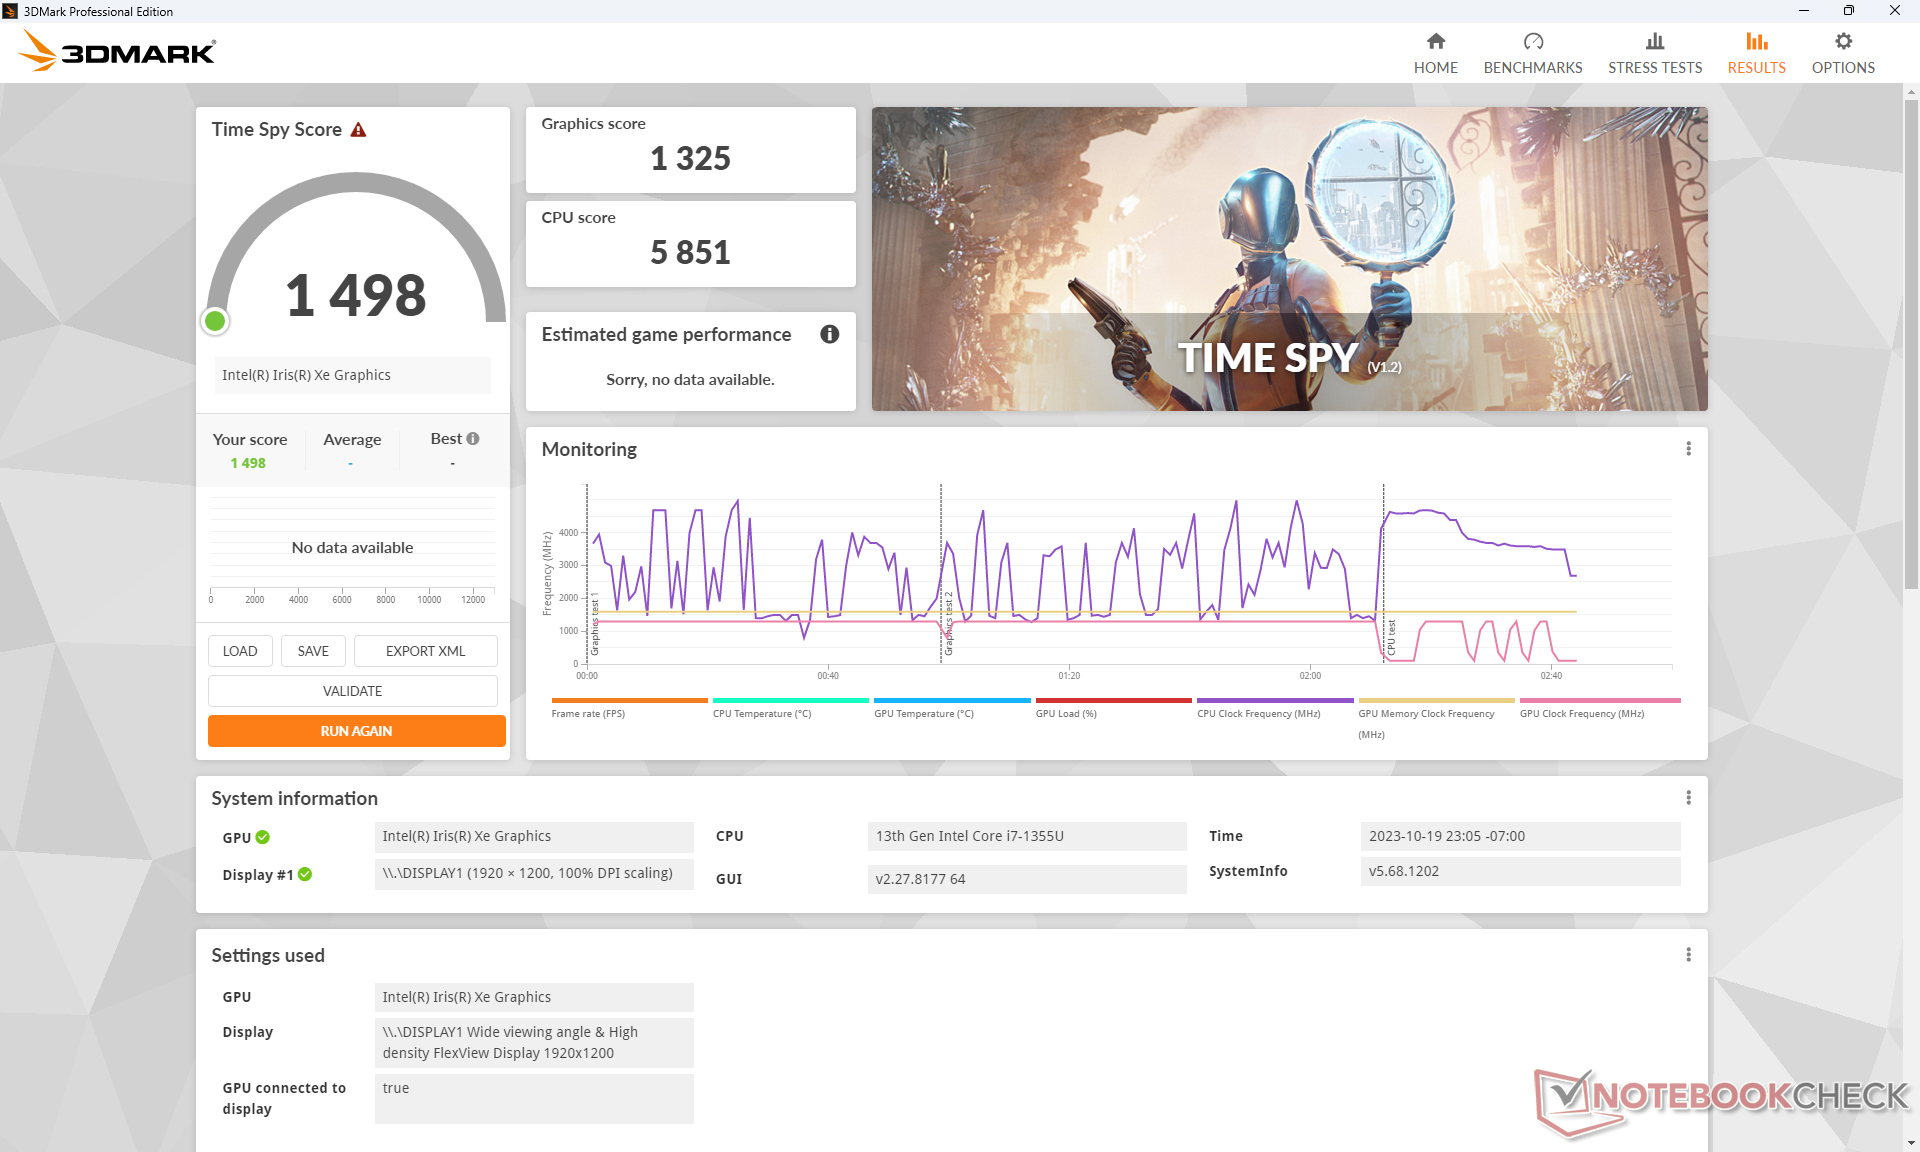
Wydajność GPU
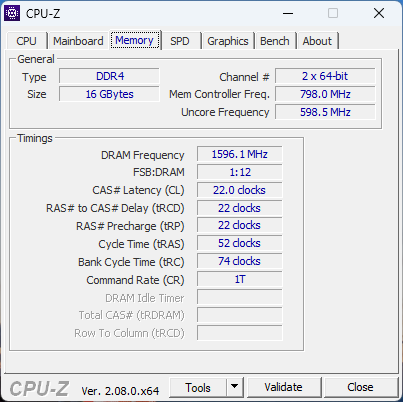
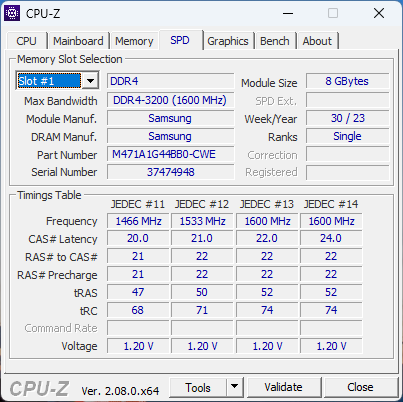
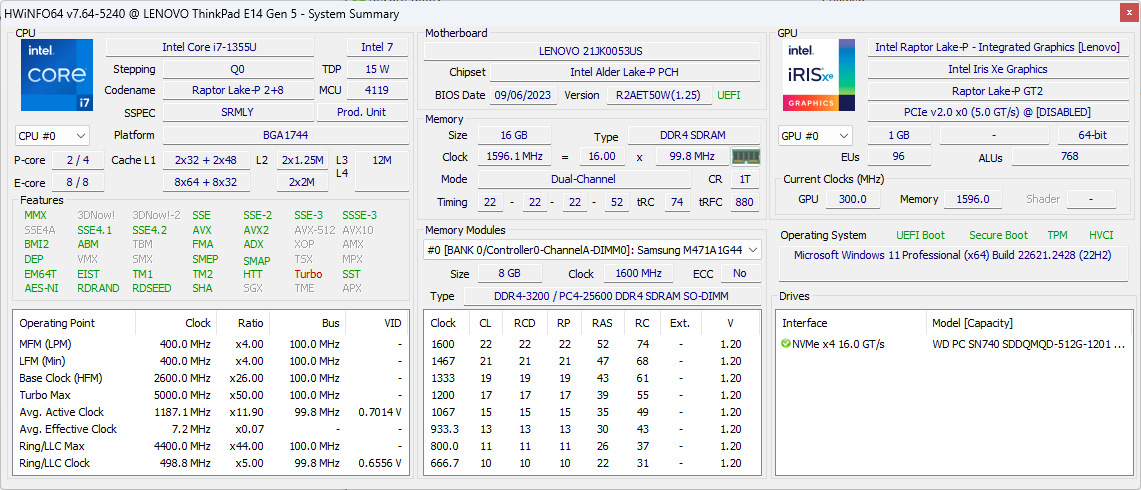
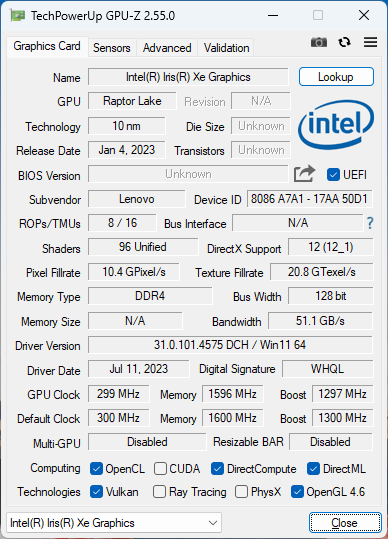
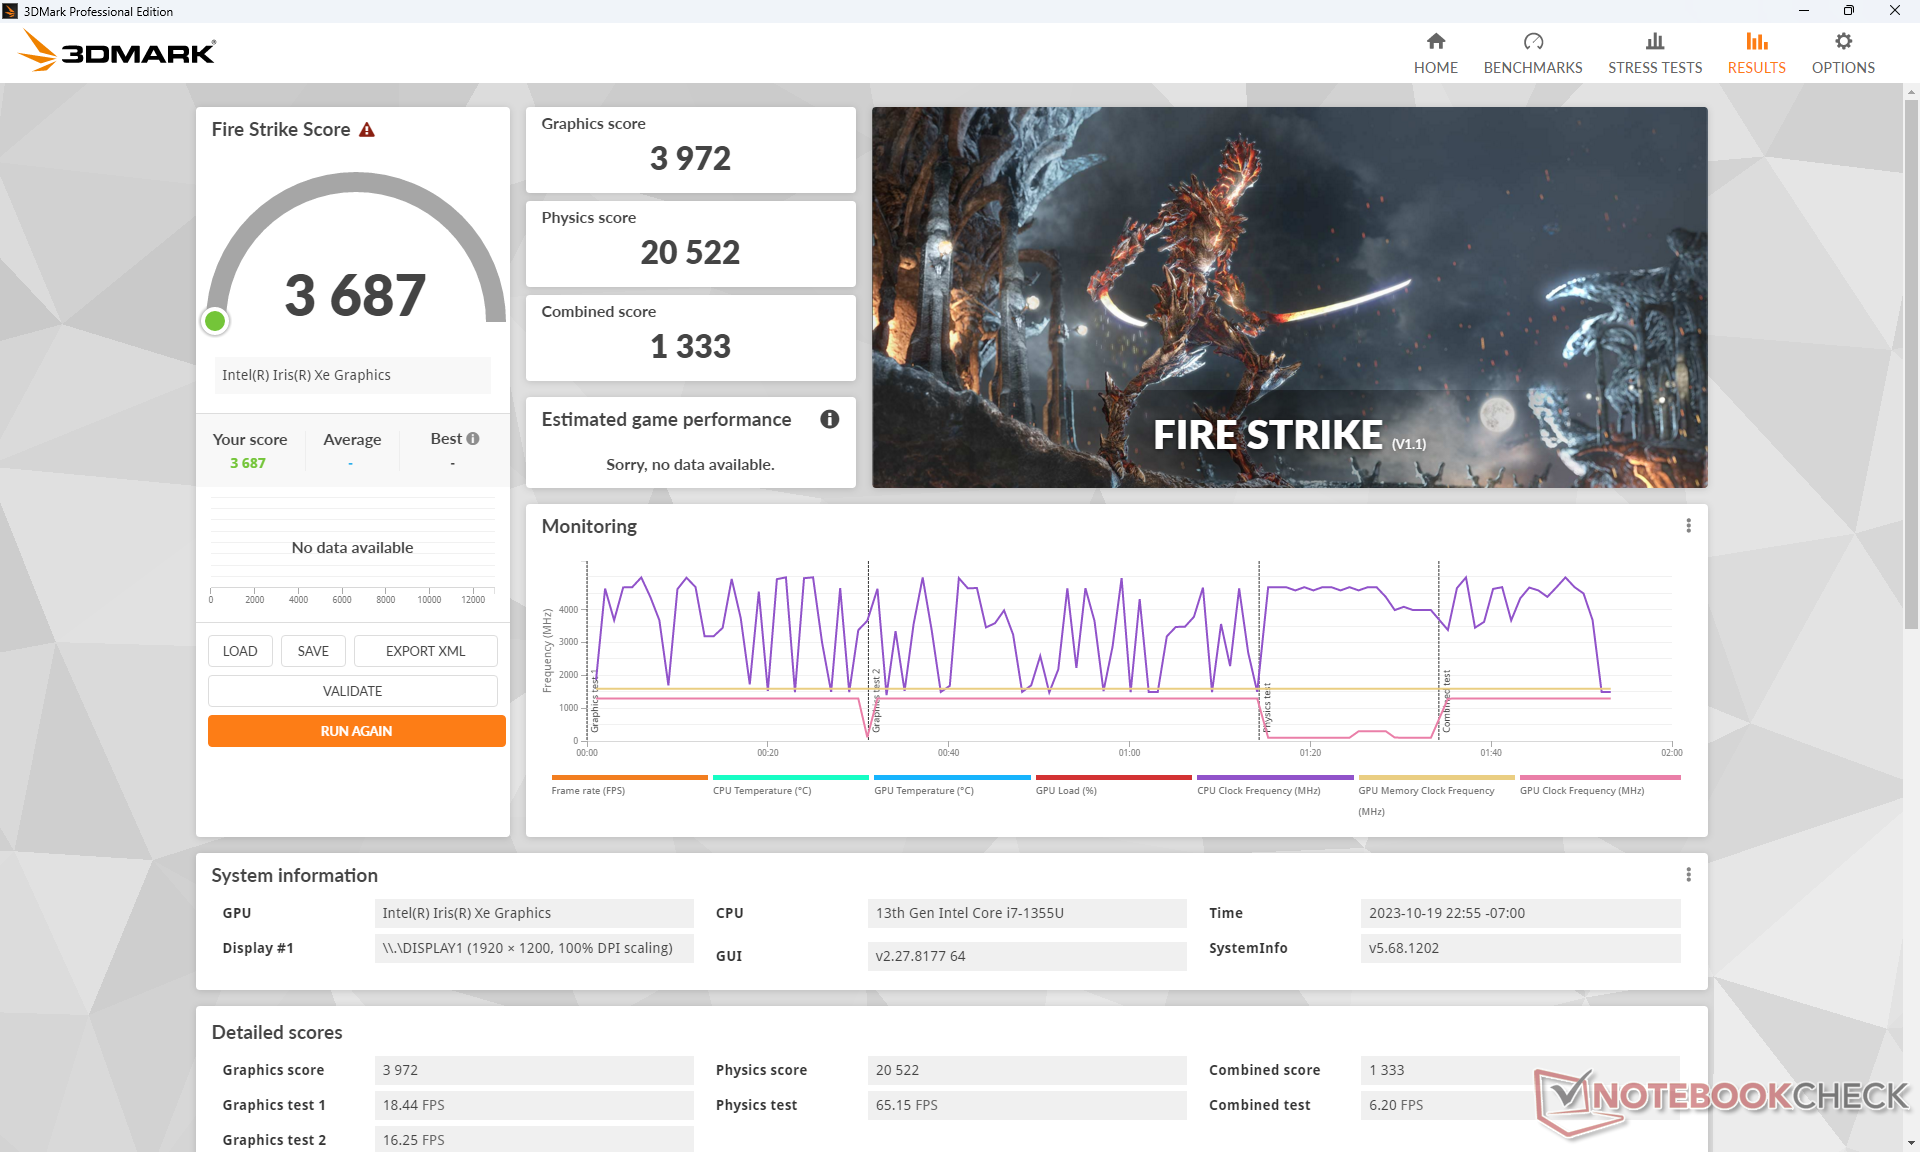
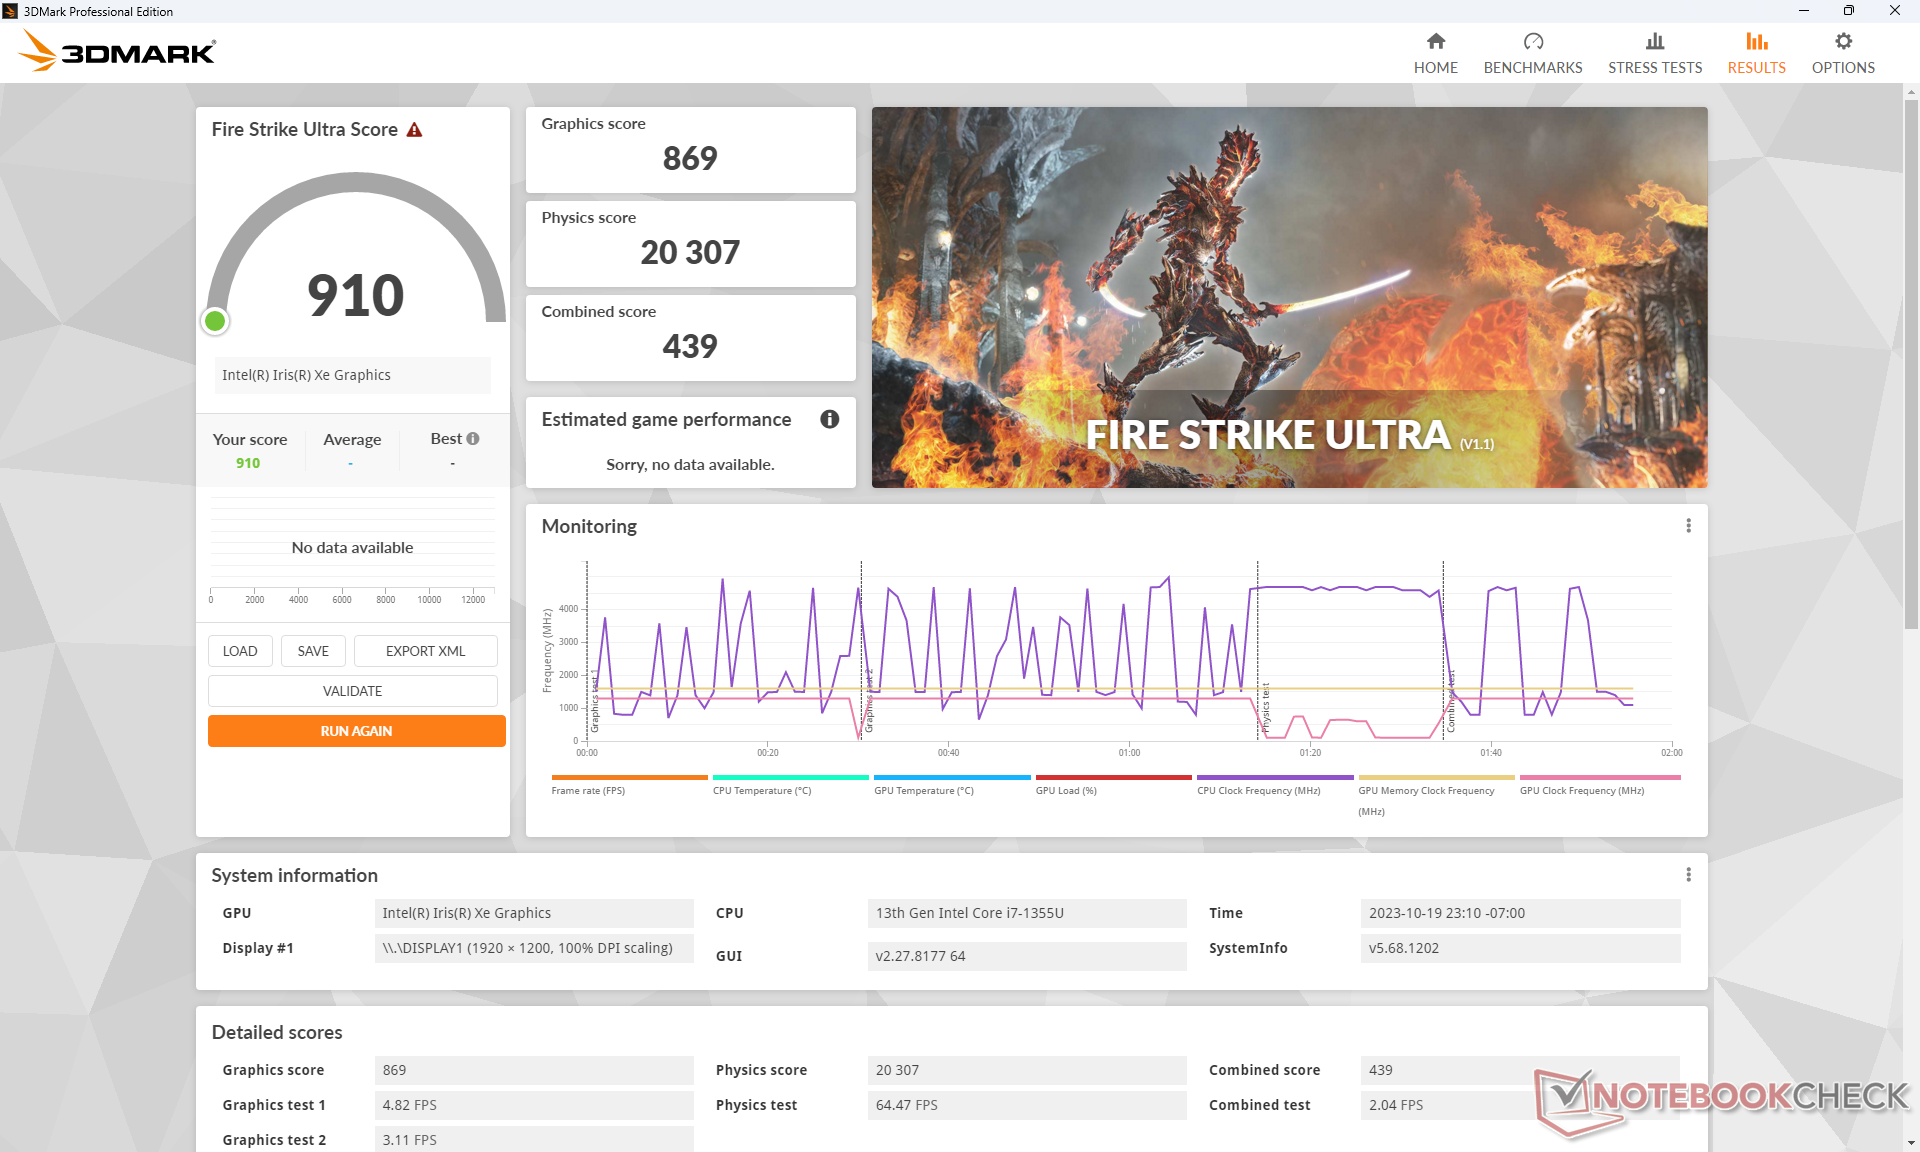
Pamięć RAM jest wolniejsza niż przeciętna i wynosi zaledwie DDR4-3200, co negatywnie wpływa na wydajność zintegrowanej grafiki. Nasze Iris Xe 96 EUs jest o około 10 do 15 procent wolniejszy niż przeciętny laptop w naszej bazie danych z tym samym GPU ze względu na dławienie procesora i wolną pamięć RAM. Ogólna wydajność jest mniej więcej taka sama jak RX Vega 8 w wersji Ryzen 7 7730U.
| 3DMark Performance rating - Percent | |
| Lenovo Yoga Pro 7 14ARP G8 | |
| HP EliteBook 845 G10 5Z4X0ES | |
| HP EliteBook 840 G9 | |
| HP EliteBook 845 G10 818N0EA | |
| Samsung Galaxy Book3 Pro 14 | |
| Przeciętny Intel Iris Xe Graphics G7 96EUs | |
| Dell Latitude 7440 | |
| Lenovo ThinkPad E14 G5 i7-1355U | |
| HP EliteBook 1040 G10 818N7EA | |
| LG Gram 14Z90Q | |
| Dell Inspiron 14 7435 2-in-1 | |
| Lenovo ThinkPad E14 G5-21JSS05C00 | |
| HP Envy 14-eb0252ng | |
| Asus ExpertBook B3 Flip B3402FEA | |
| 3DMark 11 - 1280x720 Performance GPU | |
| Lenovo Yoga Pro 7 14ARP G8 | |
| HP EliteBook 845 G10 5Z4X0ES | |
| HP EliteBook 845 G10 818N0EA | |
| HP EliteBook 840 G9 | |
| Przeciętny Intel Iris Xe Graphics G7 96EUs (2867 - 7676, n=209) | |
| Dell Inspiron 14 7435 2-in-1 | |
| Lenovo ThinkPad E14 G5 i7-1355U | |
| Samsung Galaxy Book3 Pro 14 | |
| Lenovo ThinkPad E14 G5-21JSS05C00 | |
| HP EliteBook 1040 G10 818N7EA | |
| Dell Latitude 7440 | |
| Asus ExpertBook B3 Flip B3402FEA | |
| HP Envy 14-eb0252ng | |
| LG Gram 14Z90Q | |
| 3DMark 11 Performance | 6341 pkt. | |
| 3DMark Fire Strike Score | 3687 pkt. | |
| 3DMark Time Spy Score | 1498 pkt. | |
Pomoc | ||
* ... im mniej tym lepiej
| Tiny Tina's Wonderlands | |
| 1280x720 Lowest Preset (DX12) | |
| Dell Inspiron 14 7435 2-in-1 | |
| Przeciętny Intel Iris Xe Graphics G7 96EUs (25.9 - 67.3, n=32) | |
| Lenovo ThinkPad E14 G5 i7-1355U | |
| 1920x1080 Low Preset (DX12) | |
| Przeciętny Intel Iris Xe Graphics G7 96EUs (22.3 - 53, n=32) | |
| Dell Inspiron 14 7435 2-in-1 | |
| Dell Latitude 7440 | |
| Lenovo ThinkPad E14 G5 i7-1355U | |
| HP Envy 14-eb0252ng | |
| 1920x1080 Medium Preset (DX12) | |
| Przeciętny Intel Iris Xe Graphics G7 96EUs (17 - 40.1, n=30) | |
| Dell Latitude 7440 | |
| Lenovo ThinkPad E14 G5 i7-1355U | |
| HP Envy 14-eb0252ng | |
| 1920x1080 High Preset (DX12) | |
| Przeciętny Intel Iris Xe Graphics G7 96EUs (10.6 - 24.1, n=29) | |
| Dell Latitude 7440 | |
| Lenovo ThinkPad E14 G5 i7-1355U | |
| HP Envy 14-eb0252ng | |
| 1920x1080 Badass Preset (DX12) | |
| Przeciętny Intel Iris Xe Graphics G7 96EUs (8.4 - 18.4, n=26) | |
| Dell Latitude 7440 | |
| Lenovo ThinkPad E14 G5 i7-1355U | |
Witcher 3 FPS Chart
| low | med. | high | ultra | |
|---|---|---|---|---|
| GTA V (2015) | 85.2 | 67 | 13.7 | 5.57 |
| The Witcher 3 (2015) | 74.9 | 48.9 | 24.1 | 12.1 |
| Dota 2 Reborn (2015) | 104.5 | 77.3 | 51.5 | 47.3 |
| Final Fantasy XV Benchmark (2018) | 34.3 | 18.1 | 13.1 | |
| X-Plane 11.11 (2018) | 34.2 | 28.2 | 25.6 | |
| Far Cry 5 (2018) | 40 | 20 | 19 | 18 |
| Strange Brigade (2018) | 74.5 | 28.4 | 24.2 | 19.3 |
| Cyberpunk 2077 1.6 (2022) | 13 | |||
| Tiny Tina's Wonderlands (2022) | 23.8 | 17 | 10.6 | 9.1 |
| F1 22 (2022) | 35.3 | 32.3 | 23.6 | 18.3 |
Emisje
Hałas systemowy
Hałas wentylatorów między wersjami AMD i Intel nie różni się zbytnio. Wysokie obciążenia, takie jak gry, osiągnęłyby podobne wartości maksymalne wynoszące nieco ponad 40 dB(A) w każdej wersji, podczas gdy lekkie pulsowanie wentylatora nadal występowałoby podczas niższych obciążeń, takich jak przeglądanie lub przesyłanie strumieniowe. Poza tym wentylator jest łatwy do zignorowania przy niskich i średnich obciążeniach.
Hałas
| luz |
| 23.2 / 23.2 / 23.2 dB |
| obciążenie |
| 36 / 41 dB |
 | ||
30 dB cichy 40 dB(A) słyszalny 50 dB(A) irytujący |
||
min: | ||
| Lenovo ThinkPad E14 G5 i7-1355U Iris Xe G7 96EUs, i7-1355U, WD PC SN740 512GB SDDQMQD-512G | Lenovo ThinkPad E14 G5-21JSS05C00 Vega 8, R7 7730U, WD PC SN740 SDDPNQD-1T00 | HP EliteBook 845 G10 818N0EA Radeon 780M, R9 PRO 7940HS, SK hynix PC801 HFS001TEJ9X101N | Asus ZenBook 14 UM3402Y Vega 8, R7 7730U, Micron 2400 MTFDKBA512QFM | LG Gram 14Z90Q Iris Xe G7 80EUs, i5-1240P, Samsung PM9A1 MZVL2512HCJQ | Dell Latitude 7440 Iris Xe G7 80EUs, i5-1345U, Samsung MZ9L4512HBLU-00BMV | |
|---|---|---|---|---|---|---|
| Noise | -1% | -7% | -7% | -5% | 9% | |
| wyłączone / środowisko * (dB) | 23.2 | 24.4 -5% | 25.3 -9% | 22.6 3% | 25 -8% | 22.8 2% |
| Idle Minimum * (dB) | 23.2 | 24.4 -5% | 25.3 -9% | 22.6 3% | 26 -12% | 22.8 2% |
| Idle Average * (dB) | 23.2 | 24.4 -5% | 25.3 -9% | 22.6 3% | 27 -16% | 22.8 2% |
| Idle Maximum * (dB) | 23.2 | 25.7 -11% | 25.3 -9% | 22.6 3% | 28 -21% | 22.8 2% |
| Load Average * (dB) | 36 | 31.8 12% | 34.4 4% | 40.7 -13% | 35 3% | 26.3 27% |
| Witcher 3 ultra * (dB) | 38.5 | 36.7 5% | 43.4 -13% | 46.6 -21% | 36 6% | 30 22% |
| Load Maximum * (dB) | 41 | 41.2 -0% | 43.4 -6% | 52.5 -28% | 36 12% | 38.3 7% |
* ... im mniej tym lepiej
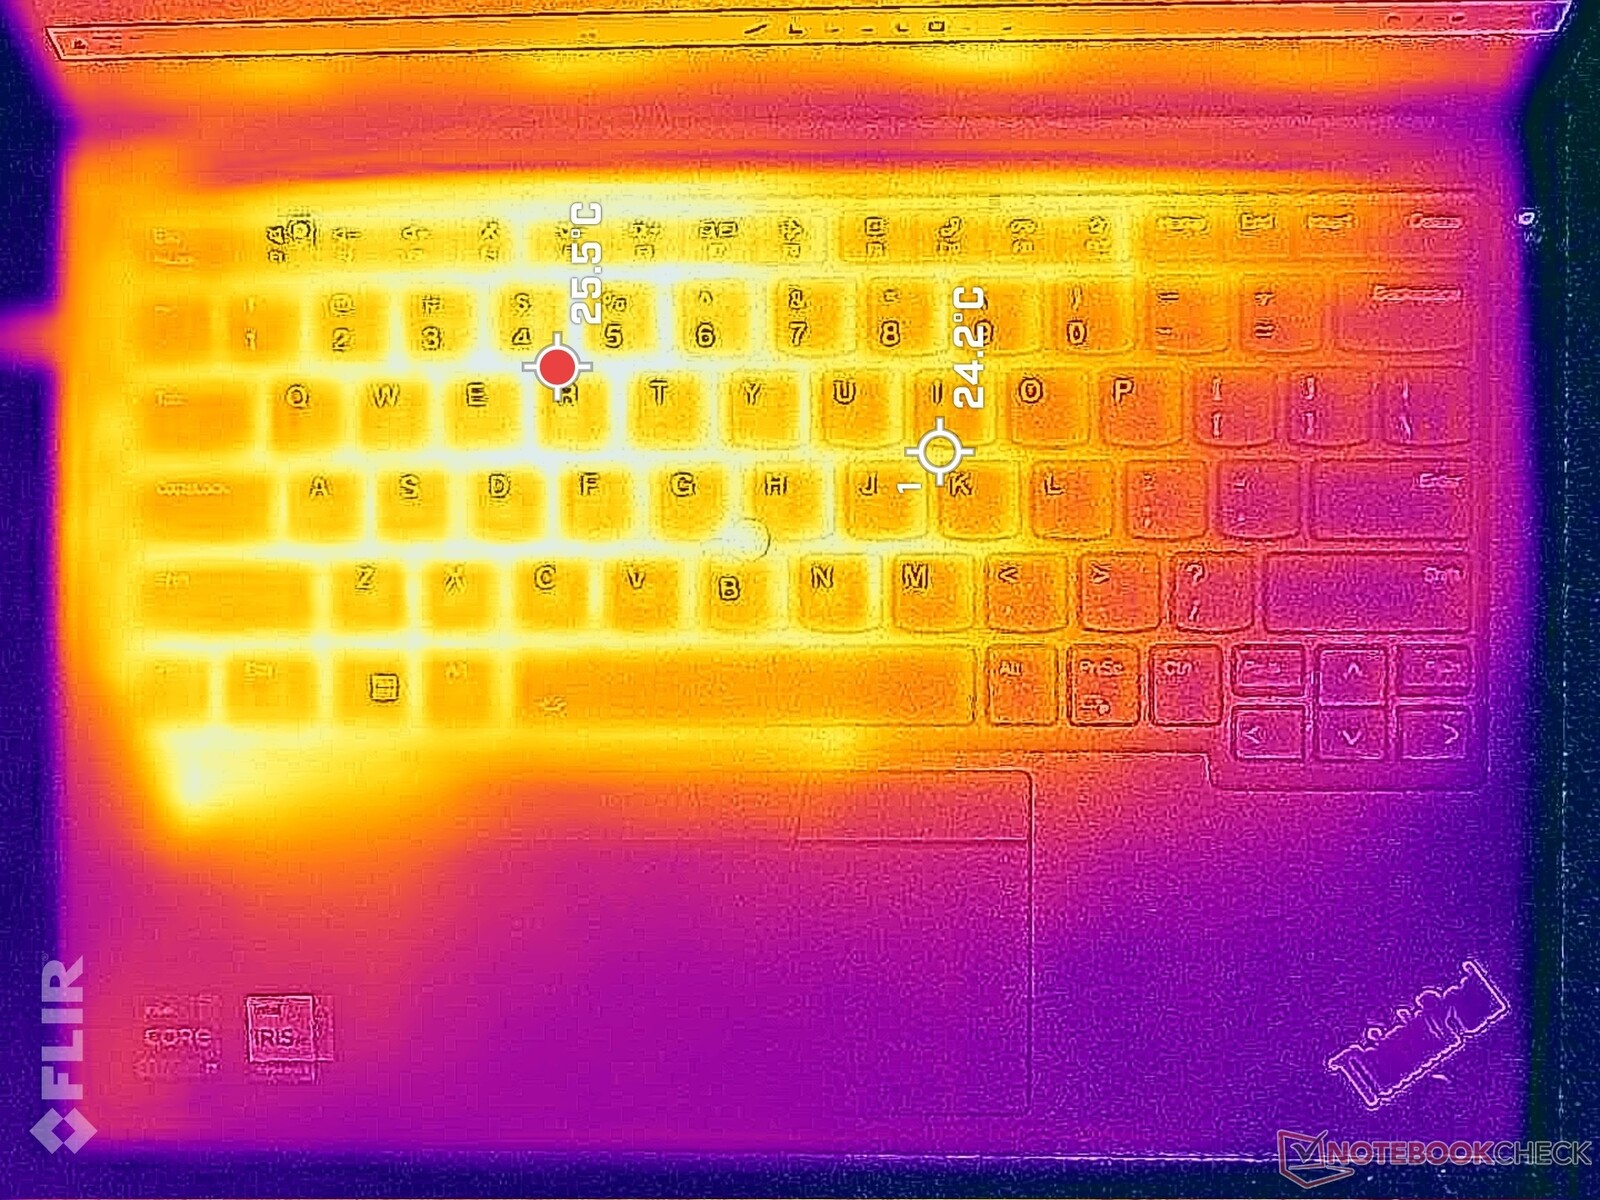
Temperatura
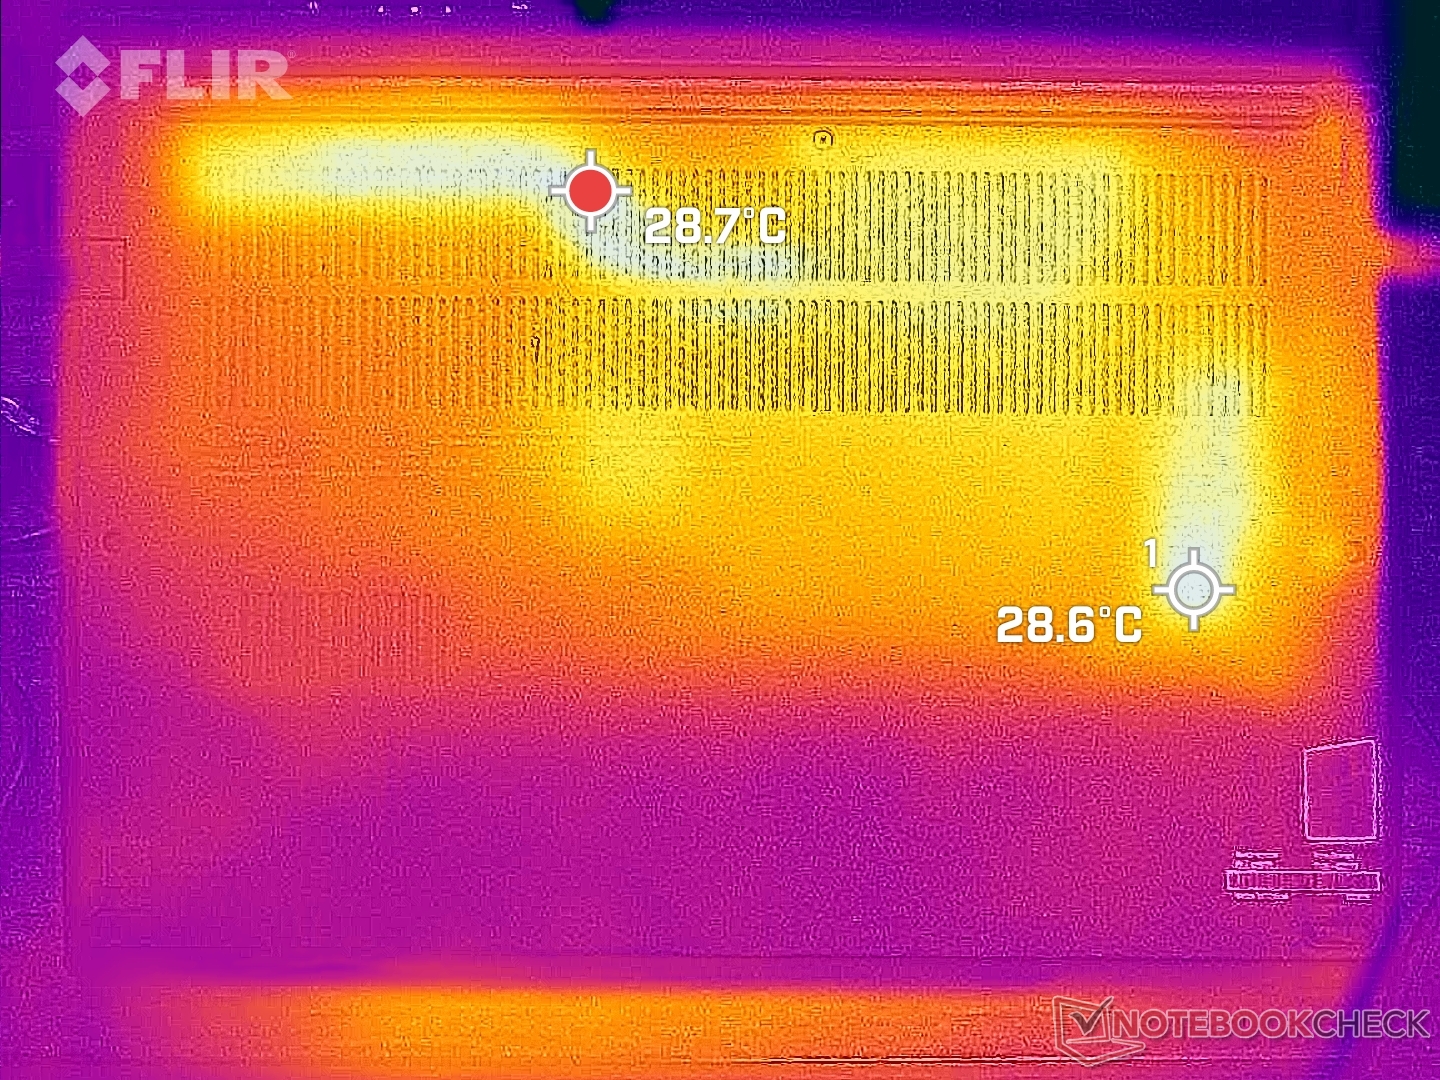
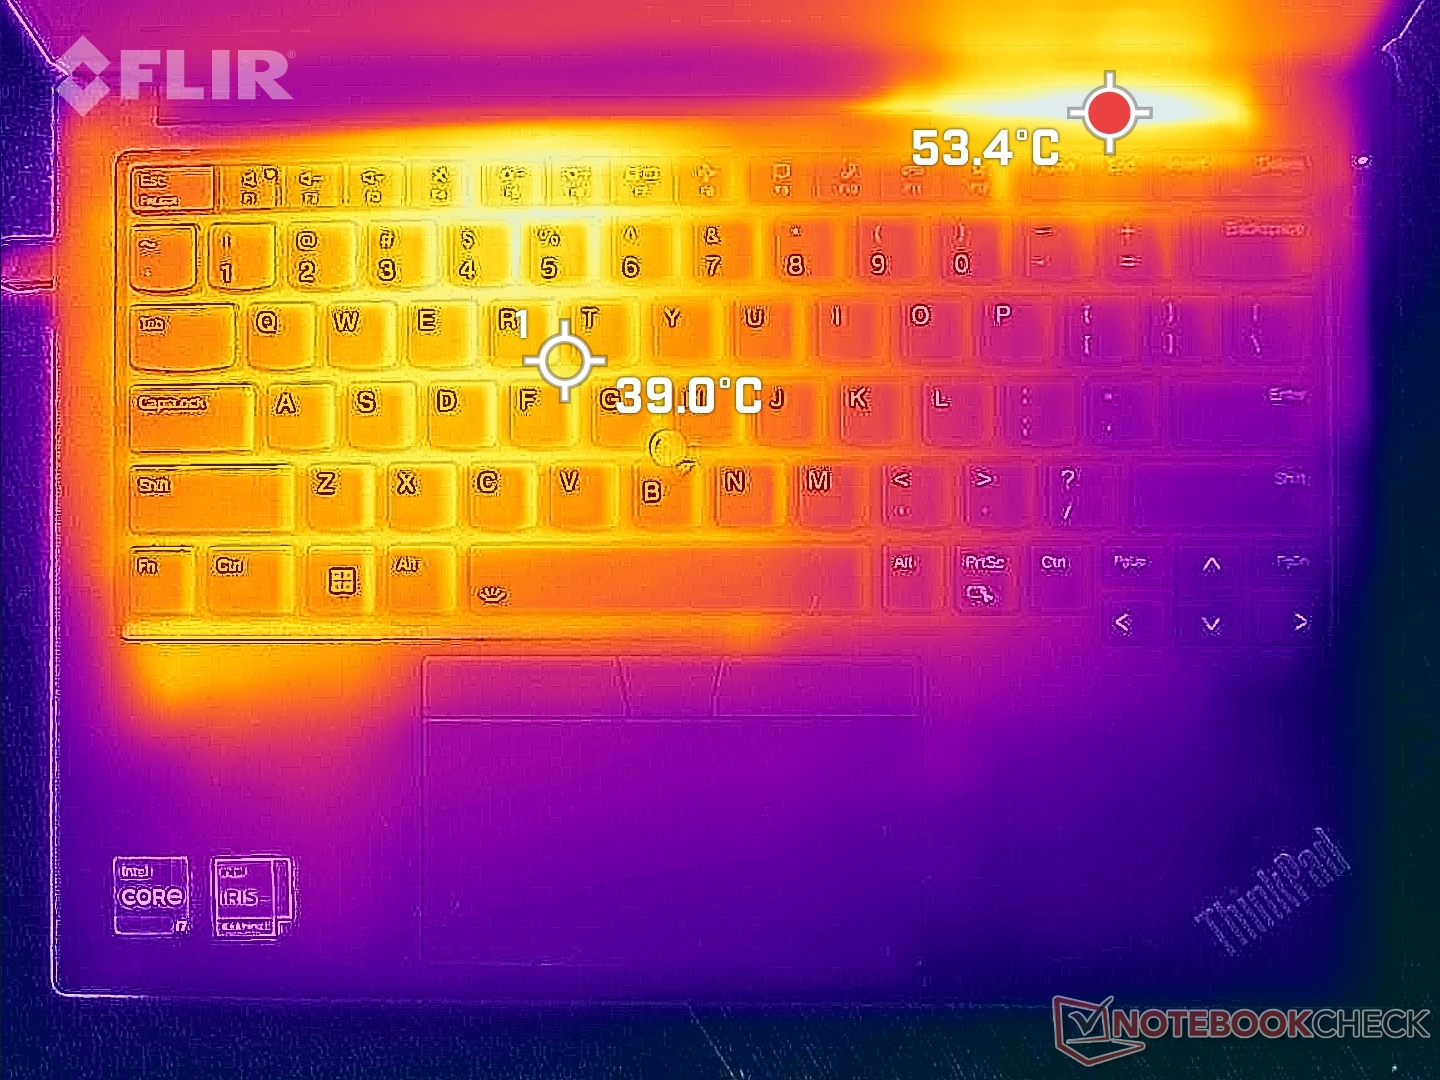
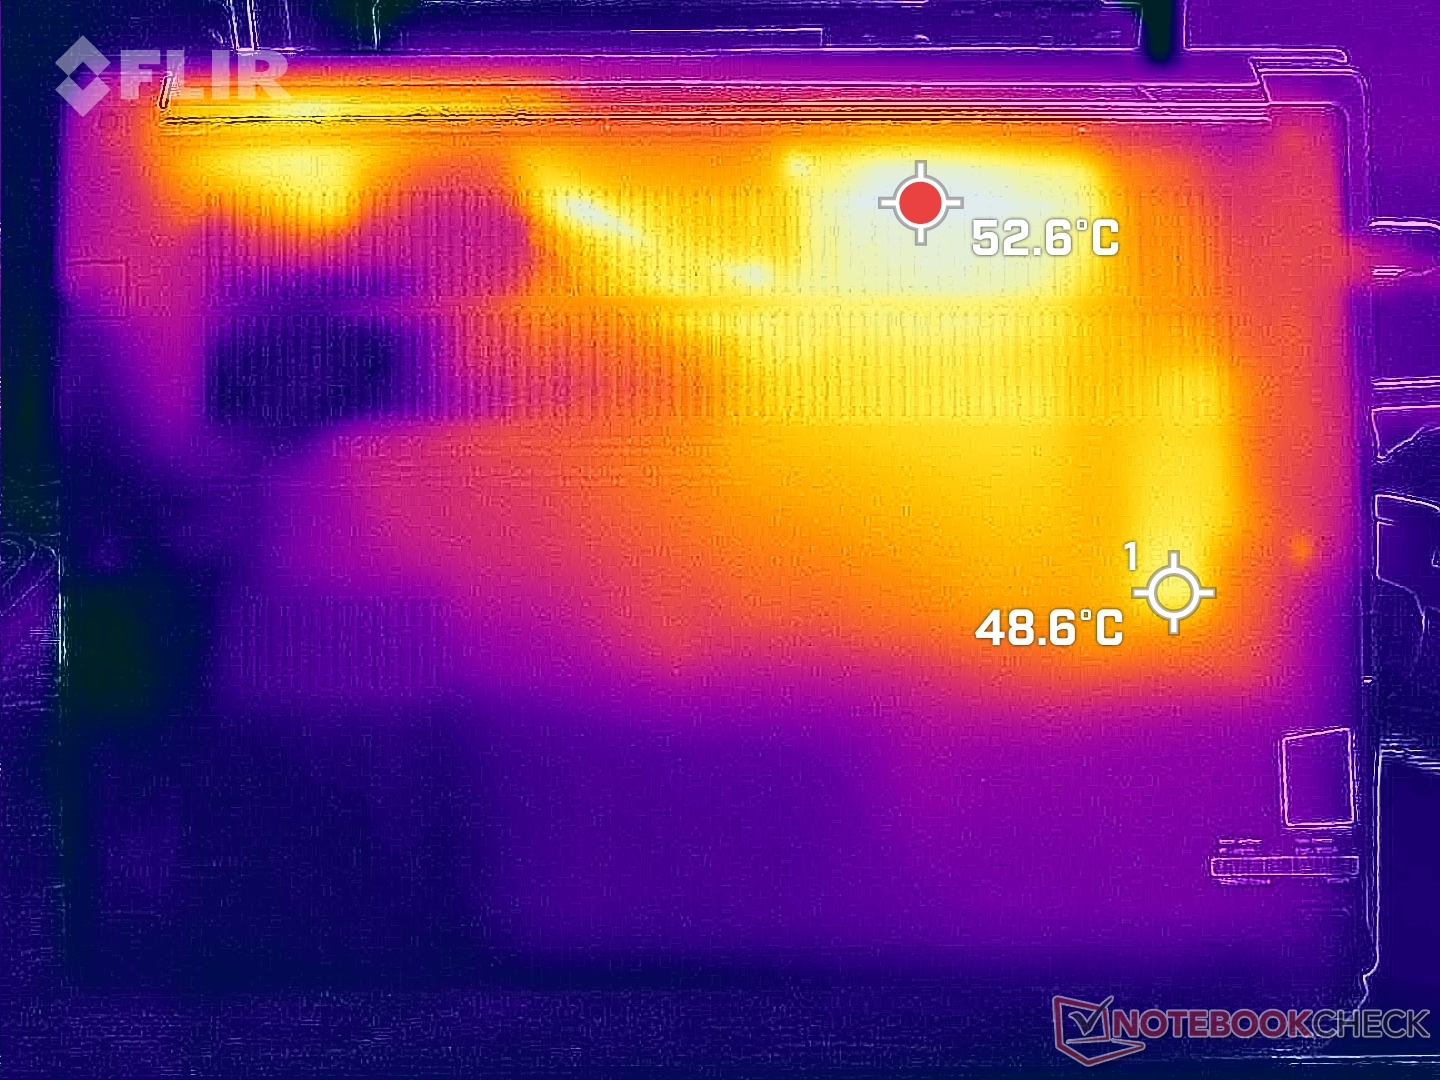
Temperatury powierzchni są najcieplejsze na lewej połowie obudowy i w pobliżu tylnych kratek wentylacyjnych. Gorące punkty na klawiaturze i dolnej powierzchni mogą osiągnąć odpowiednio do 41 C i 54 C, podobnie jak w przypadku konfiguracji AMD.
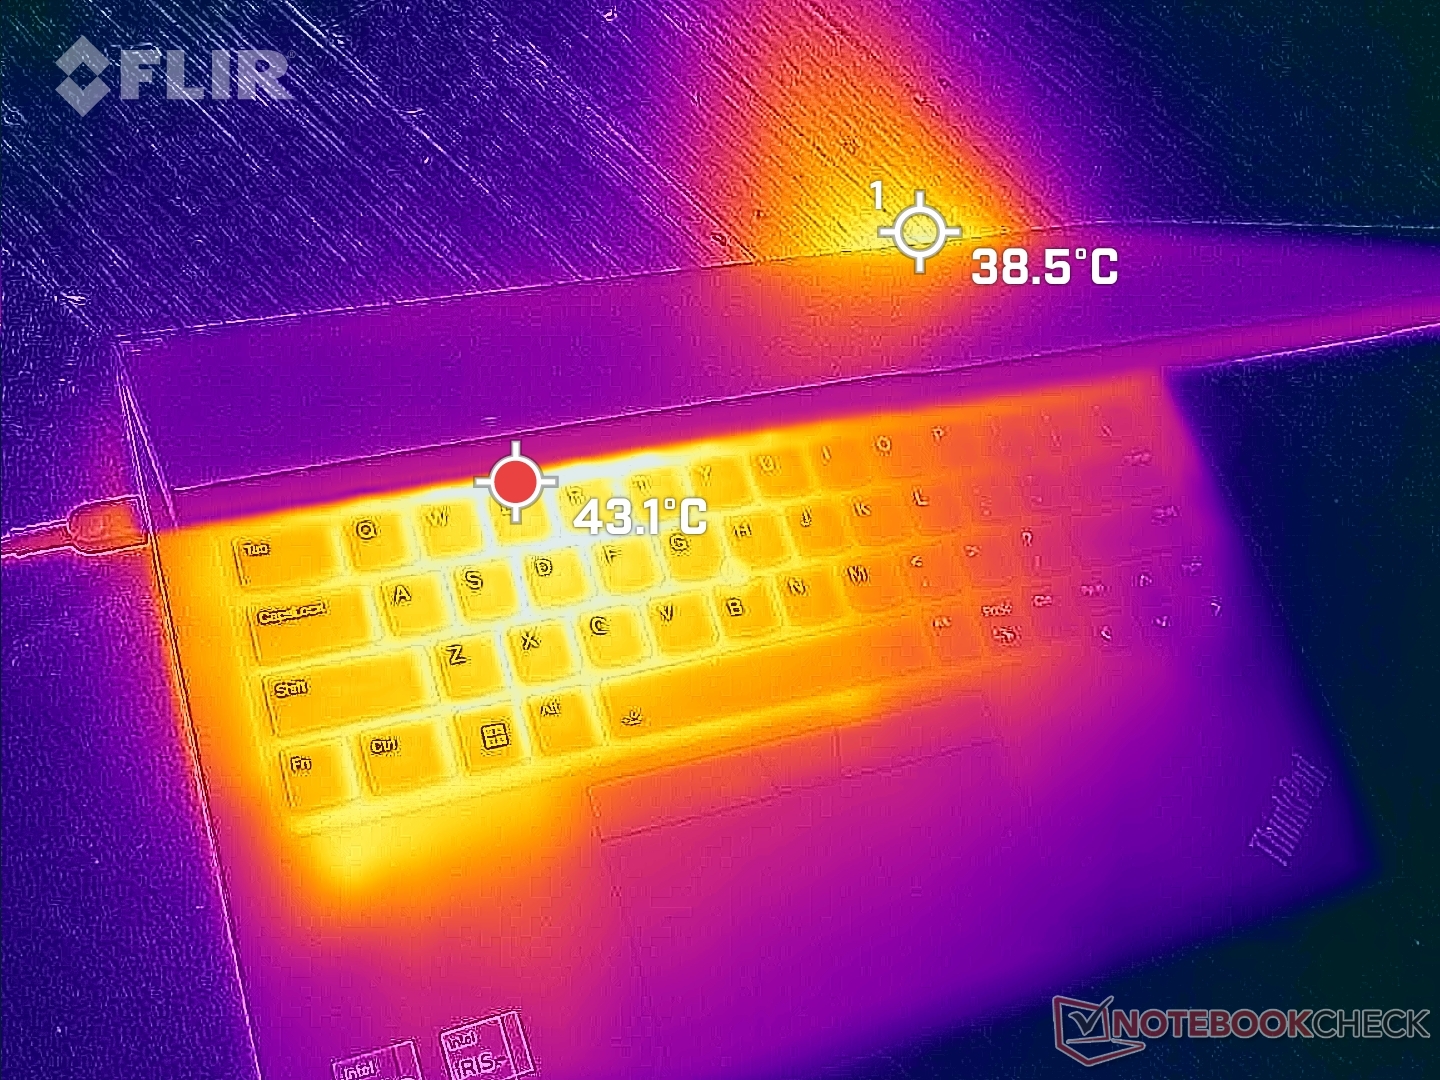
(-) Maksymalna temperatura w górnej części wynosi 45.4 °C / 114 F, w porównaniu do średniej 34.3 °C / 94 F , począwszy od 21.2 do 62.5 °C dla klasy Office.
(-) Dno nagrzewa się maksymalnie do 50.8 °C / 123 F, w porównaniu do średniej 36.8 °C / 98 F
(+) W stanie bezczynności średnia temperatura górnej części wynosi 28.8 °C / 84 F, w porównaniu ze średnią temperaturą urządzenia wynoszącą 29.5 °C / ### class_avg_f### F.
(+) Podpórki pod nadgarstki i touchpad są chłodniejsze niż temperatura skóry i maksymalnie 29.8 °C / 85.6 F i dlatego są chłodne w dotyku.
(-) Średnia temperatura obszaru podparcia dłoni w podobnych urządzeniach wynosiła 27.5 °C / 81.5 F (-2.3 °C / -4.1 F).
| Lenovo ThinkPad E14 G5 i7-1355U Intel Core i7-1355U, Intel Iris Xe Graphics G7 96EUs | Lenovo ThinkPad E14 G5-21JSS05C00 AMD Ryzen 7 7730U, AMD Radeon RX Vega 8 (Ryzen 4000/5000) | HP EliteBook 845 G10 818N0EA AMD Ryzen 9 PRO 7940HS, AMD Radeon 780M | Asus ZenBook 14 UM3402Y AMD Ryzen 7 7730U, AMD Radeon RX Vega 8 (Ryzen 4000/5000) | LG Gram 14Z90Q Intel Core i5-1240P, Intel Iris Xe Graphics G7 80EUs | Dell Latitude 7440 Intel Core i5-1345U, Intel Iris Xe Graphics G7 80EUs | |
|---|---|---|---|---|---|---|
| Heat | 8% | 7% | 10% | 11% | 14% | |
| Maximum Upper Side * (°C) | 45.4 | 42.6 6% | 45.6 -0% | 39.4 13% | 43 5% | 39 14% |
| Maximum Bottom * (°C) | 50.8 | 55.3 -9% | 51.9 -2% | 43.2 15% | 45 11% | 40.6 20% |
| Idle Upper Side * (°C) | 30.2 | 25.8 15% | 26.5 12% | 28.6 5% | 27 11% | 28 7% |
| Idle Bottom * (°C) | 33.4 | 27.4 18% | 27 19% | 30.6 8% | 28 16% | 28.8 14% |
* ... im mniej tym lepiej
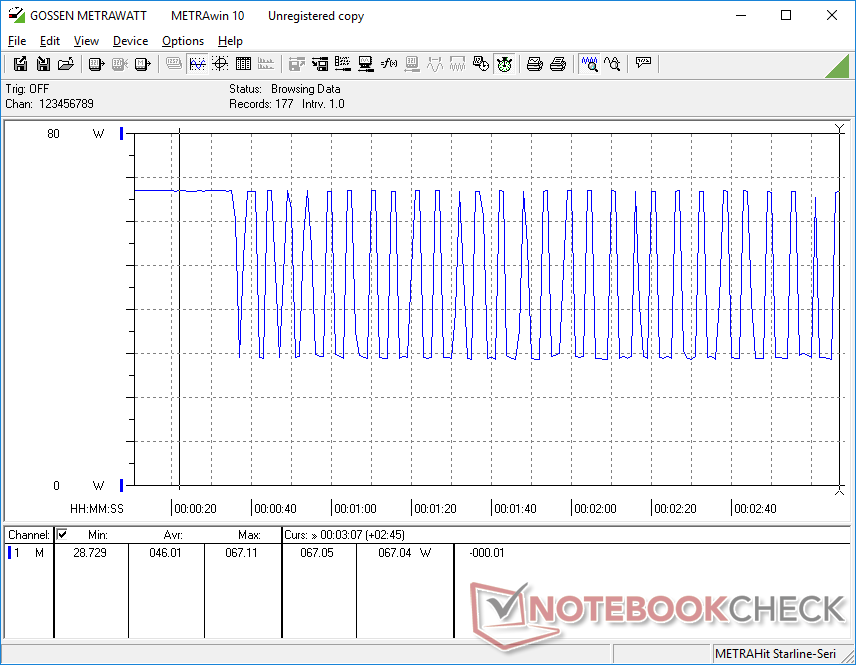
Test warunków skrajnych
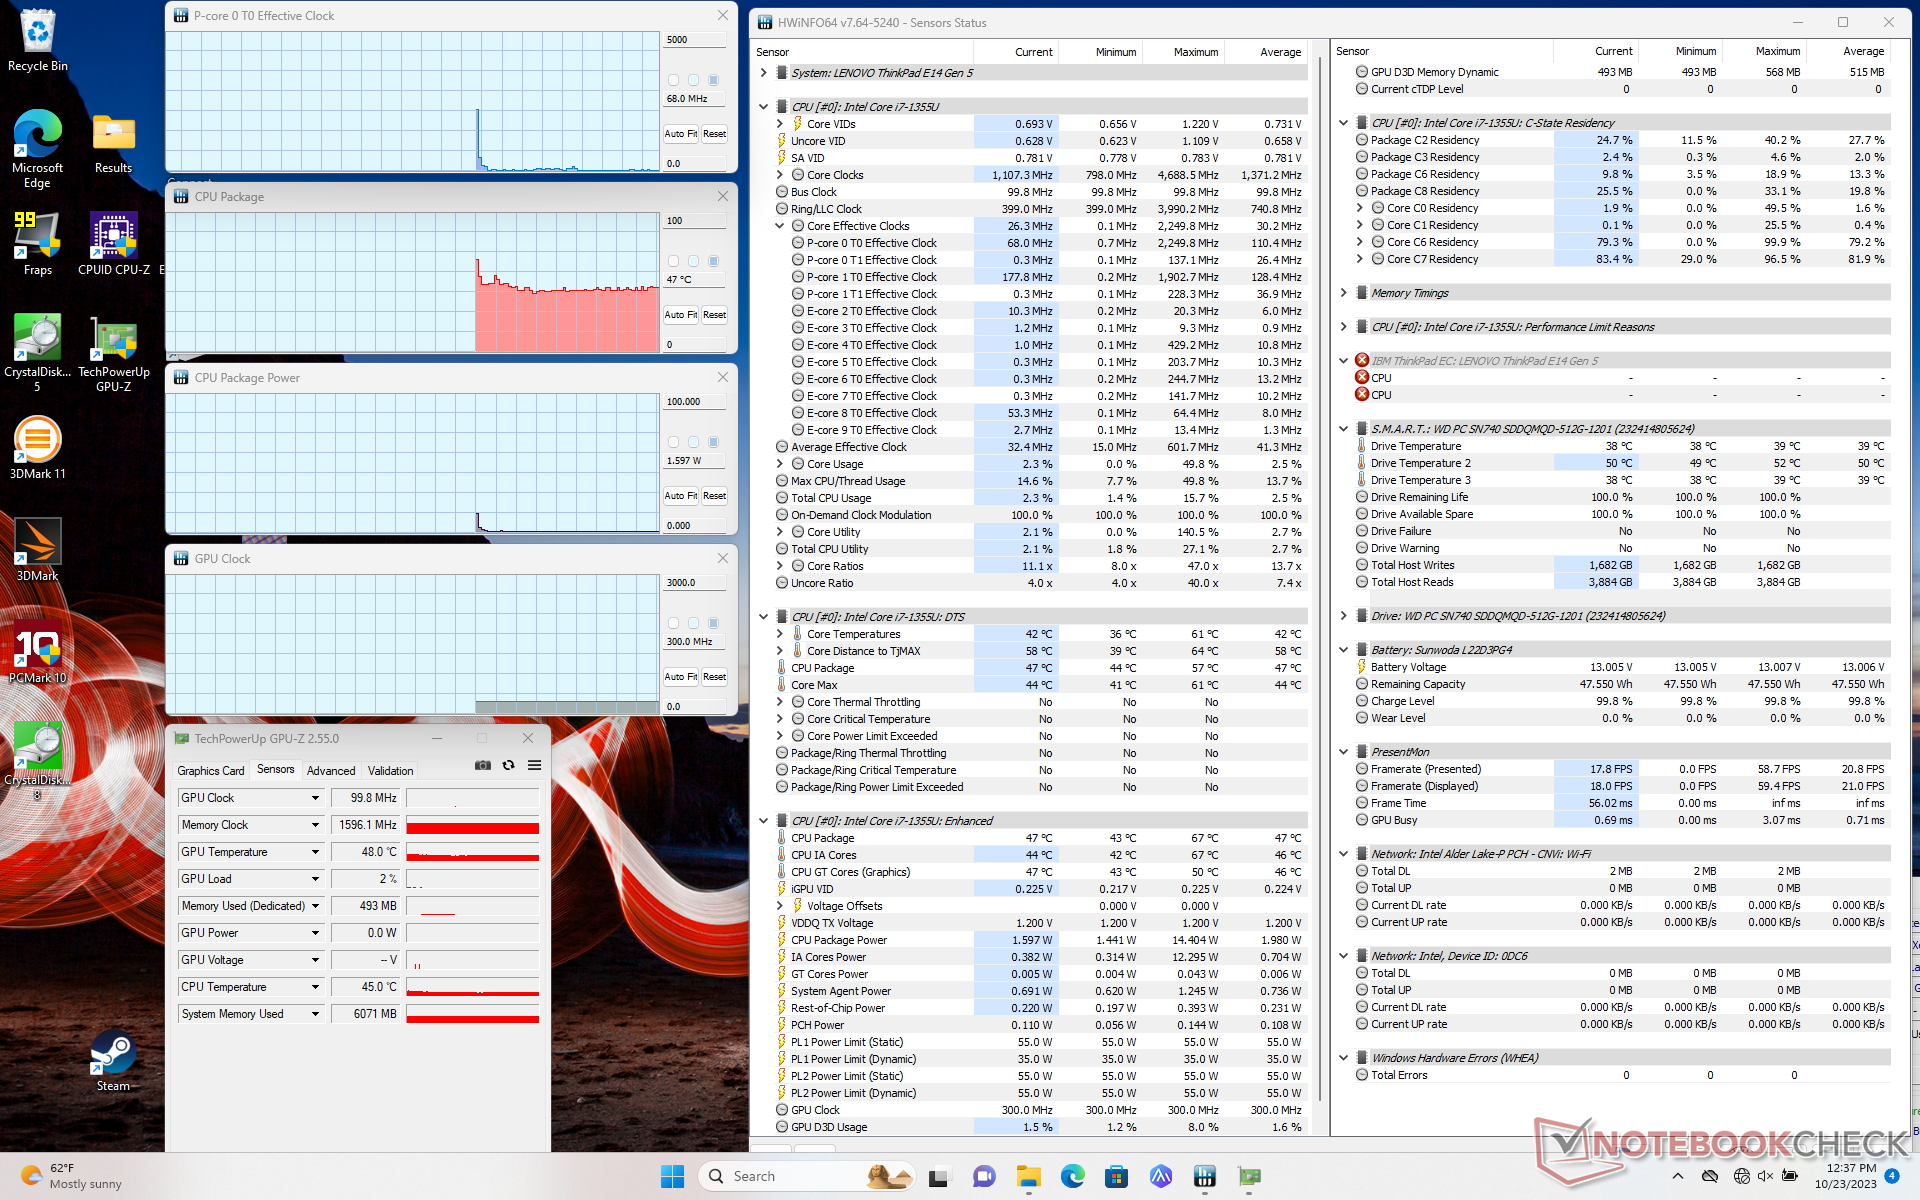
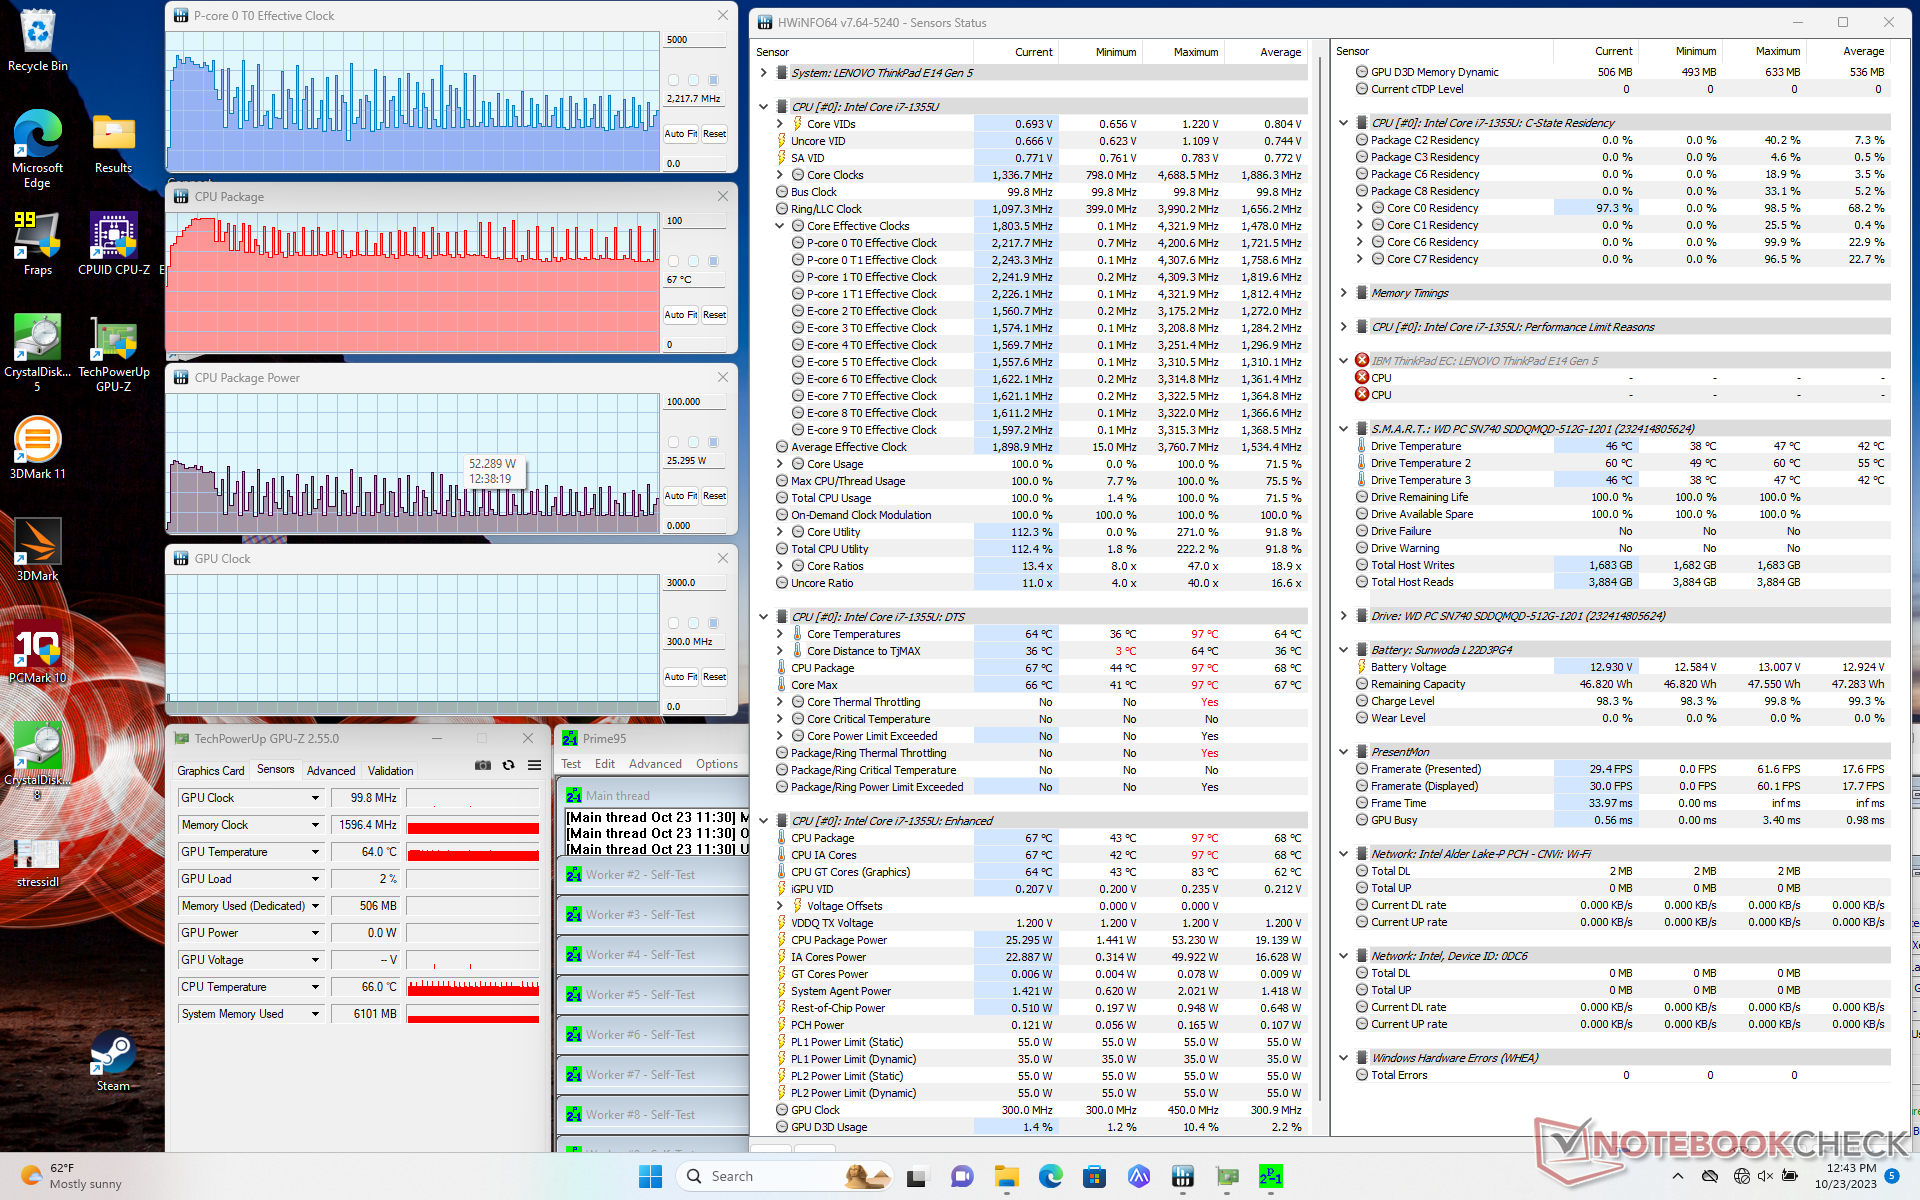
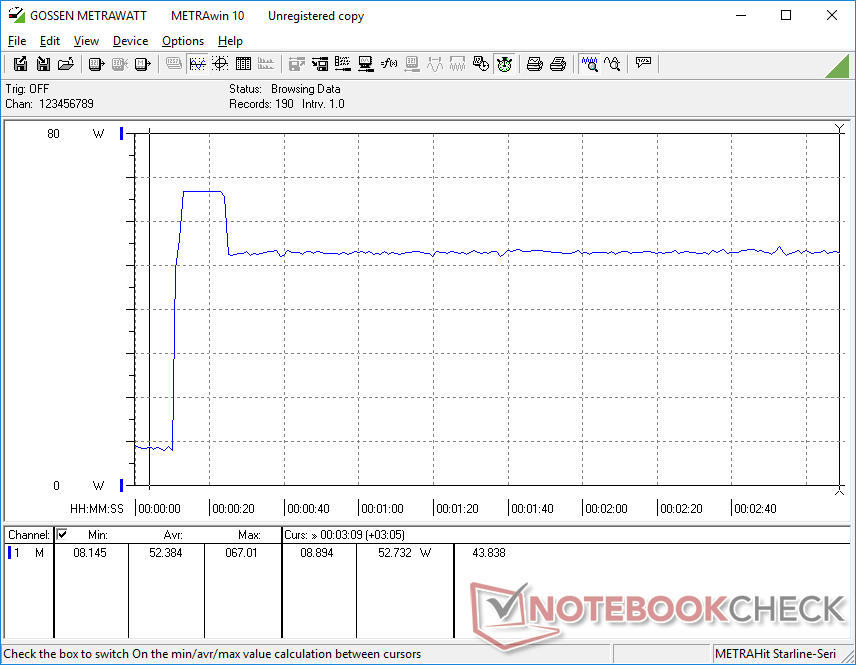
Częstotliwość taktowania procesora i pobór mocy płyty podczas inicjowania stresu Prime95 wzrosłyby odpowiednio do 4 GHz i 52 W, trwając przez około 30 sekund i przy temperaturze rdzenia 97 C. Procesor następnie przełączałby się między 1,6 GHz a 3,9 GHz, a następnie od 14 W do 43 W, aby utrzymać niższą temperaturę rdzenia, jak pokazano na poniższym zrzucie ekranu. Zakres dławienia częstotliwości taktowania jest bardzo szeroki, co wyjaśnia wolniejsze niż oczekiwano wyniki CineBench wspomniane powyżej i szerokie wartości zużycia energii w następnej sekcji.
Temperatura rdzenia oscylowałaby wokół 80 C podczas pracy z obciążeniem stresowym w porównaniu do nieco poniżej 70 C na Dell Latitude 7440.
| Taktowanie CPU (GHz) | Taktowanie GPU (MHz) | Średnia temperatura CPU (°C) | |
| System bezczynności | -- | -- | 47 |
| Prime95Stress | 1.6 - 3.9 | -- | 70 - 90 |
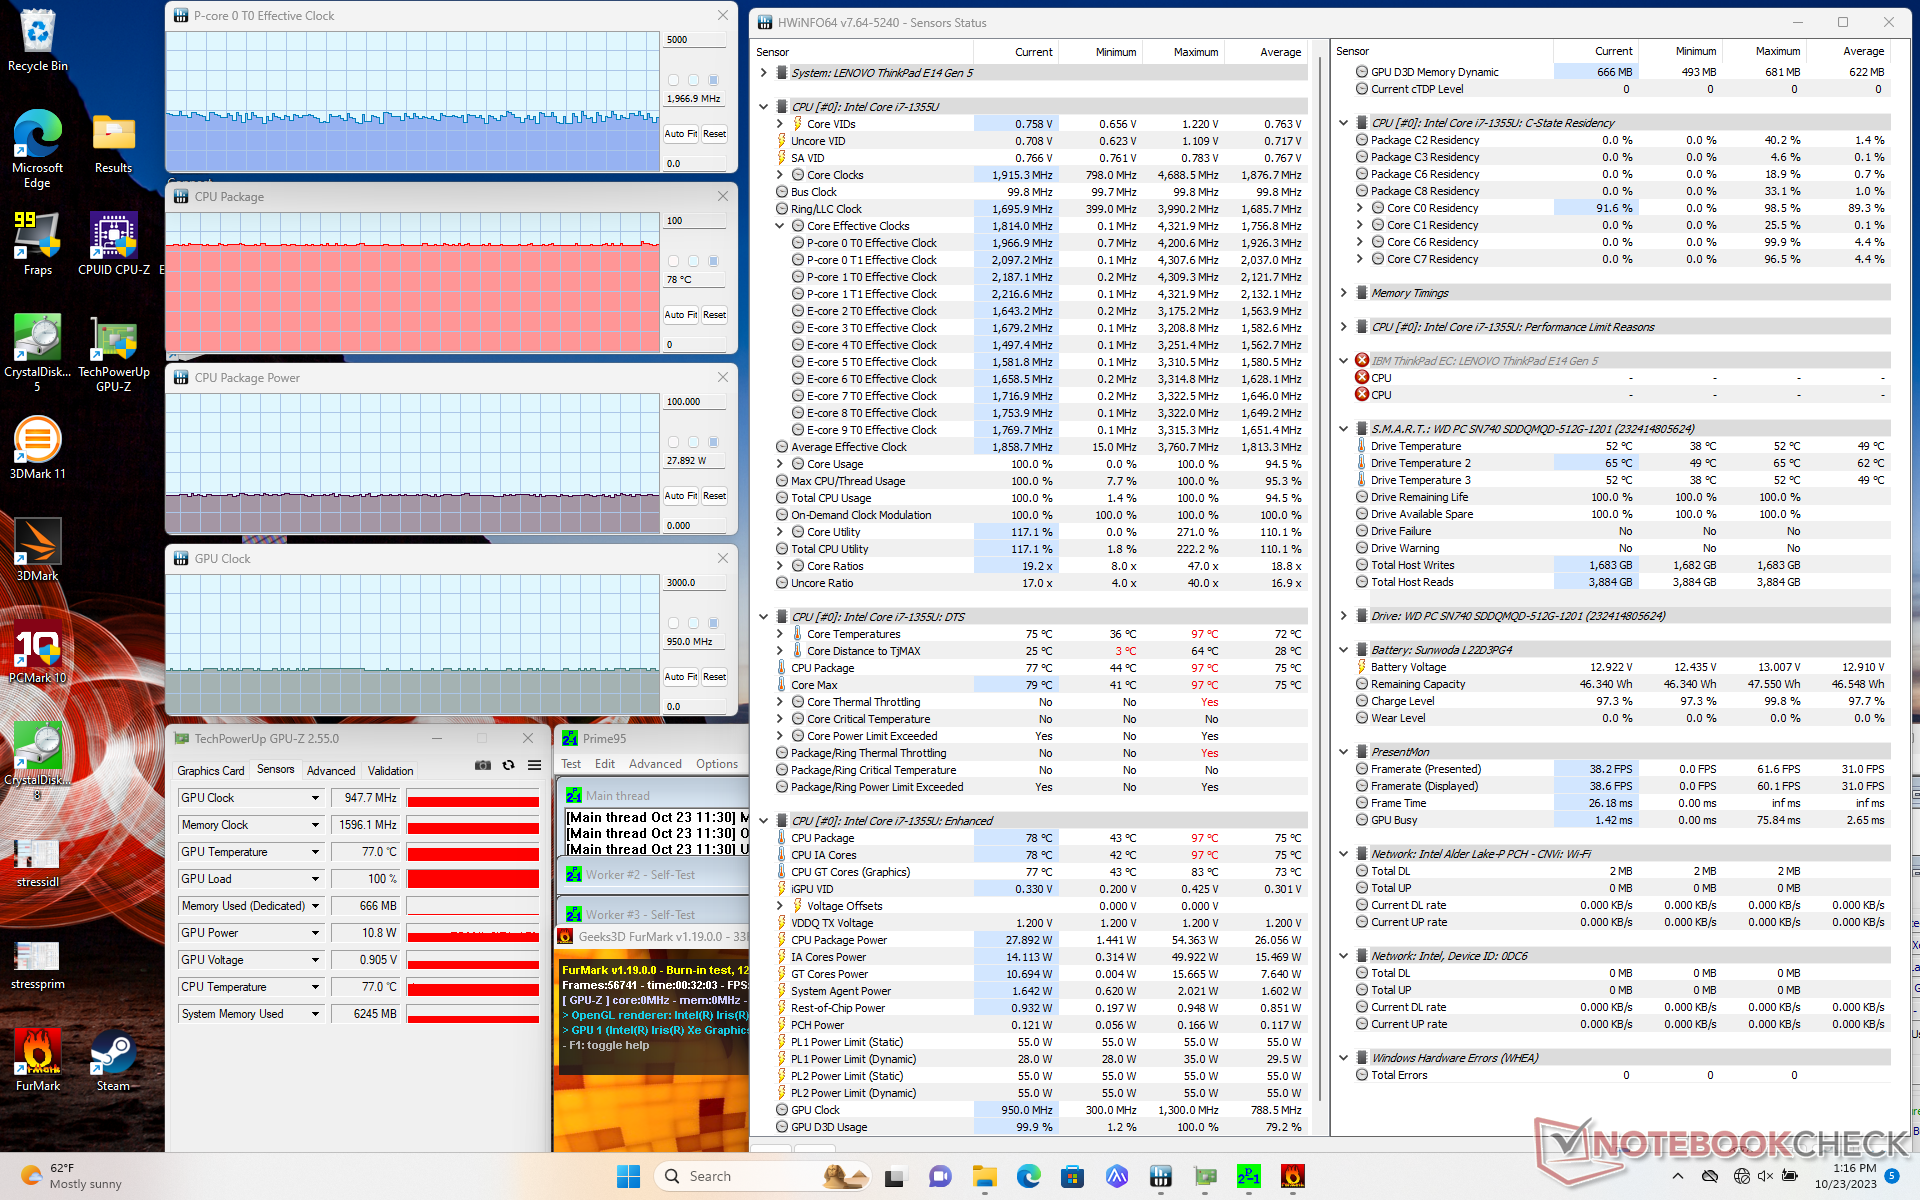
| Prime95+ FurMark Stress | ~2.0 | 950 | 78 |
| Witcher 3 Stres | ~3.0 | 1300 | 81 |
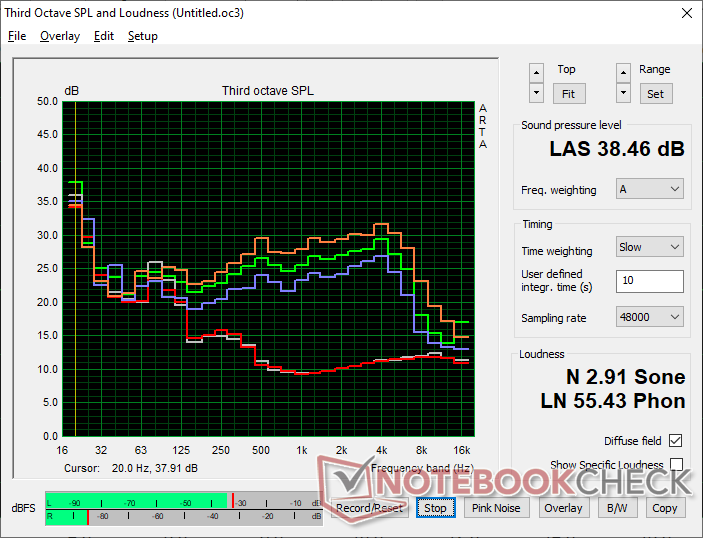
Głośniki
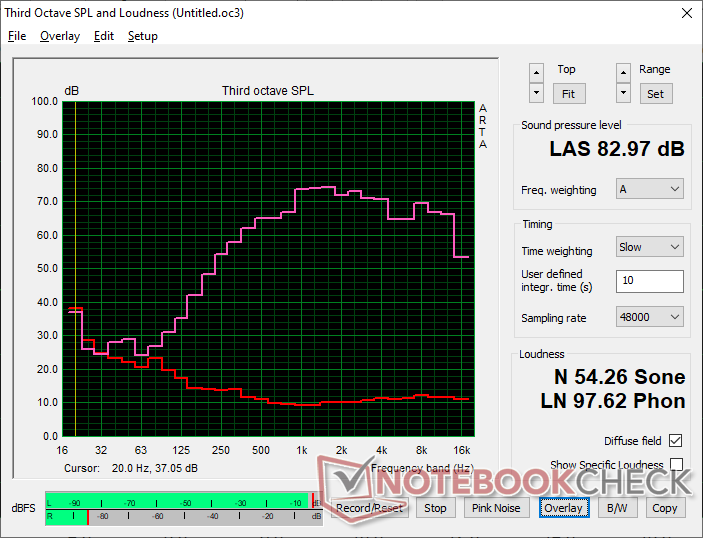
Lenovo ThinkPad E14 G5 i7-1355U analiza dźwięku
(+) | głośniki mogą odtwarzać stosunkowo głośno (83 dB)
Bas 100 - 315 Hz
(-) | prawie brak basu - średnio 20.3% niższa od mediany
(±) | liniowość basu jest średnia (9.6% delta do poprzedniej częstotliwości)
Średnie 400 - 2000 Hz
(+) | zbalansowane środki średnie - tylko 4.8% od mediany
(+) | średnie są liniowe (4.3% delta do poprzedniej częstotliwości)
Wysokie 2–16 kHz
(+) | zrównoważone maksima - tylko 3.7% od mediany
(+) | wzloty są liniowe (4.4% delta do poprzedniej częstotliwości)
Ogólnie 100 - 16.000 Hz
(±) | liniowość ogólnego dźwięku jest średnia (16.9% różnicy w stosunku do mediany)
W porównaniu do tej samej klasy
» 24% wszystkich testowanych urządzeń w tej klasie było lepszych, 7% podobnych, 70% gorszych
» Najlepszy miał deltę 7%, średnia wynosiła ###średnia###%, najgorsza wynosiła 53%
W porównaniu do wszystkich testowanych urządzeń
» 30% wszystkich testowanych urządzeń było lepszych, 8% podobnych, 62% gorszych
» Najlepszy miał deltę 4%, średnia wynosiła ###średnia###%, najgorsza wynosiła 134%
Apple MacBook Pro 16 2021 M1 Pro analiza dźwięku
(+) | głośniki mogą odtwarzać stosunkowo głośno (84.7 dB)
Bas 100 - 315 Hz
(+) | dobry bas - tylko 3.8% od mediany
(+) | bas jest liniowy (5.2% delta do poprzedniej częstotliwości)
Średnie 400 - 2000 Hz
(+) | zbalansowane środki średnie - tylko 1.3% od mediany
(+) | średnie są liniowe (2.1% delta do poprzedniej częstotliwości)
Wysokie 2–16 kHz
(+) | zrównoważone maksima - tylko 1.9% od mediany
(+) | wzloty są liniowe (2.7% delta do poprzedniej częstotliwości)
Ogólnie 100 - 16.000 Hz
(+) | ogólny dźwięk jest liniowy (4.6% różnicy w stosunku do mediany)
W porównaniu do tej samej klasy
» 0% wszystkich testowanych urządzeń w tej klasie było lepszych, 0% podobnych, 100% gorszych
» Najlepszy miał deltę 5%, średnia wynosiła ###średnia###%, najgorsza wynosiła 45%
W porównaniu do wszystkich testowanych urządzeń
» 0% wszystkich testowanych urządzeń było lepszych, 0% podobnych, 100% gorszych
» Najlepszy miał deltę 4%, średnia wynosiła ###średnia###%, najgorsza wynosiła 134%
Zarządzanie energią
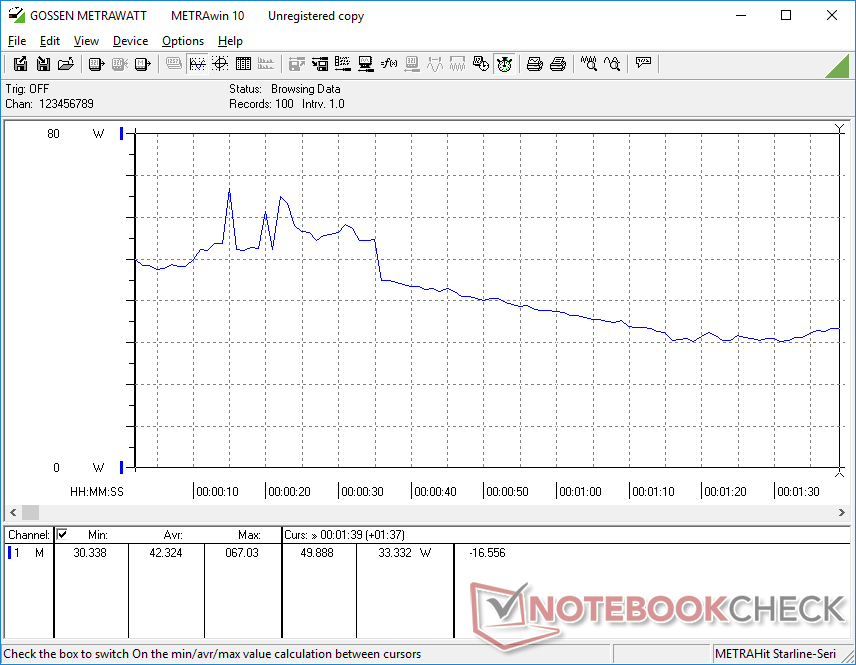
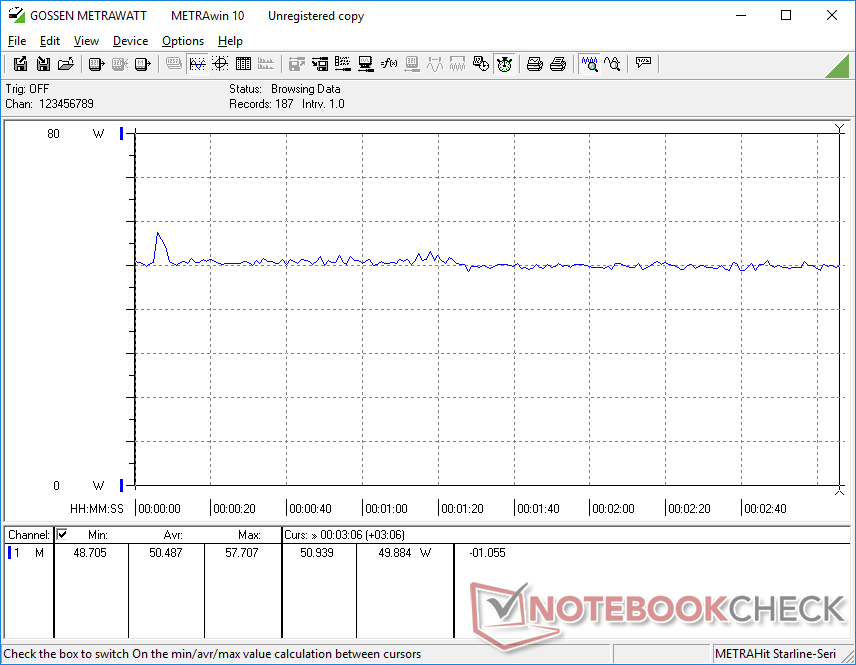
Zużycie energii
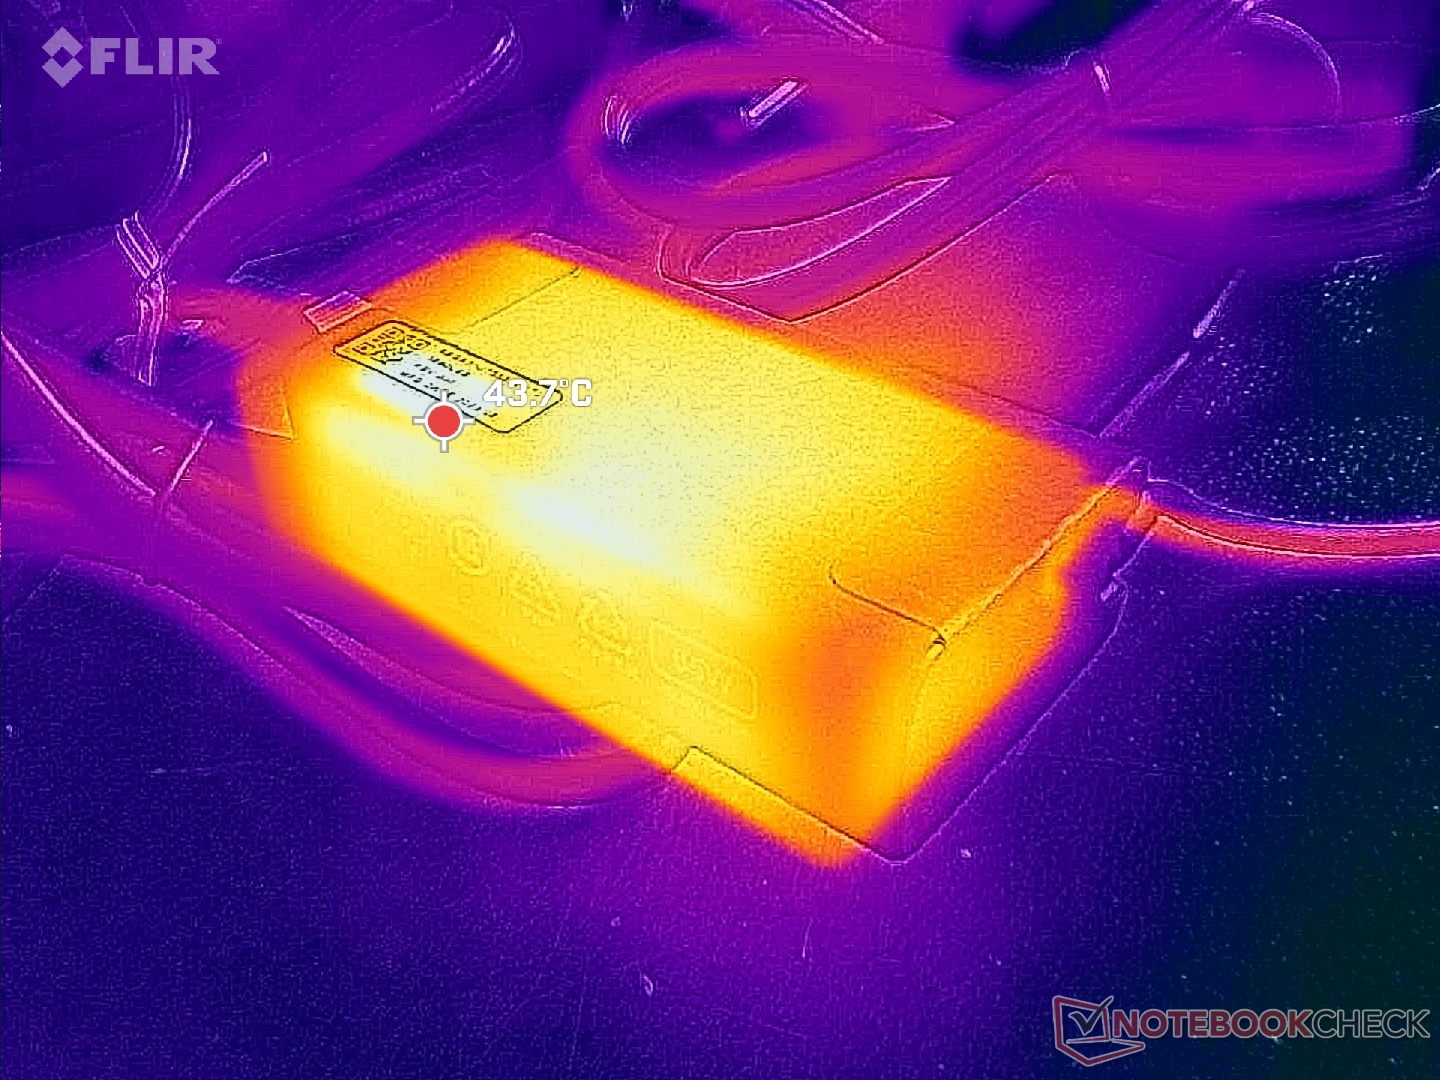
Zużycie energii odzwierciedla wspomniane powyżej strome dławienie procesora. Na przykład podczas uruchamiania Prime95 zużycie energii wahało się od 29 W do 67 W, podczas gdy dokładnie ten sam test na AMD ThinkPad E14 G5 zwróciłby bardziej stabilny wskaźnik 47 W.
Zużycie może wynosić nawet 67 W z małego (9 x 4,7 x 2,7 cm) zasilacza sieciowego USB-C o mocy 65 W, gdy procesor jest wykorzystywany w 100 procentach. System Intela jest zatem bardziej energochłonny niż system AMD, gdy Turbo Boost działa najszybciej, na przykład podczas wielozadaniowości lub uruchamiania aplikacji. Można to również zaobserwować podczas uruchamiania testu porównawczego CineBench R15 xT, jak pokazano na poniższym wykresie porównawczym. Poza tym, zużycie energii jest mniej więcej takie samo pomiędzy obiema wersjami podczas pracy na biegu jałowym na pulpicie lub podczas uruchamiania mniej wymagających obciążeń.
| wyłączony / stan wstrzymania | |
| luz | |
| obciążenie |
|
Legenda:
min: | |
| Lenovo ThinkPad E14 G5 i7-1355U i7-1355U, Iris Xe G7 96EUs, WD PC SN740 512GB SDDQMQD-512G, IPS, 1920x1200, 14" | Lenovo ThinkPad E14 G5-21JSS05C00 R7 7730U, Vega 8, WD PC SN740 SDDPNQD-1T00, IPS, 2240x1400, 14" | HP EliteBook 845 G10 818N0EA R9 PRO 7940HS, Radeon 780M, SK hynix PC801 HFS001TEJ9X101N, IPS, 2560x1600, 14" | Asus ZenBook 14 UM3402Y R7 7730U, Vega 8, Micron 2400 MTFDKBA512QFM, OLED, 2880x1800, 14" | LG Gram 14Z90Q i5-1240P, Iris Xe G7 80EUs, Samsung PM9A1 MZVL2512HCJQ, IPS, 1920x1200, 14" | Dell Latitude 7440 i5-1345U, Iris Xe G7 80EUs, Samsung MZ9L4512HBLU-00BMV, IPS, 2560x1600, 14" | |
|---|---|---|---|---|---|---|
| Power Consumption | -3% | -33% | -42% | -0% | -5% | |
| Idle Minimum * (Watt) | 3.6 | 3.3 8% | 4.3 -19% | 7.9 -119% | 3 17% | 4.5 -25% |
| Idle Average * (Watt) | 6.9 | 7.6 -10% | 10.1 -46% | 8.8 -28% | 6 13% | 6.5 6% |
| Idle Maximum * (Watt) | 7 | 8.9 -27% | 11.2 -60% | 14.7 -110% | 12 -71% | 7.3 -4% |
| Load Average * (Watt) | 42.3 | 47.3 -12% | 64.4 -52% | 46.9 -11% | 40 5% | 52.5 -24% |
| Witcher 3 ultra * (Watt) | 50.5 | 45.1 11% | 59.4 -18% | 44.9 11% | 36.5 28% | 46.2 9% |
| Load Maximum * (Watt) | 67 | 57.8 14% | 66.7 -0% | 65.2 3% | 63 6% | 63 6% |
* ... im mniej tym lepiej
Power Consumption Witcher 3 / Stresstest
Power Consumption external Monitor
Żywotność baterii
Bateria jest mniejsza w niektórych konfiguracjach Intela w porównaniu z naszą konfiguracją AMD (47 Wh vs. 57 Wh), więc użytkownicy powinni spodziewać się krótszych czasów pracy, jeśli są skonfigurowani z mniejszą opcją. Jesteśmy w stanie przeglądać strony internetowe przez około 5,5 godziny przed automatycznym wyłączeniem w porównaniu do prawie 10 godzin w wersji AMD.
Ładowanie od stanu pustego do pełnej pojemności jest poza tym bardzo szybkie i trwa nieco ponad godzinę przy użyciu dołączonego zasilacza sieciowego. Funkcja szybkiego ładowania jest domyślnie włączona.
| Lenovo ThinkPad E14 G5 i7-1355U i7-1355U, Iris Xe G7 96EUs, 47 Wh | Lenovo ThinkPad E14 G5-21JSS05C00 R7 7730U, Vega 8, 57 Wh | HP EliteBook 845 G10 818N0EA R9 PRO 7940HS, Radeon 780M, 51 Wh | Asus ZenBook 14 UM3402Y R7 7730U, Vega 8, 75 Wh | LG Gram 14Z90Q i5-1240P, Iris Xe G7 80EUs, 72 Wh | Dell Latitude 7440 i5-1345U, Iris Xe G7 80EUs, 57 Wh | |
|---|---|---|---|---|---|---|
| Czasy pracy | 80% | 44% | 120% | 116% | 136% | |
| WiFi v1.3 (h) | 5.5 | 9.9 80% | 7.9 44% | 12.1 120% | 11.9 116% | 13 136% |
| H.264 (h) | 10.8 | 9.3 | ||||
| Load (h) | 1.2 | 0.9 | 3.4 | 2.8 | 2.7 | |
| Reader / Idle (h) | 18.5 | 28.9 | 23.8 |
Za
Przeciw
Werdykt - dobry, ale trudniejszy do polecenia niż wersja AMD Ryzen 7
Nasza jednostka Intela w konfiguracji z procesorem Core i7, 16 GB pamięci RAM, ekranem dotykowym 1200p i dyskiem SSD o pojemności 512 GB kosztuje około 915 USD w porównaniu do 865 USD za wersję Ryzen 7 z taką samą pamięcią RAM, ekranem dotykowym i dyskiem SSD. Decydując się na wersję AMD, zyskają Państwo szybszą wydajność wielowątkową, dłuższy czas pracy na baterii i odpowiednią obsługę M.2 2280 SSD, podczas gdy wersja Intel zapewni szybszą wydajność jednowątkową i obsługę Thunderbolt. Inne aspekty, takie jak wydajność graficzna, temperatura powierzchni i hałas wentylatora, są poza tym bardzo podobne między obiema wersjami. Tak więc, chyba że naprawdę cenią sobie Państwo wydajność jednowątkową i Thunderbolt, wersja AMD jest łatwiejsza do polecenia niż wersja Intela dla większości zainteresowanych nabywców.
ThinkPad E14 G5 z procesorem Intela wykazuje bardziej stromy throttling niż jego tańsza alternatywa Ryzen 7.
Brakuje kilku pomocniczych funkcji biznesowych, takich jak WAN i Smart Card, ale jest to zgodne z projektem, ponieważ seria ThinkPad E ma być bardziej przystępną cenowo alternatywą dla wyższej klasy i znacznie droższej serii ThinkPad T ThinkPad serii T lub Serii X.
Cena i dostępność
Amazon wysyła teraz ThinkPada E14 Gen 5 w cenie 915 USD. Lenovo dostarcza również ten sam model, ale z dodatkową pamięcią RAM za nieco ponad 1030 USD.
Lenovo ThinkPad E14 G5 i7-1355U
- 26/10/2023 v7 (old)
Allen Ngo
Przezroczystość
Wyboru urządzeń do recenzji dokonuje nasza redakcja. Próbka testowa została udostępniona autorowi jako pożyczka od producenta lub sprzedawcy detalicznego na potrzeby tej recenzji. Pożyczkodawca nie miał wpływu na tę recenzję, producent nie otrzymał też kopii tej recenzji przed publikacją. Nie było obowiązku publikowania tej recenzji. Jako niezależna firma medialna, Notebookcheck nie podlega władzy producentów, sprzedawców detalicznych ani wydawców.
Tak testuje Notebookcheck
Każdego roku Notebookcheck niezależnie sprawdza setki laptopów i smartfonów, stosując standardowe procedury, aby zapewnić porównywalność wszystkich wyników. Od około 20 lat stale rozwijamy nasze metody badawcze, ustanawiając przy tym standardy branżowe. W naszych laboratoriach testowych doświadczeni technicy i redaktorzy korzystają z wysokiej jakości sprzętu pomiarowego. Testy te obejmują wieloetapowy proces walidacji. Nasz kompleksowy system ocen opiera się na setkach uzasadnionych pomiarów i benchmarków, co pozwala zachować obiektywizm.Price comparison

