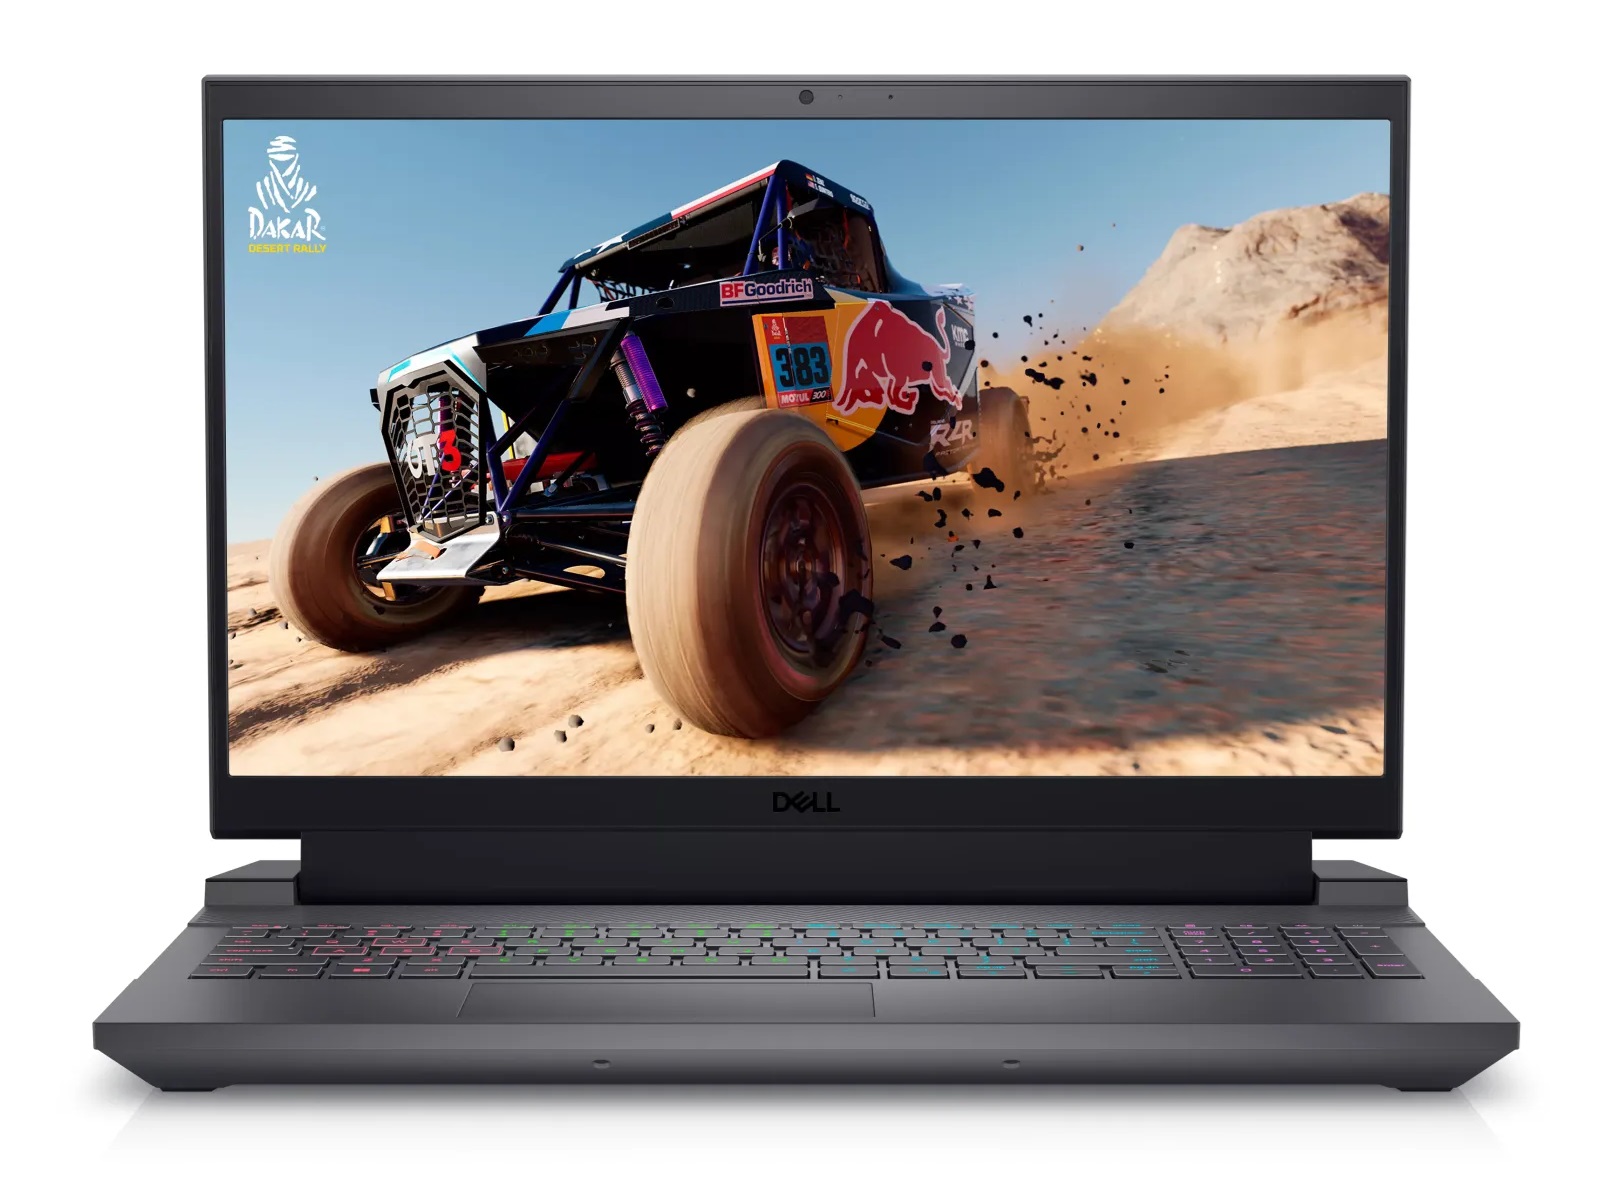
Recenzja Dell G15 5530: Laptop do gier RTX 4050 w kolorze Dark Shadow Grey

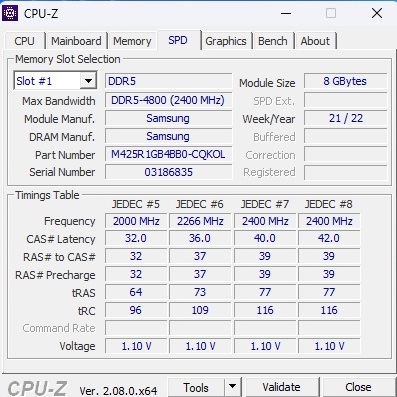
Po przetestowaniu G15 z Core i7-13650HX i GeForce RTX 4060 kilka miesięcy temu (proszę zobaczyć artykuł), teraz sprawdzamy tańszą wersję (o kilkaset euro) z procesorem Core i5-13450HX i GeForce RTX 4050. Ten wariant jest podobnie wyposażony w 16 GB pamięci RAM DDR-4800, dysk o pojemności 512 GB i wyświetlacz IPS 165 Hz, chociaż czasami używane są różne modele dla tych komponentów. Całość dopełnia 64-bitowy system operacyjny Windows 11 Home.
G15 konkuruje z innymi 15-calowymi laptopami do gier opartymi na RTX 4050, takimi jak Medion Erazer Crawler E40lenovo LOQ 15IRH8 Lenovo LOQ 15IRH8 i Asus TUF A15 FA507z których wszystkie pojawiają się w poniższych tabelach w celach porównawczych.
Ponieważ obudowa jest identyczna z G15 z wyjątkiem kolorystyki (szara zamiast białej) i języka klawiatury, w tym artykule omówimy tylko pokrótce obudowę, specyfikację i urządzenia wejściowe.
Potencjalni konkurenci w porównaniu
Ocena | Data | Model | Waga | Wysokość | Rozmiar | Rezolucja | Cena |
|---|---|---|---|---|---|---|---|
| 84.7 % v7 (old) | 01/2024 | Dell G15 5530, i5-13450HX RTX 4050 i5-13450HX, GeForce RTX 4050 Laptop GPU | 2.7 kg | 27 mm | 15.60" | 1920x1080 | |
| 85.4 % v7 (old) | 12/2023 | Medion Erazer Crawler E40 - MD 62518 i5-13500H, GeForce RTX 4050 Laptop GPU | 2.3 kg | 28 mm | 15.60" | 1920x1080 | |
| 85.9 % v7 (old) | 10/2023 | Lenovo LOQ 15IRH8 Core i7 i7-13620H, GeForce RTX 4050 Laptop GPU | 2.4 kg | 25.2 mm | 15.60" | 2560x1440 | |
| 86.3 % v7 (old) | 06/2023 | Asus TUF A15 FA507 R7 7735HS, GeForce RTX 4050 Laptop GPU | 2.2 kg | 24.9 mm | 15.60" | 1920x1080 | |
| 84.2 % v7 (old) | 06/2023 | Dell G15 5530 i7-13650HX, GeForce RTX 4060 Laptop GPU | 3 kg | 26.95 mm | 15.60" | 1920x1080 |
Sprawa
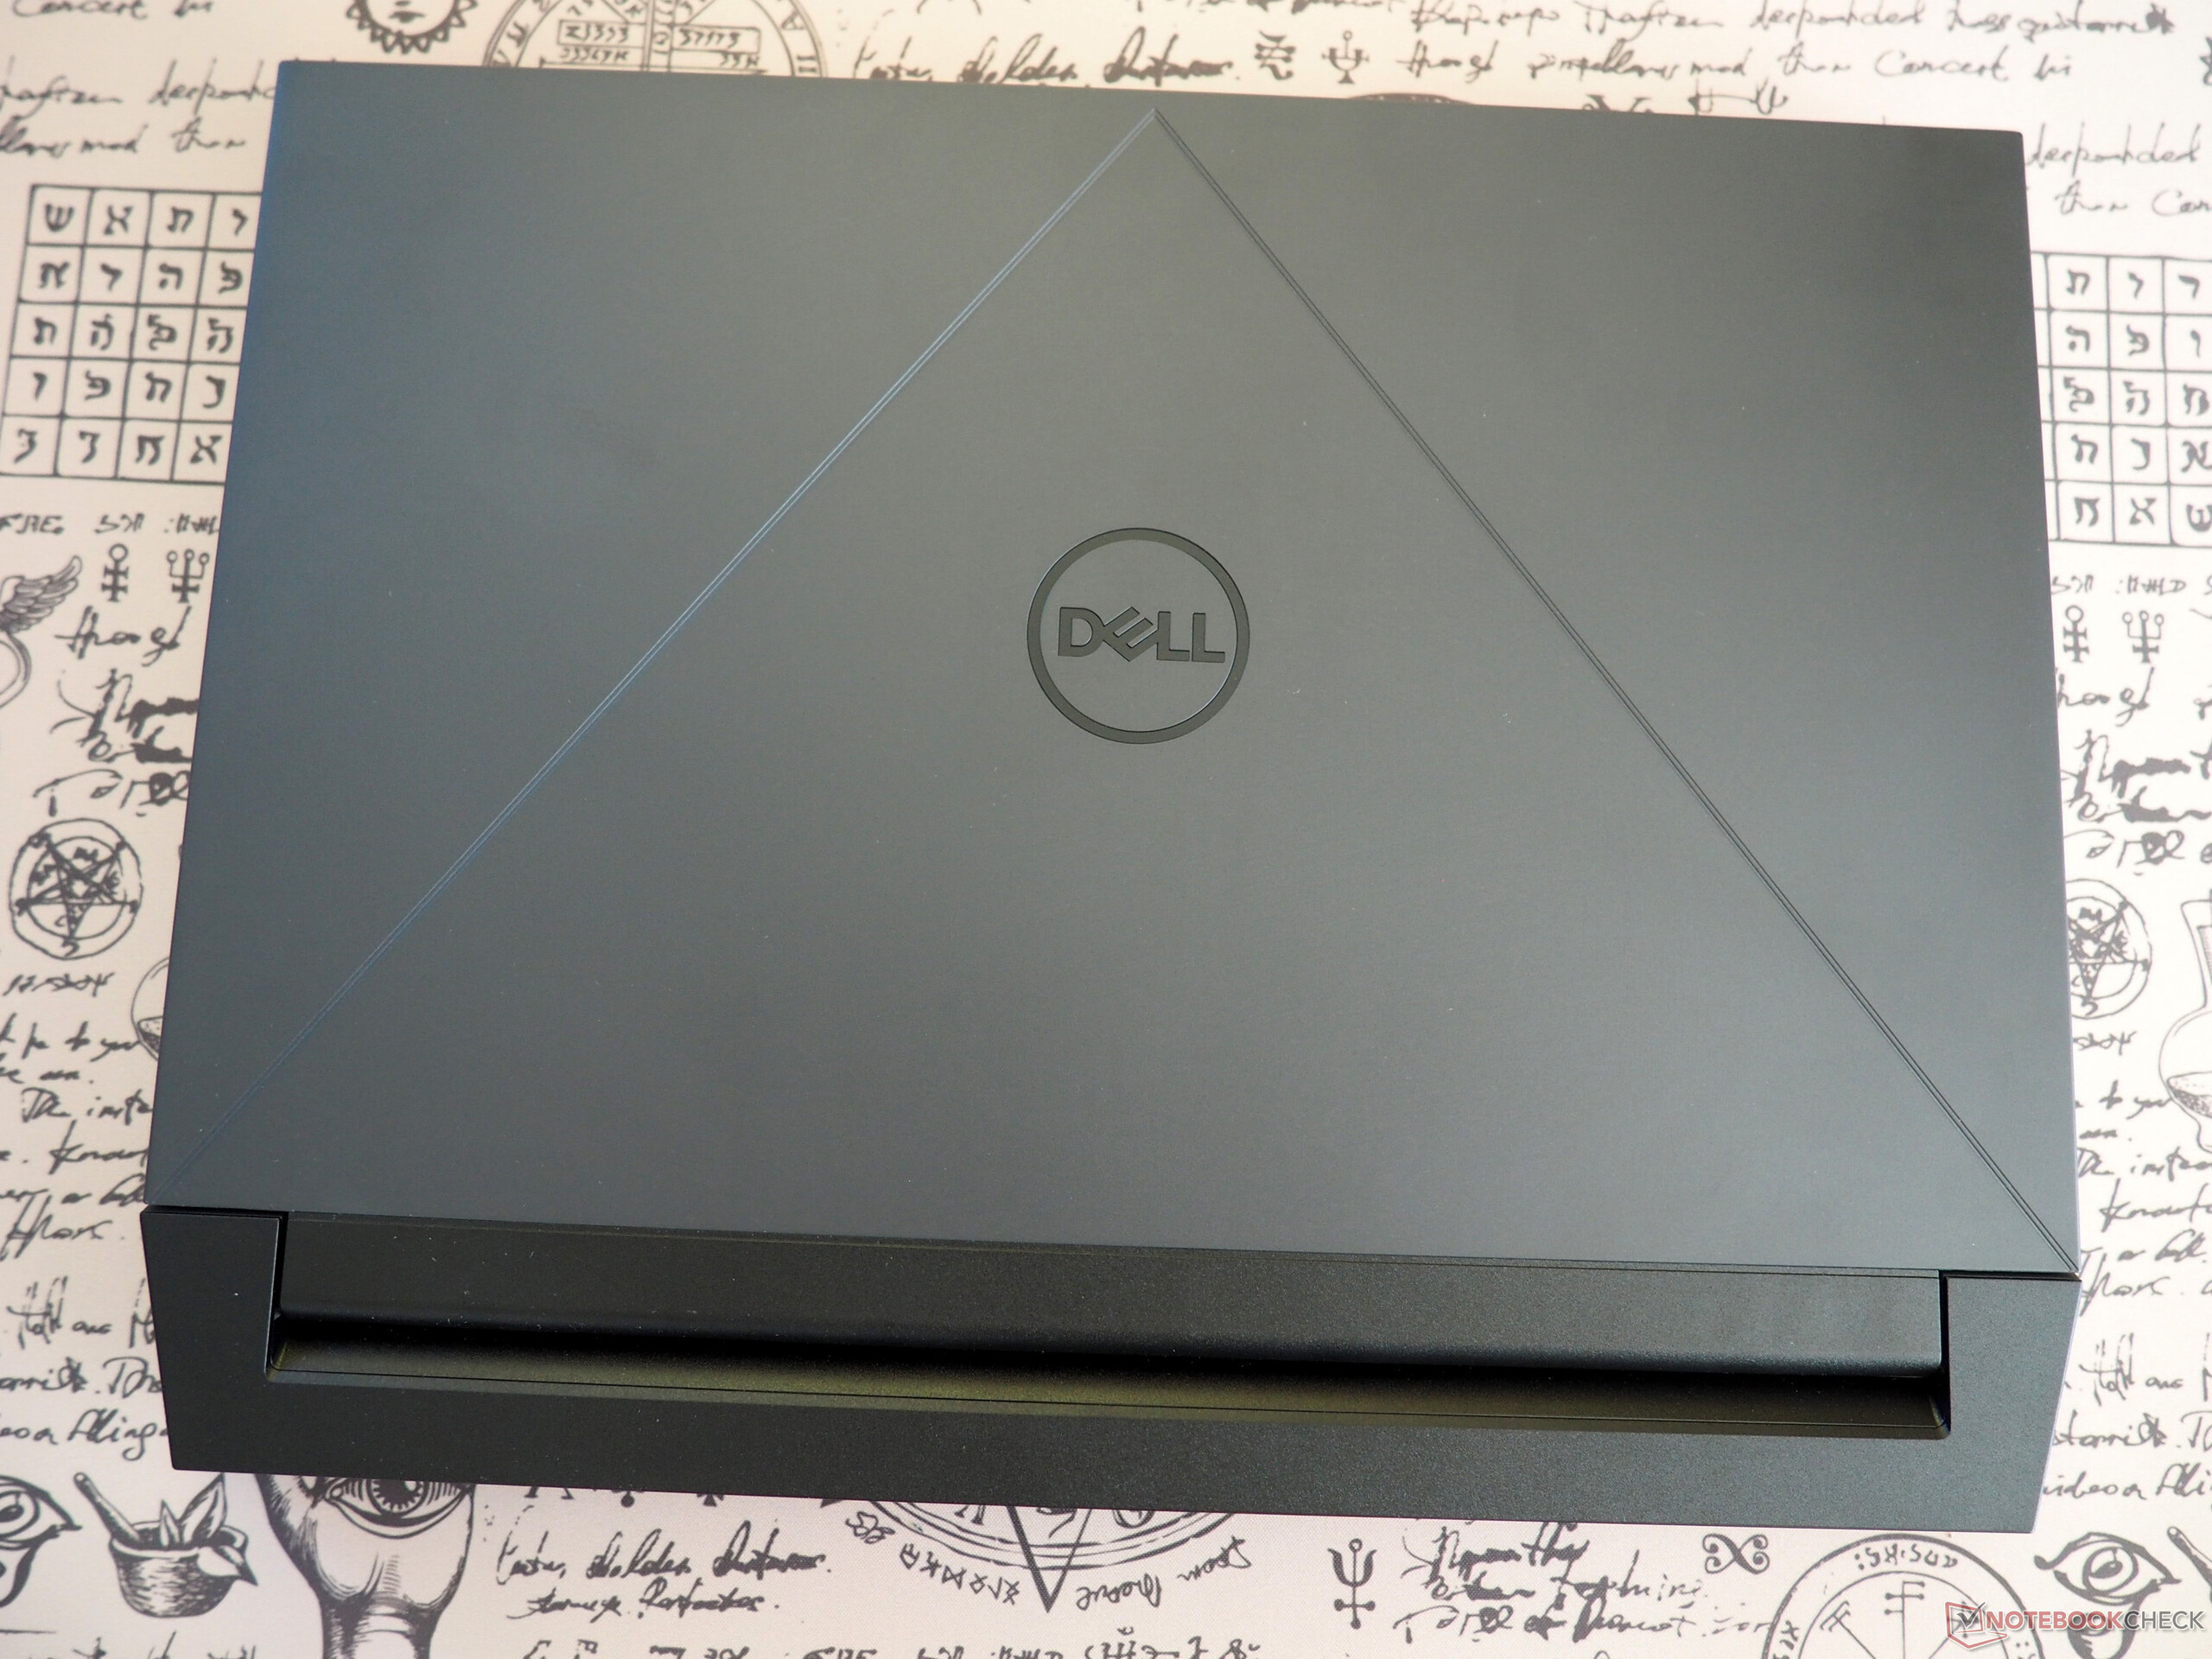
G15 okazuje się być notebookiem o klasycznej budowie, co oznacza, że nie jest ani bardzo cienki (2,7 cm lub 1,06 cala), ani szczególnie lekki (2,7 kg lub 5,95 funta). Konkurenci oferują bardziej nowoczesne konstrukcje, choć nie zawsze musi to być dobre (słowo kluczowe: emisje). Jeśli chodzi o estetykę, design laptopa jest szczególnie przyciągający wzrok, ale podobnie jak wielu innych producentów w tym przedziale cenowym, Dell zdecydował się na całkowicie plastikową obudowę, która ma tendencję do grzechotania w niektórych miejscach. Jakość spasowania i wykończenia jest natomiast dobra. Mechanizm zawiasów spisuje się przyzwoicie; laptopa można łatwo otworzyć jedną ręką.
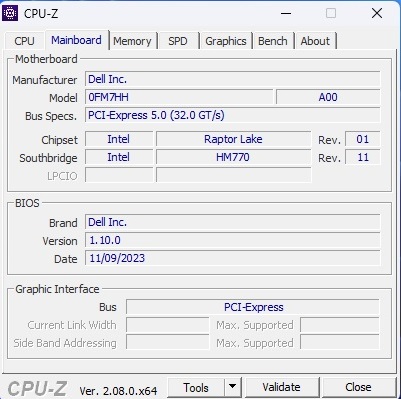
Specyfikacje
Interfejsy
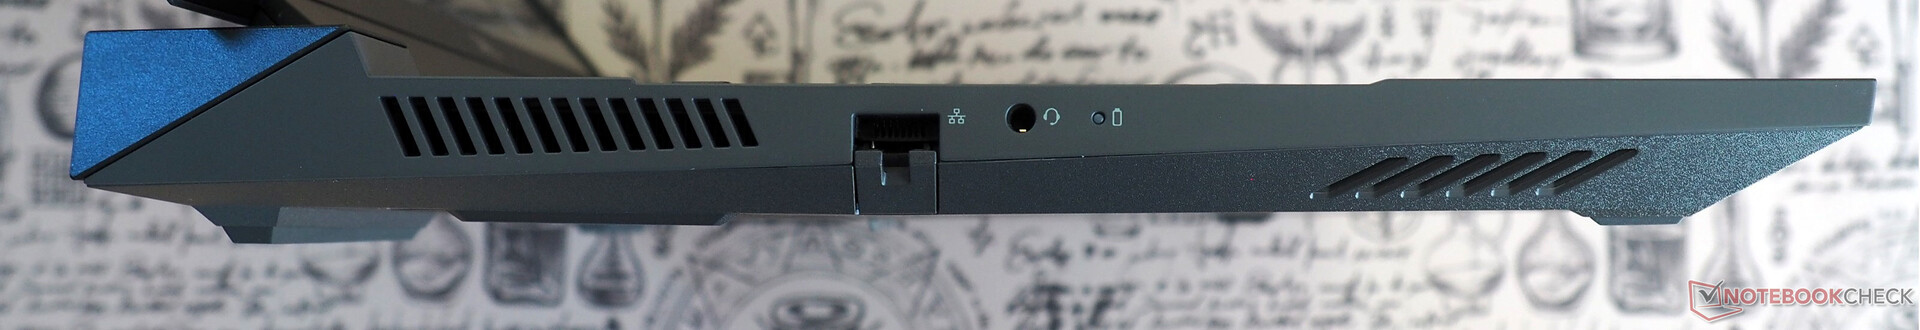
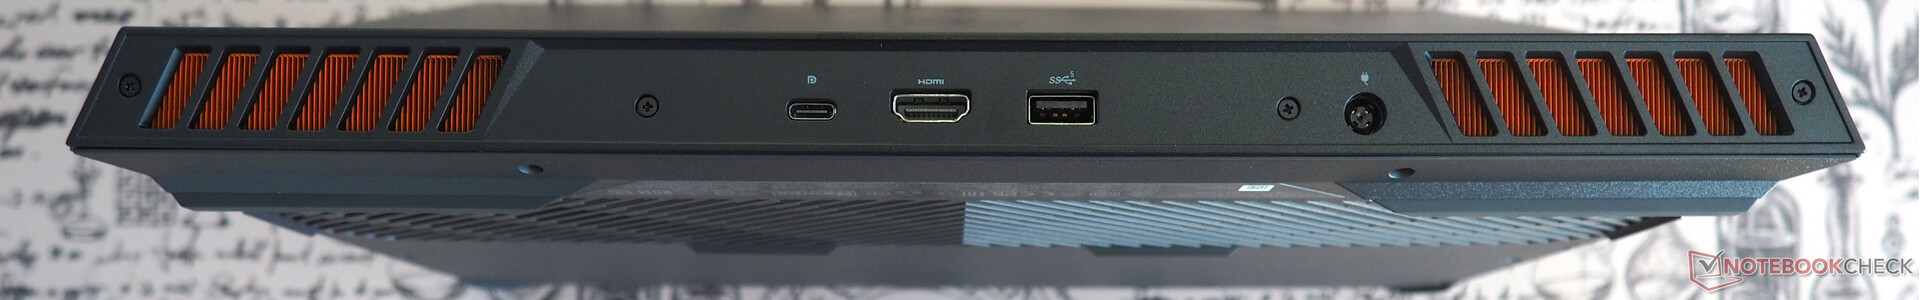
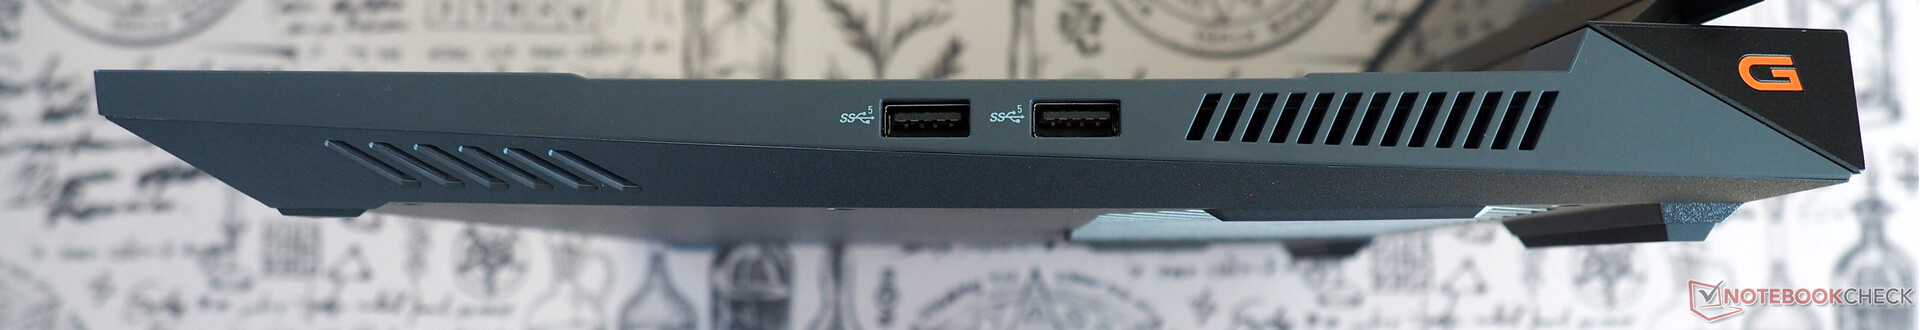
Wybór portów jest dość przestarzały i nieliczny. Na przykład, w urządzeniu nie znajdą Państwo ani jednego portu USB4. Zamiast tego jest ono wyposażone tylko w jeden port USB. 3.2 Gen 2 (typ C) i trzy porty USB 3.2 Gen 1 (typ A). Użytkownicy będą również musieli obejść się bez czytnika kart i gniazda Kensington. Ale przynajmniej urządzenie ma wyjście HDMI 2.1, port Ethernet i gniazdo audio.
Łączność
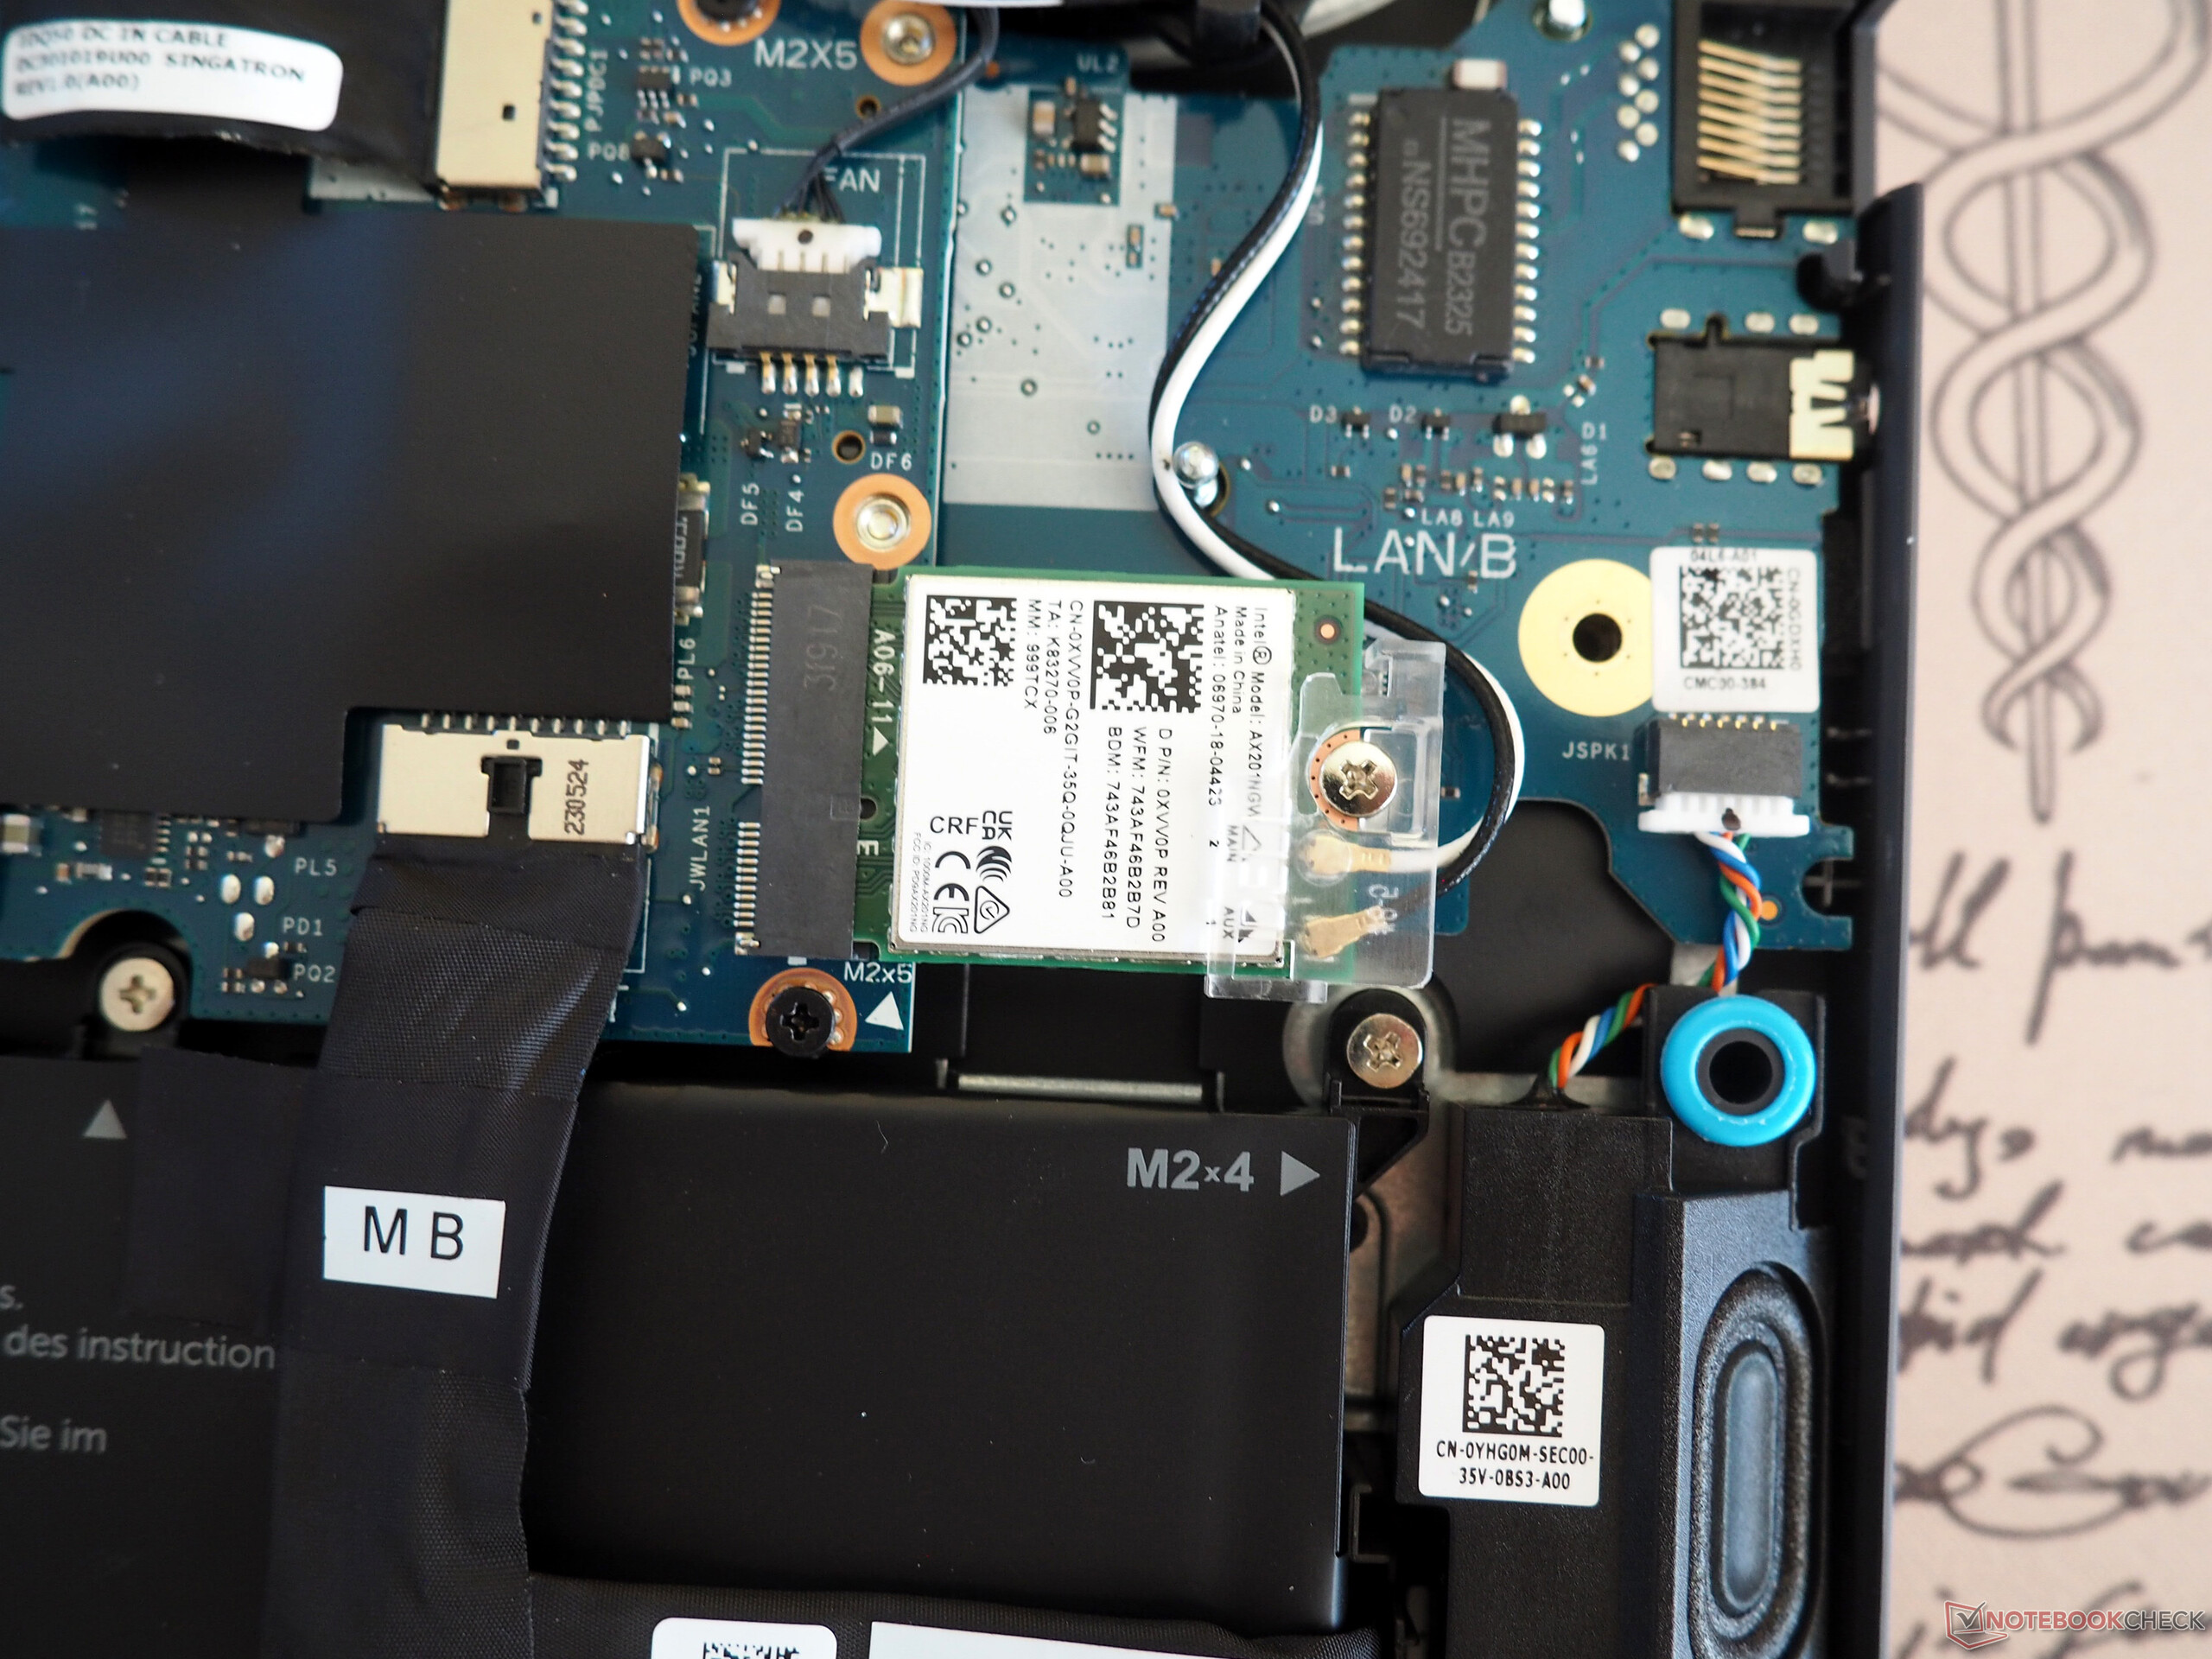
Wydajność bezprzewodowa G15 jest na równi (wysyłanie) lub wyższa (odbieranie) od średniej, jaką widzieliśmy do tej pory w tej klasie laptopów. Wbudowana karta bezprzewodowa została wyprodukowana przez firmę Intel (Wi-Fi 6 AX201).
Kamera internetowa
Kamera internetowa jest dość przeciętna pod względem jakości. Nadal jest miejsce na poprawę, jeśli chodzi o dokładność kolorów i ostrość obrazu.


Akcesoria
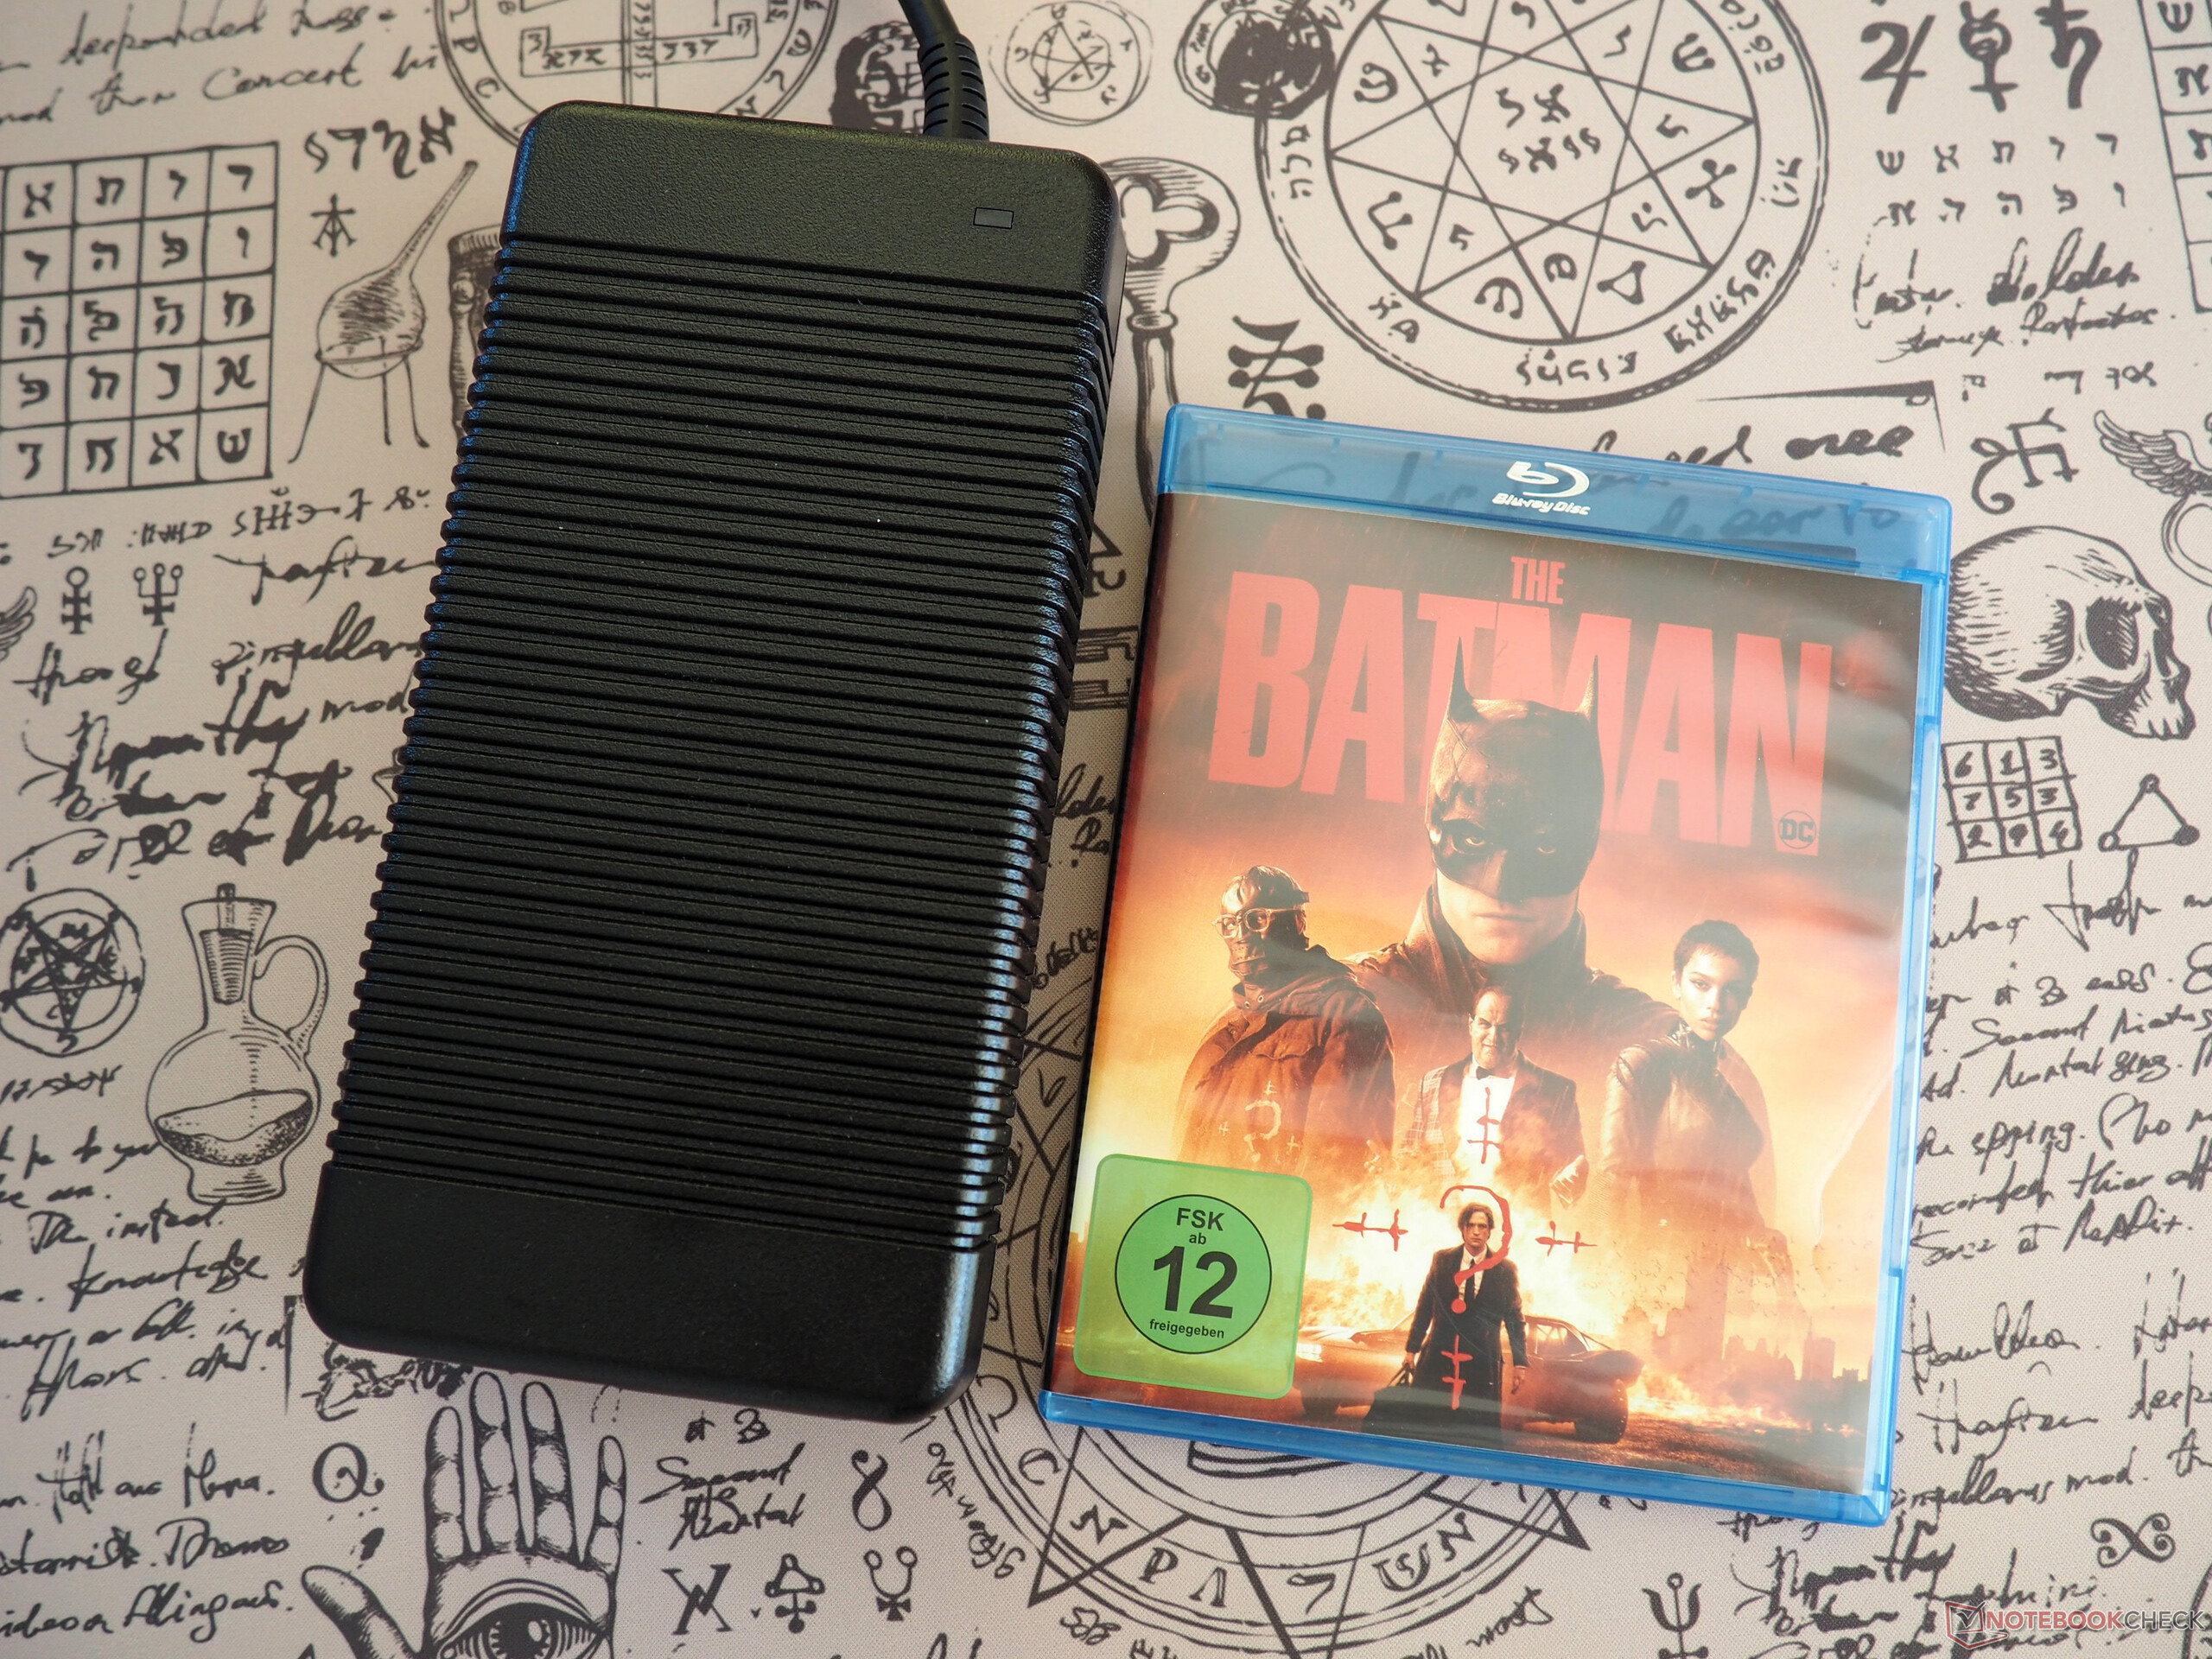
Biorąc pod uwagę poziom oferowanej wydajności, G15 jest dostarczany z absurdalnie dużym i ciężkim zasilaczem (wraz z kablem 1,5 kg lub 3,3 lb).
Konserwacja
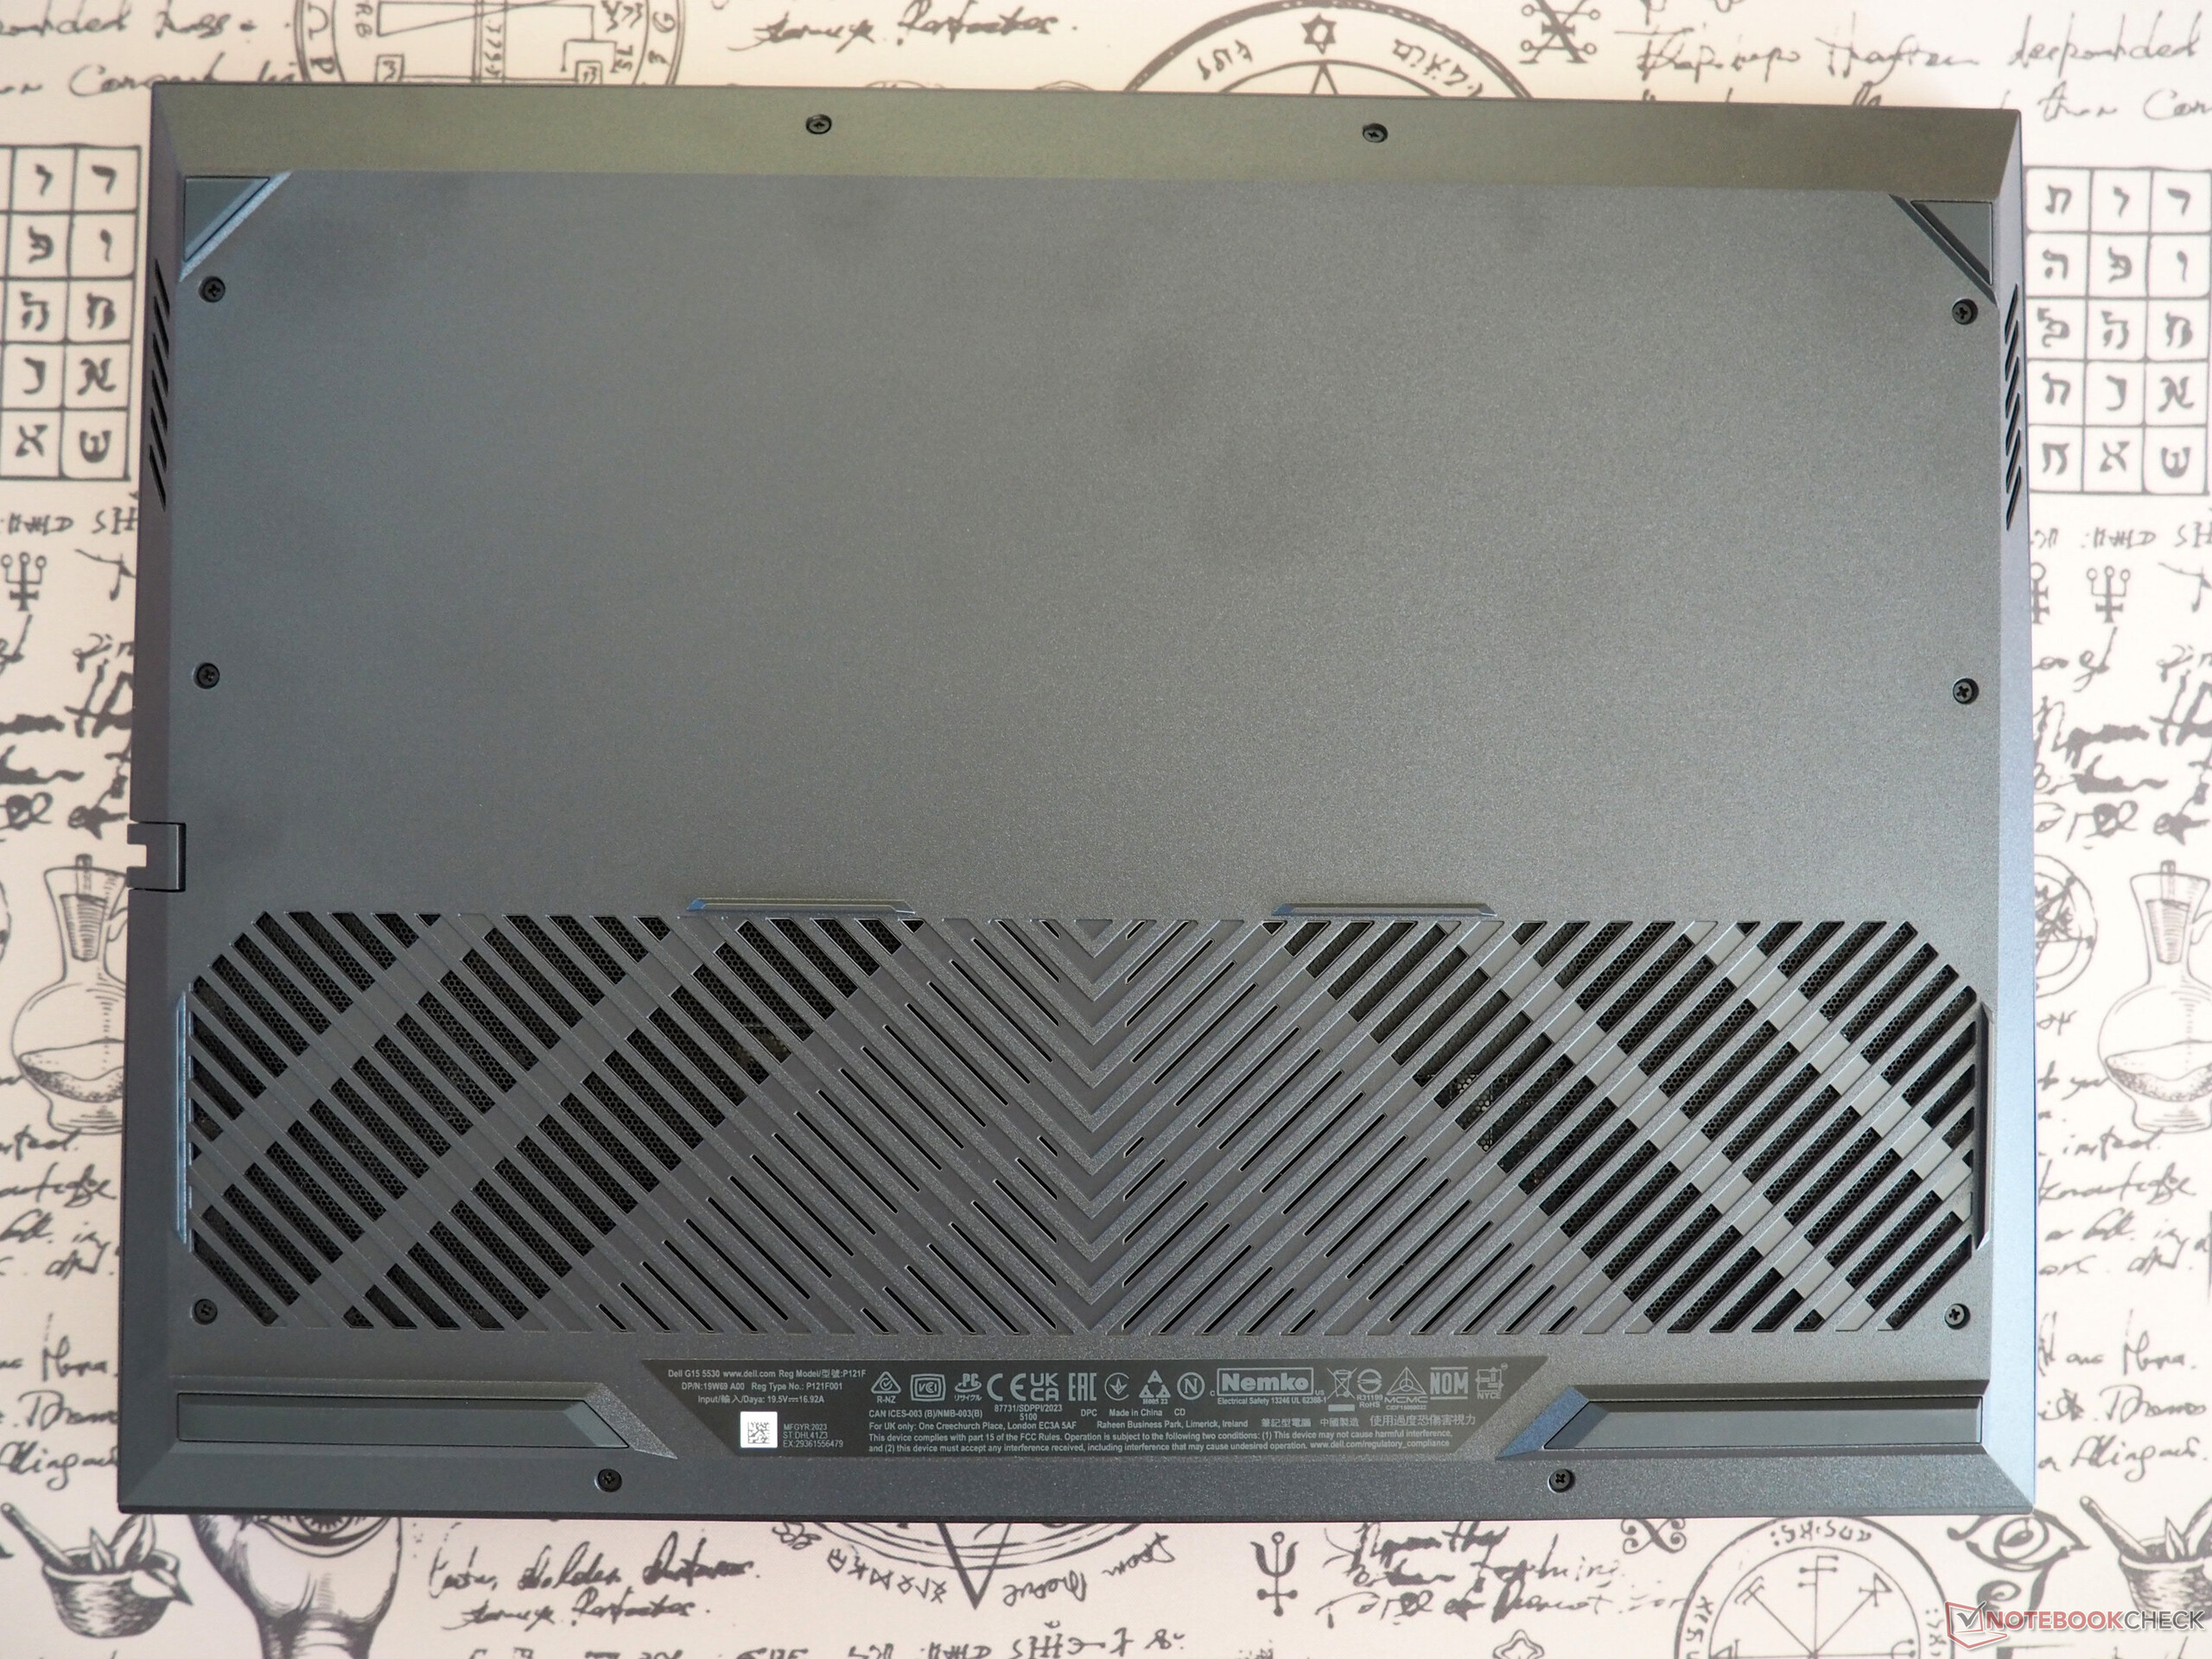
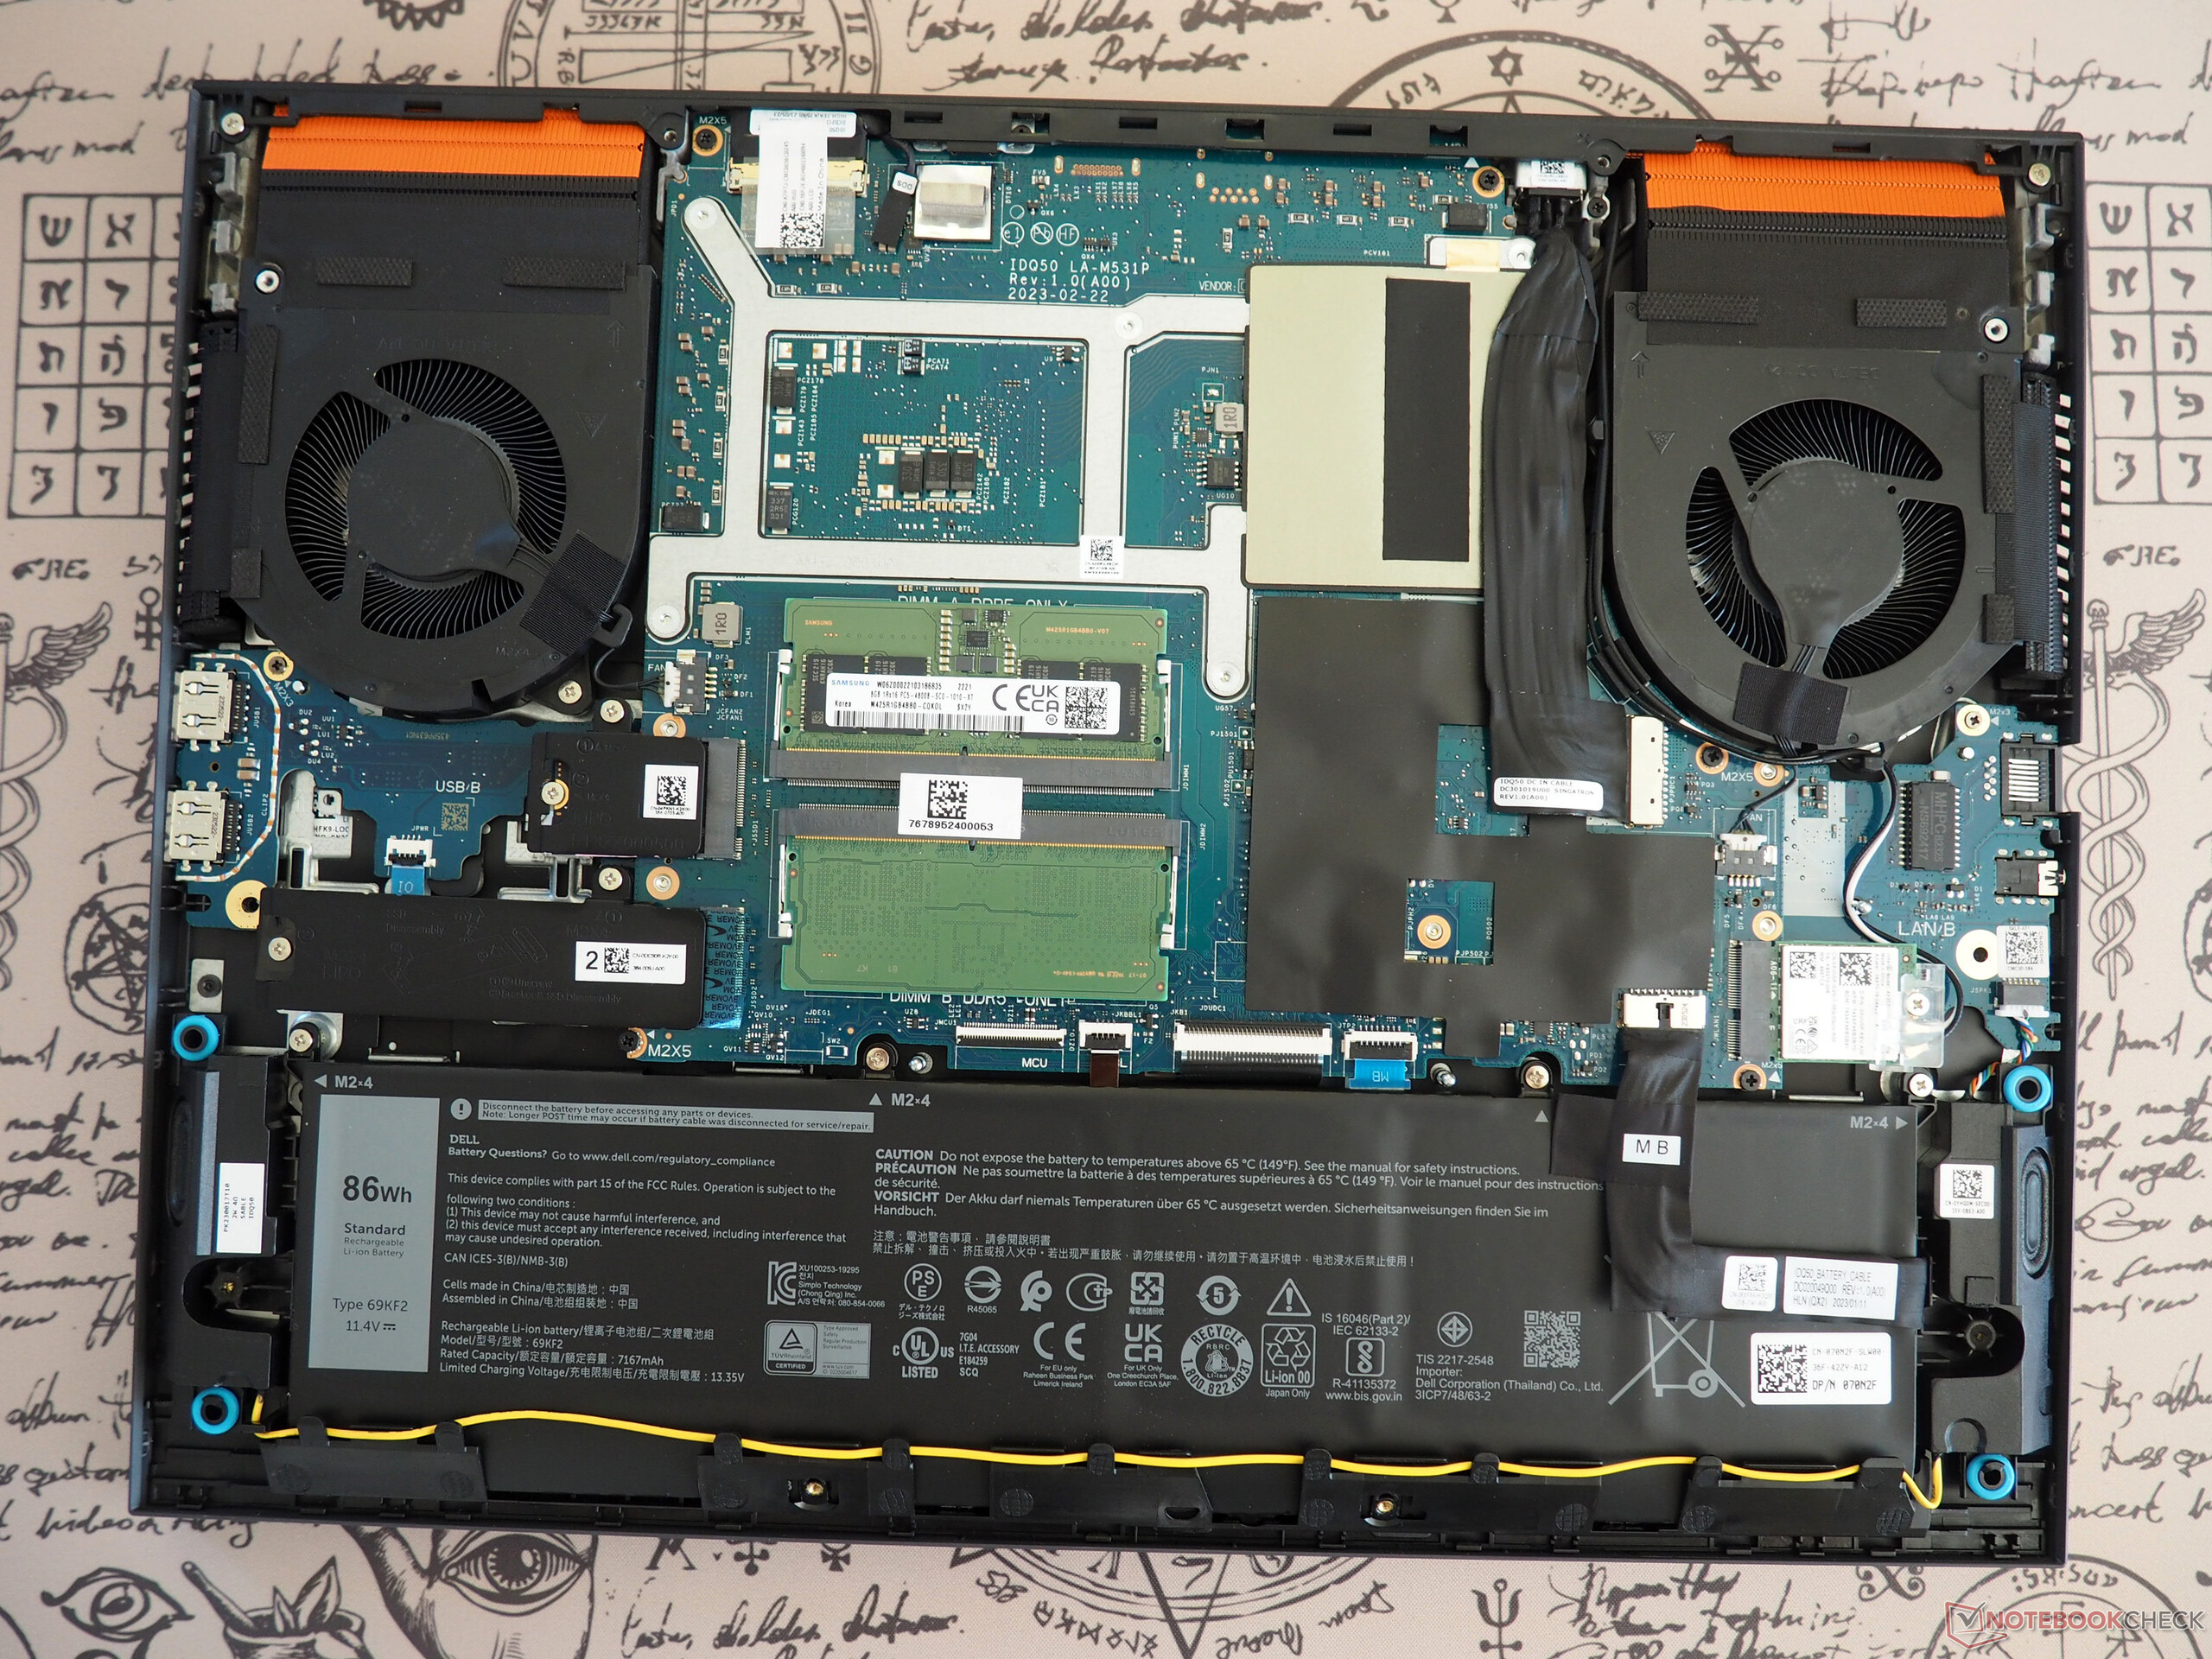
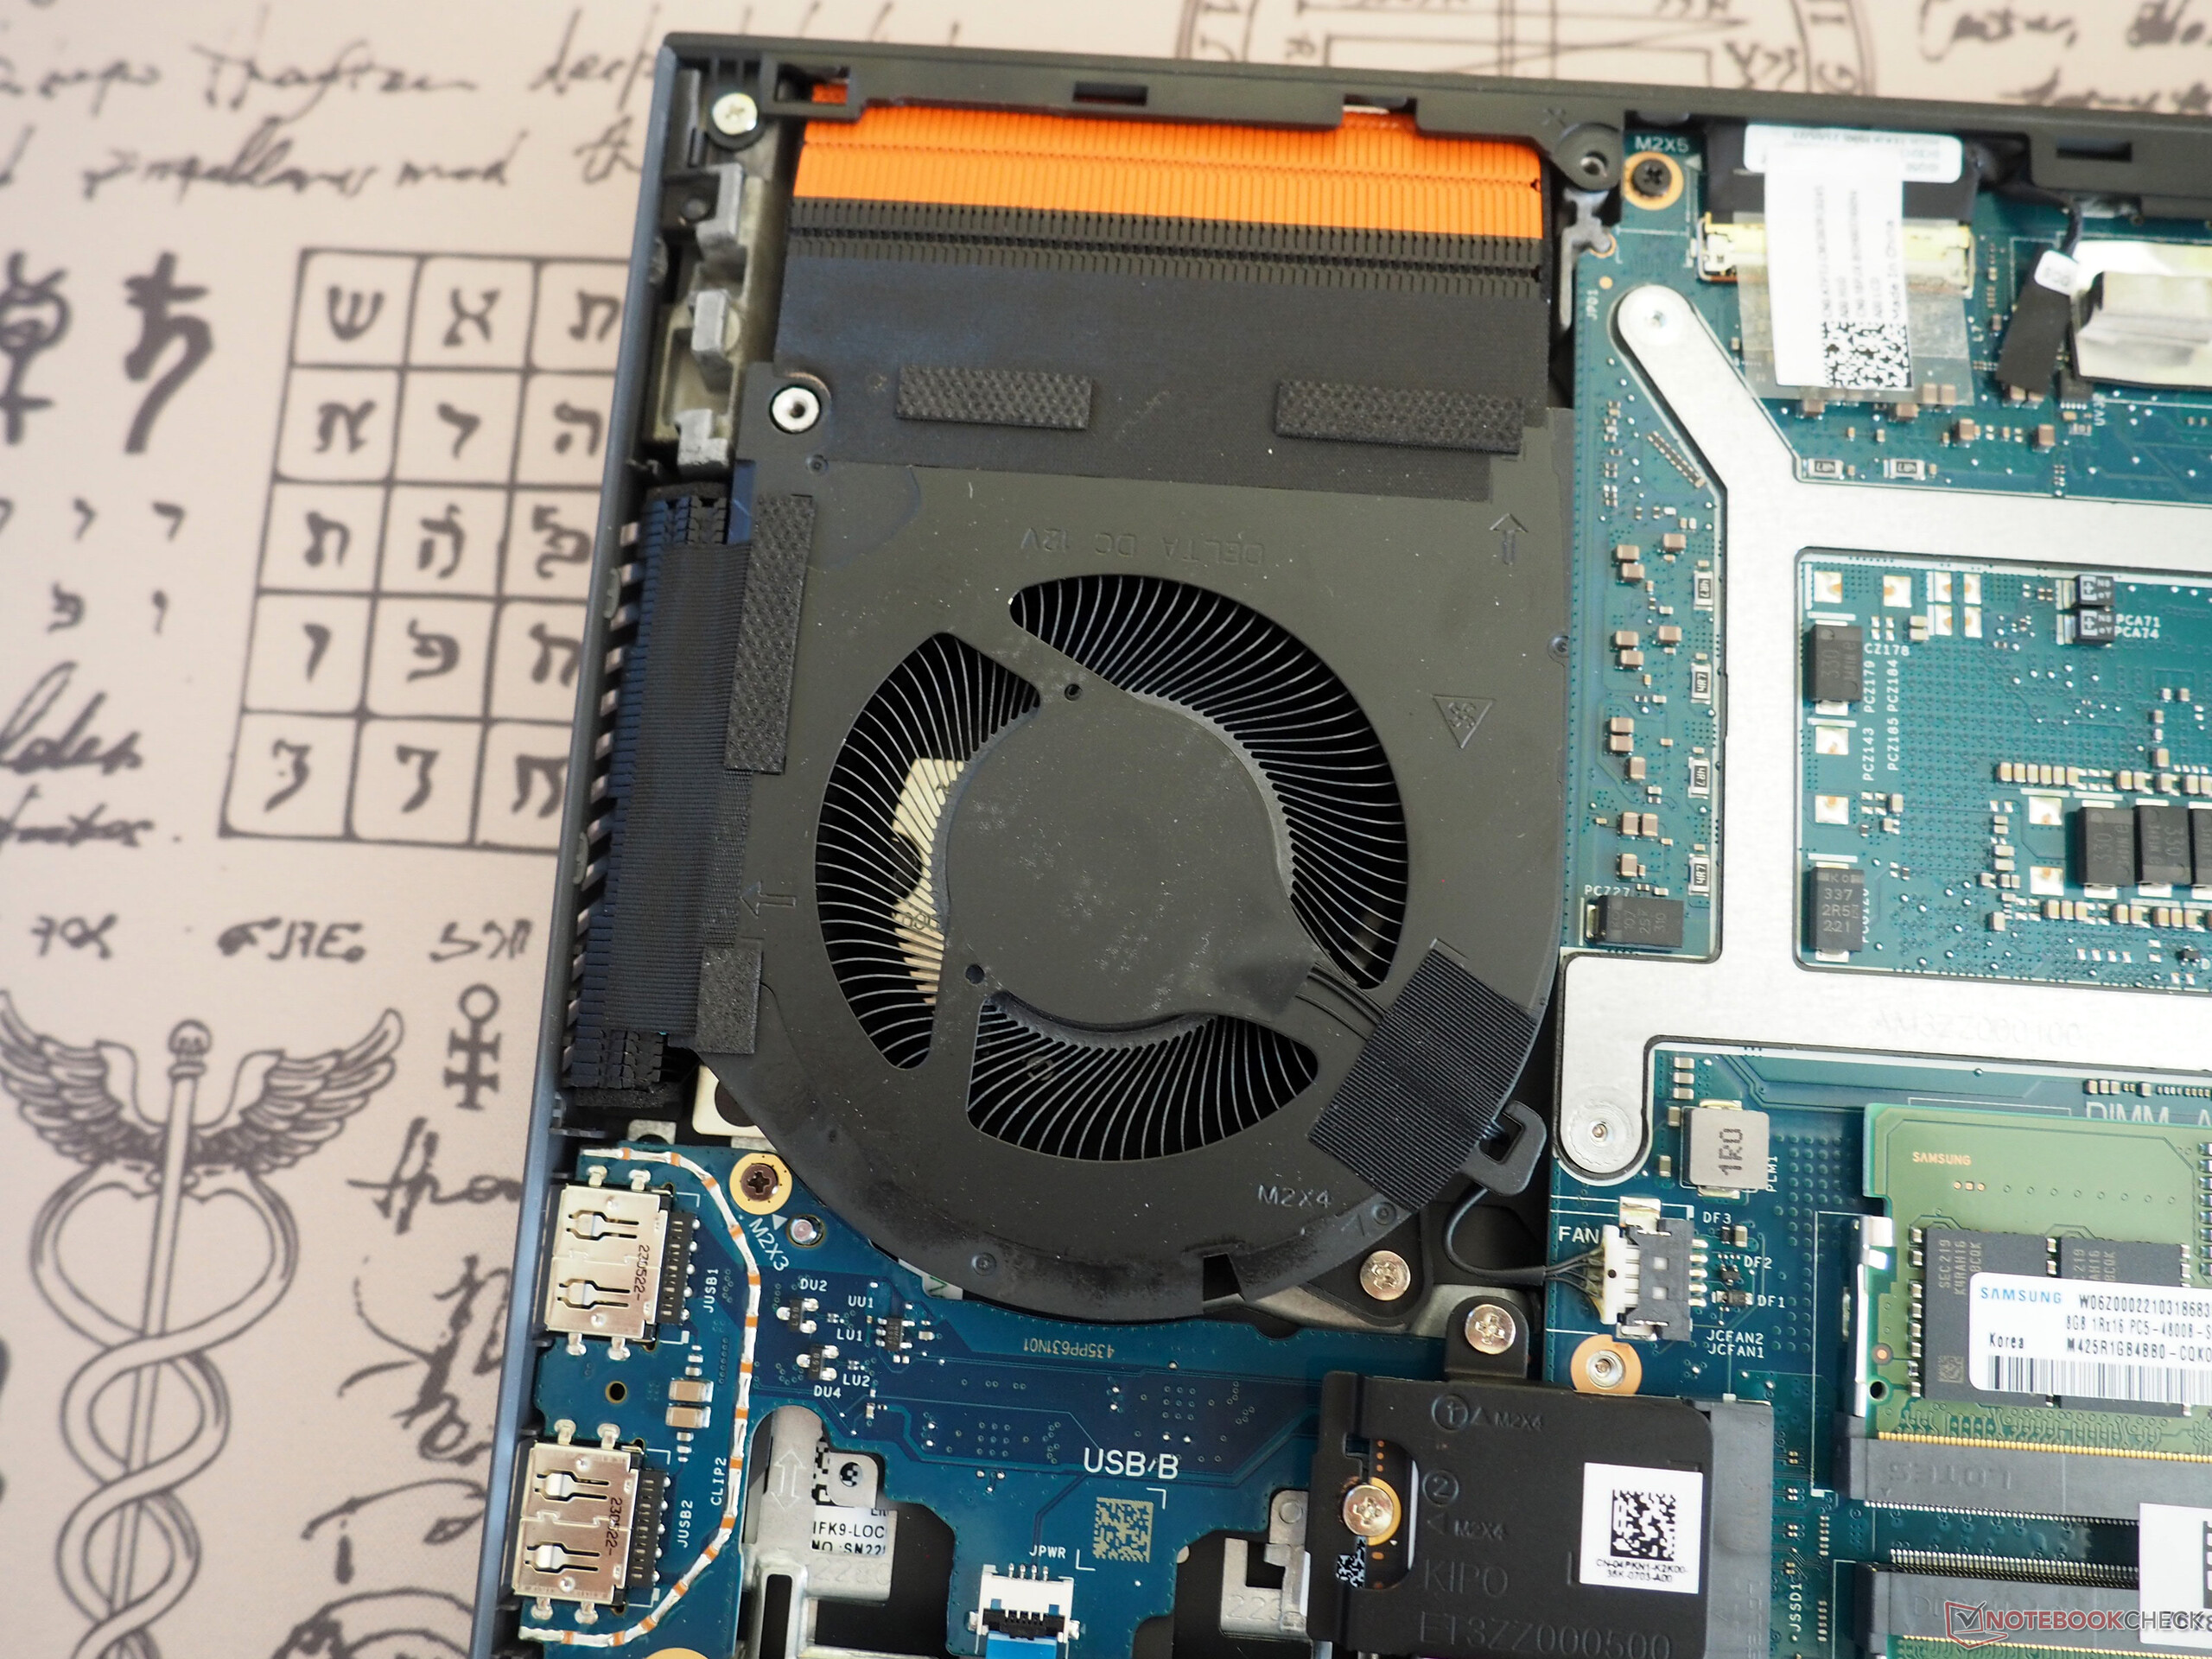
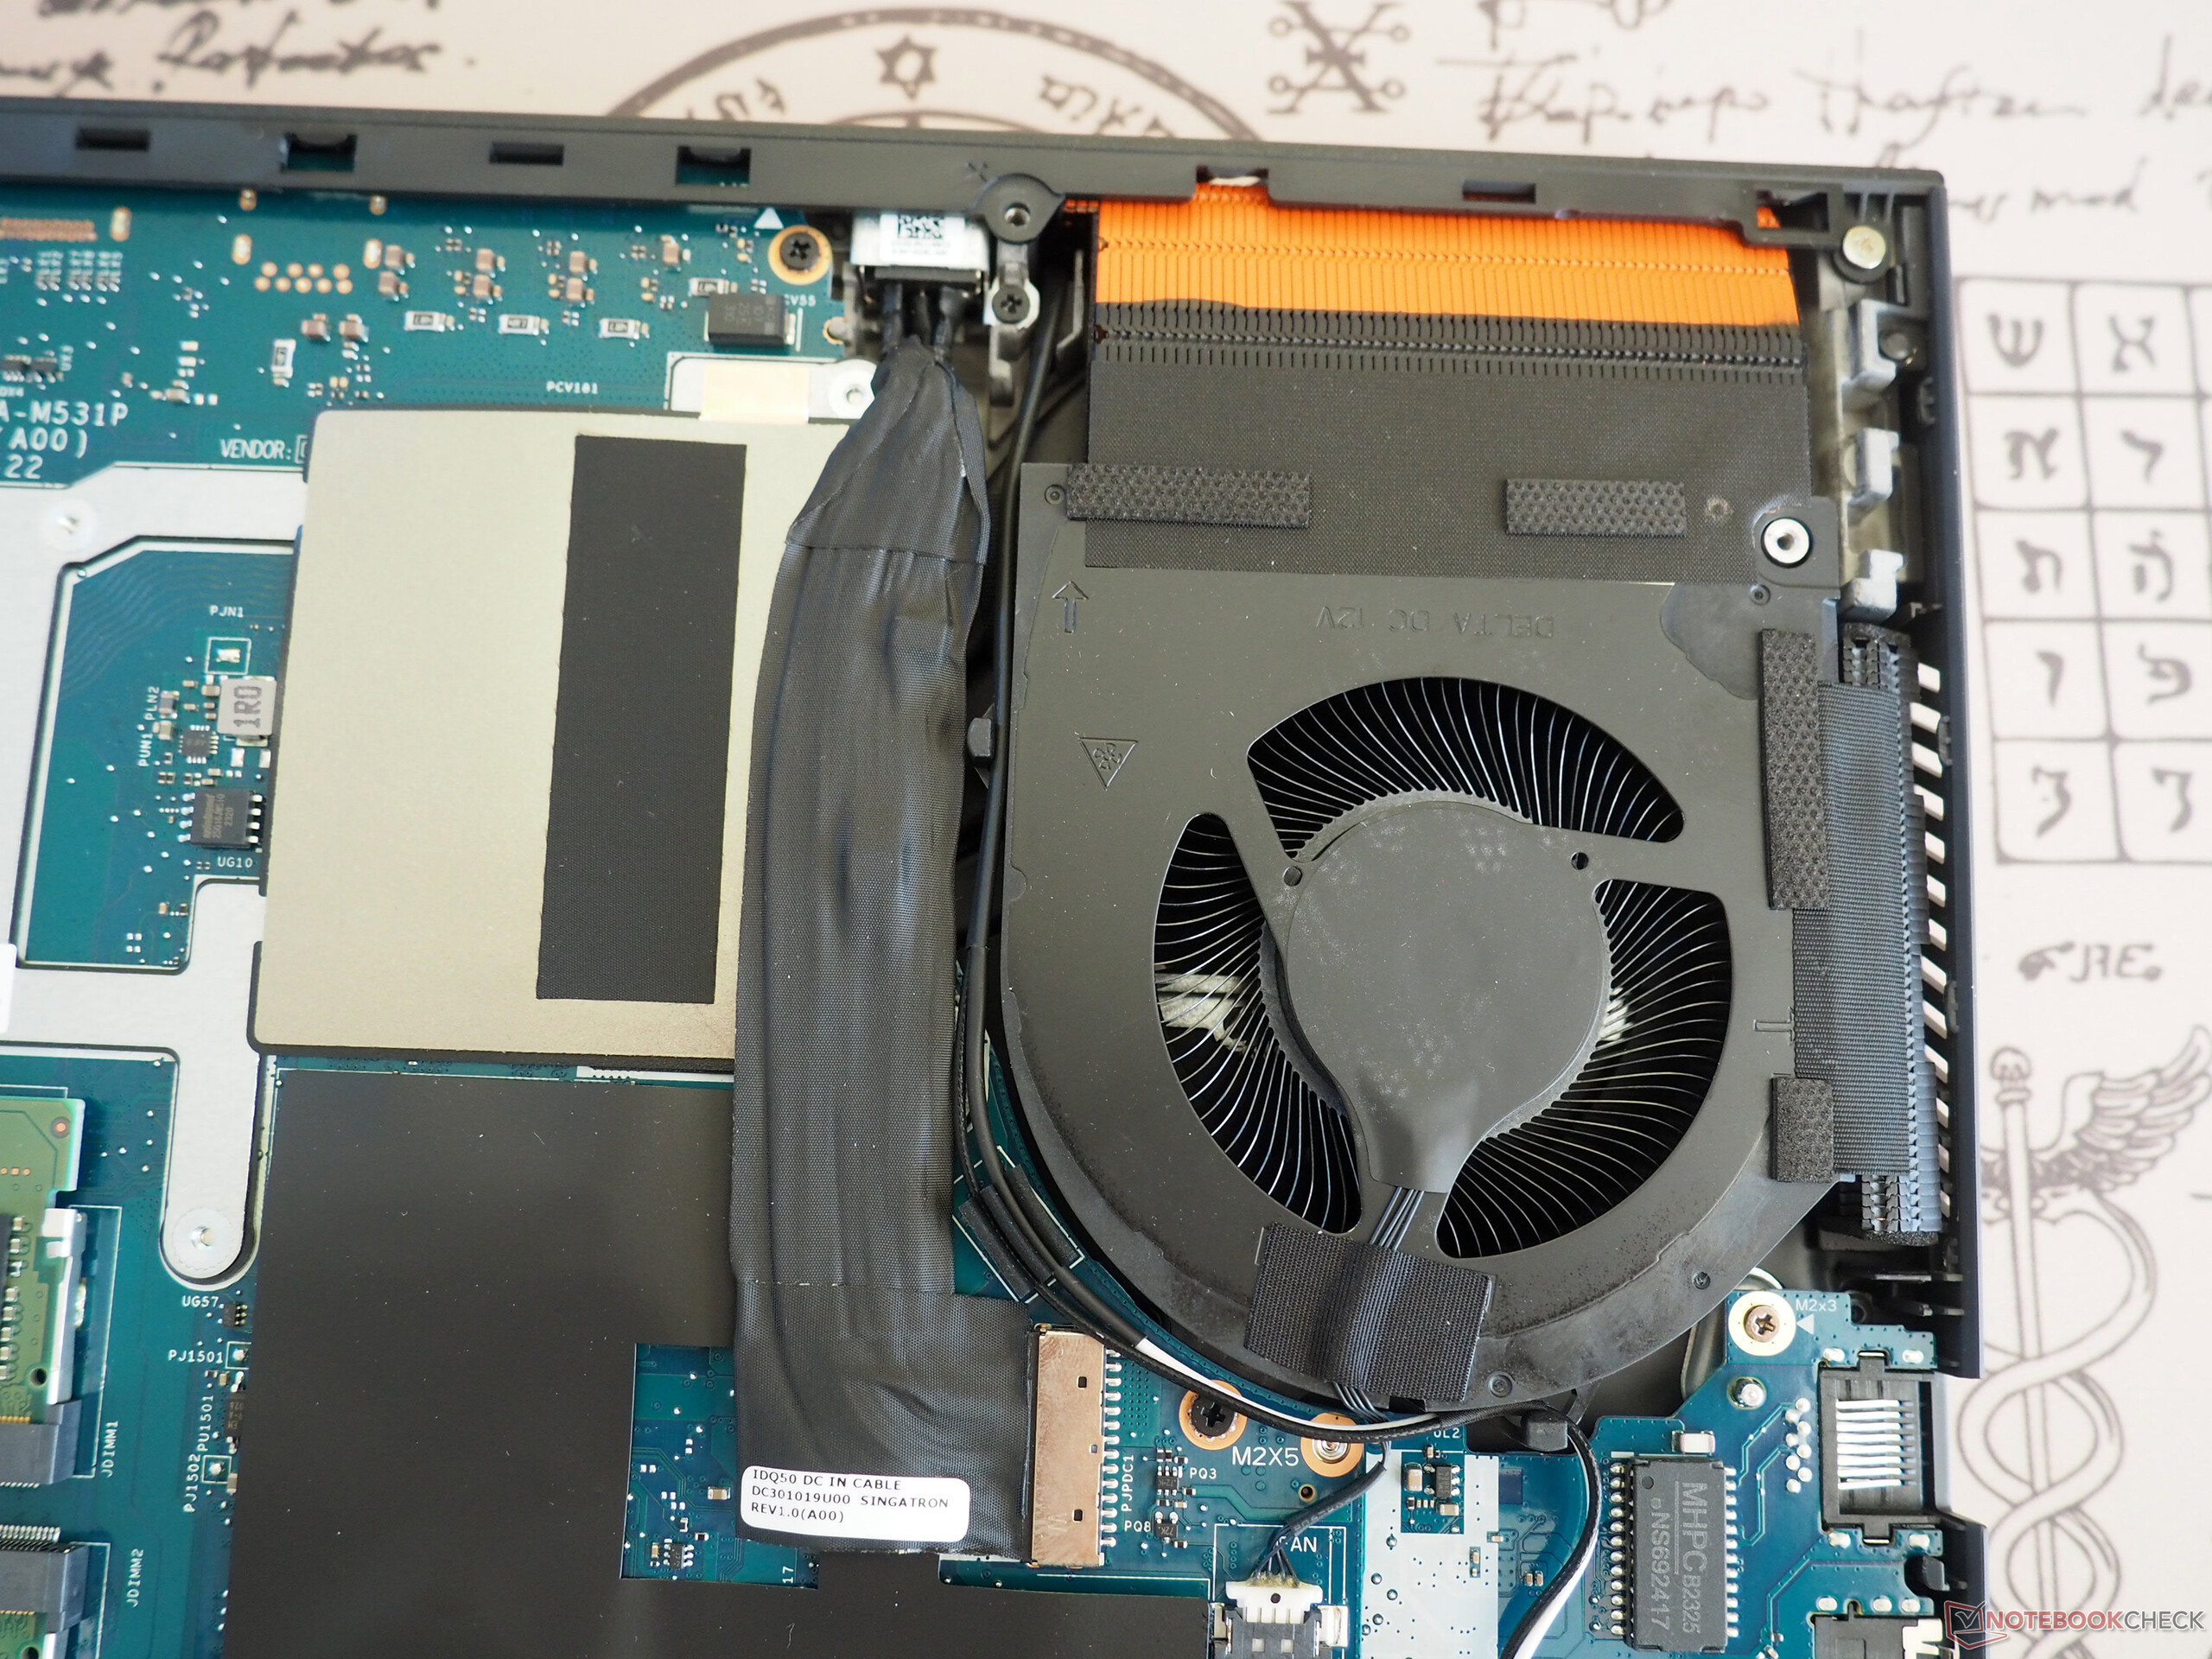
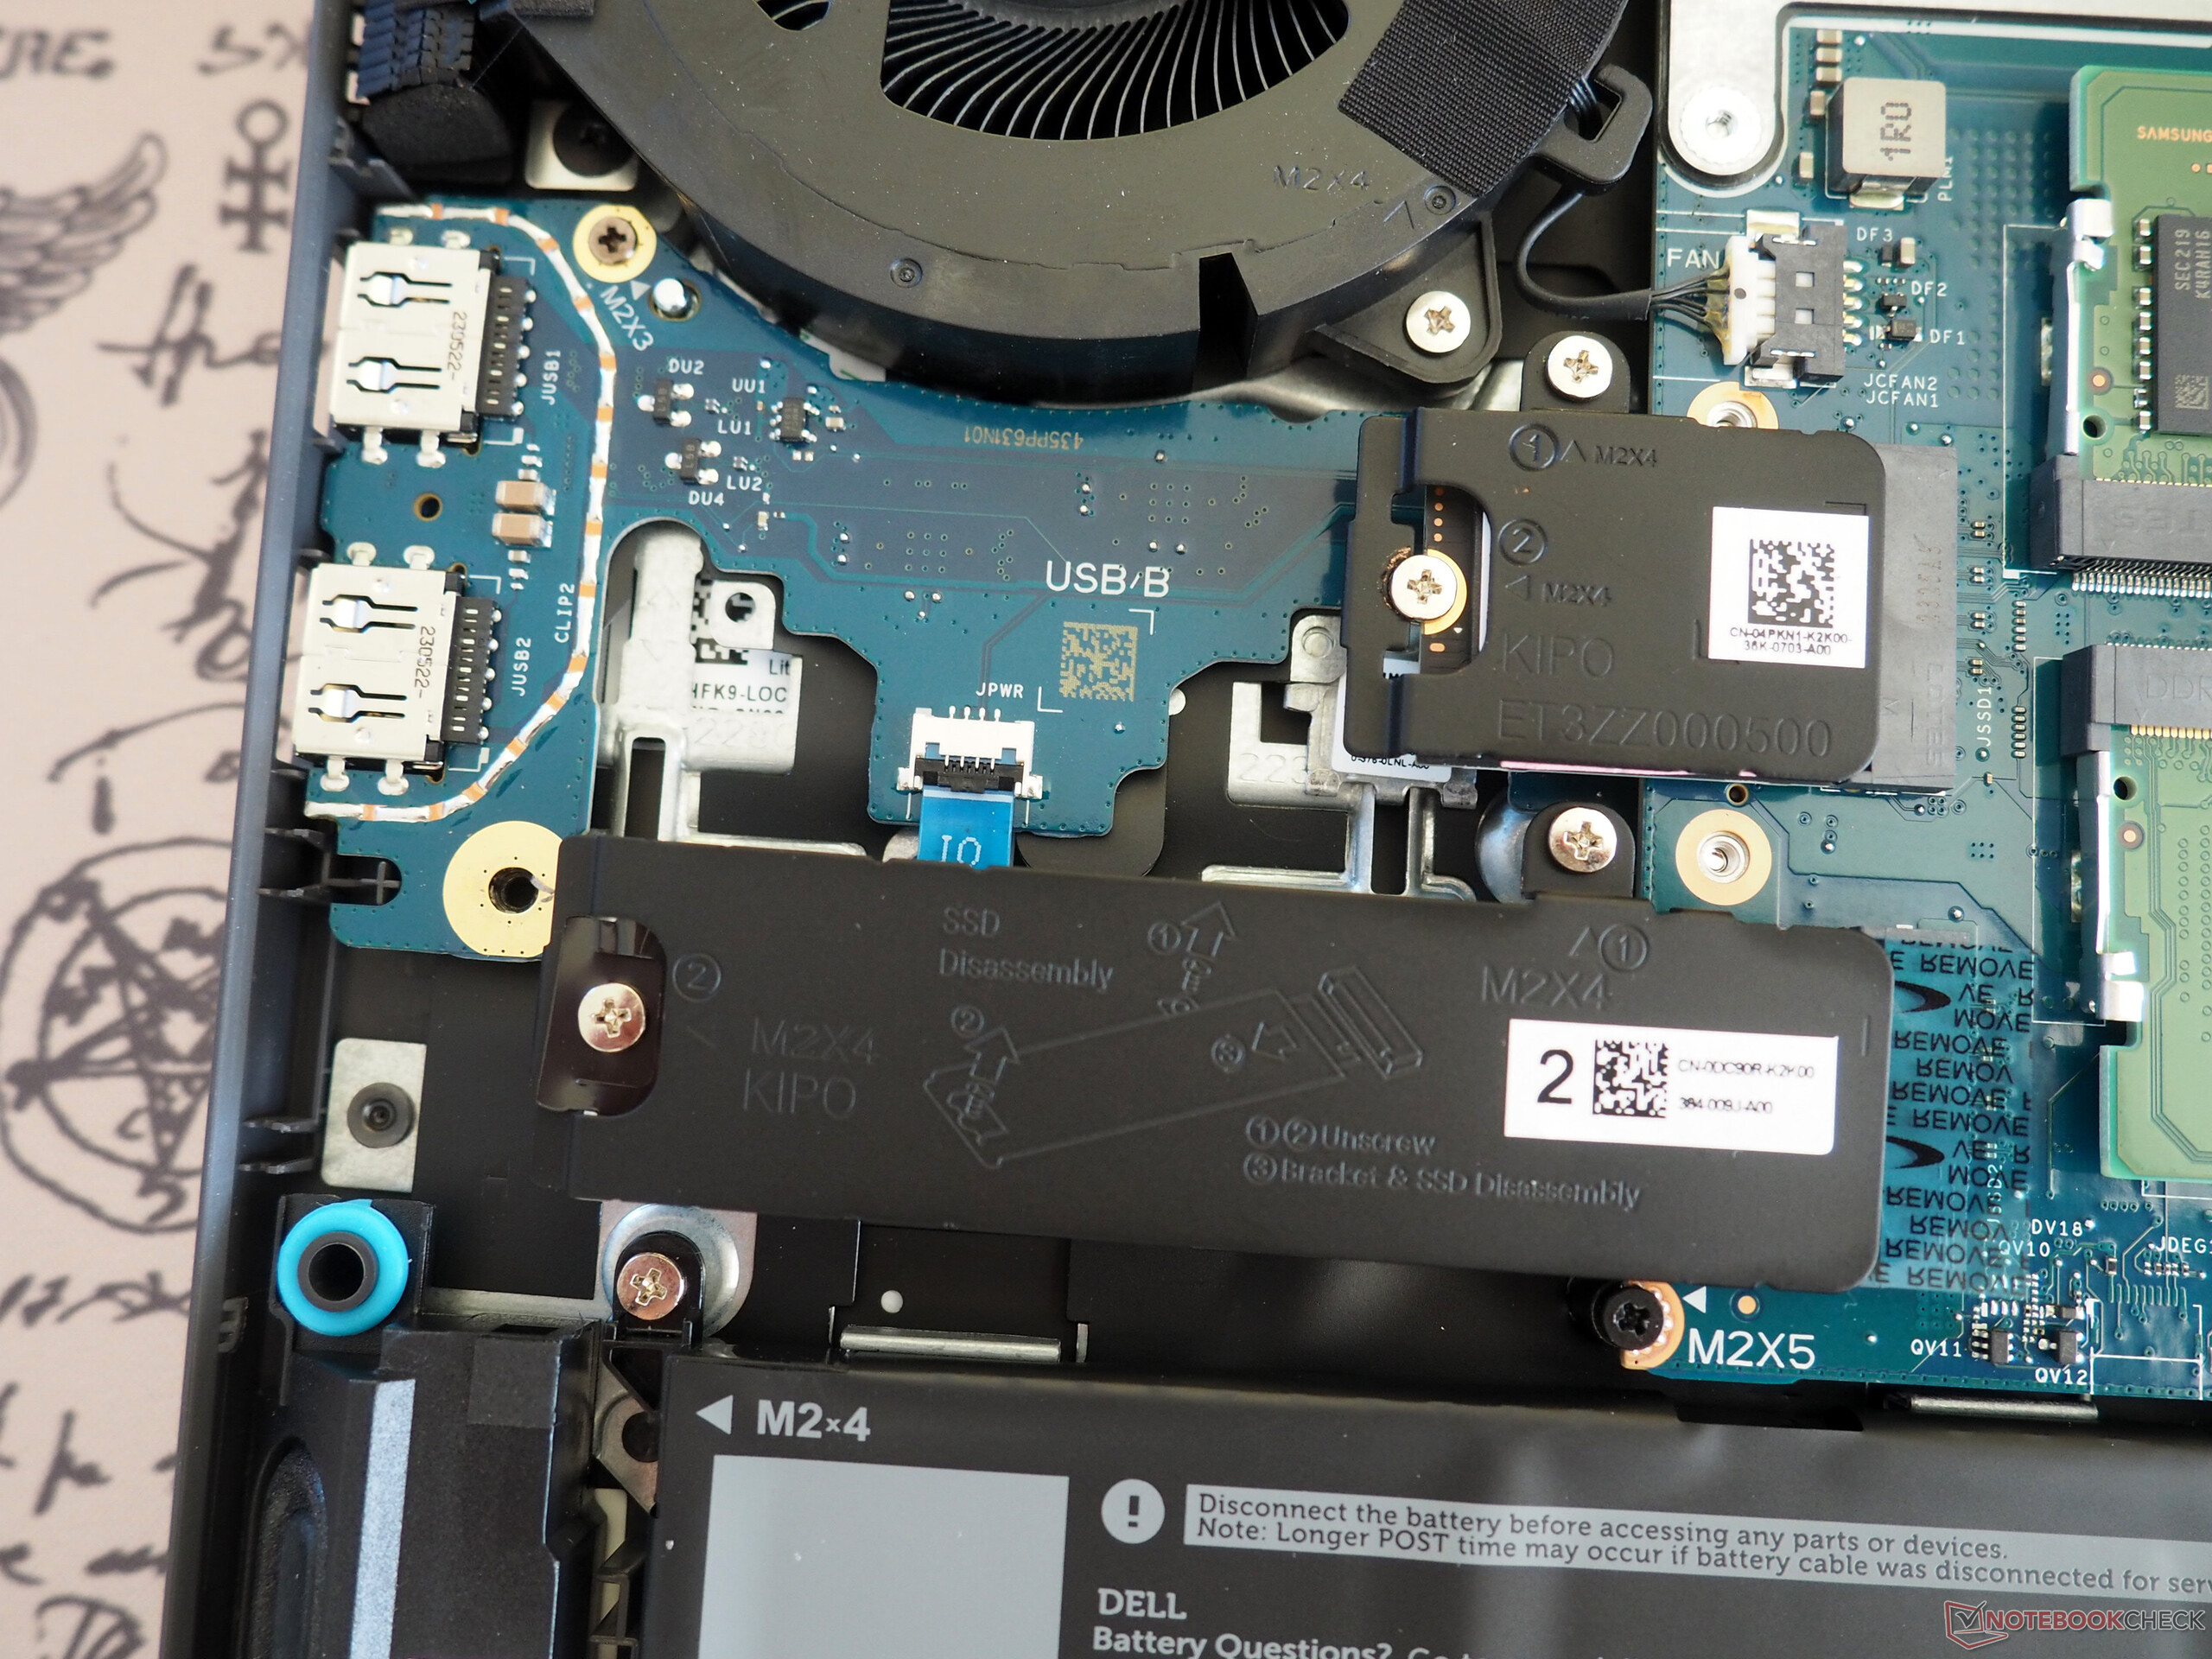
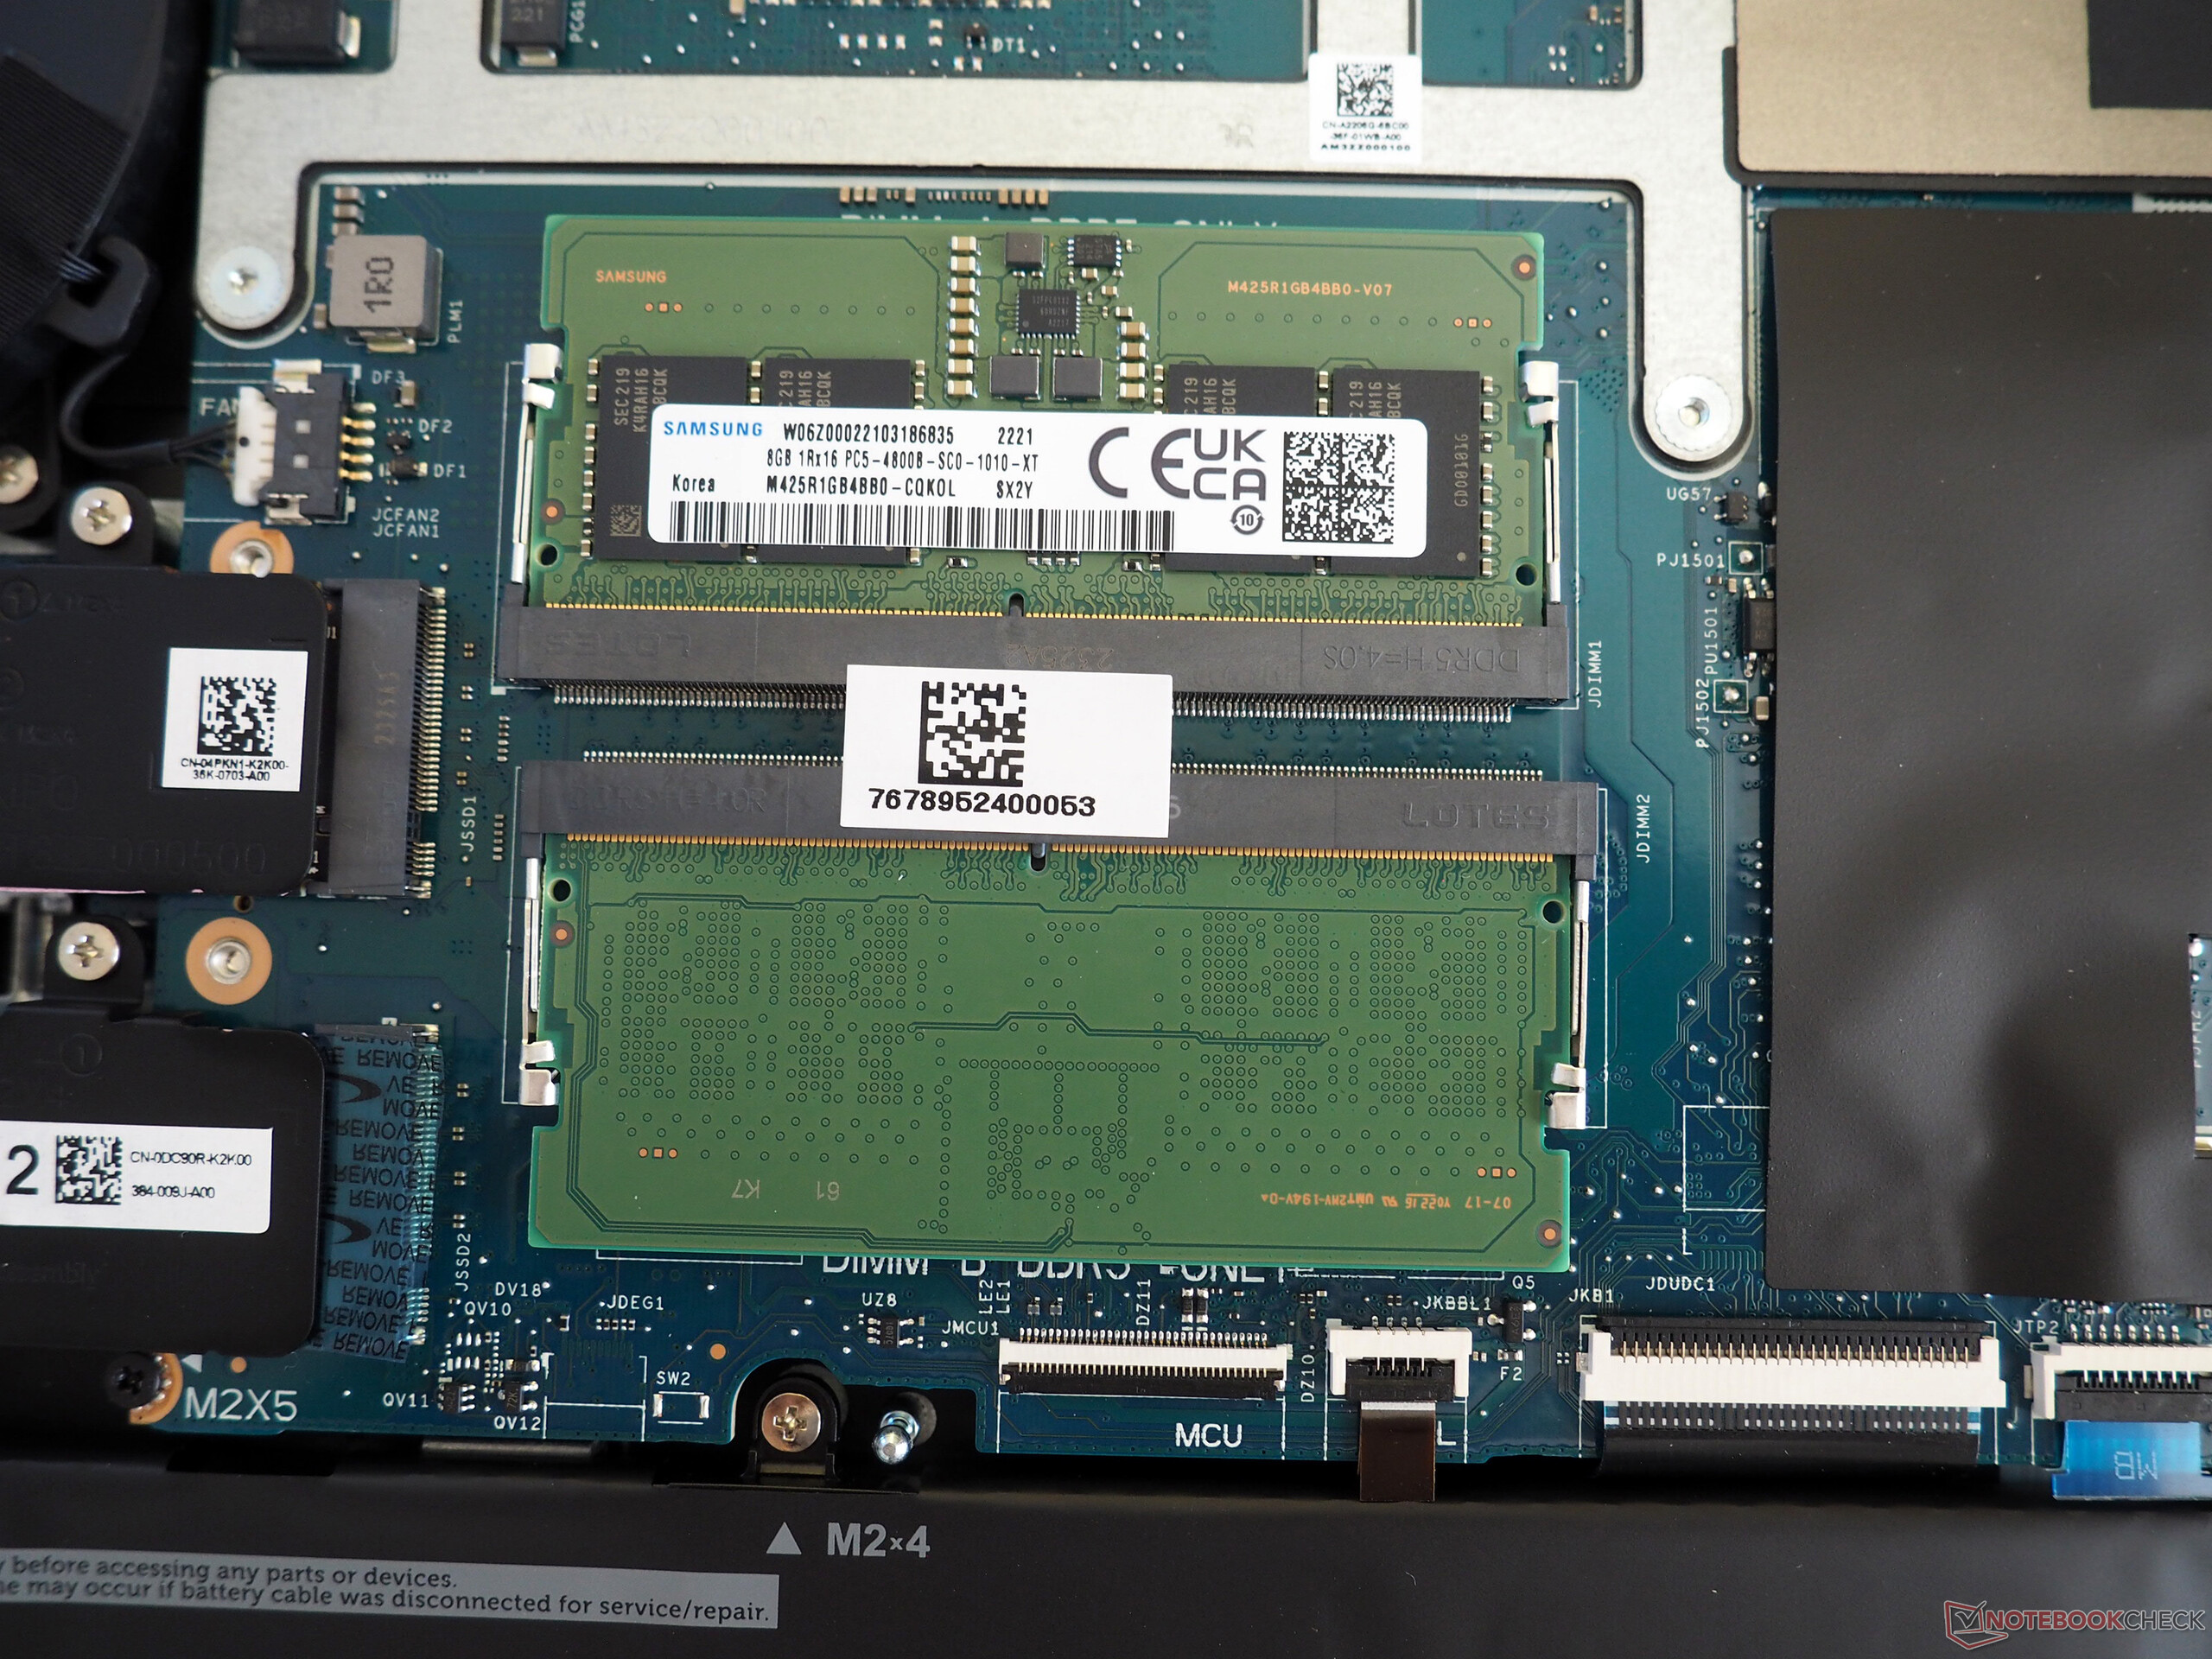
Otwarcie obudowy z pewnością może być wykonane nawet przez przeciętnego użytkownika. Po odkręceniu dziesięciu śrubek z łbem krzyżakowym, będą Państwo w stanie podnieść dolny panel z uchwytu. Pod maską czeka jednostka chłodząca, bateria, moduł Wi-Fi, dwa zajęte gniazda pamięci, jedno gniazdo M.2 2230 w użyciu i jedno wolne gniazdo M.2 2280 do rozbudowy pamięci masowej.
Gwarancja
Dell domyślnie udziela tylko 12-miesięcznej gwarancji w Niemczech. Okres gwarancji może się jednak różnić w zależności od regionu.
Urządzenia wejściowe
Klawiatura
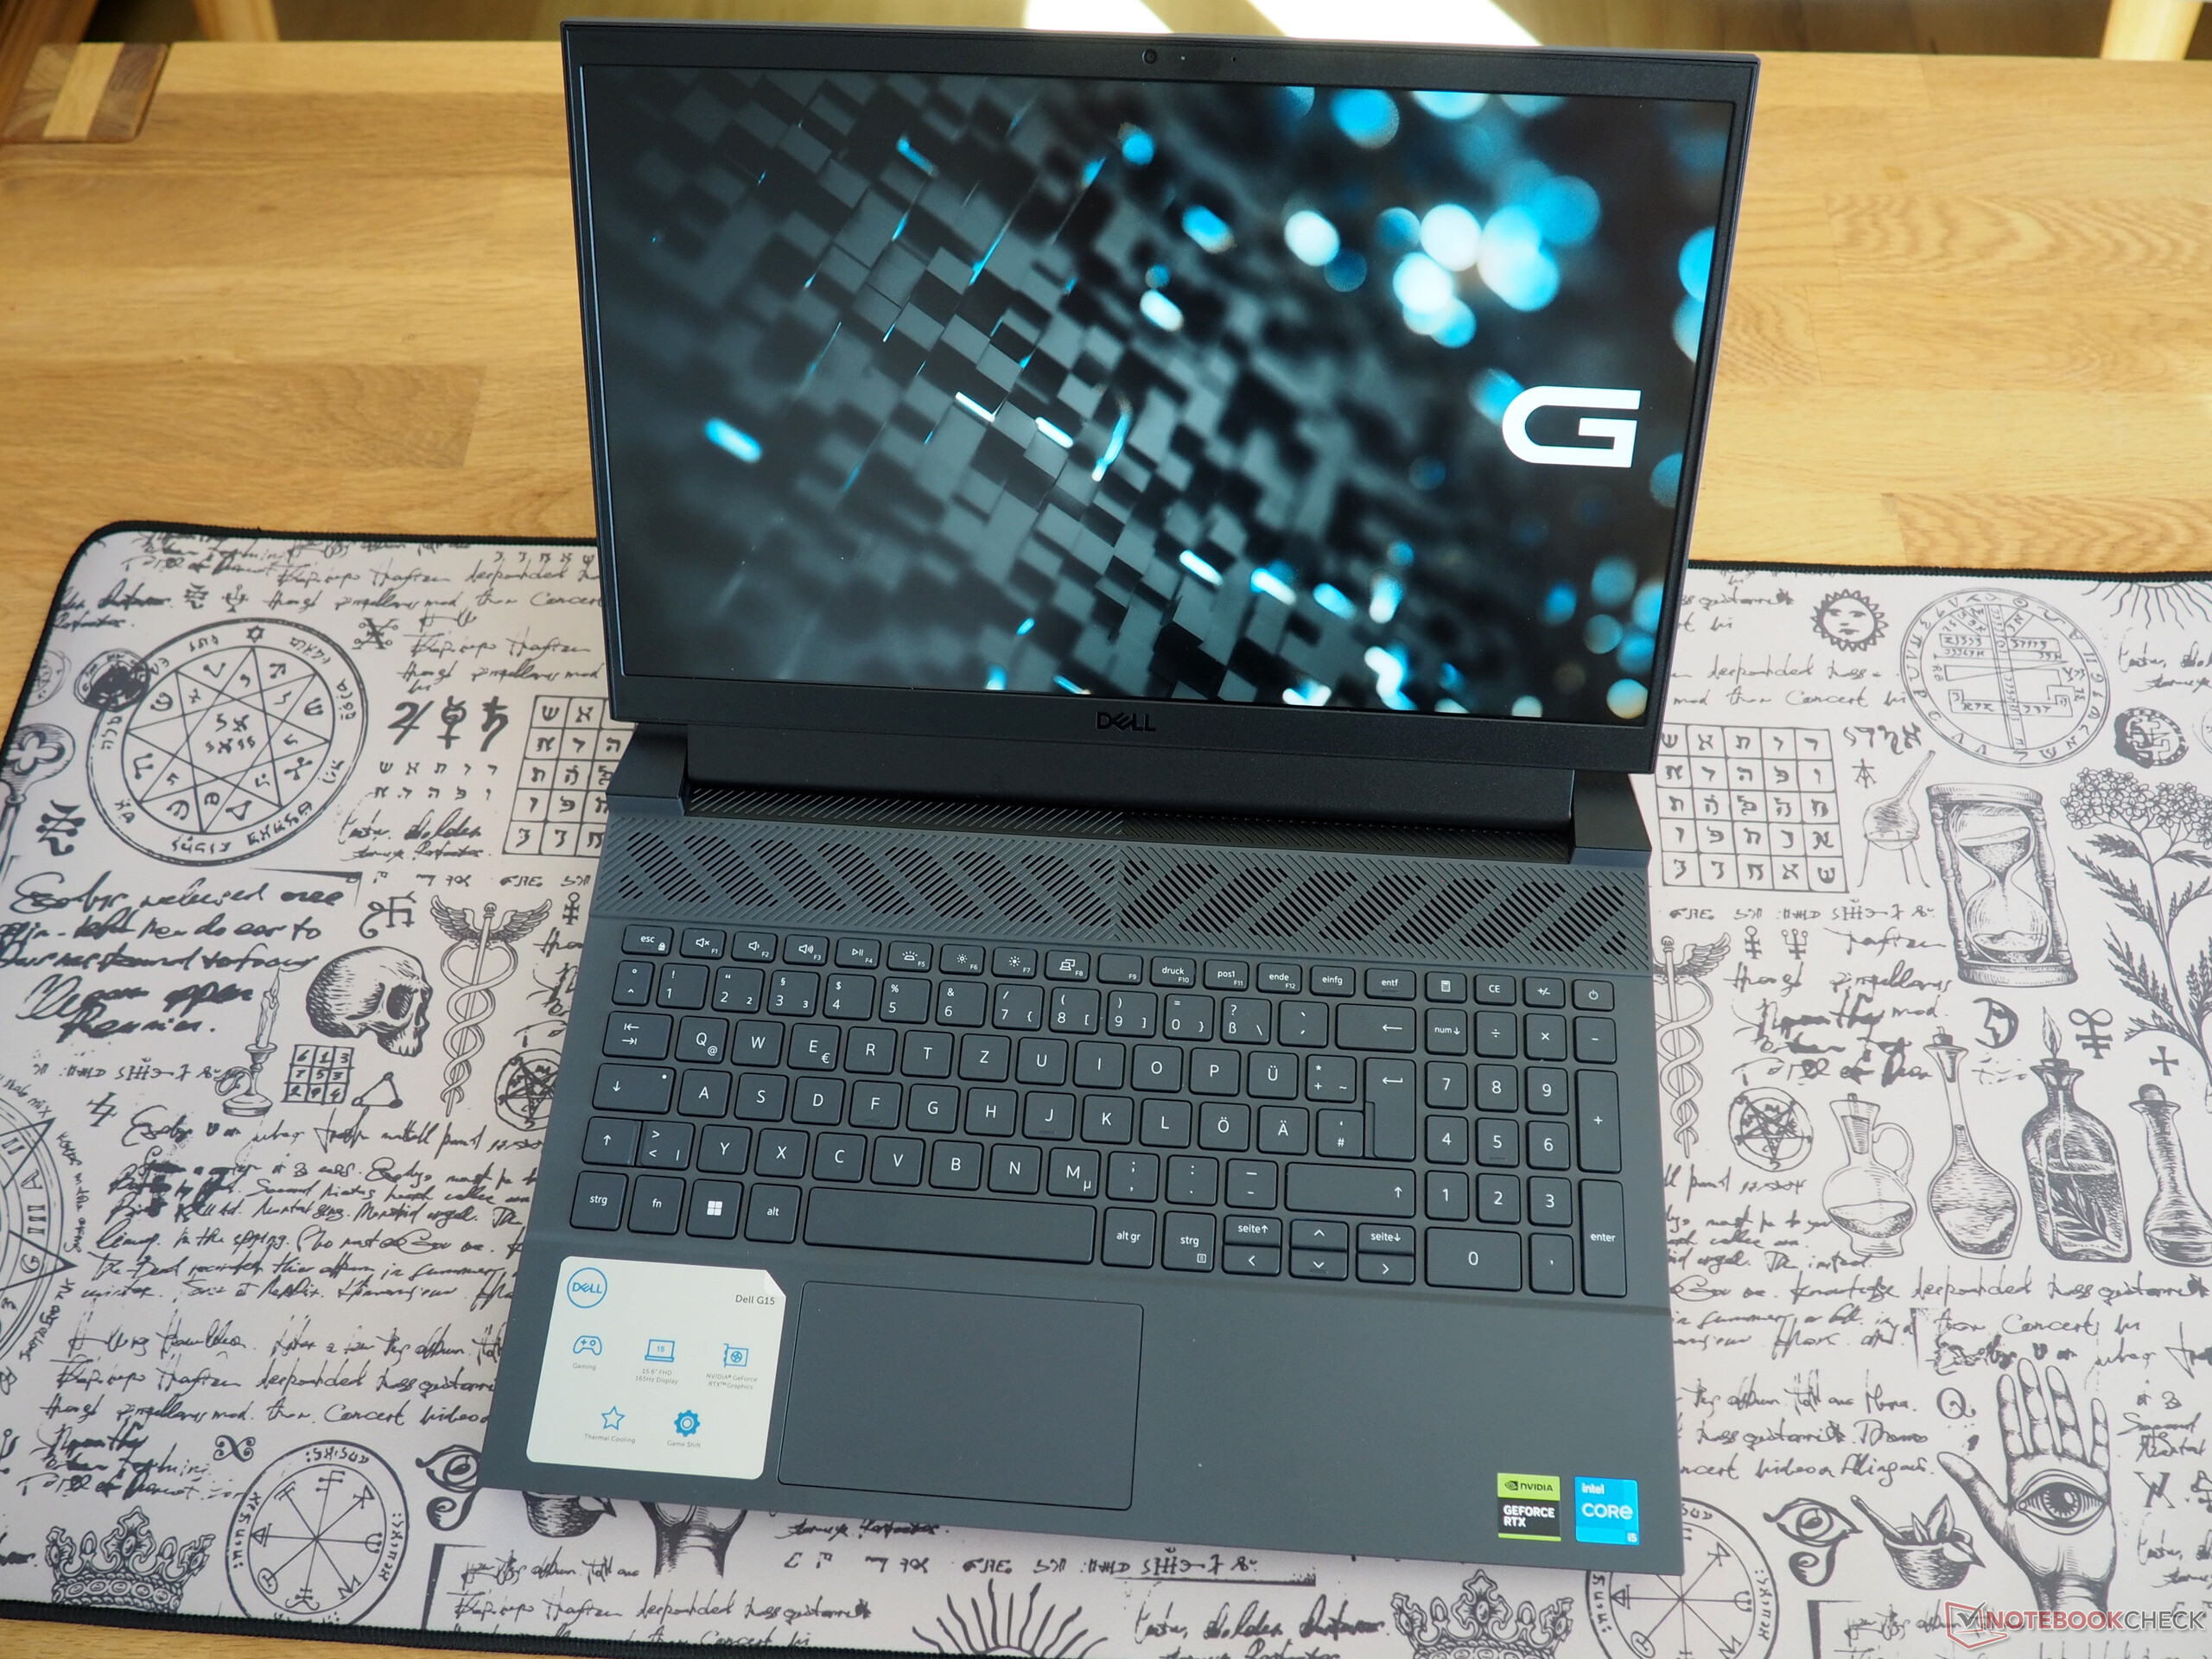
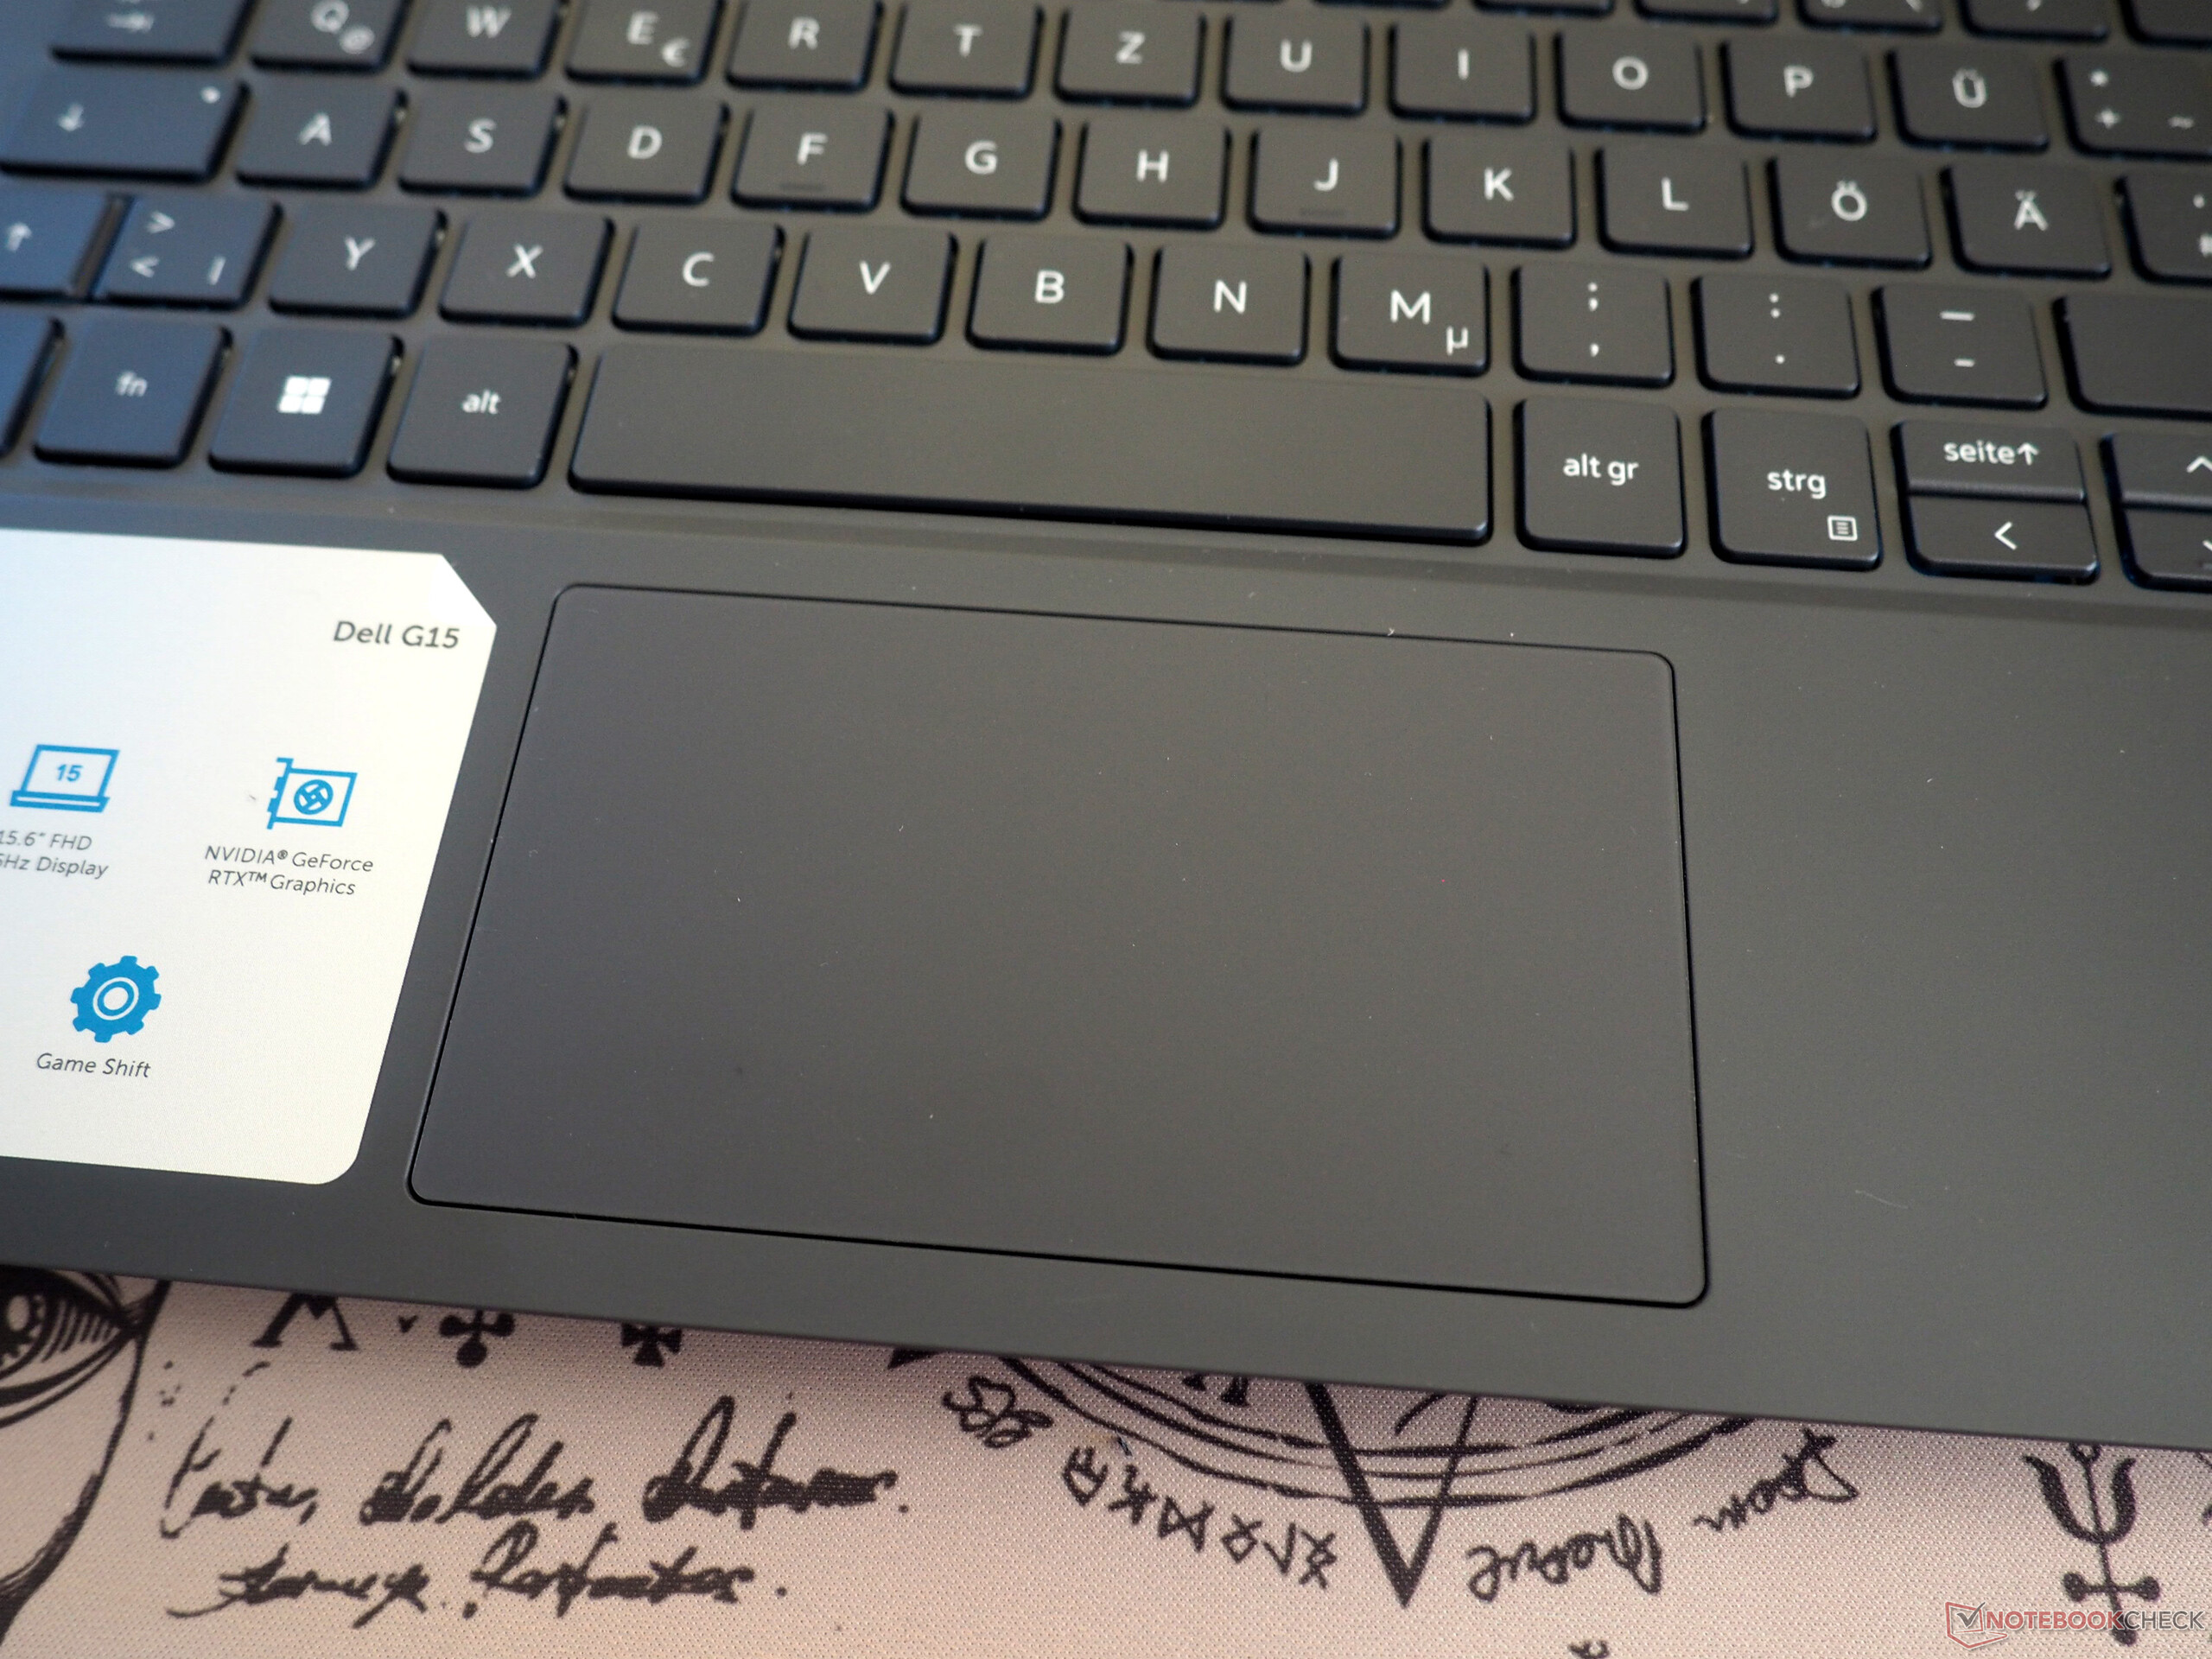
Urządzenia wejściowe są solidne, ale nie zachwycają. Niezależnie od maleńkich klawiszy strzałek, szczególnie podoba nam się układ niemieckiej klawiatury, która w dużej mierze zachowuje standardowy układ i oferuje pełnowymiarowy numpad. Odczucie pisania jest raczej przeciętne i naszym zdaniem mogłoby być jeszcze twardsze. Białe podświetlenie z dwoma poziomami jasności ułatwia pisanie w ciemnym otoczeniu.
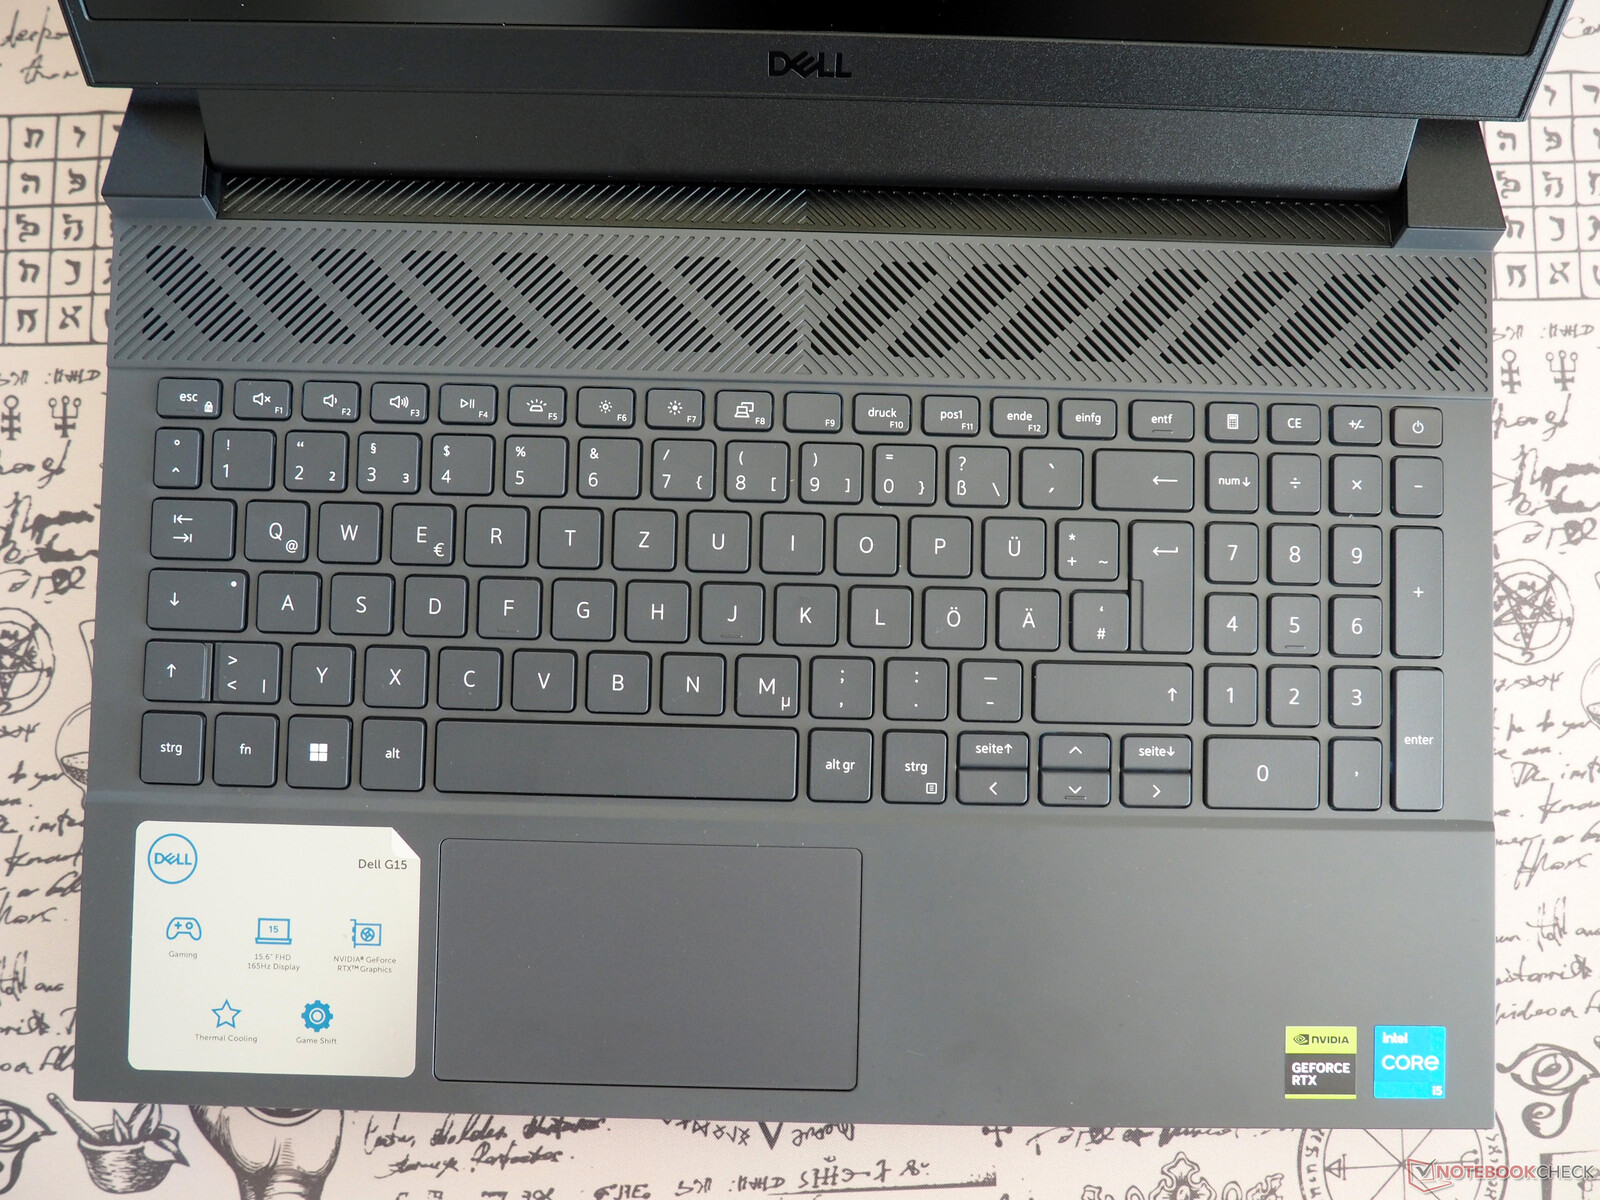
Panel dotykowy
Touchpad również mógłby zostać nieco dopracowany przez firmę Dell. Na przykład, oprócz nieco skromnych rozmiarów (około 10,5 x 6 cm, 4,1 x 2,4 cala), mamy również zastrzeżenia do bardzo luźnej powierzchni. To powiedziawszy, touchpad zapewnia akceptowalny poziom płynności i precyzji.
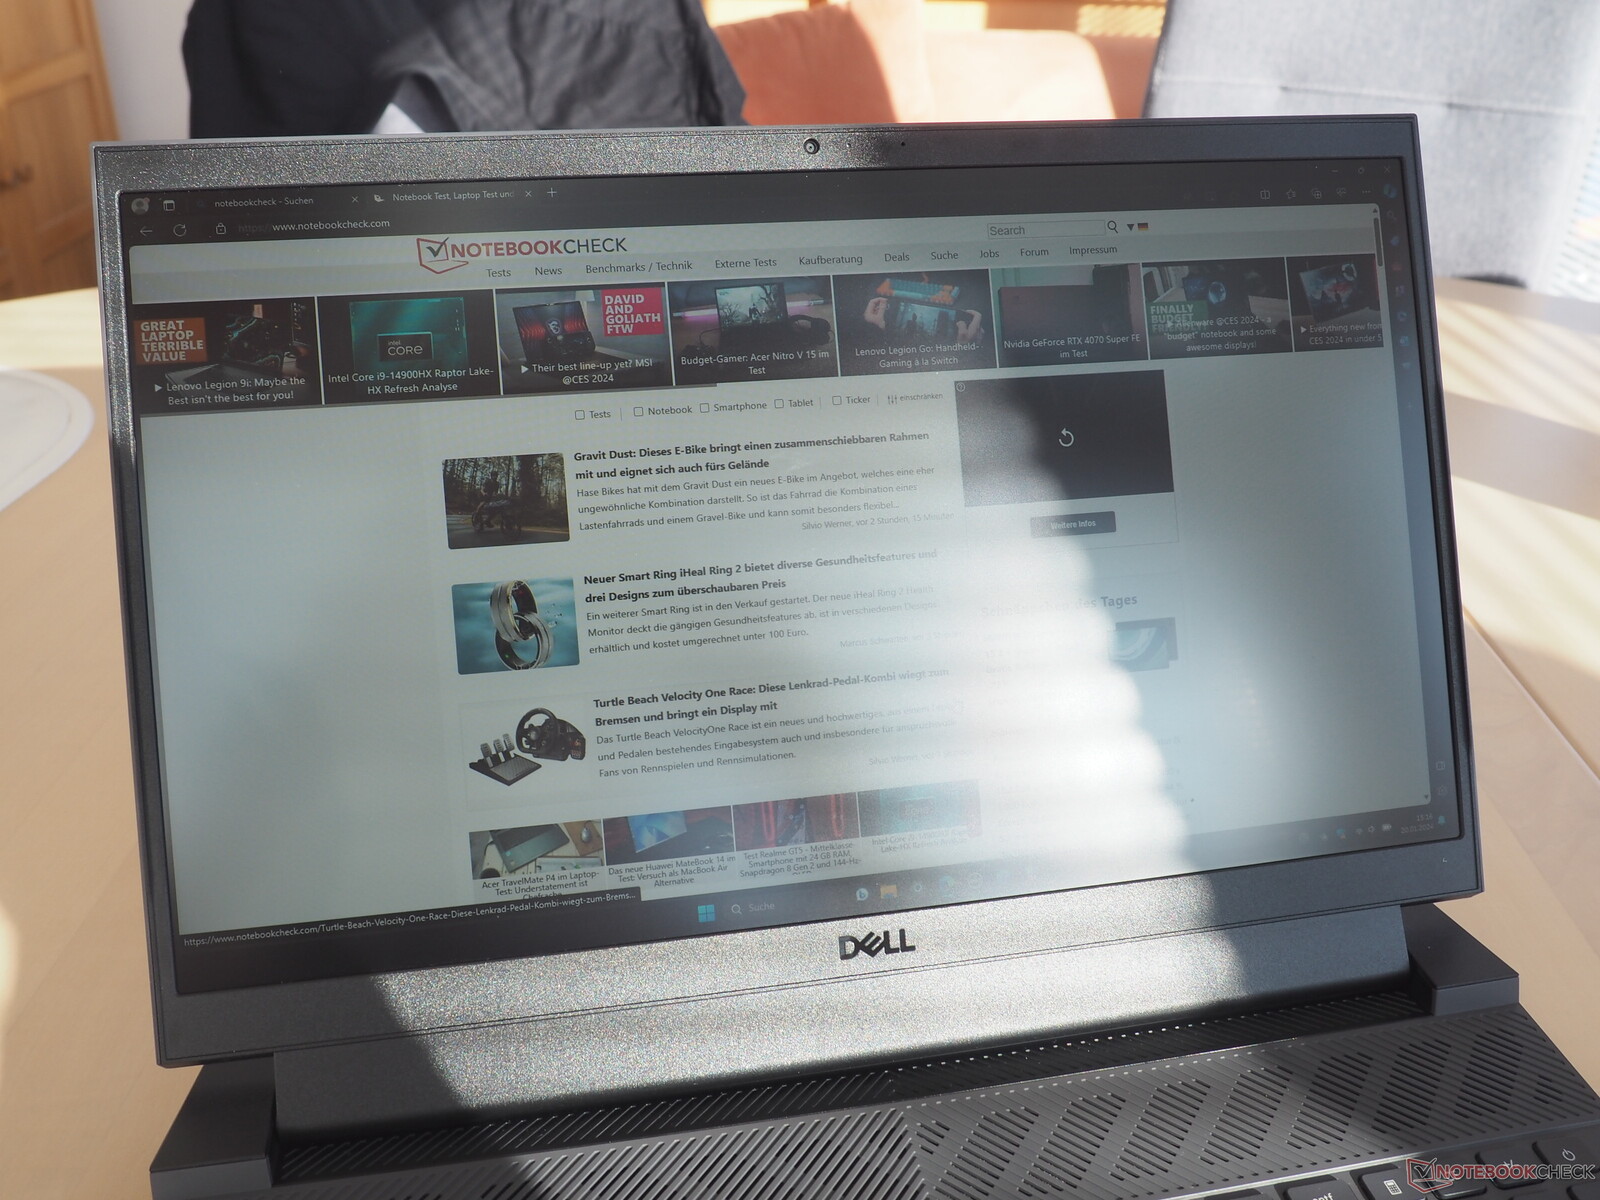
Wyświetlacz
Laptop jest również wyposażony w wyświetlacz 165 Hz. Panel różni się jednak od tego zastosowanego w modelu G15 który wcześniej recenzowaliśmy (patrz tabela). Wyjaśnia to również, dlaczego niektóre wyniki uzyskane dla obu wyświetlaczy różnią się od siebie.
| |||||||||||||||||||||||||
rozświetlenie: 89 %
na akumulatorze: 389 cd/m²
kontrast: 1111:1 (czerń: 0.35 cd/m²)
ΔE ColorChecker Calman: 3.08 | ∀{0.5-29.43 Ø4.71}
calibrated: 1.17
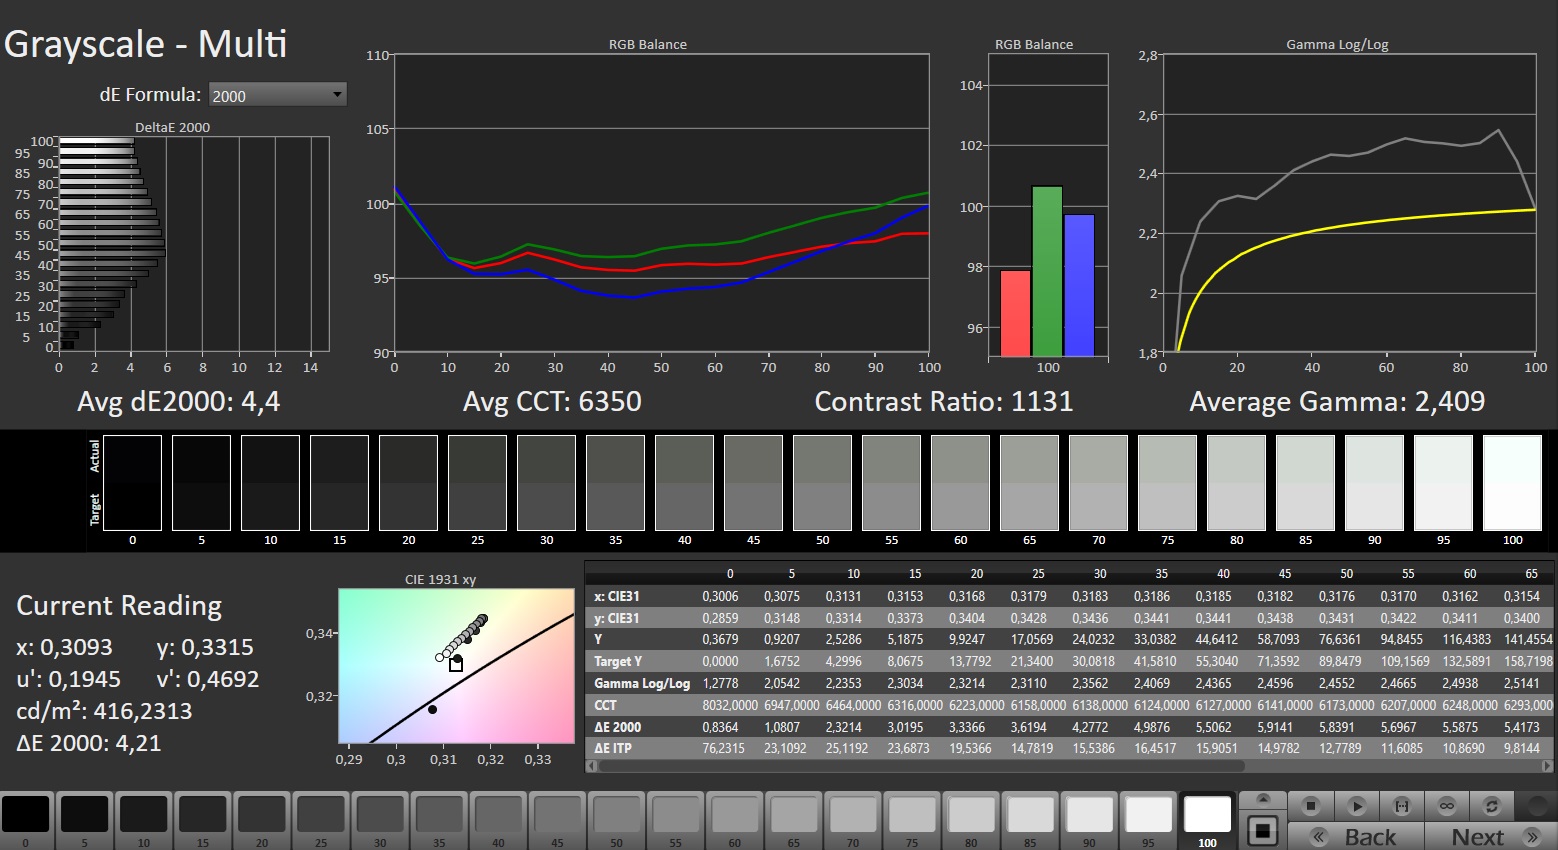
ΔE Greyscale Calman: 4.4 | ∀{0.09-98 Ø4.96}
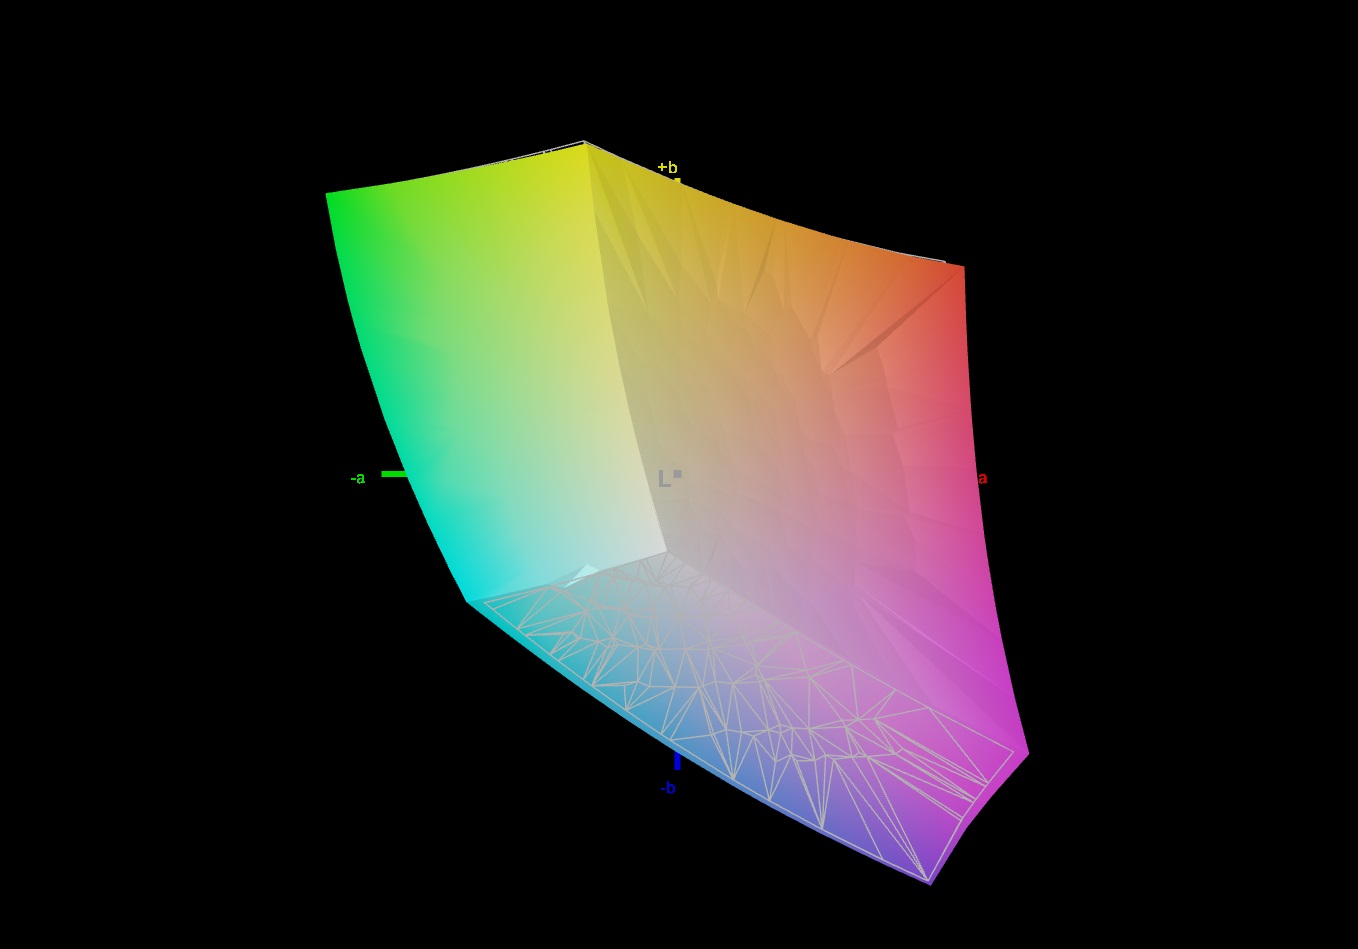
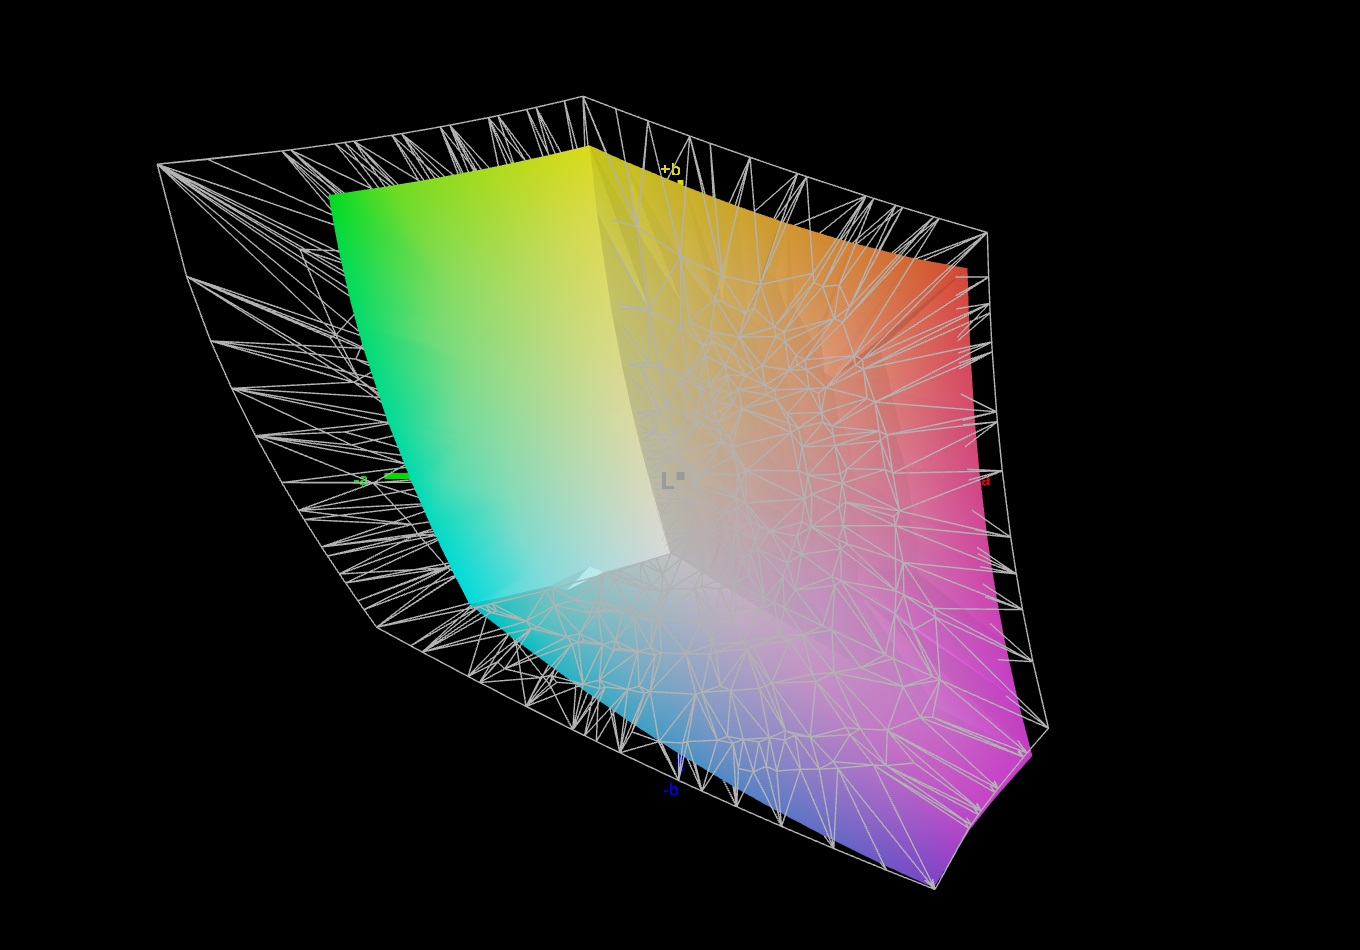
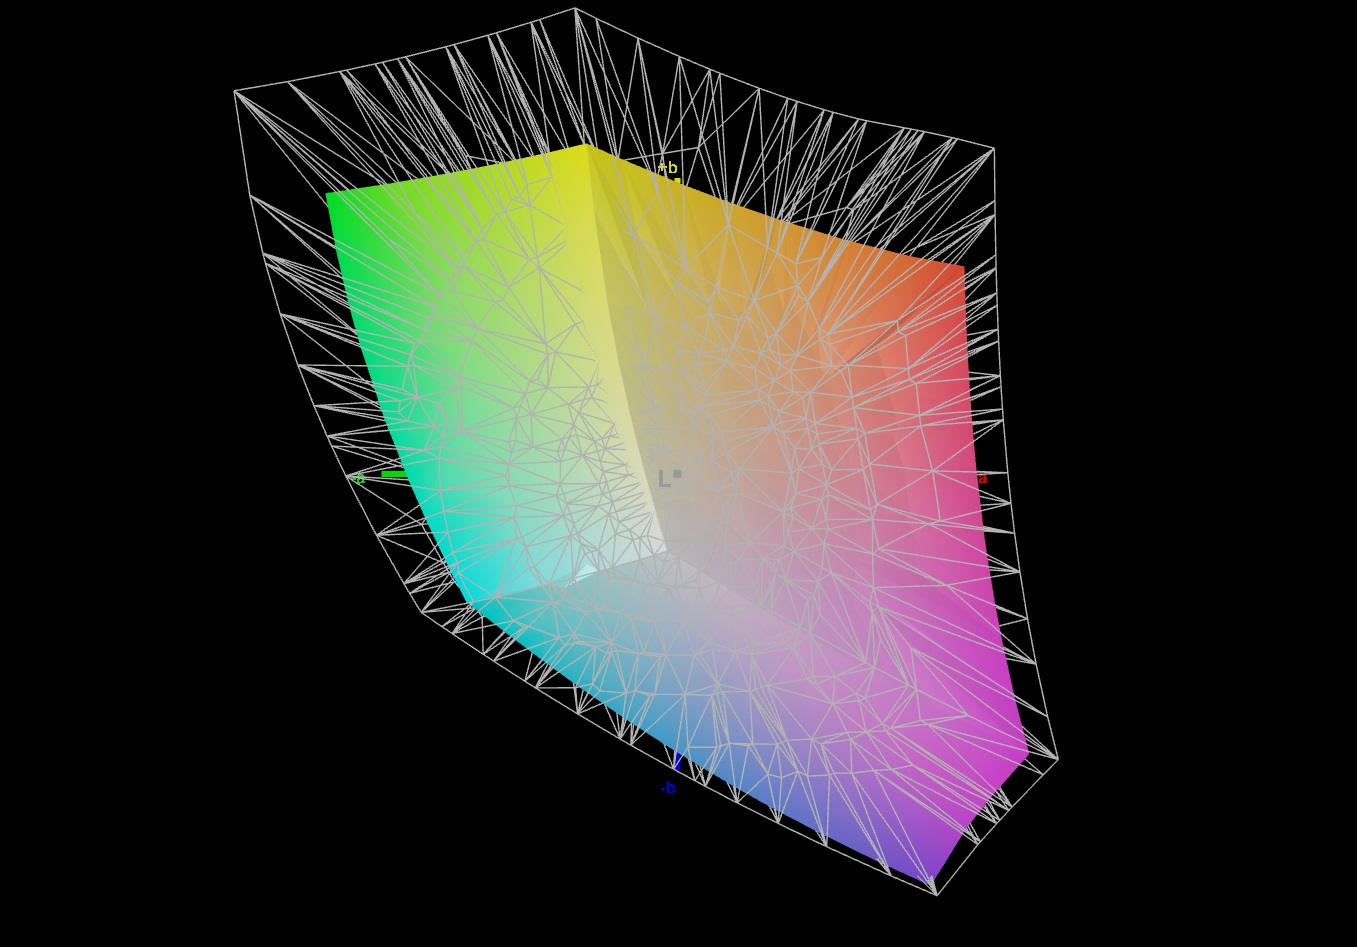
71.4% AdobeRGB 1998 (Argyll 3D)
99.3% sRGB (Argyll 3D)
71.1% Display P3 (Argyll 3D)
Gamma: 2.409
CCT: 6350 K
| Dell G15 5530, i5-13450HX RTX 4050 BOEhydis NV15NY9 (Dell 18PJX), IPS, 1920x1080, 15.6" | Medion Erazer Crawler E40 - MD 62518 BOE HF NV156FHM-N4G, IPS, 1920x1080, 15.6" | Lenovo LOQ 15IRH8 Core i7 BOE CQ NE156QHM-NY4, IPS, 2560x1440, 15.6" | Asus TUF A15 FA507 N156HMA-GA1, IPS, 1920x1080, 15.6" | Dell G15 5530 AUO B156HAN, IPS, 1920x1080, 15.6" | |
|---|---|---|---|---|---|
| Display | -12% | -5% | -6% | 2% | |
| Display P3 Coverage (%) | 71.1 | 61.4 -14% | 66.3 -7% | 64.9 -9% | 73.1 3% |
| sRGB Coverage (%) | 99.3 | 89.7 -10% | 96.6 -3% | 96.5 -3% | 98.4 -1% |
| AdobeRGB 1998 Coverage (%) | 71.4 | 63.2 -11% | 67.7 -5% | 66.6 -7% | 74.4 4% |
| Response Times | -19% | 8% | -234% | 40% | |
| Response Time Grey 50% / Grey 80% * (ms) | 8.5 ? | 8 ? 6% | 5 ? 41% | 30.4 ? -258% | 3.39 ? 60% |
| Response Time Black / White * (ms) | 6.7 ? | 9.6 ? -43% | 8.41 ? -26% | 20.8 ? -210% | 5.35 ? 20% |
| PWM Frequency (Hz) | 21620 ? | ||||
| Screen | -13% | -10% | 21% | -17% | |
| Brightness middle (cd/m²) | 389 | 364 -6% | 373 -4% | 288 -26% | 320 -18% |
| Brightness (cd/m²) | 374 | 351 -6% | 365 -2% | 271 -28% | 316 -16% |
| Brightness Distribution (%) | 89 | 91 2% | 90 1% | 91 2% | 94 6% |
| Black Level * (cd/m²) | 0.35 | 0.43 -23% | 0.33 6% | 0.17 51% | 0.21 40% |
| Contrast (:1) | 1111 | 847 -24% | 1130 2% | 1694 52% | 1524 37% |
| Colorchecker dE 2000 * | 3.08 | 3.98 -29% | 4.19 -36% | 1.9 38% | 4.55 -48% |
| Colorchecker dE 2000 max. * | 5.44 | 6.38 -17% | 8.47 -56% | 3.3 39% | 9.83 -81% |
| Colorchecker dE 2000 calibrated * | 1.17 | 1.36 -16% | 1.07 9% | 0.9 23% | 1.51 -29% |
| Greyscale dE 2000 * | 4.4 | 4.39 -0% | 5 -14% | 2.7 39% | 6.2 -41% |
| Gamma | 2.409 91% | 2.58 85% | 1.93 114% | 2.32 95% | 2.07 106% |
| CCT | 6350 102% | 7316 89% | 7520 86% | 6535 99% | 6479 100% |
| Całkowita średnia (program / ustawienia) | -15% /
-14% | -2% /
-7% | -73% /
-21% | 8% /
-5% |
* ... im mniej tym lepiej
Podczas gdy obecny panel ma nieco gorszy poziom czerni (0,35 w porównaniu do 0,21 cd/m²), jego średnia maksymalna jasność jest nieco wyższa (374 zamiast 316 cd/m²). Drugi model G15 ma lepszy kontrast i czas reakcji niż recenzowany egzemplarz. Niemniej jednak, kontrast 1,111:1 i czas reakcji od szarego do szarego wynoszący 8,5 ms są godne szacunku dla panelu IPS.
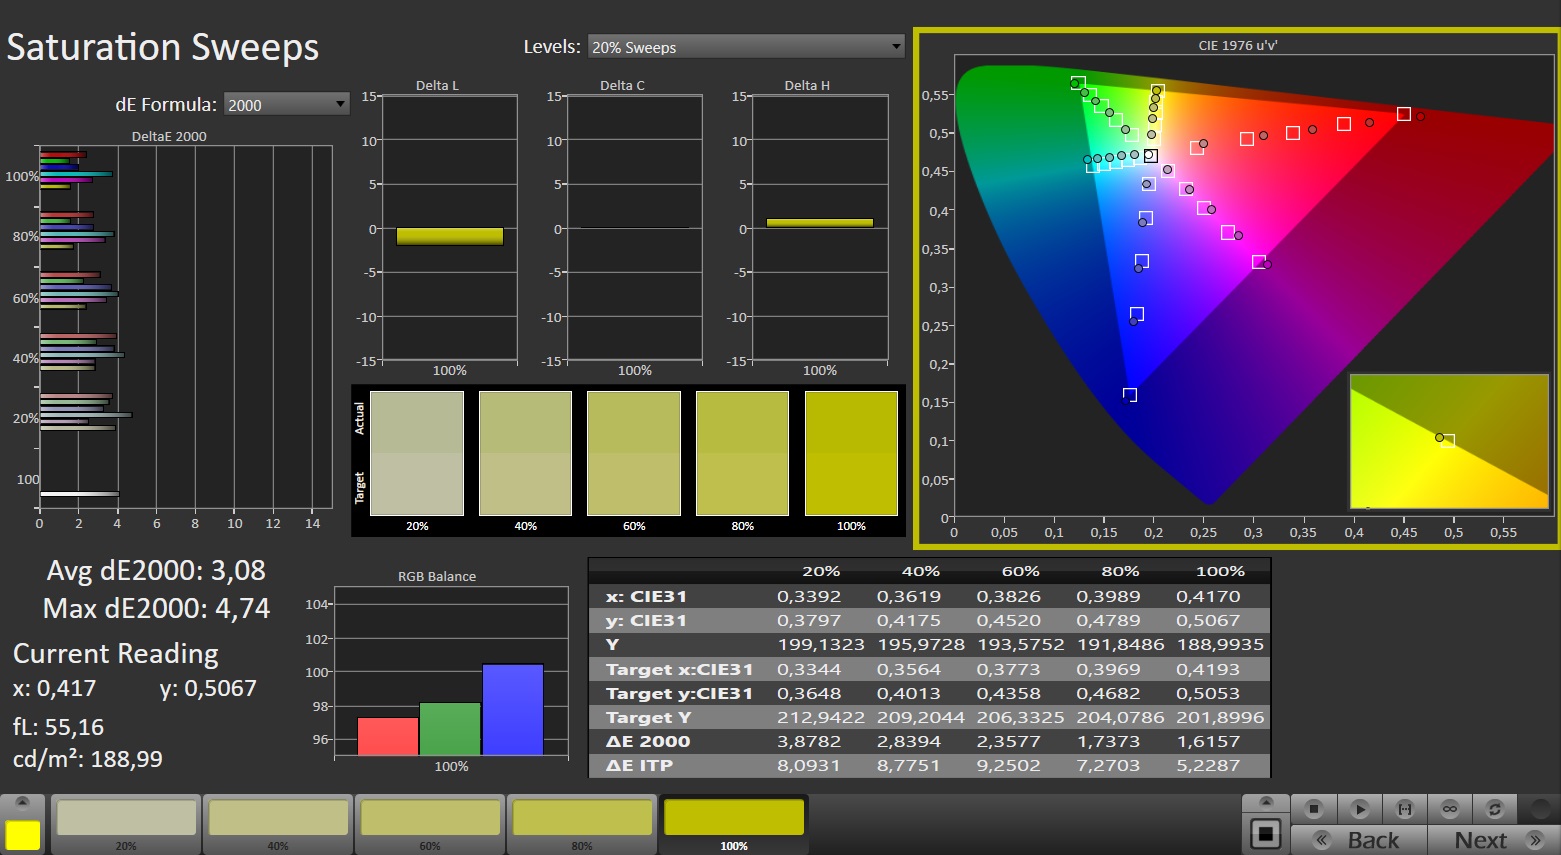
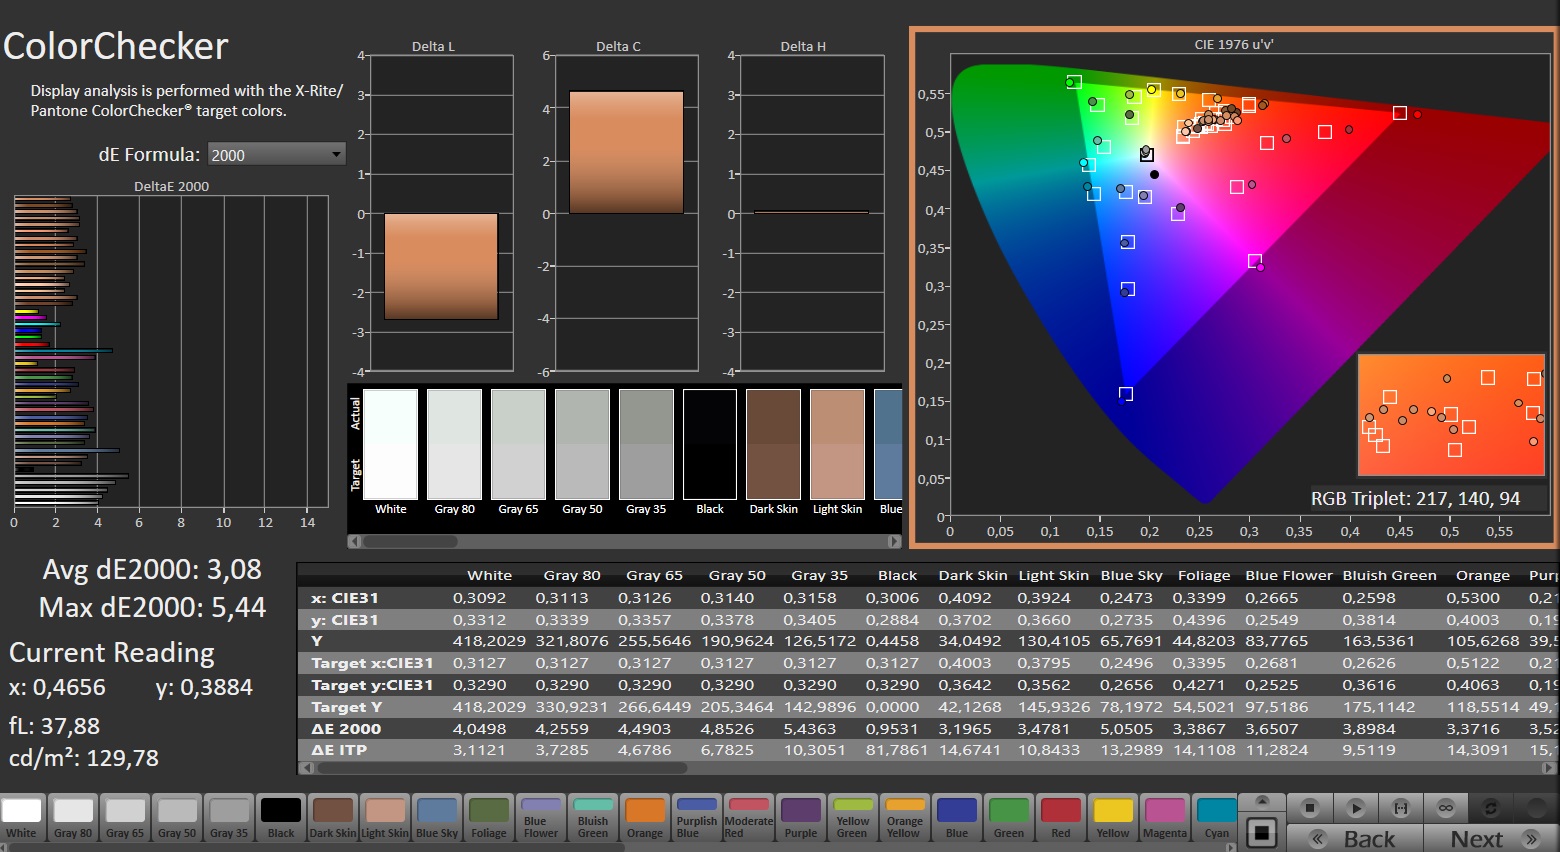
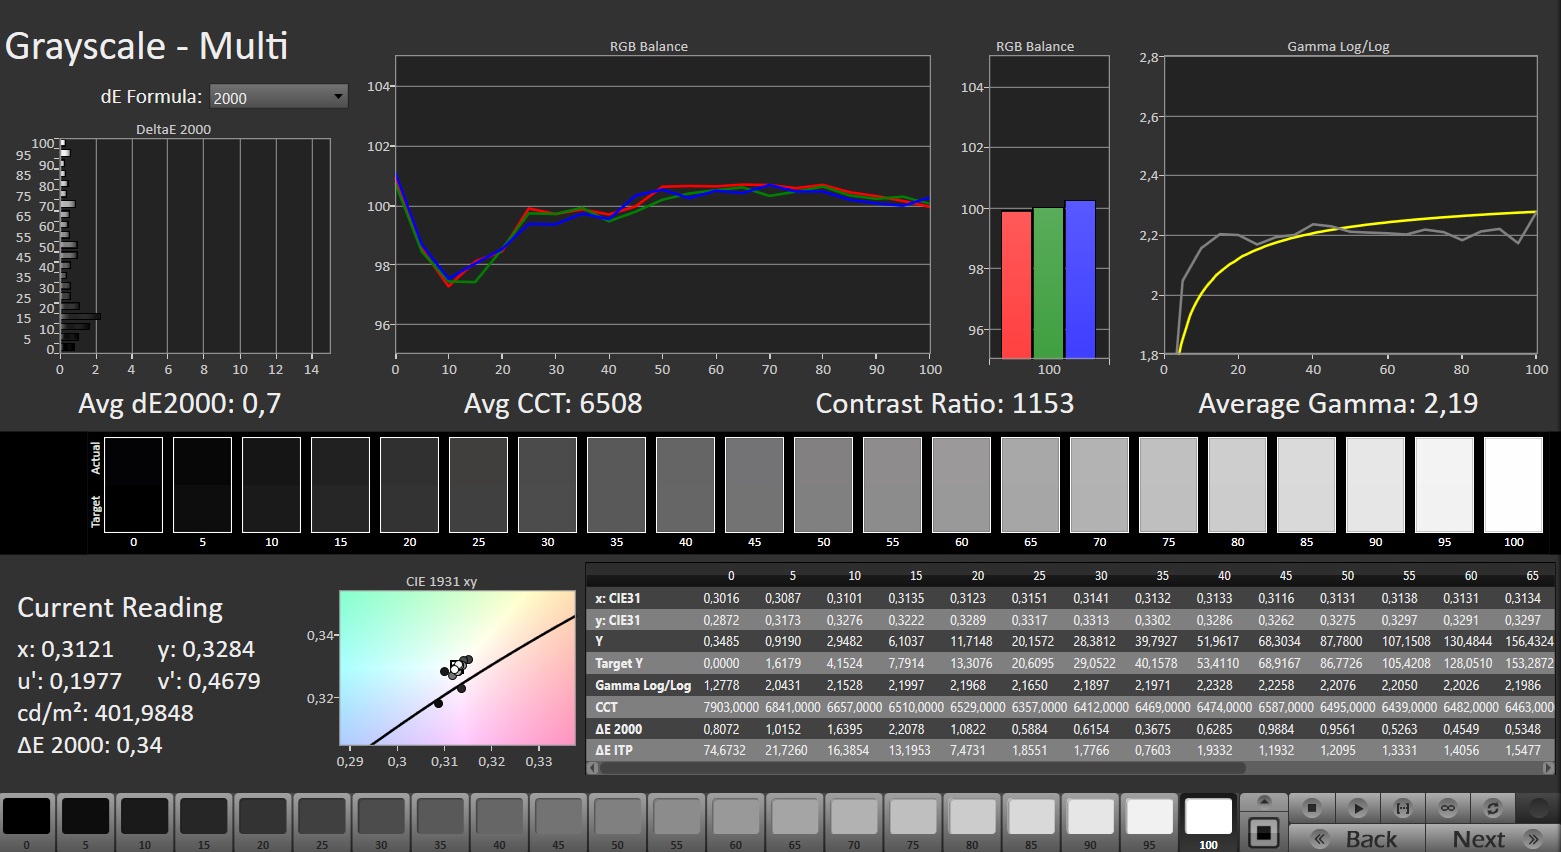
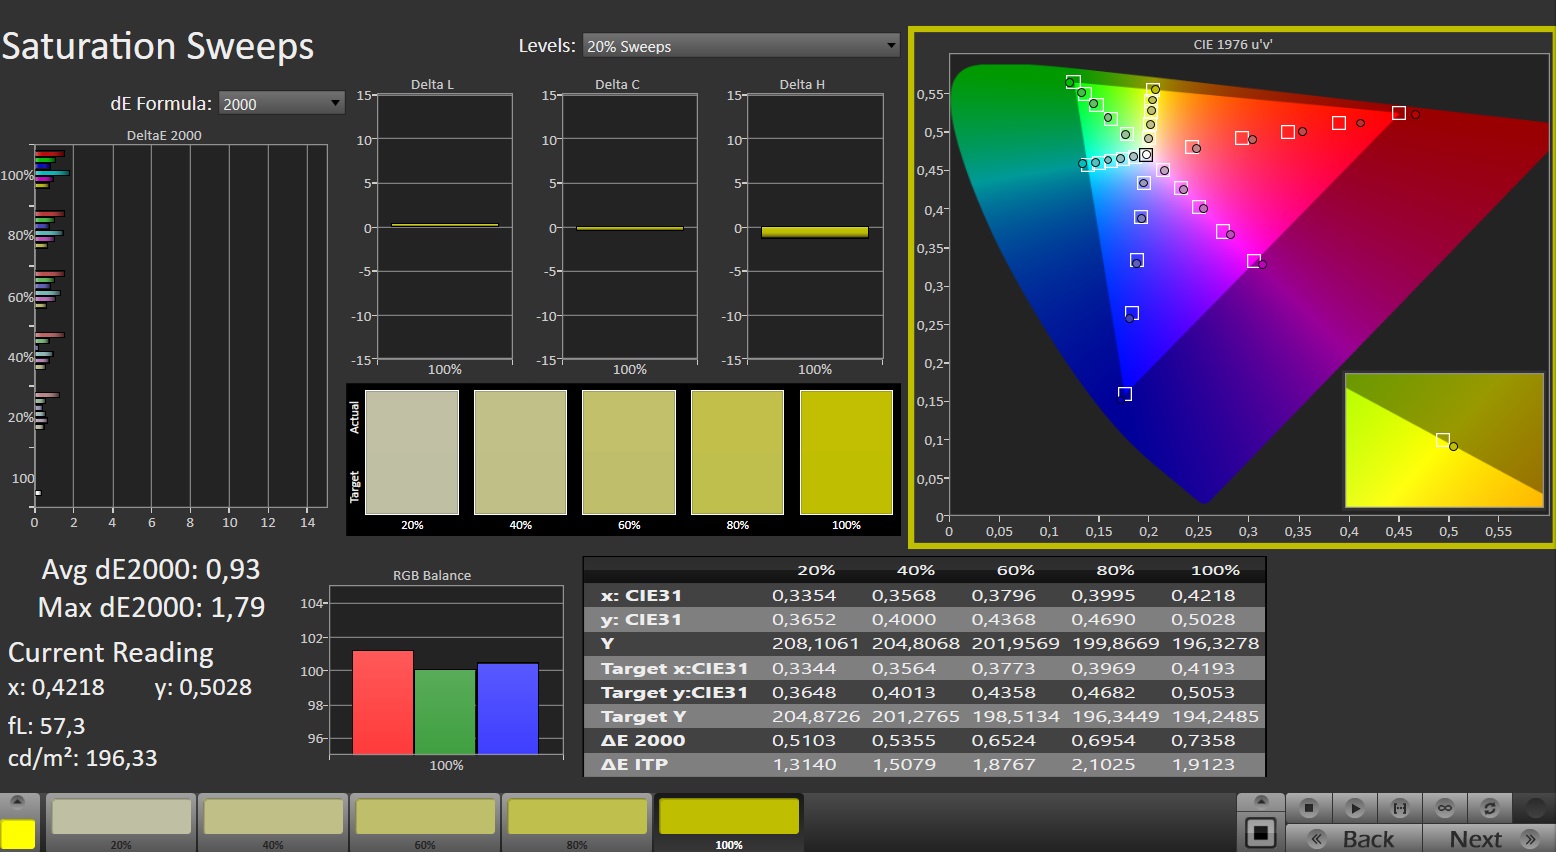
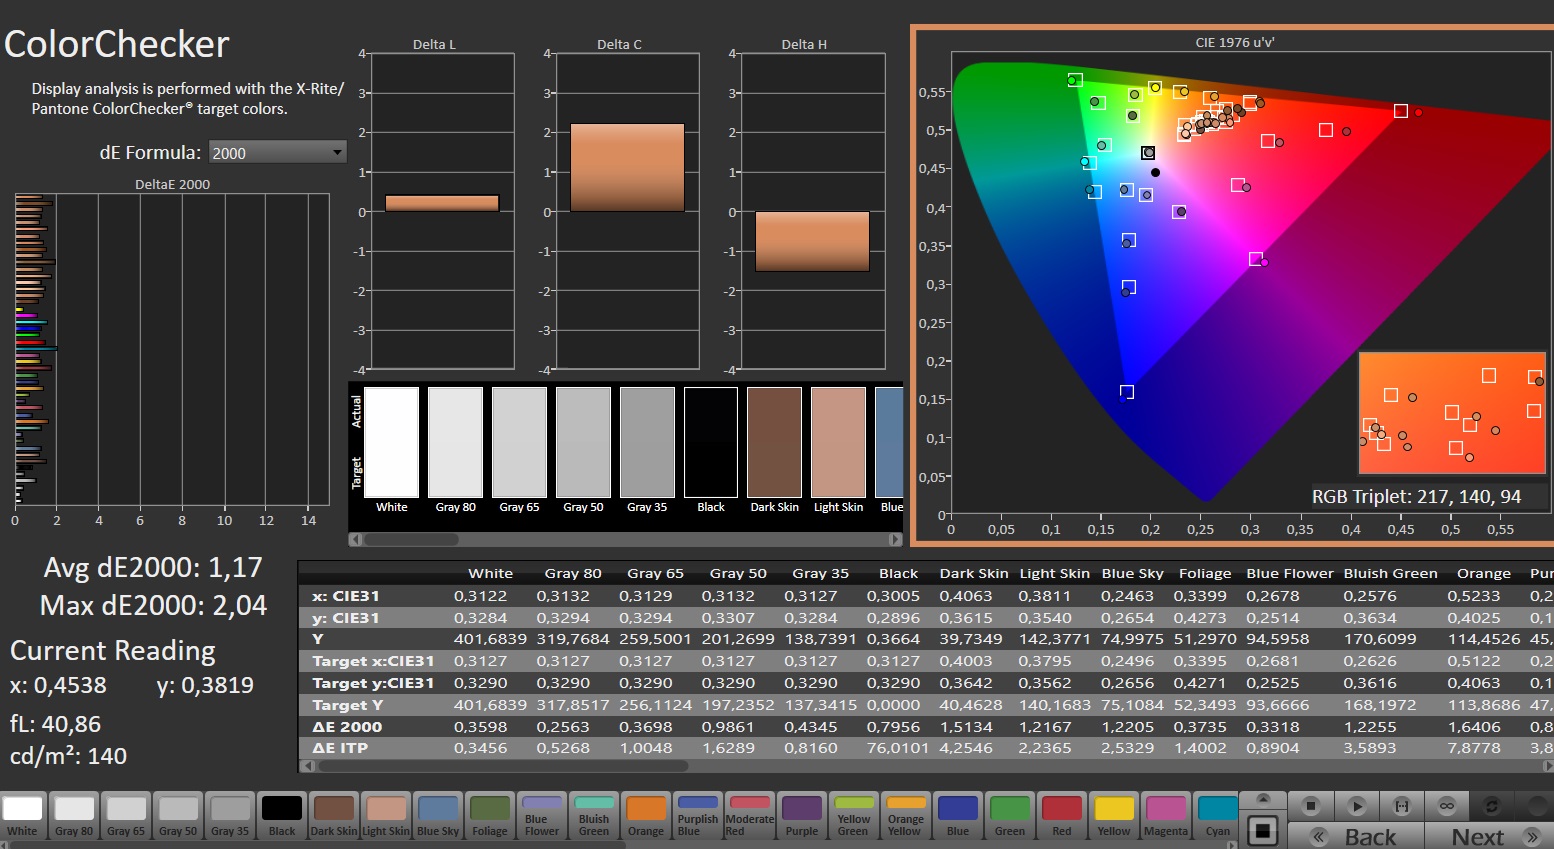
"Przyzwoite" to również trafne określenie pokrycia kolorów: nawet jeśli 15-calowy laptop nie jest w stanie w pełni odwzorować przestrzeni kolorów DCI-P3 i AdobeRGB, posiadanie prawie 100% pokrycia sRGB nie jest czymś oczywistym w przedziale cenowym 1000 euro (1090 USD), czego dowodem jest Acer Nitro V 15 którego niedawno recenzowaliśmy.
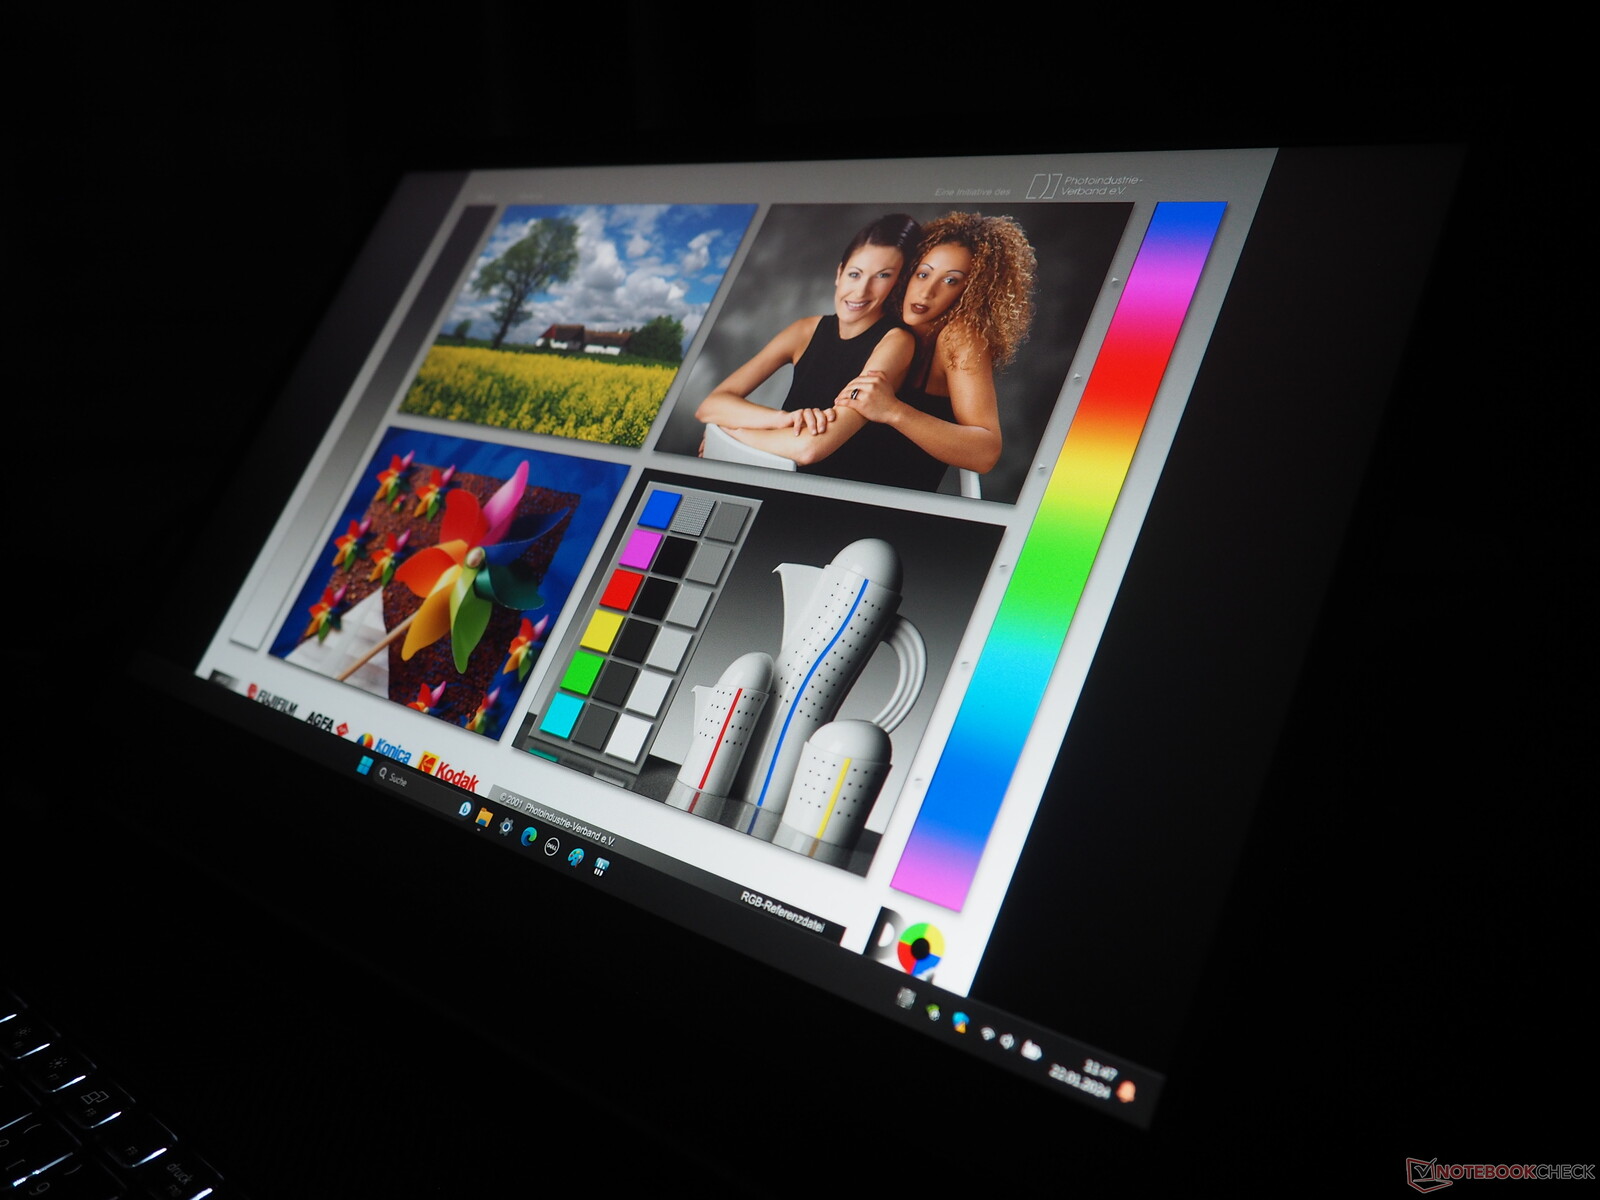
Kąty widzenia są dość typowe dla wyświetlaczy IPS, czyli całkiem dobre. Większość nabywców powinna być również zadowolona z dokładności odwzorowania kolorów.
Wyświetl czasy reakcji
| ↔ Czas reakcji od czerni do bieli | ||
|---|---|---|
| 6.7 ms ... wzrost ↗ i spadek ↘ łącznie | ↗ 3.1 ms wzrost | 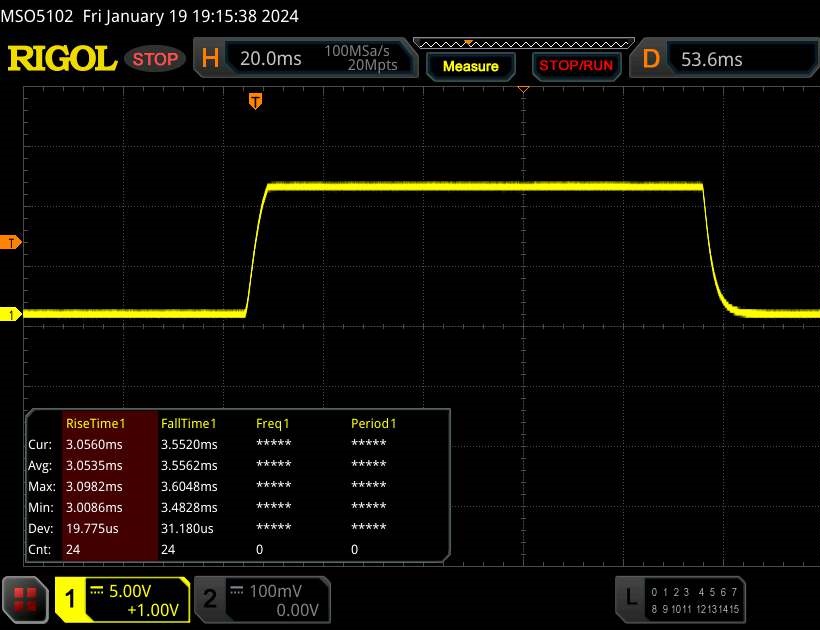 |
| ↘ 3.6 ms upadek | ||
| W naszych testach ekran wykazuje bardzo szybką reakcję i powinien bardzo dobrze nadawać się do szybkich gier. Dla porównania, wszystkie testowane urządzenia wahają się od 0.1 (minimum) do 240 (maksimum) ms. » 21 % wszystkich urządzeń jest lepszych. Oznacza to, że zmierzony czas reakcji jest lepszy od średniej wszystkich testowanych urządzeń (19.8 ms). | ||
| ↔ Czas reakcji 50% szarości do 80% szarości | ||
| 8.5 ms ... wzrost ↗ i spadek ↘ łącznie | ↗ 4.2 ms wzrost | 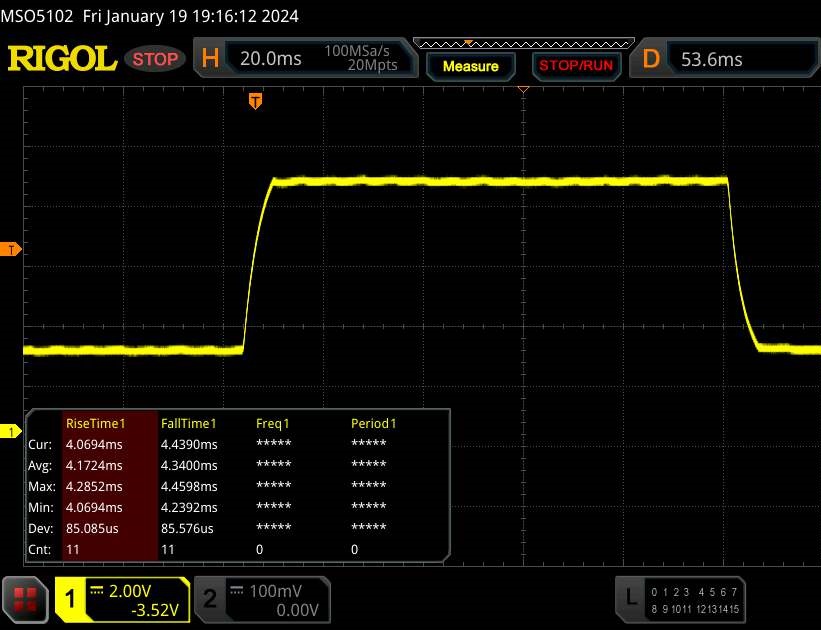 |
| ↘ 4.3 ms upadek | ||
| W naszych testach ekran wykazuje szybki czas reakcji i powinien nadawać się do gier. Dla porównania, wszystkie testowane urządzenia wahają się od 0.165 (minimum) do 636 (maksimum) ms. » 22 % wszystkich urządzeń jest lepszych. Oznacza to, że zmierzony czas reakcji jest lepszy od średniej wszystkich testowanych urządzeń (31 ms). | ||
Migotanie ekranu / PWM (modulacja szerokości impulsu)
| Migotanie ekranu/nie wykryto PWM | 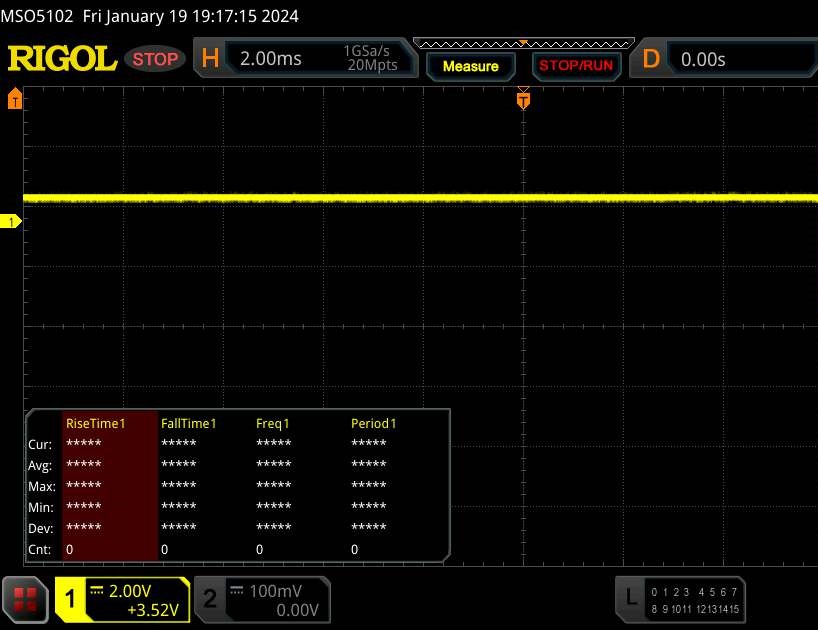 | ||
Dla porównania: 52 % wszystkich testowanych urządzeń nie używa PWM do przyciemniania wyświetlacza. Jeśli wykryto PWM, zmierzono średnio 7757 (minimum: 5 - maksimum: 343500) Hz. | |||
Wydajność
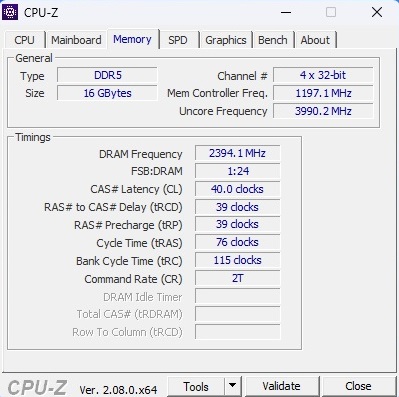
Niezależnie od tego, czy w środku znajduje się RTX 4050, czy RTX 4060, Dell G15 5530 to nadal laptop do gier średniej klasy. 16 GB pamięci DDR5 jest w tej chwili całkowicie wystarczające do gier; jak wspomniano powyżej, nieco skromne 512 GB pamięci SSD można rozszerzyć, dodając większy dysk M.2.
Warunki testu
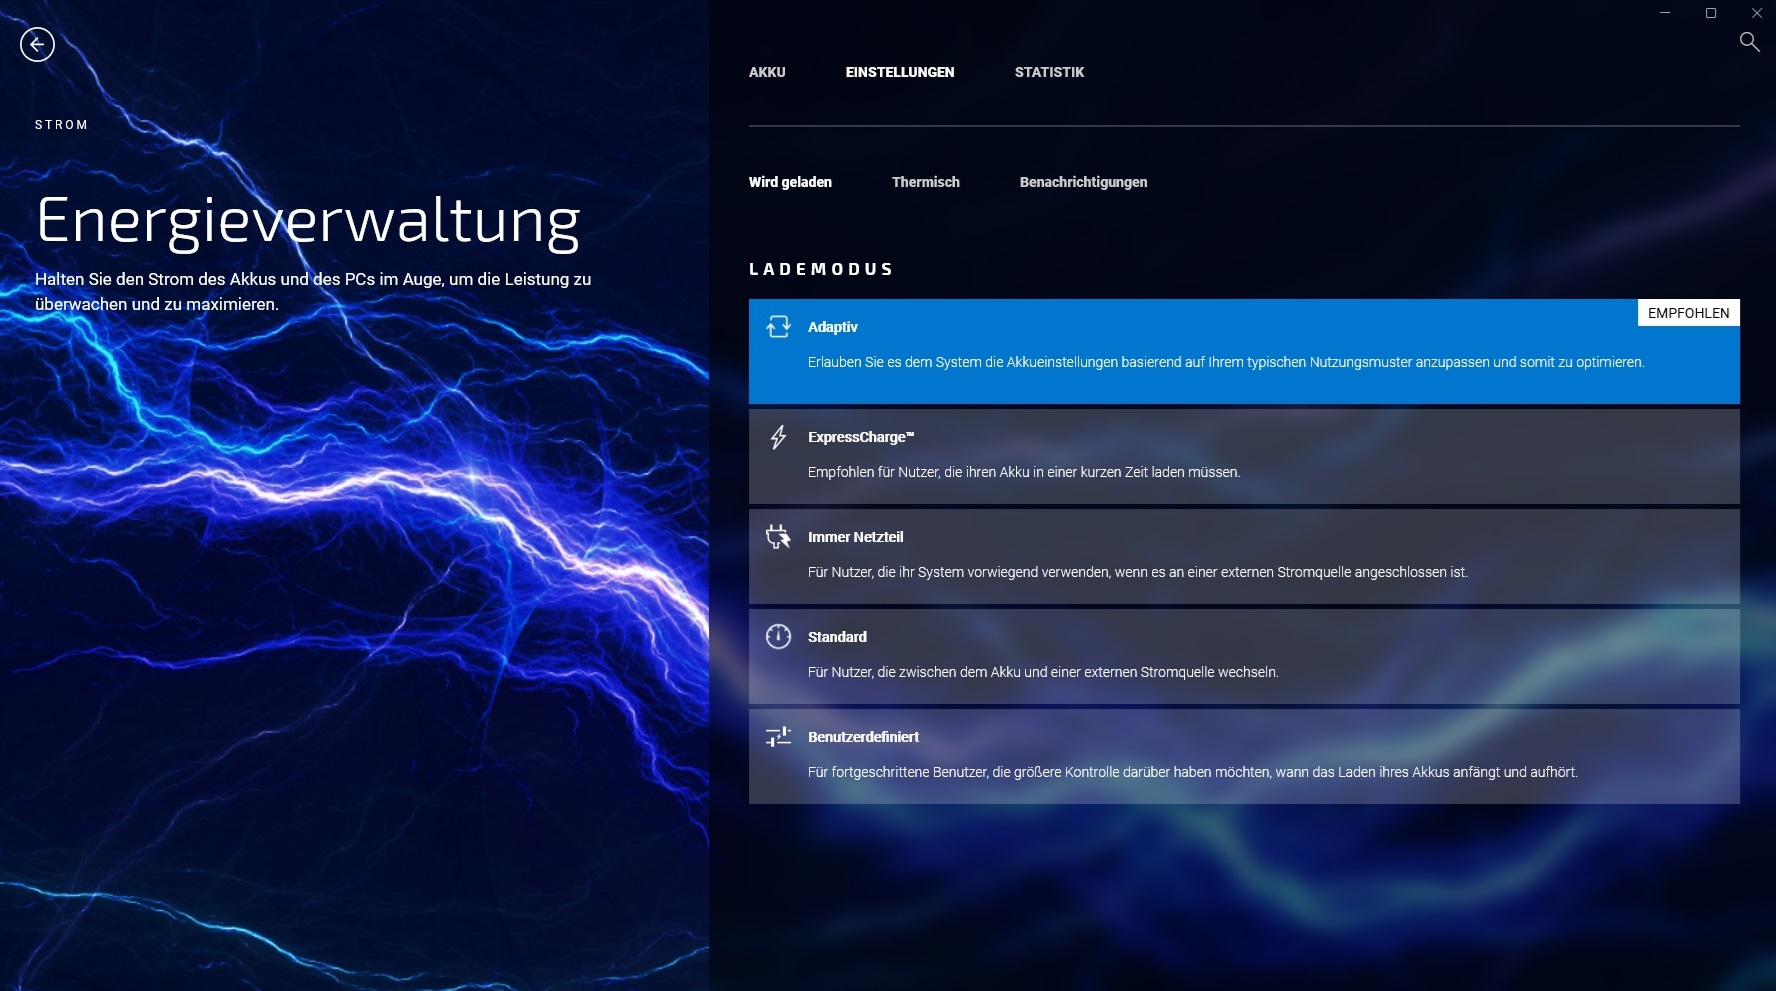
Istnieje kilka trybów zasilania ukrytych za różnymi menu w preinstalowanym oprogramowaniu Dell. Według naszych pomiarów, tryby te nie mają żadnego wpływu na wydajność 3D, ale raczej wpływają głównie na to, jak głośno laptop działa (patrz tabela). Wszystkie nasze testy zostały zatem przeprowadzone w trybie "Zoptymalizowanym", który jest domyślnie włączony zaraz po wyjęciu z pudełka. Alternatywnie, Alienware Command Center oferuje również cały szereg opcji dostosowywania.
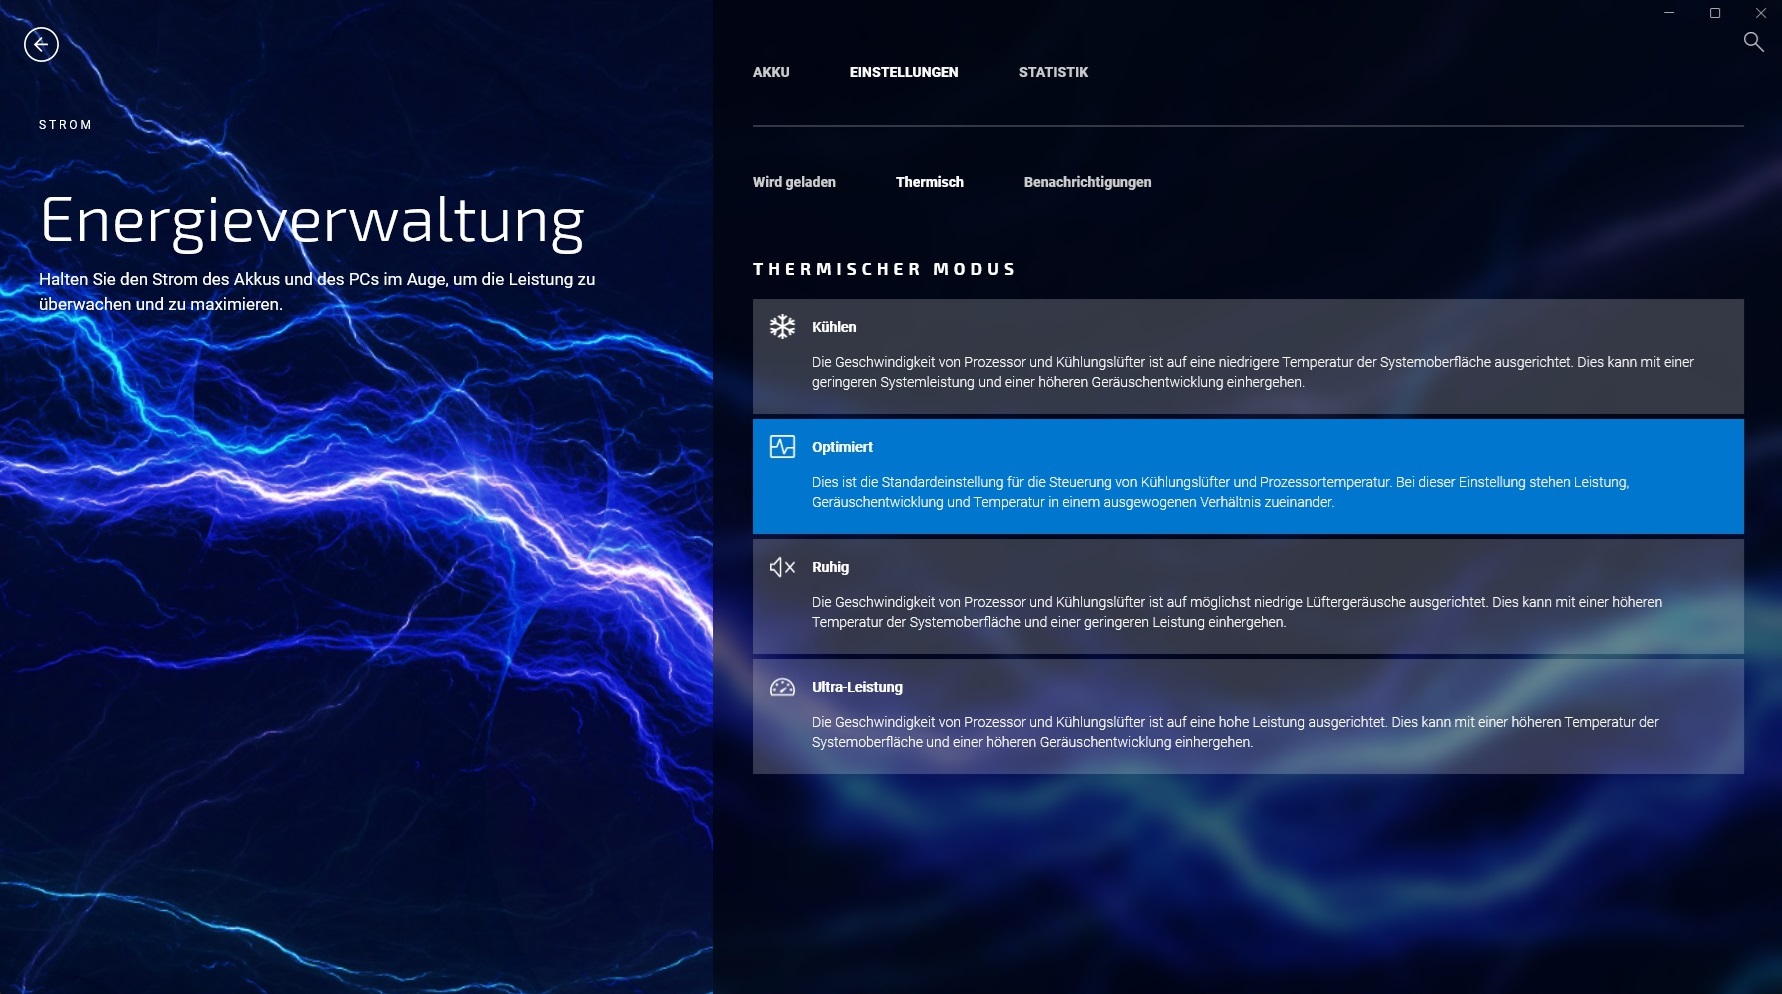
| Witcher 3 (FHD/Ultra) | Cichy | Zoptymalizowany | Chłodzenie | Ultra wydajność |
| Hałas | 40 - 41 dB(A) | 43 - 44 dB(A) | 46 - 47 dB(A) | 49 - 50 dB(A) |
| Wydajność | 84 fps | 84 fps | 84 fps | 84 fps |
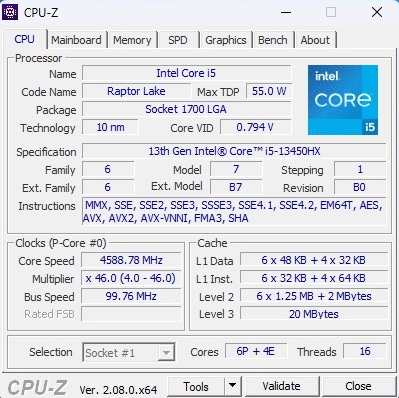
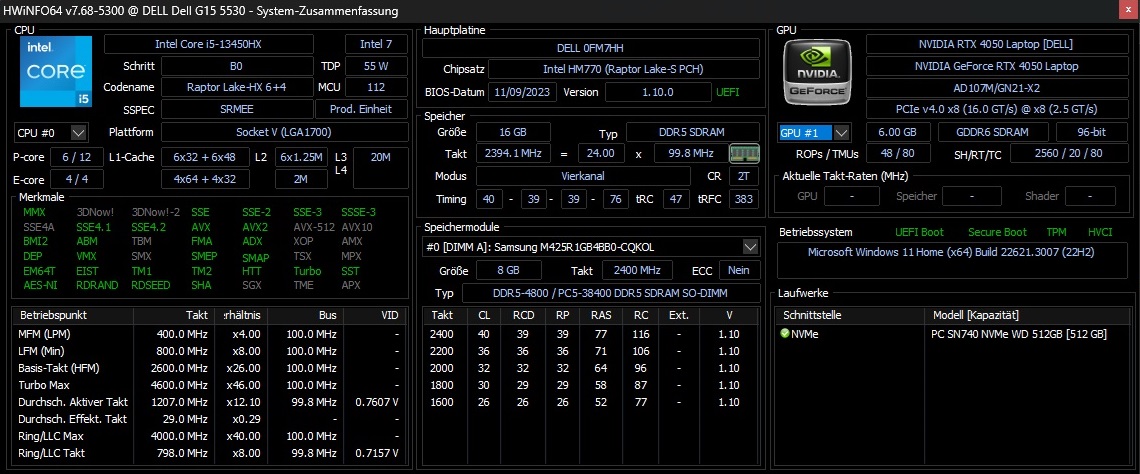
Procesor
W porównaniu do Core i7-13650HX, Core i5-13450HX ma tylko cztery zamiast ośmiu rdzeni wydajnościowych, ale liczba rdzeni wydajnościowych pozostaje taka sama i wynosi sześć. Oba procesory pochodzą z generacji Raptor Lake i zostały wyprodukowane przy użyciu ulepszonego procesu technologicznego 10 nm. Biorąc pod uwagę wszystkie benchmarki CPU, Core i5-13450HX jest około 15% wolniejszy od swojego droższego brata i plasuje się gdzieś pomiędzy Core i5-13500H (Medion Erazer Crawler E40) a procesorem Core i7-13620H (Lenovo LOQ 15IRH8). Wynik nieznacznie spadł z biegiem czasu podczas naszego testu w pętli Cinebench, ale nie było żadnych drastycznych spadków wydajności.
Cinebench R15 Multi Sustained Load
* ... im mniej tym lepiej
AIDA64: FP32 Ray-Trace | FPU Julia | CPU SHA3 | CPU Queen | FPU SinJulia | FPU Mandel | CPU AES | CPU ZLib | FP64 Ray-Trace | CPU PhotoWorxx
| Performance rating | |
| Średnia w klasie Gaming | |
| Dell G15 5530 | |
| Asus TUF A15 FA507 | |
| Dell G15 5530, i5-13450HX RTX 4050 | |
| Przeciętny Intel Core i5-13450HX | |
| Medion Erazer Crawler E40 - MD 62518 | |
| Lenovo LOQ 15IRH8 Core i7 | |
| AIDA64 / FP32 Ray-Trace | |
| Średnia w klasie Gaming (10227 - 85542, n=105, ostatnie 2 lata) | |
| Dell G15 5530 | |
| Dell G15 5530, i5-13450HX RTX 4050 | |
| Asus TUF A15 FA507 | |
| Przeciętny Intel Core i5-13450HX (13747 - 17767, n=3) | |
| Medion Erazer Crawler E40 - MD 62518 | |
| Lenovo LOQ 15IRH8 Core i7 | |
| AIDA64 / FPU Julia | |
| Średnia w klasie Gaming (51376 - 238426, n=105, ostatnie 2 lata) | |
| Asus TUF A15 FA507 | |
| Dell G15 5530 | |
| Dell G15 5530, i5-13450HX RTX 4050 | |
| Przeciętny Intel Core i5-13450HX (71834 - 83862, n=3) | |
| Medion Erazer Crawler E40 - MD 62518 | |
| Lenovo LOQ 15IRH8 Core i7 | |
| AIDA64 / CPU SHA3 | |
| Średnia w klasie Gaming (2180 - 10115, n=105, ostatnie 2 lata) | |
| Dell G15 5530 | |
| Przeciętny Intel Core i5-13450HX (3519 - 3530, n=3) | |
| Dell G15 5530, i5-13450HX RTX 4050 | |
| Medion Erazer Crawler E40 - MD 62518 | |
| Asus TUF A15 FA507 | |
| Lenovo LOQ 15IRH8 Core i7 | |
| AIDA64 / CPU Queen | |
| Średnia w klasie Gaming (49785 - 173351, n=90, ostatnie 2 lata) | |
| Dell G15 5530 | |
| Asus TUF A15 FA507 | |
| Przeciętny Intel Core i5-13450HX (85888 - 86148, n=3) | |
| Dell G15 5530, i5-13450HX RTX 4050 | |
| Medion Erazer Crawler E40 - MD 62518 | |
| Lenovo LOQ 15IRH8 Core i7 | |
| AIDA64 / FPU SinJulia | |
| Średnia w klasie Gaming (4424 - 33636, n=105, ostatnie 2 lata) | |
| Asus TUF A15 FA507 | |
| Dell G15 5530 | |
| Przeciętny Intel Core i5-13450HX (9325 - 9354, n=3) | |
| Dell G15 5530, i5-13450HX RTX 4050 | |
| Medion Erazer Crawler E40 - MD 62518 | |
| Lenovo LOQ 15IRH8 Core i7 | |
| AIDA64 / FPU Mandel | |
| Średnia w klasie Gaming (25115 - 128721, n=105, ostatnie 2 lata) | |
| Asus TUF A15 FA507 | |
| Dell G15 5530 | |
| Dell G15 5530, i5-13450HX RTX 4050 | |
| Przeciętny Intel Core i5-13450HX (34956 - 42825, n=3) | |
| Medion Erazer Crawler E40 - MD 62518 | |
| Lenovo LOQ 15IRH8 Core i7 | |
| AIDA64 / CPU AES | |
| Średnia w klasie Gaming (39258 - 247074, n=105, ostatnie 2 lata) | |
| Dell G15 5530 | |
| Dell G15 5530, i5-13450HX RTX 4050 | |
| Przeciętny Intel Core i5-13450HX (70296 - 70680, n=3) | |
| Asus TUF A15 FA507 | |
| Medion Erazer Crawler E40 - MD 62518 | |
| Lenovo LOQ 15IRH8 Core i7 | |
| AIDA64 / CPU ZLib | |
| Średnia w klasie Gaming (574 - 2531, n=105, ostatnie 2 lata) | |
| Dell G15 5530 | |
| Dell G15 5530, i5-13450HX RTX 4050 | |
| Medion Erazer Crawler E40 - MD 62518 | |
| Przeciętny Intel Core i5-13450HX (977 - 1002, n=3) | |
| Lenovo LOQ 15IRH8 Core i7 | |
| Asus TUF A15 FA507 | |
| AIDA64 / FP64 Ray-Trace | |
| Średnia w klasie Gaming (5509 - 45446, n=105, ostatnie 2 lata) | |
| Dell G15 5530 | |
| Dell G15 5530, i5-13450HX RTX 4050 | |
| Przeciętny Intel Core i5-13450HX (7428 - 9561, n=3) | |
| Asus TUF A15 FA507 | |
| Medion Erazer Crawler E40 - MD 62518 | |
| Lenovo LOQ 15IRH8 Core i7 | |
| AIDA64 / CPU PhotoWorxx | |
| Średnia w klasie Gaming (12271 - 89891, n=105, ostatnie 2 lata) | |
| Dell G15 5530 | |
| Medion Erazer Crawler E40 - MD 62518 | |
| Przeciętny Intel Core i5-13450HX (36014 - 36764, n=3) | |
| Dell G15 5530, i5-13450HX RTX 4050 | |
| Lenovo LOQ 15IRH8 Core i7 | |
| Asus TUF A15 FA507 | |
Wydajność systemu
Wszystkie urządzenia w naszym porównaniu są dość blisko siebie pod względem wydajności systemu. W teście PCMark 10 recenzowana jednostka uzyskała niemal taki sam wynik ogólny jak droższy model G15.
CrossMark: Overall | Productivity | Creativity | Responsiveness
WebXPRT 3: Overall
WebXPRT 4: Overall
Mozilla Kraken 1.1: Total
| PCMark 10 / Score | |
| Średnia w klasie Gaming (5828 - 12414, n=93, ostatnie 2 lata) | |
| Lenovo LOQ 15IRH8 Core i7 | |
| Medion Erazer Crawler E40 - MD 62518 | |
| Asus TUF A15 FA507 | |
| Dell G15 5530 | |
| Dell G15 5530, i5-13450HX RTX 4050 | |
| Przeciętny Intel Core i5-13450HX, NVIDIA GeForce RTX 4050 Laptop GPU (n=1) | |
| PCMark 10 / Essentials | |
| Dell G15 5530 | |
| Lenovo LOQ 15IRH8 Core i7 | |
| Średnia w klasie Gaming (8810 - 11935, n=97, ostatnie 2 lata) | |
| Asus TUF A15 FA507 | |
| Medion Erazer Crawler E40 - MD 62518 | |
| Dell G15 5530, i5-13450HX RTX 4050 | |
| Przeciętny Intel Core i5-13450HX, NVIDIA GeForce RTX 4050 Laptop GPU (n=1) | |
| PCMark 10 / Productivity | |
| Średnia w klasie Gaming (6845 - 25323, n=95, ostatnie 2 lata) | |
| Dell G15 5530 | |
| Lenovo LOQ 15IRH8 Core i7 | |
| Asus TUF A15 FA507 | |
| Medion Erazer Crawler E40 - MD 62518 | |
| Dell G15 5530, i5-13450HX RTX 4050 | |
| Przeciętny Intel Core i5-13450HX, NVIDIA GeForce RTX 4050 Laptop GPU (n=1) | |
| PCMark 10 / Digital Content Creation | |
| Średnia w klasie Gaming (7602 - 19954, n=95, ostatnie 2 lata) | |
| Lenovo LOQ 15IRH8 Core i7 | |
| Medion Erazer Crawler E40 - MD 62518 | |
| Dell G15 5530, i5-13450HX RTX 4050 | |
| Przeciętny Intel Core i5-13450HX, NVIDIA GeForce RTX 4050 Laptop GPU (n=1) | |
| Asus TUF A15 FA507 | |
| Dell G15 5530 | |
| CrossMark / Overall | |
| Średnia w klasie Gaming (1366 - 2409, n=94, ostatnie 2 lata) | |
| Lenovo LOQ 15IRH8 Core i7 | |
| Dell G15 5530 | |
| Medion Erazer Crawler E40 - MD 62518 | |
| Asus TUF A15 FA507 | |
| CrossMark / Productivity | |
| Średnia w klasie Gaming (1386 - 2254, n=94, ostatnie 2 lata) | |
| Lenovo LOQ 15IRH8 Core i7 | |
| Dell G15 5530 | |
| Medion Erazer Crawler E40 - MD 62518 | |
| Asus TUF A15 FA507 | |
| CrossMark / Creativity | |
| Średnia w klasie Gaming (1343 - 2786, n=94, ostatnie 2 lata) | |
| Dell G15 5530 | |
| Lenovo LOQ 15IRH8 Core i7 | |
| Medion Erazer Crawler E40 - MD 62518 | |
| Asus TUF A15 FA507 | |
| CrossMark / Responsiveness | |
| Lenovo LOQ 15IRH8 Core i7 | |
| Medion Erazer Crawler E40 - MD 62518 | |
| Średnia w klasie Gaming (1226 - 2334, n=94, ostatnie 2 lata) | |
| Dell G15 5530 | |
| Asus TUF A15 FA507 | |
| WebXPRT 3 / Overall | |
| Średnia w klasie Gaming (220 - 532, n=98, ostatnie 2 lata) | |
| Dell G15 5530 | |
| Asus TUF A15 FA507 | |
| Lenovo LOQ 15IRH8 Core i7 | |
| Dell G15 5530, i5-13450HX RTX 4050 | |
| Dell G15 5530, i5-13450HX RTX 4050 | |
| Przeciętny Intel Core i5-13450HX, NVIDIA GeForce RTX 4050 Laptop GPU (281 - 281, n=2) | |
| Medion Erazer Crawler E40 - MD 62518 | |
| WebXPRT 4 / Overall | |
| Średnia w klasie Gaming (165 - 354, n=98, ostatnie 2 lata) | |
| Dell G15 5530 | |
| Lenovo LOQ 15IRH8 Core i7 | |
| Medion Erazer Crawler E40 - MD 62518 | |
| Asus TUF A15 FA507 | |
| Mozilla Kraken 1.1 / Total | |
| Asus TUF A15 FA507 | |
| Dell G15 5530, i5-13450HX RTX 4050 | |
| Dell G15 5530, i5-13450HX RTX 4050 | |
| Przeciętny Intel Core i5-13450HX, NVIDIA GeForce RTX 4050 Laptop GPU (531 - 531, n=2) | |
| Medion Erazer Crawler E40 - MD 62518 | |
| Dell G15 5530 | |
| Lenovo LOQ 15IRH8 Core i7 | |
| Średnia w klasie Gaming (391 - 590, n=100, ostatnie 2 lata) | |
* ... im mniej tym lepiej
| PCMark 10 Score | 6969 pkt. | |
Pomoc | ||
| AIDA64 / Memory Copy | |
| Średnia w klasie Gaming (21750 - 129946, n=105, ostatnie 2 lata) | |
| Dell G15 5530 | |
| Dell G15 5530, i5-13450HX RTX 4050 | |
| Przeciętny Intel Core i5-13450HX (58673 - 58861, n=3) | |
| Medion Erazer Crawler E40 - MD 62518 | |
| Lenovo LOQ 15IRH8 Core i7 | |
| Asus TUF A15 FA507 | |
| AIDA64 / Memory Read | |
| Średnia w klasie Gaming (22956 - 118858, n=105, ostatnie 2 lata) | |
| Przeciętny Intel Core i5-13450HX (66626 - 69024, n=3) | |
| Dell G15 5530 | |
| Dell G15 5530, i5-13450HX RTX 4050 | |
| Medion Erazer Crawler E40 - MD 62518 | |
| Lenovo LOQ 15IRH8 Core i7 | |
| Asus TUF A15 FA507 | |
| AIDA64 / Memory Write | |
| Średnia w klasie Gaming (22297 - 135096, n=105, ostatnie 2 lata) | |
| Medion Erazer Crawler E40 - MD 62518 | |
| Dell G15 5530, i5-13450HX RTX 4050 | |
| Dell G15 5530 | |
| Przeciętny Intel Core i5-13450HX (58540 - 60196, n=3) | |
| Asus TUF A15 FA507 | |
| Lenovo LOQ 15IRH8 Core i7 | |
| AIDA64 / Memory Latency | |
| Lenovo LOQ 15IRH8 Core i7 | |
| Średnia w klasie Gaming (75.3 - 259, n=105, ostatnie 2 lata) | |
| Medion Erazer Crawler E40 - MD 62518 | |
| Dell G15 5530, i5-13450HX RTX 4050 | |
| Przeciętny Intel Core i5-13450HX (90 - 94.2, n=3) | |
| Dell G15 5530 | |
| Asus TUF A15 FA507 | |
* ... im mniej tym lepiej
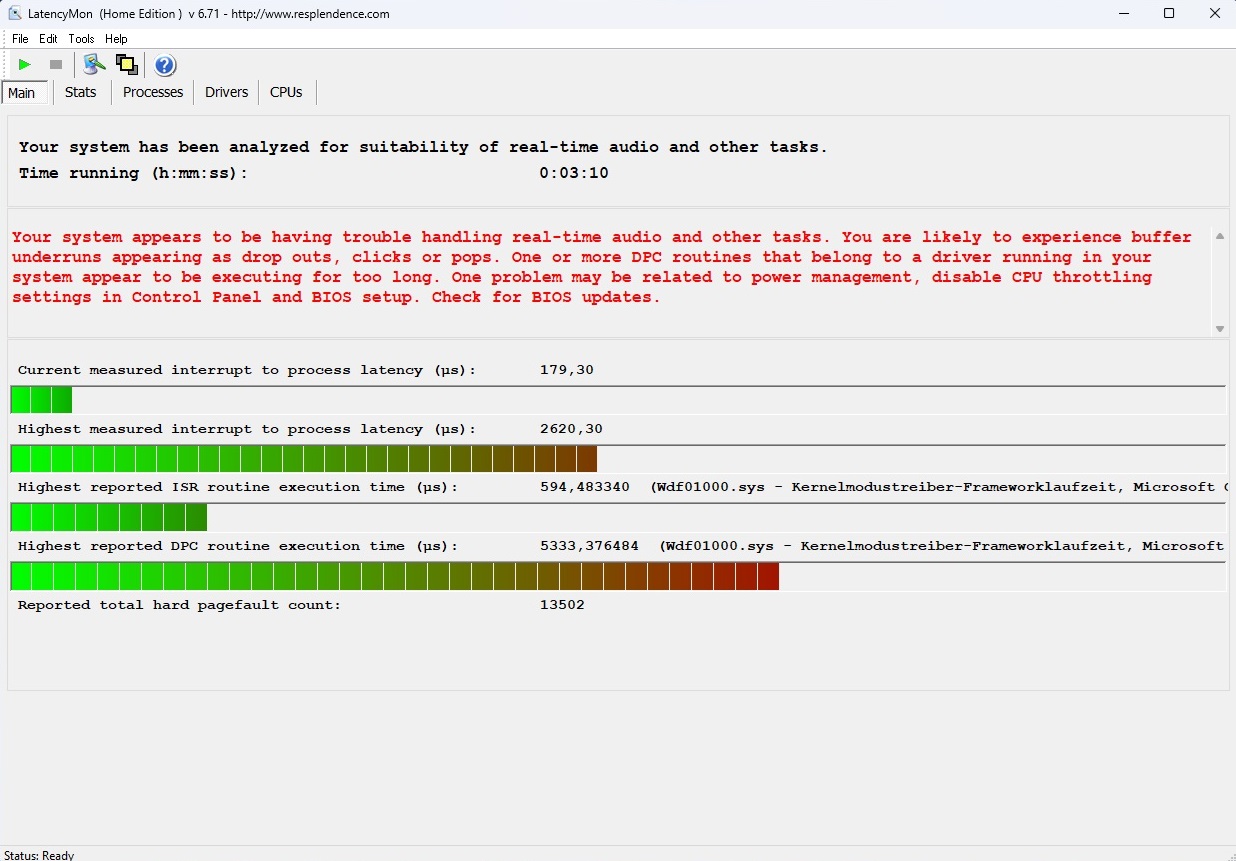
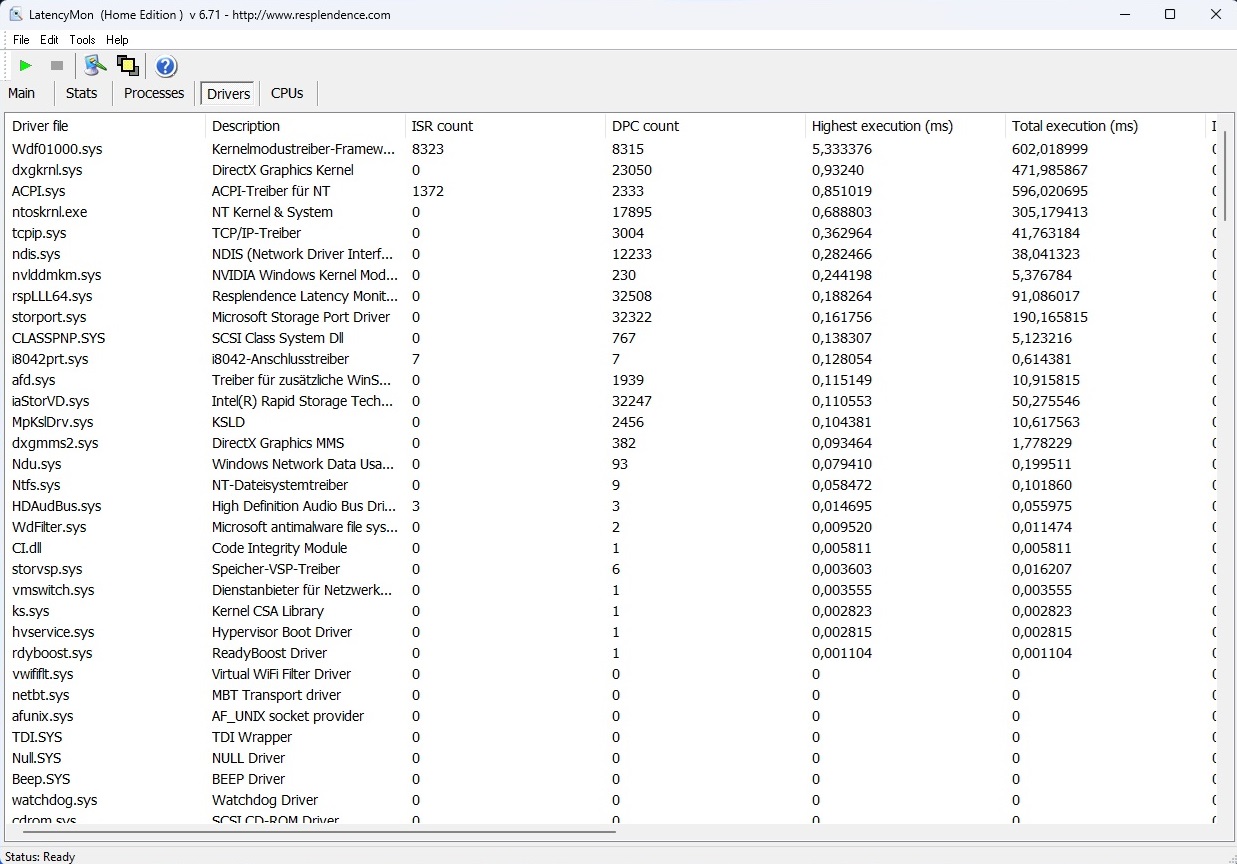
Opóźnienie DPC
15-calowy laptop ma słabe punkty w obszarze opóźnień. LatencyMon poinformował, że laptop - przynajmniej zaraz po wyjęciu z pudełka - wydaje się mieć problemy z obsługą przetwarzania audio i wideo w czasie rzeczywistym. Powinno to jednak dotyczyć tylko tych osób, które zamierzają używać laptopa do takich celów.
| DPC Latencies / LatencyMon - interrupt to process latency (max), Web, Youtube, Prime95 | |
| Dell G15 5530 | |
| Dell G15 5530, i5-13450HX RTX 4050 | |
| Medion Erazer Crawler E40 - MD 62518 | |
| Lenovo LOQ 15IRH8 Core i7 | |
* ... im mniej tym lepiej
Pamięć masowa
Na pierwszy rzut oka pamięć masowa laptopa prezentuje się znakomicie. Pomimo niewielkich rozmiarów, dysk M.2 2230 o pojemności 512 GB wyprodukowany przez WDC uzyskał niezwykle dobre wyniki w naszej serii testów porównawczych. Pomimo tego, nasz test pętli ujawnił, że przy długotrwałym obciążeniu lub stresie dysk czasami doświadczał poważnego poziomu dławienia, którego nie zaobserwowano u żadnego z konkurentów.

* ... im mniej tym lepiej
Sustained Load Read: DiskSpd Read Loop, Queue Depth 8
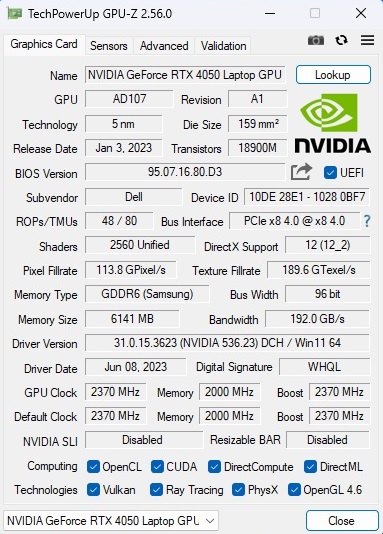
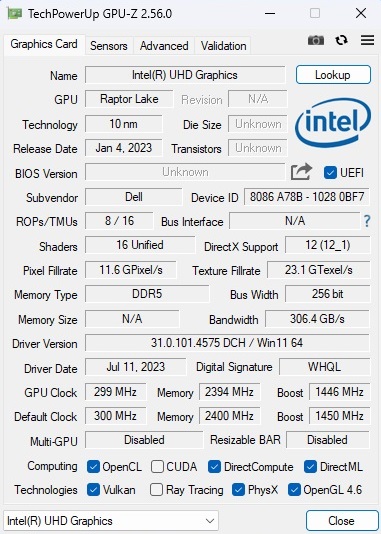
Karta graficzna
Karta graficzna GeForce RTX 4050 to popularny GPU średniej klasy z linii Ada Lovelace firmy Nvidia, ale 6 GB pamięci wideo GDDR6 i 96-bitowa magistrala są raczej ciasne jak na dzisiejsze standardy. Rzeczywista wydajność zależy w dużej mierze od systemu chłodzenia i określonego TGP. Dell zdecydował się na 140-watowy TGP dla G15, co odpowiada maksymalnemu dopuszczalnemu dla RTX 4050. Trudno się zatem dziwić, że 15-calowy laptop Della zapewnił ponadprzeciętną wydajność w benchmarku 3D, choć musimy wspomnieć, że niektórzy konkurenci często osiągali podobne wyniki przy niższym TGP, a co za tym idzie, są bardziej wydajni.
| 3DMark 11 Performance | 28326 pkt. | |
| 3DMark Ice Storm Standard Score | 222203 pkt. | |
| 3DMark Cloud Gate Standard Score | 58346 pkt. | |
| 3DMark Fire Strike Score | 19919 pkt. | |
| 3DMark Time Spy Score | 9091 pkt. | |
Pomoc | ||
* ... im mniej tym lepiej
Wydajność w grach
Wydajność w grach jest podobna do tego, co widzieliśmy w syntetycznych testach porównawczych. RTX 4050 jest generalnie wystarczająco szybki, aby płynnie uruchamiać większość nowoczesnych gier w rozdzielczości 1080p i na wysokich lub maksymalnych ustawieniach. Sprawy stają się napięte tylko wtedy, gdy grają Państwo w bardzo wymagające tytuły, takie jak Starfield. Zalecamy posiadanie co najmniej GeForce RTX 4070 jeśli chcą Państwo korzystać z wyższych rozdzielczości (QHD lub wyższych).
| The Witcher 3 - 1920x1080 Ultra Graphics & Postprocessing (HBAO+) | |
| Średnia w klasie Gaming (104.7 - 240, n=7, ostatnie 2 lata) | |
| Dell G15 5530 | |
| Lenovo LOQ 15IRH8 Core i7 | |
| Dell G15 5530, i5-13450HX RTX 4050 | |
| Asus TUF A15 FA507 | |
| Medion Erazer Crawler E40 - MD 62518 | |
| Przeciętny NVIDIA GeForce RTX 4050 Laptop GPU (18.5 - 94.7, n=40) | |
| Lies of P - 1920x1080 Best Preset | |
| XMG Focus 15 E23 | |
| Przeciętny NVIDIA GeForce RTX 4050 Laptop GPU (101.4 - 105.7, n=3) | |
| Dell G15 5530, i5-13450HX RTX 4050 | |
| The Crew Motorfest - 1920x1080 Ultra Preset | |
| XMG Focus 15 E23 | |
| Dell G15 5530, i5-13450HX RTX 4050 | |
| Przeciętny NVIDIA GeForce RTX 4050 Laptop GPU (59 - 59, n=3) | |
| Starfield - 1920x1080 Ultra Preset | |
| Średnia w klasie Gaming (n=1ostatnie 2 lata) | |
| Dell G15 5530, i5-13450HX RTX 4050 | |
| Przeciętny NVIDIA GeForce RTX 4050 Laptop GPU (35.7 - 37.3, n=3) | |
| XMG Focus 15 E23 | |
| Armored Core 6 - 1920x1080 Maximum Preset | |
| XMG Focus 15 E23 | |
| Przeciętny NVIDIA GeForce RTX 4050 Laptop GPU (79 - 87.8, n=3) | |
| Dell G15 5530, i5-13450HX RTX 4050 | |
| Średnia w klasie Gaming (n=1ostatnie 2 lata) | |
| Atlas Fallen - 1920x1080 Very High Preset | |
| Przeciętny NVIDIA GeForce RTX 4050 Laptop GPU (81.1 - 94.2, n=3) | |
| Dell G15 5530, i5-13450HX RTX 4050 | |
| XMG Focus 15 E23 | |
| Baldur's Gate 3 - 1920x1080 Ultra Preset AA:T | |
| Średnia w klasie Gaming (59.4 - 246, n=104, ostatnie 2 lata) | |
| XMG Focus 15 E23 | |
| Dell G15 5530, i5-13450HX RTX 4050 | |
| Przeciętny NVIDIA GeForce RTX 4050 Laptop GPU (48.3 - 81.3, n=11) | |
| Ratchet & Clank Rift Apart - 1920x1080 Very High Preset AA:T | |
| XMG Focus 15 E23 | |
| Przeciętny NVIDIA GeForce RTX 4050 Laptop GPU (32.9 - 45.8, n=3) | |
| Dell G15 5530, i5-13450HX RTX 4050 | |
| Resident Evil 4 Remake - 1920x1080 Max Preset | |
| Dell G15 5530, i5-13450HX RTX 4050 | |
| Przeciętny NVIDIA GeForce RTX 4050 Laptop GPU (36.8 - 53.9, n=2) | |
| XMG Focus 15 E23 | |
Użyliśmy The Witcher 3 (działającego w rozdzielczości FHD/Ultra przez około 60 minut), aby sprawdzić, jak każdy laptop radzi sobie w aplikacjach 3D przez dłuższy czas. Rezultat: liczba klatek na sekundę pozostała dość spójna na G15 5530.
Witcher 3 FPS chart
| low | med. | high | ultra | |
|---|---|---|---|---|
| GTA V (2015) | 178 | 168.6 | 96.6 | |
| The Witcher 3 (2015) | 84 | |||
| Dota 2 Reborn (2015) | 170 | 156.1 | 154.1 | 146.8 |
| Final Fantasy XV Benchmark (2018) | 120.3 | 84.1 | ||
| X-Plane 11.11 (2018) | 153.1 | 139.6 | 108.5 | |
| Strange Brigade (2018) | 203 | 171.4 | 145.1 | |
| Company of Heroes 3 (2023) | 127 | 70.2 | 68.7 | |
| Resident Evil 4 Remake (2023) | 88.6 | 80.9 | 53.9 | |
| Ratchet & Clank Rift Apart (2023) | 67.7 | 40.2 | 32.9 | |
| Atlas Fallen (2023) | 114.3 | 104.1 | 83.3 | |
| Armored Core 6 (2023) | 103.8 | 96.7 | 79 | |
| Starfield (2023) | 55.9 | 43.7 | 37.3 | |
| The Crew Motorfest (2023) | 60 | 60 | 59 | |
| Lies of P (2023) | 132.8 | 113.3 | 101.4 | |
| Baldur's Gate 3 (2023) | 84.4 | 71.3 | 69.3 |
Emisje
Emisja hałasu
Dell G15 5530 jest przeważnie cichy w trybie bezczynności. Wentylatory są albo całkowicie nieruchome, albo pracują na przyzwoitym poziomie hałasu. Wentylatory rozkręcają się dość rzadko, ale może się to zdarzać częściej podczas codziennych zadań, takich jak odtwarzanie wideo i przeglądanie stron internetowych. Niemniej jednak, przy około 44 dB(A), ilość hałasu wytwarzanego podczas grania w trybie "Zoptymalizowanym" jest poniżej średniej dla notebooka RTX 4050.
Hałas
| luz |
| 25 / 26 / 30 dB |
| obciążenie |
| 38 / 50 dB |
 | ||
30 dB cichy 40 dB(A) słyszalny 50 dB(A) irytujący |
||
min: | ||
| Dell G15 5530, i5-13450HX RTX 4050 GeForce RTX 4050 Laptop GPU, i5-13450HX | Medion Erazer Crawler E40 - MD 62518 GeForce RTX 4050 Laptop GPU, i5-13500H | Lenovo LOQ 15IRH8 Core i7 GeForce RTX 4050 Laptop GPU, i7-13620H | Asus TUF A15 FA507 GeForce RTX 4050 Laptop GPU, R7 7735HS | Dell G15 5530 GeForce RTX 4060 Laptop GPU, i7-13650HX | |
|---|---|---|---|---|---|
| Noise | -4% | -8% | 12% | 6% | |
| wyłączone / środowisko * (dB) | 25 | 23 8% | 23.69 5% | 23.3 7% | 20.41 18% |
| Idle Minimum * (dB) | 25 | 23 8% | 29.03 -16% | 23.3 7% | 26.85 -7% |
| Idle Average * (dB) | 26 | 23 12% | 29.03 -12% | 23.3 10% | 26.85 -3% |
| Idle Maximum * (dB) | 30 | 28.02 7% | 29.03 3% | 23.3 22% | 26.85 10% |
| Load Average * (dB) | 38 | 50.21 -32% | 48.7 -28% | 29.6 22% | 27.65 27% |
| Witcher 3 ultra * (dB) | 44 | 51.46 -17% | 48.5 -10% | 43 2% | 47.9 -9% |
| Load Maximum * (dB) | 50 | 56.79 -14% | 48.7 3% | 43 14% | 47.86 4% |
* ... im mniej tym lepiej
Temperatura
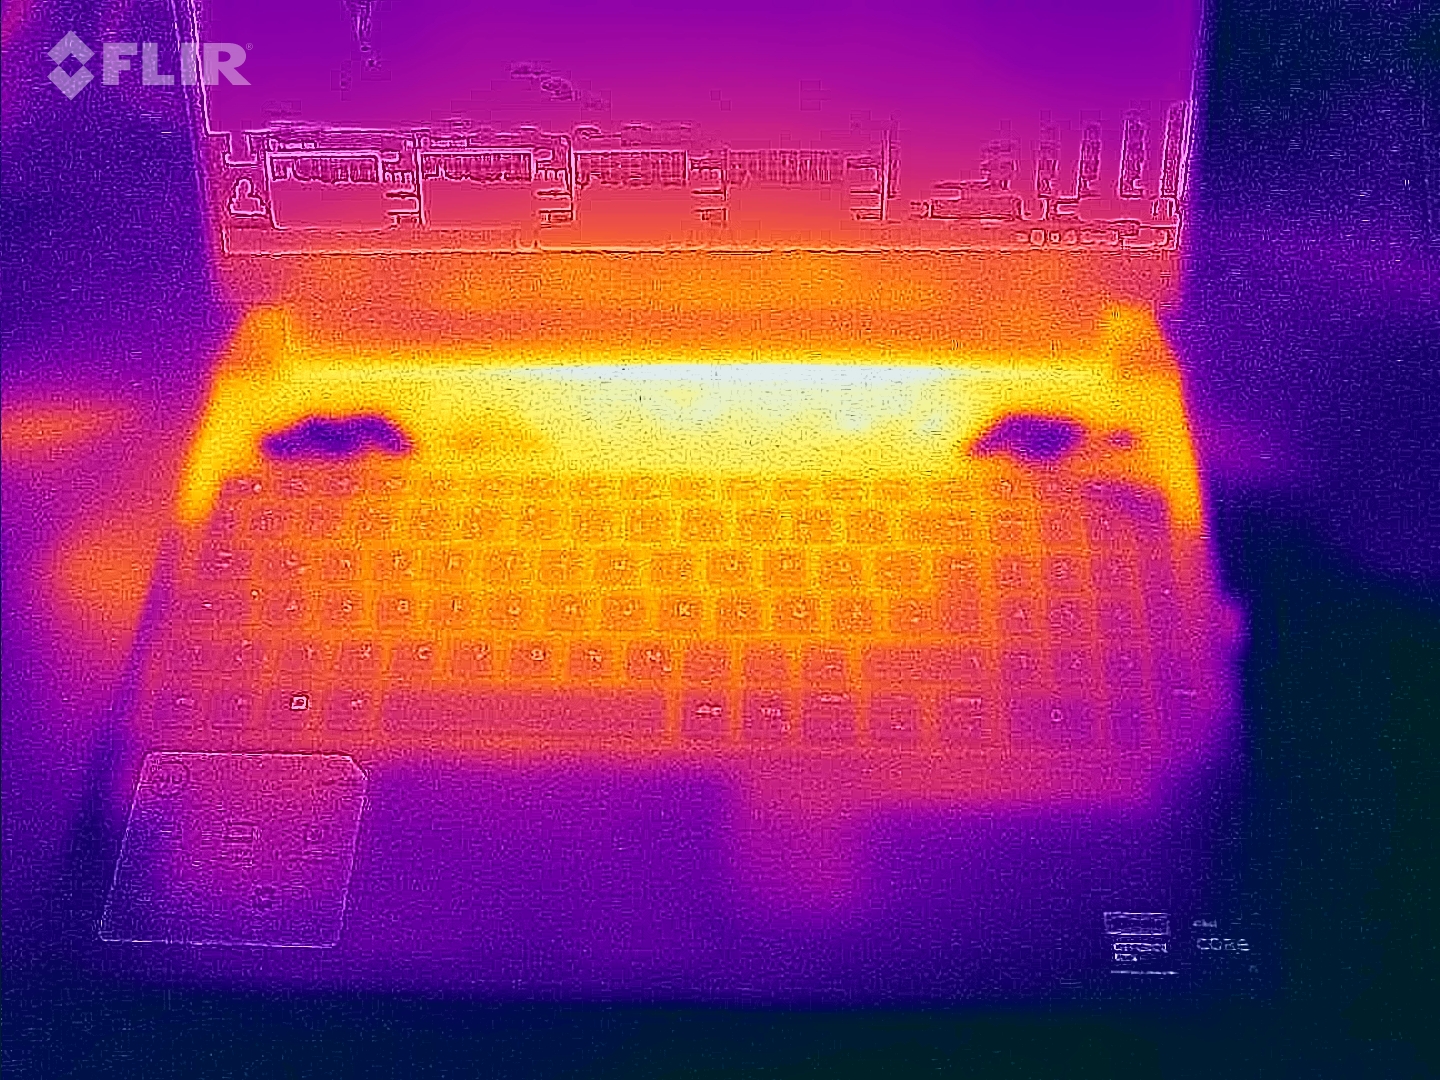
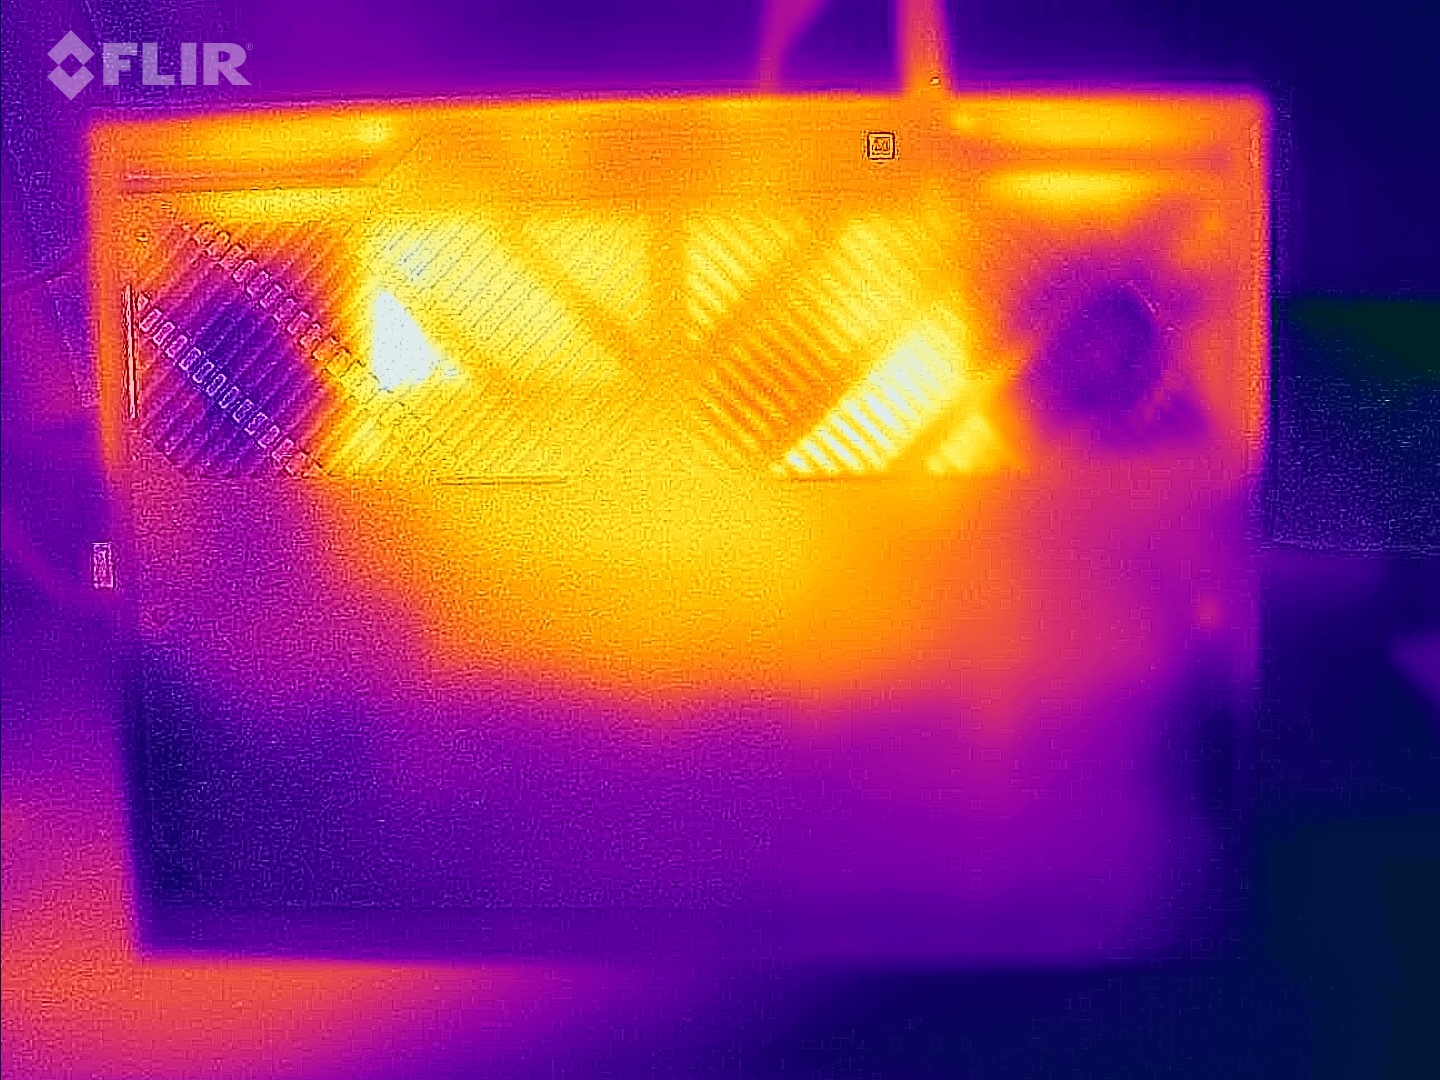
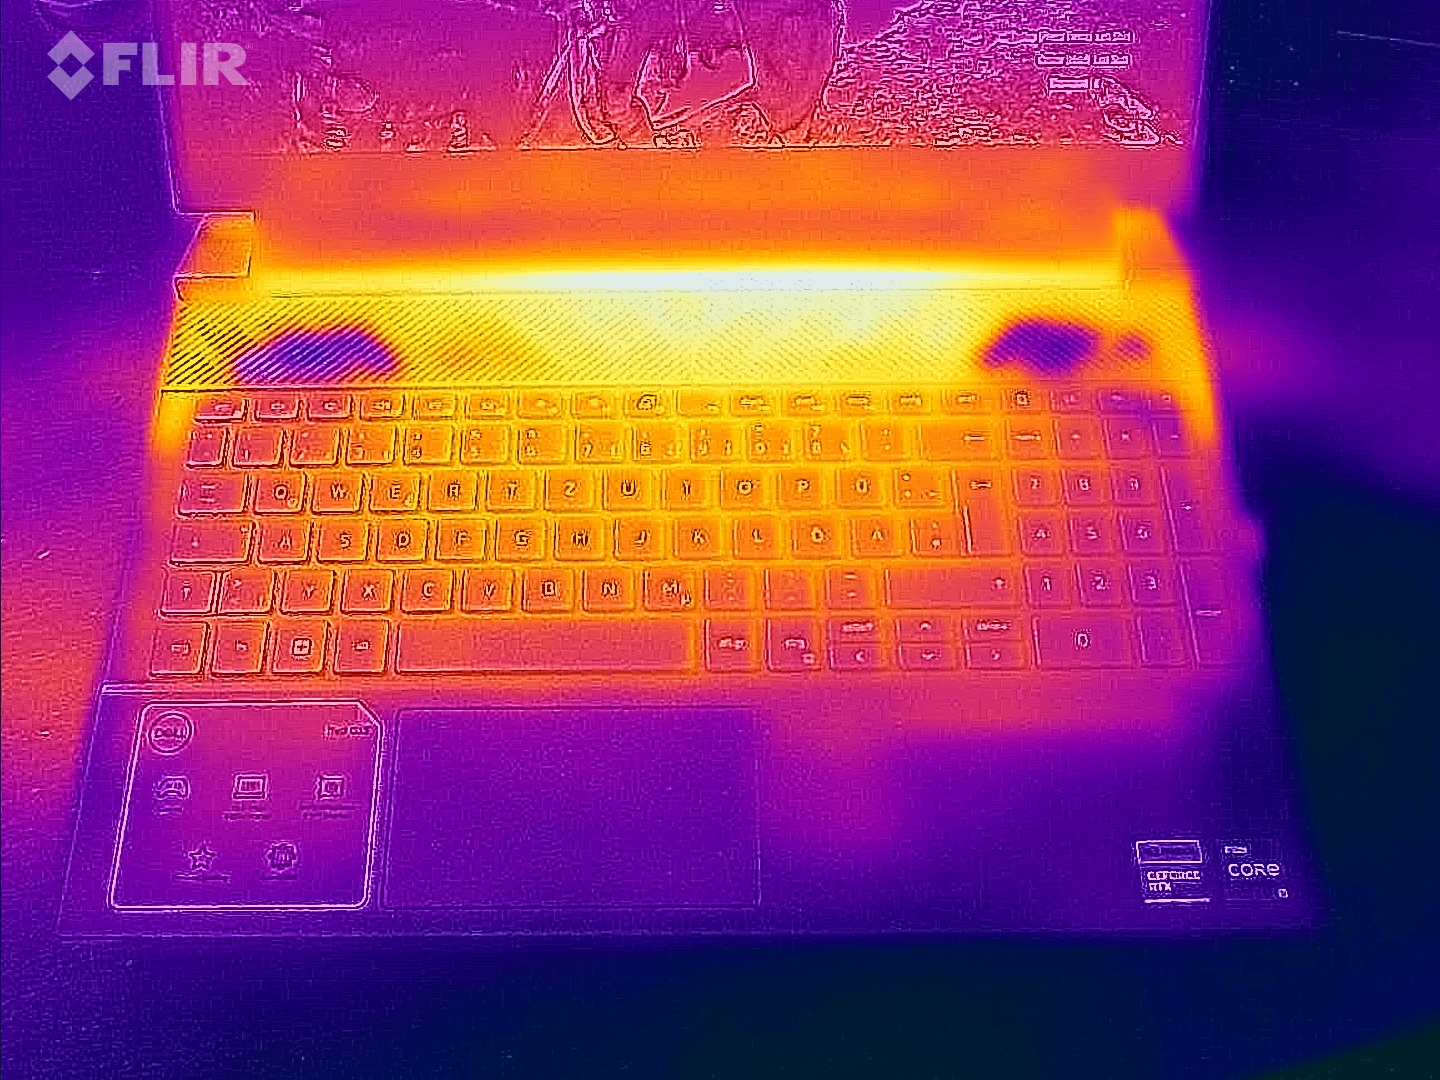
Średnio temperatury obudowy są nieco niższe niż w droższym modelu G15. Po 60 minutach grania w The Witcher 3, maksymalne temperatury zmierzone na klawiaturze i dolnym panelu wyniosły odpowiednio 54°C (129,4°F) i 52°C (125,6°F), co teoretycznie jest dość wysoką wartością. Jednakże, ponieważ podpórka pod nadgarstki nigdy nie nagrzała się bardziej niż do 32°C (89,6°F), dłuższe sesje grania nie powinny stanowić większego problemu, pod warunkiem, że nie kładziemy urządzenia na kolanach.
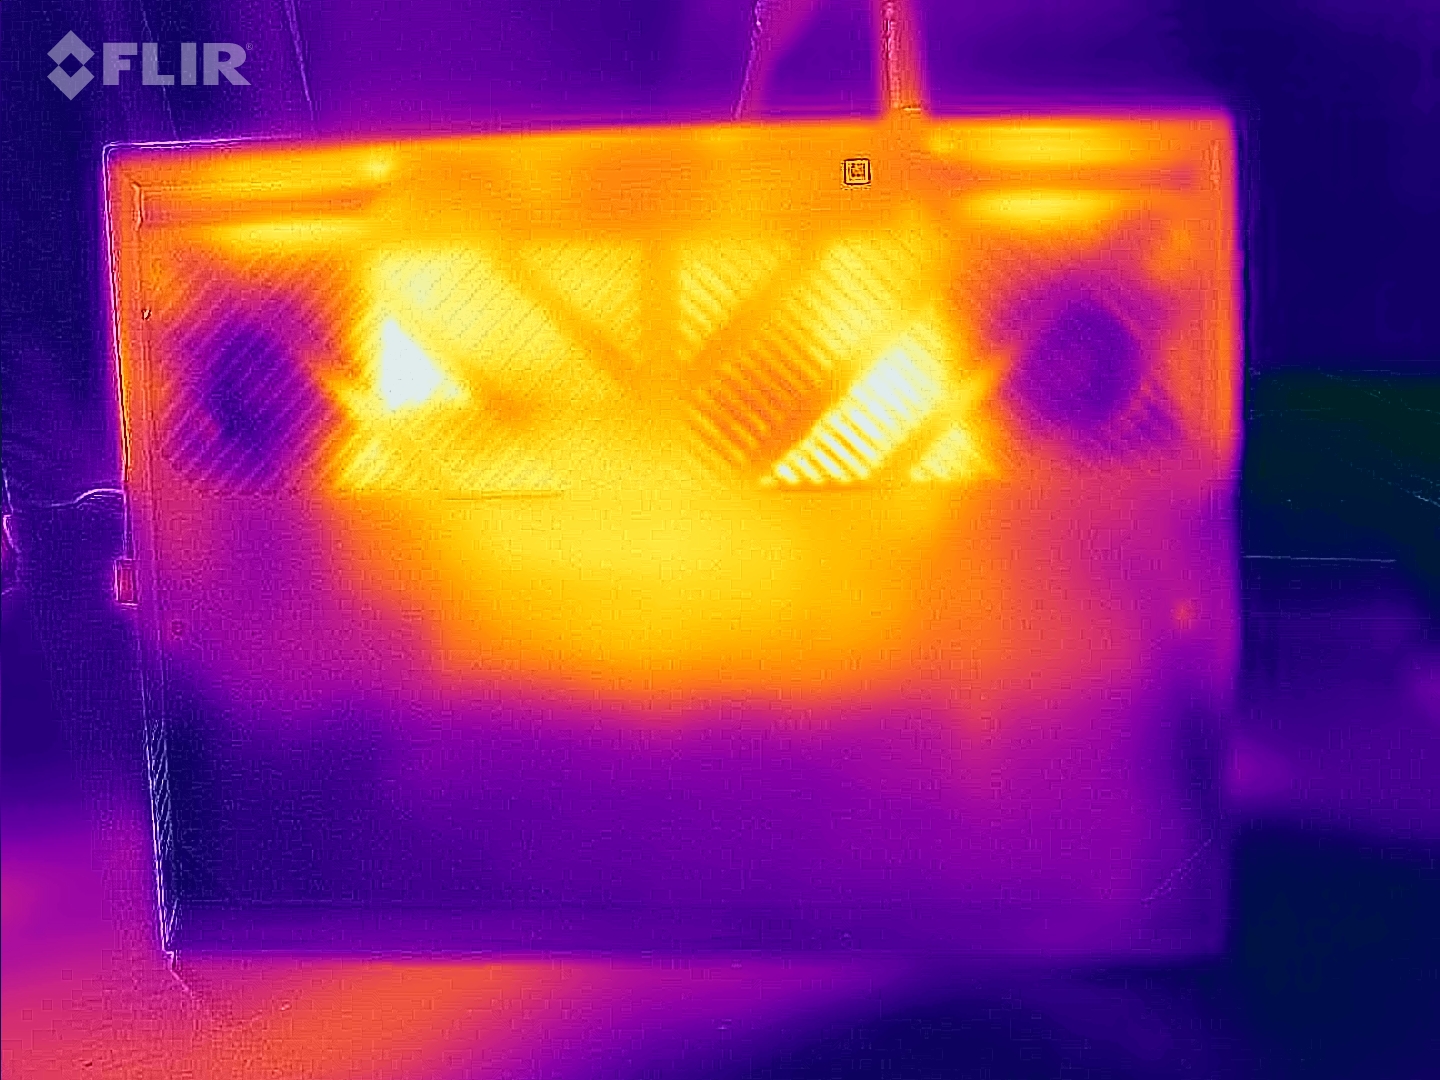
(-) Maksymalna temperatura w górnej części wynosi 58 °C / 136 F, w porównaniu do średniej 40.4 °C / 105 F , począwszy od 21.2 do 68.8 °C dla klasy Gaming.
(-) Dno nagrzewa się maksymalnie do 57 °C / 135 F, w porównaniu do średniej 43.2 °C / 110 F
(+) W stanie bezczynności średnia temperatura górnej części wynosi 26 °C / 79 F, w porównaniu ze średnią temperaturą urządzenia wynoszącą 33.9 °C / ### class_avg_f### F.
(-) Podczas gry w Wiedźmina 3 średnia temperatura górnej części wynosi 41.7 °C / 107 F, w porównaniu do średniej temperatury urządzenia wynoszącej 33.9 °C / ## #class_avg_f### F.
(+) Podparcia dłoni i touchpad osiągają maksymalną temperaturę skóry (32 °C / 89.6 F) i dlatego nie są gorące.
(-) Średnia temperatura obszaru podparcia dłoni w podobnych urządzeniach wynosiła 28.8 °C / 83.8 F (-3.2 °C / -5.8 F).
| Dell G15 5530, i5-13450HX RTX 4050 GeForce RTX 4050 Laptop GPU, i5-13450HX | Medion Erazer Crawler E40 - MD 62518 GeForce RTX 4050 Laptop GPU, i5-13500H | Lenovo LOQ 15IRH8 Core i7 GeForce RTX 4050 Laptop GPU, i7-13620H | Asus TUF A15 FA507 GeForce RTX 4050 Laptop GPU, R7 7735HS | Dell G15 5530 GeForce RTX 4060 Laptop GPU, i7-13650HX | |
|---|---|---|---|---|---|
| Heat | 24% | -6% | 13% | -7% | |
| Maximum Upper Side * (°C) | 58 | 36 38% | 46.4 20% | 48.9 16% | 54 7% |
| Maximum Bottom * (°C) | 57 | 36 37% | 59.2 -4% | 44.6 22% | 62.2 -9% |
| Idle Upper Side * (°C) | 30 | 26 13% | 34.4 -15% | 27.1 10% | 33.4 -11% |
| Idle Bottom * (°C) | 29 | 27 7% | 36.2 -25% | 27.5 5% | 33.4 -15% |
* ... im mniej tym lepiej
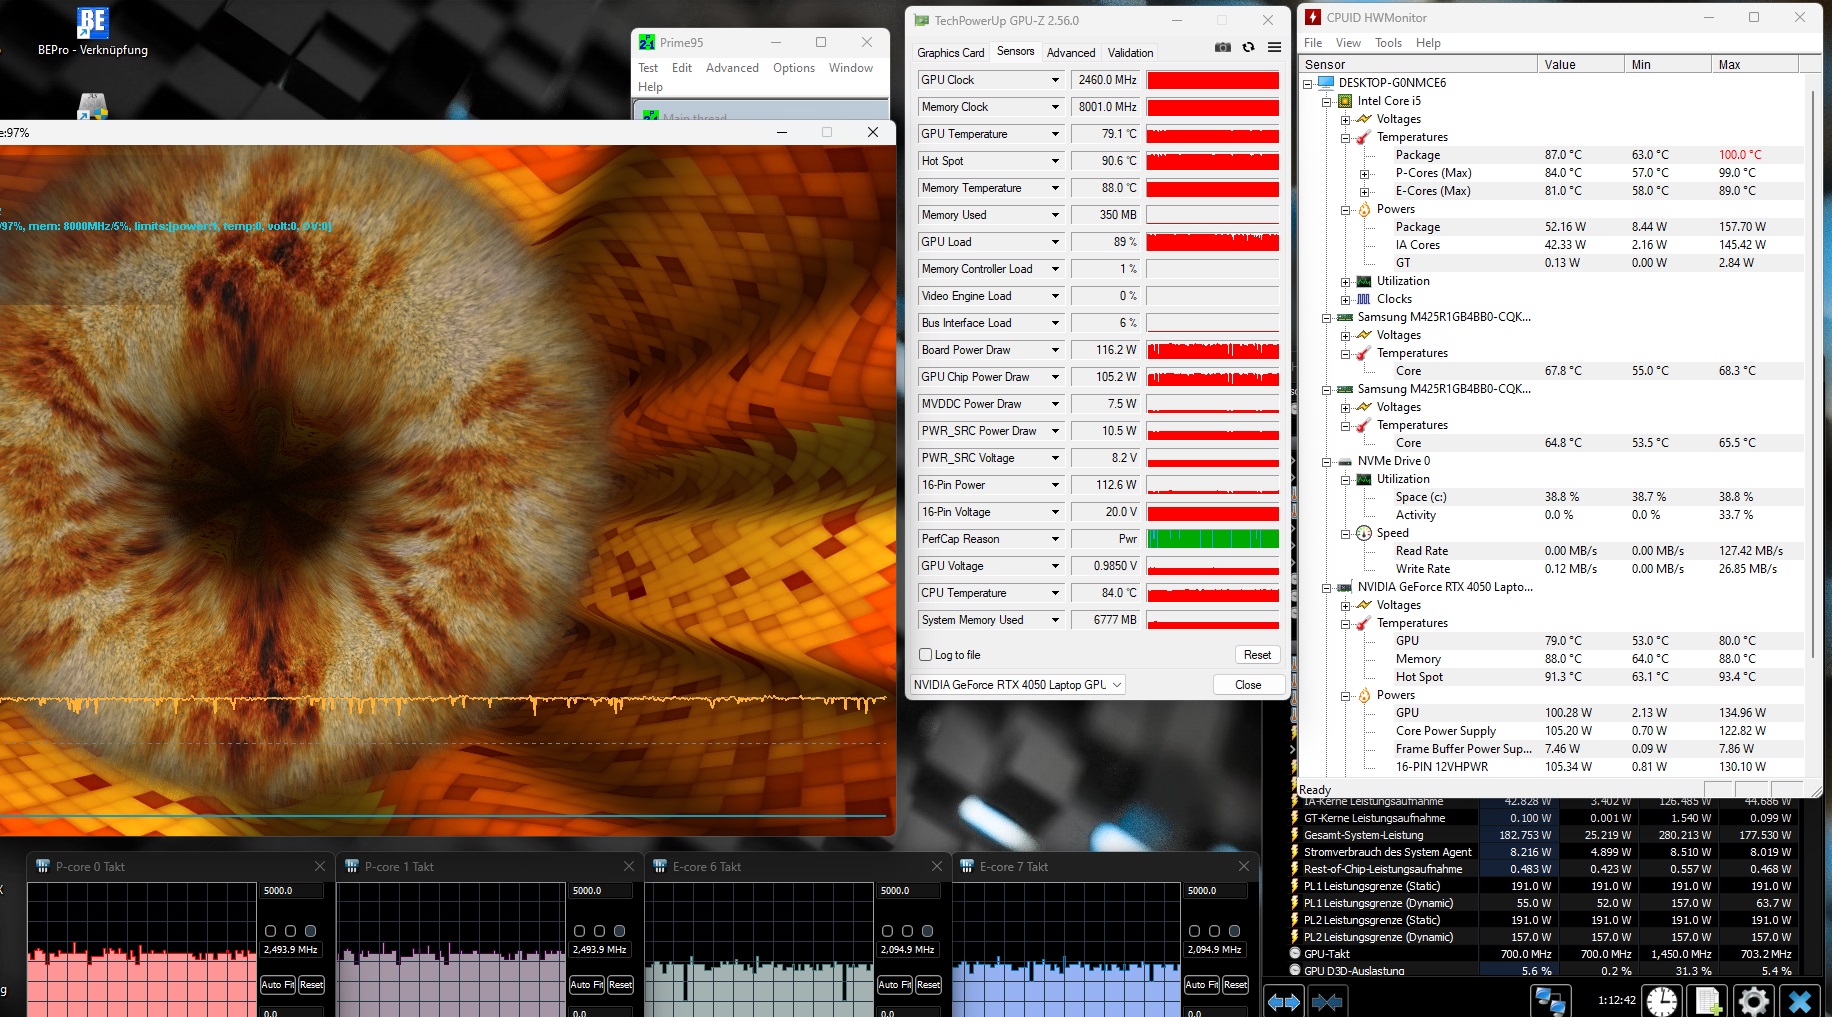
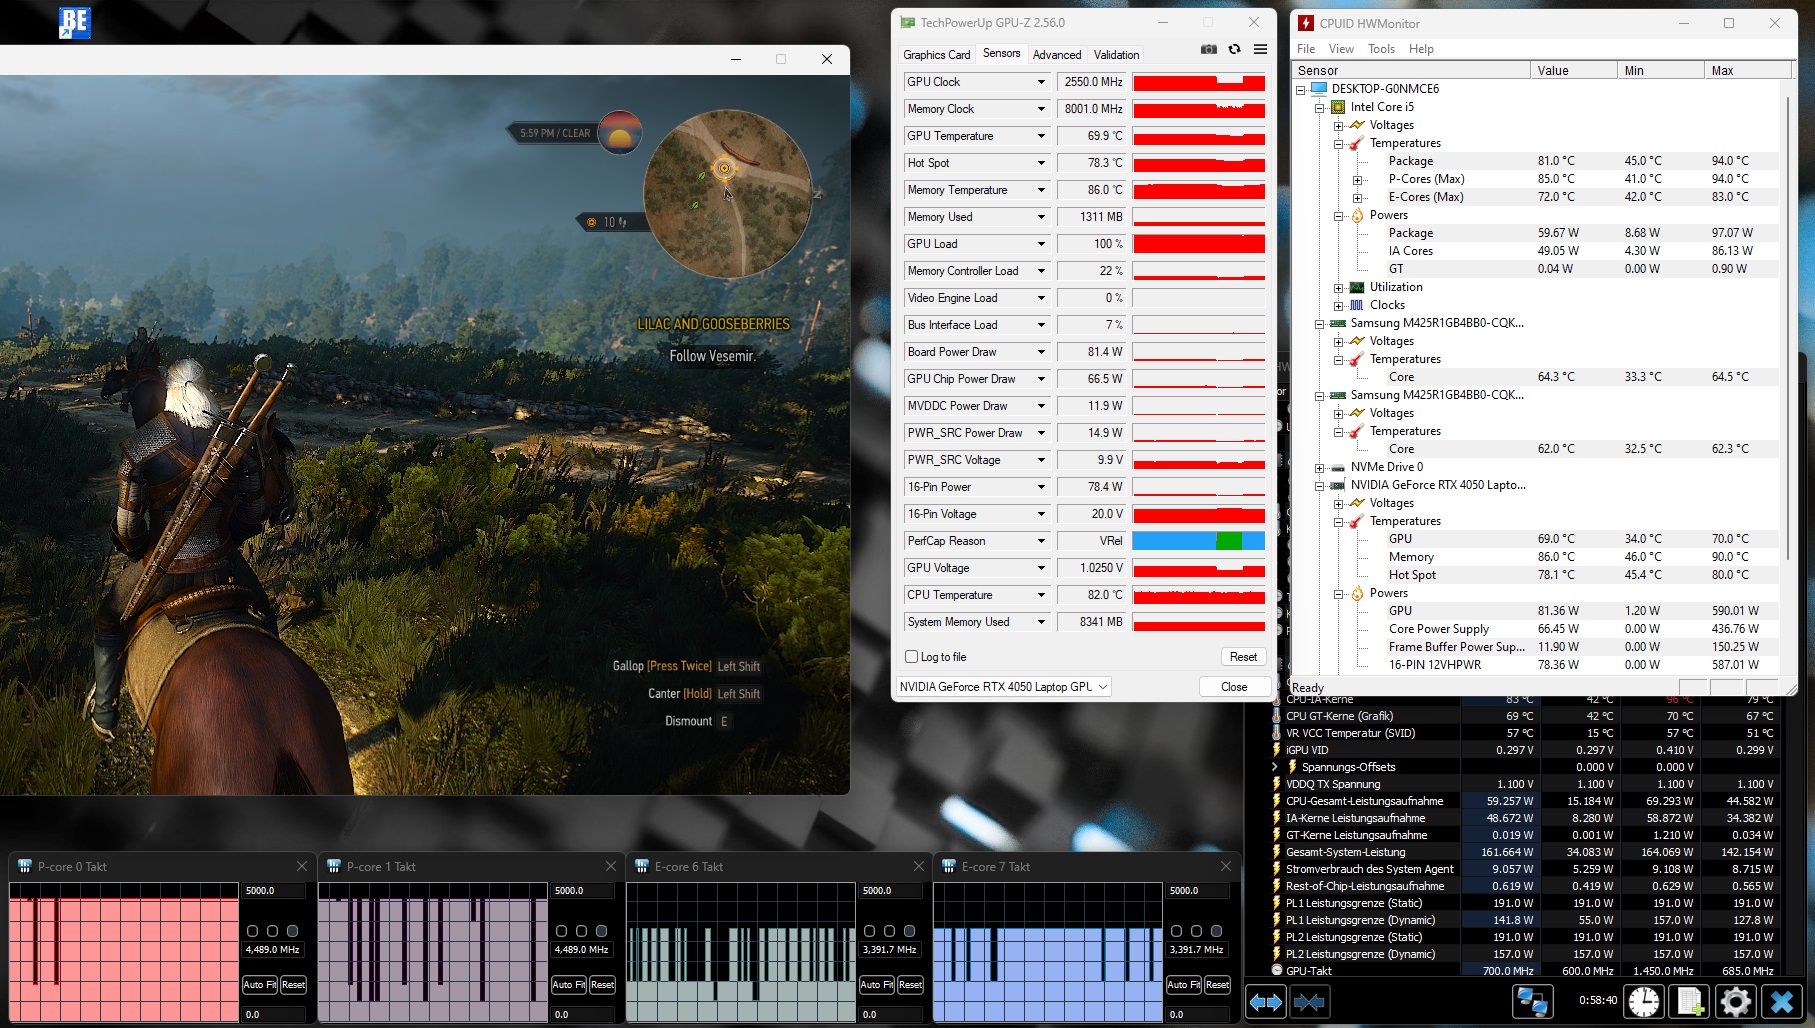
Test warunków skrajnych
Procesor, w szczególności, zmagał się podczas testu obciążeniowego przeprowadzonego przy użyciu FurMark i Prime95. Po krótkim osiągnięciu 100°C (212°F), Core i5-13450HX zmniejszył prędkość zegara, powodując wyrównanie temperatur na poziomie 80-90°C (176-194°F). Karta GeForce RTX 4050 po godzinie osiągnęła "tylko" 79°C (174,2°F), ale jej temperatura w gorącym punkcie wynosiła ok. 91°C (195,8°F).
Głośniki
Jakość dźwięku w laptopie jest przeciętna. Głośniki mają dobrą głośność maksymalną, ale ograniczają je słabe basy.
Dell G15 5530, i5-13450HX RTX 4050 analiza dźwięku
(+) | głośniki mogą odtwarzać stosunkowo głośno (86 dB)
Bas 100 - 315 Hz
(-) | prawie brak basu - średnio 32% niższa od mediany
(±) | liniowość basu jest średnia (14% delta do poprzedniej częstotliwości)
Średnie 400 - 2000 Hz
(+) | zbalansowane środki średnie - tylko 3.5% od mediany
(+) | średnie są liniowe (4.3% delta do poprzedniej częstotliwości)
Wysokie 2–16 kHz
(+) | zrównoważone maksima - tylko 2.4% od mediany
(+) | wzloty są liniowe (4.2% delta do poprzedniej częstotliwości)
Ogólnie 100 - 16.000 Hz
(±) | liniowość ogólnego dźwięku jest średnia (18% różnicy w stosunku do mediany)
W porównaniu do tej samej klasy
» 56% wszystkich testowanych urządzeń w tej klasie było lepszych, 9% podobnych, 36% gorszych
» Najlepszy miał deltę 6%, średnia wynosiła ###średnia###%, najgorsza wynosiła 132%
W porównaniu do wszystkich testowanych urządzeń
» 38% wszystkich testowanych urządzeń było lepszych, 8% podobnych, 54% gorszych
» Najlepszy miał deltę 4%, średnia wynosiła ###średnia###%, najgorsza wynosiła 134%
Medion Erazer Crawler E40 - MD 62518 analiza dźwięku
(±) | głośność głośnika jest średnia, ale dobra (81.47 dB)
Bas 100 - 315 Hz
(-) | prawie brak basu - średnio 32.7% niższa od mediany
(±) | liniowość basu jest średnia (11% delta do poprzedniej częstotliwości)
Średnie 400 - 2000 Hz
(+) | zbalansowane środki średnie - tylko 4.6% od mediany
(±) | liniowość środka jest średnia (7.1% delta do poprzedniej częstotliwości)
Wysokie 2–16 kHz
(+) | zrównoważone maksima - tylko 3.1% od mediany
(+) | wzloty są liniowe (5.7% delta do poprzedniej częstotliwości)
Ogólnie 100 - 16.000 Hz
(±) | liniowość ogólnego dźwięku jest średnia (21.8% różnicy w stosunku do mediany)
W porównaniu do tej samej klasy
» 78% wszystkich testowanych urządzeń w tej klasie było lepszych, 6% podobnych, 16% gorszych
» Najlepszy miał deltę 6%, średnia wynosiła ###średnia###%, najgorsza wynosiła 132%
W porównaniu do wszystkich testowanych urządzeń
» 62% wszystkich testowanych urządzeń było lepszych, 7% podobnych, 31% gorszych
» Najlepszy miał deltę 4%, średnia wynosiła ###średnia###%, najgorsza wynosiła 134%
Zarządzanie energią
Zużycie energii
Nasze wnioski są bardzo podzielone, jeśli chodzi o zużycie energii przez laptopa. Chociaż G15 zużywał średnio tylko 12 watów w trybie bezczynności, co jest bardzo małą ilością dla notebooka do gier, 100 do 262 watów, które wymagał pod obciążeniem, jest niezwykle wysokie w stosunku do oferowanej wydajności.
| wyłączony / stan wstrzymania | |
| luz | |
| obciążenie |
|
Legenda:
min: | |
| Dell G15 5530, i5-13450HX RTX 4050 i5-13450HX, GeForce RTX 4050 Laptop GPU | Medion Erazer Crawler E40 - MD 62518 i5-13500H, GeForce RTX 4050 Laptop GPU | Lenovo LOQ 15IRH8 Core i7 i7-13620H, GeForce RTX 4050 Laptop GPU | Asus TUF A15 FA507 R7 7735HS, GeForce RTX 4050 Laptop GPU | Dell G15 5530 i7-13650HX, GeForce RTX 4060 Laptop GPU | Średnia w klasie Gaming | |
|---|---|---|---|---|---|---|
| Power Consumption | -58% | -148% | -30% | -53% | -122% | |
| Idle Minimum * (Watt) | 2 | 10 -400% | 18.52 -826% | 8 -300% | 8.4 -320% | 13 ? -550% |
| Idle Average * (Watt) | 12 | 15.3 -28% | 22.54 -88% | 12.1 -1% | 14.98 -25% | 19 ? -58% |
| Idle Maximum * (Watt) | 27 | 15.5 43% | 29.79 -10% | 12.5 54% | 15.56 42% | 24.6 ? 9% |
| Load Average * (Watt) | 100 | 88 12% | 94.5 5% | 74.9 25% | 96.8 3% | 110.7 ? -11% |
| Witcher 3 ultra * (Watt) | 161.9 | 155 4% | 154.4 5% | 136.6 16% | 186 -15% | |
| Load Maximum * (Watt) | 262 | 202.47 23% | 190.4 27% | 185 29% | 271.42 -4% | 259 ? 1% |
* ... im mniej tym lepiej
Power consumption Witcher 3 / Stresstest
Power consumption with external monitor
Żywotność baterii
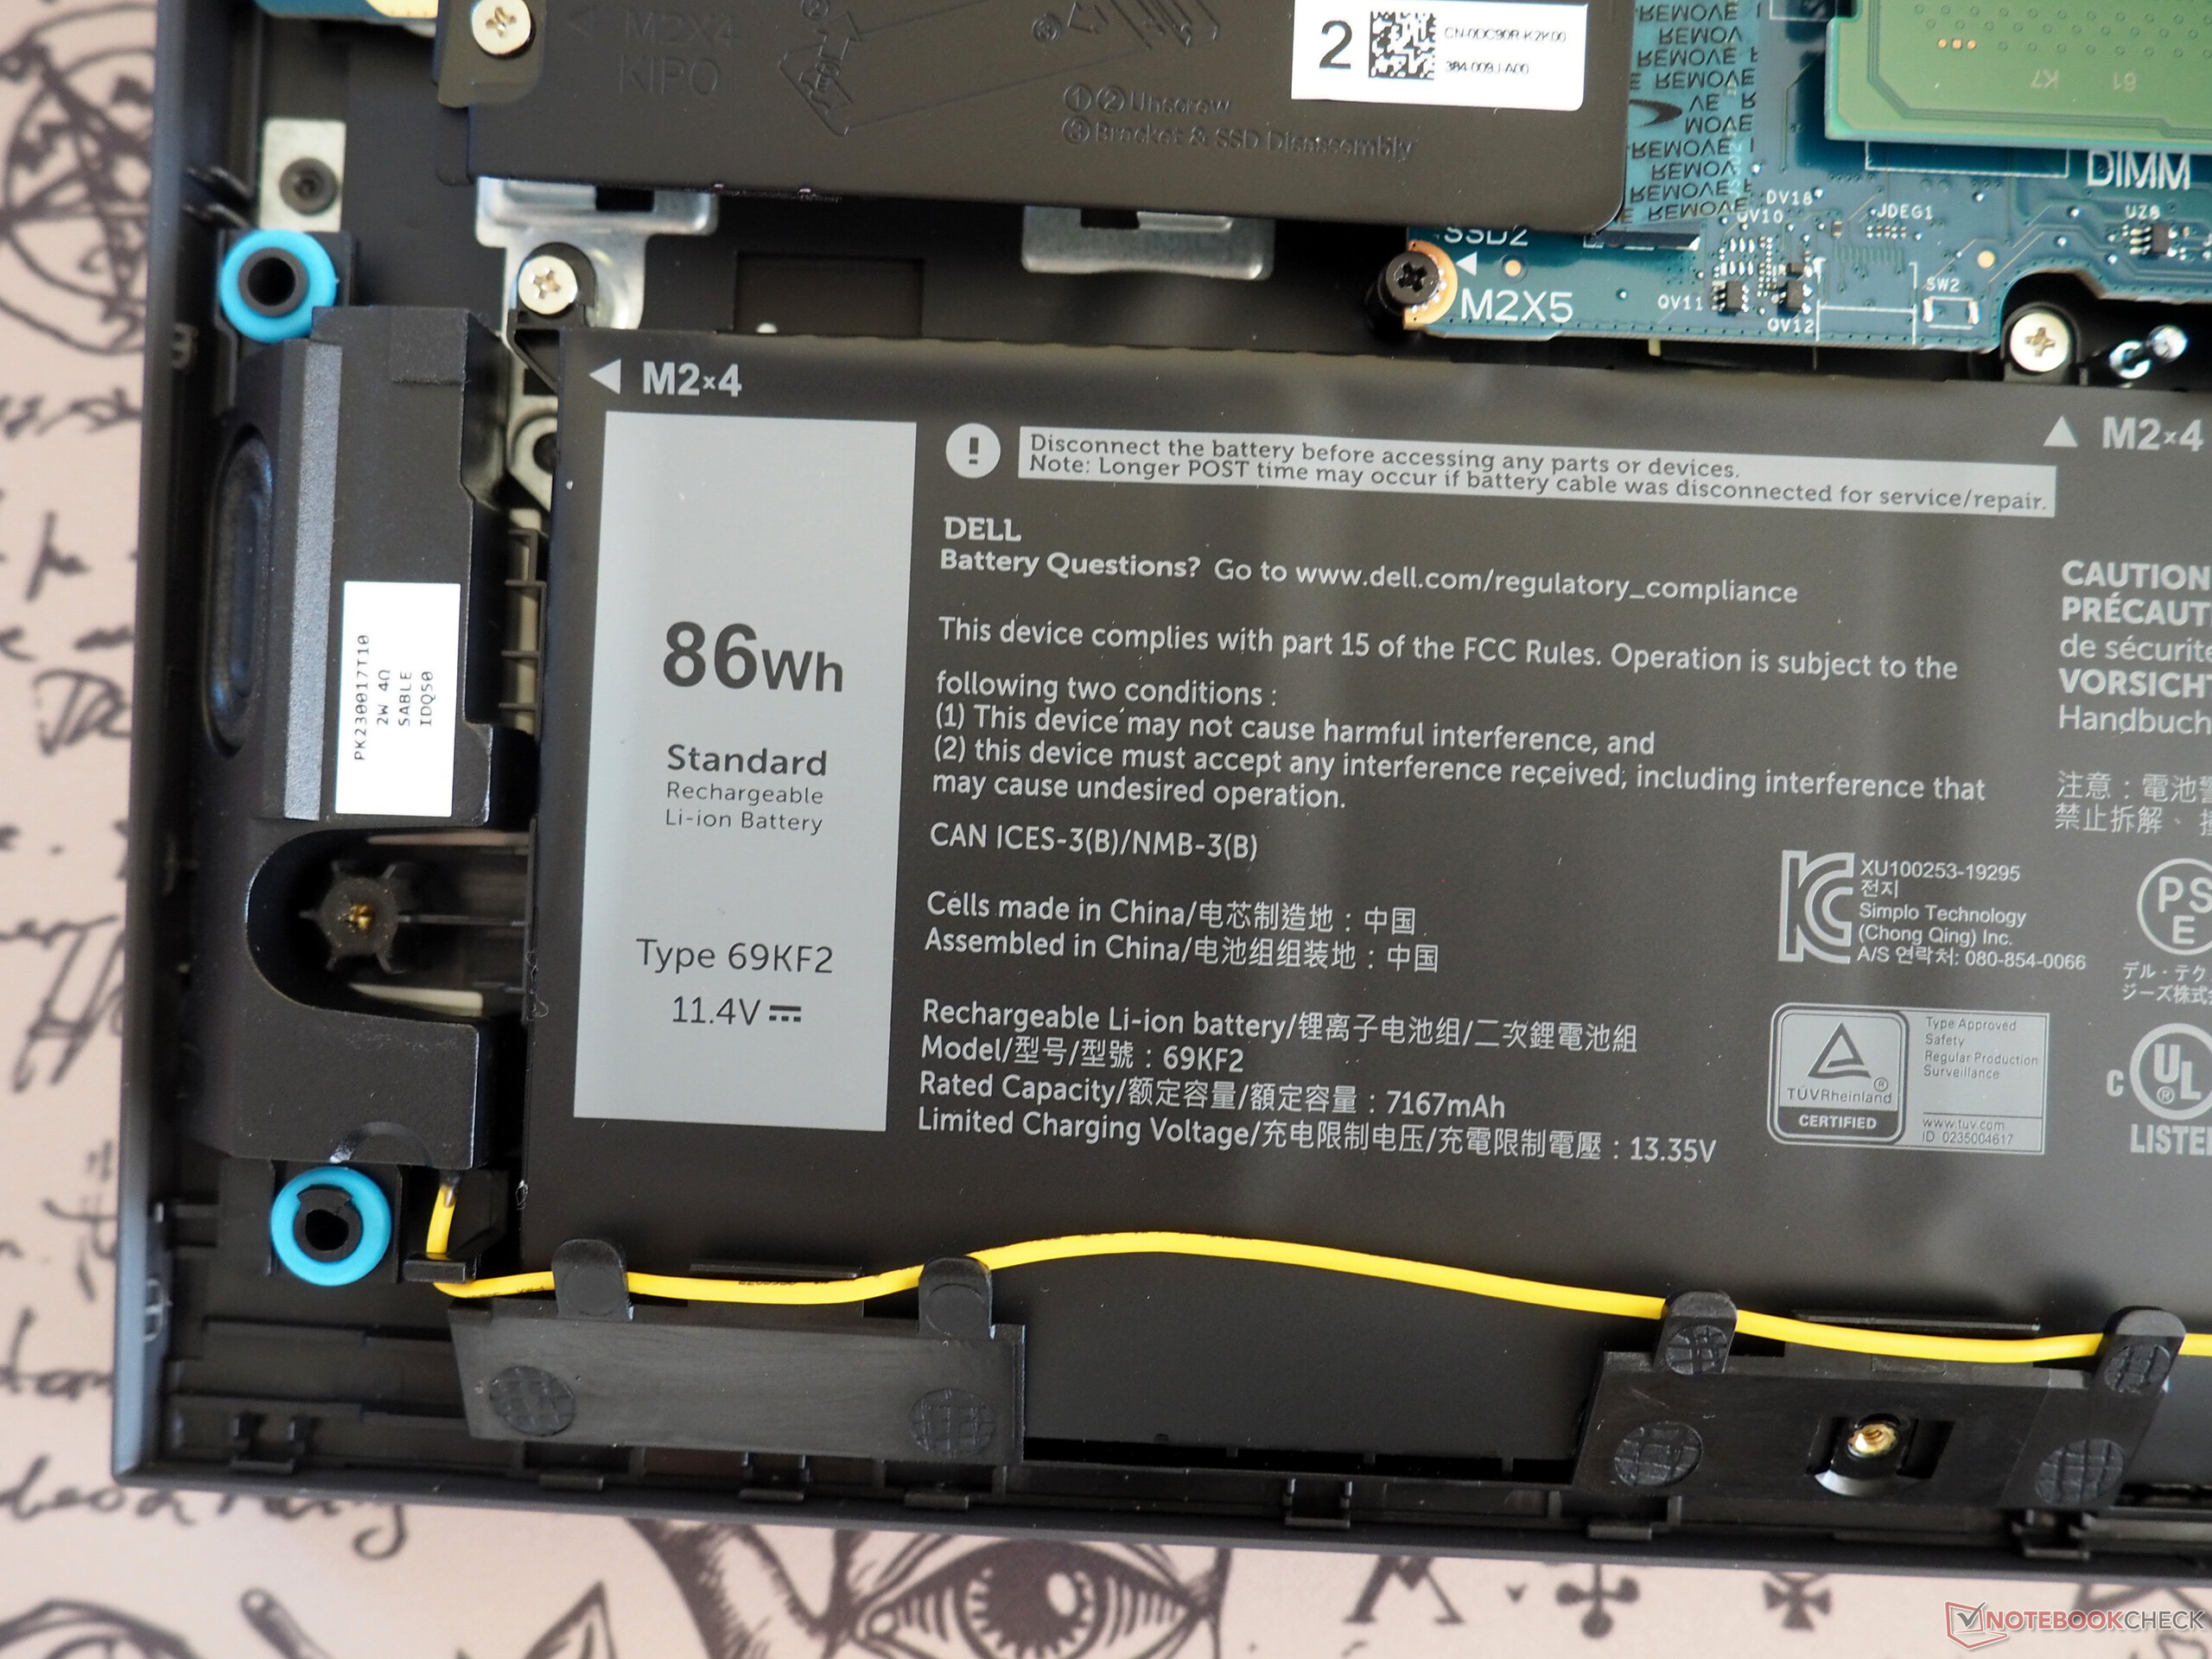
Żywotność baterii w G15 jest więcej niż przyzwoita, nie tylko dzięki przełączaniu grafiki. W naszym teście Wi-Fi (z jasnością ekranu zredukowaną do 150 cd/m²), udało nam się uzyskać około 7 godzin użytkowania z ogromnej baterii 86 Wh.
| Dell G15 5530, i5-13450HX RTX 4050 i5-13450HX, GeForce RTX 4050 Laptop GPU, 86 Wh | Medion Erazer Crawler E40 - MD 62518 i5-13500H, GeForce RTX 4050 Laptop GPU, 54 Wh | Lenovo LOQ 15IRH8 Core i7 i7-13620H, GeForce RTX 4050 Laptop GPU, 60 Wh | Asus TUF A15 FA507 R7 7735HS, GeForce RTX 4050 Laptop GPU, 90 Wh | Dell G15 5530 i7-13650HX, GeForce RTX 4060 Laptop GPU, 86 Wh | Średnia w klasie Gaming | |
|---|---|---|---|---|---|---|
| Czasy pracy | -42% | -17% | 65% | -8% | 0% | |
| WiFi v1.3 (h) | 7.1 | 4.1 -42% | 5.9 -17% | 11.7 65% | 6.5 -8% | 7.11 ? 0% |
| H.264 (h) | 3.9 | 6.1 | 12.5 | 6.8 | 8.32 ? | |
| Load (h) | 1.2 | 1 | 0.8 | 1.502 ? | ||
| Witcher 3 ultra (h) | 0.8 |
Za
Przeciw
Werdykt
Dell G15 5530 z procesorem Core i5-13450HX i GeForce RTX 4050 dziedziczy większość mocnych i słabych stron swojego droższego rodzeństwa z procesorem i7-13650HX i RTX 4060. Po stronie plusów urządzenie ma między innymi stosunkowo dobry wyświetlacz, solidny czas pracy na baterii i rozsądny stosunek jakości do ceny.
Po stronie minusów mamy jednak dość ciężką i masywną obudowę, niepotrzebnie nieporęczną ładowarkę i słaby wybór portów (brak USB4 i czytnika kart). Dell powinien również popracować nad rozwiązaniem problemu dławienia się dysku SSD podczas długotrwałego obciążenia, a także zużycia energii pod obciążeniem.
W każdym razie, G15 5530 jest ogólnie świetną opcją dla świadomych budżetu graczy szukających odpowiedniej maszyny do gier w przedziale cenowym 1000 euro (1090 USD).
Konkurenci wymienieni w recenzji (Medion Crawler E40, Asus TUF A15 i Lenovo LOQ 15) w dużej mierze zapewniają podobną wydajność, ale czasami mają inne zalety i wady.
Cena i dostępność
Dell G15 5530 z procesorem Core i5-13450HX i GeForce RTX 4050 jest obecnie dostępny w niemieckim sklepie Amazon za 950 euro. W Stanach Zjednoczonych można nabyć wersję o podobnej specyfikacji bezpośrednio od firmy Dell za 900 USD lub model z procesorem Core i7-13650HX i kartą RTX 4060 od Amazon US za 1200 USD.
Dell G15 5530, i5-13450HX RTX 4050
- 23/01/2024 v7 (old)
Florian Glaser
Przezroczystość
Wyboru urządzeń do recenzji dokonuje nasza redakcja. Próbka testowa została udostępniona autorowi jako pożyczka od producenta lub sprzedawcy detalicznego na potrzeby tej recenzji. Pożyczkodawca nie miał wpływu na tę recenzję, producent nie otrzymał też kopii tej recenzji przed publikacją. Nie było obowiązku publikowania tej recenzji. Jako niezależna firma medialna, Notebookcheck nie podlega władzy producentów, sprzedawców detalicznych ani wydawców.
Tak testuje Notebookcheck
Każdego roku Notebookcheck niezależnie sprawdza setki laptopów i smartfonów, stosując standardowe procedury, aby zapewnić porównywalność wszystkich wyników. Od około 20 lat stale rozwijamy nasze metody badawcze, ustanawiając przy tym standardy branżowe. W naszych laboratoriach testowych doświadczeni technicy i redaktorzy korzystają z wysokiej jakości sprzętu pomiarowego. Testy te obejmują wieloetapowy proces walidacji. Nasz kompleksowy system ocen opiera się na setkach uzasadnionych pomiarów i benchmarków, co pozwala zachować obiektywizm.Price comparison

