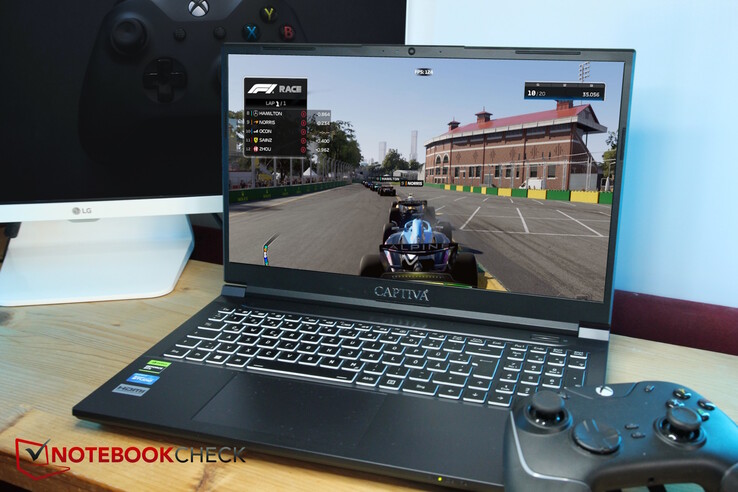
Recenzja Captiva Advanced Gaming I74-121 (Clevo V150RND): Niedrogi laptop do gier z potężnym RTX 4060
W kilku wybranych sklepach internetowych można już zobaczyć (gamingowe) laptopy firmy Captiva, ale kim jest ten producent? Captiva jest spółką zależną Ecom Trading GmbH, niemieckiej hurtowni IT z siedzibą w Dachau. Brzmi to tak, jakby większość ich laptopów była produkowana w Chinach. Ponieważ nigdy wcześniej nie testowaliśmy laptopów Captiva, najwyższy czas to zrobić!
Można znaleźć 17- i 15-calowe wersje laptopa Captiva, które różnią się głównie konfiguracją sprzętową. Tylko te 17-calowe są opcjonalnie wyposażone w procesori9-13900HX- 15-calowe urządzenia są wyposażone tylko wi5-13500Hzainstalowany. Ponadto nasza próbka testowa jest wyposażona w kartę graficznąRTX 4060. Alternatywnie, laptop można nabyć z kartą graficznąRTX 4070a 17-calowa wersja może być również wyposażona wRTX 4080.
Nasza konfiguracja kosztuje około 1800 USD. Konkurenci obejmują inne laptopy do gier, takie jakMSI Cyborg 15, Dell G15 5530, Lenovo Legion Slim 5 16APH8, Lenovo LOQ 15i Schenker XMG Core 15 M22.
Possible competitors compared
Ocena | Data | Model | Waga | Wysokość | Rozmiar | Rezolucja | Cena |
|---|---|---|---|---|---|---|---|
| 85.7 % v7 (old) | 09/2023 | Captiva Advanced Gaming I74-121 i5-13500H, GeForce RTX 4060 Laptop GPU | 2.3 kg | 29 mm | 15.60" | 1920x1080 | |
| 82.4 % v7 (old) | 04/2023 | MSI Cyborg 15 A12VF i7-12650H, GeForce RTX 4060 Laptop GPU | 2 kg | 22.9 mm | 15.60" | 1920x1080 | |
| 84.2 % v7 (old) | 06/2023 | Dell G15 5530 i7-13650HX, GeForce RTX 4060 Laptop GPU | 3 kg | 26.95 mm | 15.60" | 1920x1080 | |
| 87.7 % v7 (old) | 08/2023 | Lenovo Legion Slim 5 16APH8 R7 7840HS, GeForce RTX 4060 Laptop GPU | 2.4 kg | 25.2 mm | 16.00" | 2560x1600 | |
| 85.7 % v7 (old) | 07/2023 | Lenovo LOQ 15APH8 R7 7840HS, GeForce RTX 4050 Laptop GPU | 2.5 kg | 25.2 mm | 15.60" | 1920x1080 | |
| 87.9 % v7 (old) | 01/2023 | Schenker XMG Core 15 (M22) R7 6800H, GeForce RTX 3060 Laptop GPU | 2.1 kg | 23 mm | 15.60" | 2560x1440 |
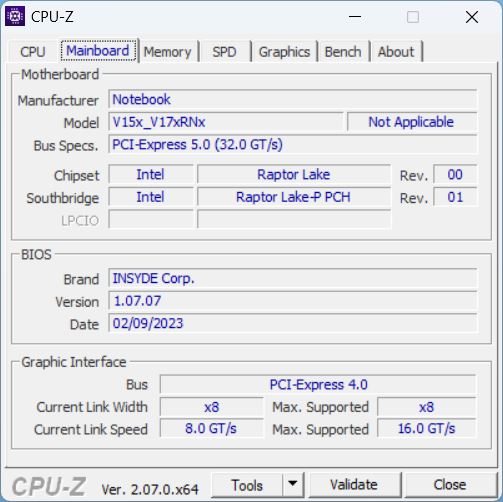
Case - Captiva barebone to tajemnica (Clevo)
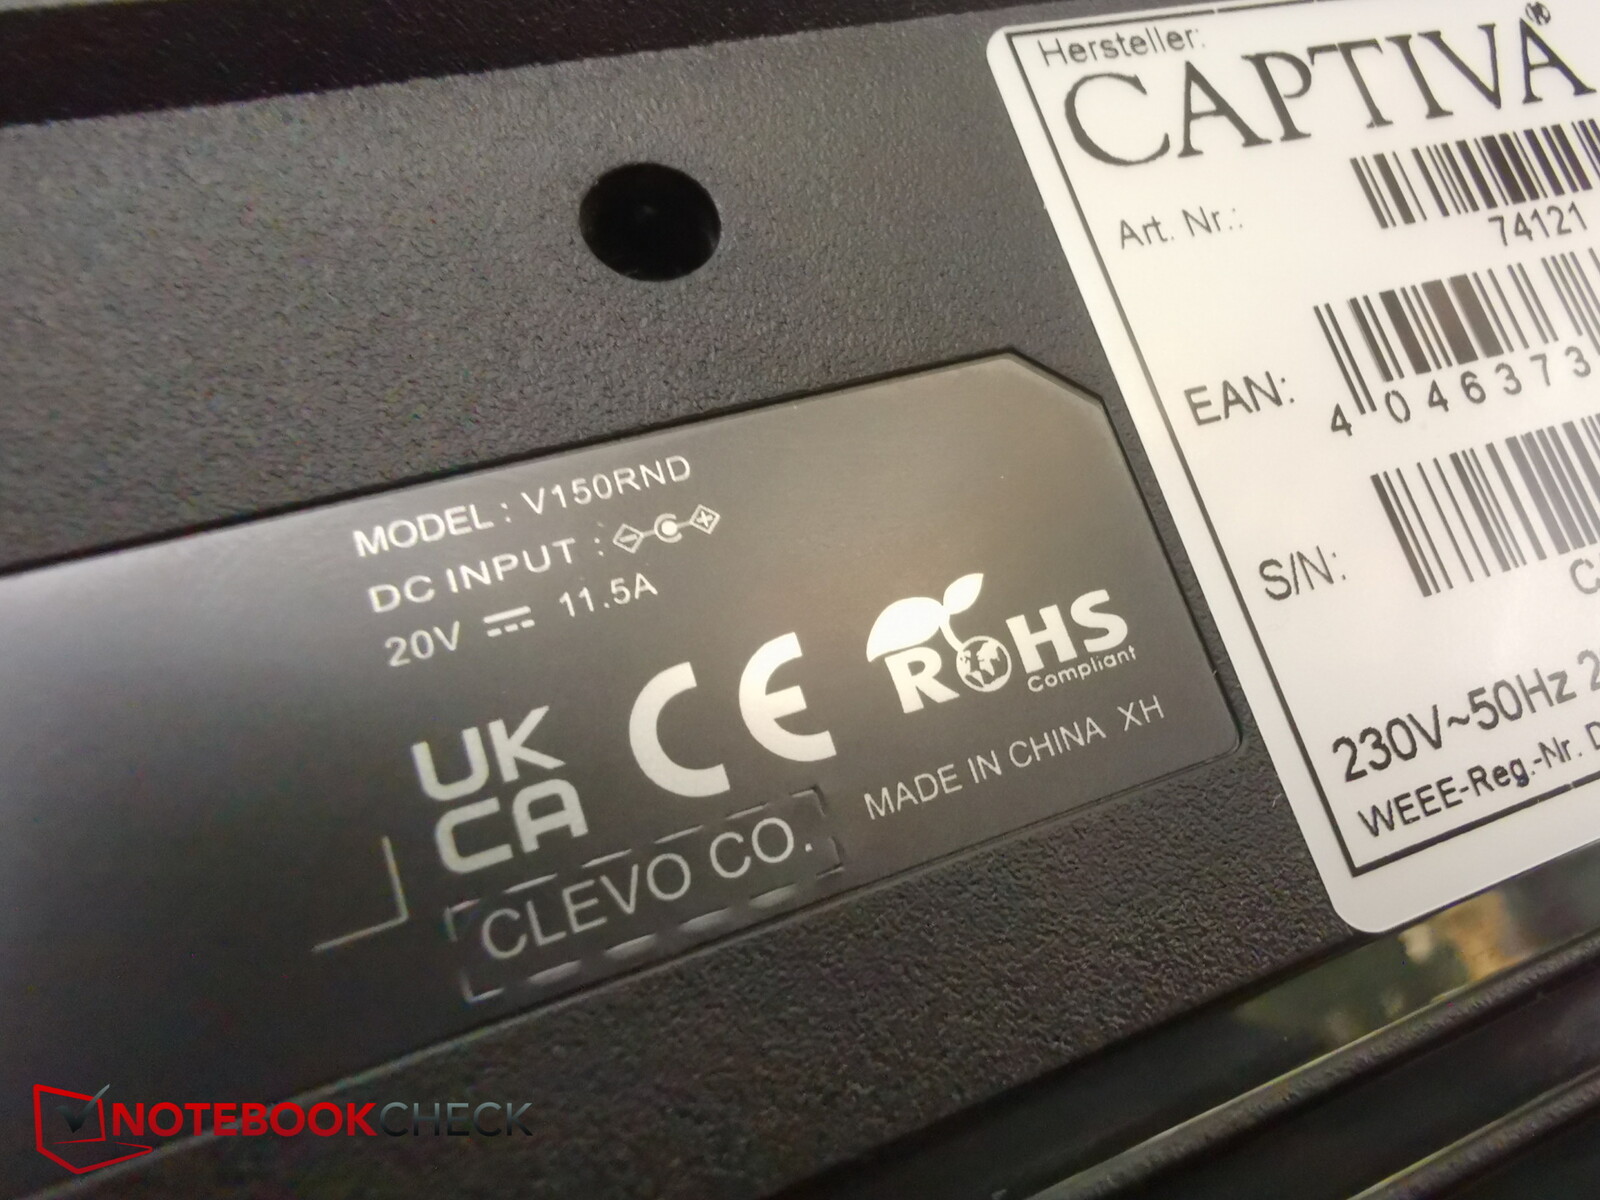
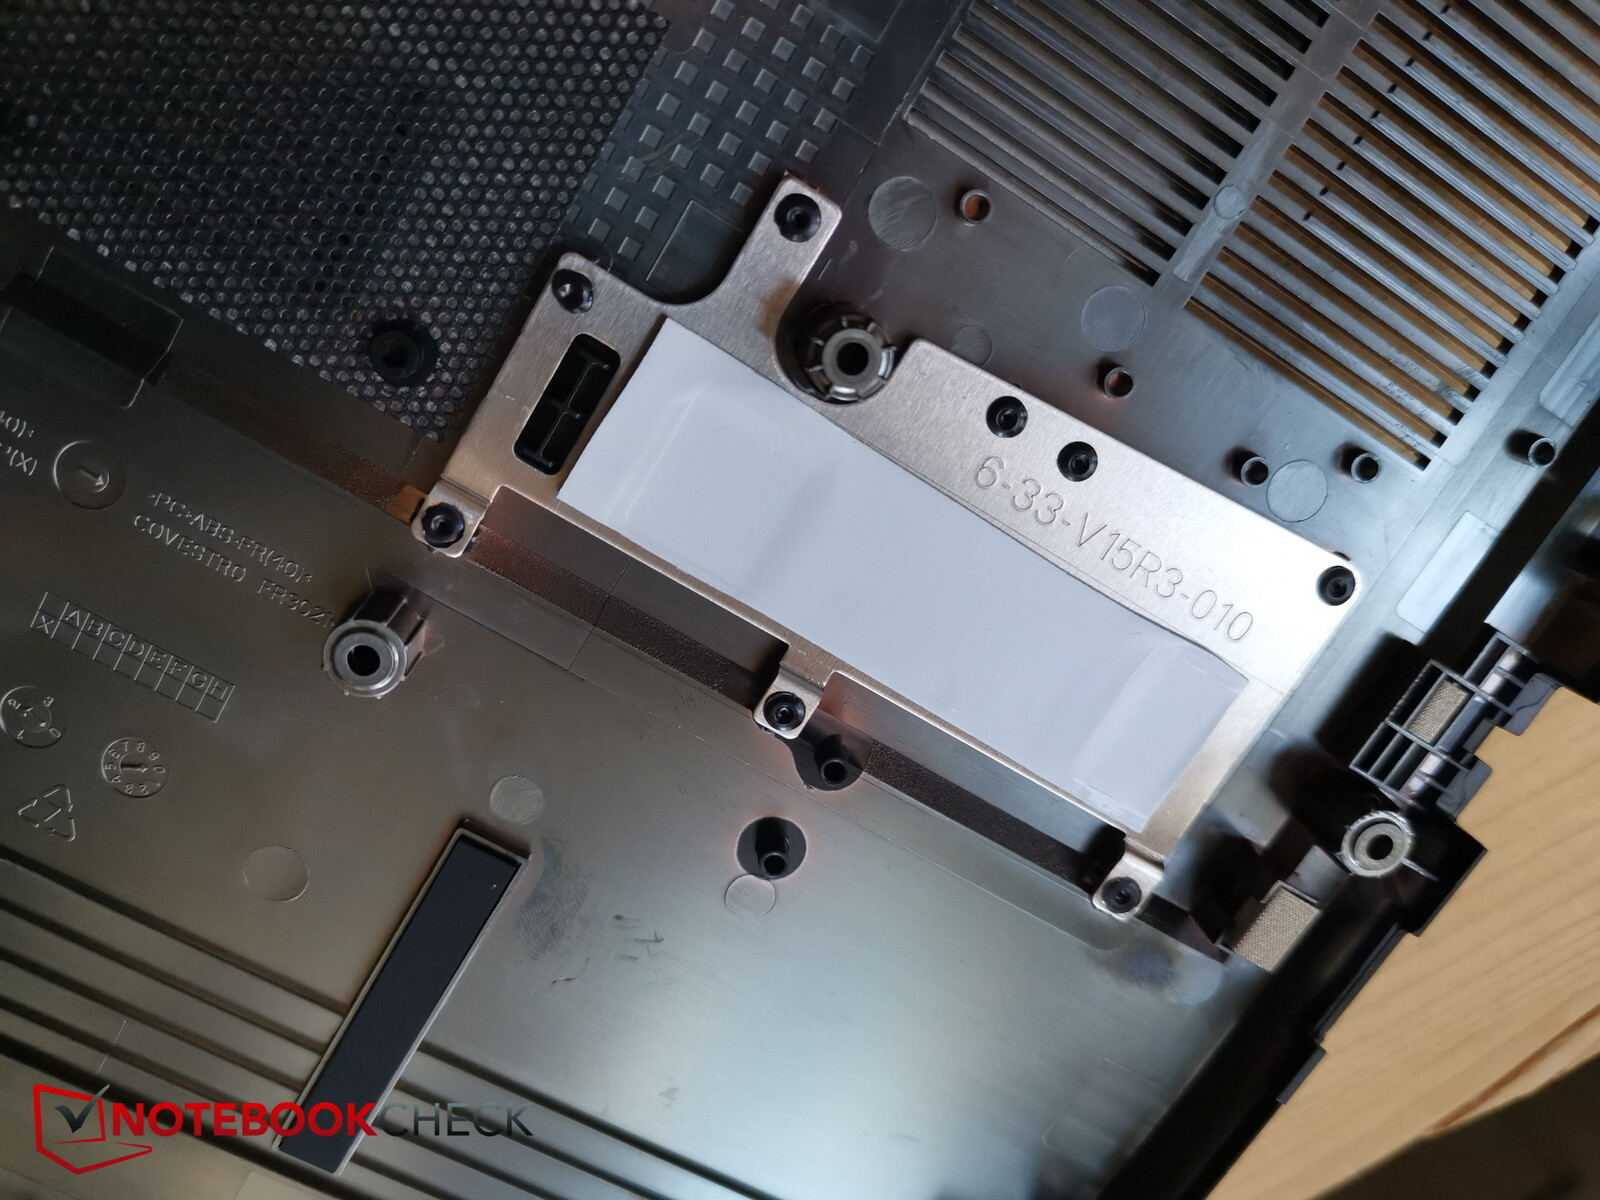
Zapytana o to Captiva odmówiła nam podania, który barebone jest używany - najwyraźniej są one produkowane "specjalnie dla Captivy". Jednak naklejka na spodzie ujawnia nam, że zaangażowany jest producent Clevo. Nie jest dla nas jasne, dlaczego Captiva ukrywa te informacje. Zidentyfikowaliśmy barebone Clevo jako Clevo V150RND.
Wewnętrzna obudowa laptopa po złożeniu przypomina Gigabyte G5. Jego klawiatura jest lekko zagłębiona, a układ jest również podobny - choć nie wydaje się być dokładnie taki sam.
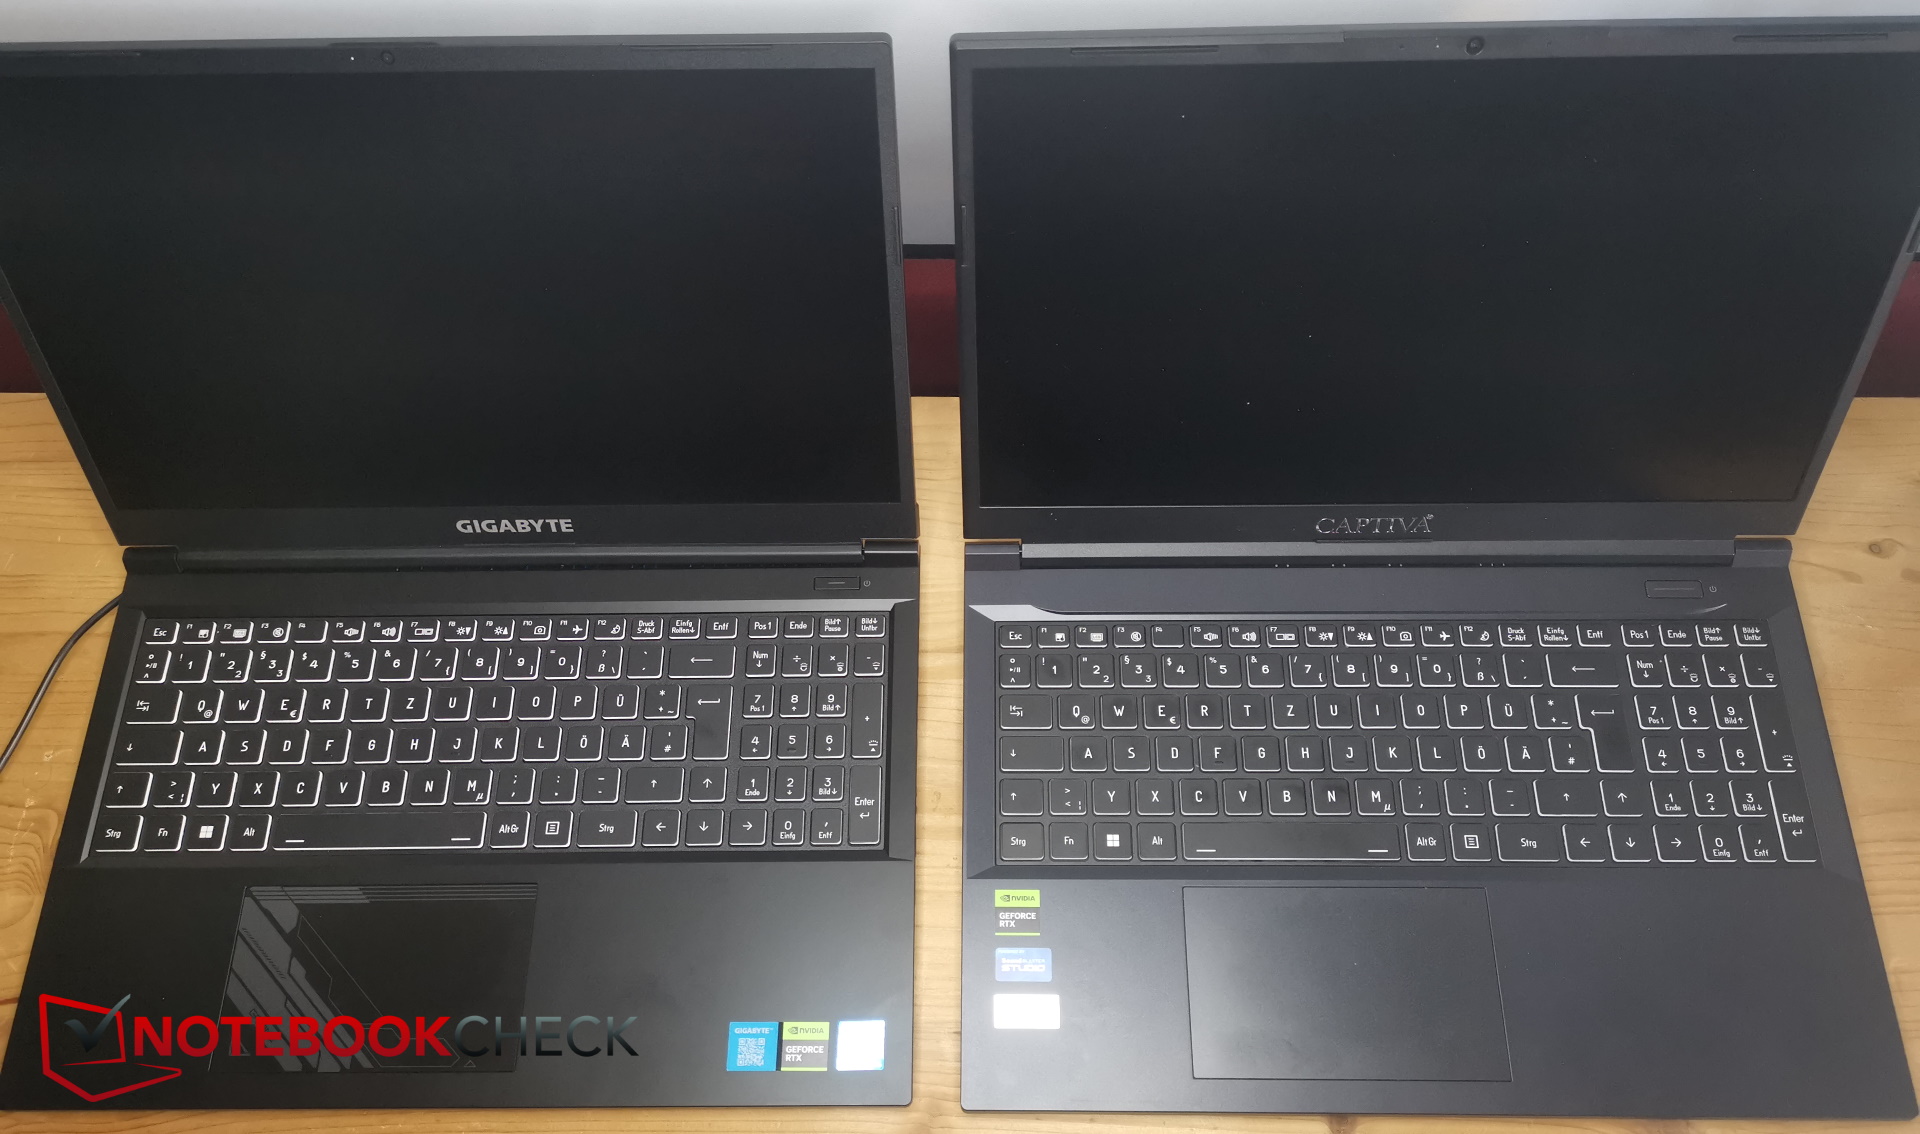
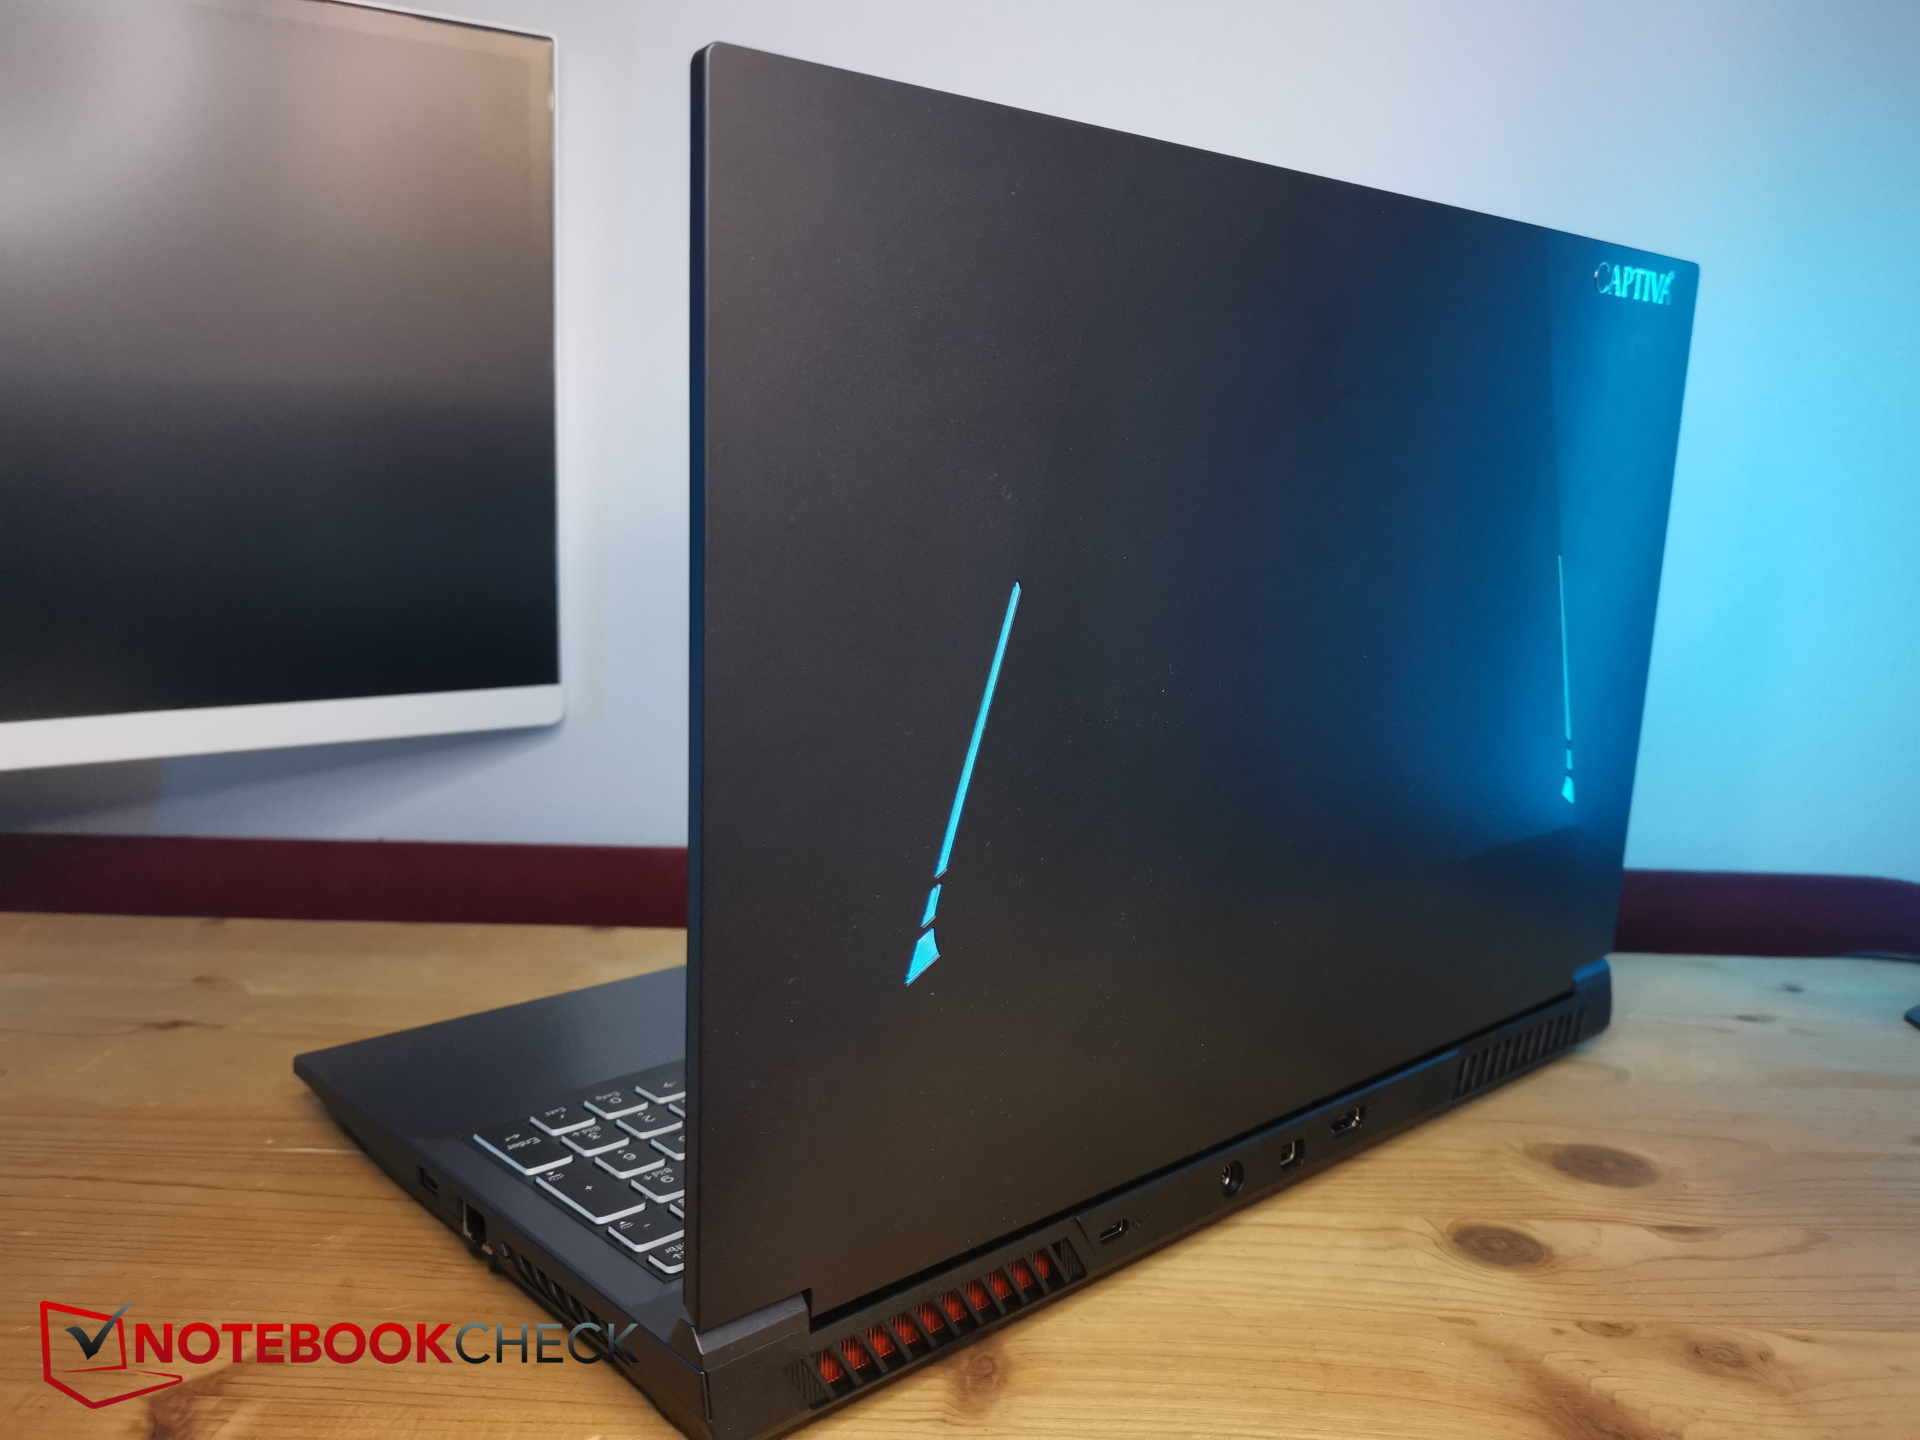
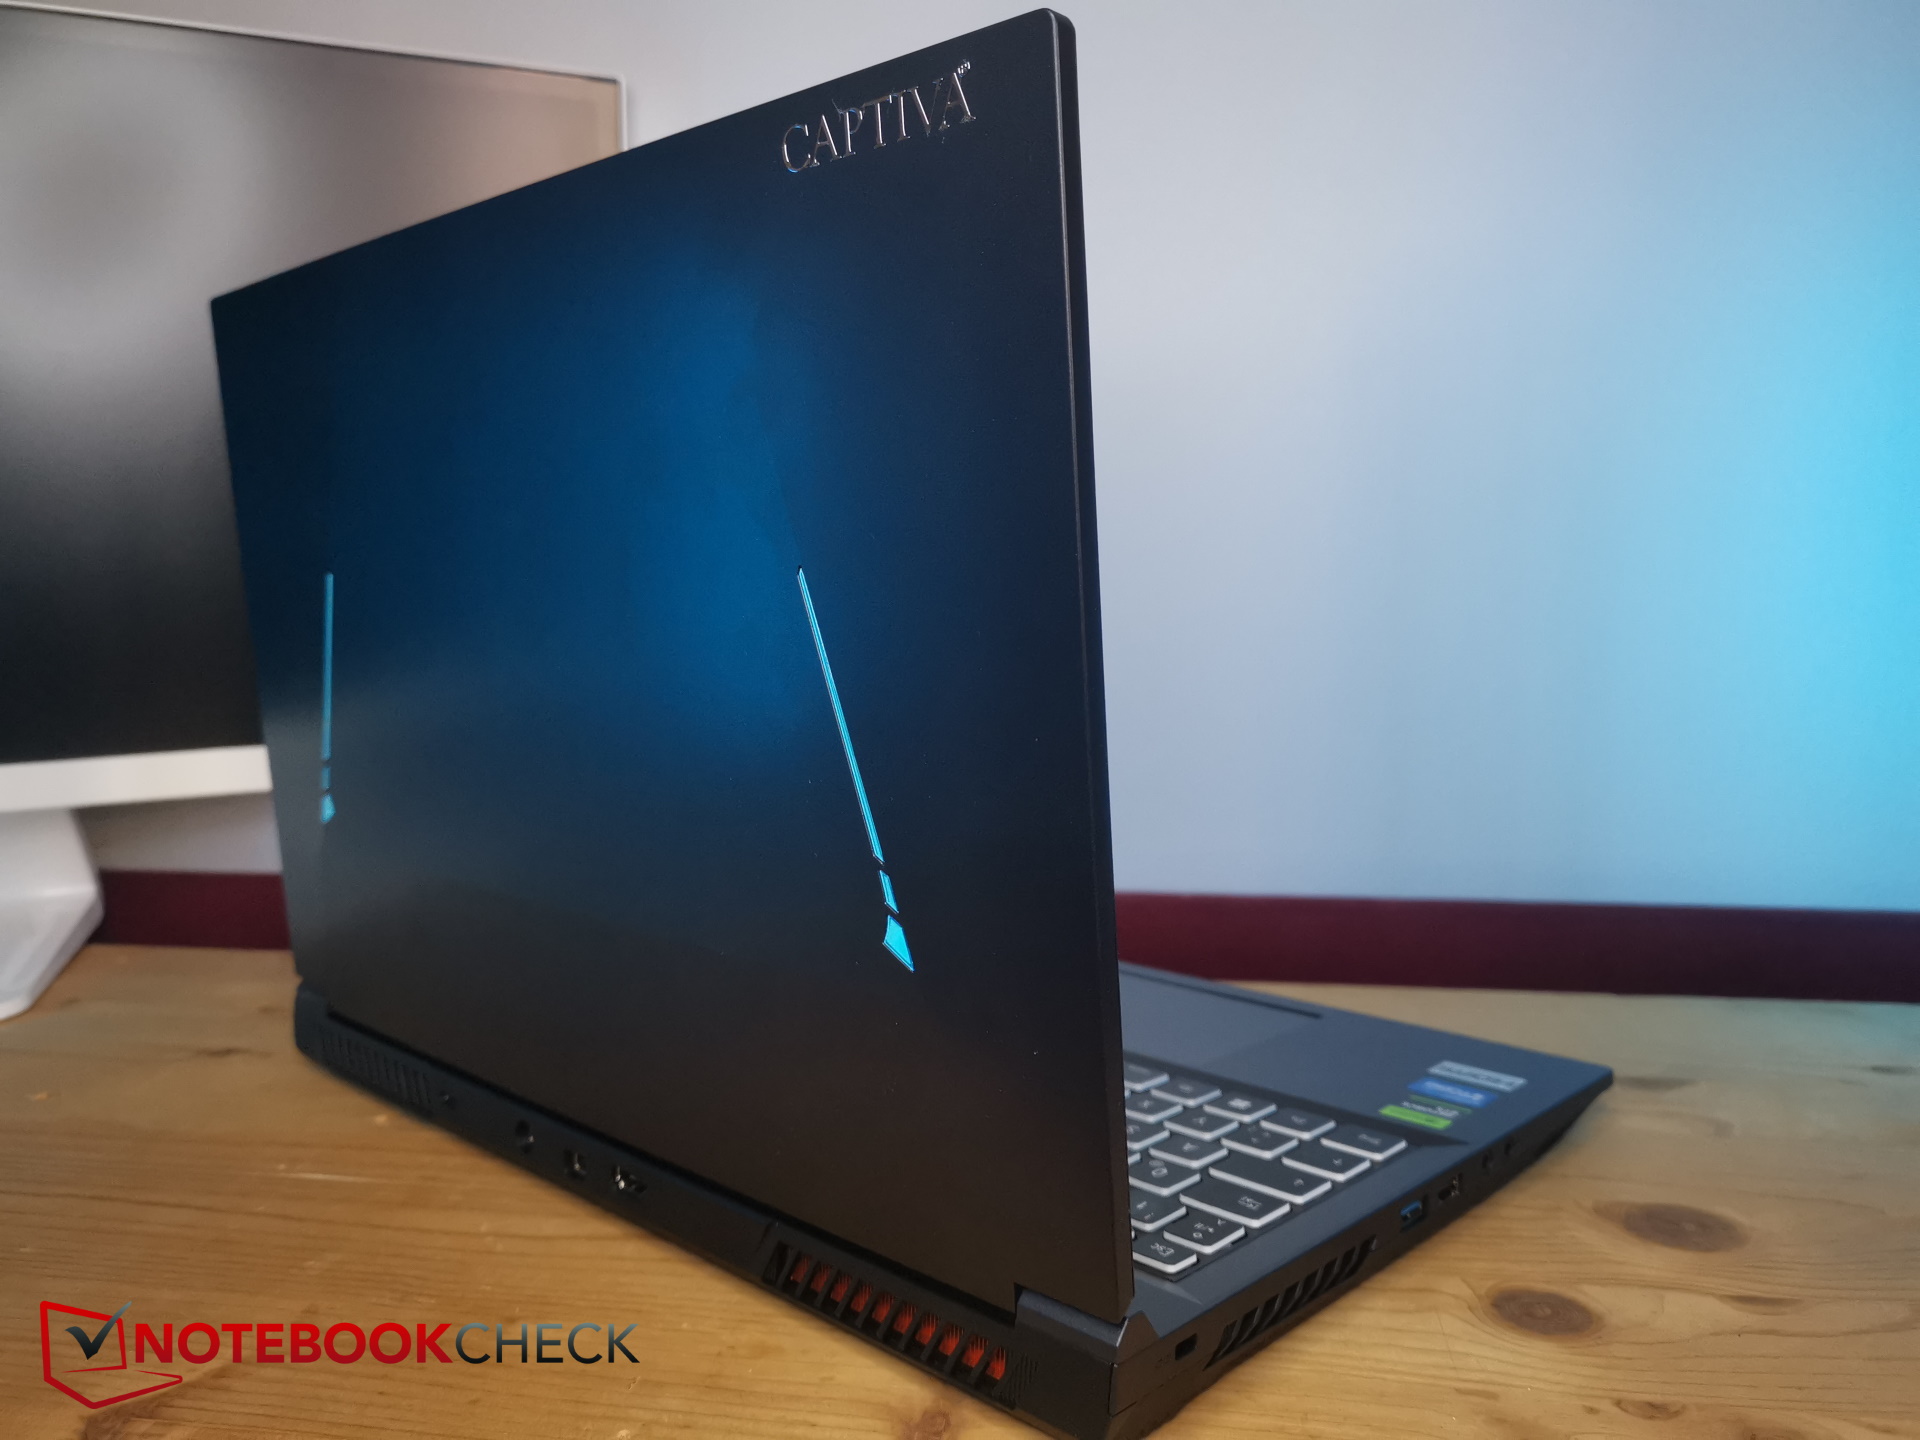
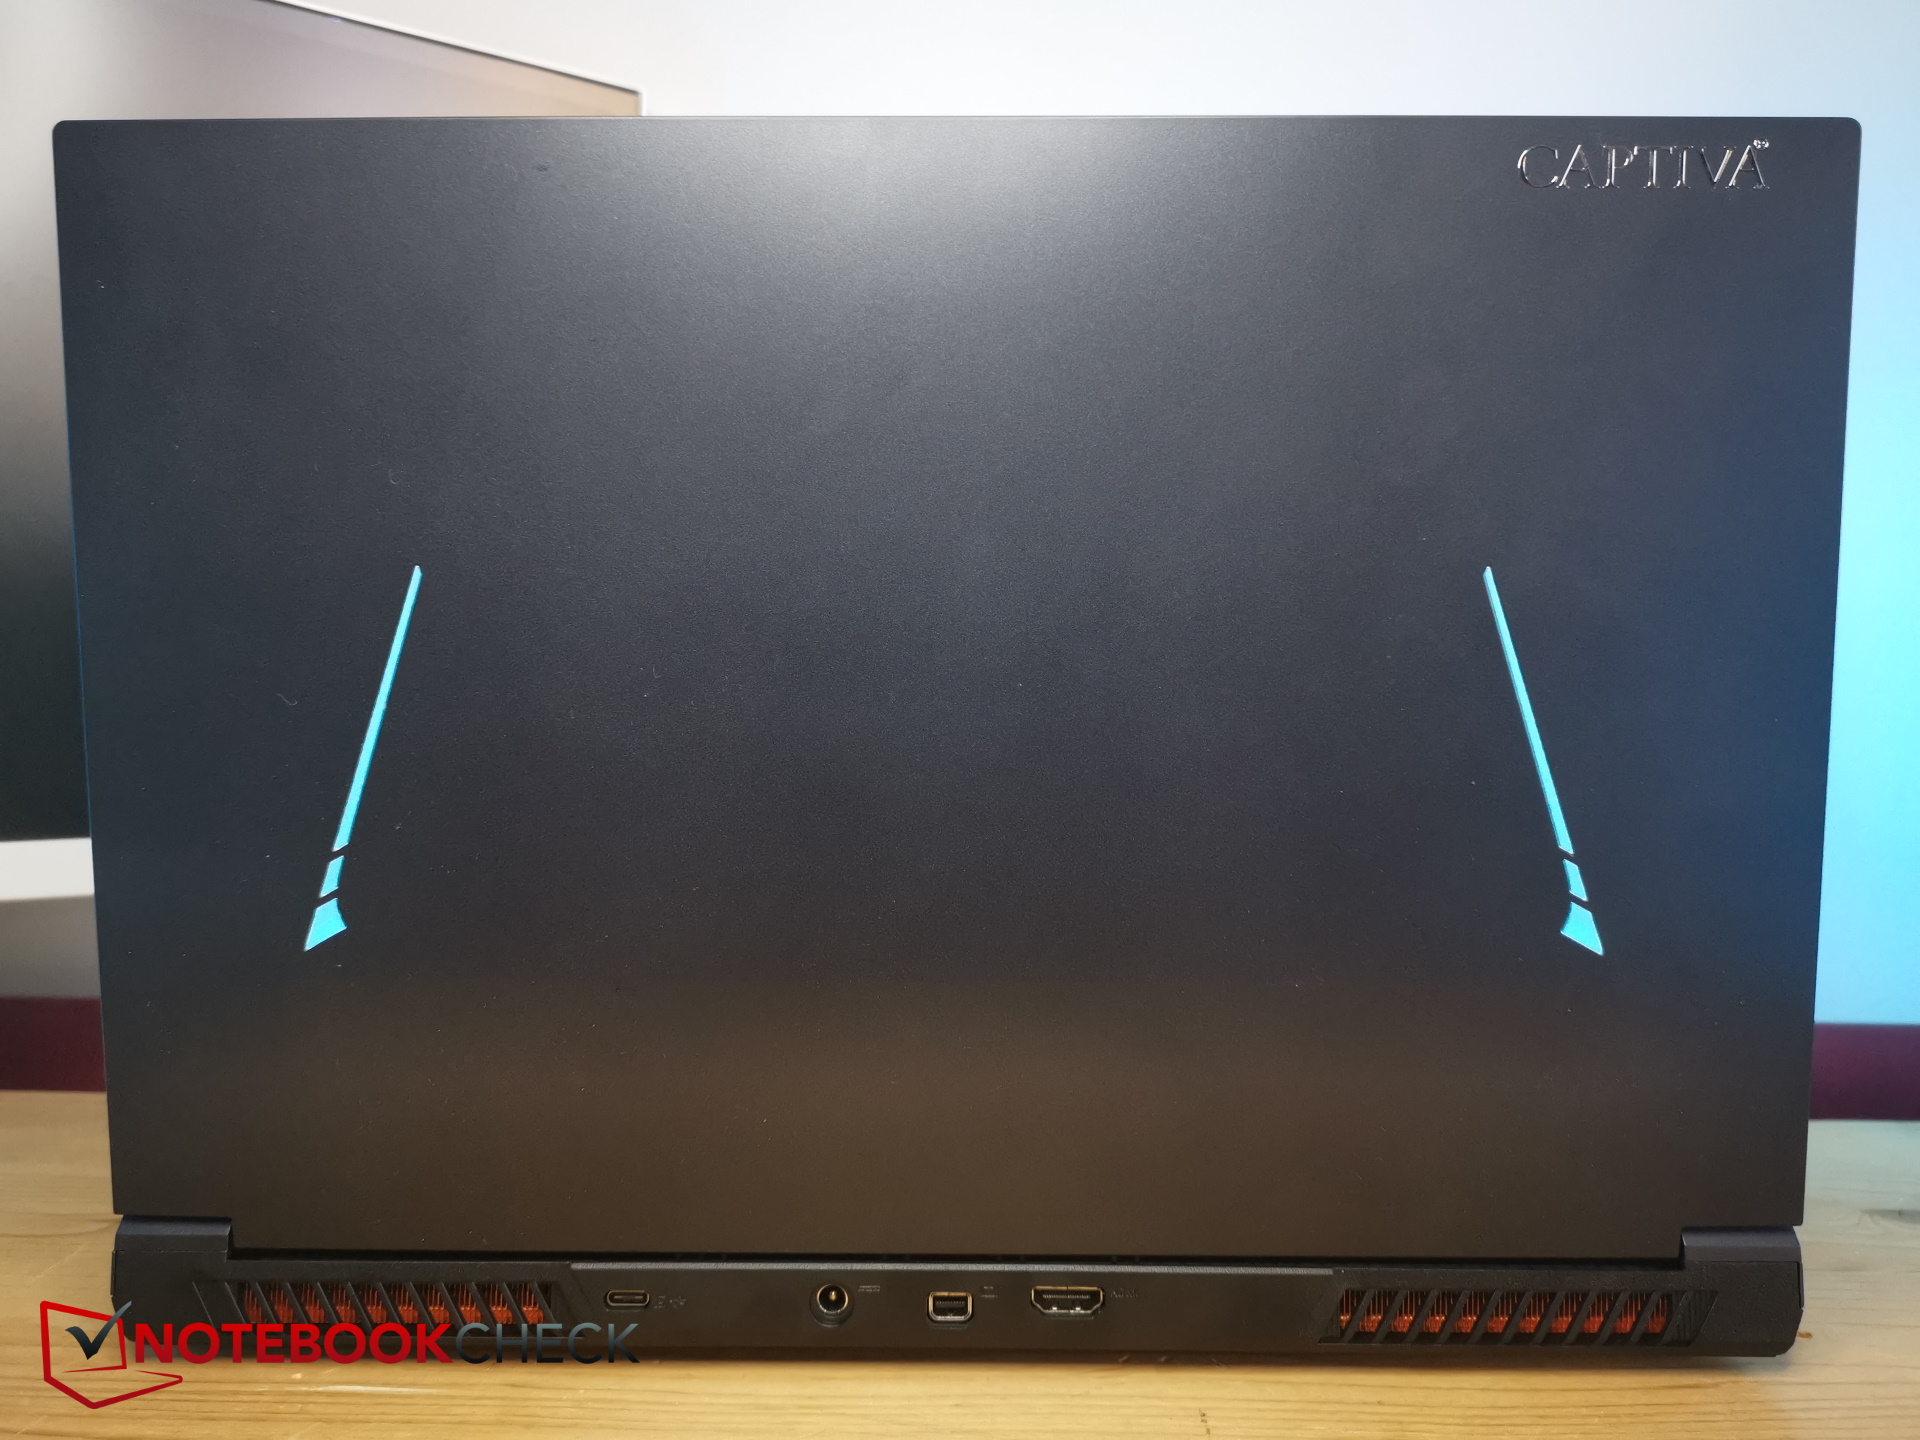
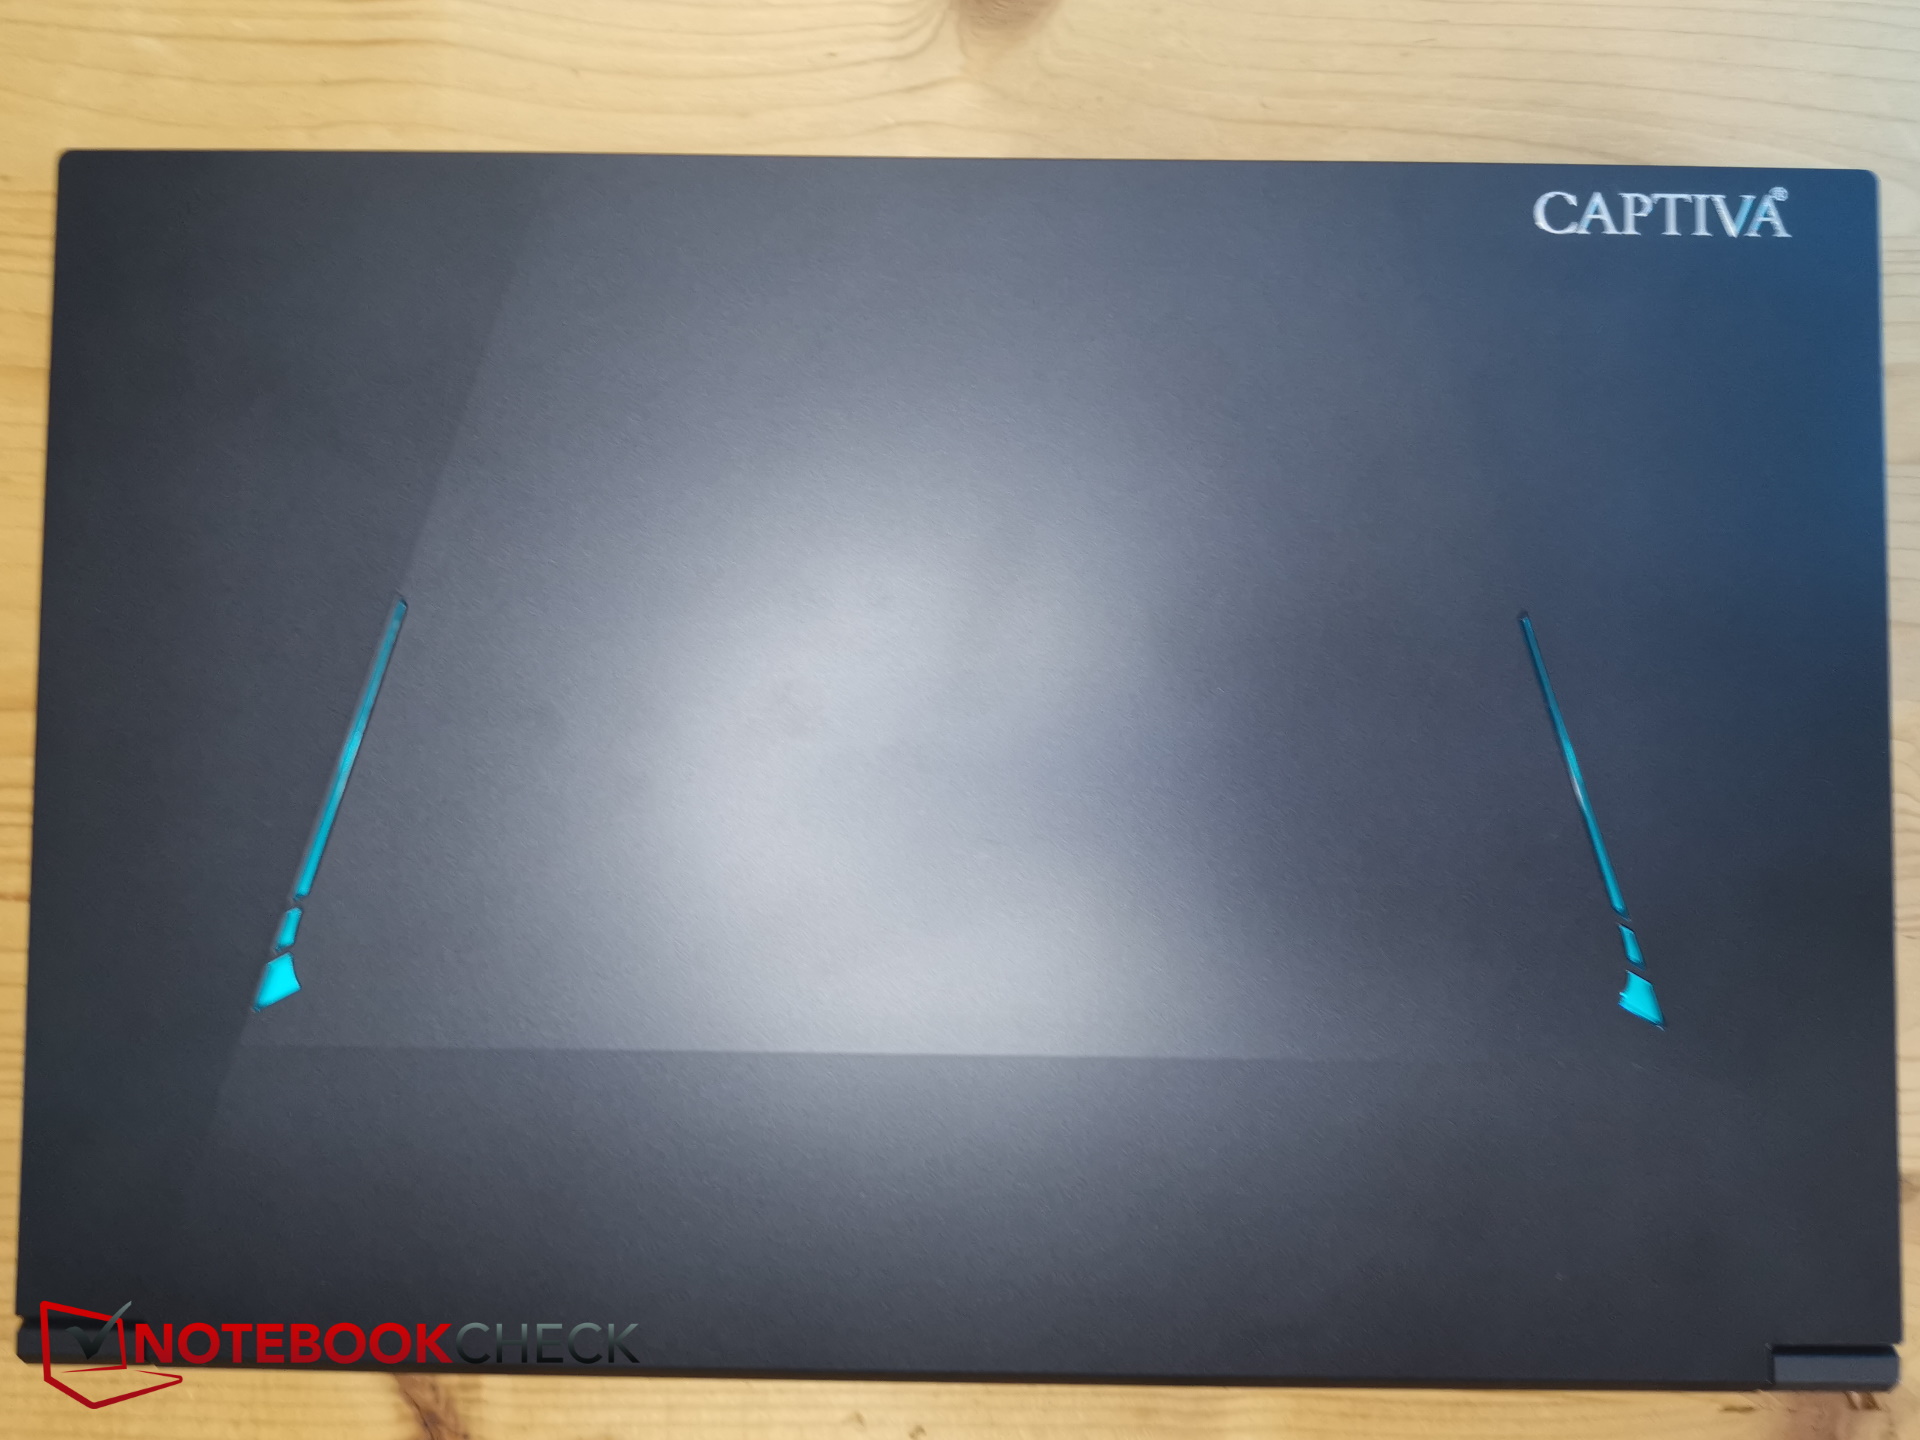
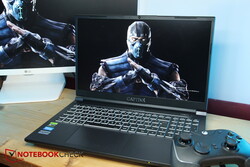
Z zewnątrz oba modele wyglądają zupełnie inaczej, nawet jeśli ich wymiary są podobne. Laptop Captiva jest sporo grubszy od G5. Na wierzchu znajdują się niebieskie, ukośne paski LED osadzone w matowej, czarnej powierzchni - w jednym rogu błyszczy srebrny napis "Captiva". Co więcej, górna część I74-121 nie jest całkowicie równa - zamiast tego ma lekkie wygięcie lub zakrzywienie.
Tworzywo sztuczne jest jedynym użytym materiałem, ale jego podstawa jest nadal wystarczająco sztywna i nie można z niej wydobyć żadnych odgłosów pękania podczas próby zginania. Nie zauważyliśmy żadnych nietypowych szczelin, a jego konstrukcja jest ogólnie całkiem dobra.
Szeroki zawias jest dobry, ale nie doskonały - pozwala na maksymalny kąt otwarcia od 135 do 140 stopni.
Dzięki minimalistycznej konstrukcji laptop Captiva jest jednym z najmniejszych urządzeń w porównywanym obszarze, zwłaszcza jeśli chodzi o głębokość. Z kolei jest to również jeden z najgrubszych laptopów w tym porównaniu. Producent podał grubość 28 mm, ale zmierzyliśmy co najmniej 29 mm wzdłuż środkowej krawędzi z tyłu urządzenia.
Ma średnią wagę - urządzenia Schenker i MSI są nieco lżejsze, a reszta jest cięższa, zwłaszcza Dell G15.
Łączność - nieco przestarzała
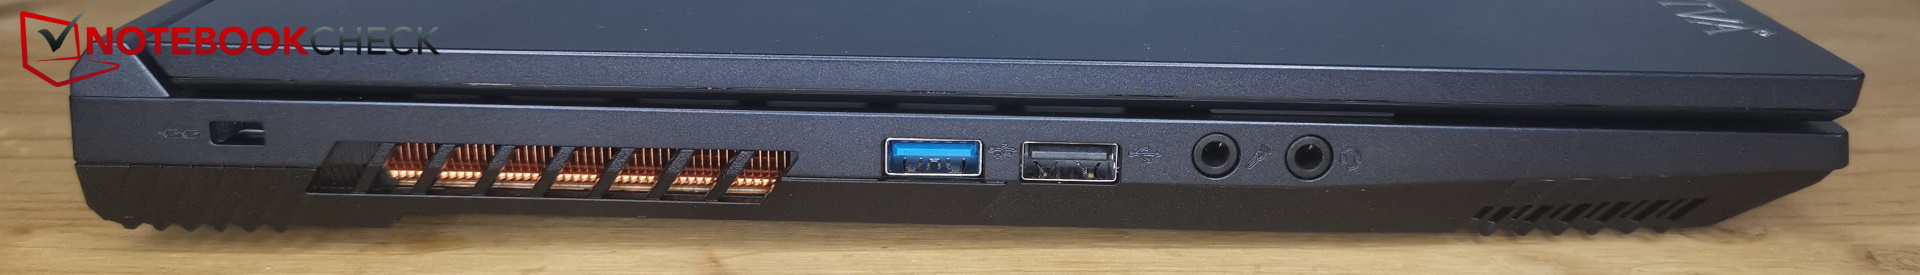
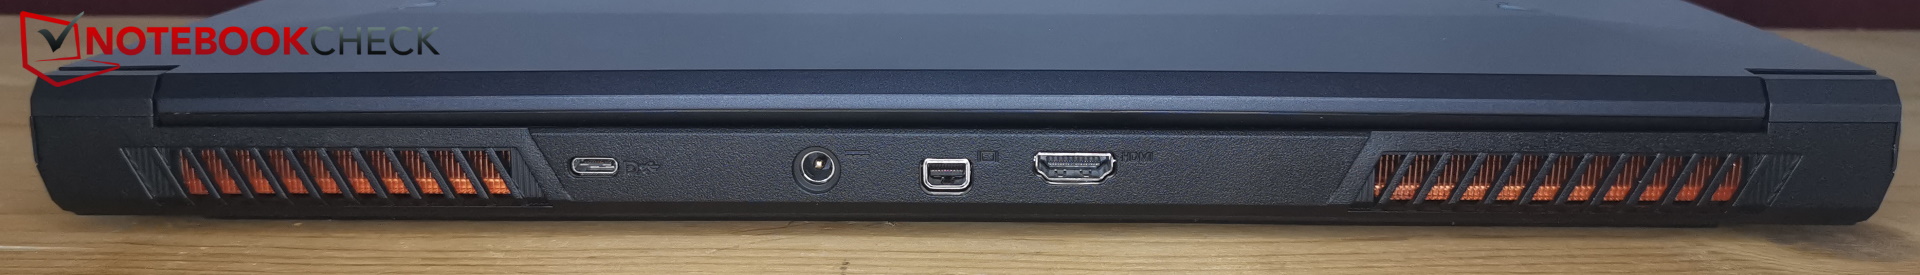
Na pierwszy rzut oka laptop posiada wszystkie najważniejsze opcje łączności. Po drugim spojrzeniu staje się jasne, że tak nie jest - a przynajmniej, że są one przestarzałe.
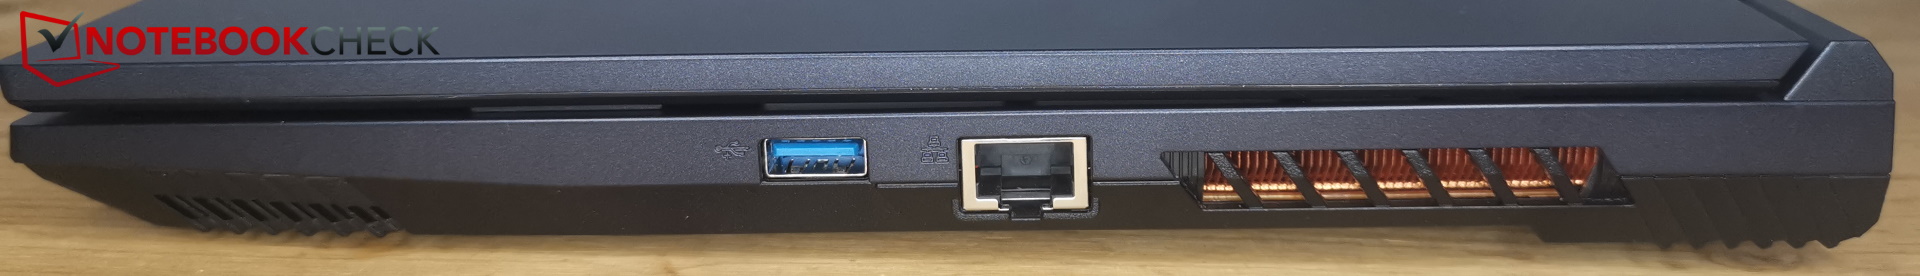
Jeden z jego portów USB-A jest nadal typu 2.0, brakuje Thunderbolt, a także nie ma czytnika kart SD. Przynajmniej laptop jest gotowy do VR dzięki połączeniu MiniDP. Jeden z dwóch portów USB-A 3.2 ma prędkość Gen2, a drugi tylko Gen1. Który z nich jest szybszym połączeniem, nie można zidentyfikować z zewnątrz.
Oba porty USB-A po lewej stronie są umieszczone bardzo blisko siebie, co oznacza, że grube pamięci USB nie mogą być podłączone obok siebie. Wszystkie pozostałe porty mają wystarczająco dużo miejsca pomiędzy sobą. Jednak połączenie sieciowe znajduje się po prawej stronie - trochę irytujące, jeśli używasz myszy prawą ręką.
Komunikacja
Moduł Intel AX211 laptopa Captiva obsługuje WiFi 6E, co oznacza, że może odbierać i wysyłać dane przy użyciu częstotliwości 2,4 GHz, 6 GHz i 6 GHz. Korzystając z 6 GHz, jego prędkości transferu są dobre, chociaż przy korzystaniu z 5 GHz laptop jest najsłabszy w polu porównawczym.
Kamera internetowa
Jego kamera internetowa również nie jest całkowicie aktualna. Zamiast nowoczesnej kamery Full HD, laptop wykorzystuje przestarzałą kamerę HD o rozdzielczości 720p.
Odchylenie kolorów jest ładne i niskie, ale nawet w dobrych warunkach oświetleniowych obraz jest dość ziarnisty i nie pokazuje zbyt wielu szczegółów.


Bezpieczeństwo
TPM jest na pokładzie dzięki układowi Intela, a urządzenie jest wyposażone w blokadę Kensington - ale jak to ma miejsce w przypadku wielu laptopów do gier, urządzenie Captiva nie jest wyposażone w skaner linii papilarnych.
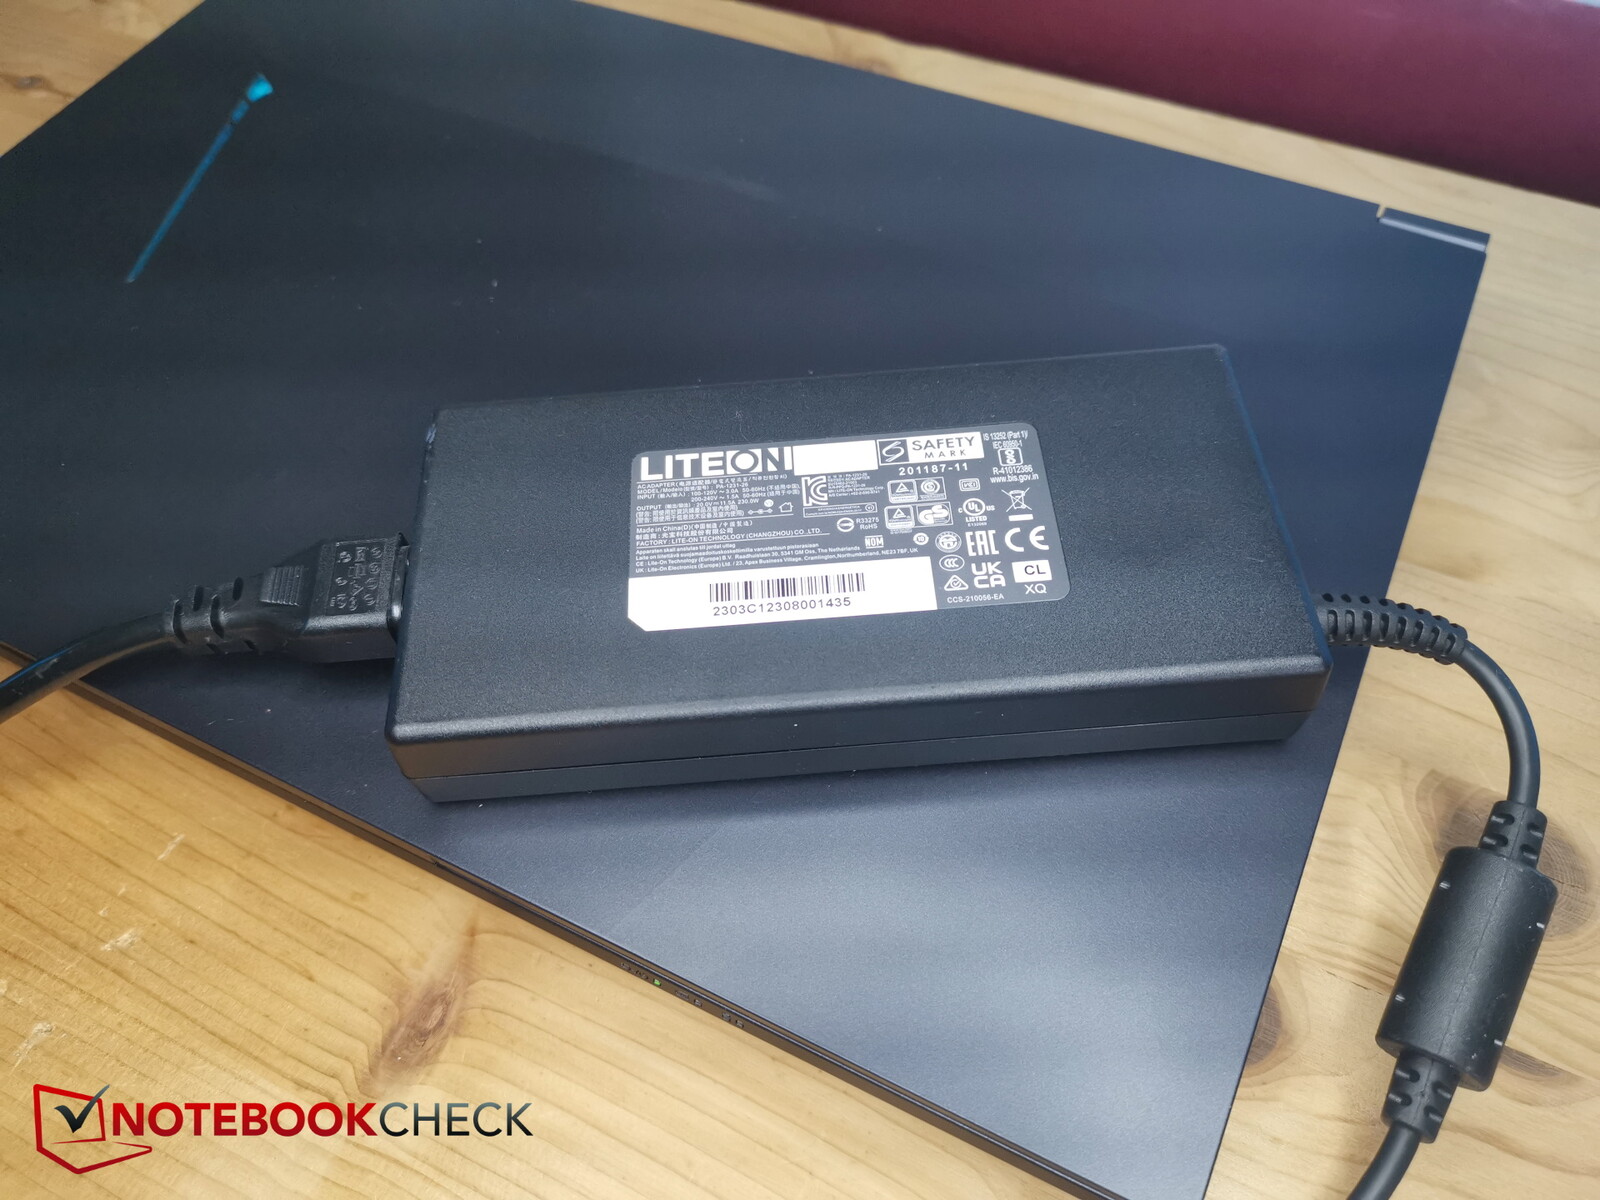
Zakres dostawy i gwarancja
Oprócz samego laptopa i opatentowanego zasilacza, zakres dostawy obejmuje wszystkie zwykłe dokumenty, 2 małe śrubki, a także płytę CD ze sterownikami. Ta ostatnia jest nieco bezużyteczna, biorąc pod uwagę, że laptop nie ma napędu CD - pamięć USB ze sterownikami, taka jak ta dołączona przez firmę Schenker, miałaby znacznie więcej sensu.
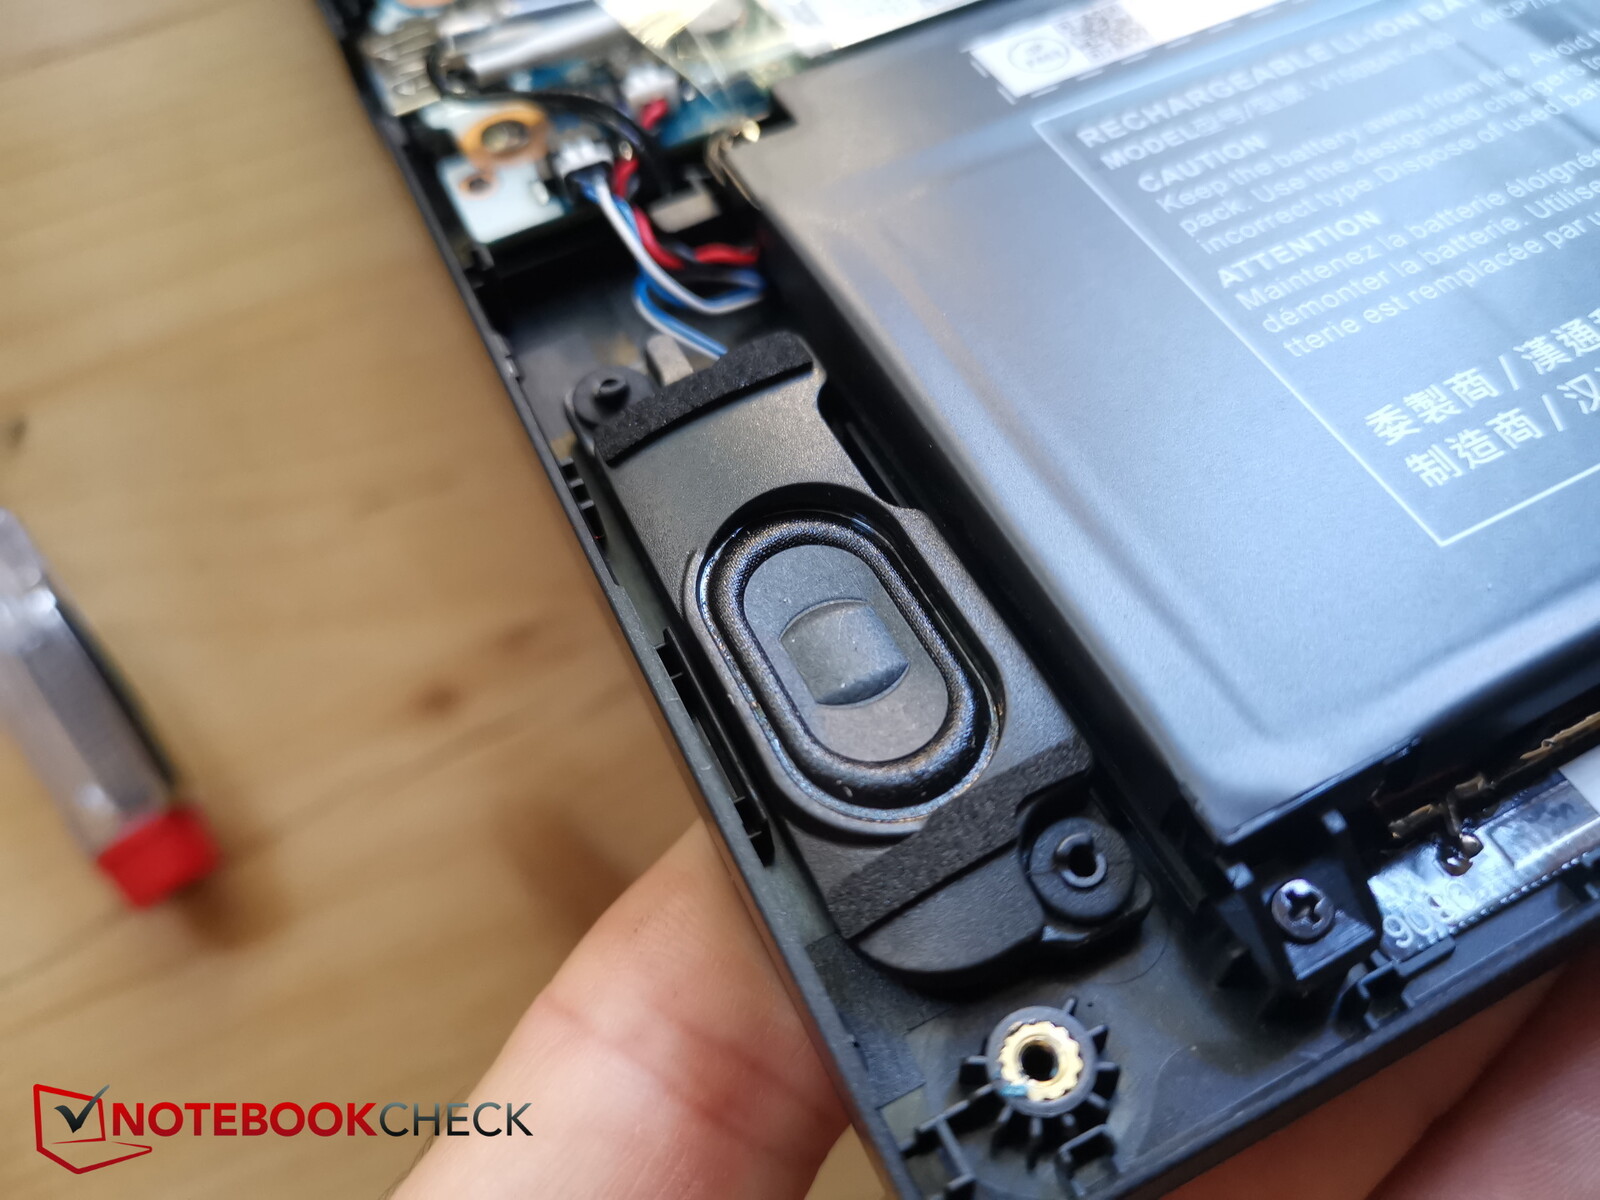
Konserwacja
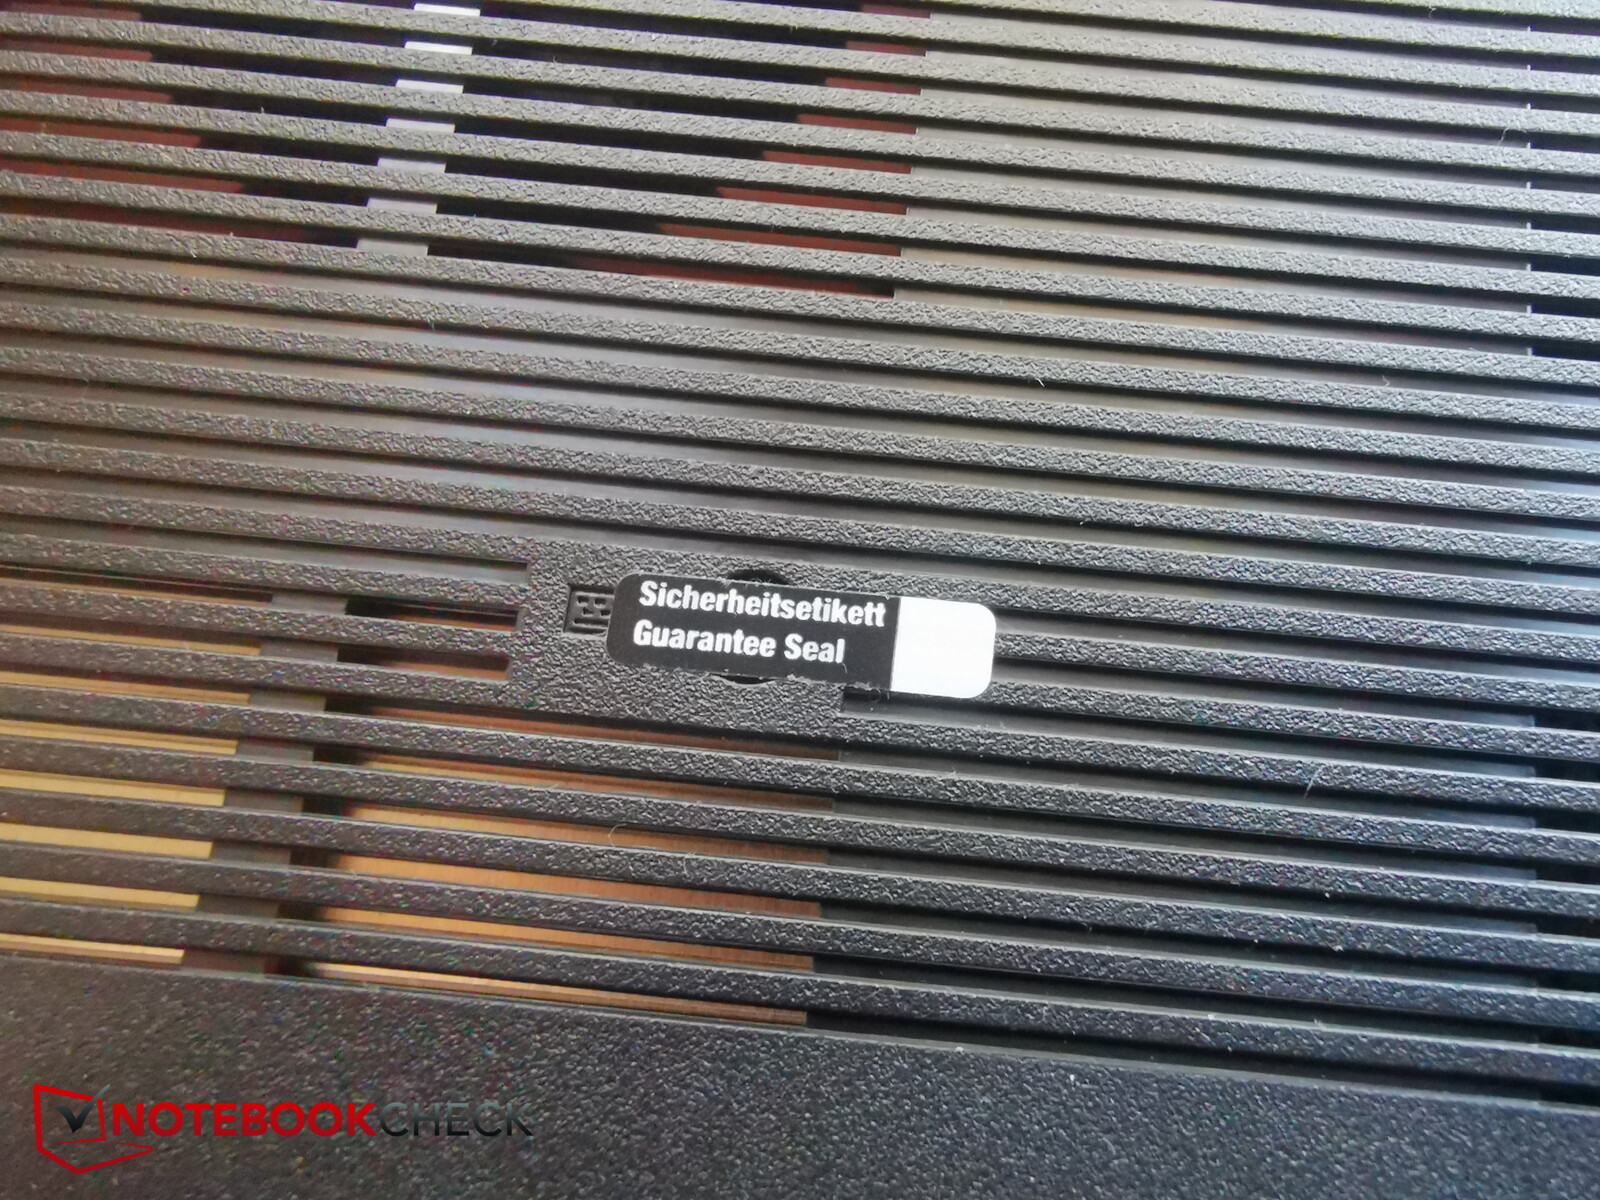
Spośród 14 śrub krzyżakowych (na szczęście wszystkie są tego samego rozmiaru), jedna znajduje się pod plombą gwarancyjną. Według Captivy, gwarancja wygasa natychmiast po otwarciu urządzenia. Producent wyraził zgodę na zerwanie plomby.
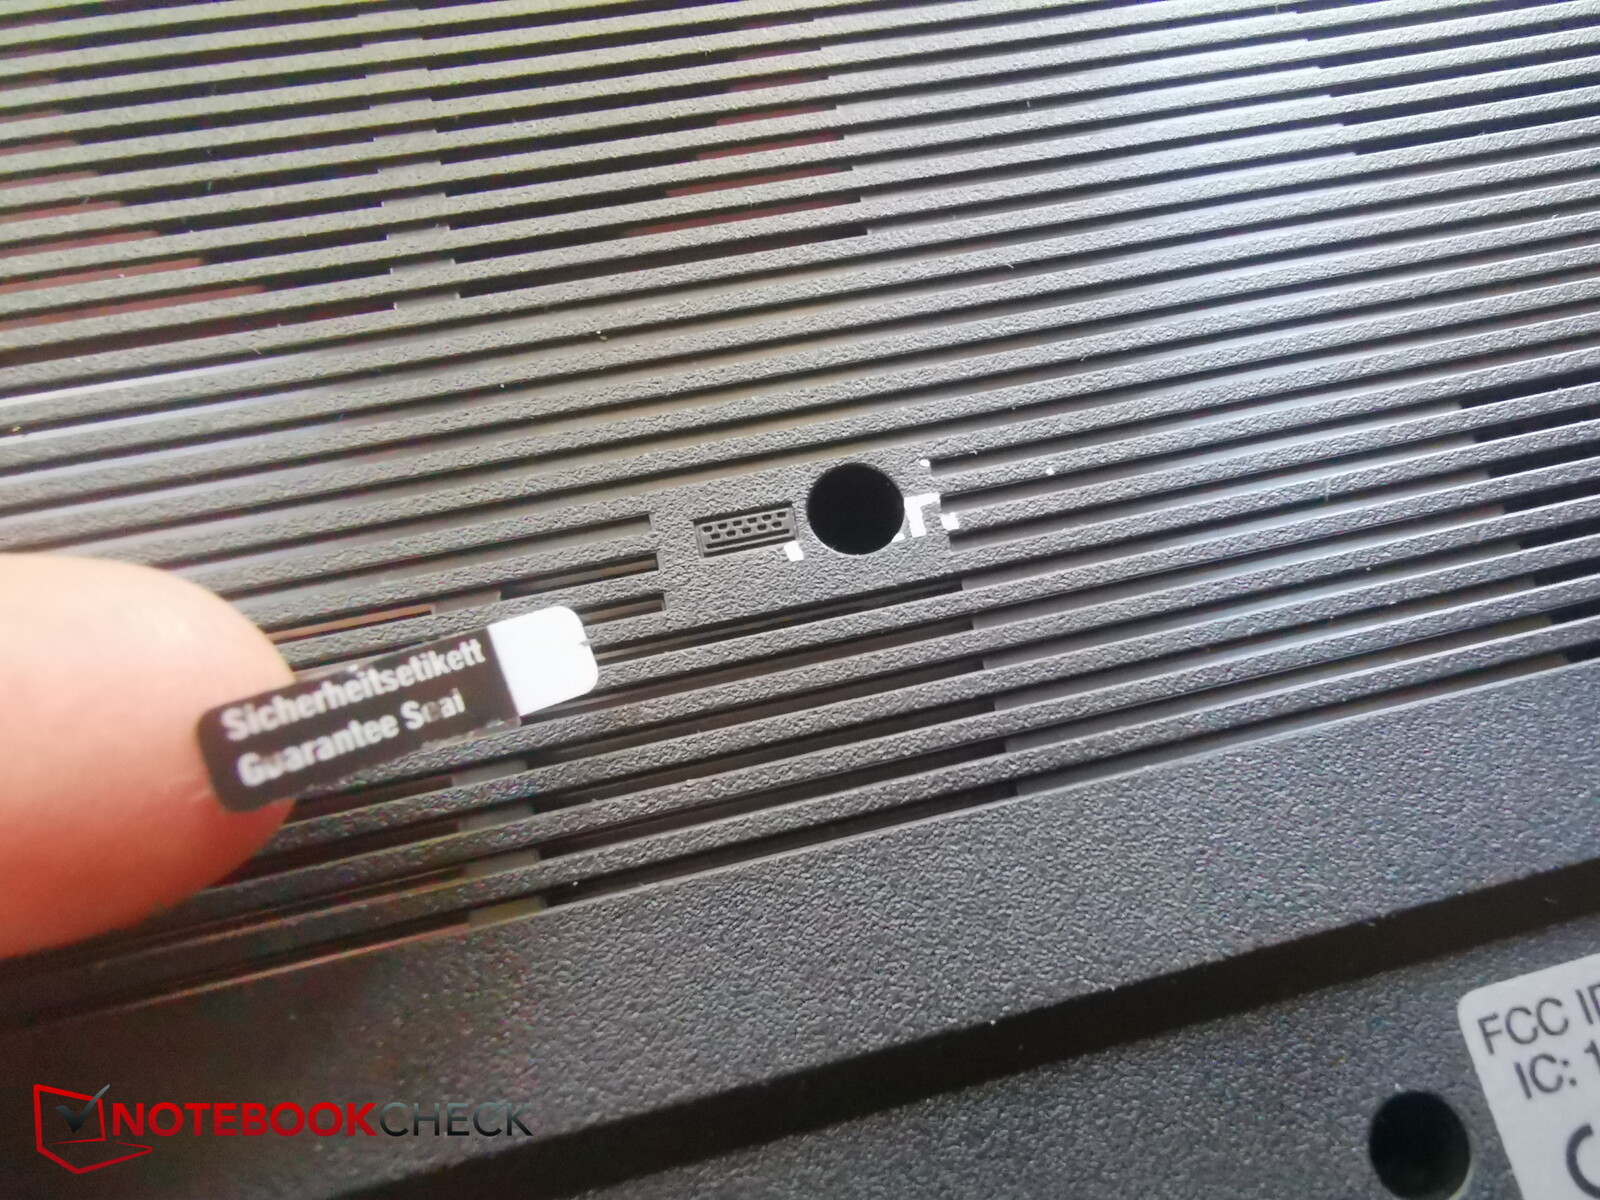
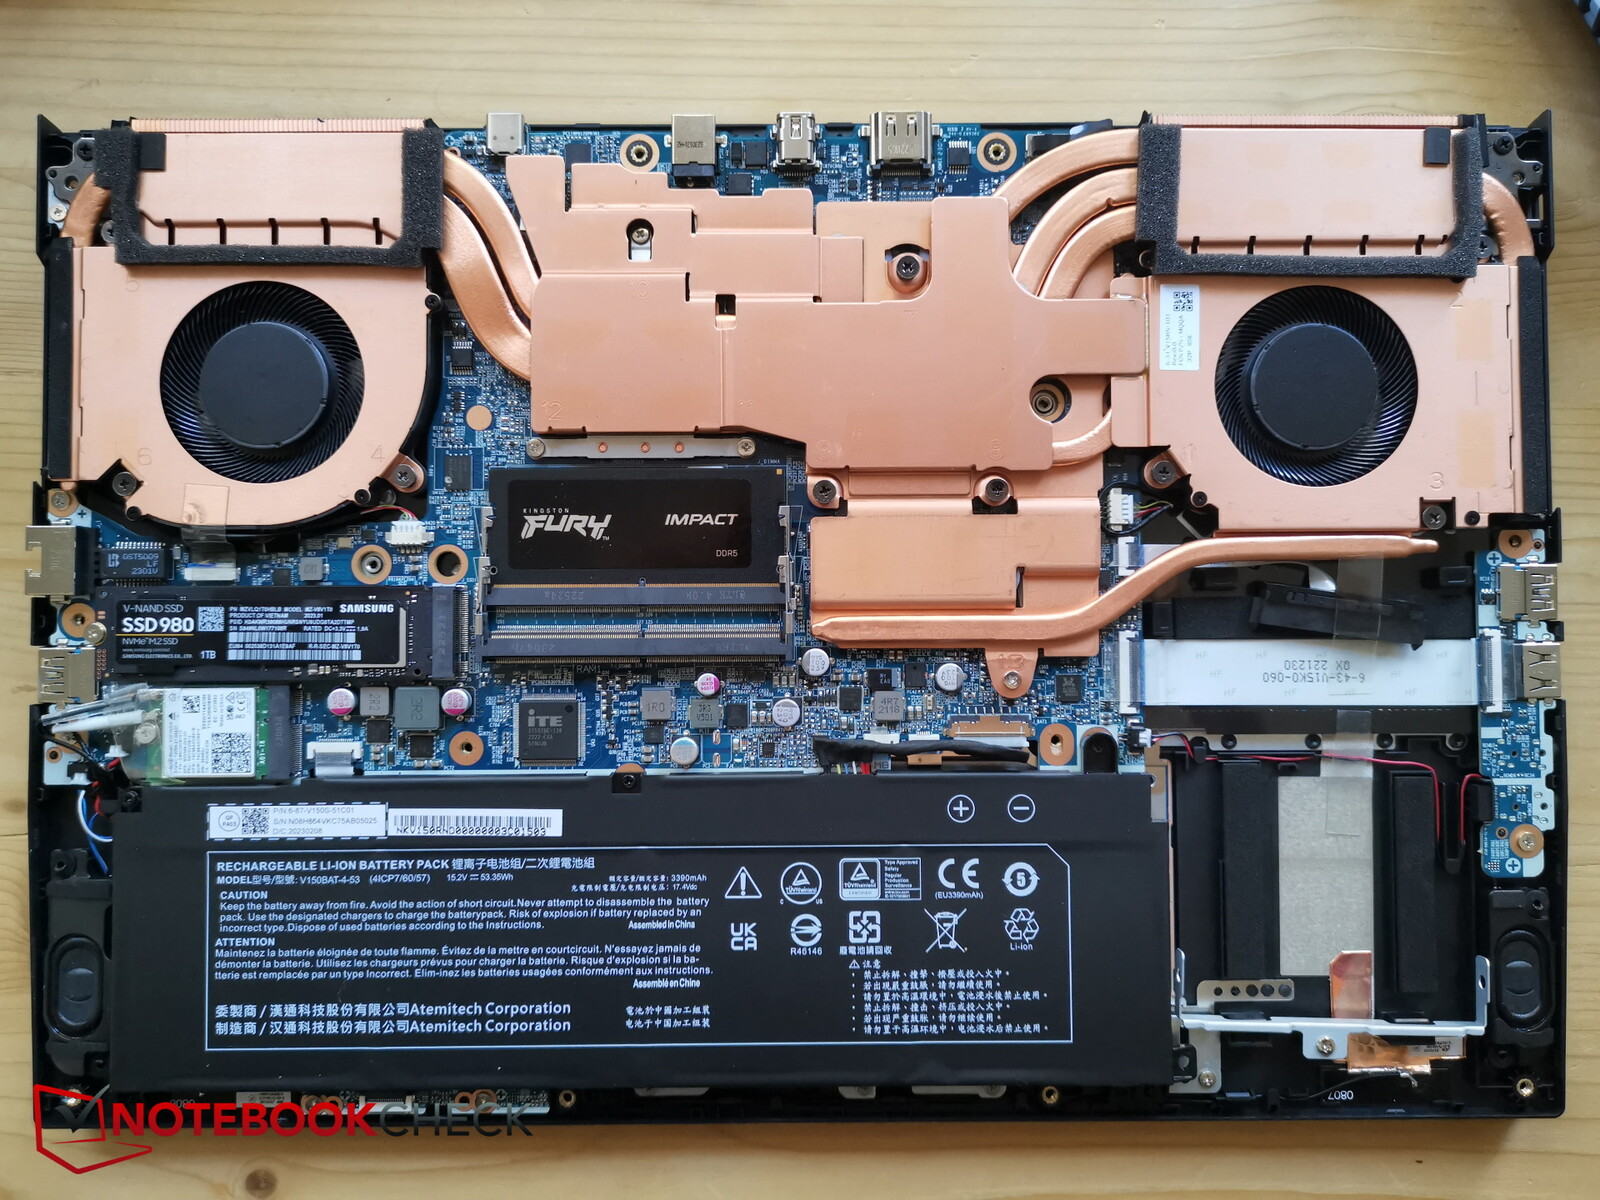
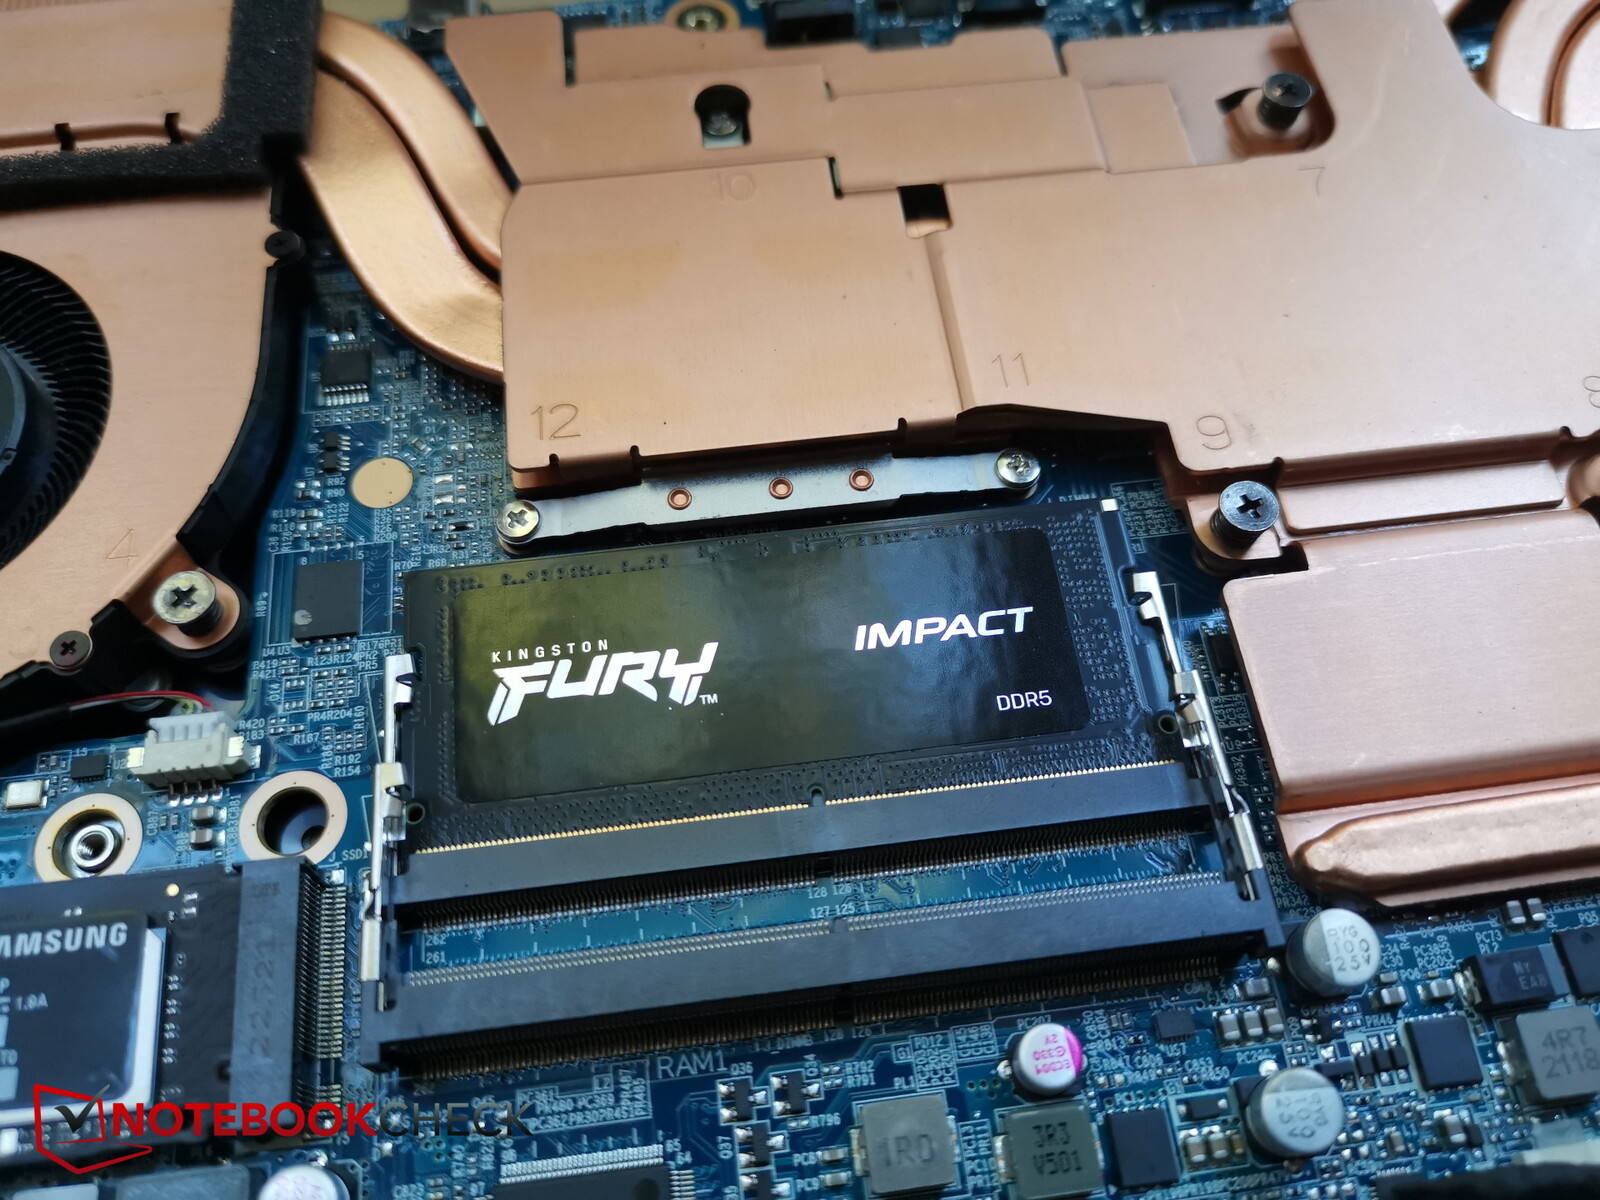
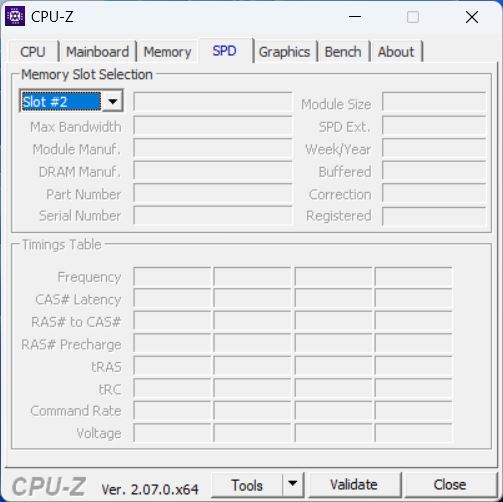
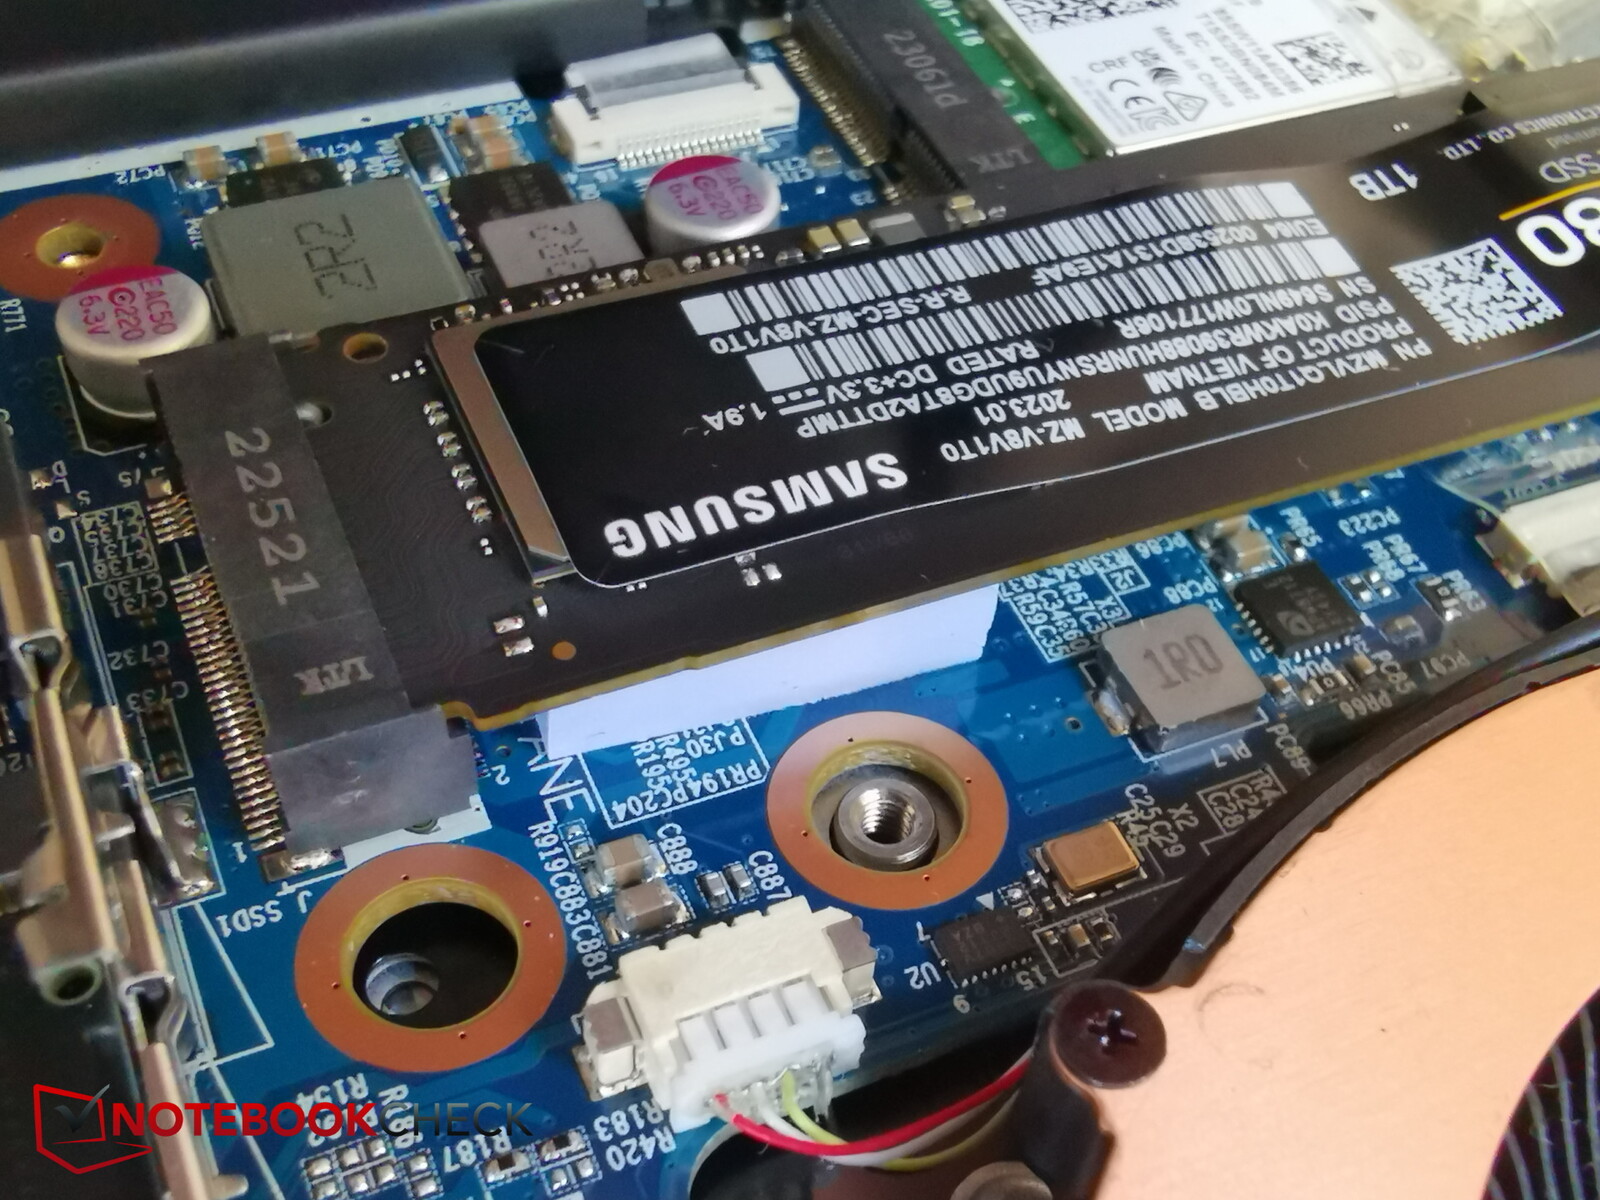
Po odkręceniu śrub bardzo łatwo jest zdjąć dolną płytę bez konieczności użycia jakichkolwiek narzędzi. Pod spodem można zobaczyć system chłodzenia składający się z dwóch wentylatorów i dużej ilości miedzi pomiędzy nimi, dwa banki pamięci RAM, z których jeden jest niezajęty, wymienny dysk SSD, a także wymienny moduł WiFi.
Zamiast drugiego gniazda NVMe jest gniazdo SATA, które może pomieścić dyski 2,5-calowe. Oprócz plomby gwarancyjnej, bardzo łatwo jest przeprowadzić prace konserwacyjne na tym laptopie.
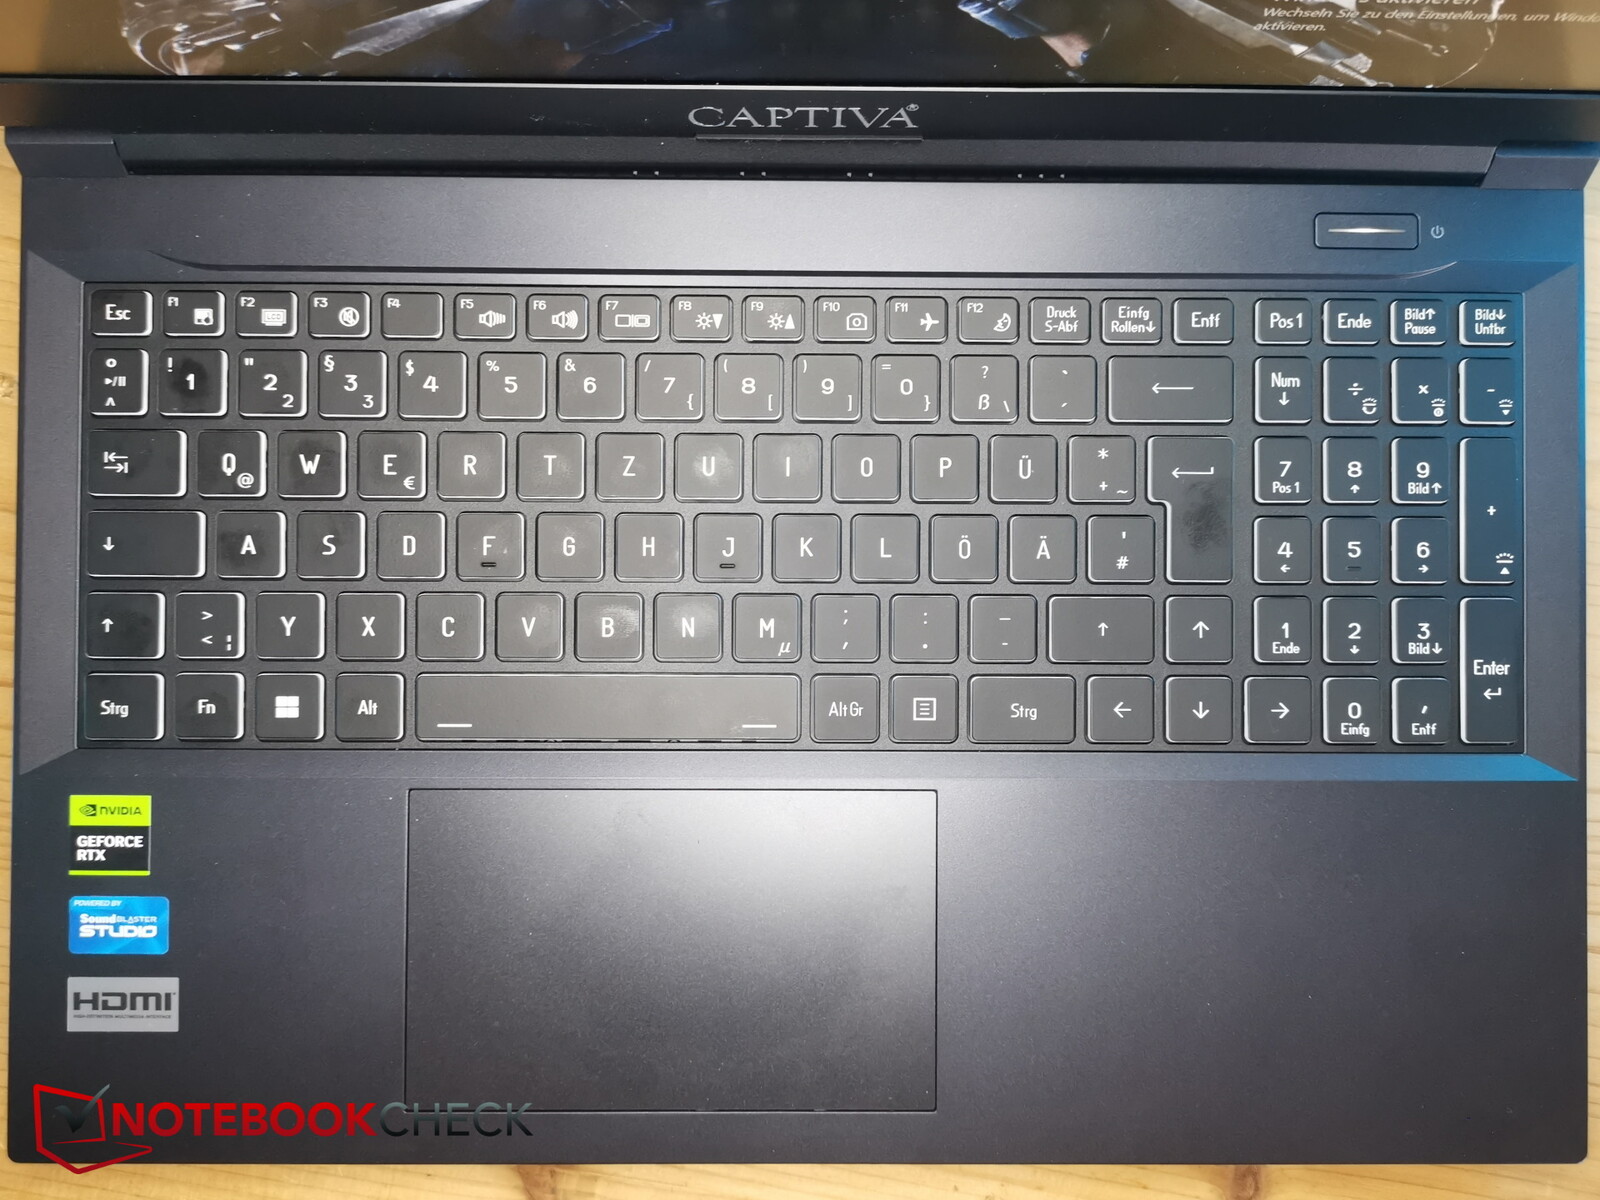
Urządzenia wejściowe - solidne i odpowiednie do codziennego użytku
Klawiatura
Układ klawiatury jest funkcjonalny i nie sprawia żadnych problemów. Klawisze strzałek mają normalny rozmiar (około 15 x 15 mm), klawiatura numeryczna ma mniejsze klawisze (15 x 12,6 mm) i płynnie łączy się po prawej stronie. W prawym górnym rogu znajduje się dodatkowy przycisk zasilania.
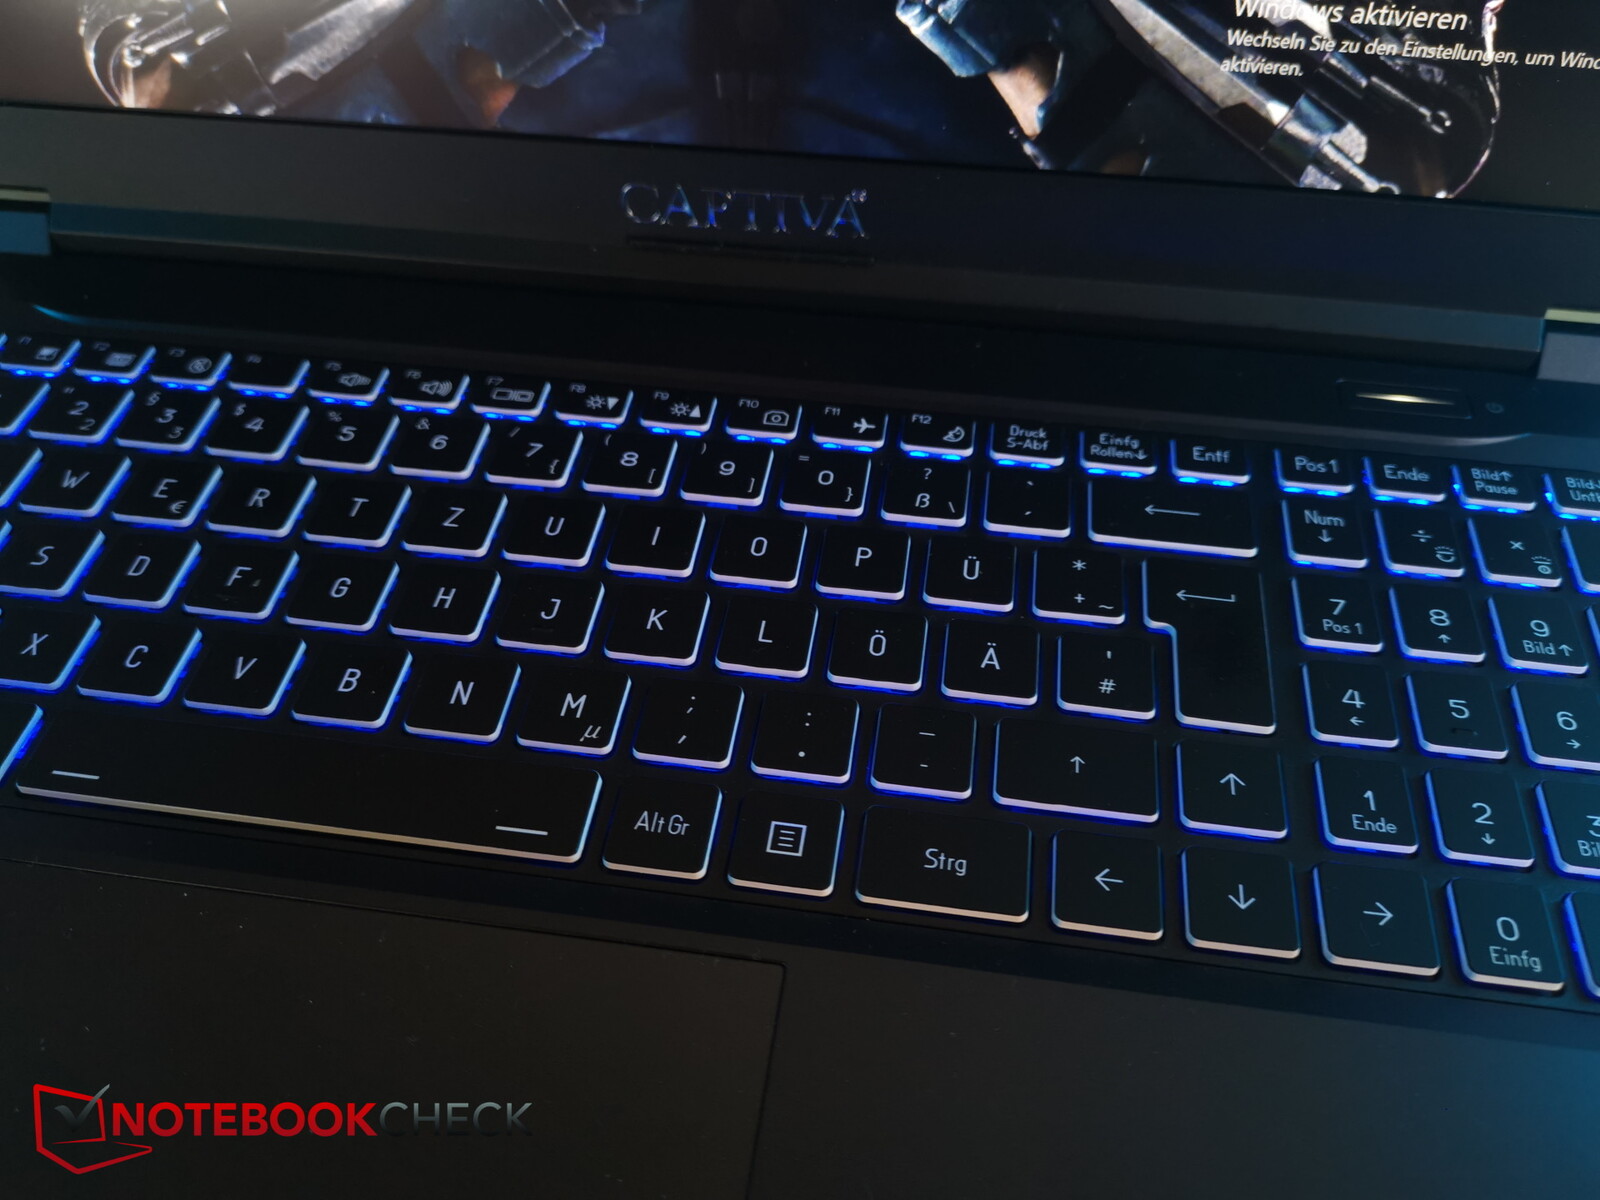
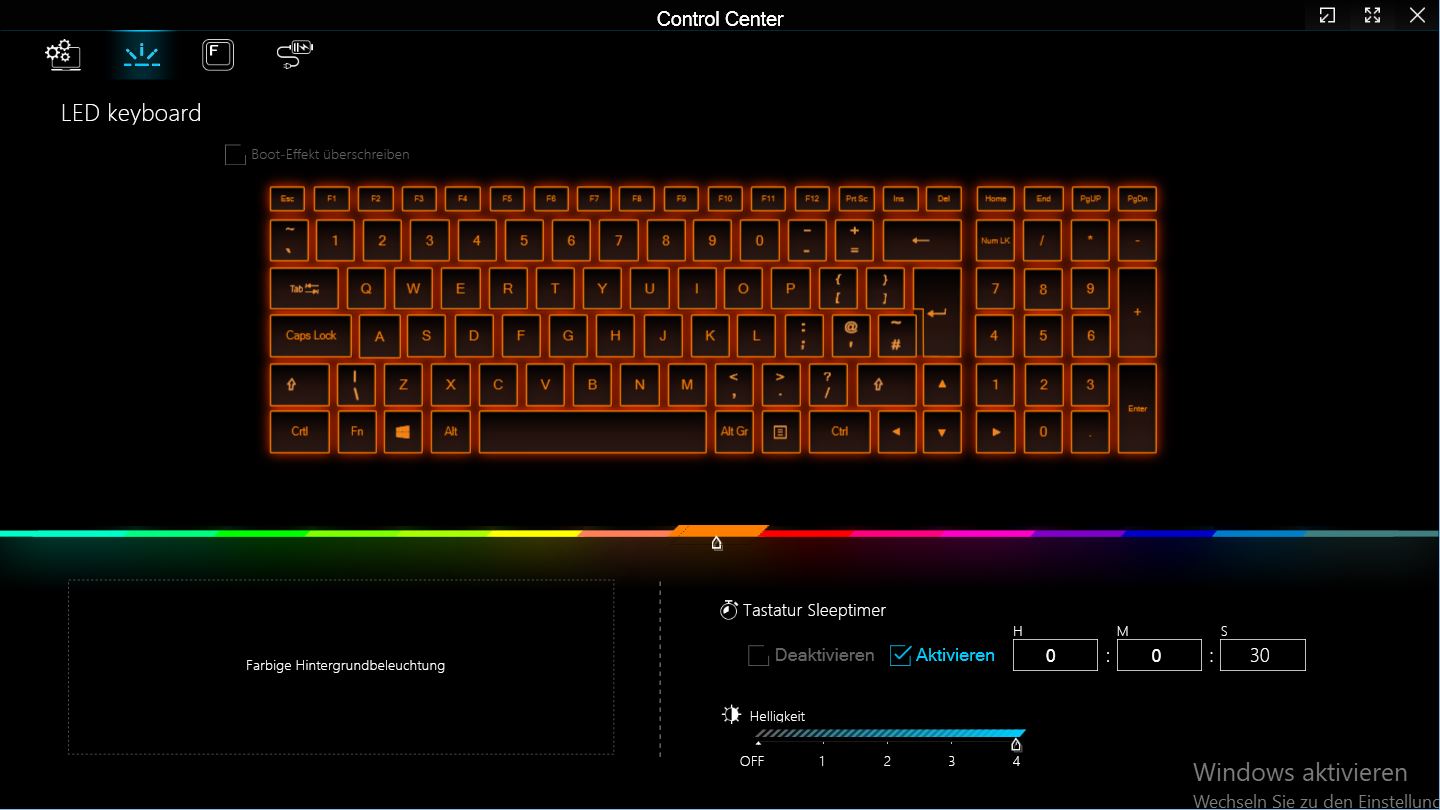
Klawisze mają wygodny, niezbyt krótki skok z przyzwoitym sprzężeniem zwrotnym. Odgłosy wydawane podczas pisania są bardzo umiarkowane. Co więcej, oznaczenia klawiszy są bardzo czytelne i sprawdzają się w ciemniejszych warunkach oświetleniowych dzięki jednostrefowemu, wielokolorowemu podświetleniu.
Touchpad
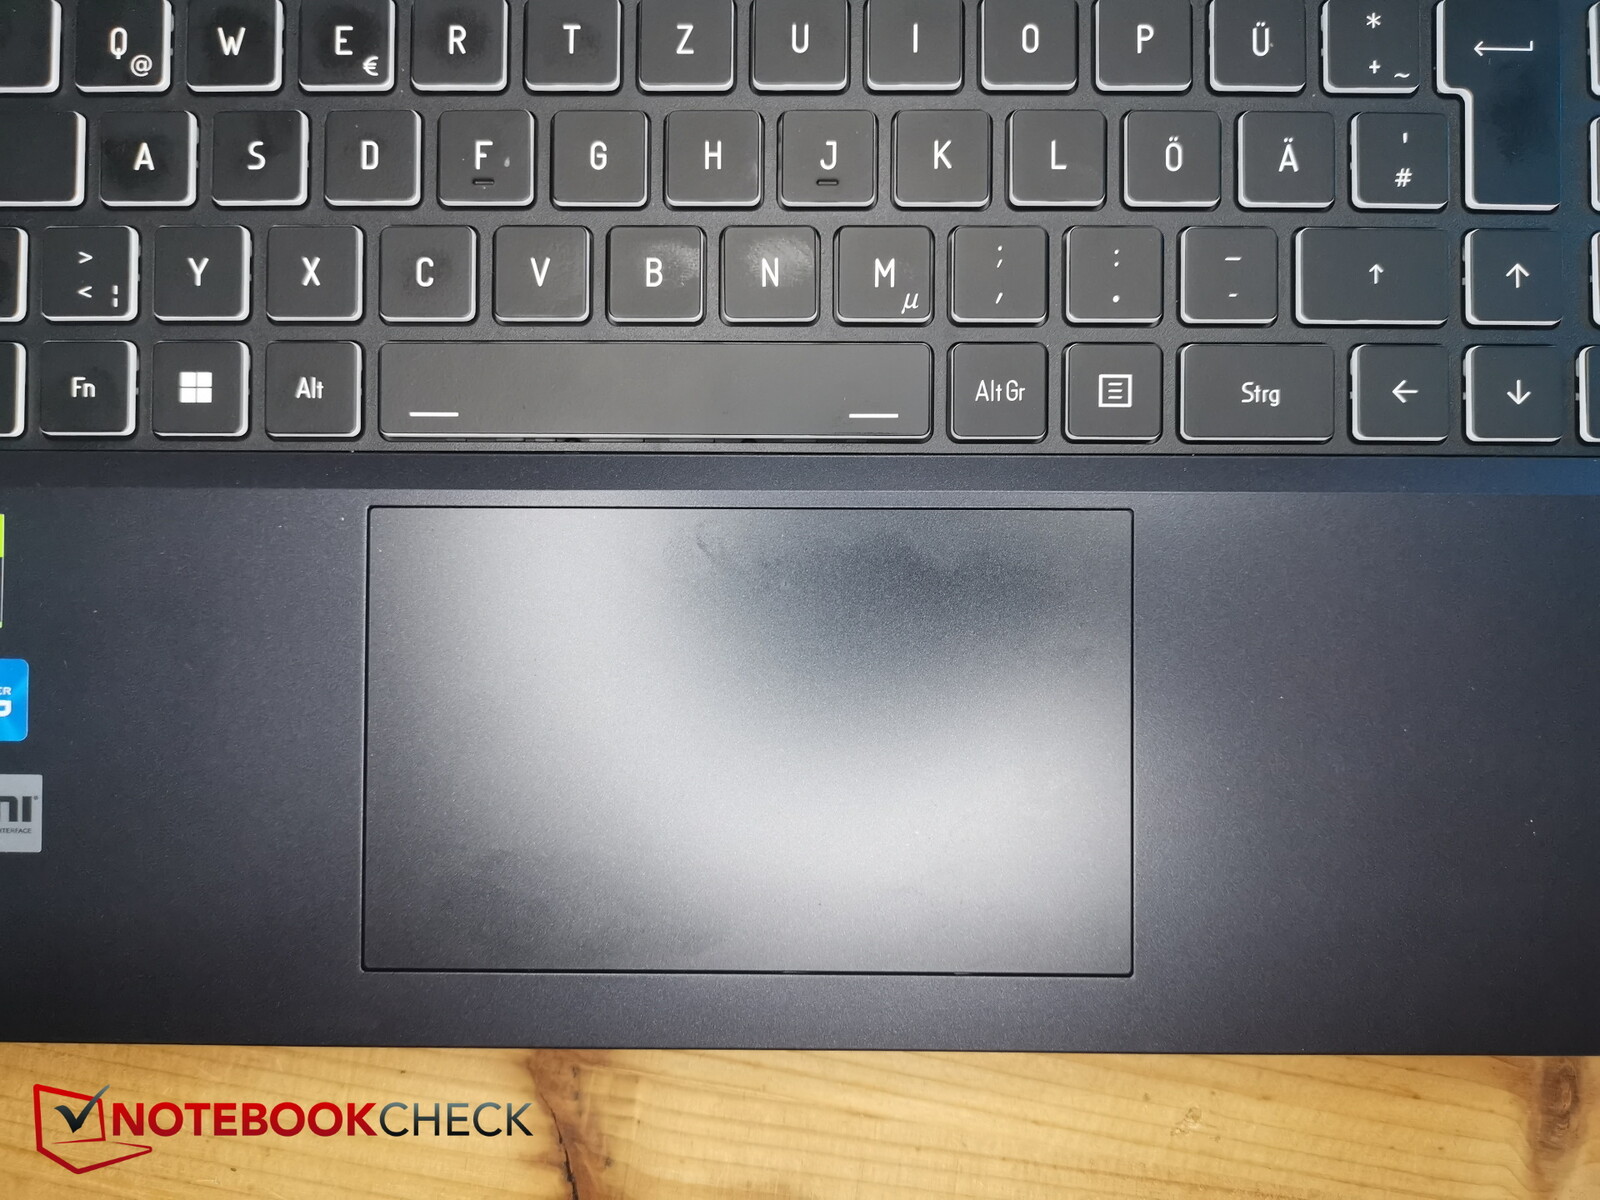
W wyniku zastosowania klawiatury numerycznej, touchpad (12 x 7,2 cm) znajduje się nieco po lewej stronie, co jest dobrym rozwiązaniem. Może się nieco zacinać podczas powolnych ruchów lub gdy dłonie się pocą, ale w normalnych sytuacjach palce gładko przesuwają się po powierzchni.
Zintegrowane klawisze mają również przyjemny poziom sprzężenia zwrotnego - odgłos kliknięcia jest nieco głośniejszy, ale nie jest denerwujący.
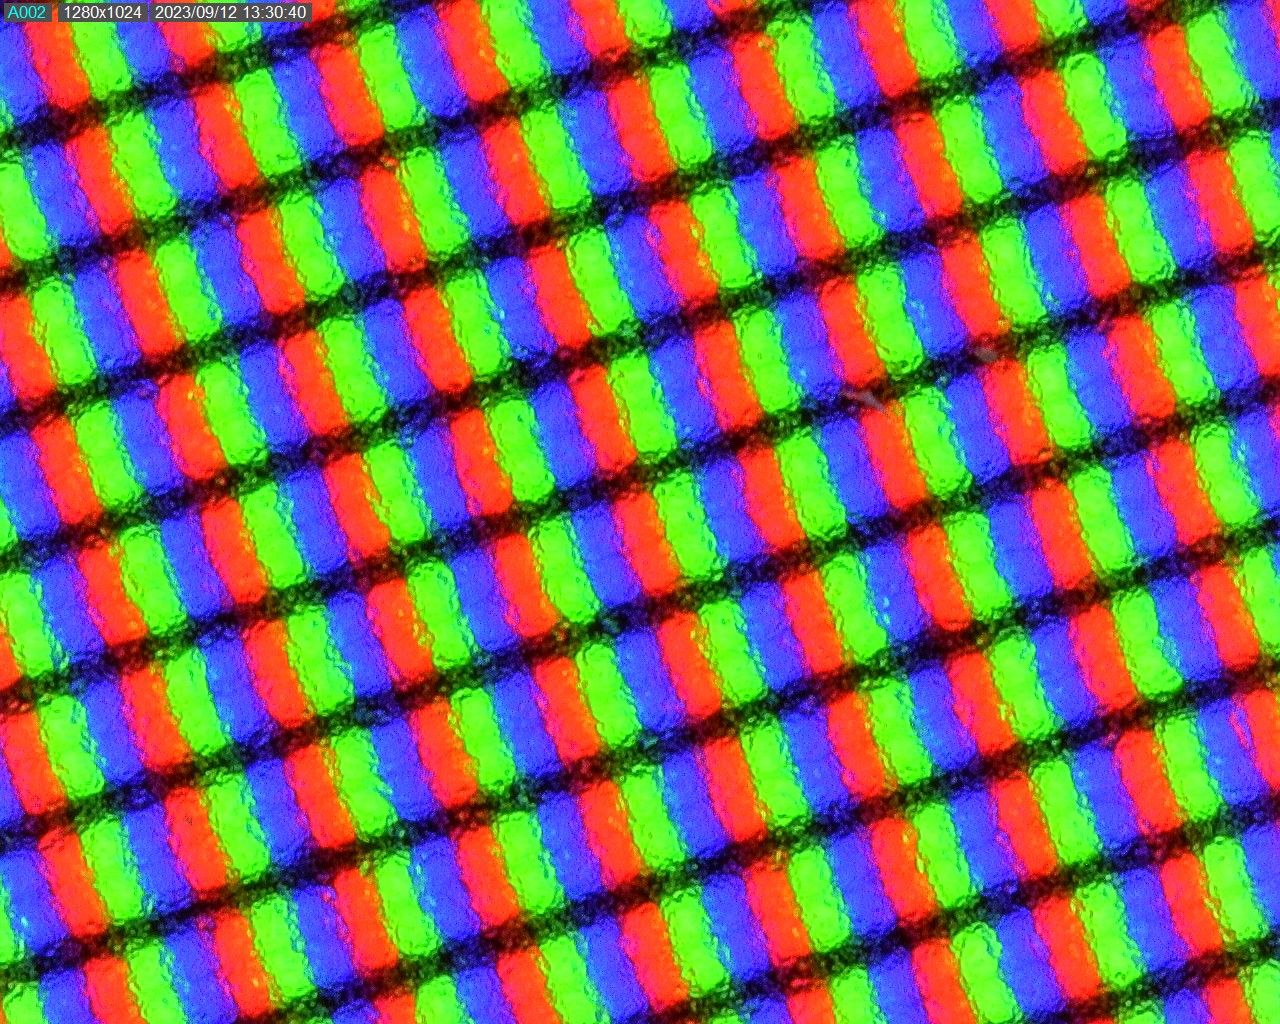
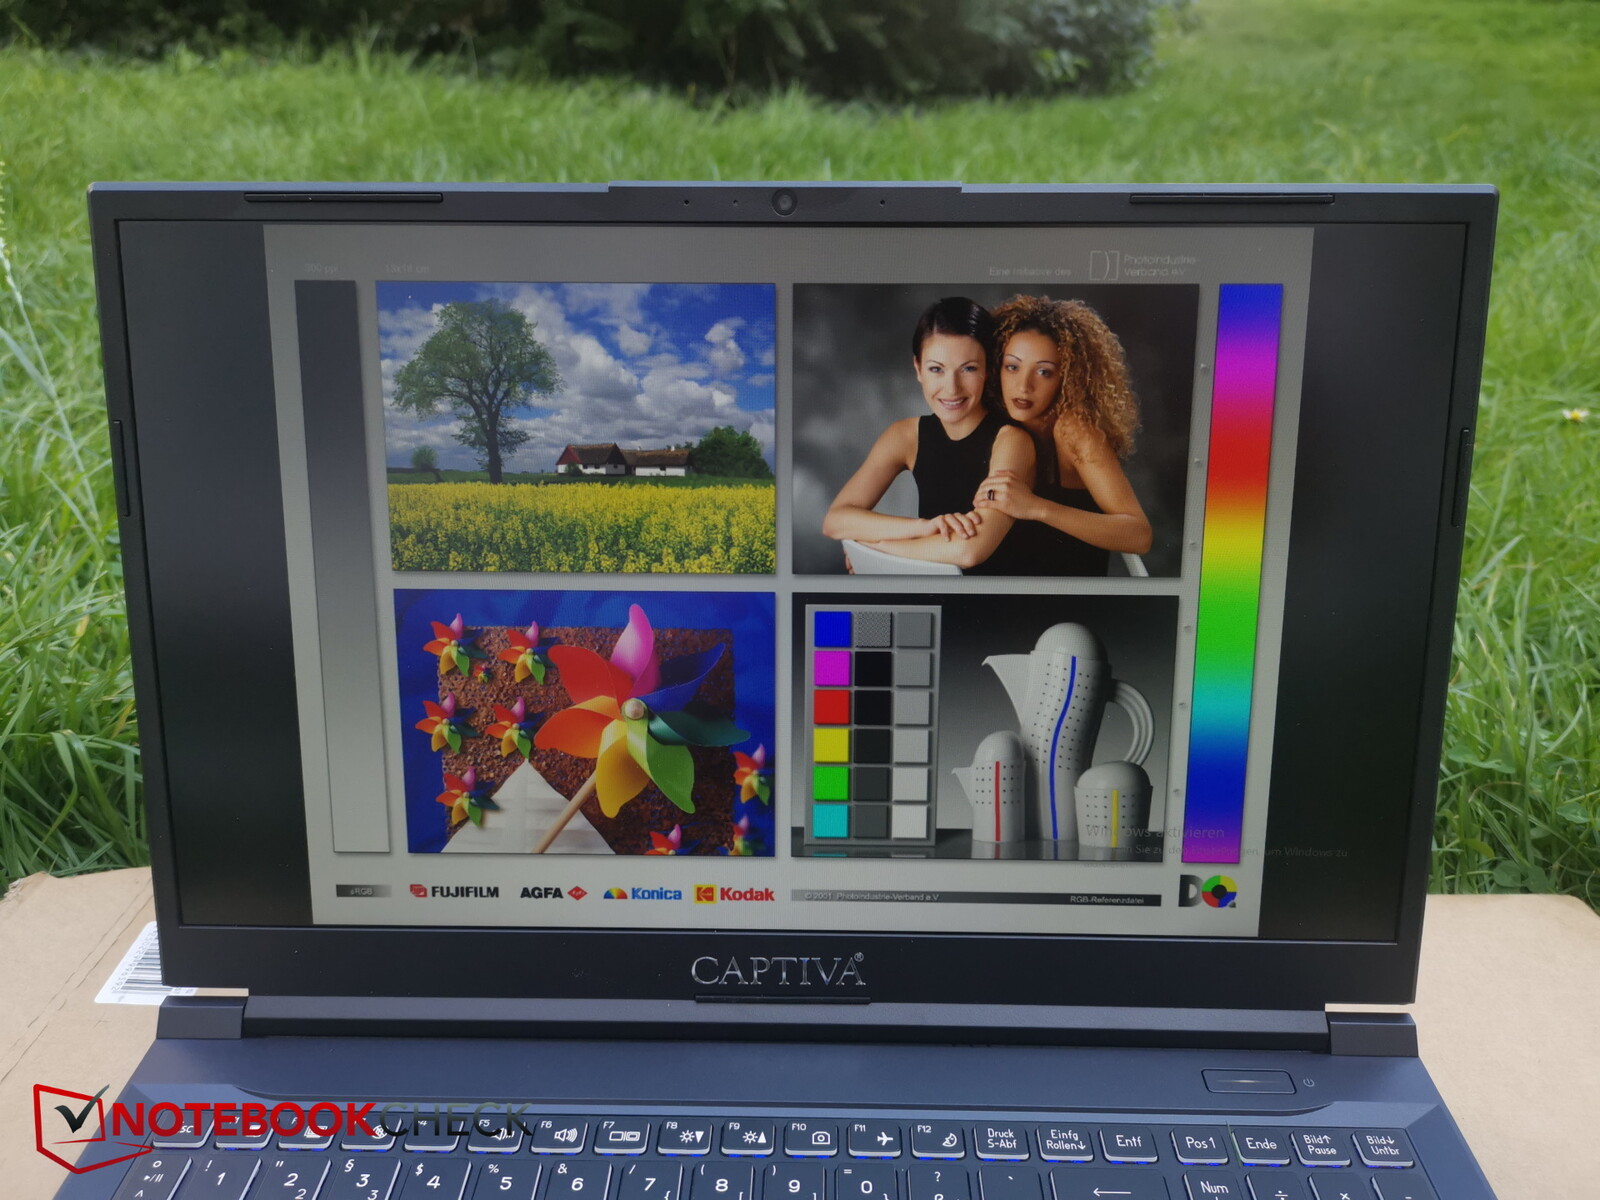
Wyświetlacz - Advanced Gaming ma tylko Full HD
Captiva zainstalowała w laptopie panel Full HD 144 Hz od BOE. Przetestowaliśmy ten sam panel w laptopie Gigabyte A5 K1. Tutaj wyświetlacz jest nieco jaśniejszy (324 vs 281 nitów), ale z kolei jego wartość czerni i kontrast są nieco gorsze. Jego podświetlenie na poziomie 90% jest nawet wystarczające.
Szybkość reakcji panelu jest dobra, nie zauważyliśmy żadnego migotania PWM i jest tylko niewielka ilość krwawienia podświetlenia, które jest ledwo zauważalne.
| |||||||||||||||||||||||||
rozświetlenie: 90 %
na akumulatorze: 346 cd/m²
kontrast: 989:1 (czerń: 0.35 cd/m²)
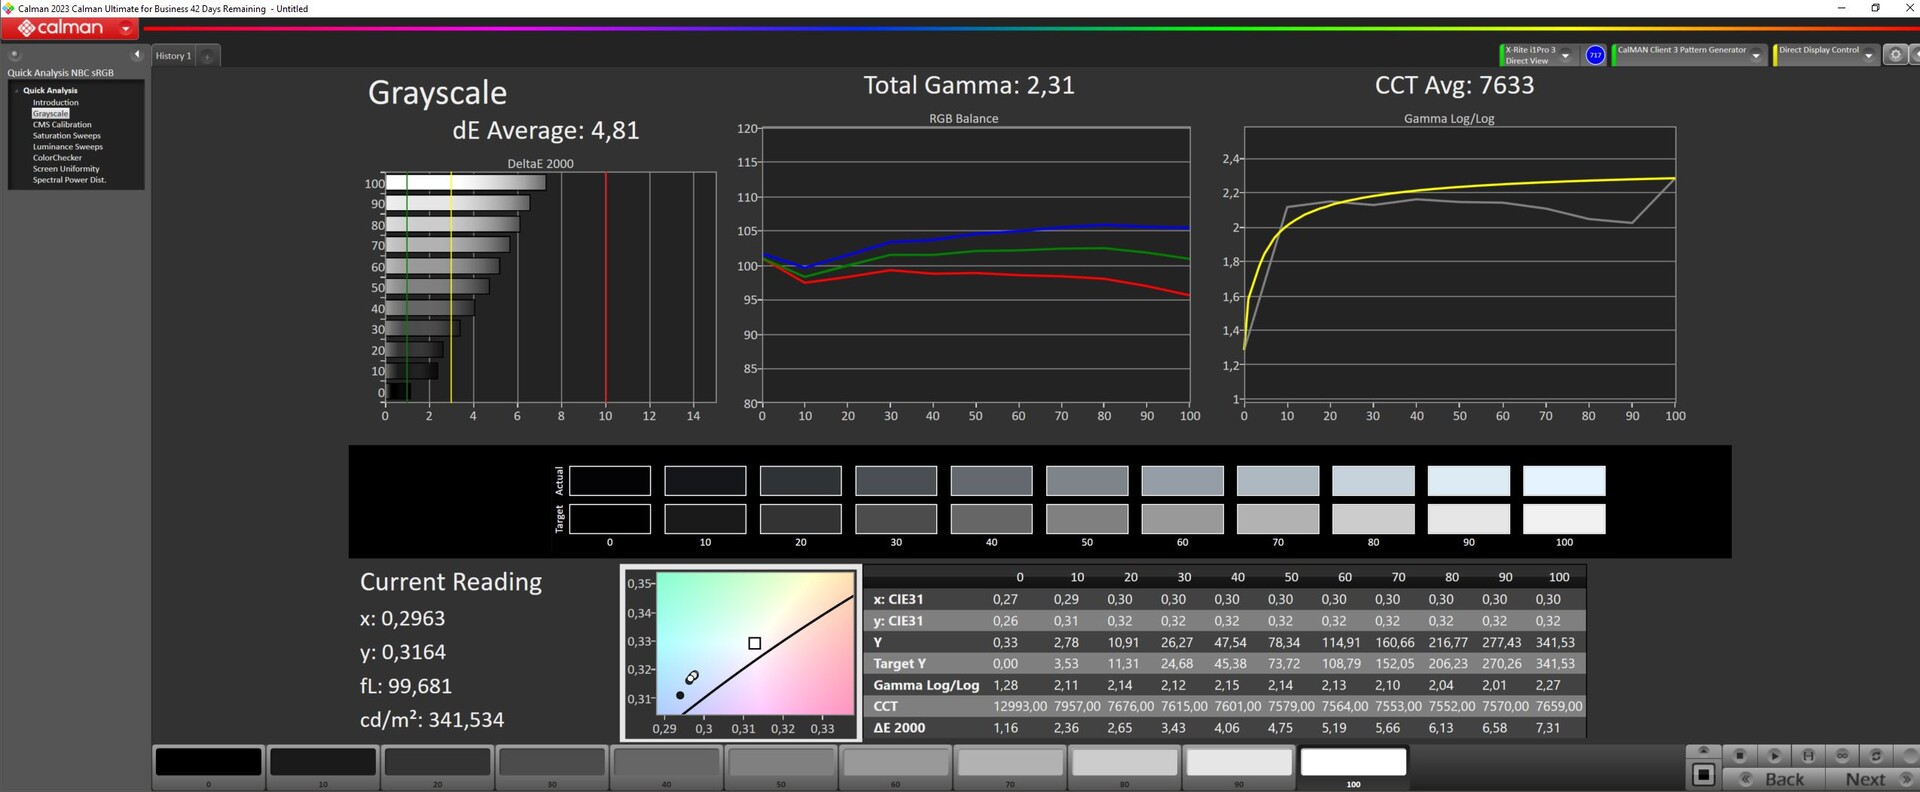
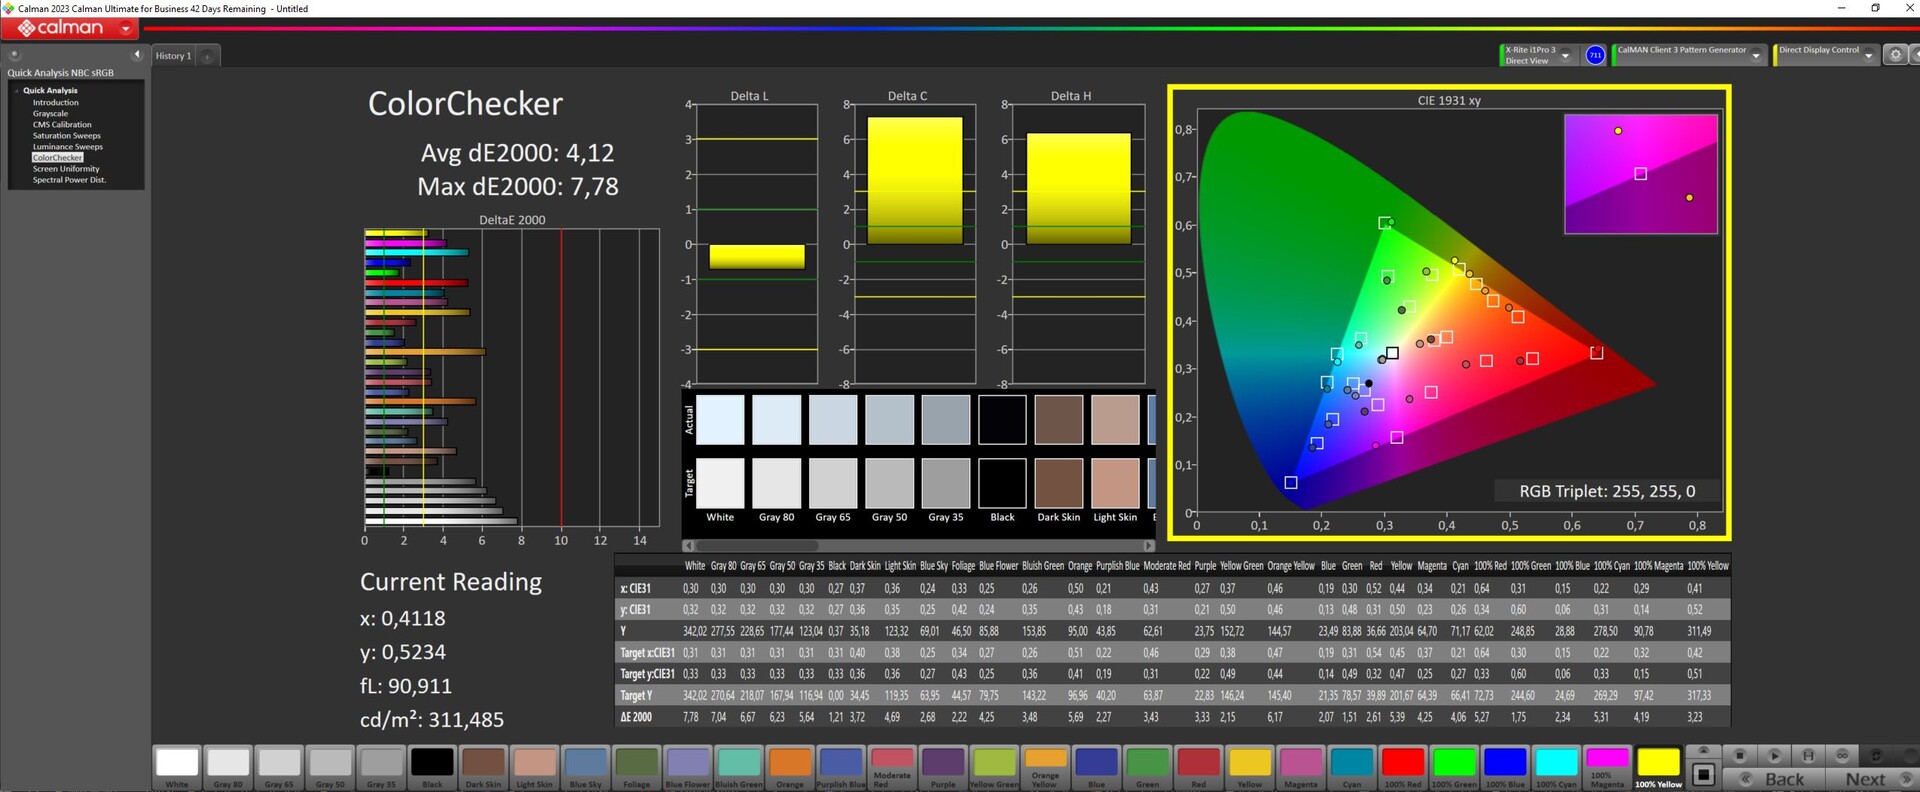
ΔE ColorChecker Calman: 4.12 | ∀{0.5-29.43 Ø4.72}
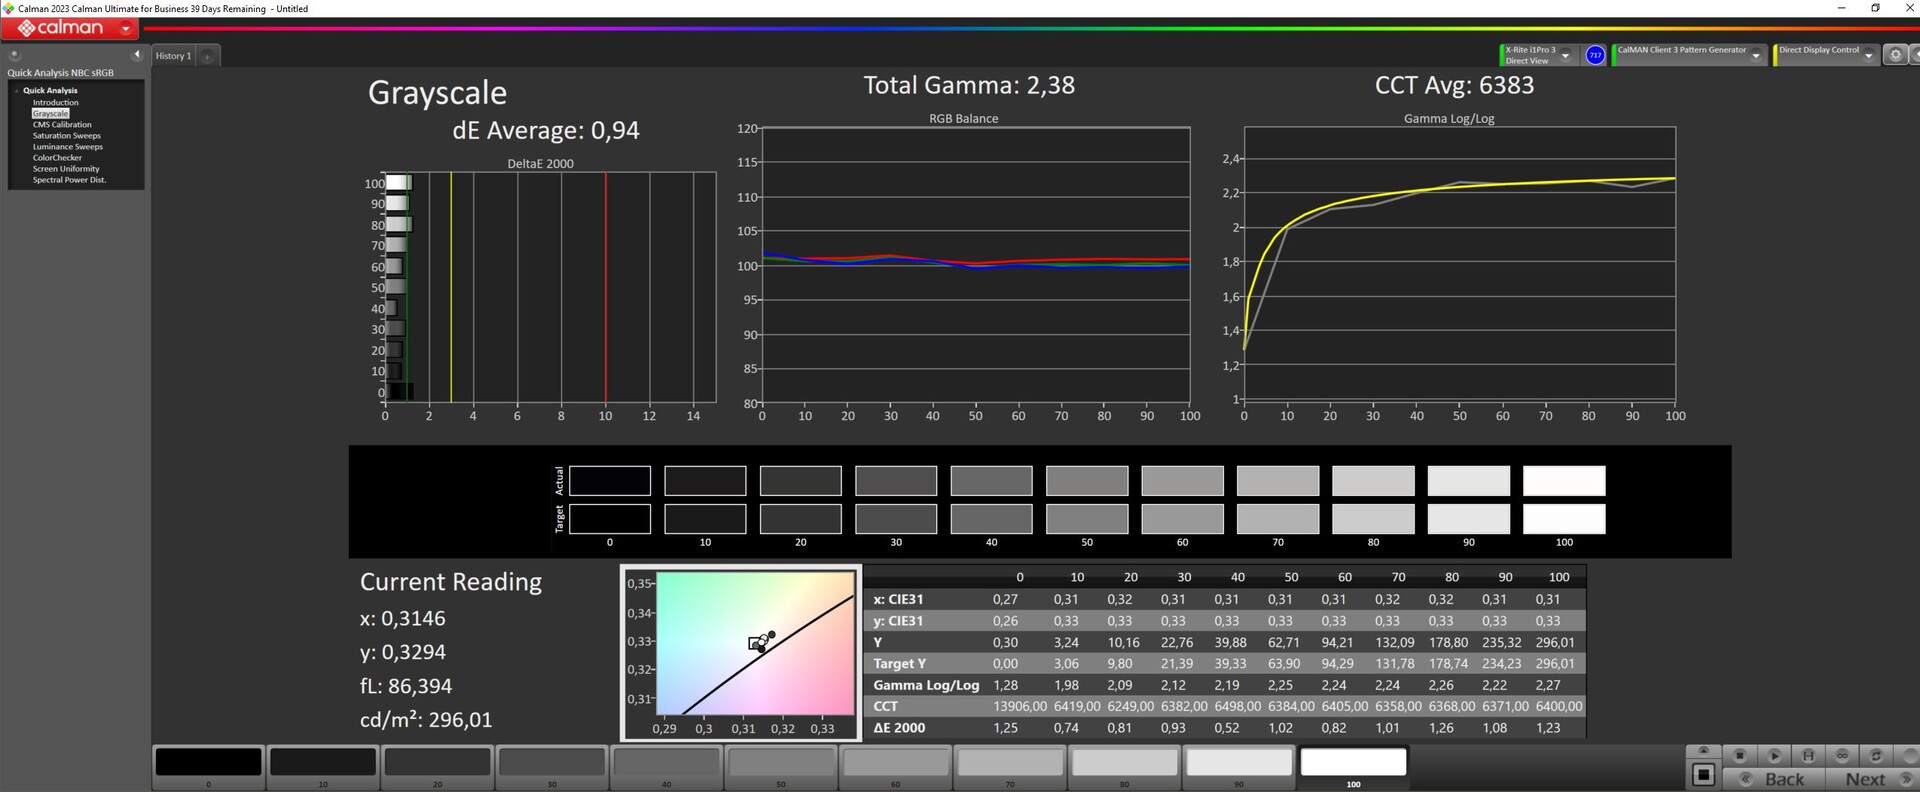
calibrated: 1.22
ΔE Greyscale Calman: 4.81 | ∀{0.09-98 Ø4.97}
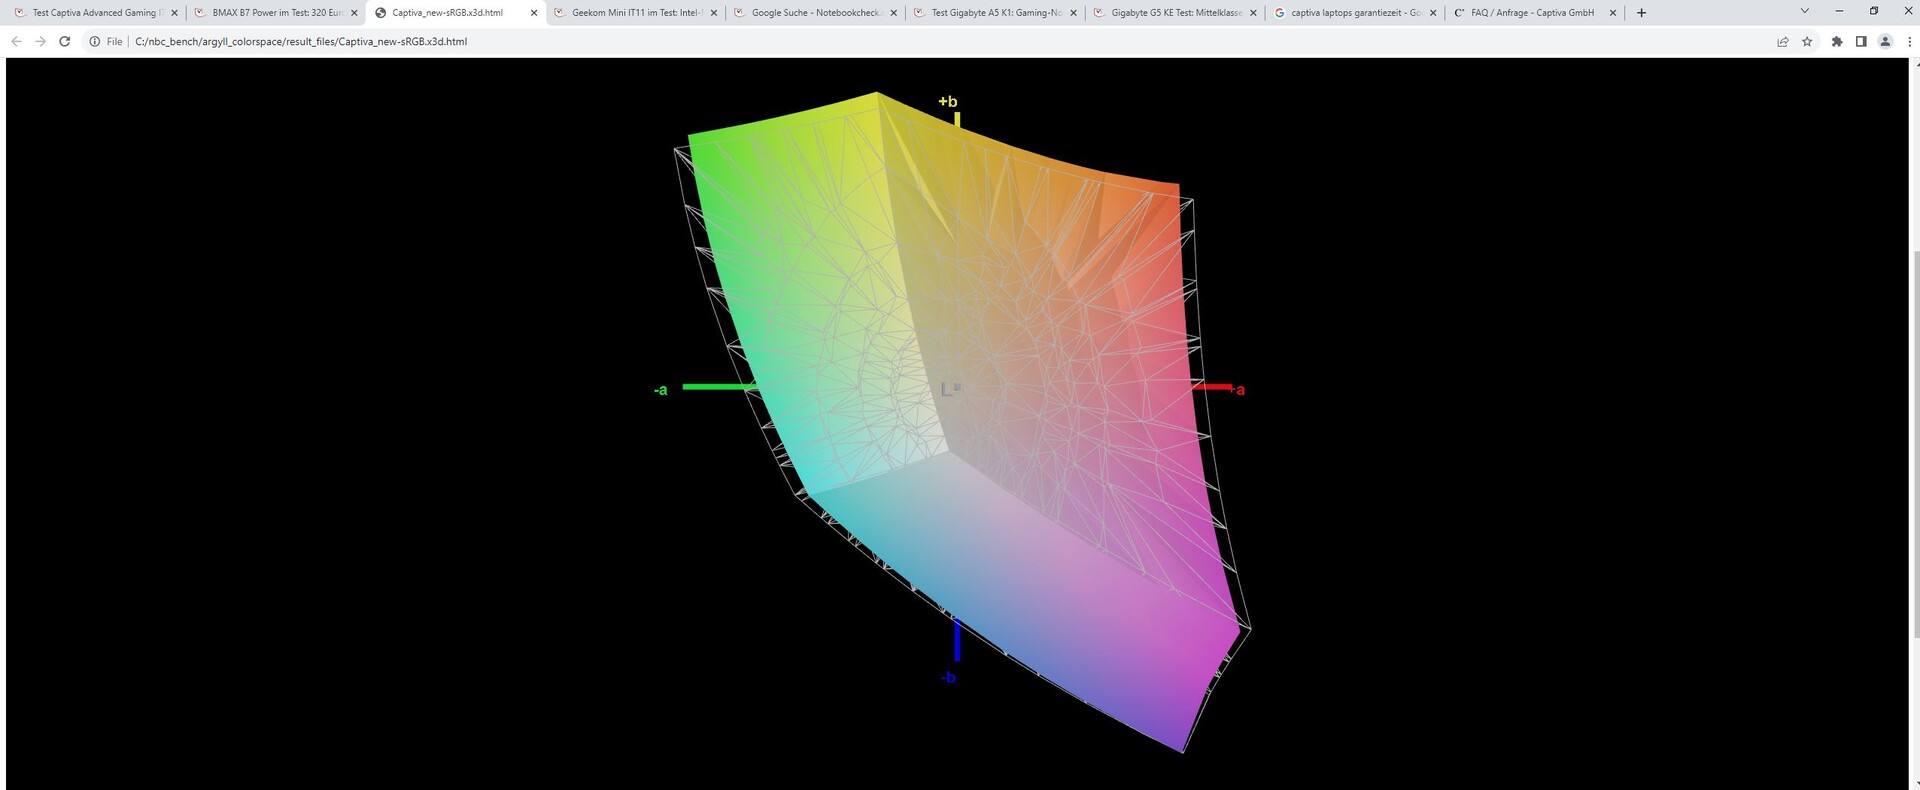
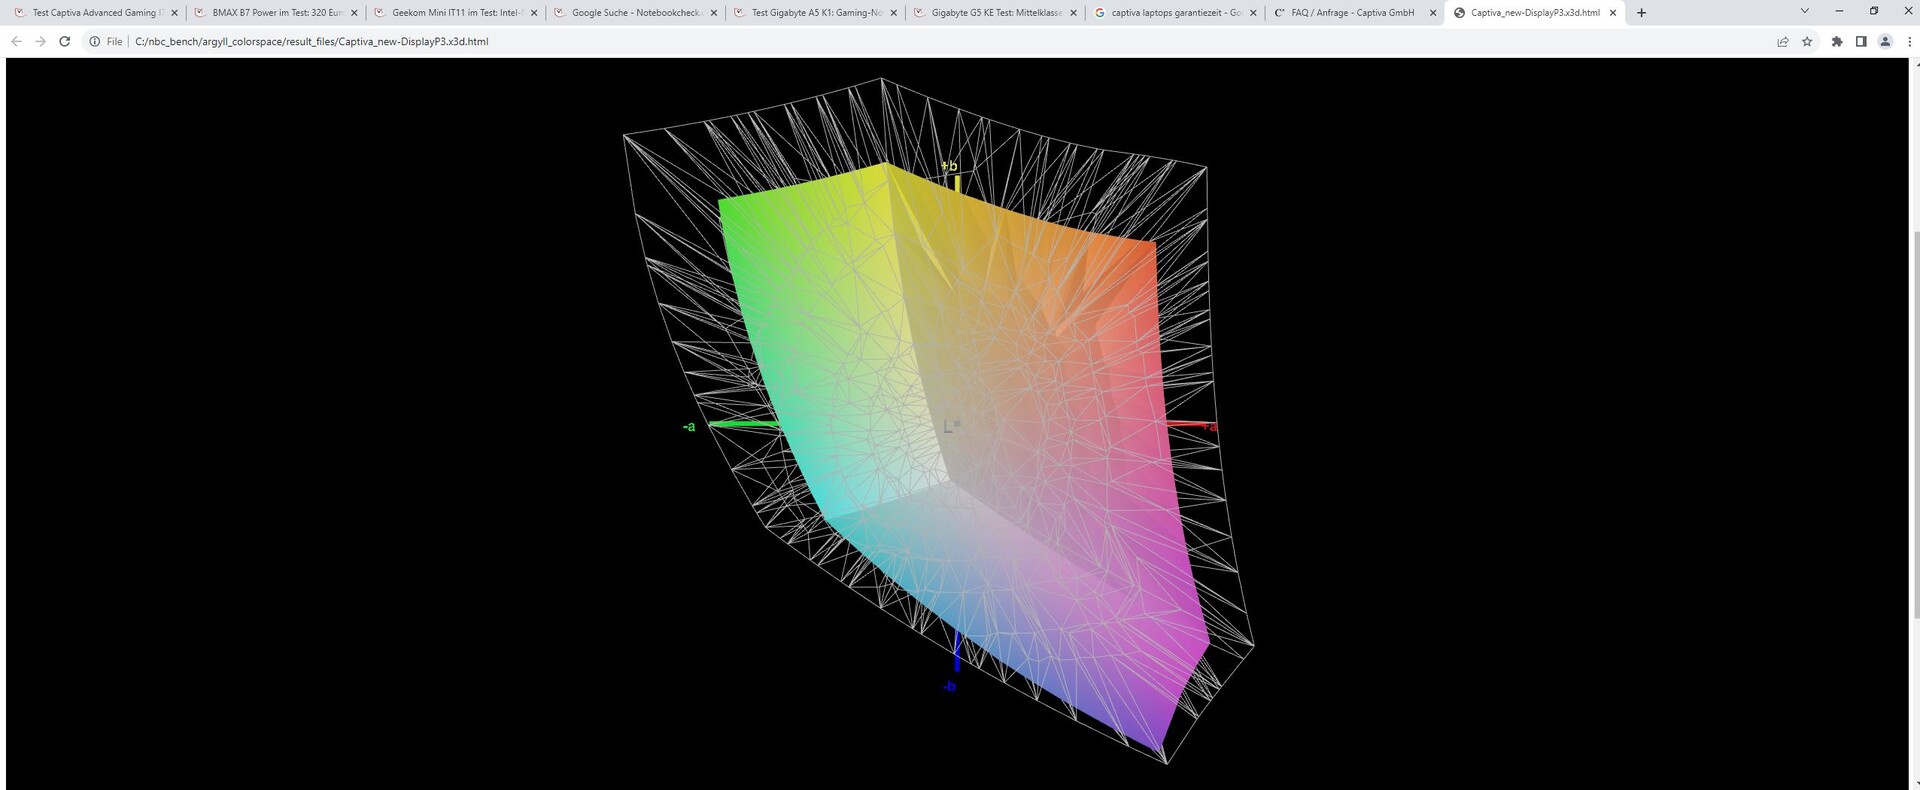
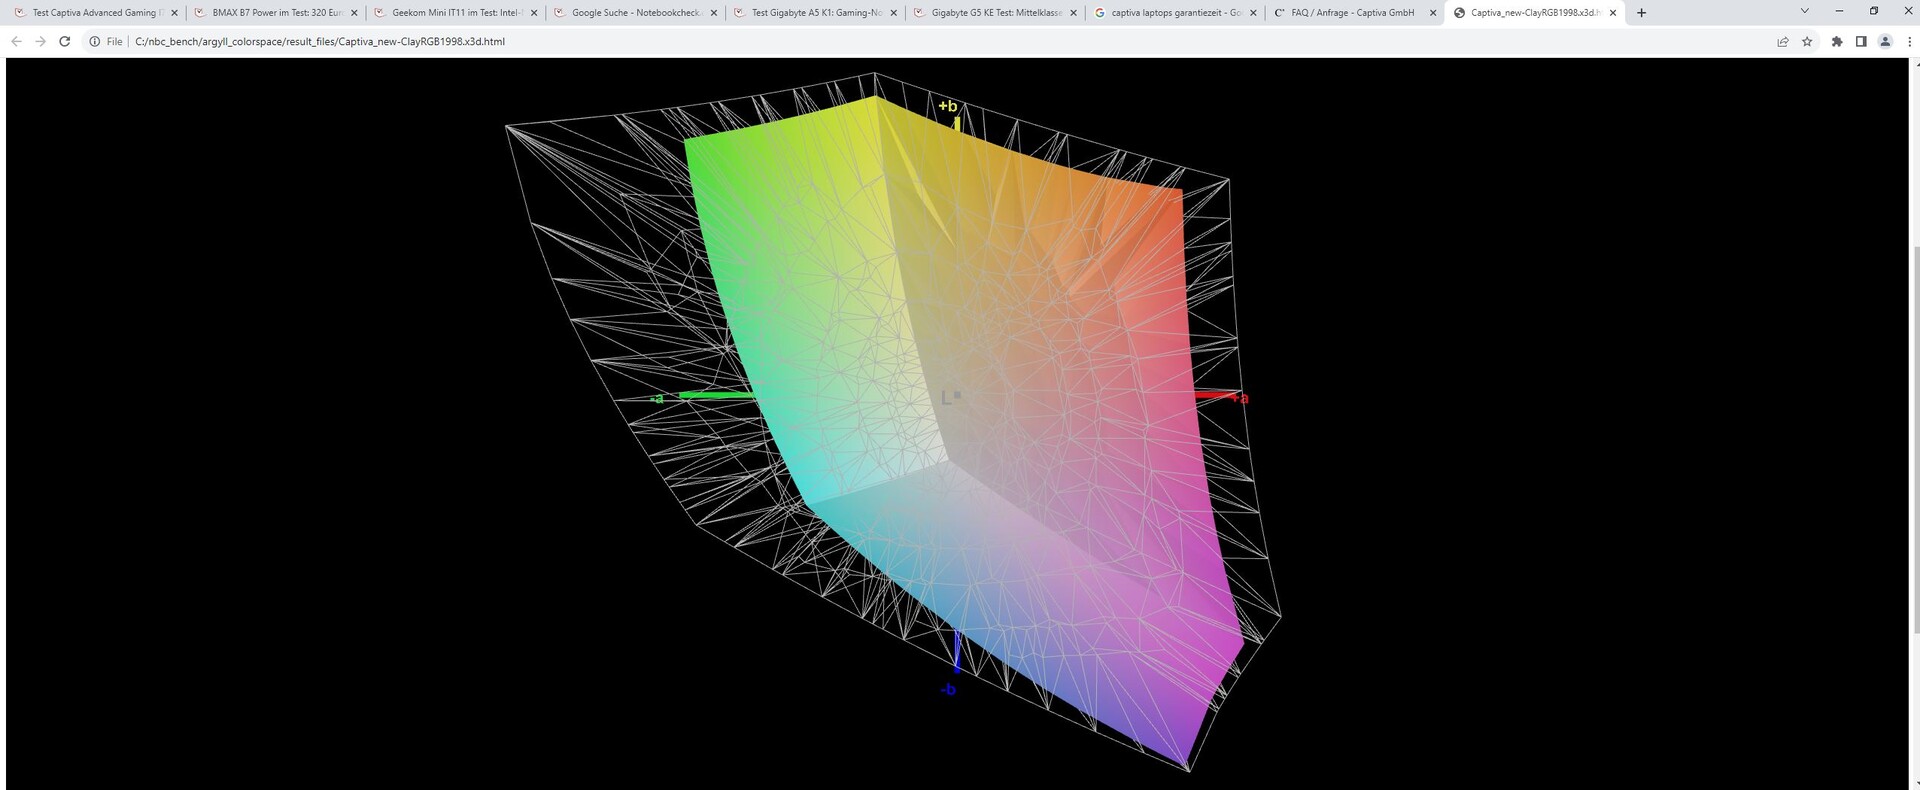
66% AdobeRGB 1998 (Argyll 3D)
93.2% sRGB (Argyll 3D)
64% Display P3 (Argyll 3D)
Gamma: 2.31
CCT: 7633 K
| Captiva Advanced Gaming I74-121 BOE08B3, IPS, 1920x1080, 15.6" | MSI Cyborg 15 A12VF AU Optronics B156HAN15.1, IPS, 1920x1080, 15.6" | Dell G15 5530 AUO B156HAN, IPS, 1920x1080, 15.6" | Lenovo Legion Slim 5 16APH8 BOE NJ NE160QDM-NYC, IPS, 2560x1600, 16" | Lenovo LOQ 15APH8 BOE NJ NE156FHM-NX3, IPS, 1920x1080, 15.6" | Schenker XMG Core 15 (M22) CSOT MNF601CA1-1, IPS, 2560x1440, 15.6" | |
|---|---|---|---|---|---|---|
| Display | -34% | 11% | 7% | -36% | 7% | |
| Display P3 Coverage (%) | 64 | 42.3 -34% | 73.1 14% | 69.3 8% | 40.2 -37% | 68.8 8% |
| sRGB Coverage (%) | 93.2 | 62.6 -33% | 98.4 6% | 100 7% | 60.2 -35% | 99.3 7% |
| AdobeRGB 1998 Coverage (%) | 66 | 43.7 -34% | 74.4 13% | 70 6% | 41.5 -37% | 69.9 6% |
| Response Times | -213% | 31% | -59% | -490% | -111% | |
| Response Time Grey 50% / Grey 80% * (ms) | 5 ? | 22 ? -340% | 3.39 ? 32% | 10.7 ? -114% | 42.7 ? -754% | 16 ? -220% |
| Response Time Black / White * (ms) | 7.55 ? | 14 ? -85% | 5.35 ? 29% | 7.8 ? -3% | 24.5 ? -225% | 7.6 ? -1% |
| PWM Frequency (Hz) | 21620 ? | |||||
| Screen | -19% | -0% | 27% | -14% | -0% | |
| Brightness middle (cd/m²) | 346 | 247 -29% | 320 -8% | 371.6 7% | 346.2 0% | 378 9% |
| Brightness (cd/m²) | 324 | 234 -28% | 316 -2% | 343 6% | 329 2% | 371 15% |
| Brightness Distribution (%) | 90 | 89 -1% | 94 4% | 84 -7% | 81 -10% | 93 3% |
| Black Level * (cd/m²) | 0.35 | 0.25 29% | 0.21 40% | 0.44 -26% | 0.31 11% | 0.33 6% |
| Contrast (:1) | 989 | 988 0% | 1524 54% | 845 -15% | 1117 13% | 1145 16% |
| Colorchecker dE 2000 * | 4.12 | 3.78 8% | 4.55 -10% | 1.52 63% | 4.19 -2% | 2.84 31% |
| Colorchecker dE 2000 max. * | 7.78 | 6.42 17% | 9.83 -26% | 2.68 66% | 19.19 -147% | 5.51 29% |
| Colorchecker dE 2000 calibrated * | 1.22 | 3.94 -223% | 1.51 -24% | 0.33 73% | 1.66 -36% | 2.75 -125% |
| Greyscale dE 2000 * | 4.81 | 2.16 55% | 6.2 -29% | 1.2 75% | 2.6 46% | 4.08 15% |
| Gamma | 2.31 95% | 2.33 94% | 2.07 106% | 2.1 105% | 2.19 100% | 2.4 92% |
| CCT | 7633 85% | 6906 94% | 6479 100% | 6503 100% | 6749 96% | 5841 111% |
| Całkowita średnia (program / ustawienia) | -89% /
-50% | 14% /
7% | -8% /
10% | -180% /
-87% | -35% /
-14% |
* ... im mniej tym lepiej
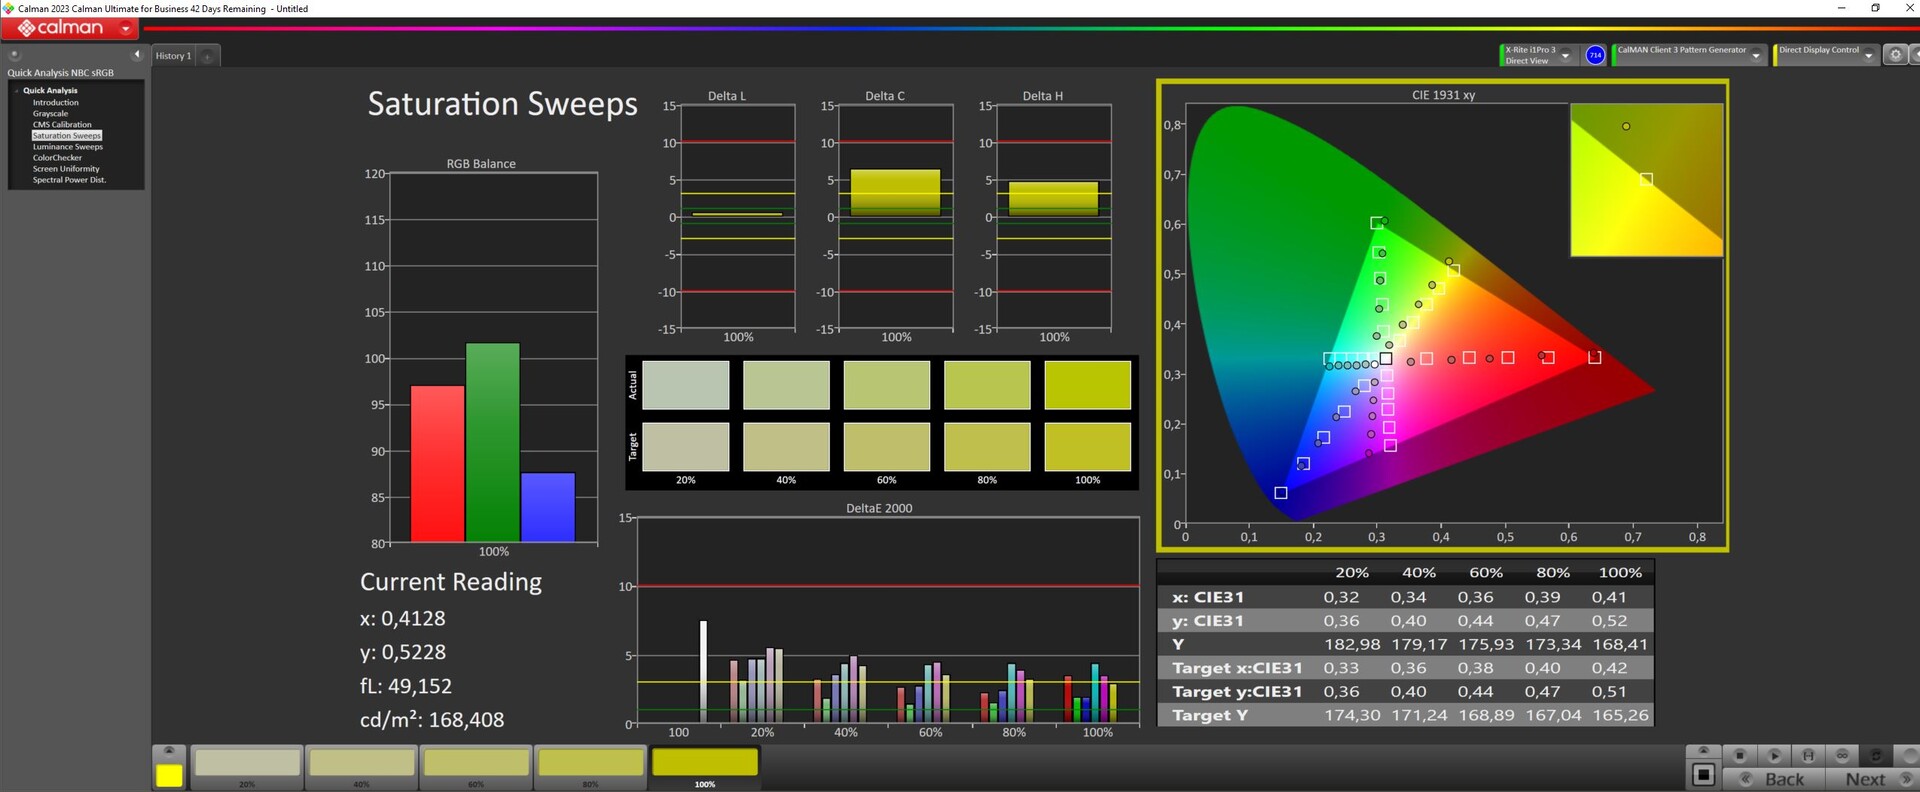
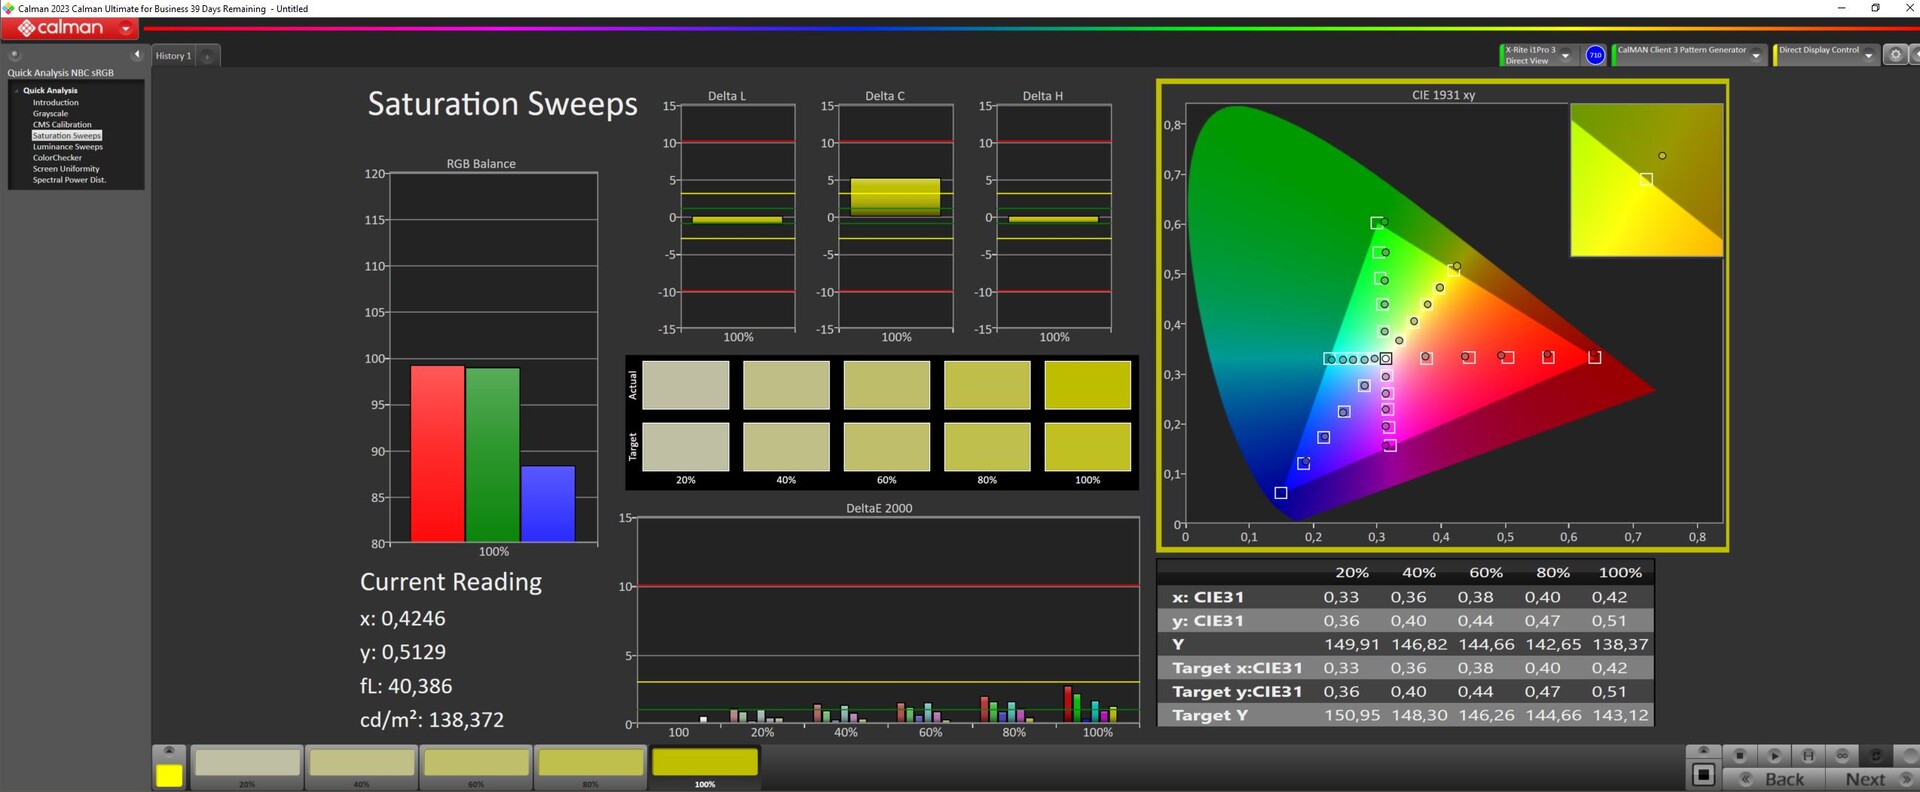
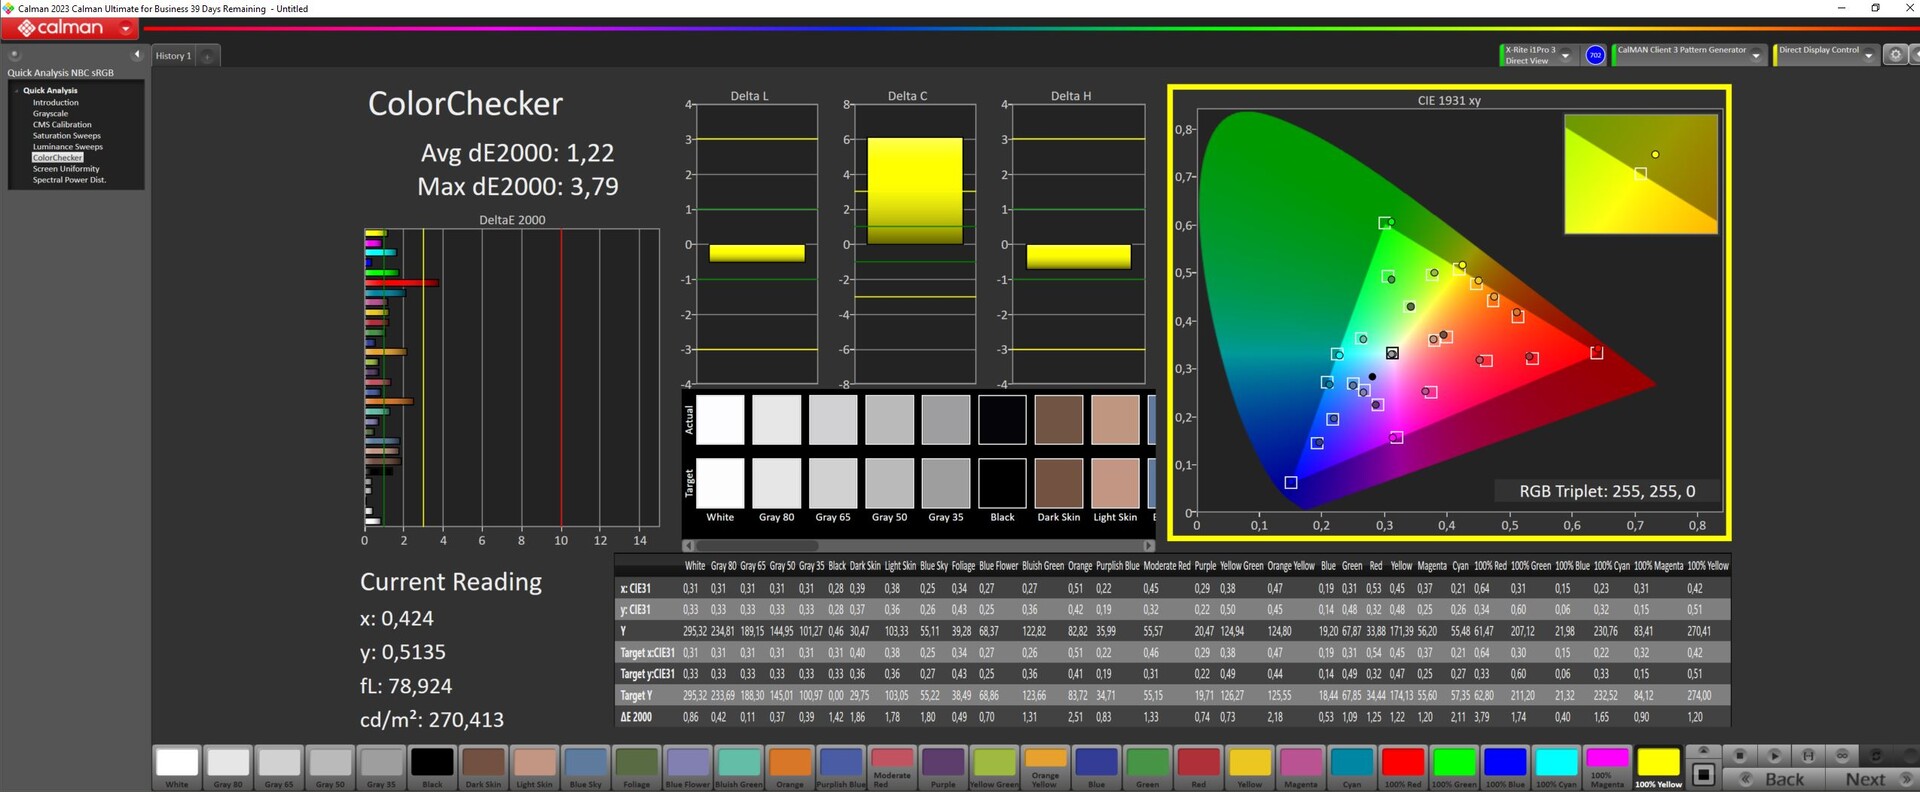
Panel BOE nie ma zbyt dużego pokrycia przestrzeni kolorów. Nawet sRGB jest pokryte tylko w 93 procentach, DisplayP3 i AdobeRGB w około 65 procentach.
Ex działa, panel jest skalibrowany nieoptymalnie, a jego odchylenia kolorów są dość wysokie. Kalibracja za pomocą urządzenia do pomiaru kolorów XRite i oprogramowania Calman znacznie obniżyła wartości DeltaE kolorów i skali szarości. Wcześniej odchylenia wynosiły ponad 4, a po kalibracji około 1.
Nasz skalibrowany profil icc można pobrać za darmo, przewijając nieco dalej.
Wyświetl czasy reakcji
| ↔ Czas reakcji od czerni do bieli | ||
|---|---|---|
| 7.55 ms ... wzrost ↗ i spadek ↘ łącznie | ↗ 3.7 ms wzrost | 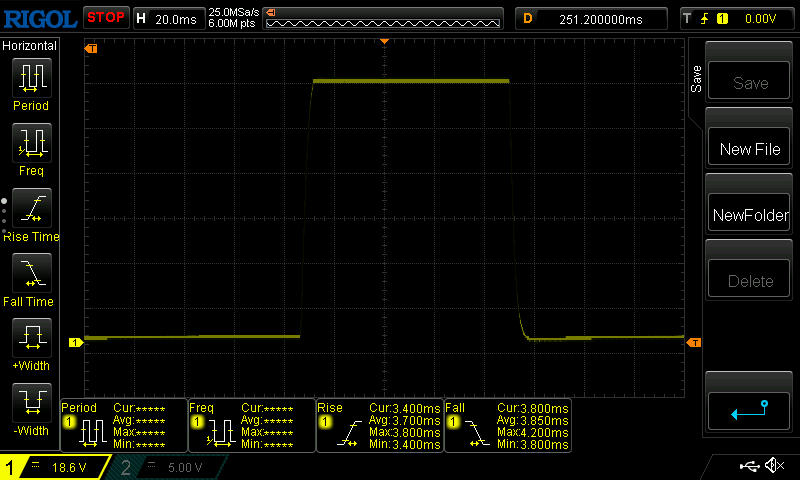 |
| ↘ 3.85 ms upadek | ||
| W naszych testach ekran wykazuje bardzo szybką reakcję i powinien bardzo dobrze nadawać się do szybkich gier. Dla porównania, wszystkie testowane urządzenia wahają się od 0.1 (minimum) do 240 (maksimum) ms. » 22 % wszystkich urządzeń jest lepszych. Oznacza to, że zmierzony czas reakcji jest lepszy od średniej wszystkich testowanych urządzeń (19.8 ms). | ||
| ↔ Czas reakcji 50% szarości do 80% szarości | ||
| 5 ms ... wzrost ↗ i spadek ↘ łącznie | ↗ 2.422 ms wzrost | 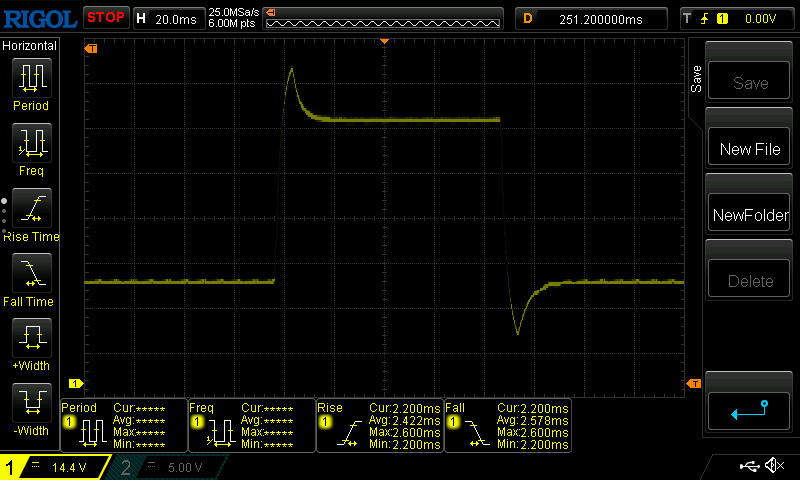 |
| ↘ 2.578 ms upadek | ||
| W naszych testach ekran wykazuje bardzo szybką reakcję i powinien bardzo dobrze nadawać się do szybkich gier. Dla porównania, wszystkie testowane urządzenia wahają się od 0.165 (minimum) do 636 (maksimum) ms. » 17 % wszystkich urządzeń jest lepszych. Oznacza to, że zmierzony czas reakcji jest lepszy od średniej wszystkich testowanych urządzeń (31 ms). | ||
Migotanie ekranu / PWM (modulacja szerokości impulsu)
| Migotanie ekranu/nie wykryto PWM | 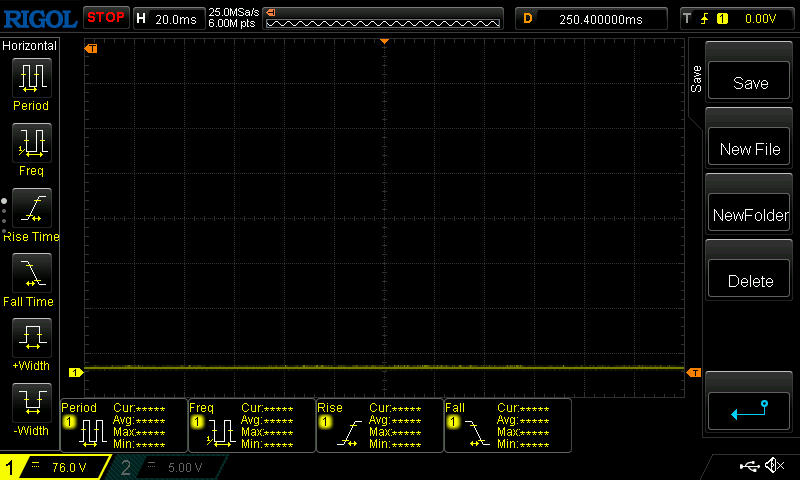 | ||
Dla porównania: 52 % wszystkich testowanych urządzeń nie używa PWM do przyciemniania wyświetlacza. Jeśli wykryto PWM, zmierzono średnio 7781 (minimum: 5 - maksimum: 343500) Hz. | |||
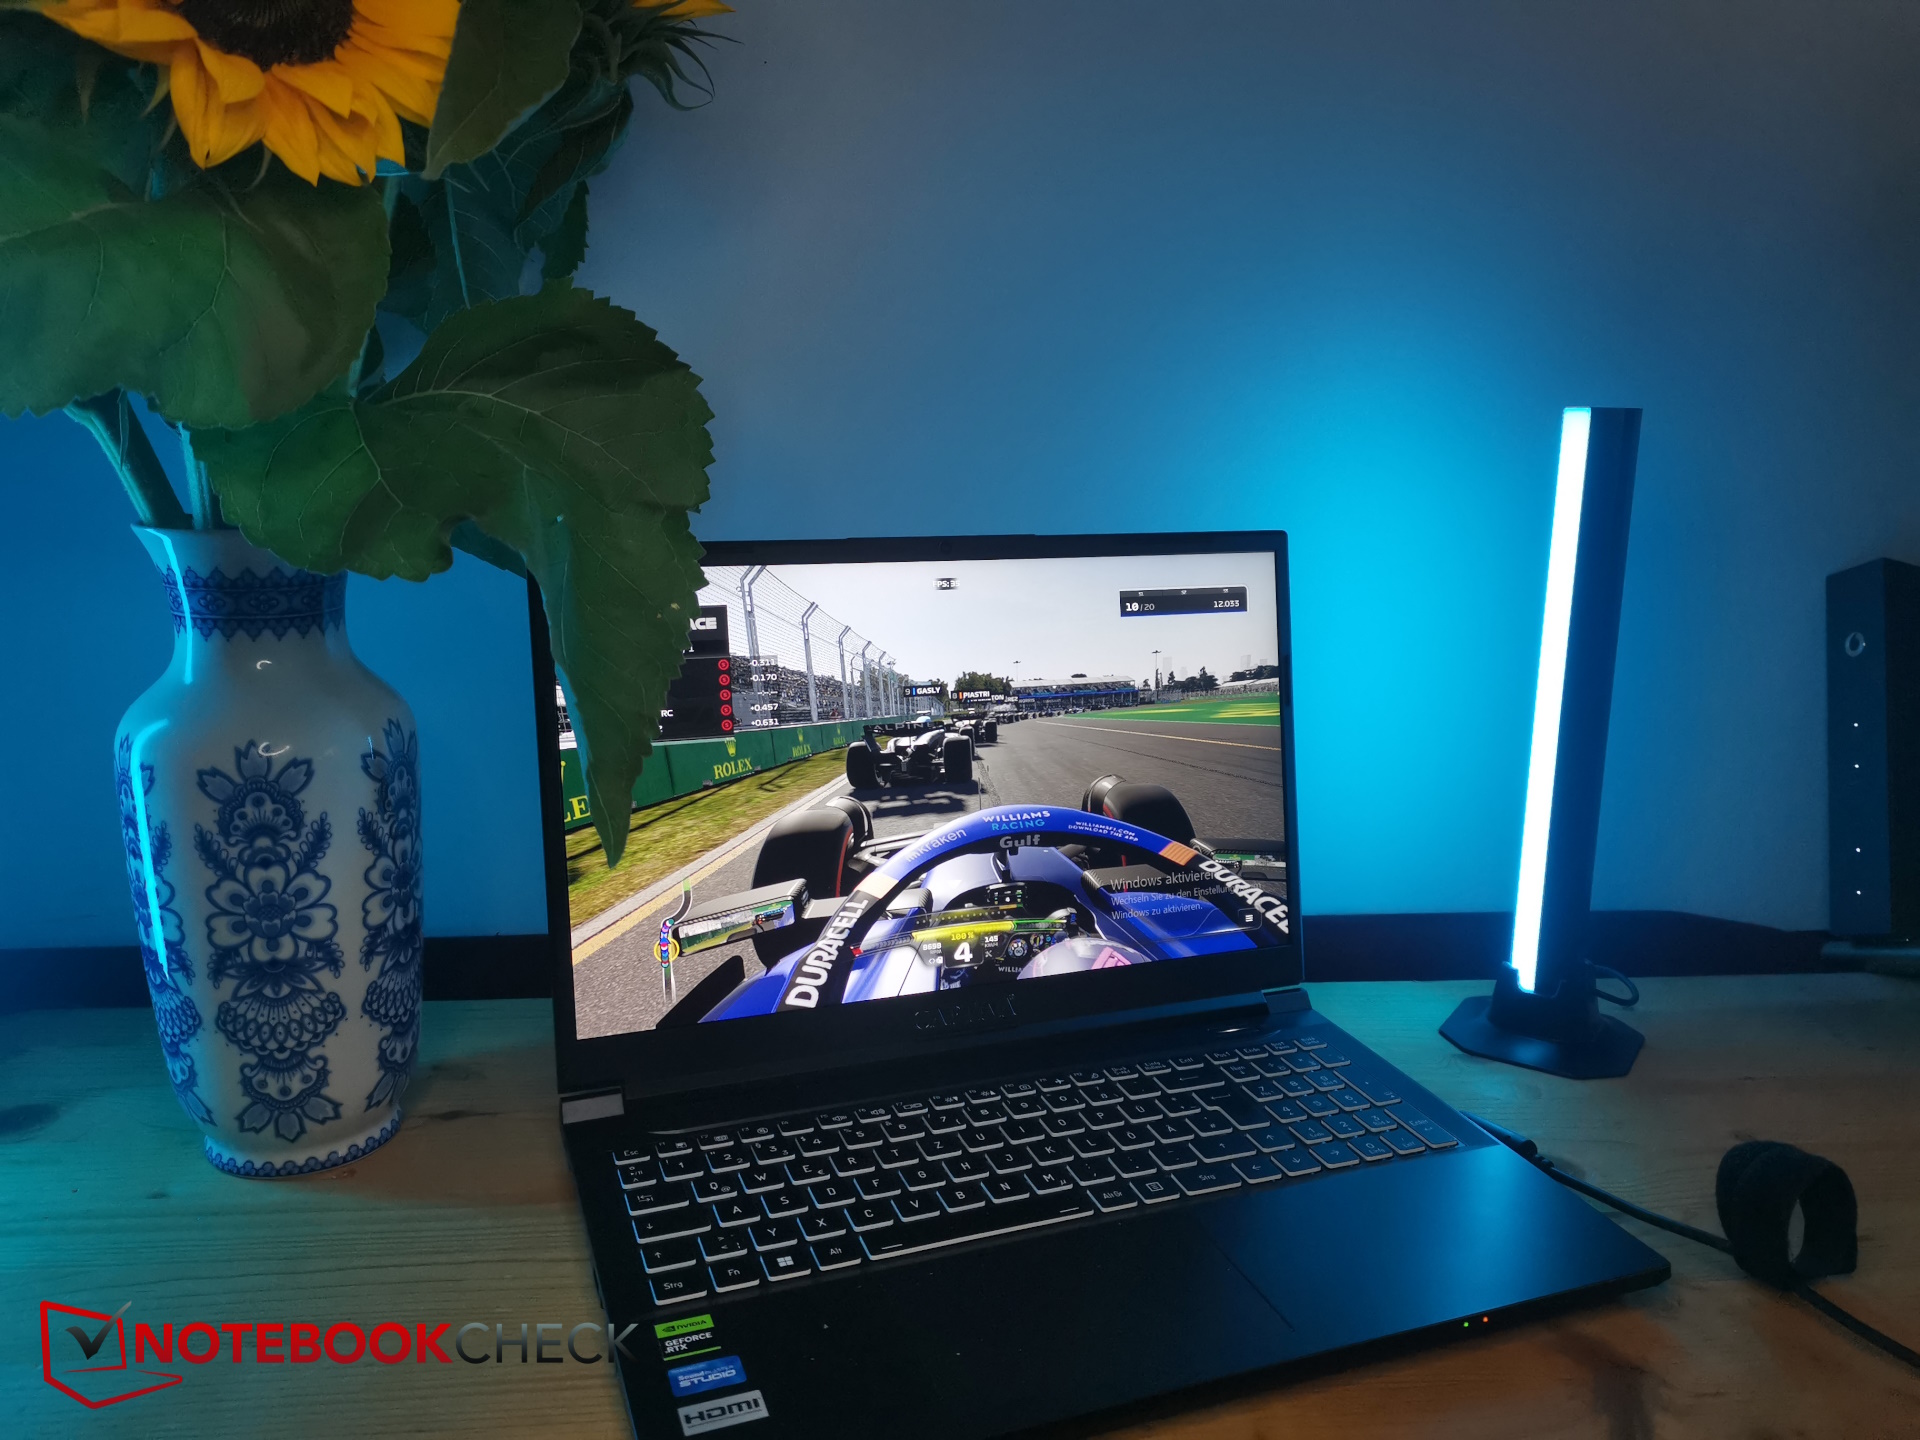
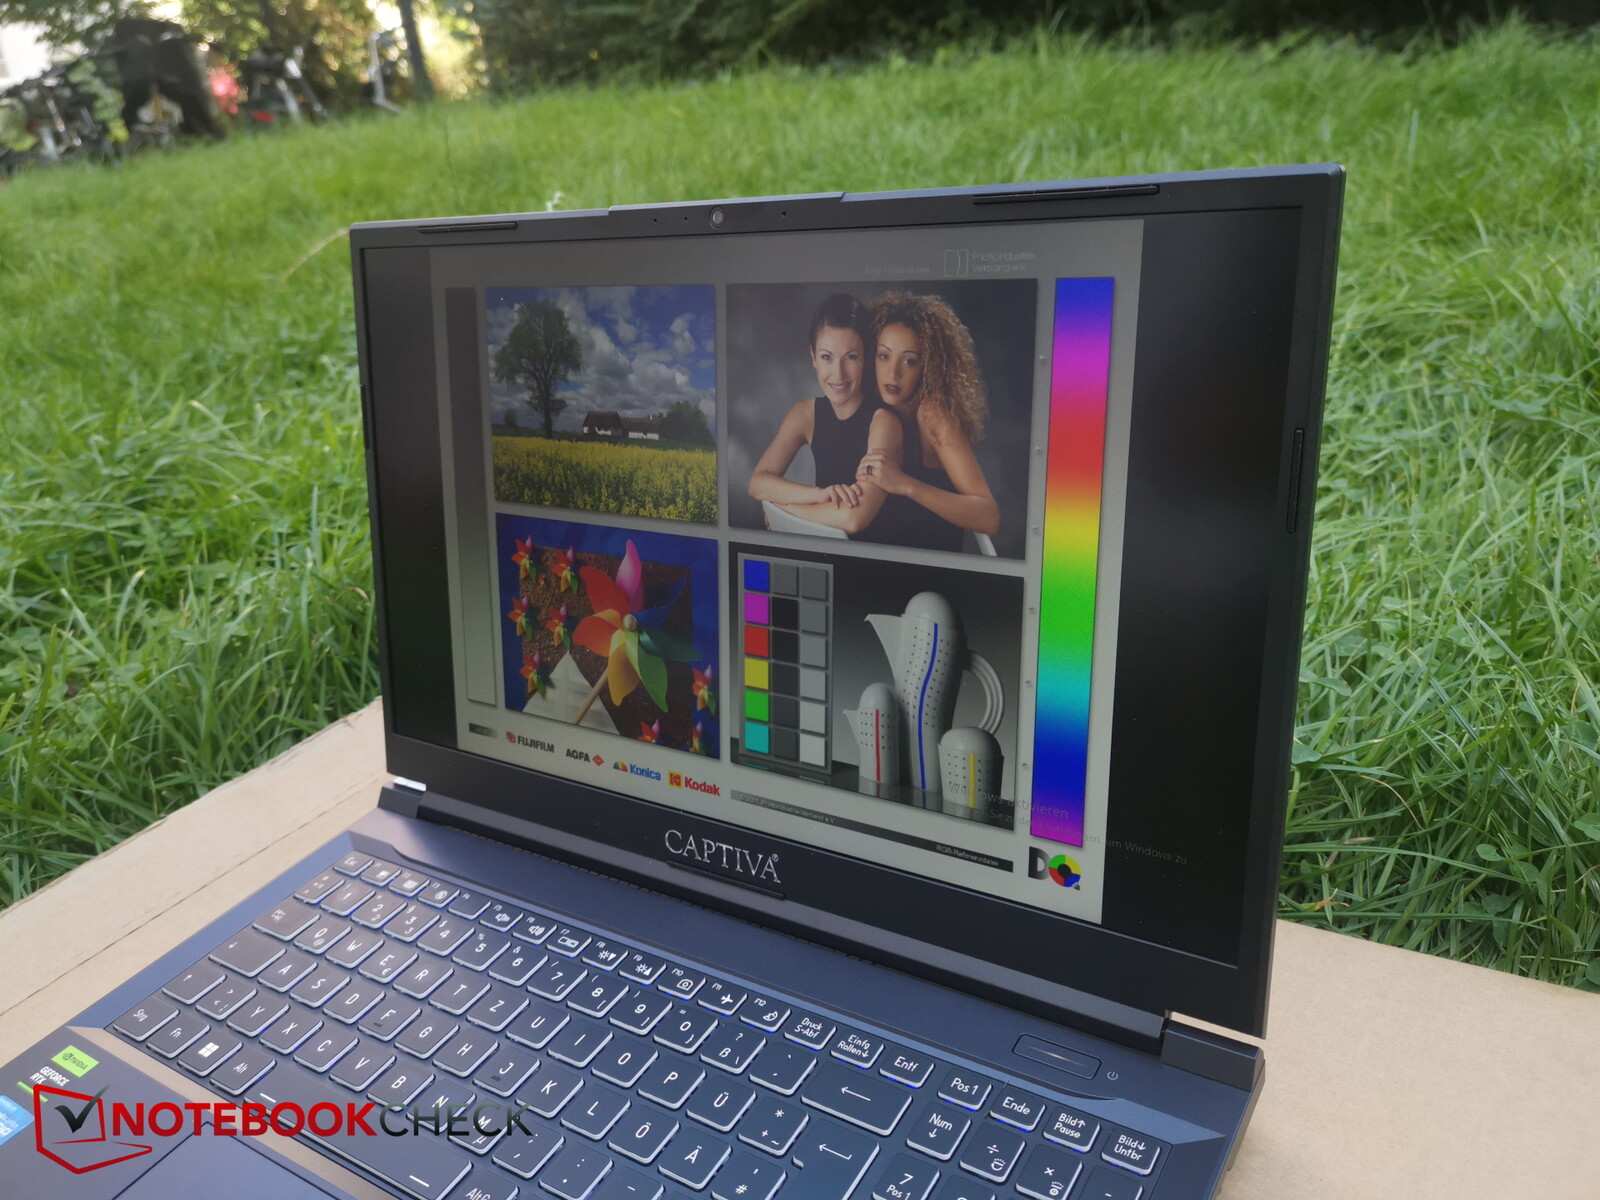
Na zewnątrz można czytać z ekranu w cieniu. Jego matowa powierzchnia zapobiega większości odbić, a jasność jest wystarczająca i wynosi ponad 300 nitów. Zdecydowanie należy jednak unikać bezpośredniego światła słonecznego.

Wydajność - i5-13500H z RTX 4060 (140 W)
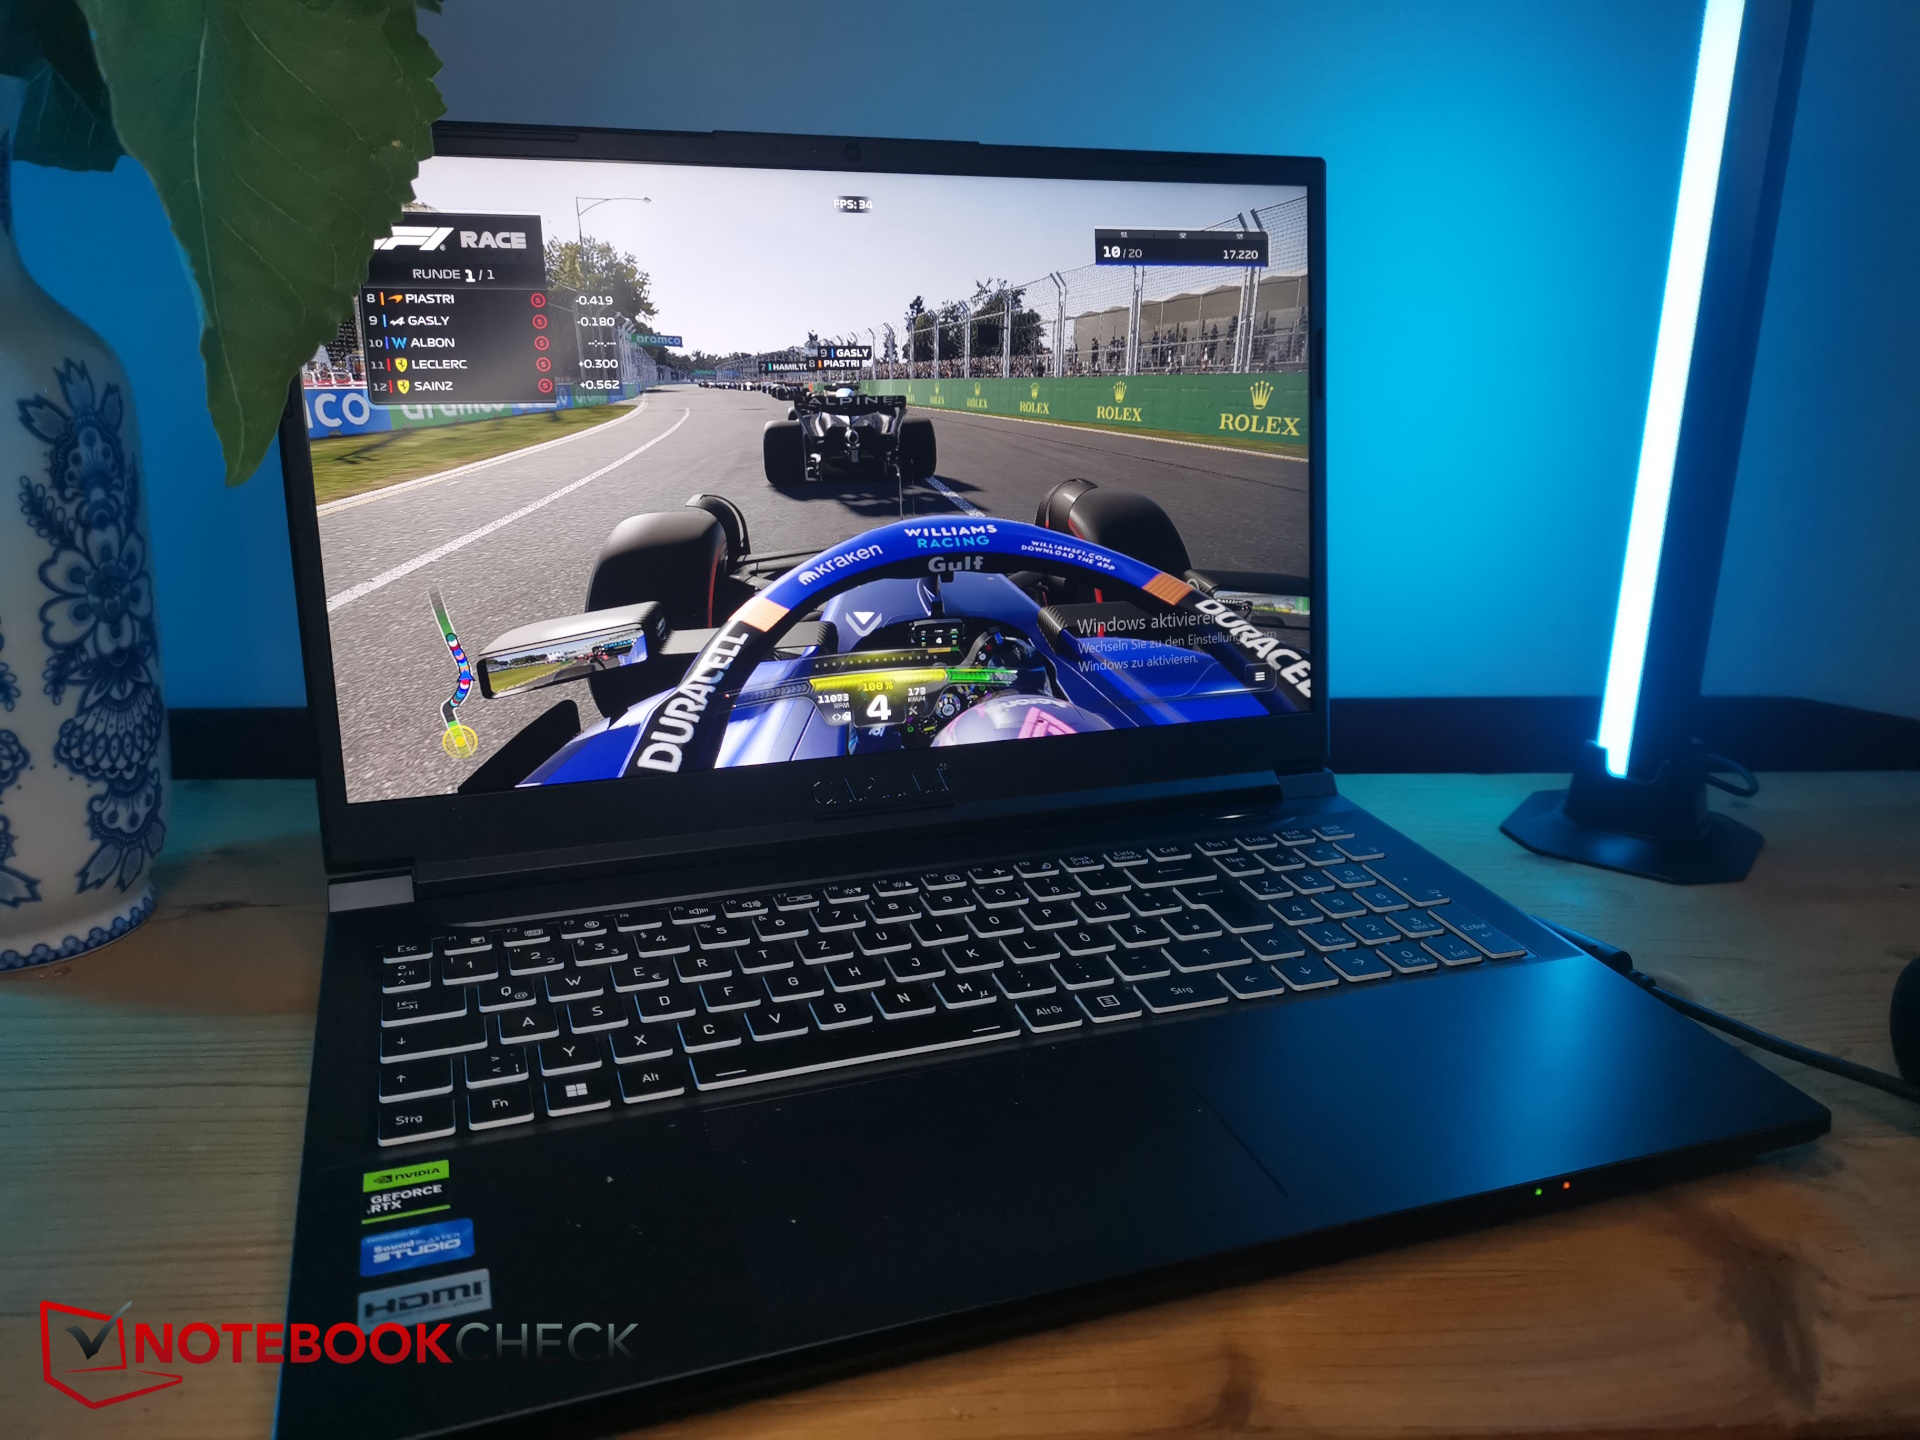
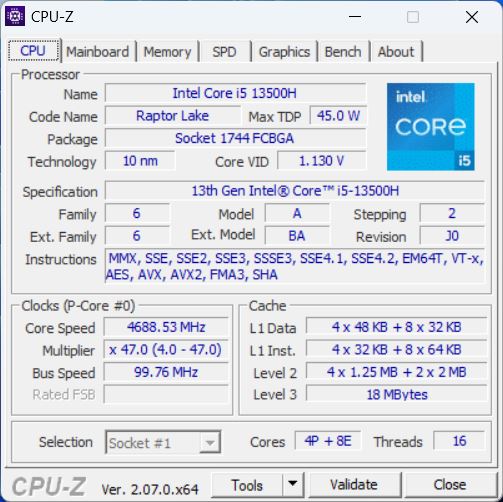
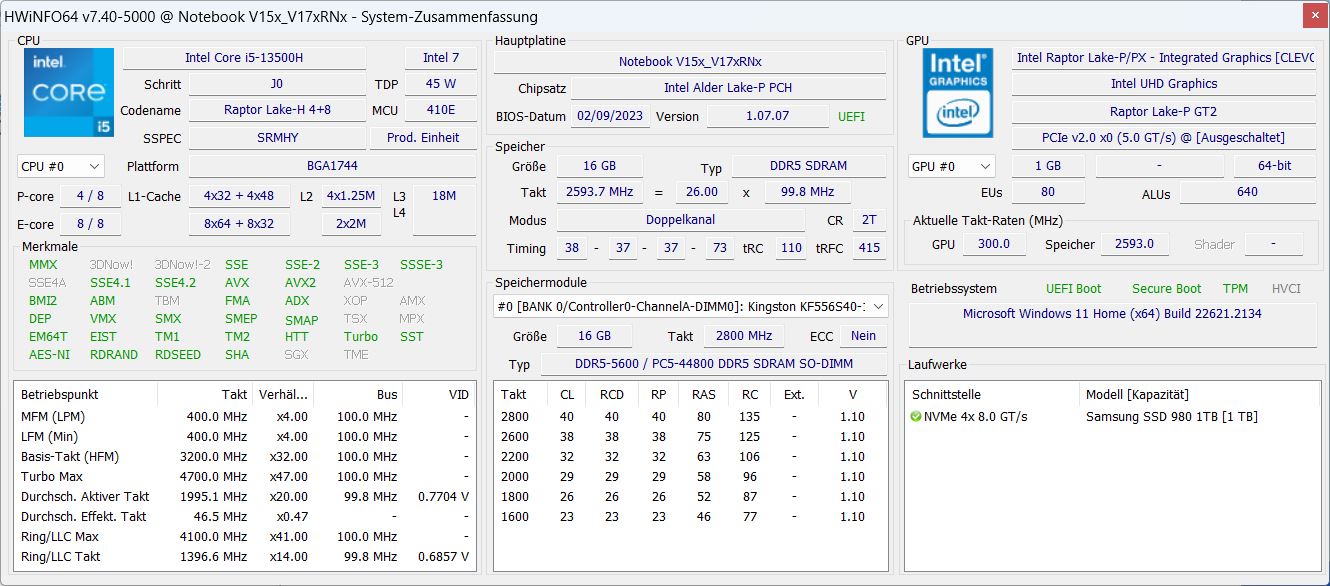
Nasz 15-calowy model jest wyposażony wCore i5-13500HorazRTX 4060, 16 GB pamięci RAM i dysk SSD o pojemności 1 TB, co czyni go laptopem do gier klasy podstawowej i średniej. Jego wyświetlacz 16:9 Full HD i stosunkowo niska cena sugerują, że można go zaklasyfikować bardziej jako urządzenie budżetowe.
Alternatywnie, można nabyć laptopa z kartą graficznąRTX 4070zamiast RTX 4060 - ale tylko 17-calowe modele oferują opcję wyboruRTX 4080a także znacznie szybsze procesory Intel HX.
Warunki testowania
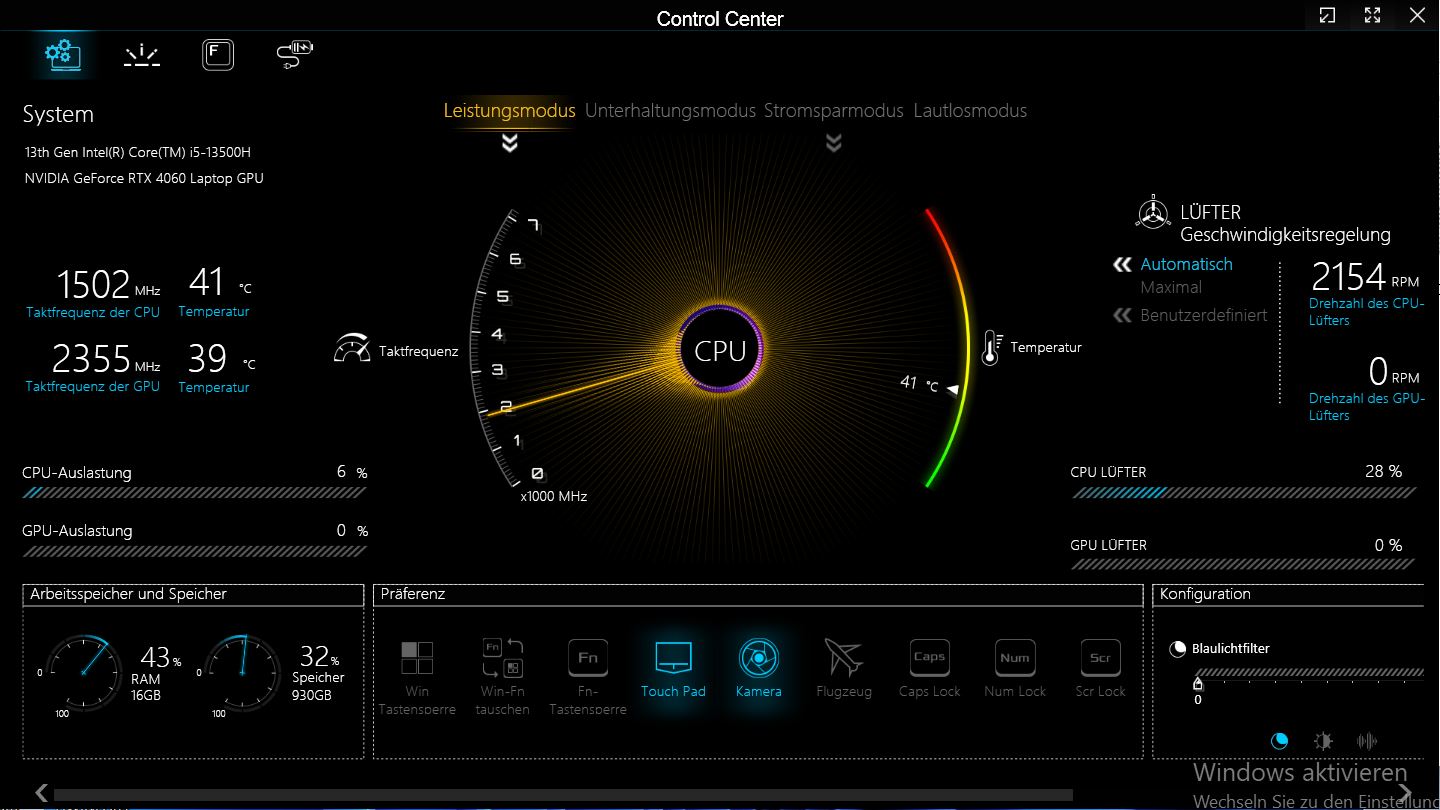
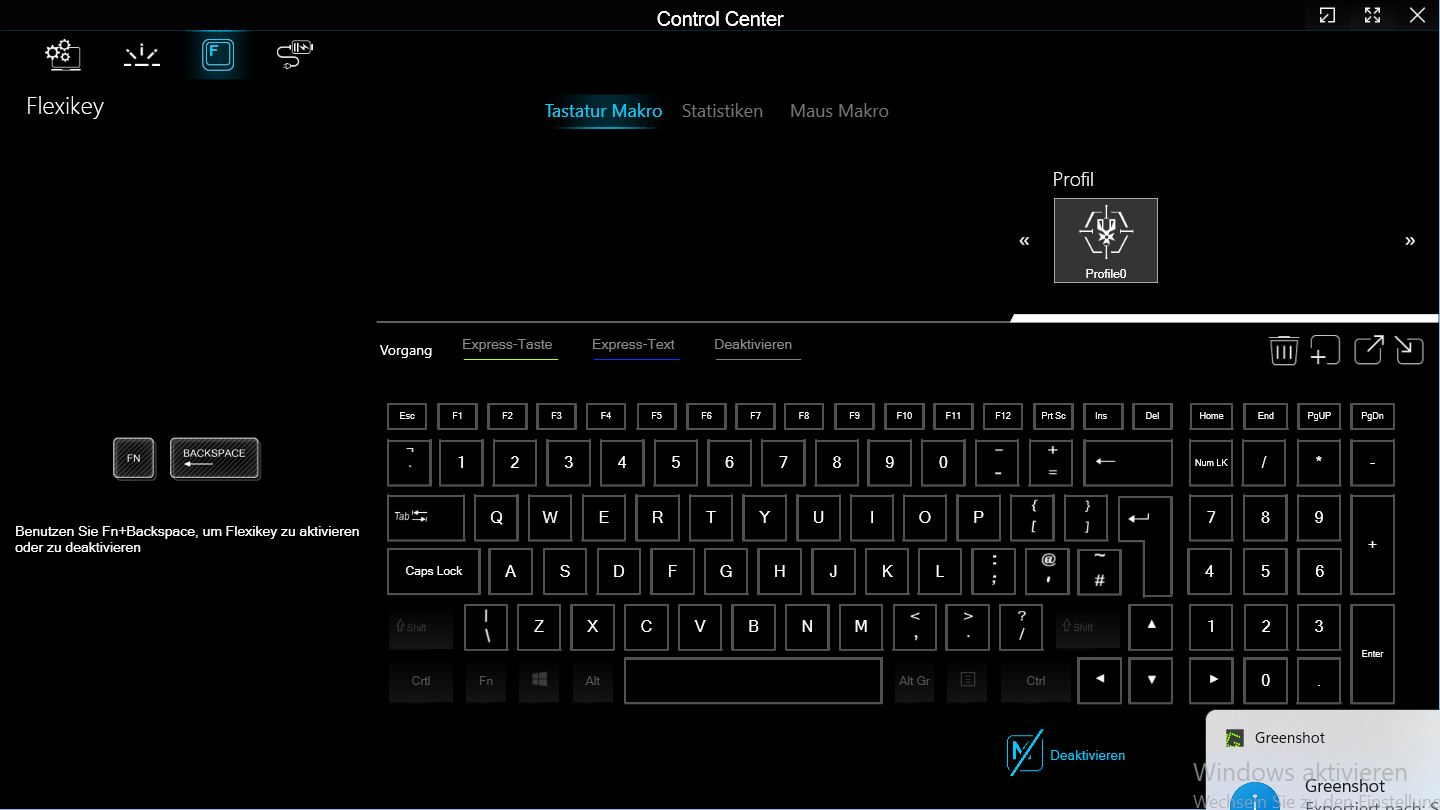
Centrum sterowania jest zainstalowane na Captivie. Znajdują się tam typowe ustawienia do sterowania wydajnością, klawiaturą, kamerą internetową itp. Do wyboru są cztery tryby wydajności: tryb wydajności, tryb rozrywki, tryb oszczędzania energii i tryb cichy.
Aby osiągnąć najlepsze wyniki w testach porównawczych, wybraliśmy tryb wydajności, jednak podczas naszych testów powiemy również nieco więcej o innych trybach.
Procesor
Intel Core i5-13500H to średniej klasy procesor z serii Raptor Lake H wydany w styczniu 2023 roku. Procesor posiada cztery rdzenie wydajnościowe i osiem rdzeni wydajnościowych. Daje to w sumie 16 wątków, ponieważ tylko rdzenie P obsługują hiperwątkowość - taktują z częstotliwością od 2,6 do 4,7 GHz (boost dla pojedynczego rdzenia, multicore-boost pozwala na maksymalnie 4,6 GHz). Rdzenie E taktowane są zegarem od 1,9 do 3,5 GHz.
W naszej pętli Cinebench R15 jego wydajność pozostała bardzo stabilna i nie odnotowaliśmy żadnego spadku wydajności po pierwszych uruchomieniach.
W trakcie wszystkich testów procesora, i5-13500H w Captivie osiągnął nieco ponadprzeciętne wyniki w porównaniu do wszystkich innych laptopów z tym samym CPU w naszej bazie danych. Dell G15 z procesorem HX jest nadal nieco szybszy, ale urządzenia Lenovo z obecnymi procesorami AMD miały tylko niewielką przewagę w szybkości.
W trybie bateryjnym TGP spada do około 20 watów, a wydajność procesora spada o około 50 procent.
Cinebench R15 Multi continuous test
Cinebench R23: Multi Core | Single Core
Cinebench R20: CPU (Multi Core) | CPU (Single Core)
Cinebench R15: CPU Multi 64Bit | CPU Single 64Bit
Blender: v2.79 BMW27 CPU
7-Zip 18.03: 7z b 4 | 7z b 4 -mmt1
Geekbench 5.5: Multi-Core | Single-Core
HWBOT x265 Benchmark v2.2: 4k Preset
LibreOffice : 20 Documents To PDF
R Benchmark 2.5: Overall mean
| CPU Performance rating | |
| Średnia w klasie Gaming | |
| Dell G15 5530 | |
| Lenovo Legion Slim 5 16APH8 | |
| Lenovo LOQ 15APH8 | |
| Captiva Advanced Gaming I74-121 | |
| MSI Cyborg 15 A12VF | |
| Przeciętny Intel Core i5-13500H | |
| Schenker XMG Core 15 (M22) | |
| Cinebench R23 / Multi Core | |
| Średnia w klasie Gaming (10488 - 40970, n=110, ostatnie 2 lata) | |
| Dell G15 5530 | |
| Lenovo Legion Slim 5 16APH8 | |
| Lenovo LOQ 15APH8 | |
| Captiva Advanced Gaming I74-121 | |
| Przeciętny Intel Core i5-13500H (13542 - 16335, n=5) | |
| Schenker XMG Core 15 (M22) | |
| MSI Cyborg 15 A12VF | |
| Cinebench R23 / Single Core | |
| Średnia w klasie Gaming (1166 - 2356, n=110, ostatnie 2 lata) | |
| Dell G15 5530 | |
| Lenovo Legion Slim 5 16APH8 | |
| Lenovo LOQ 15APH8 | |
| Captiva Advanced Gaming I74-121 | |
| MSI Cyborg 15 A12VF | |
| Przeciętny Intel Core i5-13500H (1704 - 1799, n=5) | |
| Schenker XMG Core 15 (M22) | |
| Cinebench R20 / CPU (Multi Core) | |
| Średnia w klasie Gaming (4029 - 16108, n=109, ostatnie 2 lata) | |
| Dell G15 5530 | |
| Lenovo Legion Slim 5 16APH8 | |
| Lenovo LOQ 15APH8 | |
| Captiva Advanced Gaming I74-121 | |
| Schenker XMG Core 15 (M22) | |
| MSI Cyborg 15 A12VF | |
| Przeciętny Intel Core i5-13500H (5108 - 6212, n=5) | |
| Cinebench R20 / CPU (Single Core) | |
| Średnia w klasie Gaming (442 - 895, n=109, ostatnie 2 lata) | |
| Dell G15 5530 | |
| Lenovo Legion Slim 5 16APH8 | |
| Lenovo LOQ 15APH8 | |
| Captiva Advanced Gaming I74-121 | |
| MSI Cyborg 15 A12VF | |
| Przeciętny Intel Core i5-13500H (655 - 687, n=5) | |
| Schenker XMG Core 15 (M22) | |
| Cinebench R15 / CPU Multi 64Bit | |
| Średnia w klasie Gaming (1578 - 6271, n=109, ostatnie 2 lata) | |
| Dell G15 5530 | |
| Lenovo LOQ 15APH8 | |
| Lenovo Legion Slim 5 16APH8 | |
| Captiva Advanced Gaming I74-121 | |
| Schenker XMG Core 15 (M22) | |
| Przeciętny Intel Core i5-13500H (2234 - 2475, n=5) | |
| MSI Cyborg 15 A12VF | |
| Cinebench R15 / CPU Single 64Bit | |
| Średnia w klasie Gaming (188.8 - 343, n=109, ostatnie 2 lata) | |
| Lenovo Legion Slim 5 16APH8 | |
| Lenovo LOQ 15APH8 | |
| Dell G15 5530 | |
| Captiva Advanced Gaming I74-121 | |
| Przeciętny Intel Core i5-13500H (243 - 261, n=5) | |
| Schenker XMG Core 15 (M22) | |
| MSI Cyborg 15 A12VF | |
| Blender / v2.79 BMW27 CPU | |
| MSI Cyborg 15 A12VF | |
| Przeciętny Intel Core i5-13500H (205 - 263, n=6) | |
| Schenker XMG Core 15 (M22) | |
| Captiva Advanced Gaming I74-121 | |
| Lenovo LOQ 15APH8 | |
| Lenovo Legion Slim 5 16APH8 | |
| Dell G15 5530 | |
| Średnia w klasie Gaming (80 - 330, n=107, ostatnie 2 lata) | |
| 7-Zip 18.03 / 7z b 4 | |
| Średnia w klasie Gaming (33491 - 148086, n=108, ostatnie 2 lata) | |
| Dell G15 5530 | |
| Lenovo Legion Slim 5 16APH8 | |
| Schenker XMG Core 15 (M22) | |
| Lenovo LOQ 15APH8 | |
| Captiva Advanced Gaming I74-121 | |
| MSI Cyborg 15 A12VF | |
| Przeciętny Intel Core i5-13500H (50846 - 58567, n=6) | |
| 7-Zip 18.03 / 7z b 4 -mmt1 | |
| Lenovo Legion Slim 5 16APH8 | |
| Średnia w klasie Gaming (4199 - 7436, n=108, ostatnie 2 lata) | |
| Lenovo LOQ 15APH8 | |
| Captiva Advanced Gaming I74-121 | |
| Dell G15 5530 | |
| Schenker XMG Core 15 (M22) | |
| MSI Cyborg 15 A12VF | |
| Przeciętny Intel Core i5-13500H (5500 - 5885, n=6) | |
| Geekbench 5.5 / Multi-Core | |
| Średnia w klasie Gaming (6460 - 27010, n=108, ostatnie 2 lata) | |
| Dell G15 5530 | |
| Lenovo Legion Slim 5 16APH8 | |
| MSI Cyborg 15 A12VF | |
| Przeciętny Intel Core i5-13500H (9312 - 11465, n=5) | |
| Captiva Advanced Gaming I74-121 | |
| Schenker XMG Core 15 (M22) | |
| Lenovo LOQ 15APH8 | |
| Geekbench 5.5 / Single-Core | |
| Średnia w klasie Gaming (986 - 2474, n=108, ostatnie 2 lata) | |
| Lenovo Legion Slim 5 16APH8 | |
| Dell G15 5530 | |
| Lenovo LOQ 15APH8 | |
| MSI Cyborg 15 A12VF | |
| Captiva Advanced Gaming I74-121 | |
| Przeciętny Intel Core i5-13500H (1674 - 1762, n=5) | |
| Schenker XMG Core 15 (M22) | |
| HWBOT x265 Benchmark v2.2 / 4k Preset | |
| Średnia w klasie Gaming (11.5 - 44.3, n=108, ostatnie 2 lata) | |
| Dell G15 5530 | |
| Lenovo Legion Slim 5 16APH8 | |
| Schenker XMG Core 15 (M22) | |
| Captiva Advanced Gaming I74-121 | |
| Lenovo LOQ 15APH8 | |
| MSI Cyborg 15 A12VF | |
| MSI Cyborg 15 A12VF | |
| Przeciętny Intel Core i5-13500H (14.4 - 17.9, n=6) | |
| LibreOffice / 20 Documents To PDF | |
| Schenker XMG Core 15 (M22) | |
| Captiva Advanced Gaming I74-121 | |
| Przeciętny Intel Core i5-13500H (44 - 65.5, n=5) | |
| Średnia w klasie Gaming (19 - 88.8, n=108, ostatnie 2 lata) | |
| Dell G15 5530 | |
| Lenovo LOQ 15APH8 | |
| MSI Cyborg 15 A12VF | |
| Lenovo Legion Slim 5 16APH8 | |
| R Benchmark 2.5 / Overall mean | |
| Przeciętny Intel Core i5-13500H (0.471 - 0.51, n=6) | |
| Captiva Advanced Gaming I74-121 | |
| Schenker XMG Core 15 (M22) | |
| MSI Cyborg 15 A12VF | |
| Lenovo LOQ 15APH8 | |
| Lenovo Legion Slim 5 16APH8 | |
| Średnia w klasie Gaming (0.3439 - 0.759, n=109, ostatnie 2 lata) | |
| Dell G15 5530 | |
* ... im mniej tym lepiej
AIDA64: FP32 Ray-Trace | FPU Julia | CPU SHA3 | CPU Queen | FPU SinJulia | FPU Mandel | CPU AES | CPU ZLib | FP64 Ray-Trace | CPU PhotoWorxx
| Performance rating | |
| Średnia w klasie Gaming | |
| Lenovo Legion Slim 5 16APH8 | |
| Lenovo LOQ 15APH8 | |
| Dell G15 5530 | |
| Schenker XMG Core 15 (M22) | |
| Captiva Advanced Gaming I74-121 | |
| Przeciętny Intel Core i5-13500H | |
| MSI Cyborg 15 A12VF | |
| AIDA64 / FP32 Ray-Trace | |
| Średnia w klasie Gaming (10227 - 85542, n=107, ostatnie 2 lata) | |
| Lenovo LOQ 15APH8 | |
| Lenovo Legion Slim 5 16APH8 | |
| Dell G15 5530 | |
| Schenker XMG Core 15 (M22) | |
| Captiva Advanced Gaming I74-121 | |
| Przeciętny Intel Core i5-13500H (11081 - 15390, n=6) | |
| MSI Cyborg 15 A12VF | |
| AIDA64 / FPU Julia | |
| Średnia w klasie Gaming (51376 - 238426, n=107, ostatnie 2 lata) | |
| Lenovo LOQ 15APH8 | |
| Lenovo Legion Slim 5 16APH8 | |
| Schenker XMG Core 15 (M22) | |
| Dell G15 5530 | |
| Captiva Advanced Gaming I74-121 | |
| MSI Cyborg 15 A12VF | |
| Przeciętny Intel Core i5-13500H (56813 - 74251, n=6) | |
| AIDA64 / CPU SHA3 | |
| Średnia w klasie Gaming (2180 - 9817, n=107, ostatnie 2 lata) | |
| Lenovo LOQ 15APH8 | |
| Lenovo Legion Slim 5 16APH8 | |
| Dell G15 5530 | |
| Captiva Advanced Gaming I74-121 | |
| Schenker XMG Core 15 (M22) | |
| Przeciętny Intel Core i5-13500H (2621 - 3623, n=6) | |
| MSI Cyborg 15 A12VF | |
| AIDA64 / CPU Queen | |
| Lenovo Legion Slim 5 16APH8 | |
| Lenovo LOQ 15APH8 | |
| Średnia w klasie Gaming (49785 - 173351, n=98, ostatnie 2 lata) | |
| Dell G15 5530 | |
| Schenker XMG Core 15 (M22) | |
| Captiva Advanced Gaming I74-121 | |
| MSI Cyborg 15 A12VF | |
| Przeciętny Intel Core i5-13500H (77835 - 85727, n=6) | |
| AIDA64 / FPU SinJulia | |
| Lenovo Legion Slim 5 16APH8 | |
| Lenovo LOQ 15APH8 | |
| Średnia w klasie Gaming (4424 - 33636, n=107, ostatnie 2 lata) | |
| Schenker XMG Core 15 (M22) | |
| Dell G15 5530 | |
| MSI Cyborg 15 A12VF | |
| Captiva Advanced Gaming I74-121 | |
| Przeciętny Intel Core i5-13500H (7249 - 8086, n=6) | |
| AIDA64 / FPU Mandel | |
| Średnia w klasie Gaming (25115 - 128721, n=107, ostatnie 2 lata) | |
| Lenovo LOQ 15APH8 | |
| Lenovo Legion Slim 5 16APH8 | |
| Schenker XMG Core 15 (M22) | |
| Dell G15 5530 | |
| Captiva Advanced Gaming I74-121 | |
| Przeciętny Intel Core i5-13500H (27820 - 38336, n=6) | |
| MSI Cyborg 15 A12VF | |
| AIDA64 / CPU AES | |
| Captiva Advanced Gaming I74-121 | |
| Średnia w klasie Gaming (39258 - 247074, n=107, ostatnie 2 lata) | |
| Przeciętny Intel Core i5-13500H (62657 - 120493, n=6) | |
| Dell G15 5530 | |
| Lenovo LOQ 15APH8 | |
| Lenovo Legion Slim 5 16APH8 | |
| Schenker XMG Core 15 (M22) | |
| MSI Cyborg 15 A12VF | |
| AIDA64 / CPU ZLib | |
| Średnia w klasie Gaming (574 - 2531, n=107, ostatnie 2 lata) | |
| Dell G15 5530 | |
| Lenovo LOQ 15APH8 | |
| Lenovo Legion Slim 5 16APH8 | |
| Captiva Advanced Gaming I74-121 | |
| Przeciętny Intel Core i5-13500H (782 - 992, n=6) | |
| Schenker XMG Core 15 (M22) | |
| MSI Cyborg 15 A12VF | |
| AIDA64 / FP64 Ray-Trace | |
| Średnia w klasie Gaming (5509 - 45446, n=107, ostatnie 2 lata) | |
| Lenovo LOQ 15APH8 | |
| Lenovo Legion Slim 5 16APH8 | |
| Dell G15 5530 | |
| Schenker XMG Core 15 (M22) | |
| Captiva Advanced Gaming I74-121 | |
| Przeciętny Intel Core i5-13500H (5955 - 8495, n=6) | |
| MSI Cyborg 15 A12VF | |
| AIDA64 / CPU PhotoWorxx | |
| Średnia w klasie Gaming (12271 - 89891, n=107, ostatnie 2 lata) | |
| Dell G15 5530 | |
| MSI Cyborg 15 A12VF | |
| Lenovo Legion Slim 5 16APH8 | |
| Przeciętny Intel Core i5-13500H (20212 - 37618, n=6) | |
| Schenker XMG Core 15 (M22) | |
| Captiva Advanced Gaming I74-121 | |
| Lenovo LOQ 15APH8 | |
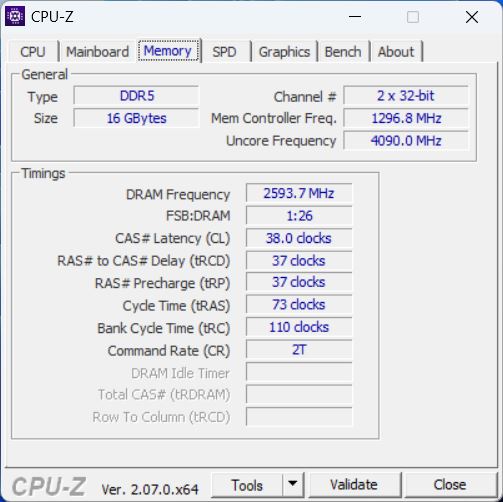
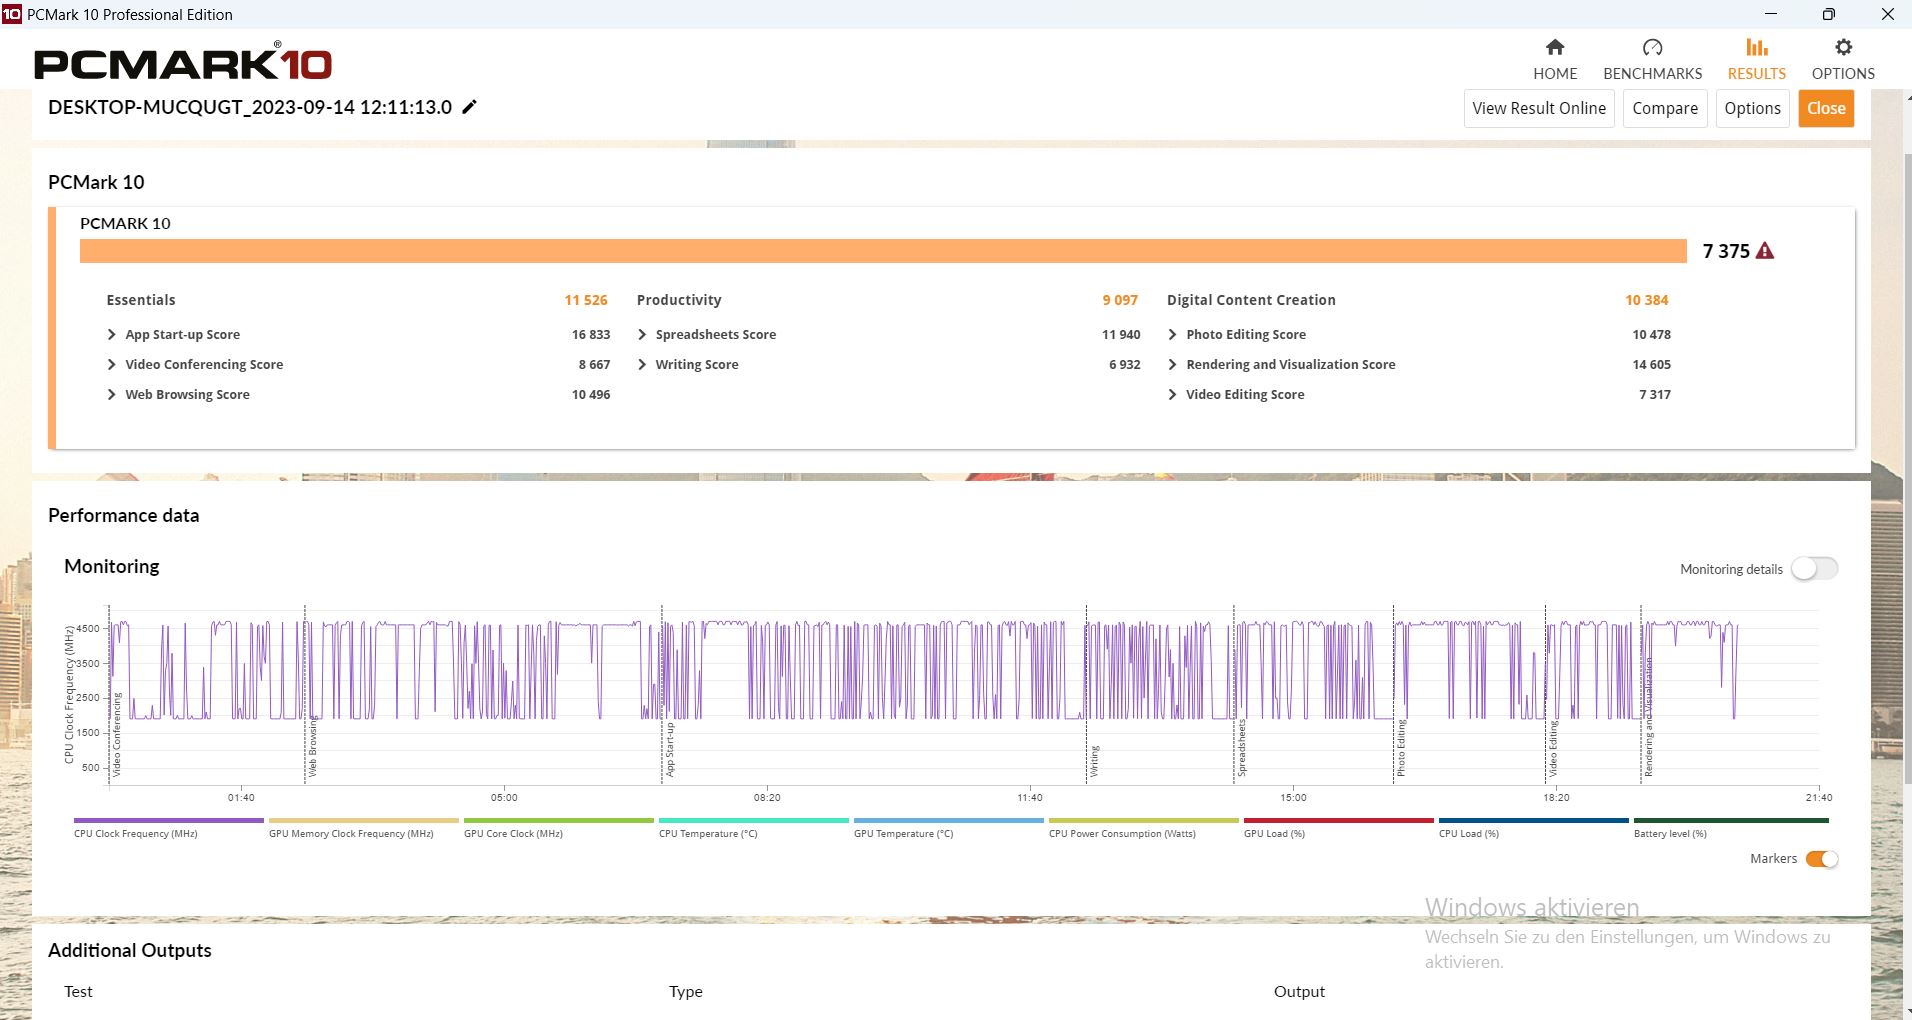
Wydajność systemu
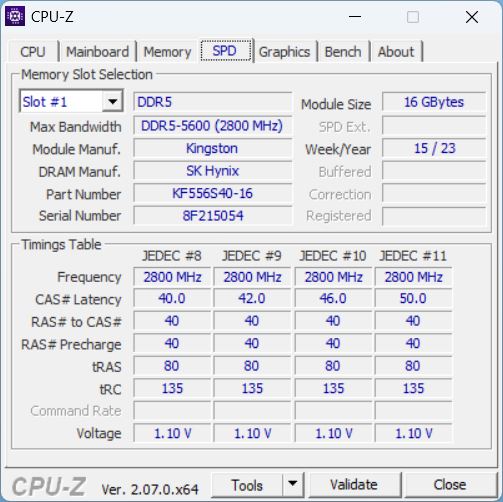
Wynik laptopa Captiva w teście PCMark był zgodny z oczekiwaniami. W podteście Essentials znalazł się nawet na szczycie. Z kolei w wydajności laptop wypadł słabiej, co prawdopodobnie wynika z nieco wolniejszej pamięci RAM, co pokazała AIDA. Podsumowując, urządzenie osiągnęło wyniki powyżej średniej dla laptopa do gier.
CrossMark: Overall | Productivity | Creativity | Responsiveness
| PCMark 10 / Score | |
| Średnia w klasie Gaming (5828 - 11574, n=95, ostatnie 2 lata) | |
| Lenovo Legion Slim 5 16APH8 | |
| Lenovo LOQ 15APH8 | |
| Captiva Advanced Gaming I74-121 | |
| Przeciętny Intel Core i5-13500H, NVIDIA GeForce RTX 4060 Laptop GPU (n=1) | |
| Schenker XMG Core 15 (M22) | |
| MSI Cyborg 15 A12VF | |
| Dell G15 5530 | |
| PCMark 10 / Essentials | |
| Captiva Advanced Gaming I74-121 | |
| Przeciętny Intel Core i5-13500H, NVIDIA GeForce RTX 4060 Laptop GPU (n=1) | |
| Lenovo Legion Slim 5 16APH8 | |
| Dell G15 5530 | |
| Schenker XMG Core 15 (M22) | |
| MSI Cyborg 15 A12VF | |
| Średnia w klasie Gaming (8810 - 12600, n=99, ostatnie 2 lata) | |
| Lenovo LOQ 15APH8 | |
| PCMark 10 / Productivity | |
| Średnia w klasie Gaming (6845 - 18766, n=97, ostatnie 2 lata) | |
| Lenovo Legion Slim 5 16APH8 | |
| Dell G15 5530 | |
| Lenovo LOQ 15APH8 | |
| MSI Cyborg 15 A12VF | |
| Schenker XMG Core 15 (M22) | |
| Captiva Advanced Gaming I74-121 | |
| Przeciętny Intel Core i5-13500H, NVIDIA GeForce RTX 4060 Laptop GPU (n=1) | |
| PCMark 10 / Digital Content Creation | |
| Średnia w klasie Gaming (7602 - 19657, n=97, ostatnie 2 lata) | |
| Lenovo Legion Slim 5 16APH8 | |
| Lenovo LOQ 15APH8 | |
| Captiva Advanced Gaming I74-121 | |
| Przeciętny Intel Core i5-13500H, NVIDIA GeForce RTX 4060 Laptop GPU (n=1) | |
| Schenker XMG Core 15 (M22) | |
| MSI Cyborg 15 A12VF | |
| Dell G15 5530 | |
| CrossMark / Overall | |
| Średnia w klasie Gaming (1366 - 2409, n=96, ostatnie 2 lata) | |
| Dell G15 5530 | |
| Lenovo Legion Slim 5 16APH8 | |
| MSI Cyborg 15 A12VF | |
| Captiva Advanced Gaming I74-121 | |
| Przeciętny Intel Core i5-13500H, NVIDIA GeForce RTX 4060 Laptop GPU (n=1) | |
| Lenovo LOQ 15APH8 | |
| Schenker XMG Core 15 (M22) | |
| CrossMark / Productivity | |
| Średnia w klasie Gaming (1386 - 2254, n=96, ostatnie 2 lata) | |
| Lenovo Legion Slim 5 16APH8 | |
| Dell G15 5530 | |
| MSI Cyborg 15 A12VF | |
| Captiva Advanced Gaming I74-121 | |
| Przeciętny Intel Core i5-13500H, NVIDIA GeForce RTX 4060 Laptop GPU (n=1) | |
| Lenovo LOQ 15APH8 | |
| Schenker XMG Core 15 (M22) | |
| CrossMark / Creativity | |
| Średnia w klasie Gaming (1343 - 2729, n=96, ostatnie 2 lata) | |
| Dell G15 5530 | |
| Lenovo Legion Slim 5 16APH8 | |
| MSI Cyborg 15 A12VF | |
| Schenker XMG Core 15 (M22) | |
| Captiva Advanced Gaming I74-121 | |
| Przeciętny Intel Core i5-13500H, NVIDIA GeForce RTX 4060 Laptop GPU (n=1) | |
| Lenovo LOQ 15APH8 | |
| CrossMark / Responsiveness | |
| Średnia w klasie Gaming (1226 - 2334, n=96, ostatnie 2 lata) | |
| MSI Cyborg 15 A12VF | |
| Captiva Advanced Gaming I74-121 | |
| Przeciętny Intel Core i5-13500H, NVIDIA GeForce RTX 4060 Laptop GPU (n=1) | |
| Dell G15 5530 | |
| Lenovo Legion Slim 5 16APH8 | |
| Lenovo LOQ 15APH8 | |
| Schenker XMG Core 15 (M22) | |
| PCMark 10 Score | 7375 pkt. | |
Pomoc | ||
| AIDA64 / Memory Copy | |
| Średnia w klasie Gaming (21750 - 129946, n=107, ostatnie 2 lata) | |
| Lenovo Legion Slim 5 16APH8 | |
| Dell G15 5530 | |
| MSI Cyborg 15 A12VF | |
| Schenker XMG Core 15 (M22) | |
| Przeciętny Intel Core i5-13500H (36916 - 57830, n=6) | |
| Captiva Advanced Gaming I74-121 | |
| Lenovo LOQ 15APH8 | |
| AIDA64 / Memory Read | |
| Średnia w klasie Gaming (22956 - 118858, n=107, ostatnie 2 lata) | |
| Dell G15 5530 | |
| MSI Cyborg 15 A12VF | |
| Lenovo Legion Slim 5 16APH8 | |
| Przeciętny Intel Core i5-13500H (41676 - 65633, n=6) | |
| Schenker XMG Core 15 (M22) | |
| Captiva Advanced Gaming I74-121 | |
| Lenovo LOQ 15APH8 | |
| AIDA64 / Memory Write | |
| Lenovo Legion Slim 5 16APH8 | |
| Średnia w klasie Gaming (22297 - 135096, n=107, ostatnie 2 lata) | |
| Dell G15 5530 | |
| MSI Cyborg 15 A12VF | |
| Schenker XMG Core 15 (M22) | |
| Przeciętny Intel Core i5-13500H (36826 - 60523, n=6) | |
| Captiva Advanced Gaming I74-121 | |
| Lenovo LOQ 15APH8 | |
| AIDA64 / Memory Latency | |
| Średnia w klasie Gaming (75.3 - 259, n=107, ostatnie 2 lata) | |
| Lenovo LOQ 15APH8 | |
| Lenovo Legion Slim 5 16APH8 | |
| Przeciętny Intel Core i5-13500H (86.2 - 96.1, n=6) | |
| MSI Cyborg 15 A12VF | |
| Dell G15 5530 | |
| Captiva Advanced Gaming I74-121 | |
| Schenker XMG Core 15 (M22) | |
* ... im mniej tym lepiej
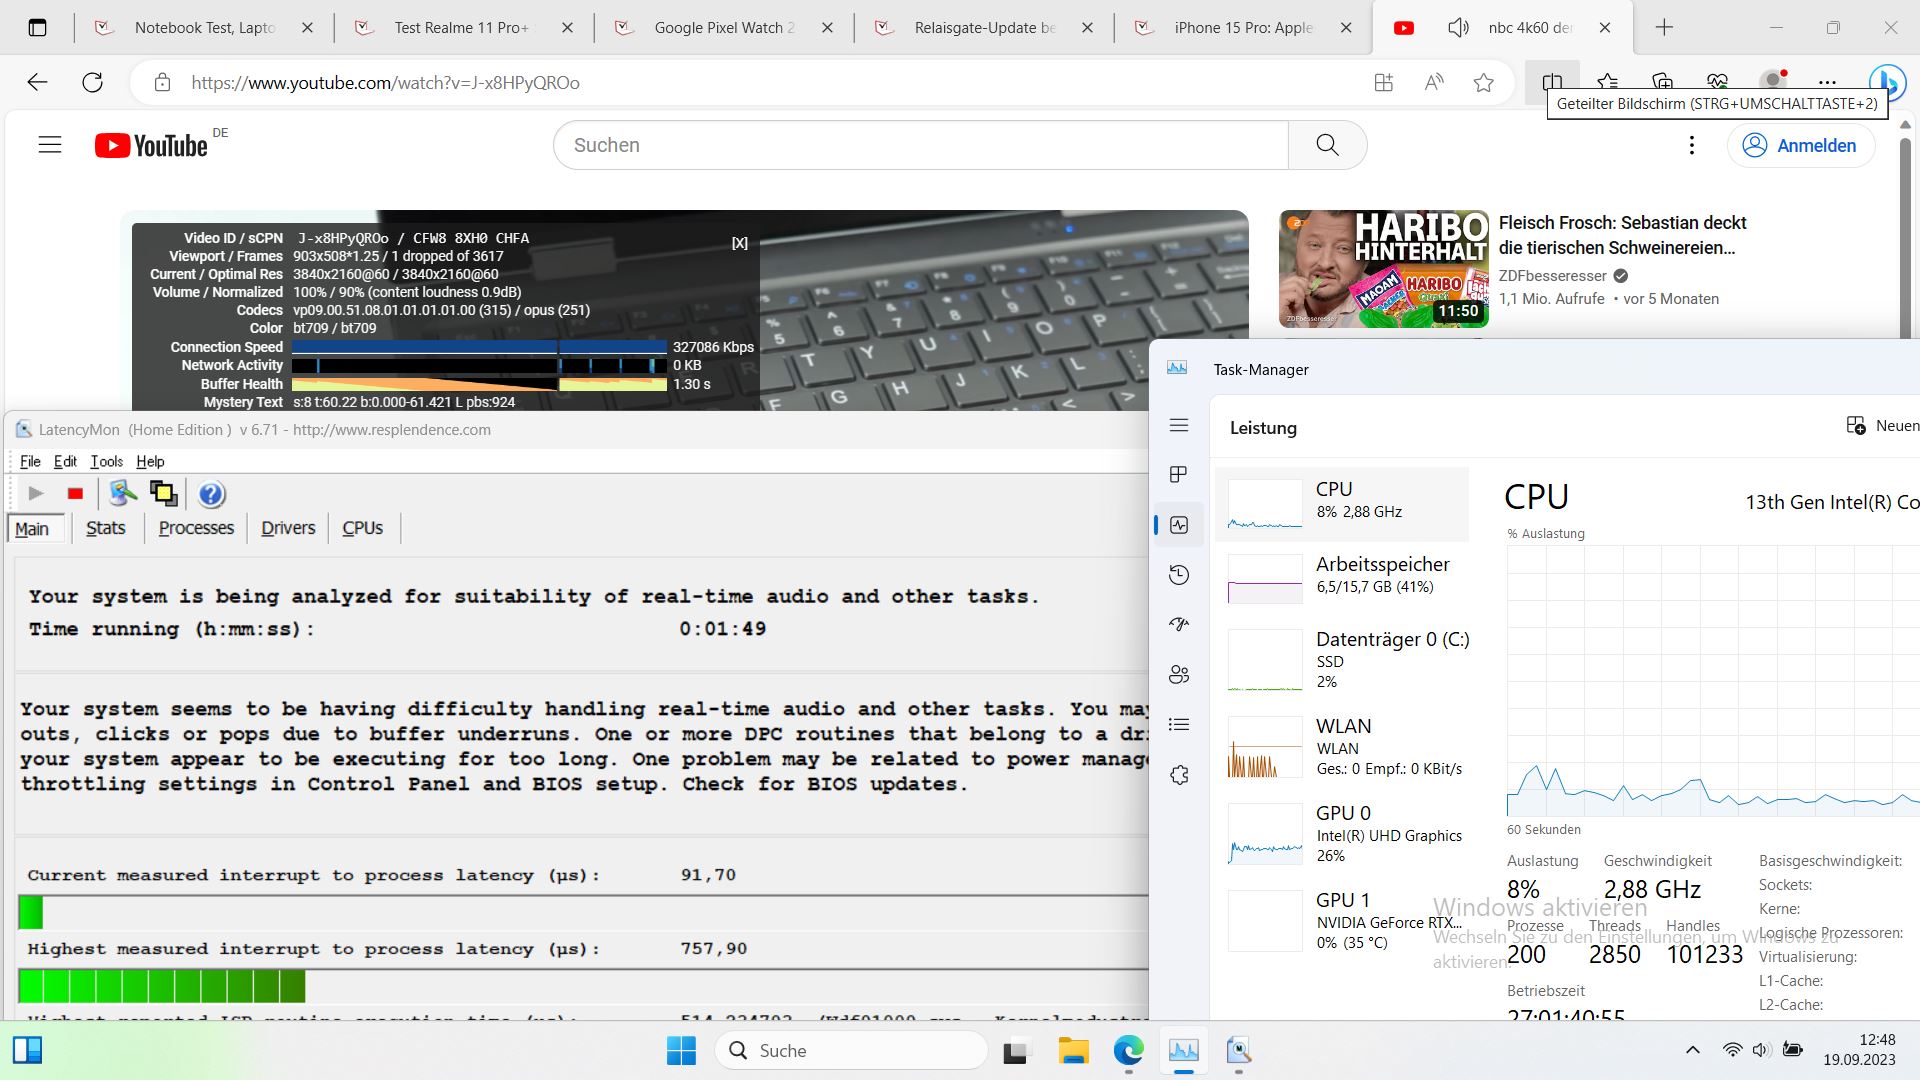
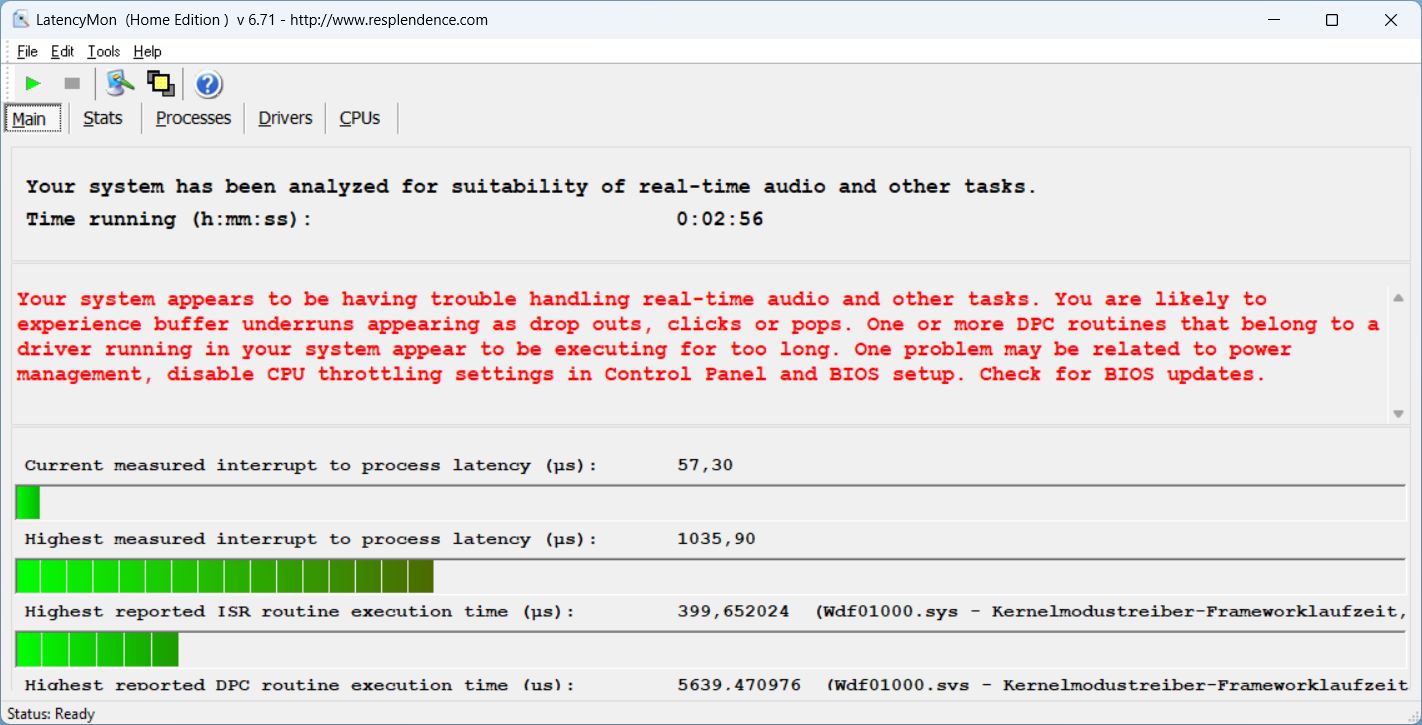
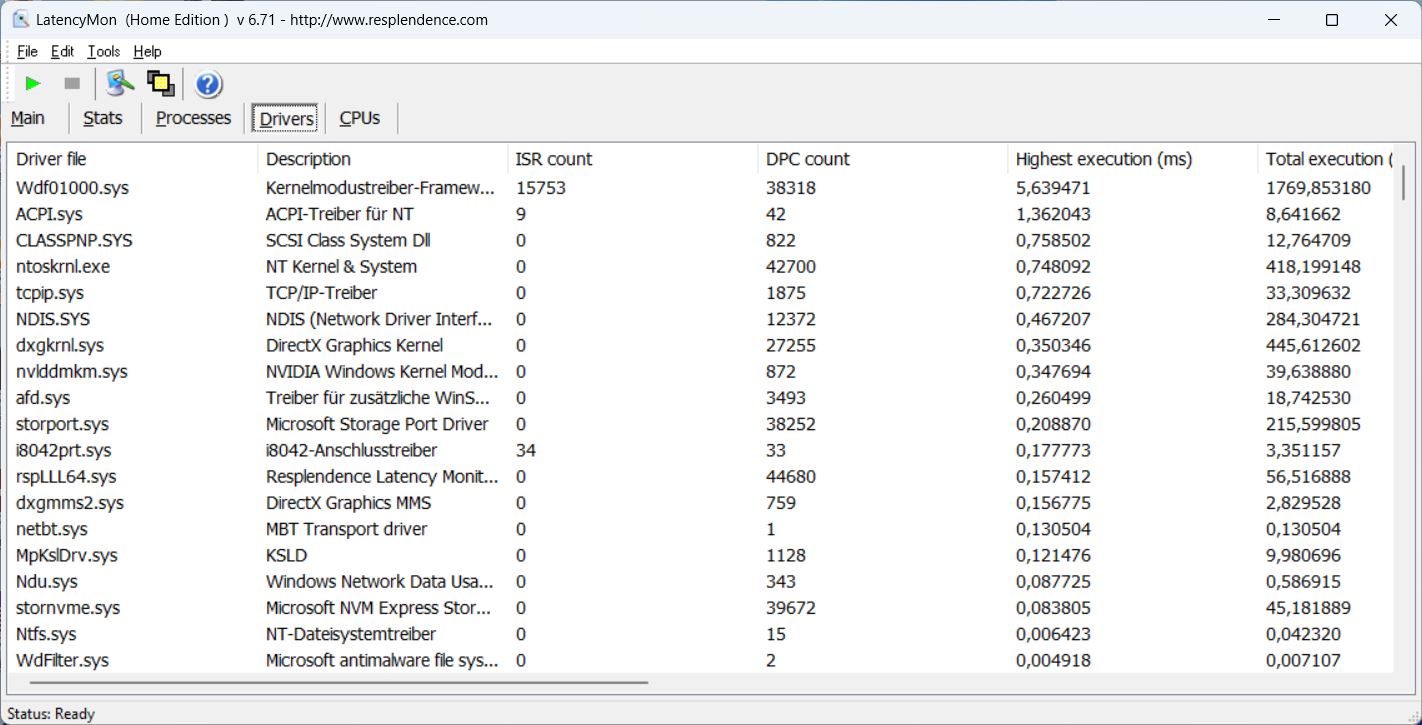
Opóźnienie DPC
Podczas otwierania wielu kart przeglądarki lub naszej strony internetowej, Captiva nie wykazywała żadnych problemów - nawet z wieloma kartami. Pierwsze małe problemy pojawiły się podczas otwierania naszego filmu 4K/60 fps na YouTube. Opóźnienia były stosunkowo niskie - z wyjątkiem jednej spadającej klatki, wideo było odtwarzane płynnie.
| DPC Latencies / LatencyMon - interrupt to process latency (max), Web, Youtube, Prime95 | |
| Dell G15 5530 | |
| Schenker XMG Core 15 (M22) | |
| Lenovo LOQ 15APH8 | |
| MSI Cyborg 15 A12VF | |
| Captiva Advanced Gaming I74-121 | |
| Lenovo Legion Slim 5 16APH8 | |
* ... im mniej tym lepiej
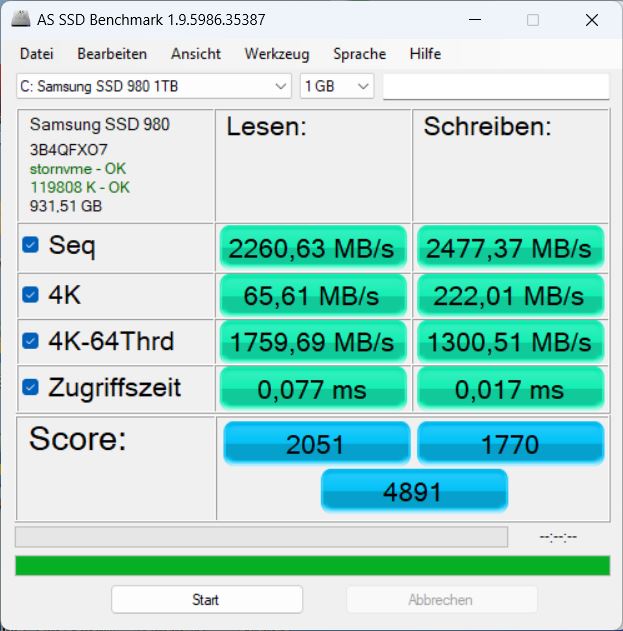
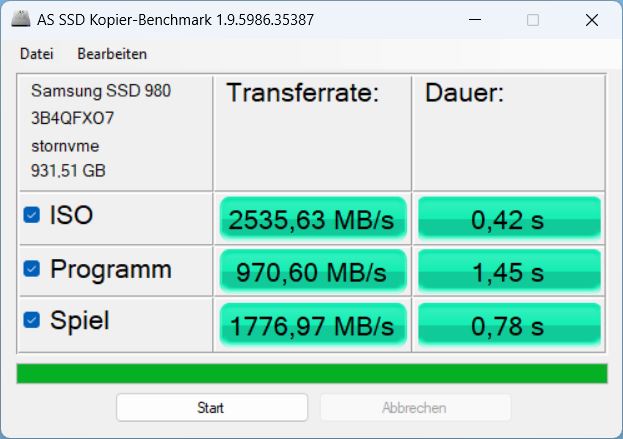
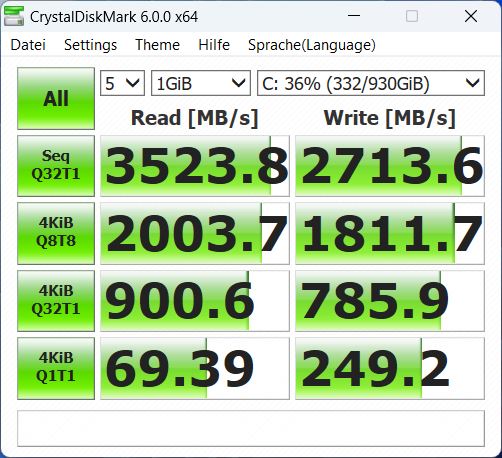
Urządzenia pamięci masowej
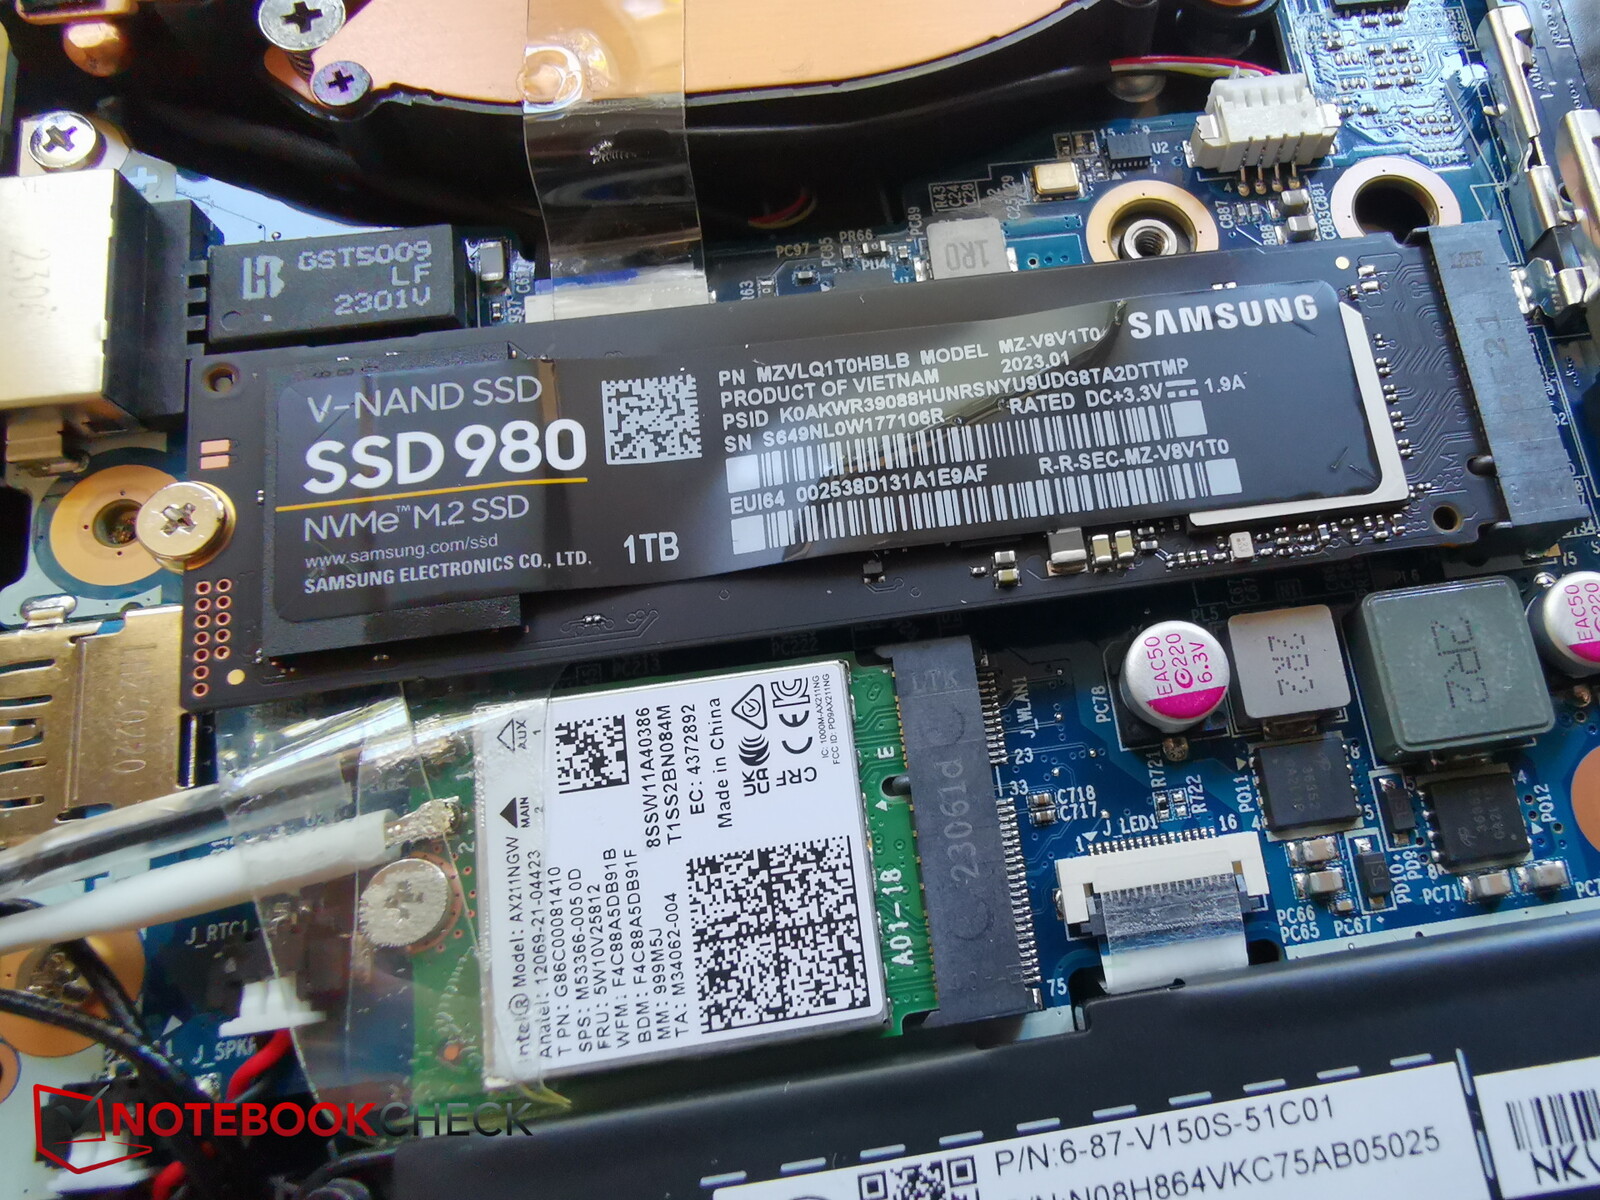
Captiva nie wykazuje żadnych słabości, jeśli chodzi o pamięć masową. W naszym modelu testowym zainstalowano bardzo dobrze znany dysk Samsung SSD 980 o pojemności 1 TB. Być może pochodzi on jeszcze z generacji PCIe 3.0, ale jest to jeden z najlepszych modeli tej firmy. Do tej pory pojawiły się również szybsze dyski SSD (jak pokazuje nasze porównanie), ale to urządzenie pamięci masowej nadal osiągało wyniki powyżej średniej.
Wewnątrz Captivy dysk SSD działał o około 10 procent szybciej niż przeciętny model (Samsung 980 1 TB) z naszej bazy danych, a ponadto jego wydajność była stała przez dłuższy czas, a dławienie termiczne nigdy nie stanowiło problemu.

* ... im mniej tym lepiej
Reading continuous performance: DiskSpd Read Loop, Queue Depth 8
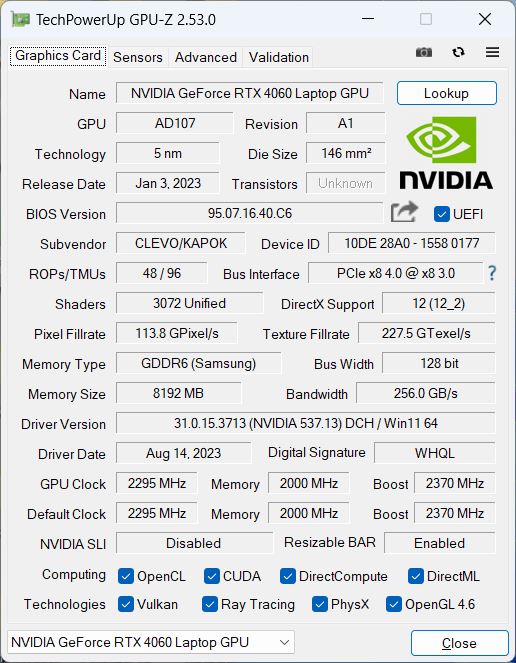
Karta graficzna
Captiva opiera się naNvidia Geforce RTX 4060jako kartę graficzną i ma dostęp do maksymalnie 140 watów, w tym Dynamic Boost.
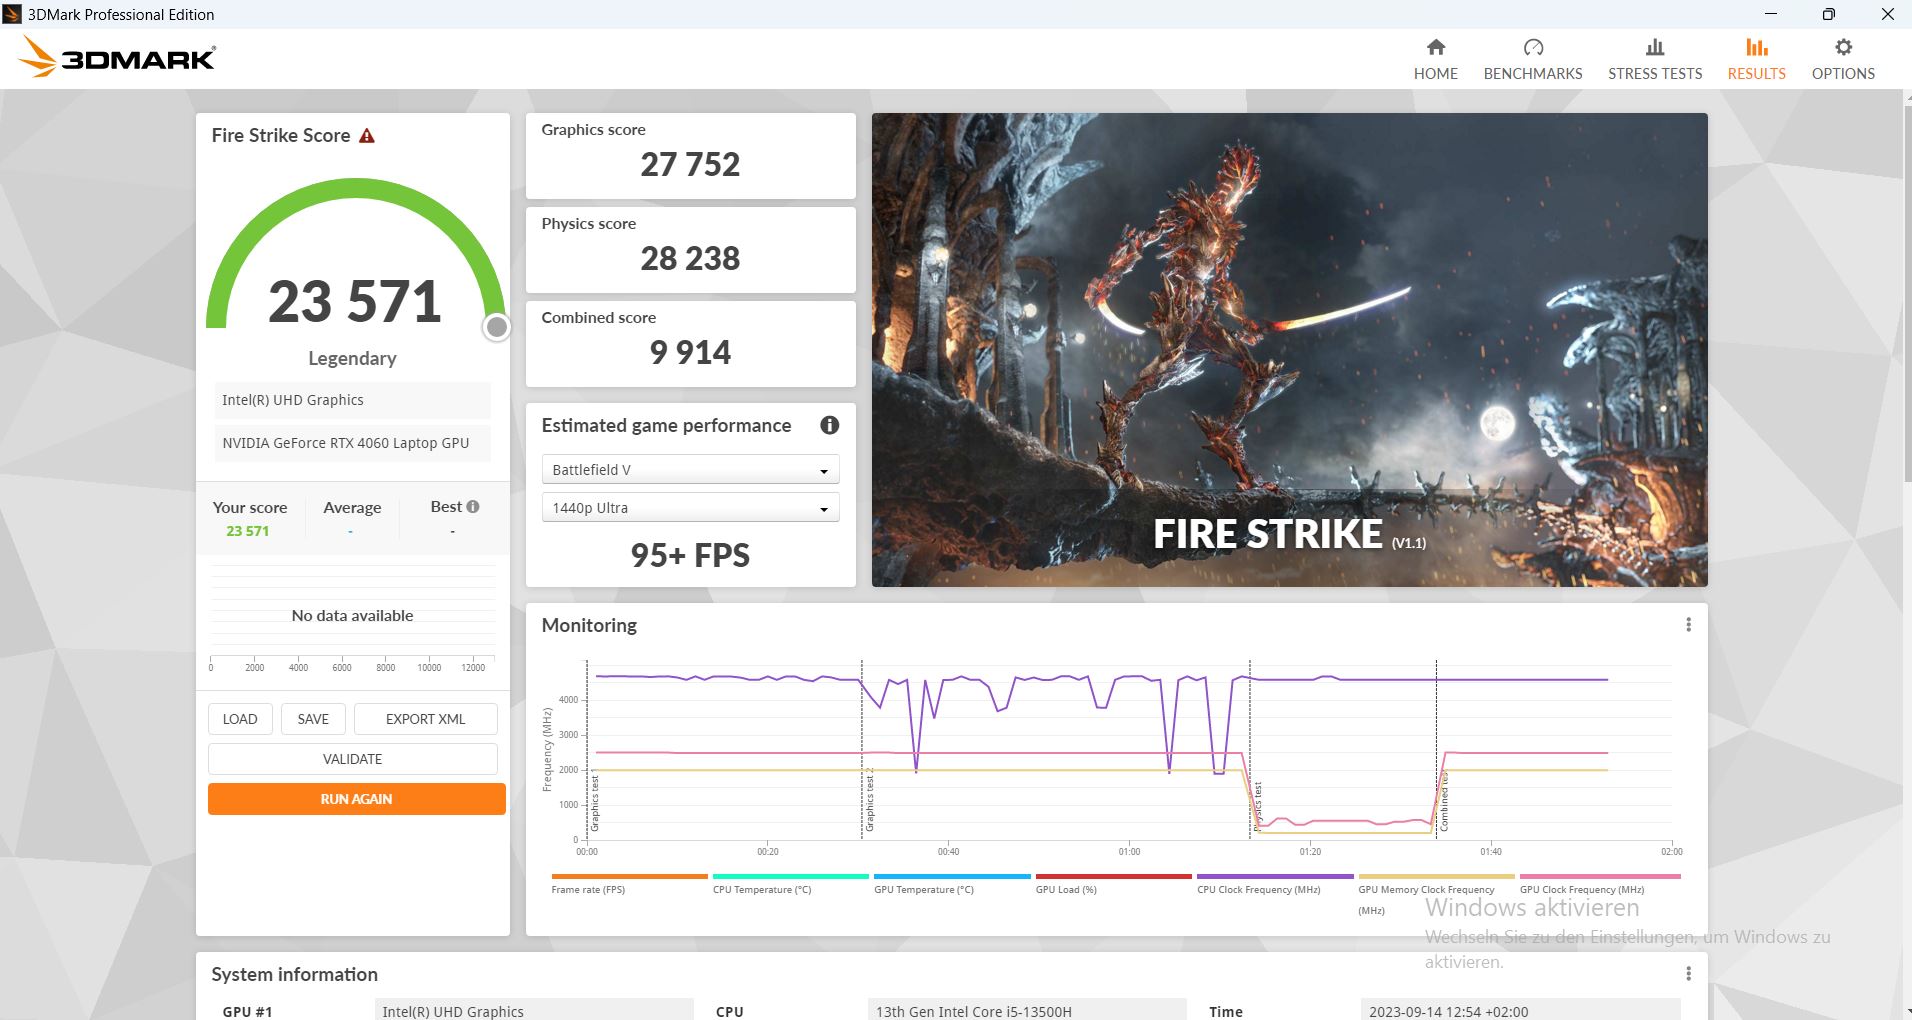
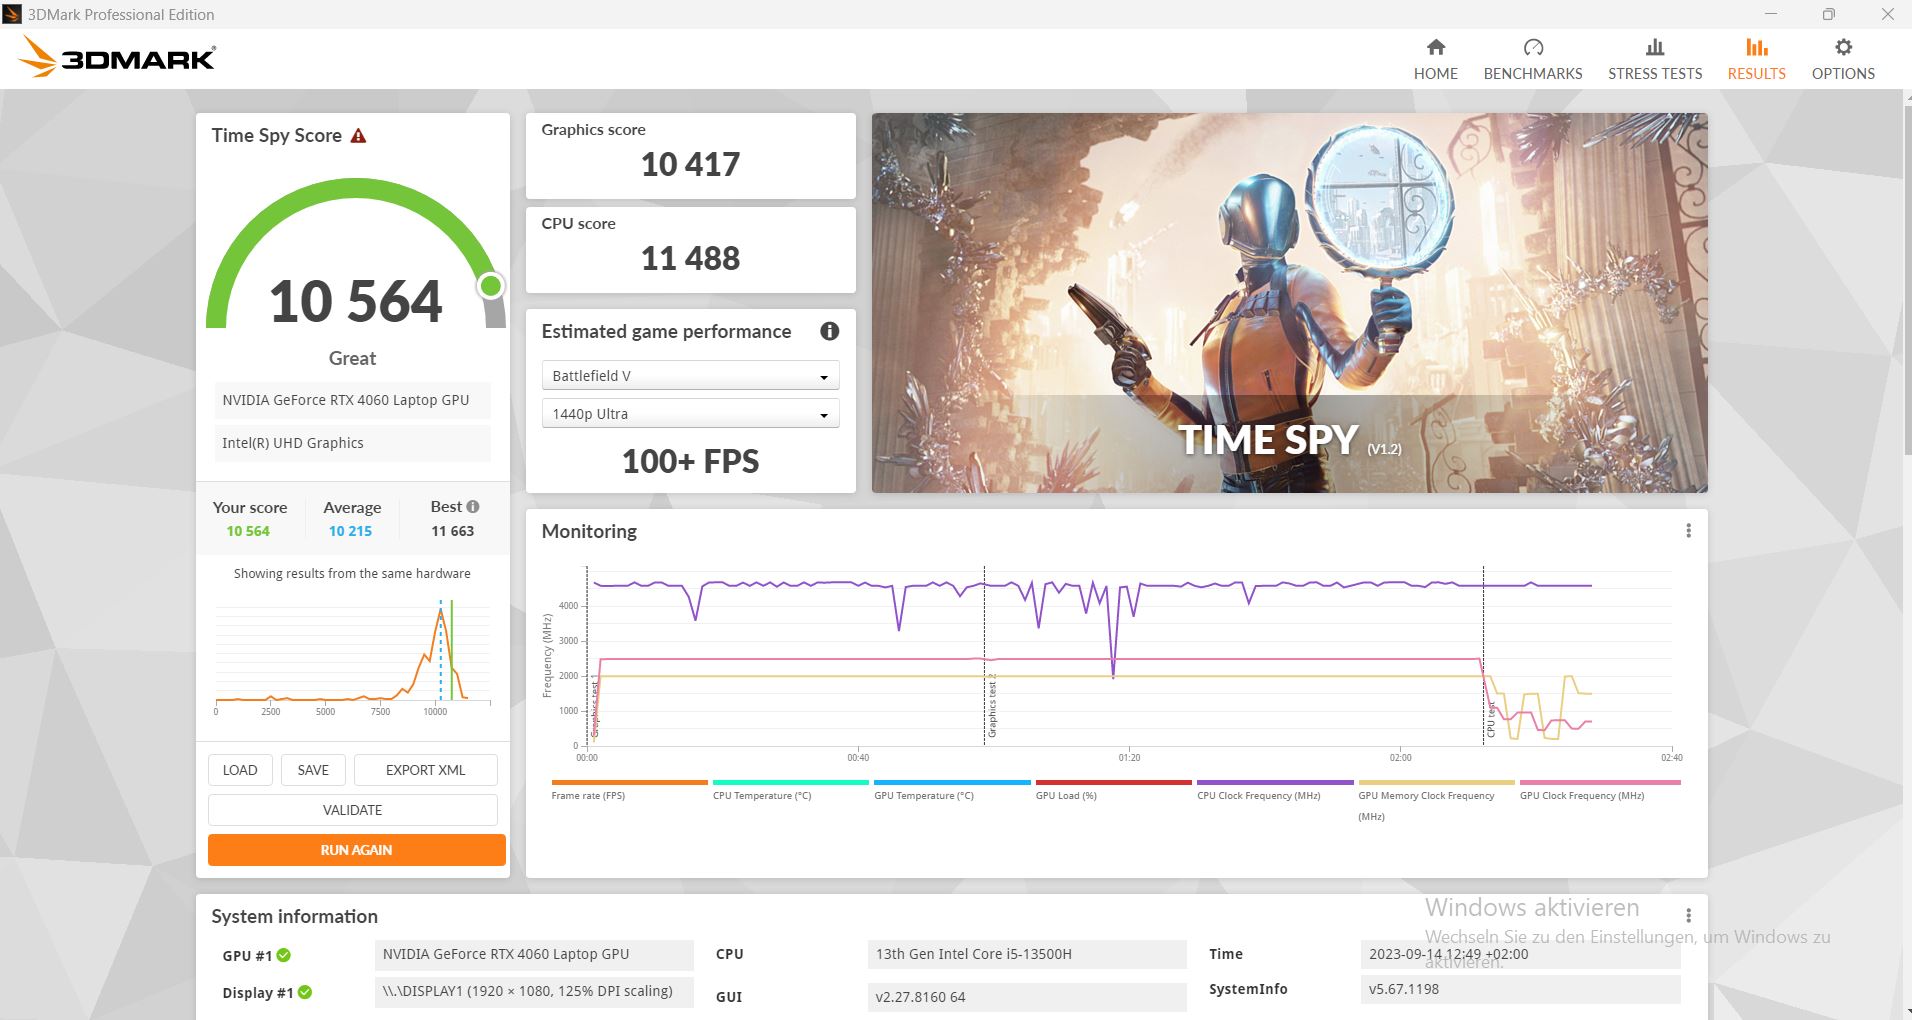
Podczas gdy wydajność procesora mieściła się w dolnej średniej, wyniki laptopa w benchmarku 3DMark doprowadziły go na szczyt - tylkoDell G15był w stanie dotrzymać mu kroku. TheLOQ 15iCyborg 15z tym samym GPU zostały wyraźnie pokonane.
Z dala od gniazdka elektrycznego, wydajność 3D znacznie spada. Z początkowych 23 571 punktów osiągniętych podczas testu Fire Strike, teraz uzyskał tylko 6 693 punkty. To aż o 72 procent mniej!

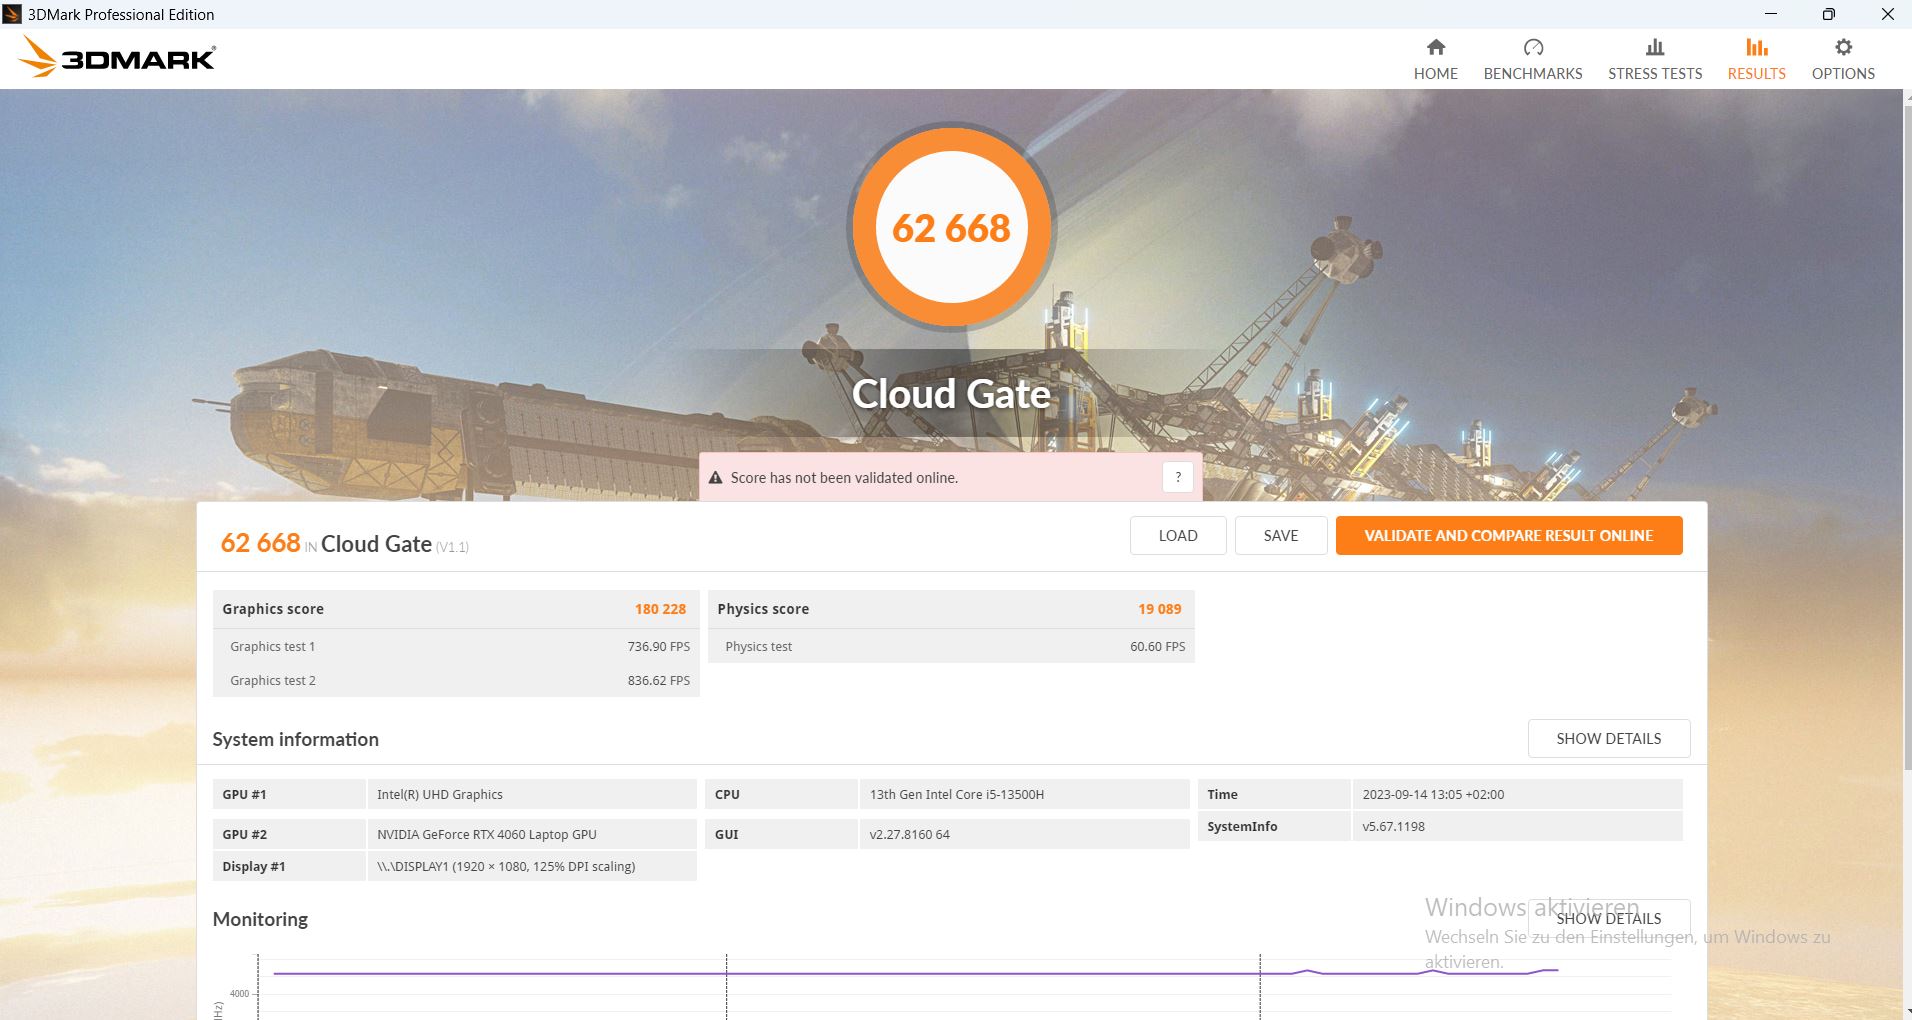
| 3DMark 11 Performance | 30608 pkt. | |
| 3DMark Cloud Gate Standard Score | 62668 pkt. | |
| 3DMark Fire Strike Score | 23571 pkt. | |
| 3DMark Time Spy Score | 10564 pkt. | |
Pomoc | ||
* ... im mniej tym lepiej
Wydajność w grach
Captiva toczyła wyrównany pojedynek zDell G15również w grach - ten ostatni zdołał wyjść na prowadzenie. Prawdopodobnie wynika to z lepszej wydajności procesora w grach z odpowiednim naciskiem.
Podsumowując, Captiva jest w stanie płynnie uruchomić prawie wszystkie obecne gry w bardzo wysokich rozdzielczościach i wypadła nieco powyżej średniej wszystkich laptopów z tym samym GPU, które przechowujemy w naszej bazie danych.
| Performance rating - Percent | |
| Średnia w klasie Gaming | |
| Dell G15 5530 | |
| Captiva Advanced Gaming I74-121 | |
| Lenovo Legion Slim 5 16APH8 | |
| MSI Cyborg 15 A12VF | |
| Schenker XMG Core 15 (M22) | |
| Lenovo LOQ 15APH8 | |
| The Witcher 3 - 1920x1080 Ultra Graphics & Postprocessing (HBAO+) | |
| Średnia w klasie Gaming (95 - 240, n=8, ostatnie 2 lata) | |
| Dell G15 5530 | |
| Captiva Advanced Gaming I74-121 | |
| Lenovo Legion Slim 5 16APH8 | |
| Lenovo LOQ 15APH8 | |
| Schenker XMG Core 15 (M22) | |
| MSI Cyborg 15 A12VF | |
| GTA V - 1920x1080 Highest AA:4xMSAA + FX AF:16x | |
| Średnia w klasie Gaming (48.3 - 186.9, n=100, ostatnie 2 lata) | |
| Captiva Advanced Gaming I74-121 | |
| Dell G15 5530 | |
| Lenovo Legion Slim 5 16APH8 | |
| Schenker XMG Core 15 (M22) | |
| MSI Cyborg 15 A12VF | |
| Lenovo LOQ 15APH8 | |
| Final Fantasy XV Benchmark - 1920x1080 High Quality | |
| Średnia w klasie Gaming (41 - 215, n=101, ostatnie 2 lata) | |
| Captiva Advanced Gaming I74-121 | |
| Dell G15 5530 | |
| Lenovo Legion Slim 5 16APH8 | |
| Schenker XMG Core 15 (M22) | |
| Lenovo LOQ 15APH8 | |
| MSI Cyborg 15 A12VF | |
| Strange Brigade - 1920x1080 ultra AA:ultra AF:16 | |
| Średnia w klasie Gaming (76.3 - 456, n=91, ostatnie 2 lata) | |
| Dell G15 5530 | |
| Captiva Advanced Gaming I74-121 | |
| Lenovo Legion Slim 5 16APH8 | |
| Lenovo LOQ 15APH8 | |
| Schenker XMG Core 15 (M22) | |
| MSI Cyborg 15 A12VF | |
| Dota 2 Reborn - 1920x1080 ultra (3/3) best looking | |
| Średnia w klasie Gaming (84.8 - 248, n=110, ostatnie 2 lata) | |
| Dell G15 5530 | |
| Captiva Advanced Gaming I74-121 | |
| Lenovo Legion Slim 5 16APH8 | |
| MSI Cyborg 15 A12VF | |
| Lenovo LOQ 15APH8 | |
| Schenker XMG Core 15 (M22) | |
| The Witcher 3 | |
| 1920x1080 High Graphics & Postprocessing (Nvidia HairWorks Off) | |
| Średnia w klasie Gaming (181 - 341, n=3, ostatnie 2 lata) | |
| Dell G15 5530 | |
| Captiva Advanced Gaming I74-121 | |
| Przeciętny NVIDIA GeForce RTX 4060 Laptop GPU (110 - 229, n=36) | |
| Lenovo Legion Slim 5 16APH8 | |
| Lenovo LOQ 15APH8 | |
| Schenker XMG Core 15 (M22) | |
| MSI Cyborg 15 A12VF | |
| 1920x1080 Ultra Graphics & Postprocessing (HBAO+) | |
| Średnia w klasie Gaming (95 - 240, n=8, ostatnie 2 lata) | |
| Dell G15 5530 | |
| Captiva Advanced Gaming I74-121 | |
| Przeciętny NVIDIA GeForce RTX 4060 Laptop GPU (77 - 159.7, n=42) | |
| Lenovo Legion Slim 5 16APH8 | |
| Lenovo LOQ 15APH8 | |
| Schenker XMG Core 15 (M22) | |
| MSI Cyborg 15 A12VF | |
| F1 23 | |
| 1920x1080 Ultra High Preset AA:T AF:16x | |
| Przeciętny NVIDIA GeForce RTX 4060 Laptop GPU (43.8 - 119.9, n=13) | |
| Captiva Advanced Gaming I74-121 | |
| Średnia w klasie Gaming (n=1ostatnie 2 lata) | |
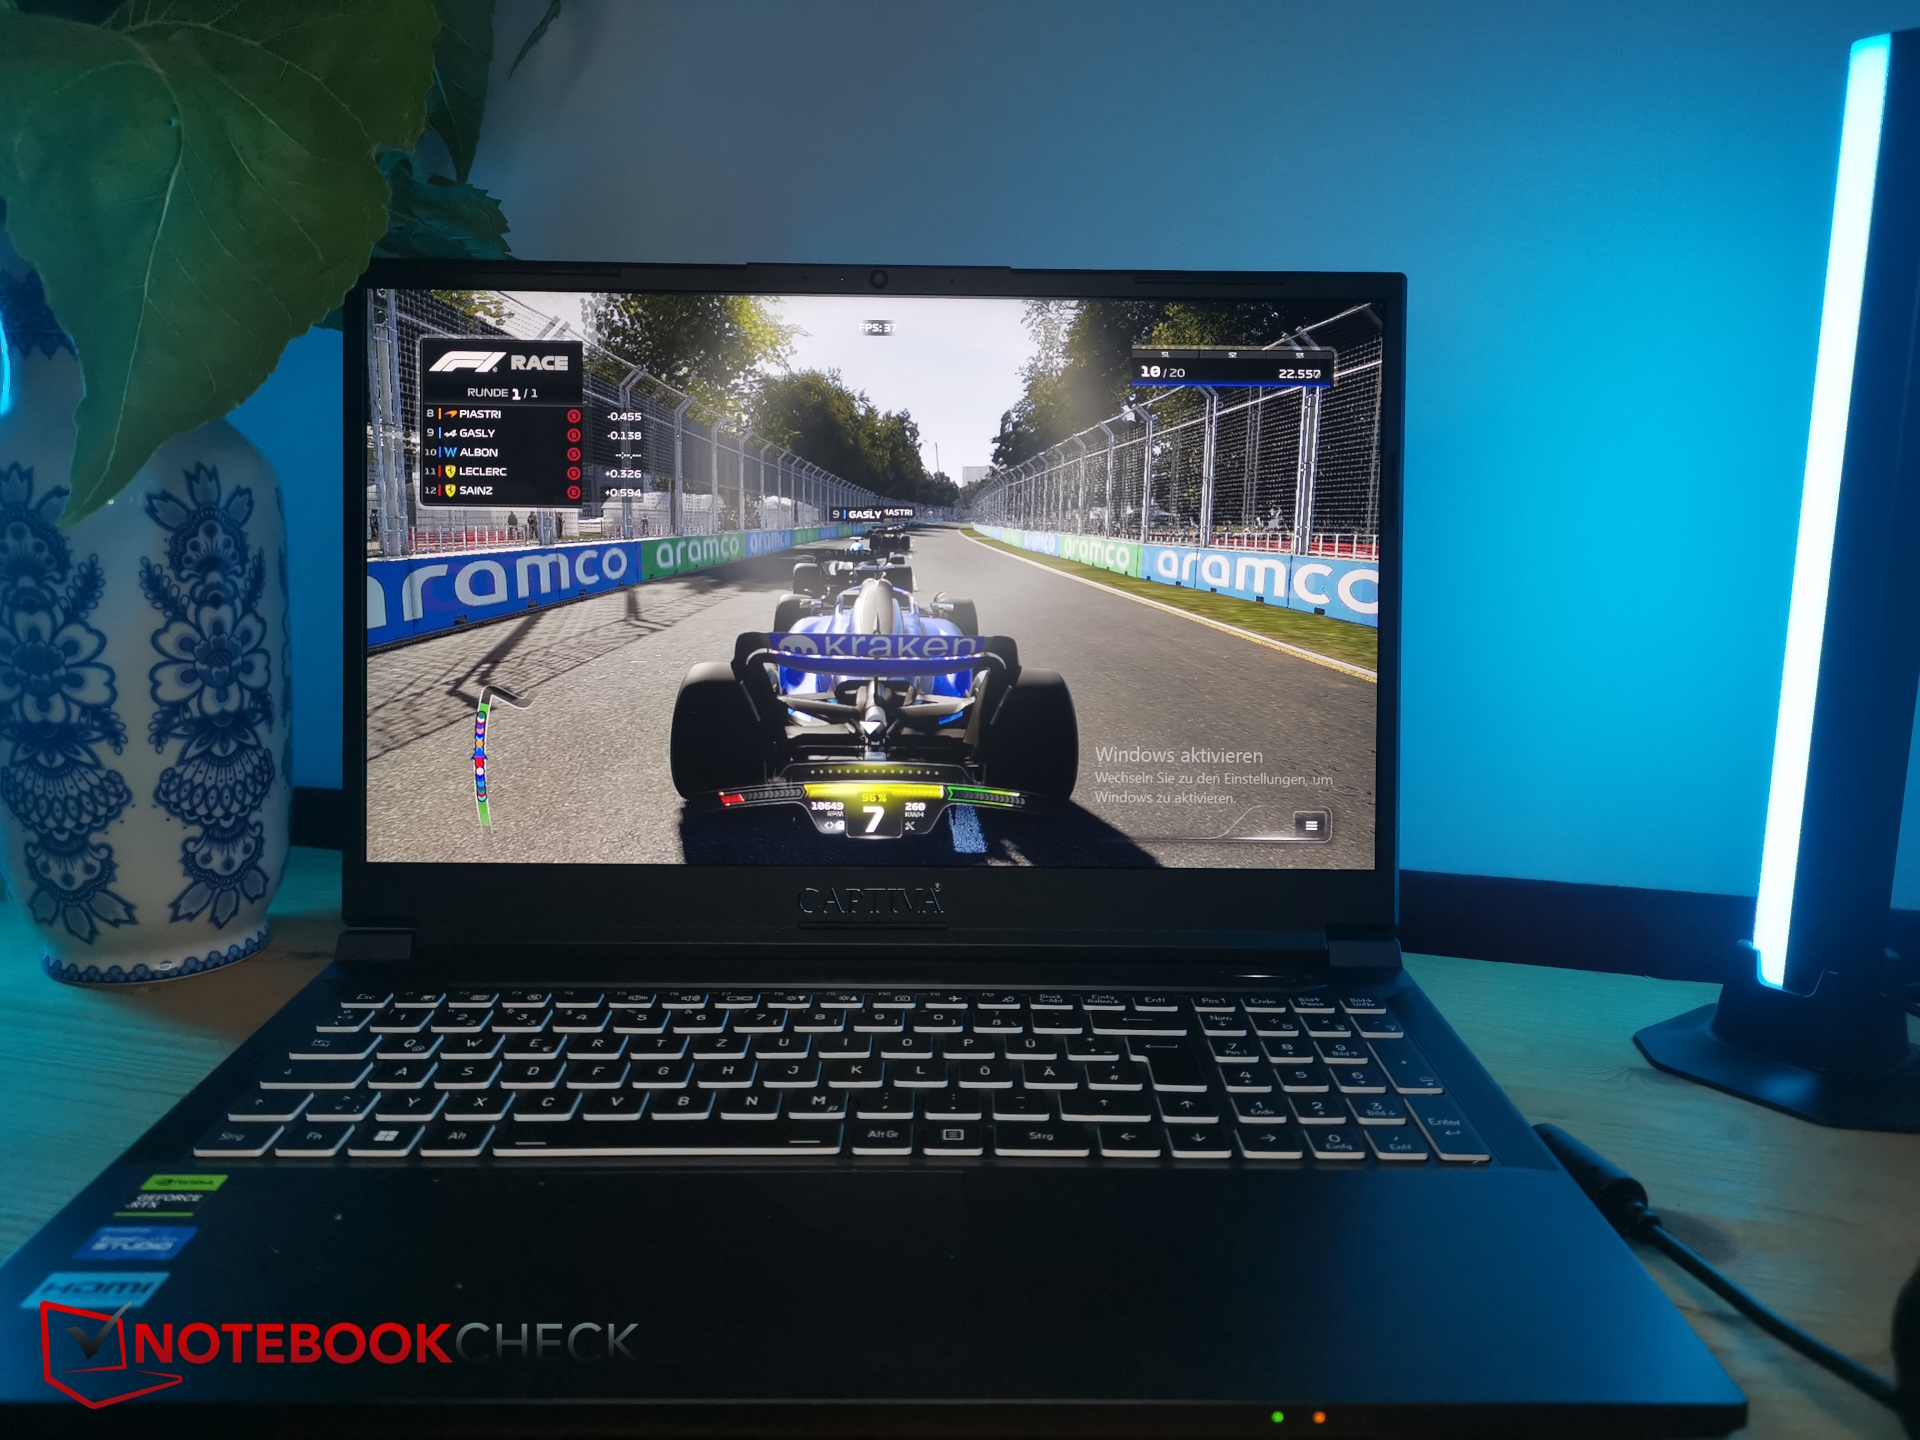
| 1920x1080 High Preset AA:T AF:16x | |
| Captiva Advanced Gaming I74-121 | |
| Przeciętny NVIDIA GeForce RTX 4060 Laptop GPU (143.7 - 207, n=13) | |
| Średnia w klasie Gaming (n=1ostatnie 2 lata) | |
Poza zwykłym rytmem dnia i nocy, liczba klatek na sekundę w The Witcher 3 pozostała bardzo stabilna. TylkoDell G15 był nieco szybszy.
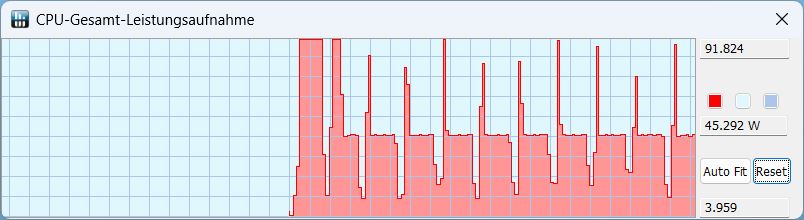
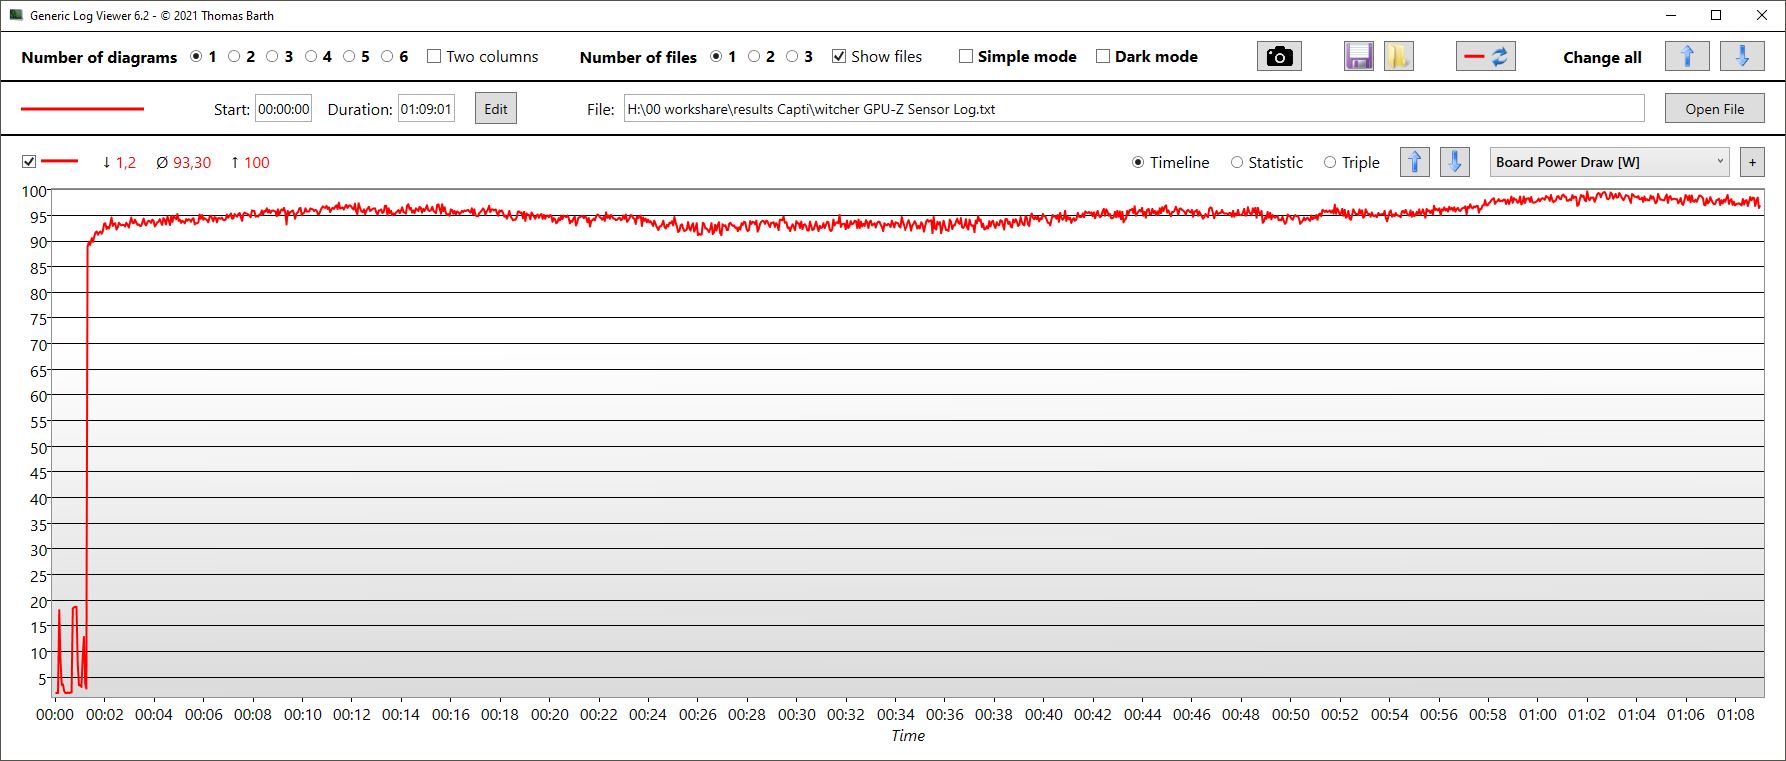
Podczas godzinnego benchmarku The Witcher 3 taktowanie GPU wynosiło stale ponad 2400 MHz, a taktowanie pamięci utrzymywało się na stałym poziomie 2000 MHz. W tym czasie GPU nagrzewał się do 72 °C, a pobór mocy wynosił około 95 watów.
W tym samym czasie procesor zmniejszył swoje TDP do około 30 W i rozgrzał się do około 77 °C.
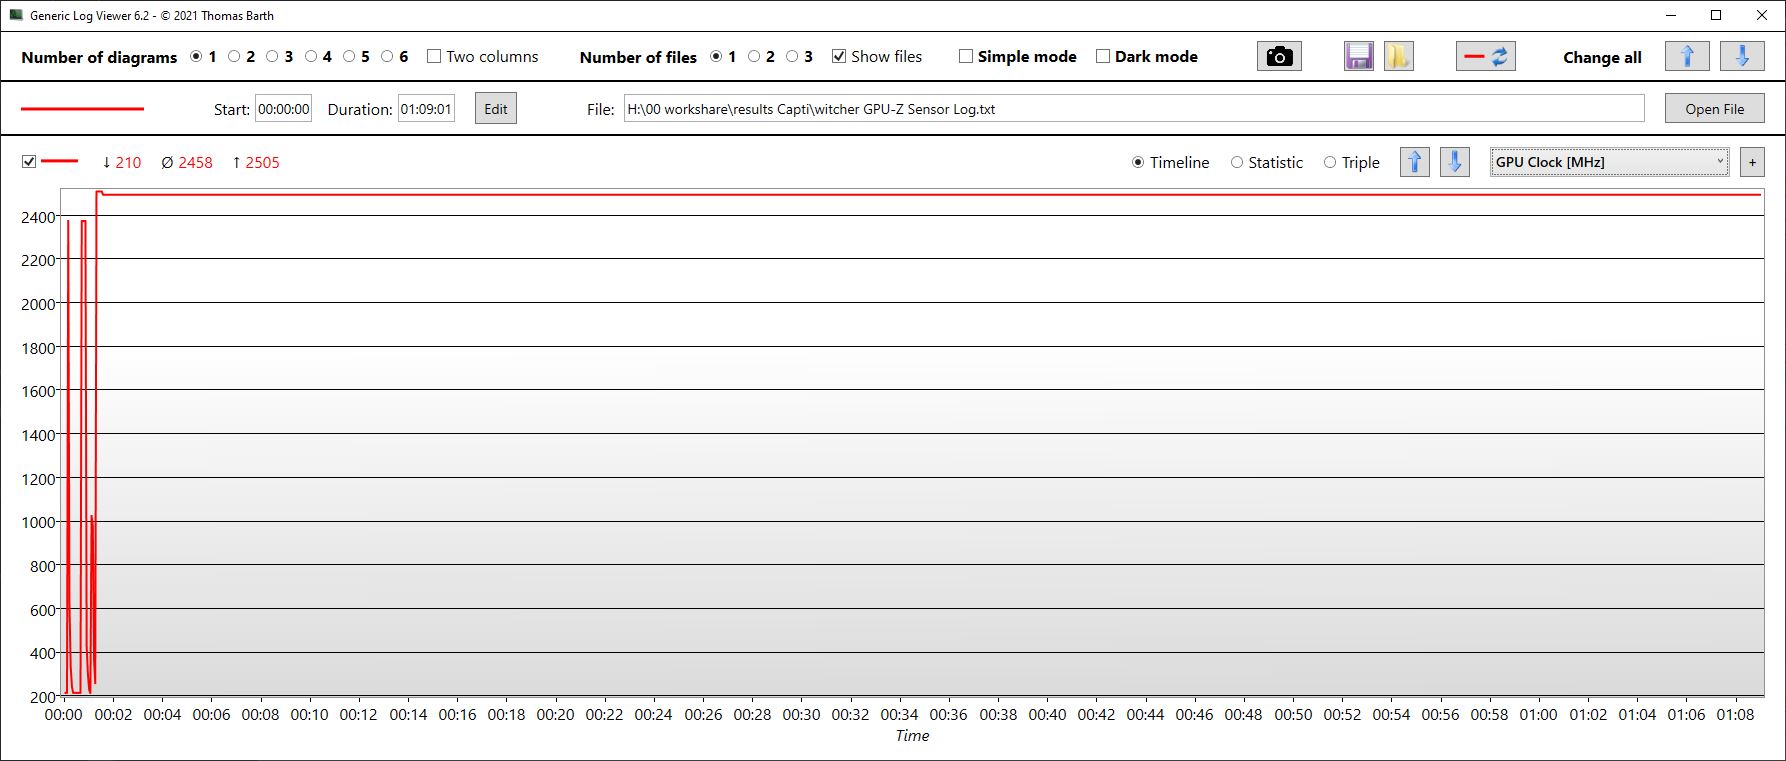
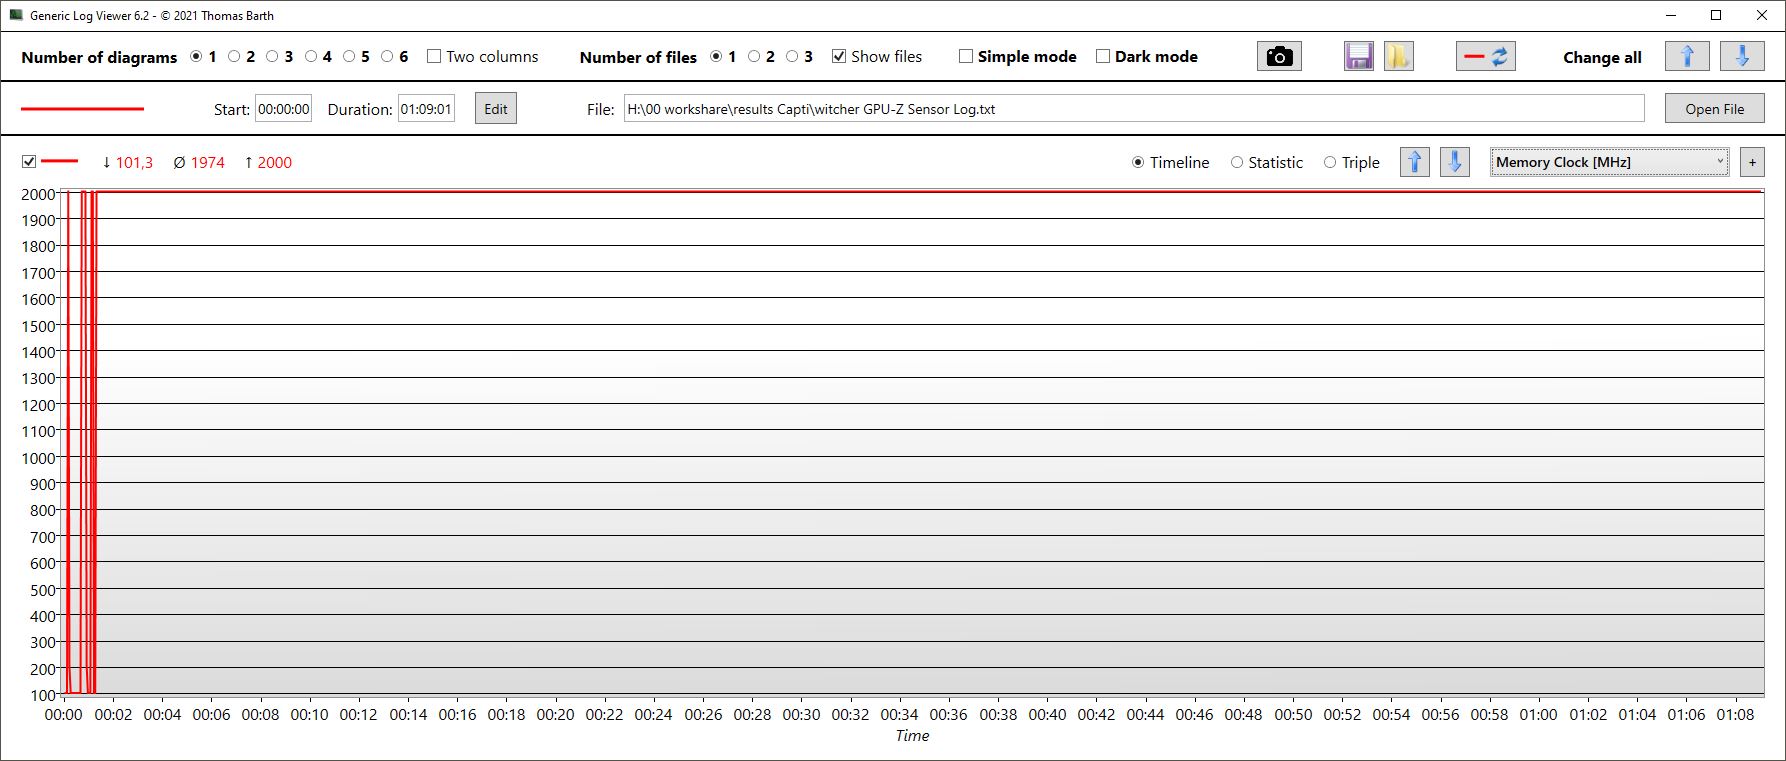
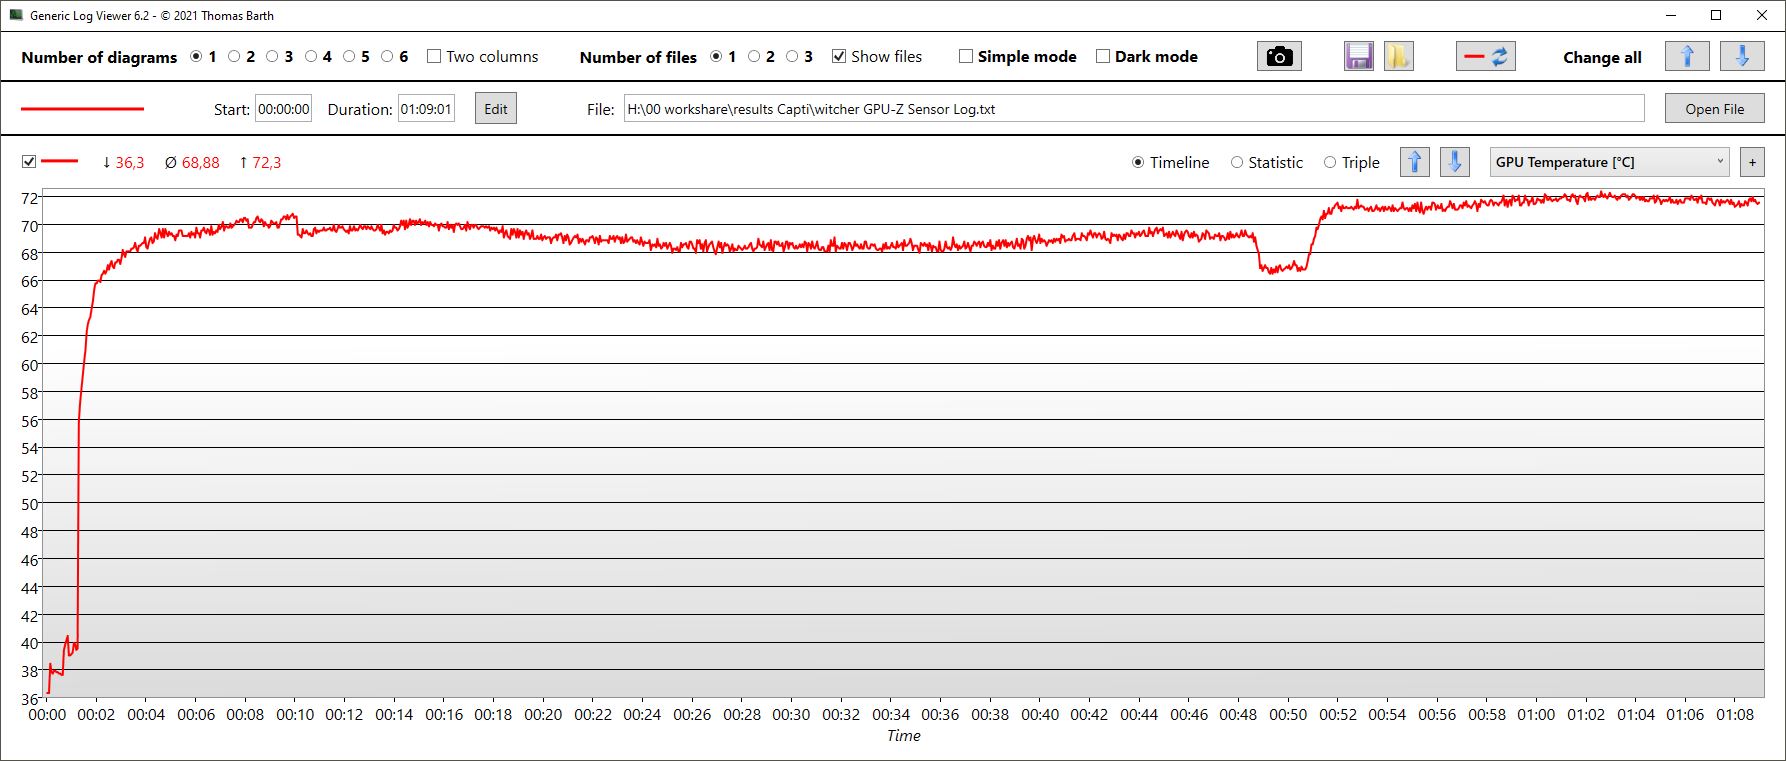
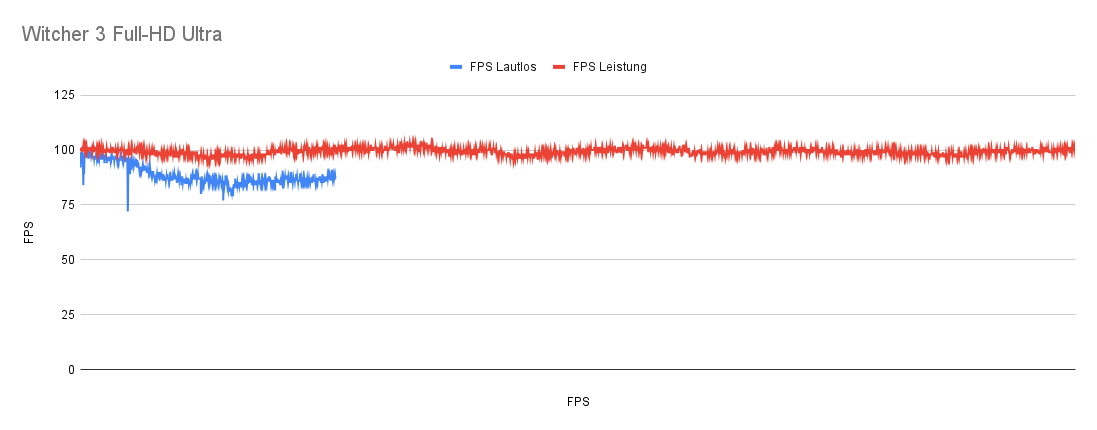
Witcher 3 FPS diagram
Tryb rozrywki przyniósł praktycznie takie same wartości i nie był nawet dużo cichszy.
W trybie cichym komputer działa znacznie ciszej (31,43 dB). Mniej aktywne wentylatory powodują, że temperatura GPU rośnie znacznie szybciej. Po około 3,5 minuty temperatura wynosiła już 87 °C, co doprowadziło do nieznacznego spadku taktowania GPU i poboru mocy. Następnie temperatura utrzymywała się na stałym poziomie 89 °C. TGP spadło ze 100 watów do 80 watów. W tym samym czasie liczba klatek na sekundę spadła ze 100 do 85.
| low | med. | high | ultra | QHD | |
|---|---|---|---|---|---|
| GTA V (2015) | 186.5 | 182.4 | 177.2 | 117 | |
| The Witcher 3 (2015) | 367 | 296 | 199 | 101 | |
| Dota 2 Reborn (2015) | 181 | 168.1 | 147.2 | 140.5 | |
| Final Fantasy XV Benchmark (2018) | 185.6 | 148 | 102.2 | 75.6 | |
| X-Plane 11.11 (2018) | 142.7 | 128.1 | 99.4 | ||
| Far Cry 5 (2018) | 175 | 153 | 147 | 138 | |
| Strange Brigade (2018) | 470 | 276 | 219 | 187.9 | |
| F1 23 (2023) | 221 | 225 | 184 | 59 |
Emisje - chłodne, ale nie ciche
Emisja hałasu
Oba wentylatory Captiva Advanced Gaming są prawie zawsze aktywne - nawet w tak zwanym "trybie cichym". Mimo to wentylatory pracują bardzo cicho w trybie bezczynności. Podczas grania laptop staje się dość głośny i osiąga taką samą emisję hałasu jak przy maksymalnym obciążeniu. Niestety, nie zauważyliśmy żadnej różnicy, na przykład takiej, jak w przypadkuLenovo LOQ.
Przynajmniej jego maksymalna emisja hałasu nie jest niezwykła - jest mniej więcej taka sama jak w innych laptopach do gier. Dell G15 jest cichszy, mimo że ma taką samą wydajność 3D.
Tryb rozrywki nie doprowadził do cichszych wyników w naszym teście. Podczas korzystania z trybu cichego poziom hałasu w grach znacznie spadł, a w trybie bezczynności wentylatory nadal pozostawały aktywne.
Witcher 3 Full HD Ultra
| Tryb/wartość | Emisja hałasu w dB | FPS |
|---|---|---|
| Wydajność | 55 | 101 |
| Rozrywka | 55 | 101 |
| Silent | 31.43 | 85 (powolny spadek od 100 kl./s) |
Hałas
| luz |
| 23 / 25.67 / 25.67 dB |
| obciążenie |
| 38.52 / 54.17 dB |
 | ||
30 dB cichy 40 dB(A) słyszalny 50 dB(A) irytujący |
||
min: | ||
| Captiva Advanced Gaming I74-121 GeForce RTX 4060 Laptop GPU, i5-13500H, Samsung SSD 980 1TB MZ-V8V1T0BW | MSI Cyborg 15 A12VF GeForce RTX 4060 Laptop GPU, i7-12650H, Samsung PM9B1 1024GB MZVL41T0HBLB | Dell G15 5530 GeForce RTX 4060 Laptop GPU, i7-13650HX, SSTC CL4-3D512-Q11 | Lenovo Legion Slim 5 16APH8 GeForce RTX 4060 Laptop GPU, R7 7840HS, SK hynix PC801 HFS512GEJ9X115N | Lenovo LOQ 15APH8 GeForce RTX 4050 Laptop GPU, R7 7840HS, Micron 2450 512GB MTFDKCD512TFK | Schenker XMG Core 15 (M22) GeForce RTX 3060 Laptop GPU, R7 6800H, Samsung SSD 980 Pro 1TB MZ-V8P1T0BW | |
|---|---|---|---|---|---|---|
| Noise | -30% | 5% | 2% | 2% | 1% | |
| wyłączone / środowisko * (dB) | 23 | 27 -17% | 20.41 11% | 22.9 -0% | 23.1 -0% | 23 -0% |
| Idle Minimum * (dB) | 23 | 27 -17% | 26.85 -17% | 23.1 -0% | 23.1 -0% | 23 -0% |
| Idle Average * (dB) | 25.67 | 37.5 -46% | 26.85 -5% | 23.1 10% | 23.1 10% | 23 10% |
| Idle Maximum * (dB) | 25.67 | 38 -48% | 26.85 -5% | 27.7 -8% | 25.2 2% | 23 10% |
| Load Average * (dB) | 38.52 | 56.3 -46% | 27.65 28% | 33.3 14% | 44.3 -15% | 42.41 -10% |
| Witcher 3 ultra * (dB) | 54.17 | 47.9 12% | 54 -0% | 45.8 15% | 54.71 -1% | |
| Load Maximum * (dB) | 54.17 | 56.3 -4% | 47.86 12% | 54 -0% | 52 4% | 55.05 -2% |
* ... im mniej tym lepiej
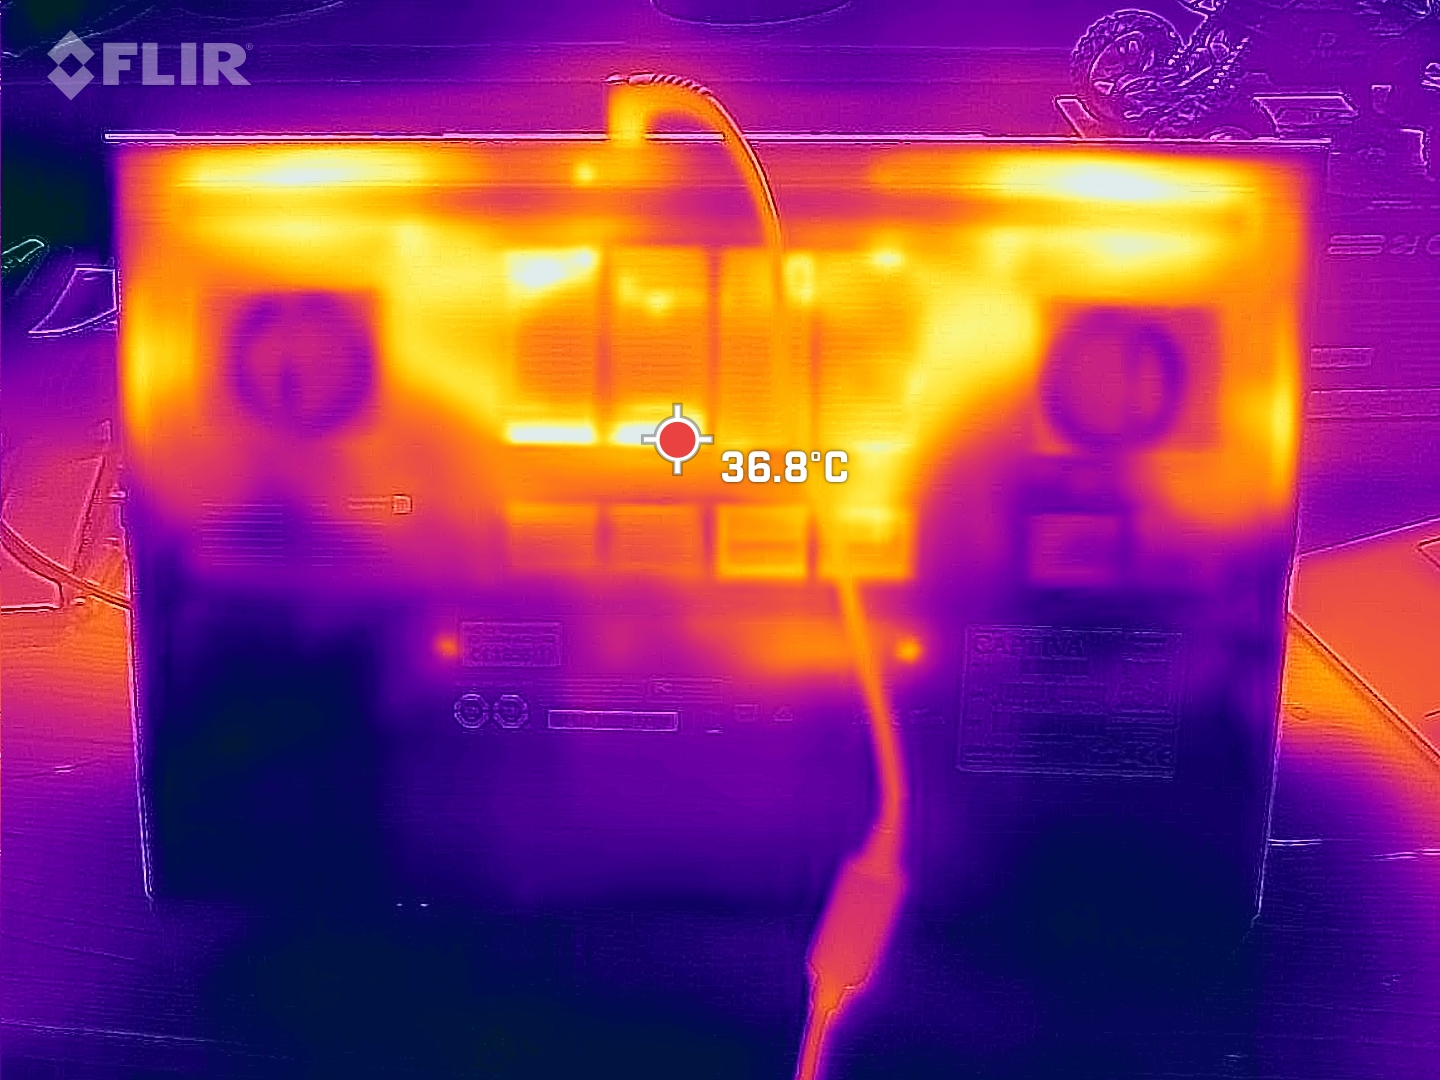
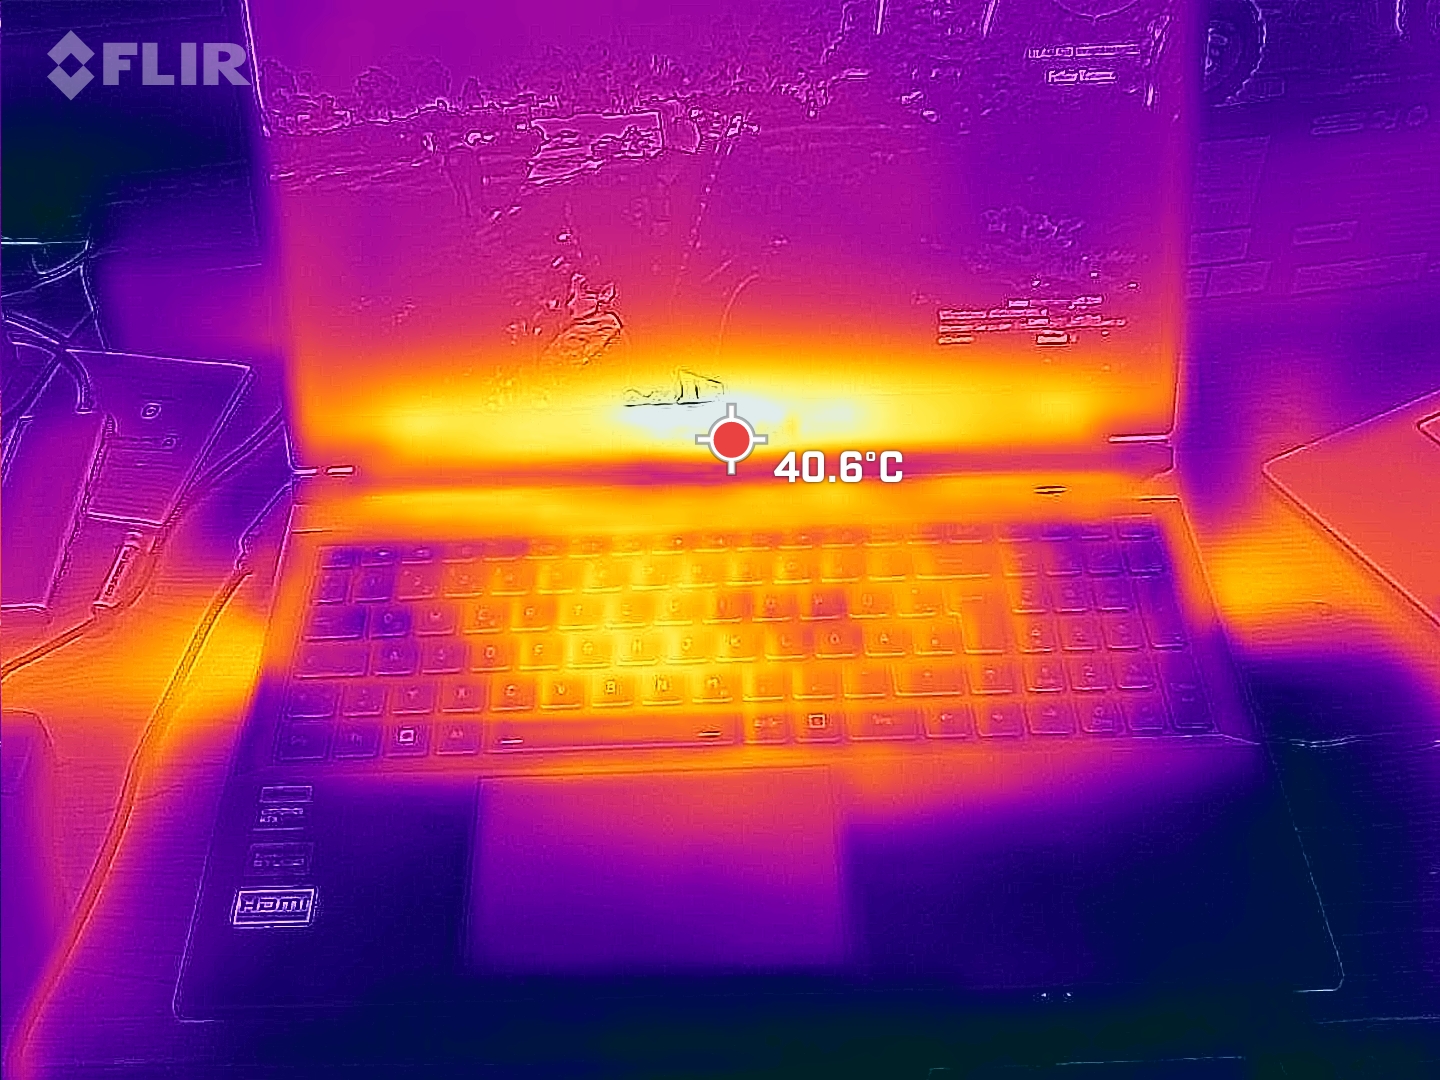
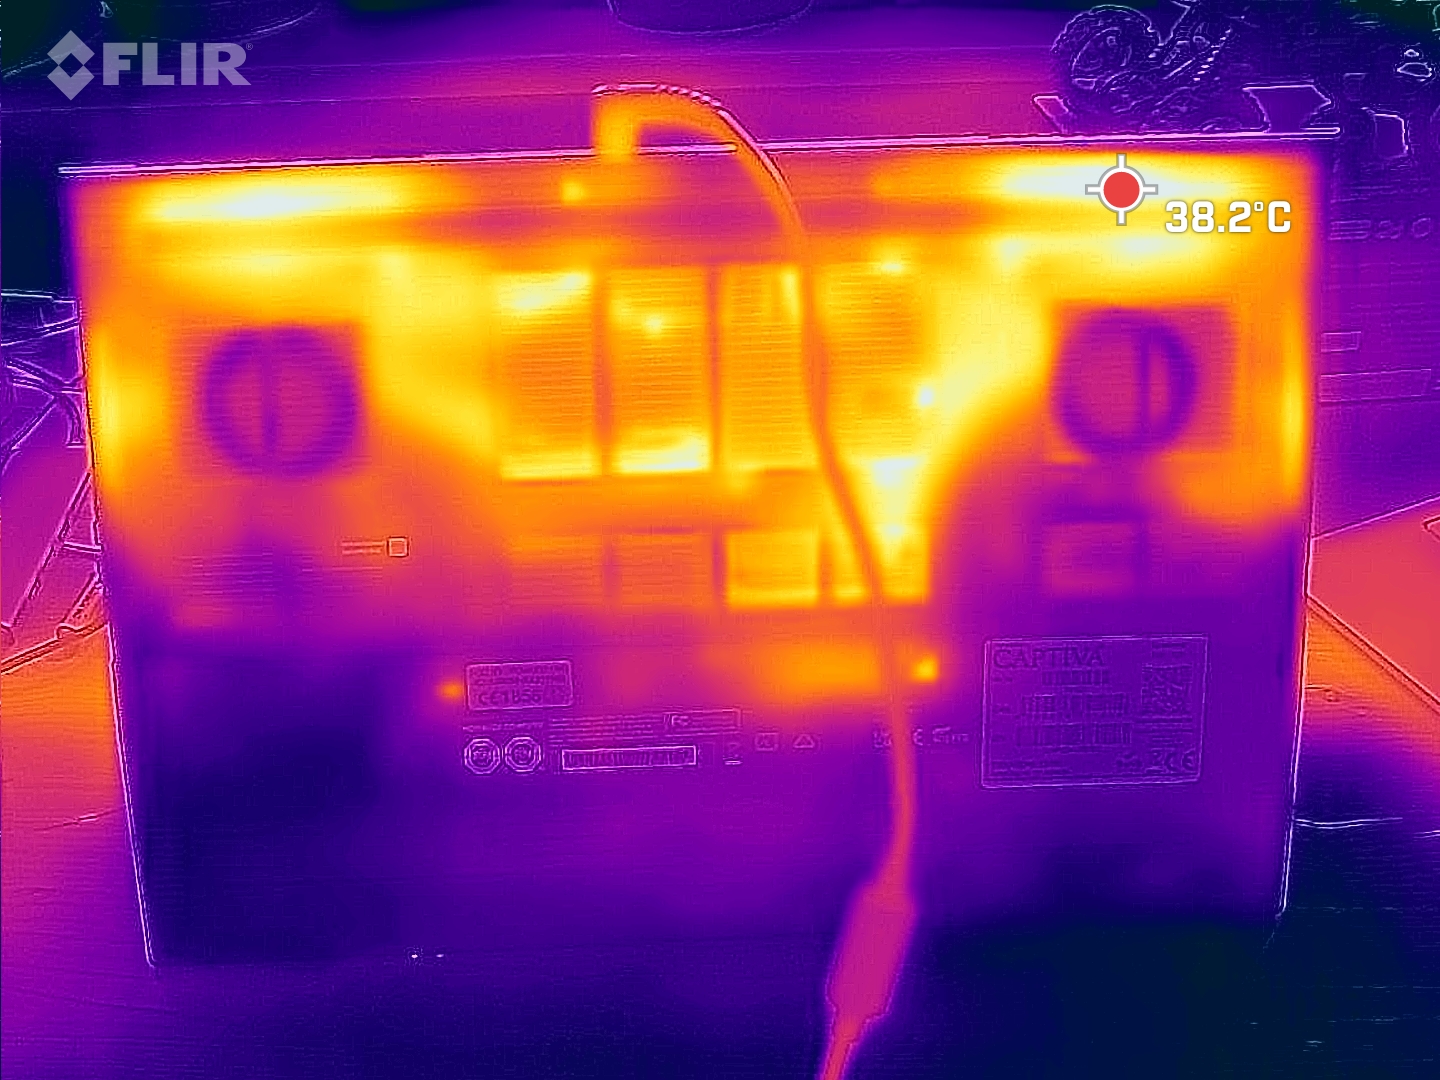
Temperatura
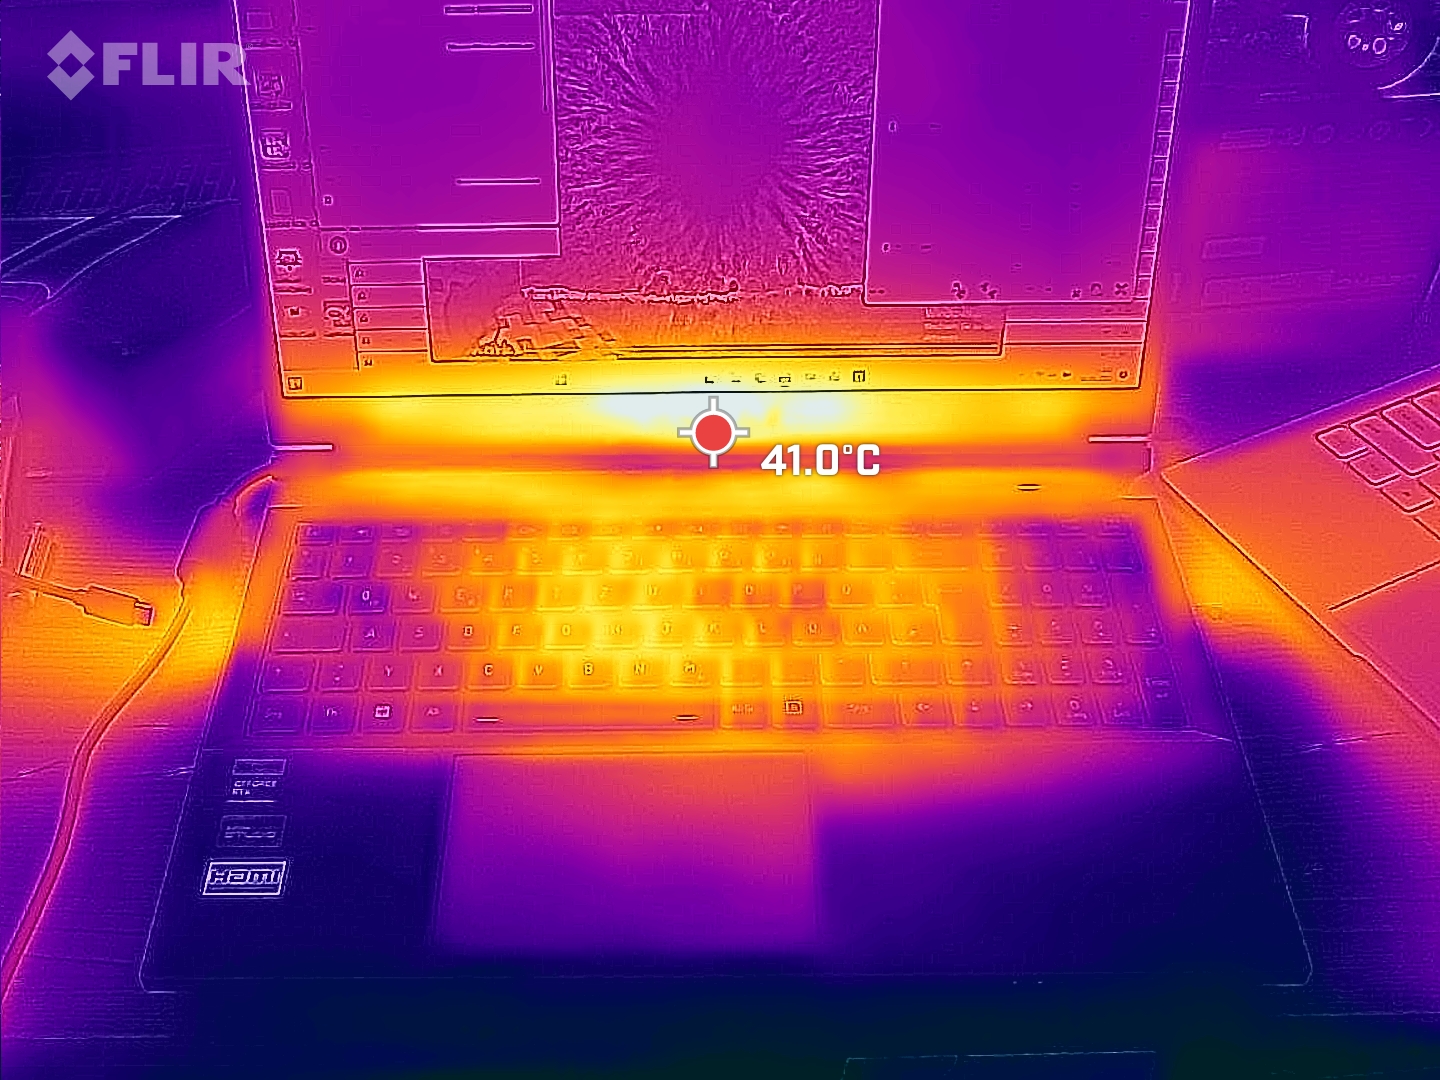
Dzięki hojnemu wykorzystaniu miedzi w laptopie i jego wentylatorom, urządzenie do gier pozostaje stosunkowo chłodne. Nawet przy pełnym obciążeniu po godzinie zmierzyliśmy tylko maksymalnie 42 °C. TutajDell G15naprawdę pokazuje, ile kosztują cichsze wentylatory - osiąga temperaturę ponad 60 °C!
(±) Maksymalna temperatura w górnej części wynosi 41 °C / 106 F, w porównaniu do średniej 40.4 °C / 105 F , począwszy od 21.2 do 68.8 °C dla klasy Gaming.
(±) Dno nagrzewa się maksymalnie do 42 °C / 108 F, w porównaniu do średniej 43.2 °C / 110 F
(+) W stanie bezczynności średnia temperatura górnej części wynosi 28.3 °C / 83 F, w porównaniu ze średnią temperaturą urządzenia wynoszącą 33.9 °C / ### class_avg_f### F.
(±) Podczas gry w Wiedźmina 3 średnia temperatura górnej części wynosi 32.9 °C / 91 F, w porównaniu do średniej temperatury urządzenia wynoszącej 33.9 °C / ## #class_avg_f### F.
(+) Podpórki pod nadgarstki i touchpad są chłodniejsze niż temperatura skóry i maksymalnie 30 °C / 86 F i dlatego są chłodne w dotyku.
(±) Średnia temperatura obszaru podparcia dłoni w podobnych urządzeniach wynosiła 28.8 °C / 83.8 F (-1.2 °C / -2.2 F).
| Captiva Advanced Gaming I74-121 Intel Core i5-13500H, NVIDIA GeForce RTX 4060 Laptop GPU | MSI Cyborg 15 A12VF Intel Core i7-12650H, NVIDIA GeForce RTX 4060 Laptop GPU | Dell G15 5530 Intel Core i7-13650HX, NVIDIA GeForce RTX 4060 Laptop GPU | Lenovo Legion Slim 5 16APH8 AMD Ryzen 7 7840HS, NVIDIA GeForce RTX 4060 Laptop GPU | Lenovo LOQ 15APH8 AMD Ryzen 7 7840HS, NVIDIA GeForce RTX 4050 Laptop GPU | Schenker XMG Core 15 (M22) AMD Ryzen 7 6800H, NVIDIA GeForce RTX 3060 Laptop GPU | |
|---|---|---|---|---|---|---|
| Heat | 7% | -20% | 10% | -1% | -5% | |
| Maximum Upper Side * (°C) | 41 | 47.5 -16% | 54 -32% | 40.6 1% | 44.4 -8% | 48 -17% |
| Maximum Bottom * (°C) | 42 | 35.5 15% | 62.2 -48% | 42 -0% | 52 -24% | 51 -21% |
| Idle Upper Side * (°C) | 32 | 27.7 13% | 33.4 -4% | 27.8 13% | 28 12% | 28 12% |
| Idle Bottom * (°C) | 35 | 29.5 16% | 33.4 5% | 26.6 24% | 29.6 15% | 33 6% |
* ... im mniej tym lepiej
Test warunków skrajnych
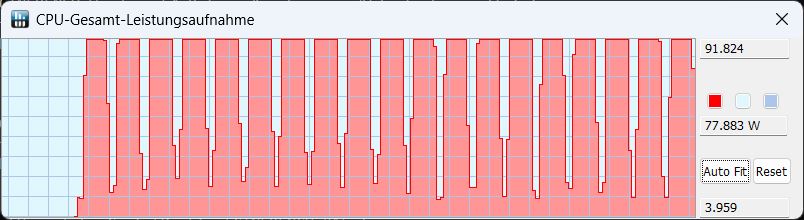
Częstotliwość taktowania procesora pozostała zaskakująco stała podczas naszego godzinnego testu obciążeniowego. Osiągnięto średnio około 3,1 GHz. Procesor rozgrzewał się do około 72 °C, a jego współczynnik TDP wynosił 45 W.
GPU zachowywał się podobnie konsekwentnie: Jego taktowanie wynosiło 2460 MHz, taktowanie pamięci 2000 MHz, a temperatura wynosiła średnio 69 °C.
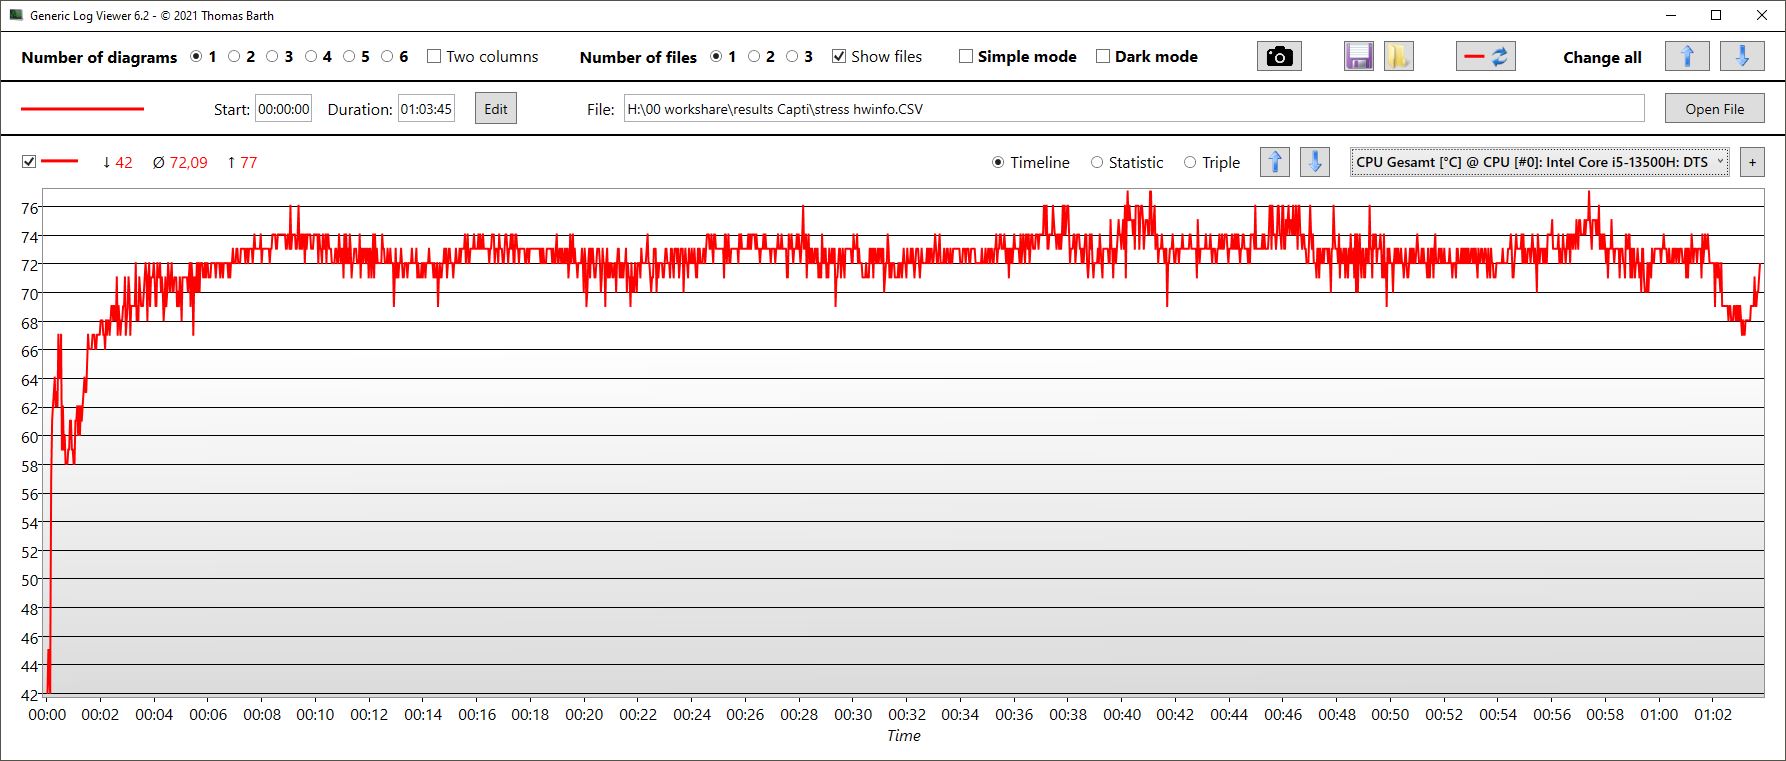
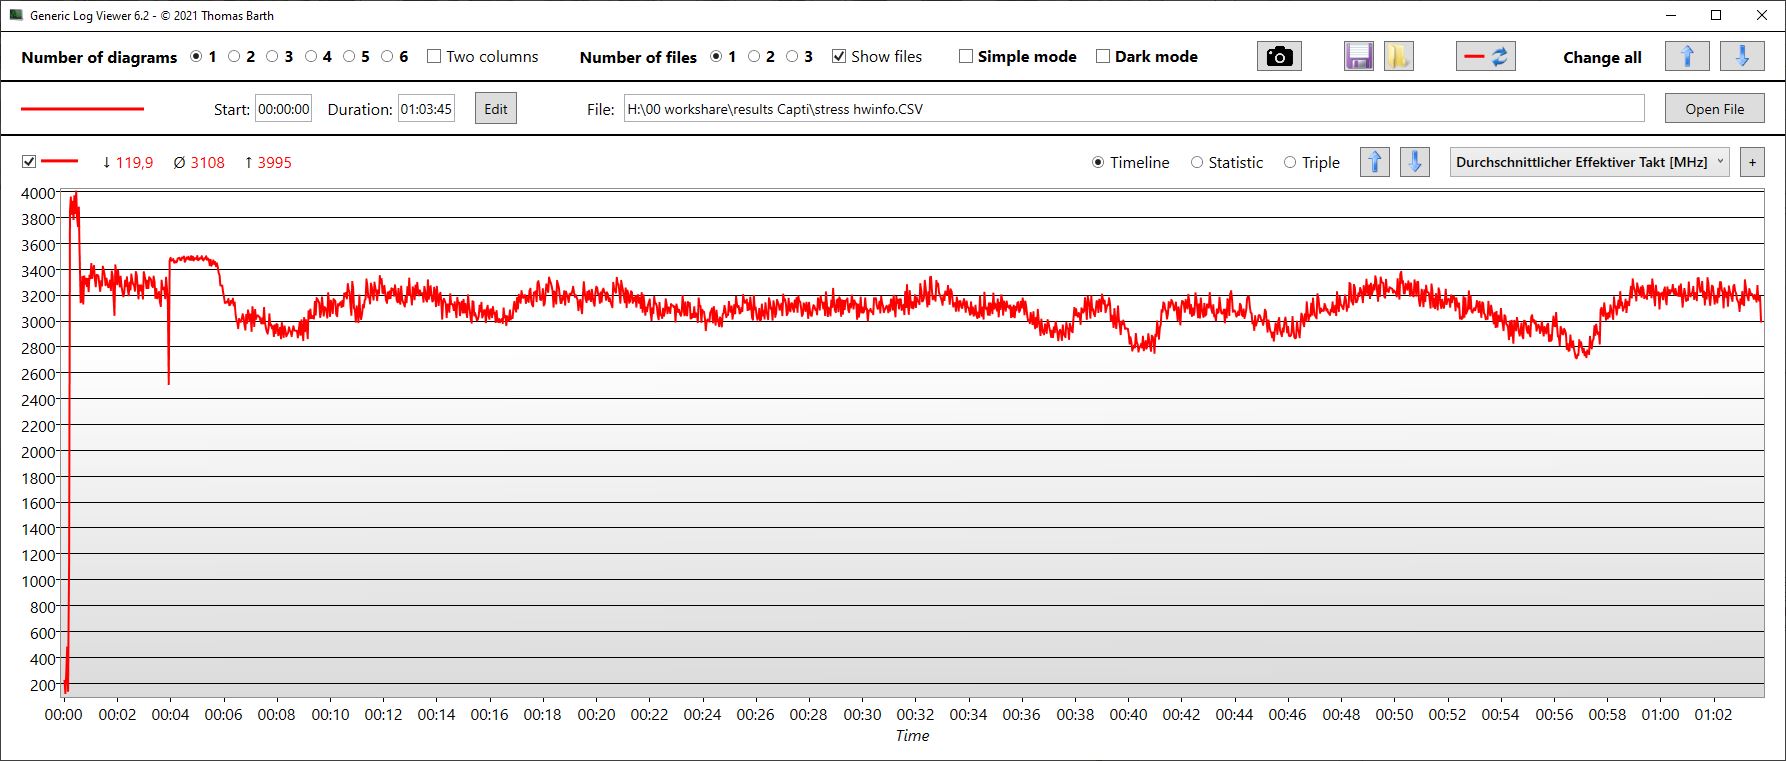
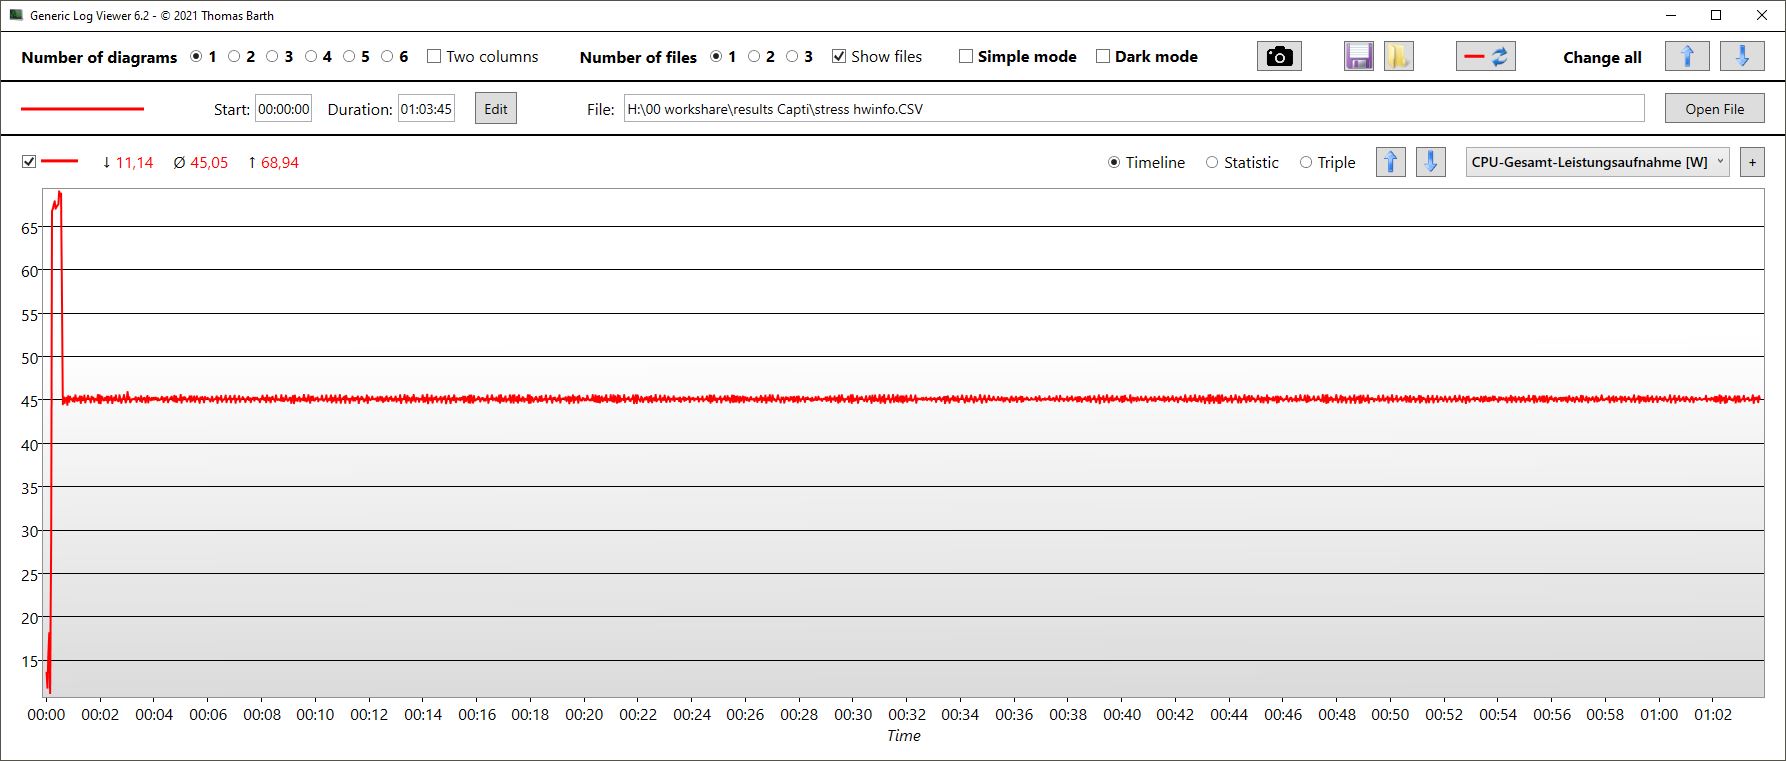
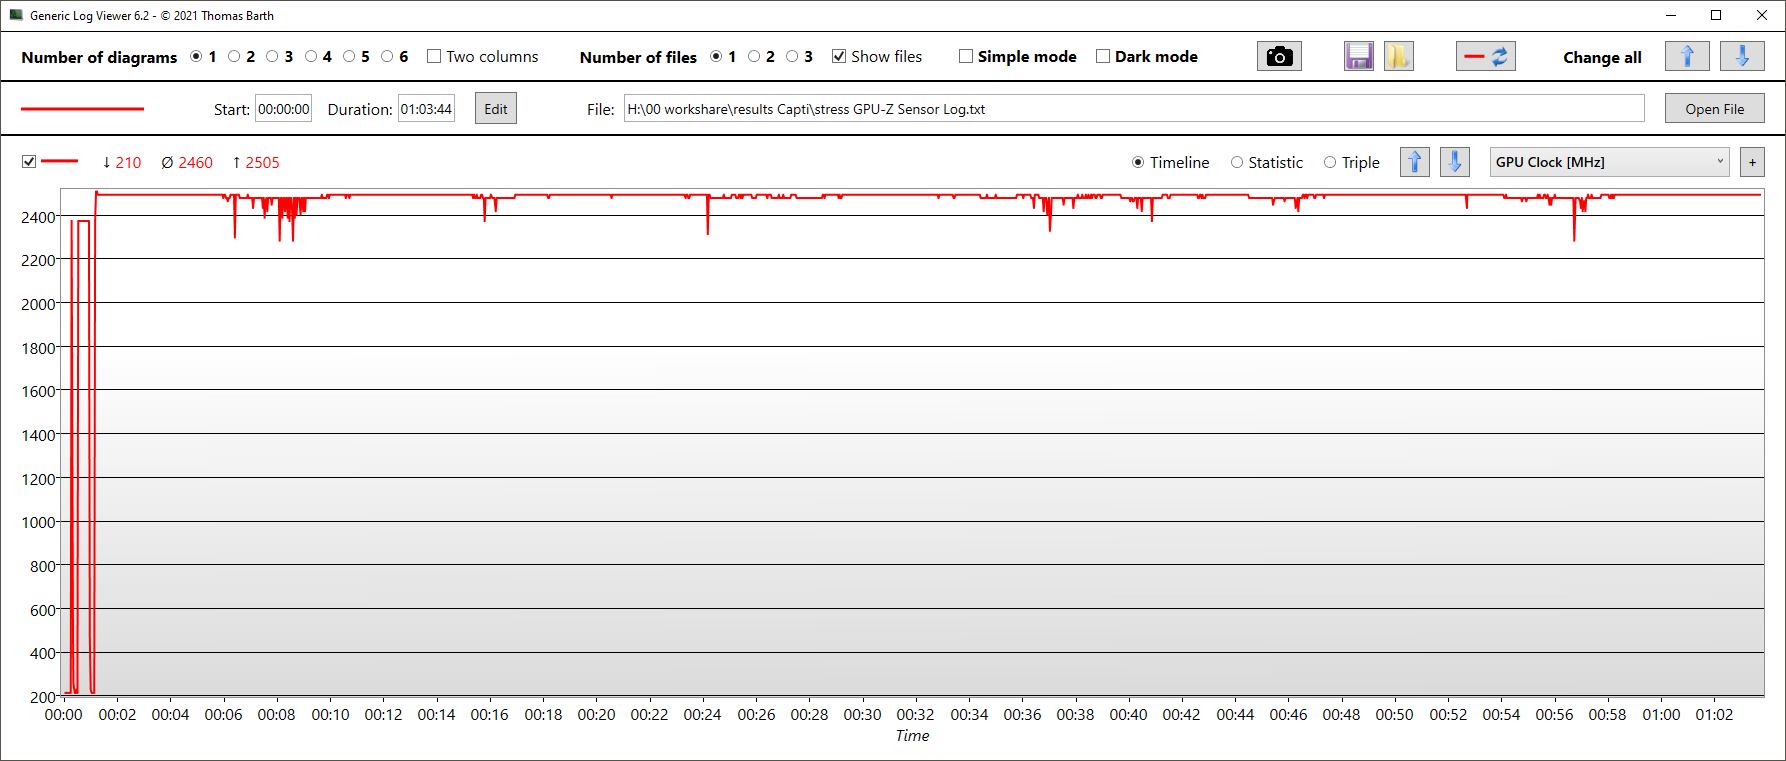
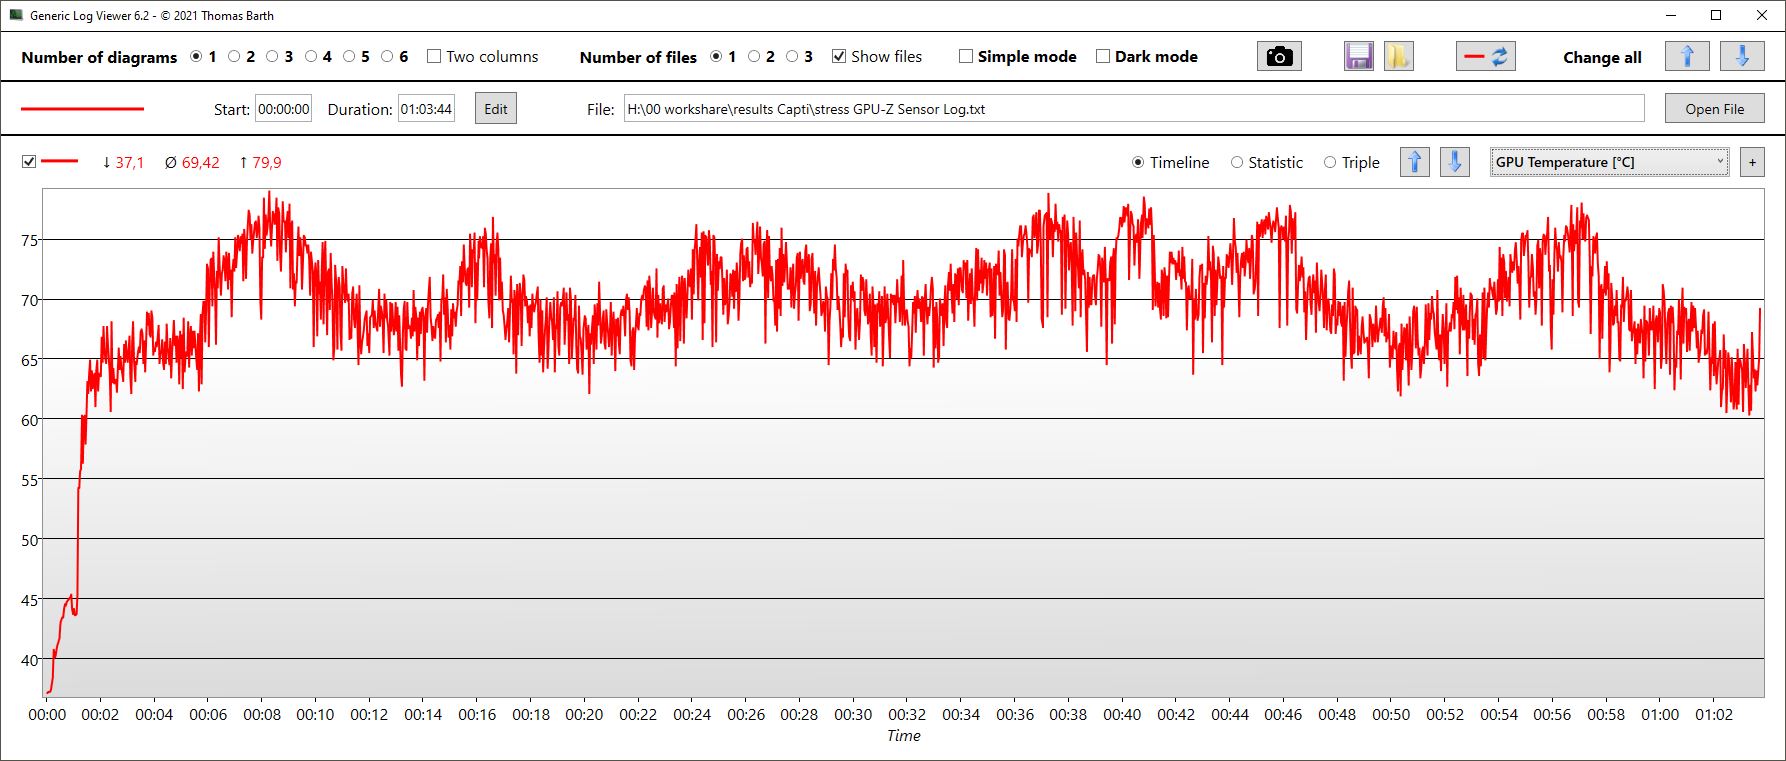
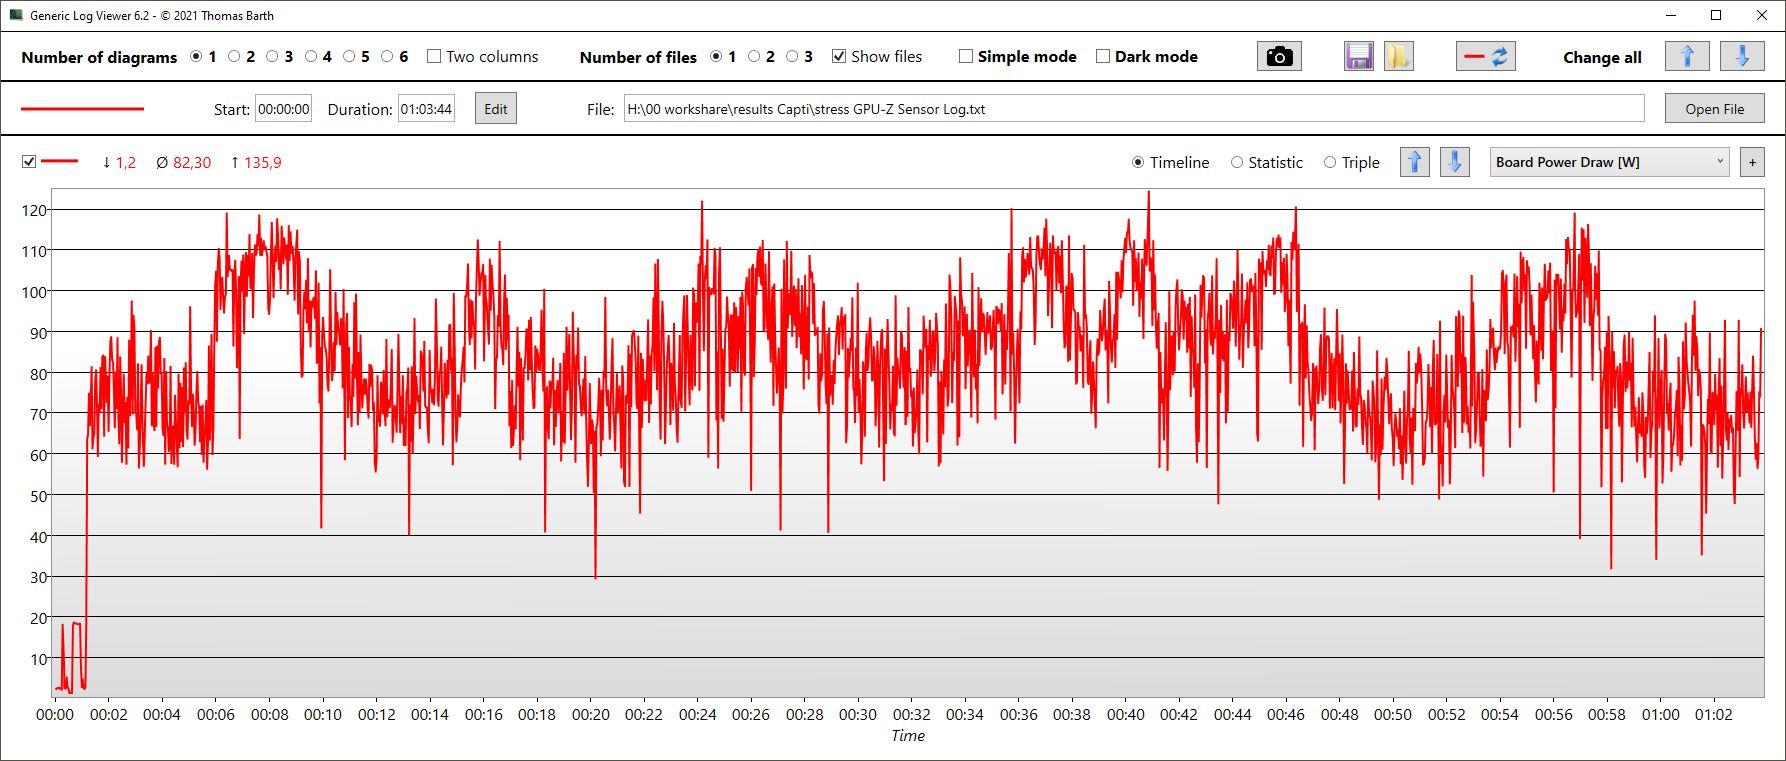
| Taktowanie CPU (GHz) | Taktowanie GPU (MHz) | Średnia temperatura CPU (°C) | Średnia temperatura GPU (°C) | |
| Prime95 + FurMark Stress | 3.1 | 2,460 | 72 | 69 |
| Witcher 3 Obciążenie | 0.8 | 2,400 | 77 | 72 |
Głośniki
Captiva zainstalowała głośniki stereo w obszarze przednich narożników. Promieniują one w dół, mogłyby być nieco głośniejsze, prawie nie mają basów i poza tym są raczej przeciętne.
Oprócz portów cyfrowych dostępne są dwa gniazda do podłączania innych urządzeń audio - jedno dla zestawów słuchawkowych i słuchawek, drugie dla mikrofonów.
Captiva Advanced Gaming I74-121 analiza dźwięku
(±) | głośność głośnika jest średnia, ale dobra (79.02 dB)
Bas 100 - 315 Hz
(-) | prawie brak basu - średnio 27.2% niższa od mediany
(±) | liniowość basu jest średnia (12.7% delta do poprzedniej częstotliwości)
Średnie 400 - 2000 Hz
(±) | wyższe średnie - średnio 10% wyższe niż mediana
(±) | liniowość środka jest średnia (14.2% delta do poprzedniej częstotliwości)
Wysokie 2–16 kHz
(+) | zrównoważone maksima - tylko 4.3% od mediany
(±) | liniowość wysokich wartości jest średnia (9.9% delta do poprzedniej częstotliwości)
Ogólnie 100 - 16.000 Hz
(-) | ogólny dźwięk nie jest liniowy (30.3% różnicy w stosunku do mediany)
W porównaniu do tej samej klasy
» 96% wszystkich testowanych urządzeń w tej klasie było lepszych, 2% podobnych, 3% gorszych
» Najlepszy miał deltę 6%, średnia wynosiła ###średnia###%, najgorsza wynosiła 132%
W porównaniu do wszystkich testowanych urządzeń
» 89% wszystkich testowanych urządzeń było lepszych, 3% podobnych, 9% gorszych
» Najlepszy miał deltę 4%, średnia wynosiła ###średnia###%, najgorsza wynosiła 134%
Apple MacBook Pro 16 2021 M1 Pro analiza dźwięku
(+) | głośniki mogą odtwarzać stosunkowo głośno (84.7 dB)
Bas 100 - 315 Hz
(+) | dobry bas - tylko 3.8% od mediany
(+) | bas jest liniowy (5.2% delta do poprzedniej częstotliwości)
Średnie 400 - 2000 Hz
(+) | zbalansowane środki średnie - tylko 1.3% od mediany
(+) | średnie są liniowe (2.1% delta do poprzedniej częstotliwości)
Wysokie 2–16 kHz
(+) | zrównoważone maksima - tylko 1.9% od mediany
(+) | wzloty są liniowe (2.7% delta do poprzedniej częstotliwości)
Ogólnie 100 - 16.000 Hz
(+) | ogólny dźwięk jest liniowy (4.6% różnicy w stosunku do mediany)
W porównaniu do tej samej klasy
» 0% wszystkich testowanych urządzeń w tej klasie było lepszych, 0% podobnych, 100% gorszych
» Najlepszy miał deltę 5%, średnia wynosiła ###średnia###%, najgorsza wynosiła 45%
W porównaniu do wszystkich testowanych urządzeń
» 0% wszystkich testowanych urządzeń było lepszych, 0% podobnych, 100% gorszych
» Najlepszy miał deltę 4%, średnia wynosiła ###średnia###%, najgorsza wynosiła 134%
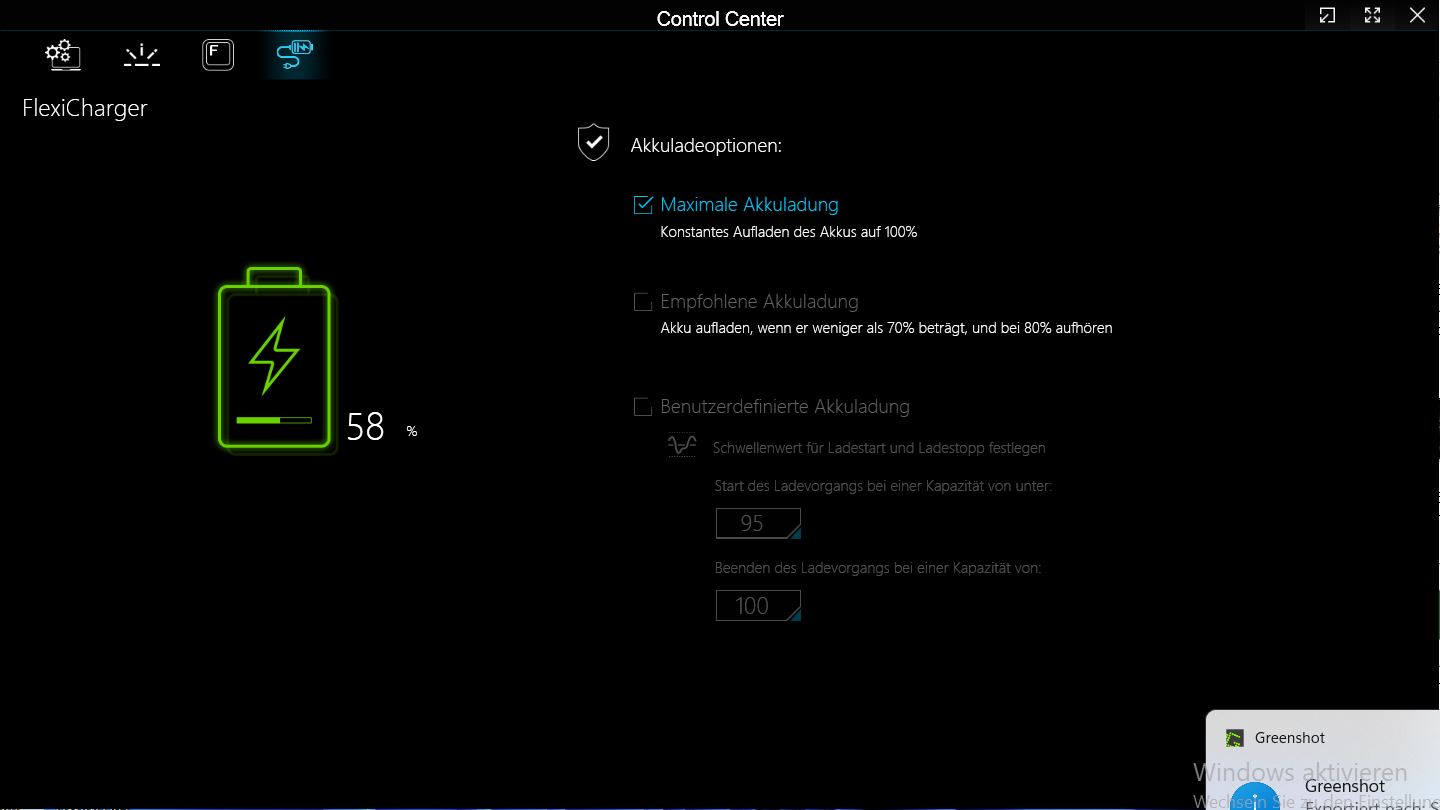
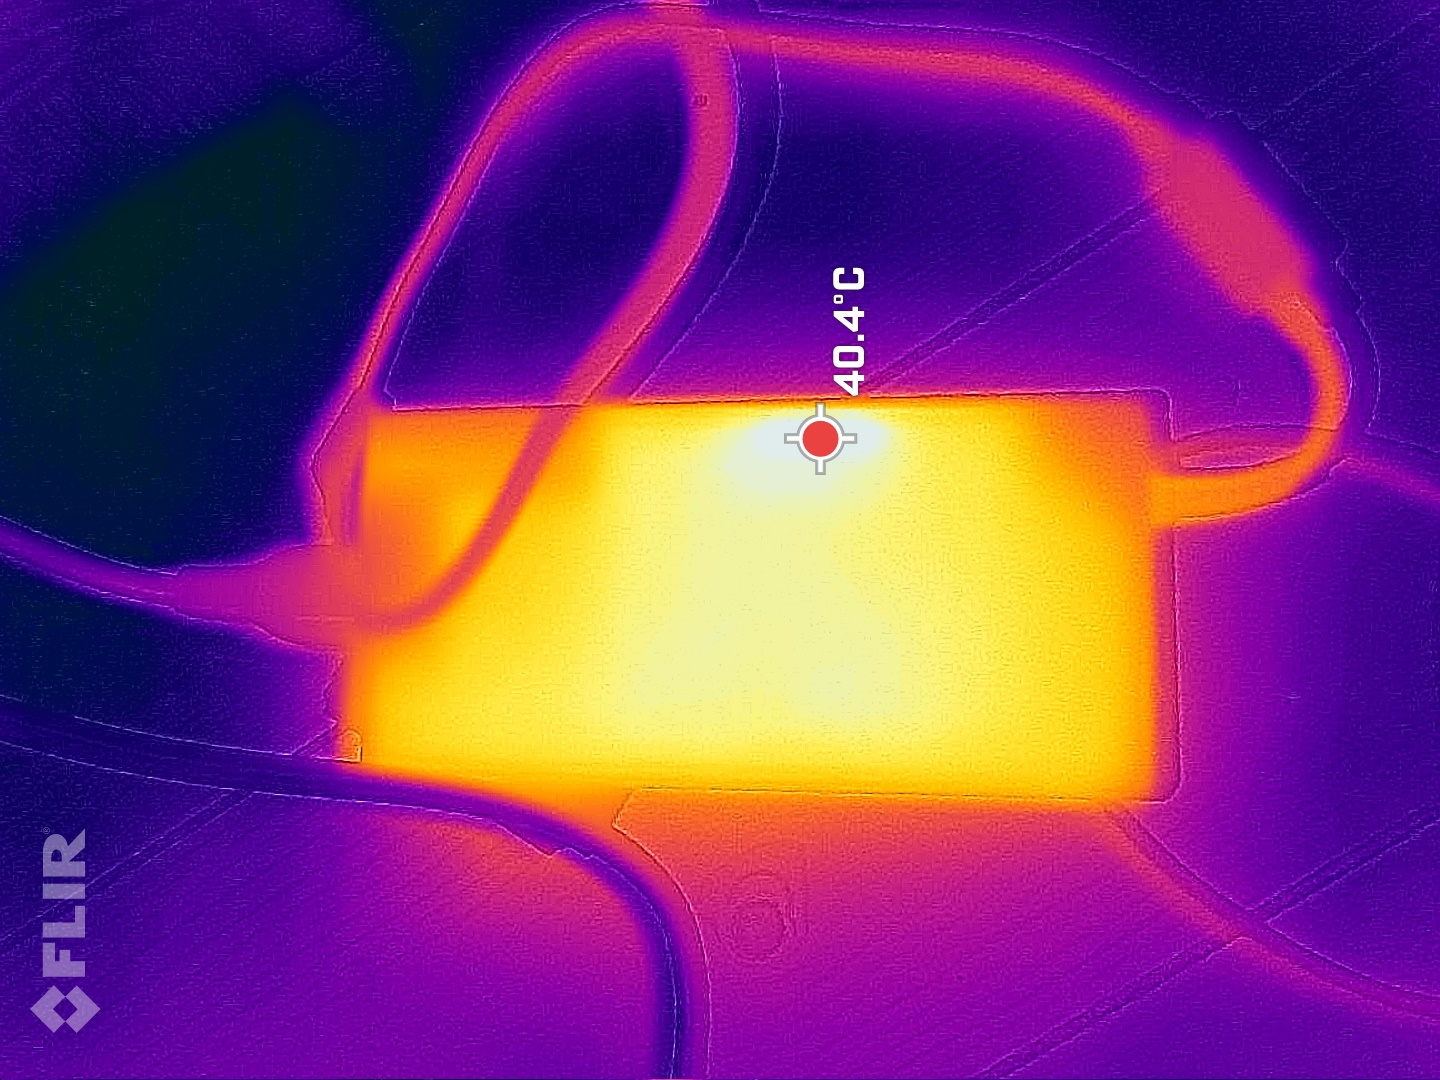
Zarządzanie energią - Captiva ma niewielki akumulator
Zużycie energii
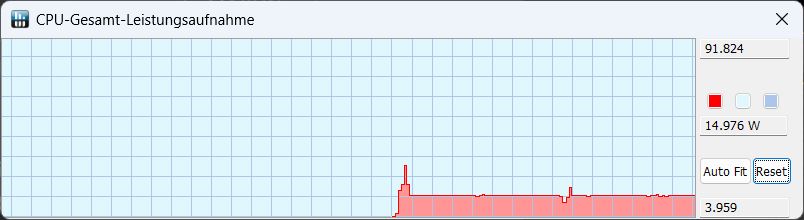
Laptop Captiva mógłby być nieco bardziej oszczędny w trybie bezczynności, ale poza tym jego wskaźniki zużycia są rozsądne w świetle jego wydajności. Dell G15, który jest mniej więcej tak samo wydajny, jeśli chodzi o gry, zużywa znacznie więcej dzięki mocniejszemu procesorowi HX.
Słabsi konkurenci są dławieni i w rezultacie są znacznie bardziej oszczędni pod obciążeniem.
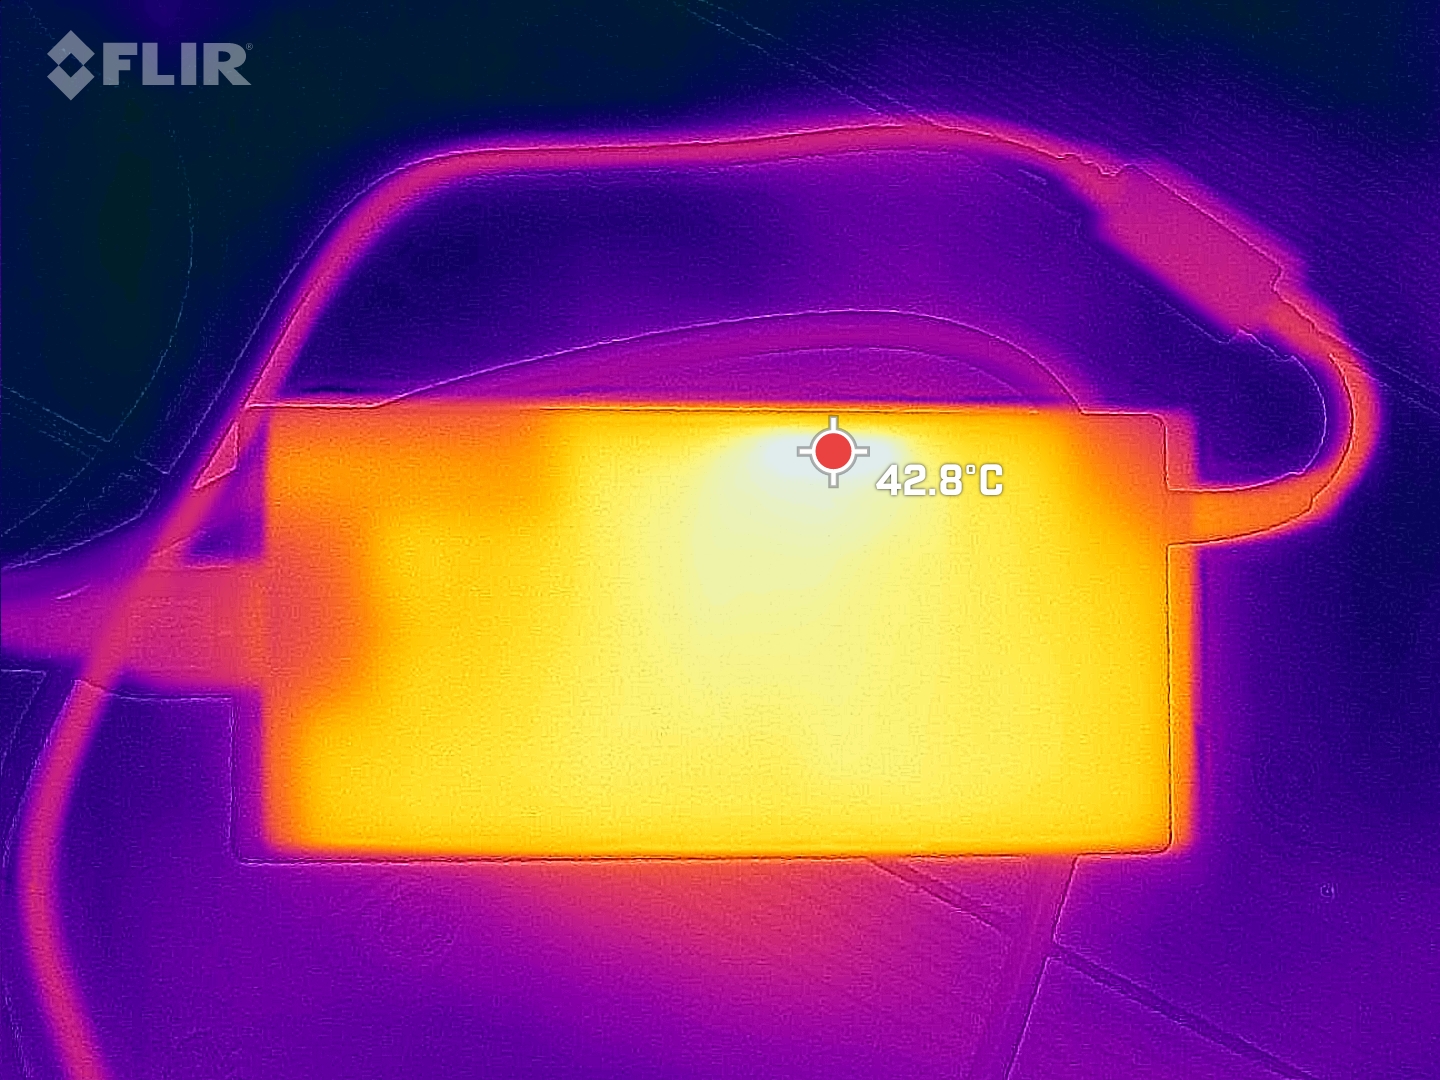
Zmierzyliśmy maksymalne obciążenie 219 watów przez krótki czas, z czym 230-watowy zasilacz poradził sobie dobrze.
| wyłączony / stan wstrzymania | |
| luz | |
| obciążenie |
|
Legenda:
min: | |
| Captiva Advanced Gaming I74-121 i5-13500H, GeForce RTX 4060 Laptop GPU, Samsung SSD 980 1TB MZ-V8V1T0BW, IPS, 1920x1080, 15.6" | MSI Cyborg 15 A12VF i7-12650H, GeForce RTX 4060 Laptop GPU, Samsung PM9B1 1024GB MZVL41T0HBLB, IPS, 1920x1080, 15.6" | Dell G15 5530 i7-13650HX, GeForce RTX 4060 Laptop GPU, SSTC CL4-3D512-Q11, IPS, 1920x1080, 15.6" | Lenovo Legion Slim 5 16APH8 R7 7840HS, GeForce RTX 4060 Laptop GPU, SK hynix PC801 HFS512GEJ9X115N, IPS, 2560x1600, 16" | Lenovo LOQ 15APH8 R7 7840HS, GeForce RTX 4050 Laptop GPU, Micron 2450 512GB MTFDKCD512TFK, IPS, 1920x1080, 15.6" | Schenker XMG Core 15 (M22) R7 6800H, GeForce RTX 3060 Laptop GPU, Samsung SSD 980 Pro 1TB MZ-V8P1T0BW, IPS, 2560x1440, 15.6" | Przeciętny NVIDIA GeForce RTX 4060 Laptop GPU | Średnia w klasie Gaming | |
|---|---|---|---|---|---|---|---|---|
| Power Consumption | 44% | 9% | 17% | 12% | 9% | 11% | -5% | |
| Idle Minimum * (Watt) | 18.4 | 6 67% | 8.4 54% | 9.4 49% | 15 18% | 11.8 36% | 11.5 ? 37% | 13.2 ? 28% |
| Idle Average * (Watt) | 20 | 8.8 56% | 14.98 25% | 15.5 22% | 17.7 11% | 14.7 26% | 16 ? 20% | 18.9 ? 5% |
| Idle Maximum * (Watt) | 20.7 | 11.9 43% | 15.56 25% | 24.4 -18% | 21.5 -4% | 15 28% | 20.3 ? 2% | 24.3 ? -17% |
| Load Average * (Watt) | 85 | 89 -5% | 96.8 -14% | 74.1 13% | 73.5 14% | 100 -18% | 92.9 ? -9% | 108.3 ? -27% |
| Witcher 3 ultra * (Watt) | 164 | 90.3 45% | 186 -13% | 112.9 31% | 138.6 15% | 184 -12% | ||
| Load Maximum * (Watt) | 219 | 99 55% | 271.42 -24% | 206.5 6% | 176.5 19% | 237 -8% | 210 ? 4% | 254 ? -16% |
* ... im mniej tym lepiej
Power consumption Witcher 3 / Stress test
Power consumption with external monitor
Czas trwania
Wyposażona w baterię 53 Wh, tania Captiva nie jest najlepsza; Dell G15 ma baterię 86 Wh, Schenker i Lenovo używają 60 Wh, a tylko MSI Cyborg używa również 53 Wh.
W rezultacie Captiva wytrzymała nieco poniżej 5 godzin w naszym teście WLAN i wideo, gdy korzystała z własnego trybu oszczędzania energii.
| Captiva Advanced Gaming I74-121 i5-13500H, GeForce RTX 4060 Laptop GPU, 53 Wh | MSI Cyborg 15 A12VF i7-12650H, GeForce RTX 4060 Laptop GPU, 53.5 Wh | Dell G15 5530 i7-13650HX, GeForce RTX 4060 Laptop GPU, 86 Wh | Lenovo Legion Slim 5 16APH8 R7 7840HS, GeForce RTX 4060 Laptop GPU, 80 Wh | Lenovo LOQ 15APH8 R7 7840HS, GeForce RTX 4050 Laptop GPU, 60 Wh | Schenker XMG Core 15 (M22) R7 6800H, GeForce RTX 3060 Laptop GPU, 62 Wh | Średnia w klasie Gaming | |
|---|---|---|---|---|---|---|---|
| Czasy pracy | 50% | 4% | 5% | 5% | 8% | 31% | |
| H.264 (h) | 4.9 | 8 63% | 6.8 39% | 8.26 ? 69% | |||
| WiFi v1.3 (h) | 5.3 | 7.5 42% | 6.5 23% | 7.1 34% | 7.4 40% | 7.8 47% | 7.04 ? 33% |
| Load (h) | 1.6 | 2.3 44% | 0.8 -50% | 1.2 -25% | 1.1 -31% | 1.1 -31% | 1.47 ? -8% |
| Reader / Idle (h) | 13.6 | 11.7 | 9.8 | 8.71 ? | |||
| Witcher 3 ultra (h) | 0.8 |
Za
Przeciw
Werdykt - Skupienie się na najważniejszych cechach laptopa do gier
Captiva Advanced Gaming może i nie wykorzystuje najszybszego procesora, ale mimo to nie pozostawia wątpliwości co do wydajności 3D swojego nieco ponadprzeciętnego RTX 4060. Następnie producent skupia się na tym, co najważniejsze: wydajności w grach.
Za stosunkowo niską cenę 1800 USD trzeba też pójść na kilka kompromisów. Obejmuje to brak Thunderbolt i czytnika kart SD, a także przestarzały port USB 2.0.
Captiva Advanced Gaming I74-121 oferuje dość wysoką wydajność 3D za stosunkowo niską cenę. Jeśli chodzi o opcje łączności, trzeba iść na kompromisy.
Istnieje kilka realnych alternatyw, choć cena jest kusząco niska. W wielu porównaniachDell G15jest jednym z najgroźniejszych konkurentów. Oferuje lepszą wydajność procesora i większą baterię, ale z kolei nagrzewa się znacznie bardziej i ma wyższe zużycie energii.
Cena i dostępność
Nasz model testowy kosztuje około 1800 USD. Obecnie nie można go kupić w żadnym sklepie internetowym w USA.
Możesz sprawdzić podobne urządzenia, takie jak Dell G15, na Amazon.
Captiva Advanced Gaming I74-121
- 22/09/2023 v7 (old)
Christian Hintze
Przezroczystość
Wyboru urządzeń do recenzji dokonuje nasza redakcja. Próbka testowa została udostępniona autorowi jako pożyczka od producenta lub sprzedawcy detalicznego na potrzeby tej recenzji. Pożyczkodawca nie miał wpływu na tę recenzję, producent nie otrzymał też kopii tej recenzji przed publikacją. Nie było obowiązku publikowania tej recenzji. Jako niezależna firma medialna, Notebookcheck nie podlega władzy producentów, sprzedawców detalicznych ani wydawców.
Tak testuje Notebookcheck
Każdego roku Notebookcheck niezależnie sprawdza setki laptopów i smartfonów, stosując standardowe procedury, aby zapewnić porównywalność wszystkich wyników. Od około 20 lat stale rozwijamy nasze metody badawcze, ustanawiając przy tym standardy branżowe. W naszych laboratoriach testowych doświadczeni technicy i redaktorzy korzystają z wysokiej jakości sprzętu pomiarowego. Testy te obejmują wieloetapowy proces walidacji. Nasz kompleksowy system ocen opiera się na setkach uzasadnionych pomiarów i benchmarków, co pozwala zachować obiektywizm.Price comparison

