Wnioski
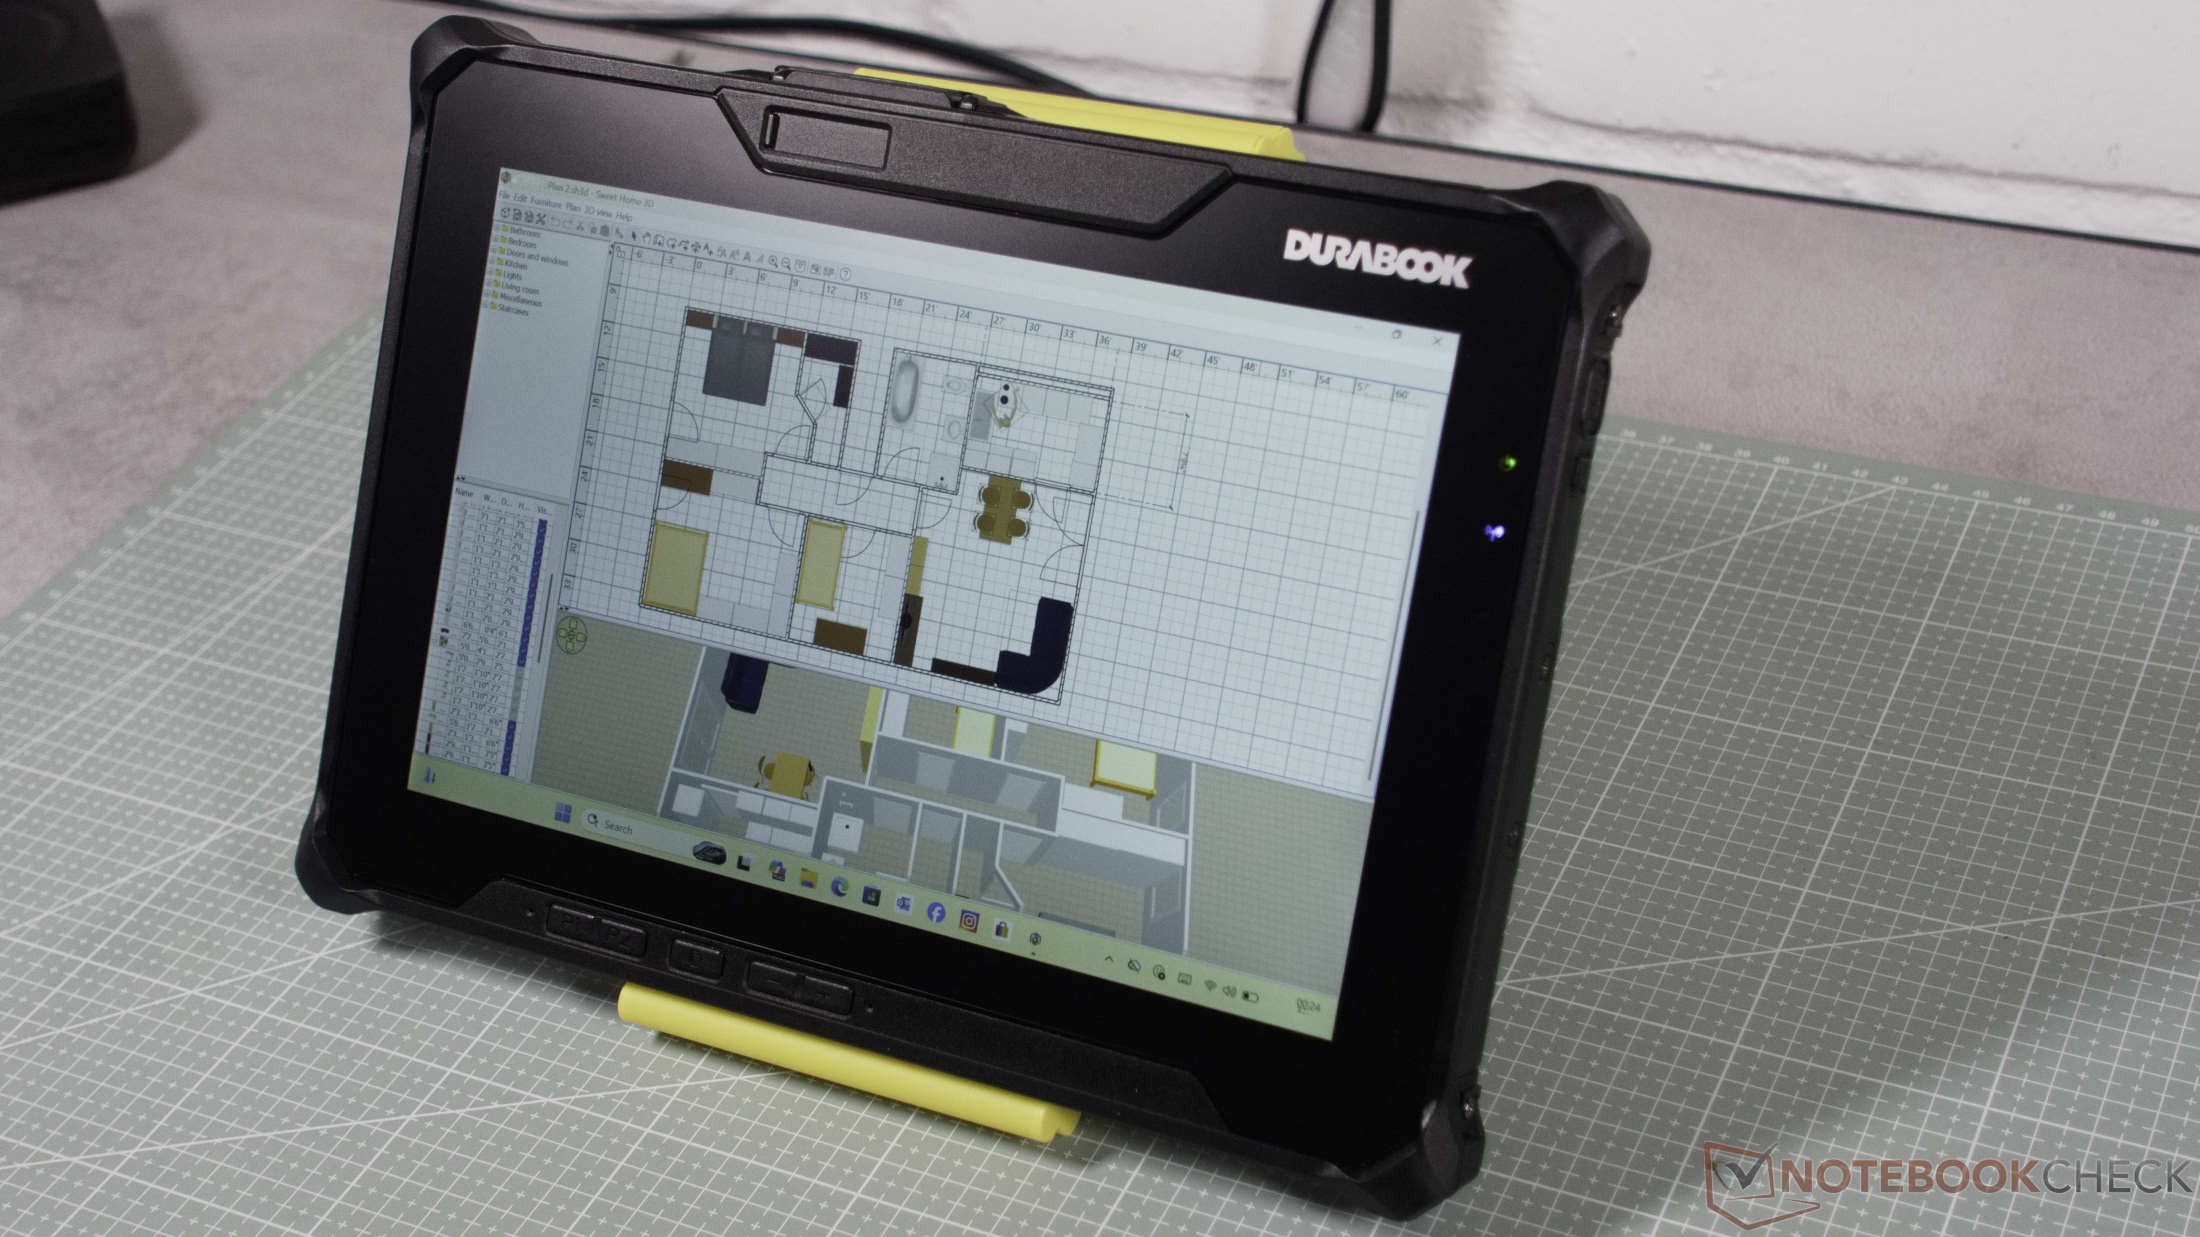
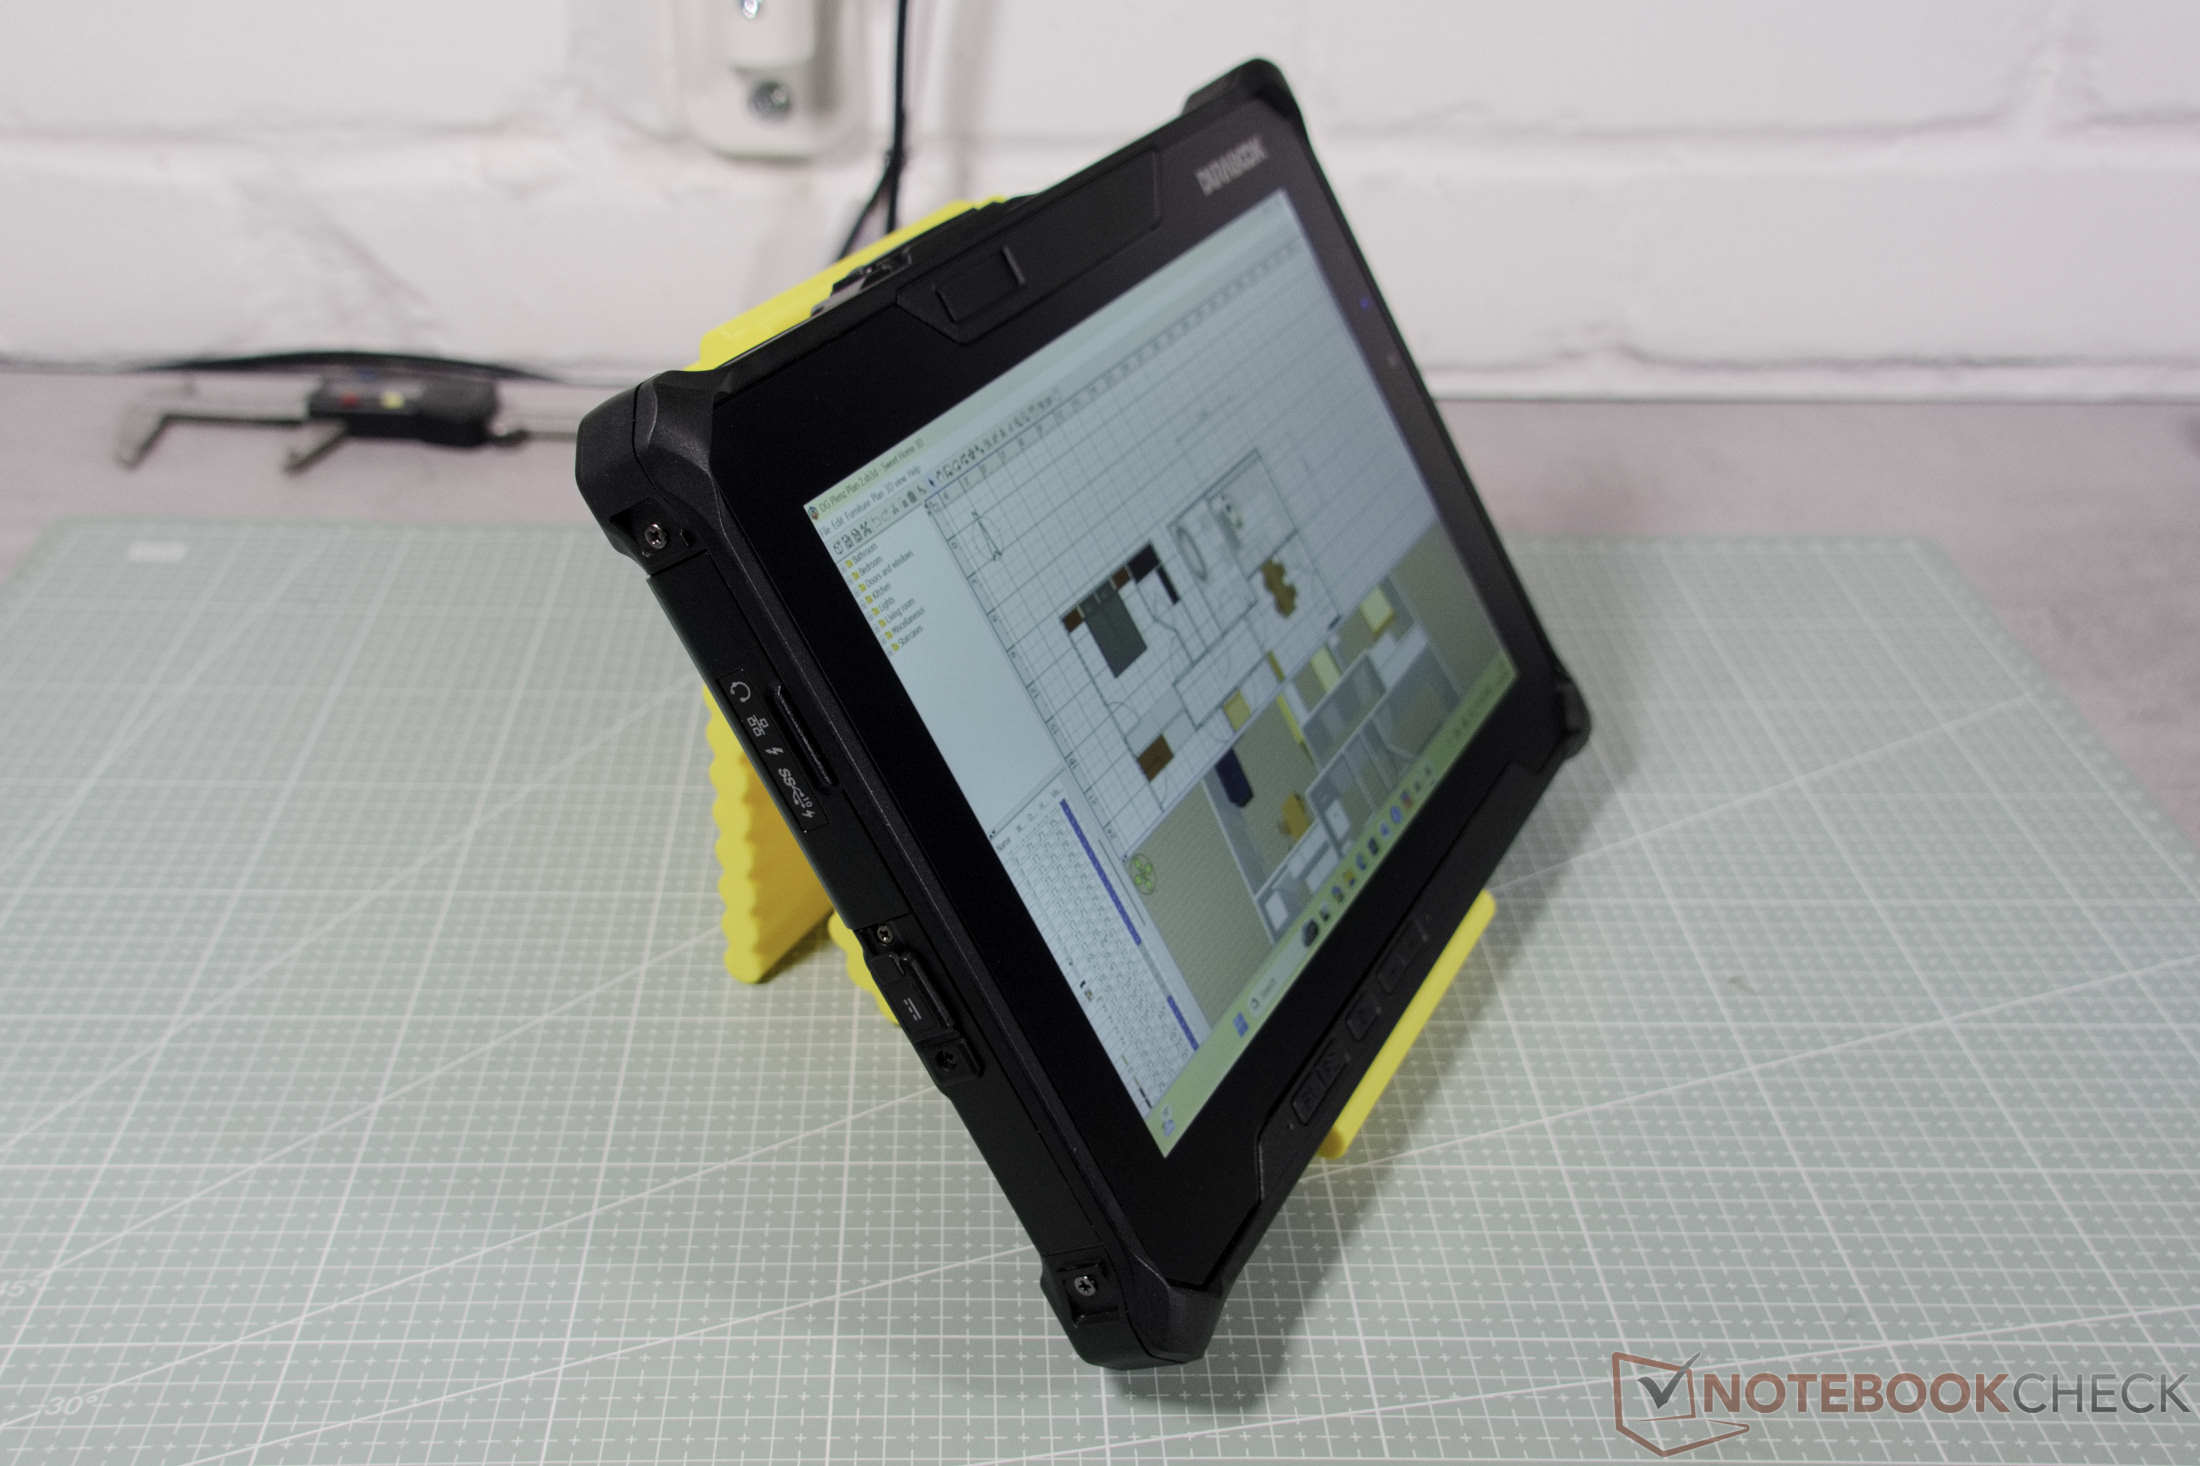
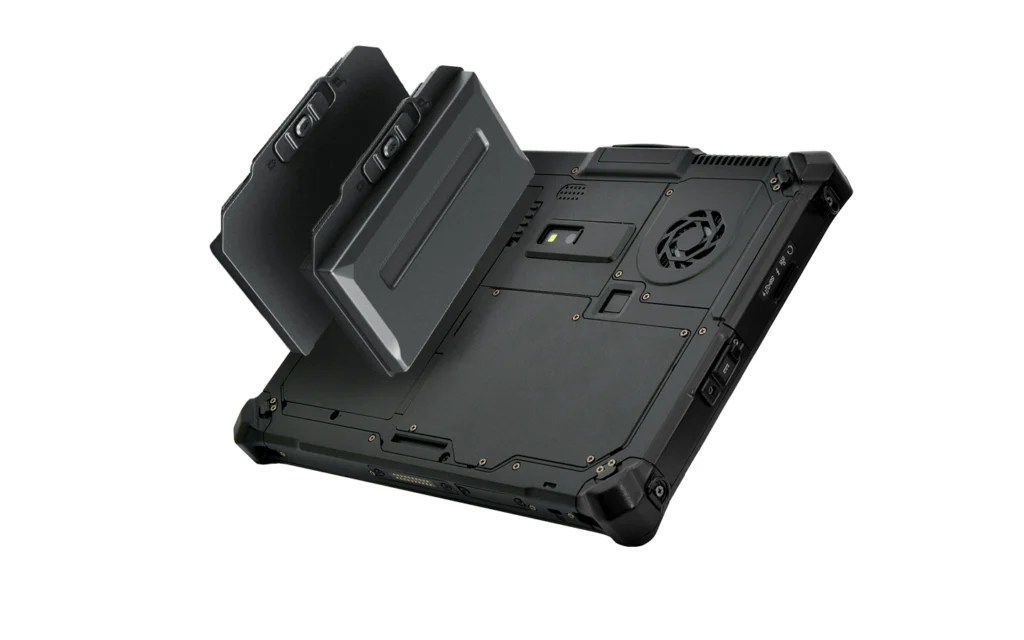
Gdy spojrzy się na Durabook R10, w porównaniu z tradycyjnymi tabletami konsumenckimi wygląda on jak cegła. Dzięki wysokości nieco poniżej trzech centymetrów, grubym ramkom wyświetlacza oraz wadze ponad 1,2 kilograma (~2,65 funta) to 10,1-calowe urządzenie wydaje się ciężkie w dłoni. Cienkość i lekkość nie są tutaj priorytetem. Producent tworzy bezkompromisowe narzędzia przeznaczone do użytku w wyjątkowo wymagających warunkach – czy to na zakurzonej budowie, w zakładzie przemysłowym, czy w terenie.
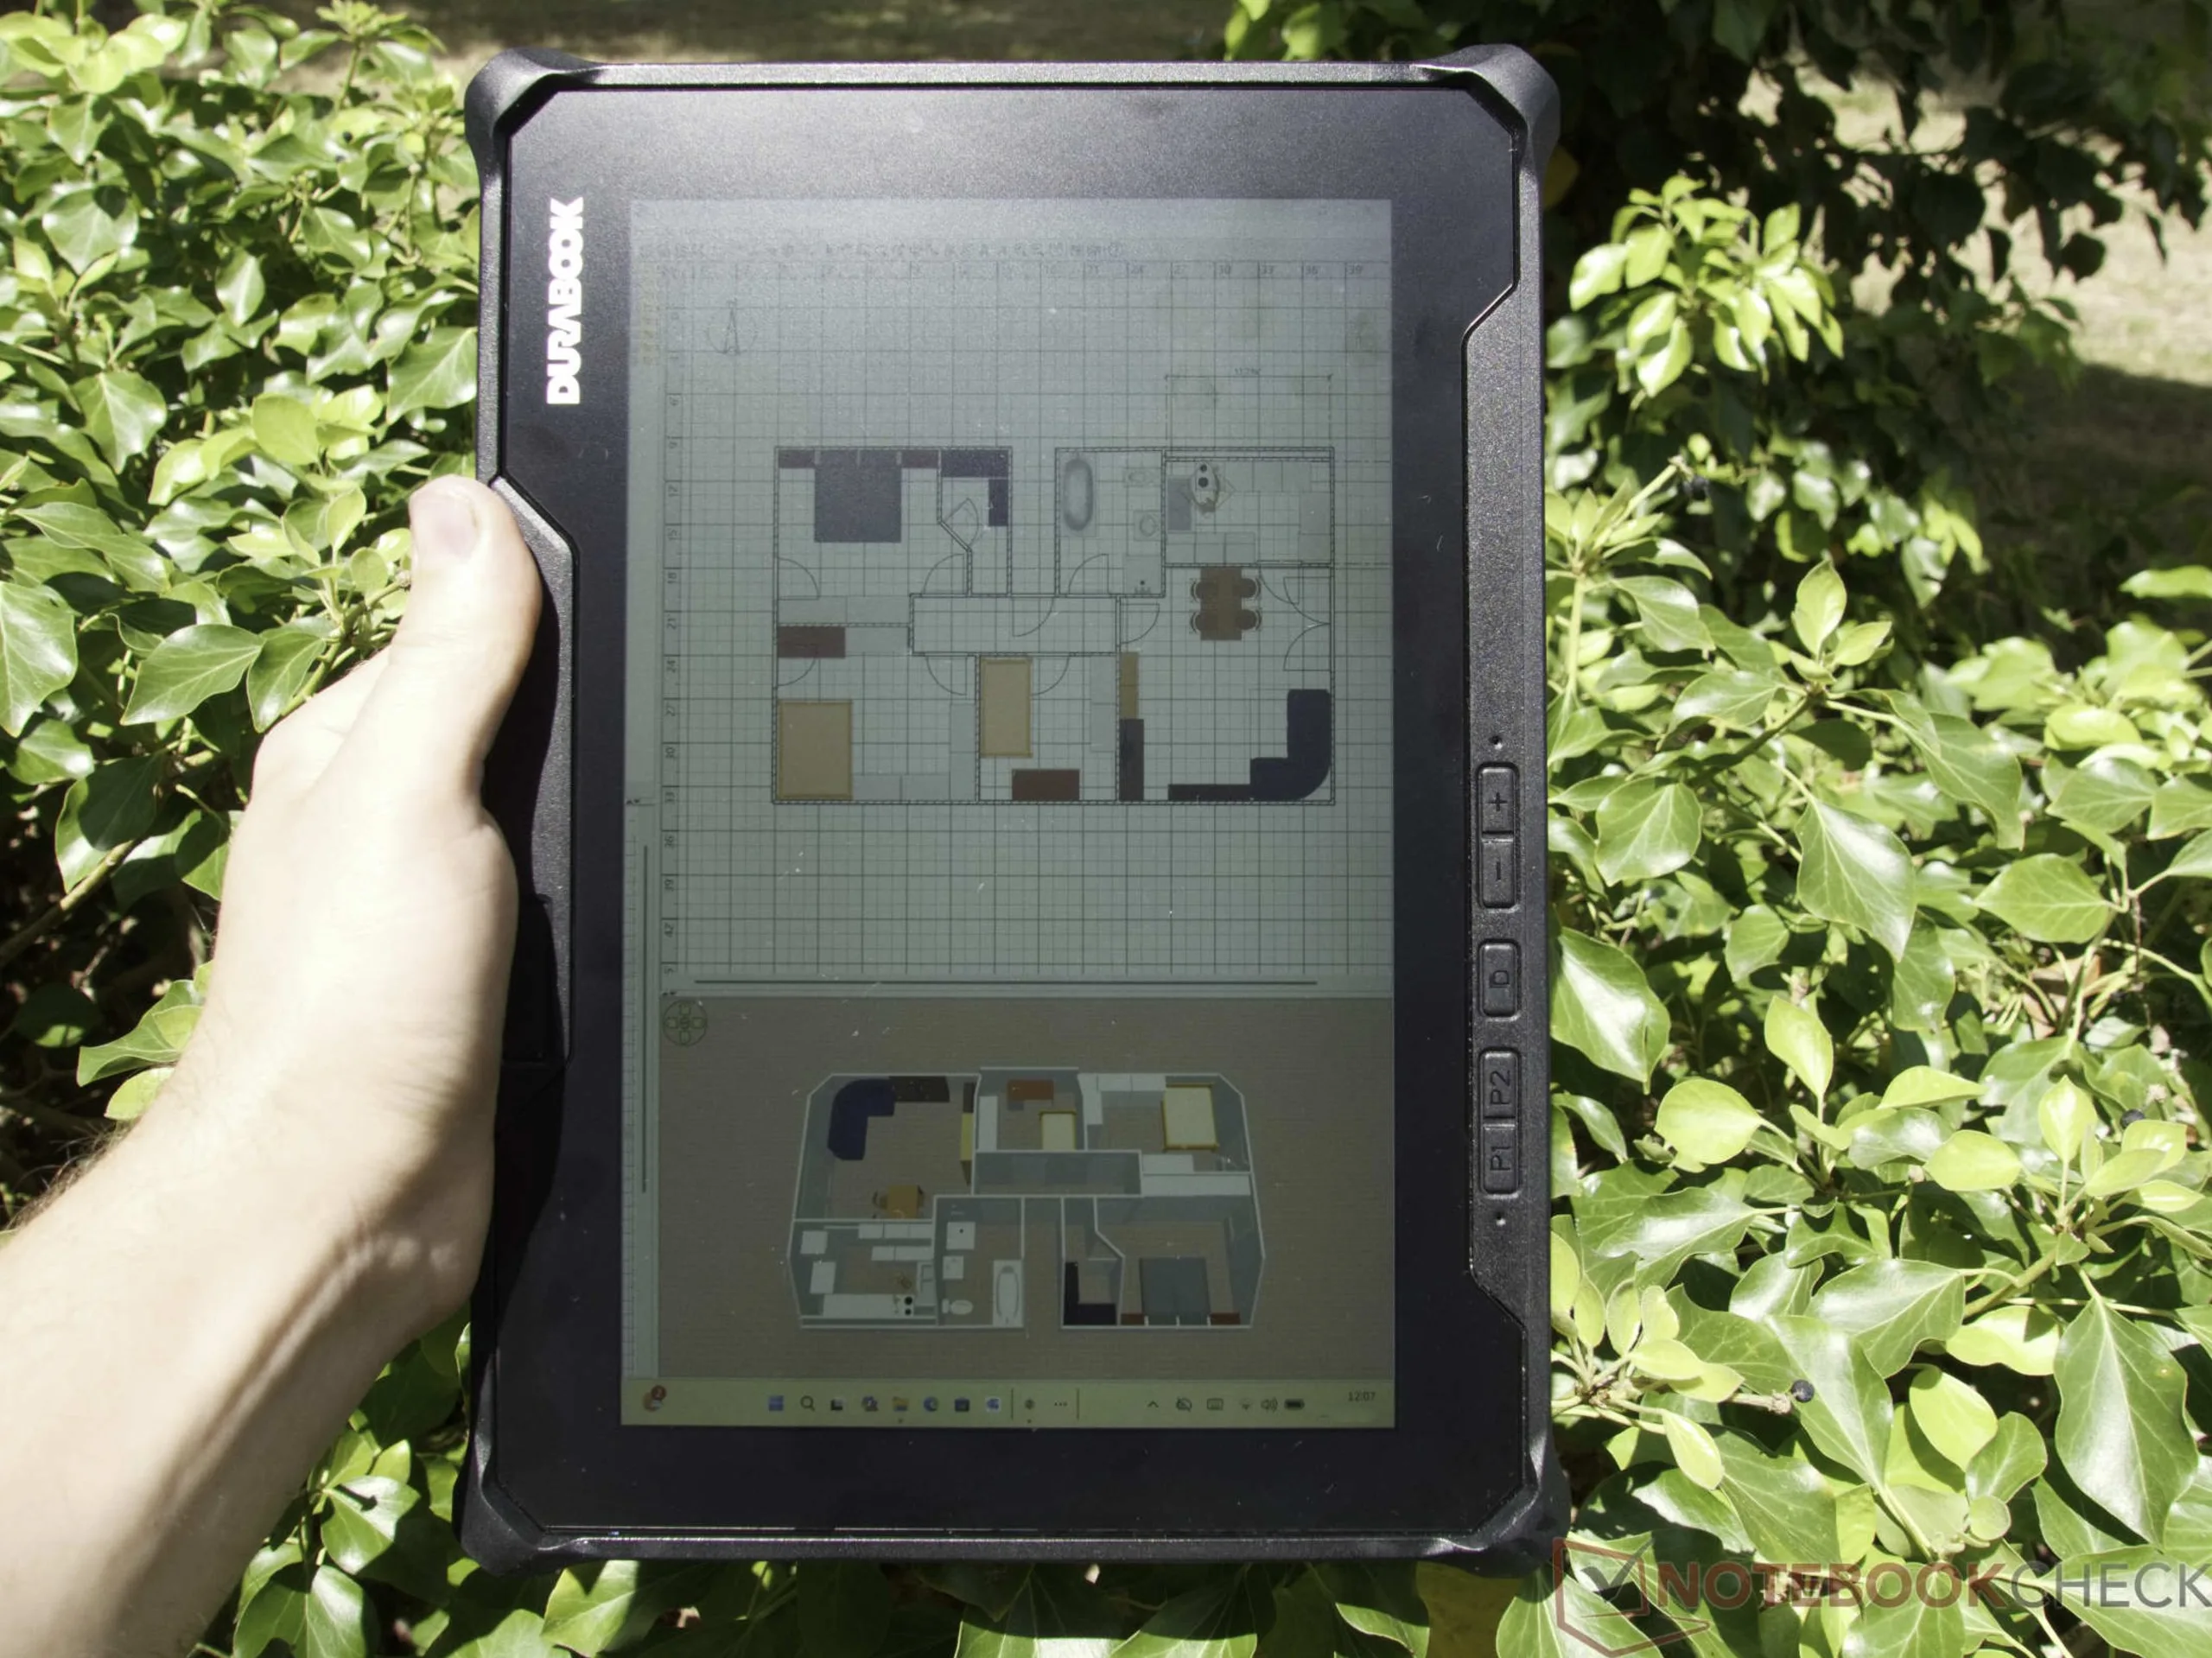
Model R10 został zaprojektowany właśnie z myślą o tych trudnych warunkach. Obudowa ze stopu magnezu jest solidna jak czołg, z łatwością wytrzymuje silne upadki i jest rygorystycznie uszczelniona przed wodą i brudem. Jednak cechami, które zdecydowanie wyróżniają to urządzenie do użytku na zewnątrz, są ekran i system zasilania. Dzięki jasności znacznie przekraczającej 1 000 cd/m² — co potwierdziły nasze testy — ten wytrzymały tablet bez trudu radzi sobie nawet w bezpośrednim świetle słonecznym. Posiada również wbudowaną baterię rezerwową, umożliwiającą prawdziwą wymianę „na gorąco”. Oznacza to, że główną baterię można łatwo wyjąć z urządzenia i wymienić, podczas gdy urządzenie nadal działa.
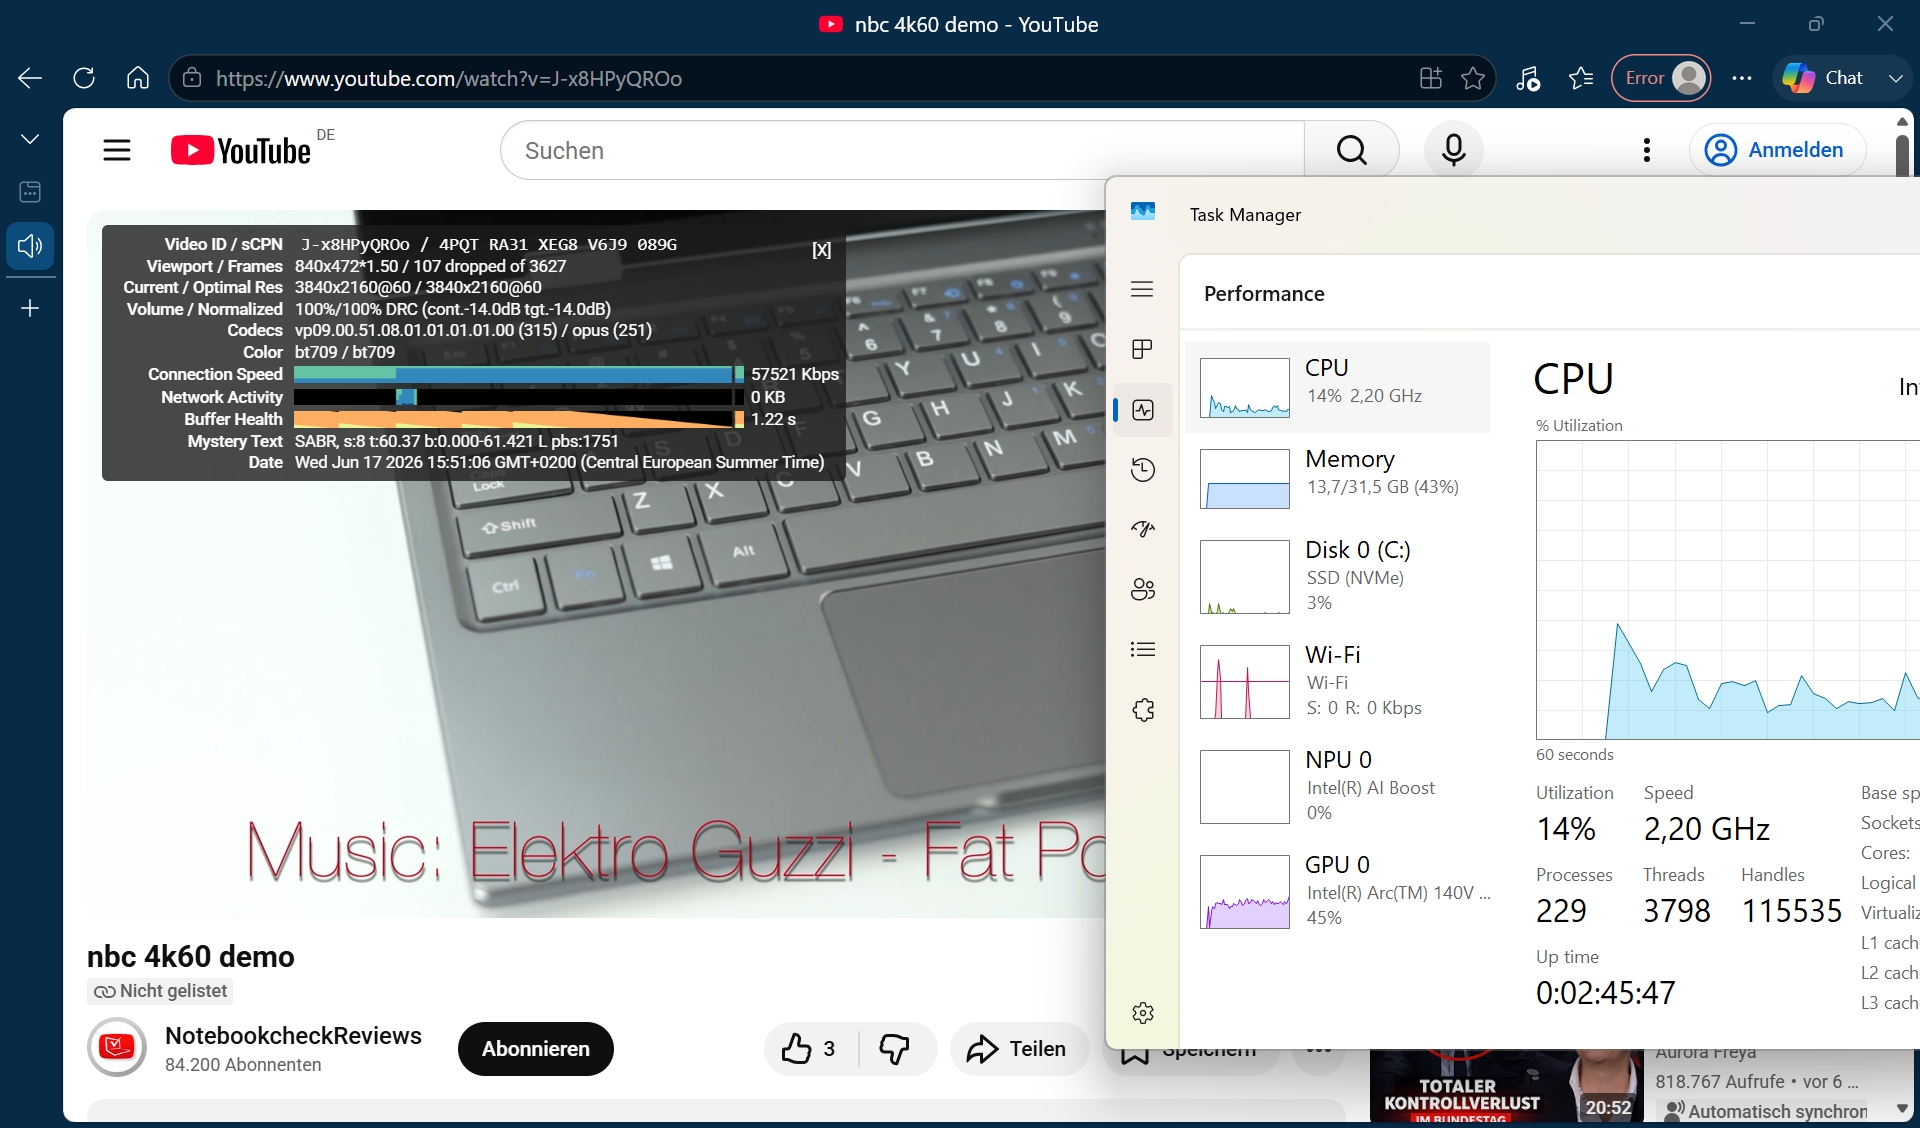
Oczywiście taki poziom specjalizacji wymaga pewnych kompromisów. W przypadku prac, w których kluczowe znaczenie ma odwzorowanie kolorów, wyświetlacz — z widocznym zielonym odcieniem — nie nadaje się do użytku, a kamery i wbudowany głośnik monofoniczny spełniają jedynie podstawowe funkcje. Wbudowany procesor Intel Core Ultra 7 258V z łatwością radzi sobie z codziennymi zadaniami biurowymi i obsługą dokumentów, jednak podczas testów wykazuje wysokie opóźnienia DPC, co może powodować problemy podczas rejestrowania danych w czasie rzeczywistym. Ponadto czytnik kart jest niewygodnie schowany za baterią. Z drugiej strony, masywna obudowa nie nagrzewa się nadmiernie nawet pod dużym obciążeniem, a wewnętrzny wentylator pracuje przyjemnie cicho w tle.
Cena i dostępność
Ceny i dostępność modelu Durabook R10 są skierowane przede wszystkim do klientów profesjonalnych. Producent nie podaje cen na swojej stronie internetowej; zamiast tego ceny są ustalane wyłącznie na indywidualne zapytanie. Wynika to również z faktu, że wiele wysoce wyspecjalizowanych konfiguracji — dostosowanych do indywidualnych wymagań klientów — jest sprzedawanych wyłącznie bezpośrednio przez firmę Durabook. Ten wytrzymały tablet można sporadycznie znaleźć w wyspecjalizowanych sklepach detalicznych. Na przykład sprzedawca Ruggedbooks oferuje model podstawowy z procesorem Intel Core Ultra 5 226V za około 2 759 euro (~3 146 USD). Natomiast na stronie Elmark-Automation cena porównywalnej konfiguracji z tym samym procesorem zaczyna się od około 2 730 euro (~3 113 USD).
Dane techniczne
Obudowy, akcesoria i urządzenia wejściowe
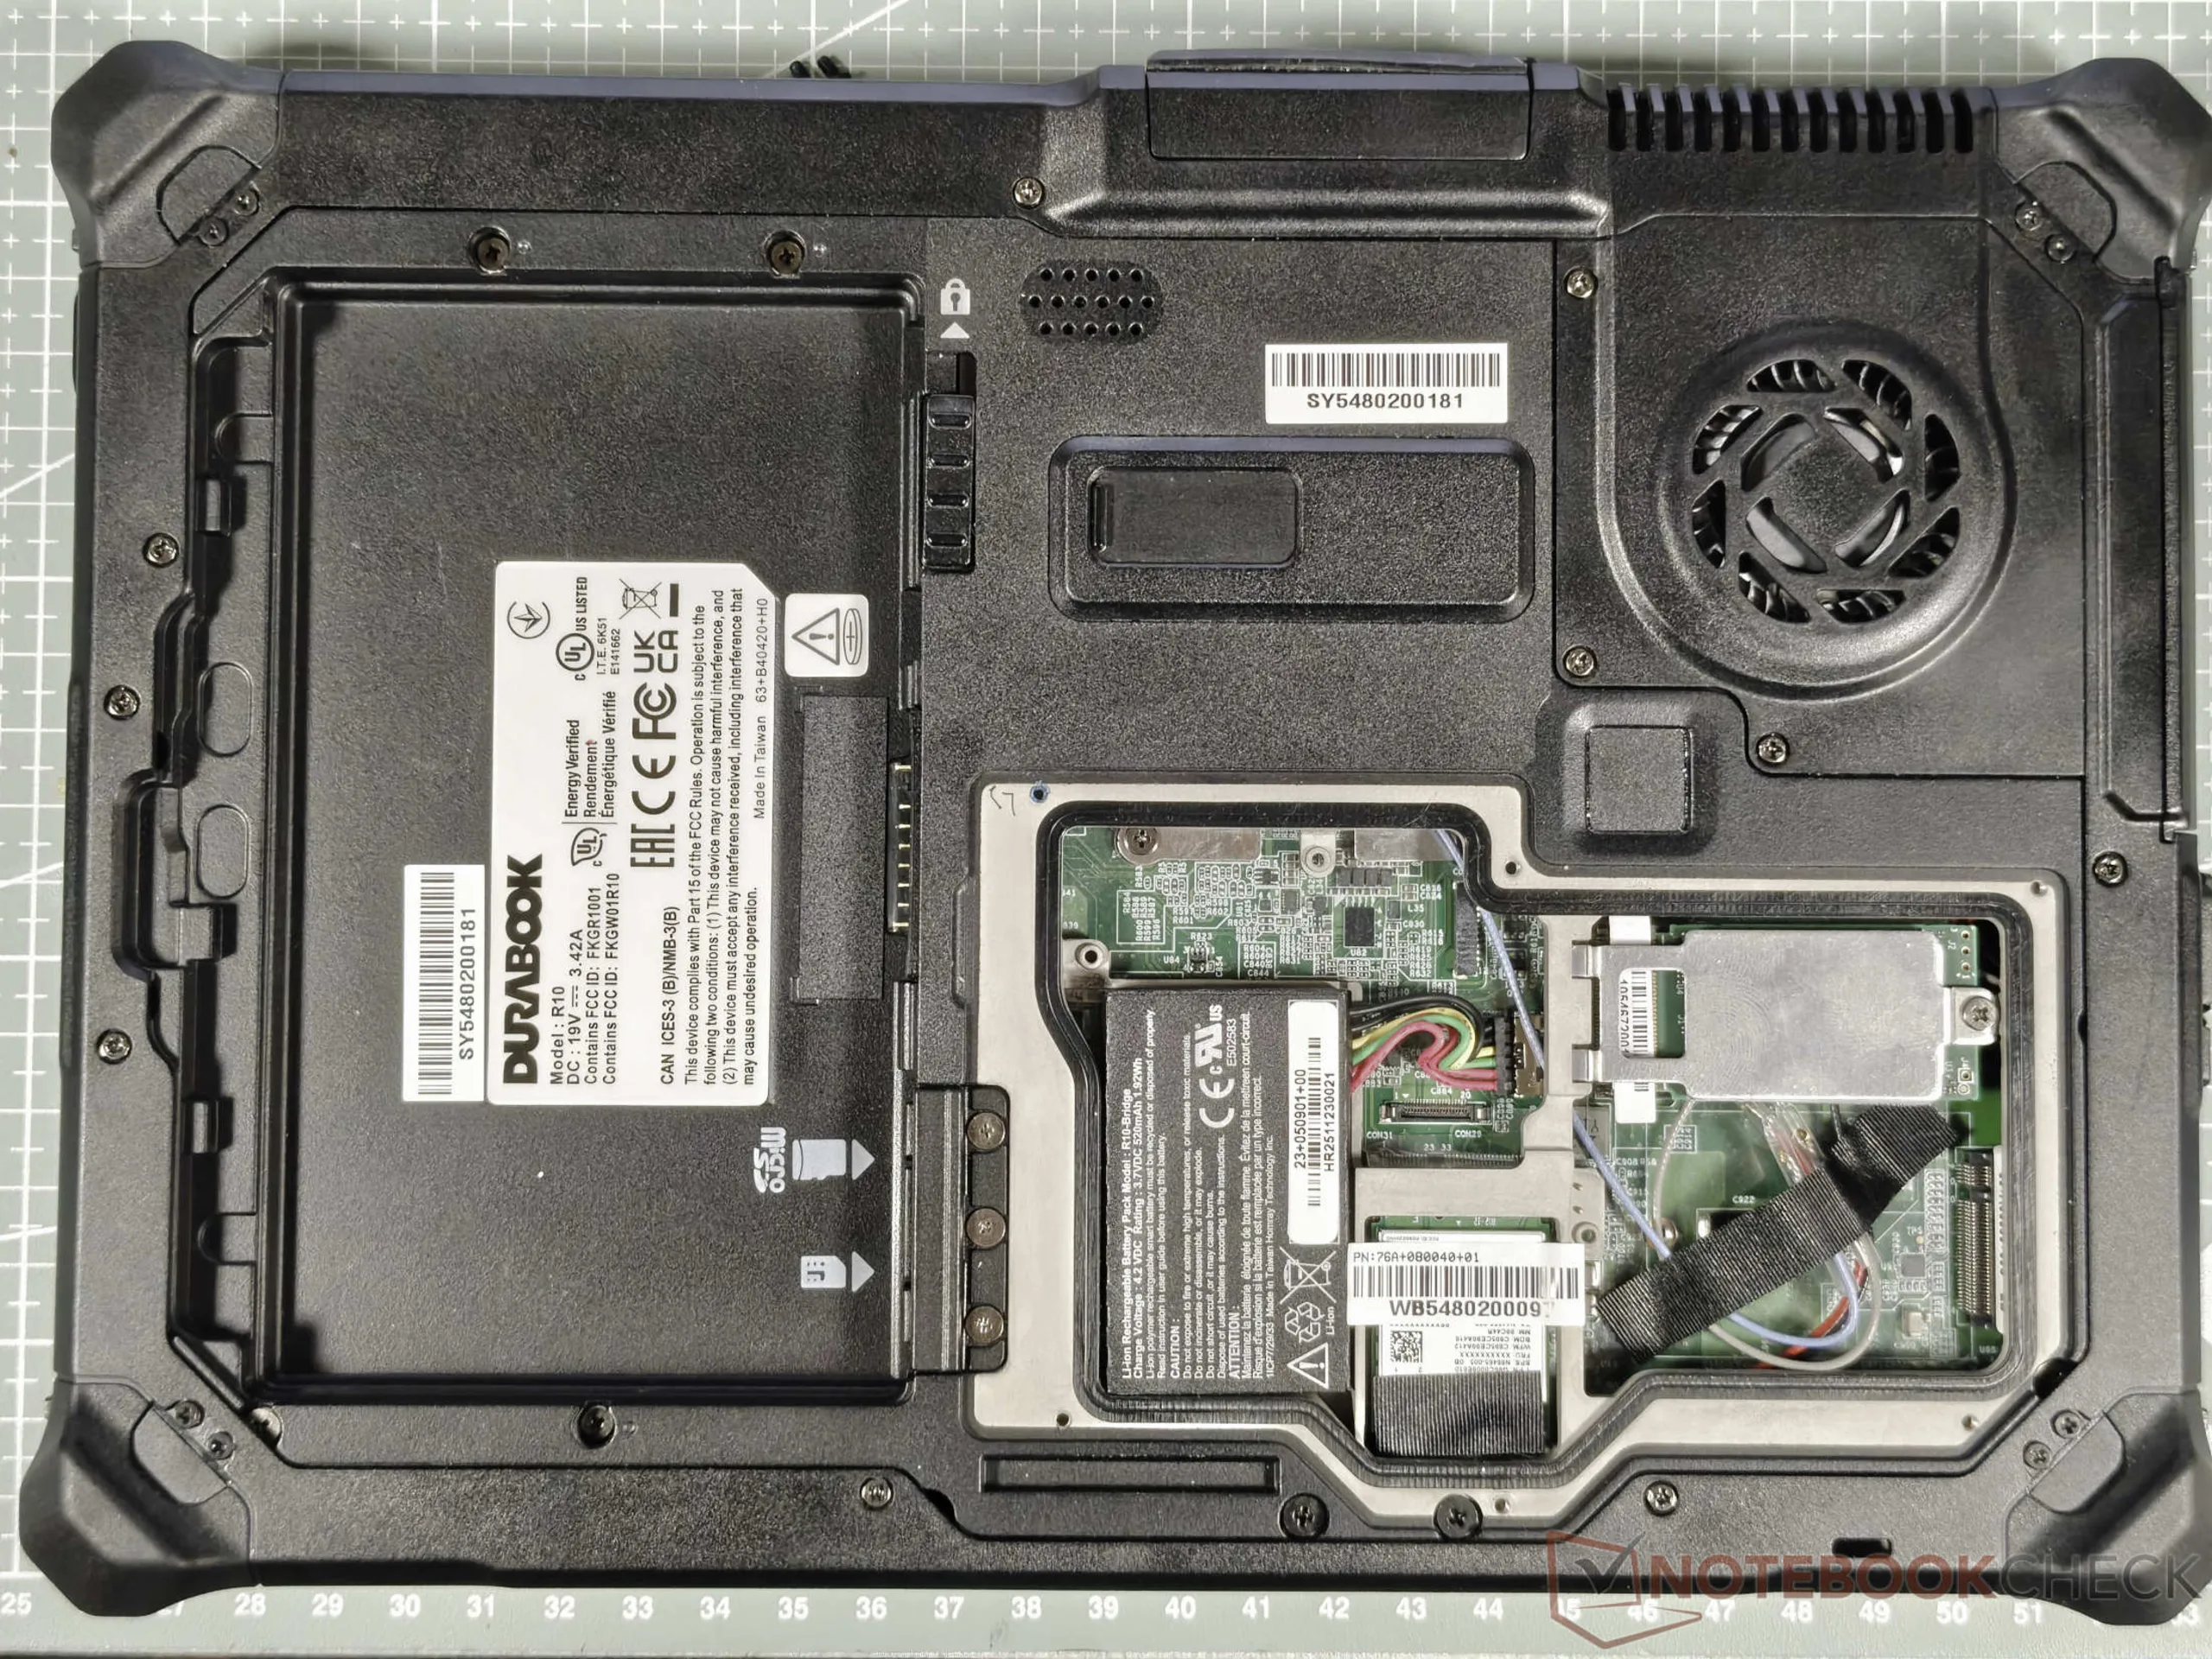
Obudowa tabletu Durabook R10 została wykonana z wytrzymałego stopu magnezu i doskonale sprawdza się w najtrudniejszych warunkach pracy. Tablet, posiadający certyfikat zgodności z amerykańską normą wojskową MIL-STD-810H, został zaprojektowany tak, aby wytrzymać upadki z wysokości do 1,8 metra (~5,9 stopy) oraz ekstremalne warunki środowiskowe. Ponadto certyfikat IP66 zapewnia ochronę przed pyłem i strumieniami wody pod wysokim ciśnieniem. W przypadku wrażliwych zastosowań certyfikat MIL-STD-461F gwarantuje również doskonałą kompatybilność elektromagnetyczną.

Durabook Z14I-HG: moc sztucznej inteligencji w ekstremalnych warunkach
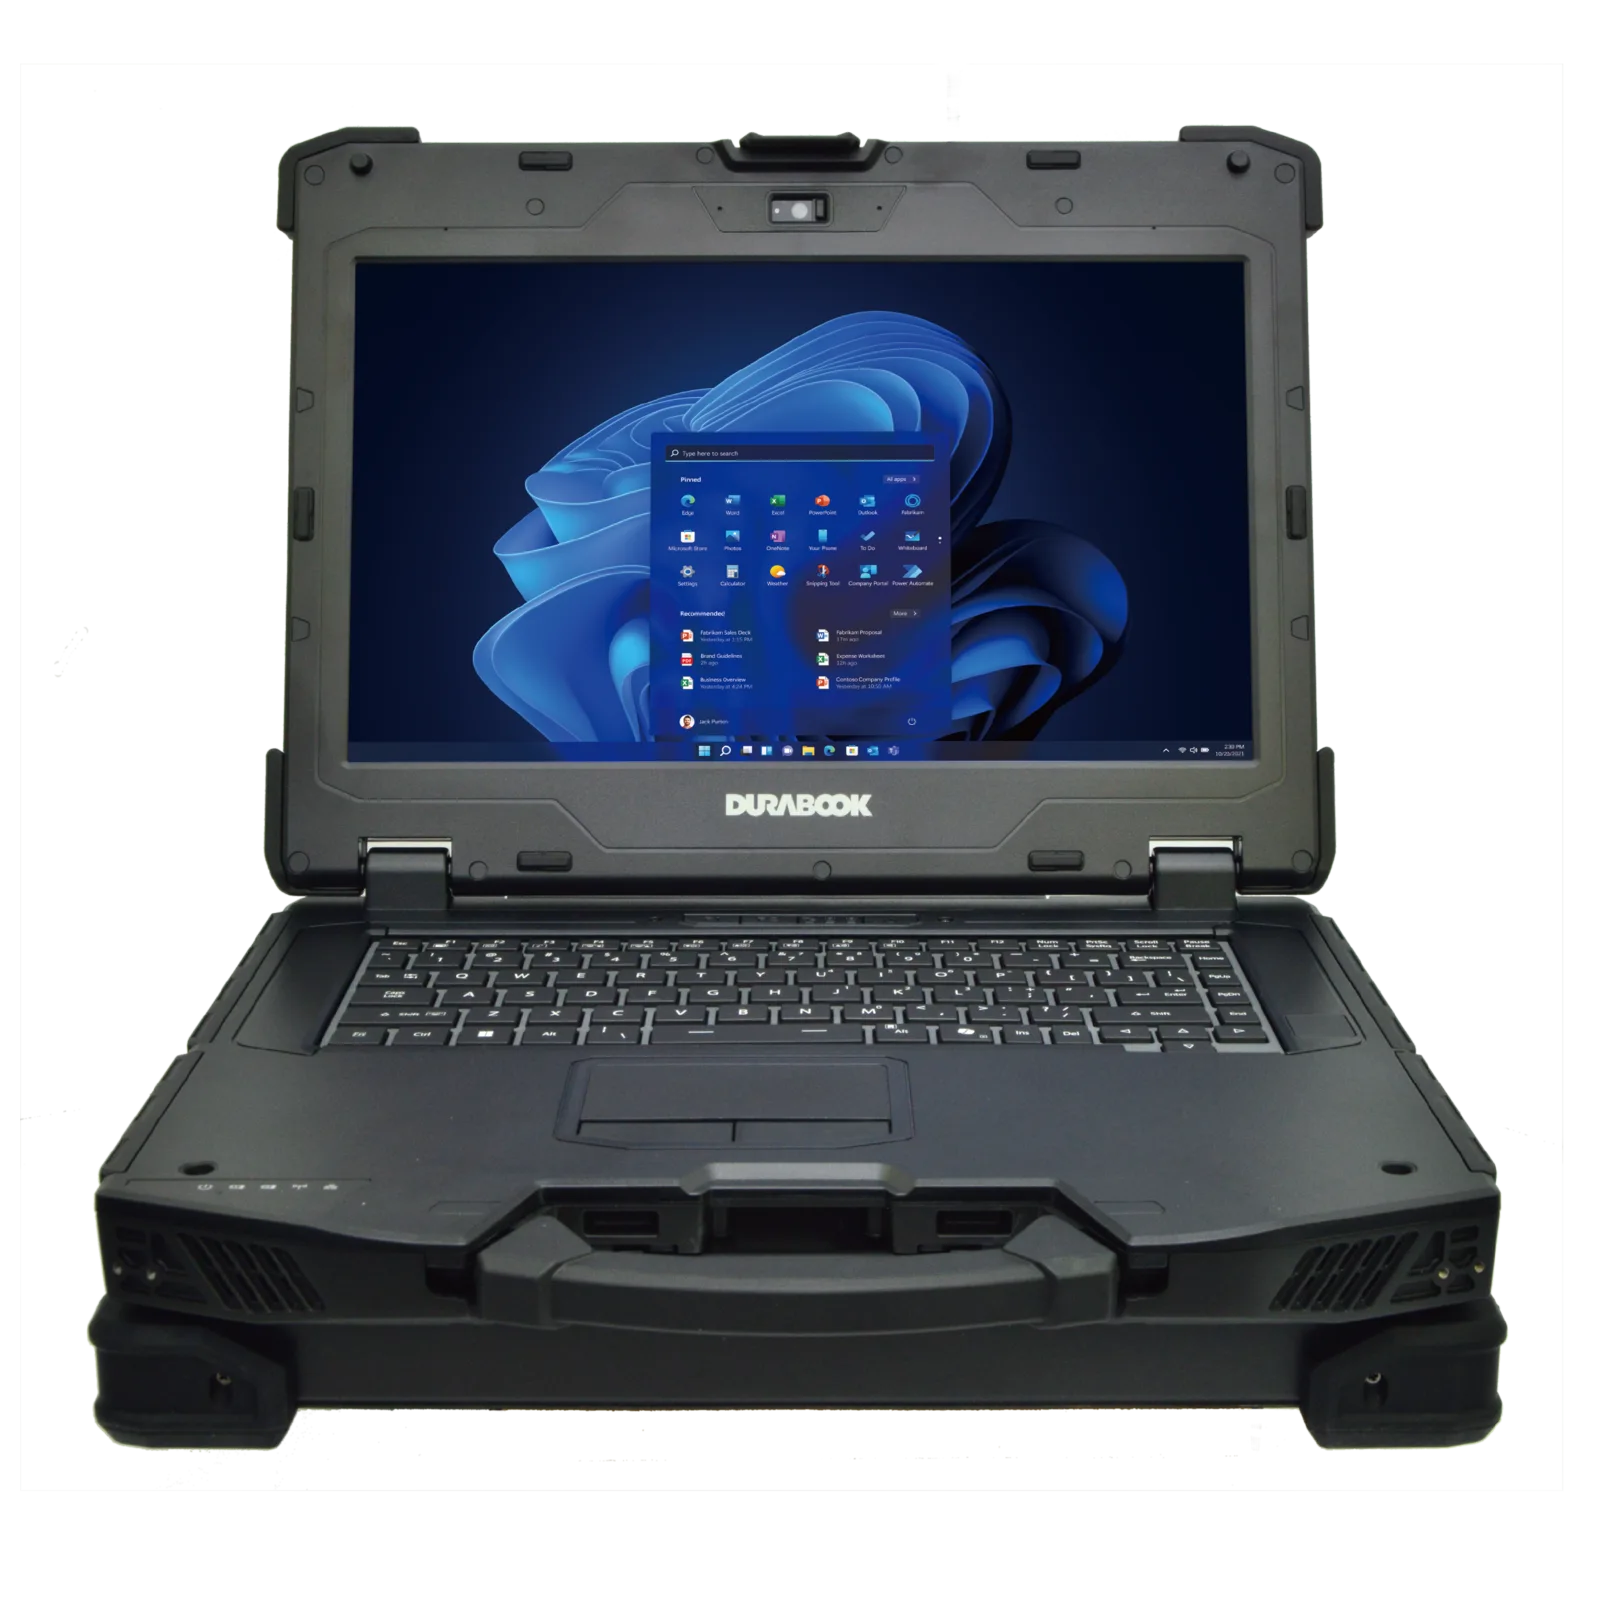
Wraz z modelem Z14I-HG firma Durabook wprowadza nową generację mobilnych stacji roboczych: w pełni wzmocnionych, przystosowanych do pracy z AI i zaprojektowanych z myślą o najbardziej wymagających zastosowaniach bezpośrednio w terenie. Ten 14-calowy system łączy w sobie wydajność sztucznej inteligencji typu edge sięgającą nawet 682 TOPS z potężnymi procesorami Intel® Core™ Ultra. Wyposażony jest również w procesor NPU AI Boost oraz, opcjonalnie, w kartę graficzną NVIDIA® RTX™ 3500 Ada (12 GB) lub RTX™ 5000 Ada (16 GB). Każdy, kto polega na wydajnym i wytrzymałym sprzęcie — na przykład w automatyce przemysłowej, serwisie terenowym lub badaniach technicznych — czerpie korzyści z szybkiej analizy opartej na sztucznej inteligencji oraz profesjonalnej wydajności graficznej w zakresie mobilnych obliczeń o wysokiej wydajności.
Niezależnie od tego, czy chodzi o renderowanie 3D w czasie rzeczywistym, wnioskowanie oparte na sztucznej inteligencji, czy symulacje wymagające przetwarzania dużych ilości danych — model Z14I-HG lokalnie przetwarza wymagające obciążenia. Pozwala to zmniejszyć opóźnienia. Jednocześnie niezależność od dostawców usług w chmurze zwiększa bezpieczeństwo danych, na przykład podczas inspekcji, konserwacji predykcyjnej lub w zastosowaniach związanych z cyfrowymi bliźniakami.
System posiada certyfikaty zgodności z normami MIL-STD-810H, MIL-STD-461G oraz IP66. Jest odporny na ekstremalne temperatury, wilgotność i zakłócenia elektromagnetyczne. Ponadto wyświetlacz DynaVue® o jasności 1200 nitów zapewnia doskonałą czytelność nawet w bezpośrednim świetle słonecznym i obsługuje wiele trybów wejściowych, a także konfiguracje wieloekranowe.
Stacja robocza Z14I-HG jest już dostępna i można ją zamówić bezpośrednio w firmie Durabook.
Łączność
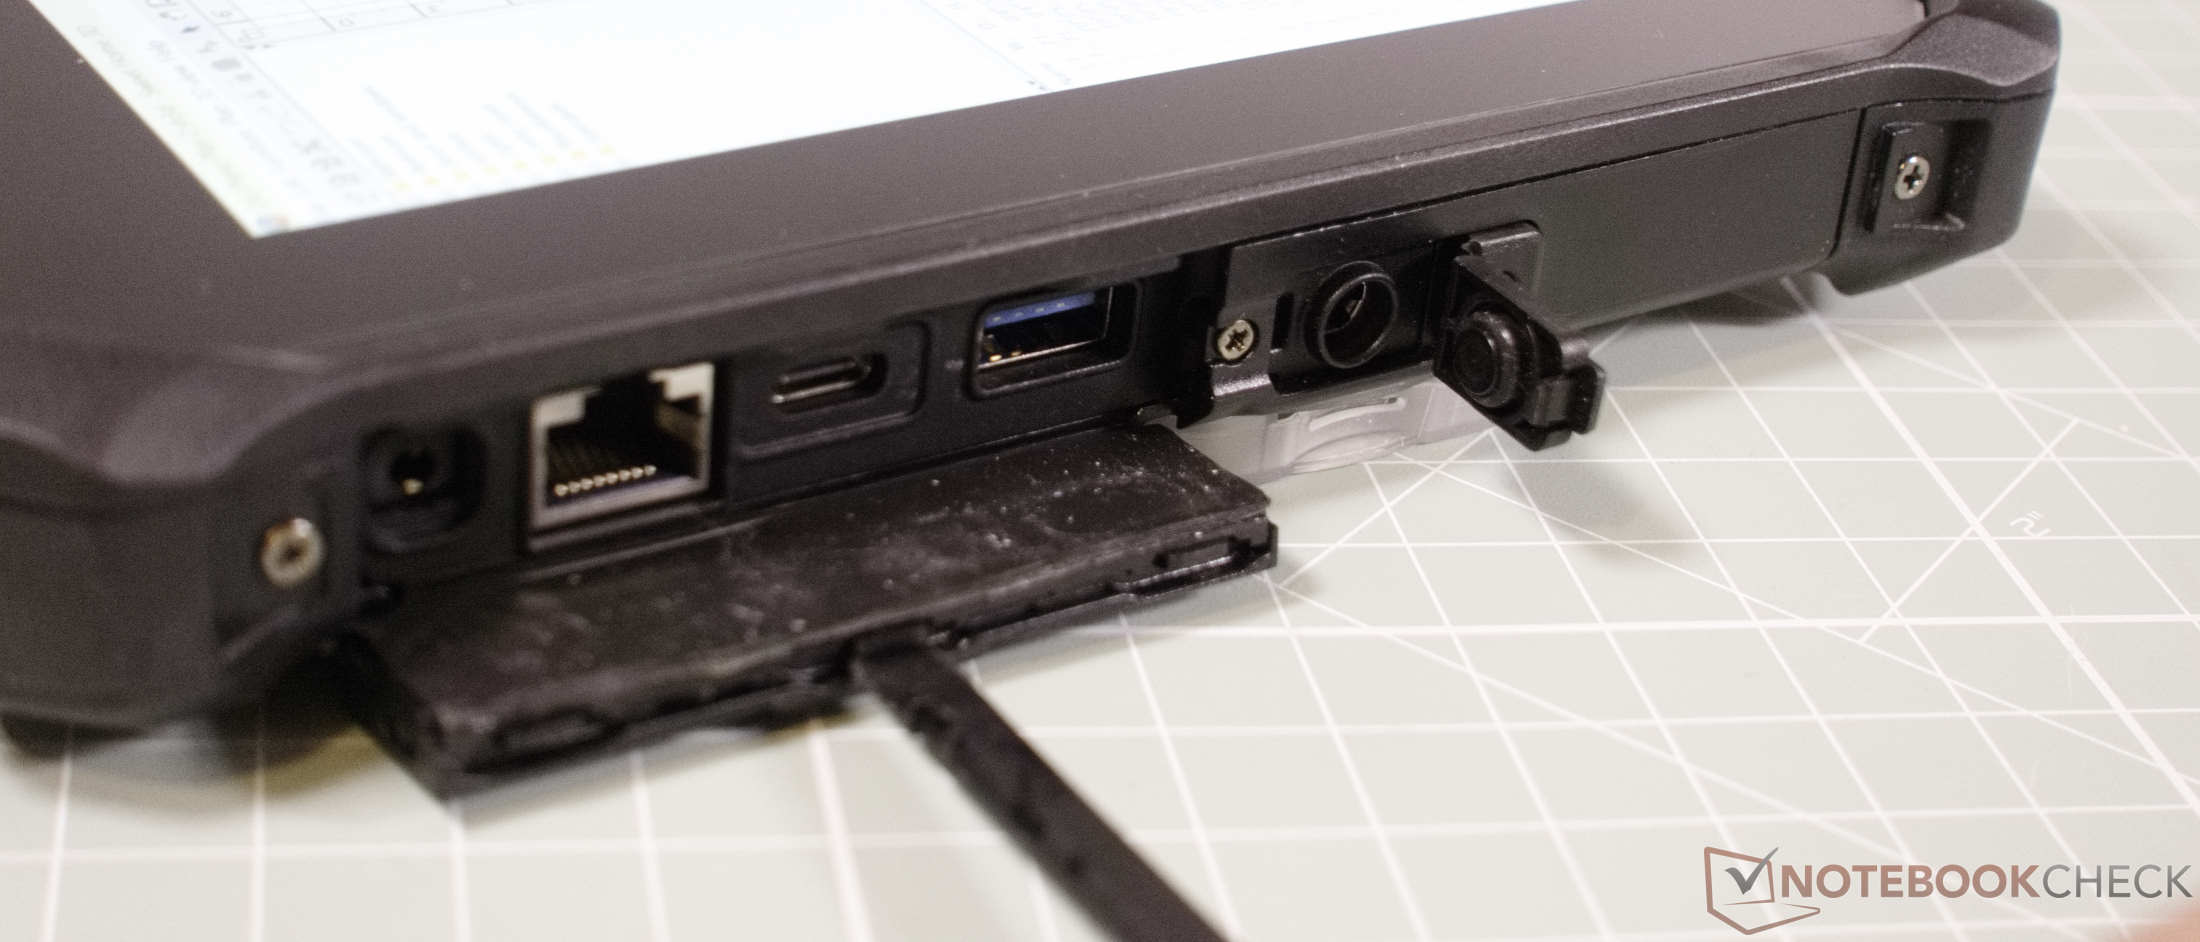
Wszystkie porty są ukryte za solidnymi osłonami ochronnymi. Tablet wyposażono w nowoczesny port USB-C obsługujący technologie Thunderbolt, DisplayPort oraz Power Delivery. Znajduje się w nim również port Gigabit Ethernet RJ-45, gniazdo słuchawkowe oraz standardowe gniazdo zasilania.
Z tyłu tabletu umieszczono również biometryczny skaner linii papilarnych, umożliwiający bezpieczne logowanie do systemu. Niestety wbudowany czytnik kart SD jest nieco trudno dostępny, ponieważ znajduje się wewnątrz urządzenia, za baterią. Działa on jednak dość szybko. Wewnątrz tabletu znajdują się również puste gniazda na karty rozszerzeń. Jeśli chodzi o łączność bezprzewodową, ten wytrzymały tablet oferuje Wi-Fi 7 oraz Bluetooth 5.4.
| SD Card Reader | |
| average JPG Copy Test (av. of 3 runs) | |
| Durabook R10 | |
| Dell Latitude 7030 Rugged Extreme (AV Pro V60) | |
| Durabook R8 Tablet (AV Pro V60) | |
| Średnia w klasie Tablet (10.2 - 79.2, n=44, ostatnie 2 lata) | |
| Dynabook Portege Z40L-N (AV PRO microSD 128 GB V60) | |
| maximum AS SSD Seq Read Test (1GB) | |
| Dell Latitude 7030 Rugged Extreme (AV Pro V60) | |
| Durabook R10 | |
| Dynabook Portege Z40L-N (AV PRO microSD 128 GB V60) | |
| Średnia w klasie Tablet (n=1ostatnie 2 lata) | |
| Durabook R8 Tablet (AV Pro V60) | |
Aparat fotograficzny
Przedni aparat o rozdzielczości Full HD doskonale sprawdza się podczas wideokonferencji. Główny aparat o rozdzielczości 11 megapikseli, umieszczony z tyłu, robi imponująco dobre zdjęcia makro, jednak ma trudności z fotografowaniem w trybie szerokokątnym ze względu na powolny autofokus i wąski zakres dynamiczny. Dzięki wbudowanej lampie błyskowej aparat nadaje się do użytku również w ciemnych pomieszczeniach.


Urządzenia wejściowe
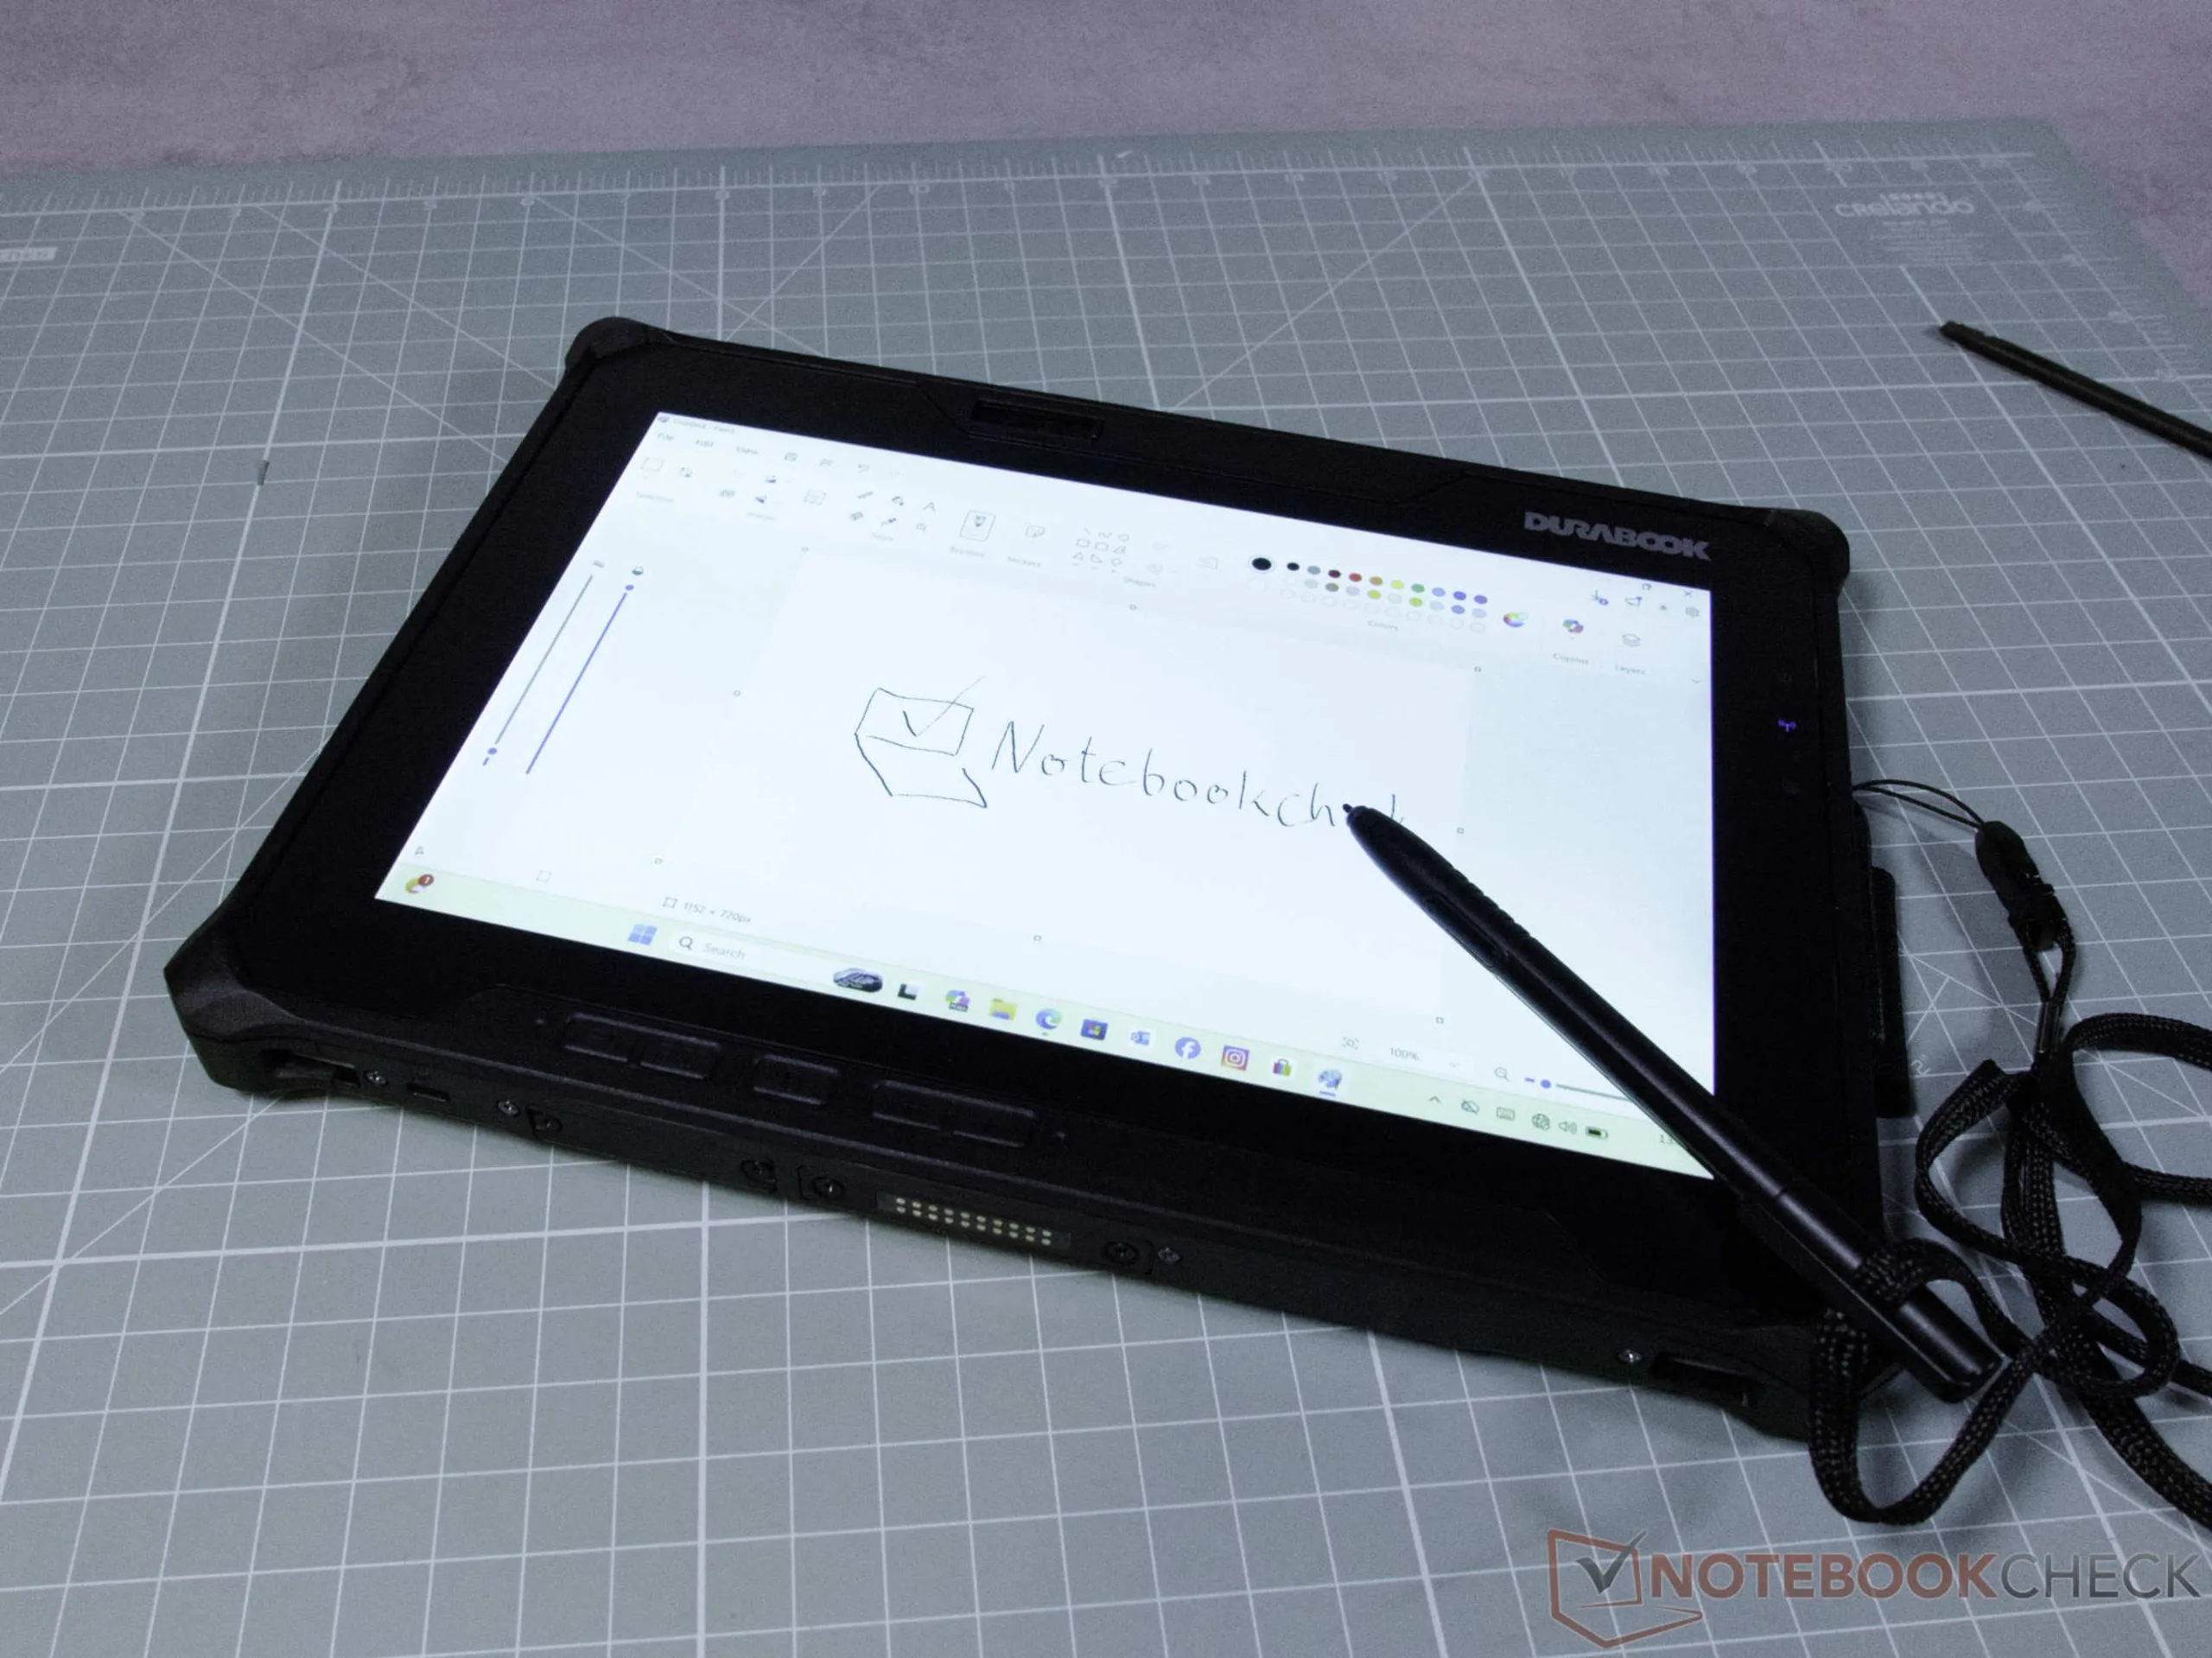
Oprócz ekranu dotykowego urządzenie Durabook R10 wyposażono w sześć przycisków, których funkcje można dostosować do własnych potrzeb. Ekran dotykowy pozostaje jednak głównym elementem sterującym i można go elastycznie dostosować do trudnych warunków pracy. Na przykład można zmienić tryb dotykowy tak, aby ekran niezawodnie rozpoznawał polecenia zarówno podczas noszenia grubych rękawic ochronnych, jak i w wilgotnych warunkach. W przypadku szczegółowych rysunków technicznych lub szkiców ekran obsługuje protokół Microsoft Pen Protocol 1.51.
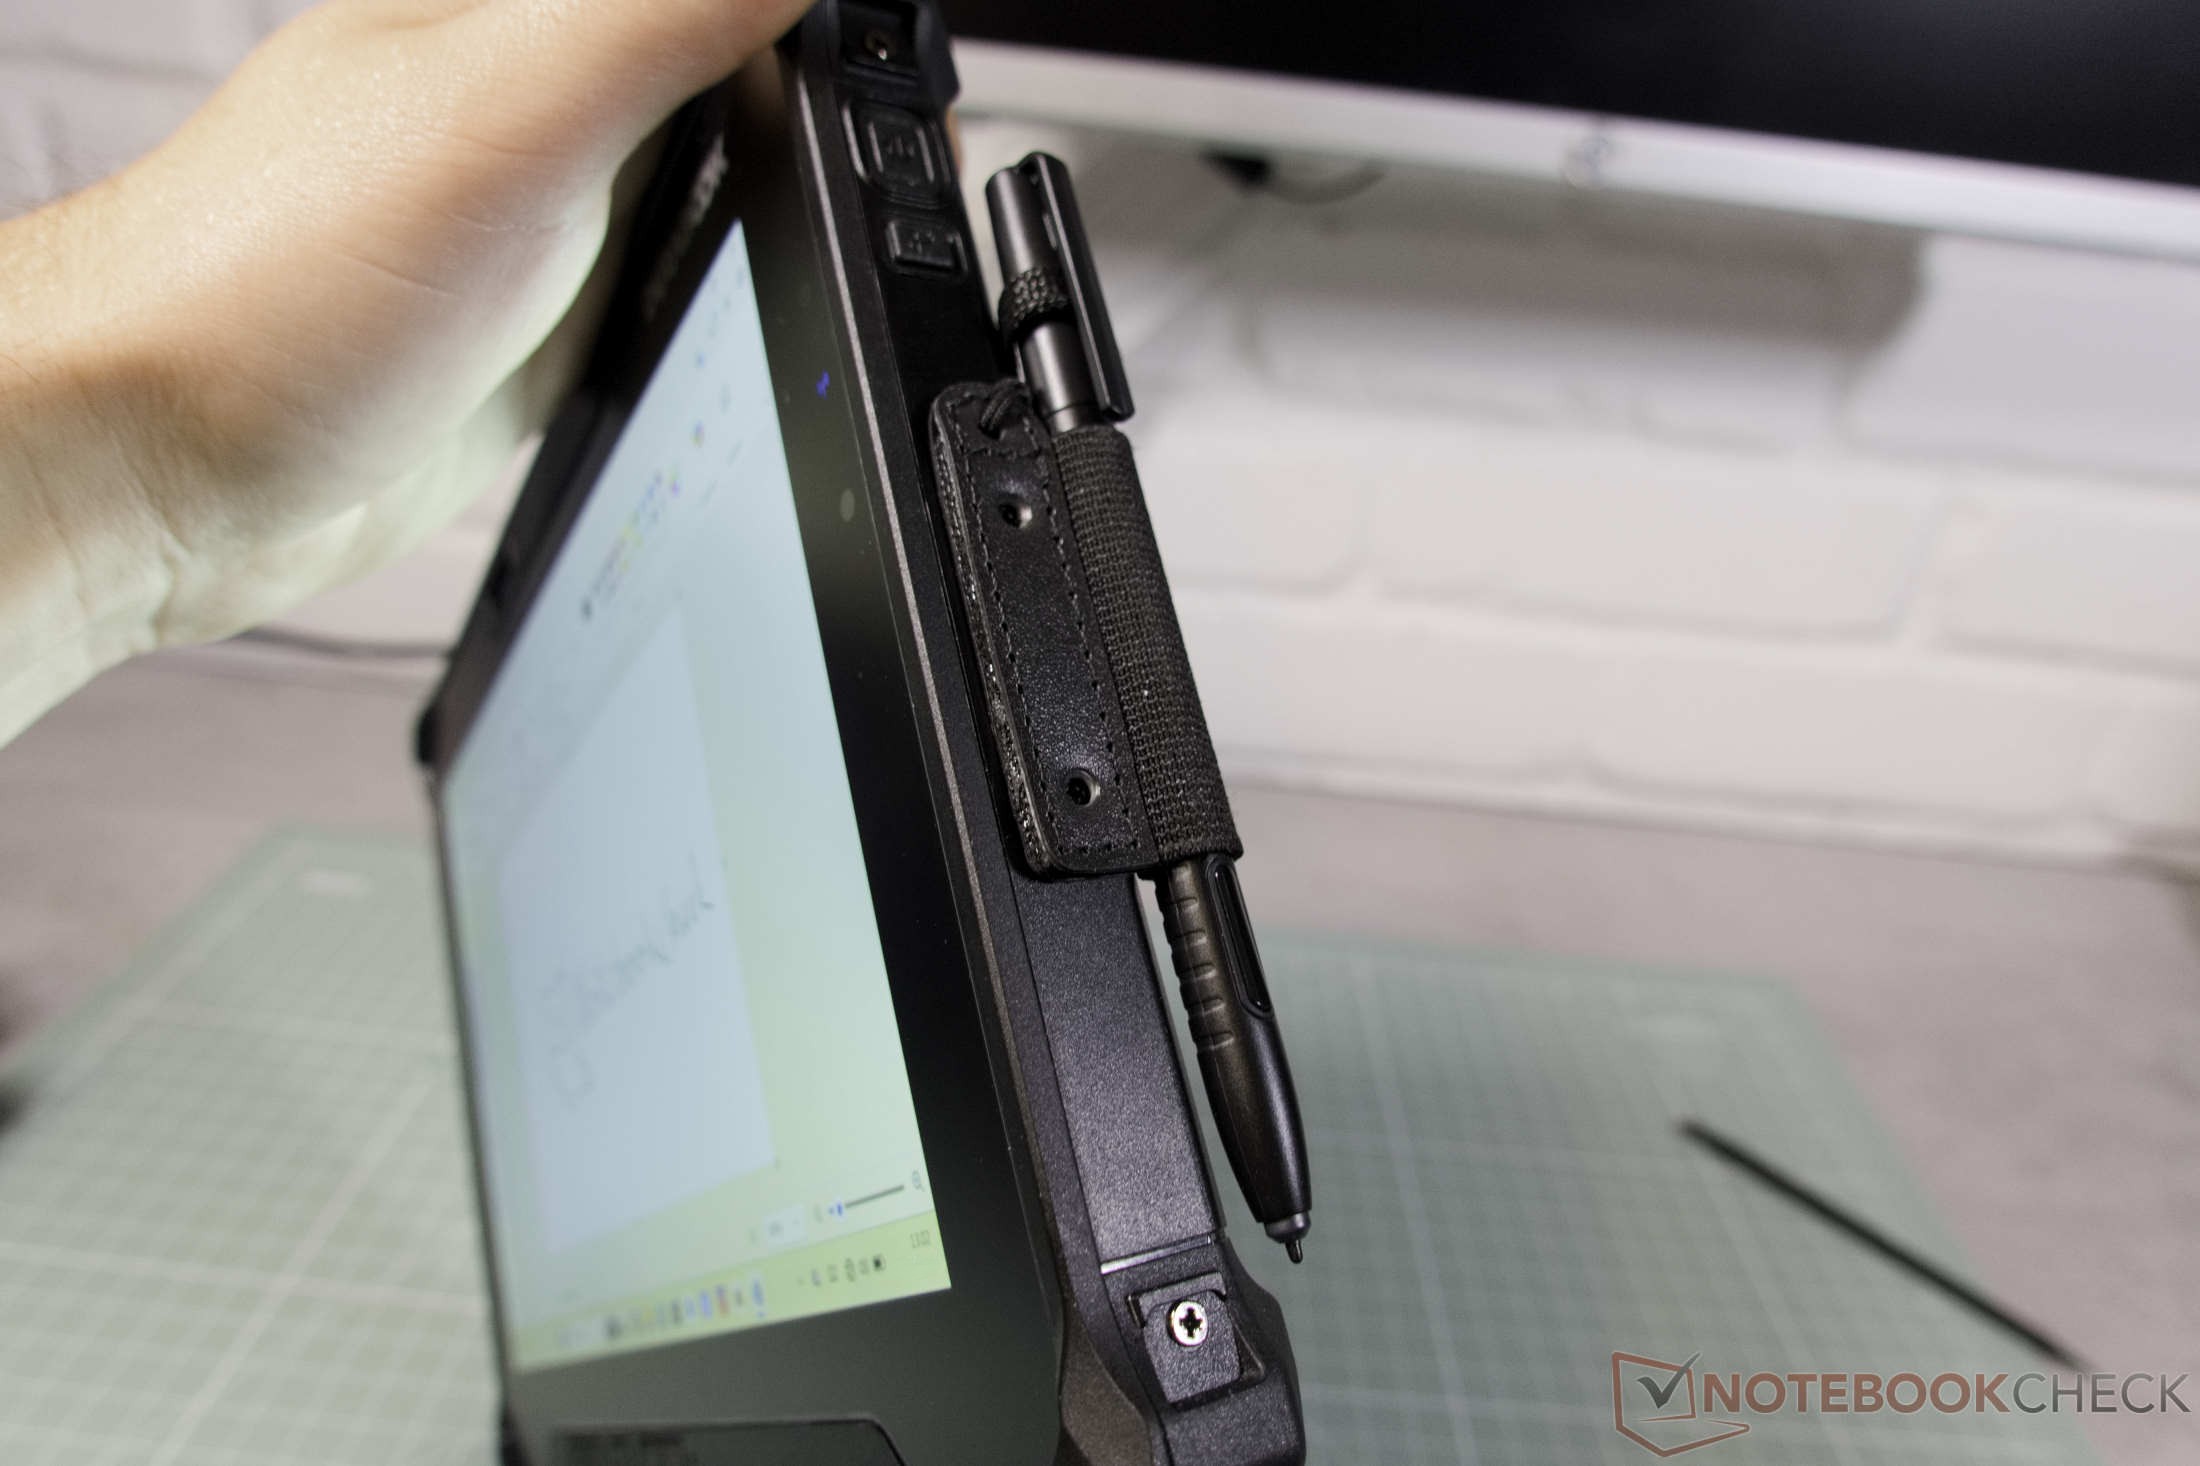
Rysik Durabook jest zaskakująco lekki, a jednocześnie precyzyjny. Do tabletu można przykręcić opcjonalny uchwyt na rysik; zawiera on również pasek zabezpieczający rysik.
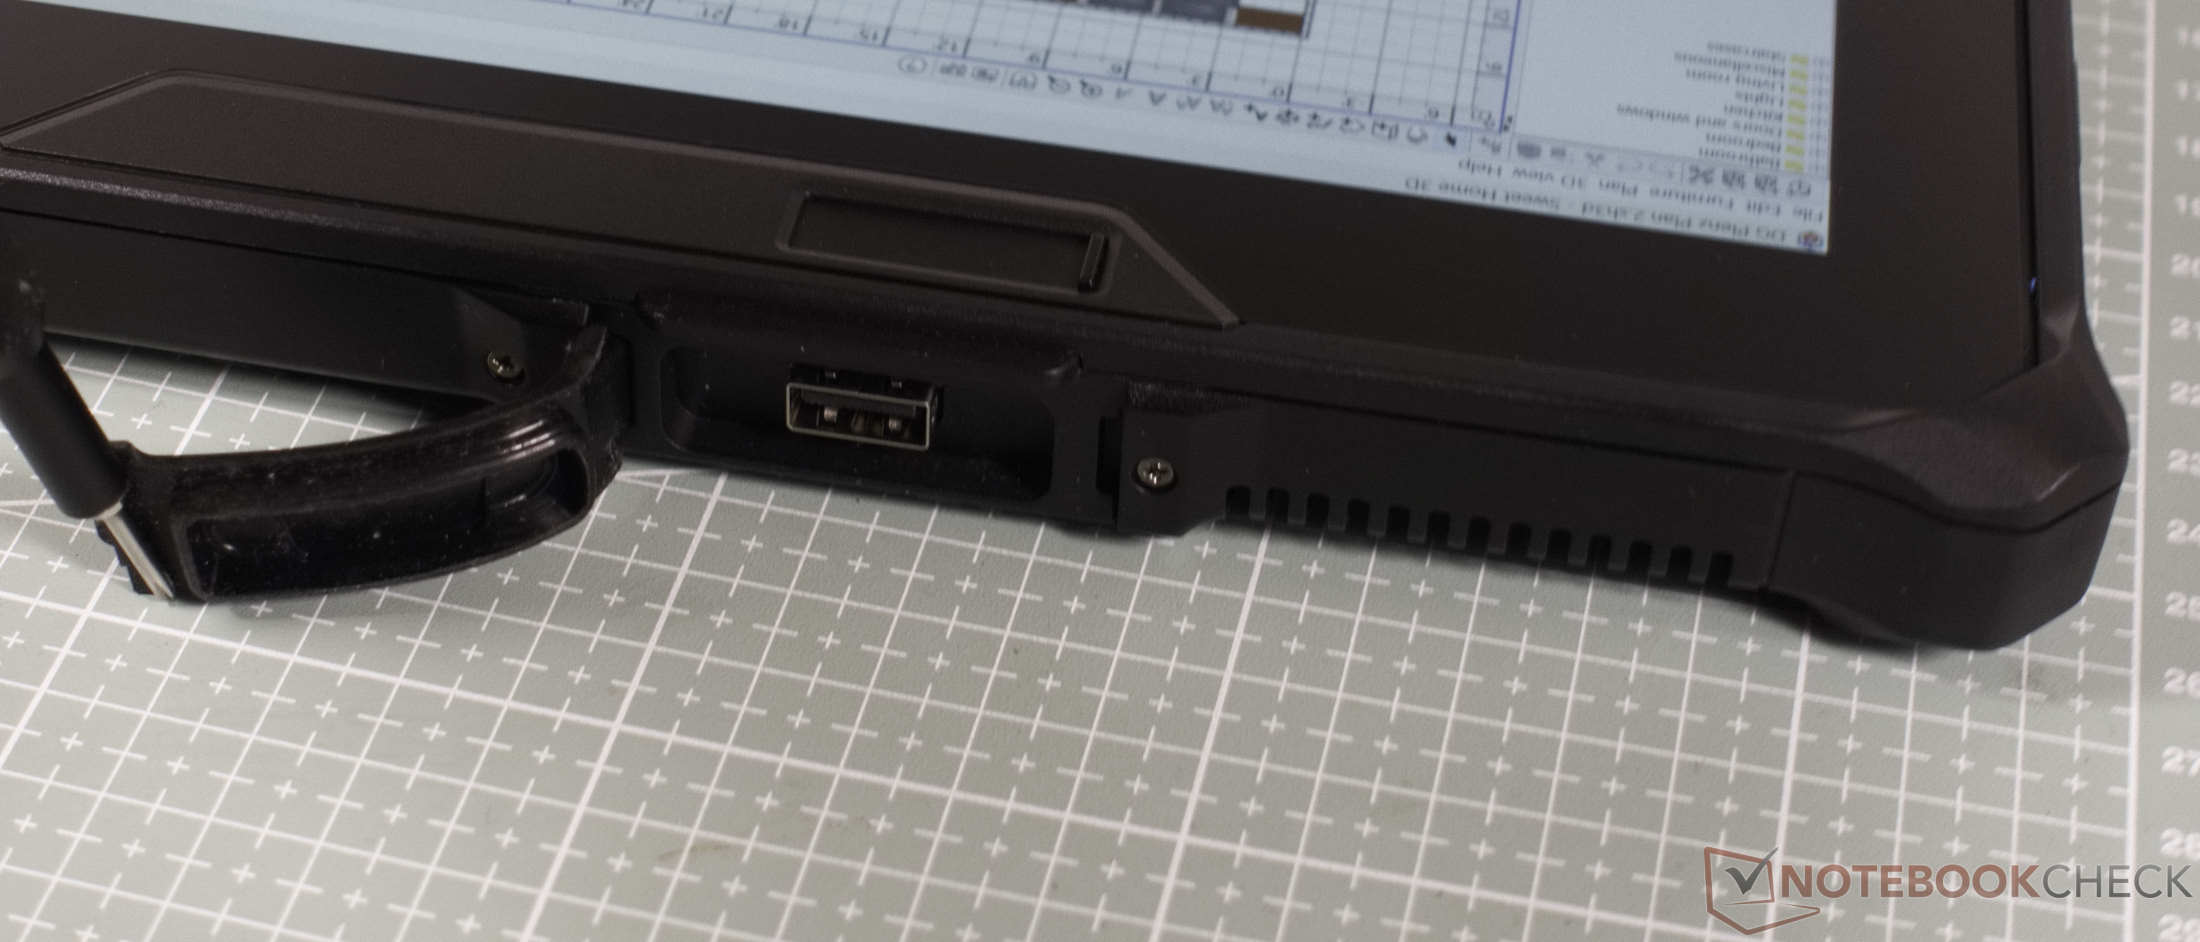
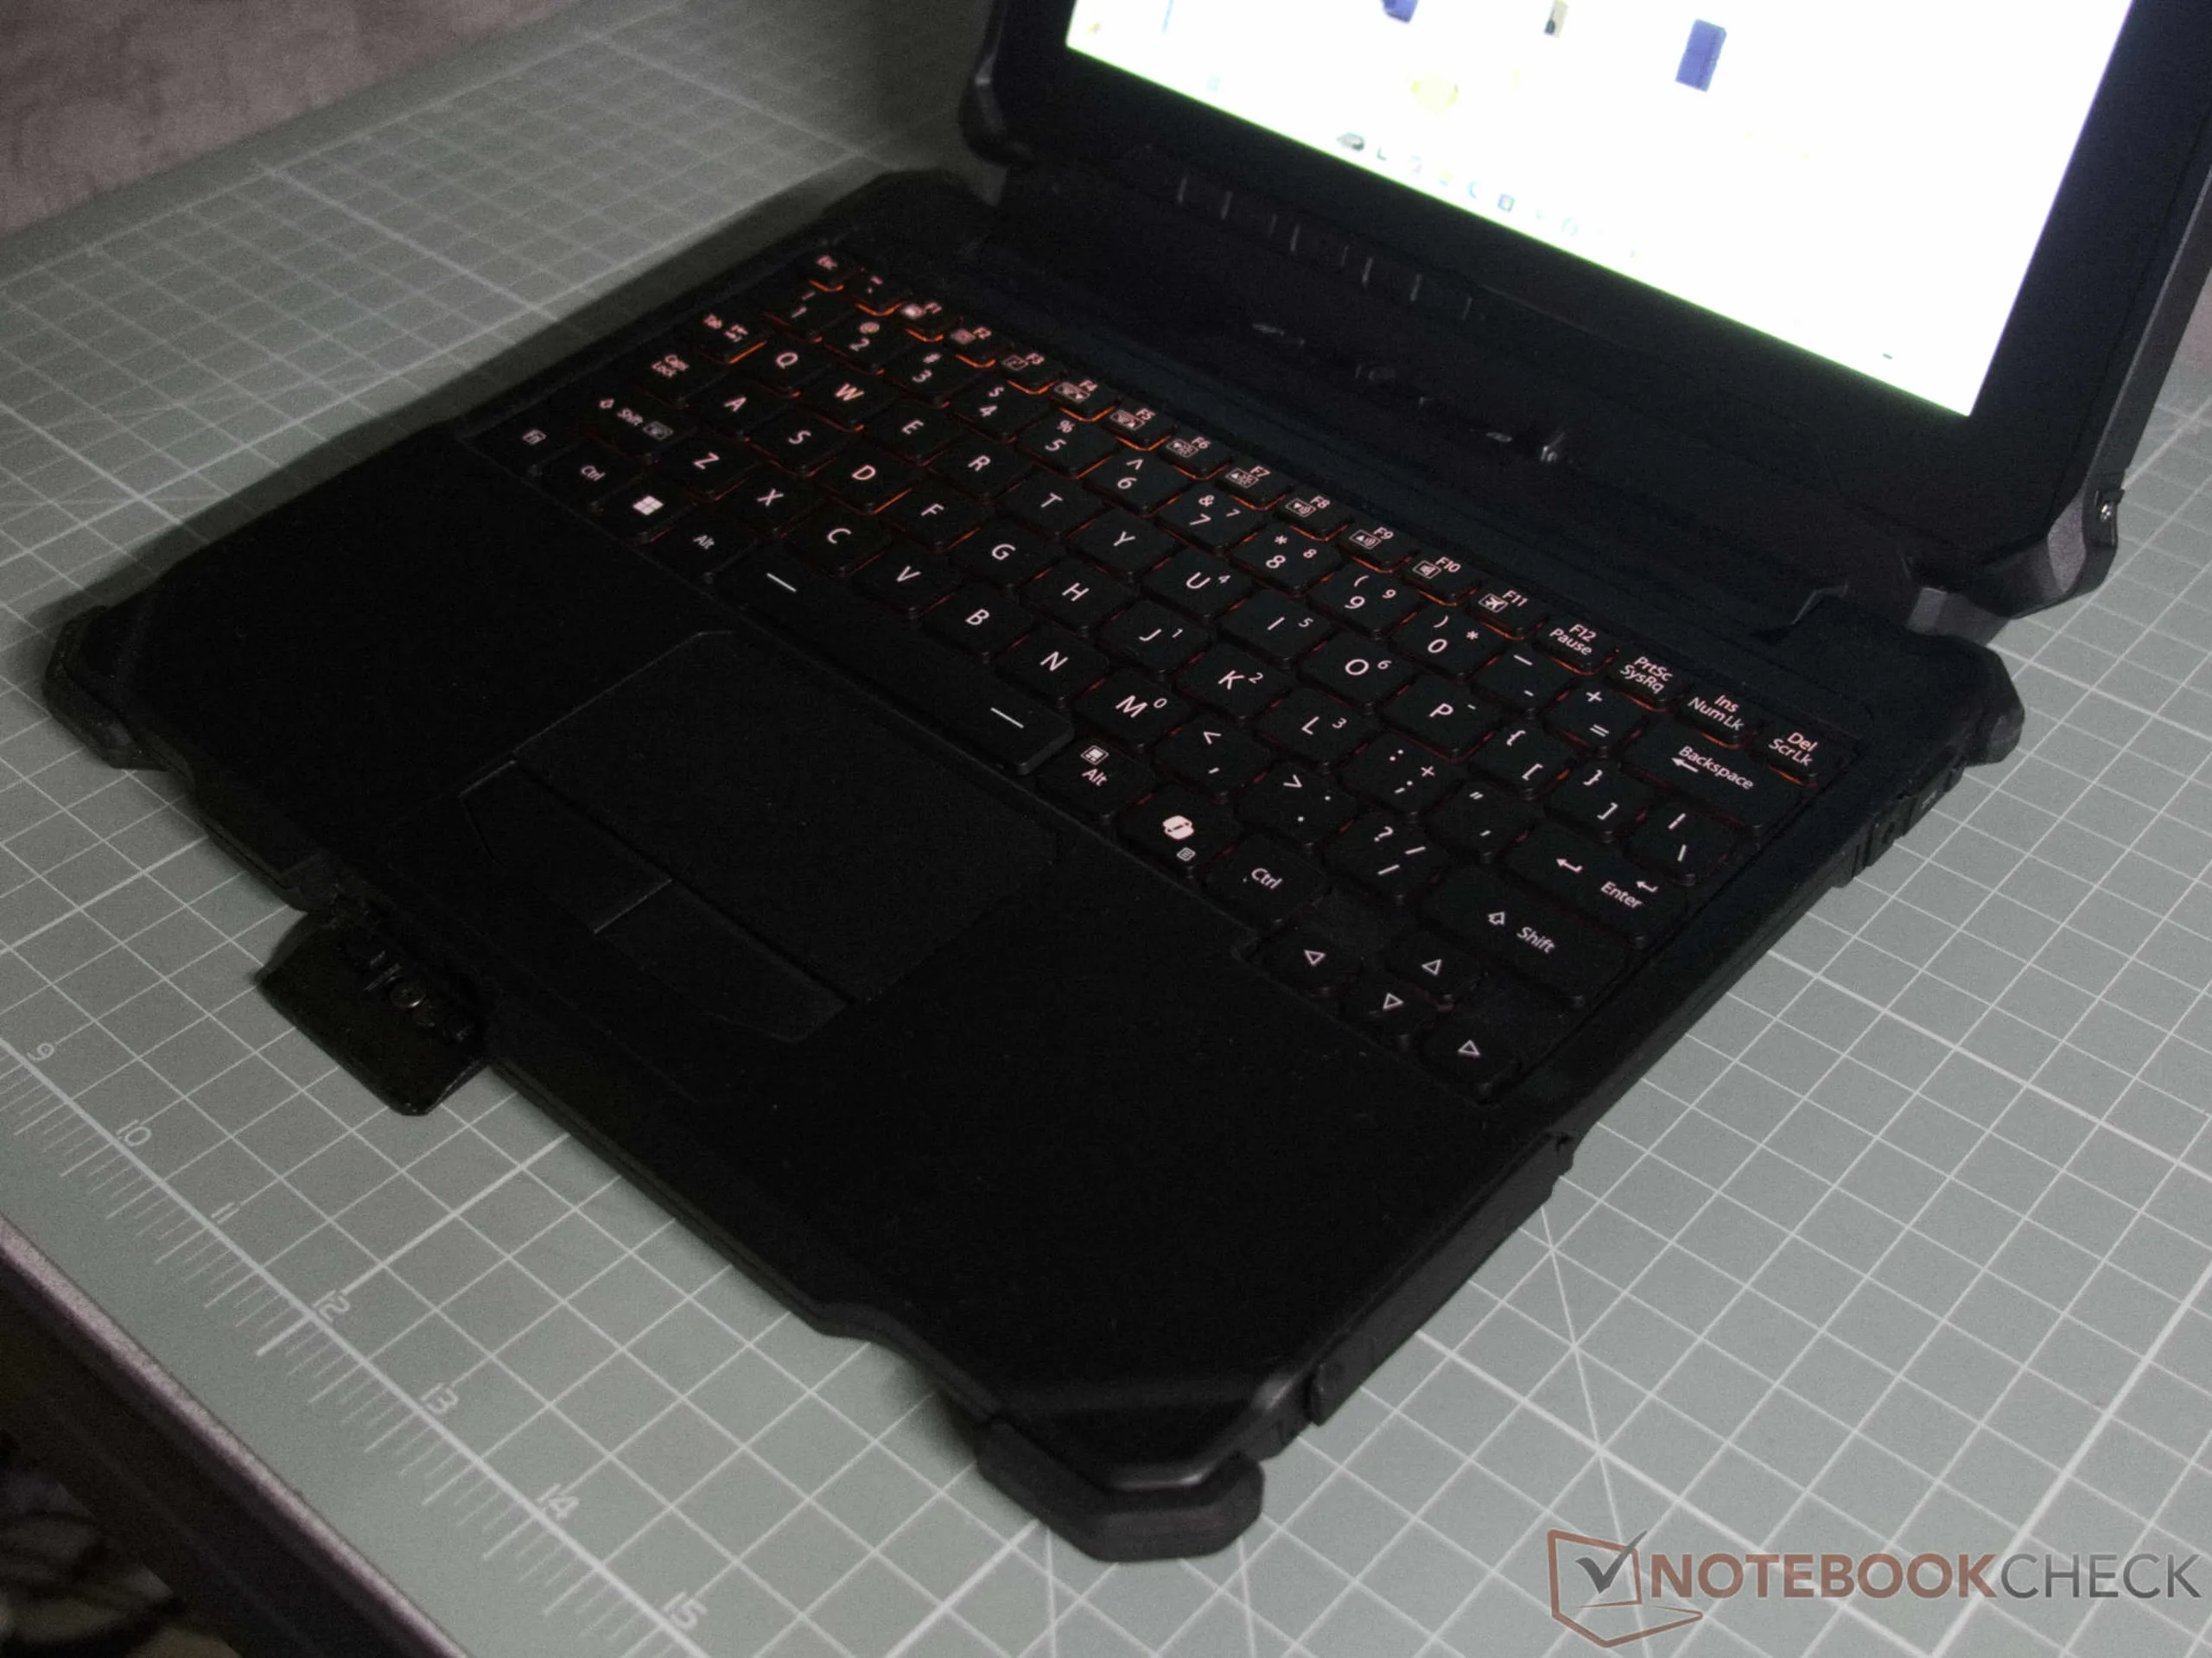
Opcjonalnie tablet można przekształcić w model odłączalny. Dołączony moduł klawiatury oferuje przyjazne dla oczu czerwone podświetlenie, a także kilka dodatkowych portów. Standardowo dostępne są dwa porty USB-A 3.2, a porty HDMI lub LAN można skonfigurować zgodnie z potrzebami. Moduł klawiatury posiada również dodatkowy port ładowania.
Wyświetlacz
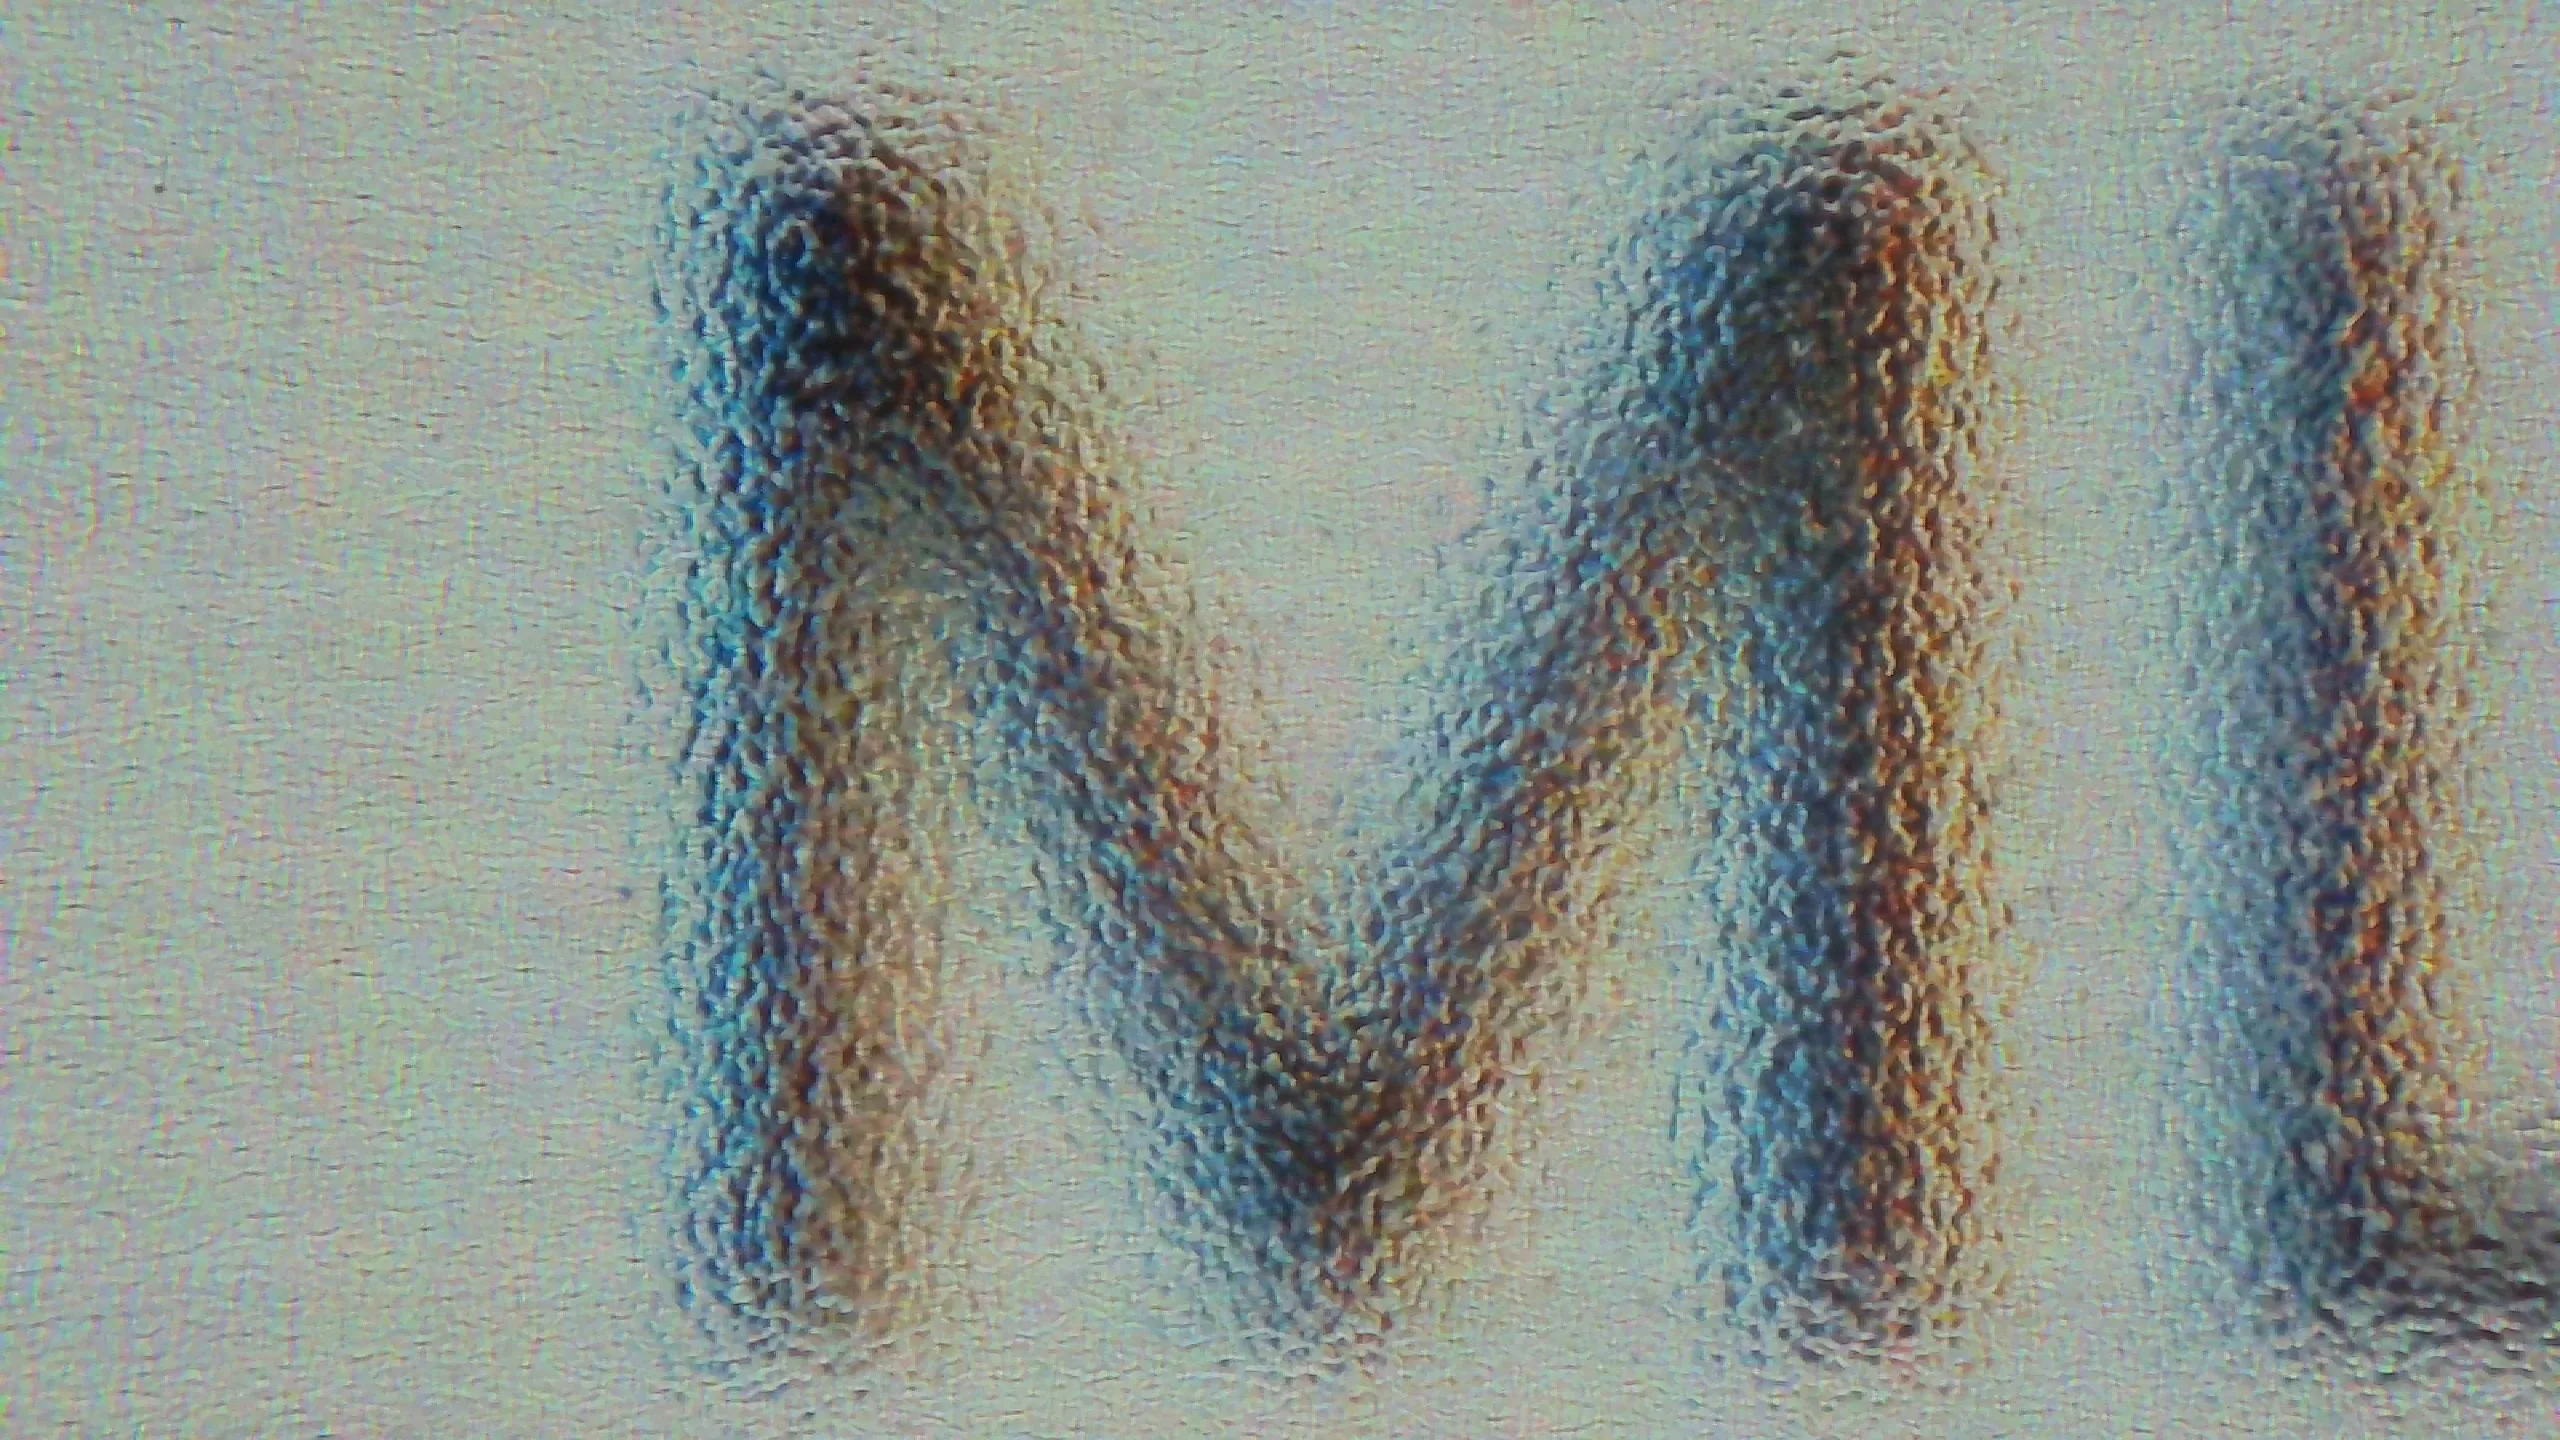
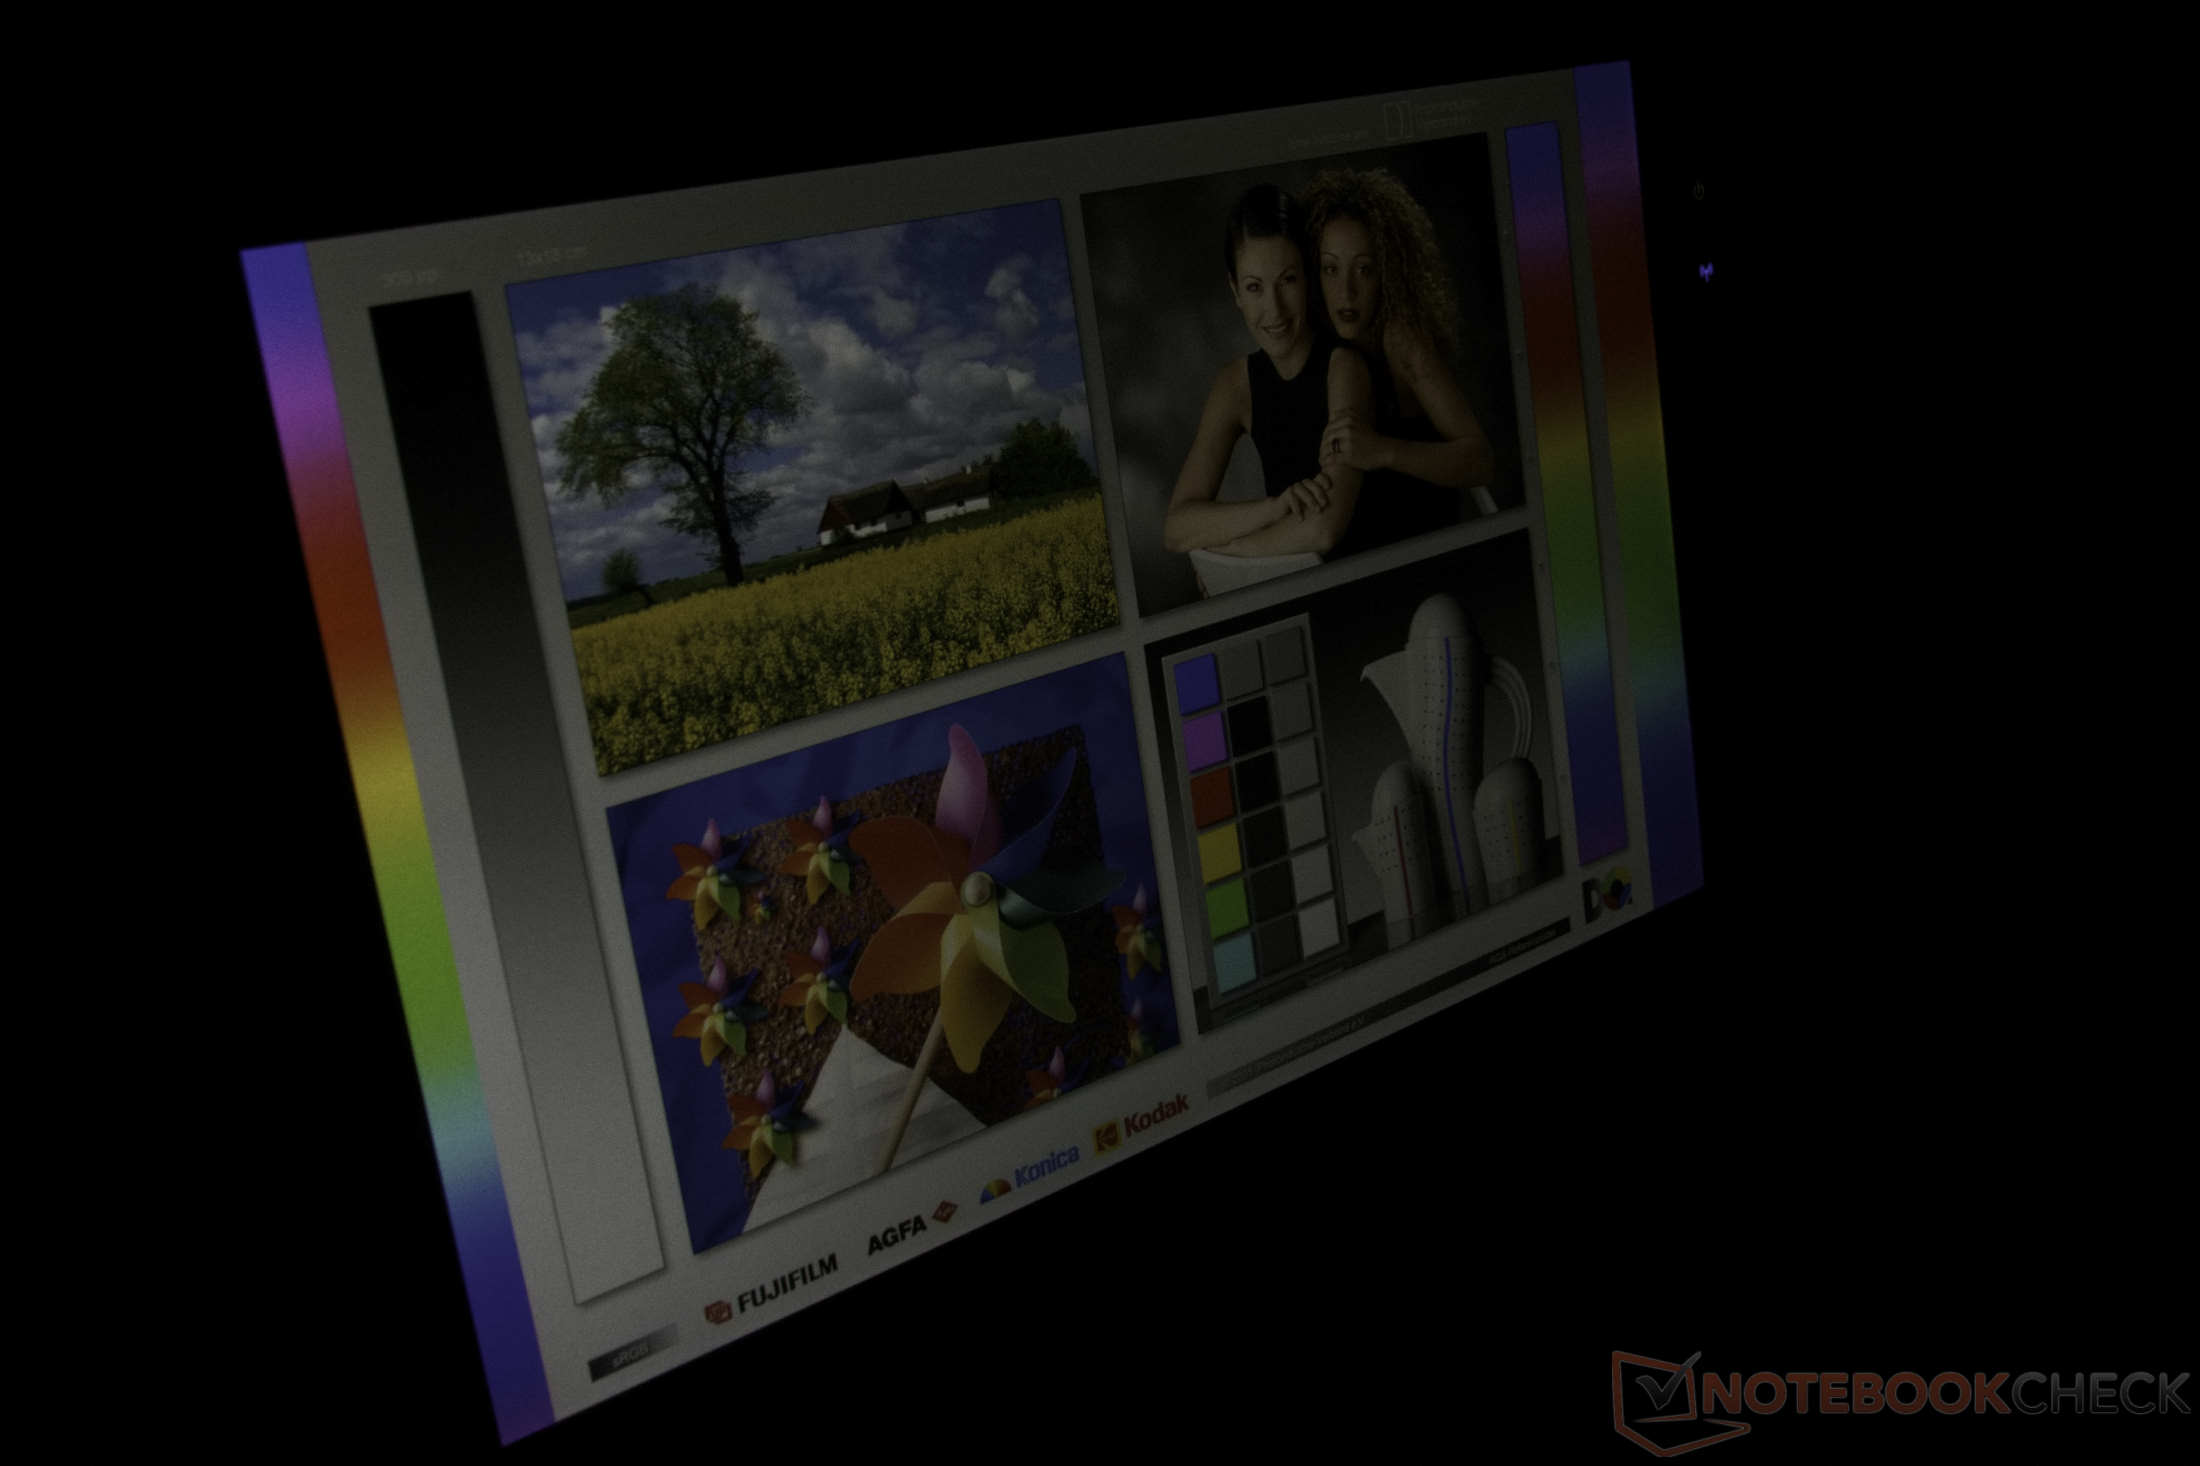
10,1-calowy ekran WUXGA został zaprojektowany bez żadnych kompromisów z myślą o użytkowaniu na zewnątrz. Dzięki ogromnej jasności wynoszącej ponad 1 000 cd/m² panel jest tak jasny, że wszystkie treści wyświetlane na ekranie pozostają doskonale czytelne nawet w bezpośrednim świetle słonecznym. Wstępnie zainstalowana matowa folia ochronna skutecznie ogranicza rozpraszające odbicia, choć powoduje ona pojawienie się delikatnego efektu tęczy w jasnych obszarach. Funkcja adaptacyjnej jasności stanowi praktyczne i wygodne udogodnienie.
| |||||||||||||||||||||||||
rozświetlenie: 92 %
na akumulatorze: 1040 cd/m²
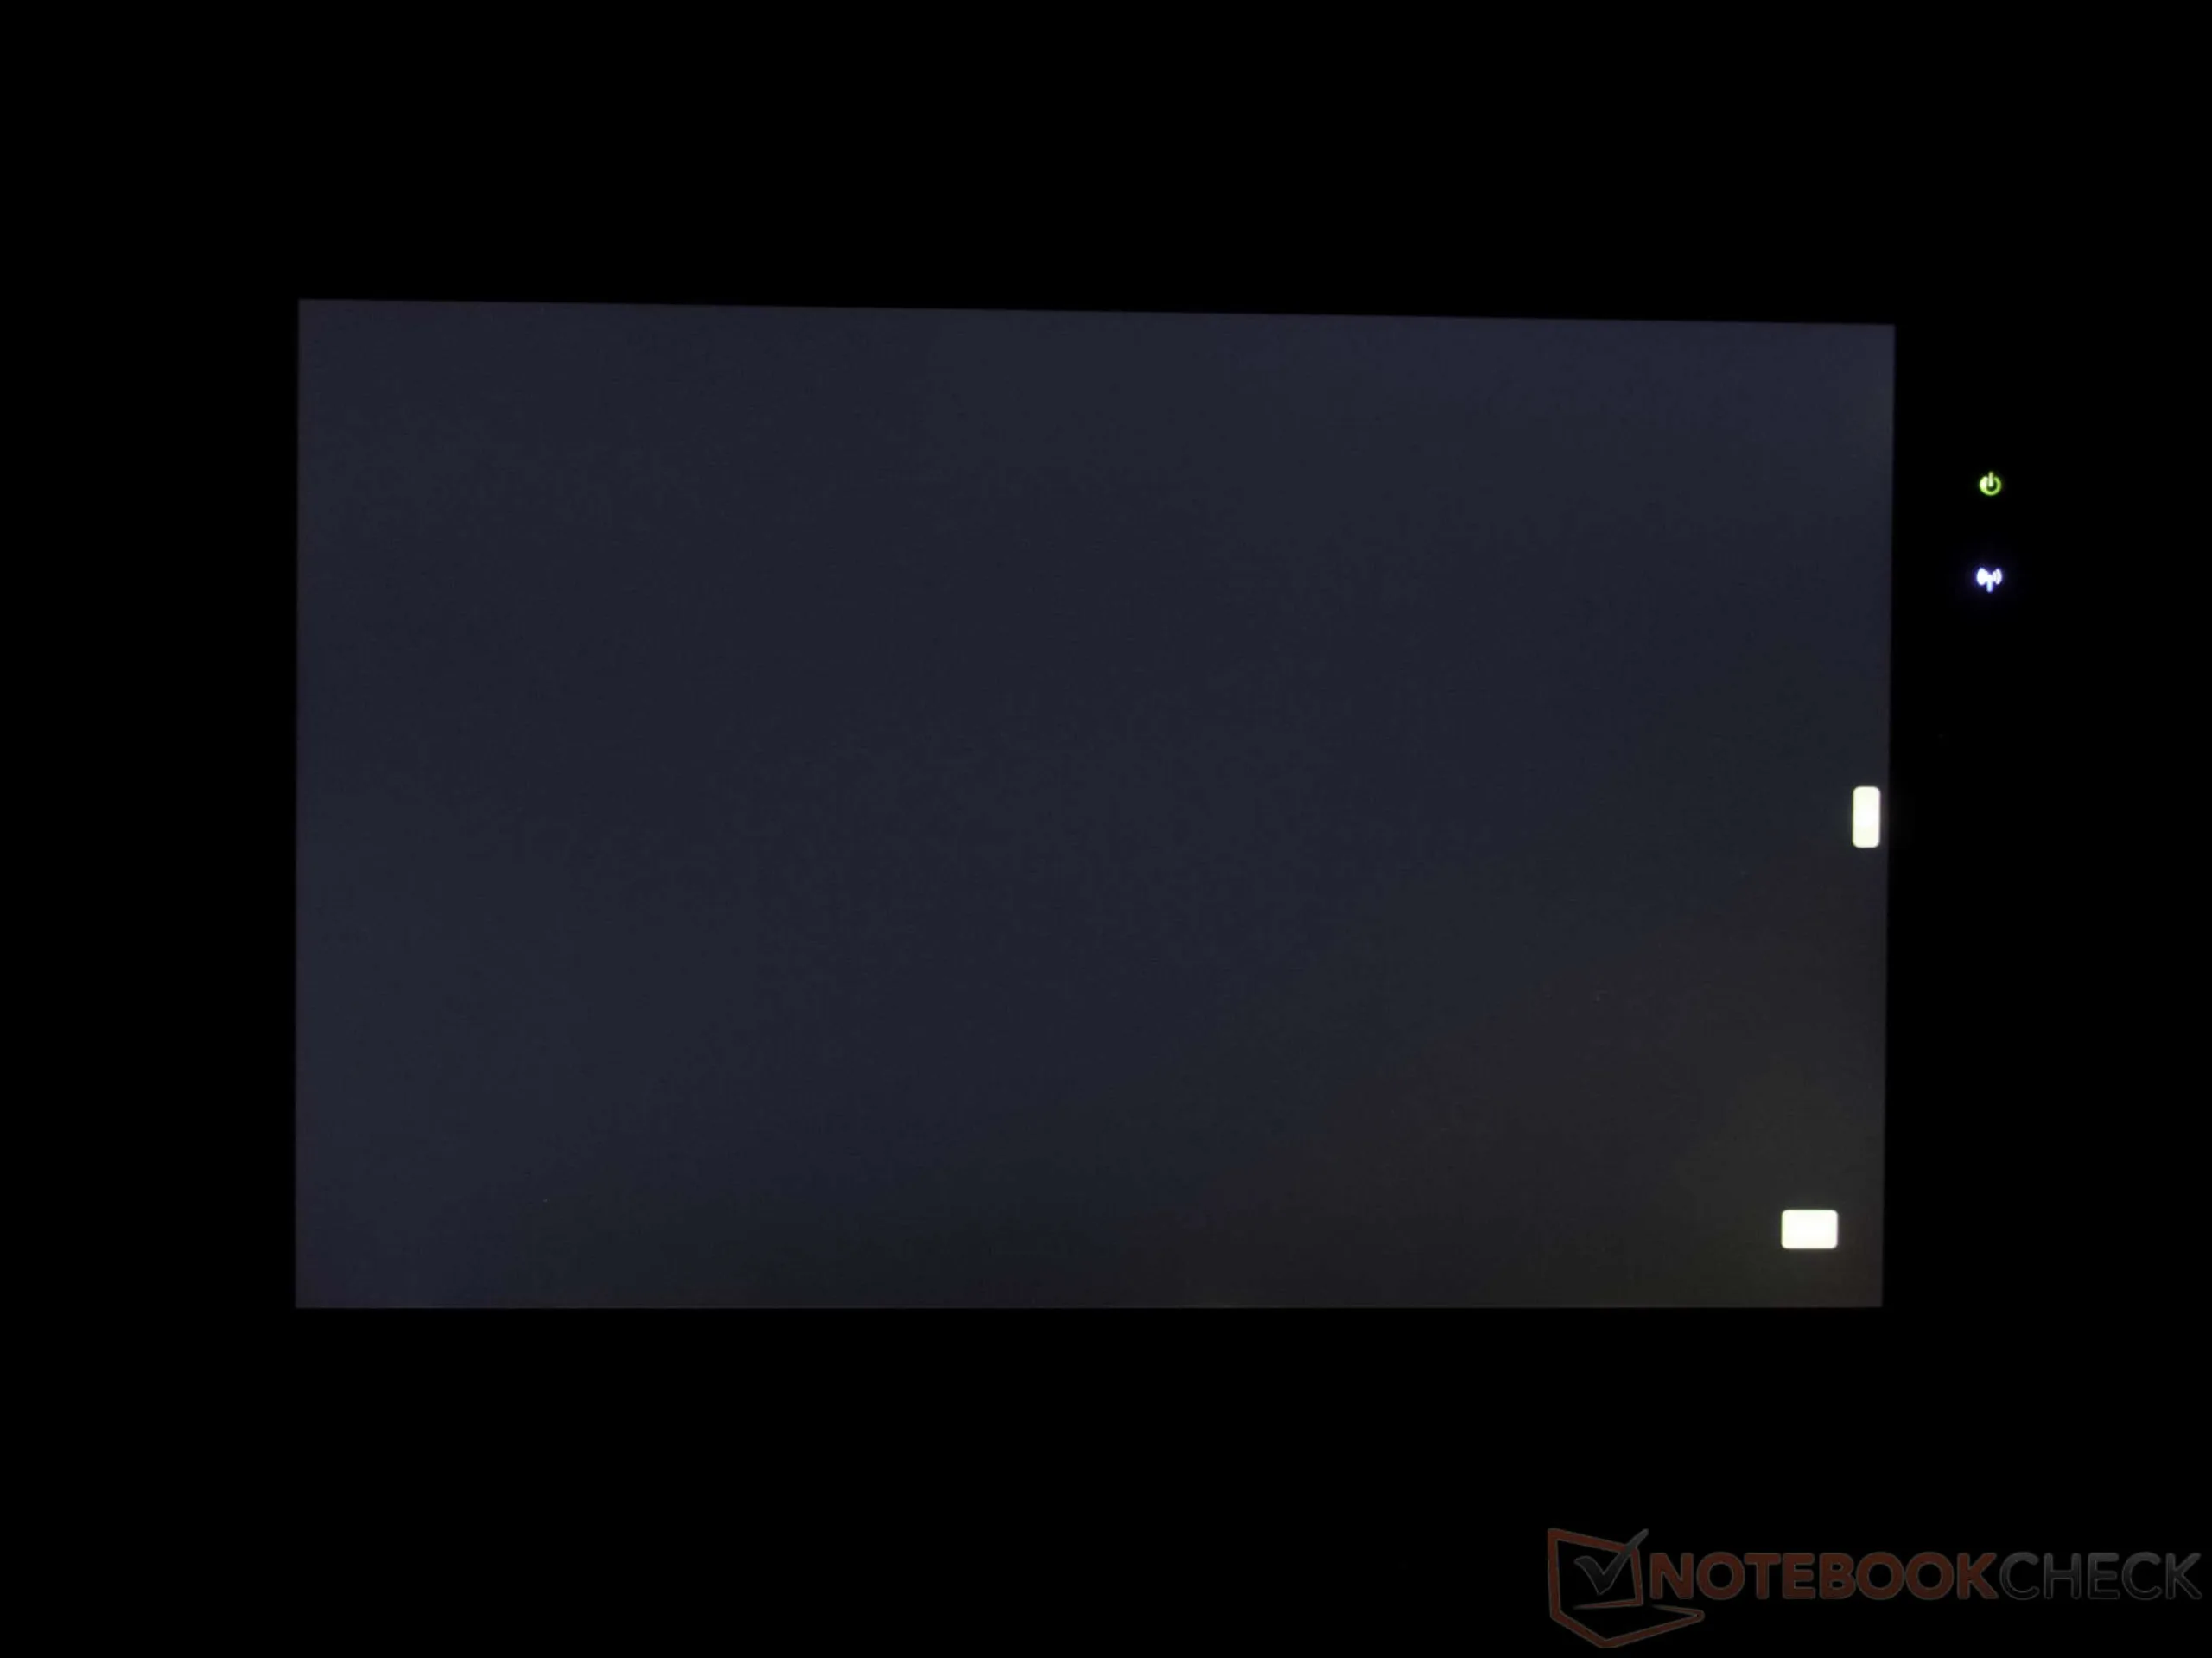
kontrast: 1024:1 (czerń: 1.05 cd/m²)
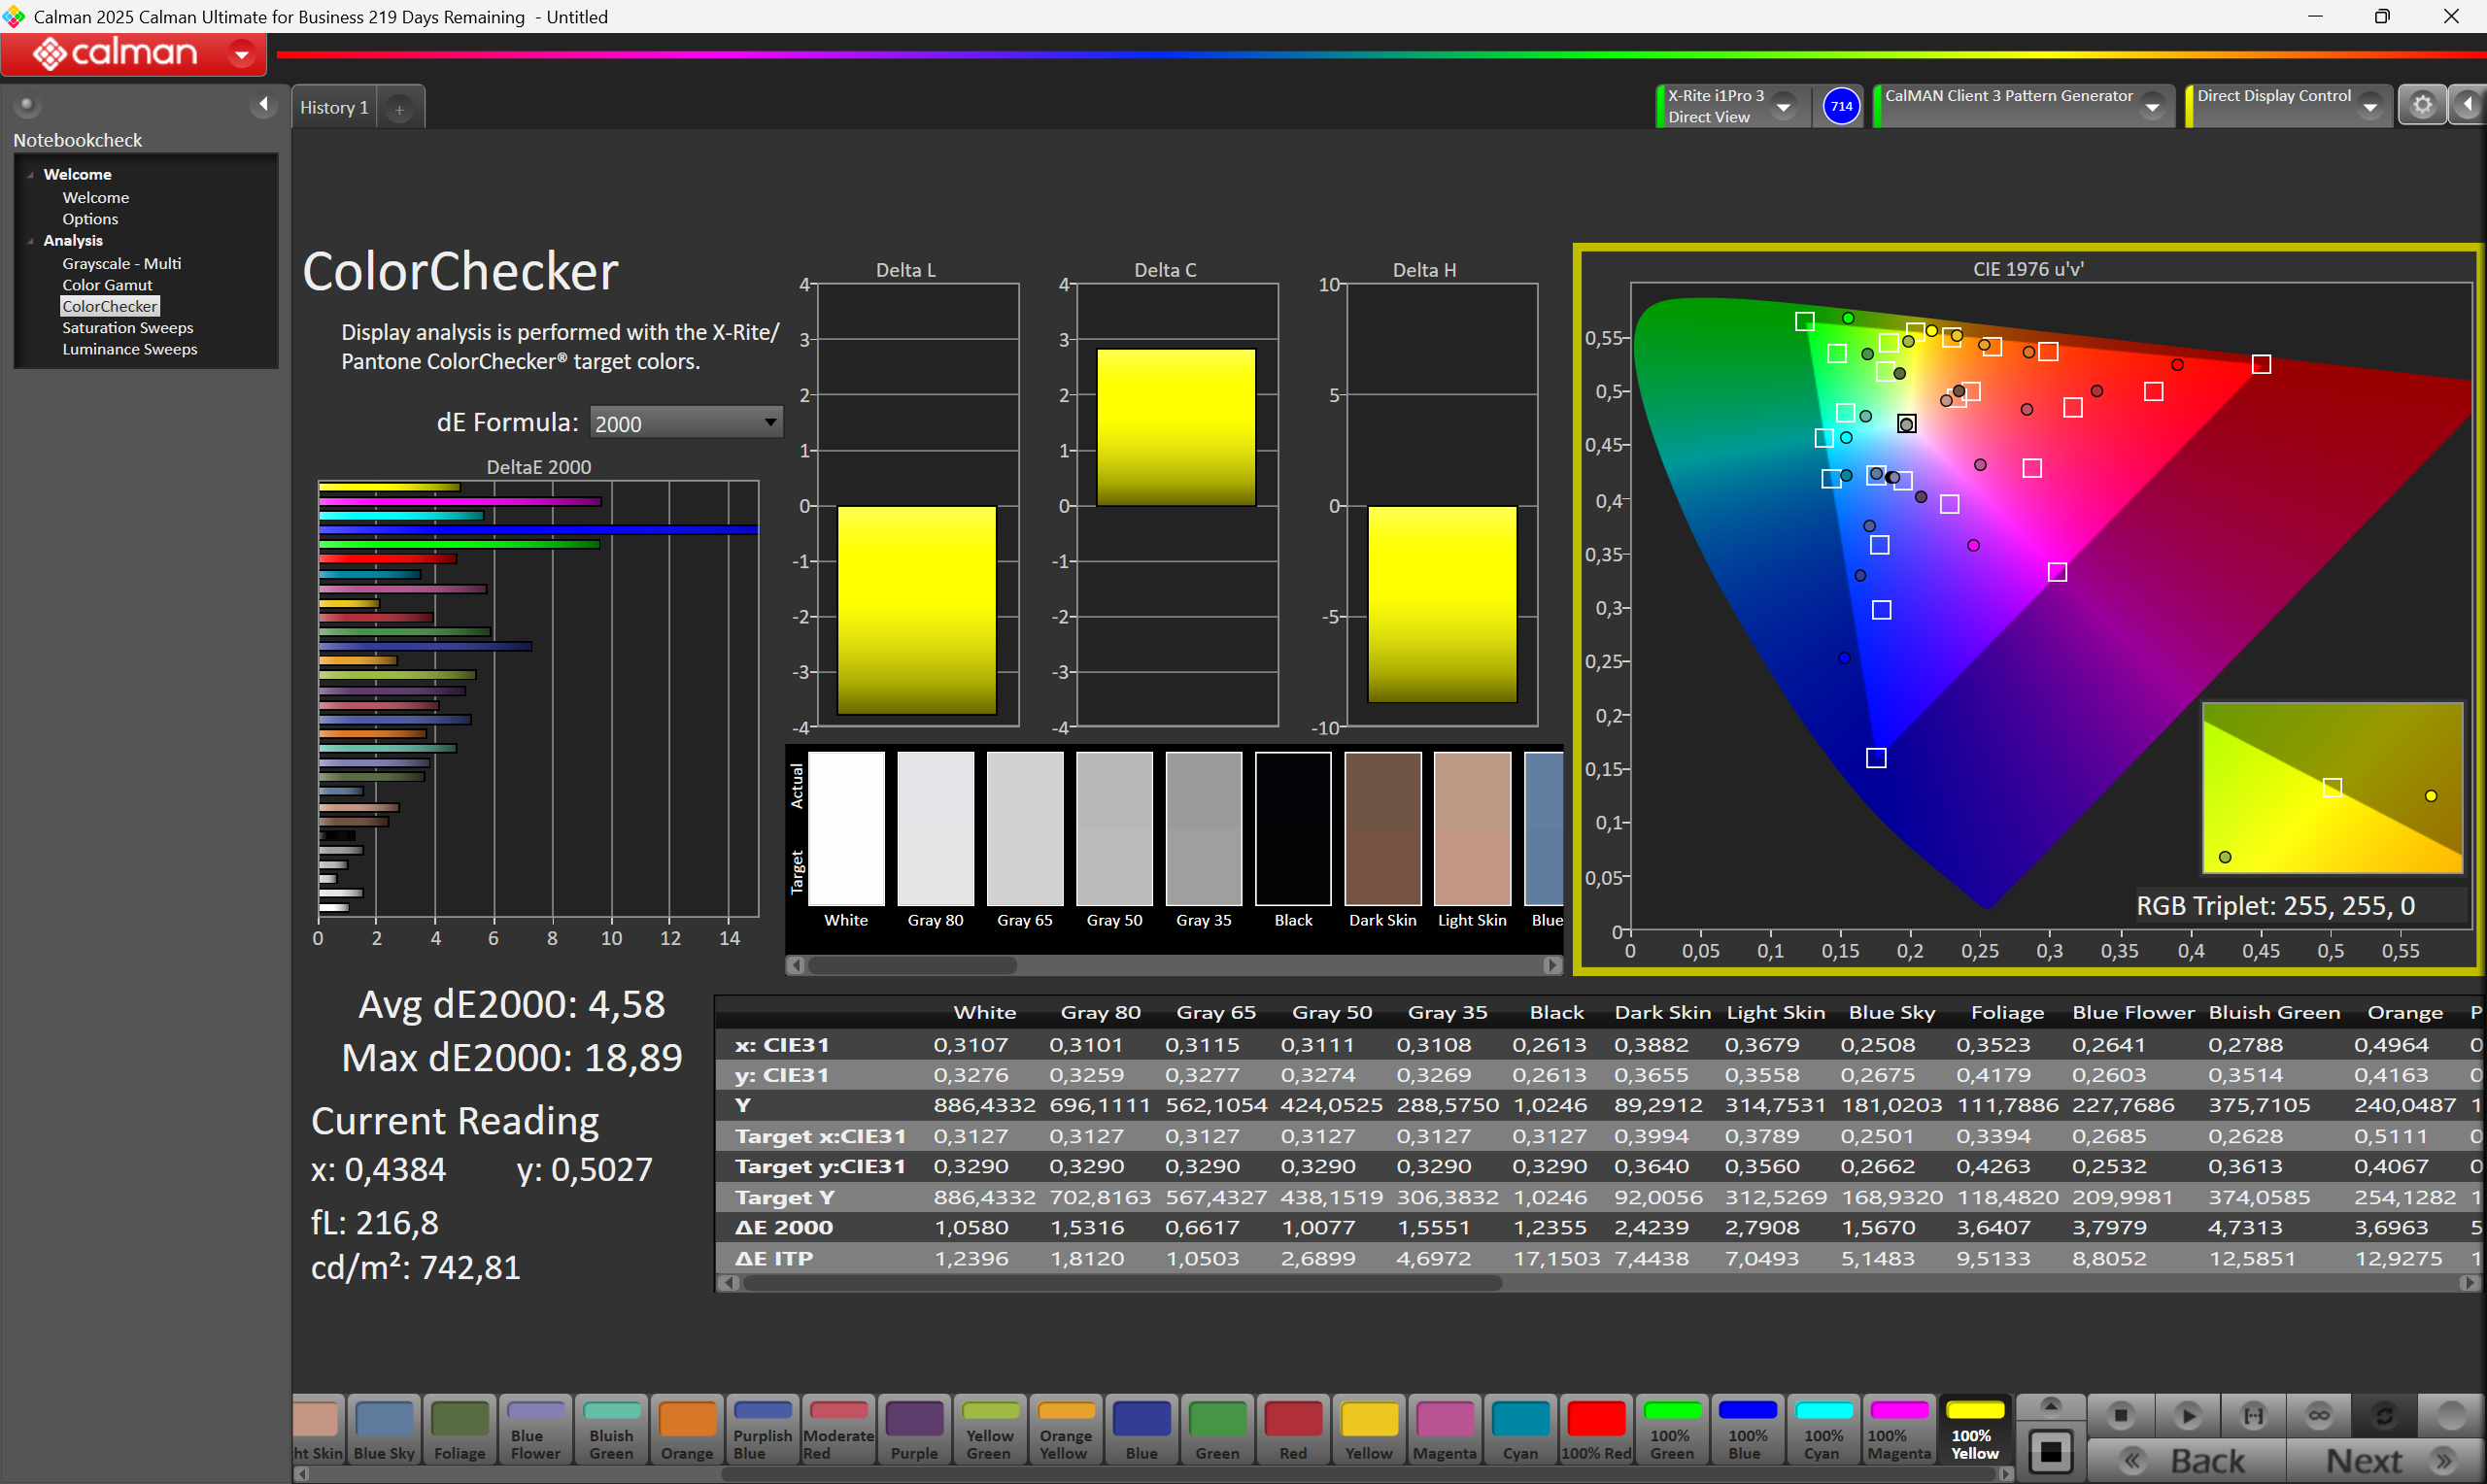
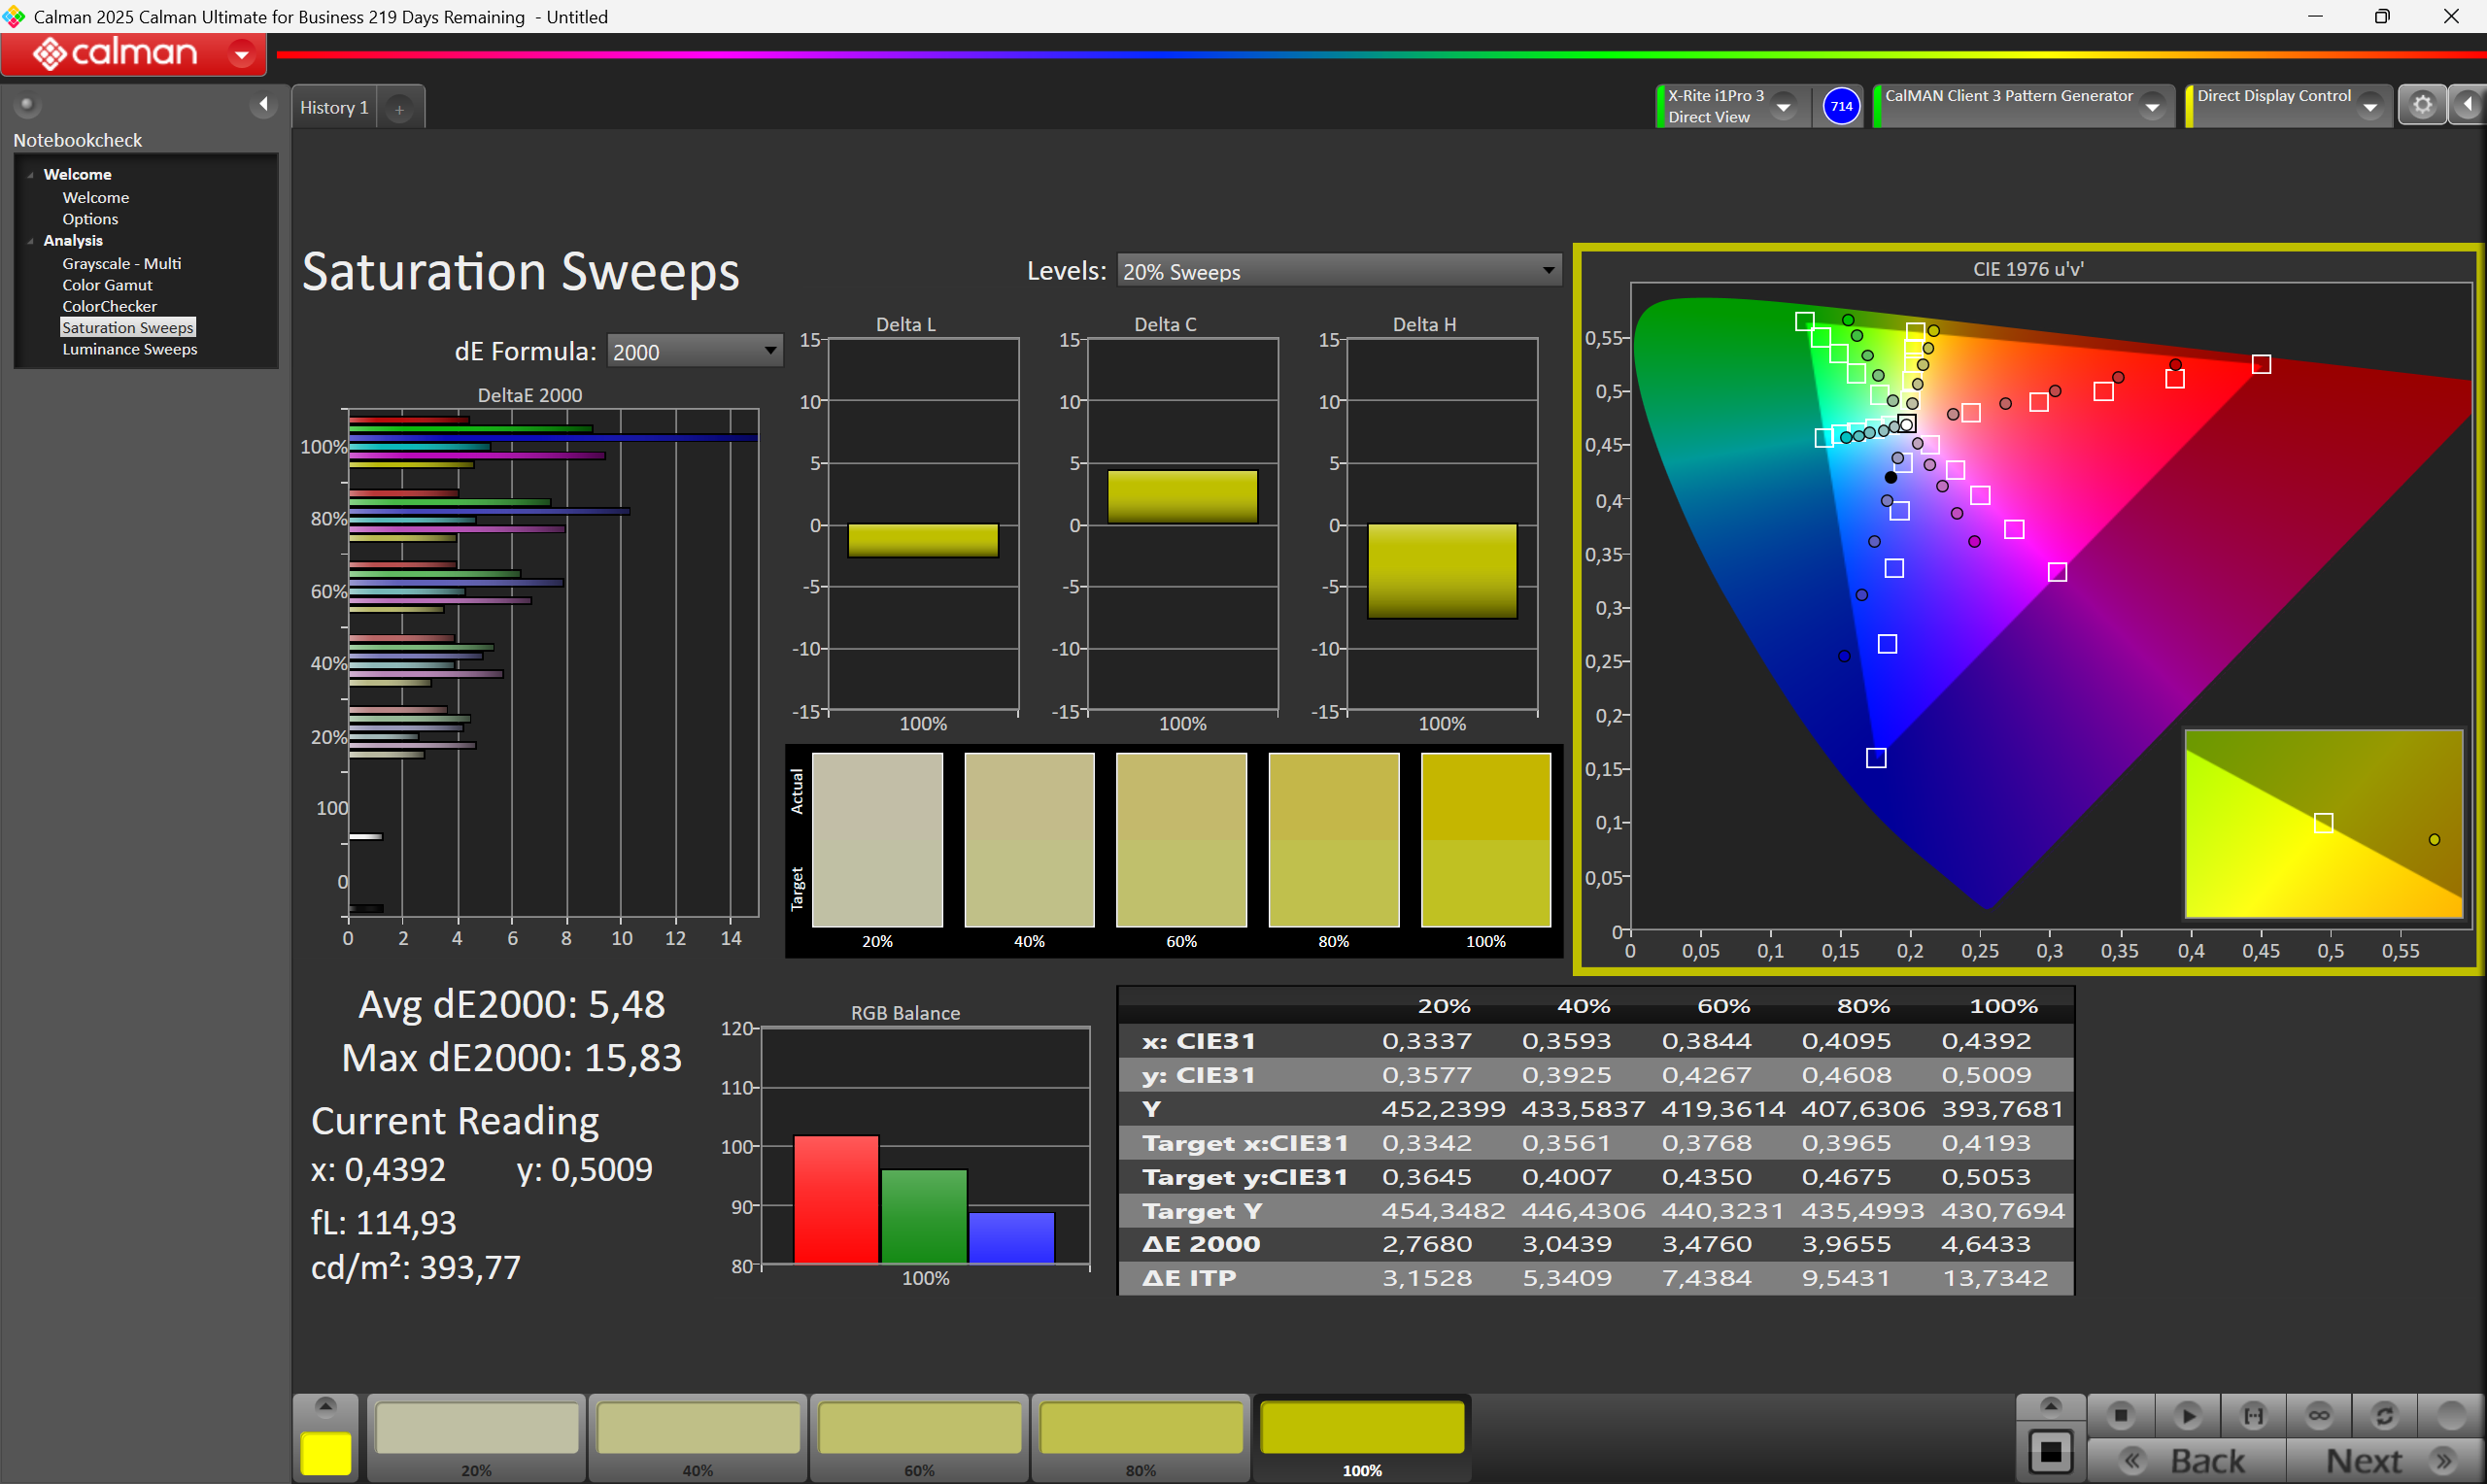
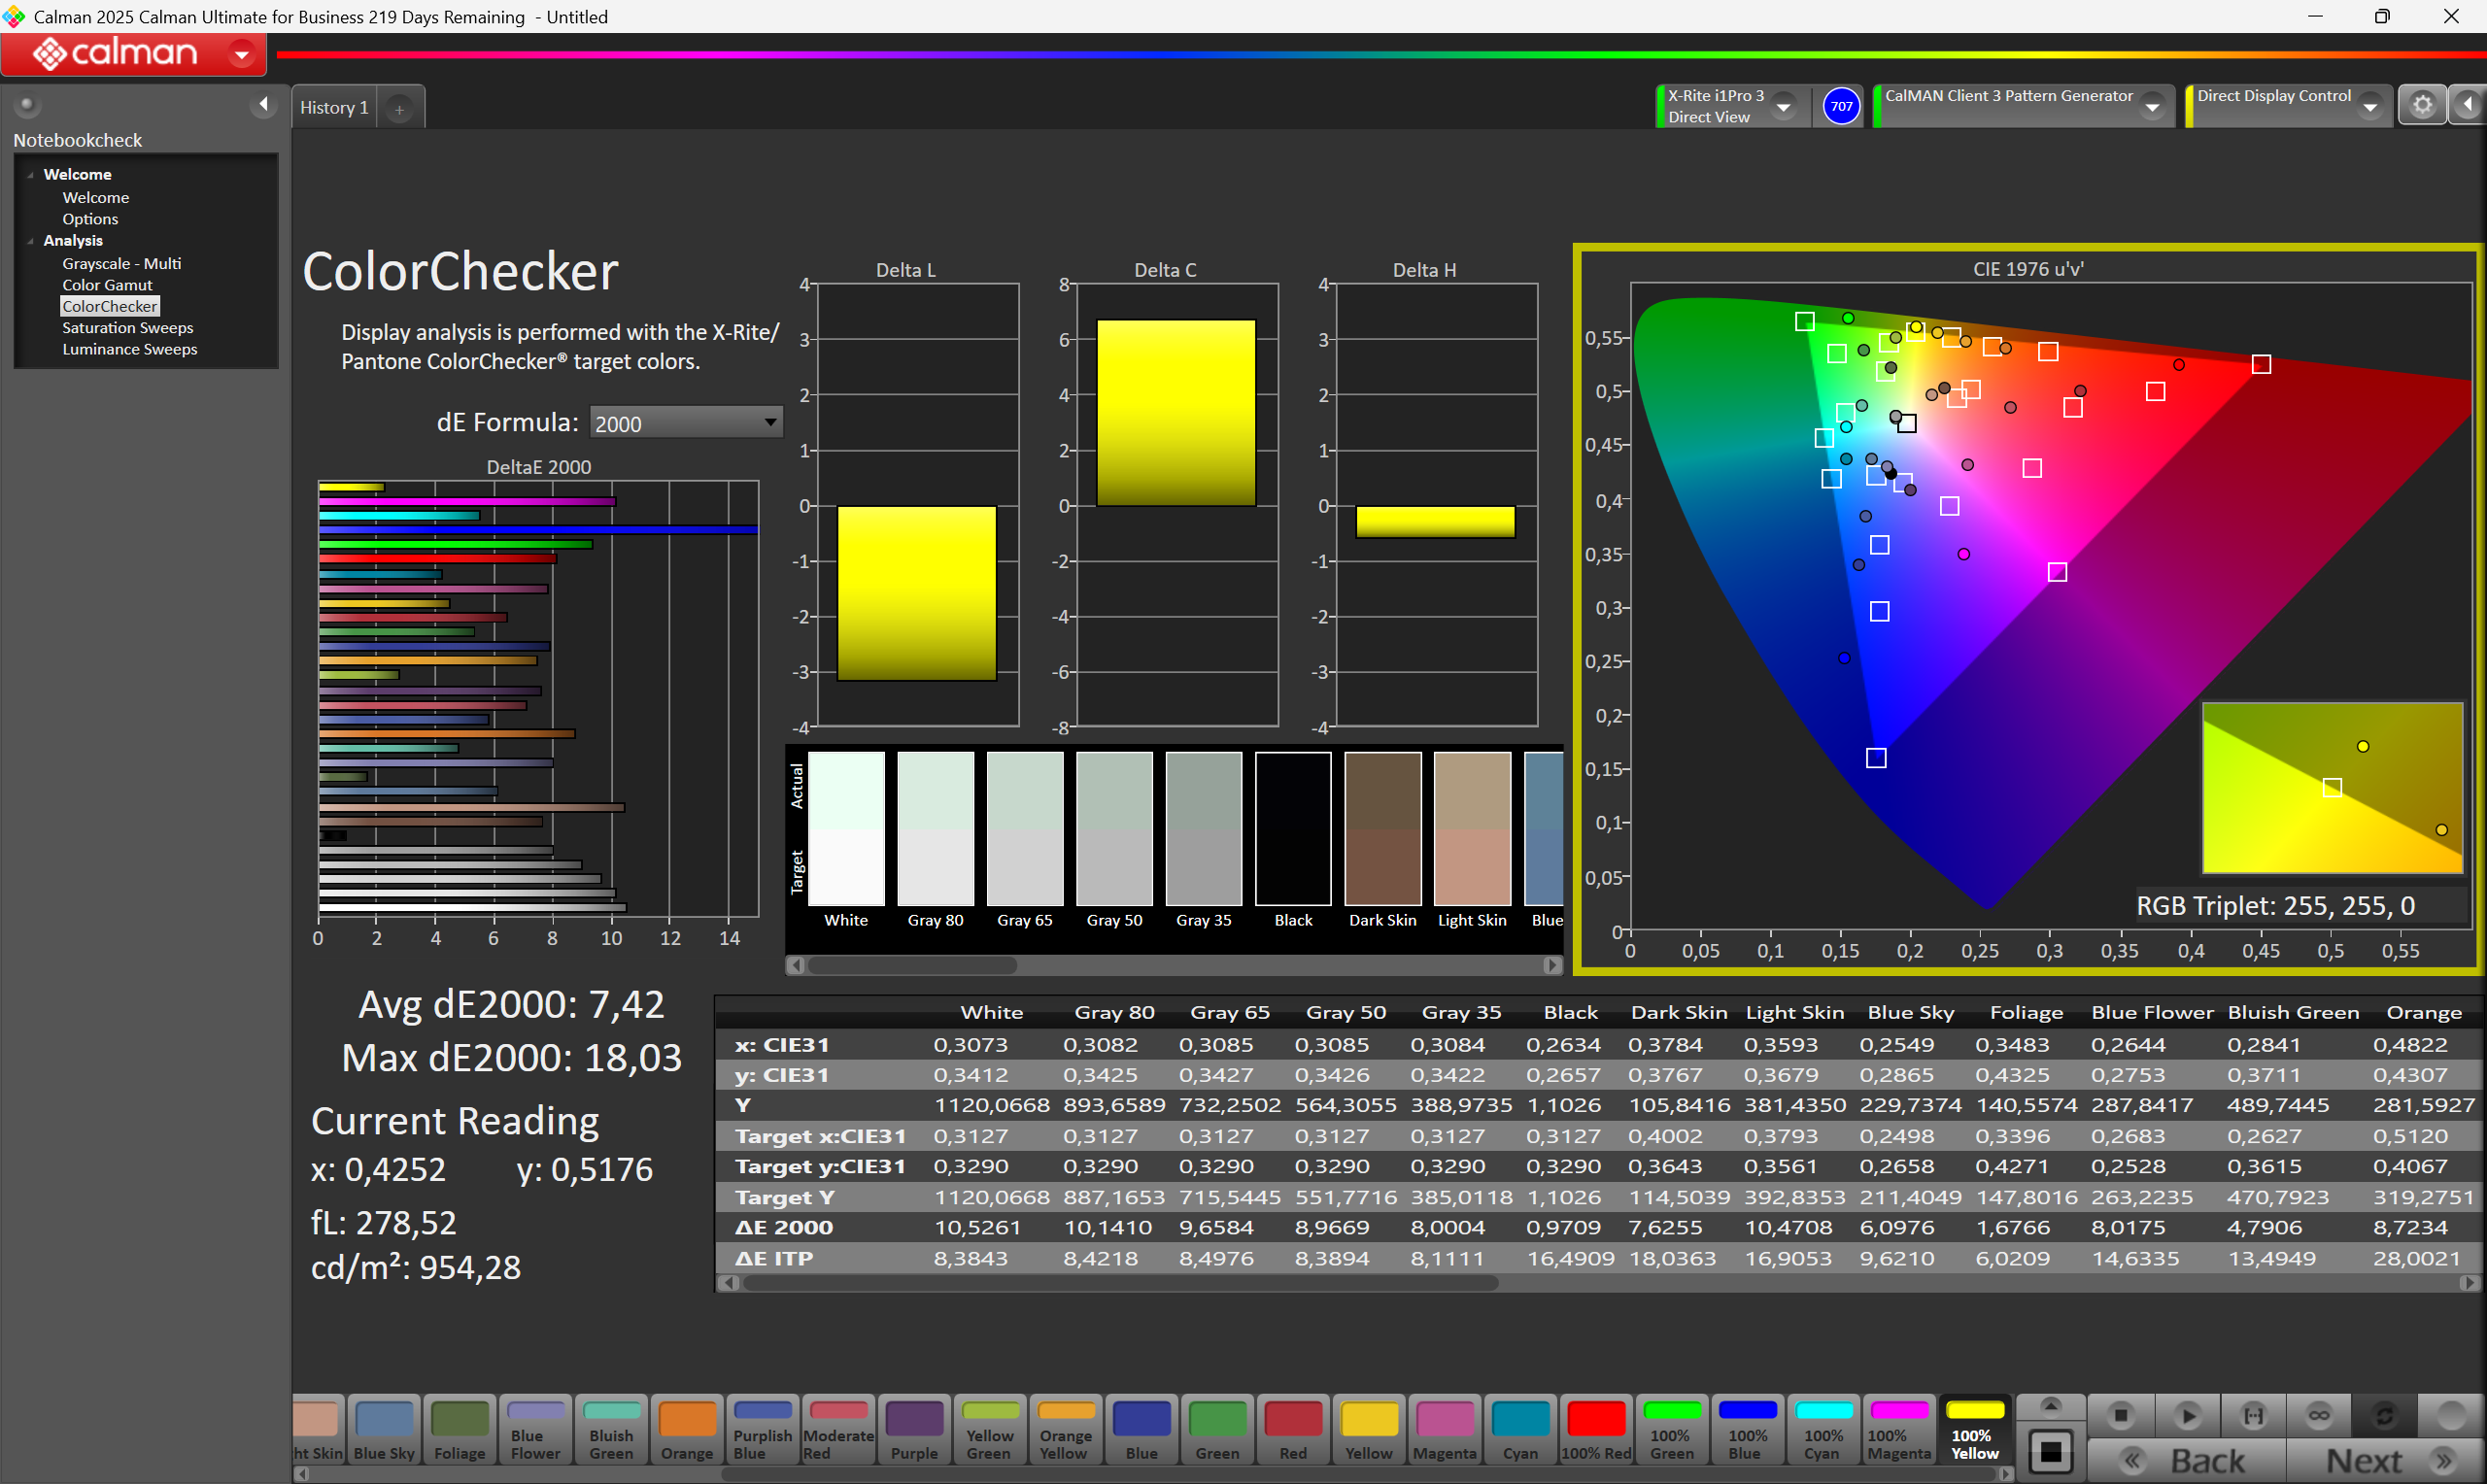
ΔE ColorChecker Calman: 7.42 | ∀{0.5-29.43 Ø4.72}
calibrated: 4.58
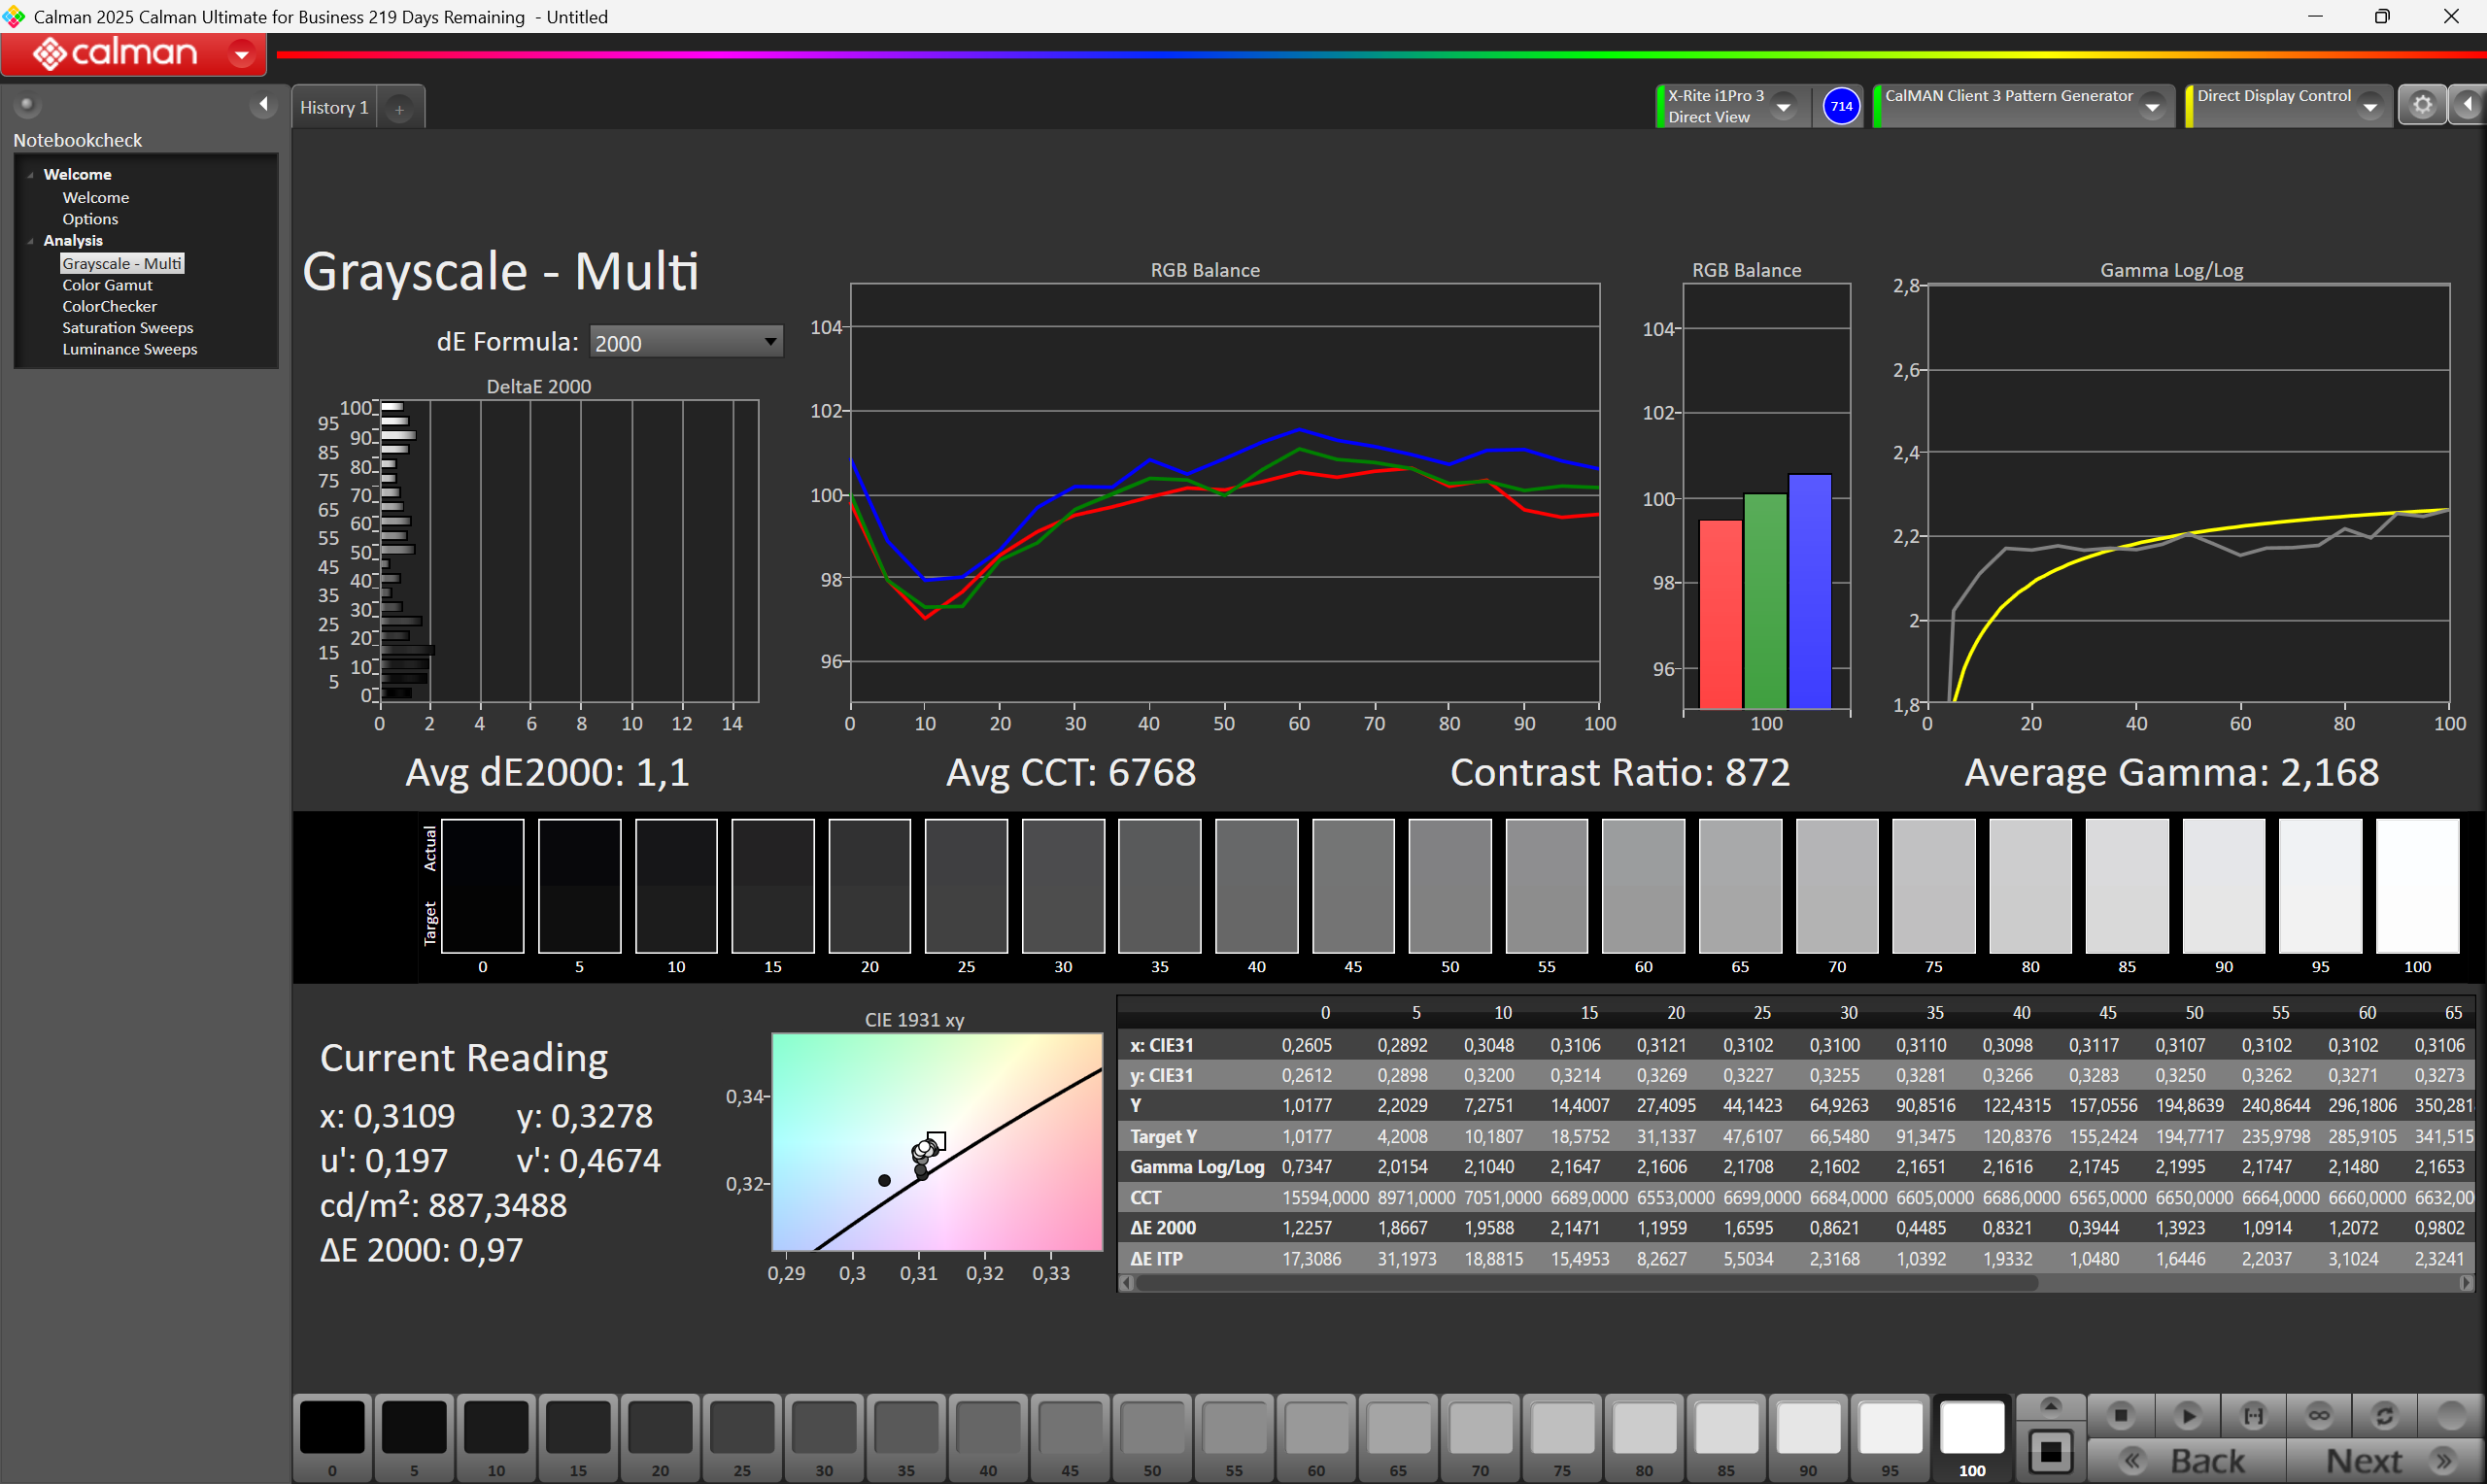
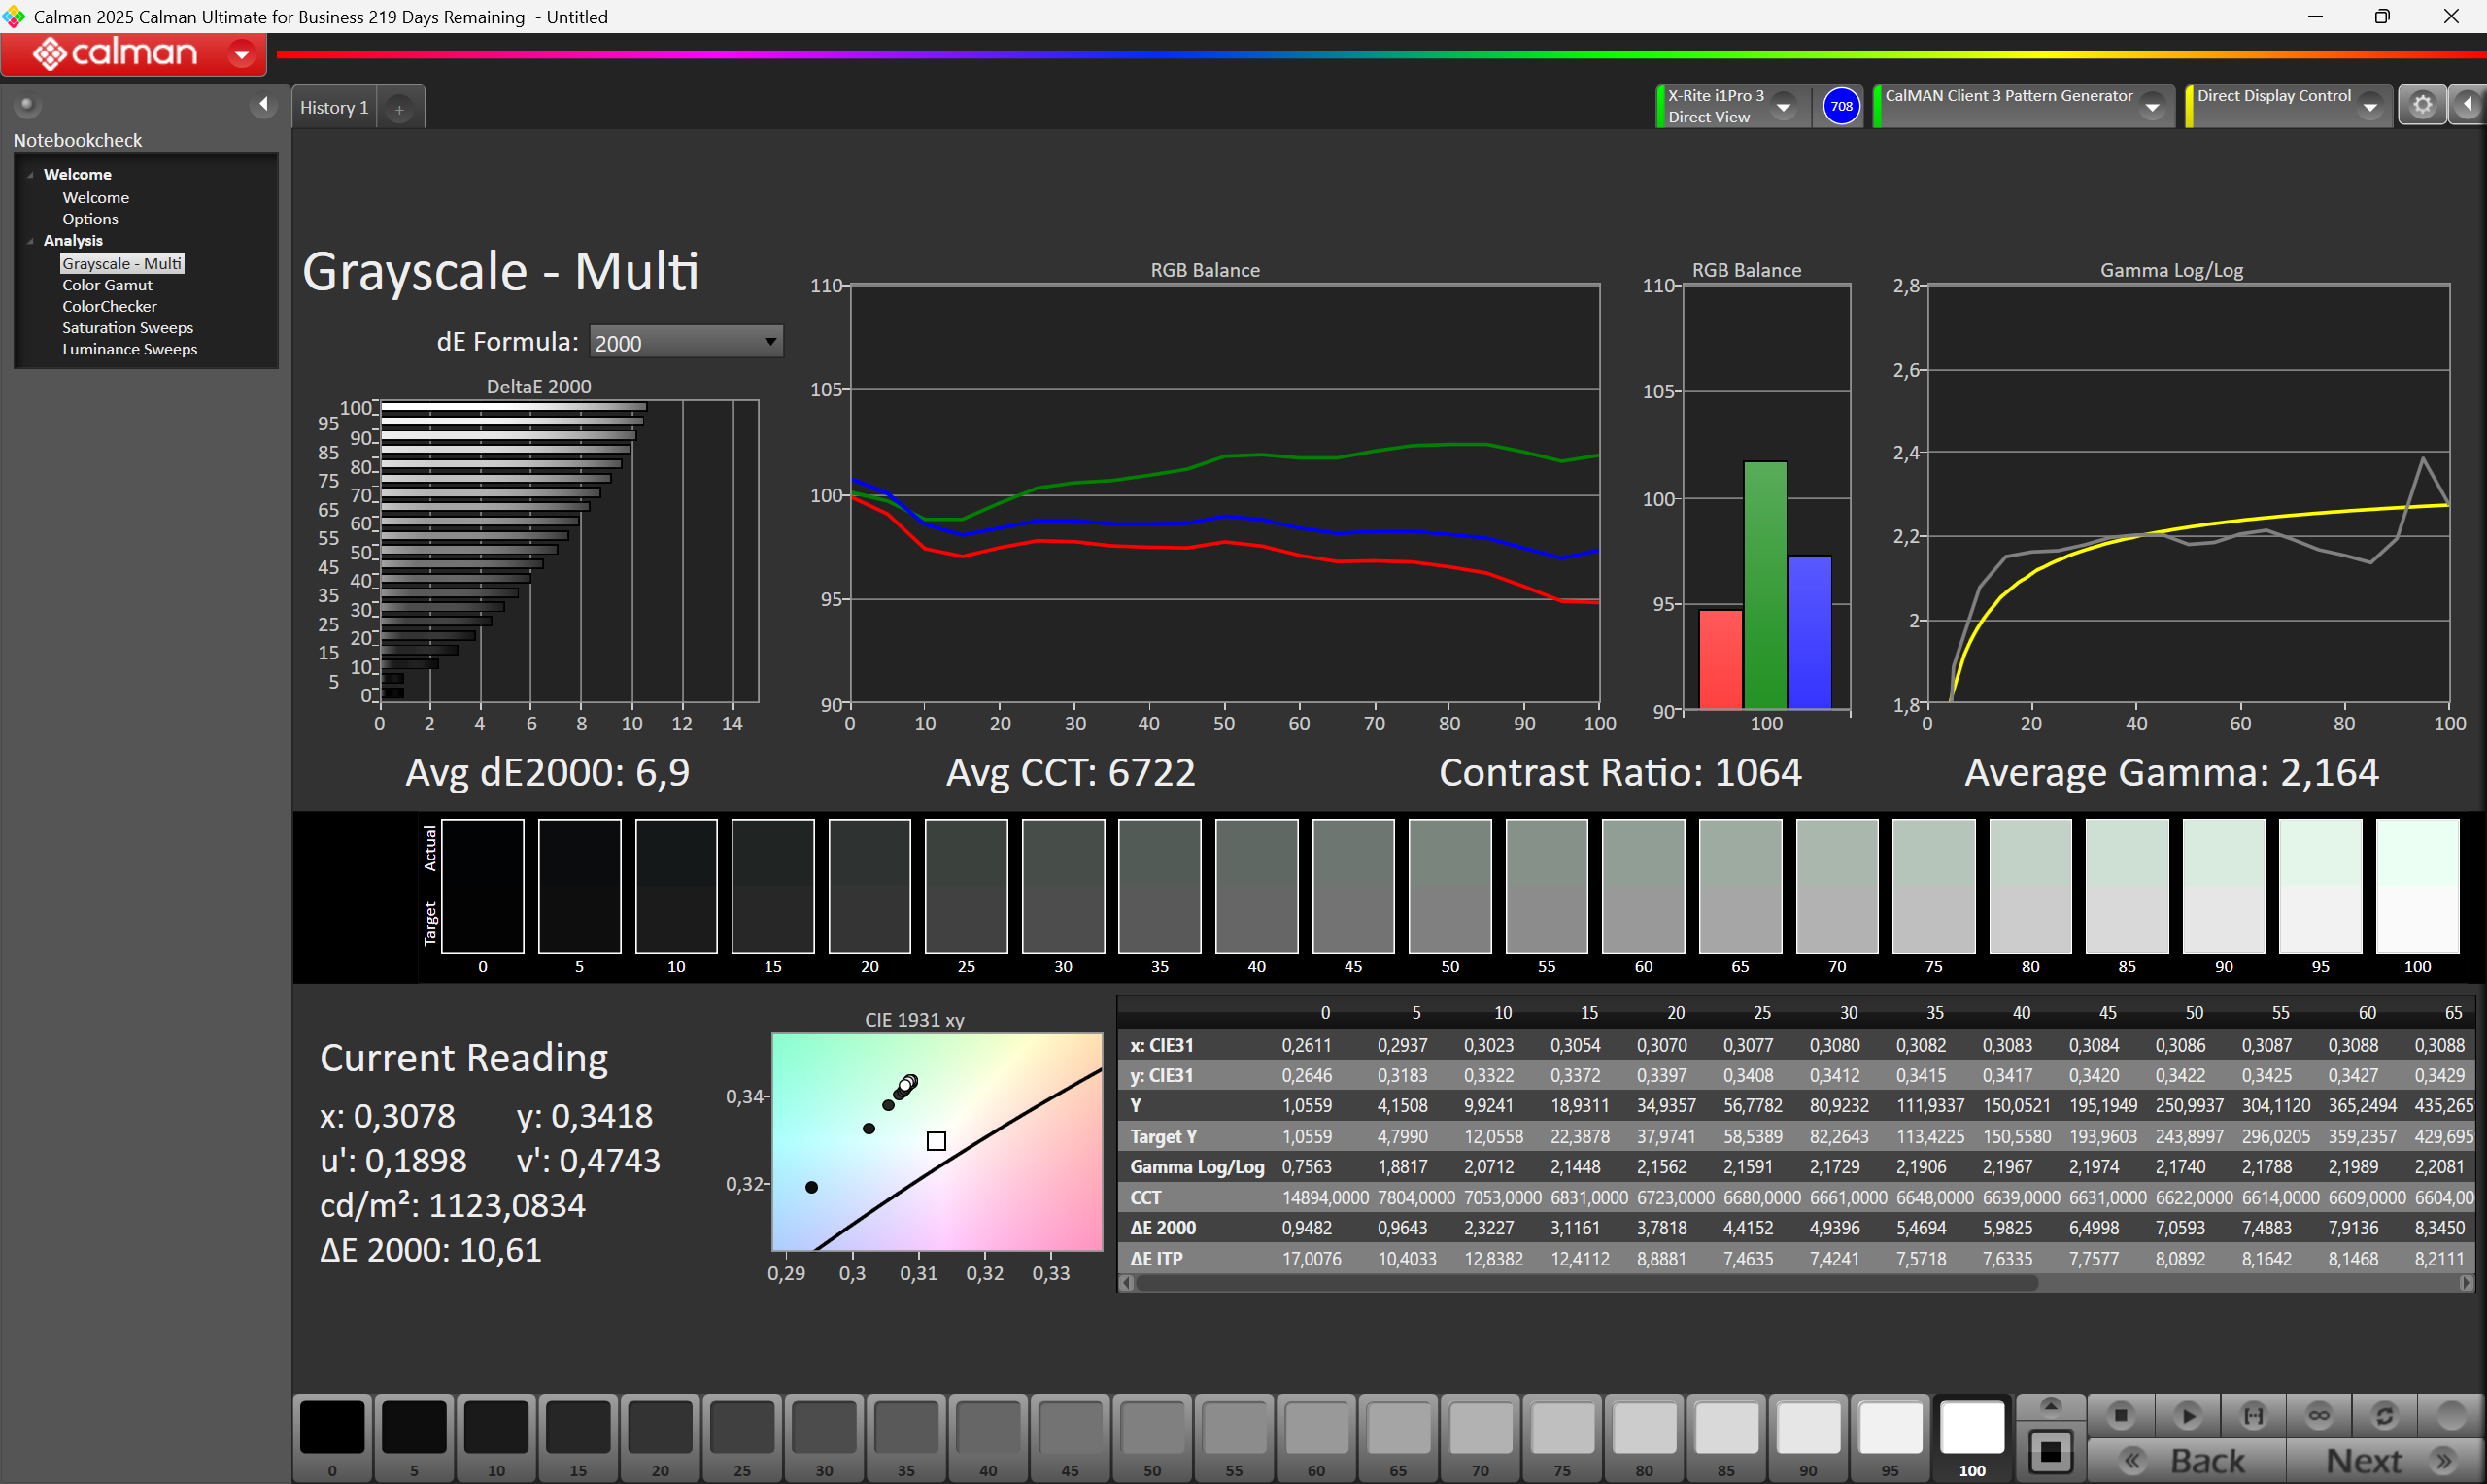
ΔE Greyscale Calman: 6.9 | ∀{0.09-98 Ø4.97}
44.17% AdobeRGB 1998 (Argyll 3D)
61.77% sRGB (Argyll 3D)
42.75% Display P3 (Argyll 3D)
Gamma: 2.164
CCT: 6722 K
| Durabook R10 HannStar 101GUW2, TFT, 1920x1200, 10.1", 60 Hz | Dell Latitude 7030 Rugged Extreme Sharp LQ101N1, IPS, 1920x1200, 10", 60 Hz | Lenovo ThinkPad T14 Gen 6 21QG001VGE MNE007JA1-3, IPS LED, 1920x1200, 14", 60 Hz | Dynabook Portege Z40L-N BOE NE140WUM-N6K, IPS, 1920x1200, 14", 60 Hz | Durabook R8 Tablet Digital Flat Panel, IPS, 1280x800, 8", 60 Hz | Lenovo ThinkPad T14 Gen 6 AMD NE140WUM-N6M, , 1920x1200, 14", 60 Hz | |
|---|---|---|---|---|---|---|
| Display | 65% | 58% | 62% | 22% | 57% | |
| Display P3 Coverage (%) | 42.75 | 72.2 69% | 67.7 58% | 70.1 64% | 51.5 20% | 66.9 56% |
| sRGB Coverage (%) | 61.77 | 99 60% | 98.3 59% | 99 60% | 77.4 25% | 98.5 59% |
| AdobeRGB 1998 Coverage (%) | 44.17 | 72.7 65% | 69.9 58% | 71.8 63% | 53.1 20% | 68.9 56% |
| Response Times | 26% | 10% | 8% | 30% | 28% | |
| Response Time Grey 50% / Grey 80% * (ms) | 53.2 ? | 35.9 ? 33% | 40.2 ? 24% | 42.1 ? 21% | 32.4 ? 39% | 31.1 ? 42% |
| Response Time Black / White * (ms) | 27.6 ? | 22.4 ? 19% | 29.1 ? -5% | 26.7 ? 3% | 21.9 ? 21% | 24.1 ? 13% |
| PWM Frequency (Hz) | 300 | 300 ? | ||||
| PWM Amplitude * (%) | 100 | 100 -0% | ||||
| Screen | 45% | 45% | 34% | 5% | 28% | |
| Brightness middle (cd/m²) | 1075 | 1183.9 10% | 554 -48% | 445.4 -59% | 943.7 -12% | 557 -48% |
| Brightness (cd/m²) | 1042 | 1140 9% | 516 -50% | 424 -59% | 870 -17% | 526 -50% |
| Brightness Distribution (%) | 92 | 88 -4% | 91 -1% | 91 -1% | 85 -8% | 84 -9% |
| Black Level * (cd/m²) | 1.05 | 0.74 30% | 0.24 77% | 0.23 78% | 0.85 19% | 0.4 62% |
| Contrast (:1) | 1024 | 1600 56% | 2308 125% | 1937 89% | 1110 8% | 1393 36% |
| Colorchecker dE 2000 * | 7.42 | 2.03 73% | 1.5 80% | 2.85 62% | 6.35 14% | 2.4 68% |
| Colorchecker dE 2000 max. * | 18.03 | 3.44 81% | 3.4 81% | 4.57 75% | 8.86 51% | 5.9 67% |
| Colorchecker dE 2000 calibrated * | 4.58 | 0.53 88% | 0.9 80% | 1.54 66% | 5.1 -11% | 0.7 85% |
| Greyscale dE 2000 * | 6.9 | 2.6 62% | 2.7 61% | 3.3 52% | 6.9 -0% | 4 42% |
| Gamma | 2.164 102% | 2.27 97% | 2.25 98% | 2.03 108% | 2.65 83% | 2.15 102% |
| CCT | 6722 97% | 6102 107% | 6882 94% | 6497 100% | 6956 93% | 7017 93% |
| Całkowita średnia (program / ustawienia) | 45% /
47% | 38% /
43% | 35% /
34% | 19% /
12% | 38% /
34% |
* ... im mniej tym lepiej
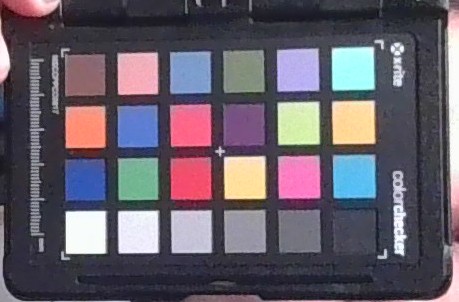
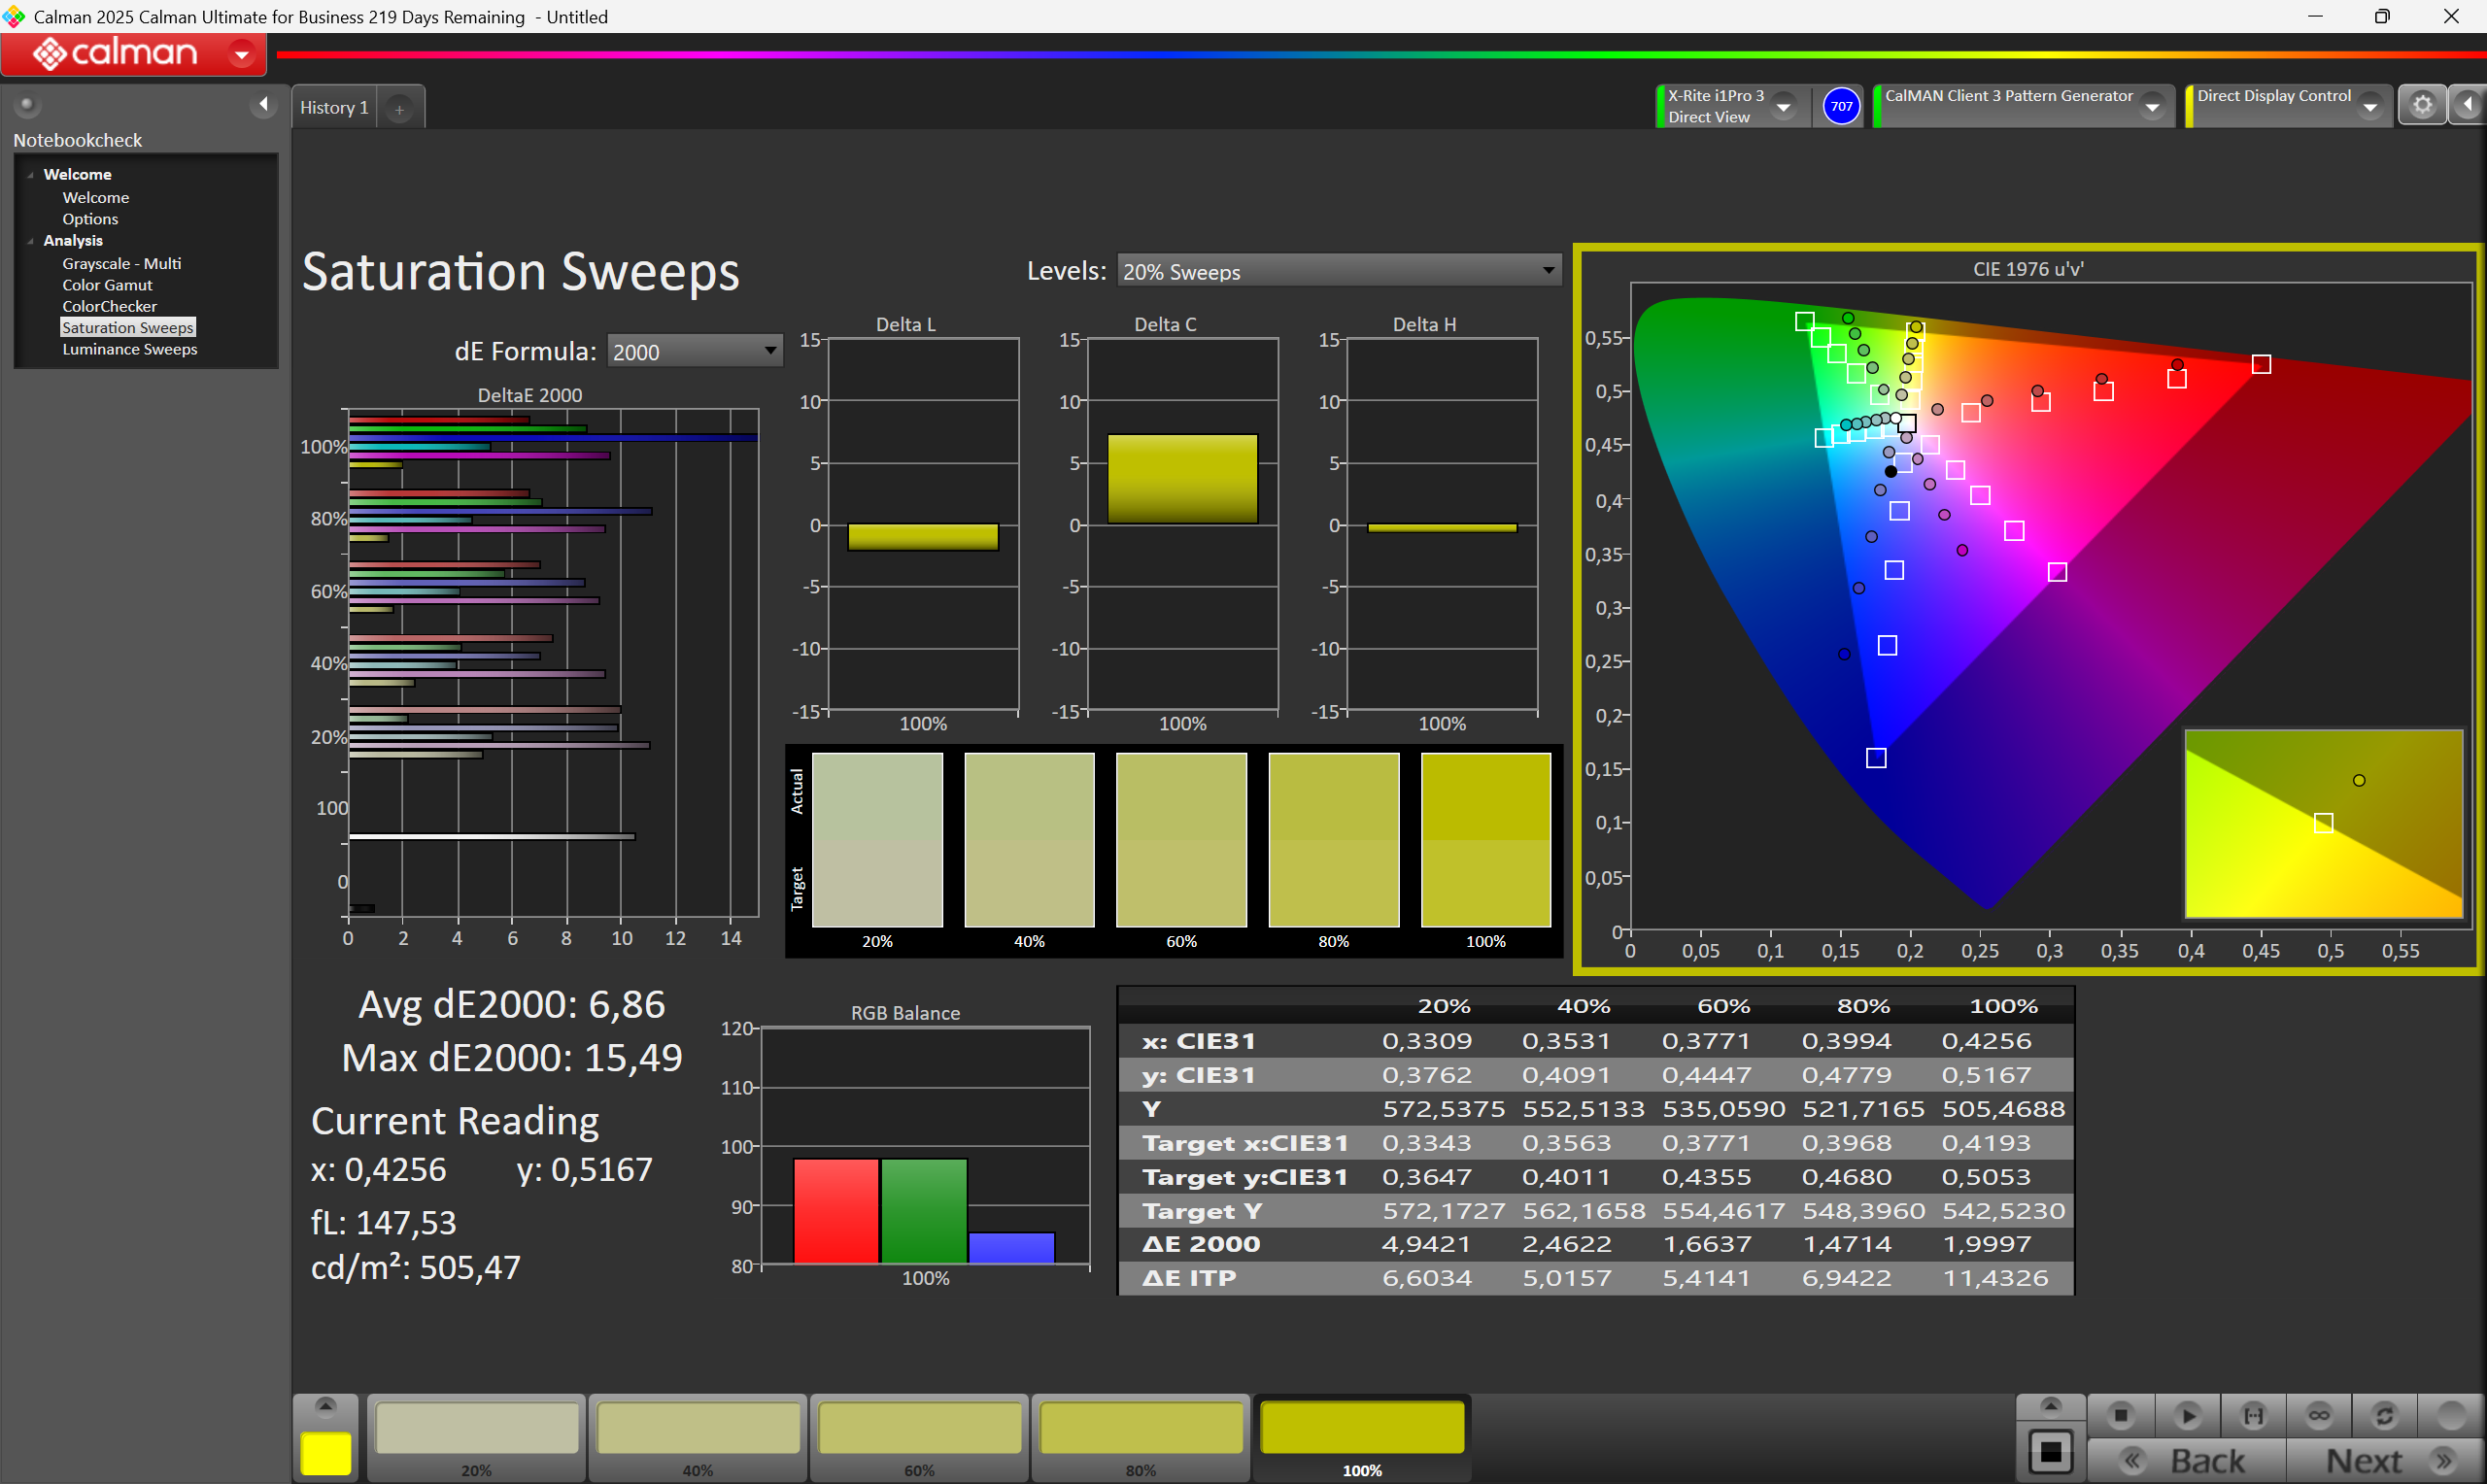
Ten tablet nie nadaje się do zadań, w których kluczowe znaczenie ma odwzorowanie kolorów. Przy zasięgu przestrzeni barwnej sRGB wynoszącym zaledwie 61 procent kolory wydają się wyblakłe. W stanie fabrycznym panel charakteryzuje się zauważalnym zielonym odcieniem.
Wyświetl czasy reakcji
| ↔ Czas reakcji od czerni do bieli | ||
|---|---|---|
| 27.6 ms ... wzrost ↗ i spadek ↘ łącznie | ↗ 16 ms wzrost |   |
| ↘ 11.6 ms upadek | ||
| W naszych testach ekran wykazuje stosunkowo powolne tempo reakcji i może być zbyt wolny dla graczy. Dla porównania, wszystkie testowane urządzenia wahają się od 0.1 (minimum) do 240 (maksimum) ms. » 70 % wszystkich urządzeń jest lepszych. Oznacza to, że zmierzony czas reakcji jest gorszy od średniej wszystkich testowanych urządzeń (19.8 ms). | ||
| ↔ Czas reakcji 50% szarości do 80% szarości | ||
| 53.2 ms ... wzrost ↗ i spadek ↘ łącznie | ↗ 20 ms wzrost |   |
| ↘ 33.2 ms upadek | ||
| W naszych testach ekran wykazuje powolne tempo reakcji, co będzie niezadowalające dla graczy. Dla porównania, wszystkie testowane urządzenia wahają się od 0.165 (minimum) do 636 (maksimum) ms. » 90 % wszystkich urządzeń jest lepszych. Oznacza to, że zmierzony czas reakcji jest gorszy od średniej wszystkich testowanych urządzeń (31 ms). | ||
Migotanie ekranu / PWM (modulacja szerokości impulsu)
| Wykryto migotanie ekranu/wykryto PWM | 300 Hz Amplitude: 100 % |  | |
Podświetlenie wyświetlacza miga z częstotliwością 300 Hz (najgorszy przypadek, np. przy użyciu PWM) . Częstotliwość 300 Hz jest stosunkowo wysoka, więc większość użytkowników wrażliwych na PWM nie powinna zauważyć żadnego migotania. Istnieją jednak doniesienia, że niektórzy użytkownicy są nadal wrażliwi na PWM przy częstotliwości 500 Hz i wyższej, więc należy zachować ostrożność. Dla porównania: 52 % wszystkich testowanych urządzeń nie używa PWM do przyciemniania wyświetlacza. Jeśli wykryto PWM, zmierzono średnio 7781 (minimum: 5 - maksimum: 343500) Hz. | |||


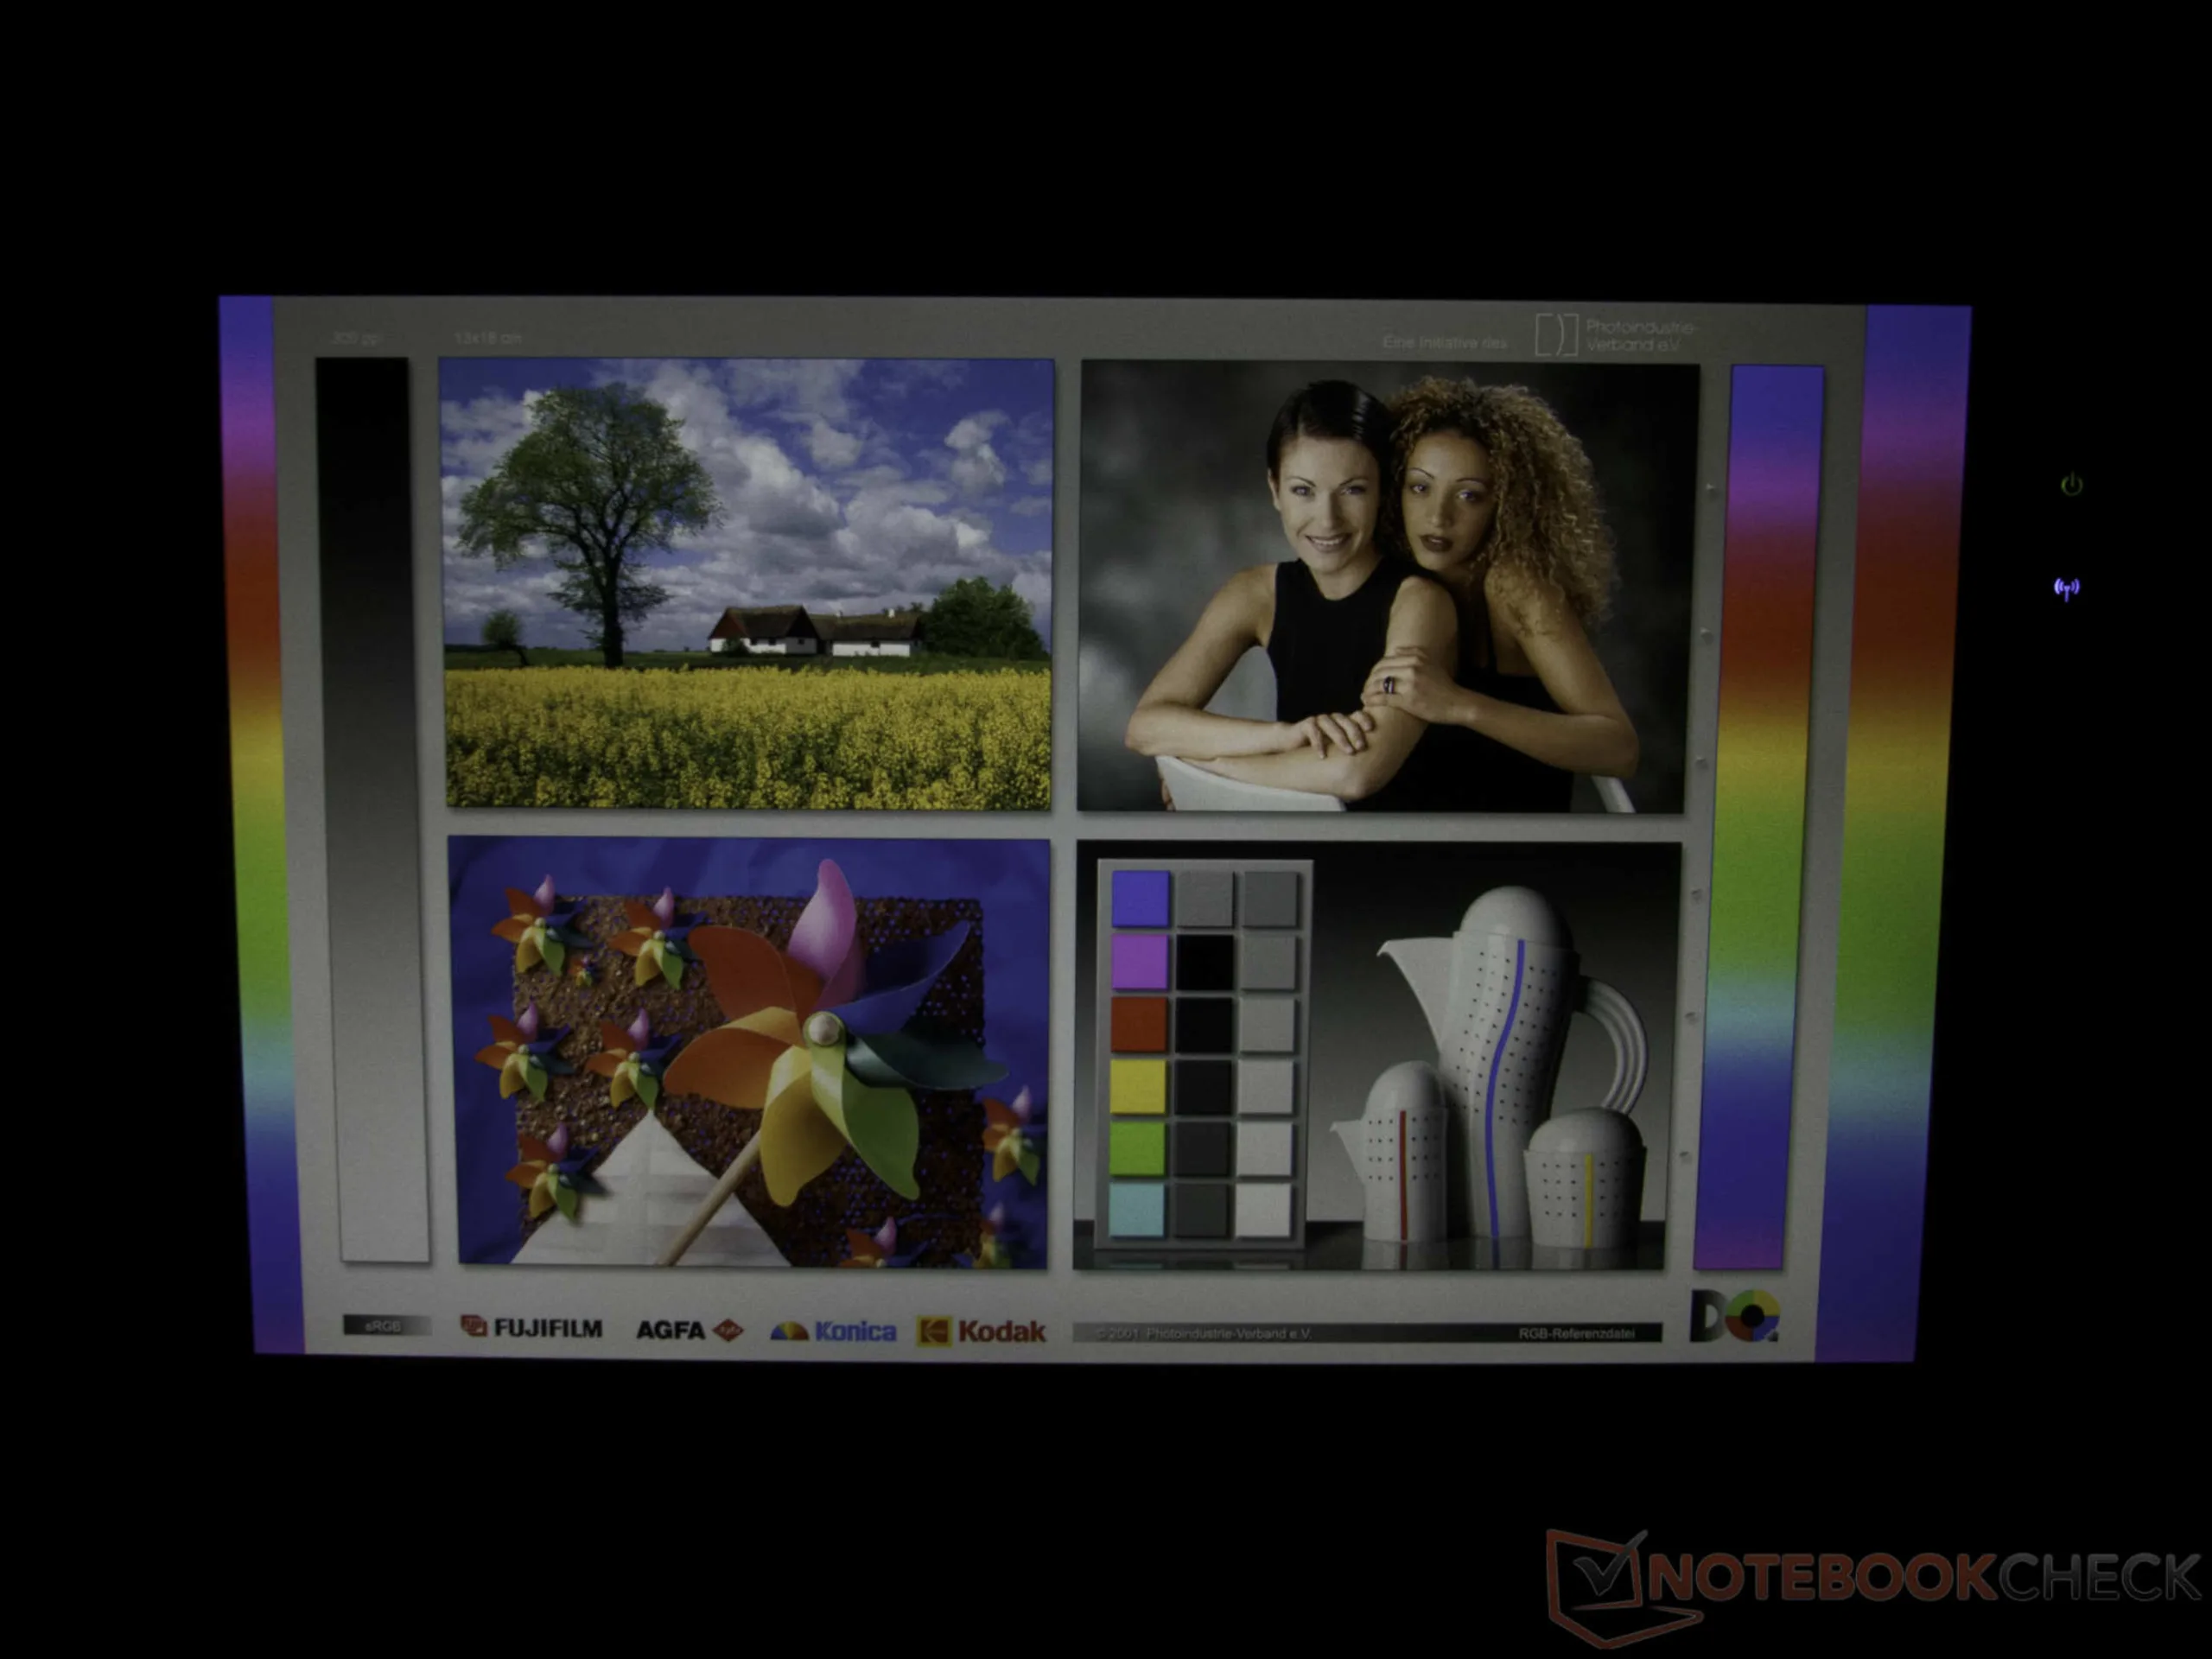
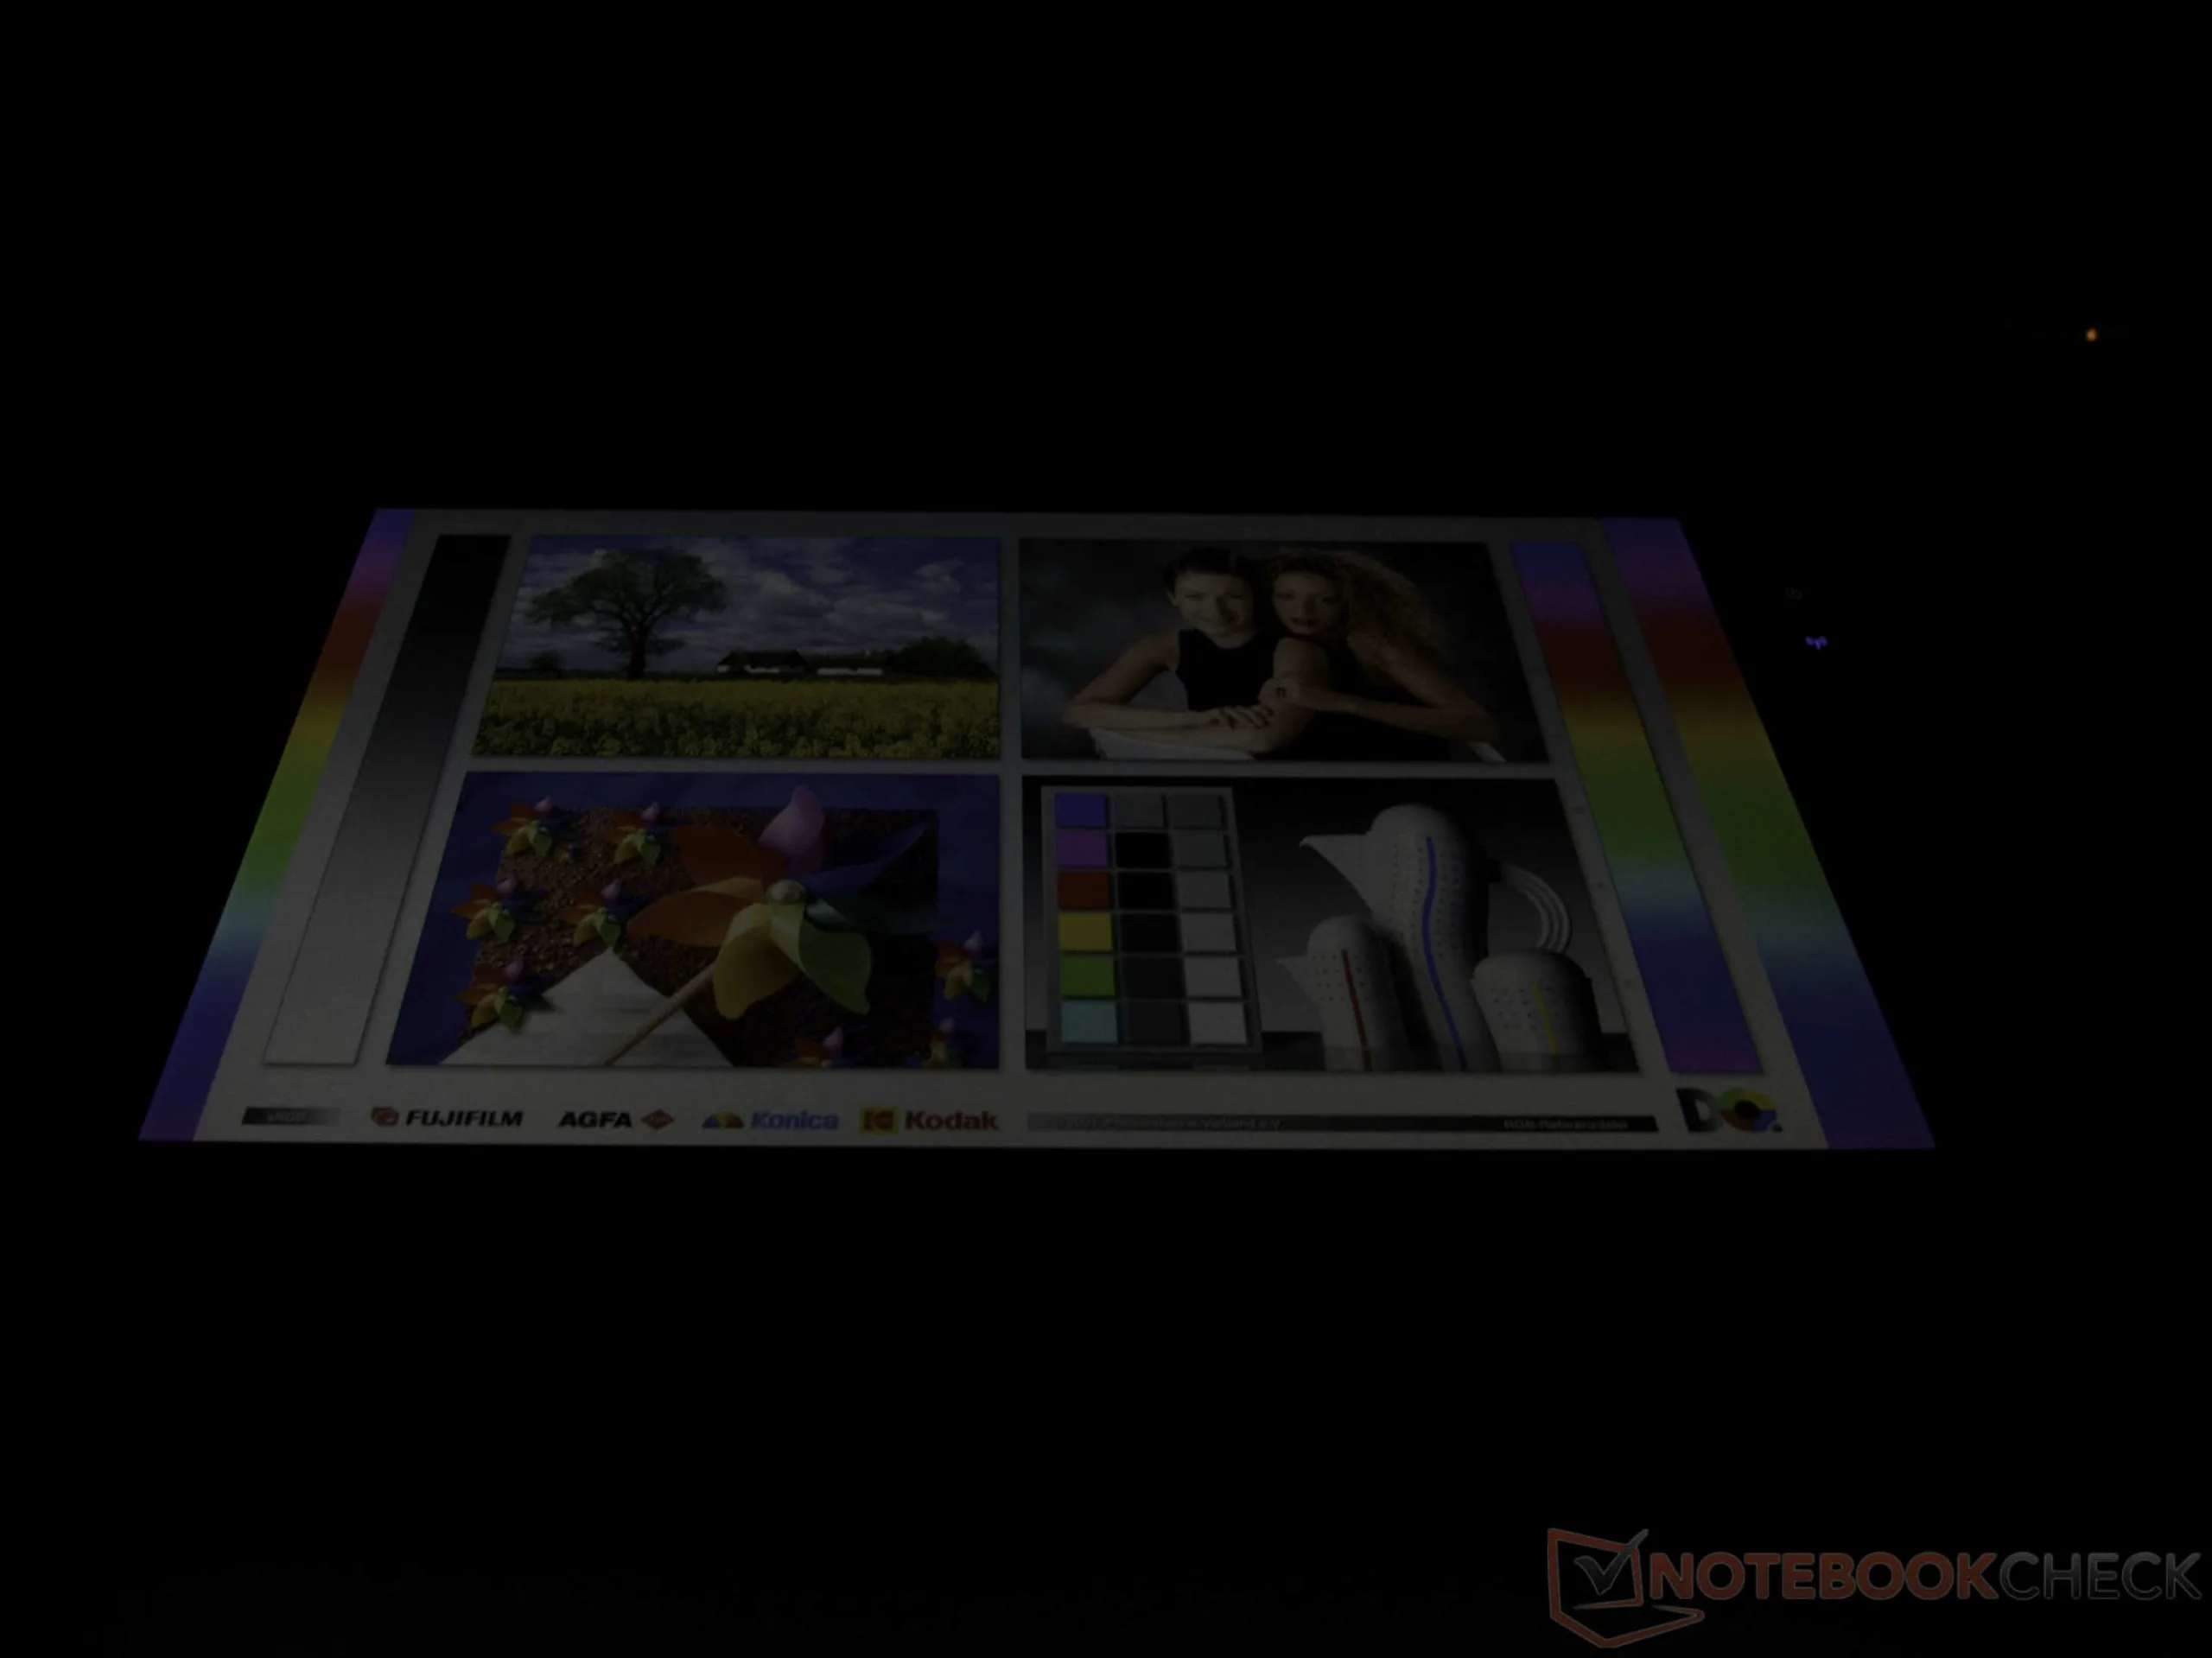
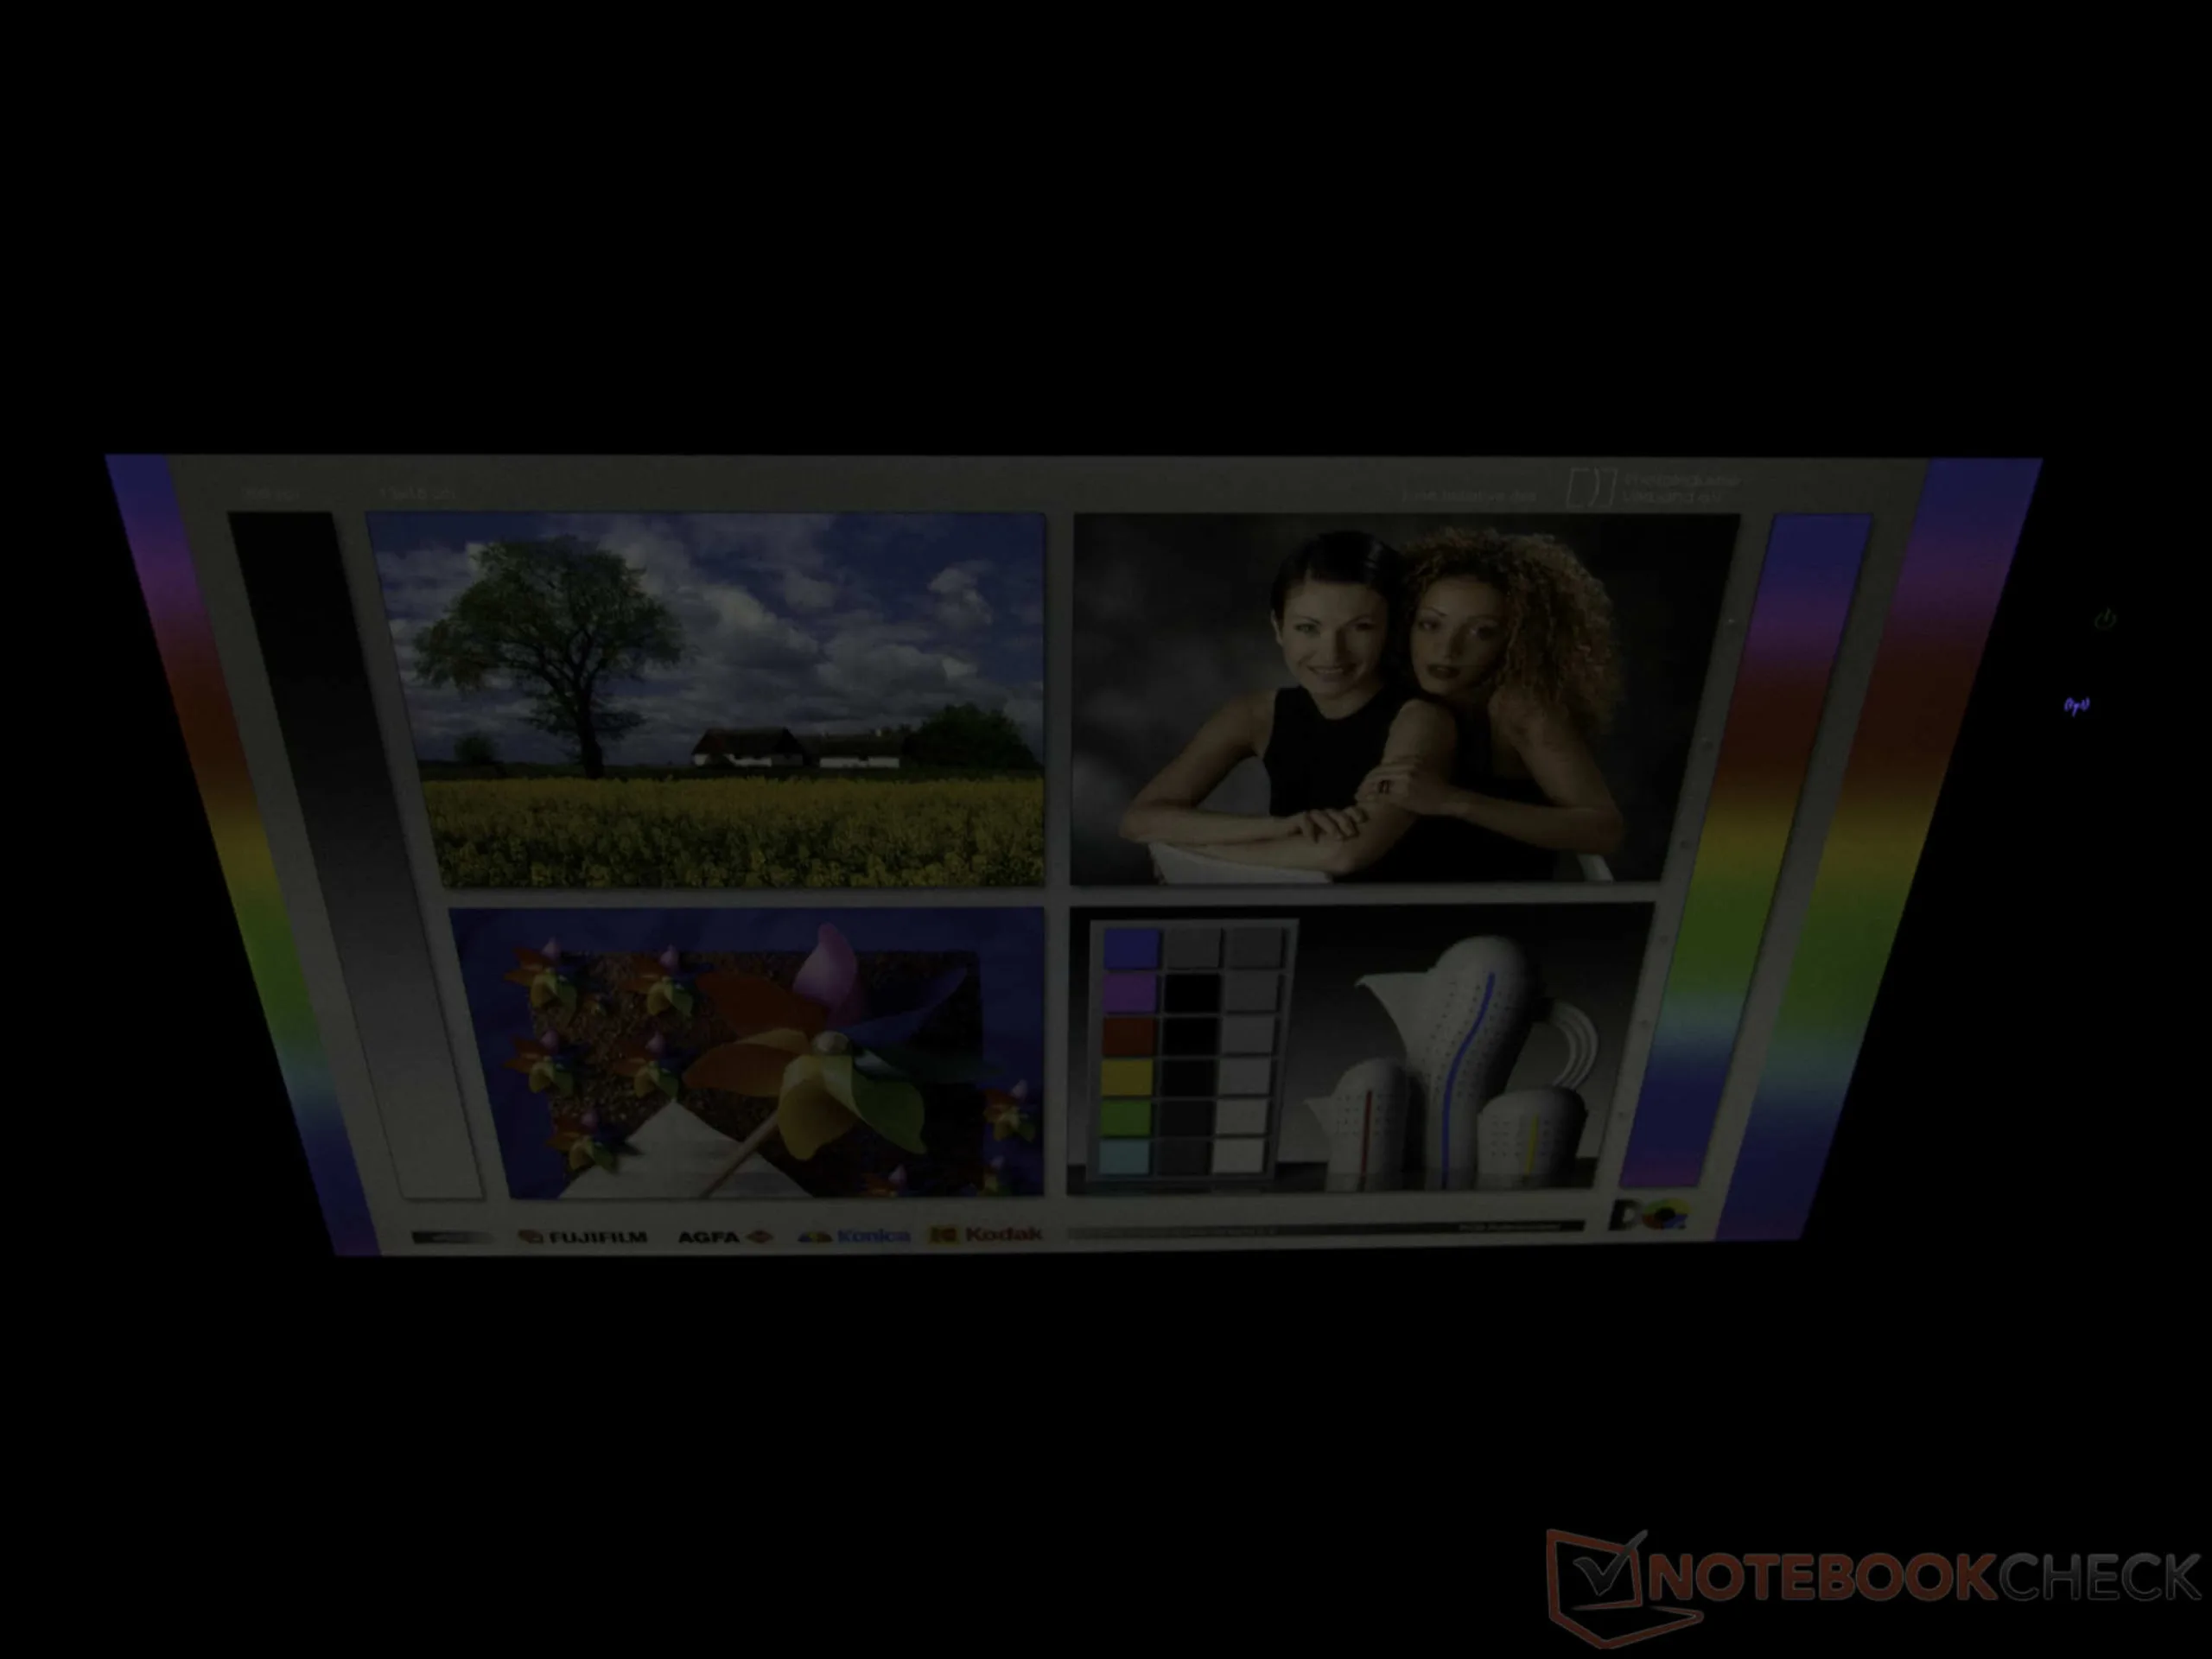
Zastosowanie na zewnątrz
Analiza perspektywiczna
Wydajność
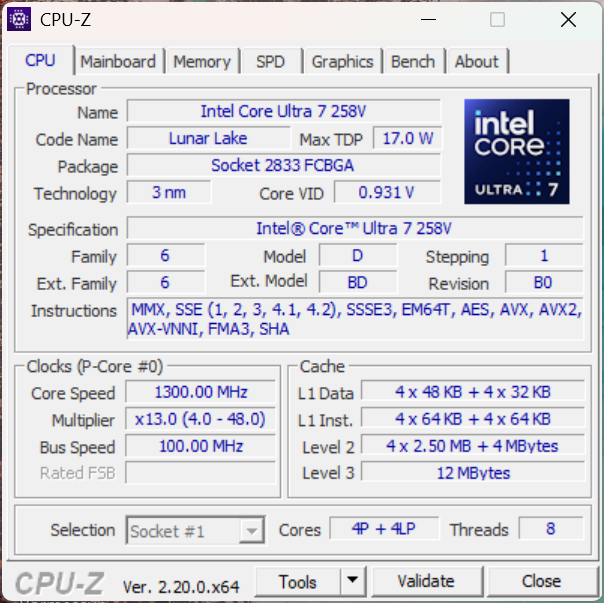
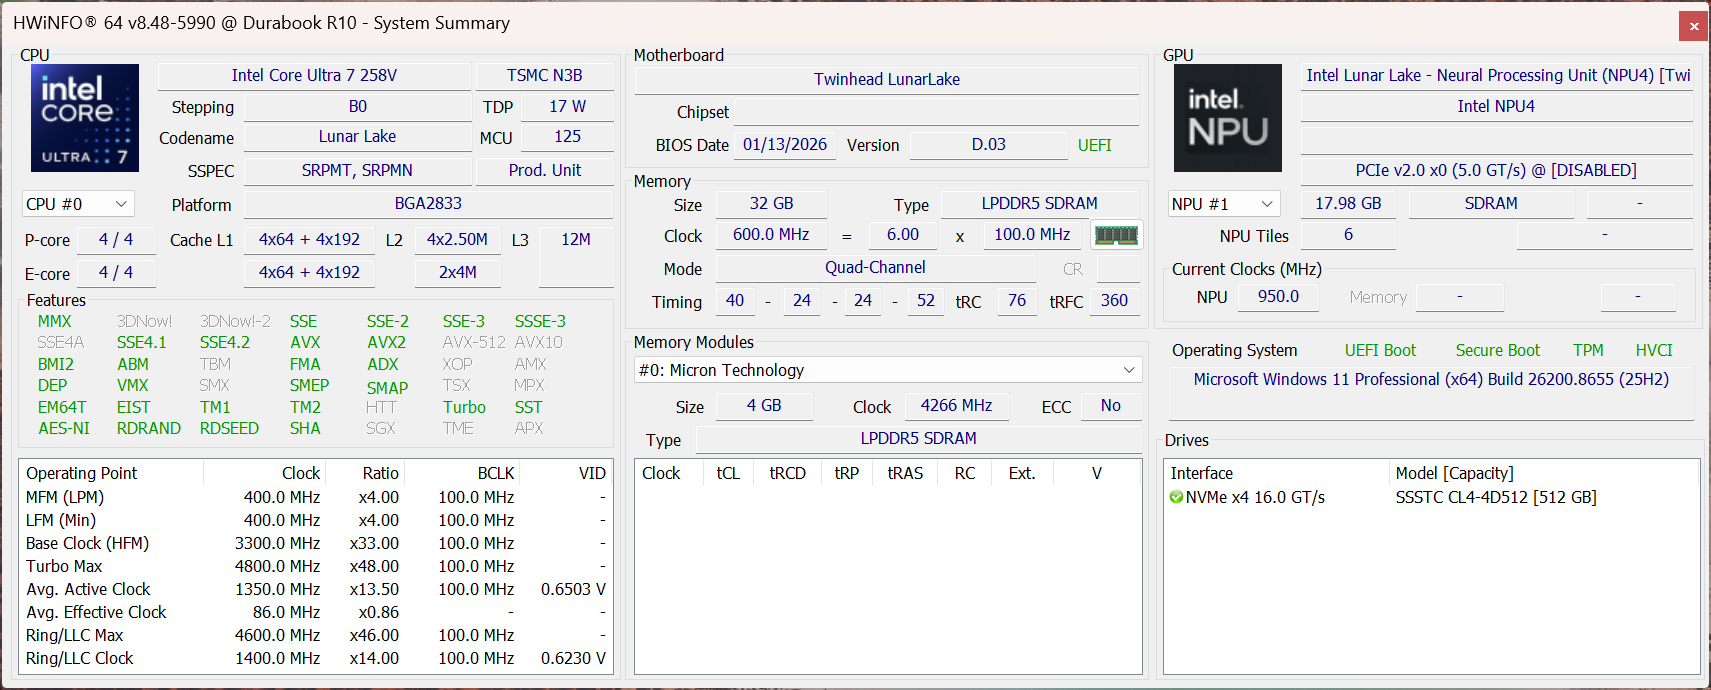
Pod wytrzymałą obudową nieustannie pracuje najnowocześniejszy procesor Intel Core Ultra. W modelu R10 można skonfigurować niemal wszystkie procesory Core Ultra 5 i Core Ultra 7 z generacji Lunar Lake. W zależności od klasy procesora dostępne są wersje vPro Enterprise.
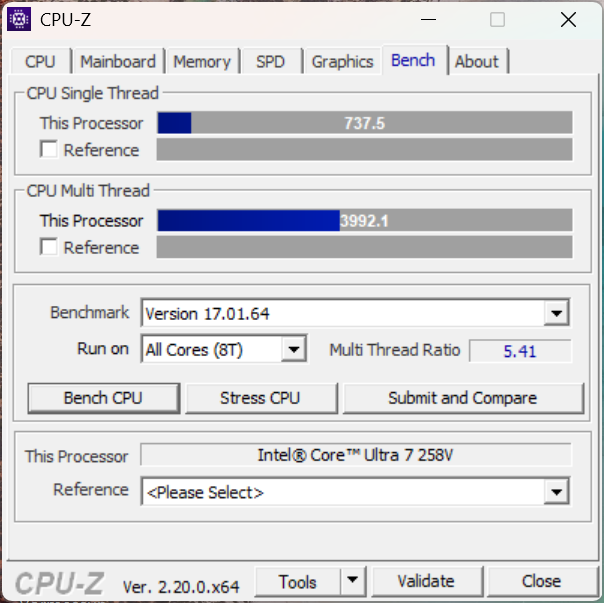
Wydajność procesora
Model 258V w testowanym egzemplarzu posiada osiem rdzeni bez obsługi wielowątkowości. Podczas krótkotrwałych skoków obciążenia system dopuszcza pobór mocy do 32 watów, po czym jest on trwale ograniczany do około 17 watów. W rezultacie wydajność procesora Core Ultra 7 w naszym porównaniu pozostaje poniżej średniej. Nie ma tu funkcji zarządzania energią z możliwością regulacji wartości TDP.
Test wytrzymałościowy Cinebench R15 dla procesorów wielordzeniowych
Cinebench R23: Multi Core | Single Core
Cinebench R20: CPU (Multi Core) | CPU (Single Core)
Cinebench R15: CPU Multi 64Bit | CPU Single 64Bit
Blender: v2.79 BMW27 CPU
7-Zip 18.03: 7z b 4 | 7z b 4 -mmt1
Geekbench 6.7: Multi-Core | Single-Core
Geekbench 5.5: Multi-Core | Single-Core
HWBOT x265 Benchmark v2.2: 4k Preset
LibreOffice : 20 Documents To PDF
R Benchmark 2.5: Overall mean
| CPU Performance rating | |
| Lenovo ThinkPad T14 Gen 6 AMD | |
| Lenovo ThinkPad T14 Gen 6 21QG001VGE | |
| Przeciętny Intel Core Ultra 7 258V | |
| Dynabook Portege Z40L-N | |
| Durabook R10 | |
| Dell Latitude 7030 Rugged Extreme | |
| Średnia w klasie Tablet | |
| Durabook R8 Tablet -2! | |
| Cinebench R23 / Multi Core | |
| Lenovo ThinkPad T14 Gen 6 AMD | |
| Lenovo ThinkPad T14 Gen 6 21QG001VGE | |
| Przeciętny Intel Core Ultra 7 258V (7920 - 11097, n=25) | |
| Średnia w klasie Tablet (8043 - 10868, n=3, ostatnie 2 lata) | |
| Dell Latitude 7030 Rugged Extreme | |
| Durabook R10 | |
| Durabook R10 | |
| Dynabook Portege Z40L-N | |
| Durabook R8 Tablet | |
| Cinebench R23 / Single Core | |
| Lenovo ThinkPad T14 Gen 6 AMD | |
| Lenovo ThinkPad T14 Gen 6 21QG001VGE | |
| Durabook R10 | |
| Durabook R10 | |
| Średnia w klasie Tablet (1822 - 1921, n=3, ostatnie 2 lata) | |
| Przeciętny Intel Core Ultra 7 258V (1664 - 1957, n=25) | |
| Dynabook Portege Z40L-N | |
| Dell Latitude 7030 Rugged Extreme | |
| Durabook R8 Tablet | |
| Cinebench R20 / CPU (Multi Core) | |
| Lenovo ThinkPad T14 Gen 6 AMD | |
| Lenovo ThinkPad T14 Gen 6 21QG001VGE | |
| Przeciętny Intel Core Ultra 7 258V (3130 - 4314, n=24) | |
| Średnia w klasie Tablet (3137 - 4255, n=2, ostatnie 2 lata) | |
| Dell Latitude 7030 Rugged Extreme | |
| Durabook R10 | |
| Dynabook Portege Z40L-N | |
| Durabook R8 Tablet | |
| Cinebench R20 / CPU (Single Core) | |
| Lenovo ThinkPad T14 Gen 6 AMD | |
| Lenovo ThinkPad T14 Gen 6 21QG001VGE | |
| Średnia w klasie Tablet (705 - 739, n=2, ostatnie 2 lata) | |
| Dynabook Portege Z40L-N | |
| Przeciętny Intel Core Ultra 7 258V (643 - 749, n=24) | |
| Durabook R10 | |
| Dell Latitude 7030 Rugged Extreme | |
| Durabook R8 Tablet | |
| Cinebench R15 / CPU Multi 64Bit | |
| Lenovo ThinkPad T14 Gen 6 AMD | |
| Lenovo ThinkPad T14 Gen 6 21QG001VGE | |
| Przeciętny Intel Core Ultra 7 258V (1280 - 1656, n=24) | |
| Średnia w klasie Tablet (1285 - 1651, n=2, ostatnie 2 lata) | |
| Dell Latitude 7030 Rugged Extreme | |
| Durabook R10 | |
| Dynabook Portege Z40L-N | |
| Durabook R8 Tablet | |
| Cinebench R15 / CPU Single 64Bit | |
| Średnia w klasie Tablet (274 - 299, n=2, ostatnie 2 lata) | |
| Lenovo ThinkPad T14 Gen 6 21QG001VGE | |
| Przeciętny Intel Core Ultra 7 258V (258 - 298, n=24) | |
| Dynabook Portege Z40L-N | |
| Durabook R10 | |
| Dell Latitude 7030 Rugged Extreme | |
| Lenovo ThinkPad T14 Gen 6 AMD | |
| Durabook R8 Tablet | |
| Blender / v2.79 BMW27 CPU | |
| Durabook R8 Tablet | |
| Durabook R10 | |
| Dynabook Portege Z40L-N | |
| Średnia w klasie Tablet (337 - 484, n=2, ostatnie 2 lata) | |
| Dell Latitude 7030 Rugged Extreme | |
| Przeciętny Intel Core Ultra 7 258V (315 - 484, n=24) | |
| Lenovo ThinkPad T14 Gen 6 21QG001VGE | |
| Lenovo ThinkPad T14 Gen 6 AMD | |
| 7-Zip 18.03 / 7z b 4 | |
| Lenovo ThinkPad T14 Gen 6 AMD | |
| Lenovo ThinkPad T14 Gen 6 21QG001VGE | |
| Dell Latitude 7030 Rugged Extreme | |
| Przeciętny Intel Core Ultra 7 258V (24486 - 36724, n=24) | |
| Średnia w klasie Tablet (24486 - 36610, n=2, ostatnie 2 lata) | |
| Dynabook Portege Z40L-N | |
| Durabook R10 | |
| Durabook R8 Tablet | |
| 7-Zip 18.03 / 7z b 4 -mmt1 | |
| Lenovo ThinkPad T14 Gen 6 AMD | |
| Lenovo ThinkPad T14 Gen 6 21QG001VGE | |
| Dynabook Portege Z40L-N | |
| Przeciętny Intel Core Ultra 7 258V (4769 - 5869, n=24) | |
| Średnia w klasie Tablet (4769 - 5991, n=2, ostatnie 2 lata) | |
| Dell Latitude 7030 Rugged Extreme | |
| Durabook R10 | |
| Durabook R8 Tablet | |
| Geekbench 6.7 / Multi-Core | |
| Lenovo ThinkPad T14 Gen 6 AMD | |
| Lenovo ThinkPad T14 Gen 6 21QG001VGE | |
| Przeciętny Intel Core Ultra 7 258V (8964 - 11334, n=24) | |
| Dynabook Portege Z40L-N | |
| Durabook R10 | |
| Dell Latitude 7030 Rugged Extreme | |
| Średnia w klasie Tablet (1104 - 16544, n=86, ostatnie 2 lata) | |
| Geekbench 6.7 / Single-Core | |
| Lenovo ThinkPad T14 Gen 6 AMD | |
| Lenovo ThinkPad T14 Gen 6 21QG001VGE | |
| Dynabook Portege Z40L-N | |
| Przeciętny Intel Core Ultra 7 258V (2593 - 2795, n=24) | |
| Durabook R10 | |
| Dell Latitude 7030 Rugged Extreme | |
| Średnia w klasie Tablet (323 - 4128, n=86, ostatnie 2 lata) | |
| Geekbench 5.5 / Multi-Core | |
| Lenovo ThinkPad T14 Gen 6 AMD | |
| Lenovo ThinkPad T14 Gen 6 21QG001VGE | |
| Przeciętny Intel Core Ultra 7 258V (7574 - 9918, n=24) | |
| Dynabook Portege Z40L-N | |
| Durabook R10 | |
| Dell Latitude 7030 Rugged Extreme | |
| Średnia w klasie Tablet (303 - 10522, n=39, ostatnie 2 lata) | |
| Durabook R8 Tablet | |
| Geekbench 5.5 / Single-Core | |
| Lenovo ThinkPad T14 Gen 6 AMD | |
| Lenovo ThinkPad T14 Gen 6 21QG001VGE | |
| Dynabook Portege Z40L-N | |
| Przeciętny Intel Core Ultra 7 258V (1891 - 2046, n=24) | |
| Durabook R10 | |
| Dell Latitude 7030 Rugged Extreme | |
| Durabook R8 Tablet | |
| Średnia w klasie Tablet (103 - 2286, n=39, ostatnie 2 lata) | |
| HWBOT x265 Benchmark v2.2 / 4k Preset | |
| Lenovo ThinkPad T14 Gen 6 AMD | |
| Lenovo ThinkPad T14 Gen 6 21QG001VGE | |
| Przeciętny Intel Core Ultra 7 258V (7.11 - 14.2, n=24) | |
| Średnia w klasie Tablet (7.11 - 12.9, n=2, ostatnie 2 lata) | |
| Dynabook Portege Z40L-N | |
| Dell Latitude 7030 Rugged Extreme | |
| Durabook R10 | |
| Durabook R8 Tablet | |
| LibreOffice / 20 Documents To PDF | |
| Durabook R10 | |
| Durabook R8 Tablet | |
| Średnia w klasie Tablet (48.3 - 62.8, n=2, ostatnie 2 lata) | |
| Lenovo ThinkPad T14 Gen 6 AMD | |
| Przeciętny Intel Core Ultra 7 258V (41.1 - 62.8, n=24) | |
| Lenovo ThinkPad T14 Gen 6 21QG001VGE | |
| Dell Latitude 7030 Rugged Extreme | |
| Dynabook Portege Z40L-N | |
| R Benchmark 2.5 / Overall mean | |
| Durabook R8 Tablet | |
| Durabook R10 | |
| Dell Latitude 7030 Rugged Extreme | |
| Średnia w klasie Tablet (0.4361 - 0.542, n=2, ostatnie 2 lata) | |
| Dynabook Portege Z40L-N | |
| Przeciętny Intel Core Ultra 7 258V (0.443 - 0.542, n=24) | |
| Lenovo ThinkPad T14 Gen 6 21QG001VGE | |
| Lenovo ThinkPad T14 Gen 6 AMD | |
* ... im mniej tym lepiej
AIDA64: FP32 Ray-Trace | FPU Julia | CPU SHA3 | FPU SinJulia | FPU Mandel | CPU AES | CPU ZLib | FP64 Ray-Trace | CPU PhotoWorxx | CPU CheckMate
| Performance rating | |
| Lenovo ThinkPad T14 Gen 6 AMD | |
| Lenovo ThinkPad T14 Gen 6 21QG001VGE -1! | |
| Przeciętny Intel Core Ultra 7 258V | |
| Średnia w klasie Tablet | |
| Durabook R10 | |
| Dynabook Portege Z40L-N -1! | |
| Dell Latitude 7030 Rugged Extreme -1! | |
| Durabook R8 Tablet -1! | |
| AIDA64 / FP32 Ray-Trace | |
| Lenovo ThinkPad T14 Gen 6 AMD (v8.20.8100) | |
| Lenovo ThinkPad T14 Gen 6 AMD (v6.92.6600) | |
| Lenovo ThinkPad T14 Gen 6 21QG001VGE (v6.92.6600) | |
| Przeciętny Intel Core Ultra 7 258V (8454 - 12781, n=26) | |
| Średnia w klasie Tablet (8485 - 12759, n=2, ostatnie 2 lata) | |
| Dynabook Portege Z40L-N (v6.92.6600) | |
| Durabook R10 (v8.20.8100) | |
| Dell Latitude 7030 Rugged Extreme (v6.92.6600) | |
| Durabook R8 Tablet (v6.85.6300) | |
| AIDA64 / FPU Julia | |
| Lenovo ThinkPad T14 Gen 6 AMD (v8.20.8100) | |
| Lenovo ThinkPad T14 Gen 6 AMD (v6.92.6600) | |
| Lenovo ThinkPad T14 Gen 6 21QG001VGE (v6.92.6600) | |
| Przeciętny Intel Core Ultra 7 258V (40875 - 63401, n=26) | |
| Średnia w klasie Tablet (42586 - 62102, n=2, ostatnie 2 lata) | |
| Dynabook Portege Z40L-N (v6.92.6600) | |
| Durabook R10 (v8.20.8100) | |
| Dell Latitude 7030 Rugged Extreme (v6.92.6600) | |
| Durabook R8 Tablet (v6.85.6300) | |
| AIDA64 / CPU SHA3 | |
| Lenovo ThinkPad T14 Gen 6 AMD (v6.92.6600) | |
| Lenovo ThinkPad T14 Gen 6 AMD (v8.20.8100) | |
| Lenovo ThinkPad T14 Gen 6 21QG001VGE (v6.92.6600) | |
| Przeciętny Intel Core Ultra 7 258V (1930 - 2817, n=26) | |
| Średnia w klasie Tablet (2056 - 2784, n=2, ostatnie 2 lata) | |
| Durabook R10 (v8.20.8100) | |
| Dynabook Portege Z40L-N (v6.92.6600) | |
| Dell Latitude 7030 Rugged Extreme (v6.92.6600) | |
| Durabook R8 Tablet (v6.85.6300) | |
| AIDA64 / FPU SinJulia | |
| Lenovo ThinkPad T14 Gen 6 AMD (v8.20.8100) | |
| Lenovo ThinkPad T14 Gen 6 AMD (v6.92.6600) | |
| Lenovo ThinkPad T14 Gen 6 21QG001VGE (v6.92.6600) | |
| Przeciętny Intel Core Ultra 7 258V (3817 - 4440, n=26) | |
| Średnia w klasie Tablet (4083 - 4429, n=2, ostatnie 2 lata) | |
| Dell Latitude 7030 Rugged Extreme (v6.92.6600) | |
| Durabook R10 (v8.20.8100) | |
| Dynabook Portege Z40L-N (v6.92.6600) | |
| Durabook R8 Tablet (v6.85.6300) | |
| AIDA64 / FPU Mandel | |
| Lenovo ThinkPad T14 Gen 6 AMD (v8.20.8100) | |
| Lenovo ThinkPad T14 Gen 6 AMD (v6.92.6600) | |
| Lenovo ThinkPad T14 Gen 6 21QG001VGE (v6.92.6600) | |
| Przeciętny Intel Core Ultra 7 258V (21670 - 33565, n=26) | |
| Średnia w klasie Tablet (22775 - 31836, n=2, ostatnie 2 lata) | |
| Dynabook Portege Z40L-N (v6.92.6600) | |
| Durabook R10 (v8.20.8100) | |
| Dell Latitude 7030 Rugged Extreme (v6.92.6600) | |
| Durabook R8 Tablet (v6.85.6300) | |
| AIDA64 / CPU AES | |
| Lenovo ThinkPad T14 Gen 6 AMD (v6.92.6600) | |
| Lenovo ThinkPad T14 Gen 6 AMD (v8.20.8100) | |
| Lenovo ThinkPad T14 Gen 6 21QG001VGE (v6.92.6600) | |
| Przeciętny Intel Core Ultra 7 258V (30957 - 40753, n=26) | |
| Średnia w klasie Tablet (34551 - 38941, n=2, ostatnie 2 lata) | |
| Dell Latitude 7030 Rugged Extreme (v6.92.6600) | |
| Durabook R10 (v8.20.8100) | |
| Dynabook Portege Z40L-N (v6.92.6600) | |
| Durabook R8 Tablet (v6.85.6300) | |
| AIDA64 / CPU ZLib | |
| Lenovo ThinkPad T14 Gen 6 AMD (v6.92.6600) | |
| Lenovo ThinkPad T14 Gen 6 AMD (v8.20.8100) | |
| Lenovo ThinkPad T14 Gen 6 21QG001VGE (v6.92.6600) | |
| Dell Latitude 7030 Rugged Extreme (v6.92.6600) | |
| Przeciętny Intel Core Ultra 7 258V (422 - 632, n=26) | |
| Średnia w klasie Tablet (434 - 631, n=2, ostatnie 2 lata) | |
| Dynabook Portege Z40L-N (v6.92.6600) | |
| Durabook R10 (v8.20.8100) | |
| Durabook R8 Tablet (v6.85.6300) | |
| AIDA64 / FP64 Ray-Trace | |
| Lenovo ThinkPad T14 Gen 6 AMD (v6.92.6600) | |
| Lenovo ThinkPad T14 Gen 6 AMD (v8.20.8100) | |
| Lenovo ThinkPad T14 Gen 6 21QG001VGE (v6.92.6600) | |
| Przeciętny Intel Core Ultra 7 258V (4258 - 6930, n=26) | |
| Średnia w klasie Tablet (4660 - 6803, n=2, ostatnie 2 lata) | |
| Dynabook Portege Z40L-N (v6.92.6600) | |
| Durabook R10 (v8.20.8100) | |
| Dell Latitude 7030 Rugged Extreme (v6.92.6600) | |
| Durabook R8 Tablet (v6.85.6300) | |
| AIDA64 / CPU PhotoWorxx | |
| Lenovo ThinkPad T14 Gen 6 21QG001VGE (v6.92.6600) | |
| Średnia w klasie Tablet (52755 - 54886, n=2, ostatnie 2 lata) | |
| Przeciętny Intel Core Ultra 7 258V (44223 - 59245, n=26) | |
| Durabook R10 (v8.20.8100) | |
| Dynabook Portege Z40L-N (v6.92.6600) | |
| Dell Latitude 7030 Rugged Extreme (v6.92.6600) | |
| Lenovo ThinkPad T14 Gen 6 AMD (v8.20.8100) | |
| Lenovo ThinkPad T14 Gen 6 AMD (v6.92.6600) | |
| Durabook R8 Tablet (v6.85.6300) | |
| AIDA64 / CPU CheckMate | |
| Lenovo ThinkPad T14 Gen 6 AMD (v8.20.8100) | |
| Przeciętny Intel Core Ultra 7 258V (2014 - 2513, n=2) | |
| Durabook R10 (v8.20.8100) | |
| Średnia w klasie Tablet (n=1ostatnie 2 lata) | |
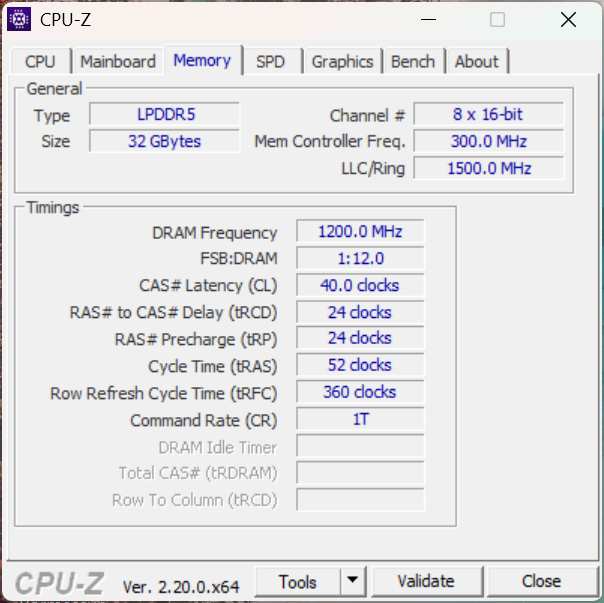
Wydajność systemu i pamięci masowej
W codziennym użytkowaniu platforma zapewnia płynną pracę przy wykonywaniu zadań w pakiecie Office. Jednak biorąc pod uwagę wyniki testów porównawczych, wydajność tabletu plasuje się ogólnie poniżej średniej dla procesorów Lunar Lake. Jedynie pod względem szybkości działania pamięci masowej tablet wyróżnia się, zapewniając wysoką wydajność typową dla procesorów Lunar Lake.
PCMark 10: Score | Essentials | Productivity | Digital Content Creation
CrossMark: Overall | Productivity | Creativity | Responsiveness
WebXPRT 3: Overall
WebXPRT 4: Overall
Mozilla Kraken 1.1: Total
| Performance rating | |
| Lenovo ThinkPad T14 Gen 6 AMD | |
| Lenovo ThinkPad T14 Gen 6 21QG001VGE | |
| Przeciętny Intel Core Ultra 7 258V, Intel Arc Graphics 140V | |
| Dynabook Portege Z40L-N | |
| Durabook R10 | |
| Dell Latitude 7030 Rugged Extreme | |
| Średnia w klasie Tablet | |
| Durabook R8 Tablet | |
| PCMark 10 / Score | |
| Durabook R10 | |
| Lenovo ThinkPad T14 Gen 6 21QG001VGE | |
| Średnia w klasie Tablet (6924 - 7420, n=2, ostatnie 2 lata) | |
| Lenovo ThinkPad T14 Gen 6 AMD | |
| Przeciętny Intel Core Ultra 7 258V, Intel Arc Graphics 140V (6265 - 7420, n=23) | |
| Dynabook Portege Z40L-N | |
| Dell Latitude 7030 Rugged Extreme | |
| Durabook R8 Tablet | |
| PCMark 10 / Essentials | |
| Lenovo ThinkPad T14 Gen 6 AMD | |
| Lenovo ThinkPad T14 Gen 6 21QG001VGE | |
| Przeciętny Intel Core Ultra 7 258V, Intel Arc Graphics 140V (9295 - 11467, n=23) | |
| Dynabook Portege Z40L-N | |
| Średnia w klasie Tablet (9991 - 10351, n=2, ostatnie 2 lata) | |
| Durabook R10 | |
| Dell Latitude 7030 Rugged Extreme | |
| Durabook R8 Tablet | |
| PCMark 10 / Productivity | |
| Durabook R10 | |
| Średnia w klasie Tablet (8823 - 13600, n=2, ostatnie 2 lata) | |
| Lenovo ThinkPad T14 Gen 6 AMD | |
| Dynabook Portege Z40L-N | |
| Lenovo ThinkPad T14 Gen 6 21QG001VGE | |
| Przeciętny Intel Core Ultra 7 258V, Intel Arc Graphics 140V (7357 - 13600, n=23) | |
| Dell Latitude 7030 Rugged Extreme | |
| Durabook R8 Tablet | |
| PCMark 10 / Digital Content Creation | |
| Lenovo ThinkPad T14 Gen 6 21QG001VGE | |
| Przeciętny Intel Core Ultra 7 258V, Intel Arc Graphics 140V (8160 - 10308, n=23) | |
| Średnia w klasie Tablet (8160 - 9863, n=2, ostatnie 2 lata) | |
| Dynabook Portege Z40L-N | |
| Lenovo ThinkPad T14 Gen 6 AMD | |
| Durabook R10 | |
| Dell Latitude 7030 Rugged Extreme | |
| Durabook R8 Tablet | |
| CrossMark / Overall | |
| Lenovo ThinkPad T14 Gen 6 AMD | |
| Lenovo ThinkPad T14 Gen 6 21QG001VGE | |
| Przeciętny Intel Core Ultra 7 258V, Intel Arc Graphics 140V (1275 - 1742, n=22) | |
| Dynabook Portege Z40L-N | |
| Dell Latitude 7030 Rugged Extreme | |
| Durabook R10 | |
| Durabook R8 Tablet | |
| Średnia w klasie Tablet (319 - 2375, n=46, ostatnie 2 lata) | |
| CrossMark / Productivity | |
| Lenovo ThinkPad T14 Gen 6 AMD | |
| Lenovo ThinkPad T14 Gen 6 21QG001VGE | |
| Przeciętny Intel Core Ultra 7 258V, Intel Arc Graphics 140V (1267 - 1684, n=22) | |
| Dynabook Portege Z40L-N | |
| Dell Latitude 7030 Rugged Extreme | |
| Durabook R10 | |
| Durabook R8 Tablet | |
| Średnia w klasie Tablet (346 - 2036, n=44, ostatnie 2 lata) | |
| CrossMark / Creativity | |
| Lenovo ThinkPad T14 Gen 6 AMD | |
| Lenovo ThinkPad T14 Gen 6 21QG001VGE | |
| Przeciętny Intel Core Ultra 7 258V, Intel Arc Graphics 140V (1393 - 1977, n=22) | |
| Dynabook Portege Z40L-N | |
| Dell Latitude 7030 Rugged Extreme | |
| Durabook R10 | |
| Durabook R8 Tablet | |
| Średnia w klasie Tablet (288 - 2620, n=44, ostatnie 2 lata) | |
| CrossMark / Responsiveness | |
| Średnia w klasie Tablet (333 - 12671, n=44, ostatnie 2 lata) | |
| Lenovo ThinkPad T14 Gen 6 AMD | |
| Lenovo ThinkPad T14 Gen 6 21QG001VGE | |
| Przeciętny Intel Core Ultra 7 258V, Intel Arc Graphics 140V (999 - 1411, n=22) | |
| Dynabook Portege Z40L-N | |
| Dell Latitude 7030 Rugged Extreme | |
| Durabook R10 | |
| Durabook R8 Tablet | |
| WebXPRT 3 / Overall | |
| Lenovo ThinkPad T14 Gen 6 AMD | |
| Dynabook Portege Z40L-N | |
| Lenovo ThinkPad T14 Gen 6 21QG001VGE | |
| Przeciętny Intel Core Ultra 7 258V, Intel Arc Graphics 140V (219 - 317, n=22) | |
| Durabook R10 | |
| Dell Latitude 7030 Rugged Extreme | |
| Średnia w klasie Tablet (108 - 480, n=10, ostatnie 2 lata) | |
| Durabook R8 Tablet | |
| WebXPRT 4 / Overall | |
| Dynabook Portege Z40L-N | |
| Lenovo ThinkPad T14 Gen 6 21QG001VGE | |
| Lenovo ThinkPad T14 Gen 6 AMD | |
| Przeciętny Intel Core Ultra 7 258V, Intel Arc Graphics 140V (199.5 - 291, n=22) | |
| Durabook R10 | |
| Dell Latitude 7030 Rugged Extreme | |
| Durabook R8 Tablet | |
| Średnia w klasie Tablet (39 - 376, n=56, ostatnie 2 lata) | |
| Mozilla Kraken 1.1 / Total | |
| Średnia w klasie Tablet (243 - 27101, n=66, ostatnie 2 lata) | |
| Durabook R8 Tablet | |
| Dell Latitude 7030 Rugged Extreme | |
| Durabook R10 | |
| Przeciętny Intel Core Ultra 7 258V, Intel Arc Graphics 140V (468 - 559, n=24) | |
| Lenovo ThinkPad T14 Gen 6 21QG001VGE | |
| Dynabook Portege Z40L-N | |
| Lenovo ThinkPad T14 Gen 6 AMD | |
* ... im mniej tym lepiej
| PCMark 10 Score | 7420 pkt. | |
Pomoc | ||
| AIDA64 / Memory Copy | |
| Durabook R10 | |
| Lenovo ThinkPad T14 Gen 6 21QG001VGE | |
| Średnia w klasie Tablet (108317 - 110050, n=2, ostatnie 2 lata) | |
| Przeciętny Intel Core Ultra 7 258V (104408 - 114336, n=24) | |
| Dynabook Portege Z40L-N | |
| Dell Latitude 7030 Rugged Extreme | |
| Lenovo ThinkPad T14 Gen 6 AMD | |
| Lenovo ThinkPad T14 Gen 6 AMD | |
| Durabook R8 Tablet | |
| AIDA64 / Memory Read | |
| Lenovo ThinkPad T14 Gen 6 21QG001VGE | |
| Przeciętny Intel Core Ultra 7 258V (82846 - 89417, n=24) | |
| Dynabook Portege Z40L-N | |
| Średnia w klasie Tablet (85395 - 87747, n=2, ostatnie 2 lata) | |
| Durabook R10 | |
| Dell Latitude 7030 Rugged Extreme | |
| Lenovo ThinkPad T14 Gen 6 AMD | |
| Lenovo ThinkPad T14 Gen 6 AMD | |
| Durabook R8 Tablet | |
| AIDA64 / Memory Write | |
| Lenovo ThinkPad T14 Gen 6 21QG001VGE | |
| Przeciętny Intel Core Ultra 7 258V (108824 - 117989, n=24) | |
| Średnia w klasie Tablet (108824 - 117859, n=2, ostatnie 2 lata) | |
| Dynabook Portege Z40L-N | |
| Durabook R10 | |
| Dell Latitude 7030 Rugged Extreme | |
| Lenovo ThinkPad T14 Gen 6 AMD | |
| Lenovo ThinkPad T14 Gen 6 AMD | |
| Durabook R8 Tablet | |
| AIDA64 / Memory Latency | |
| Dell Latitude 7030 Rugged Extreme | |
| Lenovo ThinkPad T14 Gen 6 AMD | |
| Lenovo ThinkPad T14 Gen 6 AMD | |
| Durabook R8 Tablet | |
| Durabook R10 | |
| Dynabook Portege Z40L-N | |
| Lenovo ThinkPad T14 Gen 6 21QG001VGE | |
| Średnia w klasie Tablet (94.4 - 101.7, n=2, ostatnie 2 lata) | |
| Przeciętny Intel Core Ultra 7 258V (95 - 101.7, n=24) | |
* ... im mniej tym lepiej
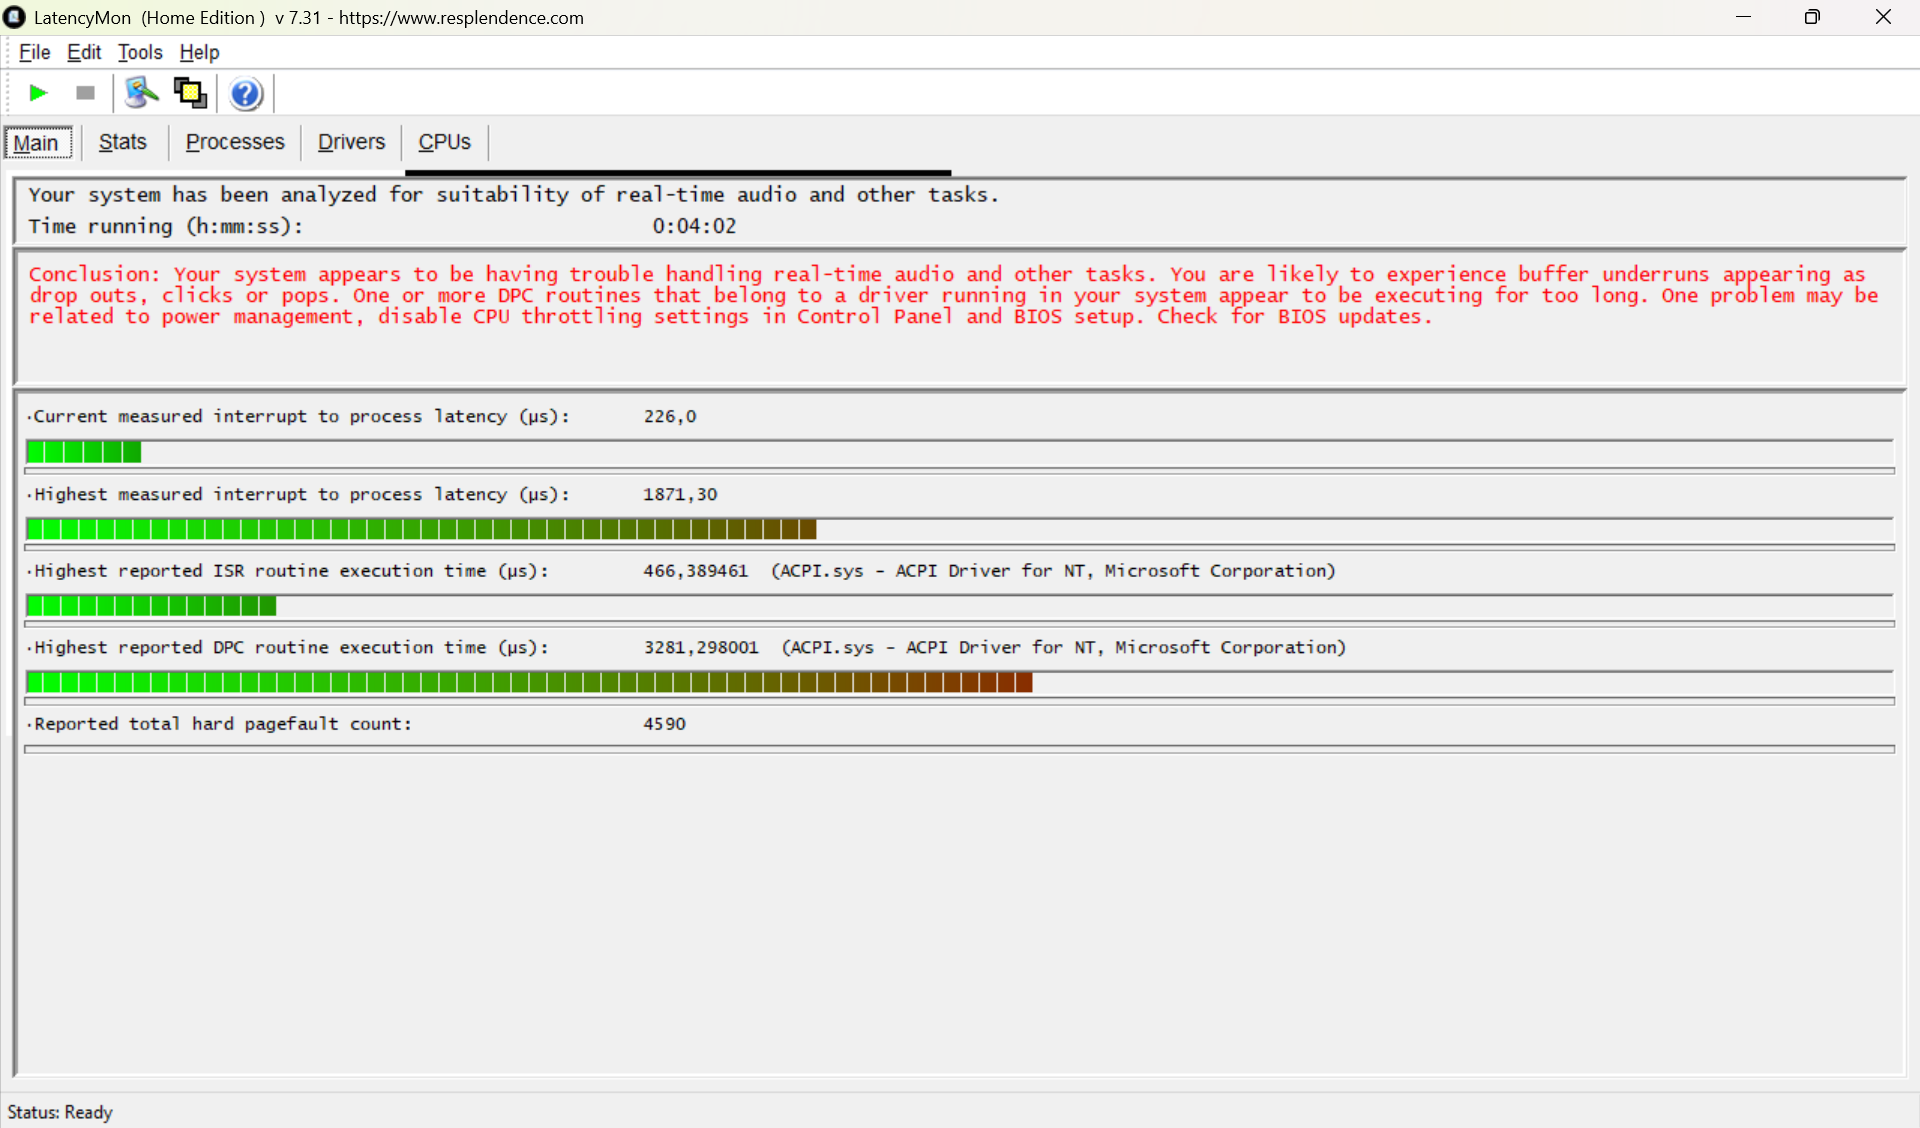
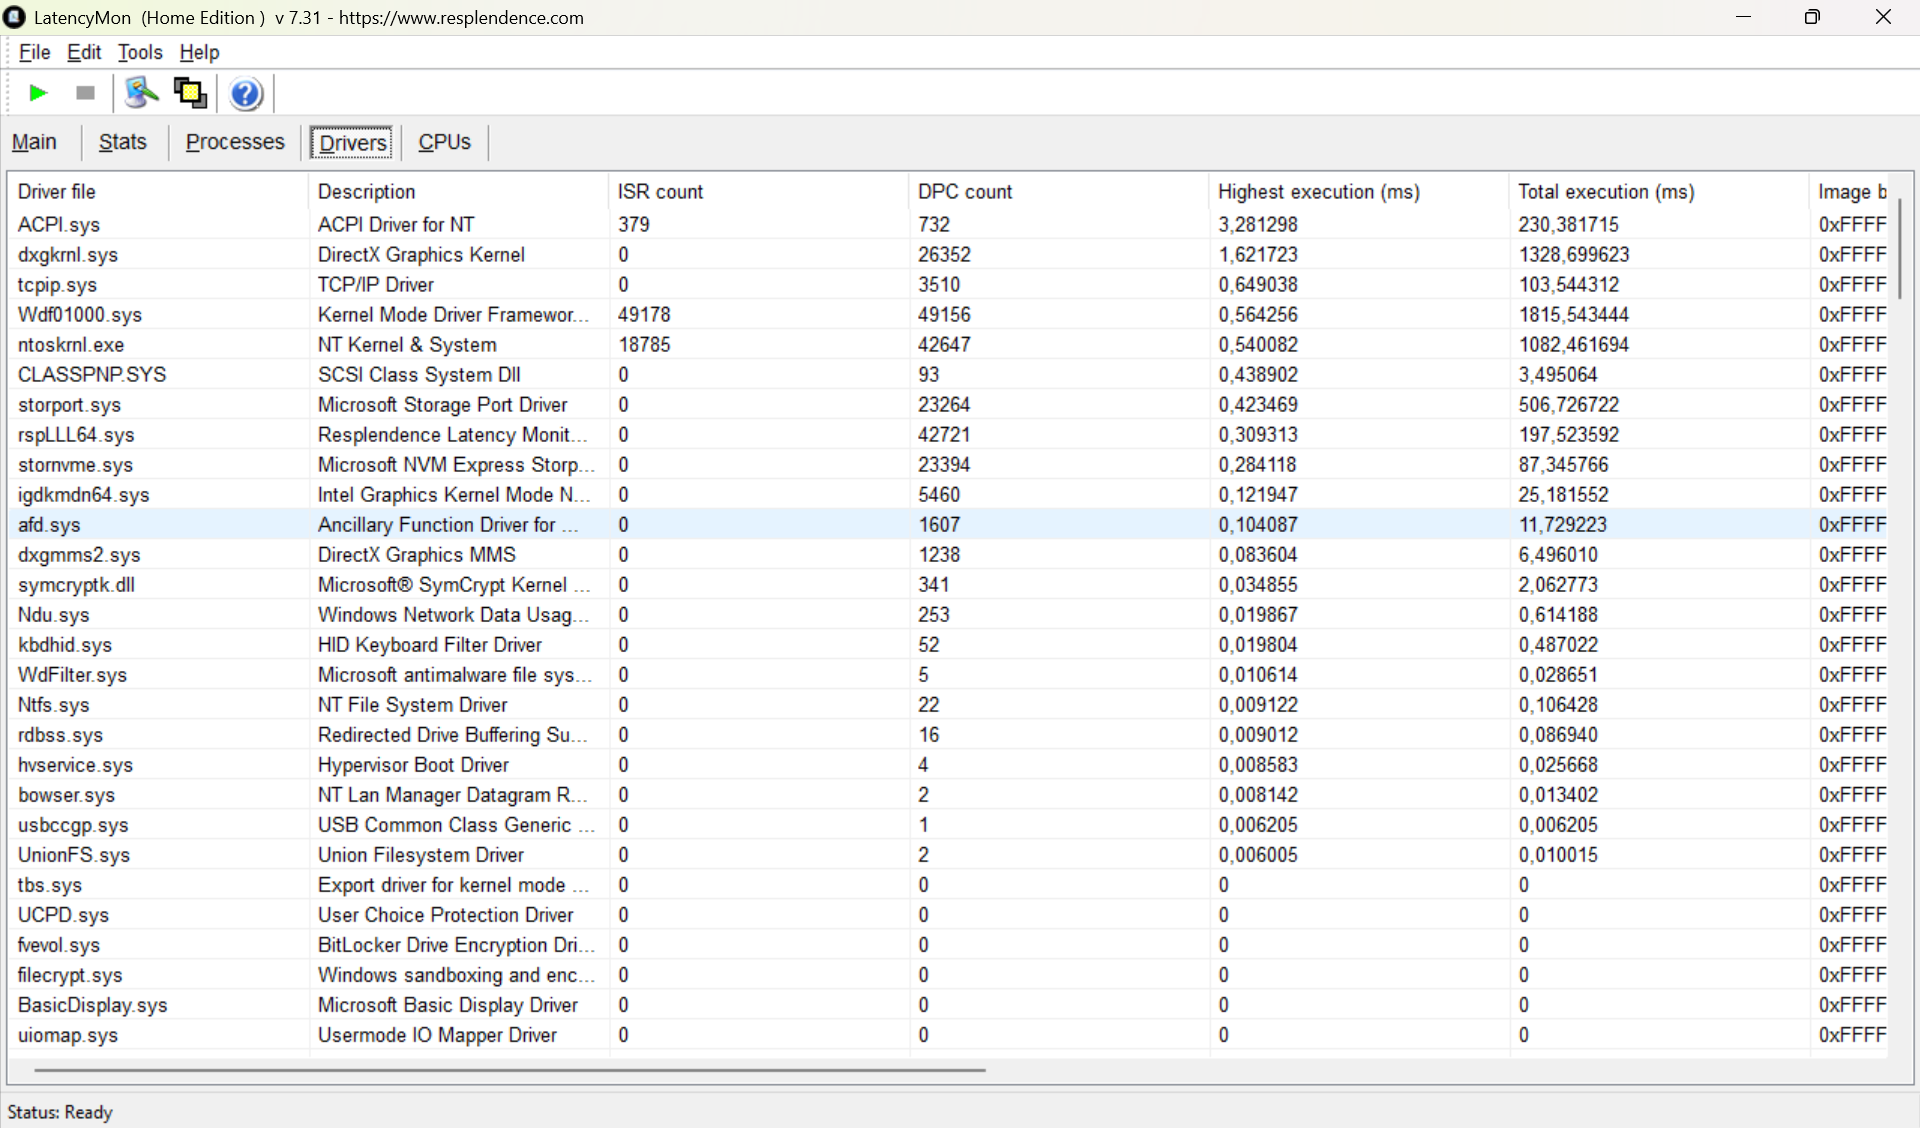
Opóźnienia DPC
Narzędzie analityczne LatencyMon wskazuje, że sterownik ACPI powoduje opóźnienia sięgające nawet 3 281 mikrosekund na tablecie. Może to prowadzić do zakłóceń podczas wykonywania zadań wymagających precyzyjnego czasu, takich jak edycja dźwięku lub pozyskiwanie danych o wysokiej częstotliwości.
| DPC Latencies / LatencyMon - interrupt to process latency (max), Web, Youtube, Prime95 | |
| Durabook R10 | |
| Dell Latitude 7030 Rugged Extreme | |
| Durabook R8 Tablet | |
| Lenovo ThinkPad T14 Gen 6 21QG001VGE | |
| Dynabook Portege Z40L-N | |
| Średnia w klasie Tablet (482 - 1871, n=2, ostatnie 2 lata) | |
* ... im mniej tym lepiej
Pamięć masowa

* ... im mniej tym lepiej
Trwała wydajność odczytu: Pętla odczytu DiskSpd, głębokość kolejki 8
Wydajność procesora graficznego i gier
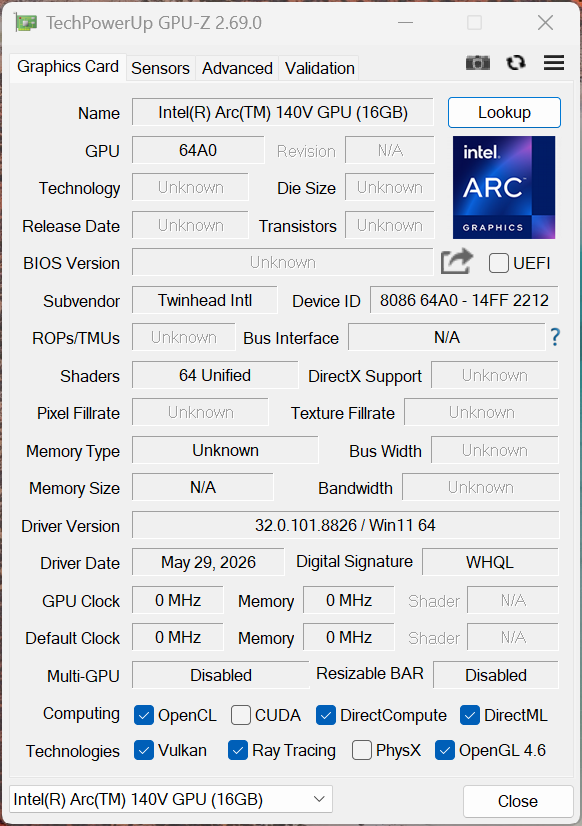
Za przetwarzanie grafiki odpowiada karta graficzna Intel Arc Graphics 140V, zintegrowana z procesorem. Z łatwością radzi sobie ona z filmami w wysokiej rozdzielczości, prostymi zadaniami 3D oraz konfiguracjami z wieloma monitorami. Jednak duże pliki CAD lub aplikacje wymagające dużej mocy obliczeniowej mogą stanowić wyzwanie dla tej karty graficznej firmy Intel.
| 3DMark 11 Performance | 9563 pkt. | |
| 3DMark Ice Storm Standard Score | 178031 pkt. | |
| 3DMark Cloud Gate Standard Score | 26729 pkt. | |
| 3DMark Fire Strike Score | 7287 pkt. | |
| 3DMark Time Spy Score | 3373 pkt. | |
| 3DMark Steel Nomad Score | 743 pkt. | |
| 3DMark Steel Nomad Light Score | 2843 pkt. | |
Pomoc | ||
* ... im mniej tym lepiej
| Performance rating - Percent | |
| Lenovo ThinkPad T14 Gen 6 21QG001VGE -1! | |
| Średnia w klasie Tablet | |
| Dynabook Portege Z40L-N | |
| Durabook R10 | |
| Lenovo ThinkPad T14 Gen 6 AMD -1! | |
| Dell Latitude 7030 Rugged Extreme -1! | |
| Durabook R8 Tablet -5! | |
| Cyberpunk 2077 - 1920x1080 Ultra Preset (FSR off) | |
| Lenovo ThinkPad T14 Gen 6 21QG001VGE | |
| Średnia w klasie Tablet (21.2 - 28.7, n=2, ostatnie 2 lata) | |
| Durabook R10 | |
| Dynabook Portege Z40L-N | |
| Lenovo ThinkPad T14 Gen 6 AMD | |
| Dell Latitude 7030 Rugged Extreme | |
| Baldur's Gate 3 - 1920x1080 Ultra Preset AA:T | |
| Lenovo ThinkPad T14 Gen 6 21QG001VGE | |
| Średnia w klasie Tablet (22.8 - 28.3, n=2, ostatnie 2 lata) | |
| Dynabook Portege Z40L-N | |
| Durabook R10 | |
| Lenovo ThinkPad T14 Gen 6 AMD | |
| GTA V - 1920x1080 Highest AA:4xMSAA + FX AF:16x | |
| Lenovo ThinkPad T14 Gen 6 21QG001VGE | |
| Średnia w klasie Tablet (21.1 - 27.8, n=2, ostatnie 2 lata) | |
| Dynabook Portege Z40L-N | |
| Durabook R10 | |
| Lenovo ThinkPad T14 Gen 6 AMD | |
| Dell Latitude 7030 Rugged Extreme | |
| Final Fantasy XV Benchmark - 1920x1080 High Quality | |
| Lenovo ThinkPad T14 Gen 6 21QG001VGE | |
| Średnia w klasie Tablet (25.4 - 34.4, n=3, ostatnie 2 lata) | |
| Durabook R10 | |
| Durabook R10 | |
| Dynabook Portege Z40L-N | |
| Lenovo ThinkPad T14 Gen 6 AMD | |
| Dell Latitude 7030 Rugged Extreme | |
| Strange Brigade - 1920x1080 ultra AA:ultra AF:16 | |
| Średnia w klasie Tablet (44.4 - 58, n=2, ostatnie 2 lata) | |
| Dynabook Portege Z40L-N | |
| Durabook R10 | |
| Dell Latitude 7030 Rugged Extreme | |
| Dota 2 Reborn - 1920x1080 ultra (3/3) best looking | |
| Lenovo ThinkPad T14 Gen 6 21QG001VGE | |
| Średnia w klasie Tablet (70.9 - 84.5, n=2, ostatnie 2 lata) | |
| Durabook R10 | |
| Dynabook Portege Z40L-N | |
| Dell Latitude 7030 Rugged Extreme | |
| Lenovo ThinkPad T14 Gen 6 AMD | |
| Durabook R8 Tablet | |
Wykres maksymalnej liczby klatek na sekundę w grze „Cyberpunk 2077”
| low | med. | high | ultra | |
|---|---|---|---|---|
| GTA V (2015) | 128.8 | 125.6 | 50.7 | 21.1 |
| Dota 2 Reborn (2015) | 92.5 | 75 | 51.7 | 70.9 |
| Final Fantasy XV Benchmark (2018) | 63.8 | 35.9 | 25.4 | |
| X-Plane 11.11 (2018) | 34.5 | 31.4 | 30.1 | |
| Strange Brigade (2018) | 161.3 | 52.1 | 52.9 | 44.4 |
| Baldur's Gate 3 (2023) | 34.1 | 24.9 | 22.8 | |
| Cyberpunk 2077 (2023) | 37.9 | 21.2 | ||
| F1 24 (2024) | 40.4 | 14.6 | ||
| F1 25 (2025) | 55.8 | 48.6 | 34.9 |
Emisje i energia
Emisja hałasu
Wentylator wewnętrzny pracuje niemal nieprzerwanie. Chociaż w stanie spoczynku systemu jest on praktycznie niesłyszalny, to nawet podczas testu obciążeniowego nie staje się zbyt głośny, osiągając poziom 31 dB(A). Jednak ten cichy szum zostaje całkowicie zagłuszony, gdy urządzenie jest używane na zewnątrz.
Hałas
| luz |
| 27.7 / 27.7 / 27.7 dB |
| obciążenie |
| / 31.6 dB |
 | ||
30 dB cichy 40 dB(A) słyszalny 50 dB(A) irytujący |
||
min: | ||
| Durabook R10 Core Ultra 7 258V, Arc 140V | Dell Latitude 7030 Rugged Extreme i7-1260U, Iris Xe G7 96EUs | Lenovo ThinkPad T14 Gen 6 21QG001VGE Core Ultra 7 258V, Arc 140V | Dynabook Portege Z40L-N Core Ultra 7 258V, Arc 140V | Durabook R8 Tablet i5-1230U, Iris Xe G7 80EUs | Lenovo ThinkPad T14 Gen 6 AMD Ryzen AI 7 PRO 350, Radeon 860M | |
|---|---|---|---|---|---|---|
| Noise | -1% | 0% | 6% | 7% | ||
| wyłączone / środowisko * (dB) | 25.9 | 23 11% | 25.1 3% | 23.5 9% | 24.5 5% | |
| Idle Minimum * (dB) | 27.7 | 23.5 15% | 25.1 9% | 23.6 15% | 24.5 12% | |
| Idle Average * (dB) | 27.7 | 23.5 15% | 25.1 9% | 23.6 15% | 24.5 12% | |
| Idle Maximum * (dB) | 27.7 | 23.5 15% | 27.1 2% | 23.6 15% | 24.5 12% | |
| Load Maximum * (dB) | 31.6 | 50.6 -60% | 38.5 -22% | 39 -23% | 33.7 -7% | |
| Load Average * (dB) | 24.1 | 34.8 | 37 | 26.8 | ||
| Cyberpunk 2077 ultra * (dB) | 50.5 | 38.3 | 37.8 | 35.3 |
* ... im mniej tym lepiej
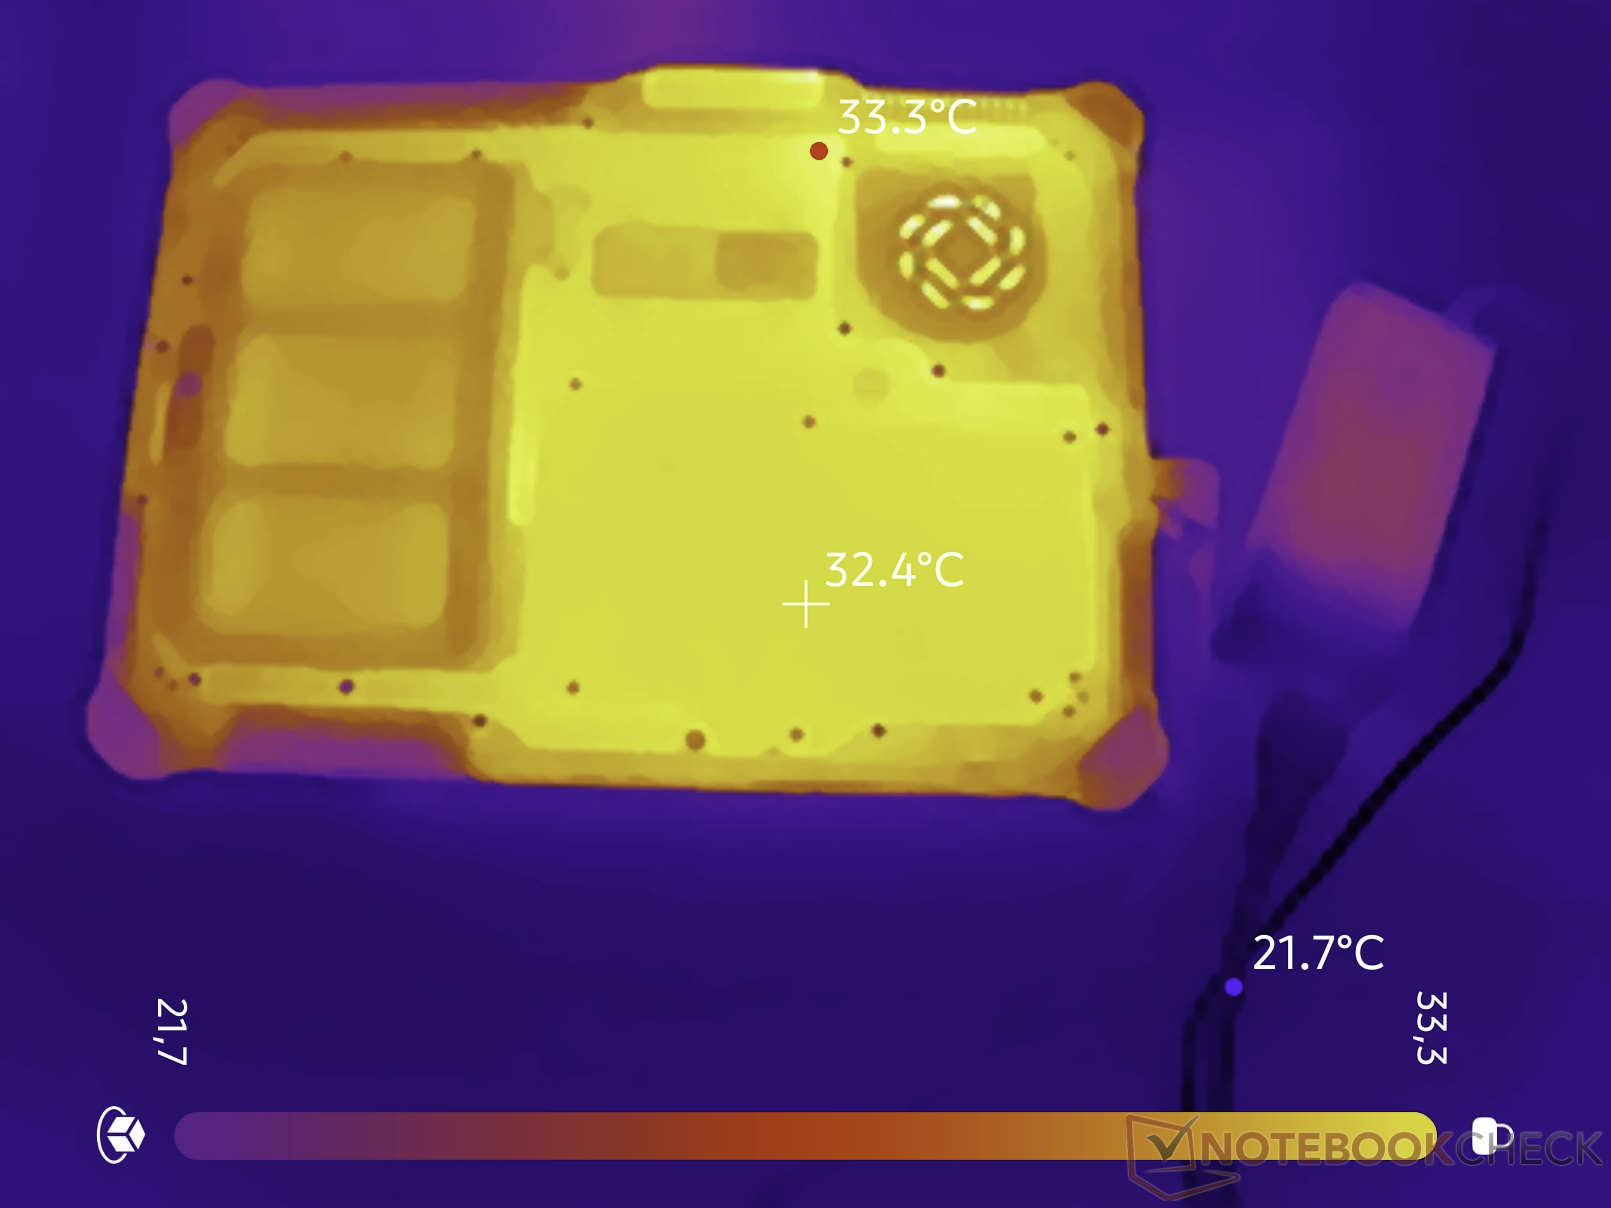
Temperatura
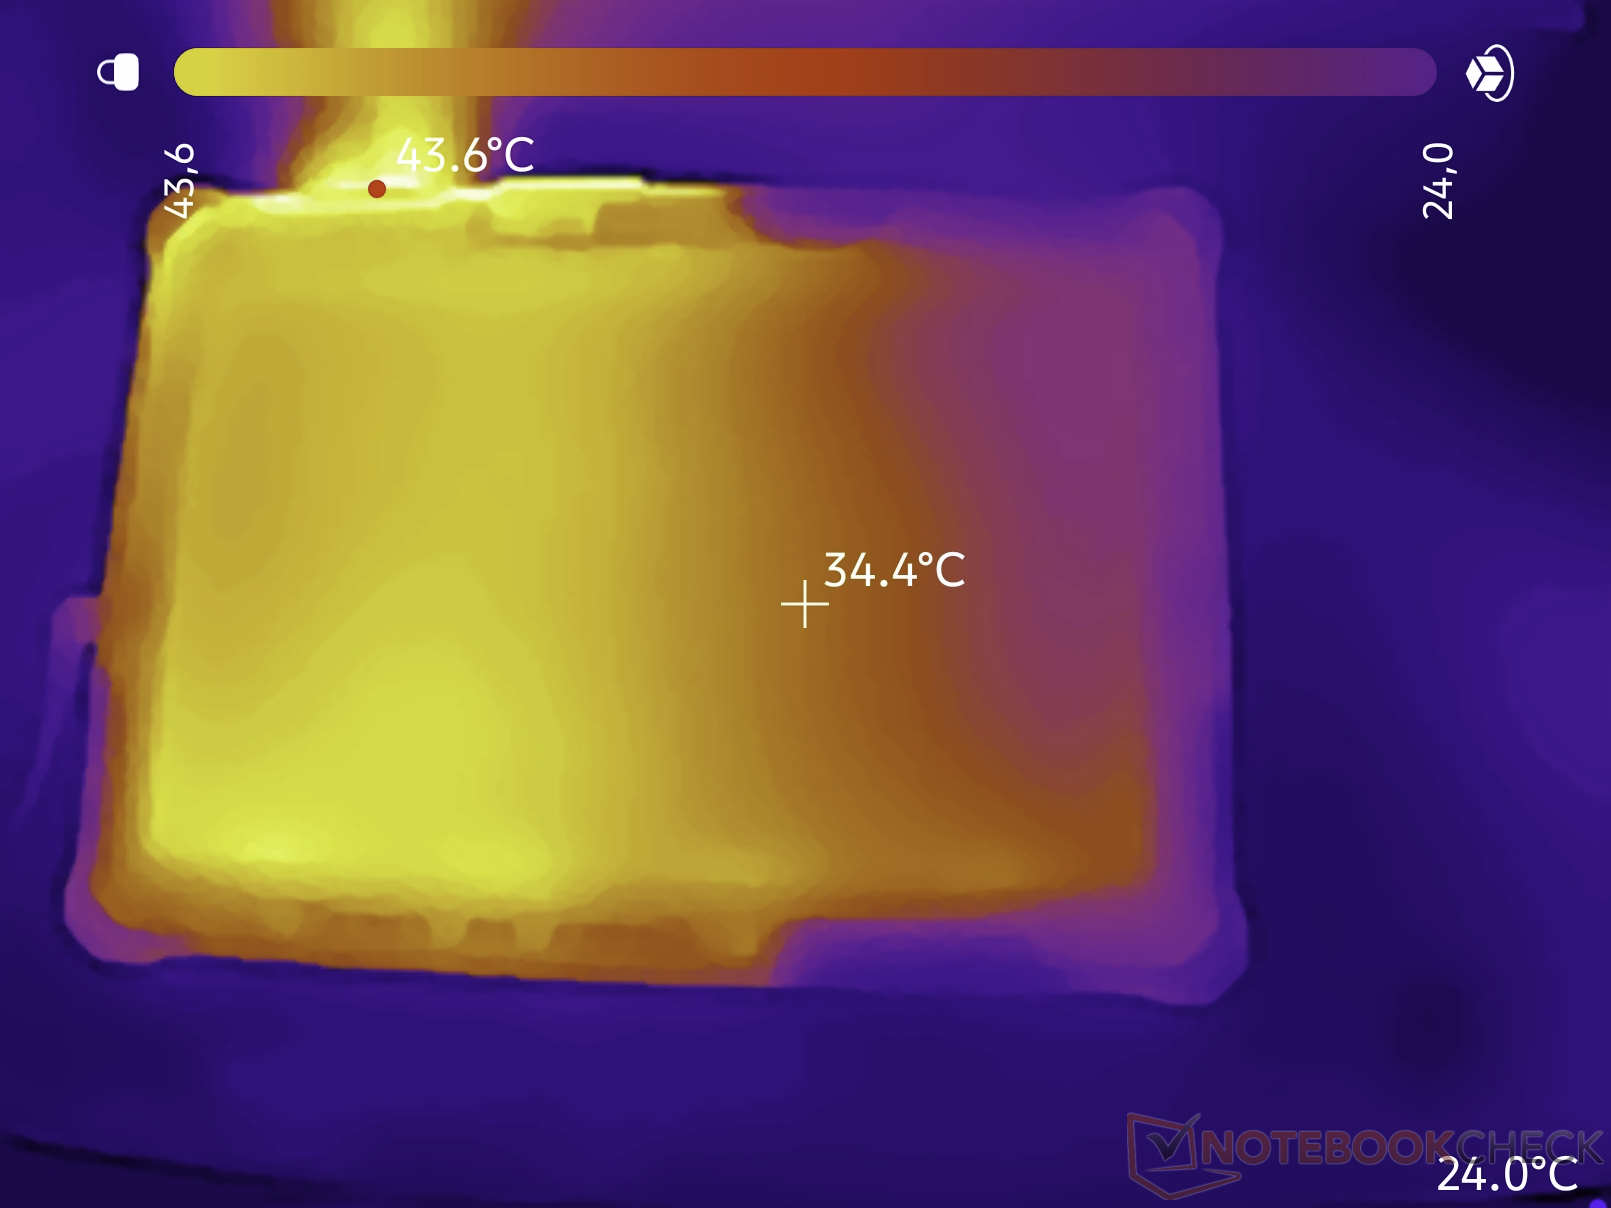
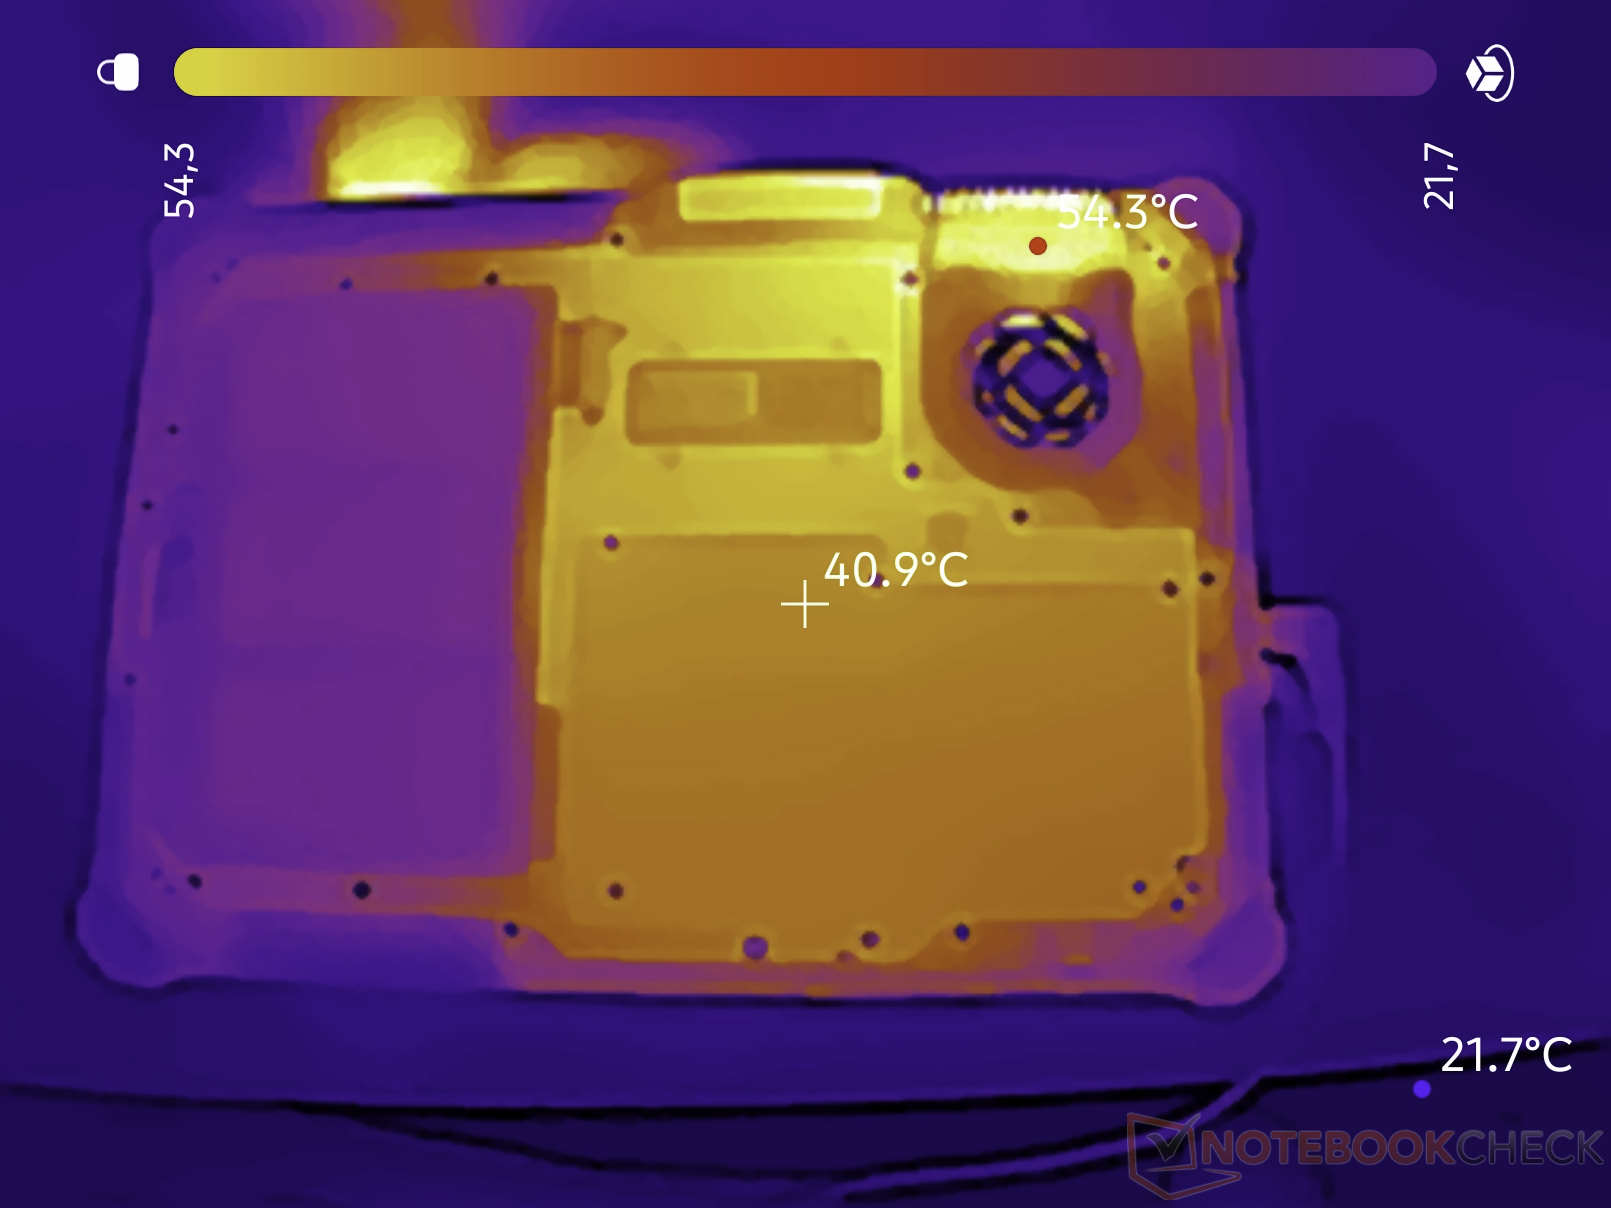
Układ chłodzenia działa wyjątkowo skutecznie. Podczas testu obciążeniowego tablet osiąga temperaturę powyżej 40 °C (104 °F) jedynie w kilku miejscach. Pozostała część solidnej obudowy utrzymuje komfortową temperaturę.
(±) Maksymalna temperatura w górnej części wynosi 43.6 °C / 110 F, w porównaniu do średniej 33.6 °C / 92 F , począwszy od 20.7 do 53.2 °C dla klasy Tablet.
(±) Dno nagrzewa się maksymalnie do 40 °C / 104 F, w porównaniu do średniej 33.2 °C / 92 F
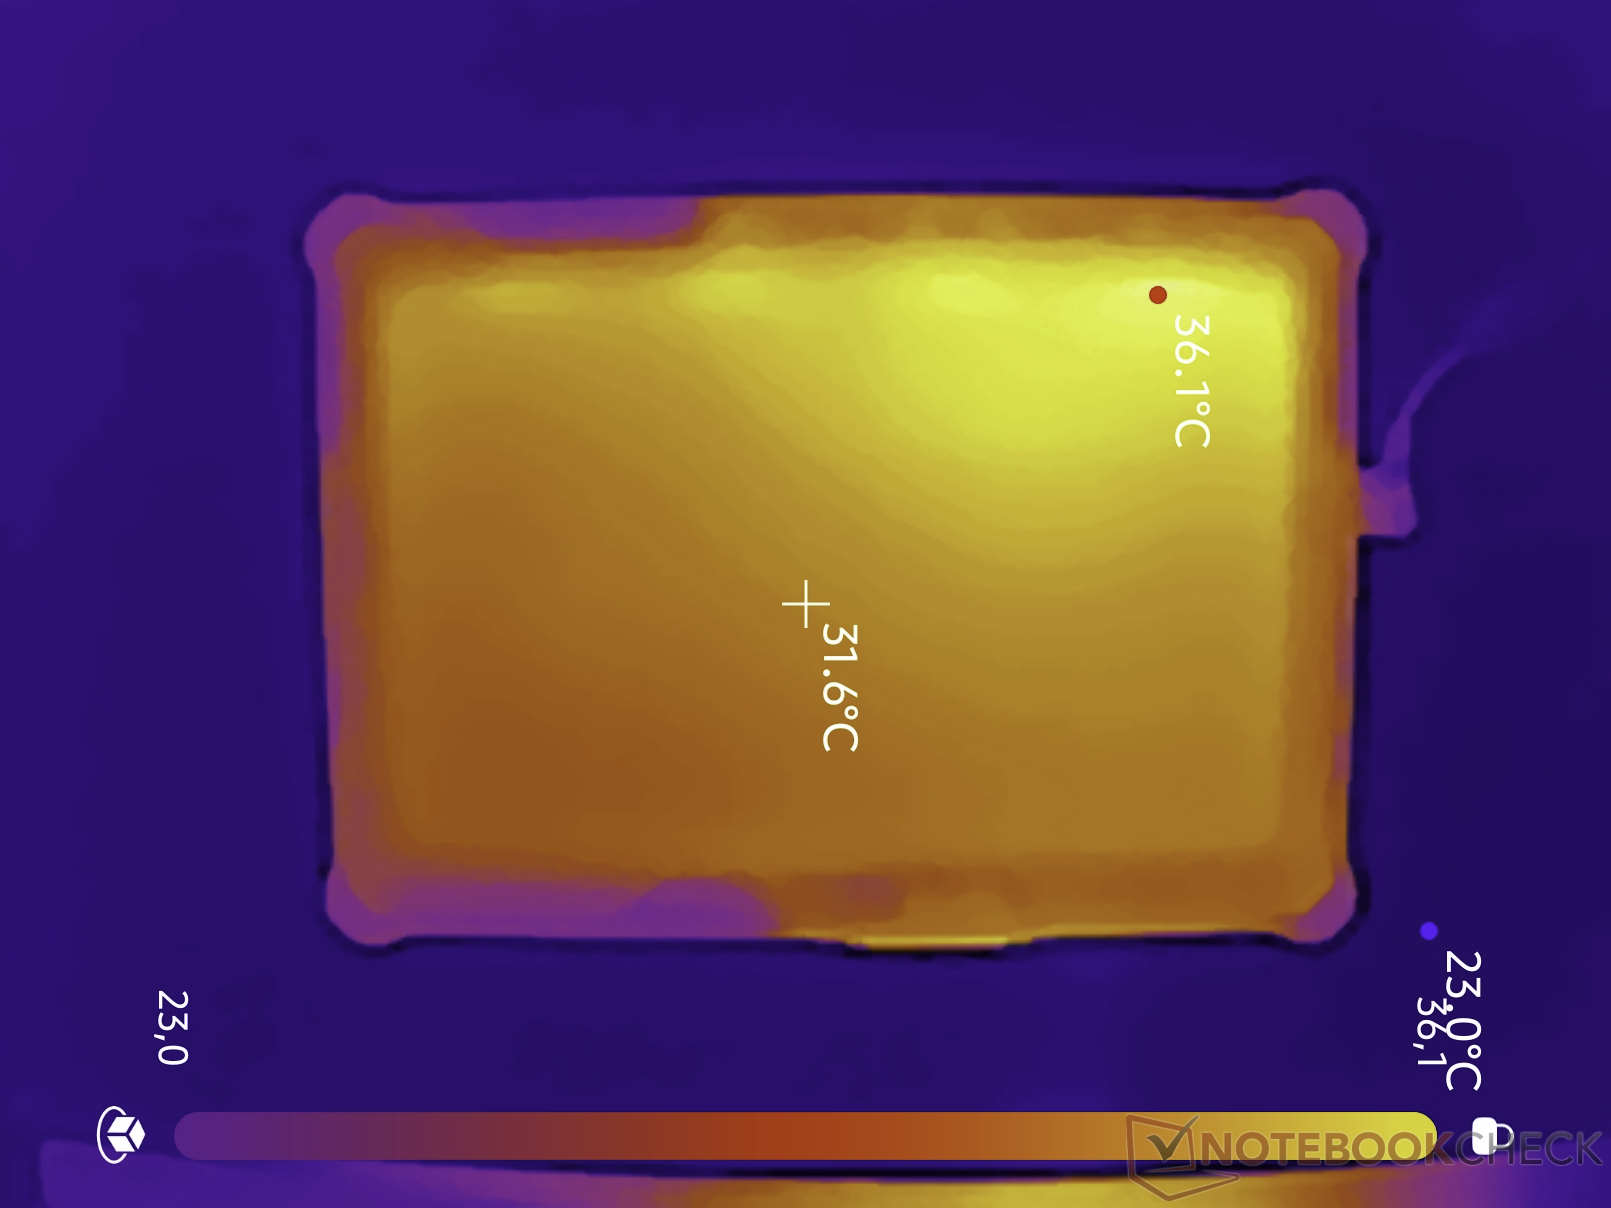
(±) W stanie bezczynności średnia temperatura górnej części wynosi 33.3 °C / 92 F, w porównaniu ze średnią temperaturą urządzenia wynoszącą 30 °C / ### class_avg_f### F.
| Durabook R10 Core Ultra 7 258V, Arc 140V | Dell Latitude 7030 Rugged Extreme i7-1260U, Iris Xe G7 96EUs | Lenovo ThinkPad T14 Gen 6 21QG001VGE Core Ultra 7 258V, Arc 140V | Dynabook Portege Z40L-N Core Ultra 7 258V, Arc 140V | Durabook R8 Tablet i5-1230U, Iris Xe G7 80EUs | Lenovo ThinkPad T14 Gen 6 AMD Ryzen AI 7 PRO 350, Radeon 860M | |
|---|---|---|---|---|---|---|
| Heat | 11% | 16% | -2% | -0% | -3% | |
| Maximum Upper Side * (°C) | 43.6 | 37.2 15% | 39.7 9% | 41.2 6% | 38.2 12% | 47.7 -9% |
| Maximum Bottom * (°C) | 40 | 43.4 -9% | 38.1 5% | 38 5% | 49.6 -24% | 49.5 -24% |
| Idle Upper Side * (°C) | 36.1 | 26.4 27% | 24.3 33% | 35.4 2% | 32.2 11% | 30.7 15% |
| Idle Bottom * (°C) | 33.3 | 29.6 11% | 27.7 17% | 39.8 -20% | 33.4 -0% | 31.6 5% |
* ... im mniej tym lepiej
Prelegent
Możliwości audio tego urządzenia są skromne. Wbudowany głośnik mono umieszczony z tyłu tabletu osiąga maksymalną głośność 54 dB(A) i zapewnia raczej przeciętną jakość dźwięku. Jest to wystarczające do odtwarzania sygnałów ostrzegawczych systemu, przynajmniej w cichym otoczeniu.
Durabook R10 analiza dźwięku
(-) | niezbyt głośne głośniki (###wartość### dB)
Bas 100 - 315 Hz
(-) | prawie brak basu - średnio 17.7% niższa od mediany
(±) | liniowość basu jest średnia (7.6% delta do poprzedniej częstotliwości)
Średnie 400 - 2000 Hz
(+) | zbalansowane środki średnie - tylko 2.9% od mediany
(±) | liniowość środka jest średnia (13.7% delta do poprzedniej częstotliwości)
Wysokie 2–16 kHz
(+) | zrównoważone maksima - tylko 4.7% od mediany
(±) | liniowość wysokich wartości jest średnia (10.2% delta do poprzedniej częstotliwości)
Ogólnie 100 - 16.000 Hz
(-) | ogólny dźwięk nie jest liniowy (31.3% różnicy w stosunku do mediany)
W porównaniu do tej samej klasy
» 90% wszystkich testowanych urządzeń w tej klasie było lepszych, 3% podobnych, 7% gorszych
» Najlepszy miał deltę 7%, średnia wynosiła ###średnia###%, najgorsza wynosiła 129%
W porównaniu do wszystkich testowanych urządzeń
» 90% wszystkich testowanych urządzeń było lepszych, 2% podobnych, 8% gorszych
» Najlepszy miał deltę 4%, średnia wynosiła ###średnia###%, najgorsza wynosiła 134%
Apple MacBook Pro 16 2021 M1 Pro analiza dźwięku
(+) | głośniki mogą odtwarzać stosunkowo głośno (84.7 dB)
Bas 100 - 315 Hz
(+) | dobry bas - tylko 3.8% od mediany
(+) | bas jest liniowy (5.2% delta do poprzedniej częstotliwości)
Średnie 400 - 2000 Hz
(+) | zbalansowane środki średnie - tylko 1.3% od mediany
(+) | średnie są liniowe (2.1% delta do poprzedniej częstotliwości)
Wysokie 2–16 kHz
(+) | zrównoważone maksima - tylko 1.9% od mediany
(+) | wzloty są liniowe (2.7% delta do poprzedniej częstotliwości)
Ogólnie 100 - 16.000 Hz
(+) | ogólny dźwięk jest liniowy (4.6% różnicy w stosunku do mediany)
W porównaniu do tej samej klasy
» 0% wszystkich testowanych urządzeń w tej klasie było lepszych, 0% podobnych, 100% gorszych
» Najlepszy miał deltę 5%, średnia wynosiła ###średnia###%, najgorsza wynosiła 45%
W porównaniu do wszystkich testowanych urządzeń
» 0% wszystkich testowanych urządzeń było lepszych, 0% podobnych, 100% gorszych
» Najlepszy miał deltę 4%, średnia wynosiła ###średnia###%, najgorsza wynosiła 134%
Zużycie energii i żywotność baterii
W naszym teście obciążeniowym odnotowaliśmy maksymalny pobór mocy na poziomie 55 watów. Zdecydowanie największym źródłem zużycia energii jest niezwykle jasny wyświetlacz, który stanowi znaczne obciążenie dla baterii lub zasilacza. W naszym teście, bez dostępu do gniazdka elektrycznego, bateria zapewniła osiem godzin pracy podczas ciągłego przeglądania stron internetowych przez Wi-Fi. Dzięki funkcji wymiany baterii podczas pracy urządzenie można wymienić, gdy urządzenie jest włączone. Wewnątrz urządzenia Durabook znajduje się niewielka bateria, która zapewnia zasilanie przez nieco ponad minutę i umożliwia wymianę baterii bez konieczności wyłączania urządzenia. Aby zapewnić jeszcze dłuższe użytkowanie bez ładowania lub wymiany baterii, producent oferuje również baterię o dużej pojemności, choć znacznie wystaje ona poza obudowę urządzenia.
| wyłączony / stan wstrzymania | |
| luz | |
| obciążenie |
|
Legenda:
min: | |
Zużycie energii w grze „Cyberpunk” / Test obciążeniowy
Zużycie energii przy podłączonym monitorze zewnętrznym
| Durabook R10 Core Ultra 7 258V, Arc 140V, 48 Wh | Dell Latitude 7030 Rugged Extreme i7-1260U, Iris Xe G7 96EUs, 36 Wh | Lenovo ThinkPad T14 Gen 6 21QG001VGE Core Ultra 7 258V, Arc 140V, 57 Wh | Dynabook Portege Z40L-N Core Ultra 7 258V, Arc 140V, 56 Wh | Durabook R8 Tablet i5-1230U, Iris Xe G7 80EUs, 27.4 Wh | Lenovo ThinkPad T14 Gen 6 AMD Ryzen AI 7 PRO 350, Radeon 860M, 57 Wh | Średnia w klasie Tablet | |
|---|---|---|---|---|---|---|---|
| Battery Runtime | |||||||
| WiFi Websurfing (h) | 8.4 | 6.1 -27% | 19.4 131% | 19.1 127% | 5.3 -37% | 13.8 64% | 15.8 ? 88% |
| Czasy pracy | -27% | 131% | 127% | -37% | 64% | 88% | |
| WiFi v1.3 (h) | 8.4 | 6.1 -27% | 19.4 131% | 19.1 127% | 5.3 -37% | 13.8 64% | 15.8 ? 88% |
| Load (h) | 1.6 | 1.1 | 4.16 ? | ||||
| Całkowita średnia (program / ustawienia) | -27% /
-27% | 131% /
131% | 127% /
127% | -37% /
-37% | 64% /
64% | 88% /
88% |
| Durabook R10 Core Ultra 7 258V, Arc 140V, 48 Wh | Dell Latitude 7030 Rugged Extreme i7-1260U, Iris Xe G7 96EUs, 36 Wh | Lenovo ThinkPad T14 Gen 6 21QG001VGE Core Ultra 7 258V, Arc 140V, 57 Wh | Dynabook Portege Z40L-N Core Ultra 7 258V, Arc 140V, 56 Wh | Durabook R8 Tablet i5-1230U, Iris Xe G7 80EUs, 27.4 Wh | Lenovo ThinkPad T14 Gen 6 AMD Ryzen AI 7 PRO 350, Radeon 860M, 57 Wh | Średnia w klasie Tablet | |
|---|---|---|---|---|---|---|---|
| Czasy pracy | -27% | 131% | 127% | -37% | 64% | 88% | |
| WiFi v1.3 (h) | 8.4 | 6.1 -27% | 19.4 131% | 19.1 127% | 5.3 -37% | 13.8 64% | 15.8 ? 88% |
| Load (h) | 1.6 | 1.1 | 4.16 ? |
Ogólna ocena serwisu Notebookcheck
Durabook R10 to prawdziwy „ciężki kaliber”, zaprojektowany z myślą o ekstremalnych warunkach pracy. Certyfikowana zgodność z normami wojskowymi, jasny wyświetlacz oraz niezawodne zasilanie robią ogromne wrażenie. Jednak poniżej średniej wydajność procesora, duże opóźnienia oraz lekko zielonkawy odcień ekranu wymagają pewnych kompromisów.
Durabook R10
- 18/06/2026 v8
Marc Herter
 Total Sustainability Score:
 Porównanie możliwych alternatyw
Obraz | Model / recenzja | Cena | Waga | Wysokość | Ekran |
|---|---|---|---|---|---|
1. 76.5%  | Durabook R10 Intel Core Ultra 7 258V ⎘ Intel Arc Graphics 140V ⎘ 32 GB Pamięć | Amazon: 1. $14.99 ZBAGUG for Durabook R10 Tabl... 2. $17.99 ZBAGUG 2-Pack for Durabook R... | 1.3 kg | 29 mm | 10.10" 1920x1200 224 PPI TFT |
2. 82.3%  | Dell Latitude 7030 Rugged Extreme Intel Core i7-1260U ⎘ Intel Iris Xe Graphics G7 96EUs ⎘ 32 GB Pamięć, 1024 GB SSD | Amazon: 1. $2,049.00 Dell Latitude Rugged Extreme... 2. $2,199.00 Dell Latitude 7330 Rugged Ex... 3. $1,850.00 Dell Latitude Rugged Extreme... Cena katalogowa: 3000 USD | 1.1 kg | 25.4 mm | 10.00" 1920x1200 226 PPI IPS |
3. 79.6% v7 (old)  | Durabook R8 Tablet Intel Core i5-1230U ⎘ Intel Iris Xe Graphics G7 80EUs ⎘ 8 GB Pamięć, 128 GB SSD | Amazon: 1. $38.99 PowerHOOD DC19V AC Power Ada... 2. $39.95 BoxWave Screen Protector Com... 3. $39.95 BoxWave Screen Protector Com... | 856 g | 20.6 mm | 8.00" 1280x800 189 PPI IPS |
Przezroczystość
Wyboru urządzeń do recenzji dokonuje nasza redakcja. Próbka testowa została udostępniona autorowi jako pożyczka od producenta lub sprzedawcy detalicznego na potrzeby tej recenzji. Pożyczkodawca nie miał wpływu na tę recenzję, producent nie otrzymał też kopii tej recenzji przed publikacją. Nie było obowiązku publikowania tej recenzji. Jako niezależna firma medialna, Notebookcheck nie podlega władzy producentów, sprzedawców detalicznych ani wydawców.
Tak testuje Notebookcheck
Każdego roku Notebookcheck niezależnie sprawdza setki laptopów i smartfonów, stosując standardowe procedury, aby zapewnić porównywalność wszystkich wyników. Od około 20 lat stale rozwijamy nasze metody badawcze, ustanawiając przy tym standardy branżowe. W naszych laboratoriach testowych doświadczeni technicy i redaktorzy korzystają z wysokiej jakości sprzętu pomiarowego. Testy te obejmują wieloetapowy proces walidacji. Nasz kompleksowy system ocen opiera się na setkach uzasadnionych pomiarów i benchmarków, co pozwala zachować obiektywizm.