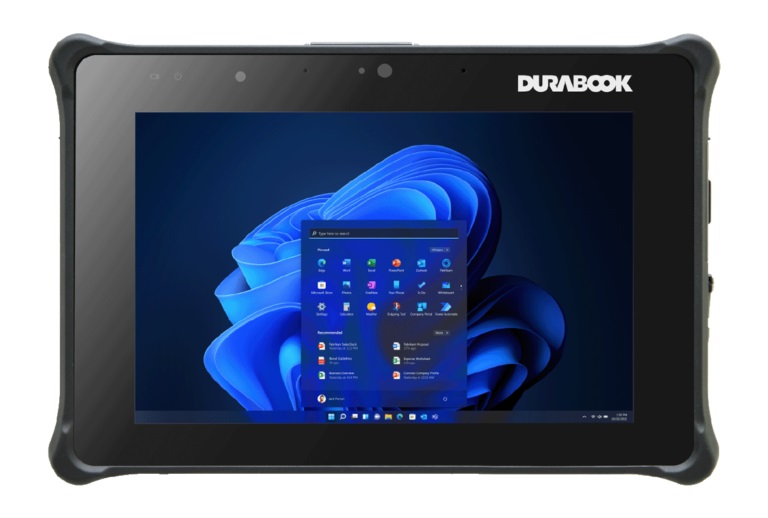
Recenzja Durabook R8: Pierwszy na świecie wytrzymały tablet bez wentylatora z procesorem Intel 12. generacji

Durabook specjalizuje się we wzmocnionych laptopach i tabletach zaprojektowanych dla wymagających środowisk, takich jak produkcja, egzekwowanie prawa, badania terenowe, agencje rządowe i inne branże poza tradycyjną przestrzenią biurową. Najnowszym modelem jest w pełni wytrzymały Durabook R8, który jest jednym z pierwszych w swojej kategorii wielkości, wyposażonym w procesory 12. generacji Alder Lake-U w obudowie bez wentylatora.
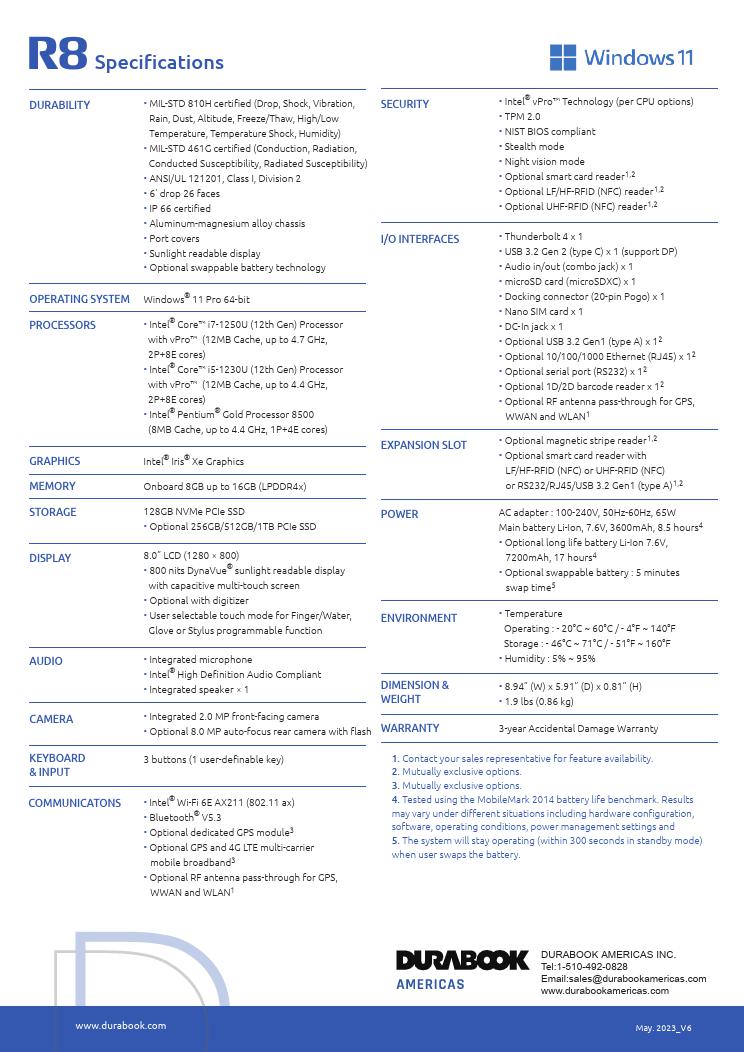
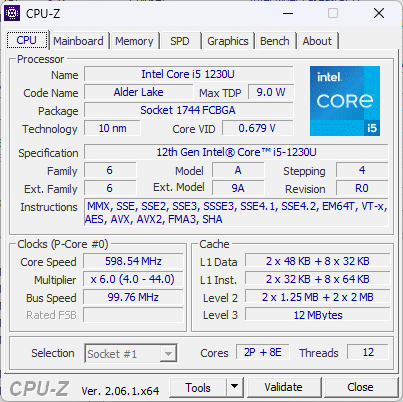
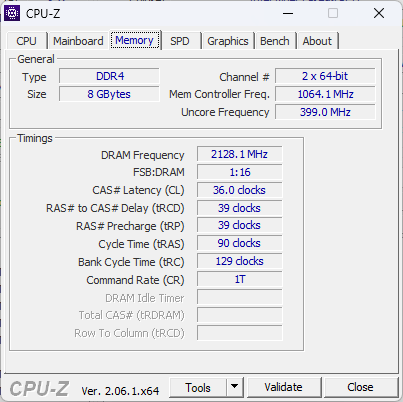
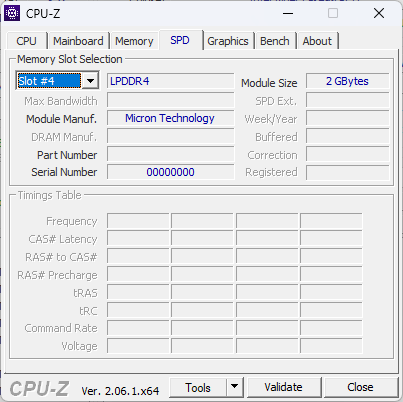
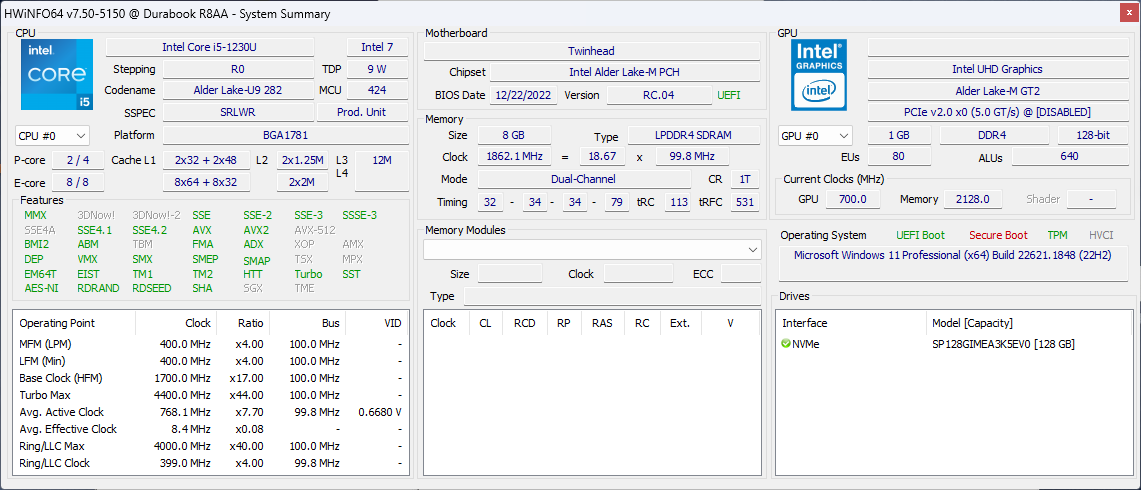
Nasz testowy egzemplarz wyposażono w procesor Core i5-1230U, 8 GB wlutowanej pamięci RAM LPDDR4x-2133 i dysk SSD o pojemności 128 GB. Inne SKU są dostępne z Pentium 8500, Core i7-1250U, 16 GB RAM lub 1 TB SSD, ale wszystkie opcje są dostarczane z tym samym 8-calowym ekranem dotykowym o rozdzielczości 1280 x 800.
Alternatywy dla Durabook R8 obejmują inne wytrzymałe tablety, takie jakAcer Enduro T1,Dell Latitude 7230 Rugged ExtremelubPanasonic Toughbook FZ-G2.
Więcej recenzji Durabook:
Potencjalni konkurenci w porównaniu
Ocena | Data | Model | Waga | Wysokość | Rozmiar | Rezolucja | Cena |
|---|---|---|---|---|---|---|---|
| 79.6 % v7 (old) | 07/2023 | Durabook R8 Tablet i5-1230U, Iris Xe G7 80EUs | 856 g | 20.6 mm | 8.00" | 1280x800 | |
v (old) | Acer Enduro T1 ET108-11A A9001 | 499 g | 10.9 mm | 8.00" | 1280x800 | ||
| 79.5 % v7 (old) | 05/2023 | Lenovo Tab M8 (Gen 4) Helio A22 MT6761, PowerVR GE8300 | 320 g | 9 mm | 8.00" | 1280x800 | |
| 83.9 % v7 (old) | 04/2023 | Dell Latitude 7230 Rugged Extreme i5-1240U, Iris Xe G7 80EUs | 1.6 kg | 23.9 mm | 12.00" | 1920x1200 | |
v (old) | Panasonic Toughbook FZ-G2 i5-10310U, UHD Graphics 620 | 1.5 kg | 28 mm | 10.10" | 1920x1200 |
Etui - Durable Durabook
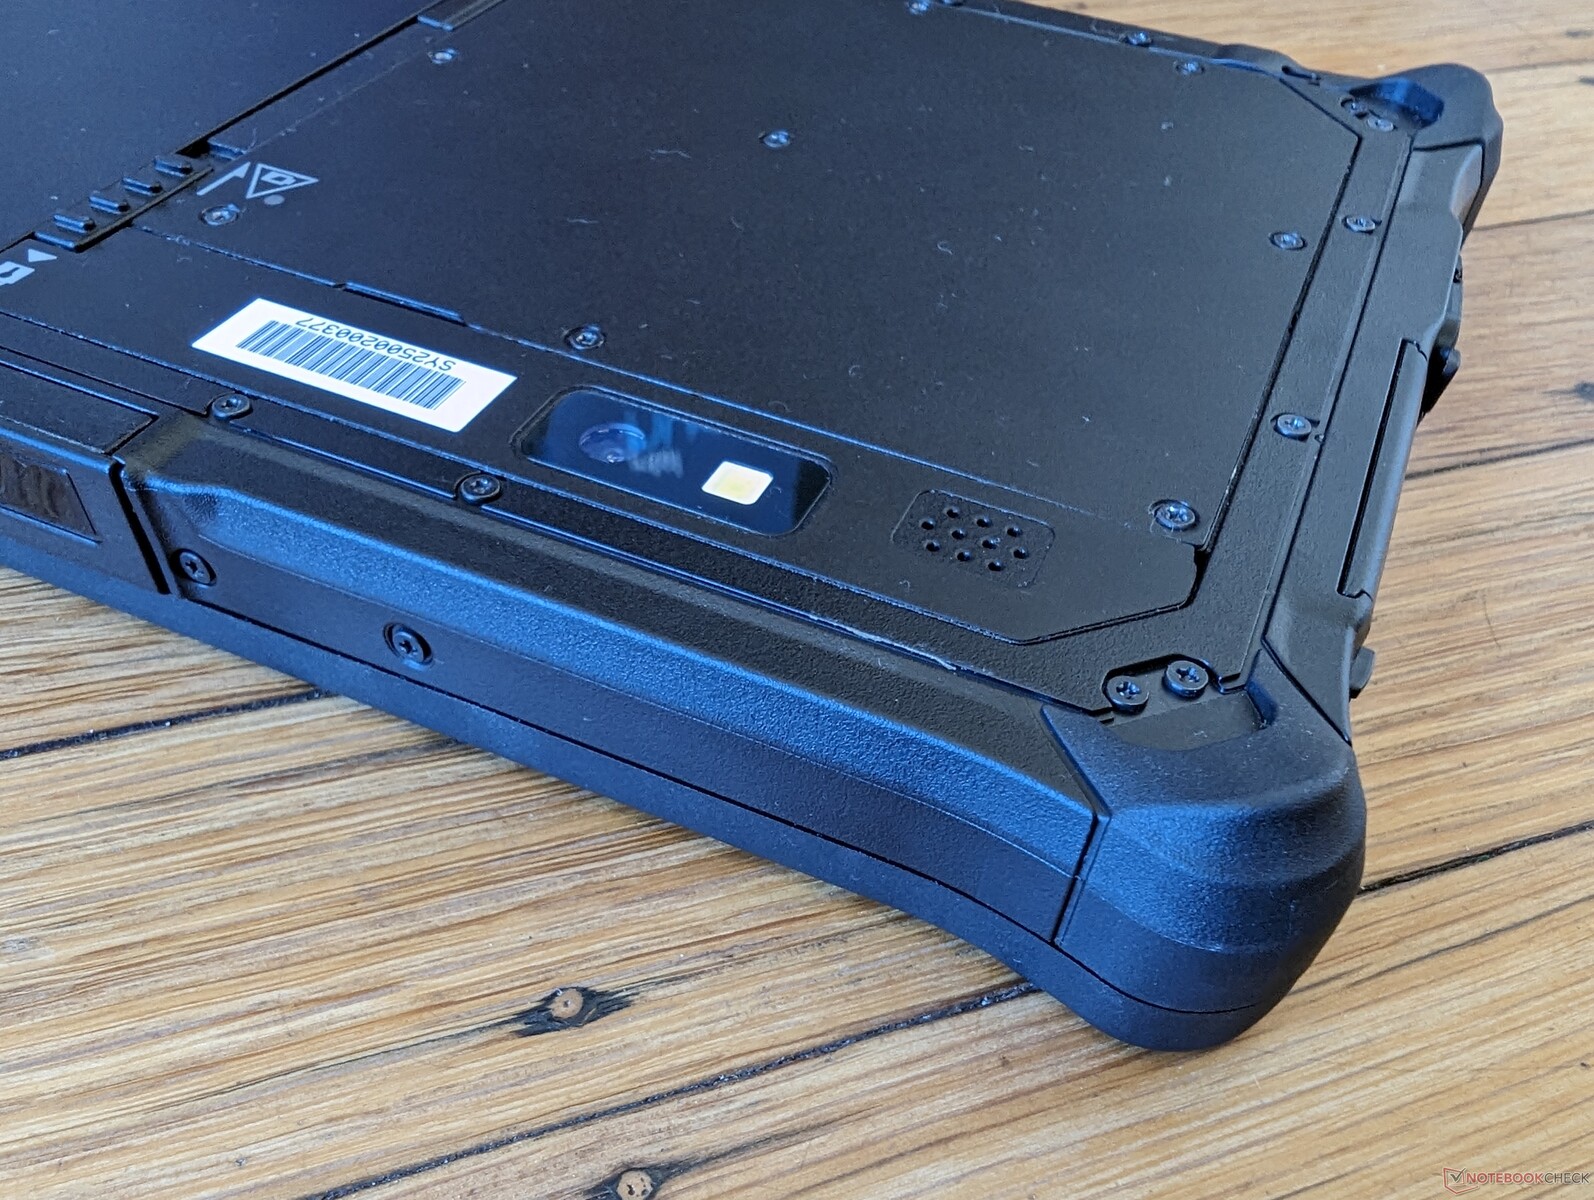
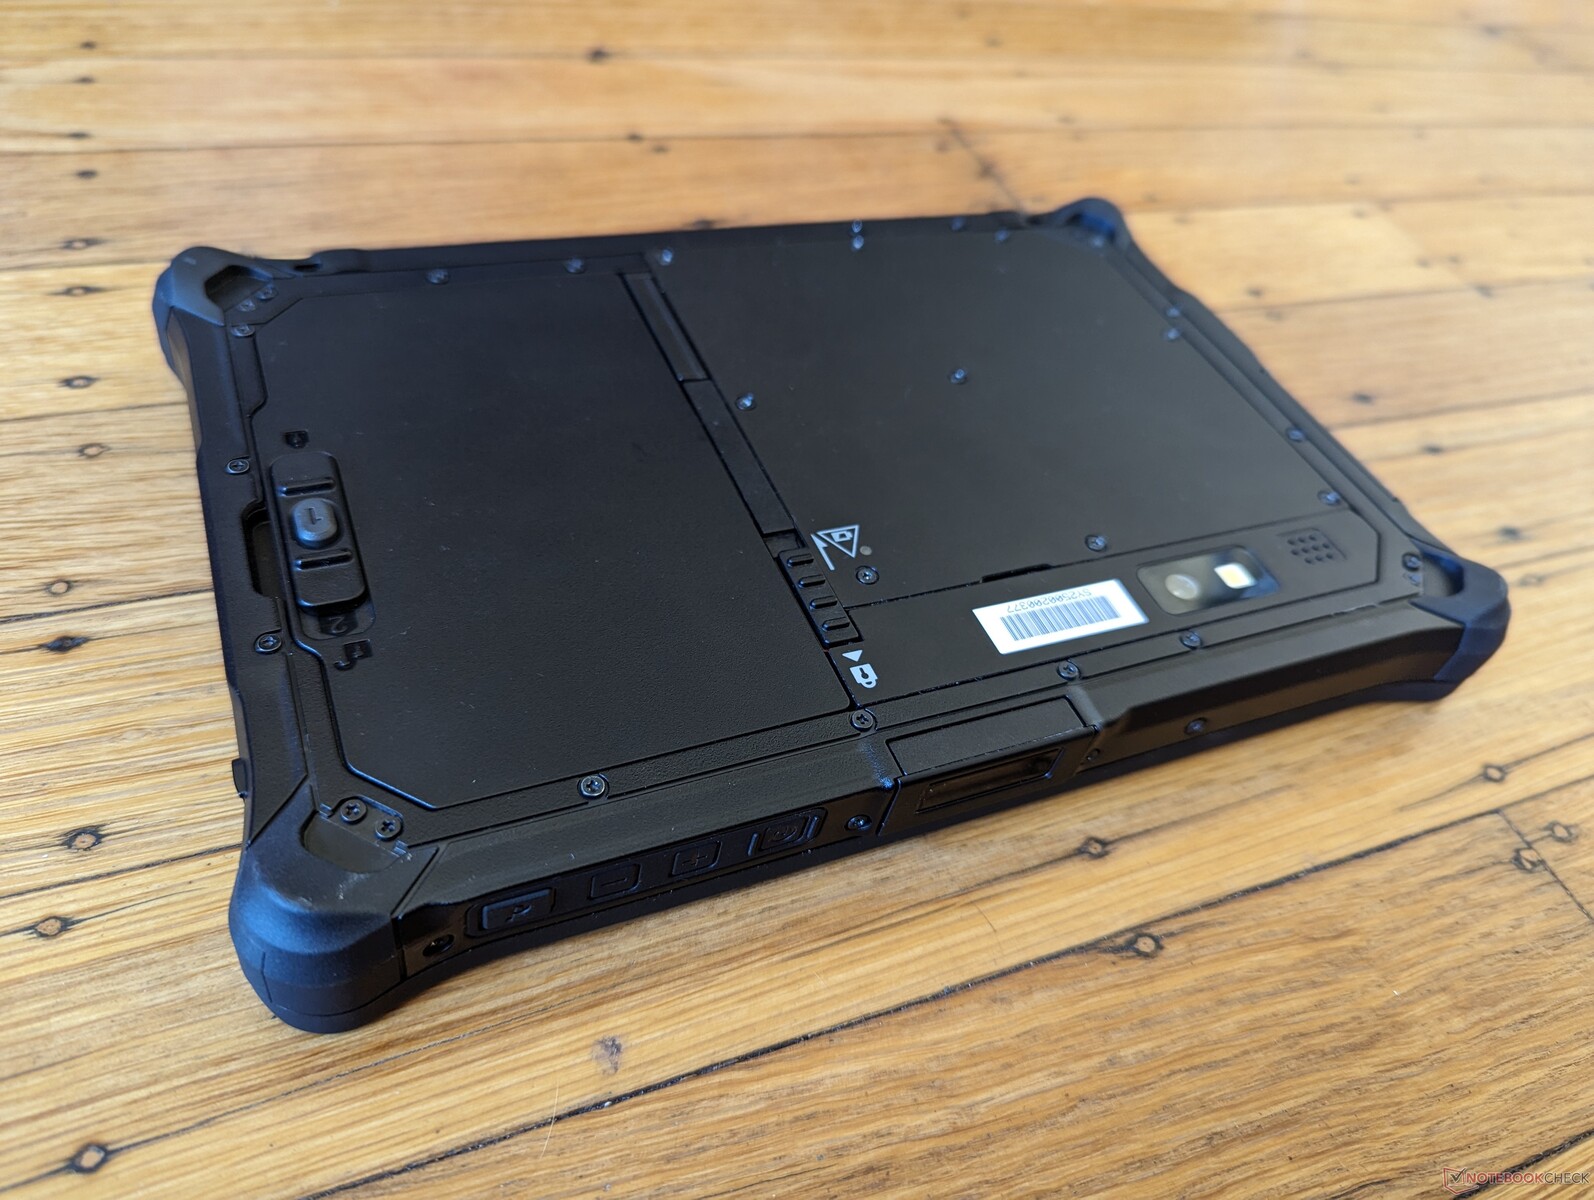
Obudowa jest zgodna z normami MIL-STD 810H, MIL-STD 461G i IP66 w zakresie odporności na różne czynniki środowiskowe. Próba przekręcenia tabletu z narożników lub wciśnięcia środka ekranu nie spowodowałaby zauważalnego skrzypienia lub wypaczenia, co zapewnia solidne pierwsze wrażenia.
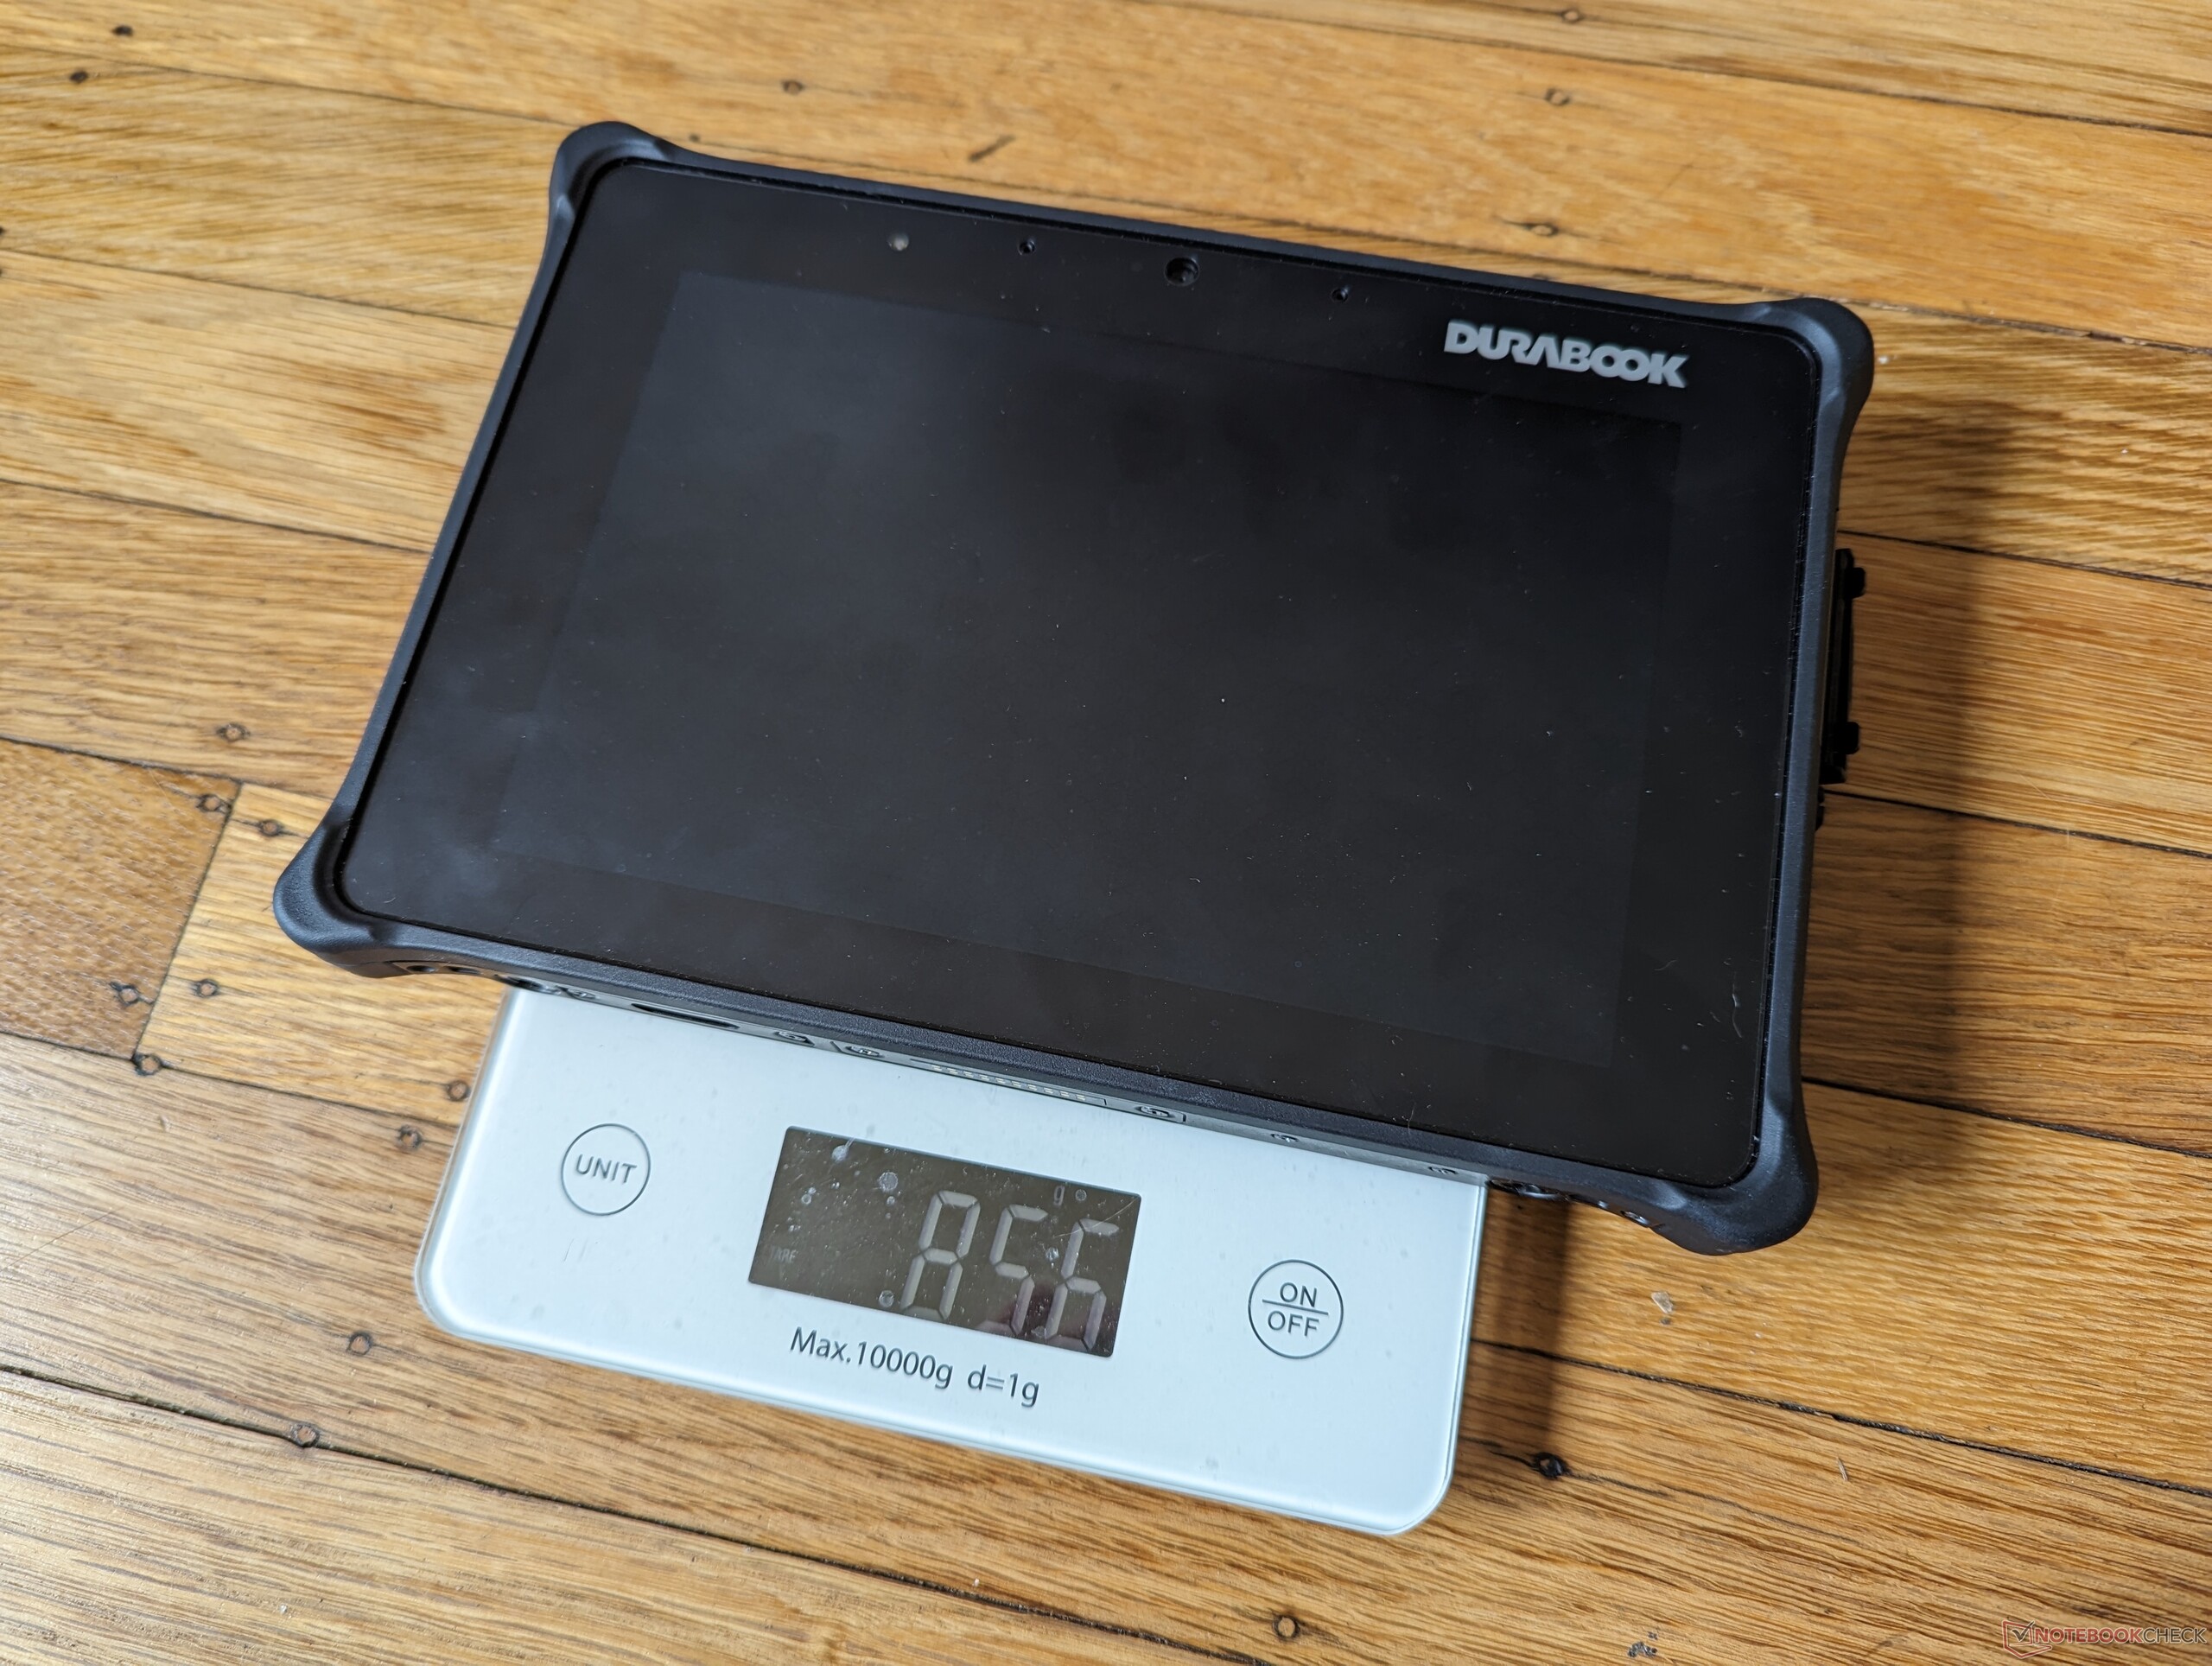
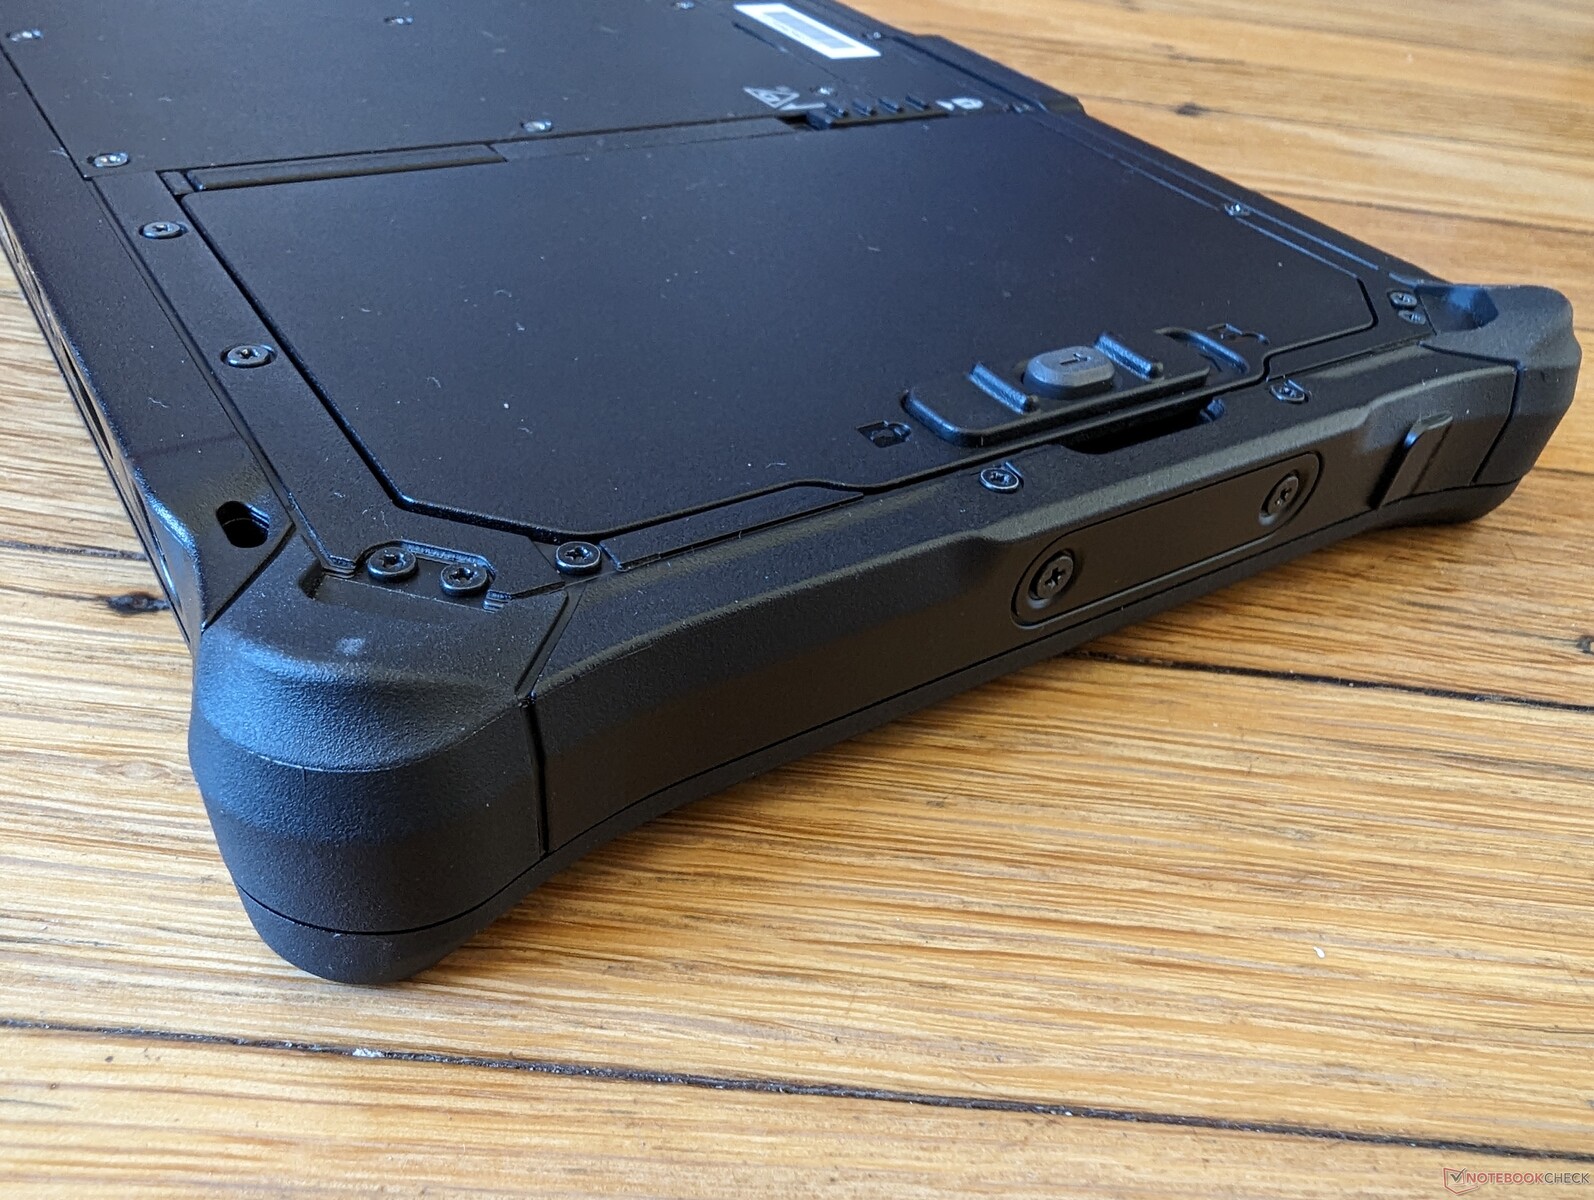
W pełni wytrzymała specyfikacja niewątpliwie zwiększa wagę i grubość konstrukcji. W porównaniu na przykład do konkurencyjnego Acer Enduro T1, nasz Durabook jest prawie dwa razy grubszy i cięższy, mimo że oba mają 8-calowe ekrany dotykowe.
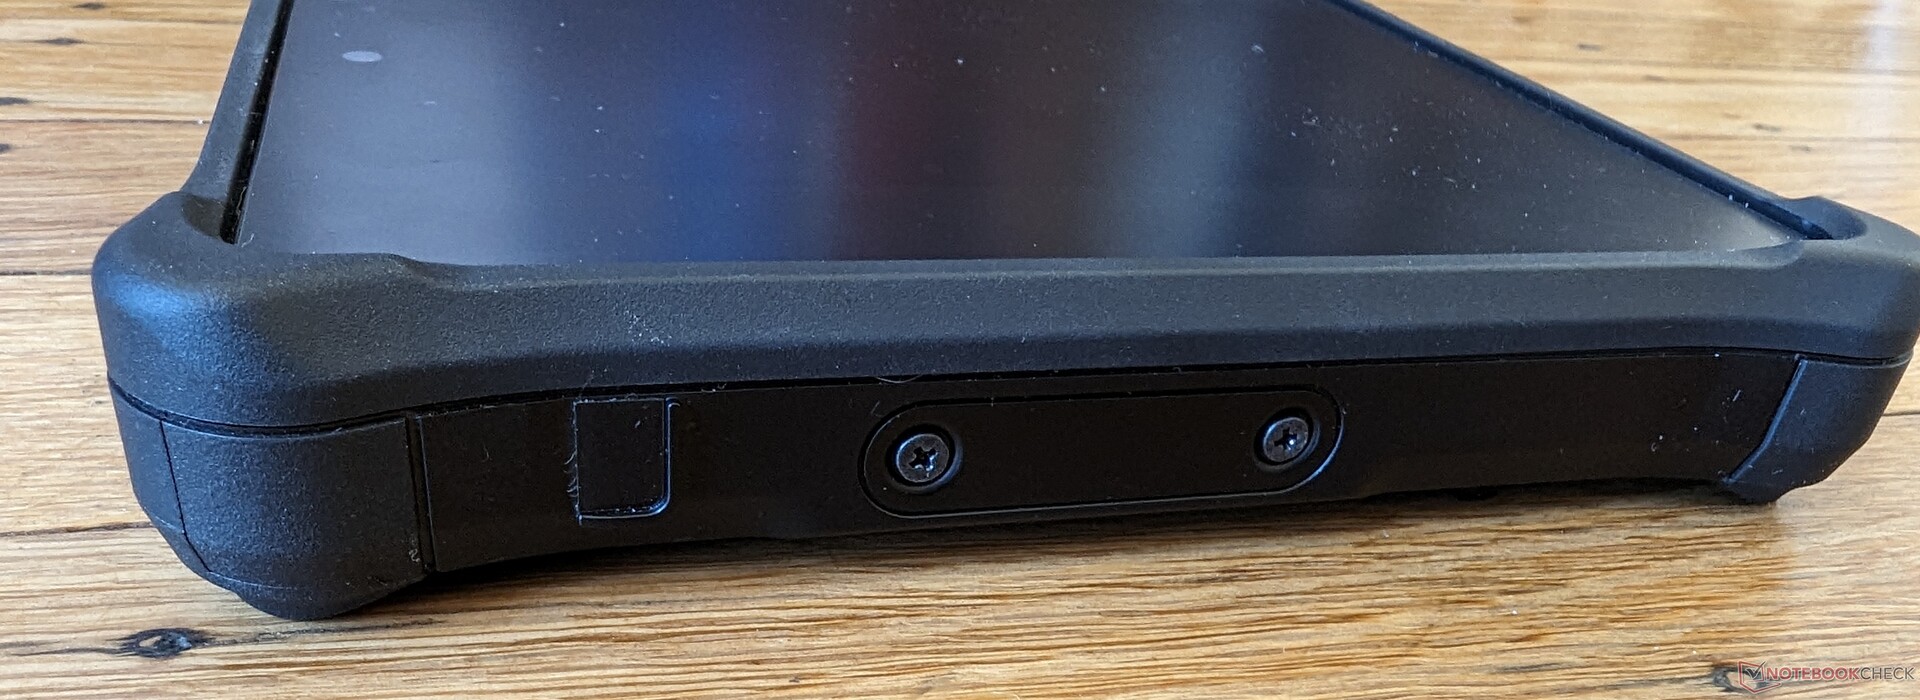
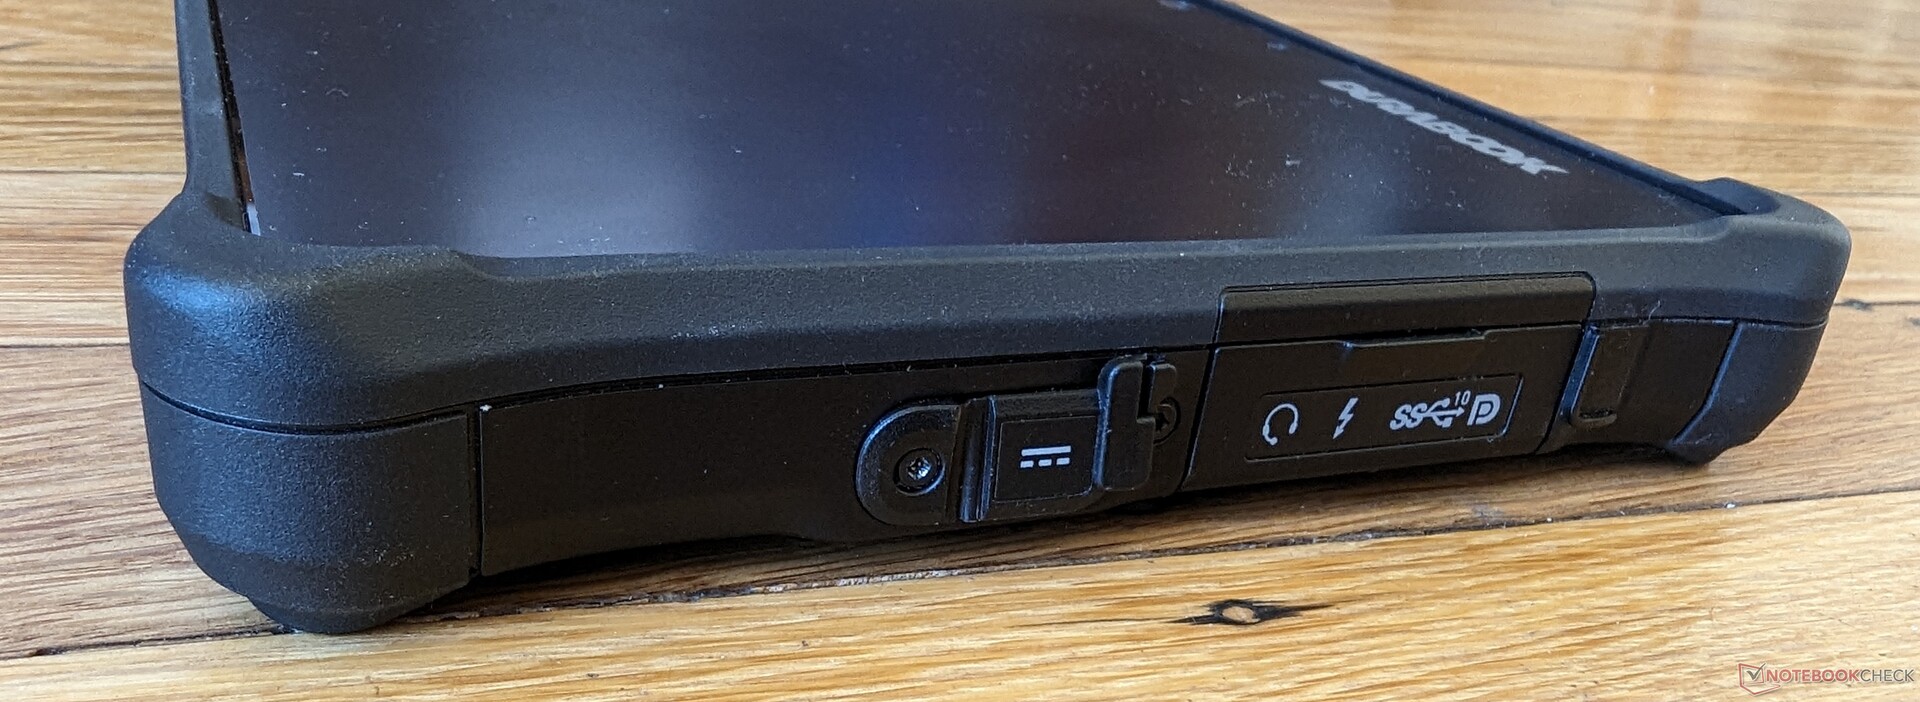
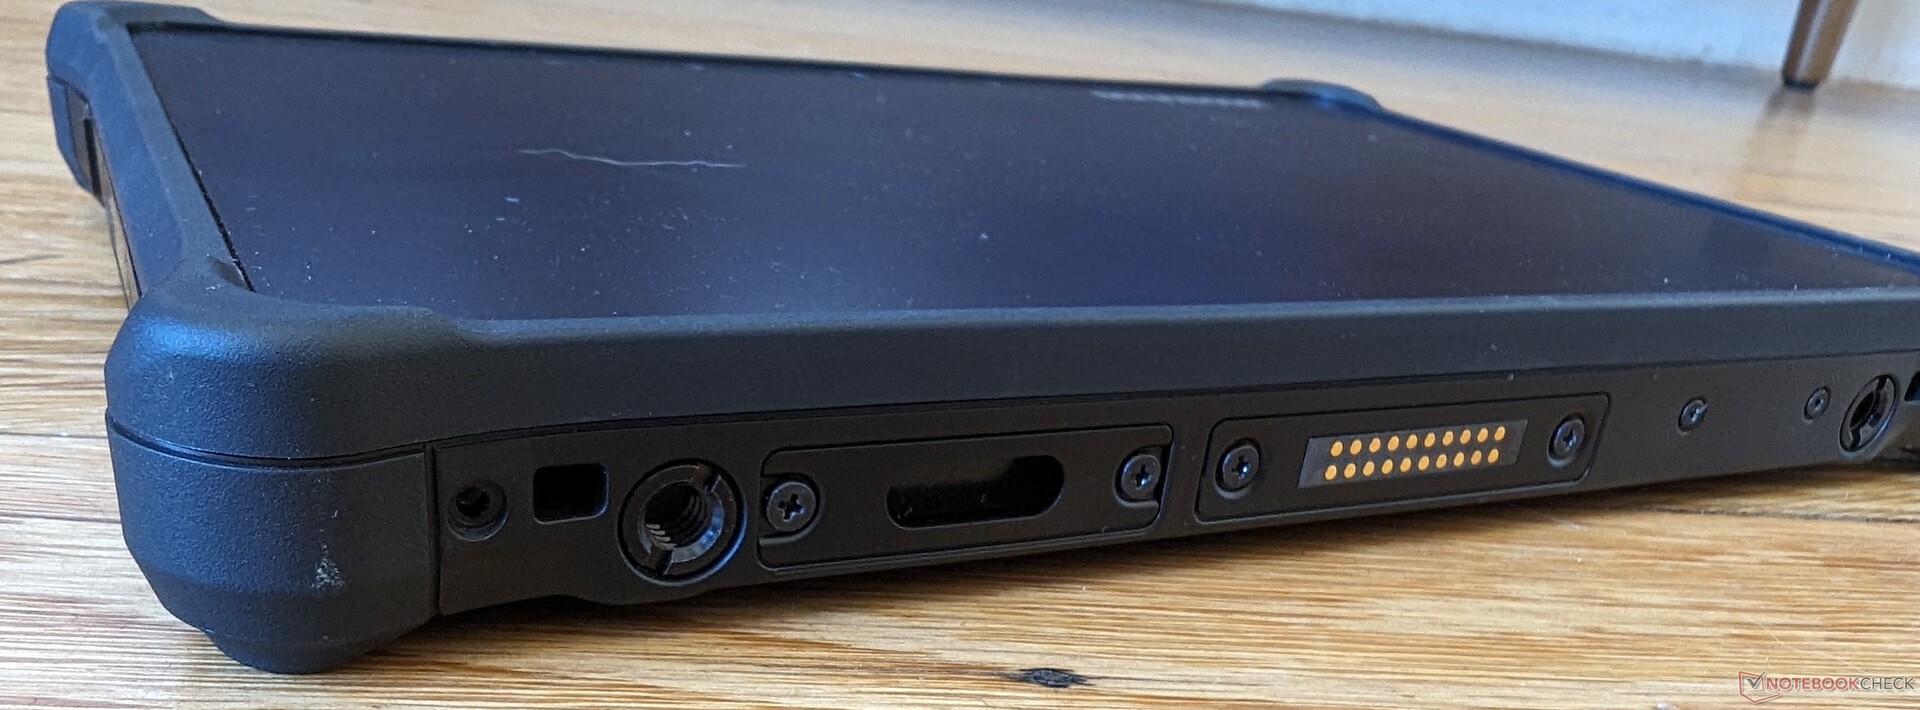
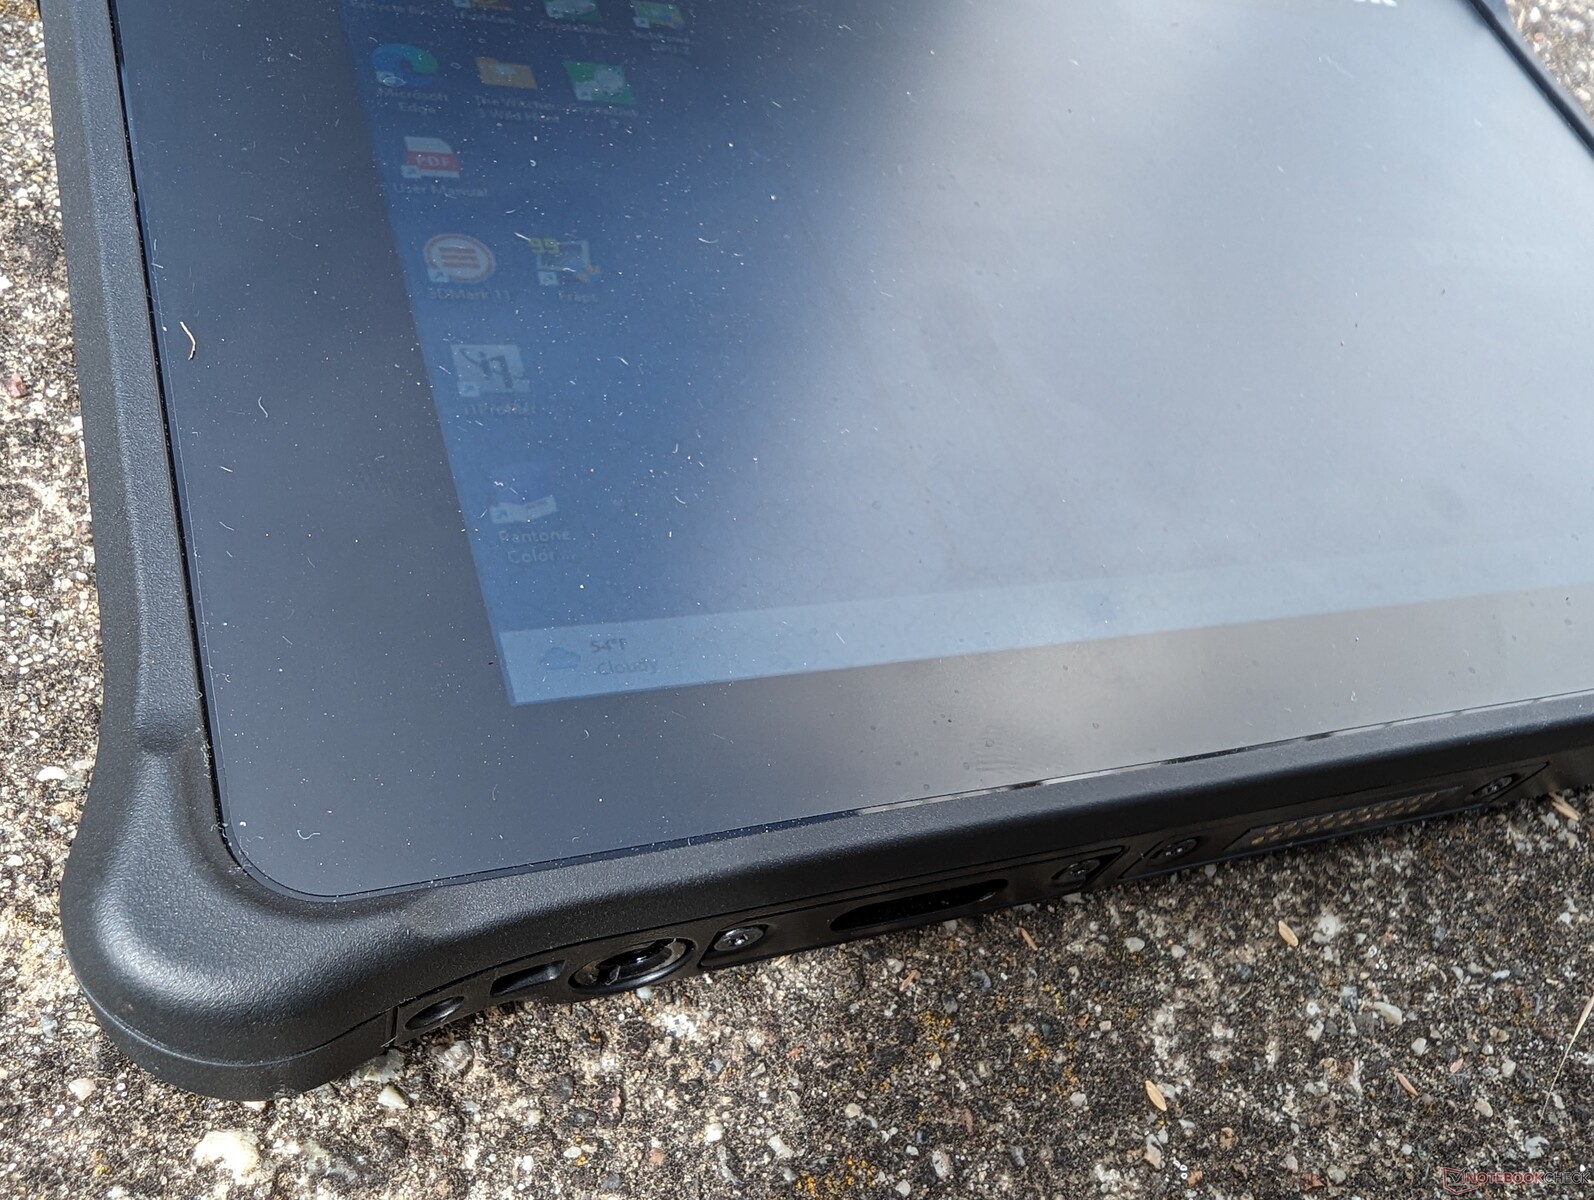
Łączność - obsługa Thunderbolt 4
Kilka portów jest standardem we wszystkich jednostkach SKU, a niektóre można dodać za dodatkową opłatą, w tym USB-A, Gigabit RJ-45, RS232 lub czytnik kodów kreskowych.
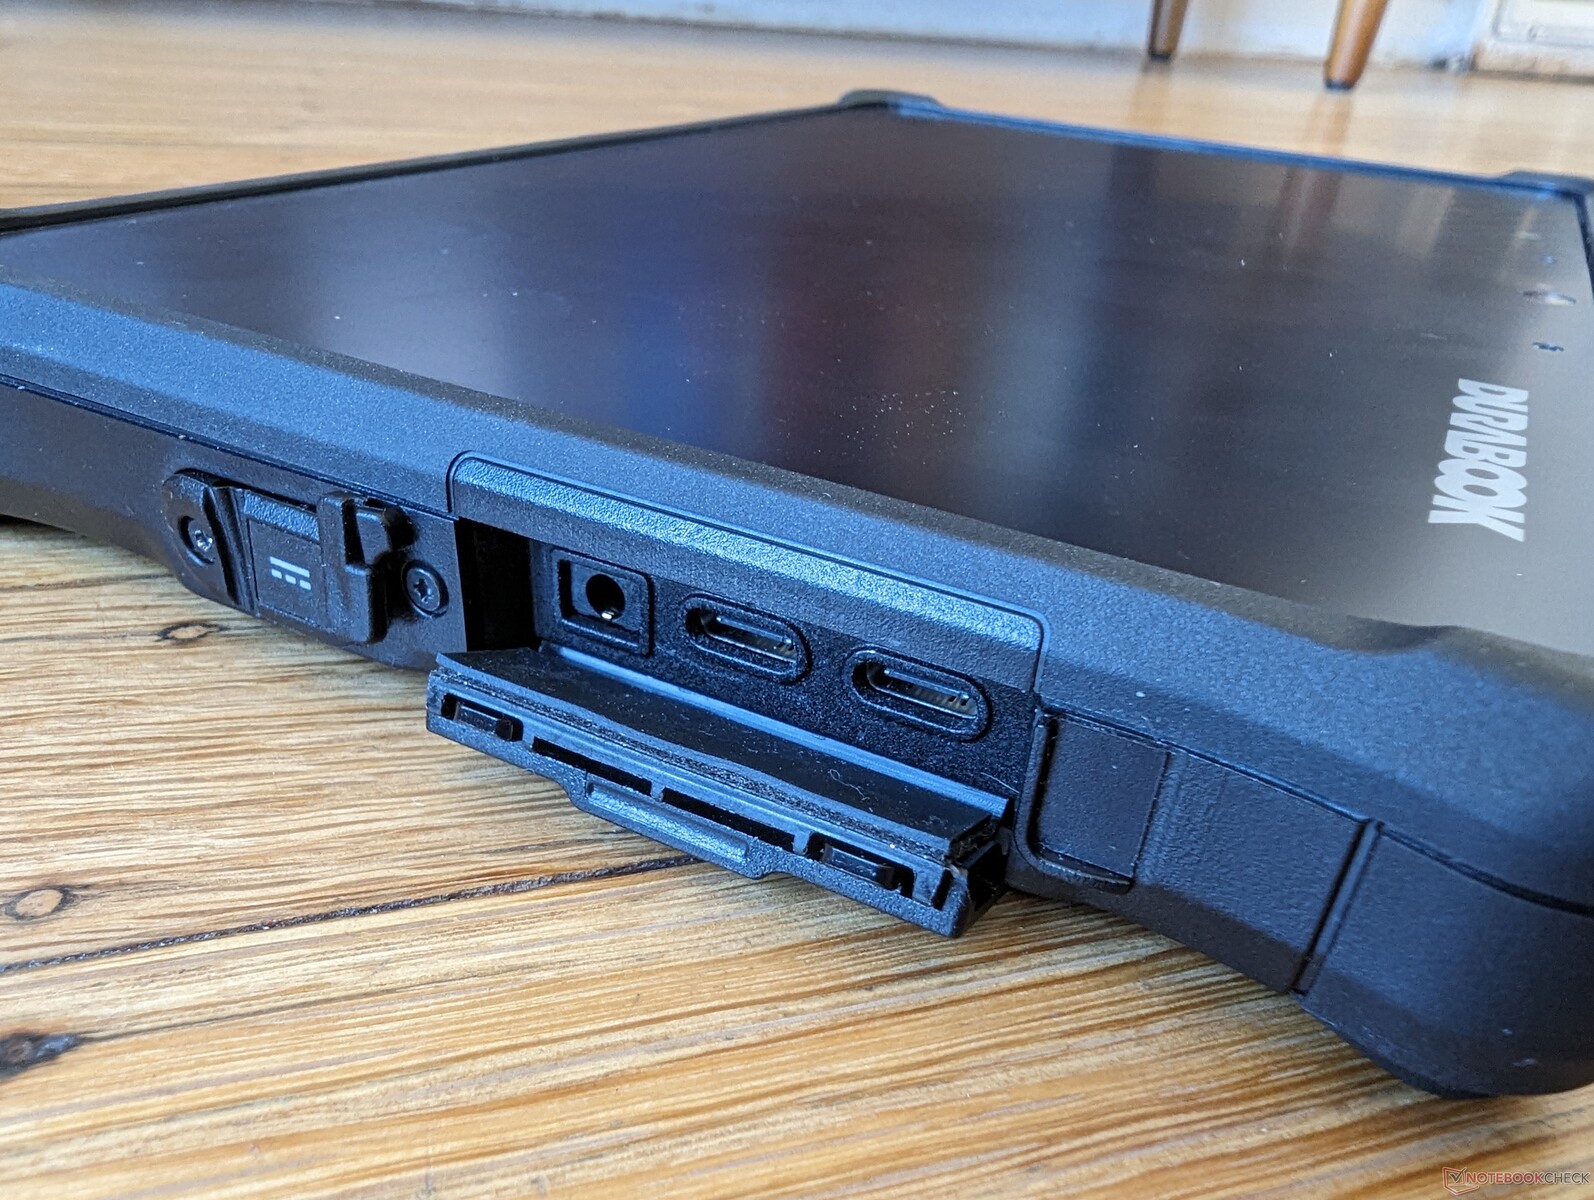
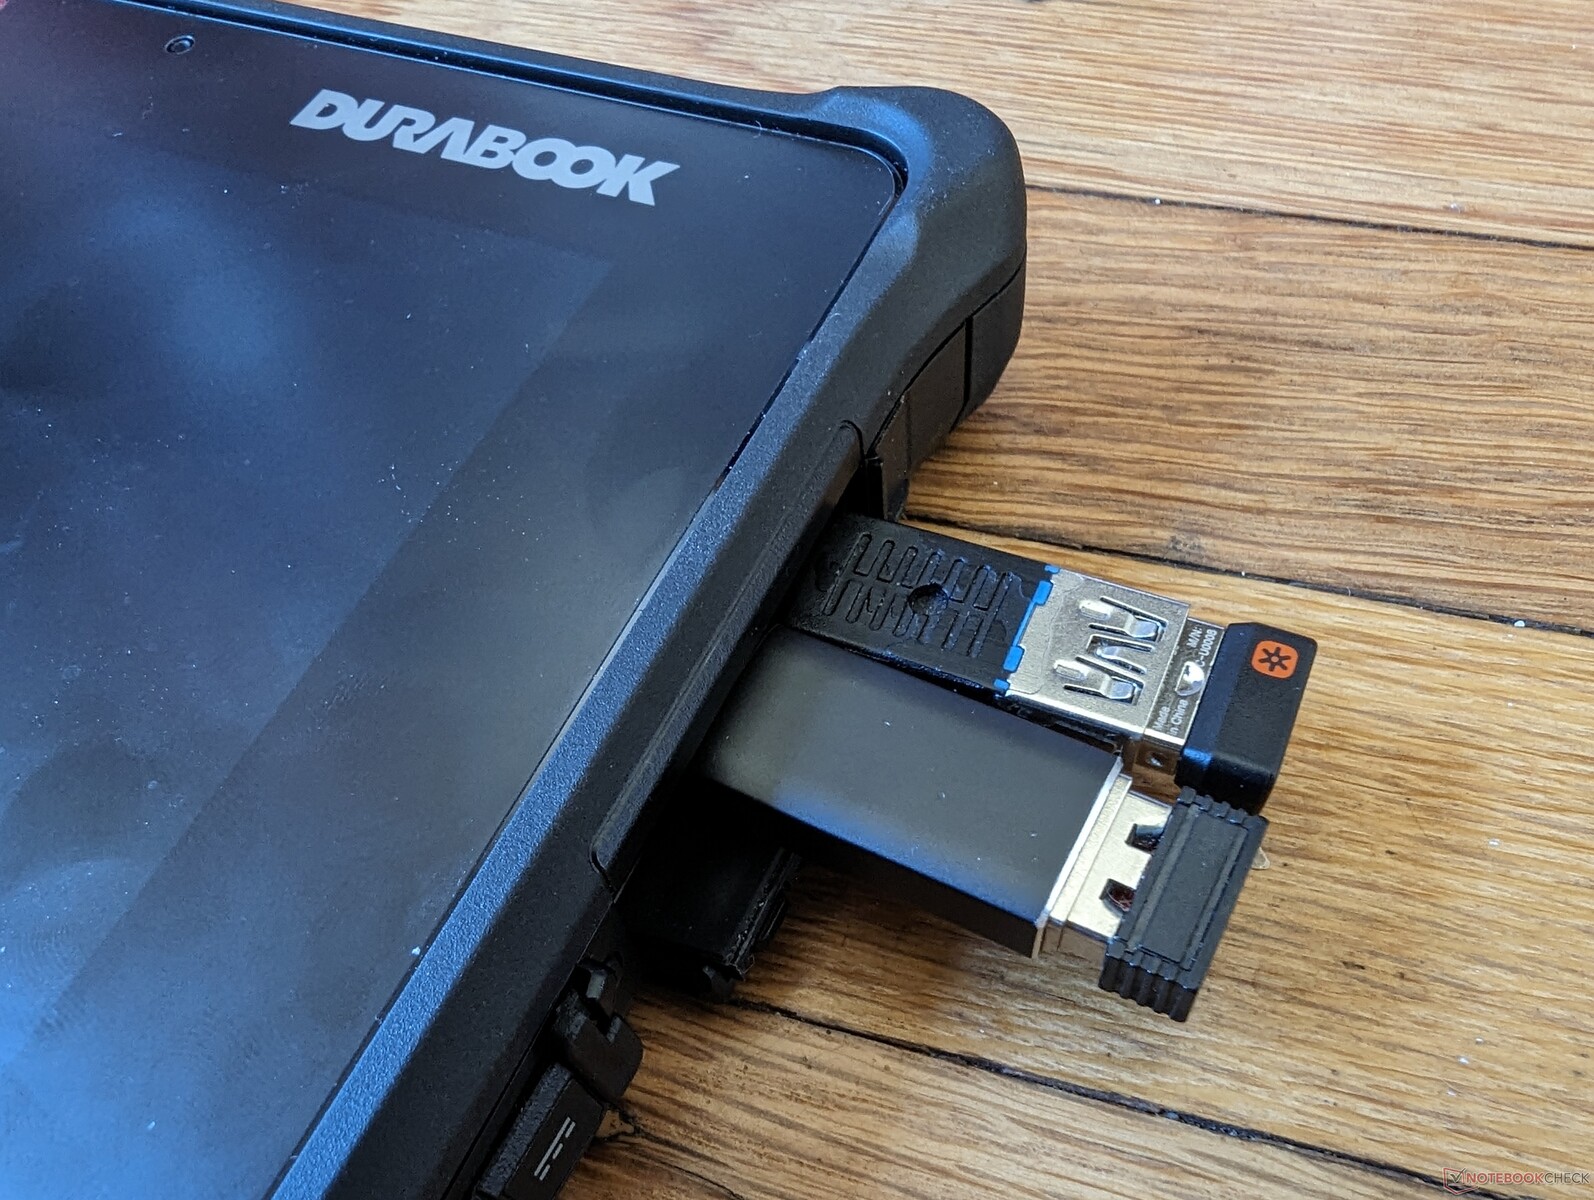
Jeden z dwóch portów USB-C obsługuje Thunderbolt 4 dla szerokiej gamy kompatybilnych urządzeń zewnętrznych. Jednak tylko jeden z portów obsługuje Power Delivery. Porty są zbyt ciasno upakowane, więc niektóre grubsze kable USB-C lub adaptery mogą częściowo blokować dostęp do innych portów, jak pokazano na obrazku po prawej stronie.
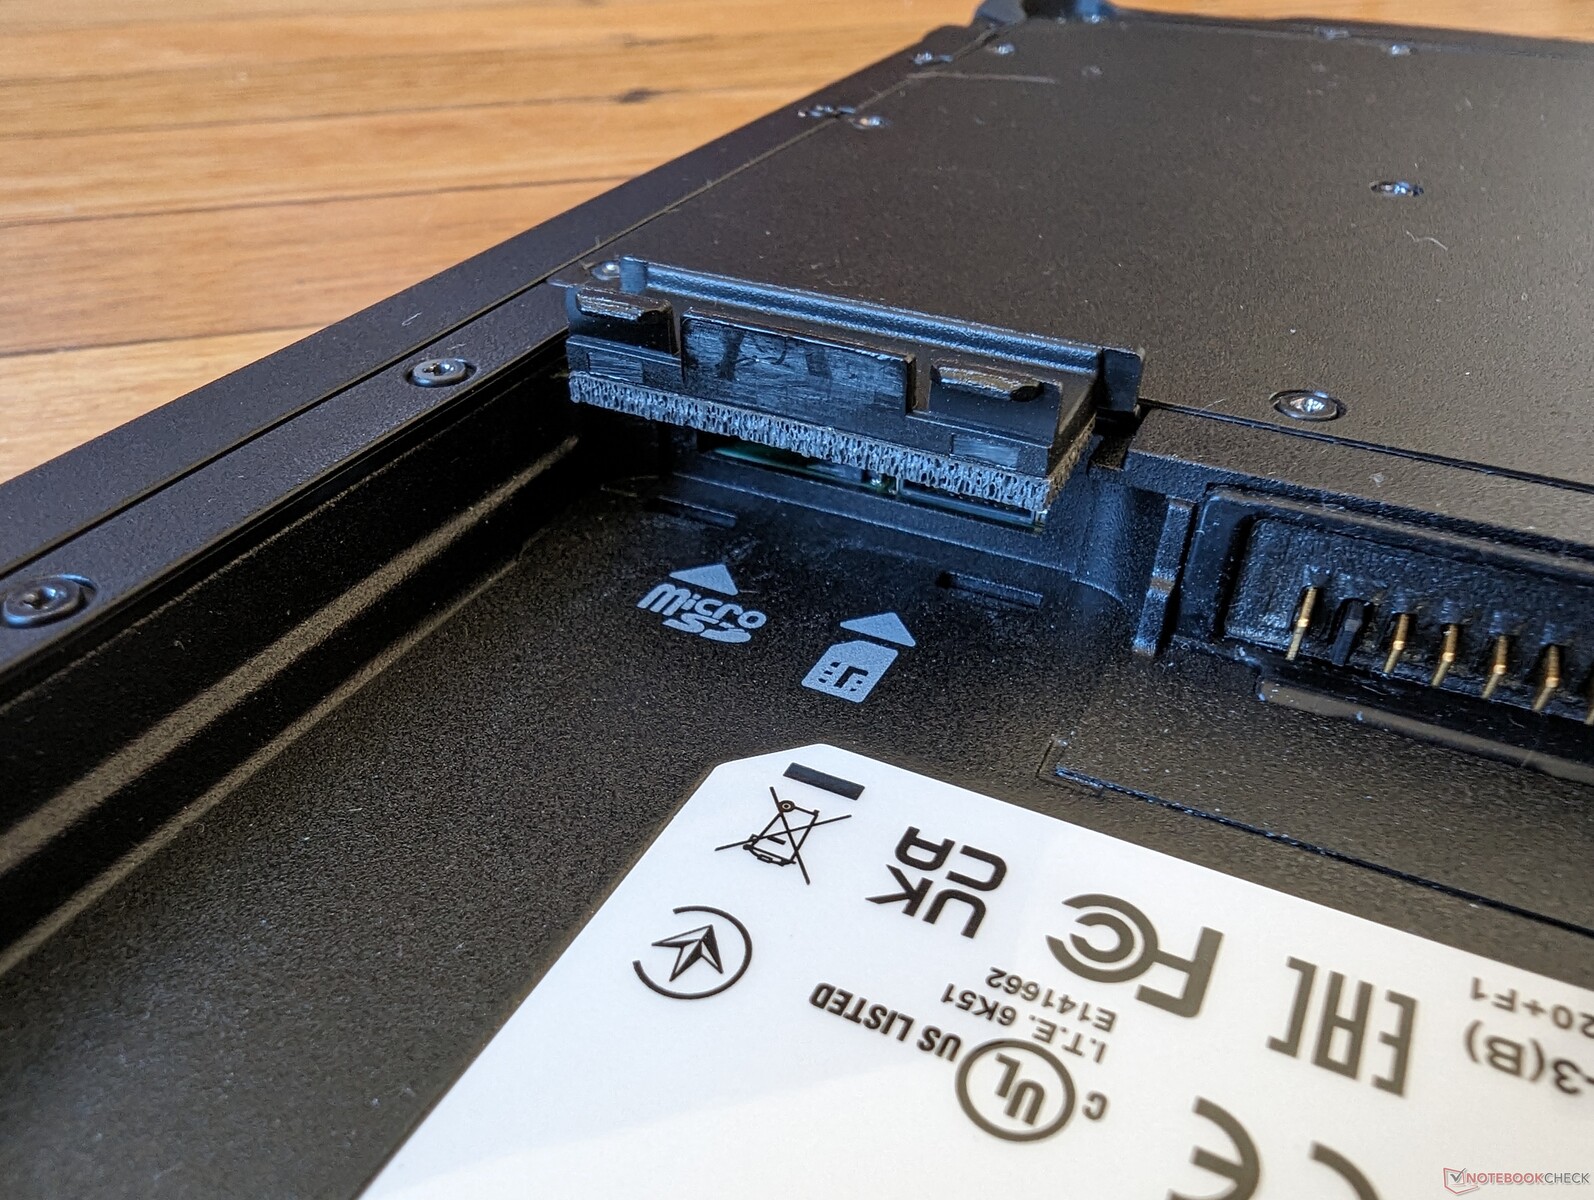
Czytnik kart SD - karta MicroSD może się zablokować
Sprężyna zwalniająca zintegrowany czytnik kart SD jest bardzo słaba w porównaniu do czytników kart w większości innych laptopów i tabletów. Nasza testowa karta MicroSD zablokowała się i wymagała użycia pęsety do jej ostrożnego wyjęcia.
| SD Card Reader | |
| average JPG Copy Test (av. of 3 runs) | |
| Dell Latitude 7230 Rugged Extreme (AV Pro V60) | |
| Durabook R8 Tablet (AV Pro V60) | |
| Lenovo Tab M8 (Gen 4) (Angelbird V60) | |
| maximum AS SSD Seq Read Test (1GB) | |
| Dell Latitude 7230 Rugged Extreme (AV Pro V60) | |
| Durabook R8 Tablet (AV Pro V60) | |
Komunikacja
Intel AX211 jest standardowo wyposażony w Wi-Fi 6E i Bluetooth 5.3. Prędkości transferu są stabilne i bezproblemowe.
| Networking | |
| iperf3 transmit AX12 | |
| Panasonic Toughbook FZ-G2 | |
| Acer Enduro T1 ET108-11A A9001 | |
| iperf3 receive AX12 | |
| Panasonic Toughbook FZ-G2 | |
| Acer Enduro T1 ET108-11A A9001 | |
| iperf3 transmit AXE11000 | |
| Durabook R8 Tablet | |
| Dell Latitude 7230 Rugged Extreme | |
| Lenovo Tab M8 (Gen 4) | |
| iperf3 receive AXE11000 | |
| Durabook R8 Tablet | |
| Dell Latitude 7230 Rugged Extreme | |
| Lenovo Tab M8 (Gen 4) | |
| iperf3 transmit AXE11000 6GHz | |
| Dell Latitude 7230 Rugged Extreme | |
| Durabook R8 Tablet | |
| iperf3 receive AXE11000 6GHz | |
| Durabook R8 Tablet | |
| Dell Latitude 7230 Rugged Extreme | |
Kamera internetowa
Przednia kamera 2 MP jest standardem, podczas gdy tylna kamera 8 MP z lampą błyskową jest opcjonalnym ulepszeniem. Jakość obrazu jest ostrzejsza niż w przypadku kamer internetowych w laptopach, ale jakość wideo jest ograniczona do 1080p i 30 FPS pomimo wyższej rozdzielczości czujnika.


Konserwacja
Akcesoria i gwarancja
Pudełko detaliczne zawiera pasywny rysik i smycz na nadgarstek. Opcjonalne akcesoria są bardzo rozbudowane i obejmują m.in. specjalistyczną stację dokującą z dodatkowymi portami, zapasową baterię o większej pojemności, wnęki do ładowania baterii, czytniki kart inteligentnych, różne rodzaje zasilaczy sieciowych i wiele innych, które można znaleźć na stronie https://media.durabook.com/wp-content/uploads/2023/06/13125656/Solutions-Guide-R8-US-06-2023.pdf.
Trzyletnia gwarancja na przypadkowe uszkodzenia jest standardem.
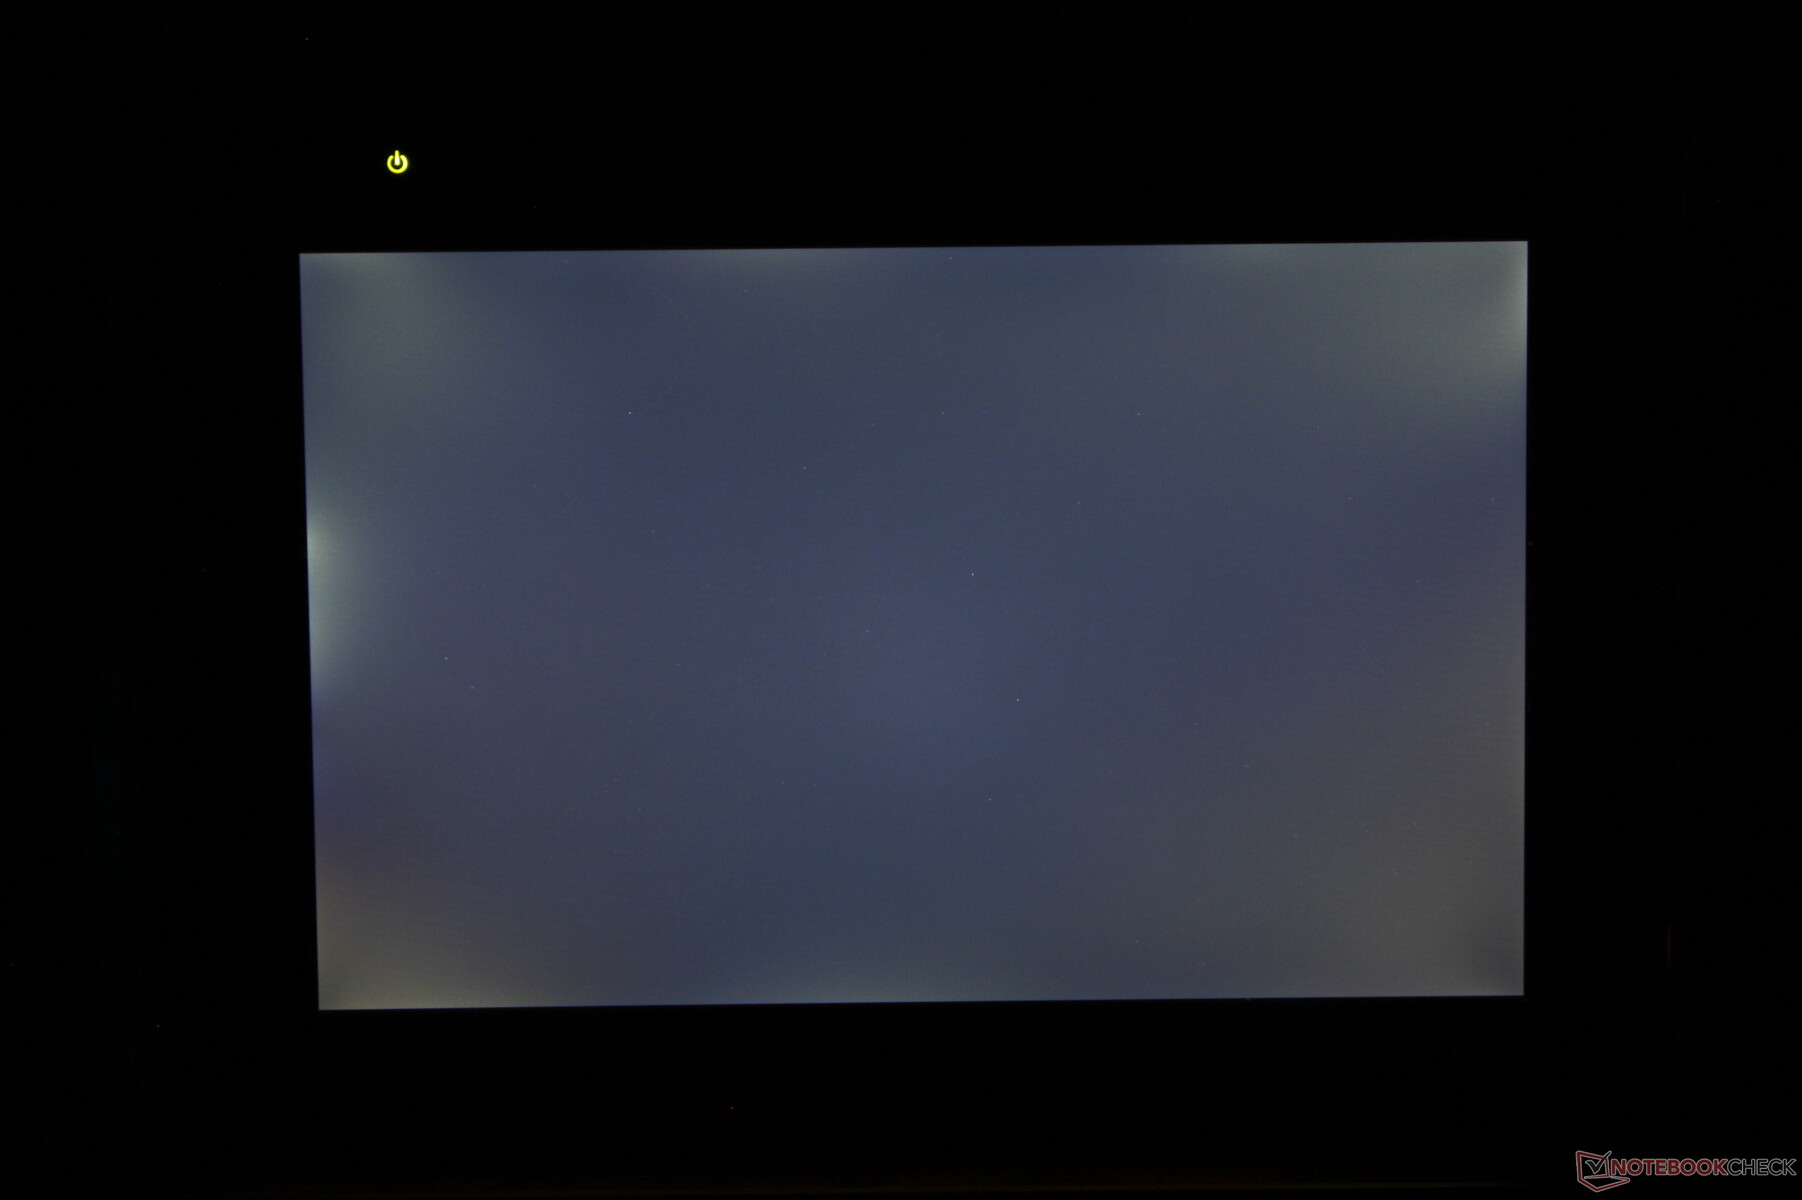
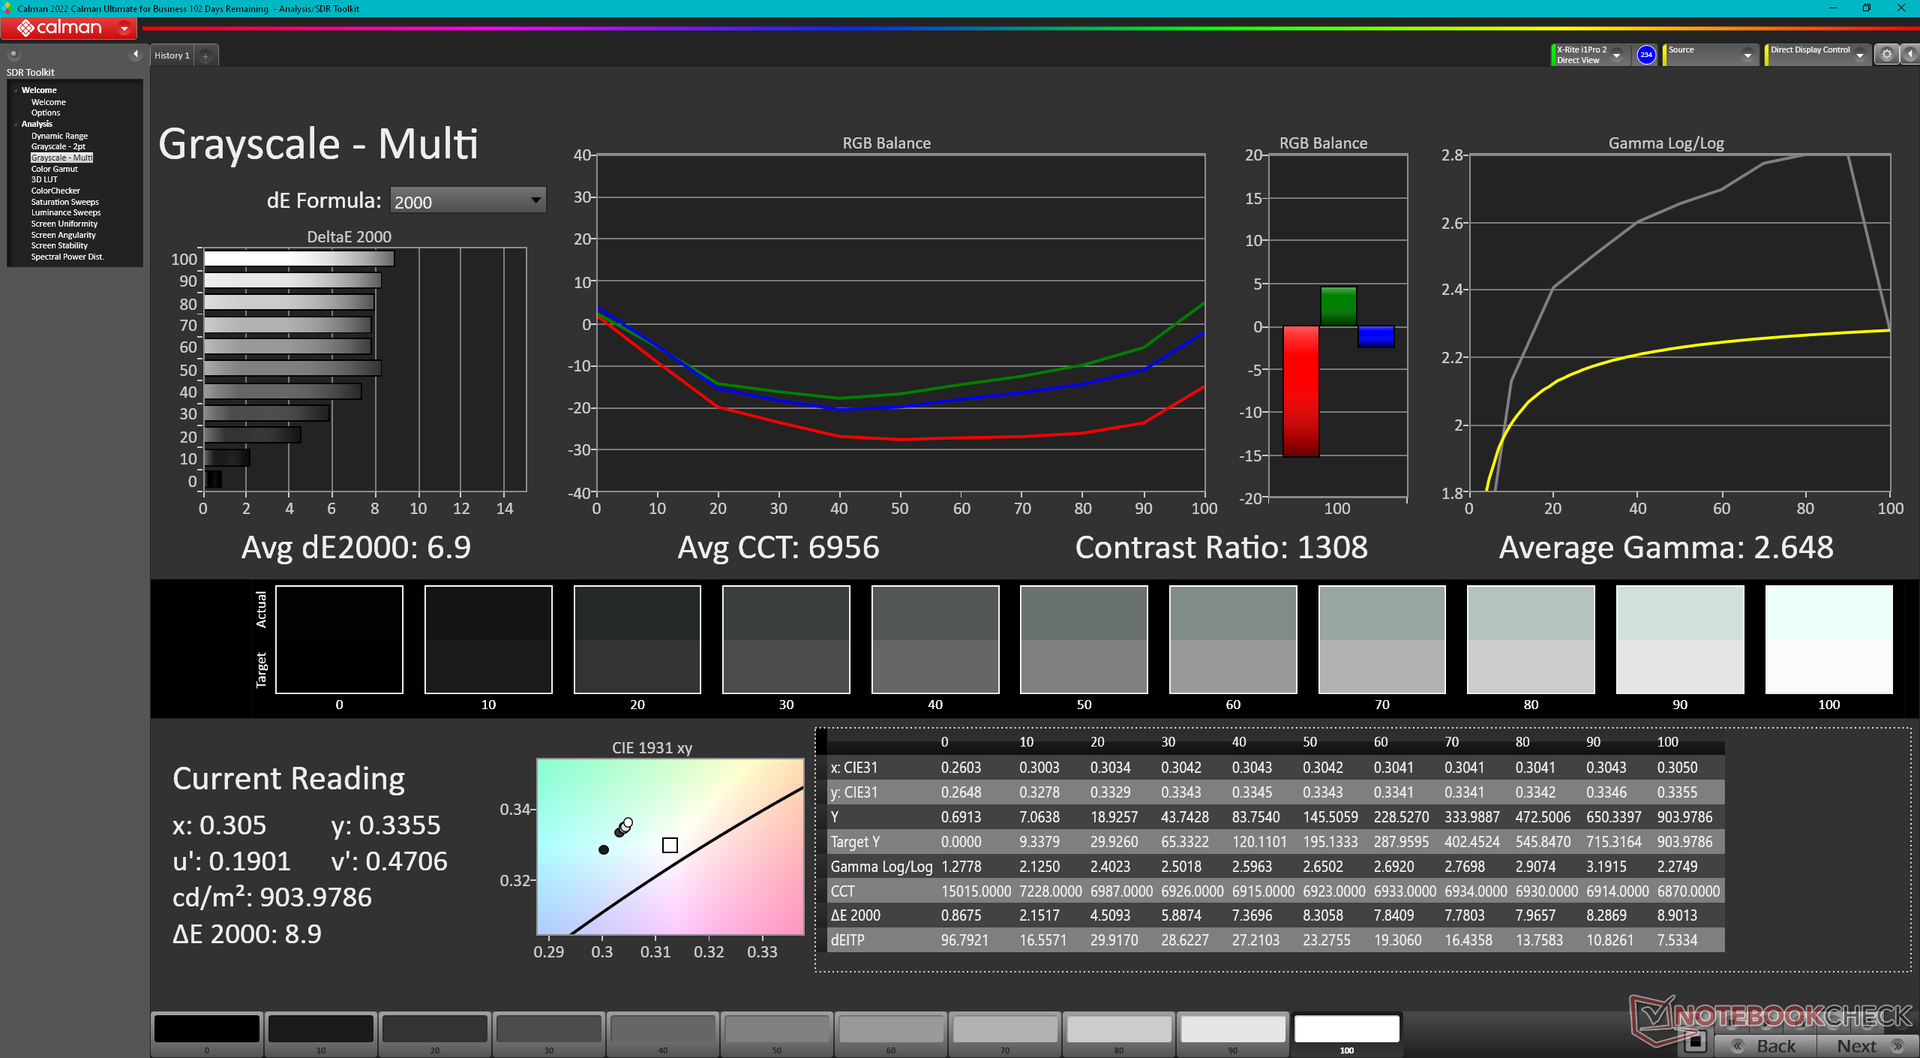
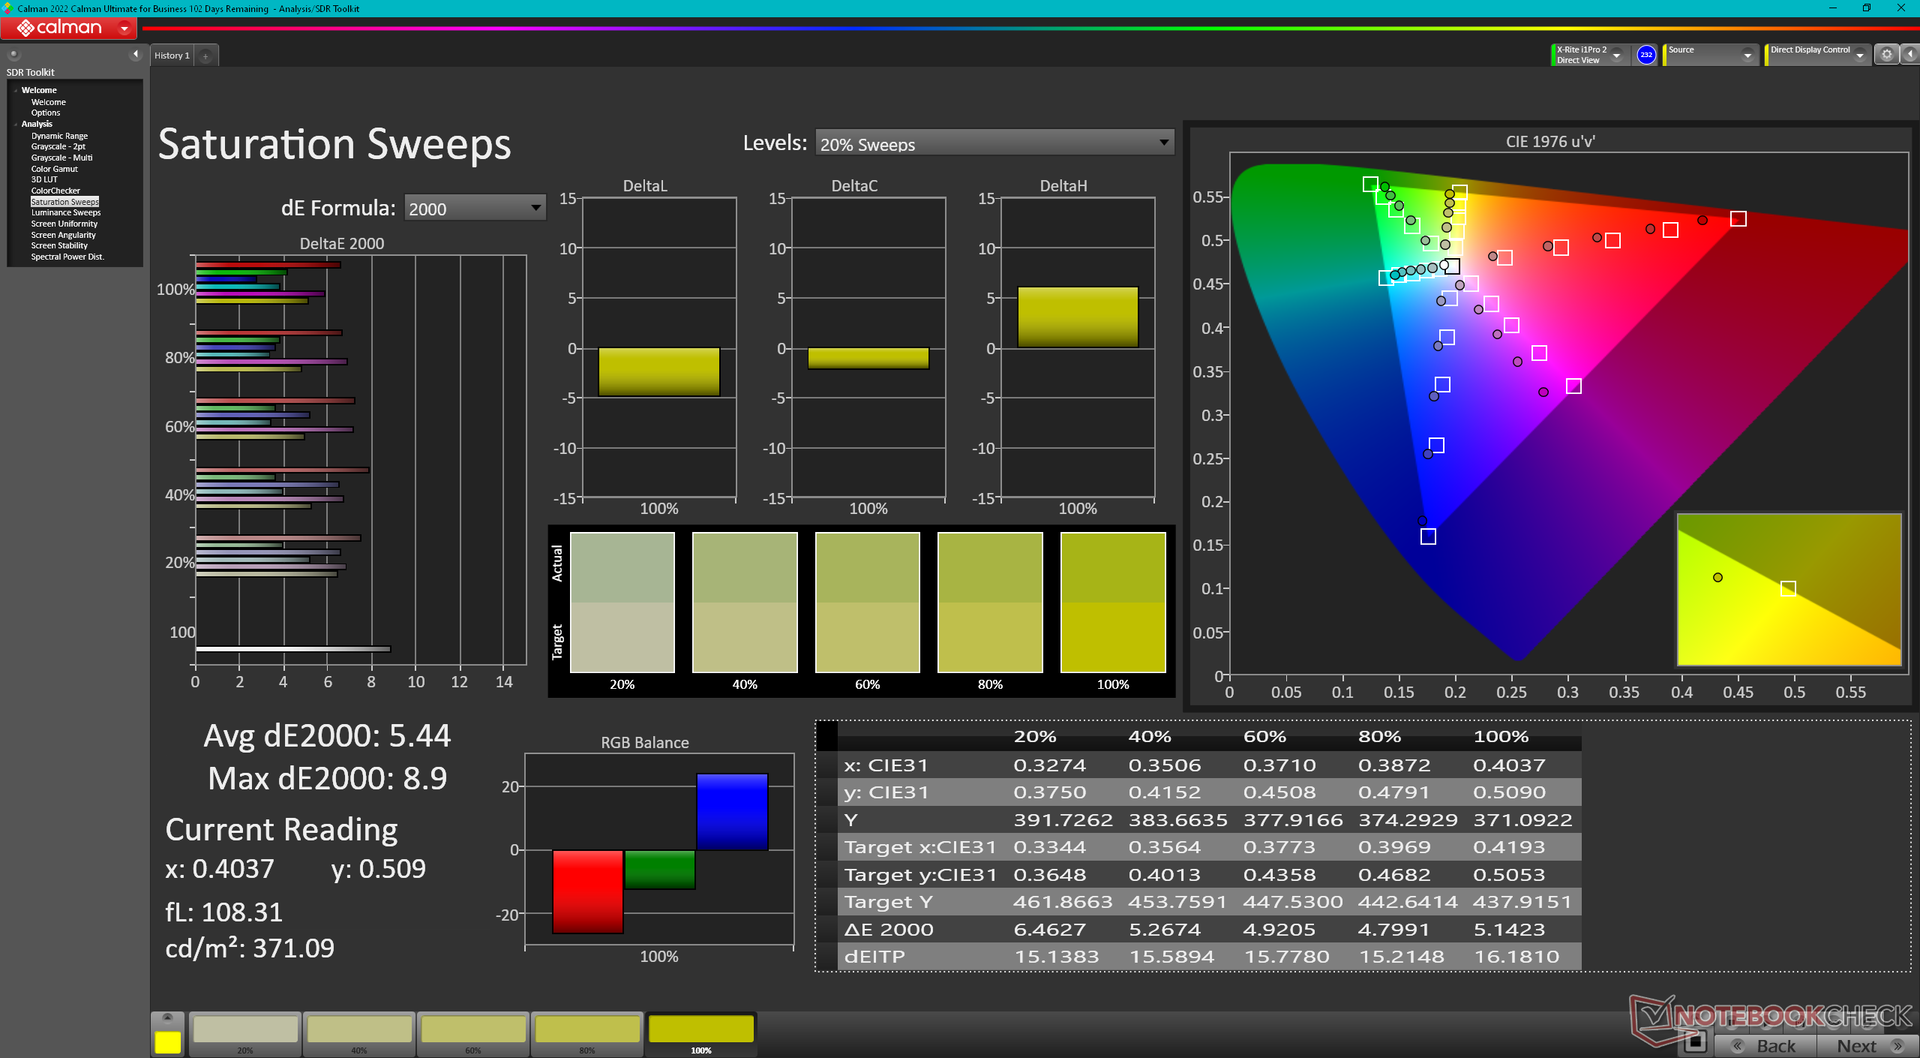
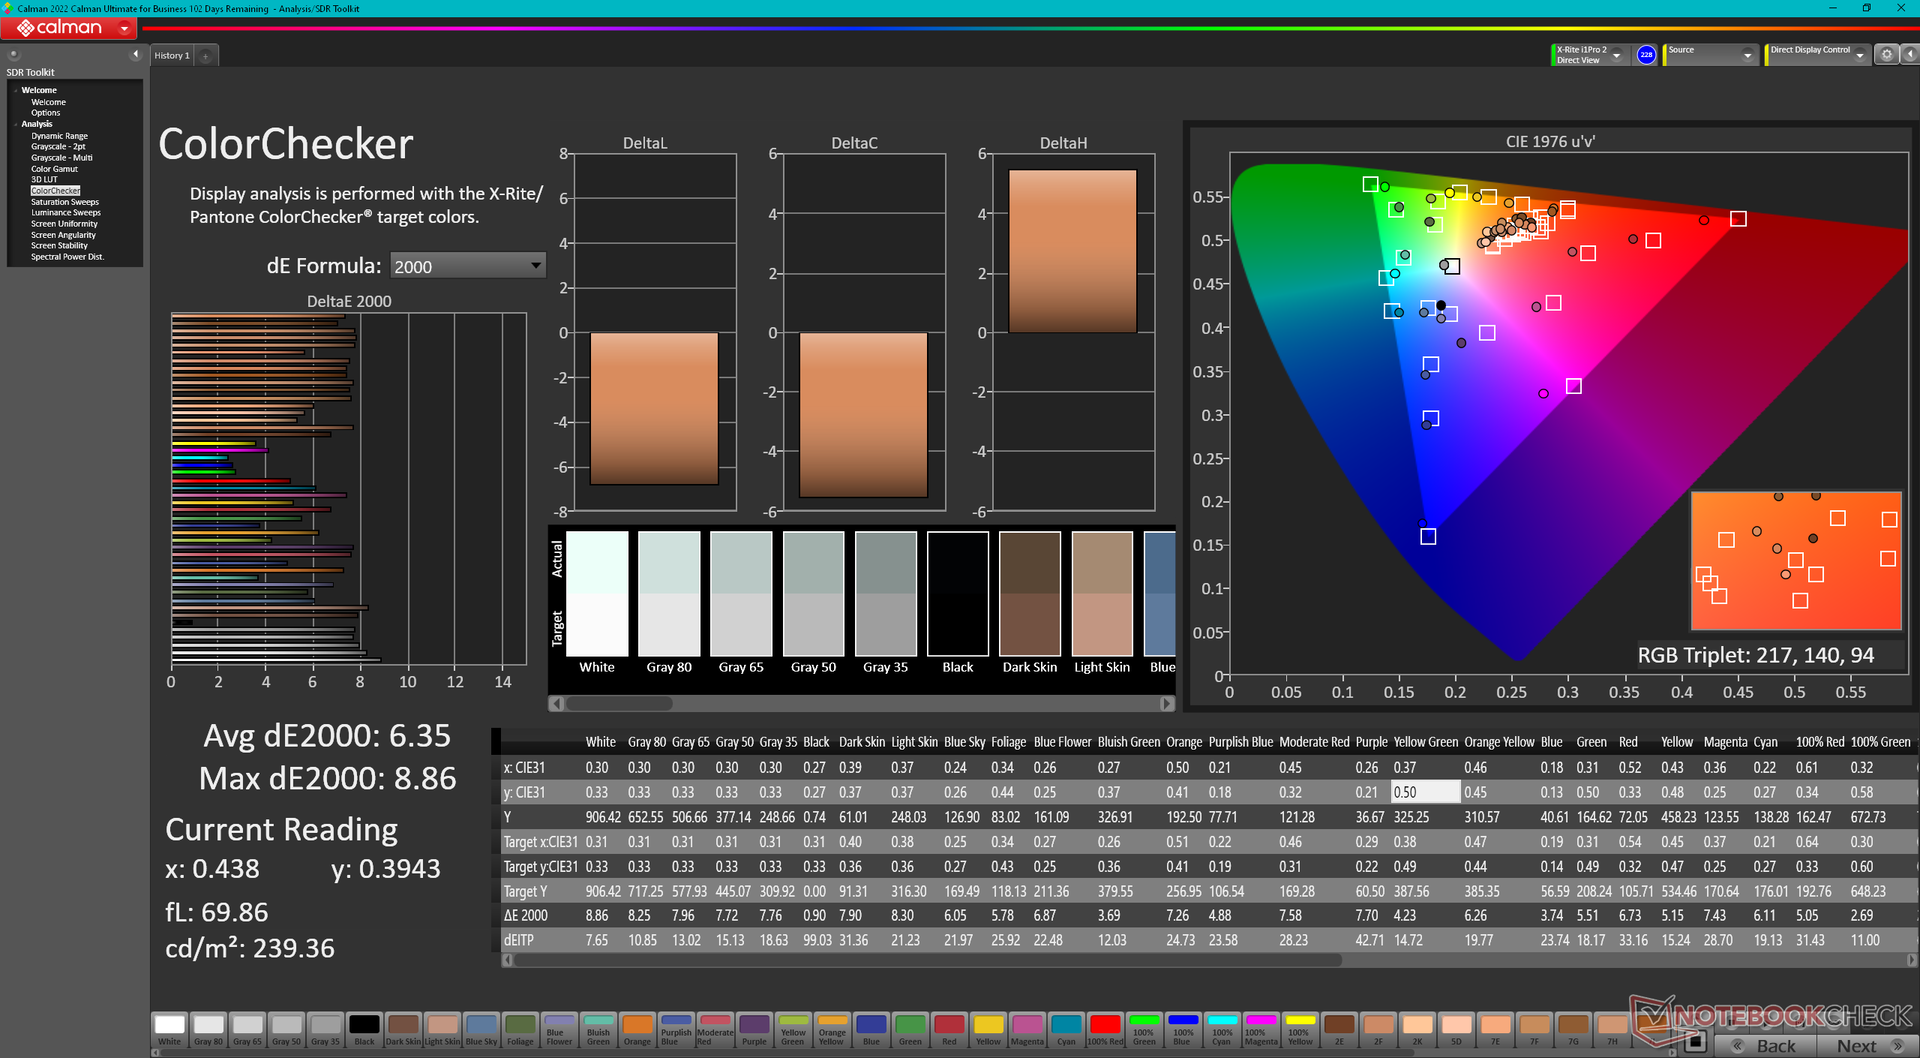
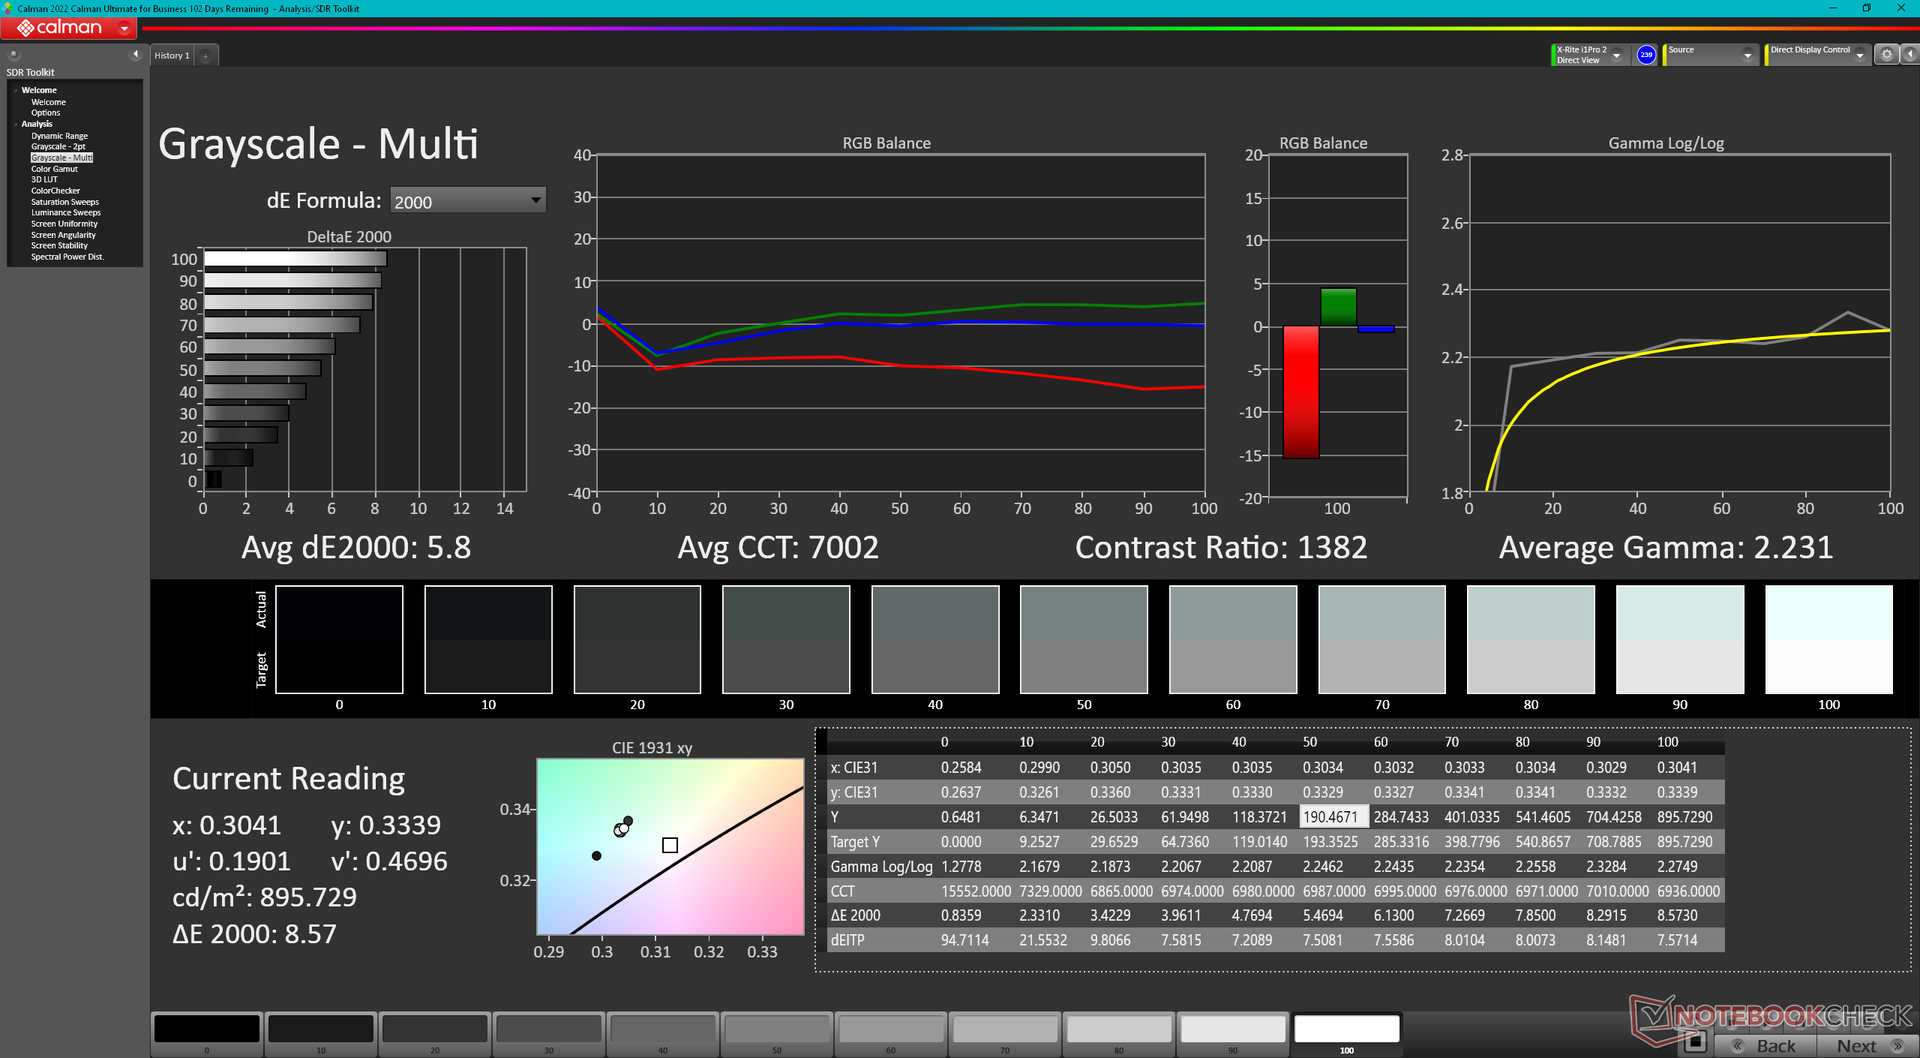
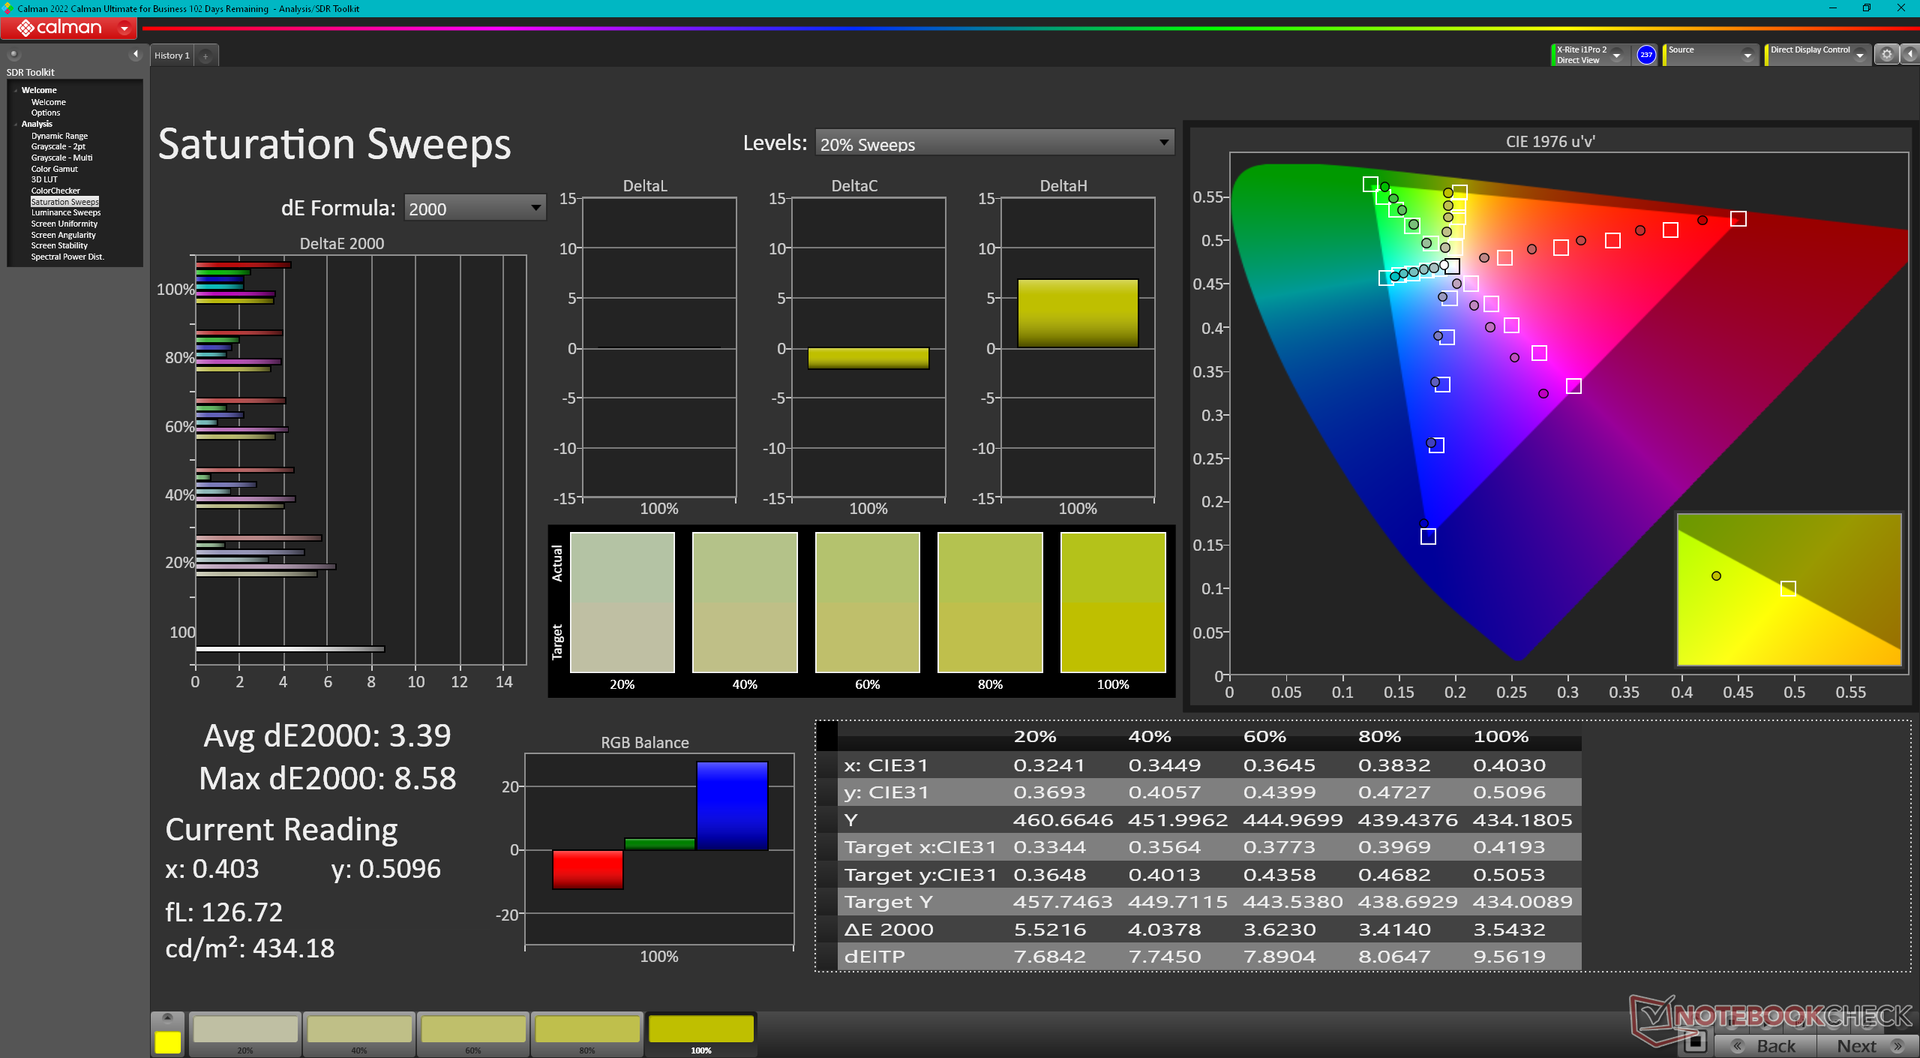
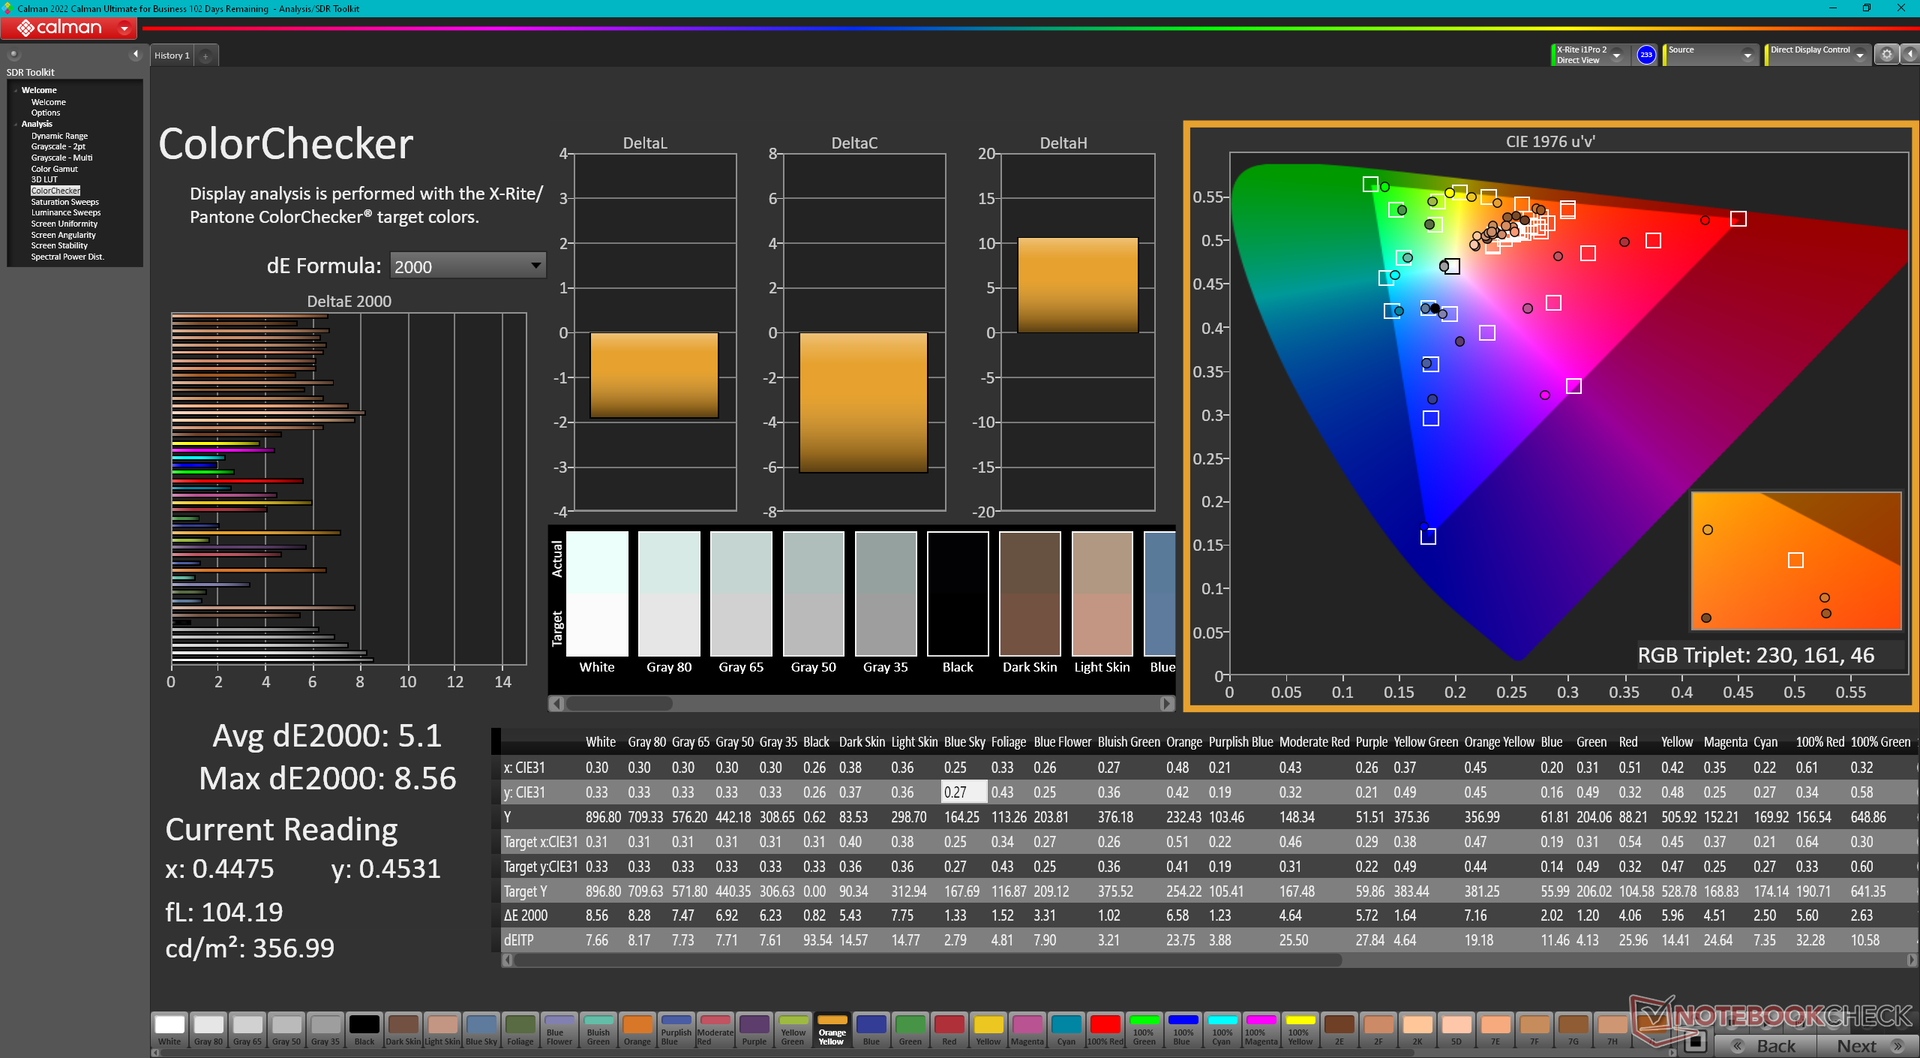
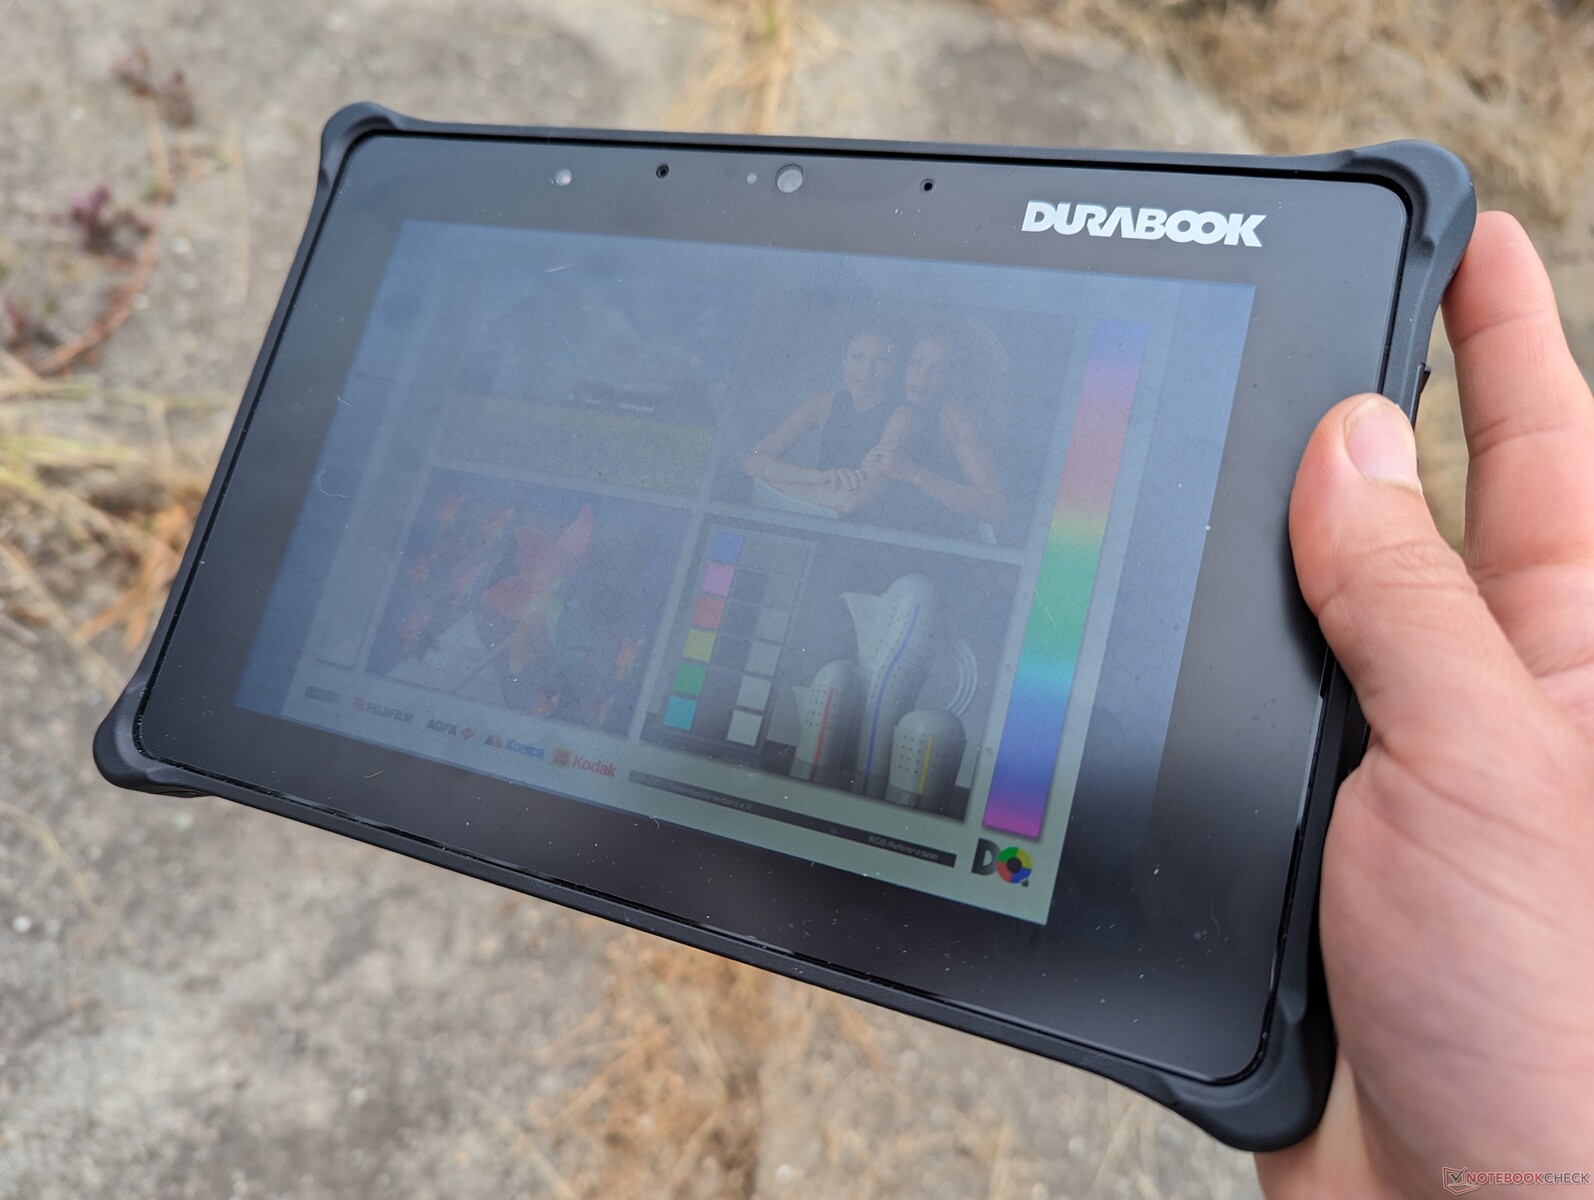
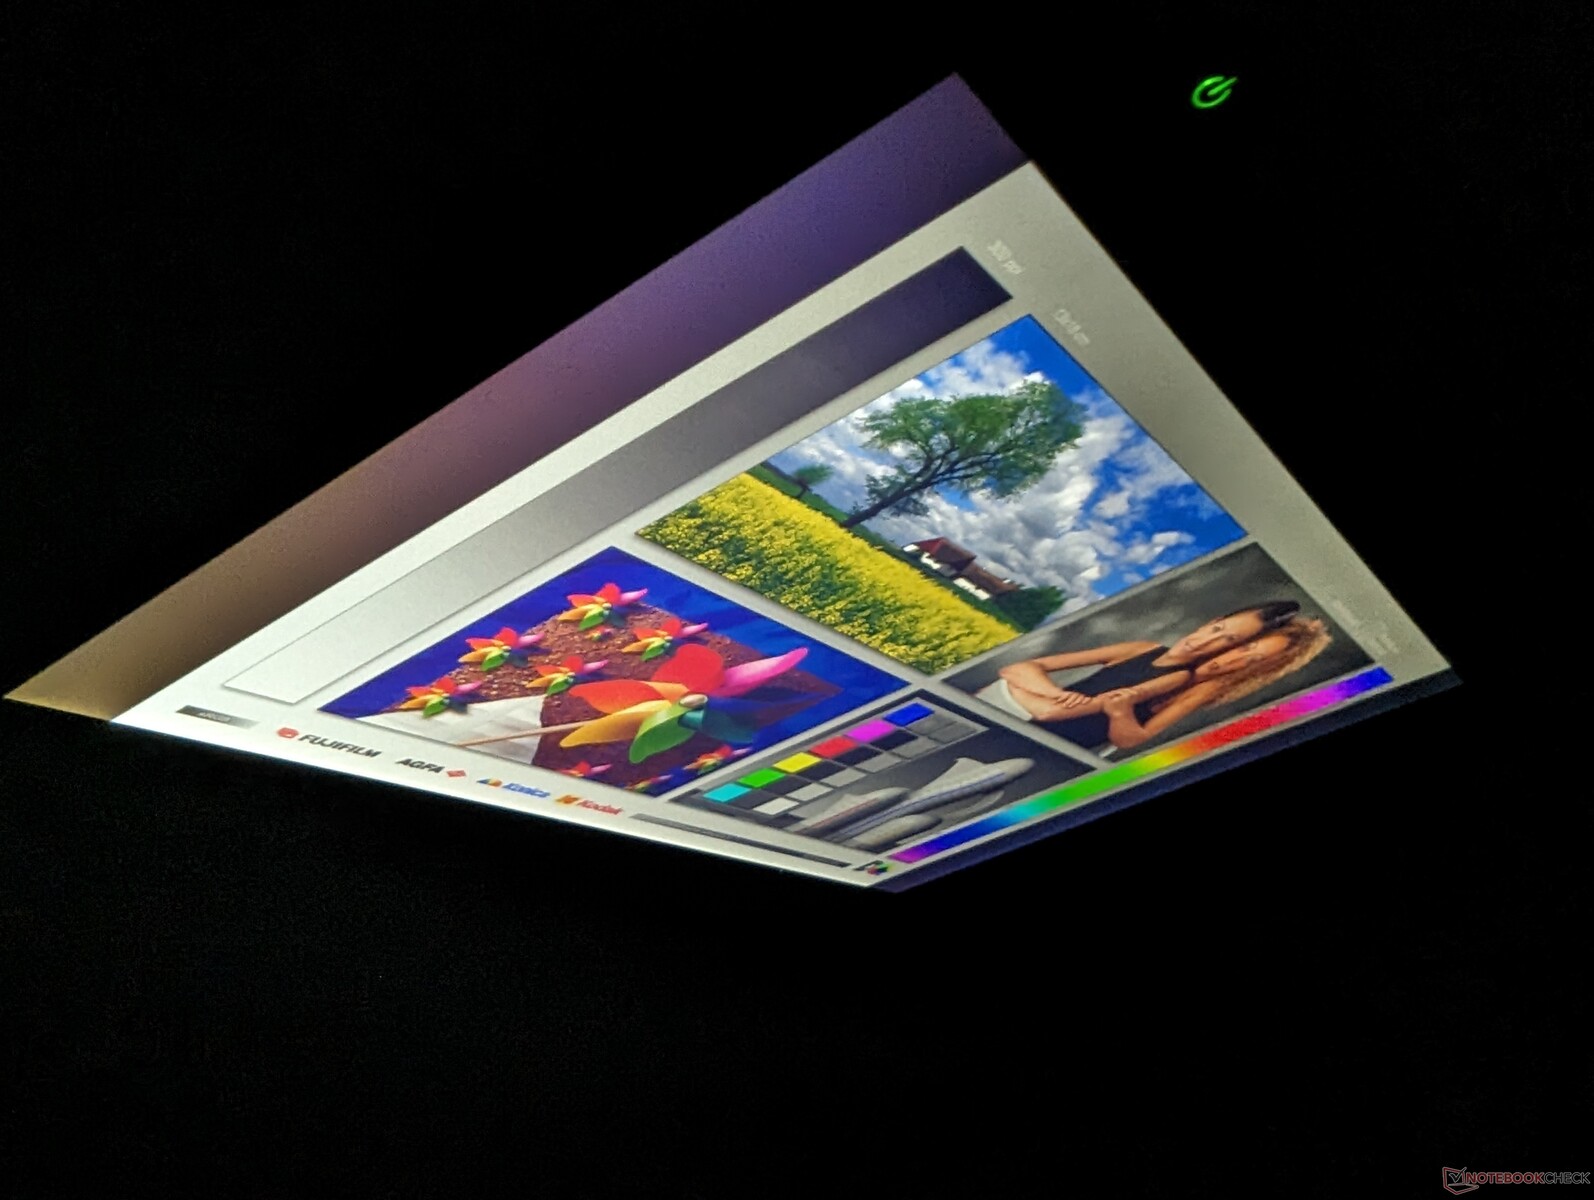
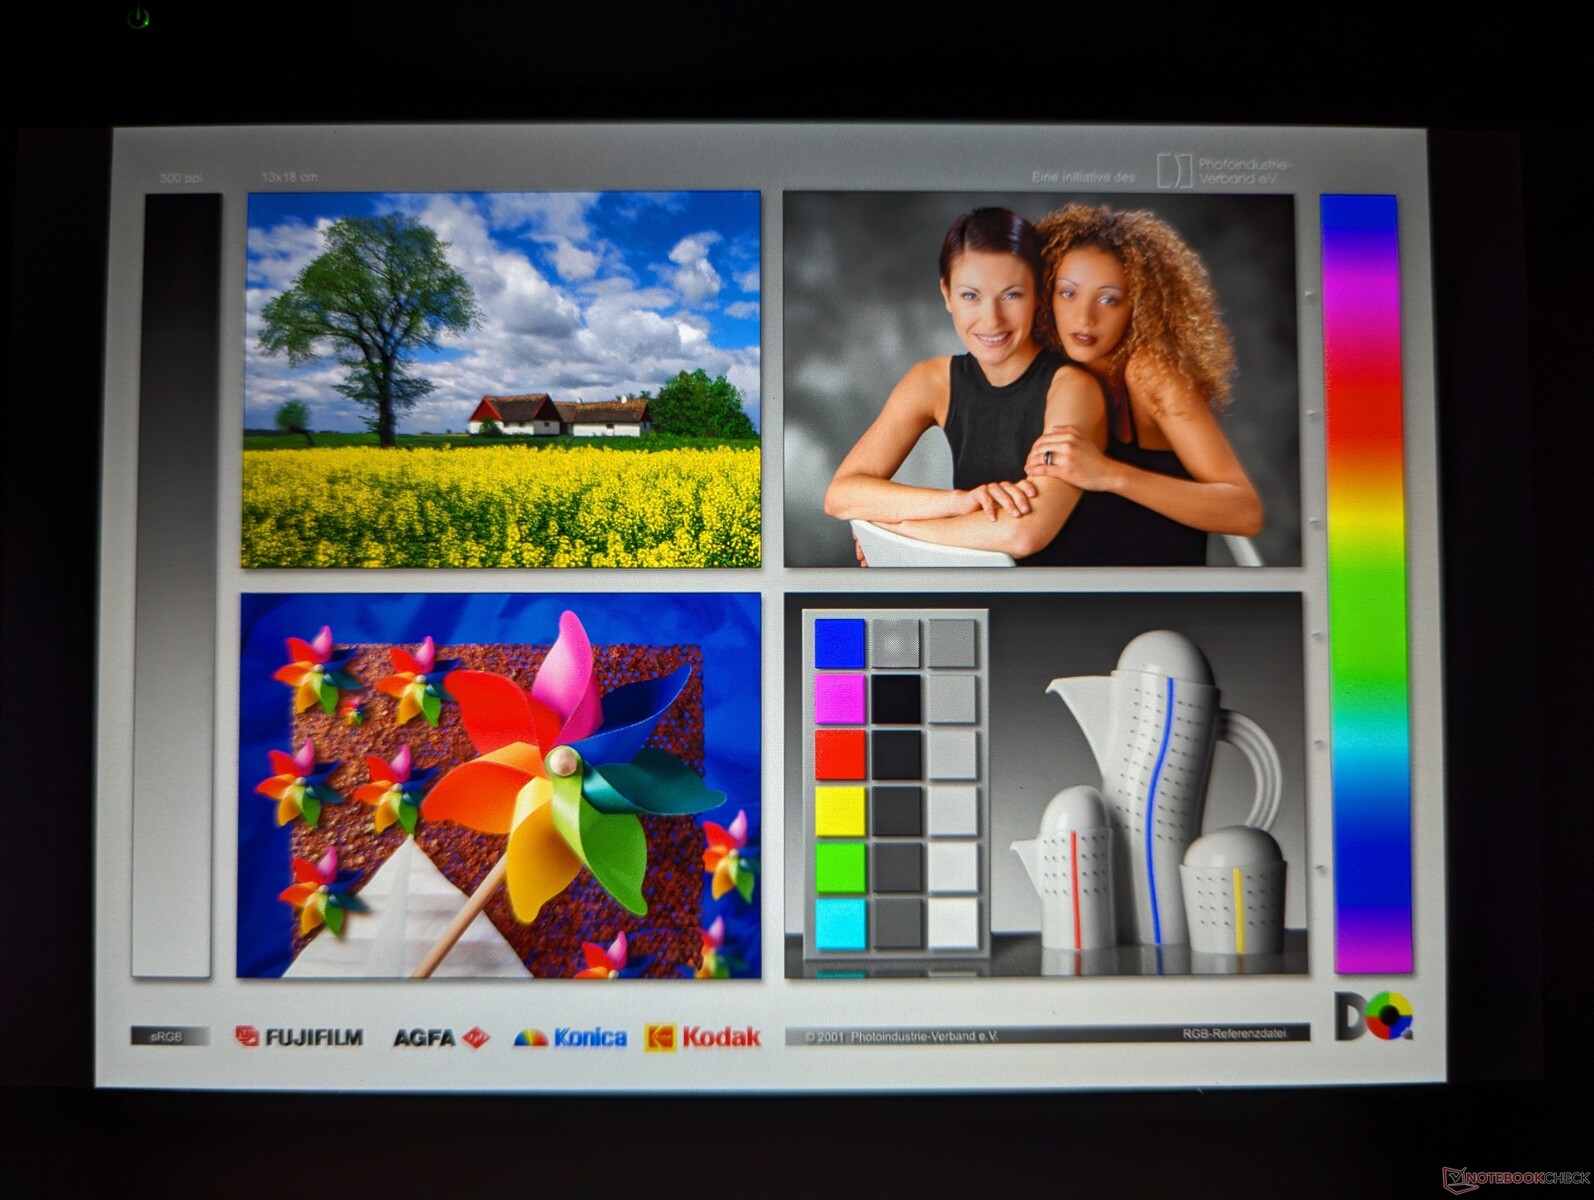
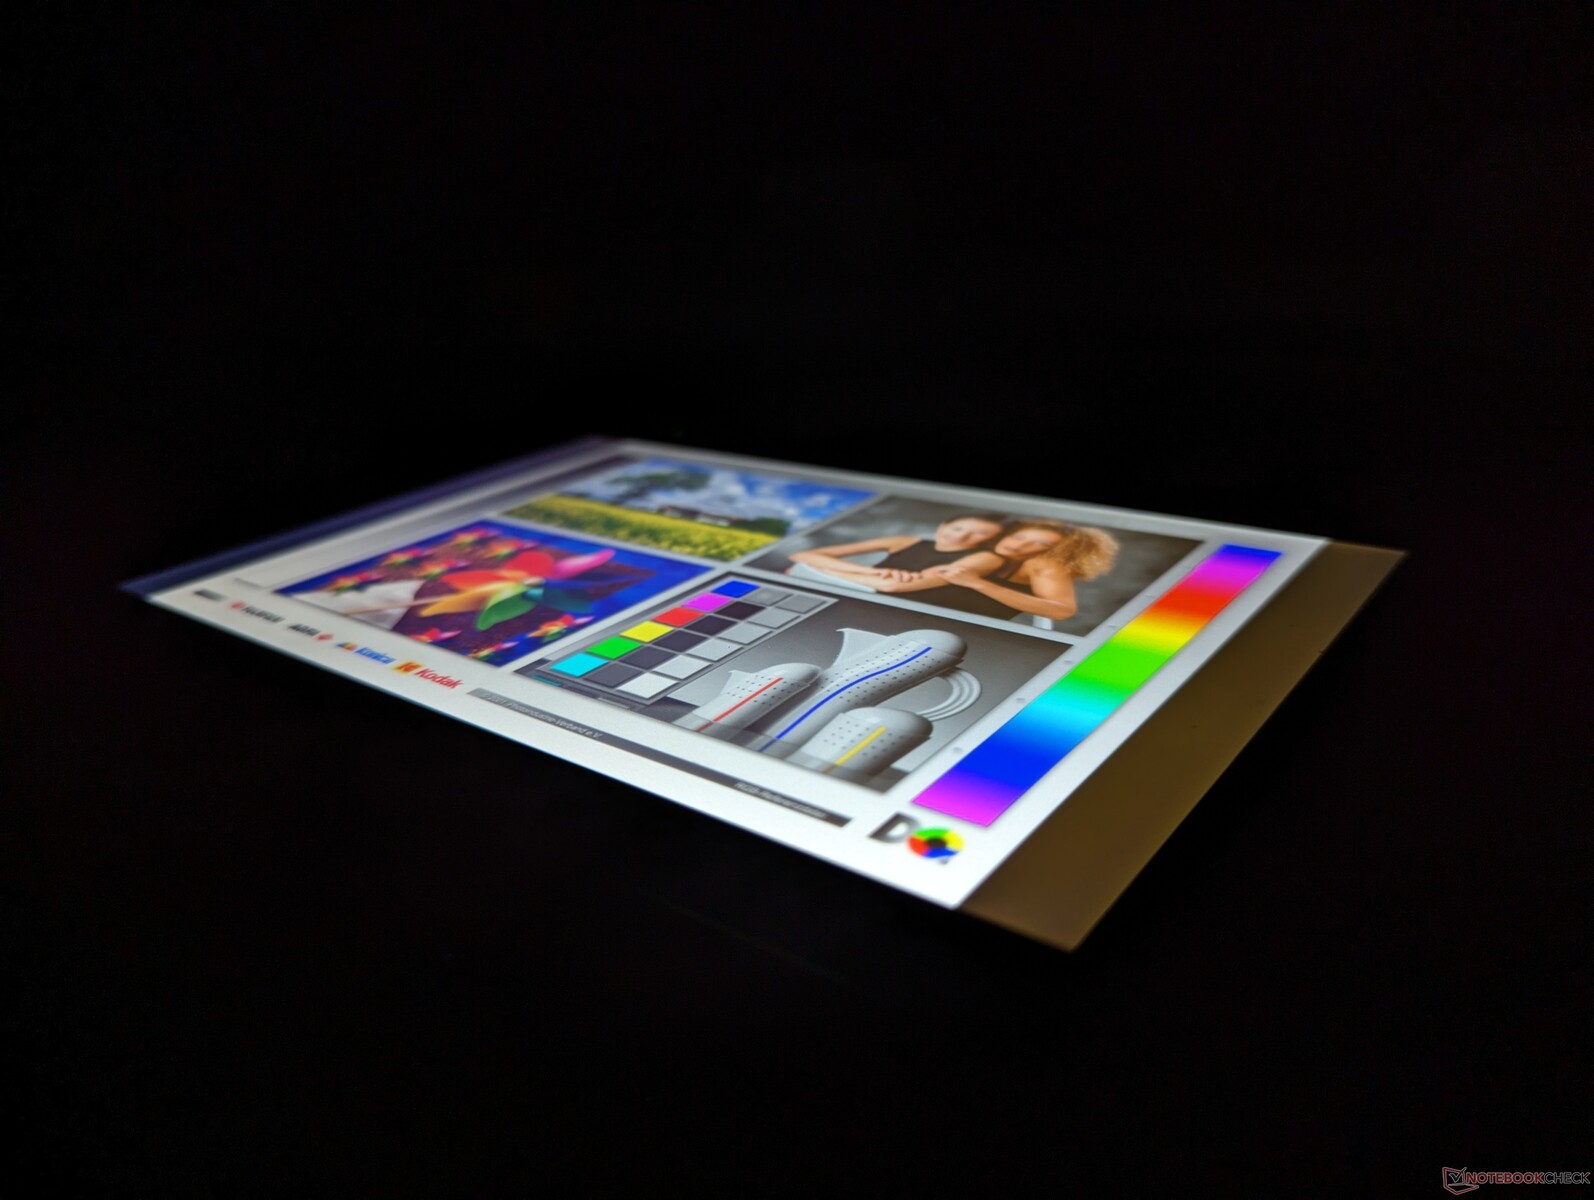
Wyświetlacz - jasny ekran dotykowy 800 nitów
Producent reklamuje maksymalną jasność na poziomie 800 nitów, co możemy potwierdzić własnymi niezależnymi pomiarami. Współczynnik kontrastu jest również przyzwoity i wynosi nieco ponad 1000:1, co jest podobne do wyświetlaczy w większości laptopów konsumenckich. Niestety, inne aspekty wyświetlacza są przeciętne, w tym ograniczone pokrycie kolorów, średni czas reakcji i nieco ziarniste piksele. Jeśli twoje zadania wymagają, aby obrazy i małe teksty były tak ostre, jak to tylko możliwe, to Durabook R8 może nie być dla ciebie.
Wielodotykowy ekran dotykowy można przełączać między trybem pojemnościowym dla wprowadzania danych palcem lub trybem rezystancyjnym dla wprowadzania danych rękawicą lub rysikiem.

| |||||||||||||||||||||||||
rozświetlenie: 85 %
na akumulatorze: 943.7 cd/m²
kontrast: 1110:1 (czerń: 0.85 cd/m²)
ΔE ColorChecker Calman: 6.35 | ∀{0.5-29.43 Ø4.72}
calibrated: 5.1
ΔE Greyscale Calman: 6.9 | ∀{0.09-98 Ø4.97}
53.1% AdobeRGB 1998 (Argyll 3D)
77.4% sRGB (Argyll 3D)
51.5% Display P3 (Argyll 3D)
Gamma: 2.65
CCT: 6956 K
| Durabook R8 Tablet Digital Flat Panel, IPS, 1280x800, 8" | Acer Enduro T1 ET108-11A A9001 IPS, 1280x800, 8" | Lenovo Tab M8 (Gen 4) IPS, 1280x800, 8" | Dell Latitude 7230 Rugged Extreme Sharp LQ120N1, IPS, 1920x1200, 12" | Panasonic Toughbook FZ-G2 InfoVision M133NWFD R1, IPS, 1920x1200, 10.1" | |
|---|---|---|---|---|---|
| Display | 27% | 1% | |||
| Display P3 Coverage (%) | 51.5 | 66.2 29% | 52.1 1% | ||
| sRGB Coverage (%) | 77.4 | 96.1 24% | 78.5 1% | ||
| AdobeRGB 1998 Coverage (%) | 53.1 | 68.4 29% | 53.8 1% | ||
| Response Times | -20% | -34% | 12% | -63% | |
| Response Time Grey 50% / Grey 80% * (ms) | 32.4 ? | 33.6 ? -4% | 29.2 ? 10% | 28.4 ? 12% | 54.4 ? -68% |
| Response Time Black / White * (ms) | 21.9 ? | 29.6 ? -35% | 39 ? -78% | 19.4 ? 11% | 34.4 ? -57% |
| PWM Frequency (Hz) | 300 ? | 211.9 ? | |||
| Screen | 2% | 17% | 47% | 38% | |
| Brightness middle (cd/m²) | 943.7 | 350 -63% | 410 -57% | 1326.7 41% | 1078.6 14% |
| Brightness (cd/m²) | 870 | 353 -59% | 380 -56% | 1193 37% | 1056 21% |
| Brightness Distribution (%) | 85 | 92 8% | 86 1% | 82 -4% | 90 6% |
| Black Level * (cd/m²) | 0.85 | 0.21 75% | 0.16 81% | 0.85 -0% | 0.48 44% |
| Contrast (:1) | 1110 | 1667 50% | 2563 131% | 1561 41% | 2247 102% |
| Colorchecker dE 2000 * | 6.35 | 5.68 11% | 4.6 28% | 1.06 83% | 4.18 34% |
| Colorchecker dE 2000 max. * | 8.86 | 10.51 -19% | 9.03 -2% | 3.78 57% | 6.2 30% |
| Colorchecker dE 2000 calibrated * | 5.1 | 0.71 86% | 1.95 62% | ||
| Greyscale dE 2000 * | 6.9 | 6.3 9% | 6.3 9% | 1.5 78% | 4.8 30% |
| Gamma | 2.65 83% | 2.12 104% | 2.519 87% | 2.19 100% | 2.05 107% |
| CCT | 6956 93% | 7390 88% | 7707 84% | 6804 96% | 7565 86% |
| Całkowita średnia (program / ustawienia) | -9% /
-3% | -9% /
7% | 29% /
37% | -8% /
16% |
* ... im mniej tym lepiej
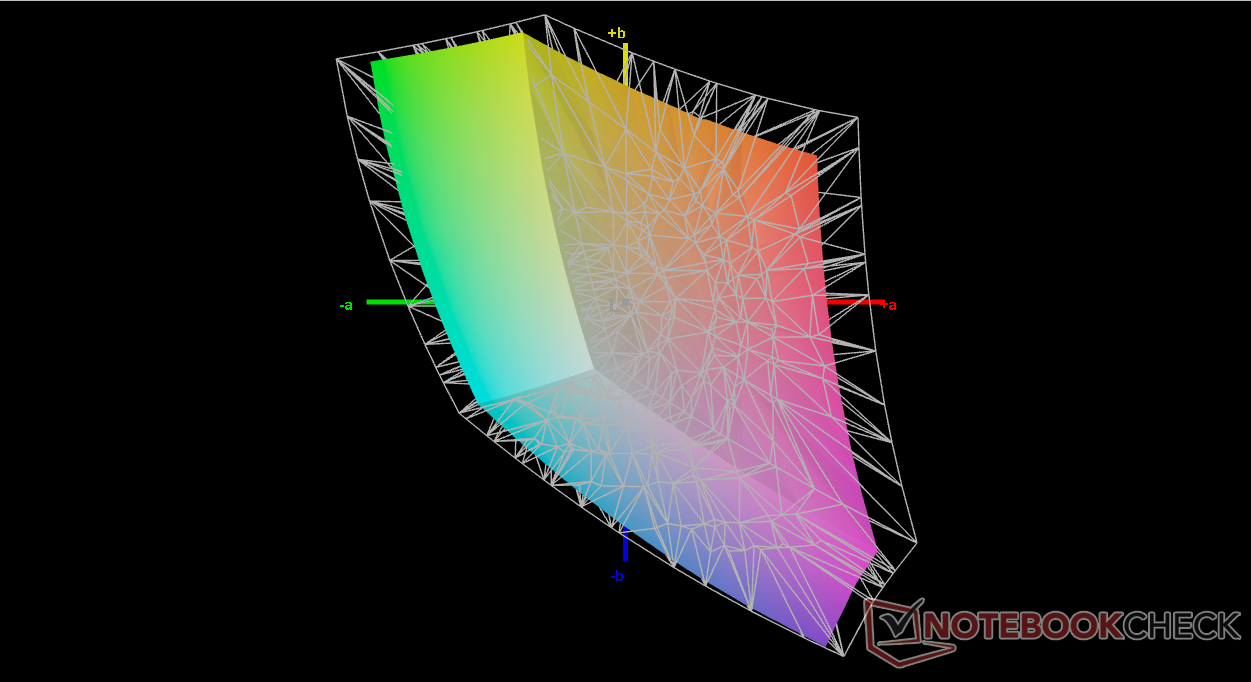
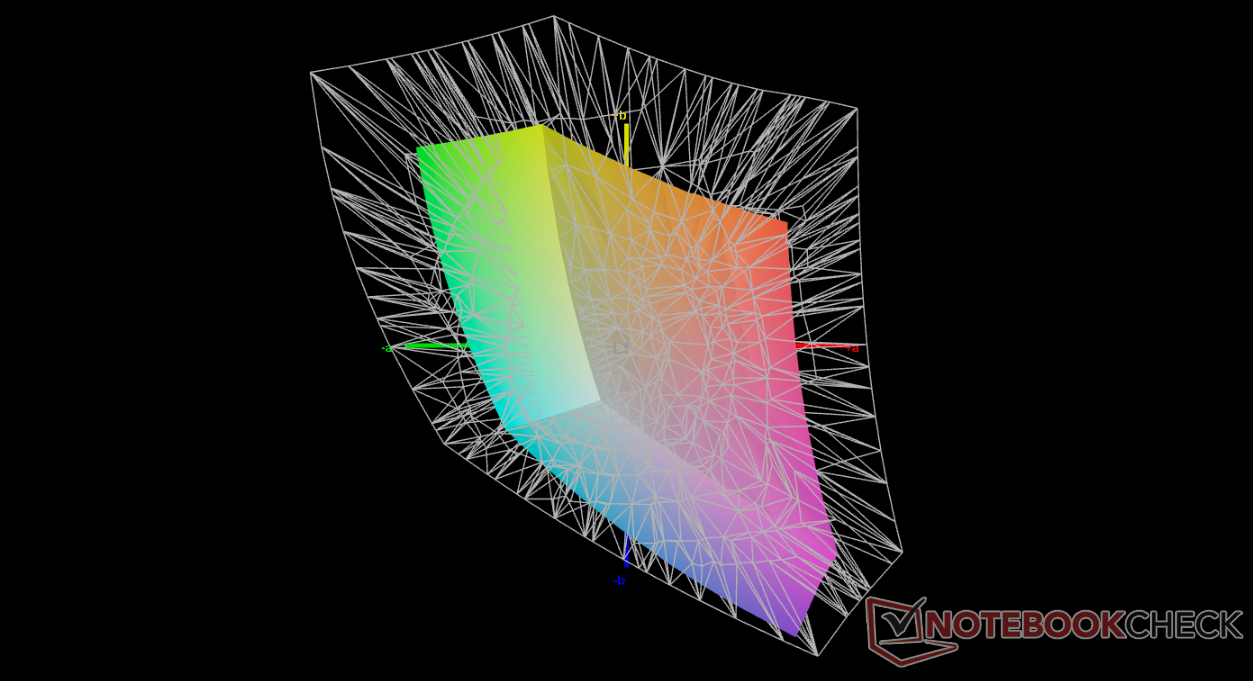
Temperatura barwowa jest domyślnie chłodna. Kalibracja wyświetlacza za pomocą naszego kolorymetru X-Rite nie przyniosłaby znaczącej poprawy ze względu na ograniczony zakres panelu wspomniany powyżej.
Wyświetl czasy reakcji
| ↔ Czas reakcji od czerni do bieli | ||
|---|---|---|
| 21.9 ms ... wzrost ↗ i spadek ↘ łącznie | ↗ 14.2 ms wzrost | 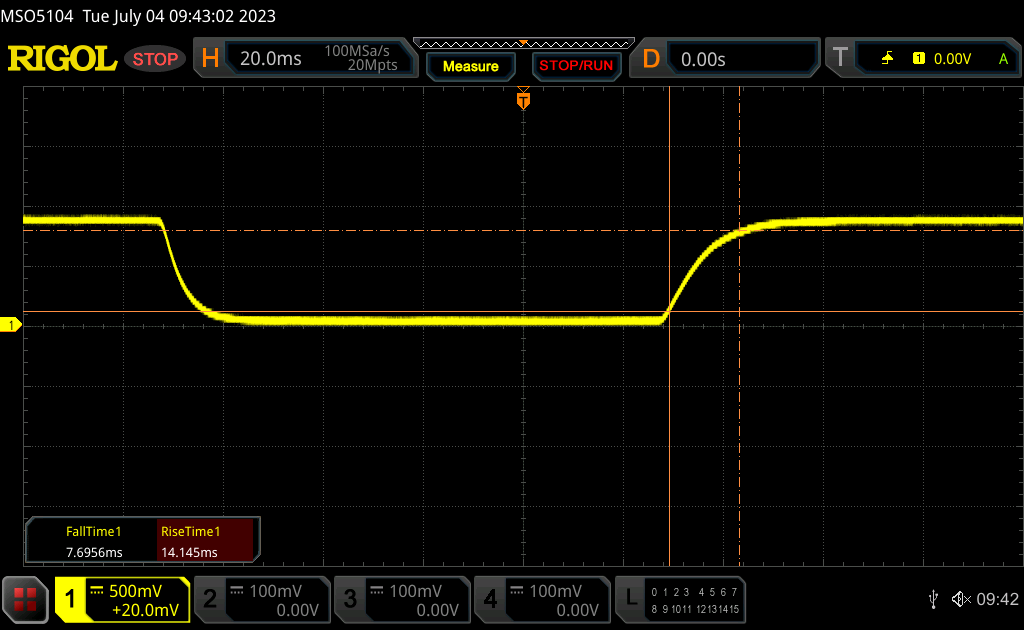 |
| ↘ 7.7 ms upadek | ||
| W naszych testach ekran wykazuje dobry współczynnik reakcji, ale może być zbyt wolny dla graczy rywalizujących ze sobą. Dla porównania, wszystkie testowane urządzenia wahają się od 0.1 (minimum) do 240 (maksimum) ms. » 49 % wszystkich urządzeń jest lepszych. Oznacza to, że zmierzony czas reakcji jest gorszy od średniej wszystkich testowanych urządzeń (19.8 ms). | ||
| ↔ Czas reakcji 50% szarości do 80% szarości | ||
| 32.4 ms ... wzrost ↗ i spadek ↘ łącznie | ↗ 16.4 ms wzrost | 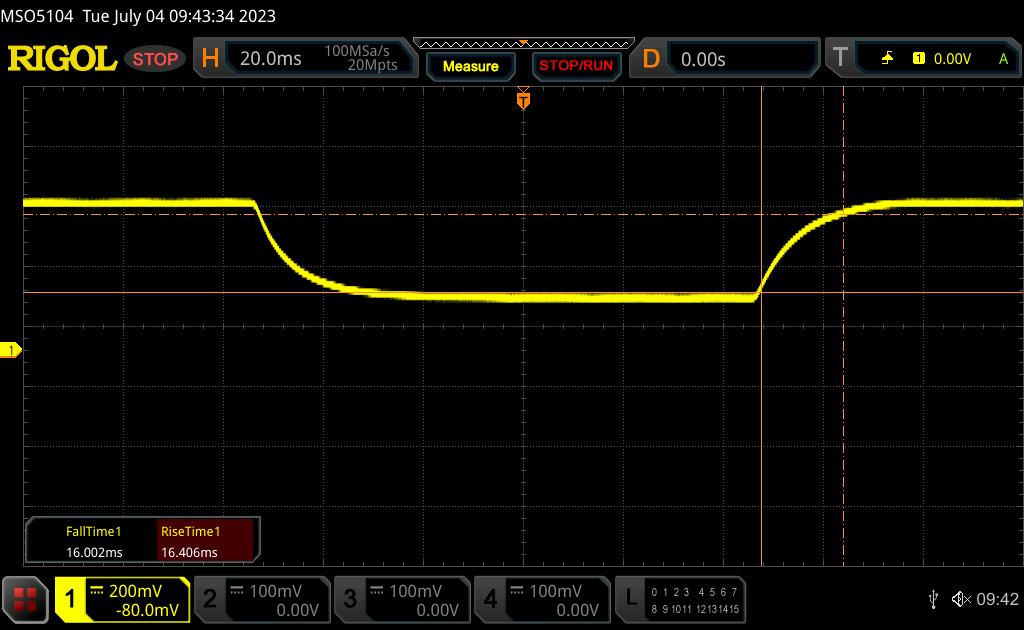 |
| ↘ 16 ms upadek | ||
| W naszych testach ekran wykazuje powolne tempo reakcji, co będzie niezadowalające dla graczy. Dla porównania, wszystkie testowane urządzenia wahają się od 0.165 (minimum) do 636 (maksimum) ms. » 44 % wszystkich urządzeń jest lepszych. Oznacza to, że zmierzony czas reakcji jest zbliżony do średniej wszystkich testowanych urządzeń (31 ms). | ||
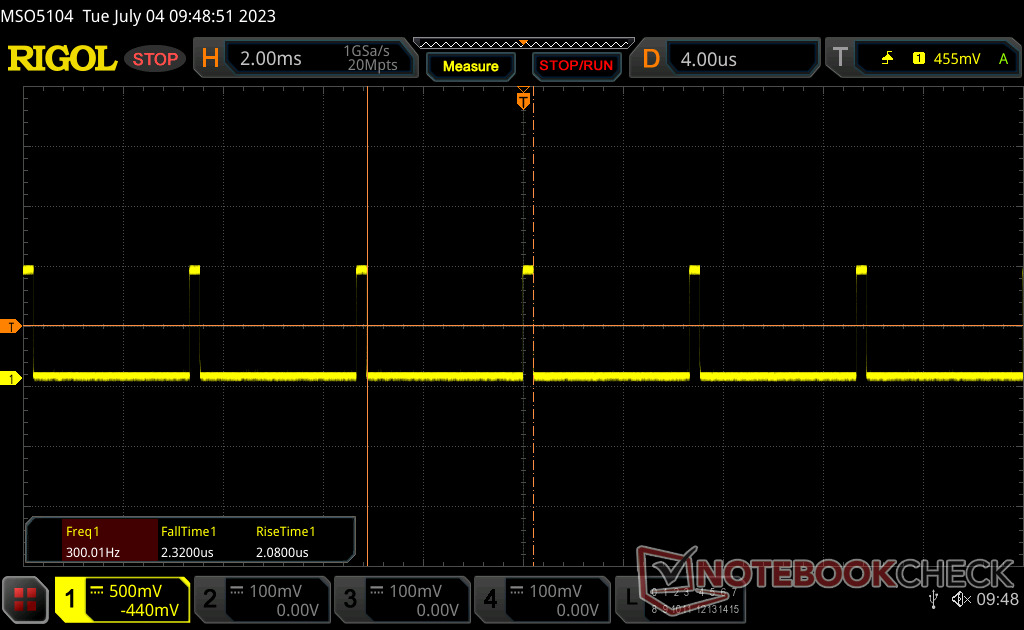
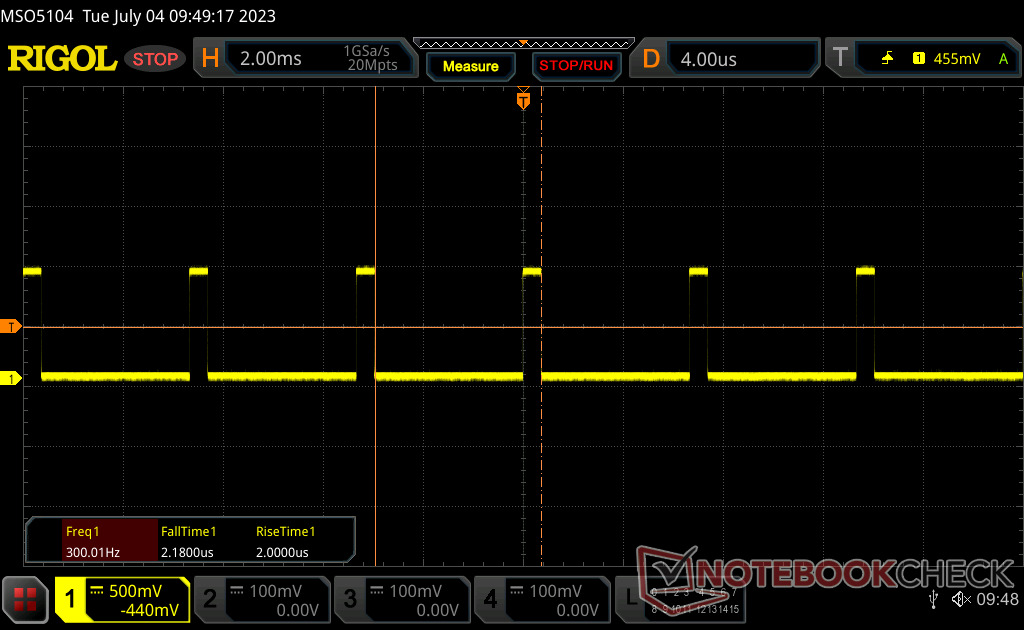
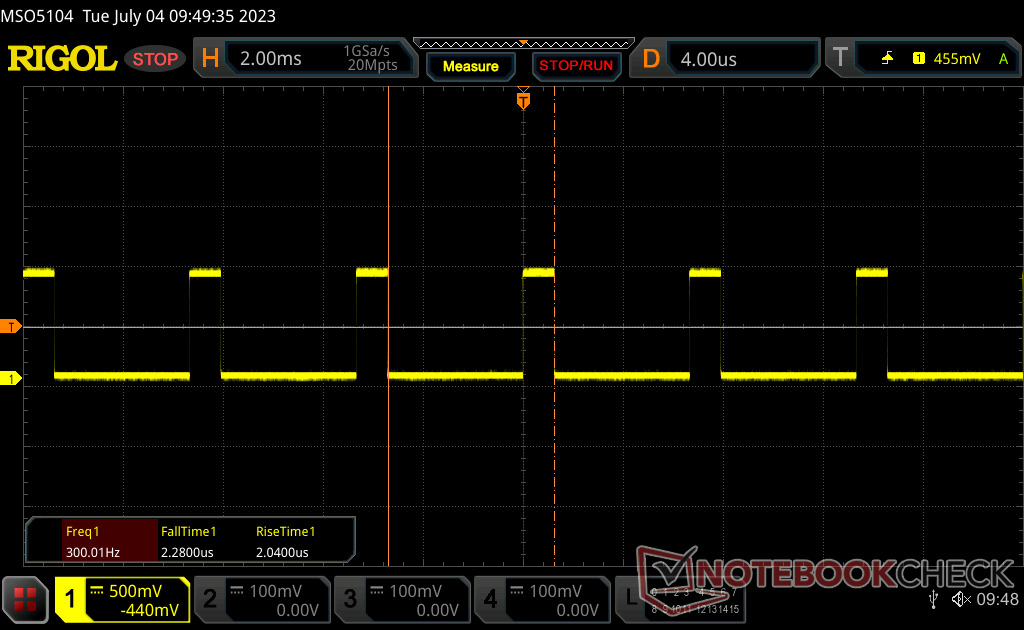
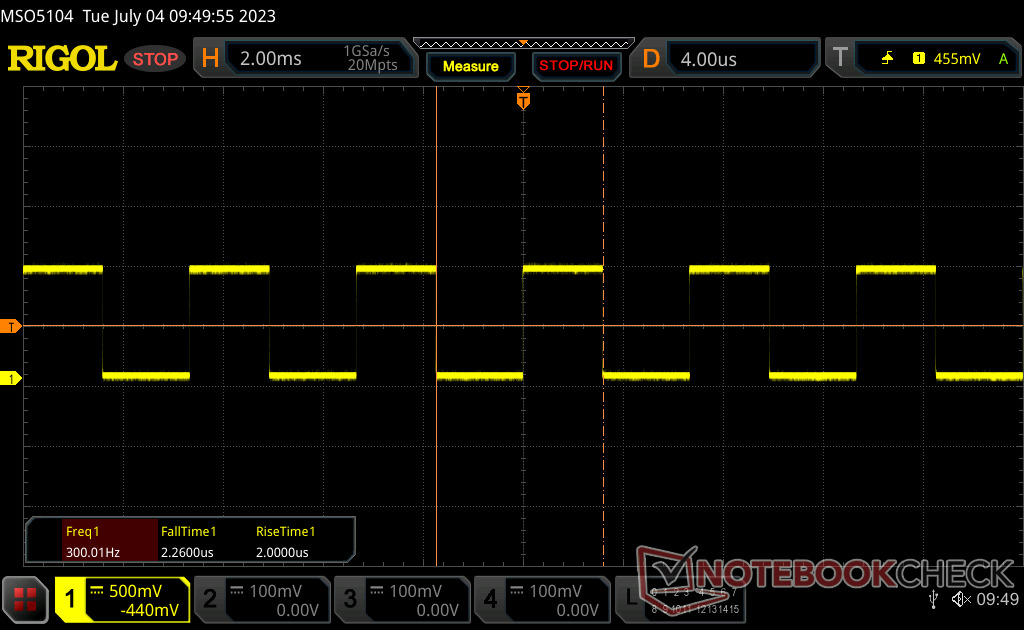
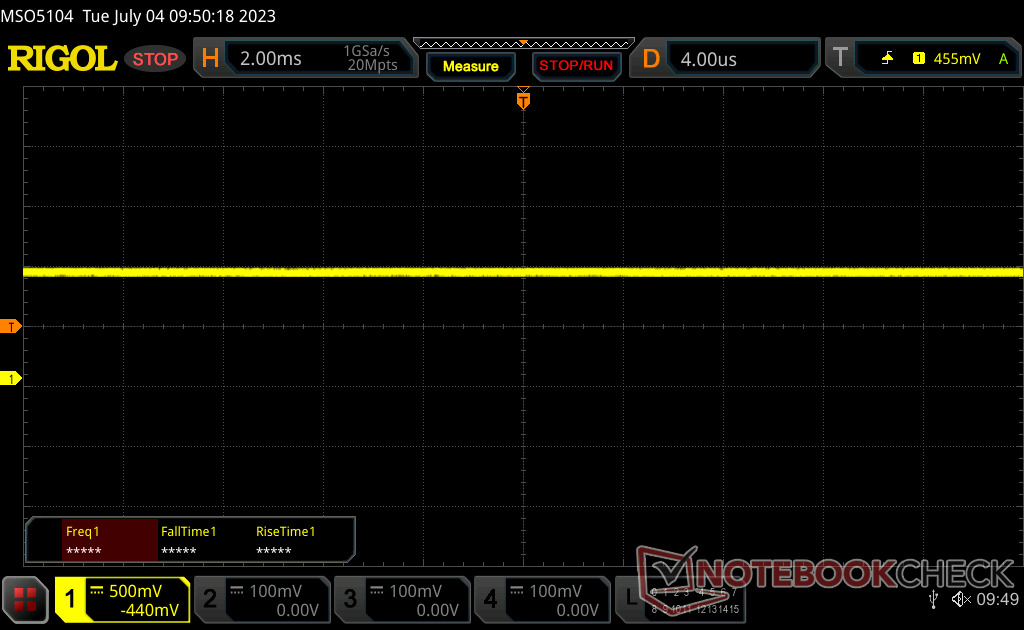
Migotanie ekranu / PWM (modulacja szerokości impulsu)
| Wykryto migotanie ekranu/wykryto PWM | 300 Hz | ≤ 99 % ustawienia jasności | 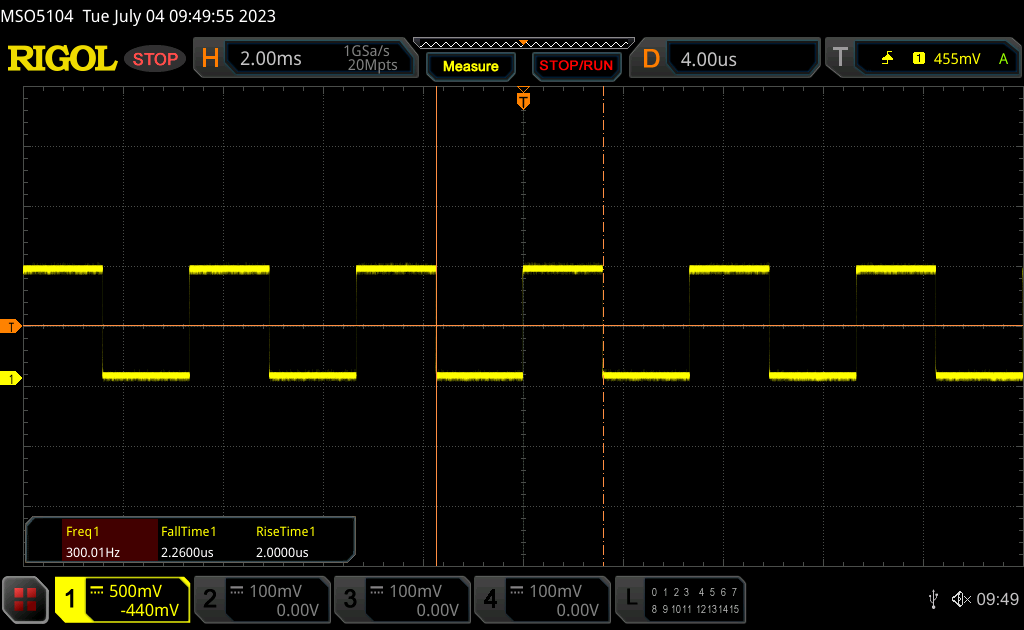 |
Podświetlenie wyświetlacza miga z częstotliwością 300 Hz (najgorszy przypadek, np. przy użyciu PWM) Wykryto migotanie przy ustawieniu jasności 99 % i poniżej. Powyżej tego ustawienia jasności nie powinno być żadnego migotania ani PWM. Częstotliwość 300 Hz jest stosunkowo wysoka, więc większość użytkowników wrażliwych na PWM nie powinna zauważyć żadnego migotania. Istnieją jednak doniesienia, że niektórzy użytkownicy są nadal wrażliwi na PWM przy częstotliwości 500 Hz i wyższej, więc należy zachować ostrożność. Dla porównania: 52 % wszystkich testowanych urządzeń nie używa PWM do przyciemniania wyświetlacza. Jeśli wykryto PWM, zmierzono średnio 7763 (minimum: 5 - maksimum: 343500) Hz. | |||
Modulacja szerokości impulsu lub migotanie o częstotliwości 300 Hz występuje na wszystkich poziomach jasności do 99 procent.
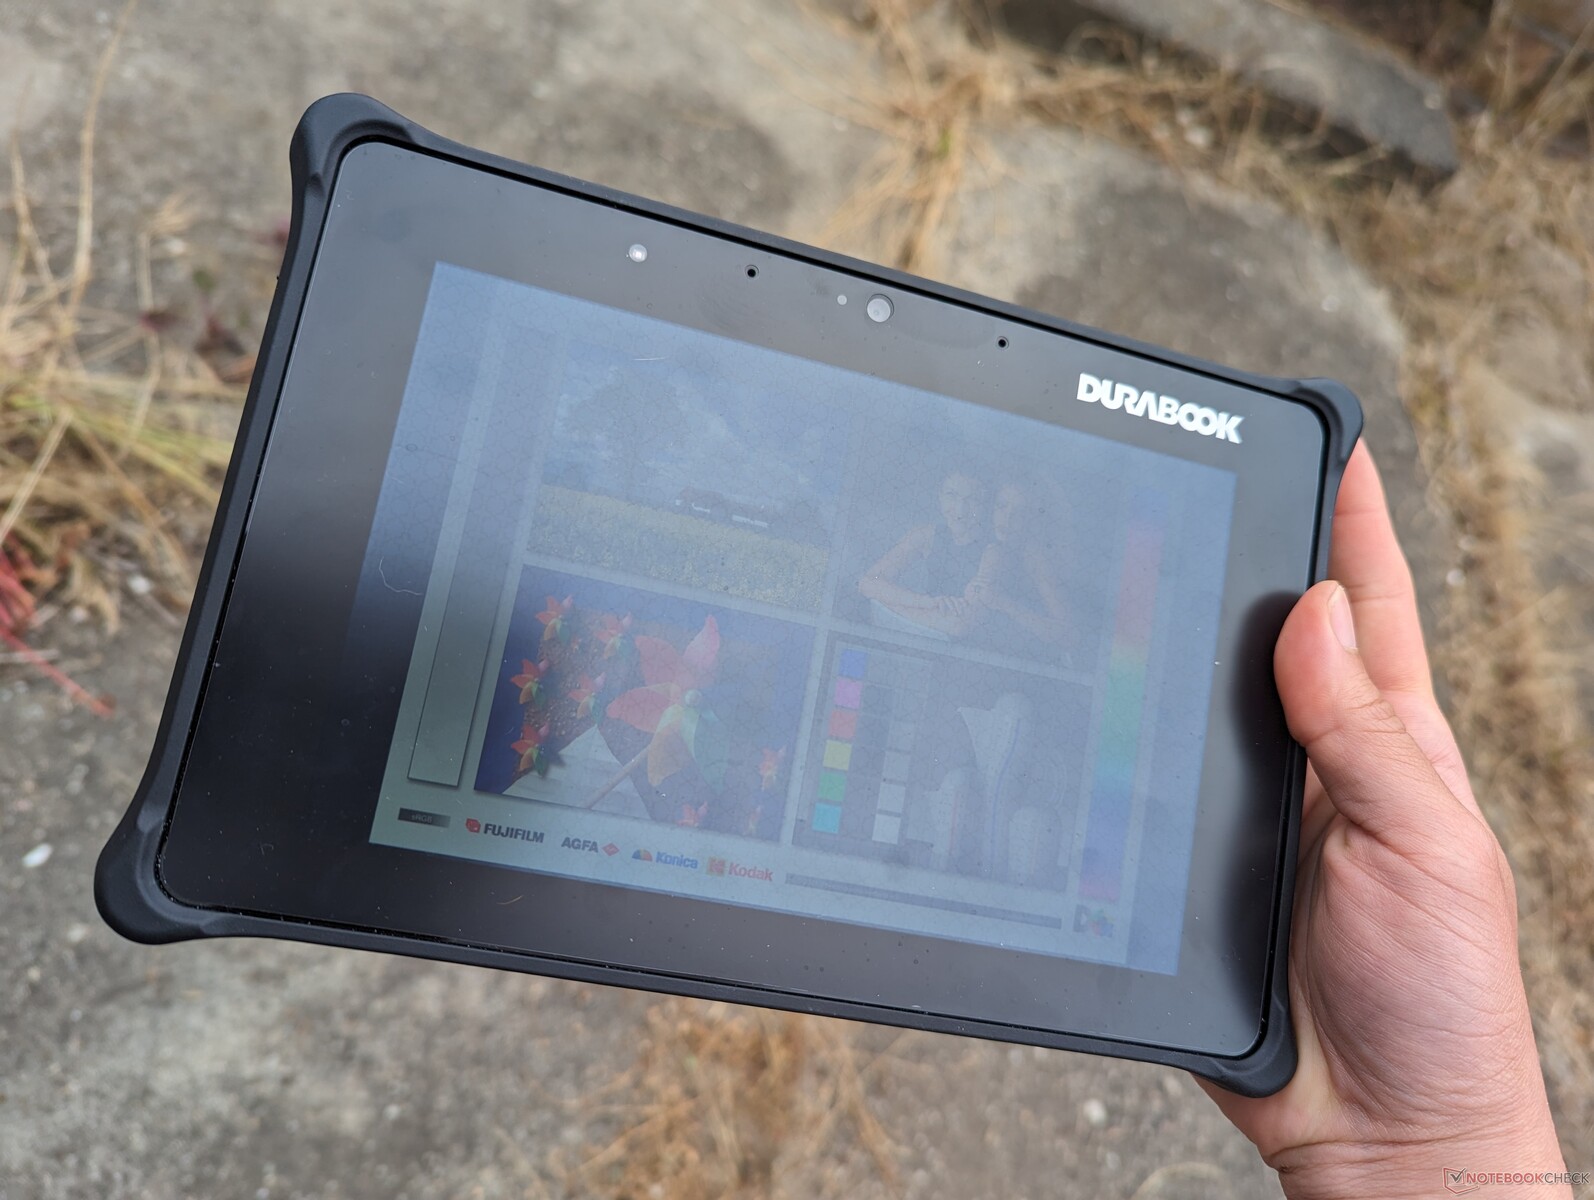
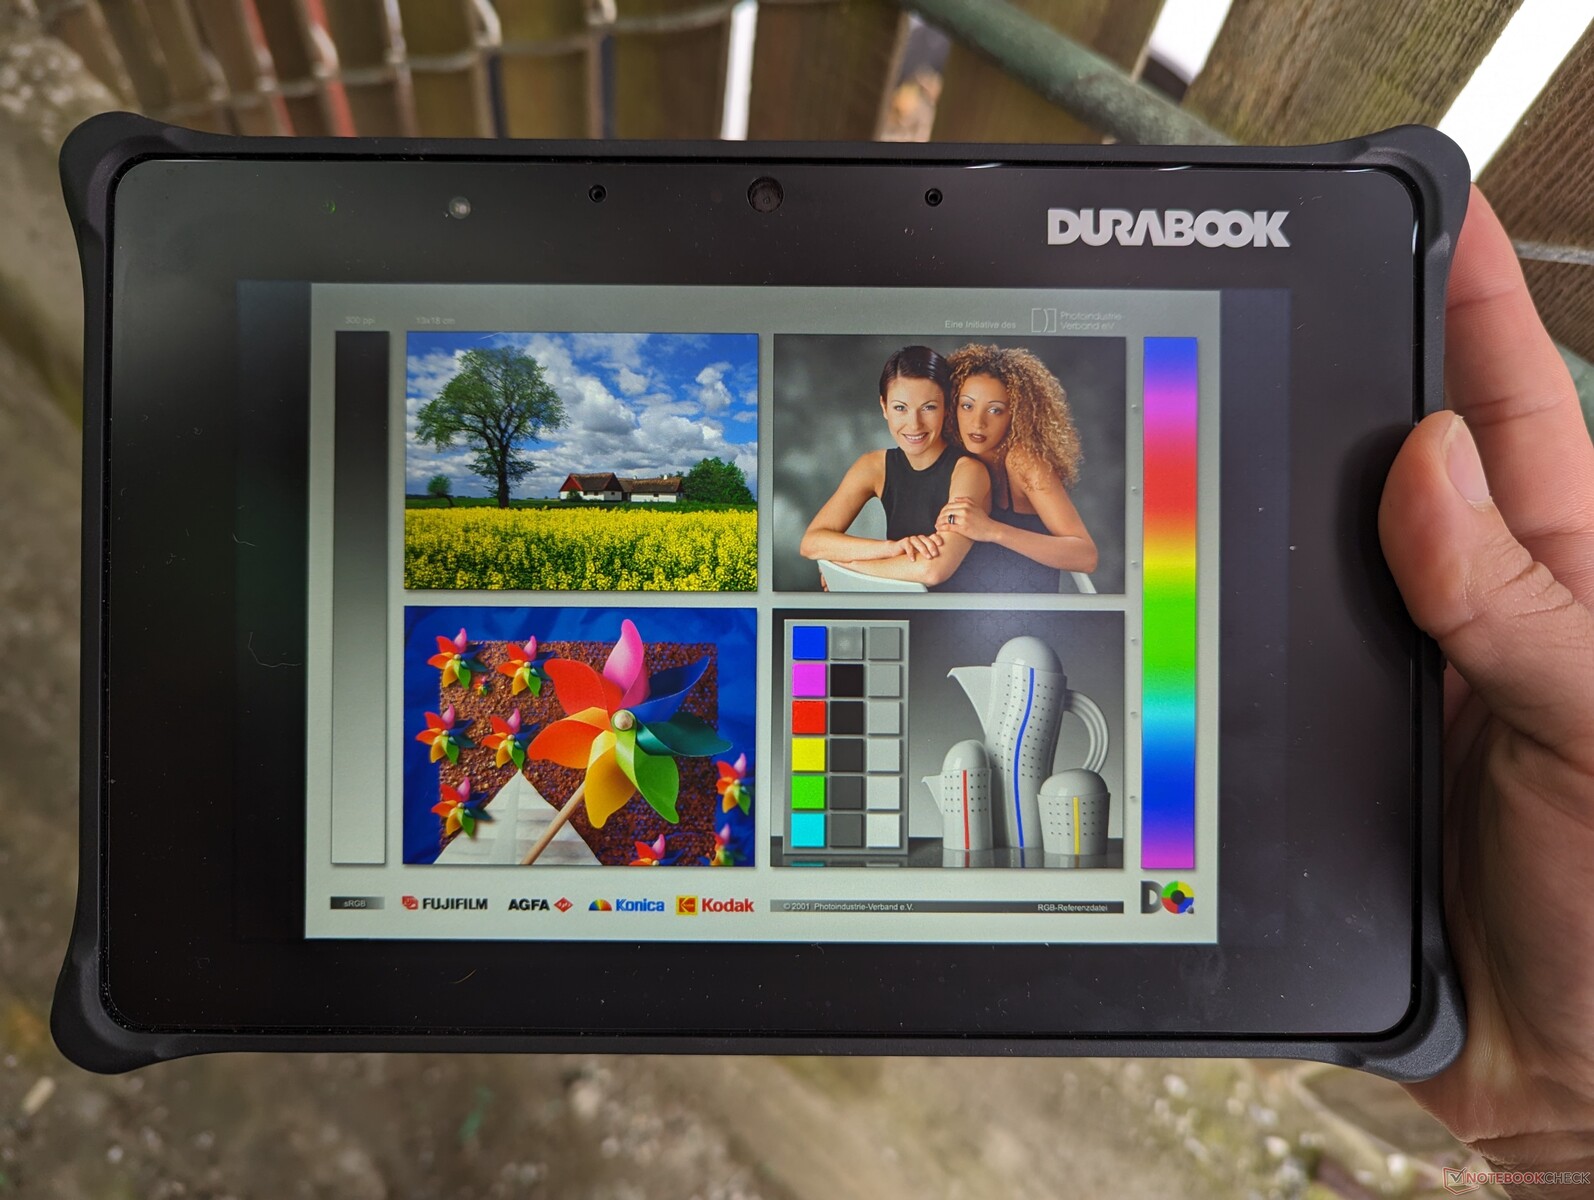
Widoczność na zewnątrz jest doskonała w cieniu dzięki bardzo jasnemu wyświetlaczowi. Odblaski mogą nadal rozmywać kolory i stanowić problem w jaśniejszych warunkach.
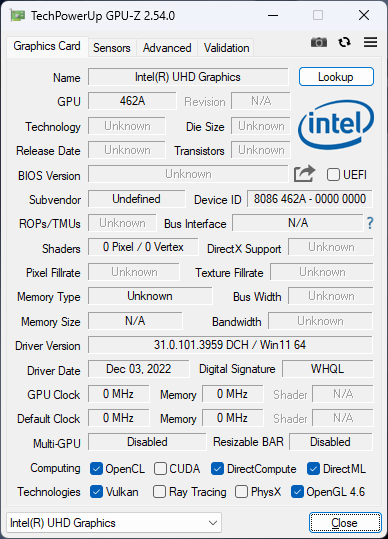
Wydajność - podkręcony Intel 12. generacji
Warunki testowania
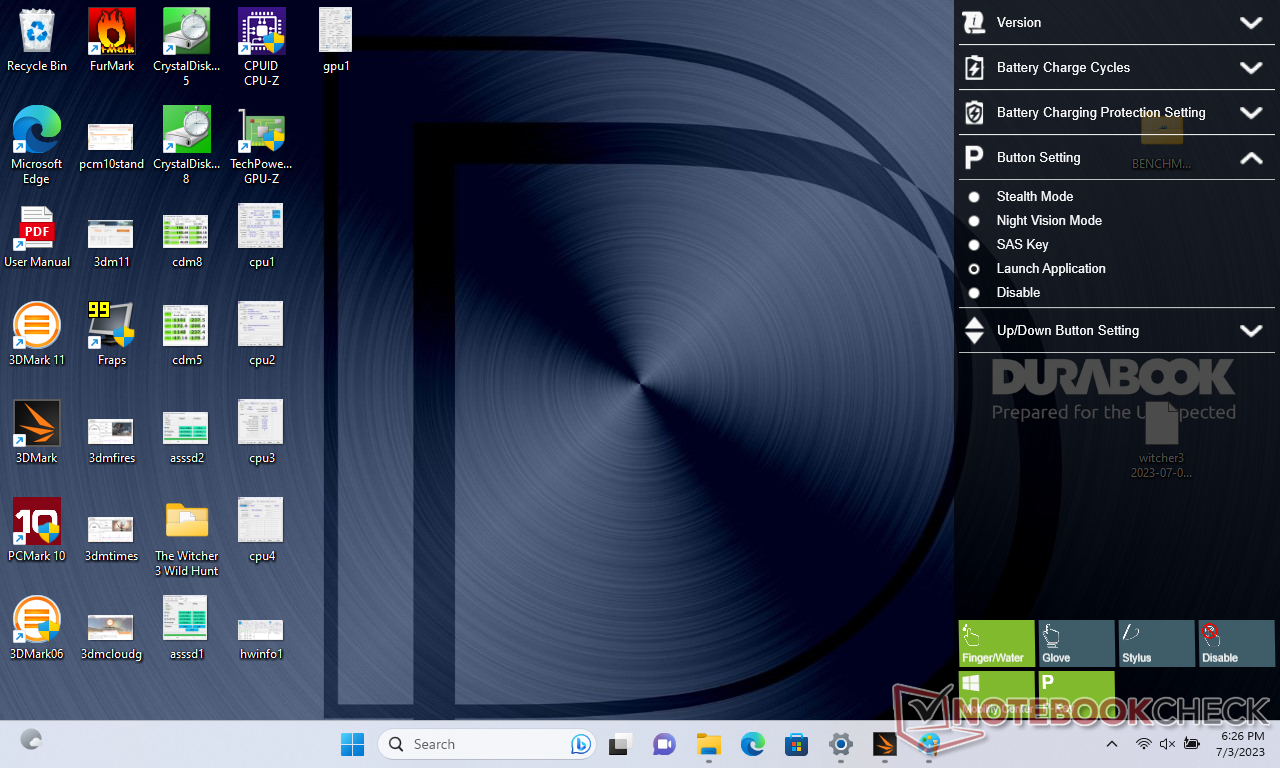
Przed uruchomieniem poniższych testów porównawczych ustawiliśmy system Windows na tryb wydajności.
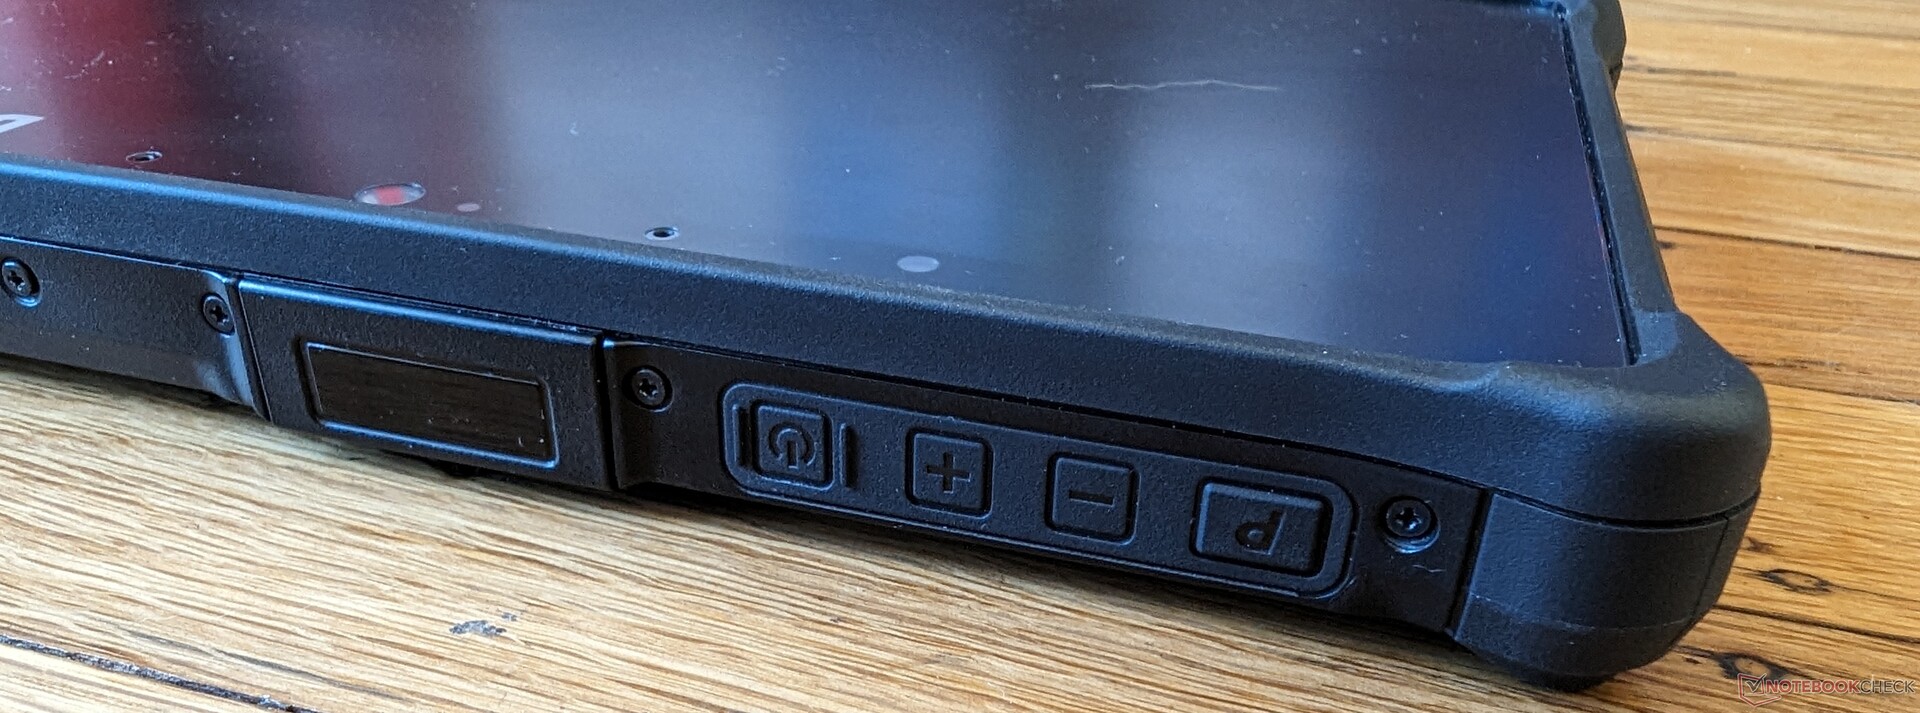
Naciśnięcie przycisku "P" na górze uruchamia menu centrum sterowania do dostosowywania różnych aspektów tabletu, takich jak ładowanie baterii, działanie przycisków i tryby ekranu dotykowego w rękawicach / palcach.
Procesor
Nasza jednostka testowa wykorzystuje ten sam Core i5-1230U procesor, który można znaleźć w Dell XPS 13 9315 i XPS 9315 2-w-1. Wydajność, niestety, została znacznie zaniżona, prawdopodobnie w celu zmaksymalizowania stabilności. Wydajność jednowątkowa i wielowątkowa jest odpowiednio o około 25 procent i 60 procent wolniejsza niż w przypadku tego samego procesora w wyżej wymienionym systemie Dell. Ogólna wydajność jest zatem bliższa trzyletniemu procesorowi 10. generacji Core i5-10310U.
Trudno powiedzieć, jak dużego wzrostu wydajności mogą oczekiwać użytkownicy, którzy dokonają aktualizacji doCore i7-1250U ponieważ nasza jednostka Core i5-1230U jest wolniejsza niż oczekiwano. Jest jednak prawdopodobne, że SKU Core i7 będzie również podkręcony.
Cinebench R15 Multi Loop
Cinebench R23: Multi Core | Single Core
Cinebench R20: CPU (Multi Core) | CPU (Single Core)
Cinebench R15: CPU Multi 64Bit | CPU Single 64Bit
Blender: v2.79 BMW27 CPU
7-Zip 18.03: 7z b 4 | 7z b 4 -mmt1
Geekbench 5.5: Multi-Core | Single-Core
HWBOT x265 Benchmark v2.2: 4k Preset
LibreOffice : 20 Documents To PDF
R Benchmark 2.5: Overall mean
| CPU Performance rating | |
| Lenovo Yoga 7-14ARB G7 | |
| Samsung Galaxy Book3 Pro 14 | |
| Lenovo ThinkPad T14s G3 21BR00CDGE | |
| HP Envy x360 13-bf0013dx | |
| Dell Latitude 7230 Rugged Extreme | |
| Dell XPS 13 9315 2-in-1 Core i5-1230U | |
| Dell Latitude 7330 Rugged Extreme | |
| Dynabook Satellite Pro C50D-B-115 | |
| Asus ZenBook 14X OLED UX5400EA-L7154W | |
| Przeciętny Intel Core i5-1230U | |
| Durabook R8 Tablet | |
| Panasonic Toughbook FZ-G2 -2! | |
| Acer Enduro T1 ET108-11A A9001 -12! | |
| Chuwi LapBook Plus -6! | |
| Lenovo Tab M8 (Gen 4) -12! | |
| Cinebench R23 / Multi Core | |
| Lenovo Yoga 7-14ARB G7 | |
| Lenovo ThinkPad T14s G3 21BR00CDGE | |
| Samsung Galaxy Book3 Pro 14 | |
| Dell Latitude 7230 Rugged Extreme | |
| HP Envy x360 13-bf0013dx | |
| Dell XPS 13 9315 2-in-1 Core i5-1230U | |
| Dynabook Satellite Pro C50D-B-115 | |
| Asus ZenBook 14X OLED UX5400EA-L7154W | |
| Dell Latitude 7330 Rugged Extreme | |
| Przeciętny Intel Core i5-1230U (3066 - 7264, n=3) | |
| Panasonic Toughbook FZ-G2 | |
| Durabook R8 Tablet | |
| Cinebench R23 / Single Core | |
| Lenovo ThinkPad T14s G3 21BR00CDGE | |
| Samsung Galaxy Book3 Pro 14 | |
| HP Envy x360 13-bf0013dx | |
| Dell Latitude 7230 Rugged Extreme | |
| Dell Latitude 7330 Rugged Extreme | |
| Lenovo Yoga 7-14ARB G7 | |
| Dell XPS 13 9315 2-in-1 Core i5-1230U | |
| Asus ZenBook 14X OLED UX5400EA-L7154W | |
| Dynabook Satellite Pro C50D-B-115 | |
| Przeciętny Intel Core i5-1230U (1135 - 1512, n=3) | |
| Durabook R8 Tablet | |
| Panasonic Toughbook FZ-G2 | |
| Cinebench R20 / CPU (Multi Core) | |
| Lenovo Yoga 7-14ARB G7 | |
| Lenovo ThinkPad T14s G3 21BR00CDGE | |
| Samsung Galaxy Book3 Pro 14 | |
| Dell Latitude 7230 Rugged Extreme | |
| HP Envy x360 13-bf0013dx | |
| Dell XPS 13 9315 2-in-1 Core i5-1230U | |
| Asus ZenBook 14X OLED UX5400EA-L7154W | |
| Dynabook Satellite Pro C50D-B-115 | |
| Dell Latitude 7330 Rugged Extreme | |
| Przeciętny Intel Core i5-1230U (1175 - 2802, n=3) | |
| Panasonic Toughbook FZ-G2 | |
| Durabook R8 Tablet | |
| Chuwi LapBook Plus | |
| Cinebench R20 / CPU (Single Core) | |
| Lenovo ThinkPad T14s G3 21BR00CDGE | |
| Samsung Galaxy Book3 Pro 14 | |
| HP Envy x360 13-bf0013dx | |
| Lenovo Yoga 7-14ARB G7 | |
| Dell Latitude 7230 Rugged Extreme | |
| Dell Latitude 7330 Rugged Extreme | |
| Dell XPS 13 9315 2-in-1 Core i5-1230U | |
| Asus ZenBook 14X OLED UX5400EA-L7154W | |
| Dynabook Satellite Pro C50D-B-115 | |
| Przeciętny Intel Core i5-1230U (441 - 580, n=3) | |
| Durabook R8 Tablet | |
| Panasonic Toughbook FZ-G2 | |
| Chuwi LapBook Plus | |
| Cinebench R15 / CPU Multi 64Bit | |
| Lenovo Yoga 7-14ARB G7 | |
| Samsung Galaxy Book3 Pro 14 | |
| Lenovo ThinkPad T14s G3 21BR00CDGE | |
| HP Envy x360 13-bf0013dx | |
| Dynabook Satellite Pro C50D-B-115 | |
| Dell XPS 13 9315 2-in-1 Core i5-1230U | |
| Dell Latitude 7230 Rugged Extreme | |
| Asus ZenBook 14X OLED UX5400EA-L7154W | |
| Dell Latitude 7330 Rugged Extreme | |
| Przeciętny Intel Core i5-1230U (433 - 1254, n=3) | |
| Panasonic Toughbook FZ-G2 | |
| Durabook R8 Tablet | |
| Chuwi LapBook Plus | |
| Cinebench R15 / CPU Single 64Bit | |
| Lenovo Yoga 7-14ARB G7 | |
| Lenovo ThinkPad T14s G3 21BR00CDGE | |
| Samsung Galaxy Book3 Pro 14 | |
| Dell Latitude 7330 Rugged Extreme | |
| HP Envy x360 13-bf0013dx | |
| Dell Latitude 7230 Rugged Extreme | |
| Dell XPS 13 9315 2-in-1 Core i5-1230U | |
| Dynabook Satellite Pro C50D-B-115 | |
| Asus ZenBook 14X OLED UX5400EA-L7154W | |
| Przeciętny Intel Core i5-1230U (120.1 - 221, n=3) | |
| Panasonic Toughbook FZ-G2 | |
| Durabook R8 Tablet | |
| Chuwi LapBook Plus | |
| Blender / v2.79 BMW27 CPU | |
| Chuwi LapBook Plus | |
| Durabook R8 Tablet | |
| Panasonic Toughbook FZ-G2 | |
| Przeciętny Intel Core i5-1230U (503 - 1005, n=2) | |
| Dell Latitude 7330 Rugged Extreme | |
| Asus ZenBook 14X OLED UX5400EA-L7154W | |
| Dell XPS 13 9315 2-in-1 Core i5-1230U | |
| Dynabook Satellite Pro C50D-B-115 | |
| HP Envy x360 13-bf0013dx | |
| Dell Latitude 7230 Rugged Extreme | |
| Lenovo ThinkPad T14s G3 21BR00CDGE | |
| Samsung Galaxy Book3 Pro 14 | |
| Lenovo Yoga 7-14ARB G7 | |
| 7-Zip 18.03 / 7z b 4 | |
| Lenovo Yoga 7-14ARB G7 | |
| Lenovo ThinkPad T14s G3 21BR00CDGE | |
| Samsung Galaxy Book3 Pro 14 | |
| Dell XPS 13 9315 2-in-1 Core i5-1230U | |
| Dynabook Satellite Pro C50D-B-115 | |
| HP Envy x360 13-bf0013dx | |
| Dell Latitude 7230 Rugged Extreme | |
| Asus ZenBook 14X OLED UX5400EA-L7154W | |
| Dell Latitude 7330 Rugged Extreme | |
| Przeciętny Intel Core i5-1230U (12470 - 34505, n=3) | |
| Panasonic Toughbook FZ-G2 | |
| Durabook R8 Tablet | |
| Chuwi LapBook Plus | |
| 7-Zip 18.03 / 7z b 4 -mmt1 | |
| Samsung Galaxy Book3 Pro 14 | |
| Lenovo Yoga 7-14ARB G7 | |
| Dell Latitude 7330 Rugged Extreme | |
| Lenovo ThinkPad T14s G3 21BR00CDGE | |
| Dynabook Satellite Pro C50D-B-115 | |
| Asus ZenBook 14X OLED UX5400EA-L7154W | |
| Dell XPS 13 9315 2-in-1 Core i5-1230U | |
| HP Envy x360 13-bf0013dx | |
| Dell Latitude 7230 Rugged Extreme | |
| Przeciętny Intel Core i5-1230U (3873 - 4870, n=3) | |
| Panasonic Toughbook FZ-G2 | |
| Durabook R8 Tablet | |
| Chuwi LapBook Plus | |
| Geekbench 5.5 / Multi-Core | |
| Samsung Galaxy Book3 Pro 14 | |
| Lenovo Yoga 7-14ARB G7 | |
| Lenovo ThinkPad T14s G3 21BR00CDGE | |
| Dell XPS 13 9315 2-in-1 Core i5-1230U | |
| HP Envy x360 13-bf0013dx | |
| Dell Latitude 7230 Rugged Extreme | |
| Przeciętny Intel Core i5-1230U (4193 - 7309, n=3) | |
| Asus ZenBook 14X OLED UX5400EA-L7154W | |
| Asus ZenBook 14X OLED UX5400EA-L7154W | |
| Dell Latitude 7330 Rugged Extreme | |
| Dynabook Satellite Pro C50D-B-115 | |
| Durabook R8 Tablet | |
| Acer Enduro T1 ET108-11A A9001 | |
| Lenovo Tab M8 (Gen 4) | |
| Geekbench 5.5 / Single-Core | |
| Samsung Galaxy Book3 Pro 14 | |
| Lenovo ThinkPad T14s G3 21BR00CDGE | |
| Dell Latitude 7230 Rugged Extreme | |
| HP Envy x360 13-bf0013dx | |
| Dell Latitude 7330 Rugged Extreme | |
| Lenovo Yoga 7-14ARB G7 | |
| Przeciętny Intel Core i5-1230U (1454 - 1640, n=3) | |
| Dell XPS 13 9315 2-in-1 Core i5-1230U | |
| Asus ZenBook 14X OLED UX5400EA-L7154W | |
| Asus ZenBook 14X OLED UX5400EA-L7154W | |
| Durabook R8 Tablet | |
| Dynabook Satellite Pro C50D-B-115 | |
| Acer Enduro T1 ET108-11A A9001 | |
| Lenovo Tab M8 (Gen 4) | |
| HWBOT x265 Benchmark v2.2 / 4k Preset | |
| Lenovo Yoga 7-14ARB G7 | |
| Samsung Galaxy Book3 Pro 14 | |
| Lenovo ThinkPad T14s G3 21BR00CDGE | |
| Dell Latitude 7230 Rugged Extreme | |
| HP Envy x360 13-bf0013dx | |
| Dell XPS 13 9315 2-in-1 Core i5-1230U | |
| Asus ZenBook 14X OLED UX5400EA-L7154W | |
| Dynabook Satellite Pro C50D-B-115 | |
| Dell Latitude 7330 Rugged Extreme | |
| Przeciętny Intel Core i5-1230U (3.59 - 8.33, n=2) | |
| Panasonic Toughbook FZ-G2 | |
| Durabook R8 Tablet | |
| Chuwi LapBook Plus | |
| LibreOffice / 20 Documents To PDF | |
| Asus ZenBook 14X OLED UX5400EA-L7154W | |
| Panasonic Toughbook FZ-G2 | |
| Durabook R8 Tablet | |
| Przeciętny Intel Core i5-1230U (51.2 - 62.5, n=2) | |
| Lenovo Yoga 7-14ARB G7 | |
| Dynabook Satellite Pro C50D-B-115 | |
| HP Envy x360 13-bf0013dx | |
| Dell Latitude 7230 Rugged Extreme | |
| Dell XPS 13 9315 2-in-1 Core i5-1230U | |
| Dell Latitude 7330 Rugged Extreme | |
| Samsung Galaxy Book3 Pro 14 | |
| Lenovo ThinkPad T14s G3 21BR00CDGE | |
| R Benchmark 2.5 / Overall mean | |
| Panasonic Toughbook FZ-G2 | |
| Durabook R8 Tablet | |
| Asus ZenBook 14X OLED UX5400EA-L7154W | |
| Przeciętny Intel Core i5-1230U (0.527 - 0.676, n=2) | |
| Dynabook Satellite Pro C50D-B-115 | |
| Dell Latitude 7330 Rugged Extreme | |
| HP Envy x360 13-bf0013dx | |
| Dell Latitude 7230 Rugged Extreme | |
| Dell XPS 13 9315 2-in-1 Core i5-1230U | |
| Lenovo Yoga 7-14ARB G7 | |
| Lenovo ThinkPad T14s G3 21BR00CDGE | |
| Samsung Galaxy Book3 Pro 14 | |
Cinebench R23: Multi Core | Single Core
Cinebench R20: CPU (Multi Core) | CPU (Single Core)
Cinebench R15: CPU Multi 64Bit | CPU Single 64Bit
Blender: v2.79 BMW27 CPU
7-Zip 18.03: 7z b 4 | 7z b 4 -mmt1
Geekbench 5.5: Multi-Core | Single-Core
HWBOT x265 Benchmark v2.2: 4k Preset
LibreOffice : 20 Documents To PDF
R Benchmark 2.5: Overall mean
* ... im mniej tym lepiej
* ... im mniej tym lepiej
AIDA64: FP32 Ray-Trace | FPU Julia | CPU SHA3 | CPU Queen | FPU SinJulia | FPU Mandel | CPU AES | CPU ZLib | FP64 Ray-Trace | CPU PhotoWorxx
| Performance rating | |
| Dell Latitude 7230 Rugged Extreme | |
| Przeciętny Intel Core i5-1230U | |
| Panasonic Toughbook FZ-G2 | |
| Durabook R8 Tablet | |
| AIDA64 / FP32 Ray-Trace | |
| Dell Latitude 7230 Rugged Extreme | |
| Przeciętny Intel Core i5-1230U (2344 - 6360, n=3) | |
| Panasonic Toughbook FZ-G2 | |
| Durabook R8 Tablet | |
| AIDA64 / FPU Julia | |
| Dell Latitude 7230 Rugged Extreme | |
| Przeciętny Intel Core i5-1230U (11867 - 31714, n=3) | |
| Panasonic Toughbook FZ-G2 | |
| Durabook R8 Tablet | |
| AIDA64 / CPU SHA3 | |
| Dell Latitude 7230 Rugged Extreme | |
| Przeciętny Intel Core i5-1230U (772 - 1711, n=3) | |
| Panasonic Toughbook FZ-G2 | |
| Durabook R8 Tablet | |
| AIDA64 / CPU Queen | |
| Dell Latitude 7230 Rugged Extreme | |
| Przeciętny Intel Core i5-1230U (30824 - 52533, n=3) | |
| Panasonic Toughbook FZ-G2 | |
| Durabook R8 Tablet | |
| AIDA64 / FPU SinJulia | |
| Dell Latitude 7230 Rugged Extreme | |
| Panasonic Toughbook FZ-G2 | |
| Przeciętny Intel Core i5-1230U (2269 - 3947, n=3) | |
| Durabook R8 Tablet | |
| AIDA64 / FPU Mandel | |
| Dell Latitude 7230 Rugged Extreme | |
| Przeciętny Intel Core i5-1230U (6379 - 15896, n=3) | |
| Panasonic Toughbook FZ-G2 | |
| Durabook R8 Tablet | |
| AIDA64 / CPU AES | |
| Dell Latitude 7230 Rugged Extreme | |
| Durabook R8 Tablet | |
| Przeciętny Intel Core i5-1230U (18011 - 31941, n=3) | |
| Panasonic Toughbook FZ-G2 | |
| AIDA64 / CPU ZLib | |
| Dell Latitude 7230 Rugged Extreme | |
| Przeciętny Intel Core i5-1230U (229 - 495, n=3) | |
| Durabook R8 Tablet | |
| Panasonic Toughbook FZ-G2 | |
| AIDA64 / FP64 Ray-Trace | |
| Dell Latitude 7230 Rugged Extreme | |
| Przeciętny Intel Core i5-1230U (1328 - 3305, n=3) | |
| Panasonic Toughbook FZ-G2 | |
| Durabook R8 Tablet | |
| AIDA64 / CPU PhotoWorxx | |
| Dell Latitude 7230 Rugged Extreme | |
| Przeciętny Intel Core i5-1230U (17516 - 37042, n=3) | |
| Panasonic Toughbook FZ-G2 | |
| Durabook R8 Tablet | |
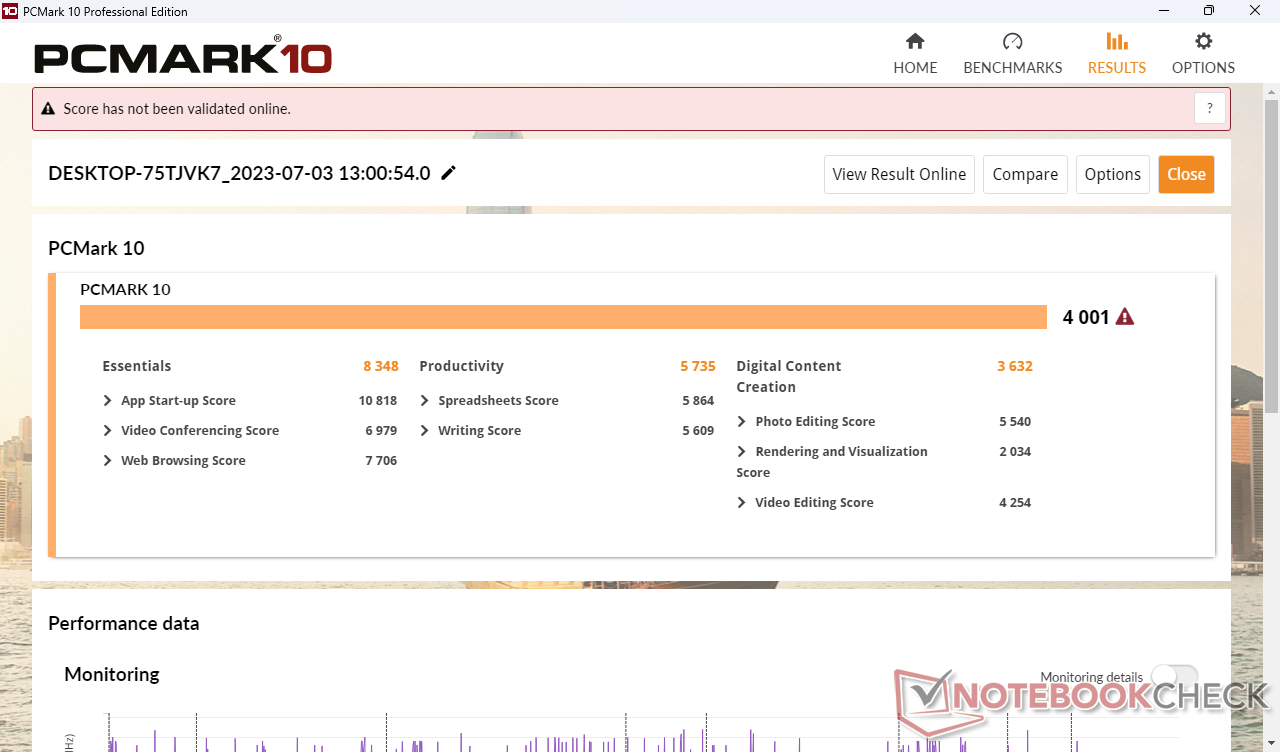
Wydajność systemu
Wyniki PCMark są porównywalne ze starszym Panasonic Toughbook FZ-G2 ponieważ procesor w naszej jednostce został obniżony, aby działał bardziej podobnie do Toughbooka.
CrossMark: Overall | Productivity | Creativity | Responsiveness
| PCMark 10 / Score | |
| Dell Latitude 7230 Rugged Extreme | |
| Przeciętny Intel Core i5-1230U, Intel Iris Xe Graphics G7 80EUs (4001 - 4943, n=3) | |
| Durabook R8 Tablet | |
| Panasonic Toughbook FZ-G2 | |
| PCMark 10 / Essentials | |
| Dell Latitude 7230 Rugged Extreme | |
| Przeciętny Intel Core i5-1230U, Intel Iris Xe Graphics G7 80EUs (8348 - 10139, n=3) | |
| Panasonic Toughbook FZ-G2 | |
| Durabook R8 Tablet | |
| PCMark 10 / Productivity | |
| Dell Latitude 7230 Rugged Extreme | |
| Przeciętny Intel Core i5-1230U, Intel Iris Xe Graphics G7 80EUs (5735 - 6692, n=3) | |
| Panasonic Toughbook FZ-G2 | |
| Durabook R8 Tablet | |
| PCMark 10 / Digital Content Creation | |
| Dell Latitude 7230 Rugged Extreme | |
| Przeciętny Intel Core i5-1230U, Intel Iris Xe Graphics G7 80EUs (3632 - 4833, n=3) | |
| Durabook R8 Tablet | |
| Panasonic Toughbook FZ-G2 | |
| CrossMark / Overall | |
| Dell Latitude 7230 Rugged Extreme | |
| Przeciętny Intel Core i5-1230U, Intel Iris Xe Graphics G7 80EUs (1117 - 1383, n=3) | |
| Durabook R8 Tablet | |
| Lenovo Tab M8 (Gen 4) | |
| CrossMark / Productivity | |
| Dell Latitude 7230 Rugged Extreme | |
| Przeciętny Intel Core i5-1230U, Intel Iris Xe Graphics G7 80EUs (1187 - 1356, n=3) | |
| Durabook R8 Tablet | |
| Lenovo Tab M8 (Gen 4) | |
| CrossMark / Creativity | |
| Dell Latitude 7230 Rugged Extreme | |
| Przeciętny Intel Core i5-1230U, Intel Iris Xe Graphics G7 80EUs (1095 - 1469, n=3) | |
| Durabook R8 Tablet | |
| Lenovo Tab M8 (Gen 4) | |
| CrossMark / Responsiveness | |
| Dell Latitude 7230 Rugged Extreme | |
| Przeciętny Intel Core i5-1230U, Intel Iris Xe Graphics G7 80EUs (990 - 1224, n=3) | |
| Durabook R8 Tablet | |
| Lenovo Tab M8 (Gen 4) | |
| PCMark 10 Score | 4001 pkt. | |
Pomoc | ||
| AIDA64 / Memory Copy | |
| Średnia w klasie Tablet (60613 - 110050, n=3, ostatnie 2 lata) | |
| Przeciętny Intel Core i5-1230U (32539 - 60944, n=3) | |
| Durabook R8 Tablet | |
| AIDA64 / Memory Read | |
| Średnia w klasie Tablet (85395 - 122306, n=3, ostatnie 2 lata) | |
| Przeciętny Intel Core i5-1230U (31342 - 60435, n=3) | |
| Durabook R8 Tablet | |
| AIDA64 / Memory Write | |
| Średnia w klasie Tablet (43045 - 117859, n=3, ostatnie 2 lata) | |
| Przeciętny Intel Core i5-1230U (33224 - 65665, n=3) | |
| Durabook R8 Tablet | |
| AIDA64 / Memory Latency | |
| Durabook R8 Tablet | |
| Średnia w klasie Tablet (94.4 - 101.7, n=2, ostatnie 2 lata) | |
| Przeciętny Intel Core i5-1230U (104.3 - 105.3, n=3) | |
* ... im mniej tym lepiej
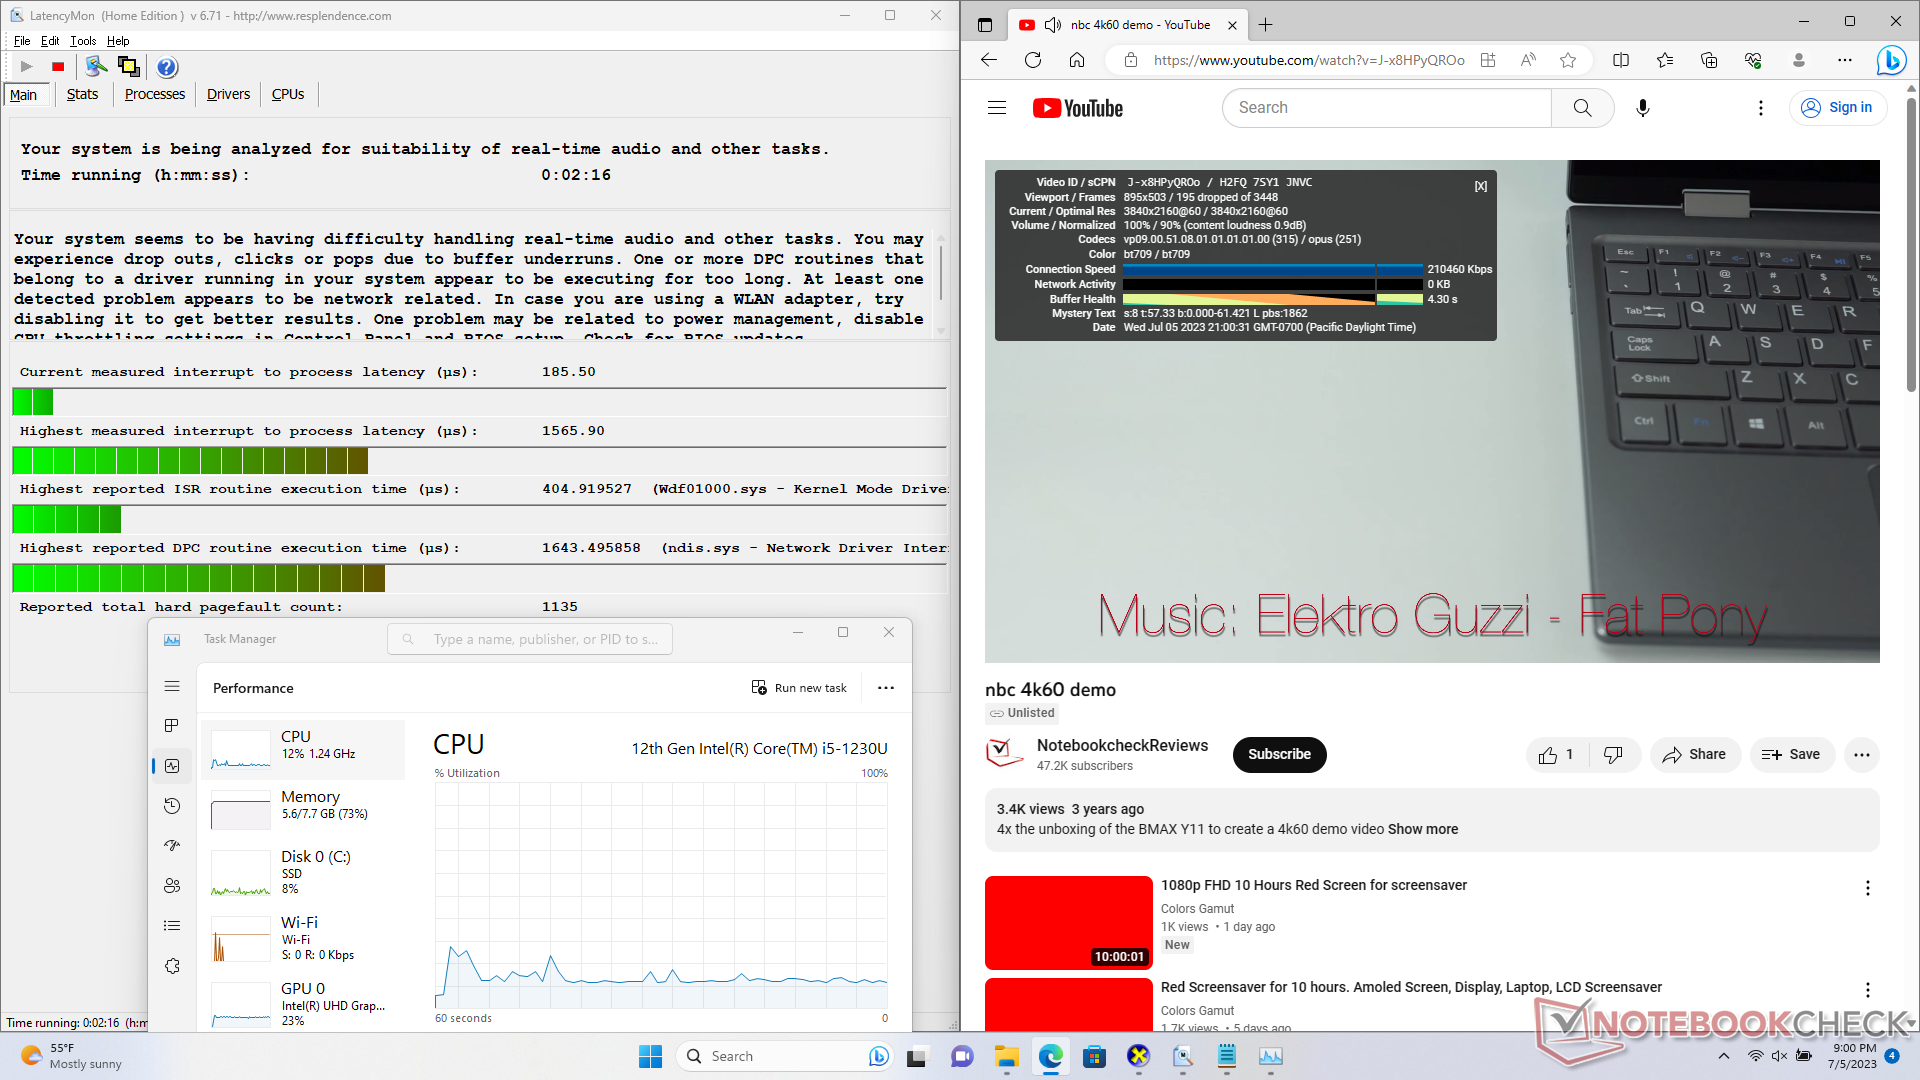
Opóźnienie DPC
LatencyMon ujawnia problemy z DPC podczas otwierania wielu kart przeglądarki na naszej stronie głównej. Dodatkowo, odtwarzanie wideo 4K przy 60 FPS również wykazywało problemy, ponieważ zarejestrowaliśmy 195 utraconych klatek podczas naszego minutowego filmu testowego.
| DPC Latencies / LatencyMon - interrupt to process latency (max), Web, Youtube, Prime95 | |
| Dell Latitude 7230 Rugged Extreme | |
| Panasonic Toughbook FZ-G2 | |
| Durabook R8 Tablet | |
* ... im mniej tym lepiej
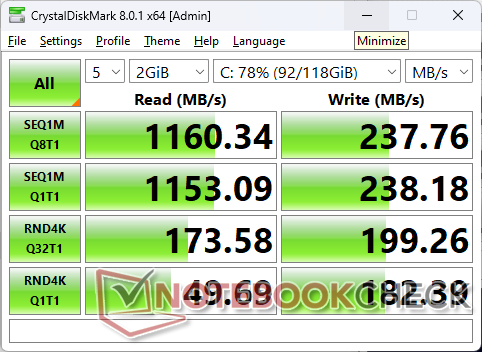
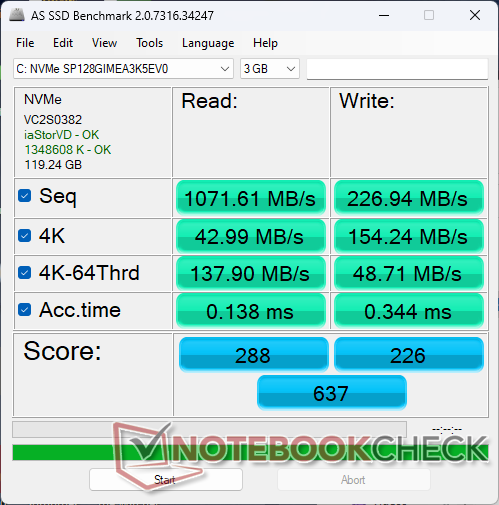
Urządzenia pamięci masowej
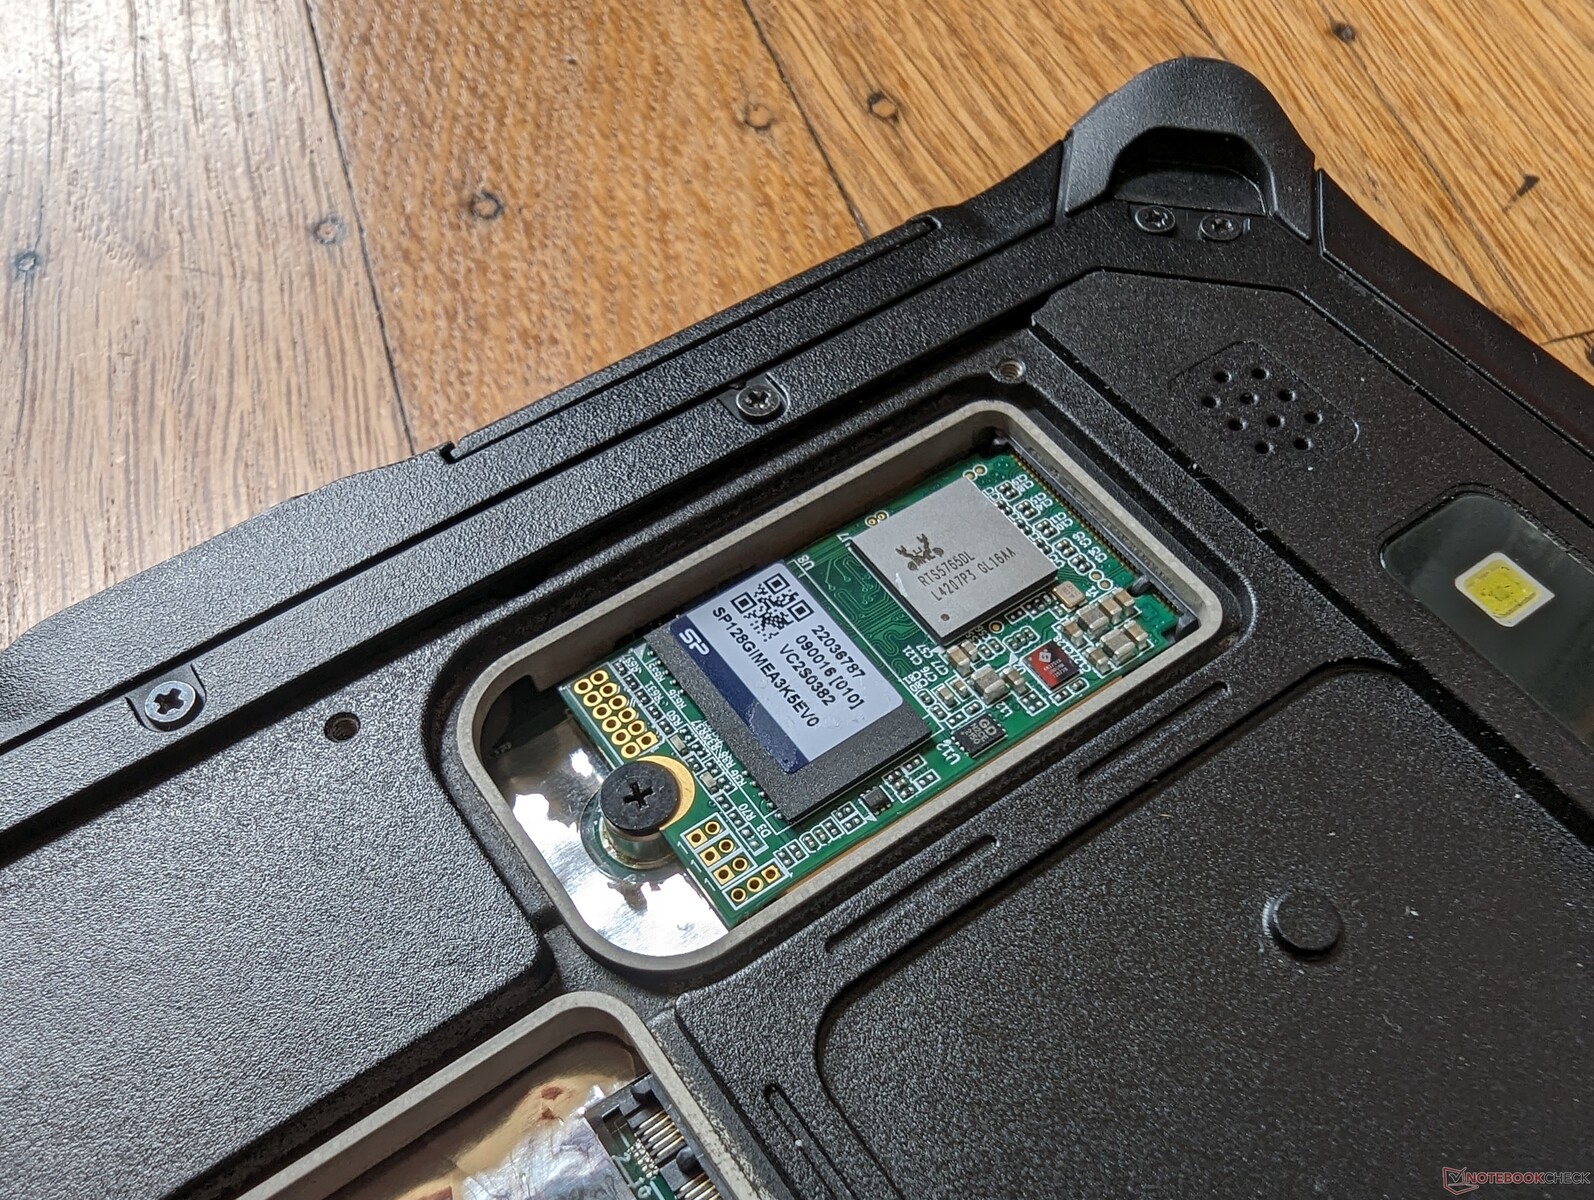
Wymienny dysk 128 GB NVMe SSD może utrzymać prędkości odczytu i zapisu odpowiednio do 1100 MB/s i 240 MB/s przez dłuższy czas. Szybkości zapisu są znacznie niższe, co nie powinno stanowić problemu dla docelowych odbiorców. Oczekuje się, że opcje o większej pojemności 256 GB, 512 GB lub 1 TB będą działać szybciej.

| Drive Performance rating - Percent | |
| Dell Latitude 7230 Rugged Extreme | |
| Panasonic Toughbook FZ-G2 | |
| Durabook R8 Tablet | |
| DiskSpd | |
| seq read | |
| Dell Latitude 7230 Rugged Extreme | |
| Panasonic Toughbook FZ-G2 | |
| Durabook R8 Tablet | |
| seq write | |
| Dell Latitude 7230 Rugged Extreme | |
| Panasonic Toughbook FZ-G2 | |
| Durabook R8 Tablet | |
| seq q8 t1 read | |
| Dell Latitude 7230 Rugged Extreme | |
| Panasonic Toughbook FZ-G2 | |
| Durabook R8 Tablet | |
| seq q8 t1 write | |
| Dell Latitude 7230 Rugged Extreme | |
| Panasonic Toughbook FZ-G2 | |
| Durabook R8 Tablet | |
| 4k q1 t1 read | |
| Dell Latitude 7230 Rugged Extreme | |
| Panasonic Toughbook FZ-G2 | |
| Durabook R8 Tablet | |
| 4k q1 t1 write | |
| Durabook R8 Tablet | |
| Dell Latitude 7230 Rugged Extreme | |
| Panasonic Toughbook FZ-G2 | |
| 4k q32 t16 read | |
| Panasonic Toughbook FZ-G2 | |
| Dell Latitude 7230 Rugged Extreme | |
| Durabook R8 Tablet | |
| 4k q32 t16 write | |
| Dell Latitude 7230 Rugged Extreme | |
| Panasonic Toughbook FZ-G2 | |
| Durabook R8 Tablet | |
| AS SSD | |
| Score Total | |
| Dell Latitude 7230 Rugged Extreme | |
| Panasonic Toughbook FZ-G2 | |
| Durabook R8 Tablet | |
| Score Read | |
| Dell Latitude 7230 Rugged Extreme | |
| Panasonic Toughbook FZ-G2 | |
| Durabook R8 Tablet | |
| Score Write | |
| Dell Latitude 7230 Rugged Extreme | |
| Panasonic Toughbook FZ-G2 | |
| Durabook R8 Tablet | |
| Seq Read | |
| Dell Latitude 7230 Rugged Extreme | |
| Panasonic Toughbook FZ-G2 | |
| Durabook R8 Tablet | |
| Seq Write | |
| Dell Latitude 7230 Rugged Extreme | |
| Panasonic Toughbook FZ-G2 | |
| Durabook R8 Tablet | |
| 4K Read | |
| Dell Latitude 7230 Rugged Extreme | |
| Panasonic Toughbook FZ-G2 | |
| Durabook R8 Tablet | |
| 4K Write | |
| Dell Latitude 7230 Rugged Extreme | |
| Durabook R8 Tablet | |
| Panasonic Toughbook FZ-G2 | |
| 4K-64 Read | |
| Dell Latitude 7230 Rugged Extreme | |
| Panasonic Toughbook FZ-G2 | |
| Durabook R8 Tablet | |
| 4K-64 Write | |
| Dell Latitude 7230 Rugged Extreme | |
| Panasonic Toughbook FZ-G2 | |
| Durabook R8 Tablet | |
| Access Time Read | |
| Durabook R8 Tablet | |
| Panasonic Toughbook FZ-G2 | |
| Dell Latitude 7230 Rugged Extreme | |
| Access Time Write | |
| Panasonic Toughbook FZ-G2 | |
| Durabook R8 Tablet | |
| Dell Latitude 7230 Rugged Extreme | |
* ... im mniej tym lepiej
Disk Throttling: DiskSpd Read Loop, Queue Depth 8
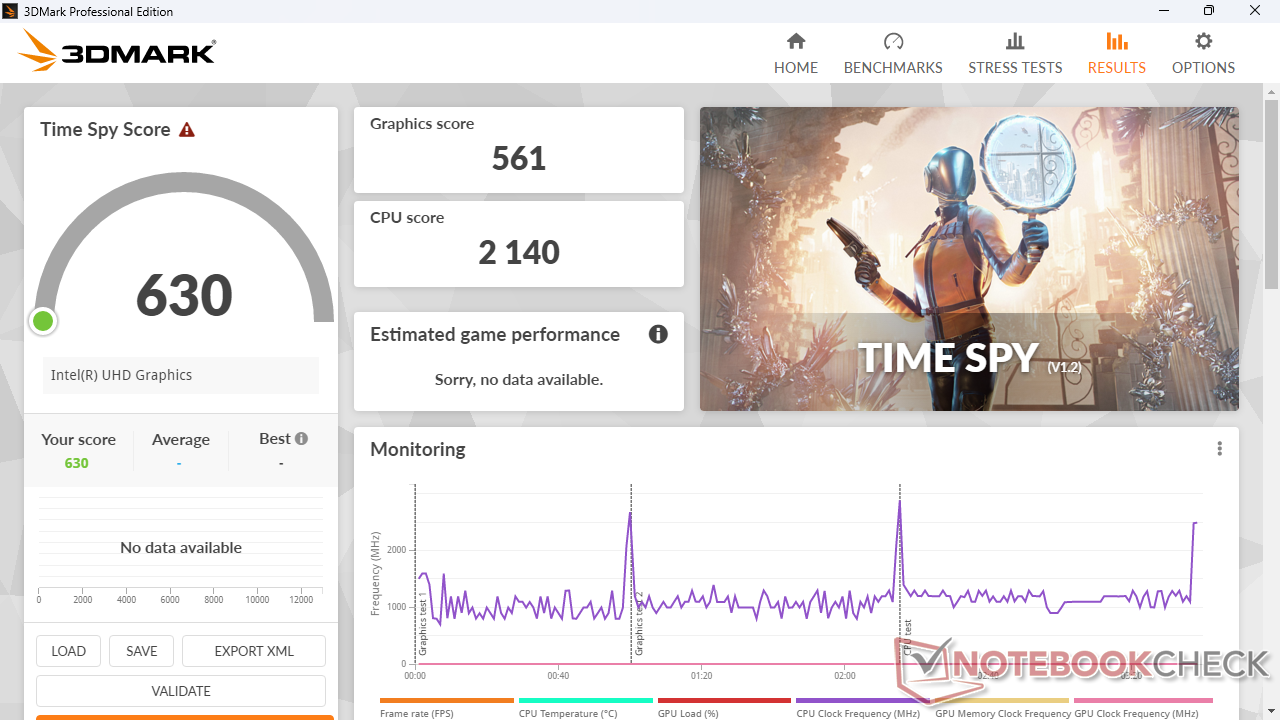
Wydajność GPU
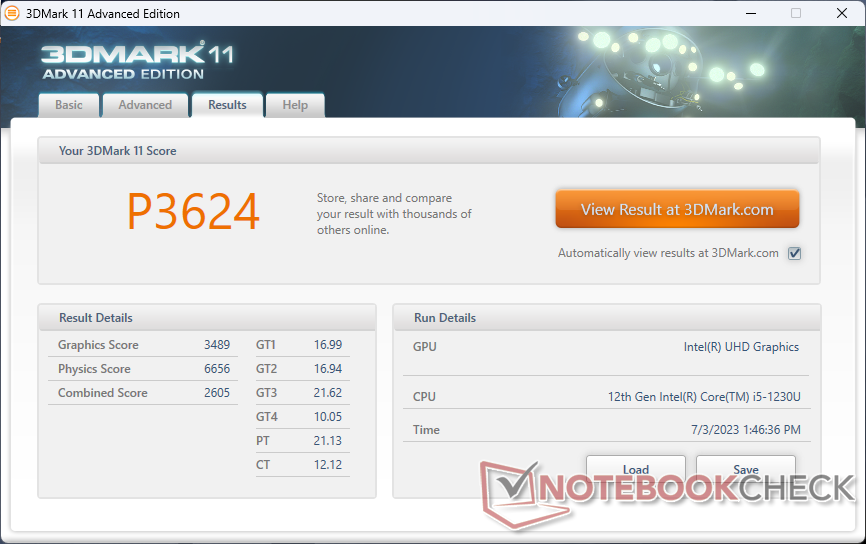
Wydajność graficzna jest o około 30 do 40 procent niższa niż w przypadku tej samej karty Iris Xe 80 EUs W XPS 13 9315, co po części wynika z niższego taktowania procesora i wolniejszej jednokanałowej pamięci RAM. Niemniej jednak, ogólna wydajność jest nadal wyższa niż w znacznie starszym modelu UHD Graphics 620 o około 40 do 50 procent.
| 3DMark Performance rating - Percent | |
| Lenovo Yoga 7-14ARB G7 | |
| Asus ZenBook 14X OLED UX5400EA-L7154W | |
| Dell Latitude 7330 Rugged Extreme | |
| Samsung Galaxy Book3 Pro 14 | |
| Lenovo ThinkPad T14s G3 21BR00CDGE | |
| Przeciętny Intel Iris Xe Graphics G7 80EUs | |
| Dell Latitude 7230 Rugged Extreme | |
| Dell XPS 13 9315 2-in-1 Core i5-1230U | |
| Durabook R8 Tablet | |
| Dynabook Satellite Pro C50D-B-115 | |
| Panasonic Toughbook FZ-G2 | |
| Chuwi LapBook Plus -1! | |
| 3DMark 11 - 1280x720 Performance GPU | |
| Lenovo Yoga 7-14ARB G7 | |
| Asus ZenBook 14X OLED UX5400EA-L7154W | |
| Dell Latitude 7330 Rugged Extreme | |
| Samsung Galaxy Book3 Pro 14 | |
| Lenovo ThinkPad T14s G3 21BR00CDGE | |
| Przeciętny Intel Iris Xe Graphics G7 80EUs (2246 - 6579, n=112) | |
| Dell Latitude 7230 Rugged Extreme | |
| Dell XPS 13 9315 2-in-1 Core i5-1230U | |
| Durabook R8 Tablet | |
| Dynabook Satellite Pro C50D-B-115 | |
| Panasonic Toughbook FZ-G2 | |
| Chuwi LapBook Plus | |
| 3DMark 11 Performance | 3624 pkt. | |
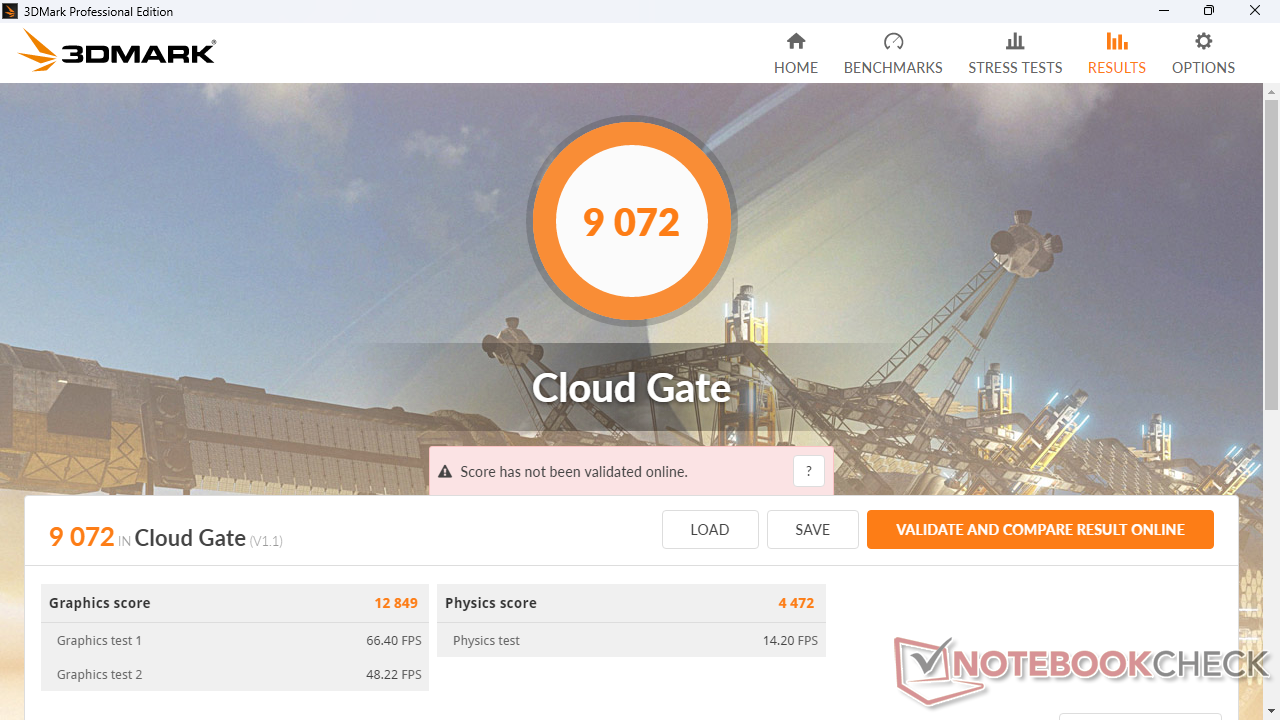
| 3DMark Cloud Gate Standard Score | 9072 pkt. | |
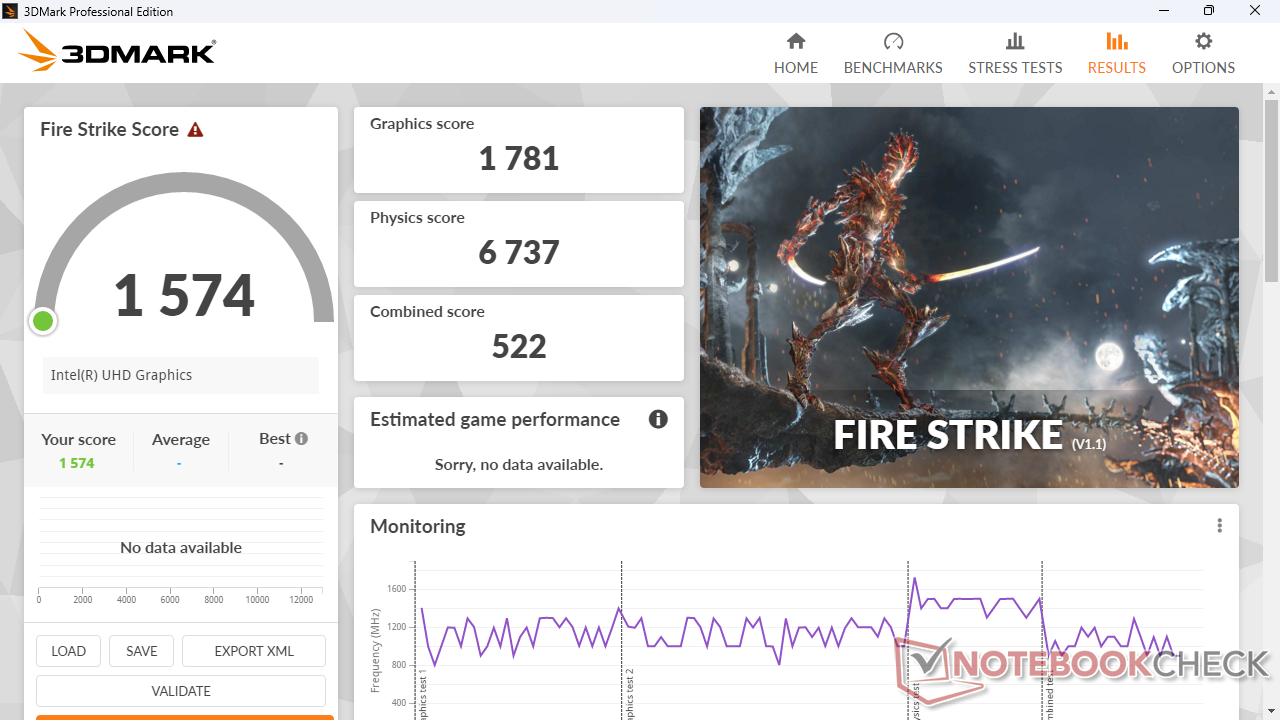
| 3DMark Fire Strike Score | 1574 pkt. | |
| 3DMark Time Spy Score | 630 pkt. | |
Pomoc | ||
| The Witcher 3 - 1024x768 Low Graphics & Postprocessing | |
| Lenovo Yoga 7-14ARB G7 | |
| Dell Latitude 7330 Rugged Extreme | |
| Samsung Galaxy Book3 Pro 14 | |
| Lenovo ThinkPad T14s G3 21BR00CDGE | |
| Dell Latitude 7230 Rugged Extreme | |
| Przeciętny Intel Iris Xe Graphics G7 80EUs (30.2 - 97.4, n=101) | |
| Dell XPS 13 9315 2-in-1 Core i5-1230U | |
| Durabook R8 Tablet | |
| Final Fantasy XV Benchmark - 1280x720 Lite Quality | |
| Asus ZenBook 14X OLED UX5400EA-L7154W | |
| Lenovo Yoga 7-14ARB G7 | |
| Dell Latitude 7330 Rugged Extreme | |
| Lenovo ThinkPad T14s G3 21BR00CDGE | |
| Samsung Galaxy Book3 Pro 14 | |
| Przeciętny Intel Iris Xe Graphics G7 80EUs (8.32 - 45.6, n=107) | |
| Dell Latitude 7230 Rugged Extreme | |
| Dell XPS 13 9315 2-in-1 Core i5-1230U | |
| Dynabook Satellite Pro C50D-B-115 | |
| Panasonic Toughbook FZ-G2 | |
| Durabook R8 Tablet | |
Witcher 3 FPS Chart
| low | med. | high | ultra | |
|---|---|---|---|---|
| The Witcher 3 (2015) | 30.2 | |||
| Dota 2 Reborn (2015) | 62.9 | 41.7 | 19.6 | 13.2 |
| Final Fantasy XV Benchmark (2018) | 12.1 | |||
| X-Plane 11.11 (2018) | 26.2 | 21.8 | 20.1 |
Emisje - konstrukcja bez wentylatora
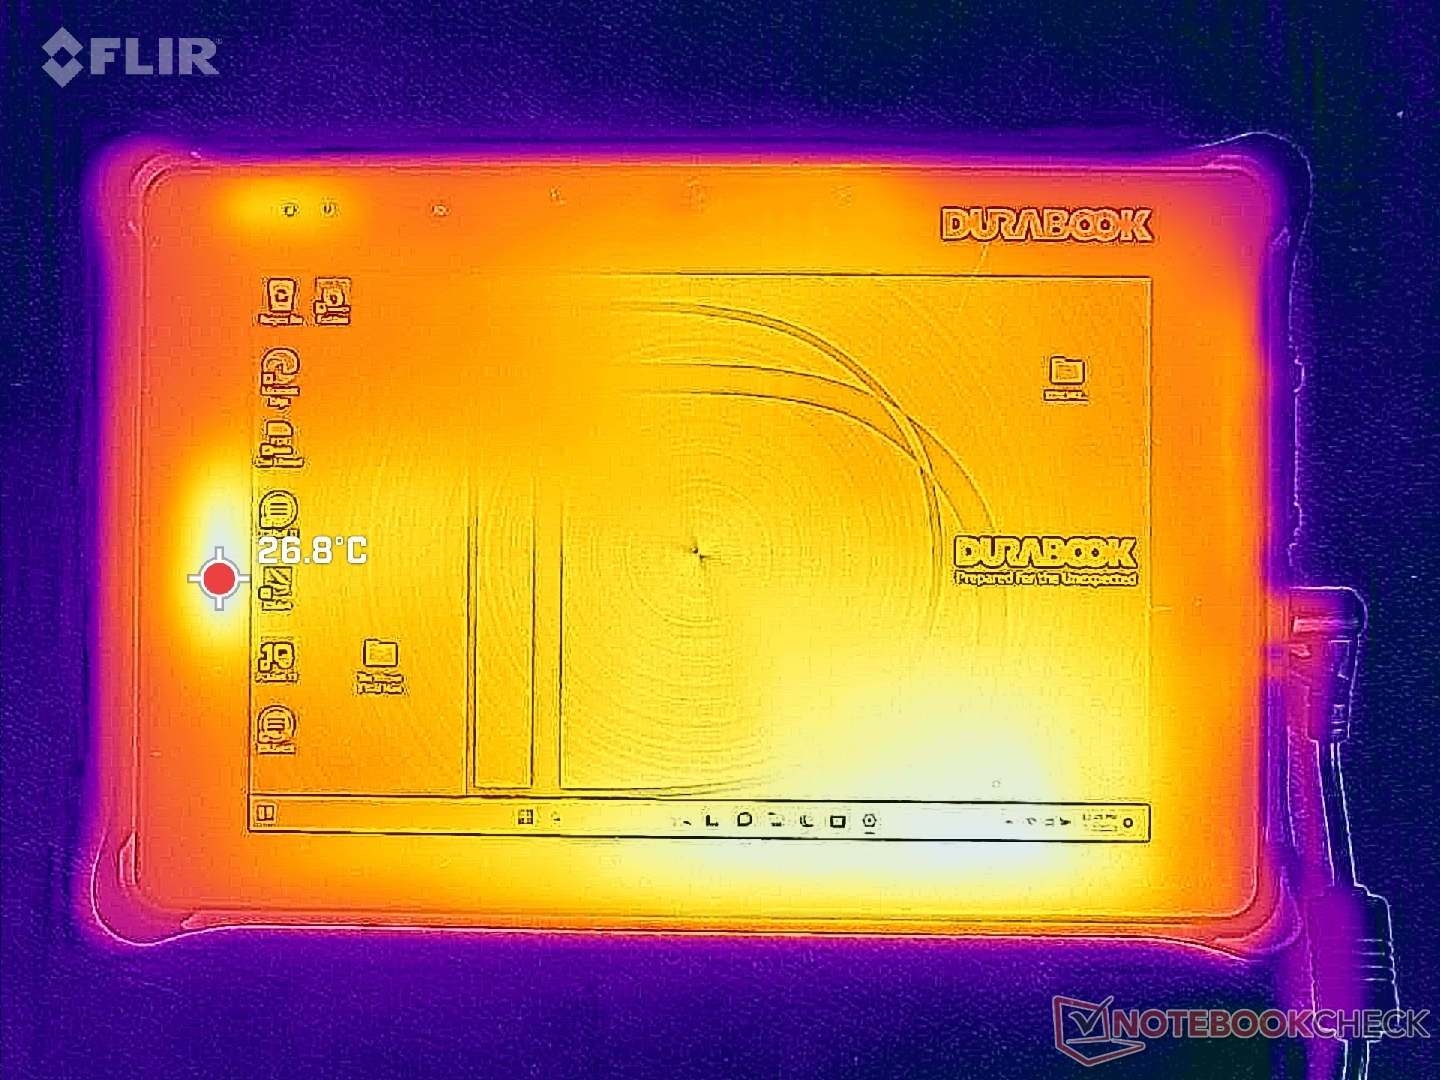
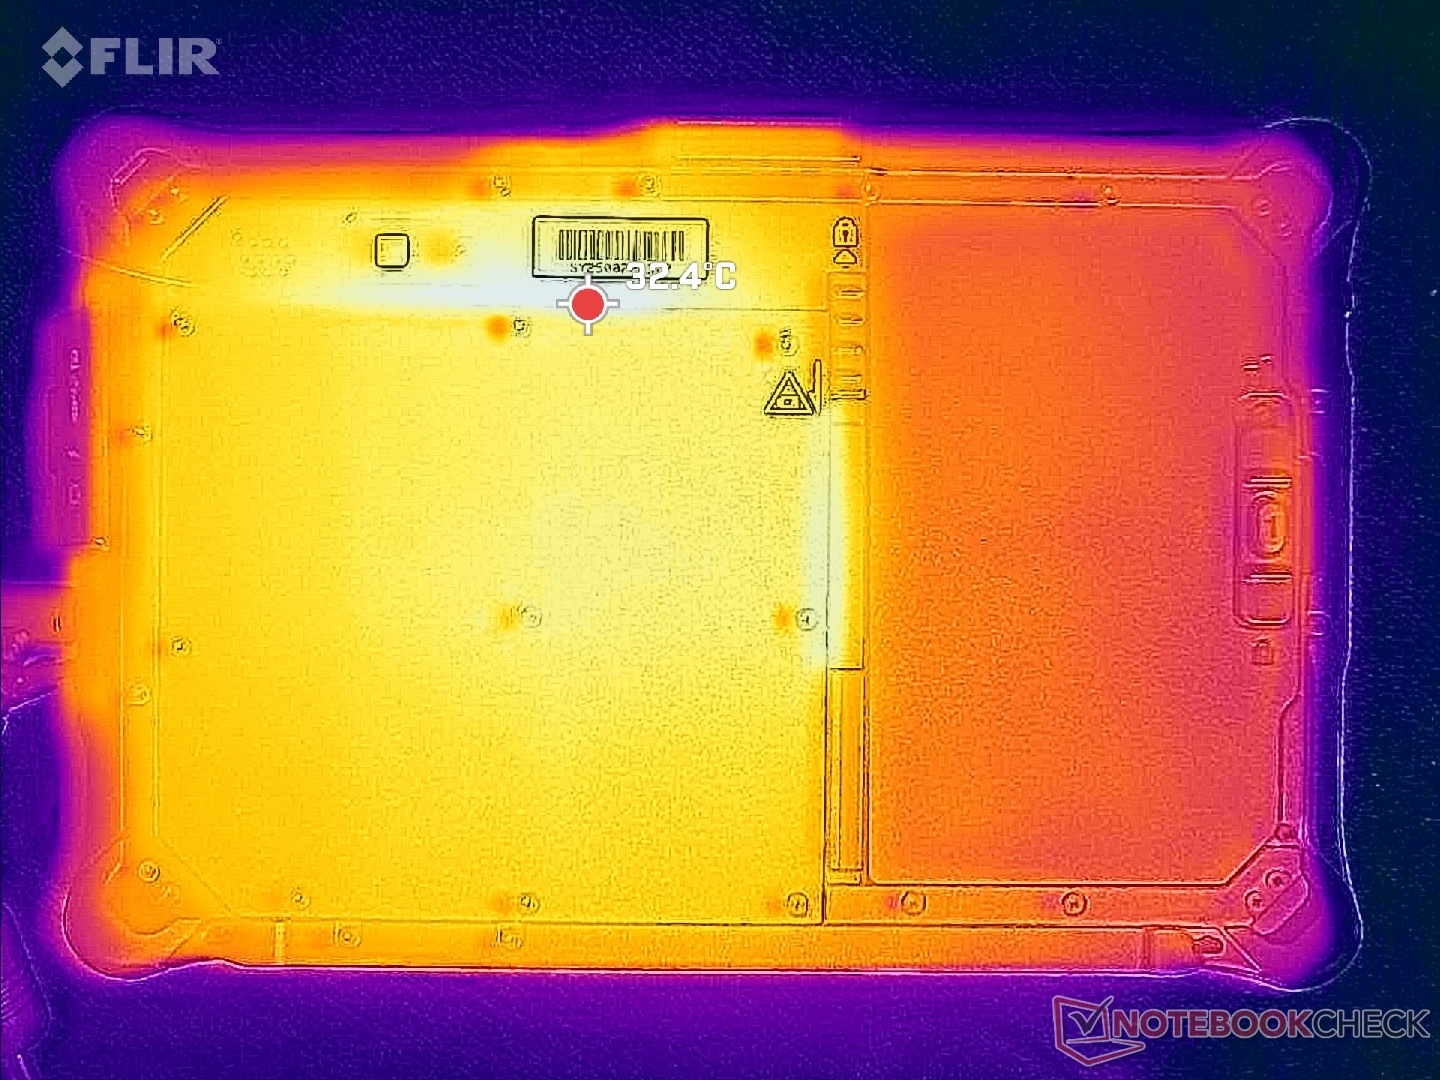
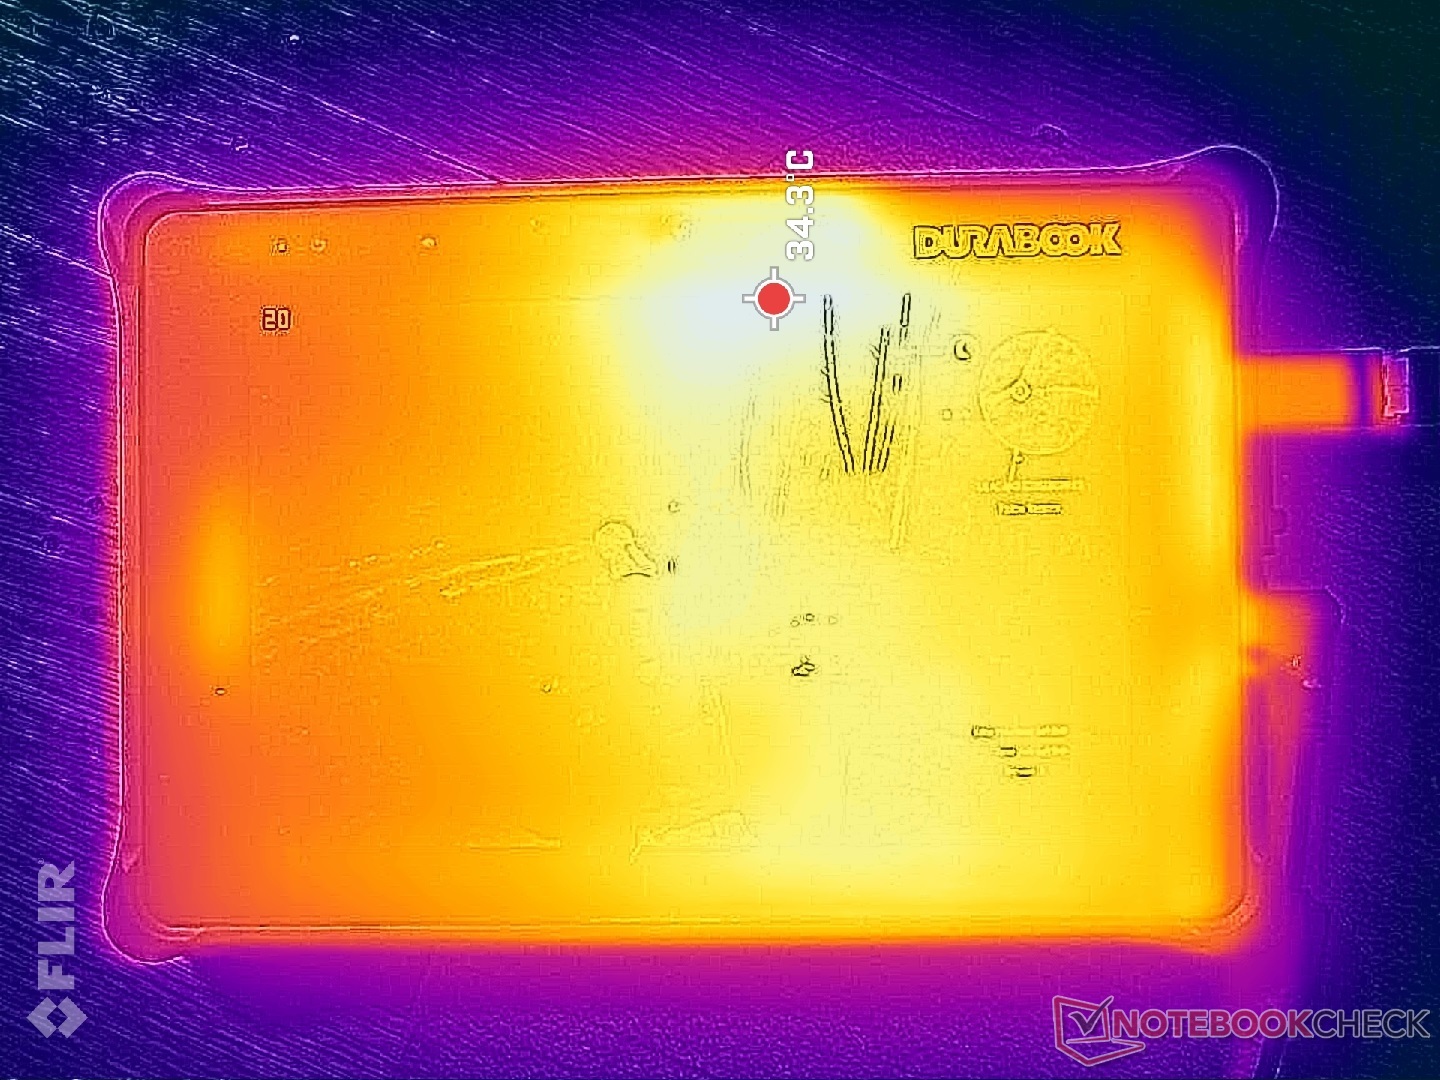
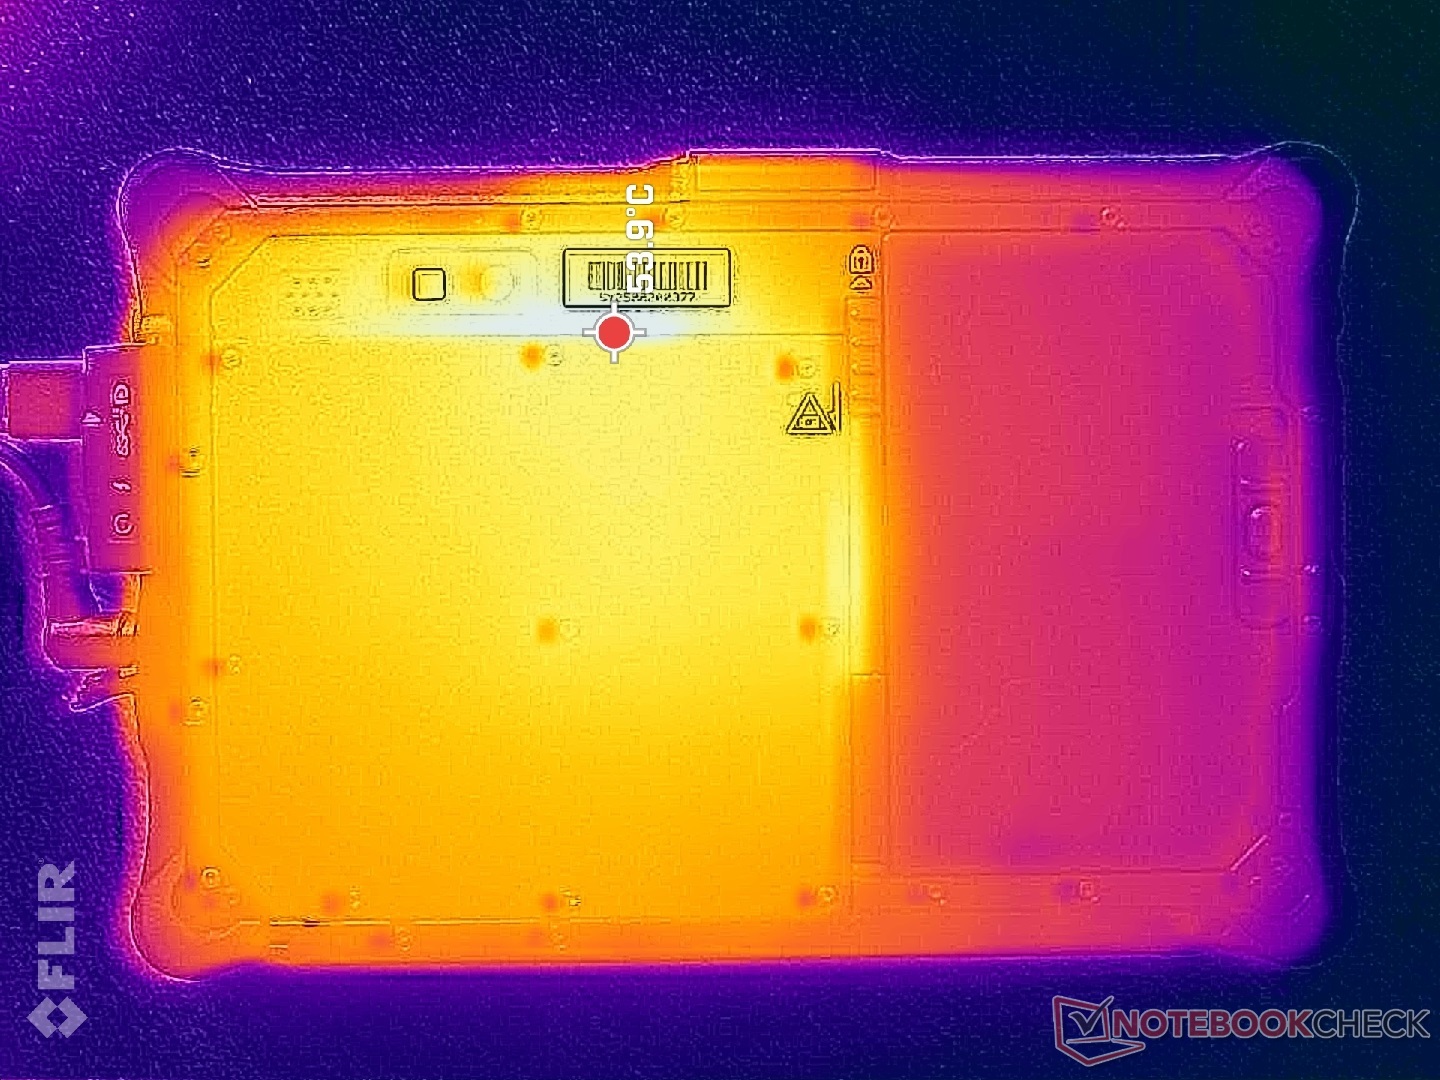
Temperatura
Temperatury powierzchni są wyższe na prawej połowie tabletu niż na lewej ze względu na umiejscowienie płyty głównej i akumulatora. Tył może być bardzo ciepły, nawet do 54 C podczas pracy z wymagającymi obciążeniami, w porównaniu do zaledwie 40 C na Android-based Acer Enduro T1.
(+) Maksymalna temperatura w górnej części wynosi 38.2 °C / 101 F, w porównaniu do średniej 33.7 °C / 93 F , począwszy od 20.7 do 53.2 °C dla klasy Tablet.
(-) Dno nagrzewa się maksymalnie do 49.6 °C / 121 F, w porównaniu do średniej 33.2 °C / 92 F
(+) W stanie bezczynności średnia temperatura górnej części wynosi 30.8 °C / 87 F, w porównaniu ze średnią temperaturą urządzenia wynoszącą 30 °C / ### class_avg_f### F.
| Durabook R8 Tablet Intel Core i5-1230U, Intel Iris Xe Graphics G7 80EUs | Acer Enduro T1 ET108-11A A9001 | Lenovo Tab M8 (Gen 4) Mediatek Helio A22 MT6761, PowerVR GE8300 | Dell Latitude 7230 Rugged Extreme Intel Core i5-1240U, Intel Iris Xe Graphics G7 80EUs | Panasonic Toughbook FZ-G2 Intel Core i5-10310U, Intel UHD Graphics 620 | |
|---|---|---|---|---|---|
| Heat | 7% | 29% | 9% | 19% | |
| Maximum Upper Side * (°C) | 38.2 | 37.8 1% | 28.6 25% | 32.6 15% | 37.4 2% |
| Maximum Bottom * (°C) | 49.6 | 39.4 21% | 30.1 39% | 40.2 19% | 36.6 26% |
| Idle Upper Side * (°C) | 32.2 | 32.8 -2% | 23.1 28% | 30.6 5% | 25.6 20% |
| Idle Bottom * (°C) | 33.4 | 31.2 7% | 25.1 25% | 35 -5% | 24 28% |
* ... im mniej tym lepiej
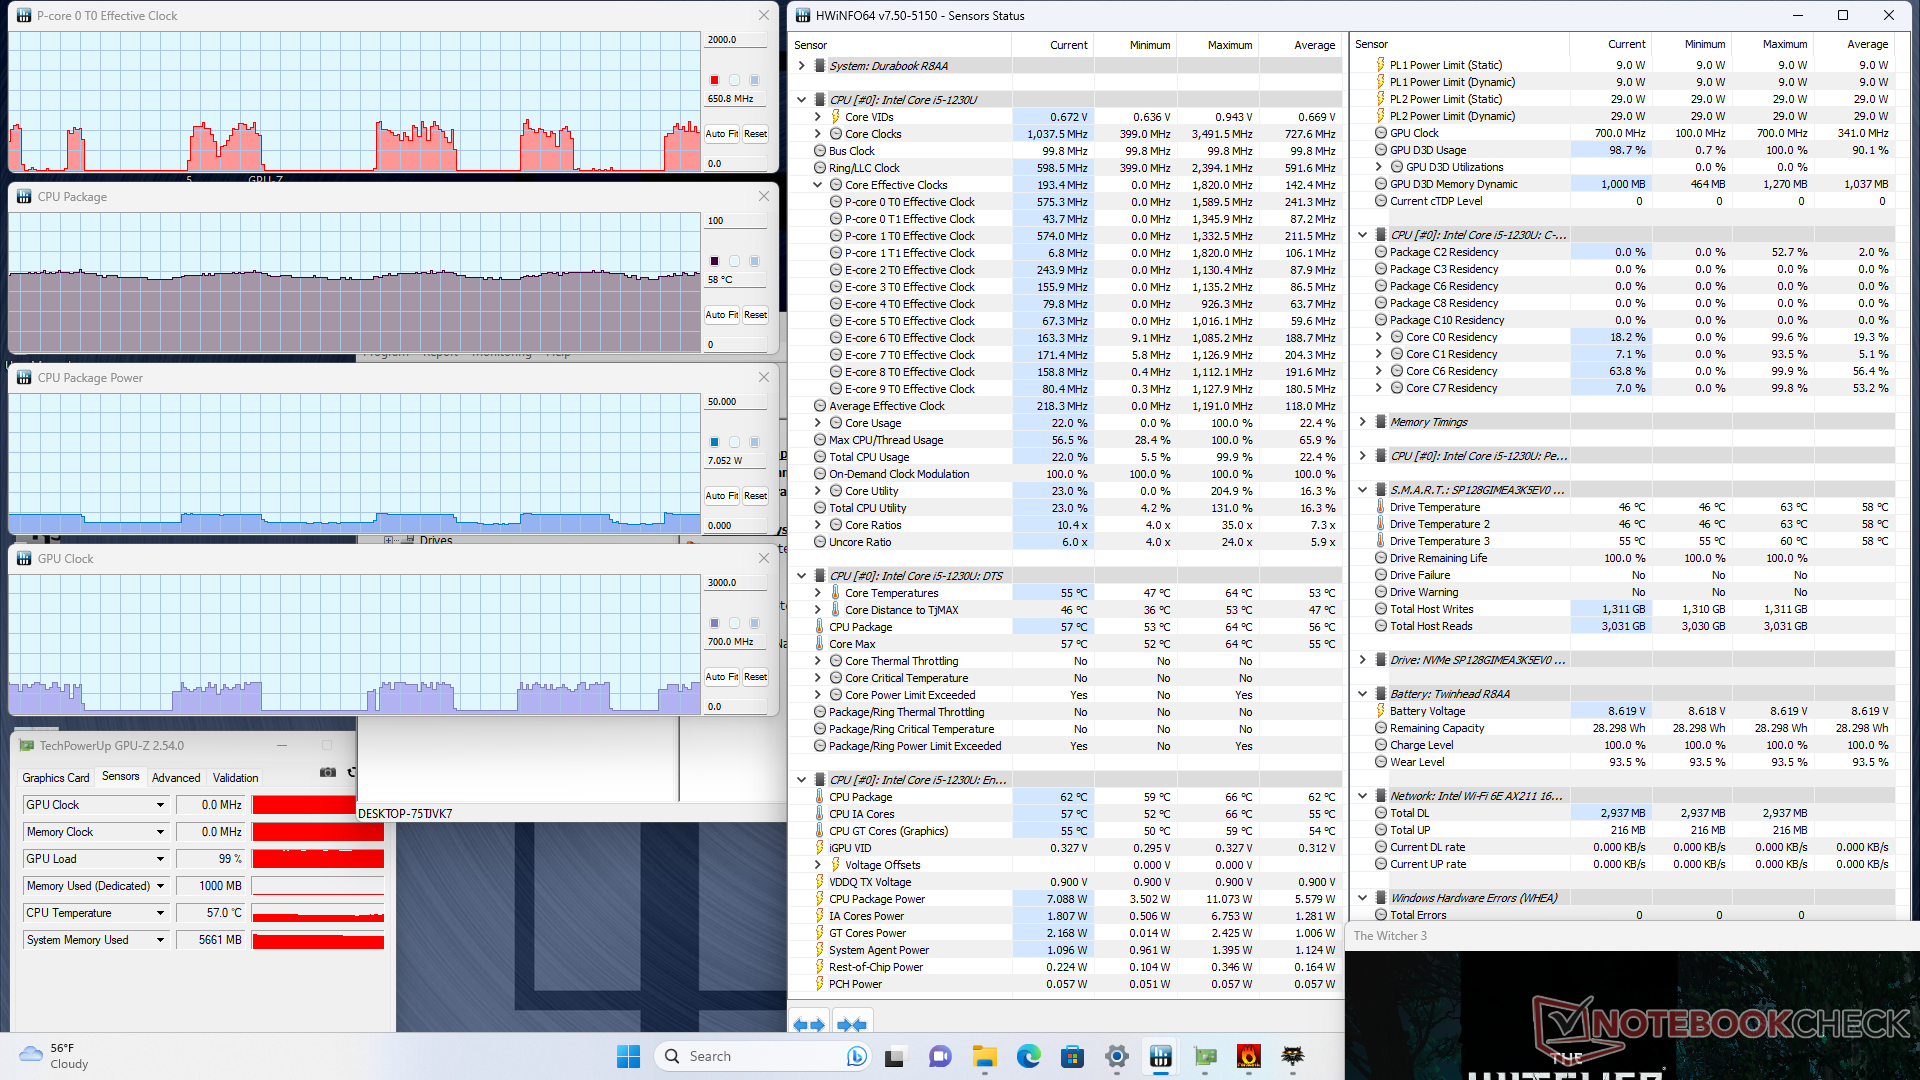
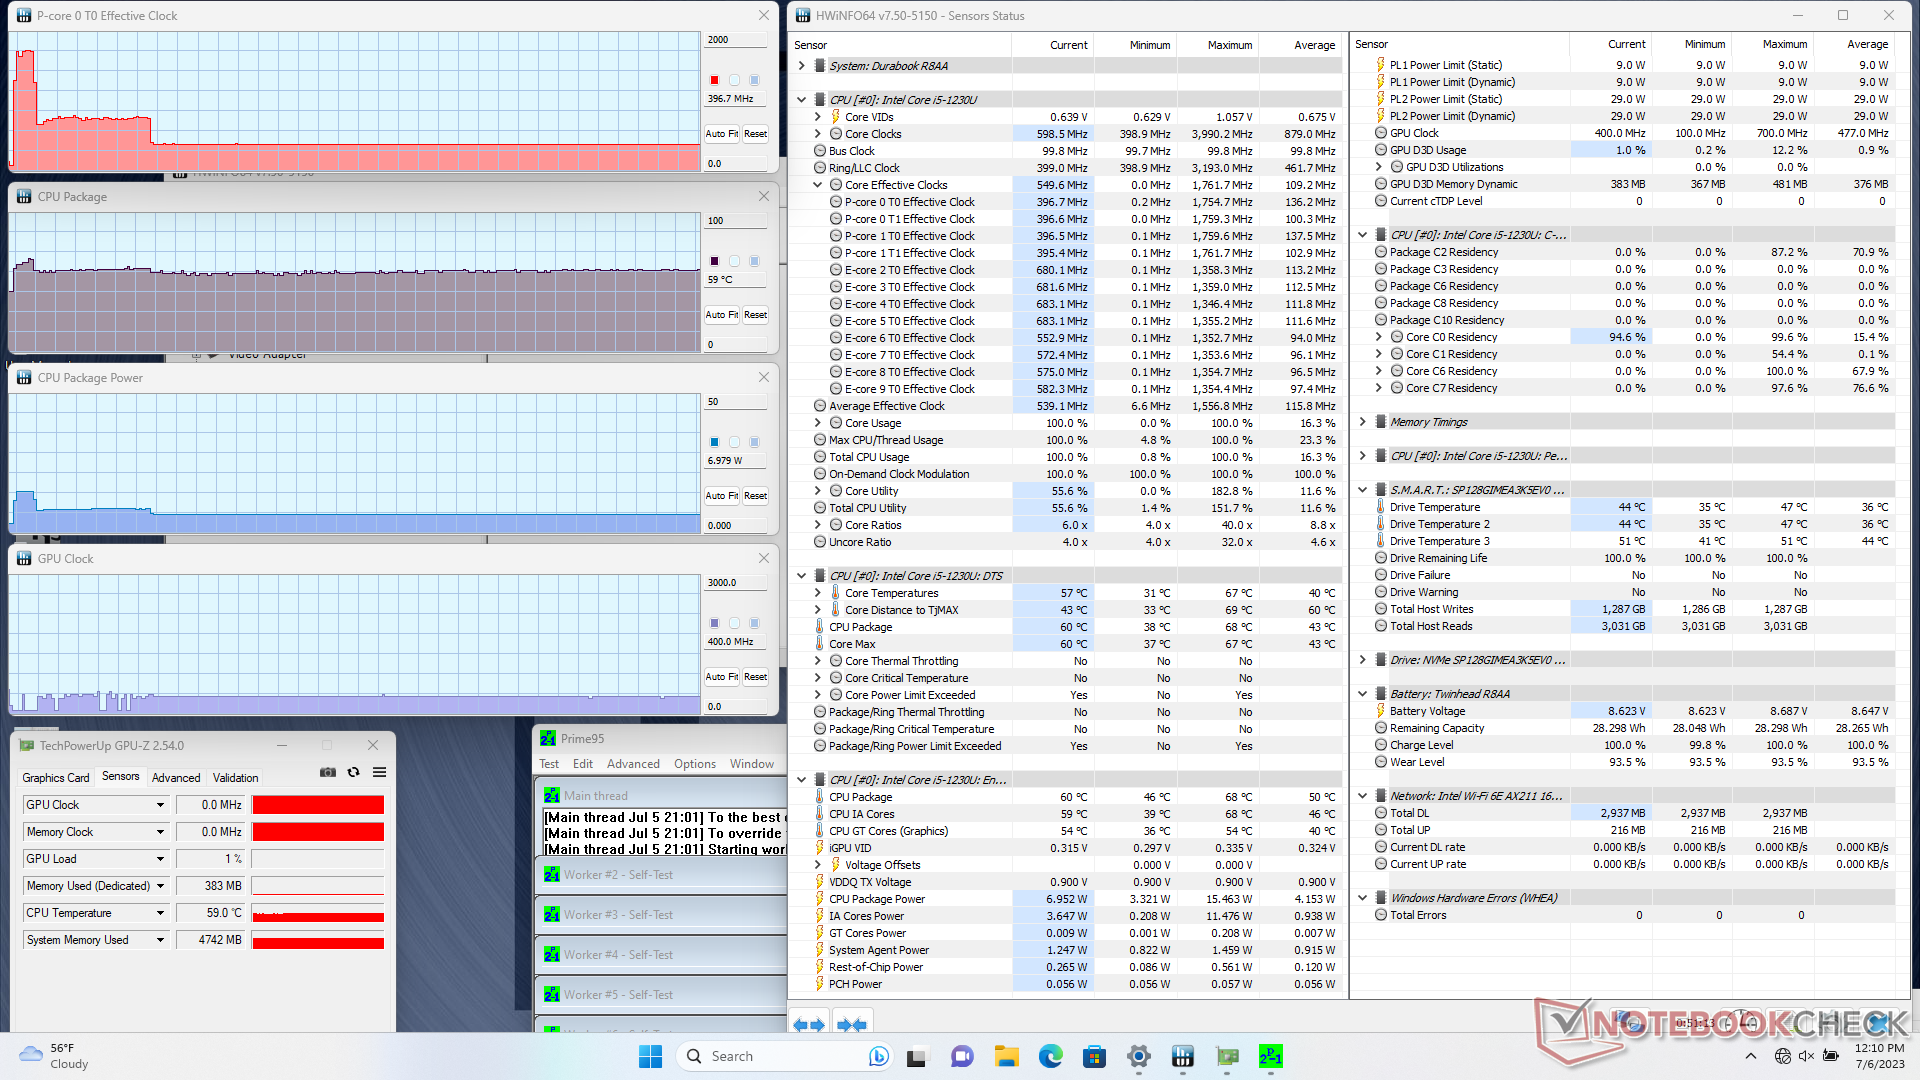
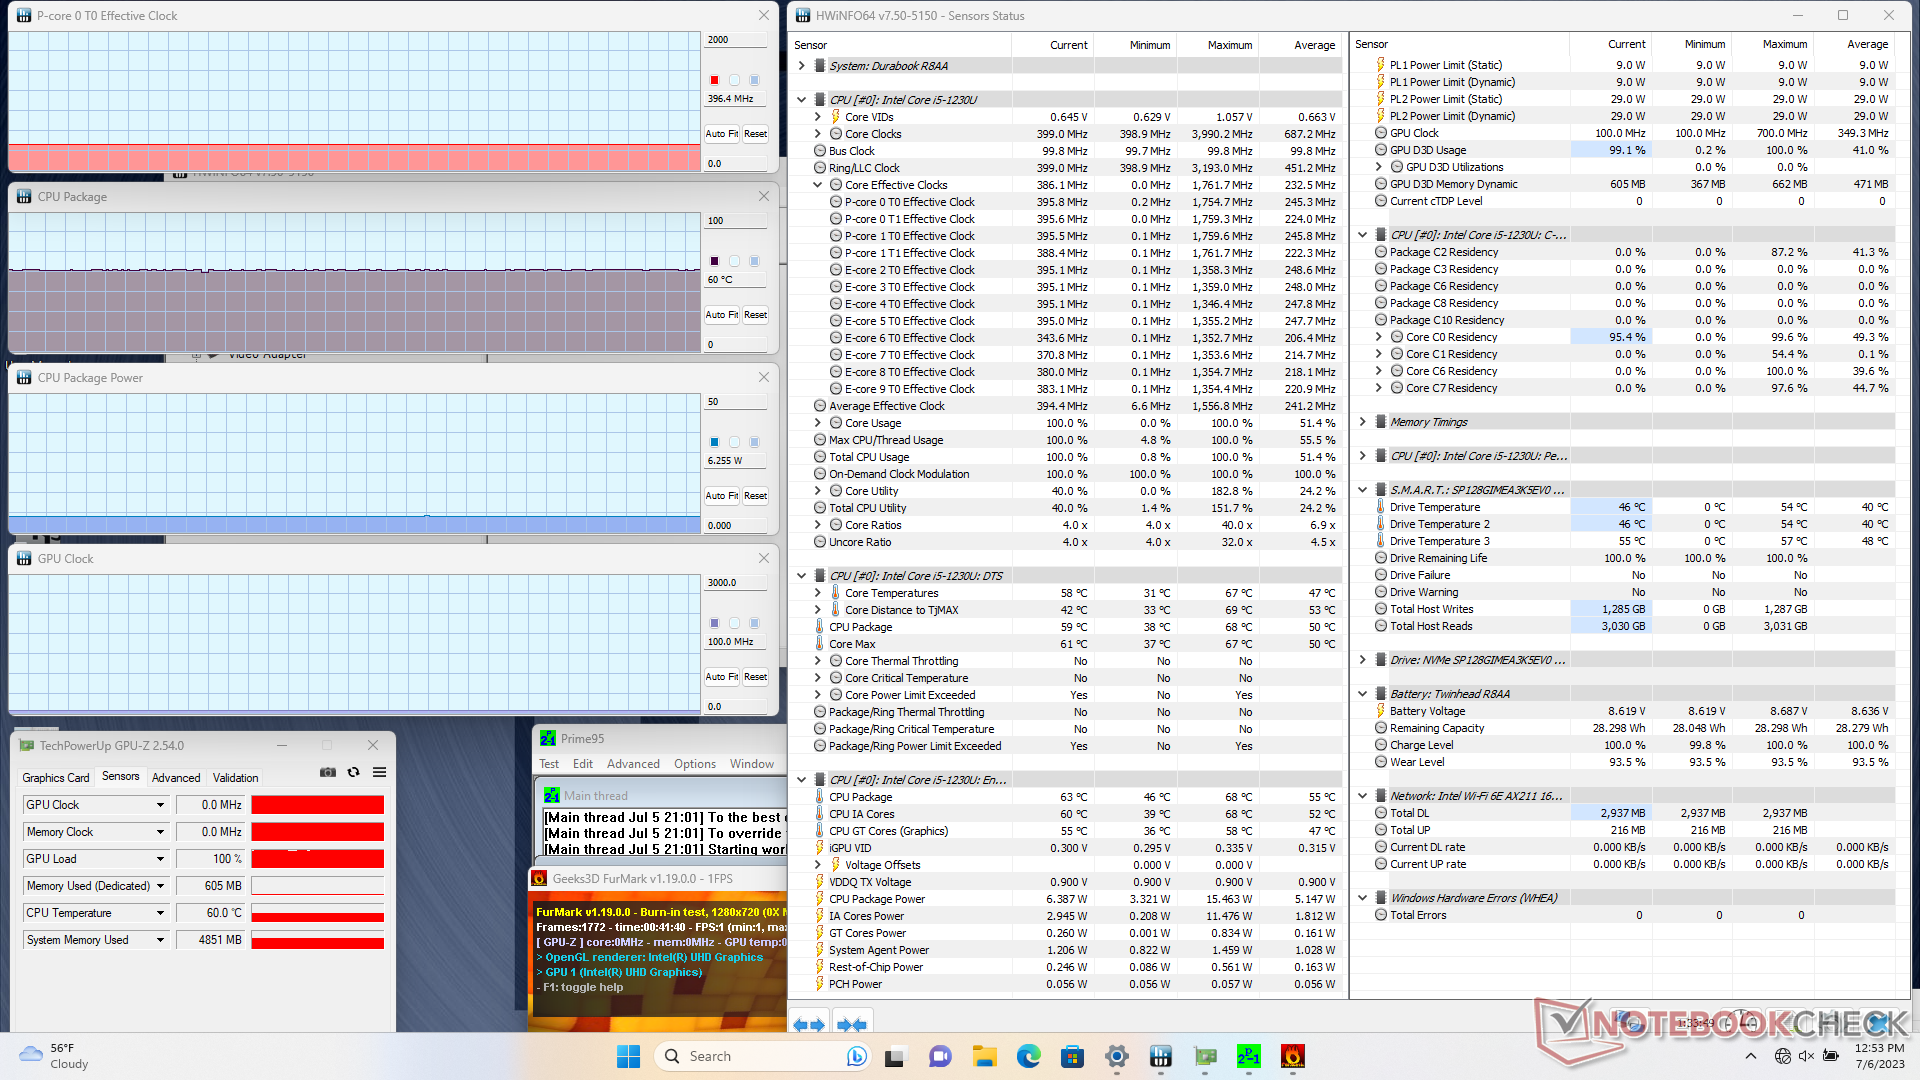
Test warunków skrajnych
Procesor przyspieszał do 1,8 GHz, 67 C i 15 W przez pierwsze kilka sekund po zainicjowaniu obciążenia Prime95, po czym spadał i stabilizował się na poziomie zaledwie 400 MHz, 59 C i 7 W. Wyniki te są znacznie niższe niż w przypadku Dell XPS 13 9315 który jest dostarczany z dokładnie tym samym procesorem i wyjaśnia niższe niż oczekiwano wyniki testów porównawczych w sekcji Wydajność procesora powyżej.
Wydajność na zasilaniu bateryjnym pozostałaby identyczna.
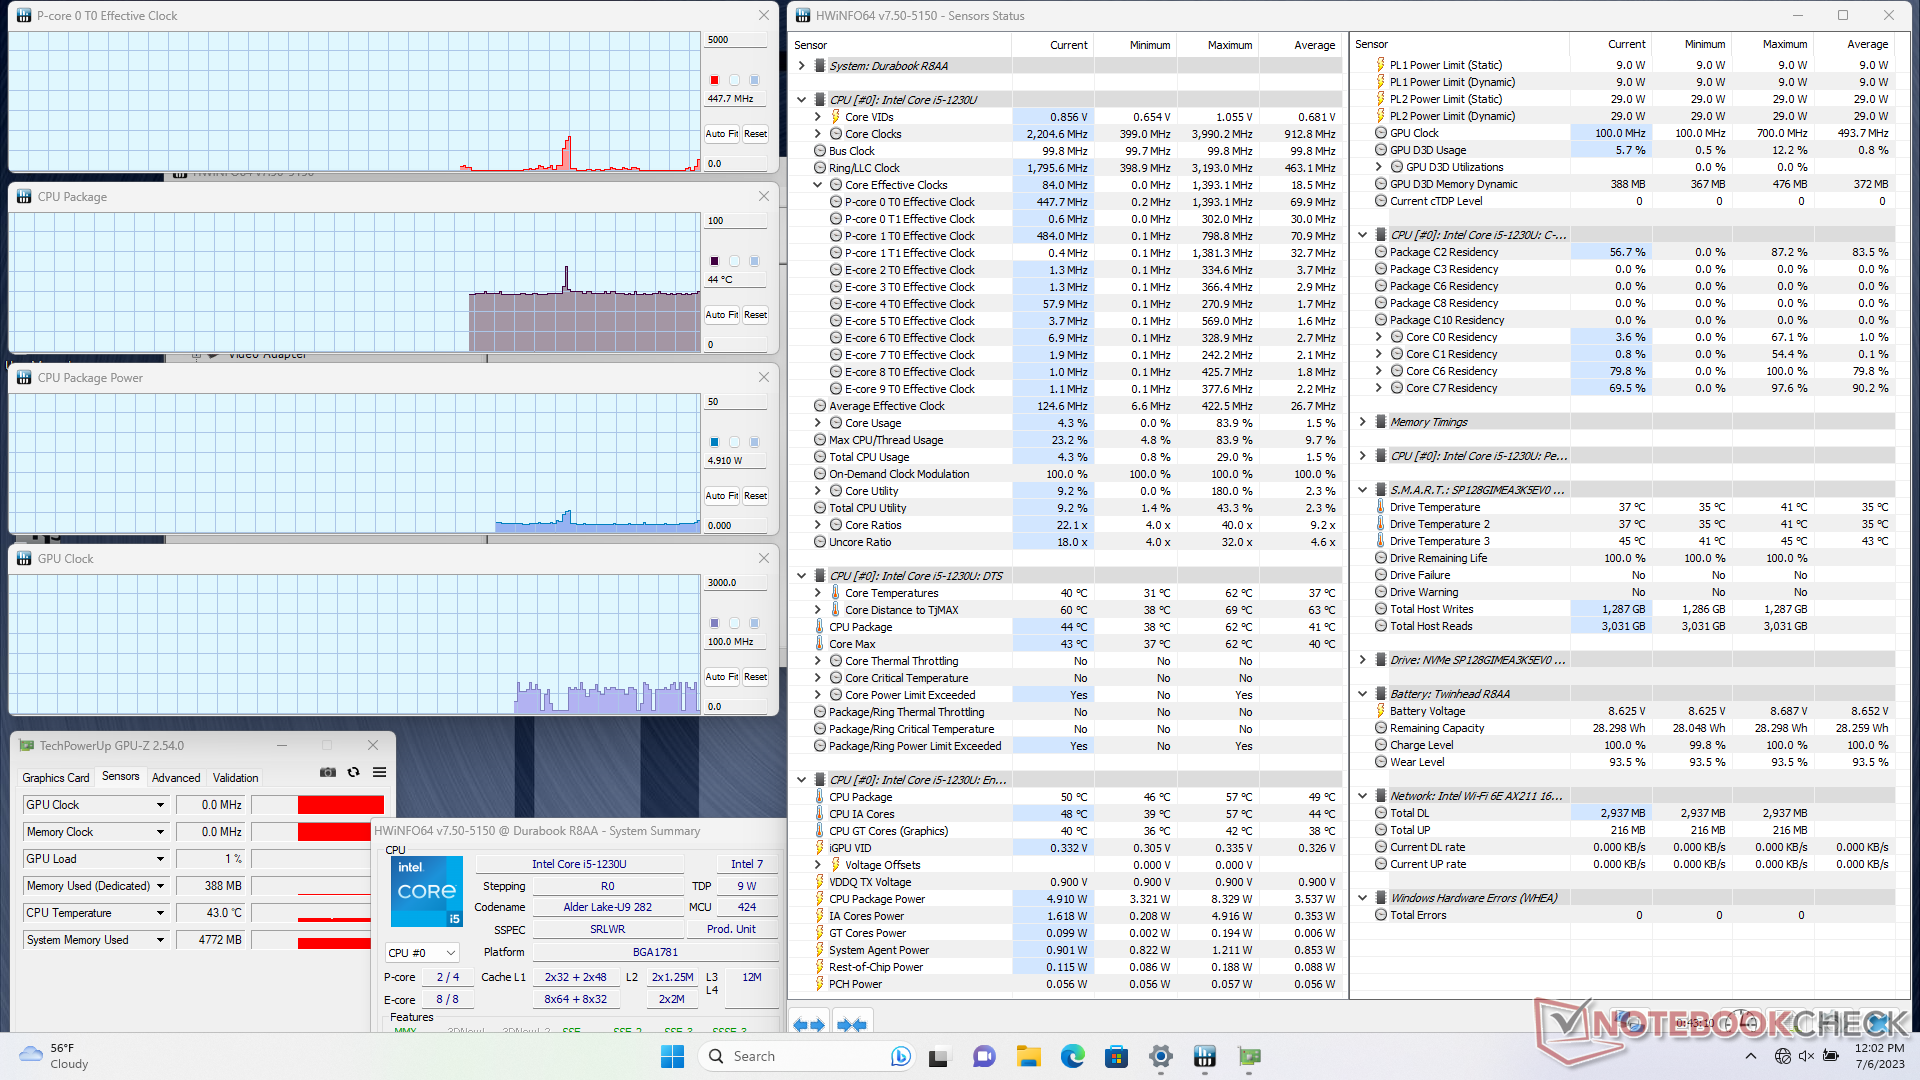
| Taktowanie CPU (GHz) | Taktowanie GPU (MHz) | Średnia temperatura CPU (°C) | |
| System bezczynności | -- | -- | 44 |
| Prime95Stress | 0.4 | -- | 59 |
| Prime95+ FurMark Stress | 0.4 | 100 | 60 |
| Witcher 3 Stres | ~0.6 | ~700 | 58 |
Głośniki
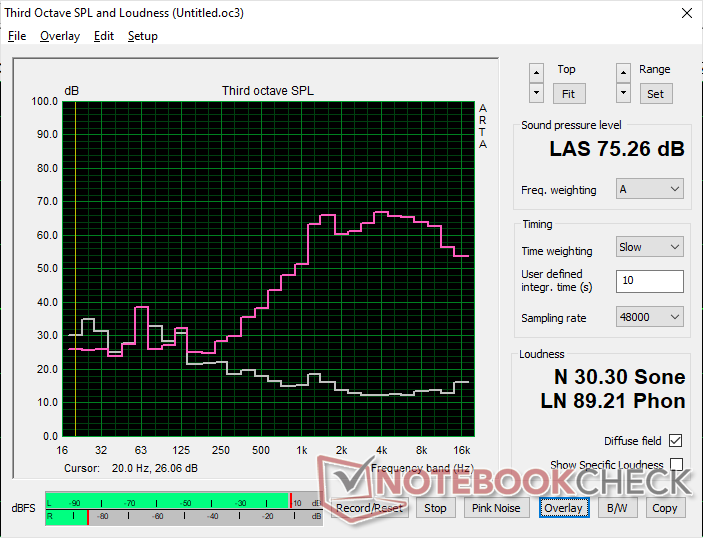
Basy są słabe, jak można się było spodziewać, ale maksymalna głośność mogłaby być głośniejsza przy zaledwie 75 dB(A) w porównaniu do 88 dB(A) w Acerduro T1 Acer Enduro T1. Głośnik w Durabook R8 jest skierowany do tyłu, co nie jest optymalne dla użytkownika.
Durabook R8 Tablet analiza dźwięku
(±) | głośność głośnika jest średnia, ale dobra (75.3 dB)
Bas 100 - 315 Hz
(-) | prawie brak basu - średnio 25.7% niższa od mediany
(±) | liniowość basu jest średnia (8.4% delta do poprzedniej częstotliwości)
Średnie 400 - 2000 Hz
(±) | zmniejszone średnie - średnio 10% niższe niż mediana
(±) | liniowość środka jest średnia (13.9% delta do poprzedniej częstotliwości)
Wysokie 2–16 kHz
(±) | wyższe maksima - średnio 10.6% wyższe od mediany
(+) | wzloty są liniowe (4.1% delta do poprzedniej częstotliwości)
Ogólnie 100 - 16.000 Hz
(-) | ogólny dźwięk nie jest liniowy (38% różnicy w stosunku do mediany)
W porównaniu do tej samej klasy
» 97% wszystkich testowanych urządzeń w tej klasie było lepszych, 1% podobnych, 2% gorszych
» Najlepszy miał deltę 7%, średnia wynosiła ###średnia###%, najgorsza wynosiła 129%
W porównaniu do wszystkich testowanych urządzeń
» 95% wszystkich testowanych urządzeń było lepszych, 1% podobnych, 5% gorszych
» Najlepszy miał deltę 4%, średnia wynosiła ###średnia###%, najgorsza wynosiła 134%
Apple MacBook Pro 16 2021 M1 Pro analiza dźwięku
(+) | głośniki mogą odtwarzać stosunkowo głośno (84.7 dB)
Bas 100 - 315 Hz
(+) | dobry bas - tylko 3.8% od mediany
(+) | bas jest liniowy (5.2% delta do poprzedniej częstotliwości)
Średnie 400 - 2000 Hz
(+) | zbalansowane środki średnie - tylko 1.3% od mediany
(+) | średnie są liniowe (2.1% delta do poprzedniej częstotliwości)
Wysokie 2–16 kHz
(+) | zrównoważone maksima - tylko 1.9% od mediany
(+) | wzloty są liniowe (2.7% delta do poprzedniej częstotliwości)
Ogólnie 100 - 16.000 Hz
(+) | ogólny dźwięk jest liniowy (4.6% różnicy w stosunku do mediany)
W porównaniu do tej samej klasy
» 0% wszystkich testowanych urządzeń w tej klasie było lepszych, 0% podobnych, 100% gorszych
» Najlepszy miał deltę 5%, średnia wynosiła ###średnia###%, najgorsza wynosiła 45%
W porównaniu do wszystkich testowanych urządzeń
» 0% wszystkich testowanych urządzeń było lepszych, 0% podobnych, 100% gorszych
» Najlepszy miał deltę 4%, średnia wynosiła ###średnia###%, najgorsza wynosiła 134%
Zarządzanie energią - wysoka wydajność w przeliczeniu na wat
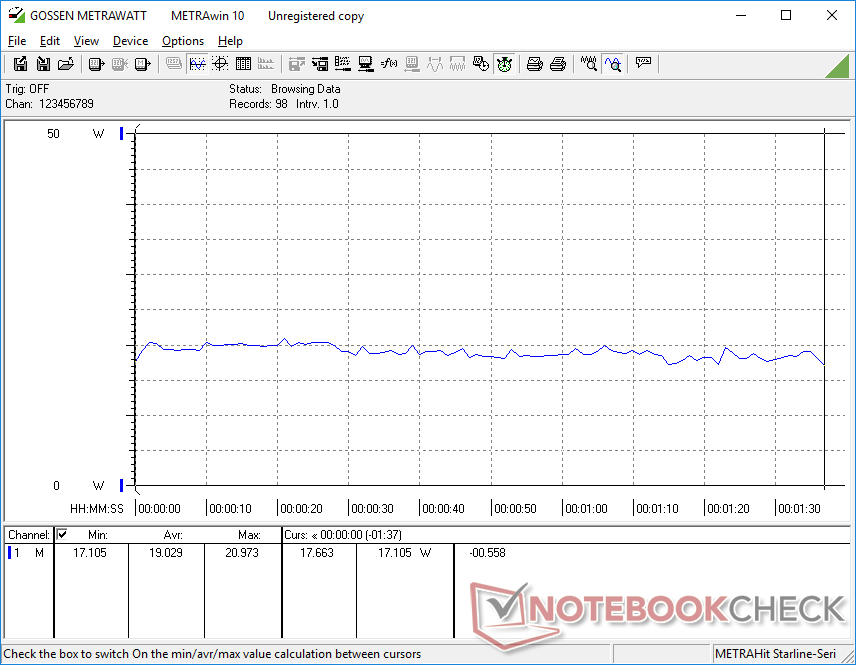
Zużycie energii
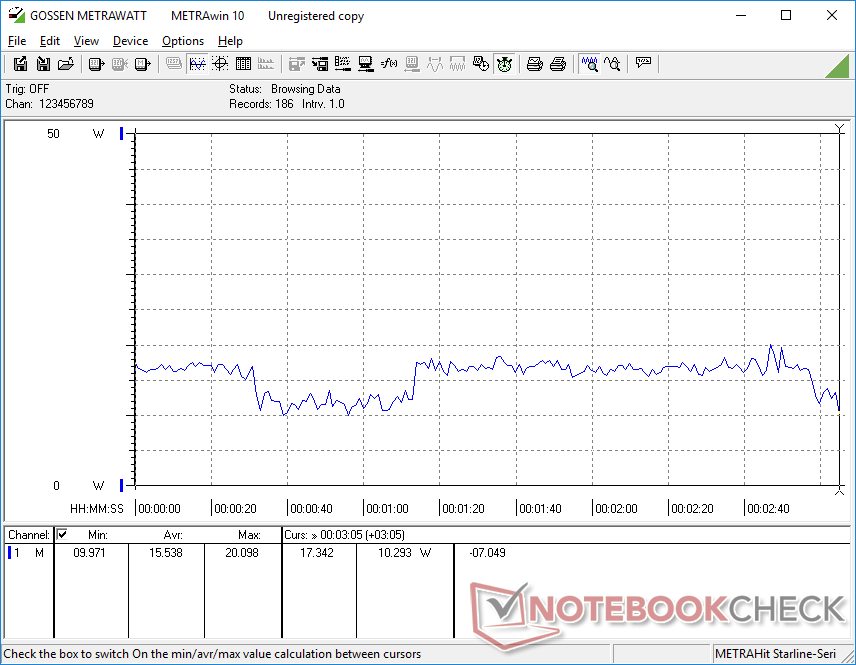
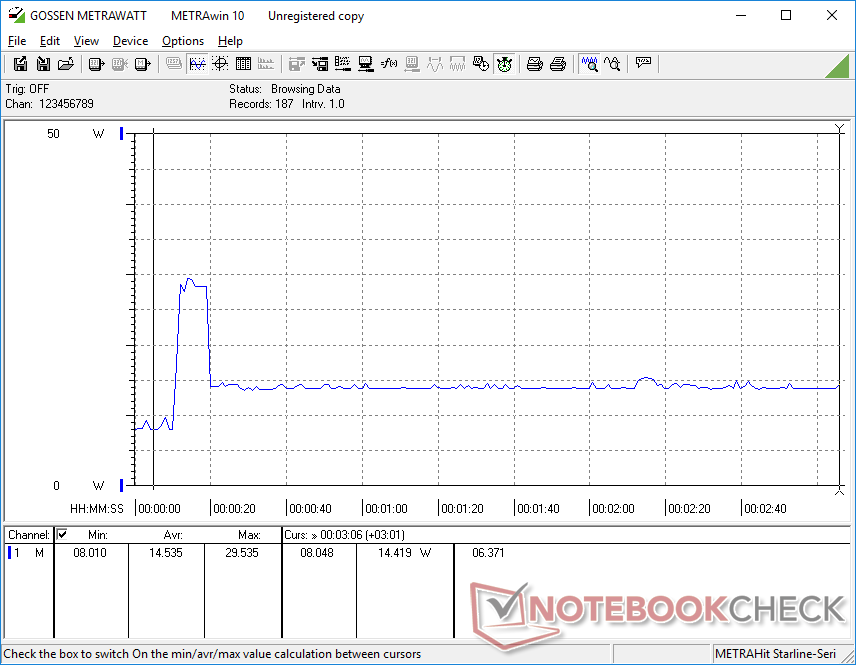
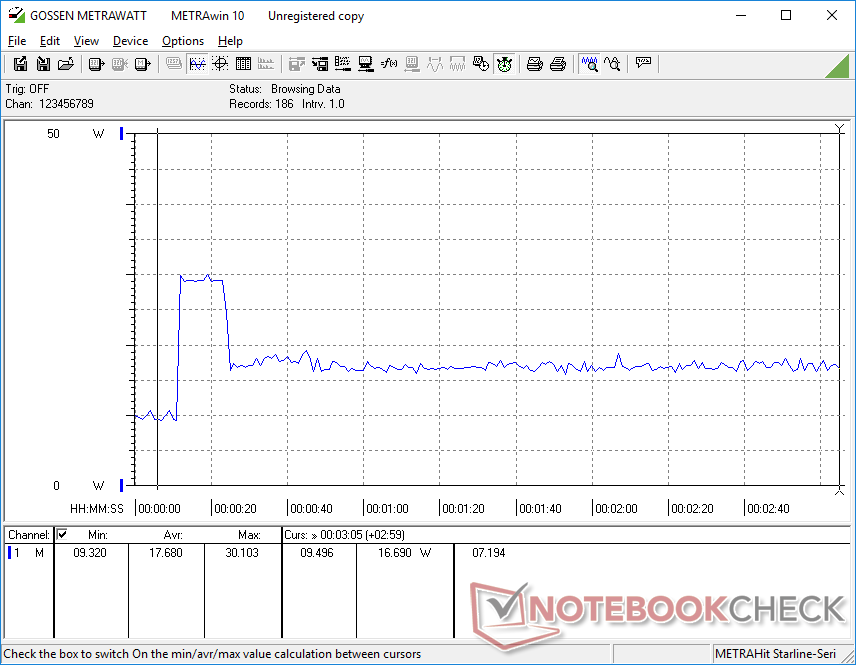
Zużycie energii może wynosić zaledwie 3 W podczas bezczynności na pulpicie przy najniższym ustawieniu jasności lub do prawie 7 W, jeśli jasność zostanie zwiększona do maksimum.
Całkowite zużycie energii przy większym obciążeniu jest o około połowę niższe niż w przypadku starszego modelu Panasonic Toughbook FZ-G2, mimo że wydajność procesora jest prawie taka sama. W ten sposób użytkownicy mogą nadal korzystać z wyższej wydajności na wat nowszego procesora Core i5-1230U.
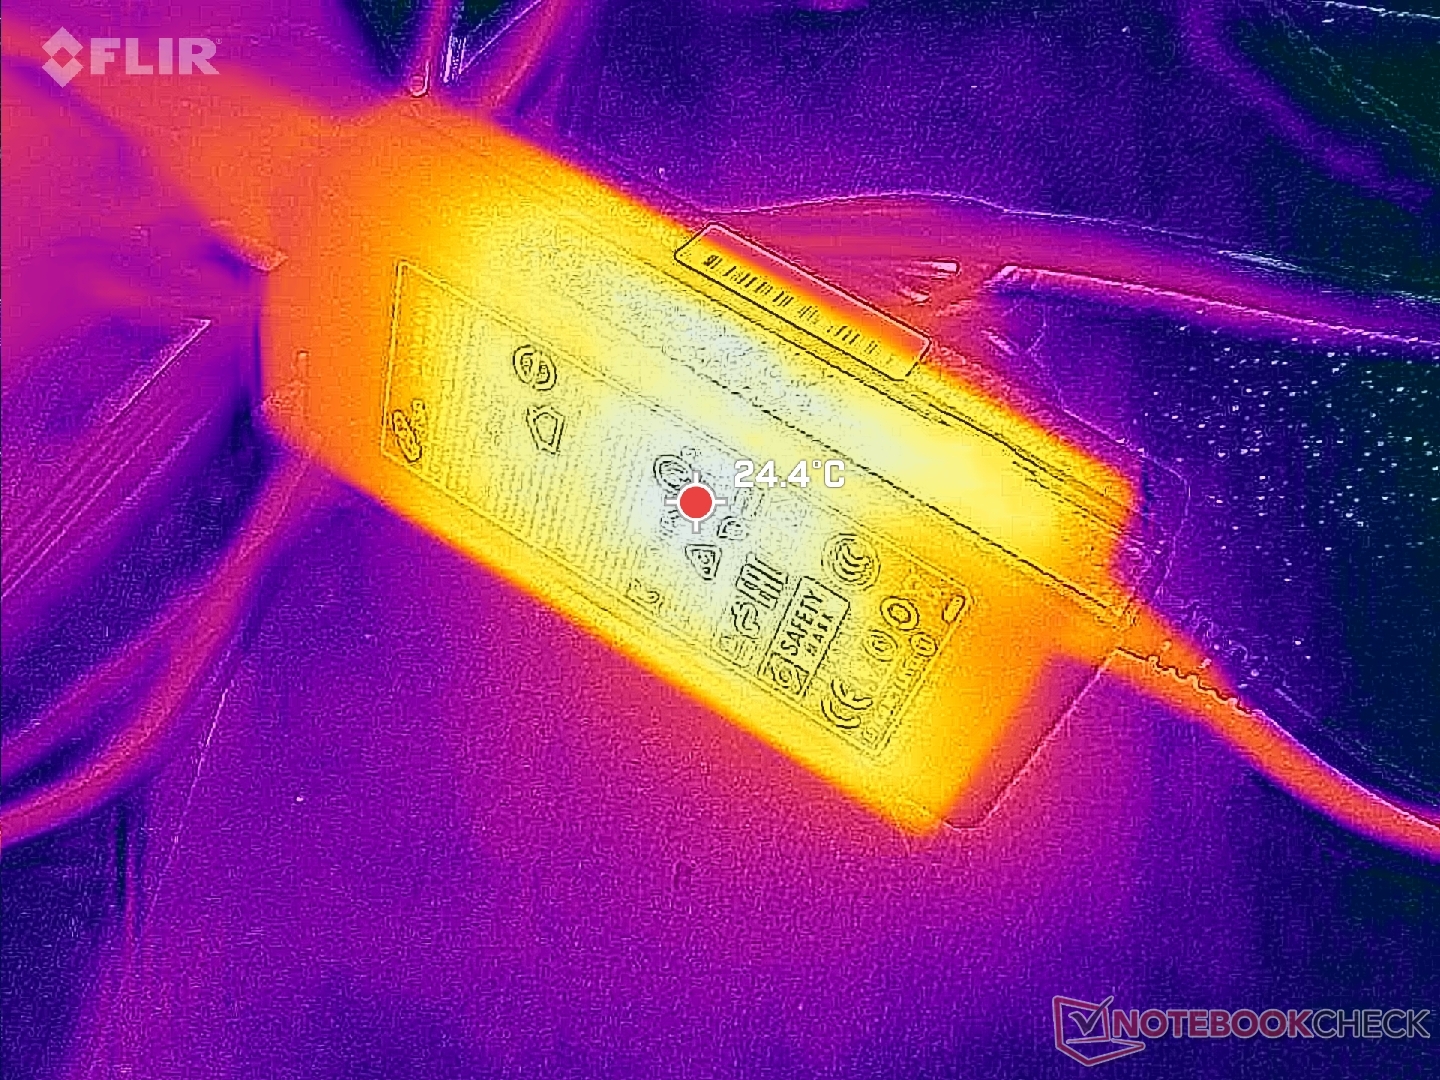
Jesteśmy w stanie zmierzyć maksymalne zużycie 30 W z małego (~ 10,5 x 4,5 x 3 cm) zasilacza sieciowego 65 W.
| wyłączony / stan wstrzymania | |
| luz | |
| obciążenie |
|
Legenda:
min: | |
| Durabook R8 Tablet i5-1230U, Iris Xe G7 80EUs, Silicon Power SP128GIMEA3K5EV0, IPS, 1280x800, 8" | Acer Enduro T1 ET108-11A A9001 64 GB eMMC Flash, IPS, 1280x800, 8" | Lenovo Tab M8 (Gen 4) Helio A22 MT6761, PowerVR GE8300, 32 GB eMMC Flash, IPS, 1280x800, 8" | Dell Latitude 7230 Rugged Extreme i5-1240U, Iris Xe G7 80EUs, WD PC SN740 512GB SDDPMQD-512G-1101, IPS, 1920x1200, 12" | Panasonic Toughbook FZ-G2 i5-10310U, UHD Graphics 620, Toshiba KIOXIA KBG4AZNV512G M.2 2280 OPAL, IPS, 1920x1200, 10.1" | |
|---|---|---|---|---|---|
| Power Consumption | 73% | 71% | -102% | -65% | |
| Idle Minimum * (Watt) | 2.8 | 1.1 61% | 1.7 39% | 6.5 -132% | 3.5 -25% |
| Idle Average * (Watt) | 6.3 | 2.2 65% | 1.9 70% | 8.9 -41% | 8.1 -29% |
| Idle Maximum * (Watt) | 10.3 | 2.2 79% | 2.4 77% | 14.3 -39% | 8.2 20% |
| Load Average * (Watt) | 19 | 3.6 81% | 3 84% | 44.9 -136% | 34.7 -83% |
| Witcher 3 ultra * (Watt) | 15.5 | 43.2 -179% | 31.8 -105% | ||
| Load Maximum * (Watt) | 30.1 | 6.7 78% | 3.9 87% | 54.8 -82% | 79.7 -165% |
* ... im mniej tym lepiej
Power Consumption Witcher 3 / Stresstest
Power Consumption external Monitor
Żywotność baterii
Rzeczywisty czas pracy w sieci WLAN wynosi zaledwie 5,5 godziny z wymiennego akumulatora o pojemności 27 Wh. Użytkownicy mogą uaktualnić do większych i cięższych zestawów baterii lub nosić kilka na raz w celu wymiany, ale żywotność baterii jest nadal rozczarowująca.
Ładowanie akumulatora 27 Wh od pustego do pełnego jest stosunkowo powolne i trwa około 2 godzin.
| Durabook R8 Tablet i5-1230U, Iris Xe G7 80EUs, 27.4 Wh | Acer Enduro T1 ET108-11A A9001 Wh | Lenovo Tab M8 (Gen 4) Helio A22 MT6761, PowerVR GE8300, Wh | Dell Latitude 7230 Rugged Extreme i5-1240U, Iris Xe G7 80EUs, 72 Wh | Panasonic Toughbook FZ-G2 i5-10310U, UHD Graphics 620, 68 Wh | |
|---|---|---|---|---|---|
| Czasy pracy | 194% | 192% | 145% | 111% | |
| WiFi v1.3 (h) | 5.3 | 15.6 194% | 15.5 192% | 13 145% | 11.2 111% |
| Reader / Idle (h) | 37.1 | ||||
| H.264 (h) | 16.6 | ||||
| Load (h) | 3.8 | 3.6 |
Za
Przeciw
Werdykt - mocny design z pewnymi irytacjami
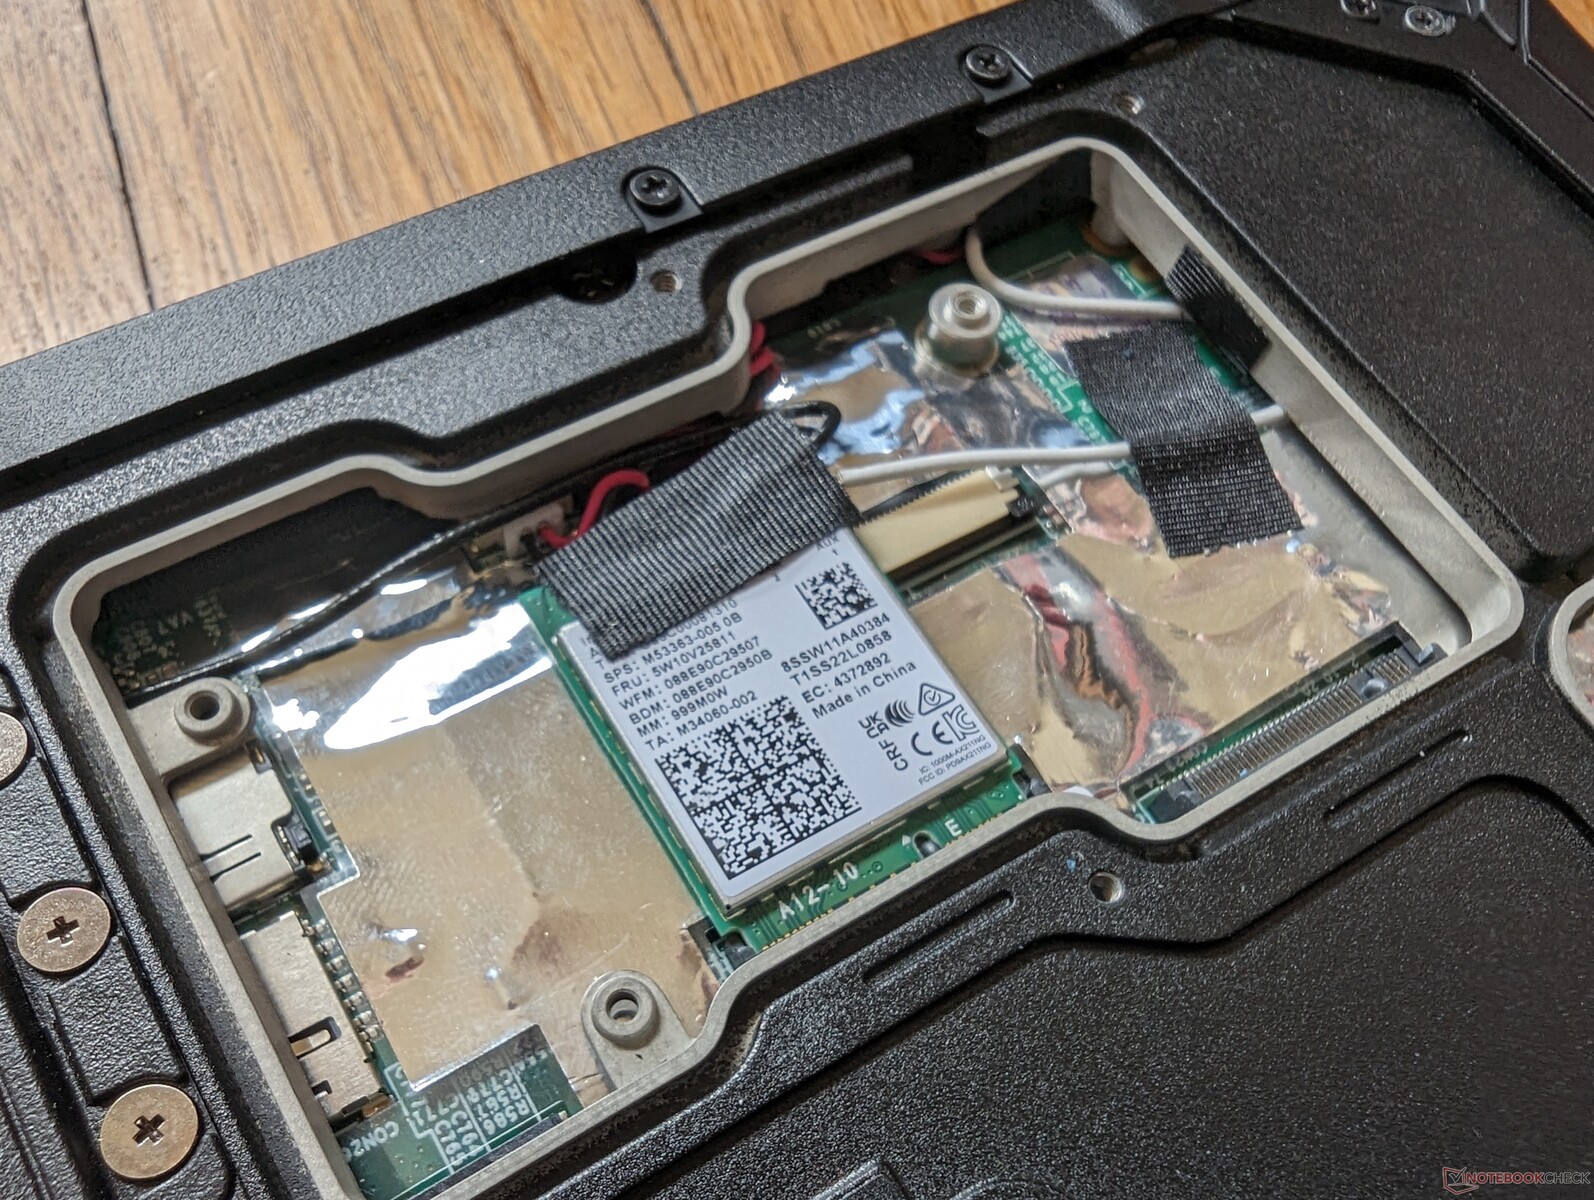
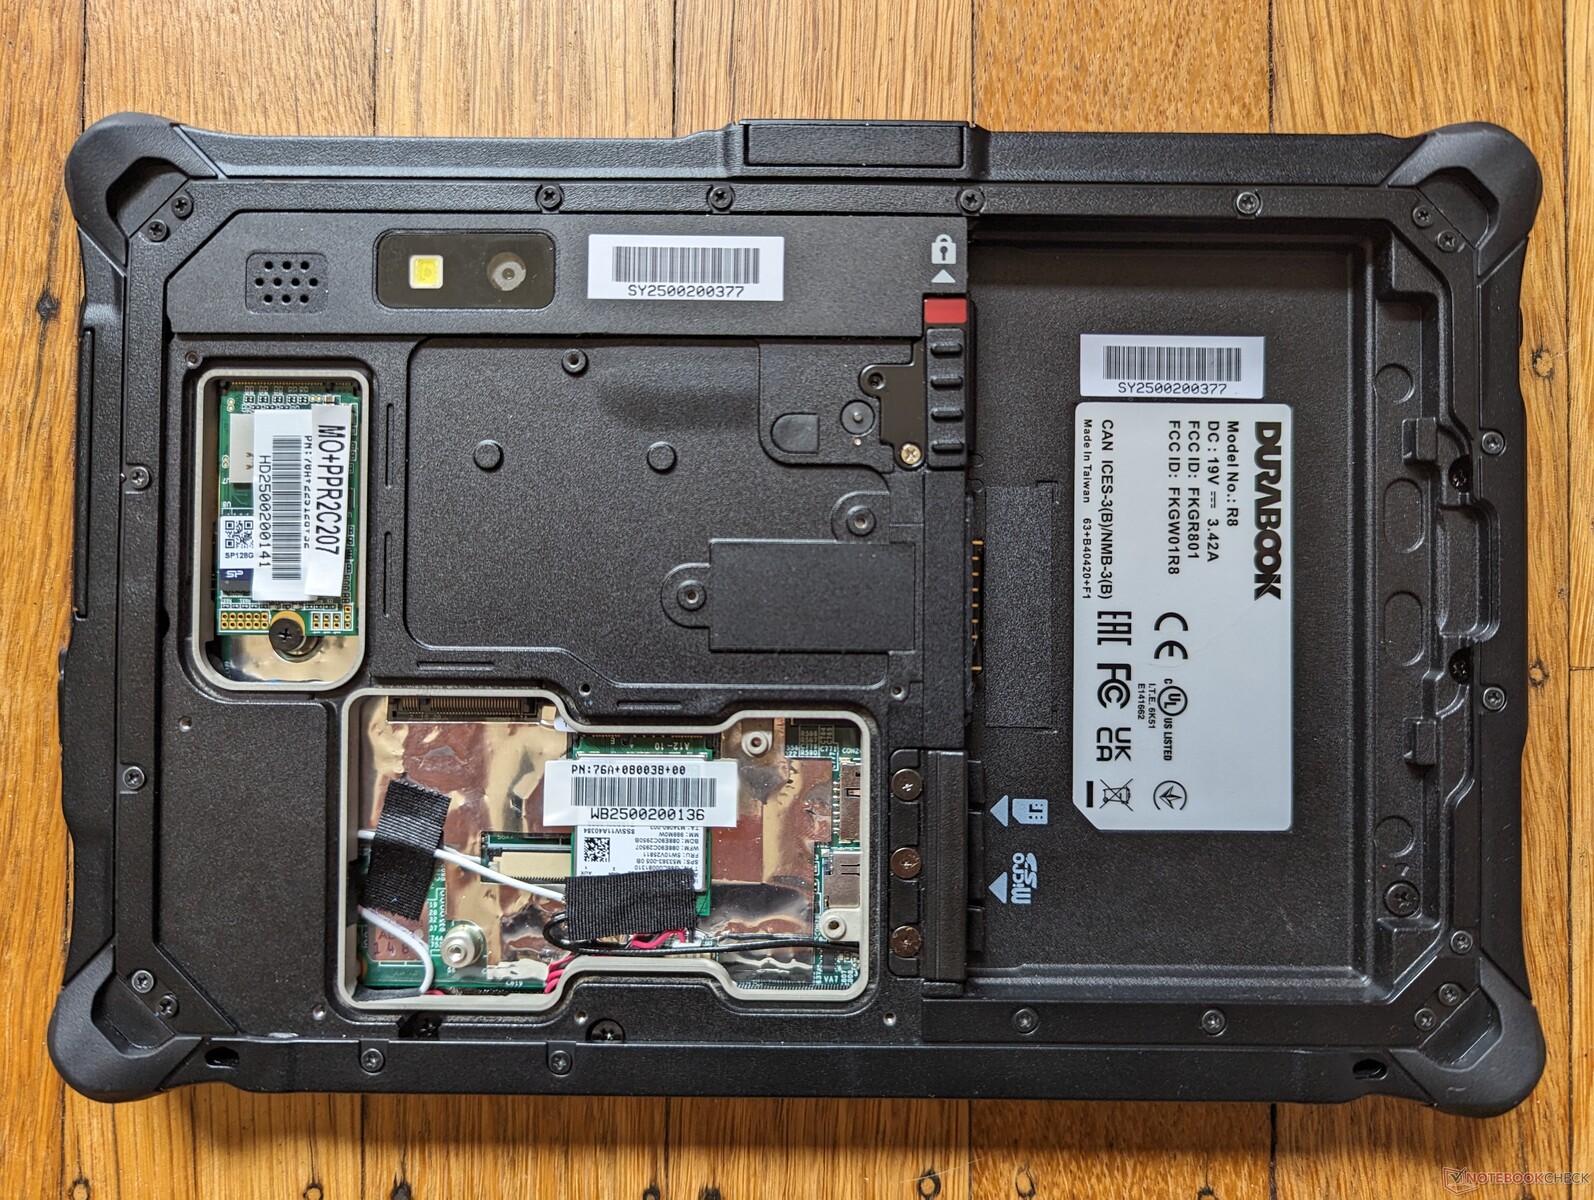
Największe atuty Durabooka R8 to bezwentylatorowa konstrukcja, wszechstronne opcje konfiguracji i obsługa Thunderbolt 4. To niecodzienna kombinacja cech, która może przypaść do gustu określonej kategorii lub profesjonalistom. Szczególnie podoba nam się łatwy dostęp do modułów SSD, WLAN i WAN z tyłu.
Podejście bez wentylatorów wiąże się jednak z typowym zestawem zastrzeżeń. Wydajność procesora została obniżona o spory margines, a temperatury powierzchni mogą stać się bardzo wysokie, szczególnie z tyłu. Nie oznacza to, że tablet jest powolny, ale nie oczekuj, że będzie działał tak szybko, jak laptop z tym samym procesorem.
Durabook R8 to przede wszystkim bezwentylatorowa konstrukcja, łatwość obsługi i szeroka obsługa urządzeń peryferyjnych. Inne aspekty, takie jak żywotność baterii i kolory, mogłyby być lepsze.
Istnieje kilka drobnych aspektów, które można by poprawić w przyszłych wersjach. Na przykład mechanizm wysuwania czytnika MicroSD musi być mocniejszy i bardziej niezawodny. Głośnik mógłby być skierowany do przodu zamiast do tyłu, aby był bardziej użyteczny. Ciasno rozmieszczone porty USB-C można by rozszerzyć, aby zmniejszyć tłok. Opatentowany port AC barrel mógłby zostać usunięty na rzecz uniwersalnego ładowania USB-C. I wreszcie, żywotność baterii na domyślnym zestawie baterii mogłaby być dłuższa, a PWM powinien zostać zmniejszony lub wyeliminowany.
Cena i dostępność
Użytkownicy mogą poprosić o wycenę tabletu Durabook R8 bezpośrednio od producenta tutaj.
Durabook R8 Tablet
- 12/07/2023 v7 (old)
Allen Ngo
Przezroczystość
Wyboru urządzeń do recenzji dokonuje nasza redakcja. Próbka testowa została udostępniona autorowi jako pożyczka od producenta lub sprzedawcy detalicznego na potrzeby tej recenzji. Pożyczkodawca nie miał wpływu na tę recenzję, producent nie otrzymał też kopii tej recenzji przed publikacją. Nie było obowiązku publikowania tej recenzji. Jako niezależna firma medialna, Notebookcheck nie podlega władzy producentów, sprzedawców detalicznych ani wydawców.
Tak testuje Notebookcheck
Każdego roku Notebookcheck niezależnie sprawdza setki laptopów i smartfonów, stosując standardowe procedury, aby zapewnić porównywalność wszystkich wyników. Od około 20 lat stale rozwijamy nasze metody badawcze, ustanawiając przy tym standardy branżowe. W naszych laboratoriach testowych doświadczeni technicy i redaktorzy korzystają z wysokiej jakości sprzętu pomiarowego. Testy te obejmują wieloetapowy proces walidacji. Nasz kompleksowy system ocen opiera się na setkach uzasadnionych pomiarów i benchmarków, co pozwala zachować obiektywizm.Price comparison

