Test laptopa MSI GF65 9SD
Tekst i zdjęcia: Allen Ngo
Tłumaczenie: Sylwester Cyba
20/01/2020
Laptop MSI GF65, jako następca modelu GF63, wnosi wiele nowości. Są to inna matryca, karta grafiki Nvidia Turing, szybsze WiFi i lepsze chłodzenie.
Obudowa
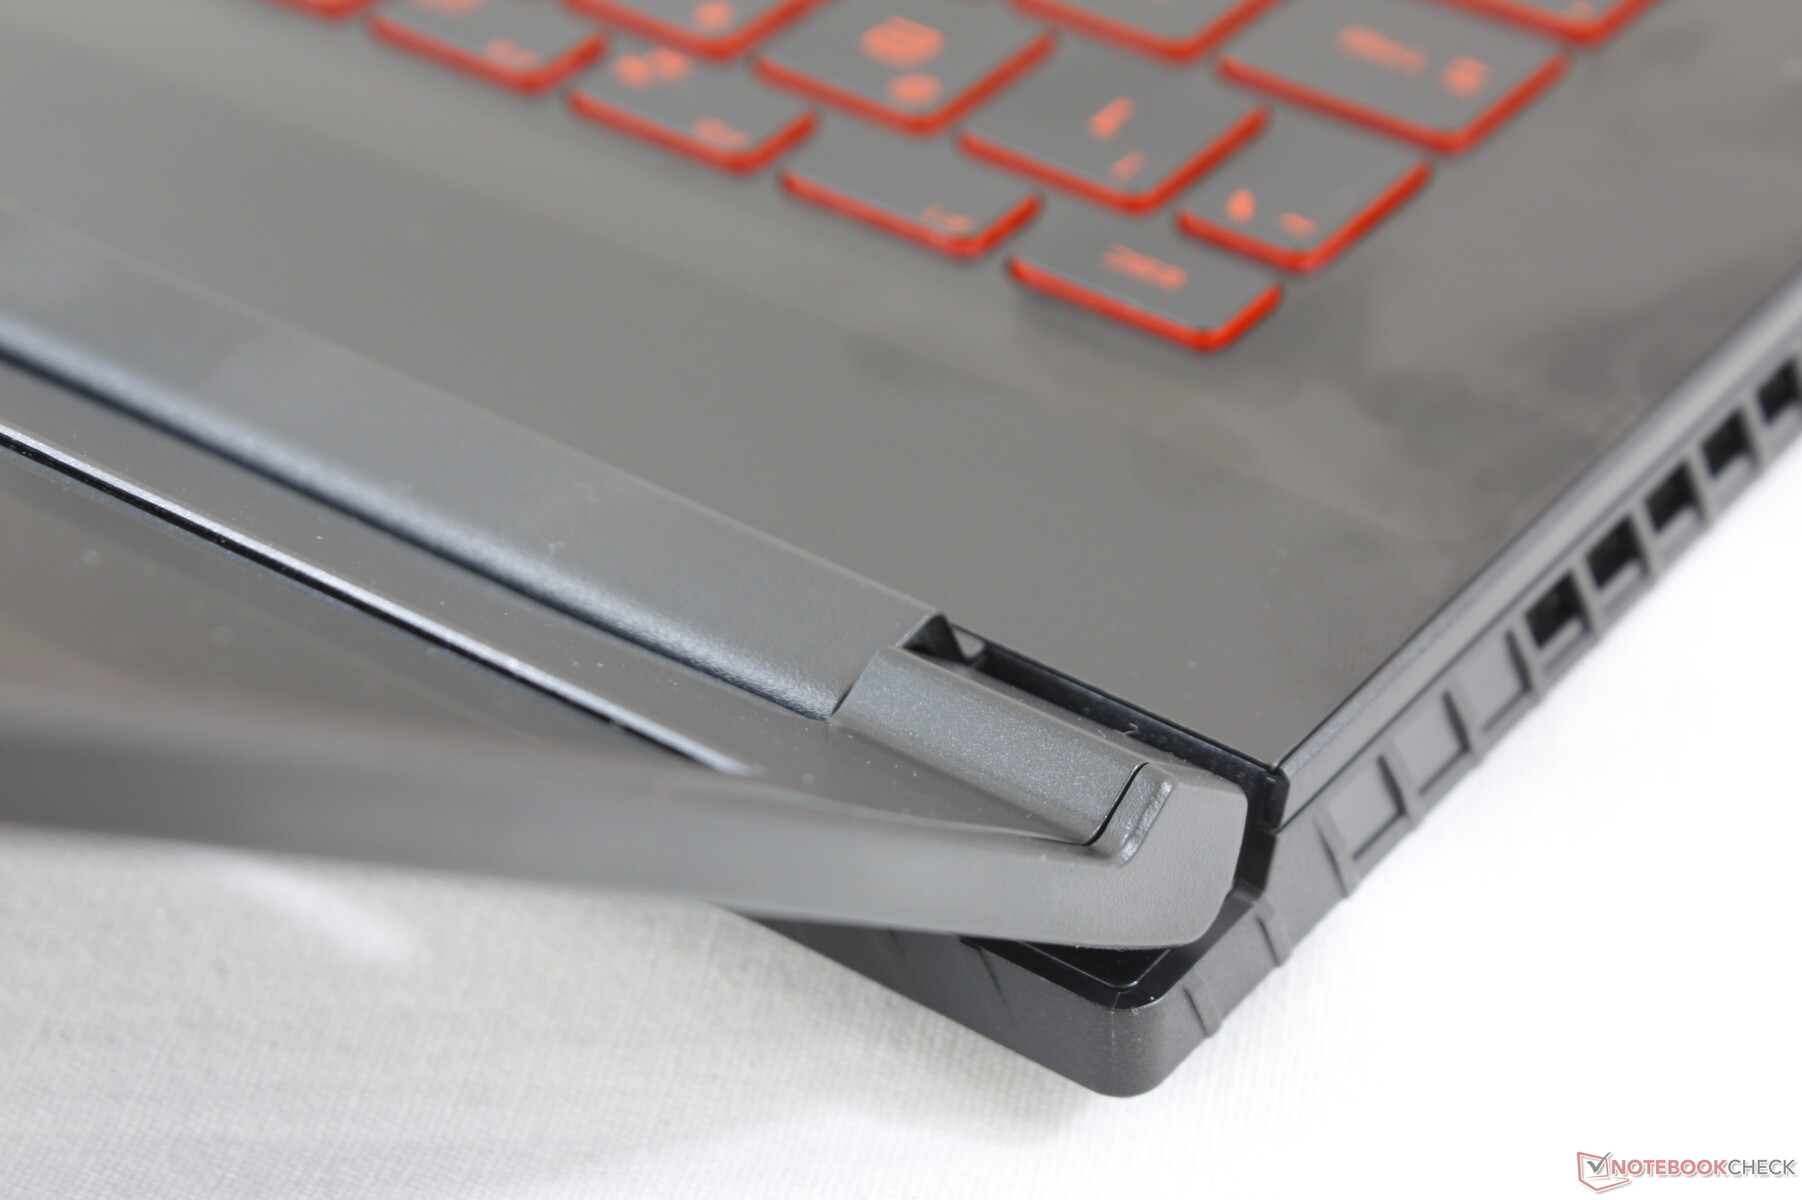
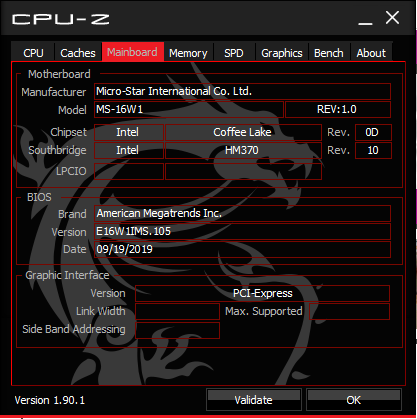
Po rozpakowaniu komputera MSI GF65 wydać jasno, że obudowa i gabaryty są te same, co w GF63. Bliższy ogląd mówi, że klawiatura, płytka dotykowa a nawet układ złączy też się nie zmieniły. Konstrukcja ta ma już rok. Pamiętajmy jednak, że w GF63 pojawiły sie po raz pierwszy w tańszych laptopach MSI dla graczy węższe ramki ekranu, widywane wcześniej w droższych modelach z serii GS.
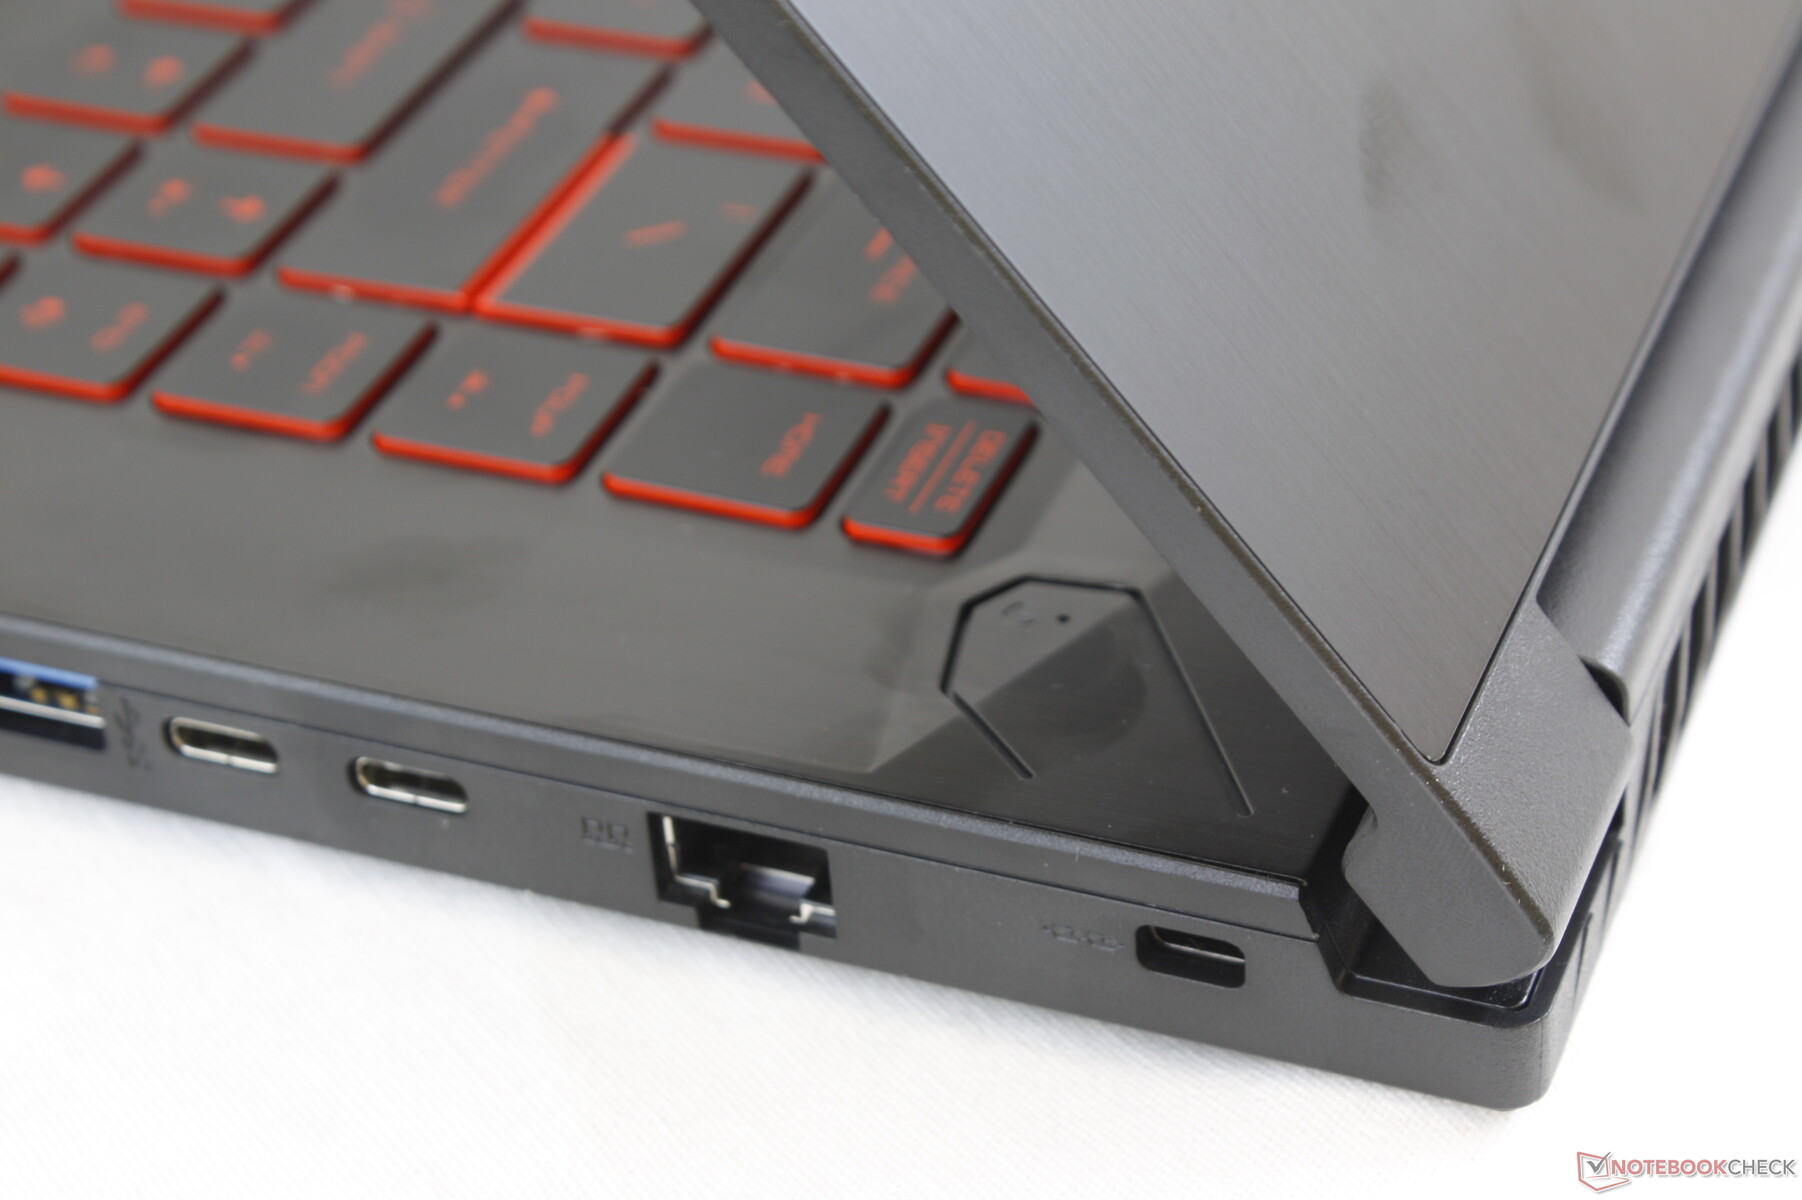
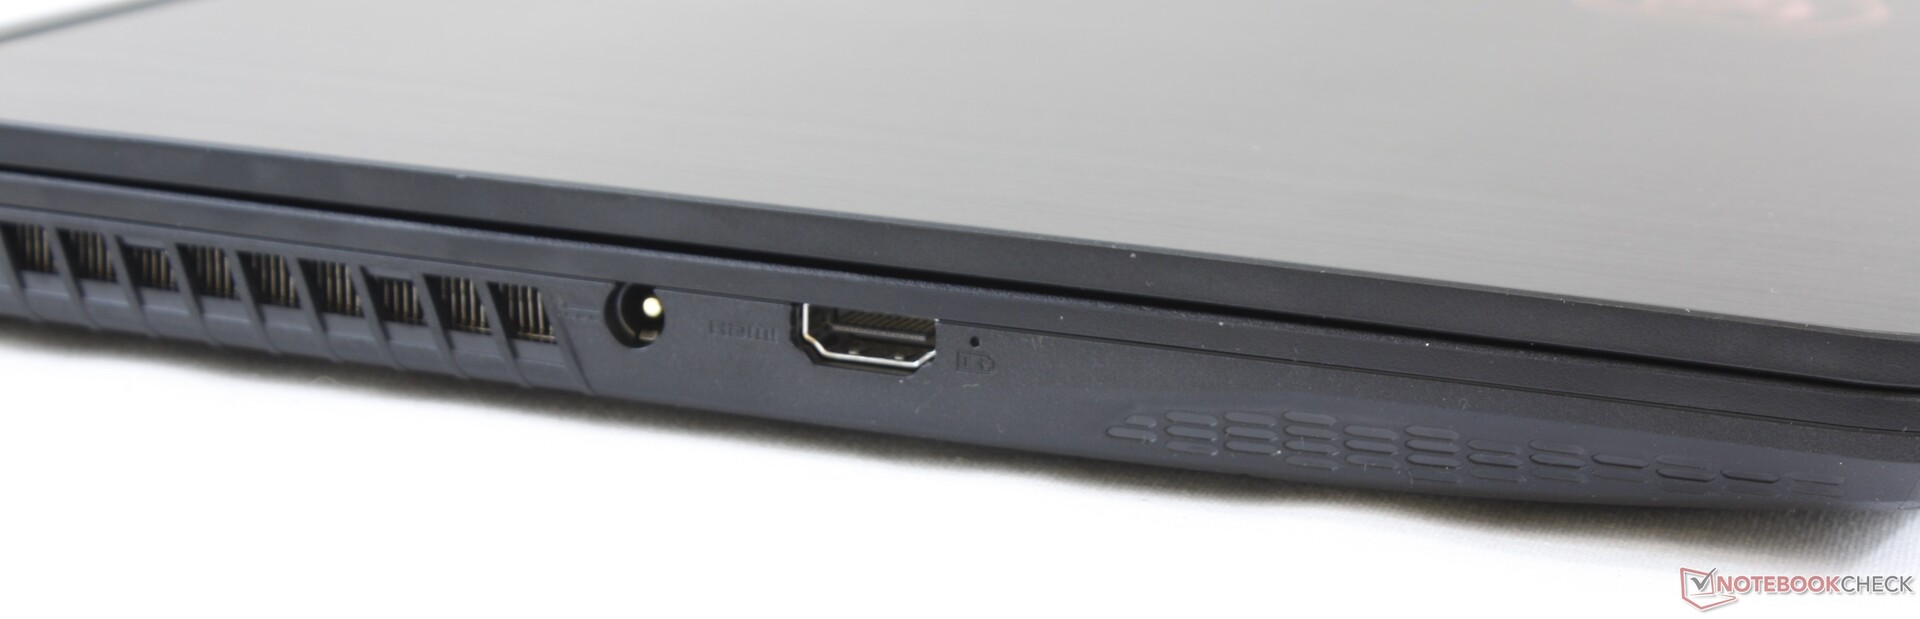
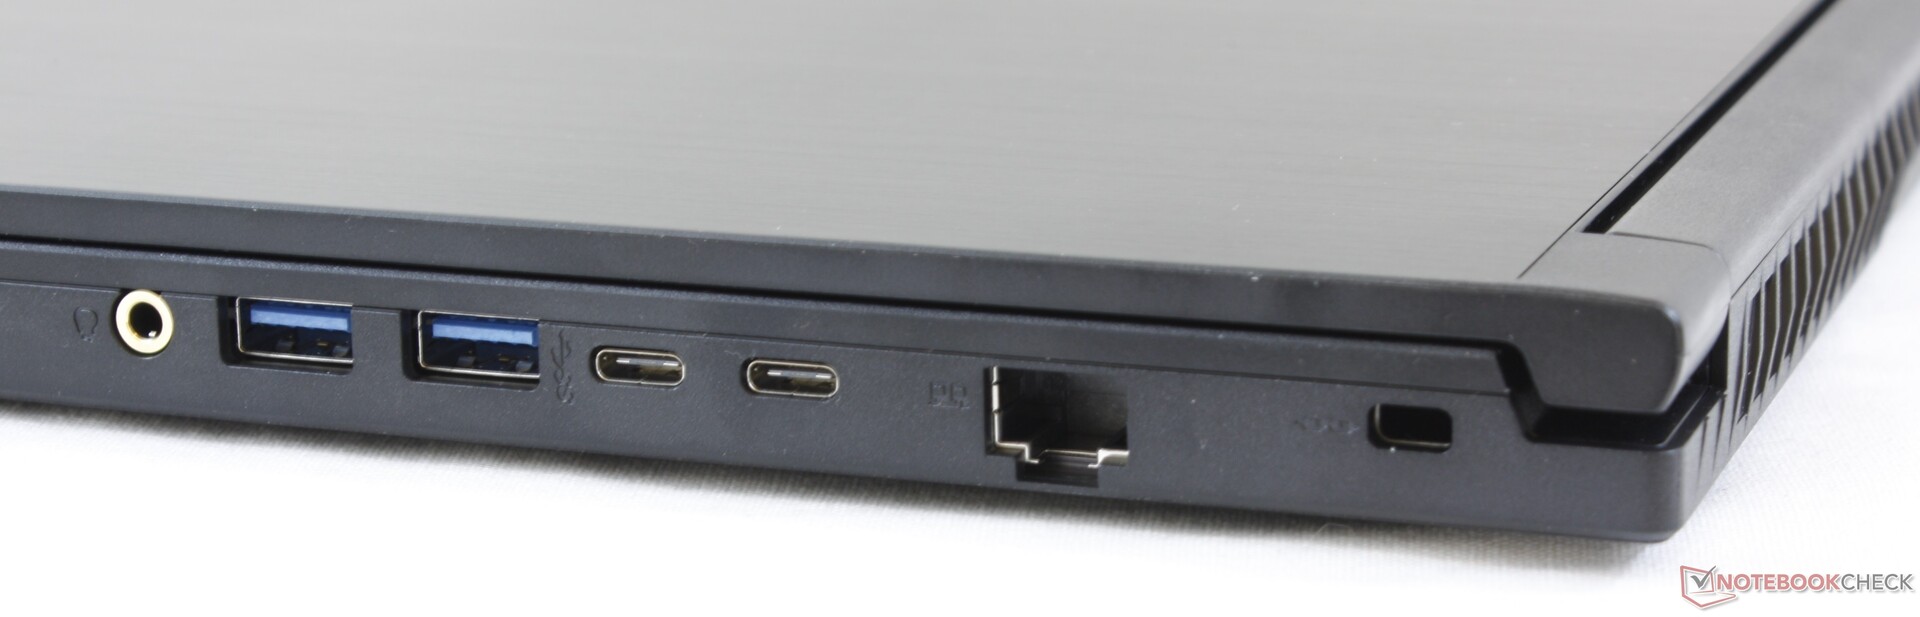
Zestaw dostępnych złączy, jak na tani laptop do gier, jest wystarczający. Niestety ich rozmieszczenie nie jest najlepsze. Po lewej nie ma ani jednego gniazda USB? To będzie problem. Do tego złącze HDMI na lewym boku jest bliżej przodu laptopa, niż tyłu.
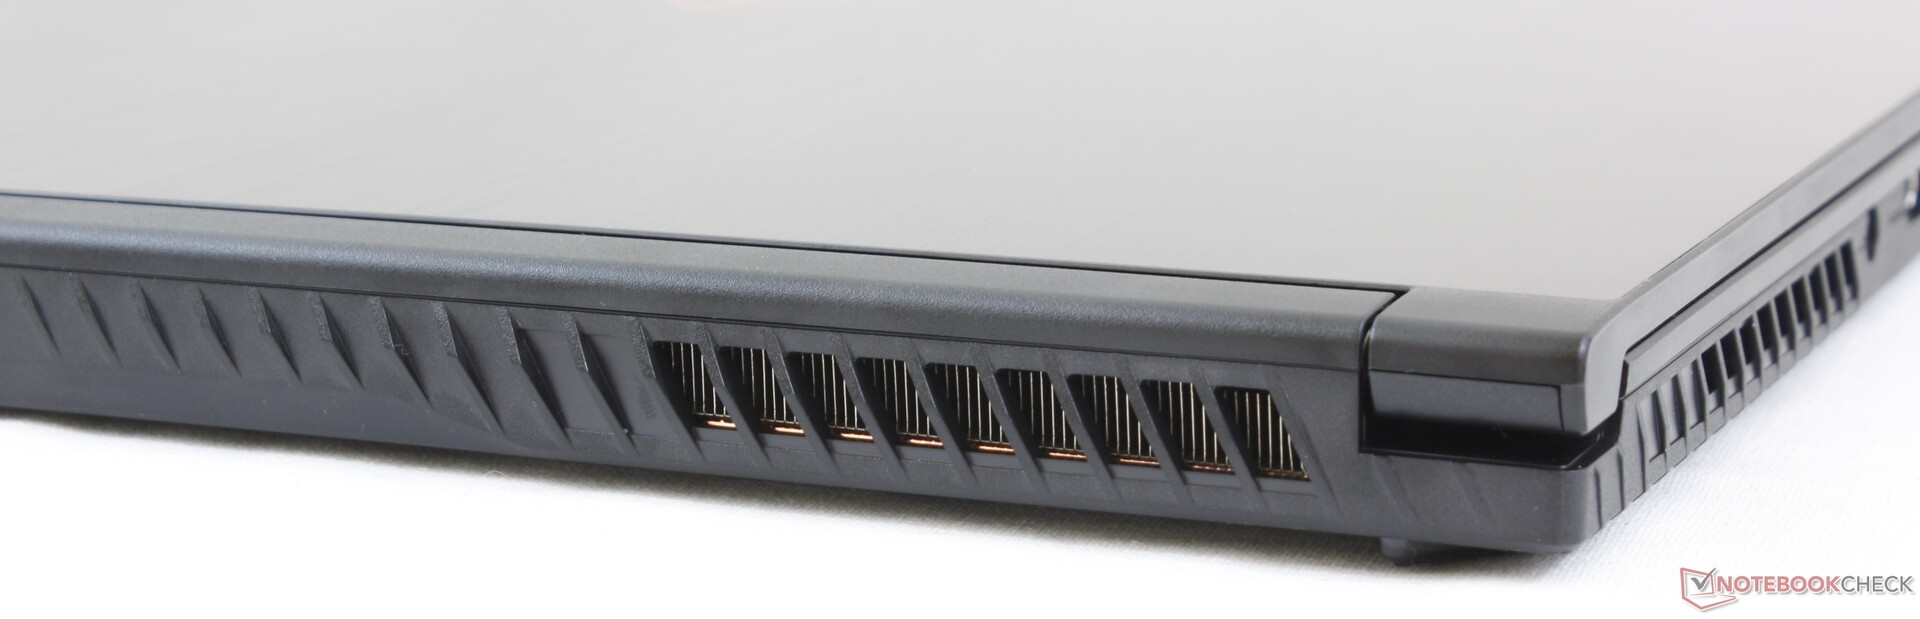
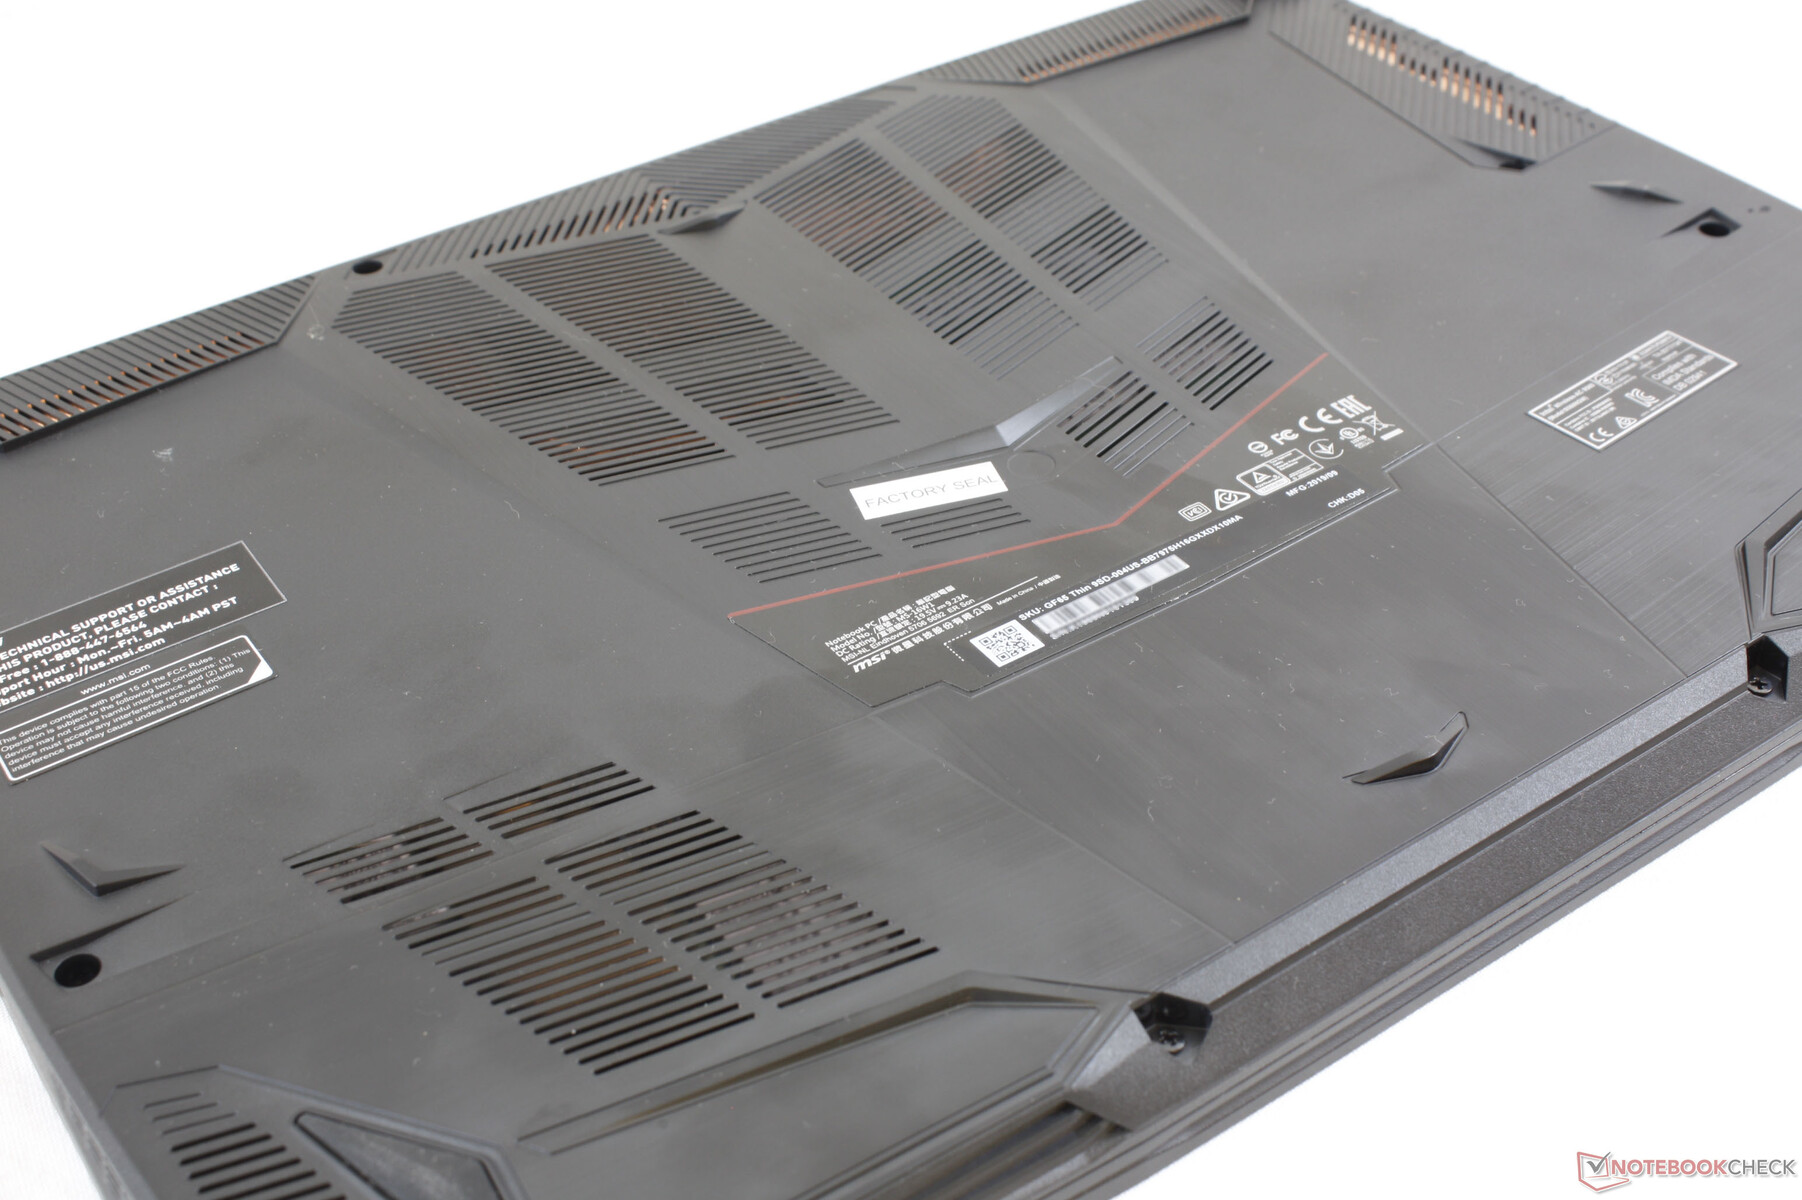
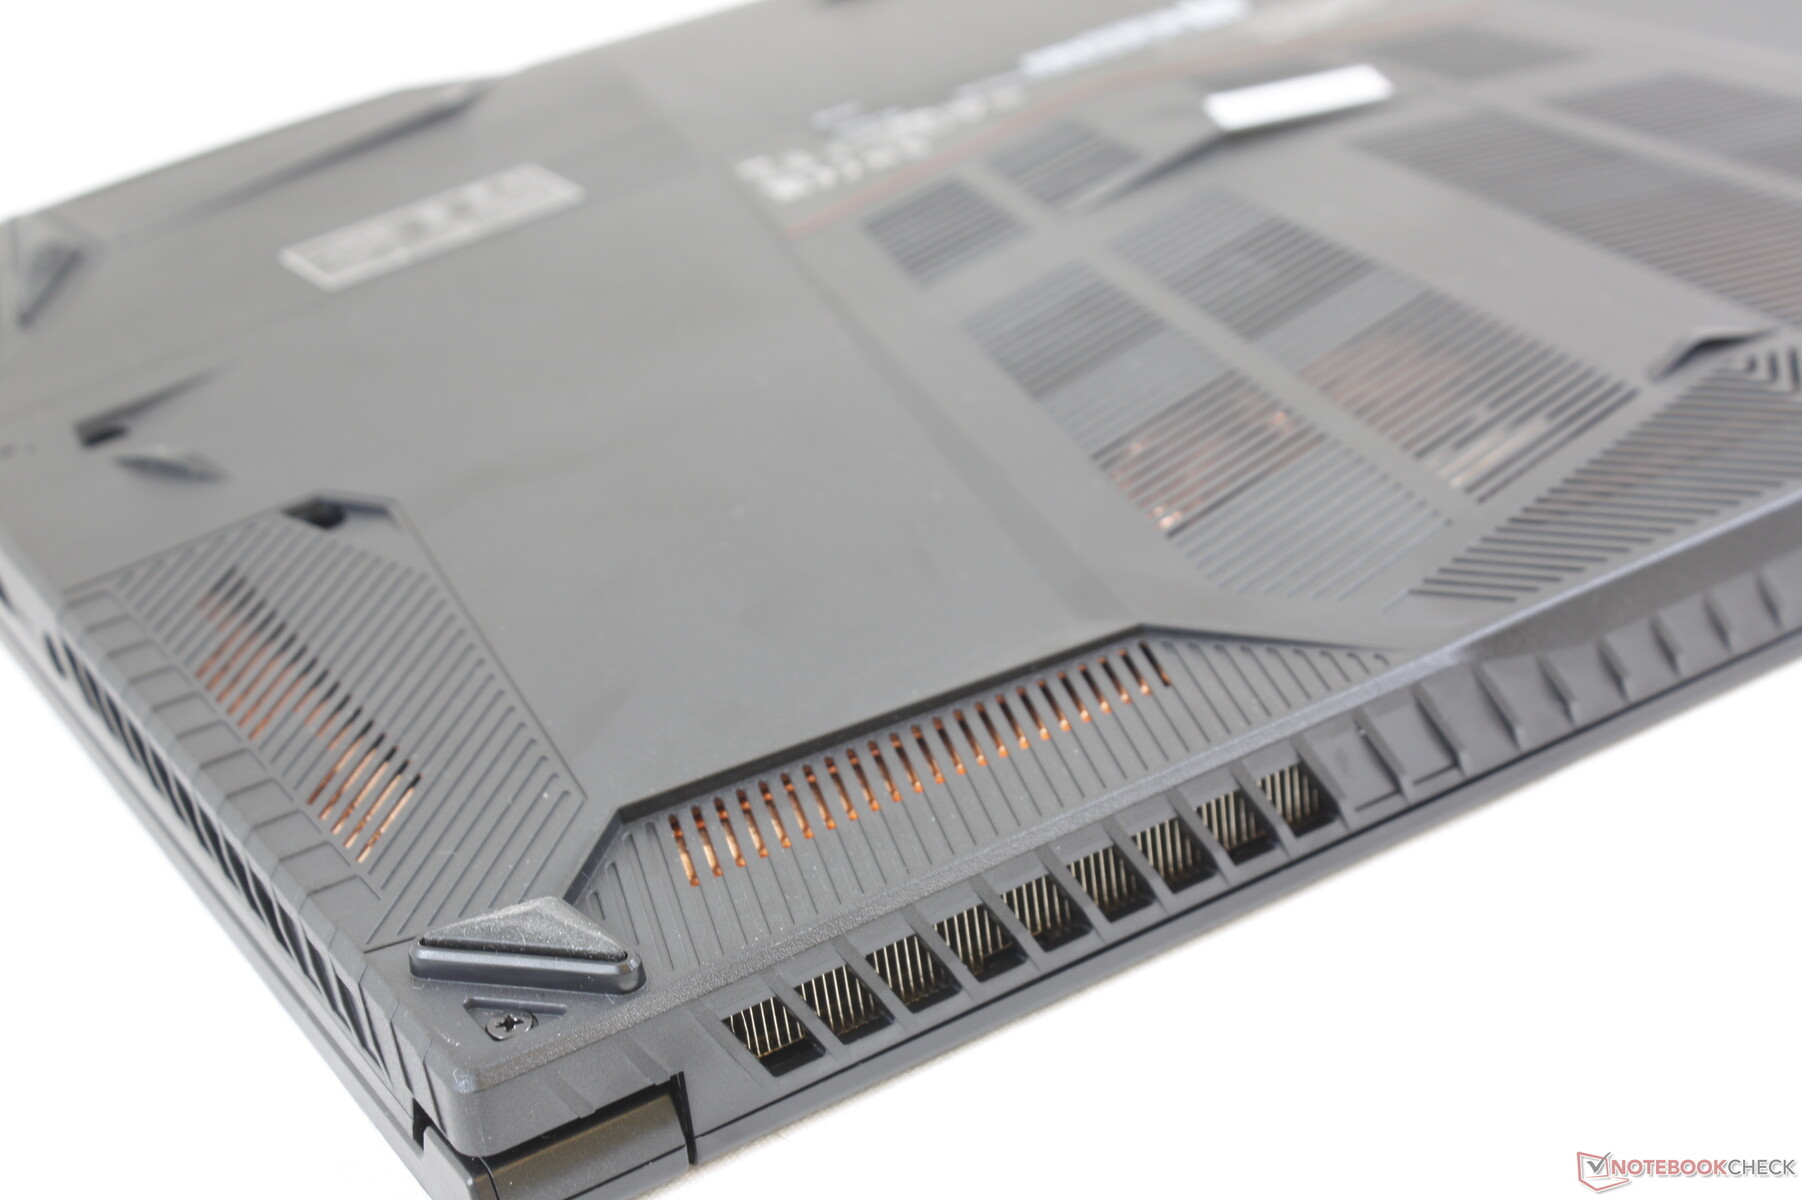
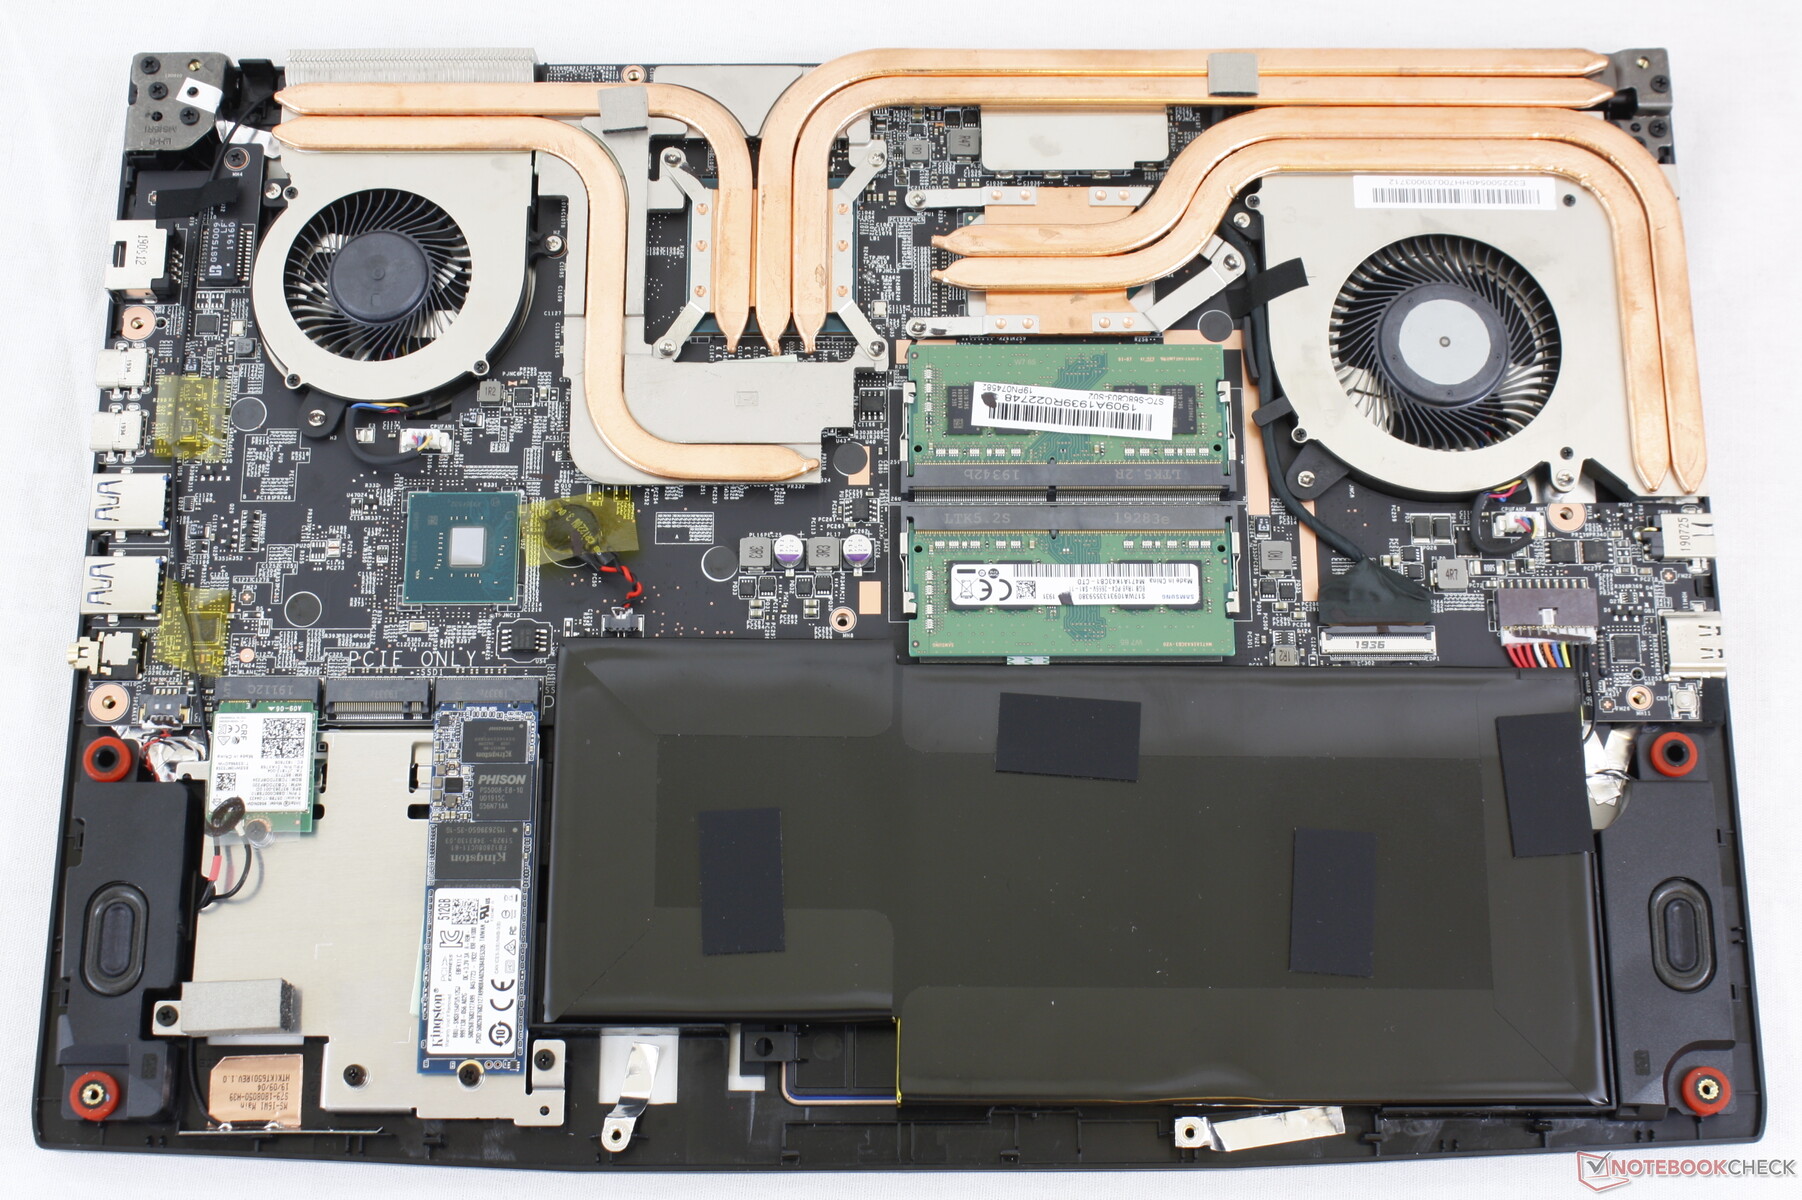
Osłonę serwisową na spodzie laptopa można bez problemu zdemontować z użyciem śrubokręta krzyżakowego. Trzeba tylko uważać na okolicę gniazda audio 3,5 mm, gdyż tam spodni panel trzyma się bardzo mocno. Więcej miedzianych rurek cieplnych dla karty grafiki wymusiło przeniesienie karty WiFi w inne miejsce.
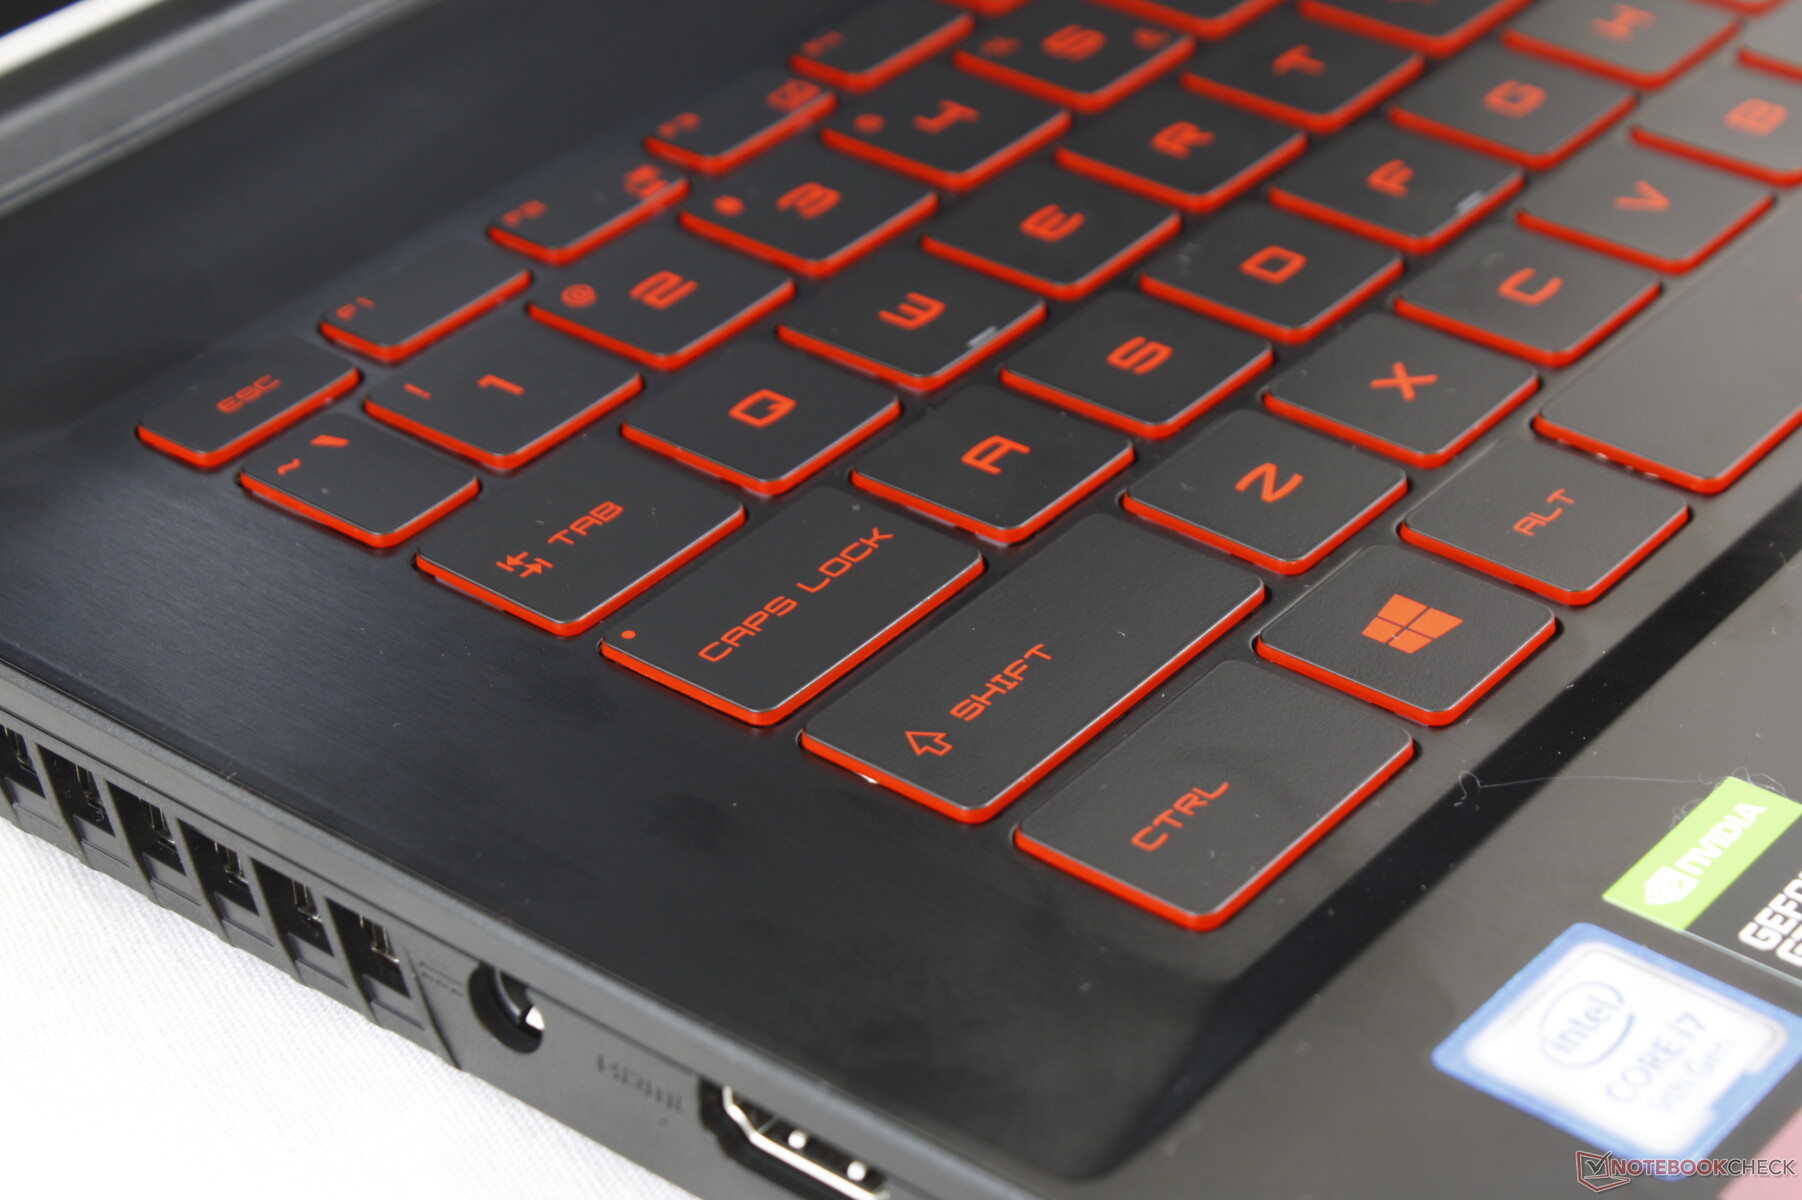
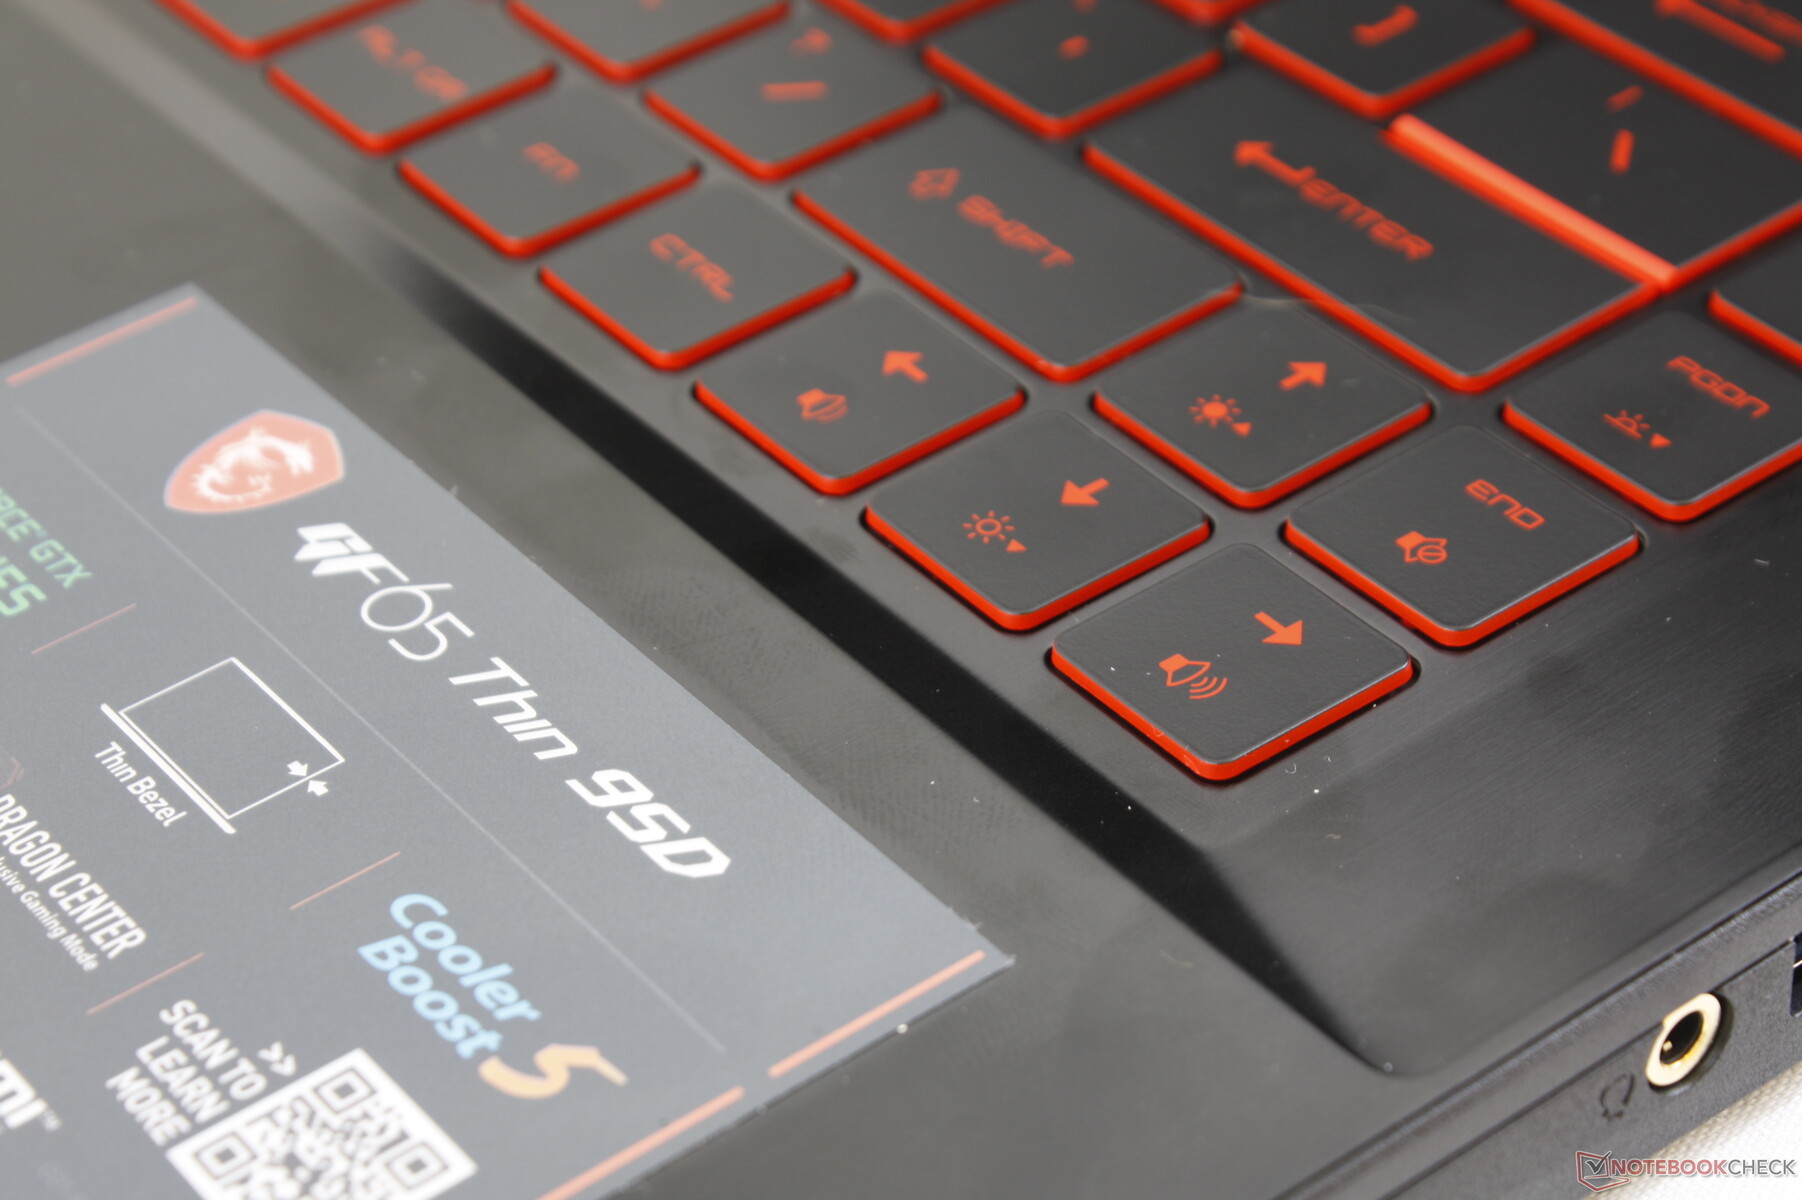
Urządzenia wejścia
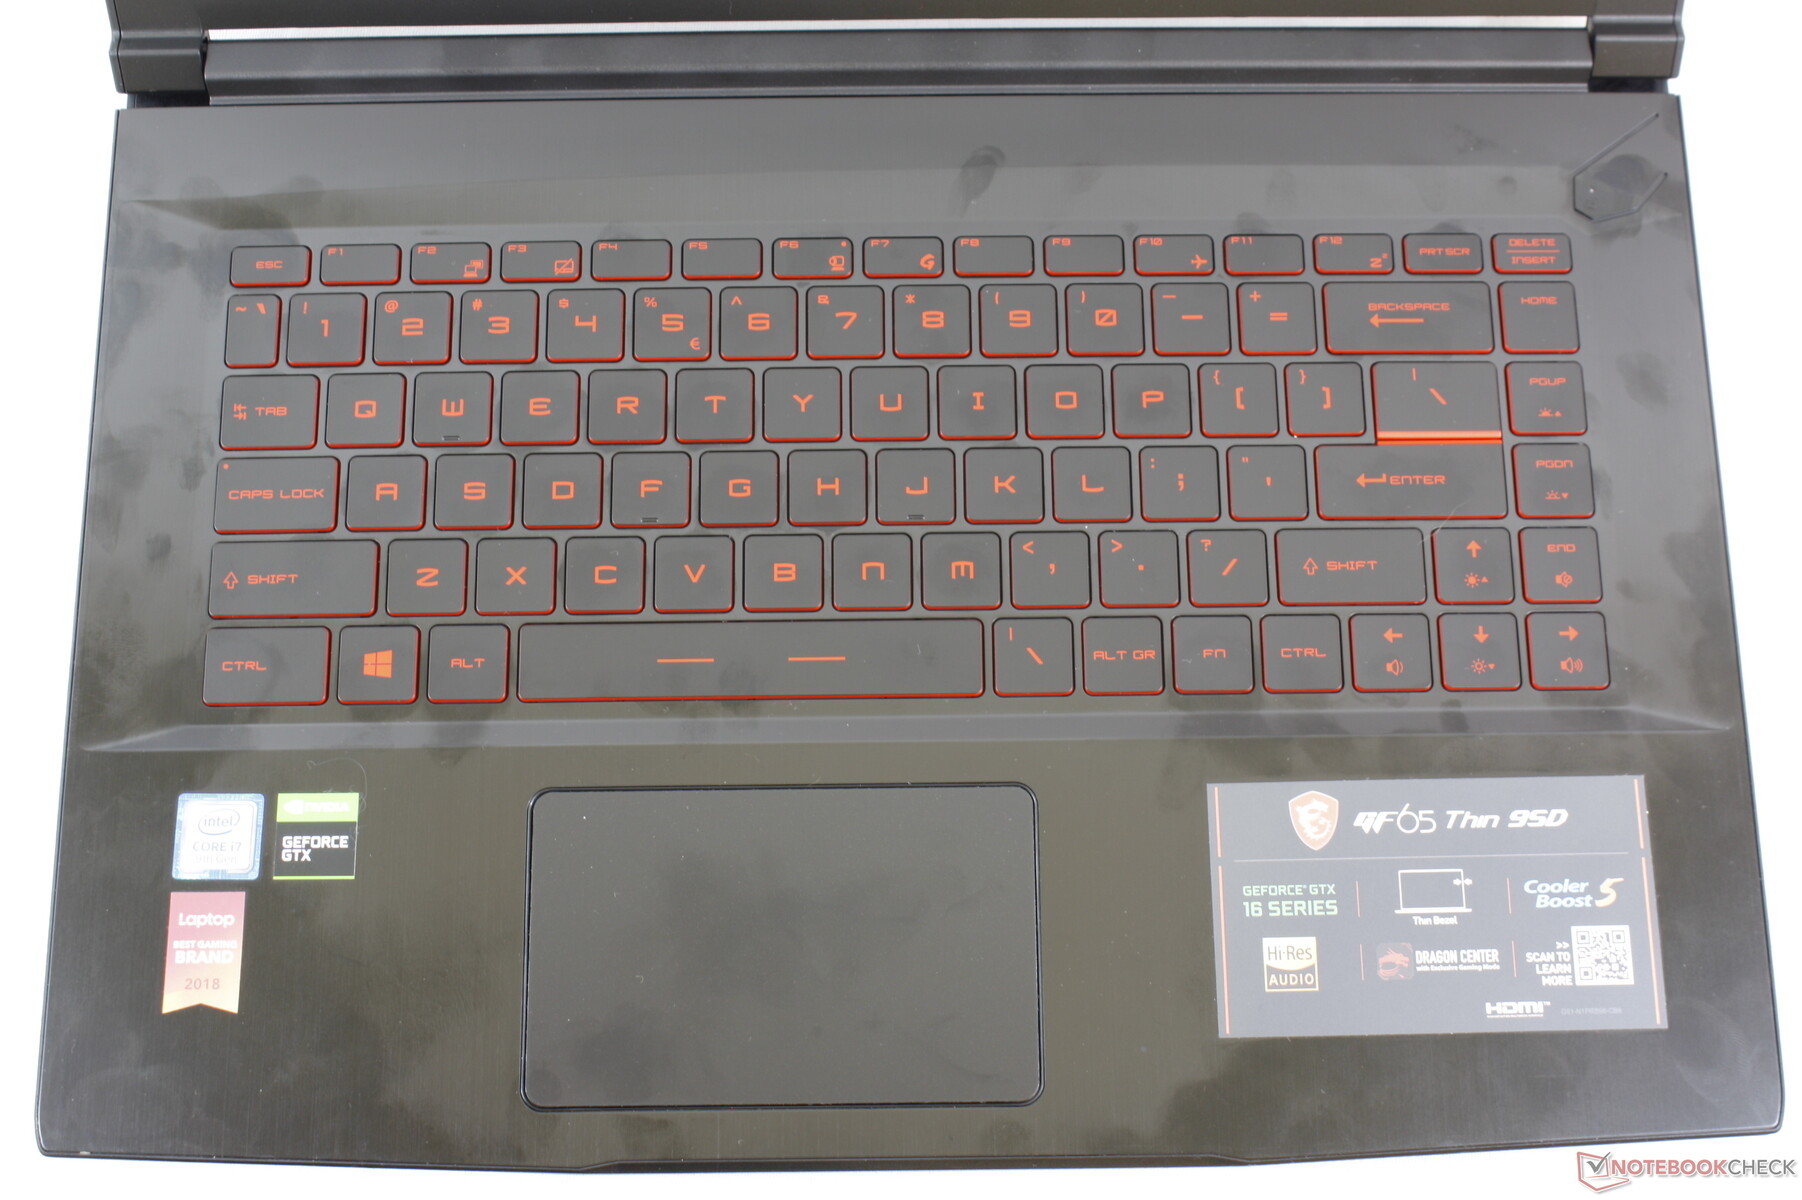
Klawiatura i płytka dotykowa (10,6 x 6,5 cm) to te same przyrządy, co w modelach GF63 i WP65. Klawisze klawiatury mają krótszy skok, niż w droższych laptopach firmy MSI. Podświetlanie jest jednostrefowe (cała klawiatura na raz) i ma trzy poziomy intensywności.
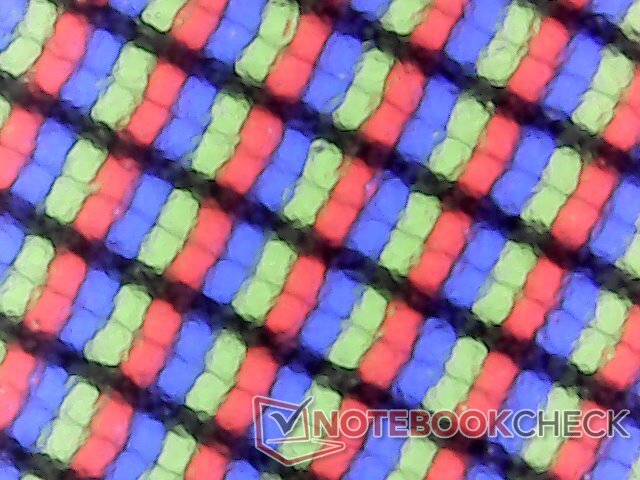
Obraz
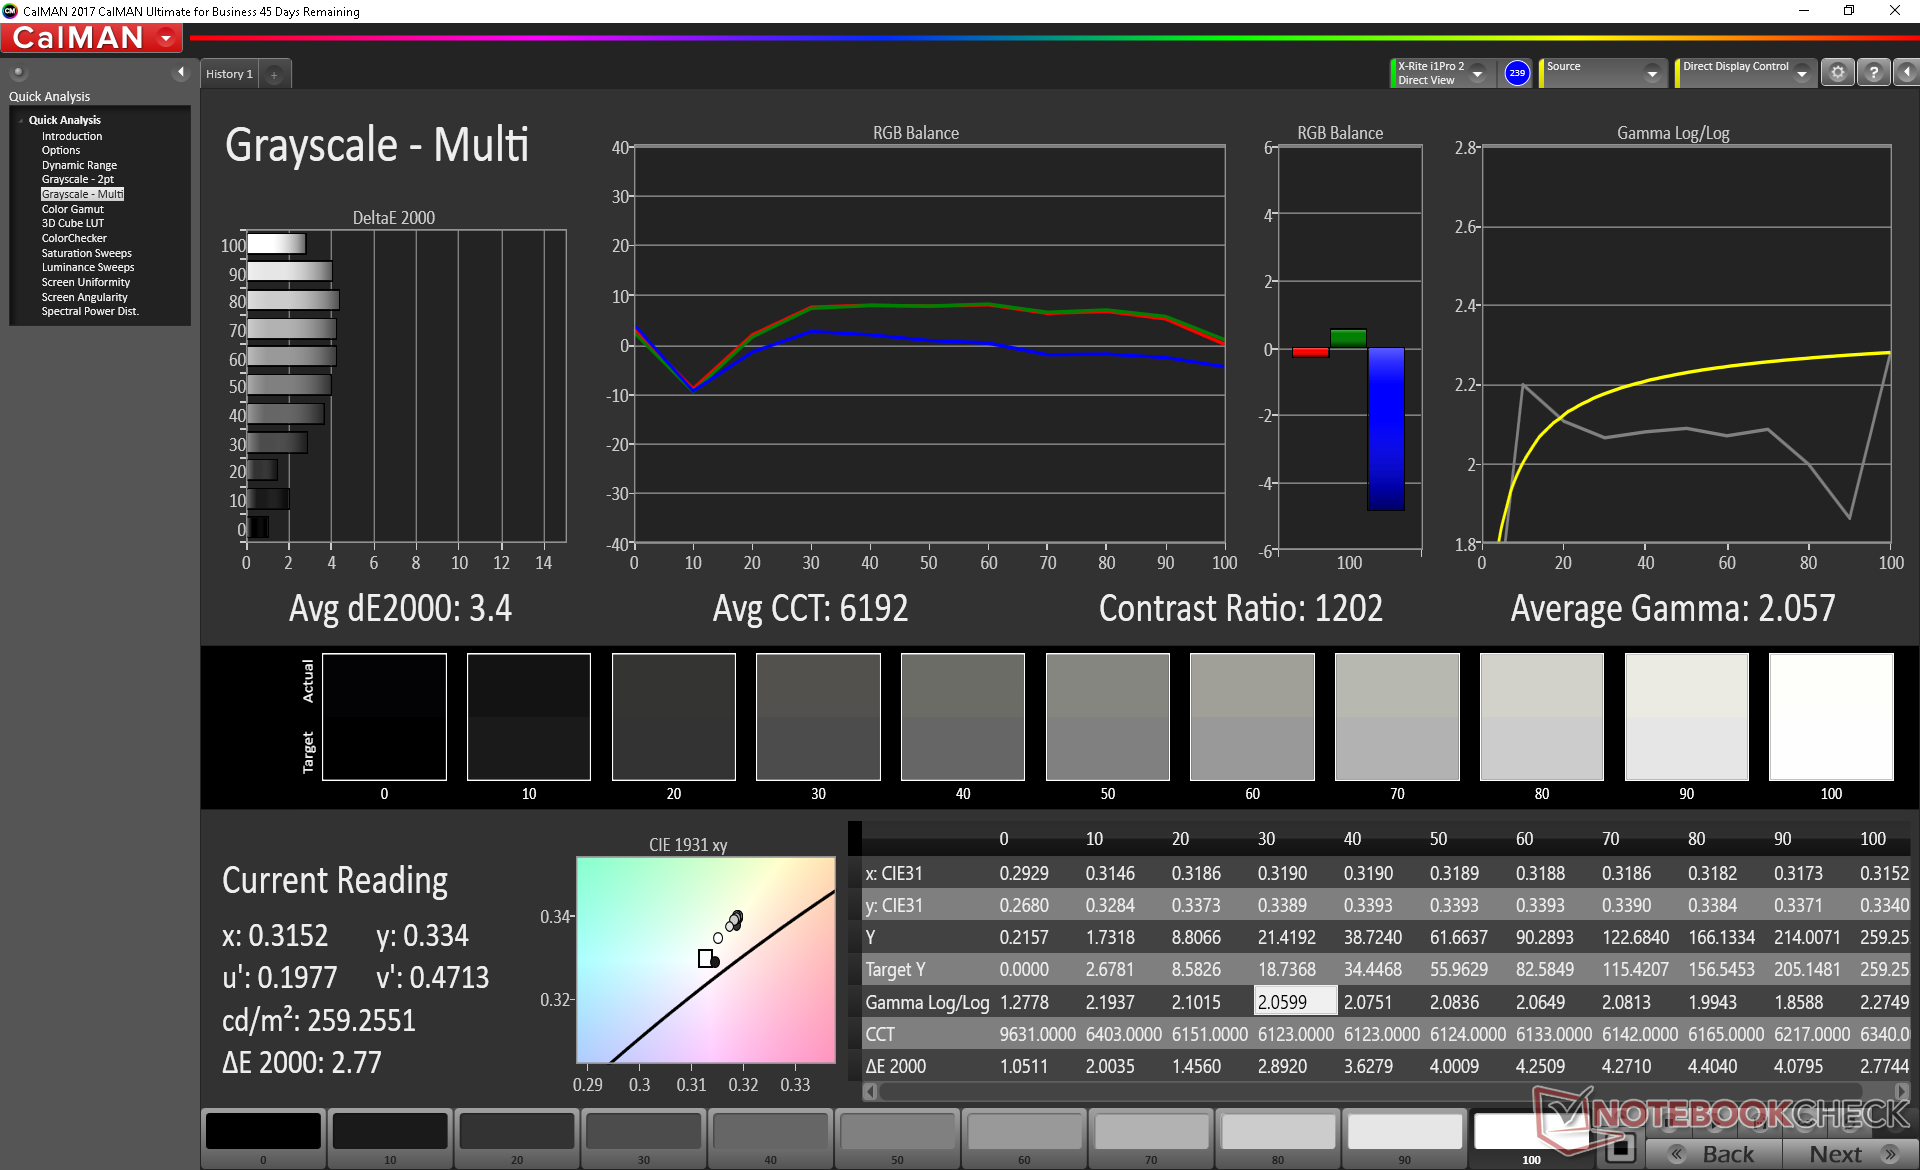
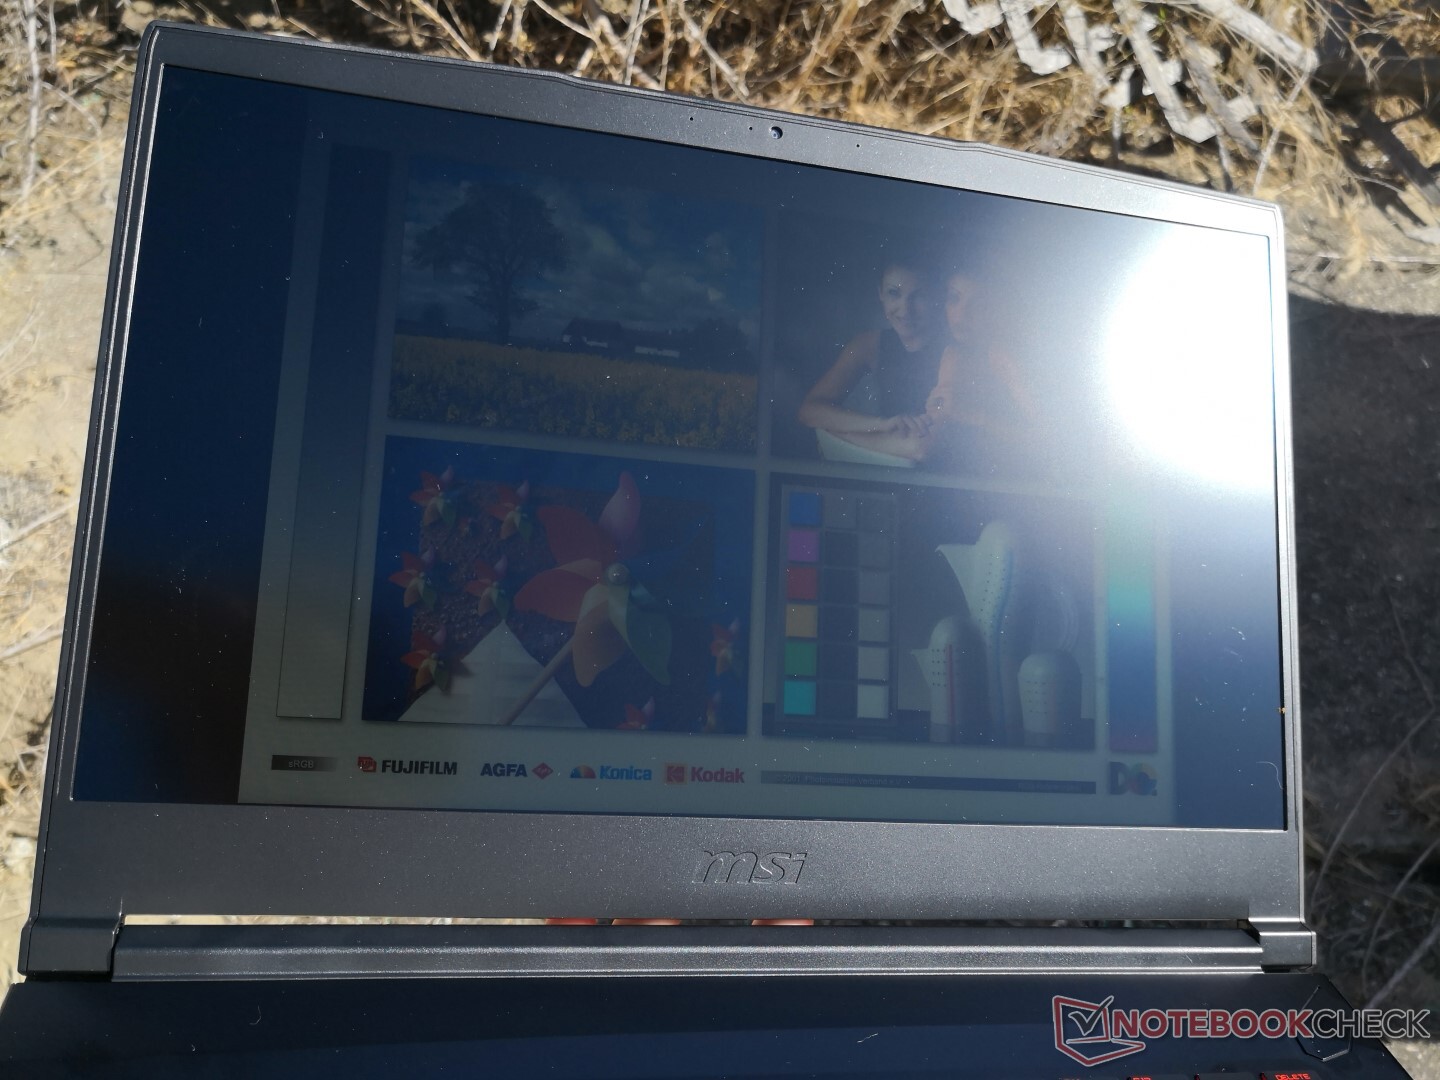
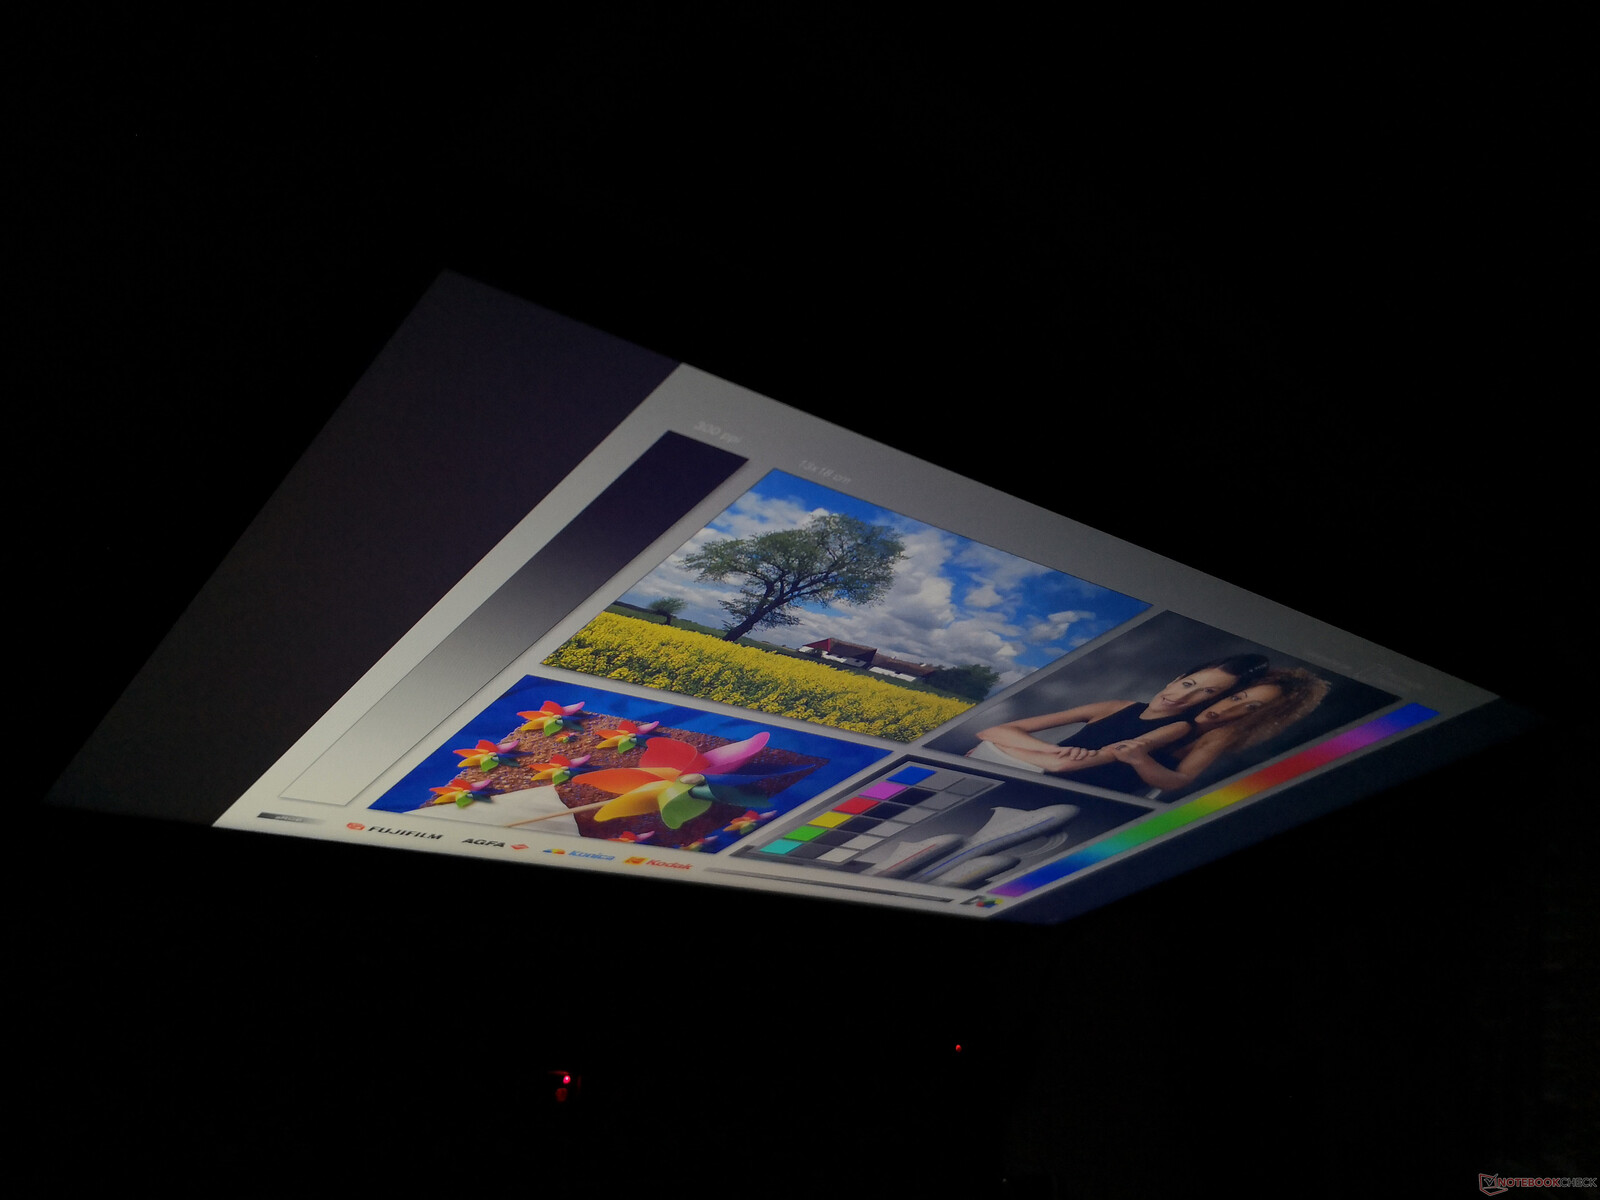
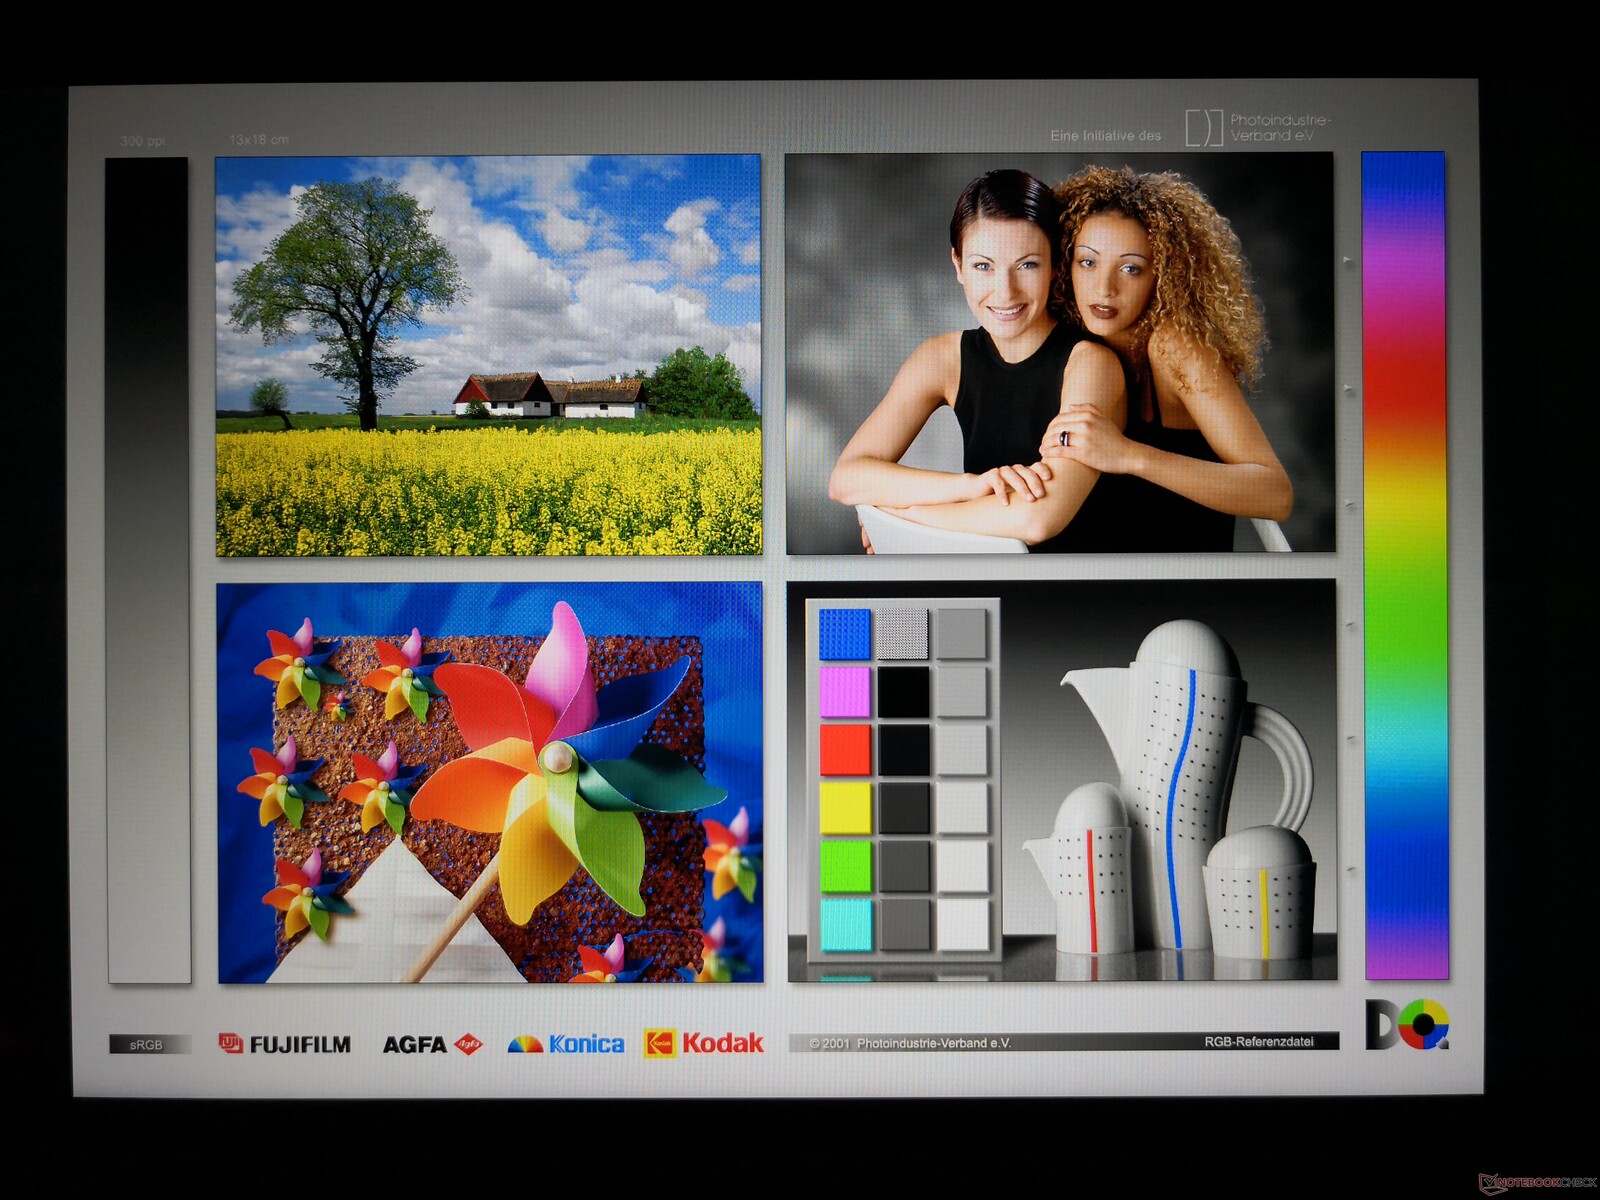
Przyjęty na testy egzemplarz został wyposażony w matrycę AU Optronics B156HAN13.0, czyli wyświetlacz IPS o rozdzielczości 1920 x 1080 pikseli i odświeżaniu 120 Hz. Wcześniej trafił się on nam m.in. w laptopie MSI GL65. Zestawiając go z ekranem starszego modelu GE63 widać postęp, bo tam był montowany klasyczny wyświetlacz 60 Hz (AU Optronics). Co ciekawe, większość parametrów jest zbliżona (czasy reakcji, jasność obrazu, odwzorowanie kolorów, głębia czerni oraz kontrast).

| |||||||||||||||||||||||||
rozświetlenie: 90 %
na akumulatorze: 258.5 cd/m²
kontrast: 923:1 (czerń: 0.28 cd/m²)
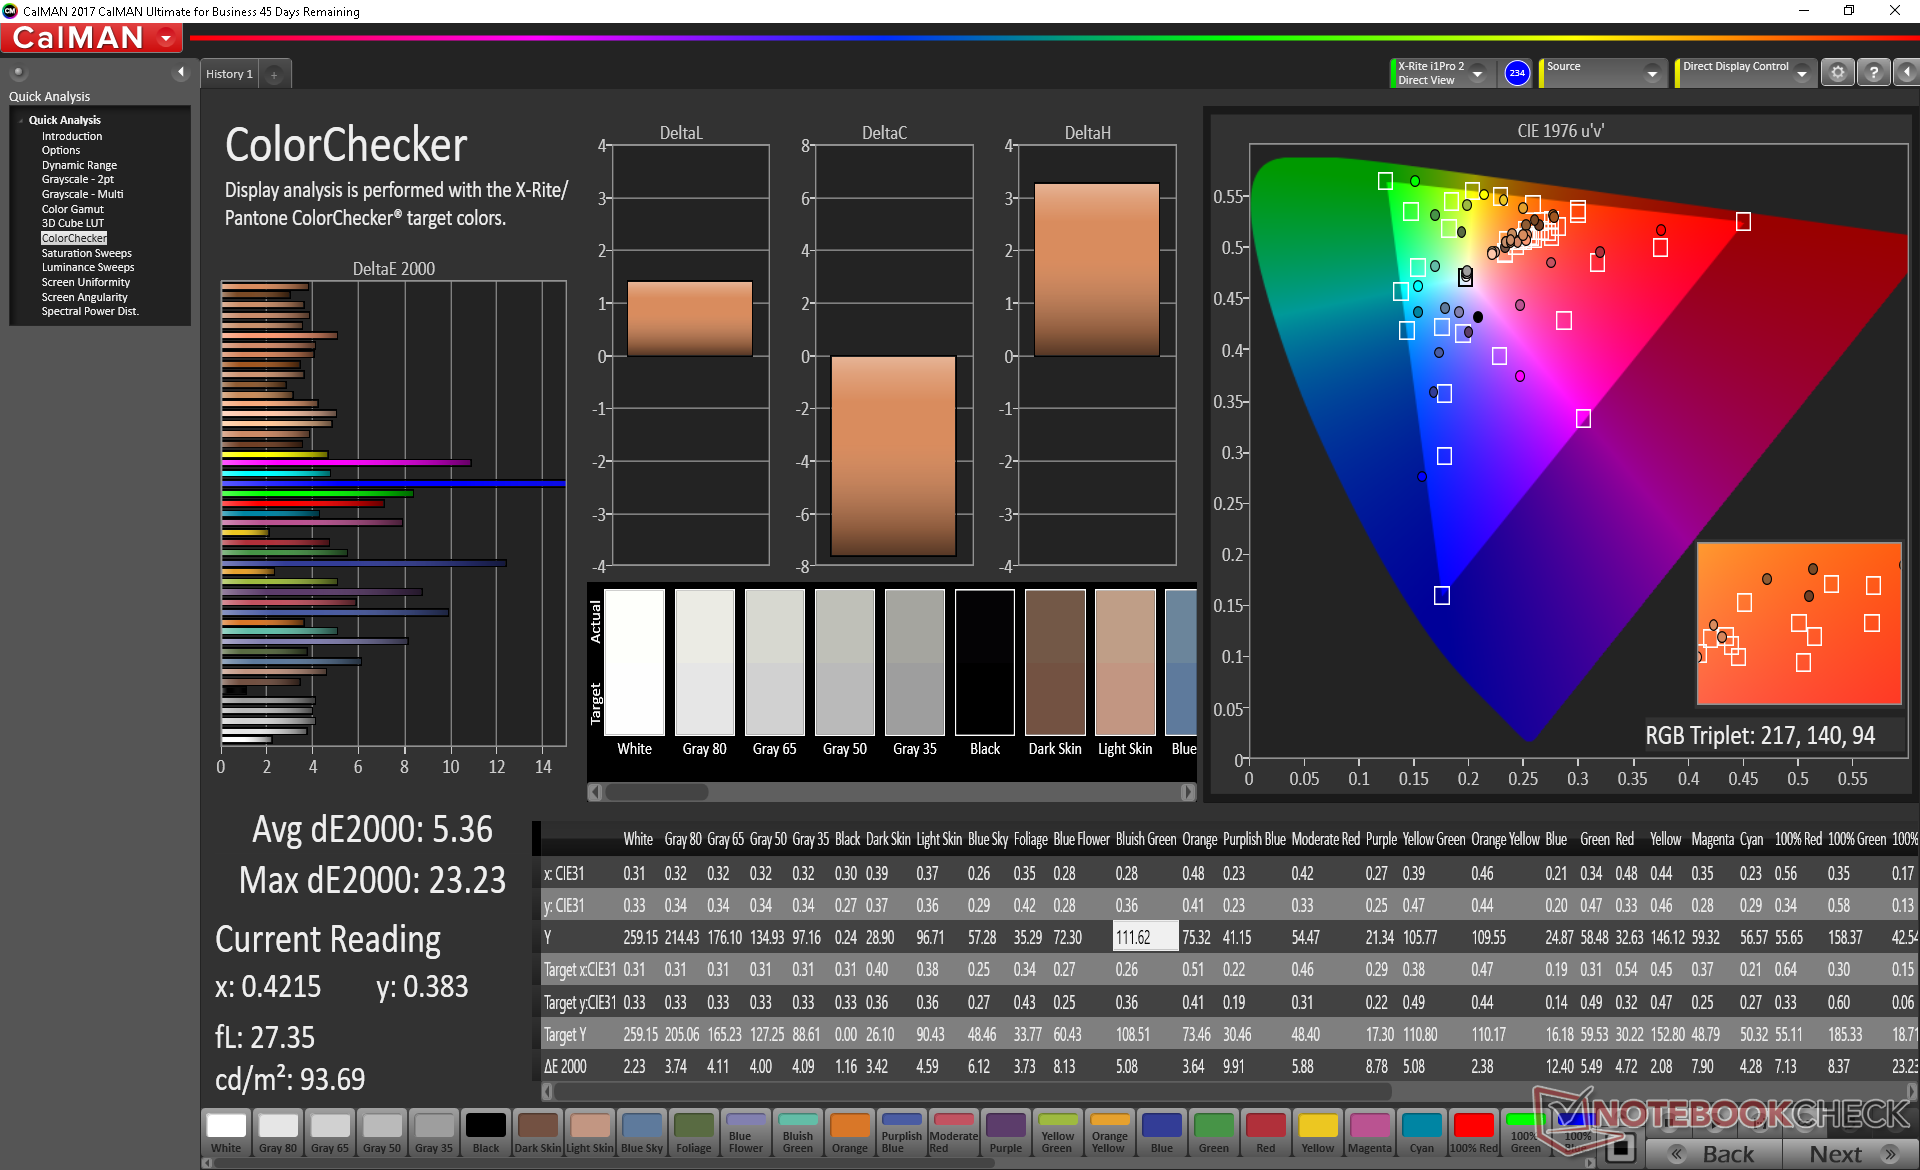
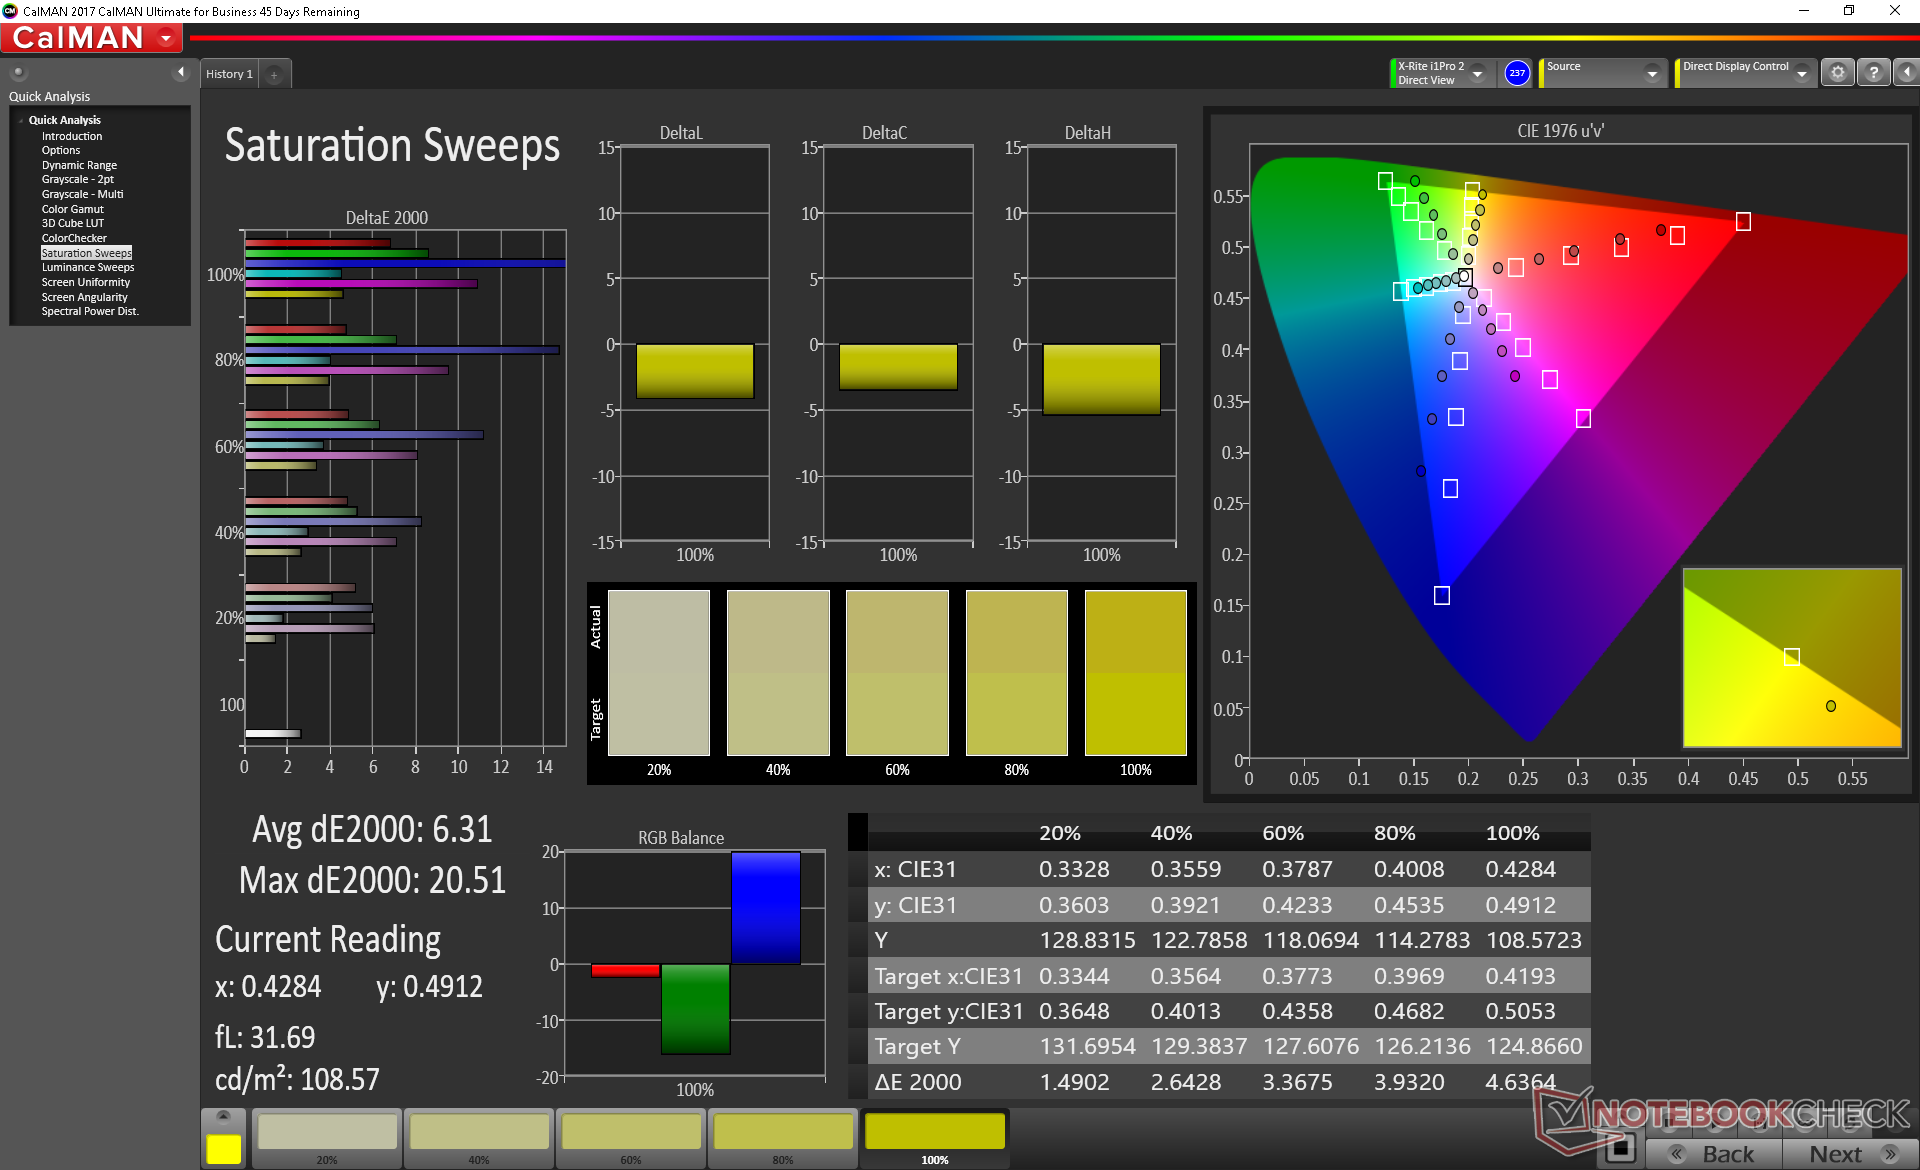
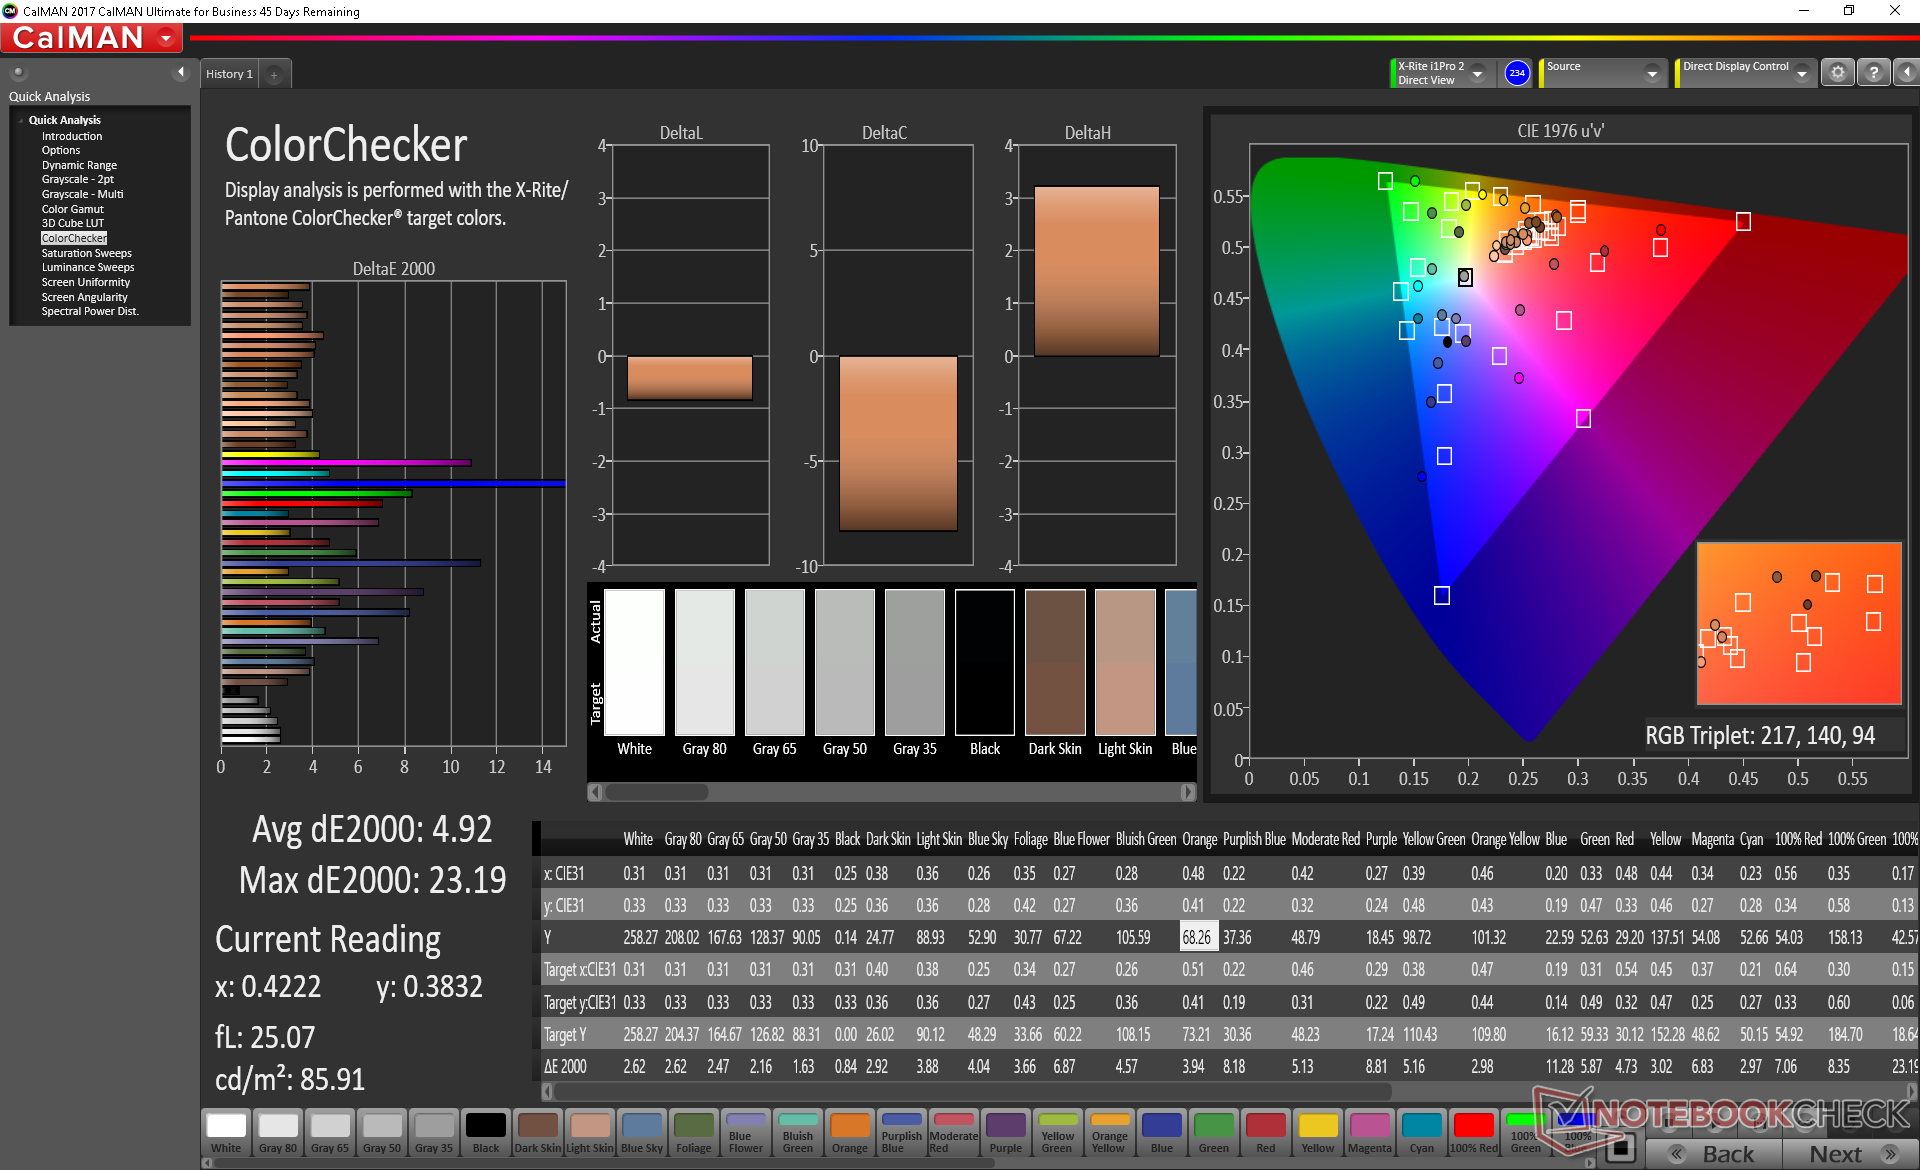
ΔE ColorChecker Calman: 5.36 | ∀{0.5-29.43 Ø4.73}
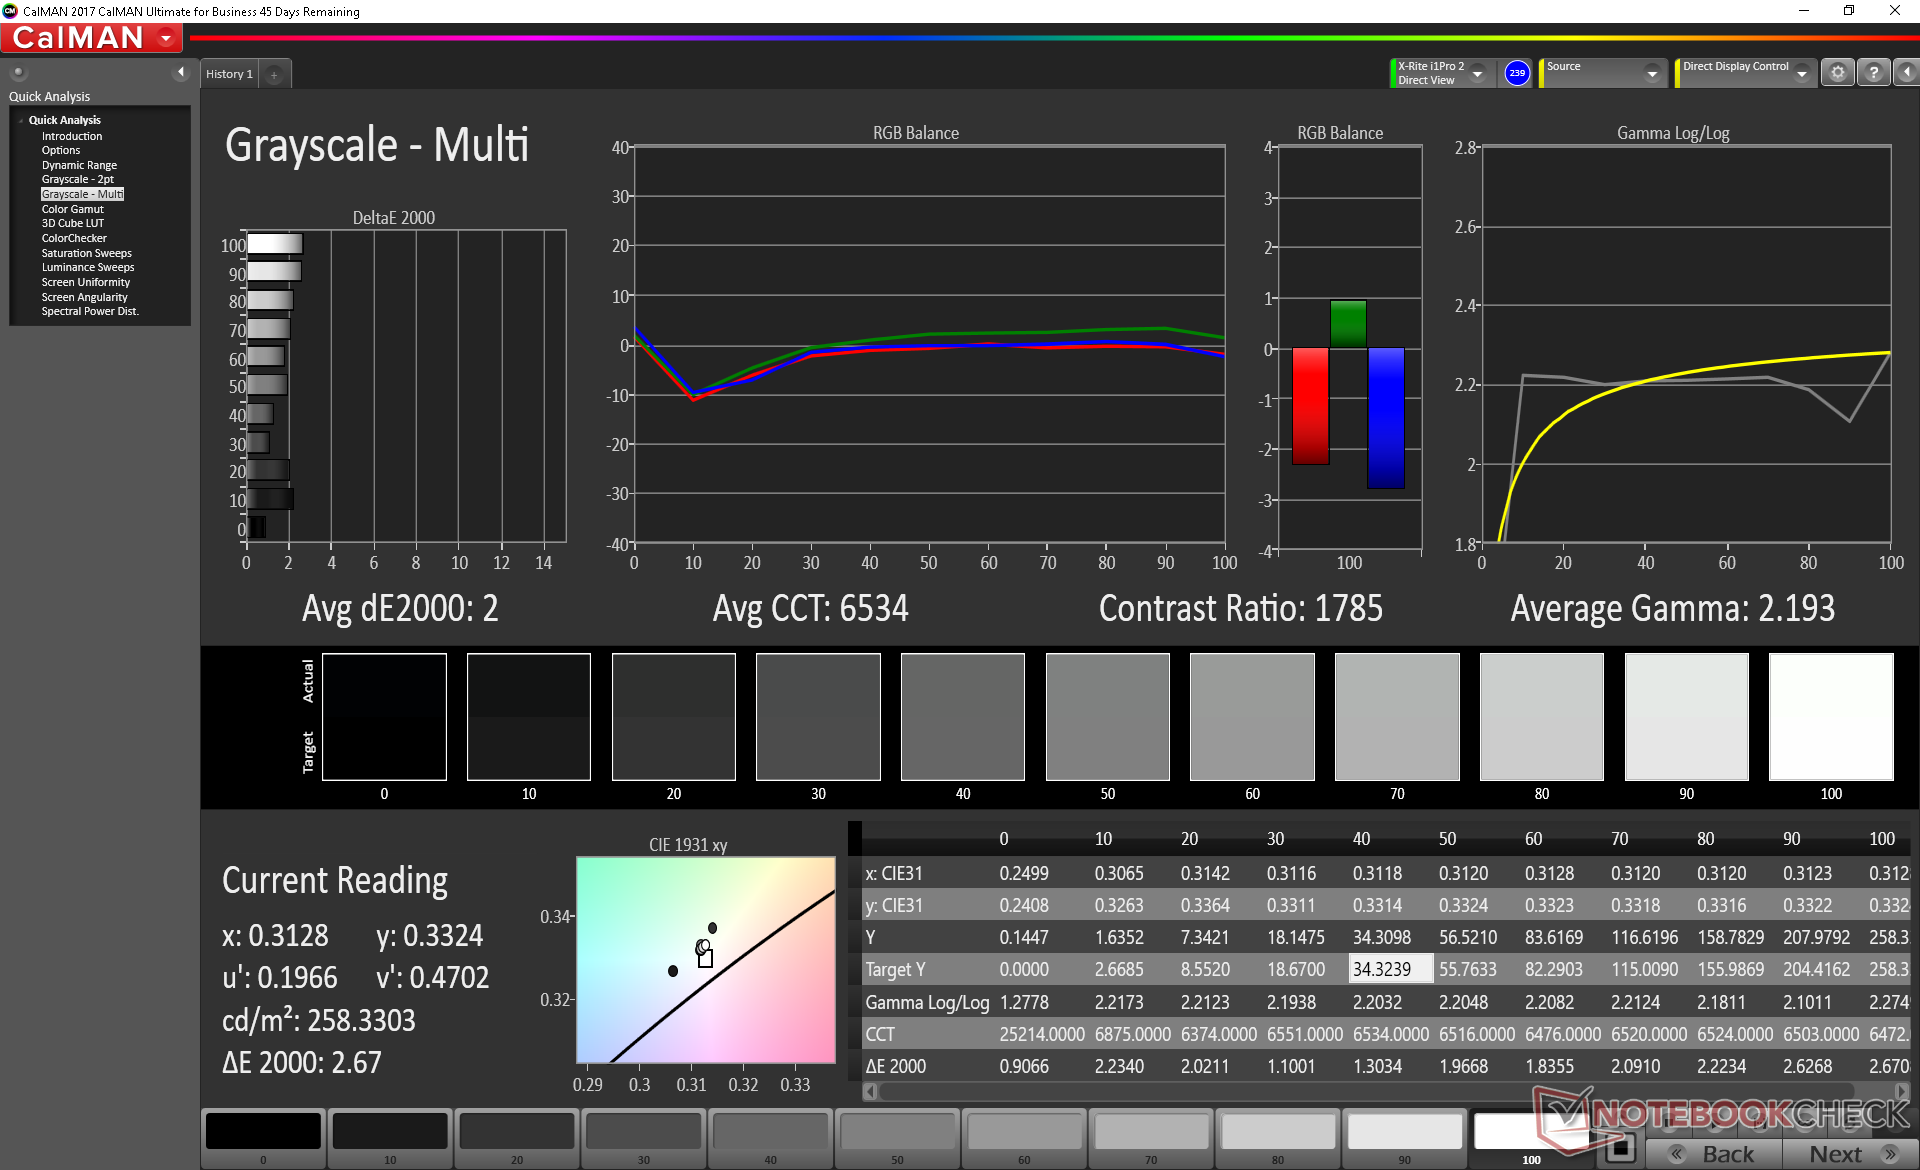
calibrated: 4.92
ΔE Greyscale Calman: 3.4 | ∀{0.09-98 Ø4.97}
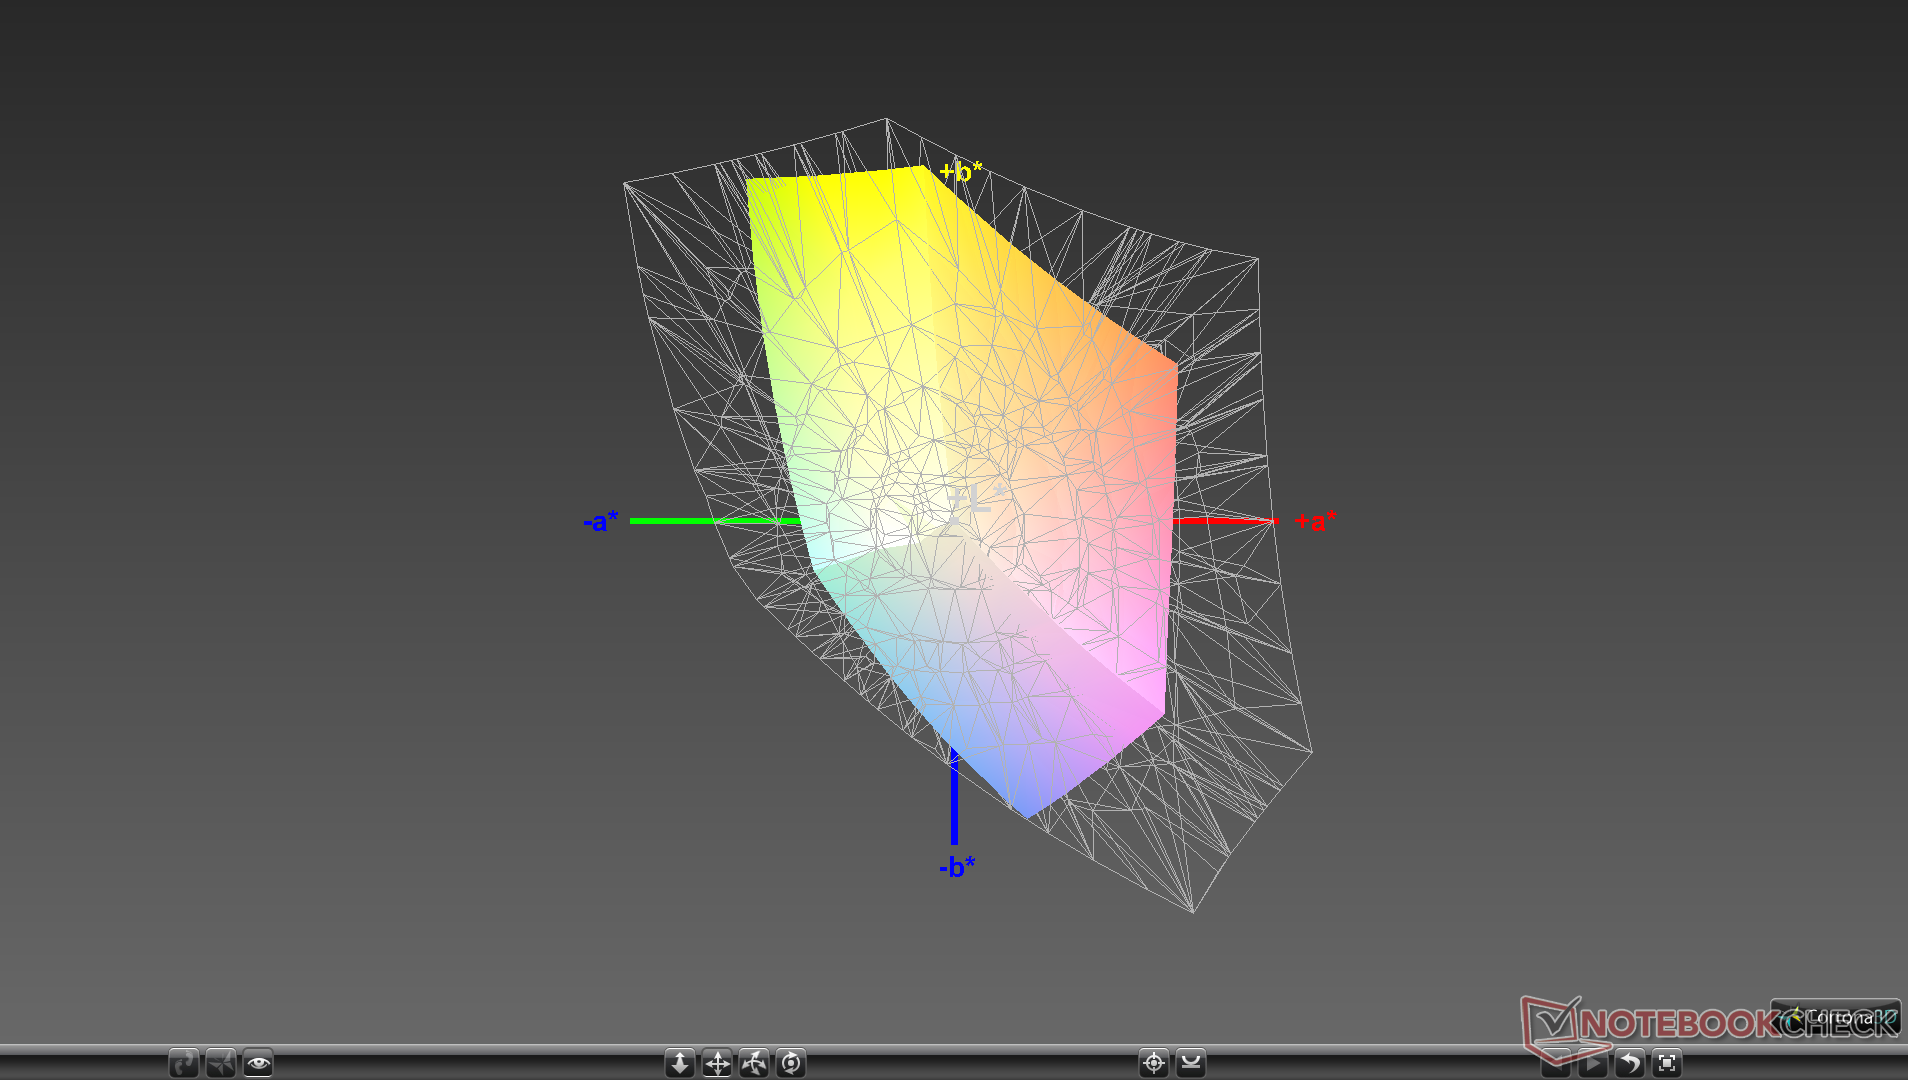
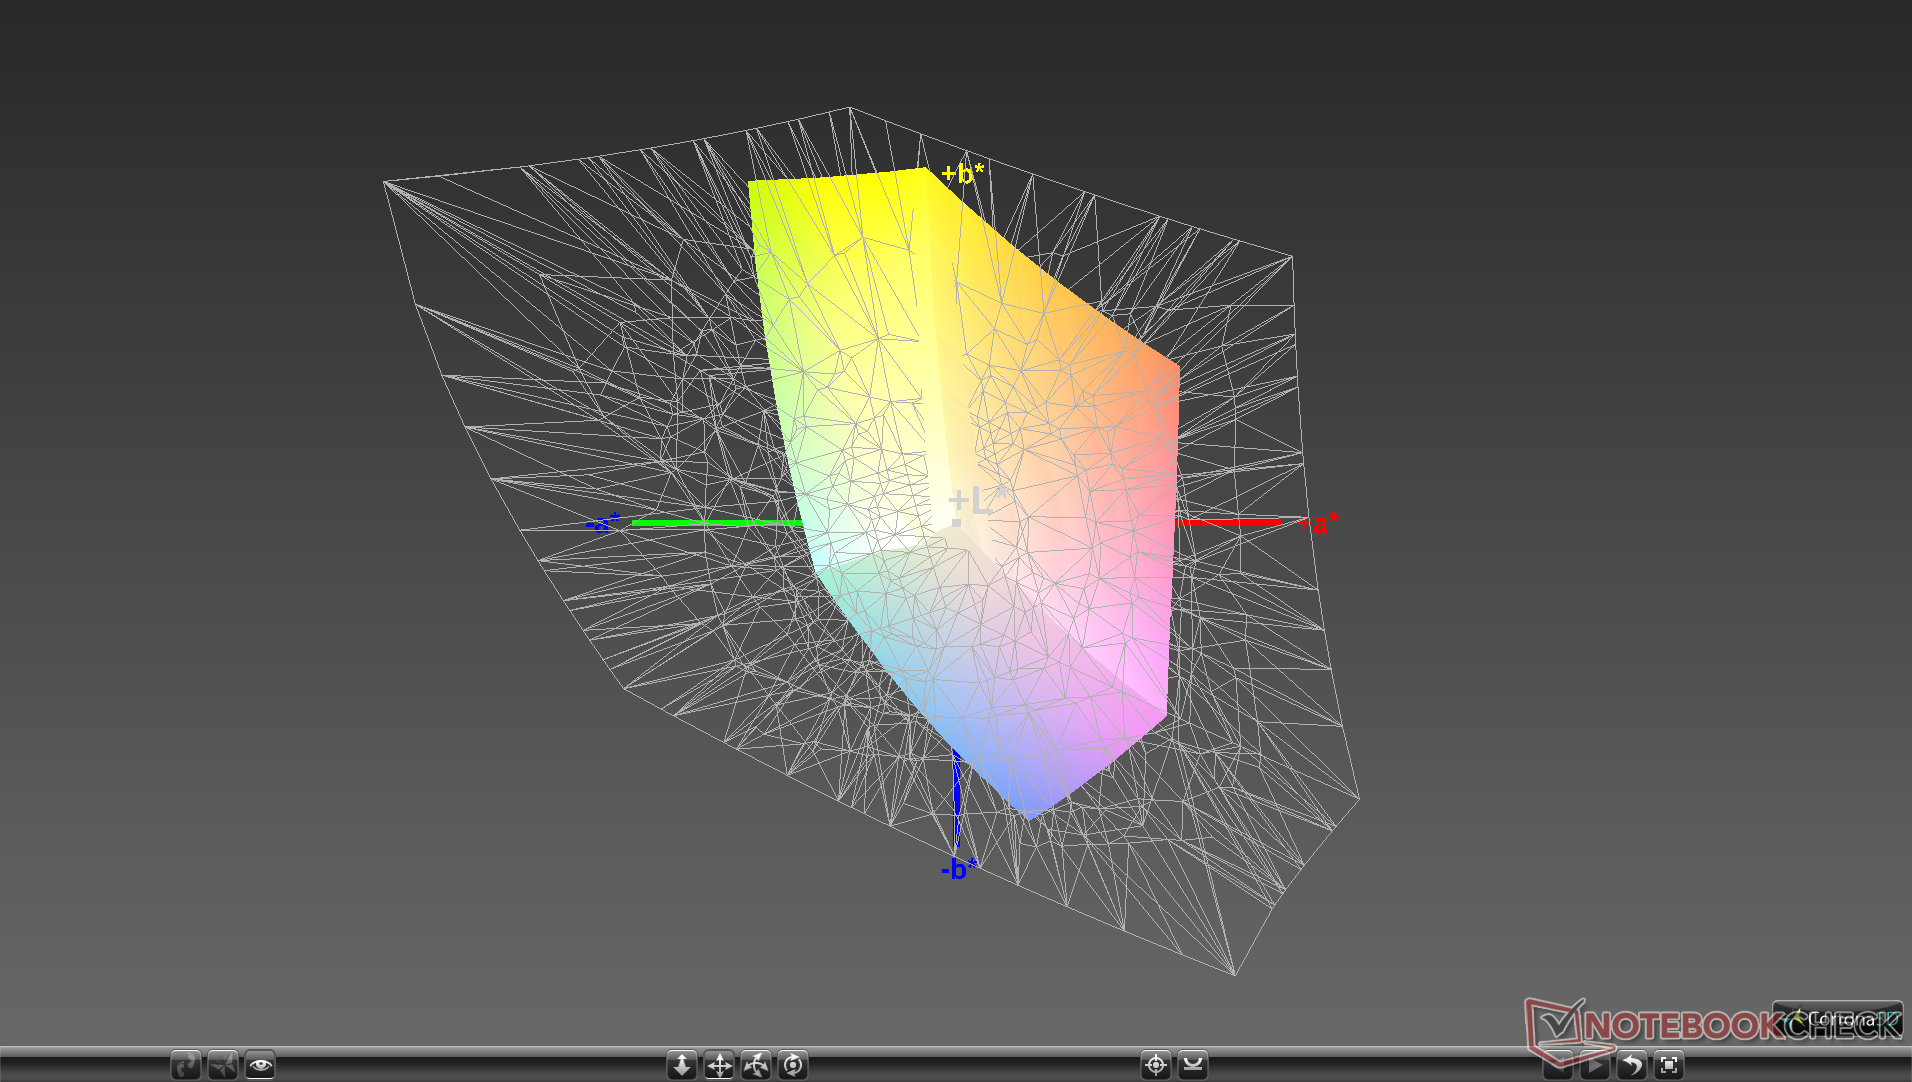
53.8% sRGB (Argyll 1.6.3 3D)
34.2% AdobeRGB 1998 (Argyll 1.6.3 3D)
37.26% AdobeRGB 1998 (Argyll 3D)
54.1% sRGB (Argyll 3D)
36.06% Display P3 (Argyll 3D)
Gamma: 2.06
CCT: 6192 K
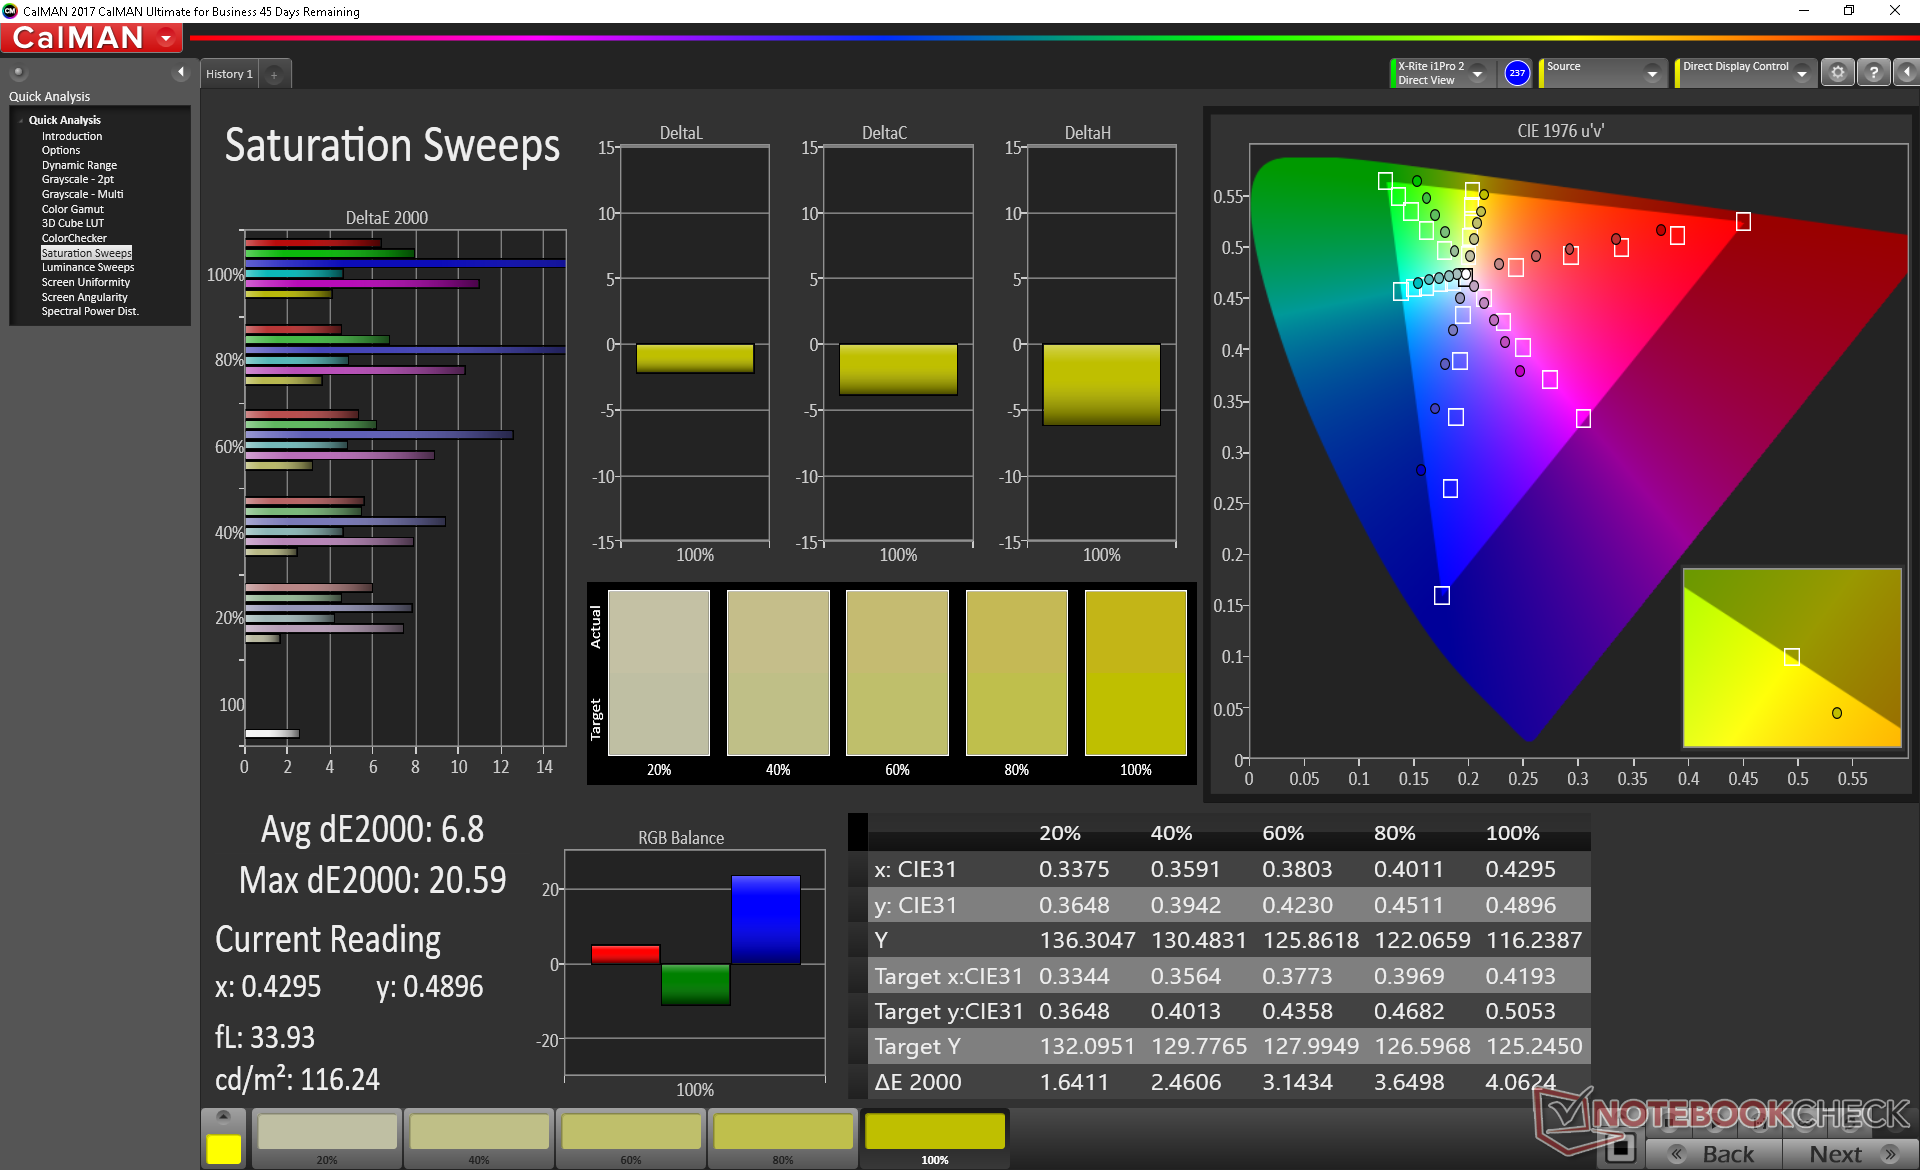
Paleta barw okazała się wąska. Wygląda to tak, że pokrycie sRGB wynosi tylko 54% a przestrzeni barwnej Adobe RGB – zaledwie 34%. To mało, bo w niektórych droższych modelach, jak Aorus 15 z matrycą 144 Hz i Dell G7 15 7590 z matrycą 144 Hz przestrzeń sRGB jest odzwierciedlana w ponad 90%.
Na ustawieniach fabrycznych kolory były zbyt ciepłe. To ciekawe, bo zwykle w tanich laptopach MSI były one za zimne. Kalibracja pozwala to poprawić i dodatkowo nieco udoskonala przejścia między odcieniami szarości. Najsłabiej wygląda kolor niebieski.
Wyświetl czasy reakcji
| ↔ Czas reakcji od czerni do bieli | ||
|---|---|---|
| 25.6 ms ... wzrost ↗ i spadek ↘ łącznie | ↗ 12.4 ms wzrost | 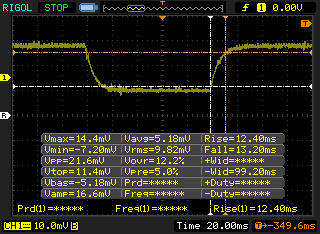 |
| ↘ 13.2 ms upadek | ||
| W naszych testach ekran wykazuje stosunkowo powolne tempo reakcji i może być zbyt wolny dla graczy. Dla porównania, wszystkie testowane urządzenia wahają się od 0.1 (minimum) do 240 (maksimum) ms. » 61 % wszystkich urządzeń jest lepszych. Oznacza to, że zmierzony czas reakcji jest gorszy od średniej wszystkich testowanych urządzeń (19.9 ms). | ||
| ↔ Czas reakcji 50% szarości do 80% szarości | ||
| 35.2 ms ... wzrost ↗ i spadek ↘ łącznie | ↗ 18 ms wzrost | 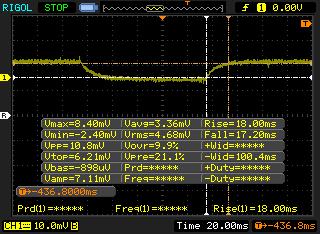 |
| ↘ 17.2 ms upadek | ||
| W naszych testach ekran wykazuje powolne tempo reakcji, co będzie niezadowalające dla graczy. Dla porównania, wszystkie testowane urządzenia wahają się od 0.165 (minimum) do 636 (maksimum) ms. » 49 % wszystkich urządzeń jest lepszych. Oznacza to, że zmierzony czas reakcji jest gorszy od średniej wszystkich testowanych urządzeń (31.1 ms). | ||
Migotanie ekranu / PWM (modulacja szerokości impulsu)
| Migotanie ekranu/nie wykryto PWM |  | ||
Dla porównania: 52 % wszystkich testowanych urządzeń nie używa PWM do przyciemniania wyświetlacza. Jeśli wykryto PWM, zmierzono średnio 7794 (minimum: 5 - maksimum: 343500) Hz. | |||

Osiągi
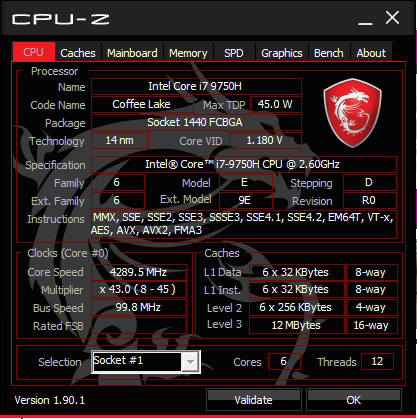
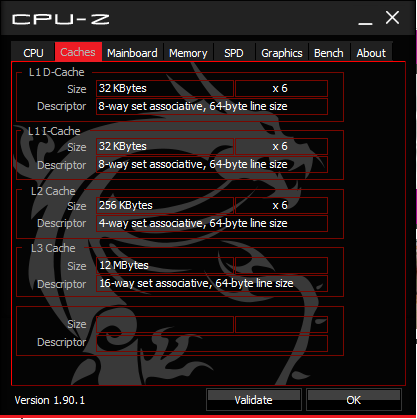
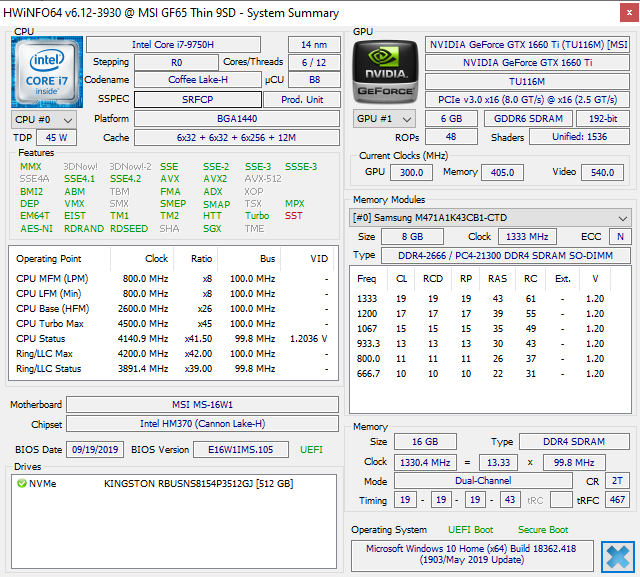
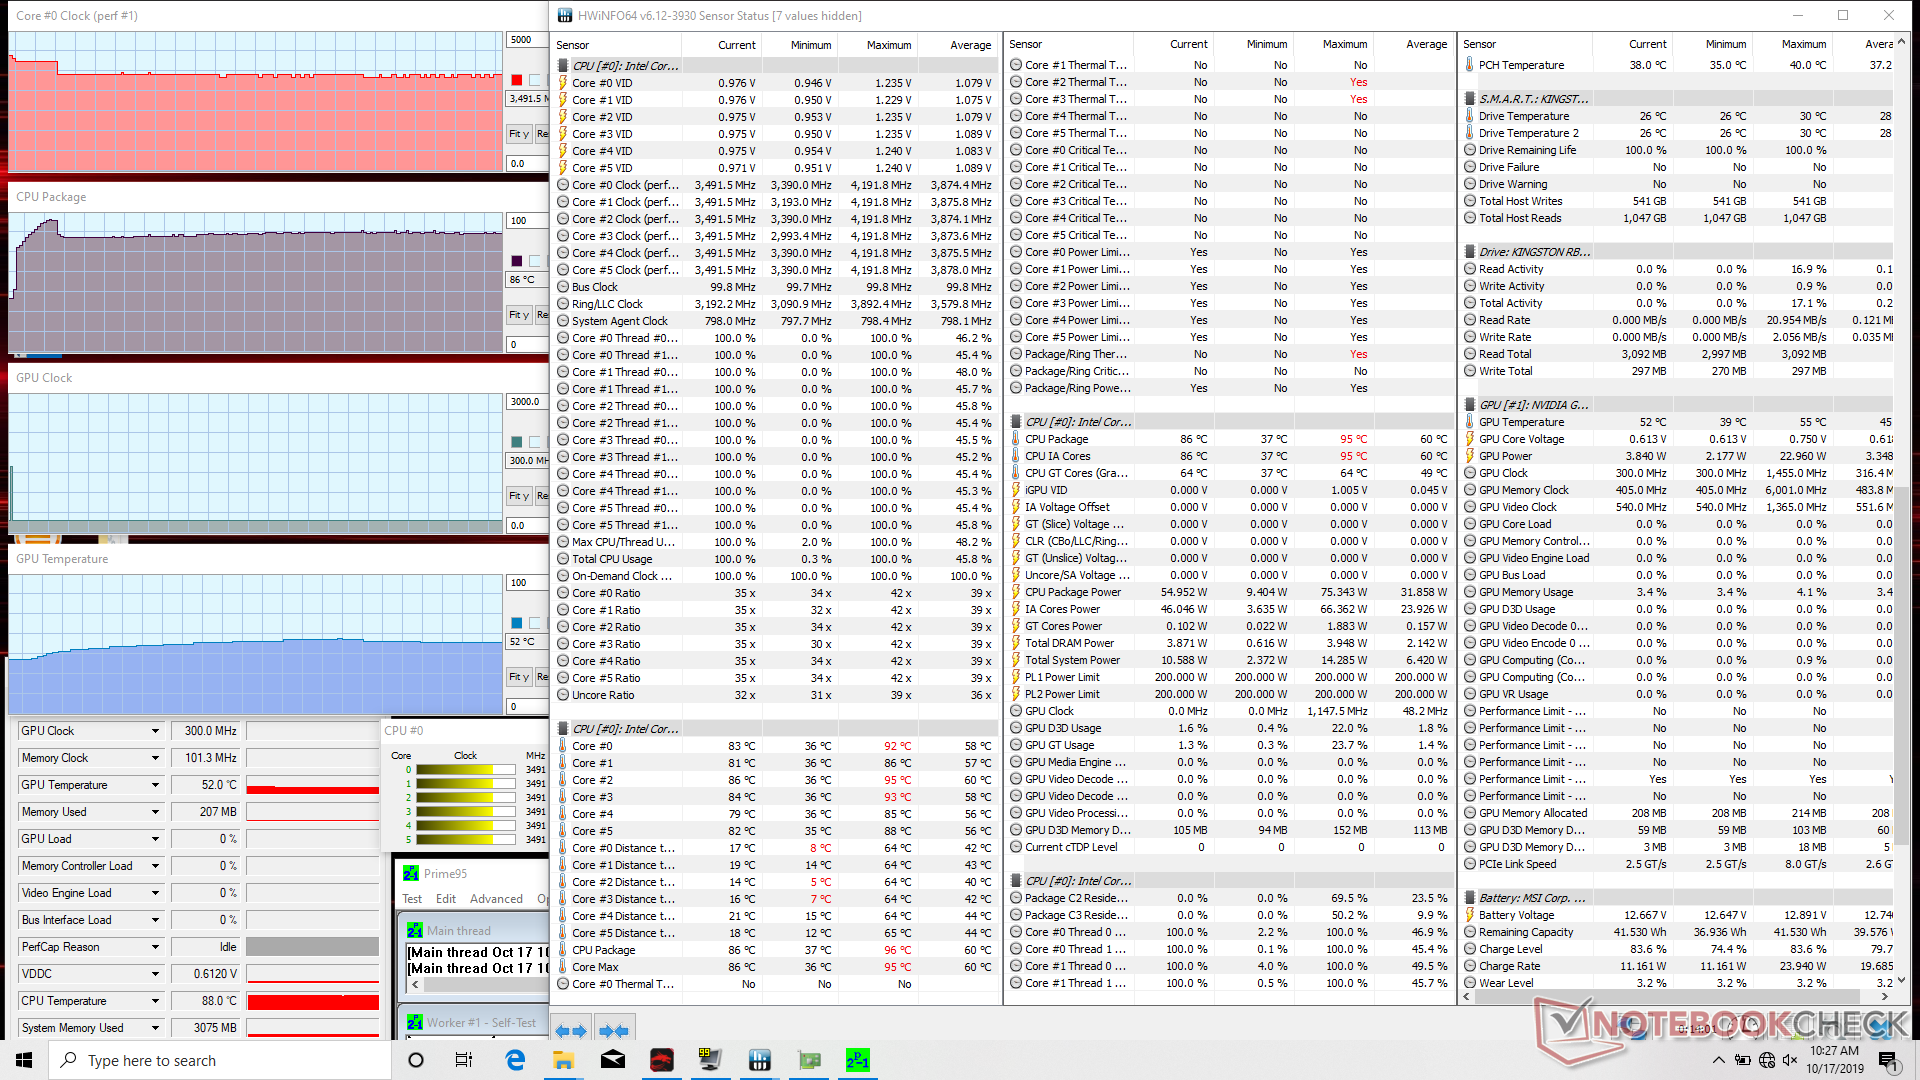
Ciekawie prezentują się najważniejsze podzespoły obliczeniowe. Procesor Intel Core i7-9750H i karta grafiki Nvidia GeForce GTX 1660 Ti są znacznie wydajniejsze od pary Core i5-9300H i GTX 1650 występującej w większości tanich laptopów do gier.
Procesor Core i7-9750H testowaliśmy już przy okazji przyglądania się osiągom laptopa MSI GL65 9SEK. W MSI GF65 w powtarzanym wielokrotnie bez przerw teście wielowątkowym Cinebench R15 stwierdzono pogorszenie kolejnych wyników względem pierwszego o 10%. Maksymalne wykorzystanie funkcji Turbo Boost jest możliwe tylko na krótką metę. W praktyce oznacza to, że posiadacz laptopa z Core i7-8750H nie zauważyłby dużej różnicy, przesiadając się na ten sprzęt. Korzyść odczują natomiast osoby, które miały wcześniej laptop z czterordzeniowym procesorem Intel Core i7-7700HQ, i5-8300H, i5-9300H lub AMD Ryzen 7 3750H.
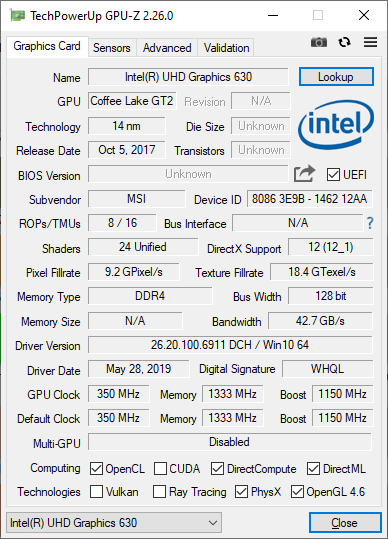
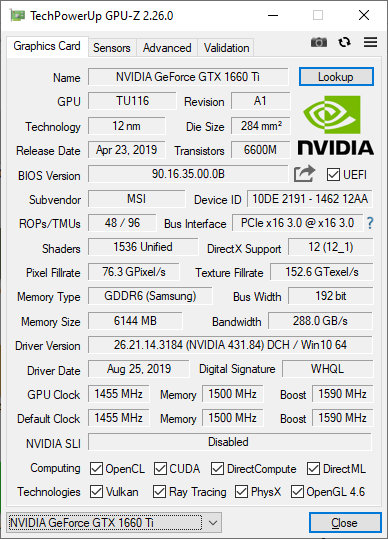
Wyniki zebrane dla układu grafiki GeForce GTX 1660 Ti niemal dokładnie pokrywały się z tym, co widać w rozpiskach osiągów Notebookcheck. Dystans do GTX-a 1660 Ti z komputerów stacjonarnych w testach referencyjnych to tylko kilka procent, czyli niewiele.
| Cinebench R15 | |
| CPU Single 64Bit | |
| MSI GT76 Titan DT 9SG | |
| MSI GT75 8RG-090 Titan | |
| MSI GE75 9SG | |
| Przeciętny Intel Core i7-9750H (170 - 194, n=82) | |
| MSI GF65 9SD | |
| MSI GE75 8SG Raider | |
| Dell XPS 13 7390 2-in-1 Core i7 | |
| Dell G3 3590 | |
| MSI GV62 8RE-016US | |
| MSI GF62VR 7RF-877 | |
| Asus ROG Zephyrus G15 GA502DU | |
| CPU Multi 64Bit | |
| MSI GT76 Titan DT 9SG | |
| MSI GE75 9SG | |
| MSI GT75 8RG-090 Titan | |
| MSI GF65 9SD | |
| Przeciętny Intel Core i7-9750H (952 - 1306, n=85) | |
| MSI GE75 8SG Raider | |
| Dell XPS 13 7390 2-in-1 Core i7 | |
| MSI GV62 8RE-016US | |
| Asus ROG Zephyrus G15 GA502DU | |
| Dell G3 3590 | |
| MSI GF62VR 7RF-877 | |
| Cinebench R11.5 | |
| CPU Single 64Bit | |
| MSI GT75 8RG-090 Titan | |
| Dell XPS 13 7390 2-in-1 Core i7 | |
| MSI GE75 9SG | |
| Przeciętny Intel Core i7-9750H (1.96 - 2.19, n=10) | |
| MSI GV62 8RE-016US | |
| MSI GF62VR 7RF-877 | |
| Asus ROG Zephyrus G15 GA502DU | |
| CPU Multi 64Bit | |
| MSI GE75 9SG | |
| MSI GT75 8RG-090 Titan | |
| Przeciętny Intel Core i7-9750H (11.3 - 14.1, n=10) | |
| Dell XPS 13 7390 2-in-1 Core i7 | |
| Asus ROG Zephyrus G15 GA502DU | |
| MSI GF62VR 7RF-877 | |
| MSI GV62 8RE-016US | |
| Cinebench R10 | |
| Rendering Multiple CPUs 32Bit | |
| MSI GE75 9SG | |
| Przeciętny Intel Core i7-9750H (28251 - 36304, n=13) | |
| Dell XPS 13 7390 2-in-1 Core i7 | |
| MSI GF62VR 7RF-877 | |
| MSI GV62 8RE-016US | |
| Asus ROG Zephyrus G15 GA502DU | |
| Rendering Single 32Bit | |
| Dell XPS 13 7390 2-in-1 Core i7 | |
| MSI GE75 9SG | |
| Przeciętny Intel Core i7-9750H (6659 - 7214, n=13) | |
| MSI GV62 8RE-016US | |
| MSI GF62VR 7RF-877 | |
| Asus ROG Zephyrus G15 GA502DU | |
| wPrime 2.10 - 1024m | |
| Dell XPS 13 7390 2-in-1 Core i7 | |
| MSI GF62VR 7RF-877 | |
| MSI GV62 8RE-016US | |
| Asus ROG Zephyrus G15 GA502DU | |
| Przeciętny Intel Core i7-9750H (n=1) | |
| MSI GE75 9SG | |
* ... im mniej tym lepiej
| PCMark 10 | |
| Score | |
| Aorus 15-SA | |
| Lenovo Legion Y540-15IRH-81SX00B2GE | |
| Przeciętny Intel Core i7-9750H, NVIDIA GeForce GTX 1660 Ti Mobile (4807 - 5829, n=15) | |
| MSI GF65 9SD | |
| Dell G7 7590 | |
| Asus TUF FX505DT-EB73 | |
| MSI GF63 8RC | |
| Essentials | |
| Aorus 15-SA | |
| Przeciętny Intel Core i7-9750H, NVIDIA GeForce GTX 1660 Ti Mobile (8621 - 10098, n=15) | |
| MSI GF65 9SD | |
| Lenovo Legion Y540-15IRH-81SX00B2GE | |
| Dell G7 7590 | |
| Asus TUF FX505DT-EB73 | |
| MSI GF63 8RC | |
| Productivity | |
| Przeciętny Intel Core i7-9750H, NVIDIA GeForce GTX 1660 Ti Mobile (7241 - 8136, n=15) | |
| Lenovo Legion Y540-15IRH-81SX00B2GE | |
| MSI GF65 9SD | |
| Aorus 15-SA | |
| Dell G7 7590 | |
| Asus TUF FX505DT-EB73 | |
| MSI GF63 8RC | |
| Digital Content Creation | |
| Aorus 15-SA | |
| Lenovo Legion Y540-15IRH-81SX00B2GE | |
| MSI GF65 9SD | |
| Dell G7 7590 | |
| Przeciętny Intel Core i7-9750H, NVIDIA GeForce GTX 1660 Ti Mobile (4426 - 7638, n=15) | |
| Asus TUF FX505DT-EB73 | |
| MSI GF63 8RC | |
| PCMark 8 | |
| Home Score Accelerated v2 | |
| Aorus 15-SA | |
| Przeciętny Intel Core i7-9750H, NVIDIA GeForce GTX 1660 Ti Mobile (4074 - 5217, n=11) | |
| Lenovo Legion Y540-15IRH-81SX00B2GE | |
| Dell G7 7590 | |
| MSI GF65 9SD | |
| Asus TUF FX505DT-EB73 | |
| MSI GF63 8RC | |
| Work Score Accelerated v2 | |
| Aorus 15-SA | |
| Dell G7 7590 | |
| Przeciętny Intel Core i7-9750H, NVIDIA GeForce GTX 1660 Ti Mobile (5041 - 5913, n=12) | |
| MSI GF65 9SD | |
| Lenovo Legion Y540-15IRH-81SX00B2GE | |
| Asus TUF FX505DT-EB73 | |
| MSI GF63 8RC | |
| PCMark 8 Home Score Accelerated v2 | 4205 pkt. | |
| PCMark 8 Work Score Accelerated v2 | 5357 pkt. | |
| PCMark 10 Score | 5508 pkt. | |
Pomoc | ||
| MSI GF65 9SD Kingston RBUSNS8154P3512GJ | Asus TUF FX505DT-EB73 Intel SSD 660p SSDPEKNW512G8 | Aorus 15-SA Intel SSD 760p SSDPEKKW512G8 | Dell G7 7590 Toshiba BG3 KBG30ZMS256G | Lenovo Legion Y540-15IRH-81SX00B2GE WDC PC SN720 SDAPNTW-512G | |
|---|---|---|---|---|---|
| AS SSD | 7% | 50% | -52% | 92% | |
| Seq Read (MB/s) | 1148 | 1019 -11% | 2601 127% | 1013 -12% | 2927 155% |
| Seq Write (MB/s) | 962 | 889 -8% | 1507 57% | 203.8 -79% | 2149 123% |
| 4K Read (MB/s) | 22.87 | 48.22 111% | 56.3 146% | 29.57 29% | 42.43 86% |
| 4K Write (MB/s) | 80.6 | 115.5 43% | 110.3 37% | 71.4 -11% | 147.1 83% |
| 4K-64 Read (MB/s) | 772 | 321.5 -58% | 877 14% | 332.1 -57% | 1286 67% |
| 4K-64 Write (MB/s) | 711 | 787 11% | 914 29% | 152.9 -78% | 1432 101% |
| Access Time Read * (ms) | 0.125 | 0.065 48% | 0.05 60% | 0.183 -46% | 0.065 48% |
| Access Time Write * (ms) | 0.138 | 0.047 66% | 0.034 75% | 0.248 -80% | 0.026 81% |
| Score Read (Points) | 910 | 472 -48% | 1193 31% | 463 -49% | 1621 78% |
| Score Write (Points) | 887 | 992 12% | 1175 32% | 245 -72% | 1794 102% |
| Score Total (Points) | 2254 | 1717 -24% | 2938 30% | 913 -59% | 4208 87% |
| Copy ISO MB/s (MB/s) | 1103 | 942 -15% | 2104 91% | 263.6 -76% | |
| Copy Program MB/s (MB/s) | 537 | 444.5 -17% | 387.7 -28% | 213.8 -60% | |
| Copy Game MB/s (MB/s) | 997 | 867 -13% | 1021 2% | 188 -81% |
* ... im mniej tym lepiej

| 3DMark | |
| 1280x720 Cloud Gate Standard Graphics | |
| MSI GT75VR 7RF-012 Titan Pro | |
| MSI GF65 9SD | |
| MSI GS63VR 7RG-005 | |
| Przeciętny NVIDIA GeForce GTX 1660 Ti Mobile (59839 - 104780, n=18) | |
| Zotac GeForce GTX 1660 Ti 6 GB | |
| MSI GP72VR 7RFX | |
| MSI GL73 8SE-010US | |
| MSI GE75 8SF | |
| MSI GF75 Thin 9SC | |
| Asus TUF FX705GE-EW096T | |
| Asus ROG Zephyrus G15 GA502DU | |
| Asus FX504GD | |
| 1920x1080 Fire Strike Graphics | |
| MSI GT75VR 7RF-012 Titan Pro | |
| MSI GE75 8SF | |
| Zotac GeForce GTX 1660 Ti 6 GB | |
| MSI GL73 8SE-010US | |
| MSI GF65 9SD | |
| Przeciętny NVIDIA GeForce GTX 1660 Ti Mobile (14186 - 16488, n=24) | |
| MSI GS63VR 7RG-005 | |
| Asus ROG Zephyrus G15 GA502DU | |
| MSI GP72VR 7RFX | |
| MSI GF75 Thin 9SC | |
| Asus TUF FX705GE-EW096T | |
| Asus FX504GD | |
| 2560x1440 Time Spy Graphics | |
| MSI GE75 8SF | |
| MSI GT75VR 7RF-012 Titan Pro | |
| Zotac GeForce GTX 1660 Ti 6 GB | |
| MSI GL73 8SE-010US | |
| MSI GF65 9SD | |
| Przeciętny NVIDIA GeForce GTX 1660 Ti Mobile (5335 - 6123, n=22) | |
| Asus ROG Zephyrus G15 GA502DU | |
| MSI GS63VR 7RG-005 | |
| MSI GP72VR 7RFX | |
| MSI GF75 Thin 9SC | |
| Asus TUF FX705GE-EW096T | |
| Asus FX504GD | |
| 3DMark 11 | |
| 1280x720 Performance GPU | |
| MSI GT75VR 7RF-012 Titan Pro | |
| MSI GE75 8SF | |
| Zotac GeForce GTX 1660 Ti 6 GB | |
| MSI GF65 9SD | |
| MSI GL73 8SE-010US | |
| Przeciętny NVIDIA GeForce GTX 1660 Ti Mobile (18610 - 22670, n=24) | |
| MSI GS63VR 7RG-005 | |
| Asus ROG Zephyrus G15 GA502DU | |
| MSI GP72VR 7RFX | |
| MSI GF75 Thin 9SC | |
| Asus TUF FX705GE-EW096T | |
| Asus FX504GD | |
| 1280x720 Performance Combined | |
| Zotac GeForce GTX 1660 Ti 6 GB | |
| MSI GF65 9SD | |
| Przeciętny NVIDIA GeForce GTX 1660 Ti Mobile (9500 - 13311, n=23) | |
| MSI GF75 Thin 9SC | |
| MSI GT75VR 7RF-012 Titan Pro | |
| MSI GL73 8SE-010US | |
| MSI GE75 8SF | |
| Asus TUF FX705GE-EW096T | |
| MSI GS63VR 7RG-005 | |
| MSI GP72VR 7RFX | |
| Asus FX504GD | |
| Asus ROG Zephyrus G15 GA502DU | |
| 3DMark 11 Performance | 18059 pkt. | |
| 3DMark Cloud Gate Standard Score | 36975 pkt. | |
| 3DMark Fire Strike Score | 13483 pkt. | |
| 3DMark Time Spy Score | 5825 pkt. | |
Pomoc | ||
| The Witcher 3 - 1920x1080 Ultra Graphics & Postprocessing (HBAO+) | |
| MSI GT76 Titan DT 9SG | |
| MSI P65 Creator 9SF-657 | |
| MSI GT75VR 7RF-012 Titan Pro | |
| MSI GE75 8SF | |
| Dell G7 7590 | |
| Zotac GeForce GTX 1660 Ti 6 GB | |
| MSI GF65 9SD | |
| Przeciętny NVIDIA GeForce GTX 1660 Ti Mobile (51.6 - 65.1, n=21) | |
| MSI GL73 8SE-010US | |
| Lenovo Legion Y540-15IRH-81SX00B2GE | |
| MSI GS63VR 7RG-005 | |
| Asus ROG Zephyrus G15 GA502DU | |
| MSI GF75 8RD-001 | |
| MSI GF62VR 7RF-877 | |
| MSI GF75 Thin 9SC | |
| MSI GF63 8RC | |
| Dell XPS 13 7390 2-in-1 Core i7 | |
| Shadow of the Tomb Raider - 1920x1080 Highest Preset AA:T | |
| Zotac GeForce GTX 1660 Ti 6 GB | |
| Dell G7 7590 | |
| Przeciętny NVIDIA GeForce GTX 1660 Ti Mobile (62 - 73, n=8) | |
| MSI GL73 8SE-010US | |
| MSI GF65 9SD | |
| Asus ROG Zephyrus G15 GA502DU | |
| MSI GF75 Thin 9SC | |
| low | med. | high | ultra | |
|---|---|---|---|---|
| BioShock Infinite (2013) | 317.1 | 264 | 250.9 | 128.6 |
| The Witcher 3 (2015) | 287.9 | 191.6 | 116 | 60.6 |
| Shadow of the Tomb Raider (2018) | 135 | 81 | 72 | 64 |
Wpływ na otoczenie
Hałas
W porównaniu z GF63 z kartą GTX 1050 układ chłodzenia jest bardziej rozbudowany i pojawił się dodatkowy (drugi) wentylator. Nawet podczas pracy obciążenia z wybranym planem oszczędzania energii występował szum o natężeniu przekraczającym 33 dB(A) przy szumie tła na poziomie 28,7 dB(A). Na szczęście intensywność szumu nie zmienia się podczas przeglądania stron internetowych i odtwarzaniu materiału wideo, co byłoby irytujące.
W teście gry natężenie hałasu wzrosło do 49,5 dB(A), czyli było głośniej, niż w przypadku MSI GF63. Na najszybszych dostępnych obrotach (tryb Cooler Boost) wentylatory wytworzyły hałas o natężeniu 59,5 dB(A).
Hałas
| luz |
| 33.3 / 33.9 / 33.9 dB |
| obciążenie |
| 41 / 59.5 dB |
 | ||
30 dB cichy 40 dB(A) słyszalny 50 dB(A) irytujący |
||
min: | ||
Temperatury
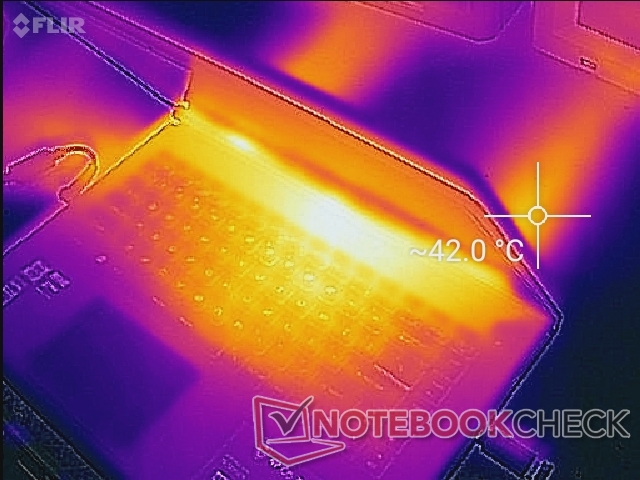
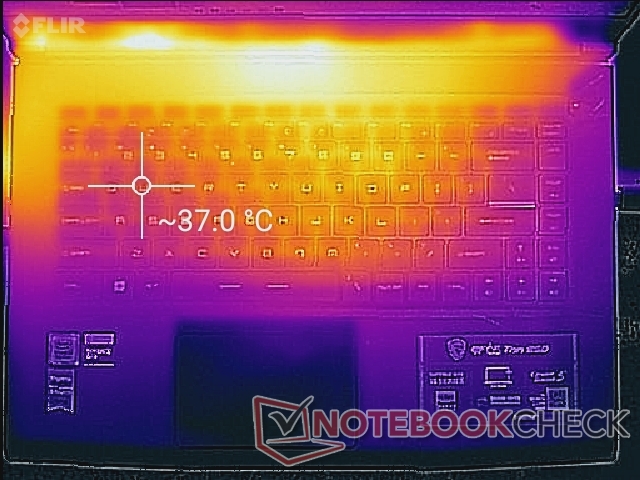
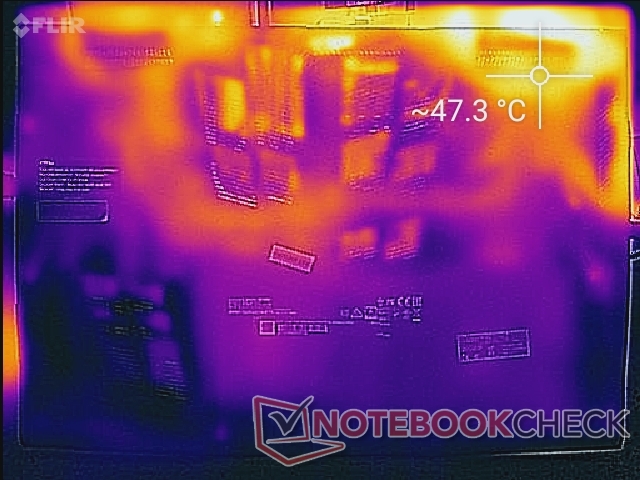
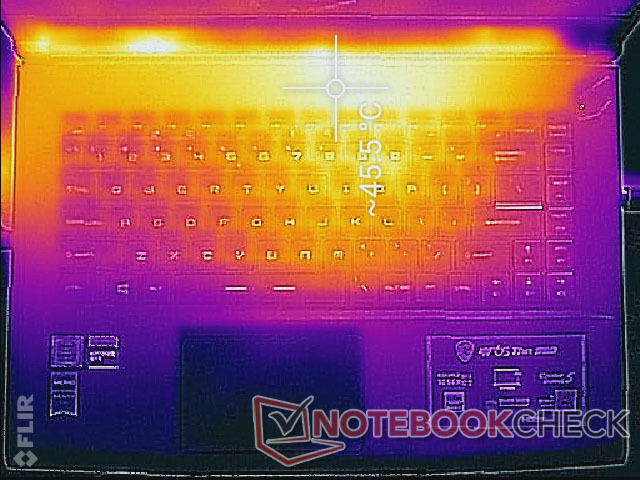
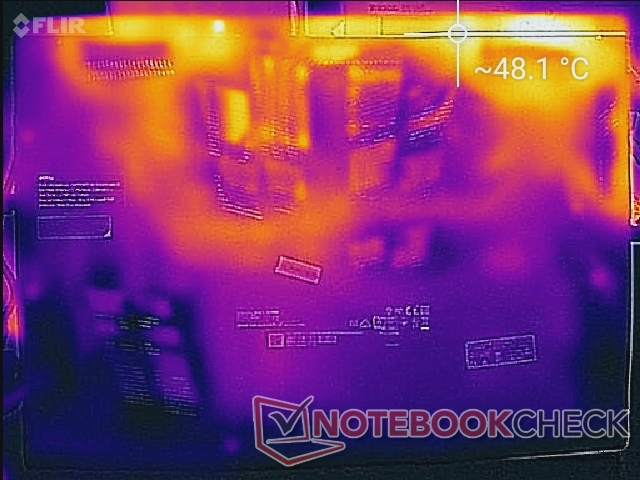
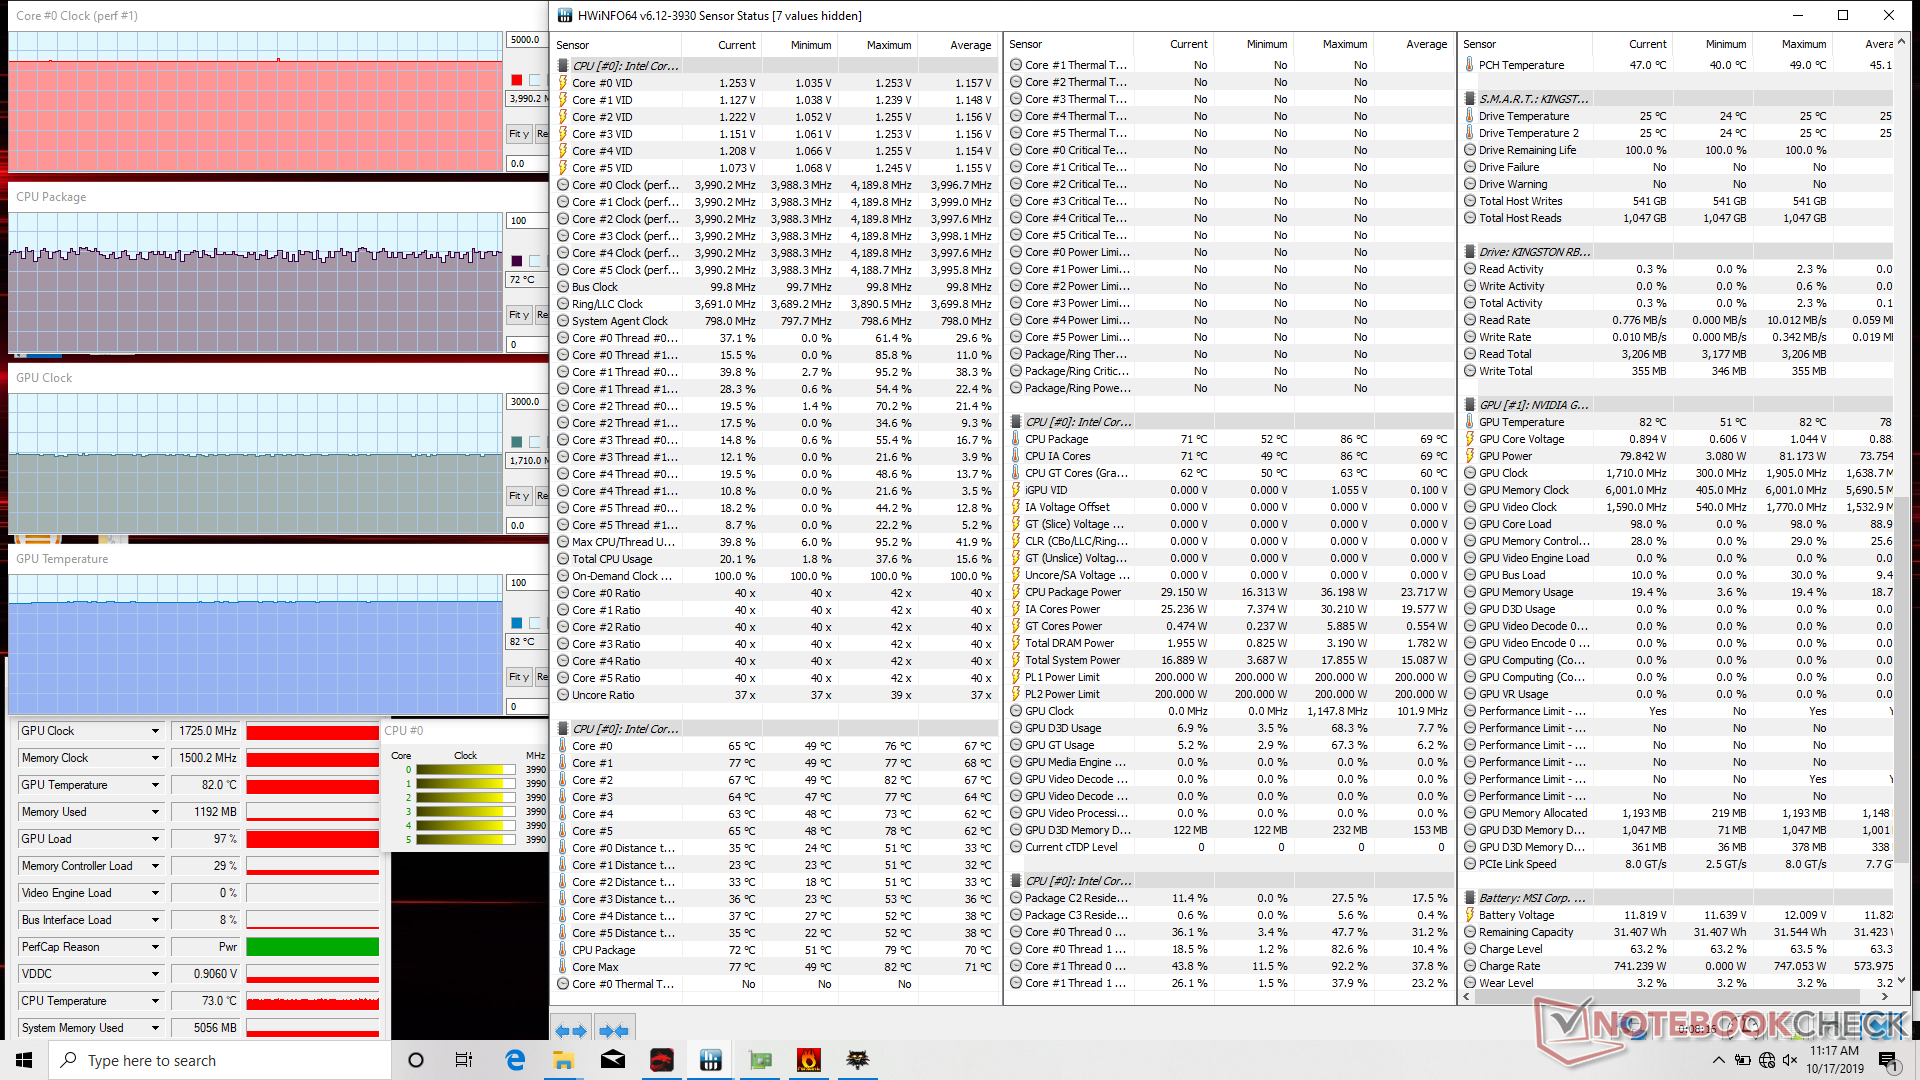
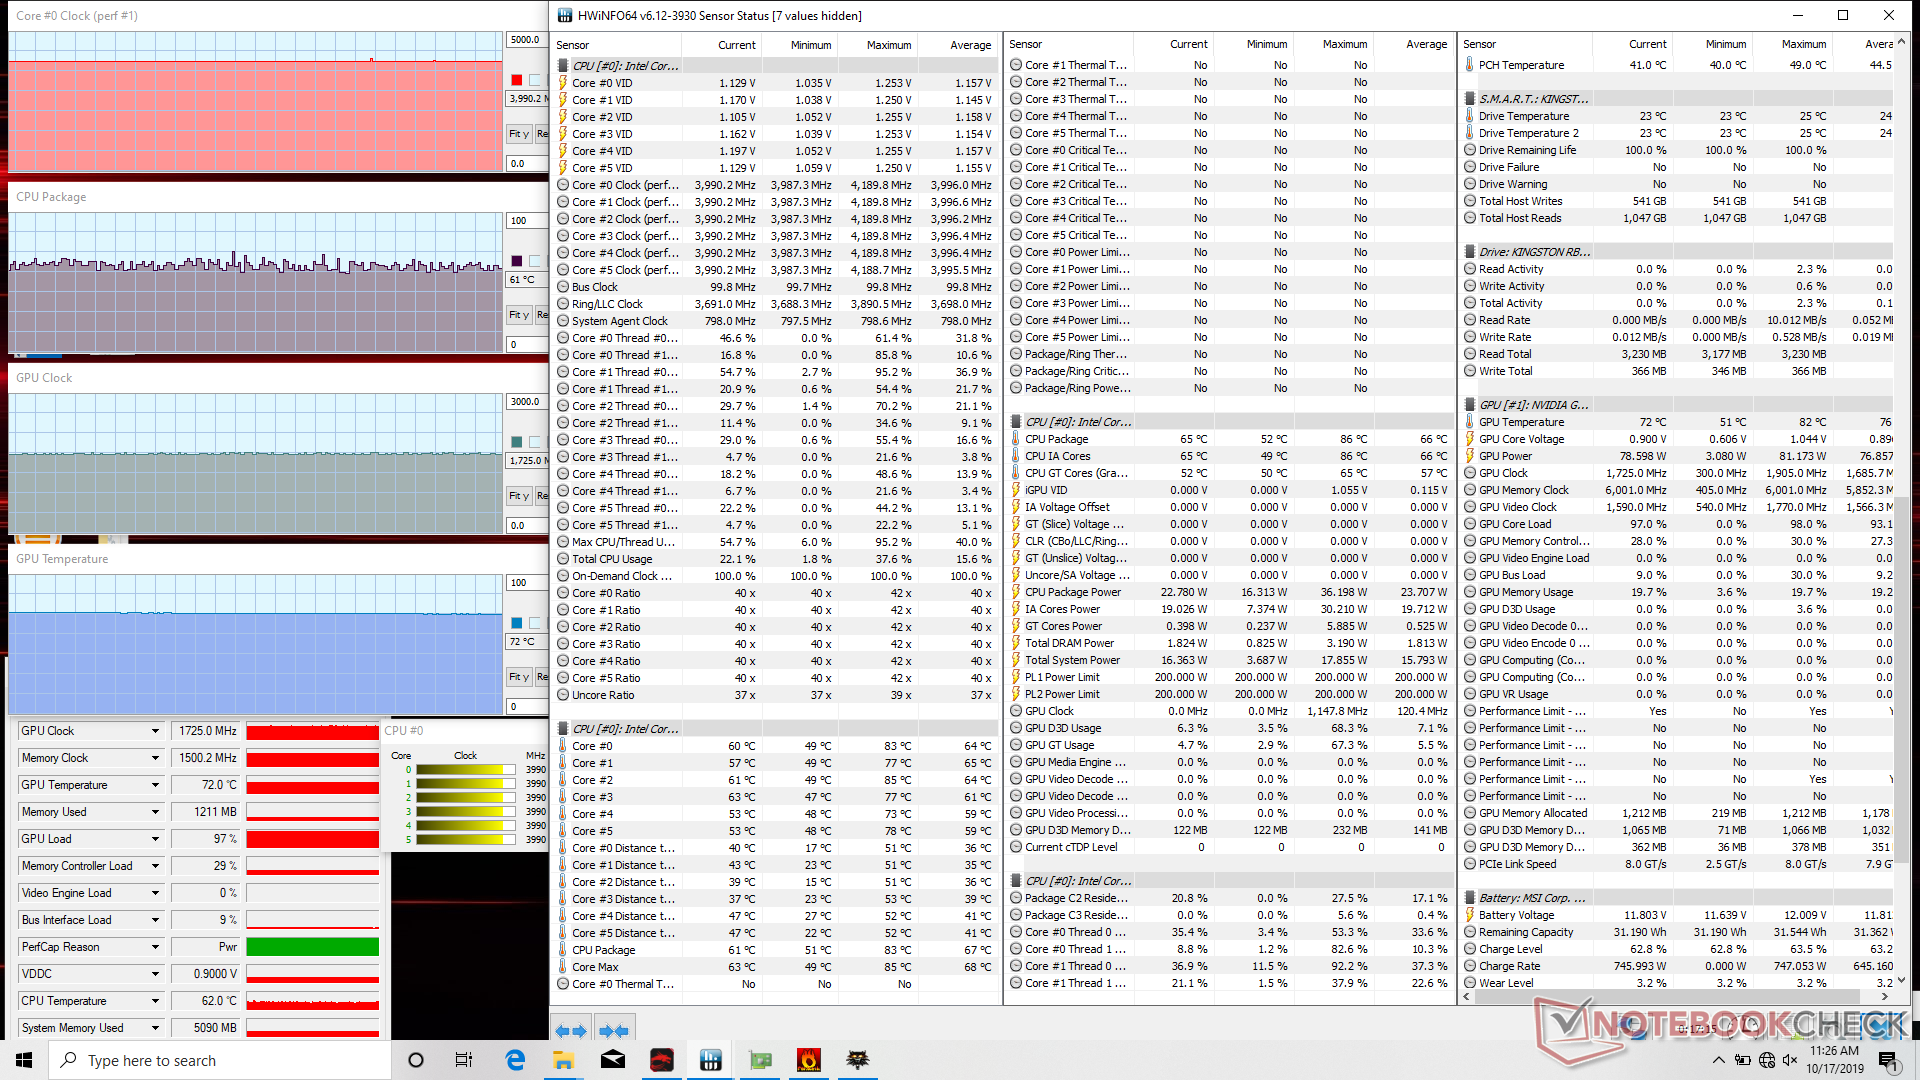
W teście bez obciążenia temperatury obudowy utrzymywały się poniżej 30°C. Najcieplej było w centralnej części klawiatury – jakieś 29°C. W teście gry Wiedźmin 3 w górnej części klawiatury zmierzono 45,6°C a na spodzie temperatura obudowy osiągnęła maksymalnie 50,6°C.
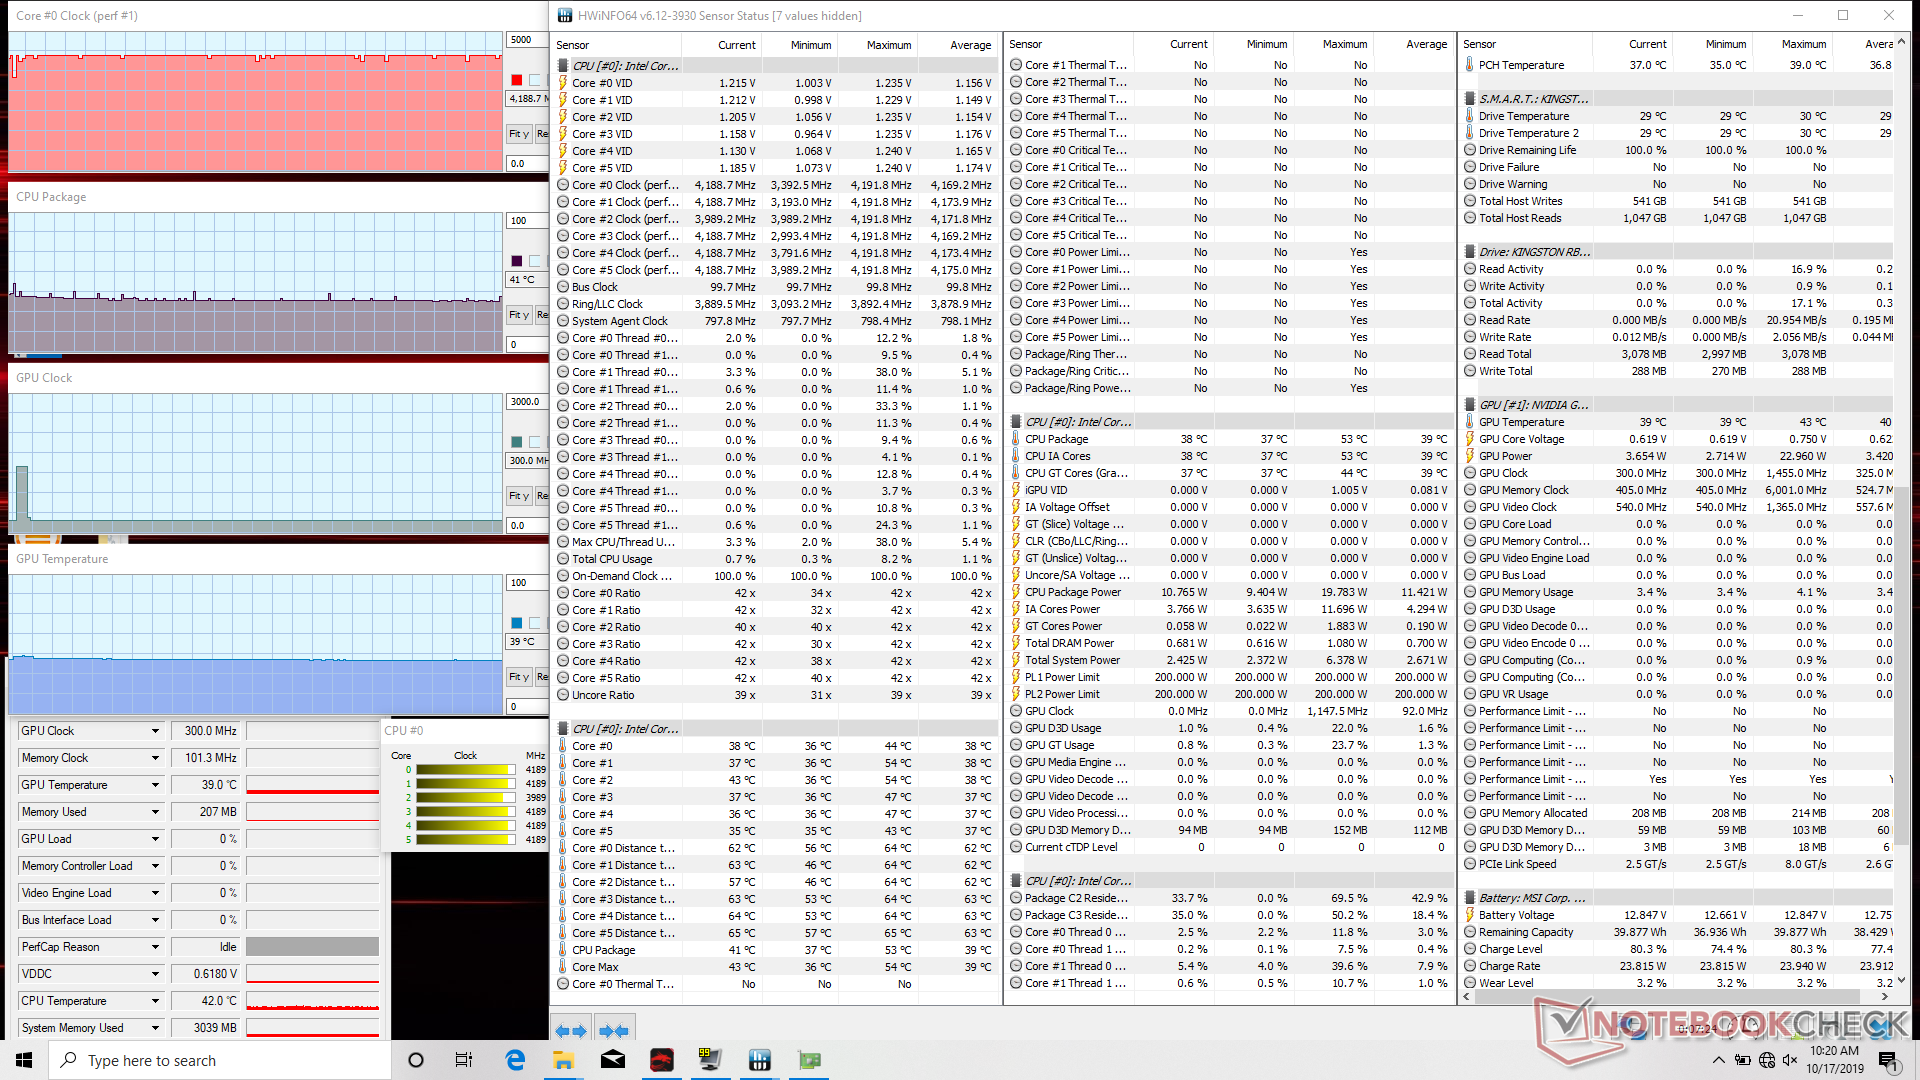
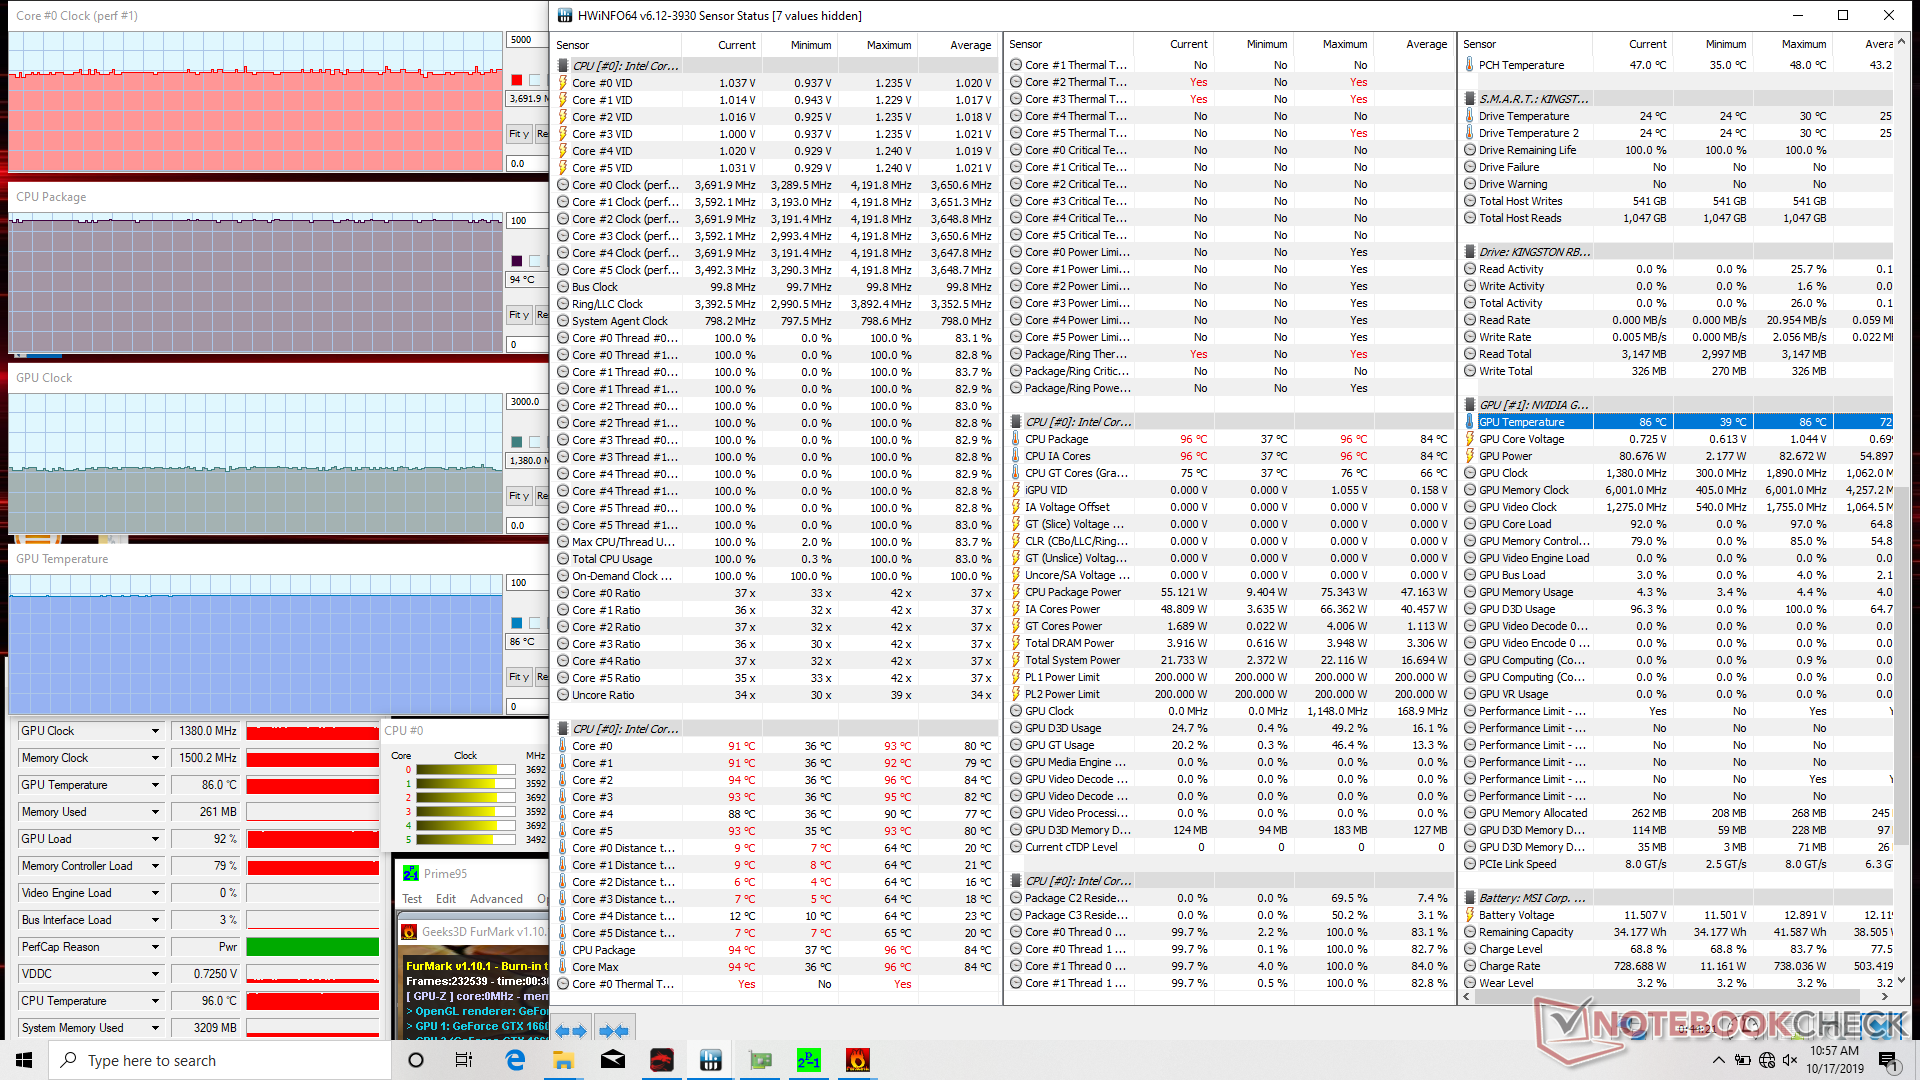
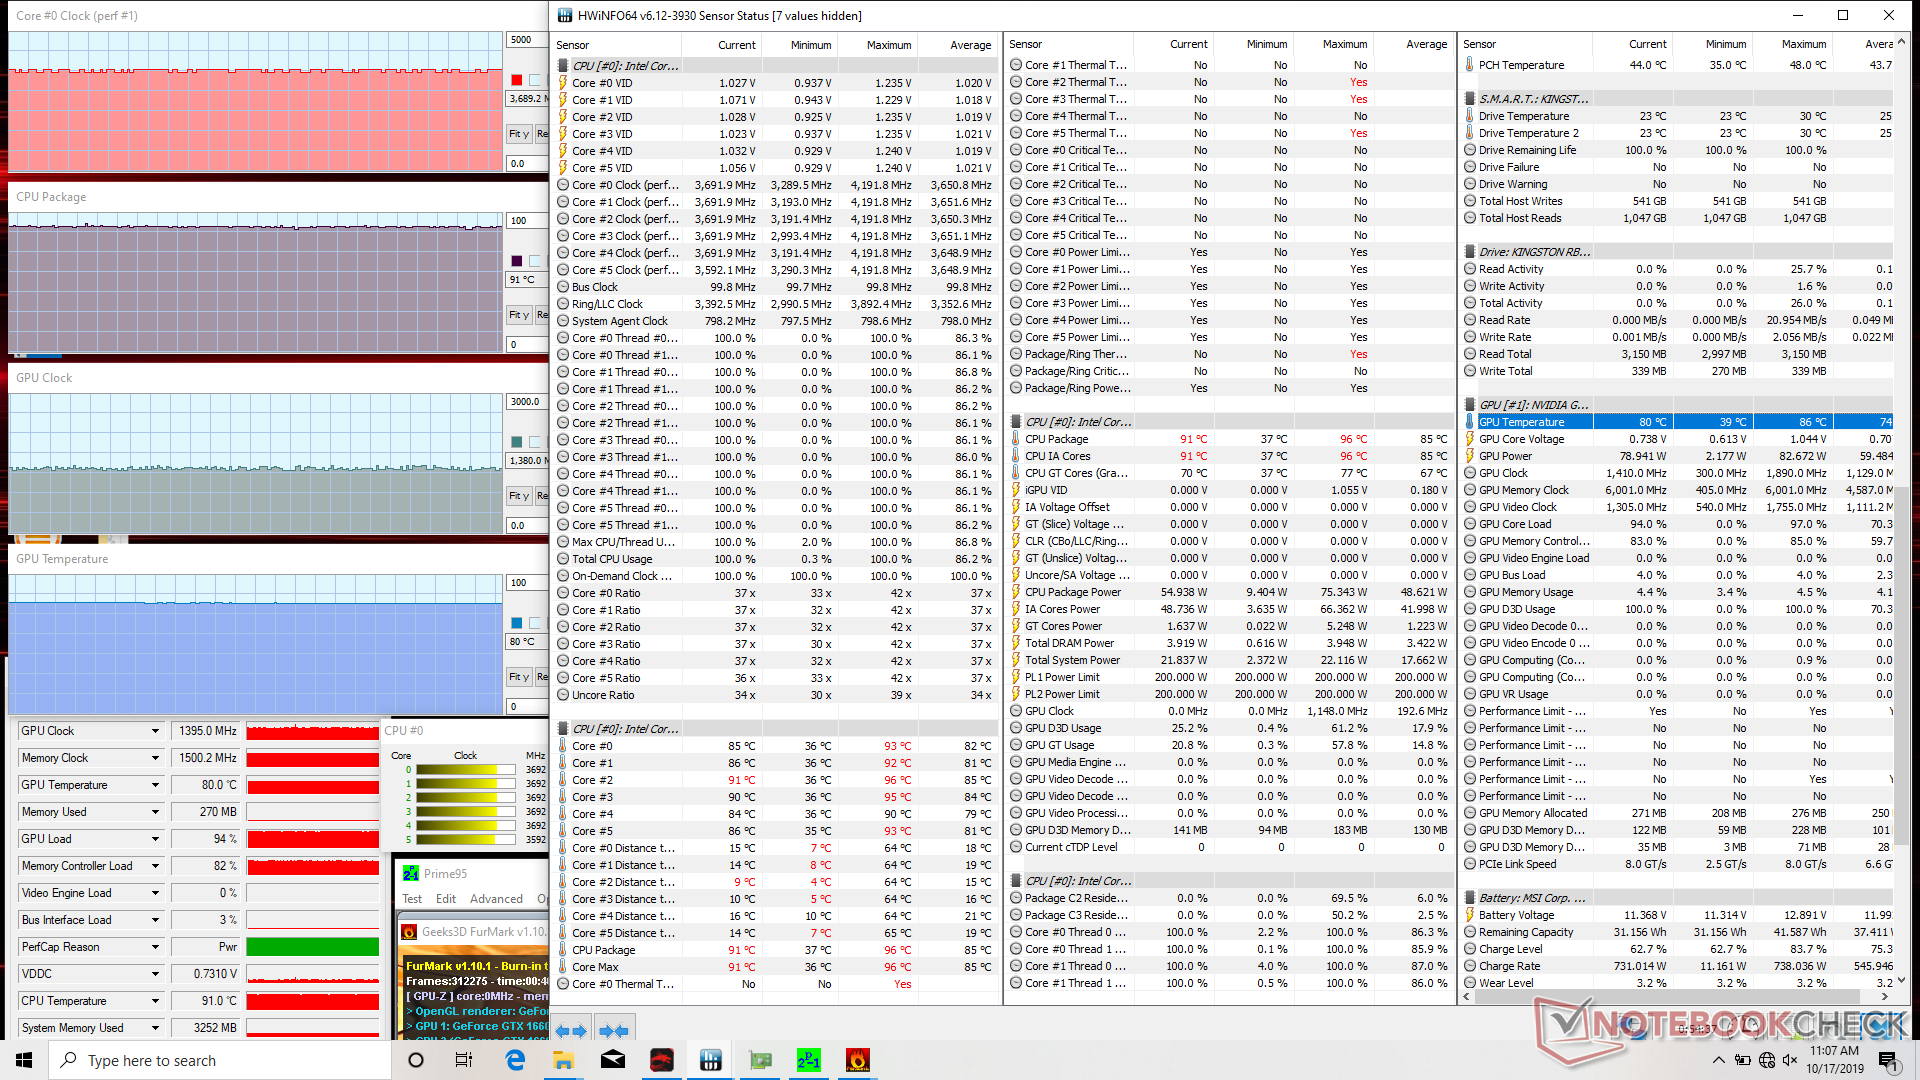
W teście Prime95 temperatura rdzeni CPU osiągnęła maksymalnie 95°C a po około 30 sekundach taktowanie zostało obniżone do 3,5 GHz. Spowodowało to spadek temperatury najcieplejszego z rdzeni CPU do 86°C. W teście pełnego obciążenia (Prime95 plus FurMark) temperatura procesora osiągnęła maksymalnie 96°C a temperatura karty grafiki doszła do 86°C. W teście gry Wiedźmin 3 temperatury podzespołów były znacznie niższe. W przypadku rdzeni CPU i GPU maksimum wyniosło 82°C.
(-) Maksymalna temperatura w górnej części wynosi 52.8 °C / 127 F, w porównaniu do średniej 40.4 °C / 105 F , począwszy od 21.2 do 68.8 °C dla klasy Gaming.
(-) Dno nagrzewa się maksymalnie do 53 °C / 127 F, w porównaniu do średniej 43.2 °C / 110 F
(+) W stanie bezczynności średnia temperatura górnej części wynosi 26.5 °C / 80 F, w porównaniu ze średnią temperaturą urządzenia wynoszącą 33.9 °C / ### class_avg_f### F.
(±) Podczas gry w Wiedźmina 3 średnia temperatura górnej części wynosi 33.4 °C / 92 F, w porównaniu do średniej temperatury urządzenia wynoszącej 33.9 °C / ## #class_avg_f### F.
(+) Podpórki pod nadgarstki i touchpad są chłodniejsze niż temperatura skóry i maksymalnie 26.2 °C / 79.2 F i dlatego są chłodne w dotyku.
(+) Średnia temperatura obszaru podparcia dłoni w podobnych urządzeniach wynosiła 28.8 °C / 83.8 F (+2.6 °C / 4.6 F).
Akumulator
Pojemność akumulatora MSI GF65 jest taka sama, jak w MSI GF63 (51 Wh). Czas pracy w teście WiFi wyniósł 5 godzin i 5 minut wobec 5 godzin i 32 minut w przypadku GF63.
| wyłączony / stan wstrzymania | |
| luz | |
| obciążenie |
|
Legenda:
min: | |
| MSI GF65 9SD i7-9750H, GeForce GTX 1660 Ti Mobile, Kingston RBUSNS8154P3512GJ, IPS, 1920x1080, 15.6" | Asus ROG Zephyrus G15 GA502DU R7 3750H, GeForce GTX 1660 Ti Max-Q, Intel SSD 660p SSDPEKNW512G8, IPS, 1920x1080, 15.6" | MSI GF63 8RC i5-8300H, GeForce GTX 1050 Mobile, Seagate BarraCuda Pro Compute 1TB ST1000LM049, IPS, 1920x1080, 15.6" | Aorus 15-SA i7-9750H, GeForce GTX 1660 Ti Mobile, Intel SSD 760p SSDPEKKW512G8, IPS, 1920x1080, 15.6" | Dell G7 7590 i7-9750H, GeForce RTX 2060 Mobile, Toshiba BG3 KBG30ZMS256G, IPS, 1920x1080, 15.6" | Lenovo Legion Y7000P-1060 i7-8750H, GeForce GTX 1060 Mobile, Samsung SSD PM981 MZVLB256HAHQ, IPS, 1920x1080, 15.6" | |
|---|---|---|---|---|---|---|
| Power Consumption | 6% | 29% | -38% | -35% | 14% | |
| Idle Minimum * (Watt) | 9.5 | 7.4 22% | 5.4 43% | 20 -111% | 11.2 -18% | 4.9 48% |
| Idle Average * (Watt) | 12.4 | 8.6 31% | 10.4 16% | 23 -85% | 16.3 -31% | 8.1 35% |
| Idle Maximum * (Watt) | 22 | 39.1 -78% | 10.5 52% | 29 -32% | 46.2 -110% | 16.5 25% |
| Load Average * (Watt) | 80.8 | 65.9 18% | 84.7 -5% | 87 -8% | 123.3 -53% | 109.2 -35% |
| Witcher 3 ultra * (Watt) | 133.9 | 106.9 20% | 92.7 31% | 136 -2% | 135.6 -1% | 124.6 7% |
| Load Maximum * (Watt) | 187.1 | 141.3 24% | 119.9 36% | 173 8% | 181.5 3% | 175.2 6% |
* ... im mniej tym lepiej
| MSI GF65 9SD i7-9750H, GeForce GTX 1660 Ti Mobile, 51 Wh | Asus ROG Zephyrus G15 GA502DU R7 3750H, GeForce GTX 1660 Ti Max-Q, 76 Wh | MSI GF63 8RC i5-8300H, GeForce GTX 1050 Mobile, 51 Wh | Lenovo Legion Y540-15IRH-81SX00B2GE i7-9750H, GeForce GTX 1660 Ti Mobile, 57 Wh | Dell G7 7590 i7-9750H, GeForce RTX 2060 Mobile, 60 Wh | Aorus 15-SA i7-9750H, GeForce GTX 1660 Ti Mobile, 62 Wh | |
|---|---|---|---|---|---|---|
| Czasy pracy | 57% | 8% | -53% | -10% | -45% | |
| WiFi v1.3 (h) | 5.1 | 8 57% | 5.5 8% | 2.4 -53% | 4.6 -10% | 2.8 -45% |
| Reader / Idle (h) | 15.3 | 9.5 | 4 | 11.1 | 3.5 | |
| Load (h) | 2.1 | 0.9 | 1.3 | 1.8 | 2 |
Za
Przeciw
Podsumowanie
Najbardziej istotną zmianą względem starszego modelu GF63 jest karta grafiki. Tytułowy komputer otrzymał układ GeForce GTX 1660 Ti. W GF63 można było mieć maksymalnie kartę GTX 1050 Ti, która jest mniej więcej o połowę słabsza.
Na tym nie koniec różnic. Laptop MSI GF65 otrzymał drugie gniazdo M.2 (pod dysk SSD), możliwość wybrania matrycy 120 Hz lub 144 Hz (ważne dla gracza komputerowego), drugi wentylator i sześć zamiast tylko trzech ciepłowodów.
Prawie cała reszta została po staremu. Czas pracy na akumulatorze jest przeciętny, czasy reakcji matrycy są średnie, jakość obudowy jest na miarę taniego laptopa, głośniki są bardzo dobre a dostęp do podzespołów nie jest bardzo trudny.
Na koniec trzeba wspomnieć, że podczas grania GF65 jest głośniejszy od poprzednika.
