Recenzja laptopa Schenker XMG Evo 15 (M24) - niemiecki ultrabook z jasnym wyświetlaczem i doskonałymi opcjami konserwacji
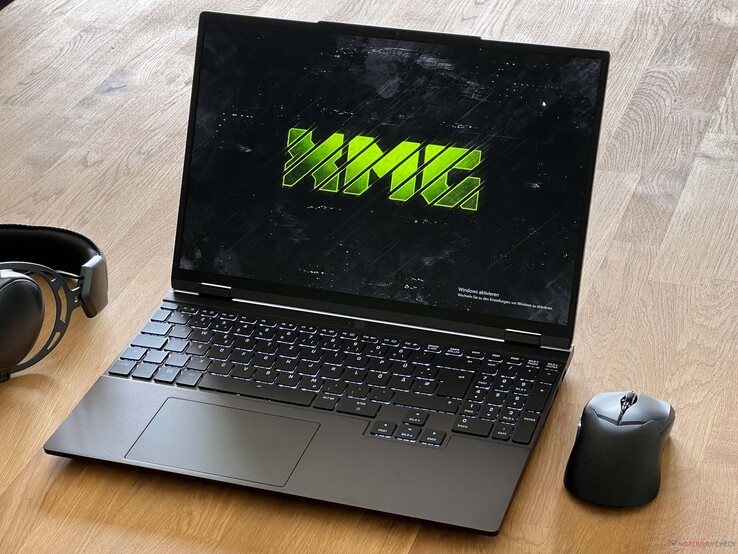
Do tej pory laptopy XMG były skierowane głównie do graczy i klientów potrzebujących szybkich dedykowanych kart graficznych. Wraz z nowymi modelami XMG Evo (14 i 15 cali), niemiecki producent wprowadza na rynek również dwa ultrabooki bez dedykowanych GPU. Obudowy są bardziej kompaktowe, ale jednocześnie nie trzeba rezygnować z rozbudowanych opcji serwisowych. Producent daje też klientom wybór pomiędzy procesorami Ryzen 8000 od AMD (od 1049 EUR) i układami Meteor Lake od Intela (od 1199 EUR), co zdaniem Schenkera nie prowadzi do większych różnic w wydajności. Wyświetlacz to zawsze matowy panel WQHD (2560 x 1600 pikseli) o jasności 500 nitów i częstotliwości 240 Hz.
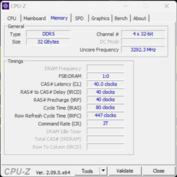
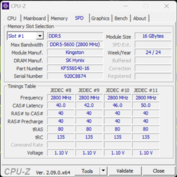
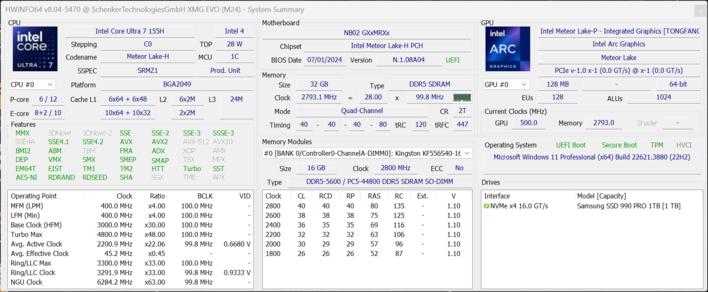
Testujemy nowy XMG Evo 15 (M24) z procesorem Intel Core Ultra 7 155H iGPU Arc Graphics w połączeniu z 32 GB pamięci RAM (DDR5-5600) i wersją Samsung 990 Pro o pojemności 1 TB. W tej konfiguracji (wraz z preinstalowanym systemem Windows 11) cena wynosi 1400 euro.
Potencjalni konkurenci w porównaniu
Ocena | Wersja | Data | Model | Waga | Wysokość | Rozmiar | Rezolucja | Cena |
|---|---|---|---|---|---|---|---|---|
| 84.7 % | v8 | 08/2024 | Schenker XMG Evo 15 (M24) Ultra 7 155H, Arc 8-Core | 1.7 kg | 19.9 mm | 15.30" | 2560x1600 | |
| 82.1 % | v8 | 07/2024 | Dell Inspiron 16 7640 2-in-1 Ultra 7 155H, Arc 8-Core | 2.1 kg | 18.99 mm | 16.00" | 2560x1600 | |
| 76.7 % | v8 | 07/2024 | Medion S10 OLED Ultra 7 155H, Arc 8-Core | 1.6 kg | 17.8 mm | 16.00" | 3840x2400 | |
| 89.7 % v7 (old) | v7 (old) | 04/2024 | Xiaomi RedmiBook Pro 16 2024 Ultra 7 155H, Arc 8-Core | 1.9 kg | 15.9 mm | 16.00" | 3072x1920 | |
| 87.9 % v7 (old) | v7 (old) | 05/2024 | Lenovo IdeaPad Pro 5 16IMH G9 Ultra 7 155H, Arc 8-Core | 1.9 kg | 17.5 mm | 16.00" | 2560x1600 | |
| 89.9 % v7 (old) | v7 (old) | 05/2024 | Lenovo ThinkPad T16 G2 21K70035GE R7 7840U, Radeon 780M | 1.8 kg | 23.8 mm | 16.00" | 1920x1200 |
Uwaga: Niedawno zaktualizowaliśmy nasz system oceny i wyniki wersji 8 nie są porównywalne z wynikami wersji 7. Więcej informacji można znaleźć tutaj.
Obudowa - Wytrzymała aluminiowa pokrywa
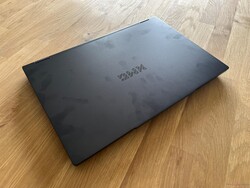
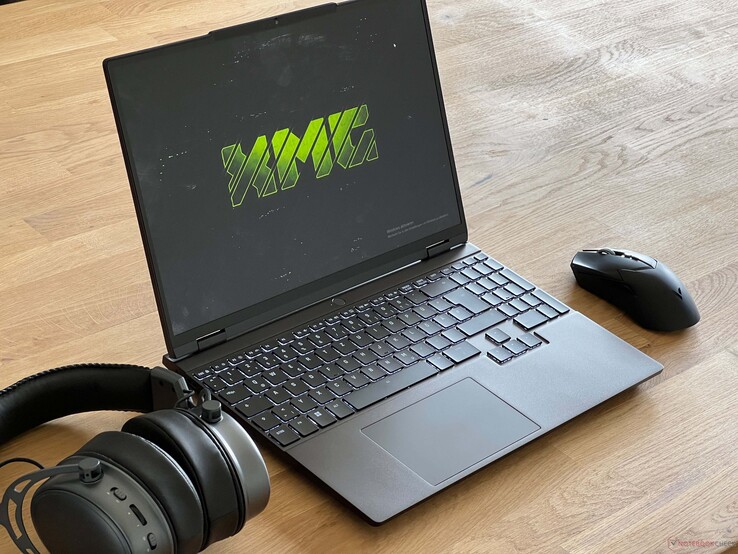
XMG Evo 15 ma czarną aluminiową obudowę, która jest nieco podobna do XMG Fusion 15 gamer. Evo 15 jest jednak bardziej kompaktowy (przede wszystkim cieńszy), a także pozbawiony otworów wentylacyjnych po obu stronach. Ogólnie rzecz biorąc, notebook wygląda bardzo prosto i może być również używany w profesjonalnym środowisku bez żadnych problemów; w razie potrzeby laptop można również zamówić bez logo na pokrywie wyświetlacza. Aluminiowe powierzchnie są jednak dość wrażliwe na odciski palców i wymagają regularnego czyszczenia.
Pod względem jakości wykonania nowy Evo 15 wypada dobrze, gdyż jakość wykonania jest bardzo dobra, a laptop sprawia ogólnie dobre wrażenie. Jednostka zasadnicza jest bardzo stabilna i można ją lekko wgnieść tylko w środkowym obszarze klawiatury, jeśli położy się na niej ręce. Pokrywa ekranu również jest stabilna i nie udało nam się sprowokować żadnych zniekształceń obrazu. Maksymalny kąt otwarcia wynosi 180 stopni, a zawiasy trzymają ekran pewnie w miejscu poza lekkim podskakiwaniem, ale otwarcie go jedną ręką jest również możliwe bez żadnych problemów dzięki lekkiemu garbowi kamery.
Przy grubości około 2 cm, Evo 15 nie jest najcieńszym notebookiem, ale też nie aspiruje do tego miana. Jego wymiary są jednak zauważalnie bardziej kompaktowe niż w przypadku 16-calowych konkurentów. Przy wadze około 1,7 kg, jest to również jeden z lżejszych modeli w naszym polu porównawczym. 100-watowy zasilacz waży 513 gramów, ale obejmuje to długi kabel zasilający (1,8 + 1,5 metra).
Funkcje - Thunderbolt 4 i USB 2.0
Porty są rozmieszczone w dwóch tylnych obszarach bocznych i z tyłu. Zasadniczo dostępne są wszystkie nowoczesne standardy, w tym Thunderbolt 4 (lub USB 4.0 w modelu AMD), a także wystarczająca liczba portów USB, ale nie wiemy, co robi port USB 2.0 w nowoczesnym laptopie. Przynajmniej jest tylko jeden z nich, pozostałe dwa są zgodne ze standardem USB 3.2 Gen1.
Czytnik kart SD
W połączeniu z naszą kartą referencyjną (Angelbird AV Pro V60), pełnoprawny czytnik kart SD osiąga prędkości transferu do 90 MB/s i ~50 MB/s podczas kopiowania danych. Ogólnie rzecz biorąc, są to wyniki nieco poniżej średniej.
| SD Card Reader | |
| average JPG Copy Test (av. of 3 runs) | |
| Schenker XMG Evo 15 (M24) (ADATA V90) | |
| Schenker XMG Evo 15 (M24) (Angelbird AV Pro V60) | |
| Średnia w klasie Multimedia (21.1 - 531, n=46, ostatnie 2 lata) | |
| Lenovo IdeaPad Pro 5 16IMH G9 (Angelbird AV Pro V60) | |
| Dell Inspiron 16 7640 2-in-1 (Toshiba Exceria Pro SDXC 64 GB UHS-II) | |
| maximum AS SSD Seq Read Test (1GB) | |
| Schenker XMG Evo 15 (M24) (ADATA V90) | |
| Schenker XMG Evo 15 (M24) (Angelbird AV Pro V60) | |
| Średnia w klasie Multimedia (27.4 - 1455, n=46, ostatnie 2 lata) | |
| Lenovo IdeaPad Pro 5 16IMH G9 (Angelbird AV Pro V60) | |
| Dell Inspiron 16 7640 2-in-1 (Toshiba Exceria Pro SDXC 64 GB UHS-II) | |
Komunikacja
Evo 15 to jeden z niewielu nowoczesnych notebooków multimedialnych, który nadal posiada gigabitowe połączenie sieciowe RJ45. Moduł AX211 od Intela jest również dostępny dla sieci bezprzewodowych (Wi-Fi 6E). W połączeniu z naszym referencyjnym routerem od Asusa, prędkości transferu były dobre i nie mieliśmy żadnych problemów z sygnałem Wi-Fi podczas testu.
| Networking | |
| Schenker XMG Evo 15 (M24) | |
| iperf3 transmit AXE11000 | |
| iperf3 receive AXE11000 | |
| Dell Inspiron 16 7640 2-in-1 | |
| iperf3 transmit AXE11000 | |
| iperf3 receive AXE11000 | |
| iperf3 transmit AXE11000 6GHz | |
| iperf3 receive AXE11000 6GHz | |
| Medion S10 OLED | |
| iperf3 transmit AXE11000 | |
| iperf3 receive AXE11000 | |
| Xiaomi RedmiBook Pro 16 2024 | |
| iperf3 transmit AXE11000 | |
| iperf3 receive AXE11000 | |
| Lenovo IdeaPad Pro 5 16IMH G9 | |
| iperf3 transmit AXE11000 | |
| iperf3 receive AXE11000 | |
| Lenovo ThinkPad T16 G2 21K70035GE | |
| iperf3 transmit AXE11000 | |
| iperf3 receive AXE11000 | |
| iperf3 transmit AXE11000 6GHz | |
| iperf3 receive AXE11000 6GHz | |
Kamera internetowa
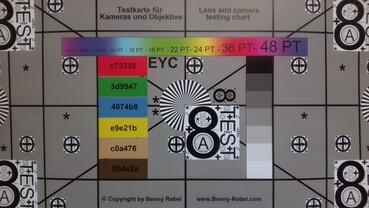
Kamera 2 MP z mechaniczną migawką jest wbudowana w górną krawędź ekranu, co zapewnia średnią jakość obrazu. Obsługiwane są również efekty Microsoft Studio, a dodatkowa kamera na podczerwień umożliwia rozpoznawanie twarzy poprzez Windows Hello.

Akcesoria
Oprócz 100-watowego zasilacza, zakres dostawy obejmuje również pamięć USB ze sterownikami oraz dużą podkładkę pod mysz XMG wykonaną z tkaniny.
Konserwacja
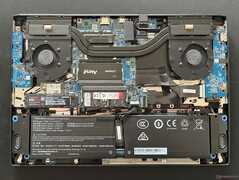
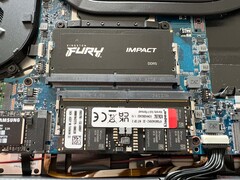
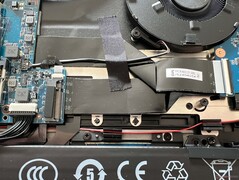
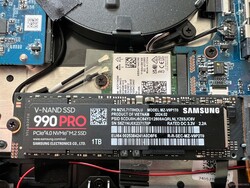
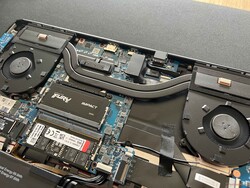
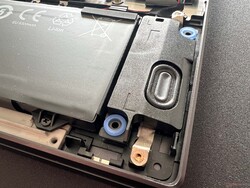
Teraz przechodzimy do najważniejszego elementu Evo 15, czyli opcji serwisowych. Po zdjęciu dolnej pokrywy (która jest mocowana zwykłymi śrubami krzyżakowymi) można uzyskać dostęp do wentylatorów i przykręconej baterii, a także dwóch gniazd SO-DIMM dla pamięci RAM i dwóch gniazd M.2 2280 SSD; aktualizacje są zatem dziecinnie proste. W razie potrzeby można również wymienić moduł WLAN.
Zrównoważony rozwój
Na stronie produktu Schenker brakuje jakichkolwiek informacji na temat emisji CO2 generowanych podczas produkcji laptopów. Opakowanie jest w dużej mierze wykonane z kartonu i plastiku. O zużyciu energii porozmawiamy później, ale pobór mocy w trybie czuwania wynoszący 1,4 W jest zbyt wysoki.
Urządzenia wejściowe - Duża klawiatura z klawiaturą numeryczną
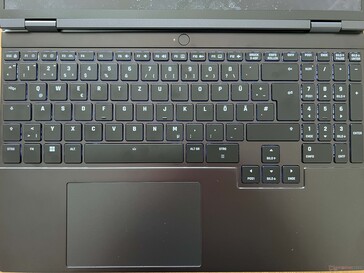
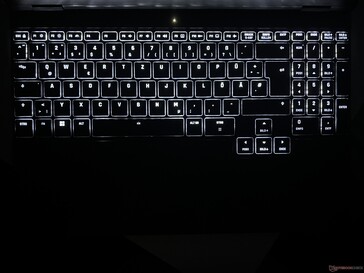
Klawiatura zajmuje całą szerokość jednostki bazowej i oferuje również dedykowaną klawiaturę numeryczną, choć te klawisze są nieco węższe. Klawisze strzałek nie zostały jednak zmniejszone. Ogólne wrażenia z pisania są komfortowe i nawet długie teksty nie stanowią problemu, chociaż laptopy biznesowe, takie jak ThinkPad T16 nadal oferują tutaj przewagę. Ponadto, szczególnie większe klawisze są dość głośne i sprawiają wrażenie nieco chwiejnych. Na podstawie ankiety przeprowadzonej wśród klientów Schenker zdecydował się nie instalować dedykowanego klawisza drugiego pilota. Białe podświetlenie oferuje obecnie dwa poziomy intensywności, ale wkrótce zostanie wydana aktualizacja, która będzie oferować cztery poziomy intensywności.
Przy wymiarach 12,3 x 7,7 cm, ClickPad oferuje wystarczającą przestrzeń do wprowadzania danych i sterowania wskaźnikiem, ale jest wyraźnie przesunięty w lewo, co wymaga trochę czasu, aby się przyzwyczaić. Pad można kliknąć w dolnym obszarze, ale skutkuje to głośnym i tanim dźwiękiem.
Wyświetlacz - IPS z 240 Hz
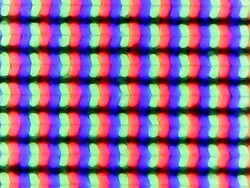
Schenker wykorzystuje znany z Fusion 15 panel WQHD o odświeżaniu 240 Hz, a więc jest to matowy panel IPS o rozdzielczości 2560 x 1600 pikseli. Subiektywne wrażenie obrazu jest doskonałe, ponieważ wszystkie treści są bardzo ostre, a odwzorowanie kolorów jest również w porządku, choć oczywiście nie można oczekiwać jasnych kolorów paneli OLED. Nie ma też migotania PWM, ale czas reakcji jest nadal bardzo szybki. Pomimo matowej powierzchni, nawet jasne powierzchnie nie wydają się ziarniste, a ruchy są bardzo płynne dzięki wysokiej częstotliwości. Synchronizacja adaptacyjna jest również obsługiwana, ale czujnik jasności nie jest zainstalowany.
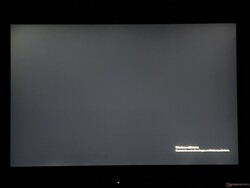
Jasność jest określona na 500 cd/m², ale nasze urządzenie testowe osiągnęło znacznie lepszy wynik ze średnią 585 cd/m². Cierpi na tym jednak wartość czerni, która wynosi 0,61 cd/m² i sprawia, że czarne treści wydają się raczej ciemnoszare. Ponadto maksymalny współczynnik kontrastu wynosi tylko ~ 1000:1.
| |||||||||||||||||||||||||
rozświetlenie: 93 %
na akumulatorze: 608 cd/m²
kontrast: 997:1 (czerń: 0.61 cd/m²)
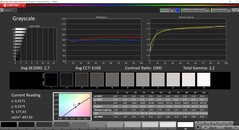
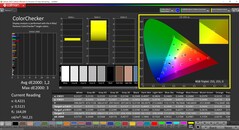
ΔE ColorChecker Calman: 2.1 | ∀{0.5-29.43 Ø4.76}
calibrated: 1.2
ΔE Greyscale Calman: 2.7 | ∀{0.09-98 Ø5}
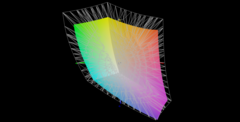
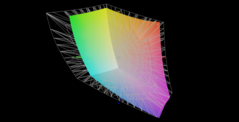
74.2% AdobeRGB 1998 (Argyll 3D)
100% sRGB (Argyll 3D)
73.6% Display P3 (Argyll 3D)
Gamma: 2.2
CCT: 6168 K
| Schenker XMG Evo 15 (M24) NE153QDM-NZ1, IPS, 2560x1600, 15.3", 240 Hz | Dell Inspiron 16 7640 2-in-1 AU Optronics B160QAT, Mini-LED, 2560x1600, 16", 90 Hz | Medion S10 OLED Samsung SDC4174, OLED, 3840x2400, 16", 60 Hz | Xiaomi RedmiBook Pro 16 2024 TL160MDMP03_0, IPS, 3072x1920, 16", 165 Hz | Lenovo IdeaPad Pro 5 16IMH G9 NE160QDM-NY2, IPS, 2560x1600, 16", 120 Hz | Lenovo ThinkPad T16 G2 21K70035GE B160UAN01.K, IPS LED, 1920x1200, 16", Hz | |
|---|---|---|---|---|---|---|
| Display | 20% | 23% | 18% | -10% | 2% | |
| Display P3 Coverage (%) | 73.6 | 99.4 35% | 99.9 36% | 98.8 34% | 63.3 -14% | 75.9 3% |
| sRGB Coverage (%) | 100 | 100 0% | 100 0% | 100 0% | 95.2 -5% | 98.2 -2% |
| AdobeRGB 1998 Coverage (%) | 74.2 | 92.5 25% | 98.6 33% | 89.9 21% | 65.3 -12% | 77.2 4% |
| Response Times | -527% | 71% | -437% | -141% | -548% | |
| Response Time Grey 50% / Grey 80% * (ms) | 4.6 ? | 15.4 ? -235% | 1.7 ? 63% | 39.2 ? -752% | 15 ? -226% | 40.8 ? -787% |
| Response Time Black / White * (ms) | 6.6 ? | 60.6 ? -818% | 1.4 ? 79% | 14.6 ? -121% | 10.3 ? -56% | 26.9 ? -308% |
| PWM Frequency (Hz) | 2753.7 ? | 60 ? | ||||
| PWM Amplitude * (%) | 90 | |||||
| Screen | 3% | 329% | -8% | -12% | -31% | |
| Brightness middle (cd/m²) | 608 | 413 -32% | 307 -50% | 520 -14% | 368 -39% | 446 -27% |
| Brightness (cd/m²) | 585 | 409 -30% | 307 -48% | 510 -13% | 368 -37% | 425 -27% |
| Brightness Distribution (%) | 93 | 97 4% | 96 3% | 93 0% | 91 -2% | 91 -2% |
| Black Level * (cd/m²) | 0.61 | 0.14 77% | 0.01 98% | 0.35 43% | 0.31 49% | 0.28 54% |
| Contrast (:1) | 997 | 2950 196% | 30700 2979% | 1486 49% | 1187 19% | 1593 60% |
| Colorchecker dE 2000 * | 2.1 | 3.48 -66% | 2.1 -0% | 2.9 -38% | 2.4 -14% | 3.7 -76% |
| Colorchecker dE 2000 max. * | 4.3 | 6.97 -62% | 4.87 -13% | 6.2 -44% | 6.5 -51% | 8.8 -105% |
| Colorchecker dE 2000 calibrated * | 1.2 | 2.08 -73% | 1.1 8% | 0.8 33% | 1.6 -33% | |
| Greyscale dE 2000 * | 2.7 | 4.5 -67% | 0.9 67% | 4.3 -59% | 4.5 -67% | 6 -122% |
| Gamma | 2.2 100% | 2.15 102% | 2.197 100% | 2.19 100% | 2.21 100% | 2.2 100% |
| CCT | 6168 105% | 6446 101% | 6513 100% | 7422 88% | 6324 103% | 6499 100% |
| Całkowita średnia (program / ustawienia) | -168% /
-75% | 141% /
227% | -142% /
-63% | -54% /
-30% | -192% /
-98% |
* ... im mniej tym lepiej
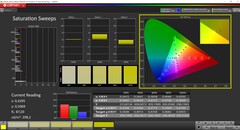
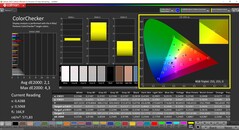
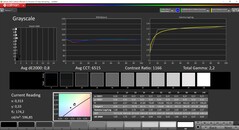
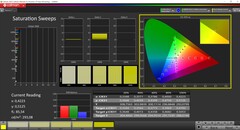
Panel mierzyliśmy profesjonalnym oprogramowaniem CalMAN (X-Rite i1 Pro2), a w Control Center można pobrać wstępnie skalibrowany profil od producenta, który również wykorzystaliśmy do pomiarów. Temperatura barwowa jest tu jednak nieco zbyt ciepła, a niektóre wartości dla kolorów i skali szarości przekraczają docelową wartość 3. Dzięki naszej własnej kalibracji (profil jest dostępny do bezpłatnego pobrania powyżej) możemy znacznie poprawić wyświetlanie, a wszystkie wartości mieszczą się w docelowym zakresie. Wraz z pełnym pokryciem sRGB, Evo 15 nadaje się również do edycji zdjęć / filmów bez ograniczeń.
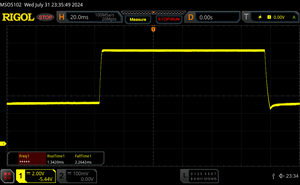
Wyświetl czasy reakcji
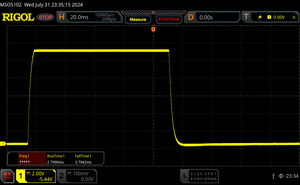
| ↔ Czas reakcji od czerni do bieli | ||
|---|---|---|
| 6.6 ms ... wzrost ↗ i spadek ↘ łącznie | ↗ 2.8 ms wzrost | |
| ↘ 3.8 ms upadek | ||
| W naszych testach ekran wykazuje bardzo szybką reakcję i powinien bardzo dobrze nadawać się do szybkich gier. Dla porównania, wszystkie testowane urządzenia wahają się od 0.1 (minimum) do 240 (maksimum) ms. » 20 % wszystkich urządzeń jest lepszych. Oznacza to, że zmierzony czas reakcji jest lepszy od średniej wszystkich testowanych urządzeń (20.1 ms). | ||
| ↔ Czas reakcji 50% szarości do 80% szarości | ||
| 4.6 ms ... wzrost ↗ i spadek ↘ łącznie | ↗ 1.3 ms wzrost | |
| ↘ 2.3 ms upadek | ||
| W naszych testach ekran wykazuje bardzo szybką reakcję i powinien bardzo dobrze nadawać się do szybkich gier. Dla porównania, wszystkie testowane urządzenia wahają się od 0.165 (minimum) do 636 (maksimum) ms. » 15 % wszystkich urządzeń jest lepszych. Oznacza to, że zmierzony czas reakcji jest lepszy od średniej wszystkich testowanych urządzeń (31.5 ms). | ||
Migotanie ekranu / PWM (modulacja szerokości impulsu)
| Migotanie ekranu/nie wykryto PWM | |||
Dla porównania: 53 % wszystkich testowanych urządzeń nie używa PWM do przyciemniania wyświetlacza. Jeśli wykryto PWM, zmierzono średnio 8023 (minimum: 5 - maksimum: 343500) Hz. | |||
Wydajność - Meteor Lake i do 96 GB pamięci RAM
XMG Evo 15 jest albo wyposażony w AMD Ryzen 7 8845HS lub Intel Core Ultra 7 155H w naszym urządzeniu testowym. Dwa gniazda pamięci RAM pozwalają na zainstalowanie do 96 GB pamięci DDR5 RAM, ale częstotliwość jest ograniczona z 5600 do 4800 MHz w przypadku korzystania z modułów 48 GB ze względu na ograniczenia termiczne.
Warunki testu
Preinstalowane Centrum Sterowania oferuje trzy różne profile energetyczne (Zrównoważony, Entuzjasta i Overboost), które można również wygodnie przełączać za pomocą kombinacji klawiszy Fn + F3. Przeprowadziliśmy testy porównawcze i pomiary przy użyciu standardowego profilu Enthusiast. Wartości wydajności trzech profili podsumowaliśmy w poniższej tabeli:
| Profil energetyczny | TDP procesora | TDP procesora (bateria) | CB R23 Multi | Time Spy Grafika | maks. Głośność wentylatora |
|---|---|---|---|---|---|
| Zrównoważony | 35 watów | 25 watów | 12 759 punktów | 2 623 punktów | 35,4 dB(A) |
| Enthusiast | 45 watów | 35 watów | 14 957 punktów | 3 690 punktów | 40,4 dB(A) |
| Overboost | 70 watów | 35 watów | 18 790 punktów | 3 633 punktów | 48,1 dB(A) |
Procesor - Core Ultra 7 155H
Procesor Intel Core Ultra 7 155H jest obecnie stosowany w wielu laptopach, ale XMG Evo 15 jest jednym z niewielu modeli, które nie mają zwiększonego krótkoterminowego limitu mocy. W trybie entuzjasty pobór wynosi 45 W i wartość ta jest utrzymywana na stałym poziomie (dotyczy to również pozostałych profili wydajnościowych o mocy 70 i 35 W) i nie występuje spadek wydajności przy ciągłym obciążeniu. W trybie entuzjasty wydajność jest już bardzo dobra, ale jeśli potrzebujemy jeszcze więcej mocy, to bez problemu możemy skorzystać z trybu overboost (+25% wydajności wielordzeniowej). W trybie bateryjnym maksymalny pobór mocy spada natomiast do 35 W, co przekłada się na spadek wydajności o 15%. Więcej testów porównawczych procesora można znaleźć w naszej sekcji technologicznej.
Cinebench R15 Multi loop
Cinebench R23: Multi Core | Single Core
Cinebench R20: CPU (Multi Core) | CPU (Single Core)
Cinebench R15: CPU Multi 64Bit | CPU Single 64Bit
Blender: v2.79 BMW27 CPU
7-Zip 18.03: 7z b 4 | 7z b 4 -mmt1
Geekbench 6.5: Multi-Core | Single-Core
Geekbench 5.5: Multi-Core | Single-Core
HWBOT x265 Benchmark v2.2: 4k Preset
LibreOffice : 20 Documents To PDF
R Benchmark 2.5: Overall mean
| CPU Performance rating | |
| Lenovo IdeaPad Pro 5 16IMH G9 | |
| Xiaomi RedmiBook Pro 16 2024 | |
| Średnia w klasie Multimedia | |
| Dell Inspiron 16 7640 2-in-1 | |
| Schenker XMG Evo 15 (M24) | |
| Medion S10 OLED | |
| Przeciętny Intel Core Ultra 7 155H | |
| Lenovo ThinkPad T16 G2 21K70035GE | |
| Cinebench R23 / Multi Core | |
| Lenovo IdeaPad Pro 5 16IMH G9 | |
| Xiaomi RedmiBook Pro 16 2024 | |
| Średnia w klasie Multimedia (4861 - 33362, n=81, ostatnie 2 lata) | |
| Dell Inspiron 16 7640 2-in-1 | |
| Medion S10 OLED | |
| Przeciętny Intel Core Ultra 7 155H (9769 - 19007, n=52) | |
| Schenker XMG Evo 15 (M24) | |
| Lenovo ThinkPad T16 G2 21K70035GE | |
| Cinebench R23 / Single Core | |
| Średnia w klasie Multimedia (1128 - 2459, n=73, ostatnie 2 lata) | |
| Medion S10 OLED | |
| Lenovo IdeaPad Pro 5 16IMH G9 | |
| Xiaomi RedmiBook Pro 16 2024 | |
| Dell Inspiron 16 7640 2-in-1 | |
| Schenker XMG Evo 15 (M24) | |
| Przeciętny Intel Core Ultra 7 155H (1496 - 1815, n=52) | |
| Lenovo ThinkPad T16 G2 21K70035GE | |
| Cinebench R20 / CPU (Multi Core) | |
| Lenovo IdeaPad Pro 5 16IMH G9 | |
| Xiaomi RedmiBook Pro 16 2024 | |
| Średnia w klasie Multimedia (1887 - 12912, n=64, ostatnie 2 lata) | |
| Dell Inspiron 16 7640 2-in-1 | |
| Medion S10 OLED | |
| Przeciętny Intel Core Ultra 7 155H (3798 - 7409, n=50) | |
| Schenker XMG Evo 15 (M24) | |
| Lenovo ThinkPad T16 G2 21K70035GE | |
| Cinebench R20 / CPU (Single Core) | |
| Średnia w klasie Multimedia (420 - 853, n=64, ostatnie 2 lata) | |
| Lenovo IdeaPad Pro 5 16IMH G9 | |
| Medion S10 OLED | |
| Schenker XMG Evo 15 (M24) | |
| Lenovo ThinkPad T16 G2 21K70035GE | |
| Xiaomi RedmiBook Pro 16 2024 | |
| Dell Inspiron 16 7640 2-in-1 | |
| Przeciętny Intel Core Ultra 7 155H (601 - 696, n=50) | |
| Cinebench R15 / CPU Multi 64Bit | |
| Xiaomi RedmiBook Pro 16 2024 | |
| Lenovo IdeaPad Pro 5 16IMH G9 | |
| Dell Inspiron 16 7640 2-in-1 | |
| Średnia w klasie Multimedia (856 - 5224, n=70, ostatnie 2 lata) | |
| Przeciętny Intel Core Ultra 7 155H (1932 - 2880, n=56) | |
| Medion S10 OLED | |
| Schenker XMG Evo 15 (M24) | |
| Lenovo ThinkPad T16 G2 21K70035GE | |
| Cinebench R15 / CPU Single 64Bit | |
| Lenovo IdeaPad Pro 5 16IMH G9 | |
| Lenovo ThinkPad T16 G2 21K70035GE | |
| Średnia w klasie Multimedia (99.6 - 326, n=67, ostatnie 2 lata) | |
| Schenker XMG Evo 15 (M24) | |
| Medion S10 OLED | |
| Xiaomi RedmiBook Pro 16 2024 | |
| Dell Inspiron 16 7640 2-in-1 | |
| Przeciętny Intel Core Ultra 7 155H (99.6 - 268, n=52) | |
| Blender / v2.79 BMW27 CPU | |
| Średnia w klasie Multimedia (100 - 557, n=65, ostatnie 2 lata) | |
| Lenovo ThinkPad T16 G2 21K70035GE | |
| Przeciętny Intel Core Ultra 7 155H (175 - 381, n=47) | |
| Dell Inspiron 16 7640 2-in-1 | |
| Schenker XMG Evo 15 (M24) | |
| Medion S10 OLED | |
| Lenovo IdeaPad Pro 5 16IMH G9 | |
| Xiaomi RedmiBook Pro 16 2024 | |
| 7-Zip 18.03 / 7z b 4 | |
| Lenovo IdeaPad Pro 5 16IMH G9 | |
| Xiaomi RedmiBook Pro 16 2024 | |
| Dell Inspiron 16 7640 2-in-1 | |
| Schenker XMG Evo 15 (M24) | |
| Średnia w klasie Multimedia (29095 - 130368, n=63, ostatnie 2 lata) | |
| Przeciętny Intel Core Ultra 7 155H (41739 - 70254, n=50) | |
| Medion S10 OLED | |
| Lenovo ThinkPad T16 G2 21K70035GE | |
| 7-Zip 18.03 / 7z b 4 -mmt1 | |
| Lenovo ThinkPad T16 G2 21K70035GE | |
| Średnia w klasie Multimedia (3666 - 7545, n=63, ostatnie 2 lata) | |
| Schenker XMG Evo 15 (M24) | |
| Medion S10 OLED | |
| Xiaomi RedmiBook Pro 16 2024 | |
| Lenovo IdeaPad Pro 5 16IMH G9 | |
| Dell Inspiron 16 7640 2-in-1 | |
| Przeciętny Intel Core Ultra 7 155H (4594 - 5621, n=50) | |
| Geekbench 6.5 / Multi-Core | |
| Średnia w klasie Multimedia (4983 - 25760, n=77, ostatnie 2 lata) | |
| Xiaomi RedmiBook Pro 16 2024 | |
| Lenovo IdeaPad Pro 5 16IMH G9 | |
| Schenker XMG Evo 15 (M24) | |
| Przeciętny Intel Core Ultra 7 155H (7732 - 13656, n=55) | |
| Dell Inspiron 16 7640 2-in-1 | |
| Medion S10 OLED | |
| Lenovo ThinkPad T16 G2 21K70035GE | |
| Geekbench 6.5 / Single-Core | |
| Średnia w klasie Multimedia (1534 - 4326, n=73, ostatnie 2 lata) | |
| Lenovo ThinkPad T16 G2 21K70035GE | |
| Schenker XMG Evo 15 (M24) | |
| Medion S10 OLED | |
| Lenovo IdeaPad Pro 5 16IMH G9 | |
| Xiaomi RedmiBook Pro 16 2024 | |
| Przeciętny Intel Core Ultra 7 155H (1901 - 2473, n=52) | |
| Dell Inspiron 16 7640 2-in-1 | |
| Geekbench 5.5 / Multi-Core | |
| Xiaomi RedmiBook Pro 16 2024 | |
| Lenovo IdeaPad Pro 5 16IMH G9 | |
| Średnia w klasie Multimedia (4652 - 20422, n=64, ostatnie 2 lata) | |
| Dell Inspiron 16 7640 2-in-1 | |
| Przeciętny Intel Core Ultra 7 155H (10017 - 13556, n=52) | |
| Schenker XMG Evo 15 (M24) | |
| Medion S10 OLED | |
| Lenovo ThinkPad T16 G2 21K70035GE | |
| Geekbench 5.5 / Single-Core | |
| Średnia w klasie Multimedia (805 - 2974, n=64, ostatnie 2 lata) | |
| Schenker XMG Evo 15 (M24) | |
| Lenovo IdeaPad Pro 5 16IMH G9 | |
| Xiaomi RedmiBook Pro 16 2024 | |
| Medion S10 OLED | |
| Dell Inspiron 16 7640 2-in-1 | |
| Lenovo ThinkPad T16 G2 21K70035GE | |
| Przeciętny Intel Core Ultra 7 155H (1462 - 1824, n=52) | |
| HWBOT x265 Benchmark v2.2 / 4k Preset | |
| Lenovo IdeaPad Pro 5 16IMH G9 | |
| Xiaomi RedmiBook Pro 16 2024 | |
| Średnia w klasie Multimedia (5.26 - 36.1, n=63, ostatnie 2 lata) | |
| Dell Inspiron 16 7640 2-in-1 | |
| Schenker XMG Evo 15 (M24) | |
| Medion S10 OLED | |
| Przeciętny Intel Core Ultra 7 155H (9.93 - 21.2, n=50) | |
| Lenovo ThinkPad T16 G2 21K70035GE | |
| LibreOffice / 20 Documents To PDF | |
| Średnia w klasie Multimedia (23.9 - 146.7, n=64, ostatnie 2 lata) | |
| Przeciętny Intel Core Ultra 7 155H (37.5 - 79.2, n=49) | |
| Medion S10 OLED | |
| Xiaomi RedmiBook Pro 16 2024 | |
| Dell Inspiron 16 7640 2-in-1 | |
| Lenovo ThinkPad T16 G2 21K70035GE | |
| Schenker XMG Evo 15 (M24) | |
| Lenovo IdeaPad Pro 5 16IMH G9 | |
| R Benchmark 2.5 / Overall mean | |
| Dell Inspiron 16 7640 2-in-1 | |
| Przeciętny Intel Core Ultra 7 155H (0.4457 - 0.53, n=49) | |
| Średnia w klasie Multimedia (0.3604 - 0.947, n=63, ostatnie 2 lata) | |
| Lenovo ThinkPad T16 G2 21K70035GE | |
| Xiaomi RedmiBook Pro 16 2024 | |
| Medion S10 OLED | |
| Lenovo IdeaPad Pro 5 16IMH G9 | |
| Schenker XMG Evo 15 (M24) | |
* ... im mniej tym lepiej
AIDA64: FP32 Ray-Trace | FPU Julia | CPU SHA3 | CPU Queen | FPU SinJulia | FPU Mandel | CPU AES | CPU ZLib | FP64 Ray-Trace | CPU PhotoWorxx
| Performance rating | |
| Lenovo ThinkPad T16 G2 21K70035GE | |
| Lenovo IdeaPad Pro 5 16IMH G9 | |
| Średnia w klasie Multimedia | |
| Xiaomi RedmiBook Pro 16 2024 | |
| Dell Inspiron 16 7640 2-in-1 | |
| Schenker XMG Evo 15 (M24) | |
| Medion S10 OLED | |
| Przeciętny Intel Core Ultra 7 155H | |
| AIDA64 / FP32 Ray-Trace | |
| Lenovo ThinkPad T16 G2 21K70035GE | |
| Lenovo IdeaPad Pro 5 16IMH G9 | |
| Średnia w klasie Multimedia (2214 - 50388, n=60, ostatnie 2 lata) | |
| Medion S10 OLED | |
| Dell Inspiron 16 7640 2-in-1 | |
| Xiaomi RedmiBook Pro 16 2024 | |
| Przeciętny Intel Core Ultra 7 155H (6670 - 18470, n=50) | |
| Schenker XMG Evo 15 (M24) | |
| AIDA64 / FPU Julia | |
| Lenovo ThinkPad T16 G2 21K70035GE | |
| Lenovo IdeaPad Pro 5 16IMH G9 | |
| Średnia w klasie Multimedia (12867 - 201874, n=61, ostatnie 2 lata) | |
| Xiaomi RedmiBook Pro 16 2024 | |
| Medion S10 OLED | |
| Dell Inspiron 16 7640 2-in-1 | |
| Schenker XMG Evo 15 (M24) | |
| Przeciętny Intel Core Ultra 7 155H (40905 - 93181, n=50) | |
| AIDA64 / CPU SHA3 | |
| Lenovo IdeaPad Pro 5 16IMH G9 | |
| Lenovo ThinkPad T16 G2 21K70035GE | |
| Średnia w klasie Multimedia (653 - 8623, n=61, ostatnie 2 lata) | |
| Xiaomi RedmiBook Pro 16 2024 | |
| Medion S10 OLED | |
| Dell Inspiron 16 7640 2-in-1 | |
| Schenker XMG Evo 15 (M24) | |
| Przeciętny Intel Core Ultra 7 155H (1940 - 4436, n=50) | |
| AIDA64 / CPU Queen | |
| Lenovo ThinkPad T16 G2 21K70035GE | |
| Dell Inspiron 16 7640 2-in-1 | |
| Xiaomi RedmiBook Pro 16 2024 | |
| Lenovo IdeaPad Pro 5 16IMH G9 | |
| Przeciętny Intel Core Ultra 7 155H (64698 - 94181, n=50) | |
| Schenker XMG Evo 15 (M24) | |
| Medion S10 OLED | |
| Średnia w klasie Multimedia (13483 - 181505, n=61, ostatnie 2 lata) | |
| AIDA64 / FPU SinJulia | |
| Lenovo ThinkPad T16 G2 21K70035GE | |
| Lenovo IdeaPad Pro 5 16IMH G9 | |
| Dell Inspiron 16 7640 2-in-1 | |
| Xiaomi RedmiBook Pro 16 2024 | |
| Średnia w klasie Multimedia (1240 - 28794, n=61, ostatnie 2 lata) | |
| Schenker XMG Evo 15 (M24) | |
| Przeciętny Intel Core Ultra 7 155H (5639 - 10647, n=50) | |
| Medion S10 OLED | |
| AIDA64 / FPU Mandel | |
| Lenovo ThinkPad T16 G2 21K70035GE | |
| Lenovo IdeaPad Pro 5 16IMH G9 | |
| Średnia w klasie Multimedia (6395 - 105740, n=60, ostatnie 2 lata) | |
| Medion S10 OLED | |
| Xiaomi RedmiBook Pro 16 2024 | |
| Dell Inspiron 16 7640 2-in-1 | |
| Schenker XMG Evo 15 (M24) | |
| Przeciętny Intel Core Ultra 7 155H (18236 - 47685, n=50) | |
| AIDA64 / CPU AES | |
| Schenker XMG Evo 15 (M24) | |
| Lenovo IdeaPad Pro 5 16IMH G9 | |
| Przeciętny Intel Core Ultra 7 155H (45713 - 152179, n=50) | |
| Lenovo ThinkPad T16 G2 21K70035GE | |
| Dell Inspiron 16 7640 2-in-1 | |
| Xiaomi RedmiBook Pro 16 2024 | |
| Medion S10 OLED | |
| Średnia w klasie Multimedia (2609 - 152179, n=61, ostatnie 2 lata) | |
| AIDA64 / CPU ZLib | |
| Lenovo IdeaPad Pro 5 16IMH G9 | |
| Xiaomi RedmiBook Pro 16 2024 | |
| Dell Inspiron 16 7640 2-in-1 | |
| Medion S10 OLED | |
| Średnia w klasie Multimedia (167.2 - 2022, n=61, ostatnie 2 lata) | |
| Przeciętny Intel Core Ultra 7 155H (557 - 1250, n=50) | |
| Schenker XMG Evo 15 (M24) | |
| Lenovo ThinkPad T16 G2 21K70035GE | |
| AIDA64 / FP64 Ray-Trace | |
| Lenovo ThinkPad T16 G2 21K70035GE | |
| Średnia w klasie Multimedia (1014 - 26875, n=61, ostatnie 2 lata) | |
| Lenovo IdeaPad Pro 5 16IMH G9 | |
| Medion S10 OLED | |
| Dell Inspiron 16 7640 2-in-1 | |
| Xiaomi RedmiBook Pro 16 2024 | |
| Schenker XMG Evo 15 (M24) | |
| Przeciętny Intel Core Ultra 7 155H (3569 - 9802, n=50) | |
| AIDA64 / CPU PhotoWorxx | |
| Lenovo IdeaPad Pro 5 16IMH G9 | |
| Xiaomi RedmiBook Pro 16 2024 | |
| Przeciętny Intel Core Ultra 7 155H (32719 - 54223, n=50) | |
| Schenker XMG Evo 15 (M24) | |
| Średnia w klasie Multimedia (12860 - 65787, n=61, ostatnie 2 lata) | |
| Dell Inspiron 16 7640 2-in-1 | |
| Medion S10 OLED | |
| Lenovo ThinkPad T16 G2 21K70035GE | |
Wydajność systemu
Ogólna wydajność systemu jest doskonała, a Evo 15 jest bardzo szybkim systemem w codziennym użytkowaniu. Nie mieliśmy również żadnych problemów ze stabilnością systemu podczas naszego okresu testowego.
CrossMark: Overall | Productivity | Creativity | Responsiveness
WebXPRT 3: Overall
WebXPRT 4: Overall
Mozilla Kraken 1.1: Total
| PCMark 10 / Score | |
| Schenker XMG Evo 15 (M24) | |
| Lenovo IdeaPad Pro 5 16IMH G9 | |
| Średnia w klasie Multimedia (4325 - 10386, n=57, ostatnie 2 lata) | |
| Dell Inspiron 16 7640 2-in-1 | |
| Xiaomi RedmiBook Pro 16 2024 | |
| Przeciętny Intel Core Ultra 7 155H, Intel Arc 8-Core iGPU (4809 - 7529, n=34) | |
| Lenovo ThinkPad T16 G2 21K70035GE | |
| Medion S10 OLED | |
| PCMark 10 / Essentials | |
| Lenovo IdeaPad Pro 5 16IMH G9 | |
| Schenker XMG Evo 15 (M24) | |
| Dell Inspiron 16 7640 2-in-1 | |
| Xiaomi RedmiBook Pro 16 2024 | |
| Przeciętny Intel Core Ultra 7 155H, Intel Arc 8-Core iGPU (7605 - 11289, n=34) | |
| Średnia w klasie Multimedia (8025 - 11664, n=57, ostatnie 2 lata) | |
| Lenovo ThinkPad T16 G2 21K70035GE | |
| Medion S10 OLED | |
| PCMark 10 / Productivity | |
| Średnia w klasie Multimedia (7323 - 18233, n=57, ostatnie 2 lata) | |
| Lenovo IdeaPad Pro 5 16IMH G9 | |
| Lenovo ThinkPad T16 G2 21K70035GE | |
| Schenker XMG Evo 15 (M24) | |
| Dell Inspiron 16 7640 2-in-1 | |
| Przeciętny Intel Core Ultra 7 155H, Intel Arc 8-Core iGPU (6042 - 10591, n=34) | |
| Xiaomi RedmiBook Pro 16 2024 | |
| Medion S10 OLED | |
| PCMark 10 / Digital Content Creation | |
| Schenker XMG Evo 15 (M24) | |
| Xiaomi RedmiBook Pro 16 2024 | |
| Lenovo IdeaPad Pro 5 16IMH G9 | |
| Średnia w klasie Multimedia (3651 - 16240, n=57, ostatnie 2 lata) | |
| Dell Inspiron 16 7640 2-in-1 | |
| Przeciętny Intel Core Ultra 7 155H, Intel Arc 8-Core iGPU (4985 - 10709, n=34) | |
| Medion S10 OLED | |
| Lenovo ThinkPad T16 G2 21K70035GE | |
| CrossMark / Overall | |
| Schenker XMG Evo 15 (M24) | |
| Xiaomi RedmiBook Pro 16 2024 | |
| Średnia w klasie Multimedia (866 - 2426, n=65, ostatnie 2 lata) | |
| Dell Inspiron 16 7640 2-in-1 | |
| Medion S10 OLED | |
| Przeciętny Intel Core Ultra 7 155H, Intel Arc 8-Core iGPU (1366 - 1903, n=34) | |
| Lenovo ThinkPad T16 G2 21K70035GE | |
| Lenovo IdeaPad Pro 5 16IMH G9 | |
| CrossMark / Productivity | |
| Schenker XMG Evo 15 (M24) | |
| Xiaomi RedmiBook Pro 16 2024 | |
| Średnia w klasie Multimedia (913 - 2344, n=65, ostatnie 2 lata) | |
| Medion S10 OLED | |
| Dell Inspiron 16 7640 2-in-1 | |
| Przeciętny Intel Core Ultra 7 155H, Intel Arc 8-Core iGPU (1291 - 1798, n=33) | |
| Lenovo ThinkPad T16 G2 21K70035GE | |
| Lenovo IdeaPad Pro 5 16IMH G9 | |
| CrossMark / Creativity | |
| Średnia w klasie Multimedia (907 - 2820, n=65, ostatnie 2 lata) | |
| Xiaomi RedmiBook Pro 16 2024 | |
| Dell Inspiron 16 7640 2-in-1 | |
| Schenker XMG Evo 15 (M24) | |
| Lenovo IdeaPad Pro 5 16IMH G9 | |
| Przeciętny Intel Core Ultra 7 155H, Intel Arc 8-Core iGPU (1519 - 1929, n=33) | |
| Medion S10 OLED | |
| Lenovo ThinkPad T16 G2 21K70035GE | |
| CrossMark / Responsiveness | |
| Schenker XMG Evo 15 (M24) | |
| Xiaomi RedmiBook Pro 16 2024 | |
| Medion S10 OLED | |
| Średnia w klasie Multimedia (605 - 2024, n=65, ostatnie 2 lata) | |
| Przeciętny Intel Core Ultra 7 155H, Intel Arc 8-Core iGPU (939 - 1802, n=33) | |
| Dell Inspiron 16 7640 2-in-1 | |
| Lenovo ThinkPad T16 G2 21K70035GE | |
| Lenovo IdeaPad Pro 5 16IMH G9 | |
| WebXPRT 3 / Overall | |
| Średnia w klasie Multimedia (136.4 - 545, n=68, ostatnie 2 lata) | |
| Lenovo IdeaPad Pro 5 16IMH G9 | |
| Dell Inspiron 16 7640 2-in-1 | |
| Schenker XMG Evo 15 (M24) | |
| Xiaomi RedmiBook Pro 16 2024 | |
| Przeciętny Intel Core Ultra 7 155H, Intel Arc 8-Core iGPU (252 - 299, n=34) | |
| Lenovo ThinkPad T16 G2 21K70035GE | |
| Medion S10 OLED | |
| WebXPRT 4 / Overall | |
| Średnia w klasie Multimedia (167.3 - 384, n=67, ostatnie 2 lata) | |
| Schenker XMG Evo 15 (M24) | |
| Lenovo IdeaPad Pro 5 16IMH G9 | |
| Dell Inspiron 16 7640 2-in-1 | |
| Xiaomi RedmiBook Pro 16 2024 | |
| Przeciętny Intel Core Ultra 7 155H, Intel Arc 8-Core iGPU (166.4 - 309, n=29) | |
| Medion S10 OLED | |
| Lenovo ThinkPad T16 G2 21K70035GE | |
| Mozilla Kraken 1.1 / Total | |
| Medion S10 OLED | |
| Medion S10 OLED | |
| Lenovo ThinkPad T16 G2 21K70035GE | |
| Przeciętny Intel Core Ultra 7 155H, Intel Arc 8-Core iGPU (517 - 614, n=35) | |
| Schenker XMG Evo 15 (M24) | |
| Dell Inspiron 16 7640 2-in-1 | |
| Xiaomi RedmiBook Pro 16 2024 | |
| Lenovo IdeaPad Pro 5 16IMH G9 | |
| Średnia w klasie Multimedia (228 - 835, n=71, ostatnie 2 lata) | |
* ... im mniej tym lepiej
| PCMark 10 Score | 7331 pkt. | |
Pomoc | ||
| AIDA64 / Memory Copy | |
| Lenovo IdeaPad Pro 5 16IMH G9 | |
| Xiaomi RedmiBook Pro 16 2024 | |
| Przeciętny Intel Core Ultra 7 155H (62397 - 96791, n=50) | |
| Dell Inspiron 16 7640 2-in-1 | |
| Średnia w klasie Multimedia (21158 - 109252, n=60, ostatnie 2 lata) | |
| Schenker XMG Evo 15 (M24) | |
| Lenovo ThinkPad T16 G2 21K70035GE | |
| Medion S10 OLED | |
| AIDA64 / Memory Read | |
| Lenovo IdeaPad Pro 5 16IMH G9 | |
| Xiaomi RedmiBook Pro 16 2024 | |
| Średnia w klasie Multimedia (19699 - 132641, n=61, ostatnie 2 lata) | |
| Przeciętny Intel Core Ultra 7 155H (60544 - 90647, n=50) | |
| Schenker XMG Evo 15 (M24) | |
| Medion S10 OLED | |
| Dell Inspiron 16 7640 2-in-1 | |
| Lenovo ThinkPad T16 G2 21K70035GE | |
| AIDA64 / Memory Write | |
| Lenovo ThinkPad T16 G2 21K70035GE | |
| Średnia w klasie Multimedia (17733 - 134966, n=61, ostatnie 2 lata) | |
| Dell Inspiron 16 7640 2-in-1 | |
| Lenovo IdeaPad Pro 5 16IMH G9 | |
| Przeciętny Intel Core Ultra 7 155H (58692 - 93451, n=50) | |
| Schenker XMG Evo 15 (M24) | |
| Xiaomi RedmiBook Pro 16 2024 | |
| Medion S10 OLED | |
| AIDA64 / Memory Latency | |
| Dell Inspiron 16 7640 2-in-1 | |
| Przeciętny Intel Core Ultra 7 155H (116.2 - 233, n=50) | |
| Medion S10 OLED | |
| Xiaomi RedmiBook Pro 16 2024 | |
| Lenovo IdeaPad Pro 5 16IMH G9 | |
| Schenker XMG Evo 15 (M24) | |
| Lenovo ThinkPad T16 G2 21K70035GE | |
| Średnia w klasie Multimedia (0 - 535, n=61, ostatnie 2 lata) | |
* ... im mniej tym lepiej
Opóźnienia DPC
W naszym standardowym teście opóźnień (surfowanie po Internecie, odtwarzanie 4K YouTube, obciążenie procesora), urządzenie testowe z aktualną wersją BIOS-u wykazuje niewielkie ograniczenia w korzystaniu z aplikacji audio w czasie rzeczywistym.
| DPC Latencies / LatencyMon - interrupt to process latency (max), Web, Youtube, Prime95 | |
| Medion S10 OLED | |
| Schenker XMG Evo 15 (M24) | |
| Dell Inspiron 16 7640 2-in-1 | |
| Lenovo IdeaPad Pro 5 16IMH G9 | |
| Lenovo ThinkPad T16 G2 21K70035GE | |
| Xiaomi RedmiBook Pro 16 2024 | |
* ... im mniej tym lepiej
Pamięć masowa
XMG Evo 15 (M24) oferuje dwa sloty M.2-2280, które są połączone przez PCIe 4.0 i obsługują również macierz RAID (0/1). Evo jest standardowo wyposażony w dysk WD Blue SN580 o pojemności 500 GB, ale nasze urządzenie testowe jest wyposażone w wersję Samsung 990 Pro o pojemności 1 TB, która jest niezwykle szybkim dyskiem SSD o szybkości transferu do 7 GB/s. Co więcej, wydajność pozostaje całkowicie stabilna nawet przy długotrwałym obciążeniu, co nie jest kwestią oczywistą. Po pierwszym uruchomieniu użytkownik ma do dyspozycji 878 GB. Dalsze benchmarki SSD można znaleźć tutaj.
* ... im mniej tym lepiej
Continuous read: DiskSpd Read Loop, Queue Depth 8
Karta graficzna - Intel Arc Graphics
Evo 15 wykorzystuje zintegrowany Arc Graphics procesora Intel, choć jest to szybka wersja z 8 rdzeniami Xe. IGPU korzysta z dwukanałowej konfiguracji pamięci RAM, a w porównaniu do konkurentów z szybszą pamięcią 7467 RAM (np. RedmiBook Pro 16 lub IdeaPad Pro 5 16), wydajność graficzna w syntetycznych testach porównawczych jest tylko nieznacznie niższa. Karta graficzna Radeon 780M został tylko wyprzedzony w testach porównawczych. W tabelach GPU uwzględniliśmy również układy Schenker Via 14 Pro z Radeonem 780M, ponieważ powinien on oferować porównywalną wydajność do XMG Evo 15 z procesorem AMD.
Obecne GPU Intela to dobry wybór do codziennych multimediów, a aktualizacje sterowników w ostatnich miesiącach poprawiły również wydajność w grach i ogólnie nie ma tu żadnych niespodzianek. Pod względem rzeczywistej wydajności w grach, Arc Graphics traci jednak swoją przewagę, a iGPU są ostatecznie na tym samym poziomie wydajności.
Wydajność graficzna pozostaje stała pod stałym obciążeniem, ale wydajność spada o około 26% w trybie bateryjnym. Więcej testów porównawczych GPU można znaleźć w naszej sekcji technologicznej.
| 3DMark 11 Performance | 13430 pkt. | |
| 3DMark Fire Strike Score | 7941 pkt. | |
| 3DMark Time Spy Score | 4067 pkt. | |
| 3DMark Steel Nomad Score | 757 pkt. | |
| 3DMark Steel Nomad Light Score | 3248 pkt. | |
Pomoc | ||
| Blender / v3.3 Classroom CPU | |
| Przeciętny Intel Arc 8-Core iGPU (294 - 692, n=42) | |
| Średnia w klasie Multimedia (160 - 1042, n=66, ostatnie 2 lata) | |
| Lenovo ThinkPad T16 G2 21K70035GE | |
| Dell Inspiron 16 7640 2-in-1 | |
| Schenker XMG Evo 15 (M24) | |
| Medion S10 OLED | |
| Xiaomi RedmiBook Pro 16 2024 | |
| Lenovo IdeaPad Pro 5 16IMH G9 | |
| Blender / v3.3 Classroom oneAPI/Intel | |
| Średnia w klasie Multimedia (106 - 401, n=12, ostatnie 2 lata) | |
| Przeciętny Intel Arc 8-Core iGPU (208 - 309, n=17) | |
| Dell Inspiron 16 7640 2-in-1 | |
* ... im mniej tym lepiej
| The Witcher 3 - 1920x1080 Ultra Graphics & Postprocessing (HBAO+) | |
| Średnia w klasie Multimedia (11 - 121, n=25, ostatnie 2 lata) | |
| Schenker XMG Evo 15 (M24) | |
| Lenovo IdeaPad Pro 5 16IMH G9 | |
| Xiaomi RedmiBook Pro 16 2024 | |
| Lenovo ThinkPad T16 G2 21K70035GE | |
| Dell Inspiron 16 7640 2-in-1 | |
Cyberpunk 2077 Ultra FPS chart
| low | med. | high | ultra | |
|---|---|---|---|---|
| GTA V (2015) | 169.3 | 160.2 | 44.7 | 17.8 |
| The Witcher 3 (2015) | 152 | 93 | 49 | 26 |
| Dota 2 Reborn (2015) | 107.4 | 90.8 | 83.3 | 80.5 |
| Final Fantasy XV Benchmark (2018) | 77 | 40.3 | 29.2 | |
| X-Plane 11.11 (2018) | 54 | 40.4 | 35.8 | |
| Far Cry 5 (2018) | 77 | 43 | 41 | 38 |
| Strange Brigade (2018) | 171 | 73 | 62 | 52 |
| F1 22 (2022) | 96.1 | 87 | 65.2 | 16.9 |
| Baldur's Gate 3 (2023) | 40.3 | 31.1 | 27.5 | 26.2 |
| Cyberpunk 2077 (2023) | 37.9 | 31.4 | 26.7 | 23.7 |
| Total War Pharaoh (2023) | 101.4 | 77.6 | 58.9 | 52 |
Emisje - Cisza w codziennym życiu
Emisja hałasu
Chłodzenie Evo 15 jest często wyłączone lub bardzo ciche na biegu jałowym lub przy niskim obciążeniu. W przypadku większego obciążenia laptopa zależy to od aktywnego profilu energetycznego. W trybie Enthusiast maksimum wynosi 40,4 dB(A), a w trybie Balanced i Battery- 35,4 dB(A). Jeśli chcemy wykorzystać pełną moc procesora w trybie Overboost, chłodzenie staje się znacznie głośniejsze, osiągając maksymalnie 48,1 dB(A). Po zakończeniu fazy obciążenia wentylatory ponownie bardzo szybko zmniejszają swoją prędkość obrotową (w każdym profilu). W naszym urządzeniu testowym Evo 15 nie było żadnych innych odgłosów elektronicznych.
Hałas
| luz |
| 24.7 / 24.7 / 28.9 dB |
| obciążenie |
| 32.7 / 40.4 dB |
 | ||
30 dB cichy 40 dB(A) słyszalny 50 dB(A) irytujący |
||
min: | ||
| Schenker XMG Evo 15 (M24) Arc 8-Core, Ultra 7 155H, Samsung 990 Pro 1 TB | Dell Inspiron 16 7640 2-in-1 Arc 8-Core, Ultra 7 155H, Micron 2550 1TB | Medion S10 OLED Arc 8-Core, Ultra 7 155H, Phison PS5019-E19 SSO1TBITC4-E19-V7 | Xiaomi RedmiBook Pro 16 2024 Arc 8-Core, Ultra 7 155H, YMTC PC300-1TB | Lenovo IdeaPad Pro 5 16IMH G9 Arc 8-Core, Ultra 7 155H, Samsung PM9C1a MZAL81T0HDLB | Lenovo ThinkPad T16 G2 21K70035GE Radeon 780M, R7 7840U, SK hynix PC801 HFS001TEJ9X162N | |
|---|---|---|---|---|---|---|
| Noise | -4% | -9% | 4% | -6% | 8% | |
| wyłączone / środowisko * (dB) | 24.7 | 22.9 7% | 25 -1% | 24.4 1% | 24.1 2% | 24.5 1% |
| Idle Minimum * (dB) | 24.7 | 22.9 7% | 26 -5% | 24.4 1% | 24.1 2% | 24.5 1% |
| Idle Average * (dB) | 24.7 | 22.9 7% | 27 -9% | 24.4 1% | 24.1 2% | 24.5 1% |
| Idle Maximum * (dB) | 28.9 | 25 13% | 28 3% | 24.4 16% | 28.2 2% | 24.5 15% |
| Load Average * (dB) | 32.7 | 45.1 -38% | 43 -31% | 32 2% | 44.4 -36% | 26.6 19% |
| Cyberpunk 2077 ultra * (dB) | 40.4 | 44.9 -11% | 42 -4% | |||
| Load Maximum * (dB) | 40.4 | 44.9 -11% | 48 -19% | 39.7 2% | 44.4 -10% | 35.5 12% |
| Witcher 3 ultra * (dB) | 30.6 | 36.5 | 37.2 |
* ... im mniej tym lepiej
Temperatura
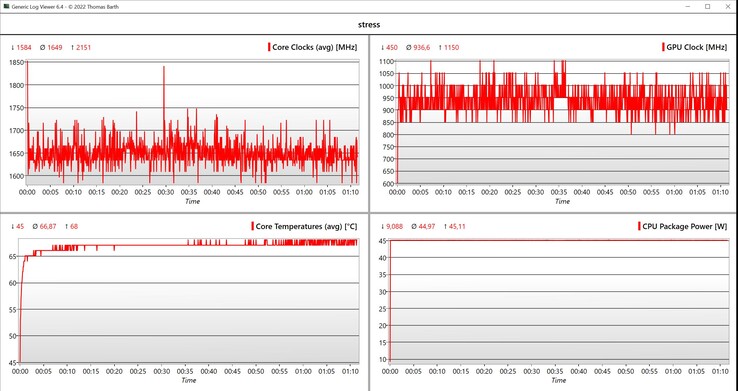
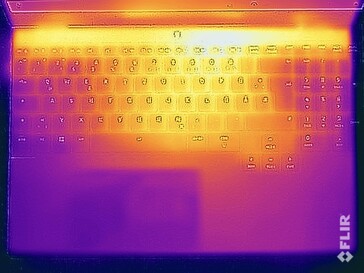
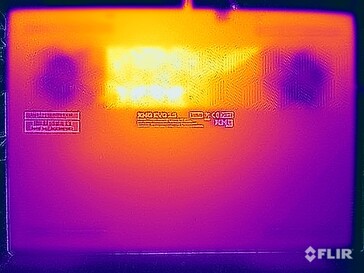
Aluminiowa obudowa Evo 15 pozostaje bardzo chłodna przy niskim obciążeniu i nie ma żadnych problemów nawet pod obciążeniem. Spód może osiągnąć prawie 50 °C w ekstremalnych przypadkach, ale gorący punkt znajduje się na spodzie w środkowej tylnej części. Urządzenia można używać nawet na udach. Obszar klawiatury pozostaje ogólnie znacznie chłodniejszy, nawet pod obciążeniem, i nie ma żadnych ograniczeń podczas pisania. W teście obciążeniowym procesor utrzymuje stałą wartość TDP.
(±) Maksymalna temperatura w górnej części wynosi 41.7 °C / 107 F, w porównaniu do średniej 36.9 °C / 98 F , począwszy od 21.1 do 71 °C dla klasy Multimedia.
(-) Dno nagrzewa się maksymalnie do 49.6 °C / 121 F, w porównaniu do średniej 39.1 °C / 102 F
(+) W stanie bezczynności średnia temperatura górnej części wynosi 29.5 °C / 85 F, w porównaniu ze średnią temperaturą urządzenia wynoszącą 31.3 °C / ### class_avg_f### F.
(±) 3: The average temperature for the upper side is 34.3 °C / 94 F, compared to the average of 31.3 °C / 88 F for the class Multimedia.
(+) Podparcia dłoni i touchpad osiągają maksymalną temperaturę skóry (32 °C / 89.6 F) i dlatego nie są gorące.
(-) Średnia temperatura obszaru podparcia dłoni w podobnych urządzeniach wynosiła 28.7 °C / 83.7 F (-3.3 °C / -5.9 F).
| Schenker XMG Evo 15 (M24) Intel Core Ultra 7 155H, Intel Arc 8-Core iGPU | Dell Inspiron 16 7640 2-in-1 Intel Core Ultra 7 155H, Intel Arc 8-Core iGPU | Medion S10 OLED Intel Core Ultra 7 155H, Intel Arc 8-Core iGPU | Xiaomi RedmiBook Pro 16 2024 Intel Core Ultra 7 155H, Intel Arc 8-Core iGPU | Lenovo IdeaPad Pro 5 16IMH G9 Intel Core Ultra 7 155H, Intel Arc 8-Core iGPU | Lenovo ThinkPad T16 G2 21K70035GE AMD Ryzen 7 7840U, AMD Radeon 780M | |
|---|---|---|---|---|---|---|
| Heat | -1% | -12% | 10% | 19% | 4% | |
| Maximum Upper Side * (°C) | 41.7 | 46.8 -12% | 55 -32% | 40.3 3% | 36.3 13% | 48.7 -17% |
| Maximum Bottom * (°C) | 49.6 | 45.6 8% | 55 -11% | 45.9 7% | 39.1 21% | 52 -5% |
| Idle Upper Side * (°C) | 31.1 | 32.2 -4% | 32 -3% | 26.3 15% | 24.9 20% | 26.4 15% |
| Idle Bottom * (°C) | 33.1 | 31.4 5% | 33 -0% | 27.9 16% | 26.1 21% | 26.3 21% |
* ... im mniej tym lepiej
Głośnik
Evo 15 oferuje dwa głośniki stereo, które zapewniają przyzwoitą jakość dźwięku. Chociaż istnieją laptopy multimedialne z lepszymi systemami dźwiękowymi (które mają również więcej głośników), Evo jest jednym z najlepszych modeli w tej dyscyplinie w grupie porównawczej. Dźwięk jest ogólnie czysty i wyraźny, a jedyny zauważalny spadek dotyczy basów.
Schenker XMG Evo 15 (M24) analiza dźwięku
(+) | głośniki mogą odtwarzać stosunkowo głośno (85.6 dB)
Bas 100 - 315 Hz
(-) | prawie brak basu - średnio 17.9% niższa od mediany
(±) | liniowość basu jest średnia (11.6% delta do poprzedniej częstotliwości)
Średnie 400 - 2000 Hz
(+) | zbalansowane środki średnie - tylko 3.7% od mediany
(+) | średnie są liniowe (4.5% delta do poprzedniej częstotliwości)
Wysokie 2–16 kHz
(+) | zrównoważone maksima - tylko 2.2% od mediany
(+) | wzloty są liniowe (6.5% delta do poprzedniej częstotliwości)
Ogólnie 100 - 16.000 Hz
(+) | ogólny dźwięk jest liniowy (11.8% różnicy w stosunku do mediany)
W porównaniu do tej samej klasy
» 17% wszystkich testowanych urządzeń w tej klasie było lepszych, 4% podobnych, 78% gorszych
» Najlepszy miał deltę 5%, średnia wynosiła ###średnia###%, najgorsza wynosiła 45%
W porównaniu do wszystkich testowanych urządzeń
» 8% wszystkich testowanych urządzeń było lepszych, 2% podobnych, 89% gorszych
» Najlepszy miał deltę 4%, średnia wynosiła ###średnia###%, najgorsza wynosiła 134%
Dell Inspiron 16 7640 2-in-1 analiza dźwięku
(+) | głośniki mogą odtwarzać stosunkowo głośno (84 dB)
Bas 100 - 315 Hz
(±) | zredukowany bas - średnio 13.9% niższy od mediany
(±) | liniowość basu jest średnia (14% delta do poprzedniej częstotliwości)
Średnie 400 - 2000 Hz
(+) | zbalansowane środki średnie - tylko 3.6% od mediany
(+) | średnie są liniowe (3.6% delta do poprzedniej częstotliwości)
Wysokie 2–16 kHz
(+) | zrównoważone maksima - tylko 4.5% od mediany
(+) | wzloty są liniowe (2.8% delta do poprzedniej częstotliwości)
Ogólnie 100 - 16.000 Hz
(+) | ogólny dźwięk jest liniowy (12% różnicy w stosunku do mediany)
W porównaniu do tej samej klasy
» 11% wszystkich testowanych urządzeń w tej klasie było lepszych, 4% podobnych, 85% gorszych
» Najlepszy miał deltę 6%, średnia wynosiła ###średnia###%, najgorsza wynosiła 57%
W porównaniu do wszystkich testowanych urządzeń
» 9% wszystkich testowanych urządzeń było lepszych, 2% podobnych, 89% gorszych
» Najlepszy miał deltę 4%, średnia wynosiła ###średnia###%, najgorsza wynosiła 134%
Medion S10 OLED analiza dźwięku
(+) | głośniki mogą odtwarzać stosunkowo głośno (85 dB)
Bas 100 - 315 Hz
(-) | prawie brak basu - średnio 17.3% niższa od mediany
(±) | liniowość basu jest średnia (9.5% delta do poprzedniej częstotliwości)
Średnie 400 - 2000 Hz
(+) | zbalansowane środki średnie - tylko 4.3% od mediany
(+) | średnie są liniowe (4.3% delta do poprzedniej częstotliwości)
Wysokie 2–16 kHz
(+) | zrównoważone maksima - tylko 1.2% od mediany
(+) | wzloty są liniowe (5% delta do poprzedniej częstotliwości)
Ogólnie 100 - 16.000 Hz
(+) | ogólny dźwięk jest liniowy (12.9% różnicy w stosunku do mediany)
W porównaniu do tej samej klasy
» 24% wszystkich testowanych urządzeń w tej klasie było lepszych, 4% podobnych, 72% gorszych
» Najlepszy miał deltę 5%, średnia wynosiła ###średnia###%, najgorsza wynosiła 45%
W porównaniu do wszystkich testowanych urządzeń
» 12% wszystkich testowanych urządzeń było lepszych, 3% podobnych, 86% gorszych
» Najlepszy miał deltę 4%, średnia wynosiła ###średnia###%, najgorsza wynosiła 134%
Xiaomi RedmiBook Pro 16 2024 analiza dźwięku
(+) | głośniki mogą odtwarzać stosunkowo głośno (83.8 dB)
Bas 100 - 315 Hz
(±) | zredukowany bas - średnio 13.6% niższy od mediany
(±) | liniowość basu jest średnia (7.9% delta do poprzedniej częstotliwości)
Średnie 400 - 2000 Hz
(±) | wyższe średnie - średnio 5.3% wyższe niż mediana
(+) | średnie są liniowe (5% delta do poprzedniej częstotliwości)
Wysokie 2–16 kHz
(+) | zrównoważone maksima - tylko 2.8% od mediany
(+) | wzloty są liniowe (5.3% delta do poprzedniej częstotliwości)
Ogólnie 100 - 16.000 Hz
(+) | ogólny dźwięk jest liniowy (13% różnicy w stosunku do mediany)
W porównaniu do tej samej klasy
» 24% wszystkich testowanych urządzeń w tej klasie było lepszych, 4% podobnych, 72% gorszych
» Najlepszy miał deltę 5%, średnia wynosiła ###średnia###%, najgorsza wynosiła 45%
W porównaniu do wszystkich testowanych urządzeń
» 12% wszystkich testowanych urządzeń było lepszych, 2% podobnych, 85% gorszych
» Najlepszy miał deltę 4%, średnia wynosiła ###średnia###%, najgorsza wynosiła 134%
Lenovo IdeaPad Pro 5 16IMH G9 analiza dźwięku
(±) | głośność głośnika jest średnia, ale dobra (81.1 dB)
Bas 100 - 315 Hz
(-) | prawie brak basu - średnio 22.3% niższa od mediany
(±) | liniowość basu jest średnia (10.5% delta do poprzedniej częstotliwości)
Średnie 400 - 2000 Hz
(+) | zbalansowane środki średnie - tylko 2.6% od mediany
(+) | średnie są liniowe (4.6% delta do poprzedniej częstotliwości)
Wysokie 2–16 kHz
(+) | zrównoważone maksima - tylko 1.2% od mediany
(+) | wzloty są liniowe (3.9% delta do poprzedniej częstotliwości)
Ogólnie 100 - 16.000 Hz
(+) | ogólny dźwięk jest liniowy (13.9% różnicy w stosunku do mediany)
W porównaniu do tej samej klasy
» 29% wszystkich testowanych urządzeń w tej klasie było lepszych, 4% podobnych, 67% gorszych
» Najlepszy miał deltę 5%, średnia wynosiła ###średnia###%, najgorsza wynosiła 45%
W porównaniu do wszystkich testowanych urządzeń
» 15% wszystkich testowanych urządzeń było lepszych, 4% podobnych, 81% gorszych
» Najlepszy miał deltę 4%, średnia wynosiła ###średnia###%, najgorsza wynosiła 134%
Lenovo ThinkPad T16 G2 21K70035GE analiza dźwięku
(±) | głośność głośnika jest średnia, ale dobra (75.1 dB)
Bas 100 - 315 Hz
(-) | prawie brak basu - średnio 23.9% niższa od mediany
(±) | liniowość basu jest średnia (13.8% delta do poprzedniej częstotliwości)
Średnie 400 - 2000 Hz
(+) | zbalansowane środki średnie - tylko 3.9% od mediany
(+) | średnie są liniowe (6.9% delta do poprzedniej częstotliwości)
Wysokie 2–16 kHz
(+) | zrównoważone maksima - tylko 2.1% od mediany
(+) | wzloty są liniowe (4.2% delta do poprzedniej częstotliwości)
Ogólnie 100 - 16.000 Hz
(±) | liniowość ogólnego dźwięku jest średnia (19.9% różnicy w stosunku do mediany)
W porównaniu do tej samej klasy
» 41% wszystkich testowanych urządzeń w tej klasie było lepszych, 9% podobnych, 50% gorszych
» Najlepszy miał deltę 7%, średnia wynosiła ###średnia###%, najgorsza wynosiła 53%
W porównaniu do wszystkich testowanych urządzeń
» 51% wszystkich testowanych urządzeń było lepszych, 7% podobnych, 42% gorszych
» Najlepszy miał deltę 4%, średnia wynosiła ###średnia###%, najgorsza wynosiła 134%
Zarządzanie energią
Zużycie energii
Duży i jasny wyświetlacz ma wpływ na zużycie energii i zmierzyliśmy maksymalnie nieco poniżej 14 watów w trybie bezczynności. Zarówno w grach, jak i w teście obciążeniowym, zużycie wynosi 76-78 watów i pozostaje absolutnie stabilne, więc 100-watowy zasilacz jest całkowicie wystarczający. W profilu Overboost zmierzyliśmy maksymalnie 107,9 W, więc zasilacz nie ma już więcej swobody, aby na przykład naładować baterię. Jednak bateria również nie jest tutaj wykorzystywana. Jak już wspomnieliśmy, zużycie energii w trybie czuwania na poziomie 1,4 wata jest zbyt wysokie.
| wyłączony / stan wstrzymania | |
| luz | |
| obciążenie |
|
Legenda:
min: | |
| Schenker XMG Evo 15 (M24) Ultra 7 155H, Arc 8-Core, Samsung 990 Pro 1 TB, IPS, 2560x1600, 15.3" | Dell Inspiron 16 7640 2-in-1 Ultra 7 155H, Arc 8-Core, Micron 2550 1TB, Mini-LED, 2560x1600, 16" | Medion S10 OLED Ultra 7 155H, Arc 8-Core, Phison PS5019-E19 SSO1TBITC4-E19-V7, OLED, 3840x2400, 16" | Xiaomi RedmiBook Pro 16 2024 Ultra 7 155H, Arc 8-Core, YMTC PC300-1TB, IPS, 3072x1920, 16" | Lenovo IdeaPad Pro 5 16IMH G9 Ultra 7 155H, Arc 8-Core, Samsung PM9C1a MZAL81T0HDLB, IPS, 2560x1600, 16" | Lenovo ThinkPad T16 G2 21K70035GE R7 7840U, Radeon 780M, SK hynix PC801 HFS001TEJ9X162N, IPS LED, 1920x1200, 16" | Przeciętny Intel Arc 8-Core iGPU | Średnia w klasie Multimedia | |
|---|---|---|---|---|---|---|---|---|
| Power Consumption | 3% | 10% | 1% | 20% | 40% | 20% | 4% | |
| Idle Minimum * (Watt) | 7.7 | 6.1 21% | 7 9% | 4.2 45% | 3.5 55% | 3.7 52% | 5.36 ? 30% | 5.95 ? 23% |
| Idle Average * (Watt) | 13.2 | 13.5 -2% | 10 24% | 11.6 12% | 9.6 27% | 7.2 45% | 8.53 ? 35% | 10.3 ? 22% |
| Idle Maximum * (Watt) | 13.7 | 13.8 -1% | 19 -39% | 12.3 10% | 9.9 28% | 8.7 36% | 11.8 ? 14% | 12.4 ? 9% |
| Load Average * (Watt) | 76.2 | 63.6 17% | 52 32% | 61.9 19% | 62.7 18% | 44.1 42% | 53.7 ? 30% | 68 ? 11% |
| Cyberpunk 2077 ultra * (Watt) | 76.7 | 67 13% | 53.2 31% | |||||
| Cyberpunk 2077 ultra external monitor * (Watt) | 72.7 | 64.6 11% | 49.2 32% | |||||
| Load Maximum * (Watt) | 78.1 | 109.7 -40% | 95 -22% | 140.6 -80% | 101.2 -30% | 58.2 25% | 84.4 ? -8% | 114.4 ? -46% |
| Witcher 3 ultra * (Watt) | 57 | 55.8 | 50.9 |
* ... im mniej tym lepiej
Powr consumption Cyberpunk / Stress test
Power consumption with the external monitor
Żywotność baterii
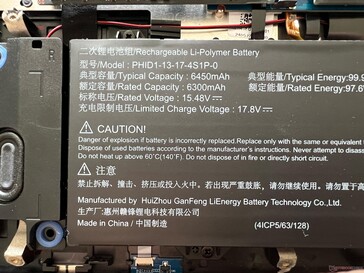
Schenker instaluje w Evo 15 potężną baterię o pojemności 99,8 Wh, co zapewnia ogólnie dobry czas pracy pomimo energochłonnego wyświetlacza, chociaż Medion S10 oferuje jeszcze większą wytrzymałość. W teście WLAN przy 150 cd/m² (co odpowiada 58% maksymalnej jasności w urządzeniu testowym) zmierzyliśmy 10:25 godzin przy 60 Hz i 08:25 godzin przy 240 Hz. Przy pełnej jasności czas pracy spada do 8 godzin (60 Hz) lub 6:39 godzin (240 Hz), więc zdecydowanie należy zmniejszyć częstotliwość w trybie baterii.
Test wideo trwa nieco ponad 12 godzin, a pod obciążeniem najgorszy scenariusz to 2:14 godziny. Pełne naładowanie zajmuje długie 165 minut, gdy urządzenie jest włączone (80% po 130 minutach) i nie ma funkcji szybkiego ładowania.
| Schenker XMG Evo 15 (M24) Ultra 7 155H, Arc 8-Core, 99.9 Wh | Dell Inspiron 16 7640 2-in-1 Ultra 7 155H, Arc 8-Core, 90 Wh | Medion S10 OLED Ultra 7 155H, Arc 8-Core, 70 Wh | Xiaomi RedmiBook Pro 16 2024 Ultra 7 155H, Arc 8-Core, 99 Wh | Lenovo IdeaPad Pro 5 16IMH G9 Ultra 7 155H, Arc 8-Core, 84 Wh | Lenovo ThinkPad T16 G2 21K70035GE R7 7840U, Radeon 780M, 52.5 Wh | Średnia w klasie Multimedia | |
|---|---|---|---|---|---|---|---|
| Czasy pracy | -9% | -30% | 44% | 1% | -27% | 6% | |
| H.264 (h) | 12.2 | 21.8 79% | 16 31% | 16 ? 31% | |||
| WiFi v1.3 (h) | 10.4 | 11.4 10% | 7.3 -30% | 16.4 58% | 12.6 21% | 11 6% | 11.5 ? 11% |
| Load (h) | 2.2 | 1.6 -27% | 2.1 -5% | 1.1 -50% | 0.9 -59% | 1.667 ? -24% |
Za
Przeciw
Werdykt - Jeden z najlepszych notebooków multimedialnych bez dGPU
Wraz z nowym XMG Evo 15 (M24), niemiecki producent Schenker wprowadza na rynek dobry notebook multimedialny bez dedykowanej karty graficznej. Nie jest to najcieńszy laptop na rynku, ale Evo 15 nie aspiruje do tego miana. Z drugiej strony otrzymujemy bardzo dobre opcje konserwacji, a zarówno pamięć RAM (maks. 96 GB), jak i pojemność dysku SSD (2 gniazda M.2-2280) można łatwo rozszerzyć. Jest też wystarczająco dużo portów, chociaż zastanawiamy się, w jaki sposób stary port USB 2.0 znalazł się w urządzeniu. Ponieważ jednak istnieje wiele innych szybkich portów USB (Intel z Thunderbolt 4, AMD z USB 4.0), nie jest to duży problem. Nie ma też zbyt wielu powodów do narzekań, jeśli chodzi o urządzenia wejściowe i głośniki.
Jeśli chodzi o wyświetlacz, można rozpoznać gamingowe korzenie i związek z XMG Fusion 15 ale nie jest to wada. Matowy panel IPS oferuje wysoką rozdzielczość i szybką częstotliwość 240 Hz. Ponadto nie ma PWM, a czasy reakcji są również szybkie. Jasność jest bardzo dobra i wynosi prawie 600 cd/m², co z kolei wpływa na poziom czerni, a tym samym na współczynnik kontrastu. Każdy, kto spodziewa się bogatej czerni jak w panelu OLED, z pewnością będzie rozczarowany. Po kalibracji dokładność odwzorowania kolorów jest doskonała, a dzięki pełnemu pokryciu palety sRGB panel nadaje się również do edycji obrazu. Duża bateria o pojemności 99,8 Wh jest w stanie dobrze zrekompensować zużycie energii przez wyświetlacz, a ogólna wytrzymałość z dala od gniazdka jest przyzwoita.
Doskonałe opcje konserwacji, jasny wyświetlacz IPS z dokładnymi kolorami i dobrymi wartościami wydajności przy spójnych profilach energetycznych: Nowy Schenker XMG Evo 15 to ekscytujący laptop multimedialny bez dedykowanej karty graficznej, który jest dostępny zarówno z procesorami AMD, jak i Intel i nie ma naprawdę słabych punktów.
Wydajność Evo 15 z procesorem Intel jest ogólnie bardzo dobra, a przede wszystkim stabilna, ponieważ nie ma absurdalnie wysokich krótkoterminowych limitów mocy. Jeśli potrzebują Państwo wyższej wydajności, mogą Państwo skorzystać z trybu Overboost, ale będą Państwo musieli pogodzić się z głośniejszymi wentylatorami. Ogólnie jednak Evo 15 jest bardzo cichym towarzyszem, szczególnie do codziennych zadań.
Dzięki tym wszystkim pozytywnym aspektom, nowy Evo 15 jest niemal bezkonkurencyjny na rynku. Pozostaje pytanie, czy powinni Państwo wybrać model Intel czy AMD. Chociaż model AMD ma tylko USB 4.0 zamiast Thunderbolt 4, producent twierdzi, że wydajność (pomimo nieco niższych limitów mocy Ryzen 7 8845HS) jest porównywalna. Nie spodziewamy się również dużych różnic w żywotności baterii, co nasuwa pytanie, dlaczego klienci mieliby płacić 150 euro więcej za procesor Intela. Model AMD, którego cena zaczyna się od 1049 euro, zdecydowanie oferuje lepszy stosunek ceny do wydajności.
Cena i dostępność
Nowy Schenker XMG Evo 15 (M24) można już zamawiać w Bestware. Model AMD zaczyna się od 1049 euro, a wersja Intel od 1199 euro.
Uwaga: Niedawno zaktualizowaliśmy nasz system oceny i wyniki wersji 8 nie są porównywalne z wynikami wersji 7. Więcej informacji można znaleźć tutaj.
Schenker XMG Evo 15 (M24)
- 31/07/2024 v8
Andreas Osthoff
Przezroczystość
Wyboru urządzeń do recenzji dokonuje nasza redakcja. Próbka testowa została udostępniona autorowi jako pożyczka od producenta lub sprzedawcy detalicznego na potrzeby tej recenzji. Pożyczkodawca nie miał wpływu na tę recenzję, producent nie otrzymał też kopii tej recenzji przed publikacją. Nie było obowiązku publikowania tej recenzji. Jako niezależna firma medialna, Notebookcheck nie podlega władzy producentów, sprzedawców detalicznych ani wydawców.
Tak testuje Notebookcheck
Każdego roku Notebookcheck niezależnie sprawdza setki laptopów i smartfonów, stosując standardowe procedury, aby zapewnić porównywalność wszystkich wyników. Od około 20 lat stale rozwijamy nasze metody badawcze, ustanawiając przy tym standardy branżowe. W naszych laboratoriach testowych doświadczeni technicy i redaktorzy korzystają z wysokiej jakości sprzętu pomiarowego. Testy te obejmują wieloetapowy proces walidacji. Nasz kompleksowy system ocen opiera się na setkach uzasadnionych pomiarów i benchmarków, co pozwala zachować obiektywizm.









 Total Sustainability Score: