Recenzja laptopa Medion Erazer Major X10: Debiut Intel Arc A730M
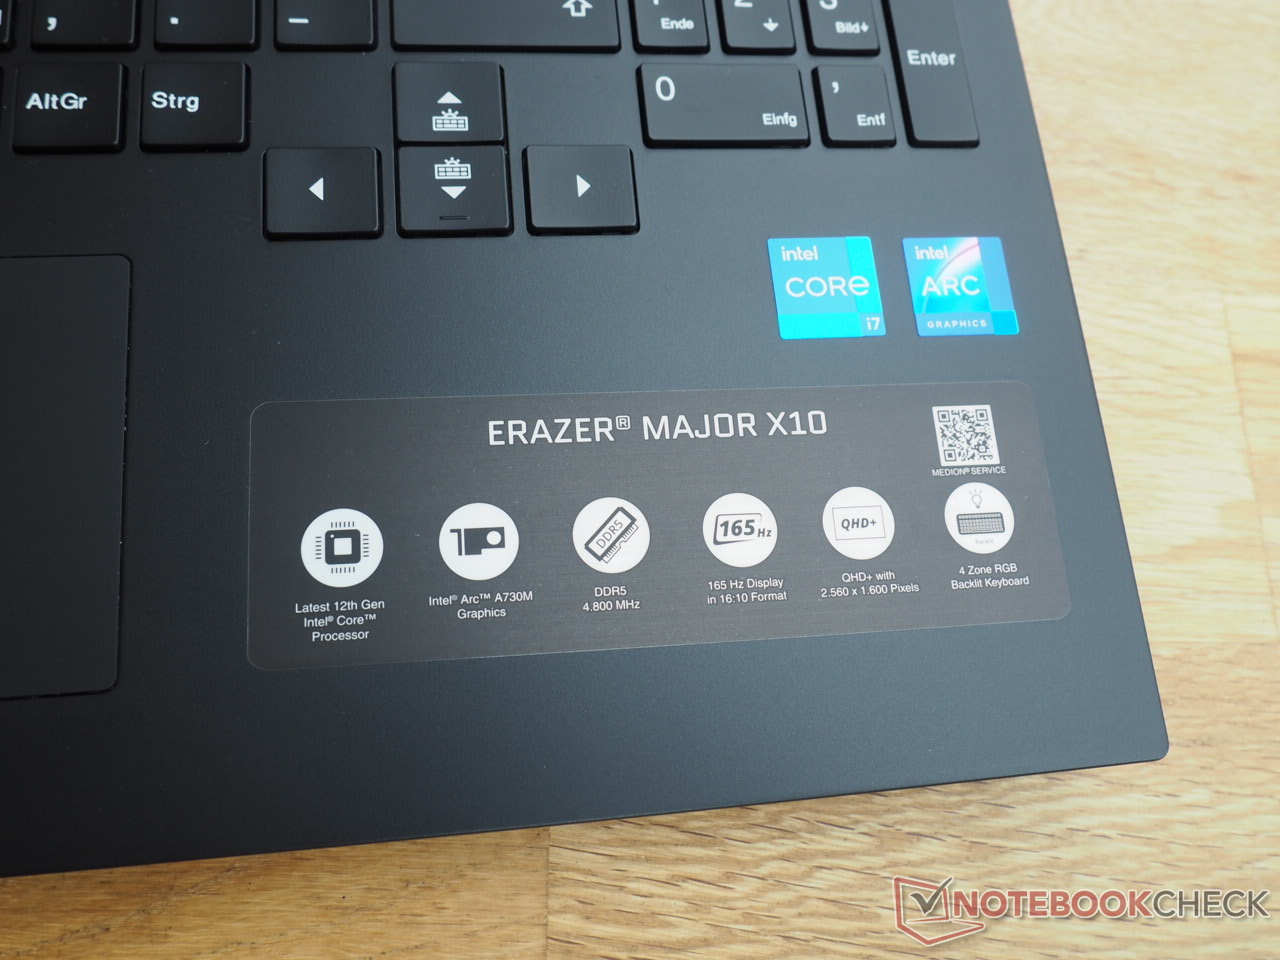
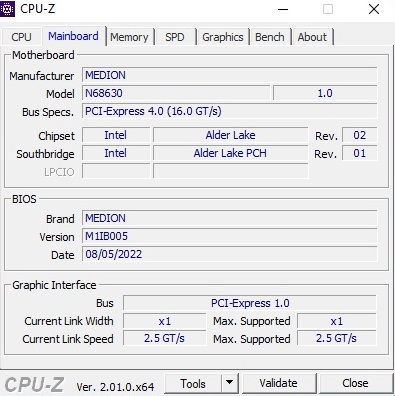
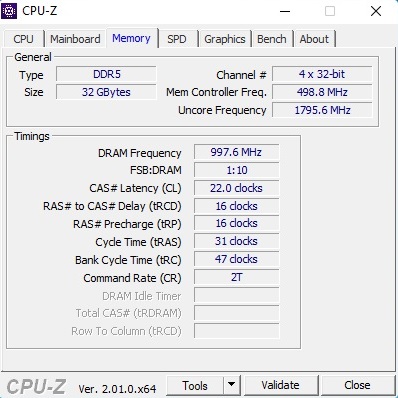
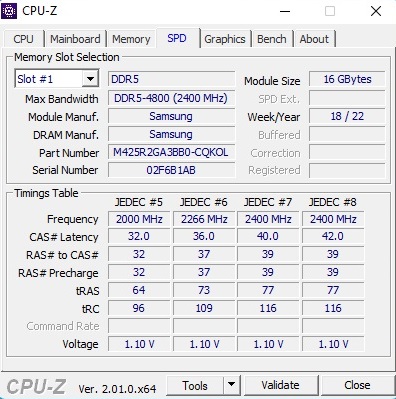
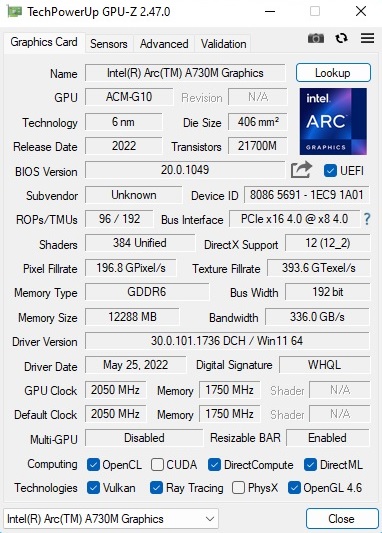
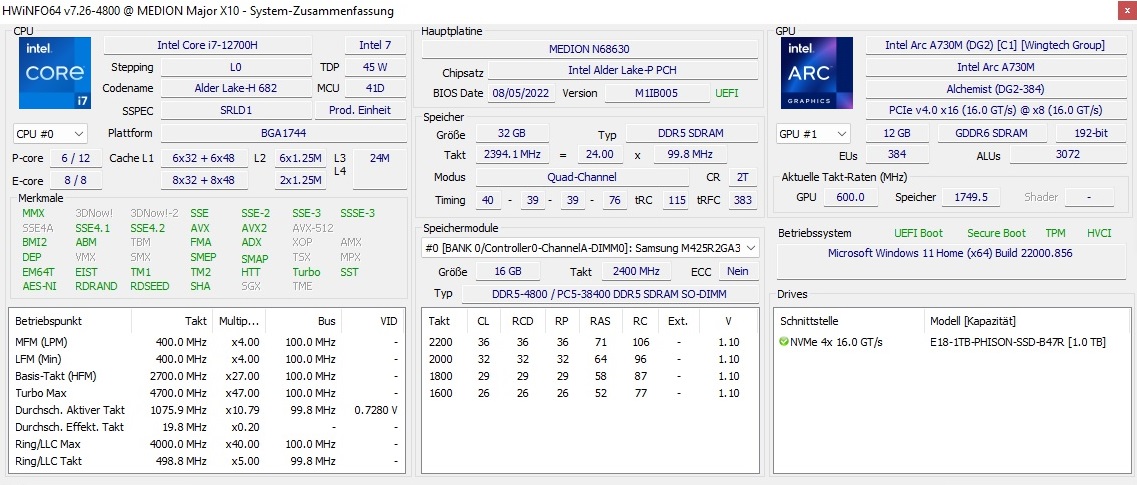
Erazer Major X10 kosztuje około 1 700 euro (1 728 dolarów) i jest dostępny w sklepie internetowym Medion https://www.medion.com/de/shop/p/core-gaming-notebooks-medion-erazer-major-x10-intel-core-i7-12700h-windows-11-home-40-6-cm-16-0--qhd-display-100-srgb-mit-165-hz-intel-arc-a730m-1-tb-pcie-ssd-32-gb-ram-high-end-gaming-notebook-30034414A1. W tej cenie otrzymujemy nie tylko 32 GB dwukanałowej pamięci RAM (2 x 16 GB DDR5-4800), ale także 1 TB pamięci masowej NVMe. W laptopie zastosowano Core i7-12700H, czyli 14-rdzeniowy procesor, który jest bardzo popularny w laptopach dla graczy. Jak wspomnieliśmy na początku, wymagającym przetwarzaniem grafiki zajmuje się Intel Arc A730M - średniej klasy GPU, które ma przede wszystkim konkurować z m.in GeForce RTX 3060 i Radeon RX 6600M. Laptop posiada również matowy wyświetlacz 165 Hz o proporcjach 16:10 i rozdzielczości 2 560 x 1 600. Windows 11 Home dopełnia całości.
Major X10 konkuruje z innymi średniej klasy laptopami do gier, takimi jak Asus TUF F17 FX707Z-HX011W, Acer Nitro 5 AN517-55-738R (oba z RTX 3060; jeden z wyższym a drugi z przeciętnym TGP) oraz HP Omen 16-c0077ng (RX 6600M). Rzekomo wolniejsze są m.in Dell Inspiron 16 Plus 7620 z GeForce RTX 3050 Ti jest podobnie uwzględniony w tabelach porównawczych. Wyjaśnimy, dlaczego w dalszej części recenzji.
Potencjalni konkurenci w porównaniu
Ocena | Data | Model | Waga | Wysokość | Rozmiar | Rezolucja | Cena |
|---|---|---|---|---|---|---|---|
| 85 % v7 (old) | 10/2022 | Medion Erazer Major X10 i7-12700H, A730M | 2.5 kg | 31 mm | 16.00" | 2560x1600 | |
| 84.1 % v7 (old) | Asus TUF Gaming F17 FX707Z-HX011W i7-12700H, GeForce RTX 3060 Laptop GPU | 2.5 kg | 25 mm | 17.30" | 1920x1080 | ||
| 83.9 % v7 (old) | Acer Nitro 5 AN517-55-738R i7-12700H, GeForce RTX 3060 Laptop GPU | 3.1 kg | 28.6 mm | 17.30" | 1920x1080 | ||
| 87.4 % v7 (old) | Dell Inspiron 16 Plus 7620 i7-12700H, GeForce RTX 3050 Ti Laptop GPU | 2.1 kg | 18.99 mm | 16.00" | 3072x1920 | ||
| 86 % v7 (old) | HP Omen 16-c0077ng R7 5800H, Radeon RX 6600M | 2.3 kg | 26 mm | 16.10" | 2560x1440 |
Podwozie
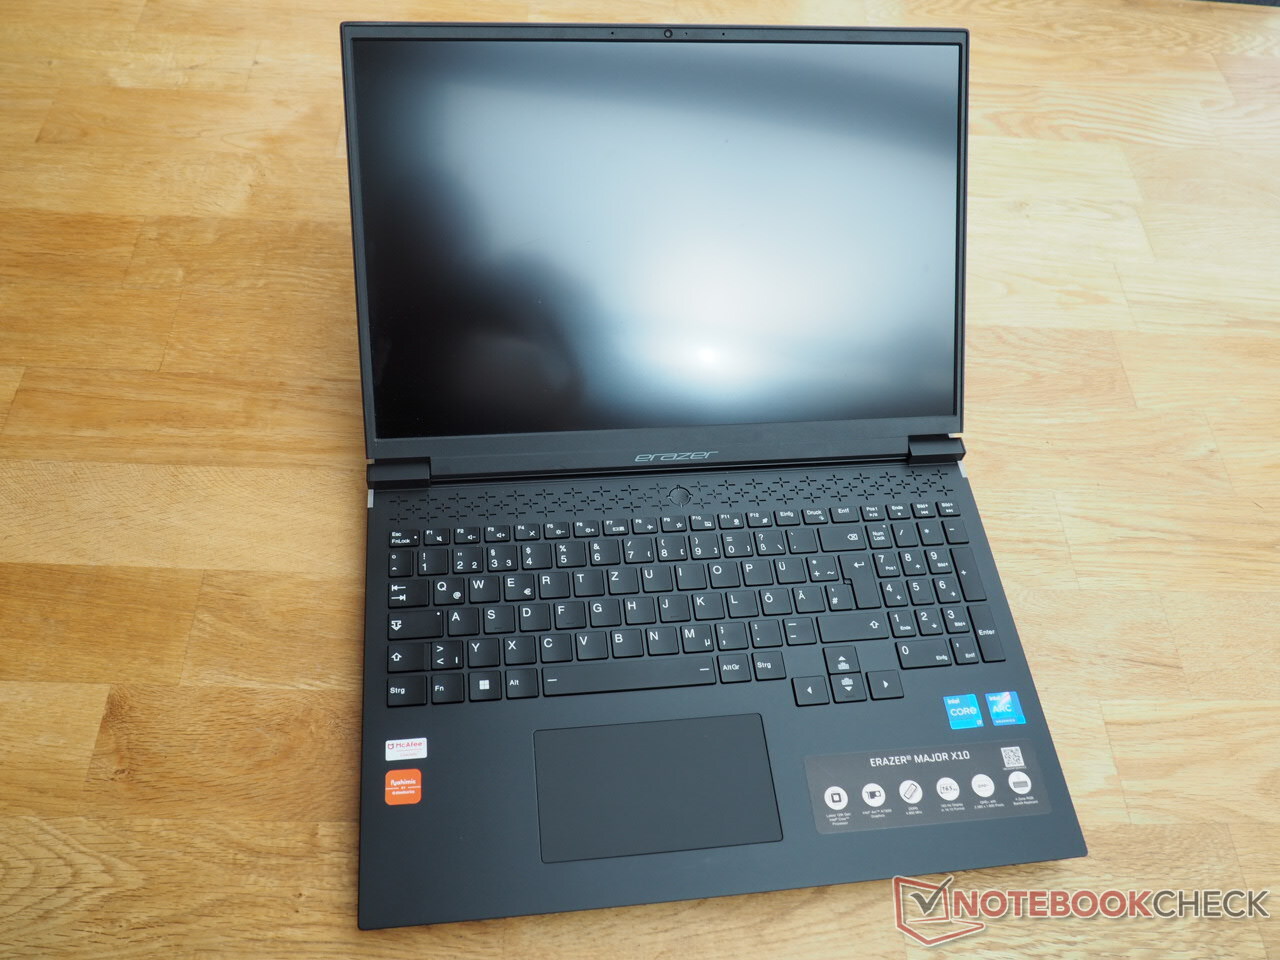
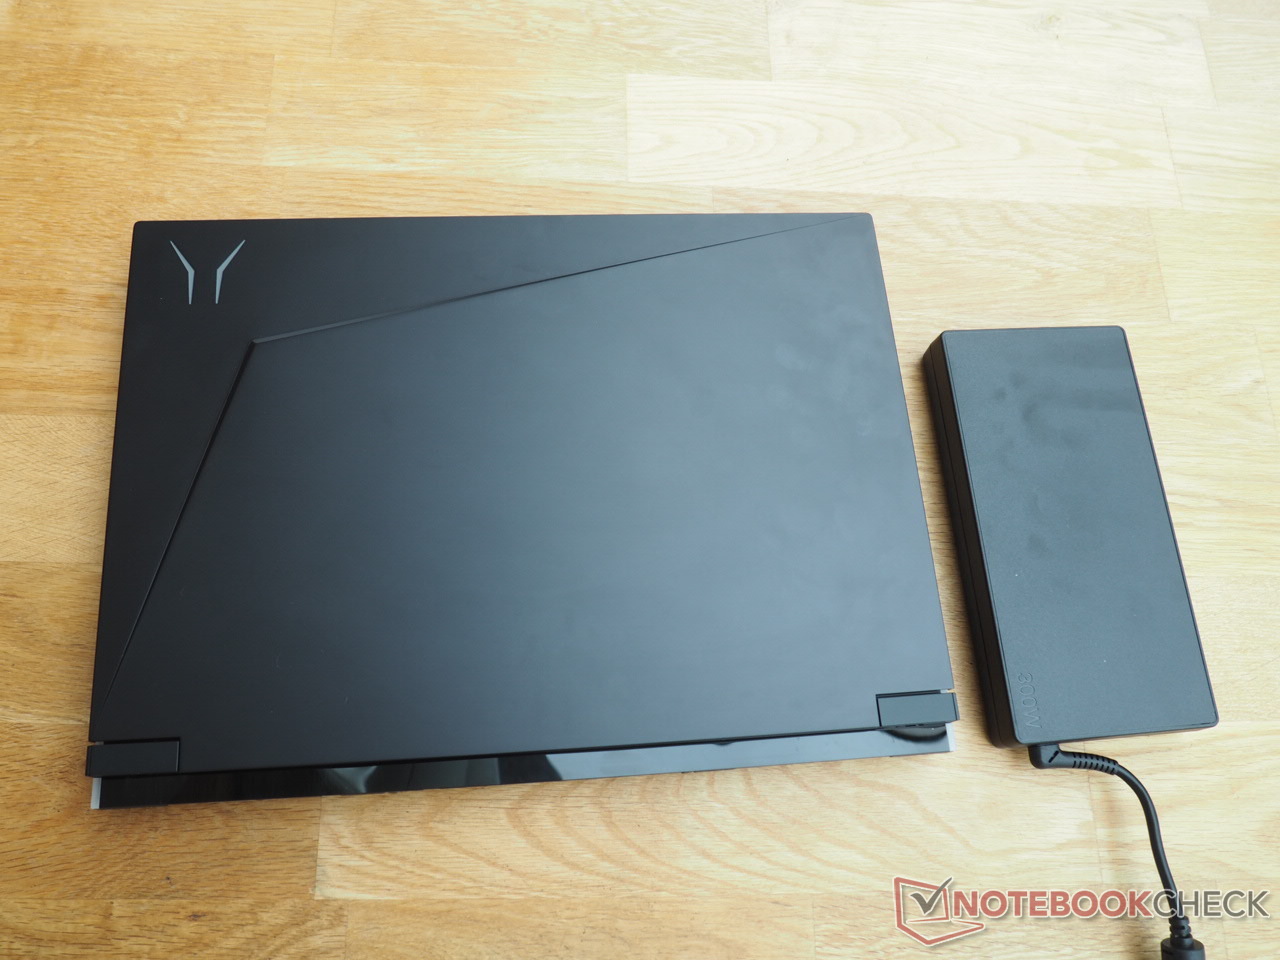
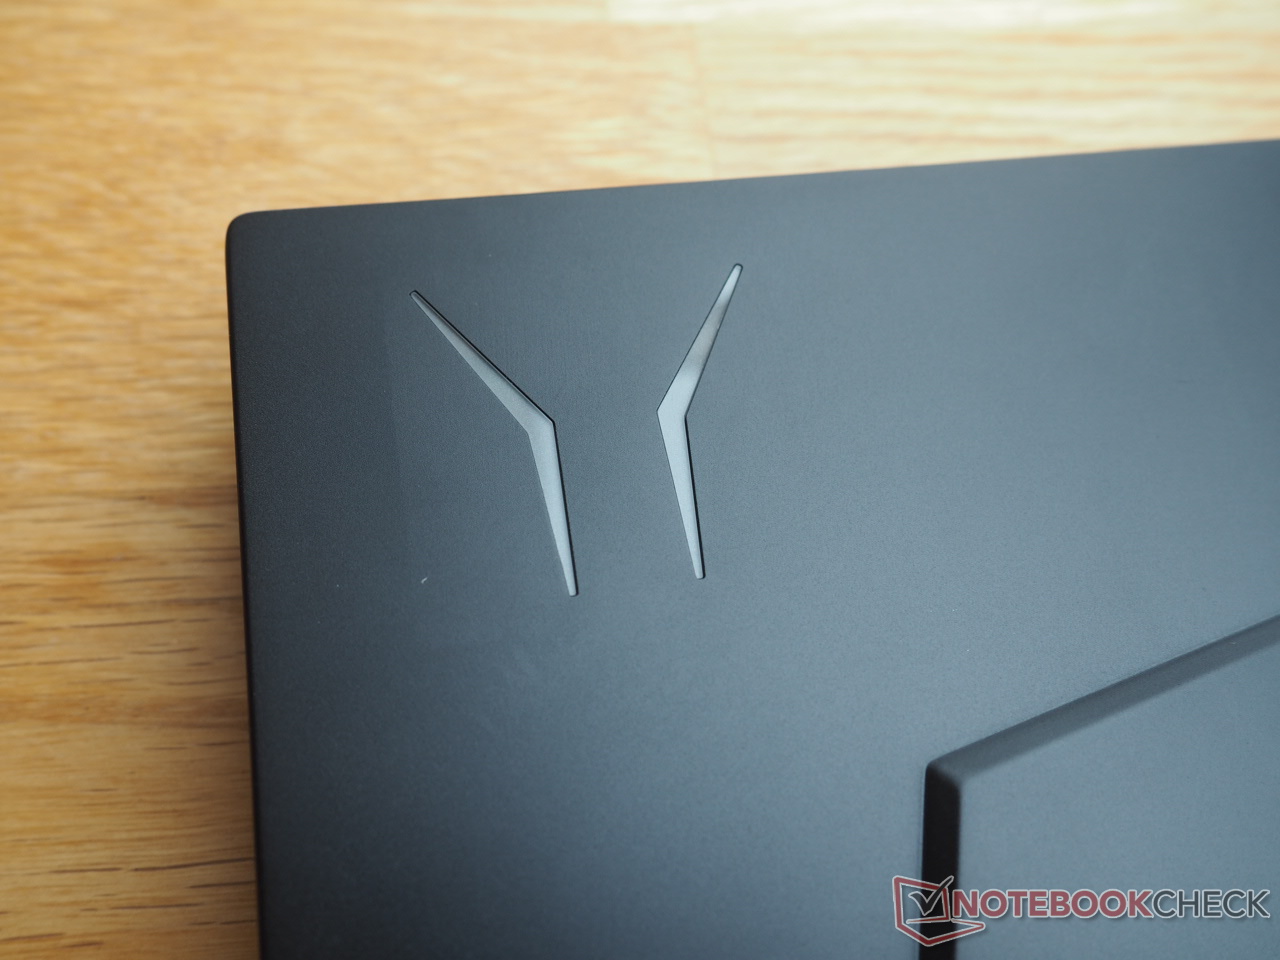
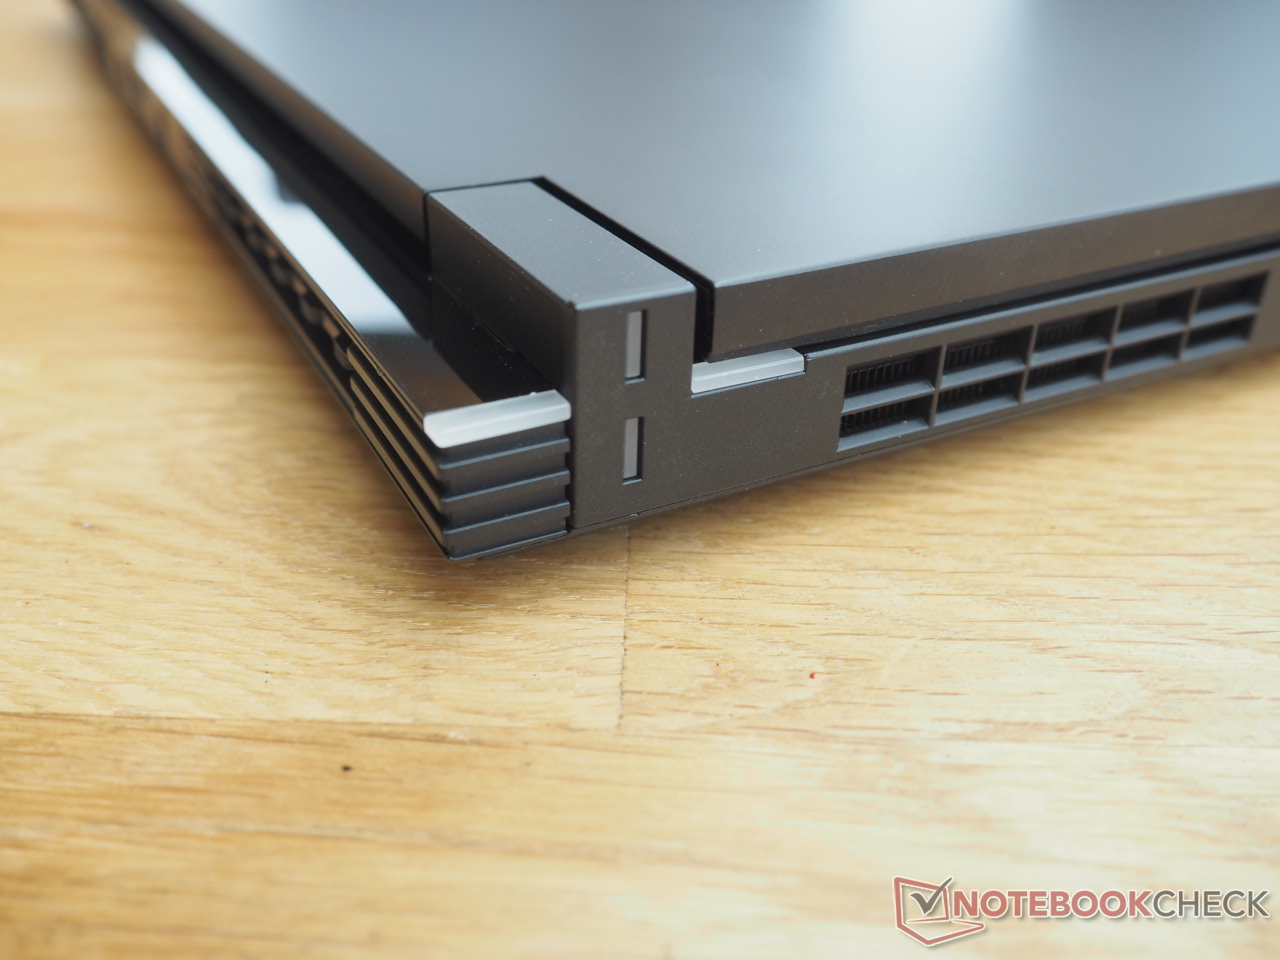
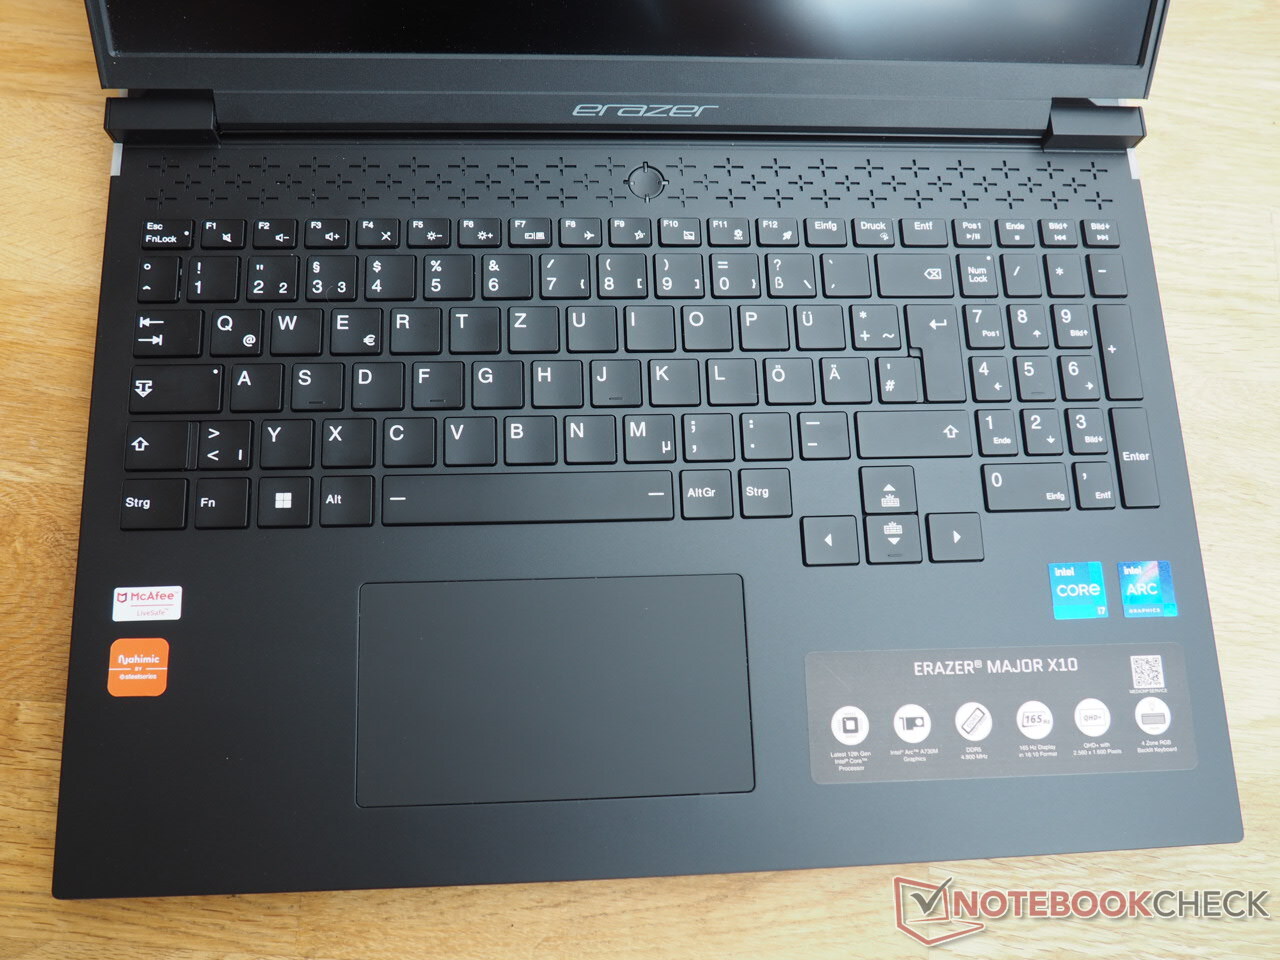
Pod względem wyglądu Major X10 przypomina nam serię Legion firmy Lenovo. Medion zdecydował się na zastosowanie matowej, czarnej obudowy z aluminiową pokrywą. Obudowa sprawia naszym zdaniem wrażenie solidnej, choć część dolna może się w niektórych miejscach uginać przy użyciu większej siły, a wieko mogłoby być nieco twardsze (jak w przypadku większości laptopów). Wyświetlacz można otworzyć do 180°, co jest raczej nietypowe dla laptopa. Natomiast zawiasy spełniają swoje zadanie bez zarzutu. Na przykład urządzenie można bez problemu otworzyć jedną ręką. Medion wyposażył laptopa w liczne elementy podświetlenia, dzięki czemu przypadnie on do gustu graczom. Oprócz klawiatury wizualnie wyróżnia się logo na pokrywie oraz krzyżyk z tyłu boków. Otwory wentylacyjne nad klawiaturą mają wzór krzyża, co dopełnia ogólnej estetyki.
Major X10 ma bardzo dobre spasowanie i wykończenie. W naszym egzemplarzu testowym wszystkie powierzchnie są połączone w sposób staranny. Przy masie 2,5 kg (5,5 lb) to 16-calowe urządzenie nie jest ani lekkie, ani szczególnie ciężkie jak na laptop do gier. Dla porównania nieco większe Asus TUF F17 i Acer Nitro 5 AN517 ważą odpowiednio 2,5 kg i 3,1 kg, a 16-calowi konkurenci Omen 16 i Inspiron 16 Plus są minimalnie lżejsi - odpowiednio 2,3 kg i 2,1 kg. Według producenta Major X10 ma grubość 2,7 cm (1,06") bez nóżek i 3,1 cm (1,22") z nimi.
Cechy
Interfejsy
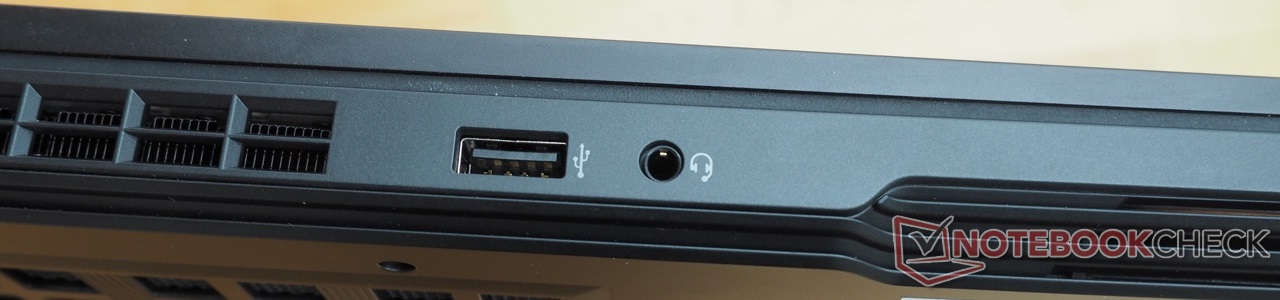
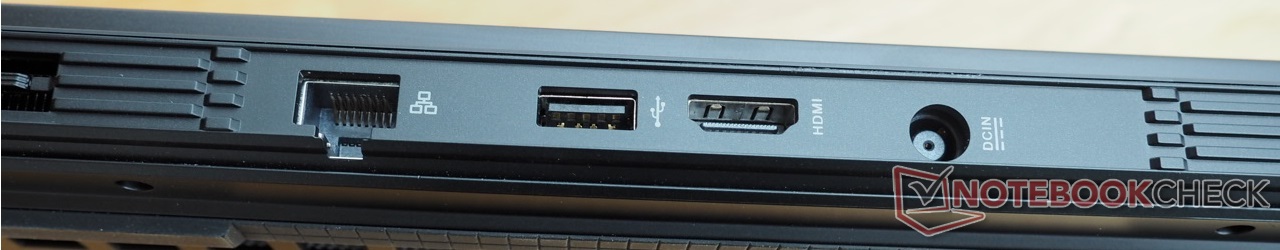
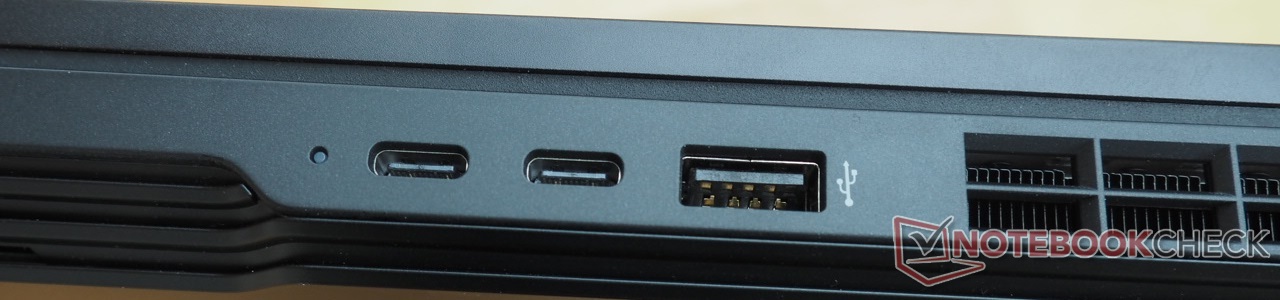
Jeżeli komuś nie przeszkadza brak portu Thunderbolt i czytnika kart, będzie zadowolony z wyboru portów w omawianym laptopie. Są tu trzy porty USB typu A i dwa typu C (kompatybilne z DisplayPort), a wszystkie oprócz jednego obsługują standard 3.2 Gen 2. Laptop posiada również combo audio jack (słuchawki i mikrofon), port Ethernet RJ45 oraz wyjście HDMI 2.0. Dzięki temu, że najważniejsze porty znajdują się z tyłu laptopa, nie będziemy musieli się martwić, że podczas gry z zewnętrzną myszką nasze ruchy będą mocno ograniczone.
Łączność
Podczas naszego testu Wi-Fi (laptop w odległości 1 m od naszego referencyjnego routera Asus AXE11000) nie było żadnych niespodzianek. Znajdujący się wewnątrz urządzenia moduł Intel Wi-Fi 6 AX201 zapewnia wysokie prędkości transferu, zgodne z oczekiwaniami.
| Networking | |
| iperf3 receive AXE11000 | |
| Medion Erazer Major X10 | |
| Średnia w klasie Gaming (680 - 1745, n=93, ostatnie 2 lata) | |
| Przeciętny Intel Wi-Fi 6 AX201 (390 - 1734, n=79) | |
| iperf3 transmit AXE11000 | |
| Medion Erazer Major X10 | |
| Przeciętny Intel Wi-Fi 6 AX201 (438 - 1715, n=74) | |
| Średnia w klasie Gaming (560 - 1862, n=93, ostatnie 2 lata) | |
Kamera internetowa
Medionowi przydałaby się lepsza kamera internetowa. Choć kamera internetowa jest nieco ostrzejsza i szybsza od wielu konkurentów, brakuje jej dokładności odwzorowania kolorów, podobnie jak wielu wbudowanym kamerom internetowym w laptopach.


Akcesoria
Nasz egzemplarz recenzencki był dostarczany tylko z 300-watowym zasilaczem, który mierzy około 20 x 9 x 2 cm (7,9 x 3,5 x 0,8").
Konserwacja
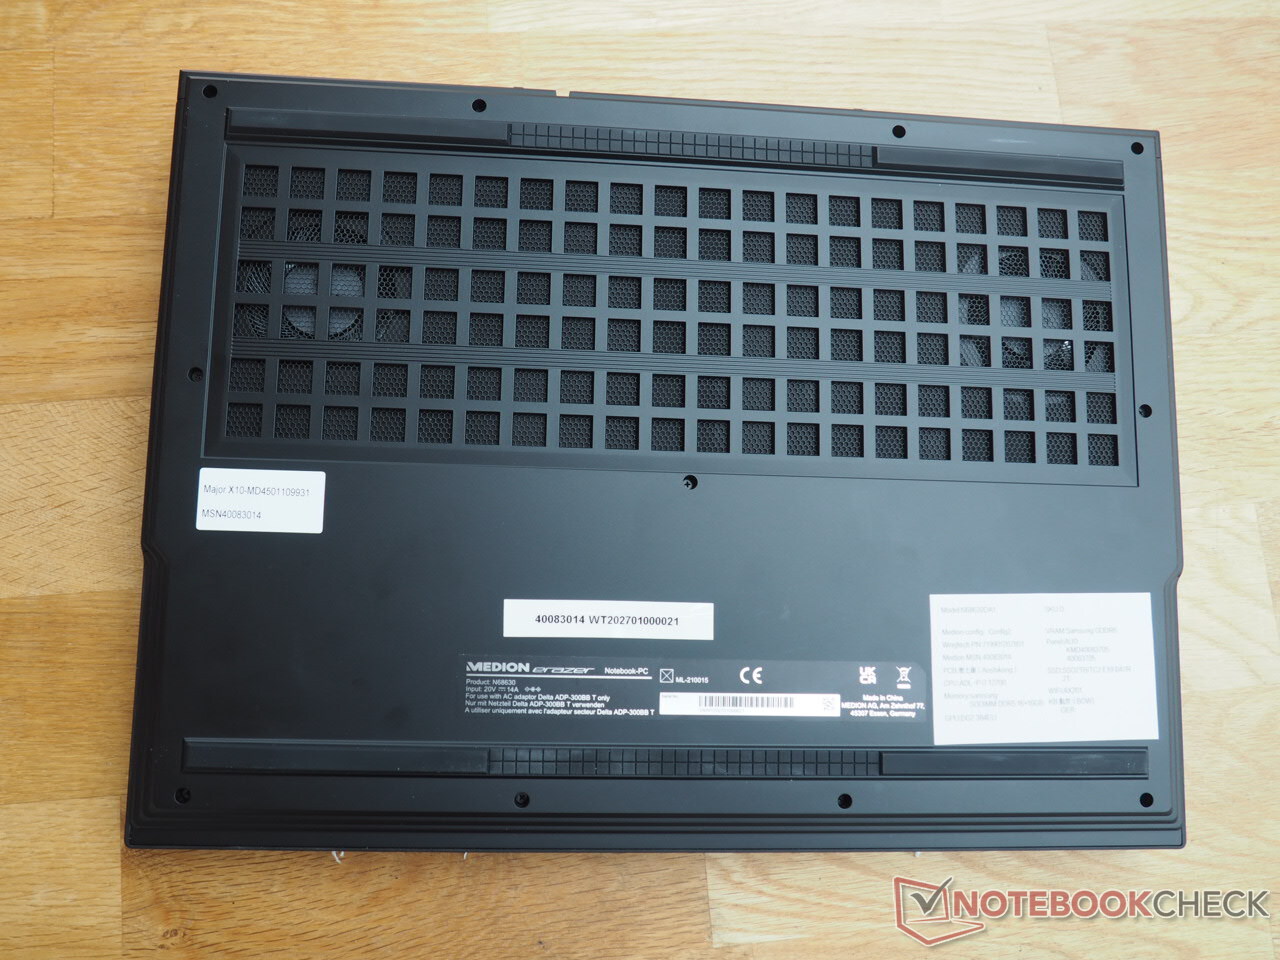
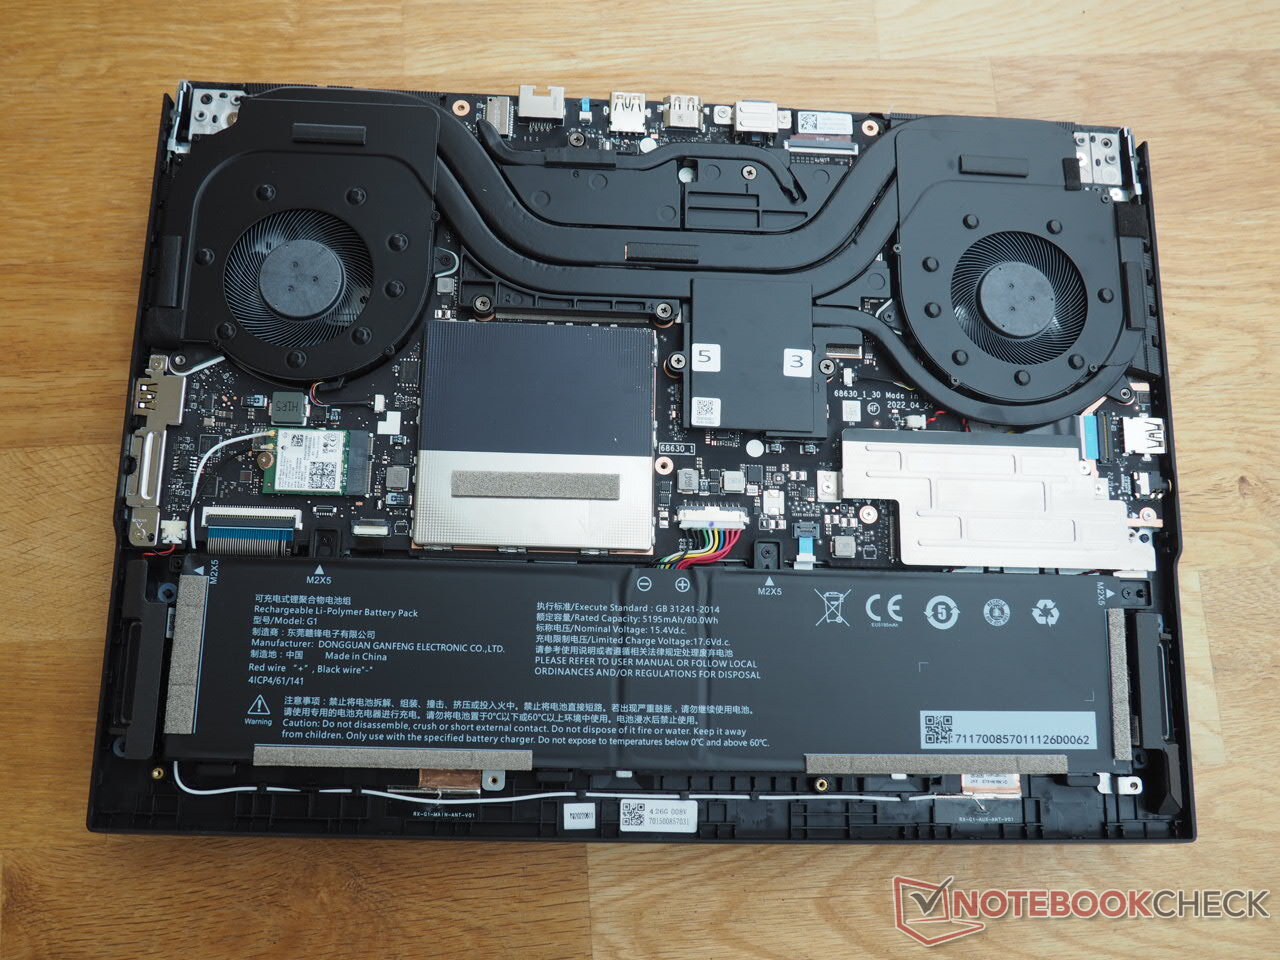
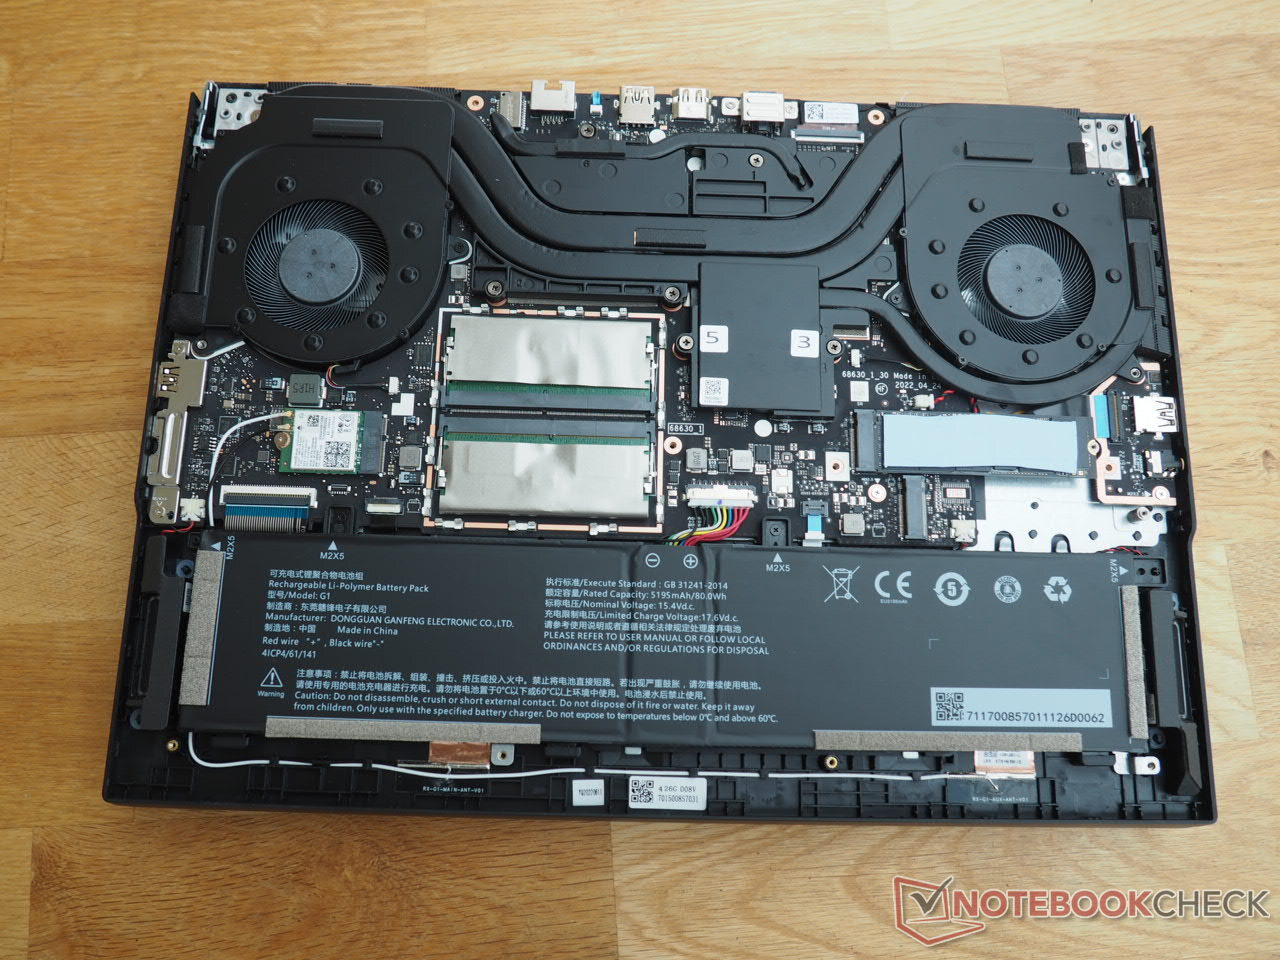
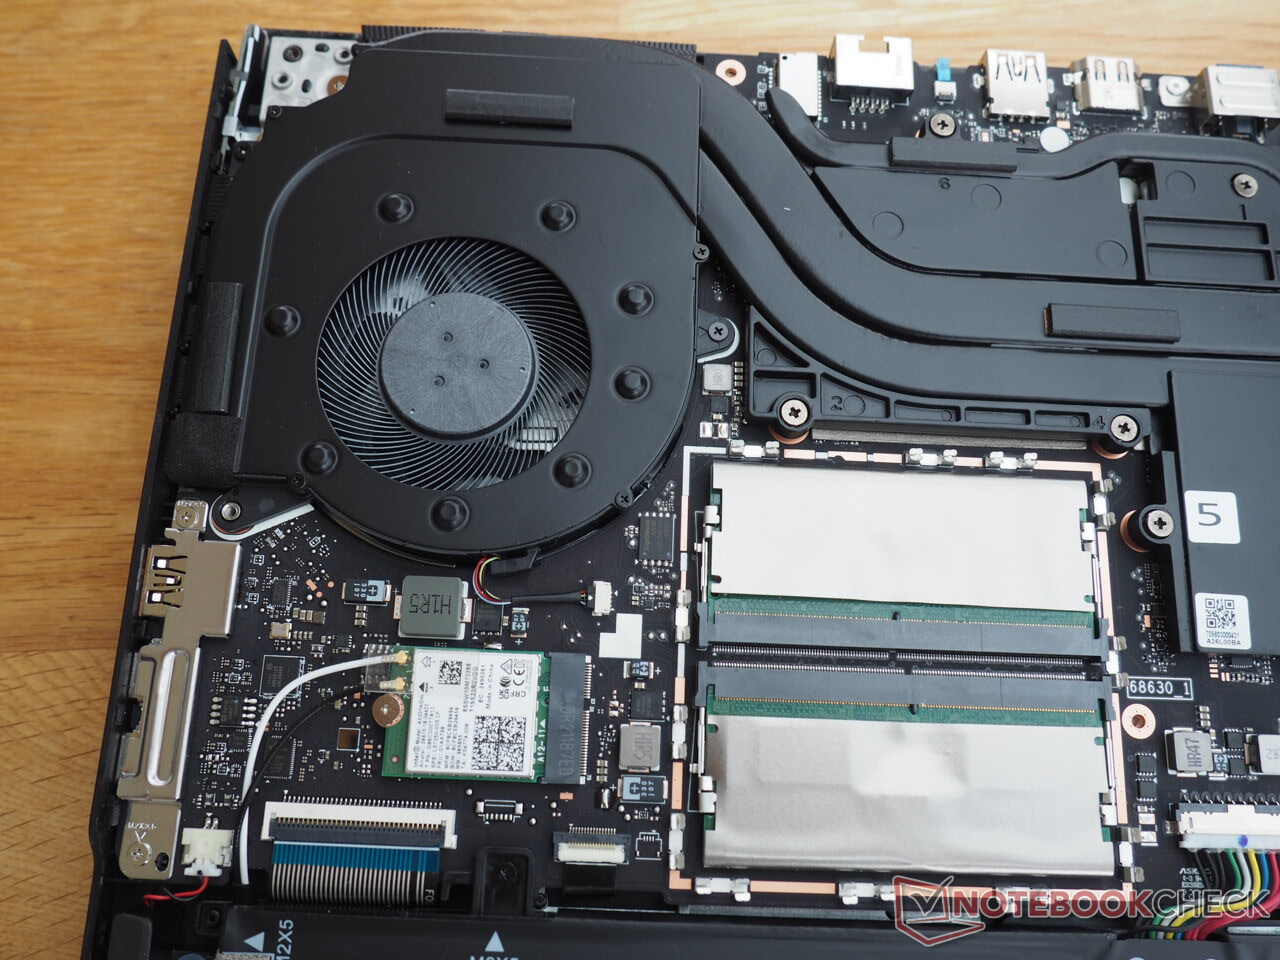
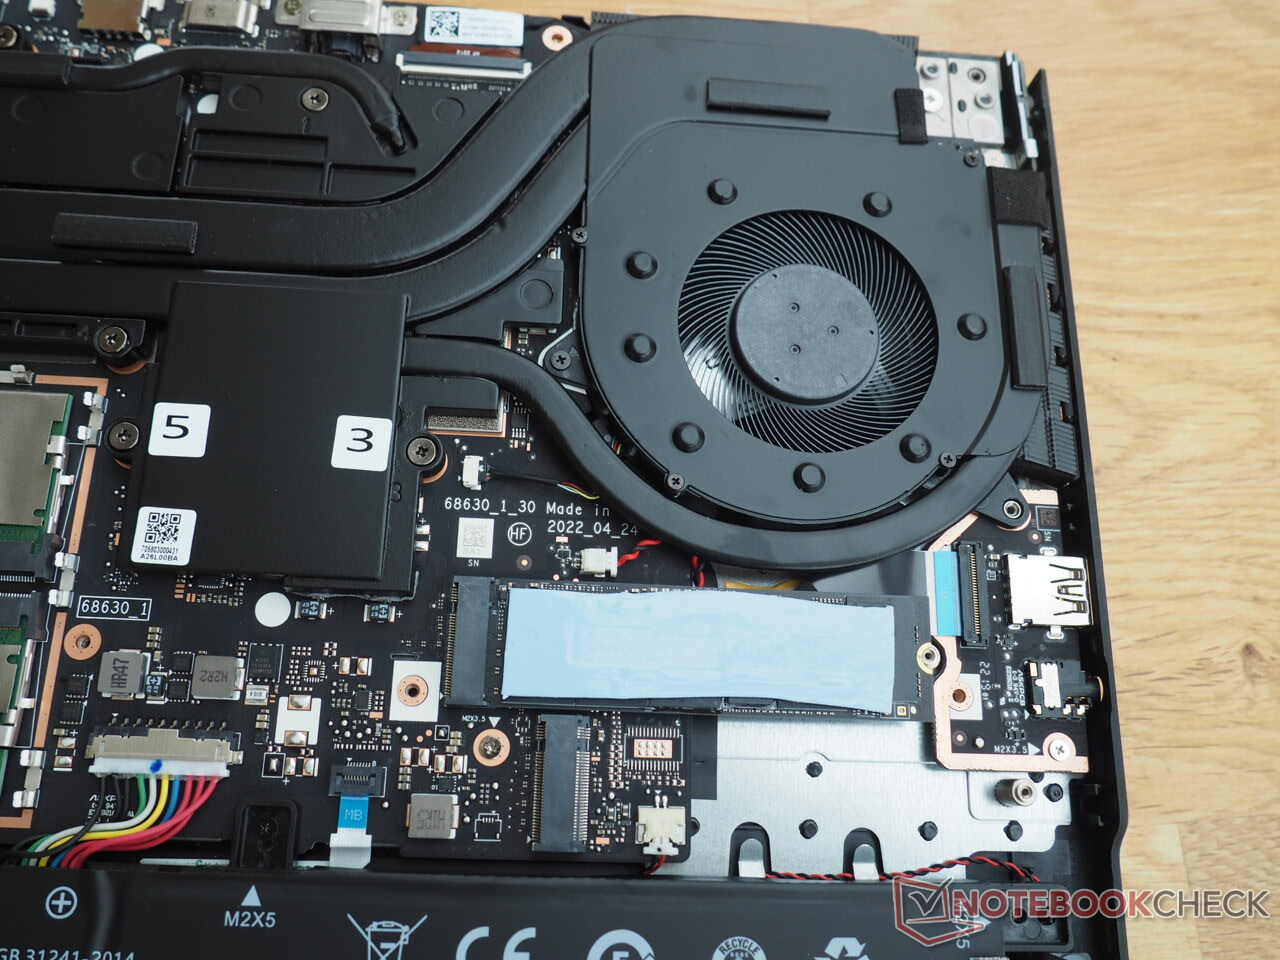
Do wnętrza urządzenia można się dostać w celu konserwacji w taki sam sposób, jak w większości laptopów gamingowych. Po odkręceniu 11 śrubek Phillips od spodu można podnieść dolną pokrywę z laptopa. Ponieważ istnieją klipsy trzymające pokrywę w miejscu, trzeba będzie przyłożyć sporą siłę przy użyciu płaskiego narzędzia, by to zrobić. Wewnątrz obudowy znajdziemy dwa gniazda SODIMM, dwa gniazda M.2 (oba znajdują się pod pokrywą), moduł sieci bezprzewodowej i akumulator. System chłodzenia składa się z dwóch wentylatorów, które współdzielą kilka ciepłowodów.
Gwarancja
Erazer Major X10 objęty jest 24-miesięczną gwarancją.
Urządzenia wejściowe
Klawiatura
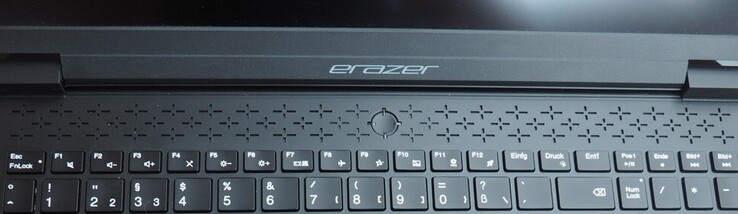
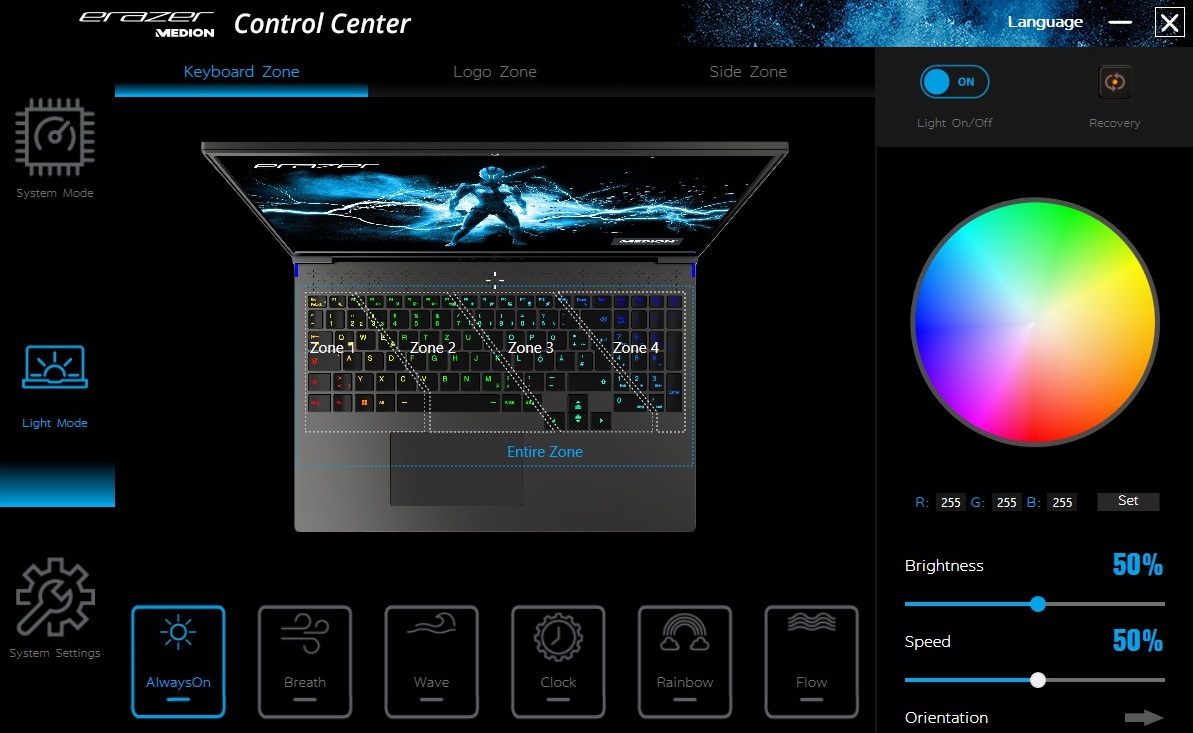
16-calowy laptop posiada klawiaturę typu chiclet z kompletnym blokiem numerycznym, którego klawisze są nieco węższe od pozostałych. W przeciwieństwie do wielu innych producentów, Medion zdecydował się na zastosowanie przyzwoitej wielkości klawiszy strzałek, a nie tych malutkich - niektórzy gracze będą z tego zadowoleni. Podoba nam się również układ klawiatury, który w większości trzyma się standardowej konstrukcji QWERTZ. Jednym z najważniejszych elementów jest czterostrefowe podświetlenie RGB z regulacją jasności. Dostępnych jest kilka trybów, które pozwalają na dostosowanie oświetlenia. Jak na laptop do gier, klawiatura jest przyzwoita, tzn. daje wystarczającą informację zwrotną.
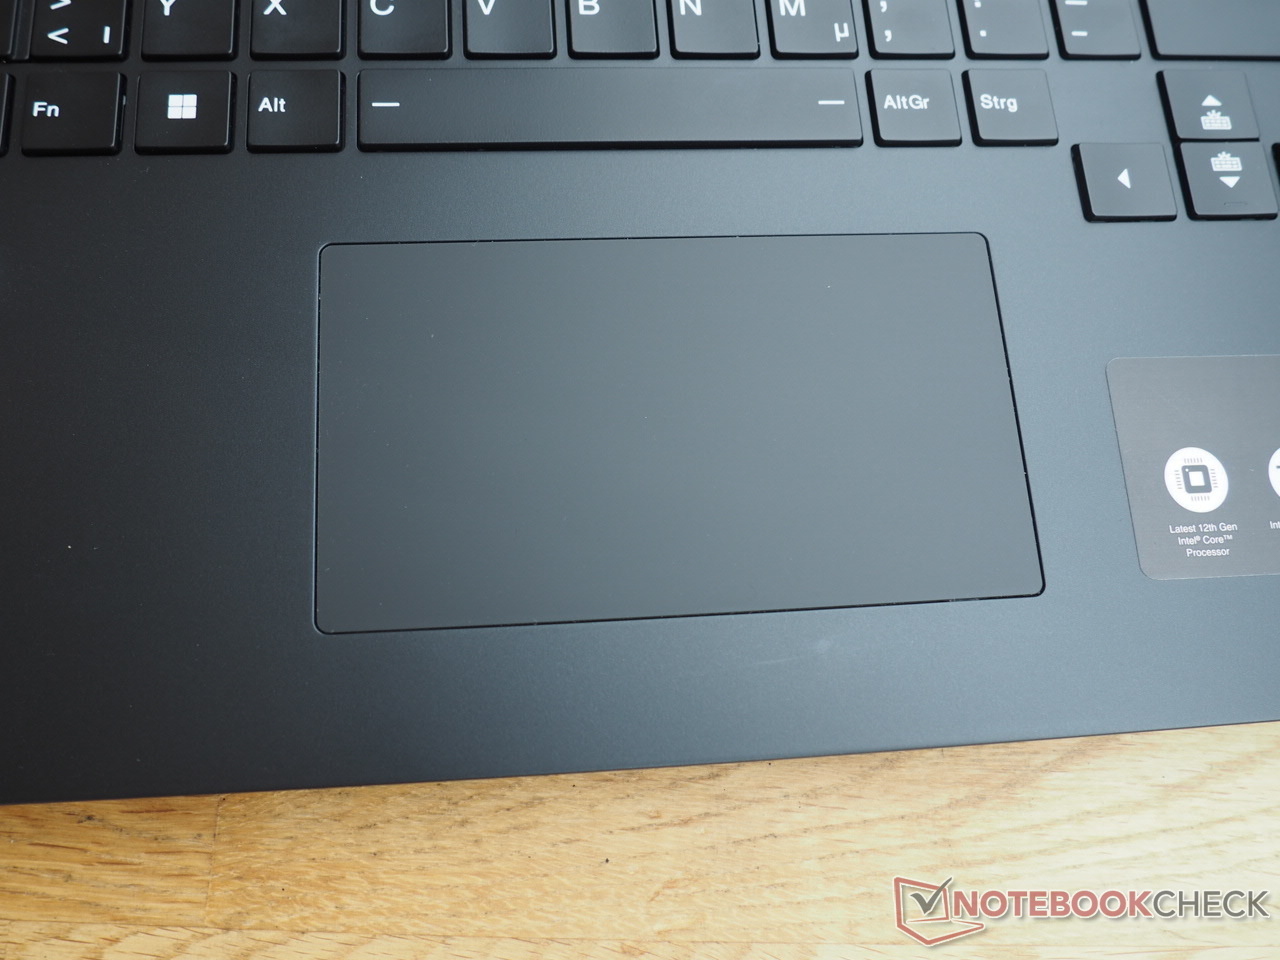
Touchpad
Na touchpad również nie ma co narzekać. Mierzący około 12 x 6,5 cm (4,7 x 2,6"), pozwala palcom ślizgać się po nim bez wysiłku dzięki dość gładkiej powierzchni, a także nie wykazuje żadnych problemów (np. z precyzją, gestami). Jedynie miejsca do klikania na dole były trochę zbyt fikuśne jak na nasz gust, mimo że są wystarczająco solidne.
Wyświetl
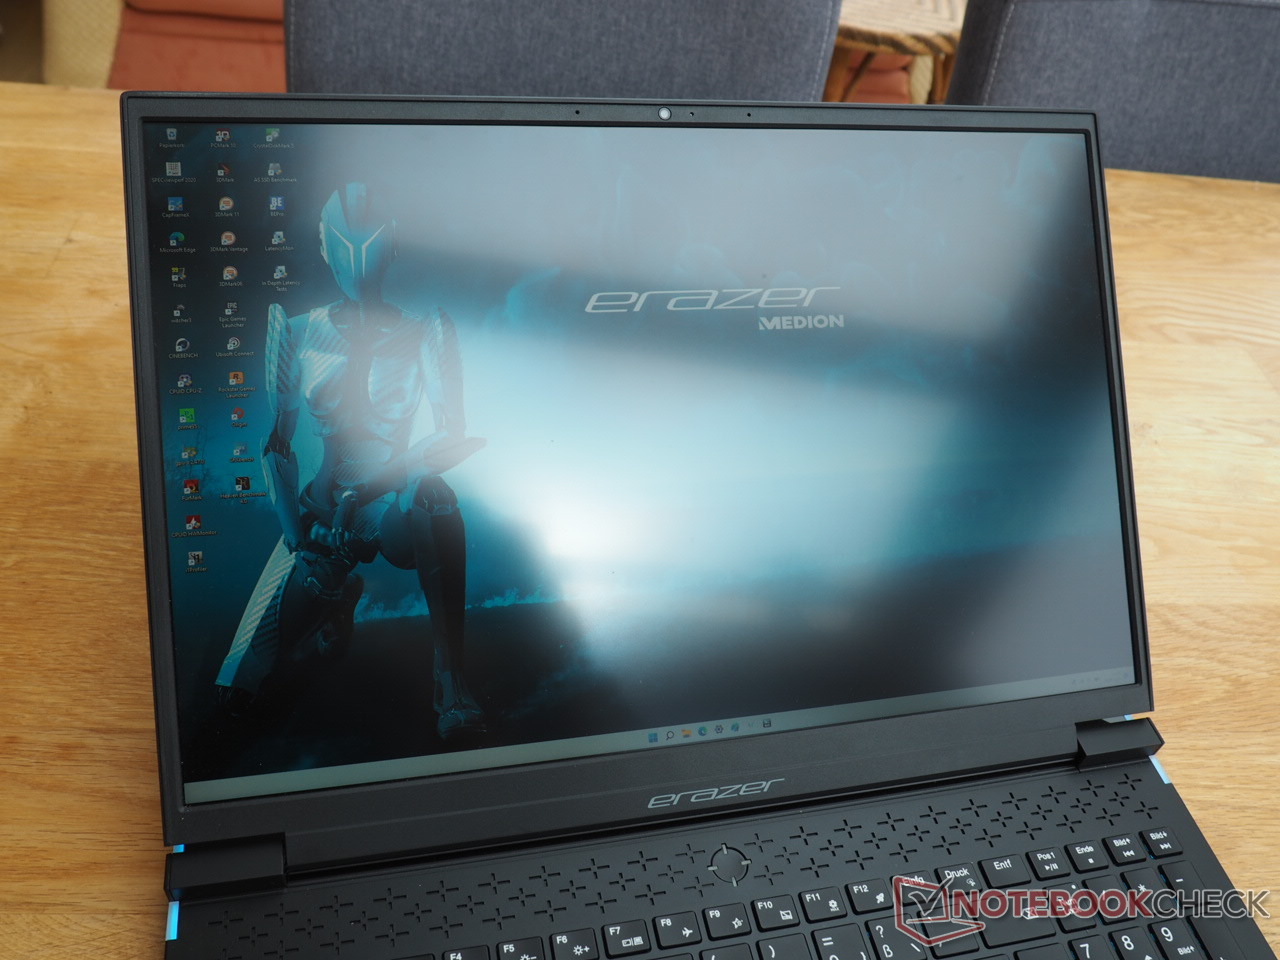
Wyróżniającą cechą urządzenia jest najwyższej klasy wyświetlacz. Właśnie teraz panele 16:10 stają się coraz bardziej popularne także w laptopach gamingowych. I Medion wpisuje się w ten trend.
| |||||||||||||||||||||||||
rozświetlenie: 82 %
na akumulatorze: 489 cd/m²
kontrast: 1223:1 (czerń: 0.4 cd/m²)
ΔE ColorChecker Calman: 2.08 | ∀{0.5-29.43 Ø4.72}
calibrated: 1.27
ΔE Greyscale Calman: 2.6 | ∀{0.09-98 Ø4.97}
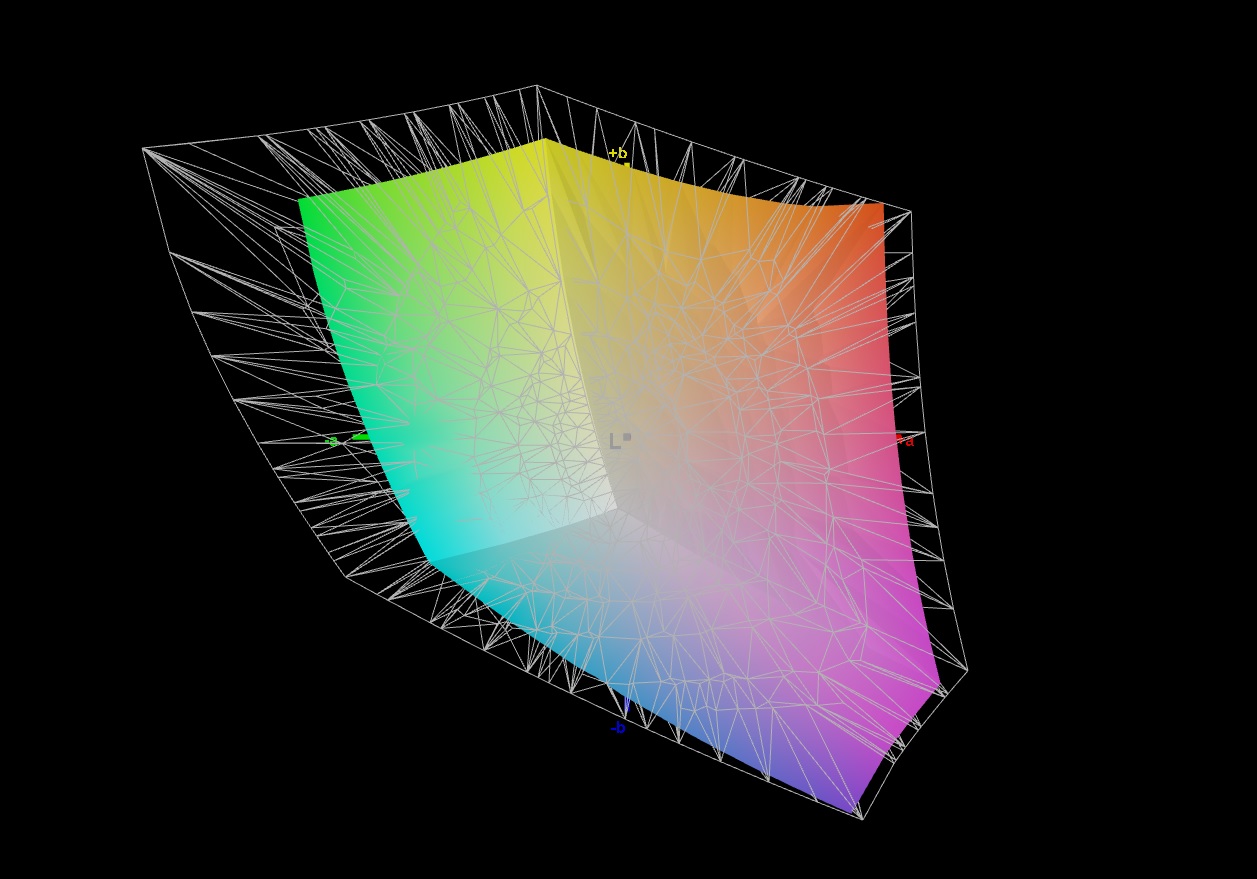
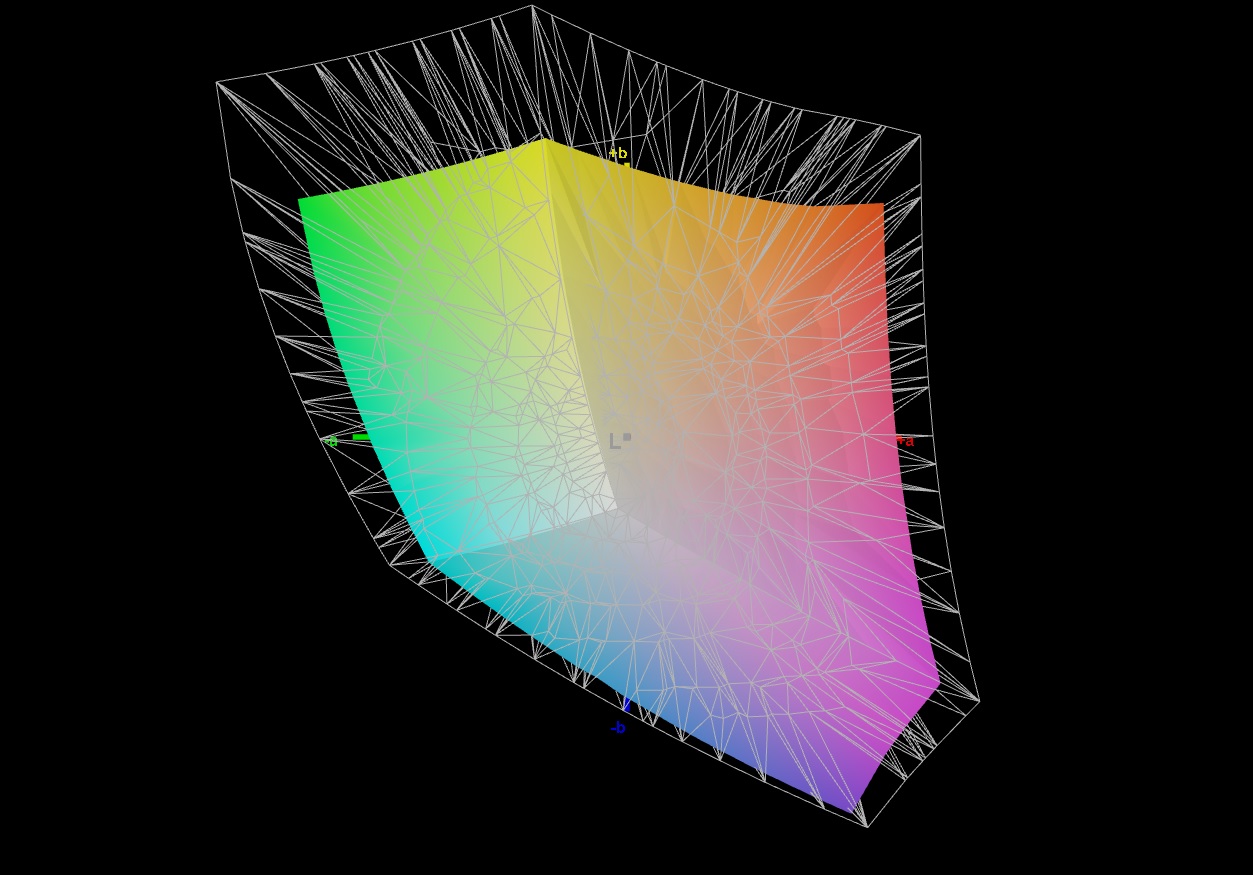
72.5% AdobeRGB 1998 (Argyll 3D)
98% sRGB (Argyll 3D)
70.4% Display P3 (Argyll 3D)
Gamma: 2.205
CCT: 6797 K
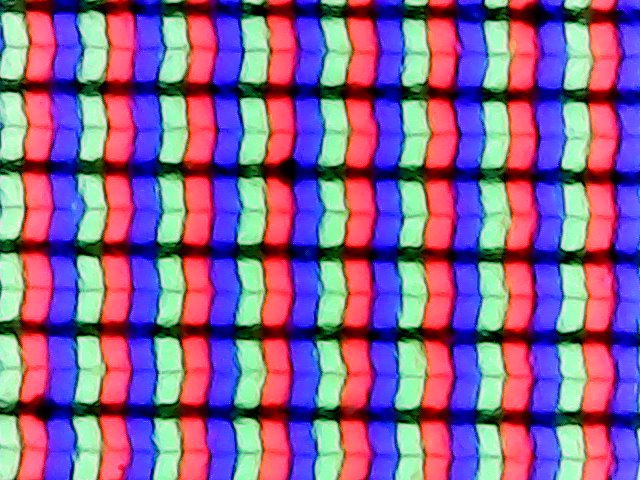
| Medion Erazer Major X10 AUO B160QAN03.H, IPS, 2560x1600, 16" | Asus TUF Gaming F17 FX707Z-HX011W AU Optronics B173HAN04.9 (AUO4B9D), IPS, 1920x1080, 17.3" | Acer Nitro 5 AN517-55-738R B173HAN04.0, IPS, 1920x1080, 17.3" | Dell Inspiron 16 Plus 7620 BOE NE16N41, IPS, 3072x1920, 16" | HP Omen 16-c0077ng BOE09E5, IPS, 2560x1440, 16.1" | |
|---|---|---|---|---|---|
| Display | -42% | -15% | 1% | -2% | |
| Display P3 Coverage (%) | 70.4 | 40.2 -43% | 58.9 -16% | 70.8 1% | 68.8 -2% |
| sRGB Coverage (%) | 98 | 59.7 -39% | 86.4 -12% | 99.5 2% | 96.9 -1% |
| AdobeRGB 1998 Coverage (%) | 72.5 | 41.5 -43% | 60.5 -17% | 73.2 1% | 71.1 -2% |
| Response Times | -273% | 16% | -256% | -25% | |
| Response Time Grey 50% / Grey 80% * (ms) | 13.9 ? | 39.2 ? -182% | 6 ? 57% | 38 ? -173% | 13 ? 6% |
| Response Time Black / White * (ms) | 6.4 ? | 29.6 ? -363% | 8 ? -25% | 28 ? -338% | 10 ? -56% |
| PWM Frequency (Hz) | |||||
| Screen | -66% | -36% | 9% | -30% | |
| Brightness middle (cd/m²) | 489 | 287 -41% | 286 -42% | 288.9 -41% | 297 -39% |
| Brightness (cd/m²) | 436 | 268 -39% | 278 -36% | 276 -37% | 283 -35% |
| Brightness Distribution (%) | 82 | 89 9% | 89 9% | 92 12% | 91 11% |
| Black Level * (cd/m²) | 0.4 | 0.17 57% | 0.32 20% | 0.26 35% | 0.22 45% |
| Contrast (:1) | 1223 | 1688 38% | 894 -27% | 1111 -9% | 1350 10% |
| Colorchecker dE 2000 * | 2.08 | 5.1 -145% | 3.05 -47% | 1.88 10% | 3.25 -56% |
| Colorchecker dE 2000 max. * | 4.27 | 8.72 -104% | 5.83 -37% | 4.37 -2% | 6.33 -48% |
| Colorchecker dE 2000 calibrated * | 1.27 | 5.1 -302% | 3.13 -146% | 0.42 67% | 1.11 13% |
| Greyscale dE 2000 * | 2.6 | 4.24 -63% | 3.17 -22% | 1.4 46% | 6.97 -168% |
| Gamma | 2.205 100% | 2.44 90% | 2.29 96% | 2.3 96% | 2.3 96% |
| CCT | 6797 96% | 6008 108% | 6916 94% | 6634 98% | 6050 107% |
| Całkowita średnia (program / ustawienia) | -127% /
-90% | -12% /
-24% | -82% /
-30% | -19% /
-23% |
* ... im mniej tym lepiej
Wyświetlacz 165Hz produkcji AUO (model B160QAN03.H) jest wyjątkowy pod niemal każdym względem. Po pierwsze, deklasuje konkurencję, jeśli chodzi o jasność szczytową. Panel ma dobrą średnią jasność szczytową na poziomie 436 cd/m², dzięki czemu Major X10 całkiem dobrze nadaje się do pracy na zewnątrz. Dla porównania, konkurencja nie jest w stanie dobić nawet do 300 cd/m².
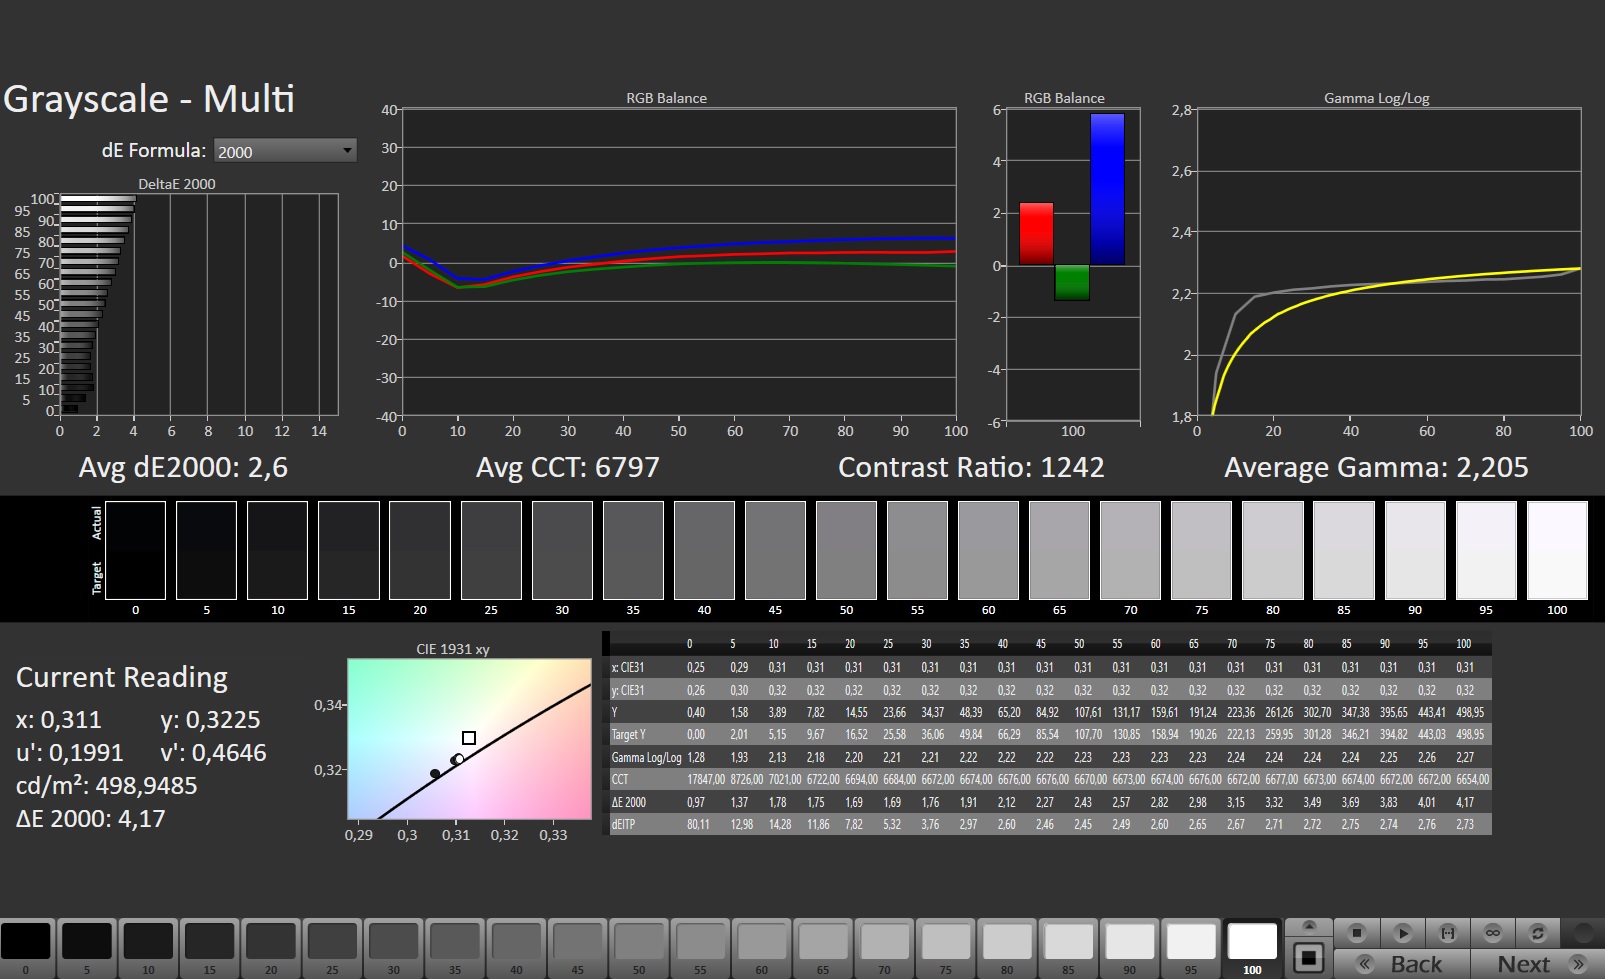
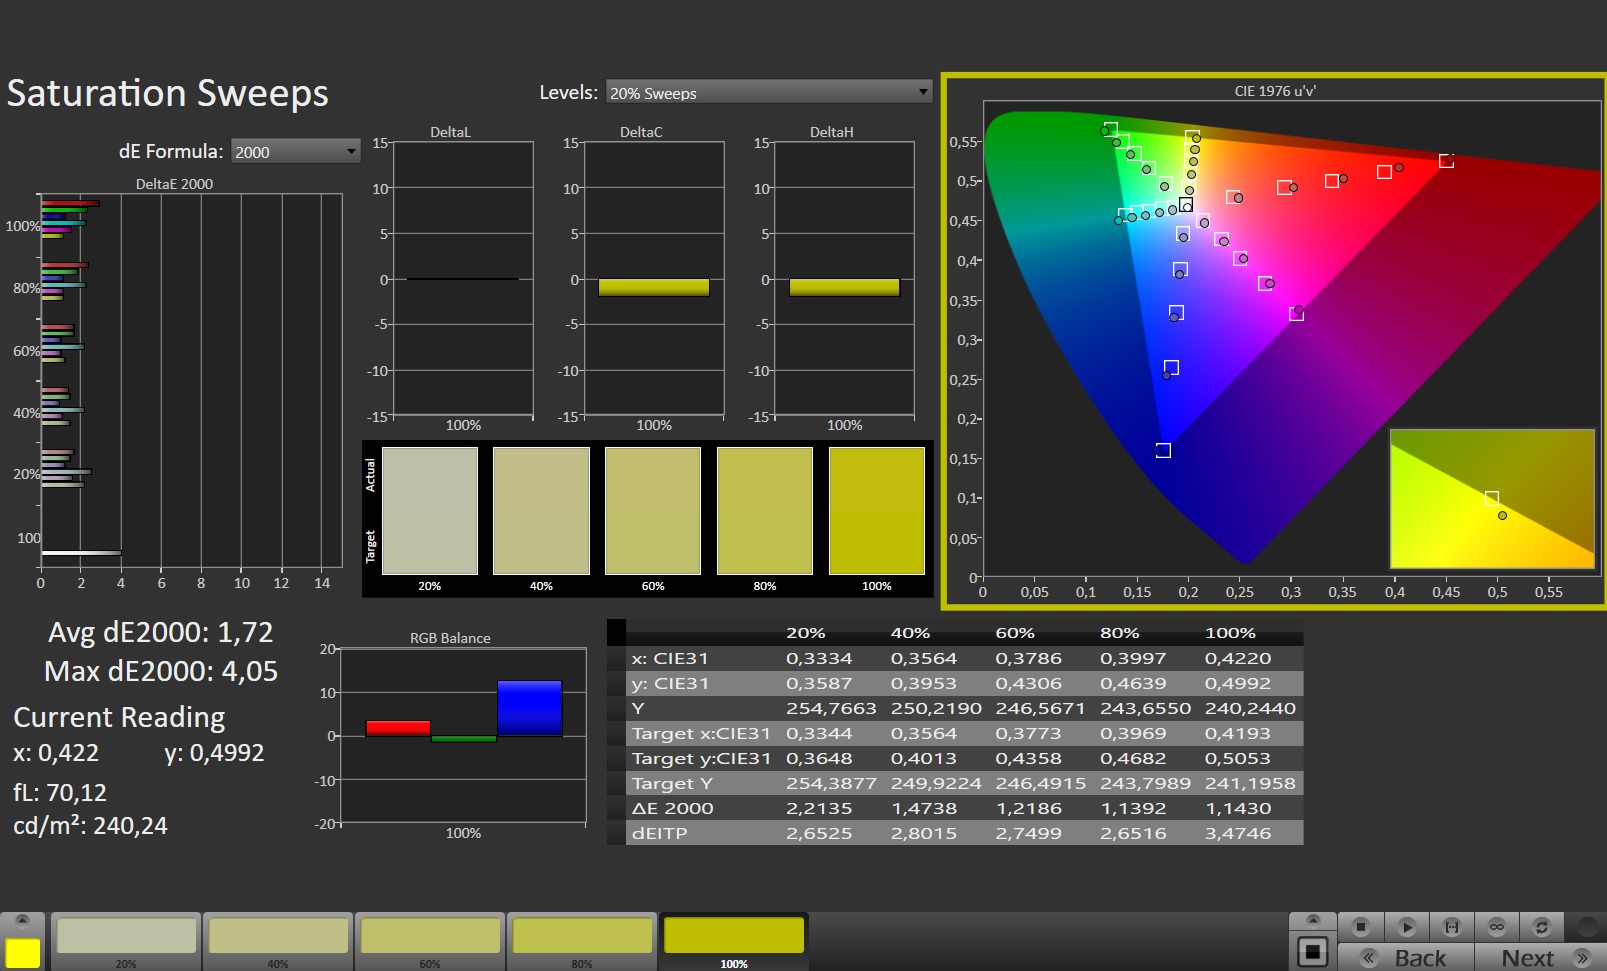
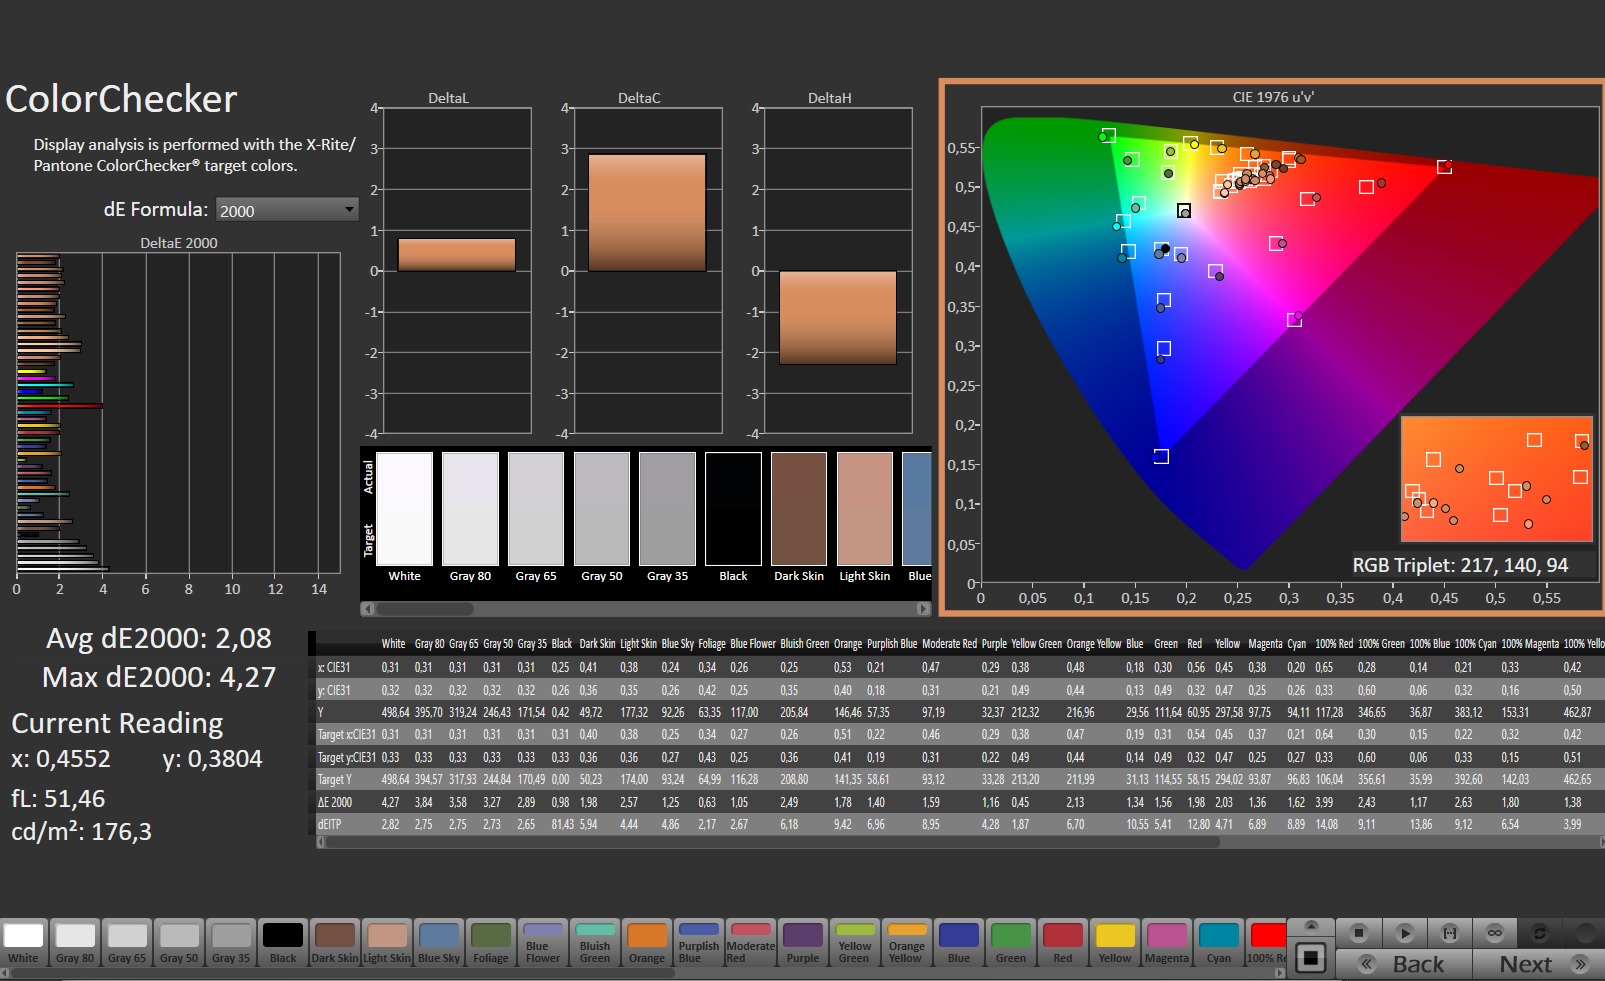
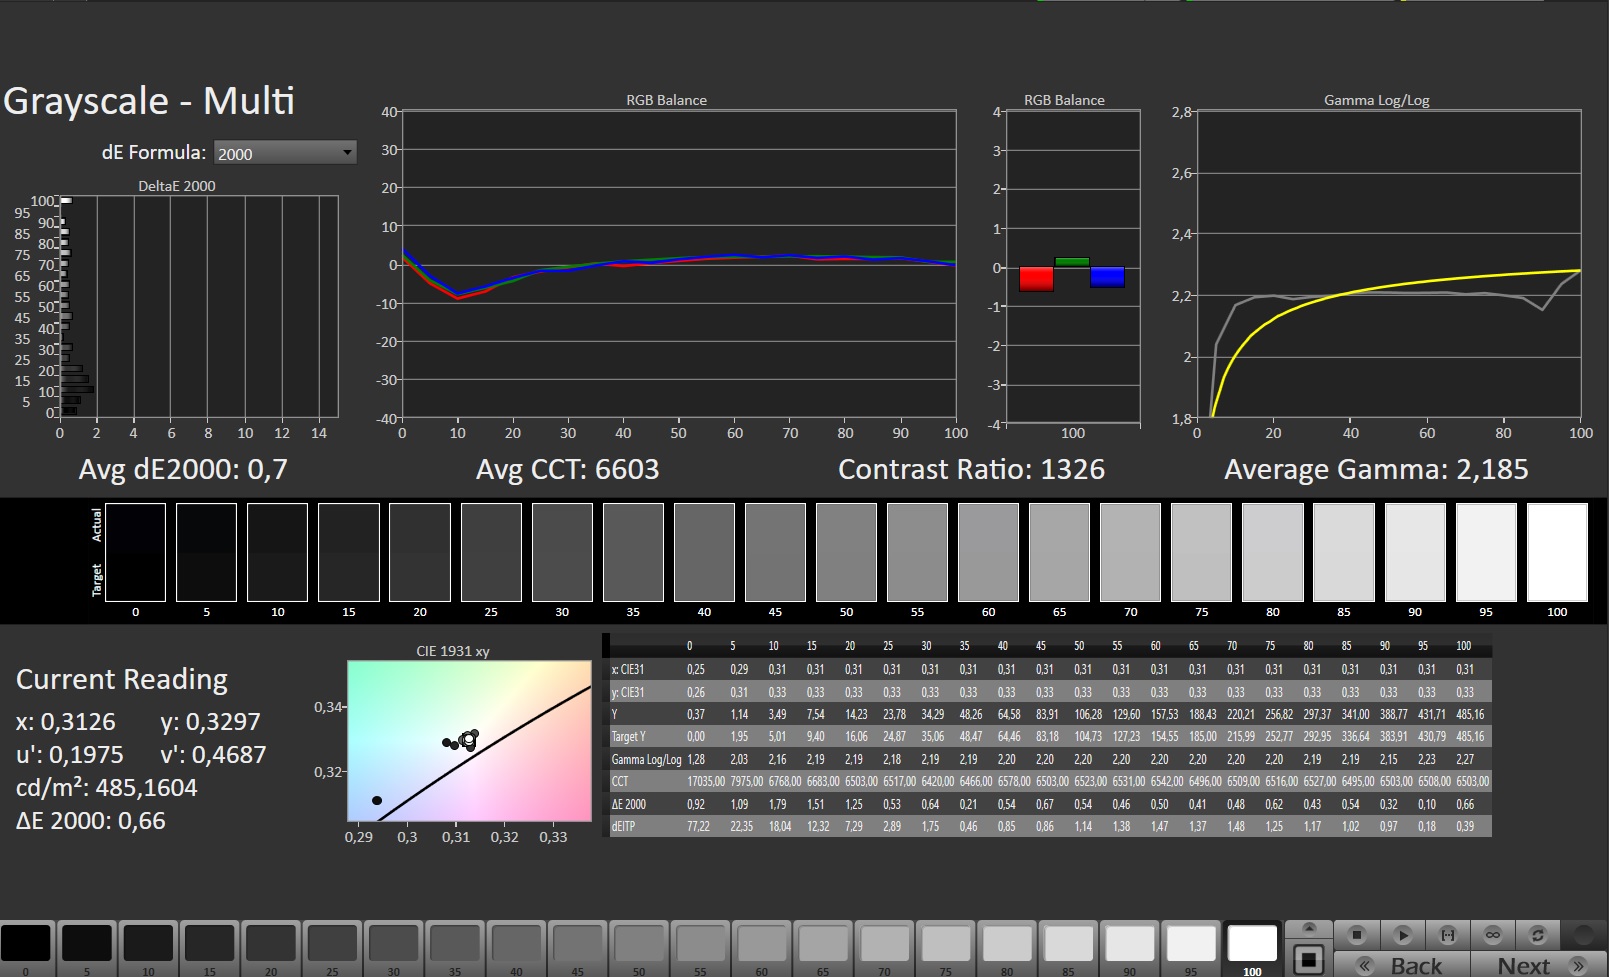
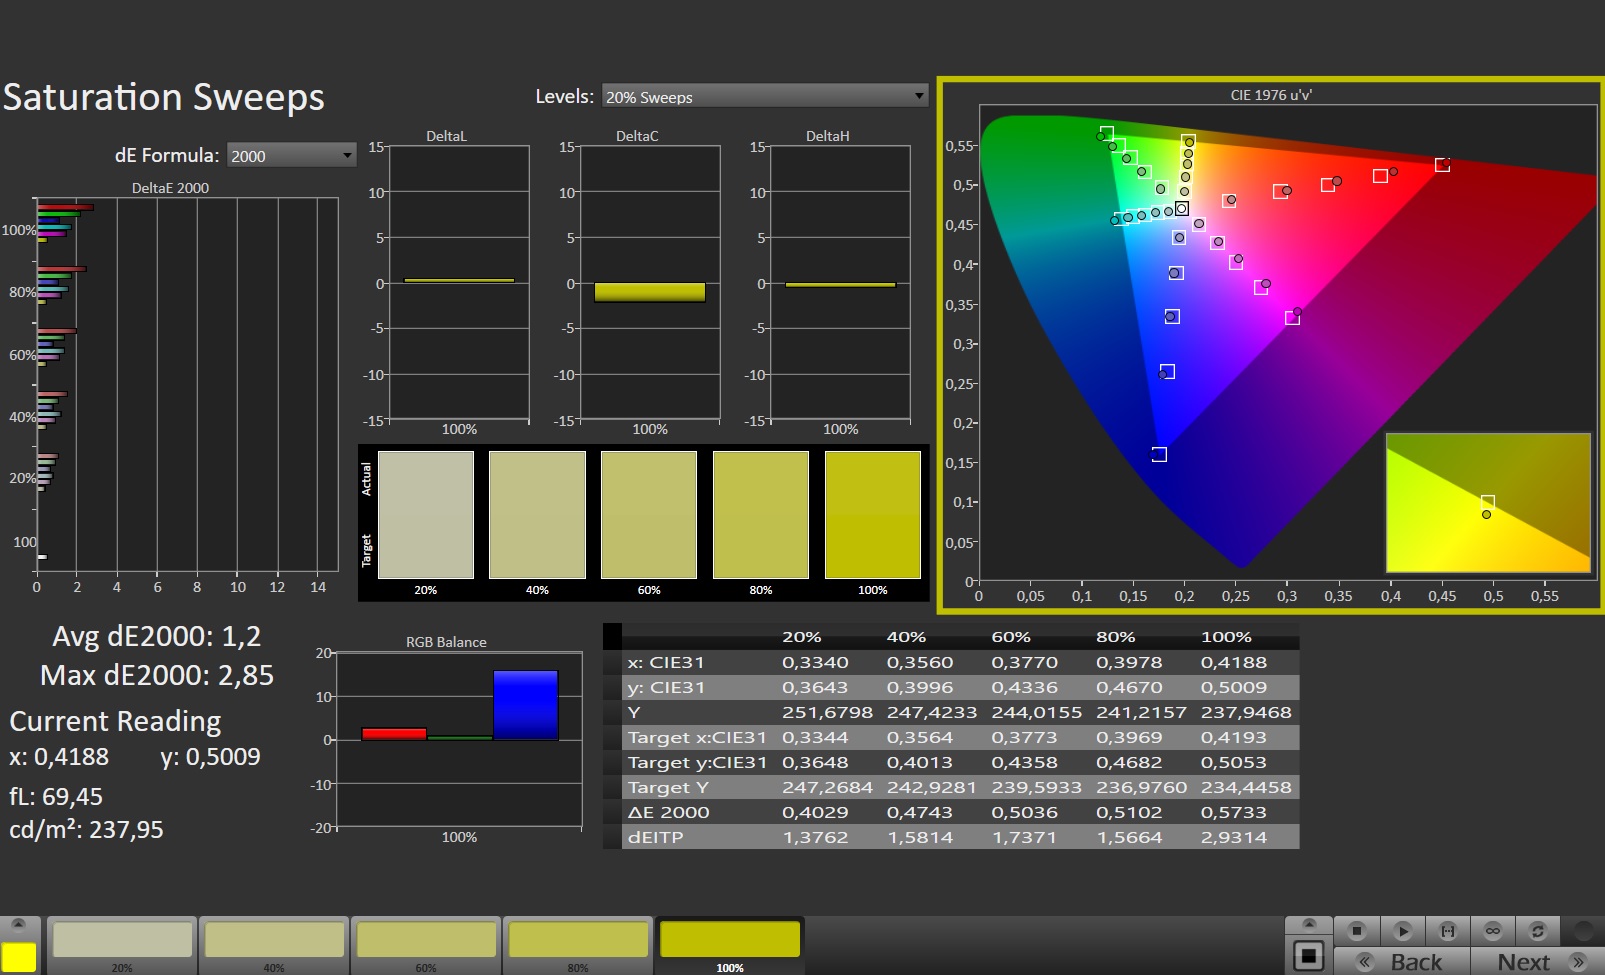
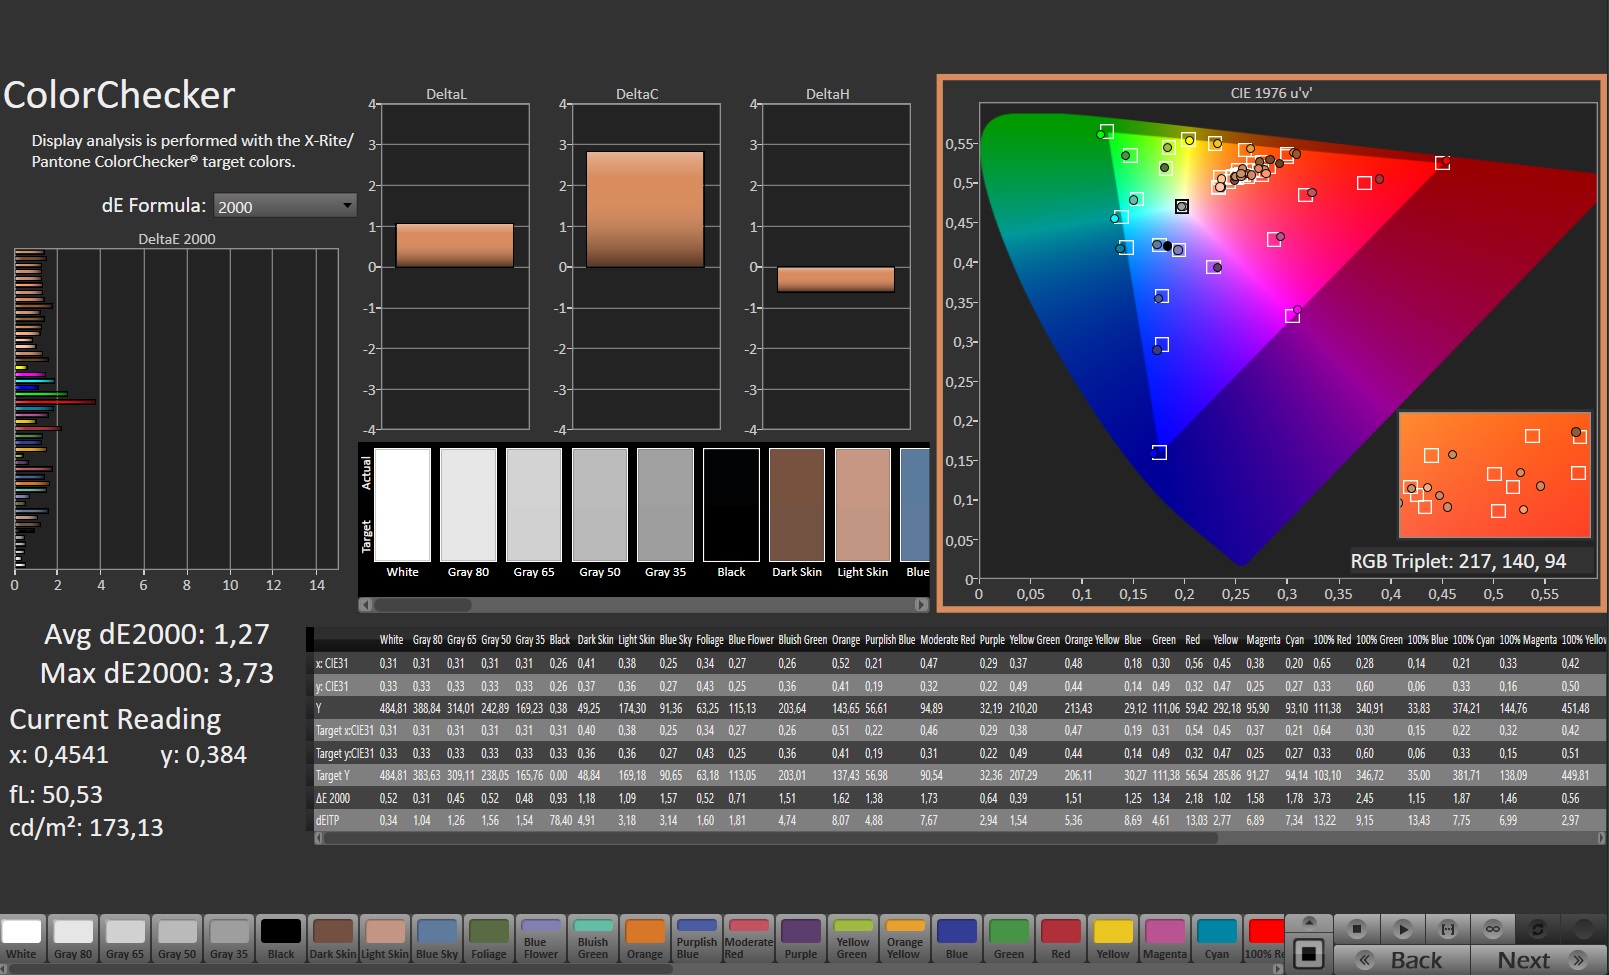
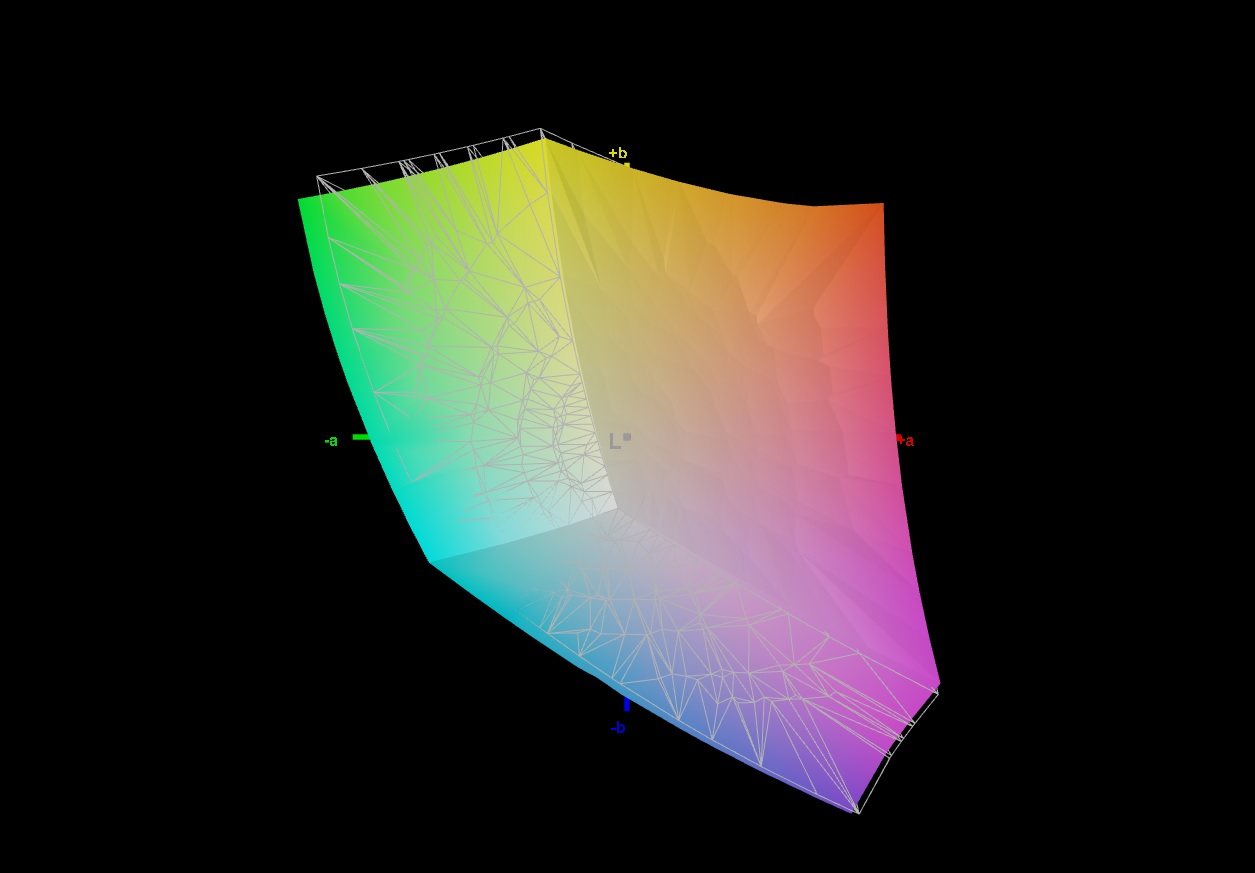
Po drugie, współczynnik kontrastu na poziomie 1 233:1 jest znakomity jak na panel IPS. Wystarczy to jednak tylko do umieszczenia laptopa w środku naszej grupy porównawczej. To powiedziawszy, wyświetlacz jest już dość dokładny kolorystycznie zaraz po wyjęciu z pudełka, co pokazują pomiary, które wykonaliśmy przy użyciu programu CalMan (patrz zrzuty ekranu). Jego pokrycie kolorów powinno zadowolić większość konsumentów - pokrycie 98% sRGB jest więcej niż wystarczające dla notebooka do gier. Ekran jest w stanie pokryć do 73% przestrzeni barw AdobeRGB i 70% przestrzeni barw P3.
Kąty widzenia są typowe dla panelu IPS. Nasze urządzenie pomiarowe odnotowało czasy reakcji na poziomie 6 ms (czarny do białego) i 14 ms (szary do szarego), co również nie jest złe w porównaniu z innymi laptopami w naszym zestawieniu. Trochę szkoda jednak, że wokół krawędzi występuje zauważalna poświata IPS. Nasz egzemplarz recenzencki miał rozkład jasności na poziomie zaledwie 82%.

Wyświetl czasy reakcji
| ↔ Czas reakcji od czerni do bieli | ||
|---|---|---|
| 6.4 ms ... wzrost ↗ i spadek ↘ łącznie | ↗ 2 ms wzrost | 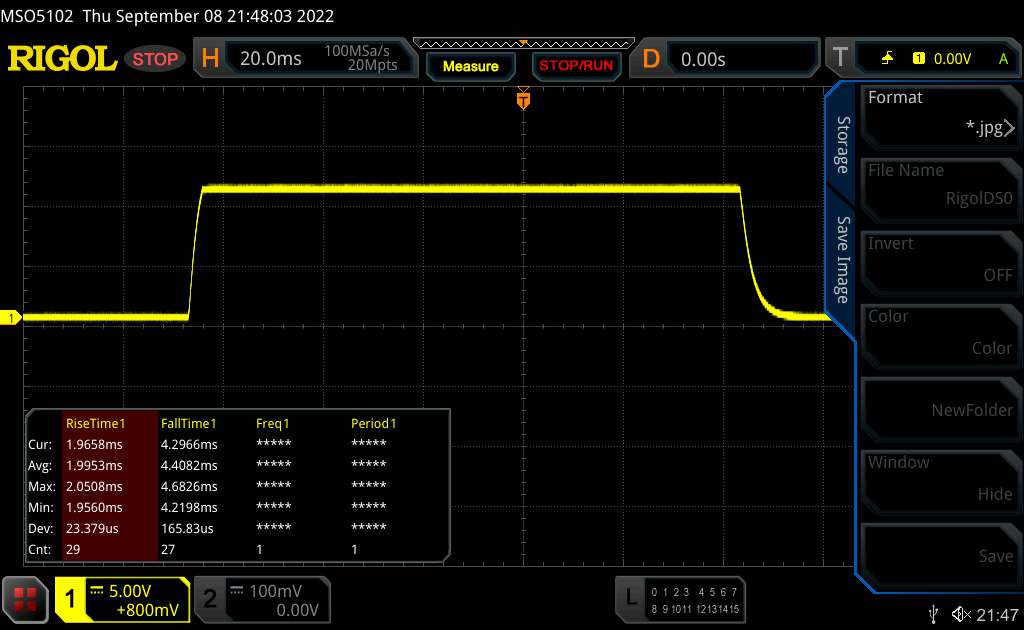 |
| ↘ 4.4 ms upadek | ||
| W naszych testach ekran wykazuje bardzo szybką reakcję i powinien bardzo dobrze nadawać się do szybkich gier. Dla porównania, wszystkie testowane urządzenia wahają się od 0.1 (minimum) do 240 (maksimum) ms. » 20 % wszystkich urządzeń jest lepszych. Oznacza to, że zmierzony czas reakcji jest lepszy od średniej wszystkich testowanych urządzeń (19.8 ms). | ||
| ↔ Czas reakcji 50% szarości do 80% szarości | ||
| 13.9 ms ... wzrost ↗ i spadek ↘ łącznie | ↗ 6.5 ms wzrost | 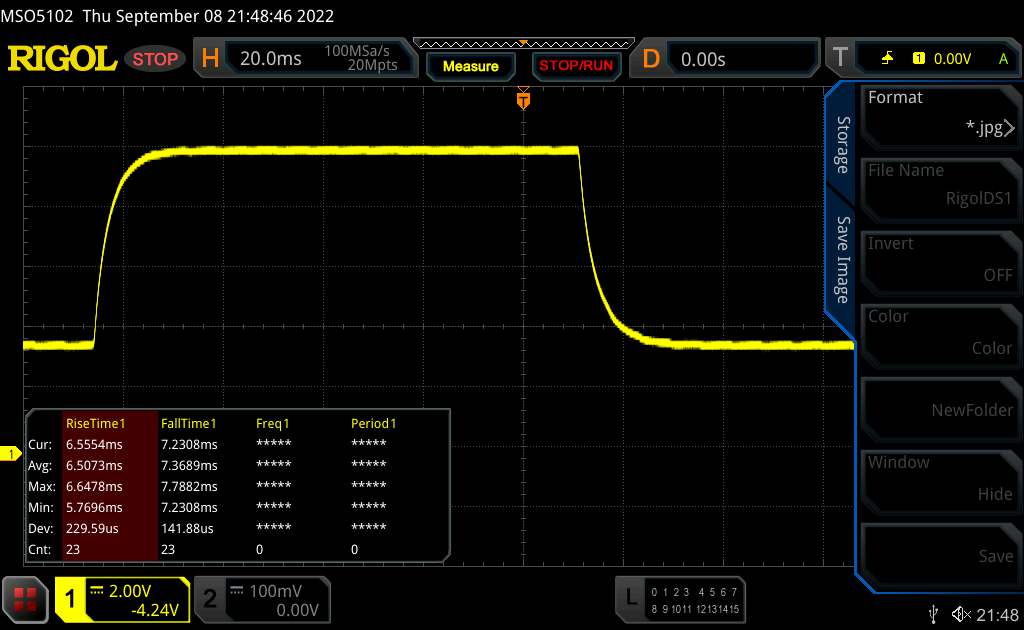 |
| ↘ 7.4 ms upadek | ||
| W naszych testach ekran wykazuje dobry współczynnik reakcji, ale może być zbyt wolny dla graczy rywalizujących ze sobą. Dla porównania, wszystkie testowane urządzenia wahają się od 0.165 (minimum) do 636 (maksimum) ms. » 28 % wszystkich urządzeń jest lepszych. Oznacza to, że zmierzony czas reakcji jest lepszy od średniej wszystkich testowanych urządzeń (31 ms). | ||
Migotanie ekranu / PWM (modulacja szerokości impulsu)
| Migotanie ekranu/nie wykryto PWM | 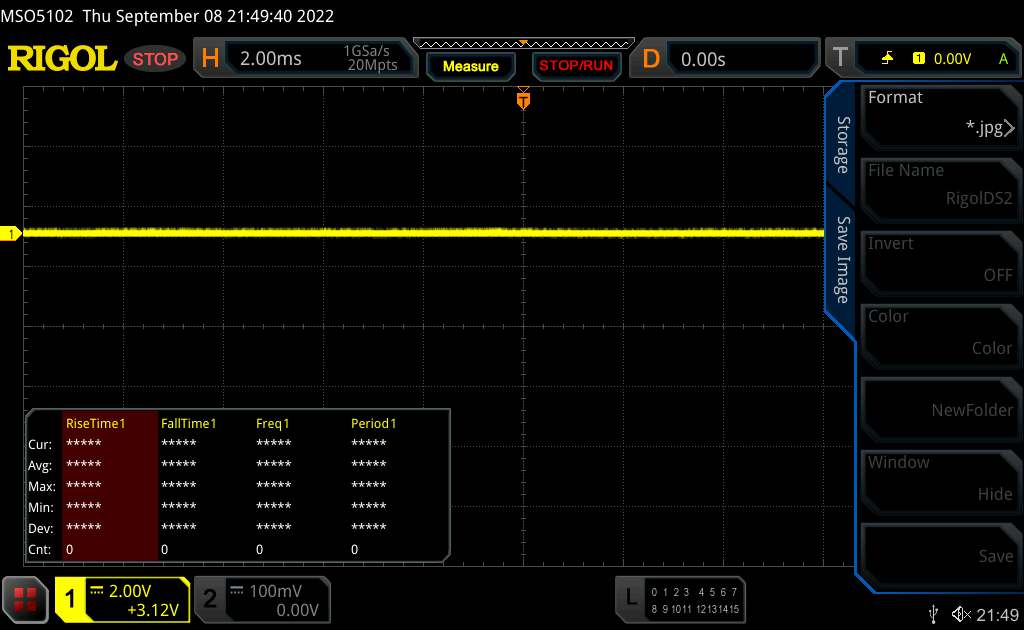 | ||
Dla porównania: 52 % wszystkich testowanych urządzeń nie używa PWM do przyciemniania wyświetlacza. Jeśli wykryto PWM, zmierzono średnio 7769 (minimum: 5 - maksimum: 343500) Hz. | |||
Wydajność
Mimo że 32 GB pamięci RAM i 12 GB pamięci VRAM to już high-end, my sklasyfikowalibyśmy Major X10 jako maszynę ze średniej półki ze względu na niezbyt dobrą wydajność graficzną (bardziej dogłębna analiza później). Cena 1,700 Euro (1,728 USD) sprawia, że cały pakiet nie może być uznany za świetną ofertę.
Warunki badania
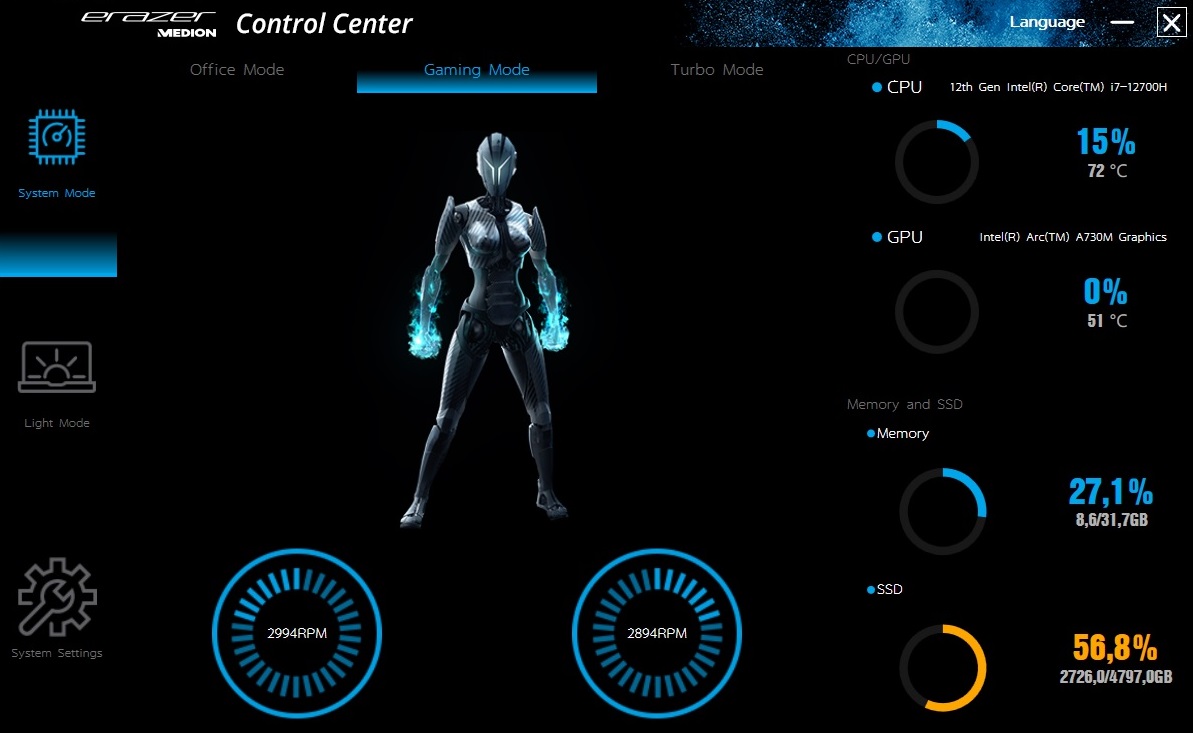
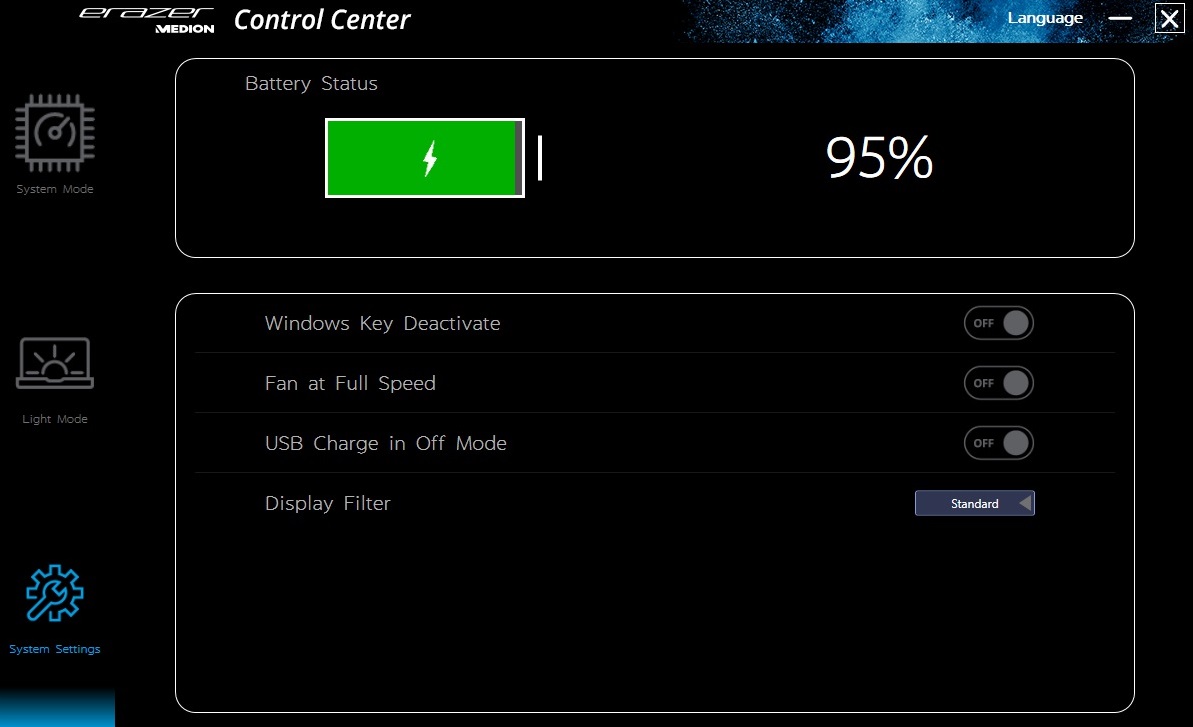
W preinstalowanym oprogramowaniu Control Center można wybrać jeden z trzech profili. Jeżeli nie zaznaczono inaczej, pomiary zostały wykonane z Majorem X10 w trybie Gaming, który powinien być podobny do trybu wydajności w innych laptopach. Ustawienia PL1 i PL2 poszczególnych profili można znaleźć w poniższej tabeli.
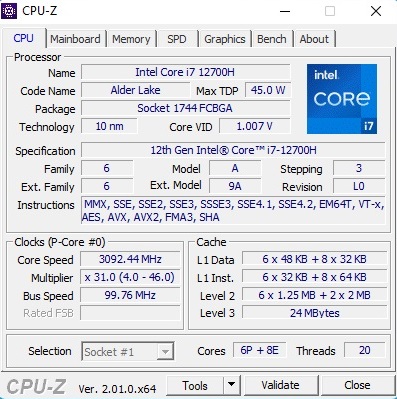
Procesor
Core i7-12700H znajdujący się w omawianym laptopie Medion to aktualny 10-nm procesor z linii Alder Lake firmy Intel. Wariant high-endowy oferuje 6 rdzeni wydajnościowych i 8 wydajnościowych oraz może obsługiwać do 20 wątków równolegle z wykorzystaniem Hyper-Threading. W naszej serii testów CPU, Major X10 wypadł dobrze nawet bez aktywnego trybu Turbo. Podczas pętli Cinebench R15 jego wydajność ustaliła się na dość stałym poziomie, który jest nieco wyższy od tego, co potrafią rywale 12700H. Nawet Ryzen 7 5800H w HP Omen 16 nie jest w stanie dorównać temu poziomowi wydajności.
Cinebench R15 Multi Sustained Load
| CPU Performance rating - Percent | |
| Średnia w klasie Gaming | |
| Medion Erazer Major X10 | |
| Przeciętny Intel Core i7-12700H | |
| Dell Inspiron 16 Plus 7620 | |
| Acer Nitro 5 AN517-55-738R | |
| Asus TUF Gaming F17 FX707Z-HX011W | |
| HP Omen 16-c0077ng -1! | |
| Cinebench R23 | |
| Multi Core | |
| Średnia w klasie Gaming (10488 - 40970, n=110, ostatnie 2 lata) | |
| Przeciętny Intel Core i7-12700H (4032 - 19330, n=64) | |
| Medion Erazer Major X10 | |
| Dell Inspiron 16 Plus 7620 | |
| Asus TUF Gaming F17 FX707Z-HX011W | |
| Acer Nitro 5 AN517-55-738R | |
| HP Omen 16-c0077ng | |
| Single Core | |
| Średnia w klasie Gaming (1166 - 2356, n=110, ostatnie 2 lata) | |
| Medion Erazer Major X10 | |
| Acer Nitro 5 AN517-55-738R | |
| Asus TUF Gaming F17 FX707Z-HX011W | |
| Dell Inspiron 16 Plus 7620 | |
| Przeciętny Intel Core i7-12700H (778 - 1826, n=63) | |
| HP Omen 16-c0077ng | |
| Cinebench R20 | |
| CPU (Multi Core) | |
| Średnia w klasie Gaming (4029 - 16108, n=109, ostatnie 2 lata) | |
| Acer Nitro 5 AN517-55-738R | |
| Przeciętny Intel Core i7-12700H (1576 - 7407, n=64) | |
| Dell Inspiron 16 Plus 7620 | |
| Medion Erazer Major X10 | |
| Asus TUF Gaming F17 FX707Z-HX011W | |
| HP Omen 16-c0077ng | |
| CPU (Single Core) | |
| Średnia w klasie Gaming (442 - 895, n=109, ostatnie 2 lata) | |
| Medion Erazer Major X10 | |
| Acer Nitro 5 AN517-55-738R | |
| Asus TUF Gaming F17 FX707Z-HX011W | |
| Dell Inspiron 16 Plus 7620 | |
| Przeciętny Intel Core i7-12700H (300 - 704, n=64) | |
| HP Omen 16-c0077ng | |
| Cinebench R15 | |
| CPU Multi 64Bit | |
| Średnia w klasie Gaming (1578 - 6271, n=108, ostatnie 2 lata) | |
| Asus TUF Gaming F17 FX707Z-HX011W | |
| Przeciętny Intel Core i7-12700H (1379 - 2916, n=70) | |
| Dell Inspiron 16 Plus 7620 | |
| Acer Nitro 5 AN517-55-738R | |
| Medion Erazer Major X10 | |
| HP Omen 16-c0077ng | |
| CPU Single 64Bit | |
| Średnia w klasie Gaming (188.8 - 343, n=109, ostatnie 2 lata) | |
| Medion Erazer Major X10 | |
| Acer Nitro 5 AN517-55-738R | |
| Asus TUF Gaming F17 FX707Z-HX011W | |
| Dell Inspiron 16 Plus 7620 | |
| Przeciętny Intel Core i7-12700H (113 - 263, n=65) | |
| HP Omen 16-c0077ng | |
| Blender - v2.79 BMW27 CPU | |
| HP Omen 16-c0077ng | |
| Asus TUF Gaming F17 FX707Z-HX011W | |
| Dell Inspiron 16 Plus 7620 | |
| Acer Nitro 5 AN517-55-738R | |
| Przeciętny Intel Core i7-12700H (168 - 732, n=63) | |
| Medion Erazer Major X10 | |
| Średnia w klasie Gaming (80 - 330, n=107, ostatnie 2 lata) | |
| 7-Zip 18.03 | |
| 7z b 4 | |
| Średnia w klasie Gaming (33491 - 148086, n=108, ostatnie 2 lata) | |
| Medion Erazer Major X10 | |
| Przeciętny Intel Core i7-12700H (22844 - 73067, n=63) | |
| Dell Inspiron 16 Plus 7620 | |
| Asus TUF Gaming F17 FX707Z-HX011W | |
| Acer Nitro 5 AN517-55-738R | |
| 7z b 4 -mmt1 | |
| Średnia w klasie Gaming (4199 - 7436, n=108, ostatnie 2 lata) | |
| Medion Erazer Major X10 | |
| Acer Nitro 5 AN517-55-738R | |
| Przeciętny Intel Core i7-12700H (2743 - 5972, n=63) | |
| Asus TUF Gaming F17 FX707Z-HX011W | |
| Dell Inspiron 16 Plus 7620 | |
| HP Omen 16-c0077ng | |
| Geekbench 5.5 | |
| Multi-Core | |
| Średnia w klasie Gaming (6460 - 27010, n=108, ostatnie 2 lata) | |
| Acer Nitro 5 AN517-55-738R | |
| Asus TUF Gaming F17 FX707Z-HX011W | |
| Medion Erazer Major X10 | |
| Dell Inspiron 16 Plus 7620 | |
| Przeciętny Intel Core i7-12700H (5144 - 13745, n=64) | |
| HP Omen 16-c0077ng | |
| Single-Core | |
| Średnia w klasie Gaming (986 - 2474, n=108, ostatnie 2 lata) | |
| Medion Erazer Major X10 | |
| Asus TUF Gaming F17 FX707Z-HX011W | |
| Dell Inspiron 16 Plus 7620 | |
| Przeciętny Intel Core i7-12700H (803 - 1851, n=64) | |
| Acer Nitro 5 AN517-55-738R | |
| HP Omen 16-c0077ng | |
| HWBOT x265 Benchmark v2.2 - 4k Preset | |
| Średnia w klasie Gaming (11.5 - 44.3, n=108, ostatnie 2 lata) | |
| Przeciętny Intel Core i7-12700H (4.67 - 21.8, n=64) | |
| Medion Erazer Major X10 | |
| Dell Inspiron 16 Plus 7620 | |
| HP Omen 16-c0077ng | |
| Asus TUF Gaming F17 FX707Z-HX011W | |
| Acer Nitro 5 AN517-55-738R | |
| LibreOffice - 20 Documents To PDF | |
| HP Omen 16-c0077ng | |
| Asus TUF Gaming F17 FX707Z-HX011W | |
| Acer Nitro 5 AN517-55-738R | |
| Średnia w klasie Gaming (19 - 88.8, n=108, ostatnie 2 lata) | |
| Medion Erazer Major X10 | |
| Dell Inspiron 16 Plus 7620 | |
| Przeciętny Intel Core i7-12700H (34.2 - 95.3, n=63) | |
| R Benchmark 2.5 - Overall mean | |
| HP Omen 16-c0077ng | |
| Dell Inspiron 16 Plus 7620 | |
| Przeciętny Intel Core i7-12700H (0.4441 - 1.052, n=63) | |
| Acer Nitro 5 AN517-55-738R | |
| Asus TUF Gaming F17 FX707Z-HX011W | |
| Medion Erazer Major X10 | |
| Średnia w klasie Gaming (0.3439 - 0.759, n=109, ostatnie 2 lata) | |
* ... im mniej tym lepiej
AIDA64: FP32 Ray-Trace | FPU Julia | CPU SHA3 | CPU Queen | FPU SinJulia | FPU Mandel | CPU AES | CPU ZLib | FP64 Ray-Trace | CPU PhotoWorxx
| Performance rating | |
| Średnia w klasie Gaming | |
| HP Omen 16-c0077ng | |
| Dell Inspiron 16 Plus 7620 | |
| Przeciętny Intel Core i7-12700H | |
| Medion Erazer Major X10 | |
| Acer Nitro 5 AN517-55-738R | |
| Asus TUF Gaming F17 FX707Z-HX011W | |
| AIDA64 / FP32 Ray-Trace | |
| Średnia w klasie Gaming (10227 - 85542, n=107, ostatnie 2 lata) | |
| HP Omen 16-c0077ng | |
| Dell Inspiron 16 Plus 7620 | |
| Przeciętny Intel Core i7-12700H (2585 - 17957, n=64) | |
| Acer Nitro 5 AN517-55-738R | |
| Medion Erazer Major X10 | |
| Asus TUF Gaming F17 FX707Z-HX011W | |
| AIDA64 / FPU Julia | |
| Średnia w klasie Gaming (51376 - 238426, n=107, ostatnie 2 lata) | |
| HP Omen 16-c0077ng | |
| Dell Inspiron 16 Plus 7620 | |
| Przeciętny Intel Core i7-12700H (12439 - 90760, n=64) | |
| Acer Nitro 5 AN517-55-738R | |
| Medion Erazer Major X10 | |
| Asus TUF Gaming F17 FX707Z-HX011W | |
| AIDA64 / CPU SHA3 | |
| Średnia w klasie Gaming (2180 - 9817, n=107, ostatnie 2 lata) | |
| HP Omen 16-c0077ng | |
| Przeciętny Intel Core i7-12700H (833 - 4242, n=64) | |
| Dell Inspiron 16 Plus 7620 | |
| Acer Nitro 5 AN517-55-738R | |
| Medion Erazer Major X10 | |
| Asus TUF Gaming F17 FX707Z-HX011W | |
| AIDA64 / CPU Queen | |
| Średnia w klasie Gaming (49785 - 173351, n=95, ostatnie 2 lata) | |
| Asus TUF Gaming F17 FX707Z-HX011W | |
| HP Omen 16-c0077ng | |
| Acer Nitro 5 AN517-55-738R | |
| Medion Erazer Major X10 | |
| Przeciętny Intel Core i7-12700H (57923 - 103202, n=63) | |
| Dell Inspiron 16 Plus 7620 | |
| AIDA64 / FPU SinJulia | |
| Średnia w klasie Gaming (4424 - 33636, n=107, ostatnie 2 lata) | |
| HP Omen 16-c0077ng | |
| Medion Erazer Major X10 | |
| Acer Nitro 5 AN517-55-738R | |
| Przeciętny Intel Core i7-12700H (3249 - 9939, n=64) | |
| Dell Inspiron 16 Plus 7620 | |
| Asus TUF Gaming F17 FX707Z-HX011W | |
| AIDA64 / FPU Mandel | |
| Średnia w klasie Gaming (25115 - 128721, n=107, ostatnie 2 lata) | |
| HP Omen 16-c0077ng | |
| Dell Inspiron 16 Plus 7620 | |
| Przeciętny Intel Core i7-12700H (7135 - 44760, n=64) | |
| Acer Nitro 5 AN517-55-738R | |
| Medion Erazer Major X10 | |
| Asus TUF Gaming F17 FX707Z-HX011W | |
| AIDA64 / CPU AES | |
| HP Omen 16-c0077ng | |
| Średnia w klasie Gaming (39258 - 247074, n=107, ostatnie 2 lata) | |
| Przeciętny Intel Core i7-12700H (31839 - 144360, n=64) | |
| Dell Inspiron 16 Plus 7620 | |
| Acer Nitro 5 AN517-55-738R | |
| Medion Erazer Major X10 | |
| Asus TUF Gaming F17 FX707Z-HX011W | |
| AIDA64 / CPU ZLib | |
| Średnia w klasie Gaming (574 - 2531, n=107, ostatnie 2 lata) | |
| Dell Inspiron 16 Plus 7620 | |
| Przeciętny Intel Core i7-12700H (305 - 1171, n=64) | |
| Medion Erazer Major X10 | |
| Acer Nitro 5 AN517-55-738R | |
| HP Omen 16-c0077ng | |
| Asus TUF Gaming F17 FX707Z-HX011W | |
| AIDA64 / FP64 Ray-Trace | |
| Średnia w klasie Gaming (5509 - 45446, n=107, ostatnie 2 lata) | |
| HP Omen 16-c0077ng | |
| Dell Inspiron 16 Plus 7620 | |
| Przeciętny Intel Core i7-12700H (1437 - 9692, n=64) | |
| Acer Nitro 5 AN517-55-738R | |
| Medion Erazer Major X10 | |
| Asus TUF Gaming F17 FX707Z-HX011W | |
| AIDA64 / CPU PhotoWorxx | |
| Średnia w klasie Gaming (12271 - 89891, n=107, ostatnie 2 lata) | |
| Medion Erazer Major X10 | |
| Dell Inspiron 16 Plus 7620 | |
| Przeciętny Intel Core i7-12700H (12863 - 52207, n=64) | |
| Asus TUF Gaming F17 FX707Z-HX011W | |
| HP Omen 16-c0077ng | |
| Acer Nitro 5 AN517-55-738R | |
Wydajność systemu
Pod względem wydajności systemu 16-calowy laptop zajął w naszym zestawieniu trzecie miejsce z doskonałym wynikiem 6 830 pkt. w PCMarku. Na podstawie naszego subiektywnego wrażenia system operacyjny jest responsywny i płynny.
CrossMark: Overall | Productivity | Creativity | Responsiveness
| PCMark 10 / Score | |
| Średnia w klasie Gaming (5828 - 11574, n=95, ostatnie 2 lata) | |
| HP Omen 16-c0077ng | |
| Dell Inspiron 16 Plus 7620 | |
| Przeciętny Intel Core i7-12700H, Intel Arc A730M (6830 - 6845, n=2) | |
| Medion Erazer Major X10 | |
| Acer Nitro 5 AN517-55-738R | |
| Asus TUF Gaming F17 FX707Z-HX011W | |
| PCMark 10 / Essentials | |
| Medion Erazer Major X10 | |
| Przeciętny Intel Core i7-12700H, Intel Arc A730M (10529 - 11116, n=2) | |
| Średnia w klasie Gaming (8810 - 12600, n=99, ostatnie 2 lata) | |
| HP Omen 16-c0077ng | |
| Dell Inspiron 16 Plus 7620 | |
| Acer Nitro 5 AN517-55-738R | |
| Asus TUF Gaming F17 FX707Z-HX011W | |
| PCMark 10 / Productivity | |
| Średnia w klasie Gaming (6845 - 21327, n=97, ostatnie 2 lata) | |
| HP Omen 16-c0077ng | |
| Acer Nitro 5 AN517-55-738R | |
| Dell Inspiron 16 Plus 7620 | |
| Medion Erazer Major X10 | |
| Przeciętny Intel Core i7-12700H, Intel Arc A730M (7070 - 7260, n=2) | |
| Asus TUF Gaming F17 FX707Z-HX011W | |
| PCMark 10 / Digital Content Creation | |
| Średnia w klasie Gaming (7602 - 19657, n=97, ostatnie 2 lata) | |
| Przeciętny Intel Core i7-12700H, Intel Arc A730M (10714 - 11691, n=2) | |
| Medion Erazer Major X10 | |
| HP Omen 16-c0077ng | |
| Asus TUF Gaming F17 FX707Z-HX011W | |
| Dell Inspiron 16 Plus 7620 | |
| Acer Nitro 5 AN517-55-738R | |
| CrossMark / Overall | |
| Średnia w klasie Gaming (1366 - 2409, n=95, ostatnie 2 lata) | |
| Przeciętny Intel Core i7-12700H, Intel Arc A730M (n=1) | |
| Acer Nitro 5 AN517-55-738R | |
| Dell Inspiron 16 Plus 7620 | |
| Asus TUF Gaming F17 FX707Z-HX011W | |
| CrossMark / Productivity | |
| Średnia w klasie Gaming (1386 - 2254, n=95, ostatnie 2 lata) | |
| Przeciętny Intel Core i7-12700H, Intel Arc A730M (n=1) | |
| Acer Nitro 5 AN517-55-738R | |
| Dell Inspiron 16 Plus 7620 | |
| Asus TUF Gaming F17 FX707Z-HX011W | |
| CrossMark / Creativity | |
| Średnia w klasie Gaming (1343 - 2729, n=95, ostatnie 2 lata) | |
| Asus TUF Gaming F17 FX707Z-HX011W | |
| Przeciętny Intel Core i7-12700H, Intel Arc A730M (n=1) | |
| Dell Inspiron 16 Plus 7620 | |
| Acer Nitro 5 AN517-55-738R | |
| CrossMark / Responsiveness | |
| Przeciętny Intel Core i7-12700H, Intel Arc A730M (n=1) | |
| Acer Nitro 5 AN517-55-738R | |
| Średnia w klasie Gaming (1226 - 2334, n=95, ostatnie 2 lata) | |
| Dell Inspiron 16 Plus 7620 | |
| Asus TUF Gaming F17 FX707Z-HX011W | |
| PCMark 10 Score | 6830 pkt. | |
Pomoc | ||
| AIDA64 / Memory Copy | |
| Średnia w klasie Gaming (21750 - 129946, n=107, ostatnie 2 lata) | |
| Medion Erazer Major X10 | |
| Dell Inspiron 16 Plus 7620 | |
| Przeciętny Intel Core i7-12700H (25615 - 80511, n=64) | |
| Asus TUF Gaming F17 FX707Z-HX011W | |
| Acer Nitro 5 AN517-55-738R | |
| HP Omen 16-c0077ng | |
| AIDA64 / Memory Read | |
| Średnia w klasie Gaming (22956 - 118858, n=107, ostatnie 2 lata) | |
| Medion Erazer Major X10 | |
| Asus TUF Gaming F17 FX707Z-HX011W | |
| Dell Inspiron 16 Plus 7620 | |
| Przeciętny Intel Core i7-12700H (25586 - 79442, n=64) | |
| HP Omen 16-c0077ng | |
| Acer Nitro 5 AN517-55-738R | |
| AIDA64 / Memory Write | |
| Średnia w klasie Gaming (22297 - 135096, n=107, ostatnie 2 lata) | |
| Medion Erazer Major X10 | |
| Asus TUF Gaming F17 FX707Z-HX011W | |
| Dell Inspiron 16 Plus 7620 | |
| Przeciętny Intel Core i7-12700H (23679 - 88660, n=64) | |
| Acer Nitro 5 AN517-55-738R | |
| HP Omen 16-c0077ng | |
| AIDA64 / Memory Latency | |
| Średnia w klasie Gaming (75.3 - 259, n=107, ostatnie 2 lata) | |
| Dell Inspiron 16 Plus 7620 | |
| HP Omen 16-c0077ng | |
| Przeciętny Intel Core i7-12700H (76.2 - 133.9, n=62) | |
| Asus TUF Gaming F17 FX707Z-HX011W | |
| Acer Nitro 5 AN517-55-738R | |
* ... im mniej tym lepiej
Opóźnienie DPC
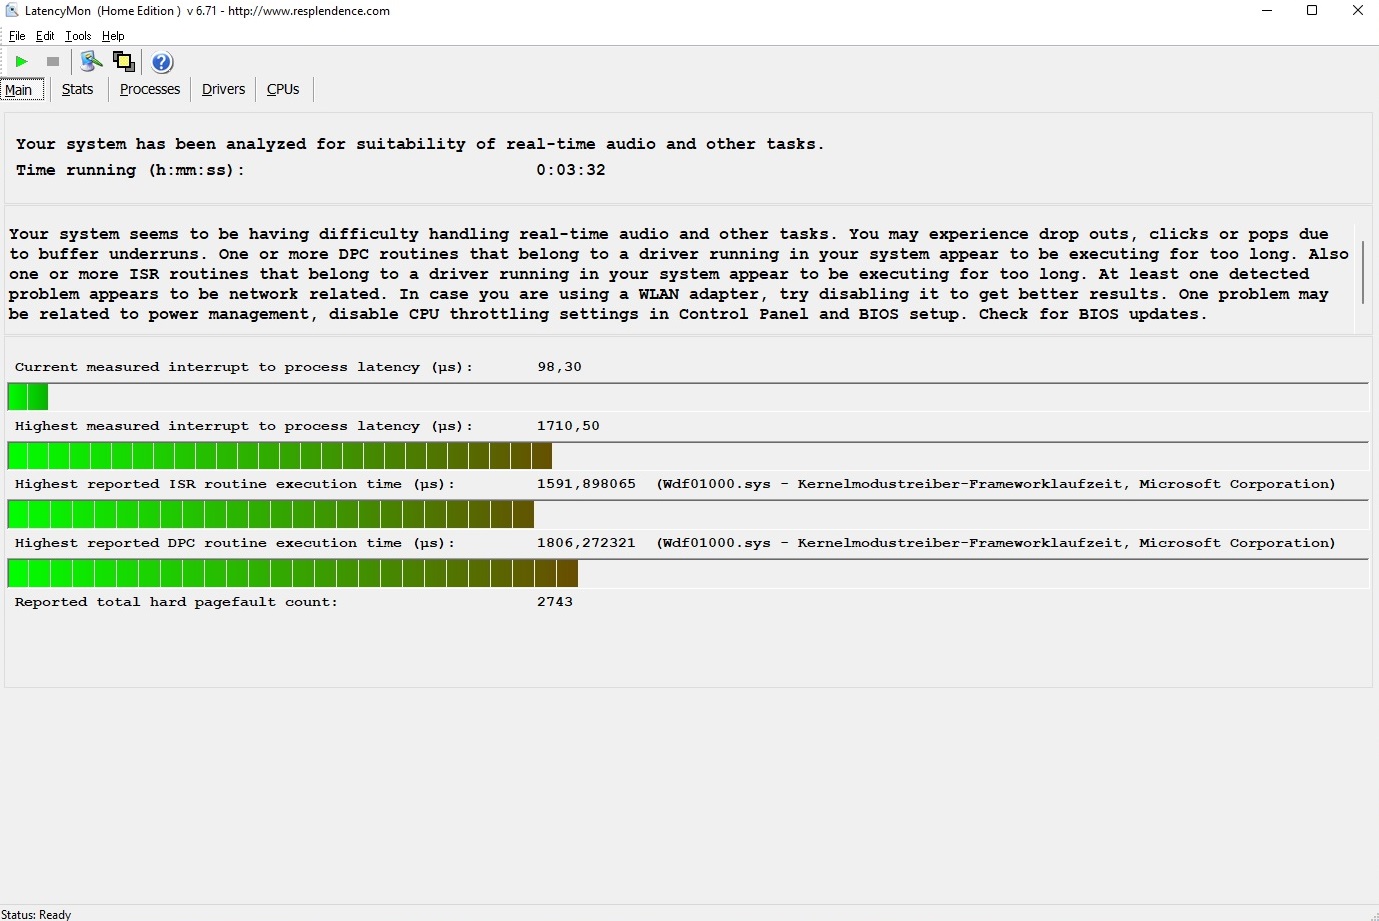
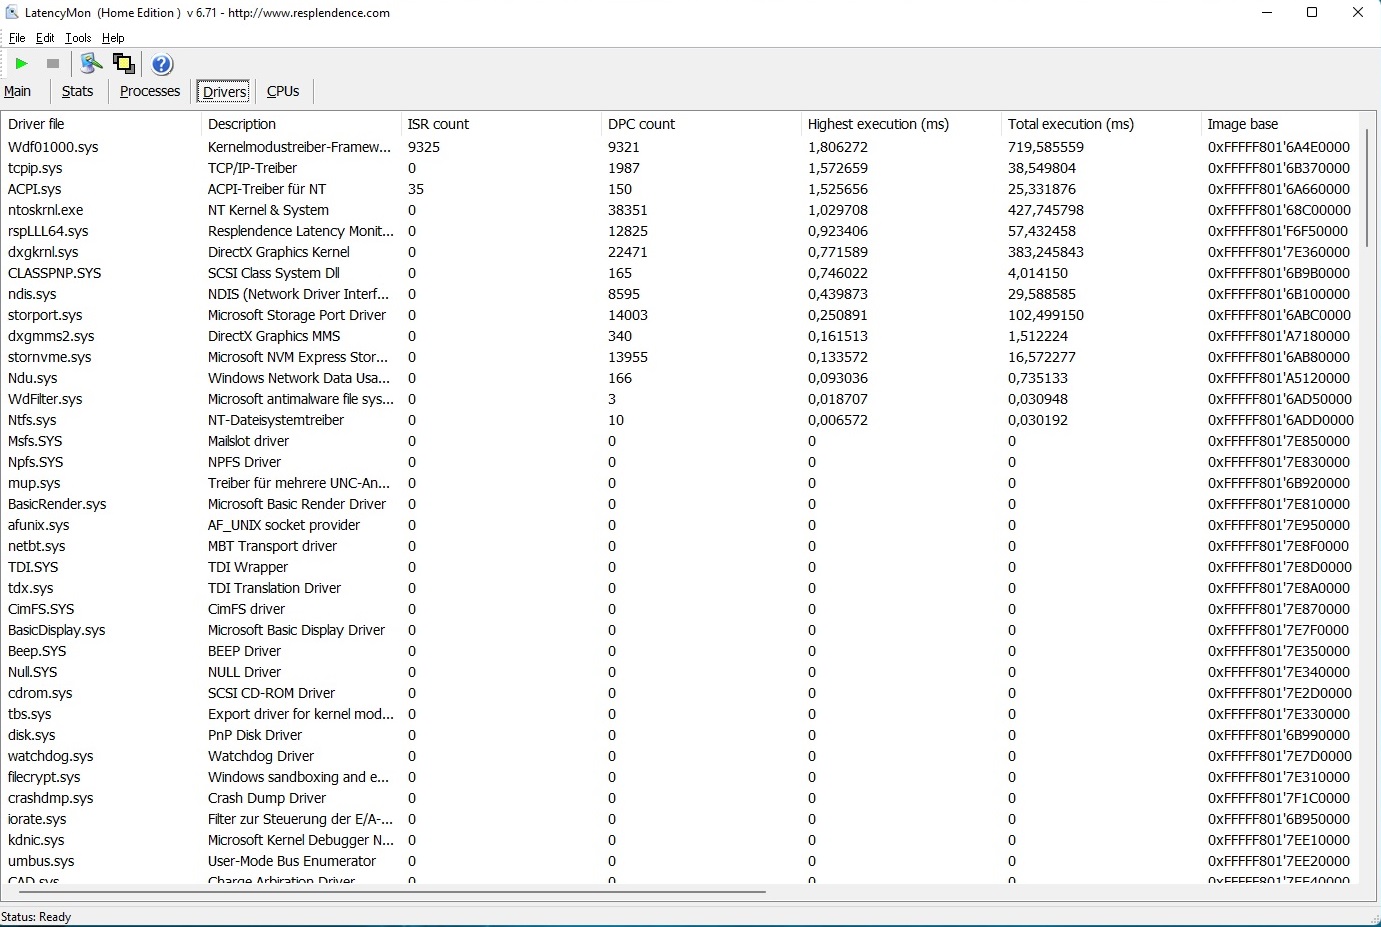
Jak to często bywa w przypadku laptopów, Major X10 ma pewne problemy z latencją. Według LatencyMon laptop ten nadaje się do obróbki audio i wideo w czasie rzeczywistym tylko w ograniczonym zakresie.
| DPC Latencies / LatencyMon - interrupt to process latency (max), Web, Youtube, Prime95 | |
| Asus TUF Gaming F17 FX707Z-HX011W | |
| HP Omen 16-c0077ng | |
| Medion Erazer Major X10 | |
| Acer Nitro 5 AN517-55-738R | |
| Dell Inspiron 16 Plus 7620 | |
* ... im mniej tym lepiej
Pamięć masowa
Major X10 mieści w sobie dysk SSD NVMe o ponadprzeciętnej prędkości, która zdenerwuje konkurencję. Charakteryzuje się on doskonałą prędkością sekwencyjnego odczytu i zapisu, wynoszącą odpowiednio ponad 5000 MB/s i 4000 MB/s (uzyskaną przy użyciu AS SSD Benchmark). Jest też drugie gniazdo PCIe M.2, abyś mógł wygodnie rozszerzyć pamięć masową, jeśli będzie to potrzebne w przyszłości.

| Drive Performance rating - Percent | |
| Medion Erazer Major X10 | |
| Średnia w klasie Gaming | |
| Acer Nitro 5 AN517-55-738R | |
| HP Omen 16-c0077ng | |
| Asus TUF Gaming F17 FX707Z-HX011W | |
| Dell Inspiron 16 Plus 7620 | |
| DiskSpd | |
| seq read | |
| Acer Nitro 5 AN517-55-738R | |
| Medion Erazer Major X10 | |
| Średnia w klasie Gaming (281 - 9494, n=102, ostatnie 2 lata) | |
| HP Omen 16-c0077ng | |
| Dell Inspiron 16 Plus 7620 | |
| Asus TUF Gaming F17 FX707Z-HX011W | |
| Asus TUF Gaming F17 FX707Z-HX011W | |
| seq write | |
| Acer Nitro 5 AN517-55-738R | |
| Średnia w klasie Gaming (1057 - 9832, n=102, ostatnie 2 lata) | |
| Medion Erazer Major X10 | |
| HP Omen 16-c0077ng | |
| Asus TUF Gaming F17 FX707Z-HX011W | |
| Asus TUF Gaming F17 FX707Z-HX011W | |
| Dell Inspiron 16 Plus 7620 | |
| seq q8 t1 read | |
| Średnia w klasie Gaming (3772 - 15056, n=102, ostatnie 2 lata) | |
| Medion Erazer Major X10 | |
| Acer Nitro 5 AN517-55-738R | |
| Asus TUF Gaming F17 FX707Z-HX011W | |
| Asus TUF Gaming F17 FX707Z-HX011W | |
| HP Omen 16-c0077ng | |
| Dell Inspiron 16 Plus 7620 | |
| seq q8 t1 write | |
| Średnia w klasie Gaming (1218 - 13519, n=102, ostatnie 2 lata) | |
| Acer Nitro 5 AN517-55-738R | |
| Medion Erazer Major X10 | |
| HP Omen 16-c0077ng | |
| Asus TUF Gaming F17 FX707Z-HX011W | |
| Asus TUF Gaming F17 FX707Z-HX011W | |
| Dell Inspiron 16 Plus 7620 | |
| 4k q1 t1 read | |
| Acer Nitro 5 AN517-55-738R | |
| Medion Erazer Major X10 | |
| Średnia w klasie Gaming (32.2 - 111.2, n=102, ostatnie 2 lata) | |
| Dell Inspiron 16 Plus 7620 | |
| HP Omen 16-c0077ng | |
| Asus TUF Gaming F17 FX707Z-HX011W | |
| Asus TUF Gaming F17 FX707Z-HX011W | |
| 4k q1 t1 write | |
| Medion Erazer Major X10 | |
| Acer Nitro 5 AN517-55-738R | |
| Asus TUF Gaming F17 FX707Z-HX011W | |
| Asus TUF Gaming F17 FX707Z-HX011W | |
| Średnia w klasie Gaming (78 - 347, n=102, ostatnie 2 lata) | |
| Dell Inspiron 16 Plus 7620 | |
| HP Omen 16-c0077ng | |
| 4k q32 t16 read | |
| Medion Erazer Major X10 | |
| Acer Nitro 5 AN517-55-738R | |
| Średnia w klasie Gaming (539 - 8067, n=102, ostatnie 2 lata) | |
| Asus TUF Gaming F17 FX707Z-HX011W | |
| Asus TUF Gaming F17 FX707Z-HX011W | |
| HP Omen 16-c0077ng | |
| Dell Inspiron 16 Plus 7620 | |
| 4k q32 t16 write | |
| Medion Erazer Major X10 | |
| Asus TUF Gaming F17 FX707Z-HX011W | |
| Asus TUF Gaming F17 FX707Z-HX011W | |
| Acer Nitro 5 AN517-55-738R | |
| HP Omen 16-c0077ng | |
| Średnia w klasie Gaming (227 - 5653, n=102, ostatnie 2 lata) | |
| Dell Inspiron 16 Plus 7620 | |
| AS SSD | |
| Score Total | |
| Medion Erazer Major X10 | |
| Średnia w klasie Gaming (2912 - 14159, n=99, ostatnie 2 lata) | |
| HP Omen 16-c0077ng | |
| Asus TUF Gaming F17 FX707Z-HX011W | |
| Acer Nitro 5 AN517-55-738R | |
| Dell Inspiron 16 Plus 7620 | |
| Score Read | |
| Medion Erazer Major X10 | |
| HP Omen 16-c0077ng | |
| Średnia w klasie Gaming (953 - 5082, n=99, ostatnie 2 lata) | |
| Acer Nitro 5 AN517-55-738R | |
| Asus TUF Gaming F17 FX707Z-HX011W | |
| Dell Inspiron 16 Plus 7620 | |
| Score Write | |
| Medion Erazer Major X10 | |
| Średnia w klasie Gaming (1136 - 6457, n=99, ostatnie 2 lata) | |
| HP Omen 16-c0077ng | |
| Asus TUF Gaming F17 FX707Z-HX011W | |
| Acer Nitro 5 AN517-55-738R | |
| Dell Inspiron 16 Plus 7620 | |
| Seq Read | |
| Średnia w klasie Gaming (2346 - 10091, n=99, ostatnie 2 lata) | |
| Acer Nitro 5 AN517-55-738R | |
| Medion Erazer Major X10 | |
| HP Omen 16-c0077ng | |
| Dell Inspiron 16 Plus 7620 | |
| Asus TUF Gaming F17 FX707Z-HX011W | |
| Seq Write | |
| Medion Erazer Major X10 | |
| Średnia w klasie Gaming (114.5 - 10726, n=99, ostatnie 2 lata) | |
| HP Omen 16-c0077ng | |
| Asus TUF Gaming F17 FX707Z-HX011W | |
| Acer Nitro 5 AN517-55-738R | |
| Dell Inspiron 16 Plus 7620 | |
| 4K Read | |
| Medion Erazer Major X10 | |
| Średnia w klasie Gaming (27.8 - 108.4, n=99, ostatnie 2 lata) | |
| Dell Inspiron 16 Plus 7620 | |
| Acer Nitro 5 AN517-55-738R | |
| HP Omen 16-c0077ng | |
| Asus TUF Gaming F17 FX707Z-HX011W | |
| 4K Write | |
| Medion Erazer Major X10 | |
| Średnia w klasie Gaming (75.6 - 307, n=99, ostatnie 2 lata) | |
| Acer Nitro 5 AN517-55-738R | |
| Dell Inspiron 16 Plus 7620 | |
| HP Omen 16-c0077ng | |
| Asus TUF Gaming F17 FX707Z-HX011W | |
| 4K-64 Read | |
| Medion Erazer Major X10 | |
| HP Omen 16-c0077ng | |
| Asus TUF Gaming F17 FX707Z-HX011W | |
| Średnia w klasie Gaming (517 - 3977, n=99, ostatnie 2 lata) | |
| Acer Nitro 5 AN517-55-738R | |
| Dell Inspiron 16 Plus 7620 | |
| 4K-64 Write | |
| Medion Erazer Major X10 | |
| Średnia w klasie Gaming (850 - 5356, n=99, ostatnie 2 lata) | |
| Asus TUF Gaming F17 FX707Z-HX011W | |
| HP Omen 16-c0077ng | |
| Acer Nitro 5 AN517-55-738R | |
| Dell Inspiron 16 Plus 7620 | |
| Access Time Read | |
| Medion Erazer Major X10 | |
| Dell Inspiron 16 Plus 7620 | |
| Asus TUF Gaming F17 FX707Z-HX011W | |
| HP Omen 16-c0077ng | |
| Średnia w klasie Gaming (0.017 - 0.623, n=99, ostatnie 2 lata) | |
| Acer Nitro 5 AN517-55-738R | |
| Access Time Write | |
| Dell Inspiron 16 Plus 7620 | |
| Asus TUF Gaming F17 FX707Z-HX011W | |
| Średnia w klasie Gaming (0.012 - 0.277, n=99, ostatnie 2 lata) | |
| HP Omen 16-c0077ng | |
| Acer Nitro 5 AN517-55-738R | |
| Medion Erazer Major X10 | |
* ... im mniej tym lepiej
Sustained Performance Read: DiskSpd Read Loop, Queue Depth 8
Karta graficzna
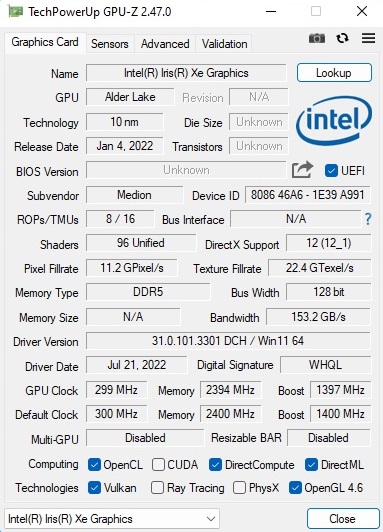
Doszliśmy do najciekawszej części Major X10: jej karty graficznej. Po raz pierwszy na naszym testbenchu wylądował Intel Arc A730M (24 rdzenie Xe i 24 jednostki Ray Tracing Units). GPU Intela świetnie radzi sobie w syntetycznych benchmarkach graficznych. W testach 3DMark znacząco przewyższa GeForce RTX 3050 Ti i jest na tym samym poziomie co GeForce RTX 3060 i Radeon RX 6600M. Z włączonym trybem Turbo laptop Medion był w stanie wydobyć z GPU prawie 20% więcej wydajności i wyprzedzić pozostałe urządzenia w naszym porównaniu. Więcej wyników benchmarków można znaleźć na naszej stronie poświęconej Arc A730M.
| 3DMark Performance rating - Percent | |
| Średnia w klasie Gaming | |
| Medion Erazer Major X10 Turbo Mode | |
| HP Omen 16-c0077ng -1! | |
| Asus TUF Gaming F17 FX707Z-HX011W -1! | |
| Przeciętny Intel Arc A730M | |
| Acer Nitro 5 AN517-55-738R | |
| Medion Erazer Major X10 | |
| Dell Inspiron 16 Plus 7620 -1! | |
| 3DMark 11 - 1280x720 Performance GPU | |
| Średnia w klasie Gaming (21841 - 80022, n=106, ostatnie 2 lata) | |
| HP Omen 16-c0077ng | |
| Medion Erazer Major X10 Turbo Mode | |
| Asus TUF Gaming F17 FX707Z-HX011W | |
| Przeciętny Intel Arc A730M (24928 - 31551, n=4) | |
| Acer Nitro 5 AN517-55-738R | |
| Medion Erazer Major X10 | |
| Dell Inspiron 16 Plus 7620 | |
| 3DMark | |
| 1920x1080 Fire Strike Graphics | |
| Średnia w klasie Gaming (12242 - 62849, n=118, ostatnie 2 lata) | |
| HP Omen 16-c0077ng | |
| Asus TUF Gaming F17 FX707Z-HX011W | |
| Medion Erazer Major X10 Turbo Mode | |
| Acer Nitro 5 AN517-55-738R | |
| Przeciętny Intel Arc A730M (19850 - 22620, n=4) | |
| Medion Erazer Major X10 | |
| Dell Inspiron 16 Plus 7620 | |
| 2560x1440 Time Spy Graphics | |
| Średnia w klasie Gaming (5012 - 26212, n=117, ostatnie 2 lata) | |
| Medion Erazer Major X10 Turbo Mode | |
| Asus TUF Gaming F17 FX707Z-HX011W | |
| Przeciętny Intel Arc A730M (7212 - 10352, n=4) | |
| Medion Erazer Major X10 | |
| Acer Nitro 5 AN517-55-738R | |
| HP Omen 16-c0077ng | |
| Dell Inspiron 16 Plus 7620 | |
| 2560x1440 Port Royal Graphics | |
| Średnia w klasie Gaming (4395 - 17286, n=71, ostatnie 2 lata) | |
| Medion Erazer Major X10 Turbo Mode | |
| Acer Nitro 5 AN517-55-738R | |
| Przeciętny Intel Arc A730M (3758 - 5678, n=3) | |
| Medion Erazer Major X10 | |
| 3DMark 06 Standard Score | 46579 pkt. | |
| 3DMark Vantage P Result | 63844 pkt. | |
| 3DMark 11 Performance | 24223 pkt. | |
| 3DMark Ice Storm Standard Score | 119799 pkt. | |
| 3DMark Cloud Gate Standard Score | 44757 pkt. | |
| 3DMark Fire Strike Score | 18543 pkt. | |
| 3DMark Time Spy Score | 9041 pkt. | |
Pomoc | ||
| Blender | |
| v3.3 Classroom OPTIX/RTX | |
| Dell Inspiron 16 Plus 7620 | |
| Średnia w klasie Gaming (9 - 32, n=109, ostatnie 2 lata) | |
| v3.3 Classroom CUDA | |
| Dell Inspiron 16 Plus 7620 | |
| Średnia w klasie Gaming (15 - 233, n=110, ostatnie 2 lata) | |
| v3.3 Classroom CPU | |
| Dell Inspiron 16 Plus 7620 | |
| Medion Erazer Major X10 | |
| Średnia w klasie Gaming (122 - 565, n=105, ostatnie 2 lata) | |
* ... im mniej tym lepiej
Wydajność w grach
Z kolei w benchmarkach gamingowych procesor graficzny prezentuje bardzo mieszany obraz. Choć Arc A730M jest czasem w stanie rzucić wyzwanie RTX 3060 i RX 6600M, to często oscyluje wokół poziomu wydajności GeForce RTX 3050 Ti, który zwykle znajduje się w znacznie tańszych laptopach do gier. W najgorszym przypadku Arc A730M jest nawet wolniejszy od RTX 3050 Ti. Jest to dość rozczarowujące, biorąc pod uwagę cenę i specyfikację GPU (12 GB vs 4 GB VRAM). Intel powinien naprawdę kontynuować poprawę wsparcia dla sterowników. Podobnie jak w przypadku układów iGPU, niektóre gry działały z artefaktami wizualnymi lub innymi różnymi problemami. Mieliśmy też do czynienia z okazjonalnymi awariami. Mimo to, przełączanie grafiki wydaje się działać dobrze. Wszystkie gry użyte w naszych testach były bezpośrednio przypisane do dGPU. Zasadniczo Arc A730M jest mniej lub bardziej przeznaczony dla wyświetlaczy Full HD. W rozdzielczości 1 920 x 1 080 prawie wszystkie gry działały płynnie z detalami ustawionymi na wysokie lub bardzo wysokie. Tymczasem wyższe rozdzielczości (takie jak natywna 2 560 x 1 600) doprowadzają GPU Intela do granic możliwości. Więcej porównań procesorów graficznych można znaleźć w naszym zestawieniu gier https://www.notebookcheck.net/Computer-Games-on-Laptop-Graphics-Cards.13849.0.html.
| The Witcher 3 | |
| 1920x1080 High Graphics & Postprocessing (Nvidia HairWorks Off) | |
| Średnia w klasie Gaming (181 - 341, n=3, ostatnie 2 lata) | |
| Asus TUF Gaming F17 FX707Z-HX011W | |
| Acer Nitro 5 AN517-55-738R | |
| HP Omen 16-c0077ng | |
| Medion Erazer Major X10 | |
| Dell Inspiron 16 Plus 7620 | |
| 1920x1080 Ultra Graphics & Postprocessing (HBAO+) | |
| Średnia w klasie Gaming (95 - 240, n=8, ostatnie 2 lata) | |
| Asus TUF Gaming F17 FX707Z-HX011W | |
| HP Omen 16-c0077ng | |
| Acer Nitro 5 AN517-55-738R | |
| Dell Inspiron 16 Plus 7620 | |
| Medion Erazer Major X10 | |
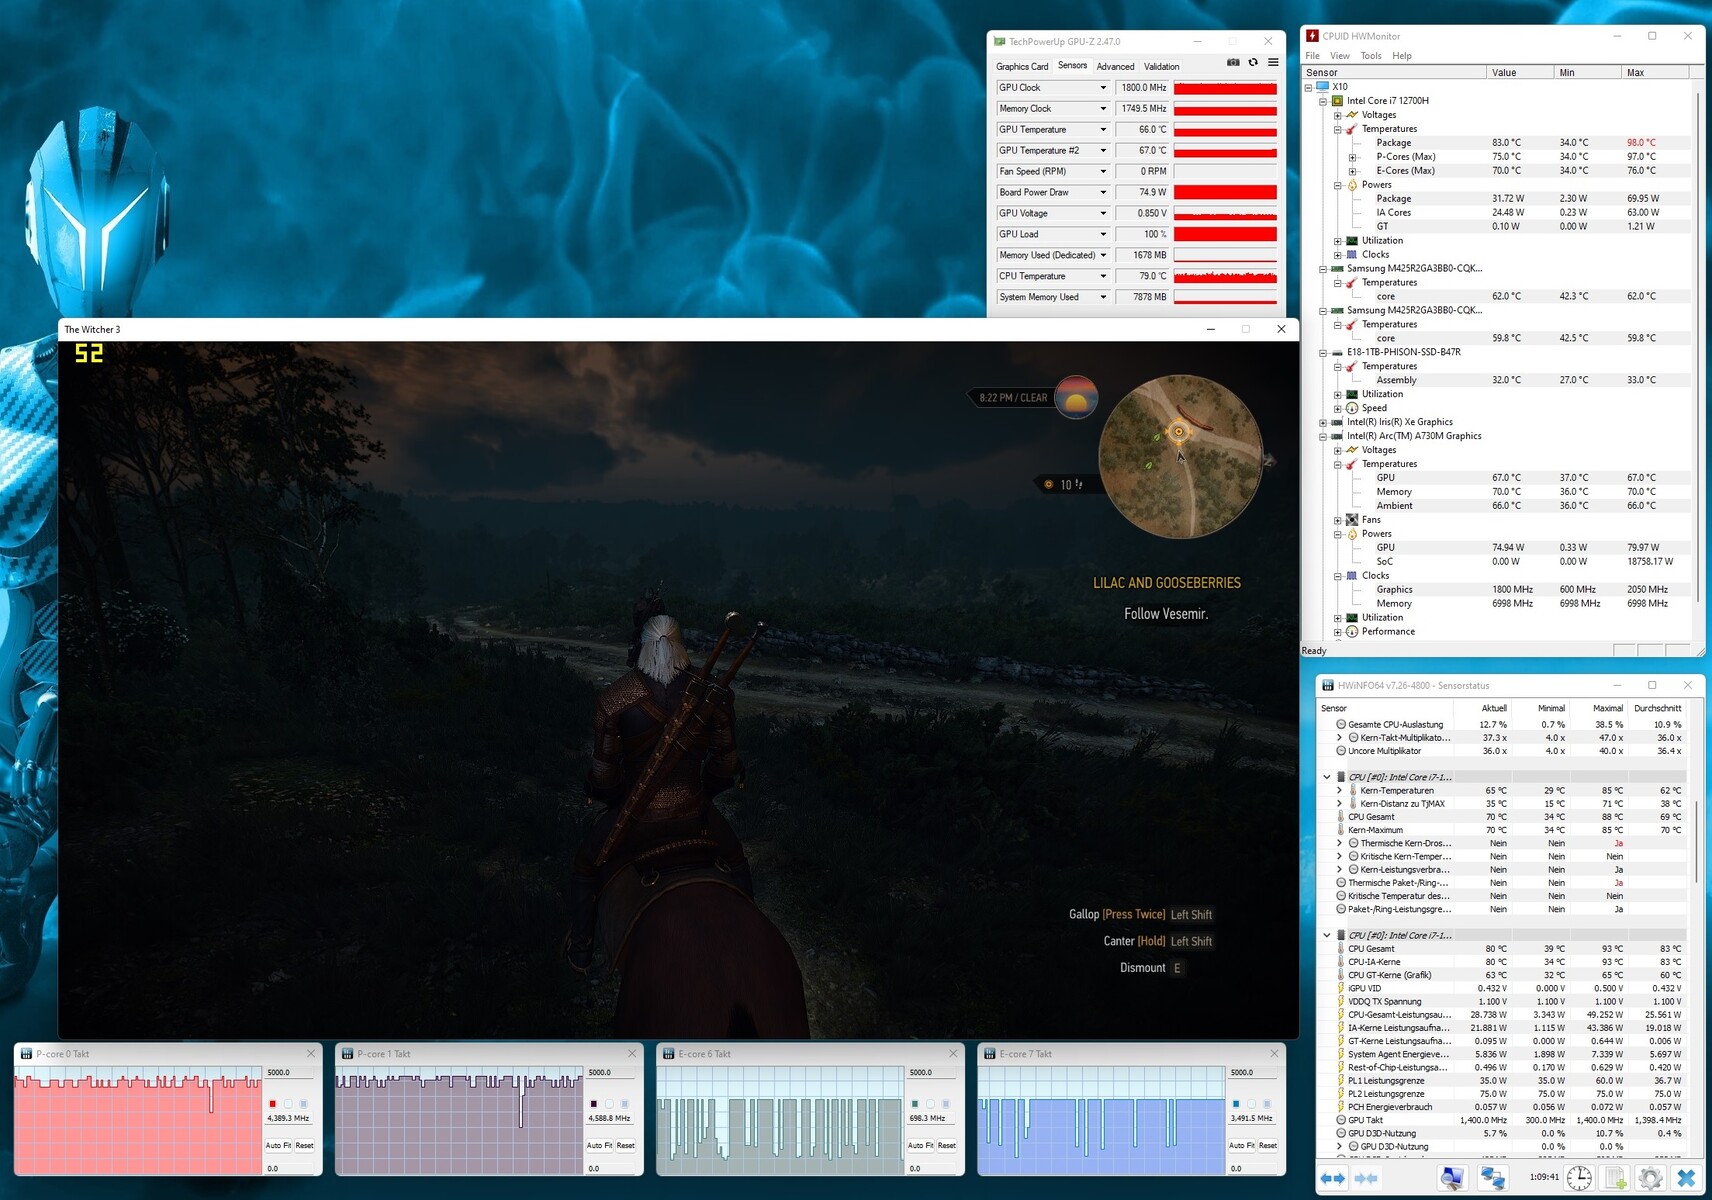
Prowadziliśmy The Witcher 3na laptopie przez godzinę, by sprawdzić, jak dobrze wydajność 3D trzyma się przez dłuższy czas. Wynik: nie było żadnych spadków wydajności ani podobnych problemów.
Witcher 3 FPS graph
| low | med. | high | ultra | QHD | |
|---|---|---|---|---|---|
| GTA V (2015) | 165.9 | 100.3 | 42.8 | ||
| The Witcher 3 (2015) | 212 | 114 | 49.4 | ||
| Dota 2 Reborn (2015) | 109.3 | 94.2 | 90.4 | 80.4 | |
| Final Fantasy XV Benchmark (2018) | 71 | 49.7 | |||
| X-Plane 11.11 (2018) | 57.3 | 47.1 | 38.6 | ||
| Far Cry 5 (2018) | 92 | 83 | 78 | ||
| Strange Brigade (2018) | 178.2 | 148.8 | 124.1 | ||
| Hunt Showdown (2020) | 88.2 | 72.3 | 50.1 | ||
| Doom Eternal (2020) | 112.4 | 104.2 | 101.7 | 70.9 | |
| Gears Tactics (2020) | 147 | 99.2 | 79.7 | 52 | |
| Death Stranding (2020) | 89.8 | 82.9 | 81.9 | 60 | |
| Crysis Remastered (2020) | 125.4 | 60.7 | 50.1 | 34.8 | |
| Serious Sam 4 (2020) | 72.7 | 54.8 | 42.5 | 34.7 | |
| Mafia Definitive Edition (2020) | 55.4 | 52.7 | 36.9 | ||
| Star Wars Squadrons (2020) | 167.1 | 149.4 | 140.6 | 97.4 | |
| Watch Dogs Legion (2020) | 85 | 75 | 48 | 35 | |
| Dirt 5 (2020) | 80.6 | 64.5 | 54 | 44.2 | |
| Assassin´s Creed Valhalla (2020) | 64 | 54 | 48 | 37 | |
| Yakuza Like a Dragon (2020) | 51.3 | 47.3 | 46.1 | 39.4 | |
| Hitman 3 (2021) | 123 | 109 | 102 | 65 | |
| Outriders (2021) | 90 | 76.1 | 69 | 43.9 | |
| Resident Evil Village (2021) | 119.9 | 107.8 | 93.3 | 61.1 | |
| Mass Effect Legendary Edition (2021) | 88.5 | 81.9 | |||
| Days Gone (2021) | 80.2 | 76 | 58.2 | 42 | |
| Deathloop (2021) | 76.2 | 65.5 | 54.6 | 37 | |
| Alan Wake Remastered (2021) | 116.7 | 98.6 | 67.5 | ||
| Far Cry 6 (2021) | 87 | 75 | 65 | 47 | |
| Back 4 Blood (2021) | 132.9 | 115.4 | 105.9 | 68.3 | |
| Guardians of the Galaxy (2021) | 81 | 76 | 73 | 52 | |
| Riders Republic (2021) | 60 | 51 | 47 | 34 | |
| Forza Horizon 5 (2021) | 86 | 80 | 50 | 41 | |
| Farming Simulator 22 (2021) | 136.6 | 110.8 | 107.2 | 80.5 | |
| Halo Infinite (2021) | 67.2 | 59.8 | 56.2 | 42.3 | |
| God of War (2022) | 53.1 | 44.9 | 36.9 | 30.7 | |
| Rainbow Six Extraction (2022) | 103 | 99 | 83 | 55 | |
| Dying Light 2 (2022) | 60.9 | 51.2 | 35.6 | ||
| GRID Legends (2022) | 109 | 91 | 71 | 56.9 | |
| Elden Ring (2022) | 59.9 | 59.7 | 56.9 | 46.2 | |
| Cyberpunk 2077 1.6 (2022) | 71 | 57.5 | 57.4 | 30.9 | |
| Elex 2 (2022) | 49.7 | 48.8 | 43.3 | 36.5 | |
| Ghostwire Tokyo (2022) | 85.4 | 83.6 | 83.3 | 52.3 | |
| Tiny Tina's Wonderlands (2022) | 86.6 | 64.6 | 52 | 35.5 | |
| Vampire Bloodhunt (2022) | 135.8 | 121.5 | 111.9 | 71.4 | |
| F1 22 (2022) | 124 | 104 | 35 | 23.4 | |
| The Quarry (2022) | 58.9 | 47.5 | 38.1 | 24.8 |
Emisje
Emisja hałasu
Major X10 jest wyraźnie słyszalny podczas pracy w trybie Gaming. Poziom hałasu może osiągnąć 49 do 51 dB(A) pod obciążeniem, co wielu użytkowników uzna zapewne za irytujące. To powiedziawszy, inne laptopy do gier mogą być tak samo głośne lub nawet głośniejsze niż Major X10. Zdecydowanie zalecalibyśmy używanie słuchawek. W stanie bezczynności można się spodziewać, że urządzenie wytwarza od 30 do 31 dB(A) hałasu, co jest dość zauważalne, ale nie jest szczególnie ciche. 16-calowy notebook rzadko jest całkowicie bezgłośny, gdyż zwykle pracują wentylatory.
Hałas
| luz |
| 25 / 30 / 31 dB |
| obciążenie |
| 49 / 51 dB |
 | ||
30 dB cichy 40 dB(A) słyszalny 50 dB(A) irytujący |
||
min: | ||
| Medion Erazer Major X10 i7-12700H, A730M | Asus TUF Gaming F17 FX707Z-HX011W i7-12700H, GeForce RTX 3060 Laptop GPU | Acer Nitro 5 AN517-55-738R i7-12700H, GeForce RTX 3060 Laptop GPU | Dell Inspiron 16 Plus 7620 i7-12700H, GeForce RTX 3050 Ti Laptop GPU | HP Omen 16-c0077ng R7 5800H, Radeon RX 6600M | |
|---|---|---|---|---|---|
| Noise | 11% | -3% | 4% | -6% | |
| wyłączone / środowisko * (dB) | 25 | 24 4% | 25.5 -2% | 23.3 7% | 25 -0% |
| Idle Minimum * (dB) | 25 | 24 4% | 25.5 -2% | 25.7 -3% | 25 -0% |
| Idle Average * (dB) | 30 | 24 20% | 25.5 15% | 26.1 13% | 31.2 -4% |
| Idle Maximum * (dB) | 31 | 24 23% | 27 13% | 30.6 1% | 33.8 -9% |
| Load Average * (dB) | 49 | 42.6 13% | 52.6 -7% | 46.2 6% | 55.4 -13% |
| Witcher 3 ultra * (dB) | 50 | 46.84 6% | 49.2 2% | ||
| Load Maximum * (dB) | 51 | 46.84 8% | 68.2 -34% | 49.4 3% | 56 -10% |
* ... im mniej tym lepiej
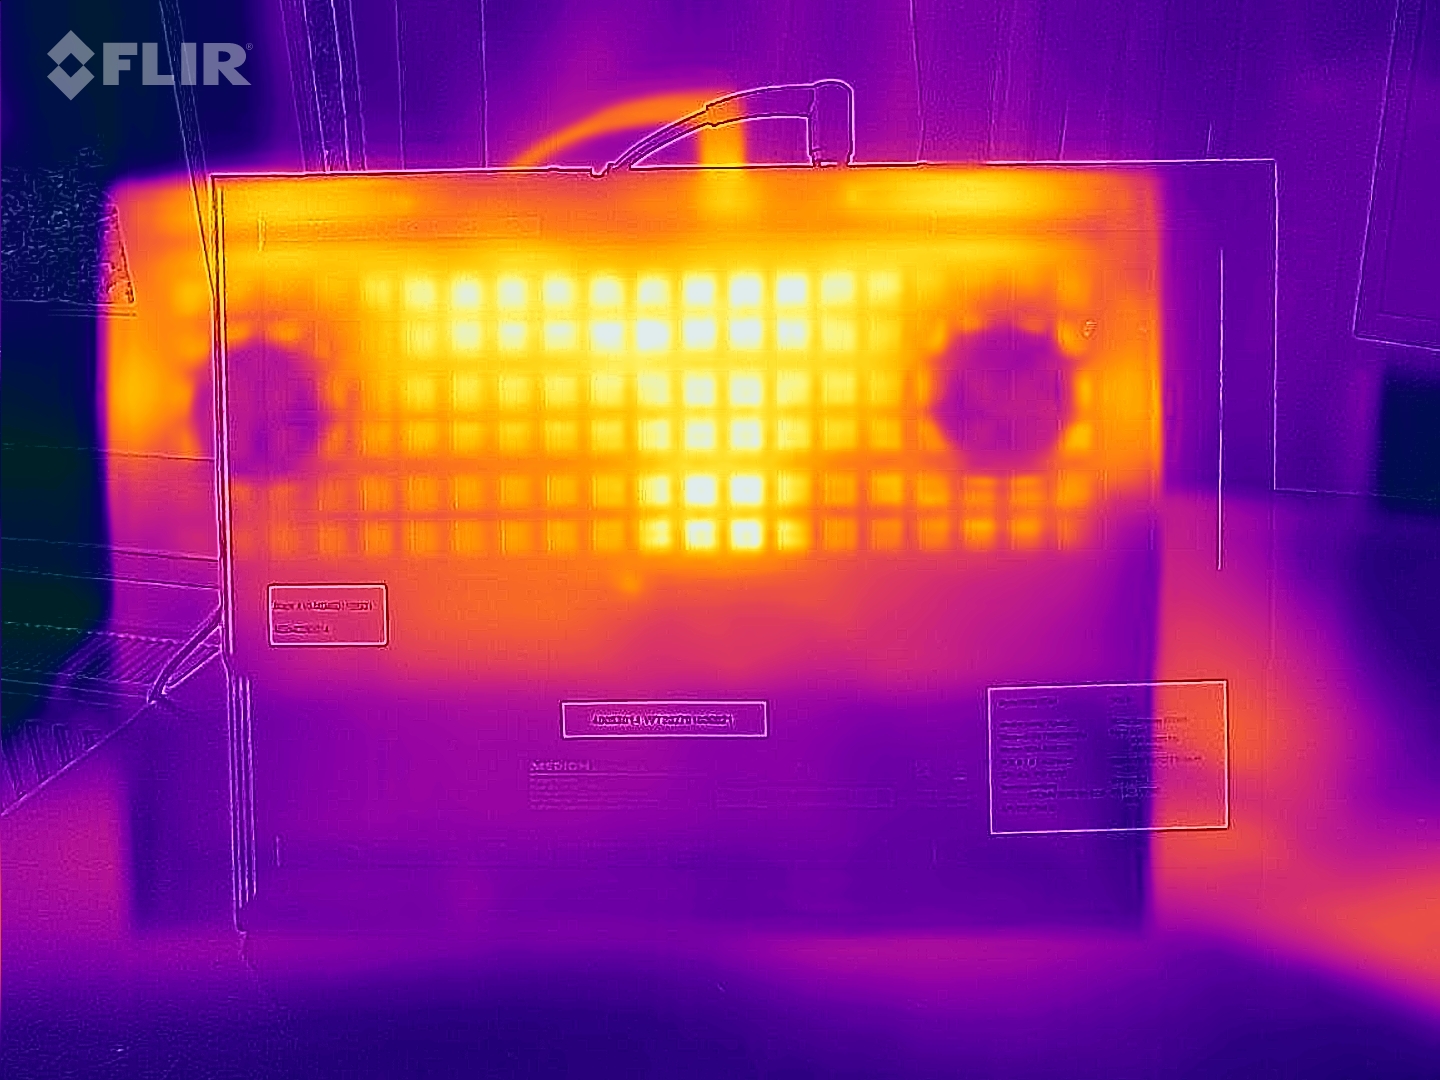
Temperatura
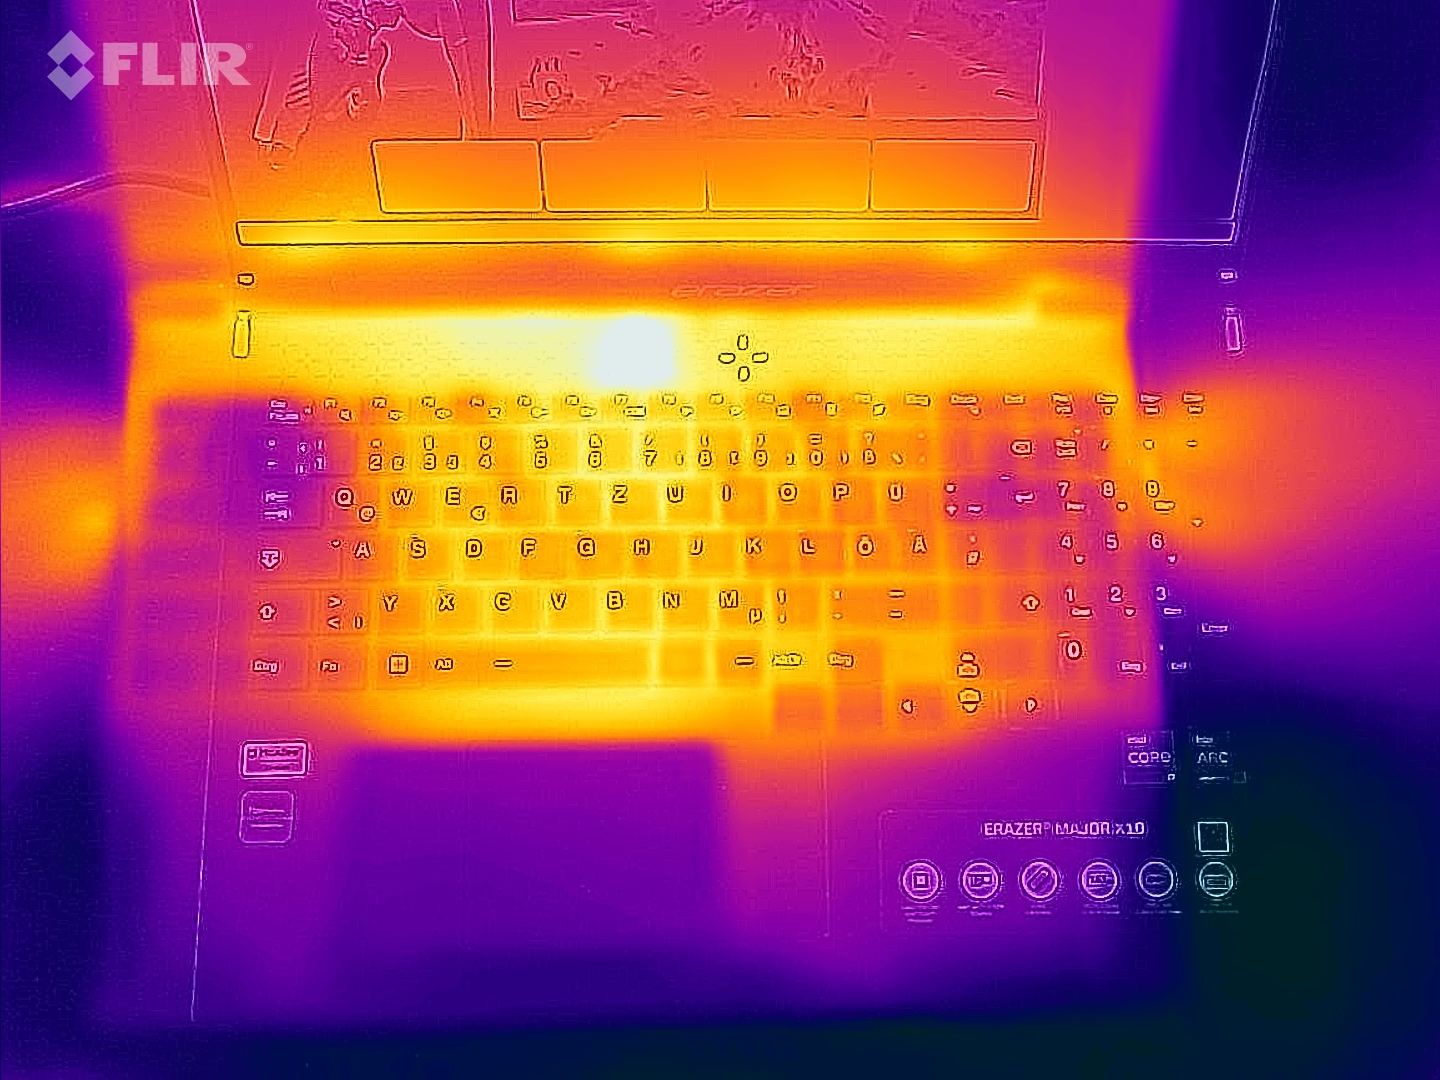
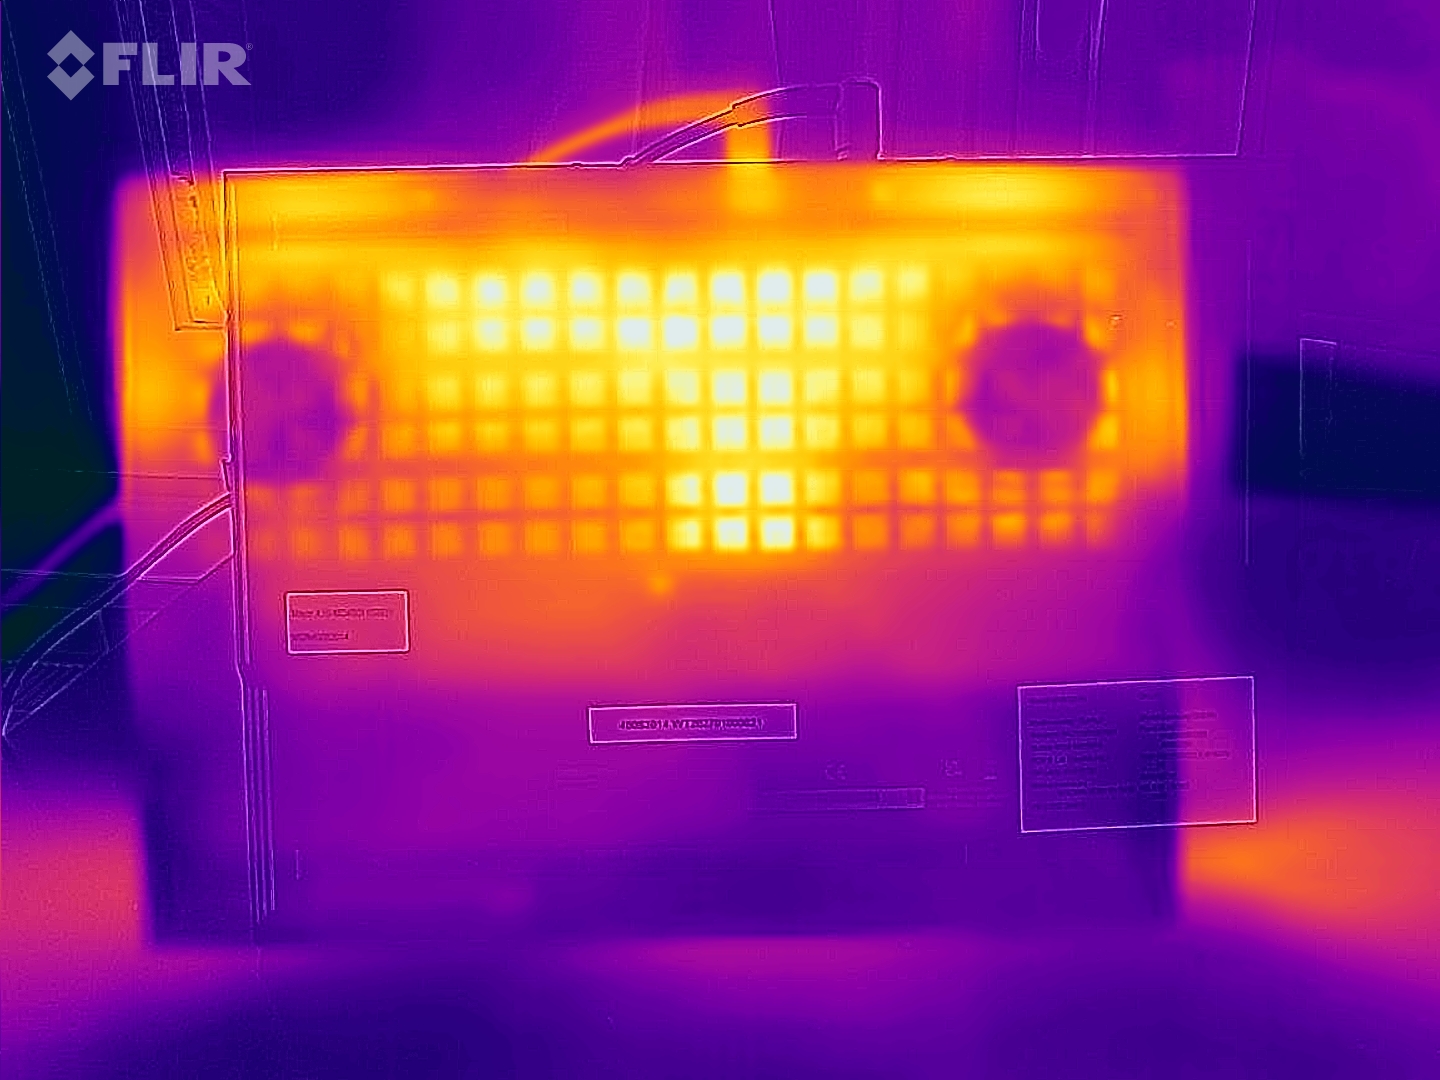
Temperatura obudowy pozostawiła nas z mieszanymi uczuciami. Z jednej strony obudowa jest cieplejsza od konkurentów w stanie spoczynku, osiągając do 45°C (113°F) na górze i 48°C (118°F) na dole. Z drugiej strony, nie jest ona zbyt ciepła, kiedy urządzenie pracuje pod pełnym obciążeniem. Mimo to, prawdopodobnie nadal nie powinno się kłaść urządzenia na kolanach podczas sesji gier.
(±) Maksymalna temperatura w górnej części wynosi 45 °C / 113 F, w porównaniu do średniej 40.4 °C / 105 F , począwszy od 21.2 do 68.8 °C dla klasy Gaming.
(-) Dno nagrzewa się maksymalnie do 48 °C / 118 F, w porównaniu do średniej 43.2 °C / 110 F
(±) W stanie bezczynności średnia temperatura górnej części wynosi 32.7 °C / 91 F, w porównaniu ze średnią temperaturą urządzenia wynoszącą 33.9 °C / ### class_avg_f### F.
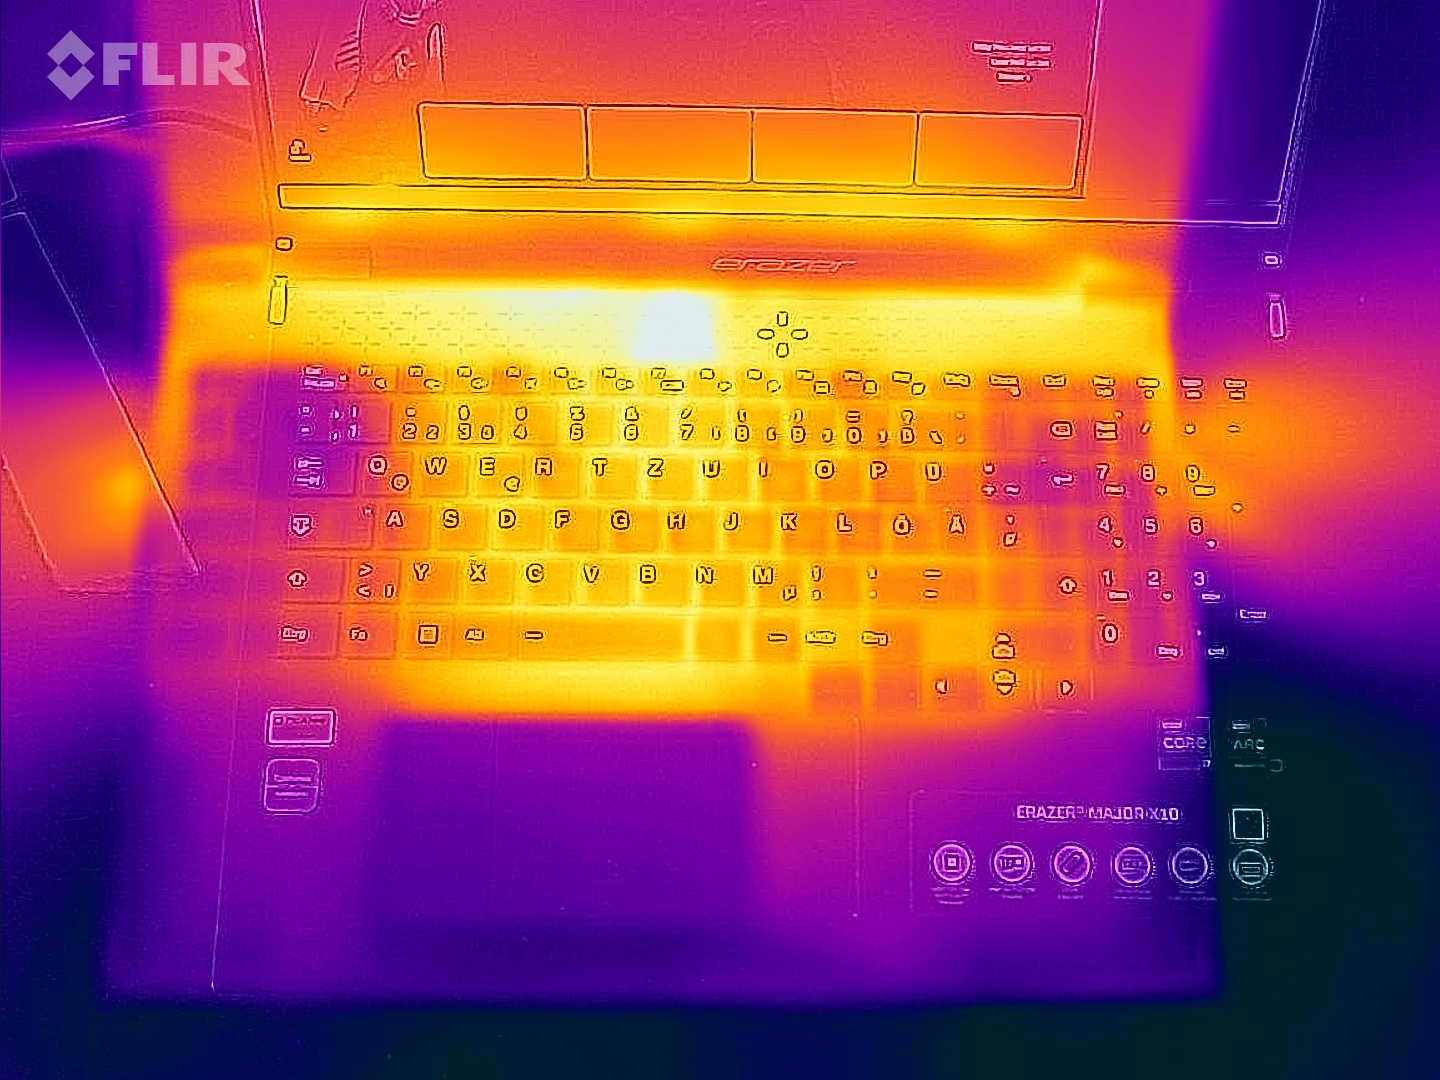
(-) Podczas gry w Wiedźmina 3 średnia temperatura górnej części wynosi 40.9 °C / 106 F, w porównaniu do średniej temperatury urządzenia wynoszącej 33.9 °C / ## #class_avg_f### F.
(±) Podpórki pod nadgarstki i touchpad mogą się bardzo nagrzać w dotyku, maksymalnie do 38 °C / 100.4 F.
(-) Średnia temperatura obszaru podparcia dłoni w podobnych urządzeniach wynosiła 28.8 °C / 83.8 F (-9.2 °C / -16.6 F).
| Medion Erazer Major X10 i7-12700H, A730M | Asus TUF Gaming F17 FX707Z-HX011W i7-12700H, GeForce RTX 3060 Laptop GPU | Acer Nitro 5 AN517-55-738R i7-12700H, GeForce RTX 3060 Laptop GPU | Dell Inspiron 16 Plus 7620 i7-12700H, GeForce RTX 3050 Ti Laptop GPU | HP Omen 16-c0077ng R7 5800H, Radeon RX 6600M | |
|---|---|---|---|---|---|
| Heat | 6% | 1% | 12% | 15% | |
| Maximum Upper Side * (°C) | 45 | 52 -16% | 48.3 -7% | 46 -2% | 40.6 10% |
| Maximum Bottom * (°C) | 48 | 47 2% | 52 -8% | 45.8 5% | 36 25% |
| Idle Upper Side * (°C) | 38 | 31 18% | 34.5 9% | 29.2 23% | 31.3 18% |
| Idle Bottom * (°C) | 39 | 31 21% | 35.8 8% | 31 21% | 36 8% |
* ... im mniej tym lepiej
Test na stres
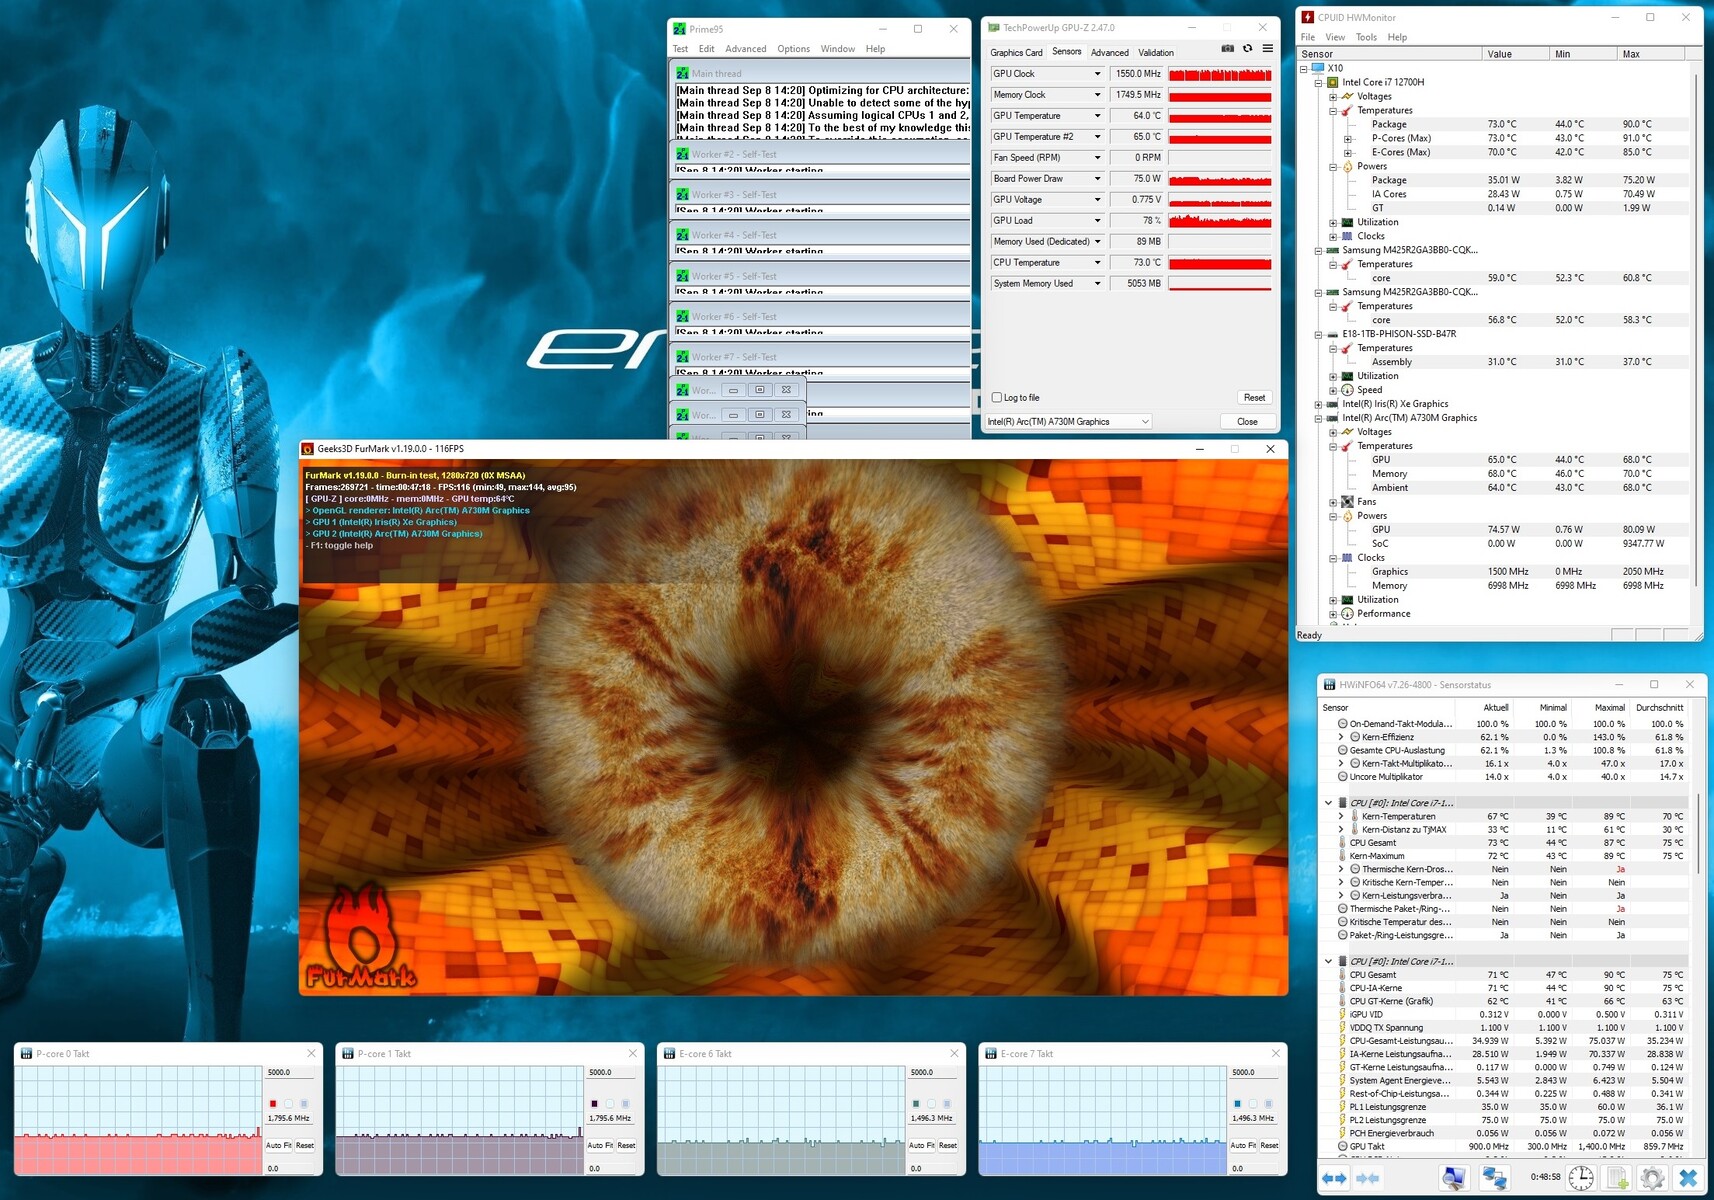
Podobnie jak w przypadku testu Witcher 3, Arc A730M ukończył godzinny test obciążeniowy (FurMark i Prime95) ze średnią temperaturą około 65°C (149°F). Tymczasem Core i7-12700H przeszedł ten test z temperaturą nieco ponad 70°C (158°F), co również jest absolutnie bezpieczne dla procesora.
Medion Erazer Major X10 analiza dźwięku
(+) | głośniki mogą odtwarzać stosunkowo głośno (82 dB)
Bas 100 - 315 Hz
(-) | prawie brak basu - średnio 16.1% niższa od mediany
(±) | liniowość basu jest średnia (12.9% delta do poprzedniej częstotliwości)
Średnie 400 - 2000 Hz
(±) | wyższe średnie - średnio 6.9% wyższe niż mediana
(+) | średnie są liniowe (4.3% delta do poprzedniej częstotliwości)
Wysokie 2–16 kHz
(+) | zrównoważone maksima - tylko 3.2% od mediany
(+) | wzloty są liniowe (6.7% delta do poprzedniej częstotliwości)
Ogólnie 100 - 16.000 Hz
(±) | liniowość ogólnego dźwięku jest średnia (17.5% różnicy w stosunku do mediany)
W porównaniu do tej samej klasy
» 49% wszystkich testowanych urządzeń w tej klasie było lepszych, 12% podobnych, 40% gorszych
» Najlepszy miał deltę 6%, średnia wynosiła ###średnia###%, najgorsza wynosiła 132%
W porównaniu do wszystkich testowanych urządzeń
» 34% wszystkich testowanych urządzeń było lepszych, 8% podobnych, 58% gorszych
» Najlepszy miał deltę 4%, średnia wynosiła ###średnia###%, najgorsza wynosiła 134%
Asus TUF Gaming F17 FX707Z-HX011W analiza dźwięku
(±) | głośność głośnika jest średnia, ale dobra (79.5 dB)
Bas 100 - 315 Hz
(±) | zredukowany bas - średnio 13.1% niższy od mediany
(±) | liniowość basu jest średnia (9% delta do poprzedniej częstotliwości)
Średnie 400 - 2000 Hz
(±) | wyższe średnie - średnio 9.1% wyższe niż mediana
(±) | liniowość środka jest średnia (7.8% delta do poprzedniej częstotliwości)
Wysokie 2–16 kHz
(+) | zrównoważone maksima - tylko 3.9% od mediany
(±) | liniowość wysokich wartości jest średnia (9.1% delta do poprzedniej częstotliwości)
Ogólnie 100 - 16.000 Hz
(±) | liniowość ogólnego dźwięku jest średnia (20.4% różnicy w stosunku do mediany)
W porównaniu do tej samej klasy
» 72% wszystkich testowanych urządzeń w tej klasie było lepszych, 6% podobnych, 22% gorszych
» Najlepszy miał deltę 6%, średnia wynosiła ###średnia###%, najgorsza wynosiła 132%
W porównaniu do wszystkich testowanych urządzeń
» 53% wszystkich testowanych urządzeń było lepszych, 8% podobnych, 39% gorszych
» Najlepszy miał deltę 4%, średnia wynosiła ###średnia###%, najgorsza wynosiła 134%
Mówcy
Jakość dźwięku w Majorze X10 jest przeciętna wśród laptopów do gier. Jak to często bywa, w głośnikach brakuje przede wszystkim basów. Dlatego też należy w miarę możliwości chwycić za parę słuchawek, jeśli chce się naprawdę cieszyć muzyką i filmami na tym laptopie.
Zarządzanie energią
Pobór mocy
Trudno zrozumieć, dlaczego Medion dołączył do laptopa nieporęczny 300-watowy zasilacz. Major X10 zużył nie więcej niż 220 W podczas naszego testu obciążeniowego, co sugeruje, że bardziej kompaktowa ładowarka 230-watowa miałaby więcej sensu. Pod obciążeniem urządzenie zużywa od 122 do 220 W mocy, czyli podobnie jak laptopy wyposażone w RTX 3060. Jednak wysoki pobór mocy w stanie bezczynności, wynoszący od 24 do 36 watów, stawia go mocno na dole grupy porównawczej.
| wyłączony / stan wstrzymania | |
| luz | |
| obciążenie |
|
Legenda:
min: | |
| Medion Erazer Major X10 i7-12700H, A730M | Asus TUF Gaming F17 FX707Z-HX011W i7-12700H, GeForce RTX 3060 Laptop GPU | Acer Nitro 5 AN517-55-738R i7-12700H, GeForce RTX 3060 Laptop GPU | Dell Inspiron 16 Plus 7620 i7-12700H, GeForce RTX 3050 Ti Laptop GPU | HP Omen 16-c0077ng R7 5800H, Radeon RX 6600M | Średnia w klasie Gaming | |
|---|---|---|---|---|---|---|
| Power Consumption | 33% | 23% | 43% | 13% | 20% | |
| Idle Minimum * (Watt) | 24 | 6.6 73% | 9.7 60% | 6.8 72% | 12 50% | 13.2 ? 45% |
| Idle Average * (Watt) | 26 | 8.3 68% | 14.6 44% | 9.6 63% | 12.8 51% | 18.9 ? 27% |
| Idle Maximum * (Watt) | 36 | 11.8 67% | 16.7 54% | 17 53% | 18.5 49% | 24.5 ? 32% |
| Load Average * (Watt) | 122 | 119 2% | 166 -36% | 117.5 4% | 190 -56% | 108.8 ? 11% |
| Witcher 3 ultra * (Watt) | 155.6 | 169 -9% | 113.1 27% | 194 -25% | ||
| Load Maximum * (Watt) | 220 | 222 -1% | 235 -7% | 137.4 38% | 200 9% | 254 ? -15% |
* ... im mniej tym lepiej
Power consumption Witcher 3 / Stress test
Power consumption with external monitor
Żywotność baterii
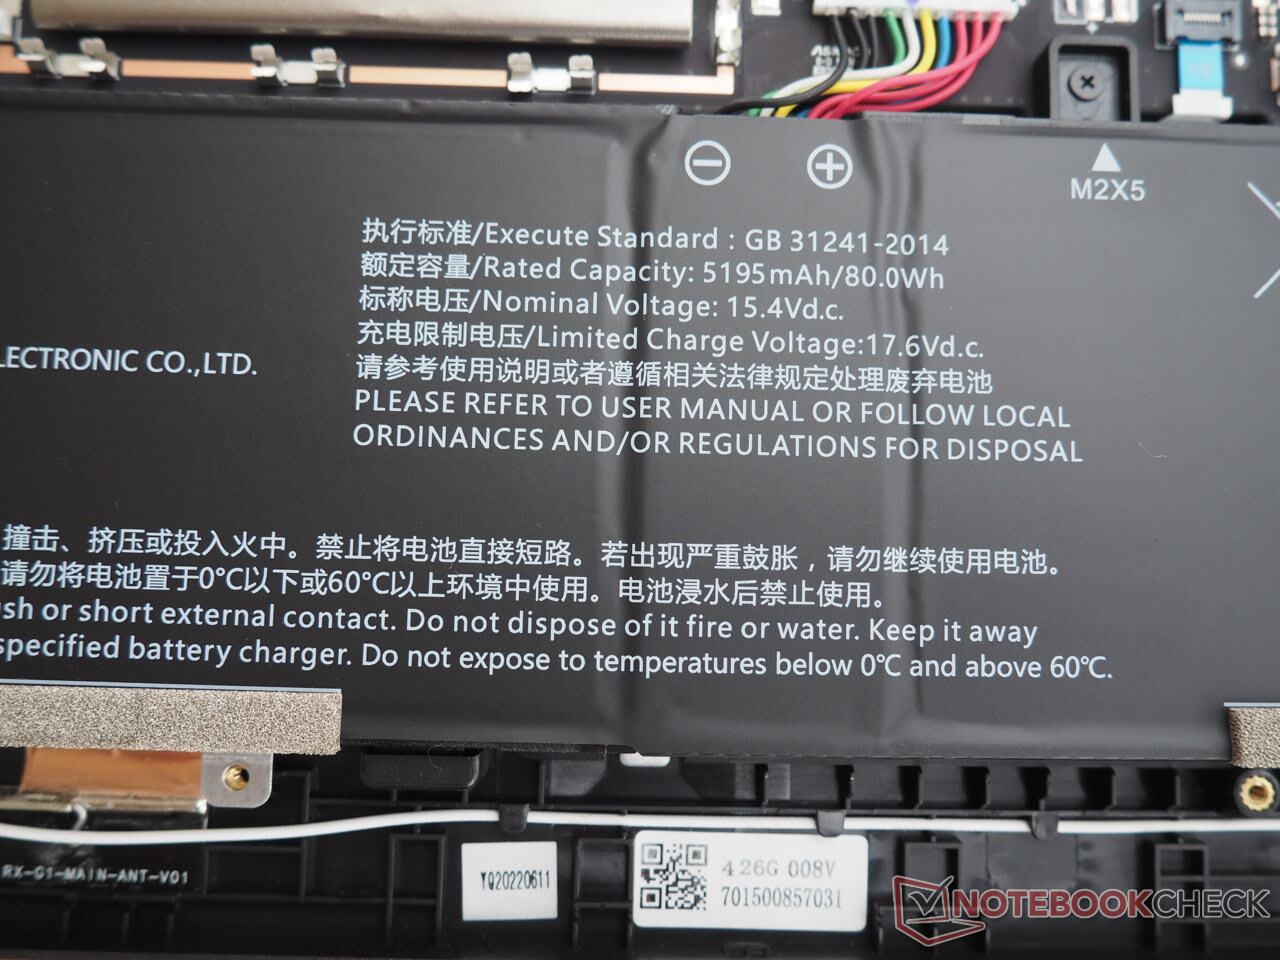
Mimo przyzwoitej pojemności akumulatora (80 Wh) Major X10 nie ma zbyt dużej wytrzymałości i często pozostaje pod tym względem w tyle za konkurencją. Mimo to wytrzymał raczej przyzwoite 6,5 godziny, kiedy używaliśmy go do przeglądania internetu przez Wi-Fi przy średniej jasności ekranu.
| Medion Erazer Major X10 i7-12700H, A730M, 80 Wh | Asus TUF Gaming F17 FX707Z-HX011W i7-12700H, GeForce RTX 3060 Laptop GPU, 90 Wh | Acer Nitro 5 AN517-55-738R i7-12700H, GeForce RTX 3060 Laptop GPU, 90.61 Wh | Dell Inspiron 16 Plus 7620 i7-12700H, GeForce RTX 3050 Ti Laptop GPU, 86 Wh | HP Omen 16-c0077ng R7 5800H, Radeon RX 6600M, 70 Wh | Średnia w klasie Gaming | |
|---|---|---|---|---|---|---|
| Czasy pracy | 109% | 59% | 73% | -9% | 31% | |
| Reader / Idle (h) | 8.2 | 11.7 43% | 18.6 127% | 8.71 ? 6% | ||
| WiFi v1.3 (h) | 6.7 | 8.7 30% | 6.5 -3% | 9.6 43% | 6.1 -9% | 6.96 ? 4% |
| Load (h) | 0.8 | 2.3 187% | 1.9 137% | 1.2 50% | 1.47 ? 84% | |
| H.264 (h) | 7.7 | 5.3 | 7 | 8.28 ? | ||
| Witcher 3 ultra (h) | 1.4 |
Za
Przeciw
Werdykt
Zbyt droga jak na wydajność w grach, którą oferuje: tak w skrócie można podsumować Medion Erazer Major X10
Podczas gdy Intel Arc A730M osiąga stosunkowo dobre wyniki w syntetycznych benchmarkach i podejmuje dobrą walkę z GeForce RTX 3060 i Radeon RX 6600M, jego różne słabości i przestoje w wydajności stają się widoczne w rzeczywistej grze, z poziomem wydajności równym lub nawet gorszym niż GeForce RTX 3050 Ti. Dlatego też trudno jest polecić Arc A730M pod względem stosunku jakości do ceny, szczególnie biorąc pod uwagę, że jego wydajność energetyczna nadal pozostawia wiele do życzenia
W przeciwnym razie Major X10 jest w większości przypadków całkiem imponujący. Zwłaszcza 16-calowy ekran stanowi przekonujący powód do zakupu tego laptopa ze względu na proporcje 16:10, wysoką rozdzielczość (2 560 x 1 600), wysoką jasność szczytową i świetne odwzorowanie kolorów.
Ogólnie rzecz biorąc, polecilibyśmy Major X10 tylko zatwardziałym fanom Intela lub tym, którzy są wyjątkowo wybredni w kwestii wyświetlaczy. Wszyscy inni gracze, którzy muszą lub chcą pilnować swojego budżetu, powinni chyba zainteresować się laptopem z RTX 3060 lub GPU o podobnej wydajności. Medion oferuje obecnie kilka urządzeń o takiej specyfikacji (nie wspominając o tym, że często są one tańsze).
Cena i dostępność
Erazer Major X10 z procesorem Core i7-12700H, Arc A730M, 32 GB RAM i 1 TB pamięci masowej SSD kosztuje około 1700 euro (1728 dolarów) i można go nabyć w niemieckim sklepie internetowym Medion. W momencie pisania tej recenzji laptop nie jest jeszcze dostępny w innych regionach.
Medion Erazer Major X10
- 12/09/2022 v7 (old)
Florian Glaser
Price comparison

