Recenzja laptopa Huawei MateBook X Pro 2022: Konkurent MacBooka Air punktuje dzięki topowemu wyświetlaczowi IPS
MateBook X Pro to tradycyjnie flagowy ultrabook Huawei i nowy model z 2022 roku trzyma się tego twierdzenia. Za 2199 euro (~US$ 2199) otrzymujemy nową obudowę z dużym, 14,2-calowym wyświetlaczem IPS w formacie 3:2, procesor Intel Alder Lake P, mnóstwo portów USB-C wraz z obsługą Thunderbolt 4 oraz nowoczesny moduł Wi-Fi 6E. Użytkownicy mogą też liczyć na ulepszoną klawiaturę i duży touchpad z dodatkowymi funkcjami
Czy to wystarczy, aby pretendować do czołowej pozycji wśród ultrabooków z systemem Windows? Czy MateBook X Pro stanowi w ogóle zagrożenie dla nowegoApple MacBook Air M2? Czy może raczej warto zdecydować się na MateBook X Pro 2021 z jego Core i7-1165G7, który jest obecnie oferowany w Huawei za bardzo przystępną cenę 1 099 euro (~1100 dolarów amerykańskich)?
Potencjalni konkurenci w porównaniu
Ocena | Data | Model | Waga | Wysokość | Rozmiar | Rezolucja | Cena |
|---|---|---|---|---|---|---|---|
| 90.3 % v7 (old) | 10/2022 | Huawei MateBook X Pro 2022 i7-1260P, Iris Xe G7 96EUs | 1.3 kg | 15.6 mm | 14.20" | 3120x2080 | |
| 92 % v7 (old) | 04/2023 | Apple MacBook Air M2 10C GPU M2, M2 10-Core GPU | 1.2 kg | 11.3 mm | 13.60" | 2560x1664 | |
| 90.6 % v7 (old) | Lenovo Yoga 9i 14 2022 i7-1260P i7-1260P, Iris Xe G7 96EUs | 1.4 kg | 15.25 mm | 14.00" | 3840x2400 | ||
| 90.1 % v7 (old) | Asus Zenbook S 13 OLED R7 6800U, Radeon 680M | 1.1 kg | 14.9 mm | 13.30" | 2880x1800 | ||
| 86.9 % v7 (old) | Dell XPS 13 Plus 9320 4K i7-1260P, Iris Xe G7 96EUs | 1.2 kg | 15.3 mm | 13.40" | 3840x2400 | ||
| 87.8 % v7 (old) | Huawei MateBook X Pro 2021 i7-1165G7, Iris Xe G7 96EUs | 1.3 kg | 14.6 mm | 13.90" | 3000x2000 |
Sprawa - Huawei wprowadza do gry magnez
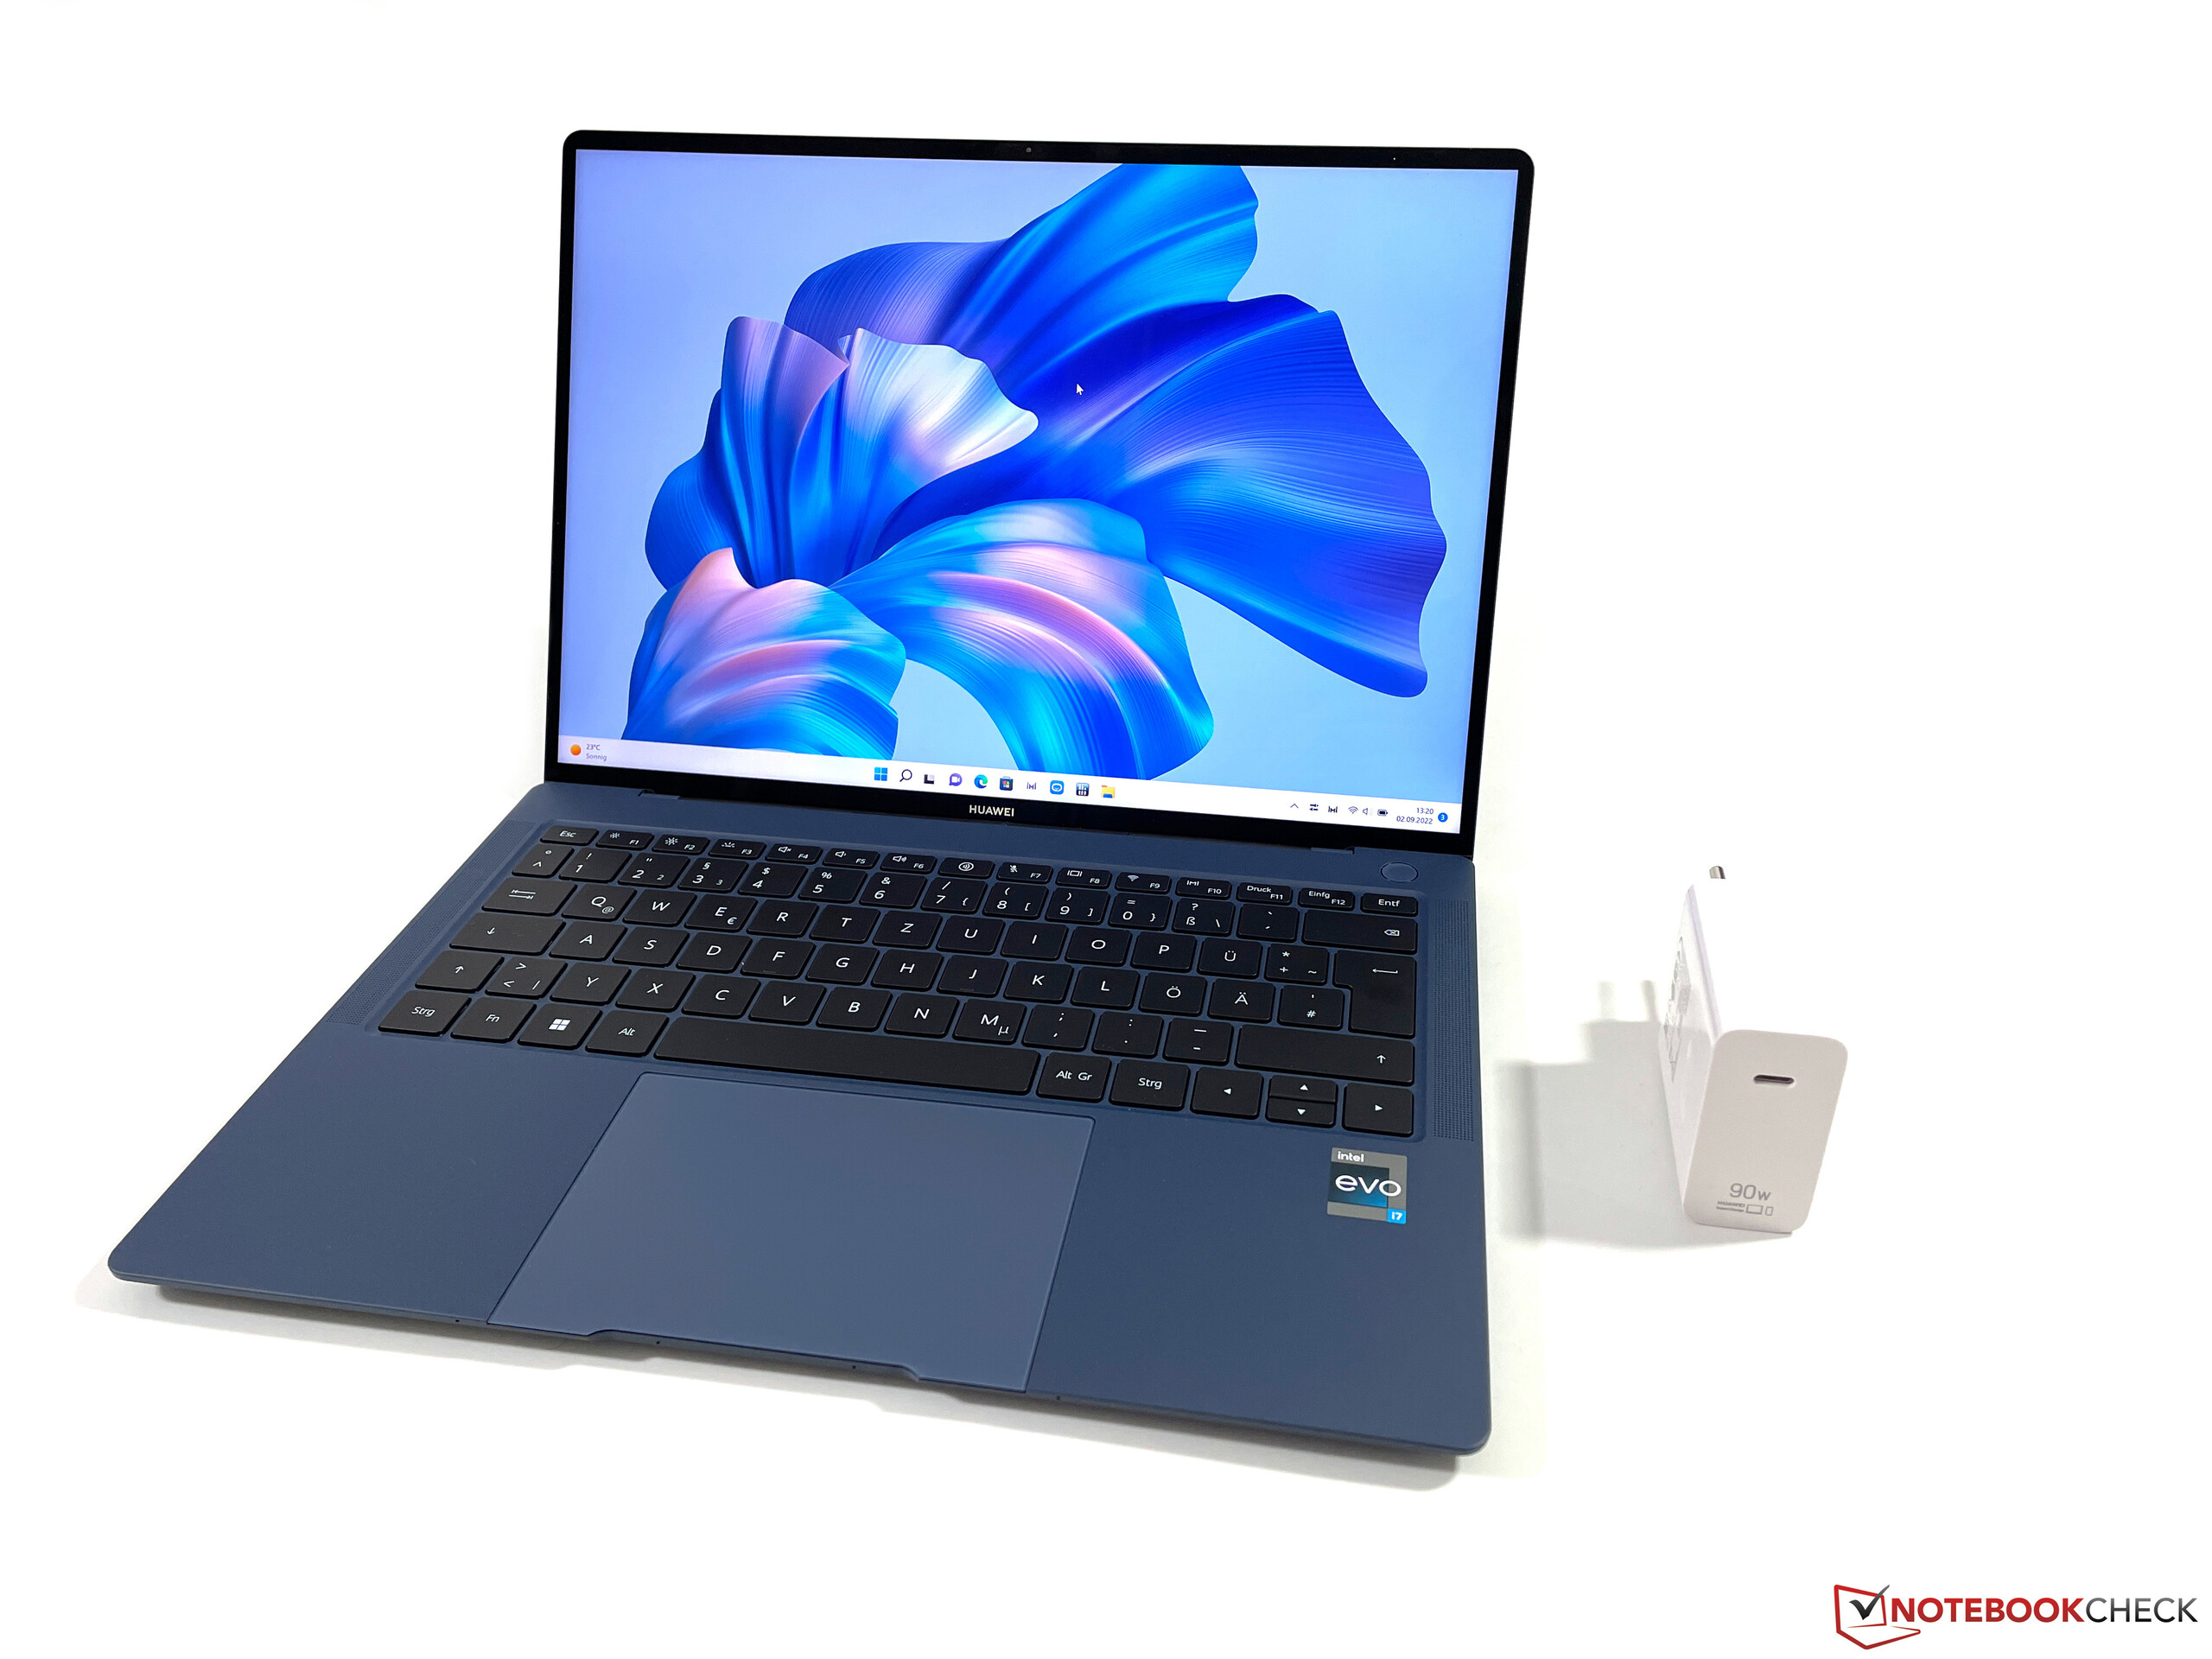
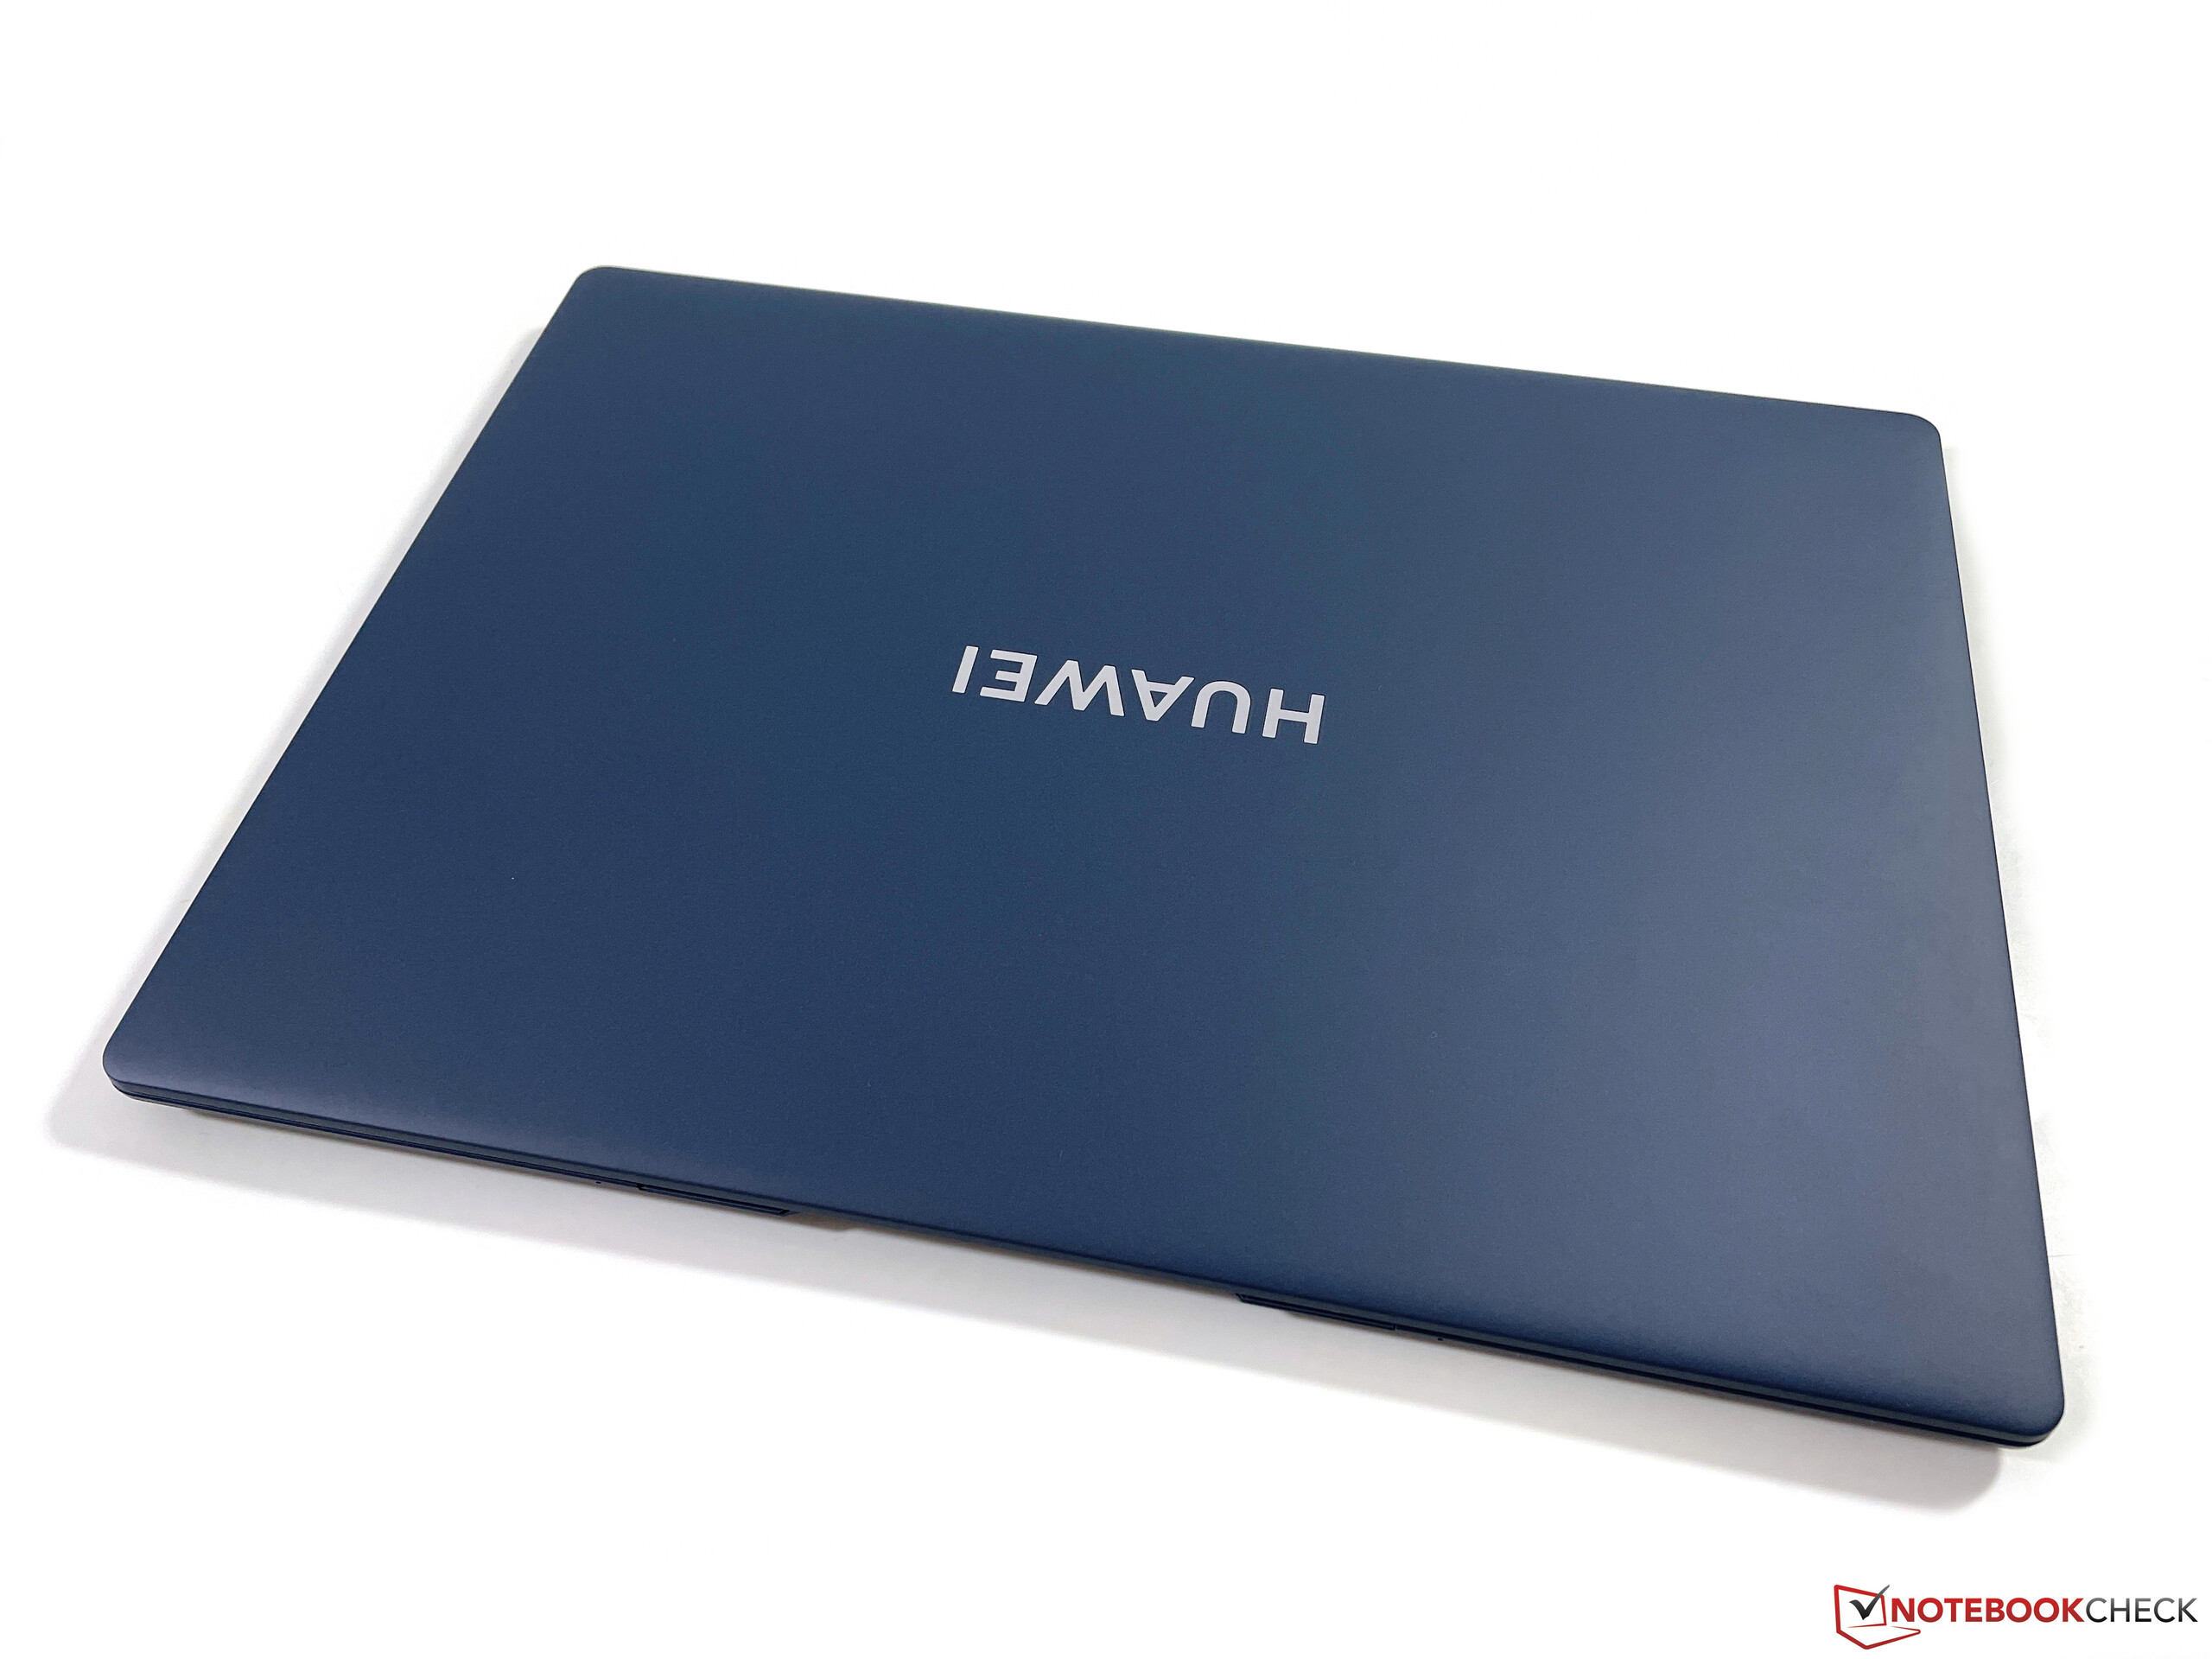
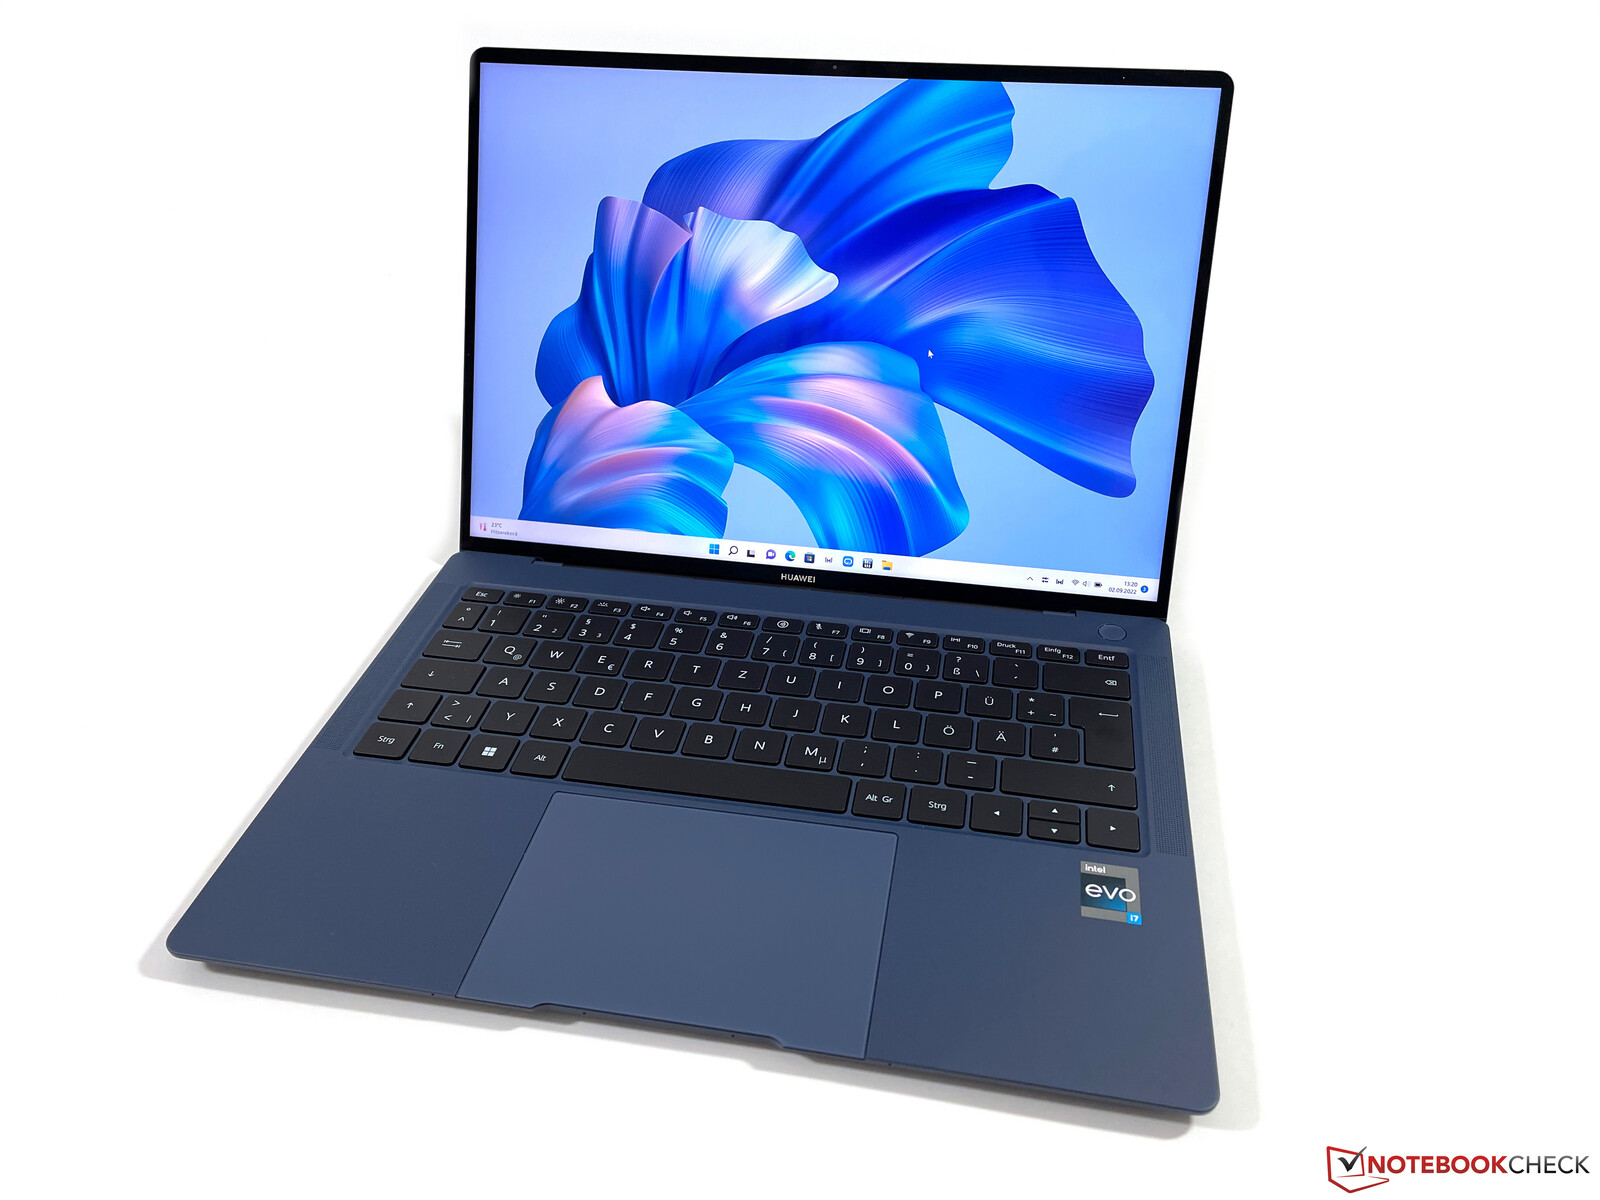
Istnieją dwie wersje MateBooka X Pro 2022. Według arkusza specyfikacji nasz próbka recenzencka to wersja premium, która wykorzystuje nową "miękką" powierzchnię w połączeniu z magnezową obudową. Oprócz ciemnoniebieskiego wariantu kolorystycznego(Ink Blue) reklamowany jest także model biały, ale ten jest obecnie niedostępny. Zwykła wersja Space Gray oferuje normalne, gładkie powierzchnie w aluminiowej obudowie i również waży nieco więcej. Obudowa jest zupełnie nowa; nie ma już na przykład polerowanej krawędzi na górze jednostki zasadniczej, jak to miało miejsce w starymMateBook X Pro, ale urządzenie nadal wygląda bardzo wysokiej jakości, a także jest bezpośrednio rozpoznawalne jako MateBook. Dzięki wąskim krawędziom ekranu, notebook wygląda również bardzo nowocześnie.
Ciemnoniebieski kolor przypomina oczywiście nowy wariant kolorystyczny m.in.Apple MacBook Air M2, który jest nieco ciemniejszy. W przeciwieństwie do MacBooka Air możemy donieść, że powierzchnie, które w dotyku są aksamitnie miękkie, są na szczęście znacznie mniej wrażliwe na odciski palców i nawet po kilku dniach prawie nie widzimy śladów. Cała obudowa sprawia też bardzo wysokiej jakości i stabilne wrażenie. Jednostka zasadnicza ugina się tylko minimalnie w górnej części obszaru klawiatury, ale nie okazuje się to uciążliwe w codziennym użytkowaniu. Pokrywa wyświetlacza jest również stabilna i nie wydaje żadnych trzeszczących dźwięków. Artefakty obrazu udało nam się wywołać tylko przy dużym selektywnym nacisku z tyłu. Zawias ekranu jest zasadniczo dobrze dopasowany i pokrywę można bez problemu otworzyć jedną ręką. Nie da się jednak całkowicie zapobiec drganiom ekranu.
Nowa obudowa urosła nieznacznie w stosunku dopoprzednika, ale wyświetlacz jest większy i również jeden z największych w naszej grupie porównawczej. Nowy MateBook X Pro 2022 ma również nieco większą powierzchnię niż nowy MacBook Air M2, ale różnica jest mało znacząca Lenovos Yoga 9i 14 convertible jest nawet nieco większy. 90-watowy zasilacz, wraz z kablem USB-C, waży 240 gramów.
Sprzęt - Huawei w końcu wprowadza Thunderbolt 4 na pokład samolotu
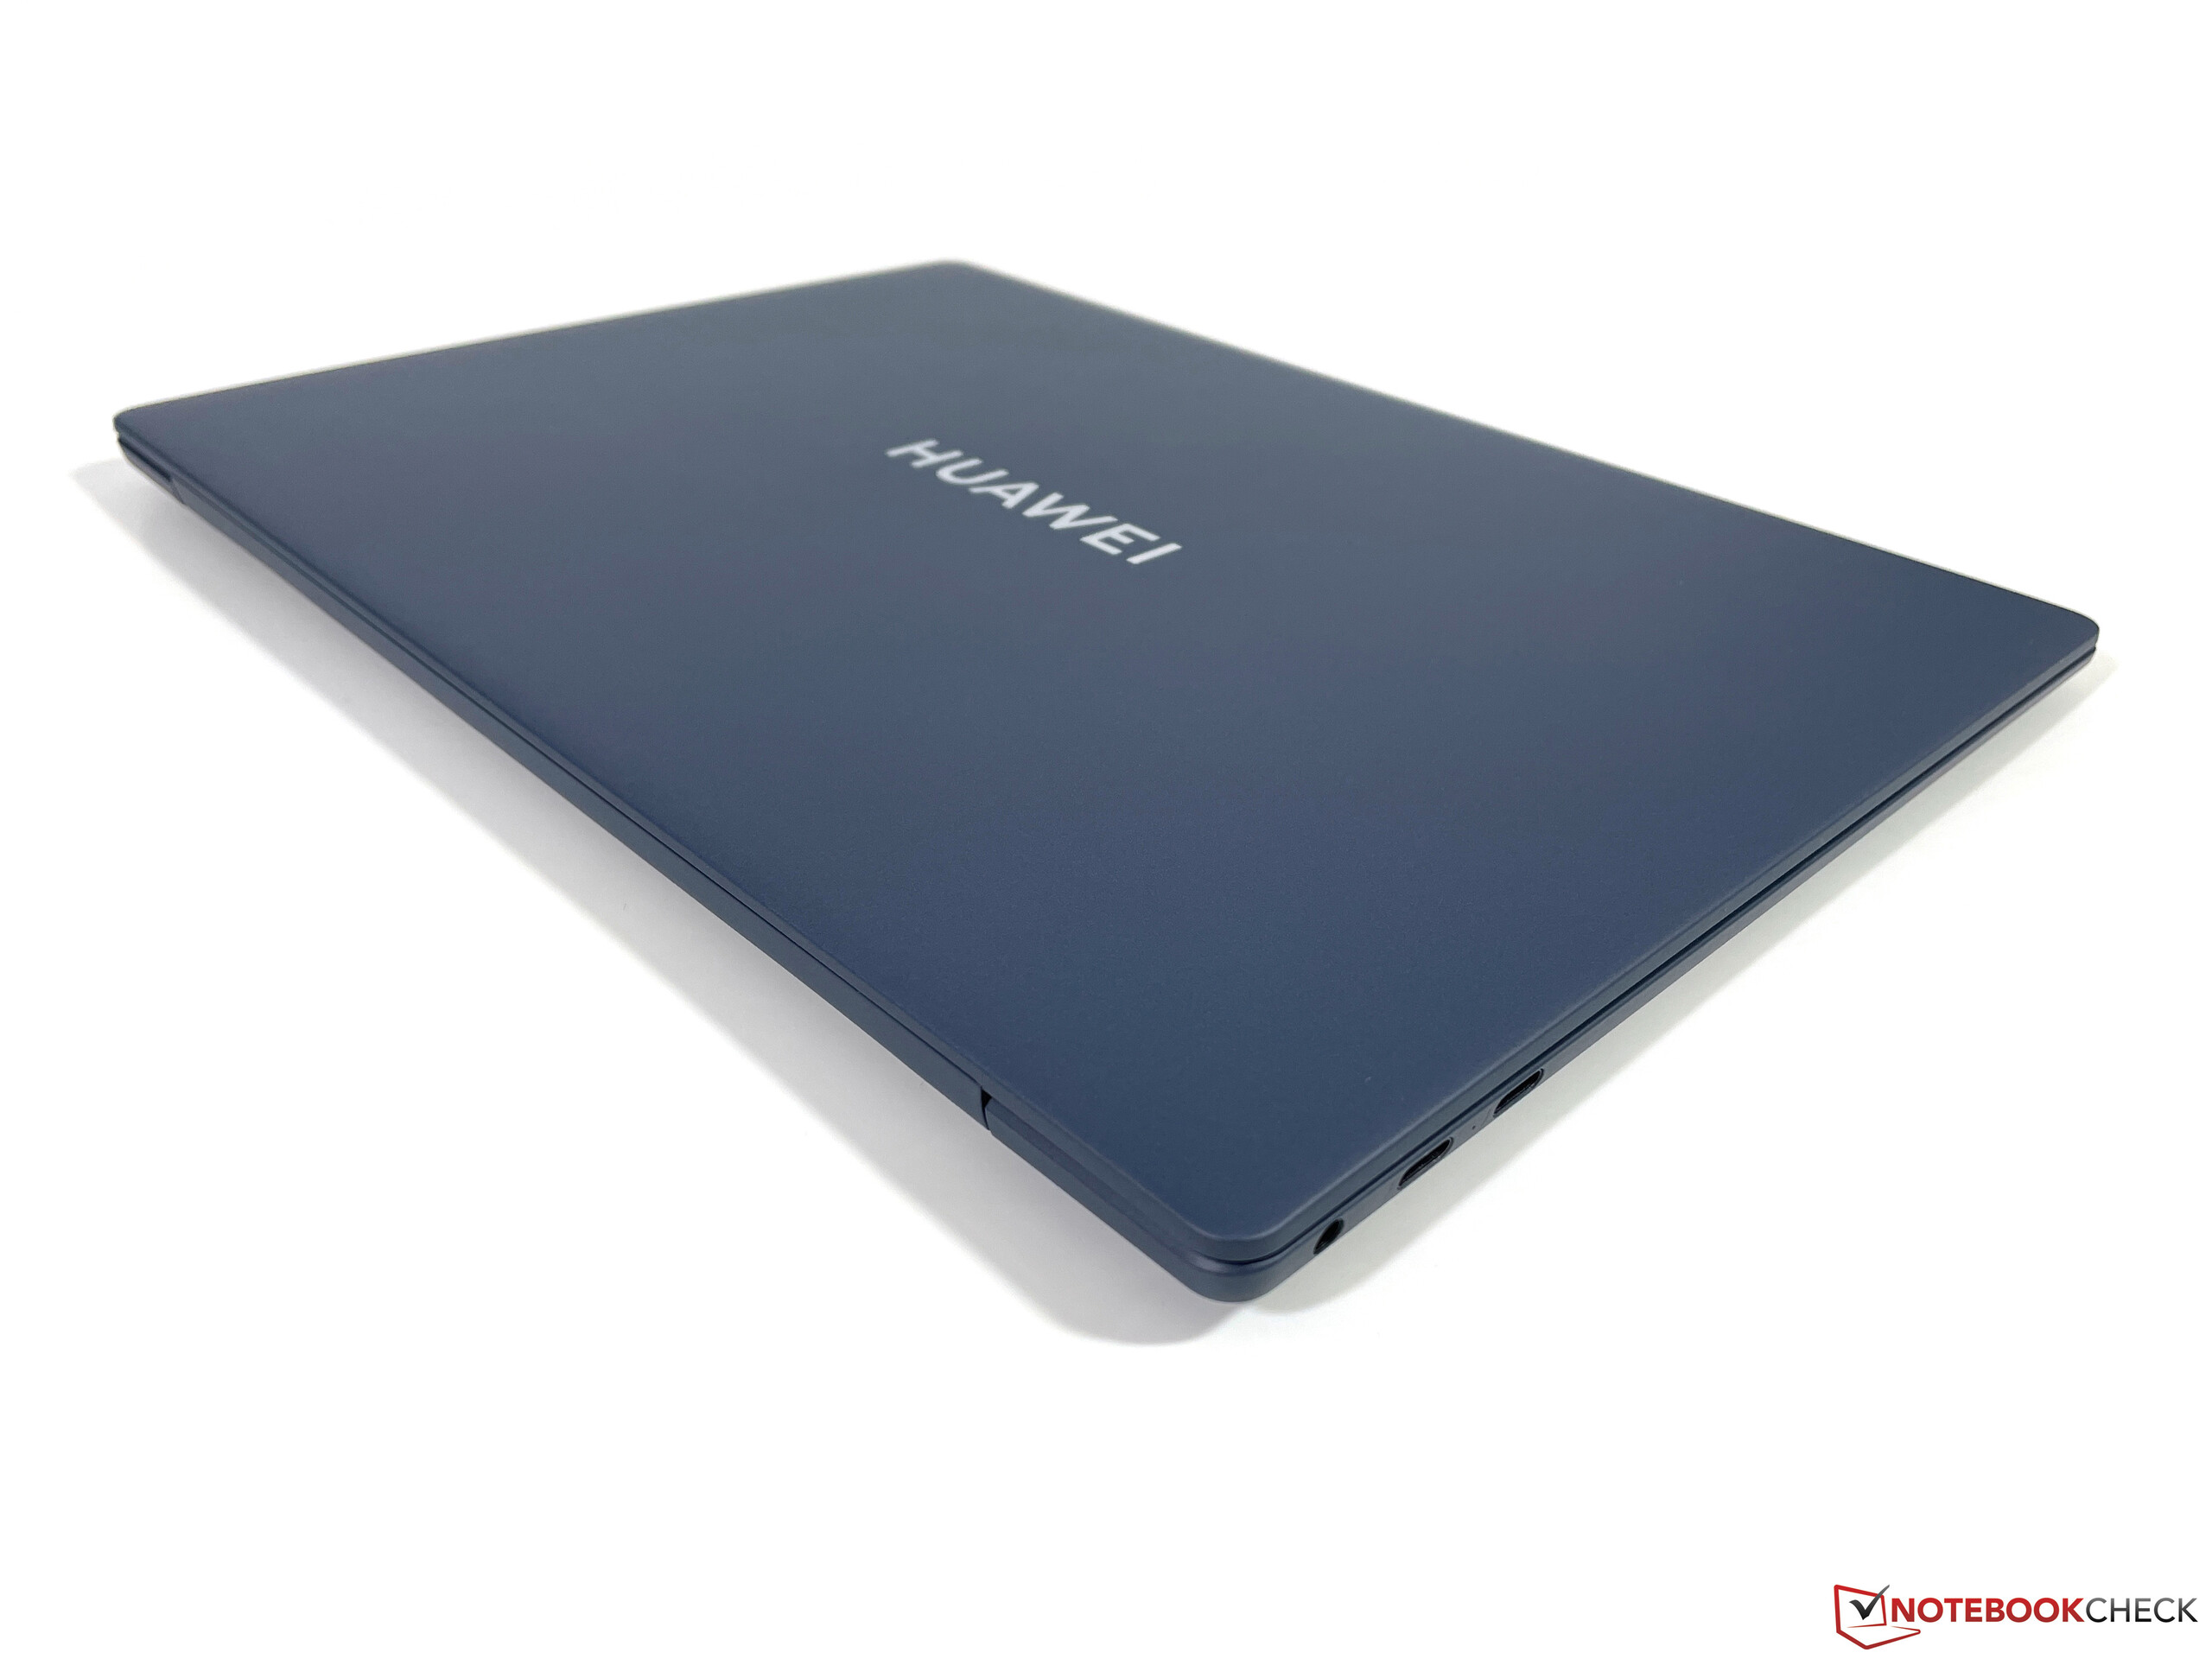
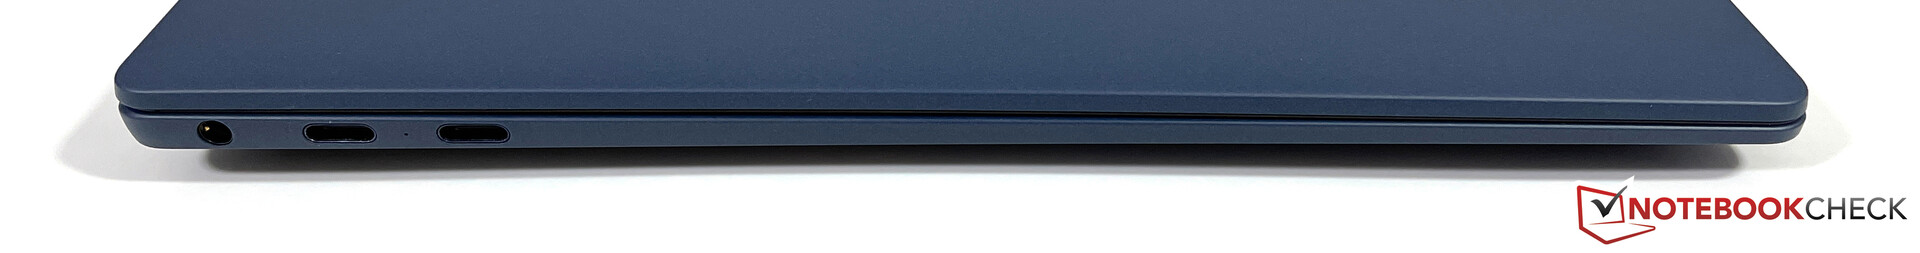
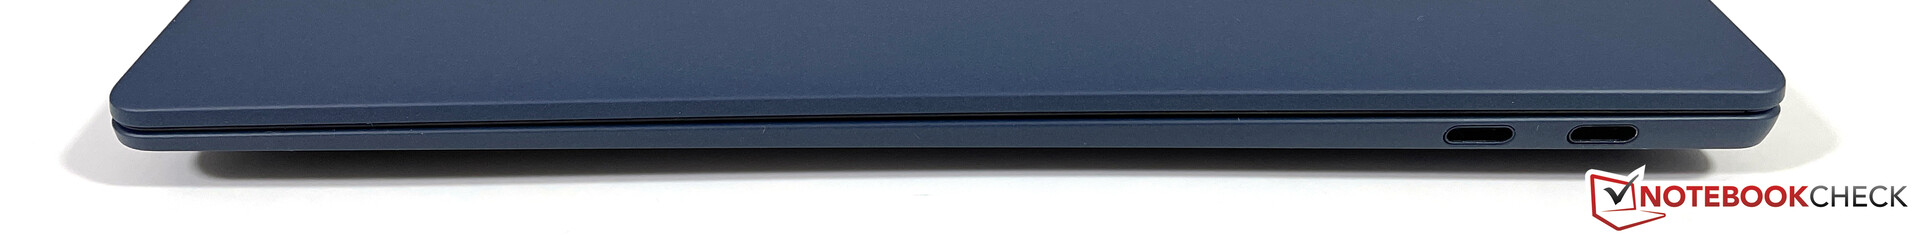
Thunderbolt był zawsze brakującą funkcją w starym MateBook X Pro. Teraz nowy model z 2022 roku oferuje dwa porty USB-C z obsługą Thunderbolt 4 po lewej stronie. Po prawej stronie znajdują się dwa dodatkowe porty USB-C, które mogą być również używane do ładowania. Zakres dostawy obejmuje również krótki kabel adapterowy dla USB-A.
Osoby korzystające również z innych urządzeń Huawei (np. tabletów, smartfonów, monitorów) skorzystają z tzw. funkcji Super Device. Podobnie jak w przypadku Apple, umożliwia ona użytkownikom łatwe udostępnianie lub przesyłanie treści pomiędzy zsynchronizowanymi urządzeniami lub rozszerzenie ekranu np. na tablet. Możliwe jest także korzystanie z maksymalnie trzech aplikacji na smartfony na laptopie.
Komunikacja
Nowy MateBook X Pro oferuje nowoczesny moduł WLAN od Intela (AX211E), który obsługuje sieci 6 GHz (Wi-Fi 6E), a także Bluetooth 5.2. Bez problemu udało nam się połączyć z siecią 6 GHz naszego referencyjnego routera Asusa, a transfery były niezmiennie bardzo wysokie i wynosiły około 1,7 GBit/s.
| Networking | |
| iperf3 transmit AXE11000 6GHz | |
| Huawei MateBook X Pro 2022 | |
| Lenovo Yoga 9i 14 2022 i7-1260P | |
| Przeciętny Intel Wi-Fi 6E AX211 (385 - 1851, n=226) | |
| iperf3 receive AXE11000 6GHz | |
| Huawei MateBook X Pro 2022 | |
| Przeciętny Intel Wi-Fi 6E AX211 (700 - 1857, n=226) | |
| Lenovo Yoga 9i 14 2022 i7-1260P | |
| iperf3 receive AXE11000 | |
| Dell XPS 13 Plus 9320 4K | |
| Asus Zenbook S 13 OLED | |
| Przeciętny Intel Wi-Fi 6E AX211 (582 - 1890, n=276) | |
| Apple MacBook Air M2 Entry | |
| iperf3 transmit AXE11000 | |
| Dell XPS 13 Plus 9320 4K | |
| Asus Zenbook S 13 OLED | |
| Przeciętny Intel Wi-Fi 6E AX211 (64 - 1921, n=276) | |
| Apple MacBook Air M2 Entry | |
Kamera internetowa
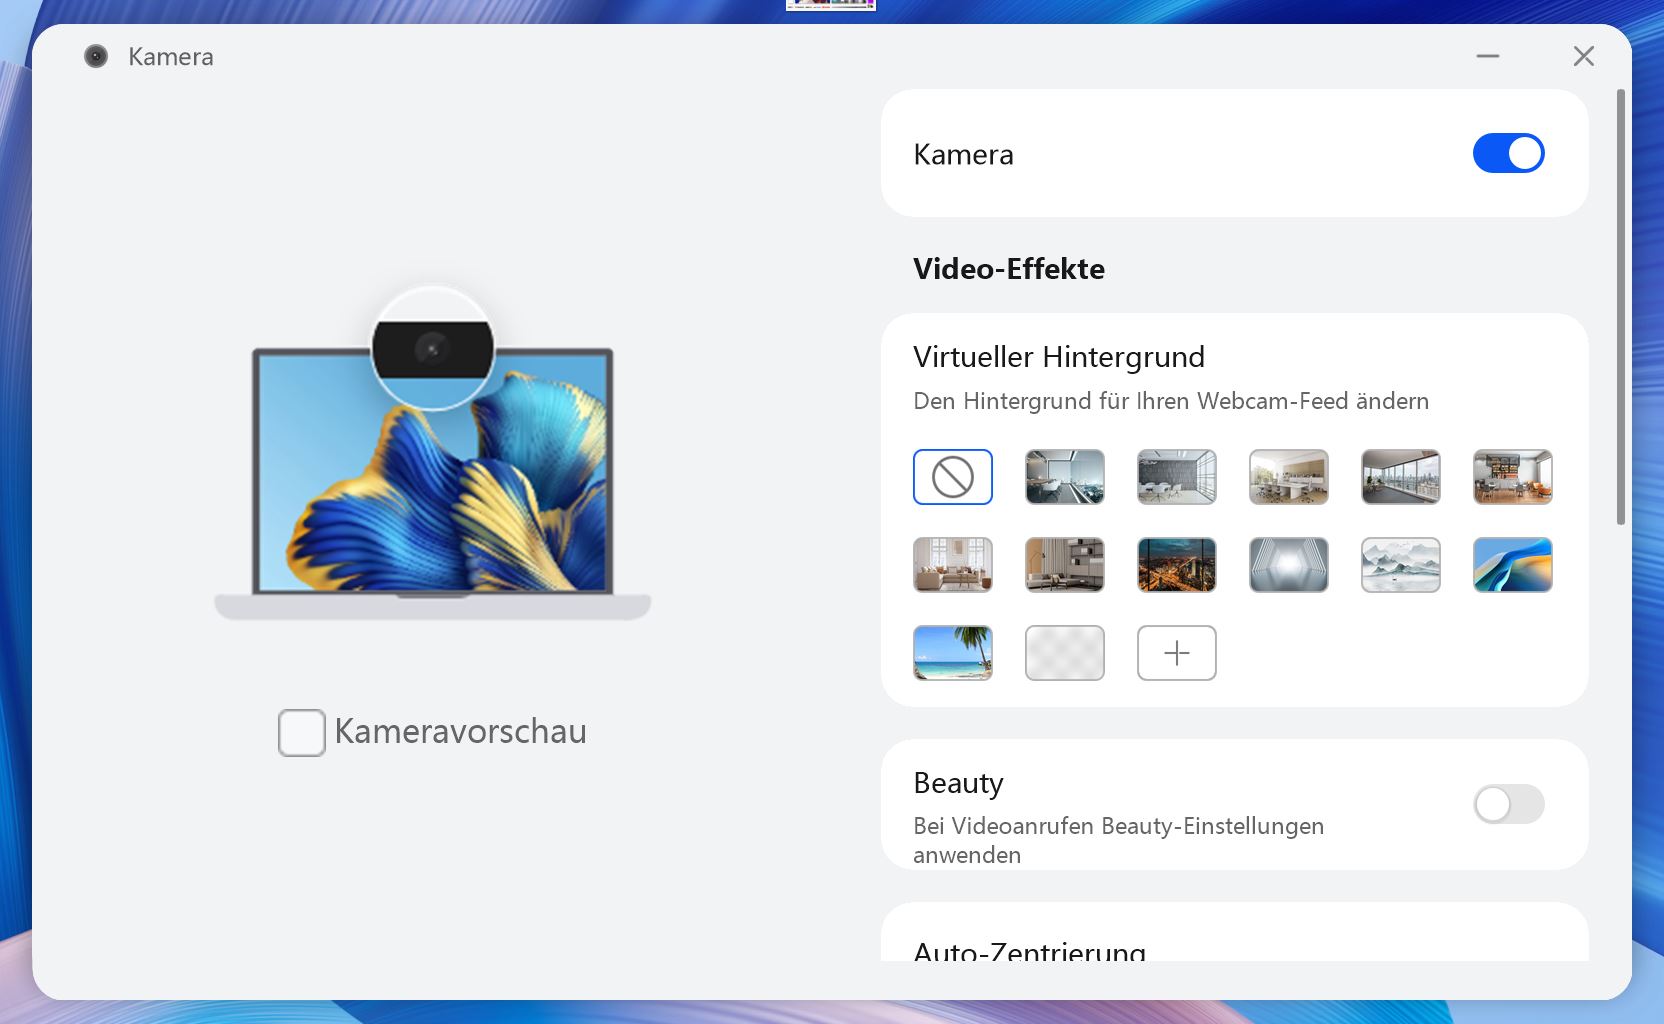
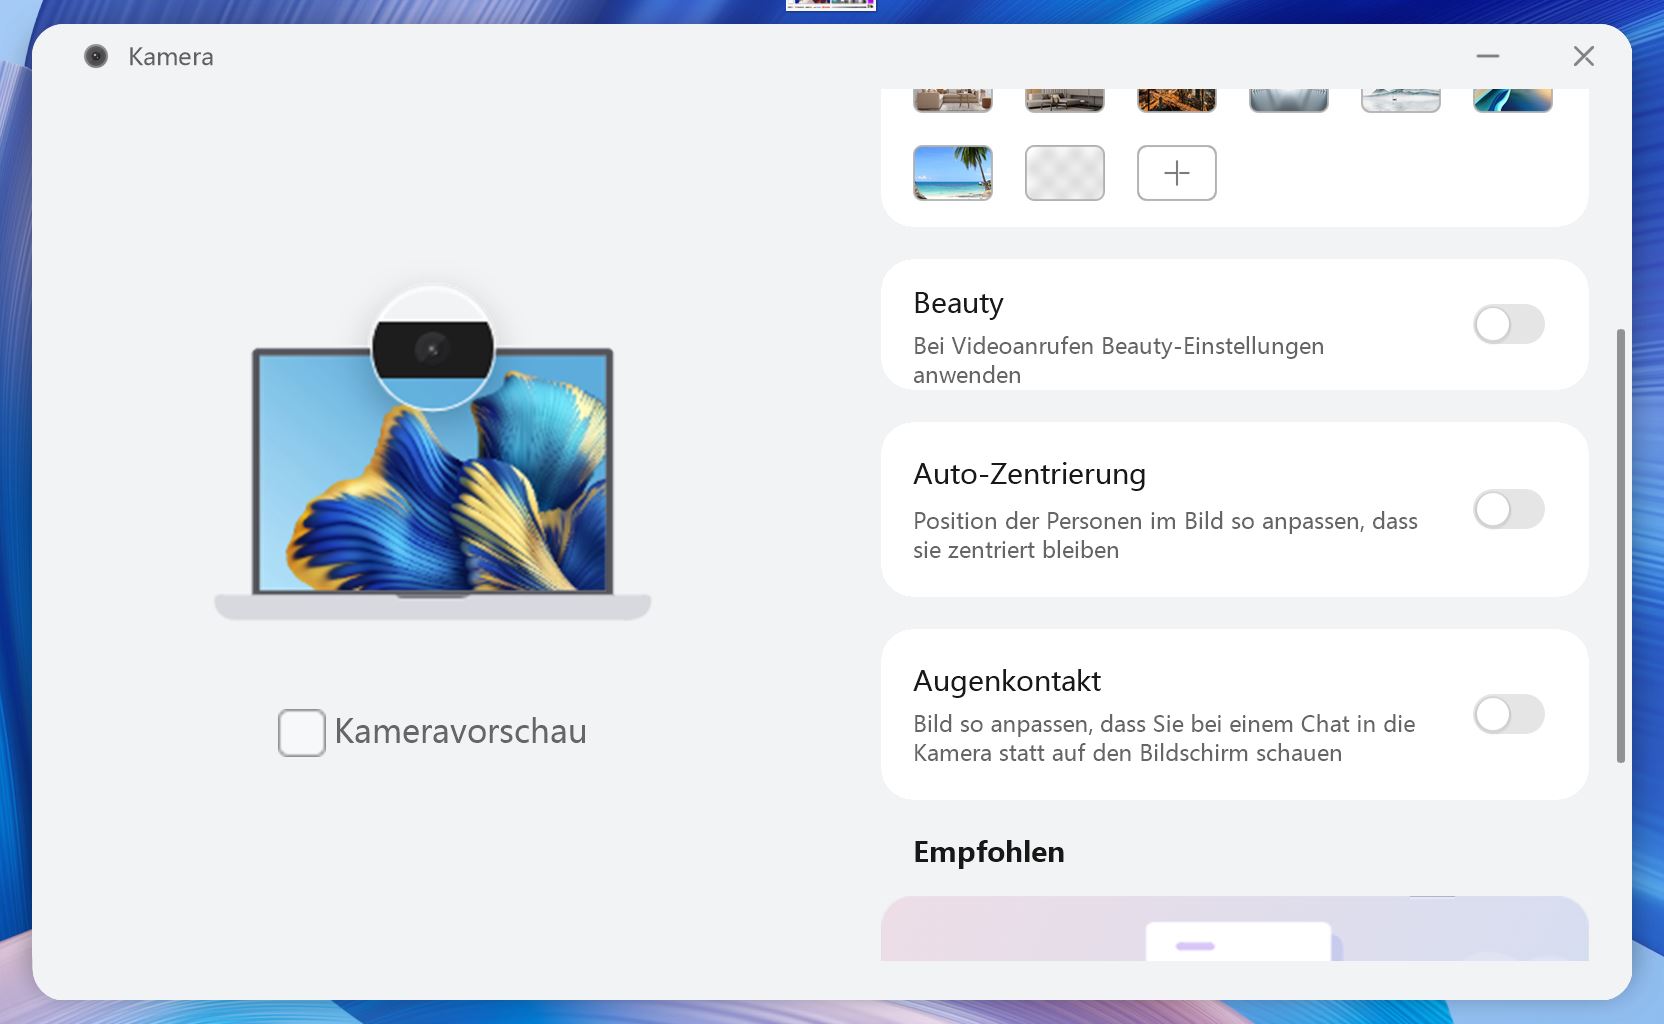
Kamerkę internetową przeniesiono z klawiatury na górną ramkę ekranu, ale zastosowano tylko matrycę 720p, która nie oferuje dobrej jakości obrazu nawet w dobrych warunkach oświetleniowych. Nie ma też mechanicznej migawki ani kamery IR.
Podobnie jak w MateBook 16s,huawei oferuje kilka dodatkowych funkcji AI dla kamerki internetowej. Są wśród nich funkcje praktyczne, jak wirtualne tła (niezależne od oprogramowania), ale też raczej zbędne sztuczki, jak tryb upiększania. Również autocentrowanie działało nieco lepiej w przypadku kamerki 1080p z MateBooka 16s.


Konserwacja
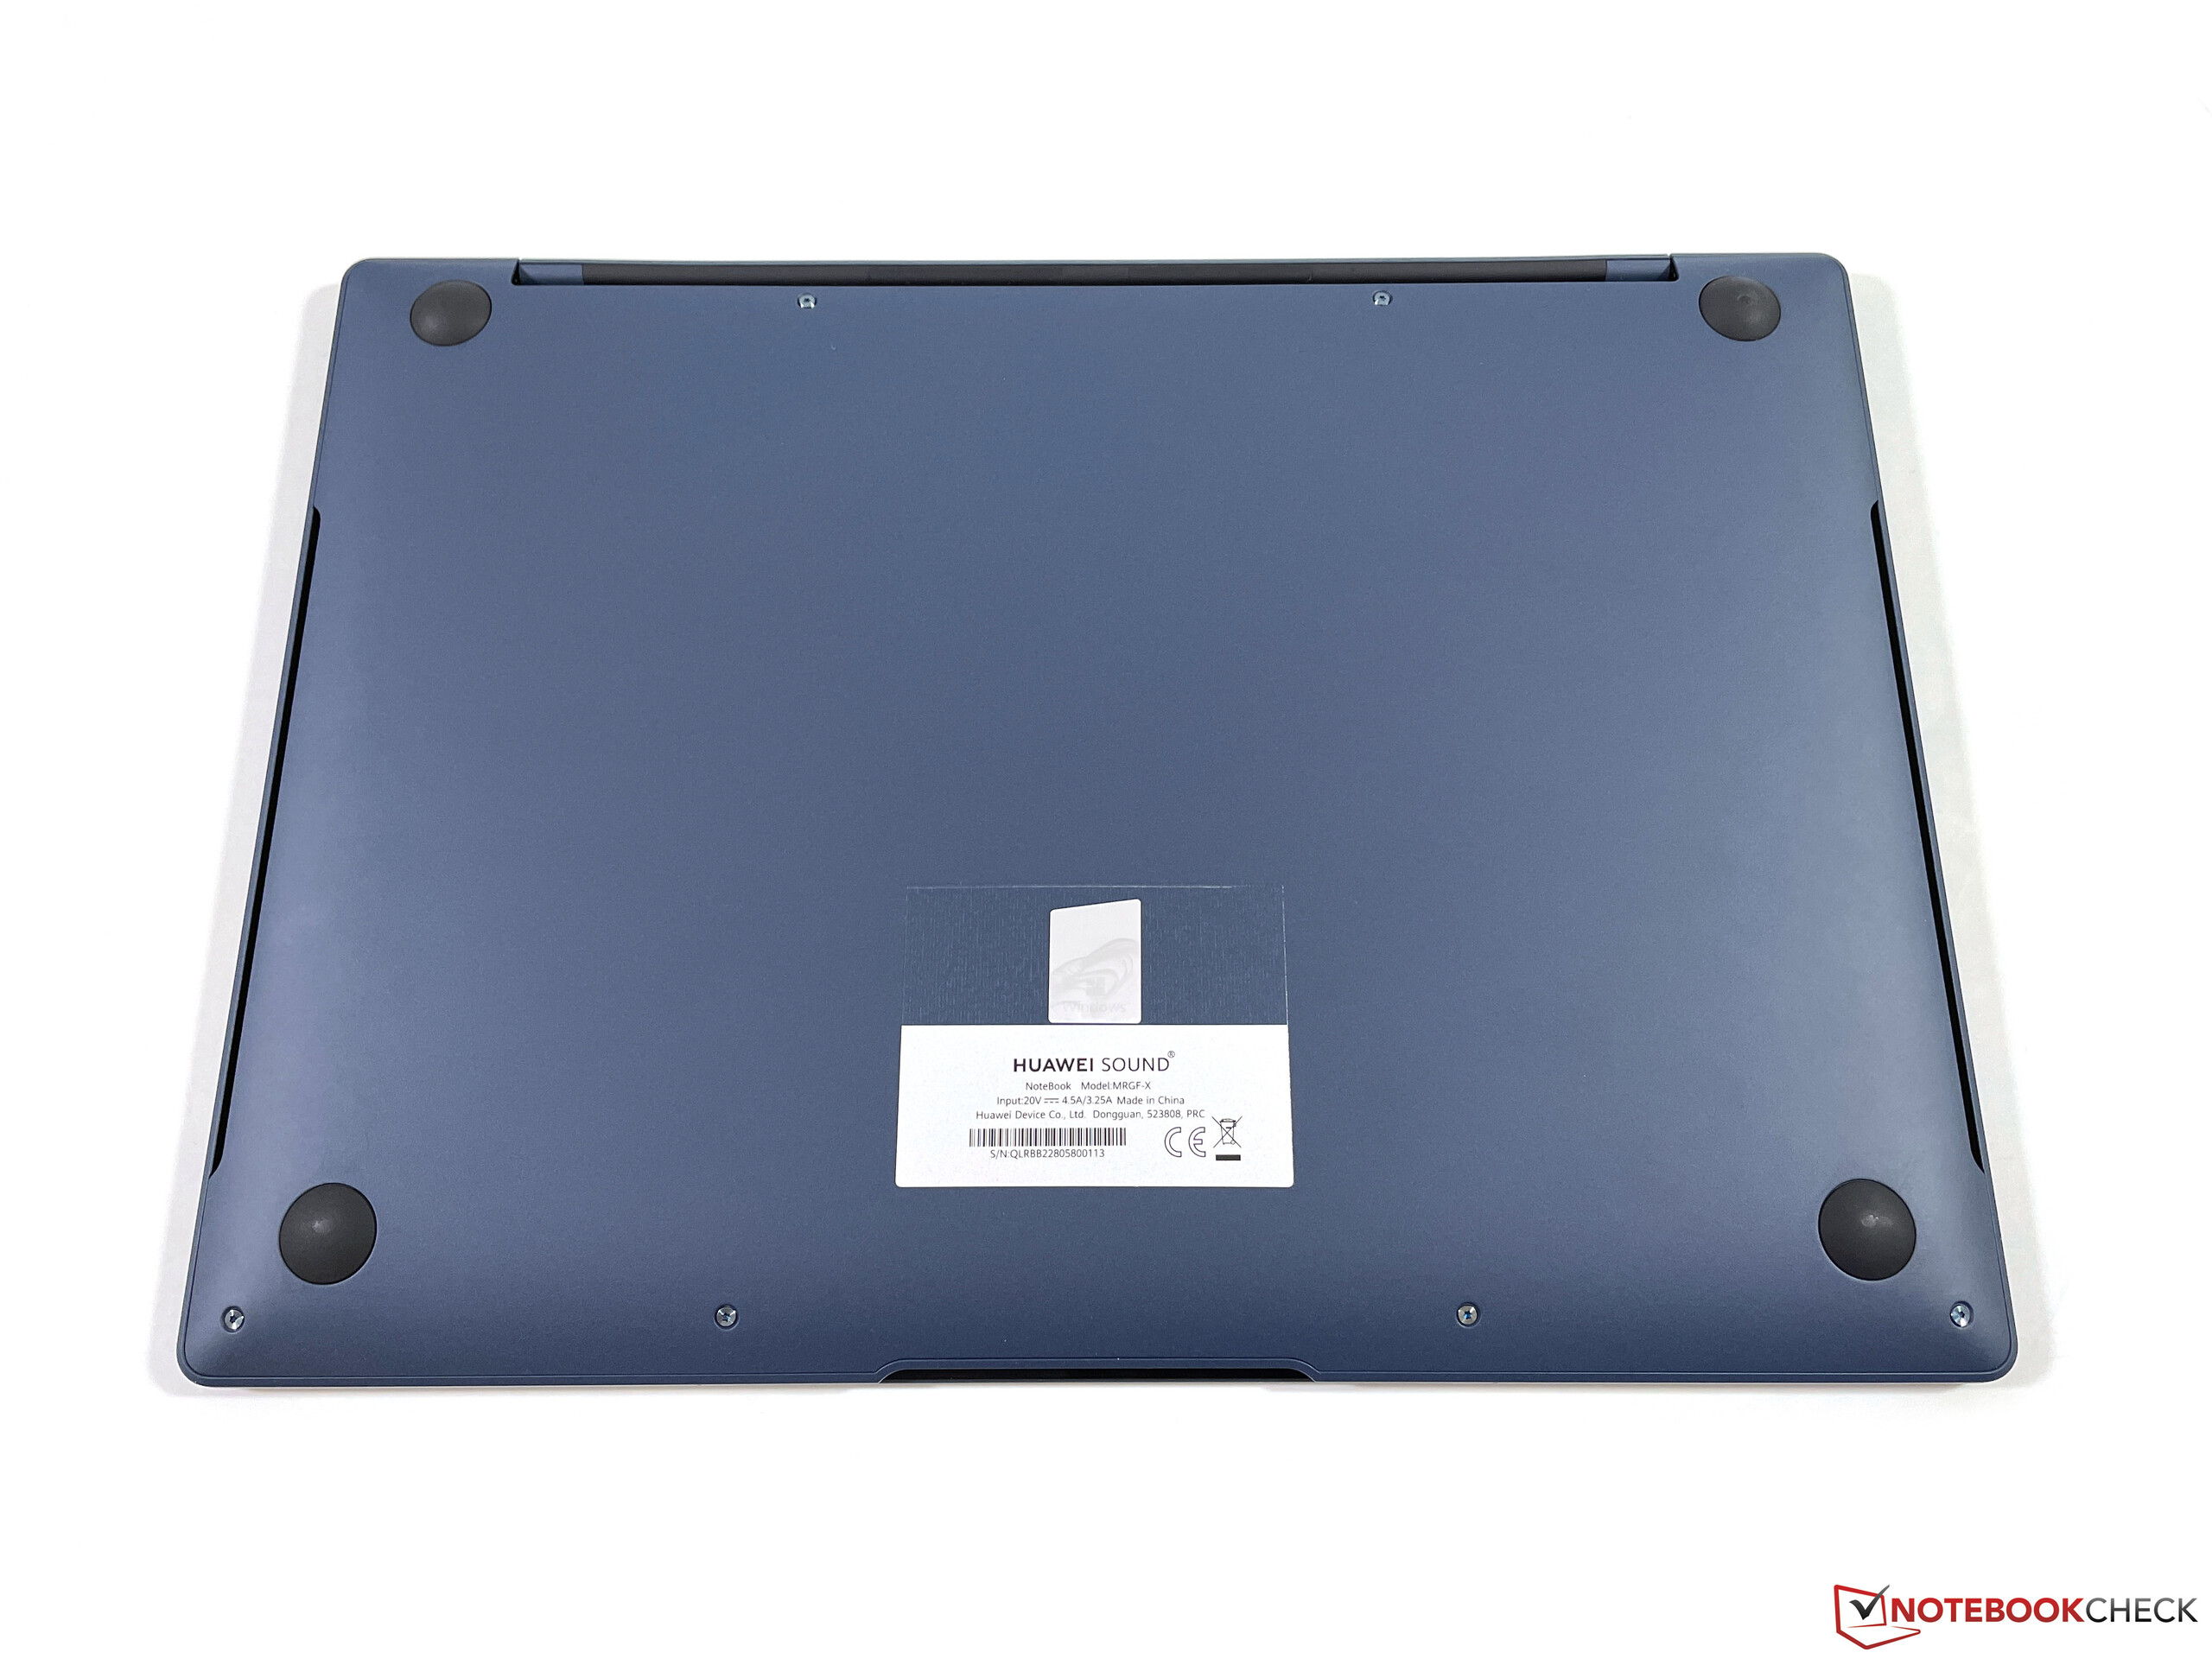
Na spodzie znajduje się sześć śrubek Torx (T5), które można łatwo odkręcić, ale nadal nie mogliśmy zdjąć baseplate. Podejrzewaliśmy, że pod tylnymi gumowymi nóżkami znajduje się więcej ukrytych śrubek, co zostało potwierdzone w filmie promocyjnym od Huawei. Gumowe nóżki są jednak wyjątkowo ciasne i Huawei prosił nas również, abyśmy ich nie zdejmowali, jak również nie otwierali obudowy w obawie przed uszkodzeniem. Użytkownicy nie mają więc możliwości przeprowadzenia prac konserwacyjnych, co uważamy za niepotrzebne ograniczenie.
Urządzenia wejściowe - skok klawiszy 1,5 mm i FreeTouch
Klawiatura
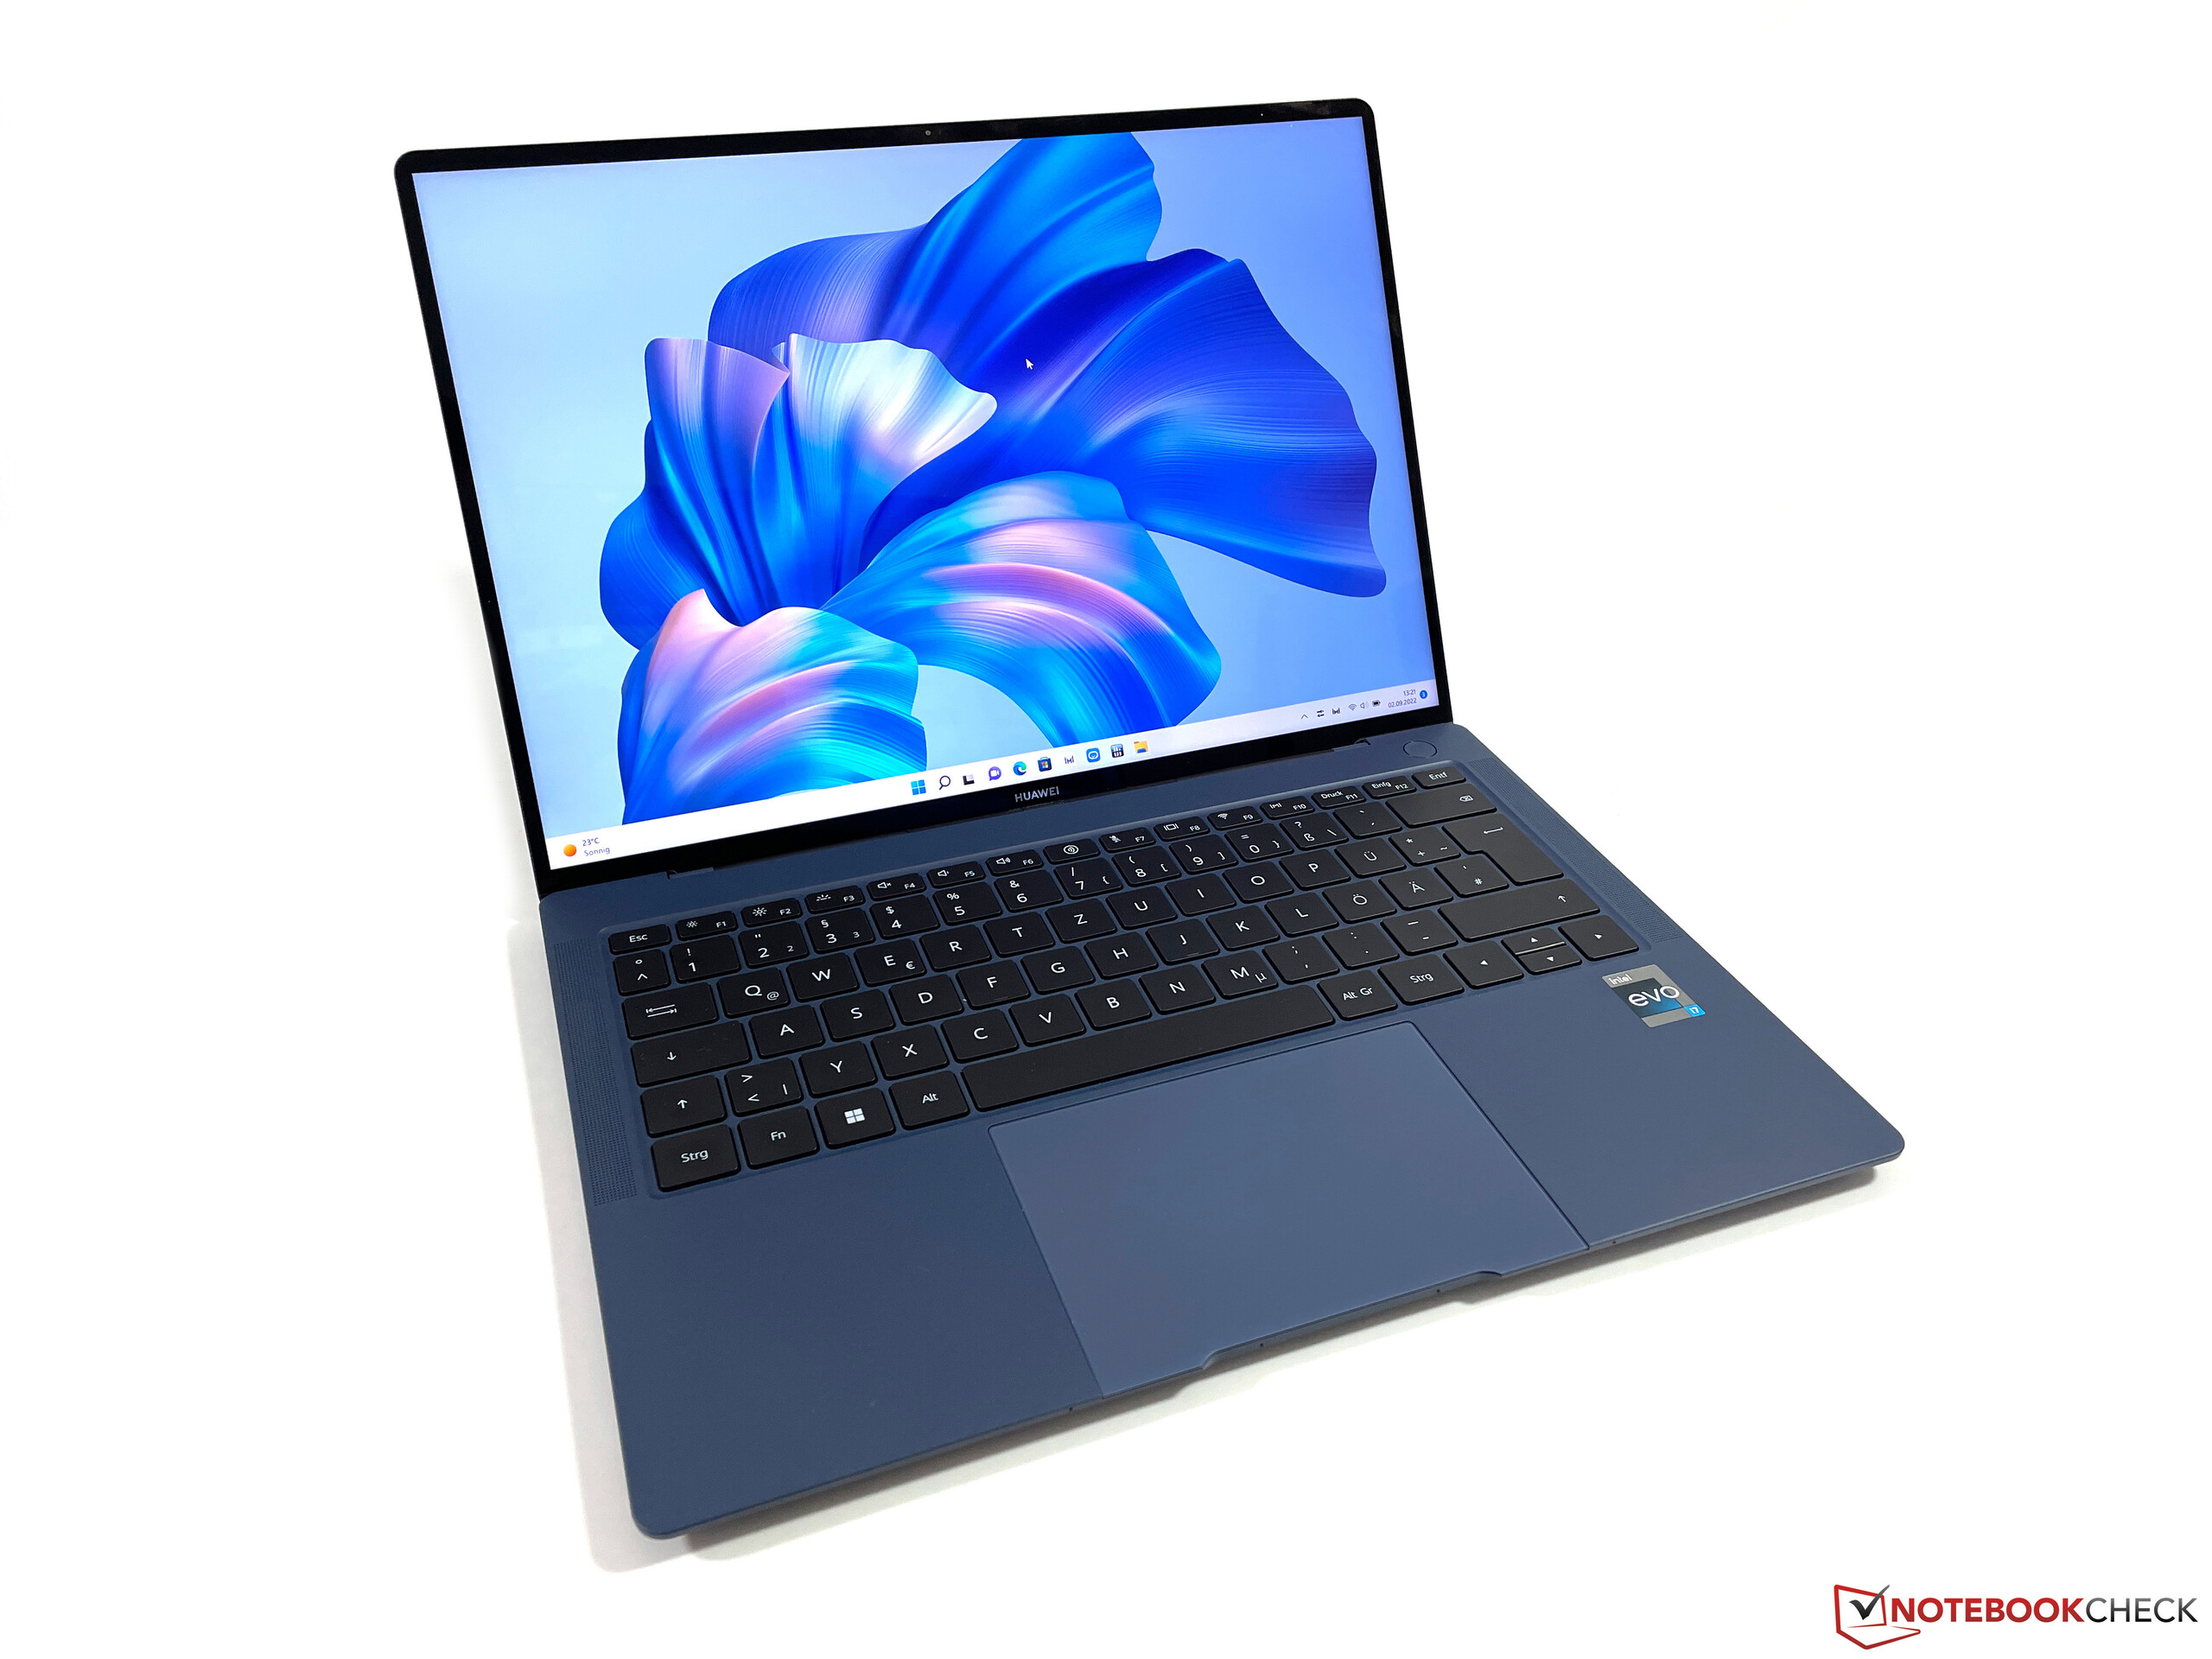
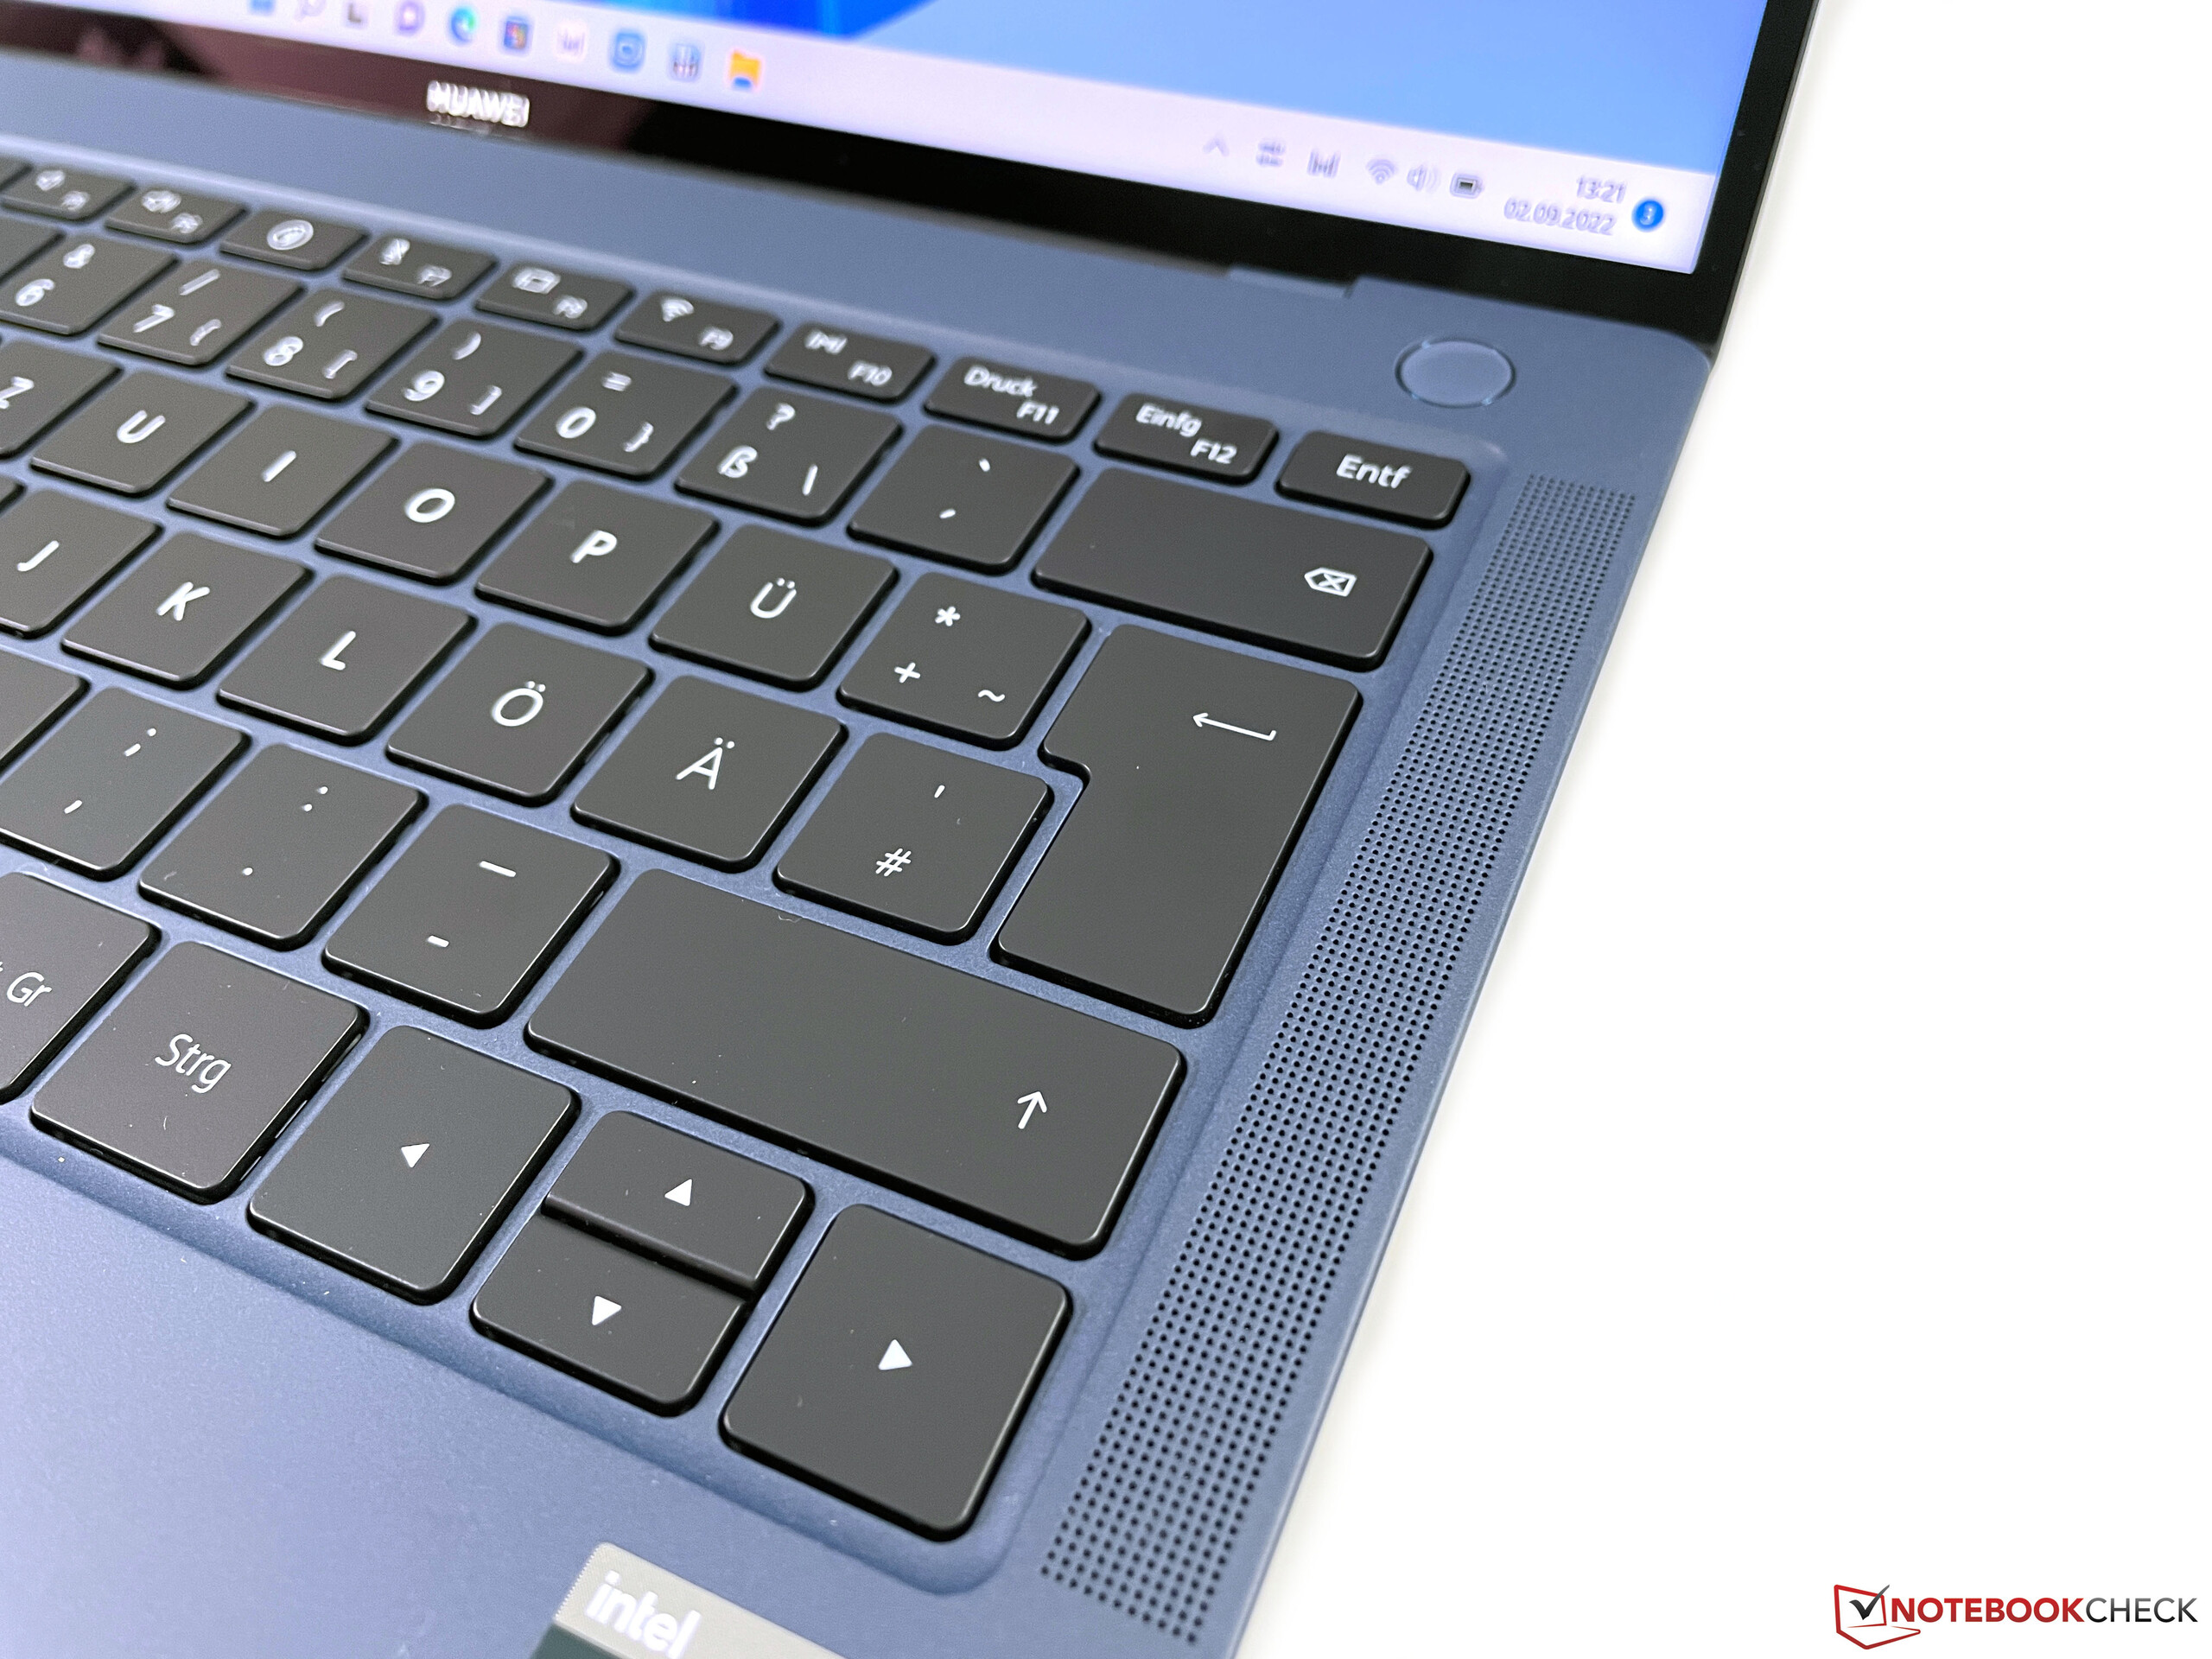
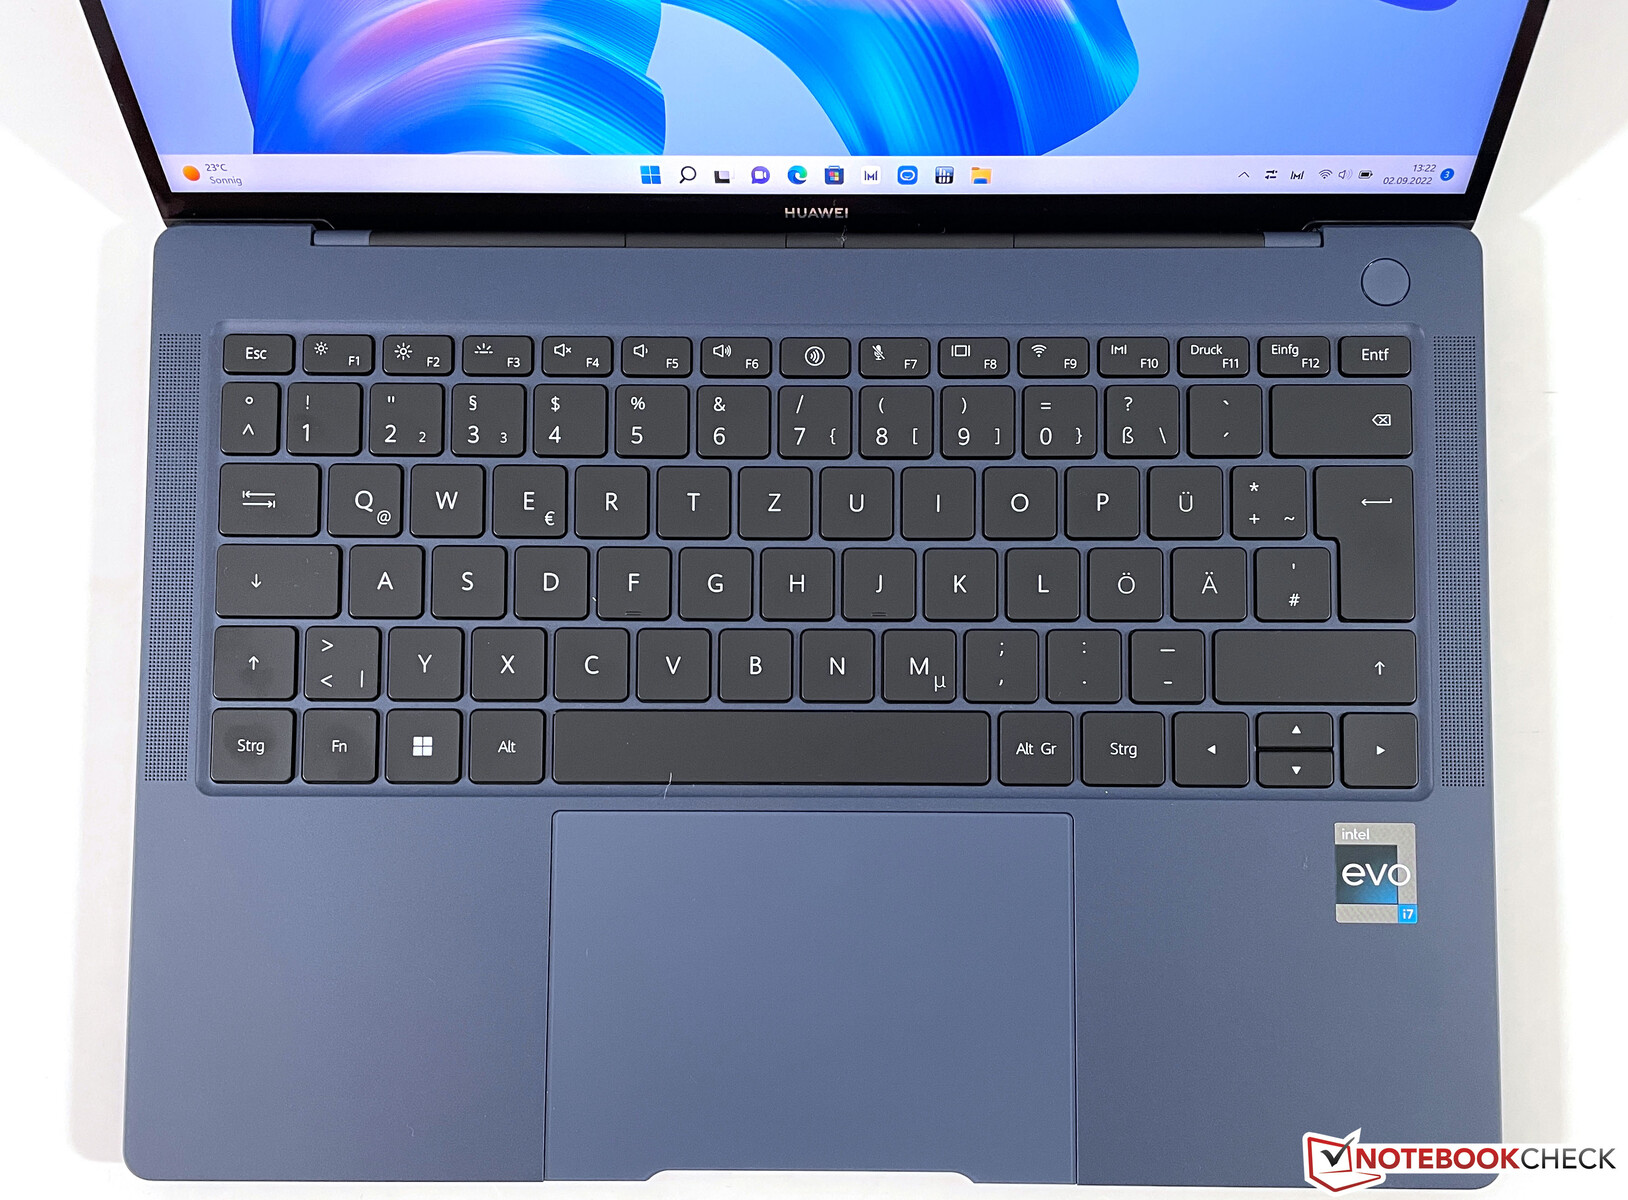
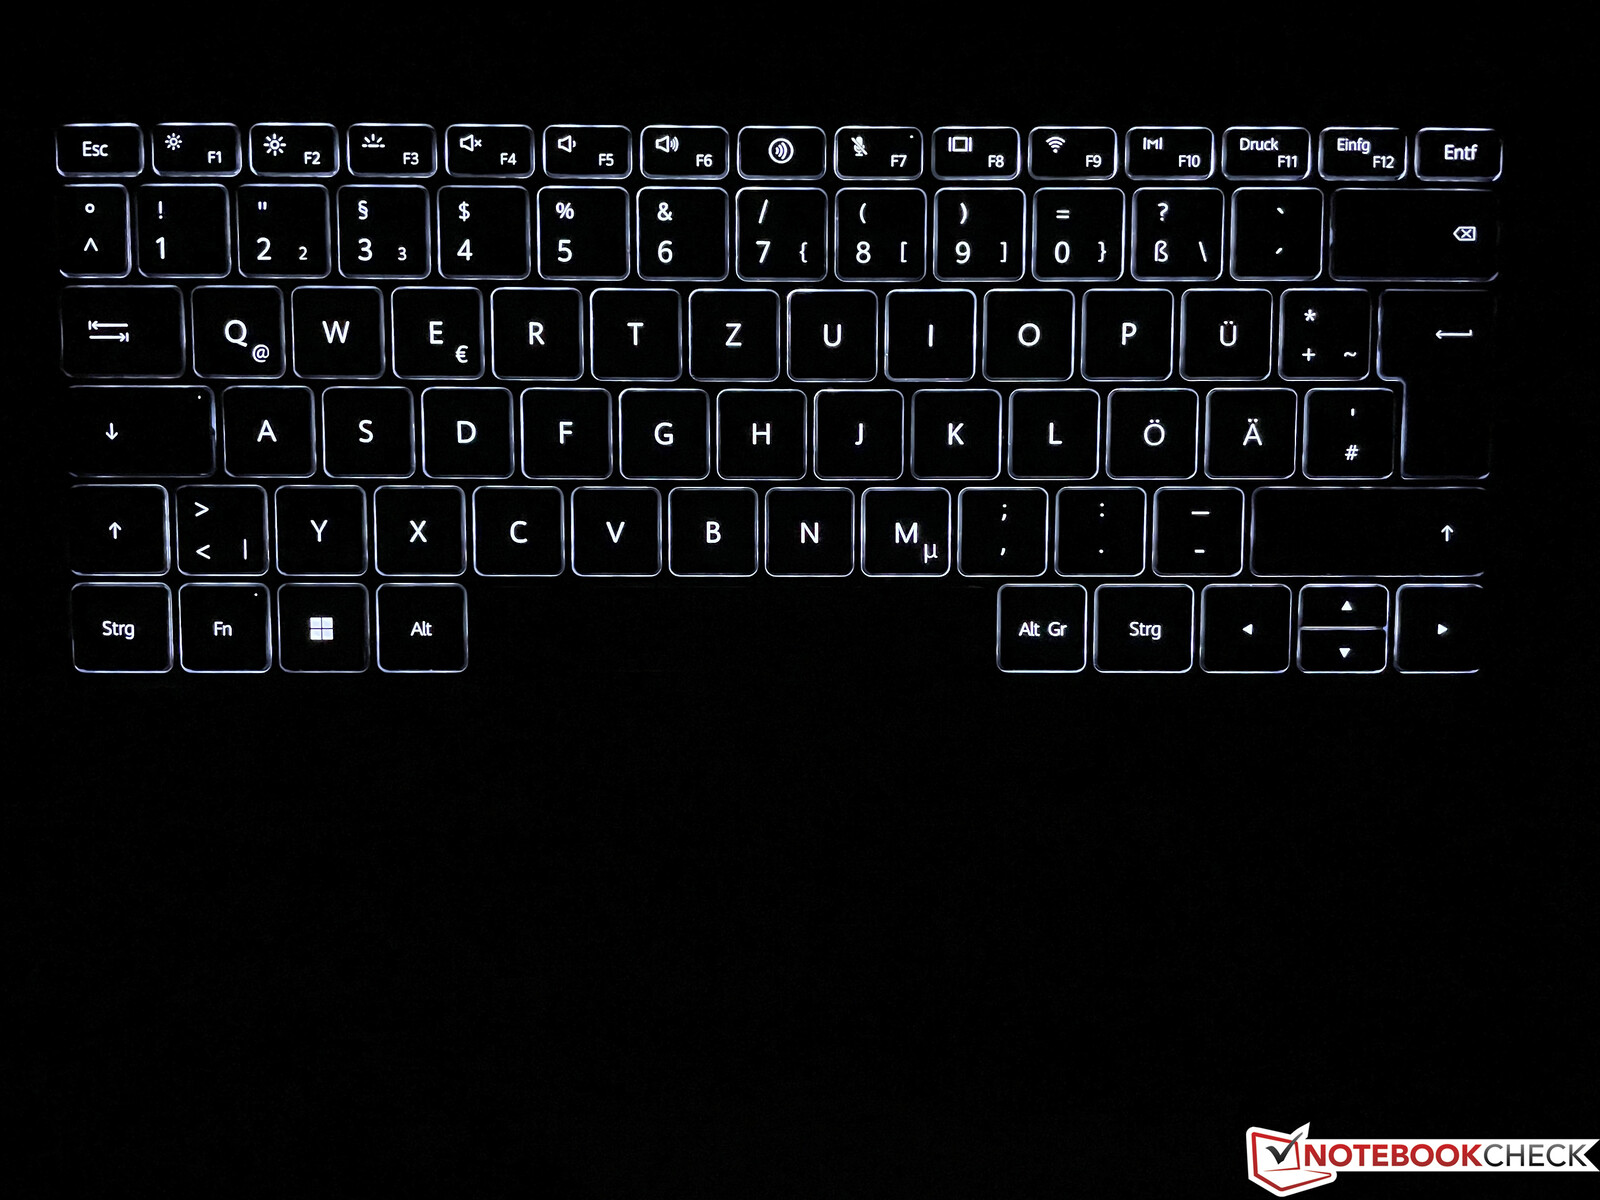
W porównaniu z starym modelem, Huawei poprawił klawiaturę i zwiększył spadek klawiszy do 1,5 mm. Czucie pisania jest bardzo precyzyjne i przyjemne, zwłaszcza jak na tak kompaktowe urządzenie. Odgłos pisania jest przeciętny, ale poza spacją nic nie grzechocze. Ogólnie jest to dobra klawiatura, na której bez problemu można pisać długie teksty. Dwustopniowe białe podświetlenie pomaga w ciemnym otoczeniu, ale trzeba je aktywować ręcznie. W programie PC Manager użytkownicy mogą ręcznie ustawić, aby podświetlenie było automatycznie wyłączane podczas bezczynności; 15 sekund to ustawienie domyślne. Przycisk zasilania znajduje się nad klawiaturą i nie przeszkadza w pisaniu. Znajduje się tam również skaner linii papilarnych, który działa niezawodnie.
Touchpad
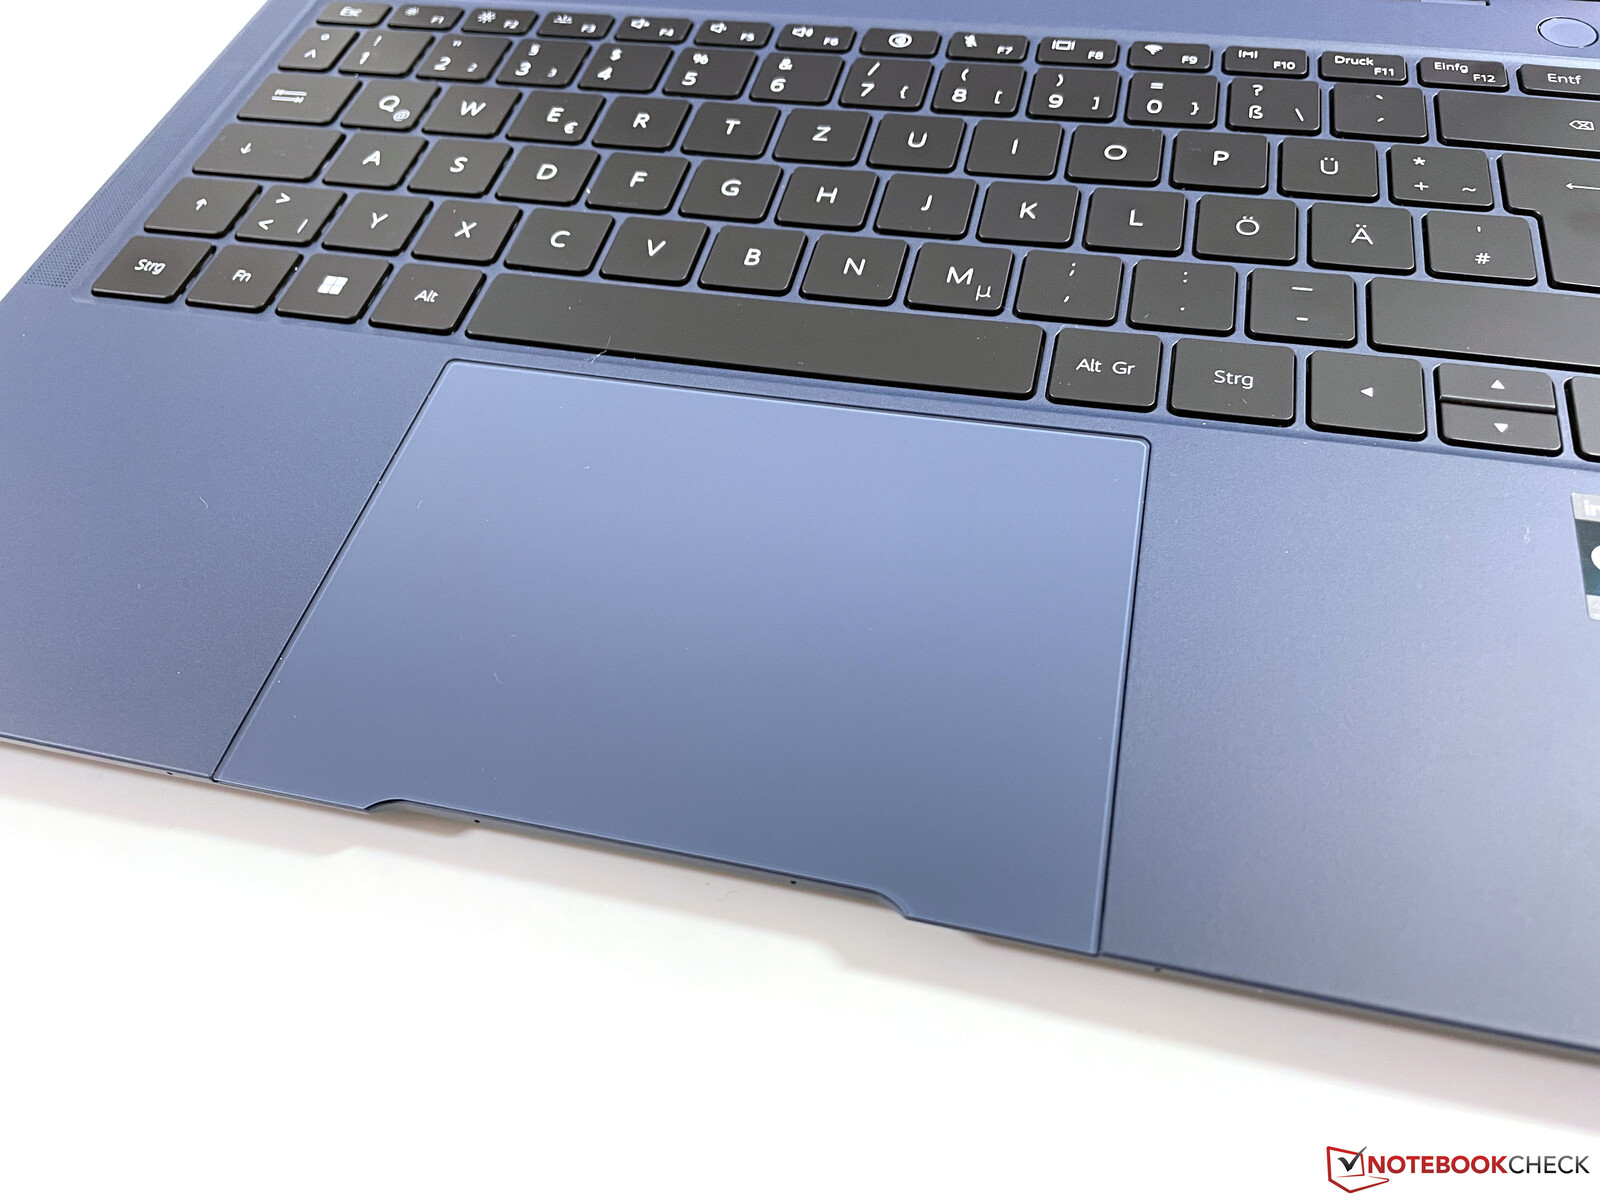
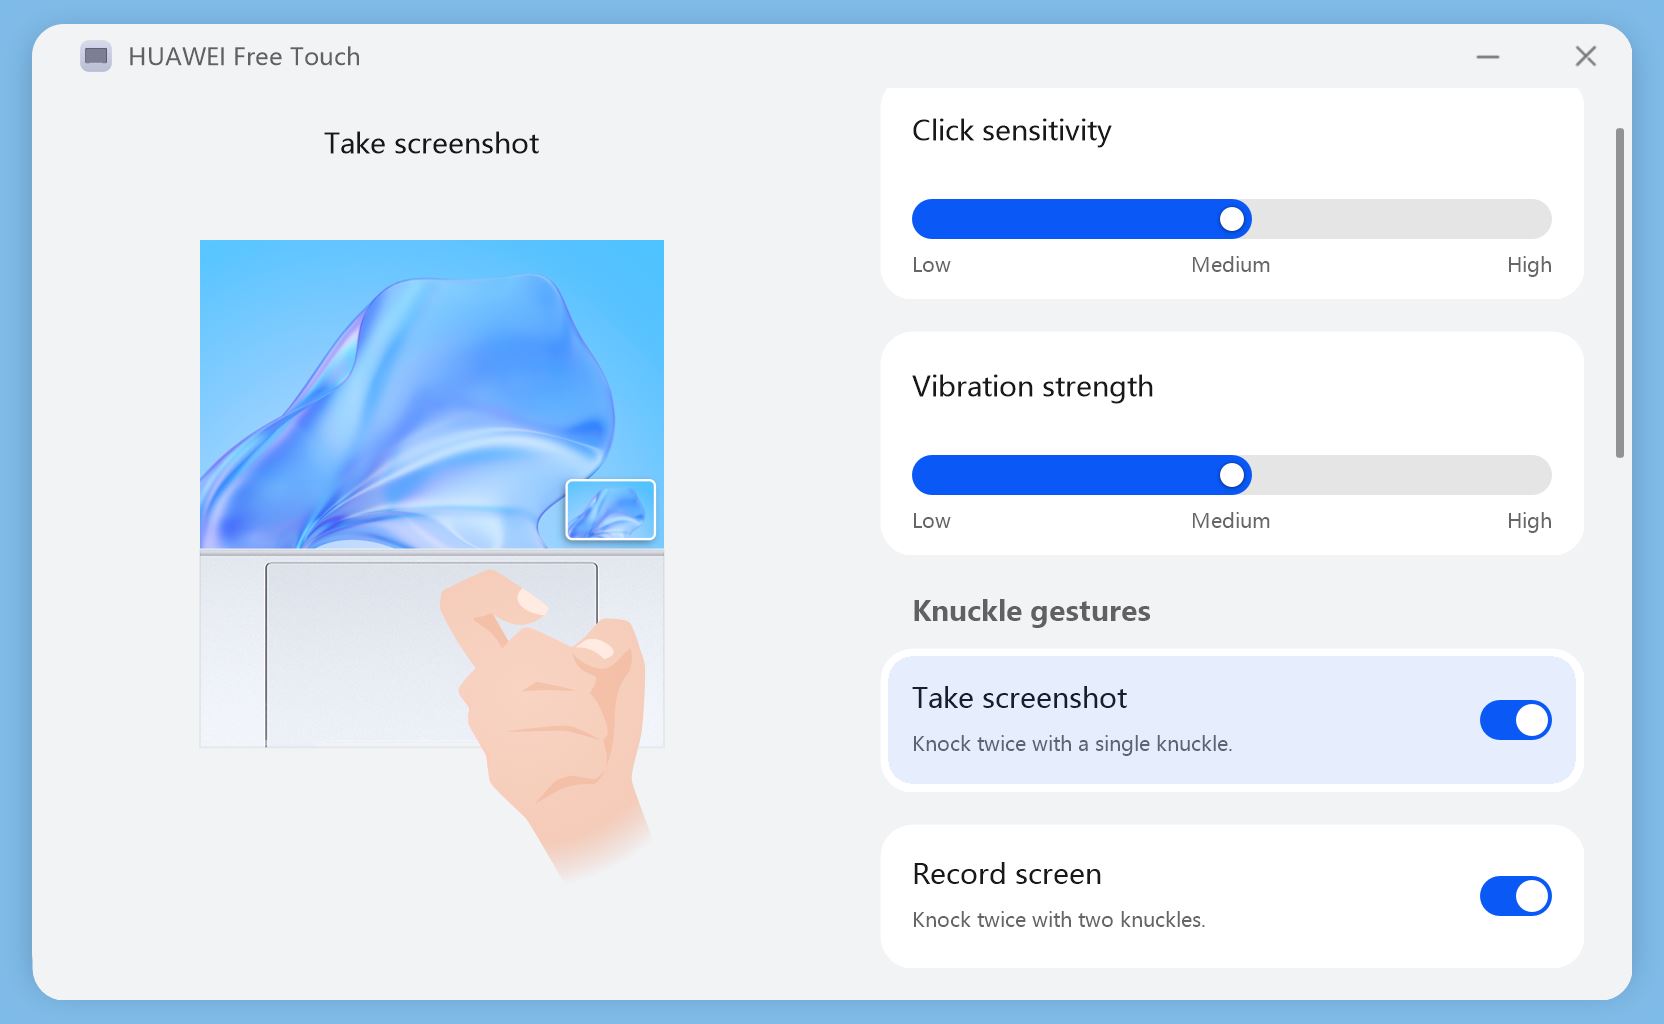
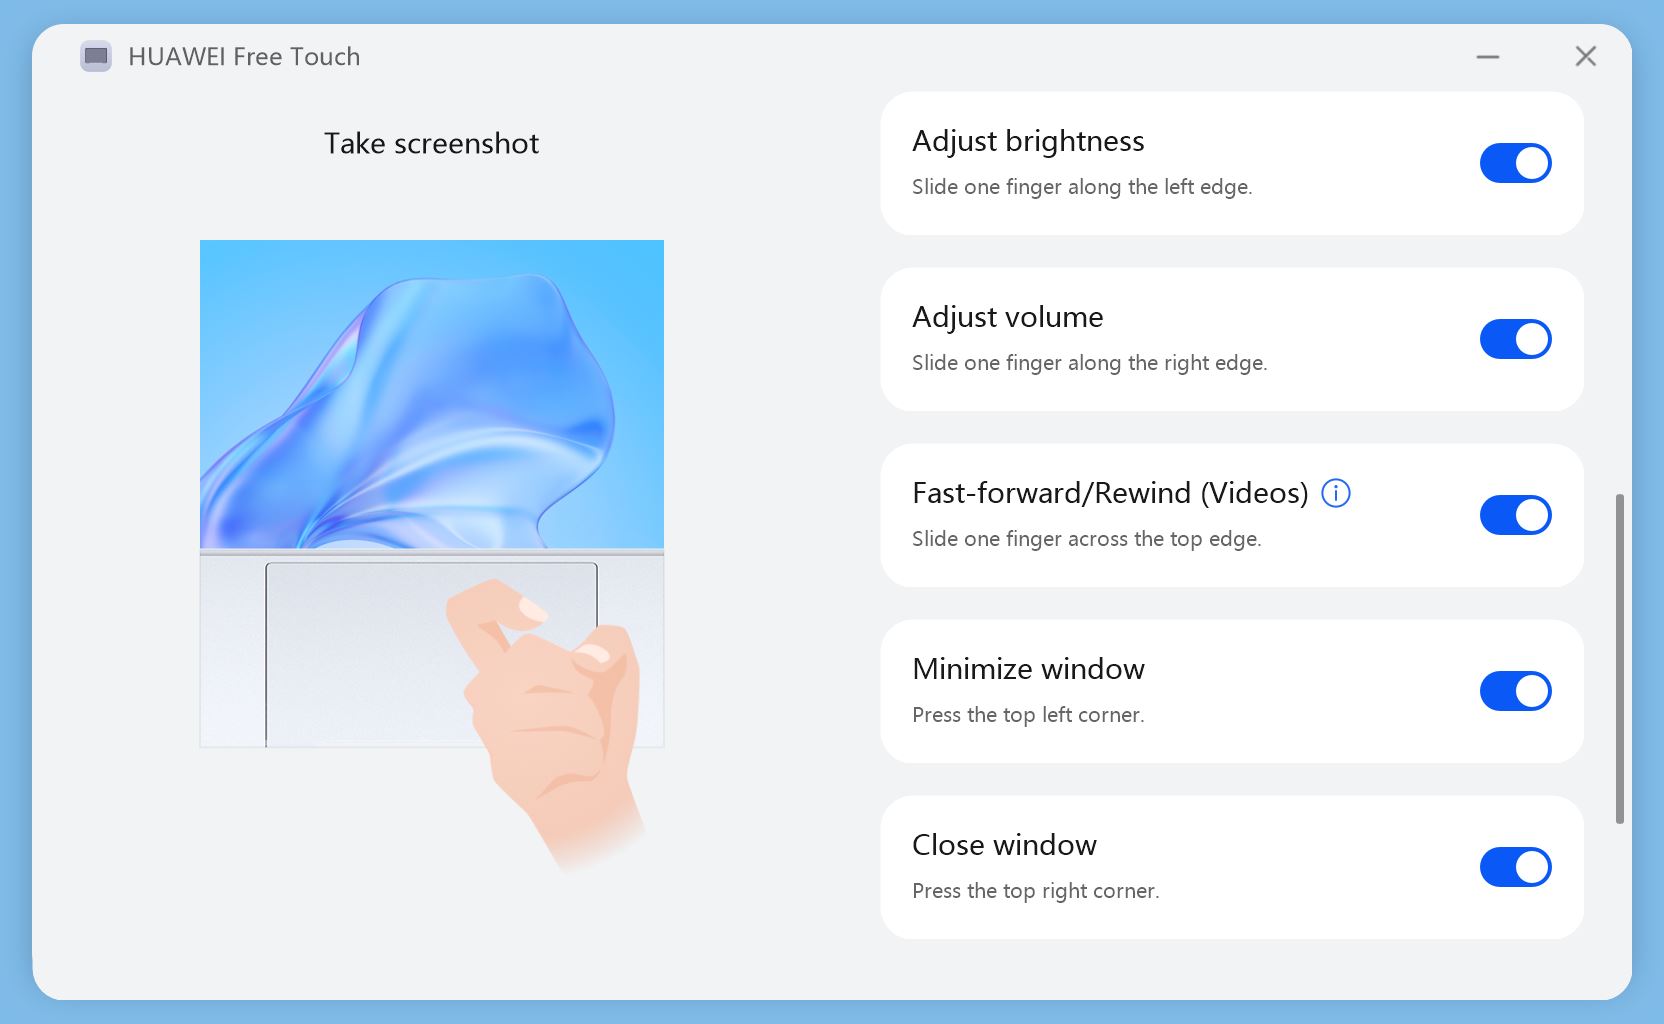
Touchpad to zdecydowanie jedna z atrakcji nowego MateBooka X Pro 2022. Nie dość, że jest bardzo duży, sięgający aż do przedniej krawędzi obudowy (wraz z wgłębieniem), to jeszcze oferuje sporo dodatkowych funkcji. Huawei grupuje je pod pojęciem FreeTouch, co wiąże się z dodatkowymi gestami. Przykładowo, można przewijać wzdłuż dwóch pionowych krawędzi, aby zmienić jasność ekranu lub głośność, co jest również wspierane przez haptyczny efekt siatki. Można też przewijać filmy lub muzykę, przewijając wzdłuż górnej krawędzi. Dostępne są również inne gesty, które zostały przedstawione na poniższych zrzutach ekranu.
Podstawowe sterowanie wskaźnikiem również działa bez zarzutu. Właściwości ślizgowe są bardzo dobre, a cały pad pozwala na wyraźne klikanie w dół. Podobnie jak Apple, potwierdza to haptyczny feedback, który skutkuje bardzo równomiernym i przyjemnie cichym odgłosem klikania. Jednocześnie sam element jest całkowicie solidny.
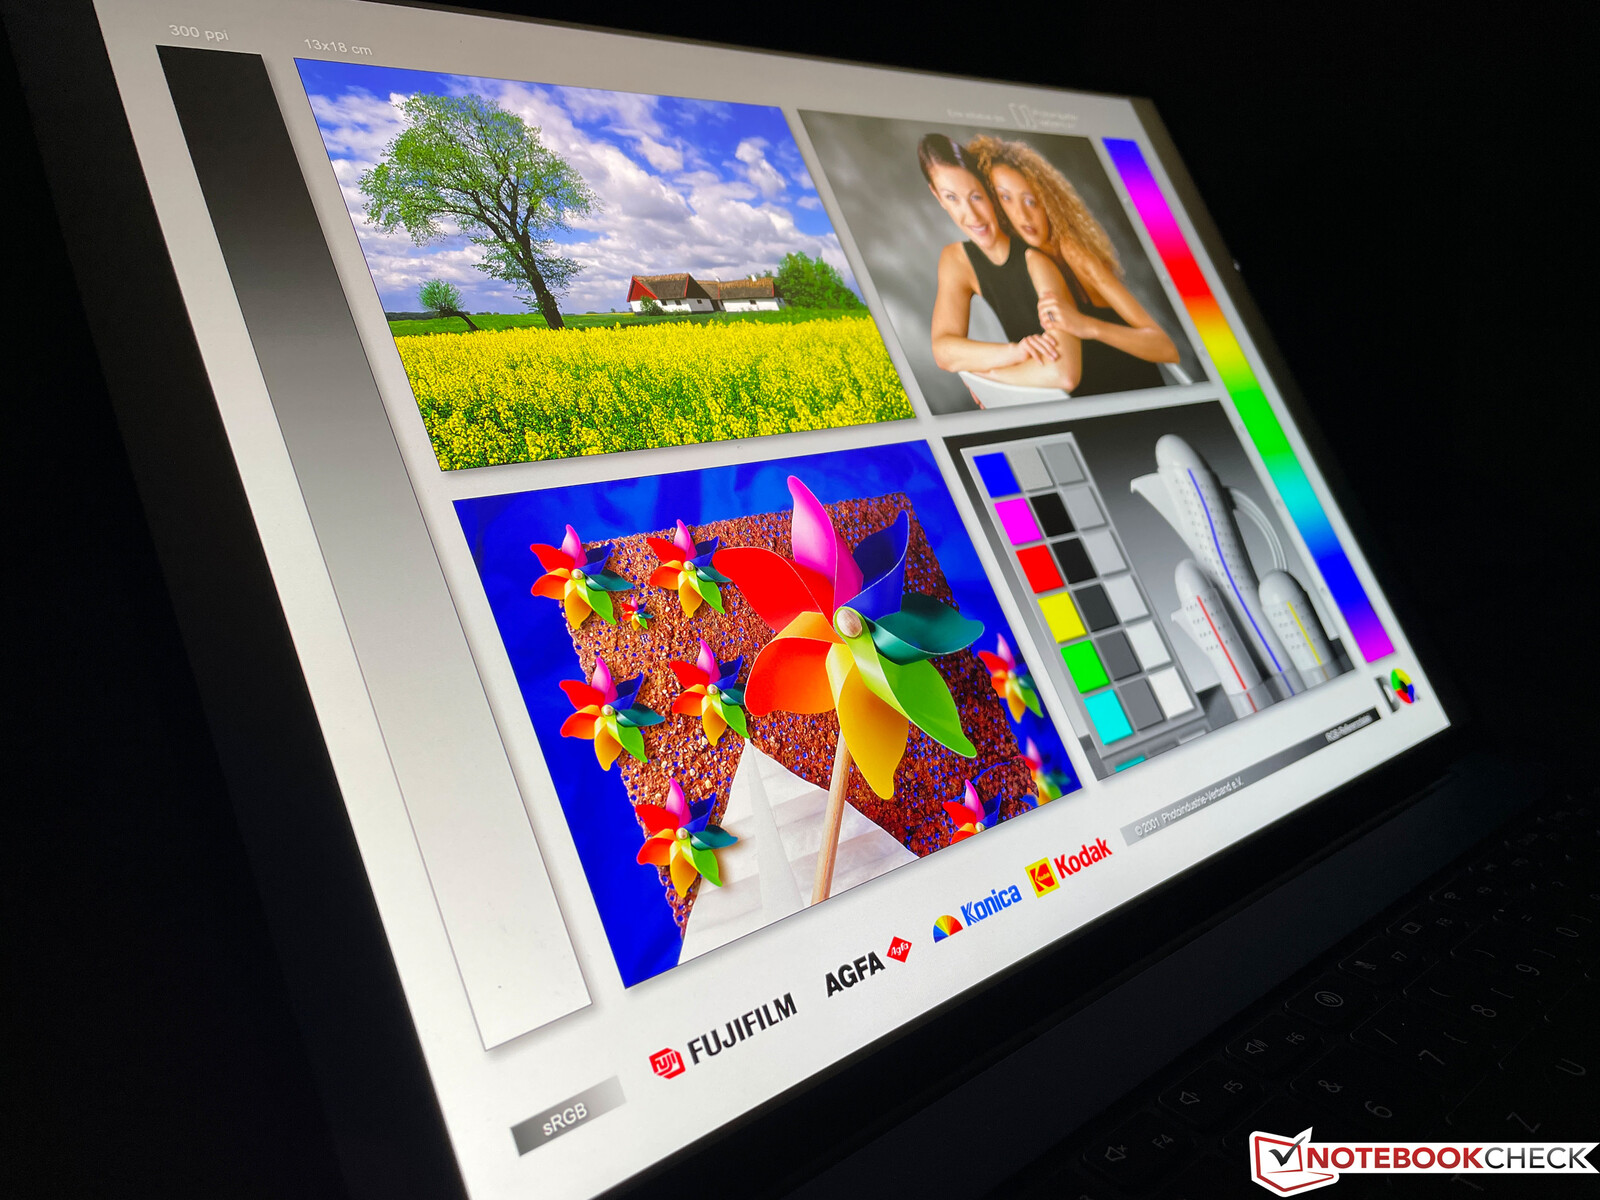
Wyświetlacz - 90 Hz, IPS i bez PWM
Huawei nadal stosuje wyświetlacz IPS o proporcjach 3:2, jak wpoprzedniku, ale zwiększył przekątną ekranu z 13,9 do 14,2 cala. Rozdzielczość również jest minimalna i wynosi 3120x2080 pikseli, co przekłada się na wysokie zagęszczenie pikseli na poziomie 264 DPI. Subiektywne wrażenie obrazu z pojemnościowego ekranu dotykowego jest znakomite, gdyż kolory wydają się bardzo bogate, a treść jest niezwykle ostra. Ponadto monitor oferuje wyższą częstotliwość odświeżania 90 Hz, co umożliwia uzyskanie znacznie płynniejszych wrażeń obrazowych podczas odtwarzania mediów wizualnych. Trzeba to jednak najpierw aktywować ręcznie, w ustawieniach wyświetlacza lub za pomocą kombinacji klawiszy Fn+R. Jasność może być regulowana automatycznie za pomocą czujnika, a temperatura barwowa również może być dostosowana do warunków oświetleniowych
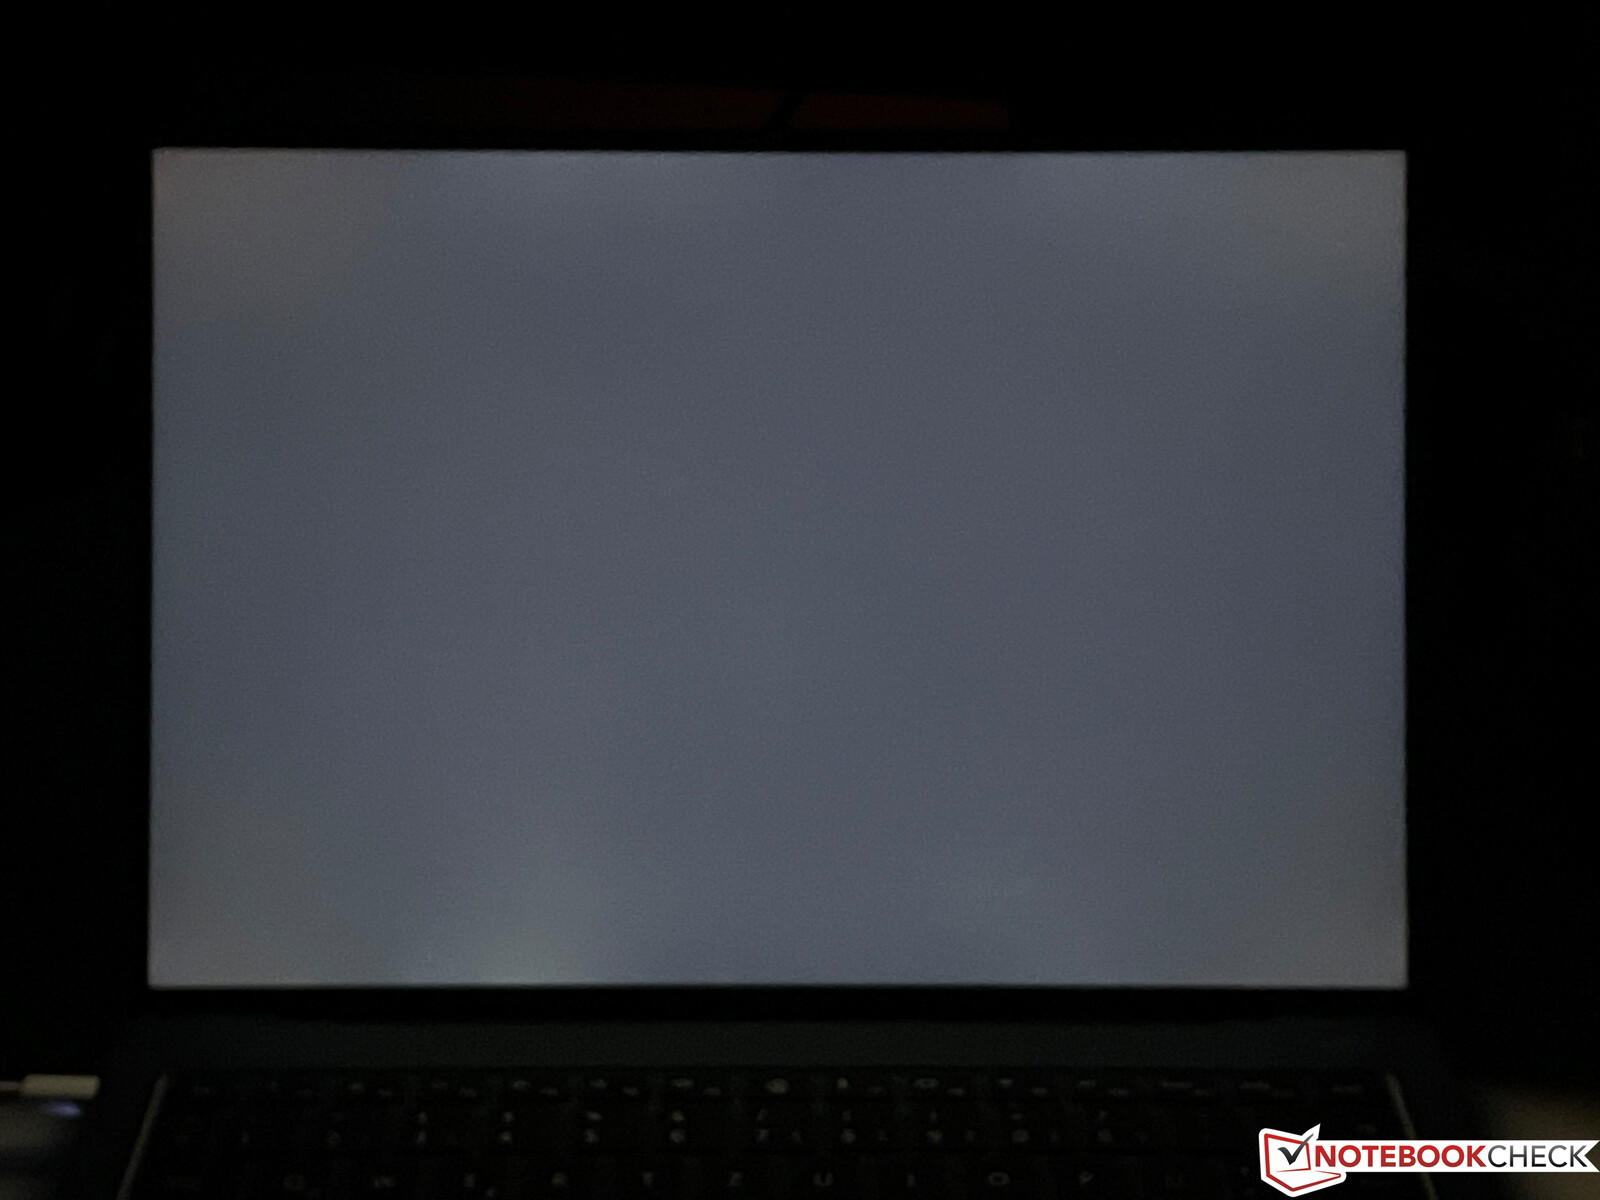
Huawei podaje jasność na poziomie 500 cd/m², którą nasz próbka recenzencka z łatwością przekracza, uzyskując średnią jasność na poziomie prawie 590 cd/m². Daje to panelowi przewagę nad wieloma ekranami OLED, które zwykle osiągają tylko 400 cd/m² w normalnym trybie SDR. Wartość czerni (0,39) i kontrast (>1 500:1) panelu IPS są oczywiście gorsze od OLED-ów, ale i tak osiągi są bardzo dobre. Aureole widać tak naprawdę tylko przy maksymalnej jasności na ciemnym tle, co w praktyce nie powinno się zdarzać zbyt często. Czasy reakcji są bardzo dobre jak na panel IPS i nie wykryto migotania PWM.
Panel obsługuje również treści HDR, ale to również trzeba najpierw aktywować w ustawieniach Windows. Odtwarzanie odpowiednich treści HDR działa poprawnie, ale subiektywnie obrazy HDR wyglądają lepiej na panelach OLED lub mini-LED, co wynika głównie z wyższego współczynnika kontrastu.
| |||||||||||||||||||||||||
rozświetlenie: 91 %
na akumulatorze: 598 cd/m²
kontrast: 1546:1 (czerń: 0.39 cd/m²)
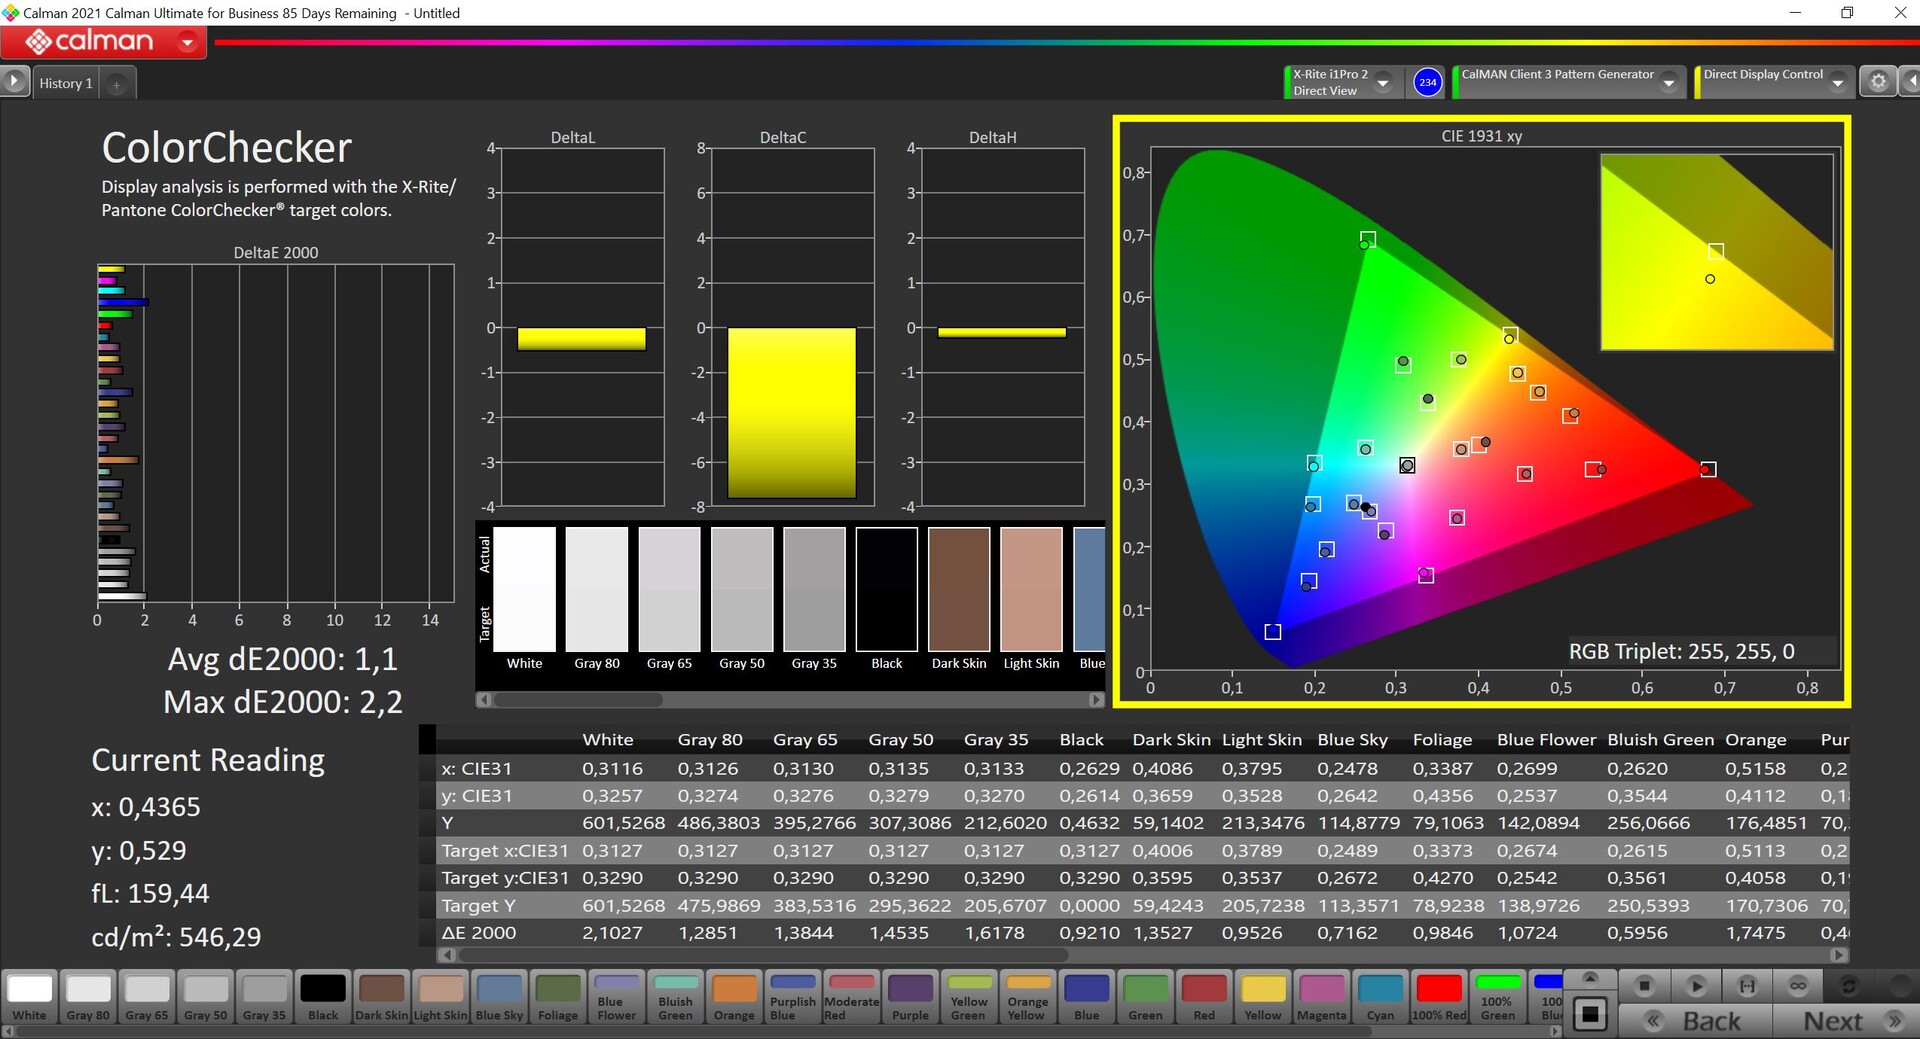
ΔE ColorChecker Calman: 1.1 | ∀{0.5-29.43 Ø4.72}
calibrated: 1.2
ΔE Greyscale Calman: 1.5 | ∀{0.09-98 Ø4.97}
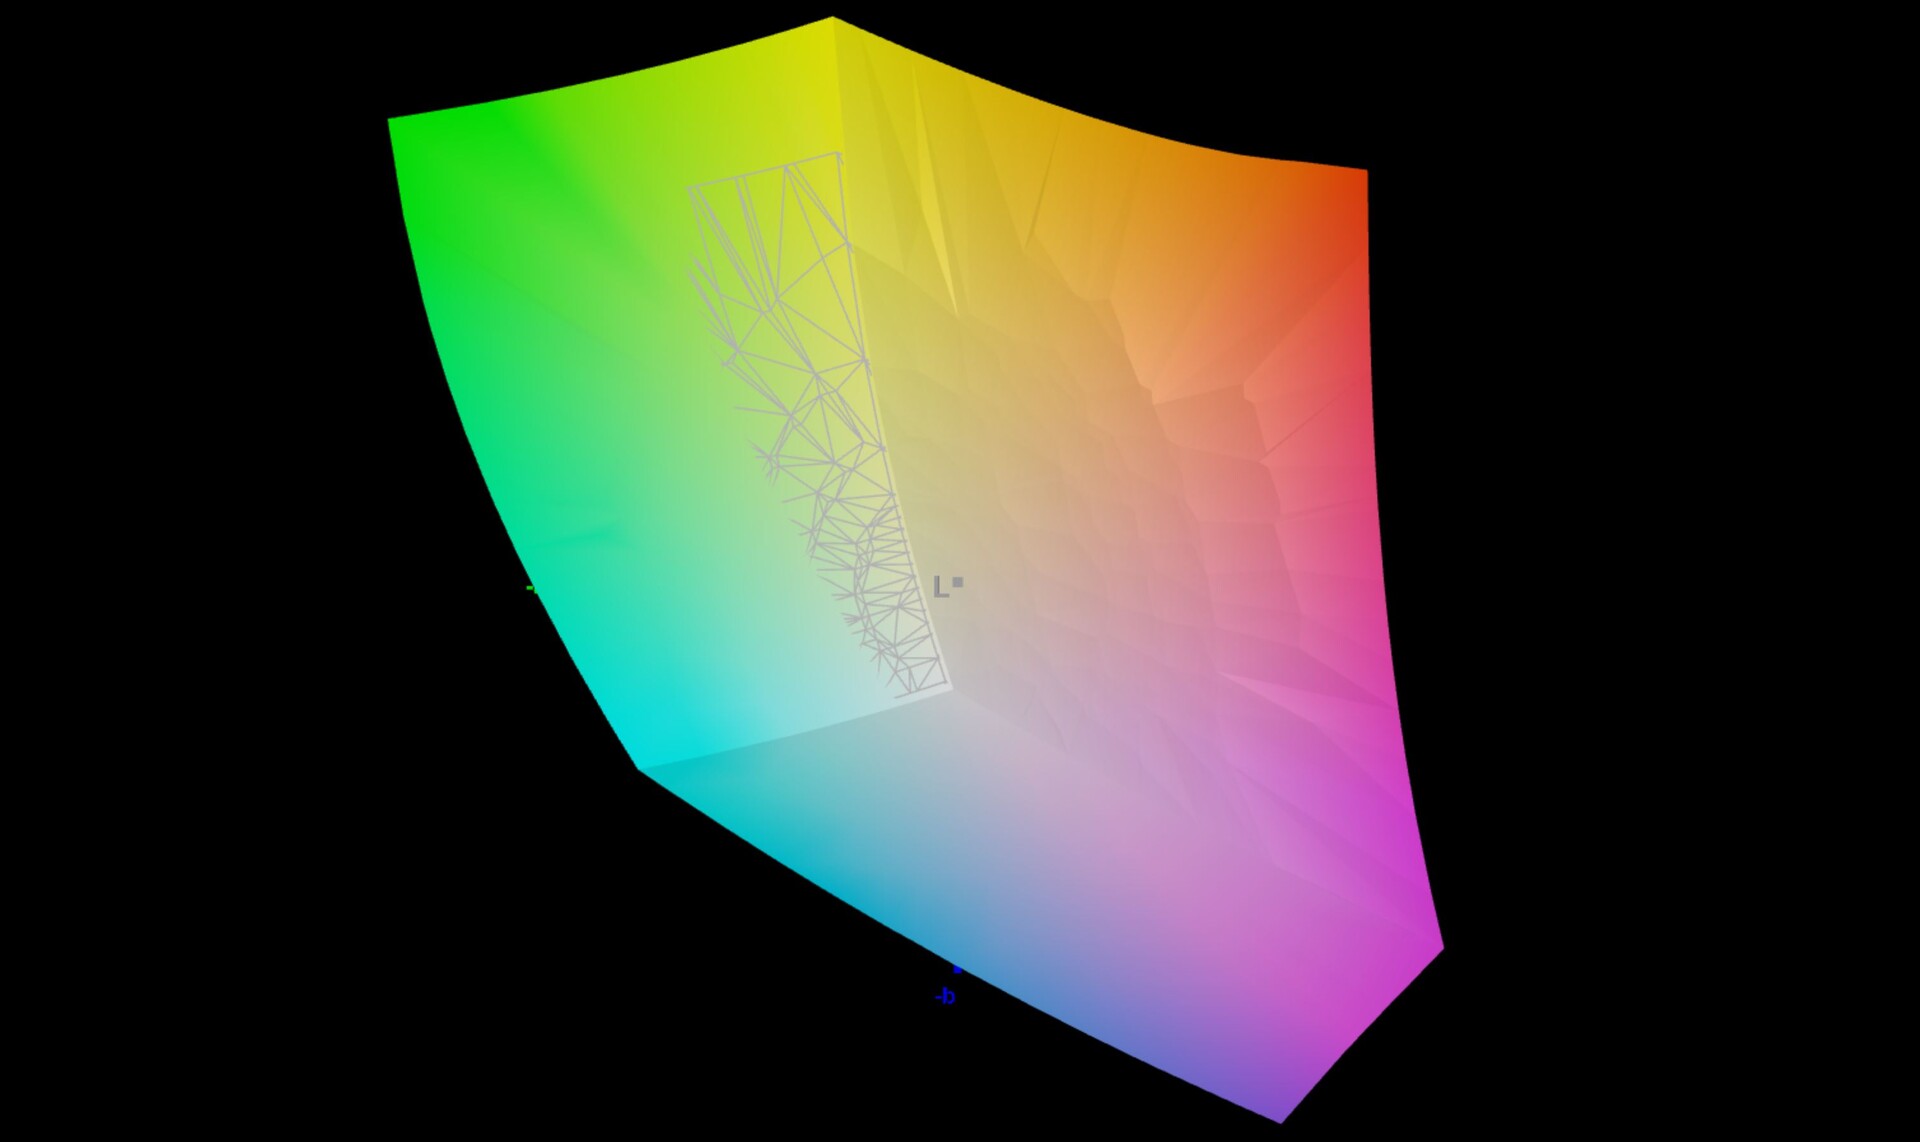
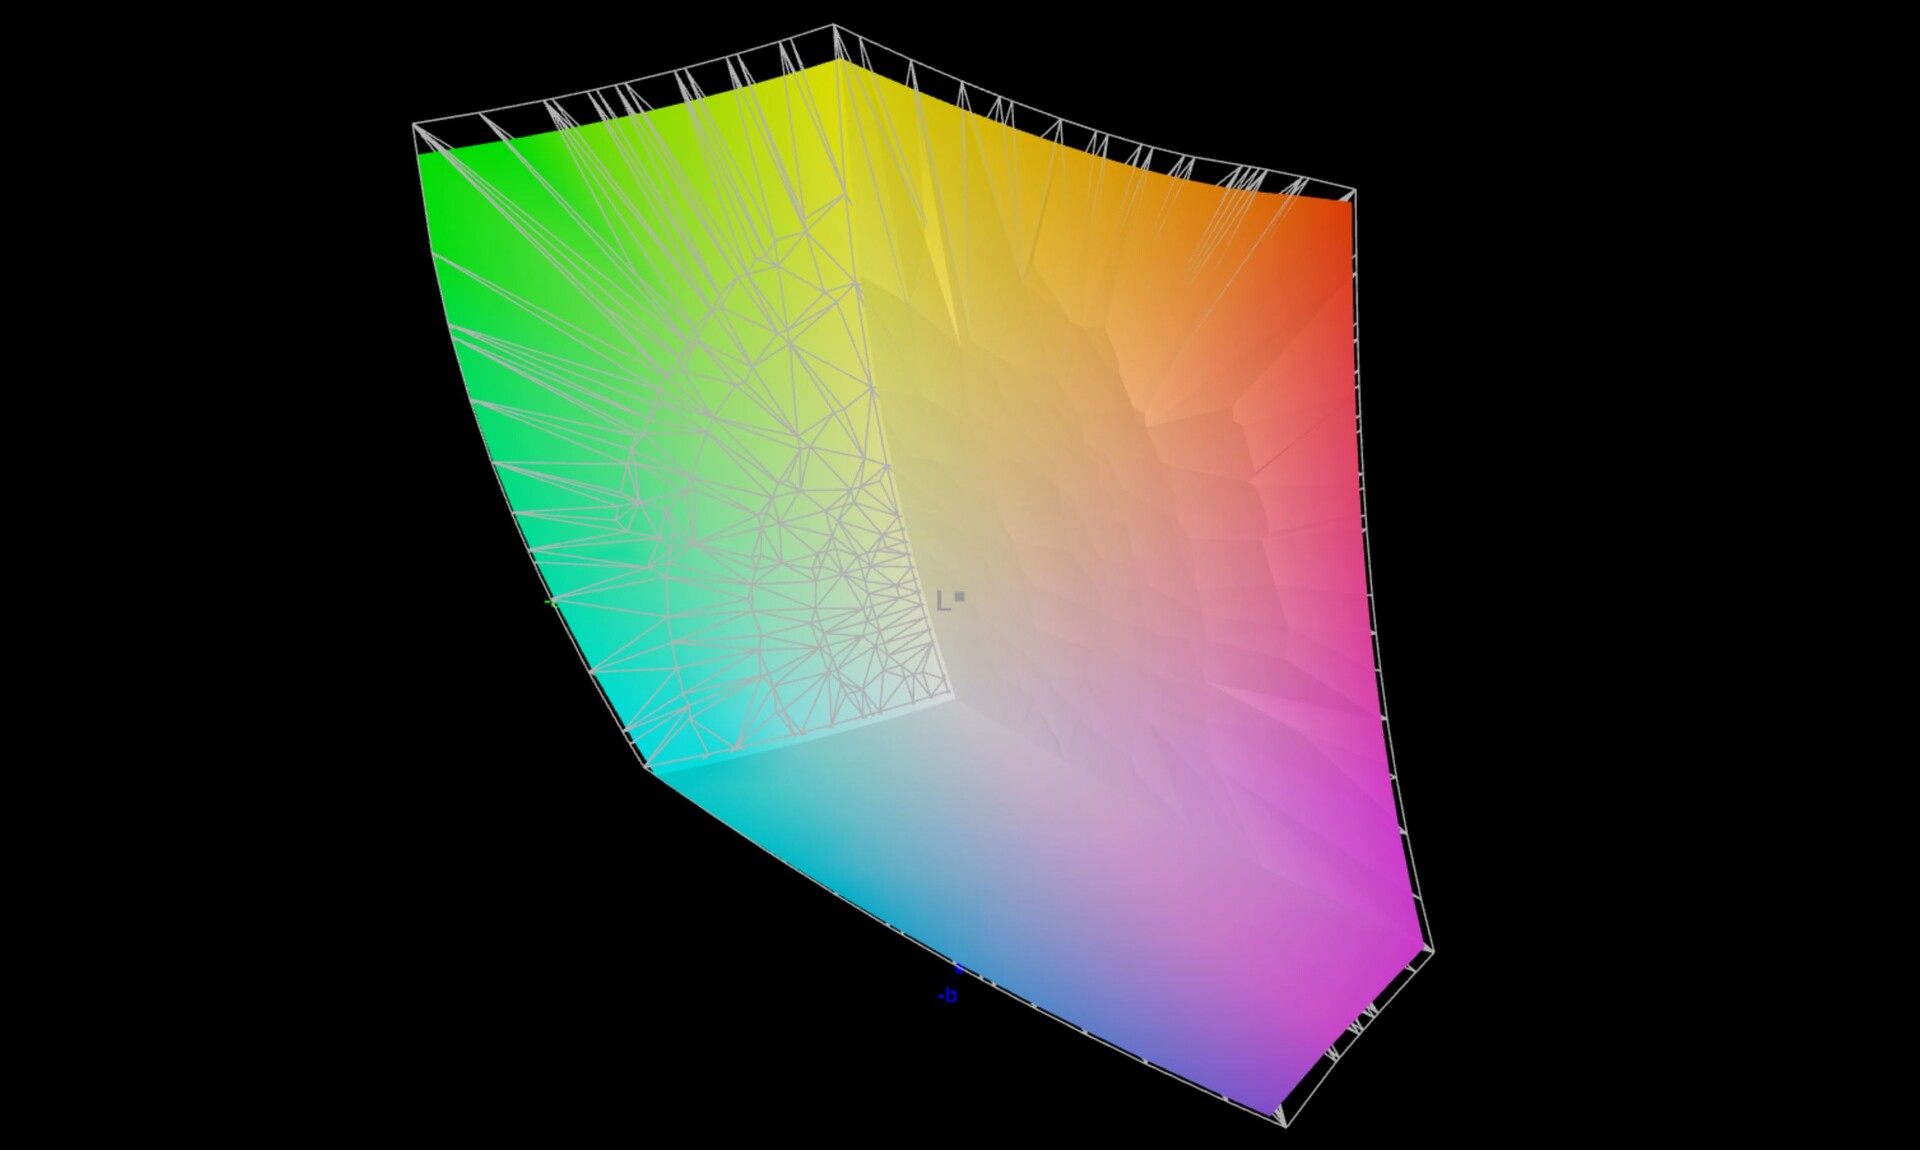
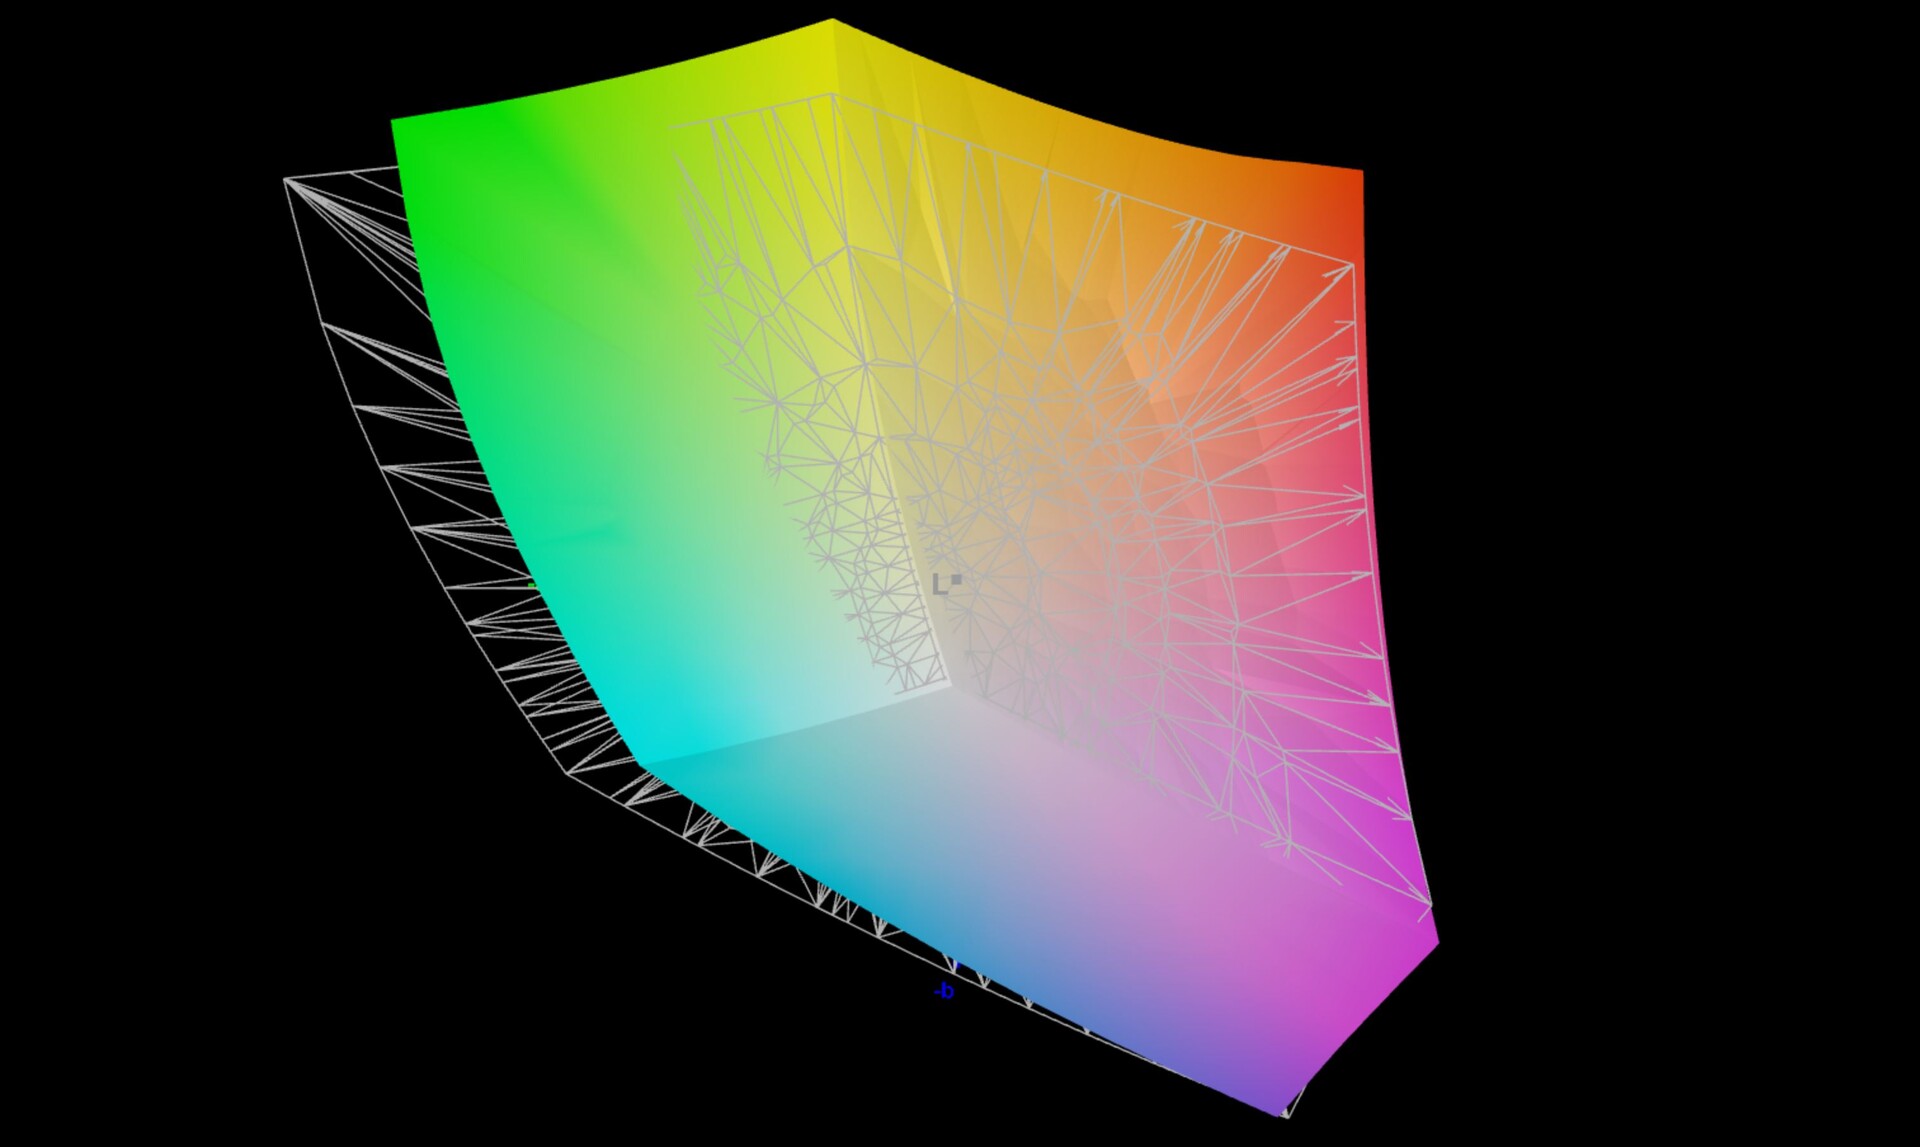
86.5% AdobeRGB 1998 (Argyll 3D)
99.5% sRGB (Argyll 3D)
94.6% Display P3 (Argyll 3D)
Gamma: 2.17
CCT: 6549 K
| Huawei MateBook X Pro 2022 TMX1422, IPS, 3120x2080, 14.2" | Apple MacBook Air M2 Entry IPS, 2560x1664, 13.6" | Lenovo Yoga 9i 14 2022 i7-1260P LEN140WQUXGA, OLED, 3840x2400, 14" | Asus Zenbook S 13 OLED SDC4172, OLED, 2880x1800, 13.3" | Dell XPS 13 Plus 9320 4K LQ134R1, IPS, 3840x2400, 13.4" | Huawei MateBook X Pro 2021 TIANMA XM, IPS, 3000x2000, 13.9" | |
|---|---|---|---|---|---|---|
| Display | 2% | 6% | 6% | -10% | -20% | |
| Display P3 Coverage (%) | 94.6 | 98.4 4% | 98.7 4% | 99.8 5% | 76.5 -19% | 64.9 -31% |
| sRGB Coverage (%) | 99.5 | 99.9 0% | 99.8 0% | 100 1% | 100 1% | 94.4 -5% |
| AdobeRGB 1998 Coverage (%) | 86.5 | 87.6 1% | 98.5 14% | 97.8 13% | 76 -12% | 66.3 -23% |
| Response Times | -38% | 87% | 91% | -41% | -51% | |
| Response Time Grey 50% / Grey 80% * (ms) | 25.4 ? | 32.9 ? -30% | 2.8 ? 89% | 2.1 ? 92% | 38.9 ? -53% | 37.6 ? -48% |
| Response Time Black / White * (ms) | 17.1 ? | 24.9 ? -46% | 2.8 ? 84% | 1.68 ? 90% | 21.9 ? -28% | 26.4 ? -54% |
| PWM Frequency (Hz) | 239.2 ? | 240.4 ? | ||||
| Screen | -8% | 2867% | 95% | -45% | -14% | |
| Brightness middle (cd/m²) | 603 | 526 -13% | 361 -40% | 336 -44% | 494 -18% | 502 -17% |
| Brightness (cd/m²) | 586 | 486 -17% | 362 -38% | 338 -42% | 474 -19% | 474 -19% |
| Brightness Distribution (%) | 91 | 87 -4% | 98 8% | 99 9% | 89 -2% | 89 -2% |
| Black Level * (cd/m²) | 0.39 | 0.38 3% | 0.001 100% | 0.02 95% | 0.28 28% | 0.33 15% |
| Contrast (:1) | 1546 | 1384 -10% | 361000 23251% | 16800 987% | 1764 14% | 1521 -2% |
| Colorchecker dE 2000 * | 1.1 | 1.3 -18% | 2.8 -155% | 1.8 -64% | 3.1 -182% | 1.35 -23% |
| Colorchecker dE 2000 max. * | 2.2 | 2.7 -23% | 5.8 -164% | 3.8 -73% | 4.2 -91% | 3.67 -67% |
| Colorchecker dE 2000 calibrated * | 1.2 | 0.7 42% | 1.8 -50% | 1.5 -25% | 1.2 -0% | |
| Greyscale dE 2000 * | 1.5 | 2 -33% | 1.9 -27% | 0.9 40% | 3.2 -113% | 1.7 -13% |
| Gamma | 2.17 101% | 2.25 98% | 2.16 102% | 2.22 99% | 2.41 91% | 2.24 98% |
| CCT | 6549 99% | 6858 95% | 6181 105% | 6580 99% | 6189 105% | 6440 101% |
| Color Space (Percent of AdobeRGB 1998) (%) | 61.1 | |||||
| Color Space (Percent of sRGB) (%) | 94.3 | |||||
| Całkowita średnia (program / ustawienia) | -15% /
-10% | 987% /
1779% | 64% /
76% | -32% /
-37% | -28% /
-21% |
* ... im mniej tym lepiej
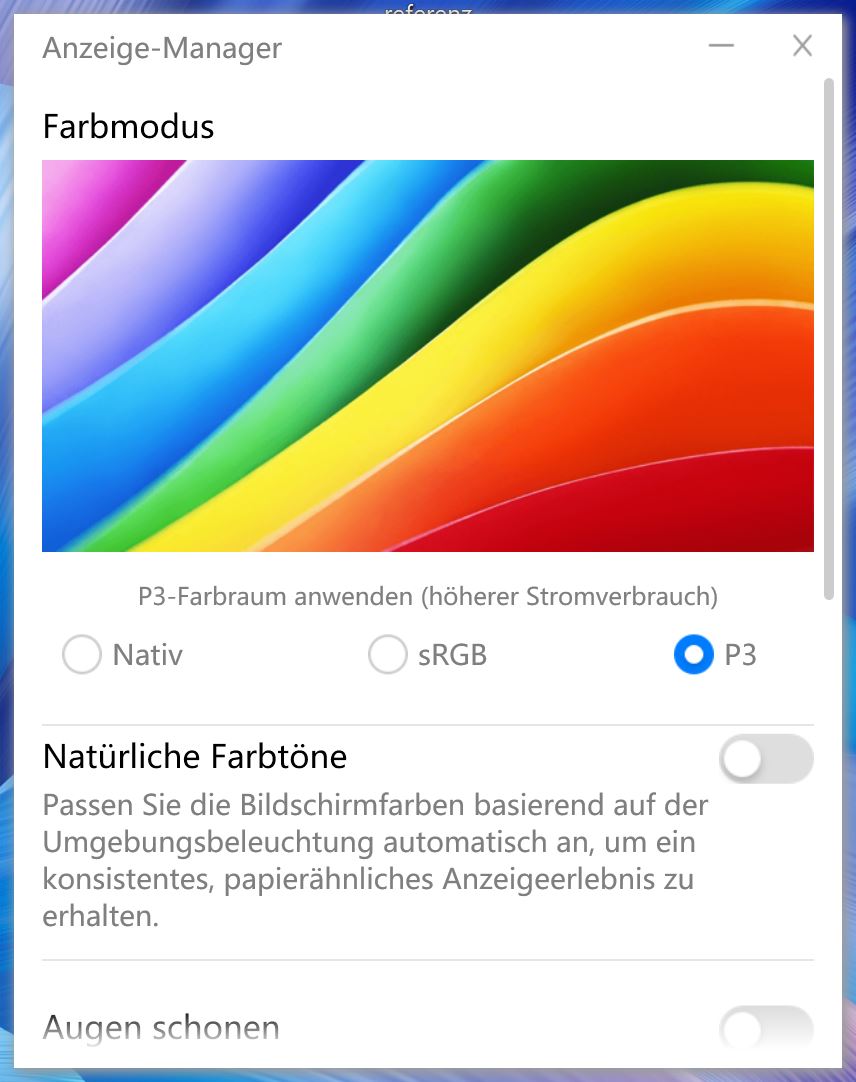
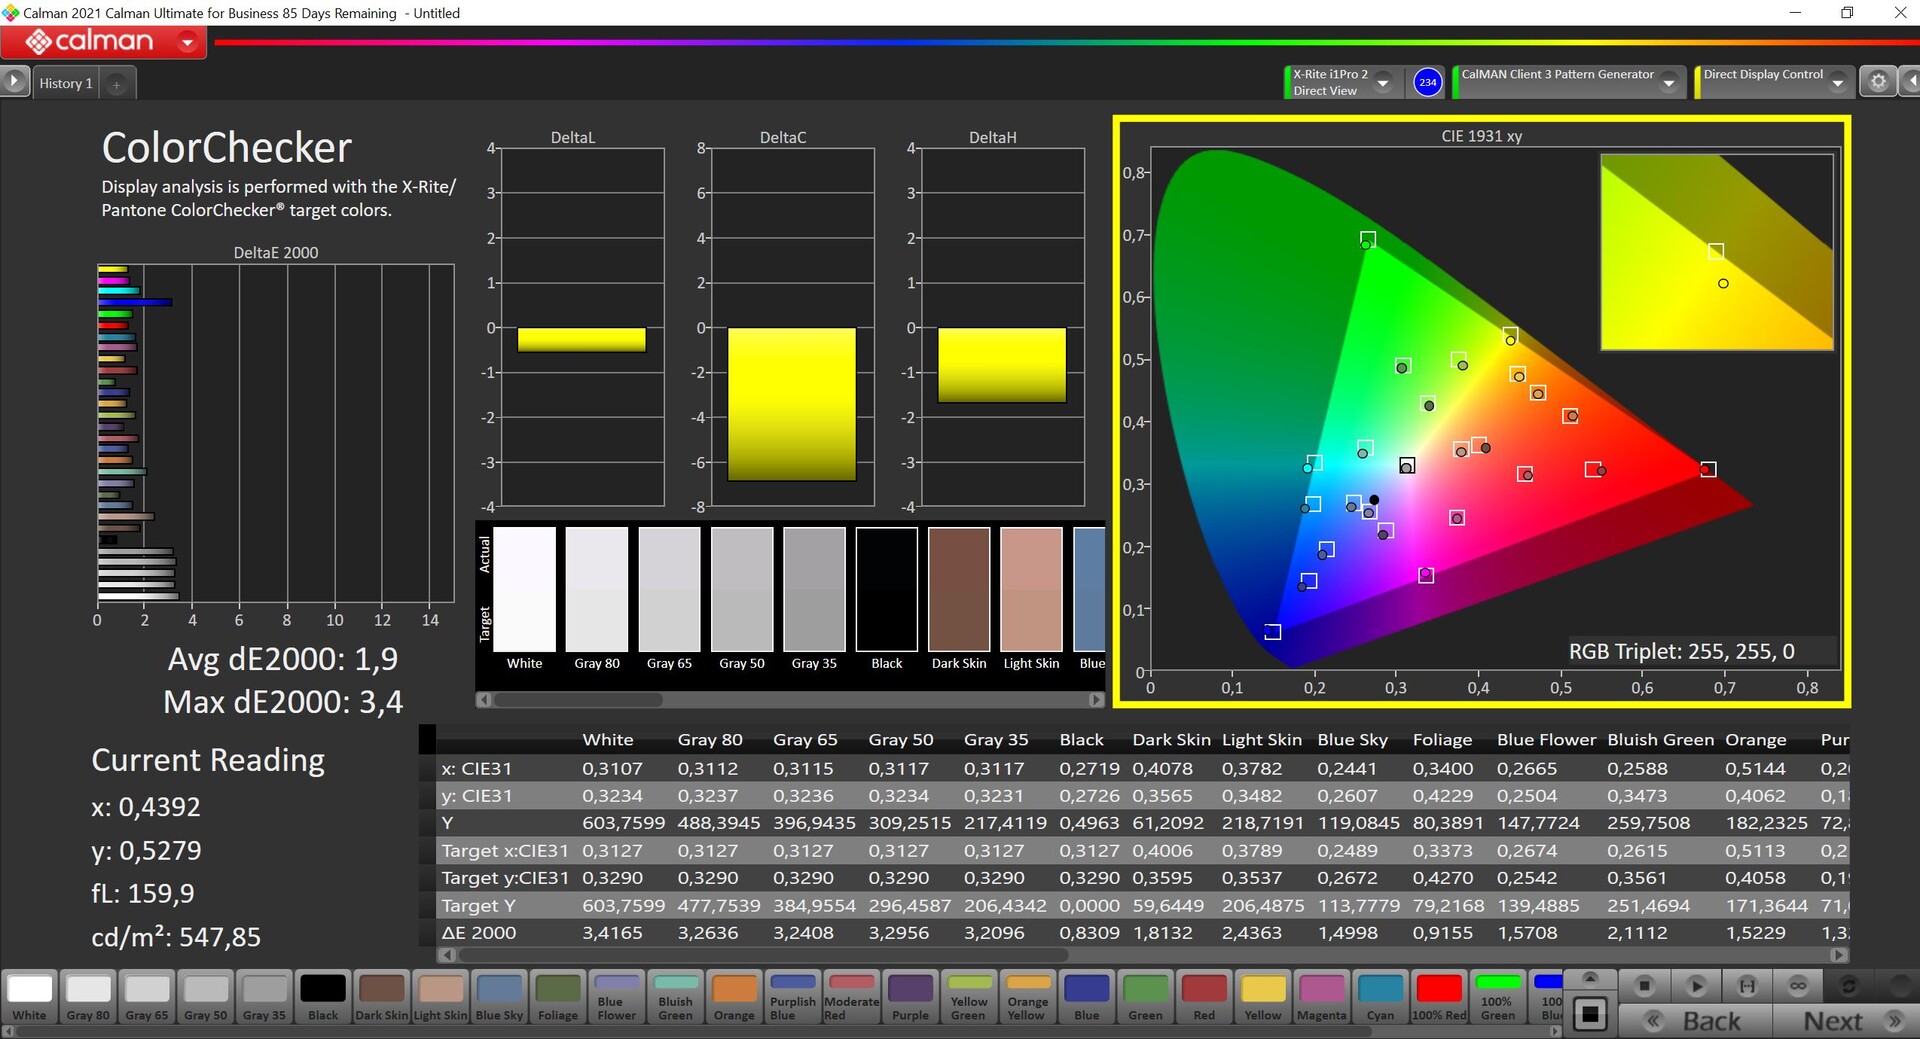
Wyświetlacz zmierzyliśmy za pomocą profesjonalnego oprogramowania CalMAN oraz spektrofotometru X-Rite i1 Pro 2. Czytelnicy powinni zauważyć, że Huawei dostarcza ex-factory trzy różne profile: Native (P3), sRGB i P3. Zmierzyliśmy wszystkie trzy profile, zanim zdecydowaliśmy się na profil P3. Mimo, że profil natywny ma również P3 jako docelową przestrzeń kolorów, wykazuje on większe odchylenia i subiektywnie daje nieco bogatsze kolory. Z drugiej strony, dzięki profilowi P3, kolory są niezwykle dokładne od razu po wyjęciu z pudełka, a wraz z prawie pełnym pokryciem P3, użytkownicy mogą przeprowadzać edycję zdjęć/wideo, ponieważ wszystkie wartości są już poniżej ważnego odchylenia DeltaE-2000 wynoszącego 3. Nie ma również odrzutu kolorów w skali szarości, a temperatura barwowa jest bardzo bliska idealnej wartości 6,500K.


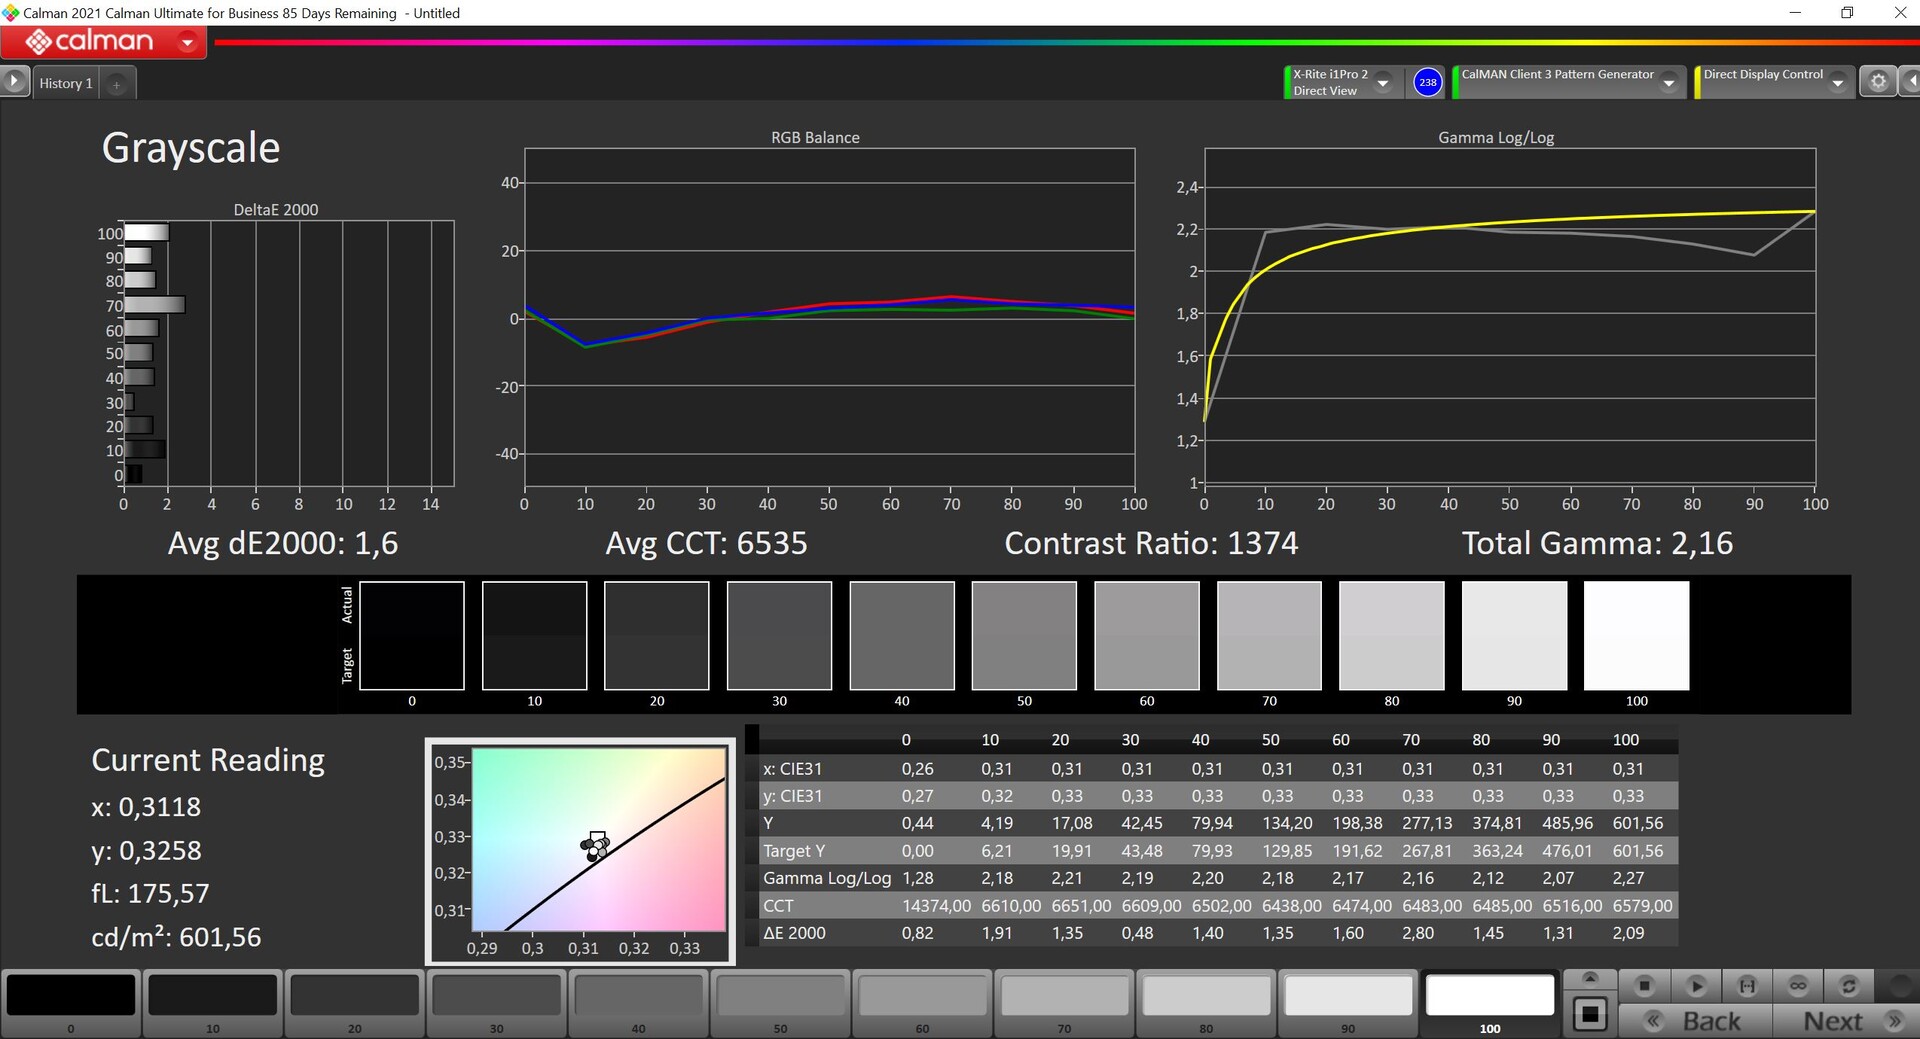
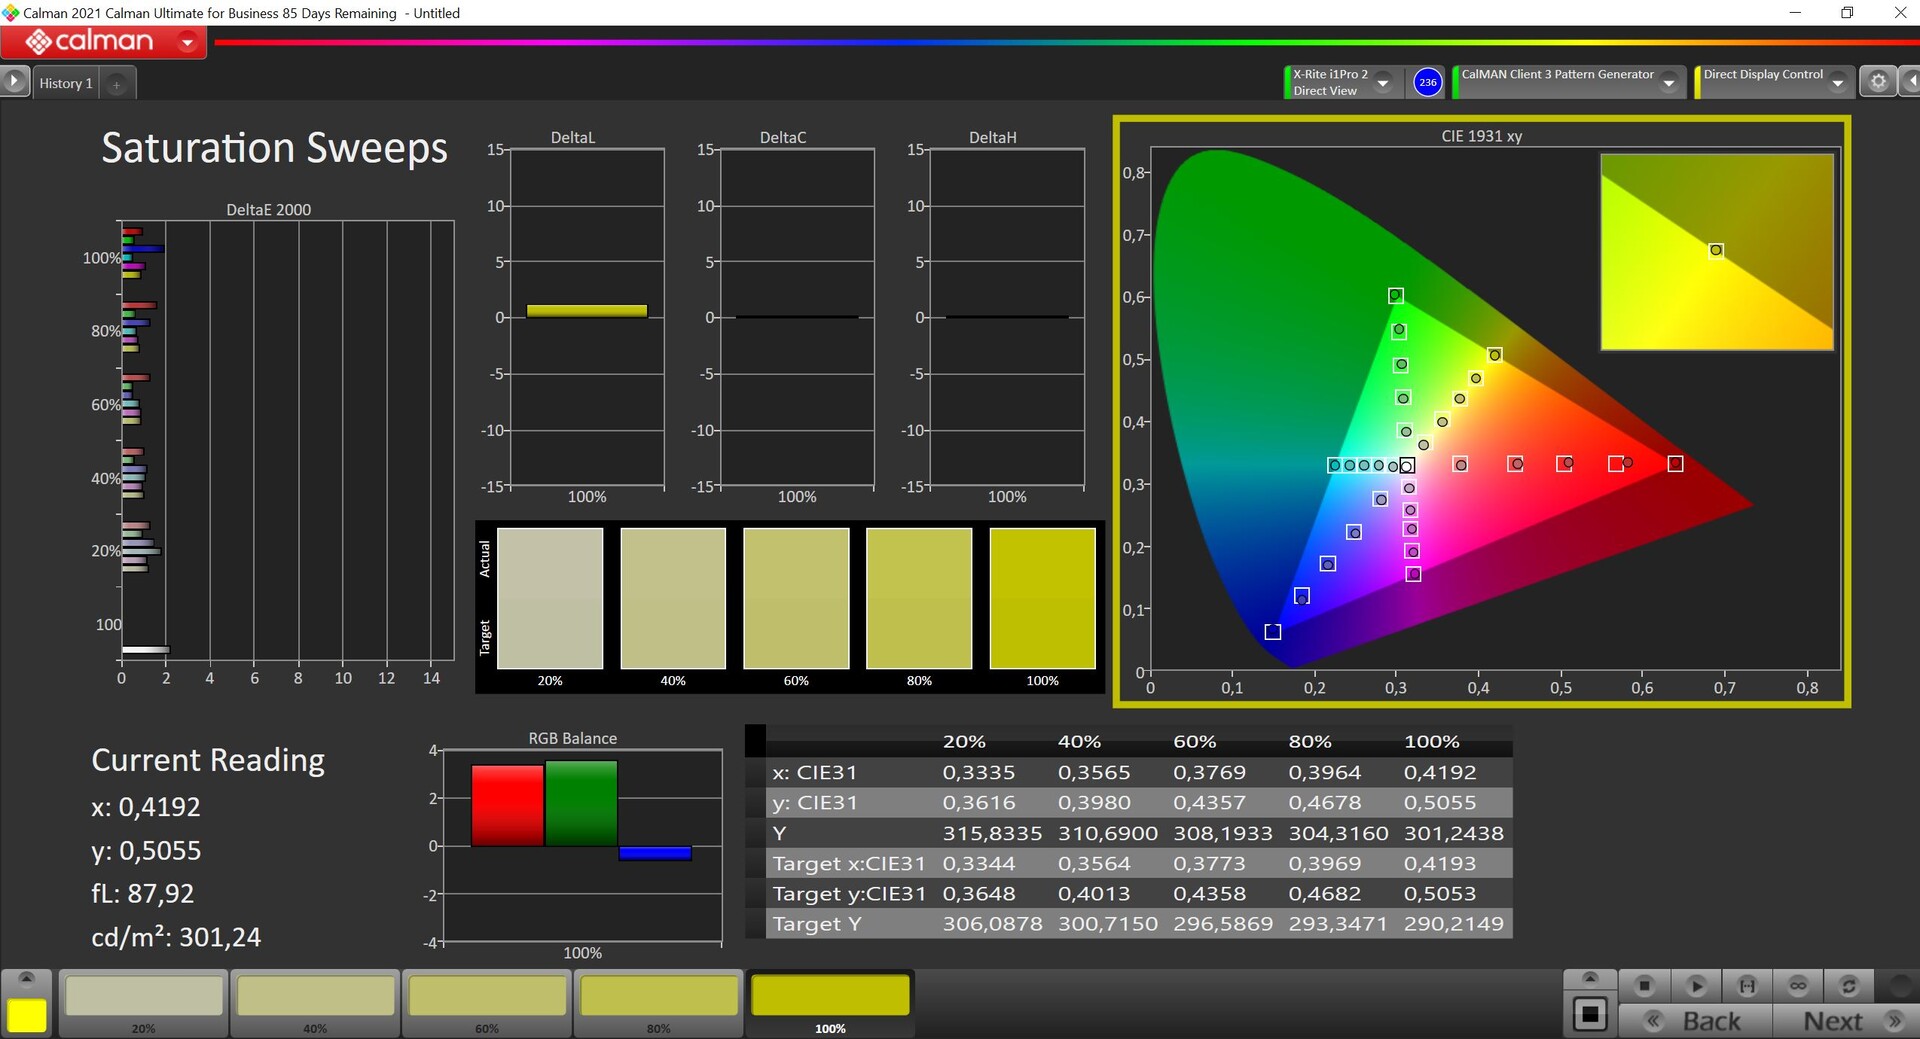
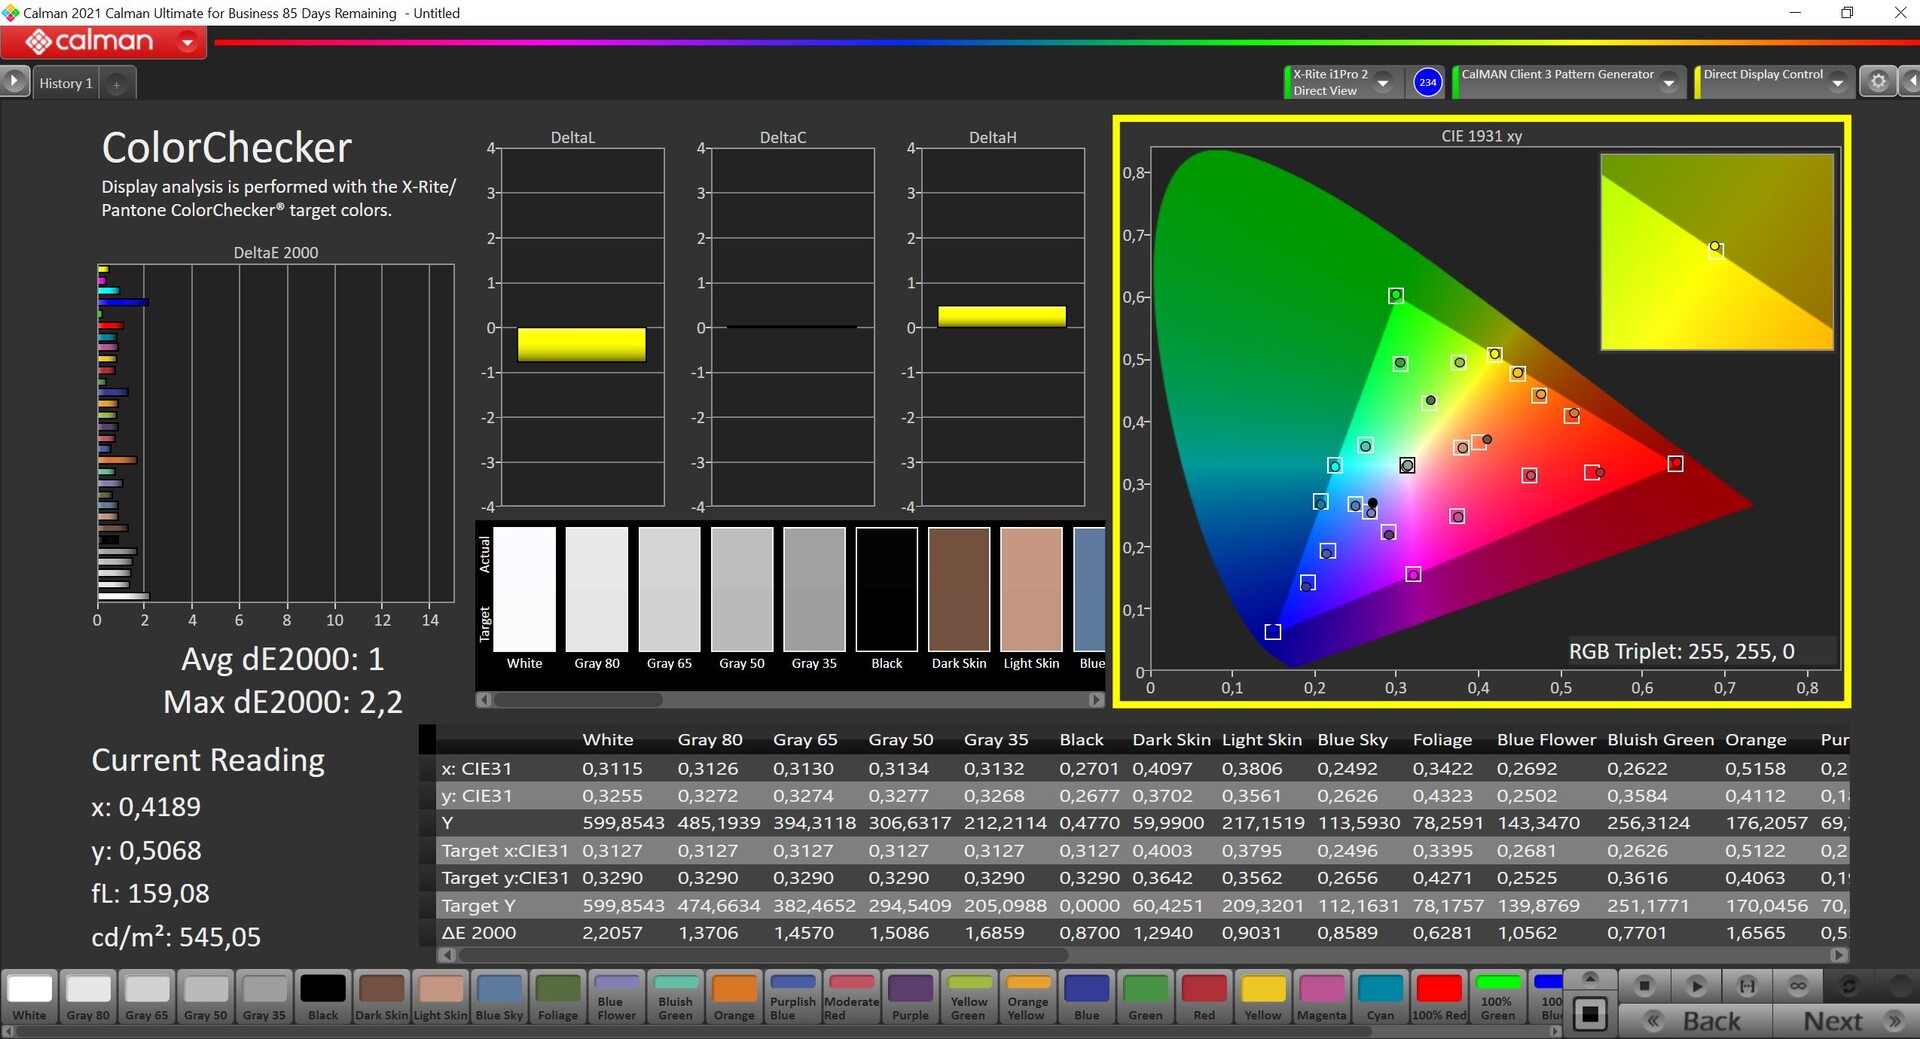
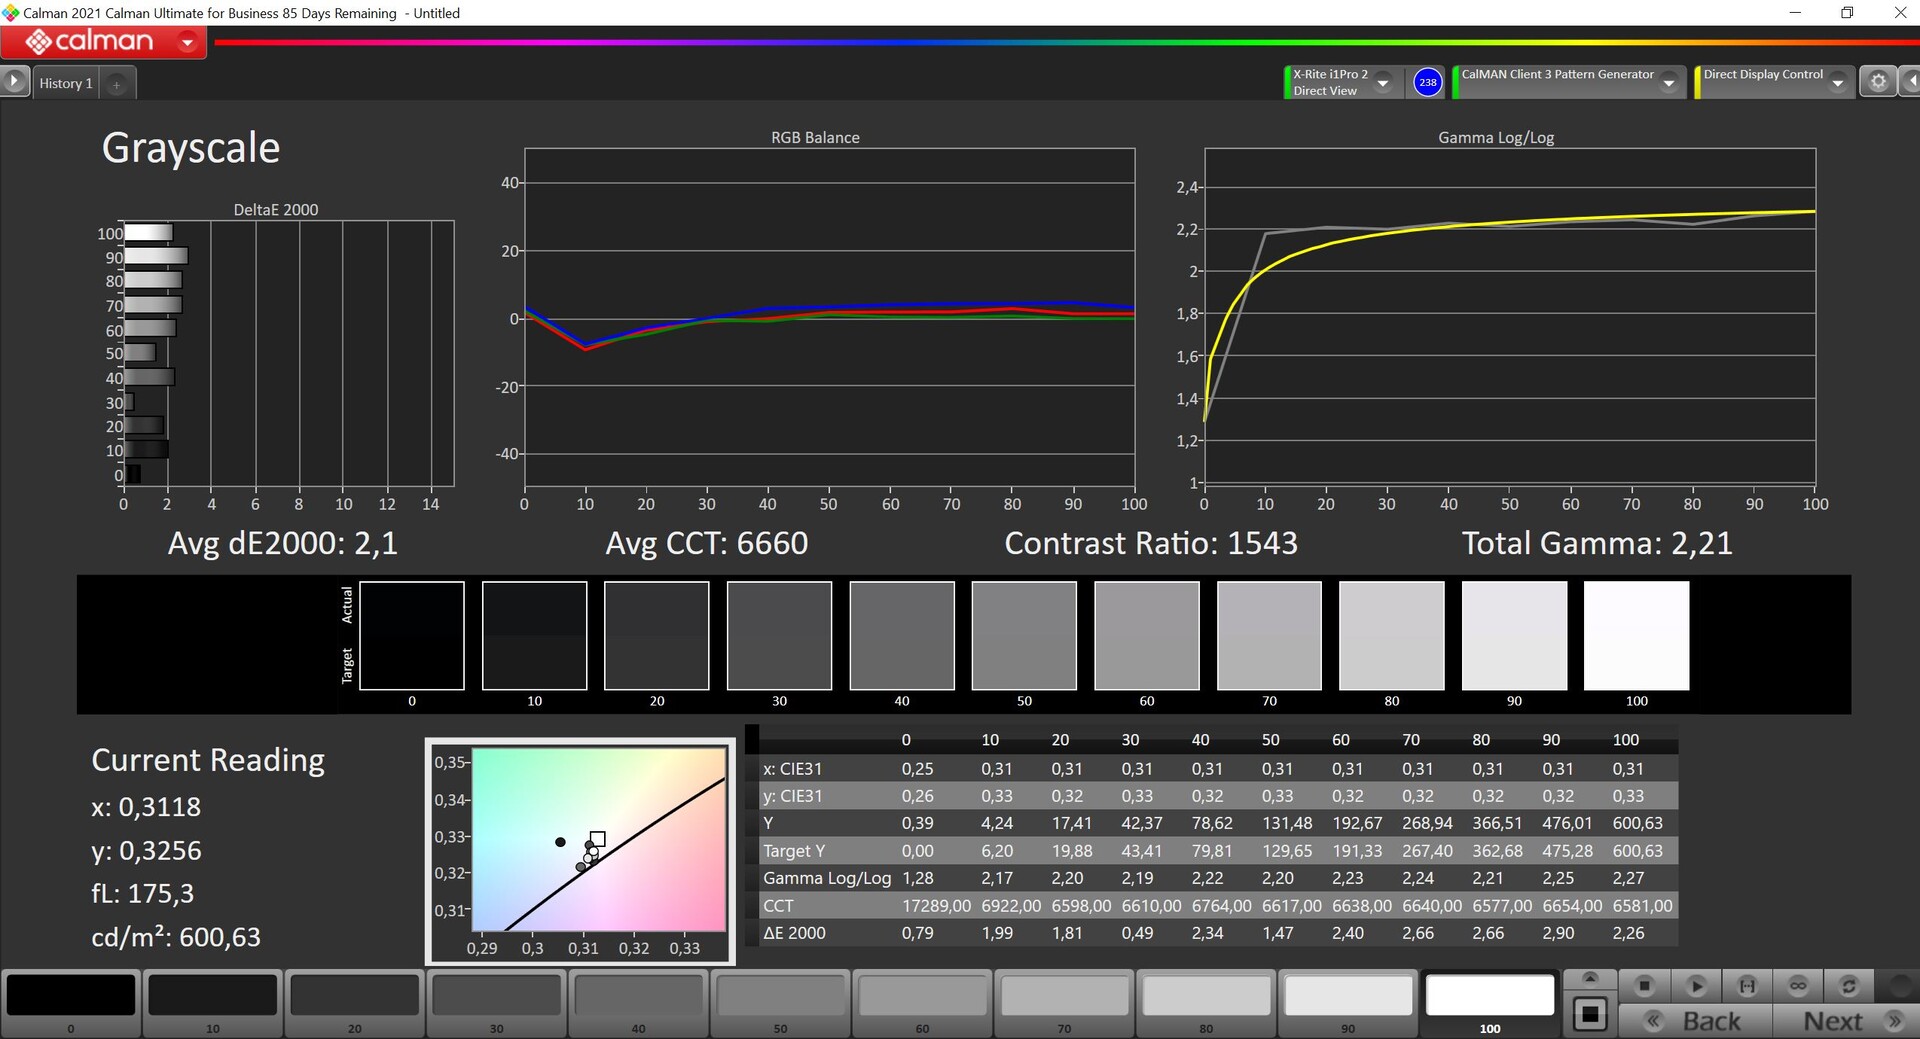
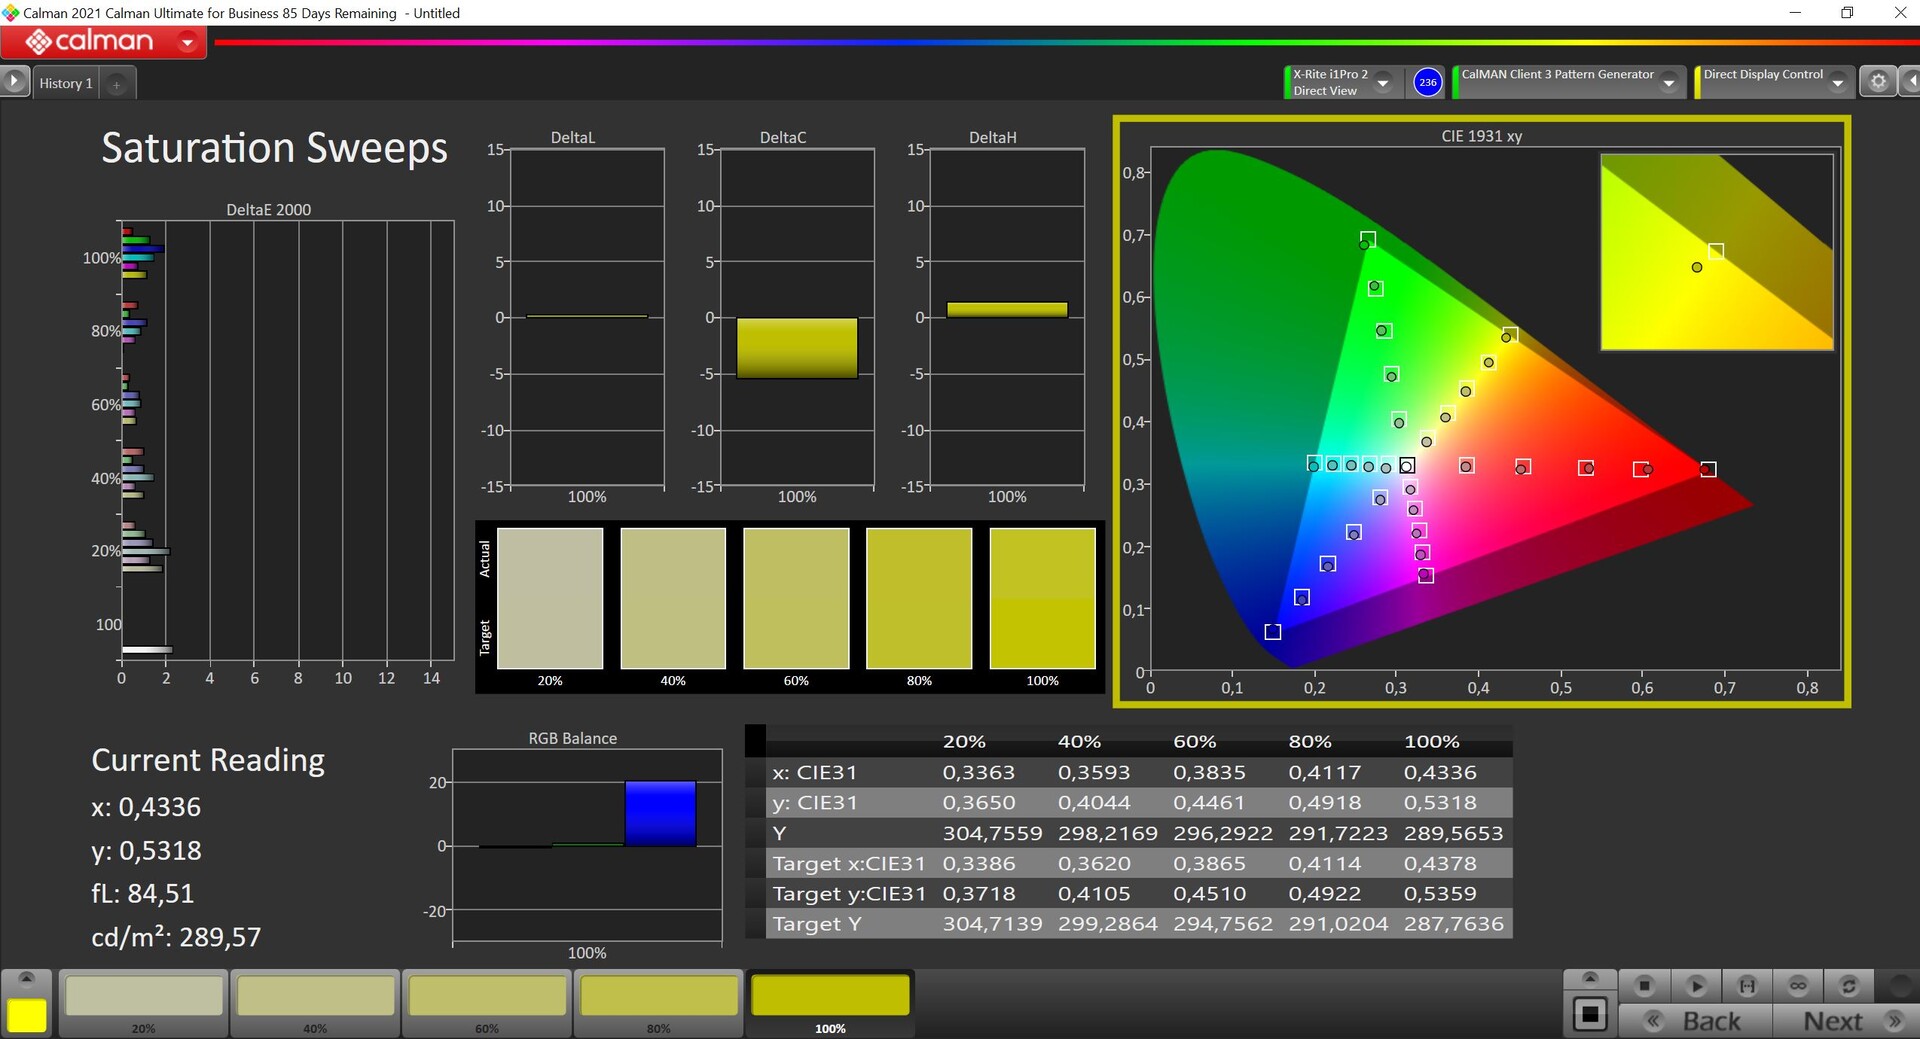

tryb sRGB jest również bardzo dokładny i rzeczywiście ogranicza przestrzeń barw do spektrum sRGB. Jest to wyraźna przewaga nad niemal wszystkimi innymi notebookami konsumenckimi na rynku. Ponieważ nasze własne wysiłki kalibracyjne zaowocowały jedynie degradacją wartości wyświetlanych, nie podajemy tutaj odpowiedniego profilu
Wyświetl czasy reakcji
| ↔ Czas reakcji od czerni do bieli | ||
|---|---|---|
| 17.1 ms ... wzrost ↗ i spadek ↘ łącznie | ↗ 8.6 ms wzrost | 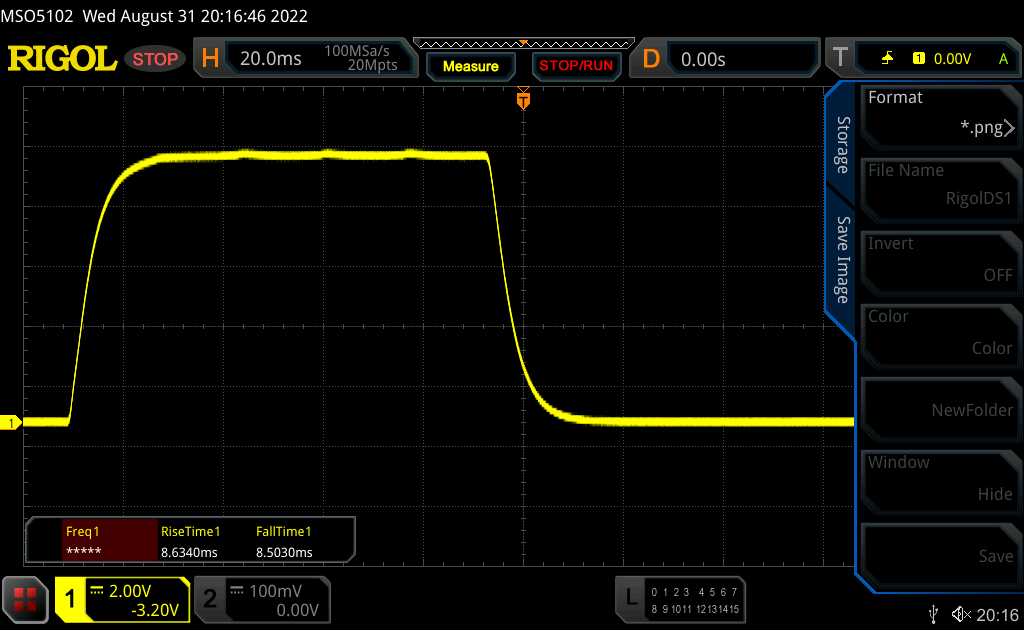 |
| ↘ 8.51 ms upadek | ||
| W naszych testach ekran wykazuje dobry współczynnik reakcji, ale może być zbyt wolny dla graczy rywalizujących ze sobą. Dla porównania, wszystkie testowane urządzenia wahają się od 0.1 (minimum) do 240 (maksimum) ms. » 39 % wszystkich urządzeń jest lepszych. Oznacza to, że zmierzony czas reakcji jest lepszy od średniej wszystkich testowanych urządzeń (19.8 ms). | ||
| ↔ Czas reakcji 50% szarości do 80% szarości | ||
| 25.4 ms ... wzrost ↗ i spadek ↘ łącznie | ↗ 11.7 ms wzrost | 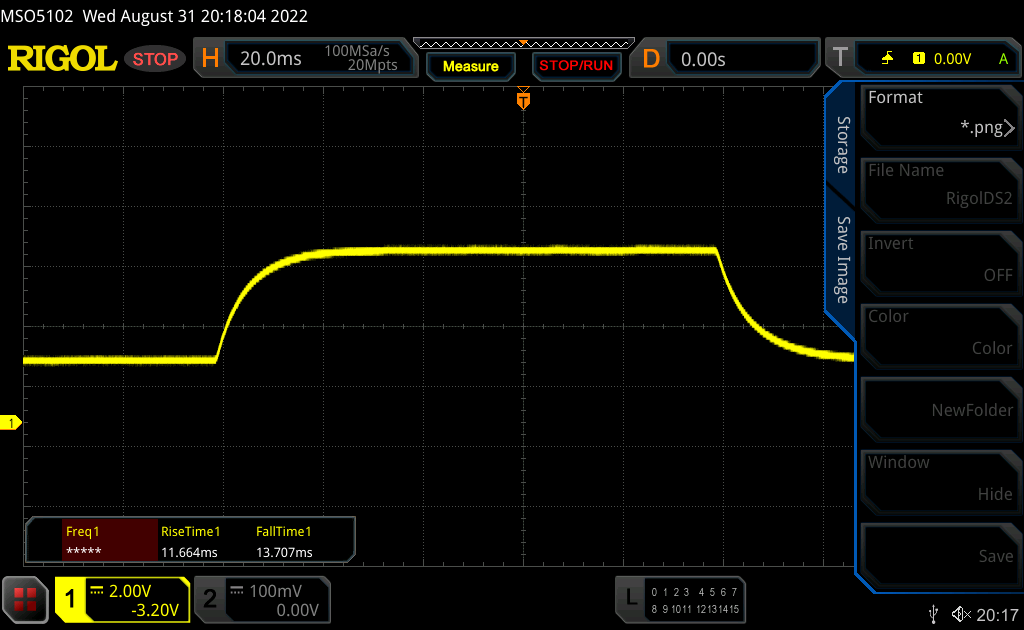 |
| ↘ 13.7 ms upadek | ||
| W naszych testach ekran wykazuje stosunkowo powolne tempo reakcji i może być zbyt wolny dla graczy. Dla porównania, wszystkie testowane urządzenia wahają się od 0.165 (minimum) do 636 (maksimum) ms. » 36 % wszystkich urządzeń jest lepszych. Oznacza to, że zmierzony czas reakcji jest lepszy od średniej wszystkich testowanych urządzeń (31 ms). | ||
Migotanie ekranu / PWM (modulacja szerokości impulsu)
| Migotanie ekranu/nie wykryto PWM | 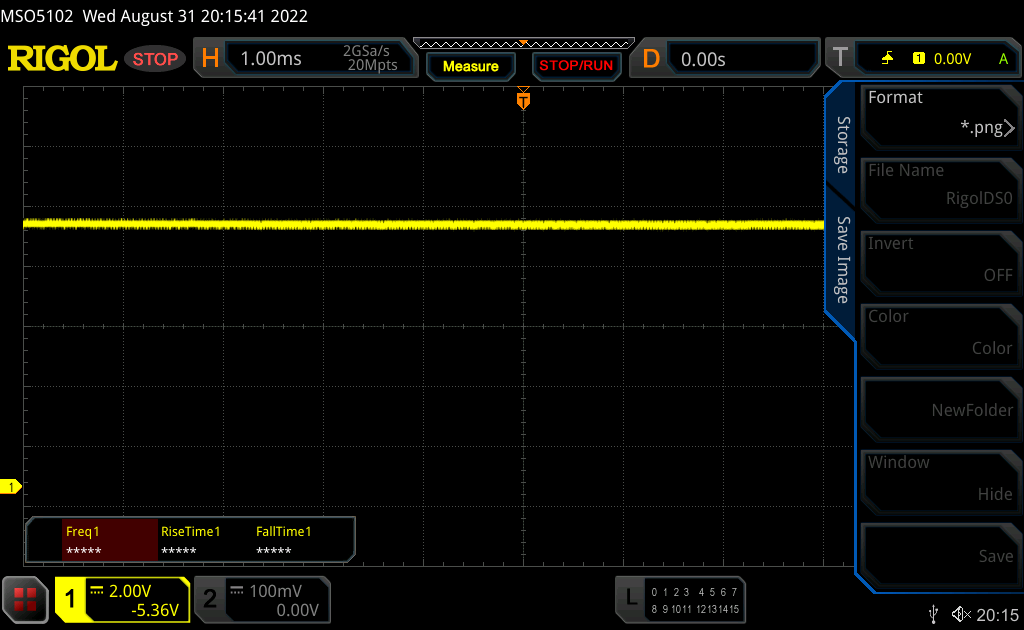 | ||
Dla porównania: 52 % wszystkich testowanych urządzeń nie używa PWM do przyciemniania wyświetlacza. Jeśli wykryto PWM, zmierzono średnio 7781 (minimum: 5 - maksimum: 343500) Hz. | |||
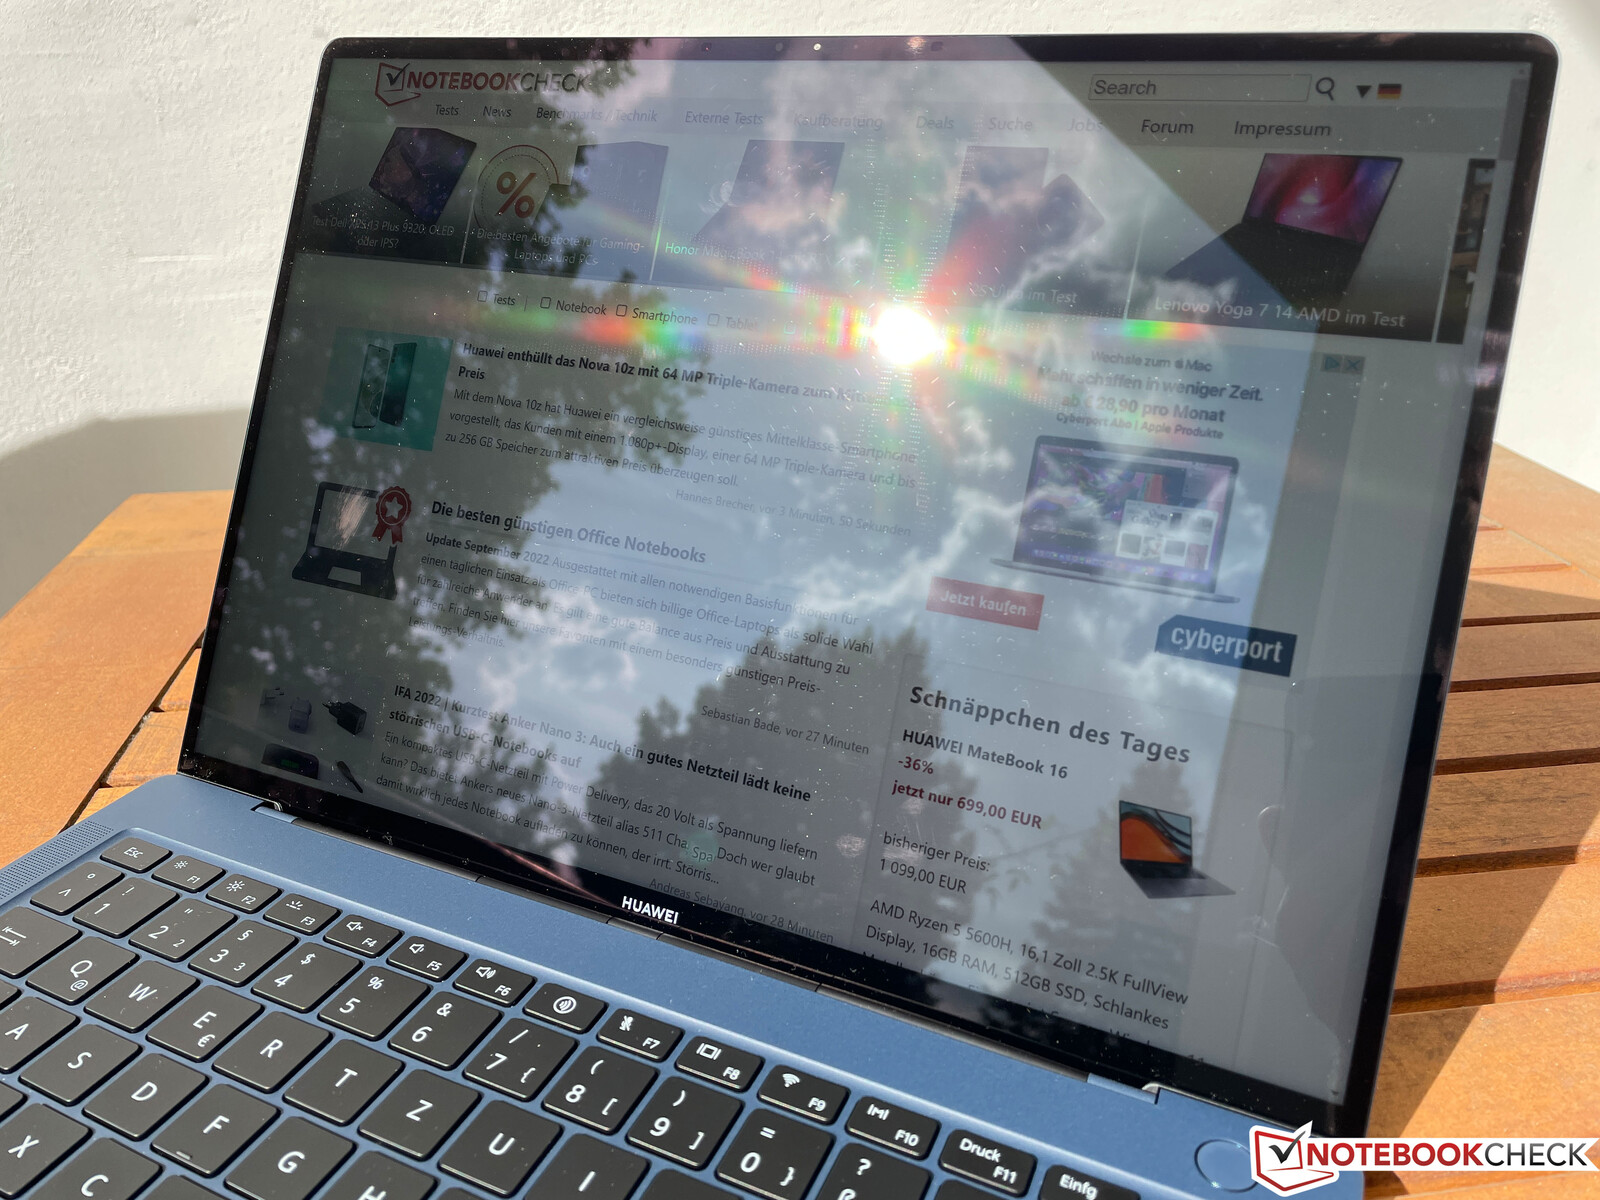
Błyszczący ekran dotykowy naturalnie zmaga się z odbiciami na zewnątrz, ale panel nie jest tak refleksyjny jak np. recenzowany niedawno Honor MagicBook 14. Ponadto wysoka jasność ekranu pomaga zrekompensować ewentualne odbicia. Nawet w pogodne dni powinno się udać znaleźć pozycje, w których będzie można rozsądnie oglądać treści. Z kolei pochmurne dni nie sprawiają żadnych problemów
Wydajność - Alder Lake-P, ale bez PCIe 4.0
Warunki badania
Jak zwykle, preinstalowany PC Manager oferuje dwa tryby wydajności, przy czym domyślnie włączony jest tryb Balanced . Tryb Performance jest dostępny jako opcjonalna alternatywa, ale tylko podczas pracy w sieci. Wartości TDP procesora wymieniliśmy w poniższej tabeli. Benchmarki i pomiary zostały przeprowadzone w trybie Performance , ale z pewnością dla świętego spokoju można skorzystać z trybu Balanced i wykorzystać znacznie cichsze wentylatory, zwłaszcza w codziennym użytkowaniu.
| Tryby | Obciążenie procesora | Maksymalny hałas wentylatora |
|---|---|---|
| Zrównoważony | 64 Watt -> 25 Watt | 33,4 dB(A) |
| Wydajność | 64 waty -> 30 watów | 40,6 -> 38,2 dB(A) |
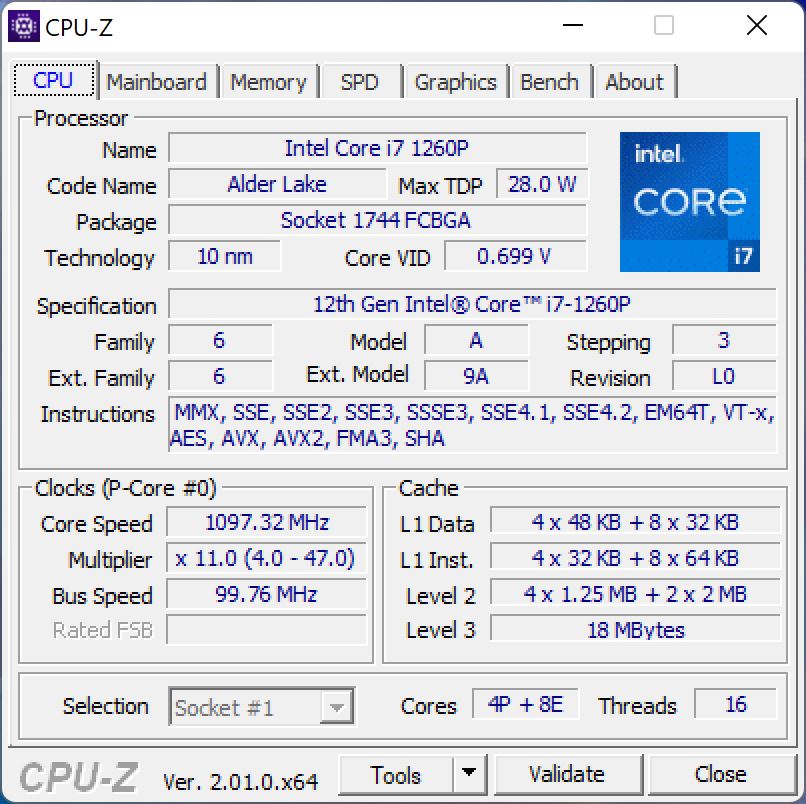
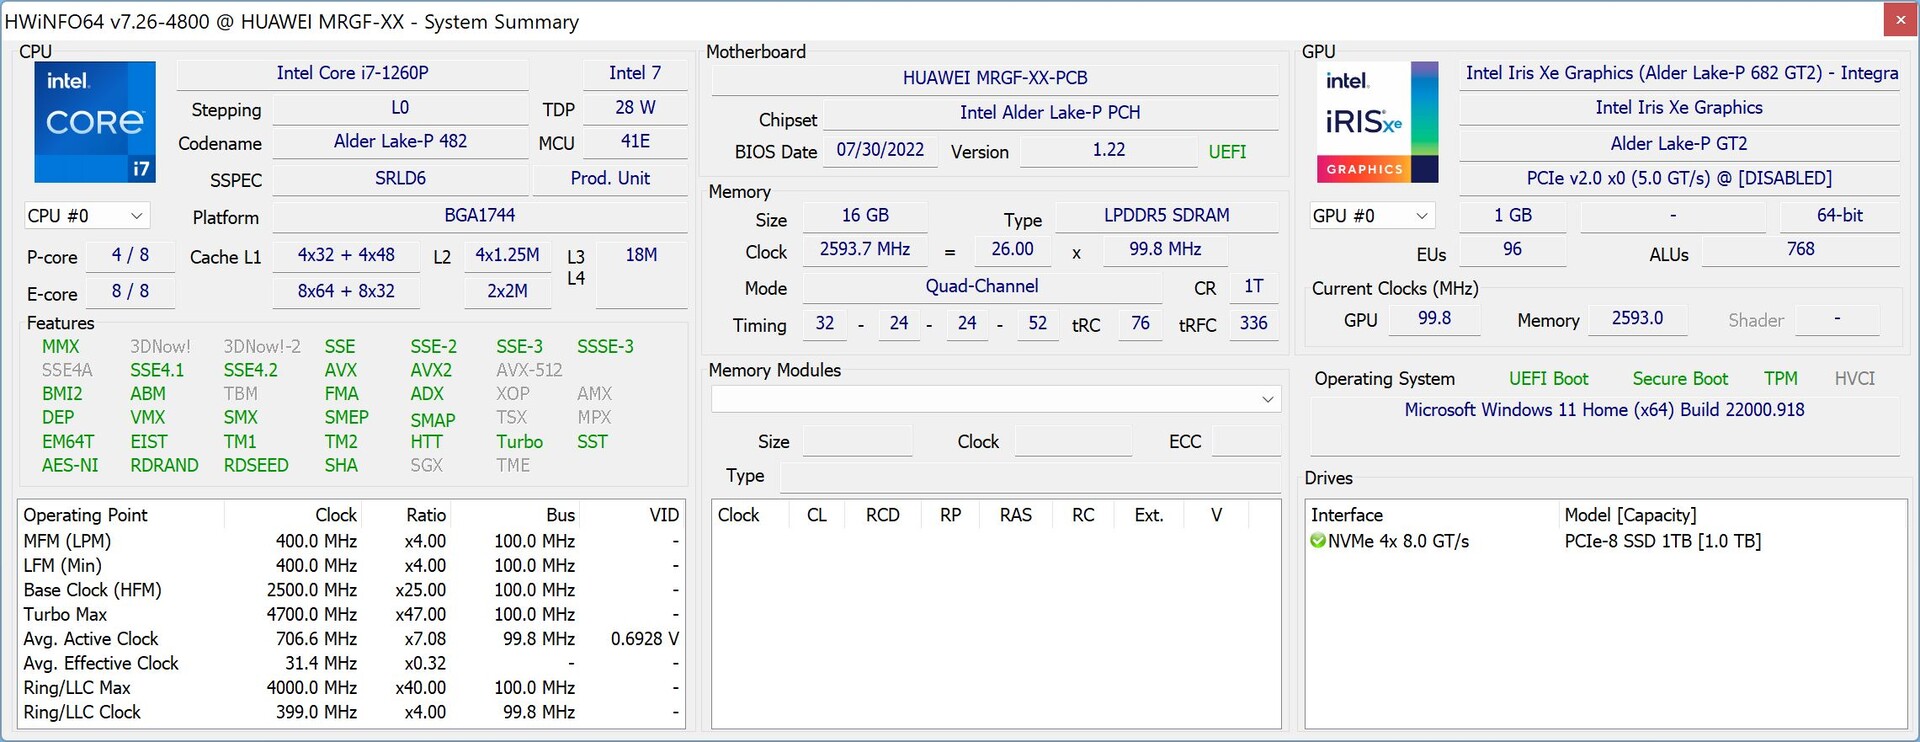
Procesor - Core i7-1260P
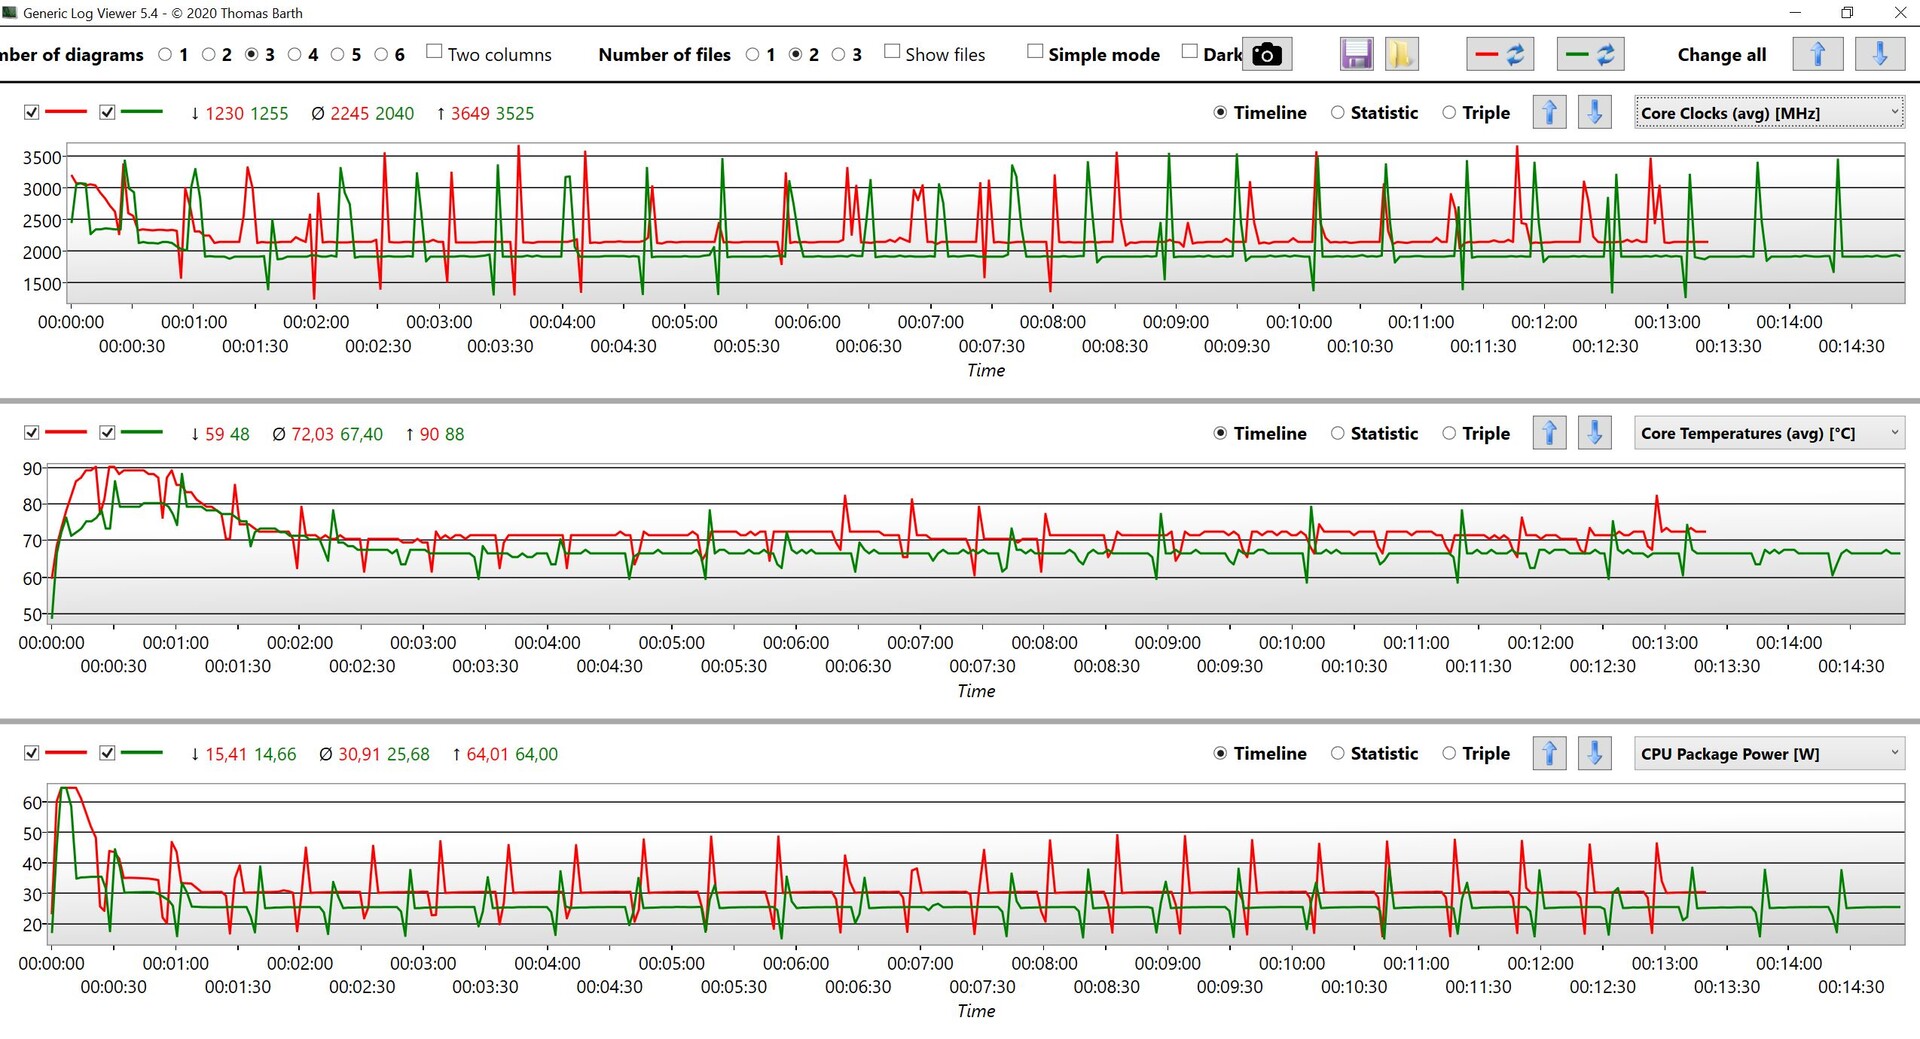
Na stronie Core i7-1260Pto drugi najszybszy procesor w ofercie Intel Alder Lake P po Core i7-1280Pi oferuje hybrydową architekturę składającą się z 4 szybkich rdzeni wydajnościowych i 8 rdzeni wydajnościowych. Jak wcześniej opisywano, maksymalny krótkotrwały pobór mocy wynosi 64 W, co jest również maksymalną granicą układów Intel Alder-Lake-P. To jednak wciąż za mało na maksymalne taktowanie wszystkich rdzeni.
Po kilku sekundach zużycie wyrównuje się do 30 lub 25 watów, w zależności od wybranego trybu zasilania, a następnie utrzymuje się na tym poziomie. MateBook X Pro nie należy więc do najszybszych urządzeń pod stałym obciążeniem, ale w codziennym użytkowaniu, a także w krótkich benchmarkach, korzysta oczywiście z wysokich limitów mocy i wysokiej wydajności pojedynczych rdzeni nowych układów wydajnościowych.Poprzednik poprzednik, z jego Tiger Lake Core i7-1165G7, szybko dławi się do 18 W i oferuje znacznie mniejszą wydajność wielordzeniową.
W trybie bateryjnym procesor jest w stanie zużyć maksymalnie 40 watów, zanim ustabilizuje się na poziomie 25 watów, co odpowiada poziomowi trybu Balanced w pracy w sieci. Kolejne benchmarki procesora dostępne są wnaszym dziale technicznym.
Cinebench R15 Multi Sustained Load
Cinebench R23: Multi Core | Single Core
Cinebench R20: CPU (Multi Core) | CPU (Single Core)
Cinebench R15: CPU Multi 64Bit | CPU Single 64Bit
Blender: v2.79 BMW27 CPU
7-Zip 18.03: 7z b 4 | 7z b 4 -mmt1
Geekbench 5.5: Multi-Core | Single-Core
HWBOT x265 Benchmark v2.2: 4k Preset
LibreOffice : 20 Documents To PDF
R Benchmark 2.5: Overall mean
| CPU Performance rating | |
| Średnia w klasie Subnotebook | |
| Lenovo Yoga 9i 14 2022 i7-1260P | |
| Huawei MateBook X Pro 2022 | |
| Dell XPS 13 Plus 9320 4K | |
| Asus Zenbook S 13 OLED | |
| Przeciętny Intel Core i7-1260P | |
| Apple MacBook Air M2 10C GPU -5! | |
| Huawei MateBook X Pro 2021 | |
| Cinebench R23 / Multi Core | |
| Średnia w klasie Subnotebook (1555 - 21812, n=59, ostatnie 2 lata) | |
| Lenovo Yoga 9i 14 2022 i7-1260P | |
| Asus Zenbook S 13 OLED | |
| Dell XPS 13 Plus 9320 4K | |
| Przeciętny Intel Core i7-1260P (3173 - 12150, n=27) | |
| Huawei MateBook X Pro 2022 | |
| Apple MacBook Air M2 10C GPU | |
| Huawei MateBook X Pro 2021 | |
| Cinebench R23 / Single Core | |
| Lenovo Yoga 9i 14 2022 i7-1260P | |
| Średnia w klasie Subnotebook (358 - 2213, n=60, ostatnie 2 lata) | |
| Dell XPS 13 Plus 9320 4K | |
| Przeciętny Intel Core i7-1260P (1155 - 1812, n=25) | |
| Huawei MateBook X Pro 2022 | |
| Apple MacBook Air M2 10C GPU | |
| Asus Zenbook S 13 OLED | |
| Huawei MateBook X Pro 2021 | |
| Cinebench R20 / CPU (Multi Core) | |
| Średnia w klasie Subnotebook (579 - 8541, n=56, ostatnie 2 lata) | |
| Asus Zenbook S 13 OLED | |
| Lenovo Yoga 9i 14 2022 i7-1260P | |
| Dell XPS 13 Plus 9320 4K | |
| Huawei MateBook X Pro 2022 | |
| Przeciętny Intel Core i7-1260P (1234 - 4748, n=25) | |
| Apple MacBook Air M2 10C GPU | |
| Huawei MateBook X Pro 2021 | |
| Cinebench R20 / CPU (Single Core) | |
| Huawei MateBook X Pro 2022 | |
| Lenovo Yoga 9i 14 2022 i7-1260P | |
| Średnia w klasie Subnotebook (128 - 832, n=56, ostatnie 2 lata) | |
| Dell XPS 13 Plus 9320 4K | |
| Przeciętny Intel Core i7-1260P (448 - 698, n=25) | |
| Asus Zenbook S 13 OLED | |
| Huawei MateBook X Pro 2021 | |
| Apple MacBook Air M2 10C GPU | |
| Cinebench R15 / CPU Multi 64Bit | |
| Średnia w klasie Subnotebook (327 - 3345, n=56, ostatnie 2 lata) | |
| Huawei MateBook X Pro 2022 | |
| Huawei MateBook X Pro 2022 | |
| Lenovo Yoga 9i 14 2022 i7-1260P | |
| Asus Zenbook S 13 OLED | |
| Dell XPS 13 Plus 9320 4K | |
| Dell XPS 13 Plus 9320 4K | |
| Przeciętny Intel Core i7-1260P (549 - 2034, n=29) | |
| Apple MacBook Air M2 10C GPU | |
| Huawei MateBook X Pro 2021 | |
| Cinebench R15 / CPU Single 64Bit | |
| Średnia w klasie Subnotebook (72.4 - 322, n=56, ostatnie 2 lata) | |
| Huawei MateBook X Pro 2022 | |
| Lenovo Yoga 9i 14 2022 i7-1260P | |
| Dell XPS 13 Plus 9320 4K | |
| Asus Zenbook S 13 OLED | |
| Przeciętny Intel Core i7-1260P (165.4 - 260, n=27) | |
| Apple MacBook Air M2 10C GPU | |
| Huawei MateBook X Pro 2021 | |
| Blender / v2.79 BMW27 CPU | |
| Huawei MateBook X Pro 2021 | |
| Apple MacBook Air M2 10C GPU | |
| Średnia w klasie Subnotebook (159 - 2271, n=57, ostatnie 2 lata) | |
| Przeciętny Intel Core i7-1260P (264 - 906, n=26) | |
| Huawei MateBook X Pro 2022 | |
| Dell XPS 13 Plus 9320 4K | |
| Asus Zenbook S 13 OLED | |
| Lenovo Yoga 9i 14 2022 i7-1260P | |
| 7-Zip 18.03 / 7z b 4 | |
| Asus Zenbook S 13 OLED | |
| Lenovo Yoga 9i 14 2022 i7-1260P | |
| Średnia w klasie Subnotebook (11668 - 77867, n=56, ostatnie 2 lata) | |
| Dell XPS 13 Plus 9320 4K | |
| Huawei MateBook X Pro 2022 | |
| Przeciętny Intel Core i7-1260P (16146 - 47064, n=25) | |
| Huawei MateBook X Pro 2021 | |
| 7-Zip 18.03 / 7z b 4 -mmt1 | |
| Średnia w klasie Subnotebook (2643 - 6699, n=58, ostatnie 2 lata) | |
| Asus Zenbook S 13 OLED | |
| Huawei MateBook X Pro 2022 | |
| Dell XPS 13 Plus 9320 4K | |
| Przeciętny Intel Core i7-1260P (4064 - 5791, n=25) | |
| Lenovo Yoga 9i 14 2022 i7-1260P | |
| Huawei MateBook X Pro 2021 | |
| Geekbench 5.5 / Multi-Core | |
| Średnia w klasie Subnotebook (2557 - 17218, n=48, ostatnie 2 lata) | |
| Lenovo Yoga 9i 14 2022 i7-1260P | |
| Huawei MateBook X Pro 2022 | |
| Dell XPS 13 Plus 9320 4K | |
| Apple MacBook Air M2 10C GPU | |
| Przeciętny Intel Core i7-1260P (3866 - 10570, n=25) | |
| Asus Zenbook S 13 OLED | |
| Huawei MateBook X Pro 2021 | |
| Geekbench 5.5 / Single-Core | |
| Apple MacBook Air M2 10C GPU | |
| Średnia w klasie Subnotebook (726 - 2224, n=48, ostatnie 2 lata) | |
| Lenovo Yoga 9i 14 2022 i7-1260P | |
| Huawei MateBook X Pro 2022 | |
| Dell XPS 13 Plus 9320 4K | |
| Przeciętny Intel Core i7-1260P (1436 - 1786, n=25) | |
| Asus Zenbook S 13 OLED | |
| Huawei MateBook X Pro 2021 | |
| HWBOT x265 Benchmark v2.2 / 4k Preset | |
| Średnia w klasie Subnotebook (0.97 - 25.1, n=56, ostatnie 2 lata) | |
| Asus Zenbook S 13 OLED | |
| Lenovo Yoga 9i 14 2022 i7-1260P | |
| Dell XPS 13 Plus 9320 4K | |
| Huawei MateBook X Pro 2022 | |
| Przeciętny Intel Core i7-1260P (3.45 - 13.6, n=26) | |
| Huawei MateBook X Pro 2021 | |
| LibreOffice / 20 Documents To PDF | |
| Średnia w klasie Subnotebook (39.9 - 220, n=55, ostatnie 2 lata) | |
| Asus Zenbook S 13 OLED | |
| Przeciętny Intel Core i7-1260P (40.2 - 65.7, n=25) | |
| Lenovo Yoga 9i 14 2022 i7-1260P | |
| Huawei MateBook X Pro 2021 | |
| Dell XPS 13 Plus 9320 4K | |
| Huawei MateBook X Pro 2022 | |
| R Benchmark 2.5 / Overall mean | |
| Huawei MateBook X Pro 2021 | |
| Średnia w klasie Subnotebook (0.4024 - 1.456, n=57, ostatnie 2 lata) | |
| Asus Zenbook S 13 OLED | |
| Przeciętny Intel Core i7-1260P (0.4559 - 0.727, n=25) | |
| Lenovo Yoga 9i 14 2022 i7-1260P | |
| Dell XPS 13 Plus 9320 4K | |
| Huawei MateBook X Pro 2022 | |
* ... im mniej tym lepiej
AIDA64: FP32 Ray-Trace | FPU Julia | CPU SHA3 | CPU Queen | FPU SinJulia | FPU Mandel | CPU AES | CPU ZLib | FP64 Ray-Trace | CPU PhotoWorxx
| Performance rating | |
| Asus Zenbook S 13 OLED | |
| Średnia w klasie Subnotebook | |
| Przeciętny Intel Core i7-1260P | |
| Huawei MateBook X Pro 2022 | |
| Dell XPS 13 Plus 9320 4K | |
| Huawei MateBook X Pro 2021 | |
| Lenovo Yoga 9i 14 2022 i7-1260P | |
| AIDA64 / FP32 Ray-Trace | |
| Średnia w klasie Subnotebook (1135 - 32888, n=57, ostatnie 2 lata) | |
| Asus Zenbook S 13 OLED | |
| Przeciętny Intel Core i7-1260P (2176 - 10898, n=26) | |
| Dell XPS 13 Plus 9320 4K | |
| Lenovo Yoga 9i 14 2022 i7-1260P | |
| Huawei MateBook X Pro 2021 | |
| Huawei MateBook X Pro 2022 | |
| AIDA64 / FPU Julia | |
| Asus Zenbook S 13 OLED | |
| Średnia w klasie Subnotebook (5218 - 123315, n=57, ostatnie 2 lata) | |
| Przeciętny Intel Core i7-1260P (11015 - 56906, n=26) | |
| Dell XPS 13 Plus 9320 4K | |
| Huawei MateBook X Pro 2022 | |
| Lenovo Yoga 9i 14 2022 i7-1260P | |
| Huawei MateBook X Pro 2021 | |
| AIDA64 / CPU SHA3 | |
| Średnia w klasie Subnotebook (444 - 5287, n=57, ostatnie 2 lata) | |
| Asus Zenbook S 13 OLED | |
| Lenovo Yoga 9i 14 2022 i7-1260P | |
| Przeciętny Intel Core i7-1260P (669 - 2709, n=26) | |
| Dell XPS 13 Plus 9320 4K | |
| Huawei MateBook X Pro 2022 | |
| Huawei MateBook X Pro 2021 | |
| AIDA64 / CPU Queen | |
| Asus Zenbook S 13 OLED | |
| Huawei MateBook X Pro 2022 | |
| Dell XPS 13 Plus 9320 4K | |
| Przeciętny Intel Core i7-1260P (42571 - 82493, n=26) | |
| Średnia w klasie Subnotebook (10579 - 95002, n=50, ostatnie 2 lata) | |
| Huawei MateBook X Pro 2021 | |
| Lenovo Yoga 9i 14 2022 i7-1260P | |
| AIDA64 / FPU SinJulia | |
| Asus Zenbook S 13 OLED | |
| Średnia w klasie Subnotebook (744 - 18418, n=57, ostatnie 2 lata) | |
| Huawei MateBook X Pro 2022 | |
| Dell XPS 13 Plus 9320 4K | |
| Przeciętny Intel Core i7-1260P (2901 - 6975, n=26) | |
| Lenovo Yoga 9i 14 2022 i7-1260P | |
| Huawei MateBook X Pro 2021 | |
| AIDA64 / FPU Mandel | |
| Asus Zenbook S 13 OLED | |
| Średnia w klasie Subnotebook (3341 - 65433, n=57, ostatnie 2 lata) | |
| Przeciętny Intel Core i7-1260P (5950 - 26376, n=26) | |
| Dell XPS 13 Plus 9320 4K | |
| Huawei MateBook X Pro 2022 | |
| Huawei MateBook X Pro 2021 | |
| Lenovo Yoga 9i 14 2022 i7-1260P | |
| AIDA64 / CPU AES | |
| Asus Zenbook S 13 OLED | |
| Huawei MateBook X Pro 2022 | |
| Średnia w klasie Subnotebook (638 - 96917, n=57, ostatnie 2 lata) | |
| Huawei MateBook X Pro 2021 | |
| Przeciętny Intel Core i7-1260P (16041 - 92356, n=26) | |
| Dell XPS 13 Plus 9320 4K | |
| Lenovo Yoga 9i 14 2022 i7-1260P | |
| AIDA64 / CPU ZLib | |
| Średnia w klasie Subnotebook (164.9 - 1379, n=57, ostatnie 2 lata) | |
| Lenovo Yoga 9i 14 2022 i7-1260P | |
| Dell XPS 13 Plus 9320 4K | |
| Huawei MateBook X Pro 2022 | |
| Asus Zenbook S 13 OLED | |
| Przeciętny Intel Core i7-1260P (259 - 771, n=26) | |
| Huawei MateBook X Pro 2021 | |
| AIDA64 / FP64 Ray-Trace | |
| Średnia w klasie Subnotebook (610 - 17495, n=57, ostatnie 2 lata) | |
| Asus Zenbook S 13 OLED | |
| Przeciętny Intel Core i7-1260P (1237 - 5858, n=26) | |
| Dell XPS 13 Plus 9320 4K | |
| Lenovo Yoga 9i 14 2022 i7-1260P | |
| Huawei MateBook X Pro 2022 | |
| Huawei MateBook X Pro 2021 | |
| AIDA64 / CPU PhotoWorxx | |
| Średnia w klasie Subnotebook (6569 - 85600, n=57, ostatnie 2 lata) | |
| Huawei MateBook X Pro 2021 | |
| Dell XPS 13 Plus 9320 4K | |
| Huawei MateBook X Pro 2022 | |
| Przeciętny Intel Core i7-1260P (13261 - 43652, n=26) | |
| Asus Zenbook S 13 OLED | |
| Lenovo Yoga 9i 14 2022 i7-1260P | |
Wydajność systemu
Subiektywne wrażenie wydajności nowego MateBooka X Pro jest znakomite, co potwierdzają dobre wyniki w benchmarkach. Trzeba tu jednak również zaznaczyć, że w praktyce różnice między najnowszymi urządzeniami są praktycznie żadne
CrossMark: Overall | Productivity | Creativity | Responsiveness
| PCMark 10 / Score | |
| Średnia w klasie Subnotebook (4920 - 9939, n=44, ostatnie 2 lata) | |
| Asus Zenbook S 13 OLED | |
| Huawei MateBook X Pro 2022 | |
| Lenovo Yoga 9i 14 2022 i7-1260P | |
| Dell XPS 13 Plus 9320 4K | |
| Przeciętny Intel Core i7-1260P, Intel Iris Xe Graphics G7 96EUs (4796 - 6068, n=17) | |
| Huawei MateBook X Pro 2021 | |
| PCMark 10 / Essentials | |
| Lenovo Yoga 9i 14 2022 i7-1260P | |
| Huawei MateBook X Pro 2022 | |
| Asus Zenbook S 13 OLED | |
| Dell XPS 13 Plus 9320 4K | |
| Średnia w klasie Subnotebook (8552 - 11646, n=44, ostatnie 2 lata) | |
| Przeciętny Intel Core i7-1260P, Intel Iris Xe Graphics G7 96EUs (9260 - 11251, n=17) | |
| Huawei MateBook X Pro 2021 | |
| PCMark 10 / Productivity | |
| Średnia w klasie Subnotebook (5435 - 16606, n=44, ostatnie 2 lata) | |
| Asus Zenbook S 13 OLED | |
| Huawei MateBook X Pro 2022 | |
| Lenovo Yoga 9i 14 2022 i7-1260P | |
| Przeciętny Intel Core i7-1260P, Intel Iris Xe Graphics G7 96EUs (6167 - 8629, n=17) | |
| Dell XPS 13 Plus 9320 4K | |
| Huawei MateBook X Pro 2021 | |
| PCMark 10 / Digital Content Creation | |
| Średnia w klasie Subnotebook (5722 - 13779, n=44, ostatnie 2 lata) | |
| Asus Zenbook S 13 OLED | |
| Lenovo Yoga 9i 14 2022 i7-1260P | |
| Huawei MateBook X Pro 2022 | |
| Dell XPS 13 Plus 9320 4K | |
| Przeciętny Intel Core i7-1260P, Intel Iris Xe Graphics G7 96EUs (5231 - 6908, n=17) | |
| Huawei MateBook X Pro 2021 | |
| CrossMark / Overall | |
| Huawei MateBook X Pro 2022 | |
| Lenovo Yoga 9i 14 2022 i7-1260P | |
| Dell XPS 13 Plus 9320 4K | |
| Średnia w klasie Subnotebook (365 - 2356, n=59, ostatnie 2 lata) | |
| Przeciętny Intel Core i7-1260P, Intel Iris Xe Graphics G7 96EUs (1484 - 1811, n=16) | |
| Apple MacBook Air M2 10C GPU | |
| Asus Zenbook S 13 OLED | |
| CrossMark / Productivity | |
| Huawei MateBook X Pro 2022 | |
| Lenovo Yoga 9i 14 2022 i7-1260P | |
| Przeciętny Intel Core i7-1260P, Intel Iris Xe Graphics G7 96EUs (1486 - 1755, n=16) | |
| Dell XPS 13 Plus 9320 4K | |
| Średnia w klasie Subnotebook (364 - 2277, n=59, ostatnie 2 lata) | |
| Asus Zenbook S 13 OLED | |
| Apple MacBook Air M2 10C GPU | |
| CrossMark / Creativity | |
| Huawei MateBook X Pro 2022 | |
| Dell XPS 13 Plus 9320 4K | |
| Średnia w klasie Subnotebook (372 - 2743, n=59, ostatnie 2 lata) | |
| Lenovo Yoga 9i 14 2022 i7-1260P | |
| Apple MacBook Air M2 10C GPU | |
| Przeciętny Intel Core i7-1260P, Intel Iris Xe Graphics G7 96EUs (1451 - 1872, n=16) | |
| Asus Zenbook S 13 OLED | |
| CrossMark / Responsiveness | |
| Huawei MateBook X Pro 2022 | |
| Lenovo Yoga 9i 14 2022 i7-1260P | |
| Przeciętny Intel Core i7-1260P, Intel Iris Xe Graphics G7 96EUs (1253 - 1807, n=16) | |
| Dell XPS 13 Plus 9320 4K | |
| Średnia w klasie Subnotebook (312 - 1854, n=59, ostatnie 2 lata) | |
| Asus Zenbook S 13 OLED | |
| Apple MacBook Air M2 10C GPU | |
| PCMark 10 Score | 6068 pkt. | |
Pomoc | ||
| AIDA64 / Memory Copy | |
| Średnia w klasie Subnotebook (14554 - 131023, n=57, ostatnie 2 lata) | |
| Dell XPS 13 Plus 9320 4K | |
| Huawei MateBook X Pro 2021 | |
| Huawei MateBook X Pro 2022 | |
| Przeciętny Intel Core i7-1260P (25125 - 71544, n=25) | |
| Asus Zenbook S 13 OLED | |
| AIDA64 / Memory Read | |
| Średnia w klasie Subnotebook (15948 - 127174, n=57, ostatnie 2 lata) | |
| Huawei MateBook X Pro 2022 | |
| Huawei MateBook X Pro 2021 | |
| Dell XPS 13 Plus 9320 4K | |
| Przeciętny Intel Core i7-1260P (24983 - 72065, n=25) | |
| Asus Zenbook S 13 OLED | |
| AIDA64 / Memory Write | |
| Średnia w klasie Subnotebook (15709 - 135141, n=57, ostatnie 2 lata) | |
| Huawei MateBook X Pro 2021 | |
| Dell XPS 13 Plus 9320 4K | |
| Huawei MateBook X Pro 2022 | |
| Przeciętny Intel Core i7-1260P (23512 - 66799, n=25) | |
| Asus Zenbook S 13 OLED | |
| AIDA64 / Memory Latency | |
| Asus Zenbook S 13 OLED | |
| Huawei MateBook X Pro 2022 | |
| Średnia w klasie Subnotebook (6.1 - 159.9, n=55, ostatnie 2 lata) | |
| Huawei MateBook X Pro 2021 | |
| Przeciętny Intel Core i7-1260P (77.9 - 118.4, n=21) | |
* ... im mniej tym lepiej
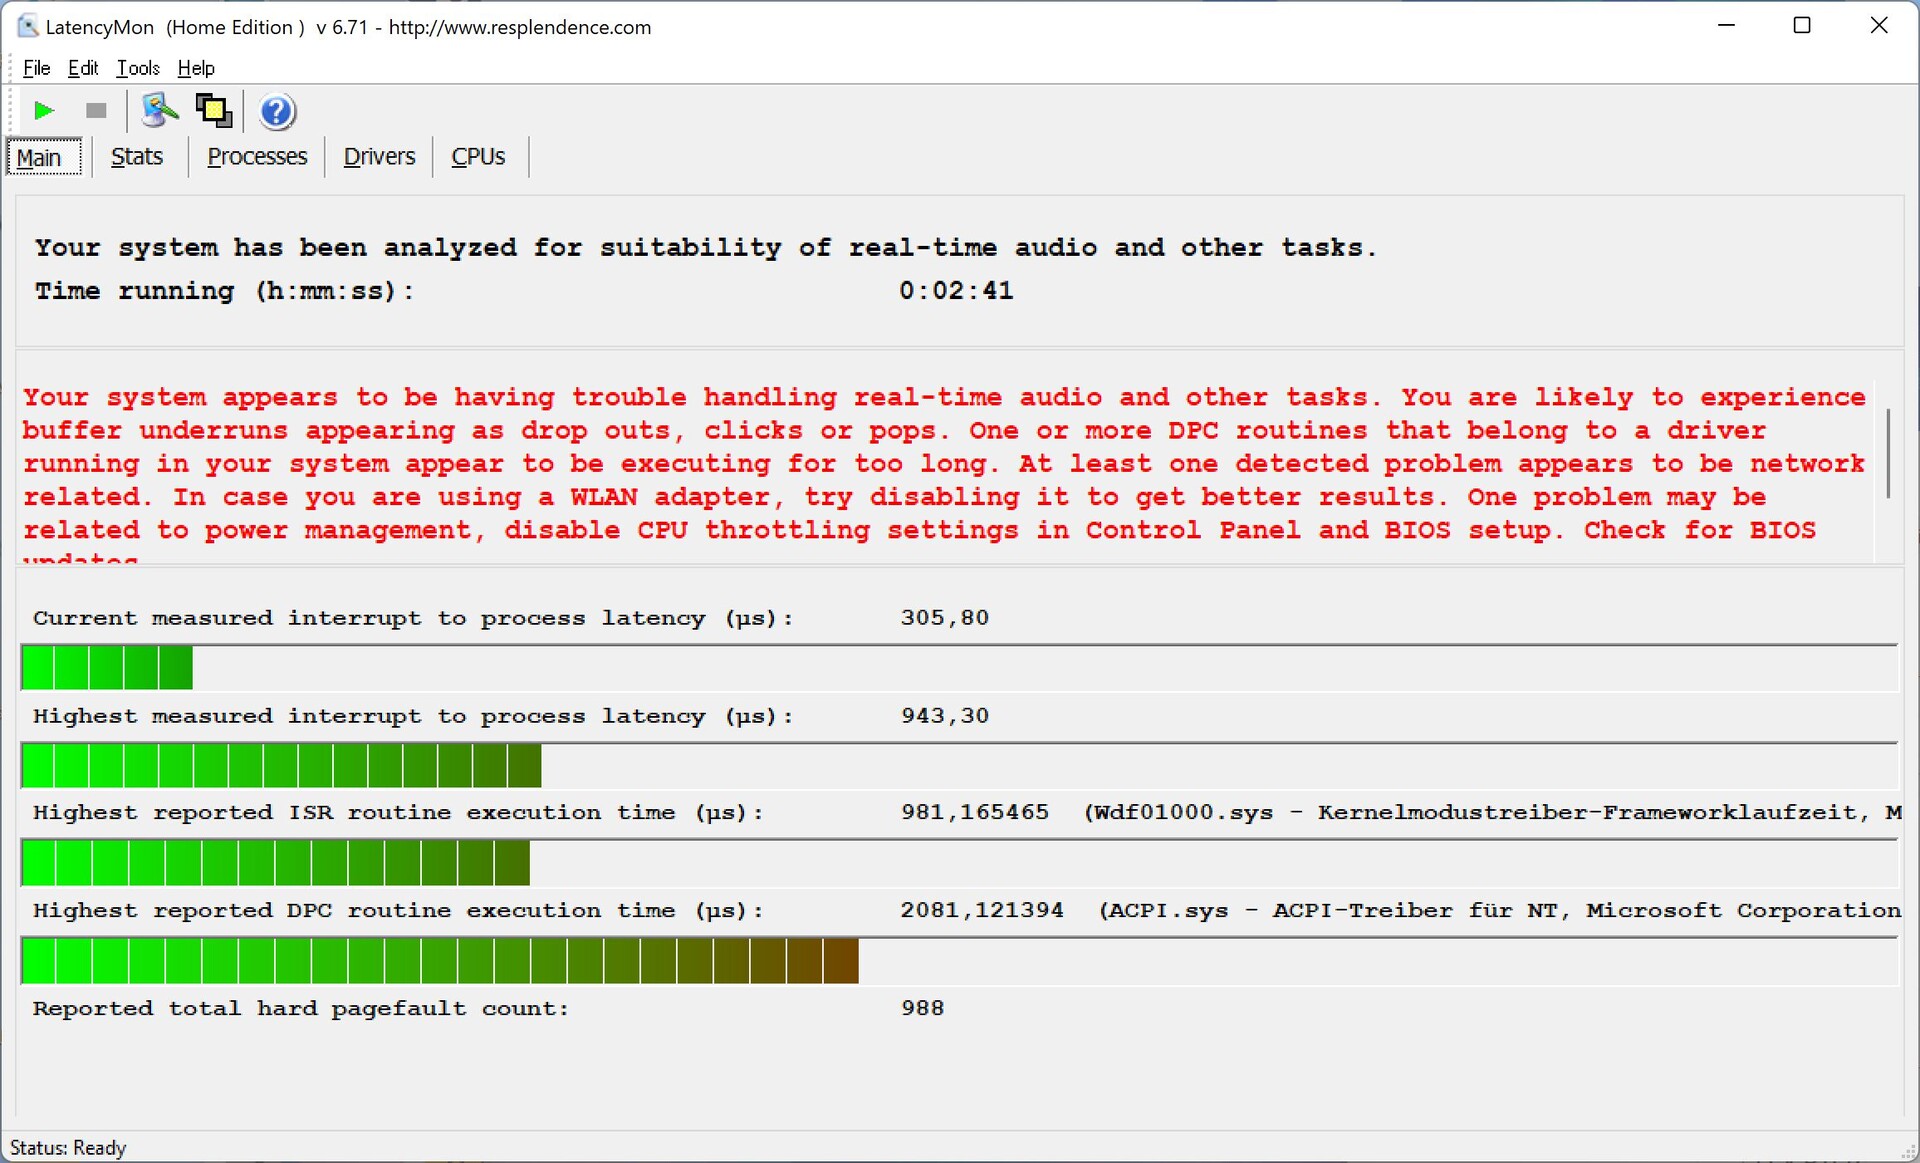
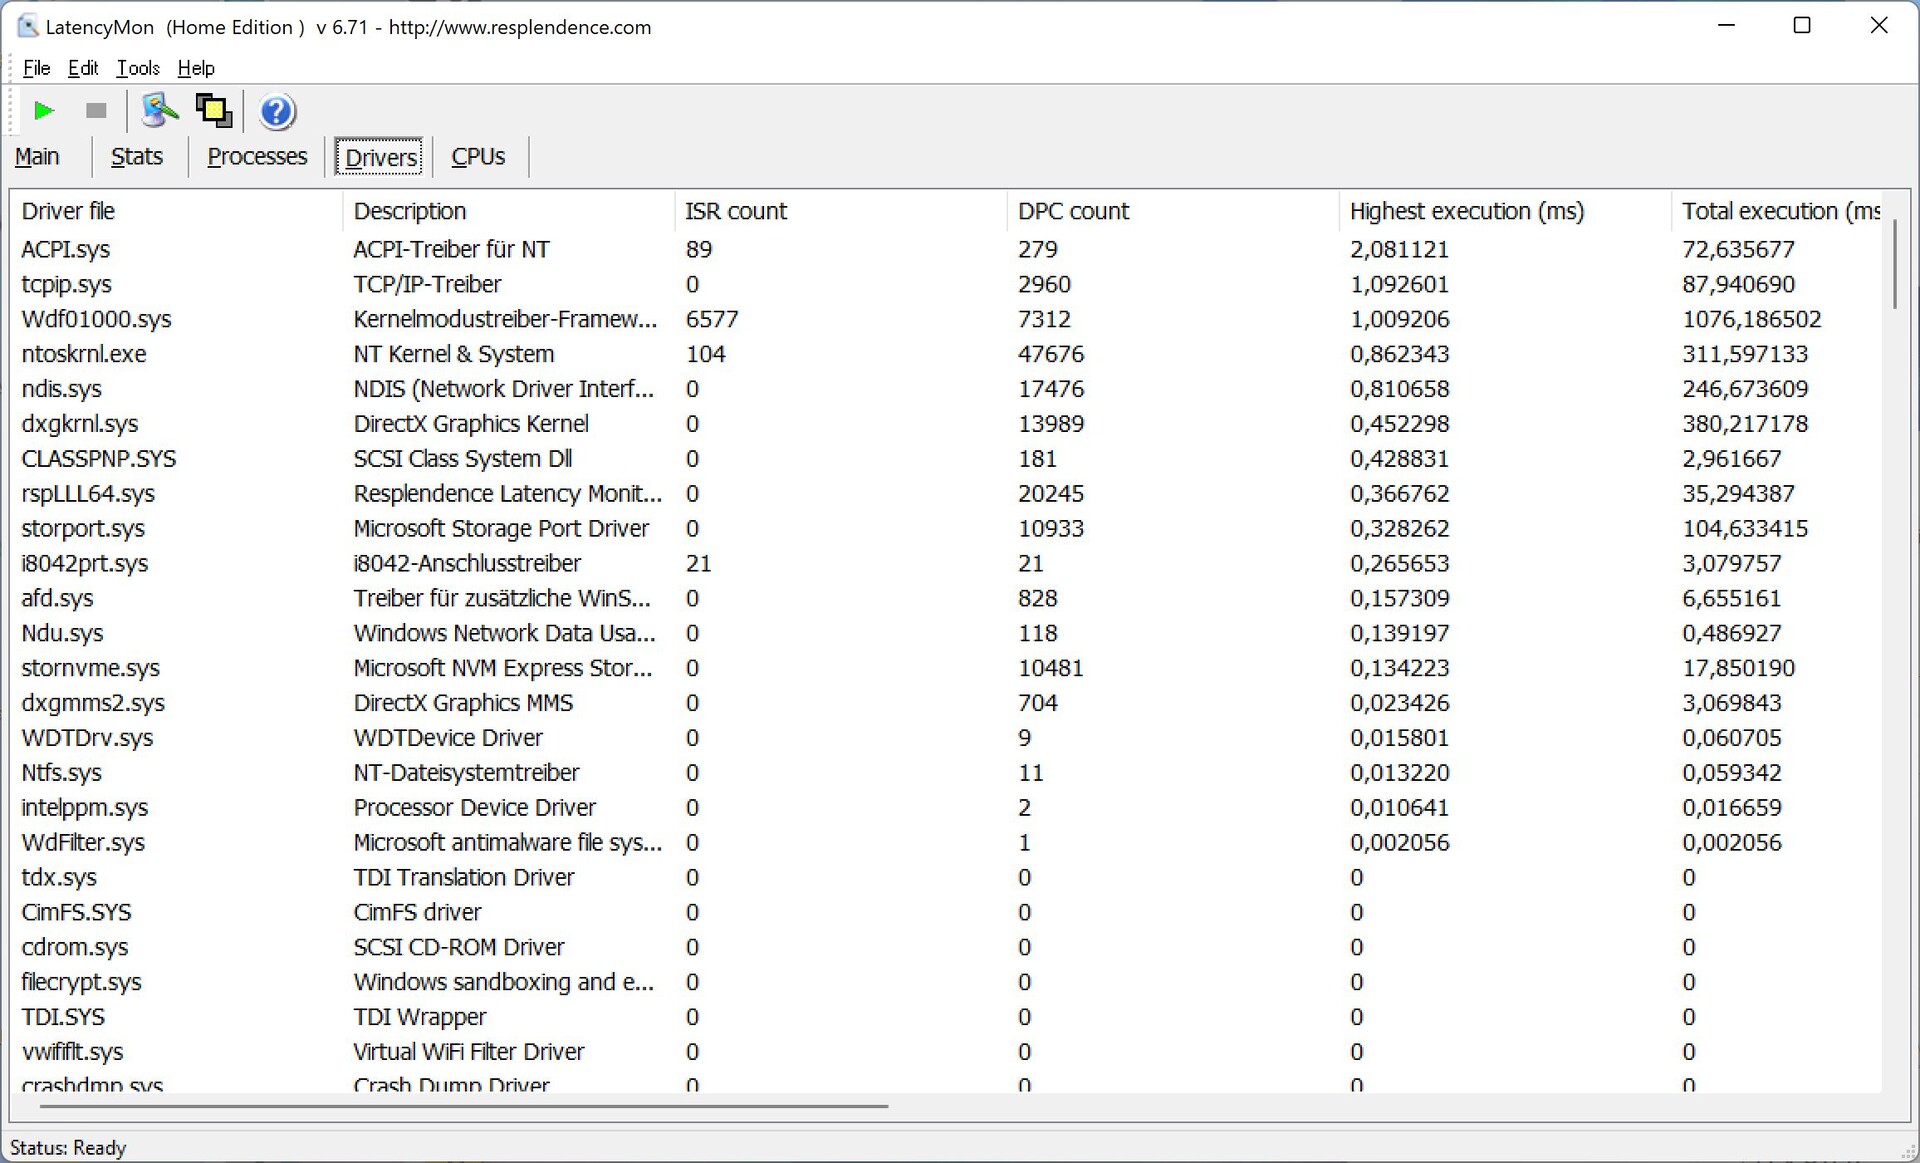
Opóźnienie DPC
W naszym standaryzowanym teście opóźnień (przeglądanie stron internetowych, odtwarzanie YouTube w rozdzielczości 4K, obciążenie procesora) nasze urządzenie recenzenckie wykazywało lekkie ograniczenia przy obecnej wersji BIOS-u, przez co tylko warunkowo nadaje się do korzystania z aplikacji audio w czasie rzeczywistym.
| DPC Latencies / LatencyMon - interrupt to process latency (max), Web, Youtube, Prime95 | |
| Huawei MateBook X Pro 2021 | |
| Lenovo Yoga 9i 14 2022 i7-1260P | |
| Huawei MateBook X Pro 2022 | |
| Dell XPS 13 Plus 9320 4K | |
| Asus Zenbook S 13 OLED | |
* ... im mniej tym lepiej
Urządzenia do przechowywania danych
Huawei zastosował dysk SSD PCIe 3.0 x4 o pojemności 1 TB, z czego po pierwszym uruchomieniu pozostaje do dyspozycji około 885 GB. Podobnie jednak jak we wszystkich innych laptopach Huawei, dysk SSD jest partycjonowany ex-factory i dysk systemowy jest bardzo mały i wynosi ~120 GB. Po odjęciu miejsca zajmowanego przez system Windows pozostaje niespełna 70 GB, co może szybko doprowadzić do problemów z przepustowością. Pozostałe 814 GB jest dostępne na dysku D
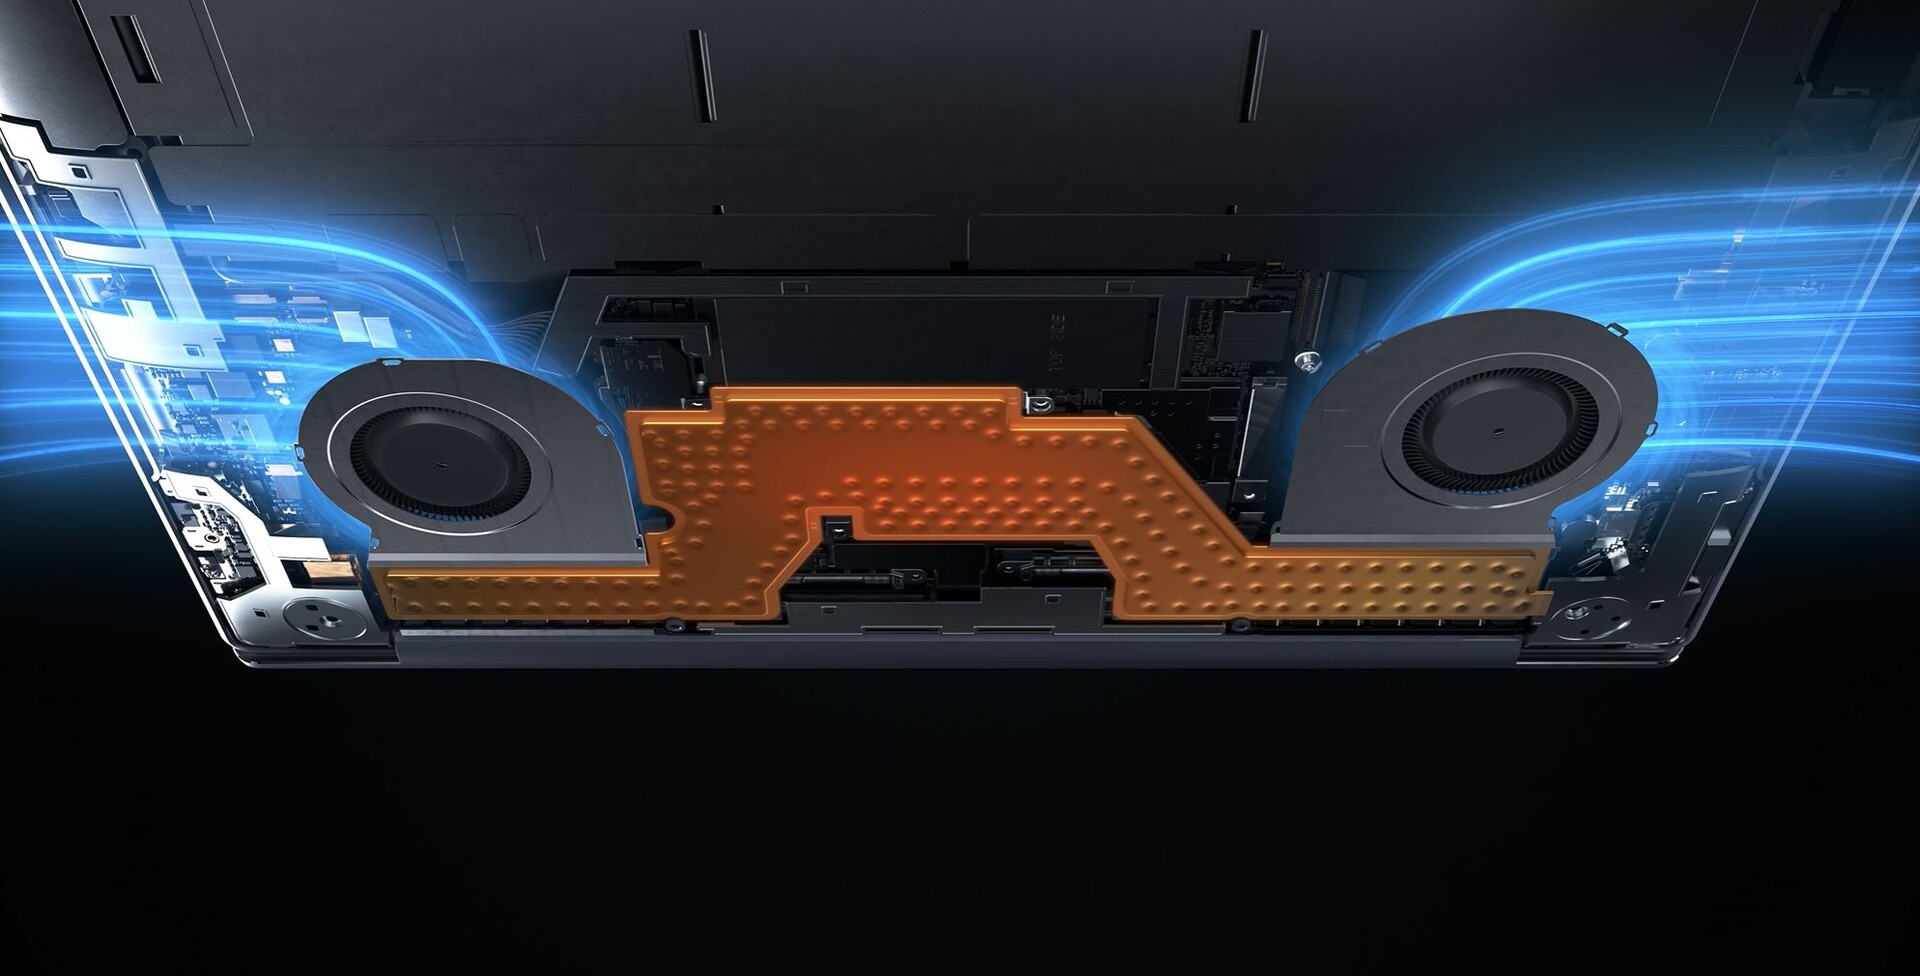
Istnieją również ograniczenia dotyczące prędkości. Zasadniczo transfery rzędu 3 GB/s są w zupełności wystarczające (nawet jeśli za cenę należałoby rozsądnie oczekiwać dysku PCIe 4.0 o wyższych transferach), ale dysk ma problemy z temperaturą pod trwałym obciążeniem (74°C wg HWiNFO) i dlatego wydajność okresowo się psuje. Spojrzenie na chłodzenie ujawnia, że dysk znajduje się bezpośrednio na radiatorze procesora. Z drugiej strony efekty są pomijalne w codziennym użytkowaniu i nie zarejestrowaliśmy żadnych ograniczeń w naszej normalnej procedurze testowej. Więcej benchmarków SSD jest dostępnychtutaj.

| Drive Performance rating - Percent | |
| Lenovo Yoga 9i 14 2022 i7-1260P | |
| Asus Zenbook S 13 OLED | |
| Dell XPS 13 Plus 9320 4K | |
| Huawei MateBook X Pro 2022 | |
| Przeciętny Silicon Motion PCIe-8 SSD 1TB | |
| Huawei MateBook X Pro 2021 | |
| Średnia w klasie Subnotebook | |
* ... im mniej tym lepiej
Sustained Read Performance: DiskSpd Read Loop, Queue Depth 8
Karta graficzna
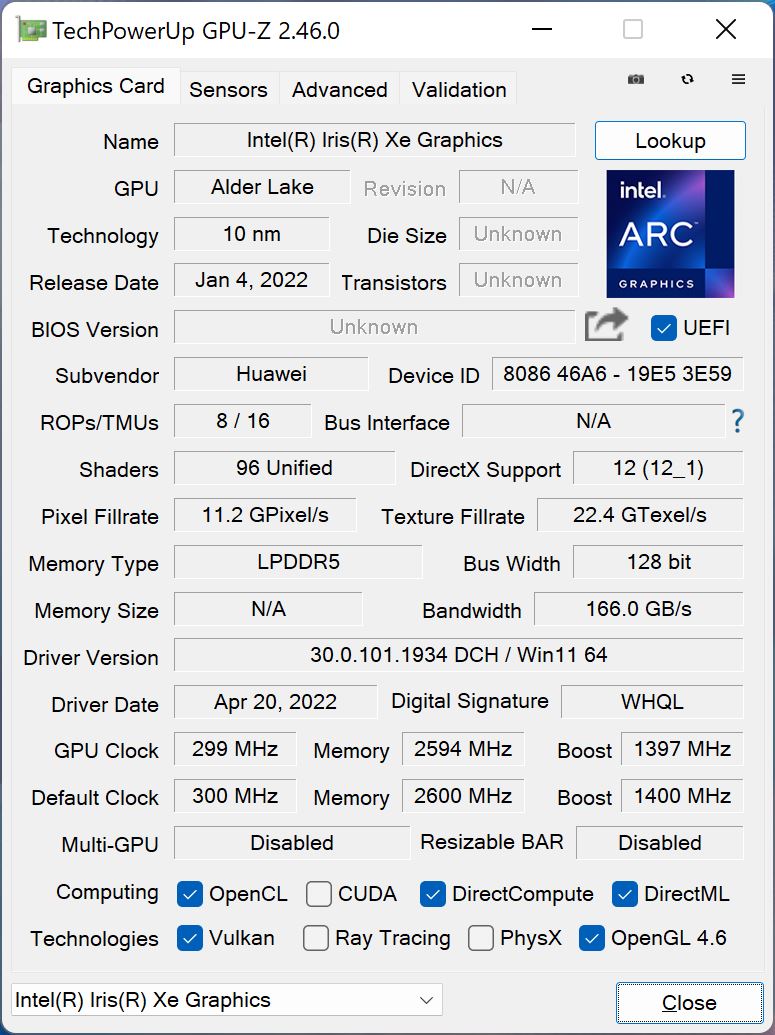
O karcie graficznej możemy wypowiedzieć się dość krótko, gdyż znanaIris Xe Graphics G7 iGPU od Intela zastosowano tutaj w szybszej wersji z 96 EU. Oferuje ona wystarczającą wydajność do normalnego, codziennego użytkowania, a także bez problemu radzi sobie z filmami w wysokiej rozdzielczości. W benchmarkach syntetycznych korzysta z dwukanałowej konfiguracji pamięci roboczej i jest na oczekiwanym poziomie, choć jest to wynik znacznie niższy od Radeon 680M iGPU oraz Apple M2 GPU (z 8 lub 10 rdzeniami). W porównaniu z poprzednikiem (z tym samym iGPU) wydajność graficzna poprawiła się tylko nieznacznie
MateBook X Pro nadaje się więc do gier tylko częściowo, a użytkownicy są często ograniczeni do niskich lub średnich detali nawet w prostych tytułach. Przynajmniej wydajność pozostaje stabilna podczas dłuższych sesji gier, co wykazała nasza pętla Witcher 3
Na zasilaniu bateryjnym wydajność jest nieco ograniczona i należy się spodziewać deficytu na poziomie ~13%. Więcej benchmarków GPU dostępnych jesttutaj.
| 3DMark Performance rating - Percent | |
| Apple MacBook Air M2 10C GPU -3! | |
| Średnia w klasie Subnotebook | |
| Apple MacBook Air M2 Entry -3! | |
| Asus Zenbook S 13 OLED | |
| Lenovo Yoga 9i 14 2022 i7-1260P -1! | |
| Dell XPS 13 Plus 9320 4K | |
| Huawei MateBook X Pro 2022 | |
| Huawei MateBook X Pro 2021 -2! | |
| Przeciętny Intel Iris Xe Graphics G7 96EUs | |
| 3DMark 11 - 1280x720 Performance GPU | |
| Średnia w klasie Subnotebook (995 - 18489, n=54, ostatnie 2 lata) | |
| Asus Zenbook S 13 OLED | |
| Dell XPS 13 Plus 9320 4K | |
| Lenovo Yoga 9i 14 2022 i7-1260P | |
| Huawei MateBook X Pro 2022 | |
| Przeciętny Intel Iris Xe Graphics G7 96EUs (2867 - 7676, n=209) | |
| Huawei MateBook X Pro 2021 | |
| 3DMark 11 Performance | 7512 pkt. | |
| 3DMark Cloud Gate Standard Score | 21739 pkt. | |
| 3DMark Fire Strike Score | 5021 pkt. | |
| 3DMark Time Spy Score | 1964 pkt. | |
Pomoc | ||
Witcher 3 FPS Chart
| low | med. | high | ultra | QHD | |
|---|---|---|---|---|---|
| GTA V (2015) | 115.4 | 102.4 | 23.9 | 10.2 | |
| The Witcher 3 (2015) | 95 | 60 | 33 | 14.2 | |
| Dota 2 Reborn (2015) | 113 | 87.5 | 65.3 | 59.1 | |
| Final Fantasy XV Benchmark (2018) | 44.7 | 25.1 | 18.5 | 13 | |
| X-Plane 11.11 (2018) | 32.8 | 31.1 | 29.8 | ||
| Far Cry 5 (2018) | 56 | 30 | 28 | 26 | 17 |
| Strange Brigade (2018) | 91.6 | 43.9 | 35.3 | 28.6 | |
| F1 2021 (2021) | 102.9 | 49.8 | 39.5 | 27.8 | |
| Farming Simulator 22 (2021) | 96 | 45 | 33 | 31 | 25 |
Emisja - MateBook z doskonałymi głośnikami
Hałas
Zasadniczo system chłodzenia z dwoma wentylatorami i komorą parową zapewnia dobre chłodzenie pasywne, ponieważ pod obciążeniem trwa ono co najmniej 20 sekund, zanim wentylatory w ogóle się włączą. Widać wyraźną różnicę między dwoma profilami wydajności w odniesieniu do hałasu wentylatorów, mimo że różnica w poborze mocy wynosi tutaj tylko 5 watów. Maksymalne natężenie 40,6 dB(A) zmierzone w teście obciążeniowym szybko ustępuje 38,2 dB(A), gdy tylko pobór mocy ustabilizuje się na poziomie 30 W. Szum wentylatora nie jest w żadnym wypadku nieprzyjemny ani wysoki, osiągając maksymalnie 33,4 dB(A) tylko w trybie Balanced, który jest znacznie cichszy. Zalecamy zatem korzystanie z trybu Balanced w codziennym użytkowaniu
Nie wykryto żadnych innych elektronicznych odgłosów, jak np. wycie cewki.
| Tryby | 3DMark 06 | Witcher 3 Ultra | Stress test |
|---|---|---|---|
| Zrównoważony | 31,5 dB(A) | 31,5 dB(A) | 33,4 dB(A) |
| Wydajność | 33,8 dB(A) | 35,4 dB(A) | 40,6 -> 38,2 dB(A) |
Hałas
| luz |
| 23.5 / 23.5 / 25.9 dB |
| obciążenie |
| 33.8 / 40.6 dB |
 | ||
30 dB cichy 40 dB(A) słyszalny 50 dB(A) irytujący |
||
min: | ||
| Huawei MateBook X Pro 2022 Iris Xe G7 96EUs, i7-1260P, Silicon Motion PCIe-8 SSD 1TB | Lenovo Yoga 9i 14 2022 i7-1260P Iris Xe G7 96EUs, i7-1260P, Samsung PM9A1 MZVL21T0HCLR | Asus Zenbook S 13 OLED Radeon 680M, R7 6800U, Samsung PM9A1 MZVL21T0HCLR | Dell XPS 13 Plus 9320 4K Iris Xe G7 96EUs, i7-1260P, Samsung PM9A1 MZVL21T0HCLR | Huawei MateBook X Pro 2021 Iris Xe G7 96EUs, i7-1165G7, Samsung PM981a MZVLB1T0HBLR | |
|---|---|---|---|---|---|
| Noise | -7% | -2% | -10% | 1% | |
| wyłączone / środowisko * (dB) | 23.5 | 24.1 -3% | 24 -2% | 24.4 -4% | 25.4 -8% |
| Idle Minimum * (dB) | 23.5 | 24.1 -3% | 24 -2% | 24.4 -4% | 25.6 -9% |
| Idle Average * (dB) | 23.5 | 24.1 -3% | 24 -2% | 24.4 -4% | 25.6 -9% |
| Idle Maximum * (dB) | 25.9 | 30 -16% | 24 7% | 25.5 2% | 25.6 1% |
| Load Average * (dB) | 33.8 | 39.4 -17% | 33.1 2% | 40.4 -20% | 28.7 15% |
| Witcher 3 ultra * (dB) | 35.4 | 39.4 -11% | 40.2 -14% | 45.5 -29% | 32 10% |
| Load Maximum * (dB) | 40.6 | 39.4 3% | 41.7 -3% | 45.5 -12% | 38.2 6% |
* ... im mniej tym lepiej
Temperatura
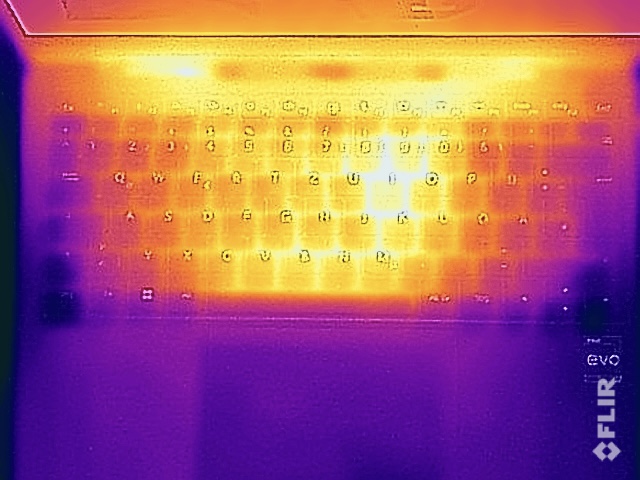
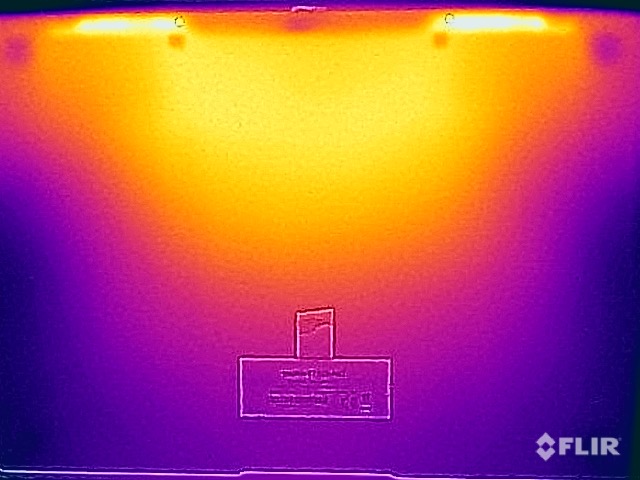
Huawei dobrze kontroluje temperatury powierzchni. W stanie bezczynności i podczas lekkich zadań obudowa robi się co prawda o kilka stopni cieplejsza niż zwykle, ale nie jest to problematyczne. Pod obciążeniem na zdjęciach w podczerwieni widać wyraźnie położenie układu chłodzenia i wentylatorów, gdyż obszary te (zwłaszcza środek) stają się gorące. Górna strona klawiatury robi się nawet nieco cieplejsza od spodu i jest to również zauważalne podczas pisania, ale nie okazuje się to ograniczające. Z kolei oparcie dłoni pozostaje przyjemnie chłodne, nawet w teście stresu. Przy maksymalnej temperaturze 42°C na spodzie można bez wahania umieścić MateBooka X Pro na kolanach, nawet pod obciążeniem.
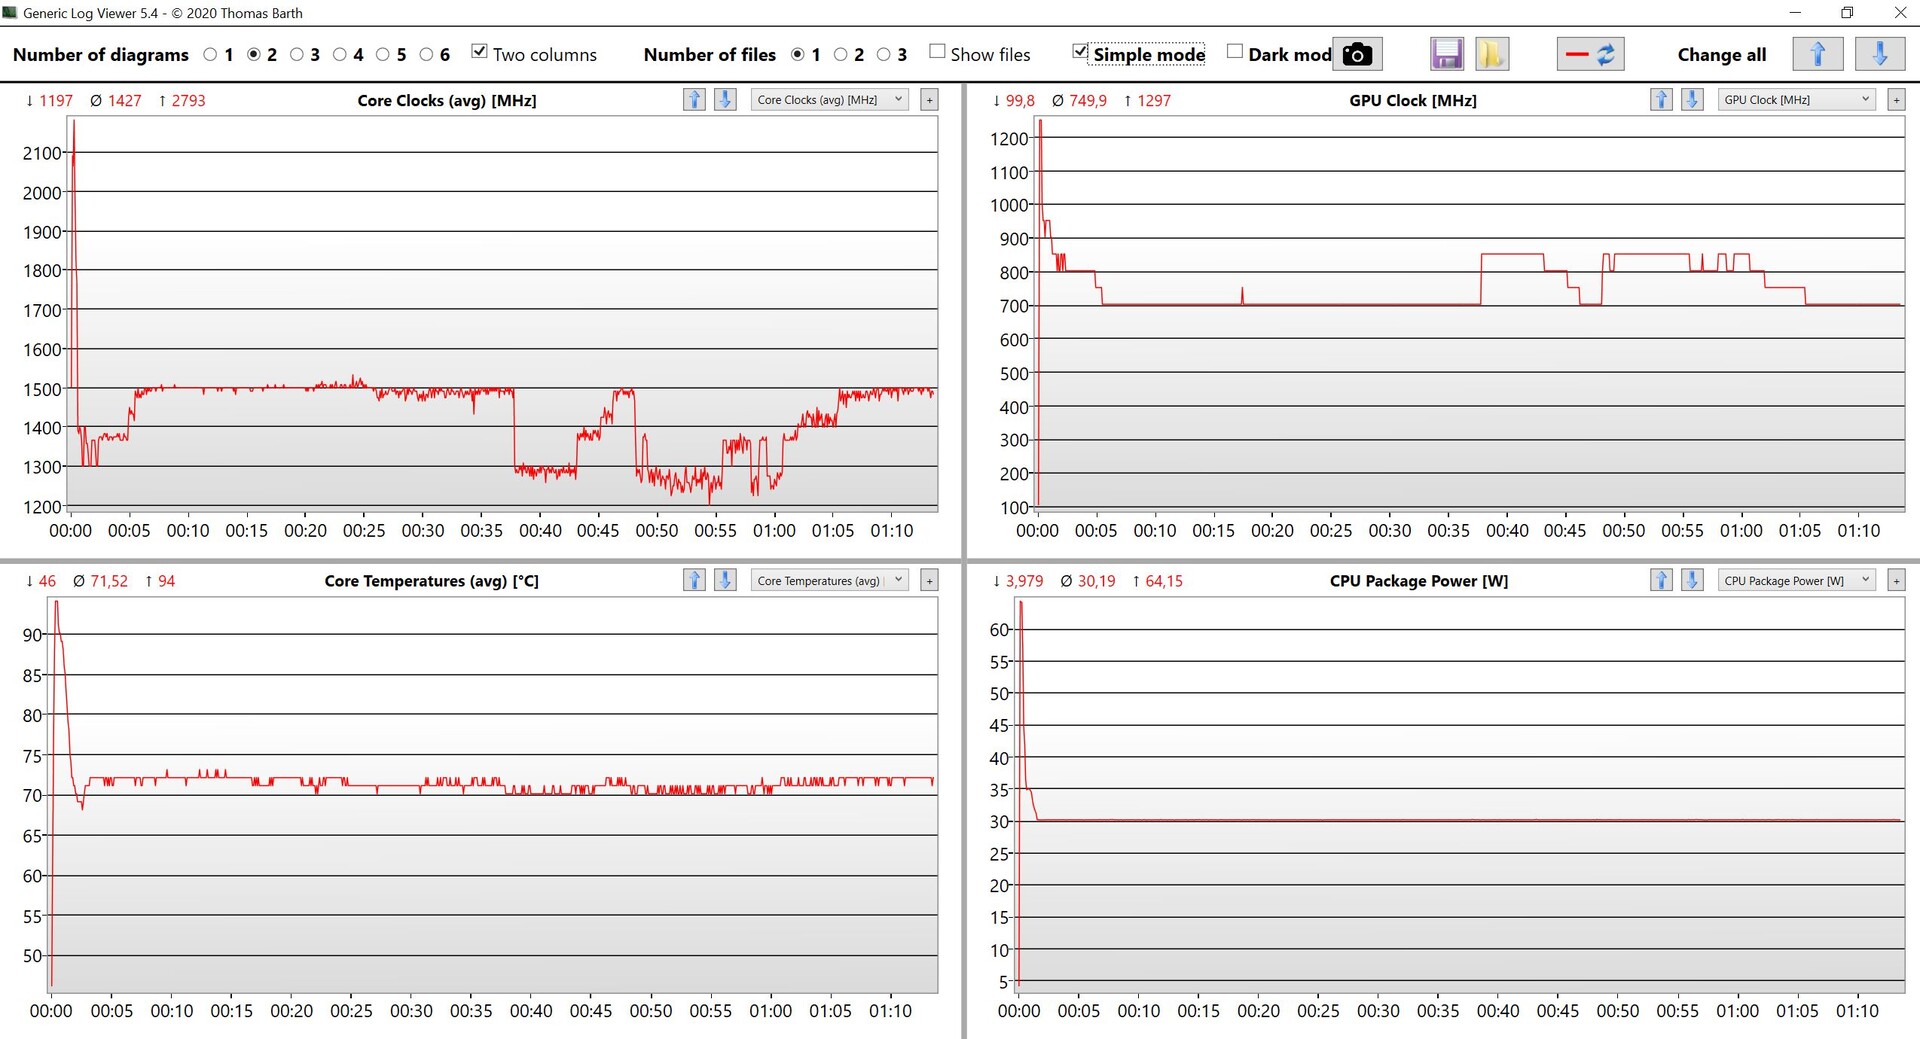
W teście stresu obserwujemy takie samo zachowanie, jak w przypadku czystego obciążenia procesora. Po krótkim szczycie zużycia na poziomie 64 W, zużycie szybko stabilizuje się na poziomie 30 W. W trakcie testu występują niewielkie przesunięcia w zegarach CPU/iGPU, ale ogólnie wszystko pozostaje dość stabilne.
(±) Maksymalna temperatura w górnej części wynosi 43.1 °C / 110 F, w porównaniu do średniej 35.9 °C / 97 F , począwszy od 21.4 do 59 °C dla klasy Subnotebook.
(±) Dno nagrzewa się maksymalnie do 42 °C / 108 F, w porównaniu do średniej 39.2 °C / 103 F
(+) W stanie bezczynności średnia temperatura górnej części wynosi 27 °C / 81 F, w porównaniu ze średnią temperaturą urządzenia wynoszącą 30.8 °C / ### class_avg_f### F.
(±) Podczas gry w Wiedźmina 3 średnia temperatura górnej części wynosi 36.2 °C / 97 F, w porównaniu do średniej temperatury urządzenia wynoszącej 30.8 °C / ## #class_avg_f### F.
(+) Podpórki pod nadgarstki i touchpad są chłodniejsze niż temperatura skóry i maksymalnie 28.6 °C / 83.5 F i dlatego są chłodne w dotyku.
(±) Średnia temperatura obszaru podparcia dłoni w podobnych urządzeniach wynosiła 28.2 °C / 82.8 F (-0.4 °C / -0.7 F).
| Huawei MateBook X Pro 2022 Intel Core i7-1260P, Intel Iris Xe Graphics G7 96EUs | Apple MacBook Air M2 10C GPU Apple M2, Apple M2 10-Core GPU | Lenovo Yoga 9i 14 2022 i7-1260P Intel Core i7-1260P, Intel Iris Xe Graphics G7 96EUs | Asus Zenbook S 13 OLED AMD Ryzen 7 6800U, AMD Radeon 680M | Dell XPS 13 Plus 9320 4K Intel Core i7-1260P, Intel Iris Xe Graphics G7 96EUs | Huawei MateBook X Pro 2021 Intel Core i7-1165G7, Intel Iris Xe Graphics G7 96EUs | |
|---|---|---|---|---|---|---|
| Heat | 5% | -6% | -7% | -2% | -3% | |
| Maximum Upper Side * (°C) | 43.1 | 44.7 -4% | 47.5 -10% | 47.9 -11% | 41.1 5% | 42.2 2% |
| Maximum Bottom * (°C) | 42 | 44.6 -6% | 52.2 -24% | 56.1 -34% | 48.8 -16% | 40.4 4% |
| Idle Upper Side * (°C) | 29.4 | 25.1 15% | 27.1 8% | 26.8 9% | 28 5% | 31.2 -6% |
| Idle Bottom * (°C) | 29.4 | 25.3 14% | 28.5 3% | 27.3 7% | 29.3 -0% | 32.2 -10% |
* ... im mniej tym lepiej
Mówcy
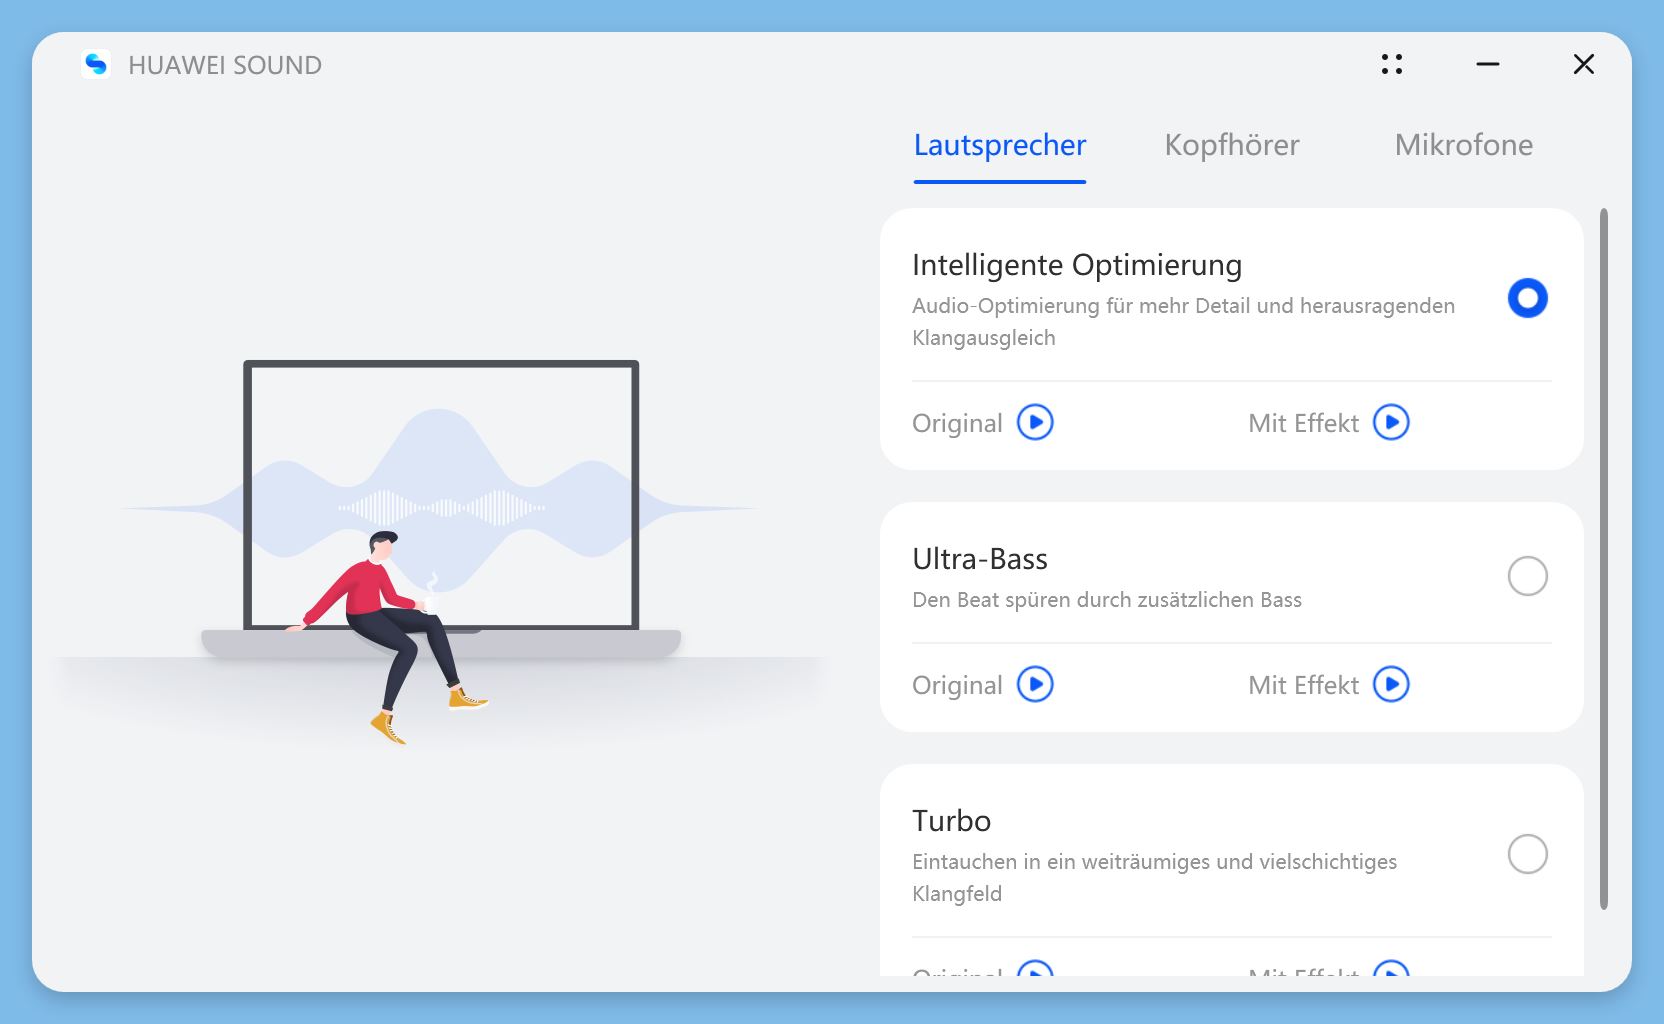
MateBook X Pro oferuje system dźwiękowy z 6 głośnikami, a jego wydajność jest znakomita. Dźwięk jest bardzo ekspansywny, mocny i bardzo głośny. Co więcej, oprogramowanie dźwiękowe Huawei oferuje pewne usprawnienia, zarówno dla głośników, podłączonych słuchawek, jak i mikrofonów. Obok naszego subiektywnego wrażenia, wynik testu jest bardzo dobry, a MateBook X Pro wyprzedza też po prostu obecnegoMacBook Air M2i tylko bardzo nieznacznie za MacBookiem Pro 14, który oferuje nieco więcej basów. Głośniki zewnętrzne w większości przypadków nie są konieczne.
Huawei MateBook X Pro 2022 analiza dźwięku
(+) | głośniki mogą odtwarzać stosunkowo głośno (85.5 dB)
Bas 100 - 315 Hz
(±) | zredukowany bas - średnio 5% niższy od mediany
(+) | bas jest liniowy (5.3% delta do poprzedniej częstotliwości)
Średnie 400 - 2000 Hz
(+) | zbalansowane środki średnie - tylko 1.5% od mediany
(+) | średnie są liniowe (2.5% delta do poprzedniej częstotliwości)
Wysokie 2–16 kHz
(+) | zrównoważone maksima - tylko 2.1% od mediany
(+) | wzloty są liniowe (5.3% delta do poprzedniej częstotliwości)
Ogólnie 100 - 16.000 Hz
(+) | ogólny dźwięk jest liniowy (5% różnicy w stosunku do mediany)
W porównaniu do tej samej klasy
» 0% wszystkich testowanych urządzeń w tej klasie było lepszych, 0% podobnych, 100% gorszych
» Najlepszy miał deltę 5%, średnia wynosiła ###średnia###%, najgorsza wynosiła 53%
W porównaniu do wszystkich testowanych urządzeń
» 0% wszystkich testowanych urządzeń było lepszych, 0% podobnych, 100% gorszych
» Najlepszy miał deltę 4%, średnia wynosiła ###średnia###%, najgorsza wynosiła 134%
Lenovo Yoga 9i 14 2022 i7-1260P analiza dźwięku
(+) | głośniki mogą odtwarzać stosunkowo głośno (84 dB)
Bas 100 - 315 Hz
(±) | zredukowany bas - średnio 7.4% niższy od mediany
(±) | liniowość basu jest średnia (7.2% delta do poprzedniej częstotliwości)
Średnie 400 - 2000 Hz
(+) | zbalansowane środki średnie - tylko 1.1% od mediany
(+) | średnie są liniowe (3.4% delta do poprzedniej częstotliwości)
Wysokie 2–16 kHz
(+) | zrównoważone maksima - tylko 2.1% od mediany
(+) | wzloty są liniowe (3.2% delta do poprzedniej częstotliwości)
Ogólnie 100 - 16.000 Hz
(+) | ogólny dźwięk jest liniowy (6% różnicy w stosunku do mediany)
W porównaniu do tej samej klasy
» 0% wszystkich testowanych urządzeń w tej klasie było lepszych, 0% podobnych, 100% gorszych
» Najlepszy miał deltę 6%, średnia wynosiła ###średnia###%, najgorsza wynosiła 57%
W porównaniu do wszystkich testowanych urządzeń
» 0% wszystkich testowanych urządzeń było lepszych, 0% podobnych, 100% gorszych
» Najlepszy miał deltę 4%, średnia wynosiła ###średnia###%, najgorsza wynosiła 134%
Apple MacBook Pro 14 2021 M1 Pro Entry analiza dźwięku
(+) | głośniki mogą odtwarzać stosunkowo głośno (84.9 dB)
Bas 100 - 315 Hz
(+) | dobry bas - tylko 4.3% od mediany
(+) | bas jest liniowy (5.9% delta do poprzedniej częstotliwości)
Średnie 400 - 2000 Hz
(+) | zbalansowane środki średnie - tylko 1.1% od mediany
(+) | średnie są liniowe (1.9% delta do poprzedniej częstotliwości)
Wysokie 2–16 kHz
(+) | zrównoważone maksima - tylko 2.9% od mediany
(+) | wzloty są liniowe (3% delta do poprzedniej częstotliwości)
Ogólnie 100 - 16.000 Hz
(+) | ogólny dźwięk jest liniowy (5.6% różnicy w stosunku do mediany)
W porównaniu do tej samej klasy
» 2% wszystkich testowanych urządzeń w tej klasie było lepszych, 1% podobnych, 97% gorszych
» Najlepszy miał deltę 5%, średnia wynosiła ###średnia###%, najgorsza wynosiła 45%
W porównaniu do wszystkich testowanych urządzeń
» 0% wszystkich testowanych urządzeń było lepszych, 0% podobnych, 100% gorszych
» Najlepszy miał deltę 4%, średnia wynosiła ###średnia###%, najgorsza wynosiła 134%
Apple MacBook Air M2 Entry analiza dźwięku
(+) | głośniki mogą odtwarzać stosunkowo głośno (82.7 dB)
Bas 100 - 315 Hz
(±) | zredukowany bas - średnio 12.2% niższy od mediany
(±) | liniowość basu jest średnia (12.6% delta do poprzedniej częstotliwości)
Średnie 400 - 2000 Hz
(+) | zbalansowane środki średnie - tylko 1.1% od mediany
(+) | średnie są liniowe (3.1% delta do poprzedniej częstotliwości)
Wysokie 2–16 kHz
(+) | zrównoważone maksima - tylko 2.4% od mediany
(+) | wzloty są liniowe (1.9% delta do poprzedniej częstotliwości)
Ogólnie 100 - 16.000 Hz
(+) | ogólny dźwięk jest liniowy (9.5% różnicy w stosunku do mediany)
W porównaniu do tej samej klasy
» 5% wszystkich testowanych urządzeń w tej klasie było lepszych, 2% podobnych, 93% gorszych
» Najlepszy miał deltę 5%, średnia wynosiła ###średnia###%, najgorsza wynosiła 53%
W porównaniu do wszystkich testowanych urządzeń
» 4% wszystkich testowanych urządzeń było lepszych, 1% podobnych, 95% gorszych
» Najlepszy miał deltę 4%, średnia wynosiła ###średnia###%, najgorsza wynosiła 134%
Zarządzanie energią - jasny wyświetlacz wyczerpuje baterię
Pobór mocy
Nowy MateBook X Pro nie jest szczególnie oszczędnym notebookiem, co wynika przede wszystkim z bardzo jasnego, a także dużego wyświetlacza. W trybie bezczynności zmierzyliśmy do 14 watów. Pod obciążeniem zużycie energii skacze do 91 watów ze względu na wysokie limity mocy procesora, ale potem poziomuje się na poziomie nieco poniżej 56 watów. Sprawdziliśmy też z mocniejszym zasilaczem, czy 90-watowy zasilacz ogranicza maksymalny pobór mocy laptopa, ale tak się nie stało. Ogólnie rzecz biorąc, zasilacz 90-watowy jest wystarczający.
| wyłączony / stan wstrzymania | |
| luz | |
| obciążenie |
|
Legenda:
min: | |
| Huawei MateBook X Pro 2022 i7-1260P, Iris Xe G7 96EUs, Silicon Motion PCIe-8 SSD 1TB, IPS, 3120x2080, 14.2" | Apple MacBook Air M2 10C GPU M2, M2 10-Core GPU, Apple SSD AP1024Z, IPS, 2560x1664, 13.6" | Lenovo Yoga 9i 14 2022 i7-1260P i7-1260P, Iris Xe G7 96EUs, Samsung PM9A1 MZVL21T0HCLR, OLED, 3840x2400, 14" | Asus Zenbook S 13 OLED R7 6800U, Radeon 680M, Samsung PM9A1 MZVL21T0HCLR, OLED, 2880x1800, 13.3" | Dell XPS 13 Plus 9320 4K i7-1260P, Iris Xe G7 96EUs, Samsung PM9A1 MZVL21T0HCLR, IPS, 3840x2400, 13.4" | Huawei MateBook X Pro 2021 i7-1165G7, Iris Xe G7 96EUs, Samsung PM981a MZVLB1T0HBLR, IPS, 3000x2000, 13.9" | Przeciętny Intel Iris Xe Graphics G7 96EUs | Średnia w klasie Subnotebook | |
|---|---|---|---|---|---|---|---|---|
| Power Consumption | 49% | 9% | 32% | 14% | 28% | 26% | 40% | |
| Idle Minimum * (Watt) | 6.5 | 1.9 71% | 7.1 -9% | 4.8 26% | 7 -8% | 6.7 -3% | 5.51 ? 15% | 3.86 ? 41% |
| Idle Average * (Watt) | 13.7 | 9.6 30% | 10 27% | 8.7 36% | 11 20% | 10 27% | 8.66 ? 37% | 6.61 ? 52% |
| Idle Maximum * (Watt) | 14.4 | 9.7 33% | 10.8 25% | 10.1 30% | 11.4 21% | 10.3 28% | 10.9 ? 24% | 8 ? 44% |
| Load Average * (Watt) | 64.6 | 32.4 50% | 64 1% | 45.6 29% | 59.7 8% | 35.7 45% | 45.6 ? 29% | 42.2 ? 35% |
| Witcher 3 ultra * (Watt) | 57.2 | 30.8 46% | 47.7 17% | 42.4 26% | 49.4 14% | 32.7 43% | ||
| Load Maximum * (Watt) | 90.9 | 35.7 61% | 97 -7% | 49.5 46% | 63 31% | 67.6 26% | 67.8 ? 25% | 64.5 ? 29% |
* ... im mniej tym lepiej
Power consumption Witcher 3 / Stress test
Power consumption with an external monitor
Czas pracy na baterii
Połączenie akumulatora o pojemności 60 Wh i wysokiego zużycia energii nie pozwala na szczególnie długie czasy pracy na baterii. Wyświetlacz jest po prostu pożeraczem energii i nawet przy jasności 150 cd/m² (odpowiadającej 56% maksymalnej jasności w naszym urządzeniu testowym) udało nam się uzyskać tylko ~7,5 godziny w obu naszych testach wideo i WLAN. Test WLAN zatrzymuje się nawet po mniej niż 5 godzinach przy pełnej jasności wyświetlacza. Konkurencja oferuje po prostu większą wytrzymałość; cały dzień pracy bez gniazdka jest w przypadku MateBooka X Pro bardzo mało prawdopodobny
Przynajmniej urządzenie ładuje się stosunkowo szybko, gdyż pełne naładowanie (z włączonym laptopem) trwa około 80 minut, przy czym 50% jest dostępne po 34 minutach a 80% po 52 minutach.
| Huawei MateBook X Pro 2022 i7-1260P, Iris Xe G7 96EUs, 60 Wh | Apple MacBook Air M2 10C GPU M2, M2 10-Core GPU, 52.6 Wh | Lenovo Yoga 9i 14 2022 i7-1260P i7-1260P, Iris Xe G7 96EUs, 75 Wh | Asus Zenbook S 13 OLED R7 6800U, Radeon 680M, 67 Wh | Dell XPS 13 Plus 9320 4K i7-1260P, Iris Xe G7 96EUs, 55 Wh | Huawei MateBook X Pro 2021 i7-1165G7, Iris Xe G7 96EUs, 56 Wh | Średnia w klasie Subnotebook | |
|---|---|---|---|---|---|---|---|
| Czasy pracy | 102% | 25% | 55% | 4% | 58% | 69% | |
| H.264 (h) | 7.6 | 15.8 108% | 12.6 66% | 15.2 100% | 11 45% | 15.4 ? 103% | |
| WiFi v1.3 (h) | 7.5 | 14.7 96% | 8.6 15% | 9.2 23% | 6.9 -8% | 10.5 40% | 14 ? 87% |
| Load (h) | 1.7 | 1.6 -6% | 2.4 41% | 1.3 -24% | 3 76% | 1.969 ? 16% |
Za
Przeciw
Werdykt: MateBook X Pro z zaledwie kilkoma słabościami
Huawei celuje w bycie top dog w ultrabookach ze swoim nowym MateBookiem X Pro z 2022 roku, co znajduje również odzwierciedlenie w pewnej cenie 2 199 euro. Po zakończeniu procesu recenzji nasze wrażenie było bardzo pozytywne: Za wysoką cenę użytkownicy otrzymują ogólnie bardzo dopracowany pakiet, który ma tylko kilka słabych punktów. Kamera 720p jest z pewnością jednym z nich, ale przynajmniej została wzbogacona o kilka nowych funkcji oprogramowania. Brak opcji konserwacji i trudny dostęp do komponentów to również punkty krytyki. Wreszcie, nie byliśmy zbyt zadowoleni z wahającej się wydajności dysku SSD i stosunkowo krótkiego czasu pracy na baterii.
W zamian otrzymujemy kompaktowe i wysokiej jakości 14,2-calowe urządzenie z bardzo dobrym wyświetlaczem IPS, który oferuje jasność na poziomie prawie 600 cd/m². Ponadto dokładność kolorów jest bardzo dobra i można przełączać się programowo między przestrzeniami barw P3 i sRGB, co potrafi niewiele stacji roboczych. Nie występuje PWM, a współczynnik kształtu 3:2 jest dobrze przystosowany do pracy.
Alder Lake Core i7-1260P i rozsądne poziomy mocy pozwalają na uzyskanie świetnej wydajności systemu, ale pod względem czystej wydajności procesora są szybsi konkurenci. W praktyce tryb zrównoważony jest w zupełności wystarczający, zwłaszcza że korzysta się ze znacznie cichszych wentylatorów; przy maksymalnie ~33 dB(A) w trybie zrównoważonym MateBook X Pro jest jednym z najcichszych modeli. Tylko pasywnie chłodzony MacBook Air M2 ma tutaj przewagę. Huawei marnuje pewien potencjał w dysku SSD, gdyż nie ma napędu PCIe 4.0, a umiejscowienie na radiatorze powoduje po pewnym czasie spadki wydajności. Niemniej jednak nie powinno to być problemem dla zdecydowanej większości użytkowników w codziennym użytkowaniu.
Wysokiej jakości obudowa, bardzo dobra wydajność systemu, świetne głośniki i topowy wyświetlacz: Nowy Huawei MateBook X Pro 2022 to ogólnie bardzo dobry pakiet. Jeśli możesz żyć z brakiem opcji konserwacji i miernymi czasami pracy na baterii, będziesz miał najlepszy ultrabook Windows na swoich rękach, a także najlepszą alternatywę dla Apple's MacBook Air obecnie
Huawei unowocześnił sprzęt i teraz po raz pierwszy oferuje dwa pełnoprawne porty Thunderbolt 4. Jest też nowoczesny moduł Wi-Fi 6E od Intela, a posiadacze innych urządzeń Huawei (takich jak smartfony czy tablety) mogą być zadowoleni z wydajnej sieci pomiędzy poszczególnymi urządzeniami. Huawei unowocześnił także urządzenia wejścia: Klawiatura oferuje teraz większy skok klawiszy i dzięki temu pisze się na niej wygodniej, ale duży touchpad również oferuje prawdziwą wartość dodaną dzięki dodatkowym gestom. Nie oszczędzono również na głośnikach, bowiem nasz próbka recenzencka może bez problemu konkurować z obecnym MacBookiem Air M2.
Mówiąc o MacBooku Air M2, jest to bez wątpienia jeden z największych rywali dla MateBooka X Pro. Jest znacznie wydajniejszy dzięki swojemu układowi M2 i zawsze cichy dzięki pasywnemu chłodzeniu. MacBook Air M2 ma jednak swoje wady, zwłaszcza w zakresie funkcji, ponieważ trzeba się obejść bez szybkiego Wi-Fi 6E (lub Wi-Fi 6 o częstotliwości 160 MHz), a także Thunderbolt 4. Na Lenovo Yoga 9i 14 to również wyjątkowo dobre urządzenie i ciekawy wybór, jeśli można skorzystać z formatu konwertowalnego. Na Asus ZenBook S 13, z drugiej strony, jest nieco bardziej kompaktowy ze swoim 13,3-calowym wyświetlaczem, ale oferuje jeszcze większą wydajność dzięki procesorowi AMD, zwłaszcza dzięki szybkiemu iGPU. Na stronie Dell XPS 13 Plus 9320 również imponuje kompaktową obudową, ale nie oferuje tak dobrego pakietu ogólnie.
Cena i dostępność
Nowo wydany MateBook X Pro 2022 nie dotarł jeszcze do wszystkich regionów na świecie, więc dostępność może być niewielka. Użytkownicy powinni sprawdzić bezpośrednio za pośrednictwem sklepu internetowego Huawei tutaj. Najpierw wybierz swoją lokalizację, a następnie wpisz MateBook X Pro 2022 w pasku wyszukiwania
Znaleźliśmy na przykład, że urządzenie jest już dostępne w Francji (2199,99€), Wielkiej Brytanii https://consumer.huawei.com/uk/laptops/matebook-x-pro-2022-12th-gen-core/buy/ (1799,99 funtów), Rumunii (9.999,00 Lei), Singapurze (2.798,00 USD), RPA (R 35,999.00), Arabia Saudyjska oraz ZEA.
Powyższa lista nie jest wyczerpująca. Ceny są na dzień 09.09.2022 i mogą ulec zmianie
Huawei MateBook X Pro 2022
- 08/09/2022 v7 (old)
Andreas Osthoff
Price comparison

