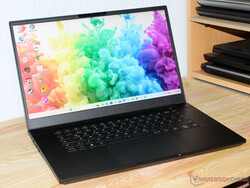
Recenzja Intel NUC X15 LAPAC71H: Multimedialny laptop z procesorem Intel Arc A730M od 1050 USD
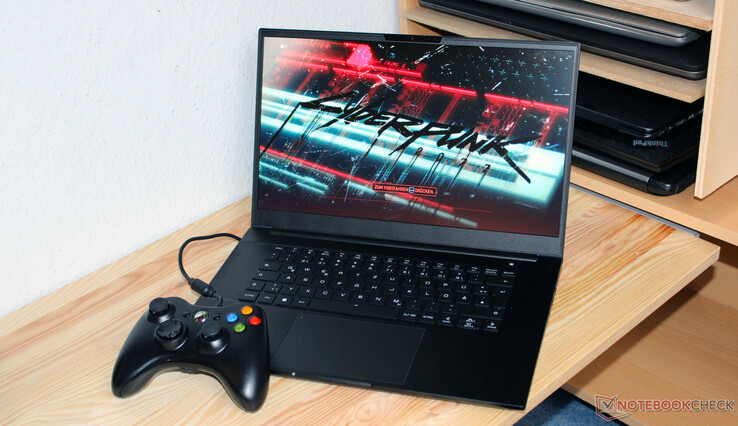
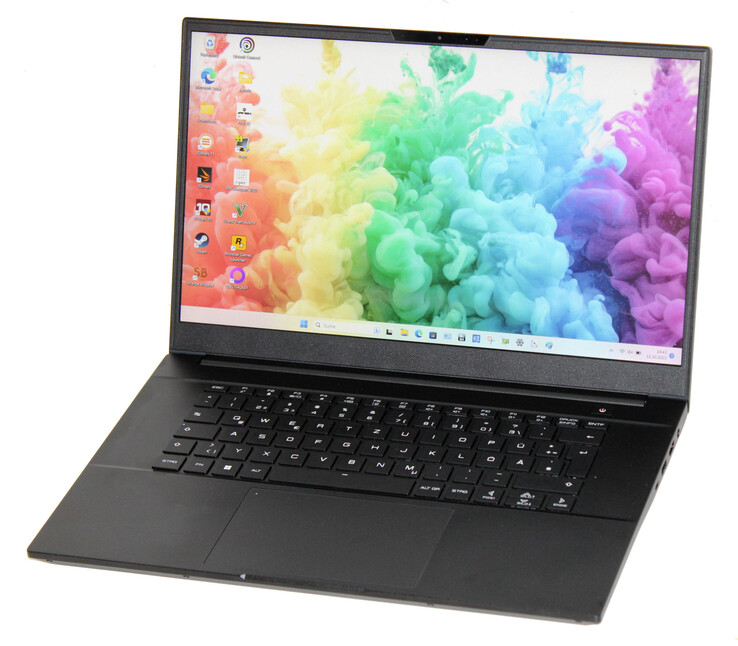
Po zapowiedzi na jesień 2022 roku, Intel NUC X15 - laptop dla graczy i twórców - w końcu ujrzał światło dzienne rok później. Powinien to być głównie przypadek pozbycia się towarów: X15, jak i cała seria NUC, zostały już wycofane przez Intela. Laptop dystrybuowany przez firmę Schenker Core i7-12700H, Arc A730Mi panel FHD, podczas gdy pamięć RAM i dysk SSD można wybrać.
Wśród konkurentów znajdują się takie urządzenia jak Asus TUF A15 FA507, Gigabyte G5 KE, MSI Cyborg 15 A12VF, Dell Inspiron 16 Plus 7630 oraz Asus VivoBook Pro 16.
Potencjalni konkurenci w porównaniu
Ocena | Data | Model | Waga | Wysokość | Rozmiar | Rezolucja | Cena |
|---|---|---|---|---|---|---|---|
| 84.4 % v7 (old) | 10/2023 | Intel NUC X15 LAPAC71H i7-12700H, A730M | 2.2 kg | 26.7 mm | 15.60" | 1920x1080 | |
| 86.3 % v7 (old) | 06/2023 | Asus TUF A15 FA507 R7 7735HS, GeForce RTX 4050 Laptop GPU | 2.2 kg | 24.9 mm | 15.60" | 1920x1080 | |
| 81.8 % v7 (old) | 04/2023 | Gigabyte G5 KE i5-12500H, GeForce RTX 3060 Laptop GPU | 2 kg | 23.9 mm | 15.60" | 1920x1080 | |
| 87.1 % v7 (old) | 08/2023 | Dell Inspiron 16 Plus 7630 i7-13700H, GeForce RTX 4060 Laptop GPU | 2.2 kg | 19.95 mm | 16.00" | 2560x1600 | |
| 86.3 % v7 (old) | 05/2023 | Asus VivoBook Pro 16 i7-12700H, GeForce RTX 3050 Ti Laptop GPU | 1.9 kg | 20 mm | 16.00" | 2560x1600 | |
| 82.4 % v7 (old) | 04/2023 | MSI Cyborg 15 A12VF i7-12650H, GeForce RTX 4060 Laptop GPU | 2 kg | 22.9 mm | 15.60" | 1920x1080 |
Obudowa i łączność - Intel NUC jest wyposażony w port Thunderbolt 4
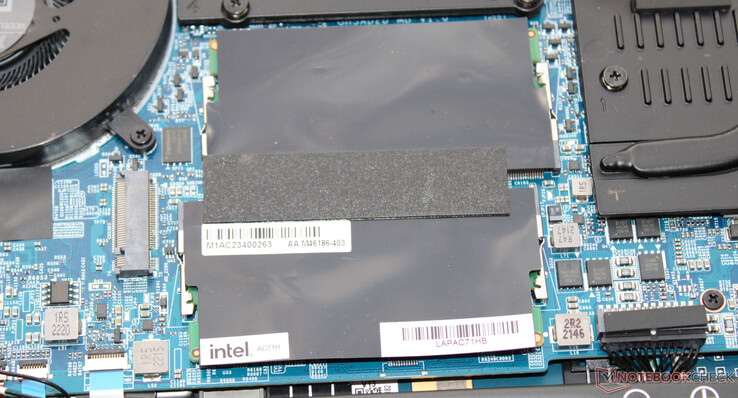
Tył pokrywy i górna część matowej, czarnej obudowy zostały wykonane z aluminium, a dolna część ramki wyświetlacza z tworzywa sztucznego. Nie odnotowaliśmy żadnych problemów z budową. Intel postawił na elegancką, okrojoną obudowę, która nie powinna zwracać na siebie zbytniej uwagi w profesjonalnym otoczeniu. Po zdemontowaniu dolnej części obudowy można uzyskać dostęp do baterii (przykręcanej, a nie przyklejanej), a także reszty wnętrza laptopa.
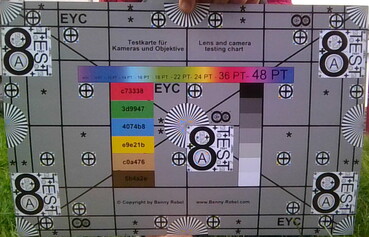
LAPAC71H posiada trzy porty USB-A (USB 3.2 Gen 1) i jeden port USB-C (Thunderbolt 4/USB 4). Ten ostatni nie obsługuje Power Delivery, ale może wyprowadzać sygnał DisplayPort. W sumie laptop ma dwa wyjścia wideo (1x HDMI, 1x DP). Intel nie wyposażył urządzenia w czytnik kart SD. Jego kamera internetowa (0,9 MP, maks. 1280 x 720 pikseli, bez osłony) zapewnia dość standardowe wyniki.
W optymalnych warunkach (brak urządzeń WiFi w bliskim sąsiedztwie, niewielka odległość między laptopem a serwerem PC) może osiągnąć doskonałe prędkości transmisji danych WiFi. Laptop wykorzystuje układ WiFi 6E (Intel AX201). Za połączenia przewodowe również odpowiada kontroler Intela (I225-V; 2,5 GBit/s).
Urządzenia wejściowe - Klawiatura z podświetleniem RGB
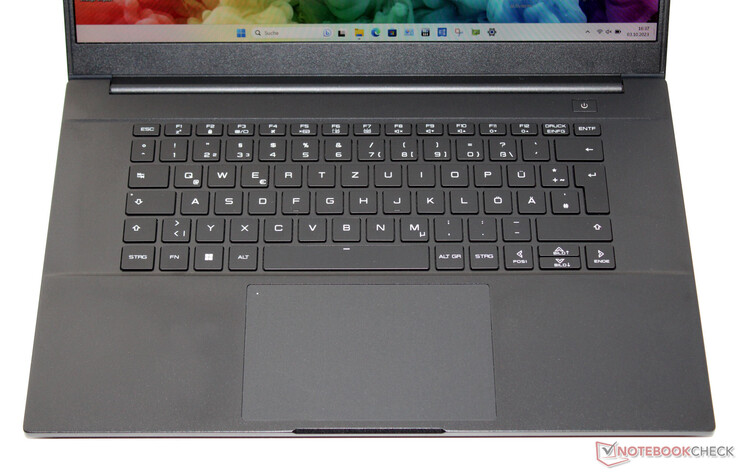
Klawiatura typu chiclet (podświetlenie RGB) laptopa nie posiada klawiatury numerycznej, mimo że byłoby na nią wystarczająco dużo miejsca. Jej równe, gładkie klawisze charakteryzują się średnim skokiem i wyraźnym punktem nacisku. Opór klawiszy mógłby być nieco bardziej wyraźny. Klawiatura nie wypacza się podczas pisania na niej. Podsumowując, Intel dostarczył klawiaturę nadającą się do codziennego użytku. Jako zamiennik myszy zainstalowano clickpad (ok. 13,3 x 8,3 cm), który charakteryzuje się krótkim skokiem i wyraźnym punktem nacisku.
Wyświetlacz - LAPAC71H posiada panel FHD o wysokim kontraście
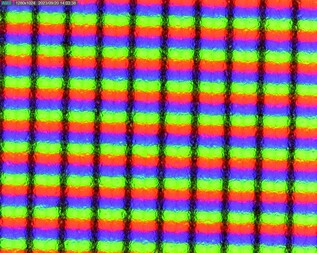
Szybko reagujący panel 144 Hz o proporcjach 16:9 nie wykazuje migotania PWM przy żadnym poziomie jasności. Jasność i kontrast 15,6-calowego wyświetlacza (1,920 x 1,080 pikseli) zostały osiągnięte (> 300 cd/m² i 1.000:1). Na uwagę zasługuje stosunkowo wysoki kontrast. Inne opcje wyświetlania nie są dostępne.
| |||||||||||||||||||||||||
rozświetlenie: 86 %
na akumulatorze: 366 cd/m²
kontrast: 2147:1 (czerń: 0.17 cd/m²)
ΔE ColorChecker Calman: 3.51 | ∀{0.5-29.43 Ø4.76}
calibrated: 1.88
ΔE Greyscale Calman: 3.83 | ∀{0.09-98 Ø5}
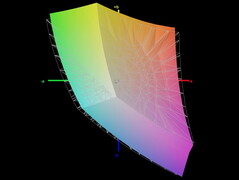
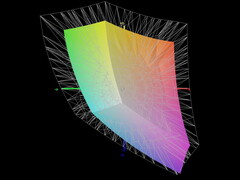
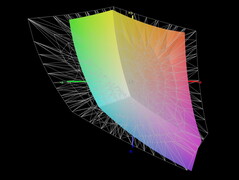
66.3% AdobeRGB 1998 (Argyll 3D)
92.6% sRGB (Argyll 3D)
64.9% Display P3 (Argyll 3D)
Gamma: 2.47
CCT: 7362 K
| Intel NUC X15 LAPAC71H BOE HF NV156FHM-N4G, IPS, 1920x1080, 15.6" | Asus TUF A15 FA507 N156HMA-GA1, IPS, 1920x1080, 15.6" | Gigabyte G5 KE Chi Mei N156HRA-EA1, IPS, 1920x1080, 15.6" | Dell Inspiron 16 Plus 7630 LG Philips 160WQ2, IPS, 2560x1600, 16" | Asus VivoBook Pro 16 Au Optronics B160QAN02.L, IPS, 2560x1600, 16" | MSI Cyborg 15 A12VF AU Optronics B156HAN15.1, IPS, 1920x1080, 15.6" | |
|---|---|---|---|---|---|---|
| Display | 1% | -36% | 8% | 30% | -34% | |
| Display P3 Coverage (%) | 64.9 | 64.9 0% | 40.7 -37% | 70.1 8% | 98.5 52% | 42.3 -35% |
| sRGB Coverage (%) | 92.6 | 96.5 4% | 61 -34% | 99.6 8% | 99.9 8% | 62.6 -32% |
| AdobeRGB 1998 Coverage (%) | 66.3 | 66.6 0% | 42.1 -37% | 72.3 9% | 86.1 30% | 43.7 -34% |
| Response Times | -238% | -199% | -291% | 32% | -137% | |
| Response Time Grey 50% / Grey 80% * (ms) | 7.8 ? | 30.4 ? -290% | 26.64 ? -242% | 35 ? -349% | 2 ? 74% | 22 ? -182% |
| Response Time Black / White * (ms) | 7.3 ? | 20.8 ? -185% | 18.65 ? -155% | 24.2 ? -232% | 8 ? -10% | 14 ? -92% |
| PWM Frequency (Hz) | ||||||
| Screen | 13% | -67% | -10% | 5% | -27% | |
| Brightness middle (cd/m²) | 365 | 288 -21% | 269 -26% | 299.4 -18% | 504 38% | 247 -32% |
| Brightness (cd/m²) | 356 | 271 -24% | 248 -30% | 290 -19% | 465 31% | 234 -34% |
| Brightness Distribution (%) | 86 | 91 6% | 85 -1% | 92 7% | 87 1% | 89 3% |
| Black Level * (cd/m²) | 0.17 | 0.17 -0% | 0.5 -194% | 0.21 -24% | 0.35 -106% | 0.25 -47% |
| Contrast (:1) | 2147 | 1694 -21% | 538 -75% | 1426 -34% | 1440 -33% | 988 -54% |
| Colorchecker dE 2000 * | 3.51 | 1.9 46% | 4.54 -29% | 4.25 -21% | 1.83 48% | 3.78 -8% |
| Colorchecker dE 2000 max. * | 6.37 | 3.3 48% | 17.28 -171% | 6.71 -5% | 5.51 14% | 6.42 -1% |
| Colorchecker dE 2000 calibrated * | 1.88 | 0.9 52% | 3.34 -78% | 0.52 72% | 1.34 29% | 3.94 -110% |
| Greyscale dE 2000 * | 3.83 | 2.7 30% | 3.8 1% | 5.5 -44% | 3.02 21% | 2.16 44% |
| Gamma | 2.47 89% | 2.32 95% | 2.17 101% | 2.35 94% | 2.39 92% | 2.33 94% |
| CCT | 7362 88% | 6535 99% | 7408 88% | 6368 102% | 6688 97% | 6906 94% |
| Całkowita średnia (program / ustawienia) | -75% /
-25% | -101% /
-79% | -98% /
-46% | 22% /
14% | -66% /
-44% |
* ... im mniej tym lepiej
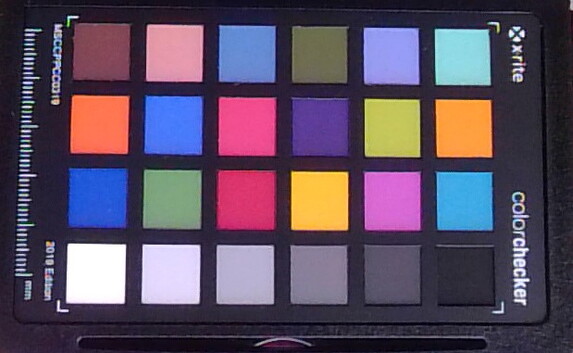
Ex działa, wyświetlacz pokazuje stosunkowo dobre odwzorowanie kolorów: Przy odchyleniu wynoszącym około 3,5, jego cel (DeltaE < 3) został właśnie osiągnięty. Kalibracja ekranu obniża odchylenie do 1,9 i prowadzi do bardziej zrównoważonych odcieni szarości. Panel może prawie całkowicie pokryć przestrzeń kolorów sRGB, ale nie AdobeRGB lub DCI P3. Większość konkurencyjnych paneli prezentuje podobny obraz. TylkoVivoBookmoże pokryć przestrzeń kolorów P3.
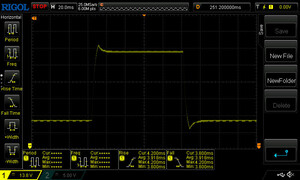
Wyświetl czasy reakcji
| ↔ Czas reakcji od czerni do bieli | ||
|---|---|---|
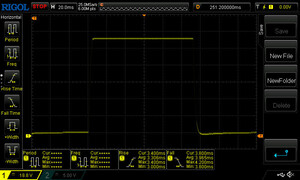
| 7.3 ms ... wzrost ↗ i spadek ↘ łącznie | ↗ 3.3 ms wzrost | |
| ↘ 4 ms upadek | ||
| W naszych testach ekran wykazuje bardzo szybką reakcję i powinien bardzo dobrze nadawać się do szybkich gier. Dla porównania, wszystkie testowane urządzenia wahają się od 0.1 (minimum) do 240 (maksimum) ms. » 21 % wszystkich urządzeń jest lepszych. Oznacza to, że zmierzony czas reakcji jest lepszy od średniej wszystkich testowanych urządzeń (20.1 ms). | ||
| ↔ Czas reakcji 50% szarości do 80% szarości | ||
| 7.8 ms ... wzrost ↗ i spadek ↘ łącznie | ↗ 3.9 ms wzrost | |
| ↘ 3.9 ms upadek | ||
| W naszych testach ekran wykazuje bardzo szybką reakcję i powinien bardzo dobrze nadawać się do szybkich gier. Dla porównania, wszystkie testowane urządzenia wahają się od 0.165 (minimum) do 636 (maksimum) ms. » 19 % wszystkich urządzeń jest lepszych. Oznacza to, że zmierzony czas reakcji jest lepszy od średniej wszystkich testowanych urządzeń (31.5 ms). | ||
Migotanie ekranu / PWM (modulacja szerokości impulsu)
| Migotanie ekranu/nie wykryto PWM | |||
Dla porównania: 53 % wszystkich testowanych urządzeń nie używa PWM do przyciemniania wyświetlacza. Jeśli wykryto PWM, zmierzono średnio 8039 (minimum: 5 - maksimum: 343500) Hz. | |||
Wydajność - zespół Intela napędza laptopa do gier
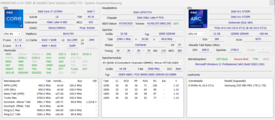
ACore i7-12700Horaz Arc A730Mzasilają komputer Intel NUC X15 LAPAC71H przeznaczony dla graczy i twórców. Inne opcje nie są dostępne. Laptop można obecnie znaleźć od około 1050 USD. Obecny wariant kosztuje około 1280 USD. Prawdopodobnie będą Państwo musieli doliczyć dodatkowe koszty za licencję na system Windows.
Warunki testowania
Oprogramowanie Intel NUC Software Studio (Control Center) udostępnia trzy profile pozwalające wpływać na wydajność i sterowanie wentylatorami (patrz tabela). Do przeprowadzenia tego testu wykorzystano profile "Wydajność" (testy porównawcze) i "Tryb oszczędzania energii" (testy baterii). Maksymalna wydajność jest dostępna tylko po aktywowaniu opcji "Benchmark Mode". Wówczas jednak wentylatory również pracują stale z pełną mocą.
| Wydajność | Zrównoważony | Tryb oszczędzania energii | Tryb testowy | |
|---|---|---|---|---|
| Limit mocy 1 (HWInfo) | 45 watów | 35 watów | 35 watów | 45 watów |
| Limit mocy 2 (HWInfo) | 90 watów | 80 watów | 65 watów | 90 watów |
| TGP (Arc Control) | 75 watów | 65 watów | 55 watów | 85 watów |
Procesor
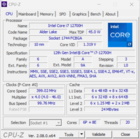
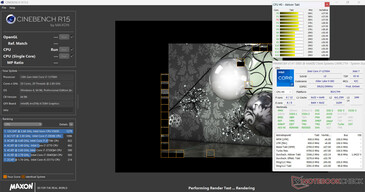
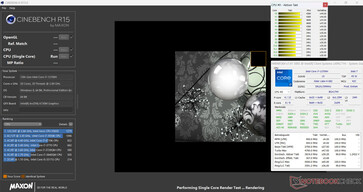
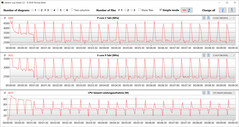
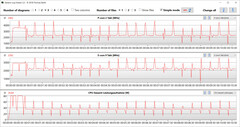
14 rdzeni procesora Core i7-12700H (6P, 8E) osiąga maksymalne taktowanie na poziomie 4,7 GHz (P) i 3,5 GHz (E). Ciągła wydajność wielowątkowa (CB15 Loop) doprowadziła do spadku taktowania turbo od pierwszego do drugiego uruchomienia. Następnie taktowanie pozostało stabilne.
Wyniki benchmarków były nieco powyżej średniej CPU po podłączeniu do sieci. W trybie bateryjnym, bardziej istotna wydajność jednowątkowa (213 punktów) spadła w mniejszym stopniu niż wydajność wielowątkowa (1,012 punktów).
Cinebench R15 Multi continuous test
* ... im mniej tym lepiej
AIDA64: FP32 Ray-Trace | FPU Julia | CPU SHA3 | CPU Queen | FPU SinJulia | FPU Mandel | CPU AES | CPU ZLib | FP64 Ray-Trace | CPU PhotoWorxx
| Performance rating | |
| Średnia w klasie Multimedia | |
| Asus TUF A15 FA507 | |
| Intel NUC X15 LAPAC71H | |
| Dell Inspiron 16 Plus 7630 | |
| Gigabyte G5 KE | |
| Asus VivoBook Pro 16 | |
| MSI Cyborg 15 A12VF | |
| Przeciętny Intel Core i7-12700H | |
| AIDA64 / FP32 Ray-Trace | |
| Średnia w klasie Multimedia (2214 - 50388, n=58, ostatnie 2 lata) | |
| Asus TUF A15 FA507 | |
| Asus VivoBook Pro 16 | |
| Dell Inspiron 16 Plus 7630 | |
| Intel NUC X15 LAPAC71H | |
| MSI Cyborg 15 A12VF | |
| Gigabyte G5 KE | |
| Przeciętny Intel Core i7-12700H (2585 - 17957, n=64) | |
| AIDA64 / FPU Julia | |
| Asus TUF A15 FA507 | |
| Średnia w klasie Multimedia (12867 - 201874, n=59, ostatnie 2 lata) | |
| Asus VivoBook Pro 16 | |
| MSI Cyborg 15 A12VF | |
| Dell Inspiron 16 Plus 7630 | |
| Gigabyte G5 KE | |
| Intel NUC X15 LAPAC71H | |
| Przeciętny Intel Core i7-12700H (12439 - 90760, n=64) | |
| AIDA64 / CPU SHA3 | |
| Średnia w klasie Multimedia (653 - 8623, n=59, ostatnie 2 lata) | |
| Asus TUF A15 FA507 | |
| Asus VivoBook Pro 16 | |
| Gigabyte G5 KE | |
| Przeciętny Intel Core i7-12700H (833 - 4242, n=64) | |
| Dell Inspiron 16 Plus 7630 | |
| Intel NUC X15 LAPAC71H | |
| MSI Cyborg 15 A12VF | |
| AIDA64 / CPU Queen | |
| Dell Inspiron 16 Plus 7630 | |
| Asus TUF A15 FA507 | |
| Asus VivoBook Pro 16 | |
| Intel NUC X15 LAPAC71H | |
| Przeciętny Intel Core i7-12700H (57923 - 103202, n=63) | |
| MSI Cyborg 15 A12VF | |
| Gigabyte G5 KE | |
| Średnia w klasie Multimedia (13483 - 181505, n=59, ostatnie 2 lata) | |
| AIDA64 / FPU SinJulia | |
| Asus TUF A15 FA507 | |
| Średnia w klasie Multimedia (1240 - 28794, n=59, ostatnie 2 lata) | |
| Przeciętny Intel Core i7-12700H (3249 - 9939, n=64) | |
| Asus VivoBook Pro 16 | |
| Dell Inspiron 16 Plus 7630 | |
| MSI Cyborg 15 A12VF | |
| Intel NUC X15 LAPAC71H | |
| Gigabyte G5 KE | |
| AIDA64 / FPU Mandel | |
| Asus TUF A15 FA507 | |
| Średnia w klasie Multimedia (6395 - 105740, n=58, ostatnie 2 lata) | |
| Asus VivoBook Pro 16 | |
| Dell Inspiron 16 Plus 7630 | |
| Gigabyte G5 KE | |
| Intel NUC X15 LAPAC71H | |
| MSI Cyborg 15 A12VF | |
| Przeciętny Intel Core i7-12700H (7135 - 44760, n=64) | |
| AIDA64 / CPU AES | |
| Intel NUC X15 LAPAC71H | |
| Gigabyte G5 KE | |
| Przeciętny Intel Core i7-12700H (31839 - 144360, n=64) | |
| Średnia w klasie Multimedia (13243 - 152179, n=59, ostatnie 2 lata) | |
| Asus TUF A15 FA507 | |
| Asus VivoBook Pro 16 | |
| MSI Cyborg 15 A12VF | |
| Dell Inspiron 16 Plus 7630 | |
| AIDA64 / CPU ZLib | |
| Średnia w klasie Multimedia (167.2 - 2022, n=59, ostatnie 2 lata) | |
| Przeciętny Intel Core i7-12700H (305 - 1171, n=64) | |
| Asus VivoBook Pro 16 | |
| Gigabyte G5 KE | |
| MSI Cyborg 15 A12VF | |
| Intel NUC X15 LAPAC71H | |
| Dell Inspiron 16 Plus 7630 | |
| Asus TUF A15 FA507 | |
| AIDA64 / FP64 Ray-Trace | |
| Średnia w klasie Multimedia (1014 - 26875, n=59, ostatnie 2 lata) | |
| Asus TUF A15 FA507 | |
| Asus VivoBook Pro 16 | |
| Dell Inspiron 16 Plus 7630 | |
| Gigabyte G5 KE | |
| Intel NUC X15 LAPAC71H | |
| MSI Cyborg 15 A12VF | |
| Przeciętny Intel Core i7-12700H (1437 - 9692, n=64) | |
| AIDA64 / CPU PhotoWorxx | |
| Średnia w klasie Multimedia (12860 - 65787, n=59, ostatnie 2 lata) | |
| Intel NUC X15 LAPAC71H | |
| Dell Inspiron 16 Plus 7630 | |
| MSI Cyborg 15 A12VF | |
| Przeciętny Intel Core i7-12700H (12863 - 52207, n=64) | |
| Gigabyte G5 KE | |
| Asus TUF A15 FA507 | |
| Asus VivoBook Pro 16 | |
Wydajność systemu
CrossMark: Overall | Productivity | Creativity | Responsiveness
| PCMark 10 / Score | |
| Dell Inspiron 16 Plus 7630 | |
| Asus TUF A15 FA507 | |
| Gigabyte G5 KE | |
| MSI Cyborg 15 A12VF | |
| Średnia w klasie Multimedia (4325 - 10386, n=54, ostatnie 2 lata) | |
| Intel NUC X15 LAPAC71H | |
| Przeciętny Intel Core i7-12700H, Intel Arc A730M (6830 - 6845, n=2) | |
| Asus VivoBook Pro 16 | |
| PCMark 10 / Essentials | |
| Dell Inspiron 16 Plus 7630 | |
| Gigabyte G5 KE | |
| Przeciętny Intel Core i7-12700H, Intel Arc A730M (10529 - 11116, n=2) | |
| MSI Cyborg 15 A12VF | |
| Asus TUF A15 FA507 | |
| Intel NUC X15 LAPAC71H | |
| Średnia w klasie Multimedia (8025 - 11664, n=54, ostatnie 2 lata) | |
| Asus VivoBook Pro 16 | |
| PCMark 10 / Productivity | |
| MSI Cyborg 15 A12VF | |
| Średnia w klasie Multimedia (7323 - 18233, n=54, ostatnie 2 lata) | |
| Gigabyte G5 KE | |
| Dell Inspiron 16 Plus 7630 | |
| Asus TUF A15 FA507 | |
| Asus VivoBook Pro 16 | |
| Przeciętny Intel Core i7-12700H, Intel Arc A730M (7070 - 7260, n=2) | |
| Intel NUC X15 LAPAC71H | |
| PCMark 10 / Digital Content Creation | |
| Intel NUC X15 LAPAC71H | |
| Dell Inspiron 16 Plus 7630 | |
| Przeciętny Intel Core i7-12700H, Intel Arc A730M (10714 - 11691, n=2) | |
| Asus TUF A15 FA507 | |
| Średnia w klasie Multimedia (3651 - 16240, n=54, ostatnie 2 lata) | |
| Gigabyte G5 KE | |
| Asus VivoBook Pro 16 | |
| MSI Cyborg 15 A12VF | |
| CrossMark / Overall | |
| Intel NUC X15 LAPAC71H | |
| Przeciętny Intel Core i7-12700H, Intel Arc A730M (n=1) | |
| Dell Inspiron 16 Plus 7630 | |
| MSI Cyborg 15 A12VF | |
| Średnia w klasie Multimedia (866 - 2426, n=62, ostatnie 2 lata) | |
| Gigabyte G5 KE | |
| Asus VivoBook Pro 16 | |
| Asus TUF A15 FA507 | |
| CrossMark / Productivity | |
| Intel NUC X15 LAPAC71H | |
| Przeciętny Intel Core i7-12700H, Intel Arc A730M (n=1) | |
| Dell Inspiron 16 Plus 7630 | |
| Gigabyte G5 KE | |
| MSI Cyborg 15 A12VF | |
| Średnia w klasie Multimedia (913 - 2344, n=62, ostatnie 2 lata) | |
| Asus VivoBook Pro 16 | |
| Asus TUF A15 FA507 | |
| CrossMark / Creativity | |
| Dell Inspiron 16 Plus 7630 | |
| Średnia w klasie Multimedia (907 - 2820, n=62, ostatnie 2 lata) | |
| Intel NUC X15 LAPAC71H | |
| Przeciętny Intel Core i7-12700H, Intel Arc A730M (n=1) | |
| MSI Cyborg 15 A12VF | |
| Gigabyte G5 KE | |
| Asus TUF A15 FA507 | |
| Asus VivoBook Pro 16 | |
| CrossMark / Responsiveness | |
| Intel NUC X15 LAPAC71H | |
| Przeciętny Intel Core i7-12700H, Intel Arc A730M (n=1) | |
| Gigabyte G5 KE | |
| Asus VivoBook Pro 16 | |
| MSI Cyborg 15 A12VF | |
| Dell Inspiron 16 Plus 7630 | |
| Średnia w klasie Multimedia (605 - 2024, n=62, ostatnie 2 lata) | |
| Asus TUF A15 FA507 | |
| PCMark 10 Score | 6845 pkt. | |
Pomoc | ||
| AIDA64 / Memory Copy | |
| Średnia w klasie Multimedia (21158 - 109252, n=59, ostatnie 2 lata) | |
| Intel NUC X15 LAPAC71H | |
| Dell Inspiron 16 Plus 7630 | |
| MSI Cyborg 15 A12VF | |
| Przeciętny Intel Core i7-12700H (25615 - 80511, n=64) | |
| Asus TUF A15 FA507 | |
| Gigabyte G5 KE | |
| Asus VivoBook Pro 16 | |
| AIDA64 / Memory Read | |
| Średnia w klasie Multimedia (19699 - 125604, n=59, ostatnie 2 lata) | |
| Dell Inspiron 16 Plus 7630 | |
| Intel NUC X15 LAPAC71H | |
| MSI Cyborg 15 A12VF | |
| Przeciętny Intel Core i7-12700H (25586 - 79442, n=64) | |
| Asus TUF A15 FA507 | |
| Gigabyte G5 KE | |
| Asus VivoBook Pro 16 | |
| AIDA64 / Memory Write | |
| Średnia w klasie Multimedia (17733 - 117933, n=59, ostatnie 2 lata) | |
| Intel NUC X15 LAPAC71H | |
| Dell Inspiron 16 Plus 7630 | |
| MSI Cyborg 15 A12VF | |
| Asus TUF A15 FA507 | |
| Przeciętny Intel Core i7-12700H (23679 - 88660, n=64) | |
| Gigabyte G5 KE | |
| Asus VivoBook Pro 16 | |
| AIDA64 / Memory Latency | |
| Średnia w klasie Multimedia (7 - 535, n=59, ostatnie 2 lata) | |
| Gigabyte G5 KE | |
| Dell Inspiron 16 Plus 7630 | |
| Asus VivoBook Pro 16 | |
| MSI Cyborg 15 A12VF | |
| Intel NUC X15 LAPAC71H | |
| Asus TUF A15 FA507 | |
| Przeciętny Intel Core i7-12700H (76.2 - 133.9, n=62) | |
* ... im mniej tym lepiej
Opóźnienie DPC
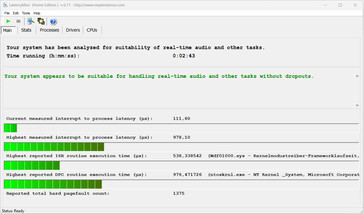
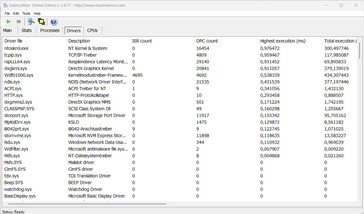
Standardowy test monitora opóźnień (surfowanie po sieci, odtwarzanie wideo 4k, wysokie obciążenie Prime95) nie wykazał żadnych nieprawidłowości. System wydaje się być odpowiedni do edycji wideo i audio w czasie rzeczywistym. Przyszłe aktualizacje oprogramowania mogą doprowadzić do poprawy lub nawet pogorszenia wydajności.
| DPC Latencies / LatencyMon - interrupt to process latency (max), Web, Youtube, Prime95 | |
| Asus VivoBook Pro 16 | |
| MSI Cyborg 15 A12VF | |
| Dell Inspiron 16 Plus 7630 | |
| Gigabyte G5 KE | |
| Intel NUC X15 LAPAC71H | |
* ... im mniej tym lepiej
Urządzenia pamięci masowej
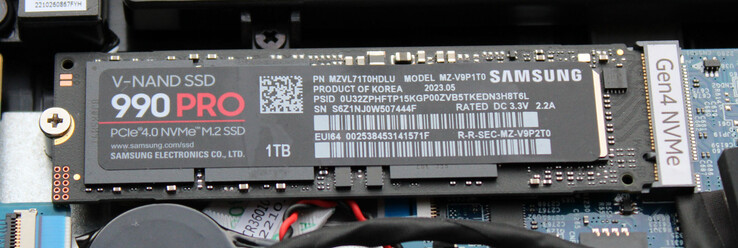
Laptop może pomieścić dwa dyski SSD M.2-2280 (1x PCIe 4.0, 1x PCIe 3.0/SATA). Obsługiwany jest RAID-0/1. Dysk SSD Samsung (1 TB, PCIe 4, M.2-2280) w naszym urządzeniu testowym zapewnił doskonałe prędkości transferu. Pozytywne: Nie wystąpił throttling termiczny.
* ... im mniej tym lepiej
Reading continuous performance: DiskSpd Read Loop, Queue Depth 8
Karta graficzna
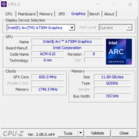
Arc A730MArc A730M- Drugi najpotężniejszy mobilny procesor graficzny Intela - ma maksymalne TGP 85 W, opiera się na superszybkiej pamięci GDDR6 (12 288 GB) i może osiągnąć maksymalną częstotliwość taktowania 2,05 GHz. Rdzeń graficzny nadaje się do grania w rozdzielczości FHD w średnich i wysokich ustawieniach. Mniej wymagające gry pozwalają na więcej.
Wydajność GPU w dużej mierze zależy od tego, który tryb wydajności jest używany: Profil "Wydajność" skutkował wynikami benchmarków poniżej (benchmarki syntetyczne) lub na równi (praktyka w grach) z wcześniej ustaloną średnią GPU. Maksymalna wydajność została osiągnięta, gdy aktywny był tryb "Benchmark" (TGP: 85 watów). Podsumowując, GPU uplasowało się pomiędzyGeForce RTX 3050 iRTX 3060 pod względem wydajności.
| 3DMark Performance rating - Percent | |
| Asus TUF A15 FA507 -1! | |
| Gigabyte G5 KE | |
| MSI Cyborg 15 A12VF | |
| Dell Inspiron 16 Plus 7630 -1! | |
| Przeciętny Intel Arc A730M | |
| Intel NUC X15 LAPAC71H | |
| Średnia w klasie Multimedia | |
| Asus VivoBook Pro 16 | |
| 3DMark 11 Performance | 23160 pkt. | |
| 3DMark Cloud Gate Standard Score | 46415 pkt. | |
| 3DMark Fire Strike Score | 17884 pkt. | |
| 3DMark Time Spy Score | 7653 pkt. | |
Pomoc | ||
* ... im mniej tym lepiej
| The Witcher 3 - 1920x1080 Ultra Graphics & Postprocessing (HBAO+) | |
| Dell Inspiron 16 Plus 7630 | |
| Gigabyte G5 KE | |
| Asus TUF A15 FA507 | |
| MSI Cyborg 15 A12VF | |
| Średnia w klasie Multimedia (11 - 121, n=25, ostatnie 2 lata) | |
| Asus VivoBook Pro 16 | |
| Przeciętny Intel Arc A730M (39.8 - 49.4, n=2) | |
| Intel NUC X15 LAPAC71H | |
| GTA V - 1920x1080 Highest AA:4xMSAA + FX AF:16x | |
| Gigabyte G5 KE | |
| MSI Cyborg 15 A12VF | |
| Asus TUF A15 FA507 | |
| Średnia w klasie Multimedia (9.51 - 141.6, n=59, ostatnie 2 lata) | |
| Asus VivoBook Pro 16 | |
| Przeciętny Intel Arc A730M (40.1 - 43.1, n=3) | |
| Intel NUC X15 LAPAC71H | |
| Final Fantasy XV Benchmark - 1920x1080 High Quality | |
| Gigabyte G5 KE | |
| Dell Inspiron 16 Plus 7630 | |
| Asus TUF A15 FA507 | |
| MSI Cyborg 15 A12VF | |
| Średnia w klasie Multimedia (7.61 - 144.4, n=64, ostatnie 2 lata) | |
| Asus VivoBook Pro 16 | |
| Przeciętny Intel Arc A730M (41.1 - 49.7, n=3) | |
| Intel NUC X15 LAPAC71H | |
| Dota 2 Reborn - 1920x1080 ultra (3/3) best looking | |
| Dell Inspiron 16 Plus 7630 | |
| Gigabyte G5 KE | |
| MSI Cyborg 15 A12VF | |
| Asus TUF A15 FA507 | |
| Asus VivoBook Pro 16 | |
| Intel NUC X15 LAPAC71H | |
| Średnia w klasie Multimedia (29 - 179.9, n=66, ostatnie 2 lata) | |
| Przeciętny Intel Arc A730M (80.4 - 91.9, n=3) | |
Witcher 3 FPS diagram
| low | med. | high | ultra | |
|---|---|---|---|---|
| GTA V (2015) | 177.4 | 170.6 | 94.3 | 40.1 |
| The Witcher 3 (2015) | 267.3 | 190.3 | 106.9 | 39.8 |
| Dota 2 Reborn (2015) | 102.2 | 101.6 | 96.8 | 91.9 |
| Final Fantasy XV Benchmark (2018) | 98.5 | 67.9 | 41.1 | |
| X-Plane 11.11 (2018) | 70.7 | 55.8 | 47.6 | |
| Strange Brigade (2018) | 377 | 167.8 | 140 | 116.6 |
| Control (2019) | 145.7 | 66 | 51.1 | |
| Flight Simulator 2020 (2020) | 69.3 | 44.2 | 33.7 | 25.7 |
| Cyberpunk 2077 1.6 (2022) | 70.5 | 57.5 | 50.4 | 47 |
| Uncharted Legacy of Thieves Collection (2022) | 31.3 | 35.3 | 27.6 | 26.7 |
| Call of Duty Modern Warfare 2 2022 (2022) | 77 | 65 | 56 | 55 |
| Spider-Man Miles Morales (2022) | 60.5 | 58 | 53.4 | 51.4 |
| The Callisto Protocol (2022) | 80.2 | 72.6 | 67.9 | 47.5 |
| Need for Speed Unbound (2022) | 59.8 | 52.5 | 44.7 | 37.9 |
| High On Life (2023) | 147.9 | 110.1 | 80.9 | 64.7 |
| The Witcher 3 v4 (2023) | 126.2 | 102.8 | 51.2 | 44.4 |
| Dead Space Remake (2023) | 48.2 | 46.7 | 42.2 | 41.3 |
| Hogwarts Legacy (2023) | 69.6 | 48.6 | 43.7 | 34.3 |
| Returnal (2023) | 55 | 53 | 49 | 41 |
| Atomic Heart (2023) | 100.1 | 73.3 | 51.1 | 37.5 |
| Company of Heroes 3 (2023) | 111.3 | 90.6 | 74 | 72.8 |
| Sons of the Forest (2023) | 53.1 | 35.2 | 34.9 | 34.2 |
| Resident Evil 4 Remake (2023) | 86.4 | 64.9 | 60 | 41.3 |
| The Last of Us (2023) | 34.3 | 32.2 | 31.3 | 28.7 |
| Star Wars Jedi Survivor (2023) | 44 | 39.4 | 36.7 | 34.7 |
| Diablo 4 (2023) | 129.7 | 115.6 | 104.5 | 87.8 |
| F1 23 (2023) | 164.9 | 150.3 | 109.6 | 33.1 |
| Ratchet & Clank Rift Apart (2023) | 55.4 | 50.7 | 42.5 | 42.1 |
| Atlas Fallen (2023) | 78 | 74.1 | 70.4 | 59.2 |
| Starfield (2023) | 34 | 30.1 | 24.8 | 22 |
| The Crew Motorfest (2023) | 60 | 57 | 50 | 46 |
| Lies of P (2023) | 97 | 85.8 | 75.1 | 67 |
| Baldur's Gate 3 (2023) | 74.6 | 63 | 55.1 | 52.8 |
| Cyberpunk 2077 (2023) | 71.6 | 57 | 50 | 47.7 |
| EA Sports FC 24 (2023) | 121.8 | |||
| Assassin's Creed Mirage (2023) | 60 | 55 | 55 | 44 |
| Total War Pharaoh (2023) | 207.4 | 121.7 | 74.9 | 60.9 |
| Lords of the Fallen (2023) | 45.1 | 40.1 | 36.8 | 35.4 |
Emisje i zasilanie - NUC X15 zapewnia skromne czasy pracy
Emisja hałasu
Podczas grania emisja hałasu laptopa wzrasta do 51 dB(A) ("Wydajność"). "Tryb Benchmark" prowadzi do jeszcze głośniejszej emisji, ponieważ wentylatory stale pracują z pełną prędkością. W trybie bezczynności i w codziennym użytkowaniu (biuro, Internet) NUC jest znacznie cichszy. Jednakże: Jeden z dwóch wentylatorów stale pracuje na niskich obrotach. Aktywując ustawienie "Passive Cooling Mode" w oprogramowaniu NUC Software Studio, można temu zapobiec.
Hałas
| luz |
| 23 / 24 / 24 dB |
| obciążenie |
| 50.61 / 50.89 dB |
 | ||
30 dB cichy 40 dB(A) słyszalny 50 dB(A) irytujący |
||
min: | ||
| Intel NUC X15 LAPAC71H A730M, i7-12700H, Samsung 990 Pro 1 TB | Asus TUF A15 FA507 GeForce RTX 4050 Laptop GPU, R7 7735HS, Micron 2400 MTFDKBA512QFM | Gigabyte G5 KE GeForce RTX 3060 Laptop GPU, i5-12500H, Gigabyte AG4512G-SI B10 | Dell Inspiron 16 Plus 7630 GeForce RTX 4060 Laptop GPU, i7-13700H, WD PC SN740 SDDPTQD-1T00 | Asus VivoBook Pro 16 GeForce RTX 3050 Ti Laptop GPU, i7-12700H, Intel SSD 670p SSDPEKNU010TZ | MSI Cyborg 15 A12VF GeForce RTX 4060 Laptop GPU, i7-12650H, Samsung PM9B1 1024GB MZVL41T0HBLB | |
|---|---|---|---|---|---|---|
| Noise | 11% | -15% | 4% | -10% | -28% | |
| wyłączone / środowisko * (dB) | 23 | 23.3 -1% | 19.52 15% | 23.2 -1% | 25.2 -10% | 27 -17% |
| Idle Minimum * (dB) | 23 | 23.3 -1% | 31.05 -35% | 23.2 -1% | 25.2 -10% | 27 -17% |
| Idle Average * (dB) | 24 | 23.3 3% | 31.05 -29% | 23.2 3% | 25.2 -5% | 37.5 -56% |
| Idle Maximum * (dB) | 24 | 23.3 3% | 31.05 -29% | 23.2 3% | 25.2 -5% | 38 -58% |
| Load Average * (dB) | 50.61 | 29.6 42% | 55.66 -10% | 35.1 31% | 55.1 -9% | 56.3 -11% |
| Witcher 3 ultra * (dB) | 50.65 | 43 15% | 55.7 -10% | 52.5 -4% | ||
| Load Maximum * (dB) | 50.89 | 43 16% | 55.51 -9% | 52.5 -3% | 61.5 -21% | 56.3 -11% |
* ... im mniej tym lepiej
Temperatura
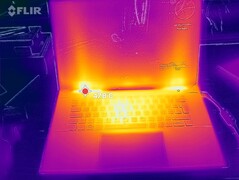
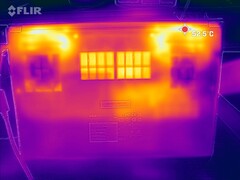
Wysokie obciążenia (stress test, Witcher 3 test) powodują znaczne nagrzewanie się laptopa w niektórych obszarach. Podsumowując, wartości nigdy nie osiągnęły krytycznych poziomów. W codziennym użytkowaniu (biuro, internet) temperatury obudowy utrzymują się w zielonej strefie.
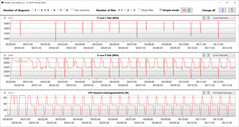
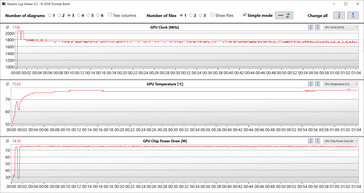
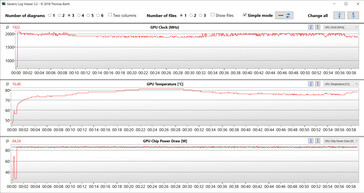
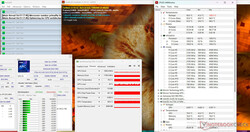
Test obciążeniowy (Prime95 i Furmark w trybie ciągłym) symuluje ekstremalny scenariusz w celu sprawdzenia stabilności systemu pod pełnym obciążeniem. Częstotliwości taktowania CPU i GPU wahały się w średnim zakresie.
(-) Maksymalna temperatura w górnej części wynosi 59 °C / 138 F, w porównaniu do średniej 36.9 °C / 98 F , począwszy od 21.1 do 71 °C dla klasy Multimedia.
(-) Dno nagrzewa się maksymalnie do 51 °C / 124 F, w porównaniu do średniej 39.2 °C / 103 F
(+) W stanie bezczynności średnia temperatura górnej części wynosi 27.3 °C / 81 F, w porównaniu ze średnią temperaturą urządzenia wynoszącą 31.3 °C / ### class_avg_f### F.
(-) Podczas gry w Wiedźmina 3 średnia temperatura górnej części wynosi 40.9 °C / 106 F, w porównaniu do średniej temperatury urządzenia wynoszącej 31.3 °C / ## #class_avg_f### F.
(±) Podpórki pod nadgarstki i touchpad mogą się bardzo nagrzać w dotyku, maksymalnie do 36 °C / 96.8 F.
(-) Średnia temperatura obszaru podparcia dłoni w podobnych urządzeniach wynosiła 28.7 °C / 83.7 F (-7.3 °C / -13.1 F).
| Intel NUC X15 LAPAC71H Intel Core i7-12700H, Intel Arc A730M | Asus TUF A15 FA507 AMD Ryzen 7 7735HS, NVIDIA GeForce RTX 4050 Laptop GPU | Gigabyte G5 KE Intel Core i5-12500H, NVIDIA GeForce RTX 3060 Laptop GPU | Dell Inspiron 16 Plus 7630 Intel Core i7-13700H, NVIDIA GeForce RTX 4060 Laptop GPU | Asus VivoBook Pro 16 Intel Core i7-12700H, NVIDIA GeForce RTX 3050 Ti Laptop GPU | MSI Cyborg 15 A12VF Intel Core i7-12650H, NVIDIA GeForce RTX 4060 Laptop GPU | |
|---|---|---|---|---|---|---|
| Heat | 10% | -12% | -2% | -6% | 13% | |
| Maximum Upper Side * (°C) | 59 | 48.9 17% | 52.6 11% | 47.8 19% | 44.2 25% | 47.5 19% |
| Maximum Bottom * (°C) | 51 | 44.6 13% | 62.4 -22% | 42.2 17% | 53 -4% | 35.5 30% |
| Idle Upper Side * (°C) | 28 | 27.1 3% | 33.6 -20% | 35.2 -26% | 32.1 -15% | 27.7 1% |
| Idle Bottom * (°C) | 30 | 27.5 8% | 34.8 -16% | 35 -17% | 38.4 -28% | 29.5 2% |
* ... im mniej tym lepiej
Głośniki
Głośniki stereo generują przyzwoity dźwięk, ale prawie bez basów.
Intel NUC X15 LAPAC71H analiza dźwięku
(±) | głośność głośnika jest średnia, ale dobra (79.38 dB)
Bas 100 - 315 Hz
(-) | prawie brak basu - średnio 17.1% niższa od mediany
(±) | liniowość basu jest średnia (14.2% delta do poprzedniej częstotliwości)
Średnie 400 - 2000 Hz
(+) | zbalansowane środki średnie - tylko 1.7% od mediany
(+) | średnie są liniowe (3.8% delta do poprzedniej częstotliwości)
Wysokie 2–16 kHz
(+) | zrównoważone maksima - tylko 2.2% od mediany
(+) | wzloty są liniowe (5.4% delta do poprzedniej częstotliwości)
Ogólnie 100 - 16.000 Hz
(+) | ogólny dźwięk jest liniowy (12.1% różnicy w stosunku do mediany)
W porównaniu do tej samej klasy
» 19% wszystkich testowanych urządzeń w tej klasie było lepszych, 3% podobnych, 78% gorszych
» Najlepszy miał deltę 5%, średnia wynosiła ###średnia###%, najgorsza wynosiła 45%
W porównaniu do wszystkich testowanych urządzeń
» 9% wszystkich testowanych urządzeń było lepszych, 2% podobnych, 89% gorszych
» Najlepszy miał deltę 4%, średnia wynosiła ###średnia###%, najgorsza wynosiła 134%
Dell Inspiron 16 Plus 7630 analiza dźwięku
(±) | głośność głośnika jest średnia, ale dobra (81.8 dB)
Bas 100 - 315 Hz
(-) | prawie brak basu - średnio 17% niższa od mediany
(±) | liniowość basu jest średnia (8.4% delta do poprzedniej częstotliwości)
Średnie 400 - 2000 Hz
(±) | wyższe średnie - średnio 6.3% wyższe niż mediana
(+) | średnie są liniowe (6.2% delta do poprzedniej częstotliwości)
Wysokie 2–16 kHz
(+) | zrównoważone maksima - tylko 2.2% od mediany
(+) | wzloty są liniowe (5.6% delta do poprzedniej częstotliwości)
Ogólnie 100 - 16.000 Hz
(±) | liniowość ogólnego dźwięku jest średnia (15.9% różnicy w stosunku do mediany)
W porównaniu do tej samej klasy
» 38% wszystkich testowanych urządzeń w tej klasie było lepszych, 6% podobnych, 56% gorszych
» Najlepszy miał deltę 5%, średnia wynosiła ###średnia###%, najgorsza wynosiła 45%
W porównaniu do wszystkich testowanych urządzeń
» 24% wszystkich testowanych urządzeń było lepszych, 5% podobnych, 71% gorszych
» Najlepszy miał deltę 4%, średnia wynosiła ###średnia###%, najgorsza wynosiła 134%
Zużycie energii
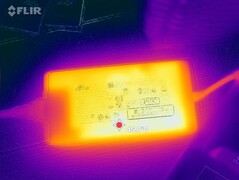
Pobór mocy laptopa jest na oczekiwanym poziomie dla zainstalowanego sprzętu. Test warunków skrajnych i Witcher 3 zostały przeprowadzone przy (nieznacznie) zmiennych poziomach poboru mocy. Dołączony zasilacz (230 W) jest wystarczającej wielkości.
Sądząc po wydajności na wat, urządzenie jest bardzo energochłonne. Dla porównania: TheMSI Cyborg potrzebuje tylko o połowę mniej energii pod obciążeniem, ale zapewnia znacznie wyższą wydajność w grach. KartaGeForce RTX 4060 w laptopie MSI, który jest ograniczony do TGP 45 watów, działa znacznie wydajniej niż Arc 730M.
| wyłączony / stan wstrzymania | |
| luz | |
| obciążenie |
|
Legenda:
min: | |
| Intel NUC X15 LAPAC71H Intel Core i7-12700H, Intel Arc A730M | Asus TUF A15 FA507 AMD Ryzen 7 7735HS, NVIDIA GeForce RTX 4050 Laptop GPU | Gigabyte G5 KE Intel Core i5-12500H, NVIDIA GeForce RTX 3060 Laptop GPU | Dell Inspiron 16 Plus 7630 Intel Core i7-13700H, NVIDIA GeForce RTX 4060 Laptop GPU | Asus VivoBook Pro 16 Intel Core i7-12700H, NVIDIA GeForce RTX 3050 Ti Laptop GPU | MSI Cyborg 15 A12VF Intel Core i7-12650H, NVIDIA GeForce RTX 4060 Laptop GPU | |
|---|---|---|---|---|---|---|
| Power Consumption | 12% | -1% | -18% | 1% | 32% | |
| Idle Minimum * (Watt) | 7.5 | 8 -7% | 7.66 -2% | 15.6 -108% | 8.7 -16% | 6 20% |
| Idle Average * (Watt) | 11.9 | 12.1 -2% | 10.3 13% | 17.7 -49% | 13.1 -10% | 8.8 26% |
| Idle Maximum * (Watt) | 13.9 | 12.5 10% | 16.05 -15% | 20.6 -48% | 18.3 -32% | 11.9 14% |
| Load Average * (Watt) | 137 | 74.9 45% | 115.8 15% | 87.4 36% | 116 15% | 89 35% |
| Witcher 3 ultra * (Watt) | 166 | 136.6 18% | 168.7 -2% | 121.7 27% | 117.6 29% | 90.3 46% |
| Load Maximum * (Watt) | 203 | 185 9% | 234.6 -16% | 138 32% | 162 20% | 99 51% |
* ... im mniej tym lepiej
Power consumption Witcher 3 / stress test
Power consumption with external monitor
Czas trwania
15,6-calowe urządzenie osiągnęło czas pracy 5:44 h w naszym realistycznym teście WLAN (mapowanie obciążenia podczas wywoływania stron internetowych za pomocą skryptu) - przyzwoita, ale nie rewelacyjna wartość.
Za
Przeciw
Werdykt - Nie ma tu żadnej okazji do negocjacji
Intel kieruje swoją ofertę NUC X15 do graczy i kreatywnych pracowników. Oznacza to, że edycja wideo i obrazów, strumieniowanie, renderowanie i gry należą do obszarów zastosowań tego laptopa. ACore i7-12700HiArc A730Mzapewniają niezbędną moc - oba układy pracują ze stałym, wysokim taktowaniem.
Intel NUC X15 ani nie zachwyca, ani nie rozczarowuje. Biorąc jednak pod uwagę wydajność procesora i wysoki pobór mocy, cena laptopa jest po prostu zbyt wysoka.
Jego nieefektywny procesor graficzny Arc zapewnia niższą wydajność w przeliczeniu na wat w porównaniu do porównywalnych konkurentów. Podobnie jak we wszystkich obecnych GPU (RX7000, RTX 4000), A730M posiada rdzenie ray-tracing i obsługę AV1 (dekodowanie i kodowanie) - funkcje, które są niezbędne w laptopie dla twórców.
Emisje urządzenia są typowe dla tej klasy. Praktyczny czas pracy wynoszący prawie 6 godzin można uznać za przyzwoity. Jego port USB-C (Thunderbolt 4) nie obsługuje Power Delivery, ale może wyprowadzać sygnał DisplayPort. Ponadto laptop oferuje opcje rozbudowy (rozwiązanie dokujące, zewnętrzne GPU). Podsumowując, zainstalowany wyświetlacz FHD (15,6 cala, IPS, 144 Hz) zrobił na nas dobre wrażenie.
Alternatywą może byćAsus VivoBook Pro 16: Charakteryzuje się nieco niższą wydajnością obliczeniową, jednak korzysta z dłuższych czasów pracy, Power Delivery i ekranu 16:10. Aorus 15 9KF-E3DE383SH może być dobrą alternatywą budżetową. Dzięki karcie GeForce RTX 4060 (TGP: 140 W) zapewnia znacznie lepszą wydajność w grach niż X15. Obecnie można go znaleźć w Internecie za około 1040 USD. Przetestowaliśmy jużmocniejszą wersjęaorus 15.
Cena i dostępność
Komputer Intel NUC X15 LAPAC71H można indywidualnie skonfigurować i zamówić za pośrednictwem sklepu internetowego Schenker. Obecne urządzenie testowe można nabyć za około 1280 USD. Wariant podstawowy (16 GB RAM, 500 GB SSD) można nabyć za około 1050 USD.
Intel NUC X15 LAPAC71H
- 13/10/2023 v7 (old)
Sascha Mölck
Przezroczystość
Wyboru urządzeń do recenzji dokonuje nasza redakcja. Próbka testowa została udostępniona autorowi jako pożyczka od producenta lub sprzedawcy detalicznego na potrzeby tej recenzji. Pożyczkodawca nie miał wpływu na tę recenzję, producent nie otrzymał też kopii tej recenzji przed publikacją. Nie było obowiązku publikowania tej recenzji. Jako niezależna firma medialna, Notebookcheck nie podlega władzy producentów, sprzedawców detalicznych ani wydawców.
Tak testuje Notebookcheck
Każdego roku Notebookcheck niezależnie sprawdza setki laptopów i smartfonów, stosując standardowe procedury, aby zapewnić porównywalność wszystkich wyników. Od około 20 lat stale rozwijamy nasze metody badawcze, ustanawiając przy tym standardy branżowe. W naszych laboratoriach testowych doświadczeni technicy i redaktorzy korzystają z wysokiej jakości sprzętu pomiarowego. Testy te obejmują wieloetapowy proces walidacji. Nasz kompleksowy system ocen opiera się na setkach uzasadnionych pomiarów i benchmarków, co pozwala zachować obiektywizm.

