 Deutsch
 English
 Español
 Français
 Italiano
 Nederlands
 Polski
 Português
 Русский
 Türkçe
 Svenska
 Chinese
 Magyar
Recenzja Beelink SER6 Pro: AMD Radeon 680M jest oszałamiający w mini PC
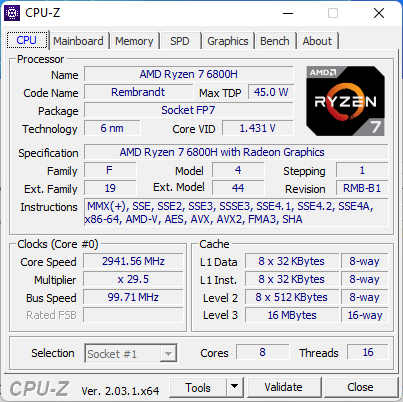
Beelink SER6 Pro jest następcą starszej generacji Beelink SER5 Pro. Wprowadza nowe zmiany zewnętrzne oraz unowocześniony procesor Zen 3+ Ryzen 7 6800H, który zastąpił Zen 3 Ryzen 7 5800H w ustępującym modelu. W chwili obecnej w SER6 Pro nie są dostępne inne opcje procesora.
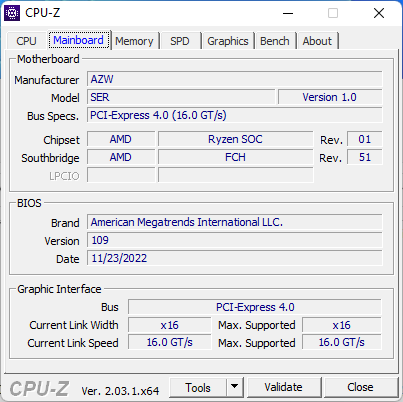
SER6 Pro konkuruje bezpośrednio z wieloma rozwiązaniami Intel NUC, a także Zotac ZBox czy MSI Cubi series. Nasza konkretna konfiguracja od Beelink kosztuje od 600 do 700 USD.
Więcej recenzji Beelink:
Potencjalni konkurenci w porównaniu
Rating | Date | Model | Weight | Height | Size | Resolution | Best Price |
|---|---|---|---|---|---|---|---|
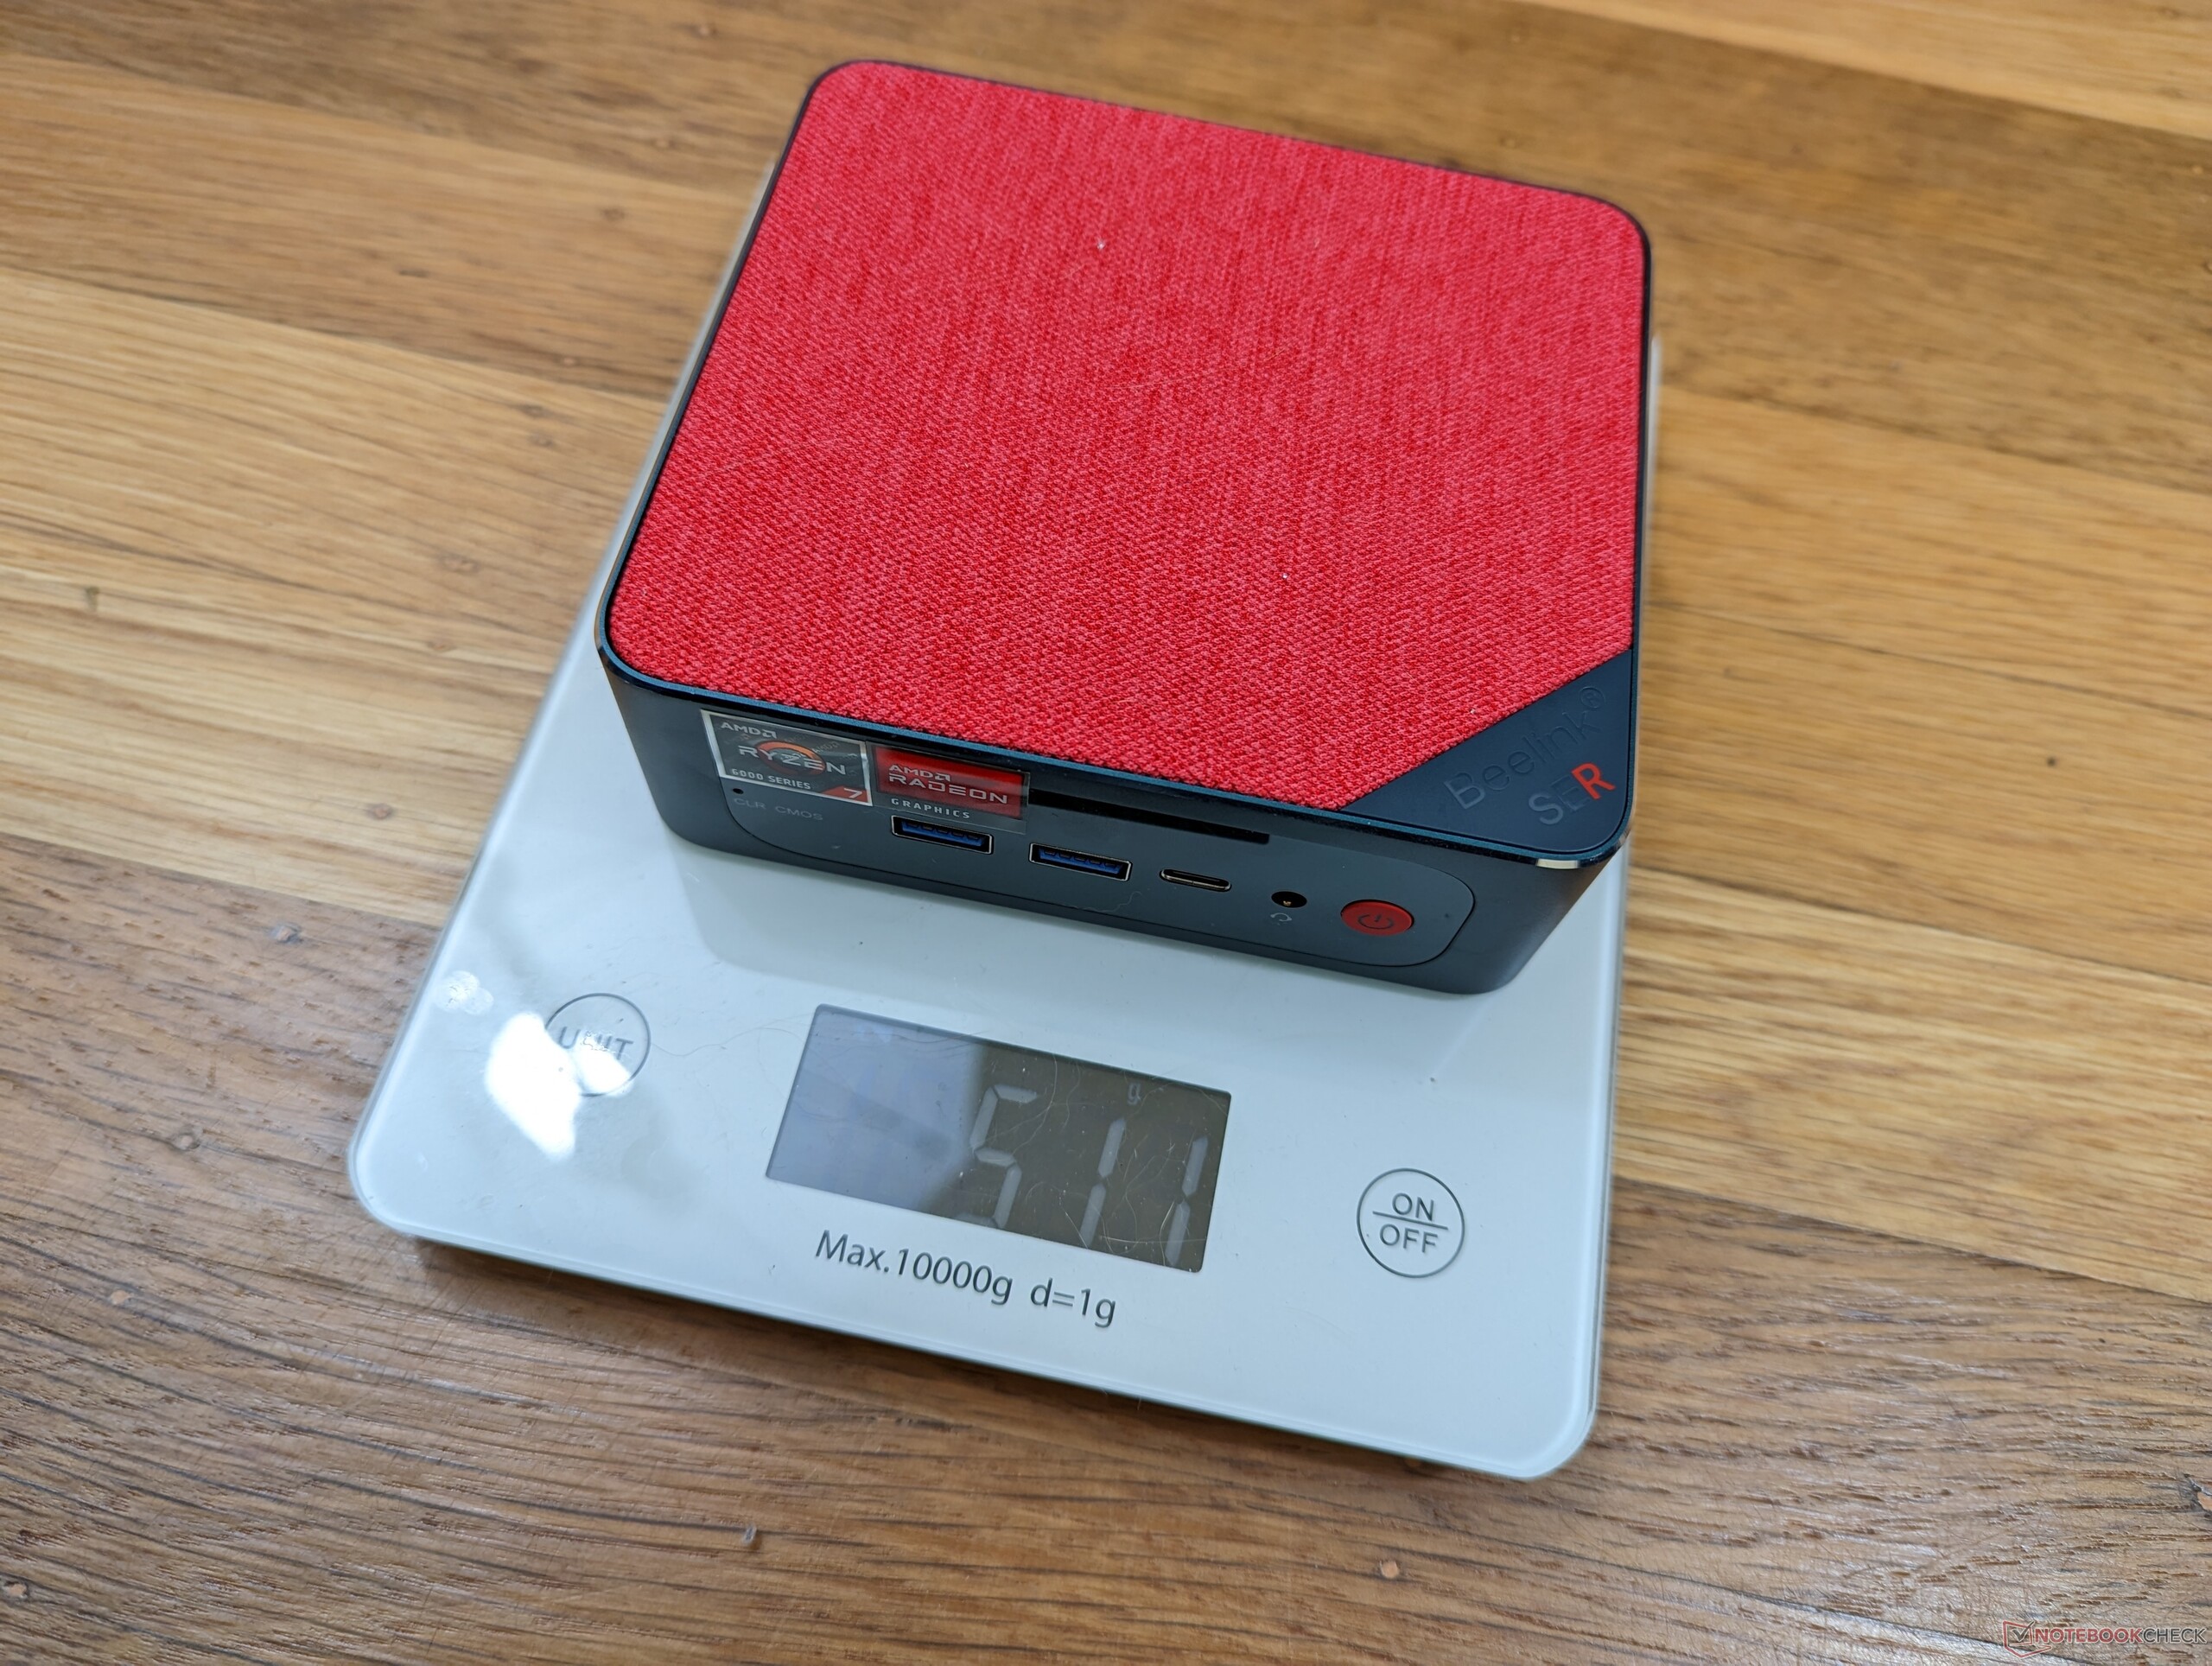
01/2023 | Beelink SER6 Pro R7 6800H, Radeon 680M | 511 g | 42 mm | x | |||
11/2022 | Beelink GTR6 R9 6900HX, Radeon 680M | 815 g | 43 mm | x | |||
10/2022 | Beelink SEi11 Pro i5-11320H, Iris Xe G7 96EUs | 440 g | 40 mm | x | |||
| 78.9 % | 11/2022 | Intel NUC 12 Pro Kit NUC12WSKi7 i7-1260P, Iris Xe G7 96EUs | 511 g | 37 mm | x | ||
| Intel NUC11PHKi7C i7-1165G7, GeForce RTX 2060 Mobile | 1.4 kg | 42 mm | x | ||||
| Intel Hades Canyon NUC8i7HVK i7-8809G, Vega M GH | 1.3 kg | 39 mm | x |
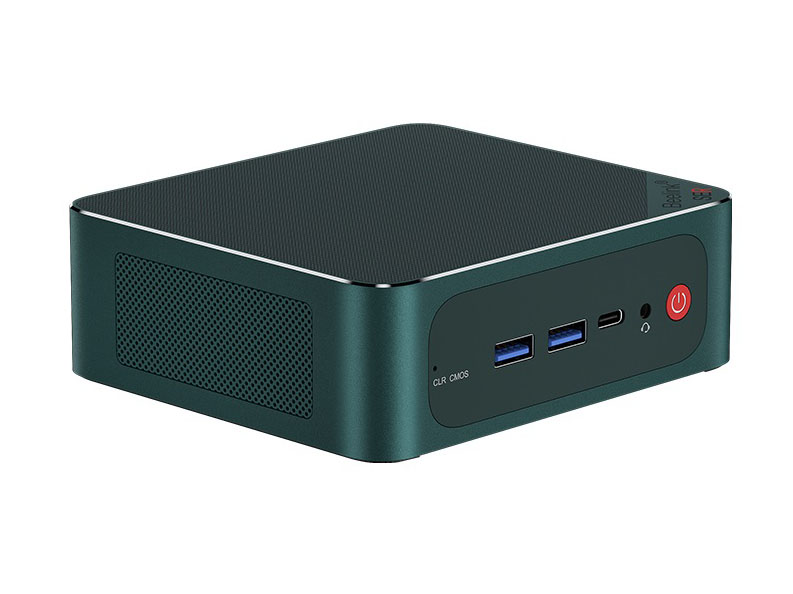
Sprawa
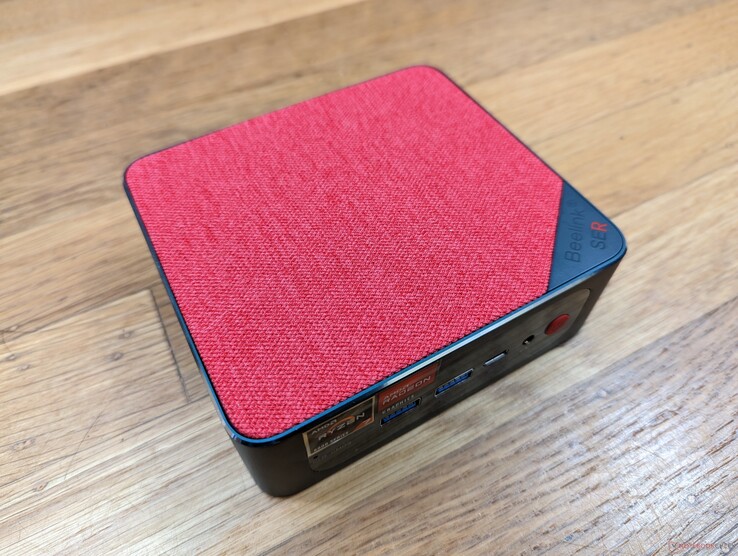
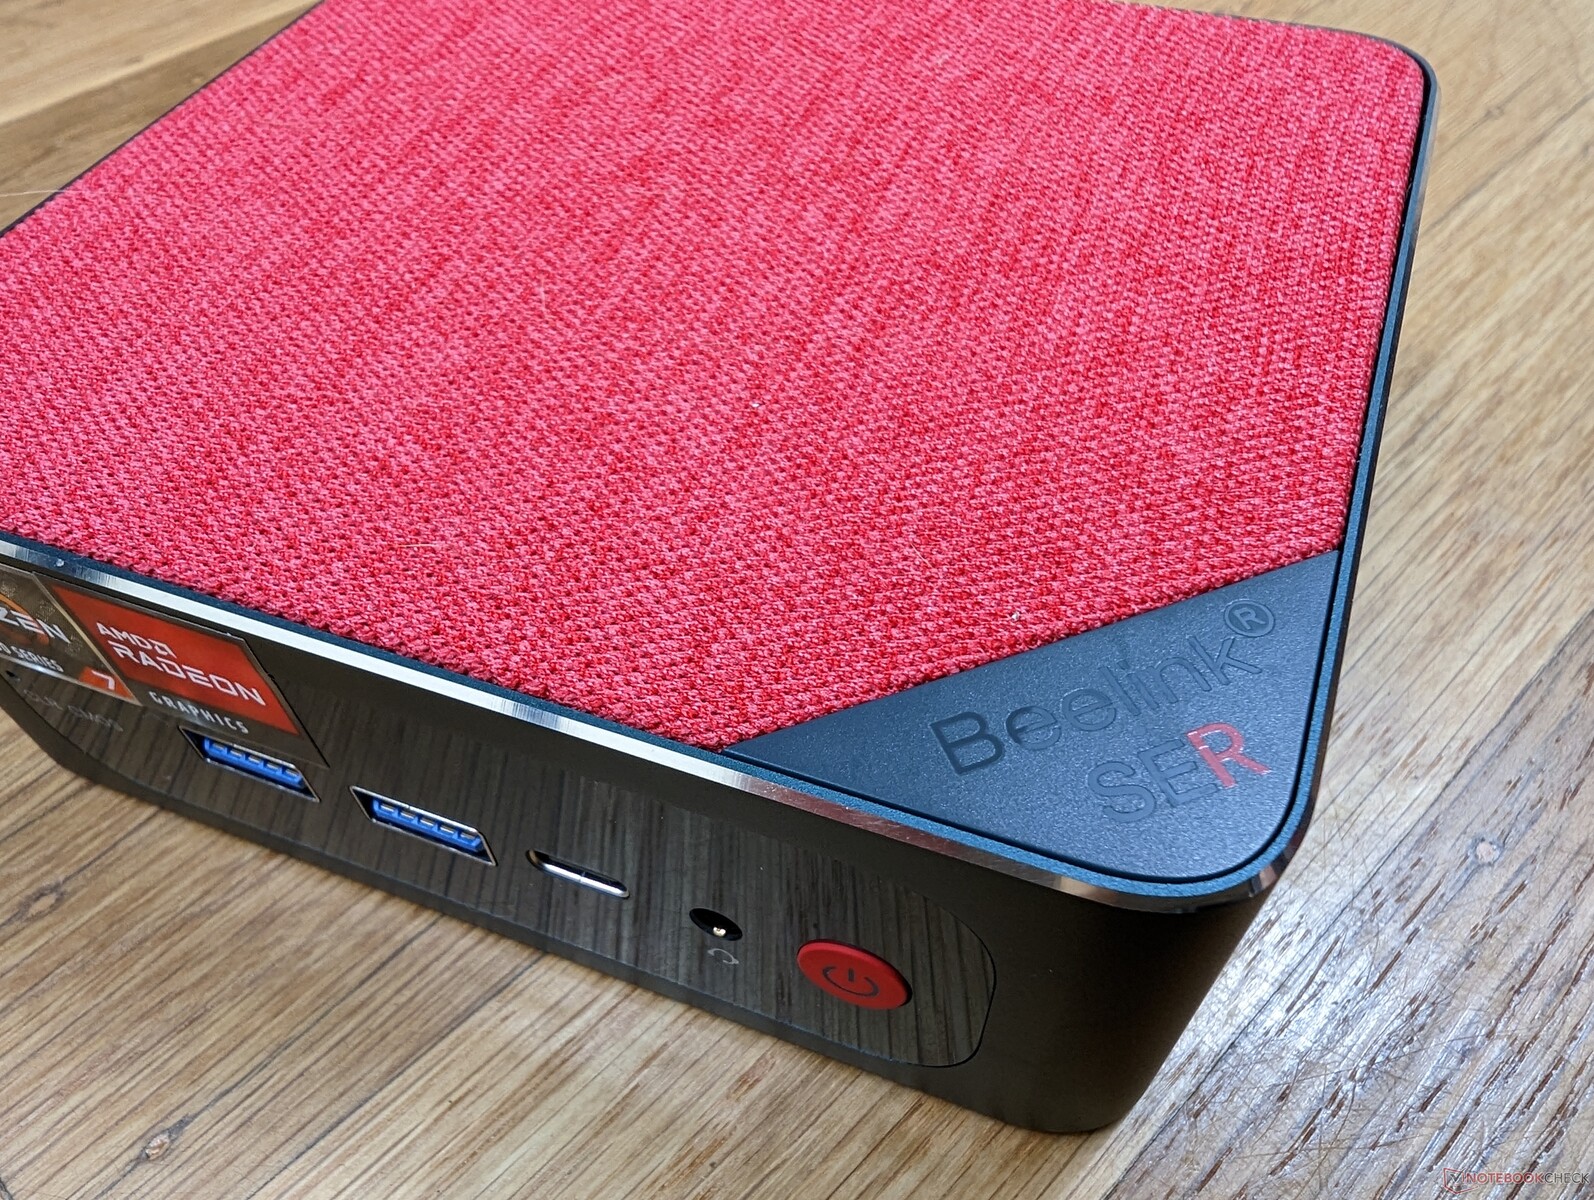
Obudowa jest metalowa ze wszystkich stron, oprócz zdejmowanej, materiałowej pokrywy górnej. Jej ogólne wymiary są bardzo podobne doSEi11 Pro choć jest nieco cięższa ze względu na poprawione wnętrze. Co zaskakujące, SER6 Pro waży tyle samo co NUC 12 Pro mimo, że NUC jest mniejszy.
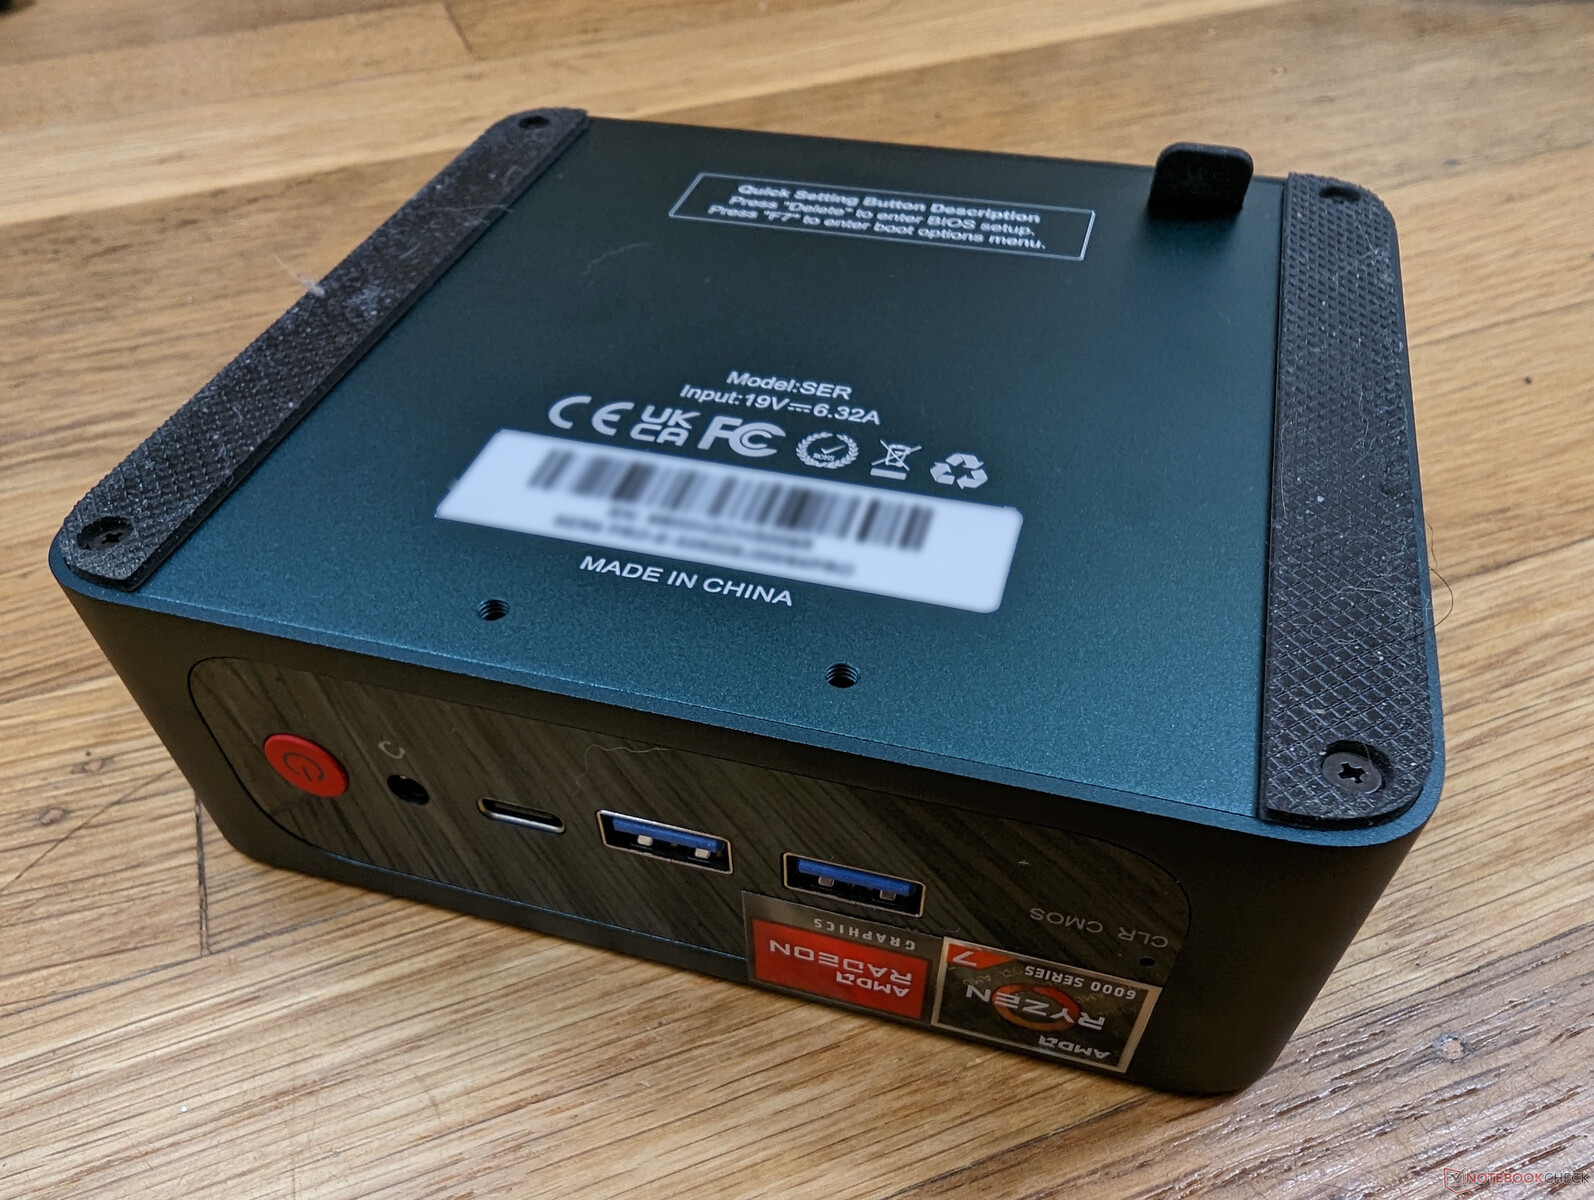
Łączność
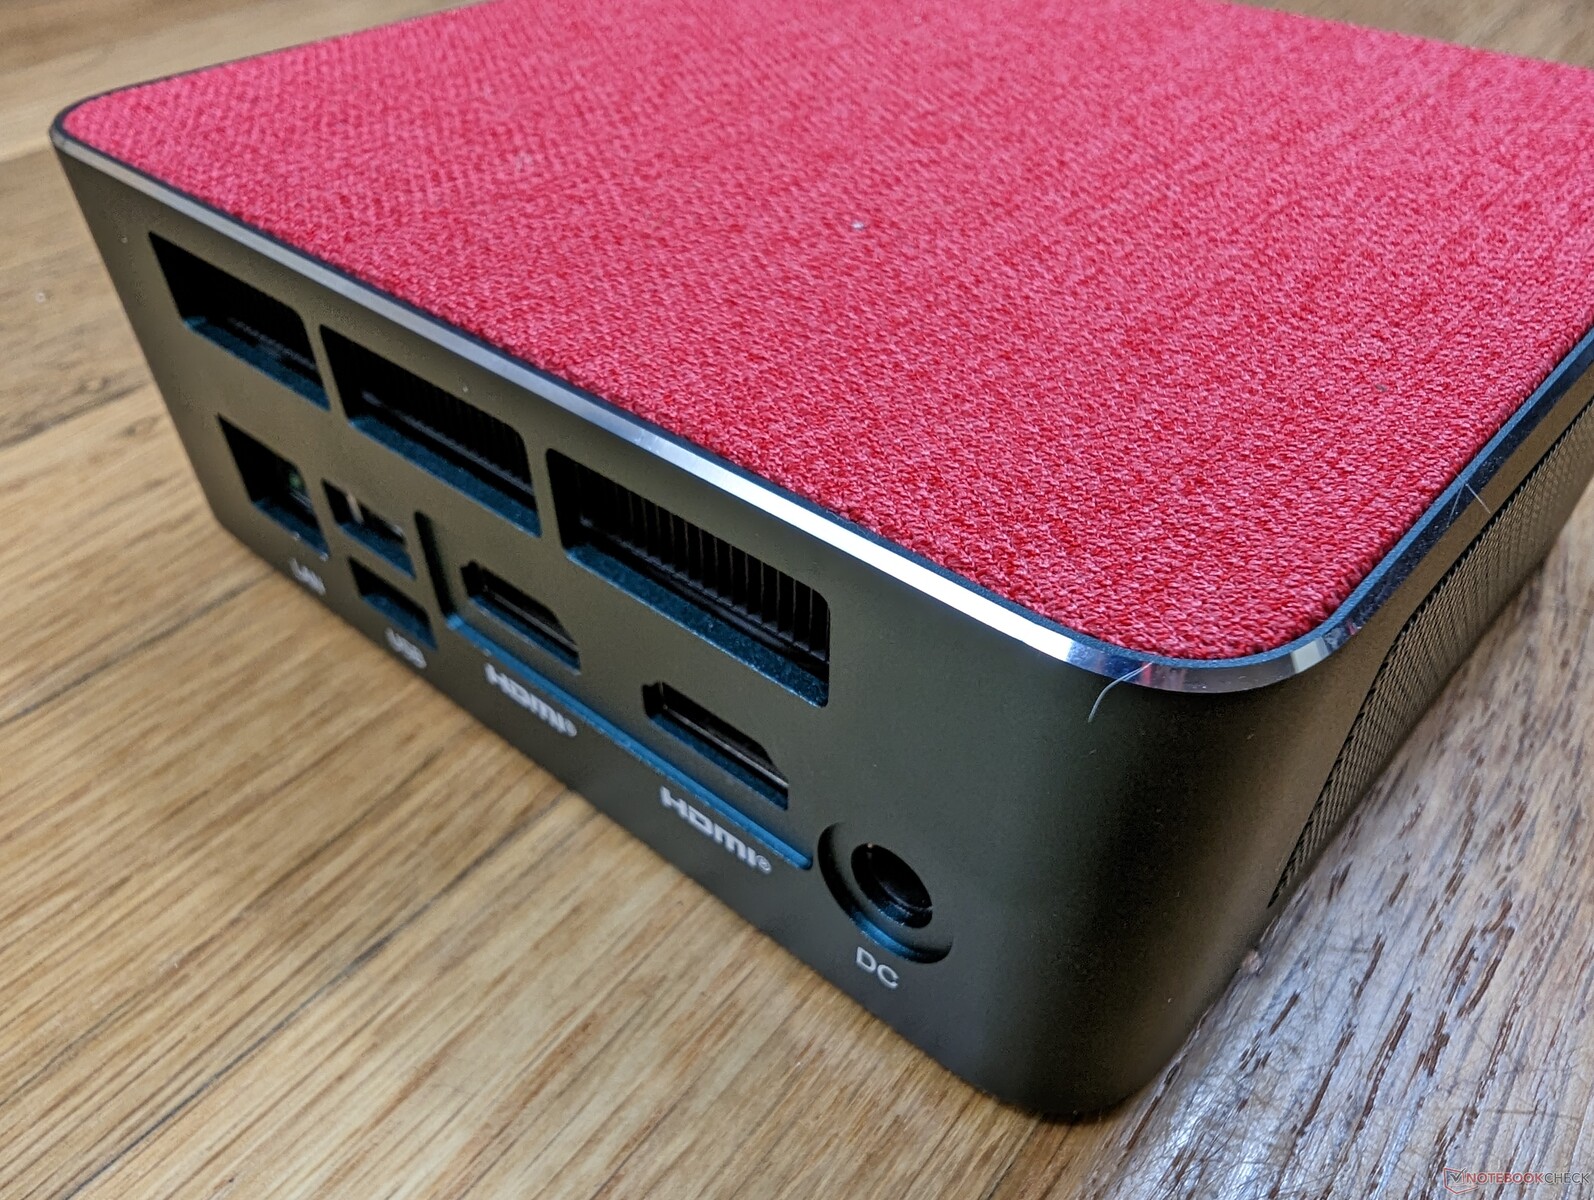
Opcje portów i ich rozmieszczenie są identyczne jak w SER5 Pro, ale z jednym znaczącym ulepszeniem: port RJ-45 obsługuje teraz prędkości 2,5 Gbps zamiast 1 Gbps. System może być również zasilany za pomocą adapterów USB-C AC innych firm, jeśli kiedykolwiek zgubisz adapter dostarczany w pudełku. Nasz adapter AC o mocy 130 W, który jest dostarczany z Dell XPS 17na przykład, zasiliłby naszego SER6 Pro bez żadnych problemów.
Komunikacja
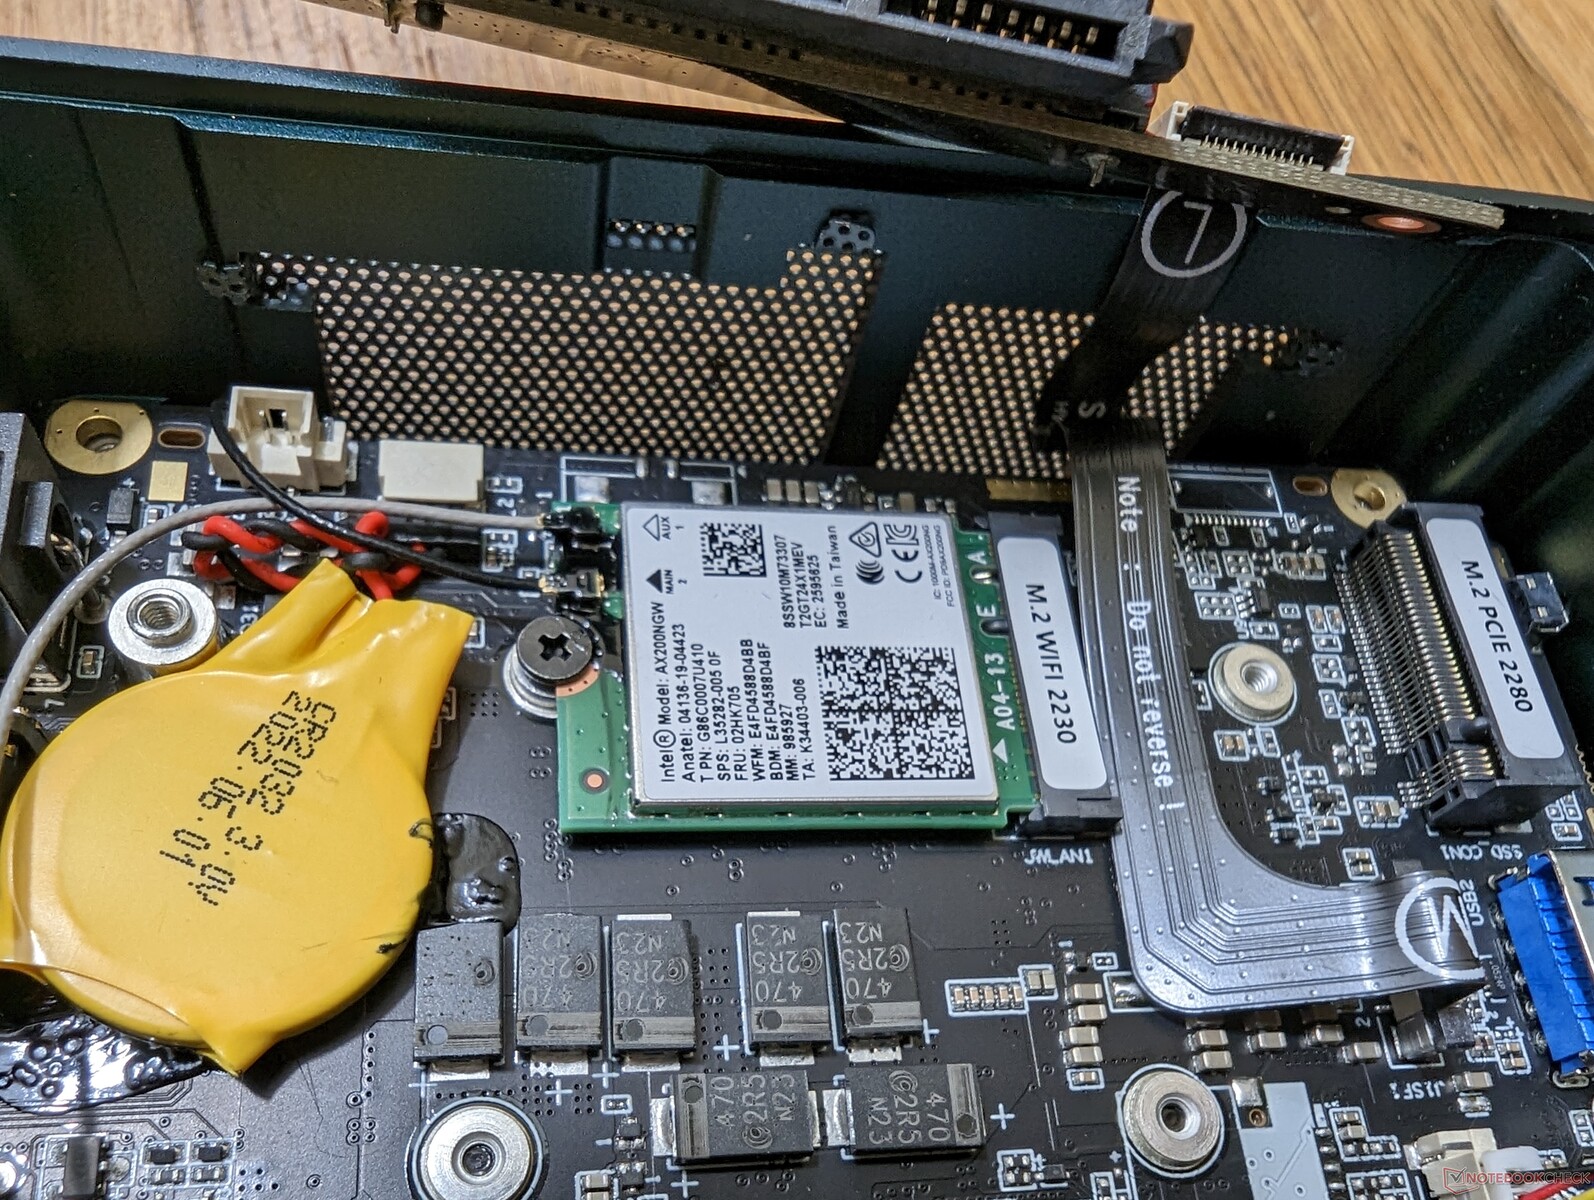
Beelink wymienił MediaTek RZ608 w SER5 Pro na bardziej powszechny moduł Intel AX200. Ten konkretny moduł Intela nie posiada możliwości Wi-Fi 6E, ale mimo to transfer jest szybki i wynosi średnio około 1200 Mbps po sparowaniu z naszym testowym routerem Asus AXE11000.
| Networking | |
| iperf3 transmit AX12 | |
| Intel NUC11PHKi7C | |
| Intel Hades Canyon NUC8i7HVK | |
| iperf3 receive AX12 | |
| Intel NUC11PHKi7C | |
| Intel Hades Canyon NUC8i7HVK | |
| iperf3 receive AXE11000 6GHz | |
| Intel NUC 12 Pro Kit NUC12WSKi7 | |
| Beelink GTR6 | |
| Beelink SEi11 Pro | |
| iperf3 receive AXE11000 | |
| Beelink SER6 Pro | |
| Beelink GTR6 | |
| iperf3 transmit AXE11000 | |
| Beelink SER6 Pro | |
| Beelink GTR6 | |
| iperf3 transmit AXE11000 6GHz | |
| Beelink GTR6 | |
| Intel NUC 12 Pro Kit NUC12WSKi7 | |
| Beelink SEi11 Pro | |
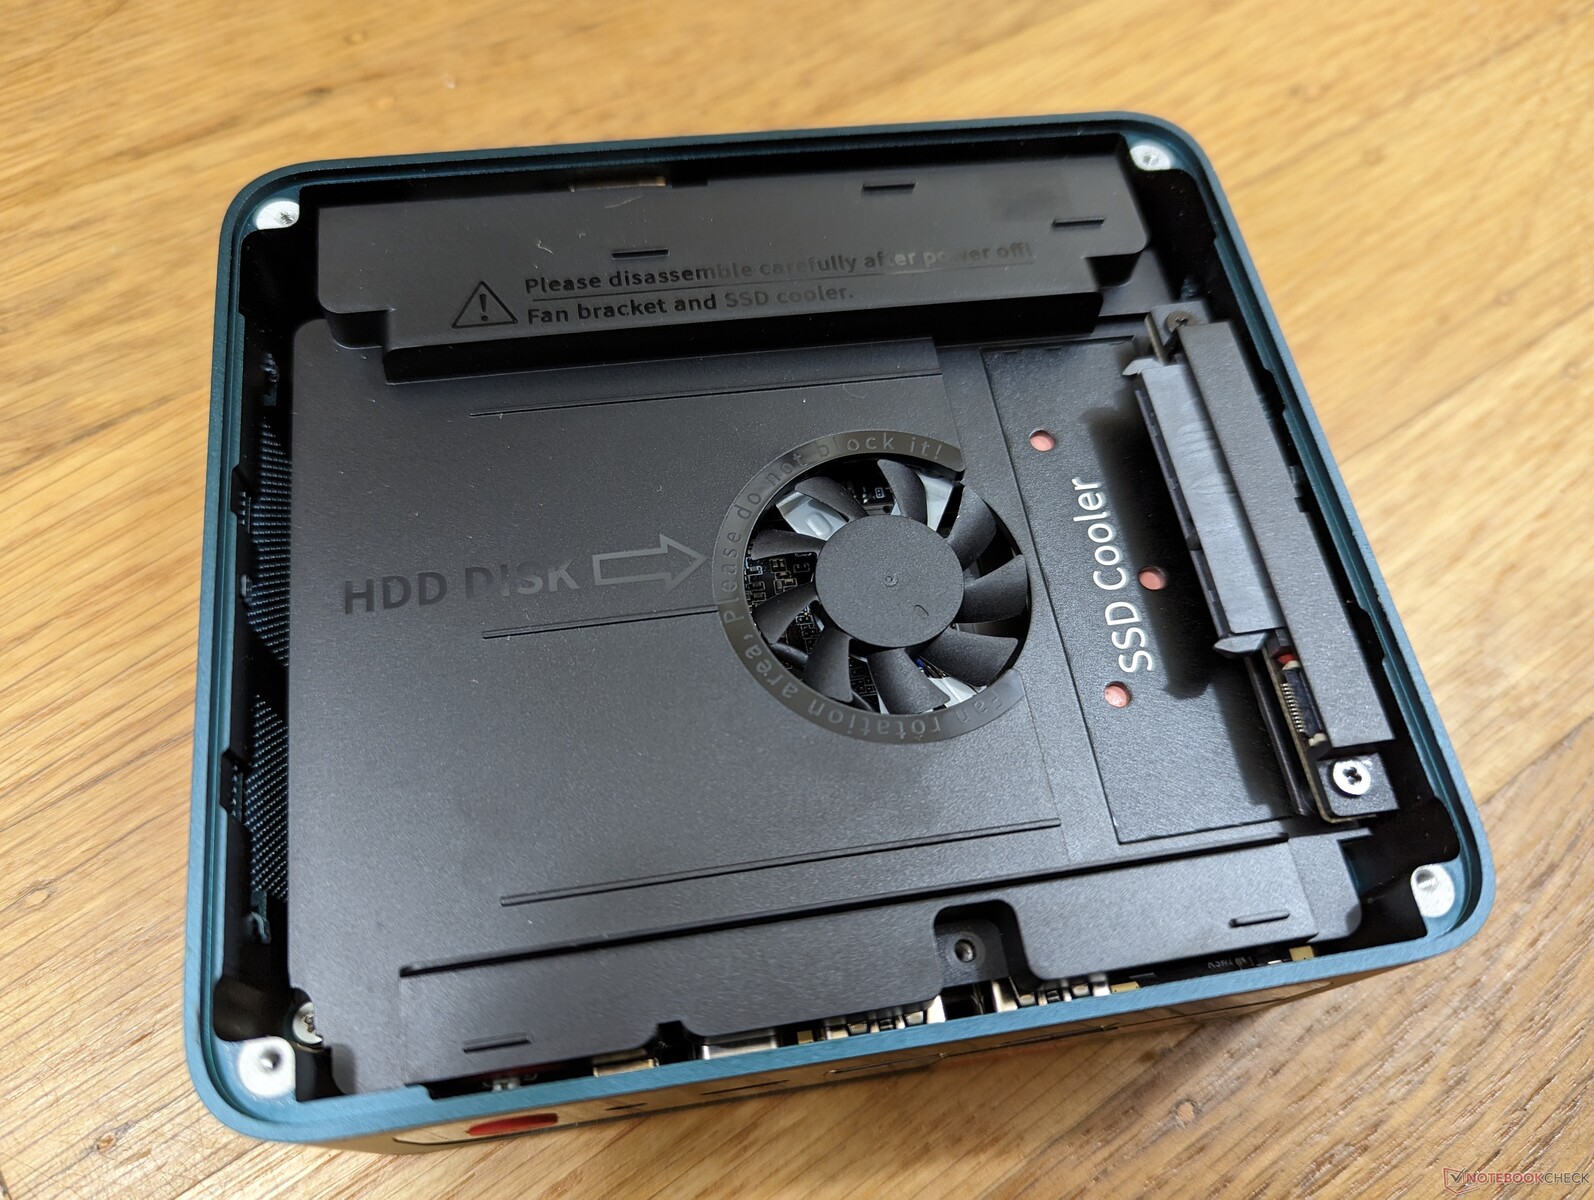
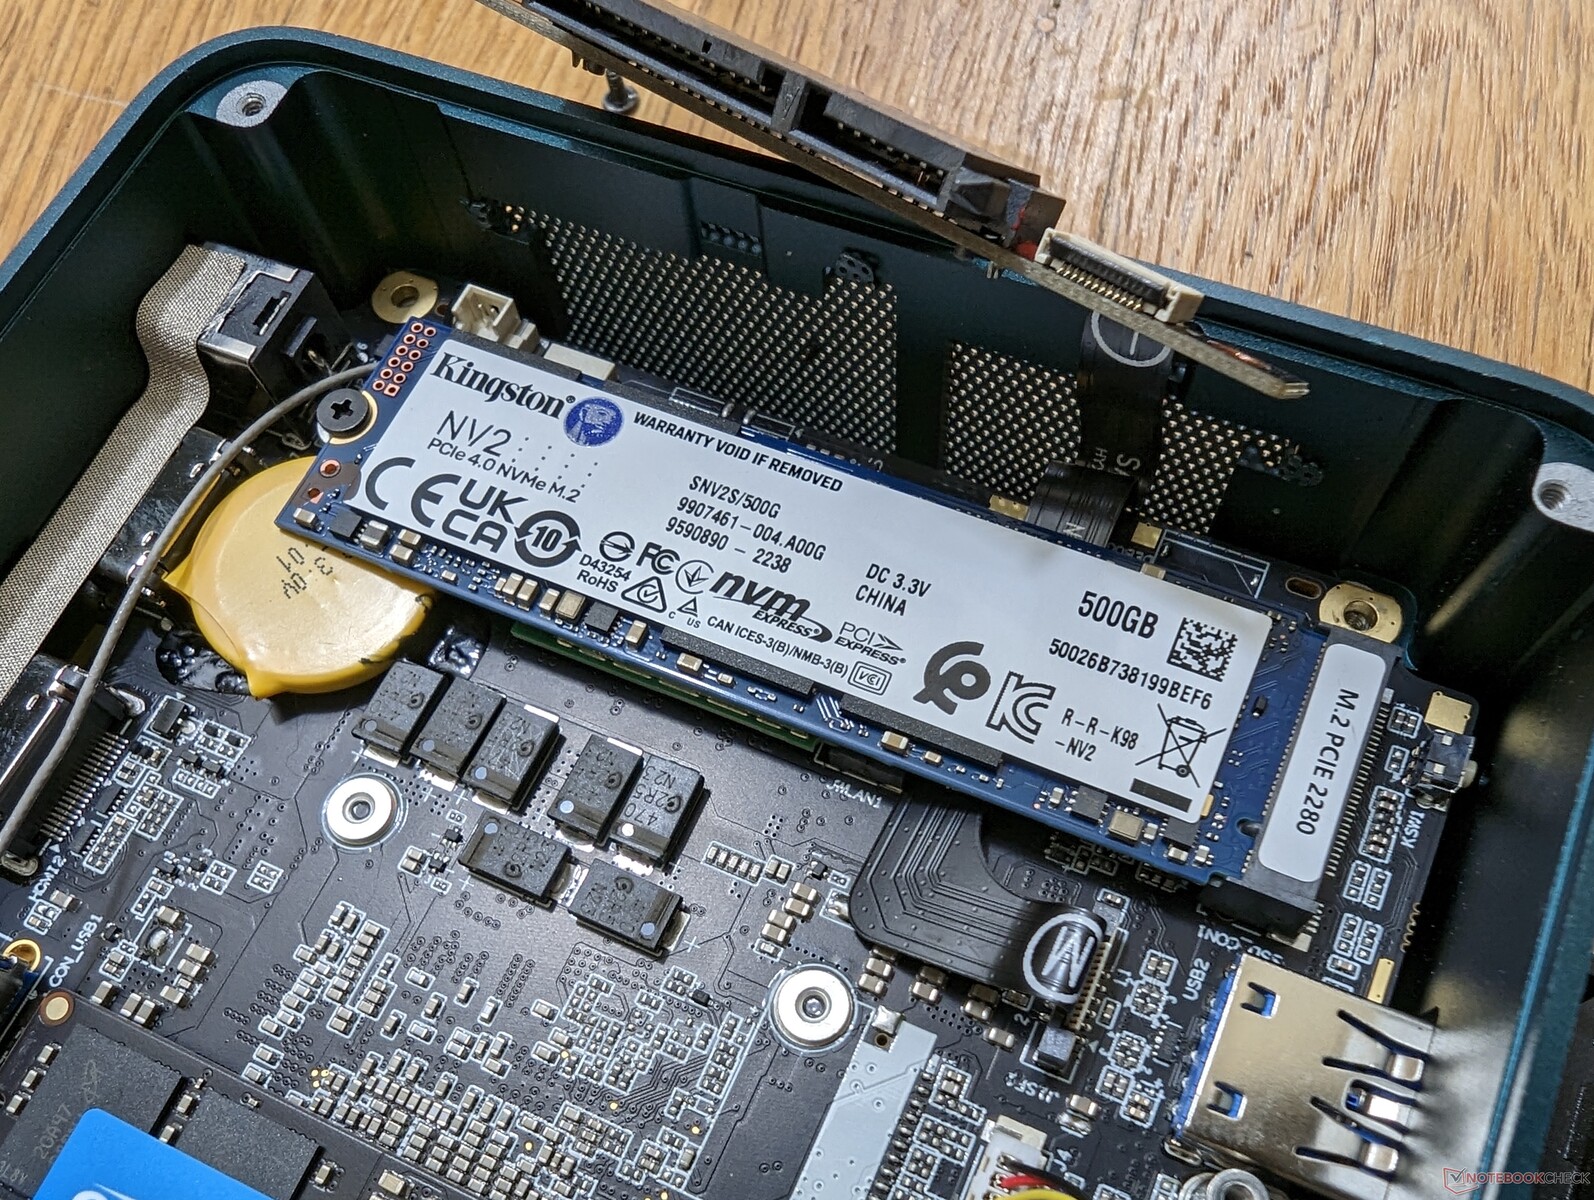
Konserwacja
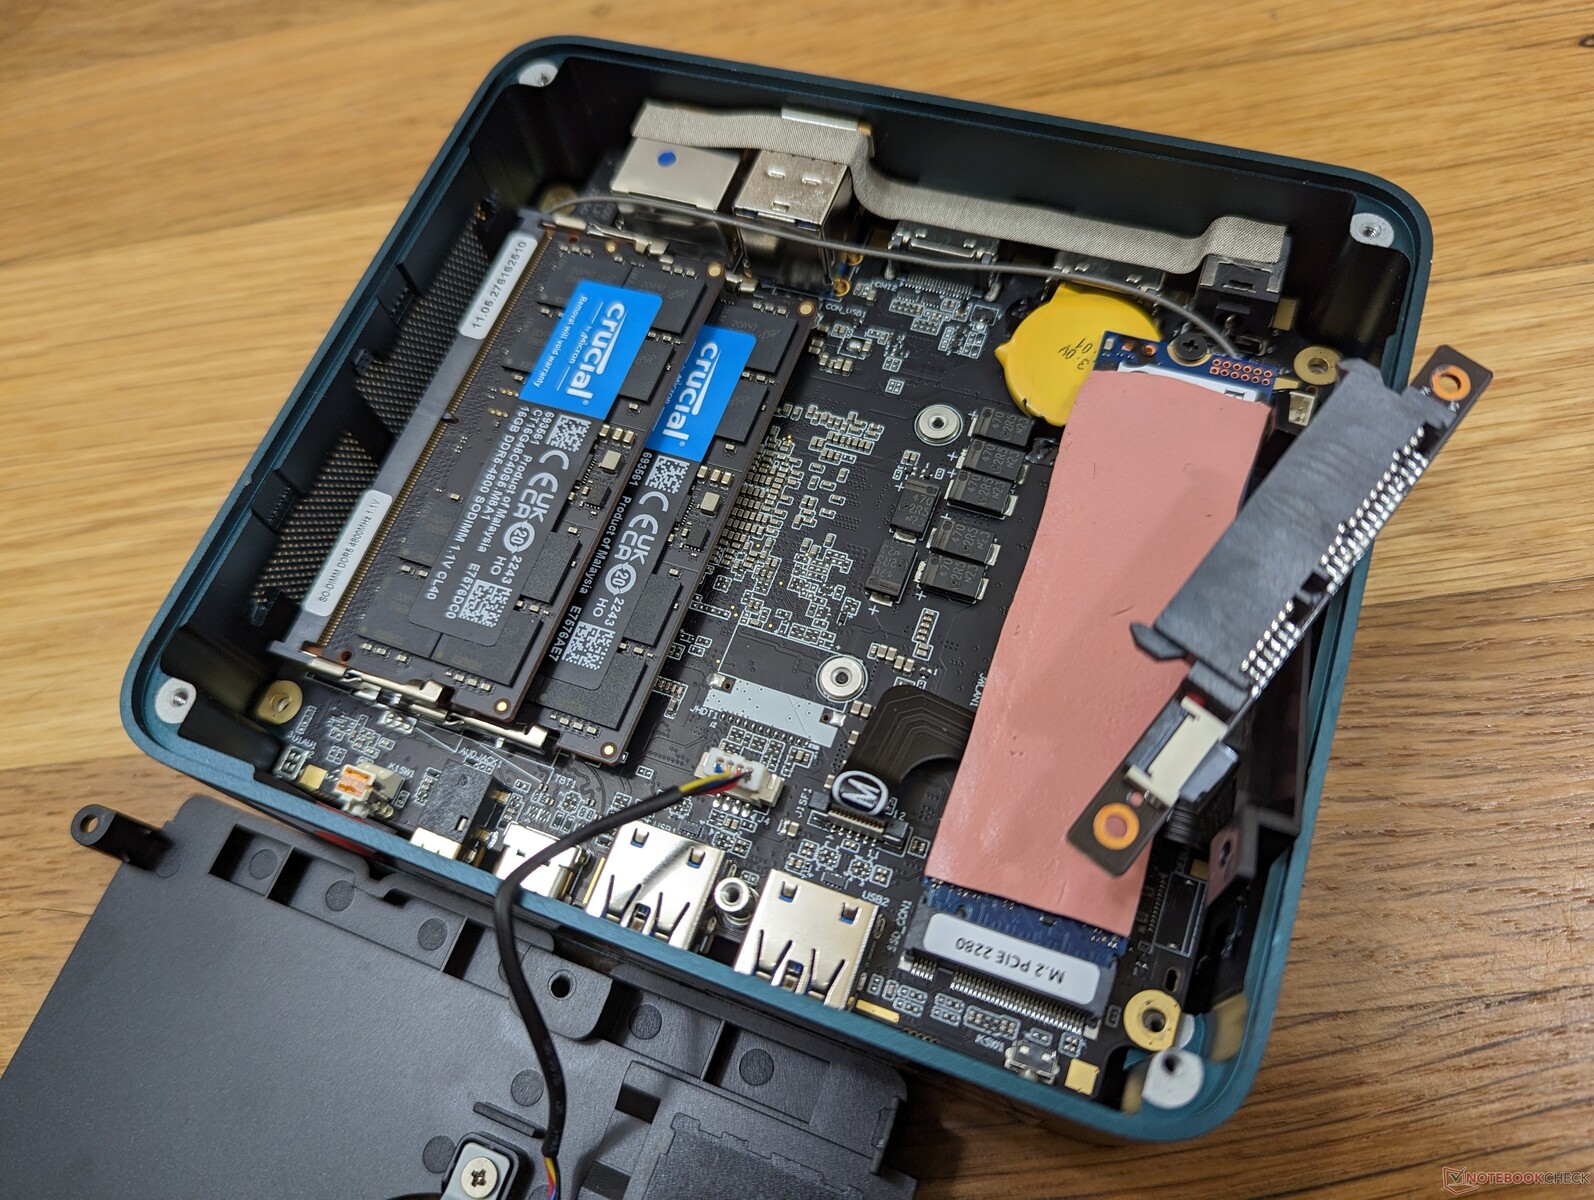
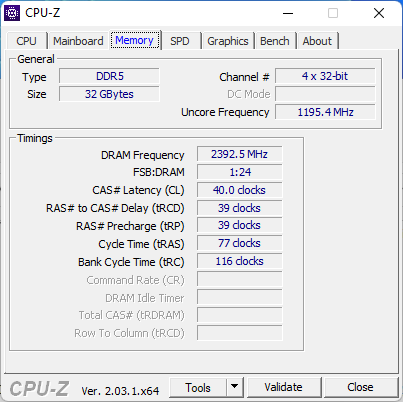
Modernizacja pamięci RAM i pamięci masowej jest łatwa i wymaga jedynie śrubokręta Philips. Użytkownicy mogą zainstalować do dwóch modułów SODIMM RAM i dwa dyski (1x M.2 PCIe4 x4 + 1x 2,5-calowy SATA III).
Akcesoria i gwarancja
W pudełku detalicznym znajdują się dwa kable HDMI, zdejmowany uchwyt montażowy VESA, czarne i czerwone pokrywy górne z tkaniny, zasilacz sieciowy i dokumenty. W przypadku zakupu w USA obowiązuje roczna ograniczona gwarancja producenta.
Wydajność
Warunki badania
Przed uruchomieniem poniższych benchmarków ustawiliśmy nasze urządzenie w trybie Performance. Nie ma żadnych preinstalowanych aplikacji typu centrum sterowania.
Procesor
Surowa wydajność procesora jest niemal identyczna jak w przypadku poprzedniej generacji Ryzen 7 5800H. Wydajność jednowątkowa może być nawet o 5 procent wyższa, ale wszelkie różnice są w najlepszym wypadku marginalne. Zamiast tego, największa poprawa pomiędzy tymi dwoma procesorami dotyczy ich zintegrowanych układów graficznych, jak pokaże nasza sekcja poświęcona GPU.
Cinebench R15 Multi Loop
Cinebench R23: Multi Core | Single Core
Cinebench R15: CPU Multi 64Bit | CPU Single 64Bit
Blender: v2.79 BMW27 CPU
7-Zip 18.03: 7z b 4 | 7z b 4 -mmt1
Geekbench 5.5: Multi-Core | Single-Core
HWBOT x265 Benchmark v2.2: 4k Preset
LibreOffice : 20 Documents To PDF
R Benchmark 2.5: Overall mean
| Cinebench R20 / CPU (Multi Core) | |
| Minisforum Neptune Series HX90G | |
| Average AMD Ryzen 7 6800H (4460 - 5661, n=8) | |
| Beelink GTR6 | |
| Dell G15 5515 | |
| Intel NUC 12 Pro Kit NUC12WSKi7 | |
| Beelink SER6 Pro | |
| Beelink SEi12 Core i5-1235U | |
| Beelink SER Pro Ryzen 5 5600H | |
| Minipc Union Ace Magician AMR5 | |
| Beelink SEi11 Pro | |
| Intel Hades Canyon NUC8i7HVK | |
| Intel NUC11PHKi7C | |
| Minipc Union NiPoGi CK10 - 10810U | |
| BMAX B5 Pro G7H8 | |
| Trigkey S3 | |
| Cinebench R20 / CPU (Single Core) | |
| Intel NUC 12 Pro Kit NUC12WSKi7 | |
| Beelink GTR6 | |
| Beelink SEi12 Core i5-1235U | |
| Average AMD Ryzen 7 6800H (580 - 605, n=8) | |
| Beelink SER6 Pro | |
| Intel NUC11PHKi7C | |
| Minisforum Neptune Series HX90G | |
| Beelink SEi11 Pro | |
| Dell G15 5515 | |
| Minipc Union Ace Magician AMR5 | |
| Beelink SER Pro Ryzen 5 5600H | |
| Minipc Union NiPoGi CK10 - 10810U | |
| Intel Hades Canyon NUC8i7HVK | |
| BMAX B5 Pro G7H8 | |
| Trigkey S3 | |
| Cinebench R23 / Multi Core | |
| Minisforum Neptune Series HX90G | |
| Average AMD Ryzen 7 6800H (11481 - 14660, n=10) | |
| Dell G15 5515 | |
| Beelink GTR6 | |
| Intel NUC 12 Pro Kit NUC12WSKi7 | |
| Beelink SER6 Pro | |
| Beelink SEi12 Core i5-1235U | |
| Beelink SER Pro Ryzen 5 5600H | |
| Minipc Union Ace Magician AMR5 | |
| Intel NUC11PHKi7C | |
| Beelink SEi11 Pro | |
| Minipc Union NiPoGi CK10 - 10810U | |
| Trigkey S3 | |
| BMAX B5 Pro G7H8 | |
| Cinebench R23 / Single Core | |
| Intel NUC 12 Pro Kit NUC12WSKi7 | |
| Beelink SEi12 Core i5-1235U | |
| Beelink GTR6 | |
| Intel NUC11PHKi7C | |
| Average AMD Ryzen 7 6800H (1500 - 1552, n=8) | |
| Beelink SER6 Pro | |
| Minisforum Neptune Series HX90G | |
| Beelink SEi11 Pro | |
| Dell G15 5515 | |
| Minipc Union Ace Magician AMR5 | |
| Beelink SER Pro Ryzen 5 5600H | |
| Minipc Union NiPoGi CK10 - 10810U | |
| Trigkey S3 | |
| BMAX B5 Pro G7H8 | |
| Cinebench R15 / CPU Multi 64Bit | |
| Minisforum Neptune Series HX90G | |
| Average AMD Ryzen 7 6800H (1585 - 2366, n=9) | |
| Beelink GTR6 | |
| Dell G15 5515 | |
| Beelink SER6 Pro | |
| Intel NUC 12 Pro Kit NUC12WSKi7 | |
| Beelink SEi12 Core i5-1235U | |
| Beelink SER Pro Ryzen 5 5600H | |
| Minipc Union Ace Magician AMR5 | |
| Intel NUC11PHKi7C | |
| Intel Hades Canyon NUC8i7HVK | |
| Beelink SEi11 Pro | |
| Trigkey S3 | |
| BMAX B5 Pro G7H8 | |
| Minipc Union NiPoGi CK10 - 10810U | |
| Cinebench R15 / CPU Single 64Bit | |
| Intel NUC 12 Pro Kit NUC12WSKi7 | |
| Beelink GTR6 | |
| Minisforum Neptune Series HX90G | |
| Beelink SER6 Pro | |
| Average AMD Ryzen 7 6800H (182.7 - 250, n=9) | |
| Beelink SEi12 Core i5-1235U | |
| Intel NUC11PHKi7C | |
| Dell G15 5515 | |
| Minipc Union Ace Magician AMR5 | |
| Beelink SER Pro Ryzen 5 5600H | |
| Beelink SEi11 Pro | |
| Intel Hades Canyon NUC8i7HVK | |
| Minipc Union NiPoGi CK10 - 10810U | |
| BMAX B5 Pro G7H8 | |
| Trigkey S3 | |
| Blender / v2.79 BMW27 CPU | |
| BMAX B5 Pro G7H8 | |
| Trigkey S3 | |
| Minipc Union NiPoGi CK10 - 10810U | |
| Intel NUC11PHKi7C | |
| Beelink SEi11 Pro | |
| Intel Hades Canyon NUC8i7HVK | |
| Minipc Union Ace Magician AMR5 | |
| Beelink SEi12 Core i5-1235U | |
| Beelink SER Pro Ryzen 5 5600H | |
| Intel NUC 12 Pro Kit NUC12WSKi7 | |
| Beelink SER6 Pro | |
| Dell G15 5515 | |
| Beelink GTR6 | |
| Average AMD Ryzen 7 6800H (213 - 268, n=7) | |
| Minisforum Neptune Series HX90G | |
| 7-Zip 18.03 / 7z b 4 | |
| Minisforum Neptune Series HX90G | |
| Average AMD Ryzen 7 6800H (55963 - 64817, n=7) | |
| Beelink GTR6 | |
| Beelink SER6 Pro | |
| Dell G15 5515 | |
| Intel NUC 12 Pro Kit NUC12WSKi7 | |
| Beelink SER Pro Ryzen 5 5600H | |
| Minipc Union Ace Magician AMR5 | |
| Beelink SEi12 Core i5-1235U | |
| Beelink SEi11 Pro | |
| Intel NUC11PHKi7C | |
| Minipc Union NiPoGi CK10 - 10810U | |
| Intel Hades Canyon NUC8i7HVK | |
| BMAX B5 Pro G7H8 | |
| Trigkey S3 | |
| 7-Zip 18.03 / 7z b 4 -mmt1 | |
| Beelink GTR6 | |
| Minisforum Neptune Series HX90G | |
| Beelink SER6 Pro | |
| Average AMD Ryzen 7 6800H (5669 - 5803, n=7) | |
| Intel NUC 12 Pro Kit NUC12WSKi7 | |
| Dell G15 5515 | |
| Beelink SER Pro Ryzen 5 5600H | |
| Intel NUC11PHKi7C | |
| Minipc Union Ace Magician AMR5 | |
| Beelink SEi12 Core i5-1235U | |
| Beelink SEi11 Pro | |
| Minipc Union NiPoGi CK10 - 10810U | |
| Intel Hades Canyon NUC8i7HVK | |
| BMAX B5 Pro G7H8 | |
| Trigkey S3 | |
| Geekbench 5.5 / Multi-Core | |
| Intel NUC 12 Pro Kit NUC12WSKi7 | |
| Average AMD Ryzen 7 6800H (9218 - 10355, n=8) | |
| Beelink GTR6 | |
| Beelink SER6 Pro | |
| Minisforum Neptune Series HX90G | |
| Beelink SEi12 Core i5-1235U | |
| Dell G15 5515 | |
| Minipc Union Ace Magician AMR5 | |
| Beelink SER Pro Ryzen 5 5600H | |
| Intel NUC11PHKi7C | |
| Beelink SEi11 Pro | |
| Minipc Union NiPoGi CK10 - 10810U | |
| Trigkey S3 | |
| BMAX B5 Pro G7H8 | |
| Geekbench 5.5 / Single-Core | |
| Intel NUC 12 Pro Kit NUC12WSKi7 | |
| Beelink GTR6 | |
| Beelink SEi12 Core i5-1235U | |
| Minisforum Neptune Series HX90G | |
| Beelink SER6 Pro | |
| Average AMD Ryzen 7 6800H (1518 - 1568, n=8) | |
| Intel NUC11PHKi7C | |
| Beelink SEi11 Pro | |
| Dell G15 5515 | |
| Beelink SER Pro Ryzen 5 5600H | |
| Minipc Union Ace Magician AMR5 | |
| Minipc Union NiPoGi CK10 - 10810U | |
| Trigkey S3 | |
| BMAX B5 Pro G7H8 | |
| HWBOT x265 Benchmark v2.2 / 4k Preset | |
| Average AMD Ryzen 7 6800H (15 - 18.5, n=8) | |
| Minisforum Neptune Series HX90G | |
| Beelink GTR6 | |
| Beelink SER6 Pro | |
| Dell G15 5515 | |
| Intel NUC 12 Pro Kit NUC12WSKi7 | |
| Beelink SER Pro Ryzen 5 5600H | |
| Minipc Union Ace Magician AMR5 | |
| Beelink SEi12 Core i5-1235U | |
| Beelink SEi11 Pro | |
| Intel NUC11PHKi7C | |
| Intel Hades Canyon NUC8i7HVK | |
| Minipc Union NiPoGi CK10 - 10810U | |
| Trigkey S3 | |
| BMAX B5 Pro G7H8 | |
| LibreOffice / 20 Documents To PDF | |
| BMAX B5 Pro G7H8 | |
| Dell G15 5515 | |
| Trigkey S3 | |
| Minipc Union NiPoGi CK10 - 10810U | |
| Minisforum Neptune Series HX90G | |
| Average AMD Ryzen 7 6800H (48.7 - 79.5, n=7) | |
| Beelink SER Pro Ryzen 5 5600H | |
| Minipc Union Ace Magician AMR5 | |
| Beelink SEi11 Pro | |
| Beelink SER6 Pro | |
| Beelink SEi12 Core i5-1235U | |
| Intel NUC11PHKi7C | |
| Beelink GTR6 | |
| Intel NUC 12 Pro Kit NUC12WSKi7 | |
| R Benchmark 2.5 / Overall mean | |
| BMAX B5 Pro G7H8 | |
| Trigkey S3 | |
| Minipc Union NiPoGi CK10 - 10810U | |
| Beelink SEi11 Pro | |
| Intel NUC11PHKi7C | |
| Minipc Union Ace Magician AMR5 | |
| Beelink SER Pro Ryzen 5 5600H | |
| Dell G15 5515 | |
| Beelink SEi12 Core i5-1235U | |
| Beelink SER6 Pro | |
| Minisforum Neptune Series HX90G | |
| Average AMD Ryzen 7 6800H (0.4783 - 0.501, n=7) | |
| Intel NUC 12 Pro Kit NUC12WSKi7 | |
| Beelink GTR6 | |
Cinebench R23: Multi Core | Single Core
Cinebench R15: CPU Multi 64Bit | CPU Single 64Bit
Blender: v2.79 BMW27 CPU
7-Zip 18.03: 7z b 4 | 7z b 4 -mmt1
Geekbench 5.5: Multi-Core | Single-Core
HWBOT x265 Benchmark v2.2: 4k Preset
LibreOffice : 20 Documents To PDF
R Benchmark 2.5: Overall mean
* ... im mniej tym lepiej
AIDA64: FP32 Ray-Trace | FPU Julia | CPU SHA3 | CPU Queen | FPU SinJulia | FPU Mandel | CPU AES | CPU ZLib | FP64 Ray-Trace | CPU PhotoWorxx
| Performance Rating | |
| Average AMD Ryzen 7 6800H | |
| Beelink GTR6 | |
| Beelink SER6 Pro | |
| Intel NUC 12 Pro Kit NUC12WSKi7 | |
| Intel NUC11PHKi7C | |
| Beelink SEi11 Pro | |
| AIDA64 / FP32 Ray-Trace | |
| Average AMD Ryzen 7 6800H (12876 - 17031, n=7) | |
| Beelink GTR6 | |
| Beelink SER6 Pro | |
| Intel NUC 12 Pro Kit NUC12WSKi7 | |
| Intel NUC11PHKi7C | |
| Beelink SEi11 Pro | |
| AIDA64 / FPU Julia | |
| Average AMD Ryzen 7 6800H (82673 - 105987, n=7) | |
| Beelink GTR6 | |
| Beelink SER6 Pro | |
| Intel NUC 12 Pro Kit NUC12WSKi7 | |
| Intel NUC11PHKi7C | |
| Beelink SEi11 Pro | |
| AIDA64 / CPU SHA3 | |
| Average AMD Ryzen 7 6800H (2886 - 3634, n=7) | |
| Beelink GTR6 | |
| Beelink SER6 Pro | |
| Intel NUC 12 Pro Kit NUC12WSKi7 | |
| Intel NUC11PHKi7C | |
| Beelink SEi11 Pro | |
| AIDA64 / CPU Queen | |
| Average AMD Ryzen 7 6800H (75117 - 106322, n=7) | |
| Beelink GTR6 | |
| Beelink SER6 Pro | |
| Intel NUC 12 Pro Kit NUC12WSKi7 | |
| Intel NUC11PHKi7C | |
| Beelink SEi11 Pro | |
| AIDA64 / FPU SinJulia | |
| Average AMD Ryzen 7 6800H (11771 - 13120, n=7) | |
| Beelink GTR6 | |
| Beelink SER6 Pro | |
| Intel NUC 12 Pro Kit NUC12WSKi7 | |
| Intel NUC11PHKi7C | |
| Beelink SEi11 Pro | |
| AIDA64 / FPU Mandel | |
| Average AMD Ryzen 7 6800H (45287 - 58327, n=7) | |
| Beelink GTR6 | |
| Beelink SER6 Pro | |
| Intel NUC 12 Pro Kit NUC12WSKi7 | |
| Intel NUC11PHKi7C | |
| Beelink SEi11 Pro | |
| AIDA64 / CPU AES | |
| Beelink GTR6 | |
| Average AMD Ryzen 7 6800H (67816 - 137383, n=7) | |
| Beelink SER6 Pro | |
| Intel NUC 12 Pro Kit NUC12WSKi7 | |
| Intel NUC11PHKi7C | |
| Beelink SEi11 Pro | |
| AIDA64 / CPU ZLib | |
| Average AMD Ryzen 7 6800H (732 - 901, n=7) | |
| Beelink GTR6 | |
| Beelink SER6 Pro | |
| Intel NUC 12 Pro Kit NUC12WSKi7 | |
| Intel NUC11PHKi7C | |
| Beelink SEi11 Pro | |
| AIDA64 / FP64 Ray-Trace | |
| Average AMD Ryzen 7 6800H (6917 - 8980, n=7) | |
| Beelink GTR6 | |
| Beelink SER6 Pro | |
| Intel NUC 12 Pro Kit NUC12WSKi7 | |
| Intel NUC11PHKi7C | |
| Beelink SEi11 Pro | |
| AIDA64 / CPU PhotoWorxx | |
| Beelink GTR6 | |
| Beelink SER6 Pro | |
| Average AMD Ryzen 7 6800H (28224 - 30360, n=7) | |
| Intel NUC 12 Pro Kit NUC12WSKi7 | |
| Intel NUC11PHKi7C | |
| Beelink SEi11 Pro | |
Wydajność systemu
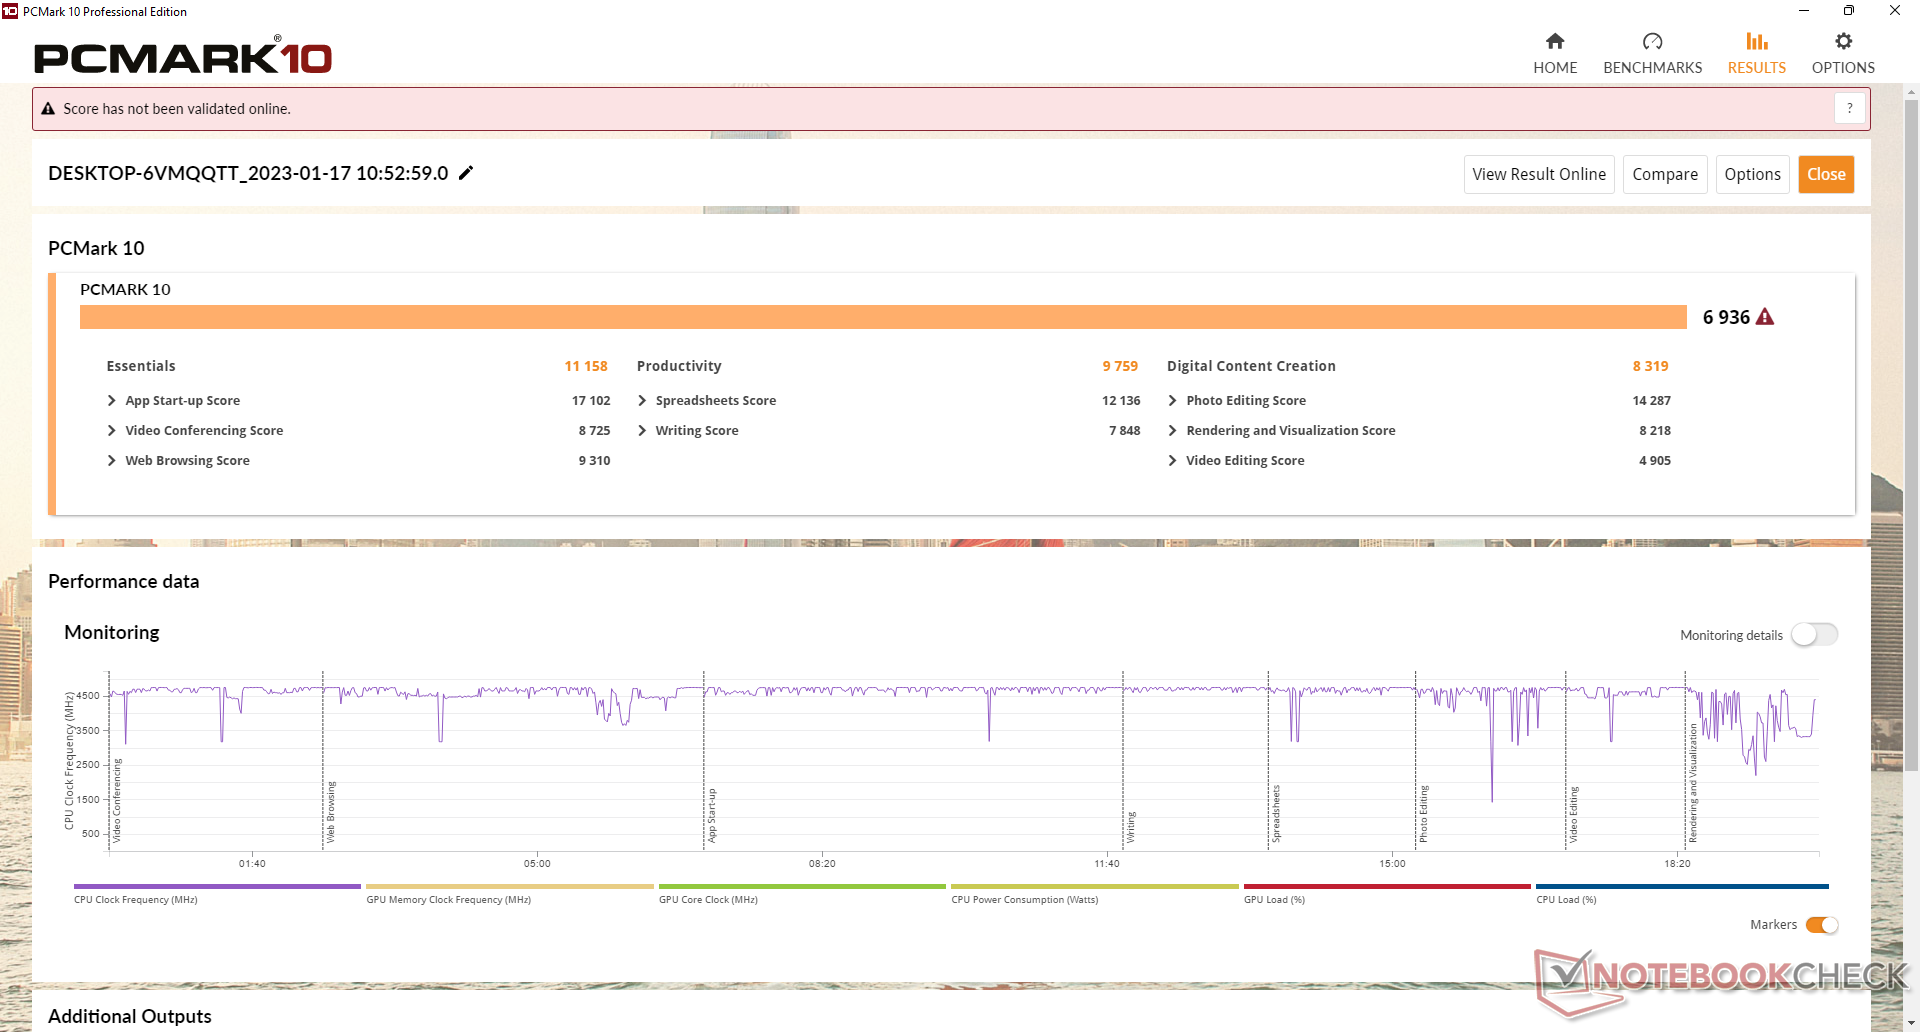
Wyniki PCMark są jednymi z najwyższych dla każdego mini PC bez dedykowanej grafiki. Wysokie wyniki są zasługą nowego Radeon 680M który jest znaczącym skokiem w stosunku do starszych zintegrowanych Radeon RX Vega lub Iris Xe.
CrossMark: Overall | Productivity | Creativity | Responsiveness
| PCMark 10 / Score | |
| Beelink GTR6 | |
| Beelink SER6 Pro | |
| Average AMD Ryzen 7 6800H, AMD Radeon 680M (6591 - 6936, n=3) | |
| Intel NUC11PHKi7C | |
| Intel NUC 12 Pro Kit NUC12WSKi7 | |
| Beelink SER Pro Ryzen 5 5600H | |
| Intel Hades Canyon NUC8i7HVK | |
| Beelink SEi11 Pro | |
| PCMark 10 / Essentials | |
| Beelink GTR6 | |
| Beelink SER6 Pro | |
| Average AMD Ryzen 7 6800H, AMD Radeon 680M (10381 - 11158, n=3) | |
| Intel NUC 12 Pro Kit NUC12WSKi7 | |
| Beelink SER Pro Ryzen 5 5600H | |
| Beelink SEi11 Pro | |
| Intel NUC11PHKi7C | |
| Intel Hades Canyon NUC8i7HVK | |
| PCMark 10 / Productivity | |
| Beelink GTR6 | |
| Beelink SER6 Pro | |
| Average AMD Ryzen 7 6800H, AMD Radeon 680M (9140 - 9759, n=3) | |
| Beelink SER Pro Ryzen 5 5600H | |
| Intel NUC11PHKi7C | |
| Intel Hades Canyon NUC8i7HVK | |
| Intel NUC 12 Pro Kit NUC12WSKi7 | |
| Beelink SEi11 Pro | |
| PCMark 10 / Digital Content Creation | |
| Beelink GTR6 | |
| Beelink SER6 Pro | |
| Average AMD Ryzen 7 6800H, AMD Radeon 680M (8092 - 8485, n=3) | |
| Intel NUC11PHKi7C | |
| Intel NUC 12 Pro Kit NUC12WSKi7 | |
| Beelink SER Pro Ryzen 5 5600H | |
| Intel Hades Canyon NUC8i7HVK | |
| Beelink SEi11 Pro | |
| CrossMark / Overall | |
| Beelink SER6 Pro | |
| Beelink GTR6 | |
| Intel NUC 12 Pro Kit NUC12WSKi7 | |
| Average AMD Ryzen 7 6800H, AMD Radeon 680M (1590 - 1704, n=2) | |
| Beelink SEi11 Pro | |
| Beelink SER Pro Ryzen 5 5600H | |
| CrossMark / Productivity | |
| Beelink GTR6 | |
| Beelink SER6 Pro | |
| Intel NUC 12 Pro Kit NUC12WSKi7 | |
| Average AMD Ryzen 7 6800H, AMD Radeon 680M (1566 - 1674, n=2) | |
| Beelink SEi11 Pro | |
| Beelink SER Pro Ryzen 5 5600H | |
| CrossMark / Creativity | |
| Intel NUC 12 Pro Kit NUC12WSKi7 | |
| Beelink SER6 Pro | |
| Average AMD Ryzen 7 6800H, AMD Radeon 680M (1708 - 1763, n=2) | |
| Beelink GTR6 | |
| Beelink SER Pro Ryzen 5 5600H | |
| Beelink SEi11 Pro | |
| CrossMark / Responsiveness | |
| Beelink GTR6 | |
| Beelink SER6 Pro | |
| Average AMD Ryzen 7 6800H, AMD Radeon 680M (1340 - 1625, n=2) | |
| Intel NUC 12 Pro Kit NUC12WSKi7 | |
| Beelink SEi11 Pro | |
| Beelink SER Pro Ryzen 5 5600H | |
| PCMark 10 Score | 6936 pkt. | |
Pomoc | ||
| AIDA64 / Memory Copy | |
| Beelink SER6 Pro | |
| Beelink GTR6 | |
| Average AMD Ryzen 7 6800H (48209 - 51186, n=7) | |
| Intel NUC 12 Pro Kit NUC12WSKi7 | |
| Beelink SEi11 Pro | |
| Intel NUC11PHKi7C | |
| AIDA64 / Memory Read | |
| Beelink GTR6 | |
| Beelink SER6 Pro | |
| Average AMD Ryzen 7 6800H (50372 - 51778, n=7) | |
| Intel NUC 12 Pro Kit NUC12WSKi7 | |
| Beelink SEi11 Pro | |
| Intel NUC11PHKi7C | |
| AIDA64 / Memory Write | |
| Beelink GTR6 | |
| Beelink SER6 Pro | |
| Average AMD Ryzen 7 6800H (55085 - 55307, n=7) | |
| Beelink SEi11 Pro | |
| Intel NUC 12 Pro Kit NUC12WSKi7 | |
| Intel NUC11PHKi7C | |
| AIDA64 / Memory Latency | |
| Intel NUC 12 Pro Kit NUC12WSKi7 | |
| Intel NUC11PHKi7C | |
| Average AMD Ryzen 7 6800H (83.1 - 89.6, n=7) | |
| Beelink SER6 Pro | |
| Beelink GTR6 | |
| Beelink SEi11 Pro | |
* ... im mniej tym lepiej
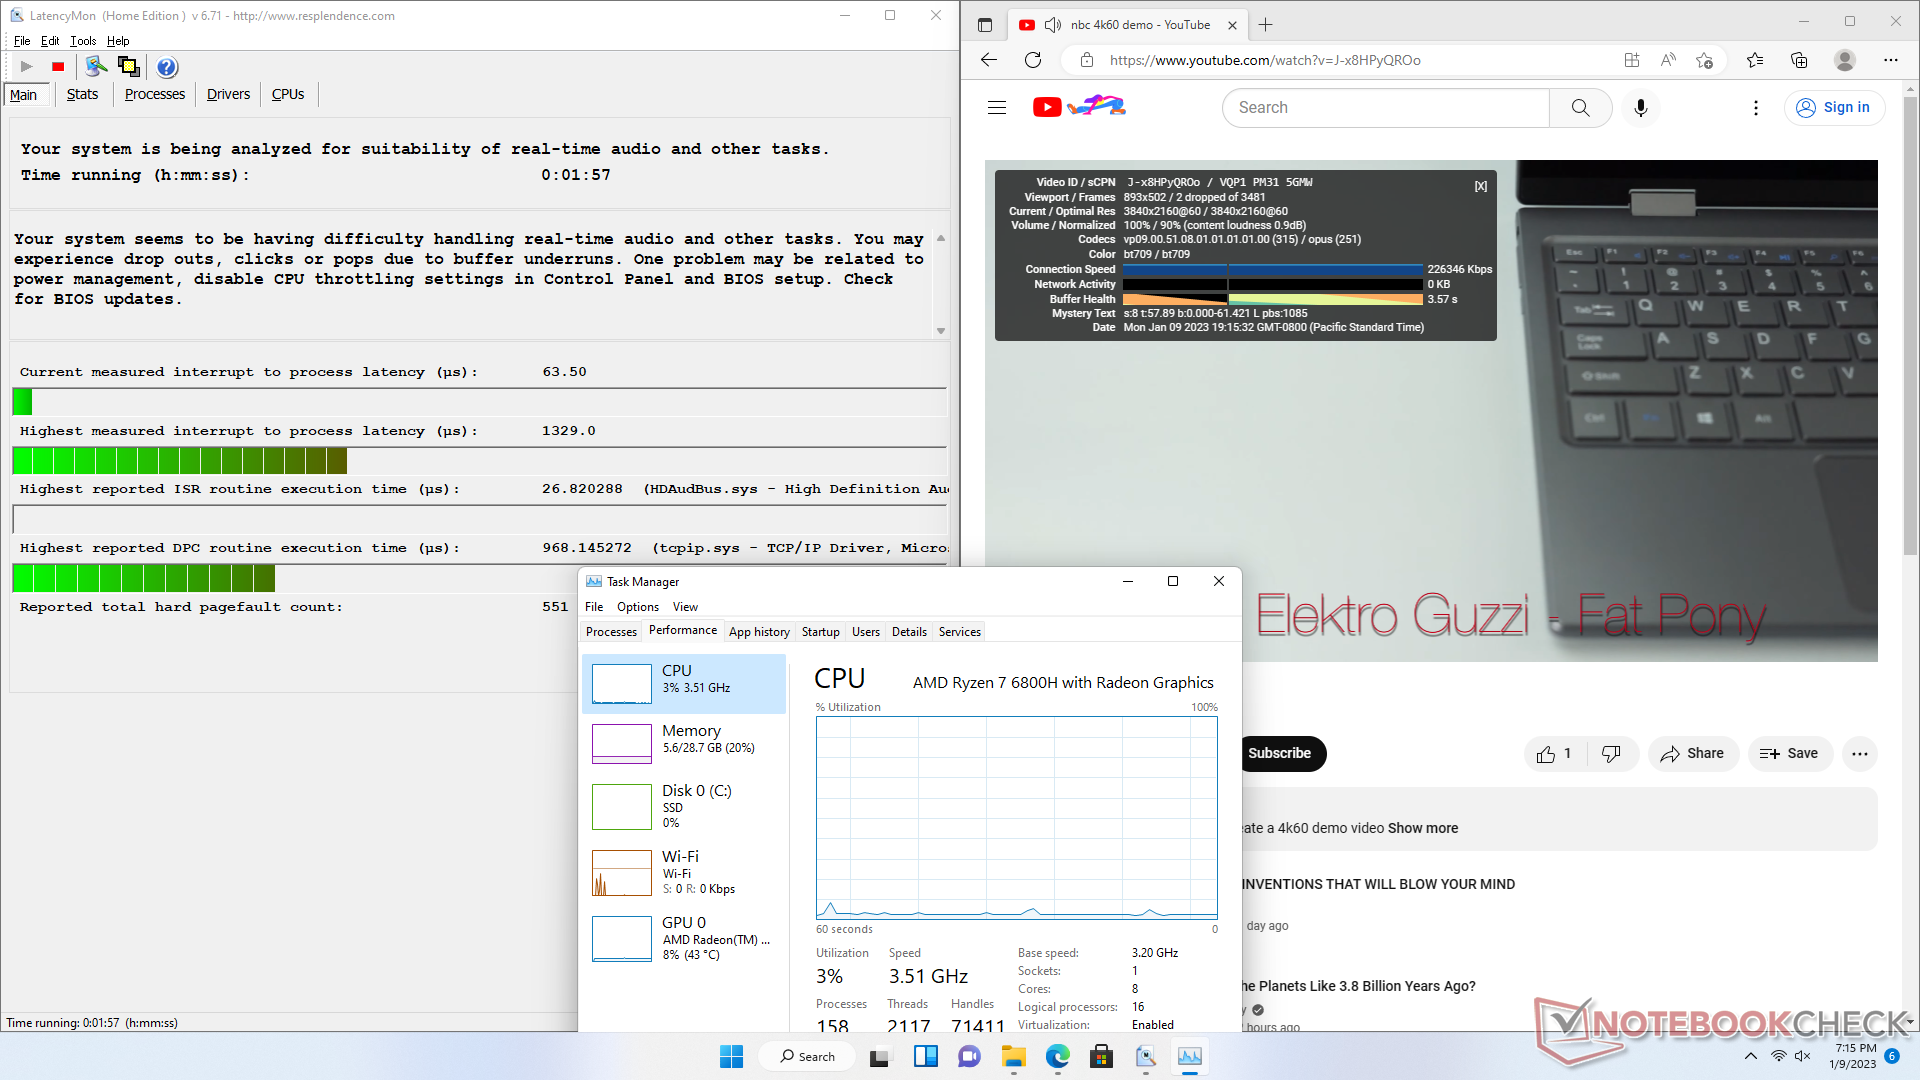
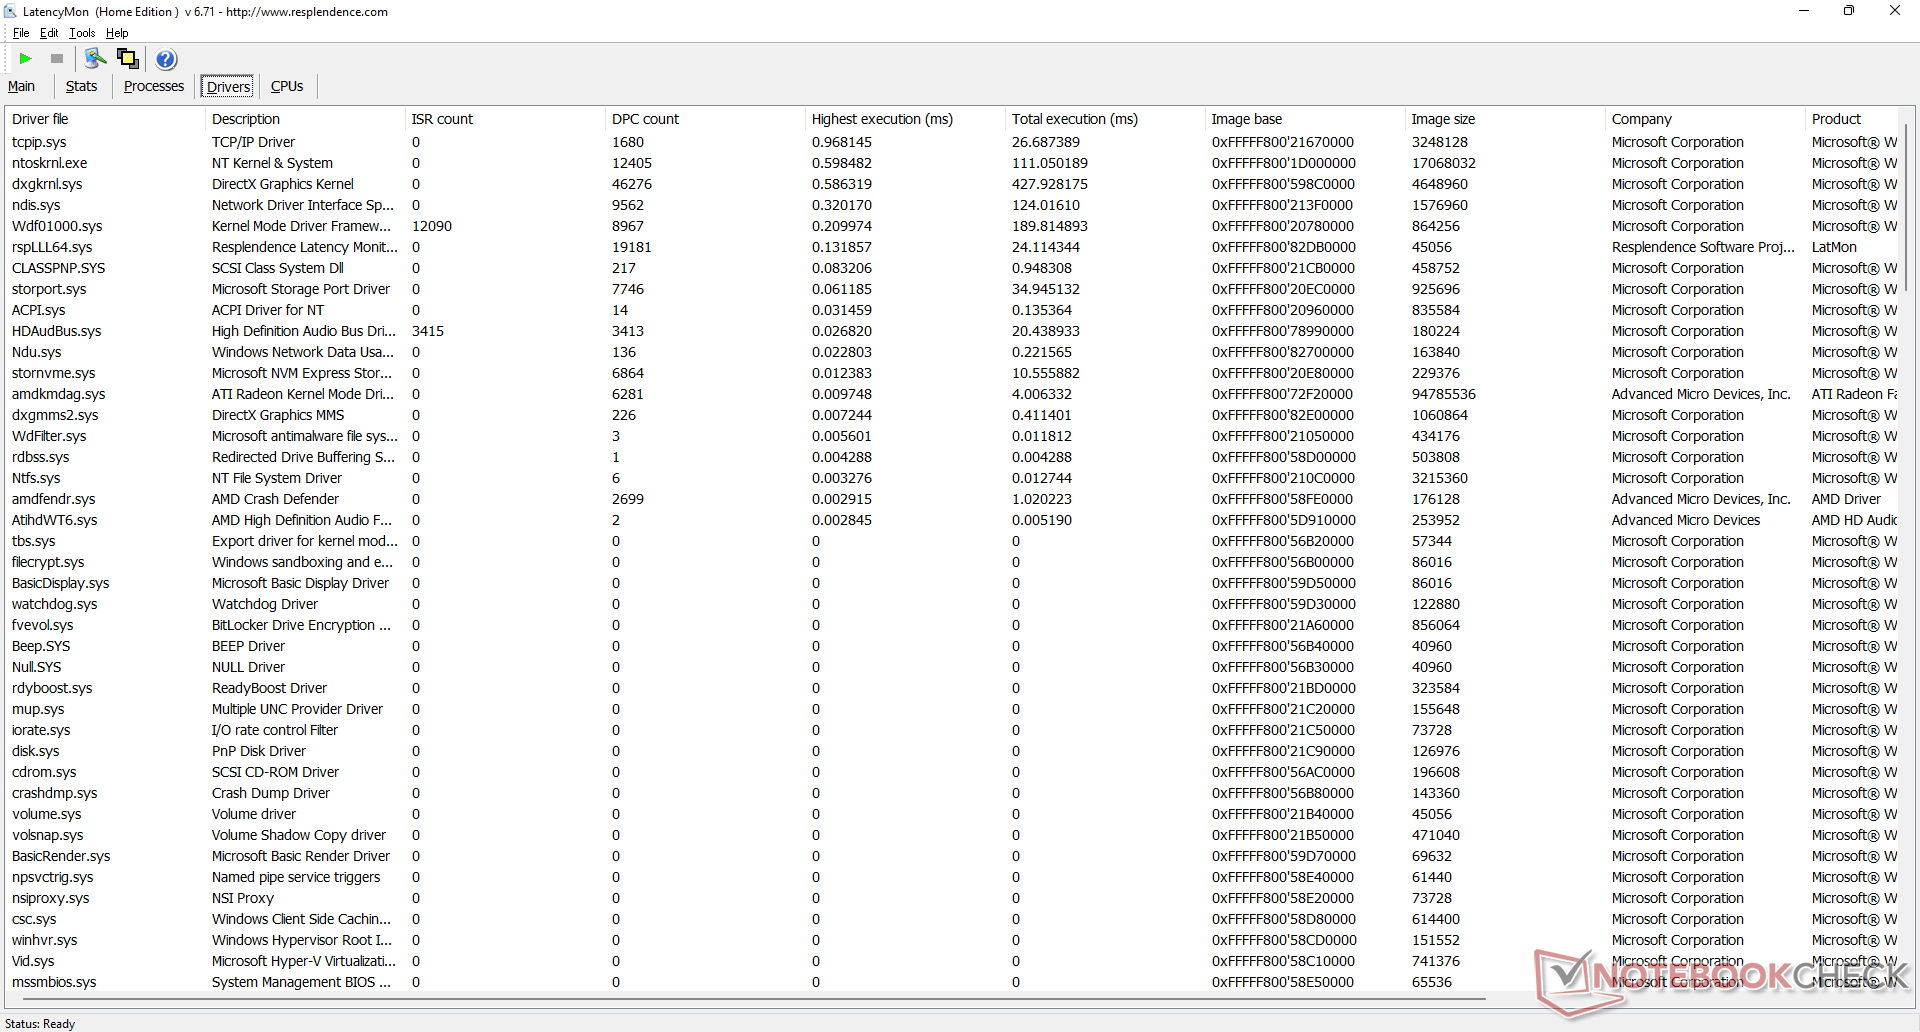
Opóźnienie DPC
LatencyMon ujawnia problemy z DPC podczas otwierania wielu kart przeglądarki na naszej stronie głównej. odtwarzanie wideo 4K przy 60 FPS jest poza tym płynne - podczas naszego jednominutowego filmu testowego spadły tylko dwie klatki.
| DPC Latencies / LatencyMon - interrupt to process latency (max), Web, Youtube, Prime95 | |
| Beelink SER6 Pro | |
| Intel NUC11PHKi7C | |
| Intel NUC 12 Pro Kit NUC12WSKi7 | |
| Beelink GTR6 | |
| Beelink SEi11 Pro | |
* ... im mniej tym lepiej
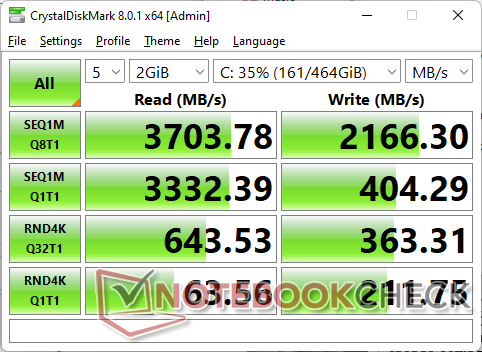
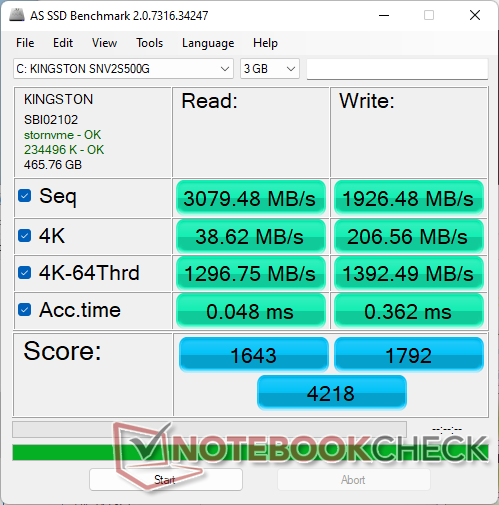
Urządzenia do przechowywania danych
strona Kingston SNV2S PCIe4 x4 SSD w naszym urządzeniu to średniej klasy dysk NVMe o sekwencyjnym odczycie i szybkości odpowiednio około 3700 MB/s i 2200 MB/s, w porównaniu do 5000 MB/s lub więcej w przypadku alternatyw takich jak Samsung PM9A1. Dysk styka się z wewnętrzną metalową płytą pod 2,5-calowym gniazdem SATA III w celu odprowadzania ciepła.

| Drive Performance Rating - Percent | |
| Beelink GTR6 | |
| Beelink SER6 Pro | |
| Intel Hades Canyon NUC8i7HVK -8! | |
| Intel NUC11PHKi7C | |
| Beelink SEi11 Pro | |
| Intel NUC 12 Pro Kit NUC12WSKi7 | |
| DiskSpd | |
| seq read | |
| Beelink GTR6 | |
| Beelink SER6 Pro | |
| Intel NUC11PHKi7C | |
| Intel NUC 12 Pro Kit NUC12WSKi7 | |
| Beelink SEi11 Pro | |
| seq write | |
| Beelink GTR6 | |
| Beelink SER6 Pro | |
| Intel NUC11PHKi7C | |
| Beelink SEi11 Pro | |
| Intel NUC 12 Pro Kit NUC12WSKi7 | |
| seq q8 t1 read | |
| Beelink GTR6 | |
| Beelink SER6 Pro | |
| Intel NUC11PHKi7C | |
| Beelink SEi11 Pro | |
| Intel NUC 12 Pro Kit NUC12WSKi7 | |
| seq q8 t1 write | |
| Beelink GTR6 | |
| Intel NUC11PHKi7C | |
| Beelink SER6 Pro | |
| Intel NUC 12 Pro Kit NUC12WSKi7 | |
| Beelink SEi11 Pro | |
| 4k q1 t1 read | |
| Beelink GTR6 | |
| Intel NUC 12 Pro Kit NUC12WSKi7 | |
| Beelink SEi11 Pro | |
| Beelink SER6 Pro | |
| Intel NUC11PHKi7C | |
| 4k q1 t1 write | |
| Beelink GTR6 | |
| Beelink SER6 Pro | |
| Intel NUC 12 Pro Kit NUC12WSKi7 | |
| Beelink SEi11 Pro | |
| Intel NUC11PHKi7C | |
| 4k q32 t16 read | |
| Beelink GTR6 | |
| Beelink SER6 Pro | |
| Intel NUC11PHKi7C | |
| Beelink SEi11 Pro | |
| Intel NUC 12 Pro Kit NUC12WSKi7 | |
| 4k q32 t16 write | |
| Beelink GTR6 | |
| Beelink SER6 Pro | |
| Beelink SEi11 Pro | |
| Intel NUC 12 Pro Kit NUC12WSKi7 | |
| Intel NUC11PHKi7C | |
* ... im mniej tym lepiej
Disk Throttling: DiskSpd Read Loop, Queue Depth 8
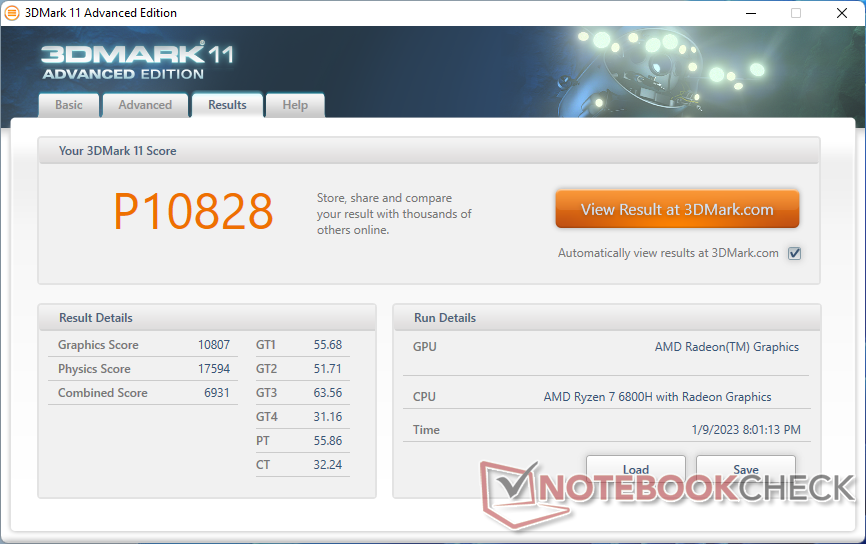
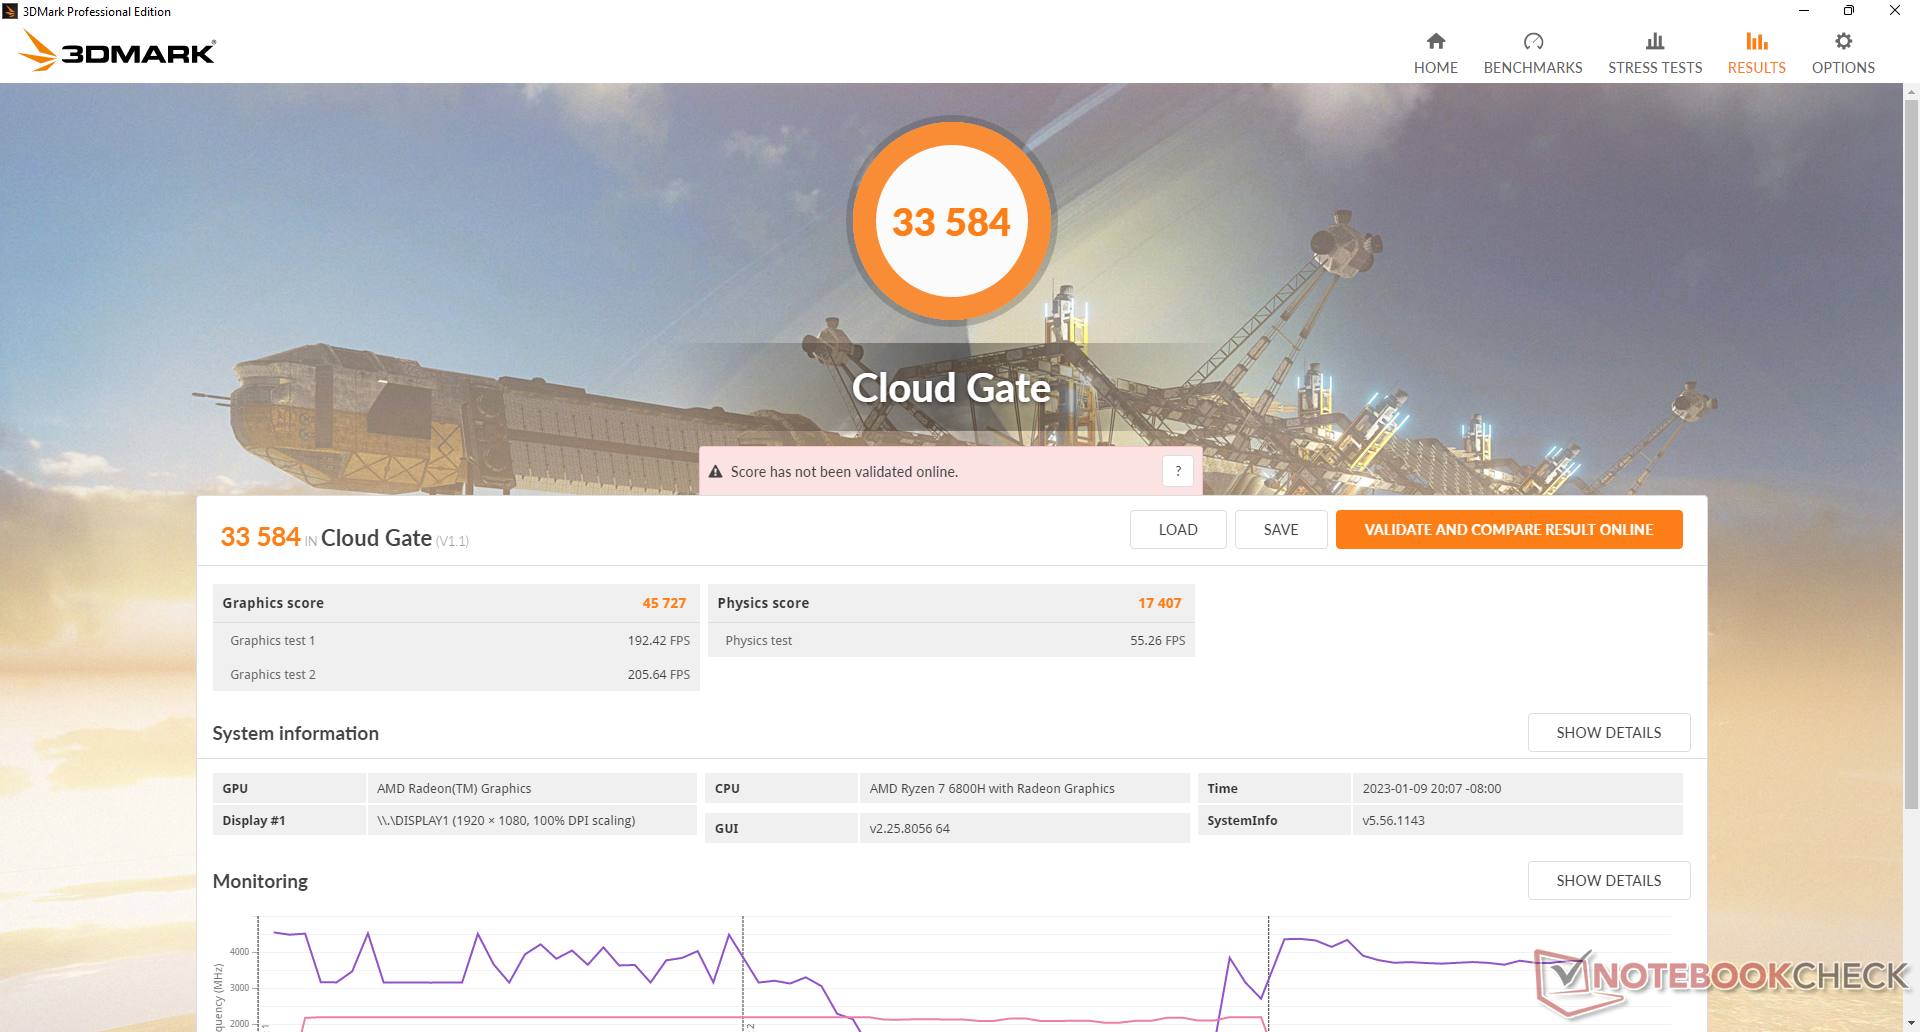
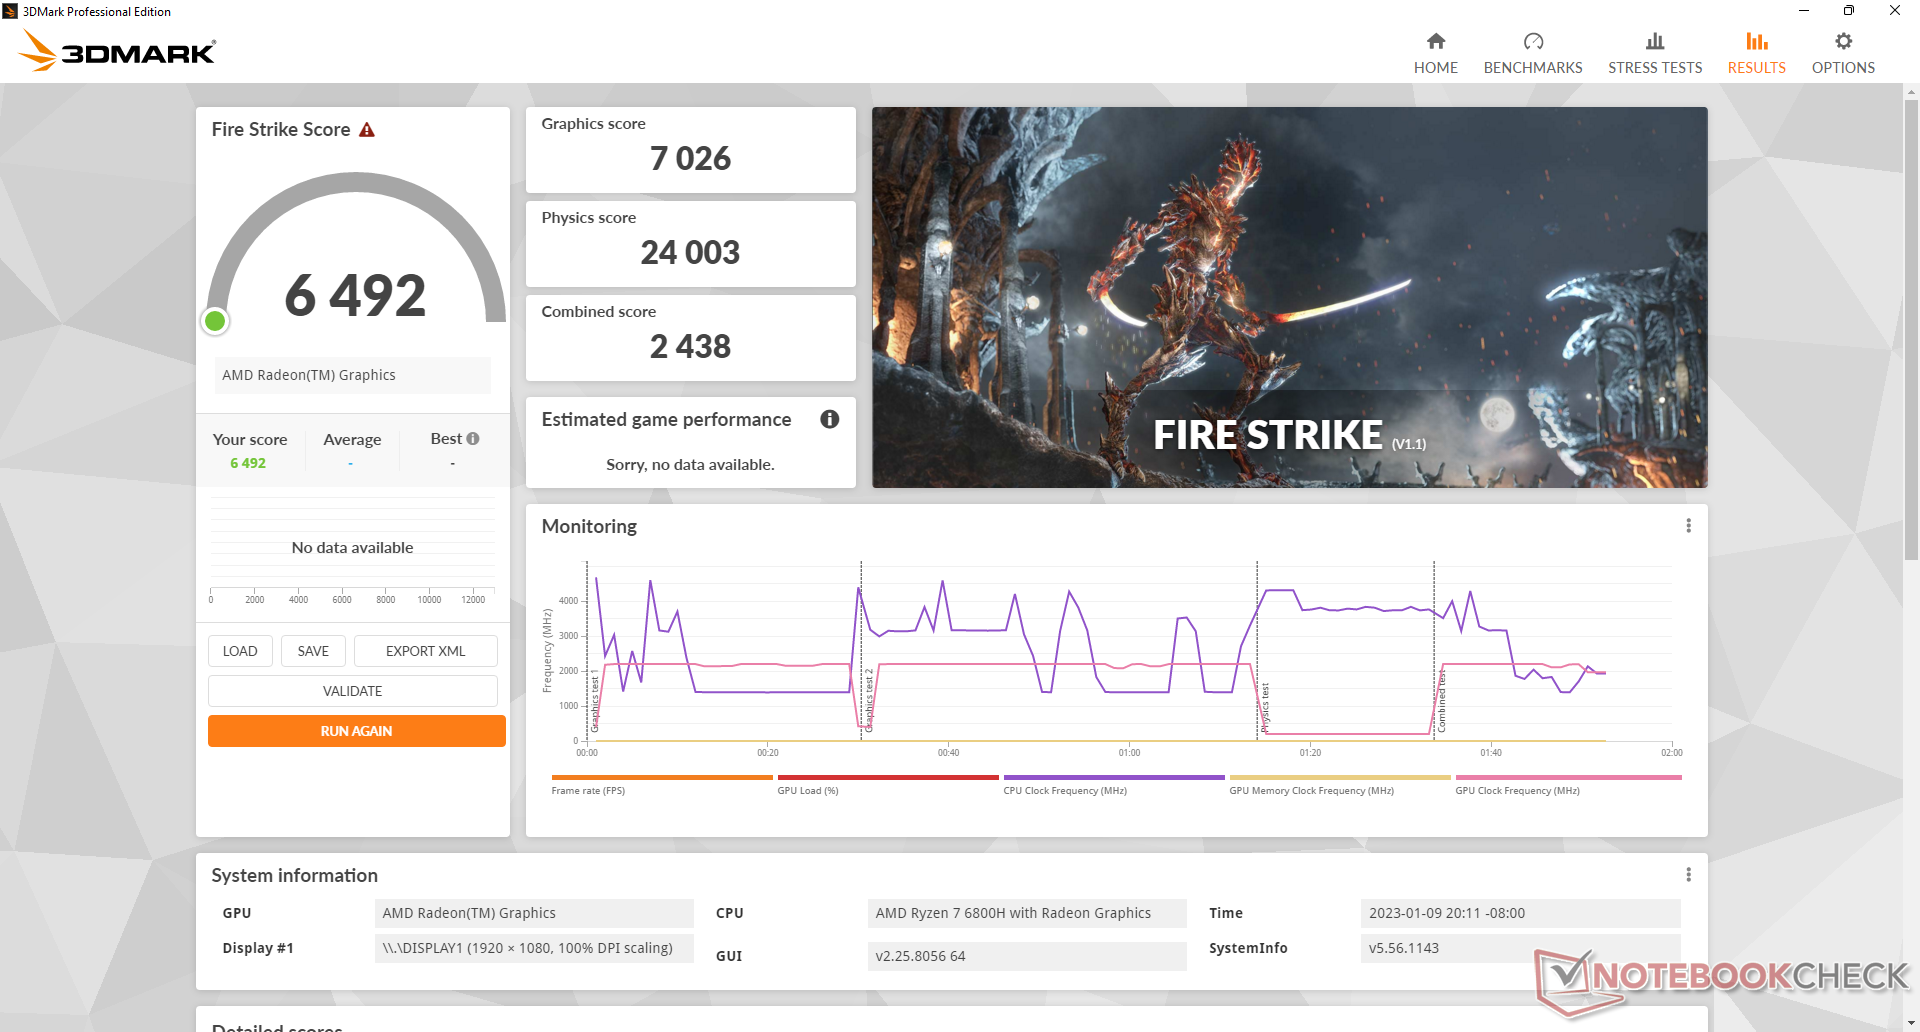
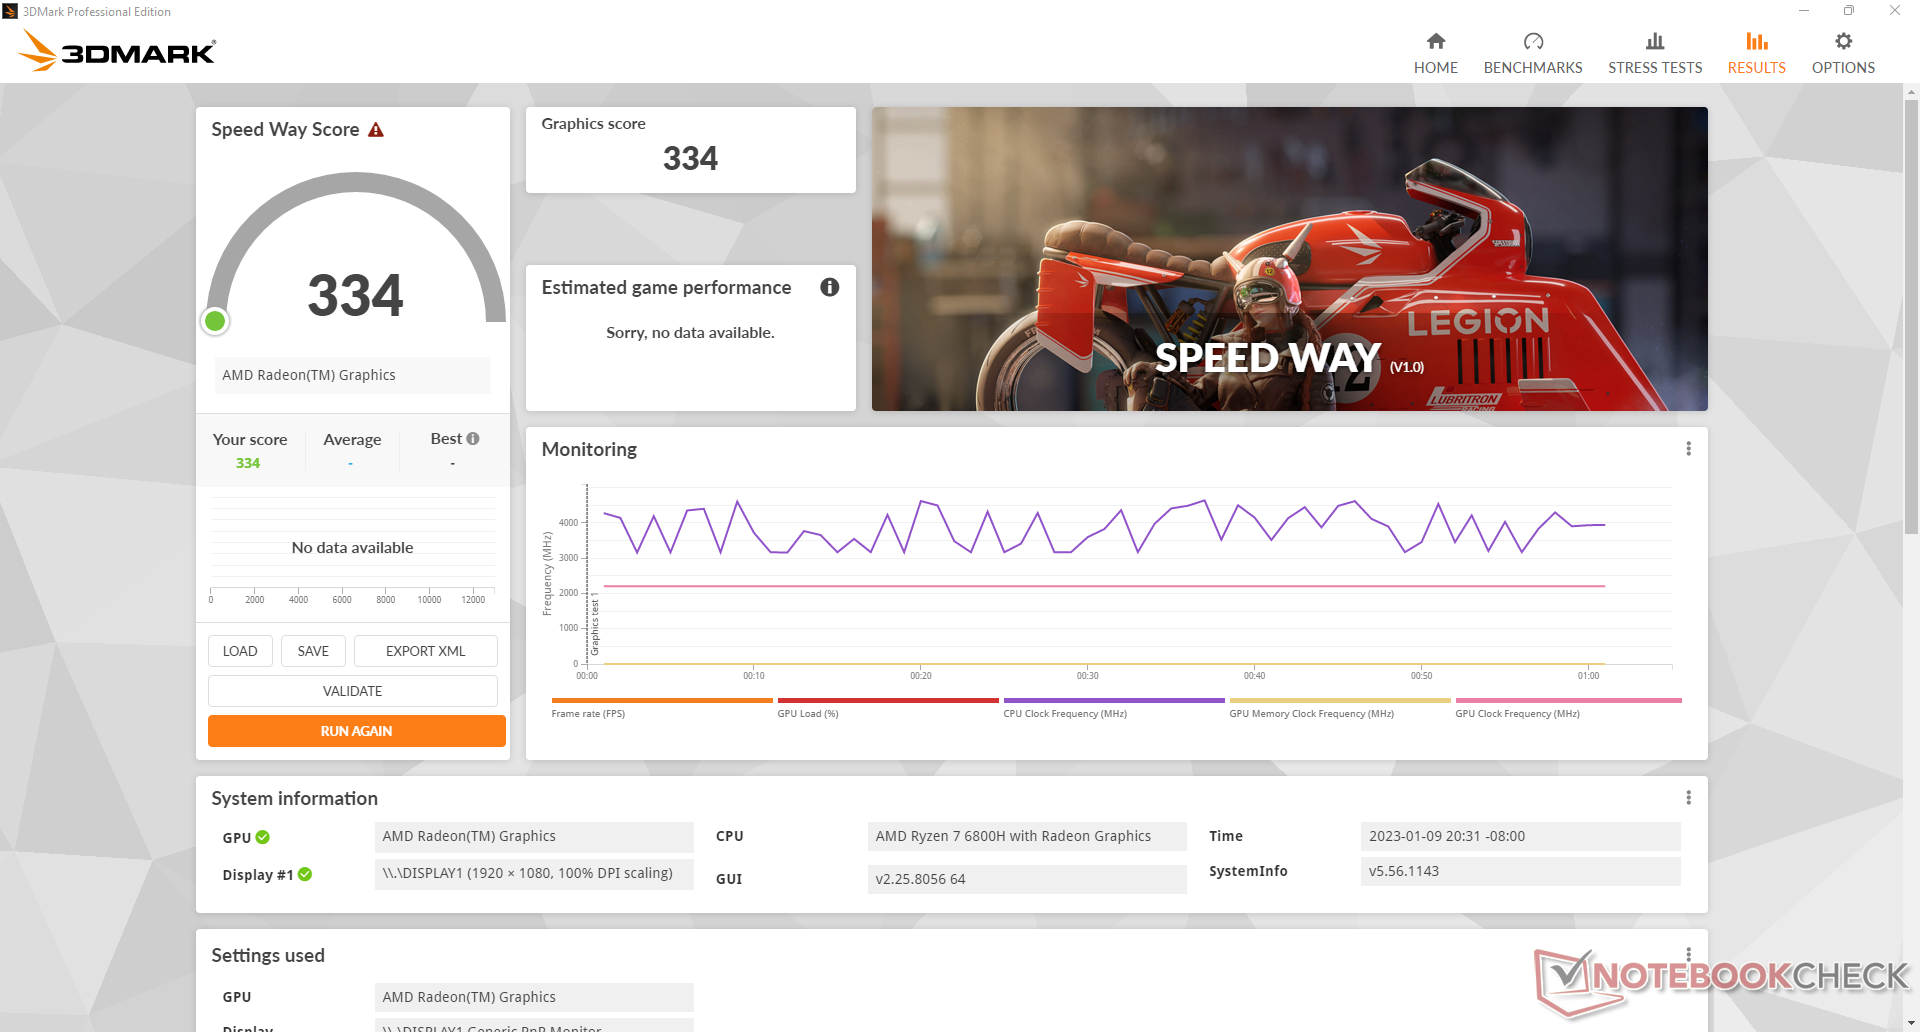
Wydajność GPU
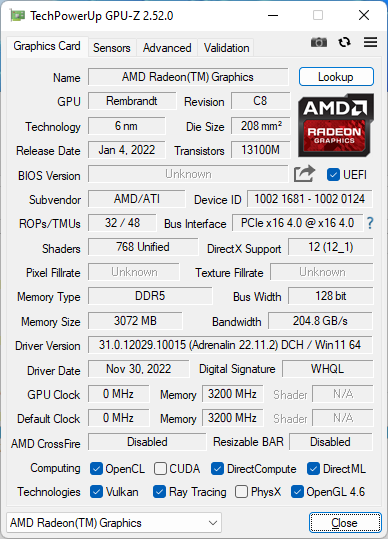
Zintegrowany Radeon 680M to znaczący upgrade w stosunku do poprzedniej generacji Radeon RX Vega 7 lub Vega 8, które można znaleźć odpowiednio w Ryzen 5 5600H lub Ryzen 7 5800H. Wydajność jest o 70 do 100 procent wyższa, co daje zauważalnie lepsze wrażenia w grach. Nie oznacza to, że SER6 Pro jest maszyną do gier, ponieważ nadal jest ponad dwukrotnie wolniejszy od GeForce RTX 2060ale wciąż ma wystarczająco dużo mocy, by wygodnie uruchamiać większość gier w 1080p na niskich lub średnich ustawieniach.
| 3DMark 11 - 1280x720 Performance GPU | |
| Minisforum Neptune Series HX90G | |
| Intel NUC11PHKi7C | |
| Intel Hades Canyon NUC8i7HVK | |
| Beelink SER6 Pro | |
| Beelink GTR6 | |
| Average AMD Radeon 680M (6858 - 11605, n=32) | |
| Intel NUC 12 Pro Kit NUC12WSKi7 | |
| Beelink SEi11 Pro | |
| Beelink SER Pro Ryzen 5 5600H | |
| Asus ZenBook Flip 14 UN5401QA-KN085W | |
| Minipc Union Ace Magician AMR5 | |
| Beelink SEi12 Core i5-1235U | |
| Trigkey S3 | |
| BMAX B5 Pro G7H8 | |
| Minipc Union NiPoGi CK10 - 10810U | |
| 3DMark 11 Performance | 10825 pkt. | |
| 3DMark Cloud Gate Standard Score | 33584 pkt. | |
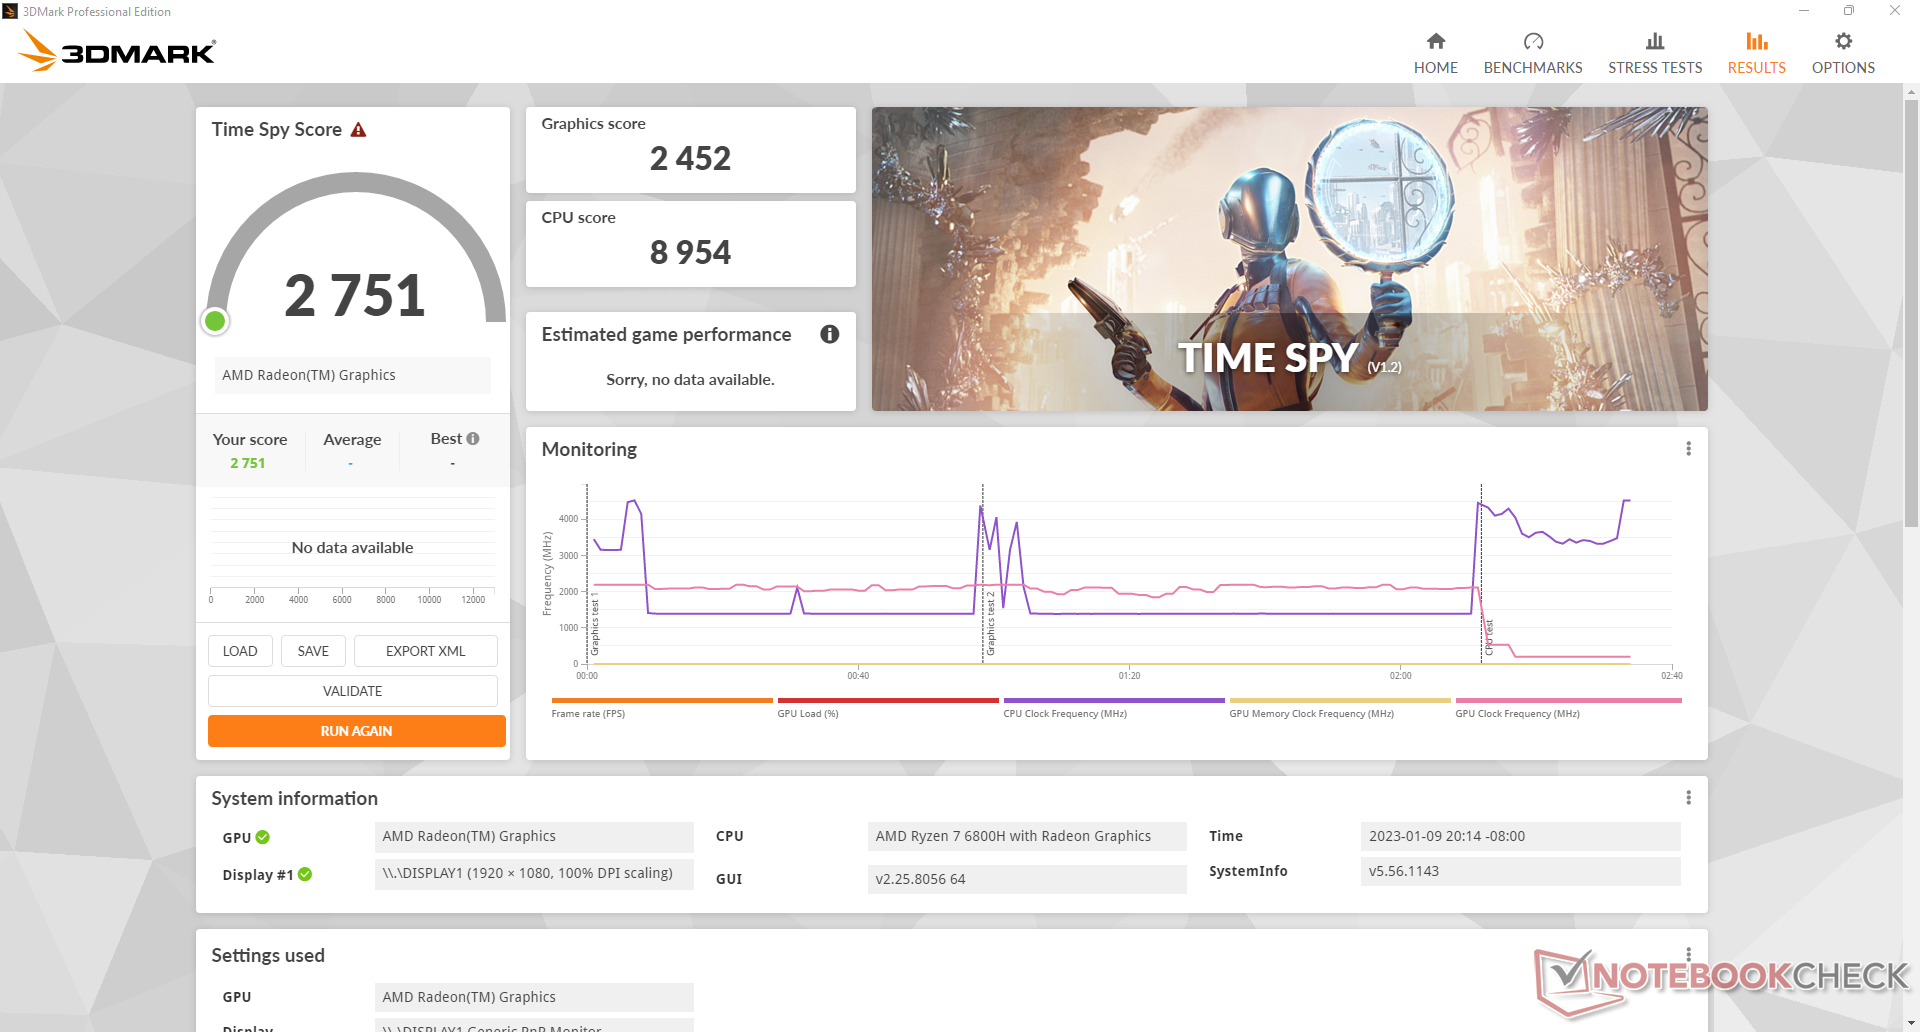
| 3DMark Fire Strike Score | 6492 pkt. | |
| 3DMark Time Spy Score | 2751 pkt. | |
Pomoc | ||
* ... im mniej tym lepiej
| X-Plane 11.11 | |
| 1280x720 low (fps_test=1) | |
| Intel NUC11PHKi7C | |
| Beelink SER6 Pro | |
| Beelink GTR6 | |
| Intel NUC 12 Pro Kit NUC12WSKi7 | |
| Intel Hades Canyon NUC8i7HVK | |
| Minisforum Neptune Series HX90G | |
| Beelink SEi11 Pro | |
| Average AMD Radeon 680M (26.8 - 66.7, n=33) | |
| Beelink SER Pro Ryzen 5 5600H | |
| Beelink SEi12 Core i5-1235U | |
| Minipc Union NiPoGi CK10 - 10810U | |
| Trigkey S3 | |
| 1920x1080 med (fps_test=2) | |
| Intel NUC11PHKi7C | |
| Beelink SER6 Pro | |
| Intel Hades Canyon NUC8i7HVK | |
| Beelink GTR6 | |
| Minisforum Neptune Series HX90G | |
| Intel NUC 12 Pro Kit NUC12WSKi7 | |
| Average AMD Radeon 680M (21.1 - 53.1, n=33) | |
| Beelink SEi11 Pro | |
| Beelink SER Pro Ryzen 5 5600H | |
| Beelink SEi12 Core i5-1235U | |
| Minipc Union NiPoGi CK10 - 10810U | |
| Trigkey S3 | |
| 1920x1080 high (fps_test=3) | |
| Intel NUC11PHKi7C | |
| Minisforum Neptune Series HX90G | |
| Intel Hades Canyon NUC8i7HVK | |
| Beelink SER6 Pro | |
| Beelink GTR6 | |
| Intel NUC 12 Pro Kit NUC12WSKi7 | |
| Beelink SEi11 Pro | |
| Beelink SER Pro Ryzen 5 5600H | |
| Average AMD Radeon 680M (16.6 - 43.1, n=33) | |
| Beelink SEi12 Core i5-1235U | |
| Minipc Union NiPoGi CK10 - 10810U | |
| Trigkey S3 | |
Nasza jednostka wykazywała problemy z utrzymaniem liczby klatek na sekundę. Podczas pracy na biegu jałowym Witcher 3liczba klatek na sekundę spadała z ~80 FPS do ~70 FPS bez żadnego powodu. Doświadczyliśmy nawet spadku do poziomu 18 FPS, jak pokazuje poniższy wykres. Niestabilność sugeruje przerwanie aktywności w tle lub słabe zarządzanie aplikacjami działającymi w tle.
Witcher 3 FPS Chart
| low | med. | high | ultra | |
| GTA V (2015) | 152.3 | 139.7 | 51.9 | 23.7 |
| The Witcher 3 (2015) | 138.1 | 85.1 | 43.3 | 27 |
| Dota 2 Reborn (2015) | 143.3 | 113.4 | 83.9 | 73.1 |
| Final Fantasy XV Benchmark (2018) | 68.1 | 34.7 | 24.6 | |
| X-Plane 11.11 (2018) | 66.4 | 52.9 | 43 | |
| Strange Brigade (2018) | 141.9 | 57.8 | 48.6 | 41.9 |
| Cyberpunk 2077 1.6 (2022) | 43.3 | 33.1 | 21.3 | 17.2 |
Emisje
Szum systemu
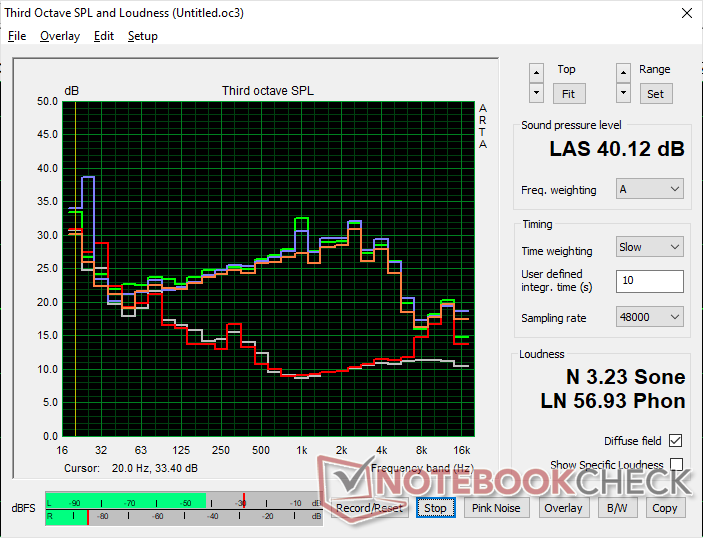
Wewnętrzne wentylatory są wrażliwe na obciążenie ekranu. Na przykład podczas przeglądania stron internetowych lub strumieniowego przesyłania wideo szum wentylatora może czasami wzrosnąć na krótko do 33 dB(A). Szum wentylatora osiąga również swoje maksimum, wynoszące około 40 dB(A), szybciej niż w większości innych komputerów mini PC.
W naszym testowanym egzemplarzu wystąpiły lekkie szumy elektroniczne lub wycie cewek. W ten sposób udało nam się zarejestrować hałas o wartości 24,1 dB(A) na tle cichego tła o wartości 22,8 dB(A), nawet gdy wentylator pracował w stanie spoczynku.
Hałas
| luz |
| 24.1 / 24.1 / 33.8 dB |
| obciążenie |
| 40.1 / 40.1 dB |
 | ||
30 dB cichy 40 dB(A) słyszalny 50 dB(A) irytujący |
||
min: | ||
| Beelink SER6 Pro Radeon 680M, R7 6800H, Kingston NV2 500GB SNV2S/500G | Beelink GTR6 Radeon 680M, R9 6900HX, Kingston KC3000 512G SKC3000S512G | Beelink SEi11 Pro Iris Xe G7 96EUs, i5-11320H, Kingston NV1 SNVS/500GCN | Intel NUC 12 Pro Kit NUC12WSKi7 Iris Xe G7 96EUs, i7-1260P, Transcend M.2 SSD 2200S TS512GMTE220S | Intel NUC11PHKi7C GeForce RTX 2060 Mobile, i7-1165G7, Samsung SSD 980 Pro 500GB MZ-V8P500BW | Intel Hades Canyon NUC8i7HVK Vega M GH, i7-8809G, Intel Optane 120 GB SSDPEK1W120GA | |
|---|---|---|---|---|---|---|
| Noise | -3% | 8% | -18% | -1% | -11% | |
| off / environment * | 22.8 | 23.2 -2% | 22.8 -0% | 30.4 -33% | 24.5 -7% | 28.7 -26% |
| Idle Minimum * | 24.1 | 23.6 2% | 24.7 -2% | 33.1 -37% | 25.3 -5% | 29 -20% |
| Idle Average * | 24.1 | 23.8 1% | 24.7 -2% | 33.1 -37% | 25.3 -5% | 29 -20% |
| Idle Maximum * | 33.8 | 36.2 -7% | 25.3 25% | 33.1 2% | 25.3 25% | 29 14% |
| Load Average * | 40.1 | 39.7 1% | 33.2 17% | 38.1 5% | 36.4 9% | 36 10% |
| Witcher 3 ultra * | 38.7 | 41 -6% | 34.5 11% | 39.7 -3% | 42 -9% | |
| Load Maximum * | 40.1 | 43 -7% | 37.8 6% | 43.6 -9% | 47.9 -19% | 49.4 -23% |
* ... im mniej tym lepiej
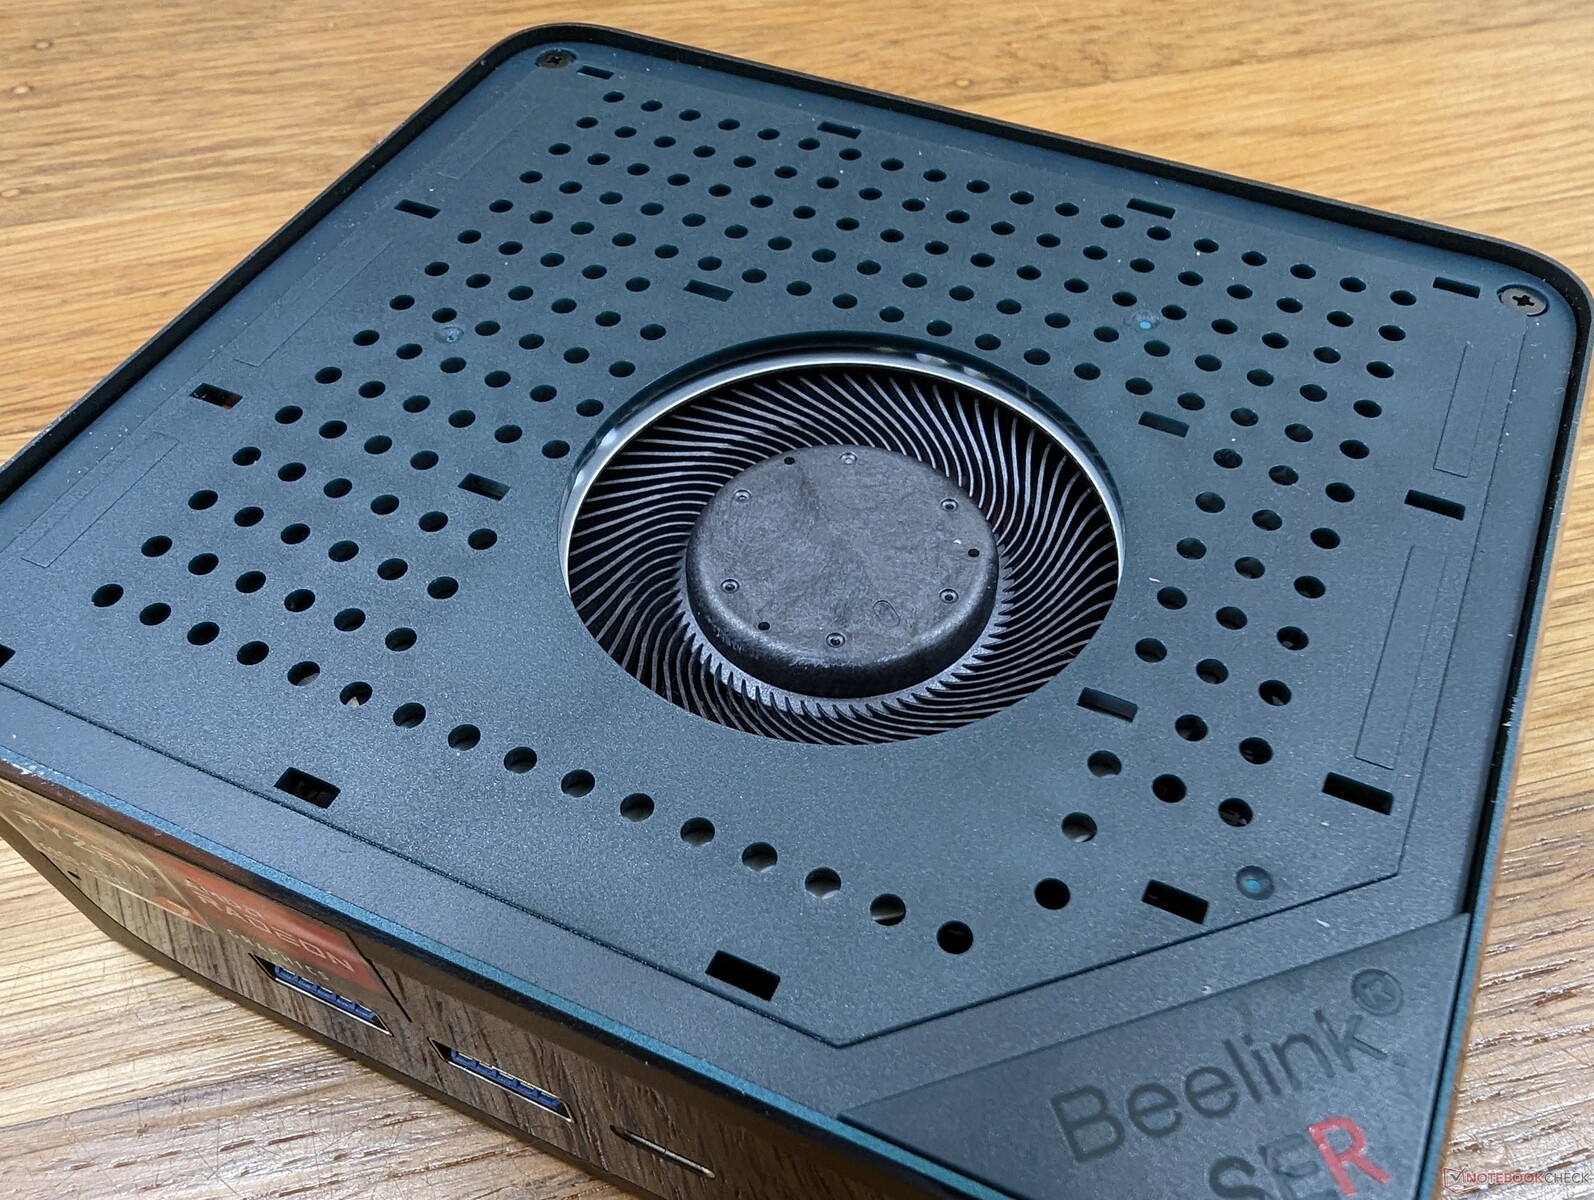
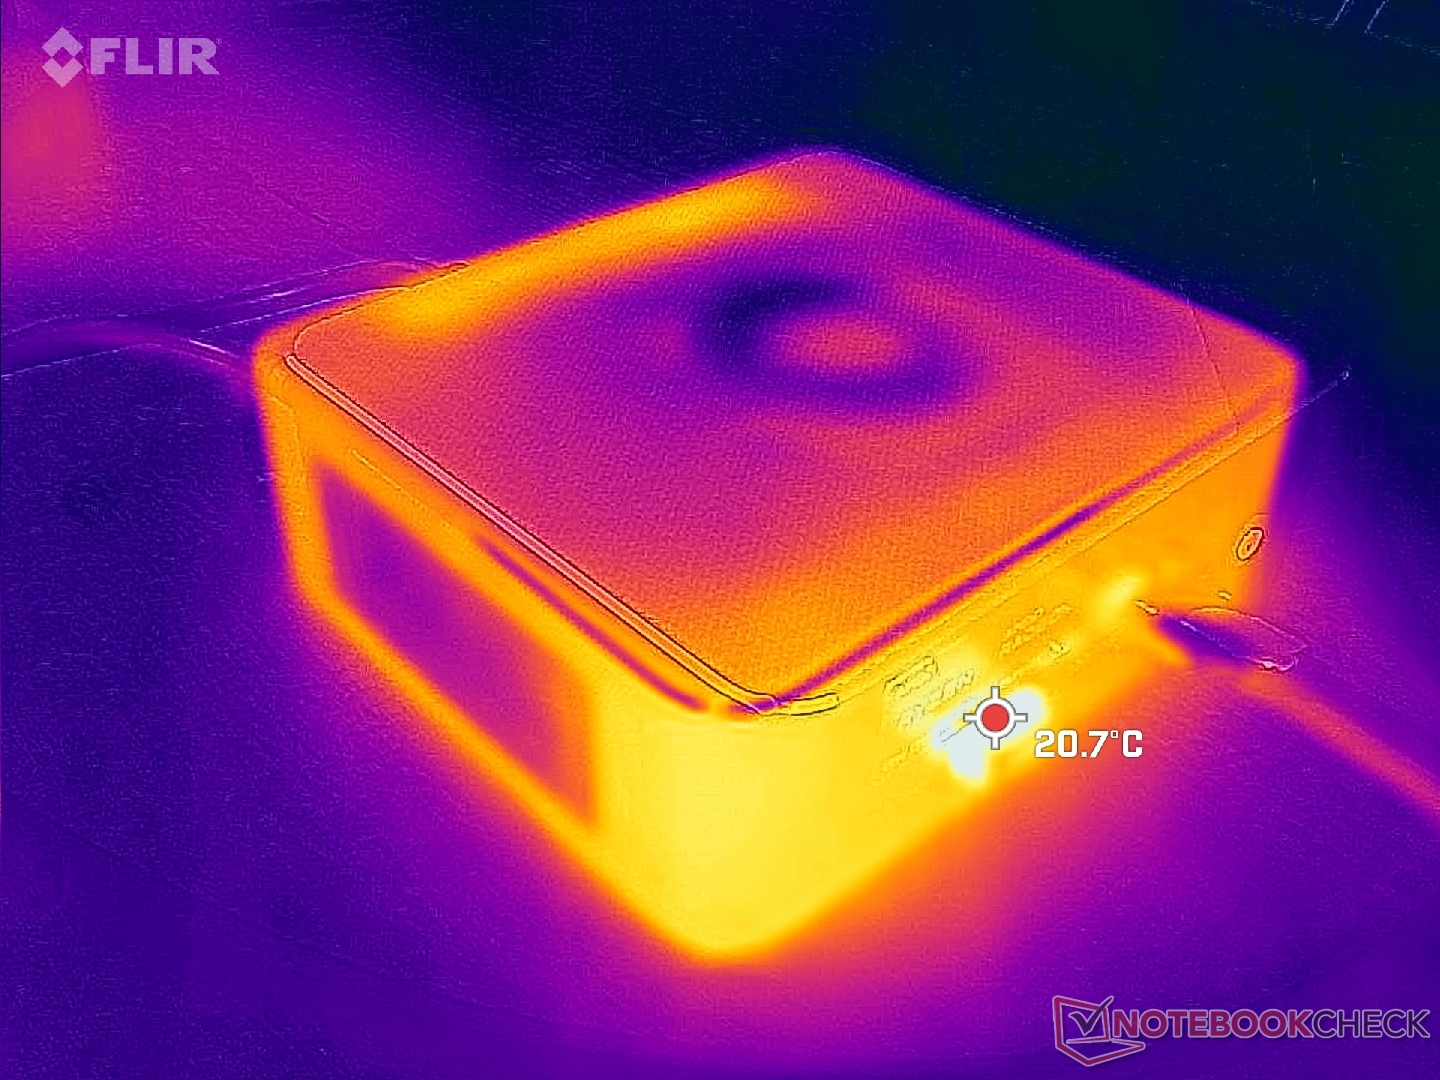
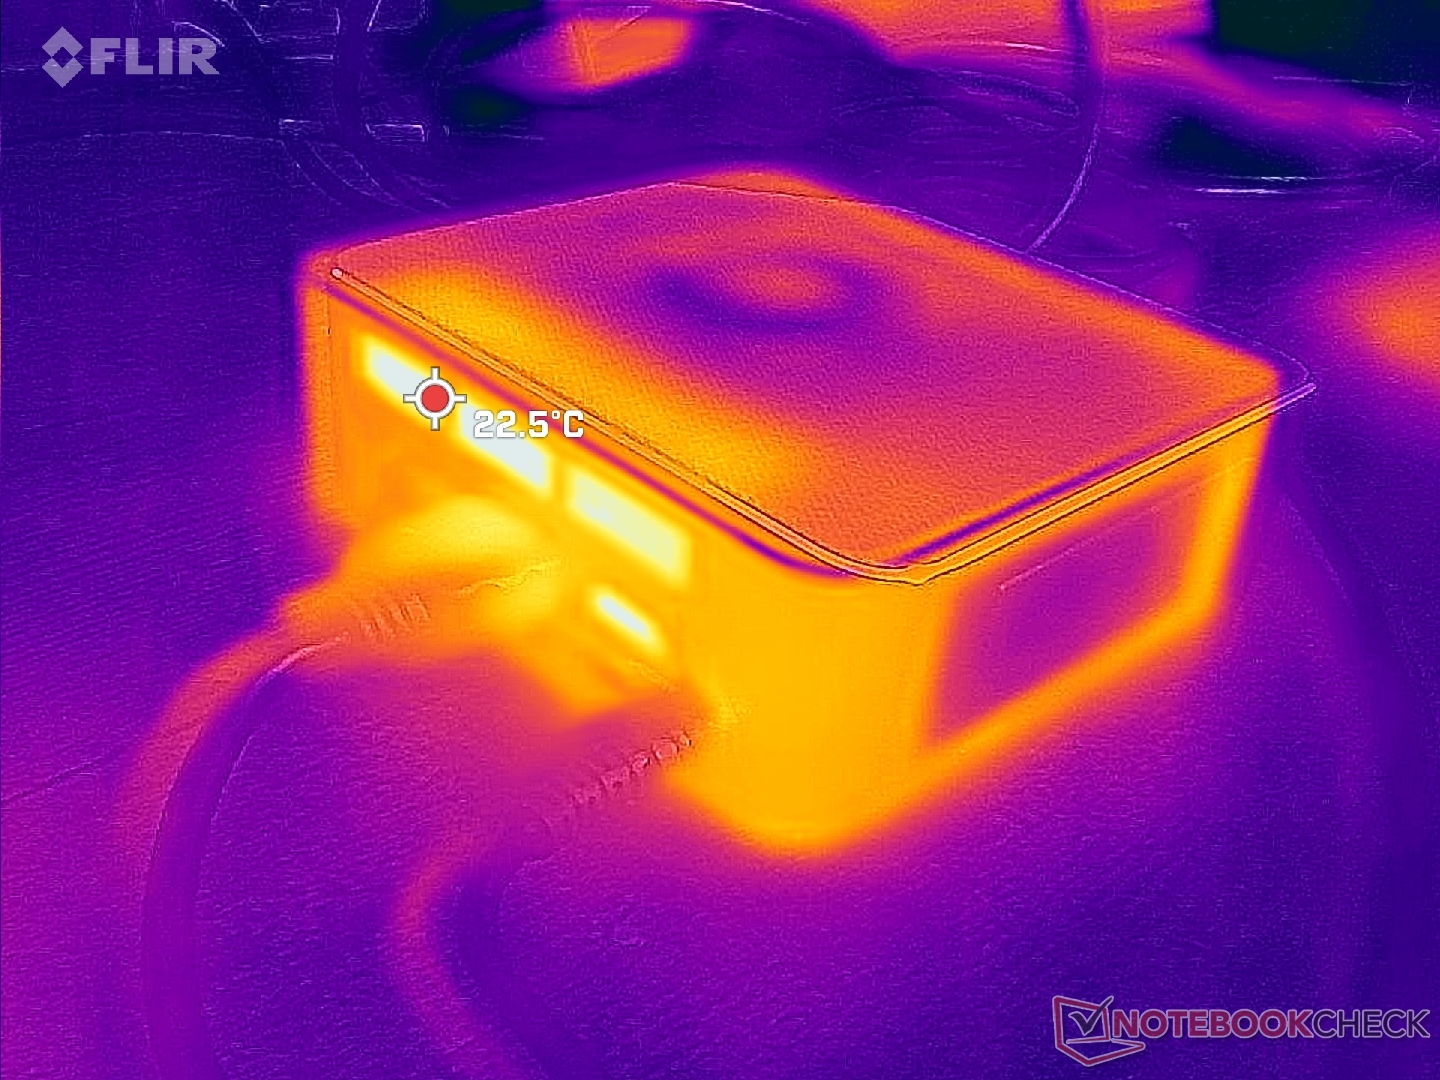
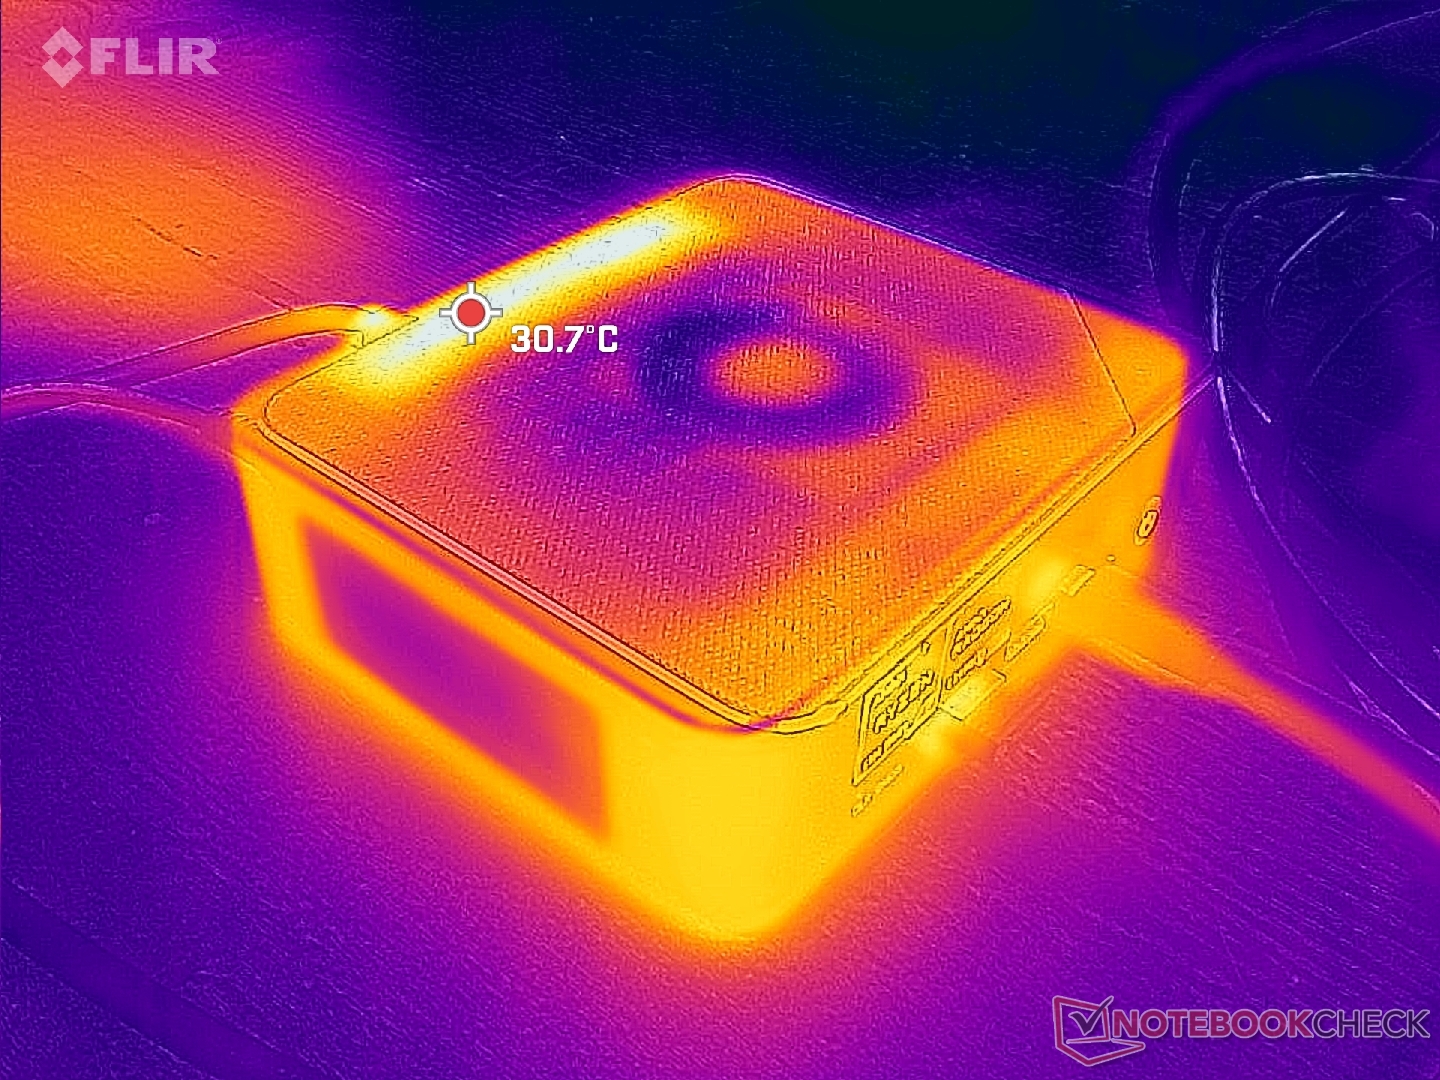
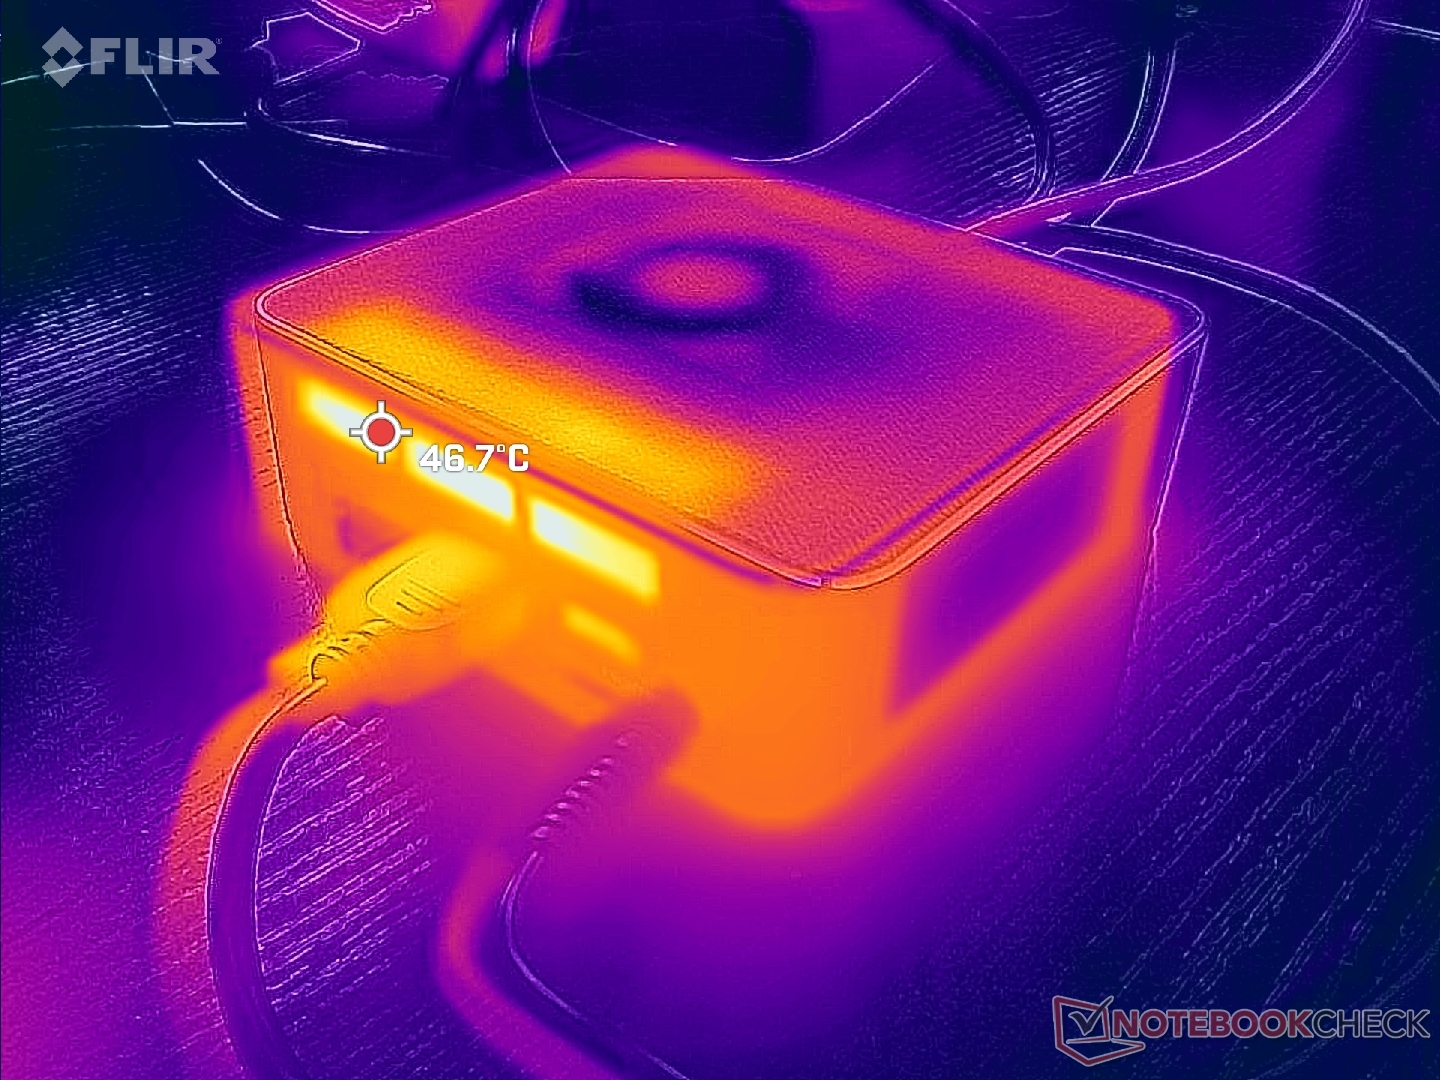
Temperatura
Temperatury powierzchni nie stanowią problemu. W przeciwieństwie do wielu innych mini PC, SER6 Pro posiada dwa wentylatory dla lepszego potencjału chłodzenia. Chłodne powietrze dostaje się z boków i z góry, natomiast gorące powietrze wydostaje się z tyłu. Umieszczanie przedmiotów na górze mini PC lub ustawianie go w pionie będzie zatem utrudniać przepływ powietrza.
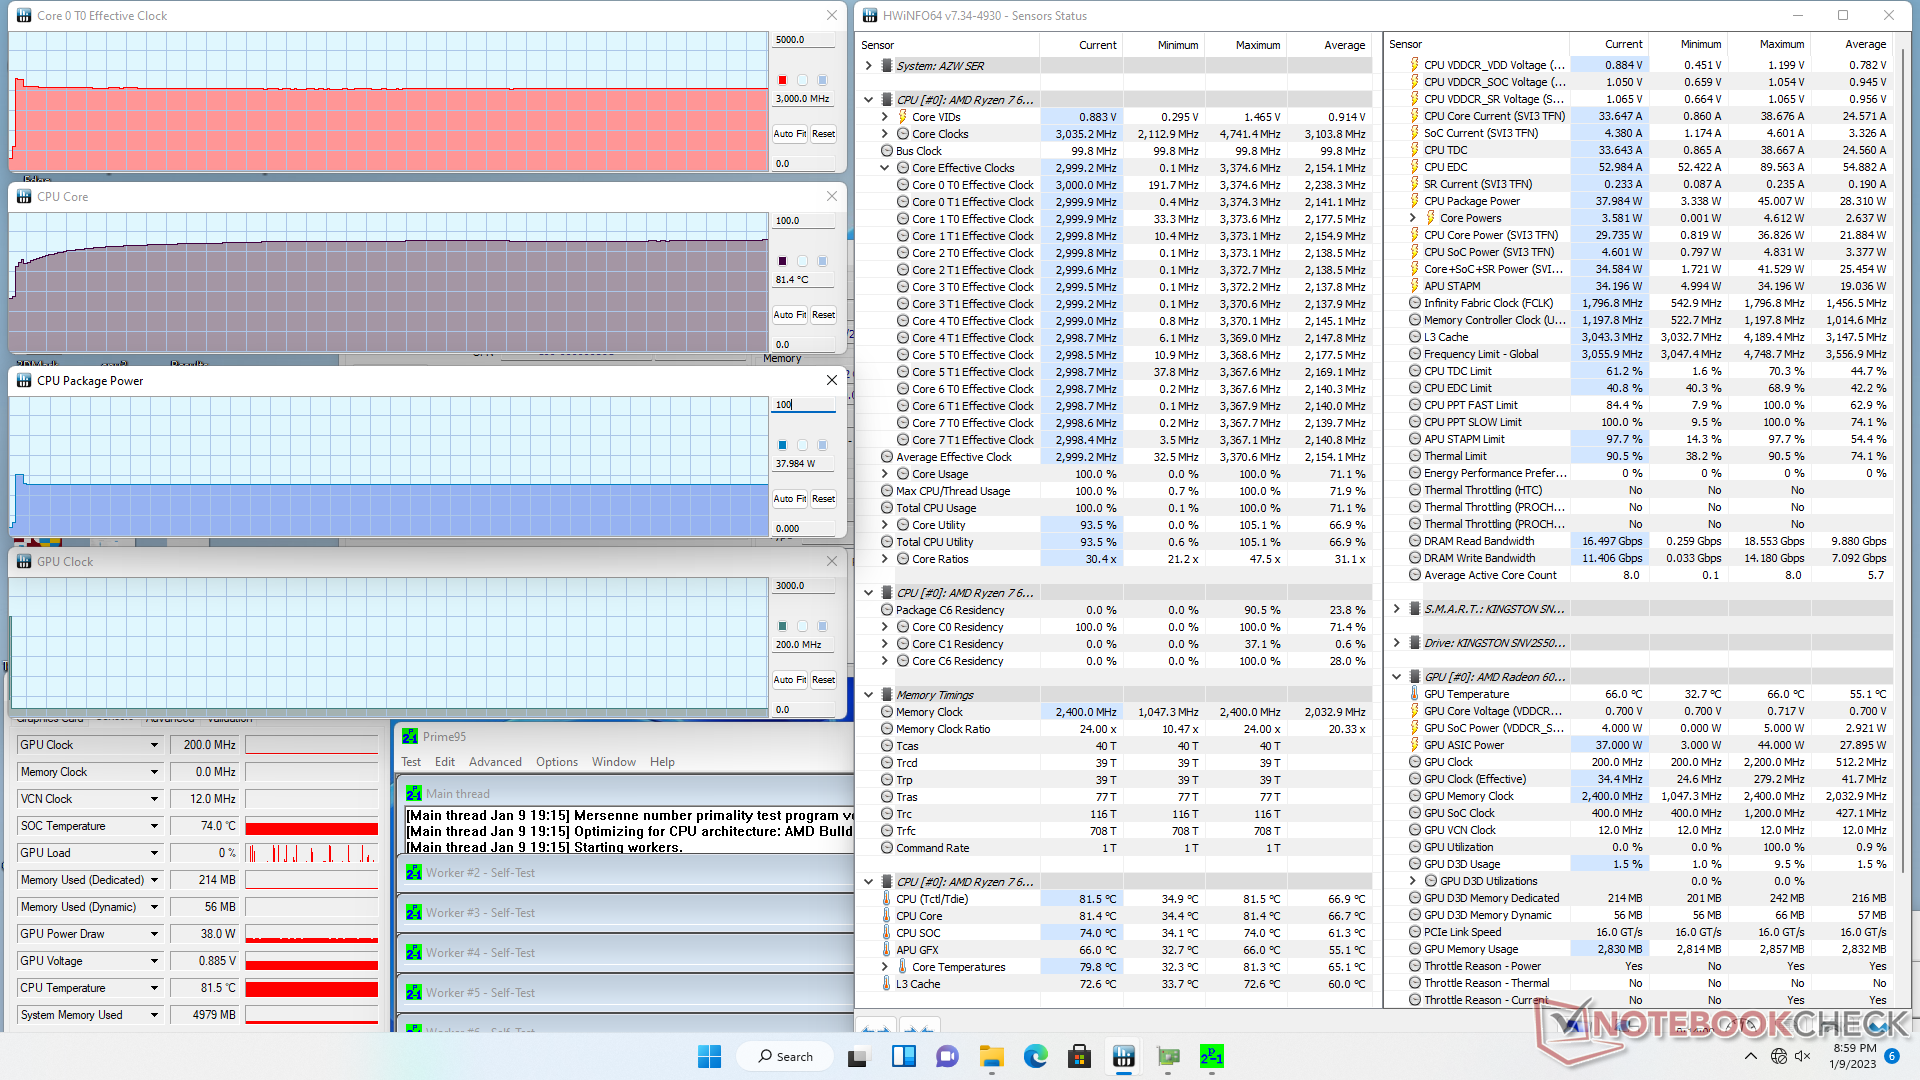
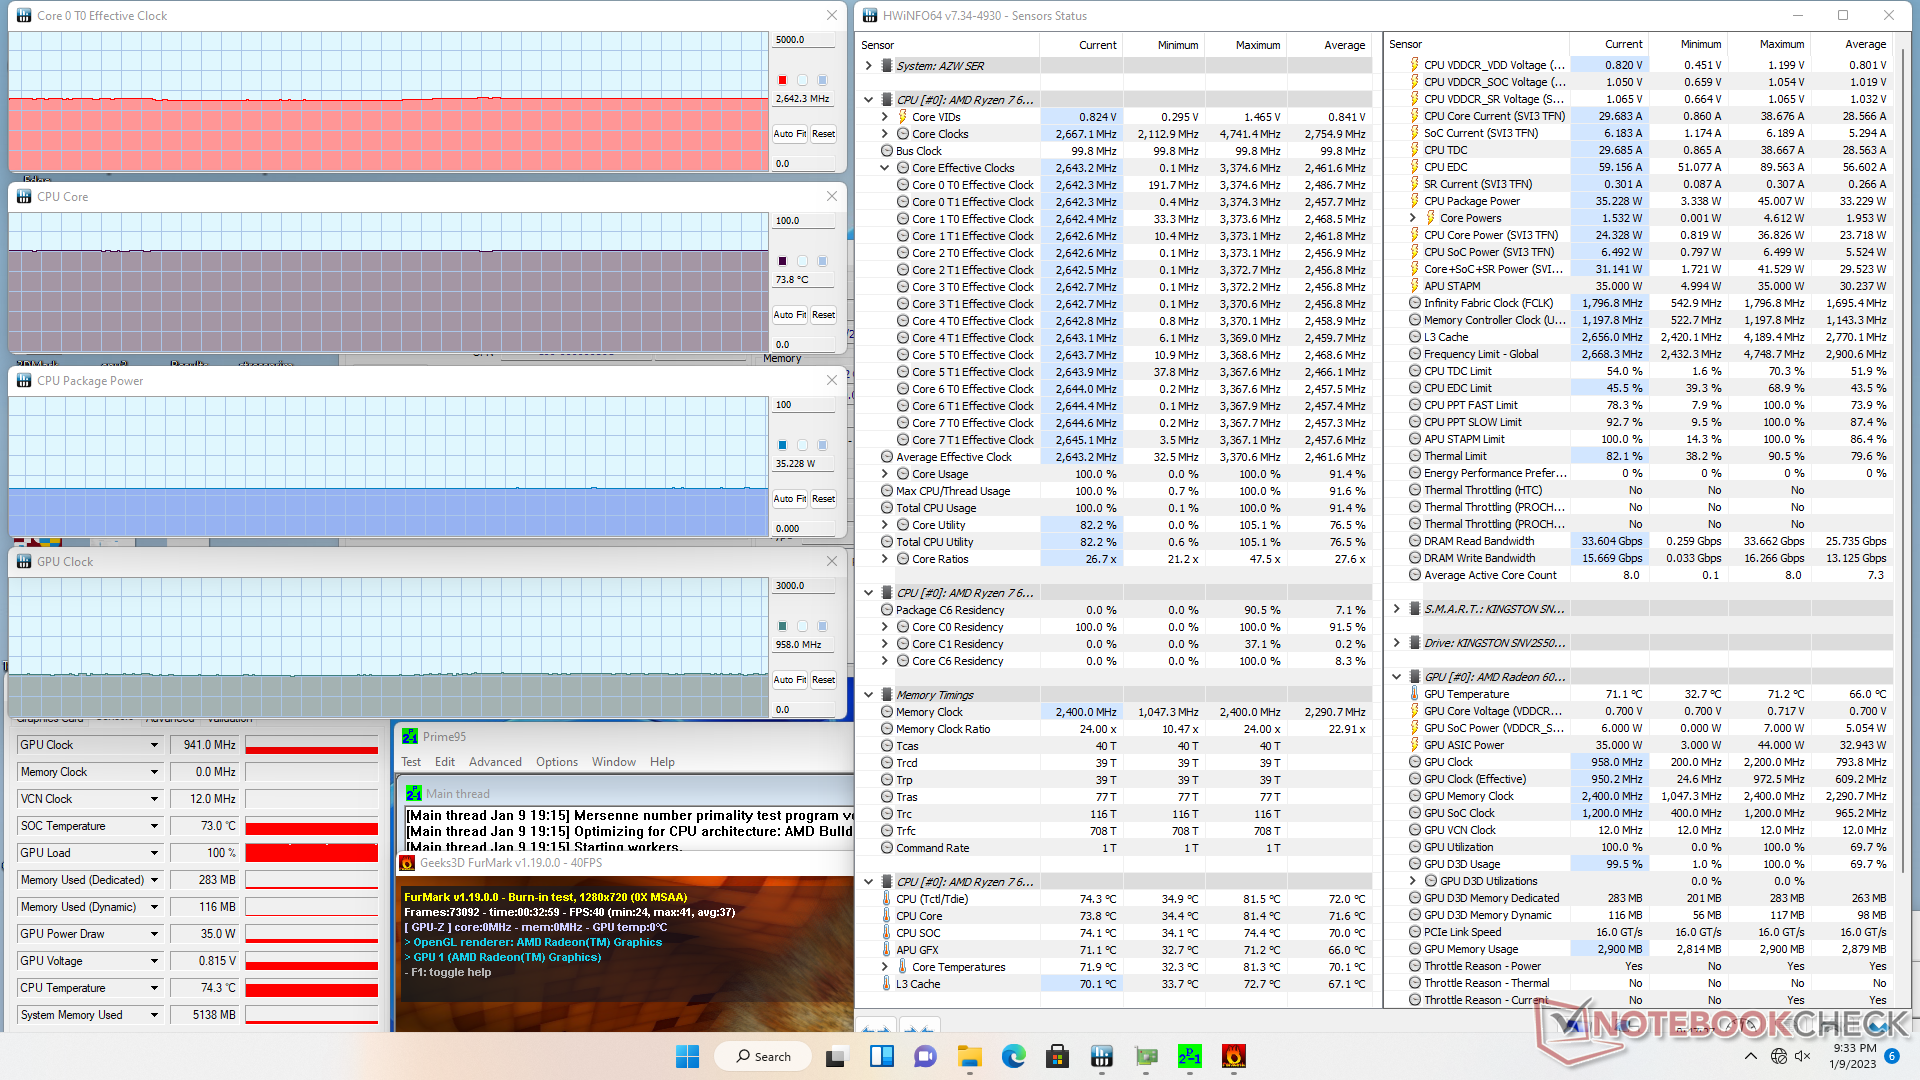
Stress Test
Po uruchomieniu Prime95 w celu obciążenia CPU, częstotliwość taktowania zegara i pobór mocy na płycie wzrosły odpowiednio do 3,3 GHz i 45 W, trwając zaledwie kilka sekund. Następnie procesor szybko ustabilizowałby się na poziomie 3 GHz, 38 W i 82 C. Powtarzając ten sam test naBeelink SEi11 z wolniejszym procesorem Core i5-11320H dało temperaturę 89°C.
Podczas pracy Witcher 3 w celu odwzorowania typowego obciążenia w grach, częstotliwość taktowania GPU i temperatura ustabilizowałyby się odpowiednio na poziomie 1956 MHz i 70 C, w porównaniu z 83 C w SEi11. SER6 Pro jest nie tylko szybszy, ale również chłodniejszy.
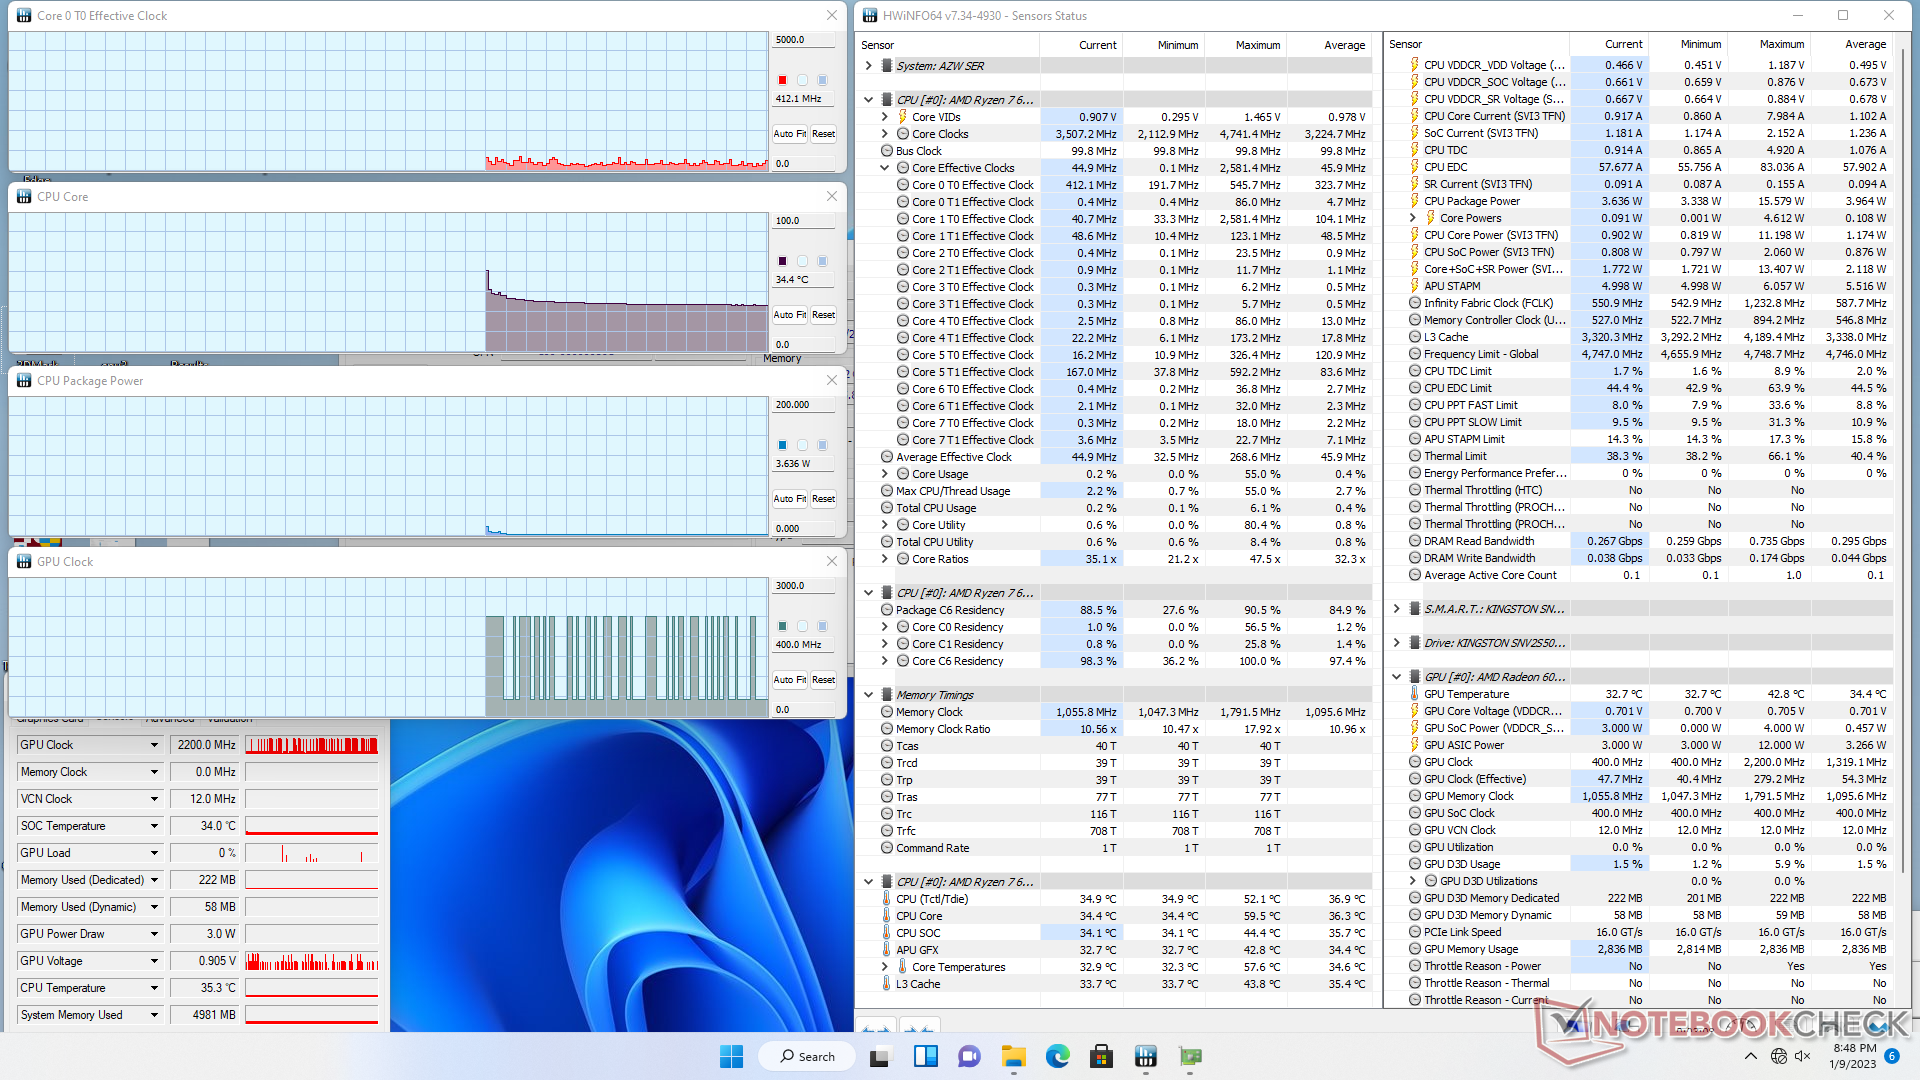
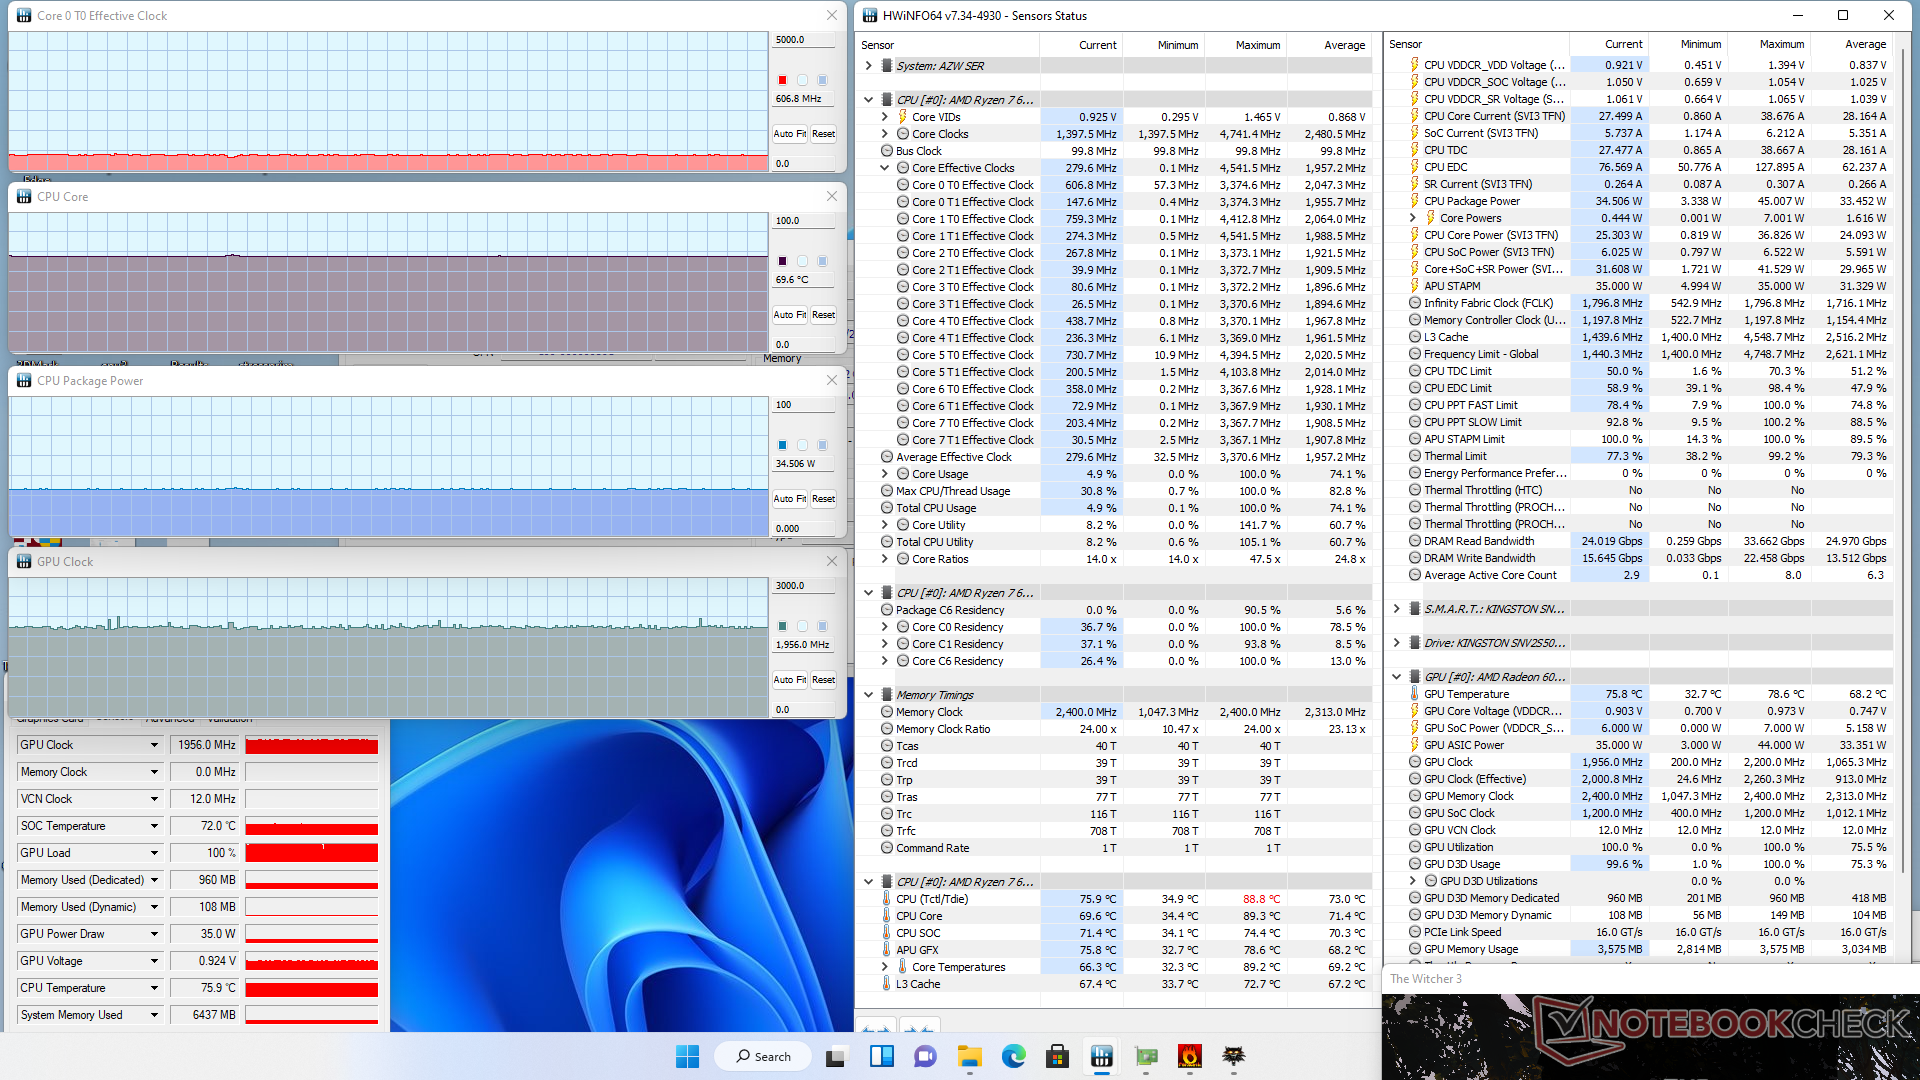
| Taktowanie CPU (GHz) | Taktowanie GPU (MHz) | Średnia temperatura CPU (°C) | |
| System Idle | -- | -- | 34 |
| Prime95 Stress | 3.0 | -- | 82 |
| Prime95 + FurMark Stress | 2.7 | 941 | 74 |
| Witcher 3 Stress | ~0.6 | 1956 | 70 |
Zarządzanie energią
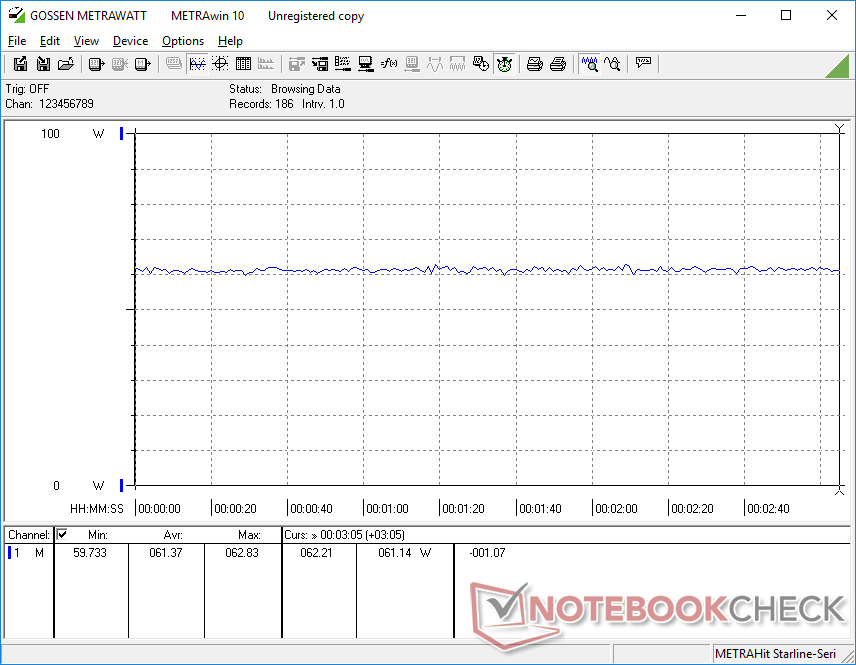
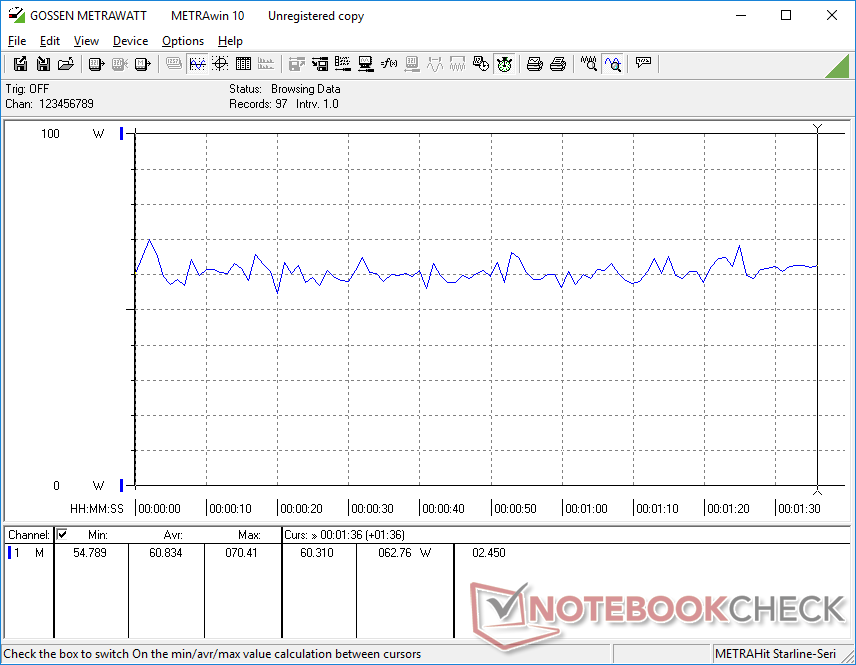
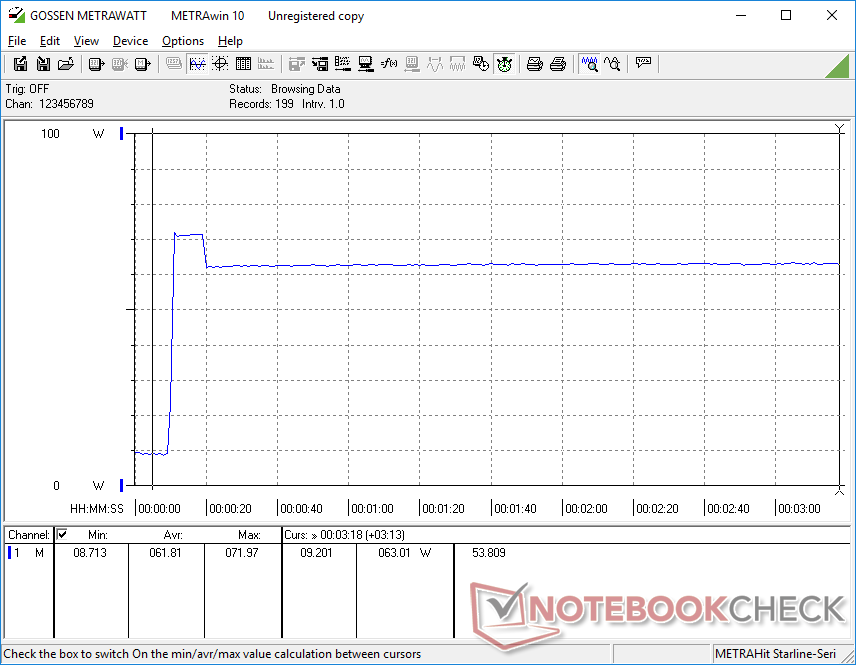
Pobór mocy
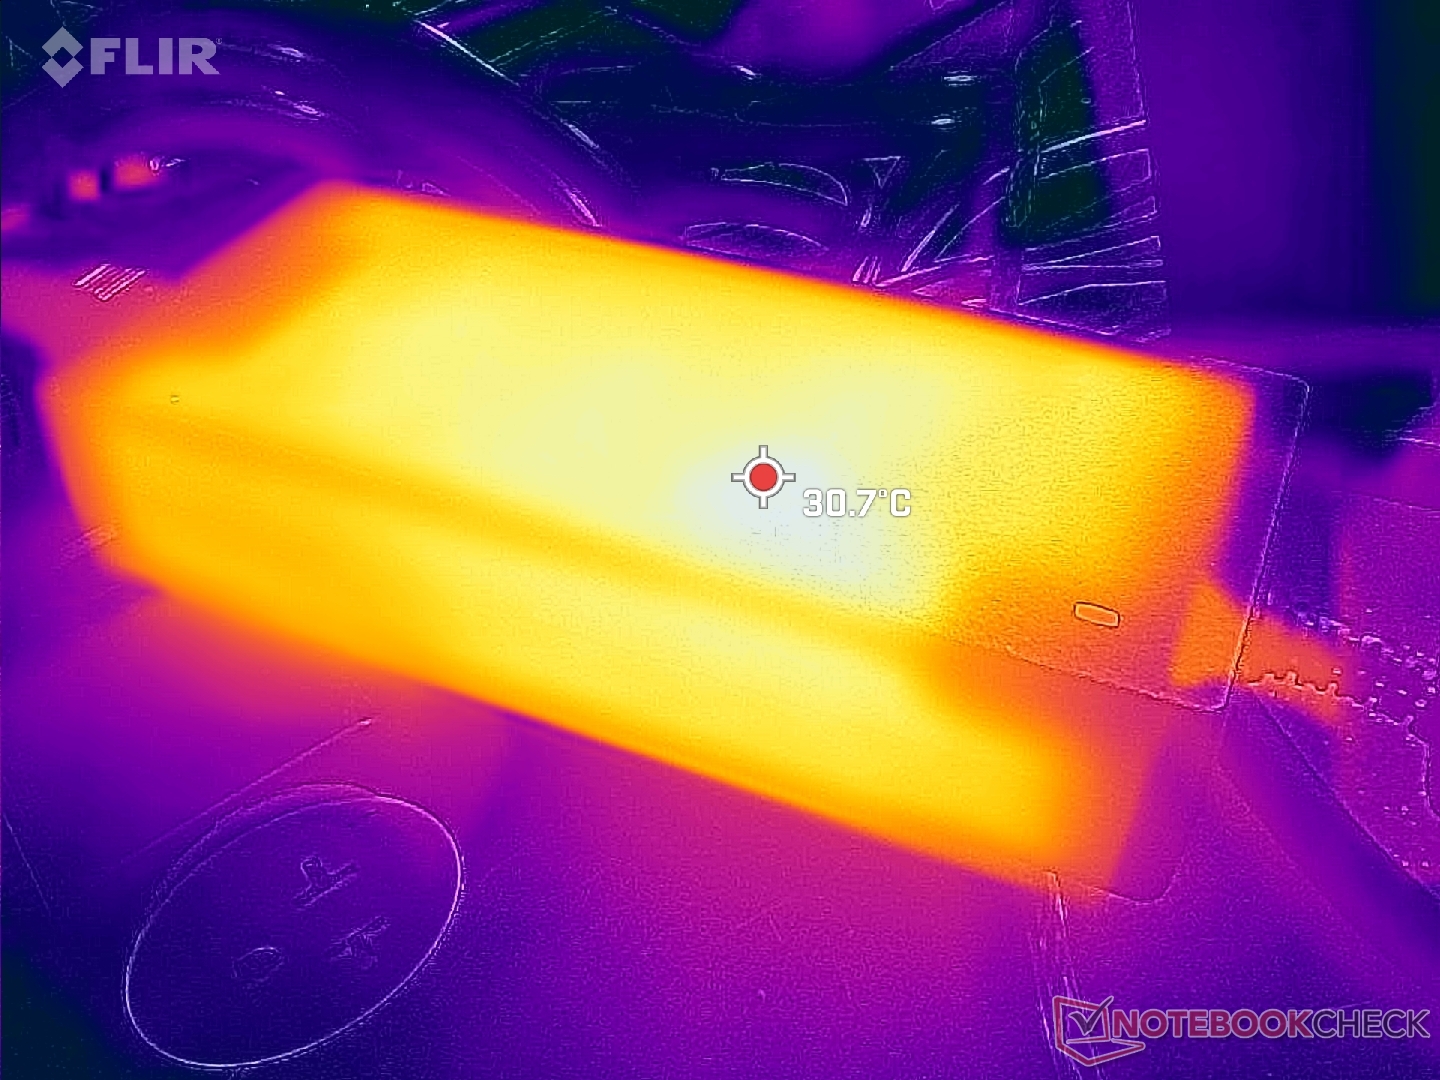
Pobór mocy podczas grania jest o około 33 procent wyższy niż w przypadku SER5 Pro działającego na ostatniej generacji Ryzen 5 5600H a także nieco wyższy niż w przypadku SEi11 Pro działającego na procesorze Intel 12. generacji Core serii H. Jeśli jednak weźmiemy pod uwagę, że nasz Radeon 680M może zaoferować nawet 2x większą wydajność niż Radeon RX Vega 7, to wyższy pobór mocy jest z pewnością tego wart. W czasie pracy na pulpicie, mimo ulepszonej grafiki, nadal zużywamy tyle samo energii co na zeszłorocznym modelu.
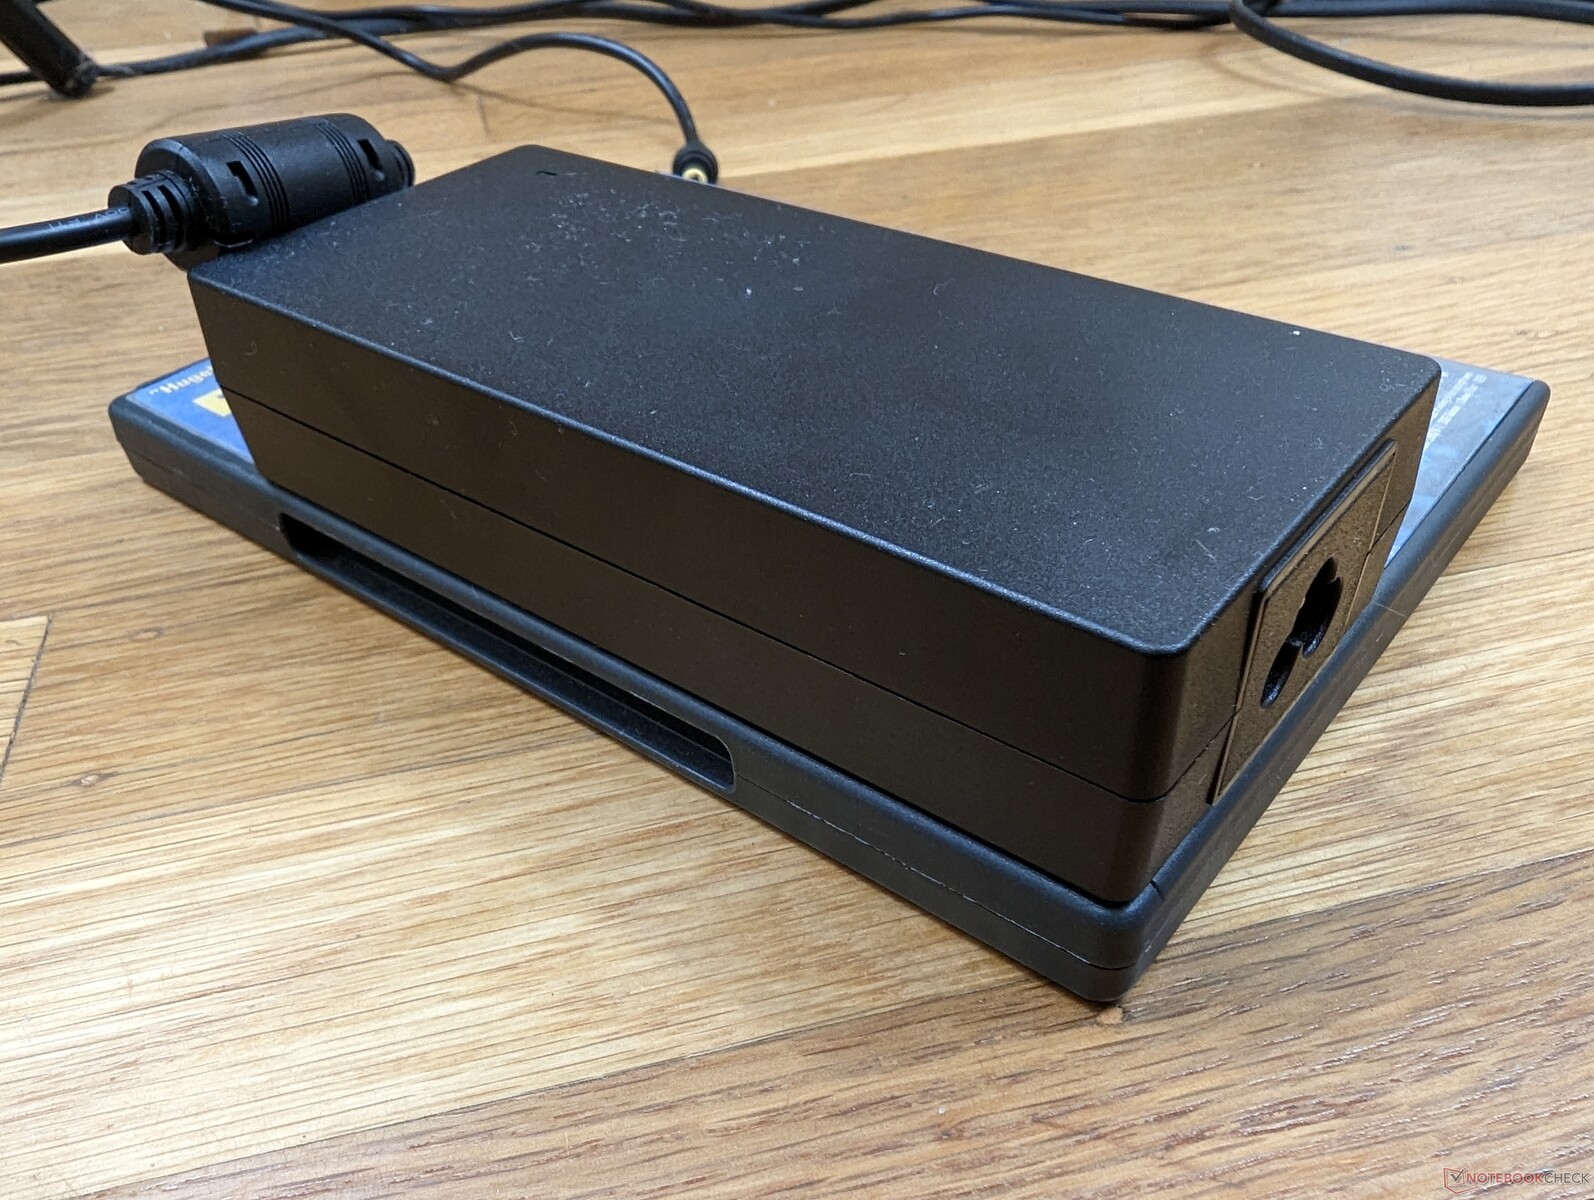
Jesteśmy w stanie zarejestrować maksymalny pobór 72 W z zasilacza 120 W, gdy procesor jest wykorzystywany w 100 procentach. Wysoki pobór pozwala mini PC na zasilanie lub ładowanie niektórych urządzeń USB-C kosztem bardziej masywnego zasilacza AC.

| wyłączony / stan wstrzymania | |
| luz | |
| obciążenie |
|
| Beelink SER6 Pro R7 6800H, Radeon 680M, Kingston NV2 500GB SNV2S/500G, , x, | Beelink SER Pro Ryzen 5 5600H R5 5600H, Vega 7, Kingston NV1 SNVS/500GCN, , x, | Beelink SEi11 Pro i5-11320H, Iris Xe G7 96EUs, Kingston NV1 SNVS/500GCN, , x, | Intel NUC 12 Pro Kit NUC12WSKi7 i7-1260P, Iris Xe G7 96EUs, Transcend M.2 SSD 2200S TS512GMTE220S, , x, | Intel NUC11PHKi7C i7-1165G7, GeForce RTX 2060 Mobile, Samsung SSD 980 Pro 500GB MZ-V8P500BW, , x, | Intel Hades Canyon NUC8i7HVK i7-8809G, Vega M GH, Intel Optane 120 GB SSDPEK1W120GA, , x, | |
|---|---|---|---|---|---|---|
| Power Consumption | 19% | -3% | -35% | -93% | -91% | |
| Idle Minimum * | 8.3 | 5.4 35% | 9.8 -18% | 12.1 -46% | 5.8 30% | 15.5 -87% |
| Idle Average * | 8.4 | 8.2 2% | 10.3 -23% | 12.2 -45% | 5.9 30% | 16.2 -93% |
| Idle Maximum * | 8.7 | 8.3 5% | 10.5 -21% | 12.3 -41% | 20.7 -138% | 16.5 -90% |
| Load Average * | 60.8 | 49.3 19% | 54.2 11% | 64 -5% | 130.8 -115% | 83.4 -37% |
| Witcher 3 ultra * | 61.4 | 46.1 25% | 53.1 14% | 154.4 -151% | 121.7 -98% | |
| Load Maximum * | 72 | 50.2 30% | 59 18% | 98.8 -37% | 225.2 -213% | 173.5 -141% |
* ... im mniej tym lepiej
Power Consumption Witcher 3 / Stresstest
Power Consumption external Monitor
Za
Przeciw
Werdykt - Śpiący hit
SER6 Pro posiada wiele tych samych zalet i wad co niedawny GTR6. W szczególności wydajność jest szczególnie wysoka w porównaniu do innych mini PC ze zintegrowaną grafiką, ale zarówno hałas wentylatora, jak i zużycie energii są odpowiednio głośniejsze i nieco wyższe. Jego dwie główne wady nie umniejszają jednak niesamowitej wartości, jaką otrzymają nabywcy: 32 GB RAM, 500 GB NVMe SSD, Windows 11 Pro i jeden z najszybszych mini PC ze zintegrowaną grafiką, a wszystko to za jedyne 650 USD.
Beelink SER6 Pro bije równoważnie wycenionego Intel Core U-series NUC zarówno pod względem wydajności, jak i wartości z dużym marginesem.
W przyszłych rewizjach chcielibyśmy zobaczyć mniejszy zasilacz AC i tylko jeden duży wewnętrzny wentylator zamiast dwóch mniejszych. Obecny zasilacz jest cięższy od samego mini PC, natomiast większy wentylator spowodowałby niższy i mniej zauważalny hałas wentylatora. Użytkownicy powinni również uważać na potencjalne problemy ze stabilnością klatek podczas gry. Poza tym, Beelink nie ma sobie równych, jeśli chodzi o jakość swoich produktów SEi i SER serii mini PC zarówno pod względem wydajności, jak i wartości.
Cena i dostępność
Amazon obecnie wys yła naszą dokładną konfigurację SER6 Pro za 650 USD. Użytkownicy mogą również zakupić bezpośrednio od producenta za 659 USD.
Transparency
The present review sample was made available to the author as a loan by the manufacturer or a shop for the purposes of review. The lender had no influence on this review, nor did the manufacturer receive a copy of this review before publication. There was no obligation to publish this review.
Pricecompare

