Recenzja laptopa Ninkear A15 Plus: Zaskakująco dobry i niedrogi

Liczba chińskich producentów laptopów jest trudna do ogarnięcia. Ninkear jest jednym z nich, oferując głównie niedrogie laptopy z wysokiej jakości obudową. Oferowane laptopy zwykle nie mają najnowszego sprzętu w środku, ale jak pokaże nasz test, nawet AMD Ryzen 7 5700U z 2021 roku ma wystarczającą moc do codziennego użytku w 2024 roku.
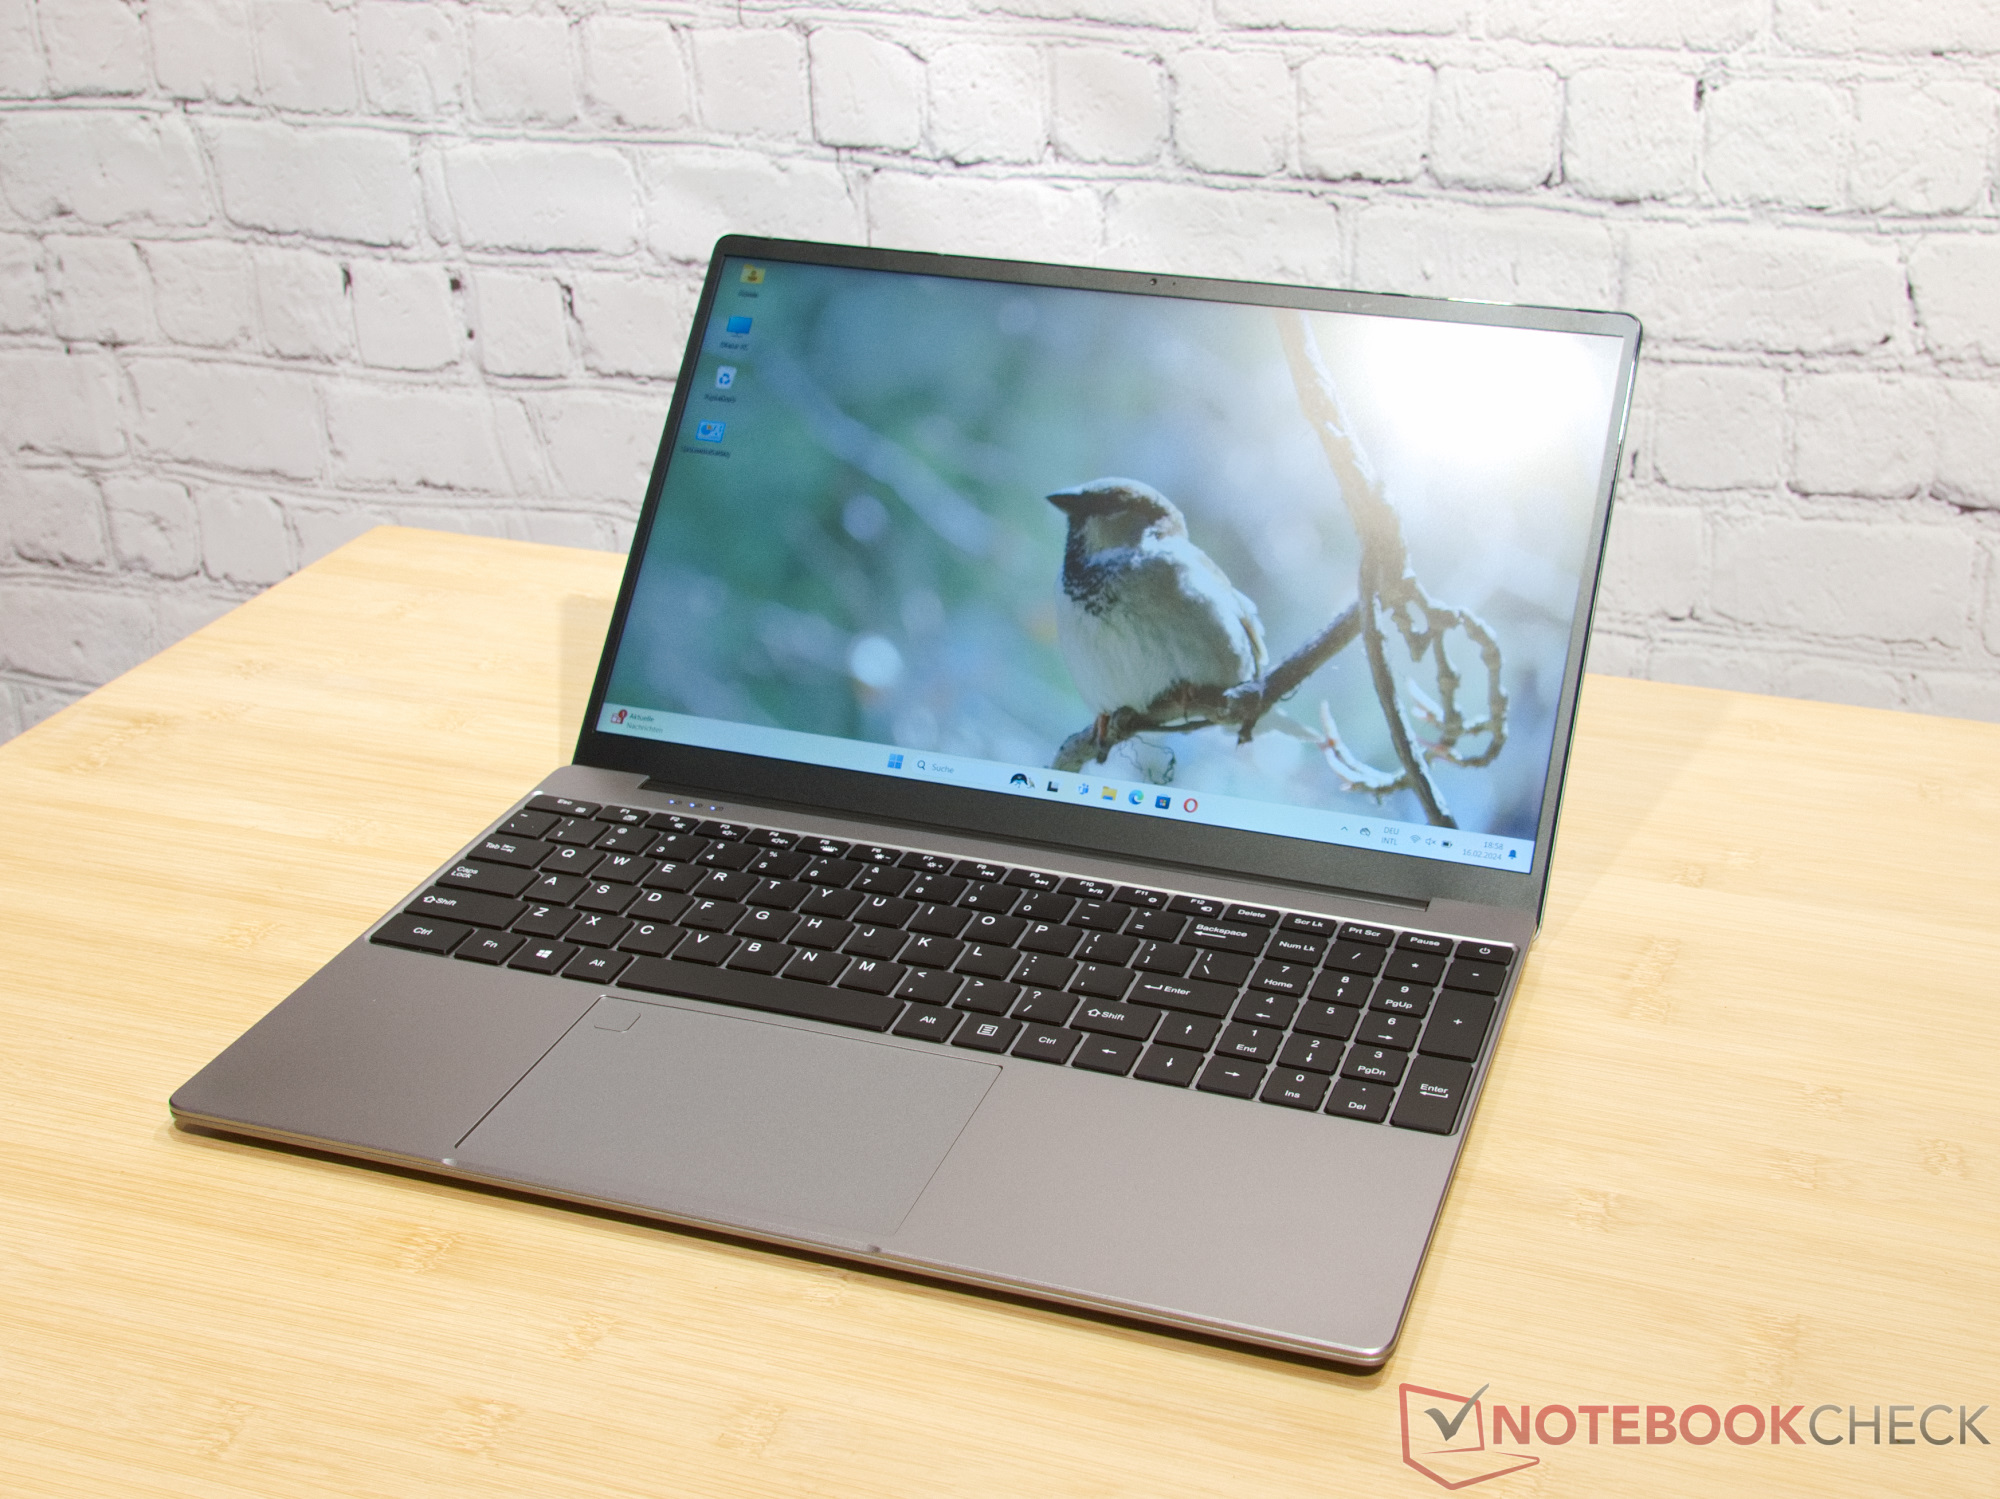
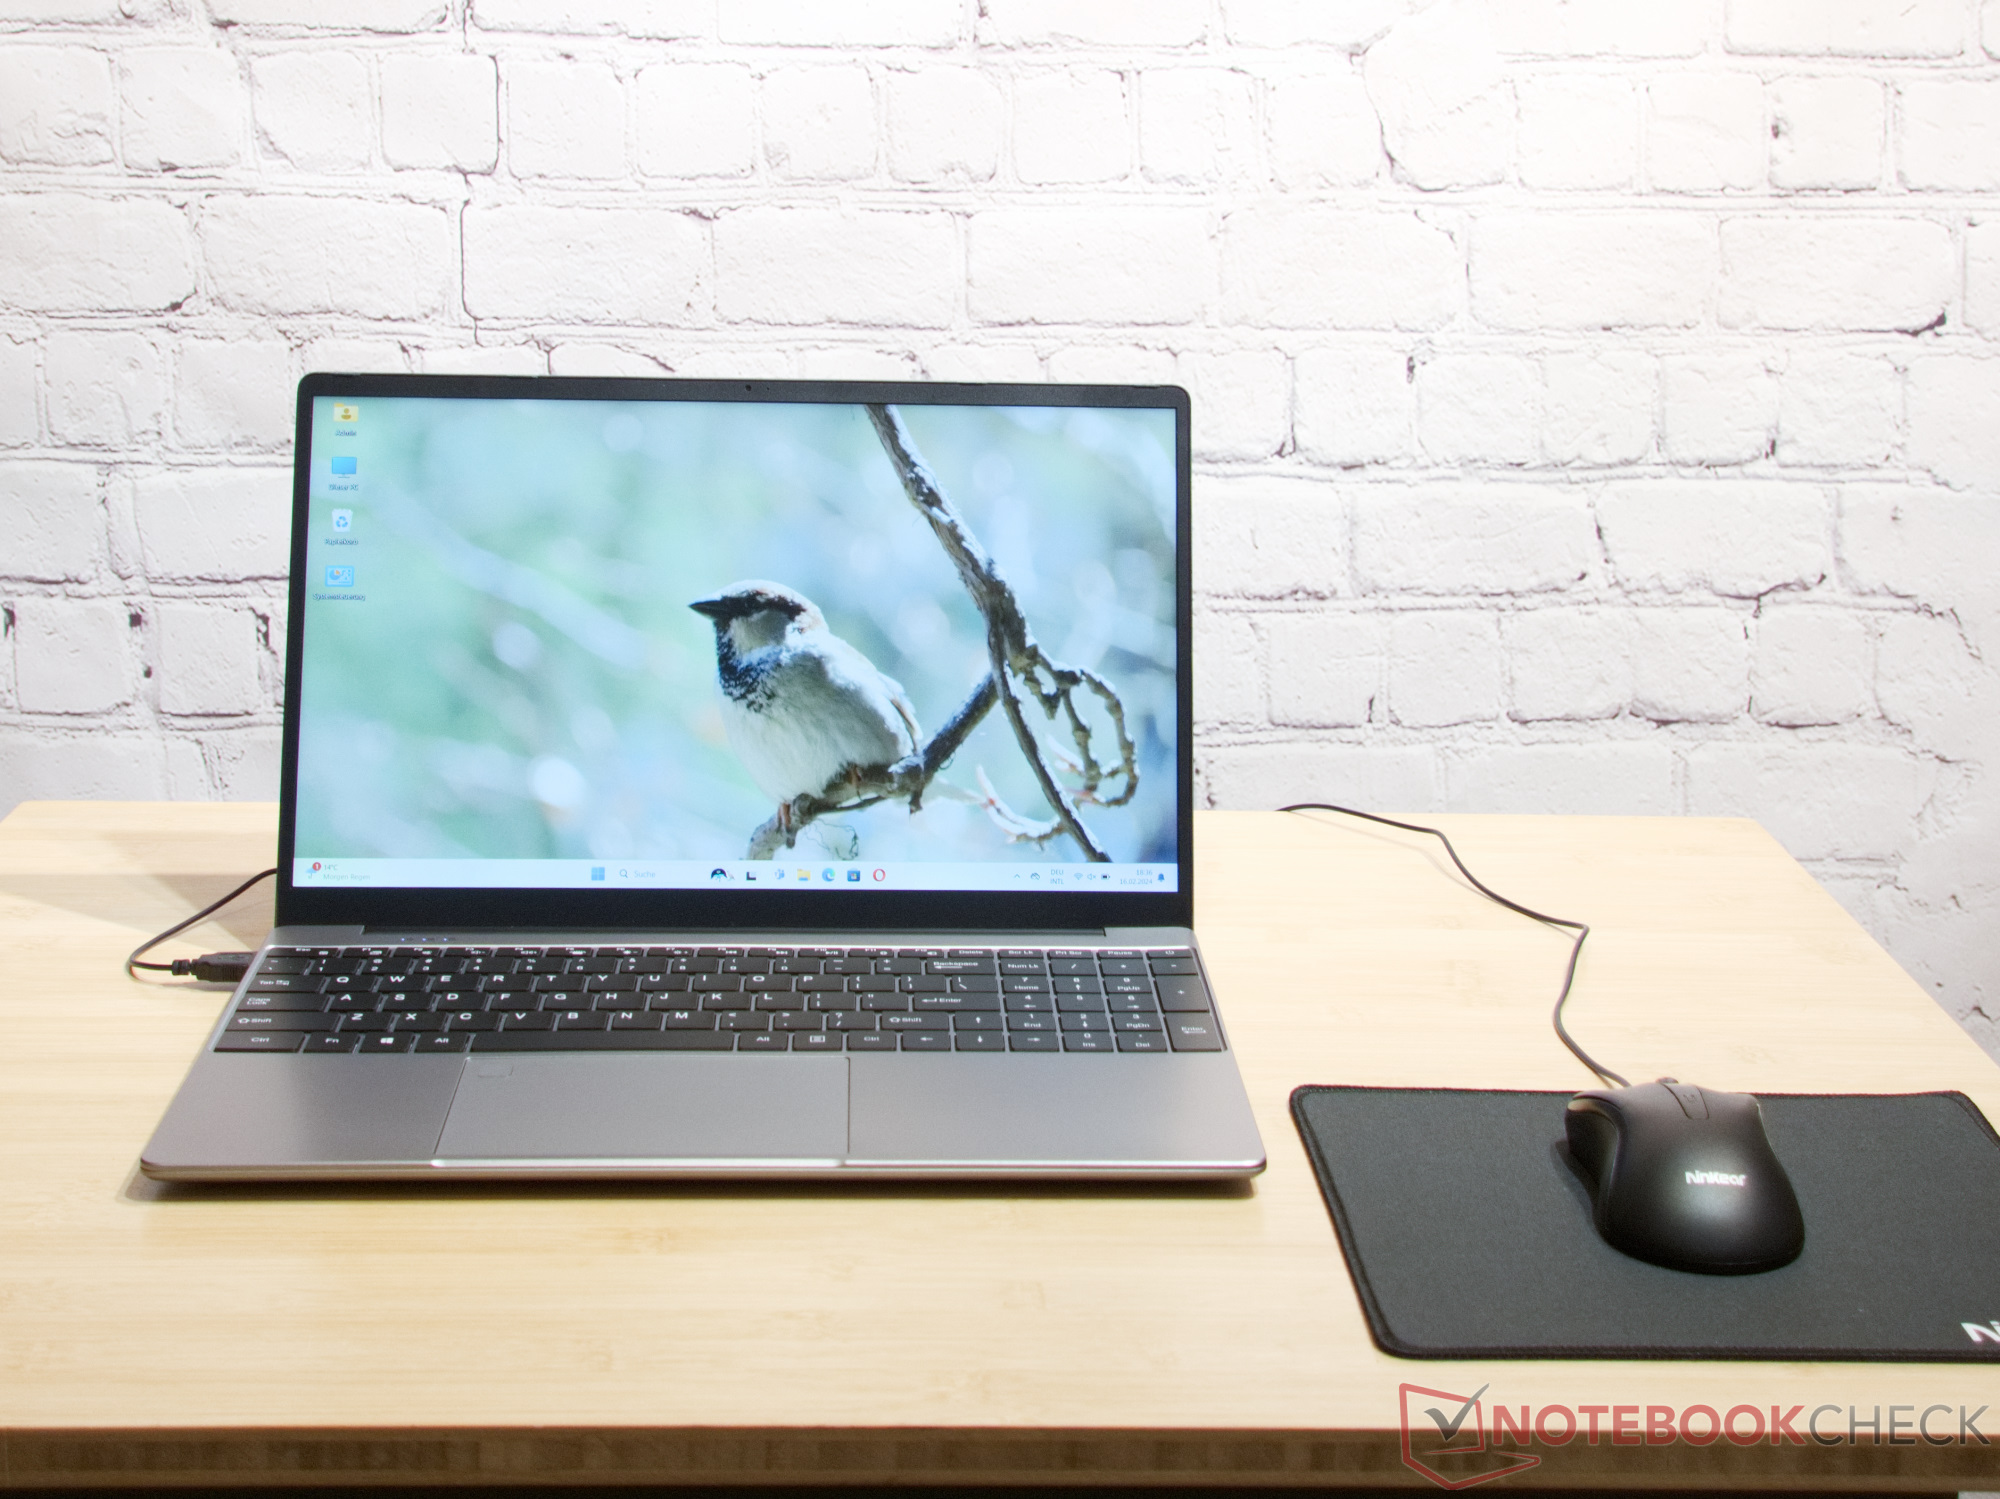
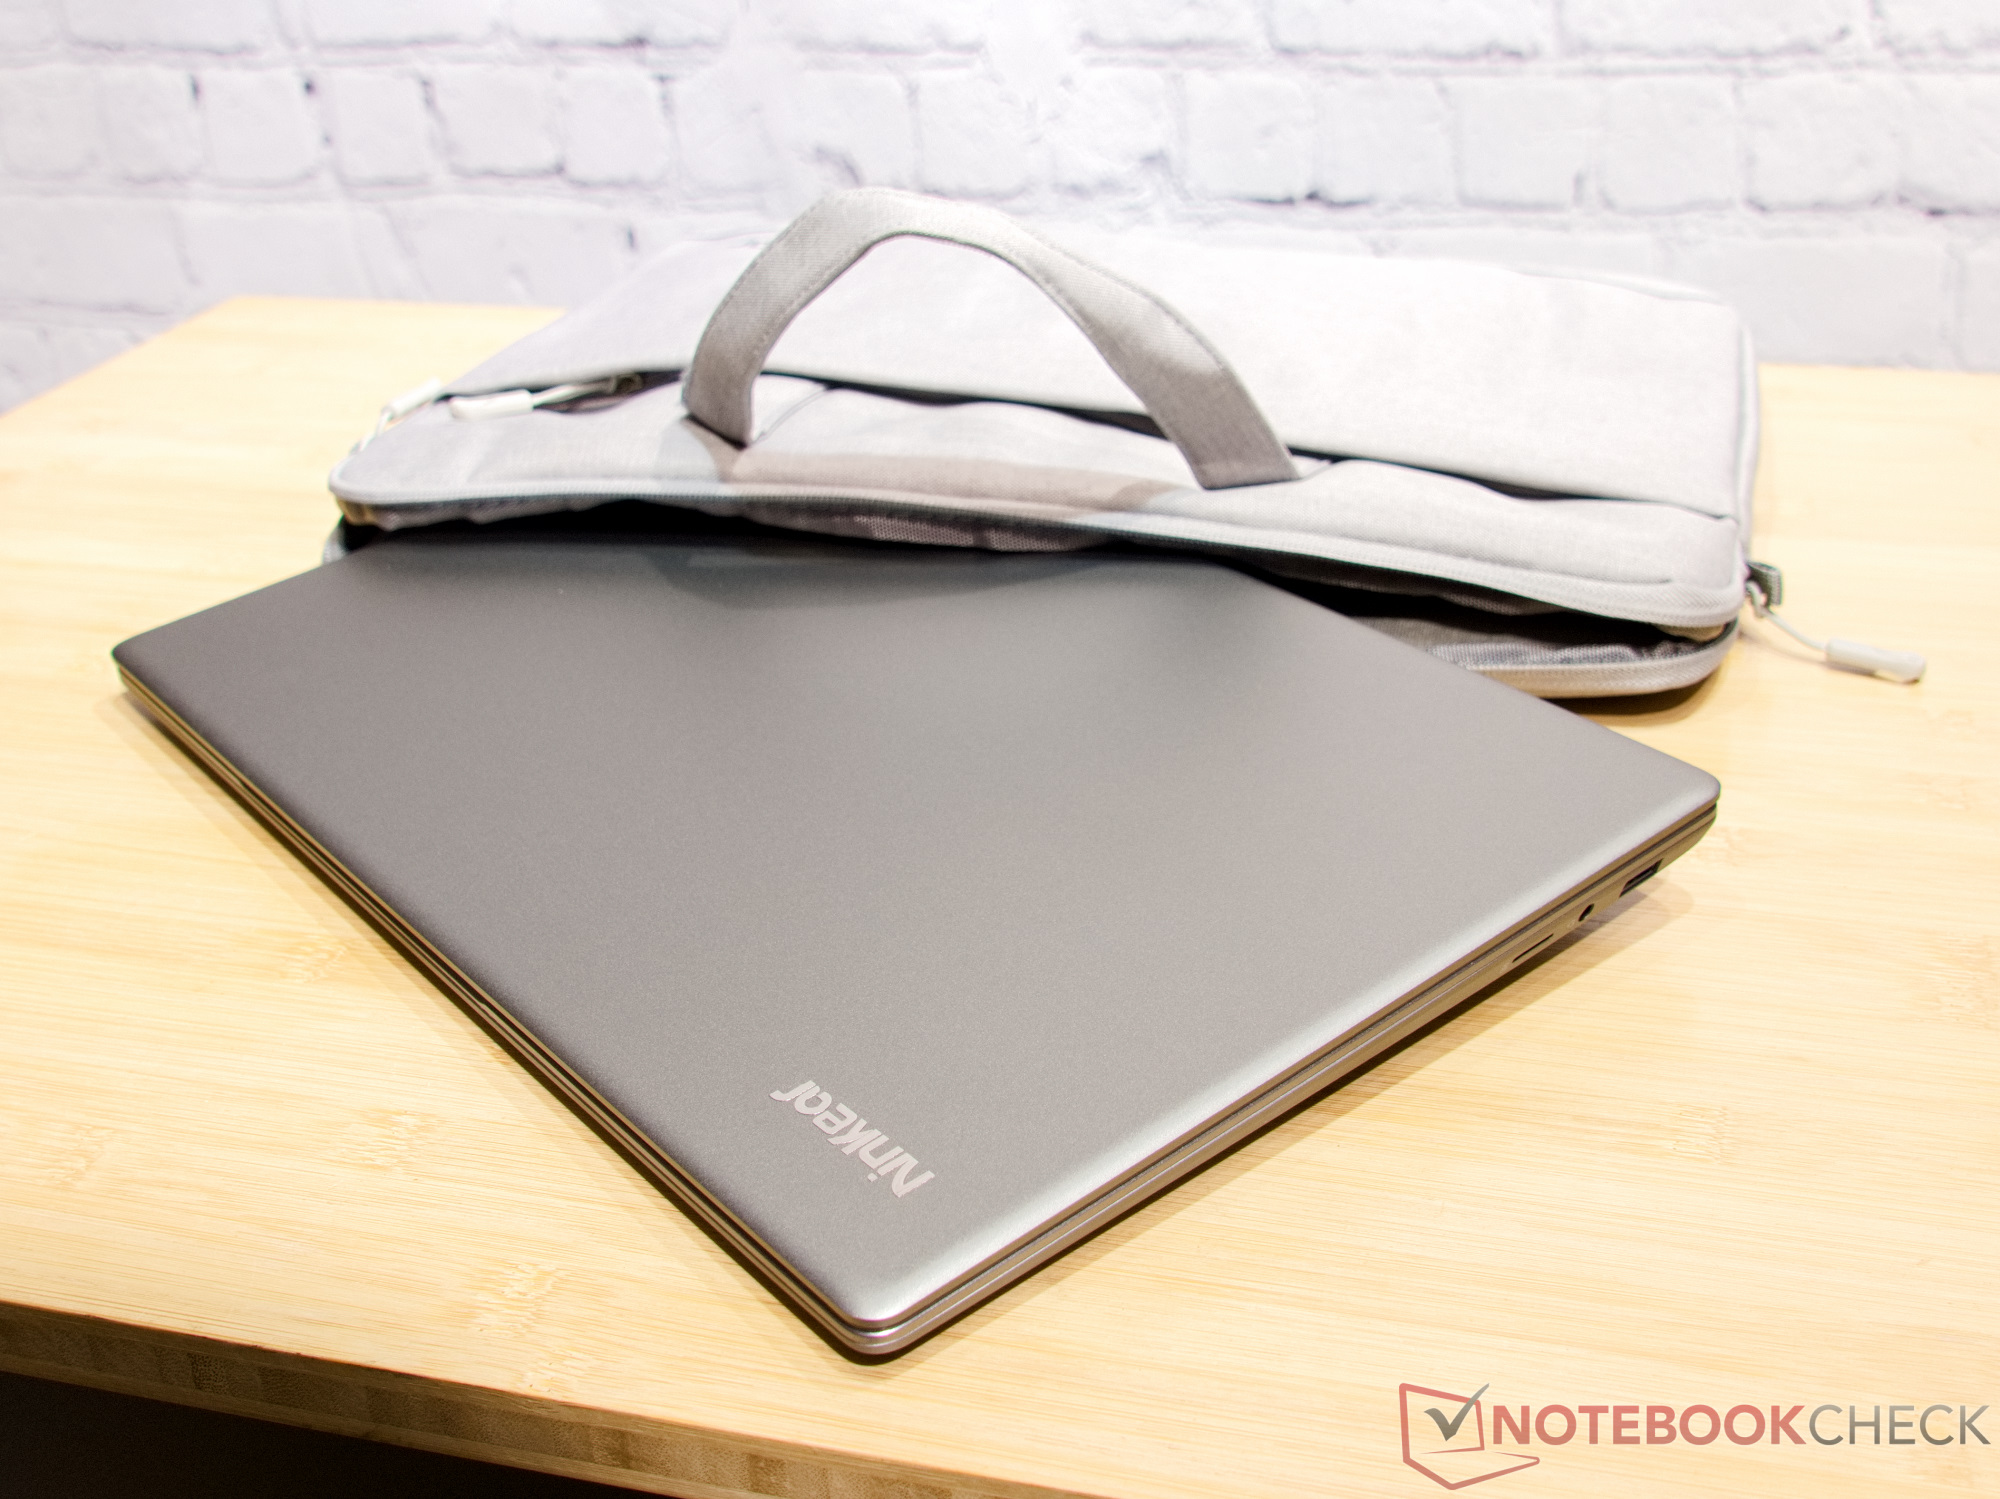
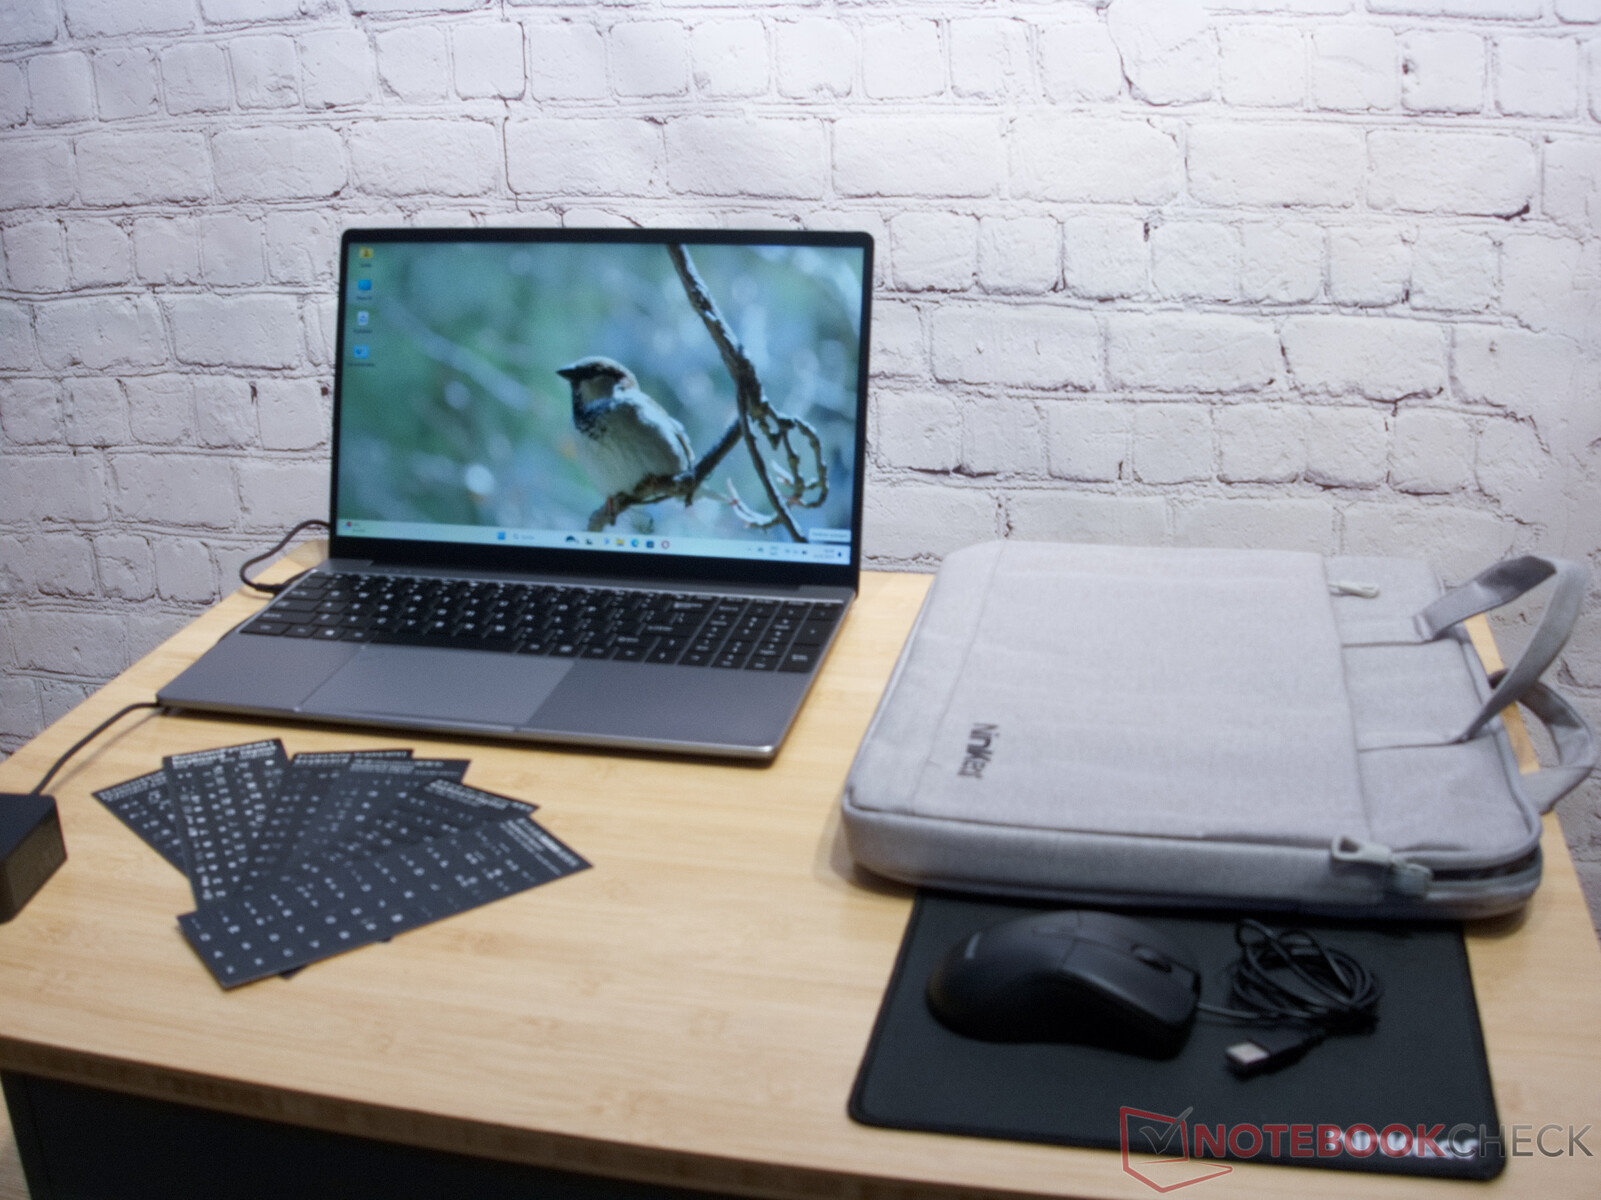
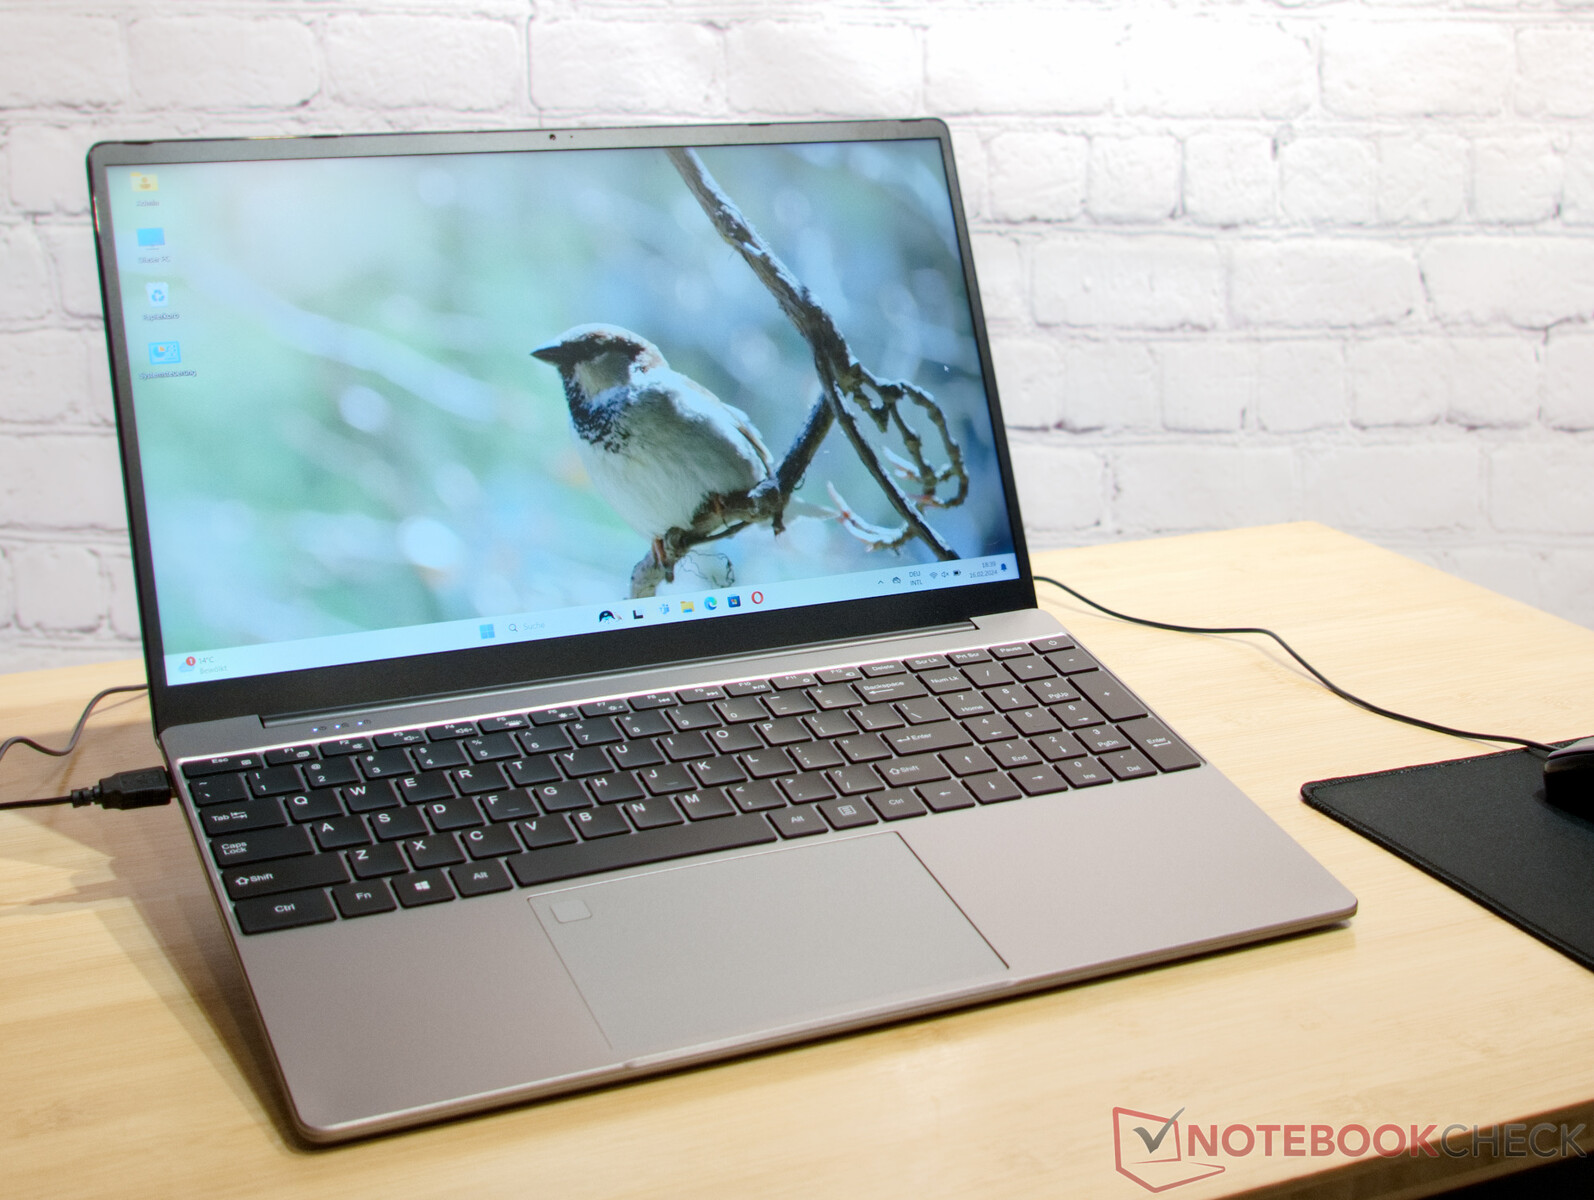
Ninkear A15 Plus jest wyposażony w 16 GB lub 32 GB pamięci RAM, 15,6-calowy panel IPS, klawiaturę QWERTY i mnóstwo akcesoriów. Ten niedrogi laptop z Chin jest również dostarczany z torbą na laptopa, myszą i podkładką pod mysz w pudełku.
Potencjalni konkurenci w porównaniu
Jako konkurentów wybraliśmy laptopy z dwóch różnych grup - Asus P1511CEA oraz HP 250 G9 które również są wycenione w regionie 500 euro, oraz Schenker VIA 15 Pro i Eurocom C315 Blitz które są znacznie droższe, ale mają podobne funkcje do naszego urządzenia testowego.
Potencjalni konkurenci w porównaniu
Ocena | Data | Model | Waga | Wysokość | Rozmiar | Rezolucja | Cena |
|---|---|---|---|---|---|---|---|
| 83.6 % v7 (old) | 03/2024 | Ninkear A15 Plus (16+512) R7 5700U, Vega 8 | 1.8 kg | 18.2 mm | 15.60" | 1920x1080 | |
| 85.7 % v7 (old) | 10/2022 | Lenovo IdeaPad 5 Pro 16ARH7 R5 6600HS, Radeon 660M | 1.9 kg | 18.4 mm | 16.00" | 2560x1600 | |
| 83.4 % v7 (old) | 11/2023 | Eurocom C315 Blitz i7-1360P, Iris Xe G7 96EUs | 1.7 kg | 19.9 mm | 15.60" | 3840x2160 | |
| 87.1 % v7 (old) | 06/2023 | Schenker VIA 15 Pro M22 R7 5700U, Vega 8 | 1.4 kg | 16.8 mm | 15.60" | 2560x1440 | |
| 75.2 % v7 (old) | 12/2023 | HP 250 G9 7N029ES i3-1215U, UHD Graphics 64EUs | 1.7 kg | 19.9 mm | 15.60" | 1920x1080 | |
| 77.5 % v7 (old) | 01/2023 | Asus P1511CEA-BQ753R i3-1115G4, UHD Graphics Xe G4 48EUs | 1.8 kg | 19.9 mm | 15.60" | 1920x1080 |
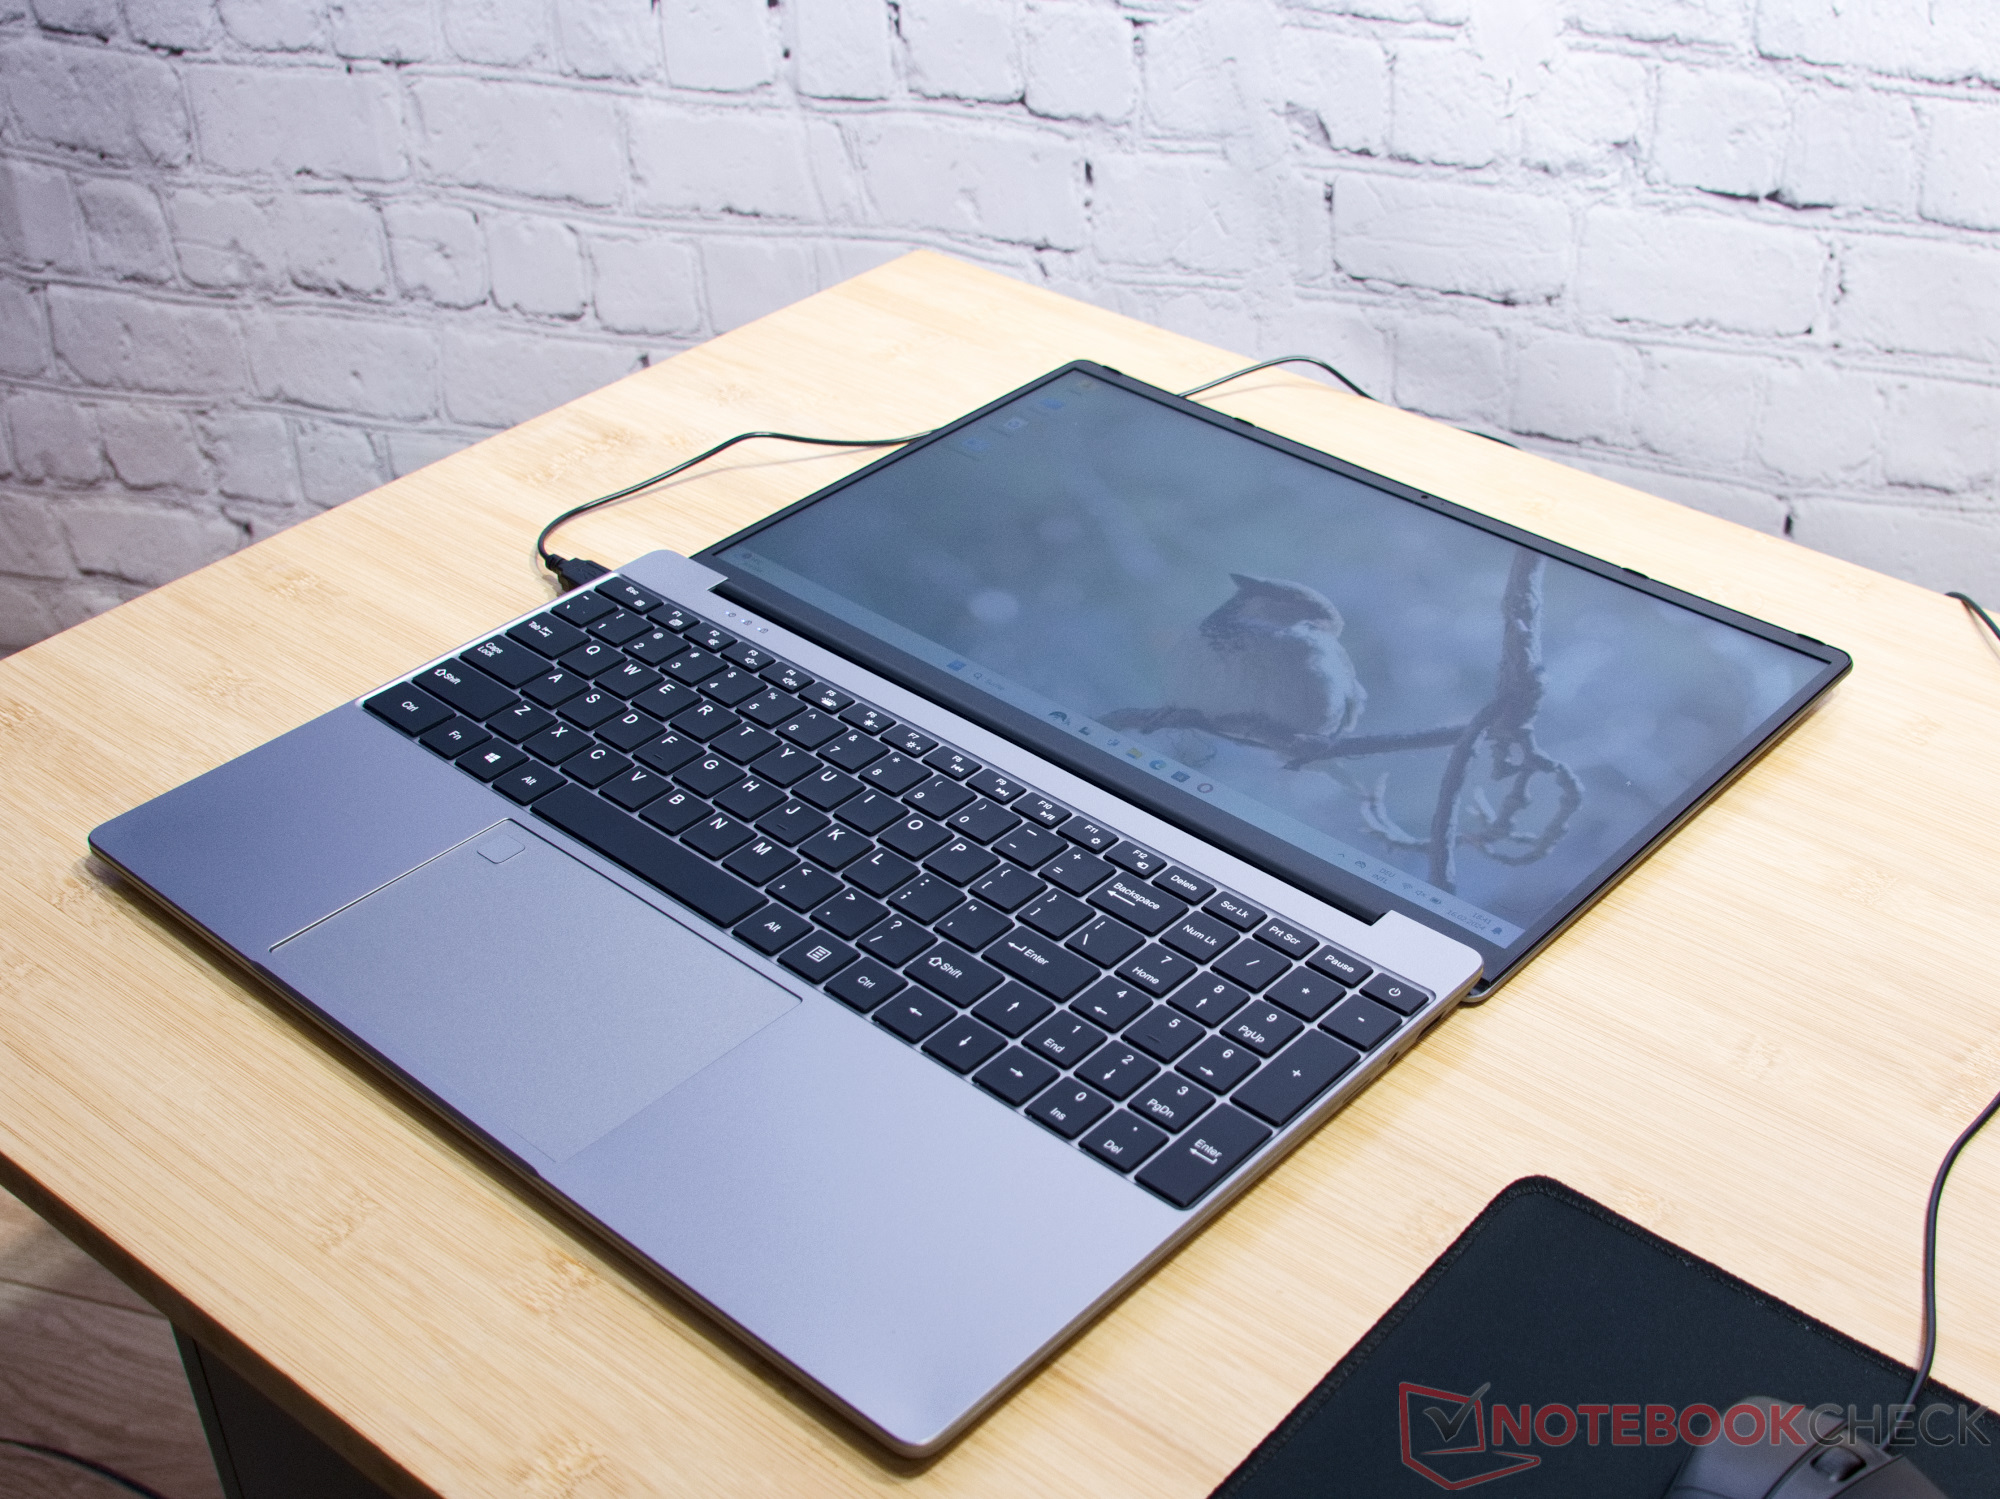
Obudowa i wyposażenie: Aluminiowa pokrywa i podstawa
Na pierwszy rzut oka obudowa Ninkear A15 Plus wygląda na bardzo wysokiej jakości. Pokrywa i podstawa laptopa zostały wykonane z aluminium, natomiast pokrywa klawiatury z lakierowanego plastiku. Producent spasował jednak kolory na tyle precyzyjnie, że nie da się odróżnić materiału po samym spojrzeniu. Fakt, że podpórki pod nadgarstki i legalna pokrywa B są wykonane z tworzywa sztucznego, ma również pewne zalety.
Powierzchnie nie nagrzewają się tak szybko jak aluminium i są znacznie przyjemniejsze w dotyku, nawet gdy są ciepłe. Wadą jest tutaj raczej trwałość. Nawet najlepsza farba z czasem się ściera.
Ogólnie jakość wykonania obudowy jest w porządku. Ekran można otworzyć płynnie do 180° bez uczucia chybotania zawiasów. Klawiaturę można wciskać tylko minimalnie, a laptop cechuje się dobrą stabilnością także pod innymi względami. Producent wie, jak ukryć fakt, że szczeliny na obudowie czasami nie są do końca idealne z celowo dobranymi szczelinami cieniującymi.
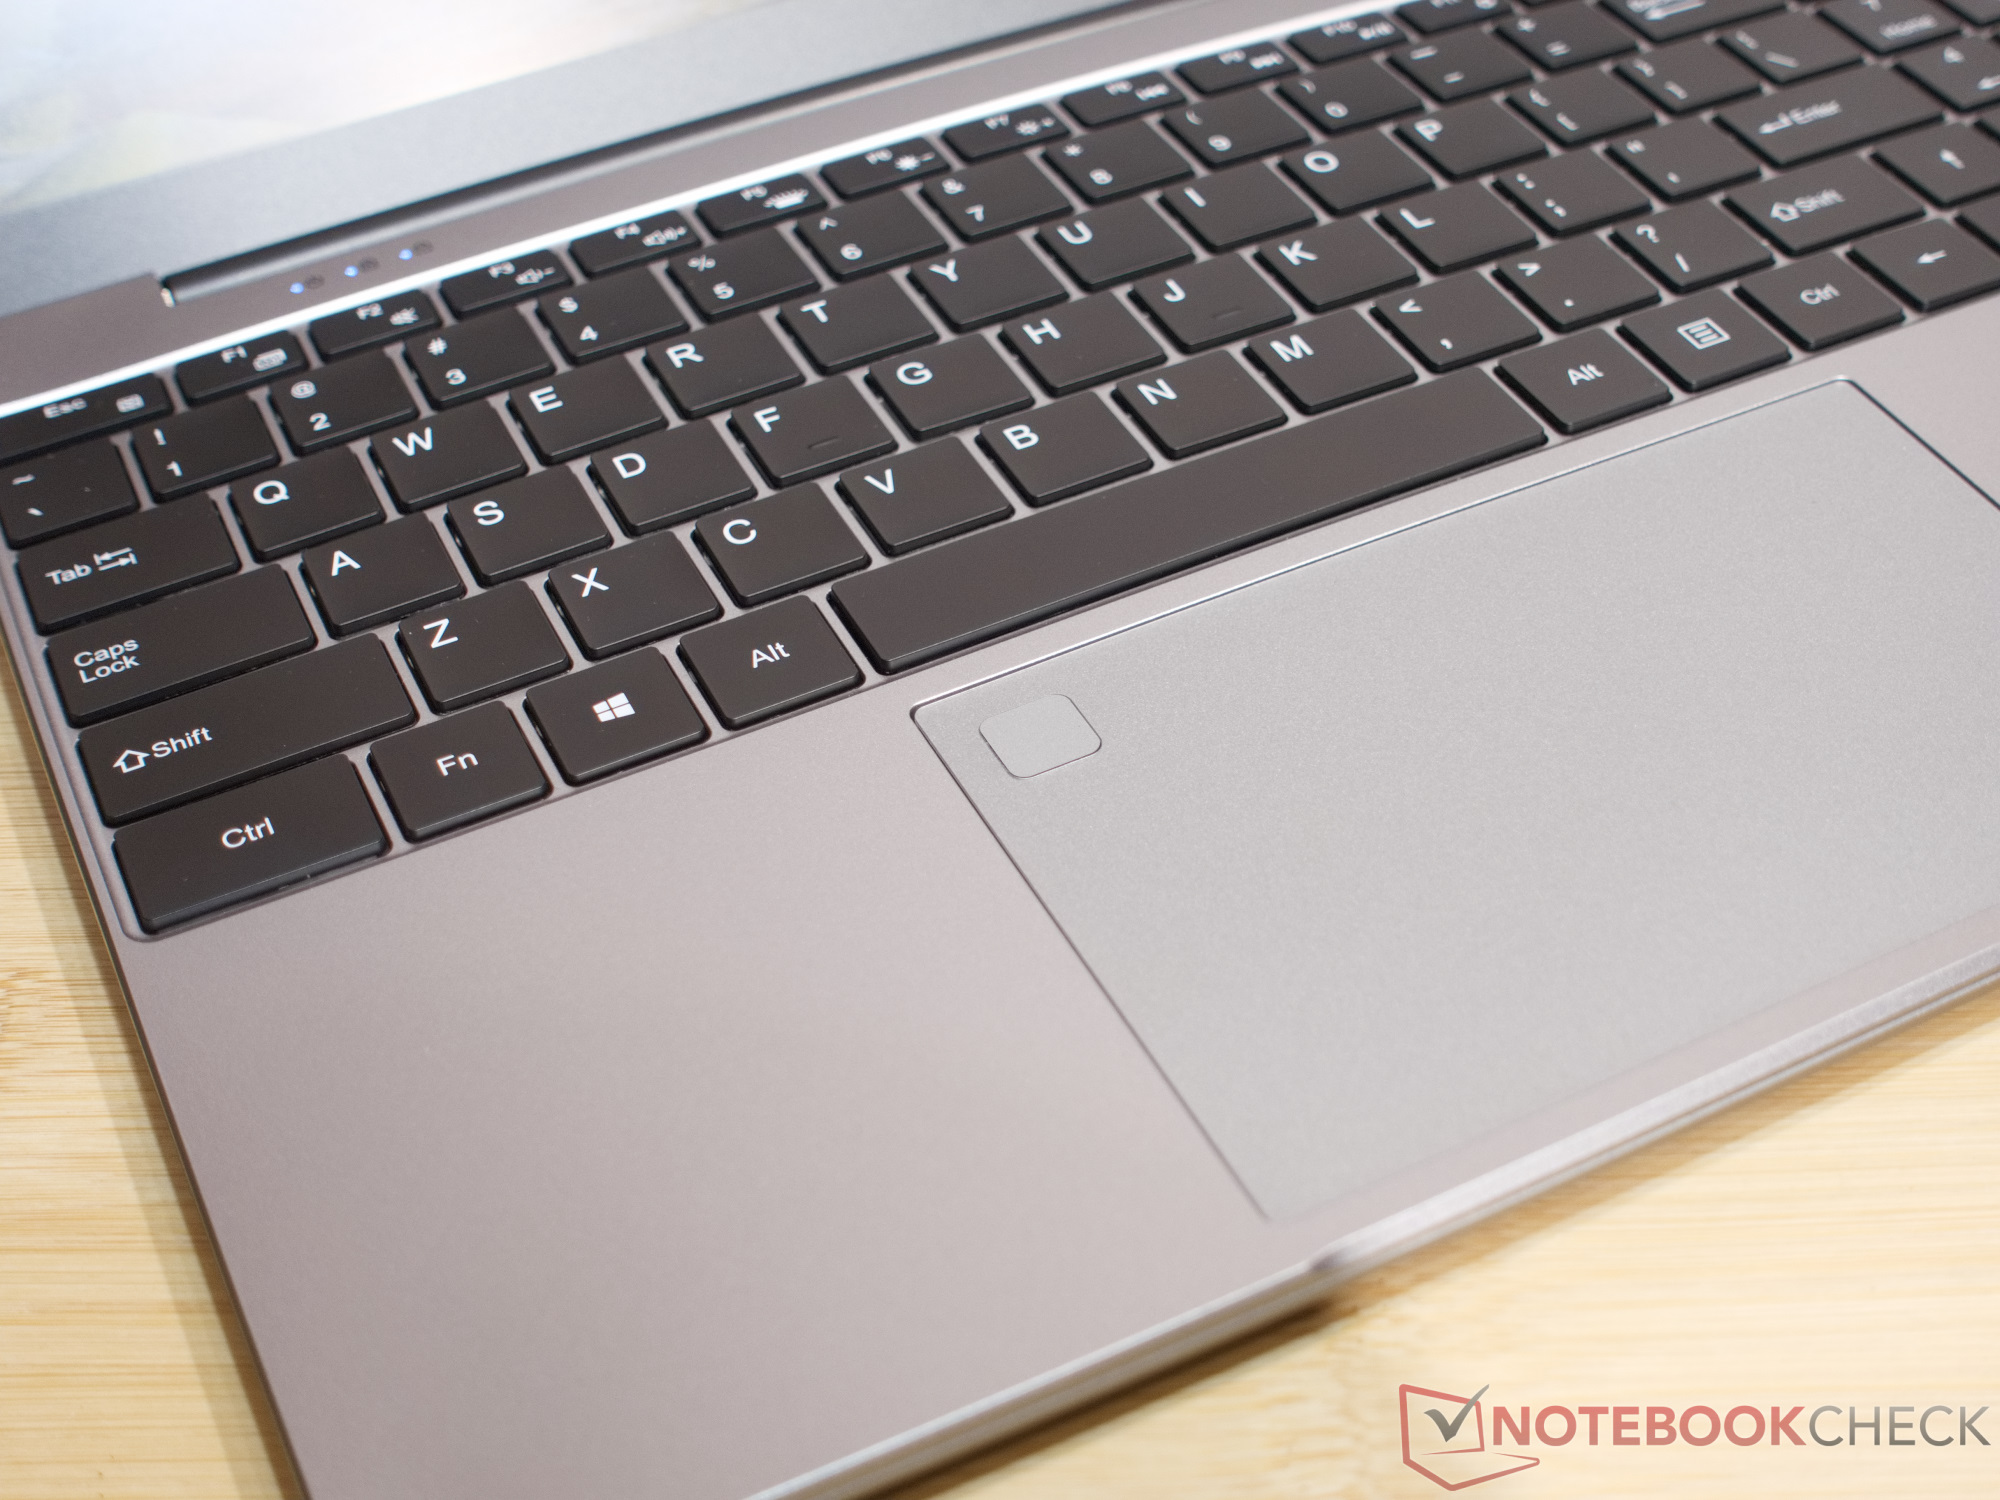
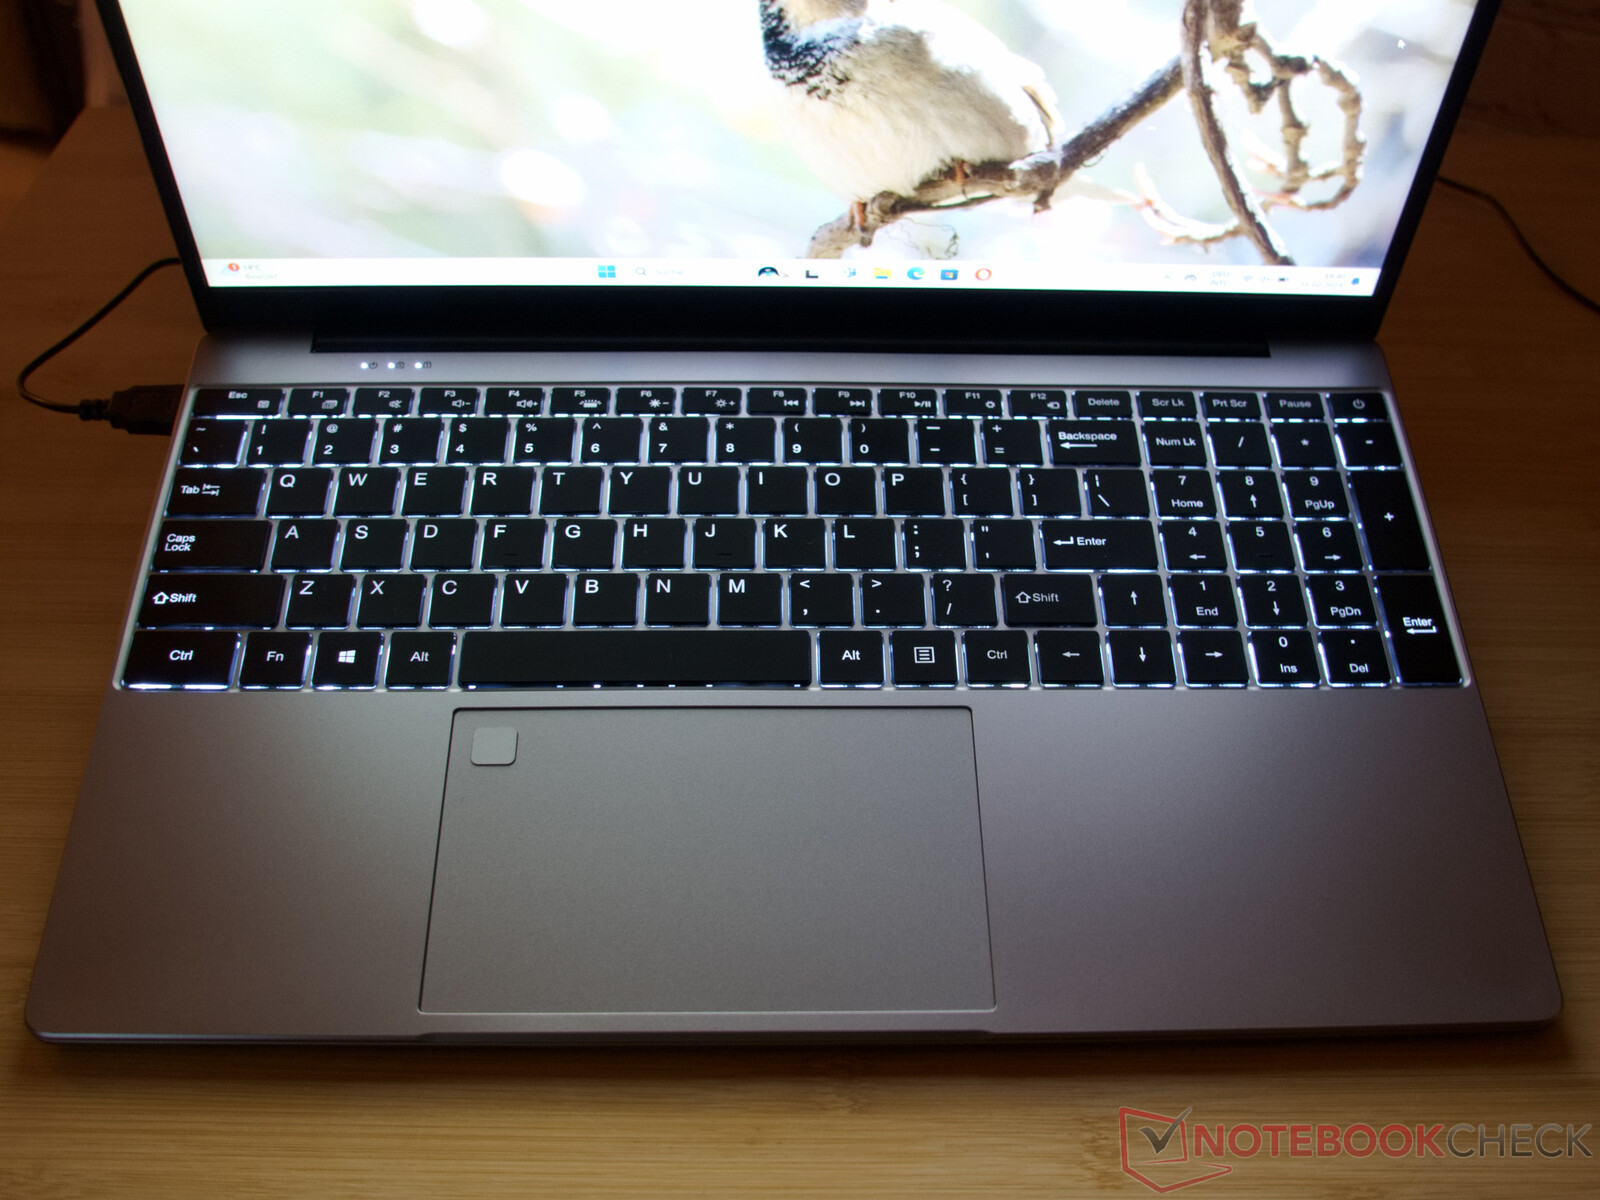
Duży ekran i duża klawiatura od razu przyciągają wzrok po otwarciu laptopa. Ninkear w pełni wykorzystuje przestrzeń w obudowie i dołącza klawiaturę z blokiem NUM i pełnowymiarowymi klawiszami.
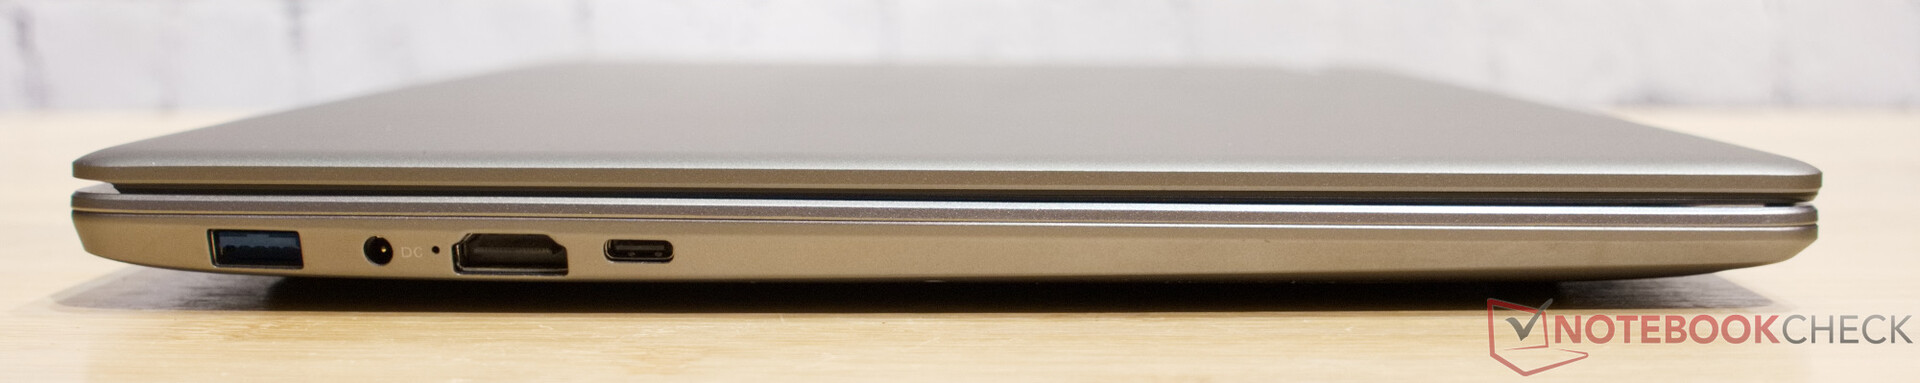
Łączność laptopa jest wystarczająca. W przeciwieństwie do niemieckojęzycznej skróconej instrukcji, port USB typu C po lewej stronie oferuje wszystkie udogodnienia, w tym DisplayPort i Power Delivery.
Dlaczego producent nie wspomina o funkcji Power Delivery, nie jest dla nas jasne. Power Delivery może być przydatne, gdyż pozwala na obsługę Ninkear A15 Plus na stacji dokującej, a zasilacz laptopa z okrągłą wtyczką można również zostawić w domu.
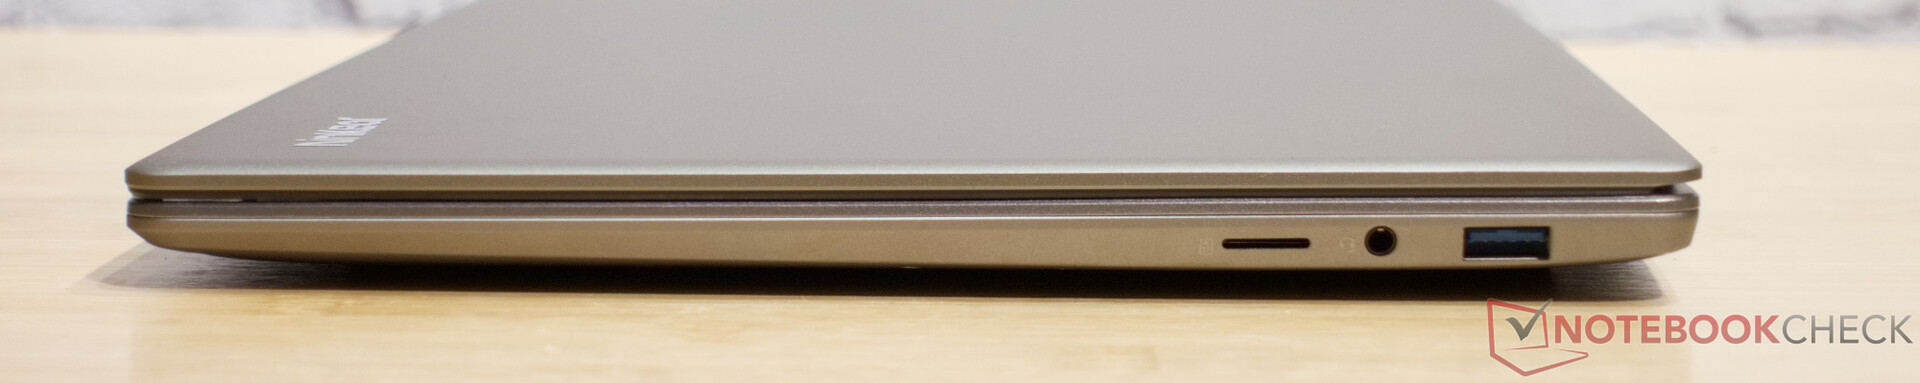
Niestety widzimy pewne problemy z czytnikiem kart microSD i Wi-Fi. Podobnie jak procesor, układ Wi-Fi w Ninkear A15 Plus jest raczej starym krzemem. Nie obsługuje on Wi-Fi 6 ani 6E. W związku z tym prędkości transmisji są tutaj odpowiednio słabe.
Przepustowość Wi-Fi jest wystarczająca do surfowania, ale trzeba uzbroić się w cierpliwość, jeśli chcemy przenieść duże pliki w sieci. To samo tyczy się powolnego czytnika kart microSD. Ten również ma ten problem, że możliwe jest wepchnięcie karty pamięci do obudowy poza slot. W najgorszym wypadku trzeba będzie rozkręcić laptopa, aby ją wyjąć!
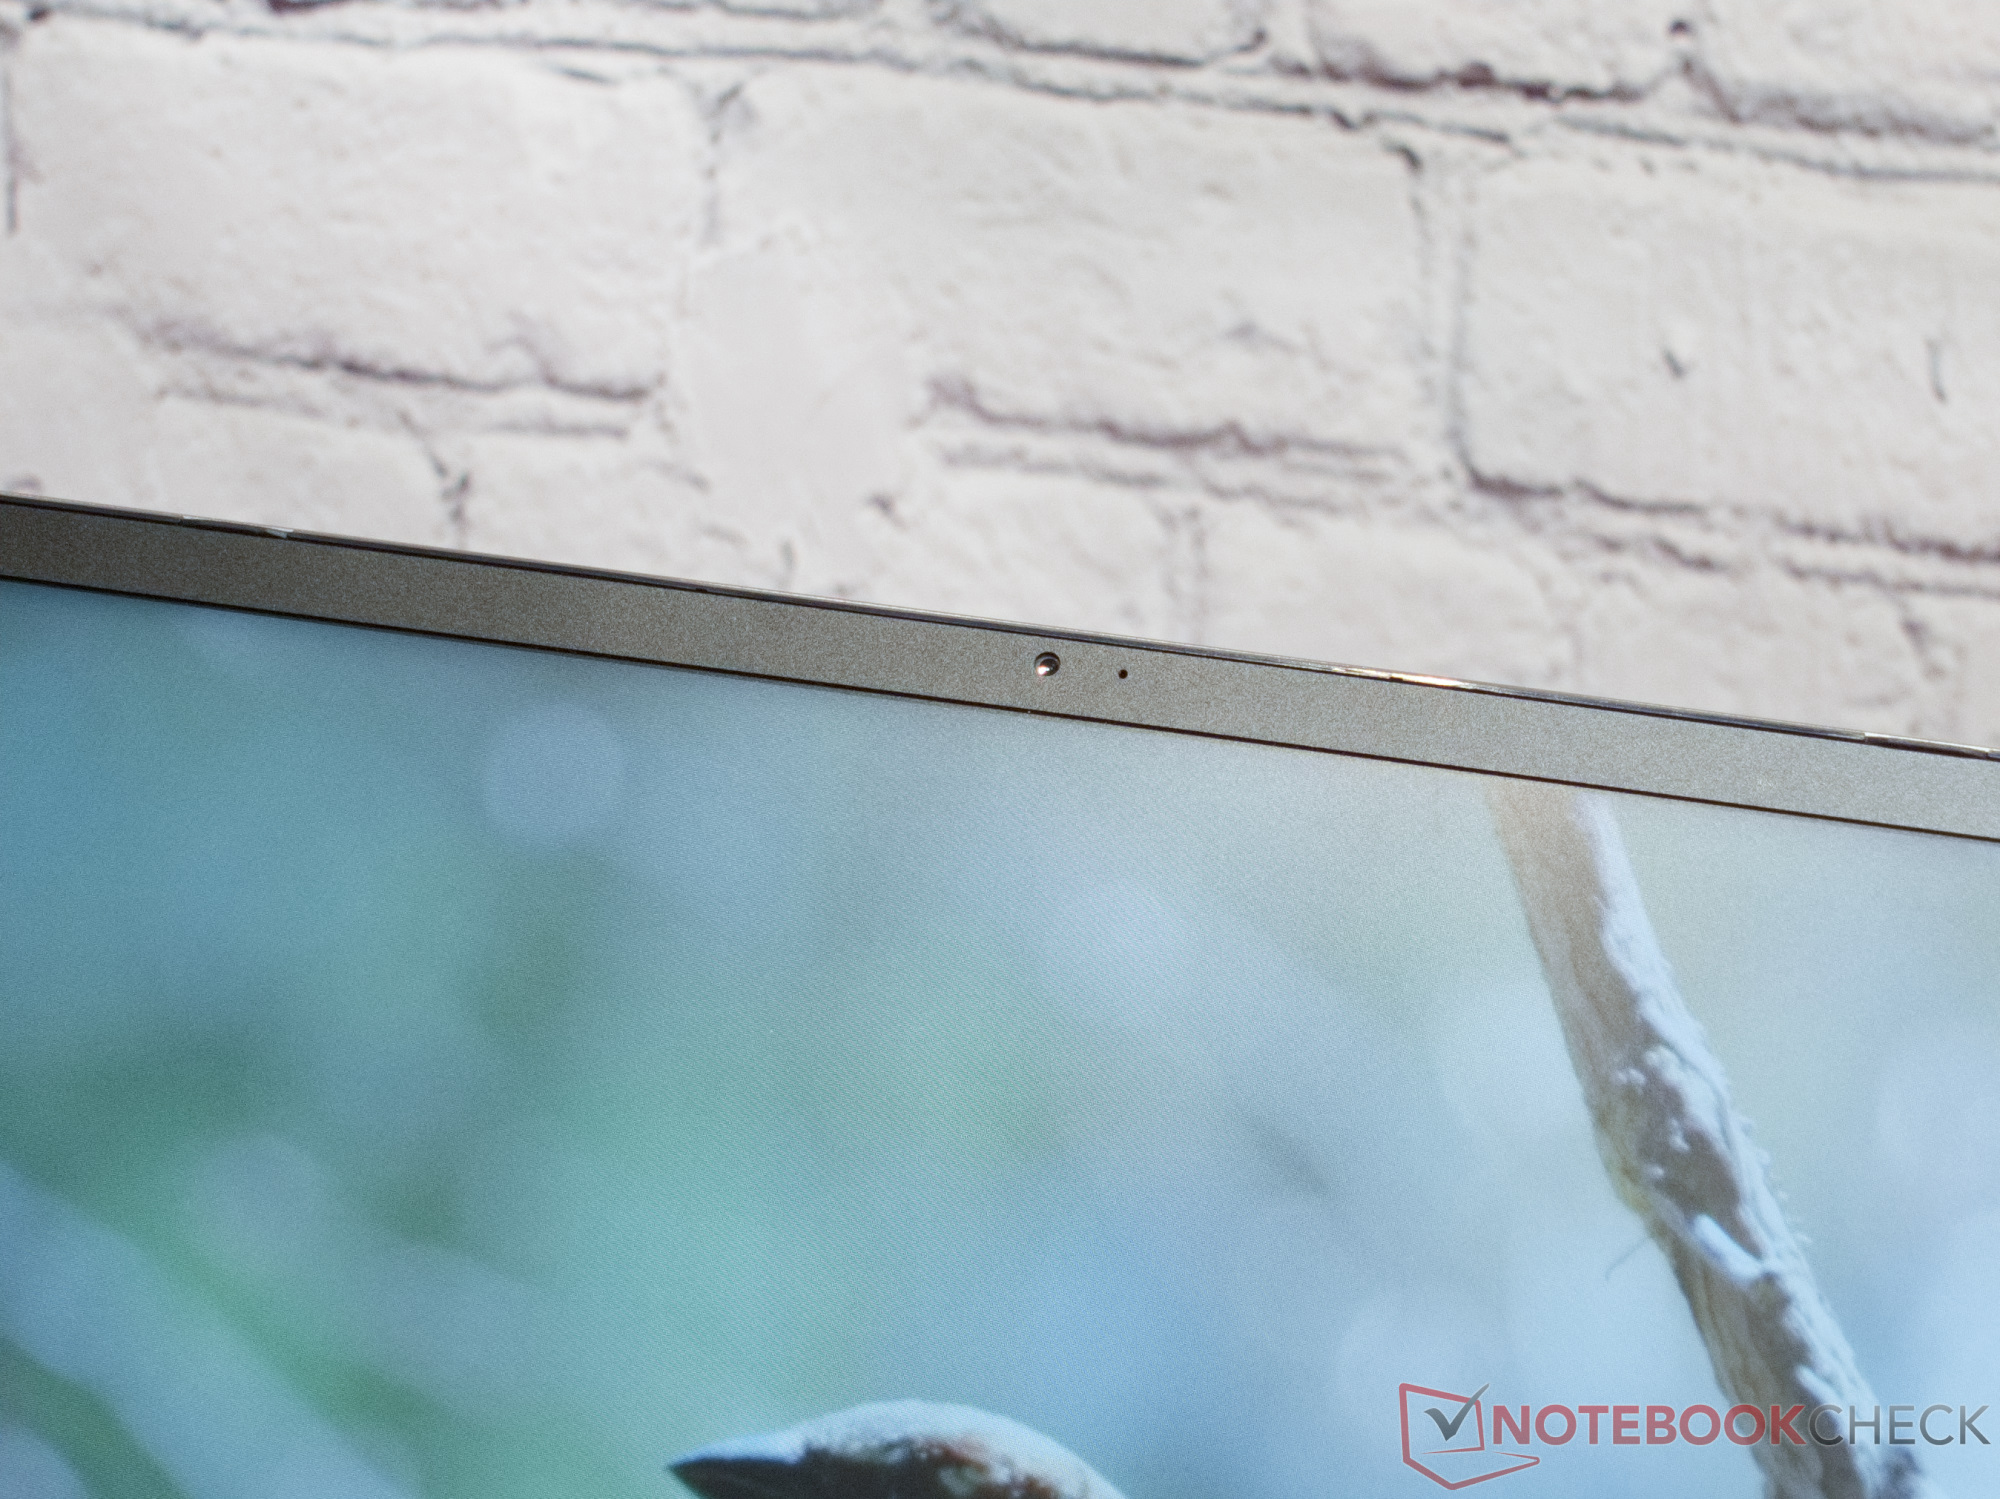
Kamera internetowa 720p i mikrofon mono są użyteczne, ale nie są najlepszej jakości. Mogą być używane do szybkich połączeń wideo w domu, ale lepiej jest polegać na zewnętrznej kamerze internetowej, jeśli często bierzesz udział w wideokonferencjach.
Ogólnie rzecz biorąc, wydajność czytnika kart, kamery internetowej i modułu WLAN jest prawie wystarczająca. Urządzenia w przedziale cenowym 500 euro również nie różnią się zbytnio od siebie.
| SD Card Reader | |
| average JPG Copy Test (av. of 3 runs) | |
| Lenovo IdeaPad 5 Pro 16ARH7 (AV PRO microSD 128 GB V60) | |
| Eurocom C315 Blitz (Angelbird AV Pro V60) | |
| Średnia w klasie Office (19.8 - 198.5, n=22, ostatnie 2 lata) | |
| Ninkear A15 Plus (16+512) | |
| HP 250 G9 7N029ES (Angelbird AV Pro V60) | |
| Schenker VIA 15 Pro M22 (Angelbird AV Pro V60) | |
| maximum AS SSD Seq Read Test (1GB) | |
| Eurocom C315 Blitz (Angelbird AV Pro V60) | |
| Średnia w klasie Office (27.4 - 249, n=21, ostatnie 2 lata) | |
| Ninkear A15 Plus (16+512) | |
| HP 250 G9 7N029ES (Angelbird AV Pro V60) | |
| Schenker VIA 15 Pro M22 (Angelbird AV Pro V60) | |

 Vega 8, R7 5700U, GOFATOO P110E-512GB")
 Vega 8, R7 5700U, GOFATOO P110E-512GB")
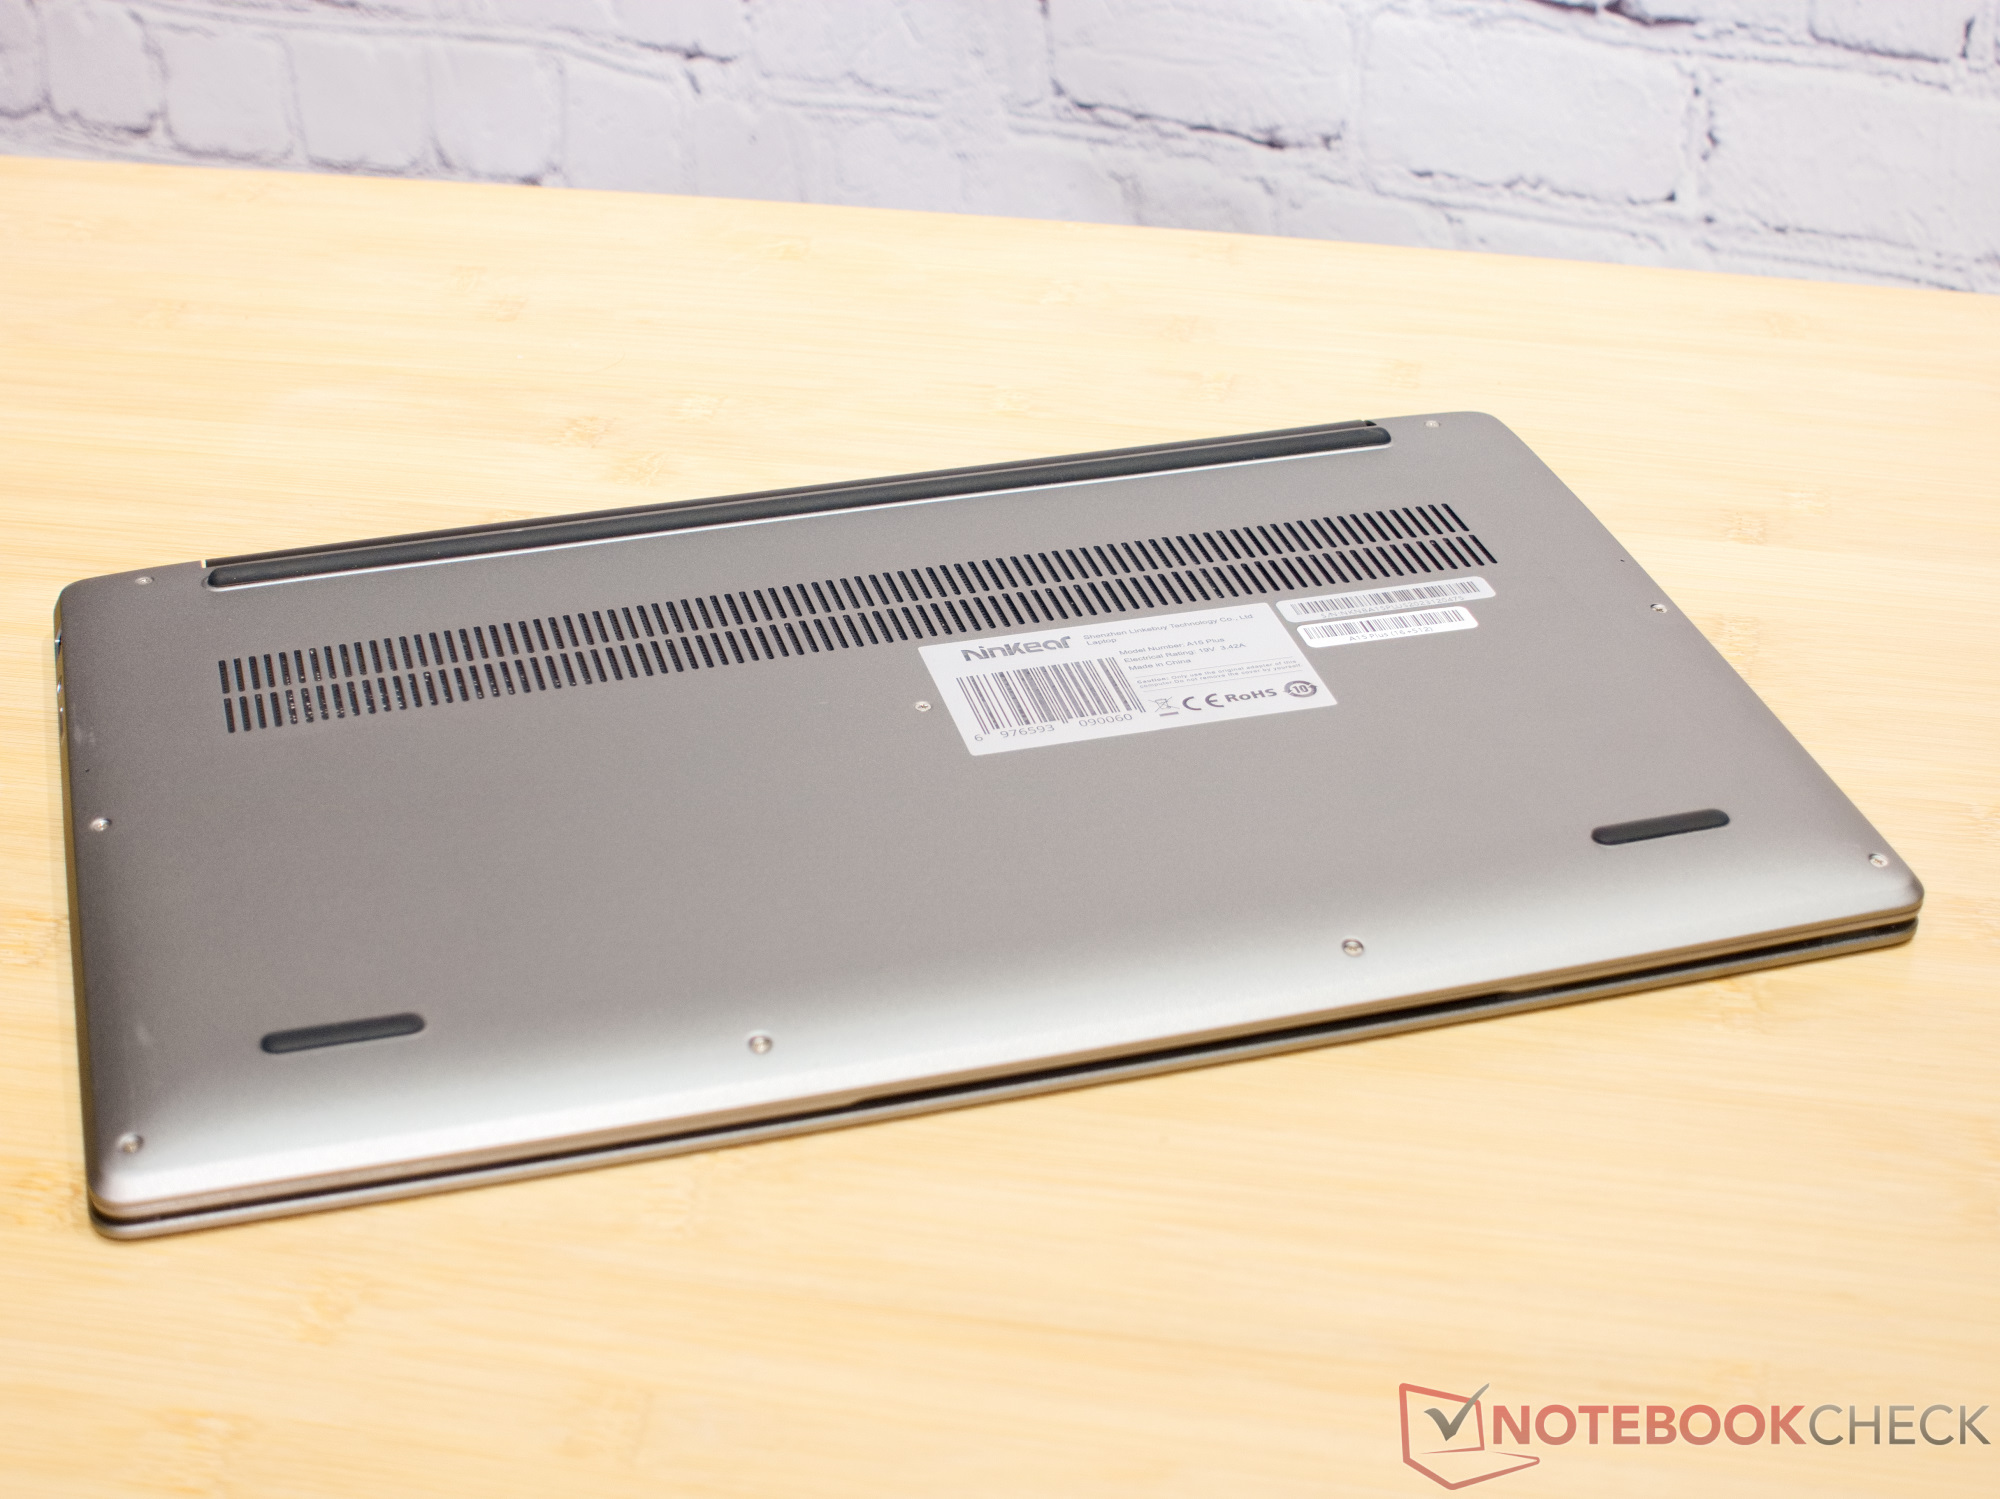
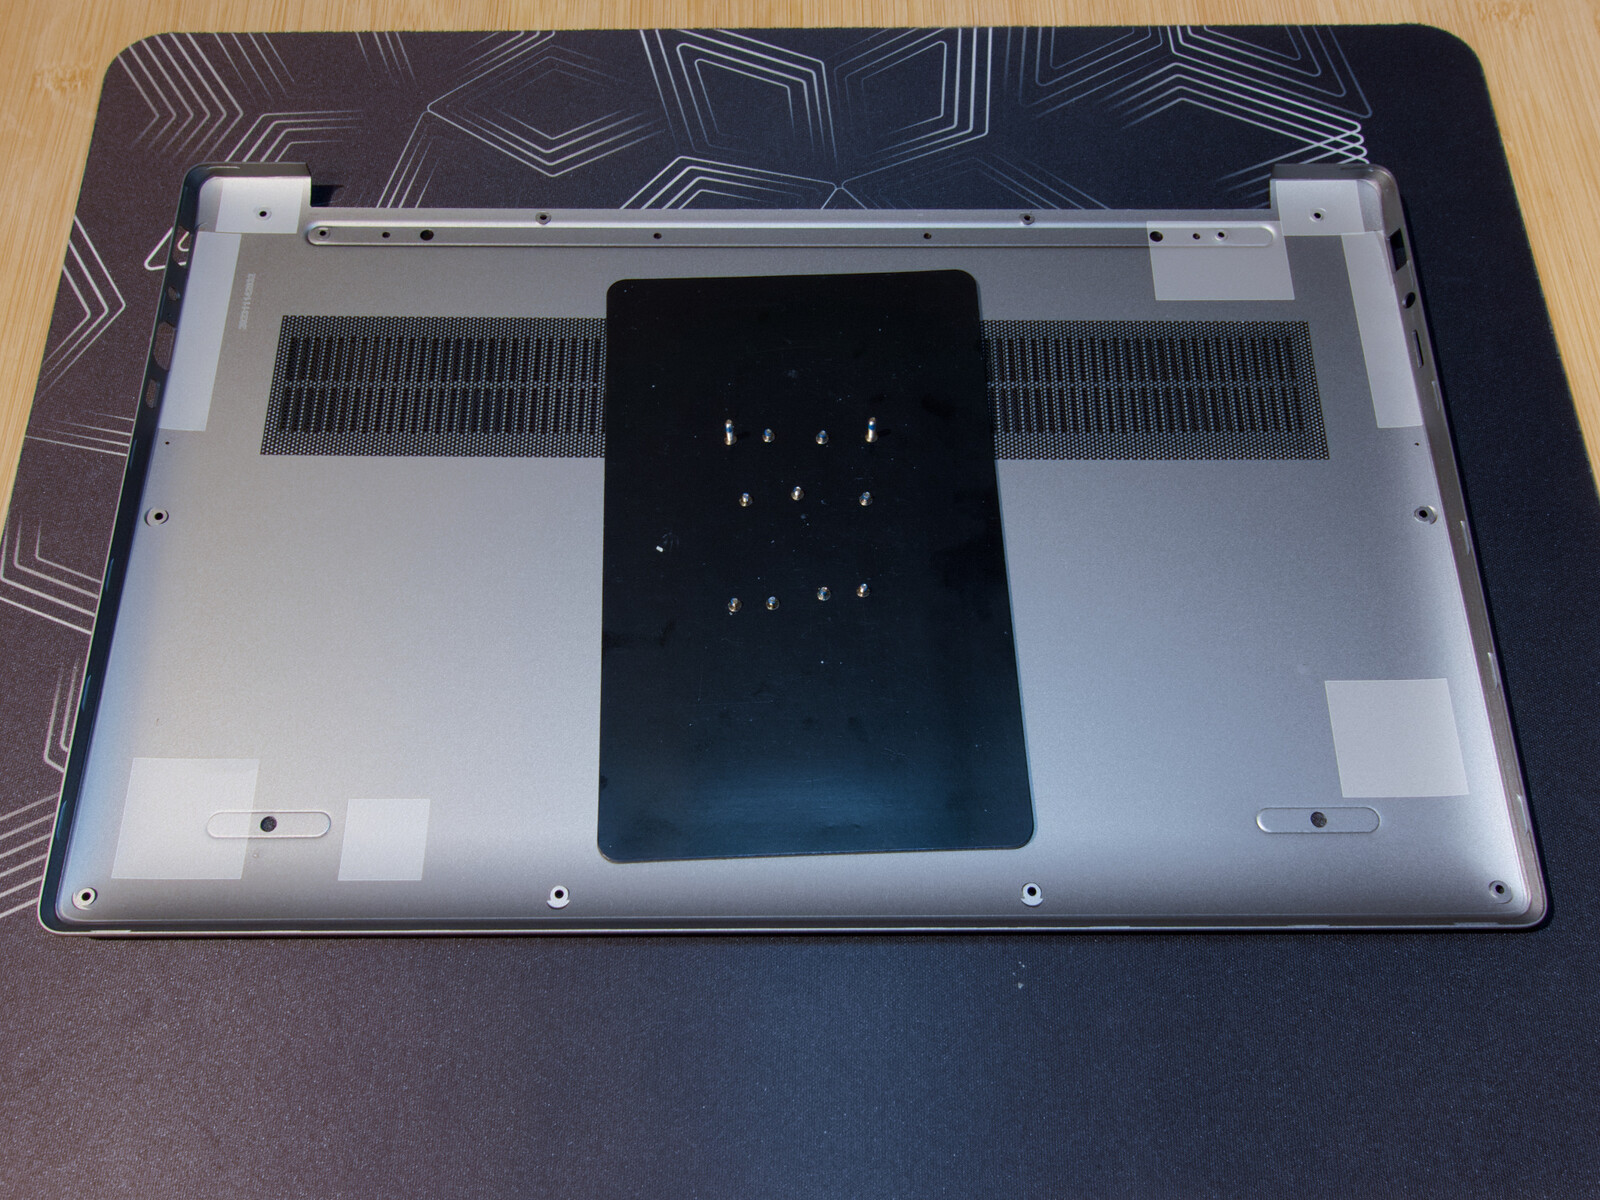
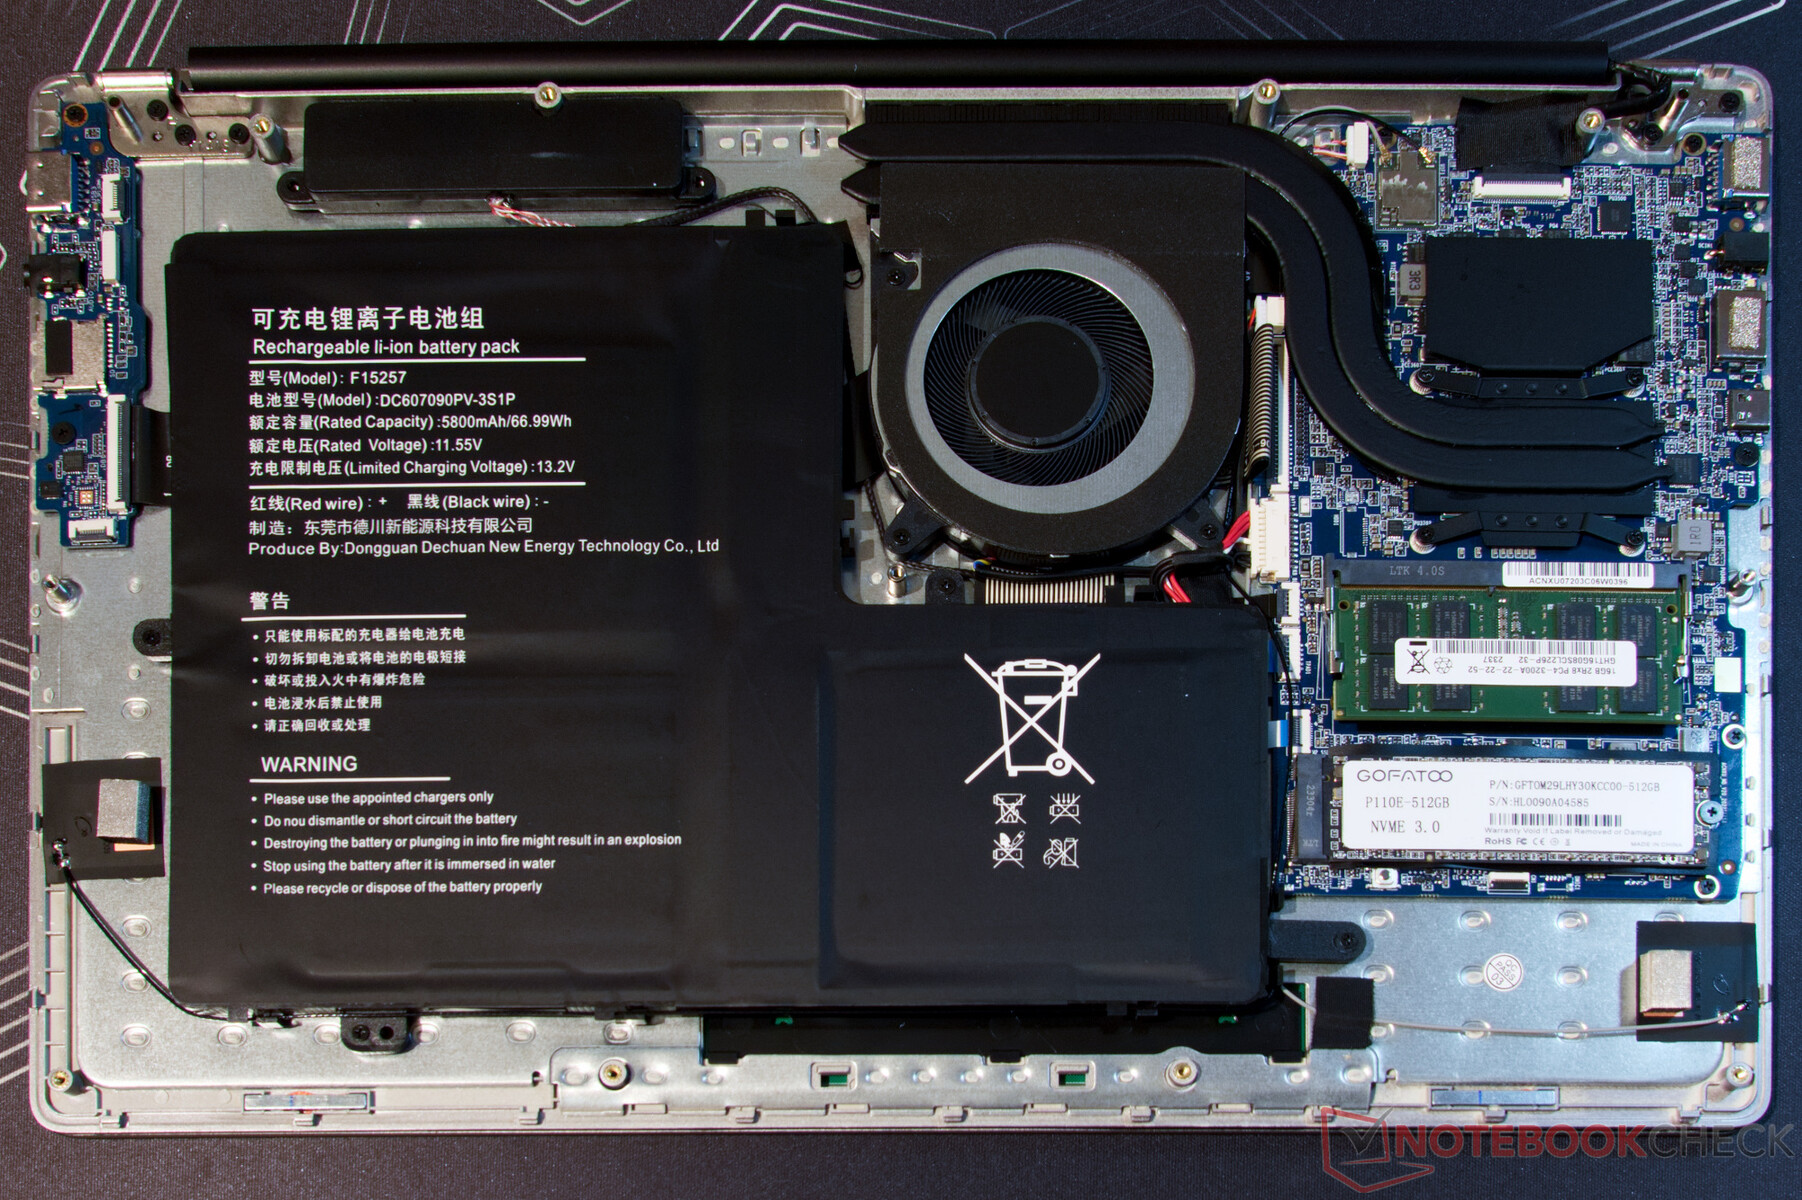
Konserwacja, gwarancja i zakres dostawy
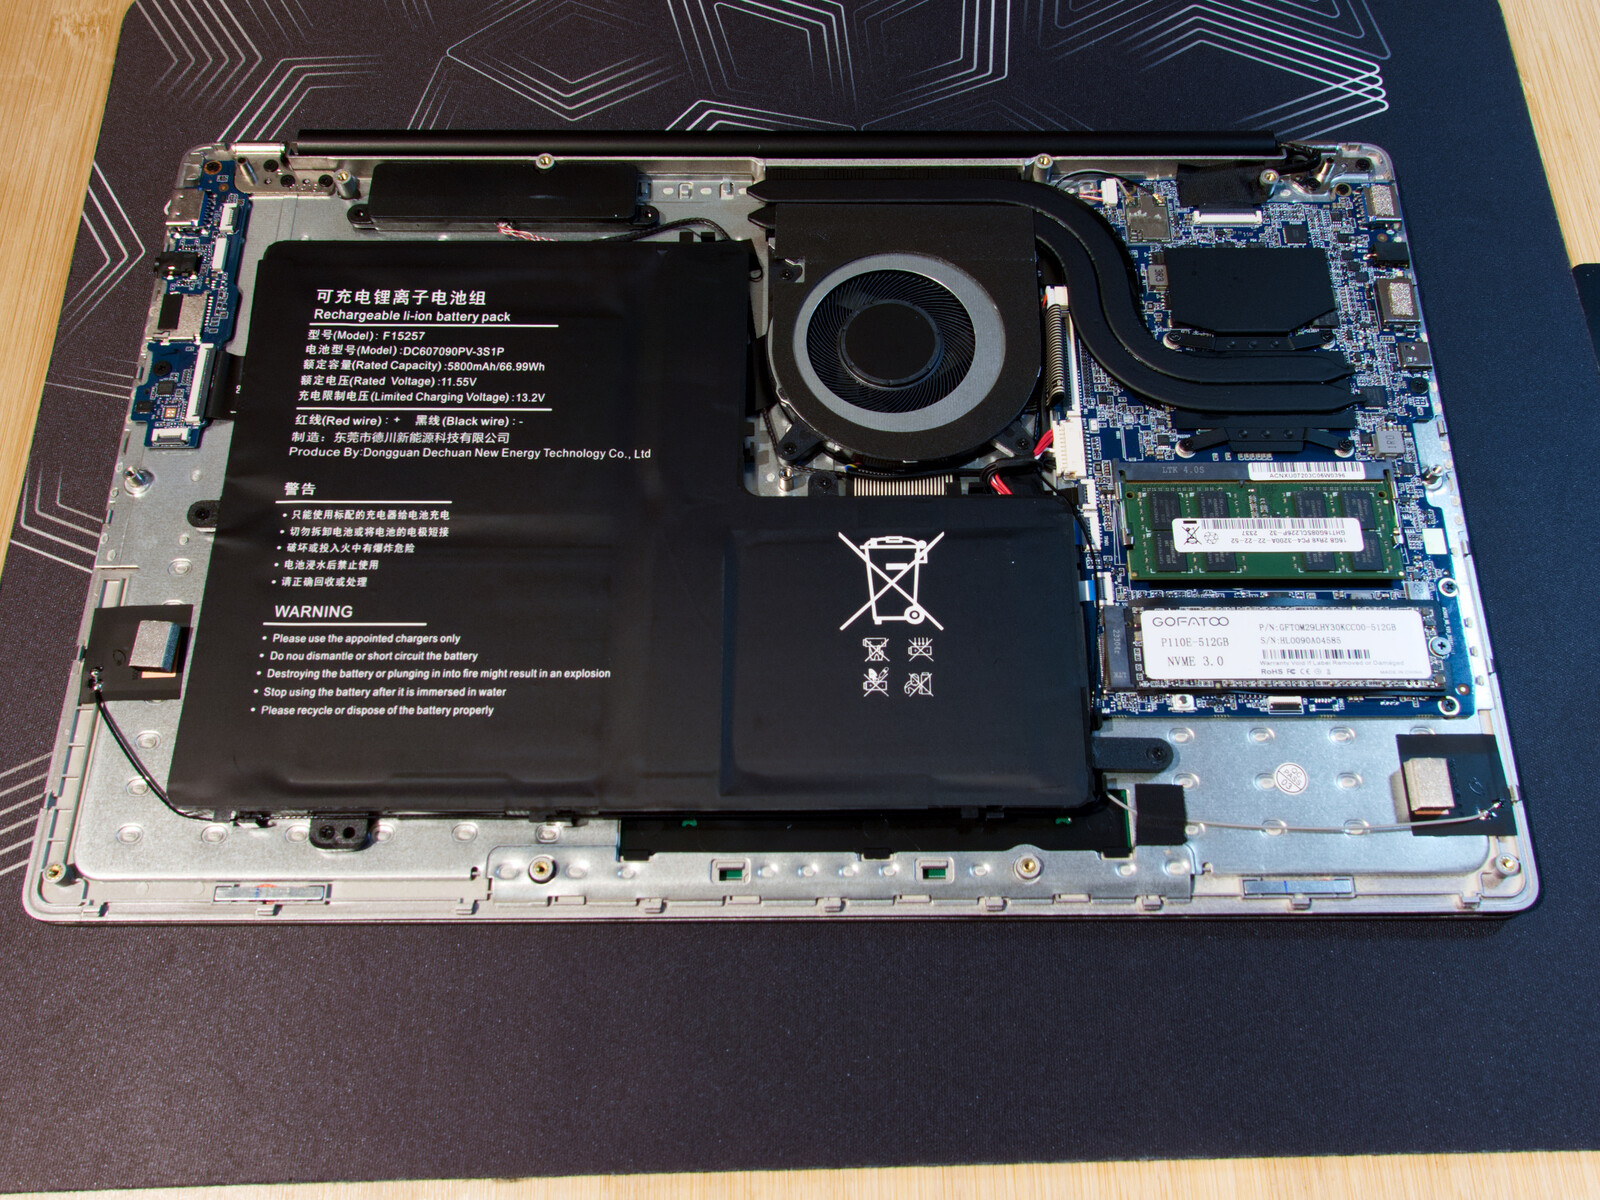
Jedenaście śrub krzyżakowych zabezpiecza aluminiową podstawę i można je łatwo usunąć. Pod spodem znajdziemy podłączoną pamięć RAM i dysk SSD M.2 NVMe. Niestety, powolny moduł WLAN jest przylutowany. W zależności od sprzedawcy, laptop objęty jest dwunastomiesięczną lub dwuletnią gwarancją.
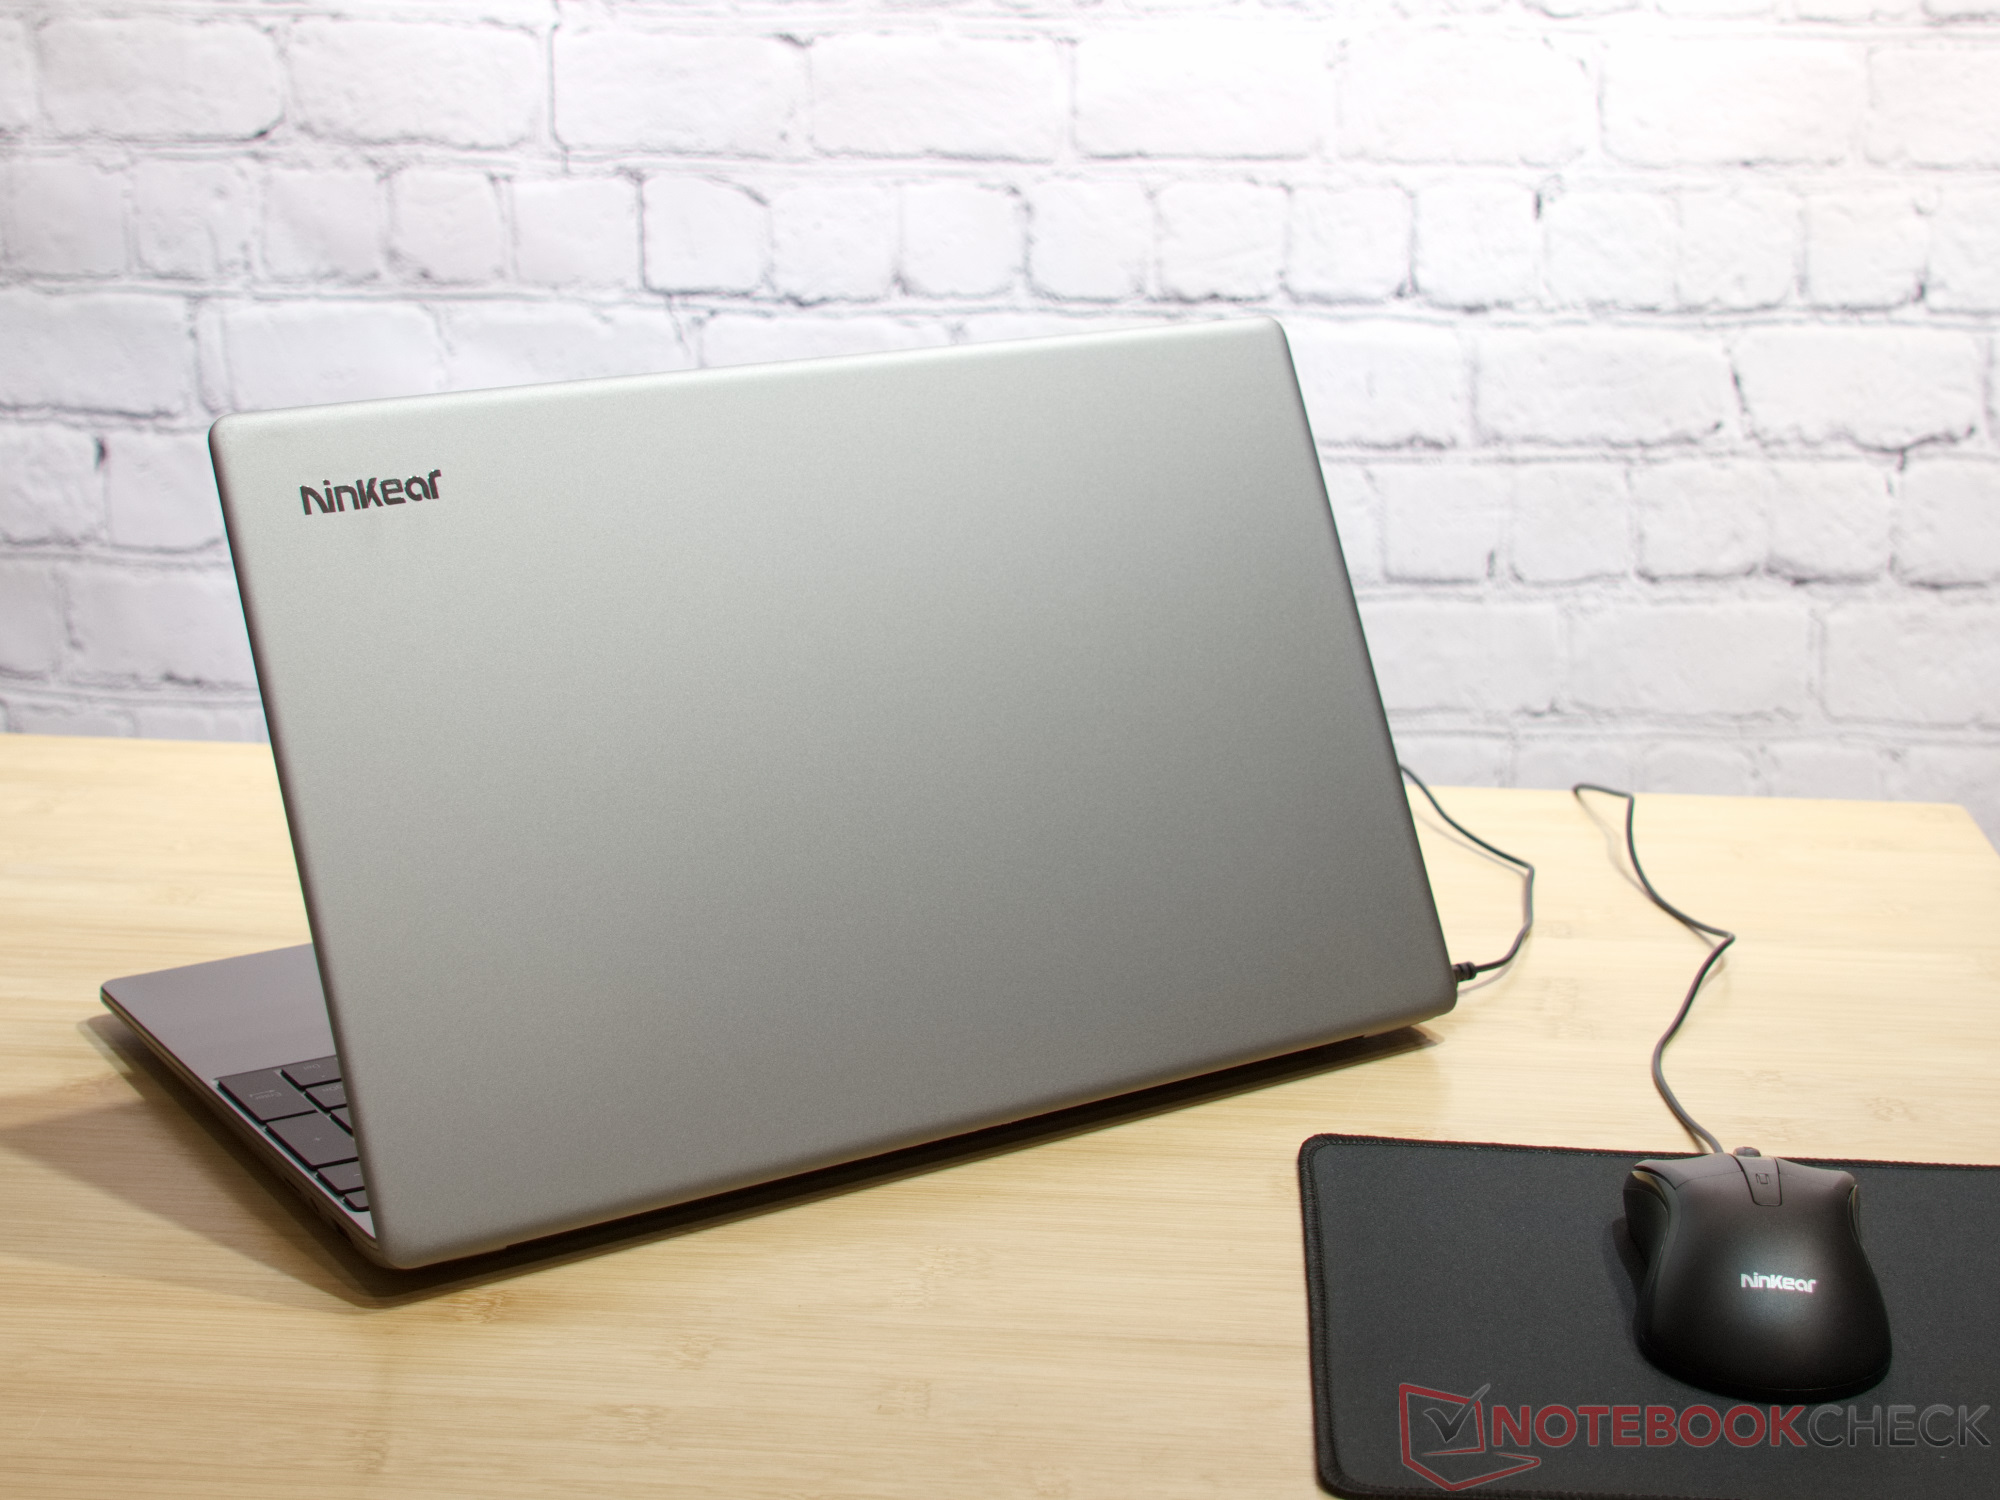
Nasz Ninkear A15 Plus był dostarczany z torbą na laptopa, myszą USB i podkładką pod mysz. W zestawie znalazły się również naklejki na różne układy klawiatury.
Urządzenia wejściowe: Świetna klawiatura, słaby touchpad
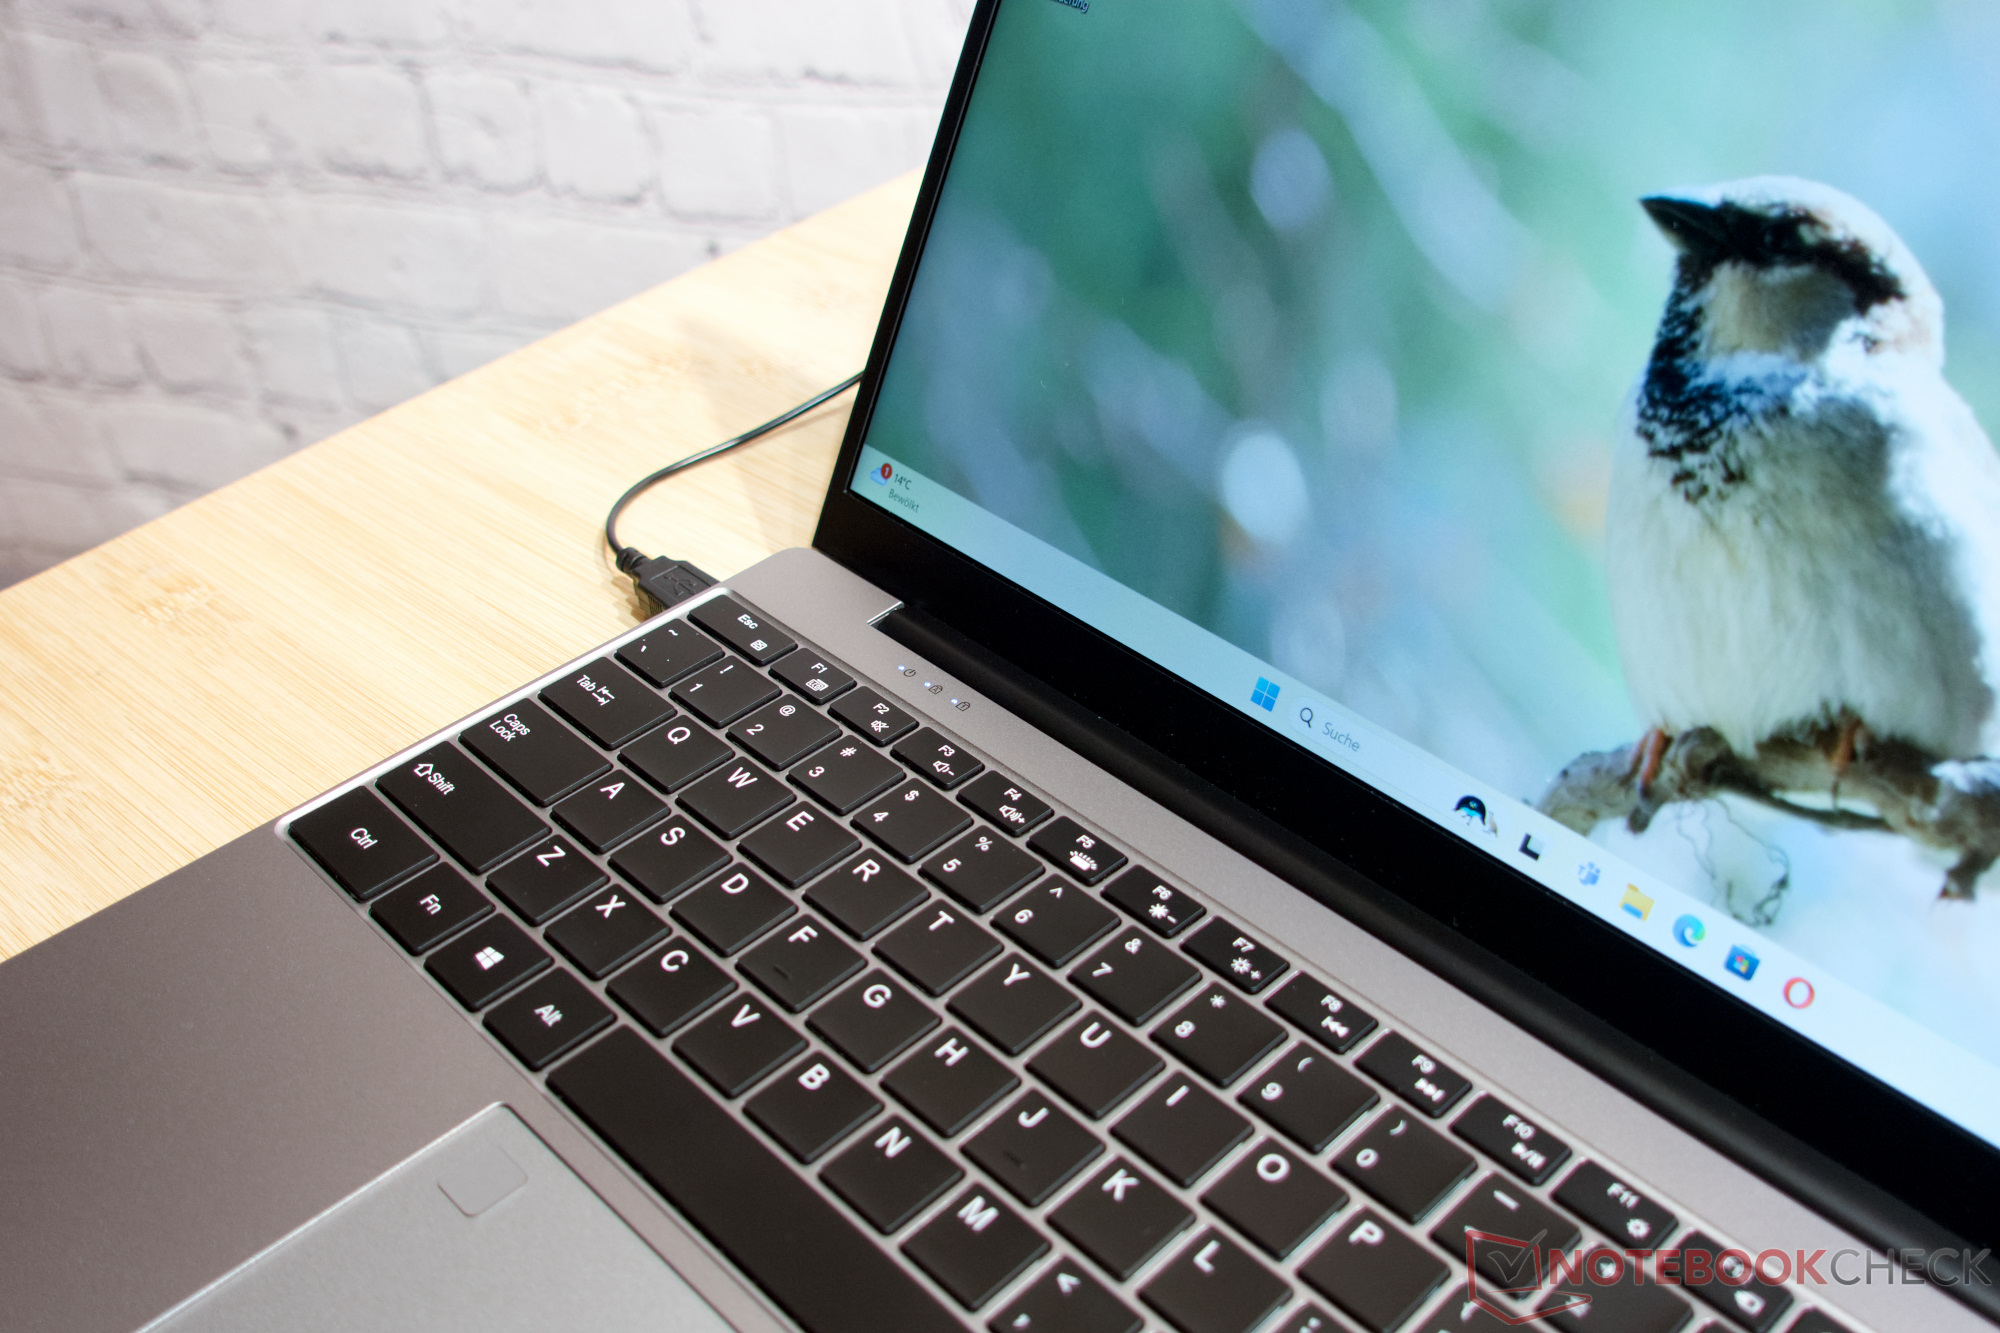
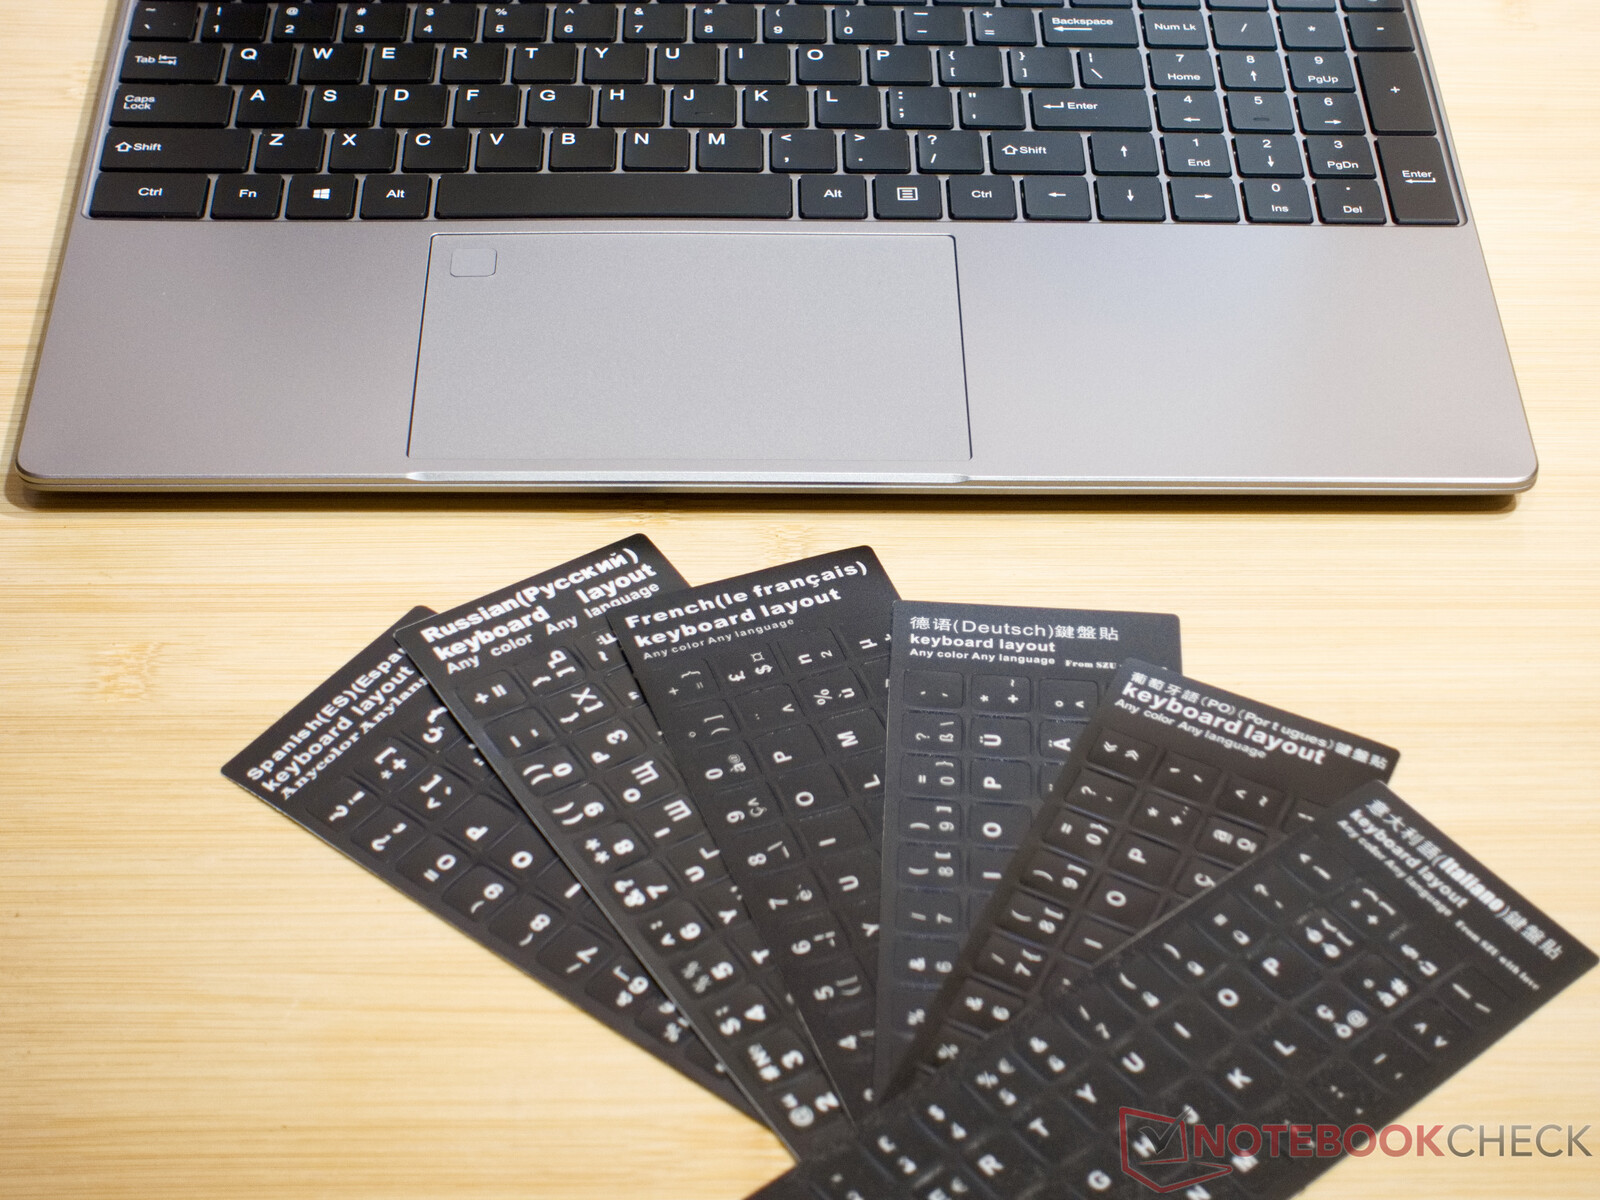
Podświetlana klawiatura Ninkear A15 Plus jest naprawdę dobra. Posiada pełnowymiarowe klawisze, w tym klawiaturę numeryczną. Skok klawiszy wynoszący 1,4 mm jest odpowiedni i sprawia wrażenie wyraźnego. Niestety, laptop jest dostępny tylko z układem amerykańskim, czyli klawiaturą QWERTY w formacie ANSI.
Oznacza to, że nie jest łatwo przełączyć się na układ QWERTY w formacie ISO. Chociaż producent dostarcza naklejki na klawiaturę dla różnych języków, niemiecki układ klawiatury ma o jeden klawisz więcej niż oferuje laptop. Ułatwia to przyzwyczajenie się do układu US International.
Chociaż duży touchpad oferuje wielodotykowe wprowadzanie danych, w naszym teście miał swoje problemy z naciskaniem klawiszy. Zdarza się, że wskaźnik myszy przeskakuje. Na szczęście producent dostarcza również mysz jako alternatywę. Problem zniknął również po kilku aktualizacjach, co odkryliśmy na krótko przed publikacją recenzji. Duży touchpad działa teraz bez zarzutu.
Wyświetlacz: Full HD IPS

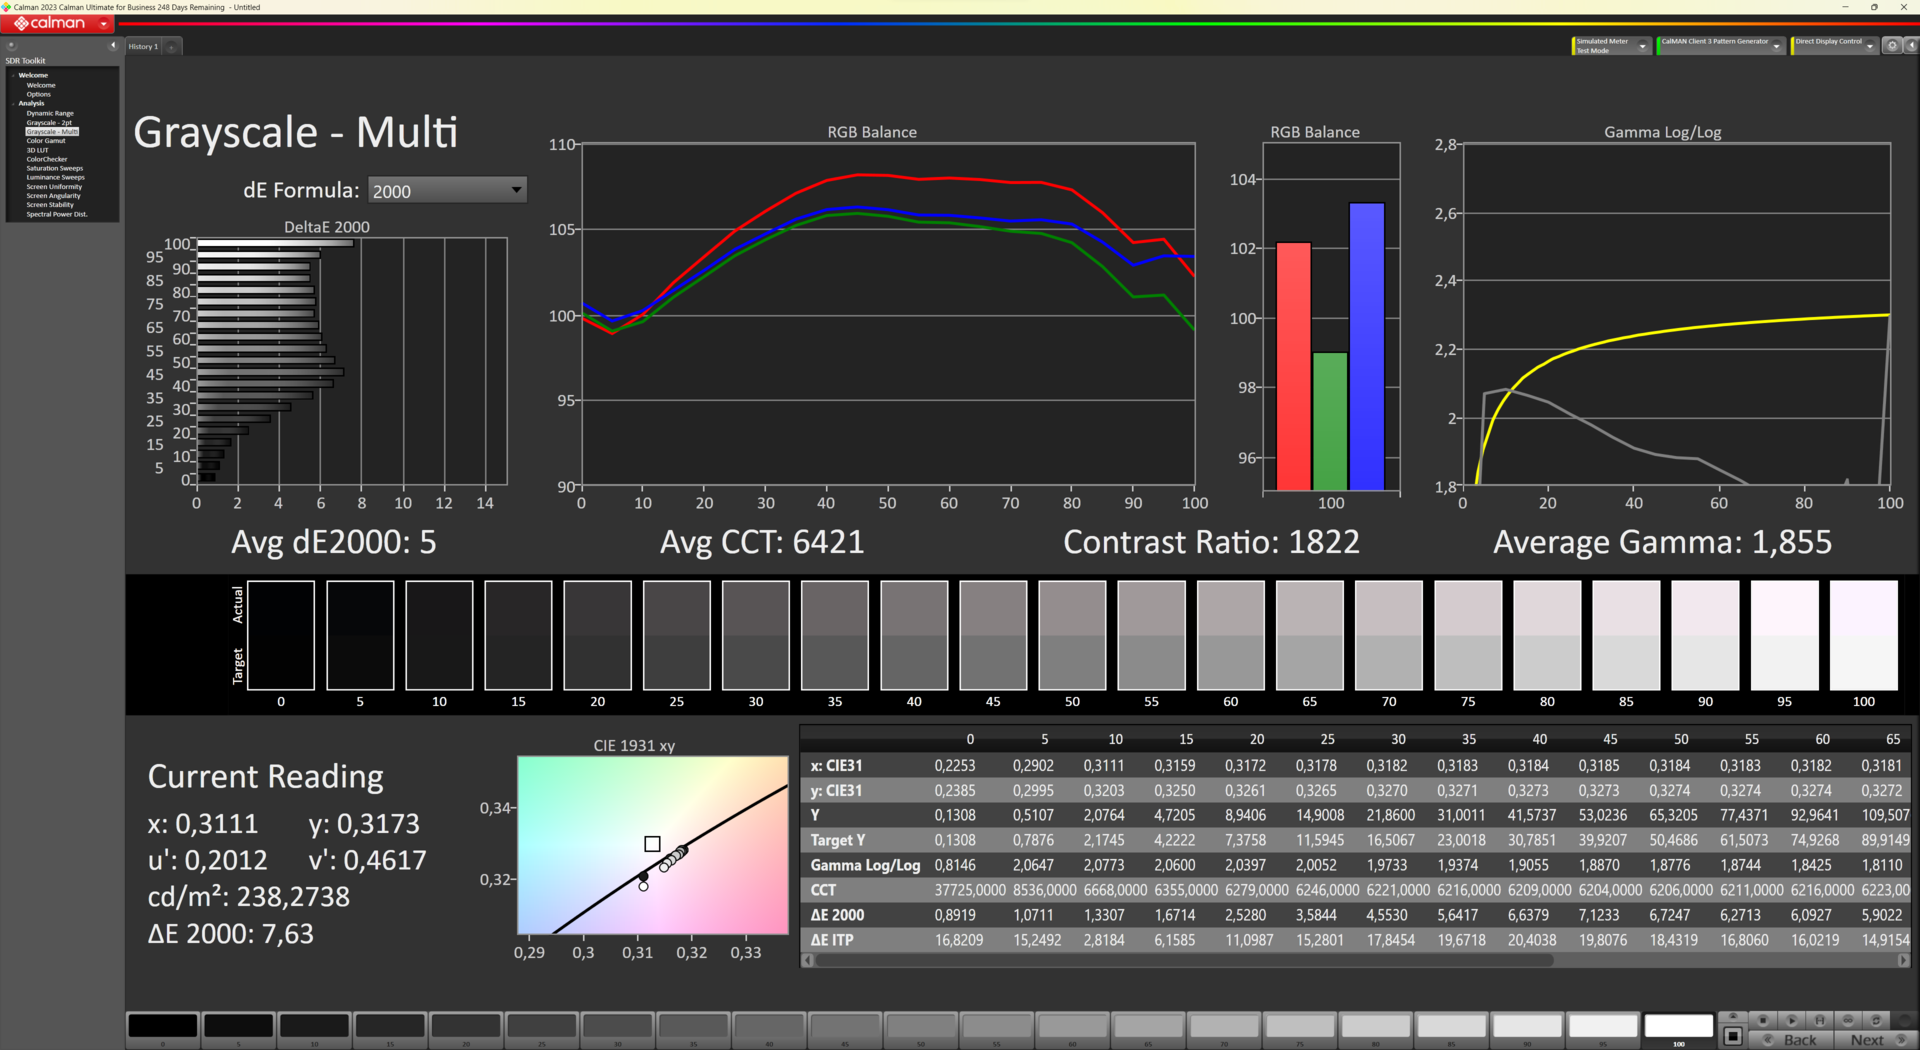
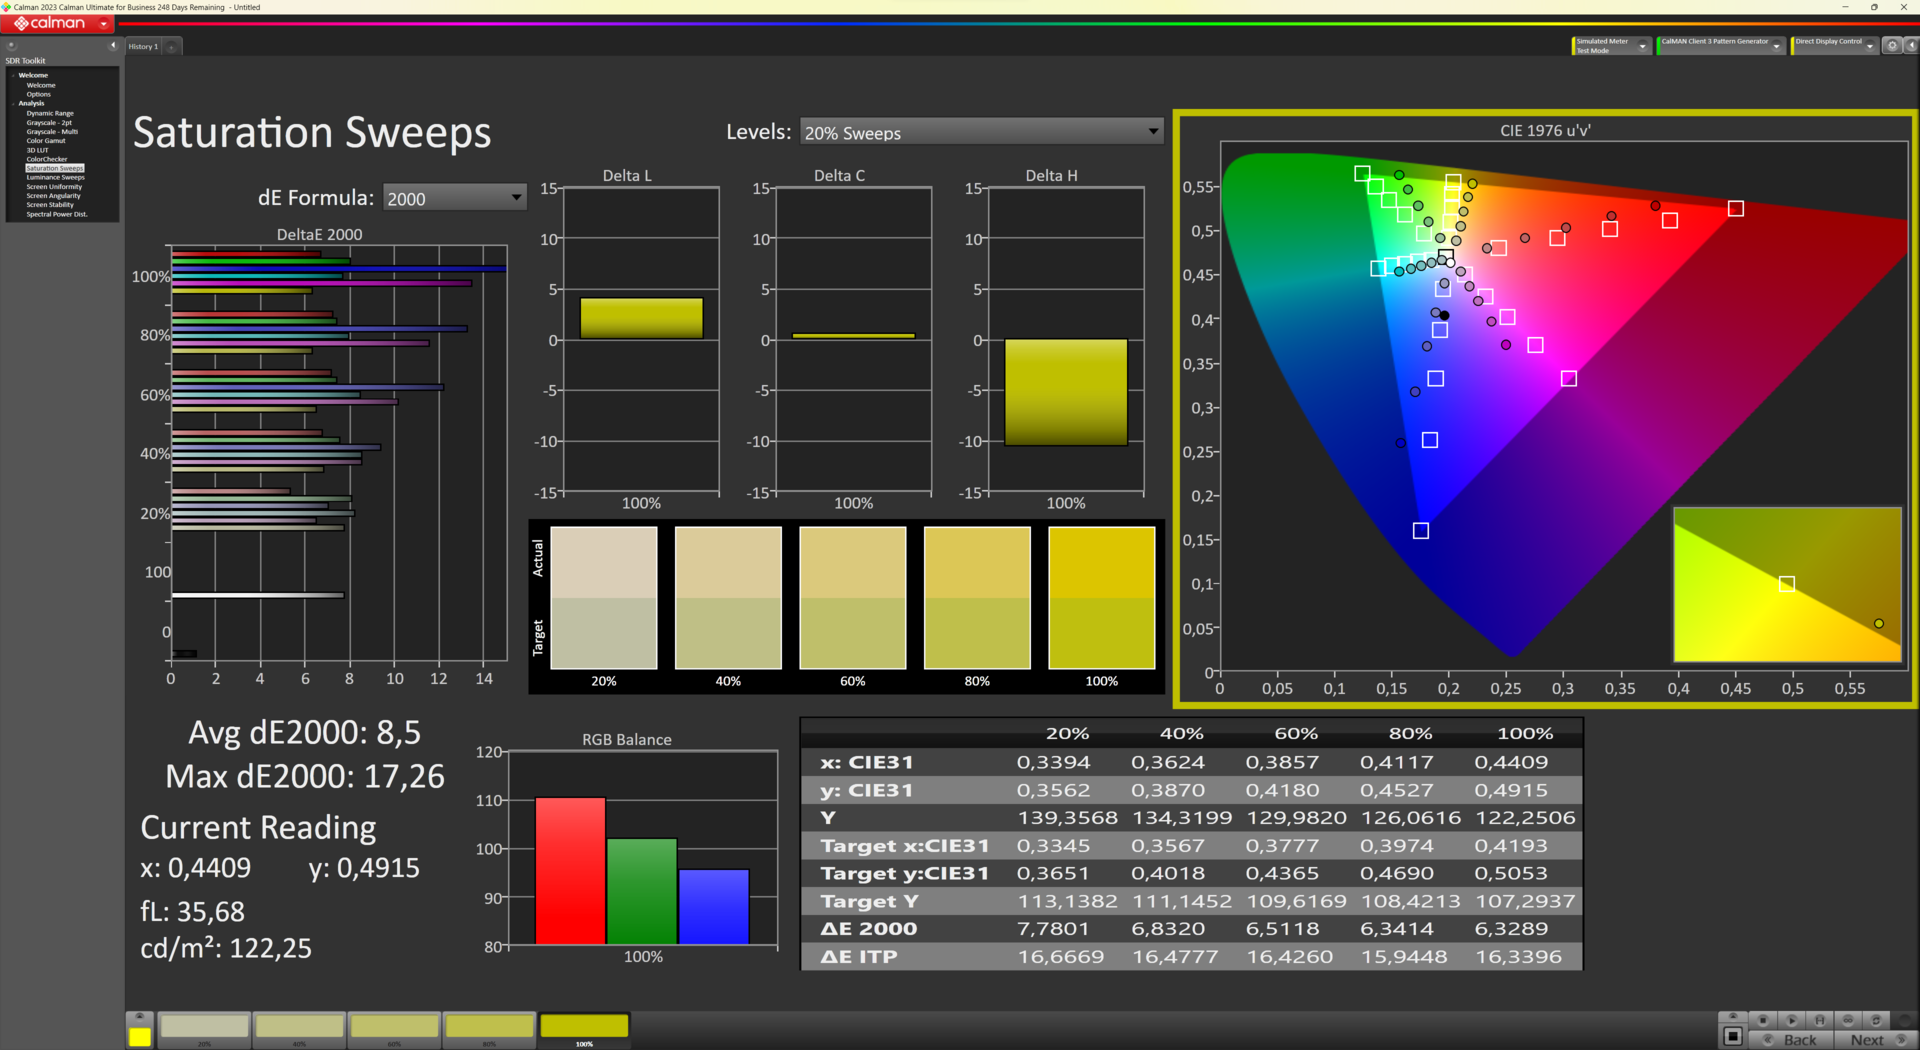
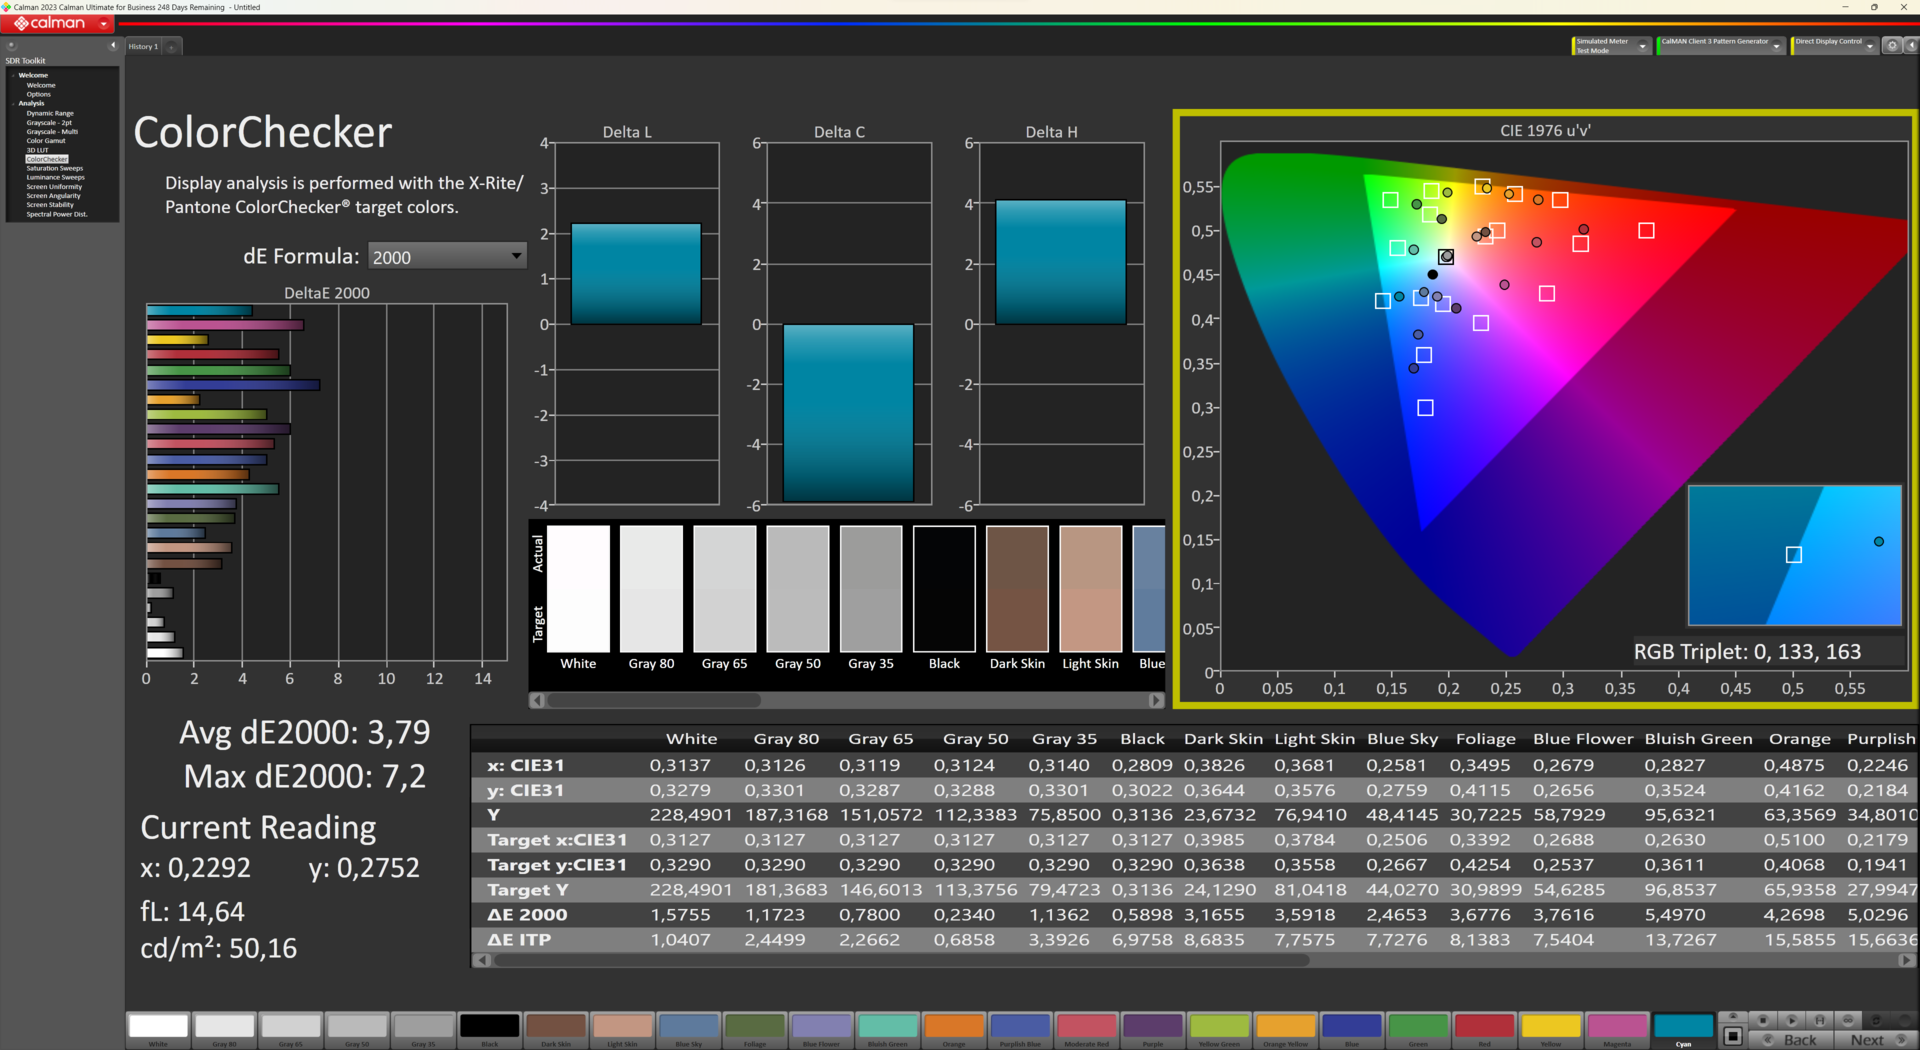
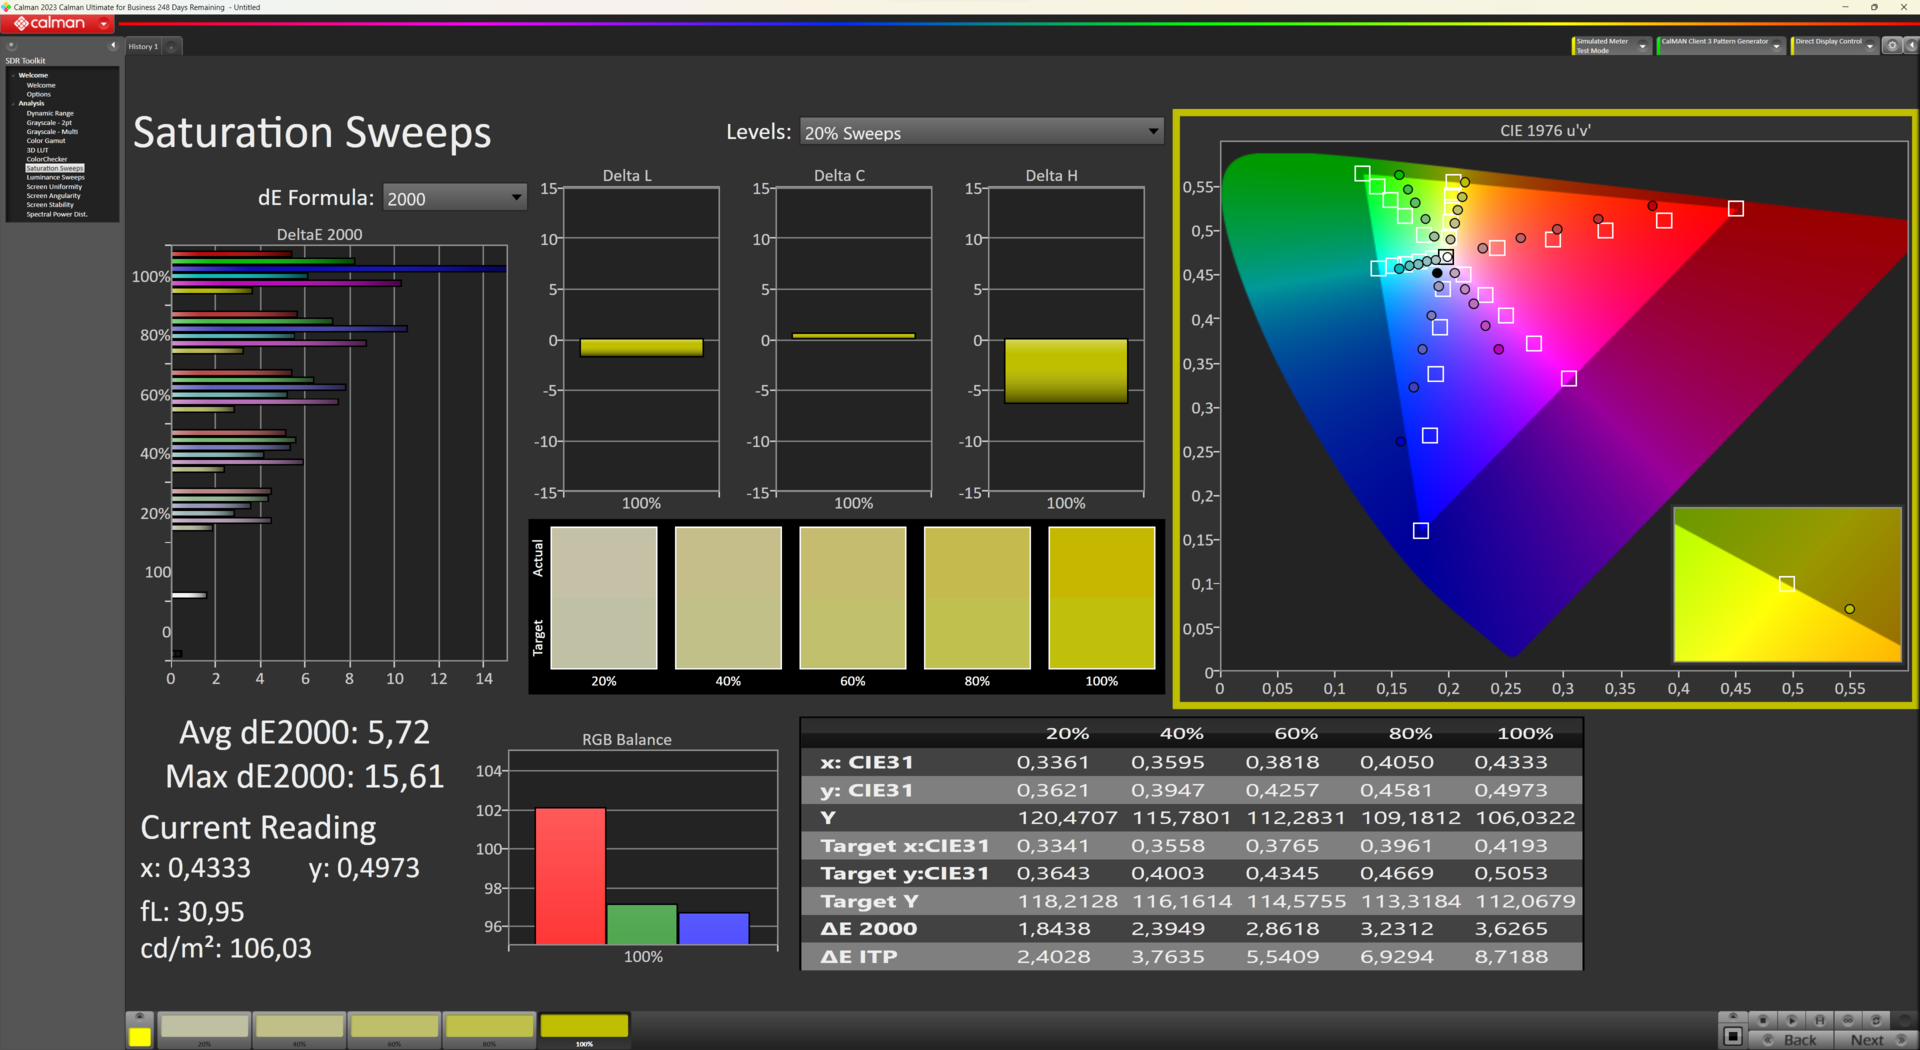
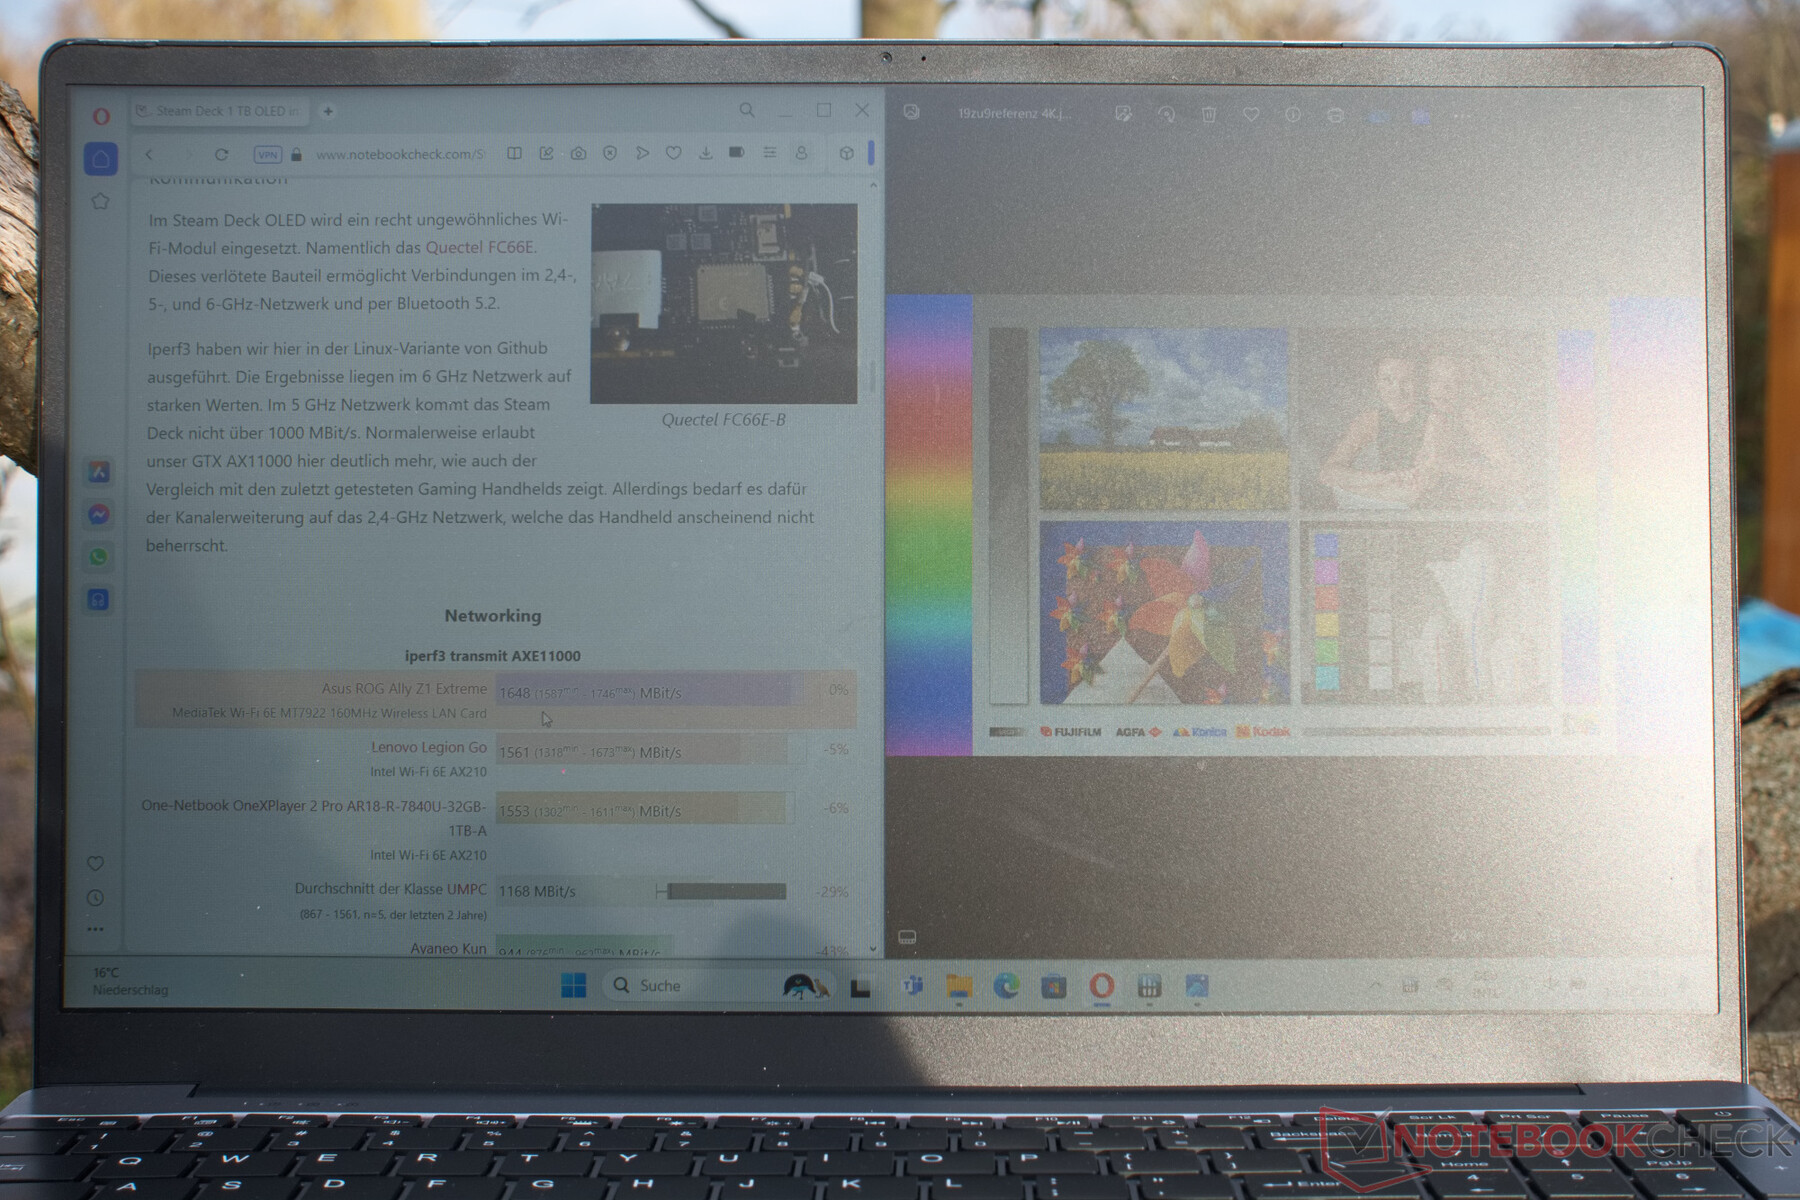
Dzięki rozdzielczości Full HD przy 60 Hz, wyświetlacz Ninkear A15 Plus niestety nie nadaje się do niczego innego niż podstawowe zastosowania biurowe. Wyświetlacz o niskim poziomie niebieskiego światła nie jest zbyt dokładny pod względem odwzorowania kolorów, a także pozostawia wiele do życzenia pod względem jasności. Nie jest możliwe osiągnięcie jasności większej niż 250 cd/m².
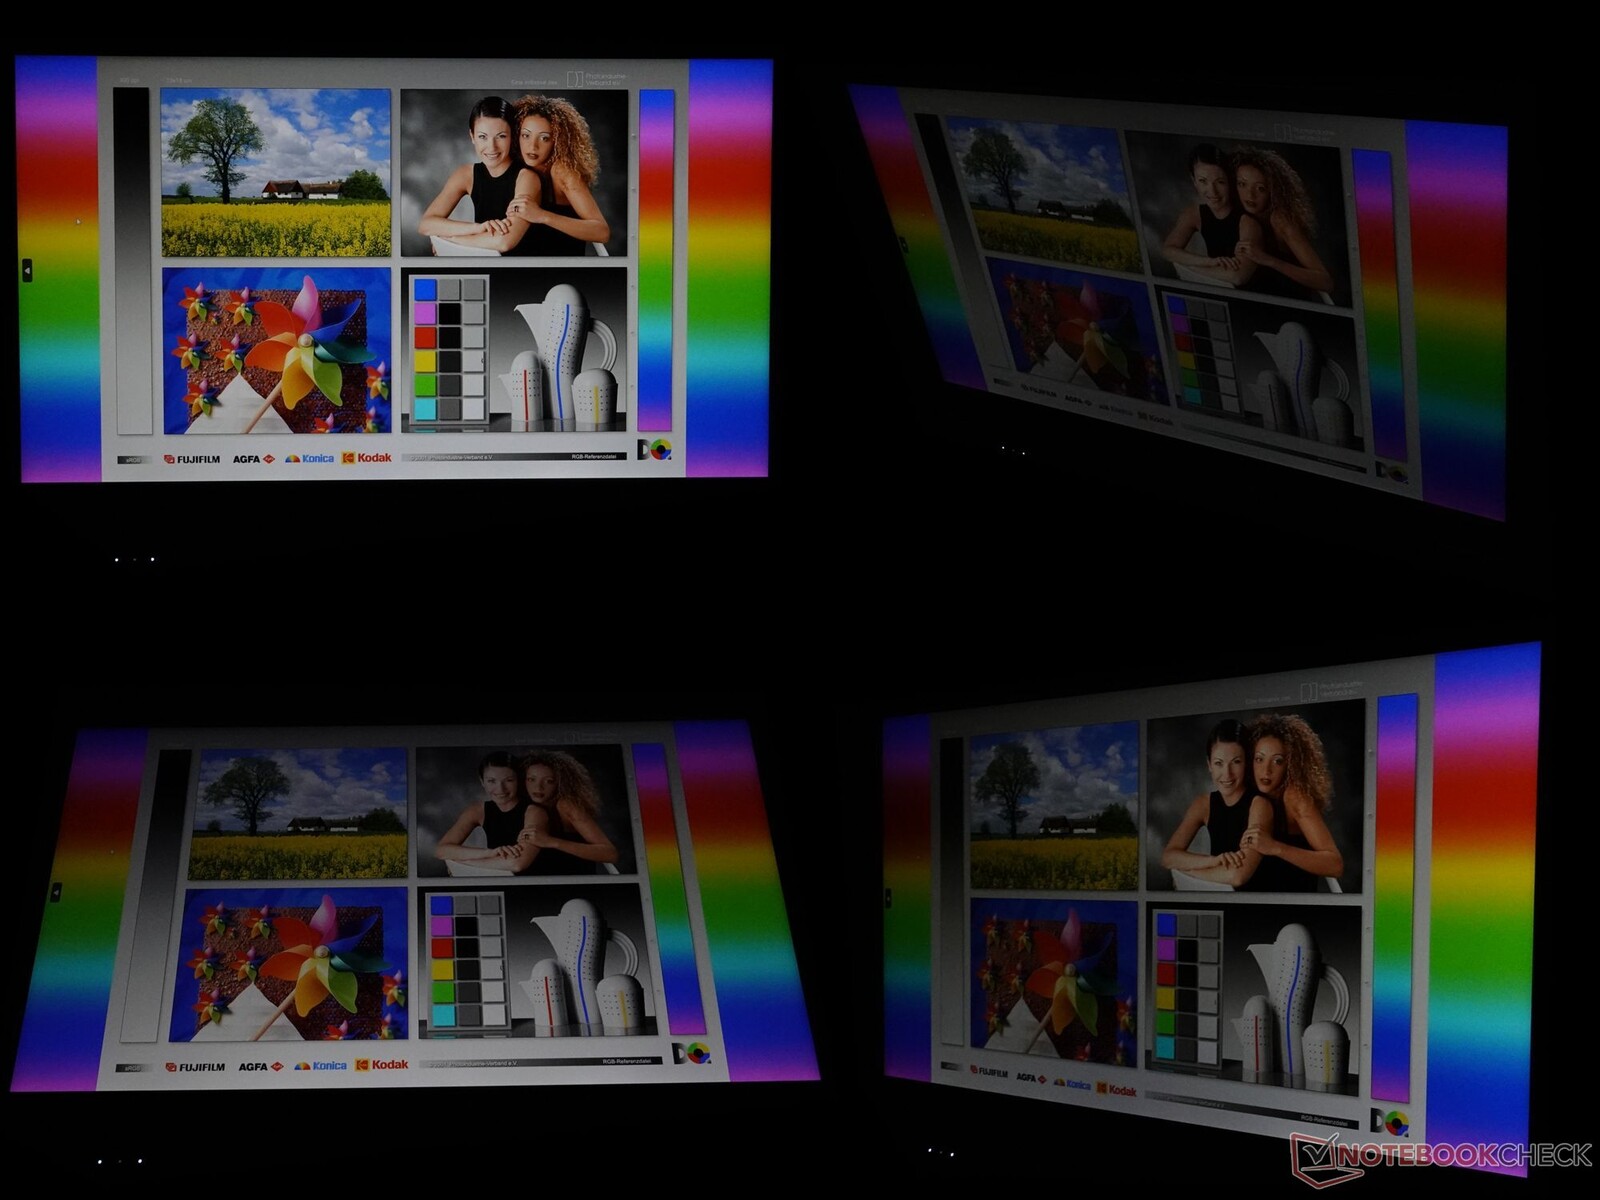
Ekran jednak nie migocze, czasy reakcji są w porządku, a podświetlenie panelu IPS o stabilnych kątach widzenia jest stosunkowo równomierne. Subiektywnie, jakość obrazu wyświetlanego na ekranie laptopa jest dobra. Urządzenie bez wątpienia nie nadaje się jednak do profesjonalnego użytku jako grafik.
| |||||||||||||||||||||||||
rozświetlenie: 89 %
na akumulatorze: 250 cd/m²
kontrast: 1601:1 (czerń: 0.1587 cd/m²)
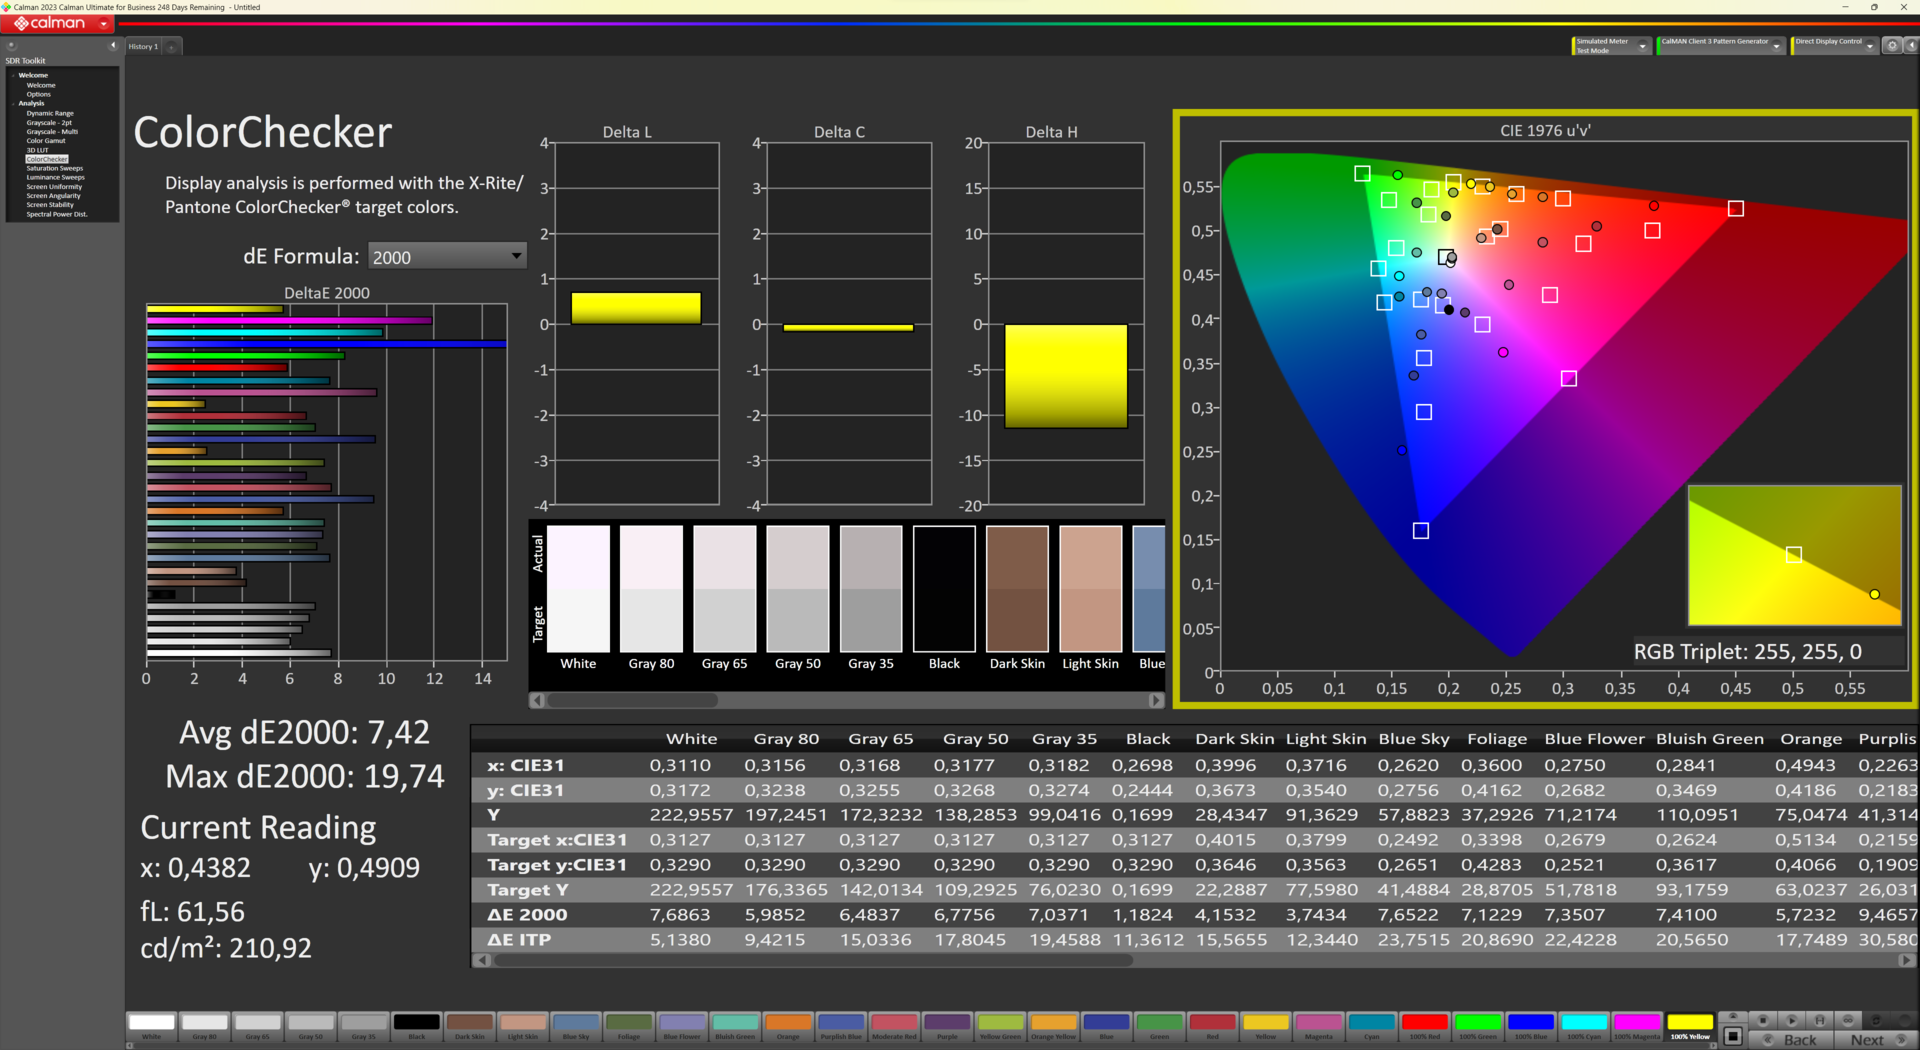
ΔE ColorChecker Calman: 7.42 | ∀{0.5-29.43 Ø4.71}
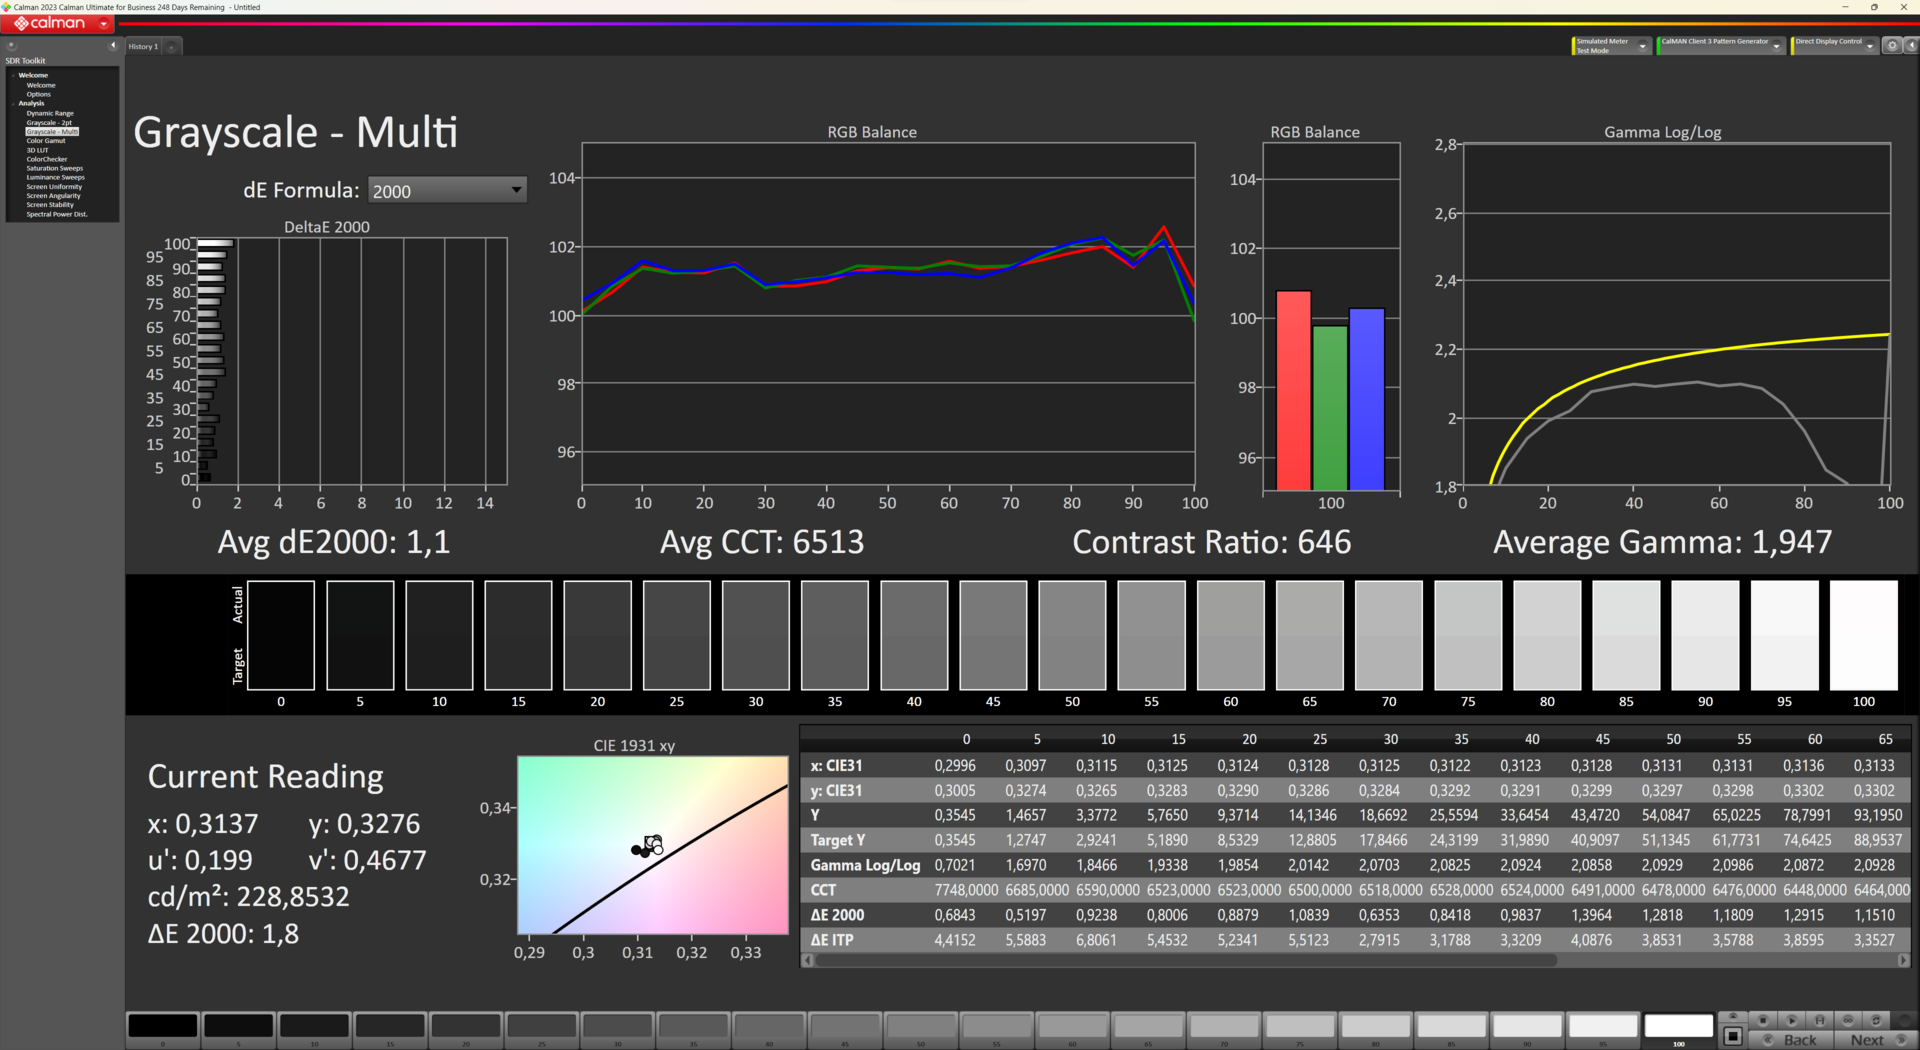
calibrated: 5.72
ΔE Greyscale Calman: 5 | ∀{0.09-98 Ø4.96}
40.34% AdobeRGB 1998 (Argyll 3D)
58.06% sRGB (Argyll 3D)
39.04% Display P3 (Argyll 3D)
Gamma: 1.855
CCT: 6421 K
| Ninkear A15 Plus (16+512) HKC023D, IPS, 1920x1080, 15.6" | Lenovo IdeaPad 5 Pro 16ARH7 AUO B160QAN02.H, IPS, 2560x1600, 16" | Eurocom C315 Blitz BOE HF NE156QUM-N64, IPS, 3840x2160, 15.6" | Schenker VIA 15 Pro M22 NE156QHM-NY2, IPS, 2560x1440, 15.6" | HP 250 G9 7N029ES CMN1538, IPS, 1920x1080, 15.6" | Asus P1511CEA-BQ753R Chi Mei N156HCA-EAB, IPS, 1920x1080, 15.6" | |
|---|---|---|---|---|---|---|
| Display | 67% | 71% | 70% | 11% | 10% | |
| Display P3 Coverage (%) | 39.04 | 65 66% | 67.7 73% | 67.5 73% | 43.3 11% | 42.8 10% |
| sRGB Coverage (%) | 58.06 | 98 69% | 96.5 66% | 97.1 67% | 64.8 12% | 64.1 10% |
| AdobeRGB 1998 Coverage (%) | 40.34 | 67.2 67% | 69.8 73% | 68.5 70% | 44.7 11% | 44.3 10% |
| Response Times | 47% | -134% | 38% | -41% | -48% | |
| Response Time Grey 50% / Grey 80% * (ms) | 25 ? | 14.1 ? 44% | 54.4 ? -118% | 13.8 ? 45% | 31.9 ? -28% | 33 ? -32% |
| Response Time Black / White * (ms) | 14 ? | 7.1 ? 49% | 34.8 ? -149% | 9.8 ? 30% | 21.6 ? -54% | 23 ? -64% |
| PWM Frequency (Hz) | ||||||
| Screen | 30% | 12% | 12% | 14% | -22% | |
| Brightness middle (cd/m²) | 254 | 415 63% | 262.5 3% | 354 39% | 281 11% | 269 6% |
| Brightness (cd/m²) | 244 | 409 68% | 260 7% | 331 36% | 257 5% | 250 2% |
| Brightness Distribution (%) | 89 | 91 2% | 85 -4% | 80 -10% | 82 -8% | 85 -4% |
| Black Level * (cd/m²) | 0.1587 | 0.32 -102% | 0.25 -58% | 0.41 -158% | 0.16 -1% | 0.67 -322% |
| Contrast (:1) | 1601 | 1297 -19% | 1050 -34% | 863 -46% | 1756 10% | 401 -75% |
| Colorchecker dE 2000 * | 7.42 | 1.92 74% | 3.34 55% | 2.4 68% | 4.7 37% | 3.81 49% |
| Colorchecker dE 2000 max. * | 19.74 | 5.71 71% | 7.72 61% | 6.4 68% | 18 9% | 7.34 63% |
| Colorchecker dE 2000 calibrated * | 5.72 | 0.58 90% | 0.91 84% | 1.4 76% | 3.7 35% | 3.91 32% |
| Greyscale dE 2000 * | 5 | 3.7 26% | 5.3 -6% | 3.2 36% | 3.6 28% | 2.46 51% |
| Gamma | 1.855 119% | 2.272 97% | 2.25 98% | 2.08 106% | 2.2 100% | 6451 0% |
| CCT | 6421 101% | 7132 91% | 7387 88% | 6786 96% | 7267 89% | 6451 101% |
| Całkowita średnia (program / ustawienia) | 48% /
41% | -17% /
4% | 40% /
28% | -5% /
6% | -20% /
-19% |
* ... im mniej tym lepiej
Wyświetlacz Ninkear A15 Plus charakteryzuje się niską emisją niebieskiego światła, ale w związku z tym ma lekko czerwony odcień po wyjęciu z pudełka. Średnie wartości ColorChecker DeltaE 2000 poprawiły się nieco po kalibracji za pomocą naszego spektrofotometru X-Rite i1Pro 3 i oprogramowania do kalibracji kolorów Calman Ultimate firmy Portrait Displays.
Wyświetl czasy reakcji
| ↔ Czas reakcji od czerni do bieli | ||
|---|---|---|
| 14 ms ... wzrost ↗ i spadek ↘ łącznie | ↗ 6.5 ms wzrost |  |
| ↘ 7.5 ms upadek | ||
| W naszych testach ekran wykazuje dobry współczynnik reakcji, ale może być zbyt wolny dla graczy rywalizujących ze sobą. Dla porównania, wszystkie testowane urządzenia wahają się od 0.1 (minimum) do 240 (maksimum) ms. » 34 % wszystkich urządzeń jest lepszych. Oznacza to, że zmierzony czas reakcji jest lepszy od średniej wszystkich testowanych urządzeń (19.8 ms). | ||
| ↔ Czas reakcji 50% szarości do 80% szarości | ||
| 25 ms ... wzrost ↗ i spadek ↘ łącznie | ↗ 15.5 ms wzrost |  |
| ↘ 9.5 ms upadek | ||
| W naszych testach ekran wykazuje stosunkowo powolne tempo reakcji i może być zbyt wolny dla graczy. Dla porównania, wszystkie testowane urządzenia wahają się od 0.165 (minimum) do 636 (maksimum) ms. » 35 % wszystkich urządzeń jest lepszych. Oznacza to, że zmierzony czas reakcji jest lepszy od średniej wszystkich testowanych urządzeń (31 ms). | ||
Migotanie ekranu / PWM (modulacja szerokości impulsu)
| Migotanie ekranu/nie wykryto PWM |  | ||
Dla porównania: 52 % wszystkich testowanych urządzeń nie używa PWM do przyciemniania wyświetlacza. Jeśli wykryto PWM, zmierzono średnio 7754 (minimum: 5 - maksimum: 343500) Hz. | |||
Dzięki matowej powierzchni wyświetlacza i dobremu kontrastowi laptop może być do pewnego stopnia używany na zewnątrz.
Wydajność: Nadaje się do codziennego użytku pomimo słabszego Ryzena 7
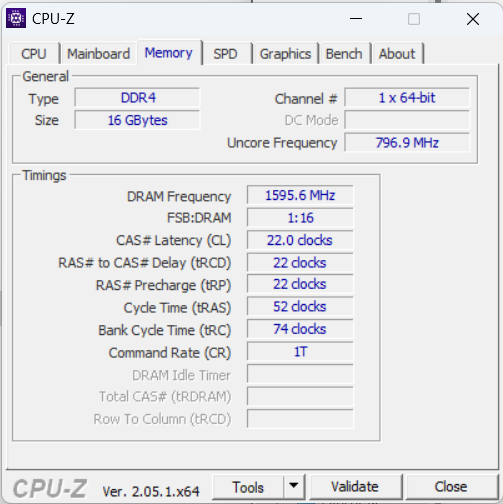
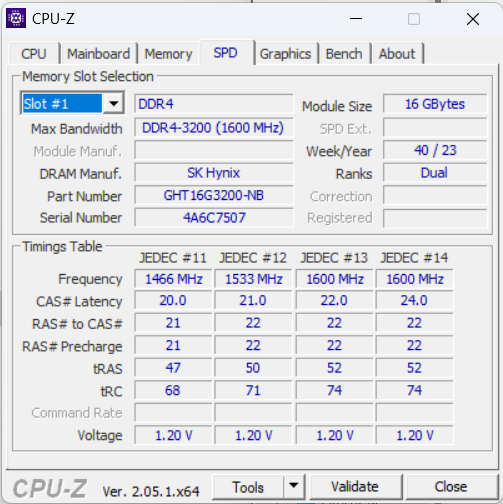
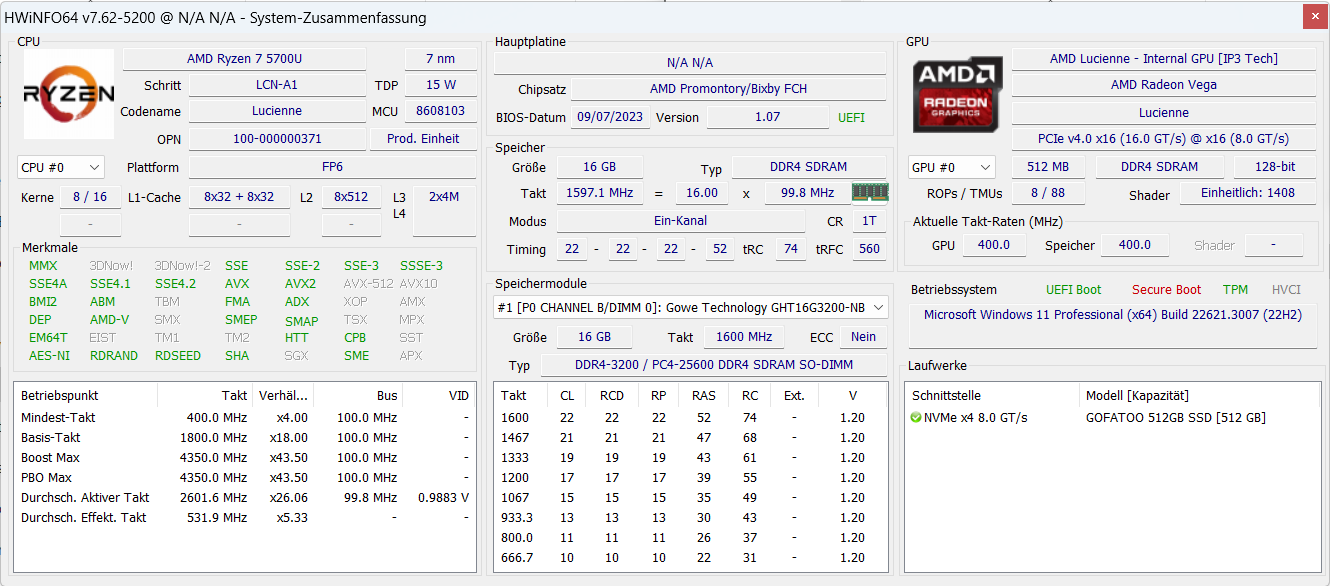
Procesor AMD Ryzen 7 5700U jest raczej starszym układem, ale dzięki 8 rdzeniom Zen 2 i 16 wątkom procesor ten może nadal oferować imponującą wydajność. Nasze urządzenie testowe jest również wyposażone w 16 GB pamięci RAM.
Ninkear A15 Plus jest również dostępny w konfiguracji z 32 GB pamięci RAM DDR 4. To jest podłączone. Urządzenie testowe ma jednak miejsce tylko na jeden moduł SO-DIMM. Jest to zatem konfiguracja jednokanałowa.
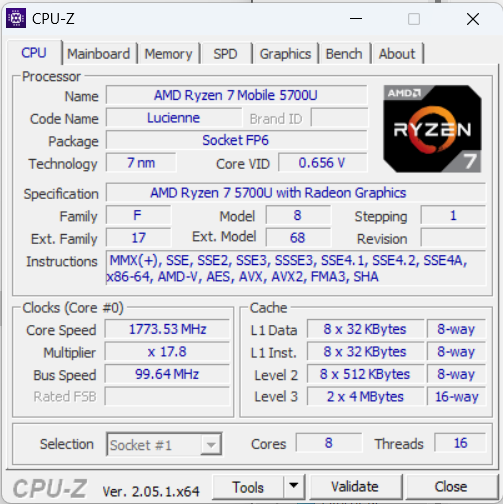
Warunki testu
Ninkear nie instaluje żadnego oprogramowania do kontroli wydajności, więc jedyną możliwą kontrolą wydajności są poziomy oferowane przez system Windows. Przetestowaliśmy laptopa w trybie "Najlepsza wydajność". Ryzen 7 5700U jest dostarczany z 30 W mocy doładowania i 15 W mocy ciągłej. Obie wartości są stosunkowo niskie w porównaniu. Jednak ze względu na niskie TDP, laptop może zazwyczaj pracować cicho lub bardzo cicho.
Procesor
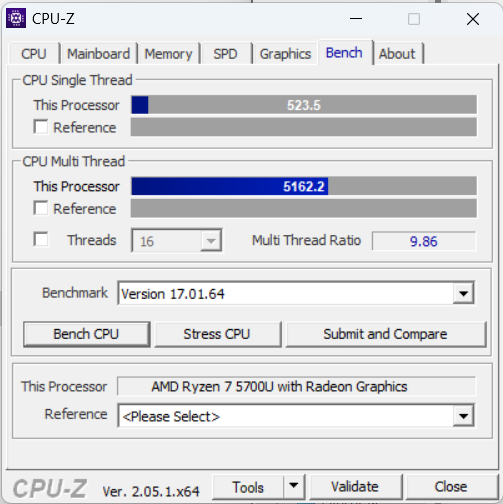
Laptopy w przedziale cenowym 500 euro są zazwyczaj wyposażone w procesor Intel Core i3 lub Ryzen 3. Niektóre są nawet wyposażone tylko w procesor Intel z serii N. Procesor Ryzen 7 5700U w Ninkear A15 Plus jest zatem znacznie mocniejszy, mimo że działa przy stosunkowo niskim TDP.
Z drugiej strony laptop pozostaje bardzo cichy, a wydajność procesora jest więcej niż wystarczająca do codziennego użytku z surfowaniem, strumieniowaniem i pracą biurową. Wydajność wielordzeniowa procesora AMD jest nadal bardzo istotna i może również konkurować z takimi procesorami jak Intel Core i7-1360Pchociaż pozostaje daleko w tyle za nowym Intel Core Ultra 7 155H.
Cinebench R15 Multi Loop test
Cinebench R23: Multi Core | Single Core
Cinebench R20: CPU (Multi Core) | CPU (Single Core)
Cinebench R15: CPU Multi 64Bit | CPU Single 64Bit
Blender: v2.79 BMW27 CPU
7-Zip 18.03: 7z b 4 | 7z b 4 -mmt1
Geekbench 6.7: Multi-Core | Single-Core
Geekbench 5.5: Multi-Core | Single-Core
HWBOT x265 Benchmark v2.2: 4k Preset
LibreOffice : 20 Documents To PDF
R Benchmark 2.5: Overall mean
| CPU Performance rating | |
| Asus ZenBook 14 UX3405MA | |
| Średnia w klasie Office | |
| Lenovo IdeaPad 5 Pro 16ARH7 -2! | |
| Eurocom C315 Blitz | |
| Schenker VIA 15 Pro M22 -2! | |
| Ninkear A15 Plus (16+512) | |
| Przeciętny AMD Ryzen 7 5700U | |
| HP 250 G9 7N029ES | |
| Asus P1511CEA-BQ753R -2! | |
| Cinebench R23 / Multi Core | |
| Asus ZenBook 14 UX3405MA | |
| Średnia w klasie Office (1673 - 22808, n=76, ostatnie 2 lata) | |
| Schenker VIA 15 Pro M22 | |
| Lenovo IdeaPad 5 Pro 16ARH7 | |
| Ninkear A15 Plus (16+512) | |
| Przeciętny AMD Ryzen 7 5700U (4861 - 10139, n=20) | |
| Eurocom C315 Blitz | |
| HP 250 G9 7N029ES | |
| Asus P1511CEA-BQ753R | |
| Cinebench R23 / Single Core | |
| Asus ZenBook 14 UX3405MA | |
| Średnia w klasie Office (708 - 2130, n=76, ostatnie 2 lata) | |
| Eurocom C315 Blitz | |
| Lenovo IdeaPad 5 Pro 16ARH7 | |
| HP 250 G9 7N029ES | |
| Asus P1511CEA-BQ753R | |
| Ninkear A15 Plus (16+512) | |
| Schenker VIA 15 Pro M22 | |
| Przeciętny AMD Ryzen 7 5700U (1177 - 1268, n=20) | |
| Cinebench R20 / CPU (Multi Core) | |
| Asus ZenBook 14 UX3405MA | |
| Średnia w klasie Office (648 - 8840, n=75, ostatnie 2 lata) | |
| Lenovo IdeaPad 5 Pro 16ARH7 | |
| Schenker VIA 15 Pro M22 | |
| Ninkear A15 Plus (16+512) | |
| Przeciętny AMD Ryzen 7 5700U (1887 - 3877, n=21) | |
| Eurocom C315 Blitz | |
| HP 250 G9 7N029ES | |
| Asus P1511CEA-BQ753R | |
| Cinebench R20 / CPU (Single Core) | |
| Asus ZenBook 14 UX3405MA | |
| Średnia w klasie Office (345 - 816, n=75, ostatnie 2 lata) | |
| Eurocom C315 Blitz | |
| Lenovo IdeaPad 5 Pro 16ARH7 | |
| HP 250 G9 7N029ES | |
| Asus P1511CEA-BQ753R | |
| Ninkear A15 Plus (16+512) | |
| Schenker VIA 15 Pro M22 | |
| Przeciętny AMD Ryzen 7 5700U (471 - 495, n=21) | |
| Cinebench R15 / CPU Multi 64Bit | |
| Asus ZenBook 14 UX3405MA | |
| Średnia w klasie Office (250 - 3380, n=77, ostatnie 2 lata) | |
| Schenker VIA 15 Pro M22 | |
| Lenovo IdeaPad 5 Pro 16ARH7 | |
| Ninkear A15 Plus (16+512) | |
| Przeciętny AMD Ryzen 7 5700U (856 - 1691, n=20) | |
| Eurocom C315 Blitz | |
| HP 250 G9 7N029ES | |
| Asus P1511CEA-BQ753R | |
| Cinebench R15 / CPU Single 64Bit | |
| Asus ZenBook 14 UX3405MA | |
| Średnia w klasie Office (99.5 - 316, n=77, ostatnie 2 lata) | |
| Lenovo IdeaPad 5 Pro 16ARH7 | |
| Eurocom C315 Blitz | |
| HP 250 G9 7N029ES | |
| Ninkear A15 Plus (16+512) | |
| Schenker VIA 15 Pro M22 | |
| Asus P1511CEA-BQ753R | |
| Przeciętny AMD Ryzen 7 5700U (181 - 190, n=19) | |
| Blender / v2.79 BMW27 CPU | |
| Asus P1511CEA-BQ753R | |
| HP 250 G9 7N029ES | |
| Eurocom C315 Blitz | |
| Ninkear A15 Plus (16+512) | |
| Przeciętny AMD Ryzen 7 5700U (292 - 557, n=20) | |
| Średnia w klasie Office (158 - 1940, n=76, ostatnie 2 lata) | |
| Lenovo IdeaPad 5 Pro 16ARH7 | |
| Schenker VIA 15 Pro M22 | |
| Asus ZenBook 14 UX3405MA | |
| 7-Zip 18.03 / 7z b 4 | |
| Asus ZenBook 14 UX3405MA | |
| Schenker VIA 15 Pro M22 | |
| Lenovo IdeaPad 5 Pro 16ARH7 | |
| Średnia w klasie Office (7098 - 76886, n=77, ostatnie 2 lata) | |
| Przeciętny AMD Ryzen 7 5700U (29095 - 47501, n=20) | |
| Ninkear A15 Plus (16+512) | |
| Eurocom C315 Blitz | |
| HP 250 G9 7N029ES | |
| Asus P1511CEA-BQ753R | |
| 7-Zip 18.03 / 7z b 4 -mmt1 | |
| Eurocom C315 Blitz | |
| Asus ZenBook 14 UX3405MA | |
| Średnia w klasie Office (3387 - 6469, n=77, ostatnie 2 lata) | |
| Lenovo IdeaPad 5 Pro 16ARH7 | |
| HP 250 G9 7N029ES | |
| Ninkear A15 Plus (16+512) | |
| Schenker VIA 15 Pro M22 | |
| Przeciętny AMD Ryzen 7 5700U (4402 - 4620, n=20) | |
| Asus P1511CEA-BQ753R | |
| Geekbench 6.7 / Multi-Core | |
| Asus ZenBook 14 UX3405MA | |
| Eurocom C315 Blitz | |
| Średnia w klasie Office (757 - 17846, n=82, ostatnie 2 lata) | |
| Ninkear A15 Plus (16+512) | |
| Ninkear A15 Plus (16+512) | |
| Przeciętny AMD Ryzen 7 5700U (4983 - 6260, n=5) | |
| HP 250 G9 7N029ES | |
| Geekbench 6.7 / Single-Core | |
| Eurocom C315 Blitz | |
| Asus ZenBook 14 UX3405MA | |
| Średnia w klasie Office (462 - 2988, n=83, ostatnie 2 lata) | |
| HP 250 G9 7N029ES | |
| Ninkear A15 Plus (16+512) | |
| Ninkear A15 Plus (16+512) | |
| Przeciętny AMD Ryzen 7 5700U (1550 - 1625, n=5) | |
| Geekbench 5.5 / Multi-Core | |
| Asus ZenBook 14 UX3405MA | |
| Średnia w klasie Office (1483 - 16999, n=73, ostatnie 2 lata) | |
| Schenker VIA 15 Pro M22 | |
| Eurocom C315 Blitz | |
| Lenovo IdeaPad 5 Pro 16ARH7 | |
| Przeciętny AMD Ryzen 7 5700U (4254 - 7635, n=19) | |
| Ninkear A15 Plus (16+512) | |
| HP 250 G9 7N029ES | |
| Asus P1511CEA-BQ753R | |
| Geekbench 5.5 / Single-Core | |
| Eurocom C315 Blitz | |
| Średnia w klasie Office (811 - 2175, n=73, ostatnie 2 lata) | |
| Asus ZenBook 14 UX3405MA | |
| HP 250 G9 7N029ES | |
| Lenovo IdeaPad 5 Pro 16ARH7 | |
| Asus P1511CEA-BQ753R | |
| Schenker VIA 15 Pro M22 | |
| Ninkear A15 Plus (16+512) | |
| Przeciętny AMD Ryzen 7 5700U (1105 - 1205, n=19) | |
| HWBOT x265 Benchmark v2.2 / 4k Preset | |
| Asus ZenBook 14 UX3405MA | |
| Średnia w klasie Office (2.21 - 26, n=76, ostatnie 2 lata) | |
| Schenker VIA 15 Pro M22 | |
| Lenovo IdeaPad 5 Pro 16ARH7 | |
| Przeciętny AMD Ryzen 7 5700U (6.08 - 12.1, n=20) | |
| Ninkear A15 Plus (16+512) | |
| Eurocom C315 Blitz | |
| HP 250 G9 7N029ES | |
| Asus P1511CEA-BQ753R | |
| LibreOffice / 20 Documents To PDF | |
| Ninkear A15 Plus (16+512) | |
| Lenovo IdeaPad 5 Pro 16ARH7 | |
| Schenker VIA 15 Pro M22 | |
| Przeciętny AMD Ryzen 7 5700U (52.4 - 75.5, n=20) | |
| Asus P1511CEA-BQ753R | |
| Średnia w klasie Office (39.9 - 102.3, n=76, ostatnie 2 lata) | |
| HP 250 G9 7N029ES | |
| Asus ZenBook 14 UX3405MA | |
| Eurocom C315 Blitz | |
| R Benchmark 2.5 / Overall mean | |
| Asus P1511CEA-BQ753R | |
| Ninkear A15 Plus (16+512) | |
| Przeciętny AMD Ryzen 7 5700U (0.567 - 0.641, n=20) | |
| Schenker VIA 15 Pro M22 | |
| HP 250 G9 7N029ES | |
| Lenovo IdeaPad 5 Pro 16ARH7 | |
| Średnia w klasie Office (0.393 - 0.888, n=76, ostatnie 2 lata) | |
| Asus ZenBook 14 UX3405MA | |
| Eurocom C315 Blitz | |
* ... im mniej tym lepiej
AIDA64: FP32 Ray-Trace | FPU Julia | CPU SHA3 | CPU Queen | FPU SinJulia | FPU Mandel | CPU AES | CPU ZLib | FP64 Ray-Trace | CPU PhotoWorxx
| Performance rating | |
| Schenker VIA 15 Pro M22 | |
| Średnia w klasie Office | |
| Lenovo IdeaPad 5 Pro 16ARH7 | |
| Ninkear A15 Plus (16+512) | |
| Przeciętny AMD Ryzen 7 5700U | |
| Eurocom C315 Blitz | |
| HP 250 G9 7N029ES | |
| Asus P1511CEA-BQ753R | |
| AIDA64 / FP32 Ray-Trace | |
| Średnia w klasie Office (2083 - 31245, n=83, ostatnie 2 lata) | |
| Schenker VIA 15 Pro M22 | |
| Lenovo IdeaPad 5 Pro 16ARH7 | |
| Ninkear A15 Plus (16+512) | |
| Przeciętny AMD Ryzen 7 5700U (5679 - 12346, n=20) | |
| Eurocom C315 Blitz | |
| HP 250 G9 7N029ES | |
| Asus P1511CEA-BQ753R | |
| AIDA64 / FPU Julia | |
| Lenovo IdeaPad 5 Pro 16ARH7 | |
| Schenker VIA 15 Pro M22 | |
| Średnia w klasie Office (8191 - 125394, n=83, ostatnie 2 lata) | |
| Przeciętny AMD Ryzen 7 5700U (39042 - 69580, n=20) | |
| Ninkear A15 Plus (16+512) | |
| Eurocom C315 Blitz | |
| HP 250 G9 7N029ES | |
| Asus P1511CEA-BQ753R | |
| AIDA64 / CPU SHA3 | |
| Średnia w klasie Office (433 - 5755, n=83, ostatnie 2 lata) | |
| Lenovo IdeaPad 5 Pro 16ARH7 | |
| Schenker VIA 15 Pro M22 | |
| Ninkear A15 Plus (16+512) | |
| Przeciętny AMD Ryzen 7 5700U (1103 - 2231, n=20) | |
| Eurocom C315 Blitz | |
| Asus P1511CEA-BQ753R | |
| HP 250 G9 7N029ES | |
| AIDA64 / CPU Queen | |
| Ninkear A15 Plus (16+512) | |
| Schenker VIA 15 Pro M22 | |
| Przeciętny AMD Ryzen 7 5700U (57016 - 99178, n=20) | |
| Eurocom C315 Blitz | |
| Lenovo IdeaPad 5 Pro 16ARH7 | |
| Średnia w klasie Office (22784 - 115197, n=67, ostatnie 2 lata) | |
| HP 250 G9 7N029ES | |
| Asus P1511CEA-BQ753R | |
| AIDA64 / FPU SinJulia | |
| Schenker VIA 15 Pro M22 | |
| Ninkear A15 Plus (16+512) | |
| Przeciętny AMD Ryzen 7 5700U (6837 - 14169, n=20) | |
| Lenovo IdeaPad 5 Pro 16ARH7 | |
| Średnia w klasie Office (1378 - 18321, n=83, ostatnie 2 lata) | |
| Eurocom C315 Blitz | |
| HP 250 G9 7N029ES | |
| Asus P1511CEA-BQ753R | |
| AIDA64 / FPU Mandel | |
| Lenovo IdeaPad 5 Pro 16ARH7 | |
| Schenker VIA 15 Pro M22 | |
| Średnia w klasie Office (4601 - 66922, n=83, ostatnie 2 lata) | |
| Przeciętny AMD Ryzen 7 5700U (20179 - 36523, n=20) | |
| Ninkear A15 Plus (16+512) | |
| Eurocom C315 Blitz | |
| HP 250 G9 7N029ES | |
| Asus P1511CEA-BQ753R | |
| AIDA64 / CPU AES | |
| Ninkear A15 Plus (16+512) | |
| Przeciętny AMD Ryzen 7 5700U (26066 - 64646, n=20) | |
| Średnia w klasie Office (4854 - 155900, n=83, ostatnie 2 lata) | |
| Schenker VIA 15 Pro M22 | |
| Lenovo IdeaPad 5 Pro 16ARH7 | |
| Asus P1511CEA-BQ753R | |
| Eurocom C315 Blitz | |
| HP 250 G9 7N029ES | |
| AIDA64 / CPU ZLib | |
| Schenker VIA 15 Pro M22 | |
| Średnia w klasie Office (114.6 - 1366, n=83, ostatnie 2 lata) | |
| Przeciętny AMD Ryzen 7 5700U (440 - 776, n=20) | |
| Lenovo IdeaPad 5 Pro 16ARH7 | |
| Ninkear A15 Plus (16+512) | |
| Eurocom C315 Blitz | |
| HP 250 G9 7N029ES | |
| Asus P1511CEA-BQ753R | |
| AIDA64 / FP64 Ray-Trace | |
| Średnia w klasie Office (1109 - 17834, n=83, ostatnie 2 lata) | |
| Schenker VIA 15 Pro M22 | |
| Lenovo IdeaPad 5 Pro 16ARH7 | |
| Ninkear A15 Plus (16+512) | |
| Przeciętny AMD Ryzen 7 5700U (2985 - 6784, n=20) | |
| Eurocom C315 Blitz | |
| HP 250 G9 7N029ES | |
| Asus P1511CEA-BQ753R | |
| AIDA64 / CPU PhotoWorxx | |
| Średnia w klasie Office (11090 - 65229, n=83, ostatnie 2 lata) | |
| Eurocom C315 Blitz | |
| Lenovo IdeaPad 5 Pro 16ARH7 | |
| Schenker VIA 15 Pro M22 | |
| Asus P1511CEA-BQ753R | |
| Przeciętny AMD Ryzen 7 5700U (6903 - 25066, n=20) | |
| HP 250 G9 7N029ES | |
| Ninkear A15 Plus (16+512) | |
Wydajność systemu
Wydajność systemu Ninkear A15 Plus jest wystarczająca w codziennym użytkowaniu. Surfowanie, streaming i Office działają płynnie.
W testach porównawczych z PCMark, CrossMark i WebXPRT 4, nasze urządzenie testowe jest tylko tuż za konkurentami z Core i7 lub Ryzen 7.
CrossMark: Overall | Productivity | Creativity | Responsiveness
WebXPRT 4: Overall
| PCMark 10 / Score | |
| Średnia w klasie Office (2601 - 9298, n=68, ostatnie 2 lata) | |
| Asus ZenBook 14 UX3405MA | |
| Lenovo IdeaPad 5 Pro 16ARH7 | |
| Eurocom C315 Blitz | |
| Przeciętny AMD Ryzen 7 5700U, AMD Radeon RX Vega 8 (Ryzen 4000/5000) (4325 - 5518, n=15) | |
| Schenker VIA 15 Pro M22 | |
| Ninkear A15 Plus (16+512) | |
| HP 250 G9 7N029ES | |
| Asus P1511CEA-BQ753R | |
| PCMark 10 / Essentials | |
| Asus ZenBook 14 UX3405MA | |
| Eurocom C315 Blitz | |
| Lenovo IdeaPad 5 Pro 16ARH7 | |
| Średnia w klasie Office (3245 - 11594, n=68, ostatnie 2 lata) | |
| HP 250 G9 7N029ES | |
| Przeciętny AMD Ryzen 7 5700U, AMD Radeon RX Vega 8 (Ryzen 4000/5000) (8025 - 10091, n=15) | |
| Schenker VIA 15 Pro M22 | |
| Ninkear A15 Plus (16+512) | |
| Asus P1511CEA-BQ753R | |
| PCMark 10 / Productivity | |
| Średnia w klasie Office (5336 - 17243, n=68, ostatnie 2 lata) | |
| Asus ZenBook 14 UX3405MA | |
| Lenovo IdeaPad 5 Pro 16ARH7 | |
| Przeciętny AMD Ryzen 7 5700U, AMD Radeon RX Vega 8 (Ryzen 4000/5000) (7001 - 8457, n=15) | |
| Ninkear A15 Plus (16+512) | |
| Schenker VIA 15 Pro M22 | |
| Eurocom C315 Blitz | |
| Asus P1511CEA-BQ753R | |
| HP 250 G9 7N029ES | |
| PCMark 10 / Digital Content Creation | |
| Średnia w klasie Office (2049 - 13541, n=68, ostatnie 2 lata) | |
| Asus ZenBook 14 UX3405MA | |
| Lenovo IdeaPad 5 Pro 16ARH7 | |
| Schenker VIA 15 Pro M22 | |
| Eurocom C315 Blitz | |
| Przeciętny AMD Ryzen 7 5700U, AMD Radeon RX Vega 8 (Ryzen 4000/5000) (3738 - 5964, n=15) | |
| Ninkear A15 Plus (16+512) | |
| HP 250 G9 7N029ES | |
| Asus P1511CEA-BQ753R | |
| CrossMark / Overall | |
| Eurocom C315 Blitz | |
| Asus ZenBook 14 UX3405MA | |
| Średnia w klasie Office (381 - 2010, n=75, ostatnie 2 lata) | |
| HP 250 G9 7N029ES | |
| Schenker VIA 15 Pro M22 | |
| Ninkear A15 Plus (16+512) | |
| Asus P1511CEA-BQ753R | |
| Przeciętny AMD Ryzen 7 5700U, AMD Radeon RX Vega 8 (Ryzen 4000/5000) (866 - 1183, n=8) | |
| CrossMark / Productivity | |
| Eurocom C315 Blitz | |
| Asus ZenBook 14 UX3405MA | |
| Średnia w klasie Office (464 - 1880, n=75, ostatnie 2 lata) | |
| HP 250 G9 7N029ES | |
| Asus P1511CEA-BQ753R | |
| Schenker VIA 15 Pro M22 | |
| Ninkear A15 Plus (16+512) | |
| Przeciętny AMD Ryzen 7 5700U, AMD Radeon RX Vega 8 (Ryzen 4000/5000) (931 - 1191, n=8) | |
| CrossMark / Creativity | |
| Eurocom C315 Blitz | |
| Asus ZenBook 14 UX3405MA | |
| Średnia w klasie Office (319 - 2361, n=75, ostatnie 2 lata) | |
| Schenker VIA 15 Pro M22 | |
| HP 250 G9 7N029ES | |
| Ninkear A15 Plus (16+512) | |
| Przeciętny AMD Ryzen 7 5700U, AMD Radeon RX Vega 8 (Ryzen 4000/5000) (907 - 1197, n=8) | |
| Asus P1511CEA-BQ753R | |
| CrossMark / Responsiveness | |
| Eurocom C315 Blitz | |
| Średnia w klasie Office (360 - 1820, n=75, ostatnie 2 lata) | |
| Asus ZenBook 14 UX3405MA | |
| Asus P1511CEA-BQ753R | |
| Schenker VIA 15 Pro M22 | |
| HP 250 G9 7N029ES | |
| Ninkear A15 Plus (16+512) | |
| Przeciętny AMD Ryzen 7 5700U, AMD Radeon RX Vega 8 (Ryzen 4000/5000) (605 - 1159, n=8) | |
| WebXPRT 4 / Overall | |
| HP 250 G9 7N029ES | |
| Asus ZenBook 14 UX3405MA | |
| Średnia w klasie Office (104.2 - 313, n=77, ostatnie 2 lata) | |
| Ninkear A15 Plus (16+512) | |
| Przeciętny AMD Ryzen 7 5700U, AMD Radeon RX Vega 8 (Ryzen 4000/5000) (158.5 - 225, n=5) | |
| Schenker VIA 15 Pro M22 | |
| Asus P1511CEA-BQ753R | |
| PCMark 10 Score | 4953 pkt. | |
Pomoc | ||
| AIDA64 / Memory Copy | |
| Eurocom C315 Blitz | |
| Średnia w klasie Office (20075 - 110930, n=80, ostatnie 2 lata) | |
| Lenovo IdeaPad 5 Pro 16ARH7 | |
| Schenker VIA 15 Pro M22 | |
| Asus P1511CEA-BQ753R | |
| Przeciętny AMD Ryzen 7 5700U (15867 - 39326, n=20) | |
| HP 250 G9 7N029ES | |
| Ninkear A15 Plus (16+512) | |
| AIDA64 / Memory Read | |
| Średnia w klasie Office (10084 - 128030, n=81, ostatnie 2 lata) | |
| Eurocom C315 Blitz | |
| Schenker VIA 15 Pro M22 | |
| Lenovo IdeaPad 5 Pro 16ARH7 | |
| Przeciętny AMD Ryzen 7 5700U (17632 - 47190, n=20) | |
| Asus P1511CEA-BQ753R | |
| Ninkear A15 Plus (16+512) | |
| HP 250 G9 7N029ES | |
| AIDA64 / Memory Write | |
| Lenovo IdeaPad 5 Pro 16ARH7 | |
| Eurocom C315 Blitz | |
| Średnia w klasie Office (20073 - 119858, n=81, ostatnie 2 lata) | |
| Schenker VIA 15 Pro M22 | |
| Asus P1511CEA-BQ753R | |
| Przeciętny AMD Ryzen 7 5700U (11554 - 47048, n=20) | |
| Ninkear A15 Plus (16+512) | |
| HP 250 G9 7N029ES | |
| AIDA64 / Memory Latency | |
| Lenovo IdeaPad 5 Pro 16ARH7 | |
| Średnia w klasie Office (7.6 - 162.9, n=76, ostatnie 2 lata) | |
| Schenker VIA 15 Pro M22 | |
| Przeciętny AMD Ryzen 7 5700U (84.9 - 113, n=20) | |
| Ninkear A15 Plus (16+512) | |
| Asus P1511CEA-BQ753R | |
| Eurocom C315 Blitz | |
| HP 250 G9 7N029ES | |
* ... im mniej tym lepiej
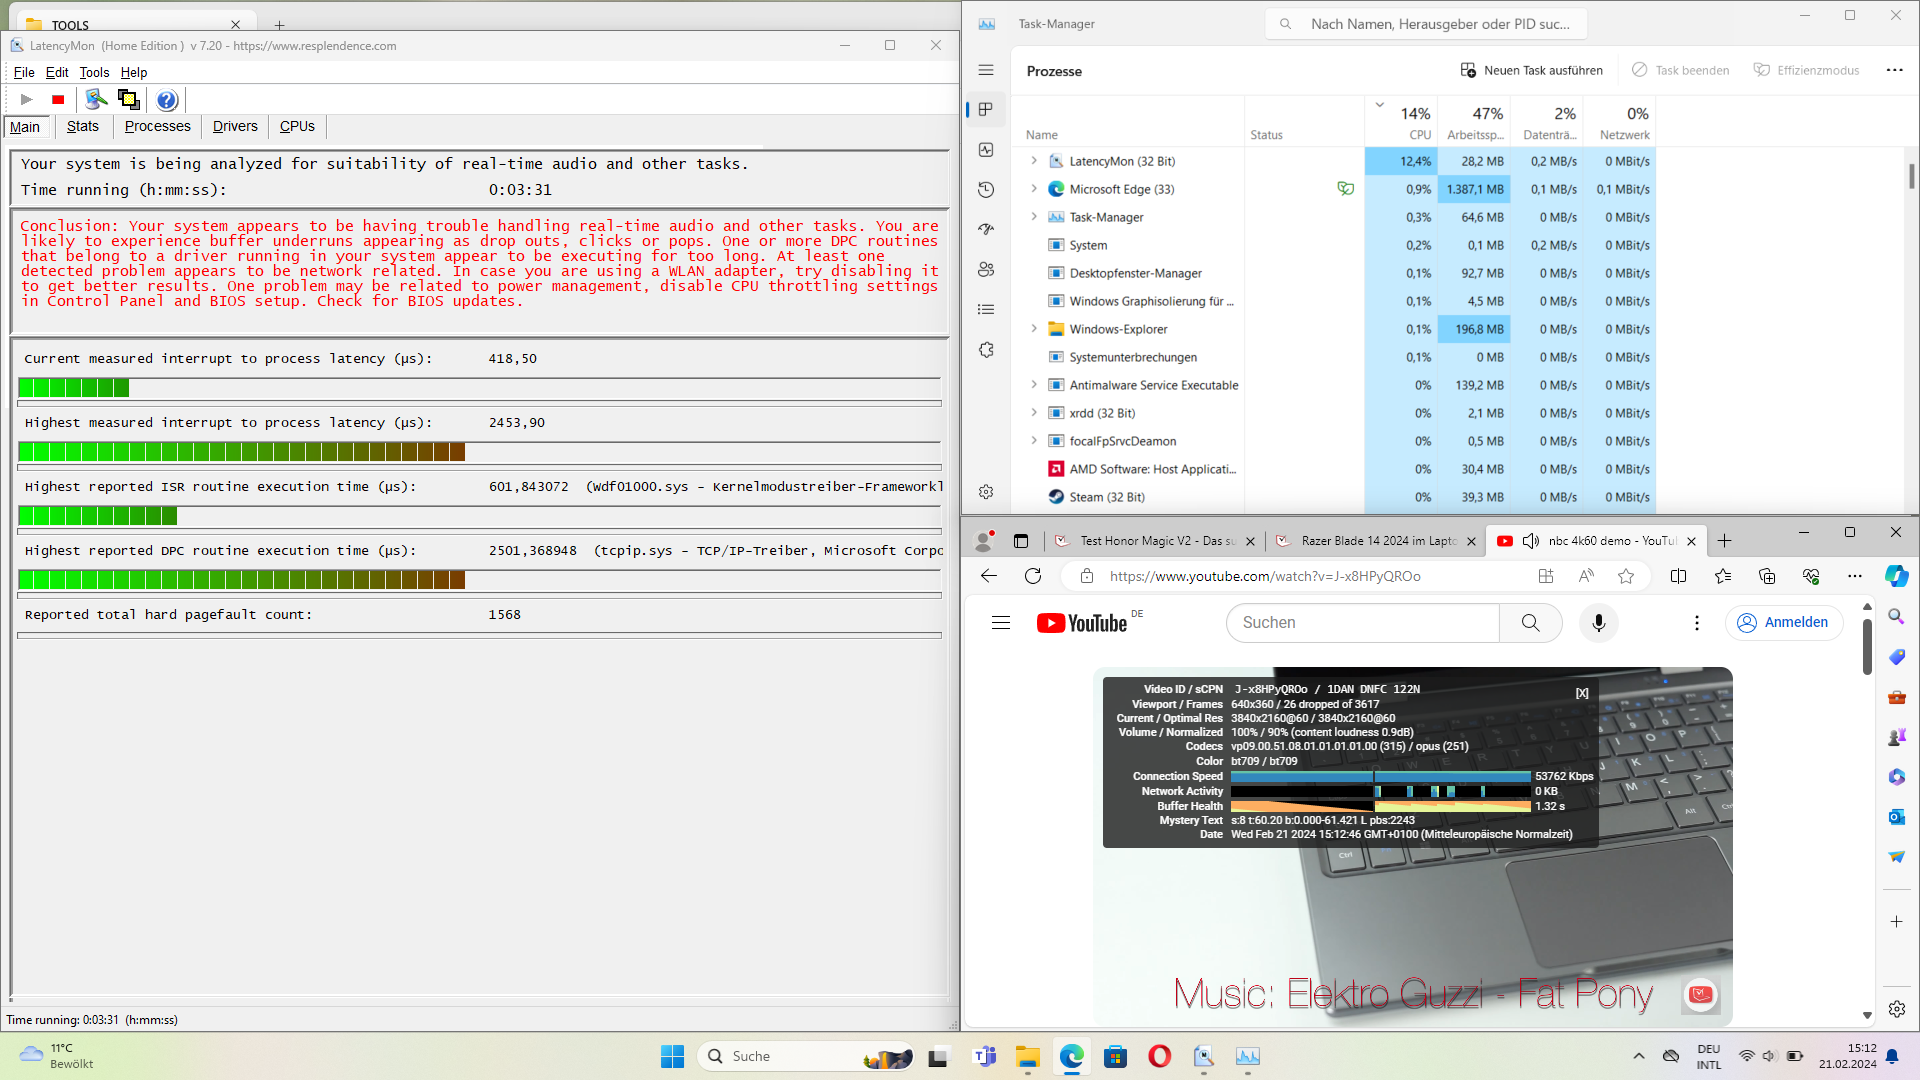
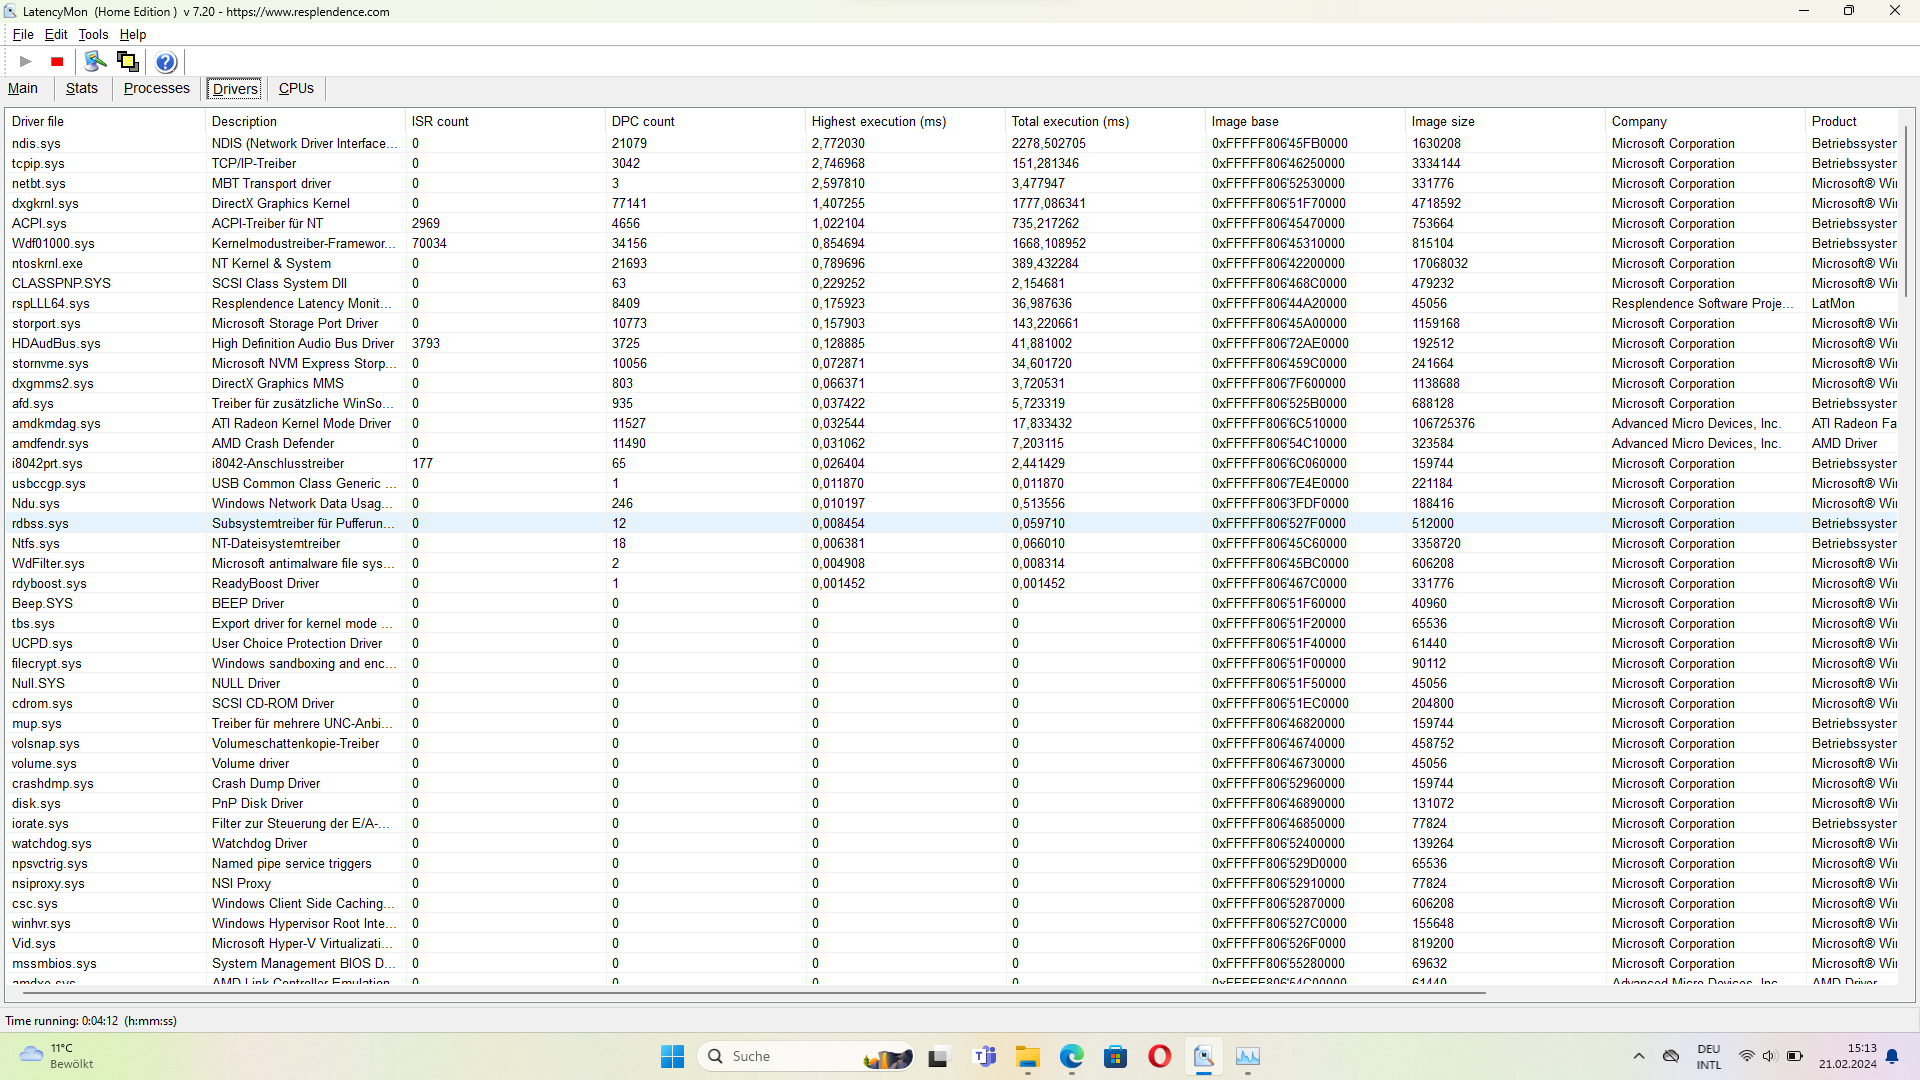
Opóźnienie DPC
Opóźnienie DPC jest dość wysokie i wynosi 2 453 µs w konfiguracji sterownika dostępnej w czasie testów. LatencyMon ocenia zatem, że laptop nie nadaje się do aplikacji czasu rzeczywistego.
| DPC Latencies / LatencyMon - interrupt to process latency (max), Web, Youtube, Prime95 | |
| Ninkear A15 Plus (16+512) | |
| Schenker VIA 15 Pro M22 | |
| HP 250 G9 7N029ES | |
| Asus P1511CEA-BQ753R | |
| Eurocom C315 Blitz | |
| Lenovo IdeaPad 5 Pro 16ARH7 | |
* ... im mniej tym lepiej
Urządzenia pamięci masowej
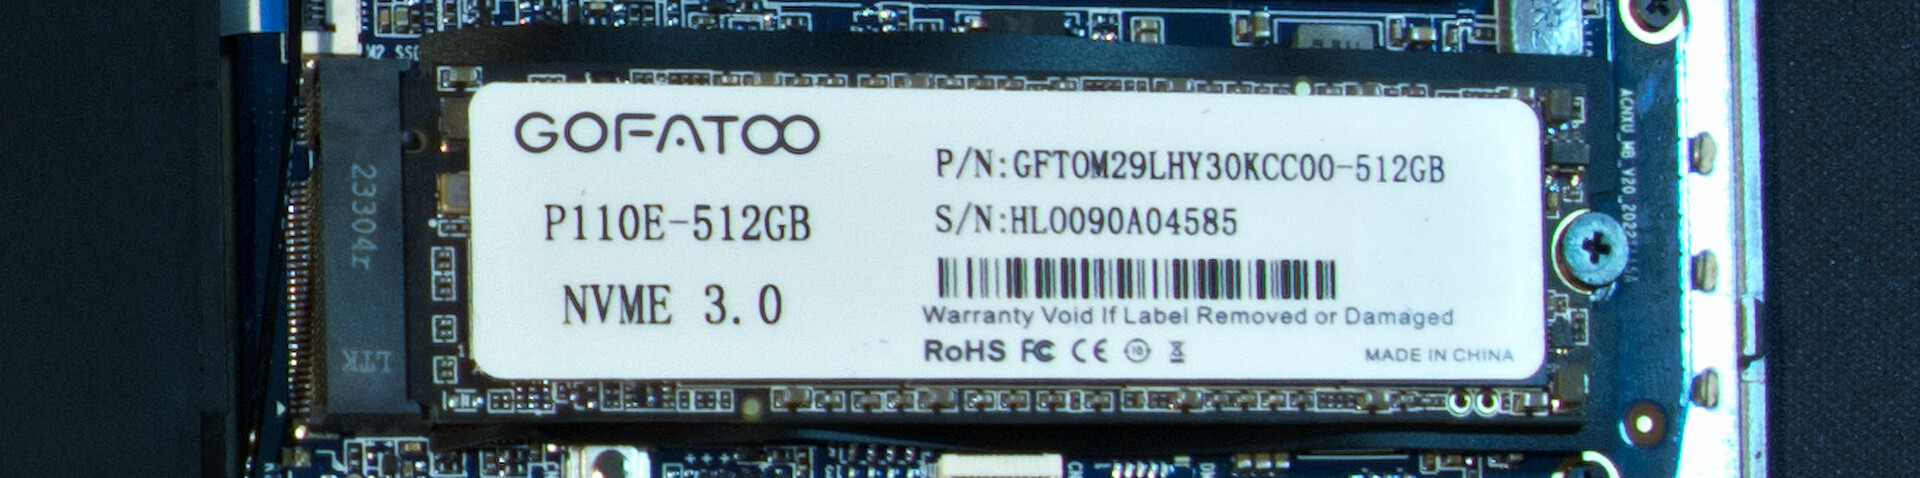
Dysk SSD NVMe od Gofatoo zainstalowany w urządzeniu testowym jest podłączony za pośrednictwem interfejsu PCI Gen 3.0. Ma on odpowiednie prędkości transferu danych, ale są one więcej niż wystarczające dla laptopa biurowego.
Pod względem prędkości odczytu, dysk SSD jest mniej więcej na równi z Samsung SSD 970 EVO Plus, który można znaleźć między innymi w Schenker Via 15 Pro.

* ... im mniej tym lepiej
Disk throttling: DiskSpd Read Loop, Queue Depth 8
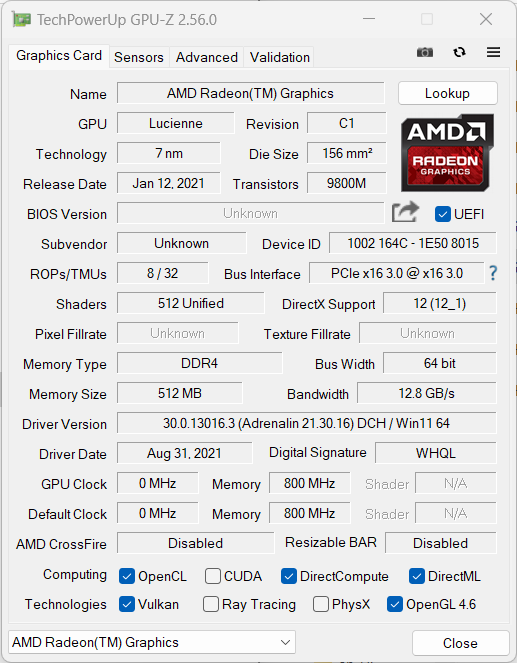
Karta graficzna
W smukłym Ninkear A15 Plus nie ma dGPU, więc iGPU z AMD Ryzen 7 5700U musi obsługiwać wszystkie zadania graficzne. Niestety, Vega 8 może zrobić tylko tyle z jednokanałową pamięcią RAM i niskim TDP. W rezultacie wydajność iGPU, która w innym przypadku byłaby użyteczna, odpowiednio spada.
Dla porównania, Ninkear A15 jest znacznie mocniejszy od swoich konkurentów z procesorami i3, ale nasze urządzenie testowe nie zbliżyło się do średniej wydajności RX Vega 8. Schenker VIA 15 Pro wypada znacznie lepiej we wszystkich benchmarkach wydajności graficznej.
Wydajność w testowanych grach jest również odpowiednio słaba. Na laptopie można trochę pograć, ale obecne tytuły AAA są bardziej narażone na frustrację.
| 3DMark 11 Performance | 4600 pkt. | |
| 3DMark Cloud Gate Standard Score | 16817 pkt. | |
| 3DMark Fire Strike Score | 2378 pkt. | |
| 3DMark Time Spy Score | 1009 pkt. | |
Pomoc | ||
| Performance rating - Percent | |
| Średnia w klasie Office | |
| Lenovo IdeaPad 5 Pro 16ARH7 | |
| Schenker VIA 15 Pro M22 | |
| Eurocom C315 Blitz | |
| Ninkear A15 Plus (16+512) | |
| The Witcher 3 - 1920x1080 Ultra Graphics & Postprocessing (HBAO+) | |
| Średnia w klasie Office (14.8 - 28.1, n=3, ostatnie 2 lata) | |
| Lenovo IdeaPad 5 Pro 16ARH7 | |
| Schenker VIA 15 Pro M22 | |
| Eurocom C315 Blitz | |
| Ninkear A15 Plus (16+512) | |
| GTA V - 1920x1080 Highest AA:4xMSAA + FX AF:16x | |
| Średnia w klasie Office (5.77 - 45.3, n=69, ostatnie 2 lata) | |
| Lenovo IdeaPad 5 Pro 16ARH7 | |
| Schenker VIA 15 Pro M22 | |
| Eurocom C315 Blitz | |
| Ninkear A15 Plus (16+512) | |
| Final Fantasy XV Benchmark - 1920x1080 High Quality | |
| Średnia w klasie Office (8.09 - 79.5, n=71, ostatnie 2 lata) | |
| Lenovo IdeaPad 5 Pro 16ARH7 | |
| Eurocom C315 Blitz | |
| Schenker VIA 15 Pro M22 | |
| Ninkear A15 Plus (16+512) | |
| Strange Brigade - 1920x1080 ultra AA:ultra AF:16 | |
| Średnia w klasie Office (12.9 - 142.1, n=53, ostatnie 2 lata) | |
| Lenovo IdeaPad 5 Pro 16ARH7 | |
| Schenker VIA 15 Pro M22 | |
| Eurocom C315 Blitz | |
| Ninkear A15 Plus (16+512) | |
| Dota 2 Reborn - 1920x1080 ultra (3/3) best looking | |
| Średnia w klasie Office (14.6 - 135, n=77, ostatnie 2 lata) | |
| Lenovo IdeaPad 5 Pro 16ARH7 | |
| Schenker VIA 15 Pro M22 | |
| Eurocom C315 Blitz | |
| Ninkear A15 Plus (16+512) | |
| X-Plane 11.11 - 1920x1080 high (fps_test=3) | |
| Lenovo IdeaPad 5 Pro 16ARH7 | |
| Średnia w klasie Office (12 - 82.4, n=69, ostatnie 2 lata) | |
| Eurocom C315 Blitz | |
| Schenker VIA 15 Pro M22 | |
| Ninkear A15 Plus (16+512) | |
| low | med. | high | ultra | QHD | |
|---|---|---|---|---|---|
| GTA V (2015) | 65.3 | 58.3 | 16.9 | 7.71 | |
| The Witcher 3 (2015) | 10.3 | ||||
| Dota 2 Reborn (2015) | 89.9 | 68 | 36.5 | 35.5 | |
| Final Fantasy XV Benchmark (2018) | 13 | 8.72 | 6.33 | ||
| X-Plane 11.11 (2018) | 36.5 | 28.6 | 26.3 | ||
| Far Cry 5 (2018) | 28 | 14 | 13 | 12 | |
| Strange Brigade (2018) | 48.3 | 19.4 | 16.4 | 14.3 | |
| F1 23 (2023) | 23.4 | 20.9 | 15.8 | 11.5 | |
| Cyberpunk 2077 (2023) | 11 | 5.71 |
Emisje i energia - Oszczędność energii i cicha praca
Emisja hałasu
Dzięki niskiemu zużyciu energii przez procesor, wentylator w Ninkear nie musi również rozpraszać dużo ciepła. Przy maksymalnym poziomie 35 dB(A) laptop pozostaje znacznie cichszy niż jego konkurenci.
Hałas
| luz |
| 24.78 / 27.6 / 26.5 dB |
| obciążenie |
| 34.38 / 34.58 dB |
 | ||
30 dB cichy 40 dB(A) słyszalny 50 dB(A) irytujący |
||
min: | ||
| Ninkear A15 Plus (16+512) Vega 8, R7 5700U, GOFATOO P110E-512GB | Lenovo IdeaPad 5 Pro 16ARH7 Radeon 660M, R5 6600HS, Samsung PM9A1 MZVL2512HCJQ | Eurocom C315 Blitz Iris Xe G7 96EUs, i7-1360P, Samsung 990 Pro 1 TB | Schenker VIA 15 Pro M22 Vega 8, R7 5700U, Samsung SSD 970 EVO Plus 1TB | HP 250 G9 7N029ES UHD Graphics 64EUs, i3-1215U, SK hynix HFS512GEJ9X125N | Asus P1511CEA-BQ753R UHD Graphics Xe G4 48EUs, i3-1115G4, Kingston OM8PDP3256B | |
|---|---|---|---|---|---|---|
| Noise | -5% | -11% | -1% | -9% | -14% | |
| wyłączone / środowisko * (dB) | 24.78 | 25 -1% | 22.5 9% | 24 3% | 24.3 2% | 26 -5% |
| Idle Minimum * (dB) | 24.78 | 25 -1% | 25.1 -1% | 24 3% | 24.3 2% | 26 -5% |
| Idle Average * (dB) | 27.6 | 26 6% | 25.1 9% | 24 13% | 24.3 12% | 29.5 -7% |
| Idle Maximum * (dB) | 26.5 | 28 -6% | 34.9 -32% | 27.5 -4% | 28.2 -6% | 29.5 -11% |
| Load Average * (dB) | 34.38 | 44 -28% | 42.1 -22% | 33.7 2% | 45.2 -31% | 43.1 -25% |
| Load Maximum * (dB) | 34.58 | 35 -1% | 44.2 -28% | 42.4 -23% | 45.2 -31% | 46 -33% |
| Witcher 3 ultra * (dB) | 35 | 44.5 | 33.7 | 45.2 |
* ... im mniej tym lepiej
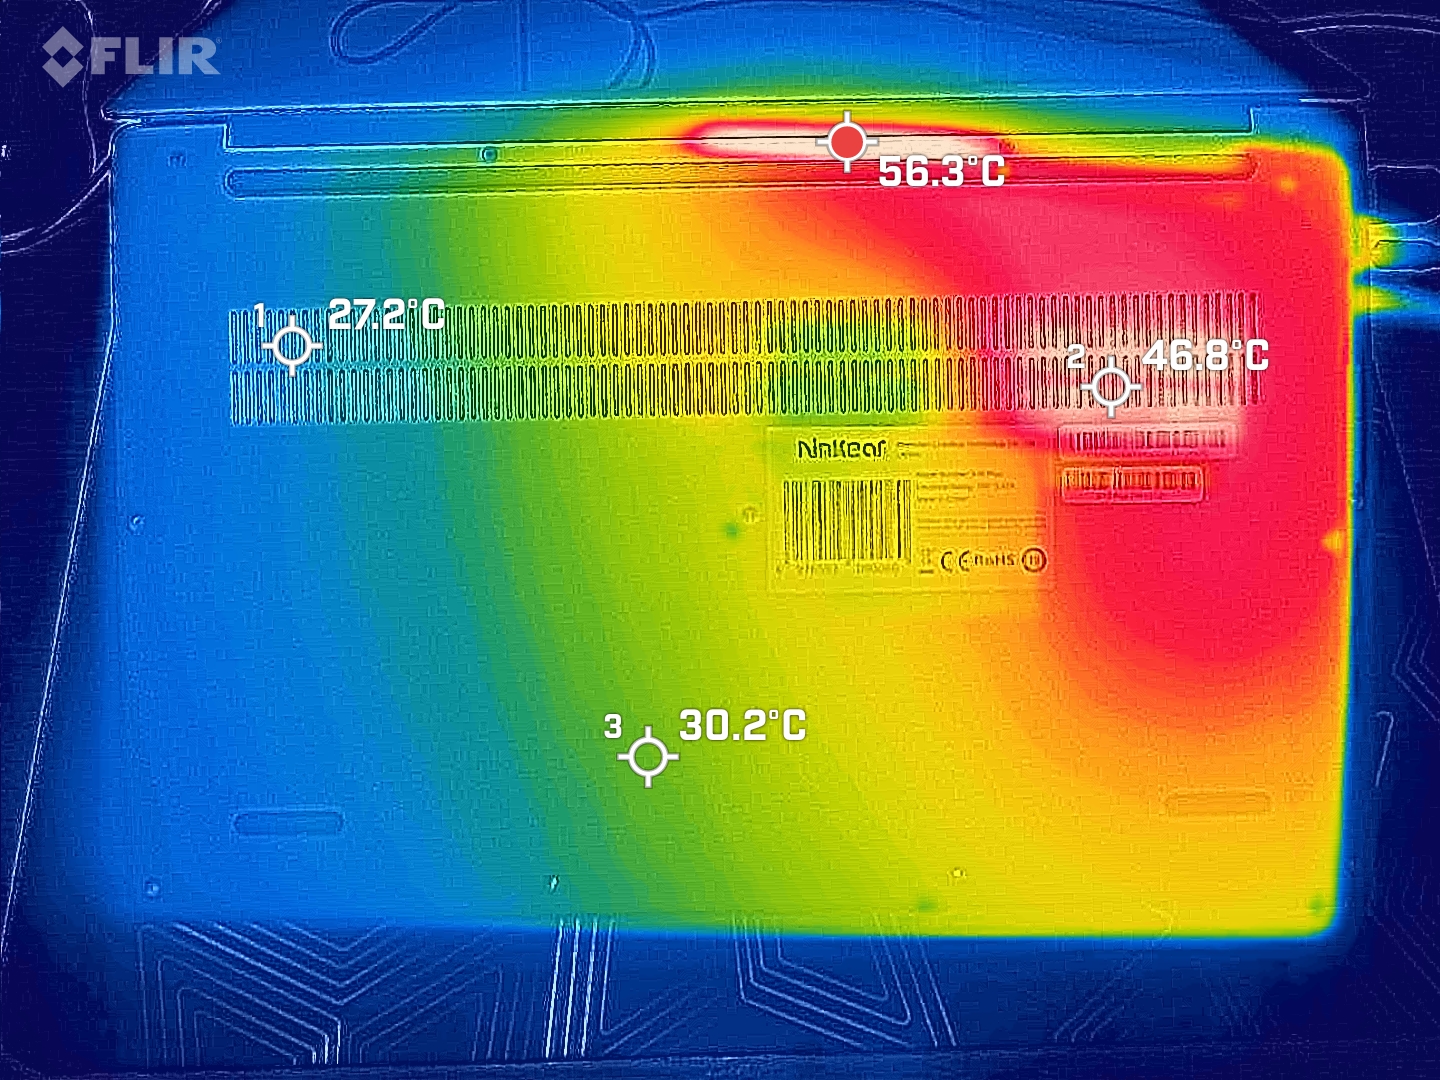
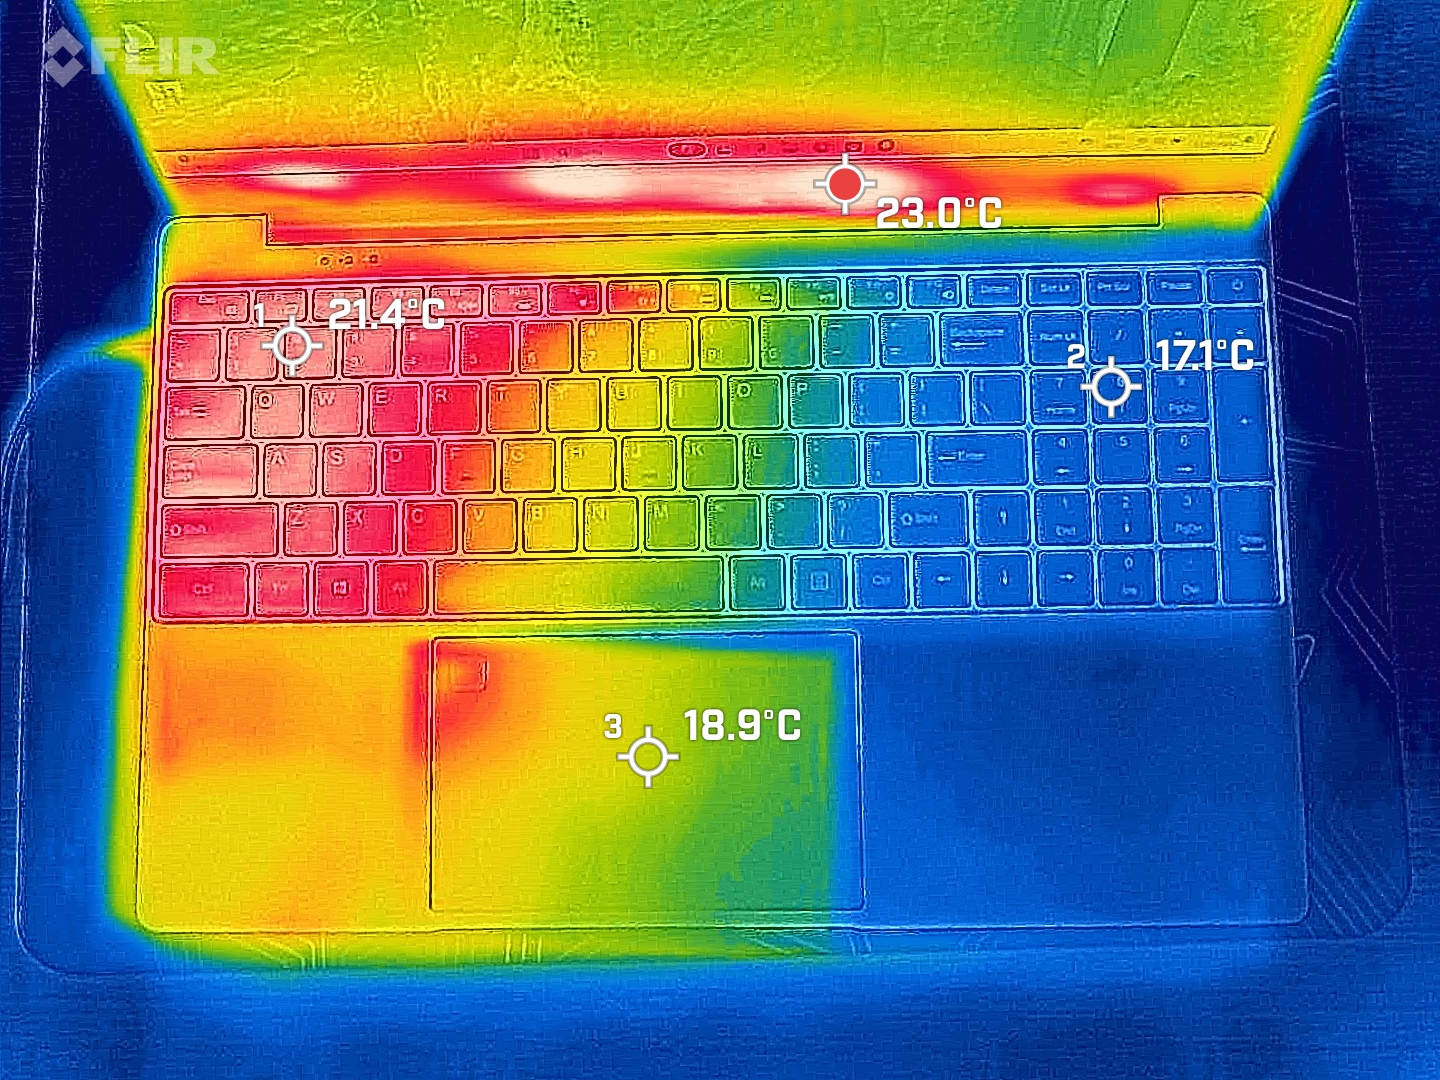
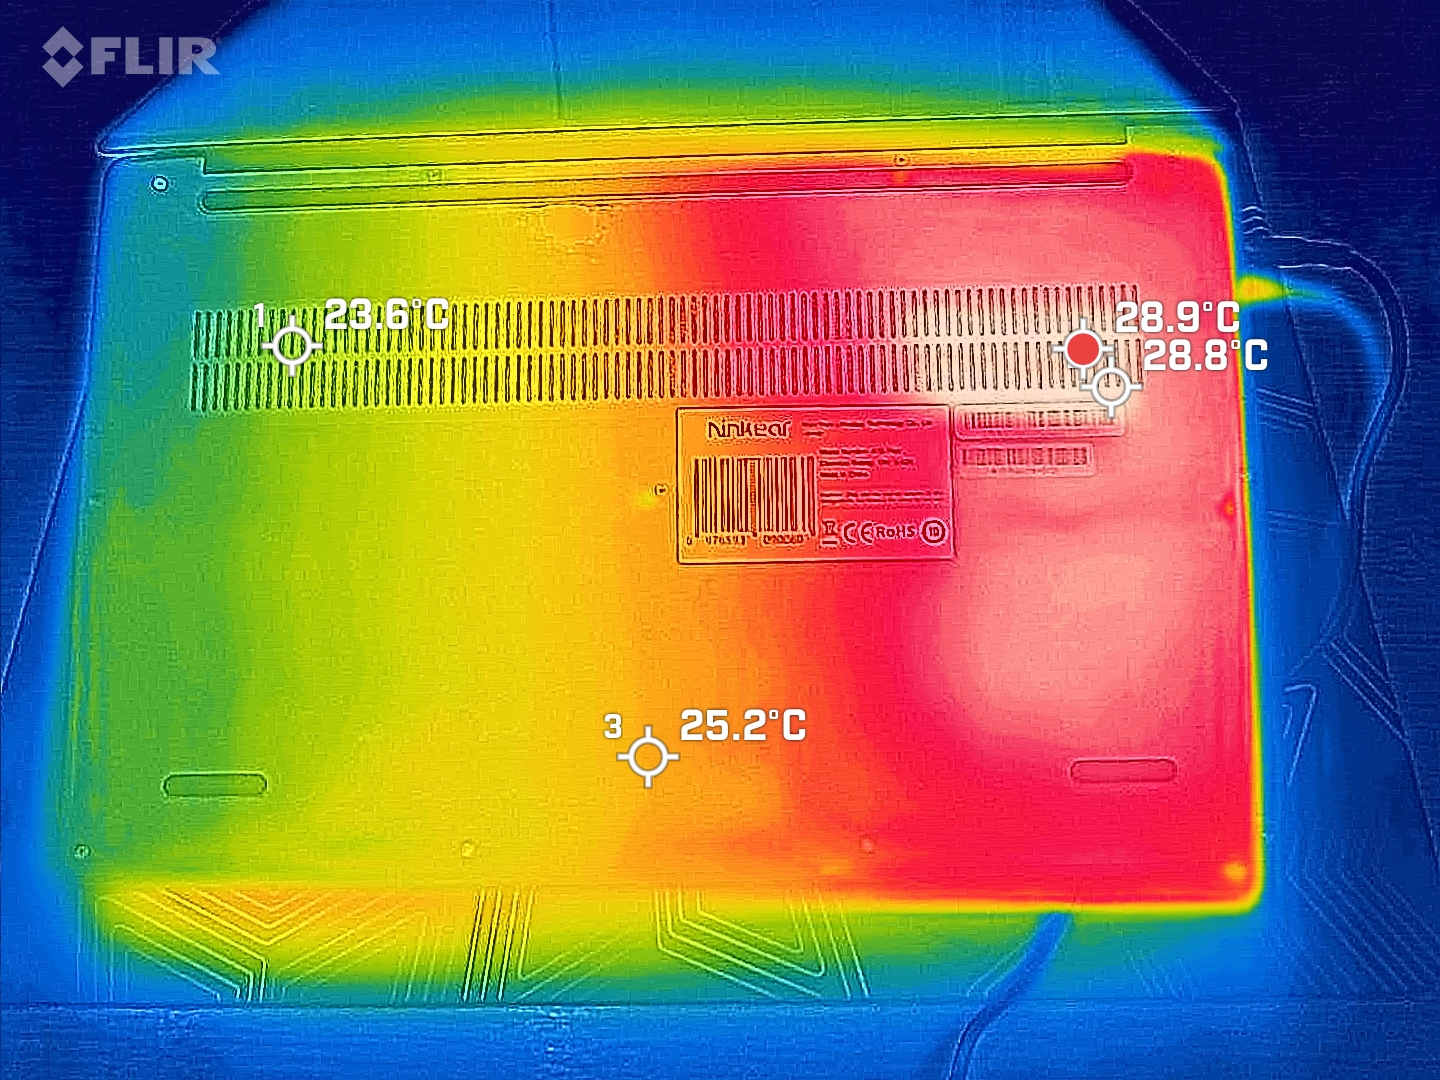
Temperatura
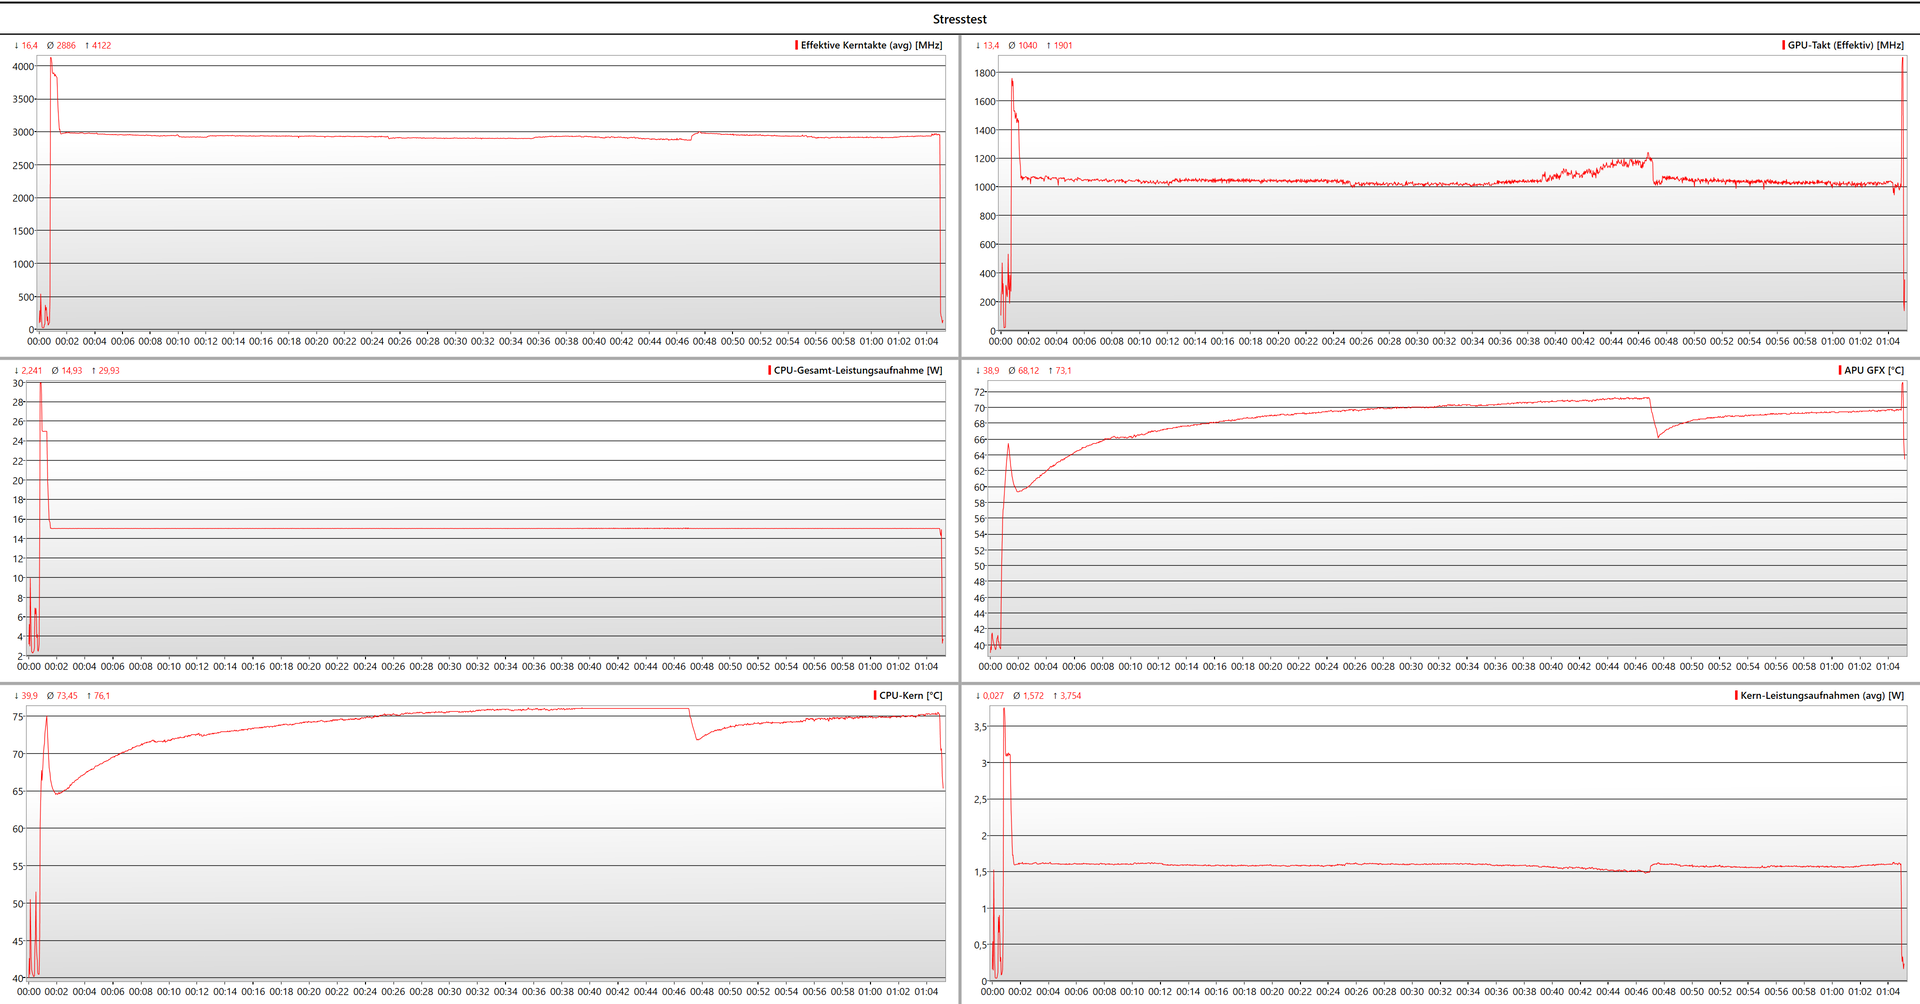
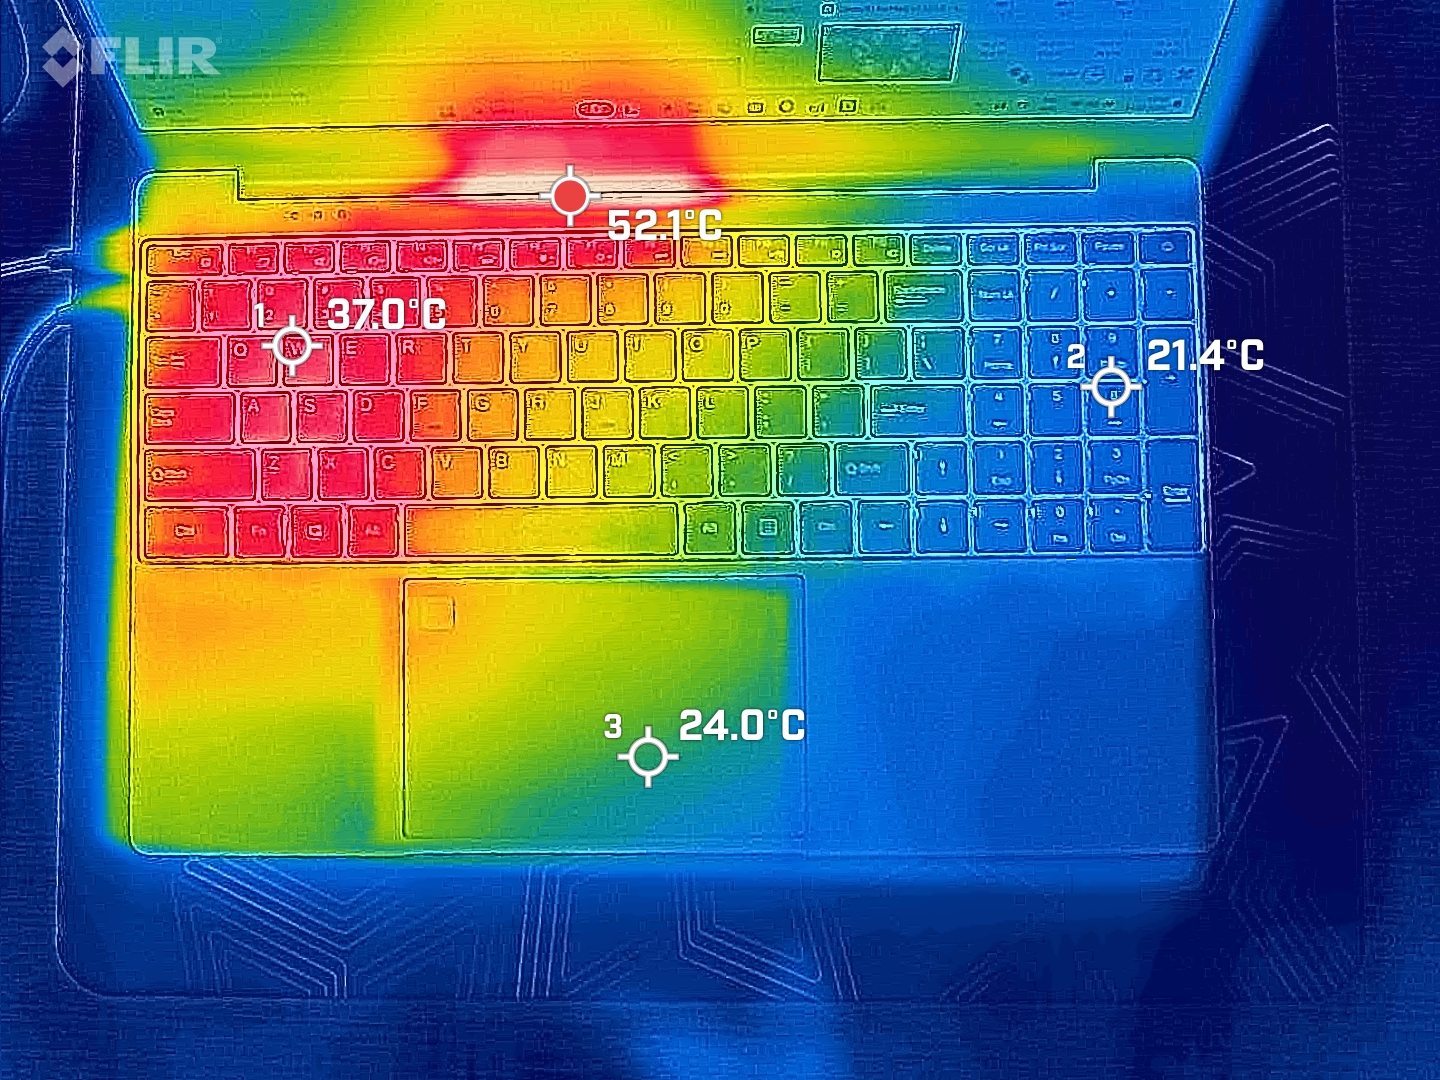
Temperatury powierzchni zarówno podczas normalnej pracy, jak i testu obciążeniowego są również utrzymywane w limitach na naszym urządzeniu testowym. Urządzenie nagrzewa się do temperatury wyższej niż temperatura ciała; laptop osiąga temperaturę powierzchni 50 °C tylko w niektórych punktach w pobliżu wylotu powietrza z radiatora.
Nasze urządzenie testowe wytrzymało test obciążeniowy z wydajnością już omówioną. Nie należy oczekiwać więcej niż 15 W ciągłej mocy od Ryzena 7 5700U w Ninkear A15 Plus.
(+) Maksymalna temperatura w górnej części wynosi 37 °C / 99 F, w porównaniu do średniej 34.3 °C / 94 F , począwszy od 21.2 do 62.5 °C dla klasy Office.
(+) Dno nagrzewa się maksymalnie do 33 °C / 91 F, w porównaniu do średniej 36.8 °C / 98 F
(+) W stanie bezczynności średnia temperatura górnej części wynosi 22.3 °C / 72 F, w porównaniu ze średnią temperaturą urządzenia wynoszącą 29.5 °C / ### class_avg_f### F.
(+) Podpórki pod nadgarstki i touchpad są chłodniejsze niż temperatura skóry i maksymalnie 27 °C / 80.6 F i dlatego są chłodne w dotyku.
(±) Średnia temperatura obszaru podparcia dłoni w podobnych urządzeniach wynosiła 27.5 °C / 81.5 F (+0.5 °C / 0.9 F).
| Ninkear A15 Plus (16+512) AMD Ryzen 7 5700U, AMD Radeon RX Vega 8 (Ryzen 4000/5000) | Lenovo IdeaPad 5 Pro 16ARH7 AMD Ryzen 5 6600HS, AMD Radeon 660M | Eurocom C315 Blitz Intel Core i7-1360P, Intel Iris Xe Graphics G7 96EUs | Schenker VIA 15 Pro M22 AMD Ryzen 7 5700U, AMD Radeon RX Vega 8 (Ryzen 4000/5000) | HP 250 G9 7N029ES Intel Core i3-1215U, Intel UHD Graphics 64EUs (Alder Lake 12th Gen) | Asus P1511CEA-BQ753R Intel Core i3-1115G4, Intel UHD Graphics Xe G4 48EUs | |
|---|---|---|---|---|---|---|
| Heat | -21% | -2% | -16% | -9% | -11% | |
| Maximum Upper Side * (°C) | 37 | 46 -24% | 35.6 4% | 41.2 -11% | 35.1 5% | 40.3 -9% |
| Maximum Bottom * (°C) | 33 | 48 -45% | 37.8 -15% | 43.5 -32% | 44.8 -36% | 39.2 -19% |
| Idle Upper Side * (°C) | 23.5 | 28 -19% | 24.2 -3% | 28.4 -21% | 25.7 -9% | 27.3 -16% |
| Idle Bottom * (°C) | 28.1 | 27 4% | 26 7% | 28.1 -0% | 26.5 6% | 28.5 -1% |
* ... im mniej tym lepiej
Głośnik
Przechodzimy teraz do najsłabszego aspektu Ninkear A15 Plus - głośnika. Moduł głośnika stereo nad dużą baterią w naszym urządzeniu testowym nie jest ani szczególnie głośny, ani nie można go w żaden sposób opisać jako dźwięczny.
Jednak nawet znacznie droższy Schenker Via 15 Pro nie brzmi lepiej. Tylko niedrogi HP 250 G9 może zrobić wgniecenie w urządzeniach biurowych i wyprodukować w miarę dobry dźwięk.
Ninkear A15 Plus (16+512) analiza dźwięku
(±) | głośność głośnika jest średnia, ale dobra (72 dB)
Bas 100 - 315 Hz
(-) | prawie brak basu - średnio 20% niższa od mediany
(±) | liniowość basu jest średnia (8.1% delta do poprzedniej częstotliwości)
Średnie 400 - 2000 Hz
(±) | wyższe średnie - średnio 8% wyższe niż mediana
(±) | liniowość środka jest średnia (11.9% delta do poprzedniej częstotliwości)
Wysokie 2–16 kHz
(±) | wyższe maksima - średnio 7.2% wyższe od mediany
(±) | liniowość wysokich wartości jest średnia (8.2% delta do poprzedniej częstotliwości)
Ogólnie 100 - 16.000 Hz
(-) | ogólny dźwięk nie jest liniowy (30.8% różnicy w stosunku do mediany)
W porównaniu do tej samej klasy
» 92% wszystkich testowanych urządzeń w tej klasie było lepszych, 3% podobnych, 5% gorszych
» Najlepszy miał deltę 7%, średnia wynosiła ###średnia###%, najgorsza wynosiła 53%
W porównaniu do wszystkich testowanych urządzeń
» 89% wszystkich testowanych urządzeń było lepszych, 3% podobnych, 8% gorszych
» Najlepszy miał deltę 4%, średnia wynosiła ###średnia###%, najgorsza wynosiła 134%
Schenker VIA 15 Pro M22 analiza dźwięku
(±) | głośność głośnika jest średnia, ale dobra (74.8 dB)
Bas 100 - 315 Hz
(-) | prawie brak basu - średnio 22.2% niższa od mediany
(±) | liniowość basu jest średnia (12% delta do poprzedniej częstotliwości)
Średnie 400 - 2000 Hz
(±) | wyższe średnie - średnio 5.1% wyższe niż mediana
(±) | liniowość środka jest średnia (10.2% delta do poprzedniej częstotliwości)
Wysokie 2–16 kHz
(+) | zrównoważone maksima - tylko 4.3% od mediany
(+) | wzloty są liniowe (6.6% delta do poprzedniej częstotliwości)
Ogólnie 100 - 16.000 Hz
(±) | liniowość ogólnego dźwięku jest średnia (22.8% różnicy w stosunku do mediany)
W porównaniu do tej samej klasy
» 63% wszystkich testowanych urządzeń w tej klasie było lepszych, 8% podobnych, 29% gorszych
» Najlepszy miał deltę 7%, średnia wynosiła ###średnia###%, najgorsza wynosiła 53%
W porównaniu do wszystkich testowanych urządzeń
» 68% wszystkich testowanych urządzeń było lepszych, 5% podobnych, 27% gorszych
» Najlepszy miał deltę 4%, średnia wynosiła ###średnia###%, najgorsza wynosiła 134%
HP 250 G9 7N029ES analiza dźwięku
(±) | głośność głośnika jest średnia, ale dobra (81.6 dB)
Bas 100 - 315 Hz
(-) | prawie brak basu - średnio 21.3% niższa od mediany
(±) | liniowość basu jest średnia (10.2% delta do poprzedniej częstotliwości)
Średnie 400 - 2000 Hz
(+) | zbalansowane środki średnie - tylko 4.3% od mediany
(+) | średnie są liniowe (5.9% delta do poprzedniej częstotliwości)
Wysokie 2–16 kHz
(+) | zrównoważone maksima - tylko 1.5% od mediany
(+) | wzloty są liniowe (4% delta do poprzedniej częstotliwości)
Ogólnie 100 - 16.000 Hz
(±) | liniowość ogólnego dźwięku jest średnia (16% różnicy w stosunku do mediany)
W porównaniu do tej samej klasy
» 19% wszystkich testowanych urządzeń w tej klasie było lepszych, 6% podobnych, 76% gorszych
» Najlepszy miał deltę 7%, średnia wynosiła ###średnia###%, najgorsza wynosiła 53%
W porównaniu do wszystkich testowanych urządzeń
» 25% wszystkich testowanych urządzeń było lepszych, 5% podobnych, 69% gorszych
» Najlepszy miał deltę 4%, średnia wynosiła ###średnia###%, najgorsza wynosiła 134%
Zużycie energii
Ninkear dostarcza do A15 Plus zasilacz o mocy 65 W. Jest to wartość w zupełności wystarczająca, gdyż laptop praktycznie nie obciąża przetwornicy napięcia nawet podczas krótkich faz boost.
| wyłączony / stan wstrzymania | |
| luz | |
| obciążenie |
|
Legenda:
min: | |
Power consumption: Integrated display
Power consumption: External monitor
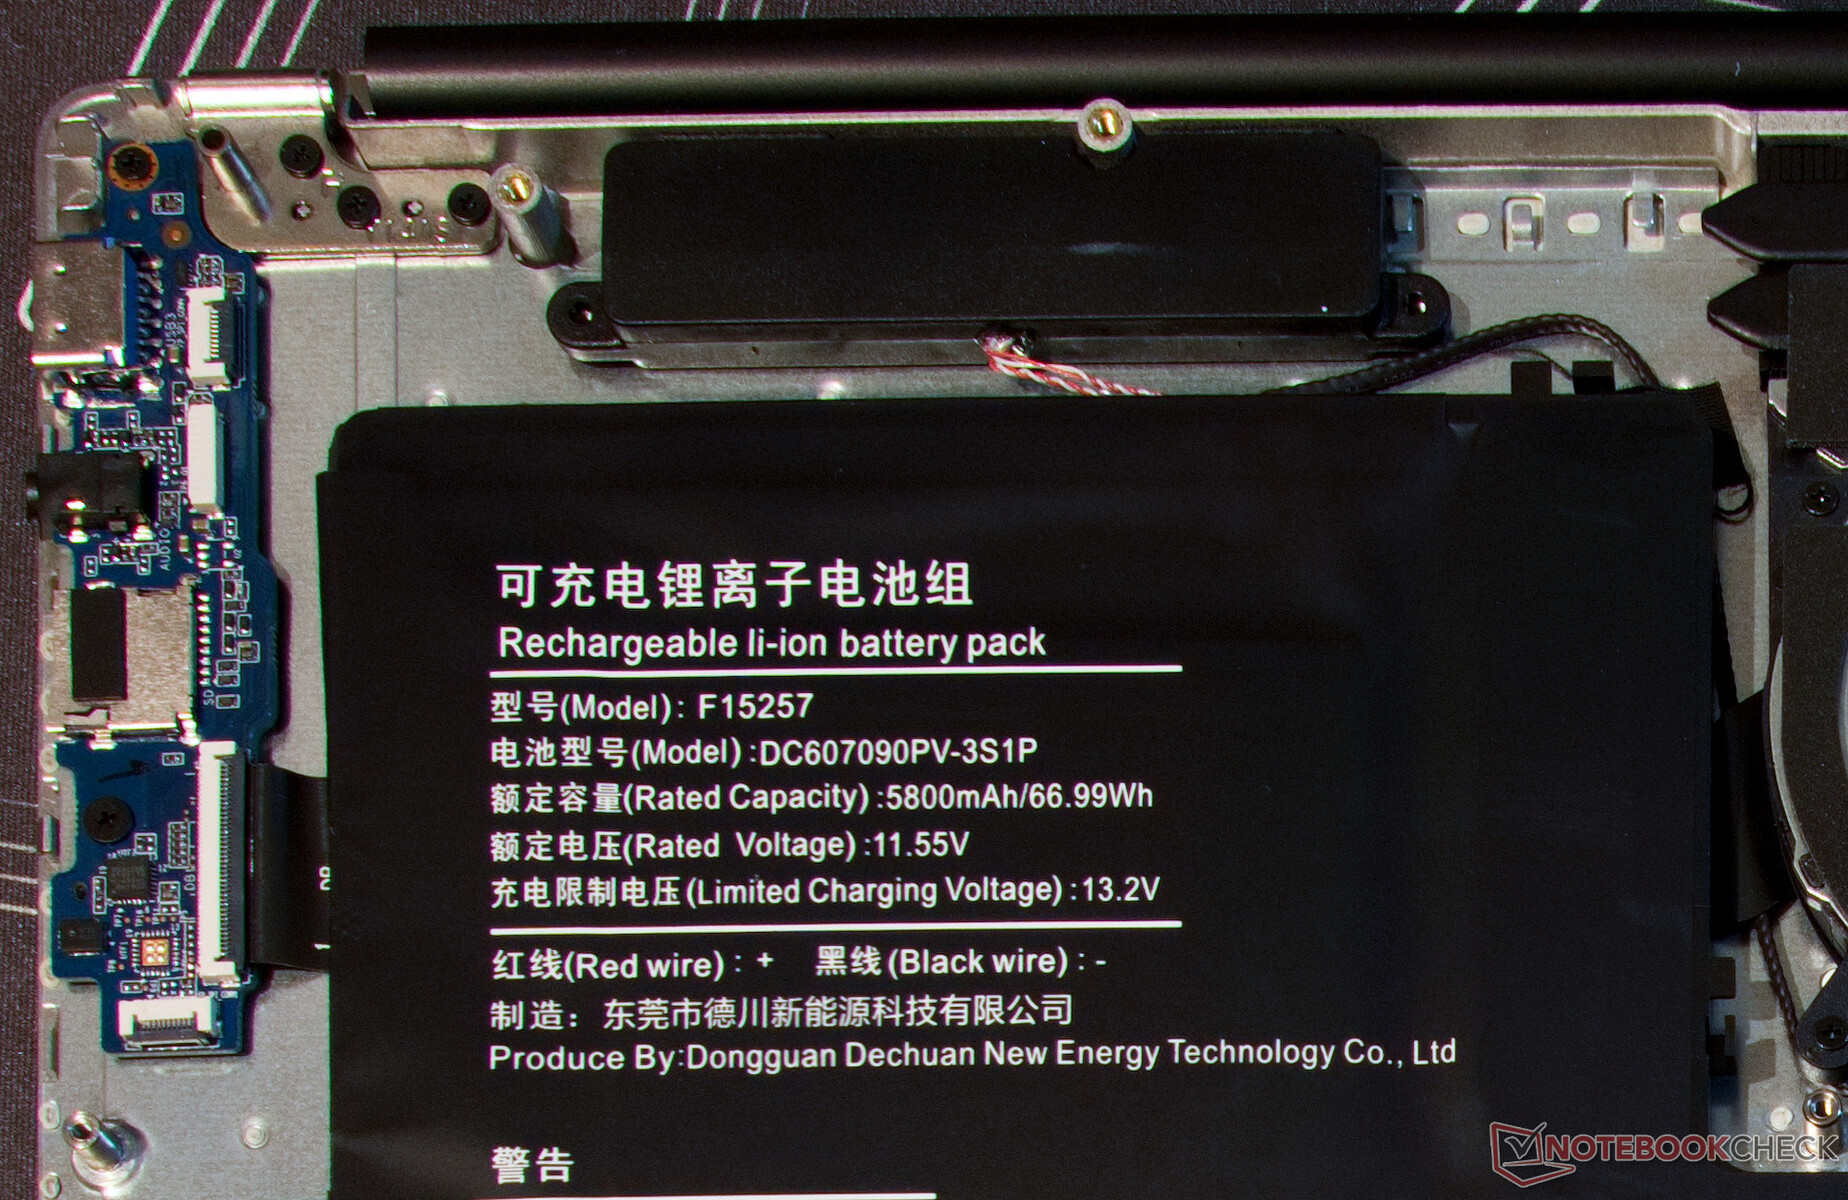
Żywotność baterii
Znacznie ponad jedną trzecią powierzchni testowanego urządzenia zajmuje bateria o pojemności prawie 67 Whr. W połączeniu z ekonomicznym procesorem i ogólnie niskim zapotrzebowaniem na energię naszego urządzenia testowego, skutkuje to długą żywotnością baterii.
Ninkear A15 Plus wytrzymuje ponad 10 godzin bez zasilania podczas surfowania. Stawia to laptopa biurowego niemal na równi z Schenker Via 15 Pro, który ma najdłuższy czas pracy na baterii w porównaniu.
| Ninkear A15 Plus (16+512) R7 5700U, Vega 8, 64.9 Wh | Lenovo IdeaPad 5 Pro 16ARH7 R5 6600HS, Radeon 660M, 75 Wh | Eurocom C315 Blitz i7-1360P, Iris Xe G7 96EUs, 73 Wh | Schenker VIA 15 Pro M22 R7 5700U, Vega 8, 91 Wh | HP 250 G9 7N029ES i3-1215U, UHD Graphics 64EUs, 41 Wh | Asus P1511CEA-BQ753R i3-1115G4, UHD Graphics Xe G4 48EUs, 37 Wh | Średnia w klasie Office | |
|---|---|---|---|---|---|---|---|
| Czasy pracy | |||||||
| WiFi v1.3 (h) | 10.6 | 9.8 -8% | 8 -25% | 11 4% | 6 -43% | 5.2 -51% | 13.2 ? 25% |
Za
Przeciw
Werdykt: Zdecydowanie nie jest to chiński złom

Ninkear A15 Plus ma więcej niż wystarczającą moc do codziennego użytku, jest cichy, ma mocną klawiaturę i atrakcyjną obudowę z lekkiego metalu, która kosztuje od 500 do 550 euro. To stosunkowo niewiele. Dla porównania Schenker Via 15 Pro M22 jest nieco lepiej wyposażony w wielu obszarach niż nasze urządzenie testowe, ale ostatecznie jest dwa razy droższy.
Aby osiągnąć niską cenę, Ninkear agresywnie wykorzystał możliwości oszczędności w niektórych obszarach. Jednokanałowa pamięć RAM i stosunkowo wolny moduł WLAN będą prawdopodobnie najmniej zauważalne w normalnym użytkowaniu. Słabe głośniki i niezbyt jasny ekran będą prawdopodobnie znacznie bardziej irytujące.
Jednak tańsze laptopy znanych producentów, takich jak HP czy Asus, zwykle nie są lepiej wyposażone w tym obszarze, a także mają znacznie słabsze procesory. Biorąc to pod uwagę, duża bateria i licencja Windows 11 Pro są również nietypowe dla tego przedziału cenowego.
W teście Ninkear A15 Plus okazał się przydatnym laptopem do domowego biura. Dobra wydajność spotyka się z atrakcyjnym wzornictwem. Jednak aspekty takie jak głośniki, WLAN i jasność ekranu muszą być kompromisowe.
W rzeczywistości Ninkear A15 Plus okazuje się silnym konkurentem dla naszych urządzeń porównawczych. Notebook biurowy ma atrakcyjną obudowę i jest więcej niż użyteczny. Dla HP 250 G9 lub Asus P1511CEA sytuacja może stać się konkurencyjna, jeśli chińscy producenci laptopów będą nadal naciskać na rynek europejski.
Ninkear A15 Plus pokazuje, że nie jest chińskim złomem. Byliśmy mile zaskoczeni tym urządzeniem i spodziewalibyśmy się znacznie mniej w tak niskiej cenie. Jedynym minusem Ninkear jest prawdopodobnie gwarancja lub rękojmia. W przypadku urządzeń i sprzedawców z Dalekiego Wschodu czasami trudno o jedno i drugie.
Cena i dostępność
Niestety, nasza konfiguracja 16+512 Ninkear A15 Plus jest obecnie niedostępna prawie wszędzie. Z 32 GB pamięci RAM i dyskiem SSD NVMe o pojemności jednego TB, laptop kosztuje obecnie €617 w Tomtop z wysyłką z niemieckiego magazynu. Oznacza to, że w UE nie ma ceł ani podobnych opłat.
Ninkear A15 Plus (16+512)
- 22/02/2024 v7 (old)
Marc Herter
Przezroczystość
Wyboru urządzeń do recenzji dokonuje nasza redakcja. Próbka testowa została udostępniona autorowi przez producenta bezpłatnie do celów recenzji. Na tę recenzję nie miały wpływu osoby trzecie, a producent nie otrzymał kopii tej recenzji przed publikacją. Nie było obowiązku publikowania tej recenzji. Jako niezależna firma medialna, Notebookcheck nie podlega władzy producentów, sprzedawców detalicznych ani wydawców.
Tak testuje Notebookcheck
Każdego roku Notebookcheck niezależnie sprawdza setki laptopów i smartfonów, stosując standardowe procedury, aby zapewnić porównywalność wszystkich wyników. Od około 20 lat stale rozwijamy nasze metody badawcze, ustanawiając przy tym standardy branżowe. W naszych laboratoriach testowych doświadczeni technicy i redaktorzy korzystają z wysokiej jakości sprzętu pomiarowego. Testy te obejmują wieloetapowy proces walidacji. Nasz kompleksowy system ocen opiera się na setkach uzasadnionych pomiarów i benchmarków, co pozwala zachować obiektywizm.Price comparison
