Recenzja Schenker VIA 15 Pro - laptop biurowy AMD o długim czasie pracy na baterii
Schenker oferuje szybki notebook biurowy z VIA 15 Pro, który wykorzystuje matowy panel IPS z częstotliwością odświeżania 165 Hz, a także dobre urządzenia wejściowe. Za wydajność odpowiada procesor AMD Ryzen, a zarówno pamięć RAM, jak i dysk SSD można skonfigurować zgodnie z własnymi potrzebami. Cena początkowa konfiguracji z procesorem Ryzen 7 5700U, 8 GB pamięci RAM i dyskiem SSD o pojemności 512 GB wynosi 1149 euro; nasza jednostka testowa z 32 GB pamięci RAM i dyskiem SSD o pojemności 1 TB kosztuje 1298 euro bez systemu operacyjnego.
Potencjalni konkurenci w porównaniu
Ocena | Data | Model | Waga | Wysokość | Rozmiar | Rezolucja | Cena |
|---|---|---|---|---|---|---|---|
| 87.1 % v7 (old) | 06/2023 | Schenker VIA 15 Pro M22 R7 5700U, Vega 8 | 1.4 kg | 16.8 mm | 15.60" | 2560x1440 | |
| 84.6 % v7 (old) | 02/2023 | Dell Latitude 3520 i5-1135G7, Iris Xe G7 80EUs | 1.8 kg | 18.06 mm | 15.60" | 1920x1080 | |
| 85 % v7 (old) | HP ProBook 450 G9 6A180EA i7-1255U, Iris Xe G7 96EUs | 1.7 kg | 19.9 mm | 15.60" | 1920x1080 | ||
| 84.7 % v7 (old) | Dell Inspiron 15 5515-H8P8F R7 5700U, Vega 8 | 1.6 kg | 18 mm | 15.60" | 1920x1080 | ||
| 84.9 % v7 (old) | 09/2022 | Lenovo ThinkBook 15 G4 21DL0009GE R5 5625U, Vega 7 | 1.8 kg | 23 mm | 15.60" | 1920x1080 |
Walizka i sprzęt
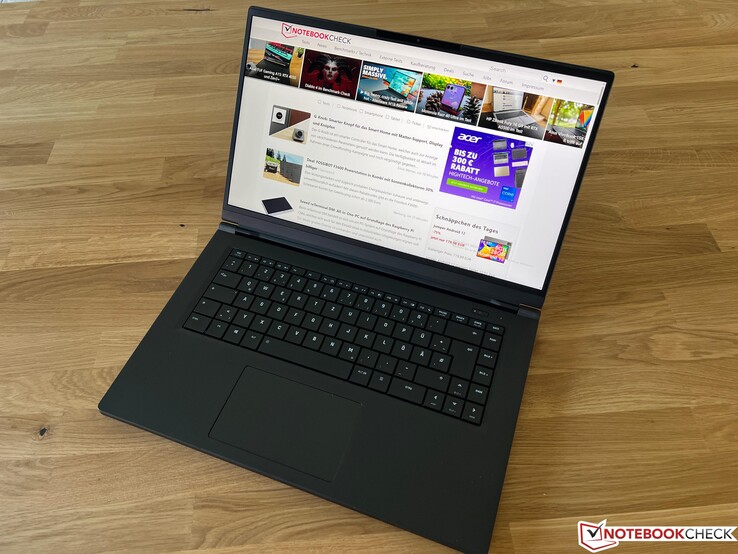
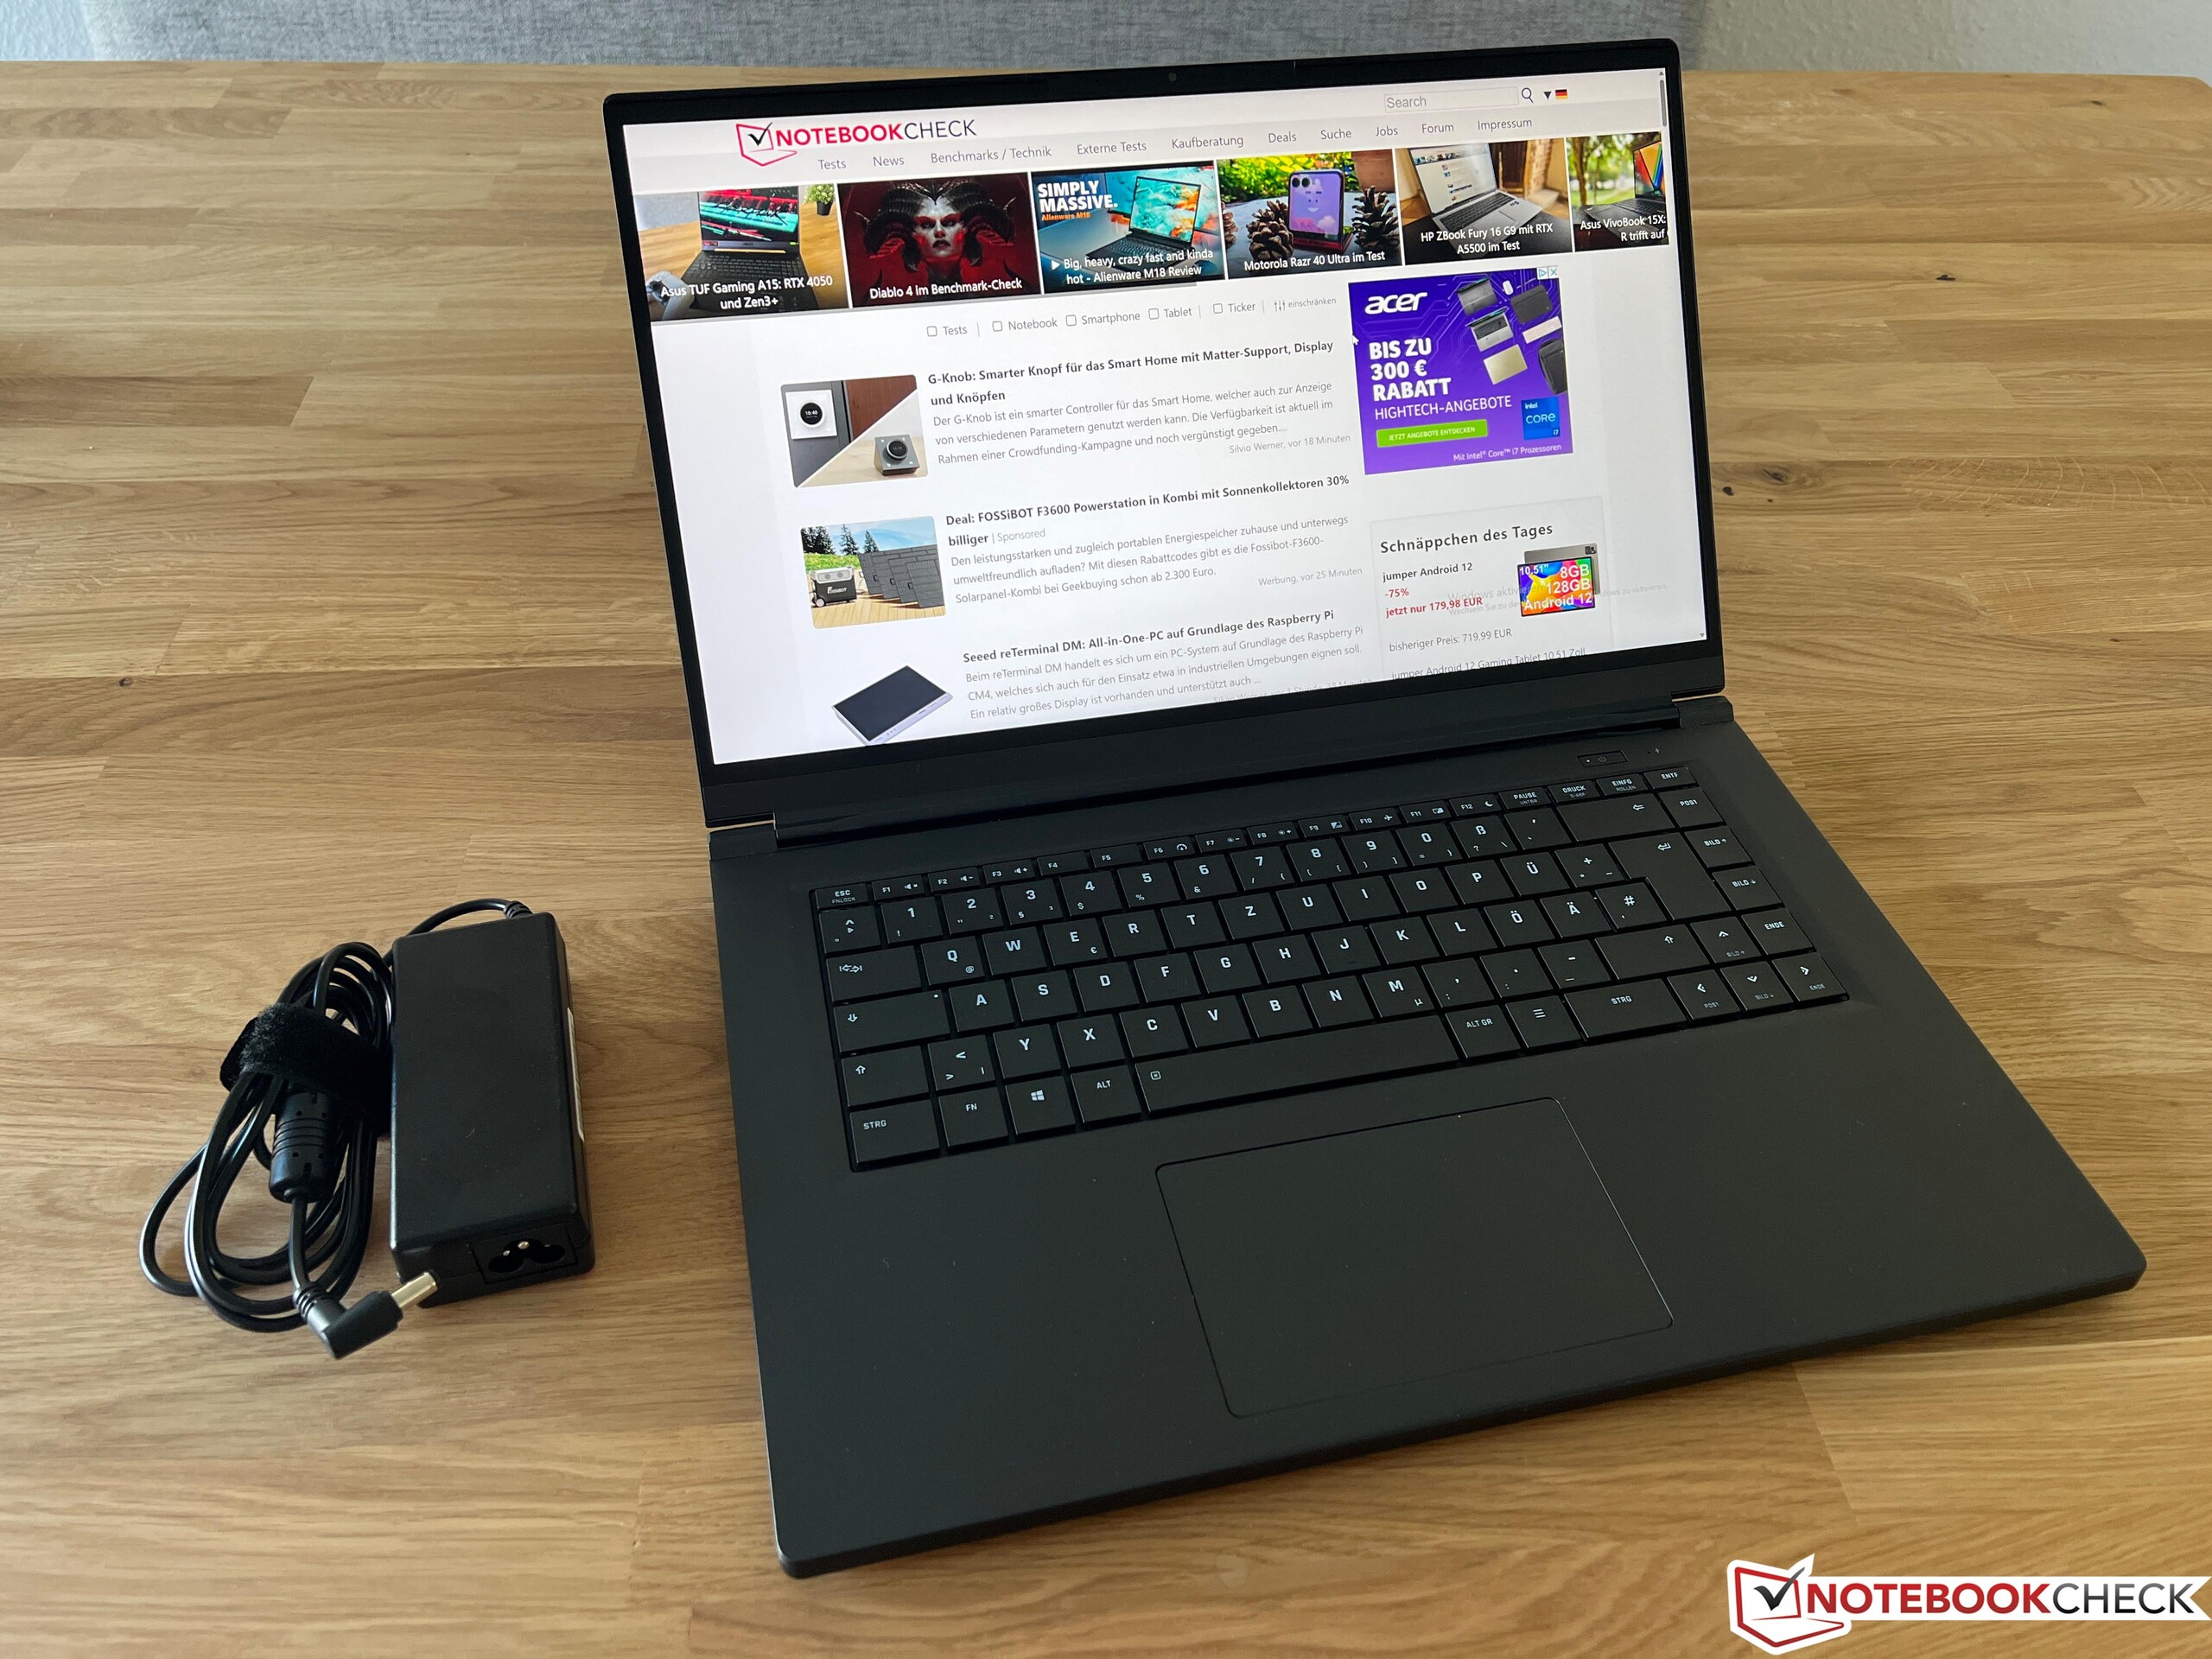
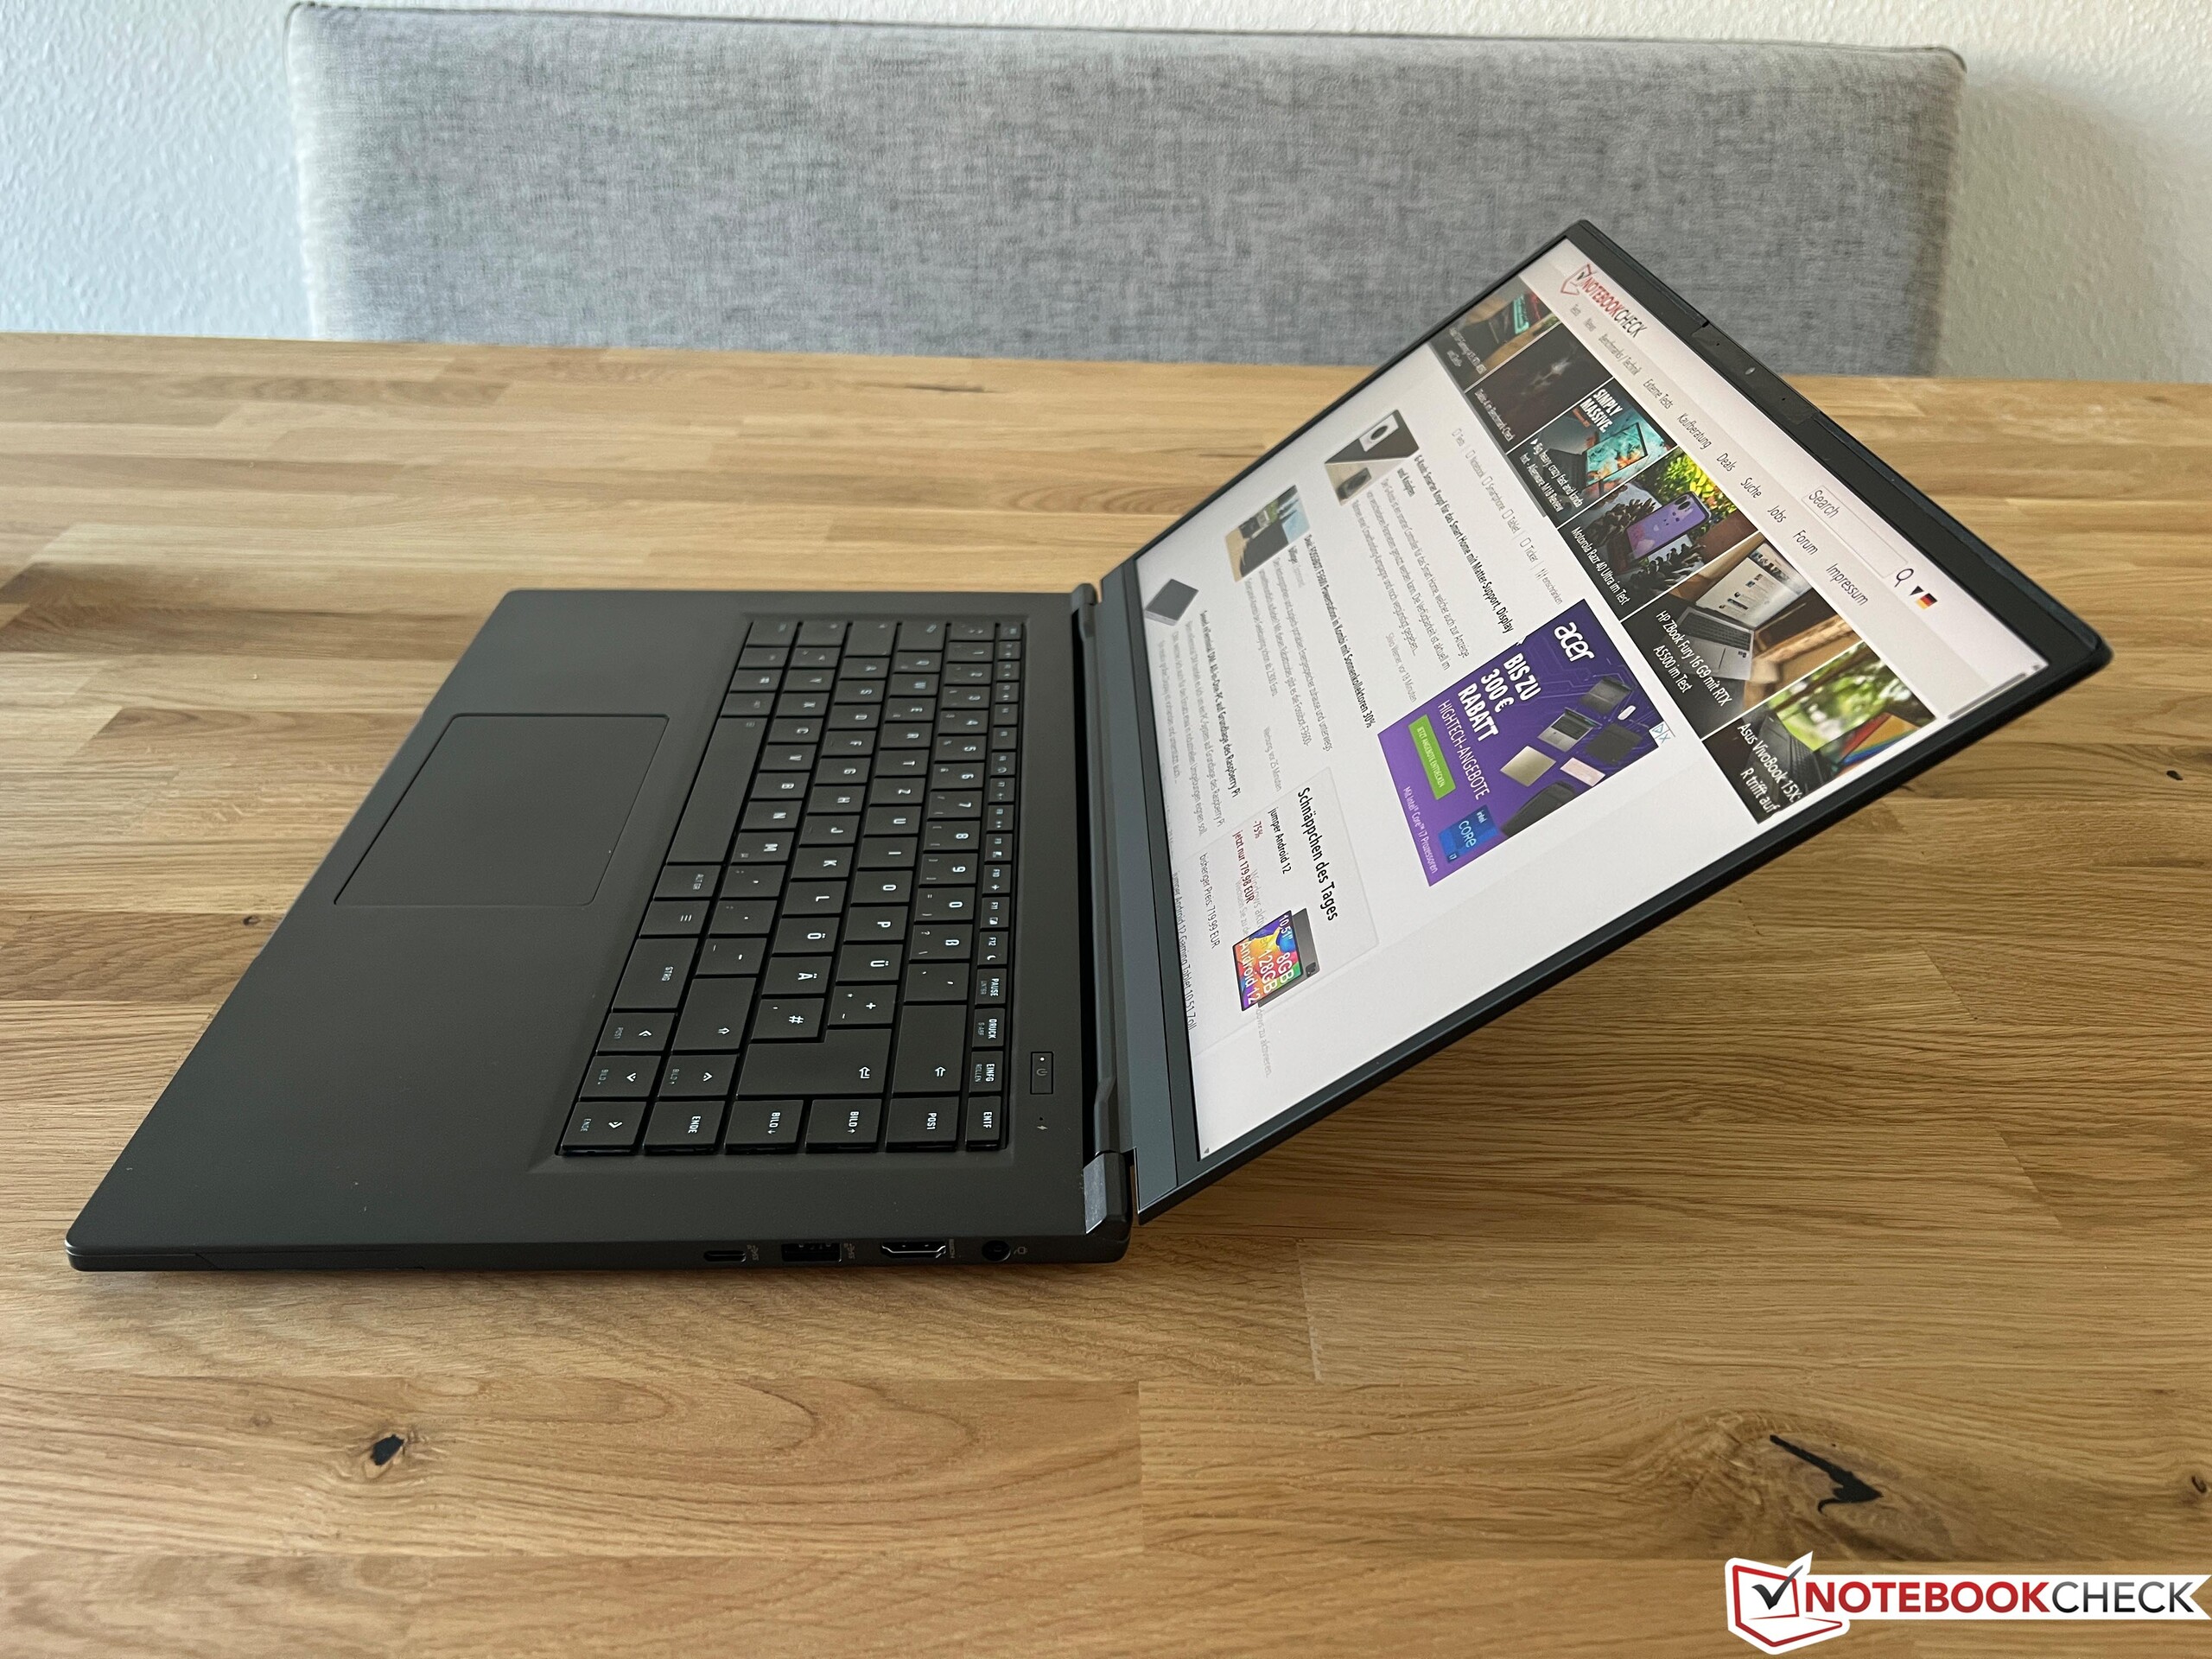
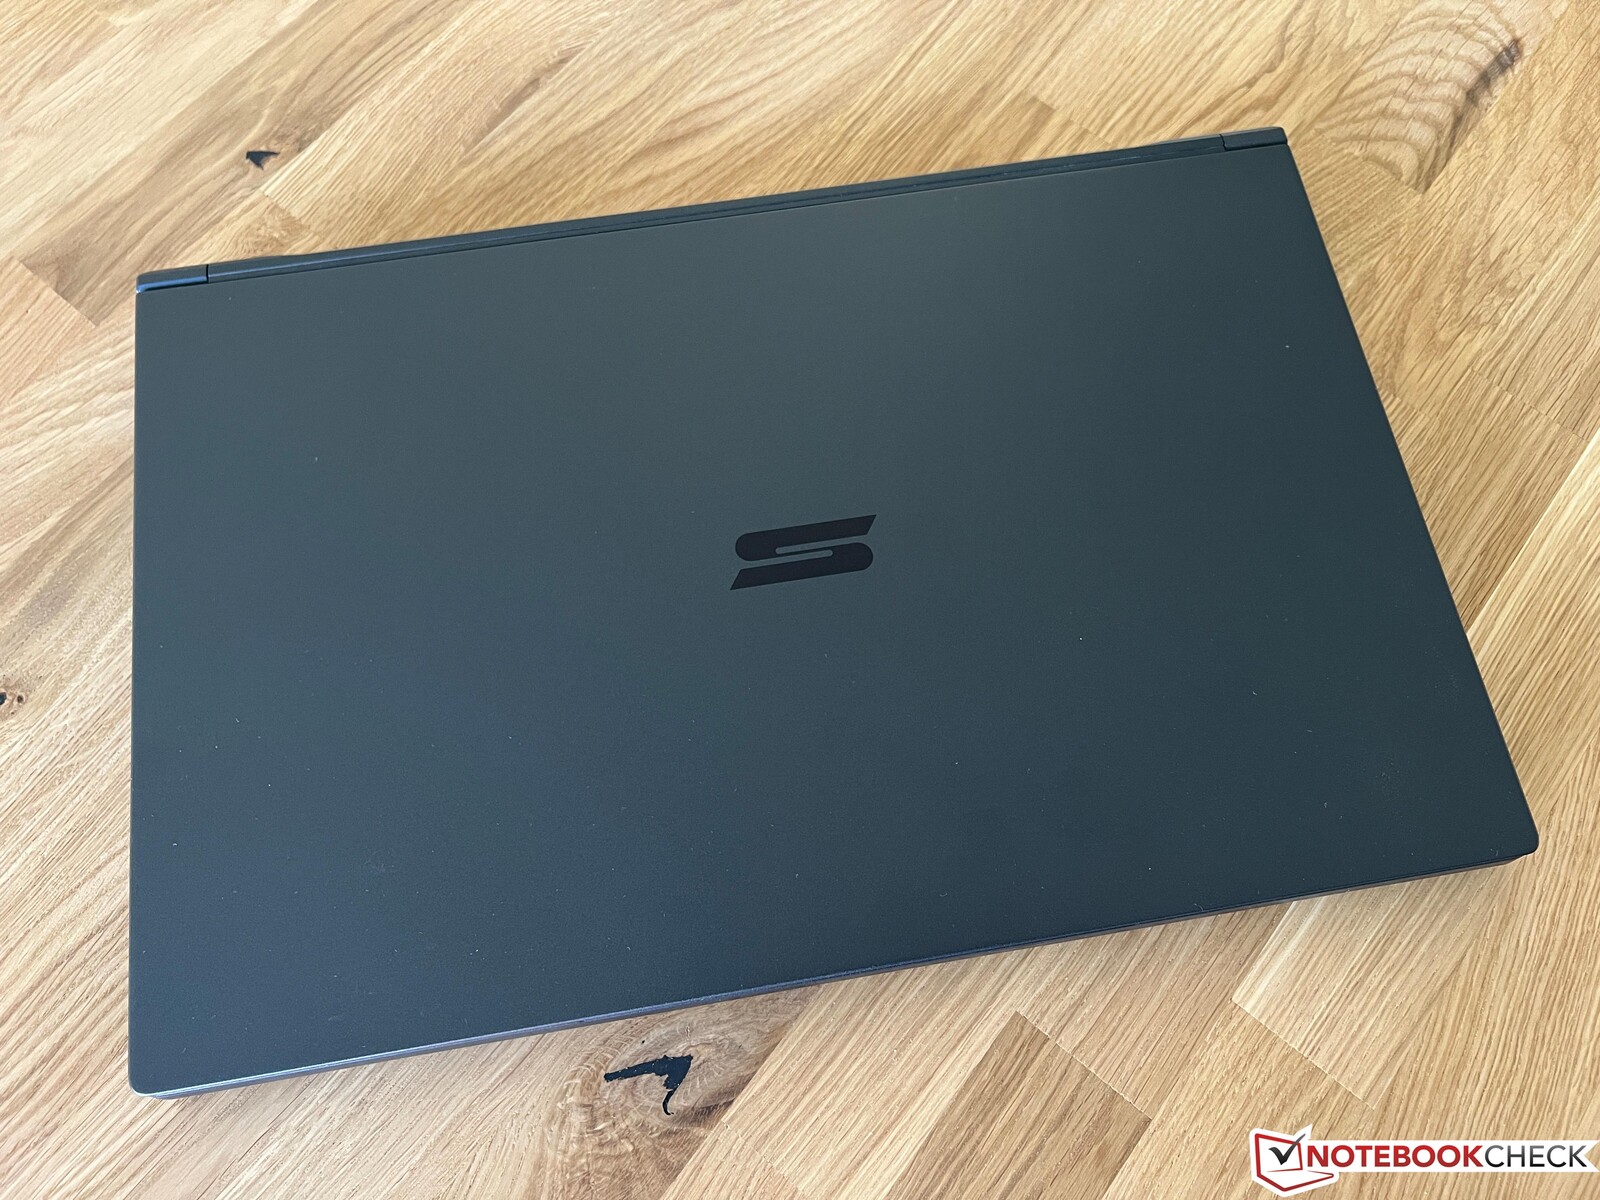
Ciemna obudowa wykonana jest ze stopu magnezu AZ91D (pokrywa i górna część jednostki bazowej, reszta aluminium), dzięki czemu 15-calowiec waży zaledwie 1,446 kg i jest zauważalnie lżejszy od swoich konkurentów. Stabilność jednostki bazowej jest bardzo dobra, tylko pokrywa jest nieco bardziej elastyczna (ale nie udało nam się sprowokować żadnych błędów obrazu). Zawiasy pozwalają na maksymalny kąt otwarcia około 145 stopni, ale nie mogą zapobiec pewnemu podskakiwaniu. Ogólnie rzecz biorąc, konstrukcja jest bardzo powściągliwa i VIA Pro może być używana w biurze bez żadnych problemów. Można nawet usunąć logo na pokrywie za dopłatą 29 euro. Odciski palców nie stanowią dużego problemu na ciemnych powierzchniach.
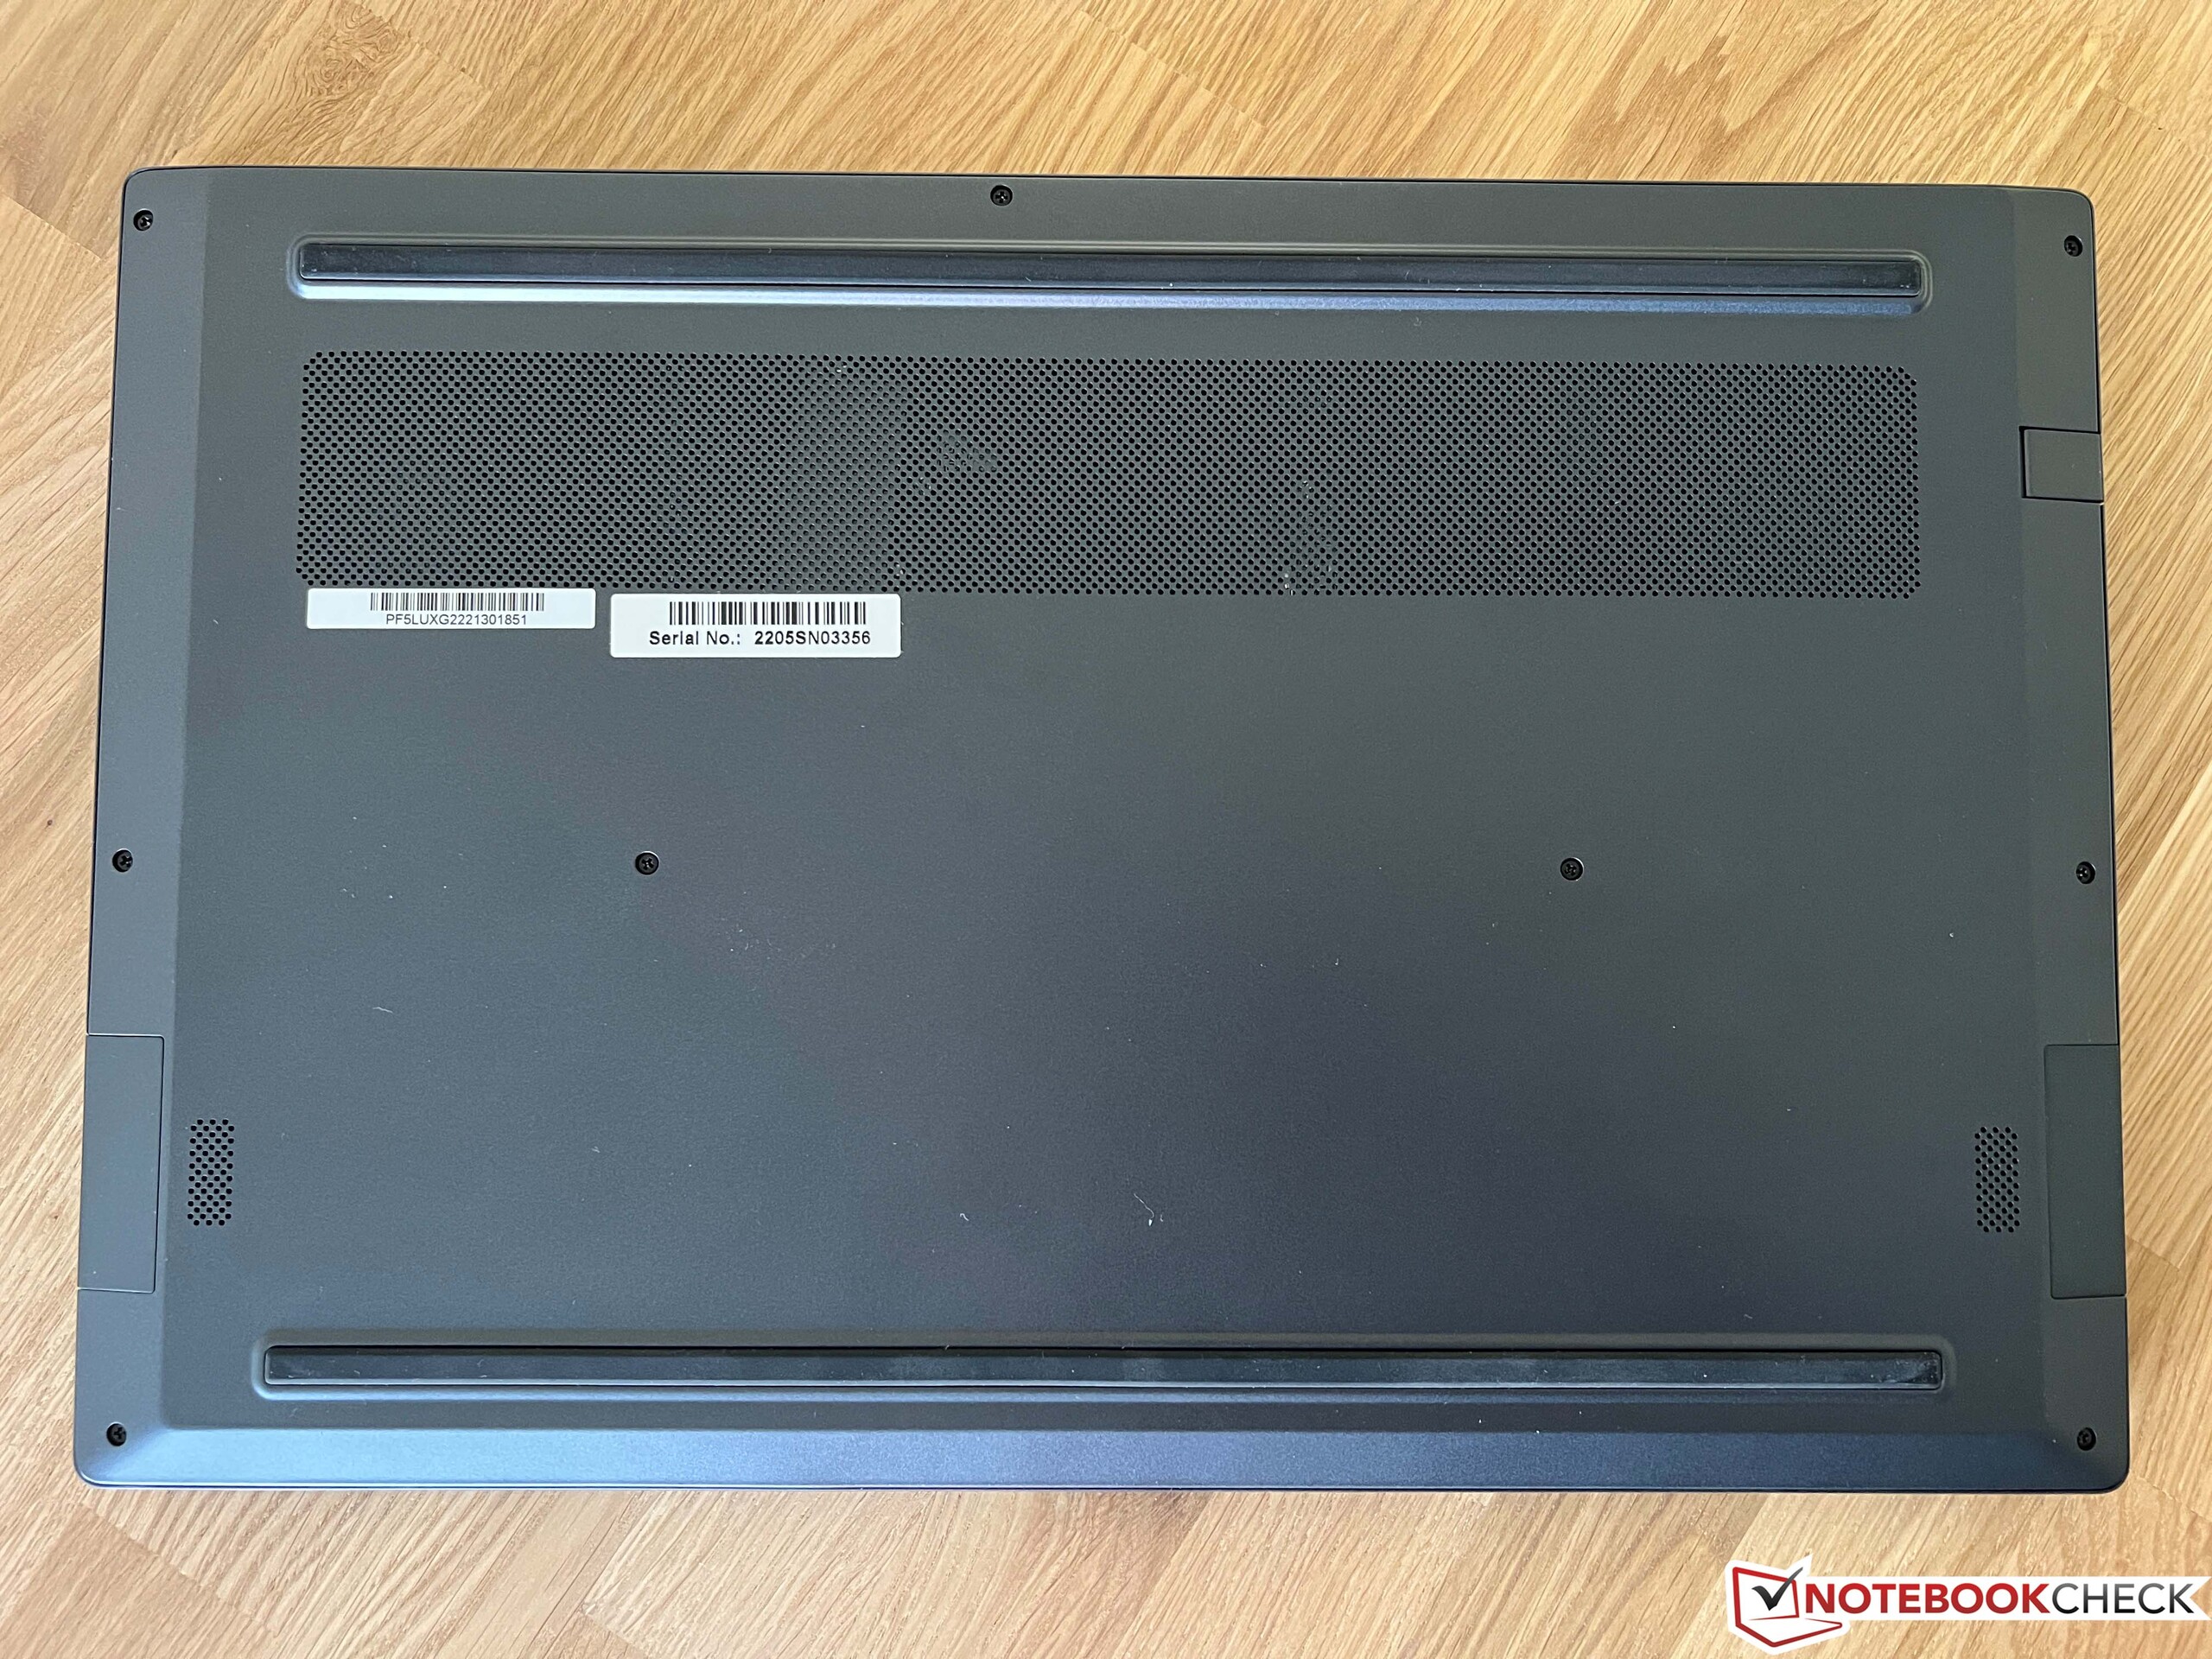
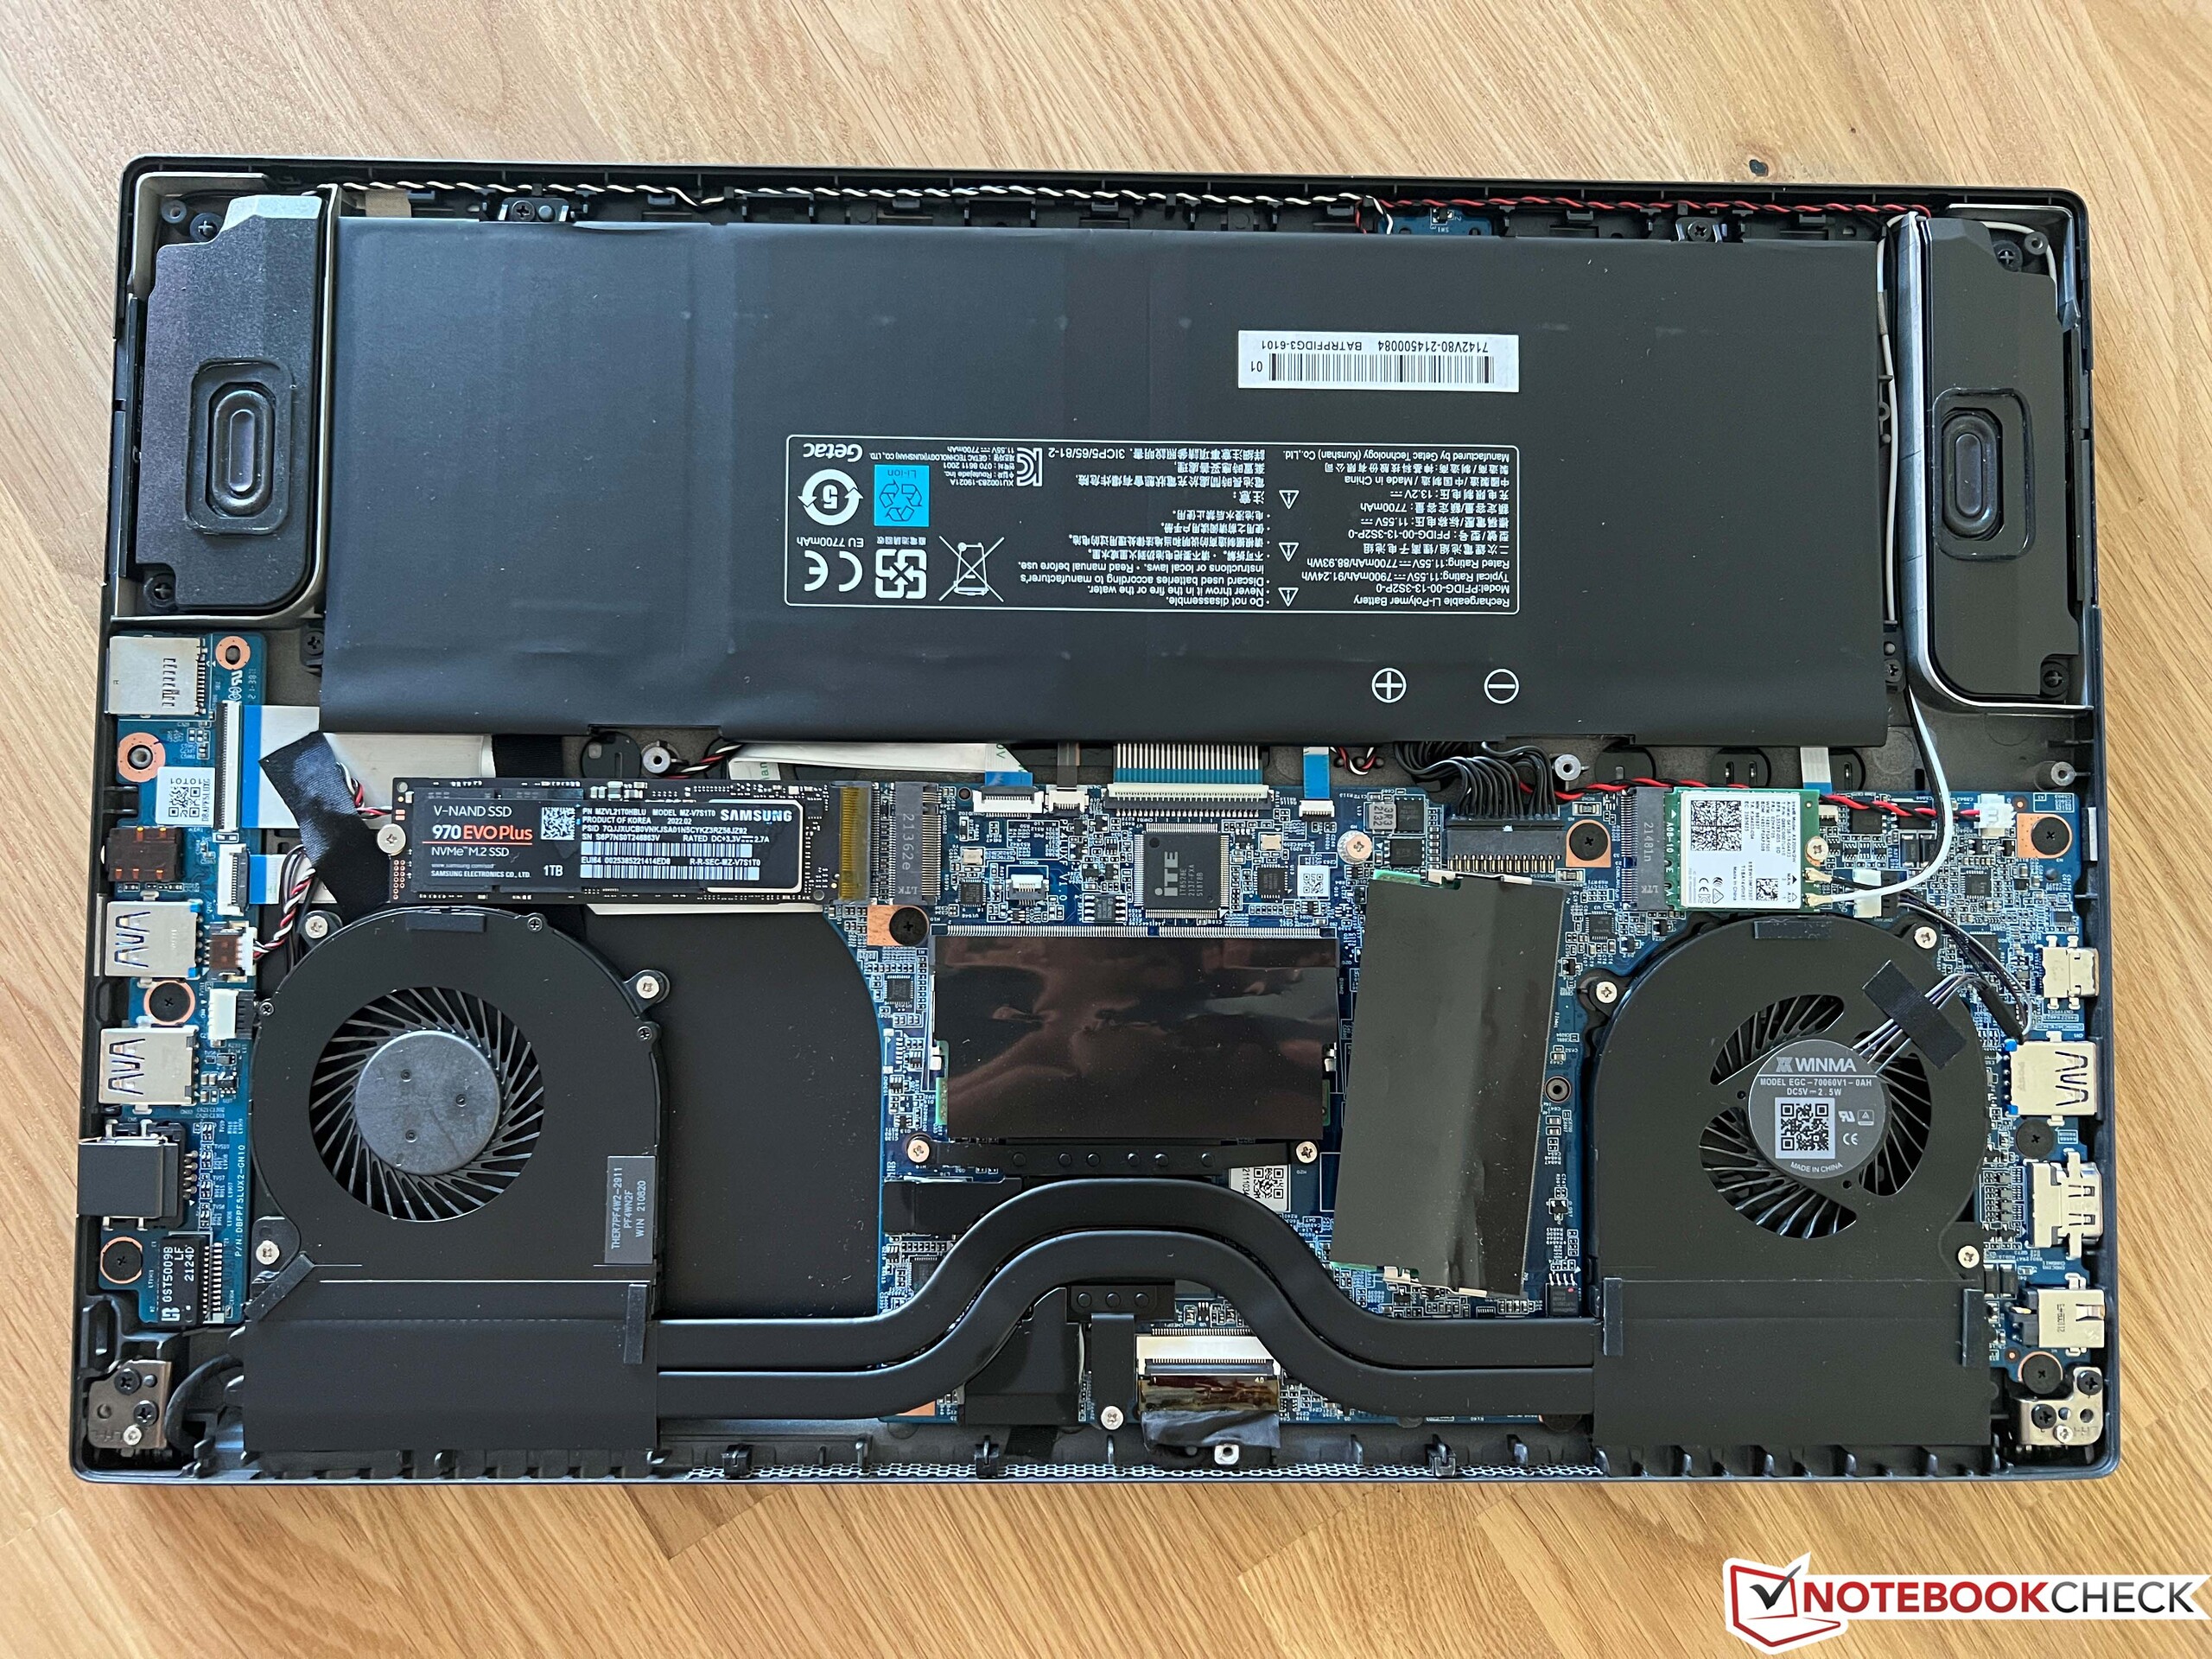
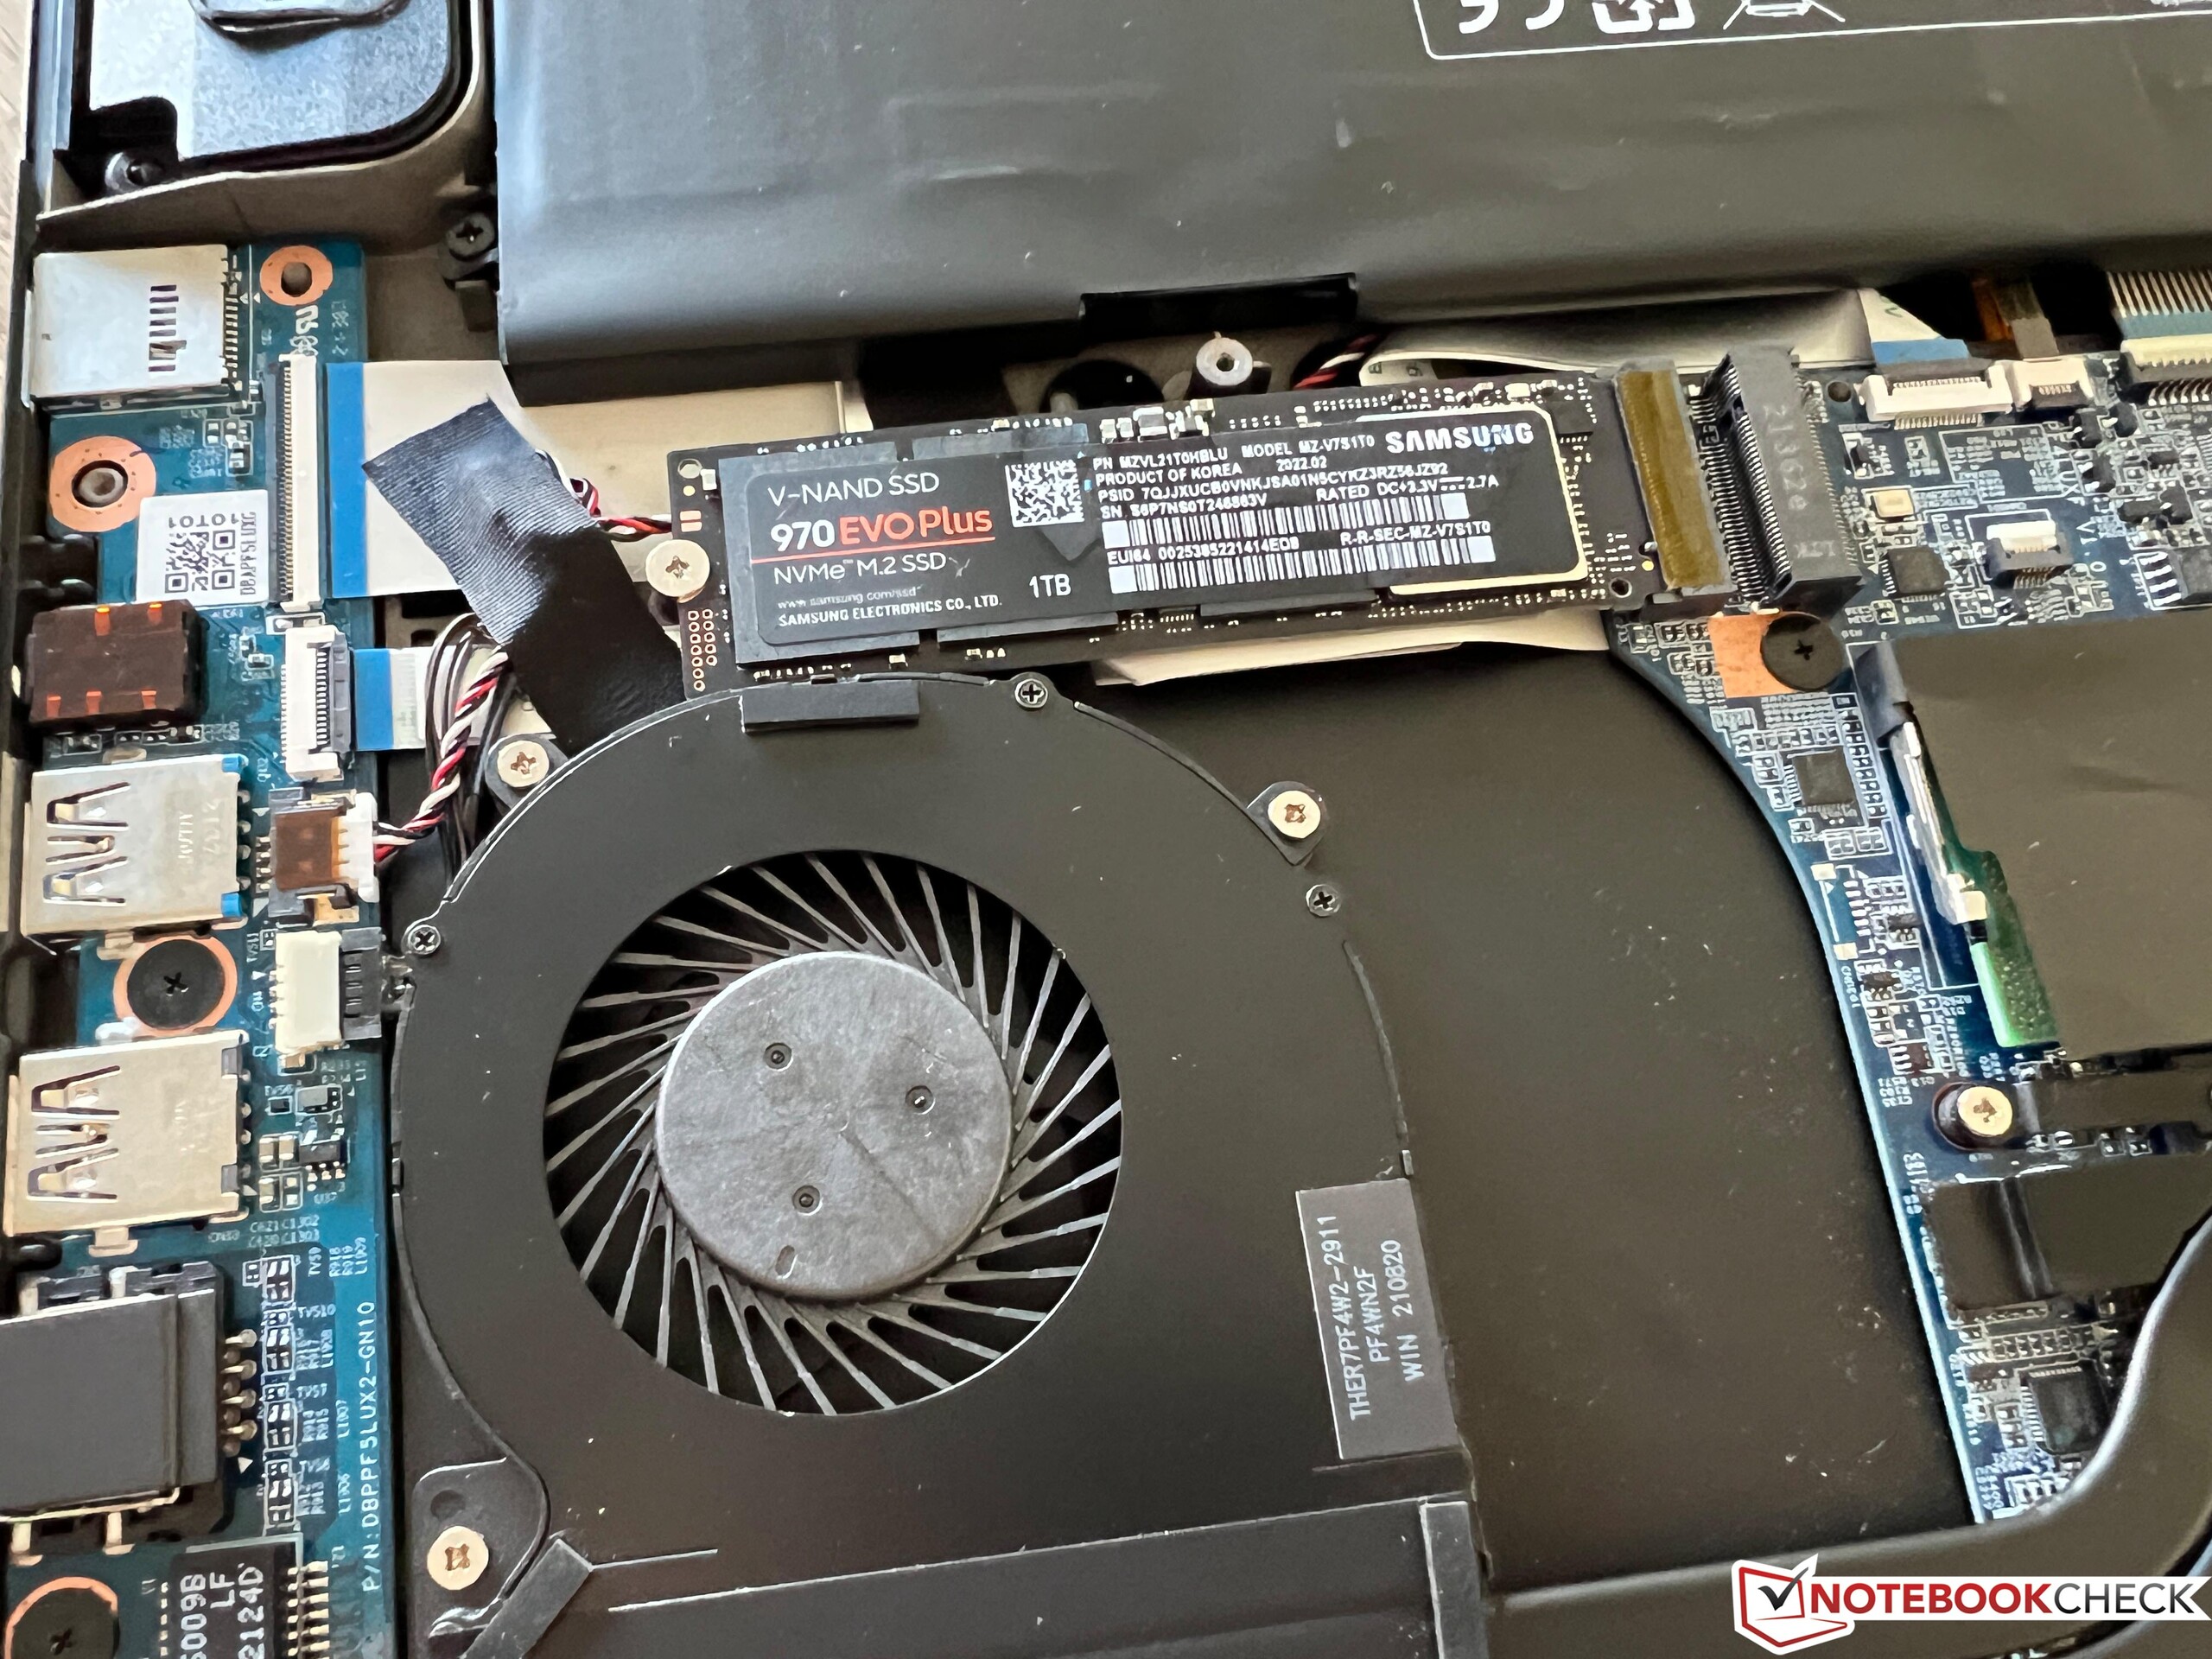
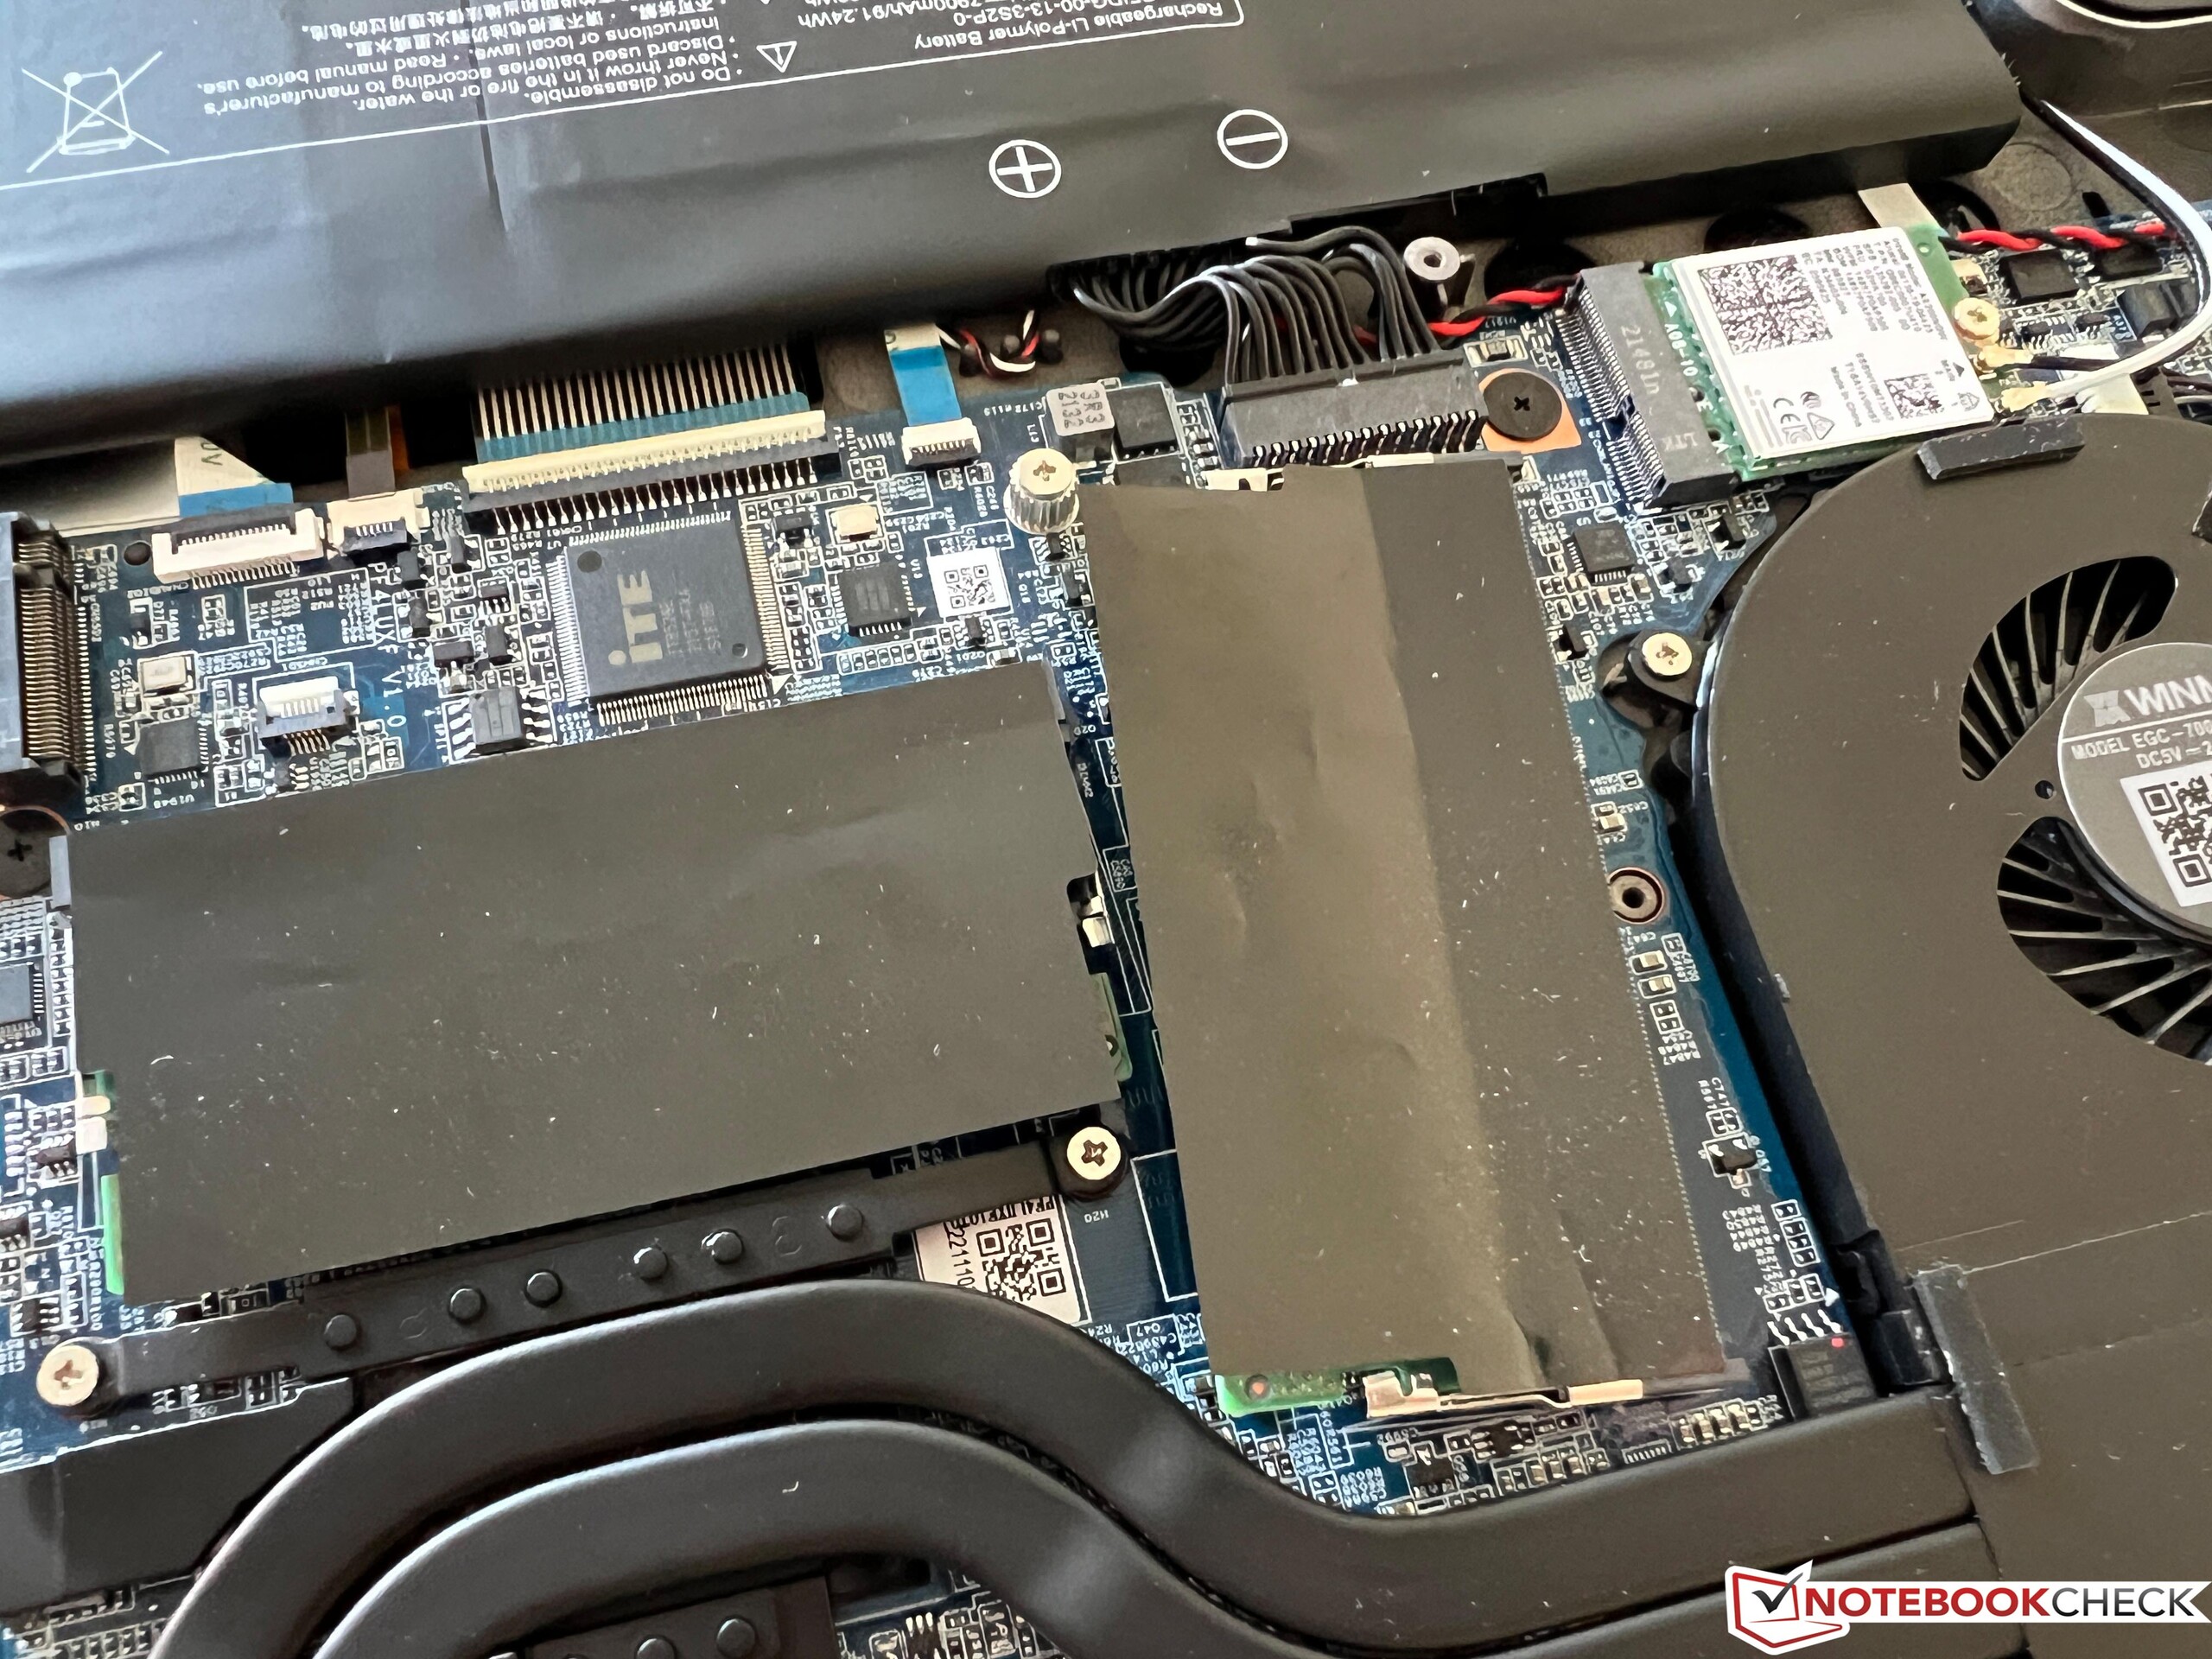
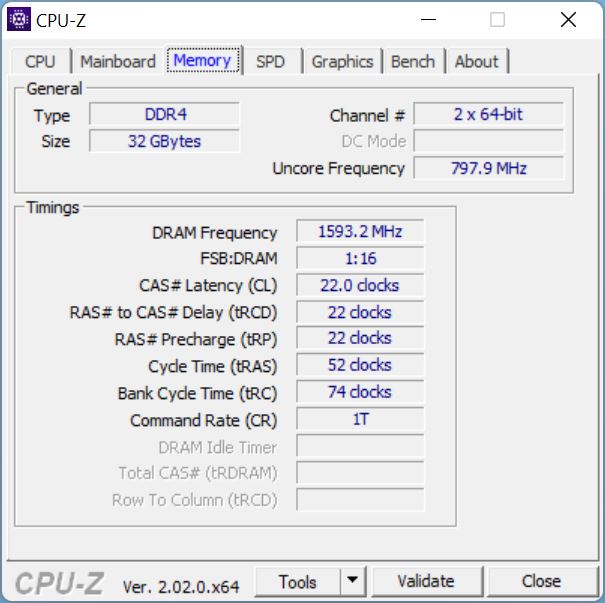
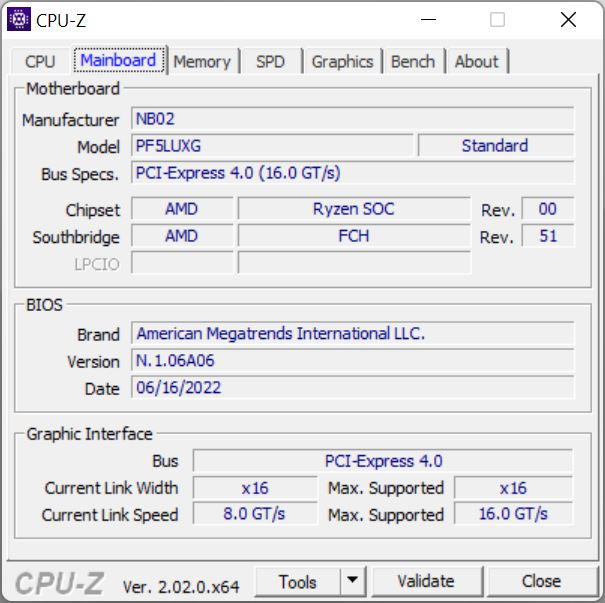
Testowane urządzenie zbiera punkty w opcjach rozbudowy, bo są po dwa sloty na moduły RAM i dyski SSD M.2-2280. Moduł WLAN również można wymienić, ale konfiguracja anten nie obsługuje sieci 6 GHz. Niemniej jednak, WLAN 6 i Bluetooth 5.1 są obsługiwane przez Intel AX200. Prędkości transferu były dobre w naszym teście. Czytnik microSD jest również zainstalowany po lewej stronie, ale nie jest szczególnie szybki z około 30 MB / s. Kamera internetowa 720p jest również tylko najbardziej potrzebna, a jakość obrazu nie jest szczególnie dobra.
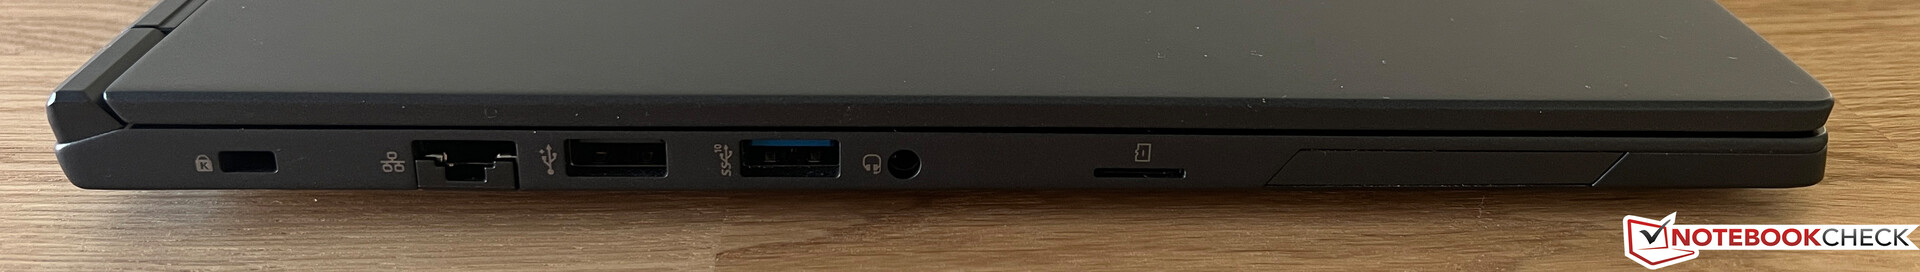
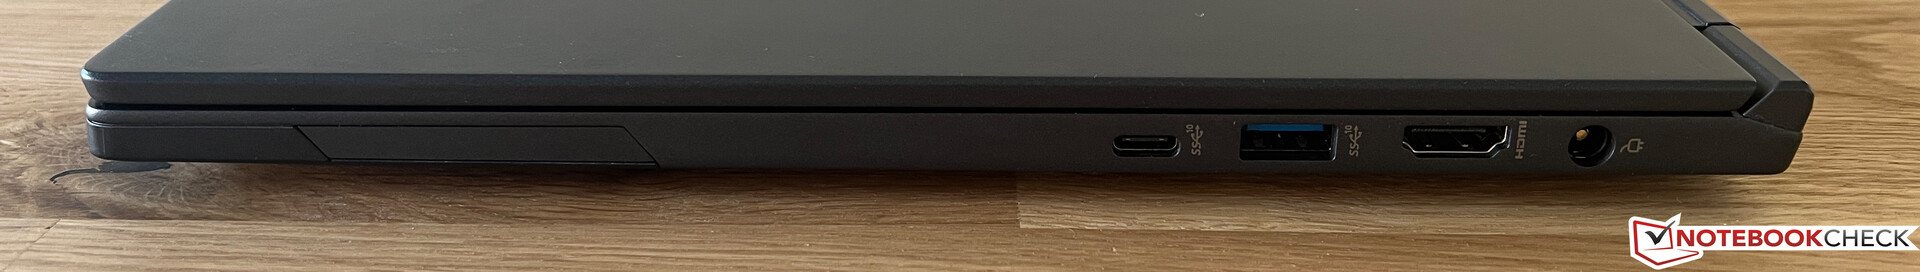
Wszystkie ważne porty są reprezentowane, przy czym jeden z portów USB-A nadal odpowiada staremu standardowi 2.0, który nie jest już aktualny. Jednak urządzenie można również ładować przez USB-C oprócz portu zasilania. Port Gigabit Ethernet jest również dostępny dla sieci przewodowych.

| SD Card Reader | |
| average JPG Copy Test (av. of 3 runs) | |
| Lenovo ThinkBook 15 G4 21DL0009GE | |
| Średnia w klasie Office (19.8 - 198.5, n=21, ostatnie 2 lata) | |
| Schenker VIA 15 Pro M22 (Angelbird AV Pro V60) | |
| Dell Latitude 3520 (AV Pro SD microSD 128 GB V60) | |
| Dell Inspiron 15 5515-H8P8F (AV Pro SD microSD 128 GB V60) | |
| maximum AS SSD Seq Read Test (1GB) | |
| Lenovo ThinkBook 15 G4 21DL0009GE | |
| Średnia w klasie Office (27.4 - 249, n=20, ostatnie 2 lata) | |
| Dell Inspiron 15 5515-H8P8F (AV Pro SD microSD 128 GB V60) | |
| Schenker VIA 15 Pro M22 (Angelbird AV Pro V60) | |
| Dell Latitude 3520 (AV Pro SD microSD 128 GB V60) | |
| Networking | |
| Schenker VIA 15 Pro M22 | |
| iperf3 transmit AXE11000 | |
| iperf3 receive AXE11000 | |
| Dell Latitude 3520 | |
| iperf3 transmit AXE11000 | |
| iperf3 receive AXE11000 | |
| HP ProBook 450 G9 6A180EA | |
| iperf3 transmit AXE11000 6GHz | |
| iperf3 receive AXE11000 6GHz | |
| Dell Inspiron 15 5515-H8P8F | |
| iperf3 transmit AXE11000 6GHz | |
| iperf3 receive AXE11000 6GHz | |
| Lenovo ThinkBook 15 G4 21DL0009GE | |
| iperf3 transmit AXE11000 | |
| iperf3 receive AXE11000 | |


Urządzenia wejściowe - Podświetlana klawiatura
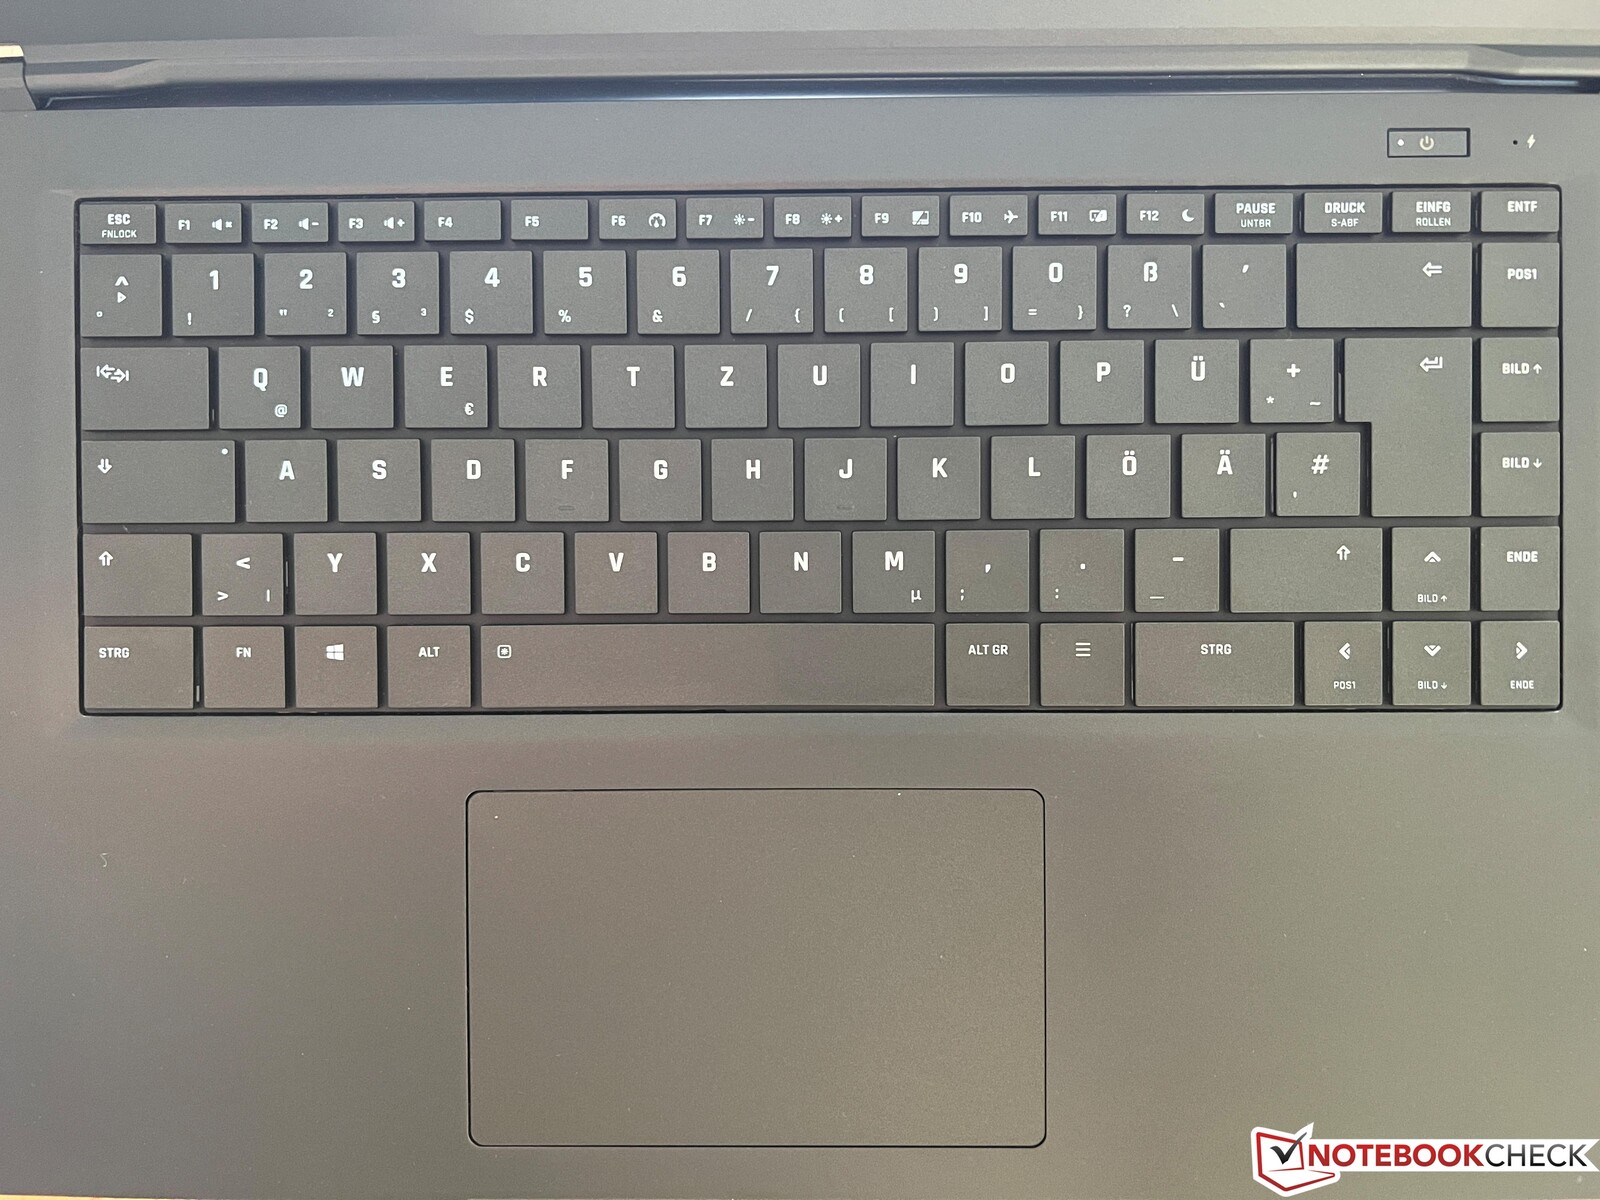
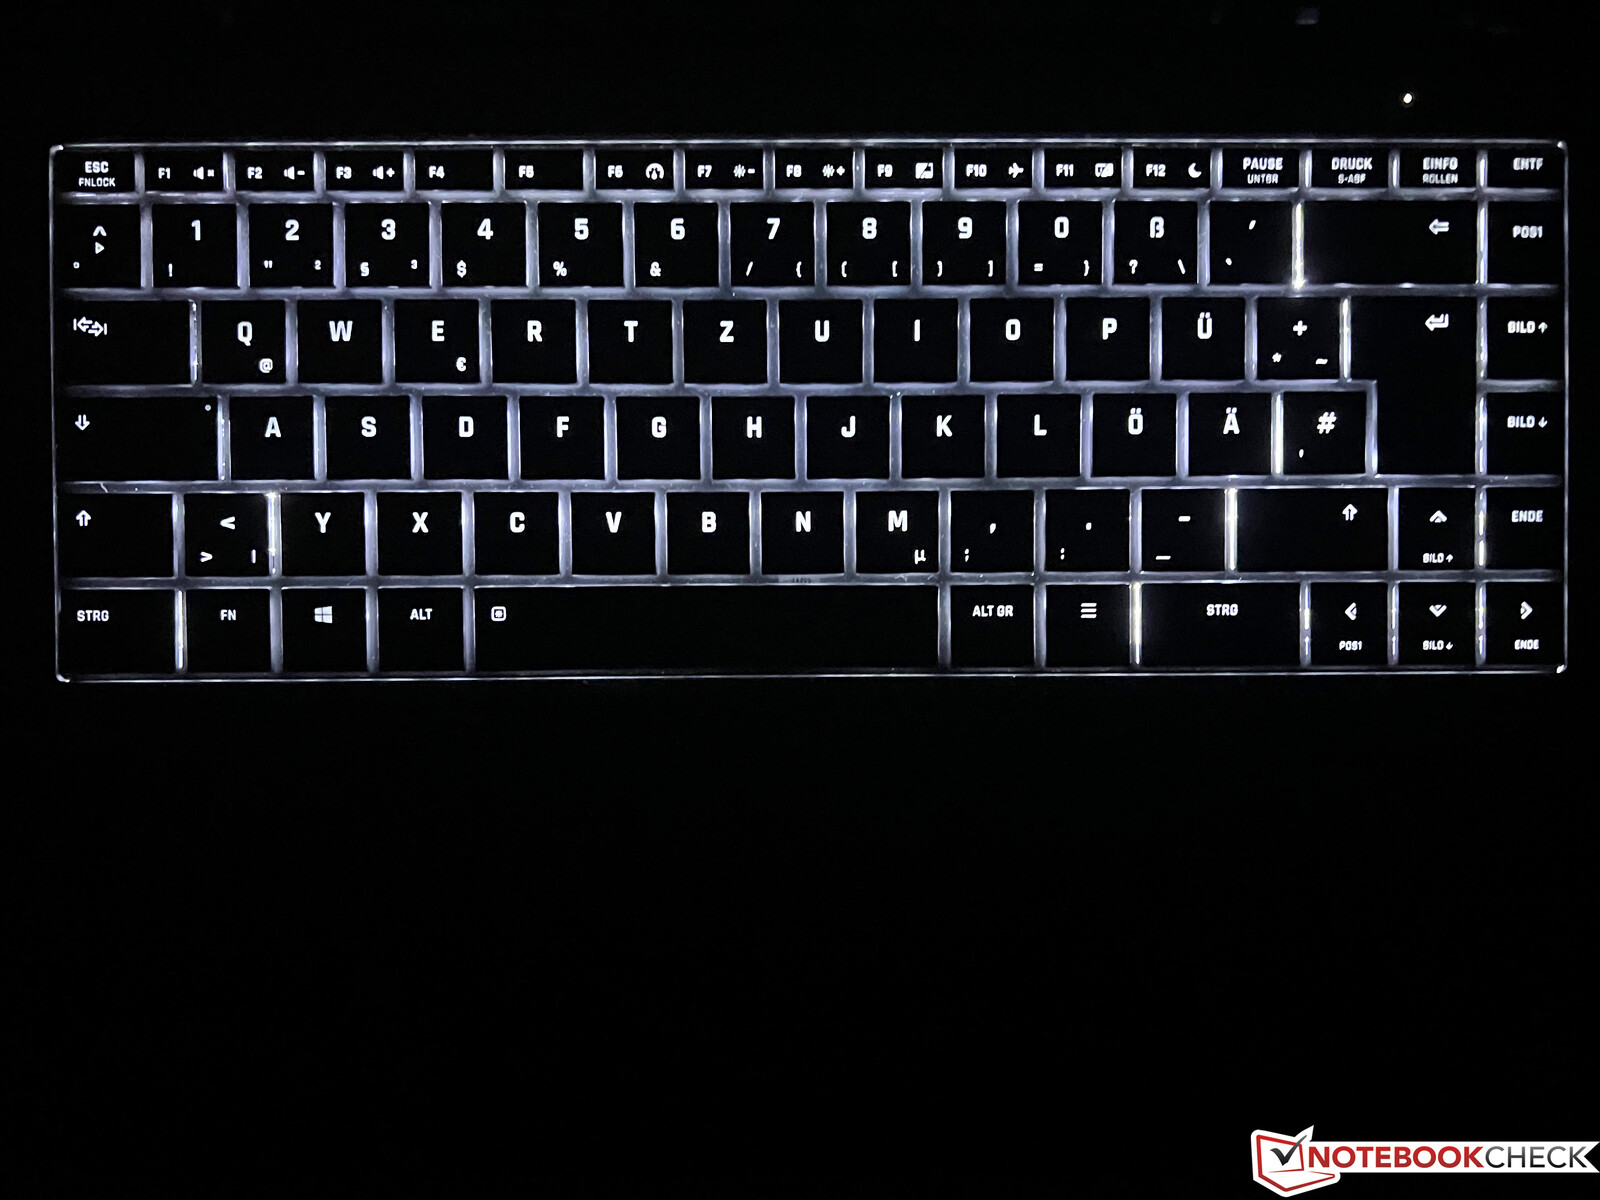
VIA Pro 15 oferuje dużą, podświetlaną klawiaturę, na której pisze się bardzo wygodnie, co ułatwia pisanie dłuższych tekstów. Do układu trzeba się jednak przyzwyczaić, gdyż po prawej stronie znajduje się dodatkowa kolumna z klawiszami specjalnymi (np. dedykowane klawisze Page Up/Page Down). Trzeba jednak obejść się bez klawiatury numerycznej. Duży ClickPad również działa bez zarzutu i można go wcisnąć w dolnej połowie, czemu towarzyszą głośne odgłosy klikania.
Wyświetlacz - panel WQHD o częstotliwości odświeżania 165 Hz
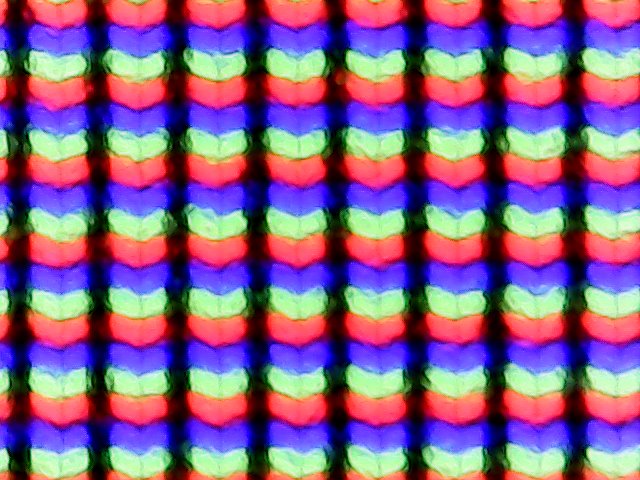
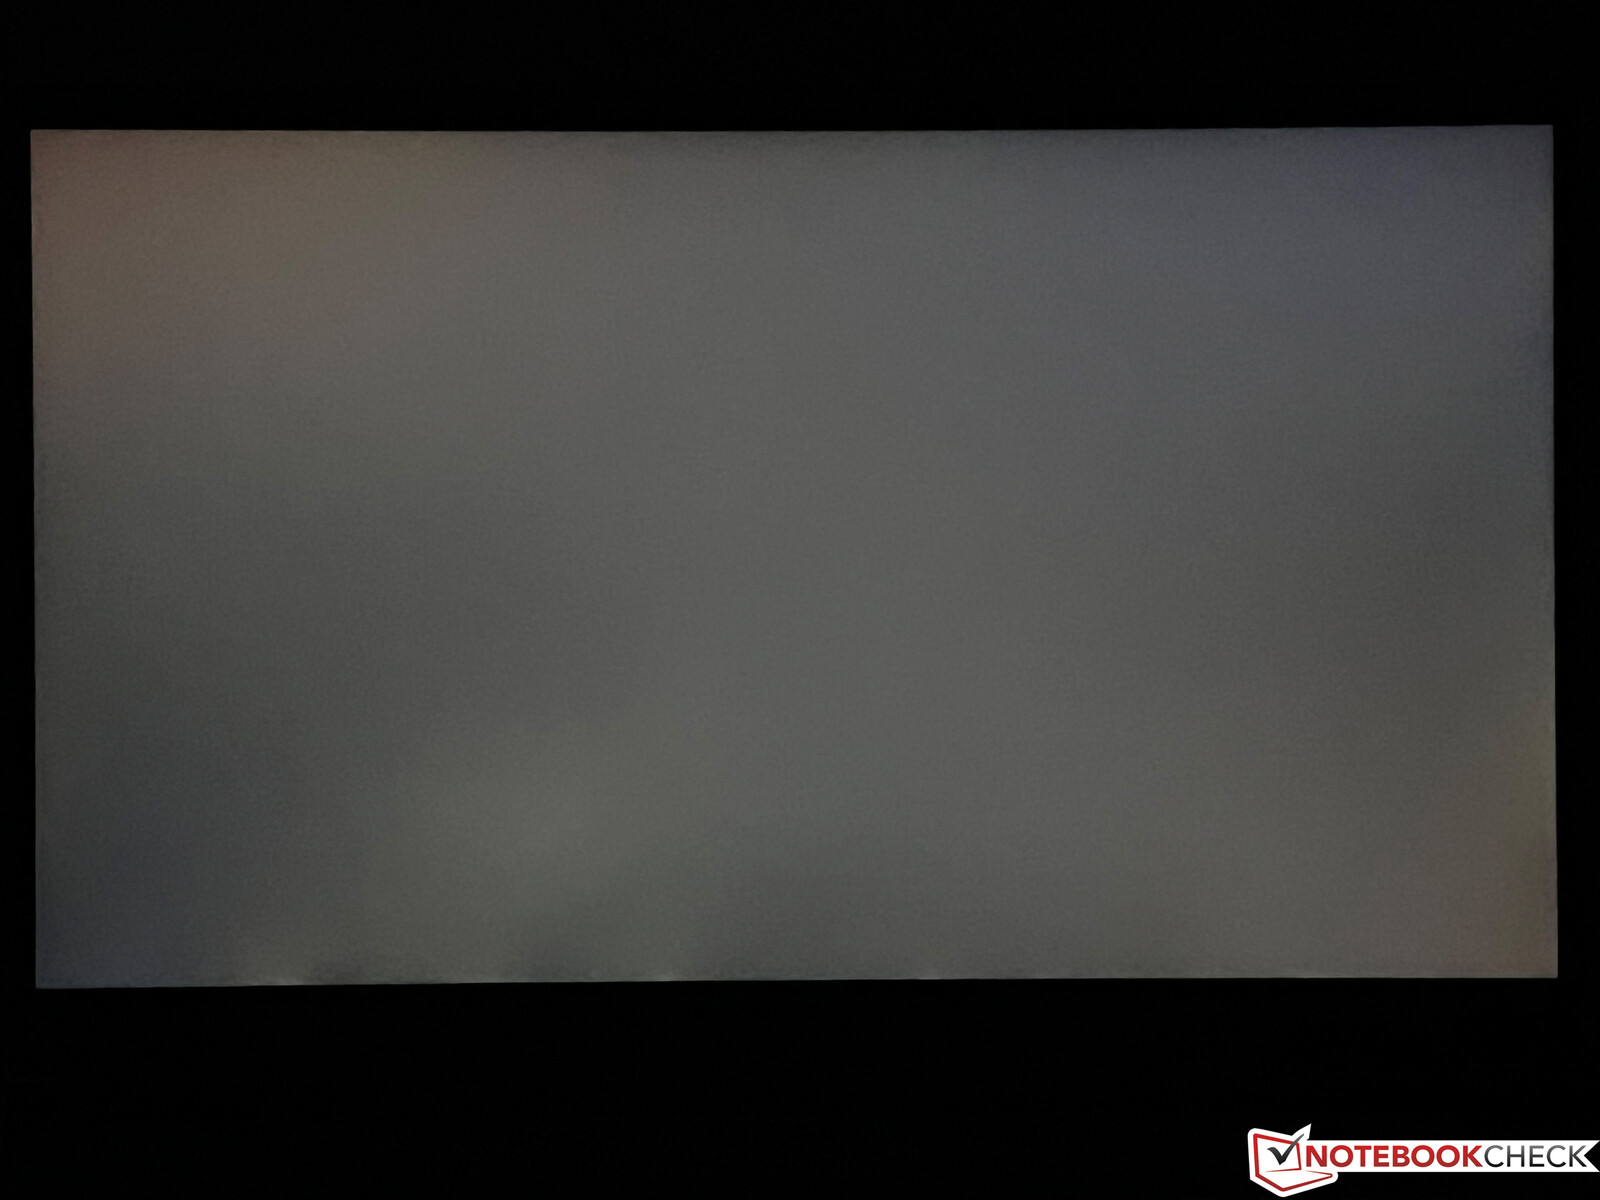
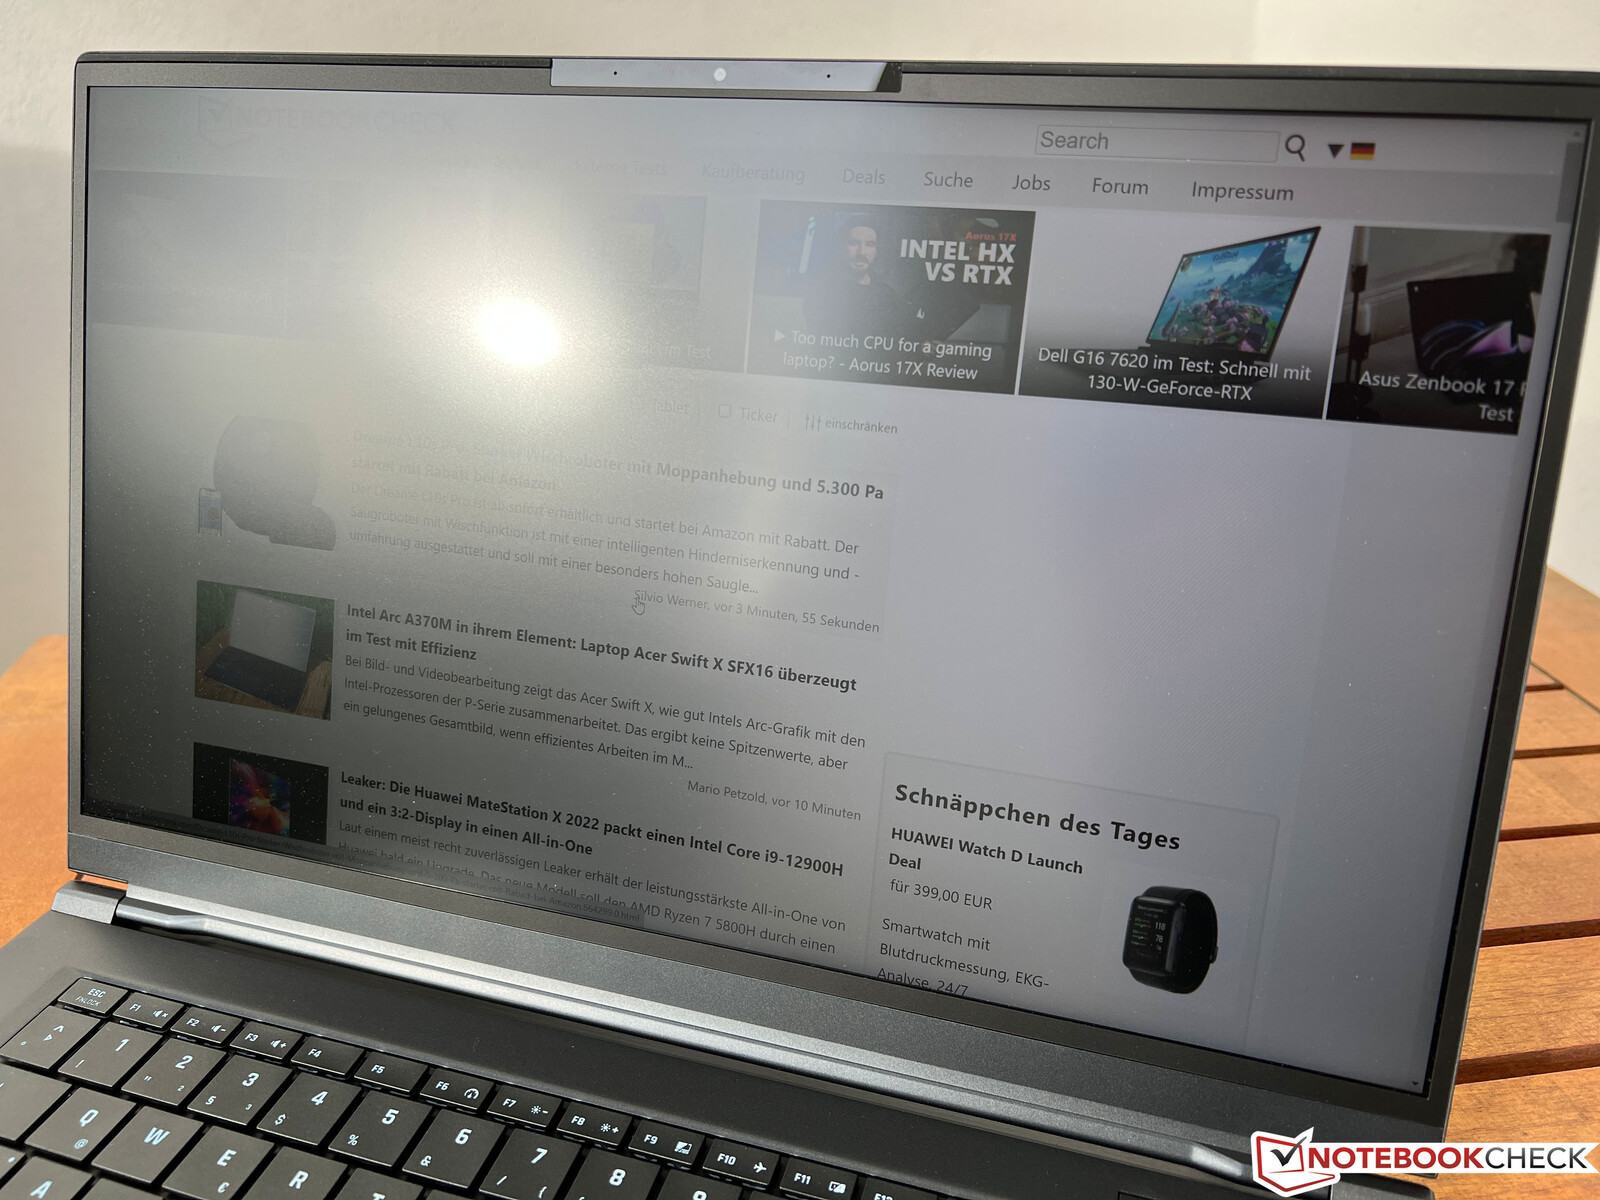
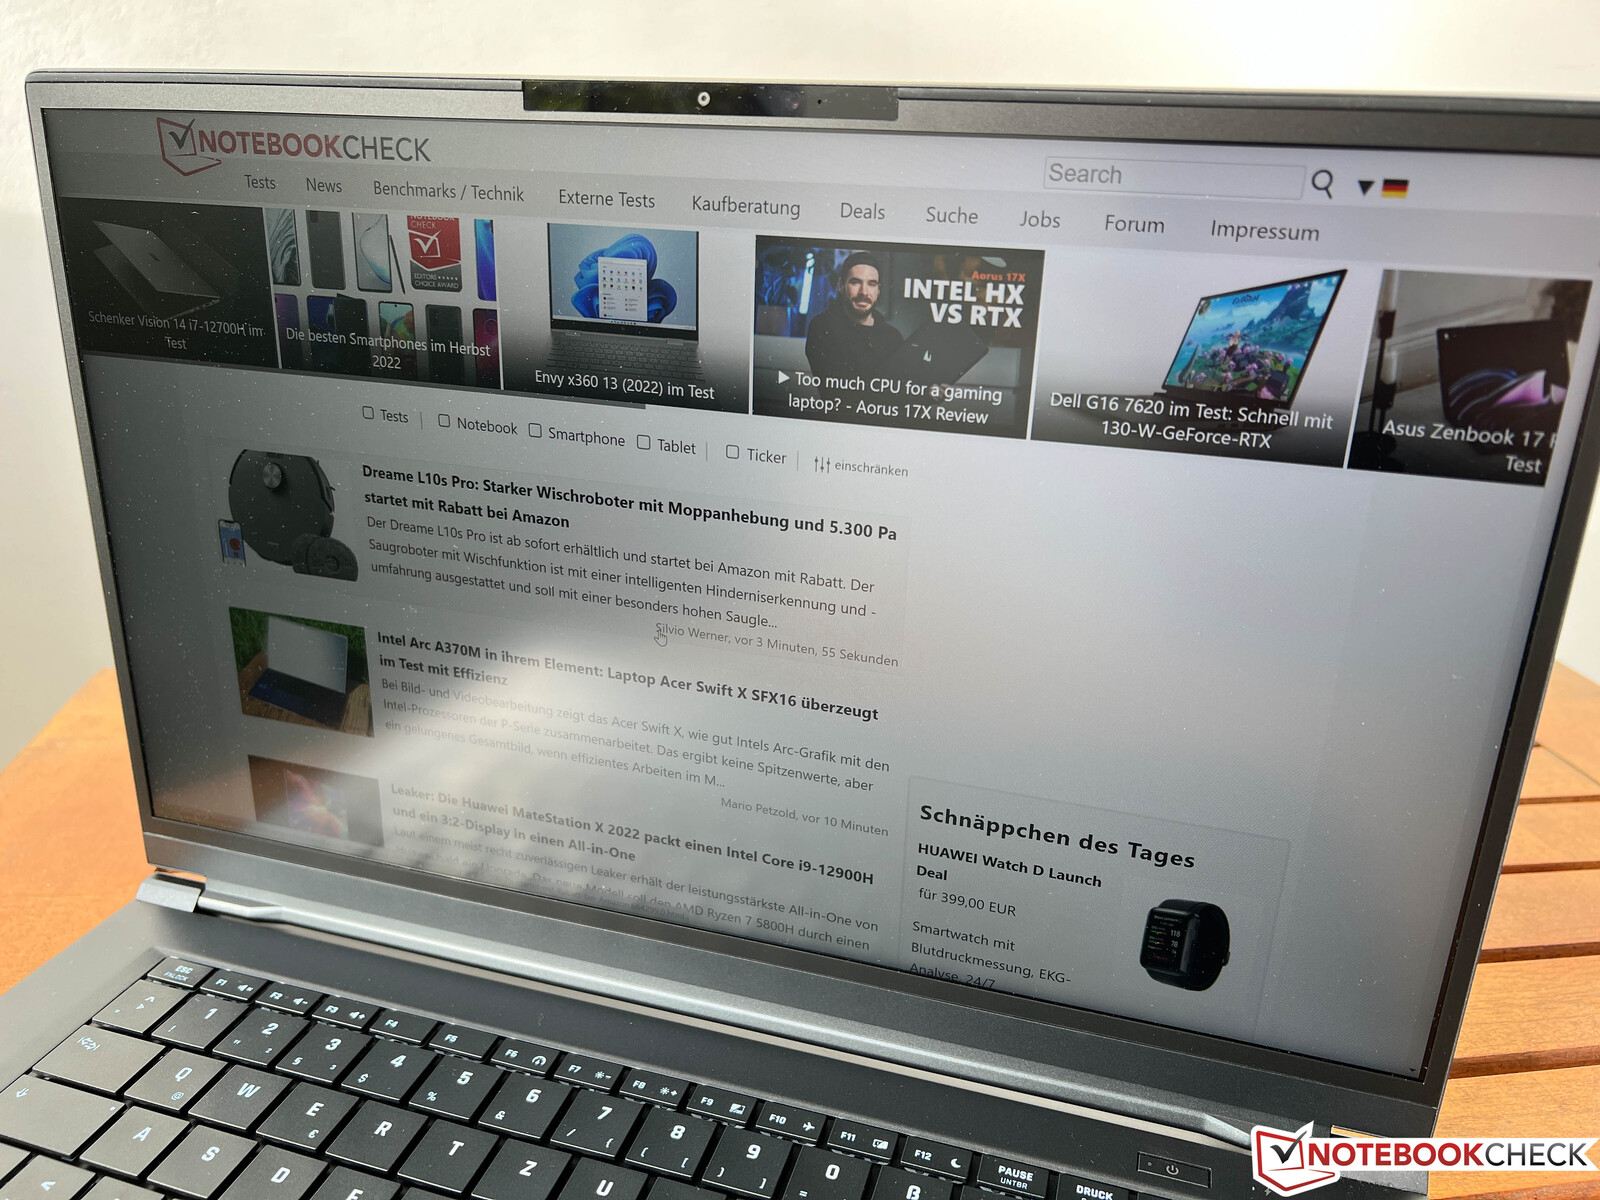
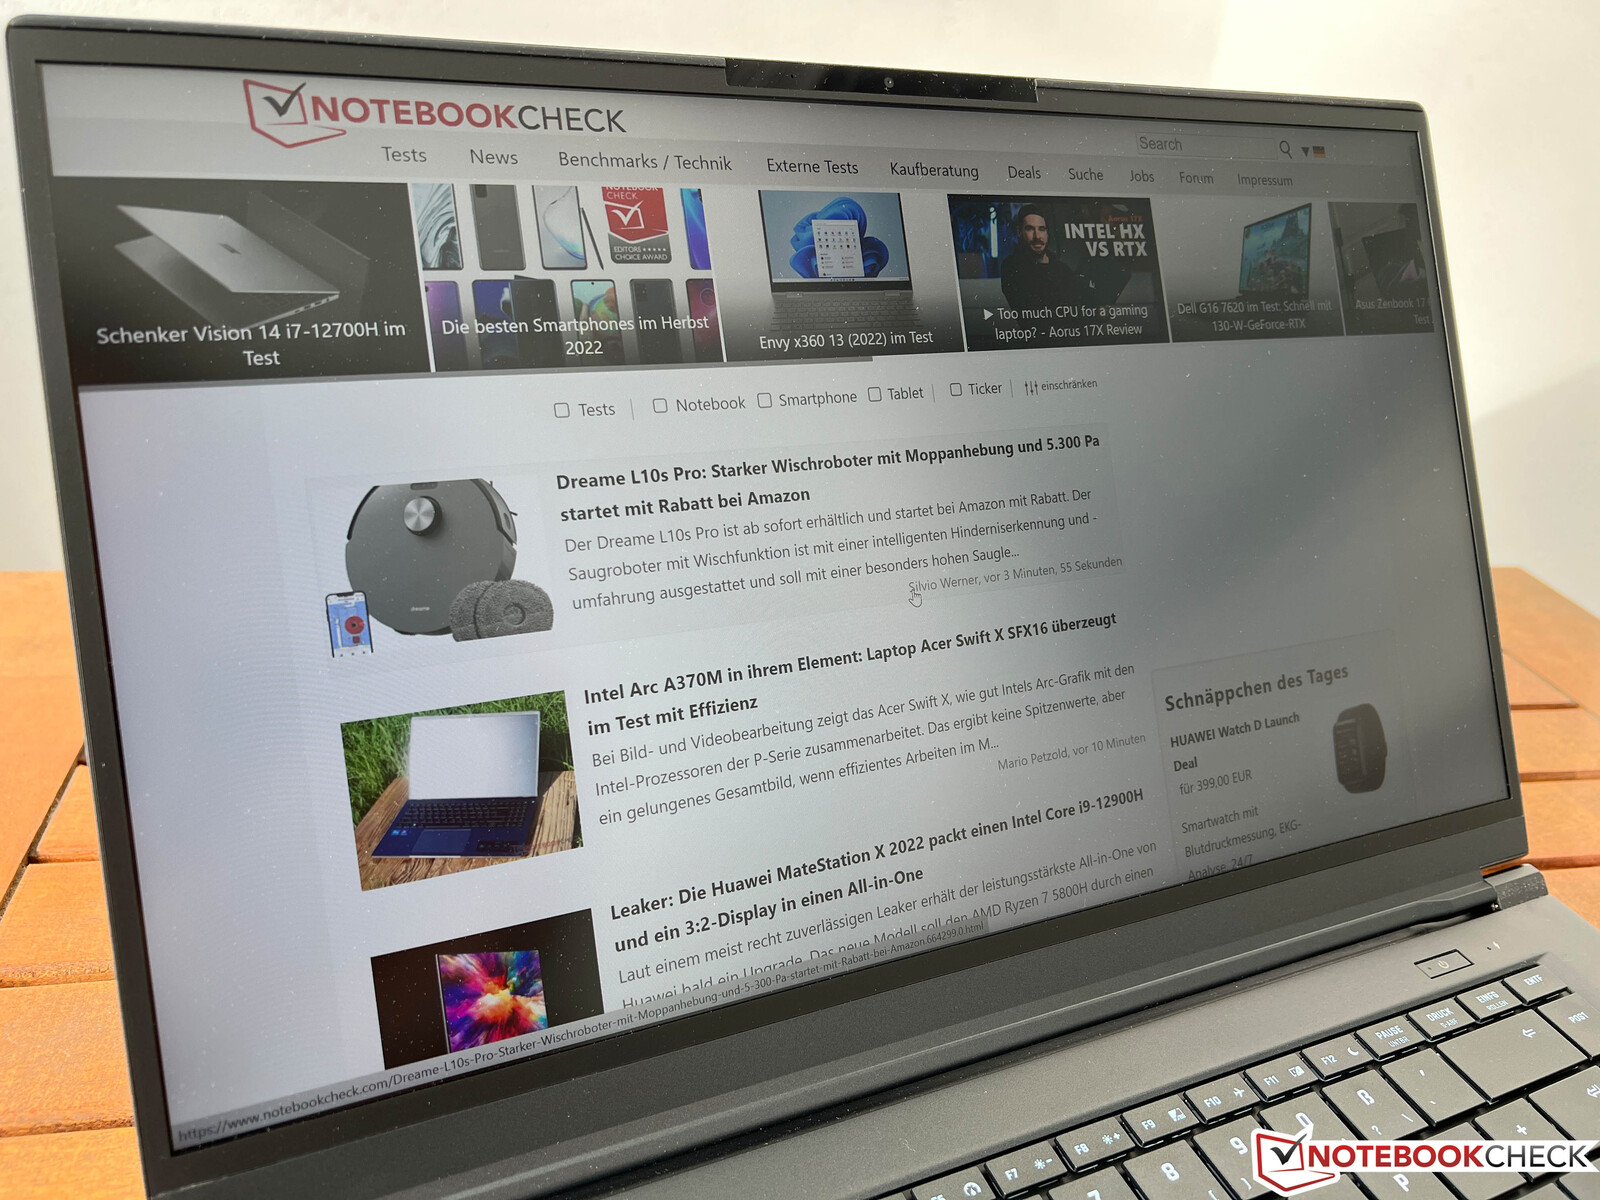
Wyświetlacz 16:9 oferuje rozdzielczość WQHD (2560 x 1440 pikseli) i szybką częstotliwość odświeżania 165 Hz. Dzięki temu ruchy są bardzo płynne, a subiektywne wrażenie obrazu z matowego panelu jest również doskonałe, ponieważ nawet jasne powierzchnie nie wyglądają na ziarniste. Czasy reakcji są przyjemnie szybkie i nie jest używany PWM, ale widoczne są aureole przy wysokiej jasności i ciemnym tle.
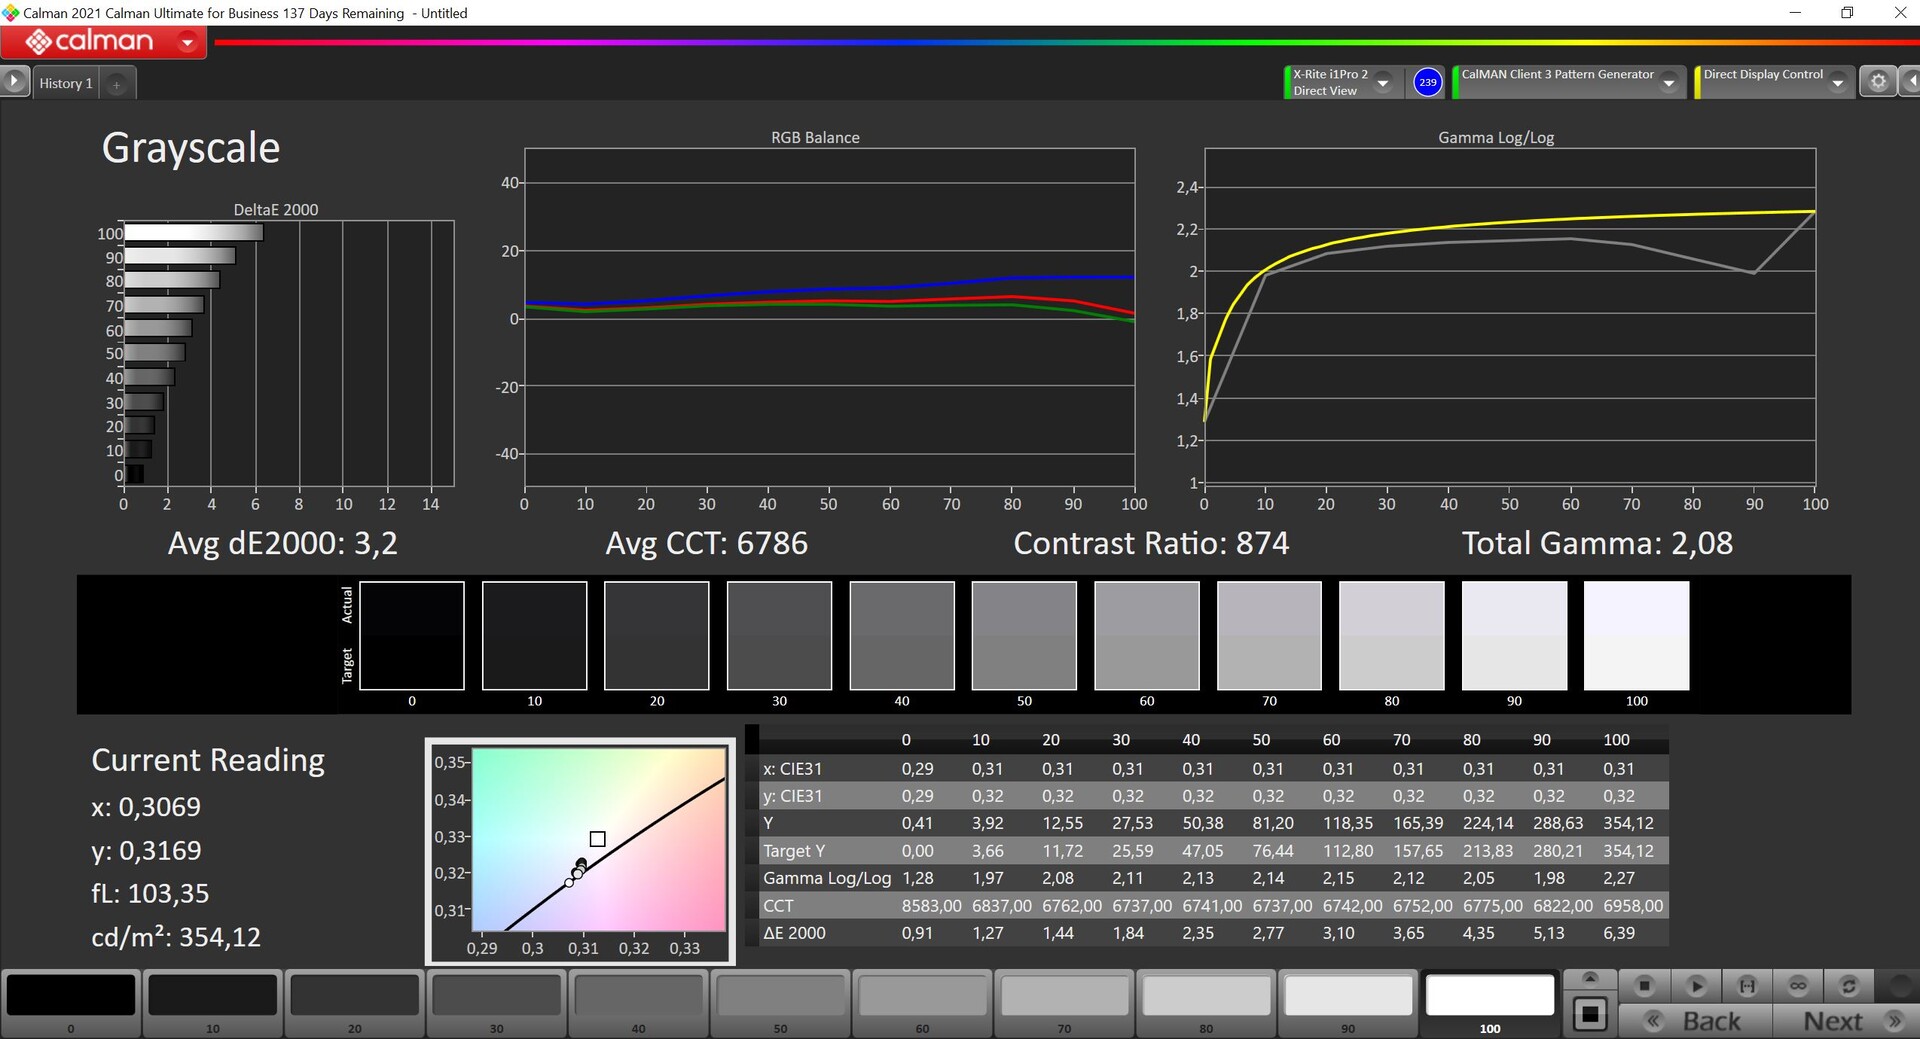
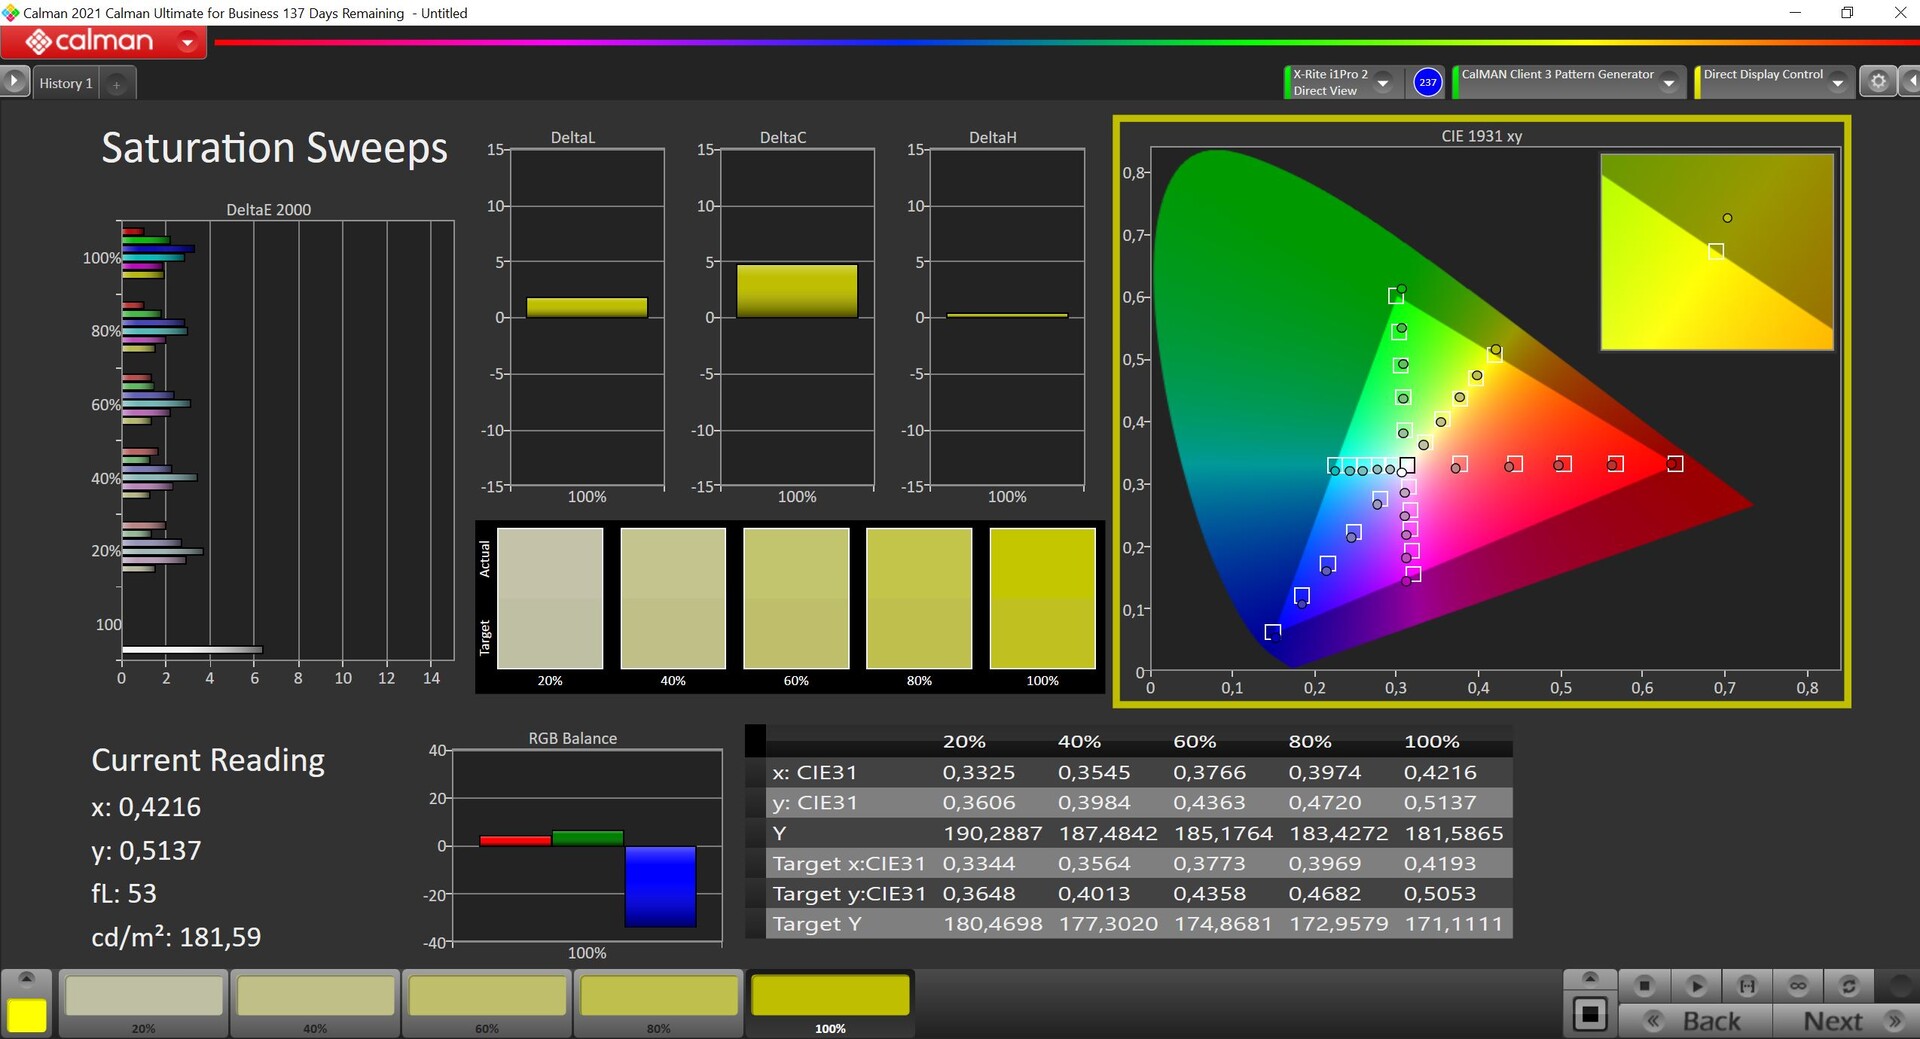
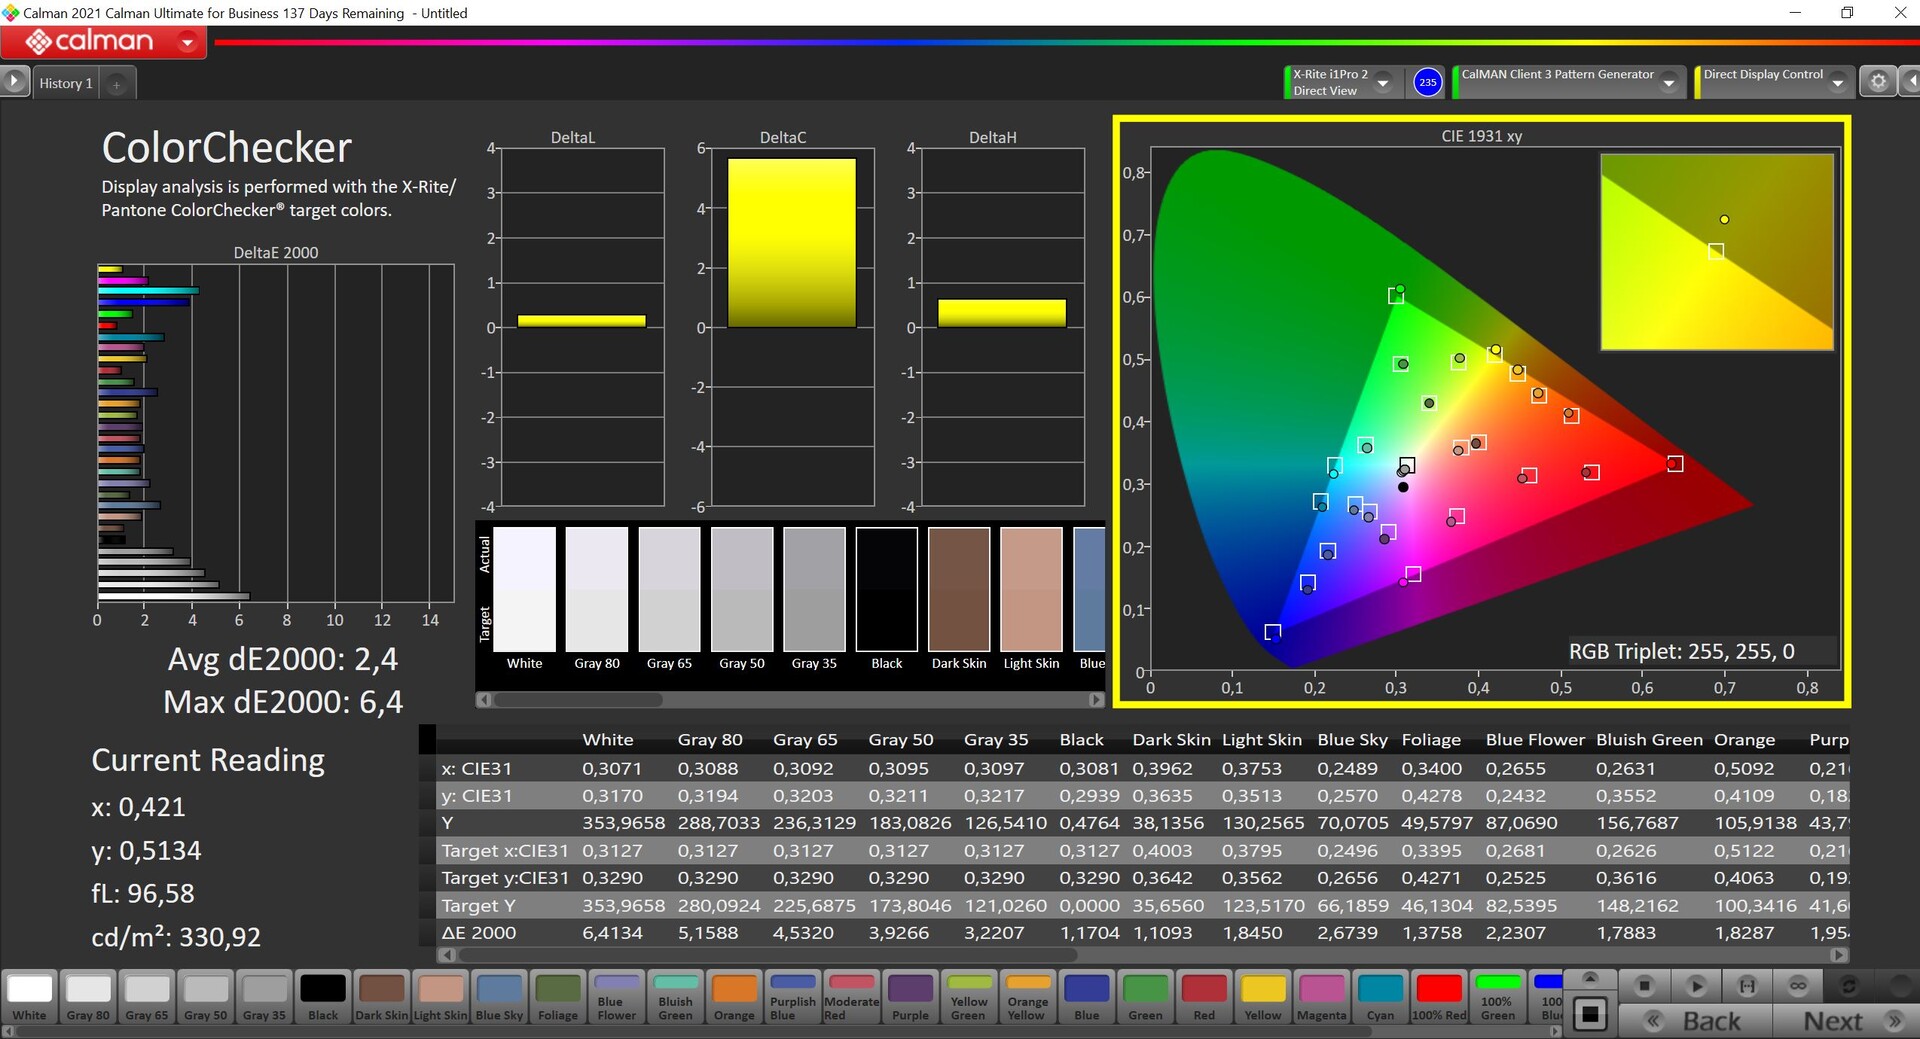
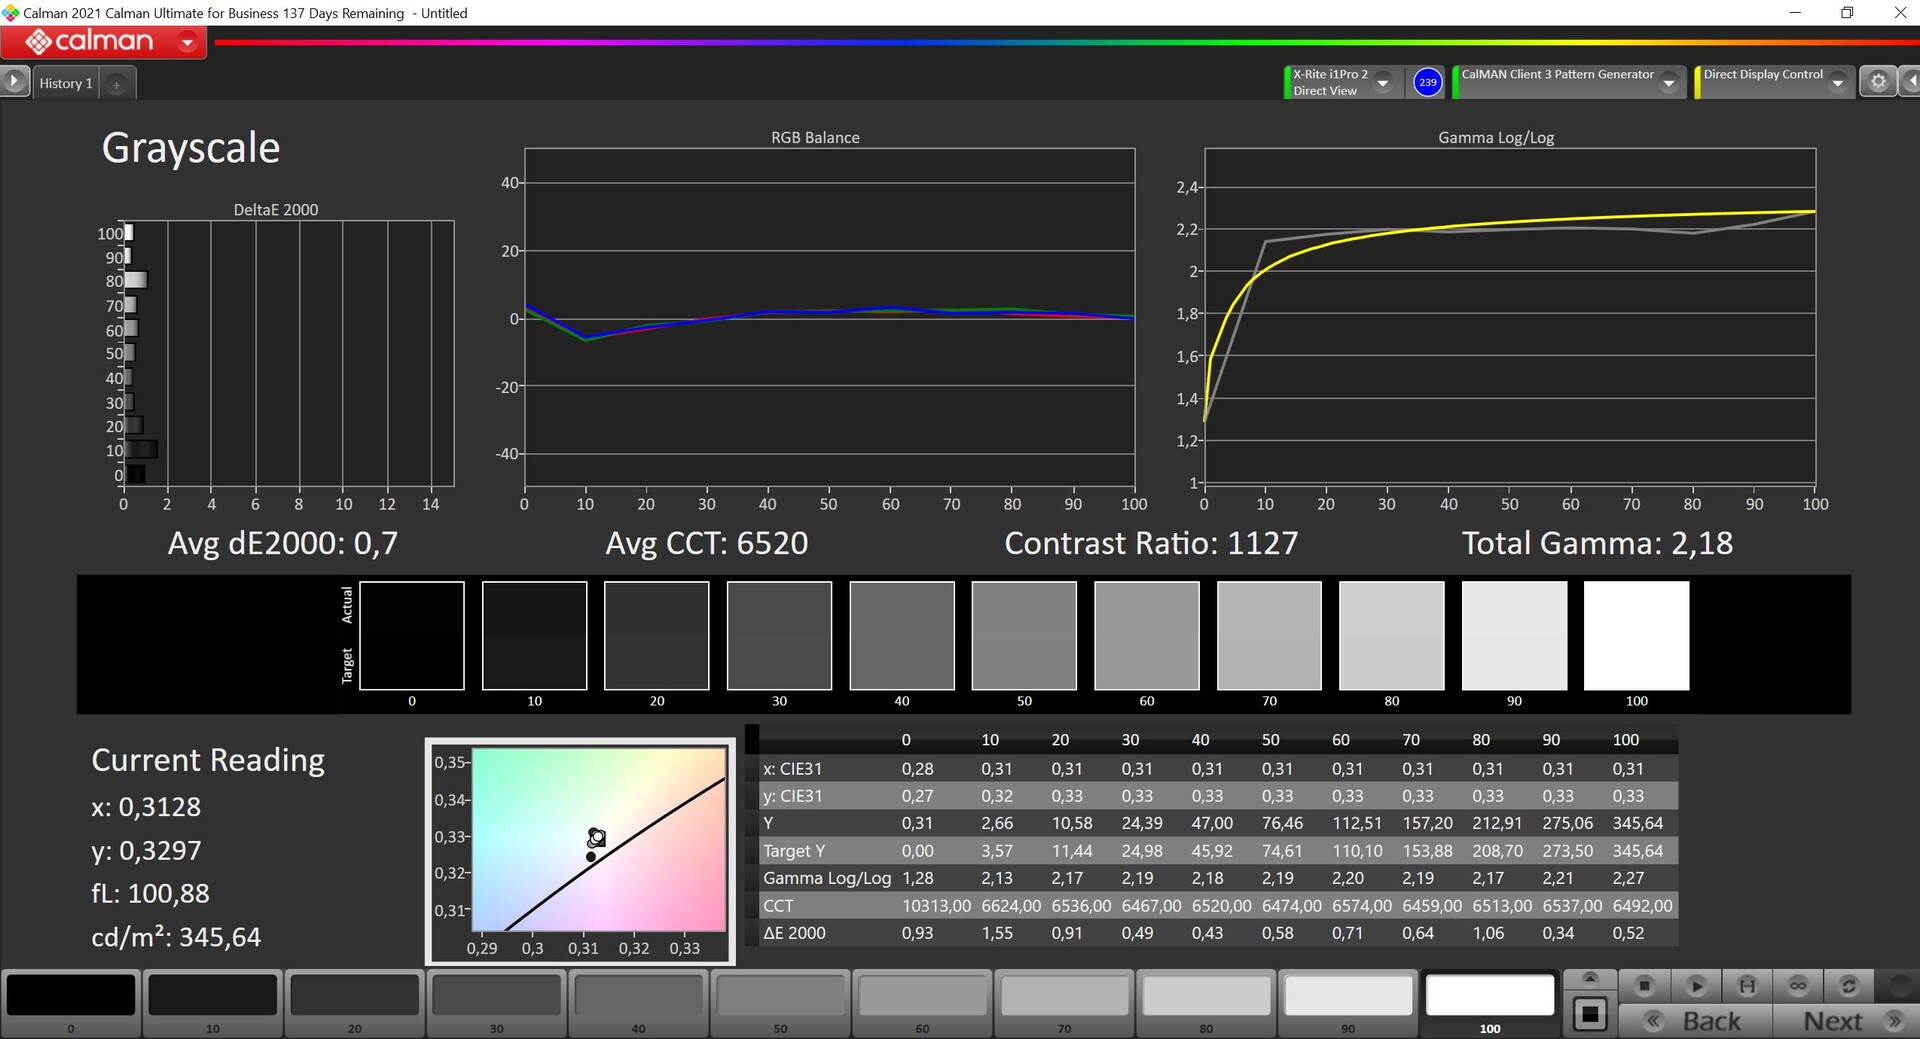
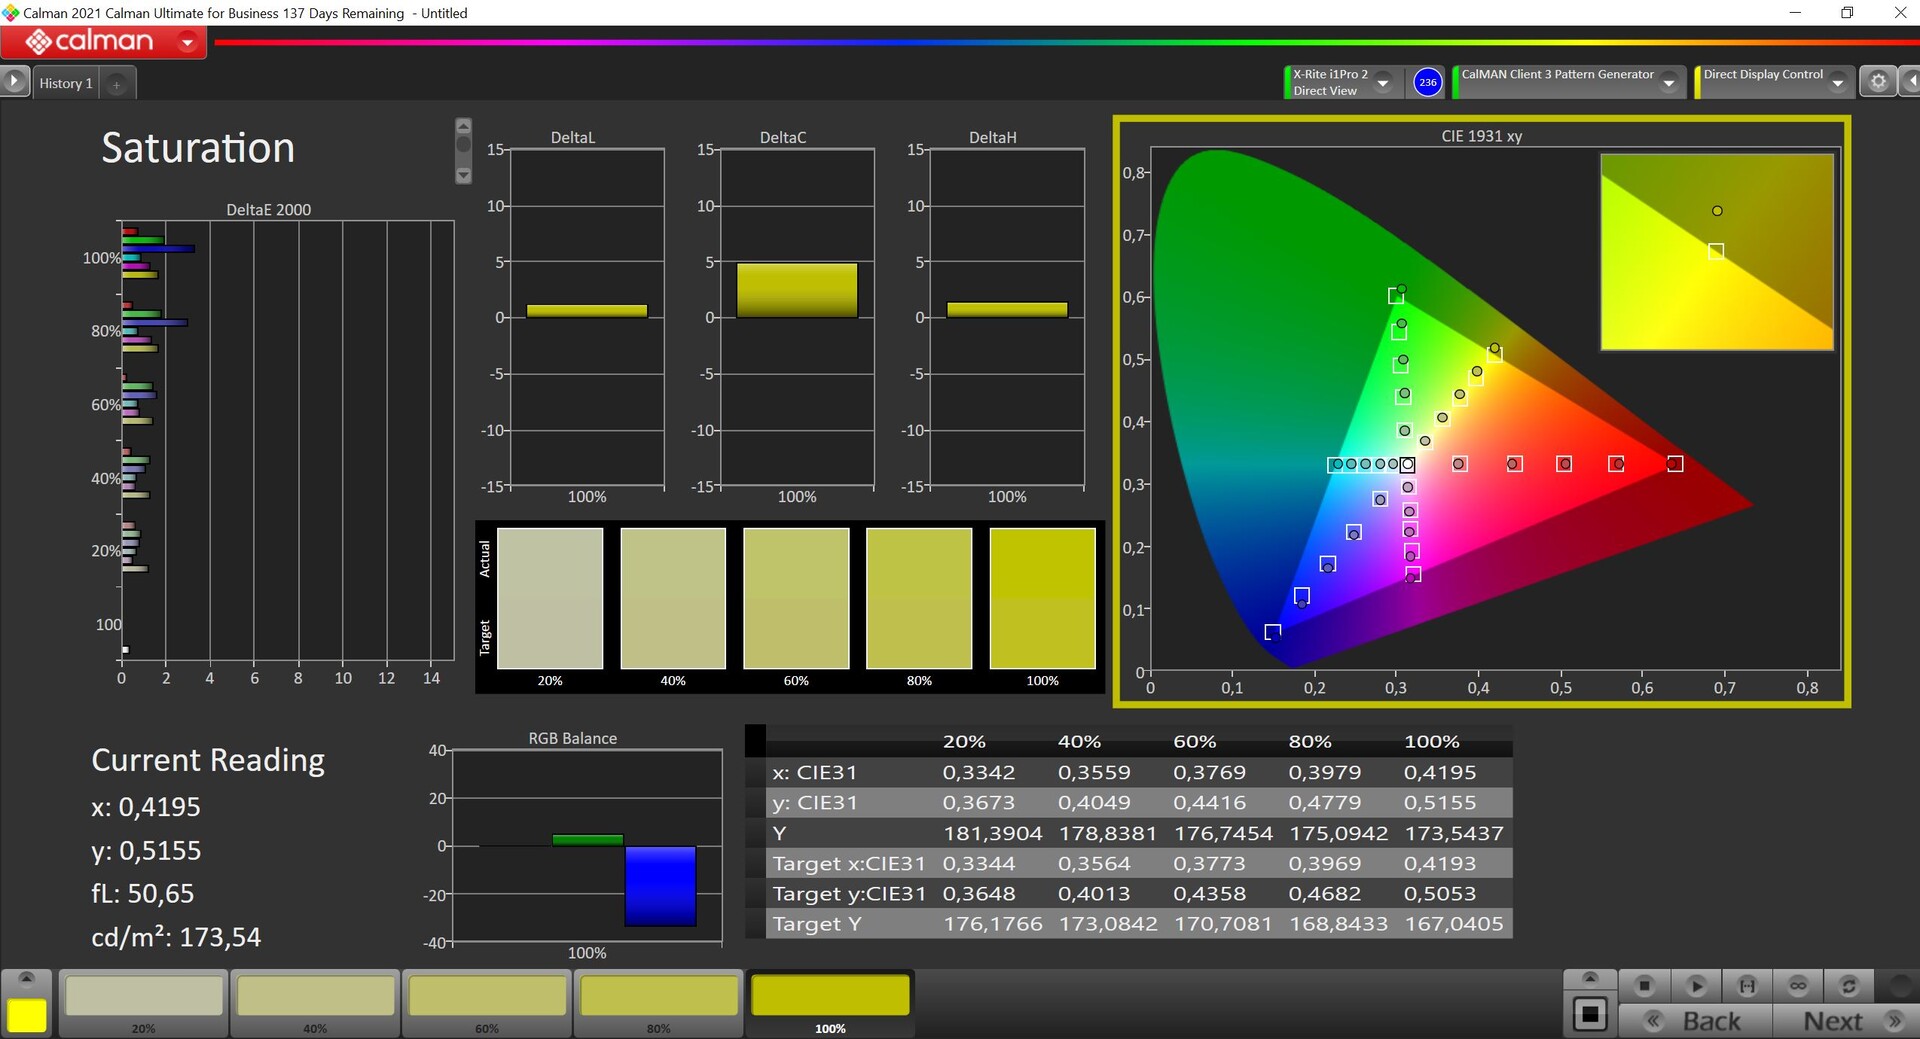
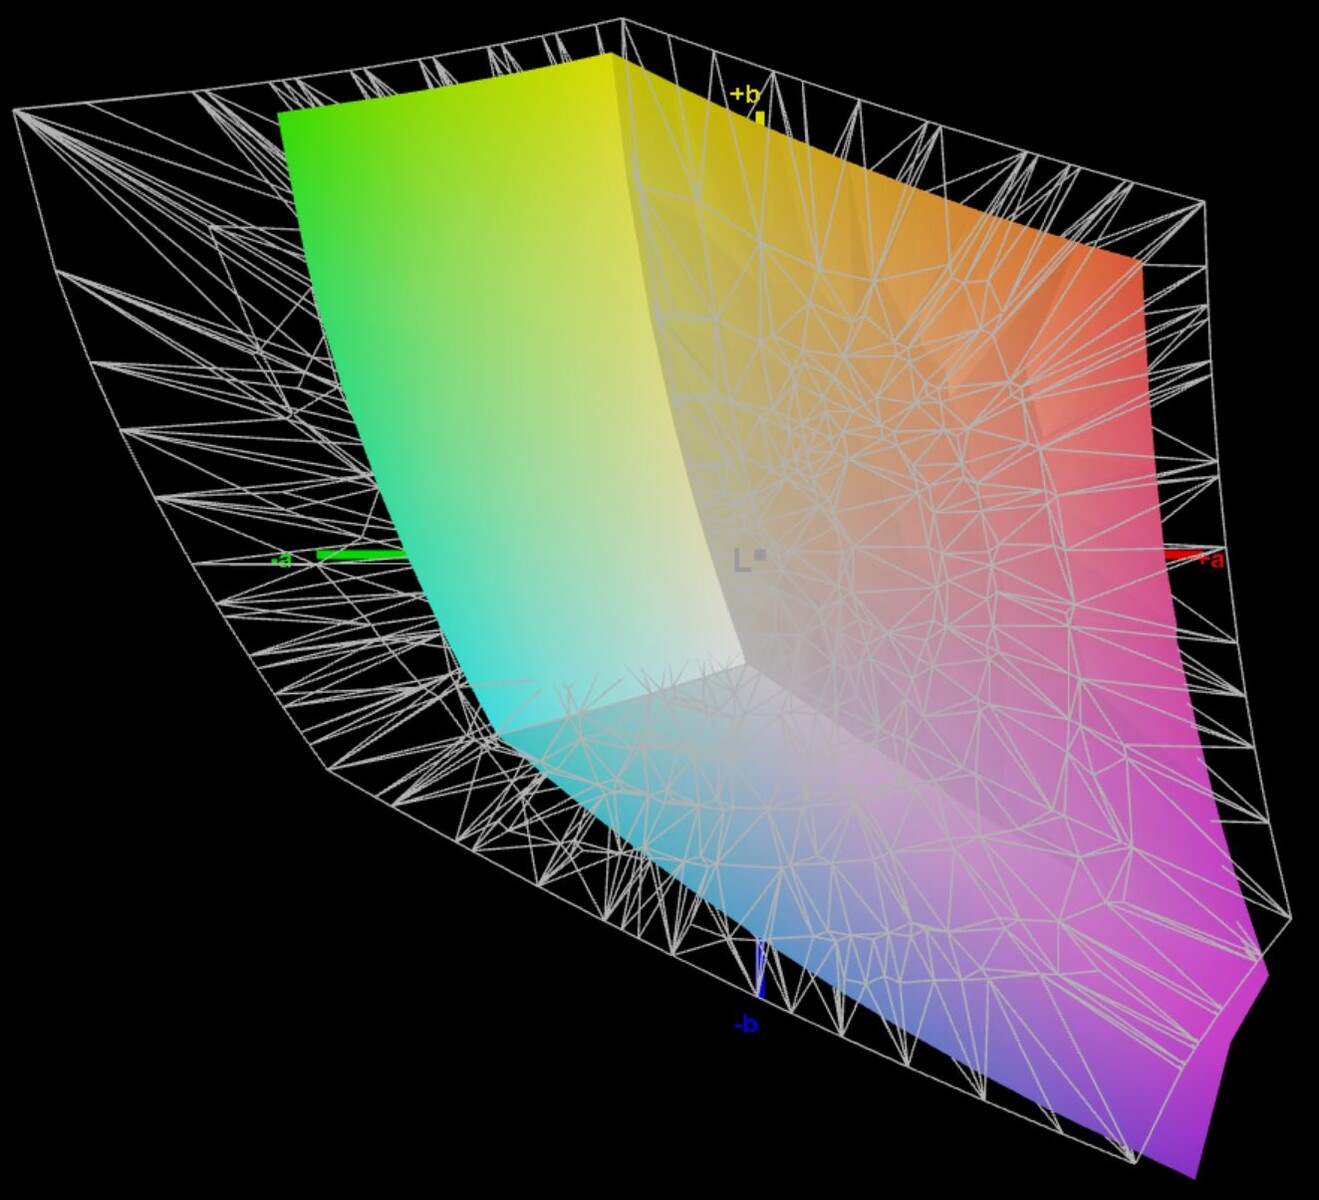
Schenker podaje jasność na poziomie 300 cd/m², która została przekroczona przez nasze urządzenie testowe ze średnią 330 cd/m². Jednak wartość czerni jest podwyższona i wynosi 0,41, dlatego współczynnik kontrastu wynosi tylko nieco poniżej 900:1. W stanie dostawy występuje minimalny niebieski odcień, ale nie przeszkadza nam to w codziennym użytkowaniu biurowym. Możemy jednak poprawić wyświetlacz za pomocą własnej kalibracji, a nawet edytować zdjęcia dzięki pełnemu pokryciu sRGB. Kąty widzenia są w porządku, ale wolelibyśmy jaśniejszy panel na zewnątrz, pomimo matowej powierzchni.
| |||||||||||||||||||||||||
rozświetlenie: 80 %
na akumulatorze: 354 cd/m²
kontrast: 863:1 (czerń: 0.41 cd/m²)
ΔE ColorChecker Calman: 2.4 | ∀{0.5-29.43 Ø4.72}
calibrated: 1.4
ΔE Greyscale Calman: 3.2 | ∀{0.09-98 Ø4.97}
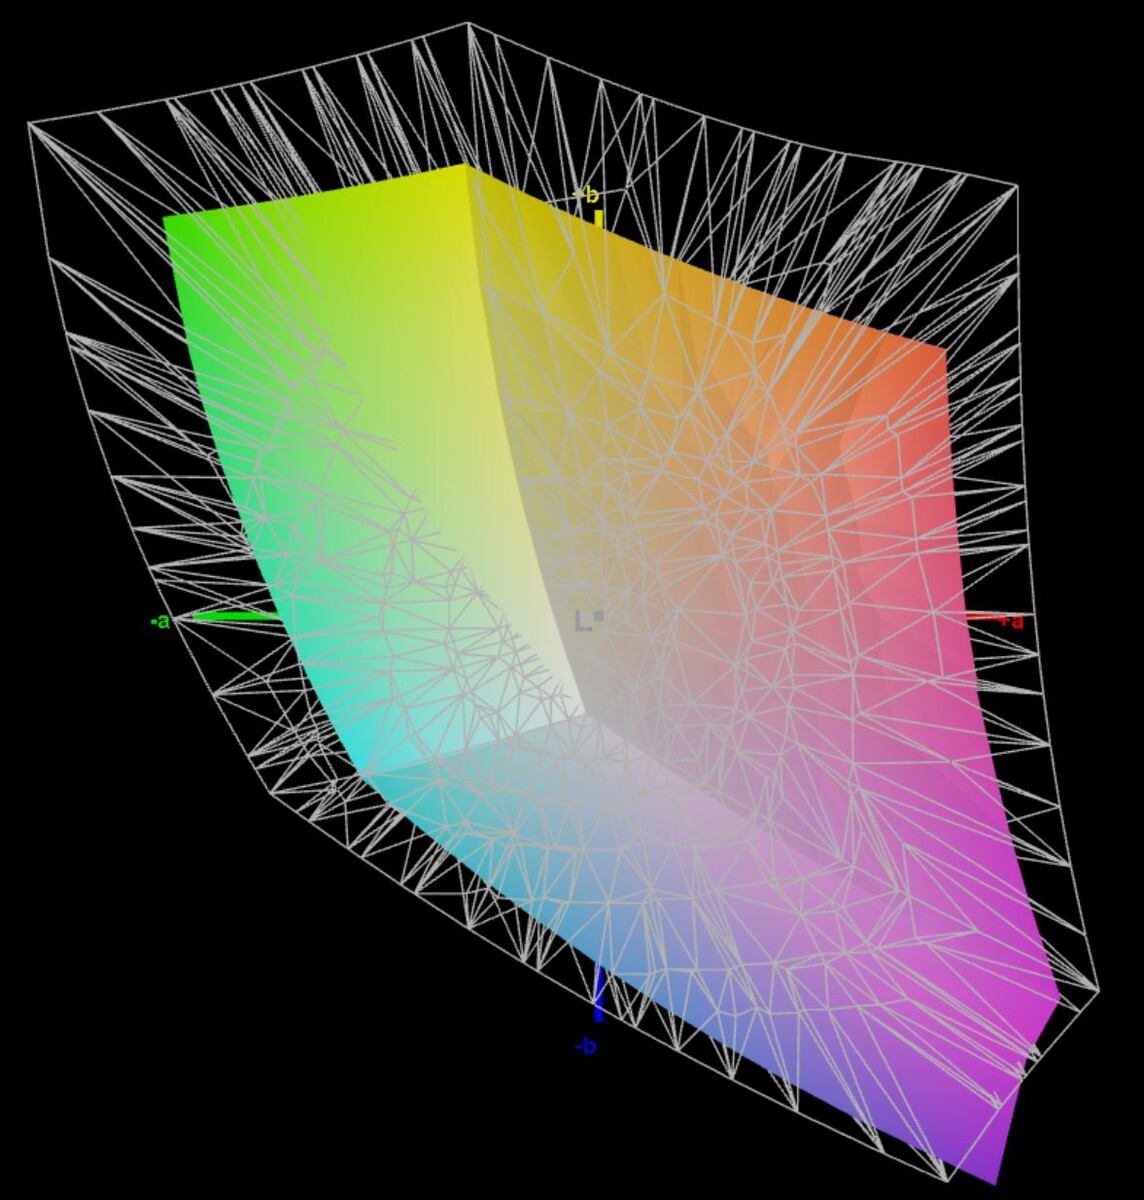
68.5% AdobeRGB 1998 (Argyll 3D)
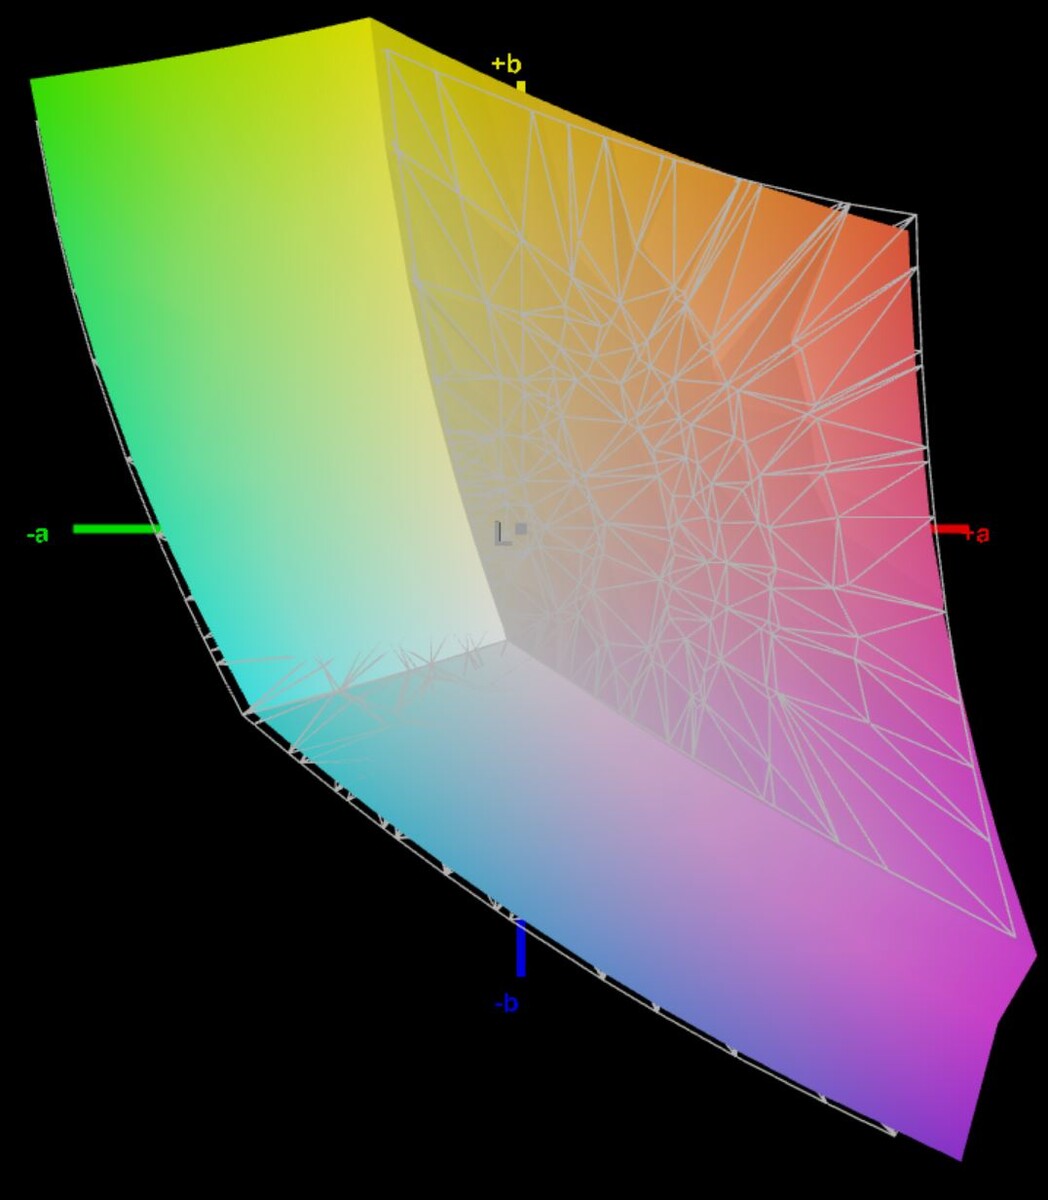
97.1% sRGB (Argyll 3D)
67.5% Display P3 (Argyll 3D)
Gamma: 2.08
CCT: 6786 K
| Schenker VIA 15 Pro M22 NE156QHM-NY2, IPS, 2560x1440, 15.6" | Dell Latitude 3520 BOE NE156FH, IPS, 1920x1080, 15.6" | HP ProBook 450 G9 6A180EA Chi Mei CMN1512, , 1920x1080, 15.6" | Dell Inspiron 15 5515-H8P8F BOE NV15N4V, IPS, 1920x1080, 15.6" | Lenovo ThinkBook 15 G4 21DL0009GE LENOVO LEN156FHD , IPS, 1920x1080, 15.6" | |
|---|---|---|---|---|---|
| Display | -40% | -35% | -45% | -32% | |
| Display P3 Coverage (%) | 67.5 | 40 -41% | 42.76 -37% | 36.58 -46% | 44.8 -34% |
| sRGB Coverage (%) | 97.1 | 60.2 -38% | 63.9 -34% | 54.37 -44% | 66.8 -31% |
| AdobeRGB 1998 Coverage (%) | 68.5 | 41.4 -40% | 44.2 -35% | 37.79 -45% | 46.3 -32% |
| Response Times | -54% | -104% | -218% | -100% | |
| Response Time Grey 50% / Grey 80% * (ms) | 13.8 ? | 24 ? -74% | 28 ? -103% | 44 ? -219% | 29 ? -110% |
| Response Time Black / White * (ms) | 9.8 ? | 13 ? -33% | 20 ? -104% | 31 ? -216% | 18.5 ? -89% |
| PWM Frequency (Hz) | 1250 ? | 37037 ? | |||
| Screen | -50% | -52% | -27% | -47% | |
| Brightness middle (cd/m²) | 354 | 322 -9% | 234 -34% | 251 -29% | 313 -12% |
| Brightness (cd/m²) | 331 | 294 -11% | 218 -34% | 241 -27% | 301 -9% |
| Brightness Distribution (%) | 80 | 87 9% | 85 6% | 87 9% | 90 13% |
| Black Level * (cd/m²) | 0.41 | 0.445 -9% | 0.17 59% | 0.23 44% | 0.21 49% |
| Contrast (:1) | 863 | 724 -16% | 1376 59% | 1091 26% | 1490 73% |
| Colorchecker dE 2000 * | 2.4 | 4.54 -89% | 5.04 -110% | 5.14 -114% | 5.3 -121% |
| Colorchecker dE 2000 max. * | 6.4 | 17.27 -170% | 18.04 -182% | 18.41 -188% | 18.7 -192% |
| Colorchecker dE 2000 calibrated * | 1.4 | 4.43 -216% | 4.13 -195% | 4 -186% | |
| Greyscale dE 2000 * | 3.2 | 1.25 61% | 4.43 -38% | 1.08 66% | 4.4 -38% |
| Gamma | 2.08 106% | 2.46 89% | 2.41 91% | 2.43 91% | 2.08 106% |
| CCT | 6786 96% | 6677 97% | 6350 102% | 6534 99% | 6479 100% |
| Color Space (Percent of AdobeRGB 1998) (%) | 37.79 | ||||
| Color Space (Percent of sRGB) (%) | 54.37 | ||||
| Całkowita średnia (program / ustawienia) | -48% /
-48% | -64% /
-56% | -97% /
-60% | -60% /
-51% |
* ... im mniej tym lepiej

Wyświetl czasy reakcji
| ↔ Czas reakcji od czerni do bieli | ||
|---|---|---|
| 9.8 ms ... wzrost ↗ i spadek ↘ łącznie | ↗ 4.8 ms wzrost | 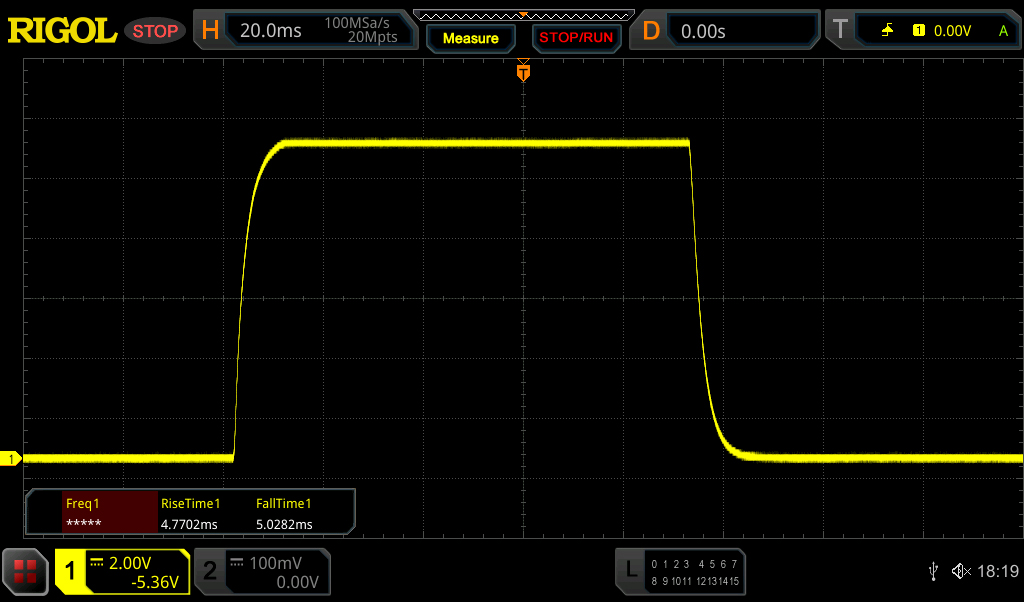 |
| ↘ 5 ms upadek | ||
| W naszych testach ekran wykazuje szybki czas reakcji i powinien nadawać się do gier. Dla porównania, wszystkie testowane urządzenia wahają się od 0.1 (minimum) do 240 (maksimum) ms. » 27 % wszystkich urządzeń jest lepszych. Oznacza to, że zmierzony czas reakcji jest lepszy od średniej wszystkich testowanych urządzeń (19.8 ms). | ||
| ↔ Czas reakcji 50% szarości do 80% szarości | ||
| 13.8 ms ... wzrost ↗ i spadek ↘ łącznie | ↗ 6.7 ms wzrost | 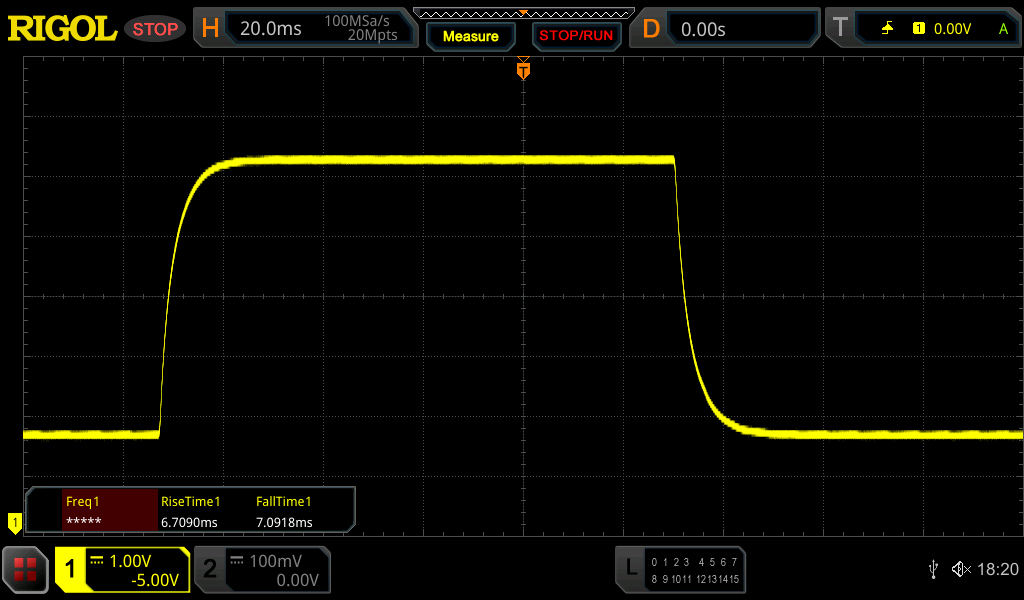 |
| ↘ 7.1 ms upadek | ||
| W naszych testach ekran wykazuje dobry współczynnik reakcji, ale może być zbyt wolny dla graczy rywalizujących ze sobą. Dla porównania, wszystkie testowane urządzenia wahają się od 0.165 (minimum) do 636 (maksimum) ms. » 28 % wszystkich urządzeń jest lepszych. Oznacza to, że zmierzony czas reakcji jest lepszy od średniej wszystkich testowanych urządzeń (31 ms). | ||
Migotanie ekranu / PWM (modulacja szerokości impulsu)
| Migotanie ekranu/nie wykryto PWM | 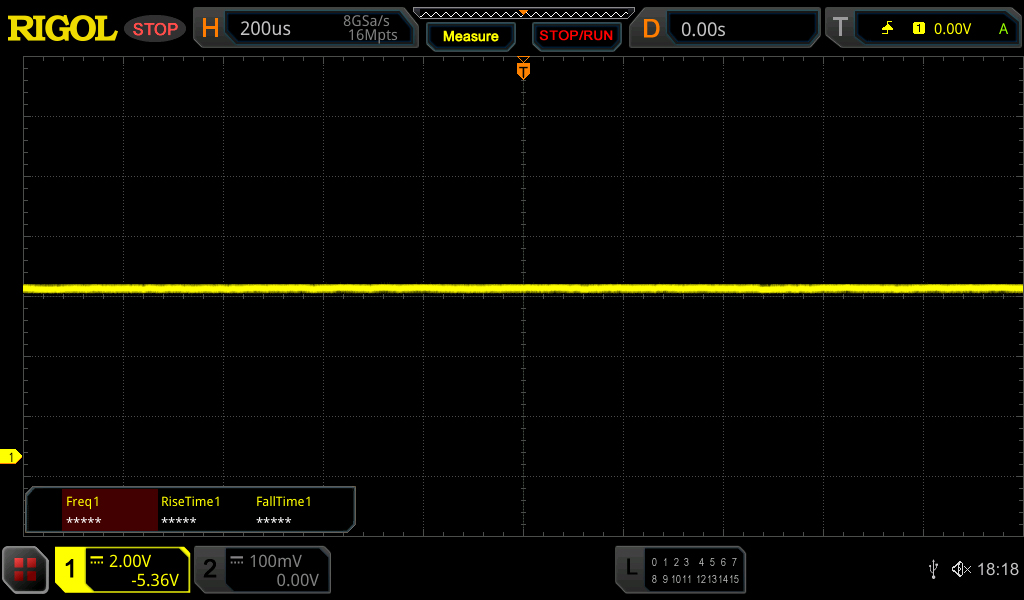 | ||
Dla porównania: 52 % wszystkich testowanych urządzeń nie używa PWM do przyciemniania wyświetlacza. Jeśli wykryto PWM, zmierzono średnio 7763 (minimum: 5 - maksimum: 343500) Hz. | |||

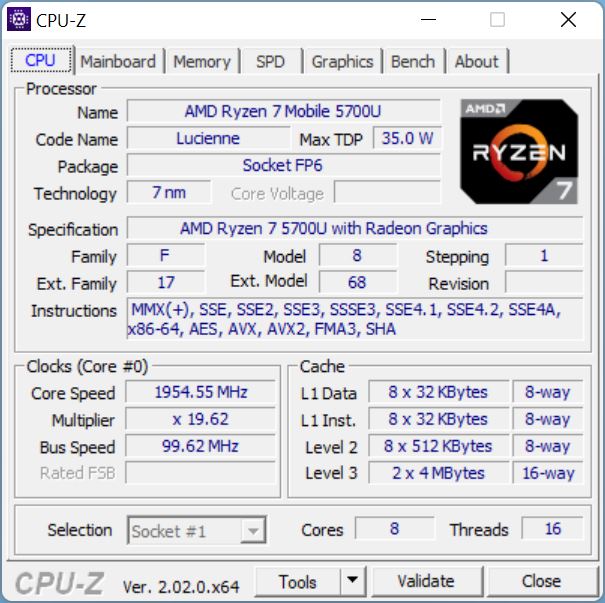
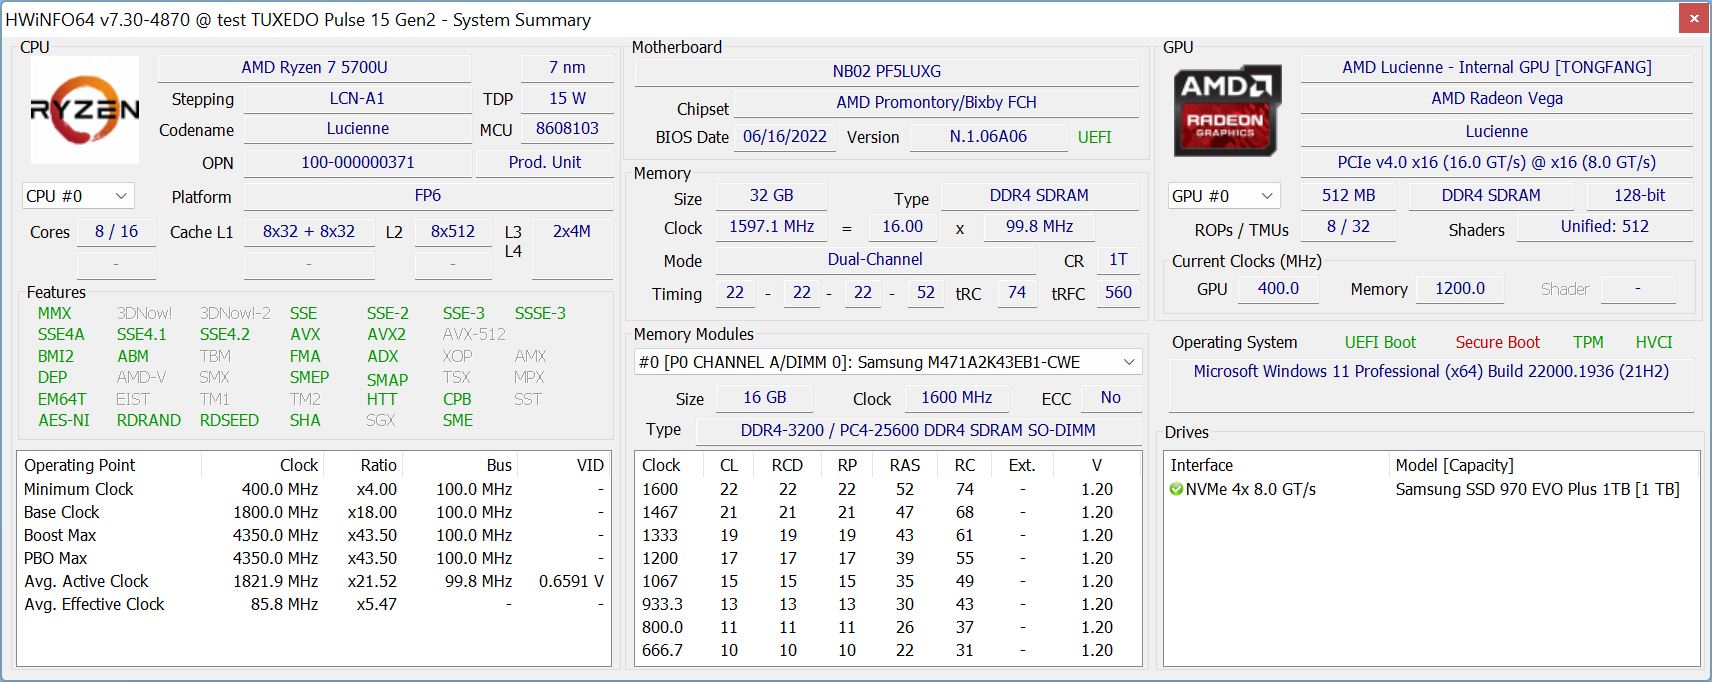
Wydajność - AMD Ryzen 7 5700U
Schenker polega na nieco zakurzonym AMD Ryzen 7 5700U z 8 rdzeniami Zen 2 dla VIA 15 Pro, ale nadal oferuje przyzwoitą wydajność. Limity mocy wynoszą 40/35 W w trybie Enthusiast (lub 25/12 W w trybie Ultra-Silent), co zapewnia bardzo wysoką i stabilną wydajność wielordzeniową. W testach wielordzeniowych pokonuje nawet obecne układy Intel Raptor Lake z serii U, takie jak Core i7-1355U w Lenovo ThinkPad X1 Yoga G8. Jednak w testach jednordzeniowych stary Ryzen cierpi.
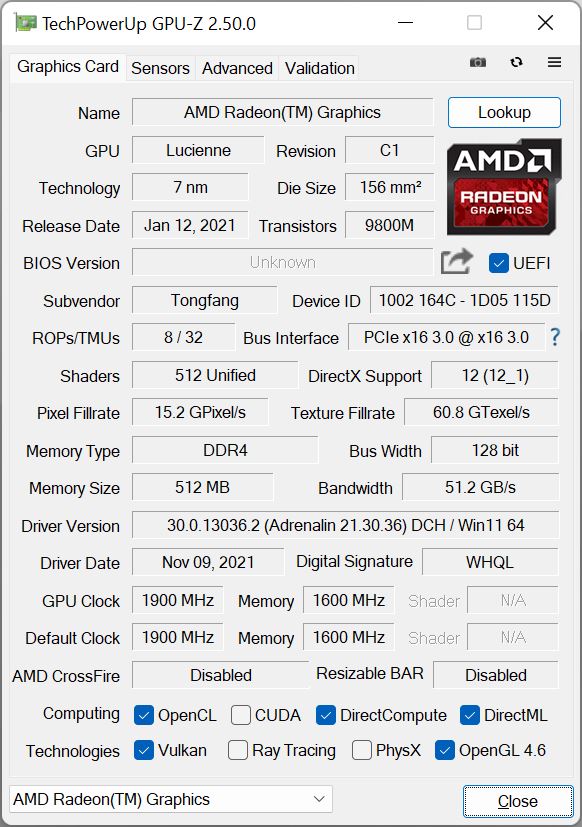
Ogólnie rzecz biorąc, wydajność jest całkowicie wystarczająca do codziennego użytku biurowego, co jest również zasługą szybkiego PCIe-SSD. Laptop jest responsywny przez cały czas i nie mogliśmy zidentyfikować żadnych problemów podczas testu. Wydajność graficzna iGPU Vega 8 jest również całkowicie wystarczająca do codziennego użytku, a renderowanie filmów w wysokiej rozdzielczości również działa bez zarzutu. Wydajność jest nawet nieco lepsza niż u rywali z Iris Xe Graphics G7. Na zasilaniu bateryjnym wydajność jest ogólnie nieco niższa, szczególnie w aplikacjach wielordzeniowych (deficyt ~25%).
Cinebench R15 Multi Loop
Cinebench R23: Multi Core | Single Core
Cinebench R20: CPU (Multi Core) | CPU (Single Core)
Cinebench R15: CPU Multi 64Bit | CPU Single 64Bit
Blender: v2.79 BMW27 CPU
7-Zip 18.03: 7z b 4 | 7z b 4 -mmt1
Geekbench 5.5: Multi-Core | Single-Core
HWBOT x265 Benchmark v2.2: 4k Preset
LibreOffice : 20 Documents To PDF
R Benchmark 2.5: Overall mean
| CPU Performance rating | |
| Lenovo ThinkPad X1 Yoga G8 i7-1355U -1! | |
| Średnia w klasie Office | |
| Lenovo ThinkBook 15 G4 21DL0009GE | |
| Schenker VIA 15 Pro M22 | |
| Przeciętny AMD Ryzen 7 5700U | |
| Dell Inspiron 15 5515-H8P8F | |
| HP ProBook 450 G9 6A180EA | |
| Dell Latitude 3520 | |
| Cinebench R23 / Multi Core | |
| Średnia w klasie Office (1673 - 22808, n=73, ostatnie 2 lata) | |
| Schenker VIA 15 Pro M22 | |
| Lenovo ThinkPad X1 Yoga G8 i7-1355U | |
| Lenovo ThinkBook 15 G4 21DL0009GE | |
| Dell Inspiron 15 5515-H8P8F | |
| Przeciętny AMD Ryzen 7 5700U (4861 - 10139, n=20) | |
| HP ProBook 450 G9 6A180EA | |
| Dell Latitude 3520 | |
| Cinebench R23 / Single Core | |
| Lenovo ThinkPad X1 Yoga G8 i7-1355U | |
| Średnia w klasie Office (708 - 2130, n=73, ostatnie 2 lata) | |
| HP ProBook 450 G9 6A180EA | |
| Lenovo ThinkBook 15 G4 21DL0009GE | |
| Dell Latitude 3520 | |
| Schenker VIA 15 Pro M22 | |
| Przeciętny AMD Ryzen 7 5700U (1177 - 1268, n=20) | |
| Dell Inspiron 15 5515-H8P8F | |
| Cinebench R20 / CPU (Multi Core) | |
| Średnia w klasie Office (648 - 8840, n=72, ostatnie 2 lata) | |
| Schenker VIA 15 Pro M22 | |
| Lenovo ThinkPad X1 Yoga G8 i7-1355U | |
| Lenovo ThinkBook 15 G4 21DL0009GE | |
| Dell Inspiron 15 5515-H8P8F | |
| Przeciętny AMD Ryzen 7 5700U (1887 - 3877, n=21) | |
| HP ProBook 450 G9 6A180EA | |
| Dell Latitude 3520 | |
| Cinebench R20 / CPU (Single Core) | |
| Lenovo ThinkPad X1 Yoga G8 i7-1355U | |
| Średnia w klasie Office (345 - 816, n=72, ostatnie 2 lata) | |
| HP ProBook 450 G9 6A180EA | |
| Lenovo ThinkBook 15 G4 21DL0009GE | |
| Dell Latitude 3520 | |
| Dell Inspiron 15 5515-H8P8F | |
| Schenker VIA 15 Pro M22 | |
| Przeciętny AMD Ryzen 7 5700U (471 - 495, n=21) | |
| Cinebench R15 / CPU Multi 64Bit | |
| Średnia w klasie Office (250 - 3380, n=74, ostatnie 2 lata) | |
| Schenker VIA 15 Pro M22 | |
| Lenovo ThinkPad X1 Yoga G8 i7-1355U | |
| Lenovo ThinkBook 15 G4 21DL0009GE | |
| Dell Inspiron 15 5515-H8P8F | |
| Przeciętny AMD Ryzen 7 5700U (856 - 1691, n=20) | |
| HP ProBook 450 G9 6A180EA | |
| Dell Latitude 3520 | |
| Cinebench R15 / CPU Single 64Bit | |
| Lenovo ThinkPad X1 Yoga G8 i7-1355U | |
| Średnia w klasie Office (99.5 - 312, n=74, ostatnie 2 lata) | |
| Lenovo ThinkBook 15 G4 21DL0009GE | |
| HP ProBook 450 G9 6A180EA | |
| Dell Latitude 3520 | |
| Dell Inspiron 15 5515-H8P8F | |
| Schenker VIA 15 Pro M22 | |
| Przeciętny AMD Ryzen 7 5700U (181 - 190, n=19) | |
| Blender / v2.79 BMW27 CPU | |
| Dell Latitude 3520 | |
| HP ProBook 450 G9 6A180EA | |
| Dell Inspiron 15 5515-H8P8F | |
| Lenovo ThinkBook 15 G4 21DL0009GE | |
| Przeciętny AMD Ryzen 7 5700U (292 - 557, n=20) | |
| Średnia w klasie Office (158 - 1940, n=73, ostatnie 2 lata) | |
| Schenker VIA 15 Pro M22 | |
| 7-Zip 18.03 / 7z b 4 | |
| Schenker VIA 15 Pro M22 | |
| Średnia w klasie Office (7098 - 76886, n=74, ostatnie 2 lata) | |
| Lenovo ThinkPad X1 Yoga G8 i7-1355U | |
| Lenovo ThinkBook 15 G4 21DL0009GE | |
| Przeciętny AMD Ryzen 7 5700U (29095 - 47501, n=20) | |
| Dell Inspiron 15 5515-H8P8F | |
| HP ProBook 450 G9 6A180EA | |
| Dell Latitude 3520 | |
| 7-Zip 18.03 / 7z b 4 -mmt1 | |
| Lenovo ThinkPad X1 Yoga G8 i7-1355U | |
| Średnia w klasie Office (3387 - 6469, n=74, ostatnie 2 lata) | |
| Lenovo ThinkBook 15 G4 21DL0009GE | |
| HP ProBook 450 G9 6A180EA | |
| Dell Latitude 3520 | |
| Schenker VIA 15 Pro M22 | |
| Przeciętny AMD Ryzen 7 5700U (4402 - 4620, n=20) | |
| Dell Inspiron 15 5515-H8P8F | |
| Geekbench 5.5 / Multi-Core | |
| Średnia w klasie Office (1483 - 16999, n=71, ostatnie 2 lata) | |
| Lenovo ThinkPad X1 Yoga G8 i7-1355U | |
| Schenker VIA 15 Pro M22 | |
| Lenovo ThinkBook 15 G4 21DL0009GE | |
| Przeciętny AMD Ryzen 7 5700U (4254 - 7635, n=19) | |
| HP ProBook 450 G9 6A180EA | |
| Dell Inspiron 15 5515-H8P8F | |
| Dell Latitude 3520 | |
| Geekbench 5.5 / Single-Core | |
| Średnia w klasie Office (811 - 2148, n=71, ostatnie 2 lata) | |
| Lenovo ThinkPad X1 Yoga G8 i7-1355U | |
| HP ProBook 450 G9 6A180EA | |
| Lenovo ThinkBook 15 G4 21DL0009GE | |
| Dell Latitude 3520 | |
| Schenker VIA 15 Pro M22 | |
| Przeciętny AMD Ryzen 7 5700U (1105 - 1205, n=19) | |
| Dell Inspiron 15 5515-H8P8F | |
| HWBOT x265 Benchmark v2.2 / 4k Preset | |
| Średnia w klasie Office (2.21 - 26, n=73, ostatnie 2 lata) | |
| Schenker VIA 15 Pro M22 | |
| Lenovo ThinkBook 15 G4 21DL0009GE | |
| Lenovo ThinkPad X1 Yoga G8 i7-1355U | |
| Przeciętny AMD Ryzen 7 5700U (6.08 - 12.1, n=20) | |
| Dell Inspiron 15 5515-H8P8F | |
| HP ProBook 450 G9 6A180EA | |
| Dell Latitude 3520 | |
| LibreOffice / 20 Documents To PDF | |
| Dell Inspiron 15 5515-H8P8F | |
| Schenker VIA 15 Pro M22 | |
| Przeciętny AMD Ryzen 7 5700U (52.4 - 75.5, n=20) | |
| Średnia w klasie Office (39.9 - 102.3, n=73, ostatnie 2 lata) | |
| Dell Latitude 3520 | |
| Lenovo ThinkBook 15 G4 21DL0009GE | |
| HP ProBook 450 G9 6A180EA | |
| Lenovo ThinkPad X1 Yoga G8 i7-1355U | |
| R Benchmark 2.5 / Overall mean | |
| Dell Latitude 3520 | |
| Dell Inspiron 15 5515-H8P8F | |
| Przeciętny AMD Ryzen 7 5700U (0.567 - 0.641, n=20) | |
| Schenker VIA 15 Pro M22 | |
| HP ProBook 450 G9 6A180EA | |
| Lenovo ThinkBook 15 G4 21DL0009GE | |
| Średnia w klasie Office (0.4098 - 0.888, n=73, ostatnie 2 lata) | |
| Lenovo ThinkPad X1 Yoga G8 i7-1355U | |
* ... im mniej tym lepiej
AIDA64: FP32 Ray-Trace | FPU Julia | CPU SHA3 | CPU Queen | FPU SinJulia | FPU Mandel | CPU AES | CPU ZLib | FP64 Ray-Trace | CPU PhotoWorxx
| Performance rating | |
| Schenker VIA 15 Pro M22 | |
| Średnia w klasie Office | |
| Lenovo ThinkBook 15 G4 21DL0009GE | |
| Przeciętny AMD Ryzen 7 5700U | |
| Dell Inspiron 15 5515-H8P8F | |
| Dell Latitude 3520 | |
| HP ProBook 450 G9 6A180EA | |
| AIDA64 / FP32 Ray-Trace | |
| Średnia w klasie Office (2083 - 31245, n=79, ostatnie 2 lata) | |
| Schenker VIA 15 Pro M22 | |
| Lenovo ThinkBook 15 G4 21DL0009GE | |
| Dell Inspiron 15 5515-H8P8F | |
| Przeciętny AMD Ryzen 7 5700U (5679 - 12346, n=20) | |
| Dell Latitude 3520 | |
| HP ProBook 450 G9 6A180EA | |
| AIDA64 / FPU Julia | |
| Schenker VIA 15 Pro M22 | |
| Lenovo ThinkBook 15 G4 21DL0009GE | |
| Średnia w klasie Office (8191 - 125394, n=79, ostatnie 2 lata) | |
| Dell Inspiron 15 5515-H8P8F | |
| Przeciętny AMD Ryzen 7 5700U (39042 - 69580, n=20) | |
| HP ProBook 450 G9 6A180EA | |
| Dell Latitude 3520 | |
| AIDA64 / CPU SHA3 | |
| Średnia w klasie Office (433 - 5755, n=79, ostatnie 2 lata) | |
| Lenovo ThinkBook 15 G4 21DL0009GE | |
| Schenker VIA 15 Pro M22 | |
| Dell Inspiron 15 5515-H8P8F | |
| Przeciętny AMD Ryzen 7 5700U (1103 - 2231, n=20) | |
| Dell Latitude 3520 | |
| HP ProBook 450 G9 6A180EA | |
| AIDA64 / CPU Queen | |
| Schenker VIA 15 Pro M22 | |
| Dell Inspiron 15 5515-H8P8F | |
| Przeciętny AMD Ryzen 7 5700U (57016 - 99178, n=20) | |
| Lenovo ThinkBook 15 G4 21DL0009GE | |
| Średnia w klasie Office (22784 - 115197, n=67, ostatnie 2 lata) | |
| HP ProBook 450 G9 6A180EA | |
| Dell Latitude 3520 | |
| AIDA64 / FPU SinJulia | |
| Schenker VIA 15 Pro M22 | |
| Dell Inspiron 15 5515-H8P8F | |
| Przeciętny AMD Ryzen 7 5700U (6837 - 14169, n=20) | |
| Lenovo ThinkBook 15 G4 21DL0009GE | |
| Średnia w klasie Office (1378 - 18321, n=79, ostatnie 2 lata) | |
| Dell Latitude 3520 | |
| HP ProBook 450 G9 6A180EA | |
| AIDA64 / FPU Mandel | |
| Lenovo ThinkBook 15 G4 21DL0009GE | |
| Schenker VIA 15 Pro M22 | |
| Średnia w klasie Office (4601 - 66922, n=79, ostatnie 2 lata) | |
| Dell Inspiron 15 5515-H8P8F | |
| Przeciętny AMD Ryzen 7 5700U (20179 - 36523, n=20) | |
| Dell Latitude 3520 | |
| HP ProBook 450 G9 6A180EA | |
| AIDA64 / CPU AES | |
| Lenovo ThinkBook 15 G4 21DL0009GE | |
| Dell Latitude 3520 | |
| Dell Inspiron 15 5515-H8P8F | |
| Przeciętny AMD Ryzen 7 5700U (26066 - 64646, n=20) | |
| Średnia w klasie Office (4854 - 155900, n=79, ostatnie 2 lata) | |
| Schenker VIA 15 Pro M22 | |
| HP ProBook 450 G9 6A180EA | |
| AIDA64 / CPU ZLib | |
| Schenker VIA 15 Pro M22 | |
| Średnia w klasie Office (114.6 - 1366, n=79, ostatnie 2 lata) | |
| Dell Inspiron 15 5515-H8P8F | |
| Przeciętny AMD Ryzen 7 5700U (440 - 776, n=20) | |
| Lenovo ThinkBook 15 G4 21DL0009GE | |
| HP ProBook 450 G9 6A180EA | |
| Dell Latitude 3520 | |
| AIDA64 / FP64 Ray-Trace | |
| Średnia w klasie Office (1109 - 17834, n=79, ostatnie 2 lata) | |
| Schenker VIA 15 Pro M22 | |
| Dell Inspiron 15 5515-H8P8F | |
| Lenovo ThinkBook 15 G4 21DL0009GE | |
| Przeciętny AMD Ryzen 7 5700U (2985 - 6784, n=20) | |
| Dell Latitude 3520 | |
| HP ProBook 450 G9 6A180EA | |
| AIDA64 / CPU PhotoWorxx | |
| Średnia w klasie Office (11090 - 65229, n=79, ostatnie 2 lata) | |
| Schenker VIA 15 Pro M22 | |
| Przeciętny AMD Ryzen 7 5700U (6903 - 25066, n=20) | |
| Lenovo ThinkBook 15 G4 21DL0009GE | |
| HP ProBook 450 G9 6A180EA | |
| Dell Latitude 3520 | |
| Dell Inspiron 15 5515-H8P8F | |
CrossMark: Overall | Productivity | Creativity | Responsiveness
| PCMark 10 / Score | |
| Średnia w klasie Office (2601 - 9298, n=65, ostatnie 2 lata) | |
| Lenovo ThinkBook 15 G4 21DL0009GE | |
| Przeciętny AMD Ryzen 7 5700U, AMD Radeon RX Vega 8 (Ryzen 4000/5000) (4325 - 5518, n=15) | |
| Schenker VIA 15 Pro M22 | |
| Dell Inspiron 15 5515-H8P8F | |
| HP ProBook 450 G9 6A180EA | |
| Dell Latitude 3520 | |
| PCMark 10 / Essentials | |
| Lenovo ThinkBook 15 G4 21DL0009GE | |
| Średnia w klasie Office (3245 - 11594, n=65, ostatnie 2 lata) | |
| HP ProBook 450 G9 6A180EA | |
| Przeciętny AMD Ryzen 7 5700U, AMD Radeon RX Vega 8 (Ryzen 4000/5000) (8025 - 10091, n=15) | |
| Dell Latitude 3520 | |
| Schenker VIA 15 Pro M22 | |
| Dell Inspiron 15 5515-H8P8F | |
| PCMark 10 / Productivity | |
| Lenovo ThinkBook 15 G4 21DL0009GE | |
| Średnia w klasie Office (5336 - 17243, n=65, ostatnie 2 lata) | |
| Przeciętny AMD Ryzen 7 5700U, AMD Radeon RX Vega 8 (Ryzen 4000/5000) (7001 - 8457, n=15) | |
| Dell Inspiron 15 5515-H8P8F | |
| Schenker VIA 15 Pro M22 | |
| HP ProBook 450 G9 6A180EA | |
| Dell Latitude 3520 | |
| PCMark 10 / Digital Content Creation | |
| Średnia w klasie Office (2049 - 13541, n=65, ostatnie 2 lata) | |
| Lenovo ThinkBook 15 G4 21DL0009GE | |
| Schenker VIA 15 Pro M22 | |
| Przeciętny AMD Ryzen 7 5700U, AMD Radeon RX Vega 8 (Ryzen 4000/5000) (3738 - 5964, n=15) | |
| Dell Inspiron 15 5515-H8P8F | |
| Dell Latitude 3520 | |
| HP ProBook 450 G9 6A180EA | |
| CrossMark / Overall | |
| Średnia w klasie Office (381 - 2010, n=72, ostatnie 2 lata) | |
| HP ProBook 450 G9 6A180EA | |
| Lenovo ThinkBook 15 G4 21DL0009GE | |
| Schenker VIA 15 Pro M22 | |
| Dell Latitude 3520 | |
| Przeciętny AMD Ryzen 7 5700U, AMD Radeon RX Vega 8 (Ryzen 4000/5000) (866 - 1183, n=8) | |
| Dell Inspiron 15 5515-H8P8F | |
| CrossMark / Productivity | |
| Średnia w klasie Office (464 - 1880, n=72, ostatnie 2 lata) | |
| Lenovo ThinkBook 15 G4 21DL0009GE | |
| HP ProBook 450 G9 6A180EA | |
| Dell Latitude 3520 | |
| Schenker VIA 15 Pro M22 | |
| Przeciętny AMD Ryzen 7 5700U, AMD Radeon RX Vega 8 (Ryzen 4000/5000) (931 - 1191, n=8) | |
| Dell Inspiron 15 5515-H8P8F | |
| CrossMark / Creativity | |
| Średnia w klasie Office (319 - 2361, n=72, ostatnie 2 lata) | |
| HP ProBook 450 G9 6A180EA | |
| Lenovo ThinkBook 15 G4 21DL0009GE | |
| Schenker VIA 15 Pro M22 | |
| Przeciętny AMD Ryzen 7 5700U, AMD Radeon RX Vega 8 (Ryzen 4000/5000) (907 - 1197, n=8) | |
| Dell Latitude 3520 | |
| Dell Inspiron 15 5515-H8P8F | |
| CrossMark / Responsiveness | |
| Średnia w klasie Office (360 - 1820, n=72, ostatnie 2 lata) | |
| Dell Latitude 3520 | |
| Lenovo ThinkBook 15 G4 21DL0009GE | |
| Schenker VIA 15 Pro M22 | |
| HP ProBook 450 G9 6A180EA | |
| Przeciętny AMD Ryzen 7 5700U, AMD Radeon RX Vega 8 (Ryzen 4000/5000) (605 - 1159, n=8) | |
| Dell Inspiron 15 5515-H8P8F | |
| PCMark 10 Score | 5025 pkt. | |
Pomoc | ||
| AIDA64 / Memory Copy | |
| Średnia w klasie Office (20075 - 110930, n=76, ostatnie 2 lata) | |
| Schenker VIA 15 Pro M22 | |
| Lenovo ThinkBook 15 G4 21DL0009GE | |
| Przeciętny AMD Ryzen 7 5700U (15867 - 39326, n=20) | |
| HP ProBook 450 G9 6A180EA | |
| Dell Latitude 3520 | |
| Dell Inspiron 15 5515-H8P8F | |
| AIDA64 / Memory Read | |
| Średnia w klasie Office (10084 - 128030, n=77, ostatnie 2 lata) | |
| Schenker VIA 15 Pro M22 | |
| Lenovo ThinkBook 15 G4 21DL0009GE | |
| Przeciętny AMD Ryzen 7 5700U (17632 - 47190, n=20) | |
| HP ProBook 450 G9 6A180EA | |
| Dell Latitude 3520 | |
| Dell Inspiron 15 5515-H8P8F | |
| AIDA64 / Memory Write | |
| Średnia w klasie Office (20073 - 119858, n=77, ostatnie 2 lata) | |
| Schenker VIA 15 Pro M22 | |
| Przeciętny AMD Ryzen 7 5700U (11554 - 47048, n=20) | |
| Lenovo ThinkBook 15 G4 21DL0009GE | |
| HP ProBook 450 G9 6A180EA | |
| Dell Latitude 3520 | |
| Dell Inspiron 15 5515-H8P8F | |
| AIDA64 / Memory Latency | |
| Średnia w klasie Office (7.6 - 162.9, n=72, ostatnie 2 lata) | |
| Schenker VIA 15 Pro M22 | |
| Dell Inspiron 15 5515-H8P8F | |
| Lenovo ThinkBook 15 G4 21DL0009GE | |
| Przeciętny AMD Ryzen 7 5700U (84.9 - 113, n=20) | |
| HP ProBook 450 G9 6A180EA | |
| Dell Latitude 3520 | |
* ... im mniej tym lepiej
| DPC Latencies / LatencyMon - interrupt to process latency (max), Web, Youtube, Prime95 | |
| Lenovo ThinkBook 15 G4 21DL0009GE | |
| HP ProBook 450 G9 6A180EA | |
| Dell Inspiron 15 5515-H8P8F | |
| Schenker VIA 15 Pro M22 | |
| Dell Latitude 3520 | |
* ... im mniej tym lepiej

| Drive Performance rating - Percent | |
| Schenker VIA 15 Pro M22 | |
| Przeciętny Samsung SSD 970 EVO Plus 1TB | |
| Średnia w klasie Office | |
| HP ProBook 450 G9 6A180EA | |
| Dell Latitude 3520 | |
| Lenovo ThinkBook 15 G4 21DL0009GE | |
| Dell Inspiron 15 5515-H8P8F | |
* ... im mniej tym lepiej
Continuous Read: DiskSpd Read Loop, Queue Depth 8
| 3DMark Performance rating - Percent | |
| Średnia w klasie Office | |
| Schenker VIA 15 Pro M22 | |
| Przeciętny AMD Radeon RX Vega 8 (Ryzen 4000/5000) | |
| Lenovo ThinkBook 15 G4 21DL0009GE | |
| HP ProBook 450 G9 6A180EA | |
| Dell Latitude 3520 | |
| Dell Inspiron 15 5515-H8P8F | |
| 3DMark 11 - 1280x720 Performance GPU | |
| Średnia w klasie Office (2551 - 18313, n=69, ostatnie 2 lata) | |
| Schenker VIA 15 Pro M22 | |
| Przeciętny AMD Radeon RX Vega 8 (Ryzen 4000/5000) (3459 - 7591, n=57) | |
| Lenovo ThinkBook 15 G4 21DL0009GE | |
| HP ProBook 450 G9 6A180EA | |
| Dell Latitude 3520 | |
| Dell Inspiron 15 5515-H8P8F | |
| 3DMark | |
| 1920x1080 Fire Strike Graphics | |
| Średnia w klasie Office (736 - 21871, n=72, ostatnie 2 lata) | |
| Schenker VIA 15 Pro M22 | |
| Przeciętny AMD Radeon RX Vega 8 (Ryzen 4000/5000) (1694 - 5041, n=57) | |
| Lenovo ThinkBook 15 G4 21DL0009GE | |
| HP ProBook 450 G9 6A180EA | |
| Dell Latitude 3520 | |
| Dell Inspiron 15 5515-H8P8F | |
| 2560x1440 Time Spy Graphics | |
| Średnia w klasie Office (493 - 6679, n=67, ostatnie 2 lata) | |
| Schenker VIA 15 Pro M22 | |
| Przeciętny AMD Radeon RX Vega 8 (Ryzen 4000/5000) (540 - 1557, n=57) | |
| Lenovo ThinkBook 15 G4 21DL0009GE | |
| HP ProBook 450 G9 6A180EA | |
| Dell Latitude 3520 | |
| Dell Inspiron 15 5515-H8P8F | |
| 3DMark 11 Performance | 6709 pkt. | |
| 3DMark Fire Strike Score | 3718 pkt. | |
| 3DMark Time Spy Score | 1456 pkt. | |
Pomoc | ||
| Blender / v3.3 Classroom CPU | |
| HP ProBook 450 G9 6A180EA | |
| Dell Latitude 3520 | |
| Lenovo ThinkBook 15 G4 21DL0009GE | |
| Średnia w klasie Office (245 - 3219, n=72, ostatnie 2 lata) | |
| Przeciętny AMD Radeon RX Vega 8 (Ryzen 4000/5000) (463 - 1042, n=21) | |
| Schenker VIA 15 Pro M22 | |
* ... im mniej tym lepiej
| Performance rating - Percent | |
| Średnia w klasie Office | |
| Schenker VIA 15 Pro M22 | |
| Lenovo ThinkBook 15 G4 21DL0009GE | |
| HP ProBook 450 G9 6A180EA -1! | |
| Dell Inspiron 15 5515-H8P8F -3! | |
| Dell Latitude 3520 -1! | |
| The Witcher 3 - 1920x1080 Ultra Graphics & Postprocessing (HBAO+) | |
| Średnia w klasie Office (14.8 - 15.3, n=2, ostatnie 2 lata) | |
| Schenker VIA 15 Pro M22 | |
| Lenovo ThinkBook 15 G4 21DL0009GE | |
| HP ProBook 450 G9 6A180EA | |
| Dell Inspiron 15 5515-H8P8F | |
| Dell Latitude 3520 | |
| GTA V - 1920x1080 Highest AA:4xMSAA + FX AF:16x | |
| Średnia w klasie Office (5.77 - 45.3, n=66, ostatnie 2 lata) | |
| Schenker VIA 15 Pro M22 | |
| Lenovo ThinkBook 15 G4 21DL0009GE | |
| Dell Latitude 3520 | |
| Final Fantasy XV Benchmark - 1920x1080 High Quality | |
| Średnia w klasie Office (8.09 - 79.5, n=68, ostatnie 2 lata) | |
| Schenker VIA 15 Pro M22 | |
| Lenovo ThinkBook 15 G4 21DL0009GE | |
| HP ProBook 450 G9 6A180EA | |
| Dell Latitude 3520 | |
| Strange Brigade - 1920x1080 ultra AA:ultra AF:16 | |
| Średnia w klasie Office (12.9 - 142.1, n=50, ostatnie 2 lata) | |
| Schenker VIA 15 Pro M22 | |
| Lenovo ThinkBook 15 G4 21DL0009GE | |
| HP ProBook 450 G9 6A180EA | |
| Dota 2 Reborn - 1920x1080 ultra (3/3) best looking | |
| Średnia w klasie Office (14.6 - 135, n=74, ostatnie 2 lata) | |
| Schenker VIA 15 Pro M22 | |
| Lenovo ThinkBook 15 G4 21DL0009GE | |
| HP ProBook 450 G9 6A180EA | |
| Dell Latitude 3520 | |
| Dell Inspiron 15 5515-H8P8F | |
| X-Plane 11.11 - 1920x1080 high (fps_test=3) | |
| Lenovo ThinkBook 15 G4 21DL0009GE | |
| Średnia w klasie Office (12 - 82.4, n=67, ostatnie 2 lata) | |
| Schenker VIA 15 Pro M22 | |
| Dell Latitude 3520 | |
| HP ProBook 450 G9 6A180EA | |
| Dell Inspiron 15 5515-H8P8F | |
Witcher 3 FPS Chart
| low | med. | high | ultra | |
|---|---|---|---|---|
| GTA V (2015) | 101 | 92.8 | 28.6 | 12 |
| The Witcher 3 (2015) | 68 | 44 | 23 | 14.8 |
| Dota 2 Reborn (2015) | 97.3 | 82.7 | 56.5 | 53.5 |
| Final Fantasy XV Benchmark (2018) | 38.3 | 19.8 | 13.9 | |
| X-Plane 11.11 (2018) | 33.7 | 29.9 | 26.5 | |
| Strange Brigade (2018) | 75.7 | 32 | 27 | 24 |
| F1 2021 (2021) | 93.1 | 40.6 | 31.7 | 21.5 |
| F1 22 (2022) | 37.4 | 32.5 | 24.3 |
Zarządzanie emisjami i energią
Dzięki dwóm wentylatorom VIA 15 Pro jest zazwyczaj bardzo cicha w codziennym użytkowaniu. Staje się głośniejszy tylko wtedy, gdy obciążenie procesora wzrasta, a w ekstremalnych przypadkach można również usłyszeć wentylatory bardzo wyraźnie z ~ 42 dB(A). Jeśli chcesz być po bezpiecznej stronie i nie potrzebujesz pełnej wydajności procesora, zalecany jest tryb ultra cichy, ponieważ mogliśmy określić tylko maksymalnie ~ 28 dB(A) nawet w teście warunków skrajnych, który jest ledwo słyszalny. Nie było żadnych innych odgłosów elektronicznych.
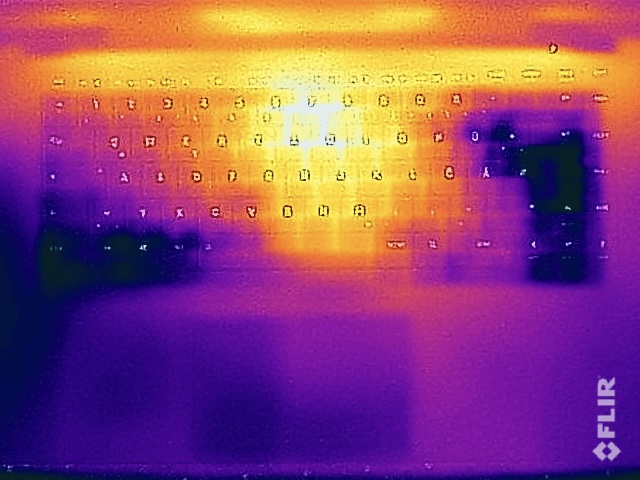
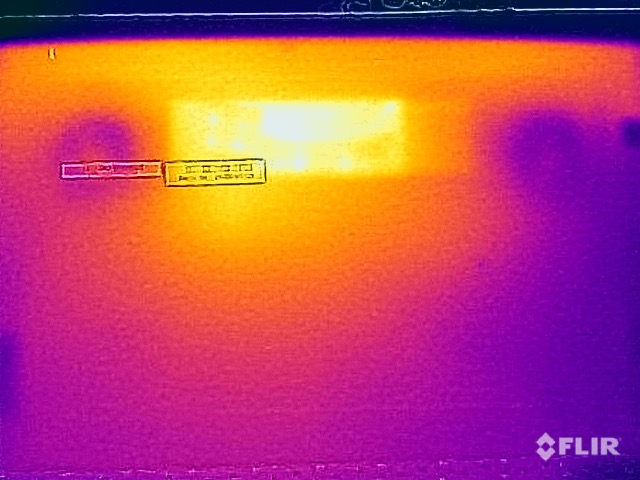
Temperatury powierzchni pozostają przyjemnie niskie w codziennym użytkowaniu i nawet w teście obciążeniowym mogliśmy zmierzyć maksymalnie 41 ° C w górnym środkowym obszarze jednostki bazowej po godzinie (~ 43 ° C na dole). Tak więc nie ma żadnych ograniczeń nawet w tym ekstremalnym scenariuszu. Dwa głośniki stereo są słabym punktem, ponieważ ogólny dźwięk jest dość cichy i bardzo cienki. Przynajmniej wysokie tony są renderowane czysto, co korzystnie wpływa na reprodukcję głosów.
Dzięki baterii 91 Wh, VIA 15 Pro osiąga bardzo dobre czasy pracy nawet przy 165 Hz. Określiliśmy 11 godzin przy dostosowanej jasności 150 cd/m² i nadal 8 godzin przy pełnej jasności.
Hałas
| luz |
| 24 / 24 / 27.5 dB |
| obciążenie |
| 33.7 / 42.4 dB |
 | ||
30 dB cichy 40 dB(A) słyszalny 50 dB(A) irytujący |
||
min: | ||
| Schenker VIA 15 Pro M22 Vega 8, R7 5700U, Samsung SSD 970 EVO Plus 1TB | Dell Latitude 3520 Iris Xe G7 80EUs, i5-1135G7, Kioxia BG5 KBG50ZNS256G | HP ProBook 450 G9 6A180EA Iris Xe G7 96EUs, i7-1255U, SK Hynix HFM512GD3JX013N | Dell Inspiron 15 5515-H8P8F Vega 8, R7 5700U, Toshiba KBG40ZNS512G NVMe | Lenovo ThinkBook 15 G4 21DL0009GE Vega 7, R5 5625U, Samsung PM991a MZALQ512HBLU | |
|---|---|---|---|---|---|
| Noise | -2% | 7% | -1% | 4% | |
| wyłączone / środowisko * (dB) | 24 | 26 -8% | 25.5 -6% | 25.4 -6% | 23.21 3% |
| Idle Minimum * (dB) | 24 | 26 -8% | 25.5 -6% | 25.4 -6% | 23.21 3% |
| Idle Average * (dB) | 24 | 26 -8% | 25.5 -6% | 25.4 -6% | 23.21 3% |
| Idle Maximum * (dB) | 27.5 | 26 5% | 25.5 7% | 25.4 8% | 23.21 16% |
| Load Average * (dB) | 33.7 | 31.1 8% | 28 17% | 34 -1% | 33 2% |
| Witcher 3 ultra * (dB) | 33.7 | ||||
| Load Maximum * (dB) | 42.4 | 41.5 2% | 27.7 35% | 40 6% | 43.34 -2% |
* ... im mniej tym lepiej
(±) Maksymalna temperatura w górnej części wynosi 41.2 °C / 106 F, w porównaniu do średniej 34.3 °C / 94 F , począwszy od 21.2 do 62.5 °C dla klasy Office.
(±) Dno nagrzewa się maksymalnie do 43.5 °C / 110 F, w porównaniu do średniej 36.8 °C / 98 F
(+) W stanie bezczynności średnia temperatura górnej części wynosi 26.2 °C / 79 F, w porównaniu ze średnią temperaturą urządzenia wynoszącą 29.5 °C / ### class_avg_f### F.
(+) Podczas gry w Wiedźmina 3 średnia temperatura górnej części wynosi 31.7 °C / 89 F, w porównaniu do średniej temperatury urządzenia wynoszącej 29.5 °C / ## #class_avg_f### F.
(+) Podpórki pod nadgarstki i touchpad są chłodniejsze niż temperatura skóry i maksymalnie 27.2 °C / 81 F i dlatego są chłodne w dotyku.
(±) Średnia temperatura obszaru podparcia dłoni w podobnych urządzeniach wynosiła 27.5 °C / 81.5 F (+0.3 °C / 0.5 F).
| Schenker VIA 15 Pro M22 AMD Ryzen 7 5700U, AMD Radeon RX Vega 8 (Ryzen 4000/5000) | Dell Latitude 3520 Intel Core i5-1135G7, Intel Iris Xe Graphics G7 80EUs | HP ProBook 450 G9 6A180EA Intel Core i7-1255U, Intel Iris Xe Graphics G7 96EUs | Dell Inspiron 15 5515-H8P8F AMD Ryzen 7 5700U, AMD Radeon RX Vega 8 (Ryzen 4000/5000) | Lenovo ThinkBook 15 G4 21DL0009GE AMD Ryzen 5 5625U, AMD Radeon RX Vega 7 | |
|---|---|---|---|---|---|
| Heat | -4% | -11% | -11% | -12% | |
| Maximum Upper Side * (°C) | 41.2 | 37.5 9% | 40.5 2% | 39.4 4% | 41.1 -0% |
| Maximum Bottom * (°C) | 43.5 | 49.7 -14% | 47.6 -9% | 45.4 -4% | 45.6 -5% |
| Idle Upper Side * (°C) | 28.4 | 29 -2% | 32.6 -15% | 33.2 -17% | 31.6 -11% |
| Idle Bottom * (°C) | 28.1 | 30.1 -7% | 34.2 -22% | 35.1 -25% | 36.5 -30% |
* ... im mniej tym lepiej
Schenker VIA 15 Pro M22 analiza dźwięku
(±) | głośność głośnika jest średnia, ale dobra (74.8 dB)
Bas 100 - 315 Hz
(-) | prawie brak basu - średnio 22.2% niższa od mediany
(±) | liniowość basu jest średnia (12% delta do poprzedniej częstotliwości)
Średnie 400 - 2000 Hz
(±) | wyższe średnie - średnio 5.1% wyższe niż mediana
(±) | liniowość środka jest średnia (10.2% delta do poprzedniej częstotliwości)
Wysokie 2–16 kHz
(+) | zrównoważone maksima - tylko 4.3% od mediany
(+) | wzloty są liniowe (6.6% delta do poprzedniej częstotliwości)
Ogólnie 100 - 16.000 Hz
(±) | liniowość ogólnego dźwięku jest średnia (22.8% różnicy w stosunku do mediany)
W porównaniu do tej samej klasy
» 62% wszystkich testowanych urządzeń w tej klasie było lepszych, 8% podobnych, 30% gorszych
» Najlepszy miał deltę 7%, średnia wynosiła ###średnia###%, najgorsza wynosiła 53%
W porównaniu do wszystkich testowanych urządzeń
» 67% wszystkich testowanych urządzeń było lepszych, 6% podobnych, 27% gorszych
» Najlepszy miał deltę 4%, średnia wynosiła ###średnia###%, najgorsza wynosiła 134%
Lenovo ThinkBook 15 G4 21DL0009GE analiza dźwięku
(-) | niezbyt głośne głośniki (###wartość### dB)
Bas 100 - 315 Hz
(±) | zredukowany bas - średnio 13.6% niższy od mediany
(-) | bas nie jest liniowy (15.1% delta do poprzedniej częstotliwości)
Średnie 400 - 2000 Hz
(+) | zbalansowane środki średnie - tylko 4.9% od mediany
(±) | liniowość środka jest średnia (8.1% delta do poprzedniej częstotliwości)
Wysokie 2–16 kHz
(+) | zrównoważone maksima - tylko 3.2% od mediany
(±) | liniowość wysokich wartości jest średnia (9.5% delta do poprzedniej częstotliwości)
Ogólnie 100 - 16.000 Hz
(±) | liniowość ogólnego dźwięku jest średnia (21.2% różnicy w stosunku do mediany)
W porównaniu do tej samej klasy
» 51% wszystkich testowanych urządzeń w tej klasie było lepszych, 9% podobnych, 40% gorszych
» Najlepszy miał deltę 7%, średnia wynosiła ###średnia###%, najgorsza wynosiła 53%
W porównaniu do wszystkich testowanych urządzeń
» 59% wszystkich testowanych urządzeń było lepszych, 7% podobnych, 34% gorszych
» Najlepszy miał deltę 4%, średnia wynosiła ###średnia###%, najgorsza wynosiła 134%
| wyłączony / stan wstrzymania | |
| luz | |
| obciążenie |
|
Legenda:
min: | |
Power consumption Witcher 3 / Stress test
Power consumption external Monitor
| Battery Runtime | |
| WiFi Websurfing | |
| Średnia w klasie Office (3.83 - 31.5, n=74, ostatnie 2 lata) | |
| Schenker VIA 15 Pro M22 | |
| Dell Inspiron 15 5515-H8P8F | |
| HP ProBook 450 G9 6A180EA | |
| Dell Latitude 3520 | |
| Lenovo ThinkBook 15 G4 21DL0009GE | |
| WiFi Websurfing max. Brightness | |
| Średnia w klasie Office (5.7 - 14.9, n=26, ostatnie 2 lata) | |
| HP ProBook 450 G9 6A180EA | |
| Dell Inspiron 15 5515-H8P8F | |
| Schenker VIA 15 Pro M22 | |
| Lenovo ThinkBook 15 G4 21DL0009GE | |
Za
Przeciw
Werdykt - VIA 15 Pro przekonuje dobrym wyświetlaczem i lekką obudową
Via 15 Pro firmy Schenker to ciekawy notebook biurowy, który przede wszystkim wyróżnia się na tle bezpośredniej konkurencji dzięki wysokiej jakości obudowie i dobremu panelowi WQHD. Przestrzeń kolorów sRGB jest w pełni pokryta, a nawet ruchome obrazy są bardzo płynne dzięki wysokiej częstotliwości odświeżania, a także krótkim czasom reakcji. Pomimo matowej powierzchni, nawet jasne treści nie są ziarniste.
Co więcej, Schenker przyjmuje inne podejście w zakresie opcji rozbudowy, ponieważ po dwa gniazda na moduły pamięci RAM i dyski SSD M.2-2280 nie są bynajmniej kwestią oczywistą. Klawiatura pozostawia dobre wrażenie, podobnie jak czas pracy na baterii, a portów jest wystarczająco dużo do codziennego użytku, choć port USB 2.0 nie jest już aktualny.
Via 15 Pro to interesująca maszyna biurowa z lekką obudową, dobrą klawiaturą i dobrym wyświetlaczem 165 Hz. Czasy pracy na baterii i opcje aktualizacji są równie przekonujące, ale stary procesor Zen 2 od AMD jest rozczarowujący w świetle dość wysokiej ceny początkowej.
Cena podstawowa wynosząca ponad 1100 euro jest z pewnością przeszkodą, zwłaszcza biorąc pod uwagę stary procesor AMD. Należy jednak powiedzieć, że wydajność wielordzeniowa jest nadal konkurencyjna, a także okazuje się lepsza niż u rywali. Kolejnym słabym punktem jest słaby system głośników.
Cena i dostępność
VIA Pro 15 można skonfigurować na stronie Bestware w cenie od 1 149 euro.
Schenker VIA 15 Pro M22
- 29/06/2023 v7 (old)
Andreas Osthoff
Przezroczystość
Wyboru urządzeń do recenzji dokonuje nasza redakcja. Próbka testowa została udostępniona autorowi jako pożyczka od producenta lub sprzedawcy detalicznego na potrzeby tej recenzji. Pożyczkodawca nie miał wpływu na tę recenzję, producent nie otrzymał też kopii tej recenzji przed publikacją. Nie było obowiązku publikowania tej recenzji. Jako niezależna firma medialna, Notebookcheck nie podlega władzy producentów, sprzedawców detalicznych ani wydawców.
Tak testuje Notebookcheck
Każdego roku Notebookcheck niezależnie sprawdza setki laptopów i smartfonów, stosując standardowe procedury, aby zapewnić porównywalność wszystkich wyników. Od około 20 lat stale rozwijamy nasze metody badawcze, ustanawiając przy tym standardy branżowe. W naszych laboratoriach testowych doświadczeni technicy i redaktorzy korzystają z wysokiej jakości sprzętu pomiarowego. Testy te obejmują wieloetapowy proces walidacji. Nasz kompleksowy system ocen opiera się na setkach uzasadnionych pomiarów i benchmarków, co pozwala zachować obiektywizm.Price comparison
