Recenzja budżetowego laptopa do gier Schenker XMG Focus 15 (E23): Duża wydajność w niższej cenie niż Pro 15

Najpierw przetestowaliśmyXMG Focus 15pod koniec 2021 roku. Focus 15 był laptopem, który wykorzystał zupełnie nową wówczas kartę graficznąRTX 3050 Ti Laptop GPUdo granic możliwości. Pomimo chłodzenia, XMG Focus 15 wykazywał jedynie ponadprzeciętną wydajność w wysokich temperaturach.
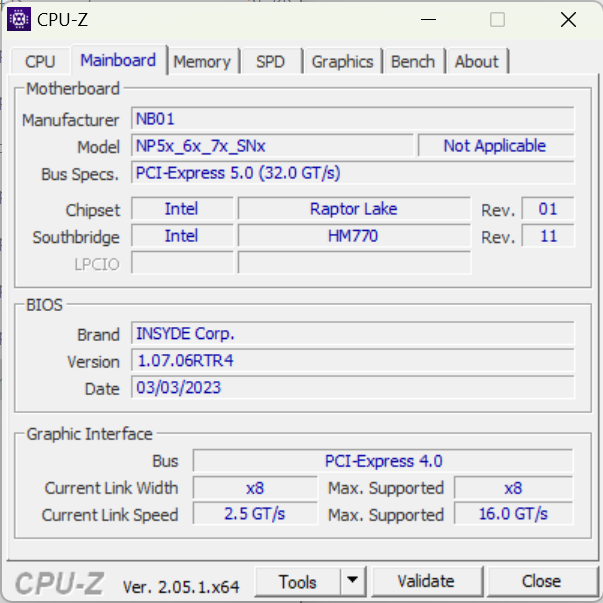
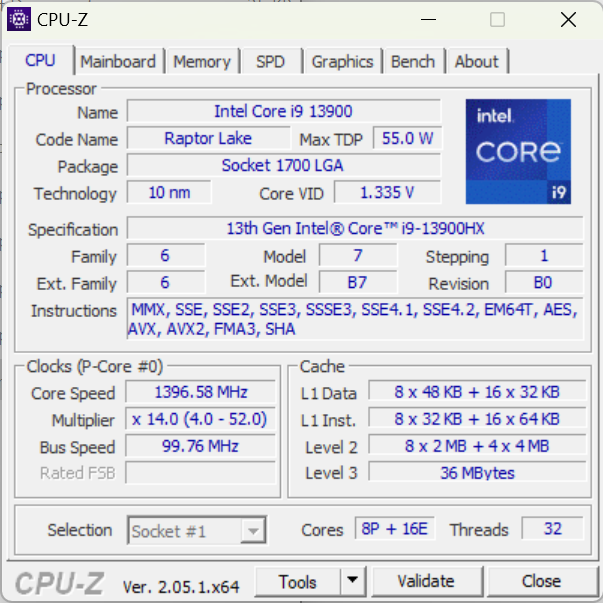
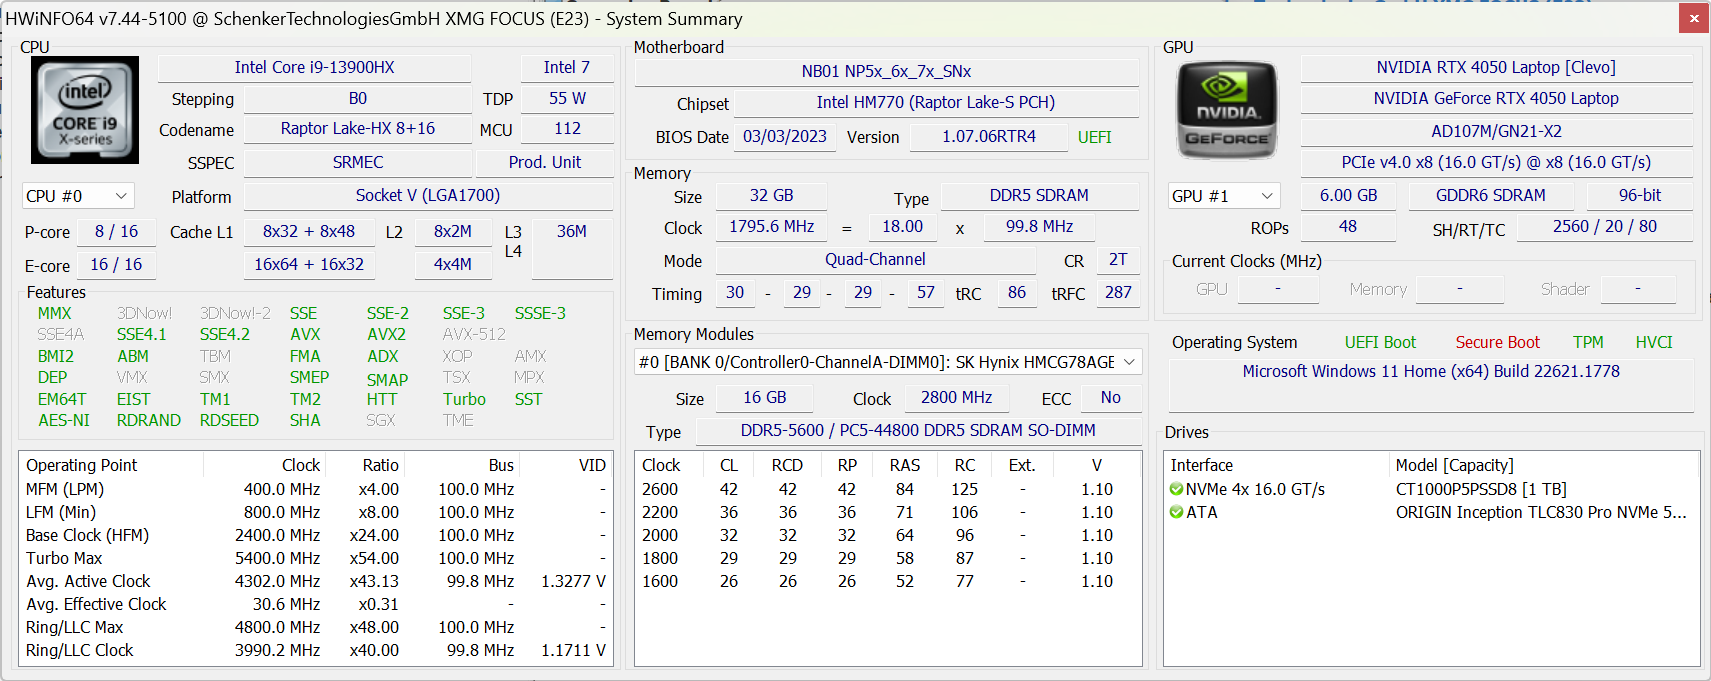
Schenker po raz kolejny polega na barebone od Clevo dla obecnego Focusa 15 i tym razem jest to obudowa NP50SNC. Podobnie jak w przypadku niedawno testowanegoXMG Pro 15znajdujemy procesorIntel Core i9-13900HXzainstalowany w nowym Focusie 15.
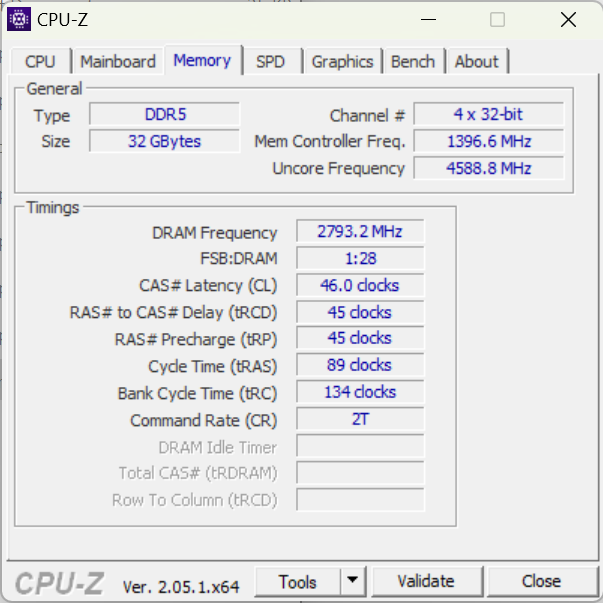
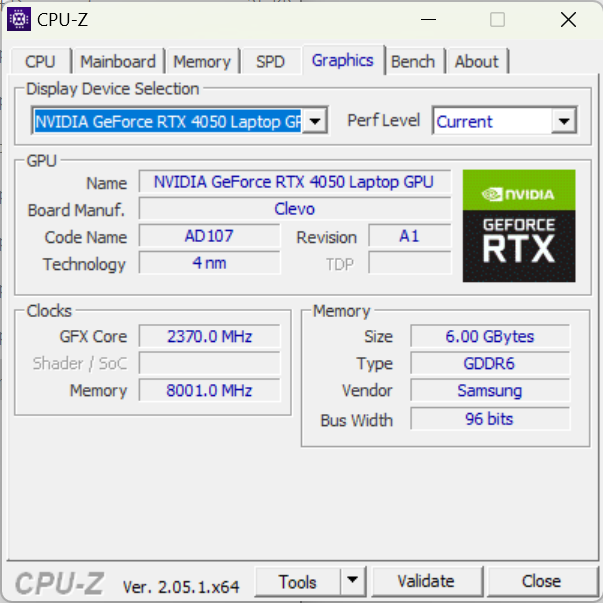
Wysokiej klasy procesor w Focusie 15 jest uzupełniony przez podstawowy układ GPU, czyliNvidia GeForce RTX 4050 Laptop GPU32 GB pamięci operacyjnej i dysk SSD Crucial NVMe o pojemności 1 TB.
Jak zwykle, Schenker oferuje szeroką gamę opcji konfiguracyjnych. Kupujący mogą również skonfigurować Focus 15 z kartą graficznąRTX 4060 Laptop GPUlubRTX 4070 Laptop GPUwraz z dodatkowymi opcjami pamięci RAM.
Ze względu na podstawową grafikę naszej próbki testowej, klasyfikujemy XMG Pro 15 jako podstawowy laptop do gier. Jednak podstawowe laptopy do gier zwykle nie mają tak wydajnego procesora i nie więcej niż 16 GB pamięci roboczej, więc szukamy również odpowiednich urządzeń porównawczych wśród laptopów multimedialnych z wyższej półki.
Wśród nich są urządzenia takie jakMSI Katana 15lubAsus TUF A15jako laptopy gamingowe orazSamsung Galaxy Book3 Ultra 16lubAcer Swift X SFX14-71Gjako laptopy multimedialne. LaptopyXMG Pro 15również znajdzie się w tym zestawieniu - droższy laptop Schenkera różni się od swojego tańszego kuzyna tylko w kilku aspektach.
Potencjalni konkurenci w porównaniu
Ocena | Data | Model | Waga | Wysokość | Rozmiar | Rezolucja | Cena |
|---|---|---|---|---|---|---|---|
| 85.1 % v7 (old) | 07/2023 | Schenker XMG Focus 15 (E23) i9-13900HX, GeForce RTX 4050 Laptop GPU | 2.4 kg | 26.9 mm | 15.60" | 2569x1440 | |
| 86.2 % v7 (old) | 07/2023 | Schenker XMG Pro 15 (E23) i9-13900HX, GeForce RTX 4060 Laptop GPU | 2.4 kg | 24.9 mm | 15.60" | 2560x1440 | |
| 86.3 % v7 (old) | 06/2023 | Asus TUF A15 FA507 R7 7735HS, GeForce RTX 4050 Laptop GPU | 2.2 kg | 24.9 mm | 15.60" | 1920x1080 | |
| 82.9 % v7 (old) | 03/2023 | MSI Katana 15 B12VEK i7-12650H, GeForce RTX 4050 Laptop GPU | 2.3 kg | 24.9 mm | 15.60" | 1920x1080 | |
| 86.3 % v7 (old) | 07/2023 | Acer Swift X SFX14-71G i7-13700H, GeForce RTX 4050 Laptop GPU | 1.5 kg | 17.9 mm | 14.50" | 2880x1800 | |
| 89.4 % v7 (old) | 04/2023 | Samsung Galaxy Book3 Ultra 16 i7-13700H, GeForce RTX 4050 Laptop GPU | 1.8 kg | 16.5 mm | 16.00" | 2880x1800 | |
| 89.4 % v7 (old) | 05/2023 | Gigabyte Aero 14 OLED BMF i7-13700H, GeForce RTX 4050 Laptop GPU | 1.4 kg | 17 mm | 14.00" | 2880x1800 |
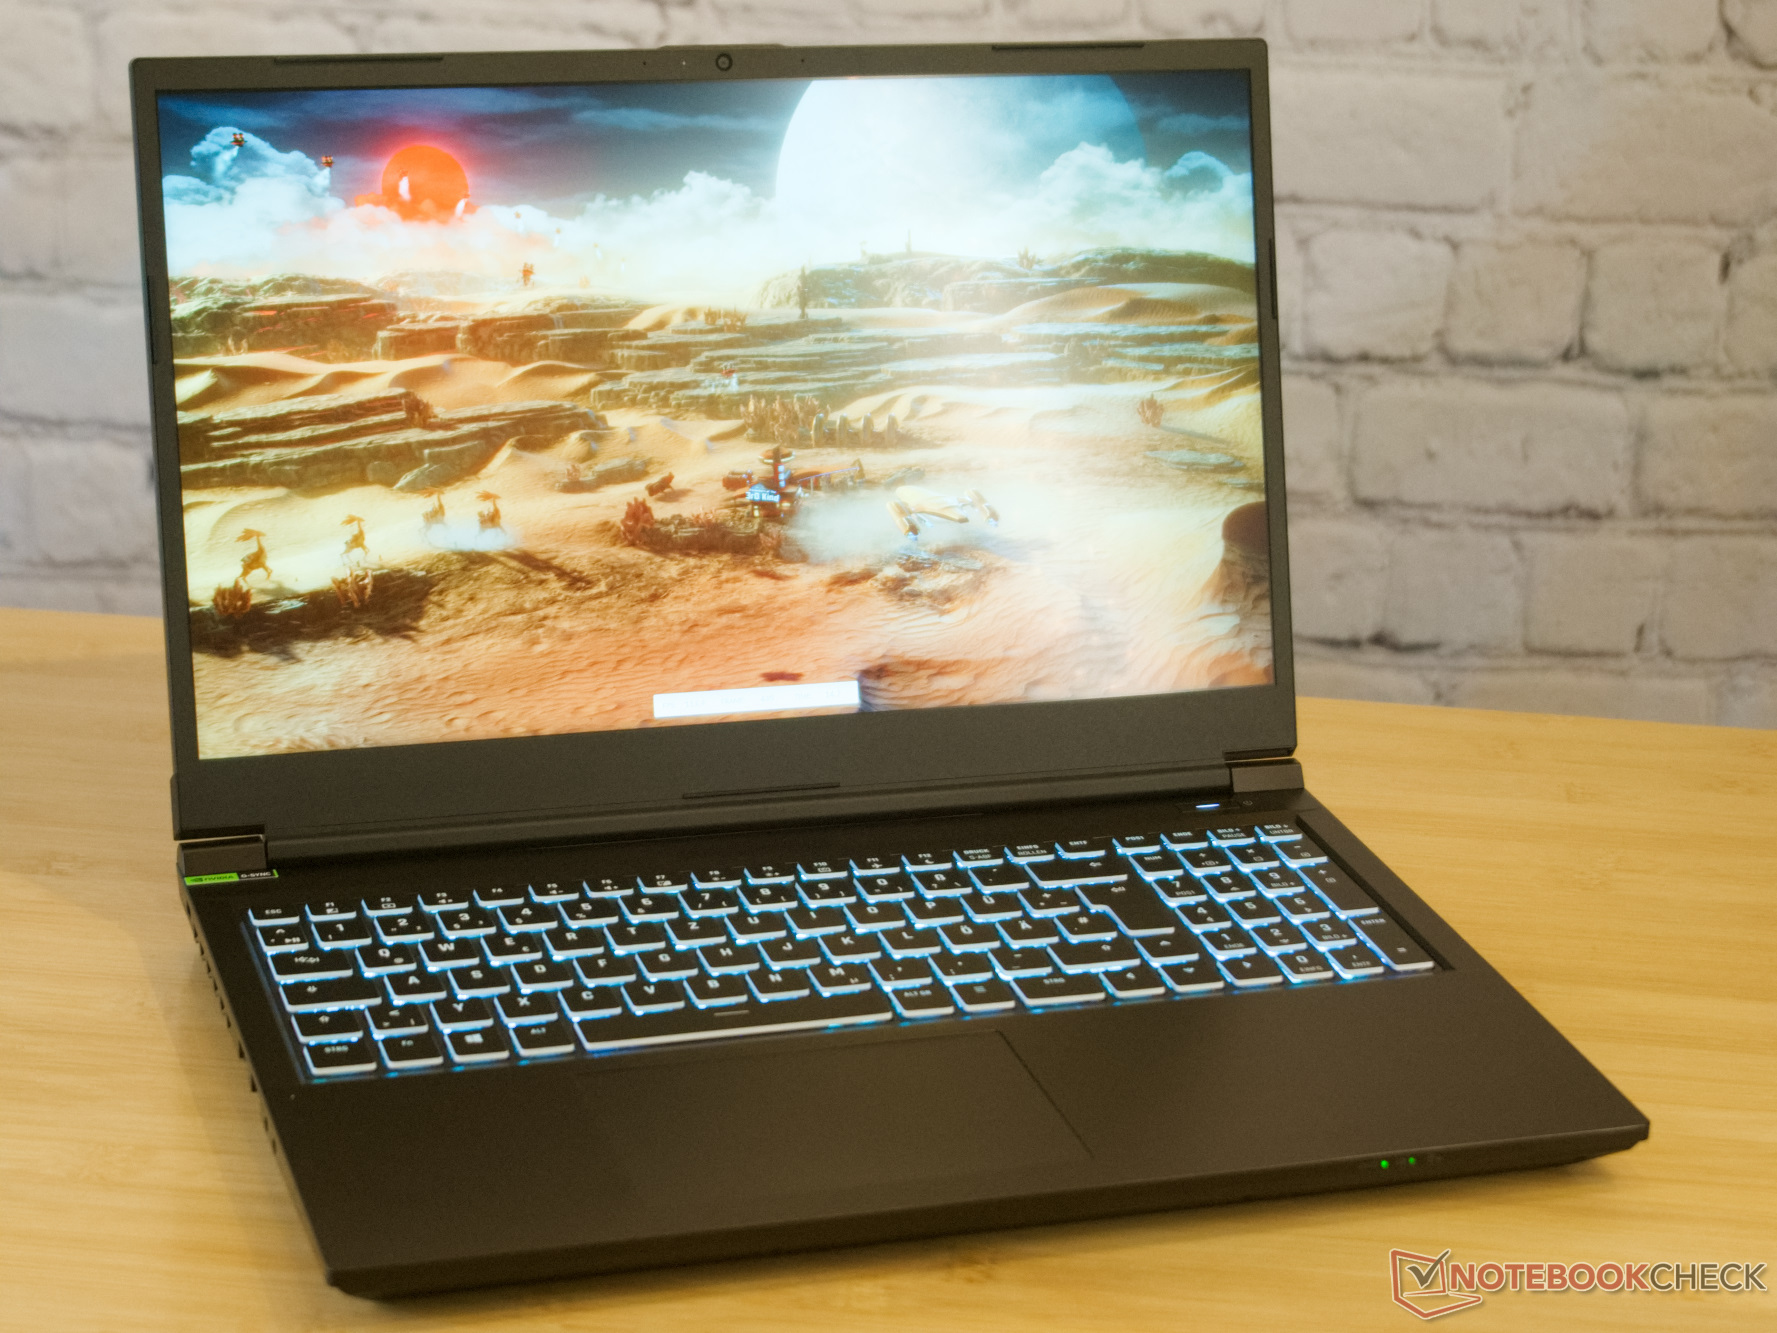
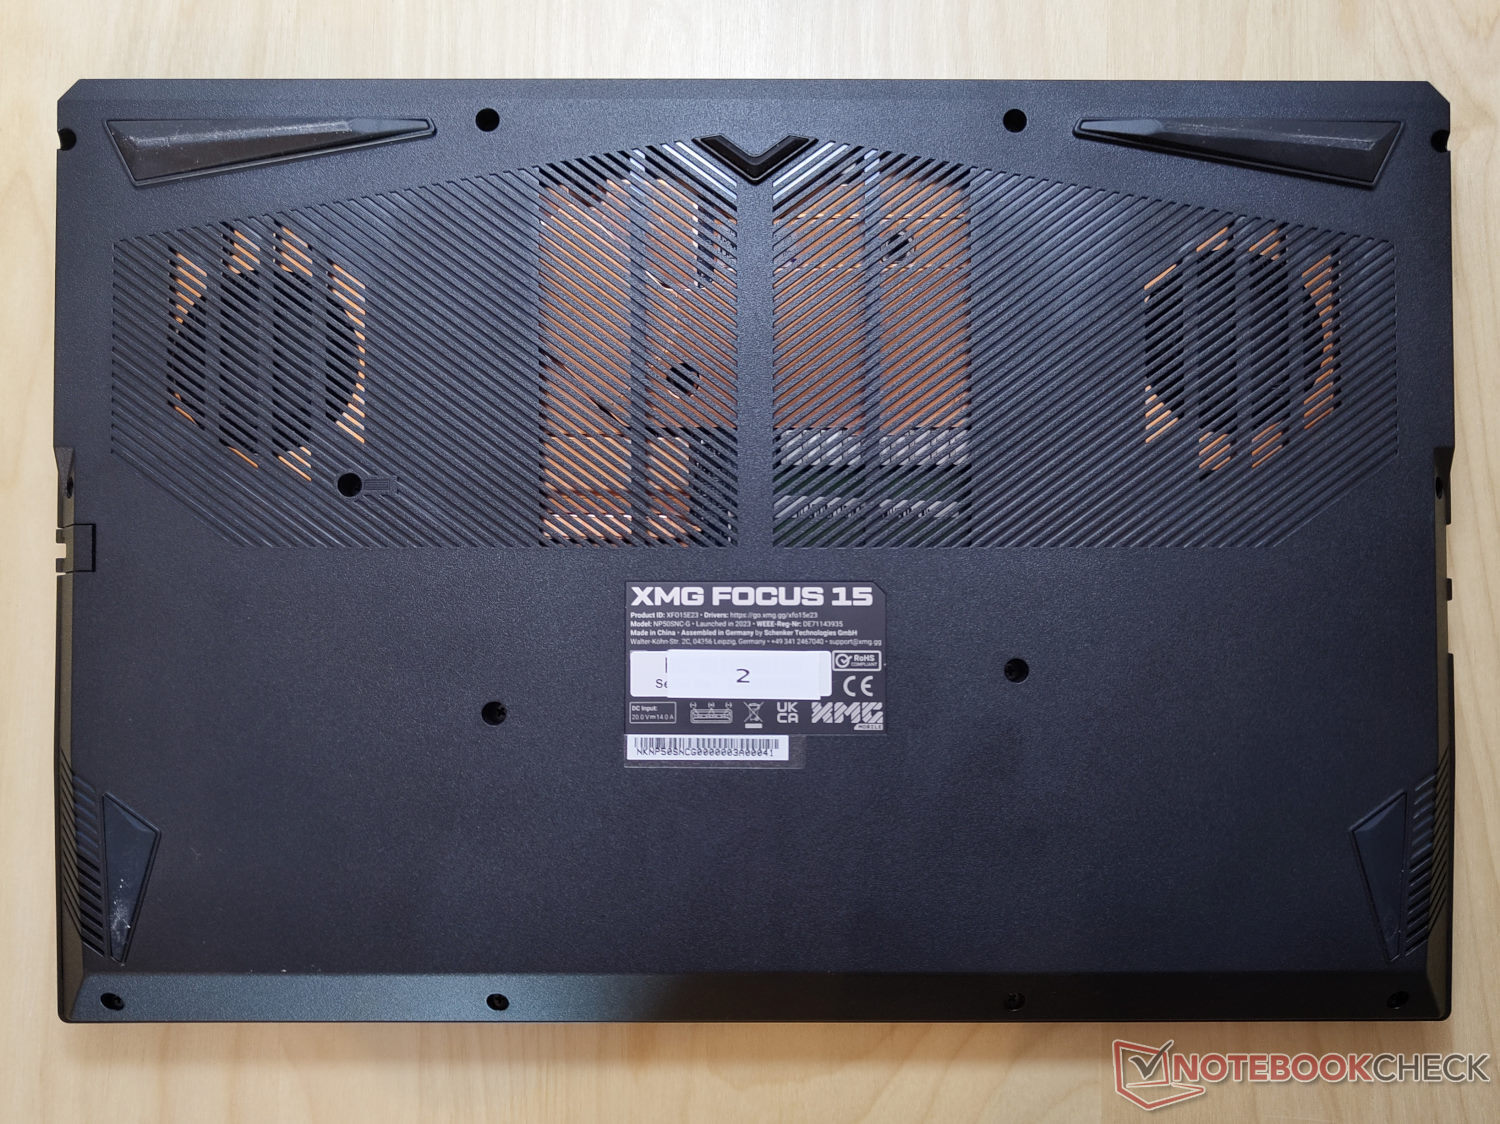
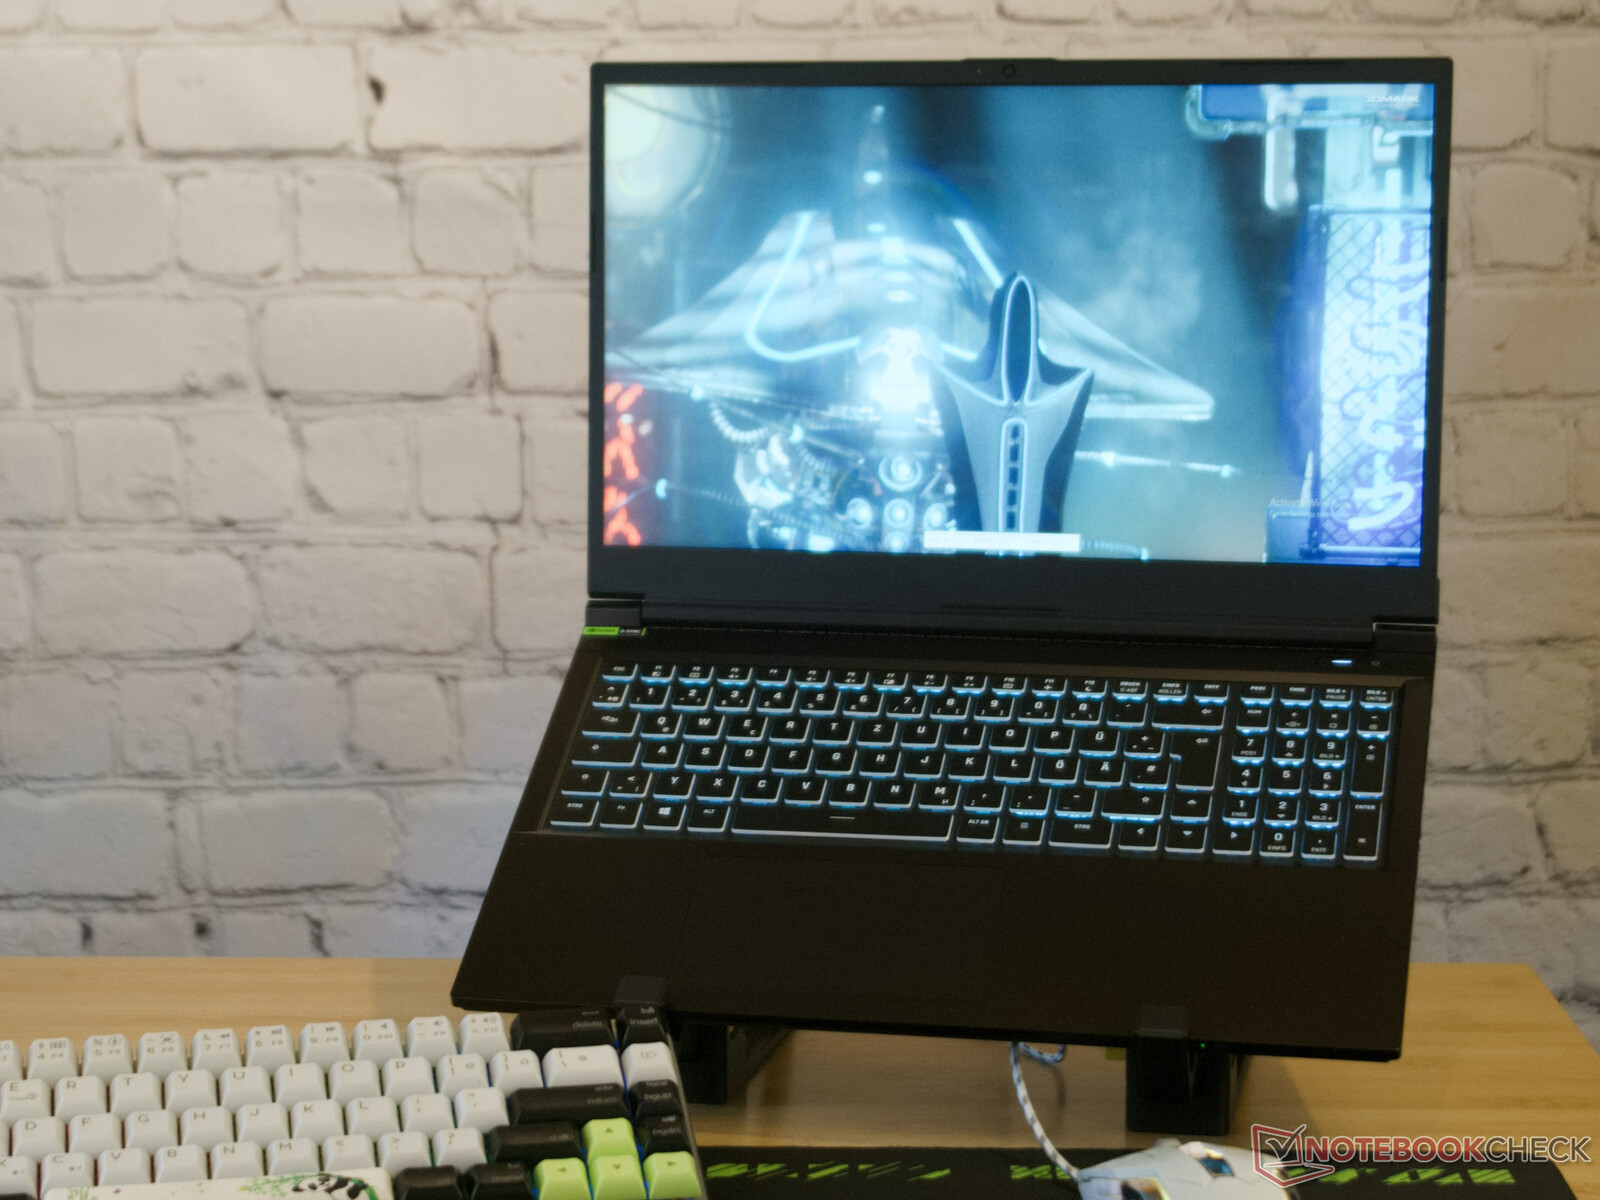
Podwozie: Wytrzymałe tworzywo sztuczne
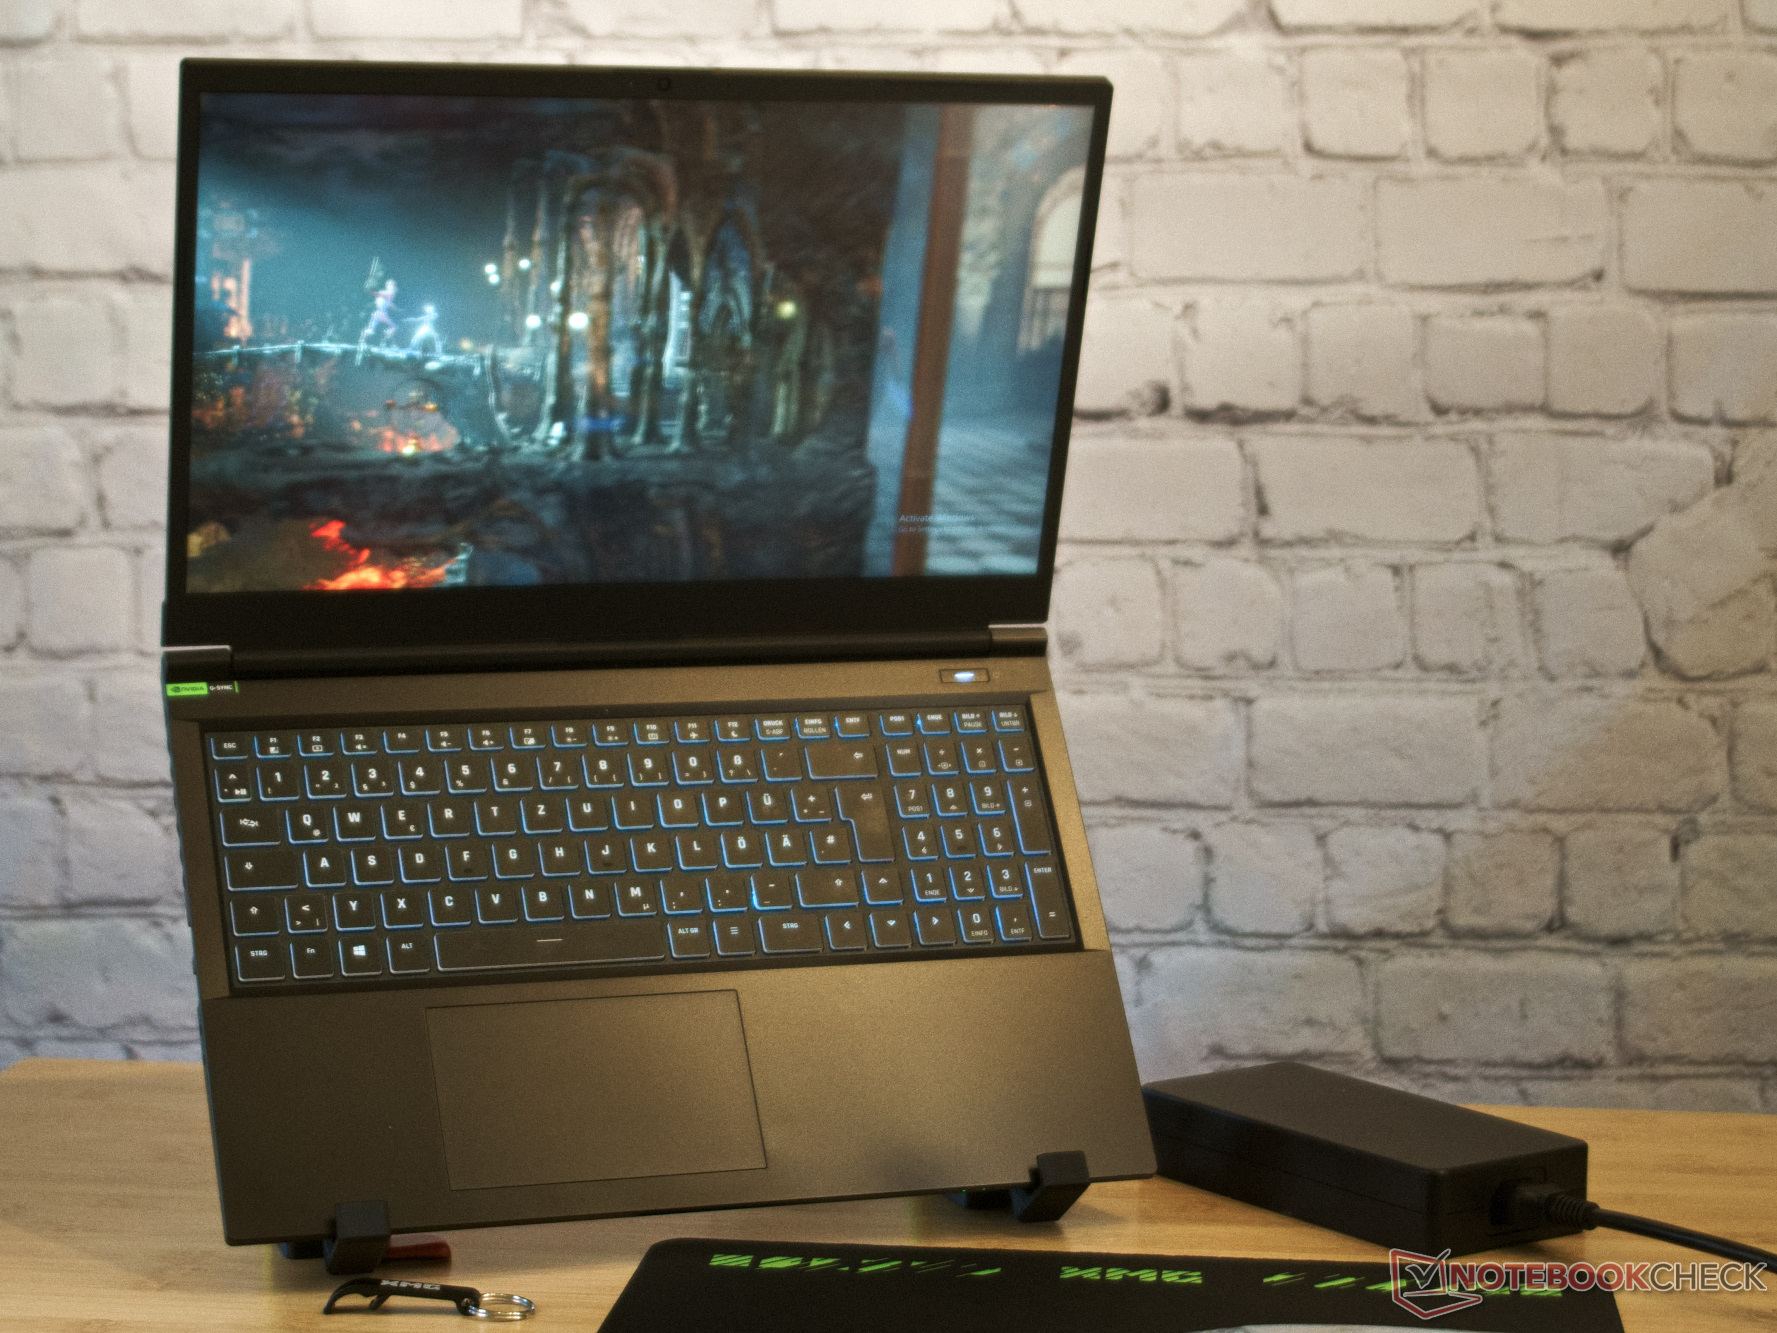
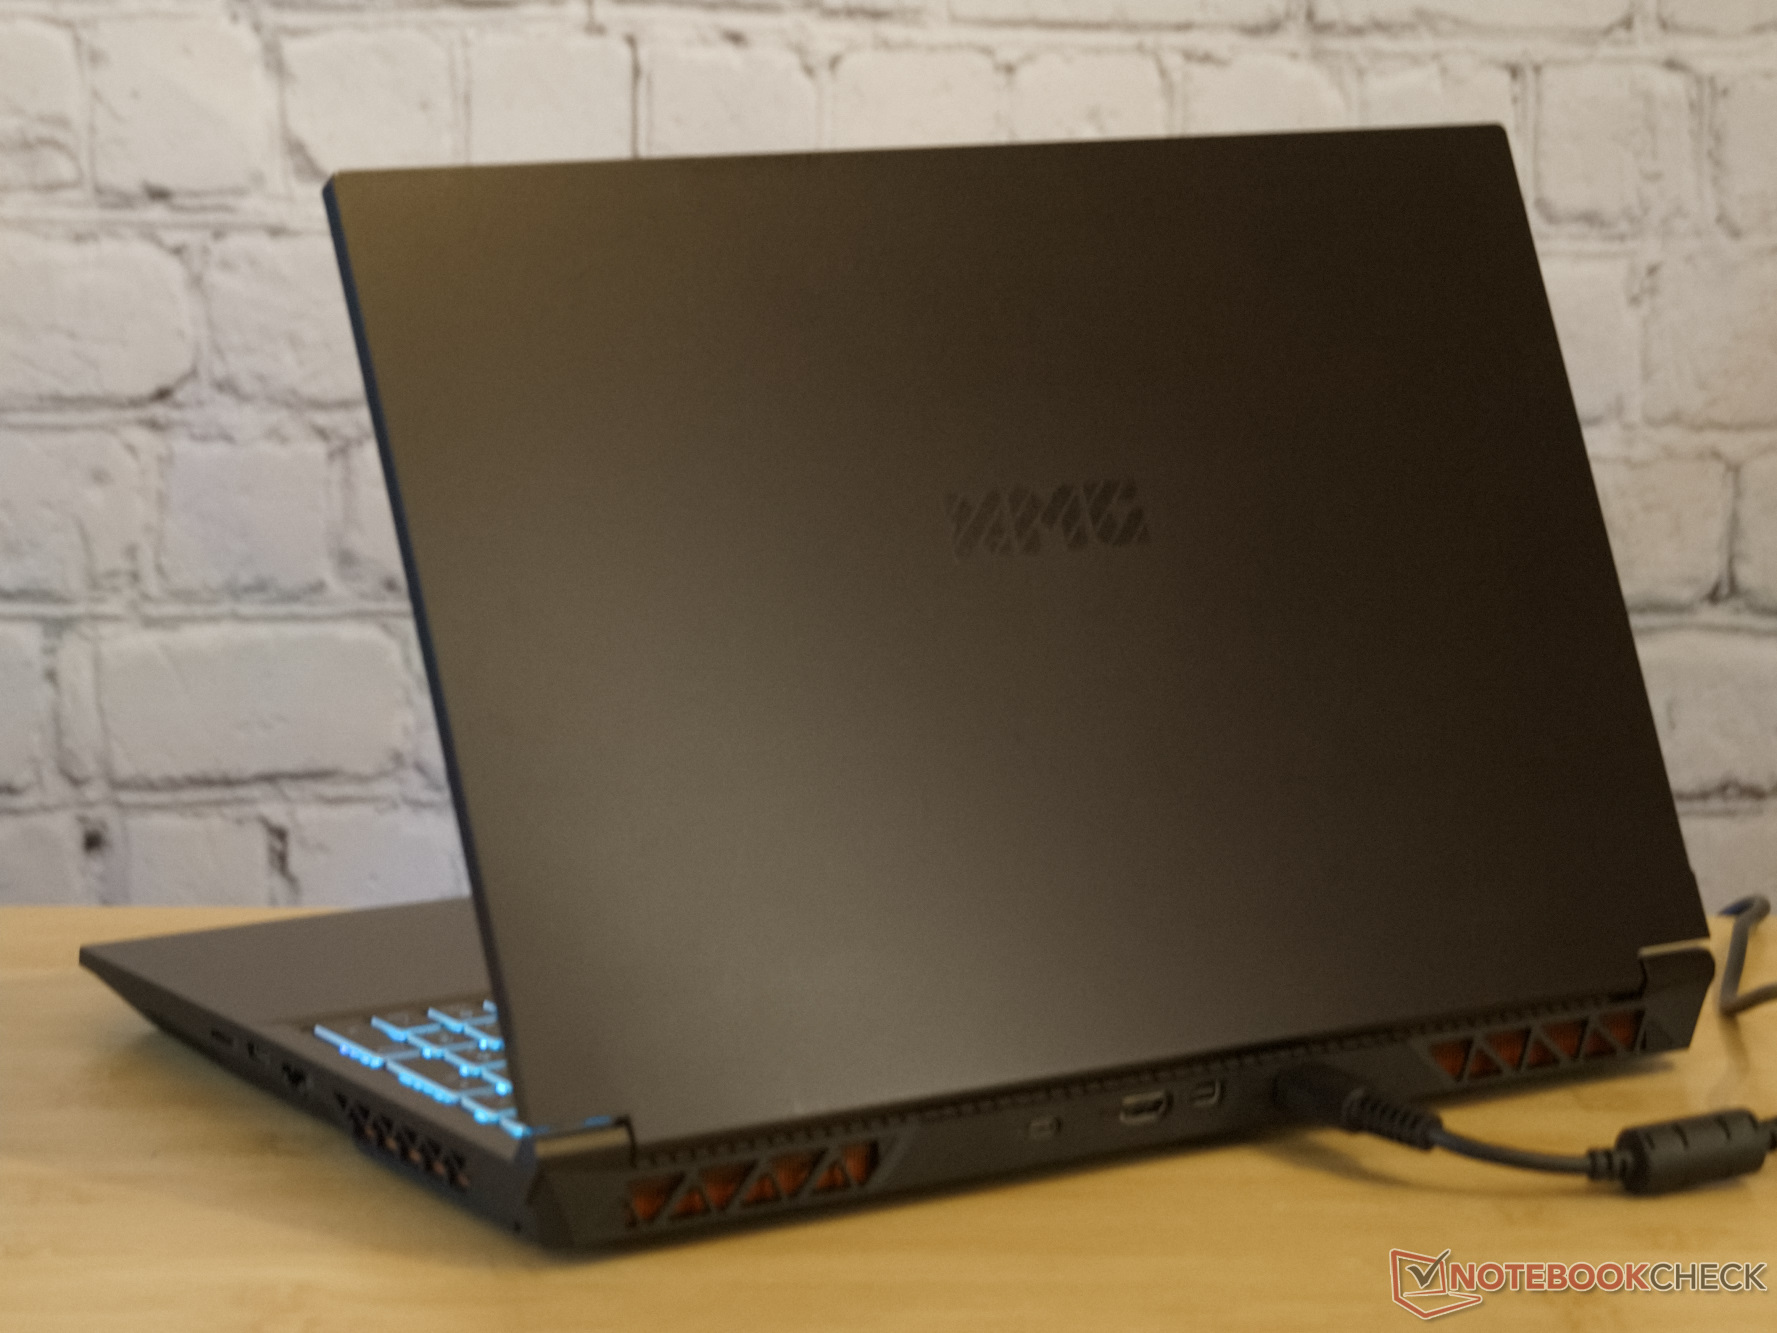
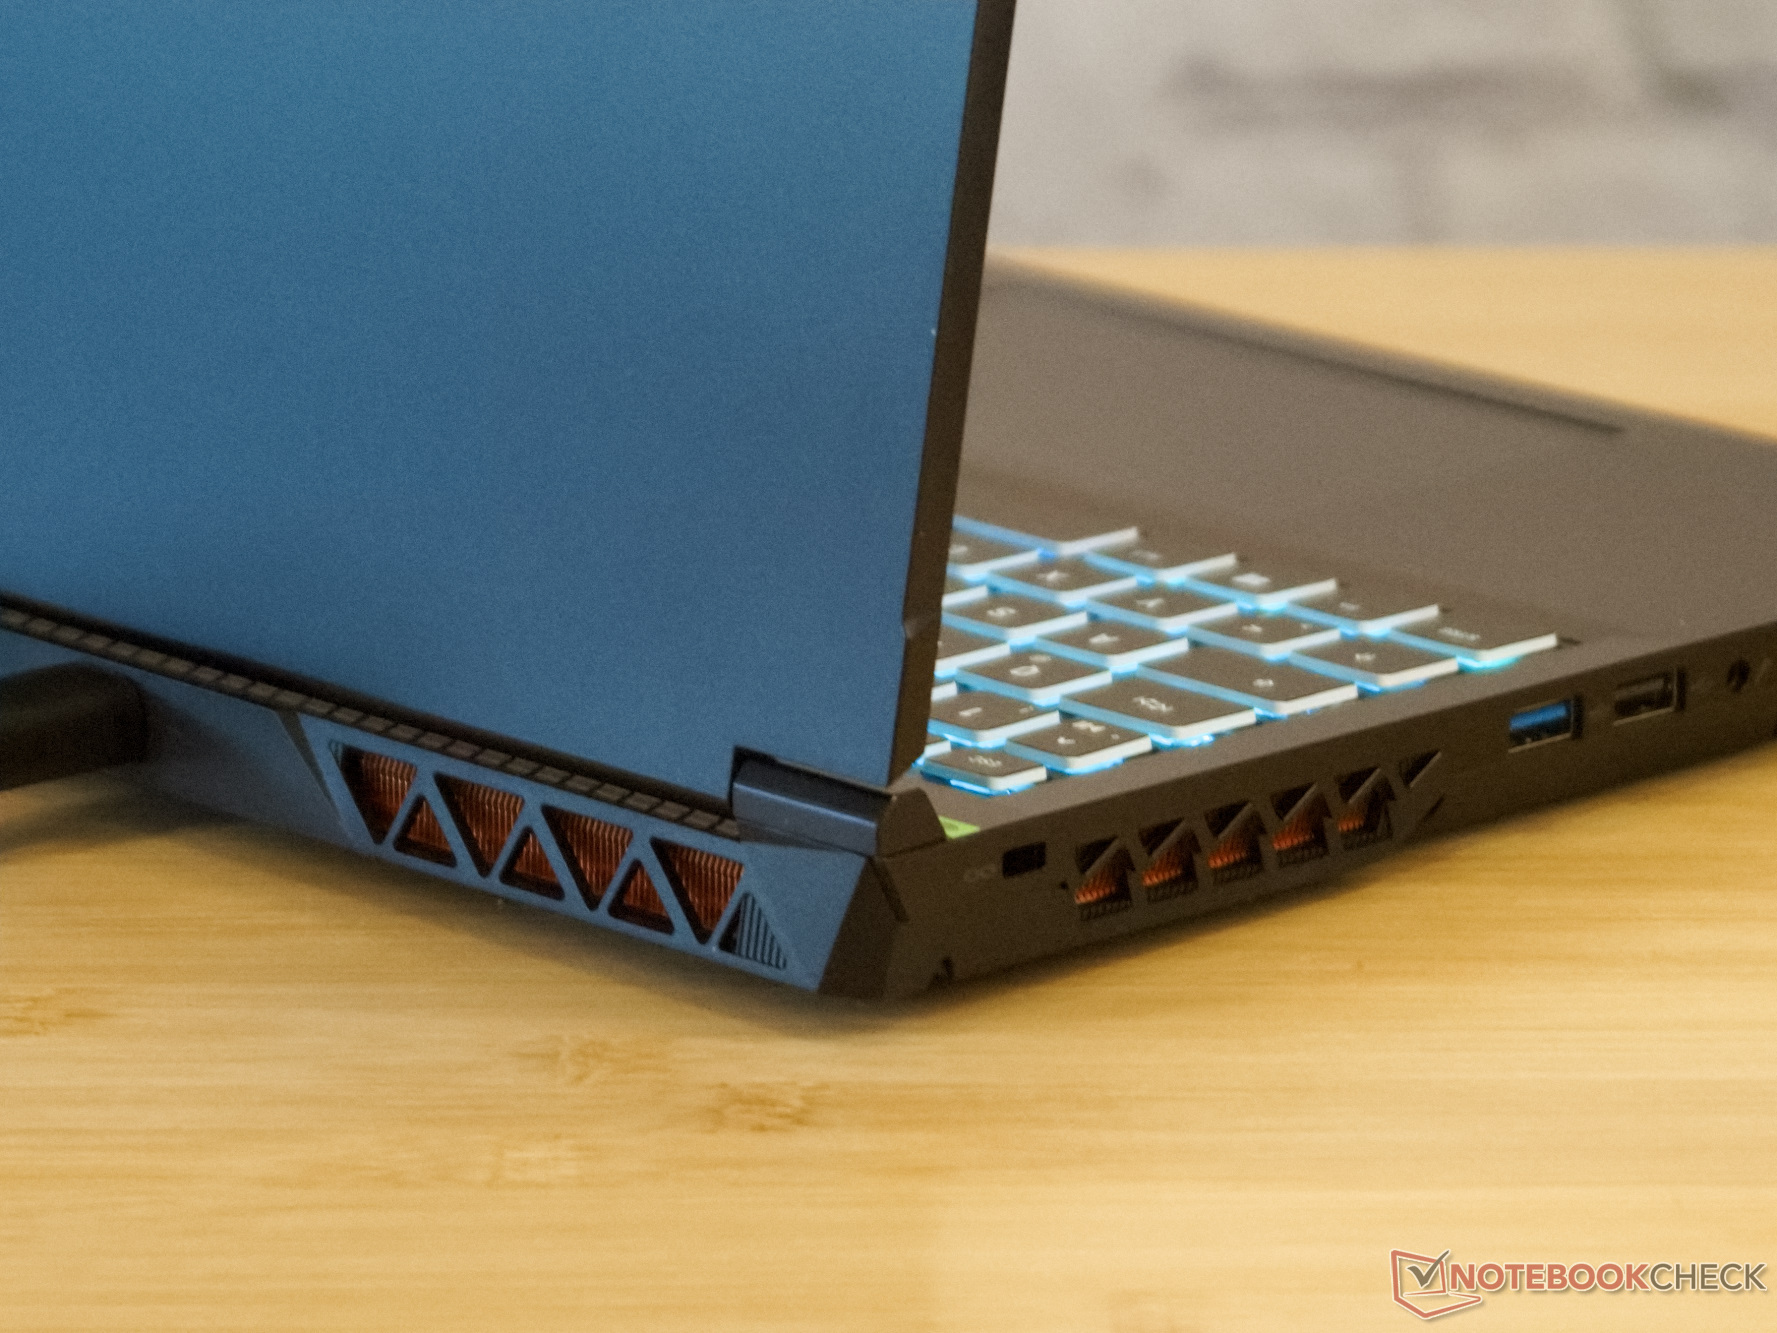
Obudowa laptopa jest w całości wykonana z wytrzymałego plastiku, a metal jest widoczny tylko z zewnątrz za maskownicami w postaci radiatora. Clevo i Schenker zachowali raczej prosty design. Branding znajduje się tylko w postaci czarnego logo XMG na czarnym tle.
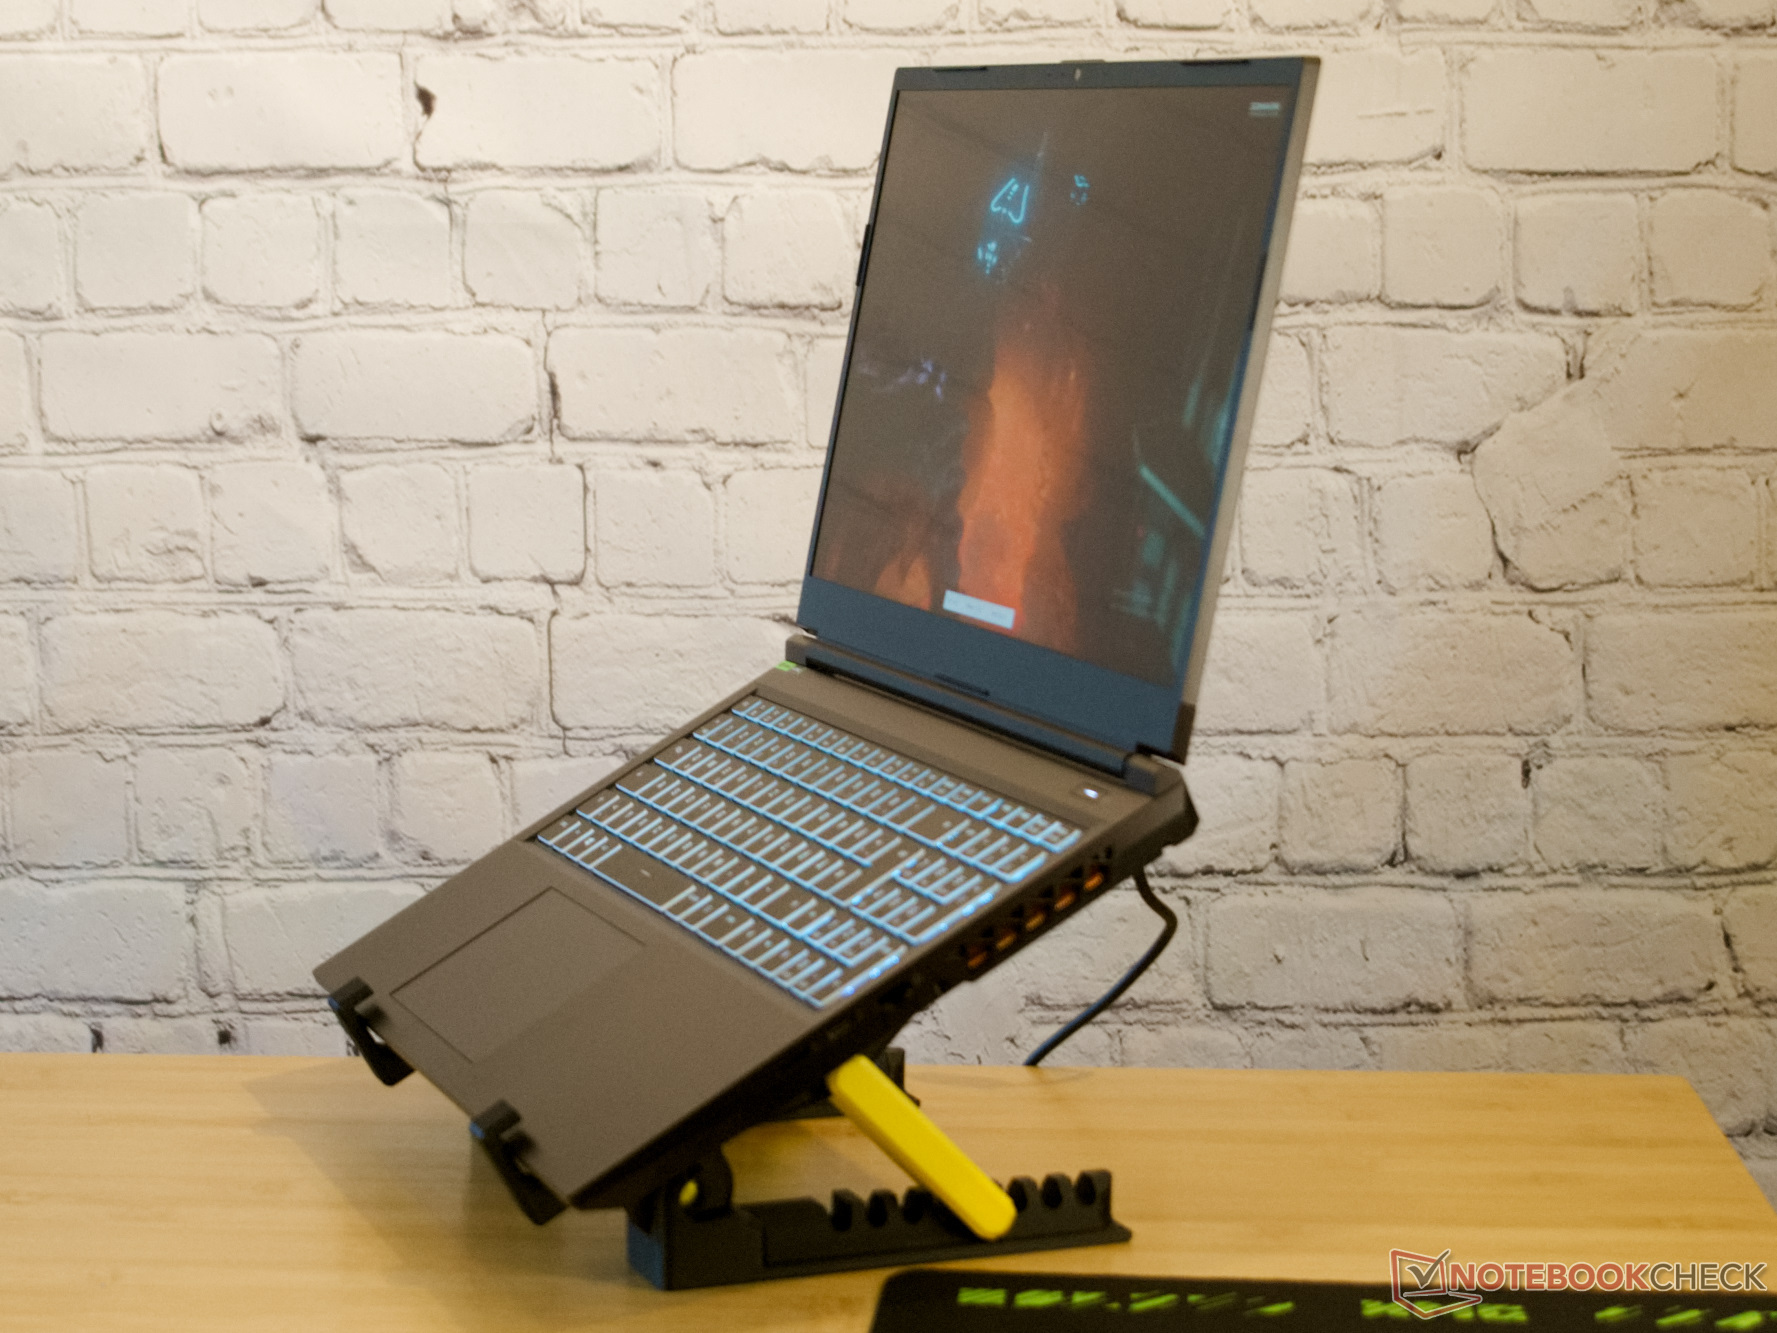
Mimo że obudowa jest wykonana głównie z tworzywa sztucznego, nie znajdujemy żadnych słabych punktów pod względem jakości. Laptop wydaje się wytrzymały pod każdym względem, nie skrzypi podczas skręcania i ma bardzo wąskie i równe szczeliny. Pokrywę wyświetlacza można otworzyć do około 140° jedną ręką i utrzymuje ona swoją pozycję przez cały czas.
Ani waga, ani grubość nie są nietypowe dla 15,6-calowego laptopa do gier w formacie 16:10. Porównanie z innymi laptopami multimedialnymi pokazuje jednak, że te z podobnym sprzętem również mogłyby być nieco smuklejsze.
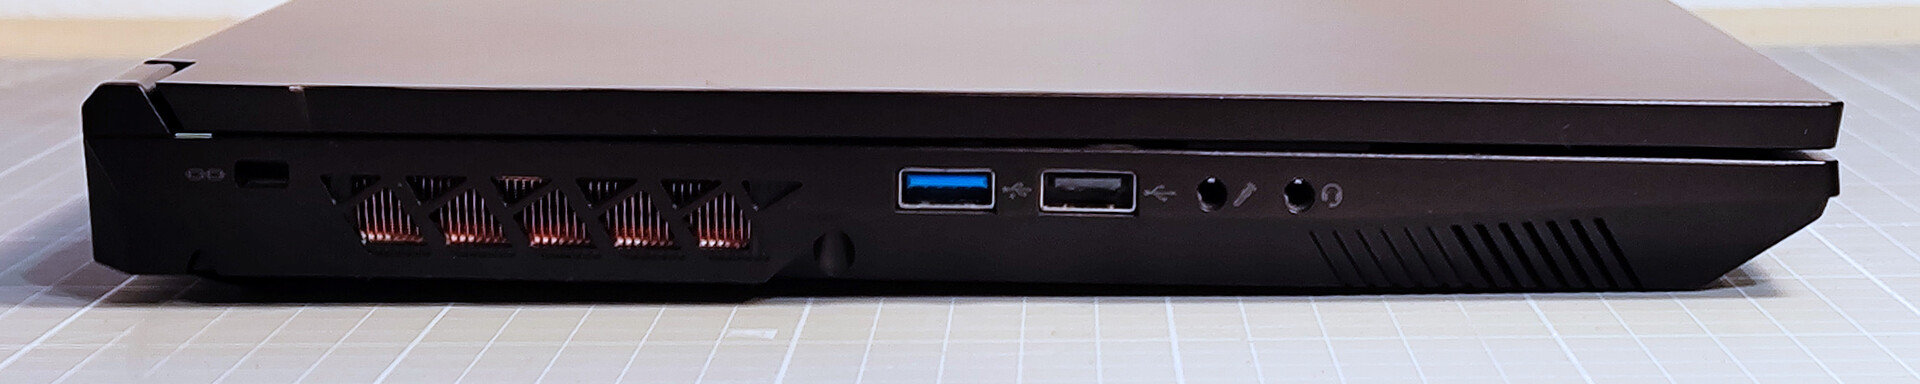
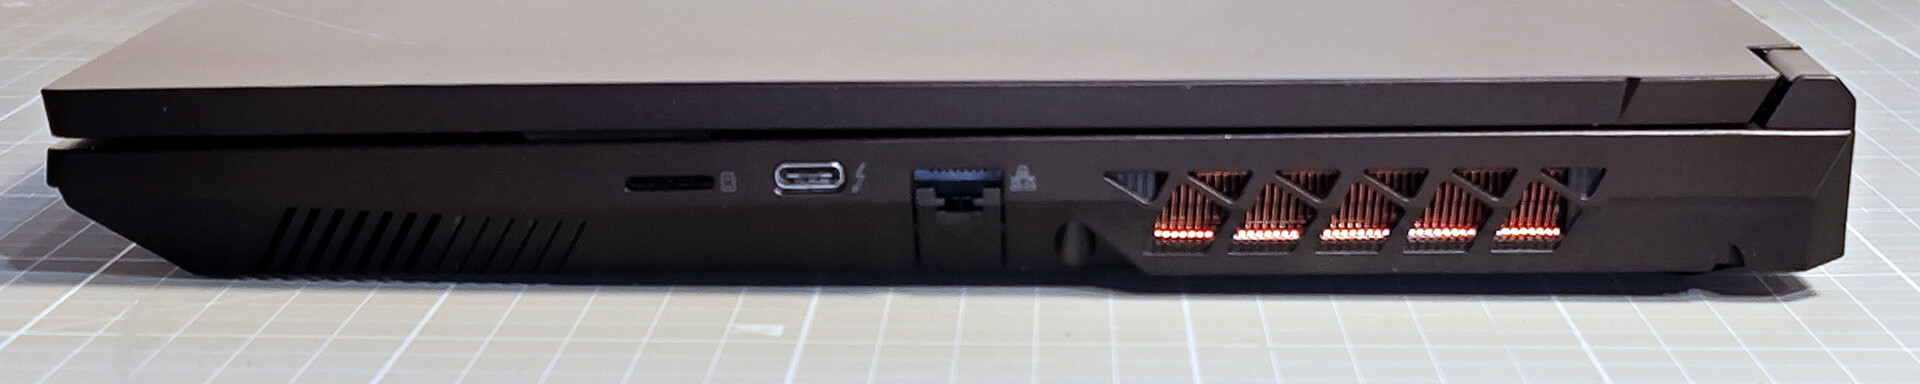
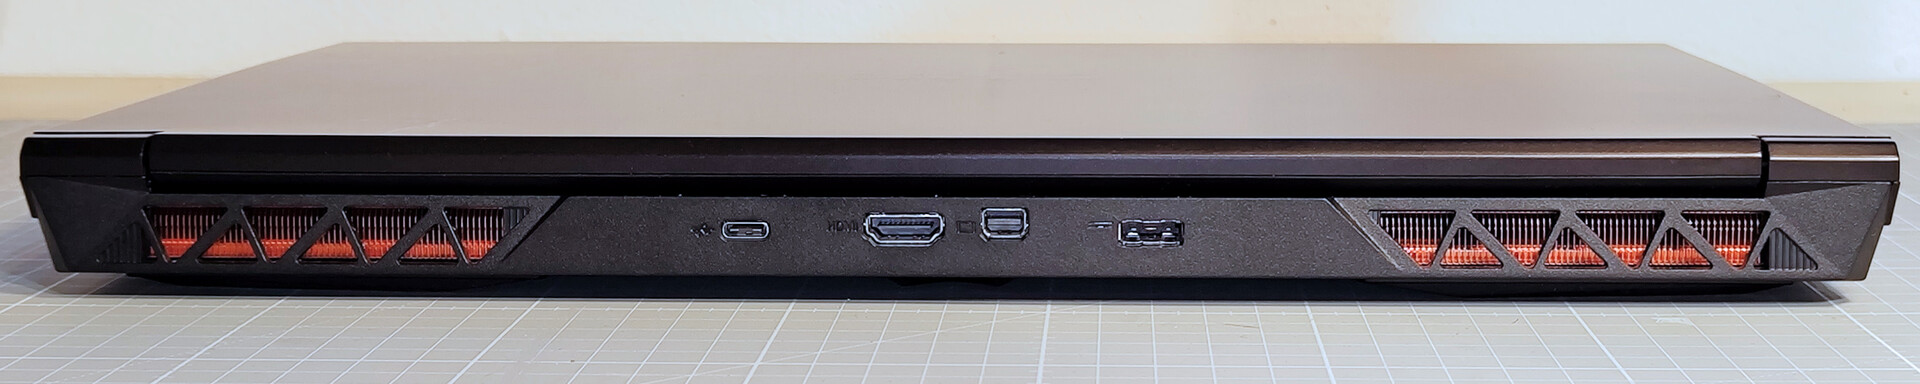
Wyposażenie: Porty USB z trzech stron
Aspekty łączności XMG Focus 15 prawie się nie zmieniły od czasu naszej ostatniej recenzji. Jedynym nowym dodatkiem jest kolejny port USB-C, ale czytnik kart SD został zredukowany do formatu microSD.
Oba porty USB typu C nie oferują zasilania. W związku z tym prawdopodobnie zawsze będziesz musiał zabrać ze sobą zasilacz, który waży prawie jeden kilogram.
Czytnik kart SD
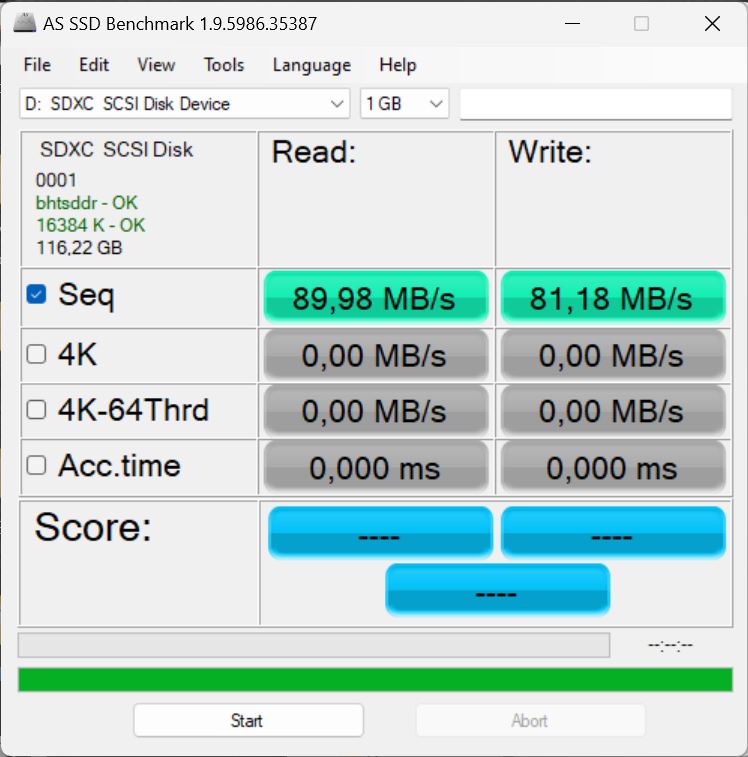
Prędkości transferu kart SD są dobre przy użyciu AV PRO microSD 128 GB V60 z naszym urządzeniem testowym lub Pro 15choć nie są wybitne.
Pozostałe dwa laptopy do gier w naszym porównaniu są dostarczane bez czytnika kart.
| SD Card Reader - maximum AS SSD Seq Read Test (1GB) | |
| Gigabyte Aero 14 OLED BMF | |
| Średnia w klasie Gaming (25.5 - 261, n=51, ostatnie 2 lata) | |
| Schenker XMG Focus 15 (E23) | |
| Acer Swift X SFX14-71G (Angelbird AV Pro V60) | |
| Samsung Galaxy Book3 Ultra 16 (AV PRO microSD 128 GB V60) | |
Komunikacja
Moduł Wi-Fi Intel AX211 w Focus 15 zapewnia wysokie prędkości transmisji w sieci Wi-Fi 6E z naszym referencyjnym routerem Asus ROG Rapture AXE-GT11000.
Z drugiej strony, prędkości transmisji w sieci 5 GHz Wi-Fi 6 wydają się poniżej średniej przy tej samej konfiguracji testowej.
Kamera internetowa
Kamera internetowa Full HD nowego Focusa 15 idealnie ustawia ostrość tylko na środku obrazu. Dlatego też środek jest ostry i bogaty w kontrast, podczas gdy krawędzie wyglądają na nieco wyblakłe.
Wysokie odchylenia kolorów kamery są irytujące, a w szczególności odcienie skóry są słabo odwzorowane.

 GeForce RTX 4050 Laptop GPU, i9-13900HX, Crucial P5 Plus 1TB CT1000P5PSSD8")
 GeForce RTX 4050 Laptop GPU, i9-13900HX, Crucial P5 Plus 1TB CT1000P5PSSD8")
Bezpieczeństwo
Focus 15 nie posiada opcji uwierzytelniania biometrycznego. Gniazdo bezpieczeństwa Kensington zapewnia fizyczną ochronę przed kradzieżą.
TPM 2.0 i SecureBoot mogą chronić przed nieautoryzowanym dostępem do danych.
Akcesoria
W pudełku oprócz zasilacza i dokumentacji znajdziemy bogaty pakiet akcesoriów. Otrzymujemy dużą podkładkę pod mysz z logo XMG i pasujący do niej otwieracz do butelek, a także instalacyjną płytę CD i pamięć USB zawierającą system Windows z odpowiednimi programami i sterownikami.
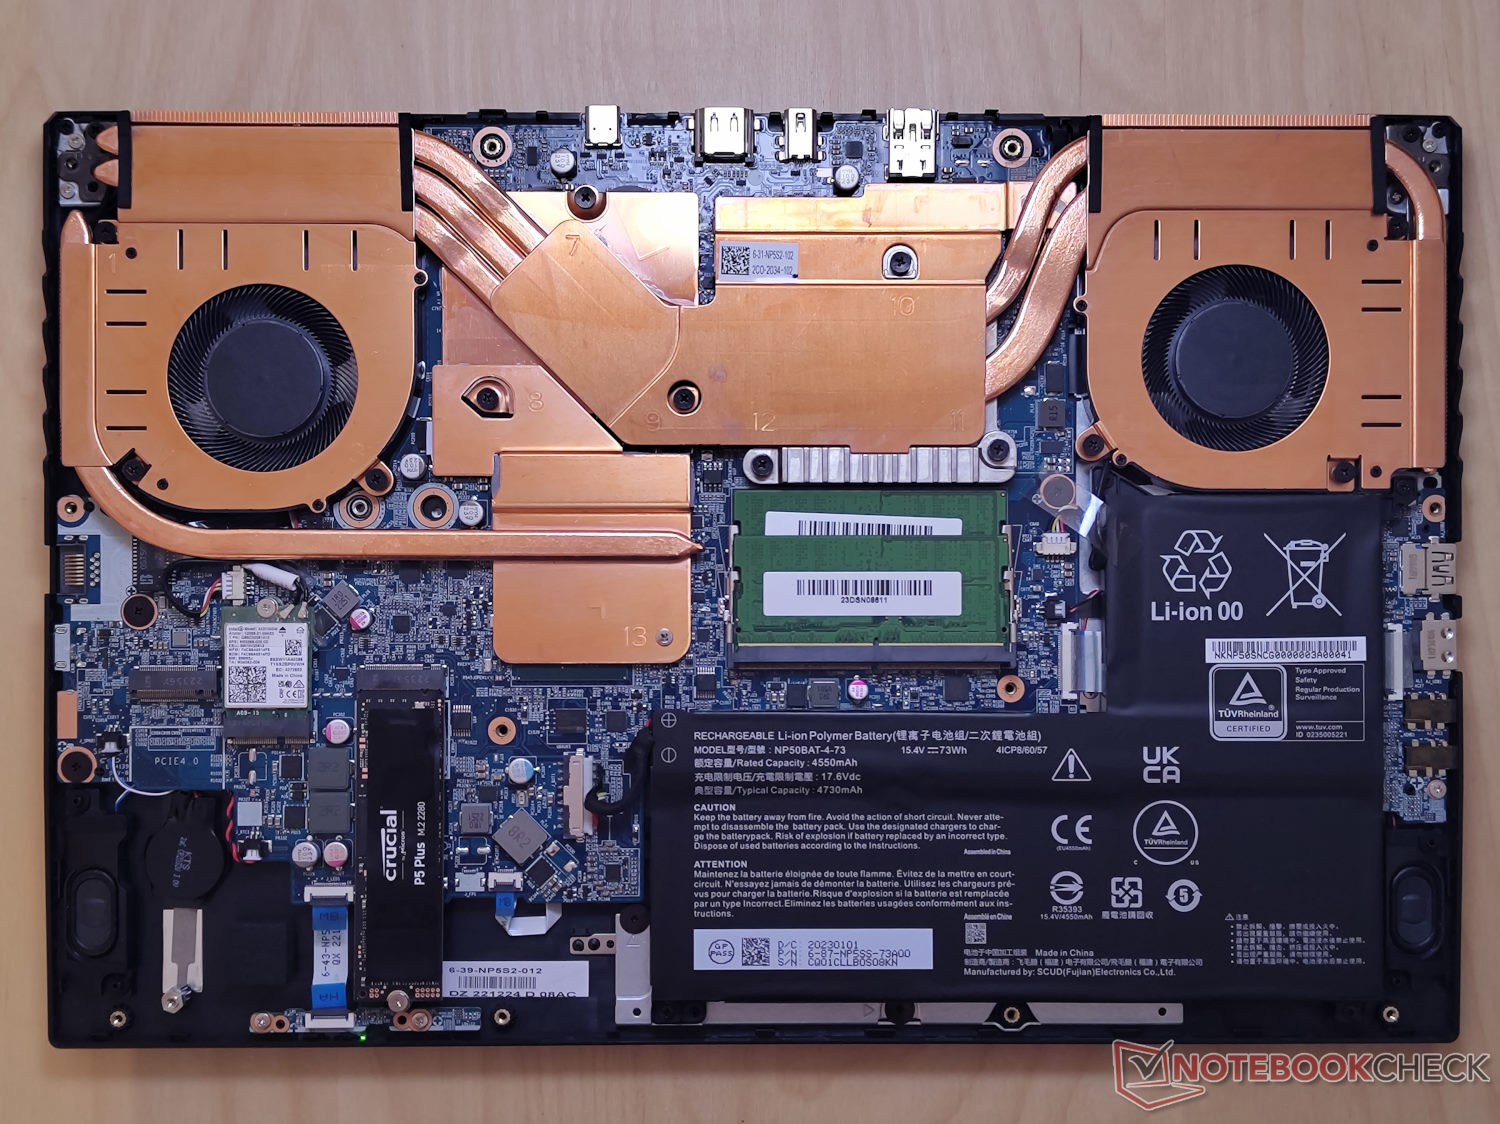
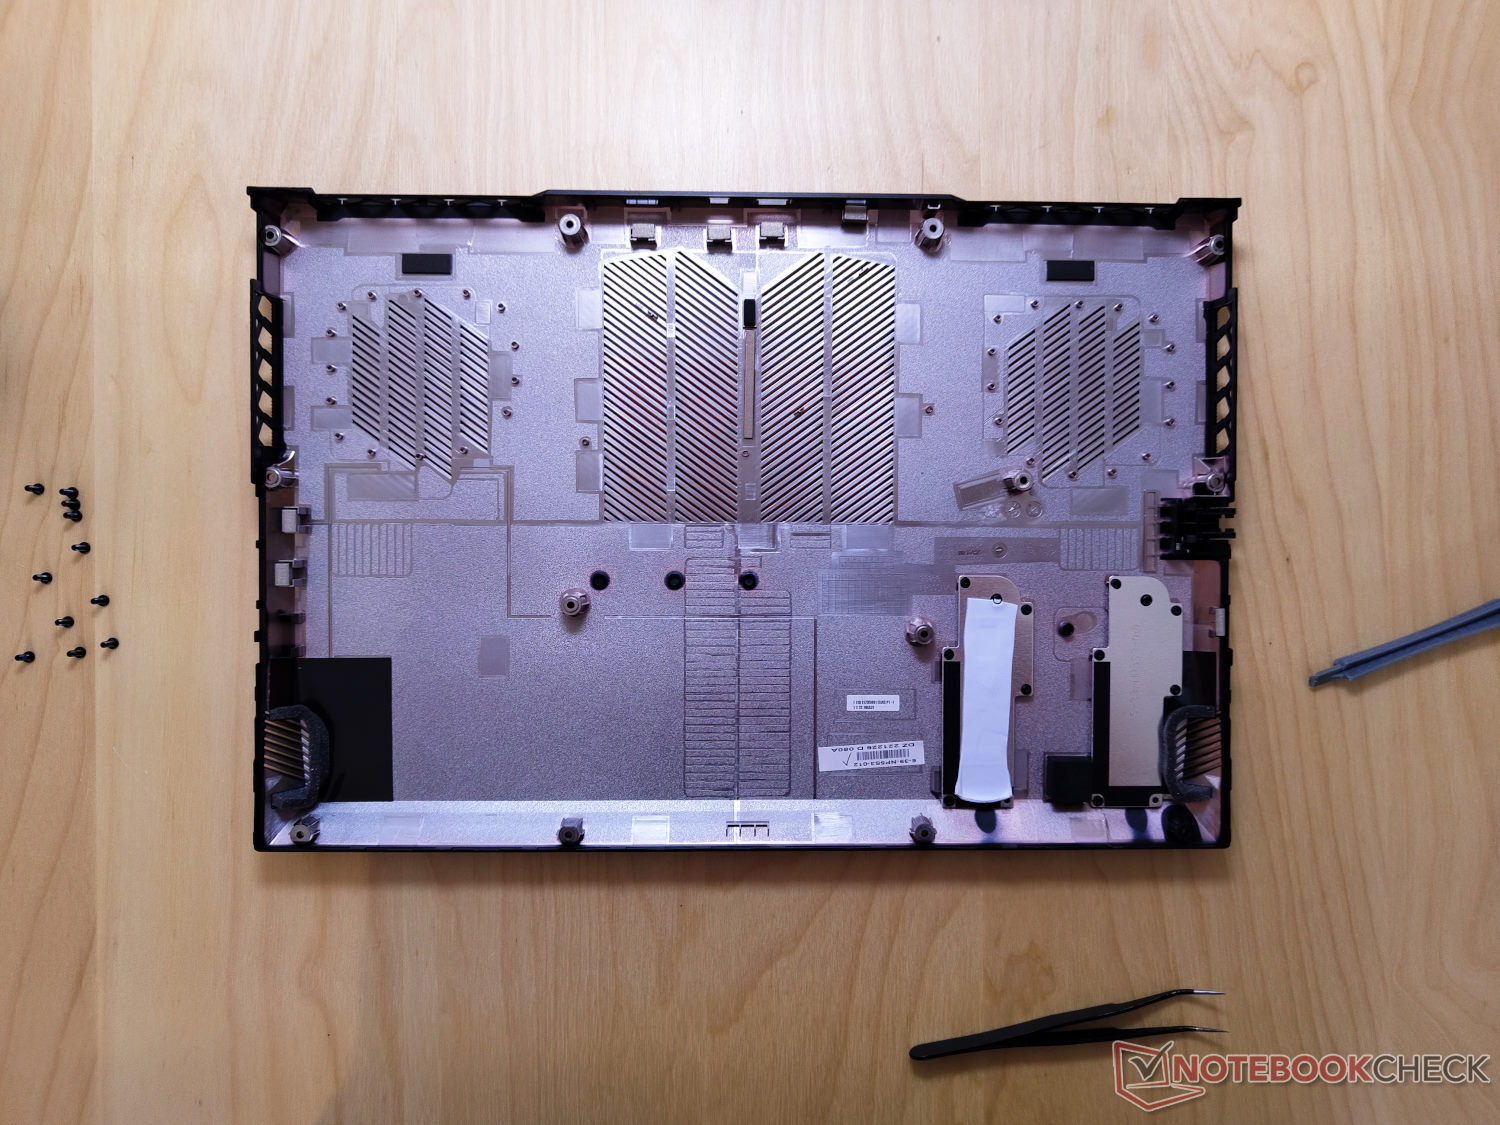
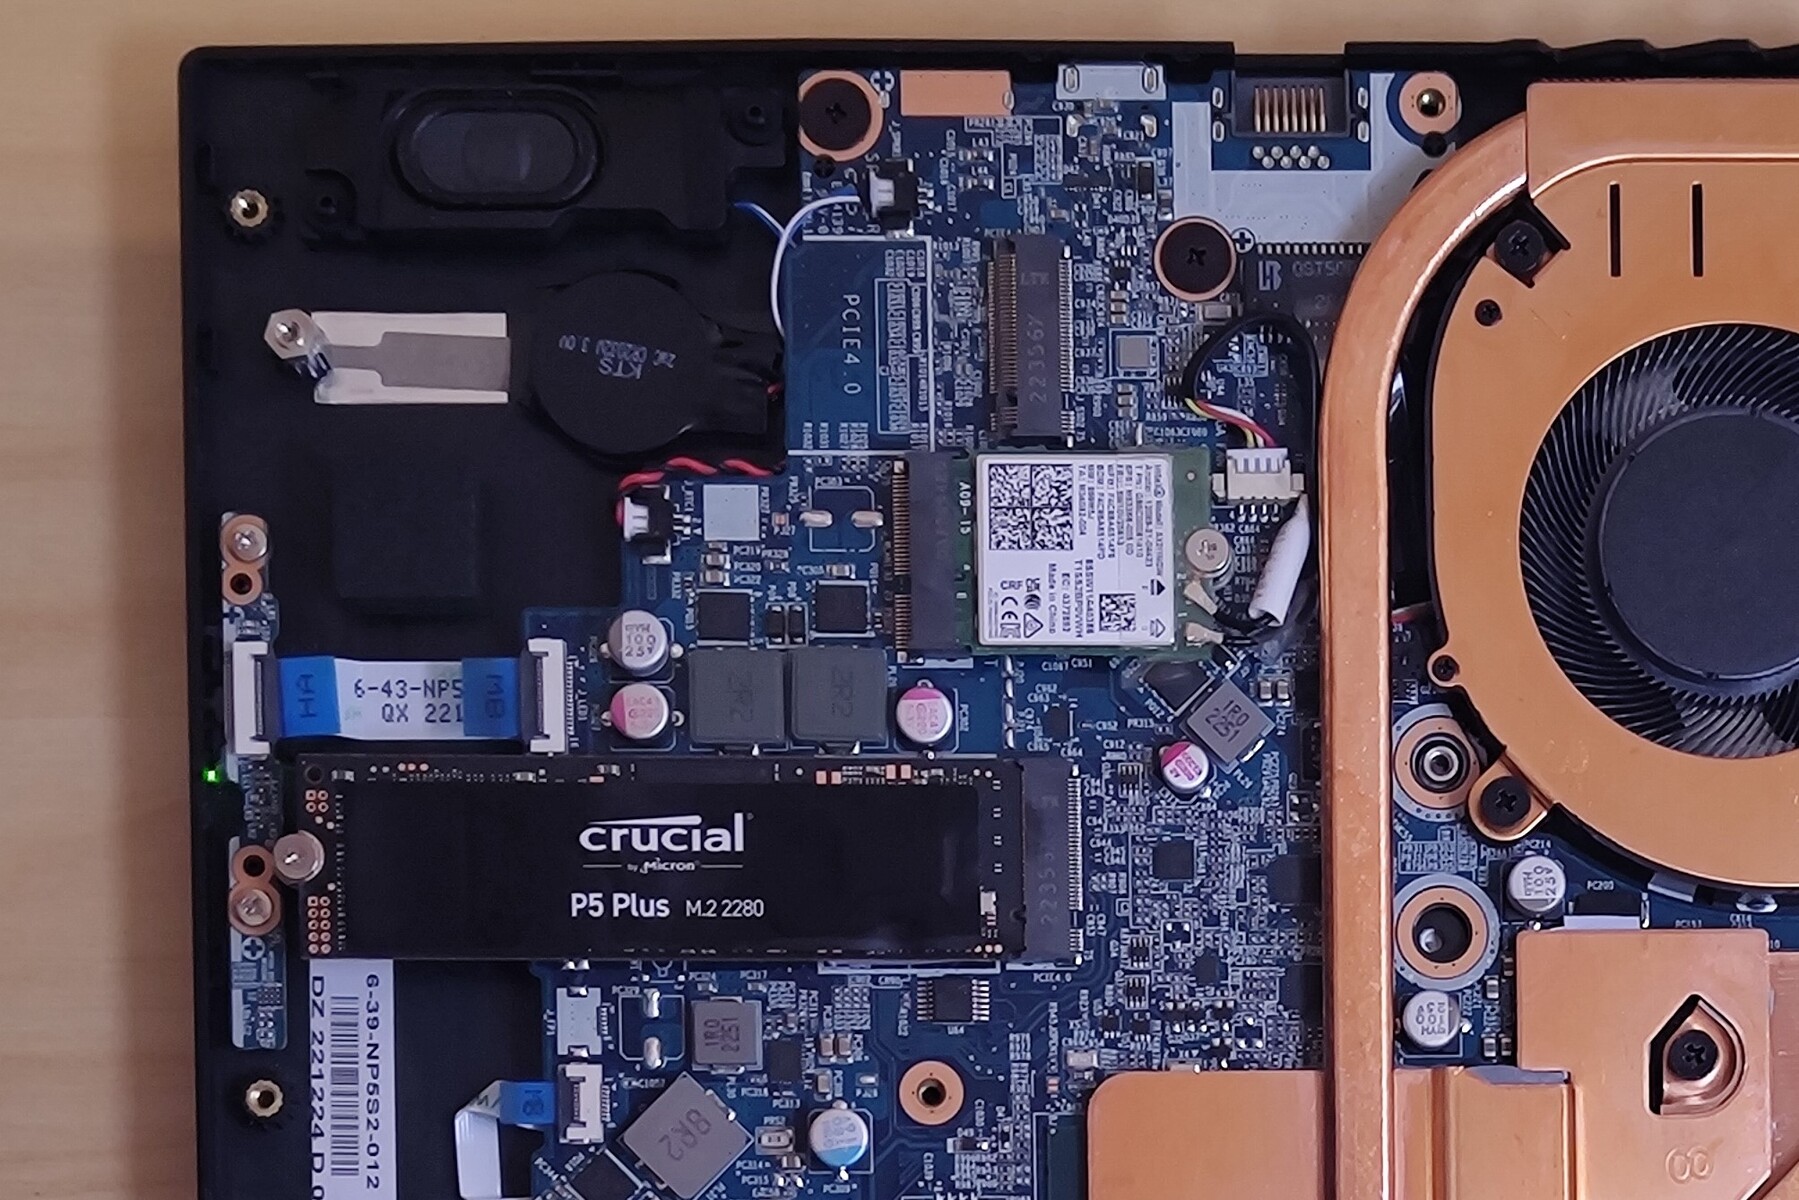
Konserwacja
Dysk SSD, pamięć robocza i moduł WLAN w XMG Focus 15 są wymienne. W naszym urządzeniu testowym dostępny jest wolny slot M.2 PCIe 4.0.
Cała płyta bazowa laptopa jest zabezpieczona 11 śrubami PH0 i można ją dość łatwo zdjąć, aby uzyskać dostęp do odpowiednich komponentów. Po odkręceniu śrubek, pokrywę można bezproblemowo zdjąć.
Gwarancja
Schenker udziela bezpłatnej 24-miesięcznej podstawowej gwarancji na laptopa. Dalsze opcje gwarancji można dodać za pośrednictwem Bestware podczas płatności.
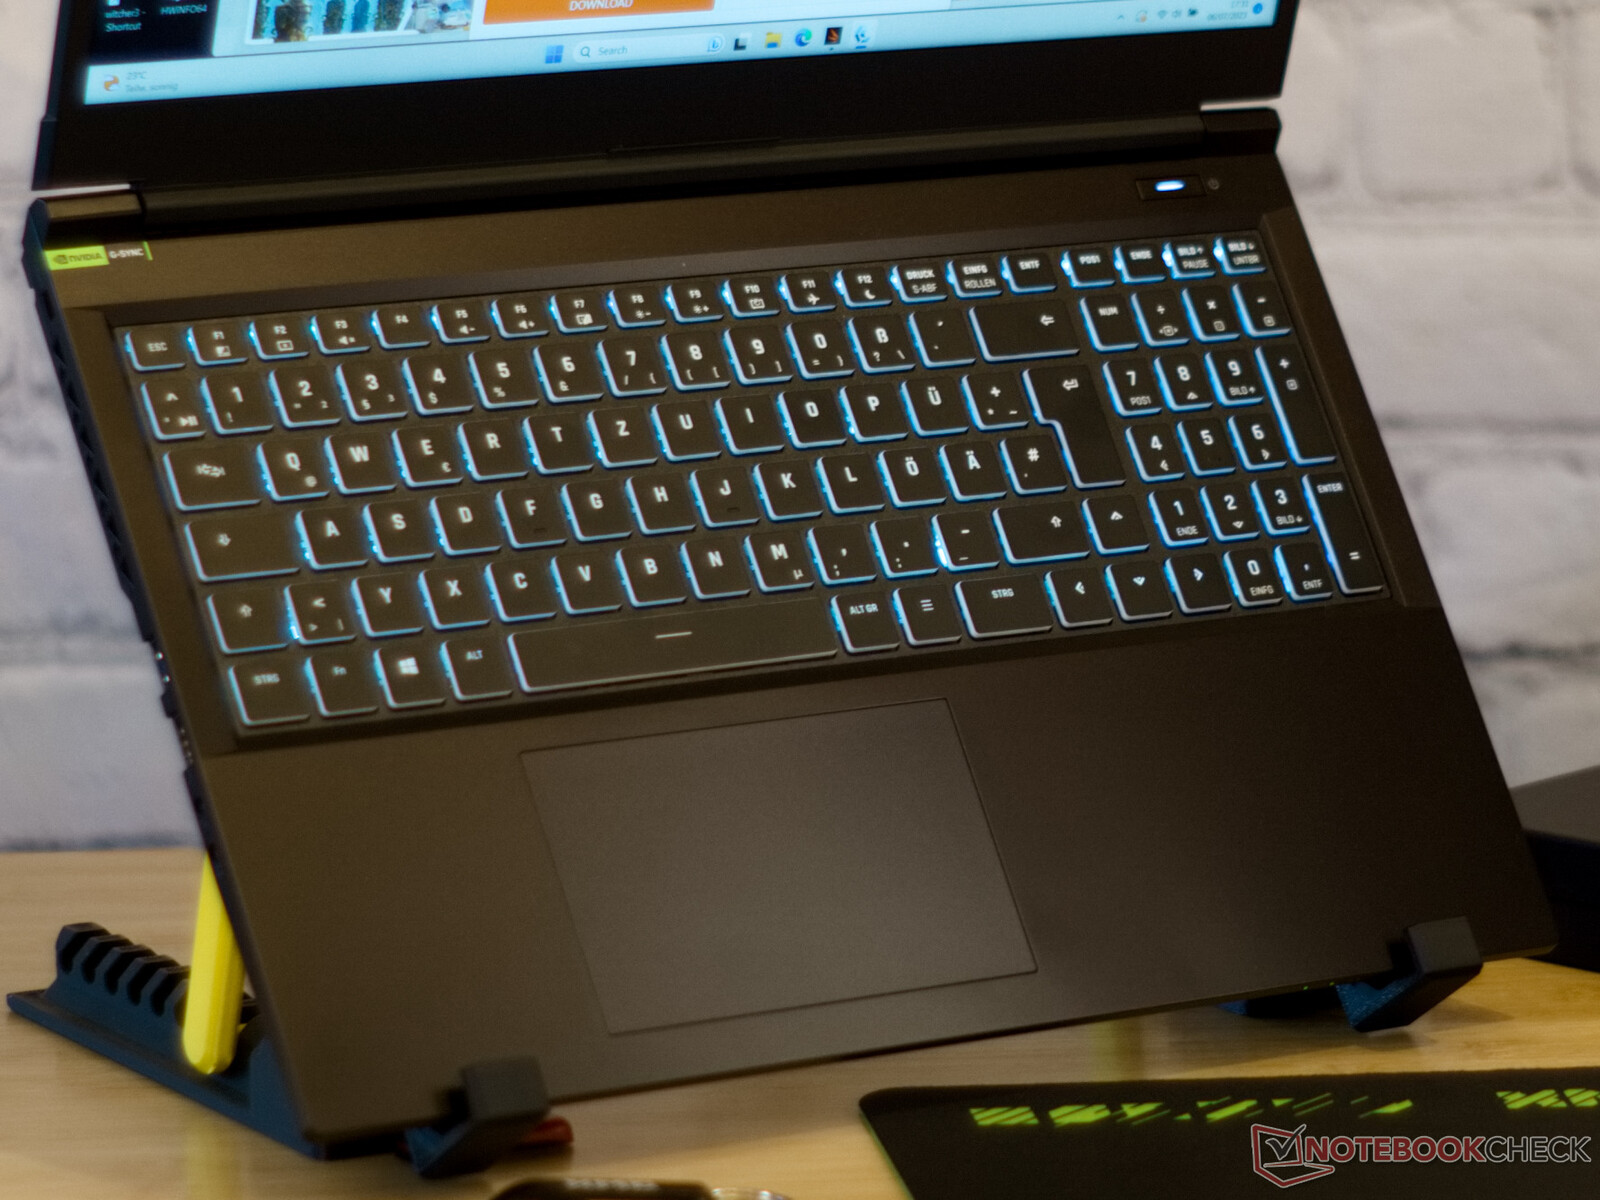
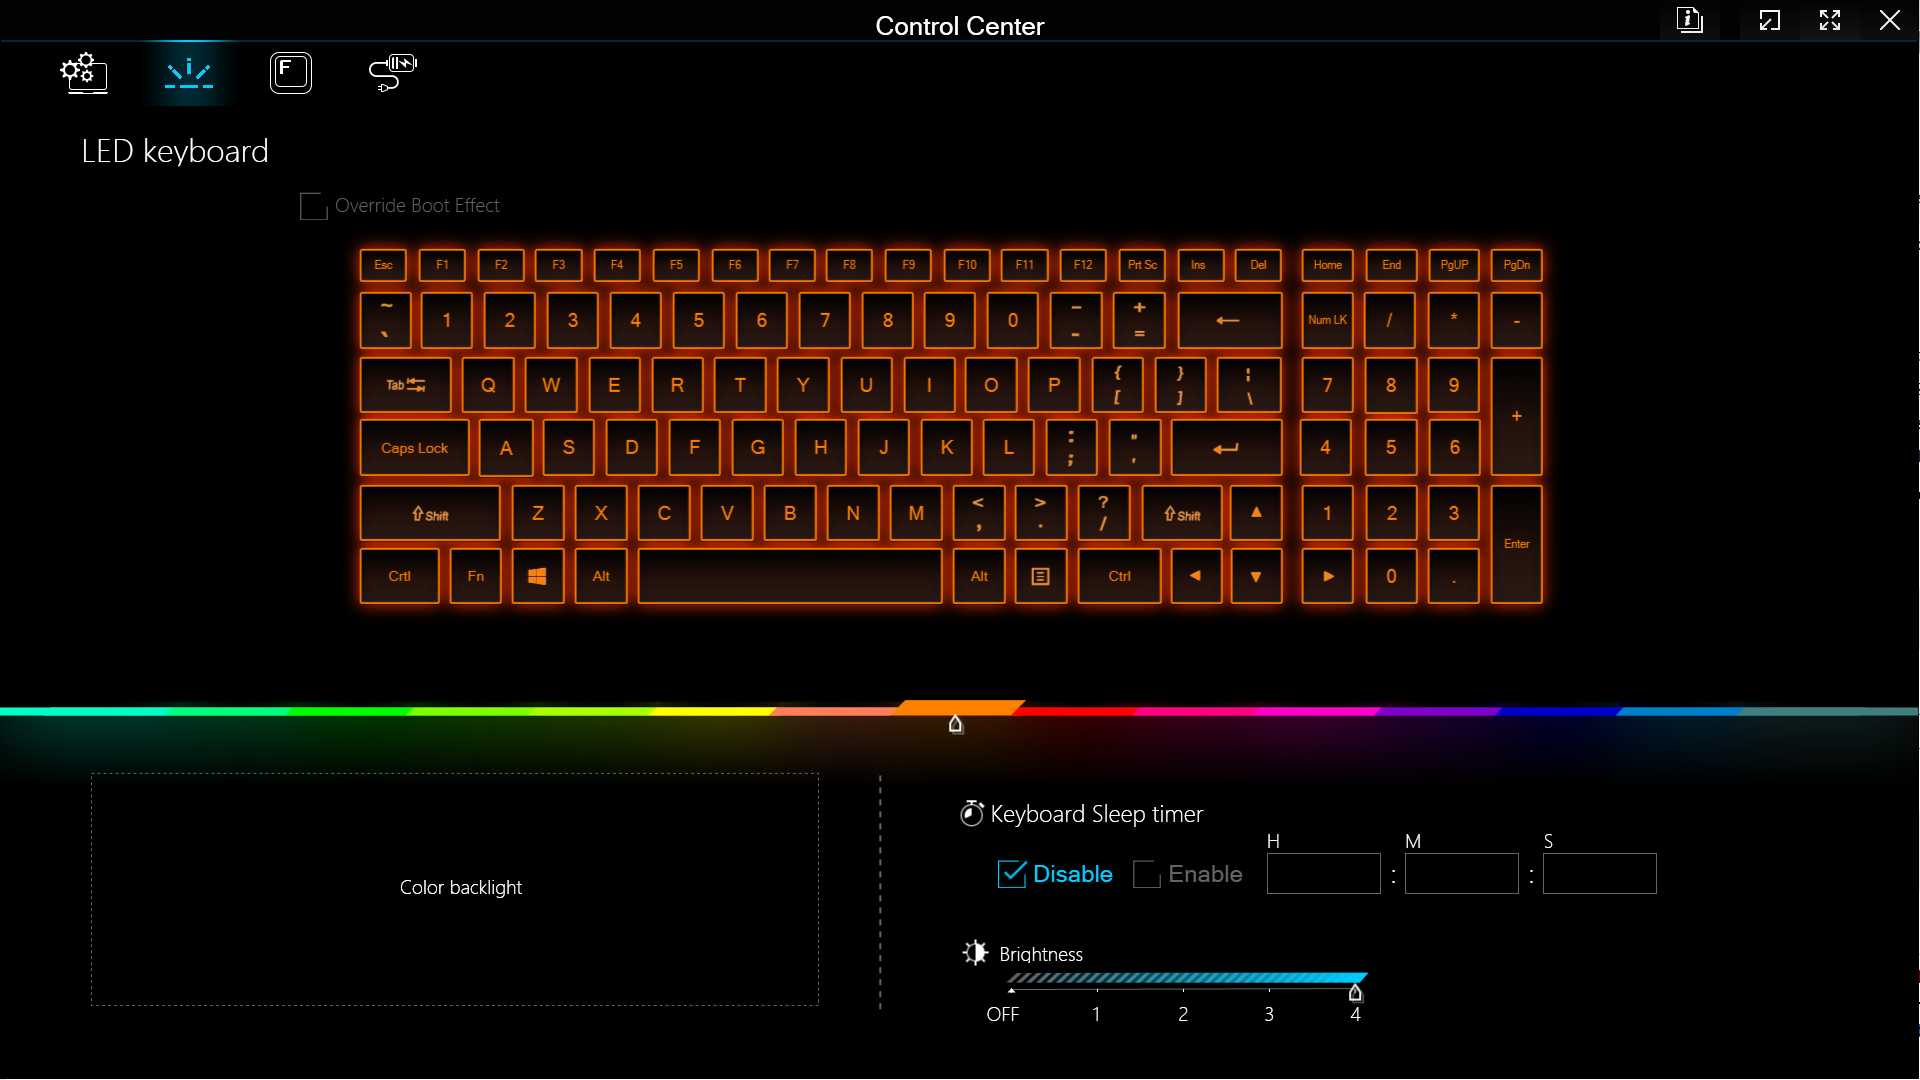
Input devices: RGB keyboard
Klawiatura
Pisanie na czarnej klawiaturze laptopa z białymi klawiszami jest dobre dzięki silnemu haptycznemu sprzężeniu zwrotnemu i skokowi klawisza 1,5 mm. Na życzenie Schenker laserowo rysuje na czarnej powierzchni każdy możliwy układ językowy. Podświetlenie RGB pozwala klawiaturze świecić w wybranym kolorze.
Touchpad
Przy wymiarach około 7 cm × 12 cm touchpad w Focus 15 jest mniejszy niż w większości laptopów do gier. Jest jednak wystarczająco duży, aby wygodnie nawigować po całym ekranie za pomocą wielu palców i wykonywać wszystkie możliwe gesty wielodotykowe.
Pozycja i rozmiar touchpada zapewniają również wystarczająco dużo miejsca, aby uniknąć błędnych wejść z pięty dłoni. Gładka powierzchnia i wygodne kliknięcia sprawiają, że wprowadzanie danych za pomocą myszy jest płynne.
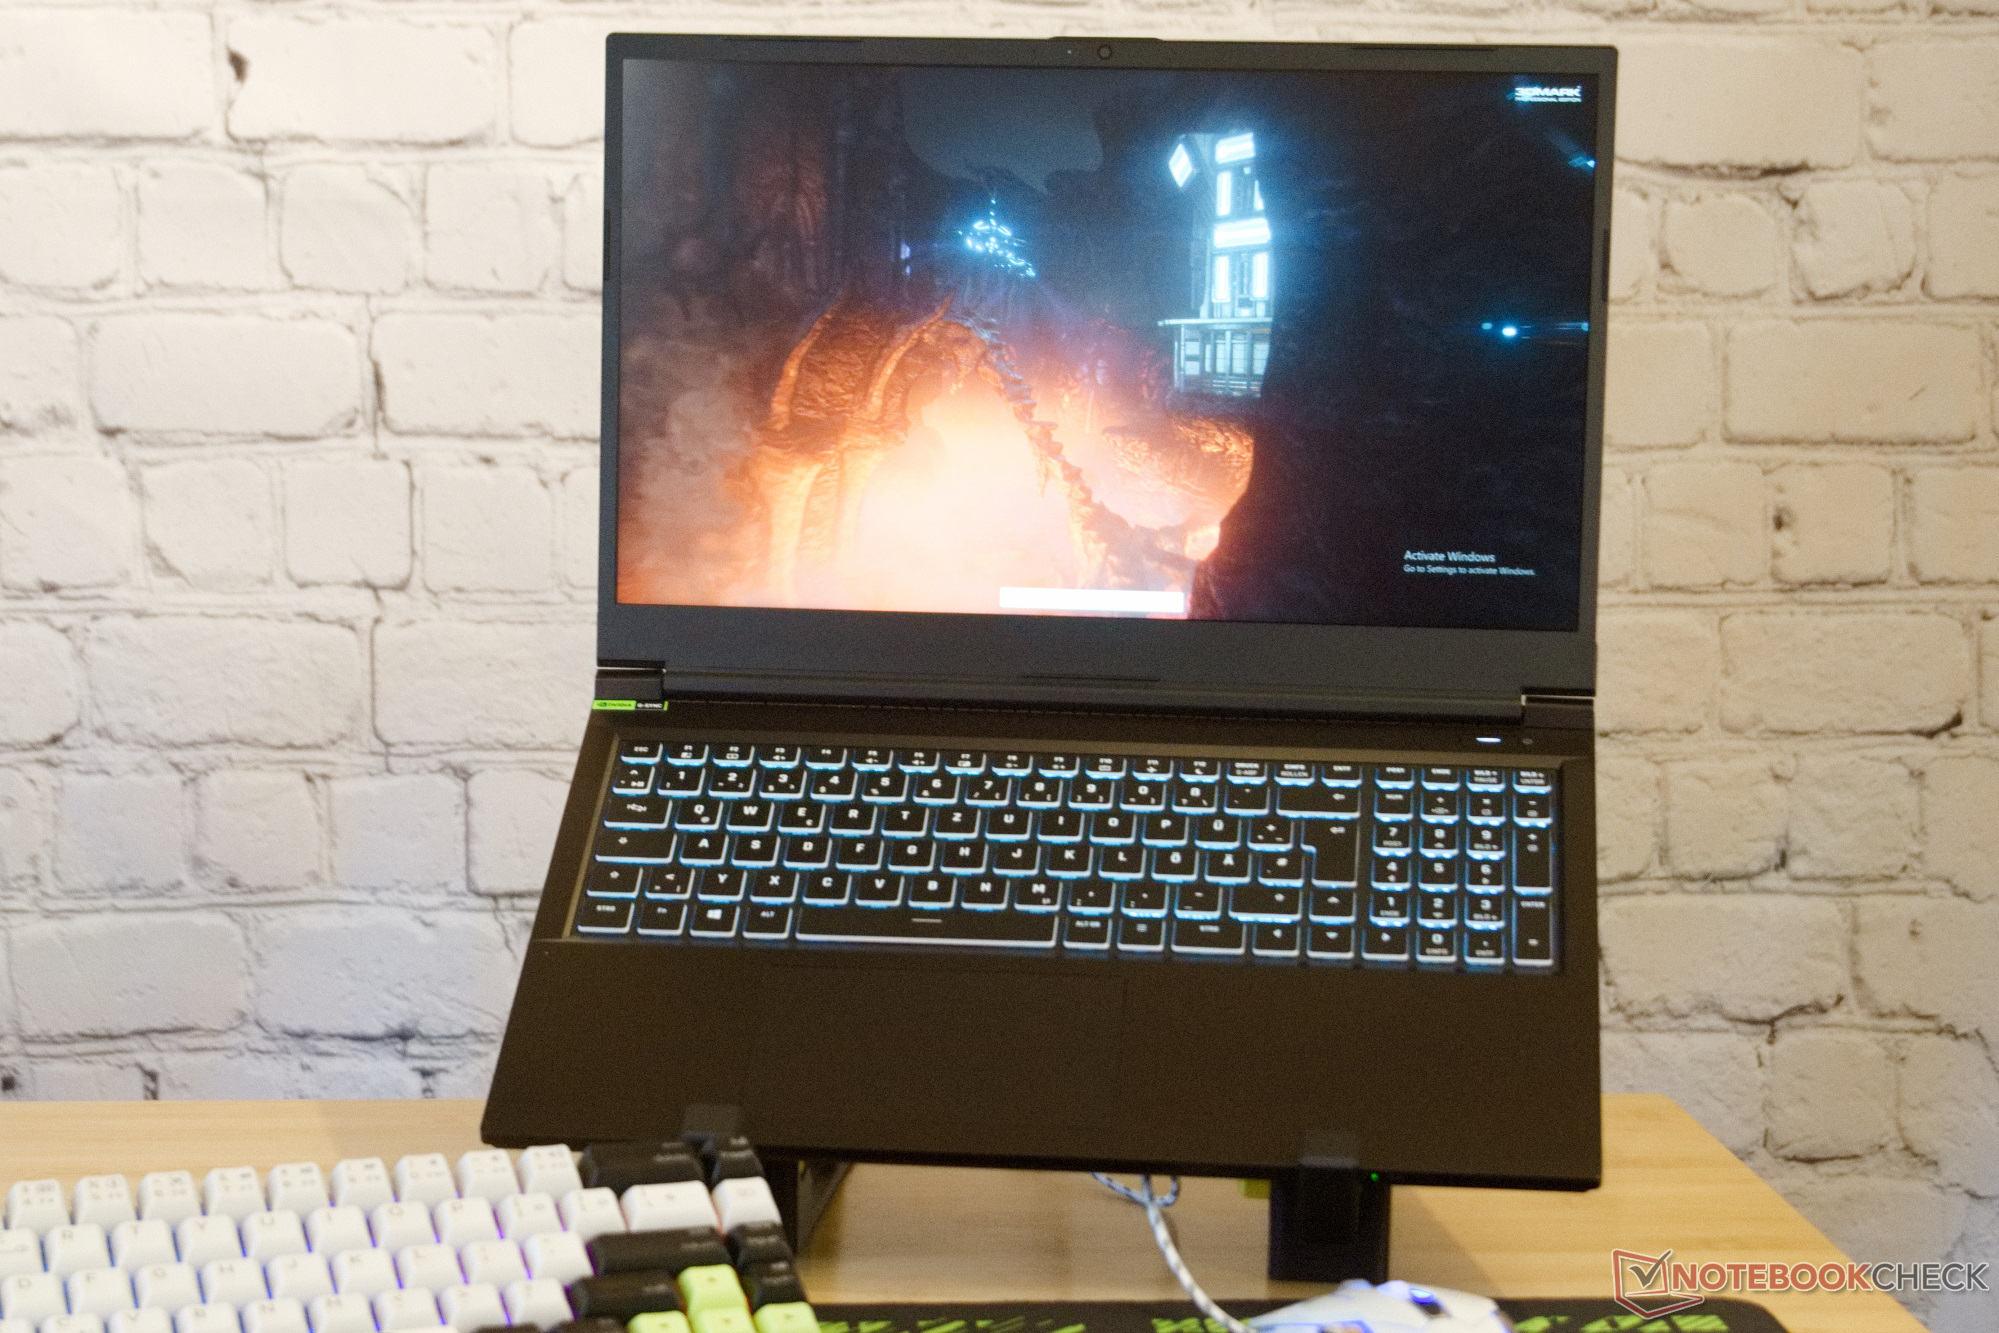
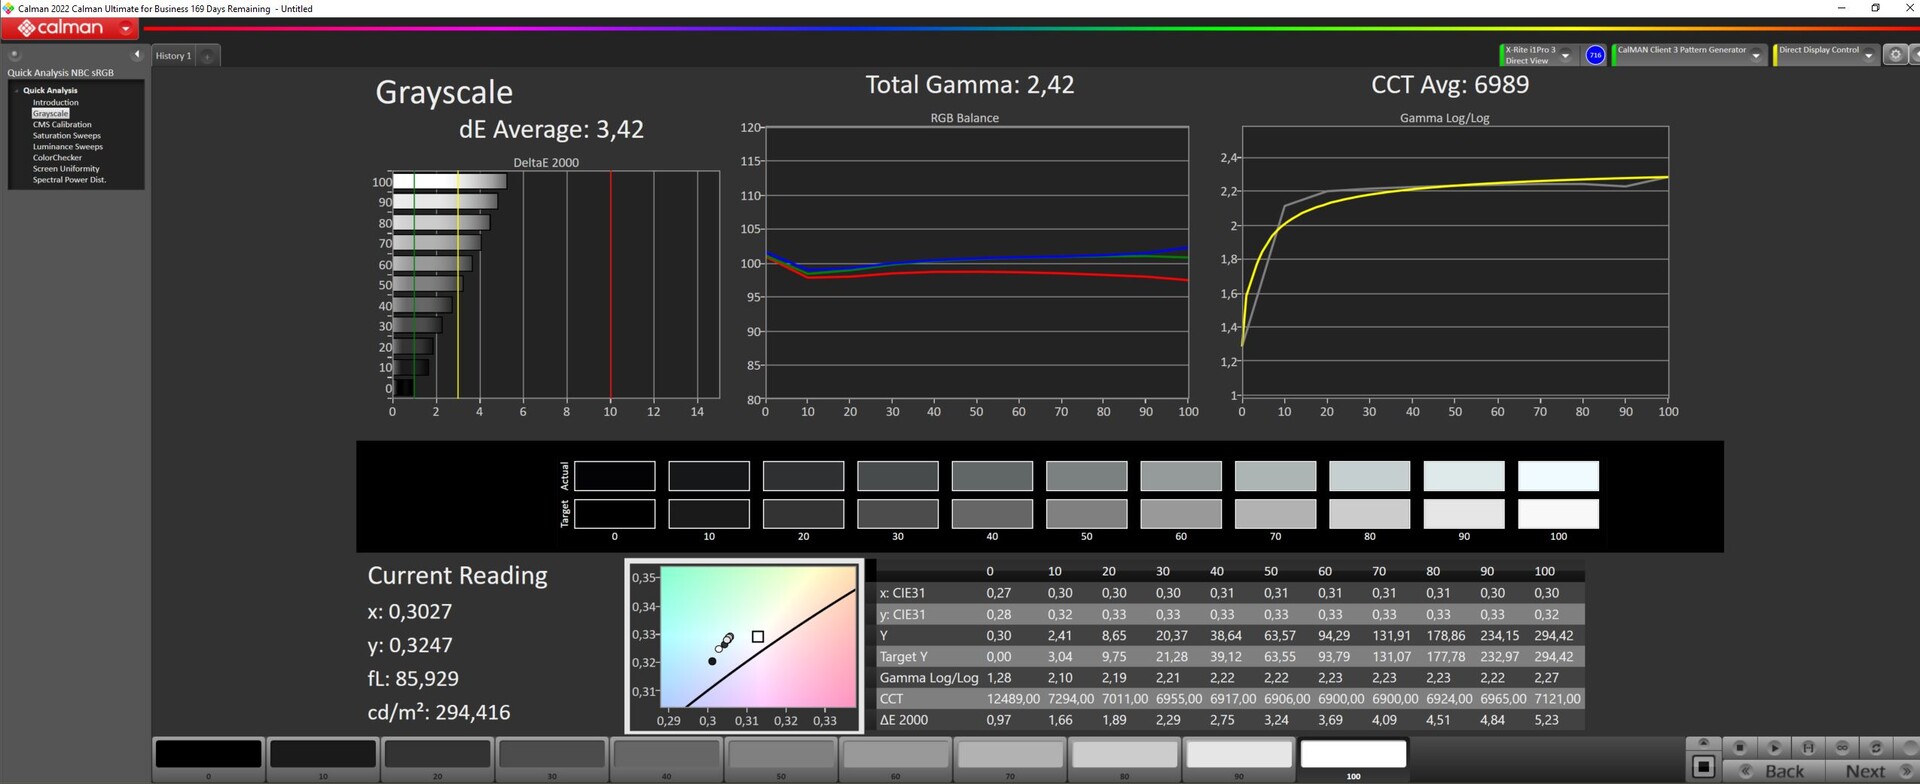
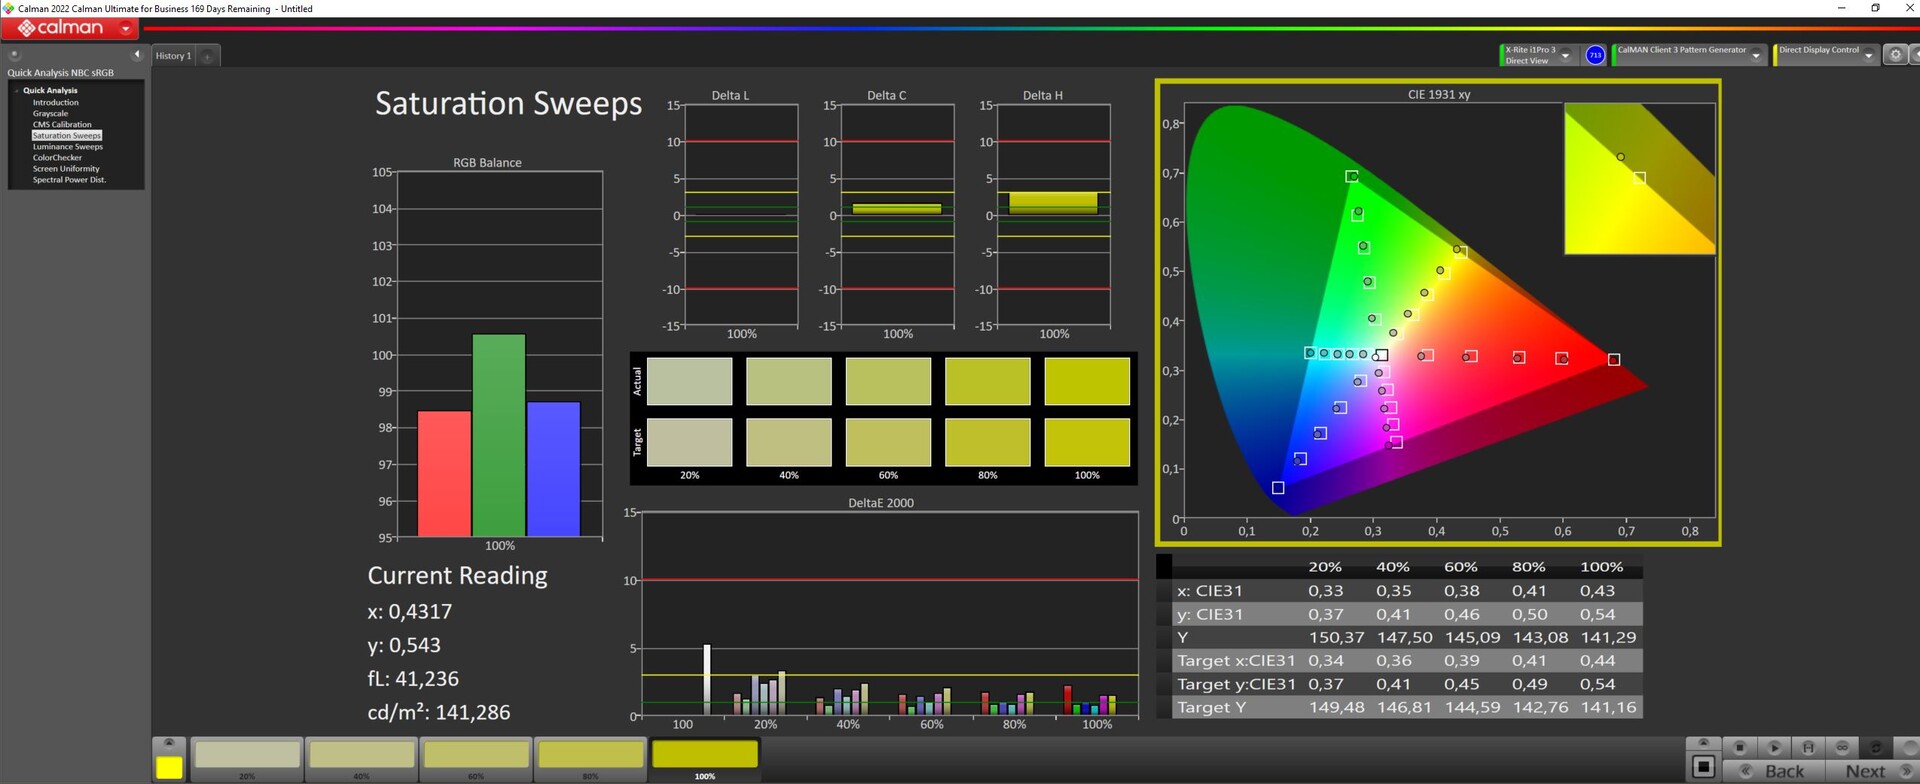
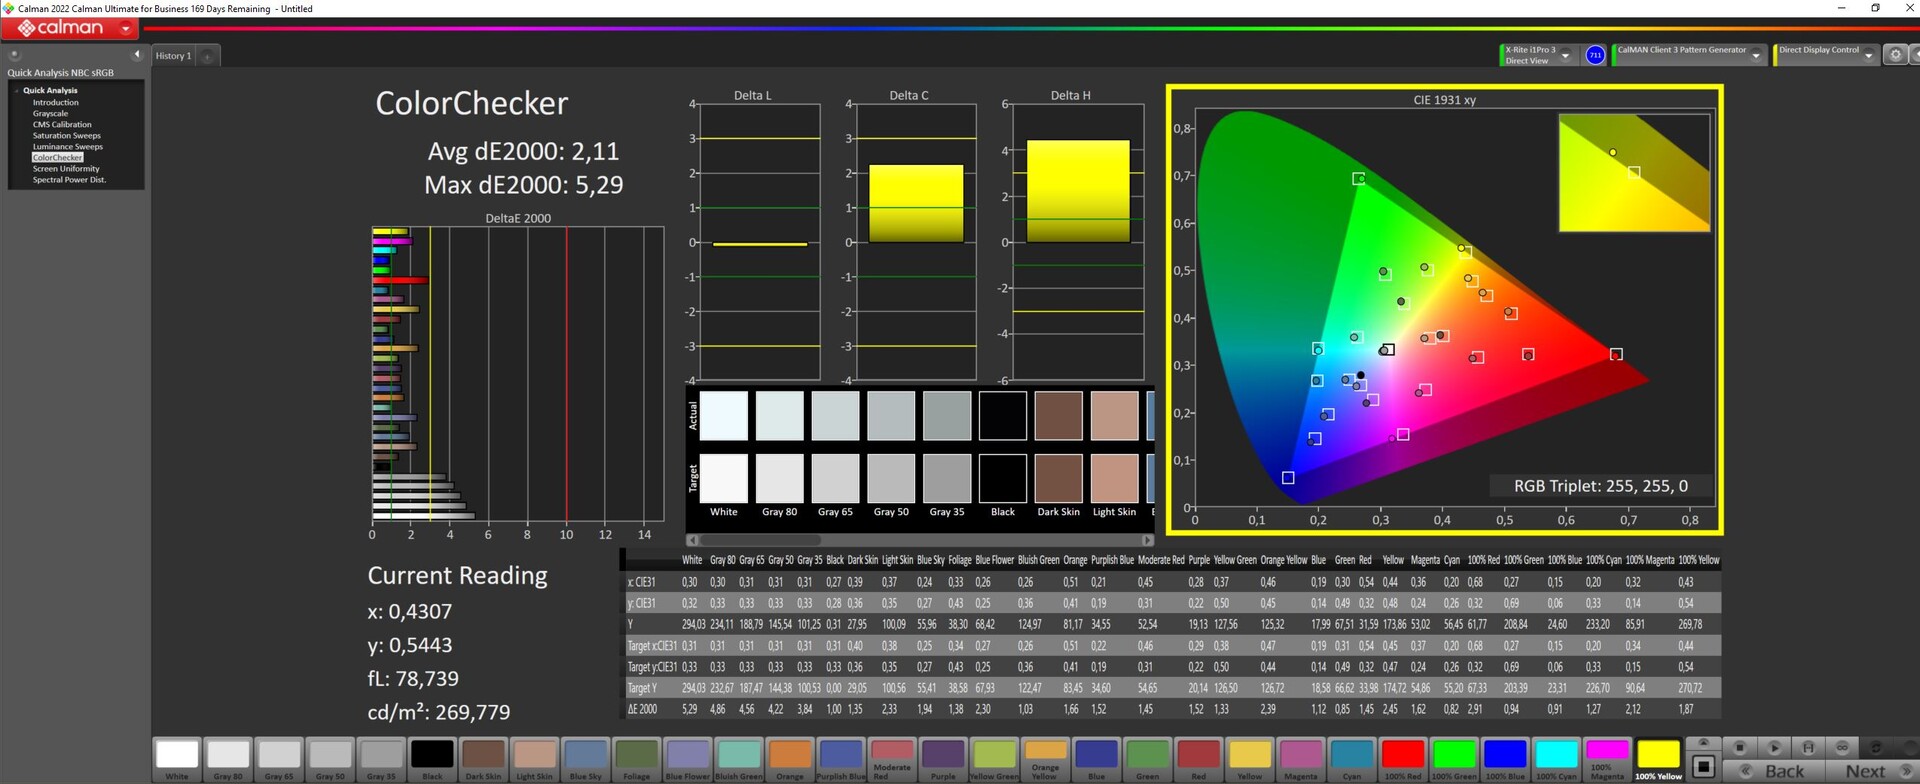
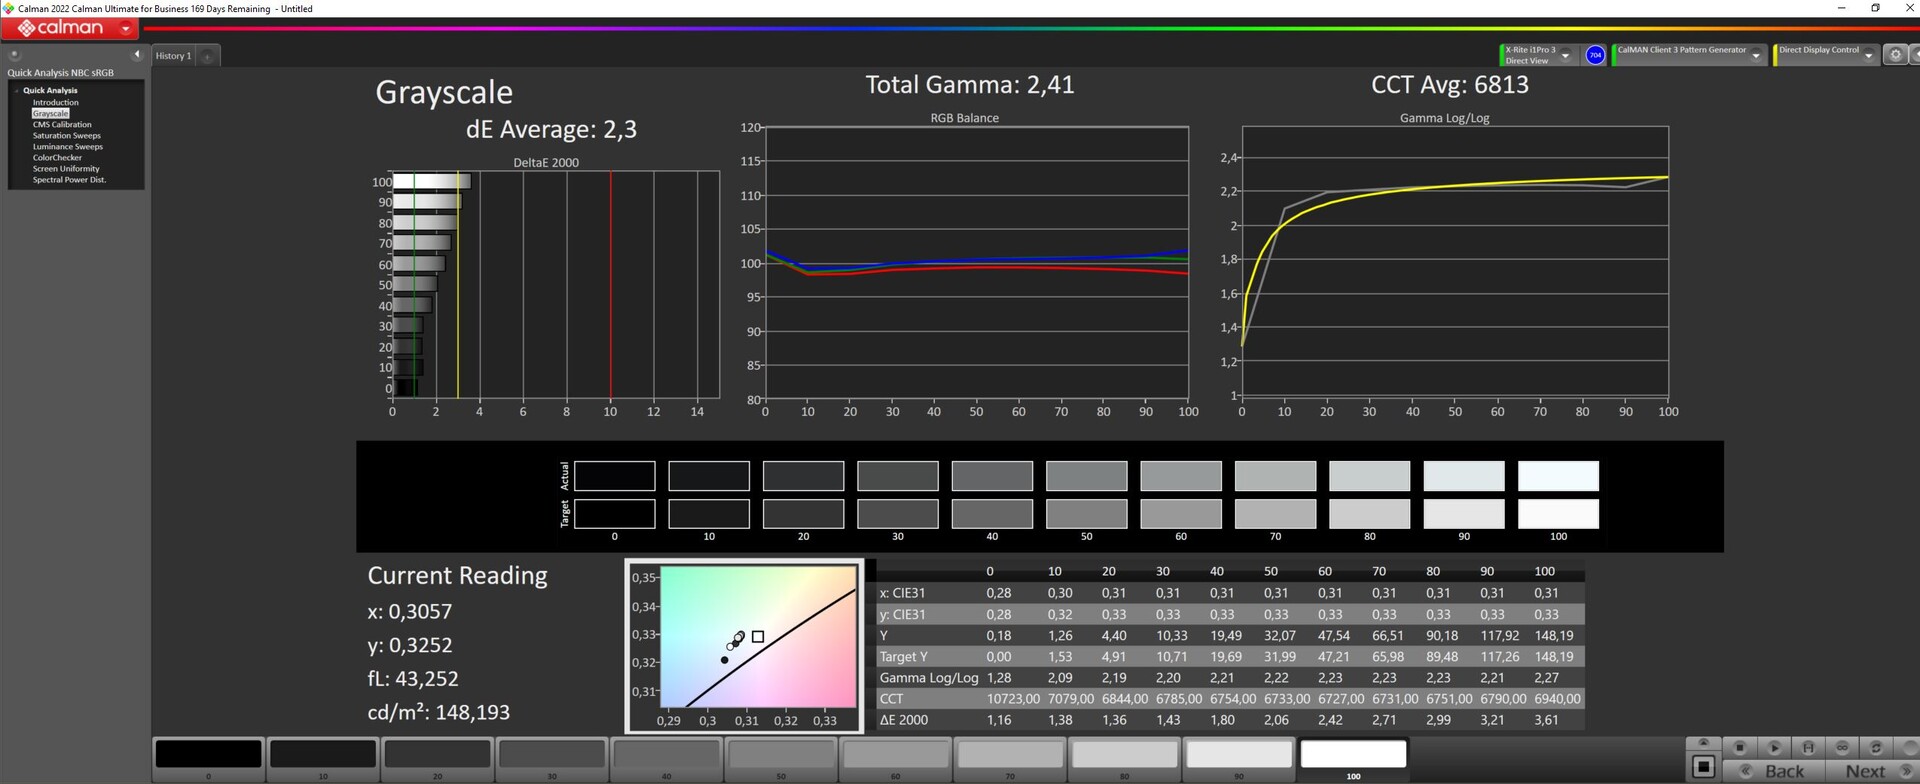
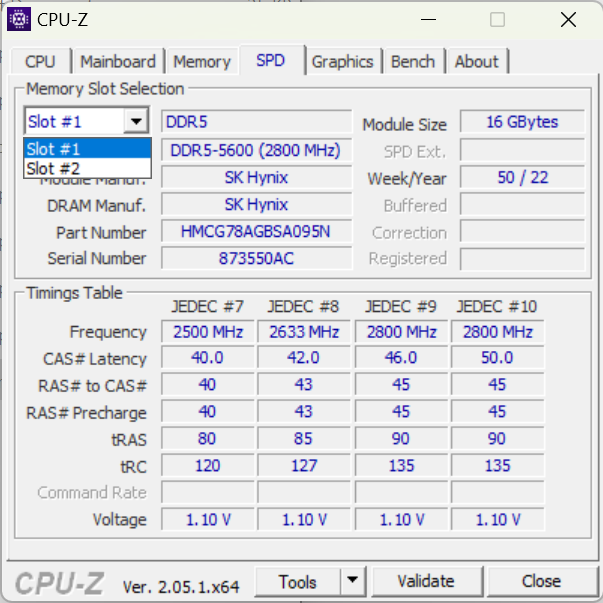
Wyświetlacz: QHD przy 240 Hz
Focus 15 wykorzystuje ten sam wysokiej jakości panel IPS, co XMG Pro 15. Jest on jednak nieco ciemniejszy niż w Pro 15 ze średnią jasnością 302 cd/m² w naszej próbce testowej. Ekran ma częstotliwość odświeżania 240 Hz i rozdzielczość 2560 × 1440.
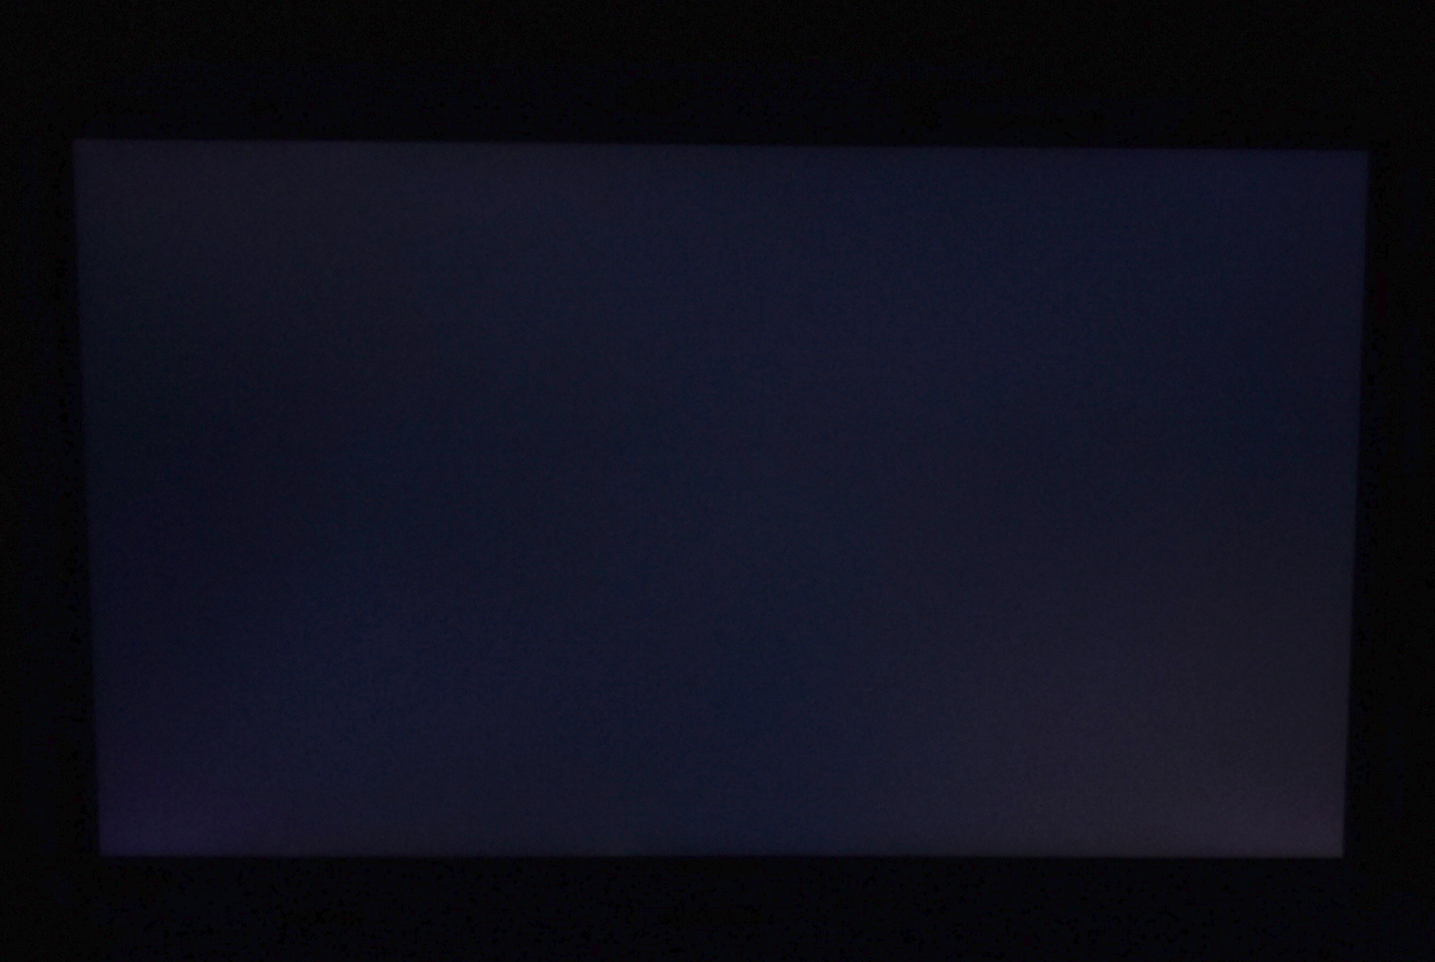
Wartość czerni i kontrast matowego wyświetlacza są akceptowalne, a podświetlenie jest również dobre. Krwawienie podświetlenia jest prawie niewidoczne na ekranie.
Oprócz wyświetlacza QHD, Schenker oferuje również opcję wyświetlacza Full HD dla XMG Focus 15. Ma on częstotliwość odświeżania 165 Hz i według Schenkera reprezentuje tylko 95% przestrzeni kolorów sRGB. Obie opcje wyświetlania obsługują jednak G-Sync.
Ci, którzy kupują laptopa jako urządzenie czysto gamingowe i chcą go używać z kartą graficzną RTX 4050 powinni rozważyć wybór wyświetlacza Full HD, który jest o około 80 euro tańszy. Większość gier i tak obsługuje tylko przestrzeń kolorów sRGB i może w pełni wykorzystać możliwości wyświetlacza w połączeniu z RTX 4050.
Rozgrywka w rozdzielczości QHD lub 4K jest możliwa tylko w ograniczonym zakresie z podstawowymi układami graficznymi Nvidia.
| |||||||||||||||||||||||||
rozświetlenie: 85 %
na akumulatorze: 302 cd/m²
kontrast: 839:1 (czerń: 0.36 cd/m²)
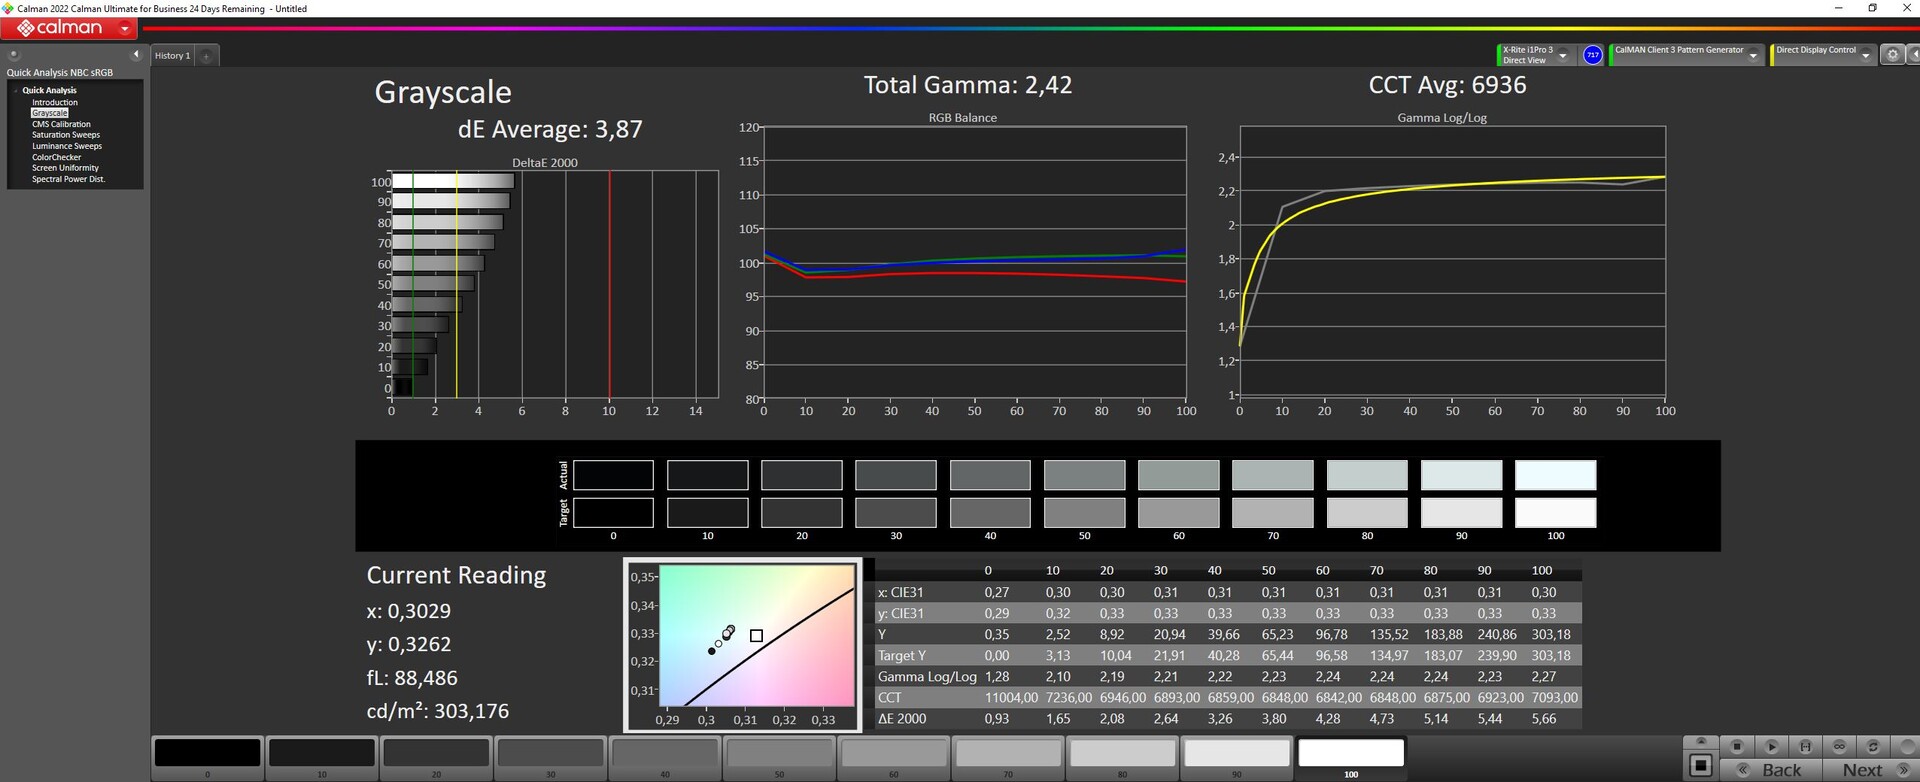
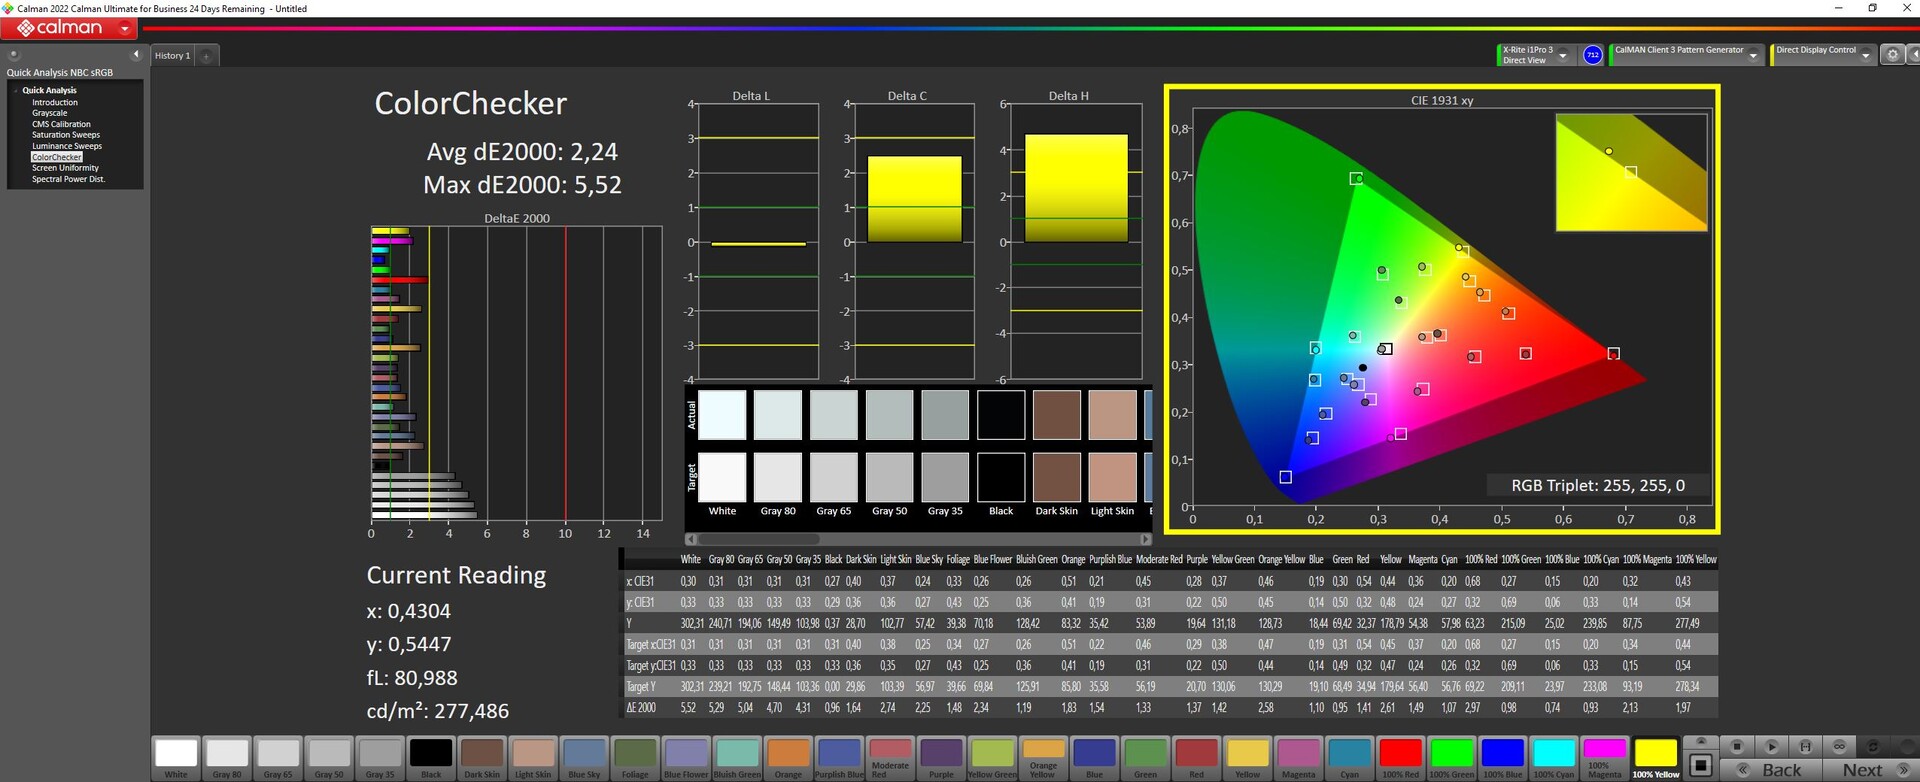
ΔE ColorChecker Calman: 2.24 | ∀{0.5-29.43 Ø4.71}
ΔE Greyscale Calman: 3.87 | ∀{0.09-98 Ø4.96}
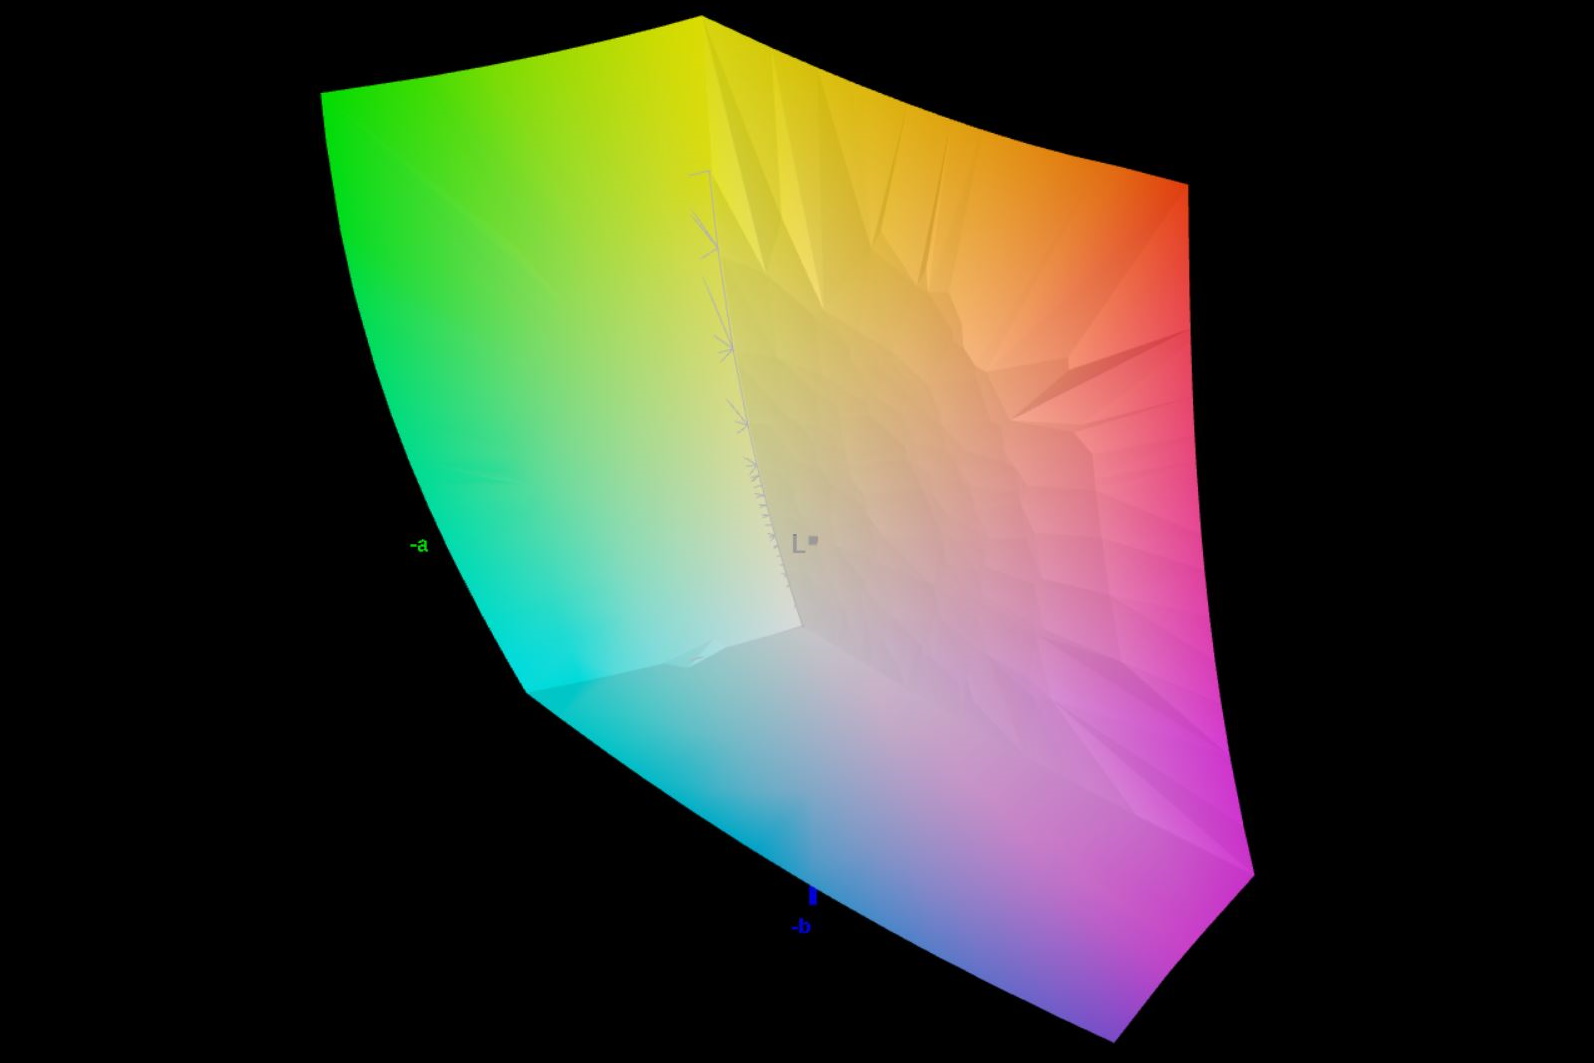
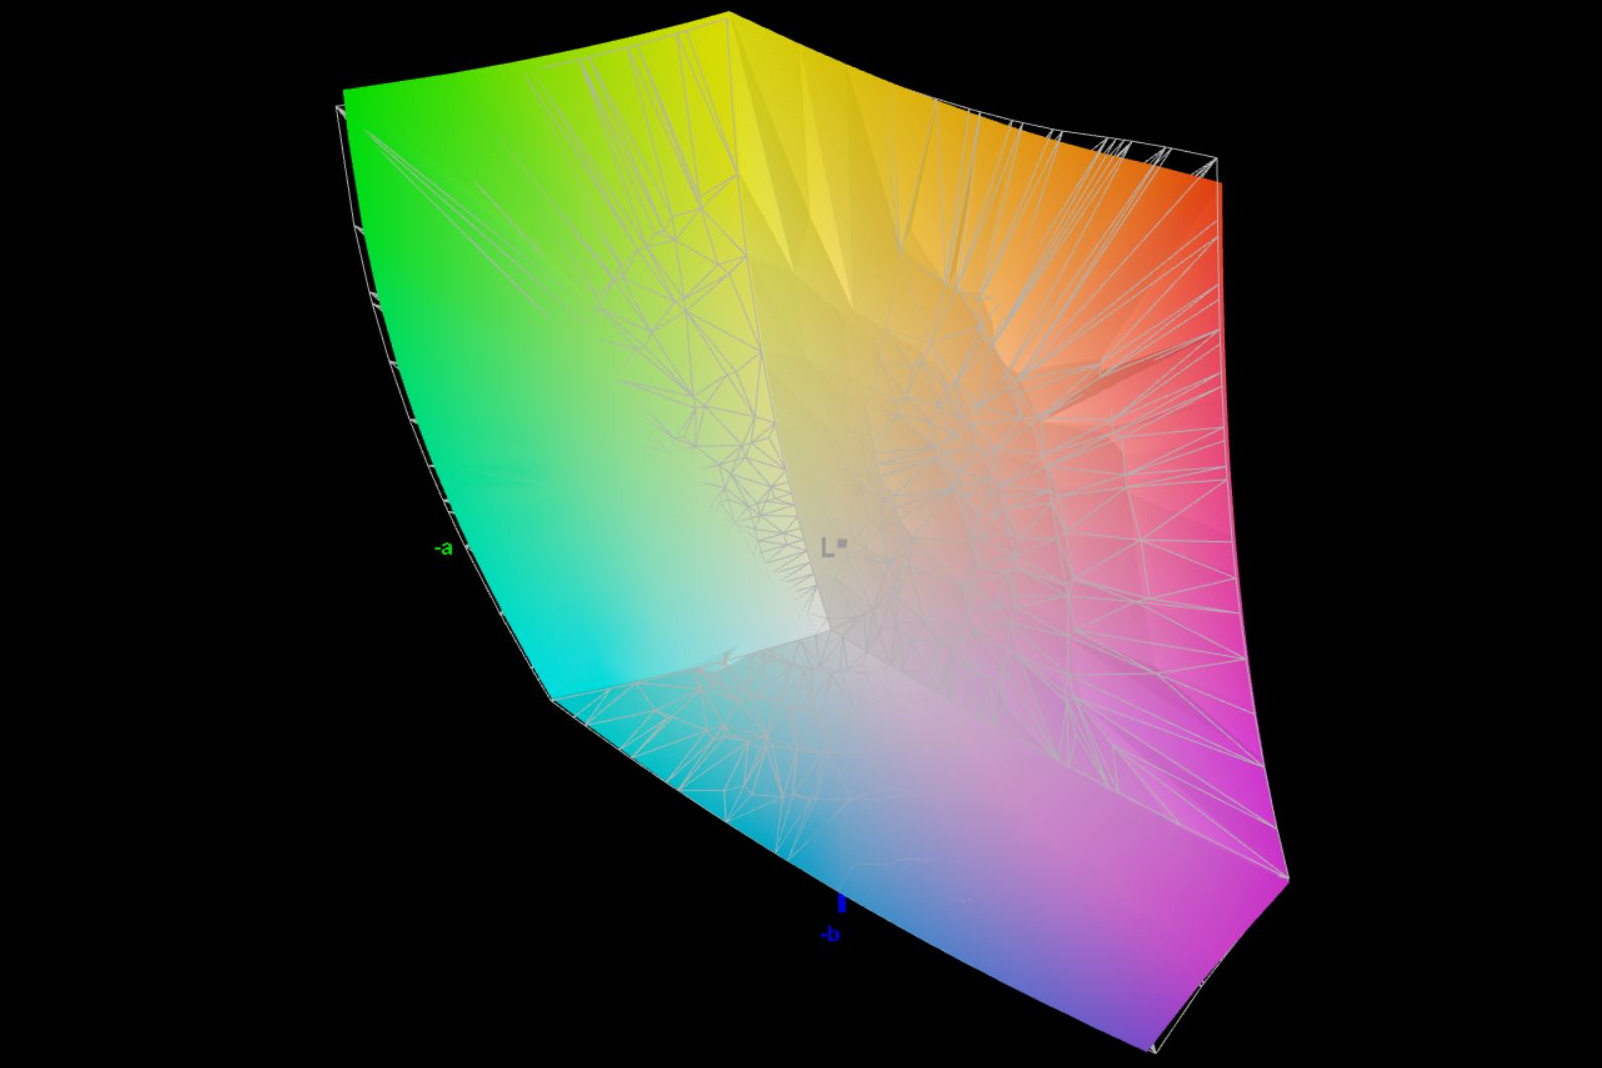
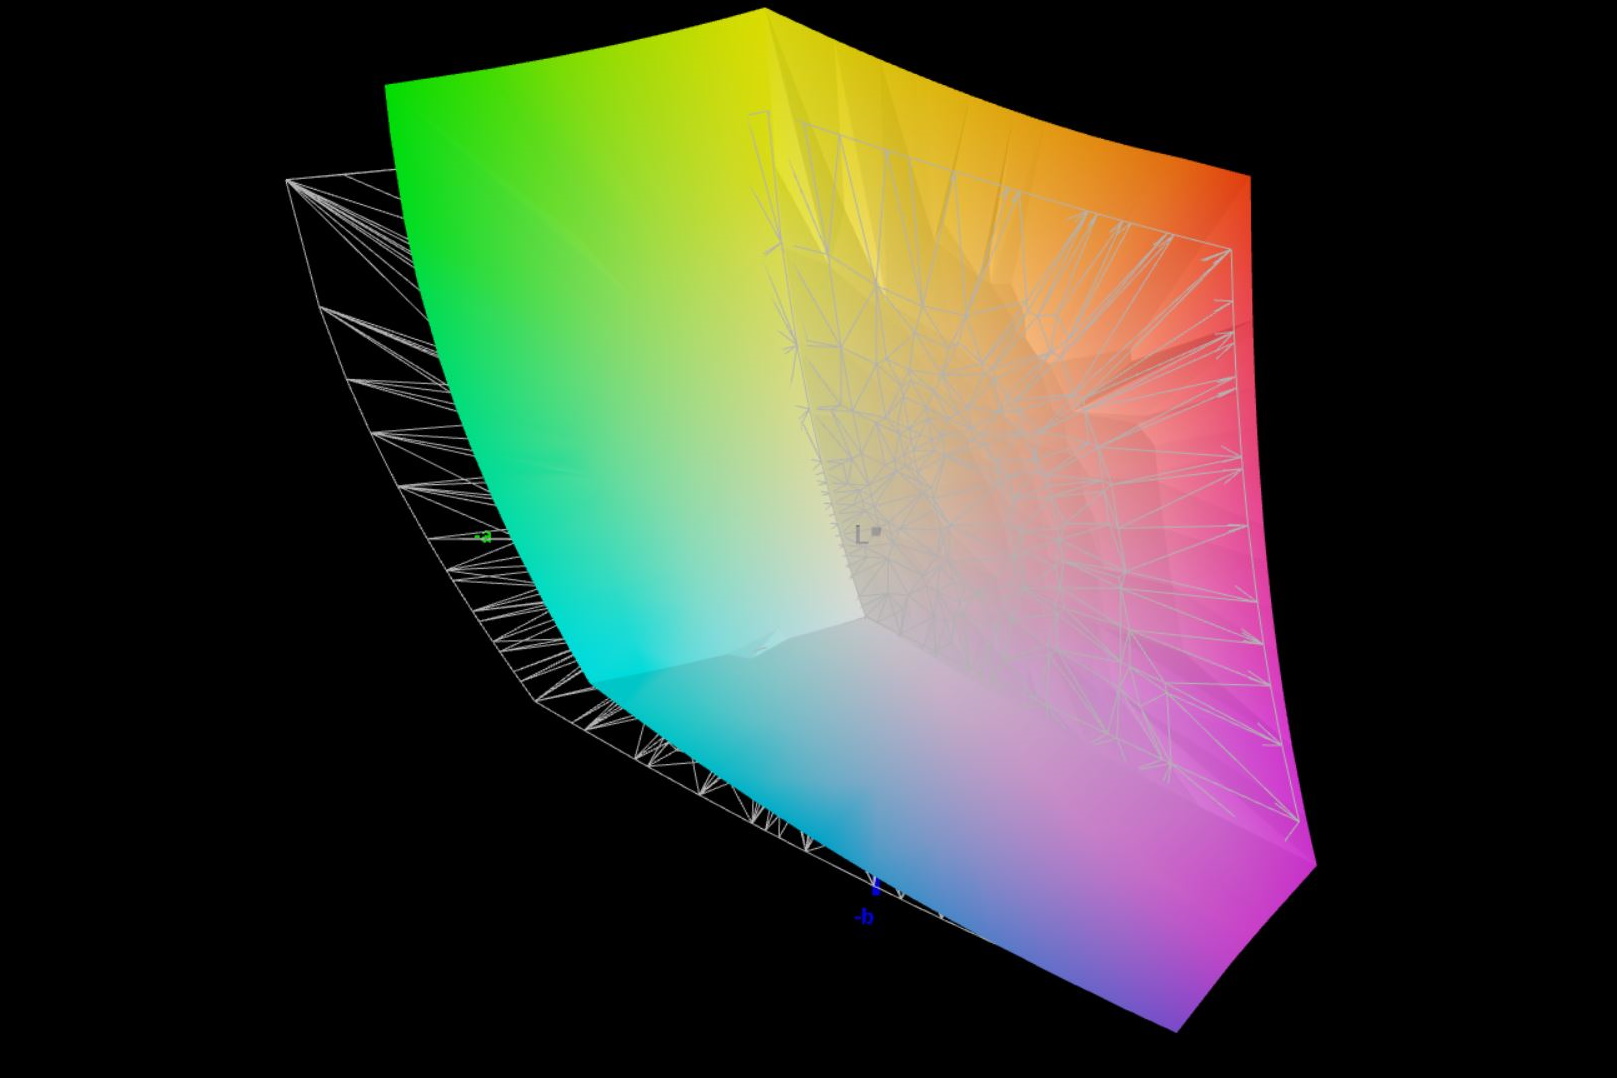
86.3% AdobeRGB 1998 (Argyll 3D)
99.9% sRGB (Argyll 3D)
98.6% Display P3 (Argyll 3D)
Gamma: 2.42
CCT: 6936 K
| Schenker XMG Focus 15 (E23) BOE0AD1, IPS, 2569x1440, 15.6" | Schenker XMG Pro 15 (E23) BOE0AD1, IPS, 2560x1440, 15.6" | Asus TUF A15 FA507 N156HMA-GA1, IPS, 1920x1080, 15.6" | MSI Katana 15 B12VEK AUOAF90 (B156HAN08.4), IPS, 1920x1080, 15.6" | Acer Swift X SFX14-71G ATNA45AF03-0, OLED, 2880x1800, 14.5" | Samsung Galaxy Book3 Ultra 16 Samsung ATNA60CL03-0, AMOLED, 2880x1800, 16" | Gigabyte Aero 14 OLED BMF Samsung SDC4192 (ATNA40YK14-0), OLED, 2880x1800, 14" | |
|---|---|---|---|---|---|---|---|
| Display | -1% | -20% | -53% | 4% | 4% | 1% | |
| Display P3 Coverage (%) | 98.6 | 97.8 -1% | 64.9 -34% | 38.1 -61% | 99.9 1% | 99.9 1% | 99.8 1% |
| sRGB Coverage (%) | 99.9 | 99.9 0% | 96.5 -3% | 56.8 -43% | 99.9 0% | 100 0% | 100 0% |
| AdobeRGB 1998 Coverage (%) | 86.3 | 85.4 -1% | 66.6 -23% | 39.3 -54% | 96.2 11% | 96.3 12% | 88.7 3% |
| Response Times | 14% | -87% | -140% | 96% | 96% | 82% | |
| Response Time Grey 50% / Grey 80% * (ms) | 15.6 ? | 14 ? 10% | 30.4 ? -95% | 38.8 ? -149% | 0.4 ? 97% | 0.49 ? 97% | 2.4 ? 85% |
| Response Time Black / White * (ms) | 11.6 ? | 9.6 ? 17% | 20.8 ? -79% | 26.8 ? -131% | 0.6 ? 95% | 0.65 ? 94% | 2.4 ? 79% |
| PWM Frequency (Hz) | 240 ? | 240 ? | 300 | ||||
| Screen | 10% | 30% | -38% | 30% | 215% | 103% | |
| Brightness middle (cd/m²) | 302 | 322 7% | 288 -5% | 261 -14% | 388 28% | 400 32% | 423 40% |
| Brightness (cd/m²) | 278 | 301 8% | 271 -3% | 258 -7% | 390 40% | 399 44% | 427 54% |
| Brightness Distribution (%) | 85 | 85 0% | 91 7% | 92 8% | 98 15% | 93 9% | 98 15% |
| Black Level * (cd/m²) | 0.36 | 0.36 -0% | 0.17 53% | 0.19 47% | 0.03 92% | 0.1 72% | |
| Contrast (:1) | 839 | 894 7% | 1694 102% | 1374 64% | 13333 1489% | 4230 404% | |
| Colorchecker dE 2000 * | 2.24 | 1.98 12% | 1.9 15% | 5.57 -149% | 2.2 2% | 2.3 -3% | 0.55 75% |
| Colorchecker dE 2000 max. * | 5.52 | 5.24 5% | 3.3 40% | 20.6 -273% | 3.9 29% | 4.15 25% | 1.15 79% |
| Greyscale dE 2000 * | 3.87 | 2.44 37% | 2.7 30% | 3.19 18% | 1.4 64% | 2.7 30% | 0.69 82% |
| Gamma | 2.42 91% | 2.42 91% | 2.32 95% | 2.45 90% | 2.22 99% | 2.266 97% | 2.42 91% |
| CCT | 6936 94% | 6984 93% | 6535 99% | 6146 106% | 6380 102% | 7047 92% | 6479 100% |
| Colorchecker dE 2000 calibrated * | 1.98 | 0.9 | 4.63 | 1.9 | 1.66 | 1.15 | |
| Całkowita średnia (program / ustawienia) | 8% /
8% | -26% /
0% | -77% /
-57% | 43% /
35% | 105% /
148% | 62% /
76% |
* ... im mniej tym lepiej
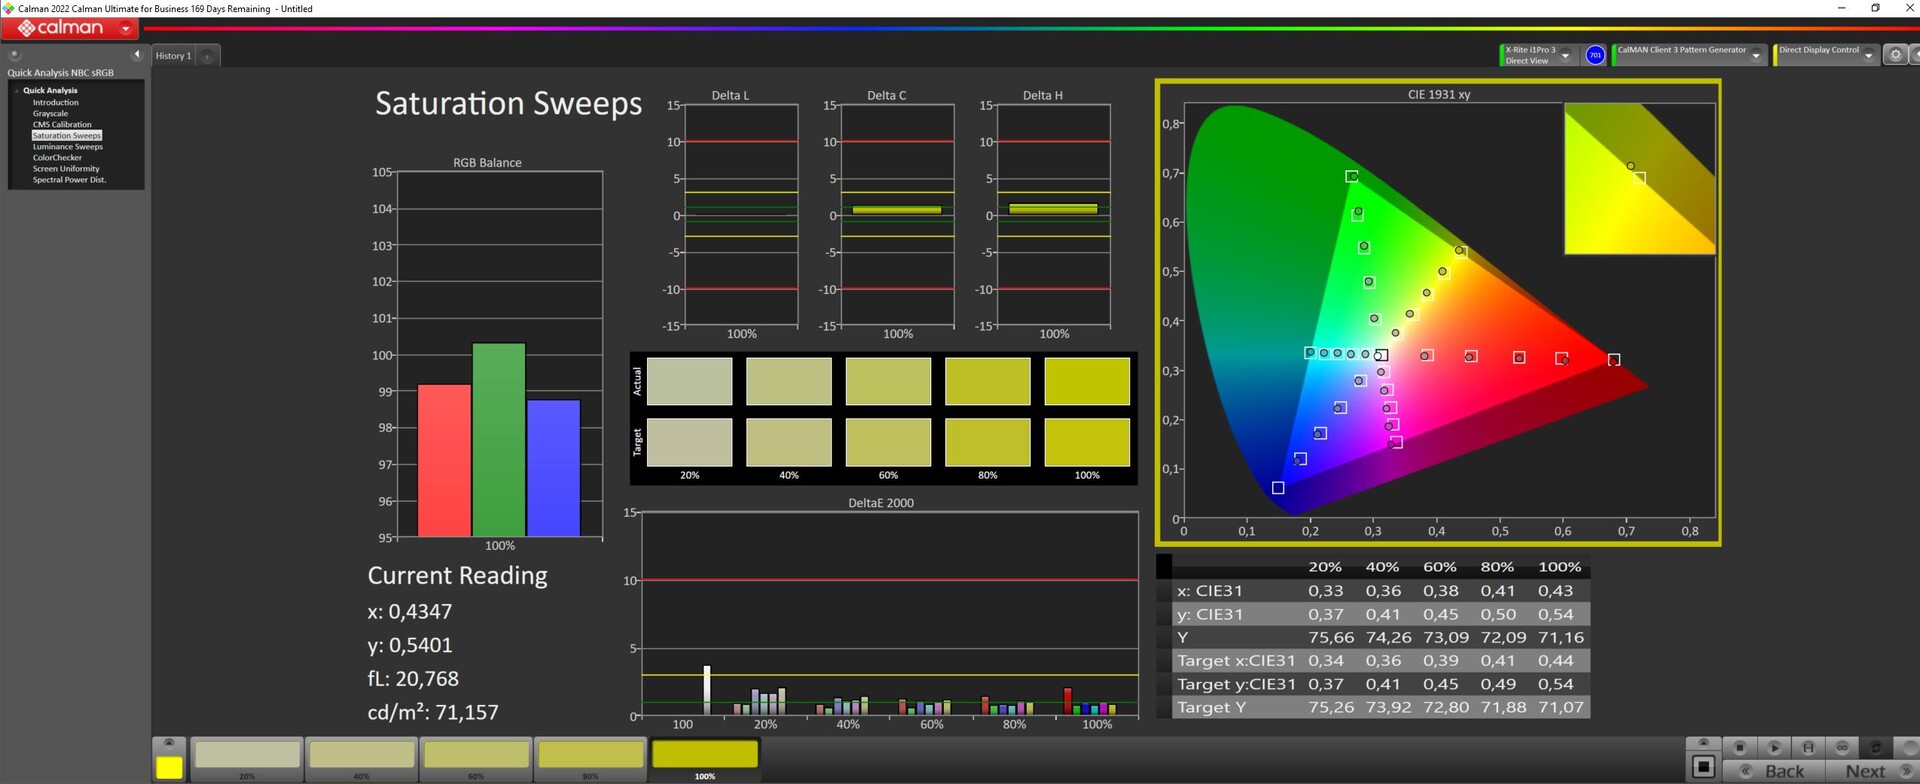
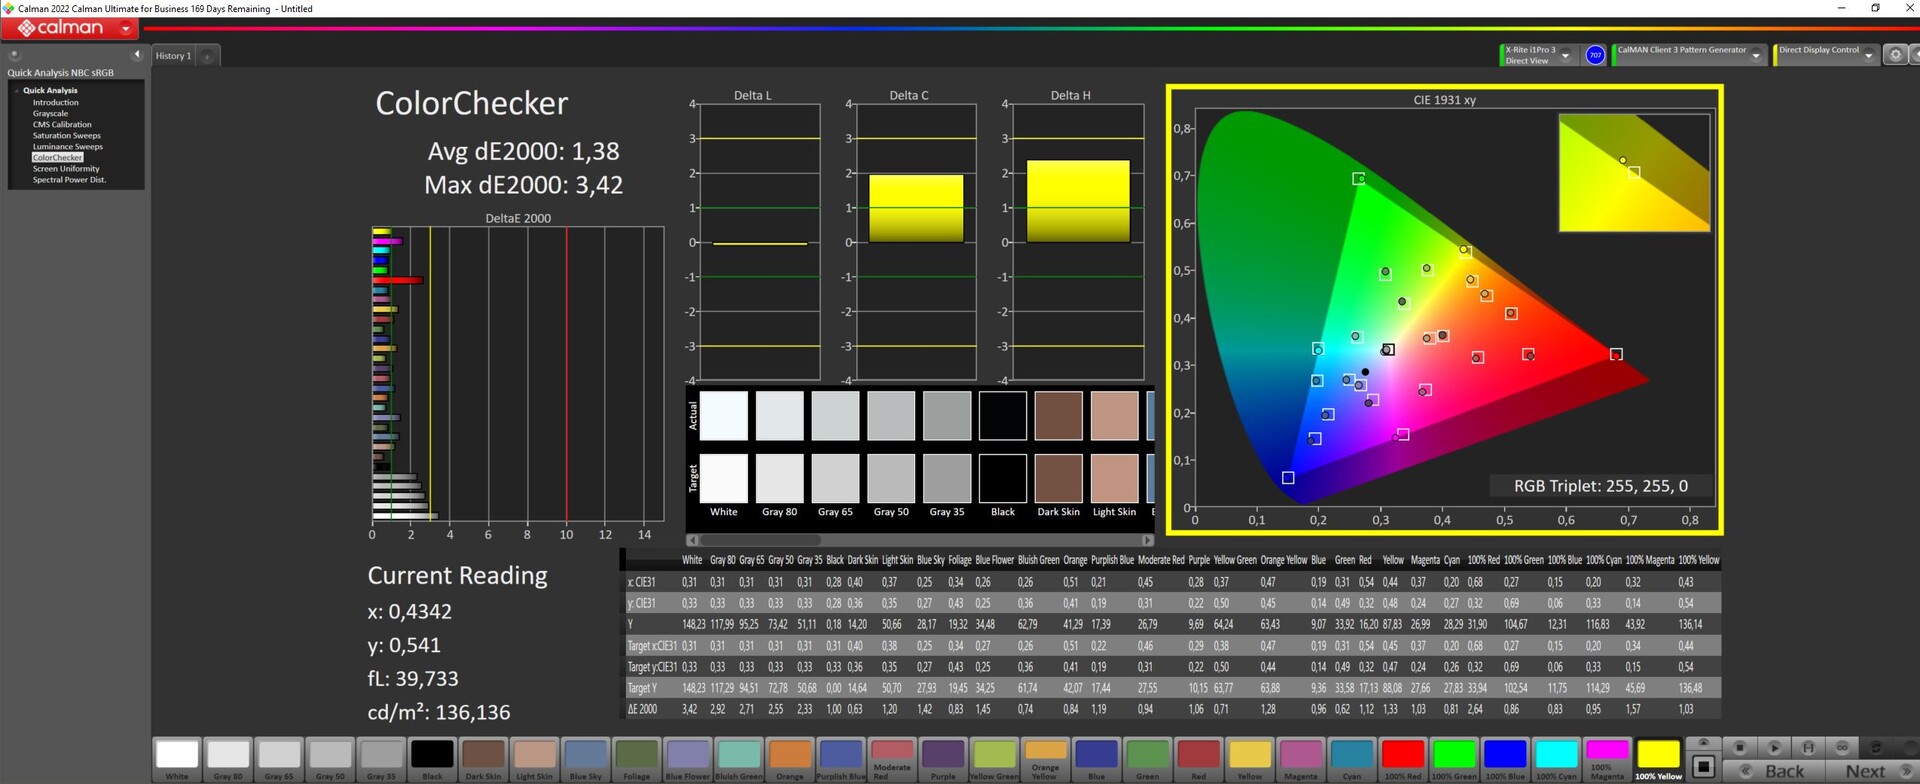
Dla kamerzystów i twórców treści, niemal pełne pokrycie przestrzeni kolorów Display P3 w XMG Focus 15 powinno być plusem. Przestrzeń kolorów AdobeRGB jest ważniejsza dla edycji i drukowania zdjęć, a Focus 15 udaje się odtworzyć tylko 88% tej przestrzeni.
Ekran w naszym urządzeniu testowym ma dobre odwzorowanie kolorów ze średnim odchyleniem kolorów ΔΕ 2,24 ex-works. Wartości te ulegają dalszej poprawie po kalibracji.
Odkryliśmy, że odwzorowanie kolorów można również poprawić, gdy podświetlenie jest ustawione na 150 nitów.

Wyświetl czasy reakcji
| ↔ Czas reakcji od czerni do bieli | ||
|---|---|---|
| 11.6 ms ... wzrost ↗ i spadek ↘ łącznie | ↗ 5.8 ms wzrost | 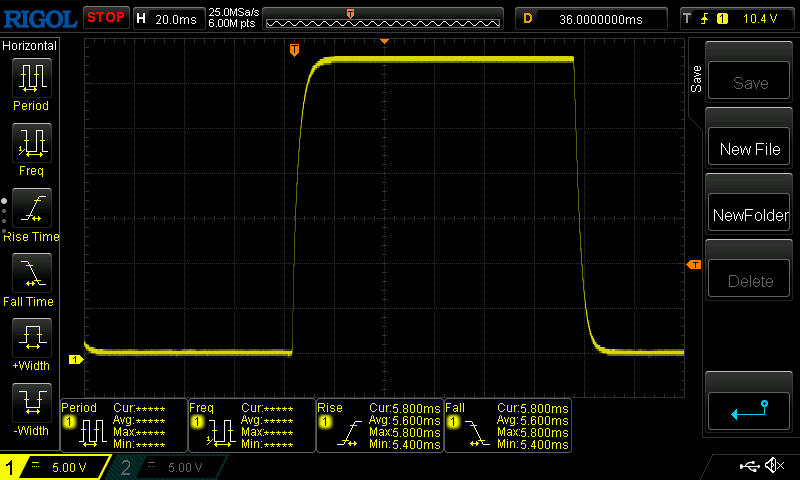 |
| ↘ 5.8 ms upadek | ||
| W naszych testach ekran wykazuje dobry współczynnik reakcji, ale może być zbyt wolny dla graczy rywalizujących ze sobą. Dla porównania, wszystkie testowane urządzenia wahają się od 0.1 (minimum) do 240 (maksimum) ms. » 31 % wszystkich urządzeń jest lepszych. Oznacza to, że zmierzony czas reakcji jest lepszy od średniej wszystkich testowanych urządzeń (19.8 ms). | ||
| ↔ Czas reakcji 50% szarości do 80% szarości | ||
| 15.6 ms ... wzrost ↗ i spadek ↘ łącznie | ↗ 7.4 ms wzrost | 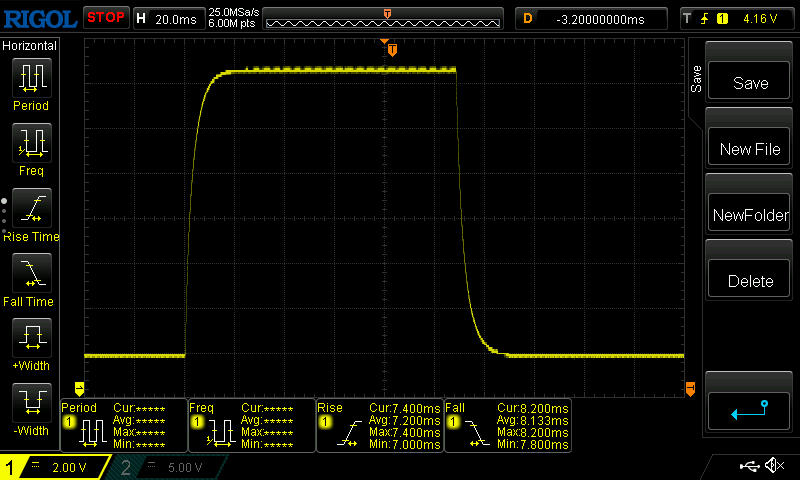 |
| ↘ 8.2 ms upadek | ||
| W naszych testach ekran wykazuje dobry współczynnik reakcji, ale może być zbyt wolny dla graczy rywalizujących ze sobą. Dla porównania, wszystkie testowane urządzenia wahają się od 0.165 (minimum) do 636 (maksimum) ms. » 30 % wszystkich urządzeń jest lepszych. Oznacza to, że zmierzony czas reakcji jest lepszy od średniej wszystkich testowanych urządzeń (31 ms). | ||
Migotanie ekranu / PWM (modulacja szerokości impulsu)
| Migotanie ekranu/nie wykryto PWM |  | ||
Dla porównania: 52 % wszystkich testowanych urządzeń nie używa PWM do przyciemniania wyświetlacza. Jeśli wykryto PWM, zmierzono średnio 7757 (minimum: 5 - maksimum: 343500) Hz. | |||
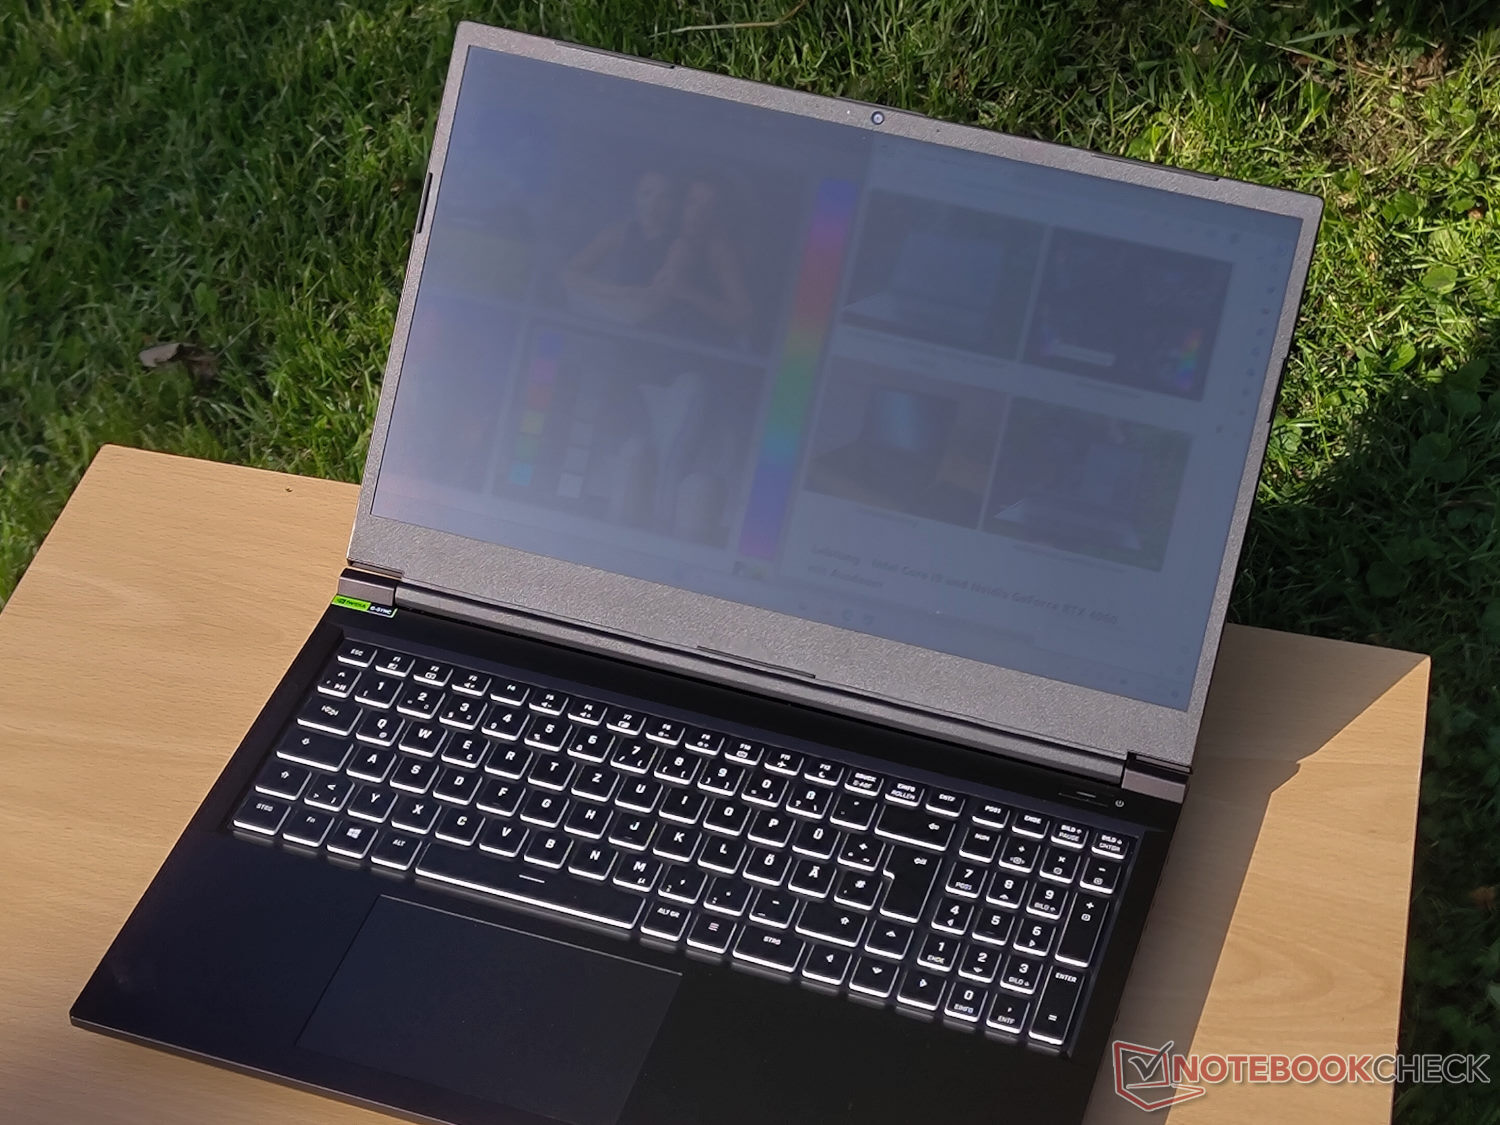
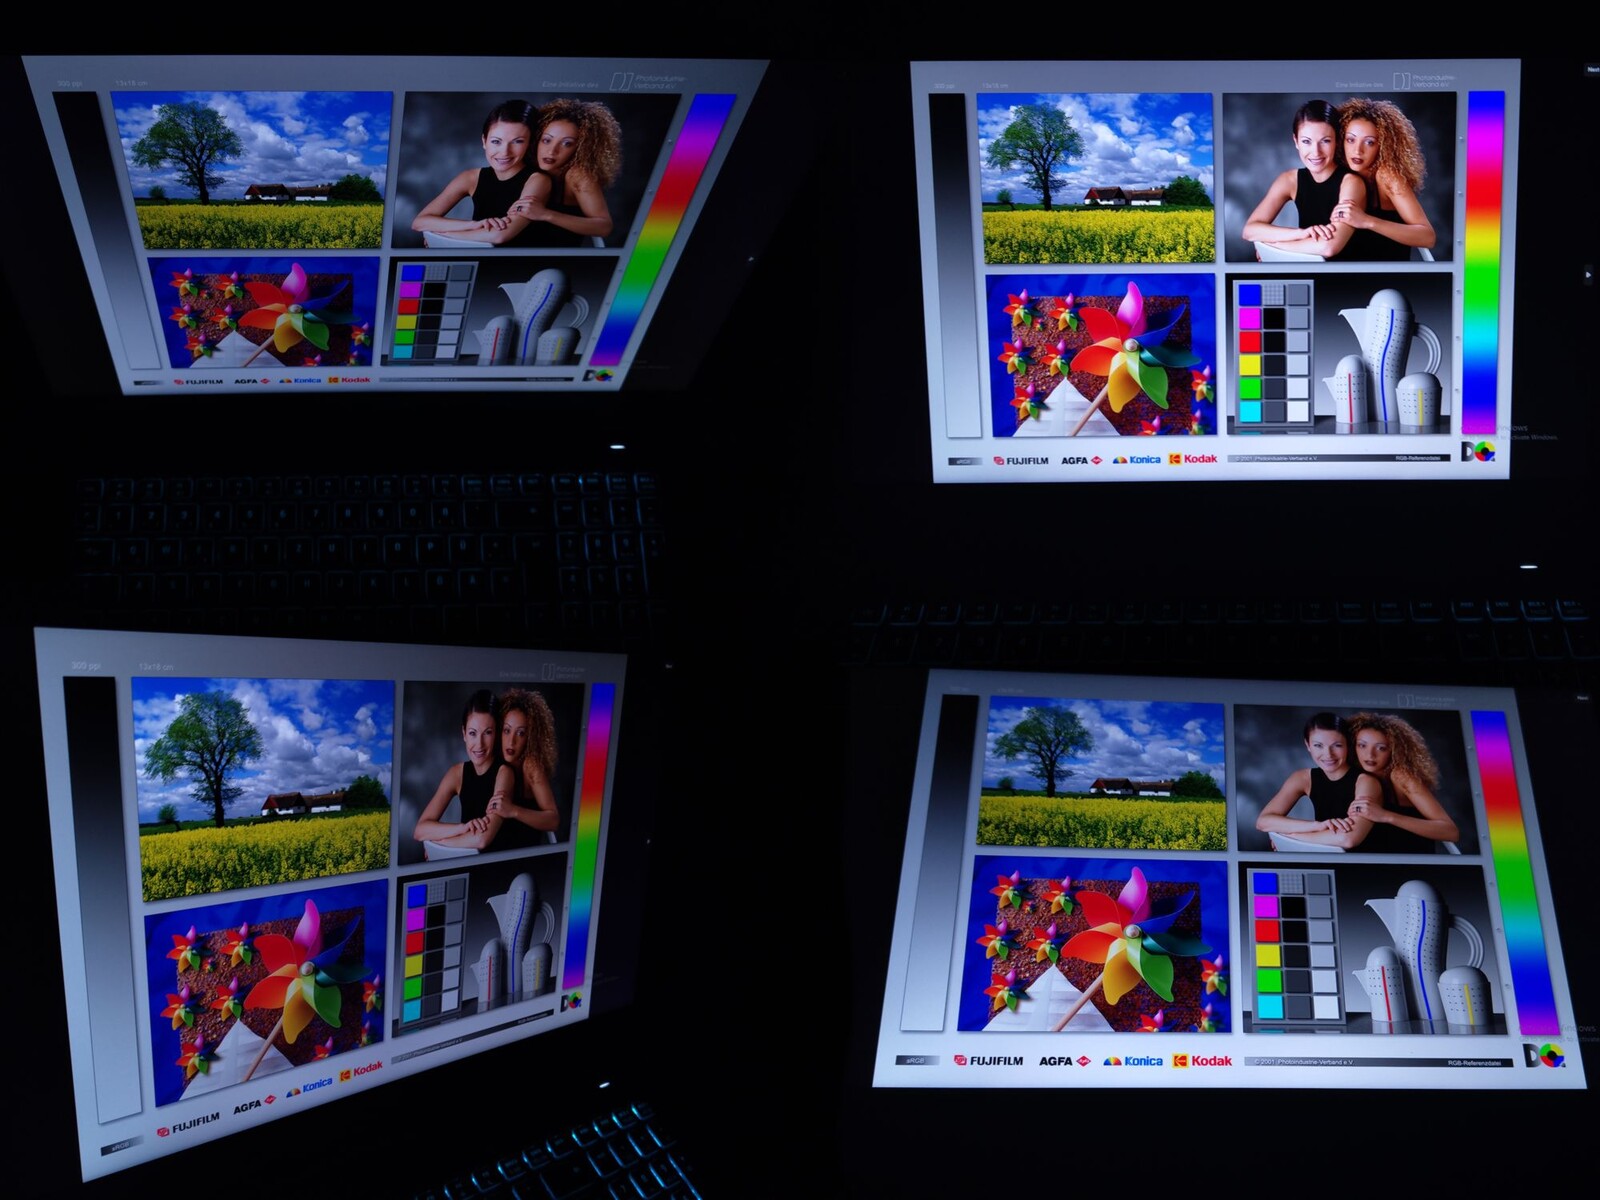
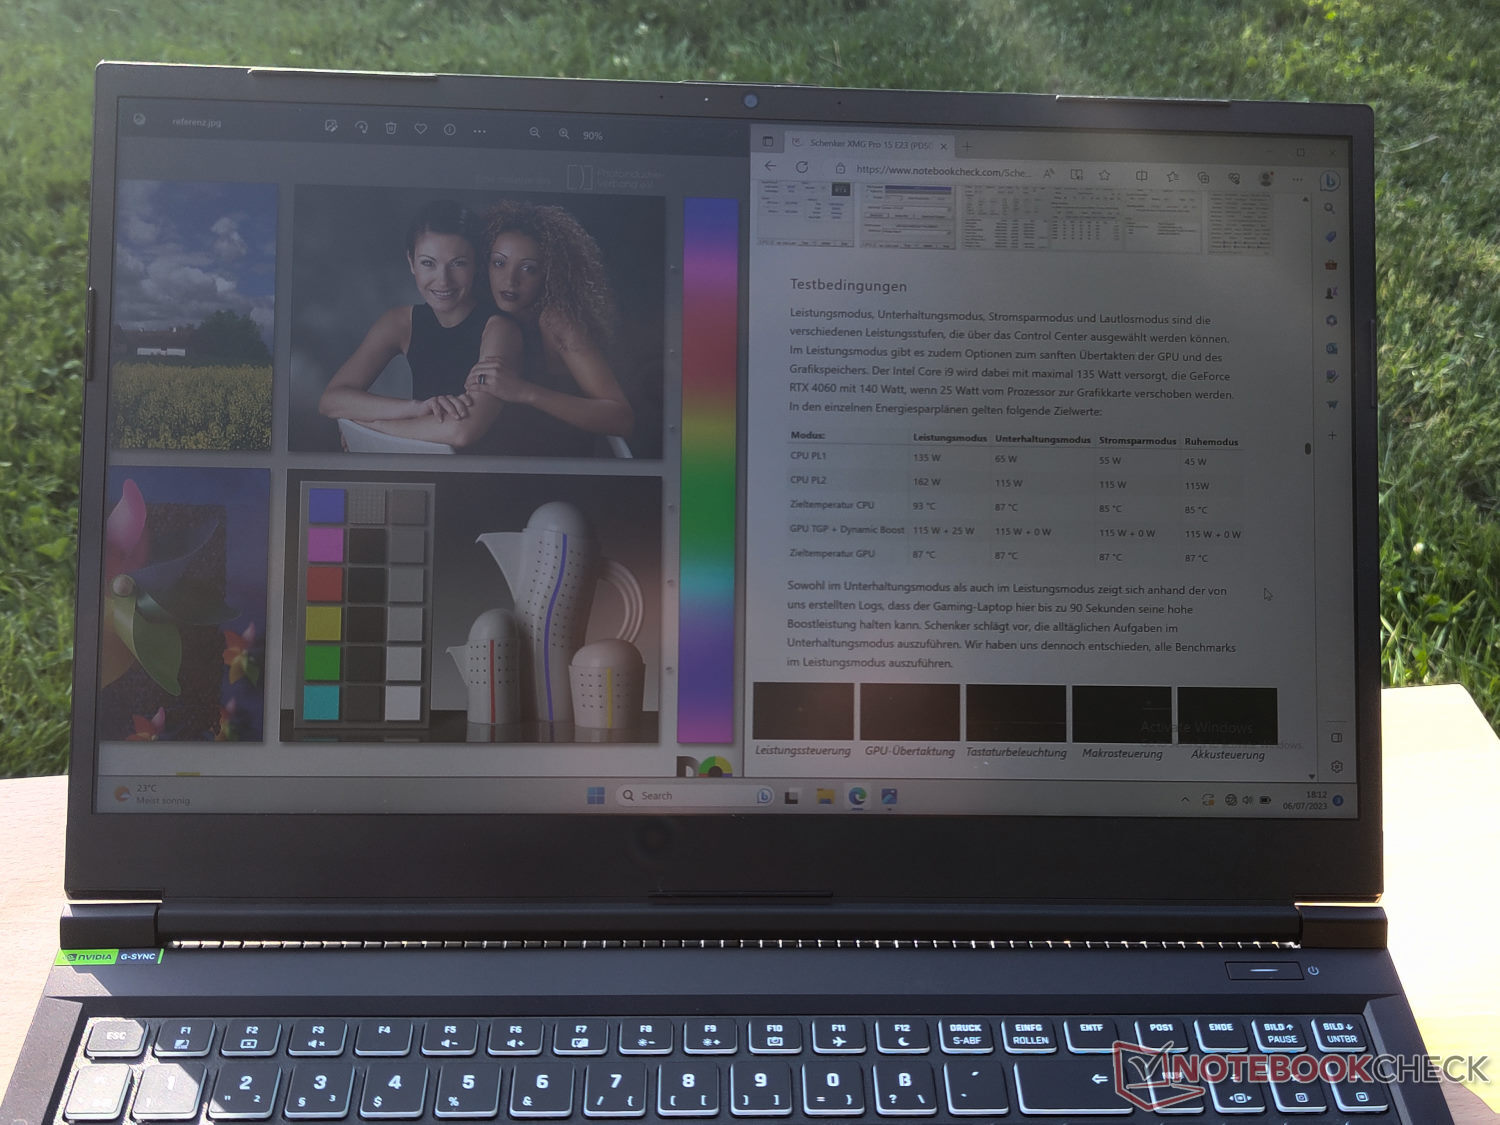
Dzięki matowej powierzchni, dość jasny wyświetlacz nadaje się również do użytku na zewnątrz, o ile zadbamy o odpowiednią lokalizację i kąt padania promieni słonecznych. Na szczęście zwykle można znaleźć korzystną pozycję, ponieważ kąty widzenia ekranu są dość stabilne.
Wydajność: Core i9 o ekstremalnej wydajności
Schenker oferuje szeroką gamę opcji konfiguracyjnych dla XMG Focus 15. Procesor we wszystkich z nich to Intel Core i9-13900HX. Jest on wspierany przez układ Nvidia z technologią GeForce RTX 4050, RTX 4060 lub RTX 4070dostępne w procesie konfiguracji w Bestware wraz z kilkoma opcjami pamięci.
Nasze urządzenie testowe zostało wyposażone w procesor graficzny Nvidia GeForce RTX 4050 Laptop i 32 GB pamięci roboczej. Dzięki najniższemu układowi graficznemu generacji Ada Lovelace, laptop jest w stanie płynnie grać w wiele aktualnych gier, choć prawdopodobnie będziesz musiał ograniczyć ustawienia jakości, jeśli chcesz wykorzystać pełną rozdzielczość QHD wyświetlacza.
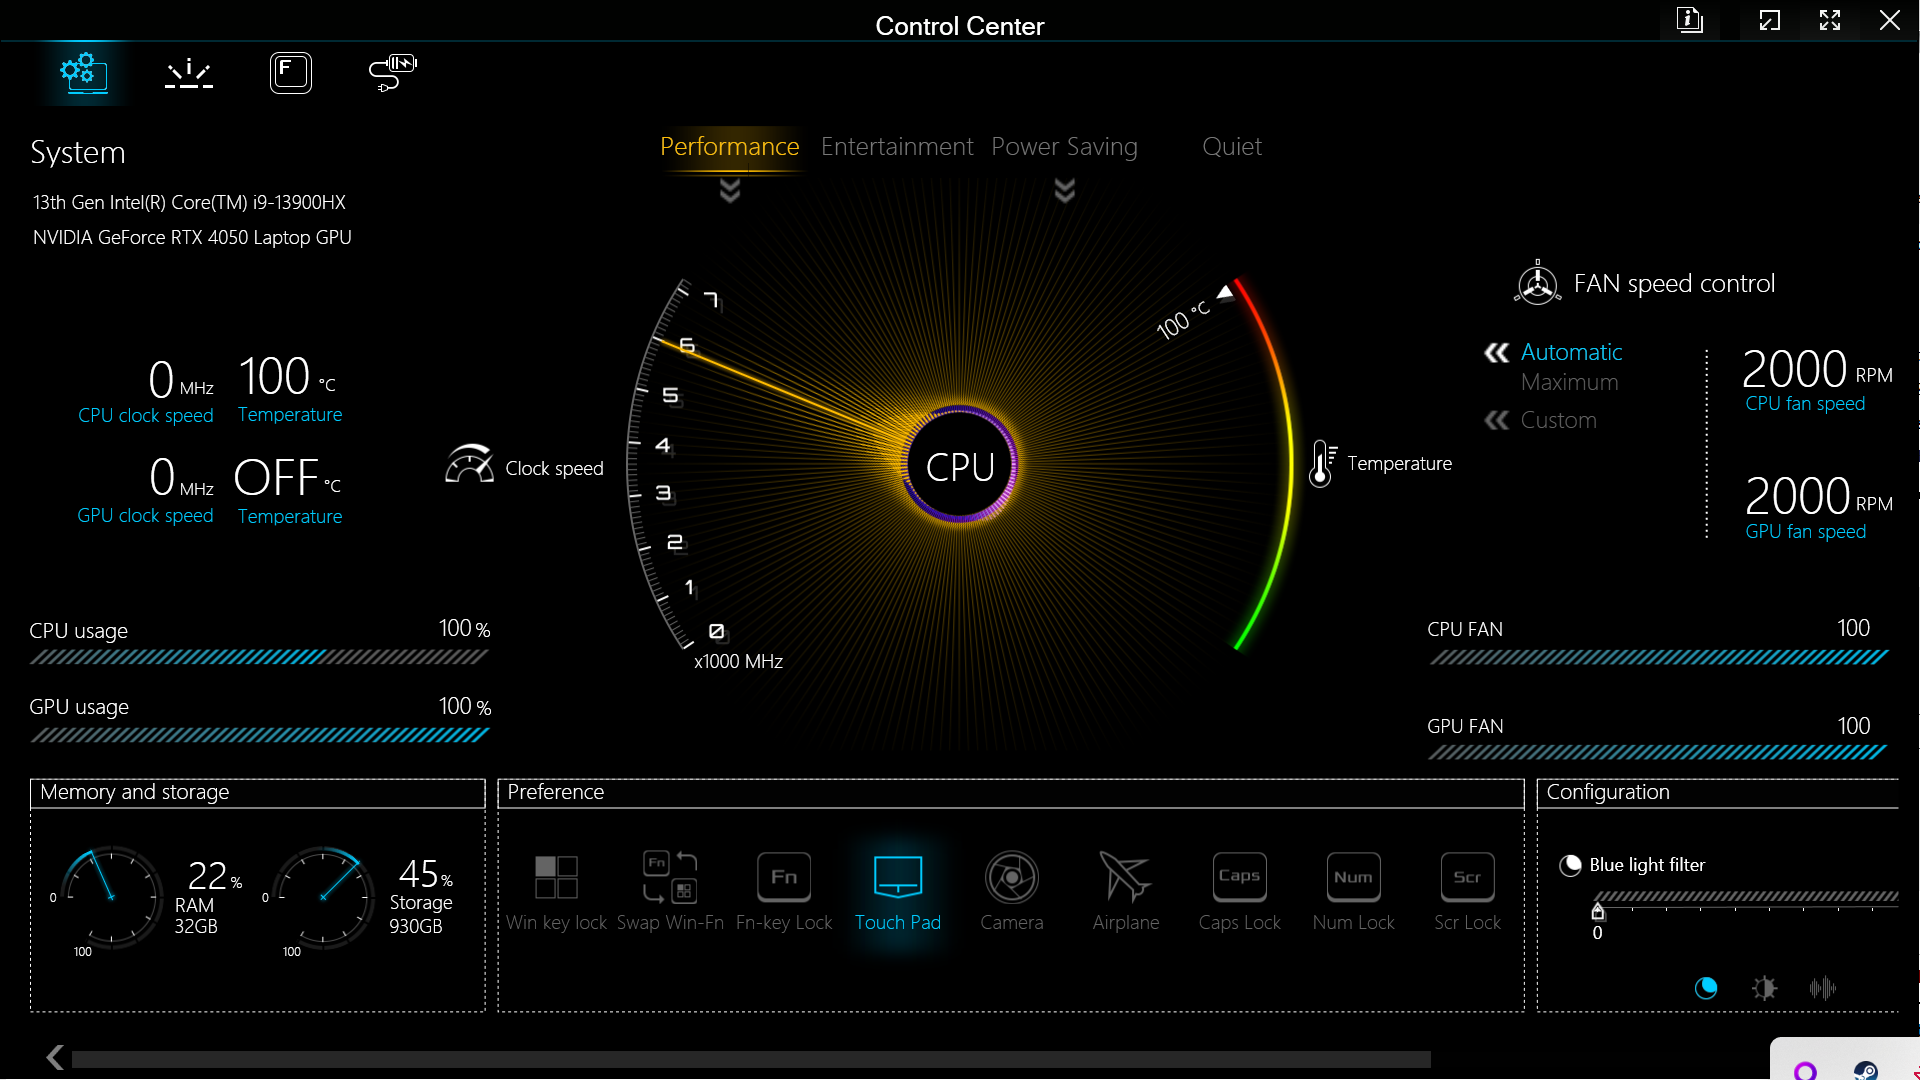
Warunki testowe
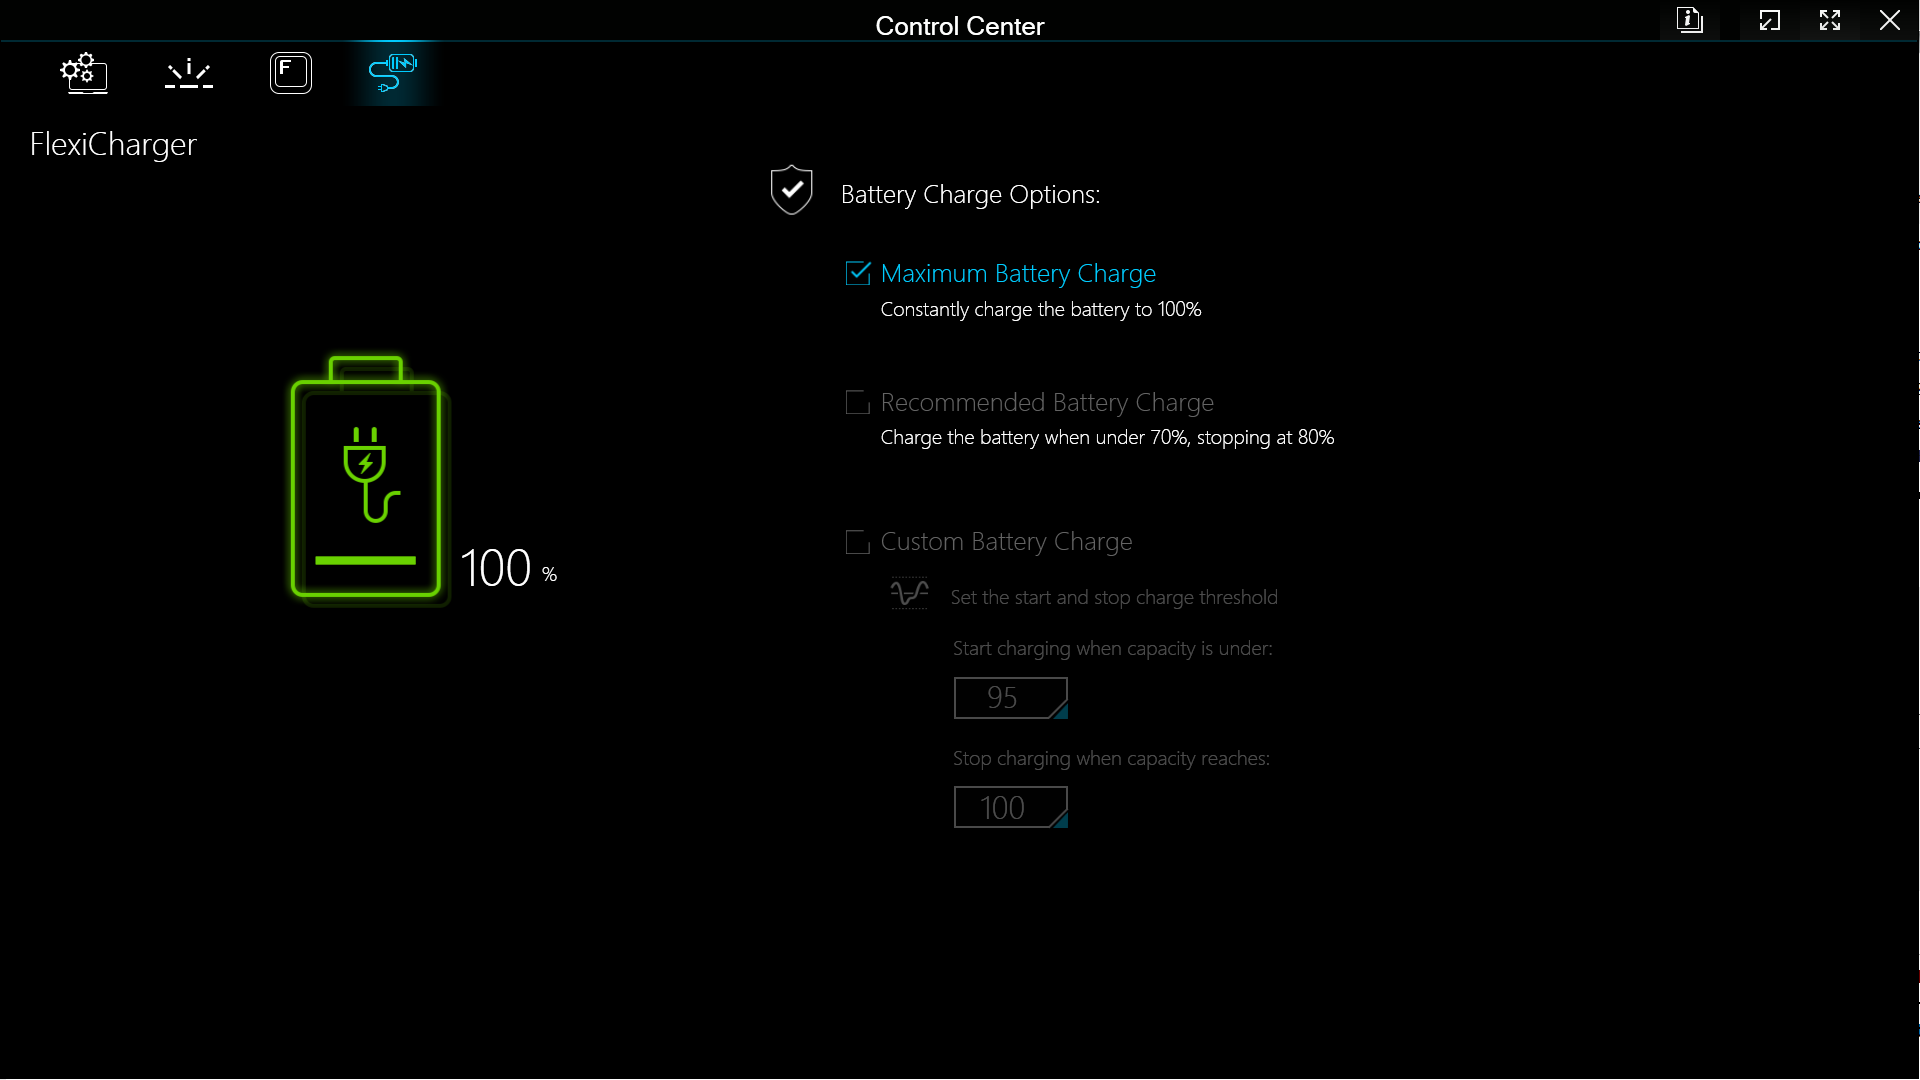
Dostęp do czterech różnych planów wydajności można uzyskać za pośrednictwem Centrum sterowania Schenker. Podczas gdy tryb oszczędzania energii i tryb uśpienia zauważalnie ograniczają wydajność testowanego urządzenia, testy porównawcze trybów wydajności i rozrywki są często dość zbliżone do siebie, gdy od laptopa wymaga się dużej wydajności przez dłuższy czas.
Biorąc to pod uwagę, faza boost procesora trwa znacznie dłużej w trybie wydajności. Przy prawie 1,5 minuty w trybie boost, procesor z łatwością przechodzi przez benchmarki takie jak Cinebench R23 czy testy Blendera. Limity mocy w poszczególnych trybach są następujące:
| Tryb: | Tryb zasilania | Tryb rozrywki | Tryb oszczędzania energii |
|---|---|---|---|
| CPU PL1 | 135 W | 55 W | 15 W |
| CPU PL2 | 162 W | 130 W | 30 W |
| Temperatura docelowa CPU | 93 °C | 87 °C | 85 °C |
| GPU TGP + Dynamic Boost | 115 W + 25 W | 115 W + 0 W | 115 W + 0 W |
| Docelowa temperatura GPU | 87 °C | 87 °C | 87 °C |
W naszych testach laptop osiągnął wysokie wartości docelowe w trybie wydajności. Odpowiadają one dokładnie wartościom, które Schenker osiągnął również z XMG Pro 15. Tak więc wydajność dwóch procesorów w Focus i Pro jest prawie identyczna.
Aby uzyskać lepsze porównanie między tymi dwoma urządzeniami, ostatecznie zdecydowaliśmy się uruchomić wszystkie testy porównawcze w trybie Performance również w XMG Focus 15.
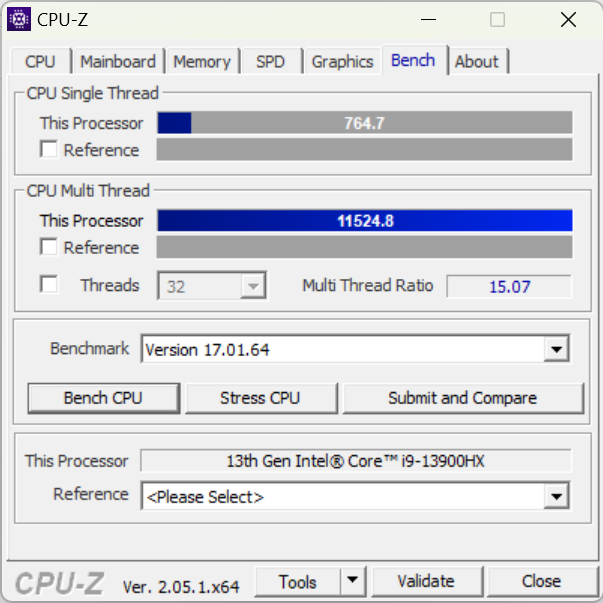
Procesor
Z procesorem Intel Core i9-13900HXw XMG Focus 15 zainstalowano jeden z najwyższej klasy procesorów do laptopów z generacji Raptor Lake-HX. Tutaj procesor jest nawet nieco szybszy niż ten w Pro 15.
Różnica jest bardziej odczuwalna w obszarze płynności działania nowoczesnych procesorów. Dzięki 8 rdzeniom P i 16 rdzeniom E, procesor ma 32 wątki, które zapewniają ekstremalną wielozadaniowość. Focus 15 i Pro 15 znajdują się w czołówce porównywanych urządzeń.
Cinebench R15 Multi Loop Test
Cinebench R23: Multi Core | Single Core
Cinebench R20: CPU (Multi Core) | CPU (Single Core)
Cinebench R15: CPU Multi 64Bit | CPU Single 64Bit
Blender: v2.79 BMW27 CPU
7-Zip 18.03: 7z b 4 | 7z b 4 -mmt1
Geekbench 5.5: Multi-Core | Single-Core
HWBOT x265 Benchmark v2.2: 4k Preset
LibreOffice : 20 Documents To PDF
R Benchmark 2.5: Overall mean
| CPU Performance rating | |
| Przeciętny Intel Core i9-13900HX | |
| Średnia w klasie Gaming | |
| Schenker XMG Focus 15 (E23) | |
| Schenker XMG Pro 15 (E23) | |
| Gigabyte Aero 14 OLED BMF | |
| Acer Swift X SFX14-71G | |
| Samsung Galaxy Book3 Ultra 16 | |
| MSI Katana 15 B12VEK | |
| Asus TUF A15 FA507 | |
| Cinebench R23 / Multi Core | |
| Przeciętny Intel Core i9-13900HX (24270 - 32623, n=23) | |
| Średnia w klasie Gaming (10488 - 42661, n=107, ostatnie 2 lata) | |
| Schenker XMG Pro 15 (E23) | |
| Schenker XMG Focus 15 (E23) | |
| Acer Swift X SFX14-71G | |
| MSI Katana 15 B12VEK | |
| Samsung Galaxy Book3 Ultra 16 | |
| Gigabyte Aero 14 OLED BMF | |
| Asus TUF A15 FA507 | |
| Cinebench R23 / Single Core | |
| Przeciętny Intel Core i9-13900HX (1867 - 2105, n=20) | |
| Średnia w klasie Gaming (1166 - 2415, n=107, ostatnie 2 lata) | |
| Schenker XMG Focus 15 (E23) | |
| Acer Swift X SFX14-71G | |
| Schenker XMG Pro 15 (E23) | |
| Gigabyte Aero 14 OLED BMF | |
| Samsung Galaxy Book3 Ultra 16 | |
| MSI Katana 15 B12VEK | |
| Asus TUF A15 FA507 | |
| Cinebench R20 / CPU (Multi Core) | |
| Przeciętny Intel Core i9-13900HX (9152 - 12541, n=21) | |
| Średnia w klasie Gaming (4029 - 16433, n=106, ostatnie 2 lata) | |
| Schenker XMG Pro 15 (E23) | |
| Schenker XMG Focus 15 (E23) | |
| Acer Swift X SFX14-71G | |
| MSI Katana 15 B12VEK | |
| Samsung Galaxy Book3 Ultra 16 | |
| Gigabyte Aero 14 OLED BMF | |
| Asus TUF A15 FA507 | |
| Cinebench R20 / CPU (Single Core) | |
| Przeciętny Intel Core i9-13900HX (722 - 810, n=21) | |
| Średnia w klasie Gaming (442 - 913, n=106, ostatnie 2 lata) | |
| Schenker XMG Focus 15 (E23) | |
| Acer Swift X SFX14-71G | |
| Schenker XMG Pro 15 (E23) | |
| Gigabyte Aero 14 OLED BMF | |
| Samsung Galaxy Book3 Ultra 16 | |
| MSI Katana 15 B12VEK | |
| Asus TUF A15 FA507 | |
| Cinebench R15 / CPU Multi 64Bit | |
| Przeciętny Intel Core i9-13900HX (3913 - 4970, n=22) | |
| Schenker XMG Focus 15 (E23) | |
| Średnia w klasie Gaming (1578 - 6330, n=105, ostatnie 2 lata) | |
| Schenker XMG Pro 15 (E23) | |
| Samsung Galaxy Book3 Ultra 16 | |
| Gigabyte Aero 14 OLED BMF | |
| Acer Swift X SFX14-71G | |
| Asus TUF A15 FA507 | |
| MSI Katana 15 B12VEK | |
| Cinebench R15 / CPU Single 64Bit | |
| Średnia w klasie Gaming (188.8 - 350, n=106, ostatnie 2 lata) | |
| Przeciętny Intel Core i9-13900HX (247 - 304, n=22) | |
| Acer Swift X SFX14-71G | |
| Schenker XMG Focus 15 (E23) | |
| Gigabyte Aero 14 OLED BMF | |
| Asus TUF A15 FA507 | |
| MSI Katana 15 B12VEK | |
| Schenker XMG Pro 15 (E23) | |
| Samsung Galaxy Book3 Ultra 16 | |
| Blender / v2.79 BMW27 CPU | |
| Acer Swift X SFX14-71G | |
| MSI Katana 15 B12VEK | |
| Gigabyte Aero 14 OLED BMF | |
| Asus TUF A15 FA507 | |
| Samsung Galaxy Book3 Ultra 16 | |
| Średnia w klasie Gaming (79 - 330, n=104, ostatnie 2 lata) | |
| Schenker XMG Pro 15 (E23) | |
| Schenker XMG Focus 15 (E23) | |
| Przeciętny Intel Core i9-13900HX (101 - 153, n=22) | |
| 7-Zip 18.03 / 7z b 4 | |
| Przeciętny Intel Core i9-13900HX (90675 - 127283, n=21) | |
| Schenker XMG Focus 15 (E23) | |
| Schenker XMG Pro 15 (E23) | |
| Średnia w klasie Gaming (33491 - 148086, n=105, ostatnie 2 lata) | |
| Samsung Galaxy Book3 Ultra 16 | |
| Asus TUF A15 FA507 | |
| MSI Katana 15 B12VEK | |
| Gigabyte Aero 14 OLED BMF | |
| Acer Swift X SFX14-71G | |
| 7-Zip 18.03 / 7z b 4 -mmt1 | |
| Przeciętny Intel Core i9-13900HX (6340 - 7177, n=21) | |
| Średnia w klasie Gaming (4199 - 7436, n=105, ostatnie 2 lata) | |
| Schenker XMG Focus 15 (E23) | |
| Schenker XMG Pro 15 (E23) | |
| Acer Swift X SFX14-71G | |
| Gigabyte Aero 14 OLED BMF | |
| Asus TUF A15 FA507 | |
| MSI Katana 15 B12VEK | |
| Samsung Galaxy Book3 Ultra 16 | |
| Geekbench 5.5 / Multi-Core | |
| Przeciętny Intel Core i9-13900HX (17614 - 21075, n=22) | |
| Schenker XMG Focus 15 (E23) | |
| Schenker XMG Pro 15 (E23) | |
| Średnia w klasie Gaming (6460 - 28263, n=105, ostatnie 2 lata) | |
| Acer Swift X SFX14-71G | |
| Samsung Galaxy Book3 Ultra 16 | |
| MSI Katana 15 B12VEK | |
| Gigabyte Aero 14 OLED BMF | |
| Asus TUF A15 FA507 | |
| Geekbench 5.5 / Single-Core | |
| Średnia w klasie Gaming (986 - 2474, n=105, ostatnie 2 lata) | |
| Przeciętny Intel Core i9-13900HX (1345 - 2093, n=22) | |
| Gigabyte Aero 14 OLED BMF | |
| Acer Swift X SFX14-71G | |
| Schenker XMG Pro 15 (E23) | |
| Samsung Galaxy Book3 Ultra 16 | |
| MSI Katana 15 B12VEK | |
| Asus TUF A15 FA507 | |
| Schenker XMG Focus 15 (E23) | |
| HWBOT x265 Benchmark v2.2 / 4k Preset | |
| Przeciętny Intel Core i9-13900HX (23.5 - 34.4, n=22) | |
| Średnia w klasie Gaming (11.5 - 44.4, n=105, ostatnie 2 lata) | |
| Schenker XMG Focus 15 (E23) | |
| Schenker XMG Pro 15 (E23) | |
| MSI Katana 15 B12VEK | |
| Asus TUF A15 FA507 | |
| Samsung Galaxy Book3 Ultra 16 | |
| Gigabyte Aero 14 OLED BMF | |
| Acer Swift X SFX14-71G | |
| LibreOffice / 20 Documents To PDF | |
| Schenker XMG Pro 15 (E23) | |
| Asus TUF A15 FA507 | |
| Średnia w klasie Gaming (33.2 - 88.8, n=105, ostatnie 2 lata) | |
| Samsung Galaxy Book3 Ultra 16 | |
| MSI Katana 15 B12VEK | |
| Przeciętny Intel Core i9-13900HX (32.8 - 51.1, n=21) | |
| Gigabyte Aero 14 OLED BMF | |
| Acer Swift X SFX14-71G | |
| Schenker XMG Focus 15 (E23) | |
| R Benchmark 2.5 / Overall mean | |
| Asus TUF A15 FA507 | |
| MSI Katana 15 B12VEK | |
| Samsung Galaxy Book3 Ultra 16 | |
| Schenker XMG Pro 15 (E23) | |
| Gigabyte Aero 14 OLED BMF | |
| Acer Swift X SFX14-71G | |
| Schenker XMG Focus 15 (E23) | |
| Średnia w klasie Gaming (0.3439 - 0.759, n=106, ostatnie 2 lata) | |
| Przeciętny Intel Core i9-13900HX (0.375 - 0.4564, n=22) | |
* ... im mniej tym lepiej
AIDA64: FP32 Ray-Trace | FPU Julia | CPU SHA3 | CPU Queen | FPU SinJulia | FPU Mandel | CPU AES | CPU ZLib | FP64 Ray-Trace | CPU PhotoWorxx
| Performance rating | |
| Średnia w klasie Gaming | |
| Przeciętny Intel Core i9-13900HX | |
| Schenker XMG Focus 15 (E23) | |
| Schenker XMG Pro 15 (E23) | |
| Asus TUF A15 FA507 | |
| Gigabyte Aero 14 OLED BMF | |
| Samsung Galaxy Book3 Ultra 16 | |
| MSI Katana 15 B12VEK | |
| Acer Swift X SFX14-71G | |
| AIDA64 / FP32 Ray-Trace | |
| Średnia w klasie Gaming (10227 - 85542, n=105, ostatnie 2 lata) | |
| Przeciętny Intel Core i9-13900HX (17589 - 27615, n=22) | |
| Schenker XMG Focus 15 (E23) | |
| Schenker XMG Pro 15 (E23) | |
| Asus TUF A15 FA507 | |
| MSI Katana 15 B12VEK | |
| Samsung Galaxy Book3 Ultra 16 | |
| Gigabyte Aero 14 OLED BMF | |
| Acer Swift X SFX14-71G | |
| AIDA64 / FPU Julia | |
| Średnia w klasie Gaming (51376 - 238426, n=105, ostatnie 2 lata) | |
| Przeciętny Intel Core i9-13900HX (88686 - 137015, n=22) | |
| Schenker XMG Focus 15 (E23) | |
| Asus TUF A15 FA507 | |
| Schenker XMG Pro 15 (E23) | |
| MSI Katana 15 B12VEK | |
| Samsung Galaxy Book3 Ultra 16 | |
| Gigabyte Aero 14 OLED BMF | |
| Acer Swift X SFX14-71G | |
| AIDA64 / CPU SHA3 | |
| Średnia w klasie Gaming (2180 - 10115, n=105, ostatnie 2 lata) | |
| Przeciętny Intel Core i9-13900HX (4362 - 7029, n=22) | |
| Schenker XMG Focus 15 (E23) | |
| Schenker XMG Pro 15 (E23) | |
| Asus TUF A15 FA507 | |
| Samsung Galaxy Book3 Ultra 16 | |
| MSI Katana 15 B12VEK | |
| Gigabyte Aero 14 OLED BMF | |
| Acer Swift X SFX14-71G | |
| AIDA64 / CPU Queen | |
| Schenker XMG Focus 15 (E23) | |
| Przeciętny Intel Core i9-13900HX (125644 - 141385, n=22) | |
| Schenker XMG Pro 15 (E23) | |
| Średnia w klasie Gaming (49785 - 173351, n=90, ostatnie 2 lata) | |
| Gigabyte Aero 14 OLED BMF | |
| Acer Swift X SFX14-71G | |
| Asus TUF A15 FA507 | |
| Samsung Galaxy Book3 Ultra 16 | |
| MSI Katana 15 B12VEK | |
| AIDA64 / FPU SinJulia | |
| Przeciętny Intel Core i9-13900HX (12334 - 17179, n=22) | |
| Średnia w klasie Gaming (4424 - 33636, n=105, ostatnie 2 lata) | |
| Schenker XMG Focus 15 (E23) | |
| Asus TUF A15 FA507 | |
| Schenker XMG Pro 15 (E23) | |
| Samsung Galaxy Book3 Ultra 16 | |
| Gigabyte Aero 14 OLED BMF | |
| MSI Katana 15 B12VEK | |
| Acer Swift X SFX14-71G | |
| AIDA64 / FPU Mandel | |
| Średnia w klasie Gaming (25115 - 128721, n=105, ostatnie 2 lata) | |
| Przeciętny Intel Core i9-13900HX (43850 - 69202, n=22) | |
| Asus TUF A15 FA507 | |
| Schenker XMG Focus 15 (E23) | |
| Schenker XMG Pro 15 (E23) | |
| MSI Katana 15 B12VEK | |
| Samsung Galaxy Book3 Ultra 16 | |
| Gigabyte Aero 14 OLED BMF | |
| Acer Swift X SFX14-71G | |
| AIDA64 / CPU AES | |
| Przeciętny Intel Core i9-13900HX (89413 - 237881, n=22) | |
| Gigabyte Aero 14 OLED BMF | |
| Średnia w klasie Gaming (39258 - 247074, n=105, ostatnie 2 lata) | |
| Schenker XMG Focus 15 (E23) | |
| Schenker XMG Pro 15 (E23) | |
| Acer Swift X SFX14-71G | |
| Samsung Galaxy Book3 Ultra 16 | |
| MSI Katana 15 B12VEK | |
| Asus TUF A15 FA507 | |
| AIDA64 / CPU ZLib | |
| Przeciętny Intel Core i9-13900HX (1284 - 1958, n=22) | |
| Schenker XMG Focus 15 (E23) | |
| Średnia w klasie Gaming (574 - 2531, n=105, ostatnie 2 lata) | |
| Schenker XMG Pro 15 (E23) | |
| Samsung Galaxy Book3 Ultra 16 | |
| MSI Katana 15 B12VEK | |
| Gigabyte Aero 14 OLED BMF | |
| Acer Swift X SFX14-71G | |
| Asus TUF A15 FA507 | |
| AIDA64 / FP64 Ray-Trace | |
| Średnia w klasie Gaming (5509 - 45446, n=105, ostatnie 2 lata) | |
| Przeciętny Intel Core i9-13900HX (9481 - 15279, n=22) | |
| Schenker XMG Focus 15 (E23) | |
| Schenker XMG Pro 15 (E23) | |
| Asus TUF A15 FA507 | |
| MSI Katana 15 B12VEK | |
| Samsung Galaxy Book3 Ultra 16 | |
| Gigabyte Aero 14 OLED BMF | |
| Acer Swift X SFX14-71G | |
| AIDA64 / CPU PhotoWorxx | |
| Gigabyte Aero 14 OLED BMF | |
| Schenker XMG Focus 15 (E23) | |
| Schenker XMG Pro 15 (E23) | |
| Przeciętny Intel Core i9-13900HX (42994 - 51994, n=22) | |
| Samsung Galaxy Book3 Ultra 16 | |
| Średnia w klasie Gaming (12271 - 89891, n=105, ostatnie 2 lata) | |
| Acer Swift X SFX14-71G | |
| MSI Katana 15 B12VEK | |
| Asus TUF A15 FA507 | |
Wydajność systemu
Z podstawowym procesorem graficznym Nvidii, układem GeForce RTX 4050focus nie może zdobyć tylu punktów w teście PCMark 10, co Pro 15. Mimo to Focus 15 nadąża za innymi urządzeniami porównawczymi.
Nieco szybszy procesor Focusa 15 jest ponownie zauważalny w benchmarku CrossMark. Recenzowana próbka uzyskała nieco więcej punktów niż Pro 15. CrossMark bierze pod uwagę wydajność karty graficznej w znacznie mniejszym stopniu niż PCMark.
CrossMark: Overall | Productivity | Creativity | Responsiveness
| PCMark 10 / Score | |
| Średnia w klasie Gaming (5828 - 12414, n=93, ostatnie 2 lata) | |
| Schenker XMG Pro 15 (E23) | |
| Gigabyte Aero 14 OLED BMF | |
| Acer Swift X SFX14-71G | |
| Asus TUF A15 FA507 | |
| Schenker XMG Focus 15 (E23) | |
| Przeciętny Intel Core i9-13900HX, NVIDIA GeForce RTX 4050 Laptop GPU (n=1) | |
| MSI Katana 15 B12VEK | |
| Samsung Galaxy Book3 Ultra 16 | |
| PCMark 10 / Essentials | |
| Gigabyte Aero 14 OLED BMF | |
| Schenker XMG Pro 15 (E23) | |
| Acer Swift X SFX14-71G | |
| Średnia w klasie Gaming (8810 - 11935, n=97, ostatnie 2 lata) | |
| Asus TUF A15 FA507 | |
| Samsung Galaxy Book3 Ultra 16 | |
| MSI Katana 15 B12VEK | |
| Schenker XMG Focus 15 (E23) | |
| Przeciętny Intel Core i9-13900HX, NVIDIA GeForce RTX 4050 Laptop GPU (n=1) | |
| PCMark 10 / Productivity | |
| Średnia w klasie Gaming (6845 - 25323, n=95, ostatnie 2 lata) | |
| Schenker XMG Pro 15 (E23) | |
| MSI Katana 15 B12VEK | |
| Schenker XMG Focus 15 (E23) | |
| Przeciętny Intel Core i9-13900HX, NVIDIA GeForce RTX 4050 Laptop GPU (n=1) | |
| Acer Swift X SFX14-71G | |
| Gigabyte Aero 14 OLED BMF | |
| Asus TUF A15 FA507 | |
| Samsung Galaxy Book3 Ultra 16 | |
| PCMark 10 / Digital Content Creation | |
| Średnia w klasie Gaming (7602 - 19954, n=95, ostatnie 2 lata) | |
| Asus TUF A15 FA507 | |
| Acer Swift X SFX14-71G | |
| Gigabyte Aero 14 OLED BMF | |
| Schenker XMG Pro 15 (E23) | |
| Schenker XMG Focus 15 (E23) | |
| Przeciętny Intel Core i9-13900HX, NVIDIA GeForce RTX 4050 Laptop GPU (n=1) | |
| Samsung Galaxy Book3 Ultra 16 | |
| MSI Katana 15 B12VEK | |
| CrossMark / Overall | |
| Schenker XMG Focus 15 (E23) | |
| Przeciętny Intel Core i9-13900HX, NVIDIA GeForce RTX 4050 Laptop GPU (n=1) | |
| Średnia w klasie Gaming (1366 - 2409, n=94, ostatnie 2 lata) | |
| Schenker XMG Pro 15 (E23) | |
| Acer Swift X SFX14-71G | |
| Gigabyte Aero 14 OLED BMF | |
| MSI Katana 15 B12VEK | |
| Samsung Galaxy Book3 Ultra 16 | |
| Asus TUF A15 FA507 | |
| CrossMark / Productivity | |
| Schenker XMG Focus 15 (E23) | |
| Przeciętny Intel Core i9-13900HX, NVIDIA GeForce RTX 4050 Laptop GPU (n=1) | |
| Acer Swift X SFX14-71G | |
| Średnia w klasie Gaming (1386 - 2254, n=94, ostatnie 2 lata) | |
| Schenker XMG Pro 15 (E23) | |
| Gigabyte Aero 14 OLED BMF | |
| MSI Katana 15 B12VEK | |
| Asus TUF A15 FA507 | |
| Samsung Galaxy Book3 Ultra 16 | |
| CrossMark / Creativity | |
| Schenker XMG Focus 15 (E23) | |
| Przeciętny Intel Core i9-13900HX, NVIDIA GeForce RTX 4050 Laptop GPU (n=1) | |
| Średnia w klasie Gaming (1343 - 2786, n=94, ostatnie 2 lata) | |
| Schenker XMG Pro 15 (E23) | |
| Acer Swift X SFX14-71G | |
| Gigabyte Aero 14 OLED BMF | |
| MSI Katana 15 B12VEK | |
| Asus TUF A15 FA507 | |
| Samsung Galaxy Book3 Ultra 16 | |
| CrossMark / Responsiveness | |
| Acer Swift X SFX14-71G | |
| Schenker XMG Focus 15 (E23) | |
| Przeciętny Intel Core i9-13900HX, NVIDIA GeForce RTX 4050 Laptop GPU (n=1) | |
| Schenker XMG Pro 15 (E23) | |
| Gigabyte Aero 14 OLED BMF | |
| Średnia w klasie Gaming (1226 - 2334, n=94, ostatnie 2 lata) | |
| MSI Katana 15 B12VEK | |
| Samsung Galaxy Book3 Ultra 16 | |
| Asus TUF A15 FA507 | |
| PCMark 10 Score | 6926 pkt. | |
Pomoc | ||
| AIDA64 / Memory Copy | |
| Gigabyte Aero 14 OLED BMF | |
| Schenker XMG Focus 15 (E23) | |
| Schenker XMG Pro 15 (E23) | |
| Przeciętny Intel Core i9-13900HX (67716 - 79193, n=22) | |
| Średnia w klasie Gaming (21750 - 129946, n=105, ostatnie 2 lata) | |
| Samsung Galaxy Book3 Ultra 16 | |
| Acer Swift X SFX14-71G | |
| MSI Katana 15 B12VEK | |
| Asus TUF A15 FA507 | |
| AIDA64 / Memory Read | |
| Schenker XMG Focus 15 (E23) | |
| Schenker XMG Pro 15 (E23) | |
| Przeciętny Intel Core i9-13900HX (73998 - 88462, n=22) | |
| Gigabyte Aero 14 OLED BMF | |
| Średnia w klasie Gaming (22956 - 118858, n=105, ostatnie 2 lata) | |
| Samsung Galaxy Book3 Ultra 16 | |
| MSI Katana 15 B12VEK | |
| Acer Swift X SFX14-71G | |
| Asus TUF A15 FA507 | |
| AIDA64 / Memory Write | |
| Gigabyte Aero 14 OLED BMF | |
| Samsung Galaxy Book3 Ultra 16 | |
| Schenker XMG Focus 15 (E23) | |
| Średnia w klasie Gaming (22297 - 135096, n=105, ostatnie 2 lata) | |
| Schenker XMG Pro 15 (E23) | |
| Przeciętny Intel Core i9-13900HX (65472 - 77045, n=22) | |
| Acer Swift X SFX14-71G | |
| MSI Katana 15 B12VEK | |
| Asus TUF A15 FA507 | |
| AIDA64 / Memory Latency | |
| Średnia w klasie Gaming (75.3 - 259, n=105, ostatnie 2 lata) | |
| Acer Swift X SFX14-71G | |
| Samsung Galaxy Book3 Ultra 16 | |
| MSI Katana 15 B12VEK | |
| Gigabyte Aero 14 OLED BMF | |
| Przeciętny Intel Core i9-13900HX (75.3 - 91.1, n=22) | |
| Schenker XMG Focus 15 (E23) | |
| Schenker XMG Pro 15 (E23) | |
| Asus TUF A15 FA507 | |
* ... im mniej tym lepiej
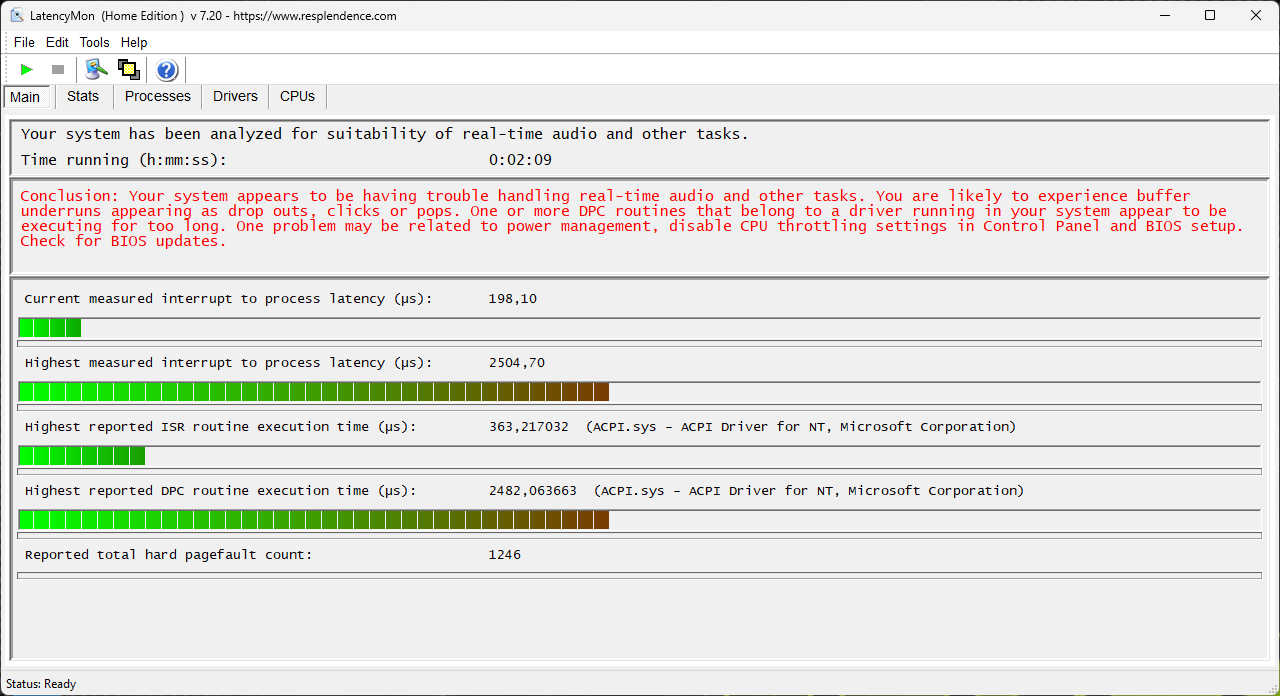
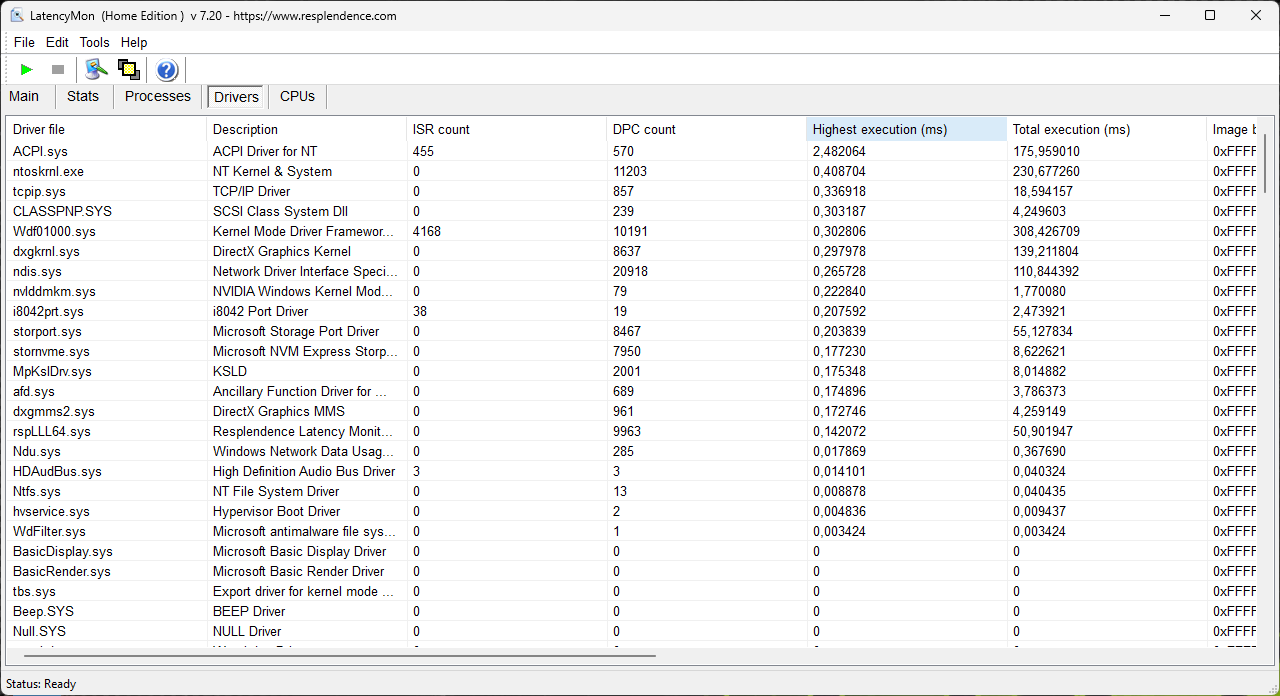
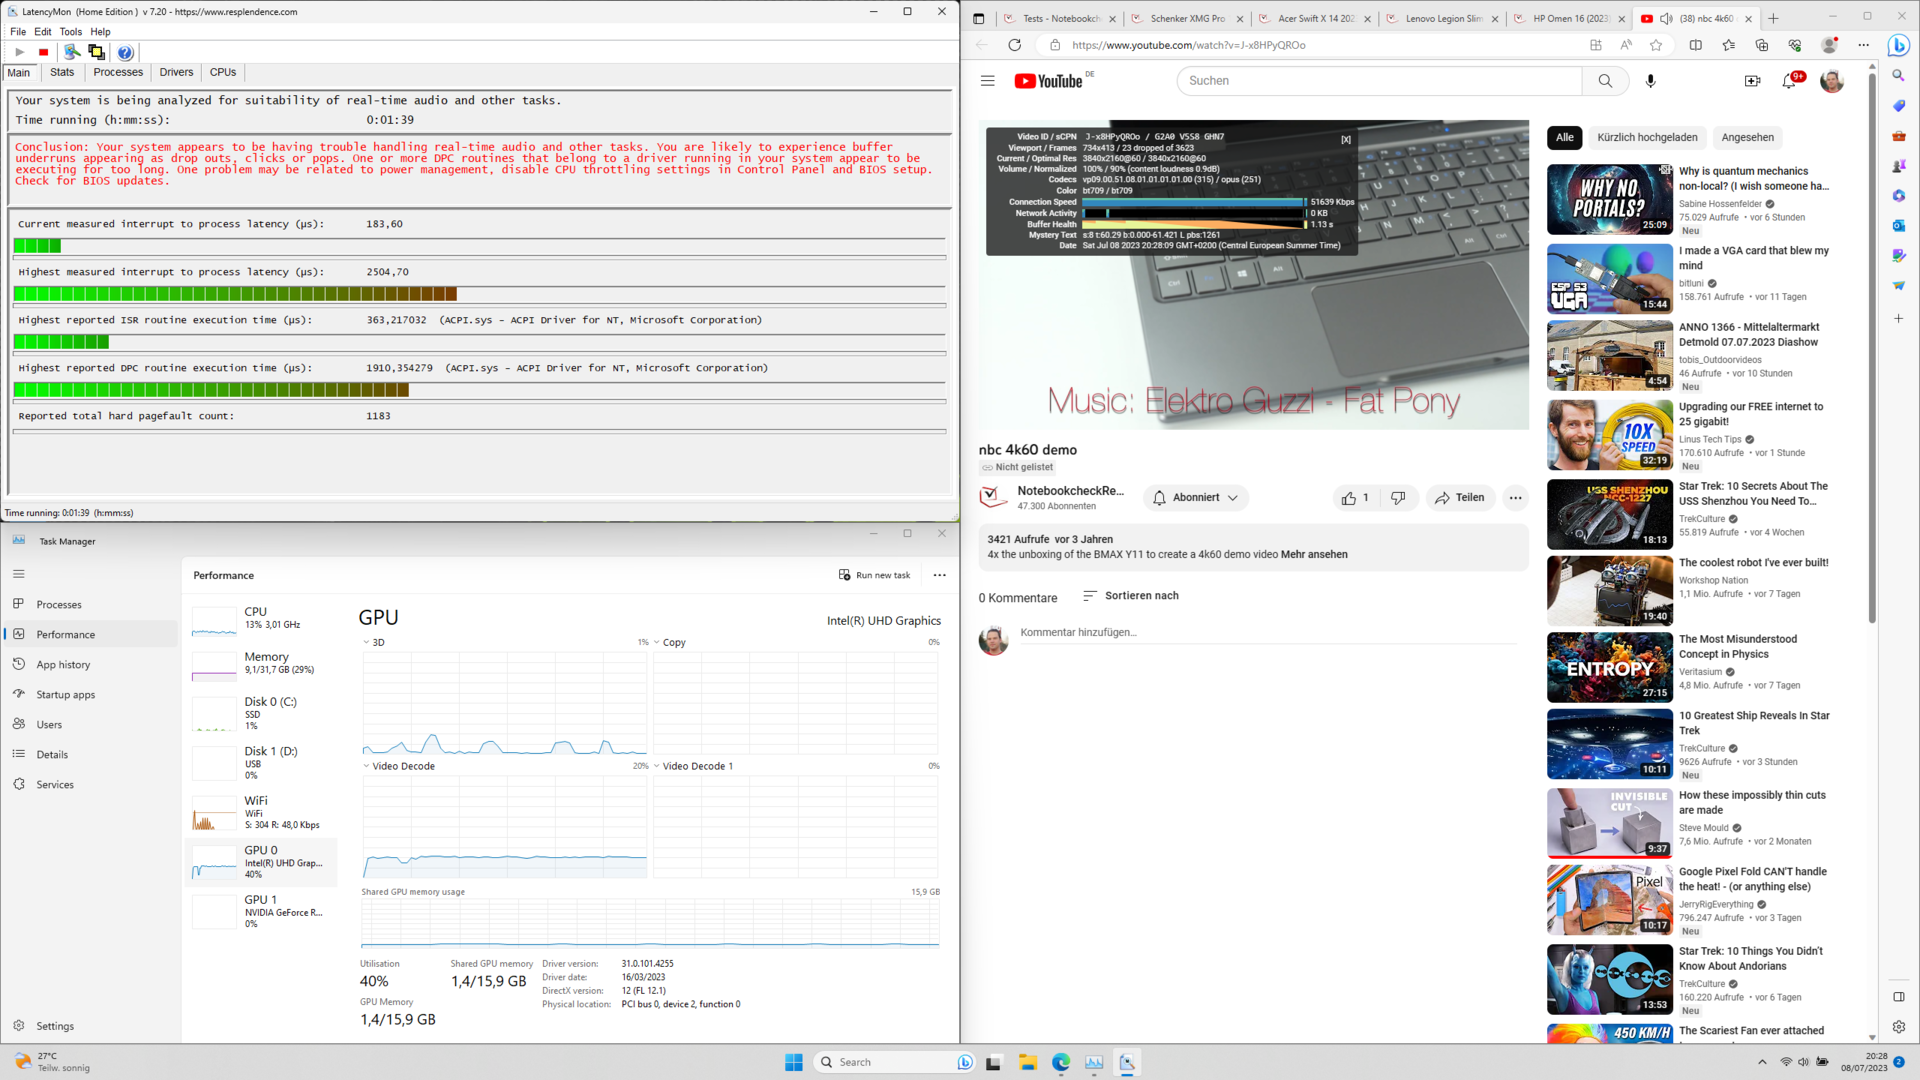
Opóźnienie DPC
Nasz test opóźnień z różnymi kartami przeglądarki, odtwarzaniem YouTube i Prime95 pokazuje, że laptop do gier ma niestety dość wysokie opóźnienia DPC.
Sterownik ACPI, który ustanawia połączenie między BIOS-em/UEFI a systemem Windows, jest tutaj widoczny. Aktualizacja UEFI nie poprawiła tej sytuacji.
| DPC Latencies / LatencyMon - interrupt to process latency (max), Web, Youtube, Prime95 | |
| MSI Katana 15 B12VEK | |
| Acer Swift X SFX14-71G | |
| Samsung Galaxy Book3 Ultra 16 | |
| Schenker XMG Focus 15 (E23) | |
| Gigabyte Aero 14 OLED BMF | |
| Schenker XMG Pro 15 (E23) | |
* ... im mniej tym lepiej
Pamięć masowa
P5 PlusCrucial P5 Plus w testowanym urządzeniu oferuje dobre prędkości transferu. Jednak najwyraźniej przegrzewa się podczas dłuższych obciążeń.
W naszym długoterminowym teście prędkości zapisu, NVMe SSD wyraźnie traci wydajność po pewnym czasie.

* ... im mniej tym lepiej
Disk throttling: DiskSpd Read Loop, Queue Depth 8
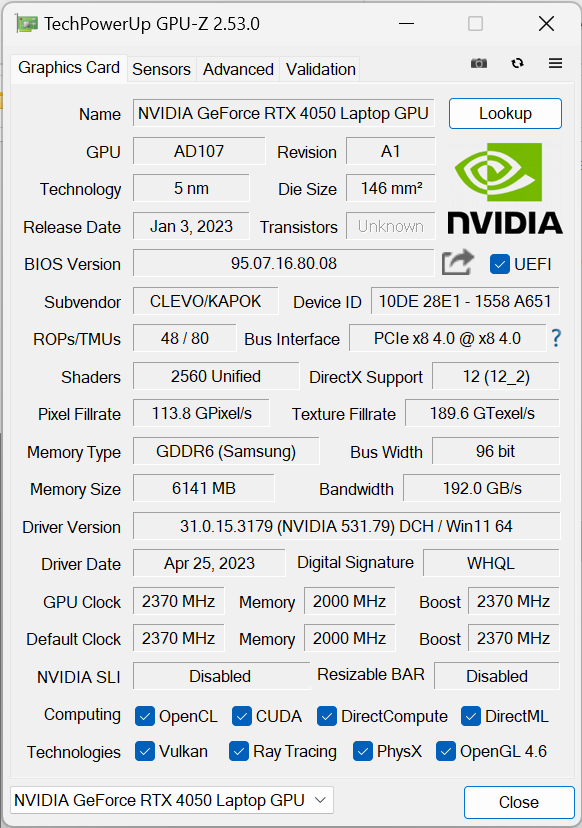
Karta graficzna
W naszej próbce Focus 15 wydajność układu graficznego jest o około 15 do 20% niższa niż w przypadkuRTX 4060 w Pro 15. Spojrzenie na Aorus 15X ASF pokazuje również, gdzie wydajność Focus 15 w połączeniu z kartą RTX 4070 w połączeniu z RTX 4070. Ponieważ wszystkie trzy laptopy mają równoważne wartości TGP, wydajność powinna być tutaj porównywalna, gdy laptopy są wyposażone w ten sam układ graficzny.
Procesor graficzny Nvidia RTX 4050 jest oceniany na maksymalnie 140 W TGP. Wartość ta znajduje się na szczycie konfiguracji TGP zalecanych przez Nvidię. Nie daje to jednak karcie graficznej żadnej przewagi nad innymi laptopami do gier przewagi nad innymi laptopami do gier w każdym benchmarku.
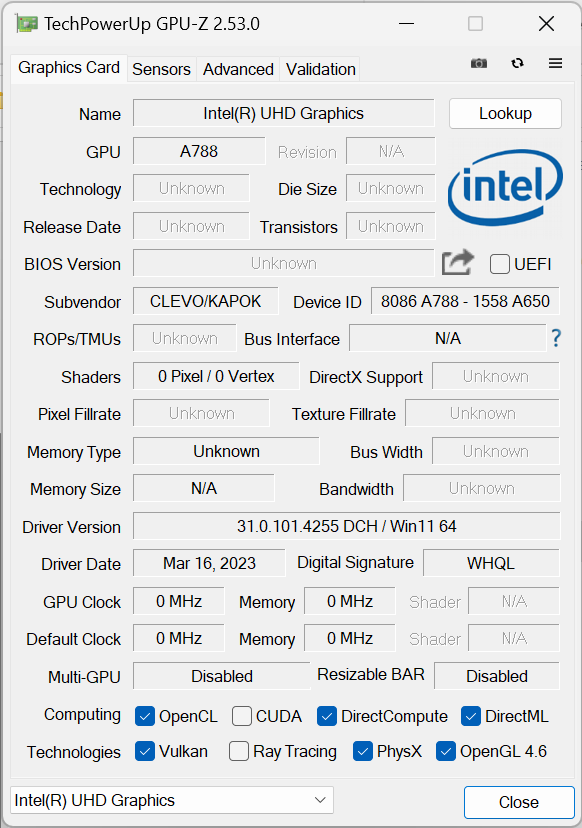
Układ graficzny można wybrać bezpośrednio w Focusie 15 za pomocą przełączników Optimus i MUX - dostępny jest również iGPU Core i9. Biorąc to pod uwagę Intel UHD Graphics 770 z 32 jednostkami EU w 13900HX jest jedną ze słabszych opcji graficznych oferowanych przez Intela w obecnych procesorach. Dlatego może wykonywać tylko podstawowe zadania.
| 3DMark 11 Performance | 27613 pkt. | |
| 3DMark Ice Storm Standard Score | 134251 pkt. | |
| 3DMark Cloud Gate Standard Score | 52615 pkt. | |
| 3DMark Fire Strike Score | 20964 pkt. | |
| 3DMark Time Spy Score | 9236 pkt. | |
Pomoc | ||
| Geekbench 6.7 - GPU OpenCL | |
| Średnia w klasie Gaming (67235 - 253130, n=103, ostatnie 2 lata) | |
| Schenker XMG Focus 15 (E23) | |
| Przeciętny NVIDIA GeForce RTX 4050 Laptop GPU (60815 - 86892, n=21) | |
* ... im mniej tym lepiej
Wydajność w grach
Jak wskazano wcześniej, grafika może być obsługiwana przez układ Intela lub Nvidia GeForce RTX 4050. W rzeczywistości chcieliśmy użyć trybu dual-GPU z automatycznym przełączaniem dla wszystkich testów porównawczych. Jednak automatyczny wybór nie działał dobrze we wszystkich przypadkach. Dlatego też nasze benchmarki do gier zostały uruchomione w trybie tylko dGPU.
Wśród urządzeń porównawczych z RTX 4050, Focus 15 wykazuje najlepszą wydajność w grach. Z wyjątkiem The Witcher 3 , RTX 4050 generuje nieco więcej klatek na sekundę niż zwykle. WynikiDota 2 Reborn i X-Plane 11mogą wydawać się rzucające się w oczy. Focus 15 osiąga więcej klatek na sekundę w obu grach niżPro 15 z mocniejszą kartą RTX 4060.
Jednak obie gry są teraz bardziej ograniczone przez wydajność procesora niż wydajność GPU. Staje się to szczególnie wyraźne, gdy porównamy wydajność Galaxy Book3 Ultra 16 z Acer Swift Go. Oba urządzenia wykorzystują procesorIntel Core i7-13700H z podobnymi wartościami TDP i mogą pokazać podobne liczby klatek na sekundę w Dota 2 Reborn.
| The Witcher 3 - 1920x1080 Ultra Graphics & Postprocessing (HBAO+) | |
| Średnia w klasie Gaming (104.7 - 240, n=7, ostatnie 2 lata) | |
| Schenker XMG Pro 15 (E23) | |
| MSI Katana 15 B12VEK | |
| Asus TUF A15 FA507 | |
| Gigabyte Aero 14 OLED BMF | |
| Gigabyte Aero 14 OLED BMF | |
| Schenker XMG Focus 15 (E23) | |
| Samsung Galaxy Book3 Ultra 16 | |
| Acer Swift X SFX14-71G | |
| Acer Swift Go SFG16-71 | |
| Final Fantasy XV Benchmark - 1920x1080 High Quality | |
| Średnia w klasie Gaming (41 - 215, n=95, ostatnie 2 lata) | |
| Schenker XMG Focus 15 (E23) | |
| MSI Katana 15 B12VEK | |
| Asus TUF A15 FA507 | |
| Acer Swift X SFX14-71G | |
| Gigabyte Aero 14 OLED BMF | |
| Samsung Galaxy Book3 Ultra 16 | |
| Acer Swift Go SFG16-71 | |
| low | med. | high | ultra | QHD | 4K | |
|---|---|---|---|---|---|---|
| GTA V (2015) | 185.6 | 175.8 | 93.7 | |||
| The Witcher 3 (2015) | 64 | |||||
| Dota 2 Reborn (2015) | 193.2 | 181.6 | 175.8 | 160.7 | 106.6 | |
| Final Fantasy XV Benchmark (2018) | 114.1 | 85 | 58.5 | |||
| X-Plane 11.11 (2018) | 165.2 | 144.9 | 117 | 108.6 | ||
| Far Cry 5 (2018) | 141 | 131 | 123 | 86 | ||
| Strange Brigade (2018) | 417 | 218 | 175.4 | 151.2 | ||
| F1 22 (2022) | 244 | 234 | 174.7 | 55.7 | ||
| F1 23 (2023) | 259 | 235 | 164.5 | 45.3 | 36.9 |
Emisje: Ciepła prawa podpórka pod nadgarstki
Emisja hałasu
Focus 15 cechuje się poziomem hałasu wentylatorów typowym dla laptopów gamingowych. Przy dochodzącym do 55 dB(A) pomiarze z odległości 15 cm testowane urządzenie robi się czasem nieprzyjemnie głośne w trybie Performance.
Tryb rozrywkowy wykazuje emisję hałasu w okolicach 50 dB(A). Notebook można również uruchomić niemal bezgłośnie w trybie uśpienia kosztem utraty znacznej mocy obliczeniowej.
Hałas
| luz |
| 24 / 25.14 / 35.14 dB |
| obciążenie |
| 55.93 / 56.34 dB |
 | ||
30 dB cichy 40 dB(A) słyszalny 50 dB(A) irytujący |
||
min: | ||
| Schenker XMG Focus 15 (E23) GeForce RTX 4050 Laptop GPU, i9-13900HX, Crucial P5 Plus 1TB CT1000P5PSSD8 | Schenker XMG Pro 15 (E23) GeForce RTX 4060 Laptop GPU, i9-13900HX, Crucial P5 Plus 1TB CT1000P5PSSD8 | Asus TUF A15 FA507 GeForce RTX 4050 Laptop GPU, R7 7735HS, Micron 2400 MTFDKBA512QFM | MSI Katana 15 B12VEK GeForce RTX 4050 Laptop GPU, i7-12650H, Micron 2400 MTFDKBA1T0QFM | Acer Swift X SFX14-71G GeForce RTX 4050 Laptop GPU, i7-13700H, Samsung PM9A1 MZVL21T0HCLR | Samsung Galaxy Book3 Ultra 16 GeForce RTX 4050 Laptop GPU, i7-13700H, Samsung PM9A1 MZVL2512HCJQ | Gigabyte Aero 14 OLED BMF GeForce RTX 4050 Laptop GPU, i7-13700H, Gigabyte AG470S1TB-SI B10 | |
|---|---|---|---|---|---|---|---|
| Noise | 7% | 20% | 13% | 1% | 12% | 6% | |
| wyłączone / środowisko * (dB) | 24 | 24 -0% | 23.3 3% | 24 -0% | 24.8 -3% | 25 -4% | 24 -0% |
| Idle Minimum * (dB) | 24 | 24 -0% | 23.3 3% | 24 -0% | 28.2 -18% | 26 -8% | 24 -0% |
| Idle Average * (dB) | 25.14 | 24 5% | 23.3 7% | 24 5% | 31.8 -26% | 27 -7% | 24 5% |
| Idle Maximum * (dB) | 35.14 | 24 32% | 23.3 34% | 24 32% | 31.8 10% | 28 20% | 35.71 -2% |
| Load Average * (dB) | 55.93 | 53.65 4% | 29.6 47% | 37.71 33% | 38.2 32% | 40 28% | |
| Witcher 3 ultra * (dB) | 54.62 | 53.53 2% | 43 21% | 45.75 16% | 50 8% | 39 29% | 40.22 26% |
| Load Maximum * (dB) | 56.34 | 53.65 5% | 43 24% | 54.55 3% | 52.2 7% | 41 27% | 51.93 8% |
* ... im mniej tym lepiej
Temperatura
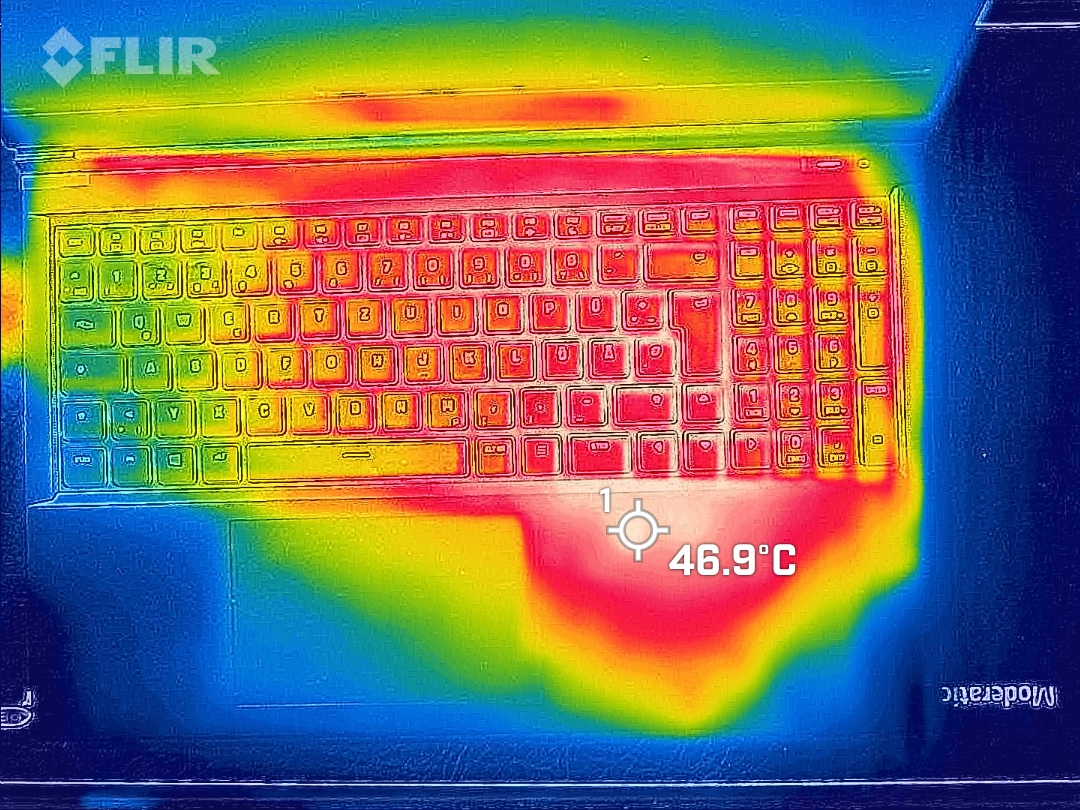
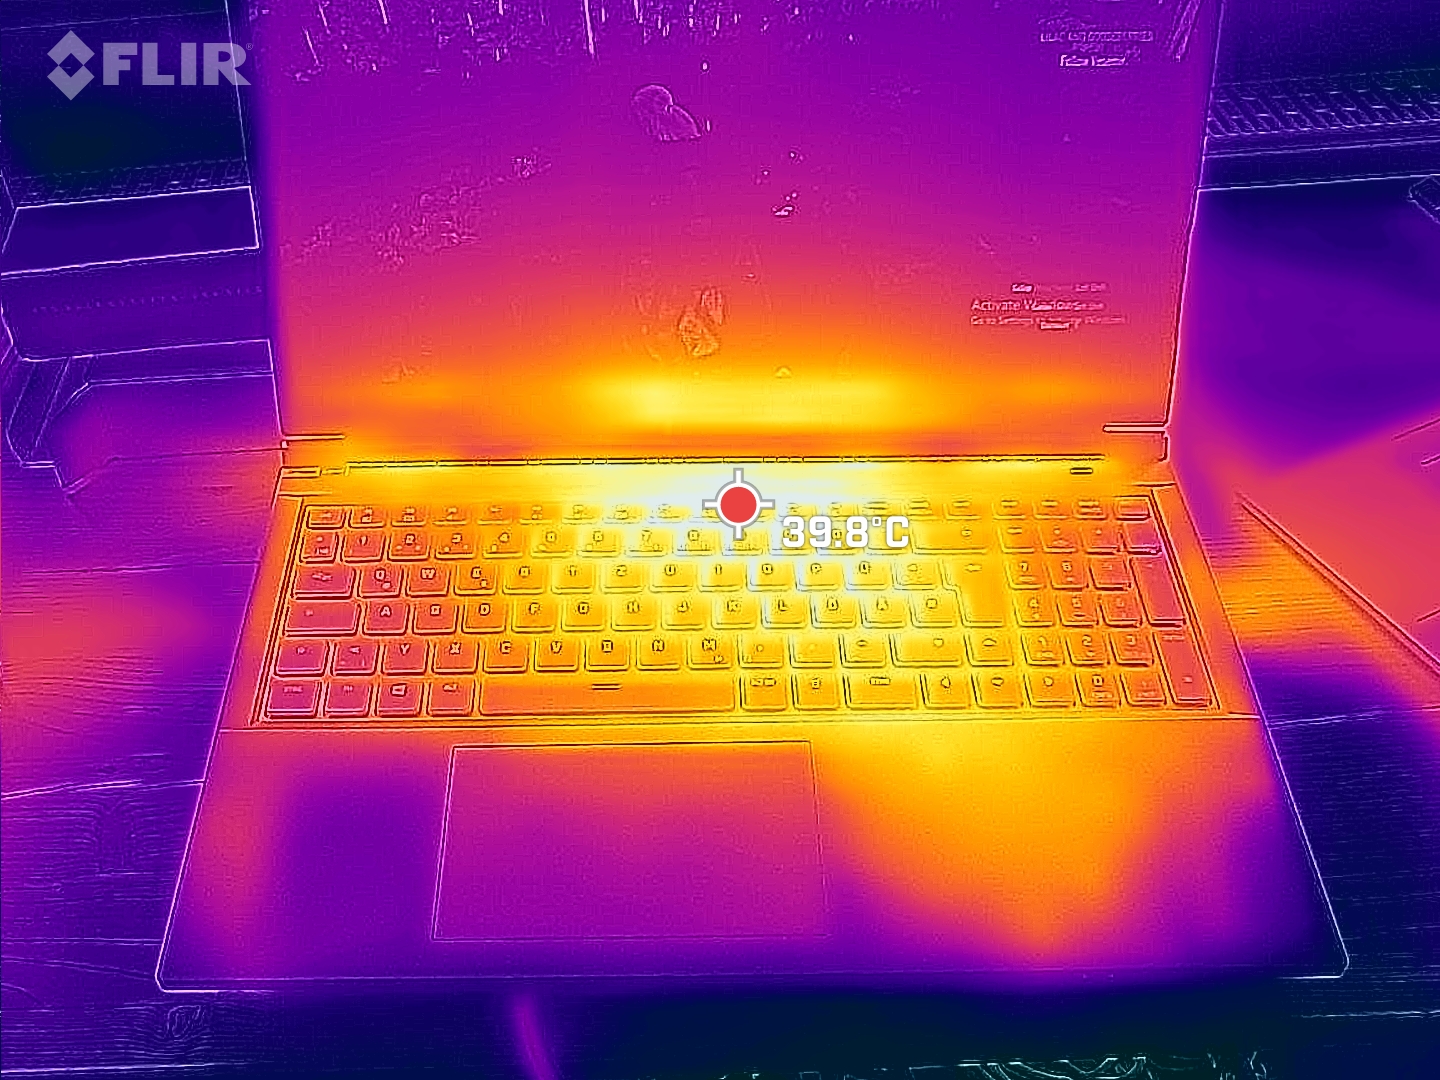
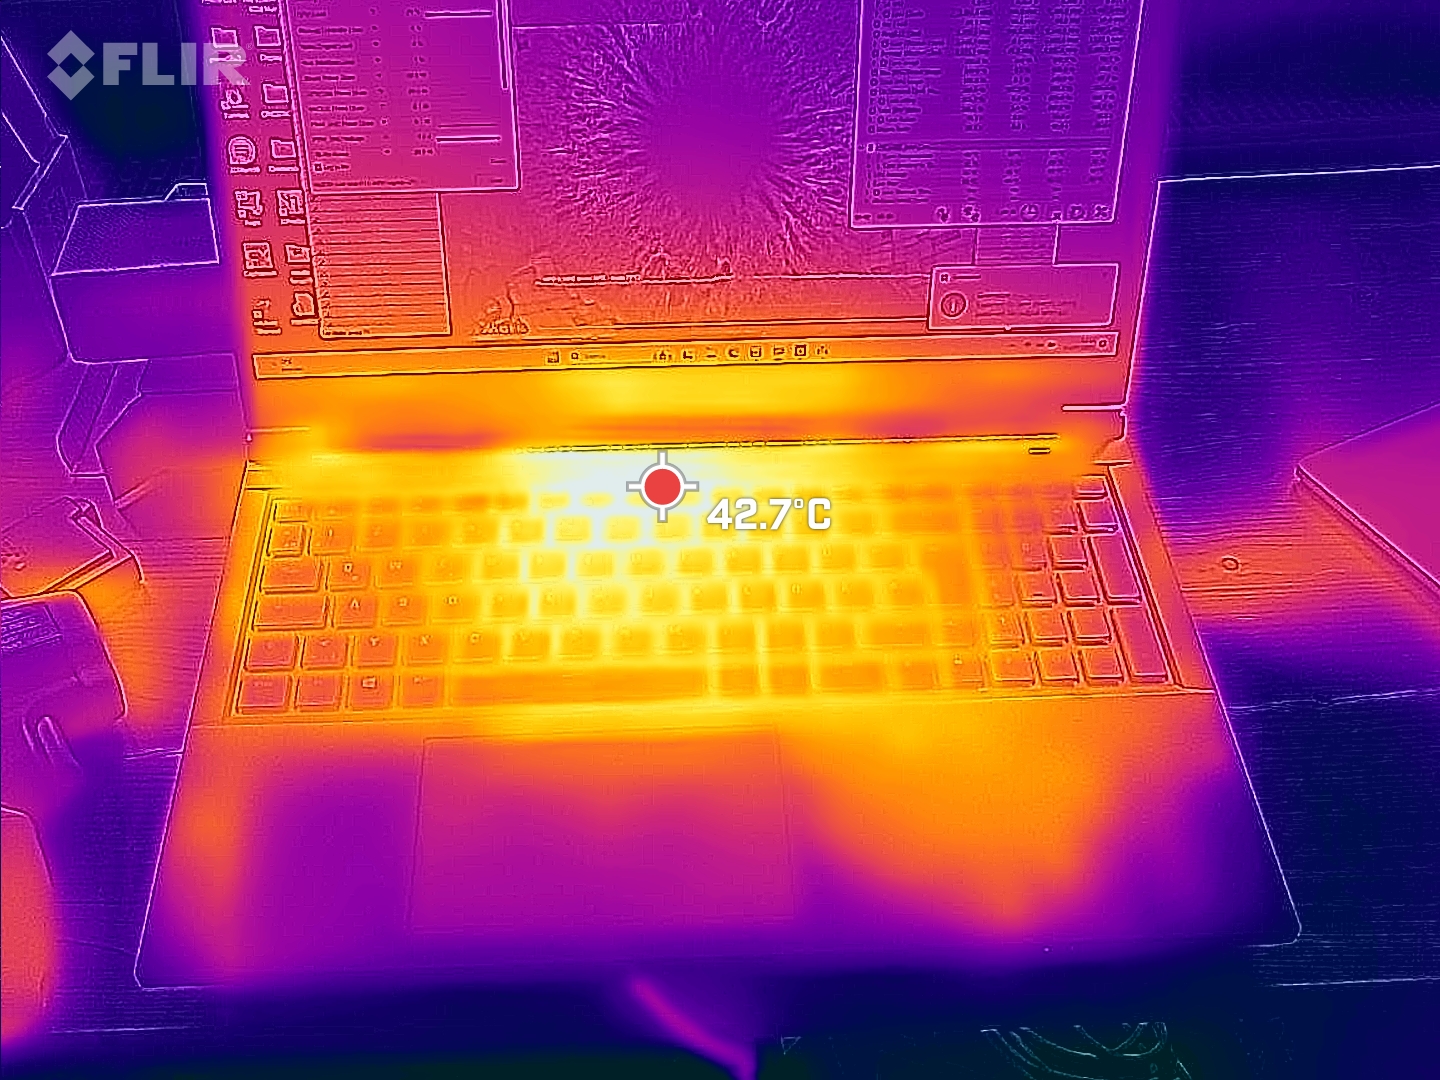
Temperatury powierzchni tego laptopa do gier wcale nie są niskie. Zmierzyliśmy gorące punkty o temperaturze 51 °C, ale na szczęście są one daleko od zwykłych punktów dotykowych.
Laptop nagrzewa się jednak również bardzo mocno na prawej podpórce pod nadgarstki podczas użytkowania. Ponieważ zazwyczaj używasz zewnętrznej myszy do gier, prawdopodobnie nie jest to duży problem dla osób praworęcznych. Lewa podpórka pod nadgarstki i klawisze W, A, S, D pozostają chłodne.
Nawet dłuższe obciążenie zainstalowanego dysku SSD NVMe wydaje się być wystarczające do znacznego wzrostu temperatury podpórki pod nadgarstki. Osiągnęła ona prawie 46 °C, gdy zainstalowaliśmy nasze gry testowe.
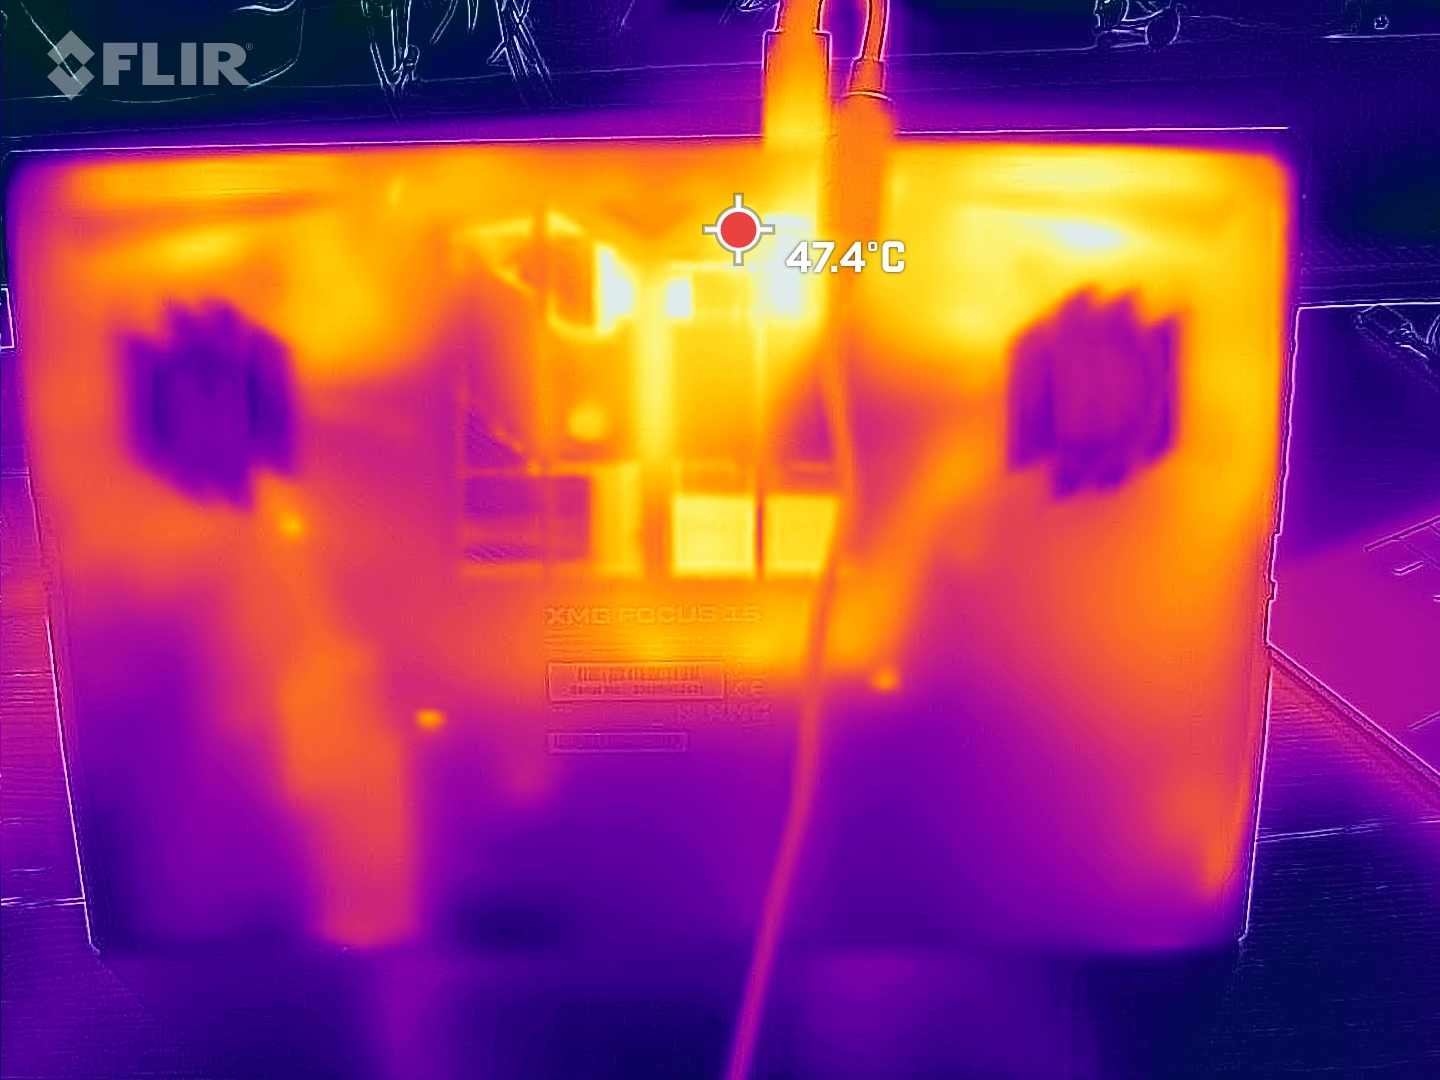
(-) Maksymalna temperatura w górnej części wynosi 51 °C / 124 F, w porównaniu do średniej 40.4 °C / 105 F , począwszy od 21.2 do 68.8 °C dla klasy Gaming.
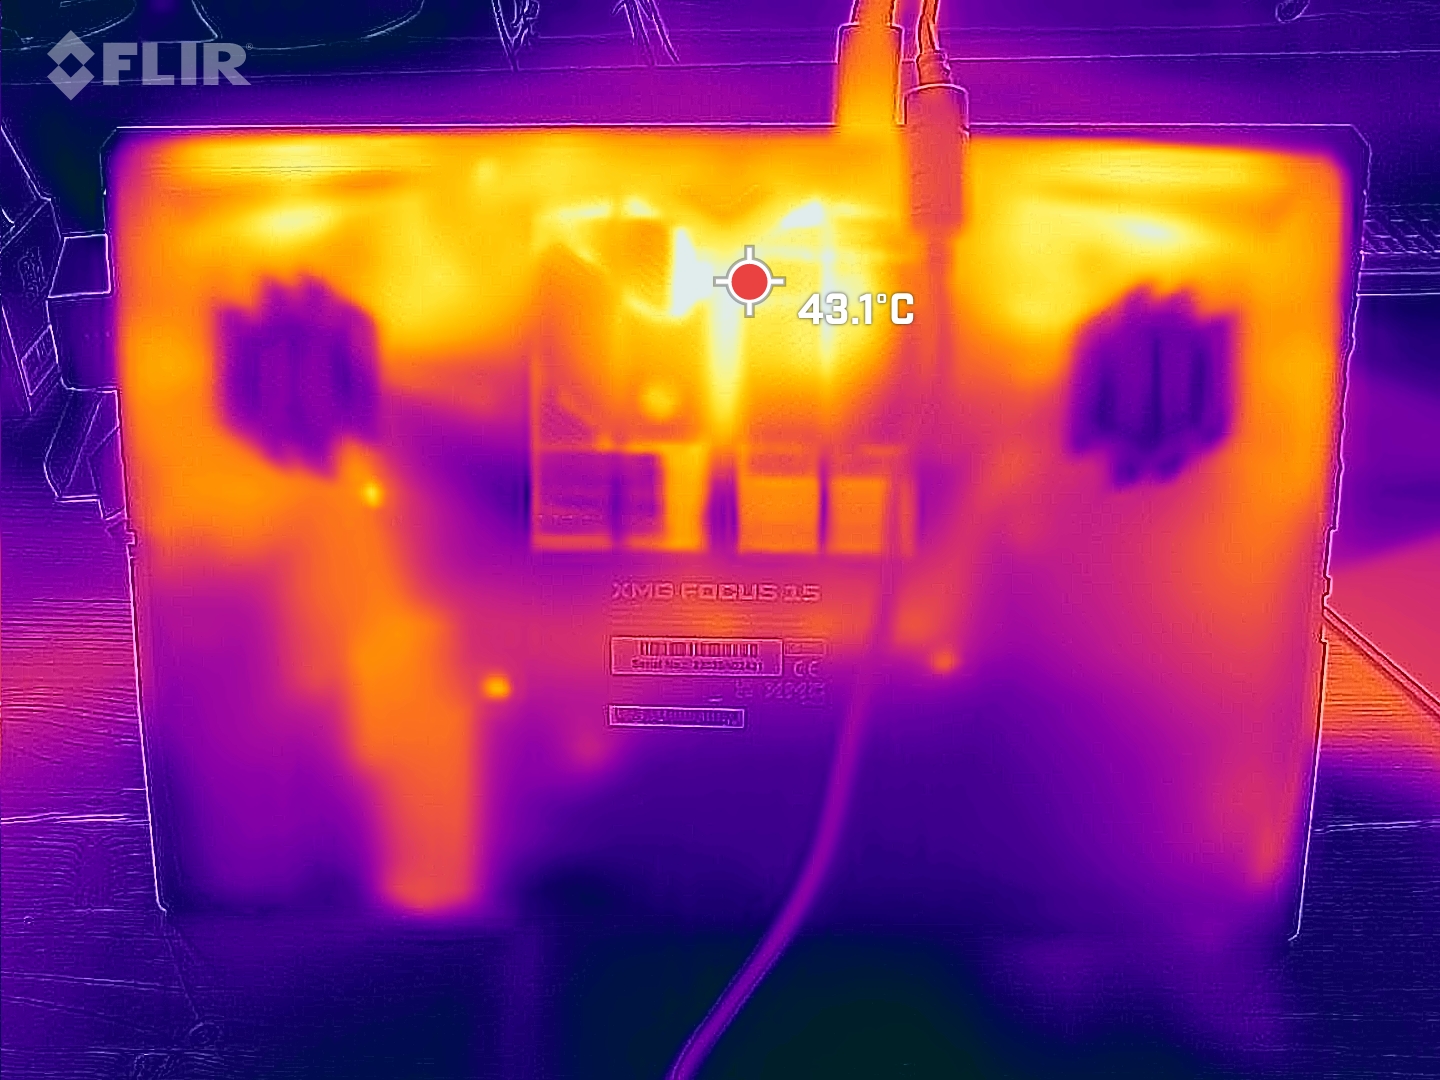
(-) Dno nagrzewa się maksymalnie do 53 °C / 127 F, w porównaniu do średniej 43.2 °C / 110 F
(+) W stanie bezczynności średnia temperatura górnej części wynosi 25.8 °C / 78 F, w porównaniu ze średnią temperaturą urządzenia wynoszącą 33.9 °C / ### class_avg_f### F.
(±) Podczas gry w Wiedźmina 3 średnia temperatura górnej części wynosi 36.2 °C / 97 F, w porównaniu do średniej temperatury urządzenia wynoszącej 33.9 °C / ## #class_avg_f### F.
(±) Podpórki pod nadgarstki i touchpad mogą się bardzo nagrzać w dotyku, maksymalnie do 36 °C / 96.8 F.
(-) Średnia temperatura obszaru podparcia dłoni w podobnych urządzeniach wynosiła 28.8 °C / 83.8 F (-7.2 °C / -13 F).
| Schenker XMG Focus 15 (E23) Intel Core i9-13900HX, NVIDIA GeForce RTX 4050 Laptop GPU | Schenker XMG Pro 15 (E23) Intel Core i9-13900HX, NVIDIA GeForce RTX 4060 Laptop GPU | Asus TUF A15 FA507 AMD Ryzen 7 7735HS, NVIDIA GeForce RTX 4050 Laptop GPU | MSI Katana 15 B12VEK Intel Core i7-12650H, NVIDIA GeForce RTX 4050 Laptop GPU | Acer Swift X SFX14-71G Intel Core i7-13700H, NVIDIA GeForce RTX 4050 Laptop GPU | Samsung Galaxy Book3 Ultra 16 Intel Core i7-13700H, NVIDIA GeForce RTX 4050 Laptop GPU | Gigabyte Aero 14 OLED BMF Intel Core i7-13700H, NVIDIA GeForce RTX 4050 Laptop GPU | |
|---|---|---|---|---|---|---|---|
| Heat | -3% | 9% | -8% | 9% | 18% | 10% | |
| Maximum Upper Side * (°C) | 51 | 50 2% | 48.9 4% | 47 8% | 46.4 9% | 41 20% | 42 18% |
| Maximum Bottom * (°C) | 53 | 50 6% | 44.6 16% | 48 9% | 49 8% | 44 17% | 52 2% |
| Idle Upper Side * (°C) | 29 | 33 -14% | 27.1 7% | 35 -21% | 26.5 9% | 23 21% | 26 10% |
| Idle Bottom * (°C) | 30 | 32 -7% | 27.5 8% | 38 -27% | 26.6 11% | 26 13% | 27 10% |
* ... im mniej tym lepiej
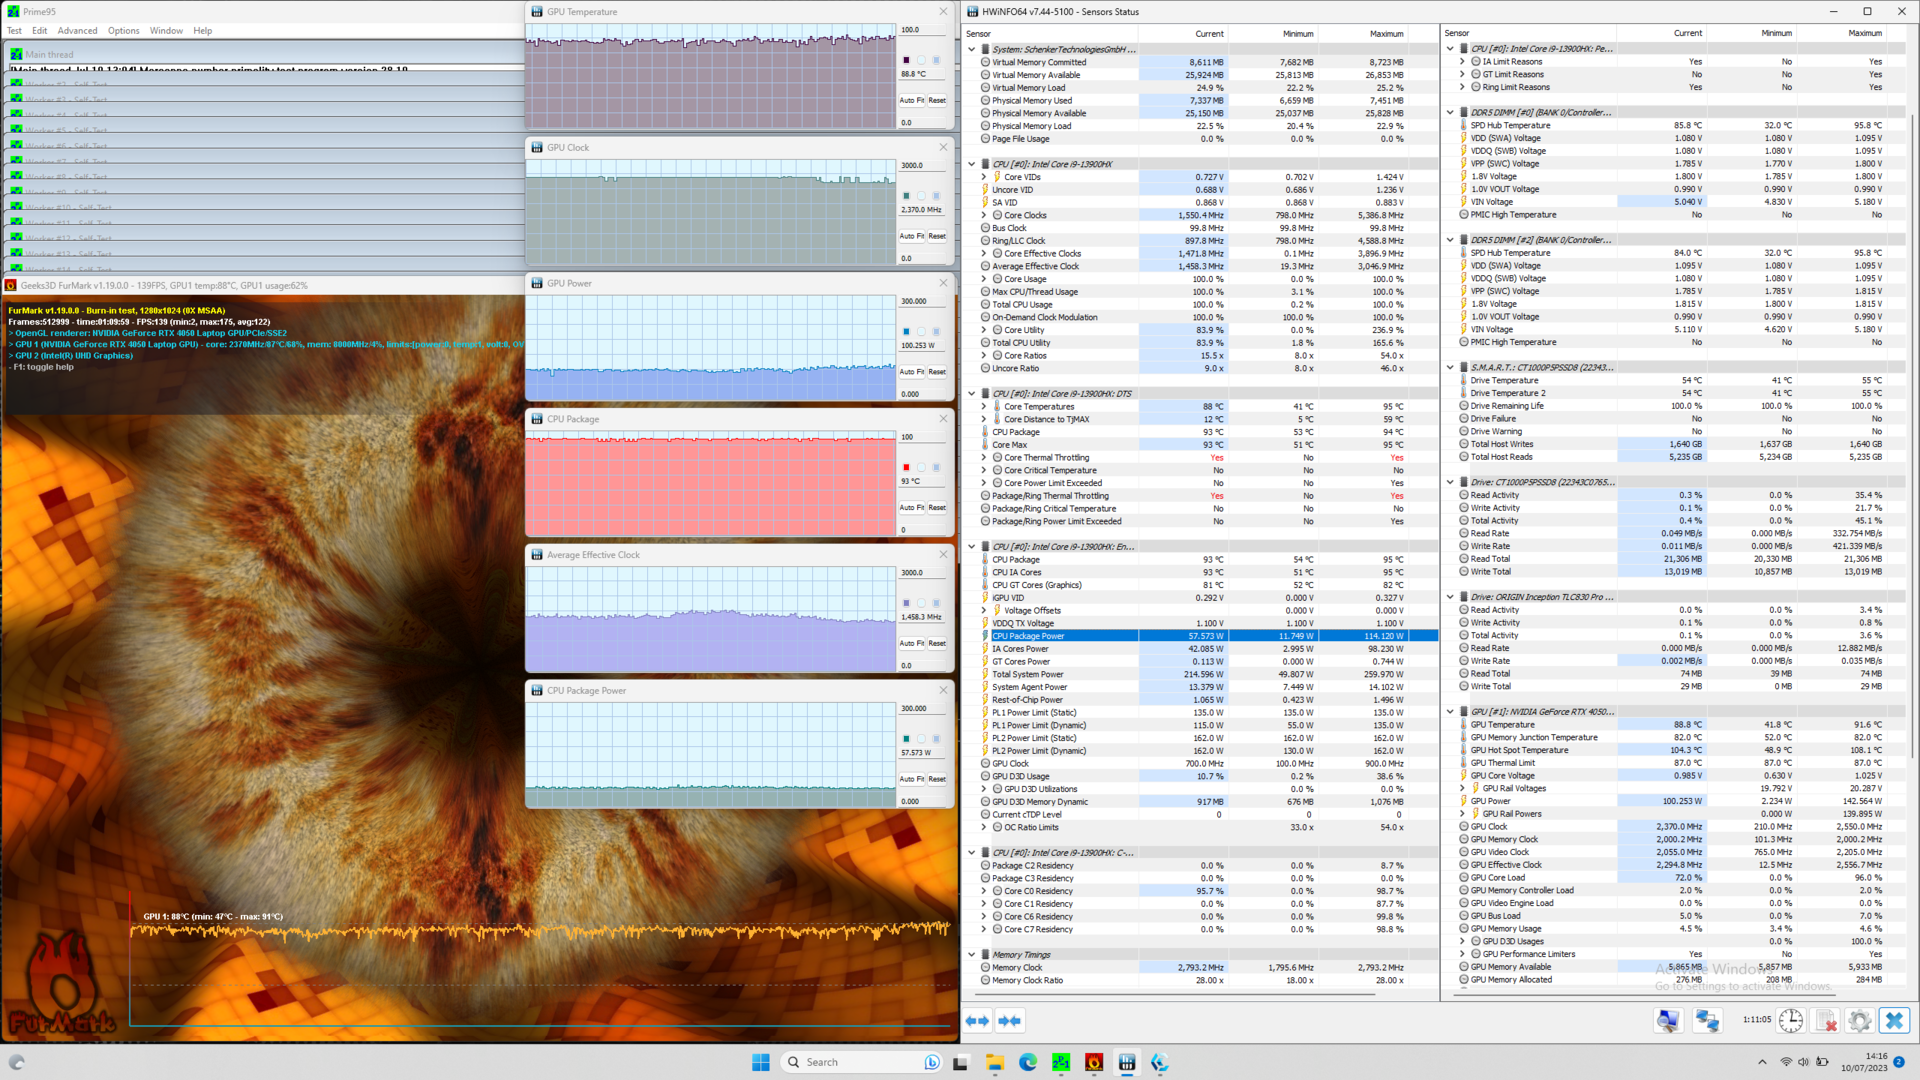
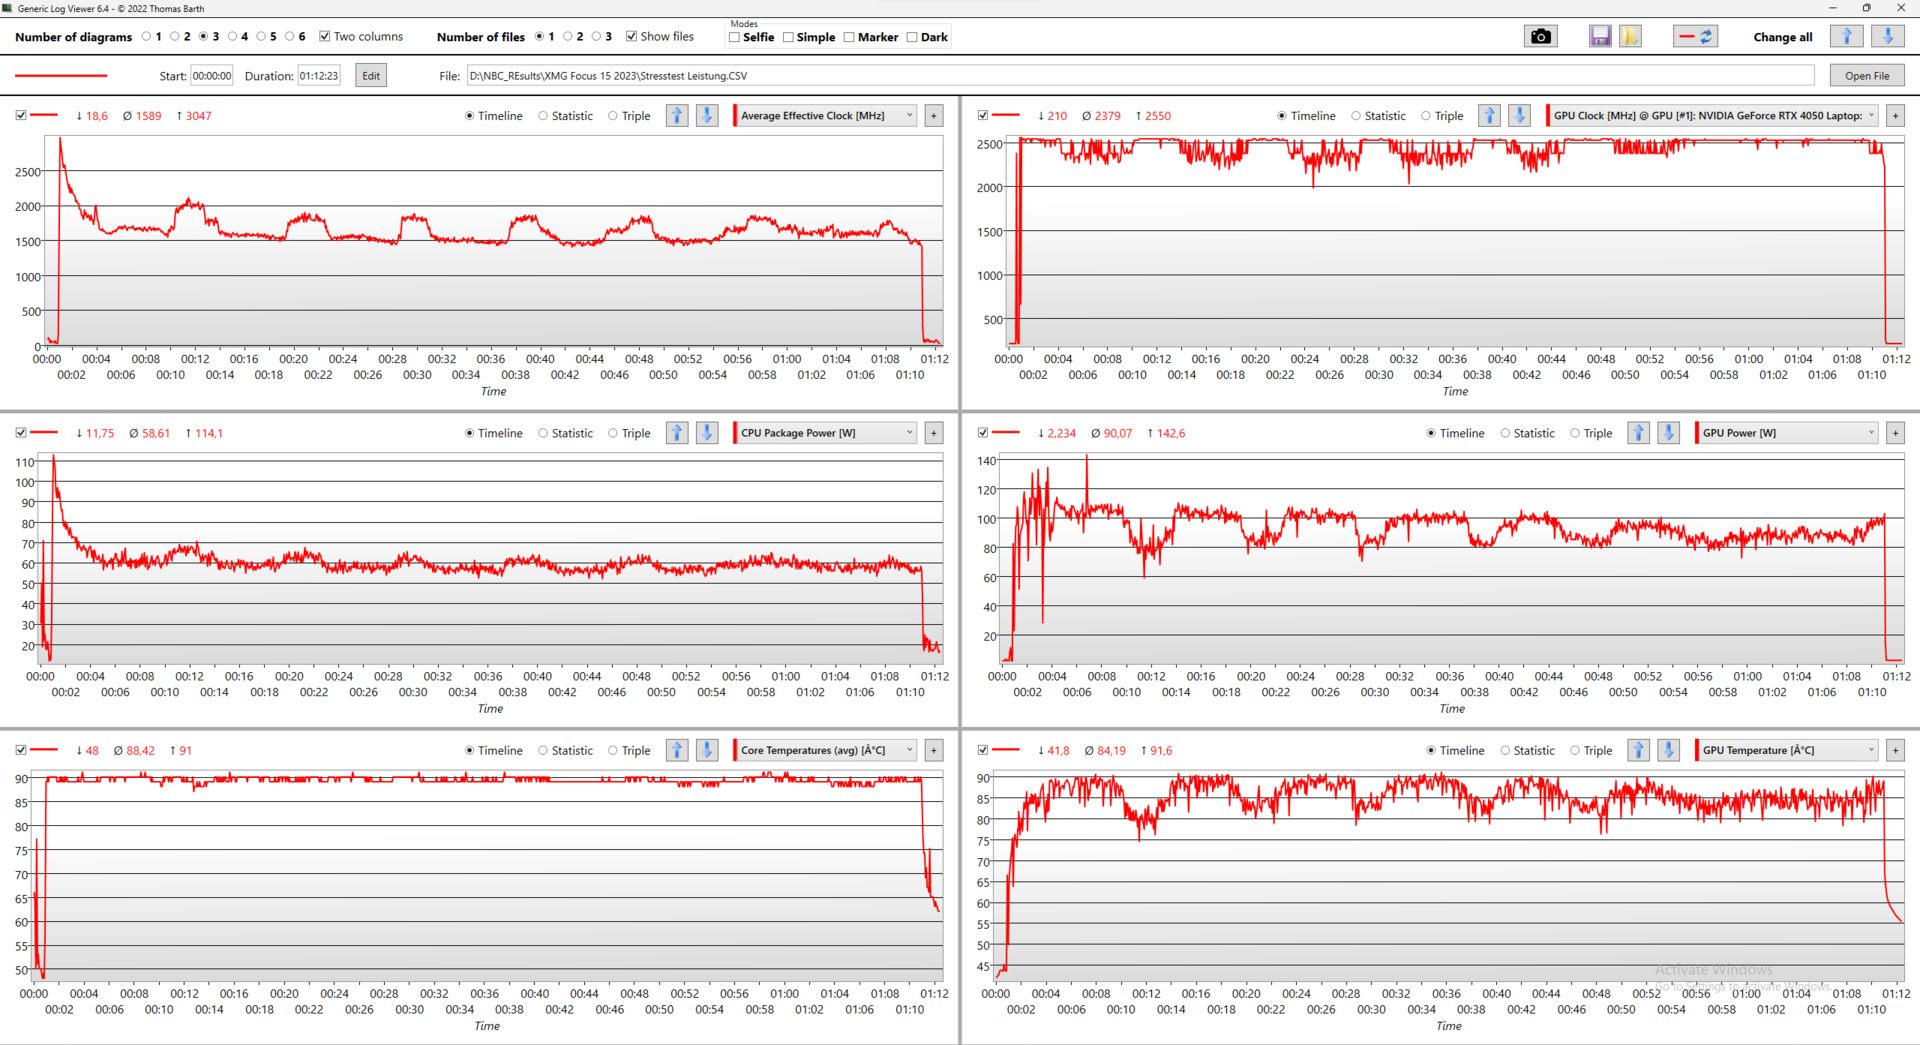
Test warunków skrajnych
XMG Focus 15 przetrwał test obciążeniowy z Prime95 i Furmark w wysokich temperaturach ze stałą wydajnością. Nie udało nam się stwierdzić spadku taktowania CPU lub GPU po fazie boost.
W zamian temperatury Core i9 są stosunkowo wysokie i wynoszą około 90 °C. Jednak patrząc na logi z testu obciążeniowego, musimy zauważyć, że wartości podane przez Schenkera nie są utrzymywane na dłuższą metę.
Po około 10 minutach testu obciążeniowego, wydajność CPU oscyluje wokół 60 W, a pobór mocy GPU na poziomie 100 W. W międzyczasie, 15 W Dynamic Boost jest co jakiś czas przełączany pomiędzy procesorem a układem graficznym.
Głośnik
Głośniki w Focus 15 prezentują średnie i wysokie tony stosunkowo dobrze, ale nie są w stanie zapewnić żadnego basu. Tym samym Focus 15 brzmi nieco lepiej niż Pro 15.
Jeśli wbudowane głośniki wydają się niewystarczające, zawsze można skorzystać z zewnętrznych urządzeń podłączonych przez Bluetooth lub gniazdo 3,5 mm.
Schenker XMG Focus 15 (E23) analiza dźwięku
(±) | głośność głośnika jest średnia, ale dobra (77.39 dB)
Bas 100 - 315 Hz
(-) | prawie brak basu - średnio 29% niższa od mediany
(±) | liniowość basu jest średnia (9.5% delta do poprzedniej częstotliwości)
Średnie 400 - 2000 Hz
(±) | wyższe średnie - średnio 5.2% wyższe niż mediana
(±) | liniowość środka jest średnia (7.2% delta do poprzedniej częstotliwości)
Wysokie 2–16 kHz
(±) | wyższe maksima - średnio 5.4% wyższe od mediany
(+) | wzloty są liniowe (3.4% delta do poprzedniej częstotliwości)
Ogólnie 100 - 16.000 Hz
(±) | liniowość ogólnego dźwięku jest średnia (24.9% różnicy w stosunku do mediany)
W porównaniu do tej samej klasy
» 89% wszystkich testowanych urządzeń w tej klasie było lepszych, 3% podobnych, 7% gorszych
» Najlepszy miał deltę 6%, średnia wynosiła ###średnia###%, najgorsza wynosiła 132%
W porównaniu do wszystkich testowanych urządzeń
» 76% wszystkich testowanych urządzeń było lepszych, 5% podobnych, 19% gorszych
» Najlepszy miał deltę 4%, średnia wynosiła ###średnia###%, najgorsza wynosiła 134%
Schenker XMG Pro 15 (E23) analiza dźwięku
(±) | głośność głośnika jest średnia, ale dobra (72.52 dB)
Bas 100 - 315 Hz
(±) | zredukowany bas - średnio 12.9% niższy od mediany
(±) | liniowość basu jest średnia (7.2% delta do poprzedniej częstotliwości)
Średnie 400 - 2000 Hz
(±) | wyższe średnie - średnio 6.2% wyższe niż mediana
(±) | liniowość środka jest średnia (7.8% delta do poprzedniej częstotliwości)
Wysokie 2–16 kHz
(+) | zrównoważone maksima - tylko 2.5% od mediany
(+) | wzloty są liniowe (4.6% delta do poprzedniej częstotliwości)
Ogólnie 100 - 16.000 Hz
(±) | liniowość ogólnego dźwięku jest średnia (18% różnicy w stosunku do mediany)
W porównaniu do tej samej klasy
» 56% wszystkich testowanych urządzeń w tej klasie było lepszych, 9% podobnych, 36% gorszych
» Najlepszy miał deltę 6%, średnia wynosiła ###średnia###%, najgorsza wynosiła 132%
W porównaniu do wszystkich testowanych urządzeń
» 38% wszystkich testowanych urządzeń było lepszych, 8% podobnych, 54% gorszych
» Najlepszy miał deltę 4%, średnia wynosiła ###średnia###%, najgorsza wynosiła 134%
Zarządzanie energią: Energochłonny laptop do gier
Zużycie energii
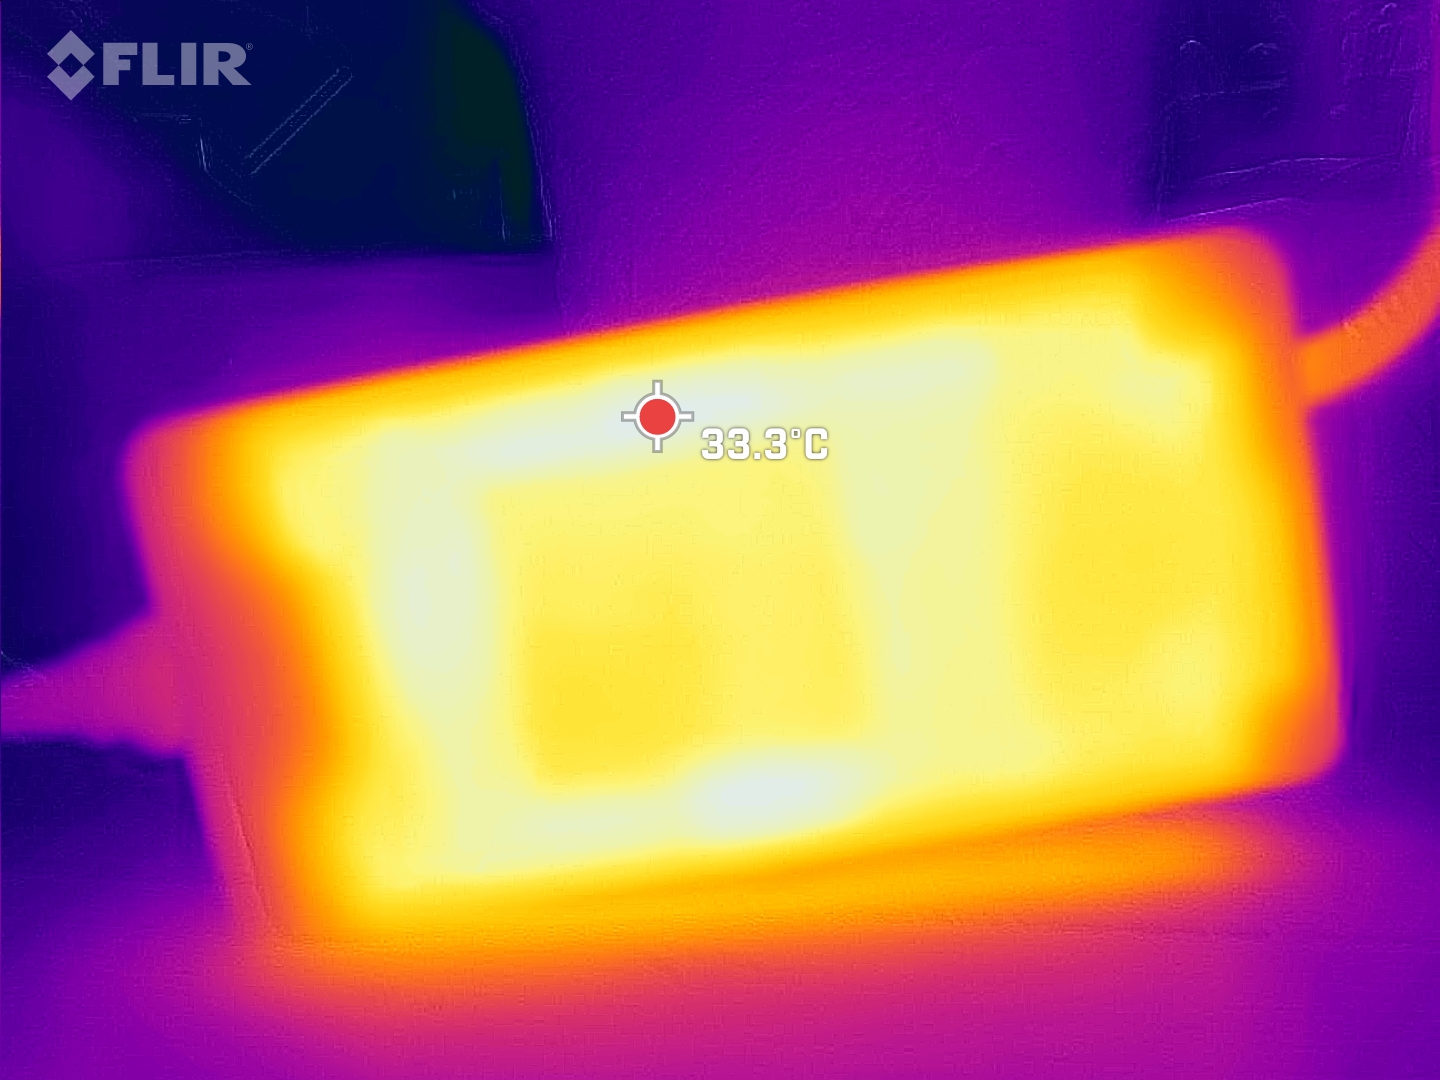
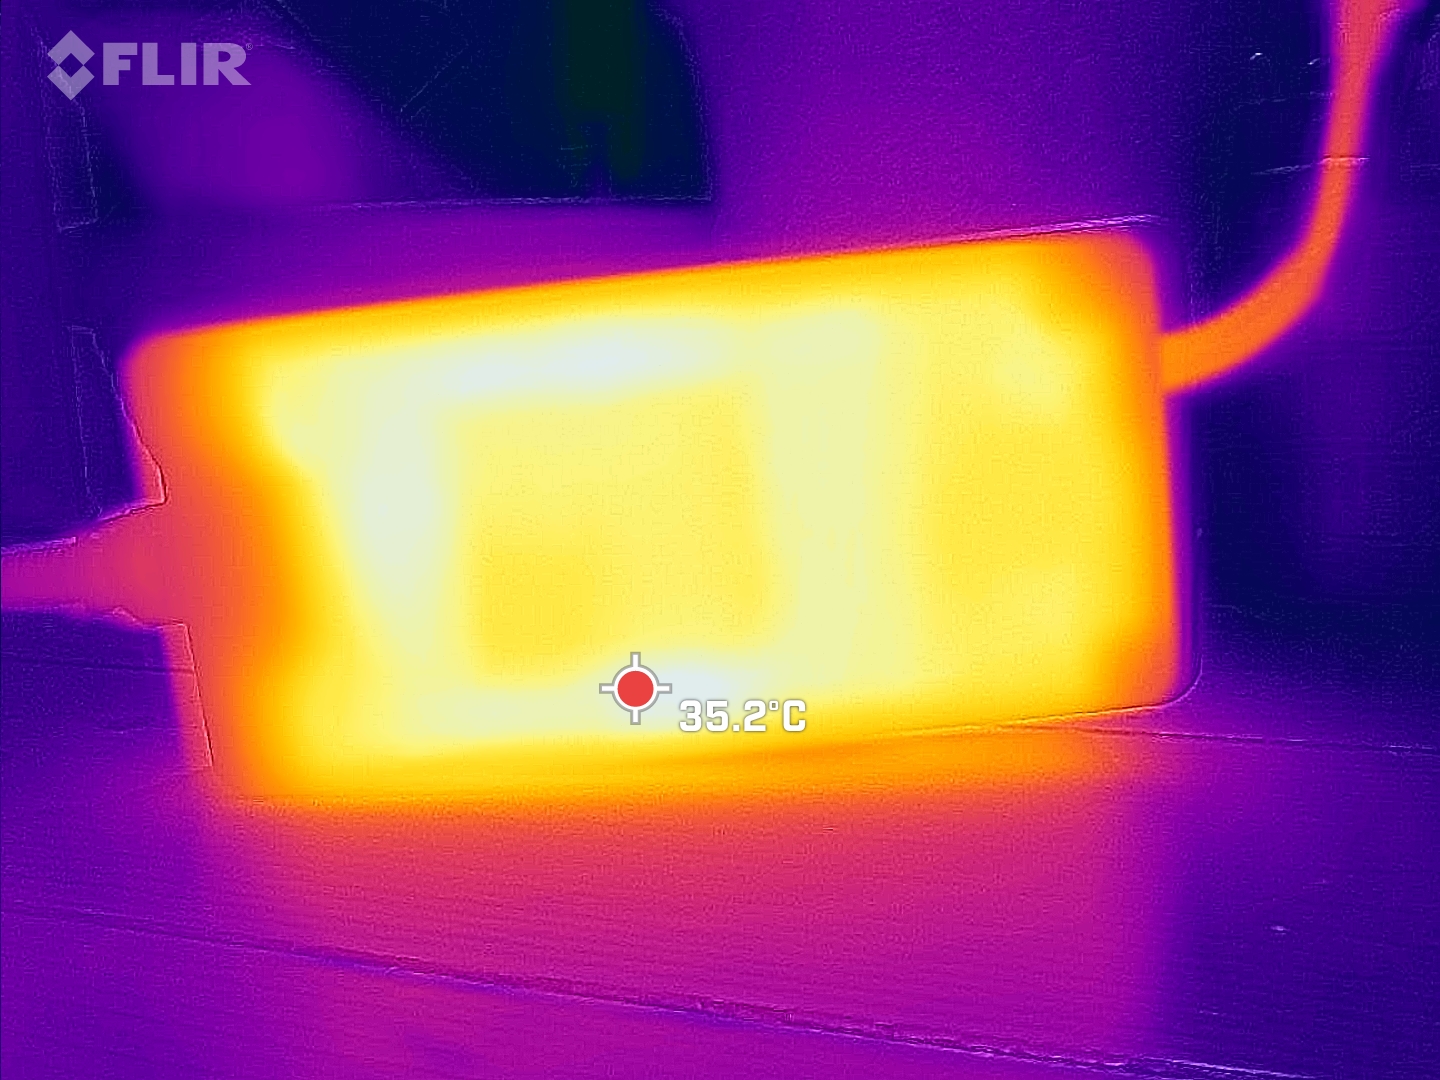
Schenker XMG Focus 15 jest wyposażony w standardowy głód energii. W zestawie znajduje się duży zasilacz, który może dostarczyć do 280 W.
Co ciekawe, szczytowy pobór mocy jest wyższy w Focusie 15 niż w Pro 15, więc moc zasilacza jest również w pełni wykorzystywana.
Podczas pracy na zewnętrznym monitorze laptop jest nawet stabilny powyżej 280 W w teście warunków skrajnych. Z monitorem wewnętrznym zużycie energii spadło nieco w krótkim czasie.
| wyłączony / stan wstrzymania | |
| luz | |
| obciążenie |
|
Legenda:
min: | |
| Schenker XMG Focus 15 (E23) i9-13900HX, GeForce RTX 4050 Laptop GPU, Crucial P5 Plus 1TB CT1000P5PSSD8, IPS, 2569x1440, 15.6" | Schenker XMG Pro 15 (E23) i9-13900HX, GeForce RTX 4060 Laptop GPU, Crucial P5 Plus 1TB CT1000P5PSSD8, IPS, 2560x1440, 15.6" | Asus TUF A15 FA507 R7 7735HS, GeForce RTX 4050 Laptop GPU, Micron 2400 MTFDKBA512QFM, IPS, 1920x1080, 15.6" | MSI Katana 15 B12VEK i7-12650H, GeForce RTX 4050 Laptop GPU, Micron 2400 MTFDKBA1T0QFM, IPS, 1920x1080, 15.6" | Acer Swift X SFX14-71G i7-13700H, GeForce RTX 4050 Laptop GPU, Samsung PM9A1 MZVL21T0HCLR, OLED, 2880x1800, 14.5" | Samsung Galaxy Book3 Ultra 16 i7-13700H, GeForce RTX 4050 Laptop GPU, Samsung PM9A1 MZVL2512HCJQ, AMOLED, 2880x1800, 16" | Gigabyte Aero 14 OLED BMF i7-13700H, GeForce RTX 4050 Laptop GPU, Gigabyte AG470S1TB-SI B10, OLED, 2880x1800, 14" | Przeciętny NVIDIA GeForce RTX 4050 Laptop GPU | Średnia w klasie Gaming | |
|---|---|---|---|---|---|---|---|---|---|
| Power Consumption | -39% | 40% | 41% | 47% | 64% | 54% | 23% | 1% | |
| Idle Minimum * (Watt) | 11.4 | 21.6 -89% | 8 30% | 8.5 25% | 8.4 26% | 3 74% | 7.4 35% | 9.95 ? 13% | 13 ? -14% |
| Idle Average * (Watt) | 16.7 | 29 -74% | 12.1 28% | 10.2 39% | 11.5 31% | 5 70% | 8.3 50% | 15.8 ? 5% | 19 ? -14% |
| Idle Maximum * (Watt) | 25.8 | 42.7 -66% | 12.5 52% | 11.3 56% | 11.9 54% | 11 57% | 8.7 66% | 20.1 ? 22% | 24.6 ? 5% |
| Load Average * (Watt) | 139 | 190 -37% | 74.9 46% | 84 40% | 84.9 39% | 72 48% | 76 45% | 88 ? 37% | 110.7 ? 20% |
| Witcher 3 ultra * (Watt) | 265 | 189 29% | 136.6 48% | 128 52% | 83.6 68% | 69.7 74% | 70 74% | ||
| Load Maximum * (Watt) | 280 | 269 4% | 185 34% | 189 32% | 104.2 63% | 108 61% | 132 53% | 176.3 ? 37% | 259 ? 7% |
* ... im mniej tym lepiej
Power consumption: The Witcher 3 / Stress test
Power consumption: External Monitor
Żywotność baterii
W praktycznym teście surfowania po sieci Wi-Fi ustaliliśmy prawie sześć godzin czasu pracy. Tym samym testowane urządzenie jest tylko dwie minuty poniżej przeciętnego laptopa do gier.
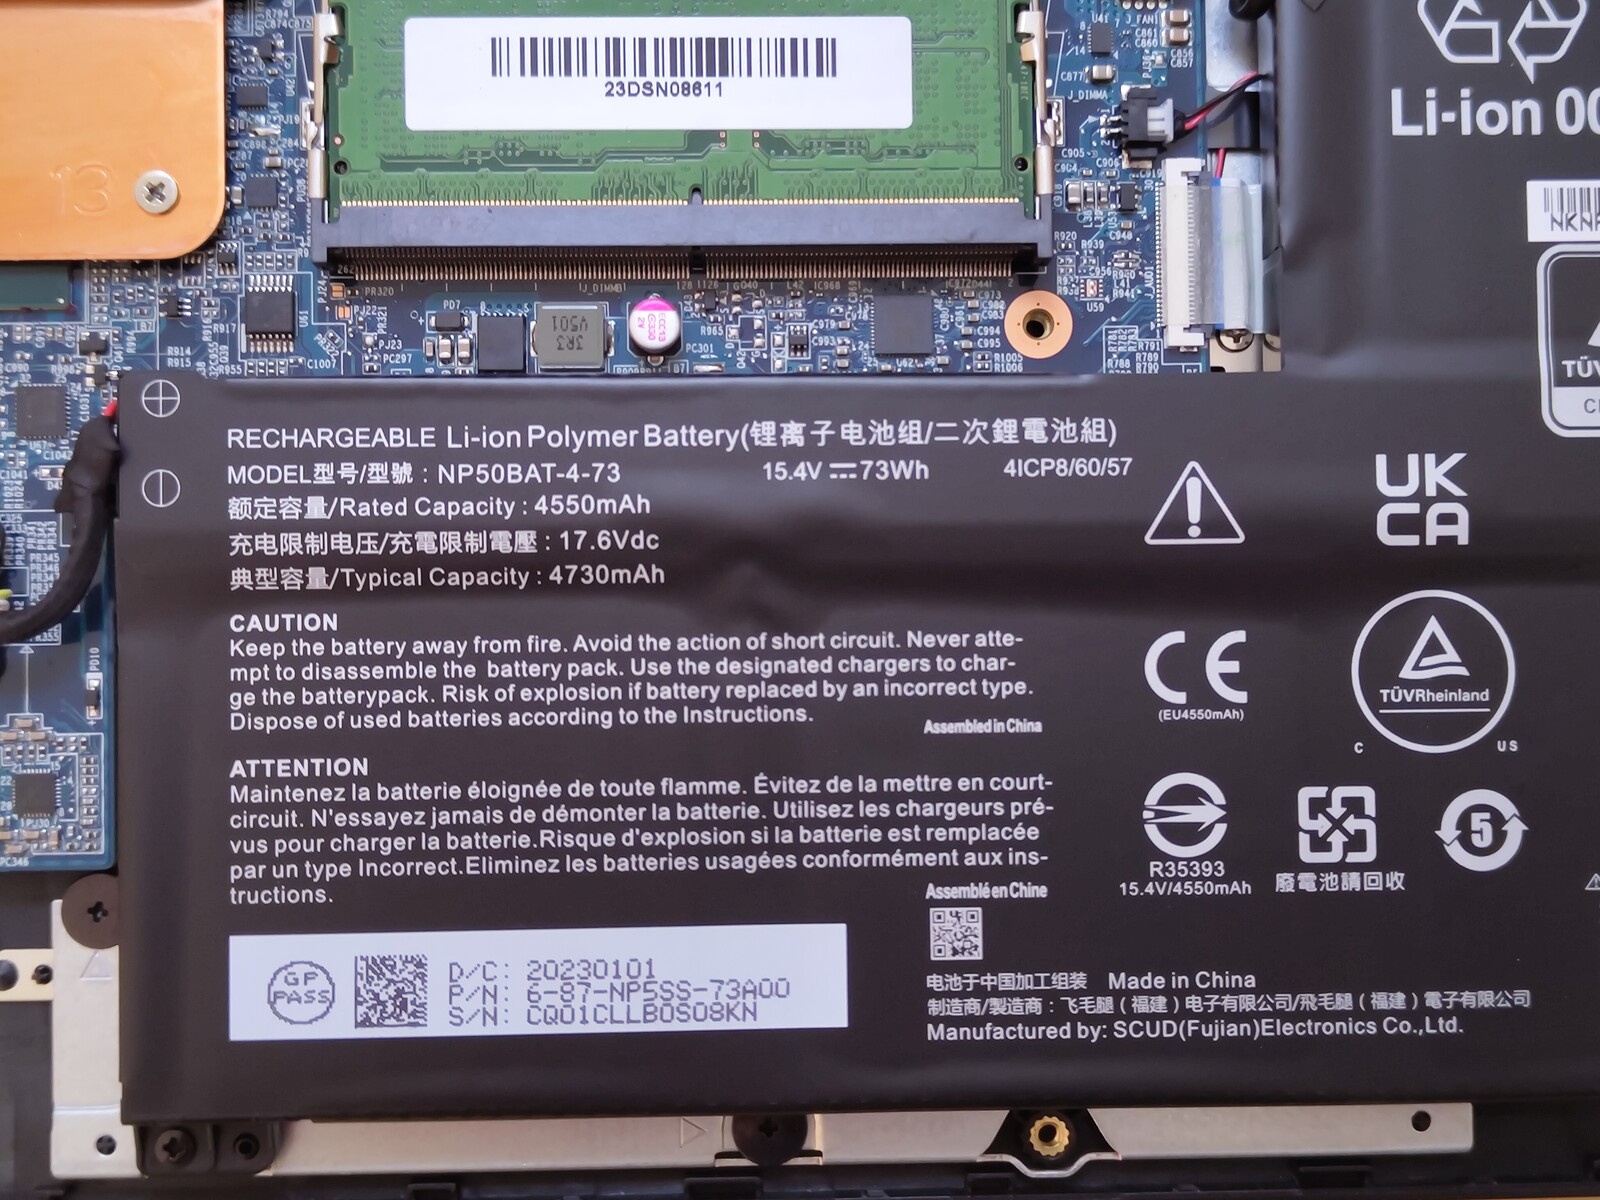
Tymczasem gracze mogą zarządzać znacznie dłuższymi czasami pracy w trybie bateryjnym. Bateria o pojemności 73 Wh wyczerpuje się jednak dość szybko.
| Schenker XMG Focus 15 (E23) i9-13900HX, GeForce RTX 4050 Laptop GPU, 73 Wh | Schenker XMG Pro 15 (E23) i9-13900HX, GeForce RTX 4060 Laptop GPU, 80 Wh | Asus TUF A15 FA507 R7 7735HS, GeForce RTX 4050 Laptop GPU, 90 Wh | MSI Katana 15 B12VEK i7-12650H, GeForce RTX 4050 Laptop GPU, 53.5 Wh | Acer Swift X SFX14-71G i7-13700H, GeForce RTX 4050 Laptop GPU, 76 Wh | Samsung Galaxy Book3 Ultra 16 i7-13700H, GeForce RTX 4050 Laptop GPU, 76 Wh | Gigabyte Aero 14 OLED BMF i7-13700H, GeForce RTX 4050 Laptop GPU, 63 Wh | Średnia w klasie Gaming | |
|---|---|---|---|---|---|---|---|---|
| Czasy pracy | 22% | 38% | -6% | -8% | 51% | 22% | 19% | |
| WiFi v1.3 (h) | 5.9 | 5.7 -3% | 11.7 98% | 4.3 -27% | 7.7 31% | 9.6 63% | 7.6 29% | 7.11 ? 21% |
| Load (h) | 1.3 | 1.9 46% | 1 -23% | 1.5 15% | 0.7 -46% | 1.8 38% | 1.5 15% | 1.502 ? 16% |
| H.264 (h) | 12.5 | 4.4 | 9.5 | 13.4 | 8.32 ? | |||
| Reader / Idle (h) | 18.2 | 11.3 | 8.27 ? |
Za
Przeciw
Werdykt: XMG oddaje istotę gier
Jeśli potrzebujesz 15,6-calowego laptopa z aktualnym procesorem graficznym Nvidia od Schenker lub XMG, masz do wyboruXMG Apex 15 Max i Focus, a także Schenker Key i Media. XMG XMG Pro 15 i XMG Focus 15 są bardzo blisko siebie w teście.
Focus 15 koncentruje się na podstawach. Laptop do gier przekonuje głównie wydajnym sprzętem obliczeniowym. ProcesorIntel Core i9-13900HX oraz Nvidia GeForce RTX 4050 pracują na bardzo wysokim poziomie wydajności. Chociaż skutkuje to wysokimi wynikami w testach porównawczych, przyczynia się również do wysokich temperatur powierzchni, głośniejszych wentylatorów i krótszych czasów pracy na baterii w porównaniu do wielu współczesnych modeli, takich jak Asus TUF A15.
To, czy obudowa musi być wykonana z dużej ilości metalu, jak w Pro 15, czy też może być wykonana z tworzywa sztucznego, jest kwestią gustu. Z zewnątrz Pro 15 i Focus 15 wyglądają bardzo podobnie. Jednak próbka testowa oferuje mniej łączności i nie ma portu USB typu C z funkcją Power Delivery.
XMG Focus 15 spełnia podstawowe wymagania laptopa do gier. Dzięki wielu opcjom konfiguracyjnym można go dostosować do potrzeb użytkownika.
Podobnie jak w przypadku Pro 15, w Focusie 15 można znaleźć tylko kilka negatywnych punktów. Wynika to z faktu, że wszystkie wady, które laptop wykazuje, są typowe dla jego klasy cenowej i wydajnościowej.
W porównaniu z innymi tańszymi laptopami do gier, takimi jak Asus TUF A15 lub MSI Katana 15, niezwykle wydajny Core i9-13900HX i dobry ekran QHD XMG Focus wyróżniają się pozytywnie.
Cena i dostępność
XMG Focus 15 można dowolnie konfigurować w Bestware. Dostępne są dwie opcje wyświetlania, trzy opcje GPU i kilka kombinacji pamięci. W absolutnie podstawowej konfiguracji, z zaledwie 8 GB pamięci roboczej i bez dysku SSD lub systemu Windows, cena podstawowa wynosi około 1440 euro (~1618 USD).
W przypadku konfiguracji z wyświetlaczem Full HD, 16 GB pamięci roboczej i dyskiem SSD Samsung o pojemności 1 TB, Bestware pobiera około 1560 euro. Nasza konfiguracja testowa kosztuje około 300 euro więcej. Jeśli planujesz pójść na całość i wybrać najdroższe komponenty, spodziewaj się wydać ponad 3500 euro za tego laptopa.
Schenker XMG Focus 15 (E23)
- 10/07/2023 v7 (old)
Marc Herter
Przezroczystość
Wyboru urządzeń do recenzji dokonuje nasza redakcja. Próbka testowa została udostępniona autorowi jako pożyczka od producenta lub sprzedawcy detalicznego na potrzeby tej recenzji. Pożyczkodawca nie miał wpływu na tę recenzję, producent nie otrzymał też kopii tej recenzji przed publikacją. Nie było obowiązku publikowania tej recenzji. Jako niezależna firma medialna, Notebookcheck nie podlega władzy producentów, sprzedawców detalicznych ani wydawców.
Tak testuje Notebookcheck
Każdego roku Notebookcheck niezależnie sprawdza setki laptopów i smartfonów, stosując standardowe procedury, aby zapewnić porównywalność wszystkich wyników. Od około 20 lat stale rozwijamy nasze metody badawcze, ustanawiając przy tym standardy branżowe. W naszych laboratoriach testowych doświadczeni technicy i redaktorzy korzystają z wysokiej jakości sprzętu pomiarowego. Testy te obejmują wieloetapowy proces walidacji. Nasz kompleksowy system ocen opiera się na setkach uzasadnionych pomiarów i benchmarków, co pozwala zachować obiektywizm.Price comparison
