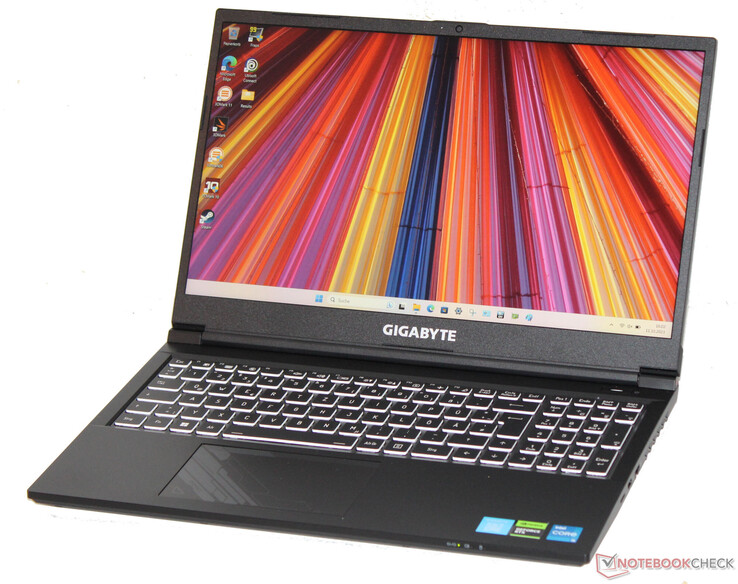
Recenzja Gigabyte G5 KF: Laptop do gier z RTX 4060 za 969 euro
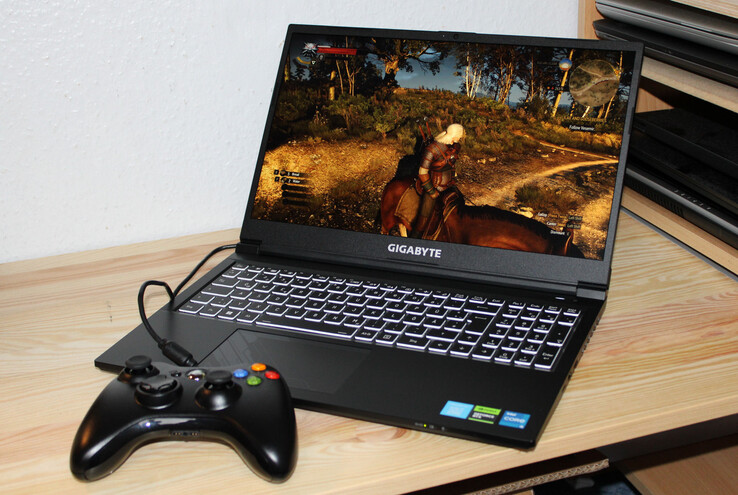
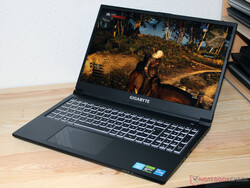
G5 KF to laptop do gier w niższym segmencie cenowym - 15,6-calowe urządzenie kosztuje około 969 euro (1026 USD). Chociaż licencja na system Windows nie jest wliczona w cenę. Laptop Gigabyte konkuruje z takimi modelami jak MSI Cyborg 15 A12VF, Intel NUC X15, Lenovo Legion Slim 5 16APH8orazAsus TUF A15 FA507.
G5 KF jest następcą G5 KE i ma tę samą konstrukcję fizyczną. Mogą więc Państwo zapoznać się z naszej recenzji G5 KE aby uzyskać więcej informacji na temat obudowy, funkcji, urządzeń wejściowych i wyświetlacza.
Potencjalni konkurenci w porównaniu
Ocena | Data | Model | Waga | Wysokość | Rozmiar | Rezolucja | Cena |
|---|---|---|---|---|---|---|---|
| 81.8 % v7 (old) | 10/2023 | Gigabyte G5 KF i5-12500H, GeForce RTX 4060 Laptop GPU | 1.9 kg | 22.7 mm | 15.60" | 1920x1080 | |
| 82.4 % v7 (old) | 04/2023 | MSI Cyborg 15 A12VF i7-12650H, GeForce RTX 4060 Laptop GPU | 2 kg | 22.9 mm | 15.60" | 1920x1080 | |
| 84.4 % v7 (old) | 10/2023 | Intel NUC X15 LAPAC71H i7-12700H, A730M | 2.2 kg | 26.7 mm | 15.60" | 1920x1080 | |
| 86.3 % v7 (old) | 06/2023 | Asus TUF A15 FA507 R7 7735HS, GeForce RTX 4050 Laptop GPU | 2.2 kg | 24.9 mm | 15.60" | 1920x1080 | |
| 87.7 % v7 (old) | 08/2023 | Lenovo Legion Slim 5 16APH8 R7 7840HS, GeForce RTX 4060 Laptop GPU | 2.4 kg | 25.2 mm | 16.00" | 2560x1600 |
| SD Card Reader | |
| average JPG Copy Test (av. of 3 runs) | |
| Średnia w klasie Gaming (20 - 210, n=64, ostatnie 2 lata) | |
| Gigabyte G5 KE (AV PRO microSD 128 GB V60) | |
| Gigabyte G5 KF | |
| Lenovo Legion Slim 5 16APH8 (PNY EliteX-Pro60 V60 256 GB) | |
| maximum AS SSD Seq Read Test (1GB) | |
| Średnia w klasie Gaming (25.5 - 261, n=61, ostatnie 2 lata) | |
| Gigabyte G5 KE (AV PRO microSD 128 GB V60) | |
| Gigabyte G5 KF | |
| Lenovo Legion Slim 5 16APH8 (PNY EliteX-Pro60 V60 256 GB) | |
Wyświetlacz - panel FHD 144 Hz
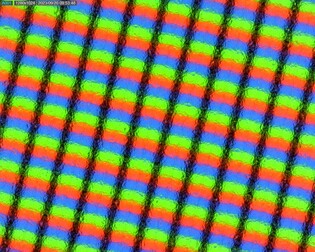
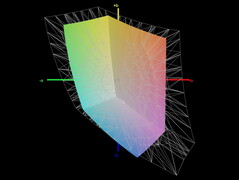
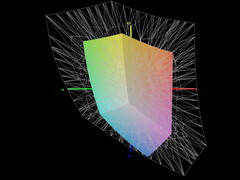
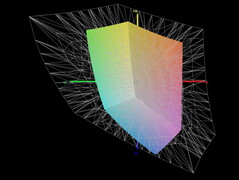
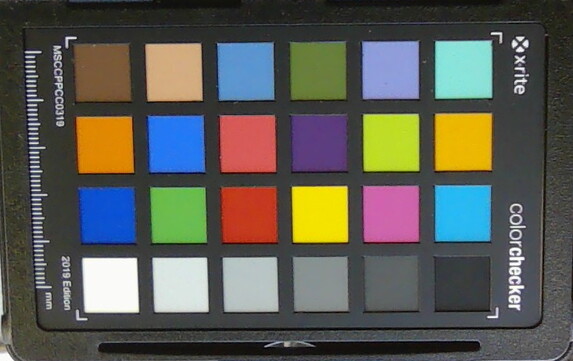
Matowy wyświetlacz FHD (wyprodukowany przez Chi Mei) został przeniesiony z G5 KE. Choć ma dobre kąty widzenia, panel IPS 144 Hz nie spełnia standardów, jeśli chodzi o jasność i kontrast. Wyświetlacz nie jest w stanie odtworzyć typowych przestrzeni kolorów (sRGB, AdobeRG i DCI-P3). Ale przynajmniej nie wykazuje migotania PWM na żadnym poziomie jasności. Nie są dostępne żadne inne opcje panelu. The Asus TUF A15, Intel NUC X15 i Lenovo Slim 5 16APH8 są wyposażone w lepsze wyświetlacze.
| |||||||||||||||||||||||||
rozświetlenie: 85 %
na akumulatorze: 297 cd/m²
kontrast: 874:1 (czerń: 0.34 cd/m²)
ΔE ColorChecker Calman: 6.23 | ∀{0.5-29.43 Ø4.76}
calibrated: 4.74
ΔE Greyscale Calman: 5.92 | ∀{0.09-98 Ø5}
44.7% AdobeRGB 1998 (Argyll 3D)
64.3% sRGB (Argyll 3D)
43.2% Display P3 (Argyll 3D)
Gamma: 2.49
CCT: 6279 K
| Gigabyte G5 KF Chi Mei N156HRA-EA1, IPS, 1920x1080, 15.6" | MSI Cyborg 15 A12VF AU Optronics B156HAN15.1, IPS, 1920x1080, 15.6" | Intel NUC X15 LAPAC71H BOE HF NV156FHM-N4G, IPS, 1920x1080, 15.6" | Asus TUF A15 FA507 N156HMA-GA1, IPS, 1920x1080, 15.6" | Lenovo Legion Slim 5 16APH8 BOE NJ NE160QDM-NYC, IPS, 2560x1600, 16" | Gigabyte G5 KE Chi Mei N156HRA-EA1, IPS, 1920x1080, 15.6" | |
|---|---|---|---|---|---|---|
| Display | -2% | 47% | 50% | 58% | -6% | |
| Display P3 Coverage (%) | 43.2 | 42.3 -2% | 64.9 50% | 64.9 50% | 69.3 60% | 40.7 -6% |
| sRGB Coverage (%) | 64.3 | 62.6 -3% | 92.6 44% | 96.5 50% | 100 56% | 61 -5% |
| AdobeRGB 1998 Coverage (%) | 44.7 | 43.7 -2% | 66.3 48% | 66.6 49% | 70 57% | 42.1 -6% |
| Response Times | -9% | 51% | -57% | 43% | -40% | |
| Response Time Grey 50% / Grey 80% * (ms) | 25.1 ? | 22 ? 12% | 7.8 ? 69% | 30.4 ? -21% | 10.7 ? 57% | 26.64 ? -6% |
| Response Time Black / White * (ms) | 10.8 ? | 14 ? -30% | 7.3 ? 32% | 20.8 ? -93% | 7.8 ? 28% | 18.65 ? -73% |
| PWM Frequency (Hz) | ||||||
| Screen | 22% | 51% | 48% | 39% | 1% | |
| Brightness middle (cd/m²) | 297 | 247 -17% | 365 23% | 288 -3% | 371.6 25% | 269 -9% |
| Brightness (cd/m²) | 275 | 234 -15% | 356 29% | 271 -1% | 343 25% | 248 -10% |
| Brightness Distribution (%) | 85 | 89 5% | 86 1% | 91 7% | 84 -1% | 85 0% |
| Black Level * (cd/m²) | 0.34 | 0.25 26% | 0.17 50% | 0.17 50% | 0.44 -29% | 0.5 -47% |
| Contrast (:1) | 874 | 988 13% | 2147 146% | 1694 94% | 845 -3% | 538 -38% |
| Colorchecker dE 2000 * | 6.23 | 3.78 39% | 3.51 44% | 1.9 70% | 1.52 76% | 4.54 27% |
| Colorchecker dE 2000 max. * | 20.93 | 6.42 69% | 6.37 70% | 3.3 84% | 2.68 87% | 17.28 17% |
| Colorchecker dE 2000 calibrated * | 4.74 | 3.94 17% | 1.88 60% | 0.9 81% | 0.33 93% | 3.34 30% |
| Greyscale dE 2000 * | 5.92 | 2.16 64% | 3.83 35% | 2.7 54% | 1.2 80% | 3.8 36% |
| Gamma | 2.49 88% | 2.33 94% | 2.47 89% | 2.32 95% | 2.1 105% | 2.17 101% |
| CCT | 6279 104% | 6906 94% | 7362 88% | 6535 99% | 6503 100% | 7408 88% |
| Całkowita średnia (program / ustawienia) | 4% /
13% | 50% /
50% | 14% /
34% | 47% /
44% | -15% /
-6% |
* ... im mniej tym lepiej
Wyświetl czasy reakcji
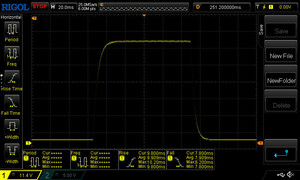
| ↔ Czas reakcji od czerni do bieli | ||
|---|---|---|
| 10.8 ms ... wzrost ↗ i spadek ↘ łącznie | ↗ 9.9 ms wzrost | |
| ↘ 7.9 ms upadek | ||
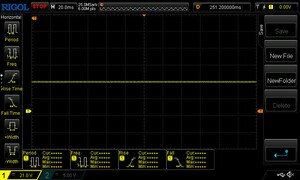
| W naszych testach ekran wykazuje dobry współczynnik reakcji, ale może być zbyt wolny dla graczy rywalizujących ze sobą. Dla porównania, wszystkie testowane urządzenia wahają się od 0.1 (minimum) do 240 (maksimum) ms. » 28 % wszystkich urządzeń jest lepszych. Oznacza to, że zmierzony czas reakcji jest lepszy od średniej wszystkich testowanych urządzeń (20.1 ms). | ||
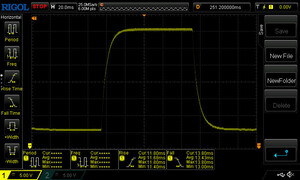
| ↔ Czas reakcji 50% szarości do 80% szarości | ||
| 25.1 ms ... wzrost ↗ i spadek ↘ łącznie | ↗ 11.7 ms wzrost | |
| ↘ 13.4 ms upadek | ||
| W naszych testach ekran wykazuje stosunkowo powolne tempo reakcji i może być zbyt wolny dla graczy. Dla porównania, wszystkie testowane urządzenia wahają się od 0.165 (minimum) do 636 (maksimum) ms. » 35 % wszystkich urządzeń jest lepszych. Oznacza to, że zmierzony czas reakcji jest lepszy od średniej wszystkich testowanych urządzeń (31.5 ms). | ||
Migotanie ekranu / PWM (modulacja szerokości impulsu)
| Migotanie ekranu/nie wykryto PWM | |||
Dla porównania: 53 % wszystkich testowanych urządzeń nie używa PWM do przyciemniania wyświetlacza. Jeśli wykryto PWM, zmierzono średnio 8082 (minimum: 5 - maksimum: 343500) Hz. | |||
Wydajność - Alder Lake spotyka Adę Lovelace
Dzięki G5 KF Gigabyte ma w swojej ofercie stosunkowo niedrogi laptop do gier FHD. Laptop wyposażony jest w Core i5-12500H i GeForce RTX 4060i można go nabyć za nieco poniżej 1000 euro (1059 USD). Firma oferuje również tańsze modele z RTX 4050 (G5 MF) lub RTX 3050 (G5 GE).
Warunki testu
G5 oferuje cztery tryby wydajności określone przez producenta (patrz tabela). Można przełączać się między nimi za pomocą oprogramowania Control Center. Użyliśmy "Trybu wydajności" do naszych testów porównawczych i "Trybu oszczędzania energii" do testów żywotności baterii.
| Tryb wydajności | Tryb rozrywki | Tryb oszczędzania energii | Tryb cichy | |
|---|---|---|---|---|
| Limit mocy 1 (HWInfo) | 60 Watt | 50 Watt | 45 Watt | 15 Watt |
| Limit mocy 2 (HWInfo) | 125 Watt | 115 Watt | 30 Watt | 30 Watt |
Procesor
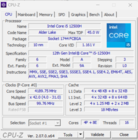
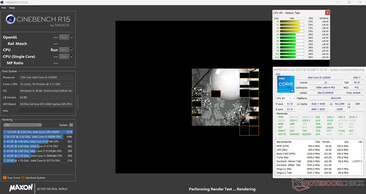
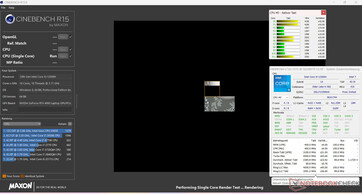
12 rdzeni procesora w Core i5-12500H (4 rdzenie P, 8 rdzeni E) może osiągnąć maksymalną częstotliwość 4,5 GHz (P) i 3,3 GHz (E). Przy długotrwałym obciążeniu wielowątkowym (tj. CB15 w pętli), prędkość zegara nieznacznie spadła między pierwszym a drugim uruchomieniem, a następnie pozostała na względnie stałym poziomie.
Wyniki testów porównawczych są na równi z tym, co widzieliśmy średnio z procesora (po podłączeniu). Na zasilaniu bateryjnym, bardziej istotny wynik jednowątkowy w CB15 (159 punktów) odnotował mniejszy spadek niż wynik wielowątkowy (741 punktów).
Cinebench R15 Multi Sustained load
* ... im mniej tym lepiej
AIDA64: FP32 Ray-Trace | FPU Julia | CPU SHA3 | CPU Queen | FPU SinJulia | FPU Mandel | CPU AES | CPU ZLib | FP64 Ray-Trace | CPU PhotoWorxx
| Performance rating | |
| Średnia w klasie Gaming | |
| Lenovo Legion Slim 5 16APH8 | |
| Asus TUF A15 FA507 | |
| Intel NUC X15 LAPAC71H | |
| Gigabyte G5 KE | |
| MSI Cyborg 15 A12VF | |
| Gigabyte G5 KF | |
| Przeciętny Intel Core i5-12500H | |
| AIDA64 / FP32 Ray-Trace | |
| Średnia w klasie Gaming (7192 - 85542, n=133, ostatnie 2 lata) | |
| Lenovo Legion Slim 5 16APH8 | |
| Asus TUF A15 FA507 | |
| Intel NUC X15 LAPAC71H | |
| MSI Cyborg 15 A12VF | |
| Gigabyte G5 KE | |
| Przeciętny Intel Core i5-12500H (6851 - 13947, n=9) | |
| Gigabyte G5 KF | |
| AIDA64 / FPU Julia | |
| Średnia w klasie Gaming (35040 - 238426, n=133, ostatnie 2 lata) | |
| Lenovo Legion Slim 5 16APH8 | |
| Asus TUF A15 FA507 | |
| MSI Cyborg 15 A12VF | |
| Gigabyte G5 KE | |
| Intel NUC X15 LAPAC71H | |
| Gigabyte G5 KF | |
| Przeciętny Intel Core i5-12500H (29874 - 68178, n=9) | |
| AIDA64 / CPU SHA3 | |
| Średnia w klasie Gaming (1728 - 9817, n=133, ostatnie 2 lata) | |
| Lenovo Legion Slim 5 16APH8 | |
| Asus TUF A15 FA507 | |
| Gigabyte G5 KE | |
| Intel NUC X15 LAPAC71H | |
| MSI Cyborg 15 A12VF | |
| Gigabyte G5 KF | |
| Przeciętny Intel Core i5-12500H (2287 - 3337, n=9) | |
| AIDA64 / CPU Queen | |
| Lenovo Legion Slim 5 16APH8 | |
| Średnia w klasie Gaming (49785 - 173351, n=133, ostatnie 2 lata) | |
| Asus TUF A15 FA507 | |
| Intel NUC X15 LAPAC71H | |
| MSI Cyborg 15 A12VF | |
| Gigabyte G5 KE | |
| Gigabyte G5 KF | |
| Przeciętny Intel Core i5-12500H (77935 - 80703, n=9) | |
| AIDA64 / FPU SinJulia | |
| Lenovo Legion Slim 5 16APH8 | |
| Średnia w klasie Gaming (4424 - 33636, n=133, ostatnie 2 lata) | |
| Asus TUF A15 FA507 | |
| MSI Cyborg 15 A12VF | |
| Intel NUC X15 LAPAC71H | |
| Gigabyte G5 KE | |
| Gigabyte G5 KF | |
| Przeciętny Intel Core i5-12500H (6590 - 7431, n=9) | |
| AIDA64 / FPU Mandel | |
| Średnia w klasie Gaming (17585 - 128721, n=133, ostatnie 2 lata) | |
| Lenovo Legion Slim 5 16APH8 | |
| Asus TUF A15 FA507 | |
| Gigabyte G5 KE | |
| Intel NUC X15 LAPAC71H | |
| MSI Cyborg 15 A12VF | |
| Przeciętny Intel Core i5-12500H (18252 - 34041, n=9) | |
| Gigabyte G5 KF | |
| AIDA64 / CPU AES | |
| Intel NUC X15 LAPAC71H | |
| Gigabyte G5 KE | |
| Średnia w klasie Gaming (19065 - 247074, n=133, ostatnie 2 lata) | |
| Gigabyte G5 KF | |
| Przeciętny Intel Core i5-12500H (50298 - 111567, n=9) | |
| Lenovo Legion Slim 5 16APH8 | |
| Asus TUF A15 FA507 | |
| MSI Cyborg 15 A12VF | |
| AIDA64 / CPU ZLib | |
| Średnia w klasie Gaming (373 - 2531, n=133, ostatnie 2 lata) | |
| Lenovo Legion Slim 5 16APH8 | |
| Gigabyte G5 KE | |
| MSI Cyborg 15 A12VF | |
| Przeciętny Intel Core i5-12500H (746 - 924, n=9) | |
| Gigabyte G5 KF | |
| Intel NUC X15 LAPAC71H | |
| Asus TUF A15 FA507 | |
| AIDA64 / FP64 Ray-Trace | |
| Średnia w klasie Gaming (3856 - 45446, n=133, ostatnie 2 lata) | |
| Lenovo Legion Slim 5 16APH8 | |
| Asus TUF A15 FA507 | |
| Gigabyte G5 KE | |
| Intel NUC X15 LAPAC71H | |
| MSI Cyborg 15 A12VF | |
| Przeciętny Intel Core i5-12500H (3848 - 7405, n=9) | |
| Gigabyte G5 KF | |
| AIDA64 / CPU PhotoWorxx | |
| Średnia w klasie Gaming (10805 - 62916, n=133, ostatnie 2 lata) | |
| Intel NUC X15 LAPAC71H | |
| MSI Cyborg 15 A12VF | |
| Lenovo Legion Slim 5 16APH8 | |
| Przeciętny Intel Core i5-12500H (13686 - 43813, n=9) | |
| Gigabyte G5 KE | |
| Asus TUF A15 FA507 | |
| Gigabyte G5 KF | |
Wydajność systemu
CrossMark: Overall | Productivity | Creativity | Responsiveness
| PCMark 10 / Score | |
| Średnia w klasie Gaming (5776 - 10060, n=112, ostatnie 2 lata) | |
| Lenovo Legion Slim 5 16APH8 | |
| Asus TUF A15 FA507 | |
| Gigabyte G5 KE | |
| MSI Cyborg 15 A12VF | |
| Intel NUC X15 LAPAC71H | |
| Gigabyte G5 KF | |
| Przeciętny Intel Core i5-12500H, NVIDIA GeForce RTX 4060 Laptop GPU (n=1) | |
| PCMark 10 / Essentials | |
| Lenovo Legion Slim 5 16APH8 | |
| Gigabyte G5 KE | |
| Średnia w klasie Gaming (8810 - 12600, n=116, ostatnie 2 lata) | |
| MSI Cyborg 15 A12VF | |
| Asus TUF A15 FA507 | |
| Intel NUC X15 LAPAC71H | |
| Gigabyte G5 KF | |
| Przeciętny Intel Core i5-12500H, NVIDIA GeForce RTX 4060 Laptop GPU (n=1) | |
| PCMark 10 / Productivity | |
| Lenovo Legion Slim 5 16APH8 | |
| Średnia w klasie Gaming (6662 - 16716, n=114, ostatnie 2 lata) | |
| MSI Cyborg 15 A12VF | |
| Gigabyte G5 KF | |
| Przeciętny Intel Core i5-12500H, NVIDIA GeForce RTX 4060 Laptop GPU (n=1) | |
| Gigabyte G5 KE | |
| Asus TUF A15 FA507 | |
| Intel NUC X15 LAPAC71H | |
| PCMark 10 / Digital Content Creation | |
| Średnia w klasie Gaming (7440 - 19351, n=114, ostatnie 2 lata) | |
| Lenovo Legion Slim 5 16APH8 | |
| Intel NUC X15 LAPAC71H | |
| Asus TUF A15 FA507 | |
| Gigabyte G5 KE | |
| MSI Cyborg 15 A12VF | |
| Gigabyte G5 KF | |
| Przeciętny Intel Core i5-12500H, NVIDIA GeForce RTX 4060 Laptop GPU (n=1) | |
| CrossMark / Overall | |
| Średnia w klasie Gaming (1247 - 2344, n=112, ostatnie 2 lata) | |
| Intel NUC X15 LAPAC71H | |
| Lenovo Legion Slim 5 16APH8 | |
| MSI Cyborg 15 A12VF | |
| Gigabyte G5 KE | |
| Gigabyte G5 KF | |
| Przeciętny Intel Core i5-12500H, NVIDIA GeForce RTX 4060 Laptop GPU (n=1) | |
| Asus TUF A15 FA507 | |
| CrossMark / Productivity | |
| Średnia w klasie Gaming (1299 - 2211, n=112, ostatnie 2 lata) | |
| Intel NUC X15 LAPAC71H | |
| Lenovo Legion Slim 5 16APH8 | |
| Gigabyte G5 KE | |
| MSI Cyborg 15 A12VF | |
| Gigabyte G5 KF | |
| Przeciętny Intel Core i5-12500H, NVIDIA GeForce RTX 4060 Laptop GPU (n=1) | |
| Asus TUF A15 FA507 | |
| CrossMark / Creativity | |
| Średnia w klasie Gaming (1275 - 2729, n=112, ostatnie 2 lata) | |
| Lenovo Legion Slim 5 16APH8 | |
| Intel NUC X15 LAPAC71H | |
| MSI Cyborg 15 A12VF | |
| Gigabyte G5 KE | |
| Gigabyte G5 KF | |
| Przeciętny Intel Core i5-12500H, NVIDIA GeForce RTX 4060 Laptop GPU (n=1) | |
| Asus TUF A15 FA507 | |
| CrossMark / Responsiveness | |
| Intel NUC X15 LAPAC71H | |
| Gigabyte G5 KF | |
| Przeciętny Intel Core i5-12500H, NVIDIA GeForce RTX 4060 Laptop GPU (n=1) | |
| Gigabyte G5 KE | |
| Średnia w klasie Gaming (1030 - 2330, n=112, ostatnie 2 lata) | |
| MSI Cyborg 15 A12VF | |
| Lenovo Legion Slim 5 16APH8 | |
| Asus TUF A15 FA507 | |
| PCMark 10 Score | 6318 pkt. | |
Pomoc | ||
| AIDA64 / Memory Copy | |
| Średnia w klasie Gaming (21750 - 108104, n=133, ostatnie 2 lata) | |
| Intel NUC X15 LAPAC71H | |
| Lenovo Legion Slim 5 16APH8 | |
| MSI Cyborg 15 A12VF | |
| Asus TUF A15 FA507 | |
| Przeciętny Intel Core i5-12500H (23850 - 66598, n=9) | |
| Gigabyte G5 KE | |
| Gigabyte G5 KF | |
| AIDA64 / Memory Read | |
| Średnia w klasie Gaming (22956 - 104349, n=133, ostatnie 2 lata) | |
| Intel NUC X15 LAPAC71H | |
| MSI Cyborg 15 A12VF | |
| Lenovo Legion Slim 5 16APH8 | |
| Przeciętny Intel Core i5-12500H (24879 - 68013, n=9) | |
| Asus TUF A15 FA507 | |
| Gigabyte G5 KE | |
| Gigabyte G5 KF | |
| AIDA64 / Memory Write | |
| Lenovo Legion Slim 5 16APH8 | |
| Średnia w klasie Gaming (22297 - 133486, n=133, ostatnie 2 lata) | |
| Intel NUC X15 LAPAC71H | |
| MSI Cyborg 15 A12VF | |
| Asus TUF A15 FA507 | |
| Przeciętny Intel Core i5-12500H (23543 - 58797, n=9) | |
| Gigabyte G5 KE | |
| Gigabyte G5 KF | |
| AIDA64 / Memory Latency | |
| Średnia w klasie Gaming (59.5 - 259, n=133, ostatnie 2 lata) | |
| Przeciętny Intel Core i5-12500H (83.8 - 114.7, n=9) | |
| Gigabyte G5 KE | |
| Lenovo Legion Slim 5 16APH8 | |
| MSI Cyborg 15 A12VF | |
| Intel NUC X15 LAPAC71H | |
| Gigabyte G5 KF | |
| Asus TUF A15 FA507 | |
* ... im mniej tym lepiej
Opóźnienie DPC
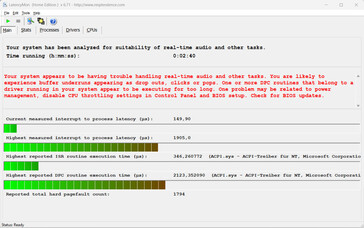
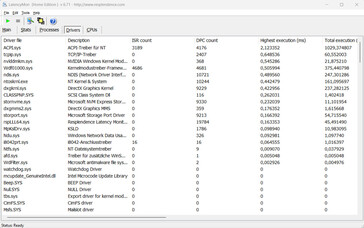
Nasz standardowy test monitora opóźnień (przeglądanie stron internetowych, odtwarzanie wideo 4K i wysokie obciążenie Prime95) ujawnił pewne problemy. System nie wydaje się być odpowiedni do przetwarzania wideo i audio w czasie rzeczywistym. Miejmy nadzieję, że uda się to poprawić w przyszłych aktualizacjach oprogramowania.
| DPC Latencies / LatencyMon - interrupt to process latency (max), Web, Youtube, Prime95 | |
| Gigabyte G5 KF | |
| MSI Cyborg 15 A12VF | |
| Lenovo Legion Slim 5 16APH8 | |
| Gigabyte G5 KE | |
| Intel NUC X15 LAPAC71H | |
* ... im mniej tym lepiej
Pamięć masowa
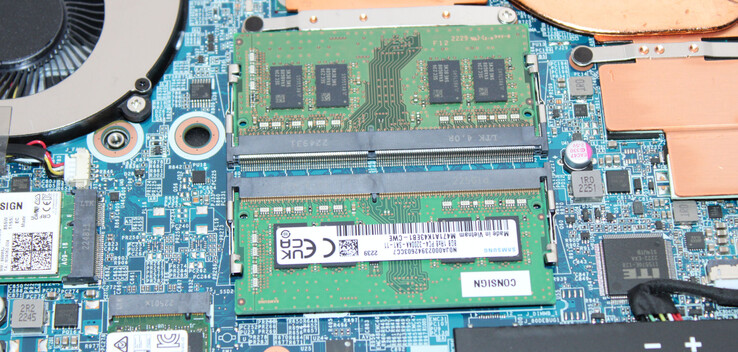
Gigabyte wyposażył G5 w dysk SSD o pojemności 512 GB (PCIe 4.0, M2. 2280) od SSSTC, który zapewnia świetne prędkości transferu danych. Jest on jednak podatny na spadki wydajności spowodowane dławieniem termicznym. Notebook posiada również gniazdo PCIe 3.0, aby pomieścić drugi dysk SSD M.2 2280.
| Drive Performance rating - Percent | |
| Intel NUC X15 LAPAC71H | |
| Gigabyte G5 KF | |
| Przeciętny SSSTC CA6-8D512 | |
| Średnia w klasie Gaming | |
| Lenovo Legion Slim 5 16APH8 | |
| Gigabyte G5 KE | |
| MSI Cyborg 15 A12VF | |
| Asus TUF A15 FA507 | |
* ... im mniej tym lepiej
Dauerleistung Lesen: DiskSpd Read Loop, Queue Depth 8
Karta graficzna
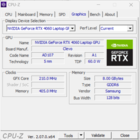
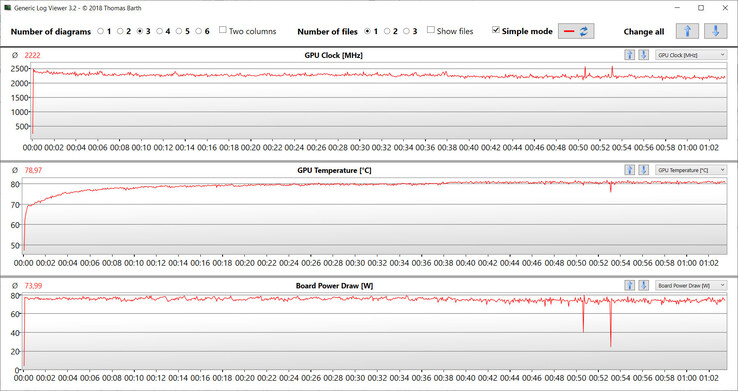
Karta graficzna GeForce RTX 4060 może pochwalić się 3 072 jednostkami cieniującymi, 128-bitową magistralą pamięci i 8 192 MB pamięci wideo GDDR6. Gigabyte określił maksymalne TGP na poziomie 75 W, co znajduje się na dolnym końcu średniego zakresu. TGP było w pełni wykorzystane podczas naszego testu Witcher 3.
Wyniki benchmarków mieszczą się w średniej tego, co do tej pory widzieliśmy z RTX 4060. Pomimo niższego TGP, RTX 4060 radzi sobie lepiej niż RTX 3060 w teście G5 KE. Wynika to z faktu, że architektura Ada Lovelace jest bardziej wydajna. G5 KF nie posiada trybu dGPU.
| 3DMark Performance rating - Percent | |
| Średnia w klasie Gaming | |
| Przeciętny NVIDIA GeForce RTX 4060 Laptop GPU | |
| Gigabyte G5 KF | |
| Gigabyte G5 KE | |
| MSI Cyborg 15 A12VF | |
| Lenovo Legion Slim 5 16APH8 -1! | |
| Asus TUF A15 FA507 -1! | |
| Intel NUC X15 LAPAC71H | |
| 3DMark 06 Standard Score | 45111 pkt. | |
| 3DMark 11 Performance | 28012 pkt. | |
| 3DMark Cloud Gate Standard Score | 51746 pkt. | |
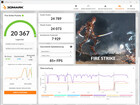
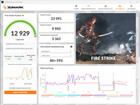
| 3DMark Fire Strike Score | 20367 pkt. | |
| 3DMark Time Spy Score | 9269 pkt. | |
Pomoc | ||
* ... im mniej tym lepiej
Wydajność w grach
Notebook Gigabyte został zaprojektowany do uruchamiania gier w rozdzielczości FHD, a także w ustawieniach od wysokich do maksymalnych. Możliwe jest korzystanie z wyższych rozdzielczości poprzez podłączenie laptopa do monitora, który je obsługuje, choć może być konieczne obniżenie niektórych ustawień. W naszych testach, liczba klatek na sekundę była poniżej tego, co RTX 4060 może zrobić średnio i mniej więcej na równi z G5 KEi mniej więcej na równi z wydajnością G5 KE.
| The Witcher 3 - 1920x1080 Ultra Graphics & Postprocessing (HBAO+) | |
| Średnia w klasie Gaming (80.2 - 240, n=36, ostatnie 2 lata) | |
| Przeciętny NVIDIA GeForce RTX 4060 Laptop GPU (77 - 159.7, n=42) | |
| Lenovo Legion Slim 5 16APH8 | |
| Gigabyte G5 KF | |
| Gigabyte G5 KE | |
| Asus TUF A15 FA507 | |
| MSI Cyborg 15 A12VF | |
| Intel NUC X15 LAPAC71H | |
| Starfield - 1920x1080 Ultra Preset | |
| XMG Pro 15 E23 | |
| Przeciętny NVIDIA GeForce RTX 4060 Laptop GPU (39.7 - 41, n=3) | |
| Gigabyte G5 KF | |
| Średnia w klasie Gaming (23.1 - 26.3, n=2, ostatnie 2 lata) | |
| Intel NUC X15 LAPAC71H | |
| Lies of P - 1920x1080 Best Preset | |
| XMG Pro 15 E23 | |
| Przeciętny NVIDIA GeForce RTX 4060 Laptop GPU (106.2 - 126.6, n=3) | |
| Gigabyte G5 KF | |
| Średnia w klasie Gaming (55.7 - 187, n=4, ostatnie 2 lata) | |
| Intel NUC X15 LAPAC71H | |
| EA Sports FC 24 - 1920x1080 Ultra Preset | |
| Gigabyte G5 KF | |
| XMG Pro 15 E23 | |
| Przeciętny NVIDIA GeForce RTX 4060 Laptop GPU (136.9 - 138, n=3) | |
| Intel NUC X15 LAPAC71H | |
| Średnia w klasie Gaming (47.9 - 93.9, n=3, ostatnie 2 lata) | |
| Assassin's Creed Mirage - 1920x1080 Ultra High Preset (Adaptive Quality Off) | |
| Średnia w klasie Gaming (31 - 160, n=8, ostatnie 2 lata) | |
| XMG Pro 15 E23 | |
| Przeciętny NVIDIA GeForce RTX 4060 Laptop GPU (65 - 93, n=6) | |
| Gigabyte G5 KF | |
| Intel NUC X15 LAPAC71H | |
| The Crew Motorfest - 1920x1080 Ultra Preset | |
| XMG Pro 15 E23 | |
| Gigabyte G5 KF | |
| Przeciętny NVIDIA GeForce RTX 4060 Laptop GPU (60 - 60, n=3) | |
| Średnia w klasie Gaming (35 - 60, n=4, ostatnie 2 lata) | |
| Intel NUC X15 LAPAC71H | |
| F1 23 - 1920x1080 Ultra High Preset AA:T AF:16x | |
| Średnia w klasie Gaming (27 - 149.2, n=10, ostatnie 2 lata) | |
| Przeciętny NVIDIA GeForce RTX 4060 Laptop GPU (43.8 - 119.9, n=13) | |
| XMG Pro 15 E23 | |
| Gigabyte G5 KF | |
| Intel NUC X15 LAPAC71H | |
| Baldur's Gate 3 - 1920x1080 Ultra Preset AA:T | |
| Średnia w klasie Gaming (37.2 - 246, n=115, ostatnie 2 lata) | |
| XMG Pro 15 E23 | |
| Przeciętny NVIDIA GeForce RTX 4060 Laptop GPU (66.5 - 105.5, n=19) | |
| Gigabyte G5 KF | |
| Intel NUC X15 LAPAC71H | |
| Diablo 4 - 3840x2160 Ultra Preset | |
| XMG Pro 15 E23 | |
| Przeciętny NVIDIA GeForce RTX 4060 Laptop GPU (n=1) | |
| Lords of the Fallen - 1920x1080 Ultra Preset | |
| XMG Pro 15 E23 | |
| Średnia w klasie Gaming (20.2 - 64.2, n=5, ostatnie 2 lata) | |
| Intel NUC X15 LAPAC71H | |
| Przeciętny NVIDIA GeForce RTX 4060 Laptop GPU (32.8 - 38.1, n=3) | |
| Gigabyte G5 KF | |
Aby sprawdzić, czy laptop jest w stanie utrzymać swoją wydajność przez dłuższy czas, uruchomiliśmy grę "The Witcher 3" na około 60 minut w rozdzielczości Full HD i maksymalnych ustawieniach. W tym czasie postać gracza nie była w ogóle poruszana. Liczba klatek na sekundę w większości przypadków pozostawała stabilna, ale zaobserwowaliśmy kilka niewielkich sporadycznych spadków (około 10 FPS) w późniejszej fazie tego testu.
Witcher 3 FPS chart
| low | med. | high | ultra | |
|---|---|---|---|---|
| GTA V (2015) | 183.5 | 178.3 | 171.5 | 107.6 |
| The Witcher 3 (2015) | 314.3 | 251.1 | 172.8 | 92.5 |
| Dota 2 Reborn (2015) | 158.6 | 146.6 | 137.55 | 131.2 |
| Final Fantasy XV Benchmark (2018) | 186.5 | 126 | 91.9 | |
| X-Plane 11.11 (2018) | 120.4 | 108 | 87.1 | |
| Far Cry 5 (2018) | 151 | 125 | 119 | 110 |
| Strange Brigade (2018) | 379 | 253 | 197.9 | 172.1 |
| Gears Tactics (2020) | 303.9 | 225.6 | 156.5 | 112.2 |
| Cyberpunk 2077 1.6 (2022) | 105.4 | 86.7 | 74.5 | 68.7 |
| Diablo 4 (2023) | 227 | 204 | 180.4 | 151 |
| F1 23 (2023) | 213 | 211 | 157.4 | 51.8 |
| Starfield (2023) | 71.2 | 61.4 | 47 | 39.8 |
| The Crew Motorfest (2023) | 60 | 60 | 60 | 60 |
| Lies of P (2023) | 159.4 | 138.5 | 126.9 | 106.2 |
| Baldur's Gate 3 (2023) | 113.1 | 93.2 | 78 | 75.1 |
| Cyberpunk 2077 (2023) | 105.9 | 91.1 | 78 | 70.5 |
| EA Sports FC 24 (2023) | 198.3 | 172.9 | 142.9 | 138 |
| Assassin's Creed Mirage (2023) | 120 | 115 | 106 | 83 |
| Lords of the Fallen (2023) | 80 | 64.7 | 46.7 | 32.8 |
Emisje - notebook może być dość głośny
Emisja hałasu
Podczas grania poziom hałasu może osiągnąć nawet 55,5 dB(A) w "Trybie wydajności". Mogą Państwo zredukować poziom hałasu przełączając się na "Tryb rozrywki" lub, jeszcze lepiej, "Tryb cichy". W codziennym użytkowaniu (np. aplikacje biurowe i przeglądanie Internetu) oba wentylatory często obracają się z niską prędkością, a czasami mogą pozostawać całkowicie nieruchome.
Hałas
| luz |
| 23 / 23 / 28 dB |
| obciążenie |
| 29.94 / 55.5 dB |
 | ||
30 dB cichy 40 dB(A) słyszalny 50 dB(A) irytujący |
||
min: | ||
| Gigabyte G5 KF GeForce RTX 4060 Laptop GPU, i5-12500H, SSSTC CA6-8D512 | MSI Cyborg 15 A12VF GeForce RTX 4060 Laptop GPU, i7-12650H, Samsung PM9B1 1024GB MZVL41T0HBLB | Intel NUC X15 LAPAC71H A730M, i7-12700H, Samsung 990 Pro 1 TB | Asus TUF A15 FA507 GeForce RTX 4050 Laptop GPU, R7 7735HS, Micron 2400 MTFDKBA512QFM | Lenovo Legion Slim 5 16APH8 GeForce RTX 4060 Laptop GPU, R7 7840HS, SK hynix PC801 HFS512GEJ9X115N | Gigabyte G5 KE GeForce RTX 3060 Laptop GPU, i5-12500H, Gigabyte AG4512G-SI B10 | |
|---|---|---|---|---|---|---|
| Noise | -37% | -6% | 9% | -1% | -22% | |
| wyłączone / środowisko * (dB) | 23 | 27 -17% | 23 -0% | 23.3 -1% | 22.9 -0% | 19.52 15% |
| Idle Minimum * (dB) | 23 | 27 -17% | 23 -0% | 23.3 -1% | 23.1 -0% | 31.05 -35% |
| Idle Average * (dB) | 23 | 37.5 -63% | 24 -4% | 23.3 -1% | 23.1 -0% | 31.05 -35% |
| Idle Maximum * (dB) | 28 | 38 -36% | 24 14% | 23.3 17% | 27.7 1% | 31.05 -11% |
| Load Average * (dB) | 29.94 | 56.3 -88% | 50.61 -69% | 29.6 1% | 33.3 -11% | 55.66 -86% |
| Witcher 3 ultra * (dB) | 55.05 | 50.65 8% | 43 22% | 54 2% | 55.7 -1% | |
| Load Maximum * (dB) | 55.5 | 56.3 -1% | 50.89 8% | 43 23% | 54 3% | 55.51 -0% |
* ... im mniej tym lepiej
Temperatura
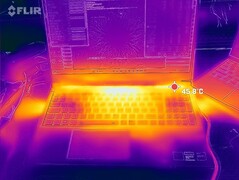
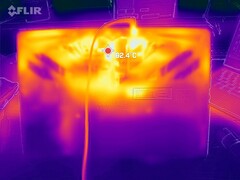
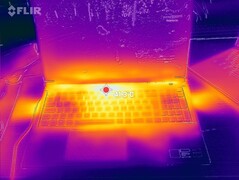
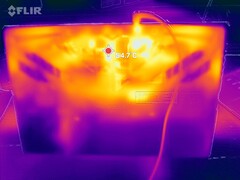
Niektóre miejsca na powierzchni laptopa stają się zauważalnie ciepłe pod dużym obciążeniem (np. test obciążeniowy, test Witcher 3 ). Dla porównania, temperatury obudowy są bardziej umiarkowane w konkurencyjnych urządzeniach. W codziennym użytkowaniu (np. aplikacje biurowe, przeglądanie Internetu) temperatury powierzchni G5 KF utrzymują się w akceptowalnym zakresie.
(-) Maksymalna temperatura w górnej części wynosi 54 °C / 129 F, w porównaniu do średniej 40.4 °C / 105 F , począwszy od 21.2 do 68.8 °C dla klasy Gaming.
(-) Dno nagrzewa się maksymalnie do 61 °C / 142 F, w porównaniu do średniej 43.3 °C / 110 F
(+) W stanie bezczynności średnia temperatura górnej części wynosi 30.7 °C / 87 F, w porównaniu ze średnią temperaturą urządzenia wynoszącą 33.9 °C / ### class_avg_f### F.
(±) Podczas gry w Wiedźmina 3 średnia temperatura górnej części wynosi 37.3 °C / 99 F, w porównaniu do średniej temperatury urządzenia wynoszącej 33.9 °C / ## #class_avg_f### F.
(+) Podparcia dłoni i touchpad osiągają maksymalną temperaturę skóry (34 °C / 93.2 F) i dlatego nie są gorące.
(-) Średnia temperatura obszaru podparcia dłoni w podobnych urządzeniach wynosiła 28.8 °C / 83.8 F (-5.2 °C / -9.4 F).
| Gigabyte G5 KF Intel Core i5-12500H, NVIDIA GeForce RTX 4060 Laptop GPU | MSI Cyborg 15 A12VF Intel Core i7-12650H, NVIDIA GeForce RTX 4060 Laptop GPU | Intel NUC X15 LAPAC71H Intel Core i7-12700H, Intel Arc A730M | Asus TUF A15 FA507 AMD Ryzen 7 7735HS, NVIDIA GeForce RTX 4050 Laptop GPU | Lenovo Legion Slim 5 16APH8 AMD Ryzen 7 7840HS, NVIDIA GeForce RTX 4060 Laptop GPU | Gigabyte G5 KE Intel Core i5-12500H, NVIDIA GeForce RTX 3060 Laptop GPU | |
|---|---|---|---|---|---|---|
| Heat | 23% | 11% | 20% | 25% | 1% | |
| Maximum Upper Side * (°C) | 54 | 47.5 12% | 59 -9% | 48.9 9% | 40.6 25% | 52.6 3% |
| Maximum Bottom * (°C) | 61 | 35.5 42% | 51 16% | 44.6 27% | 42 31% | 62.4 -2% |
| Idle Upper Side * (°C) | 34 | 27.7 19% | 28 18% | 27.1 20% | 27.8 18% | 33.6 1% |
| Idle Bottom * (°C) | 36 | 29.5 18% | 30 17% | 27.5 24% | 26.6 26% | 34.8 3% |
* ... im mniej tym lepiej
Test warunków skrajnych
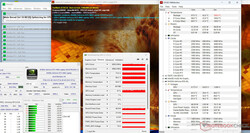
Nasz test obciążeniowy (uruchomienie Prime95 i FurMark przez dłuższy czas) reprezentuje ekstremalny scenariusz mający na celu określenie stabilności systemu przy pełnym obciążeniu. Po uruchomieniu przy wysokich prędkościach zegara, CPU i GPU zaczęły zwalniać w miarę trwania testu. Po około 30 minutach procesor działał z przybliżonym zegarem bazowym, podczas gdy karta graficzna osiągała około 2 GHz.
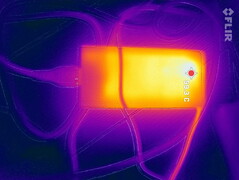
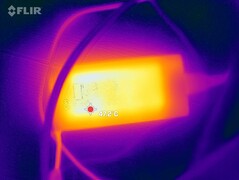
Zasilacz wyłączył się po 49 minutach testu obciążeniowego, a temperatura jego powierzchni wzrosła do 68°C (154,4°F). W dłuższym okresie, ilość energii wymaganej przez sprzęt wydaje się przekraczać to, co może dostarczyć 150-watowy zasilacz. W "typowych" przypadkach użycia (np. gry, aplikacje biurowe) nie spodziewamy się jednak, że zasilacz sam się wyłączy. Test obciążeniowy symuluje sytuację, która rzadko zdarza się w prawdziwym życiu (tj. CPU i GPU działające jednocześnie z maksymalną wydajnością).
Głośniki
Głośniki stereo brzmią przyzwoicie, ale nie mają prawie żadnych basów.
Gigabyte G5 KF analiza dźwięku
(±) | głośność głośnika jest średnia, ale dobra (78.6 dB)
Bas 100 - 315 Hz
(-) | prawie brak basu - średnio 15.6% niższa od mediany
(+) | bas jest liniowy (1.7% delta do poprzedniej częstotliwości)
Średnie 400 - 2000 Hz
(±) | wyższe średnie - średnio 9.7% wyższe niż mediana
(±) | liniowość środka jest średnia (10.4% delta do poprzedniej częstotliwości)
Wysokie 2–16 kHz
(+) | zrównoważone maksima - tylko 3.2% od mediany
(+) | wzloty są liniowe (6.9% delta do poprzedniej częstotliwości)
Ogólnie 100 - 16.000 Hz
(±) | liniowość ogólnego dźwięku jest średnia (22.7% różnicy w stosunku do mediany)
W porównaniu do tej samej klasy
» 82% wszystkich testowanych urządzeń w tej klasie było lepszych, 5% podobnych, 14% gorszych
» Najlepszy miał deltę 6%, średnia wynosiła ###średnia###%, najgorsza wynosiła 132%
W porównaniu do wszystkich testowanych urządzeń
» 67% wszystkich testowanych urządzeń było lepszych, 6% podobnych, 28% gorszych
» Najlepszy miał deltę 4%, średnia wynosiła ###średnia###%, najgorsza wynosiła 134%
Asus TUF A15 FA507 analiza dźwięku
(±) | głośność głośnika jest średnia, ale dobra (79.3 dB)
Bas 100 - 315 Hz
(±) | zredukowany bas - średnio 13.7% niższy od mediany
(+) | bas jest liniowy (6.2% delta do poprzedniej częstotliwości)
Średnie 400 - 2000 Hz
(±) | wyższe średnie - średnio 7.6% wyższe niż mediana
(±) | liniowość środka jest średnia (7.3% delta do poprzedniej częstotliwości)
Wysokie 2–16 kHz
(+) | zrównoważone maksima - tylko 2.1% od mediany
(±) | liniowość wysokich wartości jest średnia (7.5% delta do poprzedniej częstotliwości)
Ogólnie 100 - 16.000 Hz
(±) | liniowość ogólnego dźwięku jest średnia (17.2% różnicy w stosunku do mediany)
W porównaniu do tej samej klasy
» 46% wszystkich testowanych urządzeń w tej klasie było lepszych, 11% podobnych, 42% gorszych
» Najlepszy miał deltę 6%, średnia wynosiła ###średnia###%, najgorsza wynosiła 132%
W porównaniu do wszystkich testowanych urządzeń
» 31% wszystkich testowanych urządzeń było lepszych, 8% podobnych, 61% gorszych
» Najlepszy miał deltę 4%, średnia wynosiła ###średnia###%, najgorsza wynosiła 134%
Zarządzanie energią - G5 nie zadziwi Państwa swoją wytrzymałością
Zużycie energii
Podczas naszego testu Witcher 3, zużycie energii przez laptopa utrzymywało się na stabilnym poziomie, który jest tak wysoki, jak oczekiwano. Jednak zapotrzebowanie na energię wahało się podczas testu obciążeniowego; G5 KF stale pobierał więcej energii niż moc znamionowa ładowarki (150 watów). W rezultacie adapter wyłączył się samoczynnie po około 50 minutach. Zasilacz nie wydaje się mieć zbyt dużego zapasu mocy. 180-watowy model dostarczony z G5 KE byłby lepszym wyborem w tym przypadku.
| wyłączony / stan wstrzymania | |
| luz | |
| obciążenie |
|
Legenda:
min: | |
| Gigabyte G5 KF i5-12500H, GeForce RTX 4060 Laptop GPU, SSSTC CA6-8D512, IPS, 1920x1080, 15.6" | MSI Cyborg 15 A12VF i7-12650H, GeForce RTX 4060 Laptop GPU, Samsung PM9B1 1024GB MZVL41T0HBLB, IPS, 1920x1080, 15.6" | Intel NUC X15 LAPAC71H i7-12700H, A730M, Samsung 990 Pro 1 TB, IPS, 1920x1080, 15.6" | Asus TUF A15 FA507 R7 7735HS, GeForce RTX 4050 Laptop GPU, Micron 2400 MTFDKBA512QFM, IPS, 1920x1080, 15.6" | Lenovo Legion Slim 5 16APH8 R7 7840HS, GeForce RTX 4060 Laptop GPU, SK hynix PC801 HFS512GEJ9X115N, IPS, 2560x1600, 16" | Gigabyte G5 KE i5-12500H, GeForce RTX 3060 Laptop GPU, Gigabyte AG4512G-SI B10, IPS, 1920x1080, 15.6" | Przeciętny NVIDIA GeForce RTX 4060 Laptop GPU | Średnia w klasie Gaming | |
|---|---|---|---|---|---|---|---|---|
| Power Consumption | 13% | -30% | -7% | -27% | -27% | -44% | -75% | |
| Idle Minimum * (Watt) | 7 | 6 14% | 7.5 -7% | 8 -14% | 9.4 -34% | 7.66 -9% | 11.5 ? -64% | 13.7 ? -96% |
| Idle Average * (Watt) | 10.2 | 8.8 14% | 11.9 -17% | 12.1 -19% | 15.5 -52% | 10.3 -1% | 16 ? -57% | 19.5 ? -91% |
| Idle Maximum * (Watt) | 16.1 | 11.9 26% | 13.9 14% | 12.5 22% | 24.4 -52% | 16.05 -0% | 20.3 ? -26% | 25.7 ? -60% |
| Load Average * (Watt) | 59.3 | 89 -50% | 137 -131% | 74.9 -26% | 74.1 -25% | 115.8 -95% | 92.9 ? -57% | 110.2 ? -86% |
| Witcher 3 ultra * (Watt) | 129 | 90.3 30% | 166 -29% | 136.6 -6% | 112.9 12% | 168.7 -31% | ||
| Load Maximum * (Watt) | 183 | 99 46% | 203 -11% | 185 -1% | 206.5 -13% | 234.6 -28% | 210 ? -15% | 257 ? -40% |
* ... im mniej tym lepiej
Energieaufnahme Witcher 3 / Stresstest
Power consumption with external monitor
Żywotność baterii
15,6-calowe urządzenie wytrzymało odpowiednio 5h 16min i 4h 28min w naszym teście Wi-Fi (dostęp do stron internetowych za pomocą skryptu) i teście wideo (odtwarzanie krótkometrażowego filmu Big Buck Bunny w pętli, w rozdzielczości FHD i zakodowanego w formacie H.264). Podczas testów jasność wyświetlacza była ustawiona na około 150 cd/m², a moduły bezprzewodowe były wyłączone.
Jeśli chodzi o czas pracy na baterii, G5 nie wypadł dobrze w bezpośrednim porównaniu z konkurentem, takim jak MSI Cyborg. Laptop MSI może działać znacznie dłużej niż G5, mimo że mają porównywalną specyfikację sprzętową i prawie identyczną pojemność baterii.
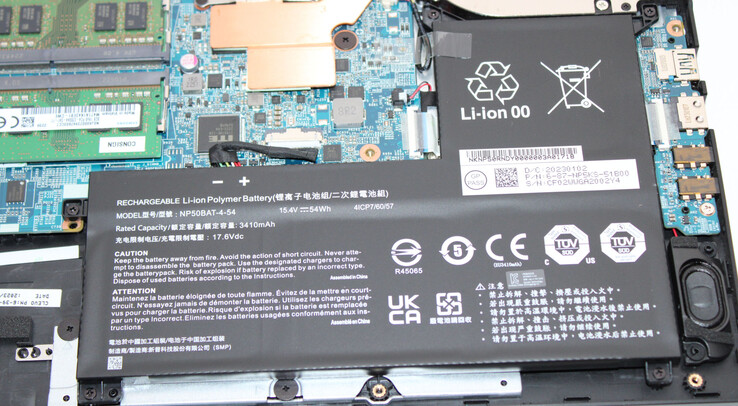
| Gigabyte G5 KF i5-12500H, GeForce RTX 4060 Laptop GPU, 54 Wh | MSI Cyborg 15 A12VF i7-12650H, GeForce RTX 4060 Laptop GPU, 53.5 Wh | Intel NUC X15 LAPAC71H i7-12700H, A730M, 62.3 Wh | Asus TUF A15 FA507 R7 7735HS, GeForce RTX 4050 Laptop GPU, 90 Wh | Lenovo Legion Slim 5 16APH8 R7 7840HS, GeForce RTX 4060 Laptop GPU, 80 Wh | Gigabyte G5 KE i5-12500H, GeForce RTX 3060 Laptop GPU, 54 Wh | Średnia w klasie Gaming | |
|---|---|---|---|---|---|---|---|
| Czasy pracy | 56% | 8% | 87% | 15% | -27% | 26% | |
| Reader / Idle (h) | 8.6 | 13.6 58% | 11.7 36% | 9.23 ? 7% | |||
| H.264 (h) | 4.5 | 8 78% | 12.5 178% | 2.2 -51% | 7.93 ? 76% | ||
| WiFi v1.3 (h) | 5.3 | 7.5 42% | 5.7 8% | 11.7 121% | 7.1 34% | 5.7 8% | 6.73 ? 27% |
| Load (h) | 1.6 | 2.3 44% | 1 -37% | 1.2 -25% | 1 -37% | 1.472 ? -8% | |
| Witcher 3 ultra (h) | 1.3 | 0.958 ? |
Za
Przeciw
Werdykt - Solidna oferta z dużym potencjałem optymalizacji
Pomimo posiadania nowszego procesora graficznego, który w teorii jest mocniejszy, G5 KF jest w stanie zaoferować "tylko" mniej więcej taką samą wydajność w grach jak jego poprzednik jego poprzednikchoć zużywa znacznie mniej energii. Bardziej wydajny RTX 4060 (75 W) działa przy niższym TGP niż RTX 3060 (115 W) w G5 KE. Przy tym samym TGP, G5 KF działa lepiej niż KE.
Gigabyte dostarczył budżetowy laptop do gier FHD z G5 KF. Ale użytkownicy będą musieli poradzić sobie z szeregiem wad.
Laptop staje się zauważalnie ciepły pod obciążeniem w niektórych obszarach, a także wytwarza sporo hałasu. Kwestię hałasu można złagodzić za pomocą dostarczonych profili wydajności, ale wydajność zostanie obniżona. Niestety, okrojony zasilacz (150 W zamiast 180 W) nie jest w stanie poradzić sobie z każdym rodzajem obciążenia (np. testami obciążeniowymi).
Ilość wbudowanej pamięci masowej (512 GB) wydaje się marna jak na notebooka do gier. Realnie rzecz biorąc, system może wytrzymać od 4 do 5,5 godziny na jednym ładowaniu - co nikogo nie powali na kolana. Co więcej, port Thunderbolt 4 w notebooku G5 KE ustąpił miejsca portowi USB 3.2 Gen 2. Matowy wyświetlacz Full HD (15,6 cala, IPS, 144 Hz) również nie zdobędzie żadnych nagród: jego pokrycie kolorów, jasność i kontrast nie spełniają standardów. Stosunkowo niska cena laptopa wynika również z faktu, że licencja Windows nie jest dołączona do systemu.
Laptop Asus TUF A15 FA507 jest alternatywą dla G5 KF. Pomimo słabszego GPU na papierze, ma tylko nieznacznie niższą wydajność graficzną niż G5. A15 oferuje również lepszą wydajność procesora, znacznie dłuższy czas pracy na baterii i port USB4. TUF A15 można obecnie nabyć za 1099 euro (około 1165 USD) z systemem Windows 11 w zestawie.
Cena i dostępność
Gigabyte G5 KF kosztuje około 984 € (950 USD) na Amazon.de lub Amazon.com. Proszę zwrócić uwagę, że model na amerykańskim Amazon ma tylko 8 GB pamięci RAM, ale jest dostarczany z systemem Windows 11. Ceny mogą się również zmieniać w czasie. Osoby z ograniczonym budżetem mogą rozważyć niższe modele G5 MF (RTX 4050, 8 GB pamięci RAM) i G5 GE (RTX 3050, 8 GB pamięci RAM), z których oba mają tę samą konstrukcję fizyczną.
Gigabyte G5 KF
- 18/10/2023 v7 (old)
Sascha Mölck
Przezroczystość
Wyboru urządzeń do recenzji dokonuje nasza redakcja. Próbka testowa została udostępniona autorowi jako pożyczka od producenta lub sprzedawcy detalicznego na potrzeby tej recenzji. Pożyczkodawca nie miał wpływu na tę recenzję, producent nie otrzymał też kopii tej recenzji przed publikacją. Nie było obowiązku publikowania tej recenzji. Jako niezależna firma medialna, Notebookcheck nie podlega władzy producentów, sprzedawców detalicznych ani wydawców.
Tak testuje Notebookcheck
Każdego roku Notebookcheck niezależnie sprawdza setki laptopów i smartfonów, stosując standardowe procedury, aby zapewnić porównywalność wszystkich wyników. Od około 20 lat stale rozwijamy nasze metody badawcze, ustanawiając przy tym standardy branżowe. W naszych laboratoriach testowych doświadczeni technicy i redaktorzy korzystają z wysokiej jakości sprzętu pomiarowego. Testy te obejmują wieloetapowy proces walidacji. Nasz kompleksowy system ocen opiera się na setkach uzasadnionych pomiarów i benchmarków, co pozwala zachować obiektywizm.

