Recenzja Asus Zenbook S 13 OLED 2023 - Najsmuklejszy ultrabook OLED na świecie zmaga się z irytującymi fanami
Asus całkowicie przerobił swój kompaktowy, 13-calowy ultrabook ZenBook S 13, skupiając się głównie na wprowadzeniu na rynek jeszcze lżejszego i smuklejszego urządzenia. Według materiałów marketingowych jest to nawet najsmuklejszy 13,3-calowy ultrabook OLED na świecie. W tym redesignie producent postanowił również zastąpić bardzo dobry procesor AMD z zeszłorocznego modelu aktualnym układem Raptor Lake od Intela. Oczywiście ocenimy, czy była to słuszna decyzja.
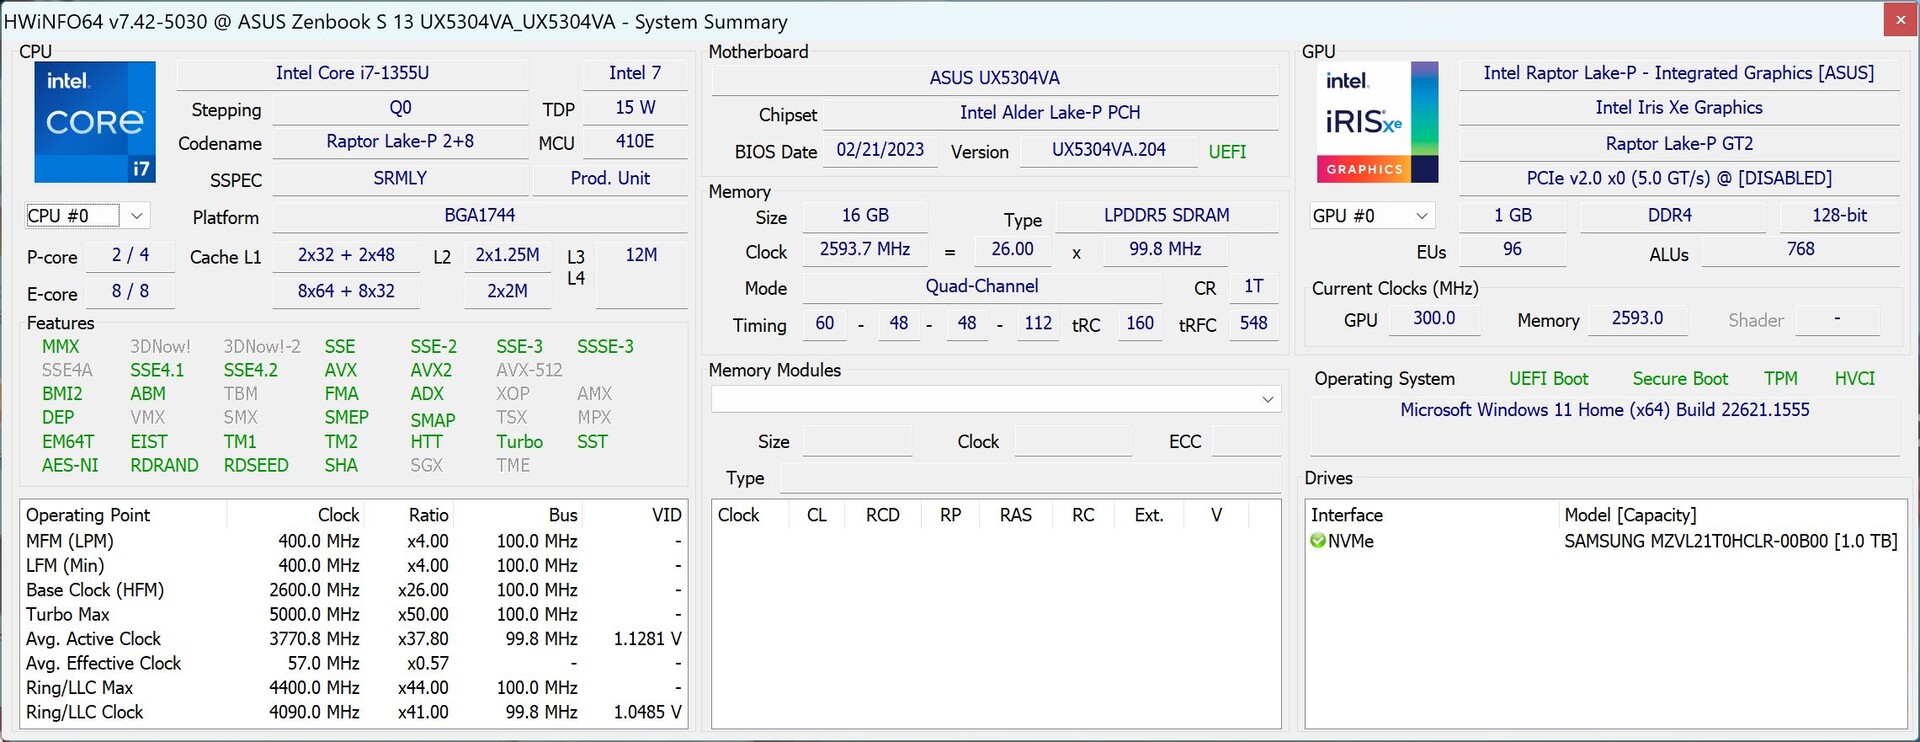
Nasz testowy egzemplarz Zenbook S 13 OLED ponownie został wyposażony w 13,3-calowy panel OLED w formacie 16:10. Ponadto w urządzeniu znajduje się m.in.Intel Core i7-1355U, 16 GB pamięci RAM i duży dysk SSD PCIe 4.0 o pojemności 1 TB, a jego cena detaliczna wynosi 1499 euro (~1 657 dolarów). Ale mamy też dobre wieści dla fanów m.in zeszłorocznego Zenbook S 13, ponieważ pojawi się również odświeżenie z procesorami AMD Zen4.
Potencjalni konkurenci w porównaniu
Ocena | Data | Model | Waga | Wysokość | Rozmiar | Rezolucja | Cena |
|---|---|---|---|---|---|---|---|
| 85.4 % v7 (old) | 05/2023 | Asus ZenBook S13 OLED UX5304 i7-1355U, Iris Xe G7 96EUs | 1 kg | 11.8 mm | 13.30" | 2880x1800 | |
| 90.1 % v7 (old) | Asus Zenbook S 13 OLED R7 6800U, Radeon 680M | 1.1 kg | 14.9 mm | 13.30" | 2880x1800 | ||
| 92 % v7 (old) | 04/2023 | Apple MacBook Air M2 10C GPU M2, M2 10-Core GPU | 1.2 kg | 11.3 mm | 13.60" | 2560x1664 | |
| 86.4 % v7 (old) | 10/2022 | Lenovo Yoga Slim 7 Carbon 13IAP7-82U9005FGE i7-1260P, Iris Xe G7 96EUs | 986 g | 14.8 mm | 13.30" | 2560x1600 | |
| 87.3 % v7 (old) | 09/2022 | Dell XPS 13 Plus 9320 i7-1280P OLED i7-1280P, Iris Xe G7 96EUs | 1.3 kg | 15.28 mm | 13.40" | 3456x2160 | |
| 86.7 % v7 (old) | Samsung Galaxy Book2 Pro 13 NP930XED-KA1DE i5-1240P, Iris Xe G7 80EUs | 885 g | 11 mm | 13.30" | 1920x1080 |
Obudowa - Asus stosuje plazmową powłokę ceramiczną
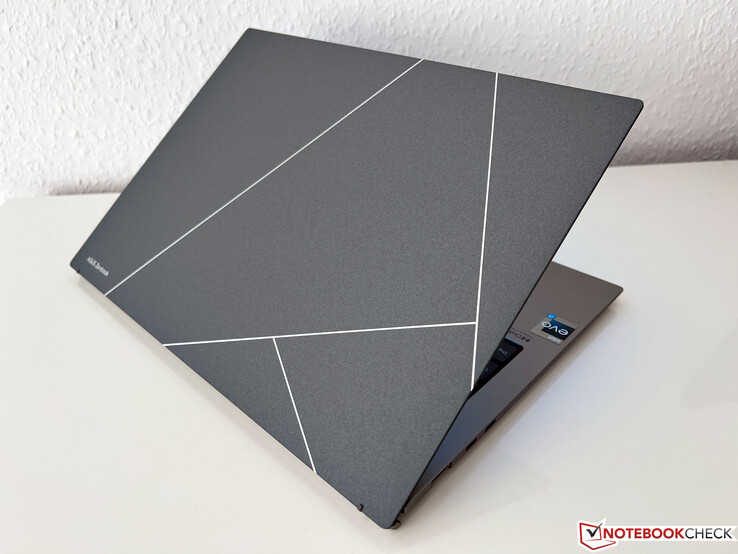
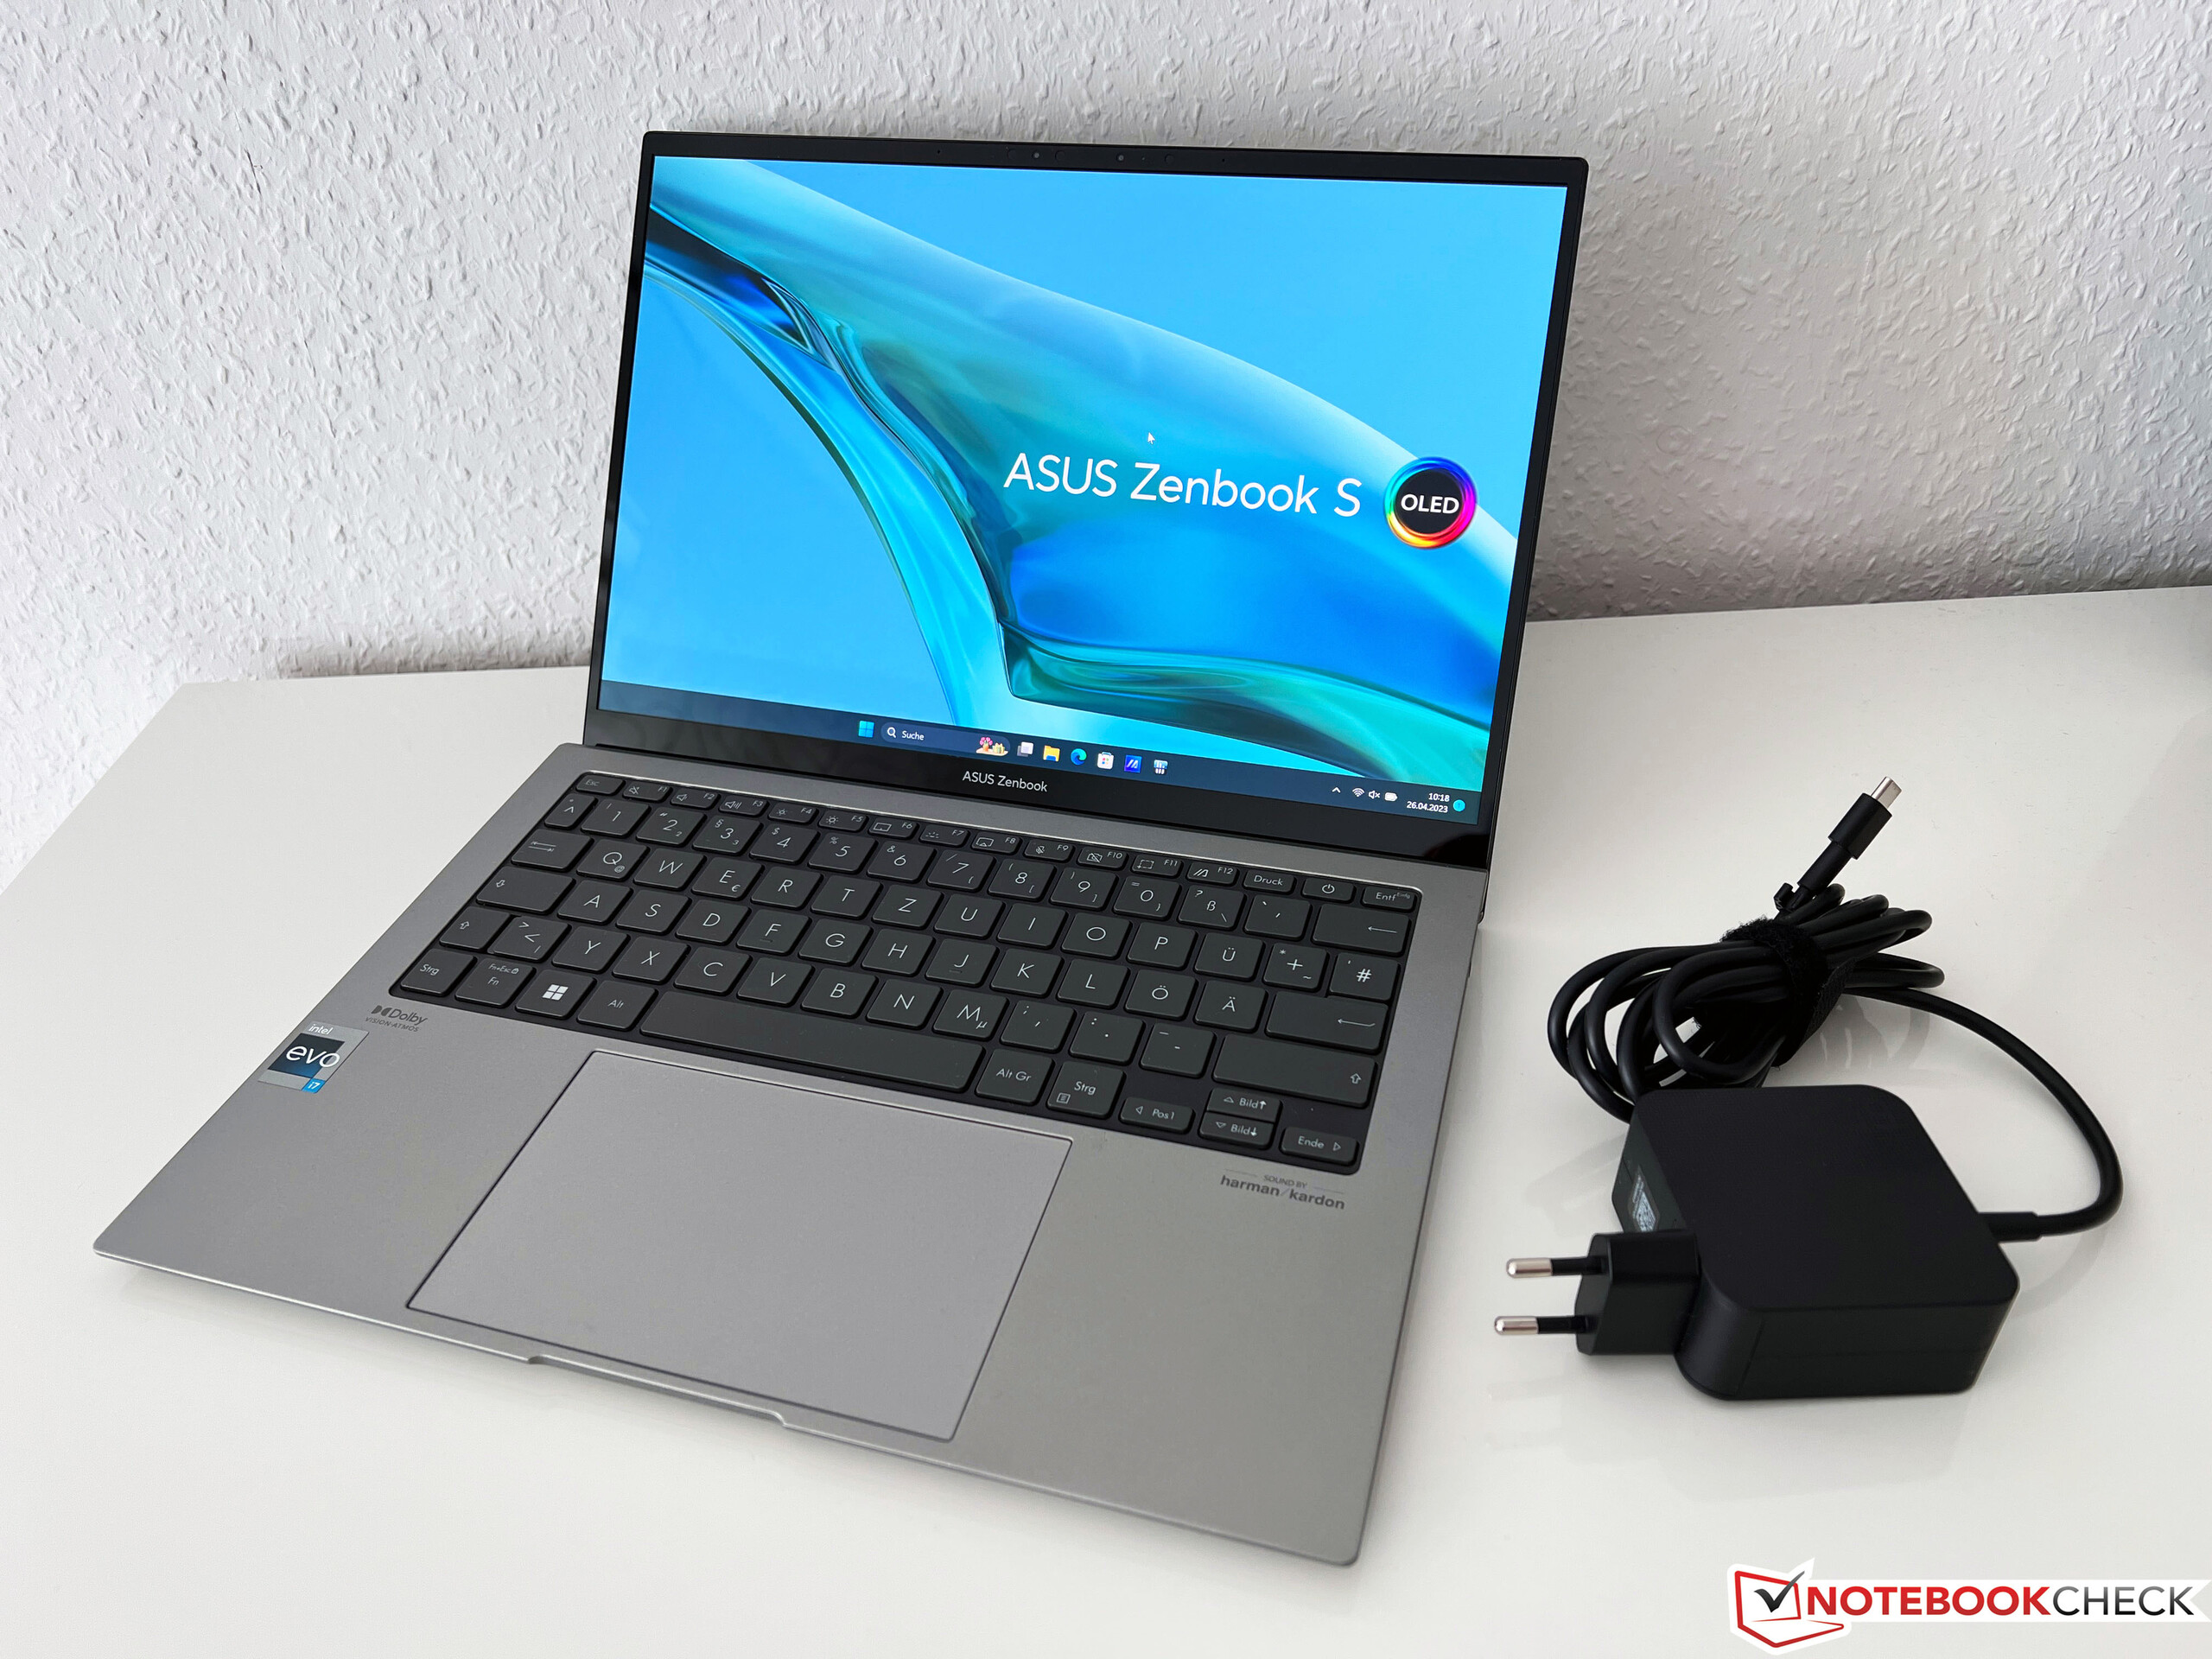
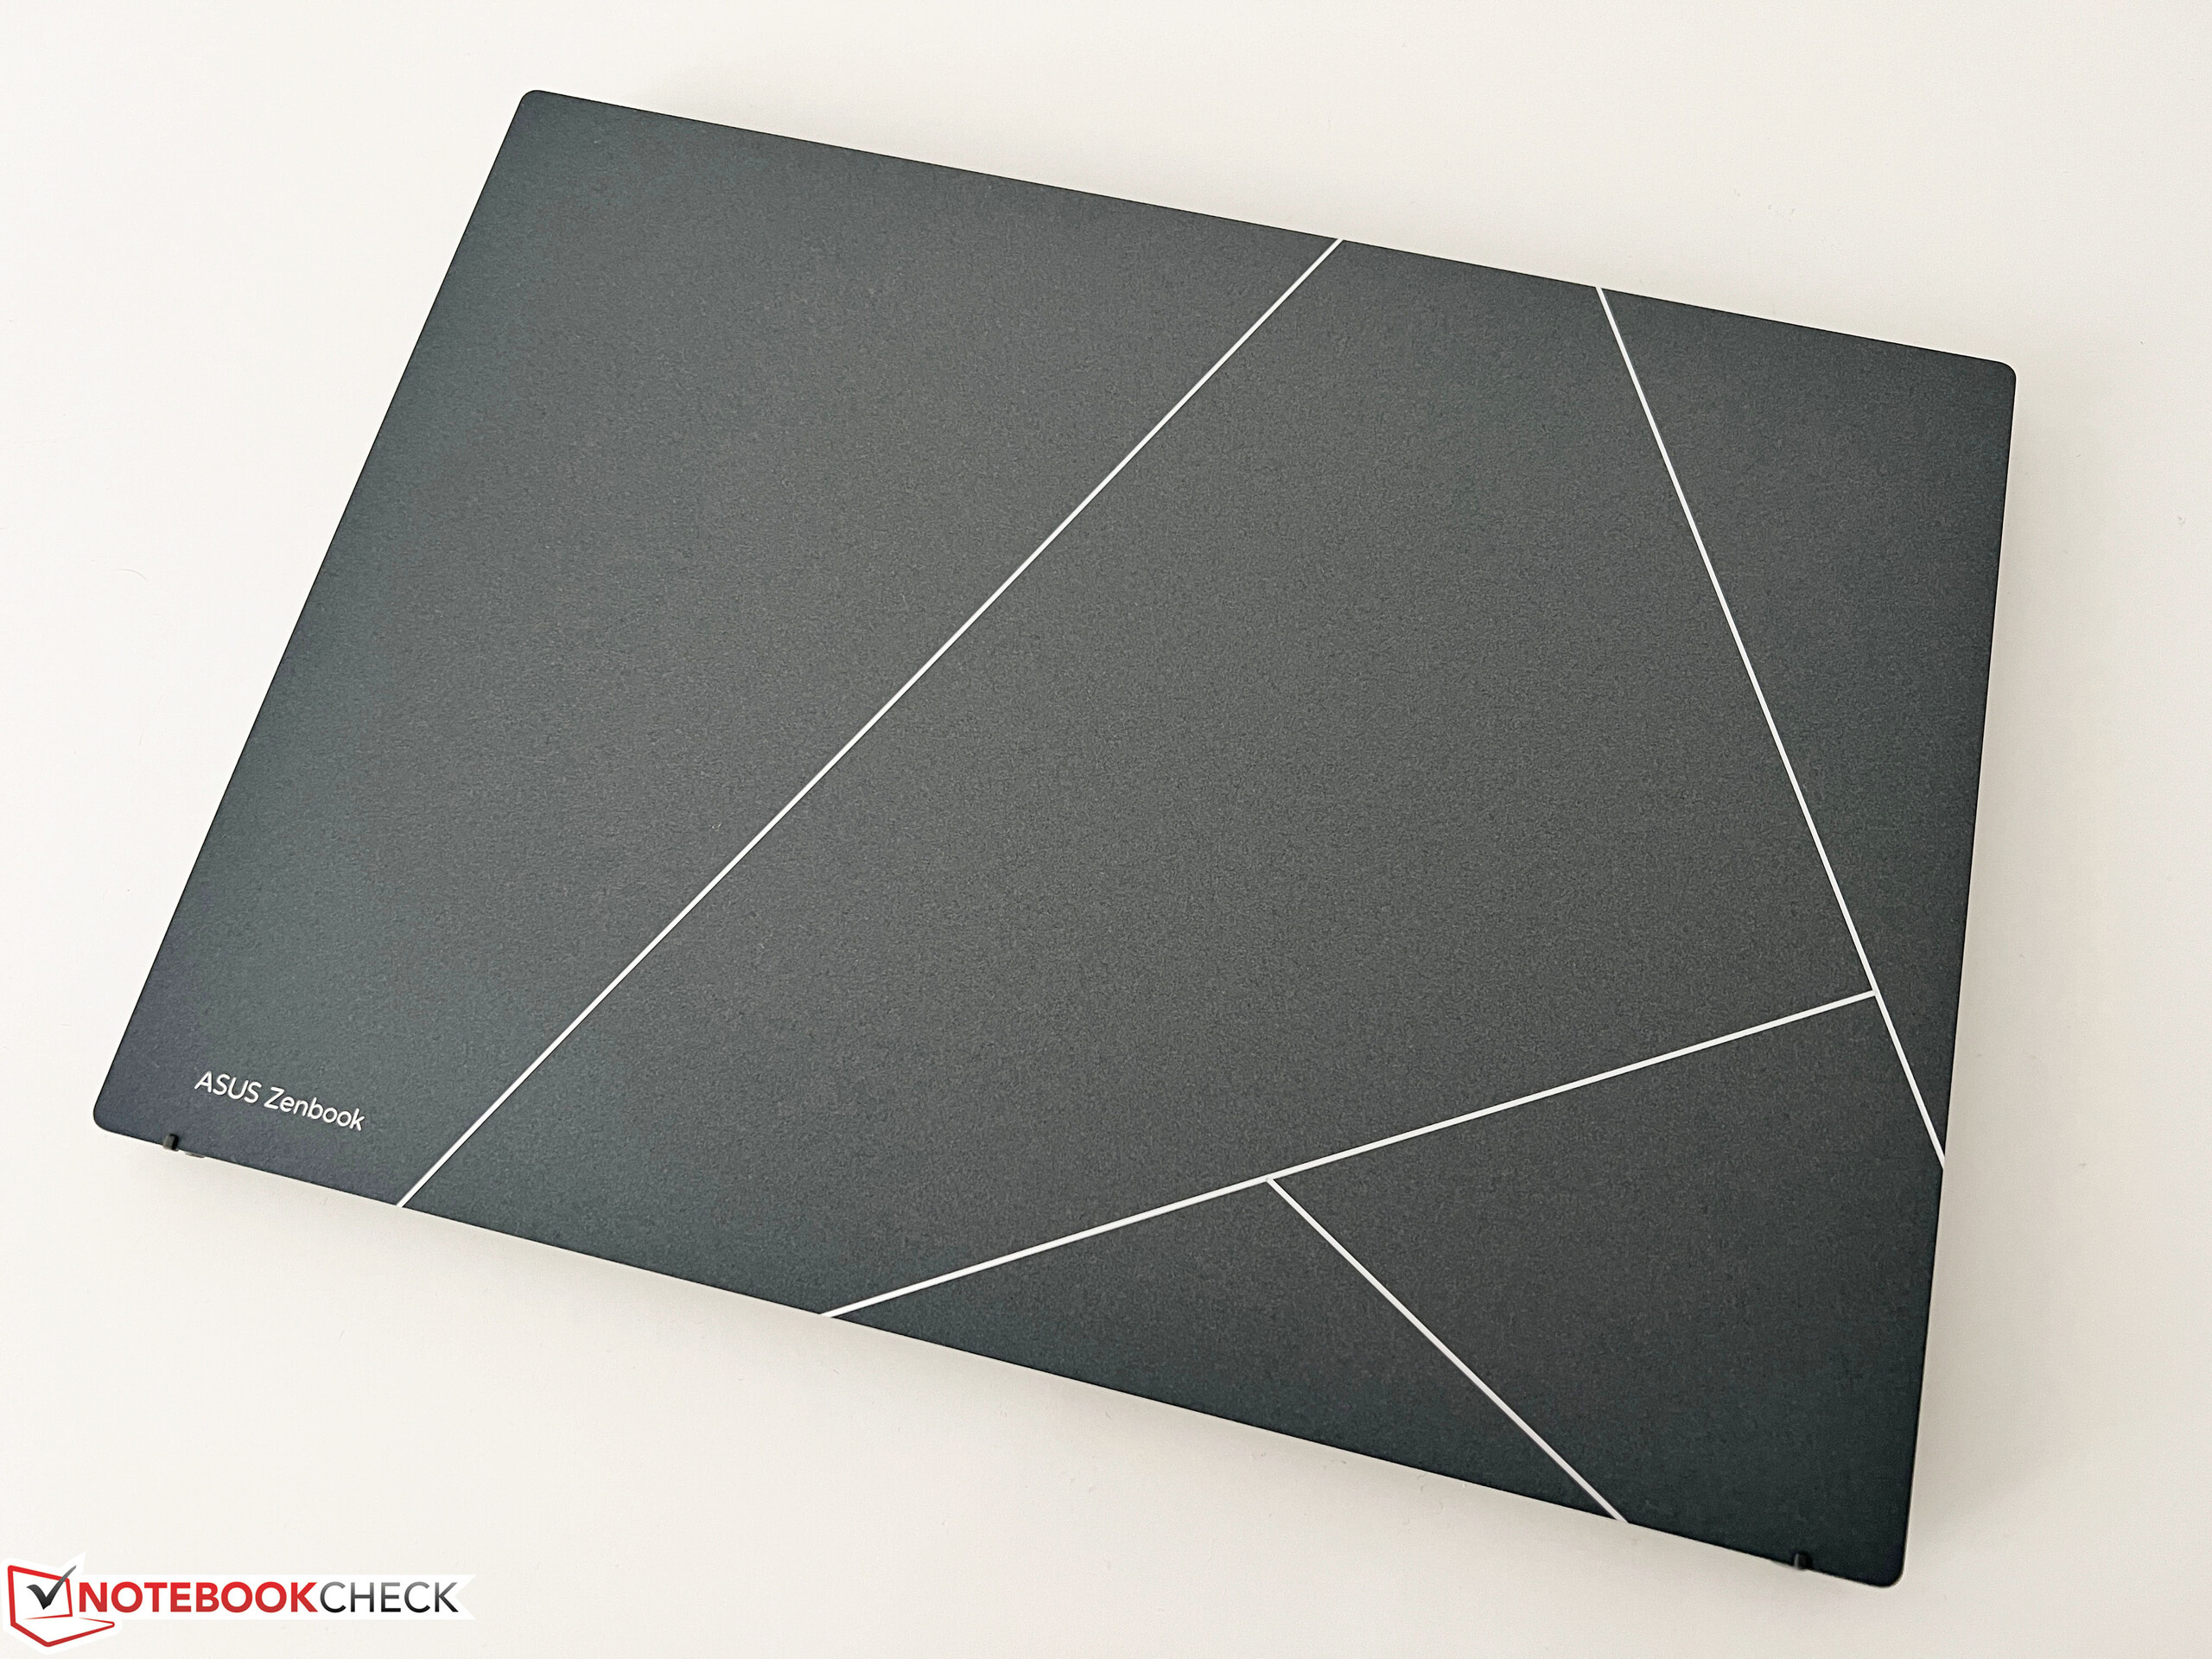
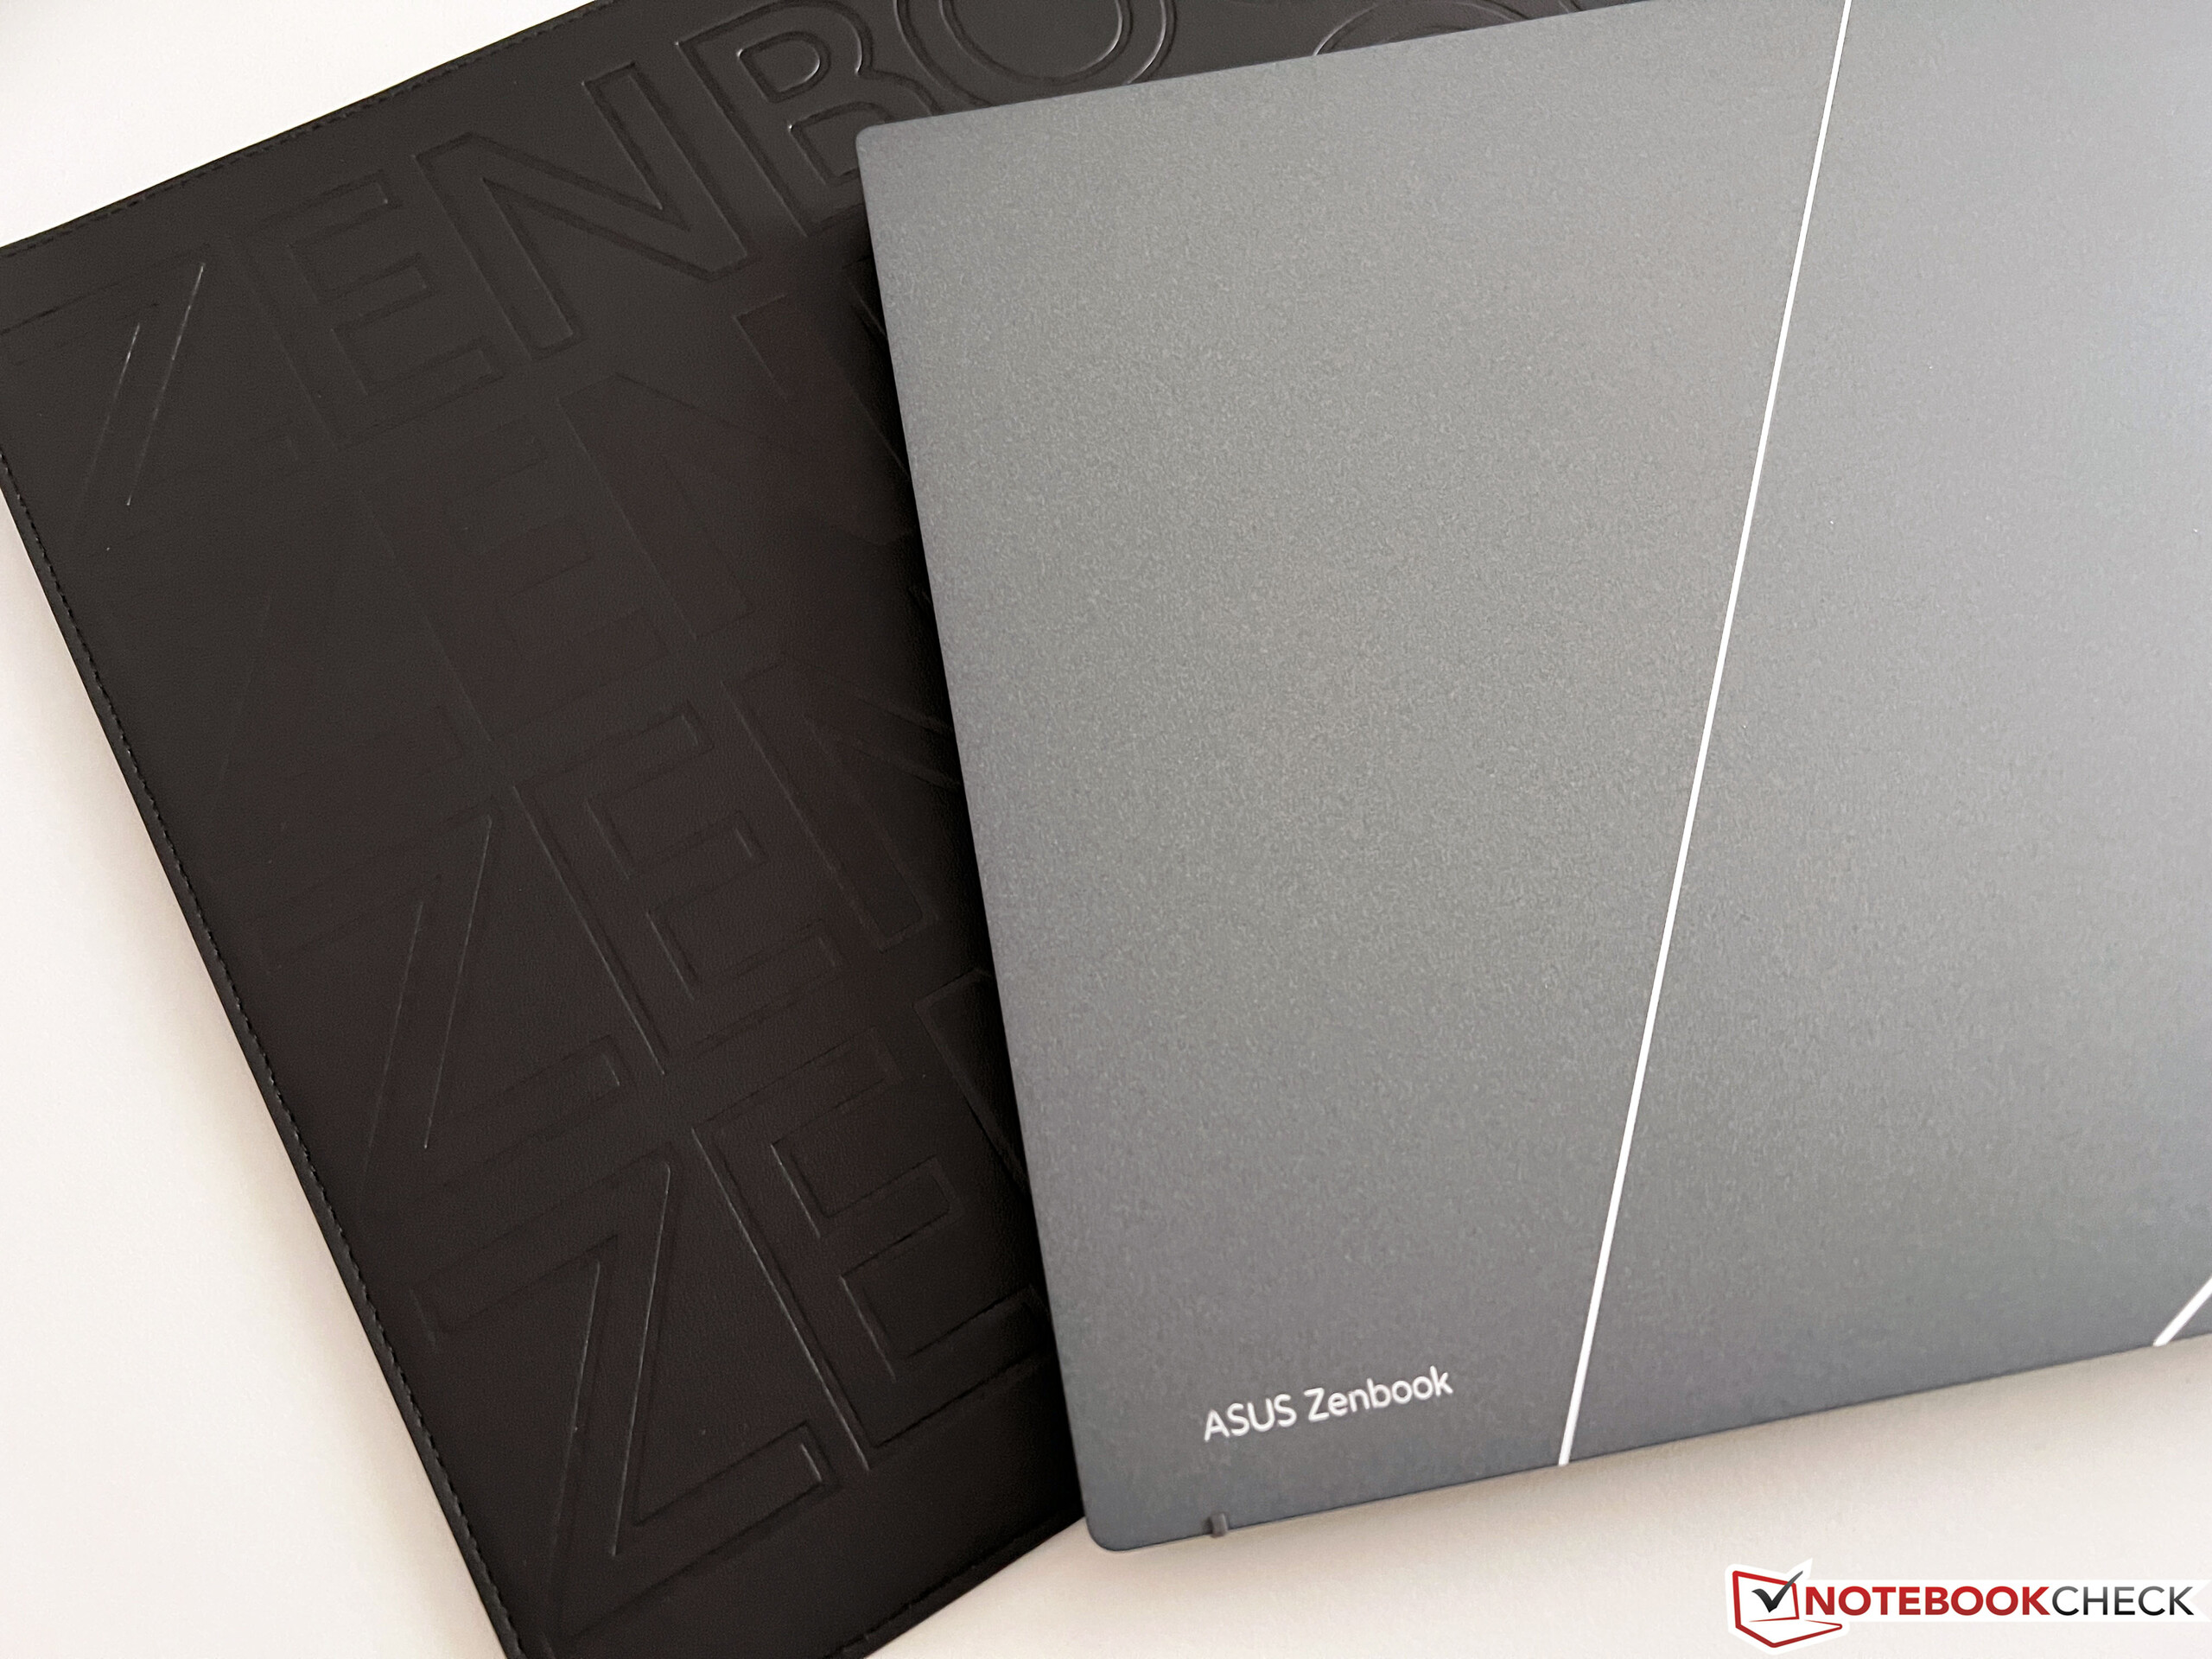
Obudowa modelu 2023 Zenbook S 13 jest zgodna z nową konstrukcją, w tym z nowym zawiasem wyświetlacza. Jest to mechanizm ErgoLift, w którym jednostka zasadnicza jest ustawiona pod kątem podczas podnoszenia pokrywy. Ma to zarówno zalety, jak i wady, i chociaż kątowa jednostka bazowa sprawia, że pisanie jest bardziej komfortowe, to przy umieszczaniu urządzenia na udach pojawia się teraz twarda krawędź. Nowy Zenbook jest dostępny w kolorze Ponder Blue lub Basalt Grey, a nasz szary egzemplarz testowy wygląda bardzo dobrze i elegancko w różnych odcieniach szarości. Ponadto bardzo podoba nam się duże logo ProArt na górze pokrywy wyświetlacza.

Oprócz nowego designu, do wykonania pokrywy użyto również nowego materiału. Zasadniczo obudowa wykonana jest z aluminium, które następnie zostało pokryte warstwą plazmowej powłoki ceramicznej. Ta nowa technologia powierzchni oferuje różne zalety, takie jak zwiększona odporność na zużycie i korozję. W codziennej eksploatacji lekko chropowata powierzchnia ma również tę zaletę, że w ogóle nie widać na niej odcisków palców. Po ponad tygodniu nie potrzebowaliśmy nawet ściereczki do czyszczenia. Według producenta proces produkcji jest również bardziej przyjazny dla środowiska.
Powierzchnia jednostki zasadniczej jest również lekko chropowata i tam również odciski palców nie stanowią problemu. Stabilność całego laptopa pozostawia u nas doskonałe wrażenie i mimo smukłej budowy ani jednostki zasadniczej, ani pokrywy nie da się nadmiernie wypaczyć czy wygiąć. Zawias jest również dobrze wyregulowany, choć nie jest to w stanie zapobiec lekkiemu chybotaniu się po zmianie kąta otwarcia. Maksymalny kąt otwarcia wynosi 180 stopni.
Z porównania rozmiarów wynika, że nowy Zenbook S 13 stał się szczególnie smuklejszy. Choć jest też mniej gruby od konkurentów z Windows, tj MacBook Air M2 z Apple jest nawet minimalnie szczuplejszy. Z drugiej strony, arkusz specyfikacji jest nieco optymistyczny, jeśli chodzi o wagę, ponieważ nasz egzemplarz testowy przynosi na wagę 1 048 gramów (~3,263 lb), plasując się z tym dopiero w środku pola. W porównaniu z poprzednikiem jest to oszczędność wagi zaledwie 47 gramów (~1,7 oz). W grubości oszczędności wynoszą co najmniej 3 mm (~0,12 cala), co jest zdecydowanie zauważalne. Według Asusa jest to najlżejszy 13,3-calowy laptop z matrycą OLED, ale niektórzy konkurenci z panelami IPS są jeszcze lżejsi. Ogólnie jednak mobilność Zenbooka S 13 jest oczywiście znakomita. Kompaktowa ładowarka dodaje do wagi kolejne 228 gramów (~8 oz).
Sprzęt - Zenbook z Thunderbolt 4
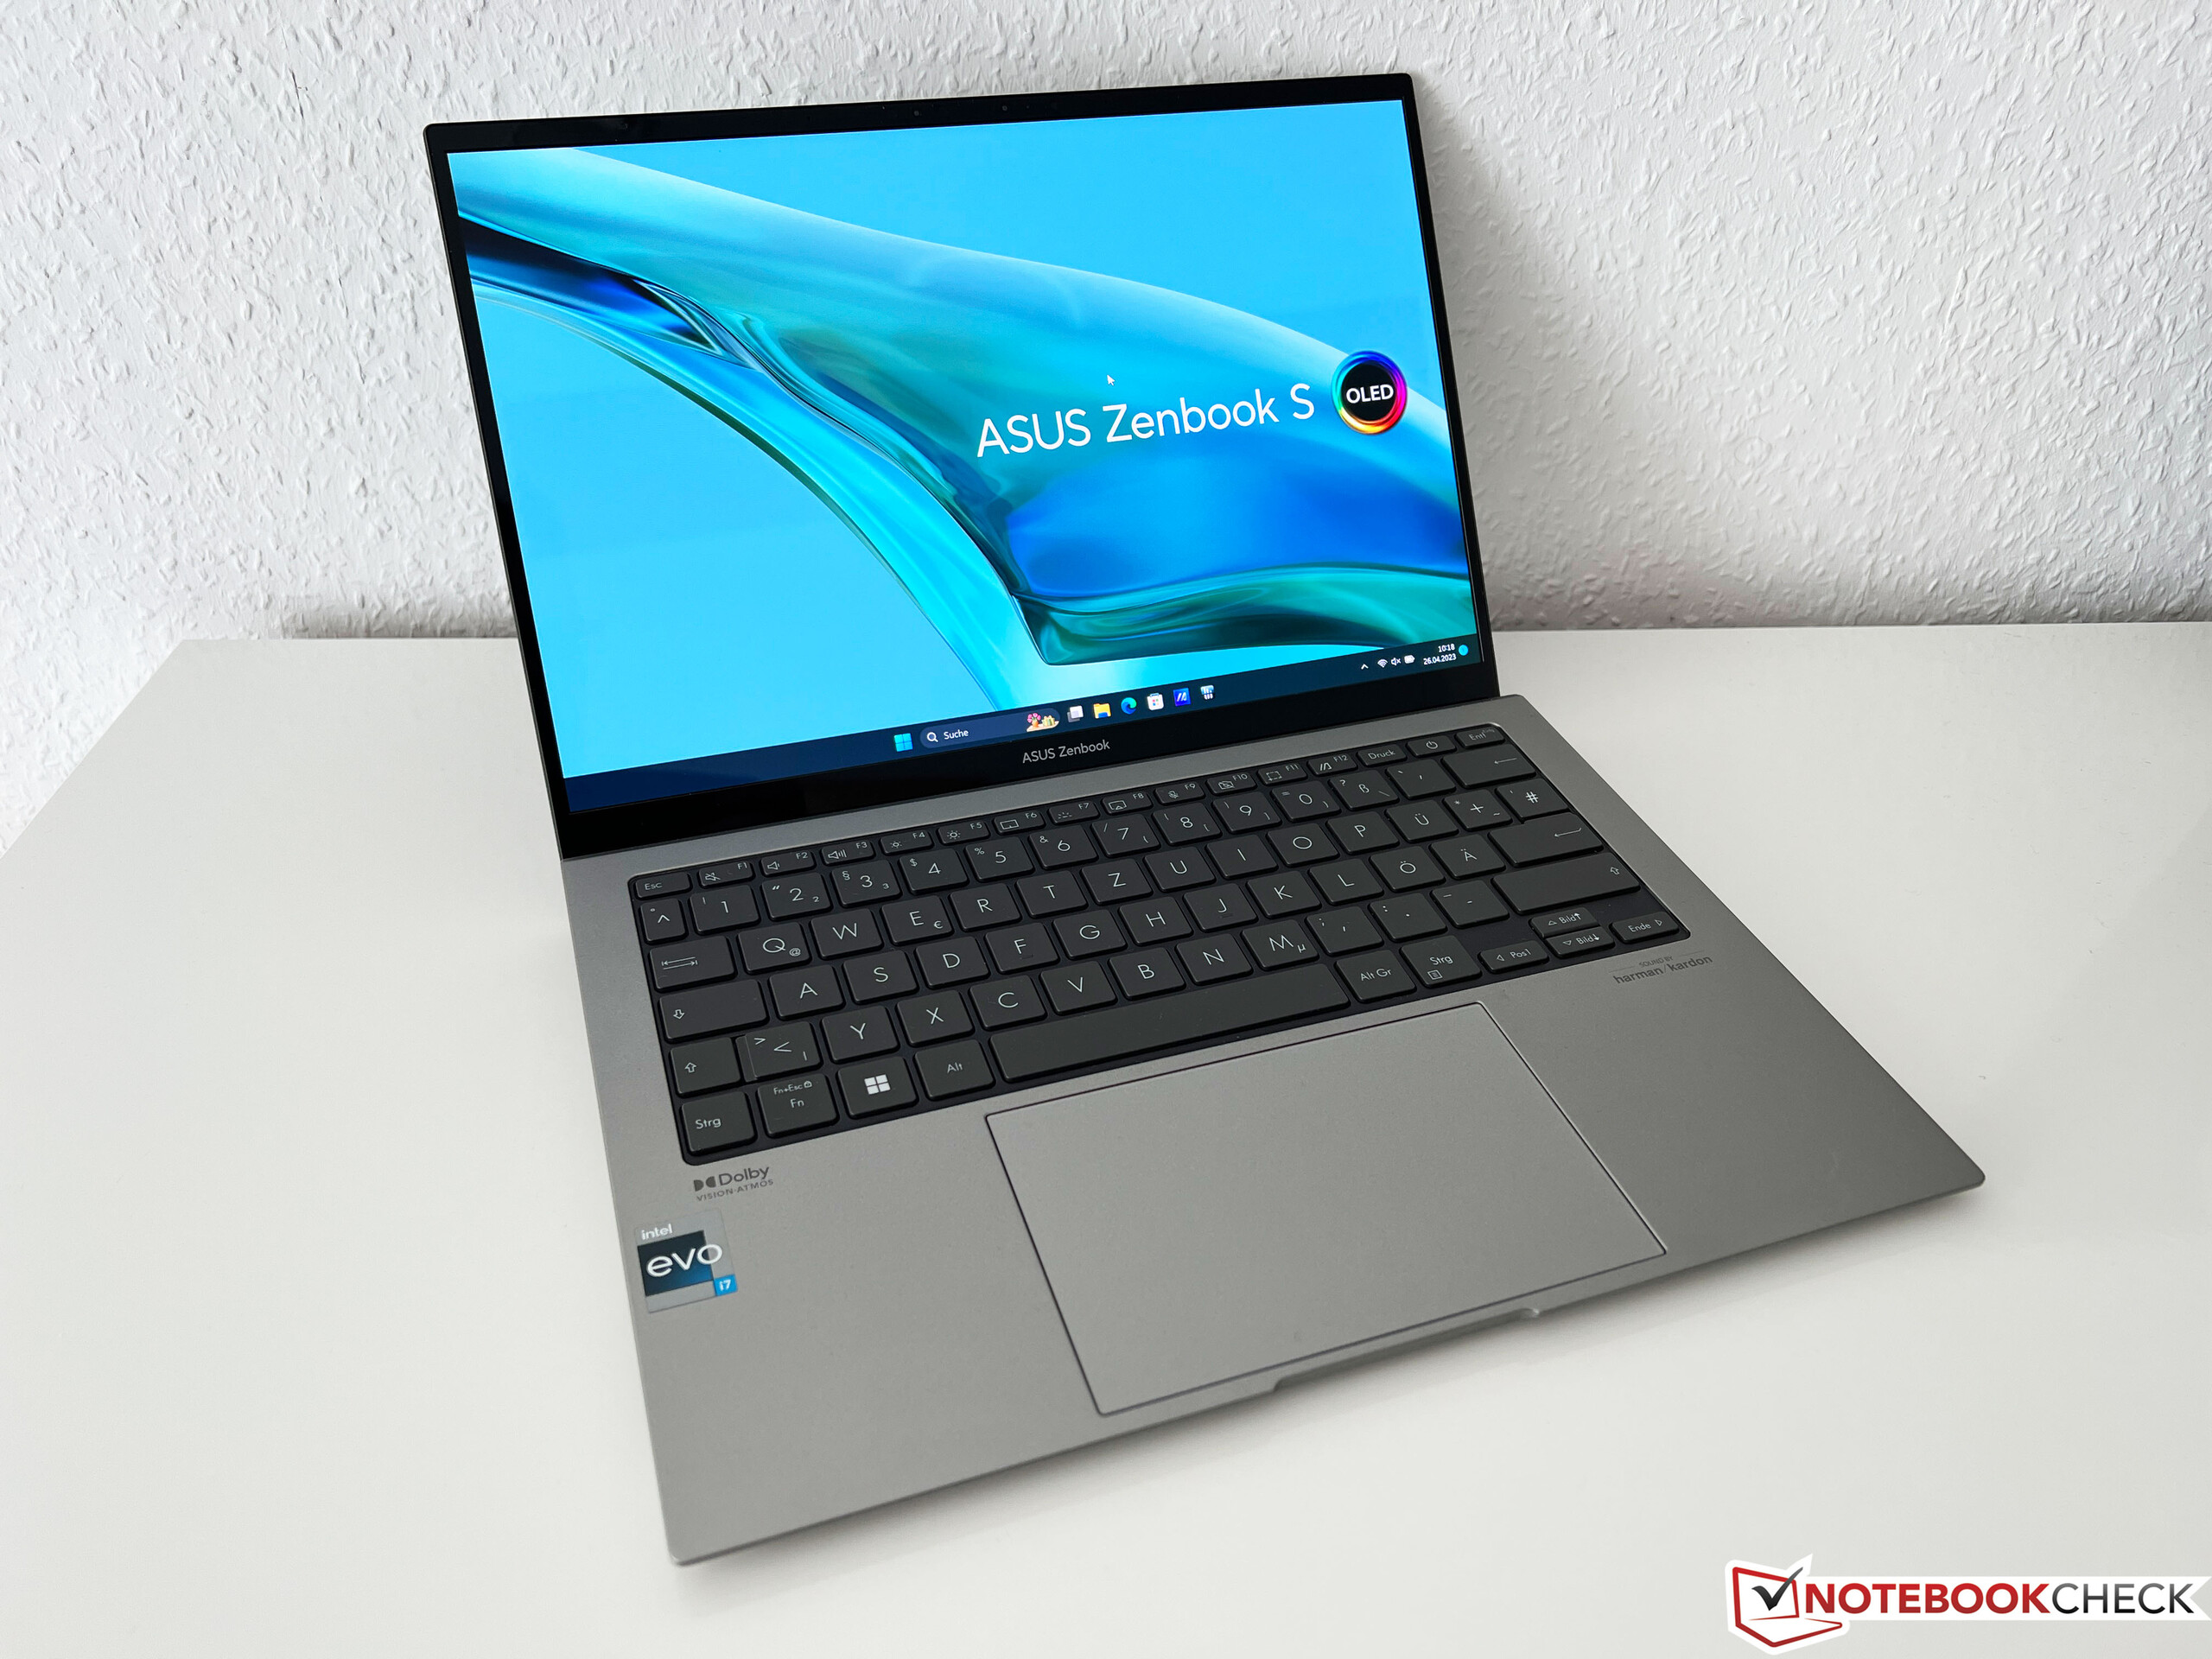
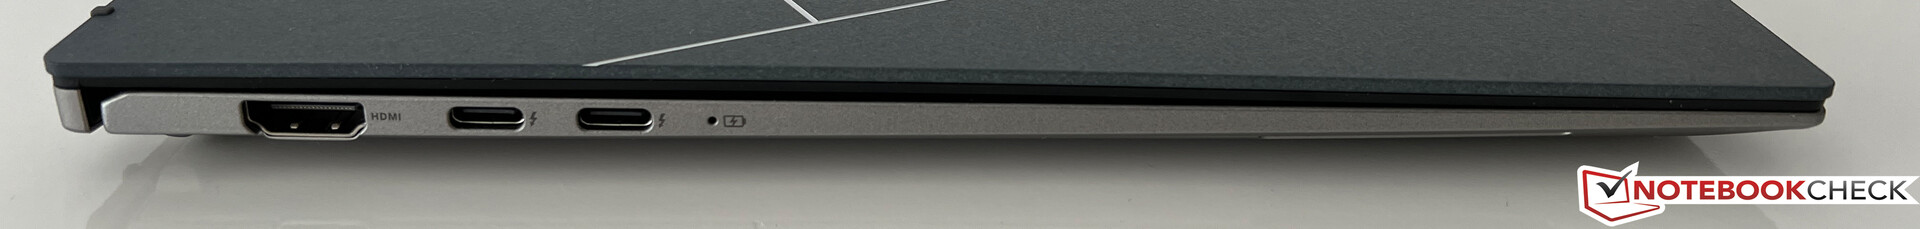
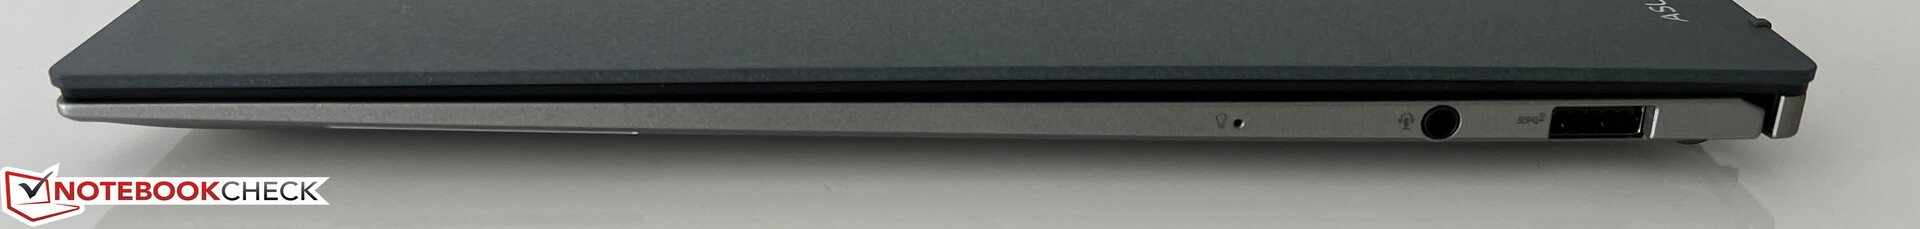
Po Zenbook S 13 z zeszłego rokukorzystał wyłącznie z trzech portów USB-C, Asus oferuje teraz 2x USB-C, dodając także port USB-A (pomimo smukłej obudowy), a także pełnowymiarowy port HDMI. Jest to po prostu dużo praktyczniejsze w codziennej eksploatacji, a ponieważ jest to laptop Intela, dwa porty USB-C oczywiście obsługują też Thunderbolt 4.
Komunikacja
Asus wykorzystuje nowoczesny moduł WLAN AZ211 od Intela, który obsługuje już najbardziej aktualny standard WLAN Wi-Fi 6E, a także Bluetooth 5.2. W naszym teście nie udało się jednak połączyć z odpowiednią siecią 6-GHz naszego referencyjnego routera Asusa i dlatego zamiast tego korzystaliśmy z sieci 5-GHz. Szybkość transferu jest ogólnie bardzo wysoka, a także w dużym stopniu stabilna. W praktyce nie zaobserwowaliśmy również żadnych problemów z połączeniem.
| Networking | |
| Asus ZenBook S13 OLED UX5304 | |
| iperf3 transmit AXE11000 | |
| iperf3 receive AXE11000 | |
| Asus Zenbook S 13 OLED | |
| iperf3 transmit AXE11000 | |
| iperf3 receive AXE11000 | |
| Apple MacBook Air M2 Entry | |
| iperf3 transmit AXE11000 | |
| iperf3 receive AXE11000 | |
| Lenovo Yoga Slim 7 Carbon 13IAP7-82U9005FGE | |
| iperf3 transmit AXE11000 6GHz | |
| iperf3 receive AXE11000 6GHz | |
| Samsung Galaxy Book2 Pro 13 NP930XED-KA1DE | |
| iperf3 transmit AXE11000 6GHz | |
| iperf3 receive AXE11000 6GHz | |
Kamera internetowa
Asus zaktualizował kamerę internetową i obecnie stosuje kamerę Full-HD wraz z czujnikiem IR do rozpoznawania twarzy w połączeniu z Windows Hello. Jakość jest nieco lepsza niż w zeszłym roku i przyzwoita w dobrych warunkach oświetleniowych.


Konserwacja
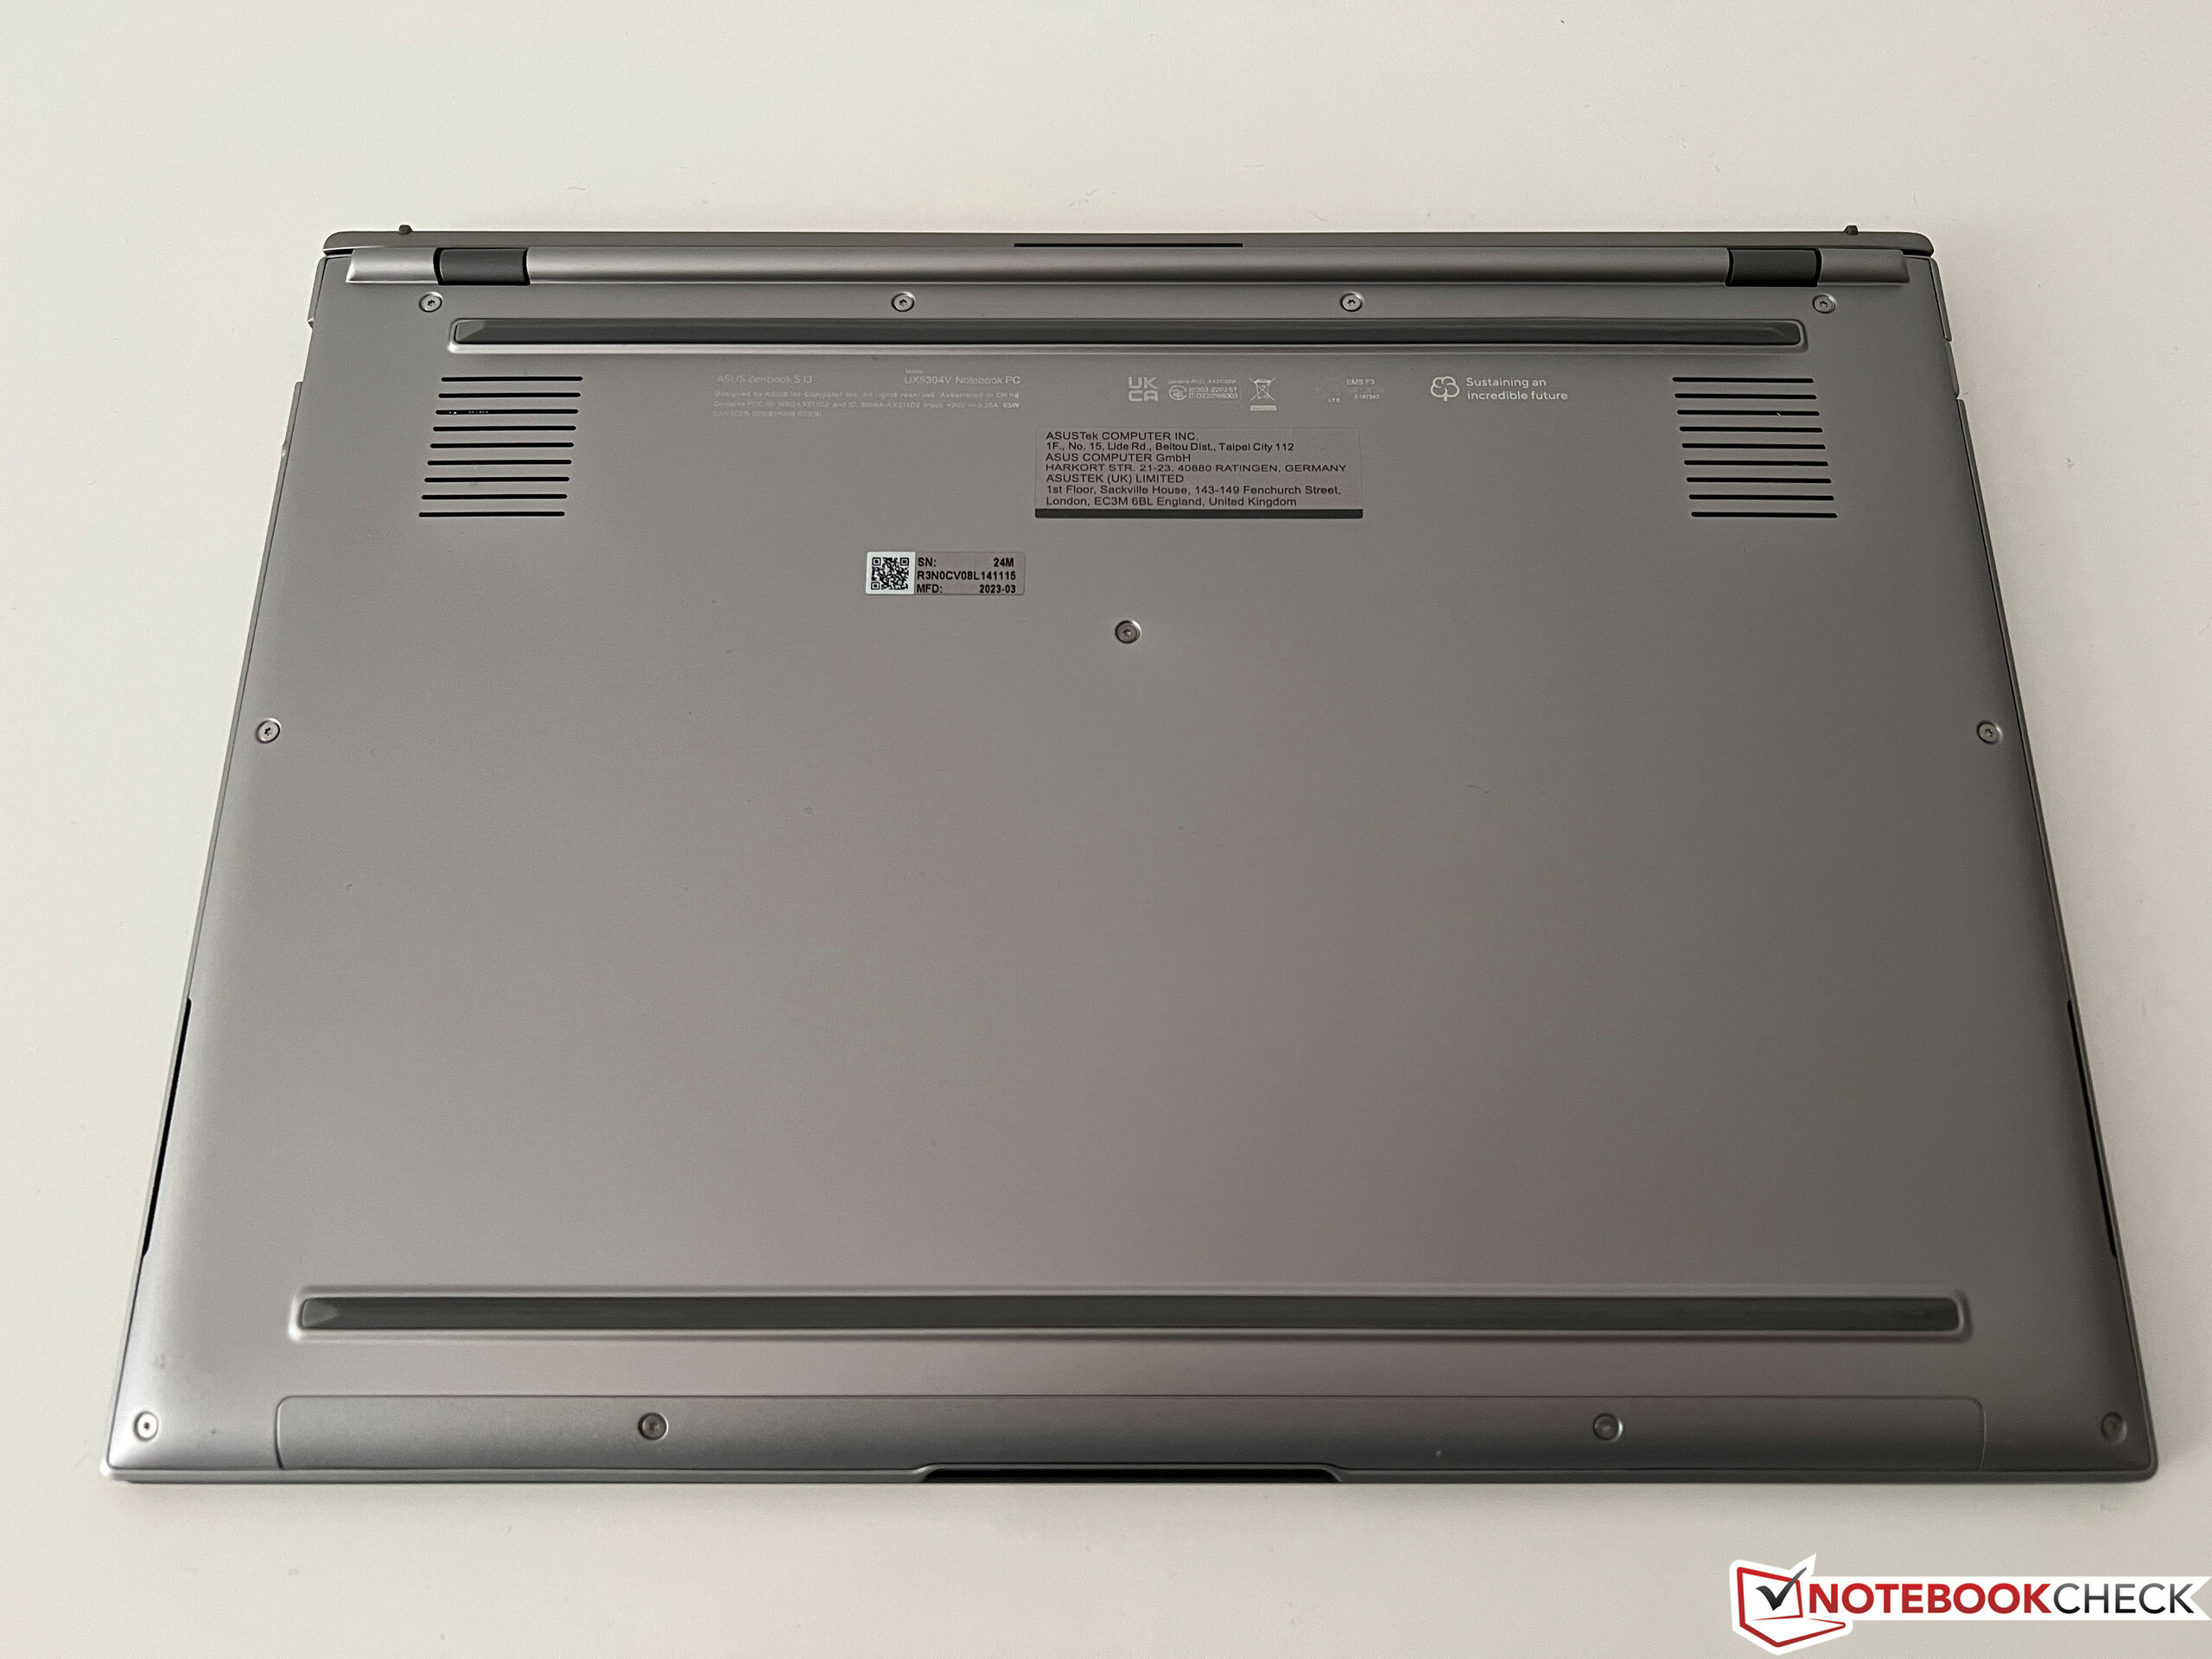
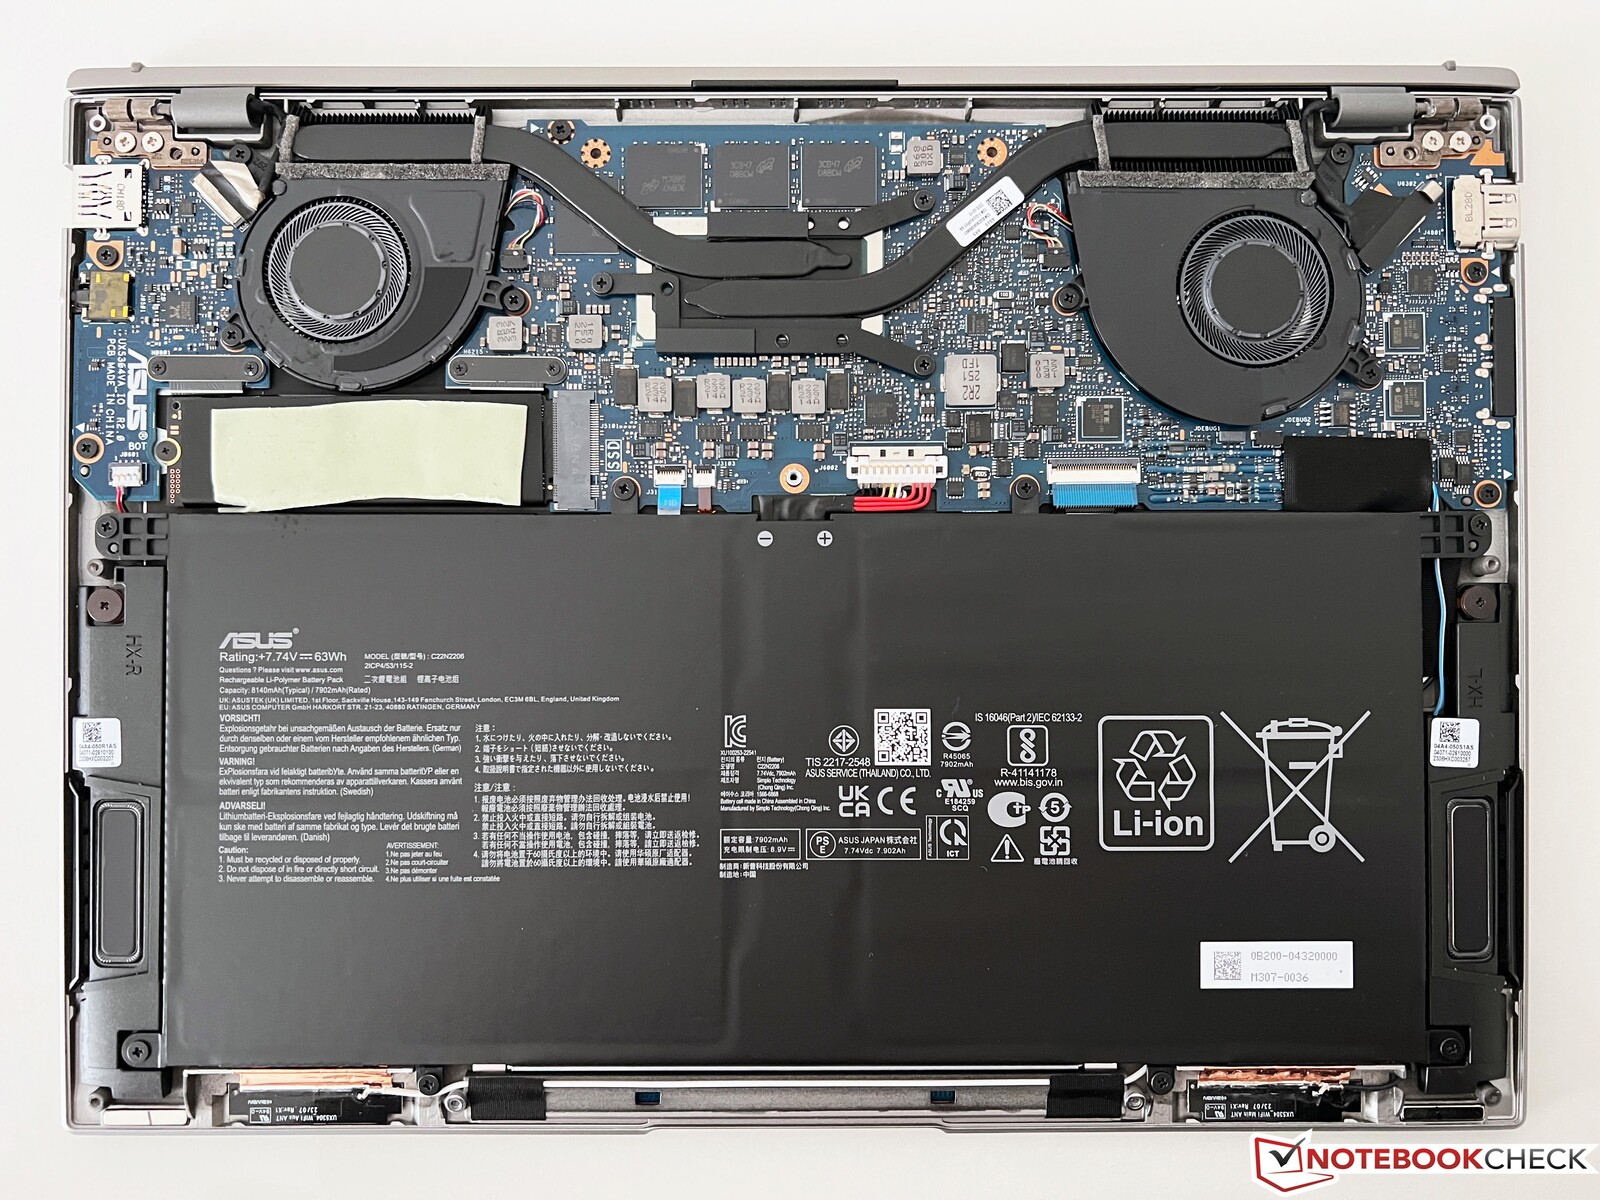
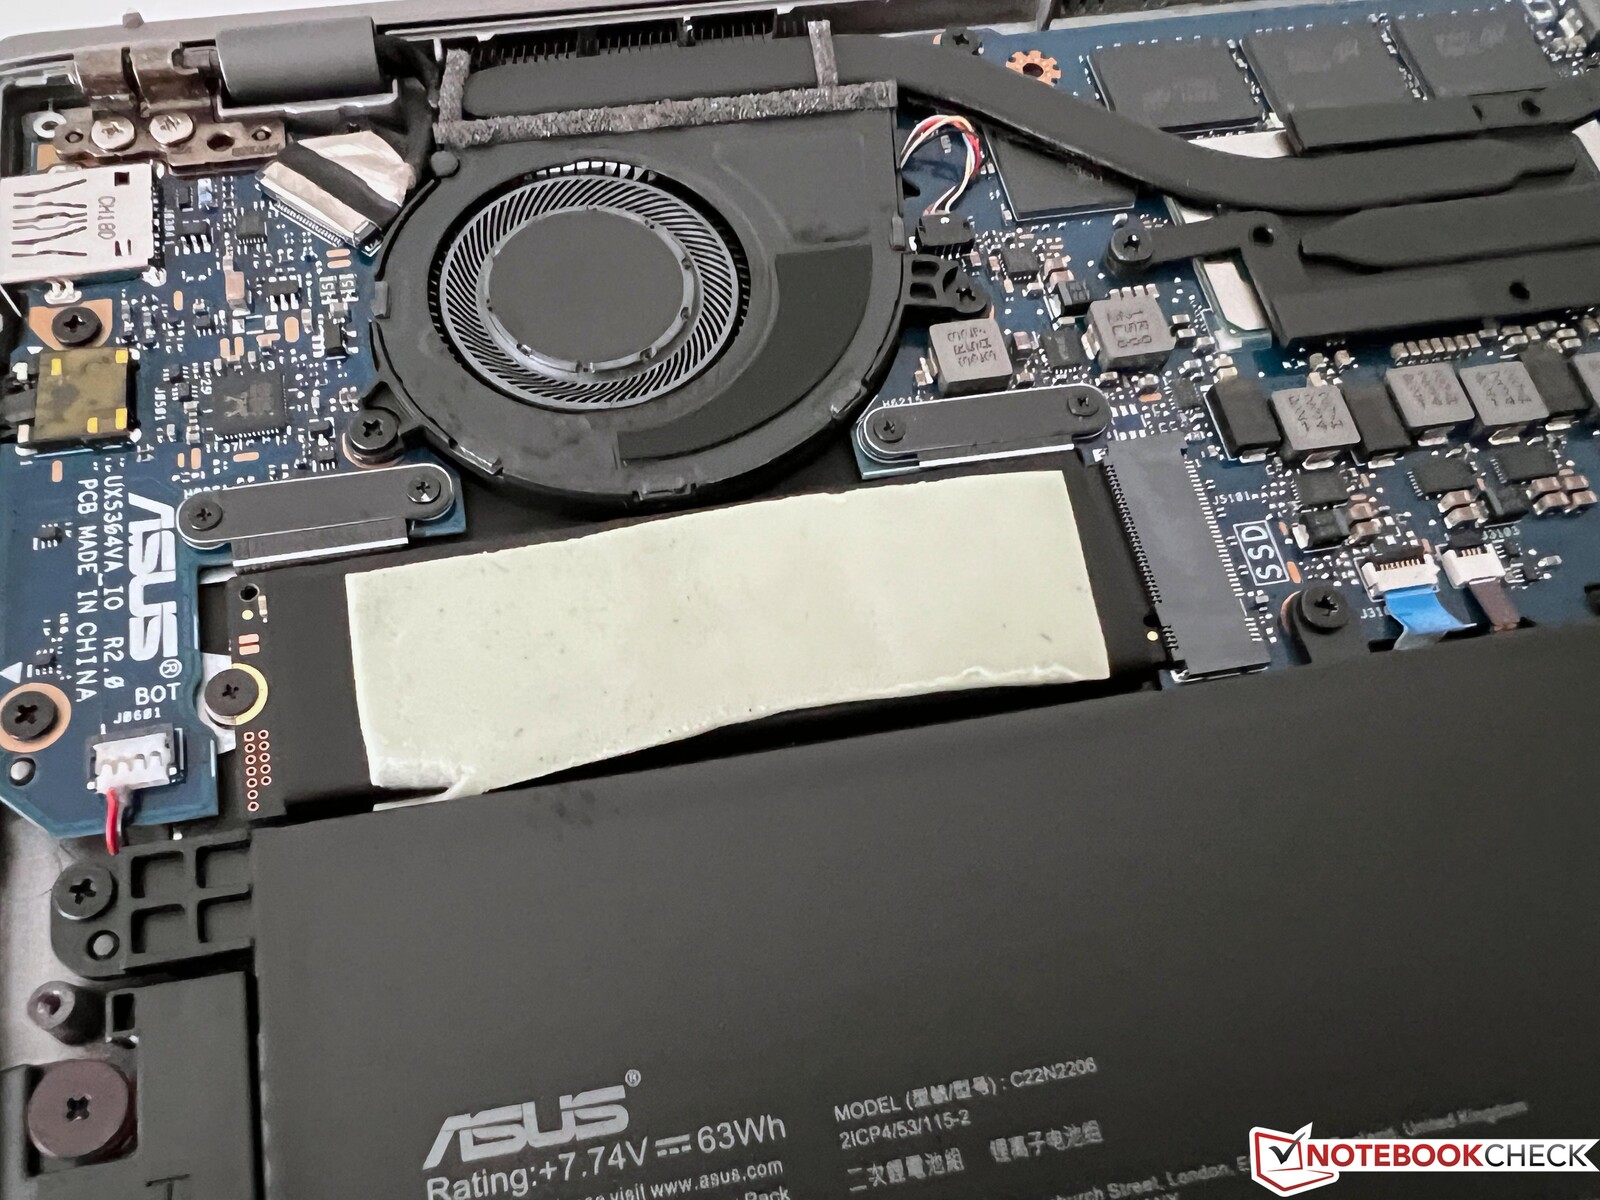
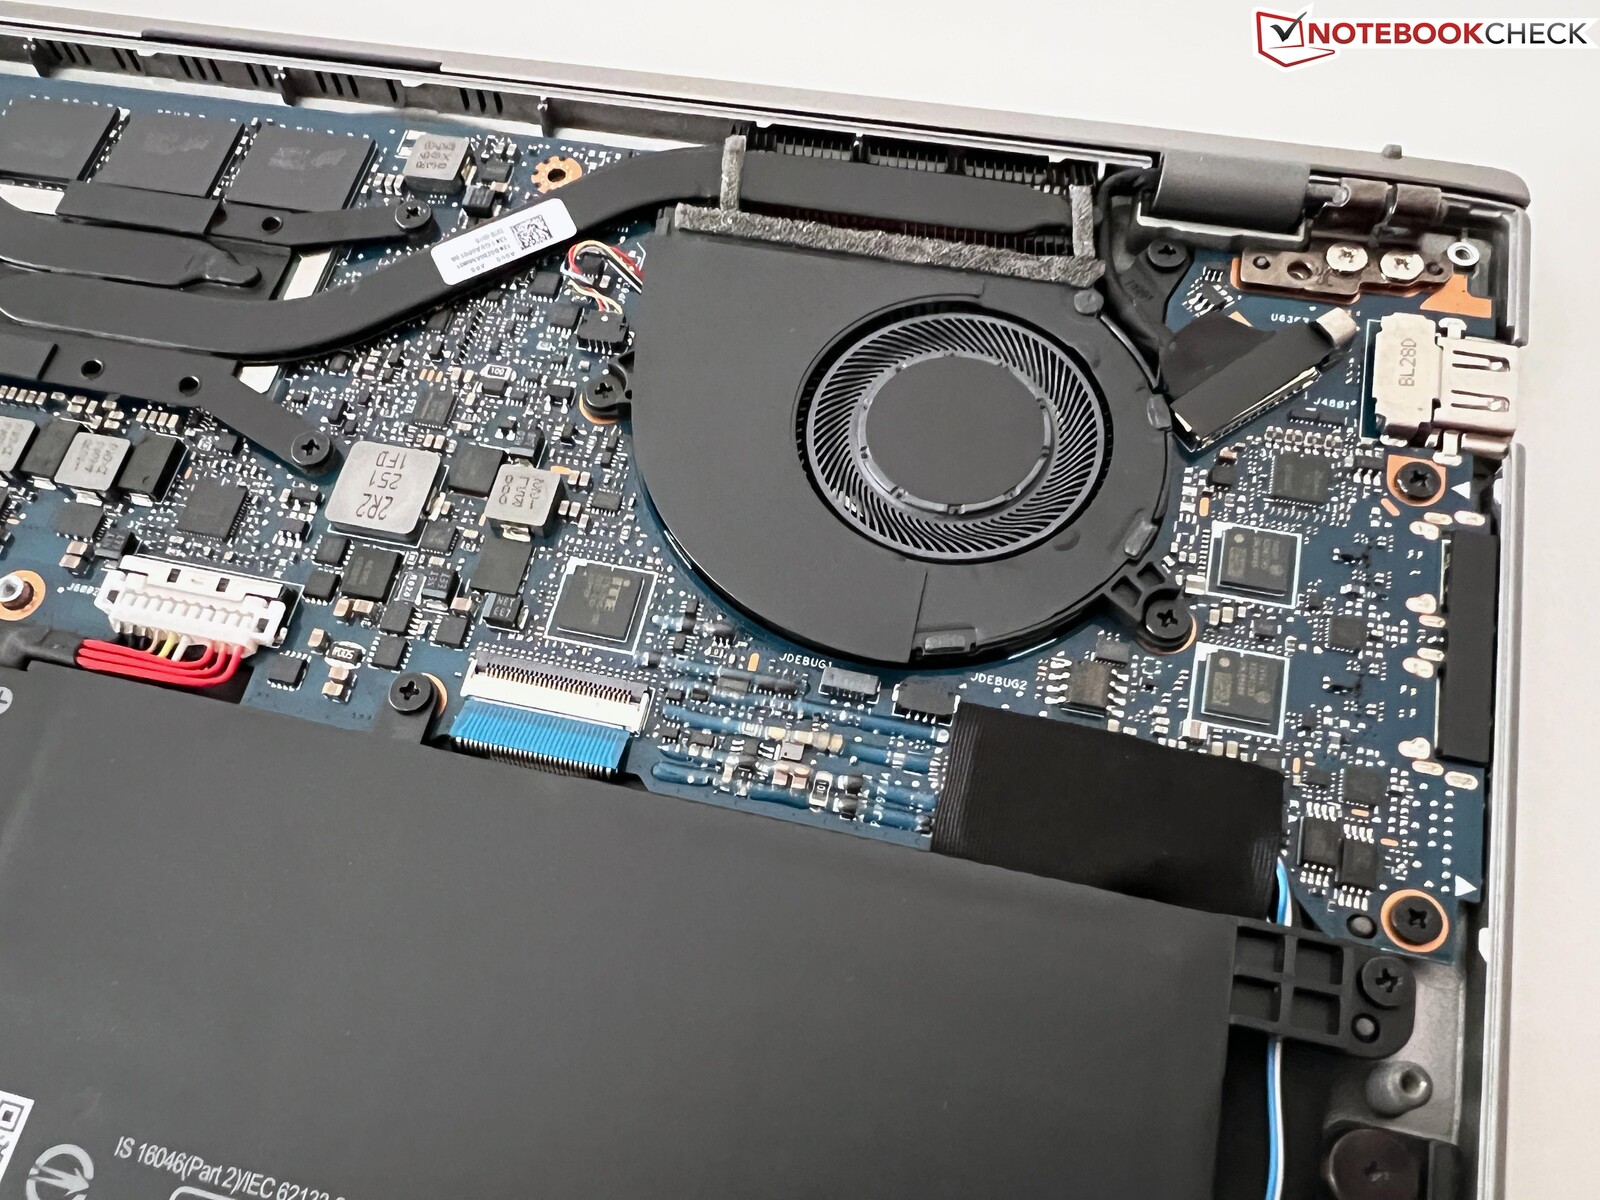
Dolna pokrywa jest zabezpieczona śrubkami Torx (T5) i można ją łatwo zdjąć. Wewnętrzna konstrukcja jest zdominowana przez duży akumulator, widać też dwa wentylatory, które można wyczyścić. O ile dysk SSD M.2 2280 można wymienić, o tyle wszystkie pozostałe elementy są wlutowane.
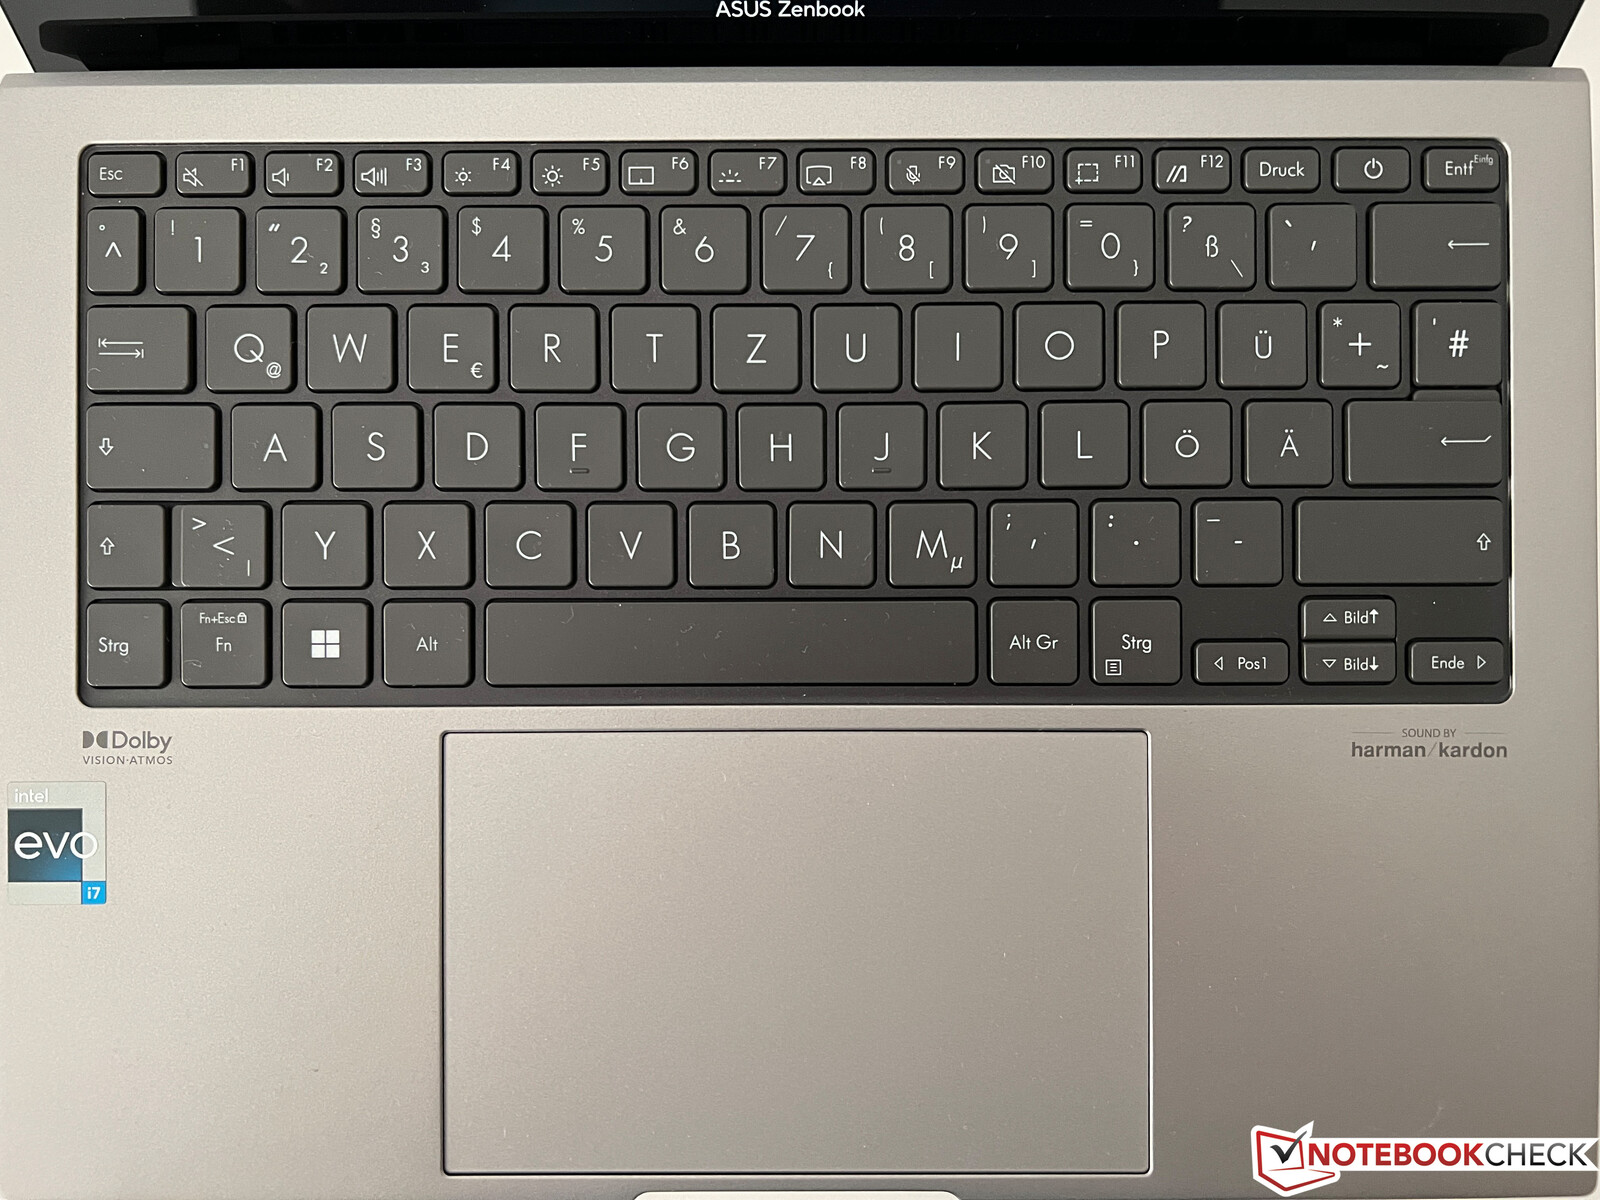
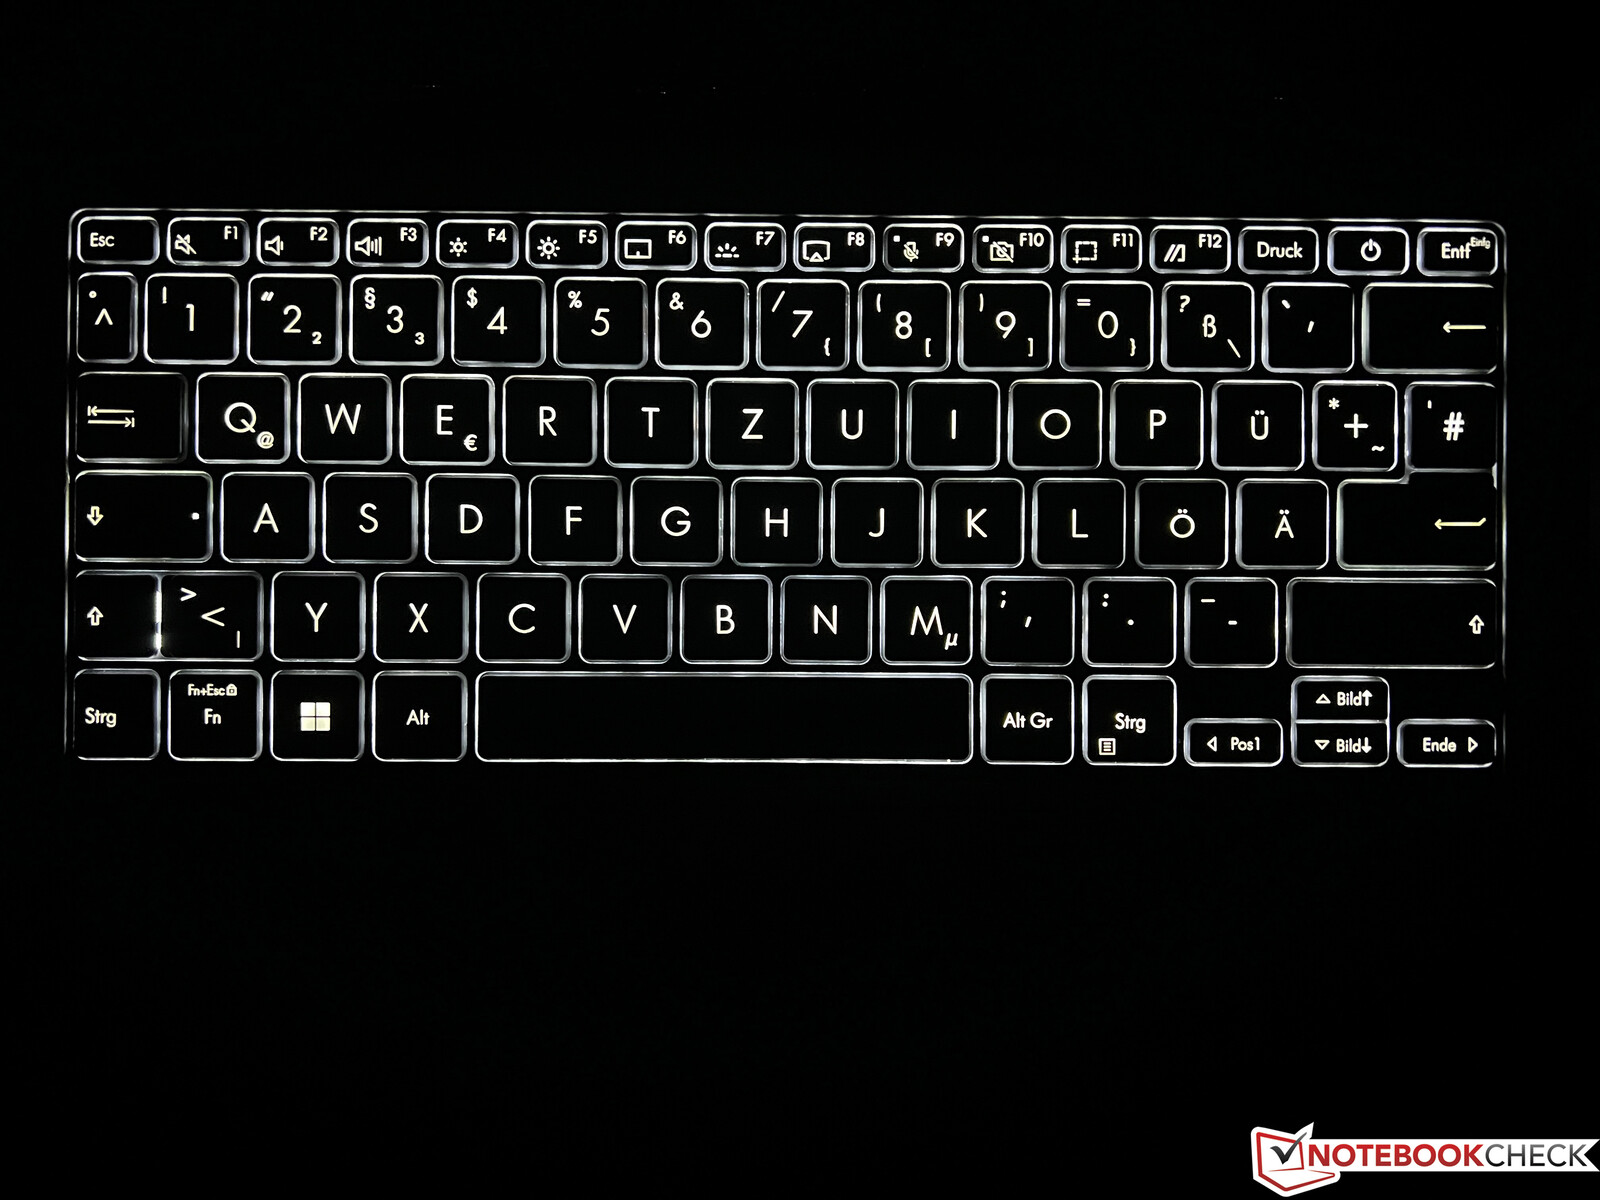
Urządzenie wejściowe - Zenbook teraz z krótszym skokiem klawisza
W przypadku smuklejszej obudowy, skok klawiszy zazwyczaj musi zostać zmniejszony i dokładnie tak jest również w Zenbook S 13. O ile w poprzedniku było to jeszcze 1,4 mm (~0,055 cala), to teraz jest to już tylko 1,1 mm (~0,043), co również jest zauważalne. Sprzężenie zwrotne nadal jest bardzo wyraźne i nie jest to w żadnym wypadku zła klawiatura, ale doświadczenie pisania było po prostu nieco bardziej komfortowe w stosunku do poprzednika. Czujnik linii papilarnych w przycisku zasilania został po prostu usunięty, bez konieczności jego wymiany. Białe, trzystopniowe podświetlenie klawiatury nie może być aktywowane automatycznie przez czujnik jasności.
Duża płytka ClickPad (13 x 8,1 cm, ~5,1 x 3,2 cala) oferuje wystarczająco dużo miejsca na ruchy kursora i gesty nawet czterech palców. Właściwości ślizgowe są bardzo dobre, a zwykłe sterowanie kursorem działa bez zarzutu. Dolny obszar ClickPada można docisnąć, czemu towarzyszą pewne głośne odgłosy klikania. W poprzednim modelu touchpada można było używać także jako bloku numerycznego, ale funkcja ta została usunięta z obecnej wersji.
Wyświetlacz - OLED z funkcją ściemniania DC
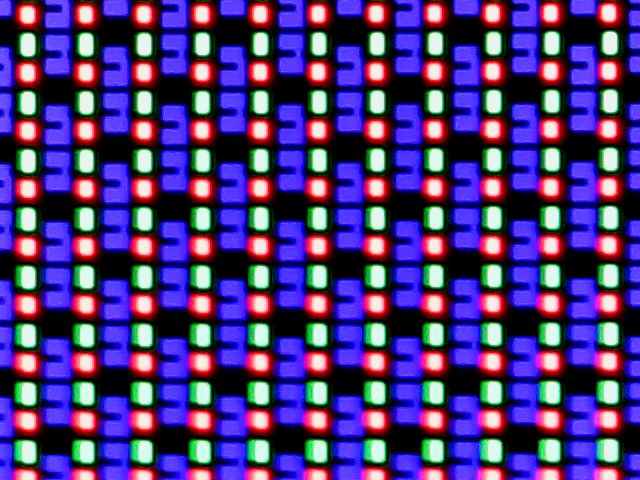
Asus utrzymuje specyfikację wyświetlacza w Zenbook S 13 bez zmian, ponieważ nadal stosuje 13,3-calowy ekran dotykowy OLED o częstotliwości odświeżania 60 Hz. Rozdzielczość wynosi 2880 x 1800 pikseli, a subiektywna jakość obrazu nadal jest doskonała. Ponadto nie występuje efekt brokatu (Moiré effect) jak w panelach OLED 2,8K w niektórych modelach Lenovo. ID panelu jest nowe i według Asusa jest to nieco cieńszy panel.
Jeśli chodzi o jasność, to nadal musimy rozróżniać zwykłe treści SDR i HDR. W trybie SDR maksymalna jasność wynosi ~360 cd/m² przy doskonałym rozkładzie jasności typowym dla OLED-ów. Jednocześnie wartość czerni wynosi 0, co powoduje niezwykle wysoki współczynnik kontrastu. W trybie HDR mierzymy maksymalnie 589 cd/m², co jest wartością nieco wyższą od podanej w specyfikacji 550 cd/m². Od zeszłego roku nic się nie zmieniło w złej implementacji HDR w systemie Windows. HDR trzeba aktywować ręcznie, a żadne profile kolorów nie będą już wtedy dostępne. W wyświetlaczach OLED nie występuje screen bleeding, a czarny obraz jest po prostu całkowicie czarny.
| |||||||||||||||||||||||||
rozświetlenie: 98 %
na akumulatorze: 361 cd/m²
kontrast: ∞:1 (czerń: 0 cd/m²)
ΔE ColorChecker Calman: 1.2 | ∀{0.5-29.43 Ø4.73}
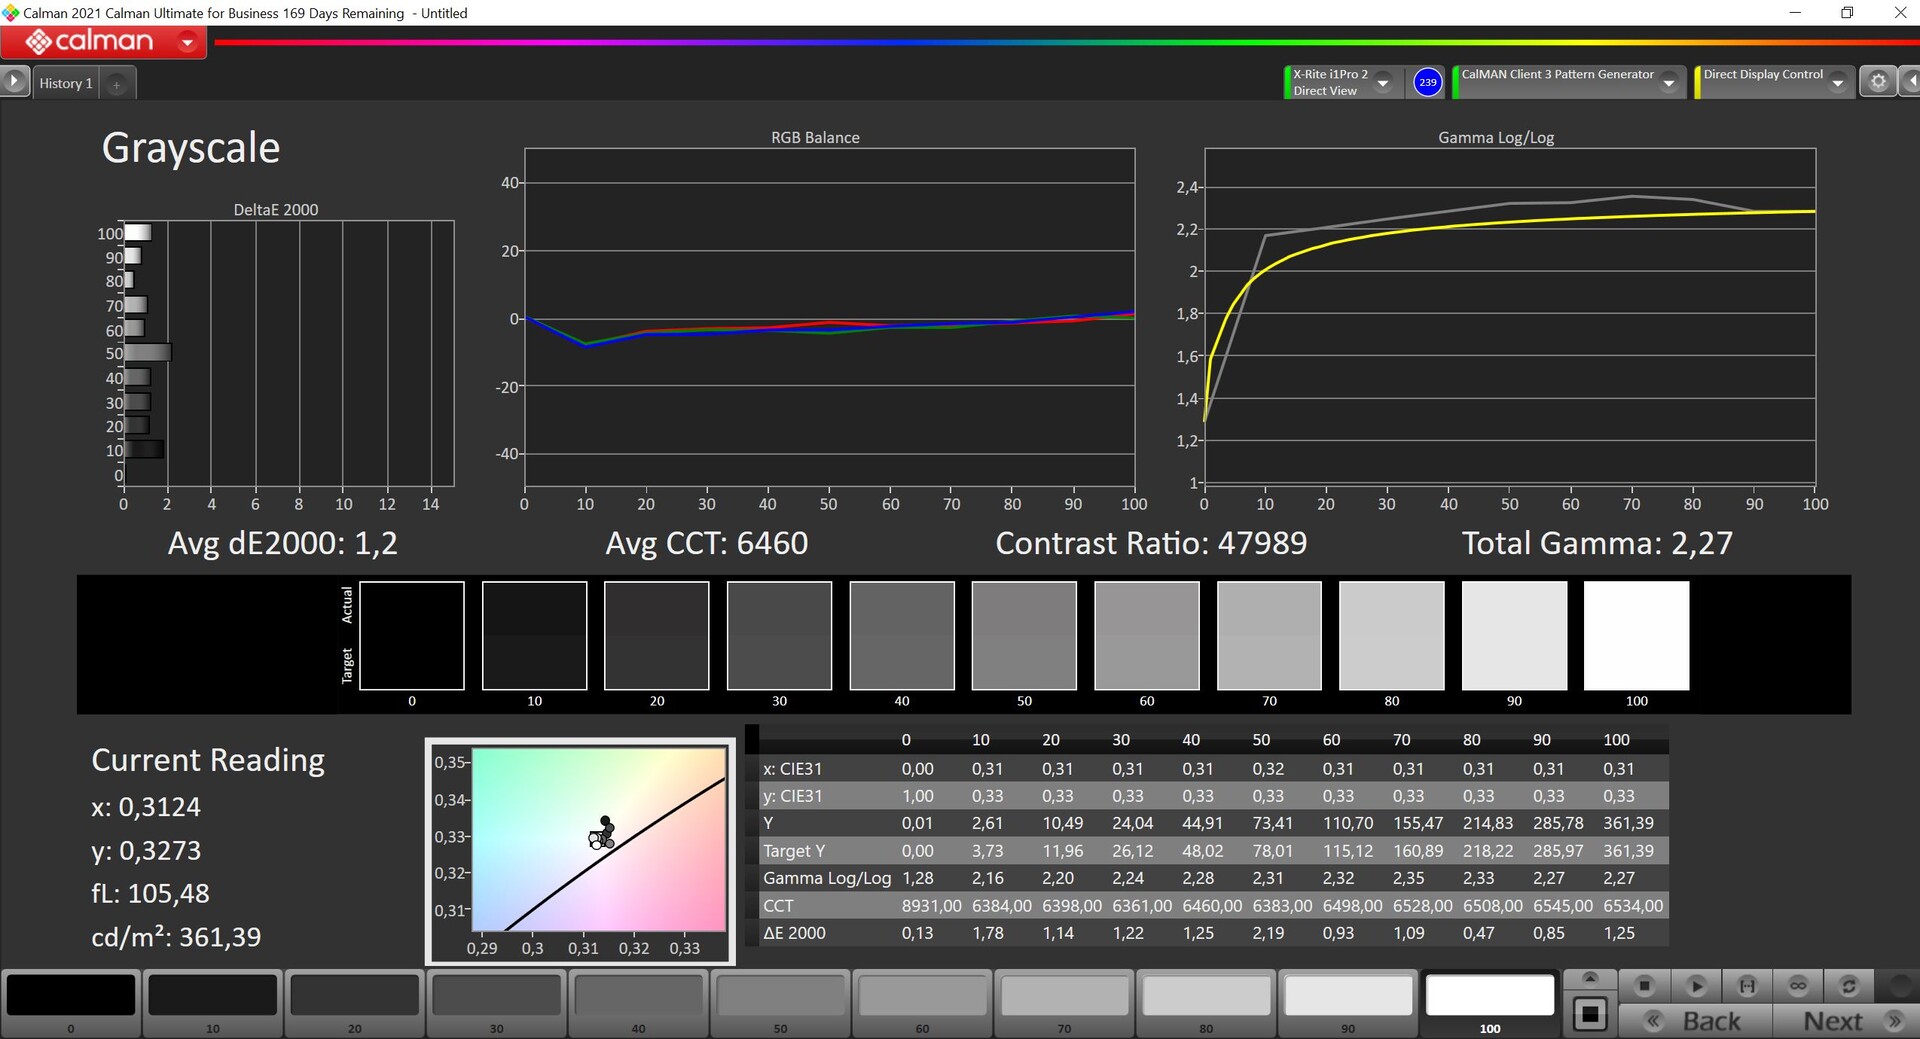
ΔE Greyscale Calman: 1.2 | ∀{0.09-98 Ø4.97}
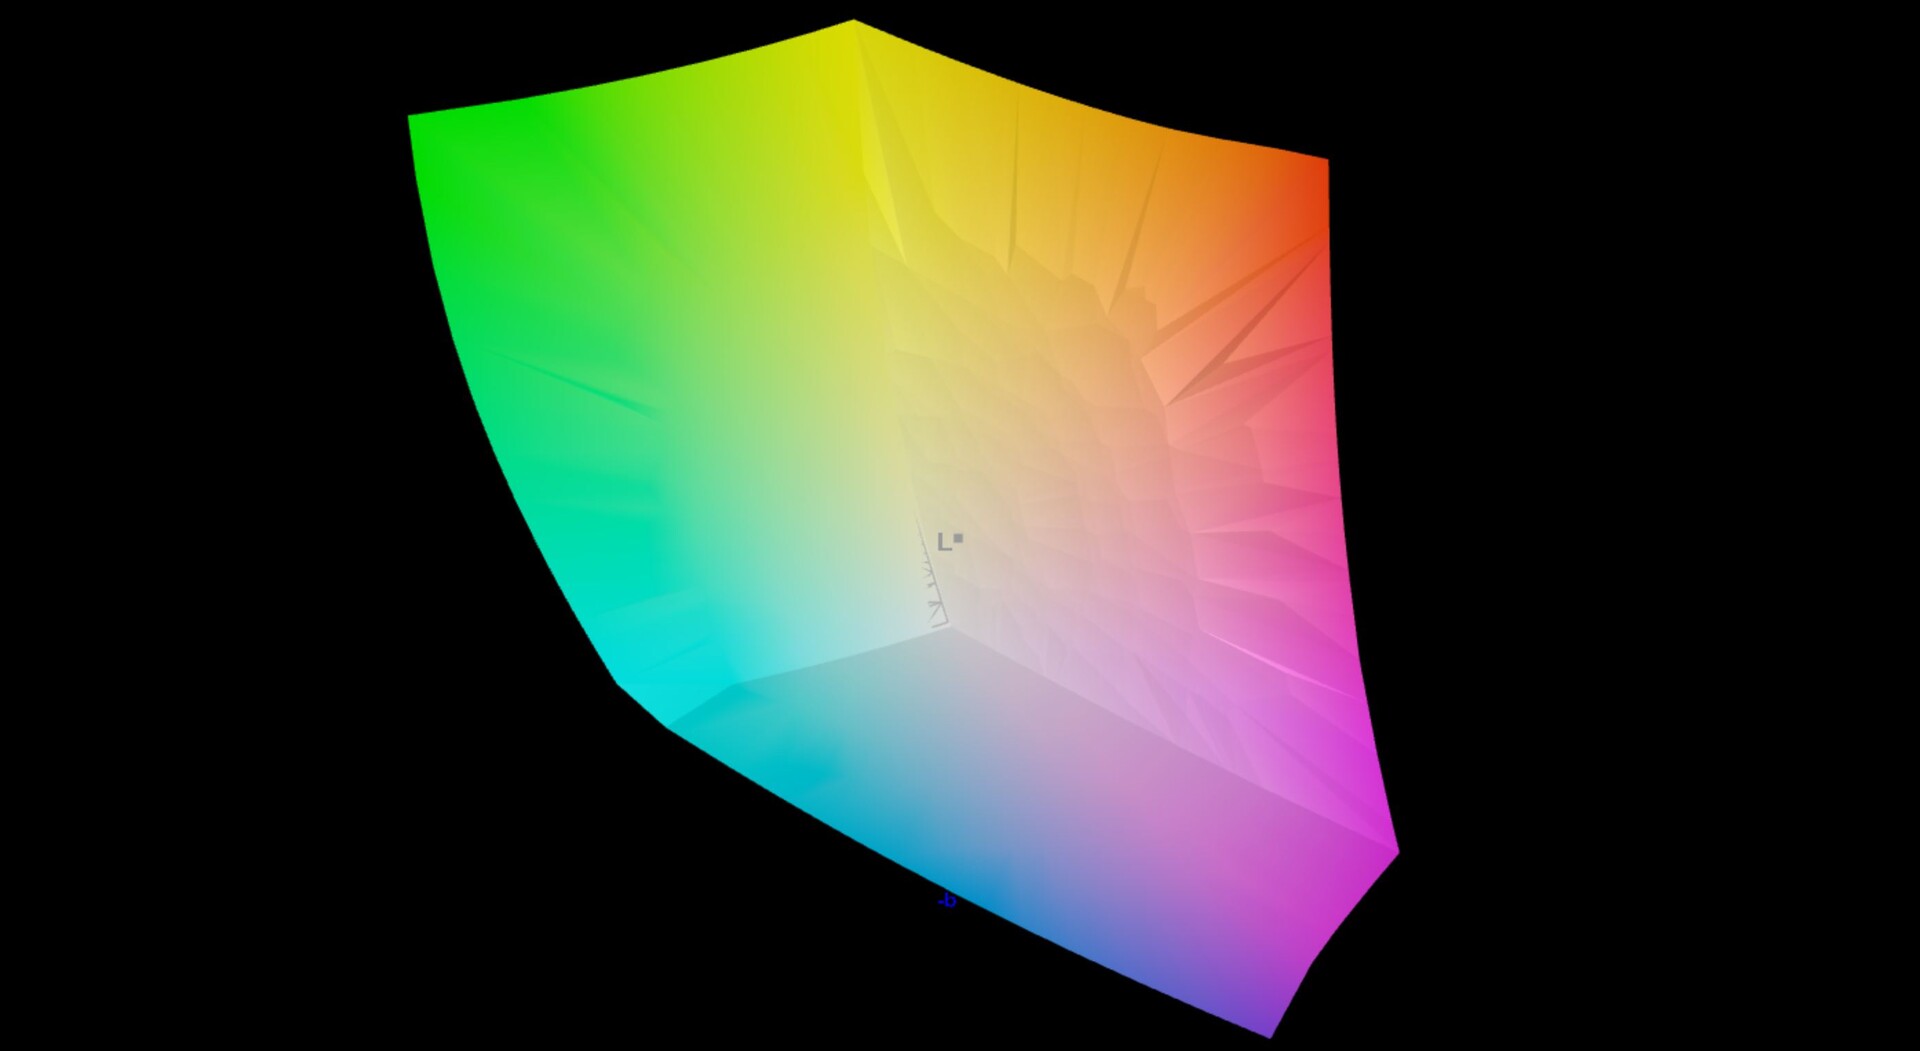
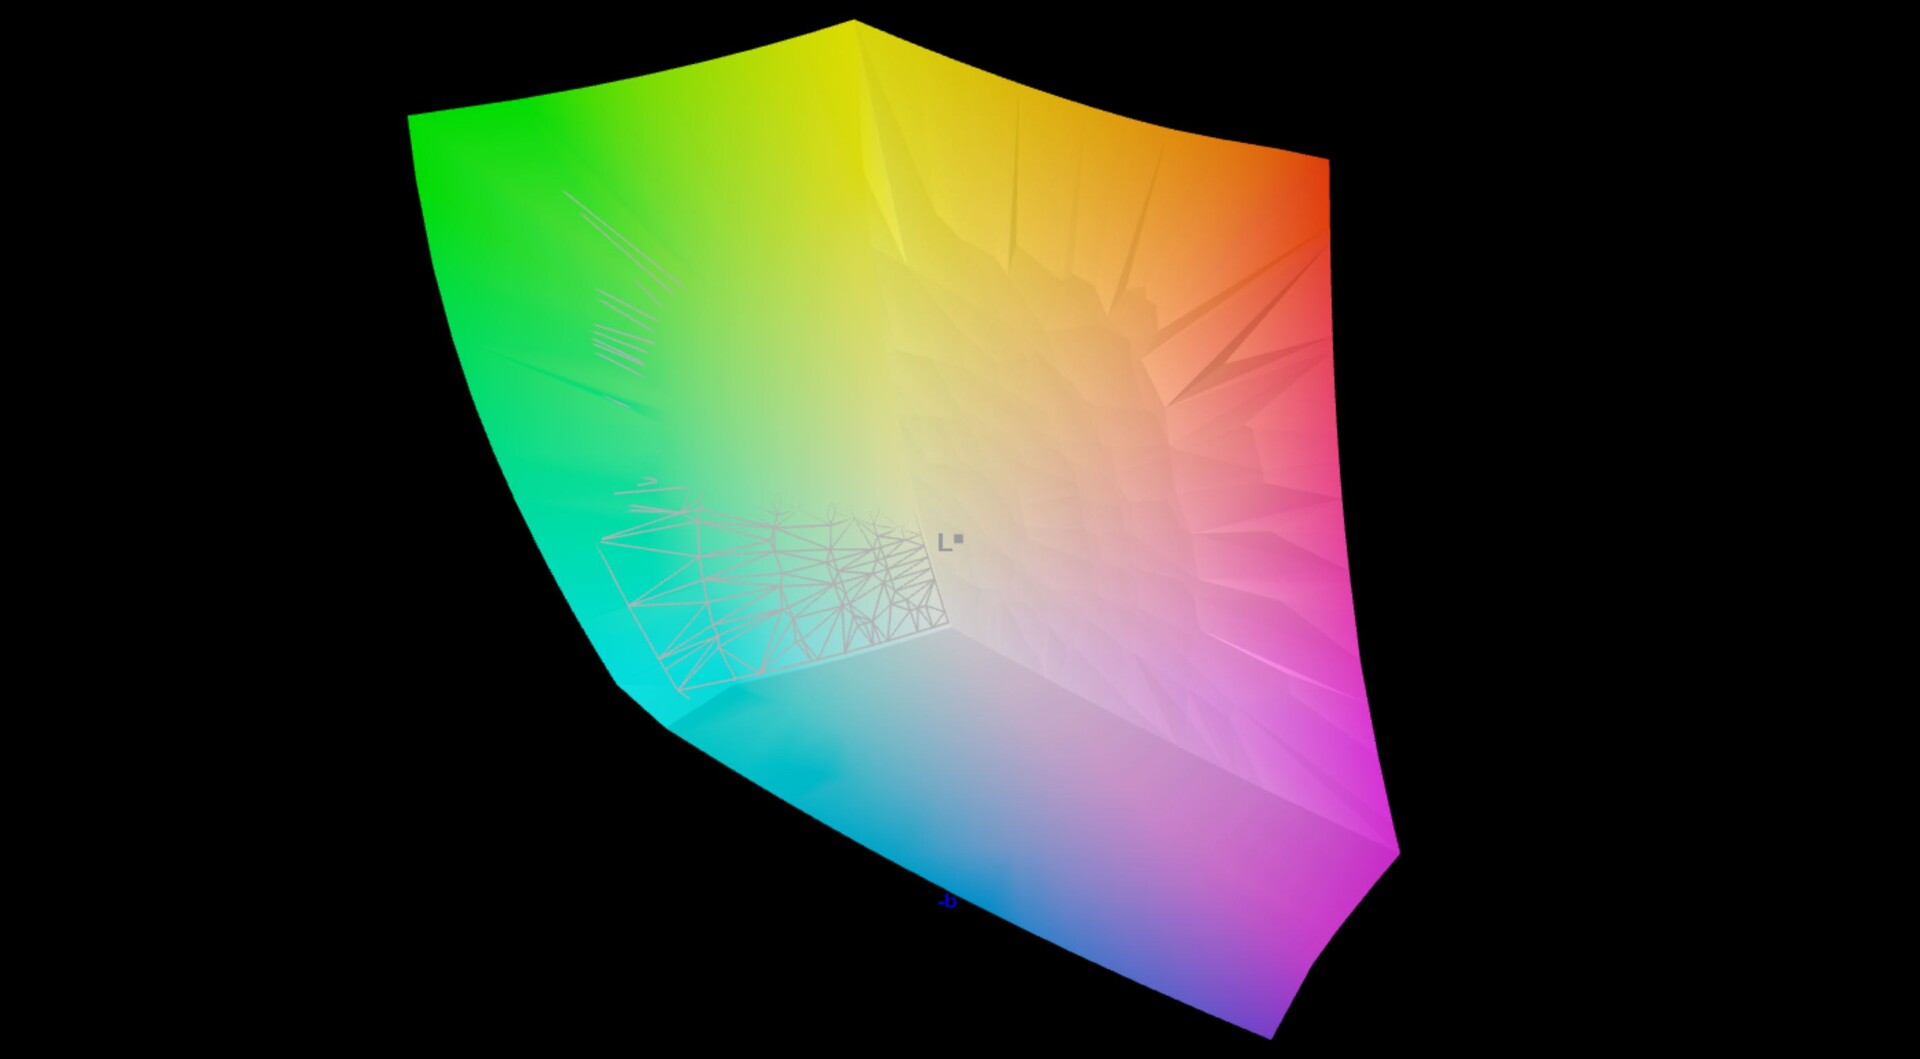
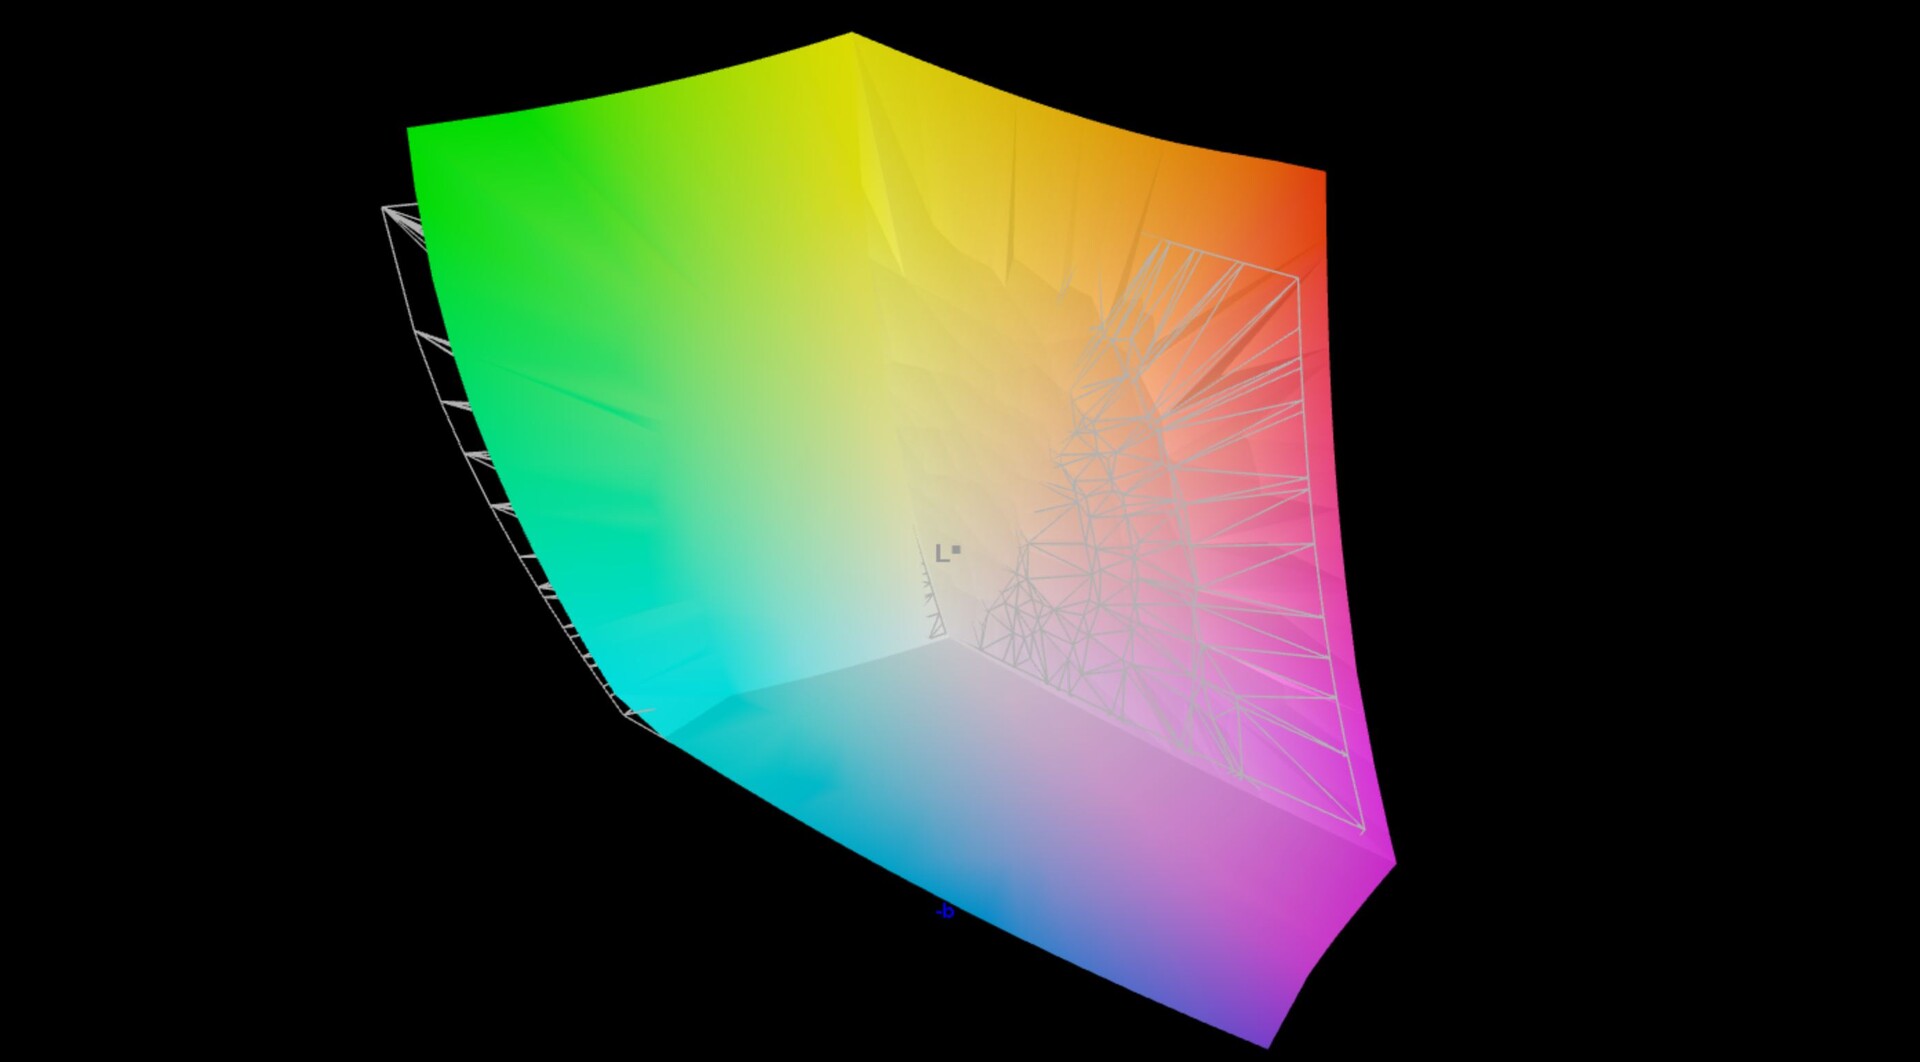
96.9% AdobeRGB 1998 (Argyll 3D)
100% sRGB (Argyll 3D)
99.7% Display P3 (Argyll 3D)
Gamma: 2.27
CCT: 6486 K
| Asus ZenBook S13 OLED UX5304 SDC417B, OLED, 2880x1800, 13.3" | Asus Zenbook S 13 OLED SDC4172, OLED, 2880x1800, 13.3" | Apple MacBook Air M2 Entry IPS, 2560x1664, 13.6" | Lenovo Yoga Slim 7 Carbon 13IAP7-82U9005FGE MND307DA1-9, IPS, 2560x1600, 13.3" | Dell XPS 13 Plus 9320 i7-1280P OLED Samsung 134XK04, OLED, 3456x2160, 13.4" | Samsung Galaxy Book2 Pro 13 NP930XED-KA1DE ATNA33XC10-0, OLED, 1920x1080, 13.3" | |
|---|---|---|---|---|---|---|
| Display | 0% | -4% | -21% | 1% | -0% | |
| Display P3 Coverage (%) | 99.7 | 99.8 0% | 98.4 -1% | 67.3 -32% | 99.5 0% | 99.81 0% |
| sRGB Coverage (%) | 100 | 100 0% | 99.9 0% | 98.9 -1% | 100 0% | 100 0% |
| AdobeRGB 1998 Coverage (%) | 96.9 | 97.8 1% | 87.6 -10% | 69.1 -29% | 98.4 2% | 95.55 -1% |
| Response Times | -5% | -1501% | -1310% | -31% | -63% | |
| Response Time Grey 50% / Grey 80% * (ms) | 2 ? | 2.1 ? -5% | 32.9 ? -1545% | 34 ? -1600% | 2.6 ? -30% | 4 ? -100% |
| Response Time Black / White * (ms) | 1.6 ? | 1.68 ? -5% | 24.9 ? -1456% | 17.9 ? -1019% | 2.1 ? -31% | 2 ? -25% |
| PWM Frequency (Hz) | 240 ? | 240.4 ? | 59.5 | 61 ? | ||
| Screen | -23% | -8% | -9% | -64% | -22% | |
| Brightness middle (cd/m²) | 361 | 336 -7% | 526 46% | 391 8% | 371.8 3% | 399 11% |
| Brightness (cd/m²) | 365 | 338 -7% | 486 33% | 362 -1% | 374 2% | 403 10% |
| Brightness Distribution (%) | 98 | 99 1% | 87 -11% | 87 -11% | 98 0% | 98 0% |
| Black Level * (cd/m²) | 0.02 | 0.38 | 0.26 | 0.07 | ||
| Colorchecker dE 2000 * | 1.2 | 1.8 -50% | 1.3 -8% | 1 17% | 2.37 -98% | 1.35 -13% |
| Colorchecker dE 2000 max. * | 1.9 | 3.8 -100% | 2.7 -42% | 2.4 -26% | 6.1 -221% | 2.77 -46% |
| Greyscale dE 2000 * | 1.2 | 0.9 25% | 2 -67% | 1.7 -42% | 2 -67% | 2.35 -96% |
| Gamma | 2.27 97% | 2.22 99% | 2.25 98% | 2.22 99% | 2.29 96% | 2.21 100% |
| CCT | 6486 100% | 6580 99% | 6858 95% | 6808 95% | 6261 104% | 6824 95% |
| Contrast (:1) | 16800 | 1384 | 1504 | 5700 | ||
| Colorchecker dE 2000 calibrated * | 1.8 | 0.7 | 1.35 | |||
| Całkowita średnia (program / ustawienia) | -9% /
-13% | -504% /
-278% | -447% /
-249% | -31% /
-40% | -28% /
-24% |
* ... im mniej tym lepiej

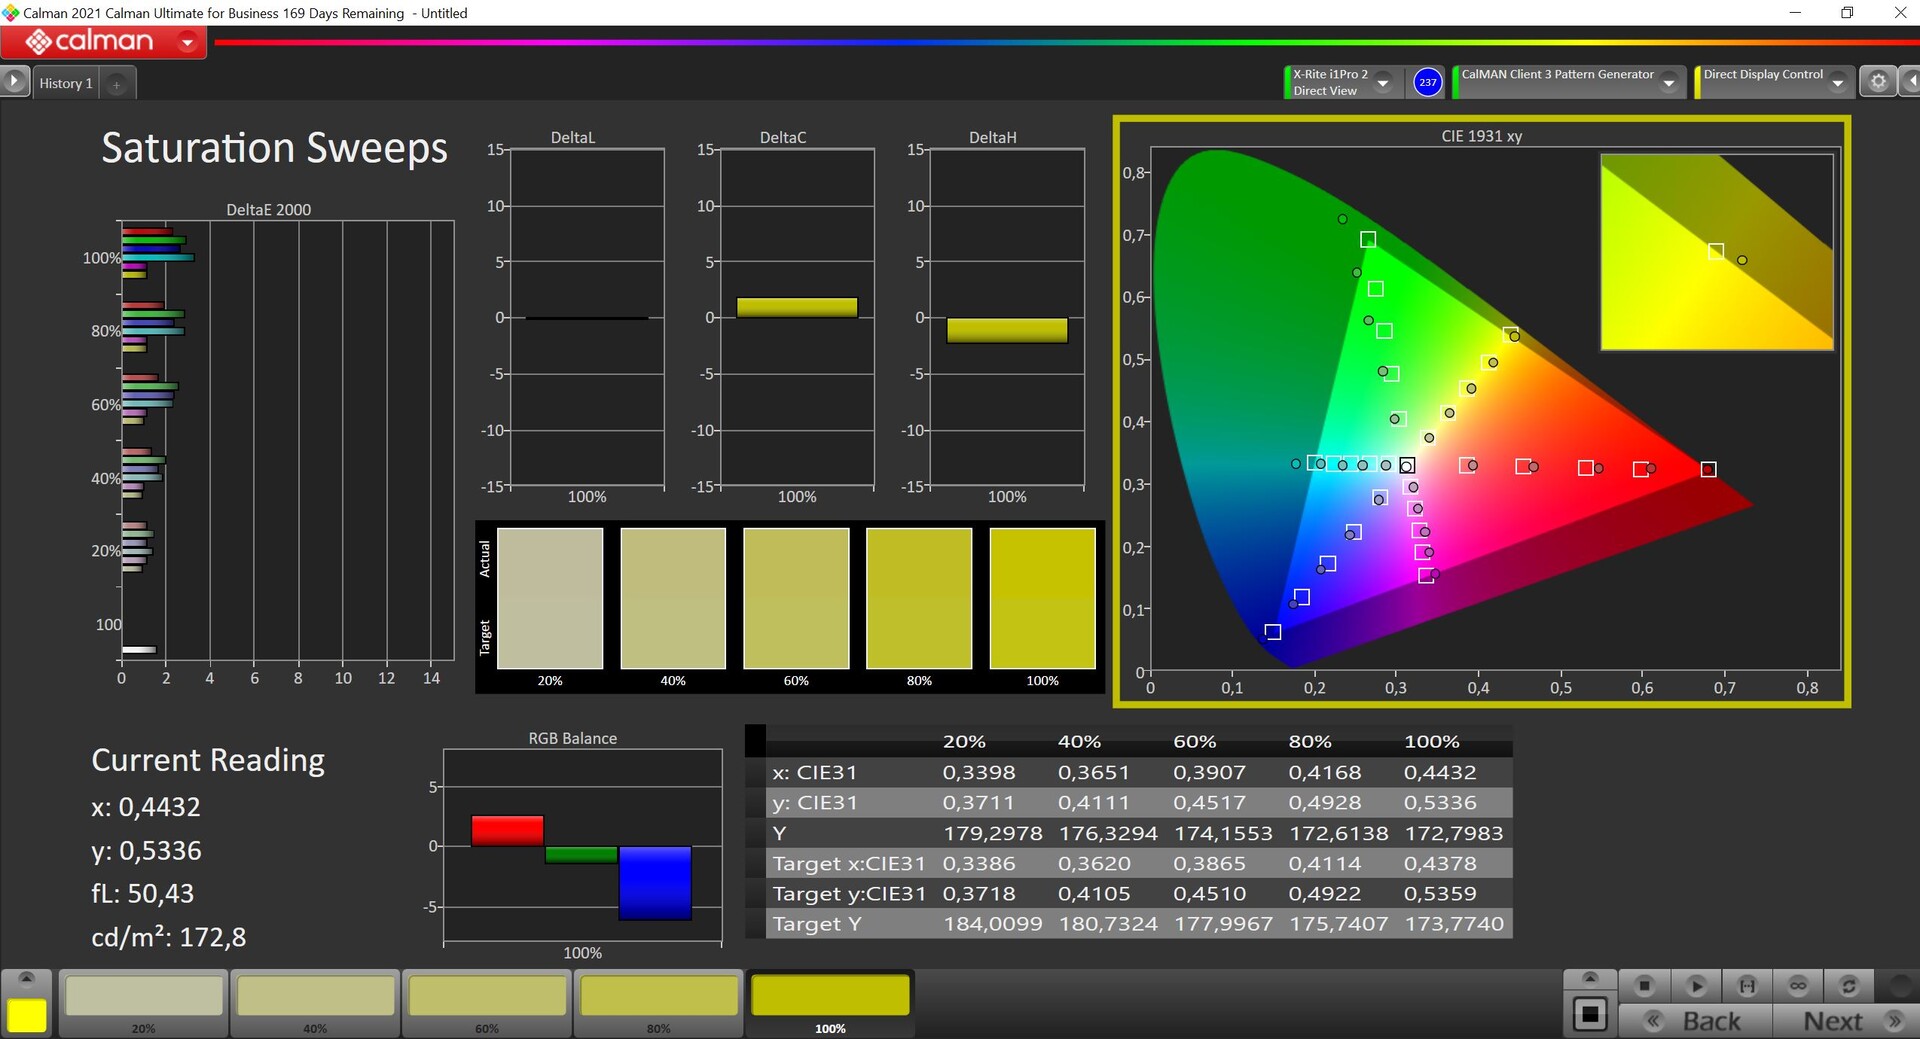


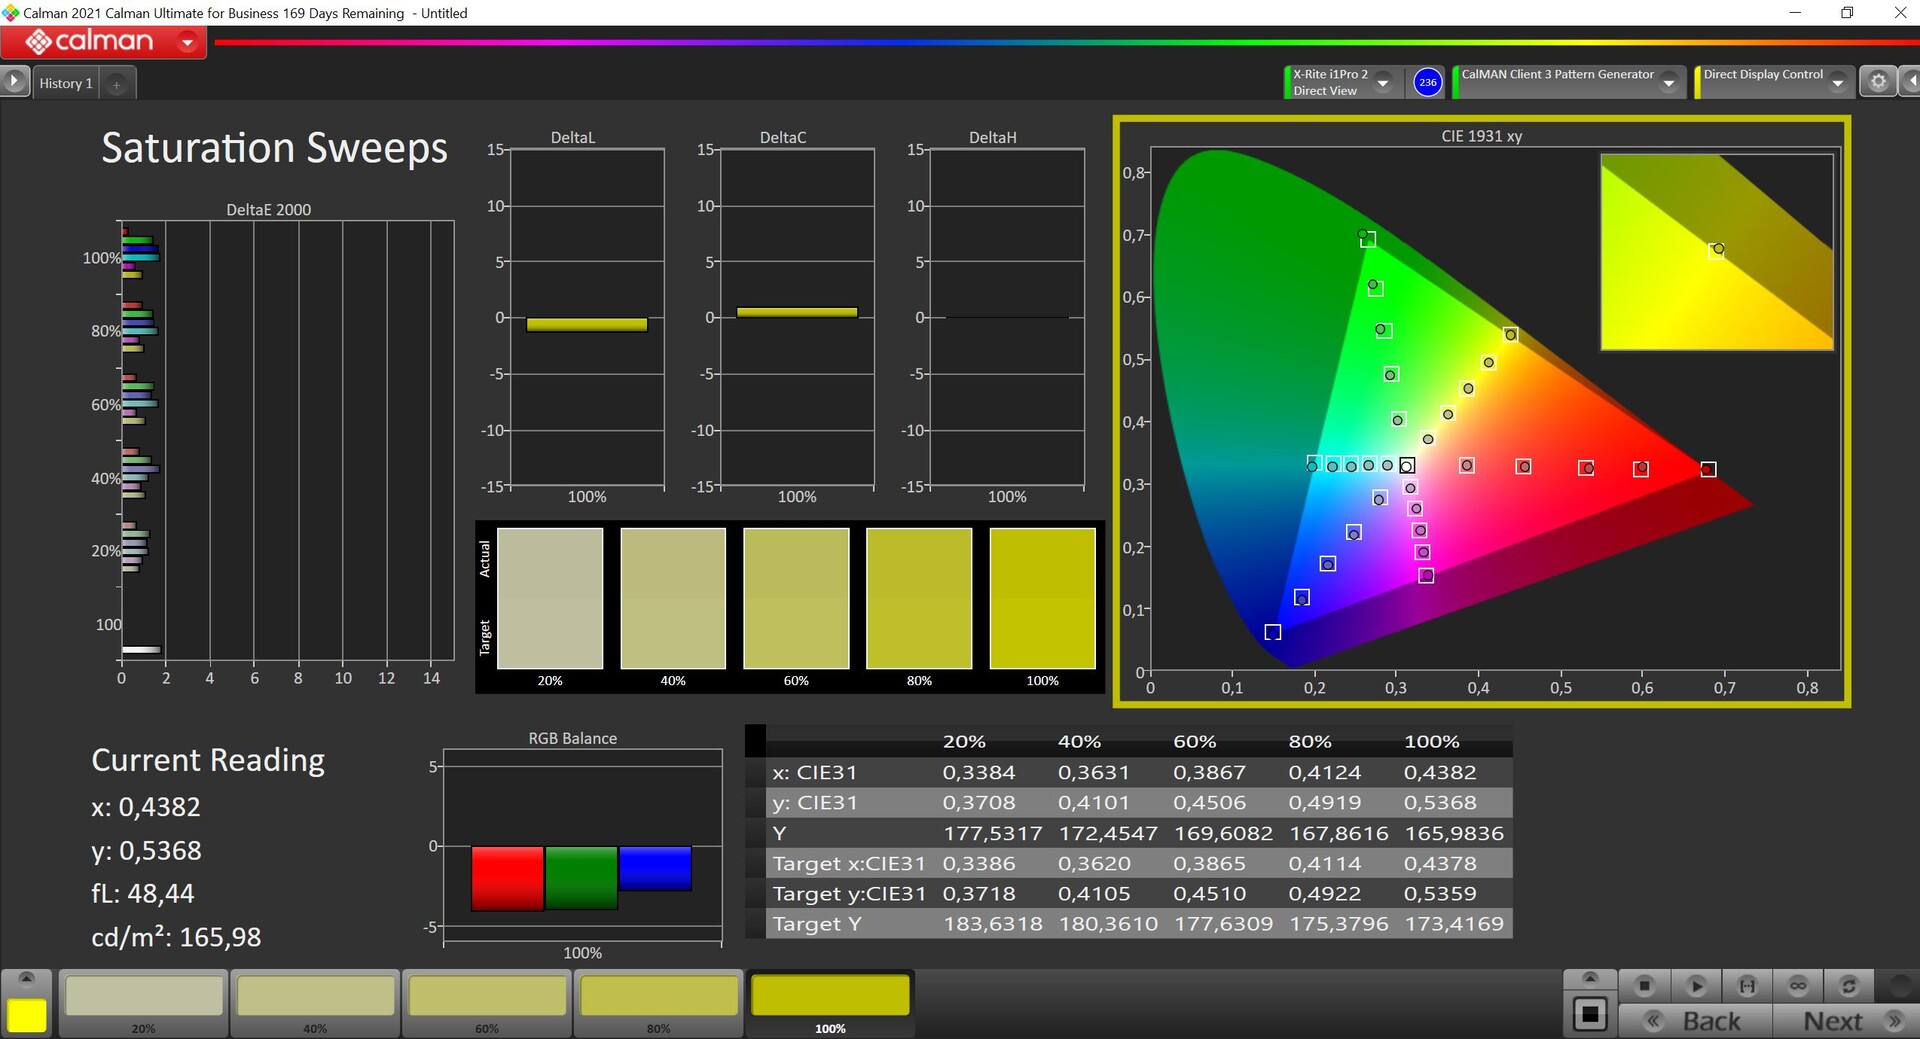
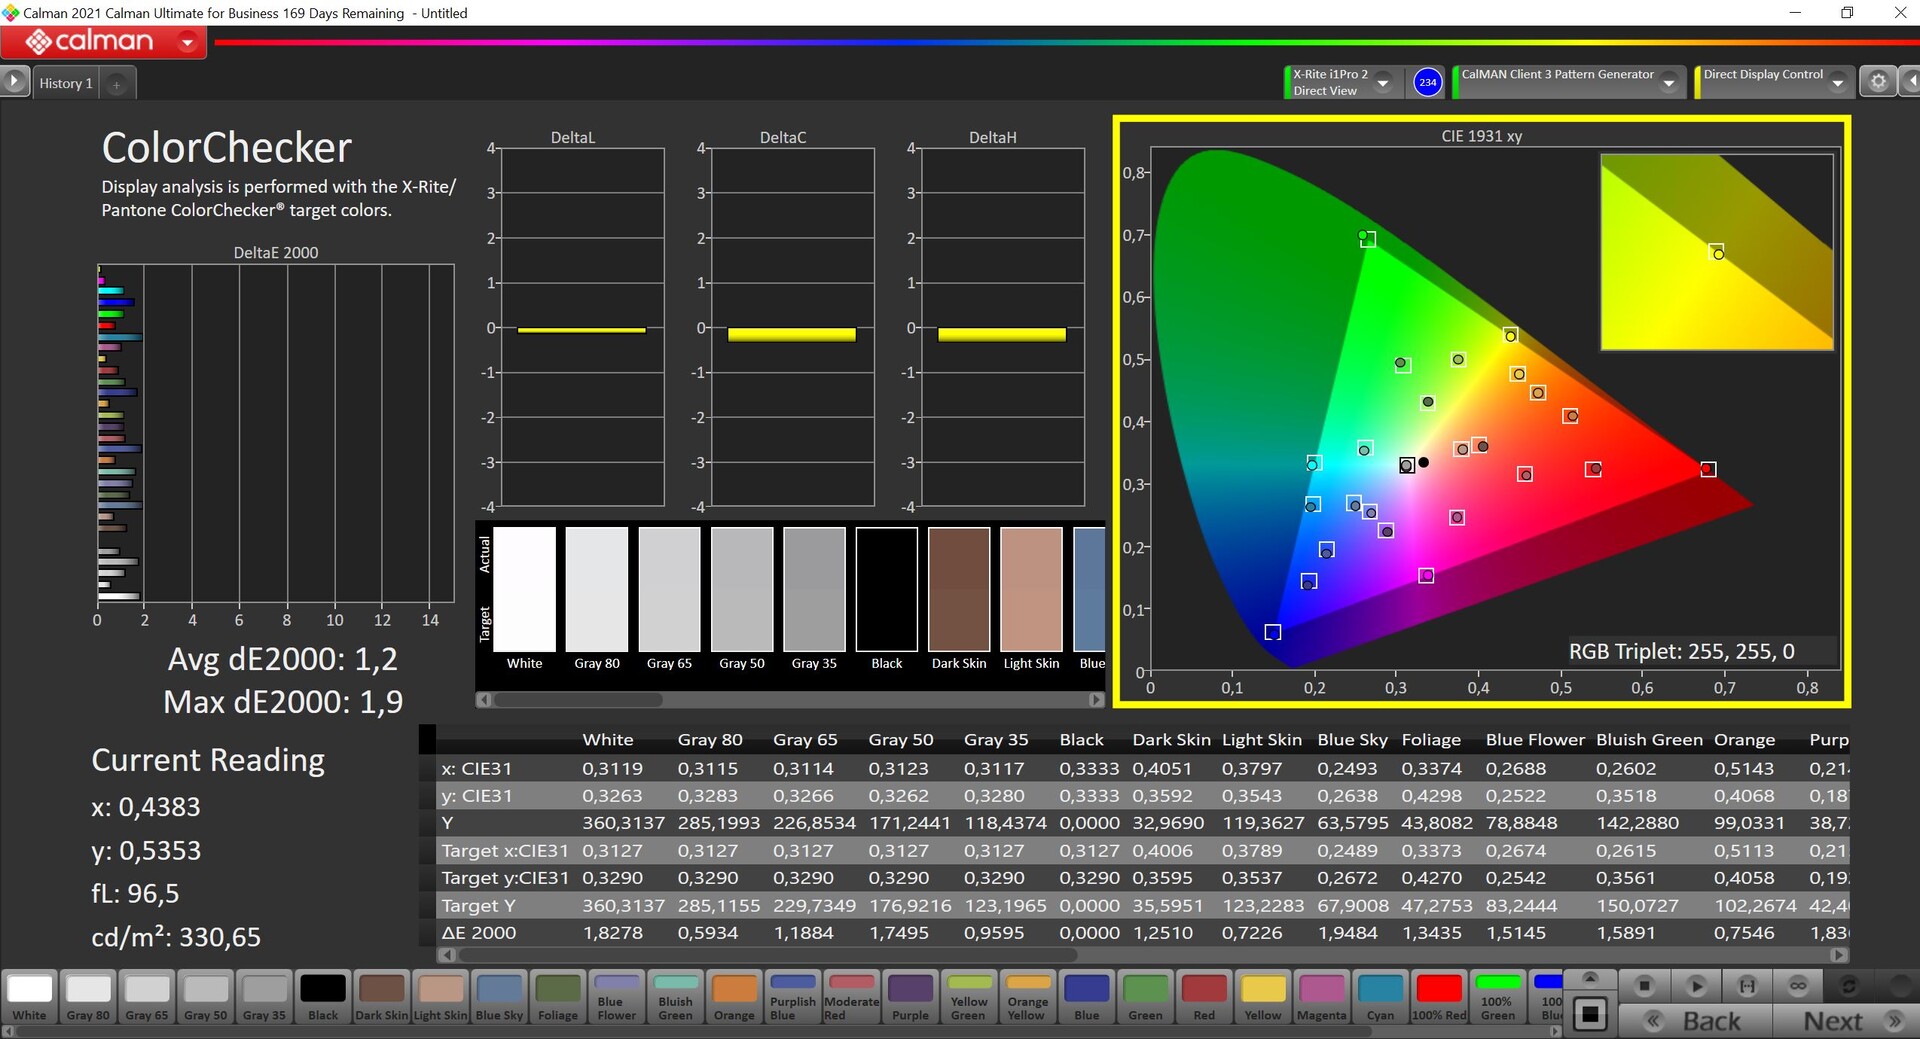
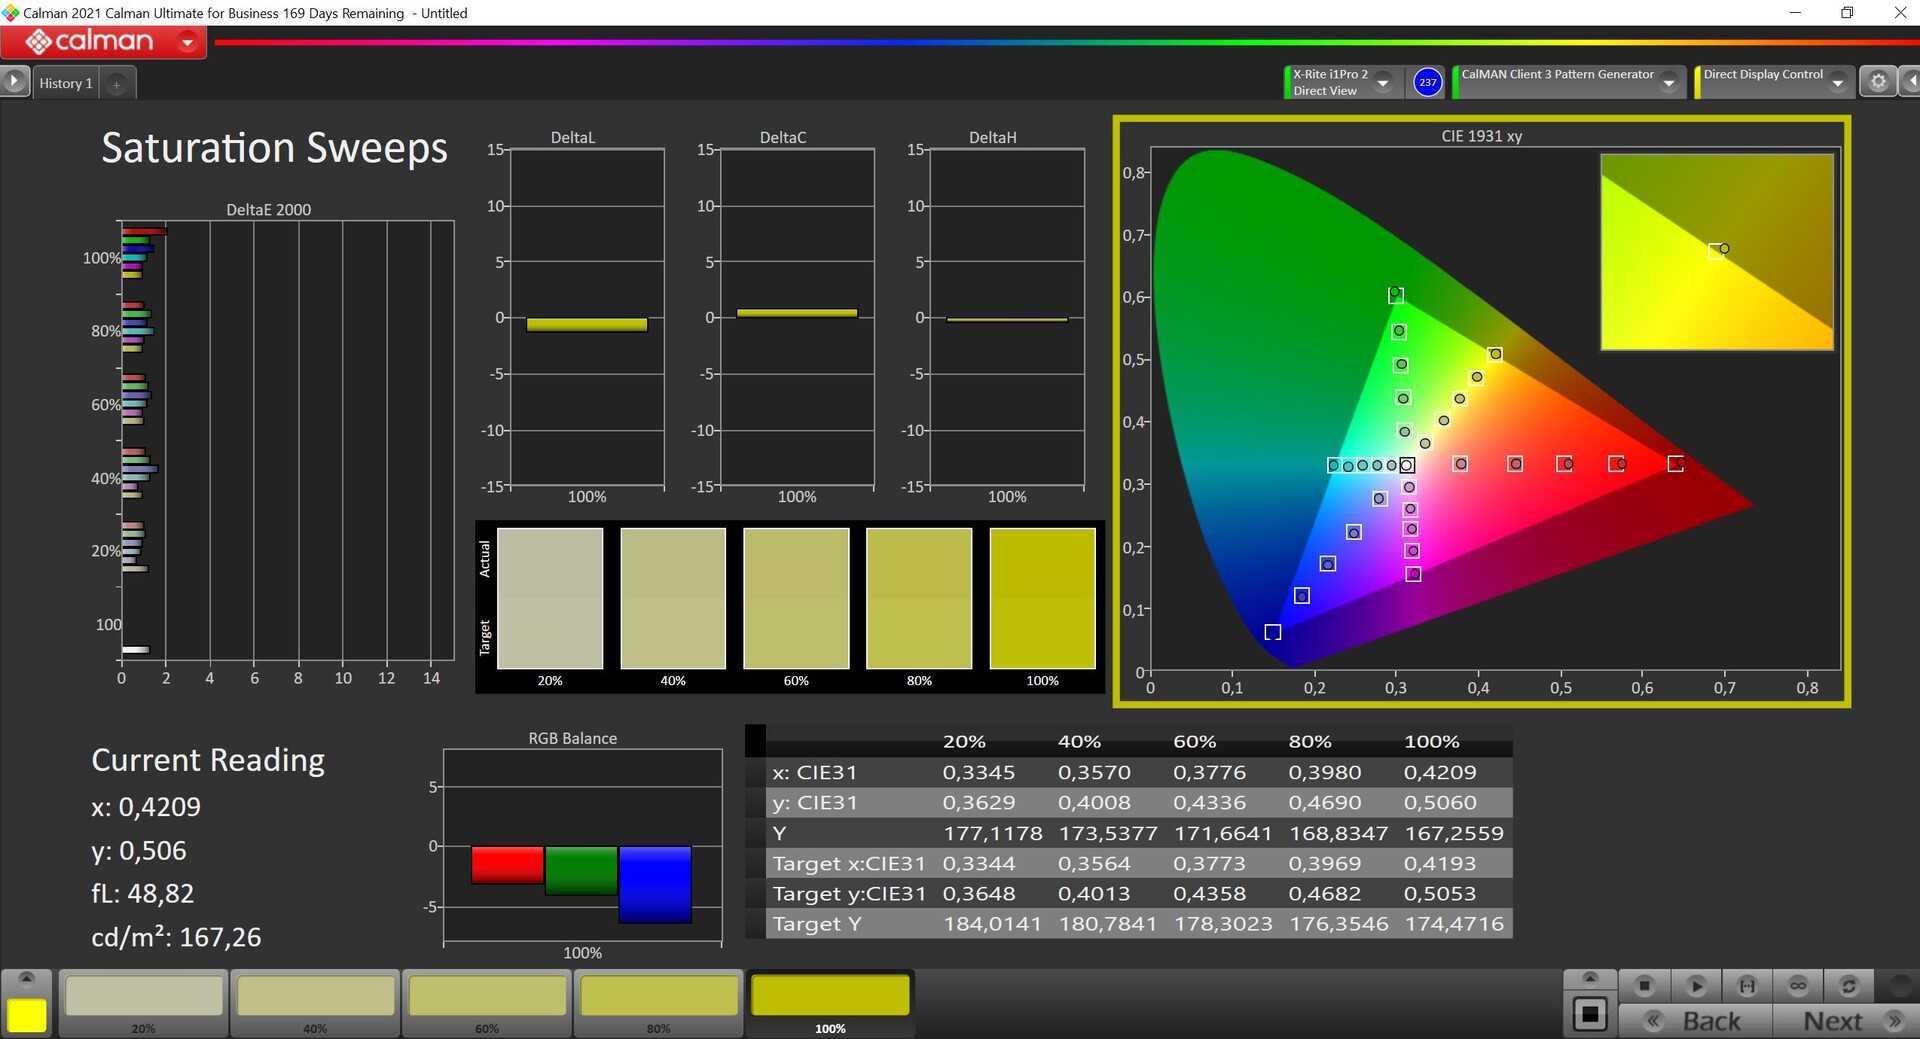
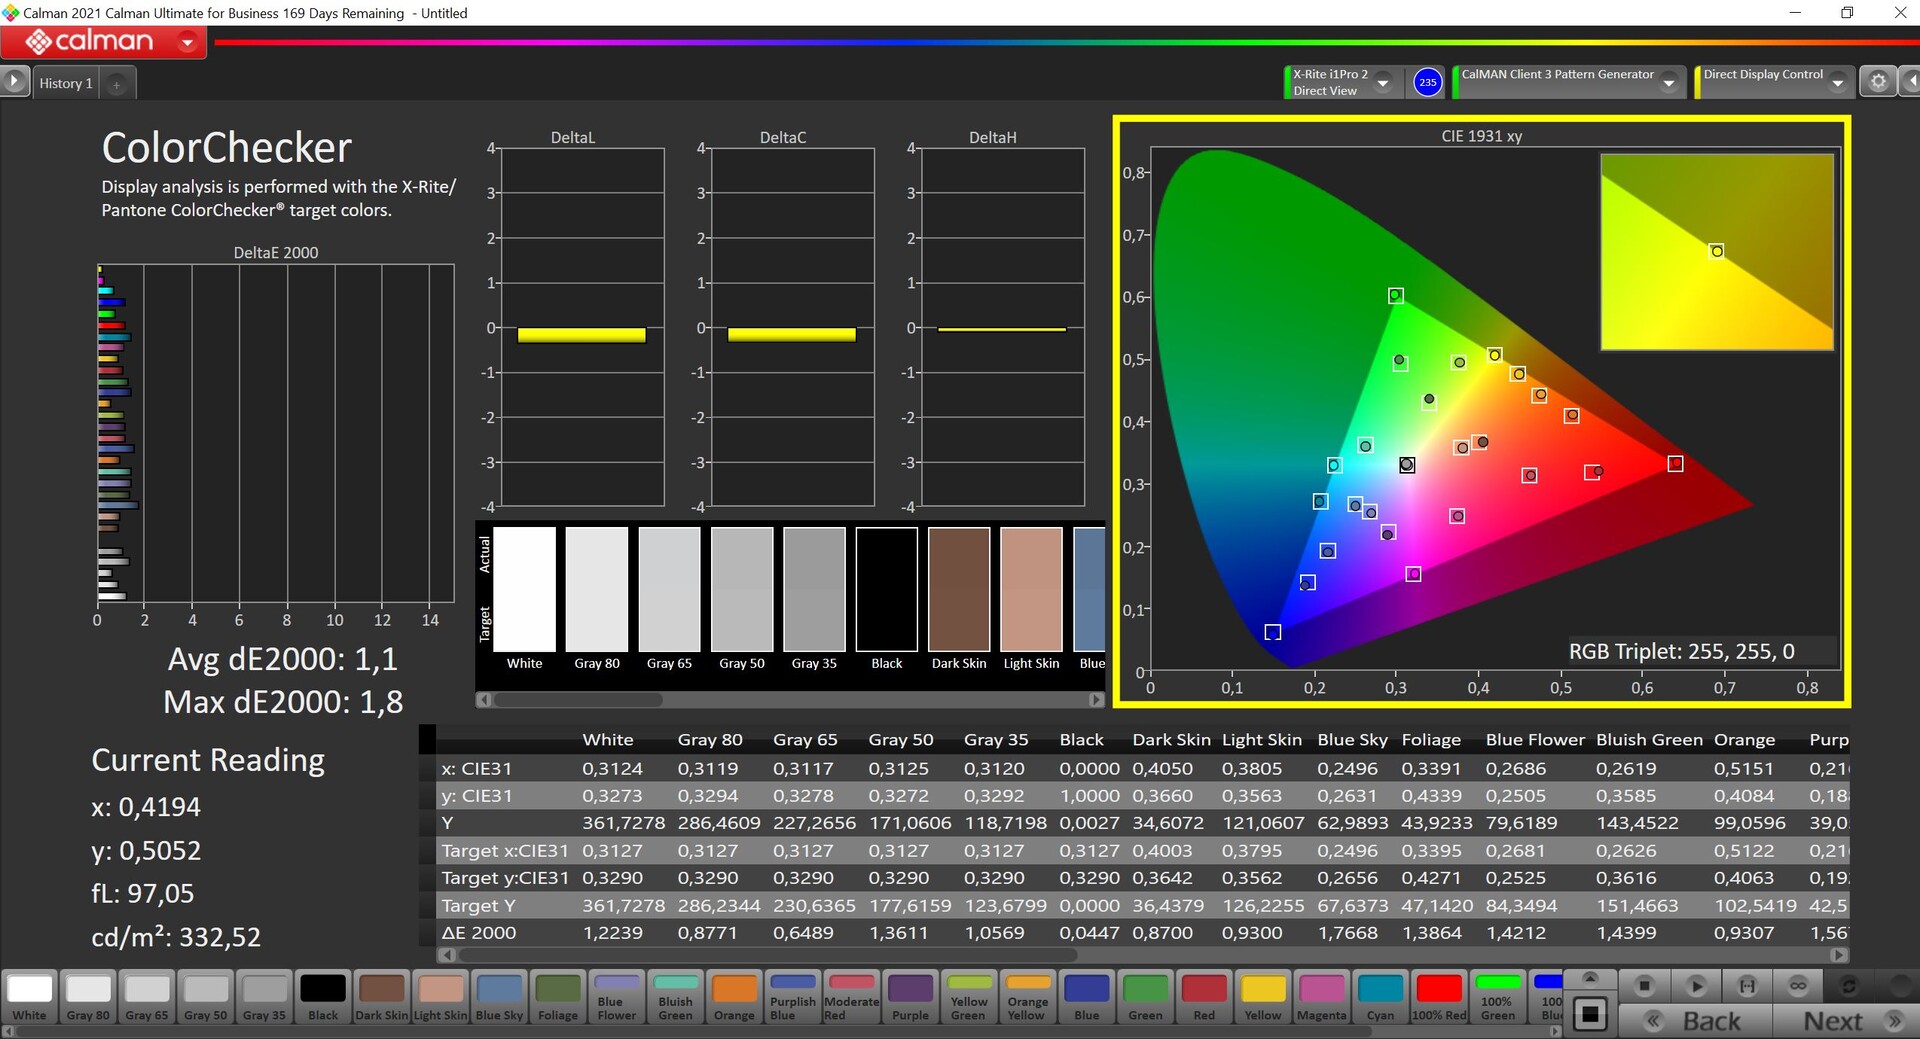
Preinstalowana aplikacja MyAsus oferuje różne profile kolorystyczne, które zmierzyliśmy za pomocą profesjonalnego oprogramowania CalMAN. Domyślnie aktywowany jest profil "Native", który odwzorowuje kolory nieco zbyt nasycone, przez co obraz subiektywnie wydaje się nieco bardziej żywy. Dodatkowo, w przypadku Display-P3 i sRGB dostępne są również dwa niezwykle dokładne profile, jeśli chcemy pracować na obrazach w odpowiednich przestrzeniach barwnych. Te dwa profile są już w stanie dostawy wyjątkowo dobrze skalibrowane, tak że nie byliśmy w stanie jeszcze bardziej poprawić wyświetlania za pomocą własnej kalibracji. W połączeniu z niemal całkowitym pokryciem przestrzeni barw P3 jest to ogólnie doskonała wydajność.
Wyświetl czasy reakcji
| ↔ Czas reakcji od czerni do bieli | ||
|---|---|---|
| 1.6 ms ... wzrost ↗ i spadek ↘ łącznie | ↗ 0.8 ms wzrost | 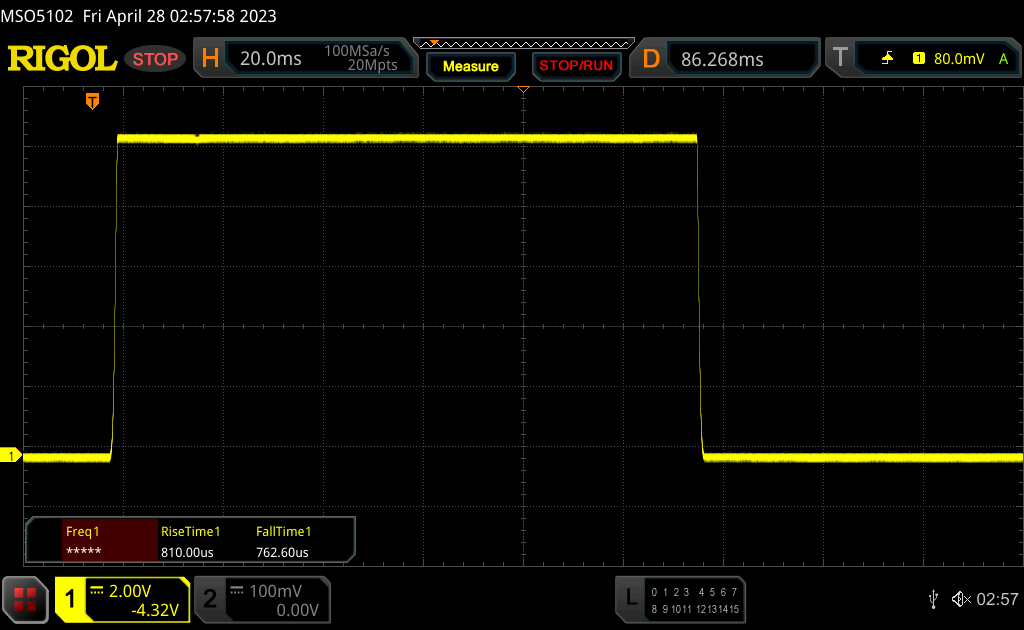 |
| ↘ 0.8 ms upadek | ||
| W naszych testach ekran wykazuje bardzo szybką reakcję i powinien bardzo dobrze nadawać się do szybkich gier. Dla porównania, wszystkie testowane urządzenia wahają się od 0.1 (minimum) do 240 (maksimum) ms. » 9 % wszystkich urządzeń jest lepszych. Oznacza to, że zmierzony czas reakcji jest lepszy od średniej wszystkich testowanych urządzeń (19.9 ms). | ||
| ↔ Czas reakcji 50% szarości do 80% szarości | ||
| 2 ms ... wzrost ↗ i spadek ↘ łącznie | ↗ 1.1 ms wzrost | 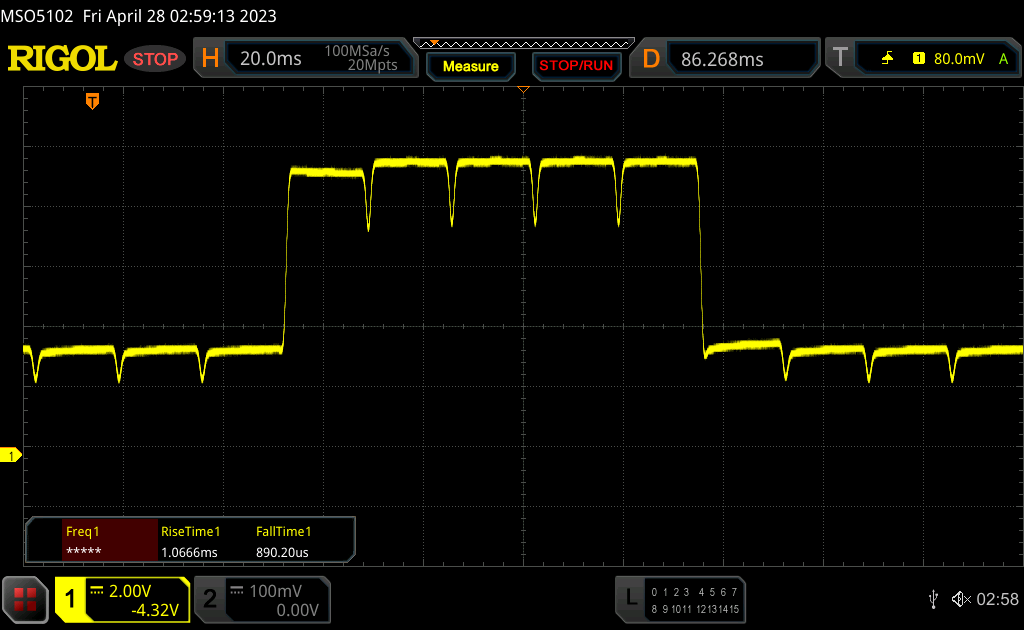 |
| ↘ 0.9 ms upadek | ||
| W naszych testach ekran wykazuje bardzo szybką reakcję i powinien bardzo dobrze nadawać się do szybkich gier. Dla porównania, wszystkie testowane urządzenia wahają się od 0.165 (minimum) do 636 (maksimum) ms. » 10 % wszystkich urządzeń jest lepszych. Oznacza to, że zmierzony czas reakcji jest lepszy od średniej wszystkich testowanych urządzeń (31.1 ms). | ||
Migotanie ekranu / PWM (modulacja szerokości impulsu)
| Wykryto migotanie ekranu/wykryto PWM | 240 Hz | ≤ 57 % ustawienia jasności | 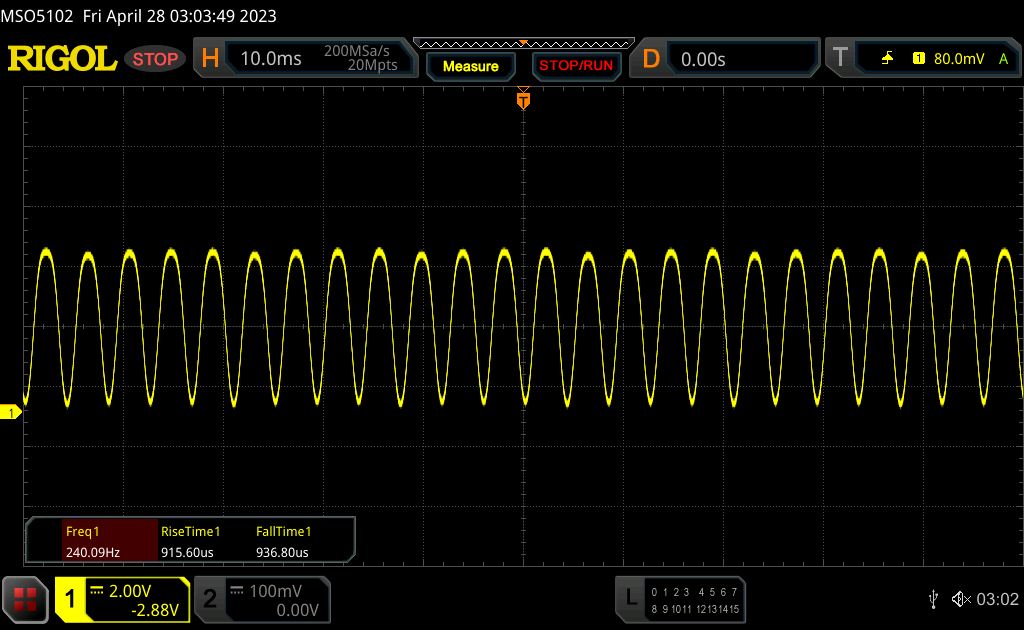 |
| ≤ 88 jasność cd/m² | |||
Podświetlenie wyświetlacza miga z częstotliwością 240 Hz (najgorszy przypadek, np. przy użyciu PWM) Wykryto migotanie przy ustawieniu jasności 57 % (88 cd/m²) i poniżej. Powyżej tego ustawienia jasności nie powinno być żadnego migotania ani PWM. Częstotliwość 240 Hz jest stosunkowo niska, więc wrażliwi użytkownicy prawdopodobnie zauważą migotanie i odczują zmęczenie oczu przy podanym ustawieniu jasności i poniżej. Migotanie występuje przy stosunkowo niskich ustawieniach jasności, dlatego długotrwałe użytkowanie przy tym ustawieniu jasności lub niższym może powodować zmęczenie oczu. Dla porównania: 52 % wszystkich testowanych urządzeń nie używa PWM do przyciemniania wyświetlacza. Jeśli wykryto PWM, zmierzono średnio 7798 (minimum: 5 - maksimum: 343500) Hz. | |||
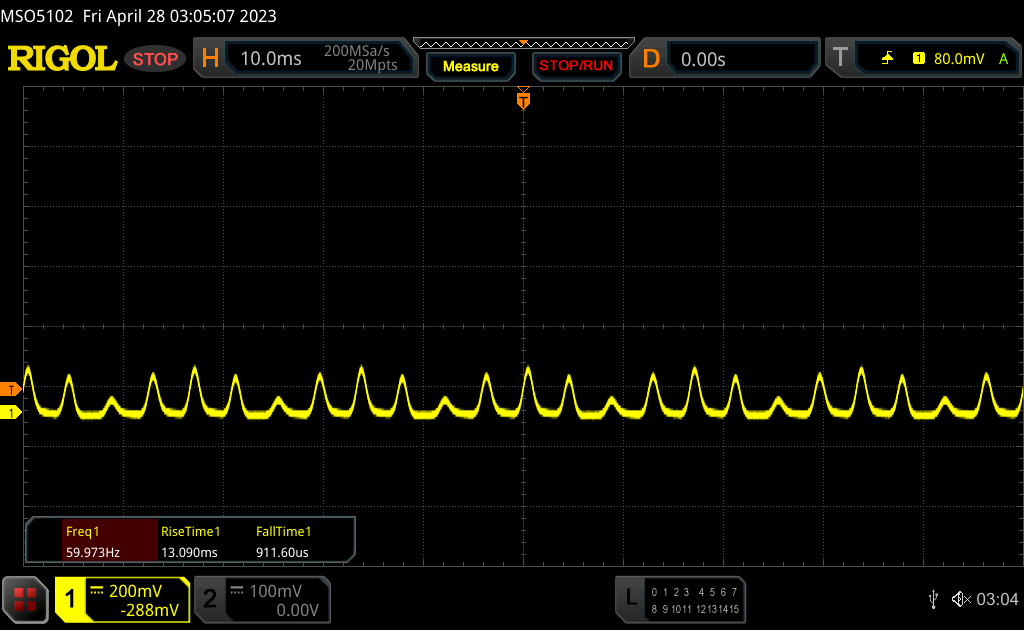
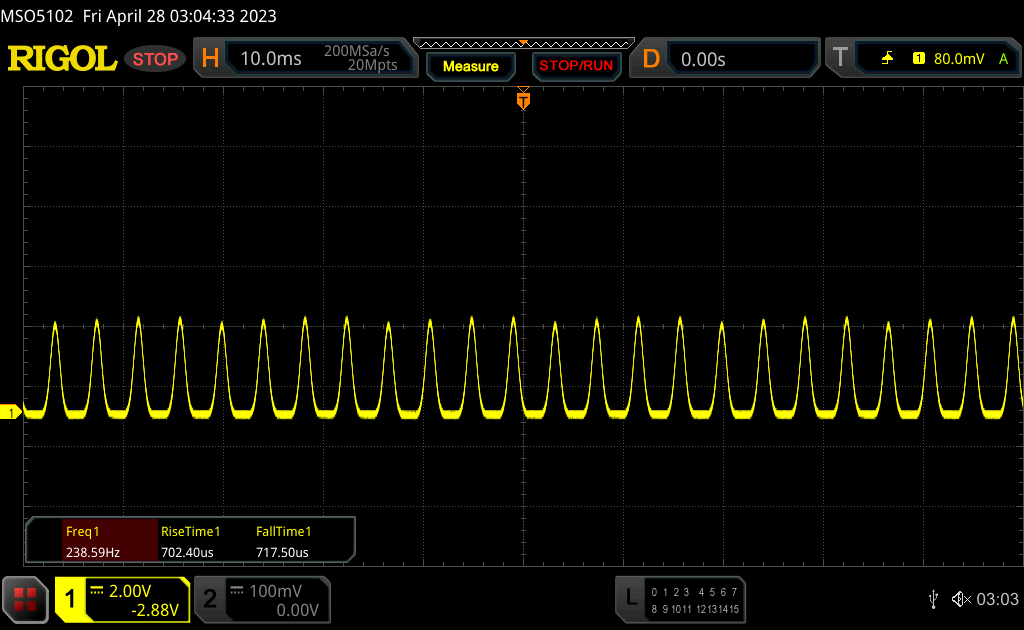
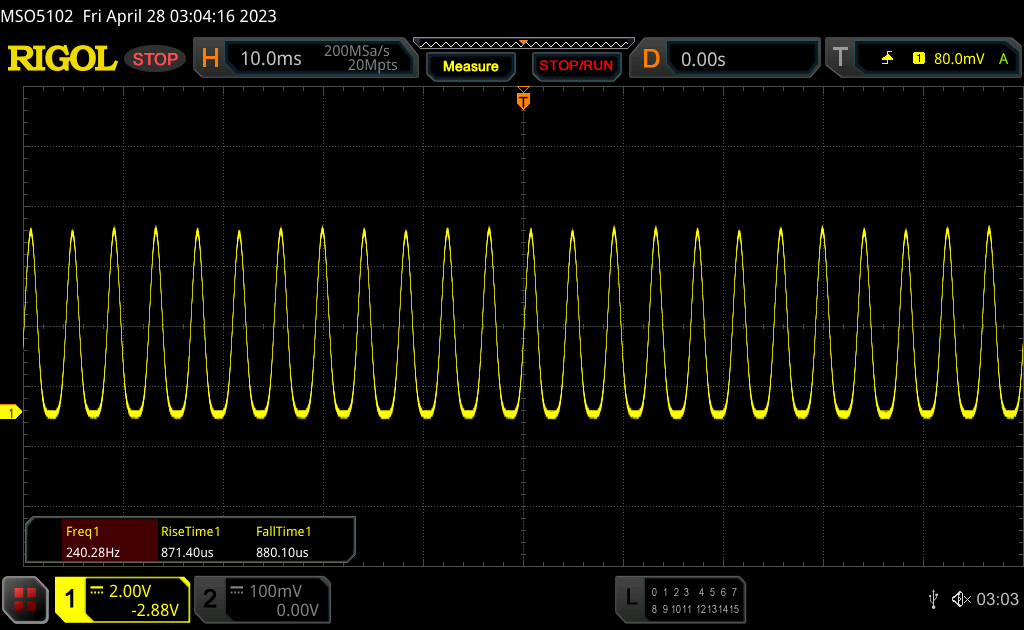
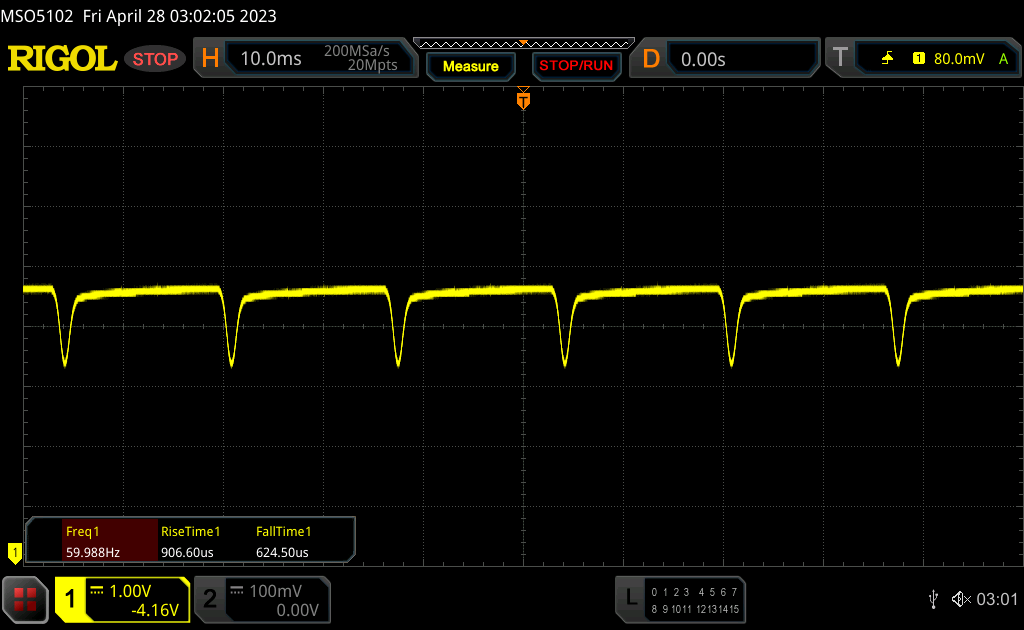
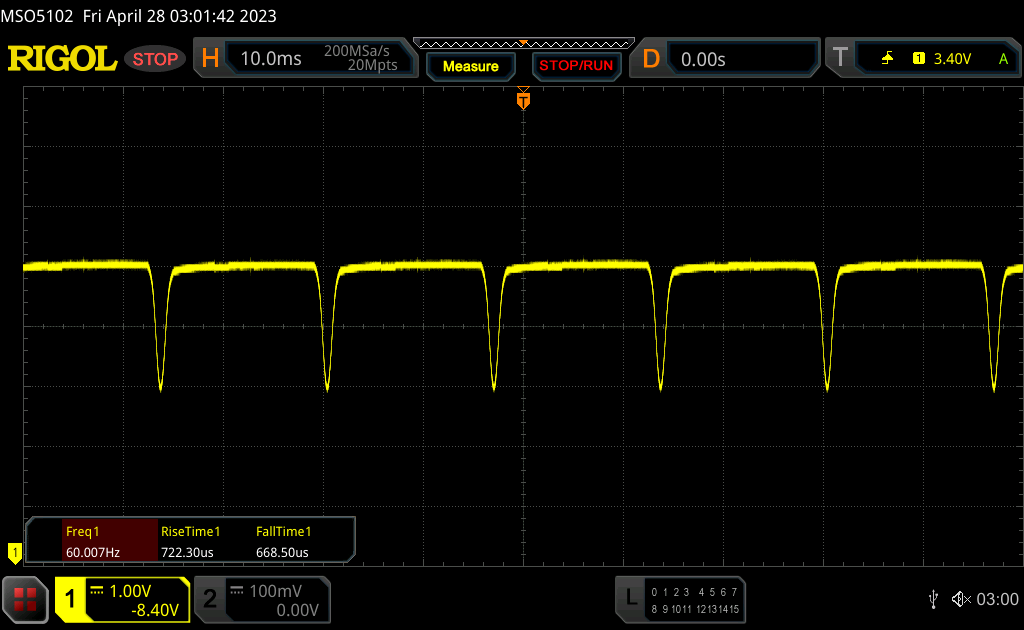
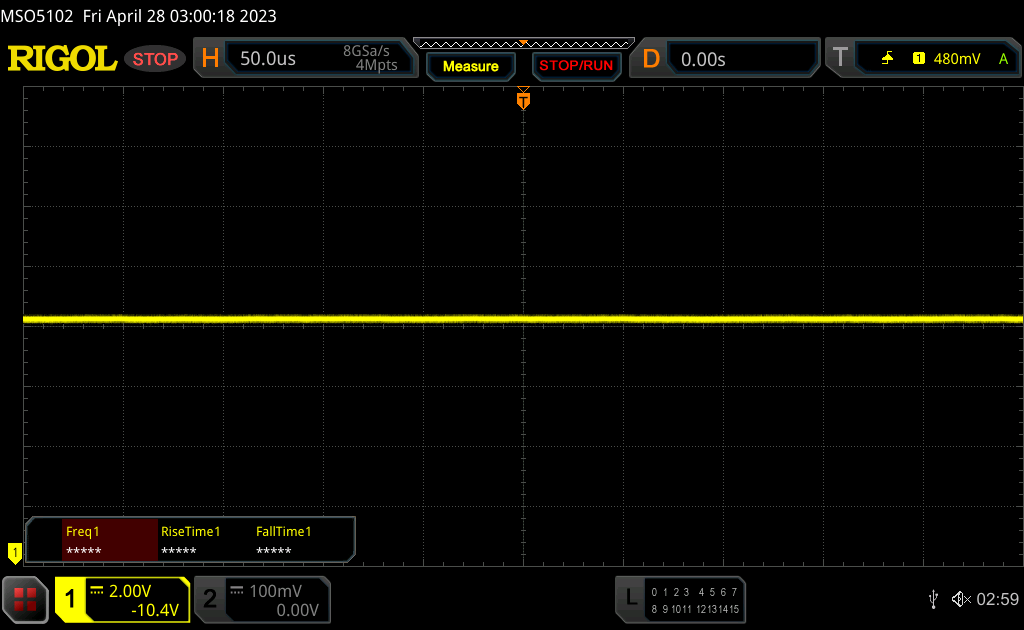
Do tematu PWM musimy odnieść się bardziej szczegółowo, gdyż podobnie jak w poprzedniku, jest kilka czynników, które należy wziąć pod uwagę. Przy jasności 100% nie ma PWM; w zakresie 58-99% stosowane jest ściemnianie DC z częstotliwością 60 Hz; a począwszy od 57% (88 cd/m²) i niżej jest to klasyczne i potencjalnie bardziej szkodliwe migotanie PWM z częstotliwością 240 Hz. Początkowo częstotliwość ściemniania DC na poziomie 60 Hz brzmi gorzej niż jest, ale ze względu na znacznie niższą amplitudę nie można jej porównywać z klasycznym PWM i nie powinna sprawiać żadnych problemów.
Asus nadal oferuje rozwiązanie programowe pozwalające na zmniejszenie jasności bez wchodzenia w szkodliwy obszar PWM. Asus nazywa tę funkcję "flicker free OLED darkening", umożliwiając dalsze zmniejszanie jasności w krokach. W praktyce nie należy schodzić poniżej jasności Windowsa wynoszącej 60%, a w celu dodatkowego zmniejszenia należy zamiast tego skorzystać z oprogramowania. Choć Asus zapewnia tutaj powiadomienie ostrzegawcze, to oczywiście wolelibyśmy bardziej komfortowe rozwiązanie, w którym metoda programowa jest bezpośrednio zintegrowana z ustawieniami Windows, a użytkownik w ogóle nie miałby możliwości dostania się do klasycznego obszaru PWM.
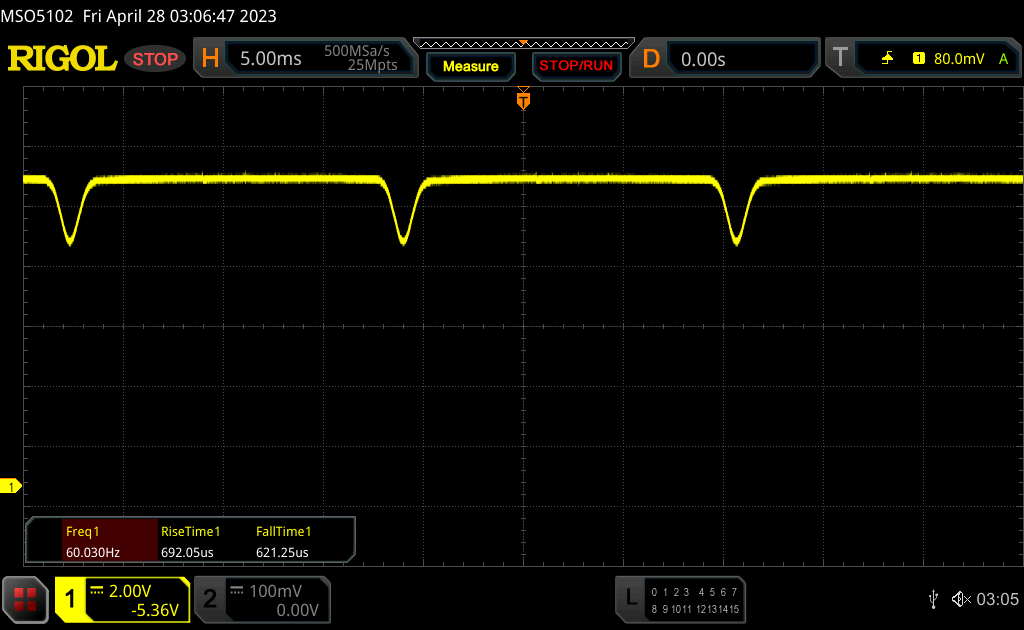
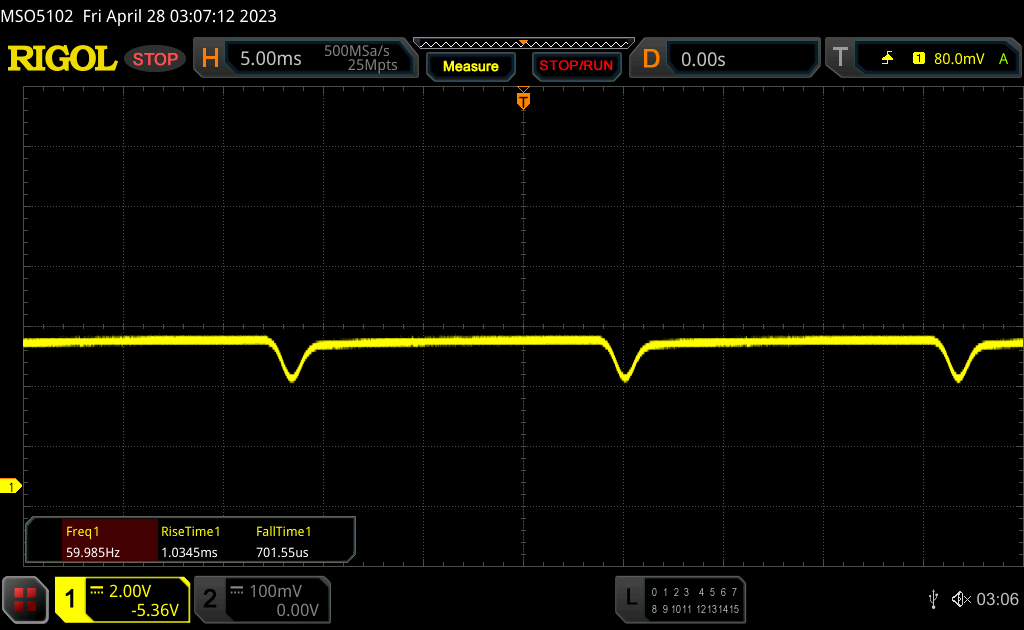
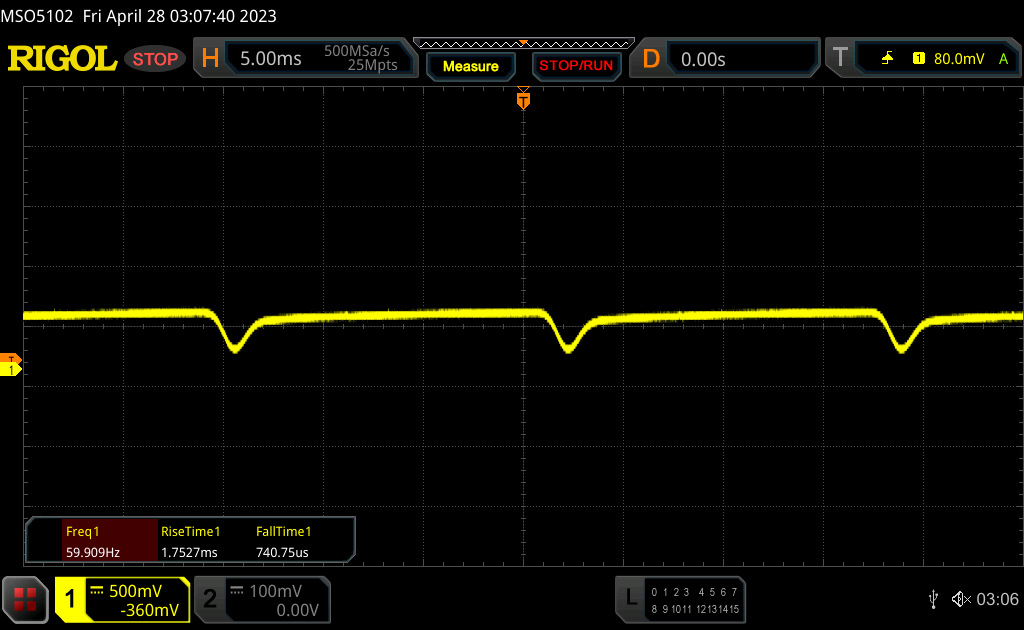
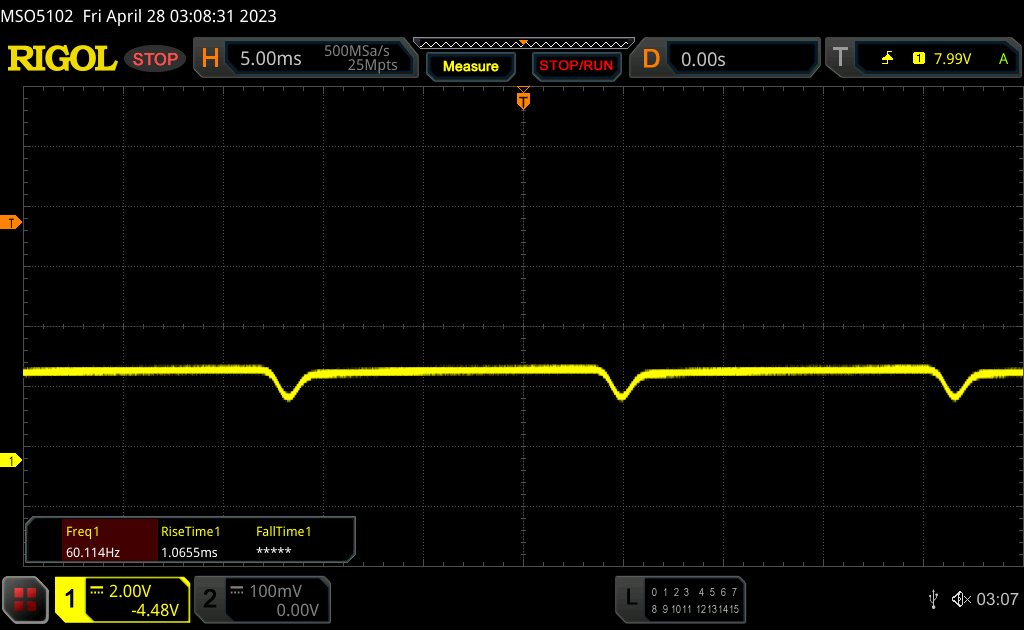
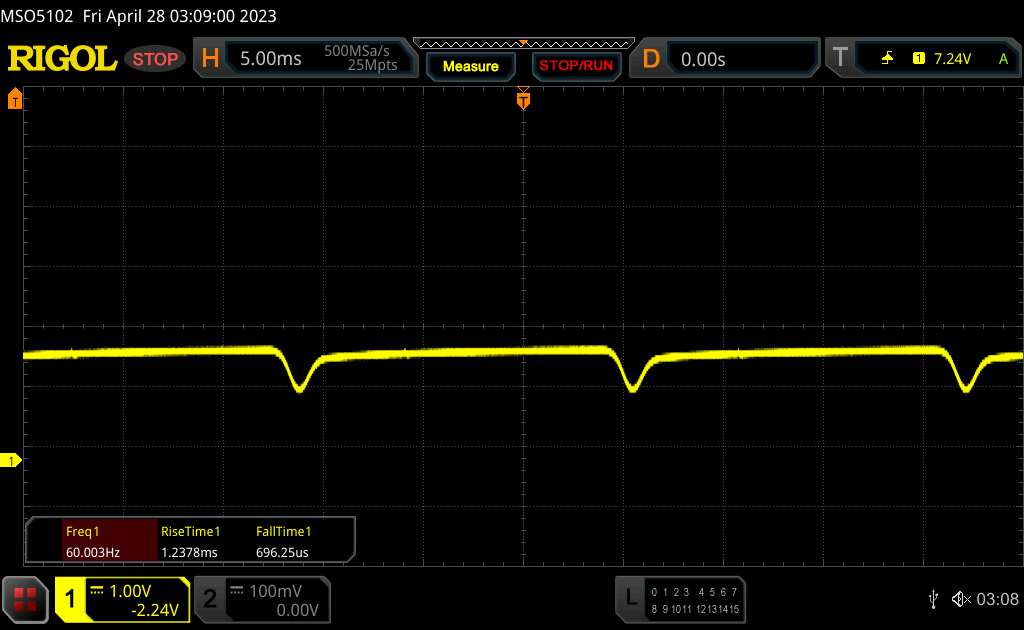
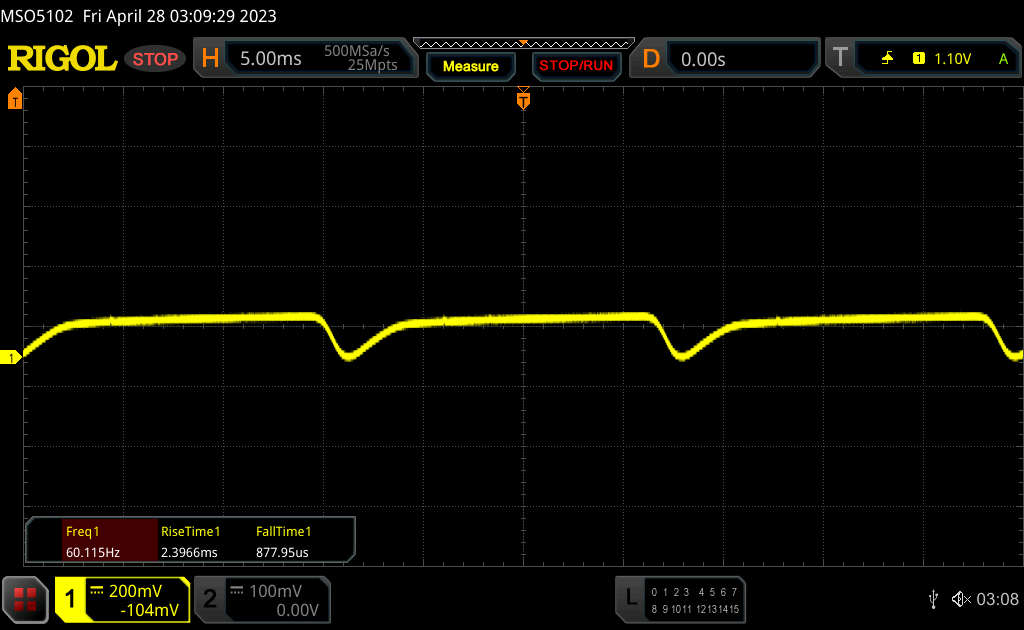
Jako przykłady zmierzyliśmy kilka ustawień z dwoma podstawowymi ustawieniami jasności i różnymi poziomami przyciemnienia. Widać wyraźnie, że można również wdrożyć niższe poziomy jasności z DC dimming poprzez zastosowanie programowego przyciemniania.
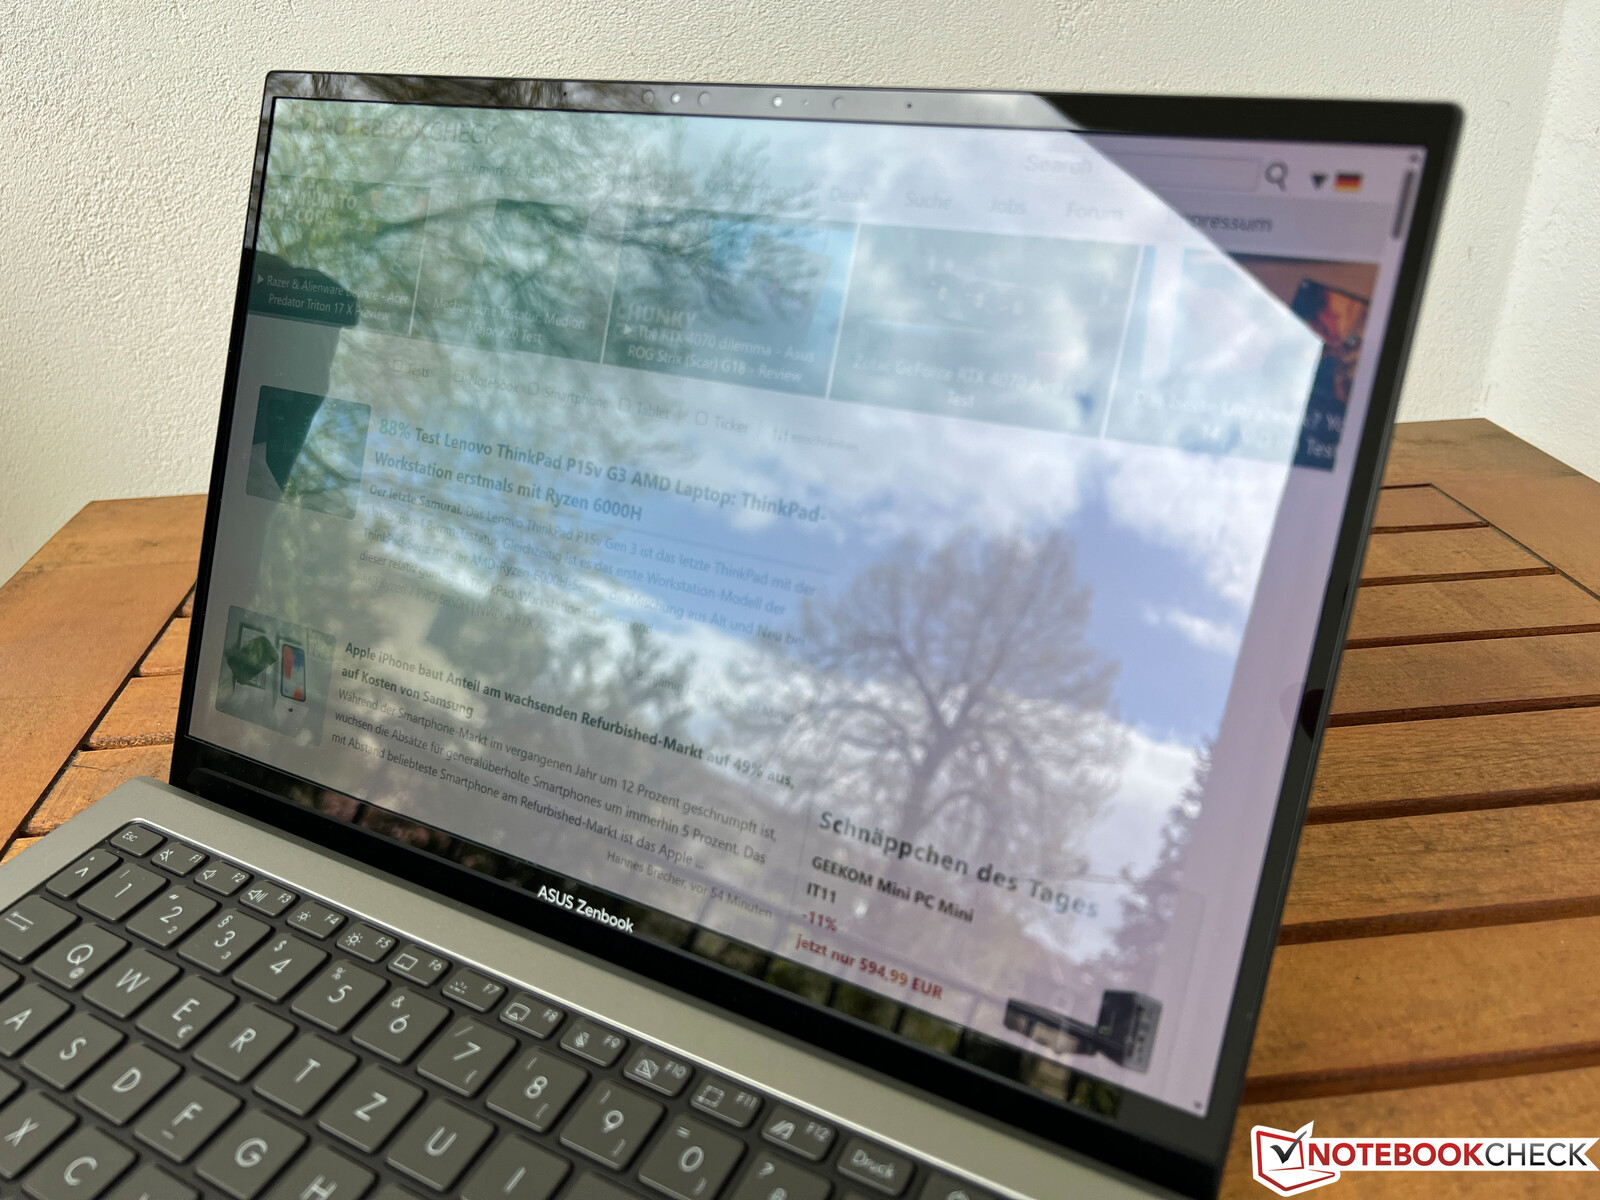
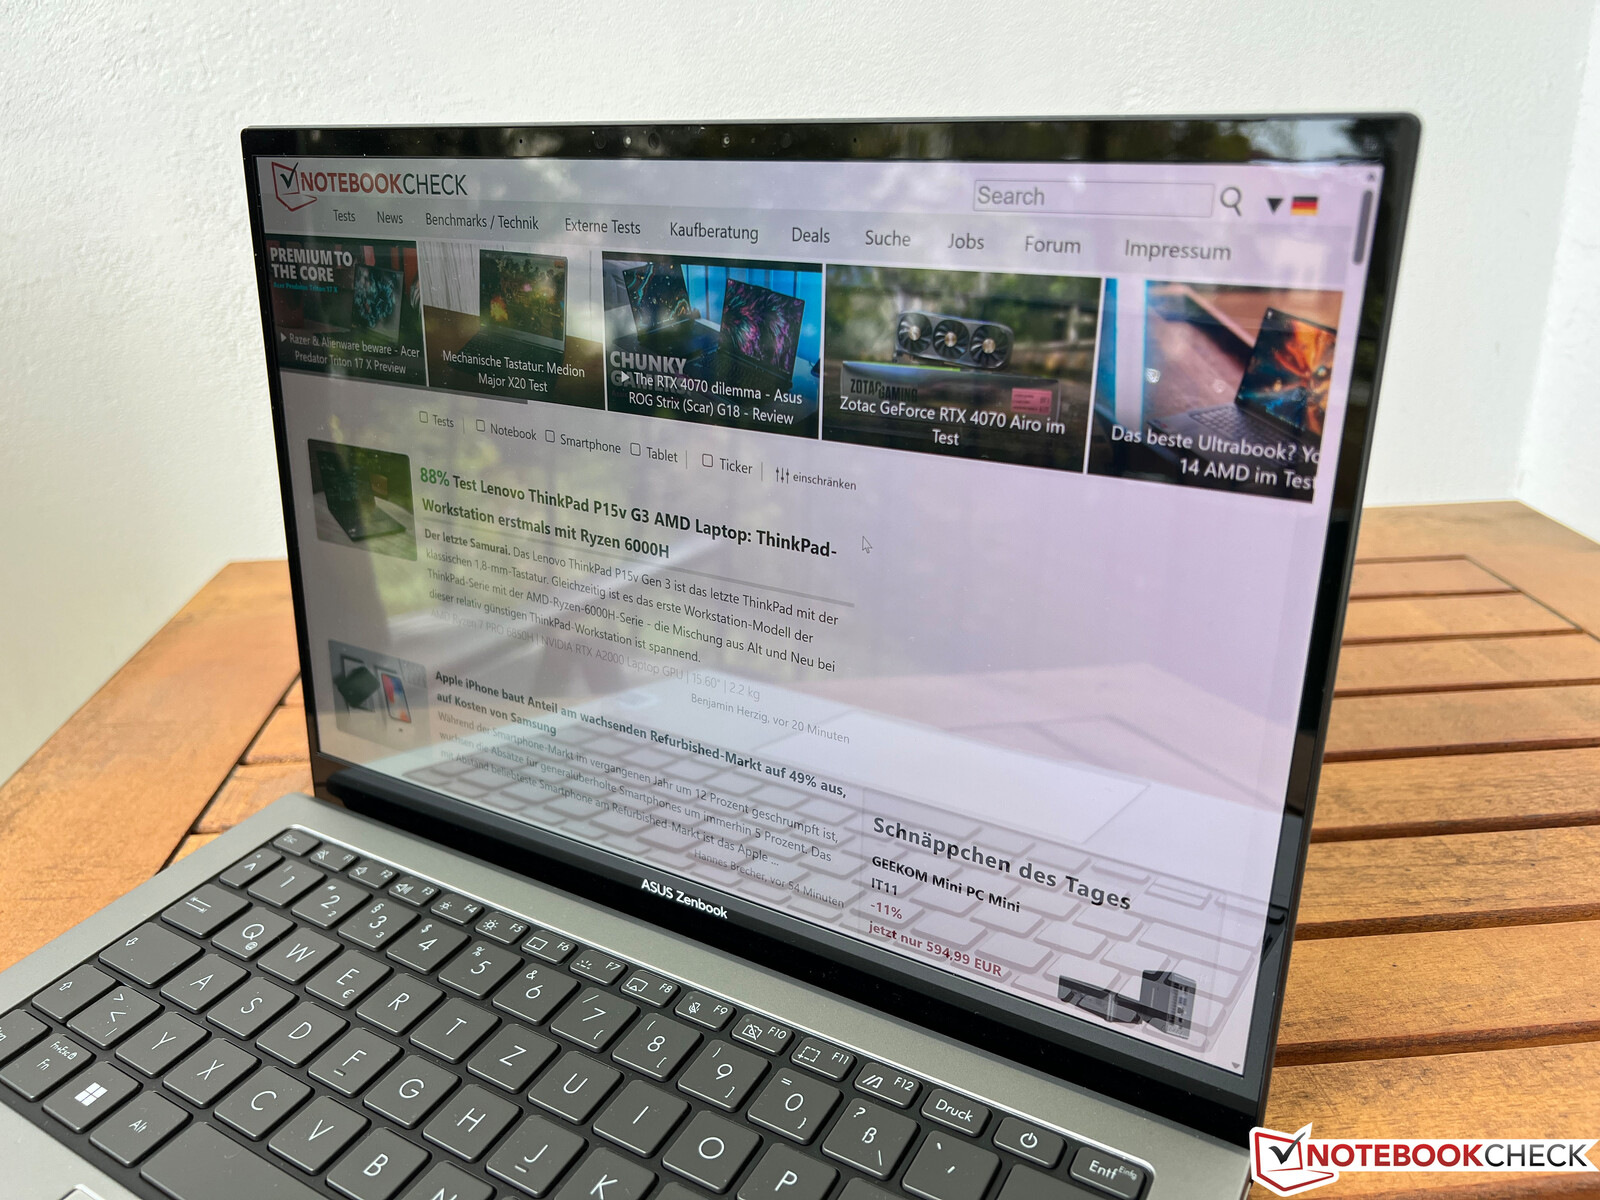
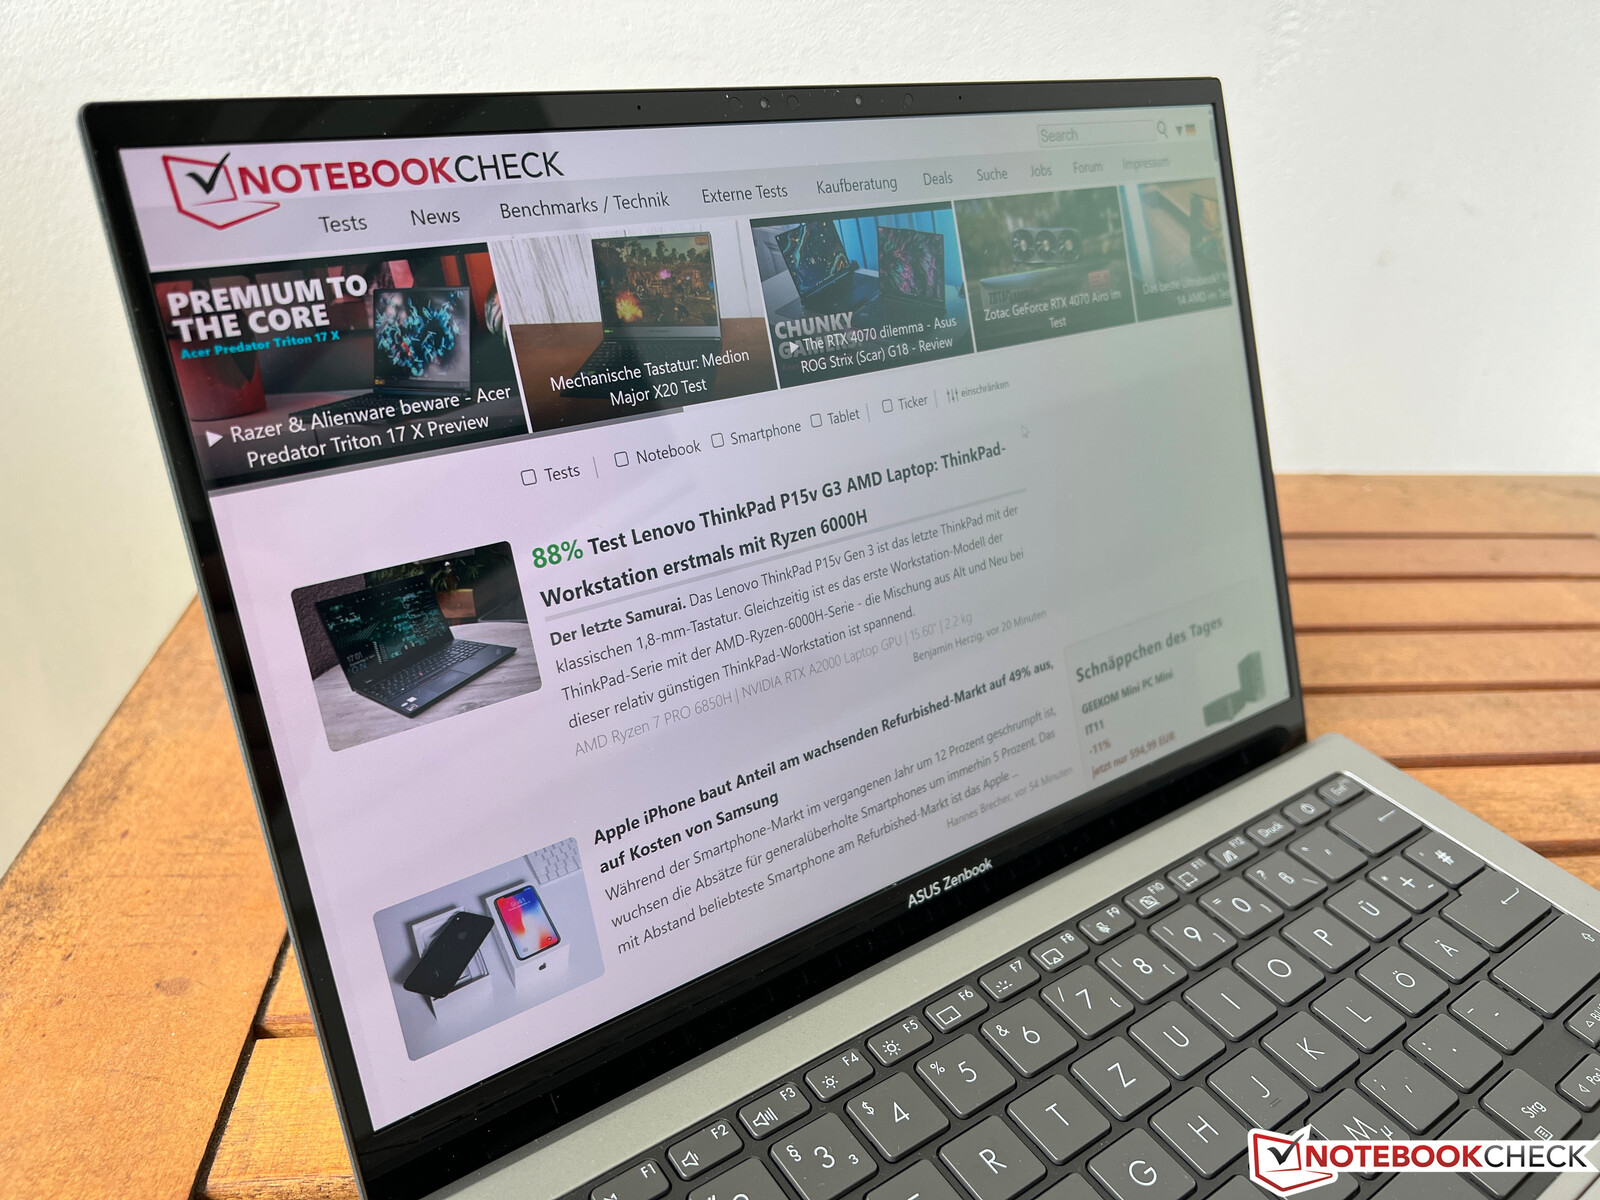
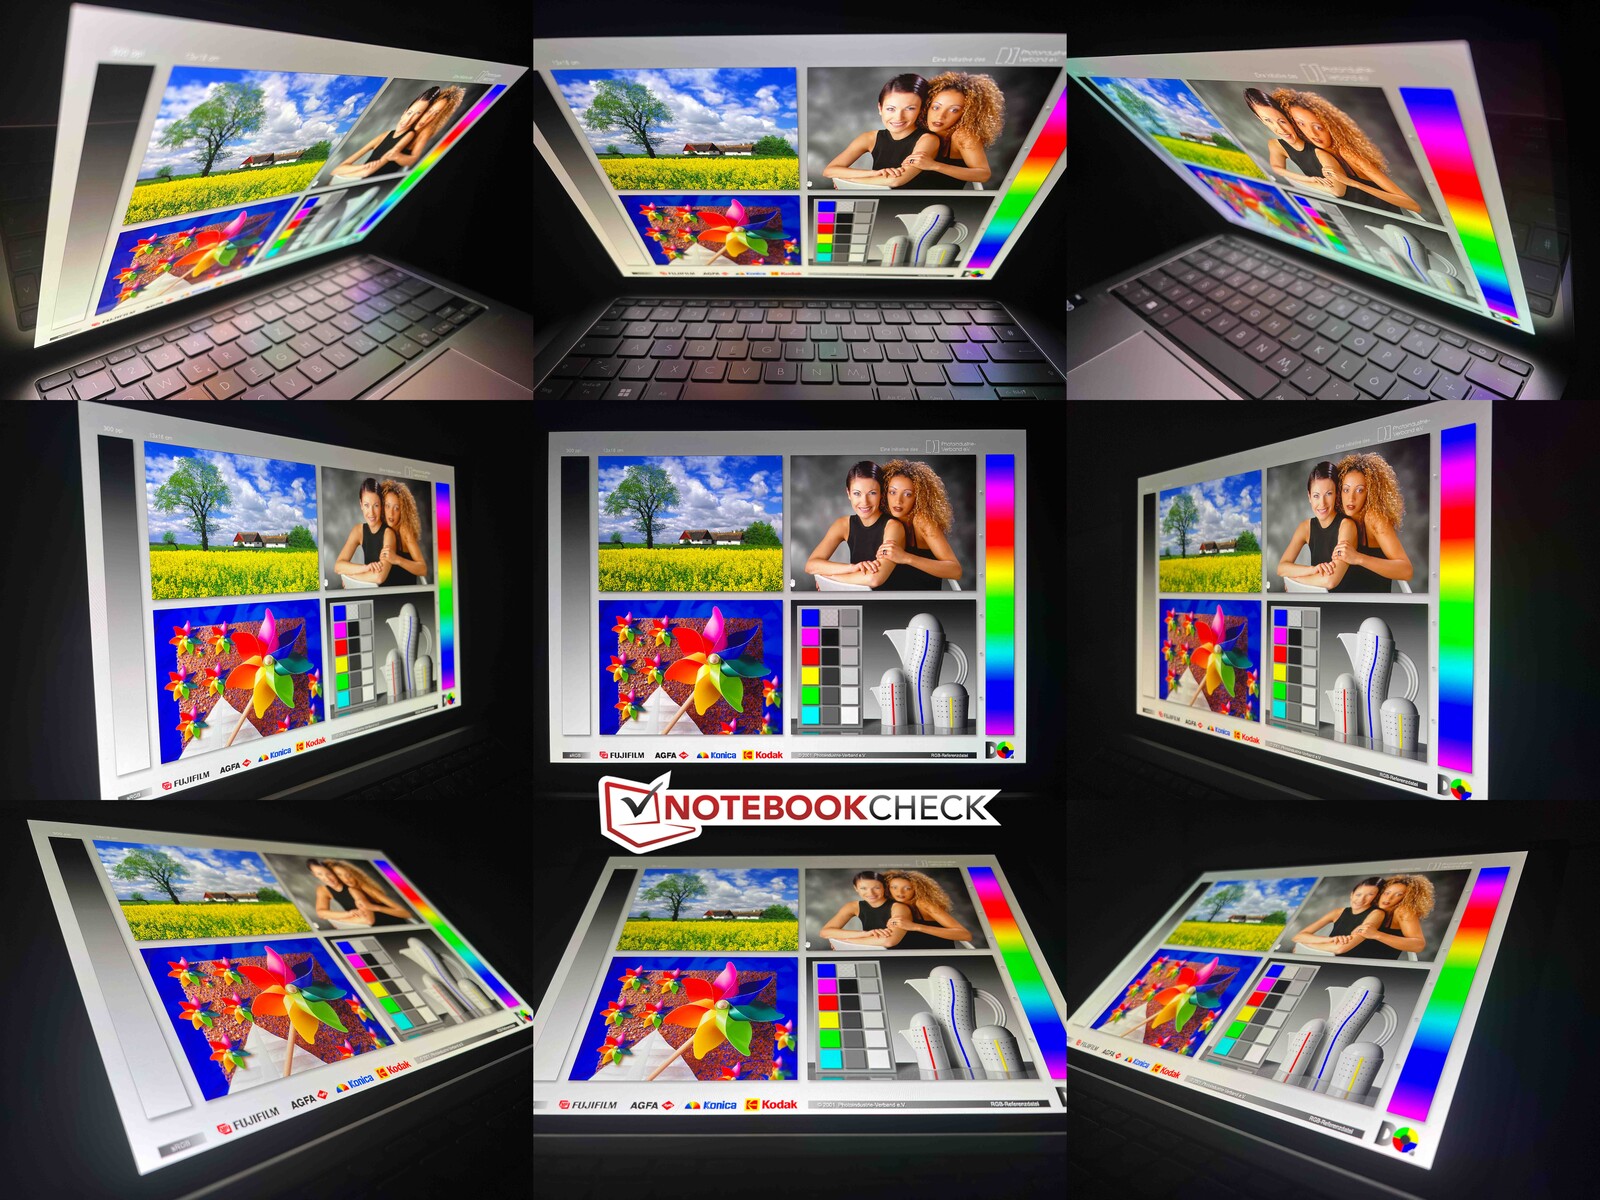
Na dworze Zenbook korzysta z wyjątkowo wysokiego kontrastu, ale wciąż korzysta z ekranu refleksyjnego, co siłą rzeczy będzie prowadzić do pewnych odbić. Wyższa jasność SDR na pewno przyniosłaby tu również pewne korzyści. Stabilność kątów widzenia jest ogólnie bardzo dobra i tylko pod pewnymi (bardzo stromymi) kątami widzenia można dostrzec lekki niebieski odcień, który jest typowy dla paneli OLED.
Wydajność - Asus stosuje teraz Raptor Lake U
Warunki badania
Asus oferuje trzy różne profile wydajności: Tryb Whisper, Tryb Standard oraz Tryb Performance. Ze względu na głośne wentylatory (nie przynoszące zauważalnego wzrostu wydajności), ten ostatni dyskwalifikuje się z użycia. Nasze benchmarki i pomiary poniżej przeprowadziliśmy w trybie Standard. W przypadku korzystania z trybu Whisper wentylatory są znacznie cichsze, ale niekoniecznie jest to zaletą w przypadku szumu wentylatorów o wysokiej częstotliwości. Ale o tym więcej później.
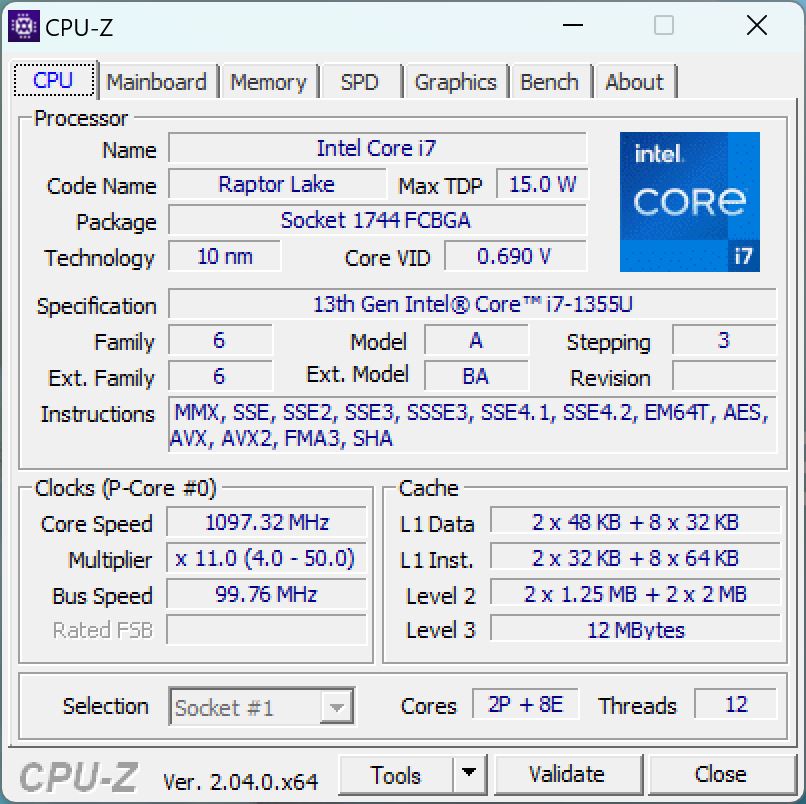
Procesor - Core i7-1355U
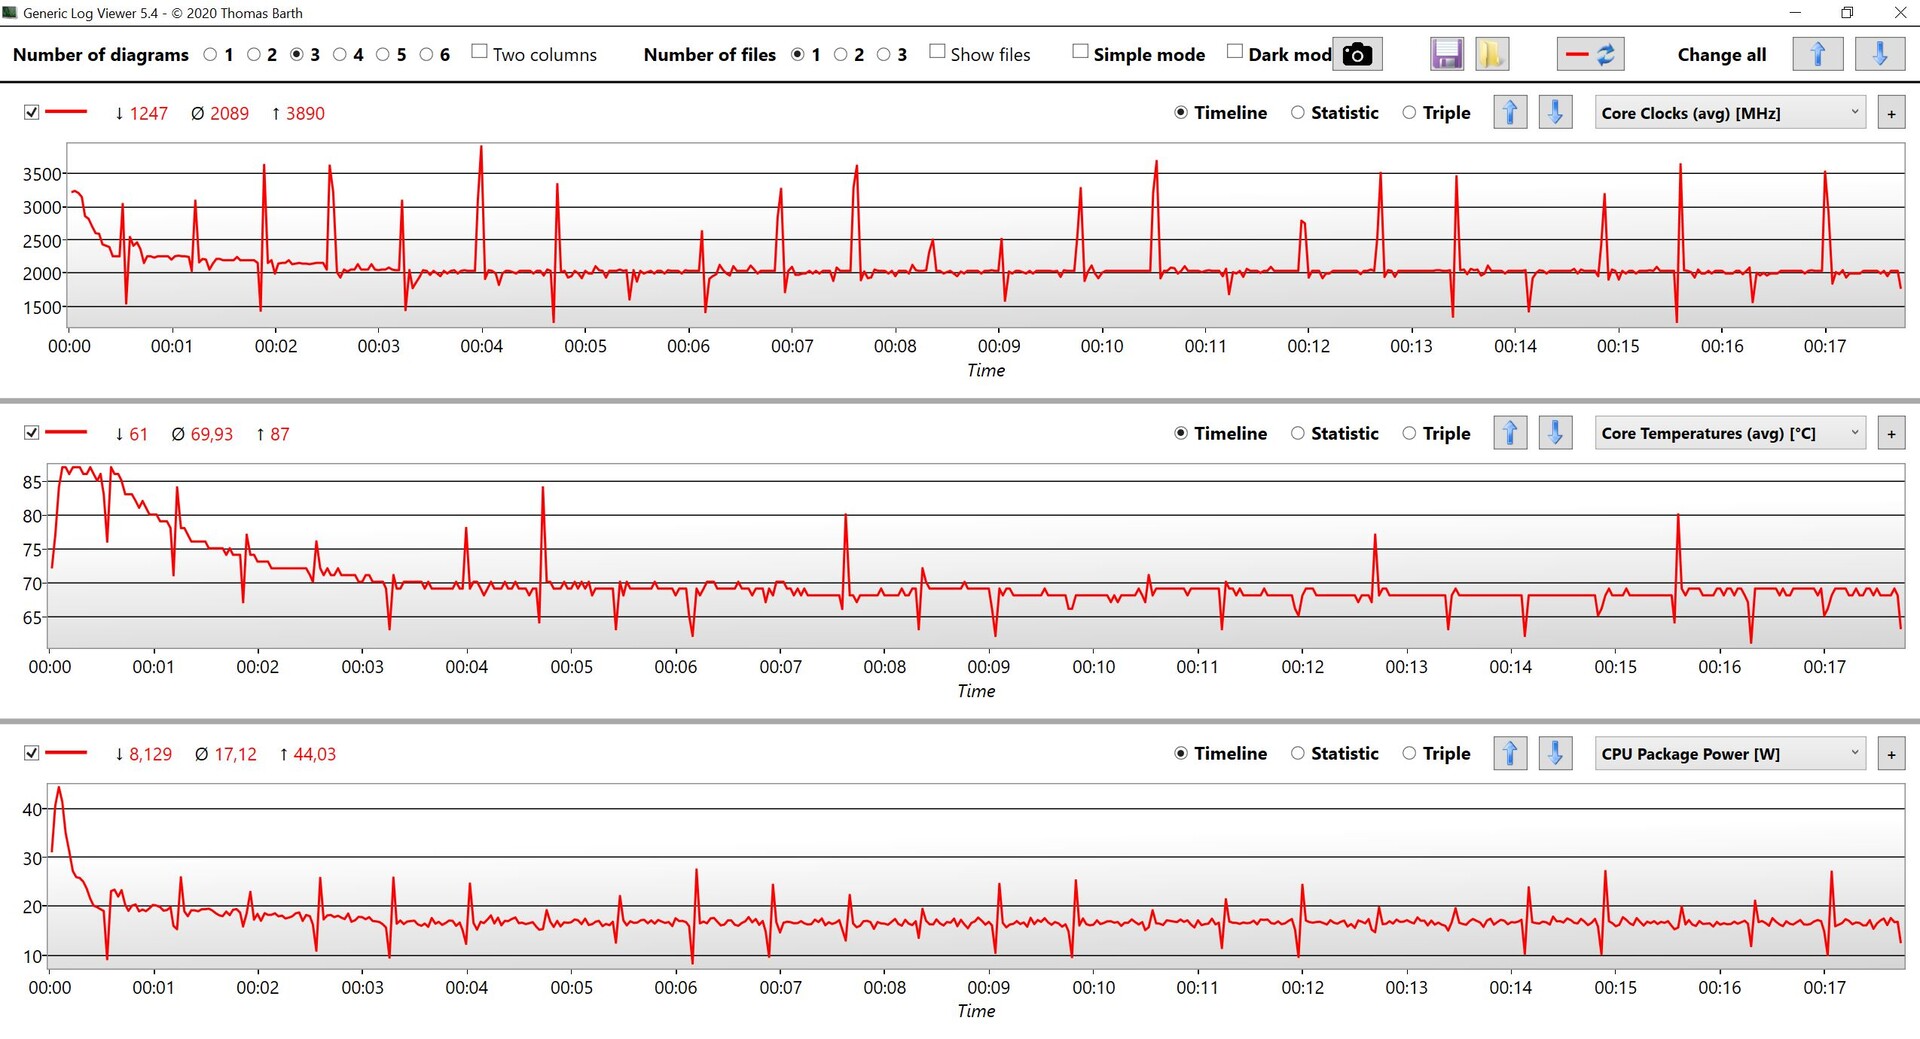
Na stronie .Intel Core i7-1355Uz obecnej generacji Raptor Lake oferuje dwa szybkie rdzenie Performance i osiem Efficiency. W zasadzie jest to zeszłorocznyAlder Lake Core i7-1255Uz nieco podniesionymi taktowaniami. Procesor ma prawo pobierać do 44 W przez krótki czas, ale pod stałym obciążeniem zużycie szybko spada do około 17 W.
W testach wielordzeniowych wydajność jest więc konkurencyjna tylko przez krótki czas, a chłodzony pasywnie MacBook Air M2, na przykład w drugim przebiegu jest już szybszy (mimo że trzeba tu emulować Cinebench R15). W porównaniu z ubiegłorocznym Zenbooka S 13 z procesorem Ryzen 7 6800U, wydajność wielordzeniowa jest również wyraźnie gorsza. Tylko w testach jednordzeniowych widzimy niewielką, najwyżej 20% przewagę w porównaniu z Ryzen 7 6800U. Jednak we wszystkich benchmarkach CPU nowy model nadal plasuje się o 10% za Zenbookiem S 13 z zeszłego roku.
W trybie pracy na akumulatorze zużycie energii jest jeszcze nieco mniejsze, a wydajność wielordzeniowa spada o około 17%. Z drugiej strony 3% spadek wydajności jednordzeniowej jest nieistotny. Dodatkowe benchmarki procesora można znaleźć m.in tutaj.
Cinebench R15 Multi Constant Load Test
Cinebench R23: Multi Core | Single Core
Cinebench R20: CPU (Multi Core) | CPU (Single Core)
Cinebench R15: CPU Multi 64Bit | CPU Single 64Bit
Blender: v2.79 BMW27 CPU
7-Zip 18.03: 7z b 4 | 7z b 4 -mmt1
Geekbench 5.5: Multi-Core | Single-Core
HWBOT x265 Benchmark v2.2: 4k Preset
LibreOffice : 20 Documents To PDF
R Benchmark 2.5: Overall mean
| CPU Performance rating | |
| Dell XPS 13 Plus 9320 i7-1280P OLED | |
| Średnia w klasie Subnotebook | |
| Lenovo Yoga Slim 7 Carbon 13IAP7-82U9005FGE | |
| Asus Zenbook S 13 OLED | |
| Przeciętny Intel Core i7-1355U | |
| Asus ZenBook S13 OLED UX5304 | |
| Apple MacBook Air M2 10C GPU -5! | |
| Samsung Galaxy Book2 Pro 13 NP930XED-KA1DE | |
| Cinebench R23 / Multi Core | |
| Średnia w klasie Subnotebook (1555 - 21812, n=61, ostatnie 2 lata) | |
| Dell XPS 13 Plus 9320 i7-1280P OLED | |
| Asus Zenbook S 13 OLED | |
| Lenovo Yoga Slim 7 Carbon 13IAP7-82U9005FGE | |
| Przeciętny Intel Core i7-1355U (6936 - 10252, n=18) | |
| Apple MacBook Air M2 10C GPU | |
| Asus ZenBook S13 OLED UX5304 | |
| Samsung Galaxy Book2 Pro 13 NP930XED-KA1DE | |
| Cinebench R23 / Single Core | |
| Przeciętny Intel Core i7-1355U (1687 - 1889, n=18) | |
| Lenovo Yoga Slim 7 Carbon 13IAP7-82U9005FGE | |
| Asus ZenBook S13 OLED UX5304 | |
| Średnia w klasie Subnotebook (358 - 2213, n=62, ostatnie 2 lata) | |
| Dell XPS 13 Plus 9320 i7-1280P OLED | |
| Apple MacBook Air M2 10C GPU | |
| Asus Zenbook S 13 OLED | |
| Samsung Galaxy Book2 Pro 13 NP930XED-KA1DE | |
| Cinebench R20 / CPU (Multi Core) | |
| Średnia w klasie Subnotebook (579 - 8541, n=58, ostatnie 2 lata) | |
| Dell XPS 13 Plus 9320 i7-1280P OLED | |
| Asus Zenbook S 13 OLED | |
| Lenovo Yoga Slim 7 Carbon 13IAP7-82U9005FGE | |
| Przeciętny Intel Core i7-1355U (2849 - 3907, n=18) | |
| Asus ZenBook S13 OLED UX5304 | |
| Apple MacBook Air M2 10C GPU | |
| Samsung Galaxy Book2 Pro 13 NP930XED-KA1DE | |
| Cinebench R20 / CPU (Single Core) | |
| Przeciętny Intel Core i7-1355U (654 - 725, n=18) | |
| Asus ZenBook S13 OLED UX5304 | |
| Lenovo Yoga Slim 7 Carbon 13IAP7-82U9005FGE | |
| Średnia w klasie Subnotebook (128 - 832, n=58, ostatnie 2 lata) | |
| Dell XPS 13 Plus 9320 i7-1280P OLED | |
| Asus Zenbook S 13 OLED | |
| Apple MacBook Air M2 10C GPU | |
| Samsung Galaxy Book2 Pro 13 NP930XED-KA1DE | |
| Cinebench R15 / CPU Multi 64Bit | |
| Średnia w klasie Subnotebook (327 - 3345, n=58, ostatnie 2 lata) | |
| Dell XPS 13 Plus 9320 i7-1280P OLED | |
| Lenovo Yoga Slim 7 Carbon 13IAP7-82U9005FGE | |
| Asus Zenbook S 13 OLED | |
| Przeciętny Intel Core i7-1355U (1206 - 1735, n=18) | |
| Asus ZenBook S13 OLED UX5304 | |
| Apple MacBook Air M2 10C GPU | |
| Samsung Galaxy Book2 Pro 13 NP930XED-KA1DE | |
| Cinebench R15 / CPU Single 64Bit | |
| Średnia w klasie Subnotebook (72.4 - 322, n=58, ostatnie 2 lata) | |
| Przeciętny Intel Core i7-1355U (237 - 267, n=18) | |
| Asus ZenBook S13 OLED UX5304 | |
| Lenovo Yoga Slim 7 Carbon 13IAP7-82U9005FGE | |
| Asus Zenbook S 13 OLED | |
| Dell XPS 13 Plus 9320 i7-1280P OLED | |
| Apple MacBook Air M2 10C GPU | |
| Samsung Galaxy Book2 Pro 13 NP930XED-KA1DE | |
| Blender / v2.79 BMW27 CPU | |
| Apple MacBook Air M2 10C GPU | |
| Samsung Galaxy Book2 Pro 13 NP930XED-KA1DE | |
| Asus ZenBook S13 OLED UX5304 | |
| Asus ZenBook S13 OLED UX5304 | |
| Przeciętny Intel Core i7-1355U (328 - 503, n=18) | |
| Średnia w klasie Subnotebook (159 - 2271, n=59, ostatnie 2 lata) | |
| Lenovo Yoga Slim 7 Carbon 13IAP7-82U9005FGE | |
| Asus Zenbook S 13 OLED | |
| Dell XPS 13 Plus 9320 i7-1280P OLED | |
| 7-Zip 18.03 / 7z b 4 | |
| Dell XPS 13 Plus 9320 i7-1280P OLED | |
| Asus Zenbook S 13 OLED | |
| Średnia w klasie Subnotebook (11668 - 77867, n=58, ostatnie 2 lata) | |
| Lenovo Yoga Slim 7 Carbon 13IAP7-82U9005FGE | |
| Przeciętny Intel Core i7-1355U (30255 - 42092, n=18) | |
| Asus ZenBook S13 OLED UX5304 | |
| Samsung Galaxy Book2 Pro 13 NP930XED-KA1DE | |
| 7-Zip 18.03 / 7z b 4 -mmt1 | |
| Asus ZenBook S13 OLED UX5304 | |
| Przeciętny Intel Core i7-1355U (5301 - 5911, n=18) | |
| Średnia w klasie Subnotebook (2643 - 6699, n=60, ostatnie 2 lata) | |
| Asus Zenbook S 13 OLED | |
| Lenovo Yoga Slim 7 Carbon 13IAP7-82U9005FGE | |
| Dell XPS 13 Plus 9320 i7-1280P OLED | |
| Samsung Galaxy Book2 Pro 13 NP930XED-KA1DE | |
| Geekbench 5.5 / Multi-Core | |
| Dell XPS 13 Plus 9320 i7-1280P OLED | |
| Średnia w klasie Subnotebook (2557 - 17218, n=49, ostatnie 2 lata) | |
| Lenovo Yoga Slim 7 Carbon 13IAP7-82U9005FGE | |
| Apple MacBook Air M2 10C GPU | |
| Przeciętny Intel Core i7-1355U (7507 - 9328, n=18) | |
| Asus ZenBook S13 OLED UX5304 | |
| Asus Zenbook S 13 OLED | |
| Samsung Galaxy Book2 Pro 13 NP930XED-KA1DE | |
| Geekbench 5.5 / Single-Core | |
| Apple MacBook Air M2 10C GPU | |
| Średnia w klasie Subnotebook (726 - 2224, n=49, ostatnie 2 lata) | |
| Dell XPS 13 Plus 9320 i7-1280P OLED | |
| Przeciętny Intel Core i7-1355U (1678 - 1872, n=18) | |
| Asus ZenBook S13 OLED UX5304 | |
| Lenovo Yoga Slim 7 Carbon 13IAP7-82U9005FGE | |
| Asus Zenbook S 13 OLED | |
| Samsung Galaxy Book2 Pro 13 NP930XED-KA1DE | |
| HWBOT x265 Benchmark v2.2 / 4k Preset | |
| Dell XPS 13 Plus 9320 i7-1280P OLED | |
| Średnia w klasie Subnotebook (0.97 - 25.1, n=58, ostatnie 2 lata) | |
| Asus Zenbook S 13 OLED | |
| Lenovo Yoga Slim 7 Carbon 13IAP7-82U9005FGE | |
| Przeciętny Intel Core i7-1355U (7.83 - 11.4, n=18) | |
| Asus ZenBook S13 OLED UX5304 | |
| Samsung Galaxy Book2 Pro 13 NP930XED-KA1DE | |
| LibreOffice / 20 Documents To PDF | |
| Samsung Galaxy Book2 Pro 13 NP930XED-KA1DE | |
| Średnia w klasie Subnotebook (39.9 - 220, n=57, ostatnie 2 lata) | |
| Asus Zenbook S 13 OLED | |
| Przeciętny Intel Core i7-1355U (41.1 - 108.6, n=18) | |
| Dell XPS 13 Plus 9320 i7-1280P OLED | |
| Asus ZenBook S13 OLED UX5304 | |
| Lenovo Yoga Slim 7 Carbon 13IAP7-82U9005FGE | |
| R Benchmark 2.5 / Overall mean | |
| Samsung Galaxy Book2 Pro 13 NP930XED-KA1DE | |
| Średnia w klasie Subnotebook (0.4024 - 1.456, n=59, ostatnie 2 lata) | |
| Asus Zenbook S 13 OLED | |
| Dell XPS 13 Plus 9320 i7-1280P OLED | |
| Przeciętny Intel Core i7-1355U (0.4481 - 0.832, n=18) | |
| Lenovo Yoga Slim 7 Carbon 13IAP7-82U9005FGE | |
| Asus ZenBook S13 OLED UX5304 | |
* ... im mniej tym lepiej
AIDA64: FP32 Ray-Trace | FPU Julia | CPU SHA3 | CPU Queen | FPU SinJulia | FPU Mandel | CPU AES | CPU ZLib | FP64 Ray-Trace | CPU PhotoWorxx
| Performance rating | |
| Asus Zenbook S 13 OLED | |
| Średnia w klasie Subnotebook | |
| Dell XPS 13 Plus 9320 i7-1280P OLED | |
| Przeciętny Intel Core i7-1355U | |
| Lenovo Yoga Slim 7 Carbon 13IAP7-82U9005FGE | |
| Asus ZenBook S13 OLED UX5304 | |
| Samsung Galaxy Book2 Pro 13 NP930XED-KA1DE | |
| AIDA64 / FP32 Ray-Trace | |
| Średnia w klasie Subnotebook (1135 - 32888, n=59, ostatnie 2 lata) | |
| Asus Zenbook S 13 OLED | |
| Dell XPS 13 Plus 9320 i7-1280P OLED | |
| Przeciętny Intel Core i7-1355U (5673 - 8424, n=18) | |
| Asus ZenBook S13 OLED UX5304 | |
| Lenovo Yoga Slim 7 Carbon 13IAP7-82U9005FGE | |
| Samsung Galaxy Book2 Pro 13 NP930XED-KA1DE | |
| AIDA64 / FPU Julia | |
| Asus Zenbook S 13 OLED | |
| Średnia w klasie Subnotebook (5218 - 123315, n=59, ostatnie 2 lata) | |
| Dell XPS 13 Plus 9320 i7-1280P OLED | |
| Przeciętny Intel Core i7-1355U (29580 - 42706, n=18) | |
| Asus ZenBook S13 OLED UX5304 | |
| Lenovo Yoga Slim 7 Carbon 13IAP7-82U9005FGE | |
| Samsung Galaxy Book2 Pro 13 NP930XED-KA1DE | |
| AIDA64 / CPU SHA3 | |
| Średnia w klasie Subnotebook (444 - 5287, n=59, ostatnie 2 lata) | |
| Dell XPS 13 Plus 9320 i7-1280P OLED | |
| Asus Zenbook S 13 OLED | |
| Przeciętny Intel Core i7-1355U (1529 - 2200, n=18) | |
| Lenovo Yoga Slim 7 Carbon 13IAP7-82U9005FGE | |
| Asus ZenBook S13 OLED UX5304 | |
| Samsung Galaxy Book2 Pro 13 NP930XED-KA1DE | |
| AIDA64 / CPU Queen | |
| Dell XPS 13 Plus 9320 i7-1280P OLED | |
| Asus Zenbook S 13 OLED | |
| Lenovo Yoga Slim 7 Carbon 13IAP7-82U9005FGE | |
| Asus ZenBook S13 OLED UX5304 | |
| Przeciętny Intel Core i7-1355U (21547 - 66907, n=18) | |
| Średnia w klasie Subnotebook (10579 - 95002, n=52, ostatnie 2 lata) | |
| Samsung Galaxy Book2 Pro 13 NP930XED-KA1DE | |
| AIDA64 / FPU SinJulia | |
| Asus Zenbook S 13 OLED | |
| Dell XPS 13 Plus 9320 i7-1280P OLED | |
| Średnia w klasie Subnotebook (744 - 18418, n=59, ostatnie 2 lata) | |
| Lenovo Yoga Slim 7 Carbon 13IAP7-82U9005FGE | |
| Przeciętny Intel Core i7-1355U (4045 - 5426, n=18) | |
| Asus ZenBook S13 OLED UX5304 | |
| Samsung Galaxy Book2 Pro 13 NP930XED-KA1DE | |
| AIDA64 / FPU Mandel | |
| Asus Zenbook S 13 OLED | |
| Średnia w klasie Subnotebook (3341 - 65433, n=59, ostatnie 2 lata) | |
| Dell XPS 13 Plus 9320 i7-1280P OLED | |
| Przeciętny Intel Core i7-1355U (14596 - 21627, n=18) | |
| Asus ZenBook S13 OLED UX5304 | |
| Lenovo Yoga Slim 7 Carbon 13IAP7-82U9005FGE | |
| Samsung Galaxy Book2 Pro 13 NP930XED-KA1DE | |
| AIDA64 / CPU AES | |
| Asus Zenbook S 13 OLED | |
| Dell XPS 13 Plus 9320 i7-1280P OLED | |
| Średnia w klasie Subnotebook (638 - 96917, n=59, ostatnie 2 lata) | |
| Przeciętny Intel Core i7-1355U (31432 - 75408, n=18) | |
| Lenovo Yoga Slim 7 Carbon 13IAP7-82U9005FGE | |
| Asus ZenBook S13 OLED UX5304 | |
| Samsung Galaxy Book2 Pro 13 NP930XED-KA1DE | |
| AIDA64 / CPU ZLib | |
| Średnia w klasie Subnotebook (164.9 - 1379, n=59, ostatnie 2 lata) | |
| Dell XPS 13 Plus 9320 i7-1280P OLED | |
| Asus Zenbook S 13 OLED | |
| Lenovo Yoga Slim 7 Carbon 13IAP7-82U9005FGE | |
| Przeciętny Intel Core i7-1355U (454 - 684, n=18) | |
| Asus ZenBook S13 OLED UX5304 | |
| Samsung Galaxy Book2 Pro 13 NP930XED-KA1DE | |
| AIDA64 / FP64 Ray-Trace | |
| Średnia w klasie Subnotebook (610 - 17495, n=59, ostatnie 2 lata) | |
| Dell XPS 13 Plus 9320 i7-1280P OLED | |
| Asus Zenbook S 13 OLED | |
| Przeciętny Intel Core i7-1355U (2991 - 4453, n=18) | |
| Asus ZenBook S13 OLED UX5304 | |
| Lenovo Yoga Slim 7 Carbon 13IAP7-82U9005FGE | |
| Samsung Galaxy Book2 Pro 13 NP930XED-KA1DE | |
| AIDA64 / CPU PhotoWorxx | |
| Dell XPS 13 Plus 9320 i7-1280P OLED | |
| Średnia w klasie Subnotebook (6569 - 85600, n=59, ostatnie 2 lata) | |
| Asus ZenBook S13 OLED UX5304 | |
| Przeciętny Intel Core i7-1355U (21800 - 46154, n=18) | |
| Lenovo Yoga Slim 7 Carbon 13IAP7-82U9005FGE | |
| Samsung Galaxy Book2 Pro 13 NP930XED-KA1DE | |
| Asus Zenbook S 13 OLED | |
Wydajność systemu
Subiektywne wrażenie wydajności nowego Zenbooka S 13 jest bardzo dobre, a wszystkie wejścia są realizowane bez zauważalnych opóźnień. Wyniki w benchmarkach syntetycznych są przeciętne, a w części pozostają nawet w tyle za poprzednikiem. W praktyce jednak nic z tego nie jest zauważalne.
CrossMark: Overall | Productivity | Creativity | Responsiveness
| PCMark 10 / Score | |
| Średnia w klasie Subnotebook (4920 - 9939, n=45, ostatnie 2 lata) | |
| Asus Zenbook S 13 OLED | |
| Przeciętny Intel Core i7-1355U, Intel Iris Xe Graphics G7 96EUs (5455 - 5933, n=15) | |
| Dell XPS 13 Plus 9320 i7-1280P OLED | |
| Lenovo Yoga Slim 7 Carbon 13IAP7-82U9005FGE | |
| Asus ZenBook S13 OLED UX5304 | |
| Samsung Galaxy Book2 Pro 13 NP930XED-KA1DE | |
| PCMark 10 / Essentials | |
| Przeciętny Intel Core i7-1355U, Intel Iris Xe Graphics G7 96EUs (10203 - 11822, n=15) | |
| Asus Zenbook S 13 OLED | |
| Asus ZenBook S13 OLED UX5304 | |
| Lenovo Yoga Slim 7 Carbon 13IAP7-82U9005FGE | |
| Dell XPS 13 Plus 9320 i7-1280P OLED | |
| Średnia w klasie Subnotebook (8552 - 11646, n=45, ostatnie 2 lata) | |
| Samsung Galaxy Book2 Pro 13 NP930XED-KA1DE | |
| PCMark 10 / Productivity | |
| Średnia w klasie Subnotebook (5435 - 16606, n=45, ostatnie 2 lata) | |
| Asus Zenbook S 13 OLED | |
| Przeciętny Intel Core i7-1355U, Intel Iris Xe Graphics G7 96EUs (6763 - 7536, n=15) | |
| Asus ZenBook S13 OLED UX5304 | |
| Dell XPS 13 Plus 9320 i7-1280P OLED | |
| Lenovo Yoga Slim 7 Carbon 13IAP7-82U9005FGE | |
| Samsung Galaxy Book2 Pro 13 NP930XED-KA1DE | |
| PCMark 10 / Digital Content Creation | |
| Średnia w klasie Subnotebook (5722 - 13779, n=45, ostatnie 2 lata) | |
| Asus Zenbook S 13 OLED | |
| Dell XPS 13 Plus 9320 i7-1280P OLED | |
| Lenovo Yoga Slim 7 Carbon 13IAP7-82U9005FGE | |
| Przeciętny Intel Core i7-1355U, Intel Iris Xe Graphics G7 96EUs (5723 - 6712, n=15) | |
| Asus ZenBook S13 OLED UX5304 | |
| Samsung Galaxy Book2 Pro 13 NP930XED-KA1DE | |
| CrossMark / Overall | |
| Dell XPS 13 Plus 9320 i7-1280P OLED | |
| Średnia w klasie Subnotebook (365 - 2356, n=61, ostatnie 2 lata) | |
| Lenovo Yoga Slim 7 Carbon 13IAP7-82U9005FGE | |
| Asus ZenBook S13 OLED UX5304 | |
| Przeciętny Intel Core i7-1355U, Intel Iris Xe Graphics G7 96EUs (1478 - 1643, n=15) | |
| Apple MacBook Air M2 10C GPU | |
| Asus Zenbook S 13 OLED | |
| CrossMark / Productivity | |
| Dell XPS 13 Plus 9320 i7-1280P OLED | |
| Asus ZenBook S13 OLED UX5304 | |
| Średnia w klasie Subnotebook (364 - 2277, n=61, ostatnie 2 lata) | |
| Przeciętny Intel Core i7-1355U, Intel Iris Xe Graphics G7 96EUs (1444 - 1665, n=15) | |
| Lenovo Yoga Slim 7 Carbon 13IAP7-82U9005FGE | |
| Asus Zenbook S 13 OLED | |
| Apple MacBook Air M2 10C GPU | |
| CrossMark / Creativity | |
| Dell XPS 13 Plus 9320 i7-1280P OLED | |
| Średnia w klasie Subnotebook (372 - 2743, n=61, ostatnie 2 lata) | |
| Apple MacBook Air M2 10C GPU | |
| Lenovo Yoga Slim 7 Carbon 13IAP7-82U9005FGE | |
| Asus ZenBook S13 OLED UX5304 | |
| Przeciętny Intel Core i7-1355U, Intel Iris Xe Graphics G7 96EUs (1563 - 1732, n=15) | |
| Asus Zenbook S 13 OLED | |
| CrossMark / Responsiveness | |
| Dell XPS 13 Plus 9320 i7-1280P OLED | |
| Asus ZenBook S13 OLED UX5304 | |
| Przeciętny Intel Core i7-1355U, Intel Iris Xe Graphics G7 96EUs (1217 - 1681, n=15) | |
| Lenovo Yoga Slim 7 Carbon 13IAP7-82U9005FGE | |
| Średnia w klasie Subnotebook (312 - 1854, n=61, ostatnie 2 lata) | |
| Asus Zenbook S 13 OLED | |
| Apple MacBook Air M2 10C GPU | |
| PCMark 10 Score | 5576 pkt. | |
Pomoc | ||
| AIDA64 / Memory Copy | |
| Średnia w klasie Subnotebook (14554 - 131023, n=59, ostatnie 2 lata) | |
| Dell XPS 13 Plus 9320 i7-1280P OLED | |
| Asus ZenBook S13 OLED UX5304 | |
| Lenovo Yoga Slim 7 Carbon 13IAP7-82U9005FGE | |
| Przeciętny Intel Core i7-1355U (35017 - 71600, n=18) | |
| Samsung Galaxy Book2 Pro 13 NP930XED-KA1DE | |
| Asus Zenbook S 13 OLED | |
| AIDA64 / Memory Read | |
| Średnia w klasie Subnotebook (15948 - 127174, n=59, ostatnie 2 lata) | |
| Dell XPS 13 Plus 9320 i7-1280P OLED | |
| Lenovo Yoga Slim 7 Carbon 13IAP7-82U9005FGE | |
| Samsung Galaxy Book2 Pro 13 NP930XED-KA1DE | |
| Przeciętny Intel Core i7-1355U (38551 - 73377, n=18) | |
| Asus ZenBook S13 OLED UX5304 | |
| Asus Zenbook S 13 OLED | |
| AIDA64 / Memory Write | |
| Średnia w klasie Subnotebook (15709 - 135141, n=59, ostatnie 2 lata) | |
| Asus ZenBook S13 OLED UX5304 | |
| Przeciętny Intel Core i7-1355U (35910 - 93342, n=18) | |
| Dell XPS 13 Plus 9320 i7-1280P OLED | |
| Lenovo Yoga Slim 7 Carbon 13IAP7-82U9005FGE | |
| Samsung Galaxy Book2 Pro 13 NP930XED-KA1DE | |
| Asus Zenbook S 13 OLED | |
| AIDA64 / Memory Latency | |
| Asus Zenbook S 13 OLED | |
| Lenovo Yoga Slim 7 Carbon 13IAP7-82U9005FGE | |
| Przeciętny Intel Core i7-1355U (72.2 - 346, n=18) | |
| Dell XPS 13 Plus 9320 i7-1280P OLED | |
| Średnia w klasie Subnotebook (6.1 - 159.9, n=57, ostatnie 2 lata) | |
| Asus ZenBook S13 OLED UX5304 | |
* ... im mniej tym lepiej
Opóźnienia DPC
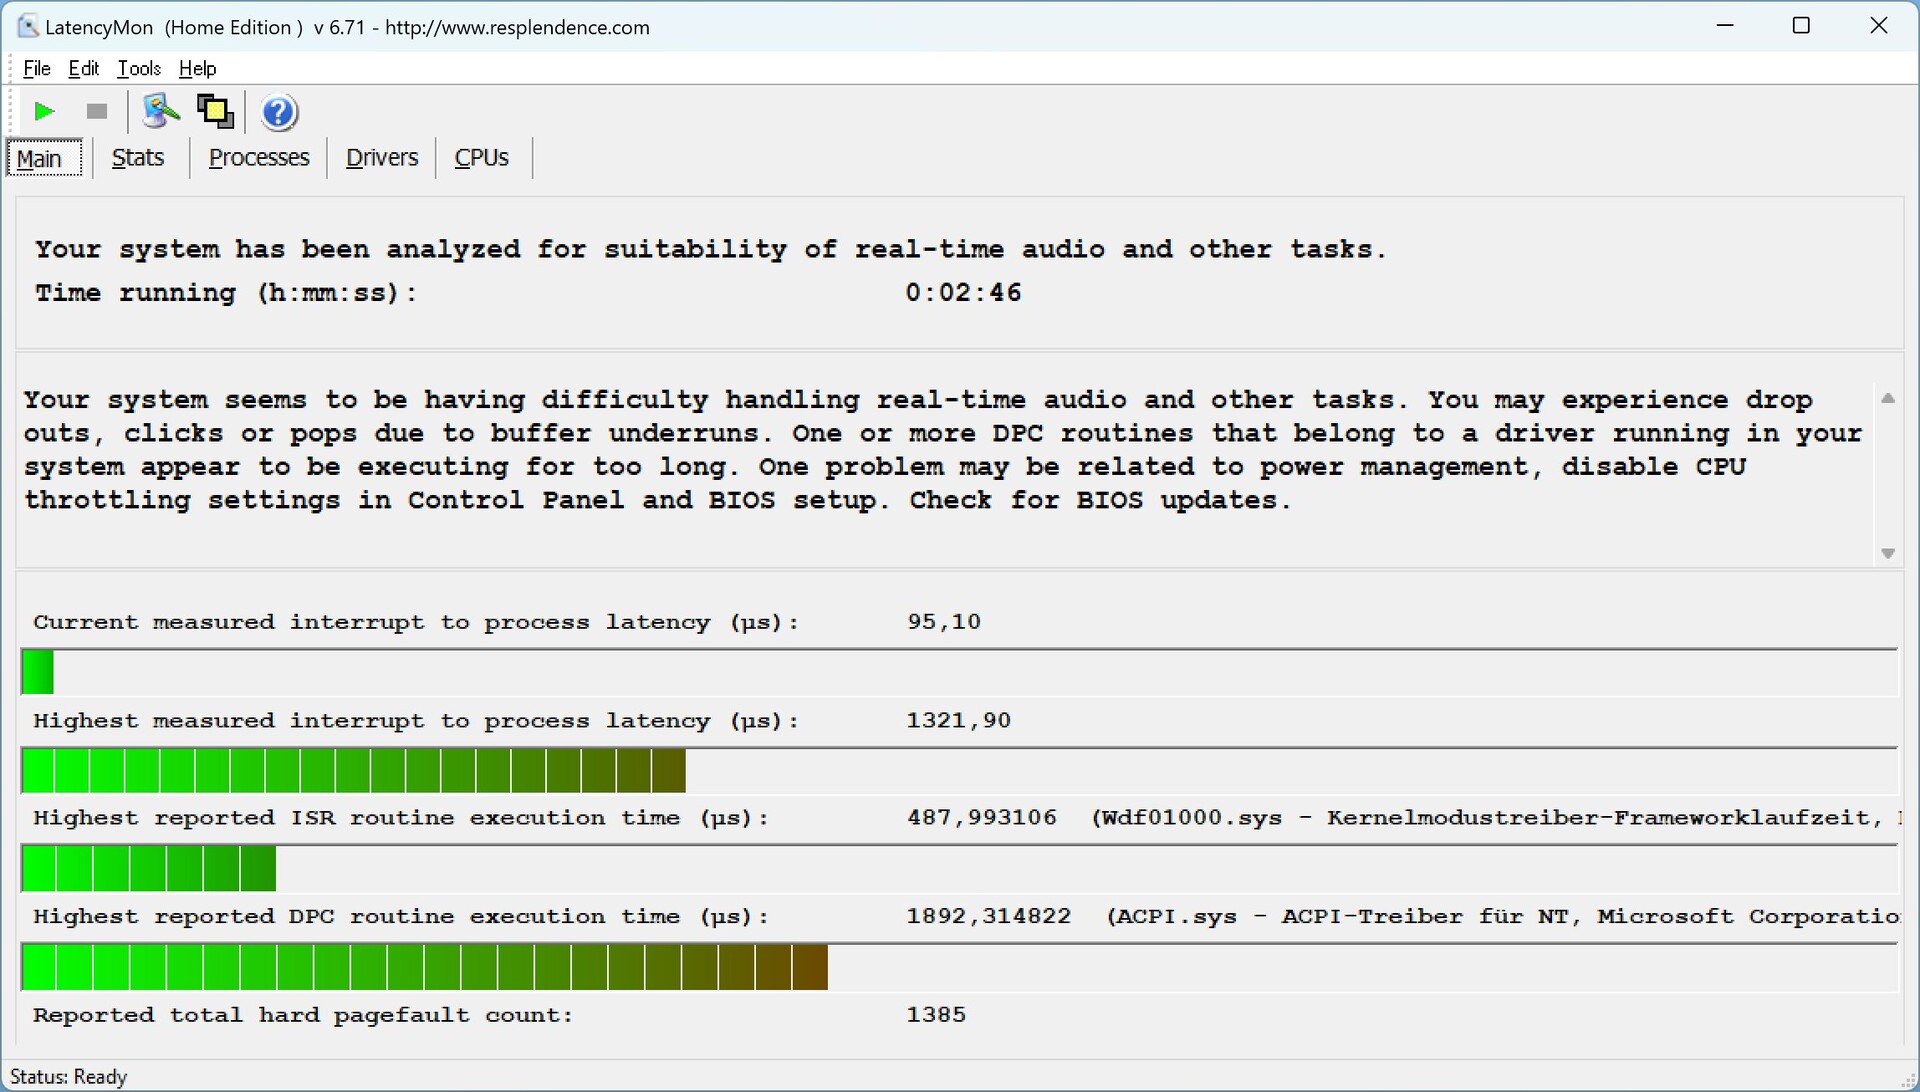
W naszym standardowym teście opóźnień (z surfowaniem po internecie, odtwarzaniem filmów 4K z YouTube i obciążeniem procesora) jednostka testowa z odpowiednią wersją BIOS-u wykazuje pewne lekkie ograniczenia i dlatego nie nadaje się bezwarunkowo do korzystania z aplikacji działających w czasie rzeczywistym.
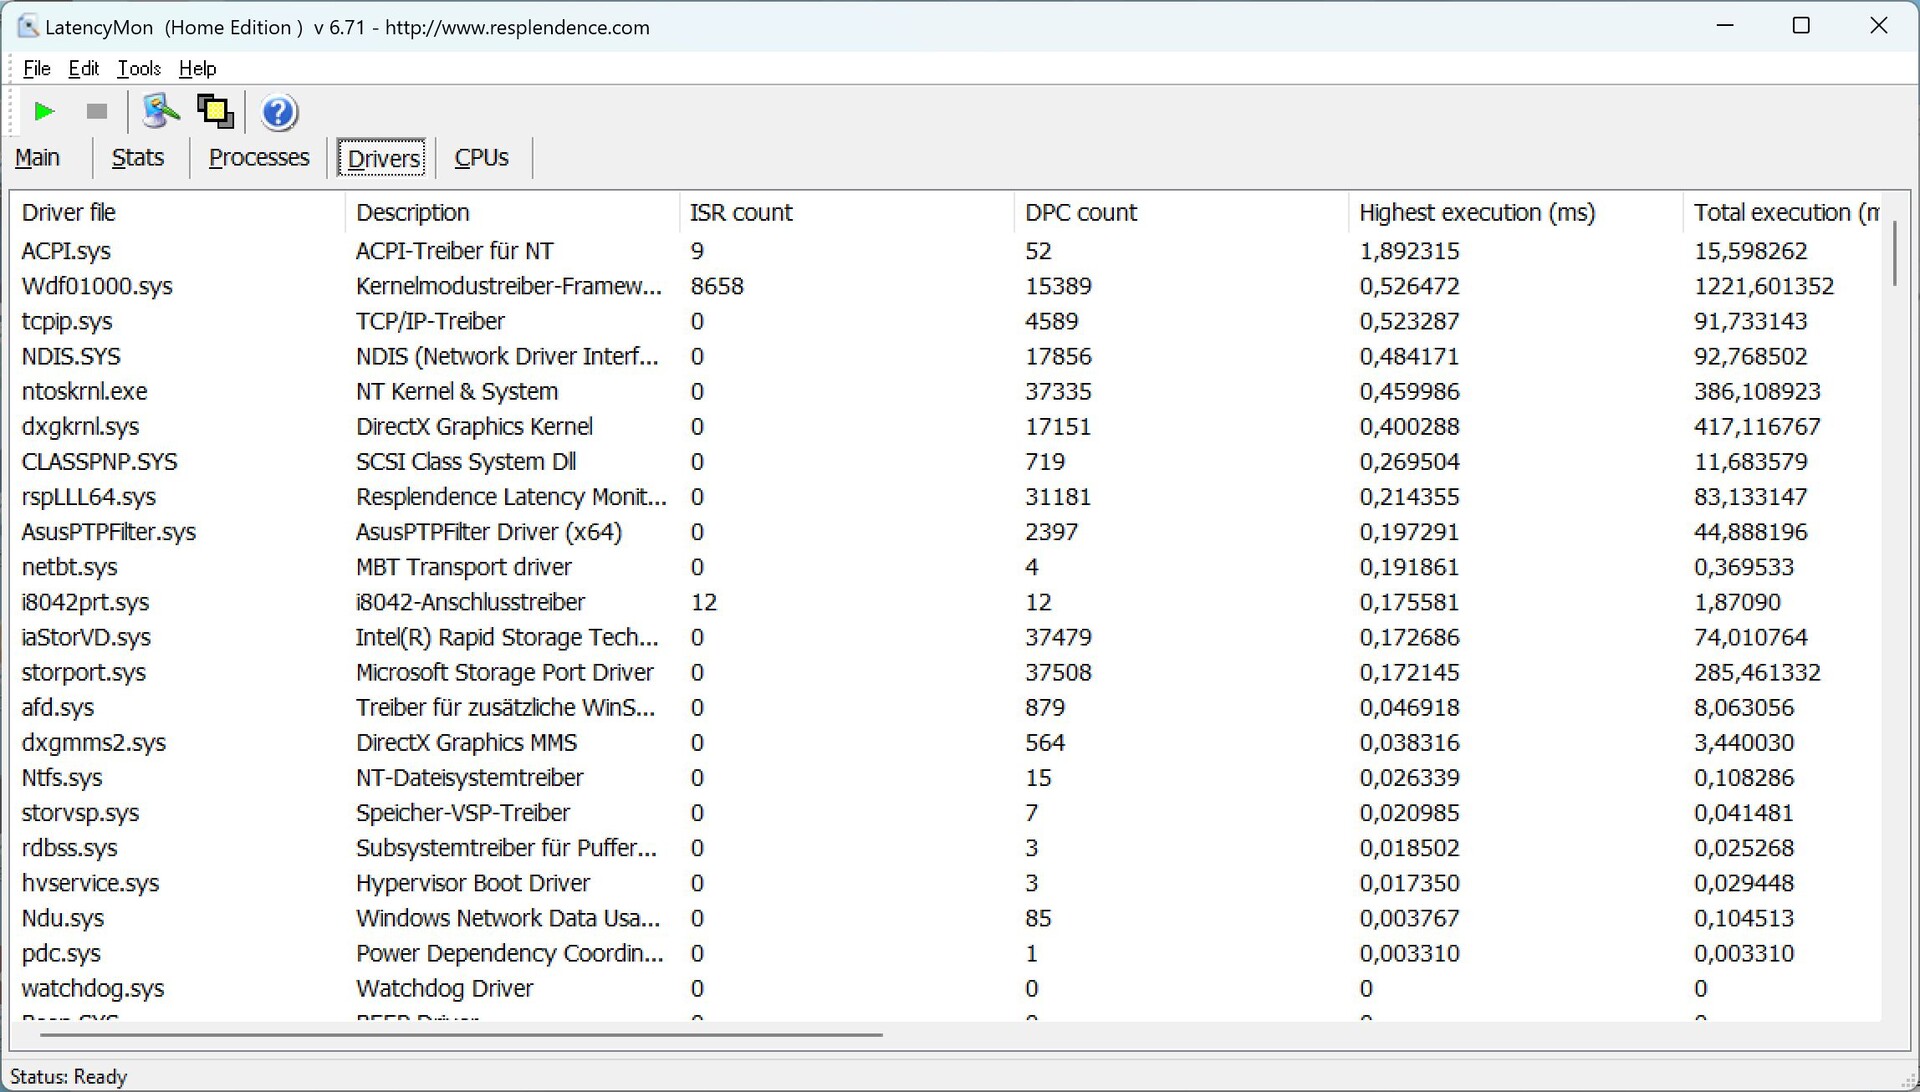
| DPC Latencies / LatencyMon - interrupt to process latency (max), Web, Youtube, Prime95 | |
| Samsung Galaxy Book2 Pro 13 NP930XED-KA1DE | |
| Asus ZenBook S13 OLED UX5304 | |
| Lenovo Yoga Slim 7 Carbon 13IAP7-82U9005FGE | |
| Asus Zenbook S 13 OLED | |
| Dell XPS 13 Plus 9320 i7-1280P OLED | |
* ... im mniej tym lepiej
Rozwiązanie w zakresie przechowywania
Asus wyposażył Zenbooka S 13 w szybki dysk SSD PCIe 4.0 od Samsunga, który oferuje pojemność 1 TB. Po pierwszym uruchomieniu do dyspozycji użytkownika na przechowywanie danych pozostaje 903 GB. PM9A1 osiąga transfery powyżej 7 GB/s, a stała wydajność również pozostaje stabilna przez długi czas, z tylko minimalnym spadkiem wydajności pod koniec naszego testu stałej wydajności. Biorąc pod uwagę smukłą obudowę, jest to bardzo dobry wynik. Dodatkowe benchmarki SSD można znaleźć tutaj.

| Drive Performance rating - Percent | |
| Przeciętny Samsung PM9A1 MZVL21T0HCLR | |
| Asus Zenbook S 13 OLED | |
| Dell XPS 13 Plus 9320 i7-1280P OLED | |
| Asus ZenBook S13 OLED UX5304 | |
| Lenovo Yoga Slim 7 Carbon 13IAP7-82U9005FGE | |
| Średnia w klasie Subnotebook | |
| Samsung Galaxy Book2 Pro 13 NP930XED-KA1DE | |
* ... im mniej tym lepiej
Disk Throttling: DiskSpd Read Loop, Queue Depth 8
Karta graficzna
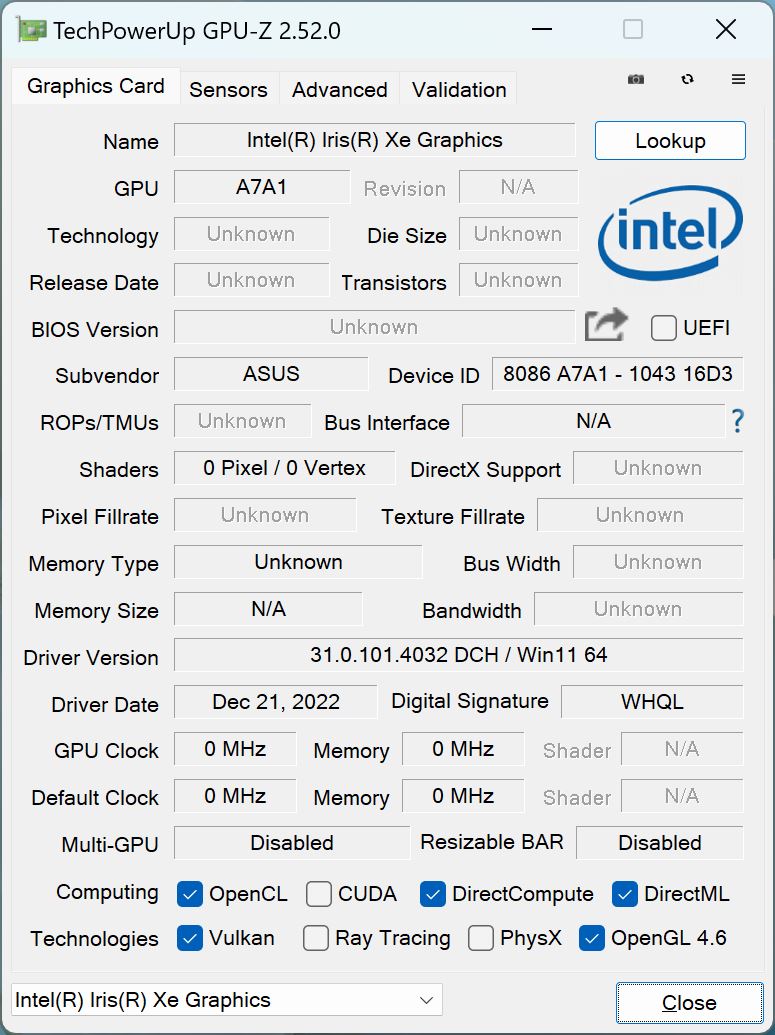
Znamy już zintegrowany Iris Xe Graphics G7kartę graficzną od Intela od jakiegoś czasu, a w Zenbooku zastosowano jej szybszą wersję z 96 EU i maksymalnym taktowaniem 1300 MHz. Do codziennych zadań, w tym odtwarzania filmów w wysokiej rozdzielczości, iGPU również jest wystarczające, ale problem ujawnia się w porównaniu z m.in.Radeonem 680M w poprzedniku, który w naszych syntetycznych testach GPU działa średnio o 36% szybciej.
W naszych benchmarkach dla gier różnica w rozdzielczości 1080p i na wysokich detalach jest jeszcze bardziej wyraźna, a stary Radeon 680M jest nawet o pokaźne 56% szybszy. Oznacza to, że wydajność w grach nowego Zenbooka S 13 jest znacznie niższa i jeśli lubisz gry, musisz znacznie zmniejszyć detale graficzne. Ale przynajmniej wydajność grafiki pozostaje stabilna nawet podczas dłuższych sesji gier. W trybie pracy na baterii wydajność jest jednak o 12% niższa. Dodatkowe benchmarki GPU można znaleźć m.in tutaj.
| 3DMark Performance rating - Percent | |
| Apple MacBook Air M2 10C GPU -3! | |
| Średnia w klasie Subnotebook | |
| Asus Zenbook S 13 OLED | |
| Dell XPS 13 Plus 9320 i7-1280P OLED -1! | |
| Lenovo Yoga Slim 7 Carbon 13IAP7-82U9005FGE | |
| Asus ZenBook S13 OLED UX5304 | |
| Przeciętny Intel Iris Xe Graphics G7 96EUs | |
| Samsung Galaxy Book2 Pro 13 NP930XED-KA1DE -1! | |
| 3DMark 11 - 1280x720 Performance GPU | |
| Średnia w klasie Subnotebook (995 - 18489, n=56, ostatnie 2 lata) | |
| Asus Zenbook S 13 OLED | |
| Dell XPS 13 Plus 9320 i7-1280P OLED | |
| Lenovo Yoga Slim 7 Carbon 13IAP7-82U9005FGE | |
| Przeciętny Intel Iris Xe Graphics G7 96EUs (2867 - 7676, n=209) | |
| Asus ZenBook S13 OLED UX5304 | |
| Samsung Galaxy Book2 Pro 13 NP930XED-KA1DE | |
| 3DMark | |
| 1920x1080 Fire Strike Graphics | |
| Średnia w klasie Subnotebook (832 - 16347, n=57, ostatnie 2 lata) | |
| Asus Zenbook S 13 OLED | |
| Dell XPS 13 Plus 9320 i7-1280P OLED | |
| Lenovo Yoga Slim 7 Carbon 13IAP7-82U9005FGE | |
| Asus ZenBook S13 OLED UX5304 | |
| Przeciętny Intel Iris Xe Graphics G7 96EUs (2286 - 6624, n=222) | |
| Samsung Galaxy Book2 Pro 13 NP930XED-KA1DE | |
| 2560x1440 Time Spy Graphics | |
| Średnia w klasie Subnotebook (804 - 6288, n=56, ostatnie 2 lata) | |
| Asus Zenbook S 13 OLED | |
| Dell XPS 13 Plus 9320 i7-1280P OLED | |
| Lenovo Yoga Slim 7 Carbon 13IAP7-82U9005FGE | |
| Asus ZenBook S13 OLED UX5304 | |
| Przeciętny Intel Iris Xe Graphics G7 96EUs (707 - 1890, n=218) | |
| Samsung Galaxy Book2 Pro 13 NP930XED-KA1DE | |
| Wild Life Extreme Unlimited | |
| Apple MacBook Air M2 10C GPU | |
| Średnia w klasie Subnotebook (3225 - 9092, n=15, ostatnie 2 lata) | |
| Lenovo Yoga Slim 7 Carbon 13IAP7-82U9005FGE | |
| Asus Zenbook S 13 OLED | |
| Przeciętny Intel Iris Xe Graphics G7 96EUs (2054 - 4304, n=21) | |
| Asus ZenBook S13 OLED UX5304 | |
| 3DMark 06 Standard Score | 25303 pkt. | |
| 3DMark 11 Performance | 6644 pkt. | |
| 3DMark Fire Strike Score | 4613 pkt. | |
| 3DMark Time Spy Score | 1683 pkt. | |
Pomoc | ||
* ... im mniej tym lepiej
| Performance rating - Percent | |
| Średnia w klasie Subnotebook | |
| Asus Zenbook S 13 OLED | |
| Dell XPS 13 Plus 9320 i7-1280P OLED | |
| Lenovo Yoga Slim 7 Carbon 13IAP7-82U9005FGE | |
| Asus ZenBook S13 OLED UX5304 | |
| Samsung Galaxy Book2 Pro 13 NP930XED-KA1DE -2! | |
| The Witcher 3 - 1920x1080 Ultra Graphics & Postprocessing (HBAO+) | |
| Średnia w klasie Subnotebook (13.9 - 34.6, n=14, ostatnie 2 lata) | |
| Asus Zenbook S 13 OLED | |
| Dell XPS 13 Plus 9320 i7-1280P OLED | |
| Lenovo Yoga Slim 7 Carbon 13IAP7-82U9005FGE | |
| Asus ZenBook S13 OLED UX5304 | |
| Samsung Galaxy Book2 Pro 13 NP930XED-KA1DE | |
| GTA V - 1920x1080 Highest AA:4xMSAA + FX AF:16x | |
| Średnia w klasie Subnotebook (10.7 - 43.7, n=56, ostatnie 2 lata) | |
| Asus Zenbook S 13 OLED | |
| Dell XPS 13 Plus 9320 i7-1280P OLED | |
| Asus ZenBook S13 OLED UX5304 | |
| Lenovo Yoga Slim 7 Carbon 13IAP7-82U9005FGE | |
| Samsung Galaxy Book2 Pro 13 NP930XED-KA1DE | |
| Final Fantasy XV Benchmark - 1920x1080 High Quality | |
| Średnia w klasie Subnotebook (11.6 - 54.5, n=55, ostatnie 2 lata) | |
| Lenovo Yoga Slim 7 Carbon 13IAP7-82U9005FGE | |
| Asus Zenbook S 13 OLED | |
| Dell XPS 13 Plus 9320 i7-1280P OLED | |
| Asus ZenBook S13 OLED UX5304 | |
| Strange Brigade - 1920x1080 ultra AA:ultra AF:16 | |
| Średnia w klasie Subnotebook (19 - 101.3, n=51, ostatnie 2 lata) | |
| Asus Zenbook S 13 OLED | |
| Dell XPS 13 Plus 9320 i7-1280P OLED | |
| Asus ZenBook S13 OLED UX5304 | |
| Lenovo Yoga Slim 7 Carbon 13IAP7-82U9005FGE | |
| Dota 2 Reborn - 1920x1080 ultra (3/3) best looking | |
| Średnia w klasie Subnotebook (13 - 97, n=62, ostatnie 2 lata) | |
| Asus Zenbook S 13 OLED | |
| Dell XPS 13 Plus 9320 i7-1280P OLED | |
| Lenovo Yoga Slim 7 Carbon 13IAP7-82U9005FGE | |
| Asus ZenBook S13 OLED UX5304 | |
| Samsung Galaxy Book2 Pro 13 NP930XED-KA1DE | |
| X-Plane 11.11 - 1920x1080 high (fps_test=3) | |
| Dell XPS 13 Plus 9320 i7-1280P OLED | |
| Lenovo Yoga Slim 7 Carbon 13IAP7-82U9005FGE | |
| Średnia w klasie Subnotebook (20.7 - 50.5, n=52, ostatnie 2 lata) | |
| Asus Zenbook S 13 OLED | |
| Asus ZenBook S13 OLED UX5304 | |
| Samsung Galaxy Book2 Pro 13 NP930XED-KA1DE | |
The Witcher 3 FPS Chart
| low | med. | high | ultra | |
|---|---|---|---|---|
| GTA V (2015) | 94.8 | 81 | 22.5 | 9.42 |
| The Witcher 3 (2015) | 79 | 51 | 28 | 12.3 |
| Dota 2 Reborn (2015) | 84.8 | 66.7 | 54.9 | 51.1 |
| Final Fantasy XV Benchmark (2018) | 37.4 | 20.5 | 14.9 | |
| X-Plane 11.11 (2018) | 34.6 | 32.1 | 27.3 | |
| Far Cry 5 (2018) | 42 | 25 | 24 | 22 |
| Strange Brigade (2018) | 88.4 | 37.8 | 29.1 | 23.6 |
| F1 2021 (2021) | 94.8 | 45.6 | 35.2 | 24.9 |
| F1 22 (2022) | 41.6 | 36.6 | 27.6 | 20.7 |
Emisje - Zenbook cierpi z powodu hałasu wentylatora o wysokiej częstotliwości
Poziomy hałasu
Dwa niewielkie wentylatory wyraźnie stanowią największy problem Zenbooka S 13. O ile natężenie hałasu pozostaje w zasadzie w granicach normy - o ile pominiemy tryb Performance, który wytwarza maksymalnie 47,8 dB(A) - o tyle problemem jest szum o bardzo wysokiej częstotliwości. Patrząc na poniższy wykres, można by pomyśleć, że tryb Whisper może być najlepszym wyborem, ale już przy niskich obrotach wentylatorów wyraźnie słychać szum o wysokiej częstotliwości i staje się on bardzo irytujący. W trybie Standard część z niego jest przynajmniej przykryta przez szum warkotu. Dodatkowo wentylatory szybko się rozpędzają, na przykład podczas odtwarzania filmu z YouTube, co jeszcze bardziej pogarsza sprawę. Ten problem zdecydowanie stanowiłby dla nas punkt dyskwalifikujący.
| Tryb szeptania | Tryb standardowy | Tryb wydajnościowy | |
|---|---|---|---|
| 3DMark 06 | 26 dB(A) | 37,7 dB(A) | 47,8 dB(A) |
| Witcher 3 | 26 dB(A) | 40,1 dB(A) | 47,8 dB(A) |
| Stress test | 26 dB(A) | 40,1 dB(A) | 47,8 dB(A) |
Hałas
| luz |
| 23.3 / 23.3 / 23.3 dB |
| obciążenie |
| 37.7 / 40.1 dB |
 | ||
30 dB cichy 40 dB(A) słyszalny 50 dB(A) irytujący |
||
min: | ||
| Asus ZenBook S13 OLED UX5304 Iris Xe G7 96EUs, i7-1355U, Samsung PM9A1 MZVL21T0HCLR | Asus Zenbook S 13 OLED Radeon 680M, R7 6800U, Samsung PM9A1 MZVL21T0HCLR | Lenovo Yoga Slim 7 Carbon 13IAP7-82U9005FGE Iris Xe G7 96EUs, i7-1260P, Samsung PM9A1 MZVL21T0HCLR | Dell XPS 13 Plus 9320 i7-1280P OLED Iris Xe G7 96EUs, i7-1280P, WDC PC SN810 512GB | Samsung Galaxy Book2 Pro 13 NP930XED-KA1DE Iris Xe G7 80EUs, i5-1240P, Samsung PM991a MZVLQ256HBJD | |
|---|---|---|---|---|---|
| Noise | -1% | -6% | 0% | -5% | |
| wyłączone / środowisko * (dB) | 23.3 | 24 -3% | 24.2 -4% | 23.4 -0% | 24.6 -6% |
| Idle Minimum * (dB) | 23.3 | 24 -3% | 24.2 -4% | 23.4 -0% | 24.6 -6% |
| Idle Average * (dB) | 23.3 | 24 -3% | 24.2 -4% | 23.4 -0% | 24.6 -6% |
| Idle Maximum * (dB) | 23.3 | 24 -3% | 25.1 -8% | 23.4 -0% | 26.3 -13% |
| Load Average * (dB) | 37.7 | 33.1 12% | 41.9 -11% | 35 7% | 38.4 -2% |
| Witcher 3 ultra * (dB) | 40.1 | 40.2 -0% | 41.9 -4% | 41.6 -4% | |
| Load Maximum * (dB) | 40.1 | 41.7 -4% | 41.9 -4% | 39.9 -0% | 38.7 3% |
* ... im mniej tym lepiej
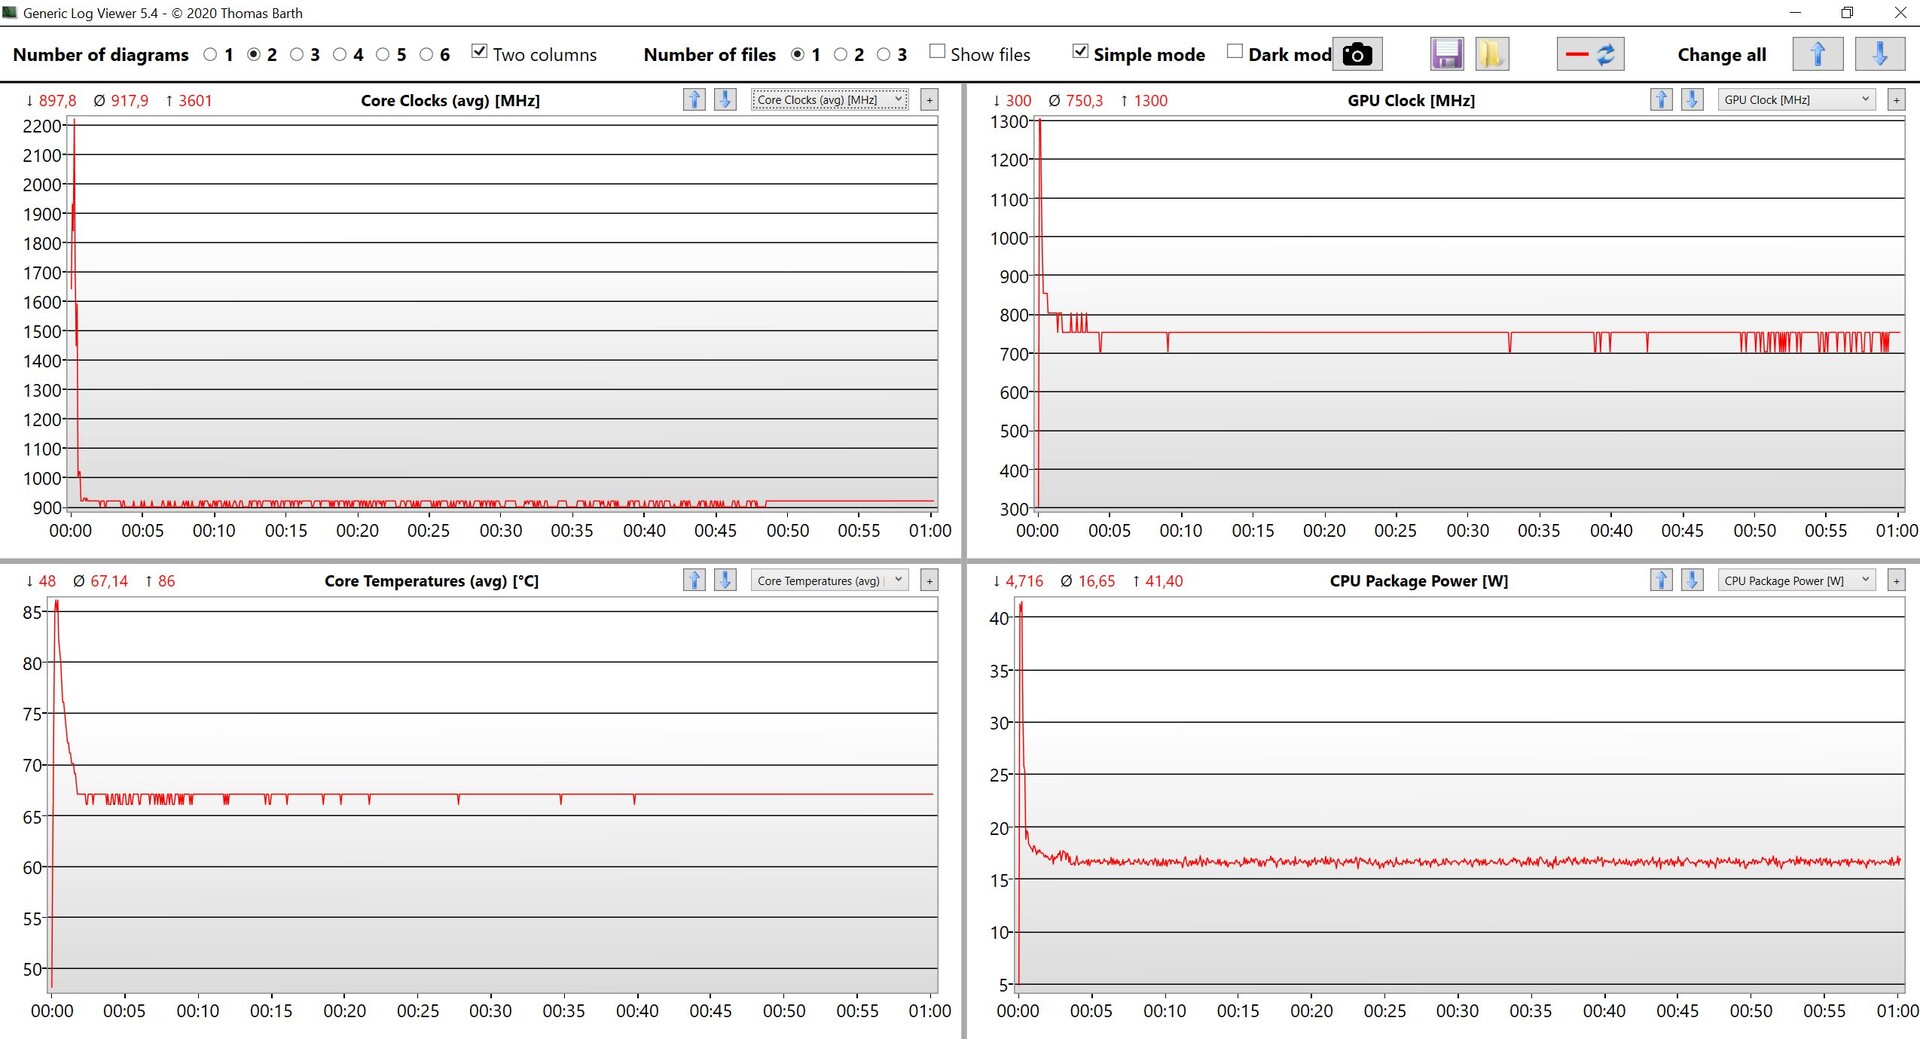
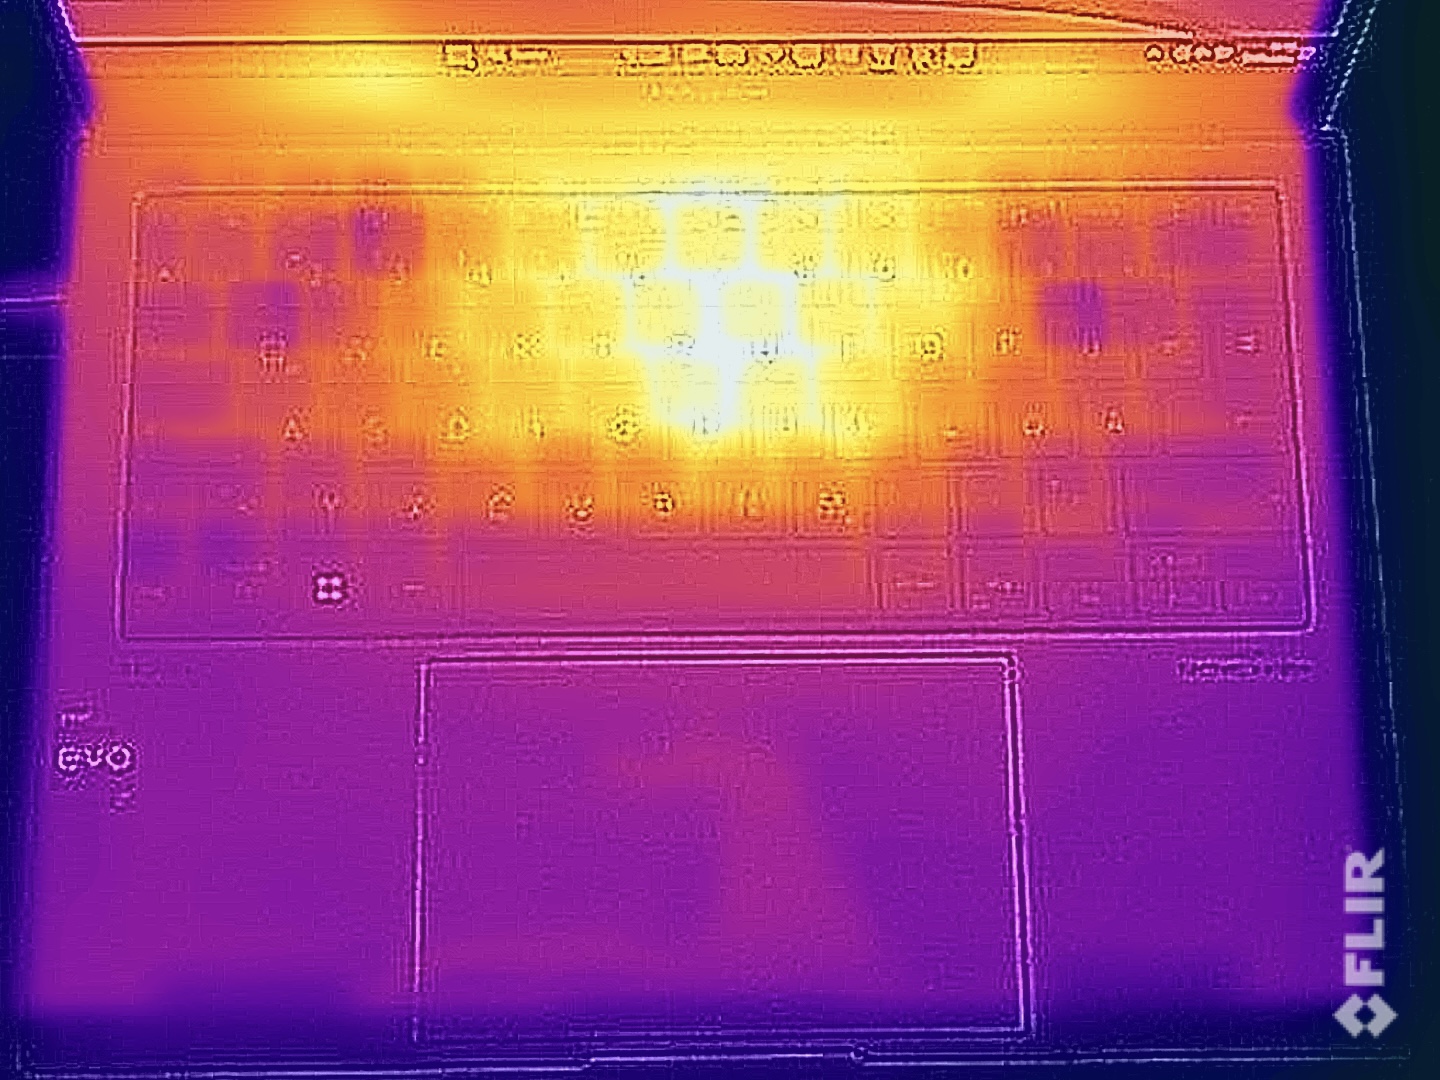
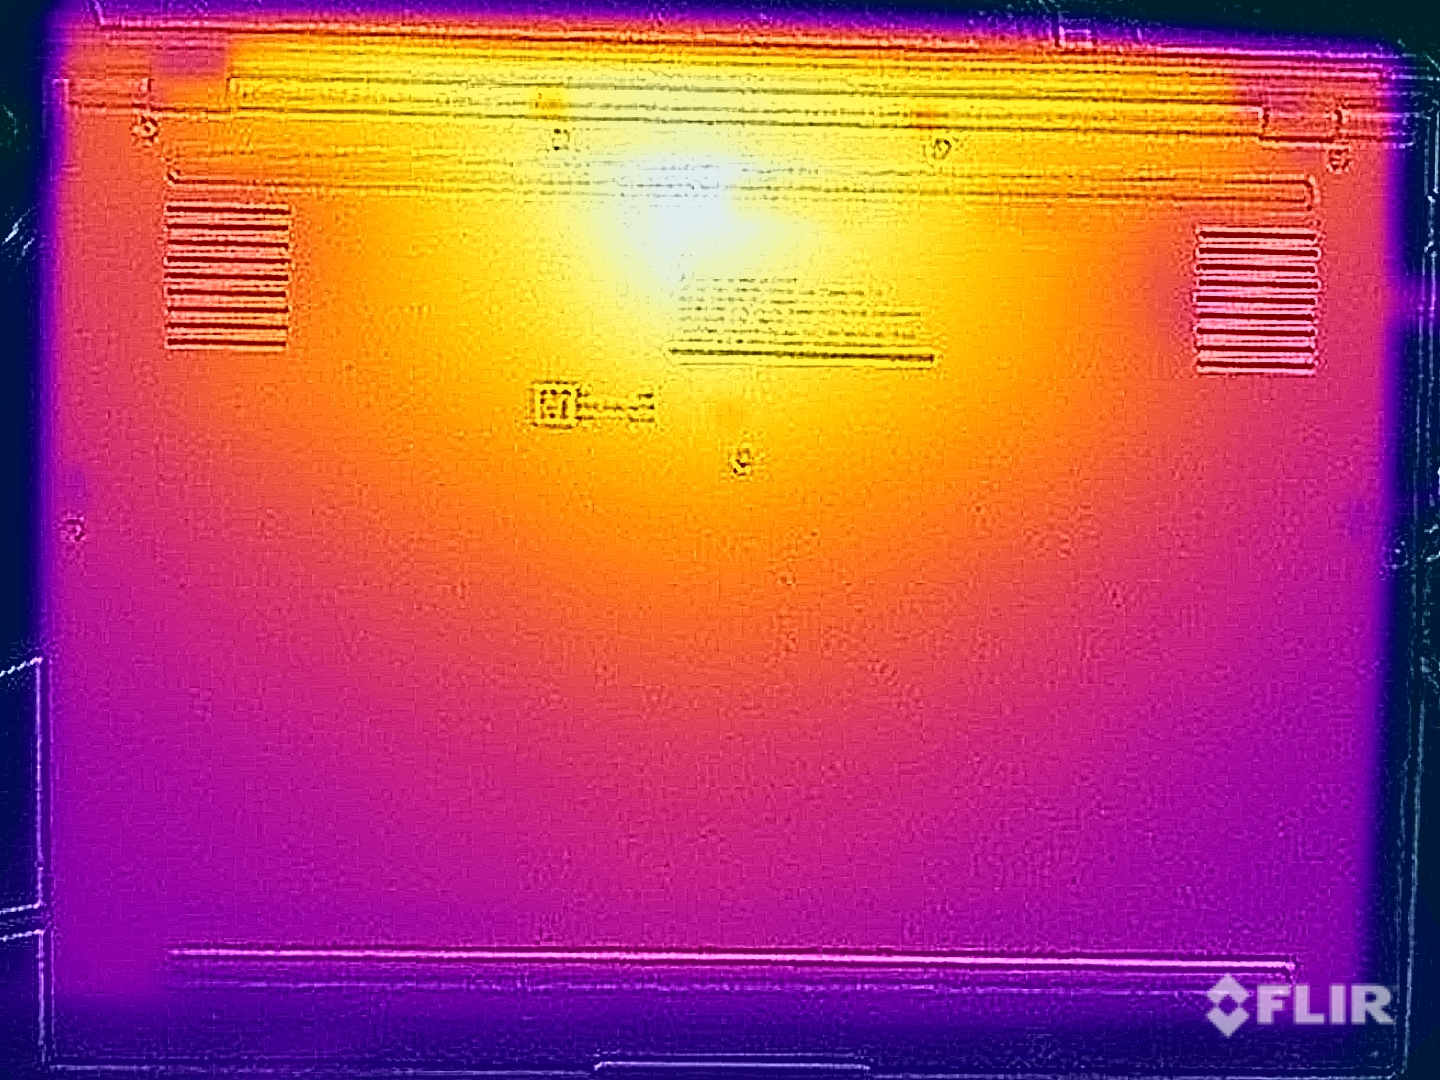
Temperatury
W codziennej eksploatacji Zenbook pozostaje bardzo chłodny. Pod obciążeniem nagrzewa się zwłaszcza centralny obszar na szczycie jednostki zasadniczej. Nadal jednak można bez problemu trzymać urządzenie na kolanach, gdyż jednostka zasadnicza jest nieco uniesiona. Ciepło staje się również odczuwalne podczas pisania na klawiaturze, ale nie stwarza to żadnych ograniczeń.
Podczas stress testu na krótko widzimy zużycie ponad 40 watów, ale już po kilku sekundach wartość ta wyrównuje się do nieco mniej niż 17 watów, pozostając później na tym poziomie.
(±) Maksymalna temperatura w górnej części wynosi 43.1 °C / 110 F, w porównaniu do średniej 35.9 °C / 97 F , począwszy od 21.4 do 59 °C dla klasy Subnotebook.
(±) Dno nagrzewa się maksymalnie do 45 °C / 113 F, w porównaniu do średniej 39.2 °C / 103 F
(+) W stanie bezczynności średnia temperatura górnej części wynosi 24.6 °C / 76 F, w porównaniu ze średnią temperaturą urządzenia wynoszącą 30.8 °C / ### class_avg_f### F.
(±) Podczas gry w Wiedźmina 3 średnia temperatura górnej części wynosi 34.8 °C / 95 F, w porównaniu do średniej temperatury urządzenia wynoszącej 30.8 °C / ## #class_avg_f### F.
(+) Podpórki pod nadgarstki i touchpad są chłodniejsze niż temperatura skóry i maksymalnie 26.1 °C / 79 F i dlatego są chłodne w dotyku.
(+) Średnia temperatura obszaru podparcia dłoni w podobnych urządzeniach wynosiła 28.2 °C / 82.8 F (+2.1 °C / 3.8 F).
| Asus ZenBook S13 OLED UX5304 Intel Core i7-1355U, Intel Iris Xe Graphics G7 96EUs | Asus Zenbook S 13 OLED AMD Ryzen 7 6800U, AMD Radeon 680M | Apple MacBook Air M2 10C GPU Apple M2, Apple M2 10-Core GPU | Lenovo Yoga Slim 7 Carbon 13IAP7-82U9005FGE Intel Core i7-1260P, Intel Iris Xe Graphics G7 96EUs | Samsung Galaxy Book2 Pro 13 NP930XED-KA1DE Intel Core i5-1240P, Intel Iris Xe Graphics G7 80EUs | |
|---|---|---|---|---|---|
| Heat | -8% | 4% | -10% | -9% | |
| Maximum Upper Side * (°C) | 43.1 | 47.9 -11% | 44.7 -4% | 43.9 -2% | 47.9 -11% |
| Maximum Bottom * (°C) | 45 | 56.1 -25% | 44.6 1% | 53.1 -18% | 51.3 -14% |
| Idle Upper Side * (°C) | 27.3 | 26.8 2% | 25.1 8% | 28.7 -5% | 28.5 -4% |
| Idle Bottom * (°C) | 27.8 | 27.3 2% | 25.3 9% | 31.6 -14% | 29.6 -6% |
* ... im mniej tym lepiej
Mówcy
Dwa wbudowane głośniki oferują dobrą wydajność, a dzięki programowemu wzmocnieniu mogą stać się nawet bardzo głośne. Jest jednak wyraźnie słyszalna różnica w stosunku do obecnych Apple MacBook Air M2ogólnie. Jakość jest jednak nadal całkowicie wystarczająca do odtwarzania muzyki w tle lub filmów.
Asus ZenBook S13 OLED UX5304 analiza dźwięku
(+) | głośniki mogą odtwarzać stosunkowo głośno (83 dB)
Bas 100 - 315 Hz
(±) | zredukowany bas - średnio 14.4% niższy od mediany
(+) | bas jest liniowy (6.6% delta do poprzedniej częstotliwości)
Średnie 400 - 2000 Hz
(+) | zbalansowane środki średnie - tylko 3.2% od mediany
(+) | średnie są liniowe (4.1% delta do poprzedniej częstotliwości)
Wysokie 2–16 kHz
(+) | zrównoważone maksima - tylko 2.7% od mediany
(+) | wzloty są liniowe (3.5% delta do poprzedniej częstotliwości)
Ogólnie 100 - 16.000 Hz
(+) | ogólny dźwięk jest liniowy (12.8% różnicy w stosunku do mediany)
W porównaniu do tej samej klasy
» 19% wszystkich testowanych urządzeń w tej klasie było lepszych, 4% podobnych, 77% gorszych
» Najlepszy miał deltę 5%, średnia wynosiła ###średnia###%, najgorsza wynosiła 53%
W porównaniu do wszystkich testowanych urządzeń
» 12% wszystkich testowanych urządzeń było lepszych, 3% podobnych, 85% gorszych
» Najlepszy miał deltę 4%, średnia wynosiła ###średnia###%, najgorsza wynosiła 134%
Apple MacBook Air M2 10C GPU analiza dźwięku
(+) | głośniki mogą odtwarzać stosunkowo głośno (82.7 dB)
Bas 100 - 315 Hz
(±) | zredukowany bas - średnio 12.2% niższy od mediany
(±) | liniowość basu jest średnia (12.6% delta do poprzedniej częstotliwości)
Średnie 400 - 2000 Hz
(+) | zbalansowane środki średnie - tylko 1.1% od mediany
(+) | średnie są liniowe (3.1% delta do poprzedniej częstotliwości)
Wysokie 2–16 kHz
(+) | zrównoważone maksima - tylko 2.4% od mediany
(+) | wzloty są liniowe (1.9% delta do poprzedniej częstotliwości)
Ogólnie 100 - 16.000 Hz
(+) | ogólny dźwięk jest liniowy (9.5% różnicy w stosunku do mediany)
W porównaniu do tej samej klasy
» 5% wszystkich testowanych urządzeń w tej klasie było lepszych, 2% podobnych, 93% gorszych
» Najlepszy miał deltę 5%, średnia wynosiła ###średnia###%, najgorsza wynosiła 53%
W porównaniu do wszystkich testowanych urządzeń
» 4% wszystkich testowanych urządzeń było lepszych, 1% podobnych, 95% gorszych
» Najlepszy miał deltę 4%, średnia wynosiła ###średnia###%, najgorsza wynosiła 134%
Zarządzanie energią - długotrwały Zenbook
Pobór mocy
Podczas pracy w trybie jałowym nowy model jest nieco wydajniejszy od swojego Poprzednika od AMD. Zmierzyliśmy oba modele z tą samą tapetą i ciemnym trybem Windows. Przy jasnych treściach obrazu zużycie energii przez panel OLED wzrasta. Dzieje się tak również podczas odtwarzania filmów HDR, gdzie szczytowe wartości mogą osiągnąć ponad 20 watów przy pełnej jasności.
Podczas stress testu mierzymy maksymalnie prawie 60 watów na początku, ale już po kilku sekundach zużycie wyrównuje się w okolicach 30 watów. Dołączona do zestawu 65-watowa ładowarka jest w zupełności wystarczająca.
| wyłączony / stan wstrzymania | |
| luz | |
| obciążenie |
|
Legenda:
min: | |
| Asus ZenBook S13 OLED UX5304 i7-1355U, Iris Xe G7 96EUs, Samsung PM9A1 MZVL21T0HCLR, OLED, 2880x1800, 13.3" | Asus Zenbook S 13 OLED R7 6800U, Radeon 680M, Samsung PM9A1 MZVL21T0HCLR, OLED, 2880x1800, 13.3" | Apple MacBook Air M2 10C GPU M2, M2 10-Core GPU, Apple SSD AP1024Z, IPS, 2560x1664, 13.6" | Lenovo Yoga Slim 7 Carbon 13IAP7-82U9005FGE i7-1260P, Iris Xe G7 96EUs, Samsung PM9A1 MZVL21T0HCLR, IPS, 2560x1600, 13.3" | Dell XPS 13 Plus 9320 i7-1280P OLED i7-1280P, Iris Xe G7 96EUs, WDC PC SN810 512GB, OLED, 3456x2160, 13.4" | Samsung Galaxy Book2 Pro 13 NP930XED-KA1DE i5-1240P, Iris Xe G7 80EUs, Samsung PM991a MZVLQ256HBJD, OLED, 1920x1080, 13.3" | Przeciętny Intel Iris Xe Graphics G7 96EUs | Średnia w klasie Subnotebook | |
|---|---|---|---|---|---|---|---|---|
| Power Consumption | -11% | 13% | -29% | -33% | 5% | -13% | 8% | |
| Idle Minimum * (Watt) | 5.8 | 4.8 17% | 1.9 67% | 6.9 -19% | 6.5 -12% | 4.3 26% | 5.51 ? 5% | 3.79 ? 35% |
| Idle Average * (Watt) | 8.5 | 8.7 -2% | 9.6 -13% | 10.3 -21% | 7.8 8% | 6 29% | 8.66 ? -2% | 6.57 ? 23% |
| Idle Maximum * (Watt) | 8.8 | 10.1 -15% | 9.7 -10% | 10.9 -24% | 13 -48% | 8.8 -0% | 10.9 ? -24% | 7.94 ? 10% |
| Load Average * (Watt) | 35.1 | 45.6 -30% | 32.4 8% | 49.2 -40% | 56.6 -61% | 36 -3% | 45.6 ? -30% | 41.8 ? -19% |
| Witcher 3 ultra * (Watt) | 27.6 | 42.4 -54% | 30.8 -12% | 45.3 -64% | 49.2 -78% | 32.9 -19% | ||
| Load Maximum * (Watt) | 59.5 | 49.5 17% | 35.7 40% | 62.5 -5% | 63 -6% | 60 -1% | 67.8 ? -14% | 64.1 ? -8% |
* ... im mniej tym lepiej
Power Consumption The Witcher 3 / Stress Test
Power Consumption With External Monitor
Czas pracy na baterii
Przy 63 Wh, pojemność baterii jest nieco niższa niż w przypadku starego modelu. W naszym teście wideo przy 150 cd/m² (co odpowiada 74% maksymalnej jasności SDR w naszym egzemplarzu testowym) czas pracy na akumulatorze wynoszący prawie 14 godzin to wciąż bardzo dobry wynik. Test WLAN trwa ponad 11 godzin przy 150 cd/m² i wciąż nieco ponad 8 godzin przy pełnej jasności. Film HDR z YouTube'a trwa 4,5 godziny przy pełnej jasności. Ogólnie rzecz biorąc, są to bardzo dobre wyniki jak na smukłego Zenbooka.
| Asus ZenBook S13 OLED UX5304 i7-1355U, Iris Xe G7 96EUs, 63 Wh | Asus Zenbook S 13 OLED R7 6800U, Radeon 680M, 67 Wh | Apple MacBook Air M2 10C GPU M2, M2 10-Core GPU, 52.6 Wh | Lenovo Yoga Slim 7 Carbon 13IAP7-82U9005FGE i7-1260P, Iris Xe G7 96EUs, 50.2 Wh | Dell XPS 13 Plus 9320 i7-1280P OLED i7-1280P, Iris Xe G7 96EUs, 55 Wh | Samsung Galaxy Book2 Pro 13 NP930XED-KA1DE i5-1240P, Iris Xe G7 80EUs, 63 Wh | Średnia w klasie Subnotebook | |
|---|---|---|---|---|---|---|---|
| Czasy pracy | -3% | 22% | -37% | -49% | -3% | 6% | |
| H.264 (h) | 13.8 | 15.2 10% | 15.8 14% | 10.5 -24% | 11.6 -16% | 15.6 ? 13% | |
| WiFi v1.3 (h) | 11.3 | 9.2 -19% | 14.7 30% | 7.5 -34% | 5.8 -49% | 11.6 3% | 14 ? 24% |
| Load (h) | 2.4 | 2.4 0% | 1.1 -54% | 2.5 4% | 1.946 ? -19% |
Za
Przeciw
Werdykt - Dużo światła, ale i ciemny cień
Nowy Zenbook S 13 pozostawia nas z mieszanymi uczuciami, zwłaszcza że zeszłoroczny modelbył tak dobry. Asus całkowicie przerobił urządzenie, dzięki czemu laptop jest zauważalnie smuklejszy. Rezultat wygląda również dobrze, a obudowa robi świetne wrażenie, szczególnie również pod względem stabilności. Nowa plazmowo-ceramiczna powierzchnia sprawia wrażenie świetnej i nie ma problemów z odciskami palców. Ponadto zawiera ona teraz niektóre znane złącza, takie jak port HDMI i zwykłe złącze USB-A, co jest dobrym osiągnięciem w tak smukłym urządzeniu.
Skok klawiszy musiał jednak zostać skrócony o 0,3 mm (~0,012 cala) na potrzeby odchudzenia konstrukcji. O ile klawiatura nadal jest przyzwoita, o tyle stary Zenbook oferował bardziej komfortowe pisanie. Ponadto chłodzenie jest teraz słabsze i nawet jeśli nowy Intel Core i7-1355U Procesor Raptor Lake oferuje nieco wyższą wydajność jednordzeniową, to wyraźnie ustępował mu ubiegłoroczny AMD Ryzen 7 6800U w scenariuszach wielordzeniowych, a zwłaszcza w zakresie iGPU.
Wyświetlacz OLED nadal oferuje świetną jakość obrazu, osiągając bardzo dokładne odwzorowanie kolorów już w stanie dostawy. Ponadto Asus jest obecnie jedynym producentem, który oferuje rozwiązanie programowe zapobiegające szkodliwemu migotaniu PWM, umożliwiając przyciemnianie DC nawet przy niskich ustawieniach jasności.
Nowy Asus Zenbook S 13 stał się znacznie smuklejszy, ale nowy procesor Intela oferuje też ogólnie niższą wydajność niż jego poprzednik od AMD. Największym problemem jest jednak wysoki hałas wentylatora nawet przy niskich obrotach wentylatora.
Największy problem nowego Zenbooka stanowią wentylatory, które nawet przy niskich poziomach prędkości wytwarzają hałas o bardzo wysokiej częstotliwości. Jest to po prostu irytujące, nawet podczas codziennych zadań. Dlatego też obniżyliśmy ocenę również w tej kategorii. Choć w wielu obszarach wydajność jest dobra, to z tego powodu trudno nam polecić nowy model. Osoby, którym nie przeszkadza 3-mm (~0,12 cala) grubość urządzenia, powinny raczej przyjrzeć się m.in zeszłoroczny Zenbook S 13lub poczekać na zaktualizowaną wersję 2022 z nowym układem Ryzen Zen4.
Cena i dostępność
Nowy Zenbook S 13 OLED jest obecnie dostępny na przykład w Amazonie za 1529 dolarów.
Asus ZenBook S13 OLED UX5304
- 29/04/2023 v7 (old)
Andreas Osthoff
Przezroczystość
Wyboru urządzeń do recenzji dokonuje nasza redakcja. Próbka testowa została udostępniona autorowi jako pożyczka od producenta lub sprzedawcy detalicznego na potrzeby tej recenzji. Pożyczkodawca nie miał wpływu na tę recenzję, producent nie otrzymał też kopii tej recenzji przed publikacją. Nie było obowiązku publikowania tej recenzji. Jako niezależna firma medialna, Notebookcheck nie podlega władzy producentów, sprzedawców detalicznych ani wydawców.
Tak testuje Notebookcheck
Każdego roku Notebookcheck niezależnie sprawdza setki laptopów i smartfonów, stosując standardowe procedury, aby zapewnić porównywalność wszystkich wyników. Od około 20 lat stale rozwijamy nasze metody badawcze, ustanawiając przy tym standardy branżowe. W naszych laboratoriach testowych doświadczeni technicy i redaktorzy korzystają z wysokiej jakości sprzętu pomiarowego. Testy te obejmują wieloetapowy proces walidacji. Nasz kompleksowy system ocen opiera się na setkach uzasadnionych pomiarów i benchmarków, co pozwala zachować obiektywizm.Price comparison

