Recenzja laptopa Schenker XMG Focus 16: Maszyna do gier składana w Niemczech
Laptopy z Lipska dostępne są w ofercie niemieckiego producenta komputerów, firmy Schenker. W modelu XMG Focus 16 mamy średniej klasy laptop do gier z 16-calowym ekranem. Laptop jest niezawodny, solidny jak skała i posiada charakterystyczny dla Schenkera design. Urządzenie wygląda nieco pudełkowato i niekonwencjonalnie, ale nie rzuca się w oczy. Schenker wyposażył XMG Focus 16 w wydajny sprzęt i ekran o proporcjach 16:10.
Nasi konkurenci zostali wybrani przede wszystkim ze średniej kategorii cenowej laptopów gamingowych, np Dell G16 7620 czy teżLenovo Legion 5 Pro. Jednak cienki laptop multimedialny o podobnej specyfikacji, tj.Asus Zenbook Pro 16X, jest znacznie smuklejszy od typowych laptopów do gier, ale oferuje podobnie wysoki poziom wydajności.
Potencjalni konkurenci w porównaniu
Ocena | Data | Model | Waga | Wysokość | Rozmiar | Rezolucja | Cena |
|---|---|---|---|---|---|---|---|
| 87 % v7 (old) | 01/2023 | Schenker XMG Focus 16 (i7-12700H, RTX 3060) i7-12700H, GeForce RTX 3060 Laptop GPU | 2.2 kg | 24.3 mm | 16.00" | 2560x1600 | |
| 88.4 % v7 (old) | 12/2022 | Asus ZenBook Pro 16X OLED UX7602ZM-ME115W i9-12900H, GeForce RTX 3060 Laptop GPU | 2.4 kg | 19.5 mm | 16.00" | 3840x2400 | |
| 86.1 % v7 (old) | 10/2022 | Dell G16 7620 i7-12700H, GeForce RTX 3060 Laptop GPU | 2.6 kg | 26.9 mm | 16.00" | 2560x1600 | |
| 89.5 % v7 (old) | Asus ROG Flow X16 GV601RW-M5082W R9 6900HS, GeForce RTX 3070 Ti Laptop GPU | 2.1 kg | 19.4 mm | 16.10" | 2560x1600 | ||
| 88.7 % v7 (old) | 12/2022 | Lenovo ThinkPad X1 Extreme G5-21DE003RGE i7-12700H, GeForce RTX 3060 Laptop GPU | 2.1 kg | 17.9 mm | 16.00" | 3840x2400 | |
| 87.9 % v7 (old) | 11/2022 | Lenovo Legion Slim 7-16IAH 82TF004YGE i7-12700H, GeForce RTX 3060 Laptop GPU | 2.2 kg | 16.9 mm | 16.00" | 2560x1600 | |
| 86.6 % v7 (old) | 08/2025 | Lenovo Legion 5 Pro 16IAH7H i7-12700H, GeForce RTX 3060 Laptop GPU | 2.6 kg | 27 mm | 16.00" | 2560x1600 |
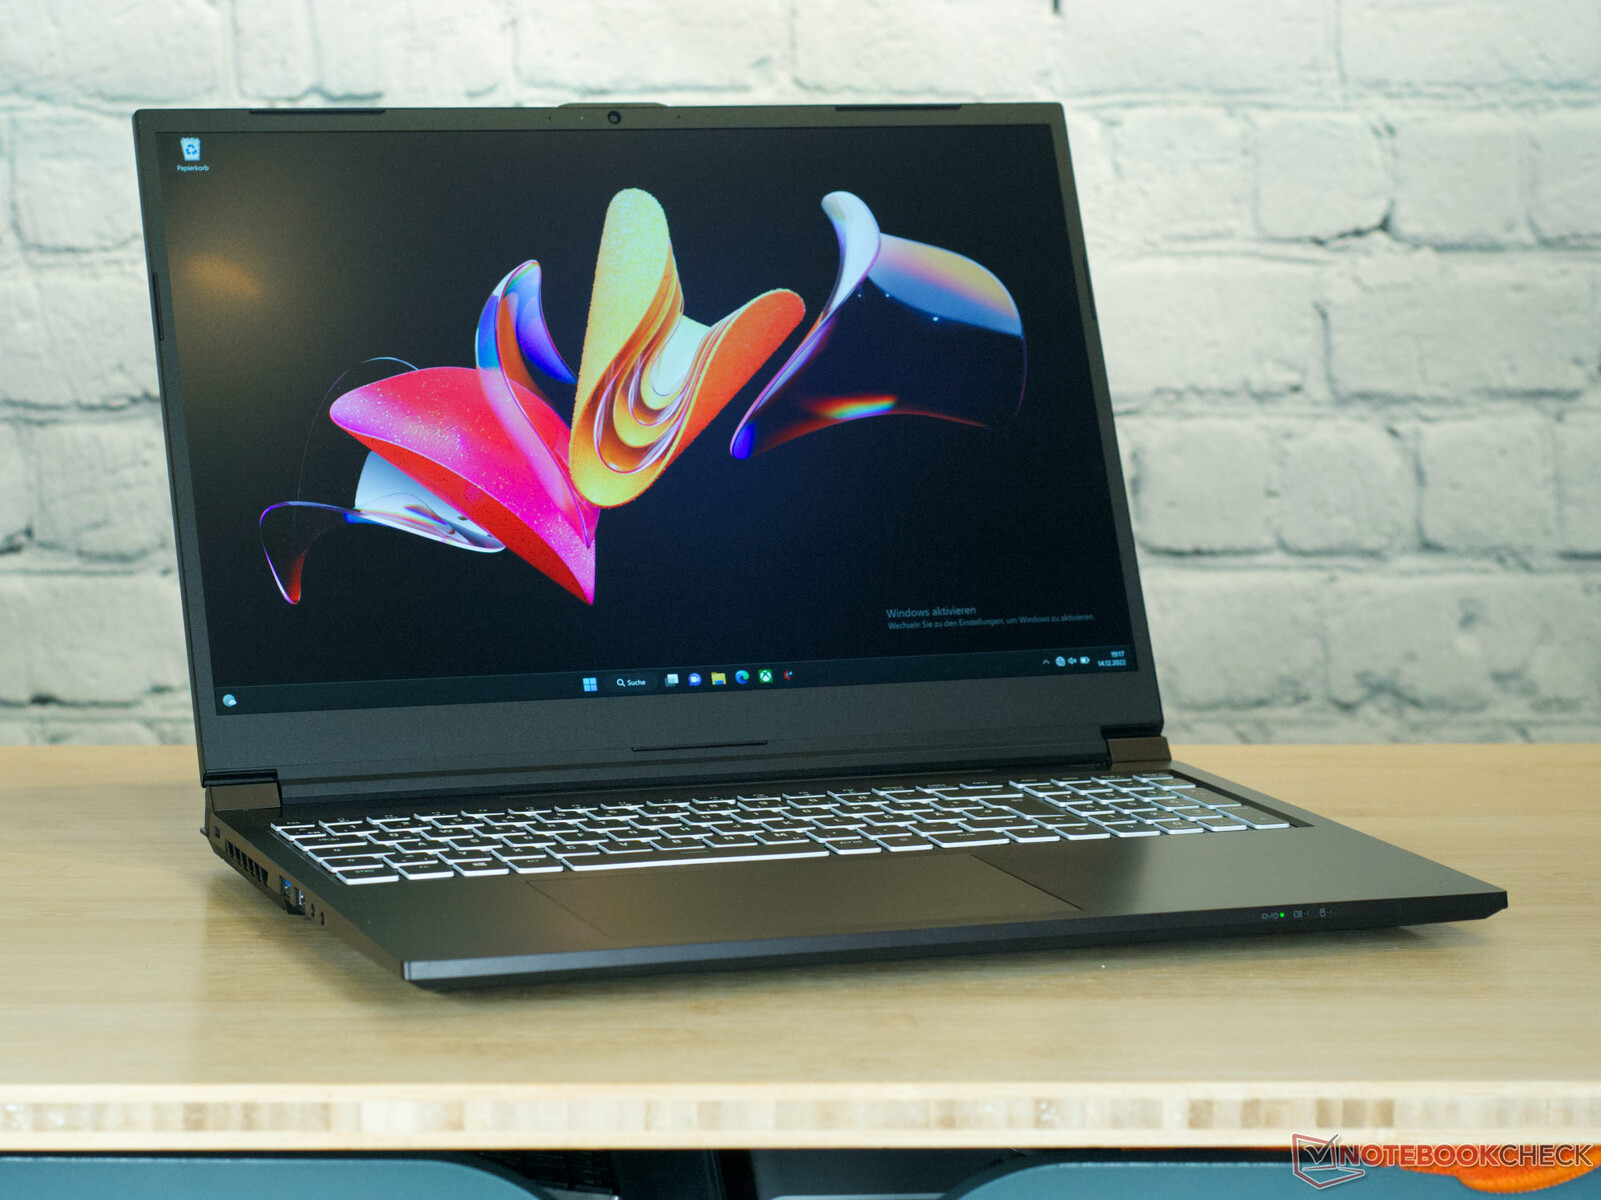
Obudowa - czarna, pudełkowa i dużo aluminium
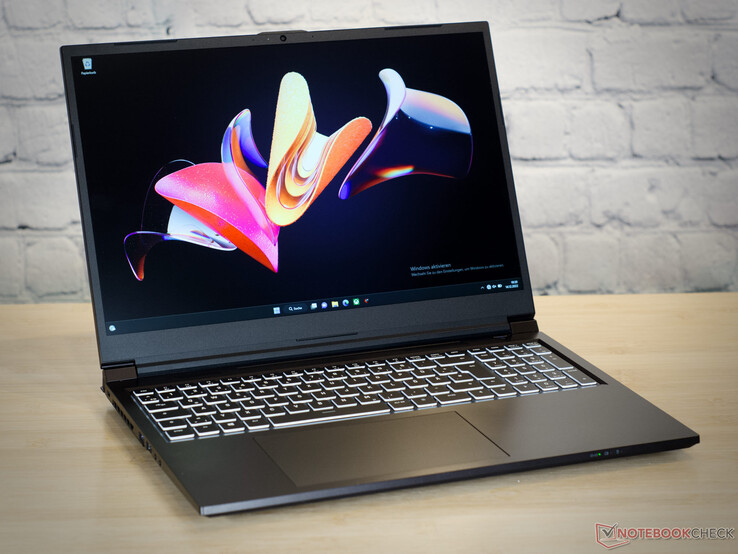
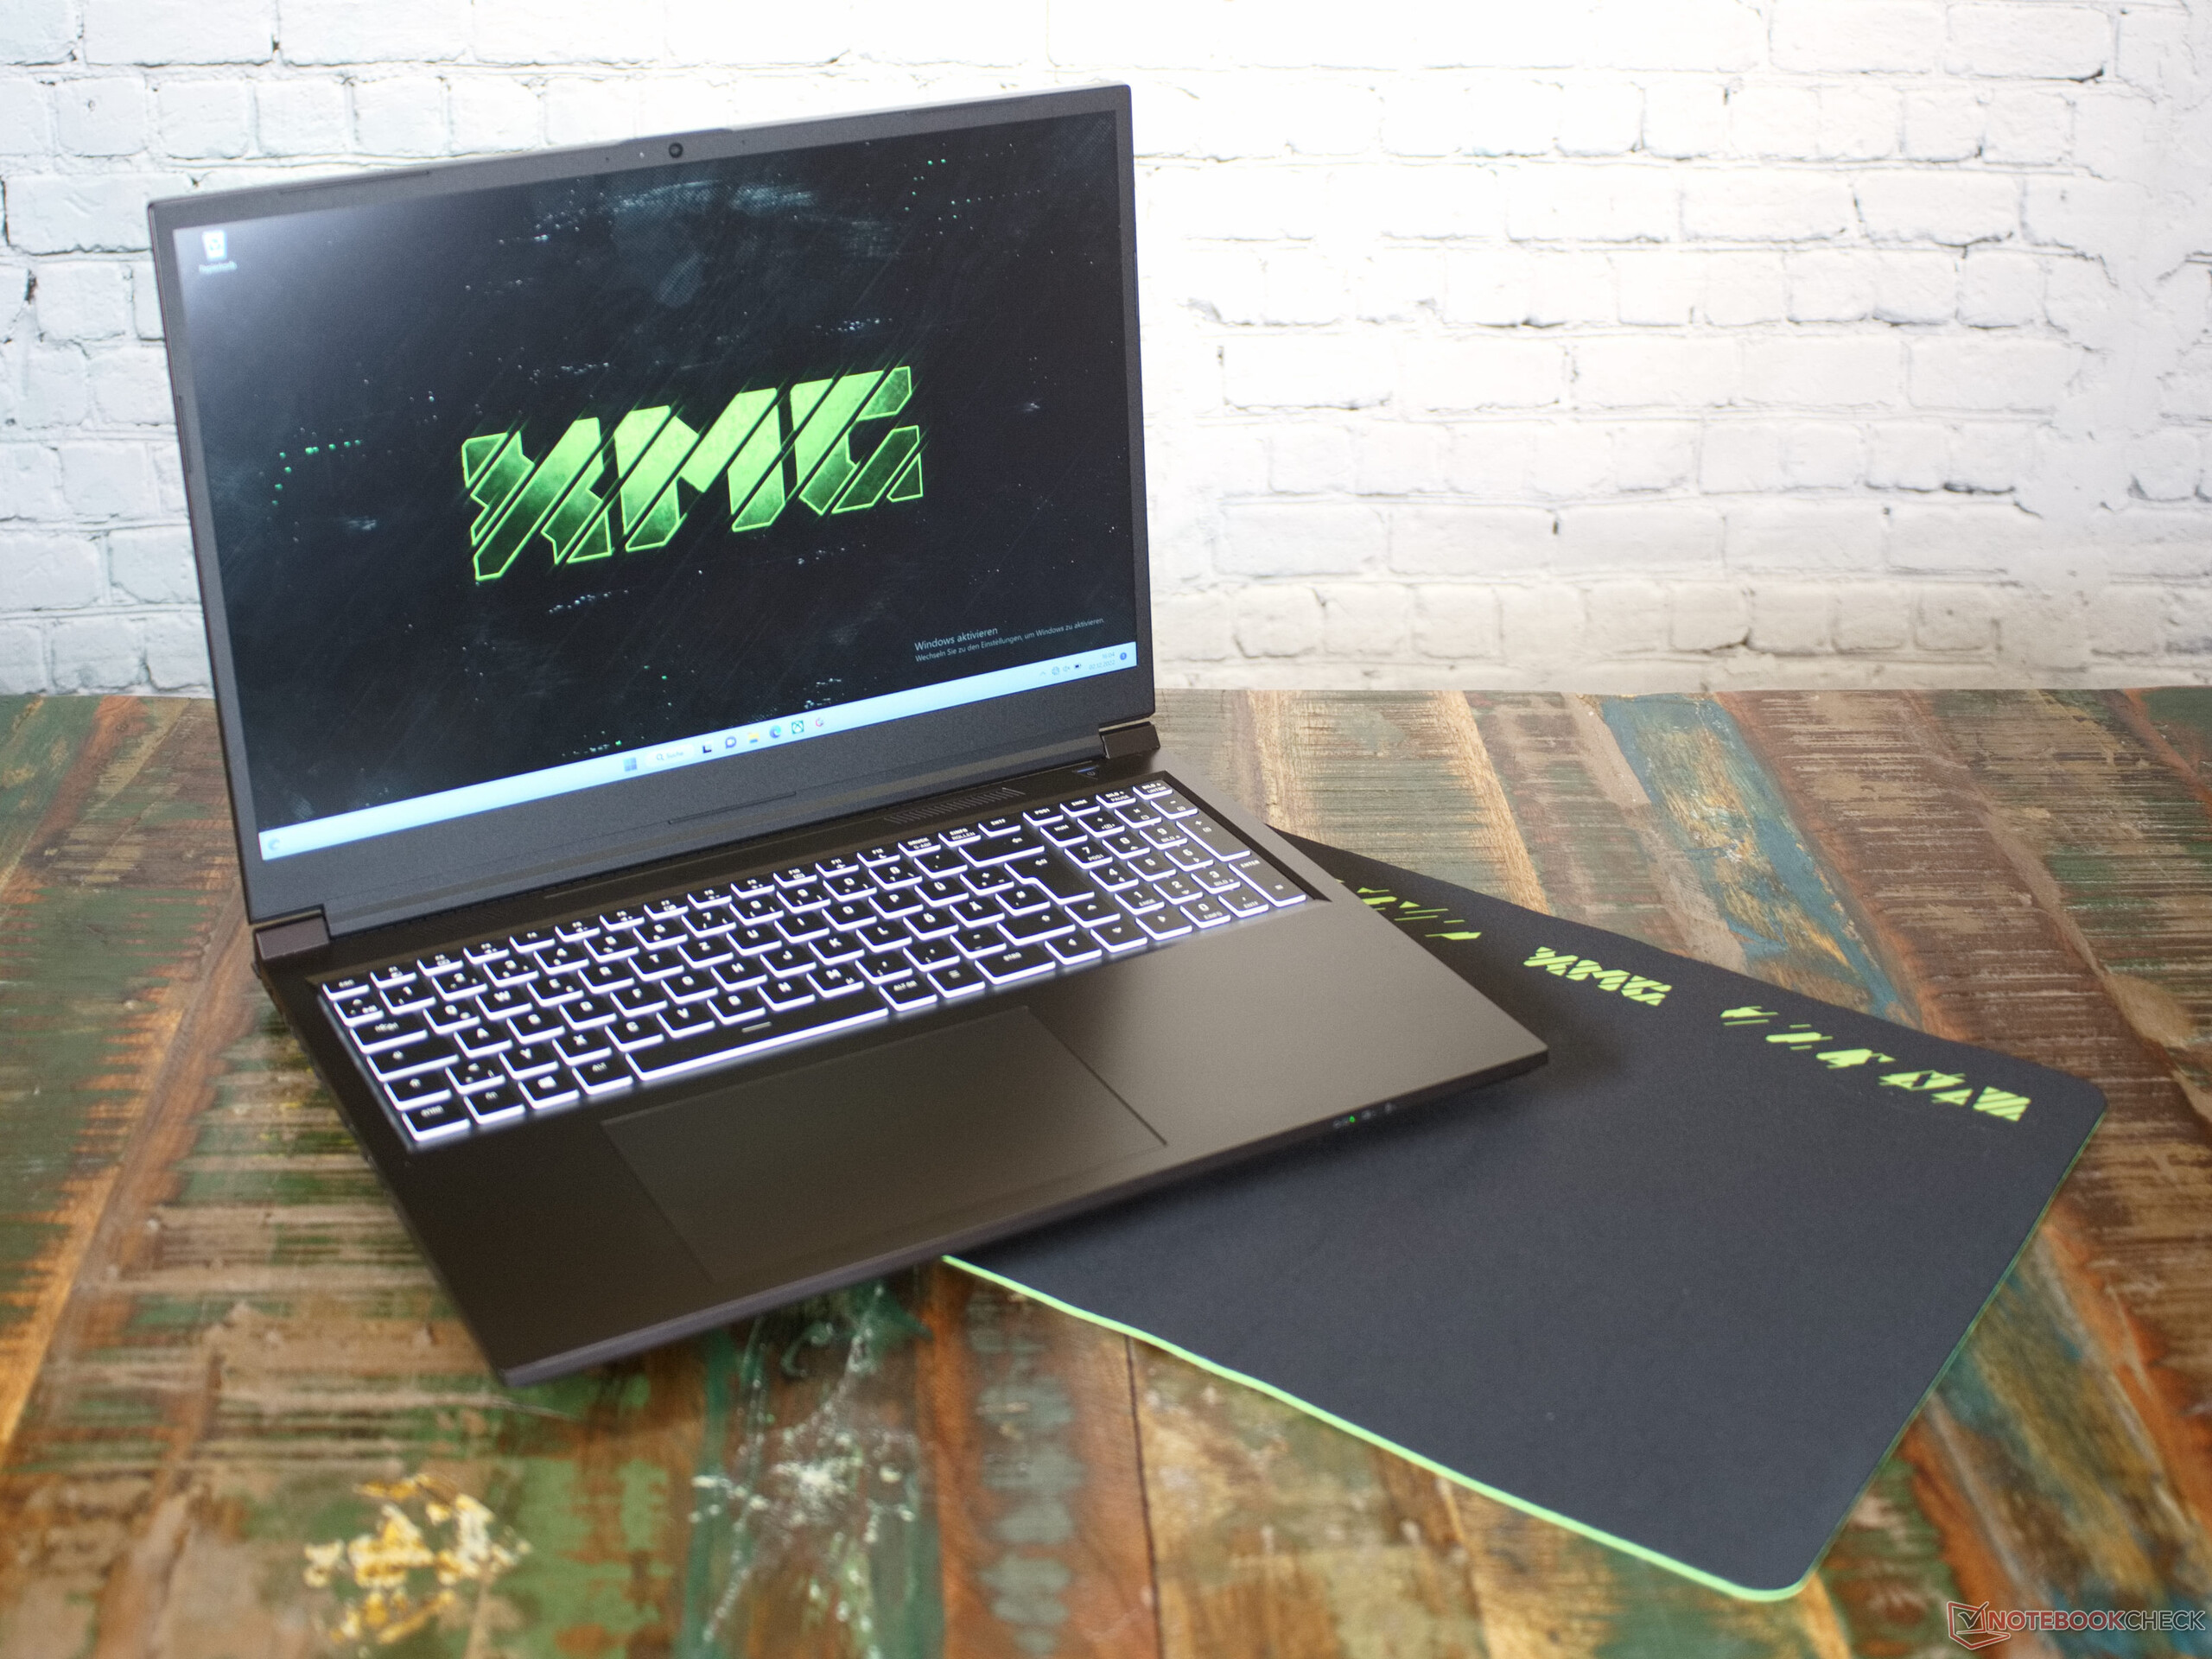
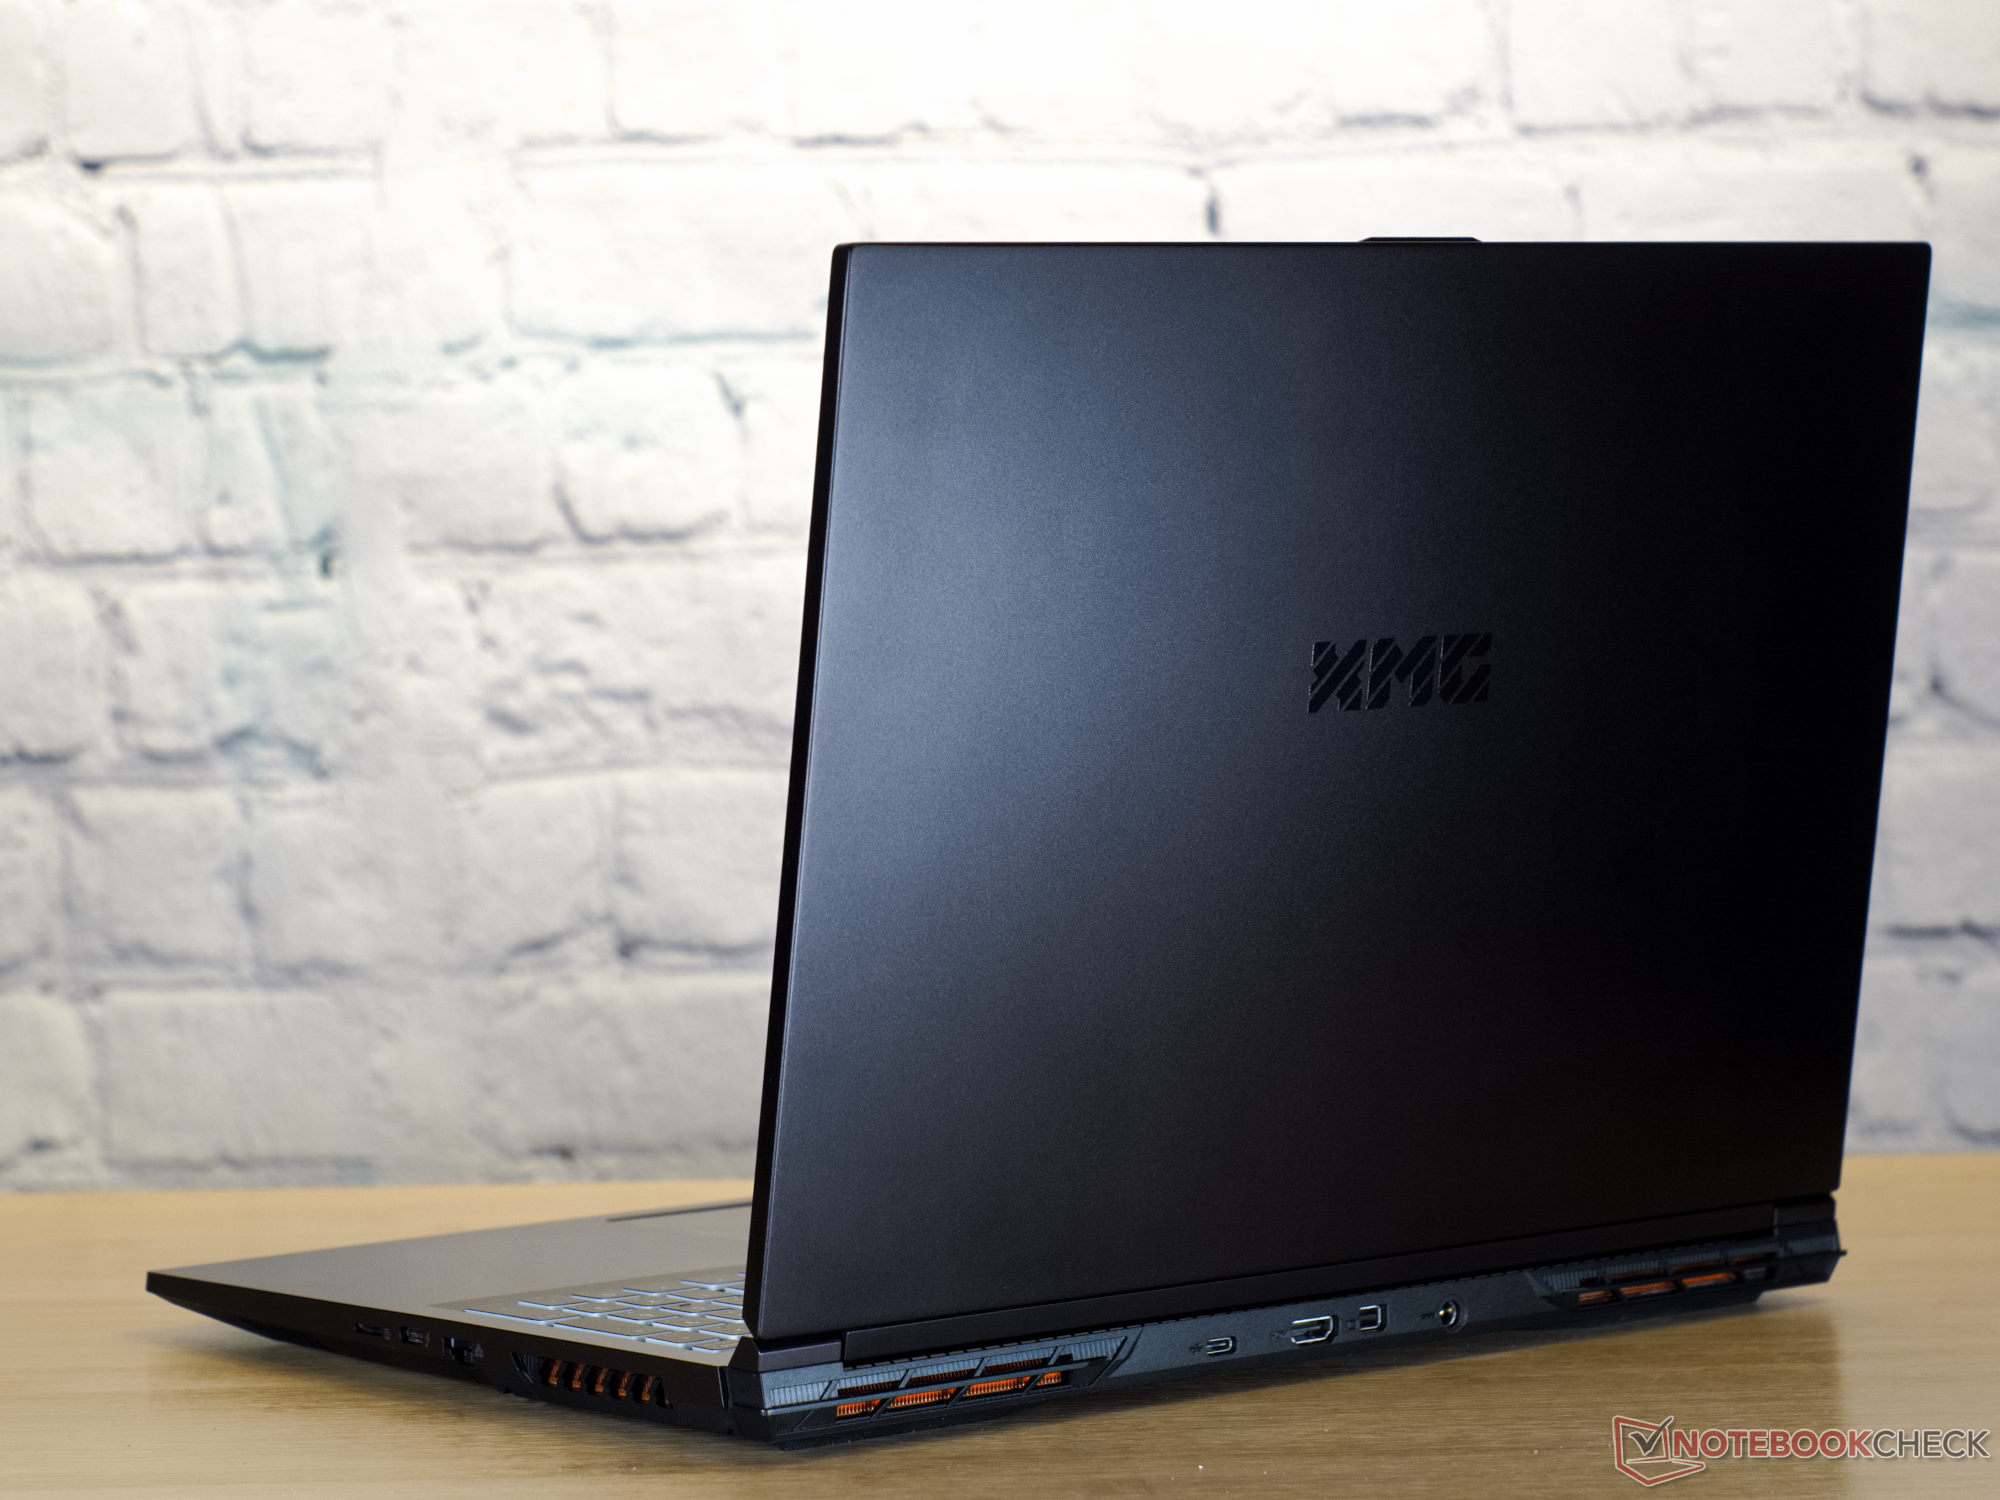
XMG Schenker Focus 16 jest czarno-biały i bazuje na barebone NP60PNP od Clevo. Zarówno pokrywa wyświetlacza - którą można otworzyć do kąta 130 ° - jak i górna część podstawy składają się z czarnego powlekanego aluminium, w przeciwieństwie do pokrywy podstawy, która jest wykonana z czarnego plastiku. Po otwarciu urządzenia znajdziemy rodzaj klawiatury, która jest typowo spotykana w wielu laptopach Schenker i Clevo. Poszczególne klawisze mają białe obwódki i czarne powierzchnie do pisania. Jak w przypadku niemal wszystkich laptopów Schenkera, XMG Focus 16 ma dość pudełkowaty i podstawowy wygląd, ale cechuje się dobrą jakością wykonania. Mamy w rękach wygodne urządzenie, które nie wykazuje oznak skrzypienia i może pochwalić się stabilnym zawiasem.
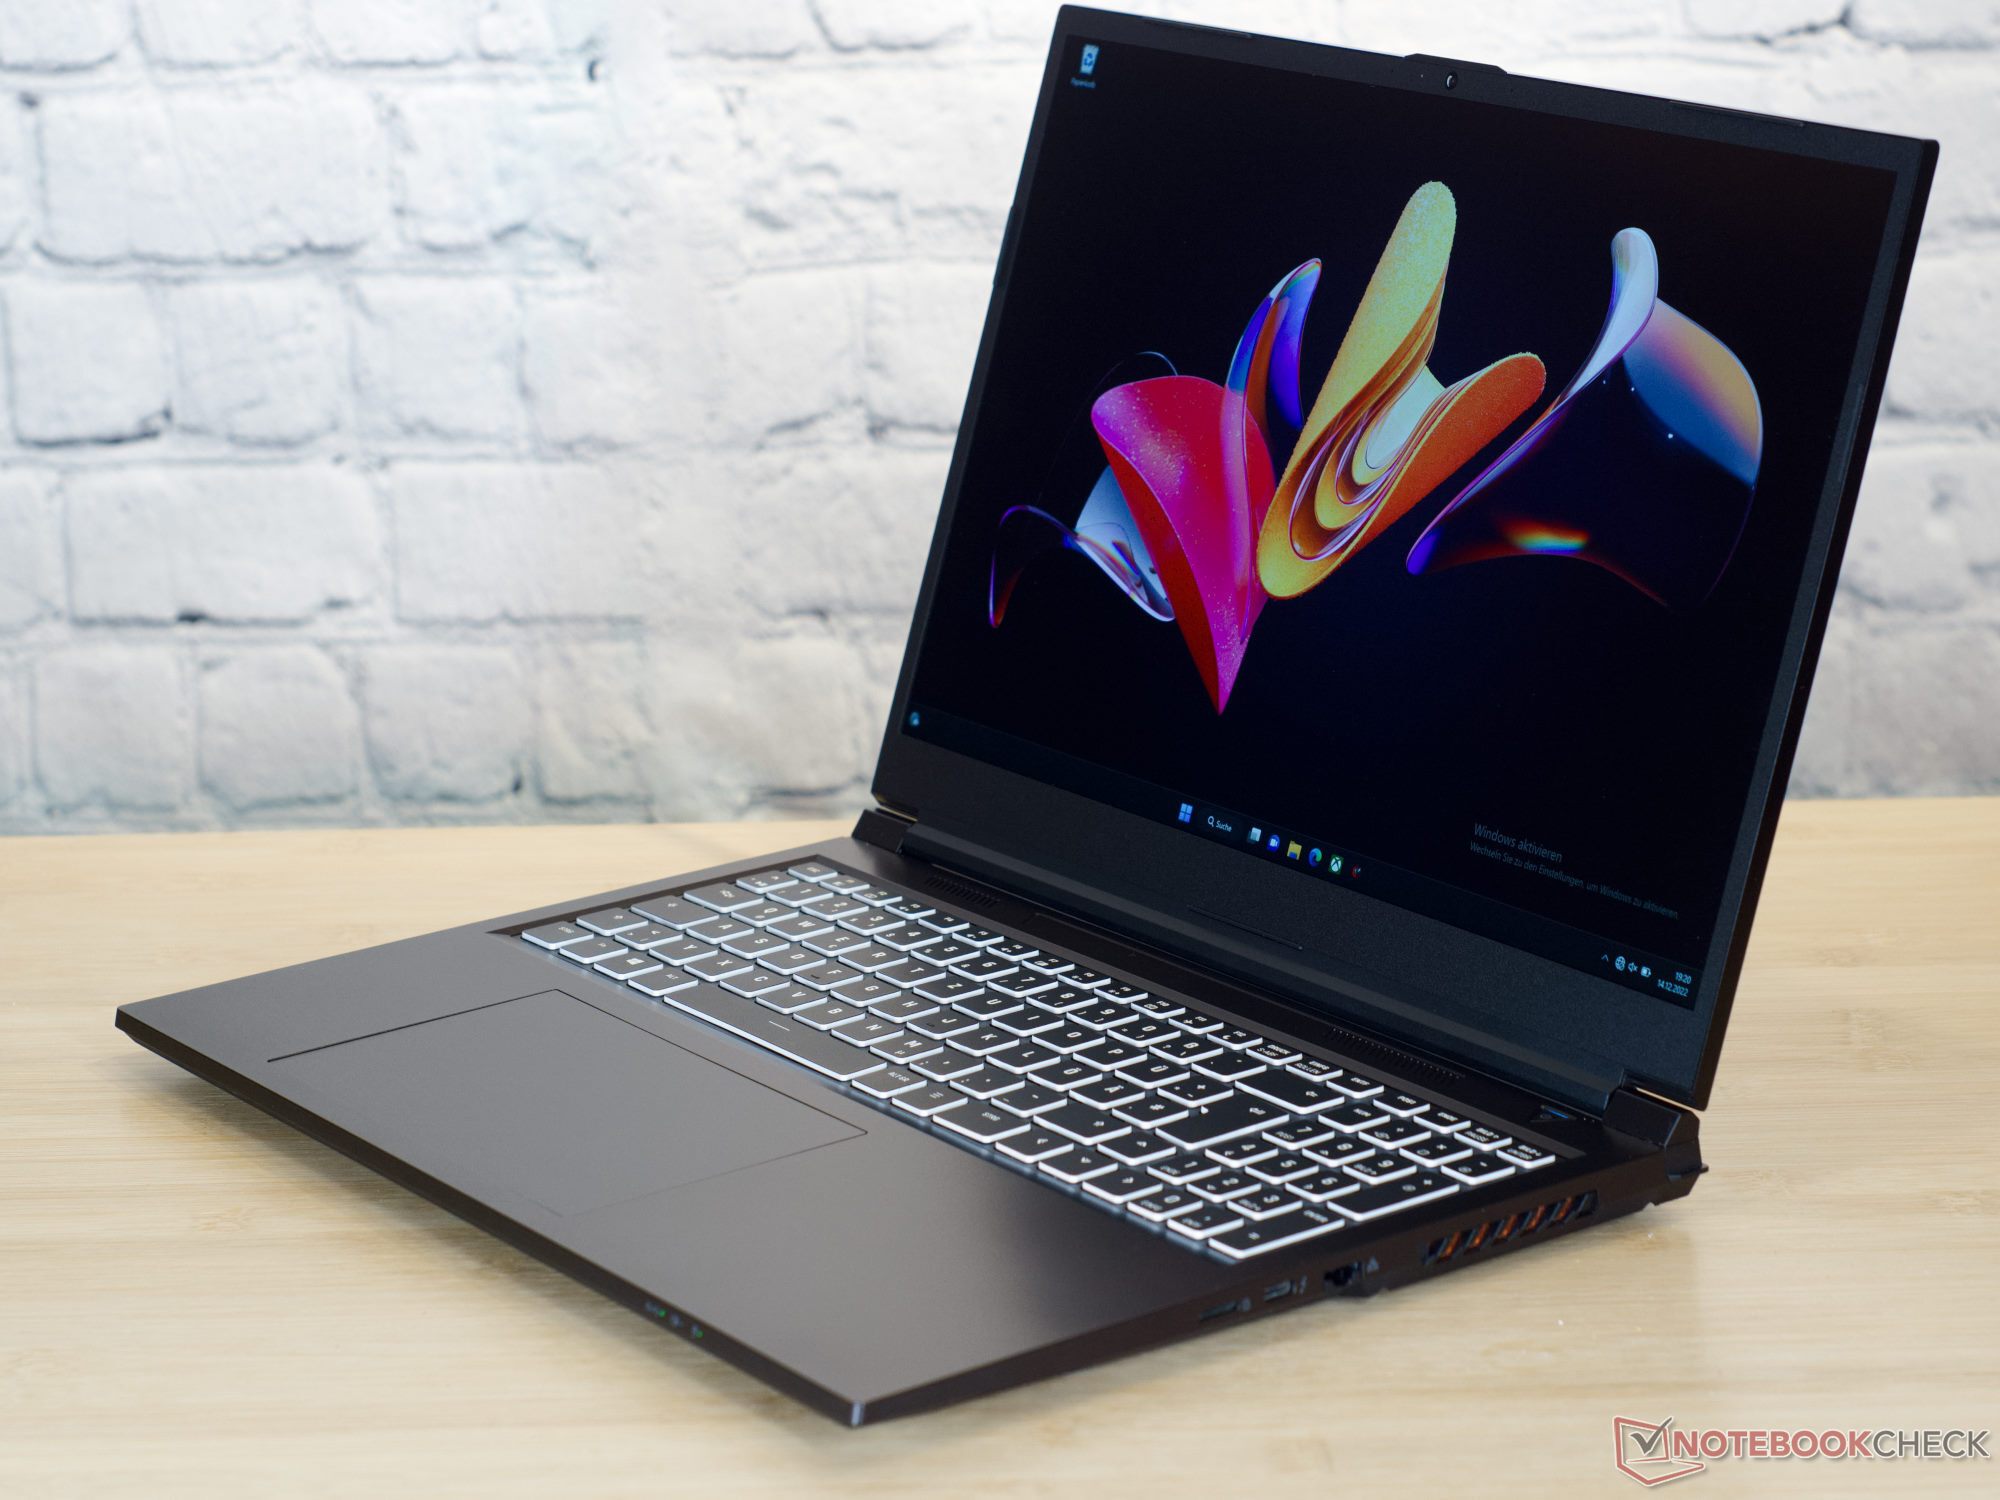

Ważący 2,3 kg i mierzący 2,4 cm grubości laptop do gier nie wyróżnia się na tle swoich bezpośrednich konkurentów.
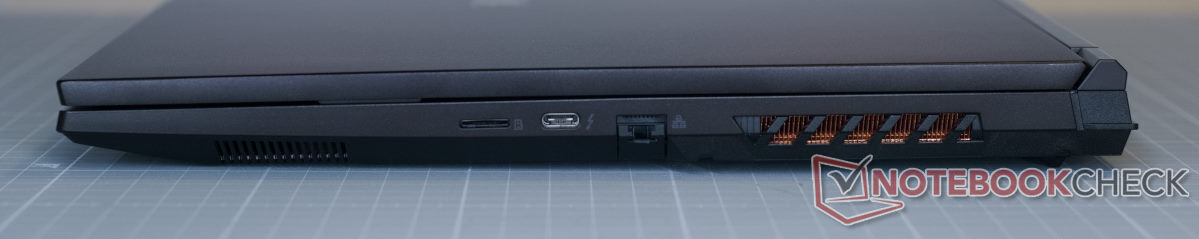
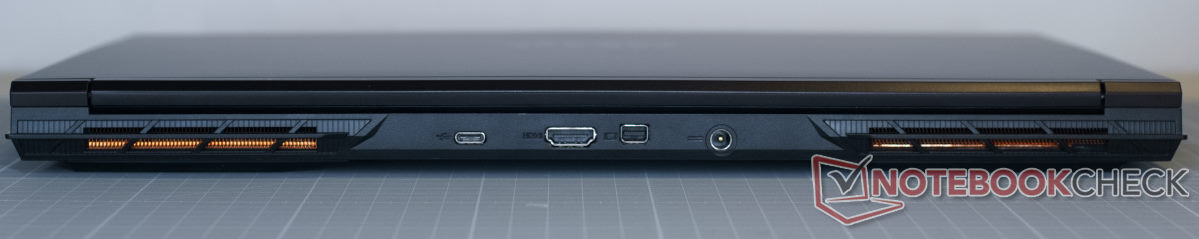
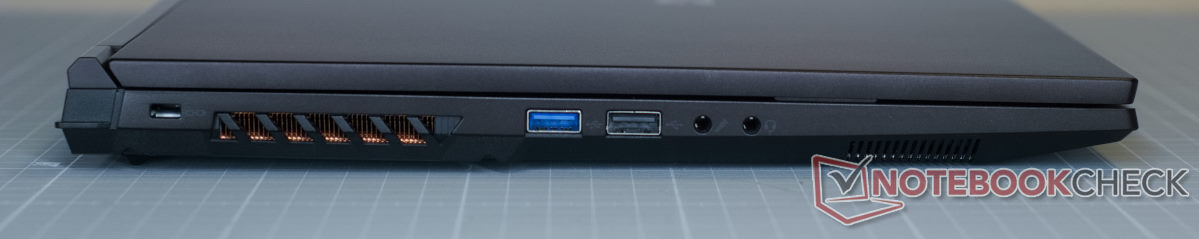
Cechy - wiele portów, wysoka prędkość transferu i WiFi 6E
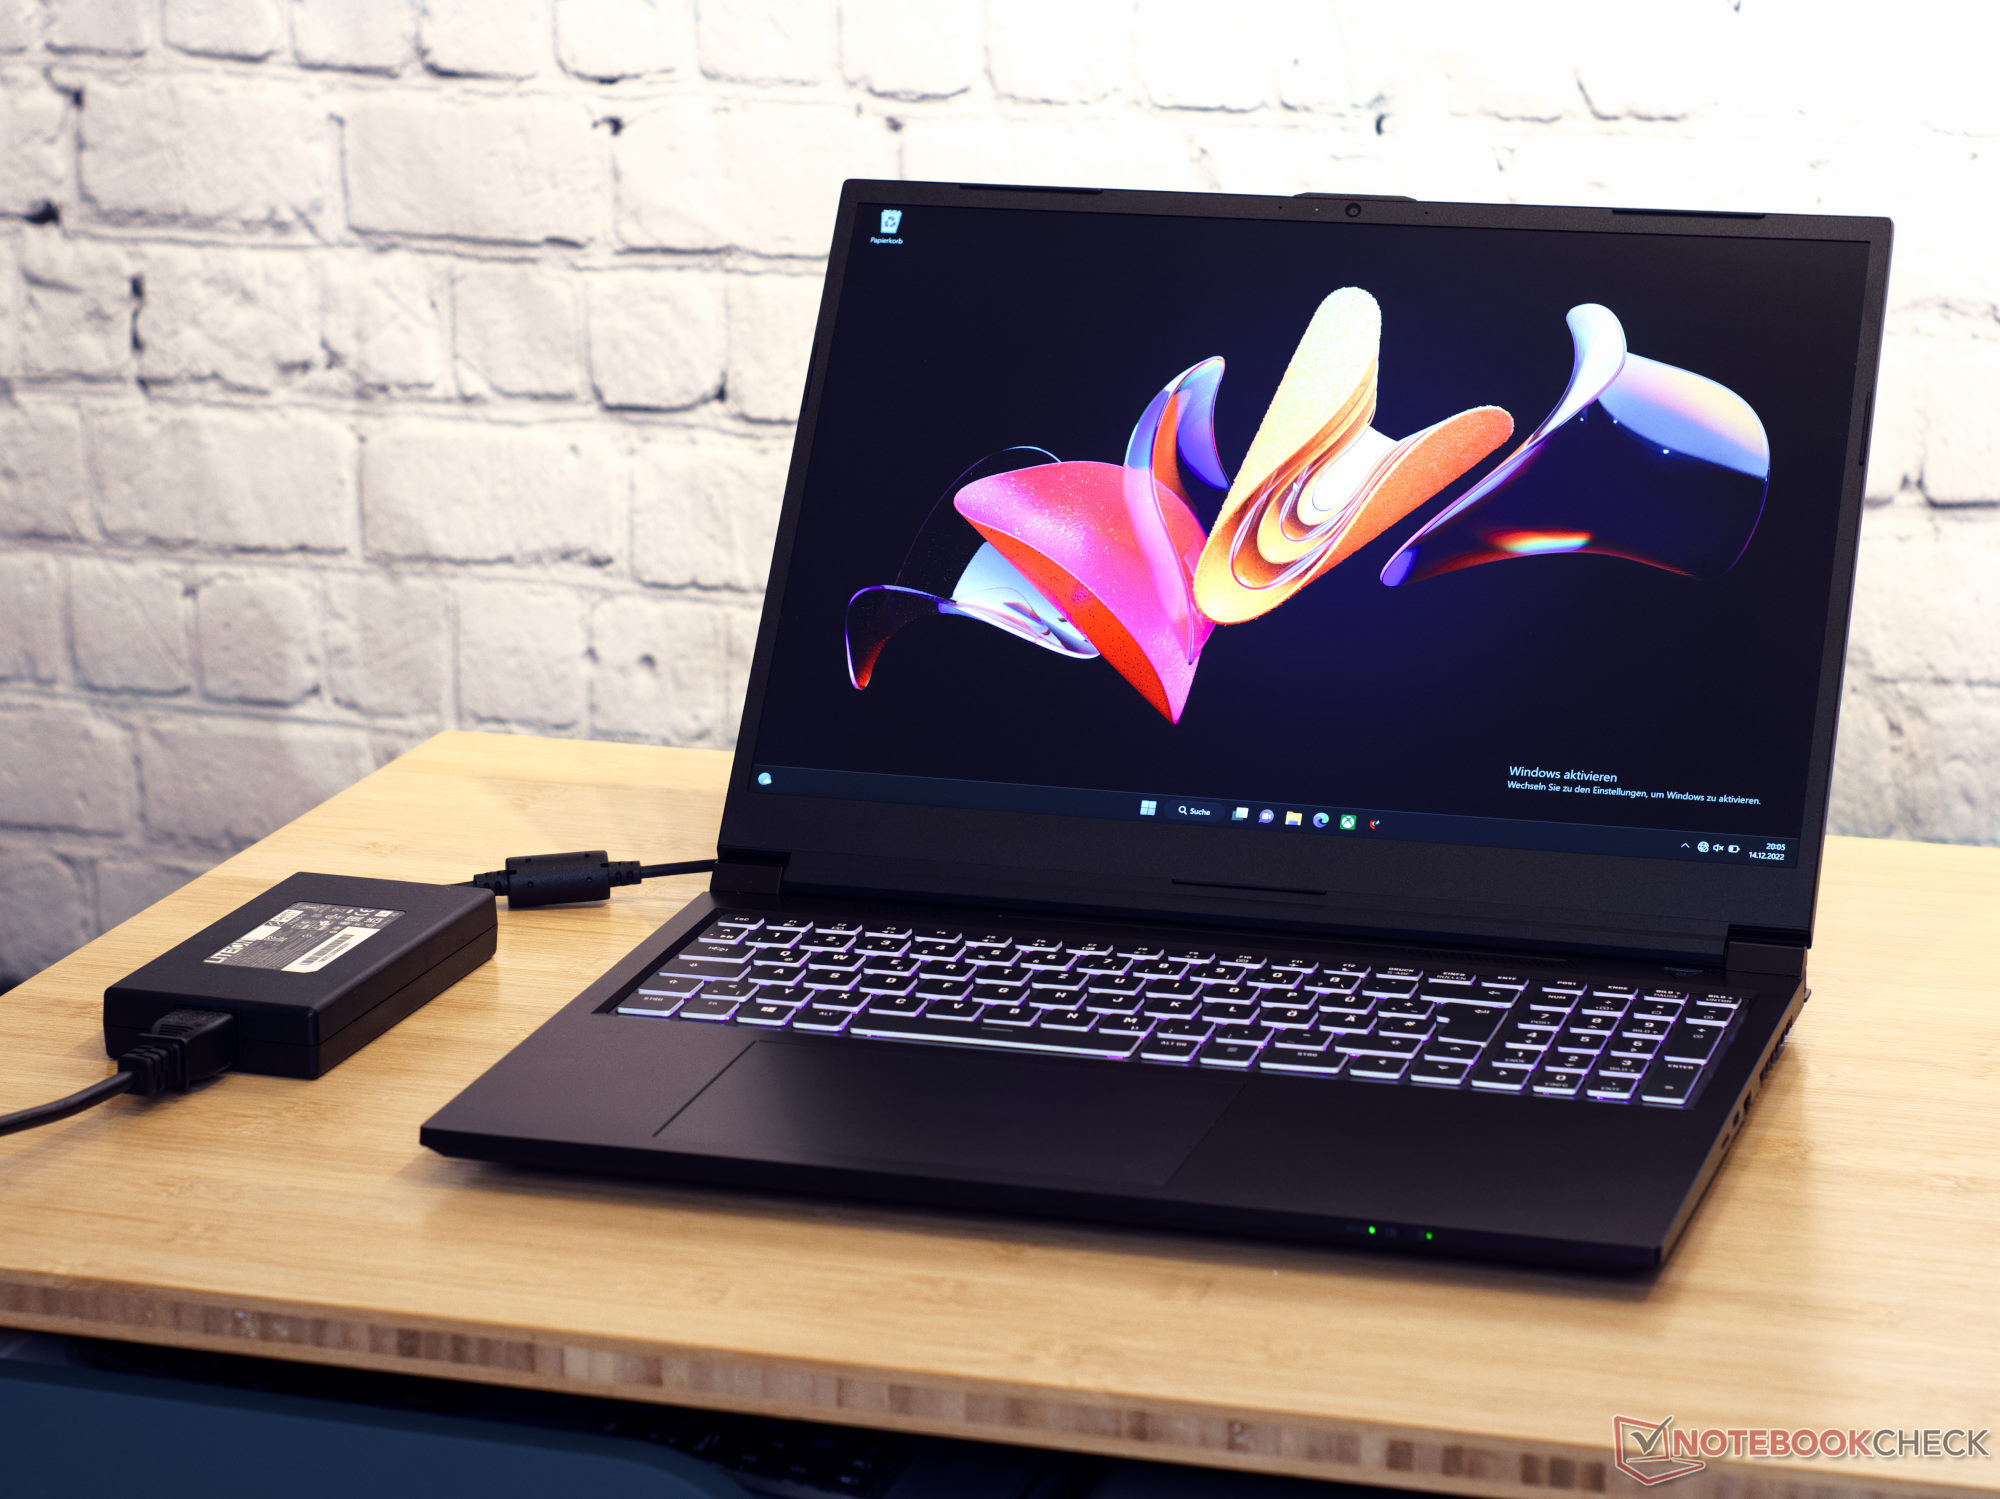
Schenker umieścił porty w różnych miejscach wokół Focusa. Porty wyświetlacza, gniazdo zasilania, a także port USB-C znajdziemy z tyłu laptopa. Dzięki temu kable nie będą przeszkadzać podczas grania.
Czytnik kart SD
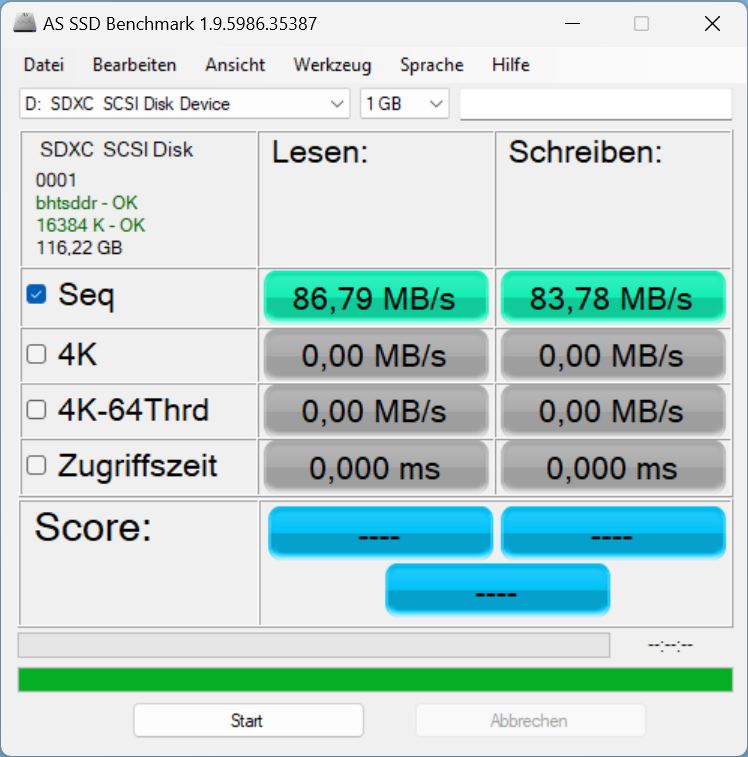
Laptop do gier jest wyposażony w czytnik kart microSD.
Przeciętnie oferuje on wysokie prędkości transferu dla połączeń USB-3.0 ze sprzętem. Połączenie z naszym AV PRO microSD 128 GB V60mogłoby być szybsze - co pokazuje m.in.Asus Rog Flow.
| SD Card Reader | |
| average JPG Copy Test (av. of 3 runs) | |
| Asus ROG Flow X16 GV601RW-M5082W (AV Pro SD microSD 128 GB V60) | |
| Średnia w klasie Gaming (20.9 - 210, n=54, ostatnie 2 lata) | |
| Schenker XMG Focus 16 (i7-12700H, RTX 3060) (AV Pro SD microSD 128 GB V60) | |
| Asus ZenBook Pro 16X OLED UX7602ZM-ME115W (AV Pro SD microSD 128 GB V60) | |
| Lenovo ThinkPad X1 Extreme G5-21DE003RGE (AV Pro V60) | |
| Lenovo Legion Slim 7-16IAH 82TF004YGE | |
| maximum AS SSD Seq Read Test (1GB) | |
| Asus ROG Flow X16 GV601RW-M5082W (AV Pro SD microSD 128 GB V60) | |
| Średnia w klasie Gaming (25.5 - 261, n=51, ostatnie 2 lata) | |
| Lenovo Legion Slim 7-16IAH 82TF004YGE | |
| Schenker XMG Focus 16 (i7-12700H, RTX 3060) (AV Pro SD microSD 128 GB V60) | |
| Asus ZenBook Pro 16X OLED UX7602ZM-ME115W (AV Pro SD microSD 128 GB V60) | |
| Lenovo ThinkPad X1 Extreme G5-21DE003RGE (AV Pro V60) | |
Komunikacja
Połączenie WiFi jest ponadprzeciętne pod względem szybkości i stabilności. Moduł LAN Intel X211 pokazuje tu pełnię swoich możliwości.
Kamera internetowa
Wewnątrz laptopa Schenkera można znaleźć typową kamerkę internetową 720p. Co najwyżej mogliśmy stwierdzić stosunkowo niewielkie odchylenia w kolorach. W pozostałych przypadkach jakość obrazu z kamerki jest na typowym poziomie.


 GeForce RTX 3060 Laptop GPU, i7-12700H, Samsung SSD 980 Pro 1TB MZ-V8P1T0BW")
 GeForce RTX 3060 Laptop GPU, i7-12700H, Samsung SSD 980 Pro 1TB MZ-V8P1T0BW")
Bezpieczeństwo
Schenker XMG Focus 16 posiada gniazdo bezpieczeństwa Kensington. W pozostałych przypadkach wszystkie standardy są spełnione. Na pokładzie znajduje się TPM 2.0 (poprzez Intel PTT).
Dodatki
Schenker do wszystkich swoich laptopów dołącza obszerną dokumentację. W pudełku znaleźliśmy płytę CD ze sterownikami, pamięć USB z prekonfigurowanym systemem Windows, a także dużą podkładkę pod mysz z logo XMG.
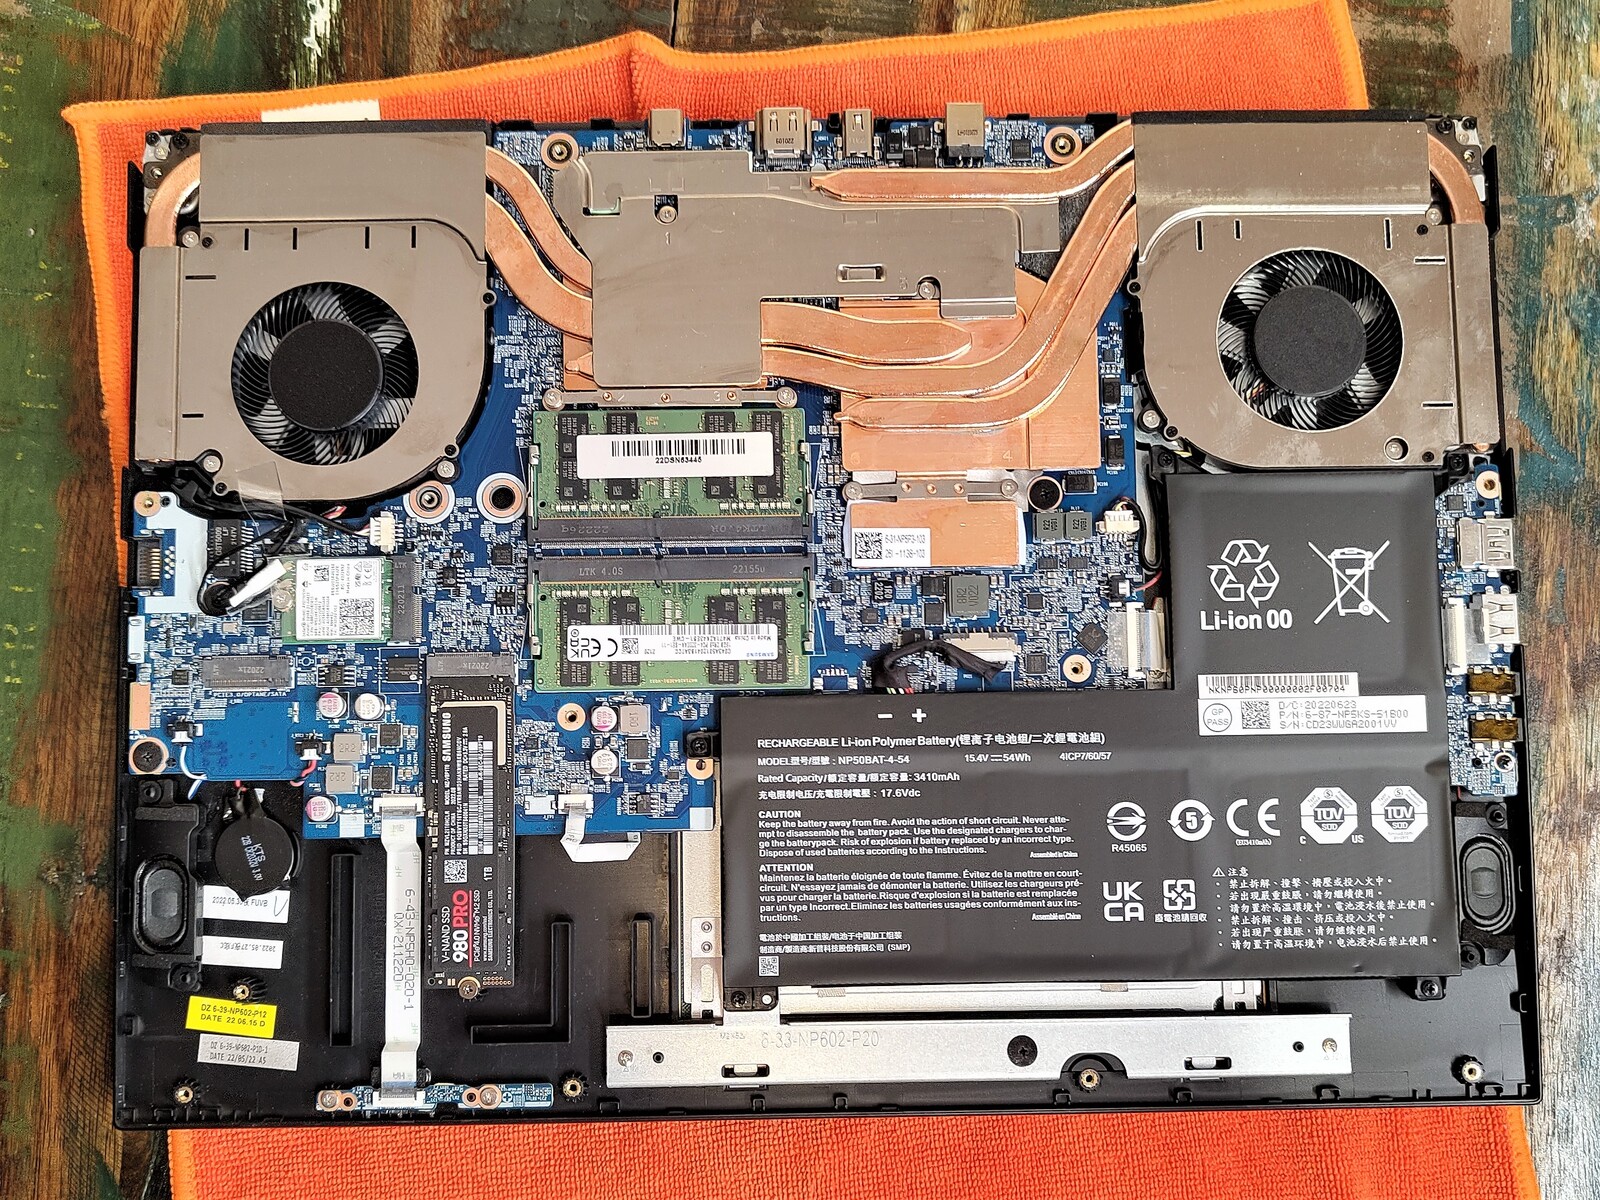
Serwis
Trzynaście śrub krzyżowych mocno trzyma pokrywę podstawy. Po ich odkręceniu można bez problemu podnieść płytę wierzchnią. Wewnątrz laptopa znajdziemy dwa (zajęte już) gniazda pamięci RAM i dwa gniazda M.2 (jedno zajęte). Wszystkie pozostałe części są przykręcone, ale nie przyklejone.
Gwarancja

To, jakie usługi gwarancyjne zapewnia Schenker, zależy od indywidualnych wyborów dokonanych przy zakupie urządzenia. Podstawą jest gwarancja na 24 miesiące obejmująca zarówno usługę Pick-up & Return, jak i szybką naprawę w pierwszych sześciu miesiącach.
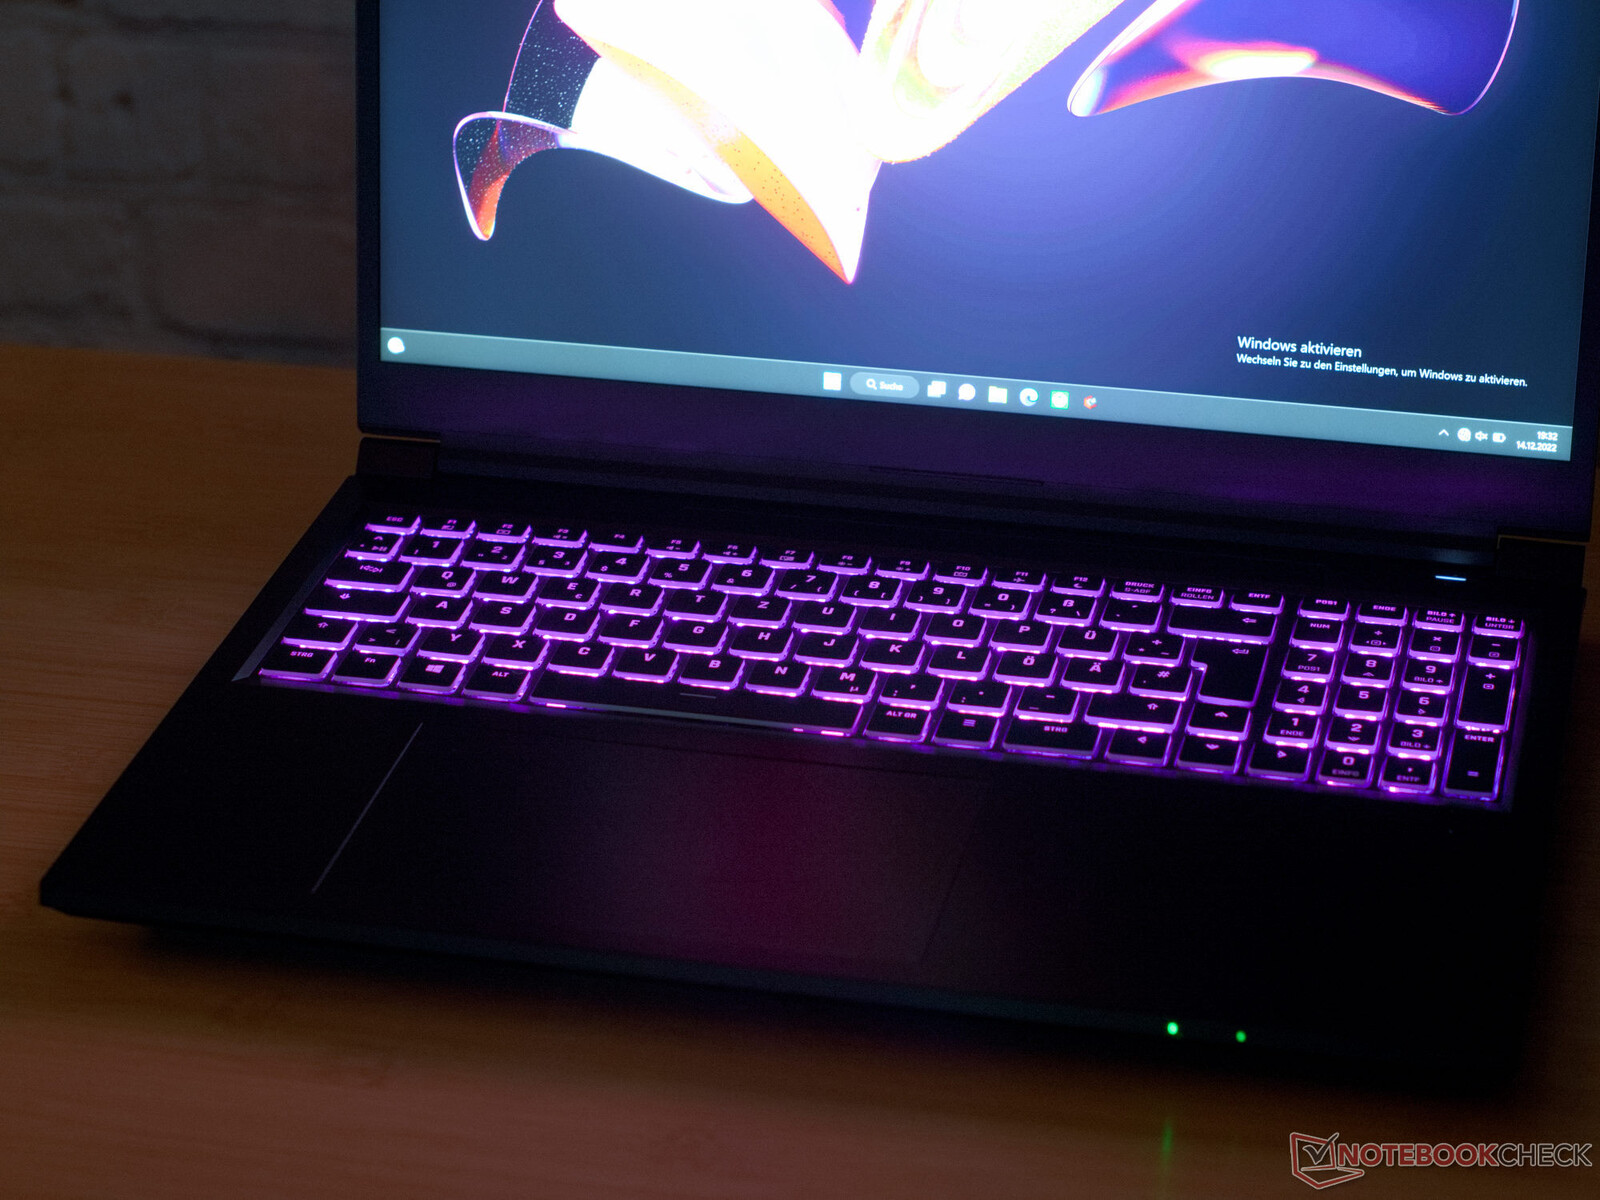
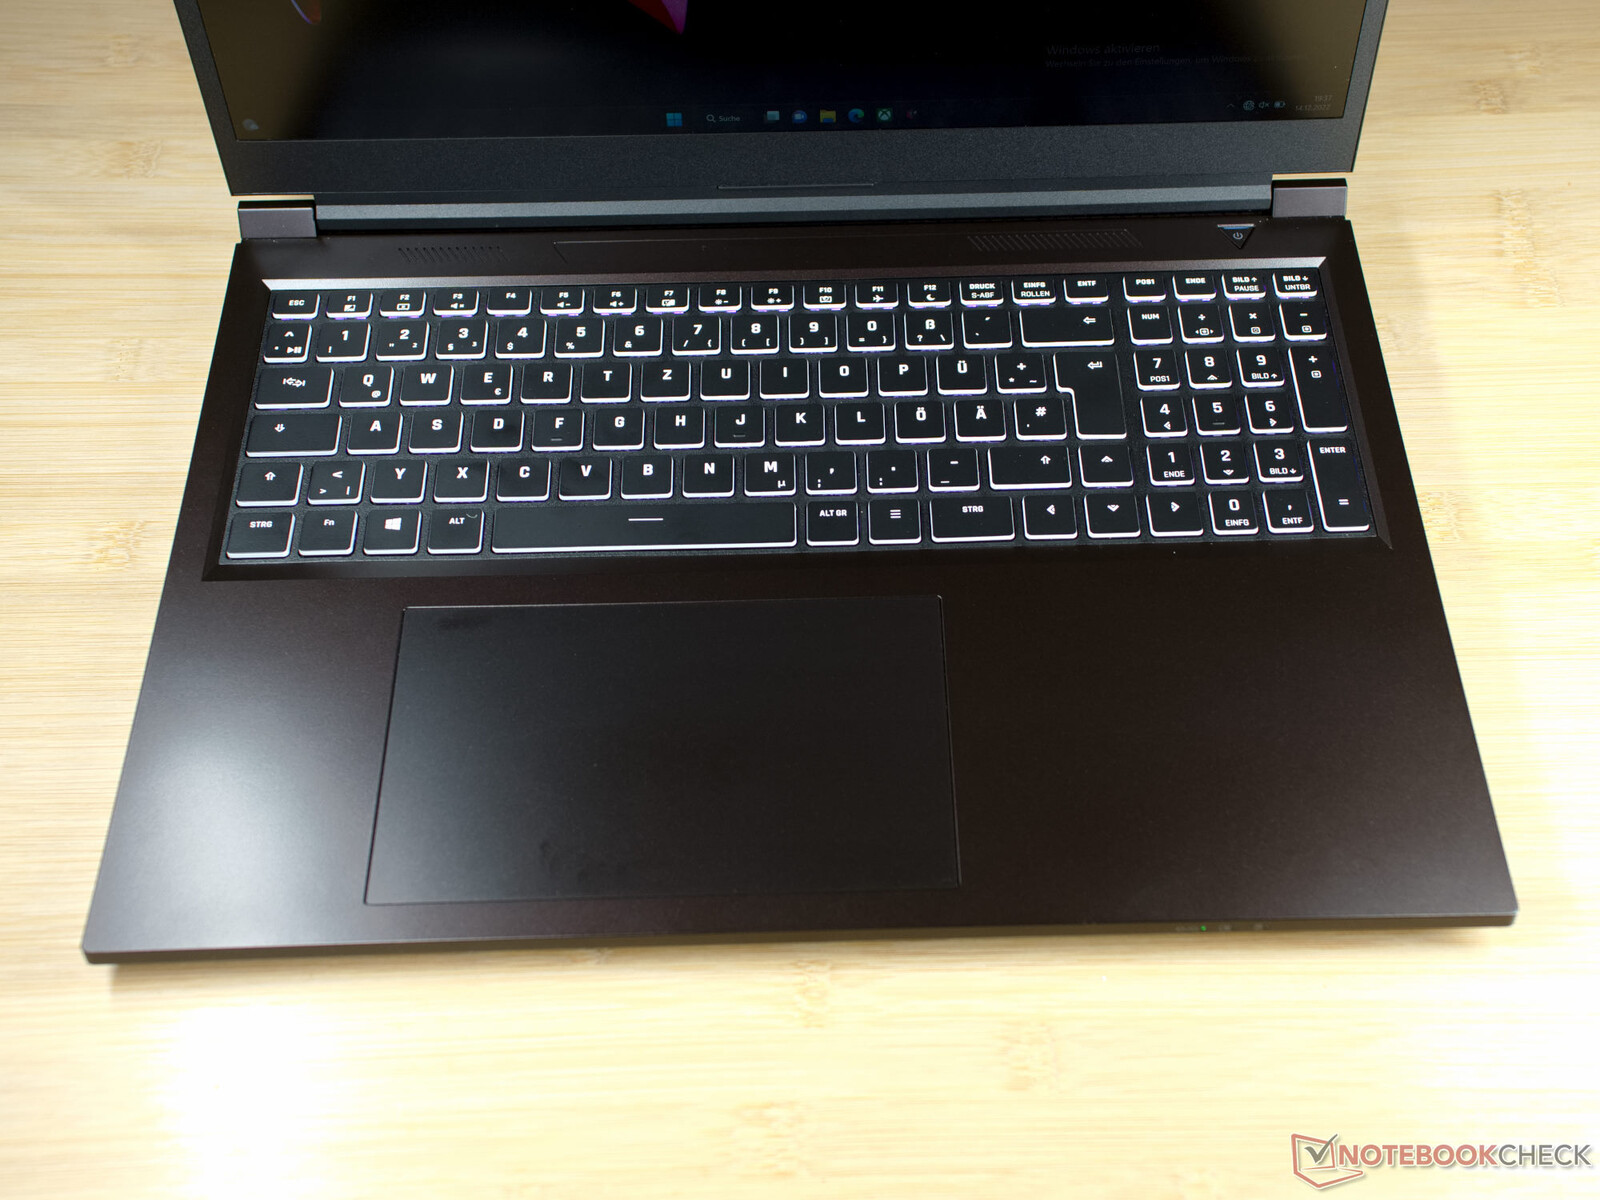
Urządzenia wejściowe - długi skok klawiszy
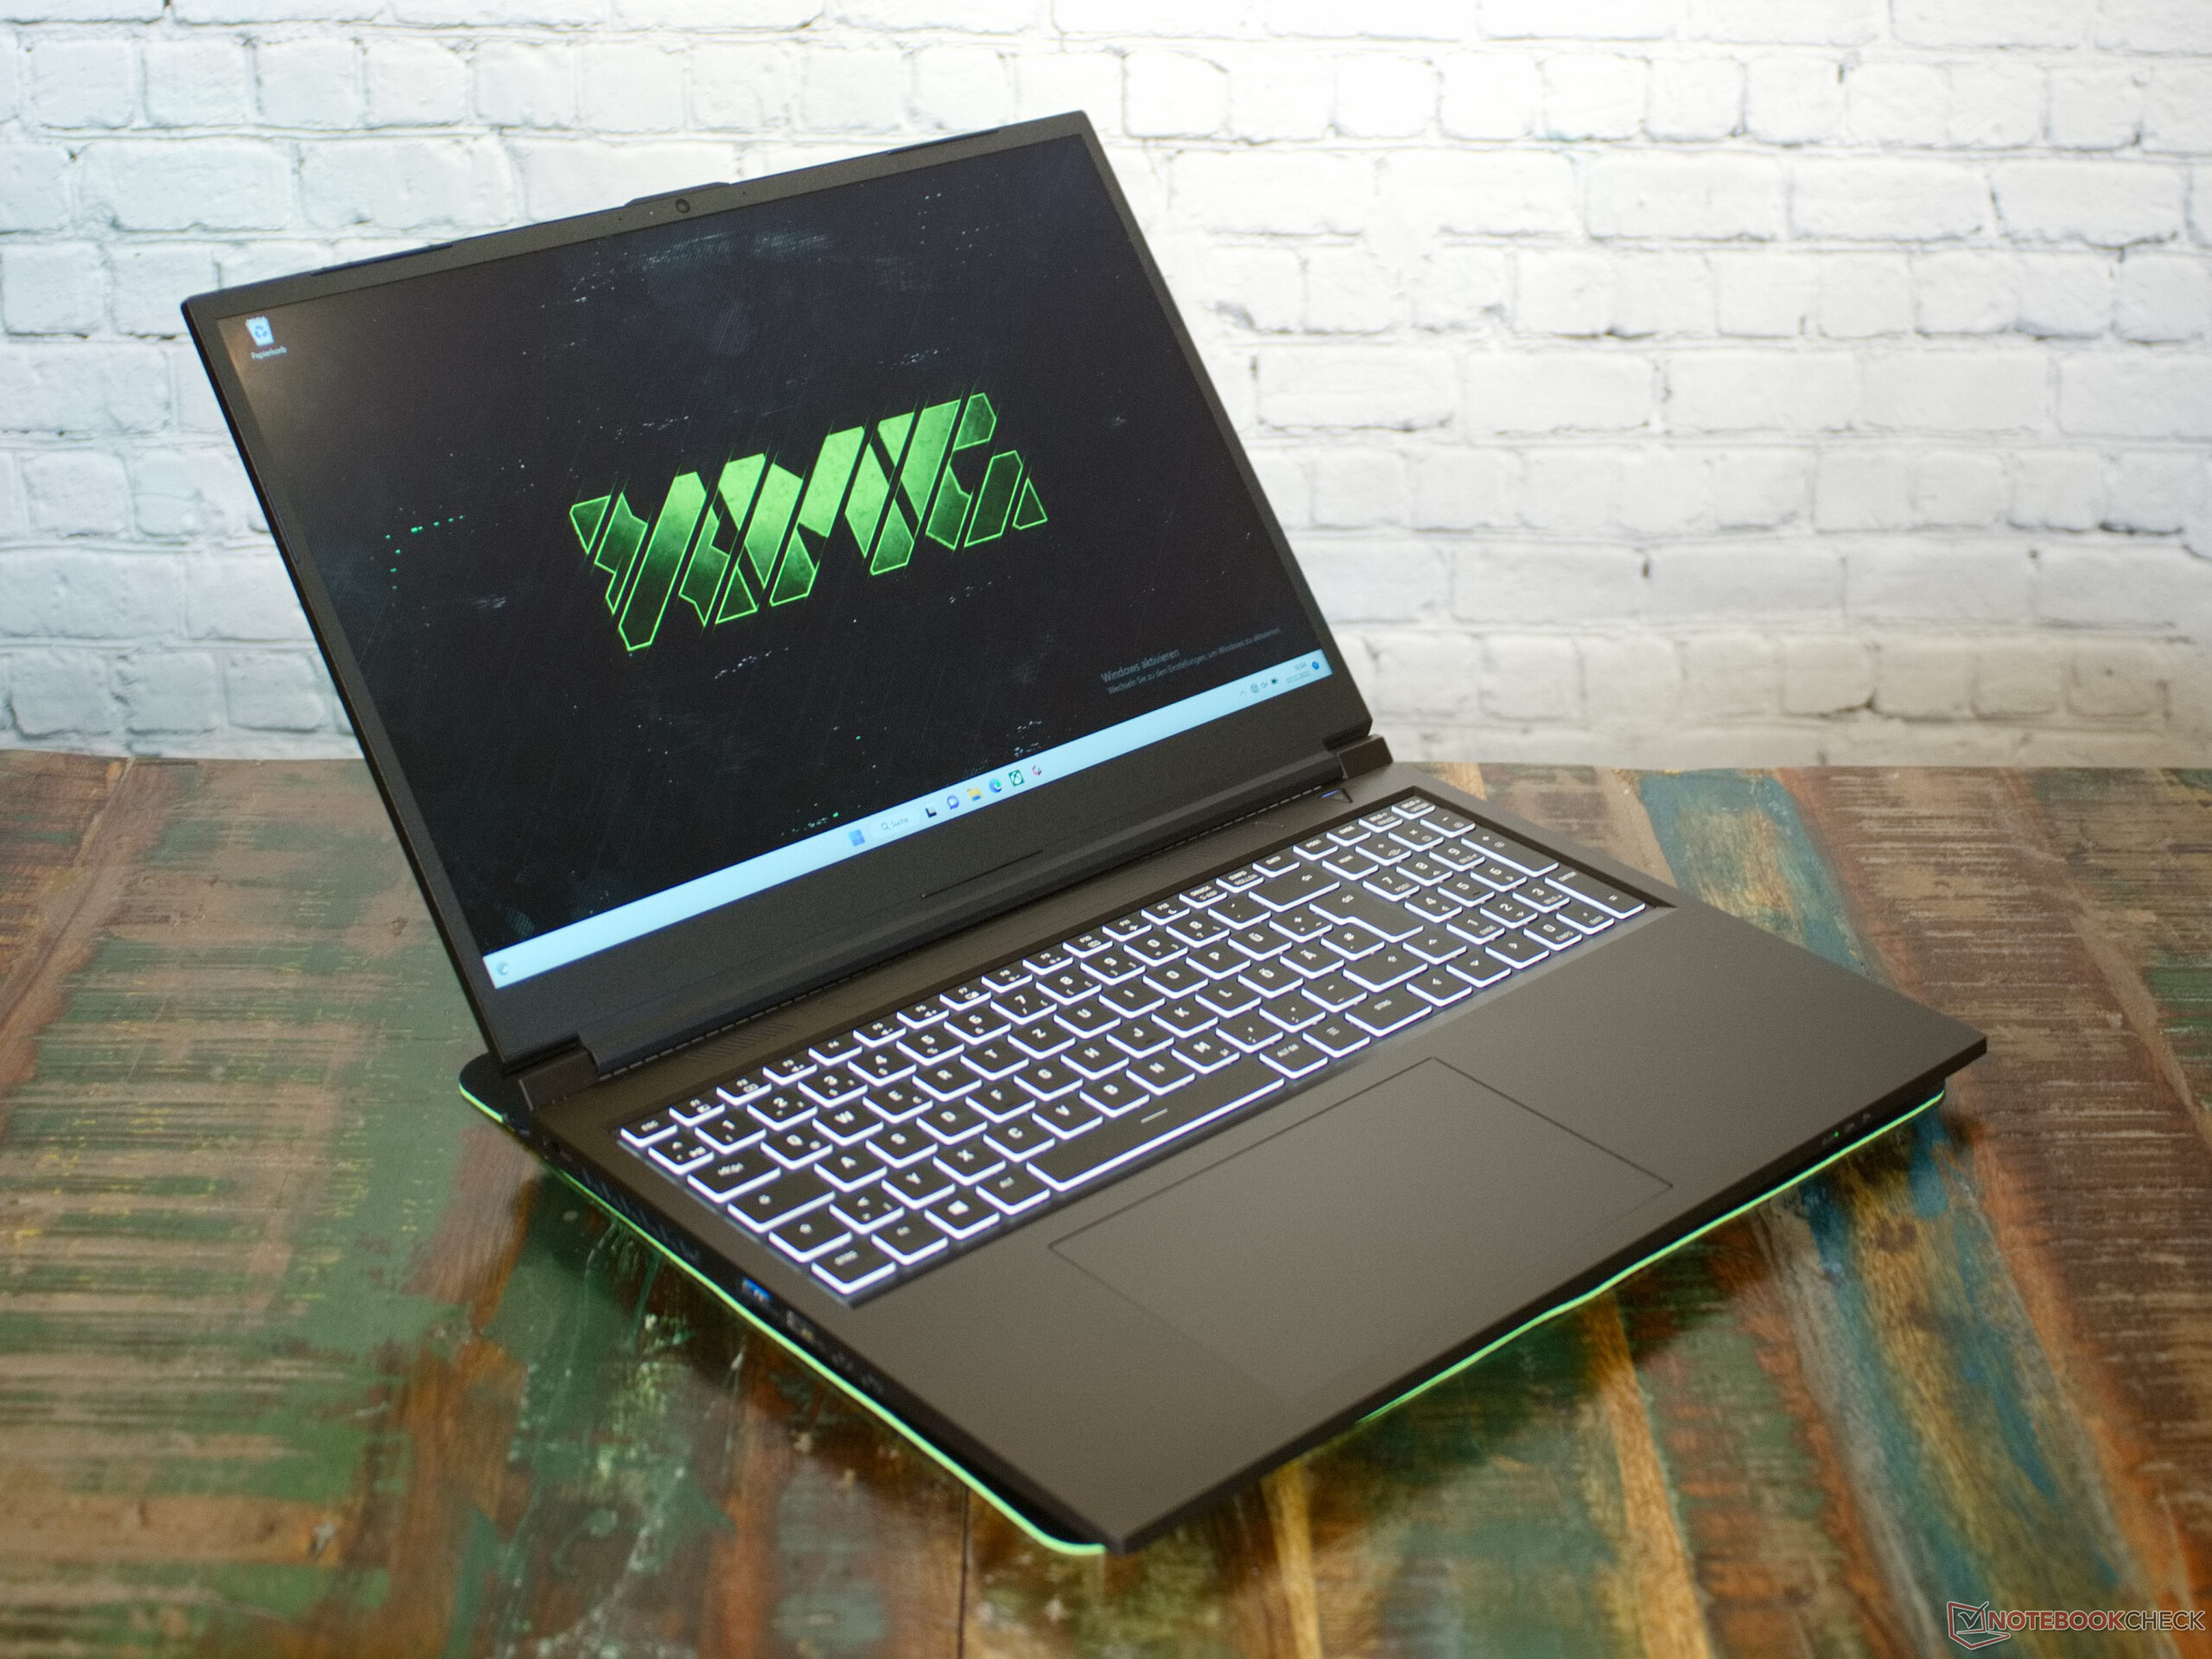
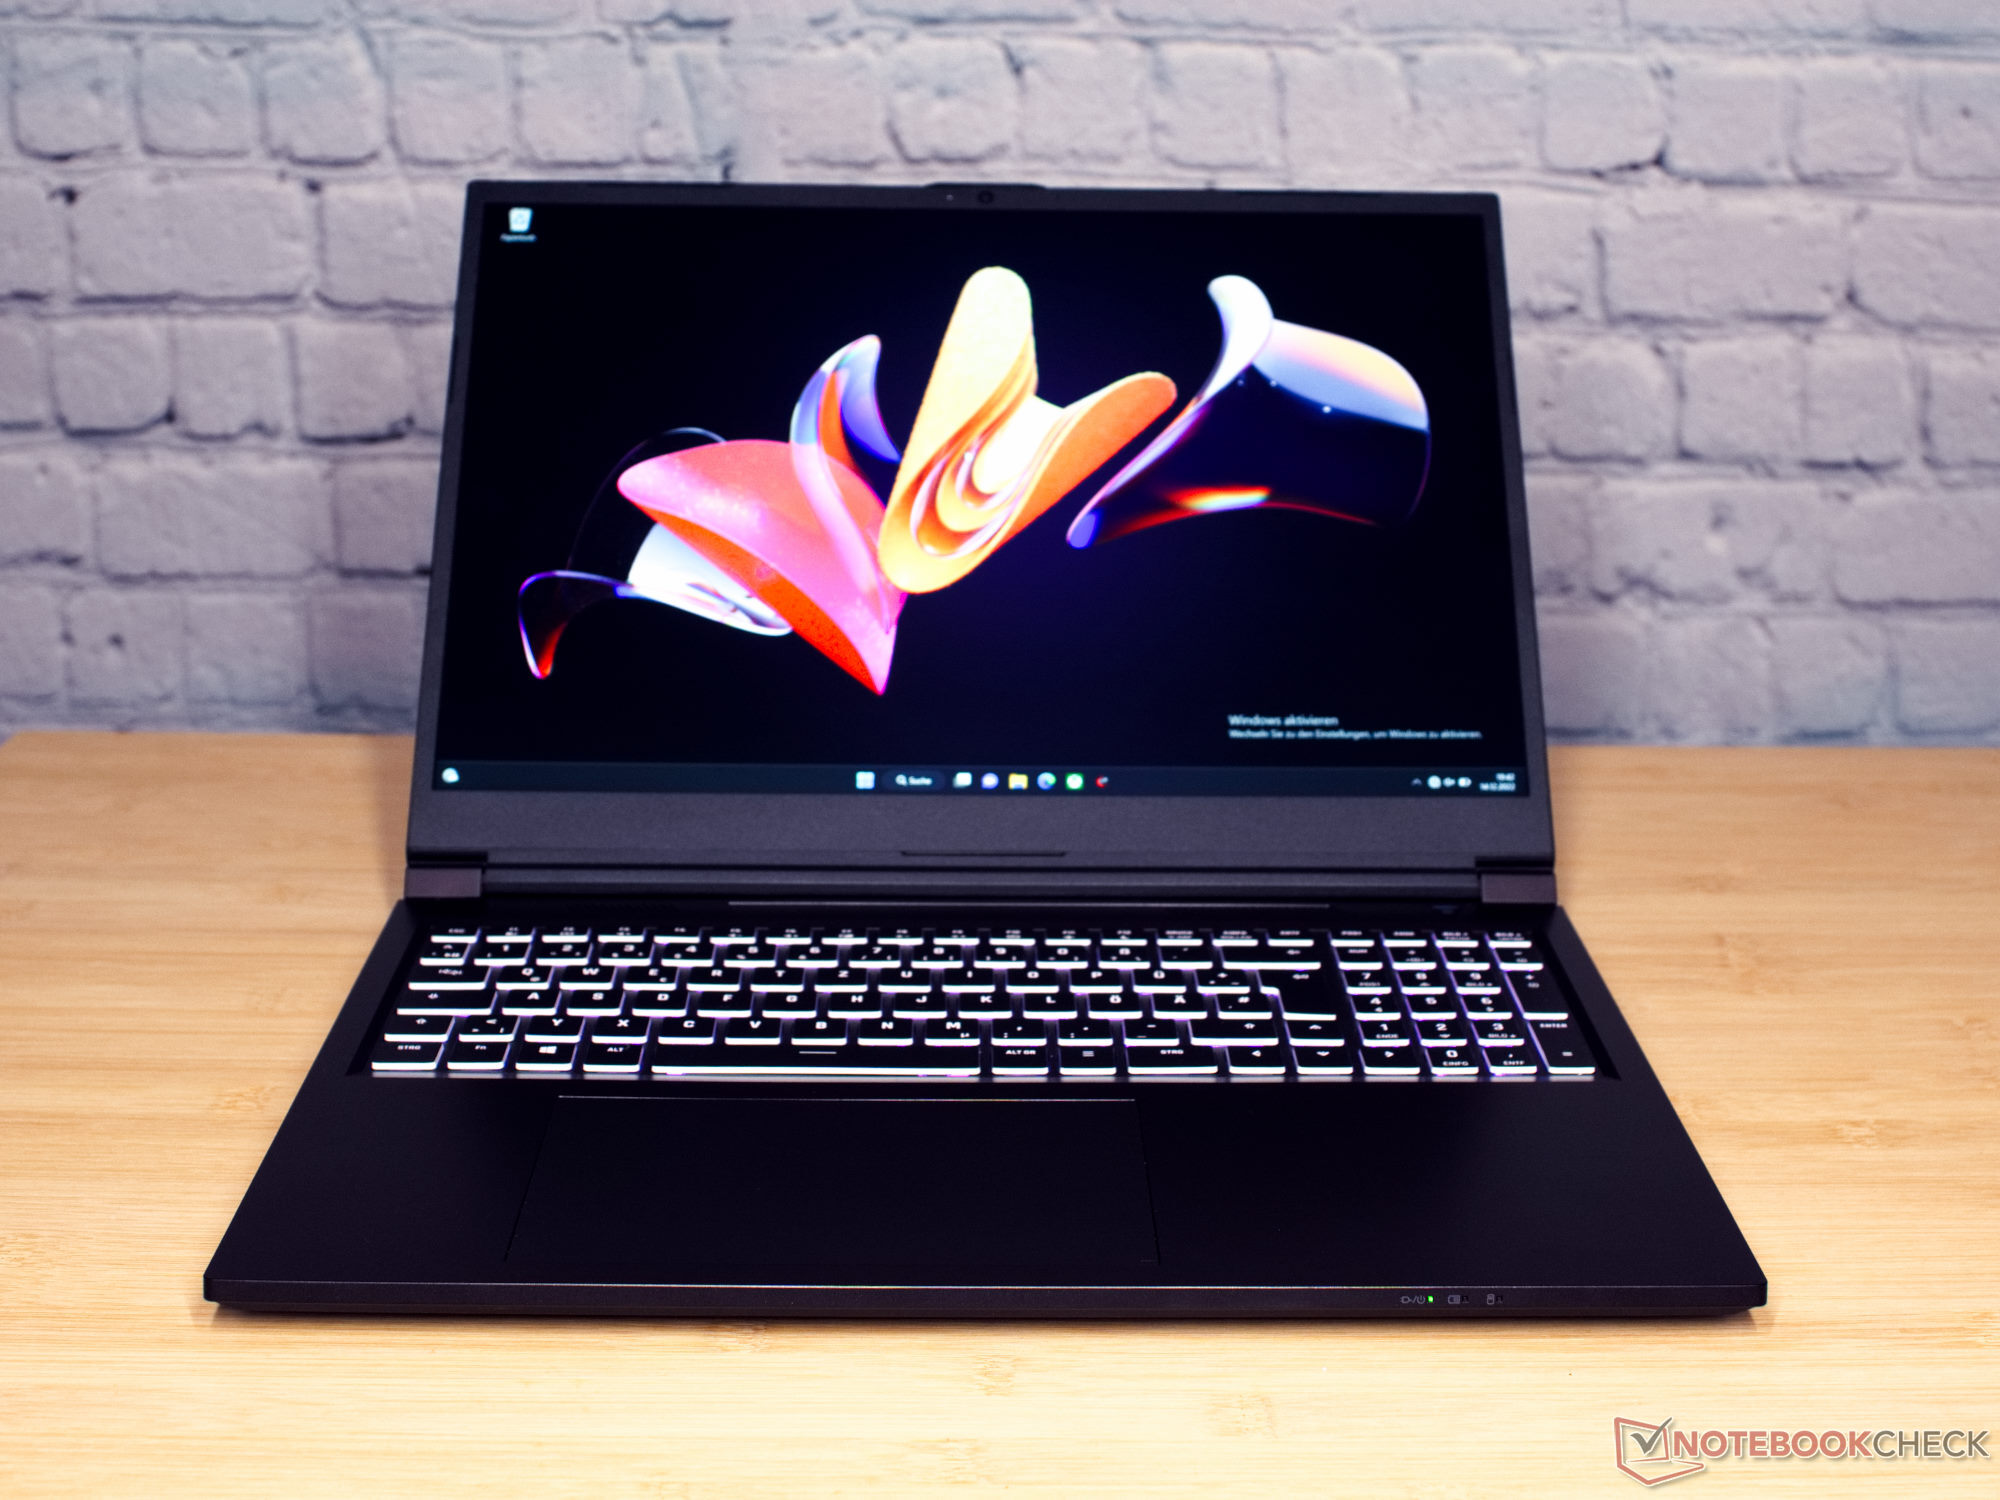
Laserowo drukowane napisy na klawiaturze są łatwe do odczytania dzięki skokowi klawiszy wynoszącemu prawie 2 mm, a także pełnowymiarowym klawiszom strzałek, podświetleniu RGB i klawiaturze numerycznej. Na życzenie Schenker wydrukuje laserowo każdy możliwy układ klawiatury.
Gładzik laptopa, o wymiarach 15 × 9 cm, jest bardzo duży. Wstyd dla Schenkera: w momencie dostawy kabel taśmowy gładzika nie był prawidłowo podłączony, co oznaczało, że początkowo zmagaliśmy się z niereagującym gładzikiem. Po naprawieniu tego błędu urządzenie wejściowe działało na najwyższym poziomie.
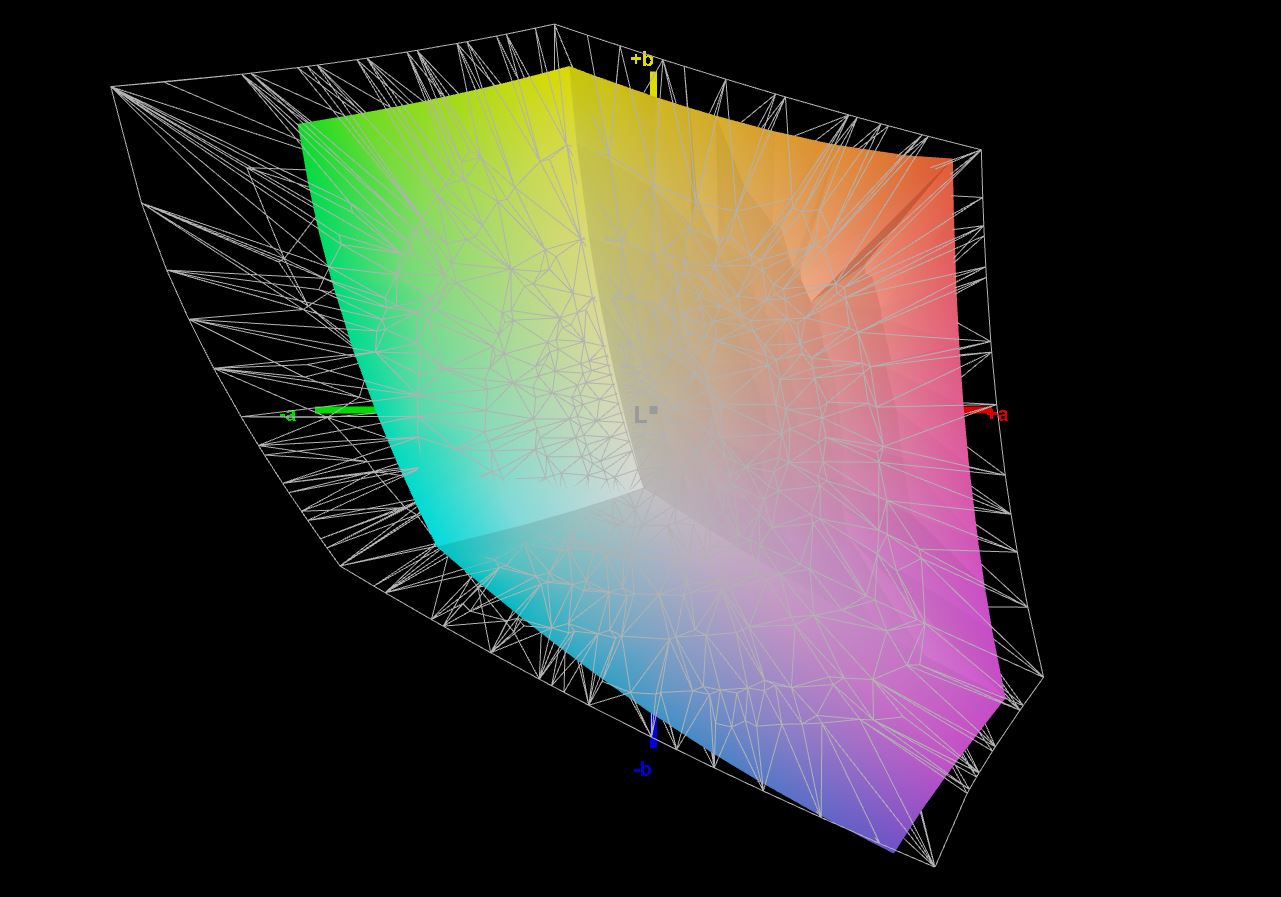
Wyświetlacz - wyświetlacz 16:10 o rozdzielczości QHD+
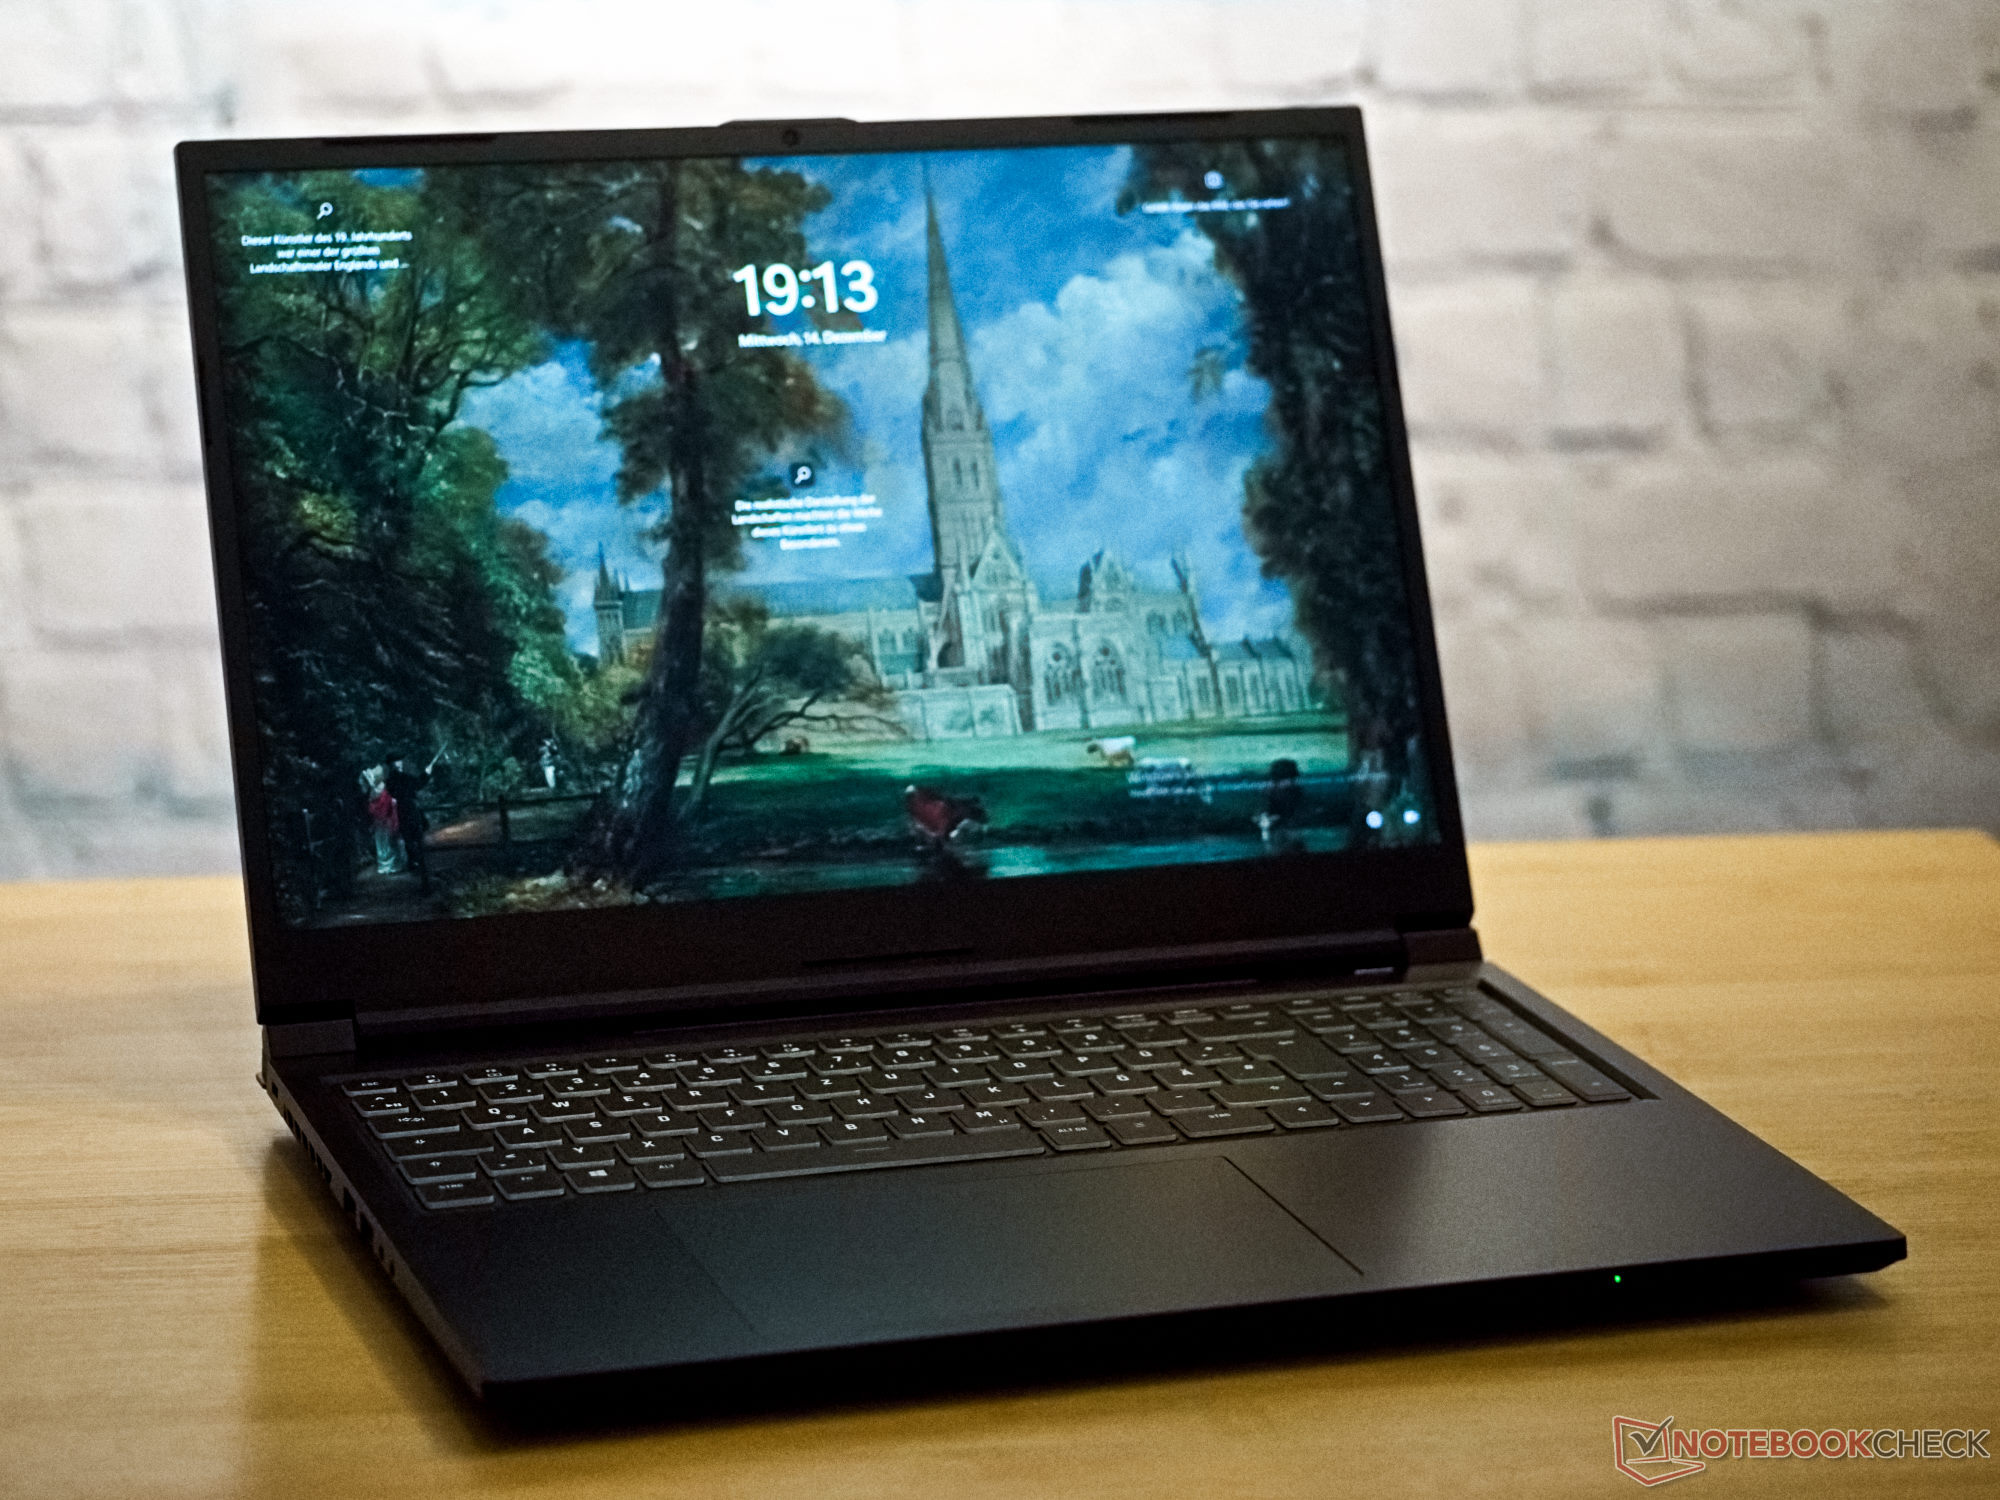
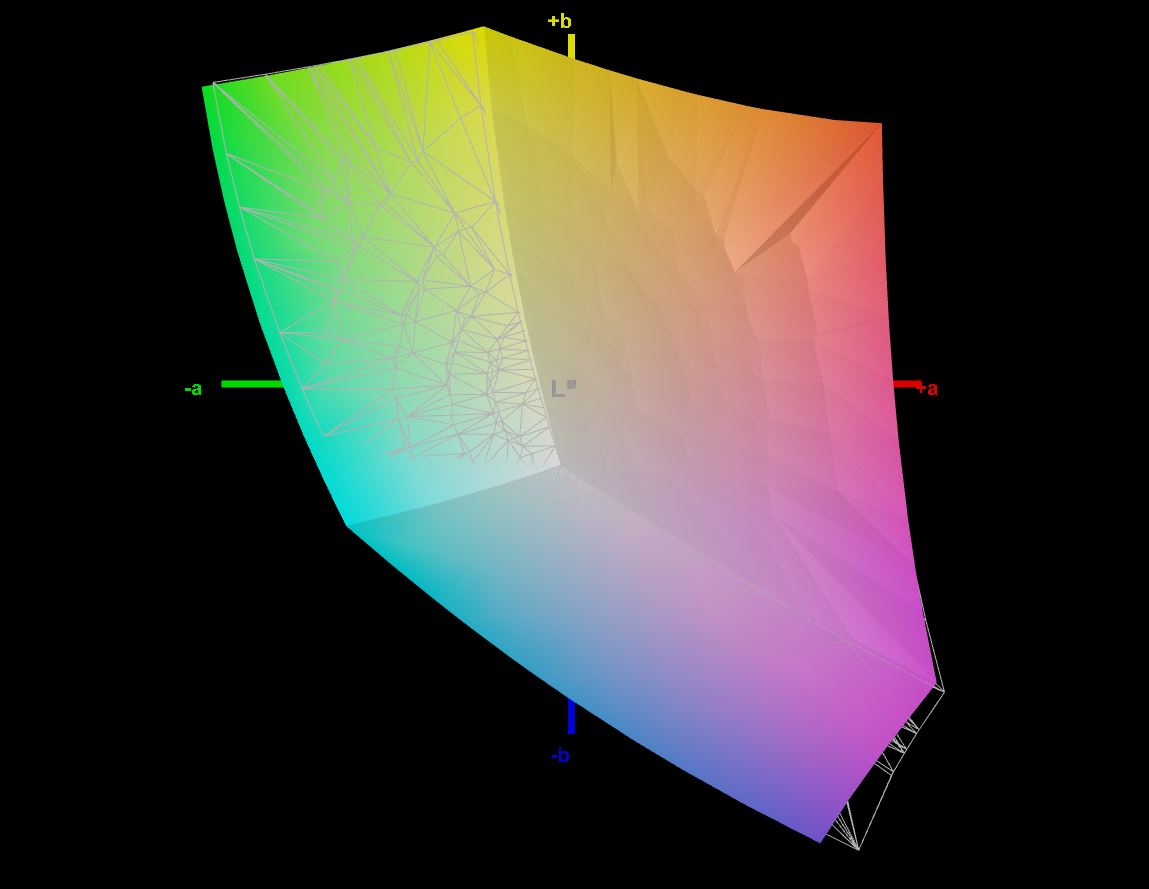
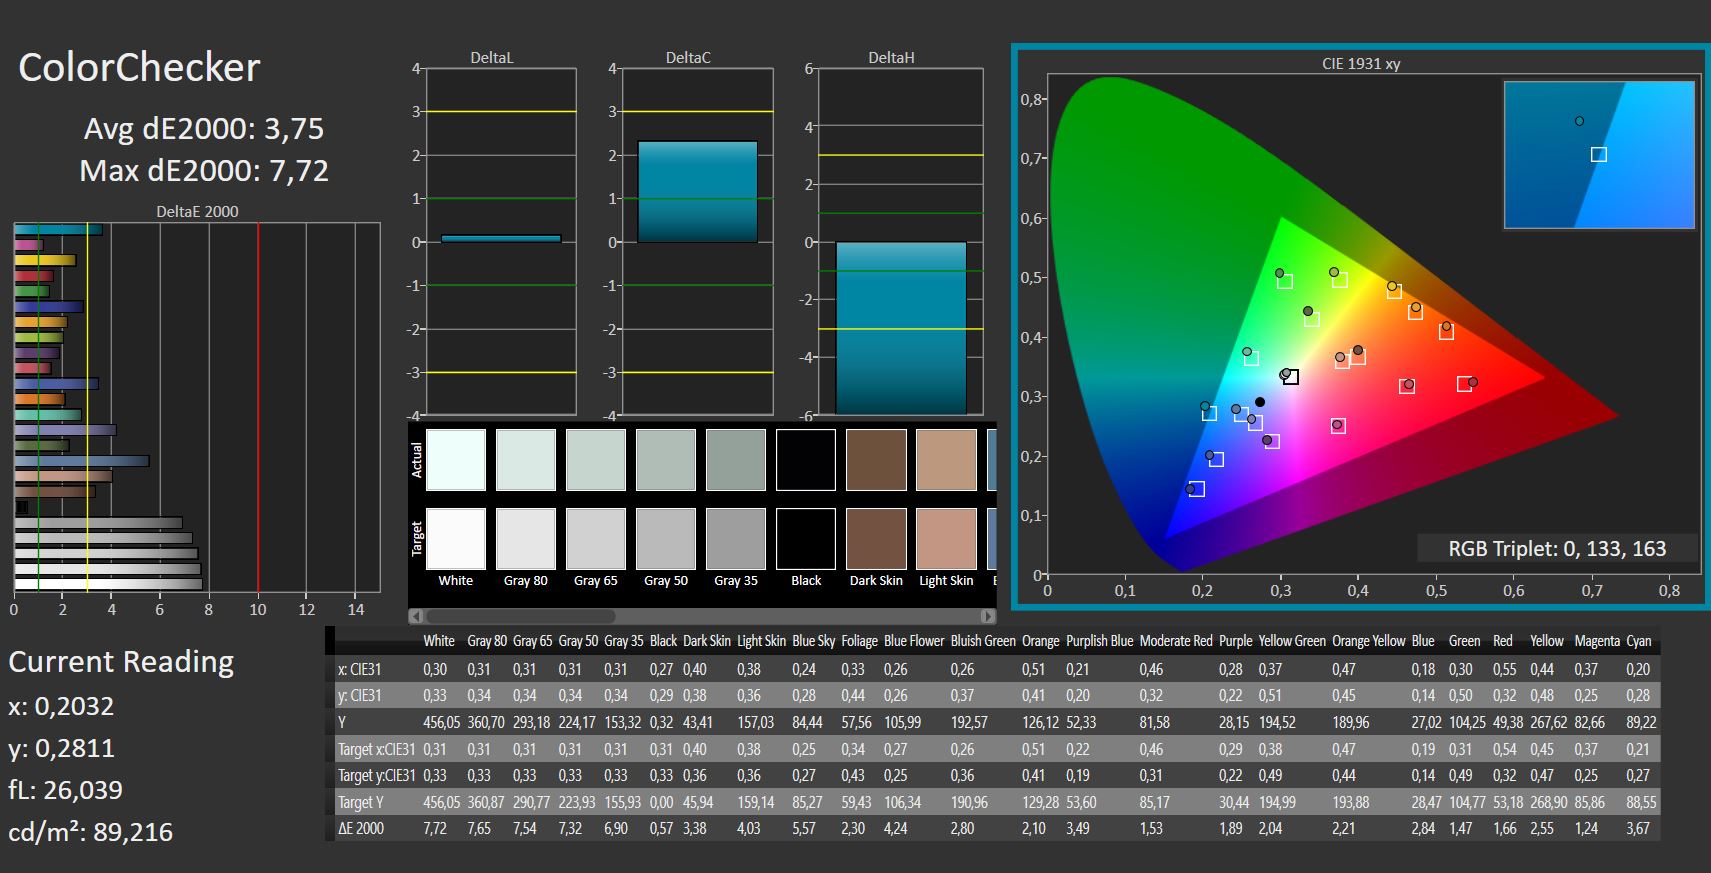
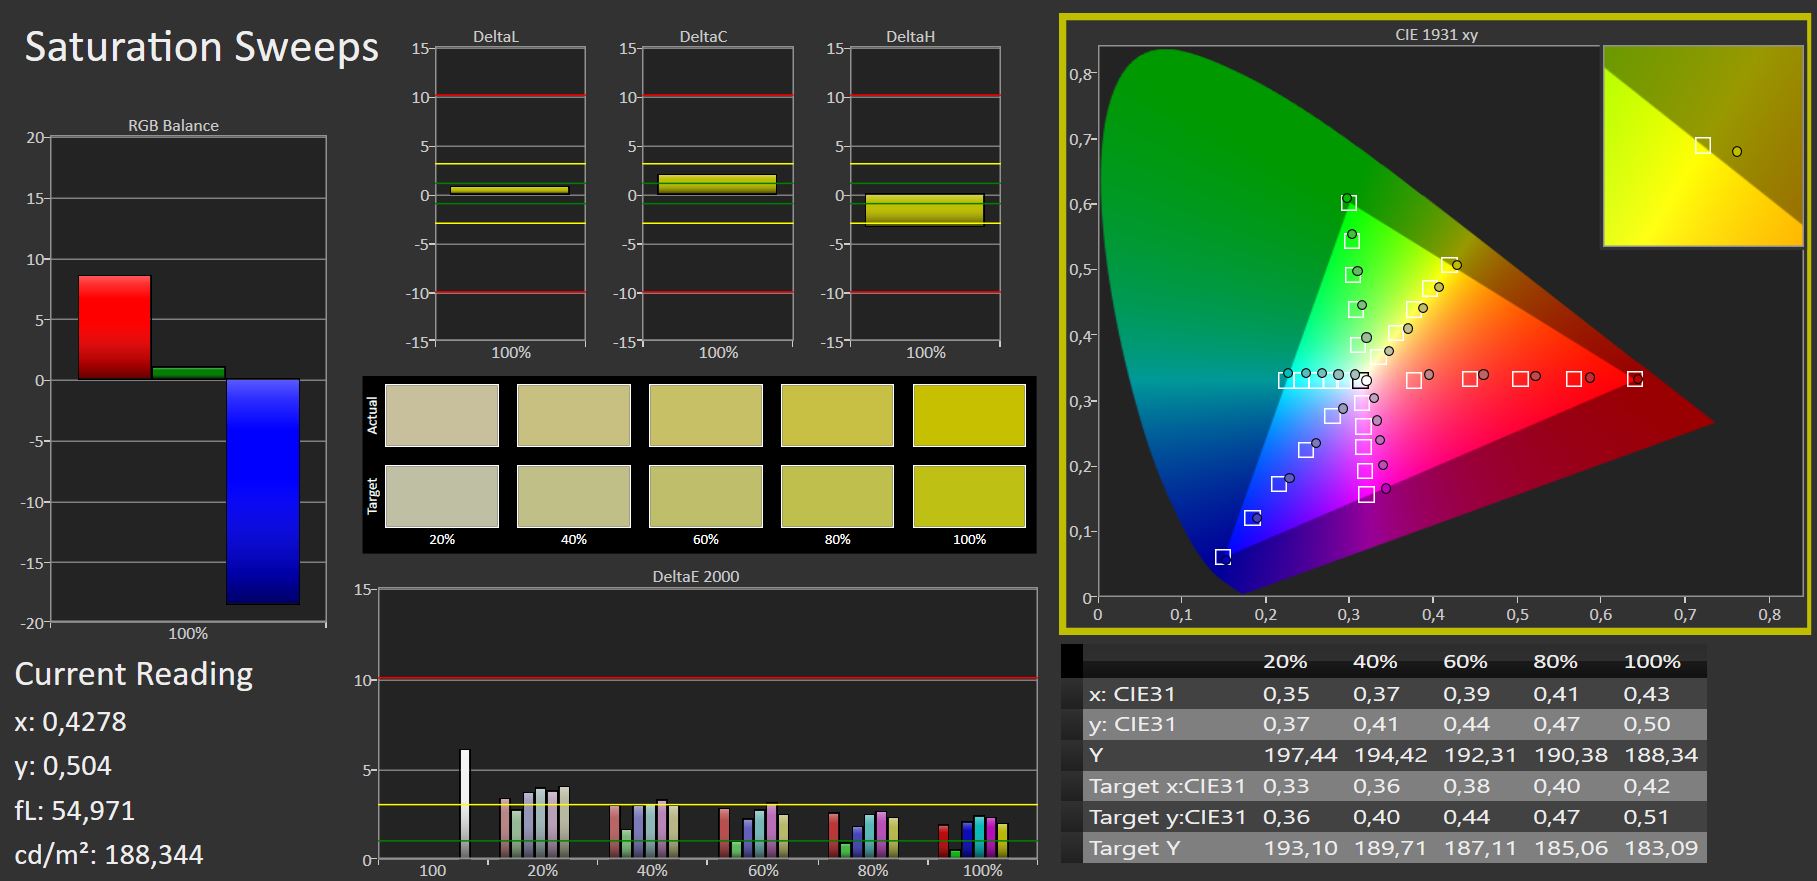
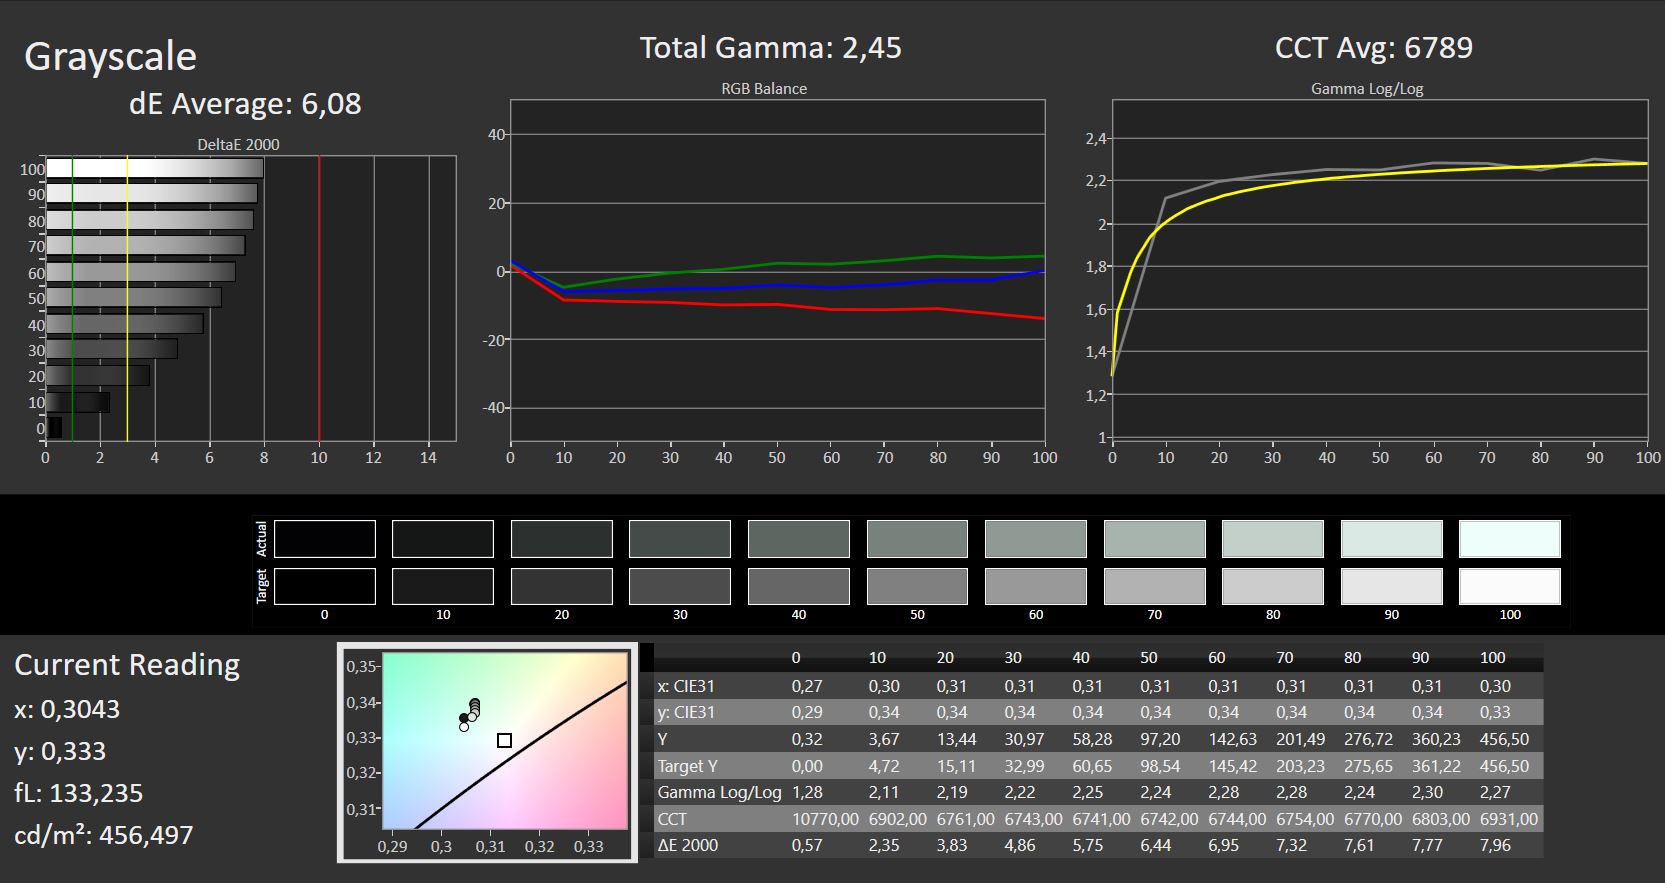
Przy proporcjach 16:10 wyświetlacz XMG Focus 16 nie jest do końca typowy. Choć oferuje on wysoką rozdzielczość 2560 × 1600 pikseli i częstotliwość odświeżania 165 Hz, czas reakcji tego jasnego ekranu o jasności 450 cd/m² nie jest tak niski, jak można by się spodziewać po laptopie do gier. Poziomy kontrastu, pokrycie kolorów, poziomy czerni i podświetlenie można określić jako dobre. Nie udało nam się wykryć żadnego krwawienia światła.
| |||||||||||||||||||||||||
rozświetlenie: 89 %
na akumulatorze: 455 cd/m²
kontrast: 1438:1 (czerń: 0.32 cd/m²)
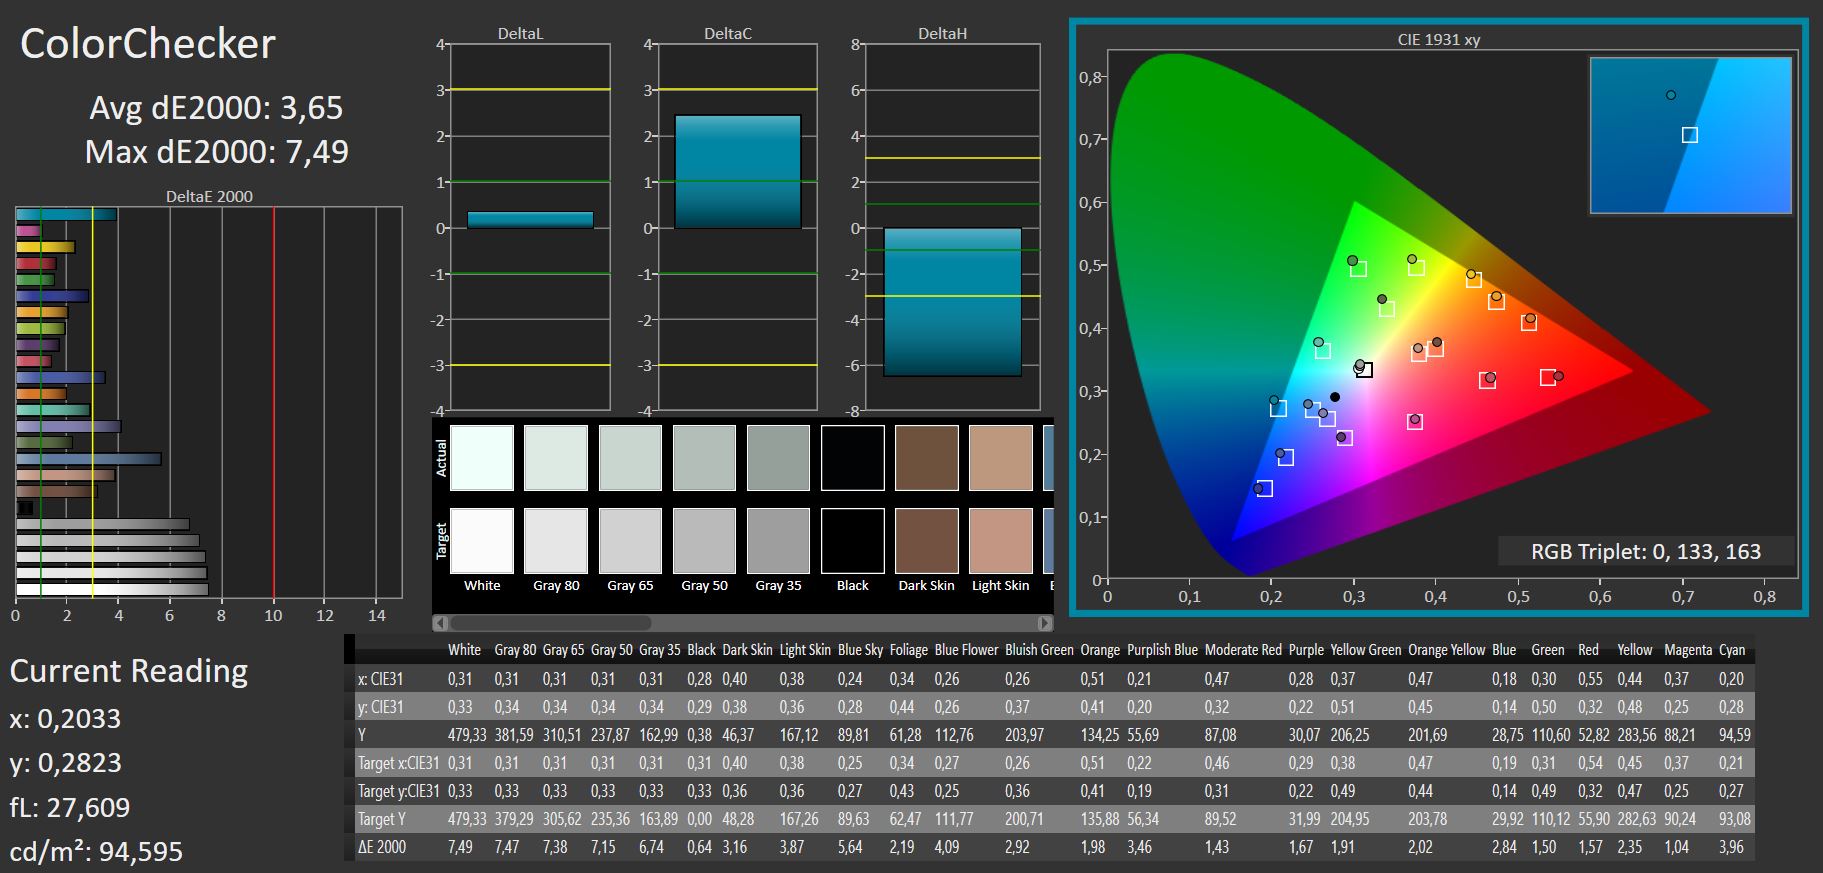
ΔE ColorChecker Calman: 3.65 | ∀{0.5-29.43 Ø4.73}
calibrated: 3.65
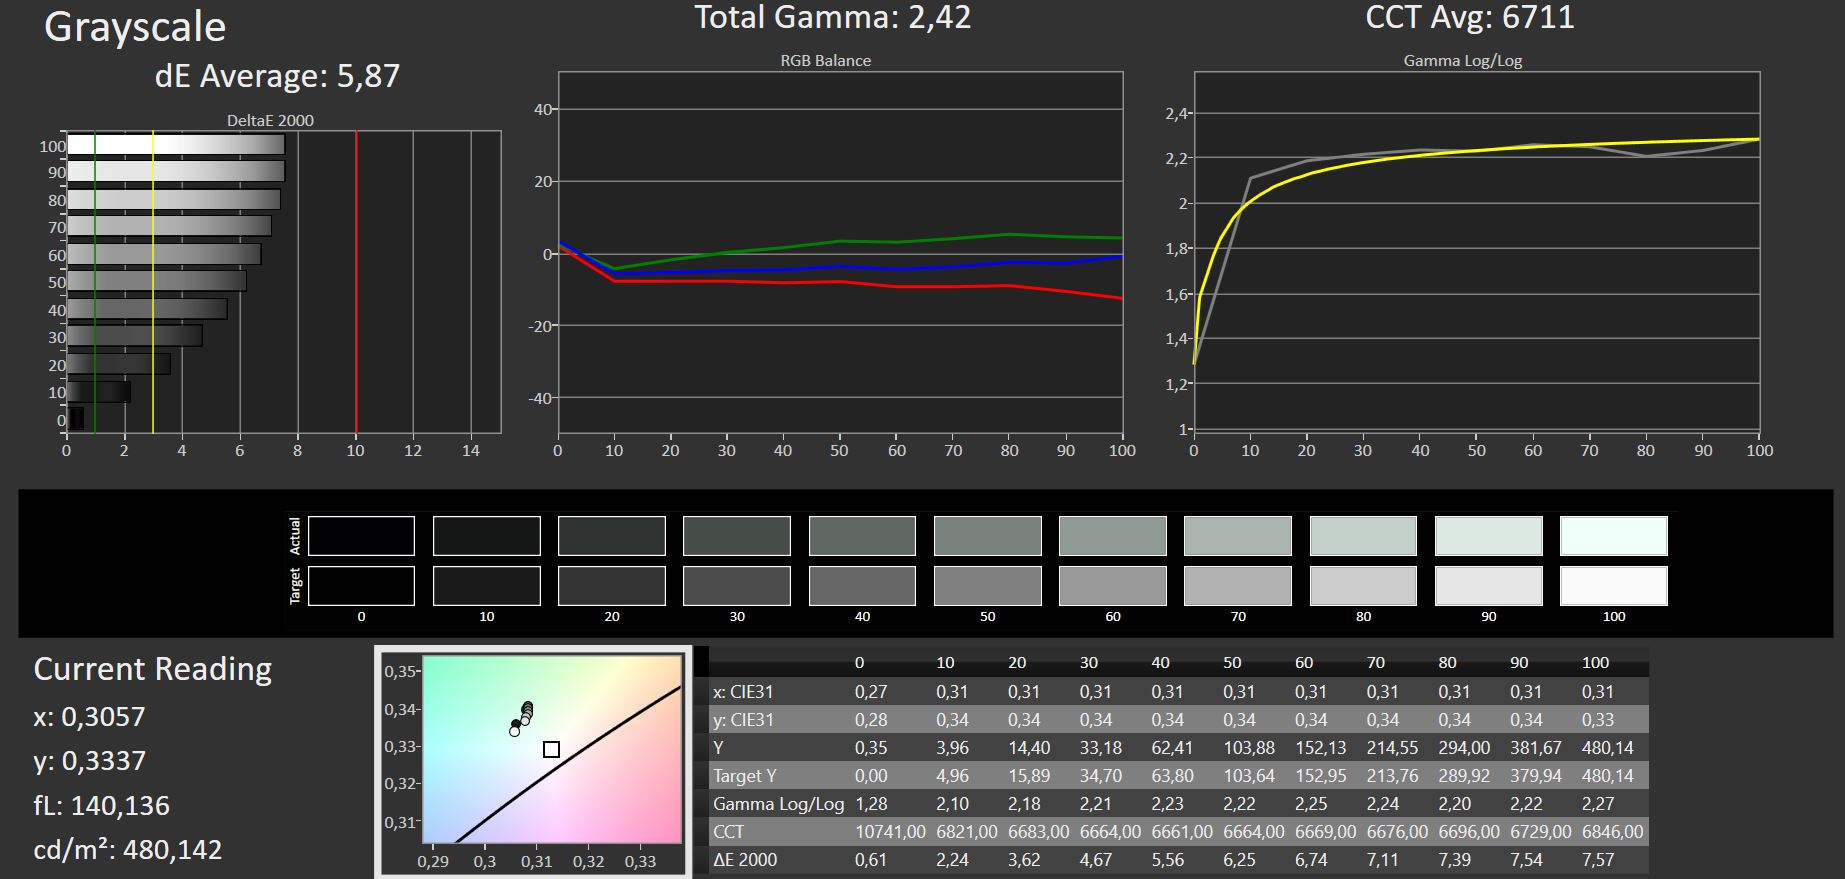
ΔE Greyscale Calman: 5.87 | ∀{0.09-98 Ø4.97}
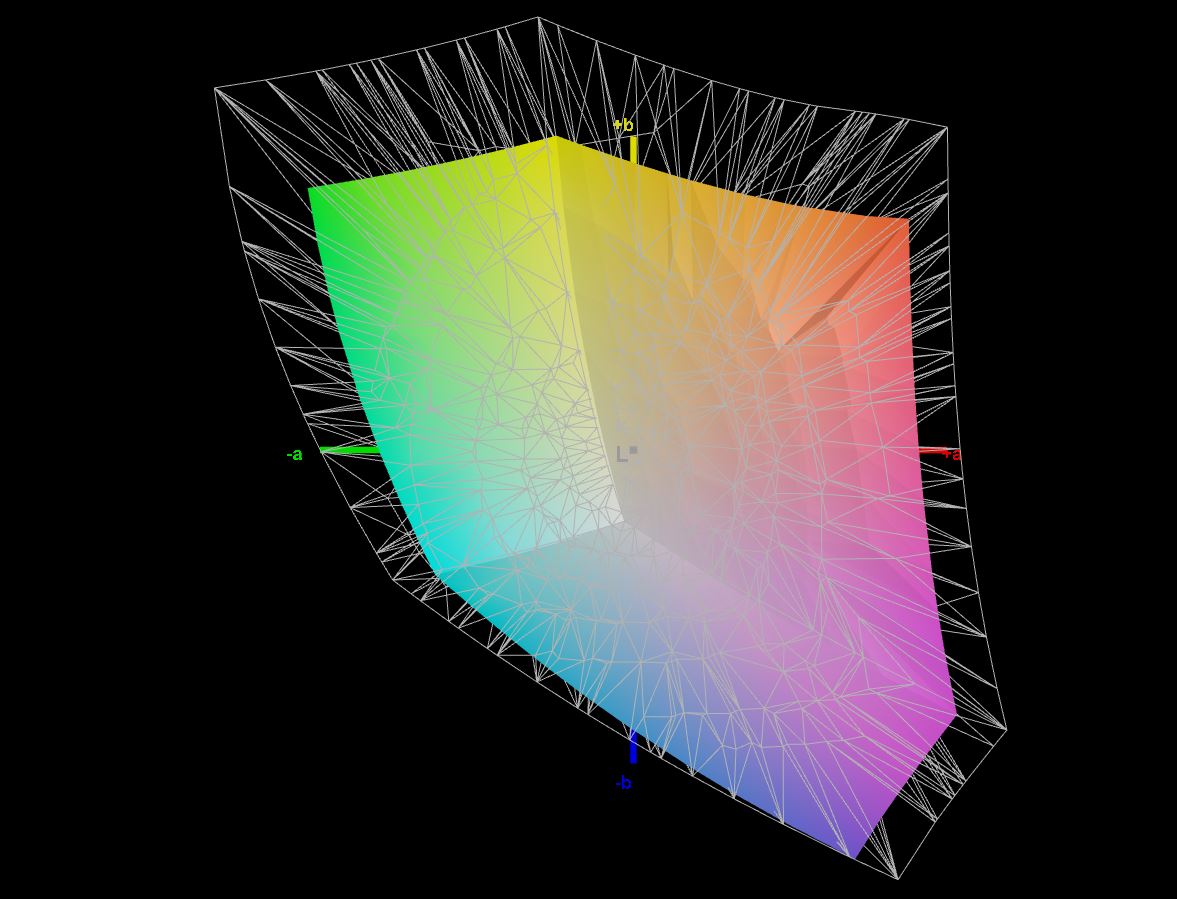
70.6% AdobeRGB 1998 (Argyll 3D)
96.6% sRGB (Argyll 3D)
68.3% Display P3 (Argyll 3D)
Gamma: 2.42
CCT: 6711 K
| Schenker XMG Focus 16 (i7-12700H, RTX 3060) BOE NE16oQDM-NY1, IPS, 2560x1600, 16" | Dell G16 7620 BOE NE16QDM, IPS, 2560x1600, 16" | Asus ZenBook Pro 16X OLED UX7602ZM-ME115W Samsung SDC415D, OLED, 3840x2400, 16" | Asus ROG Flow X16 GV601RW-M5082W AUO B160QAN02.S, Mini LED, 2560x1600, 16.1" | Lenovo ThinkPad X1 Extreme G5-21DE003RGE LP160UQ1-SPB1, IPS, 3840x2400, 16" | Lenovo Legion Slim 7-16IAH 82TF004YGE MNG007DA1-G , IPS LED, 2560x1600, 16" | Lenovo Legion 5 Pro 16IAH7H BOE CCQ_NE160QDM_NY1, IPS, 2560x1600, 16" | |
|---|---|---|---|---|---|---|---|
| Display | 0% | 25% | 26% | 22% | 3% | 1% | |
| Display P3 Coverage (%) | 68.3 | 68.3 0% | 99.84 46% | 99.82 46% | 84.6 24% | 70.5 3% | 68.53 0% |
| sRGB Coverage (%) | 96.6 | 98 1% | 99.99 4% | 99.99 4% | 99.2 3% | 99.1 3% | 98.38 2% |
| AdobeRGB 1998 Coverage (%) | 70.6 | 70.5 0% | 88.9 26% | 90.21 28% | 97.7 38% | 72.8 3% | 70.45 0% |
| Response Times | 26% | 85% | 16% | -129% | 31% | 30% | |
| Response Time Grey 50% / Grey 80% * (ms) | 16.4 ? | 8.6 ? 48% | 2 ? 88% | 11 ? 33% | 46 ? -180% | 12 ? 27% | 14 ? 15% |
| Response Time Black / White * (ms) | 10.8 ? | 10.4 ? 4% | 2 ? 81% | 11 ? -2% | 19.2 ? -78% | 7 ? 35% | 6 ? 44% |
| PWM Frequency (Hz) | 59 ? | 7400 ? | |||||
| Screen | 15% | 21% | 52% | 23% | 19% | 17% | |
| Brightness middle (cd/m²) | 460 | 369.4 -20% | 346 -25% | 498 8% | 476 3% | 523 14% | 515 12% |
| Brightness (cd/m²) | 442 | 348 -21% | 354 -20% | 502 14% | 470 6% | 494 12% | 475 7% |
| Brightness Distribution (%) | 89 | 83 -7% | 96 8% | 94 6% | 90 1% | 90 1% | 85 -4% |
| Black Level * (cd/m²) | 0.32 | 0.32 -0% | 0.11 66% | 0.35 -9% | 0.4 -25% | 0.45 -41% | |
| Contrast (:1) | 1438 | 1154 -20% | 4527 215% | 1360 -5% | 1308 -9% | 1144 -20% | |
| Colorchecker dE 2000 * | 3.65 | 1.78 51% | 2.28 38% | 1.87 49% | 1.9 48% | 2.6 29% | 2.38 35% |
| Colorchecker dE 2000 max. * | 7.49 | 4.41 41% | 4.94 34% | 6.15 18% | 4.7 37% | 5 33% | 4.37 42% |
| Colorchecker dE 2000 calibrated * | 3.65 | 1.22 67% | 2.16 41% | 1.94 47% | 1.3 64% | 1 73% | 1.1 70% |
| Greyscale dE 2000 * | 5.87 | 3.2 45% | 1.64 72% | 3.15 46% | 2.4 59% | 3.3 44% | 2.71 54% |
| Gamma | 2.42 91% | 2.2 100% | 2.37 93% | 330.95 1% | 2.24 98% | 2.17 101% | 2.49 88% |
| CCT | 6711 97% | 6750 96% | 6384 102% | 7294 89% | 6377 102% | 6013 108% | 6117 106% |
| Całkowita średnia (program / ustawienia) | 14% /
14% | 44% /
33% | 31% /
41% | -28% /
1% | 18% /
17% | 16% /
15% |
* ... im mniej tym lepiej
Wyświetlacz laptopa do gier Schenker pokrywa 95 % przestrzeni sRGB, a AdobeRGB i DisplayP3 - około 70 %. Odwzorowanie kolorów jest dobre, jeśli nie do końca idealne. Pożądana byłaby wartość ΔΕ poniżej 3, a Focus 16 uzyskał średnią ΔΕ na poziomie 3,65. Tak więc, odchylenia kolorów od normy są akceptowalne. Nasz profil ICC nie spowodował żadnej poprawy w reprodukcji kolorów.

Wyświetl czasy reakcji
| ↔ Czas reakcji od czerni do bieli | ||
|---|---|---|
| 10.8 ms ... wzrost ↗ i spadek ↘ łącznie | ↗ 5 ms wzrost | 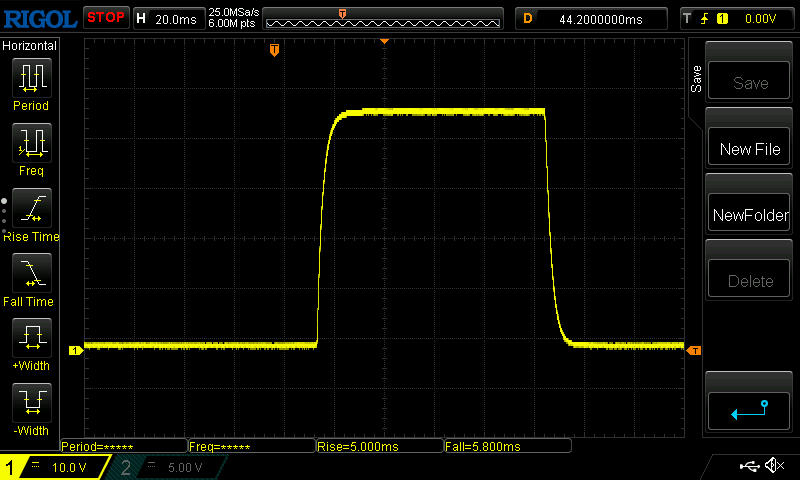 |
| ↘ 5.8 ms upadek | ||
| W naszych testach ekran wykazuje dobry współczynnik reakcji, ale może być zbyt wolny dla graczy rywalizujących ze sobą. Dla porównania, wszystkie testowane urządzenia wahają się od 0.1 (minimum) do 240 (maksimum) ms. » 29 % wszystkich urządzeń jest lepszych. Oznacza to, że zmierzony czas reakcji jest lepszy od średniej wszystkich testowanych urządzeń (19.9 ms). | ||
| ↔ Czas reakcji 50% szarości do 80% szarości | ||
| 16.4 ms ... wzrost ↗ i spadek ↘ łącznie | ↗ 7.4 ms wzrost | 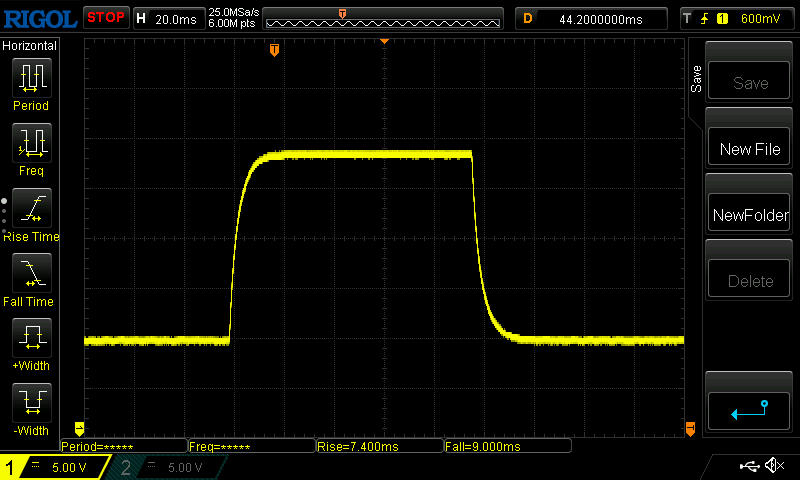 |
| ↘ 9 ms upadek | ||
| W naszych testach ekran wykazuje dobry współczynnik reakcji, ale może być zbyt wolny dla graczy rywalizujących ze sobą. Dla porównania, wszystkie testowane urządzenia wahają się od 0.165 (minimum) do 636 (maksimum) ms. » 30 % wszystkich urządzeń jest lepszych. Oznacza to, że zmierzony czas reakcji jest lepszy od średniej wszystkich testowanych urządzeń (31.1 ms). | ||
Migotanie ekranu / PWM (modulacja szerokości impulsu)
| Migotanie ekranu/nie wykryto PWM | 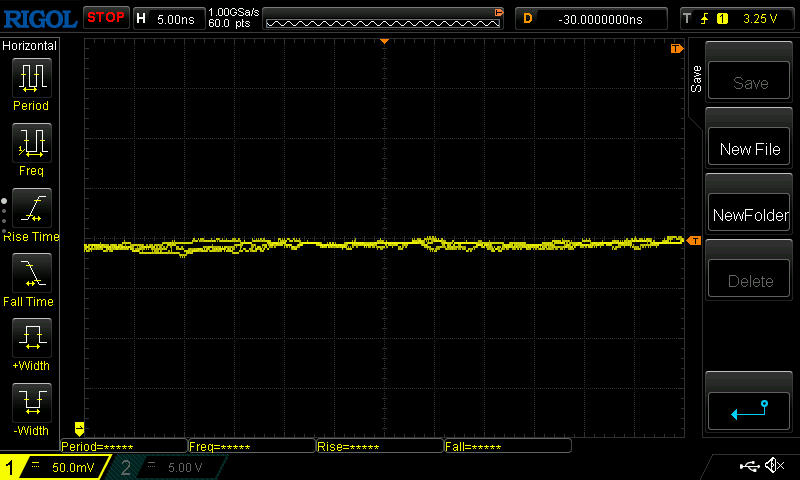 | ||
Dla porównania: 52 % wszystkich testowanych urządzeń nie używa PWM do przyciemniania wyświetlacza. Jeśli wykryto PWM, zmierzono średnio 7798 (minimum: 5 - maksimum: 343500) Hz. | |||
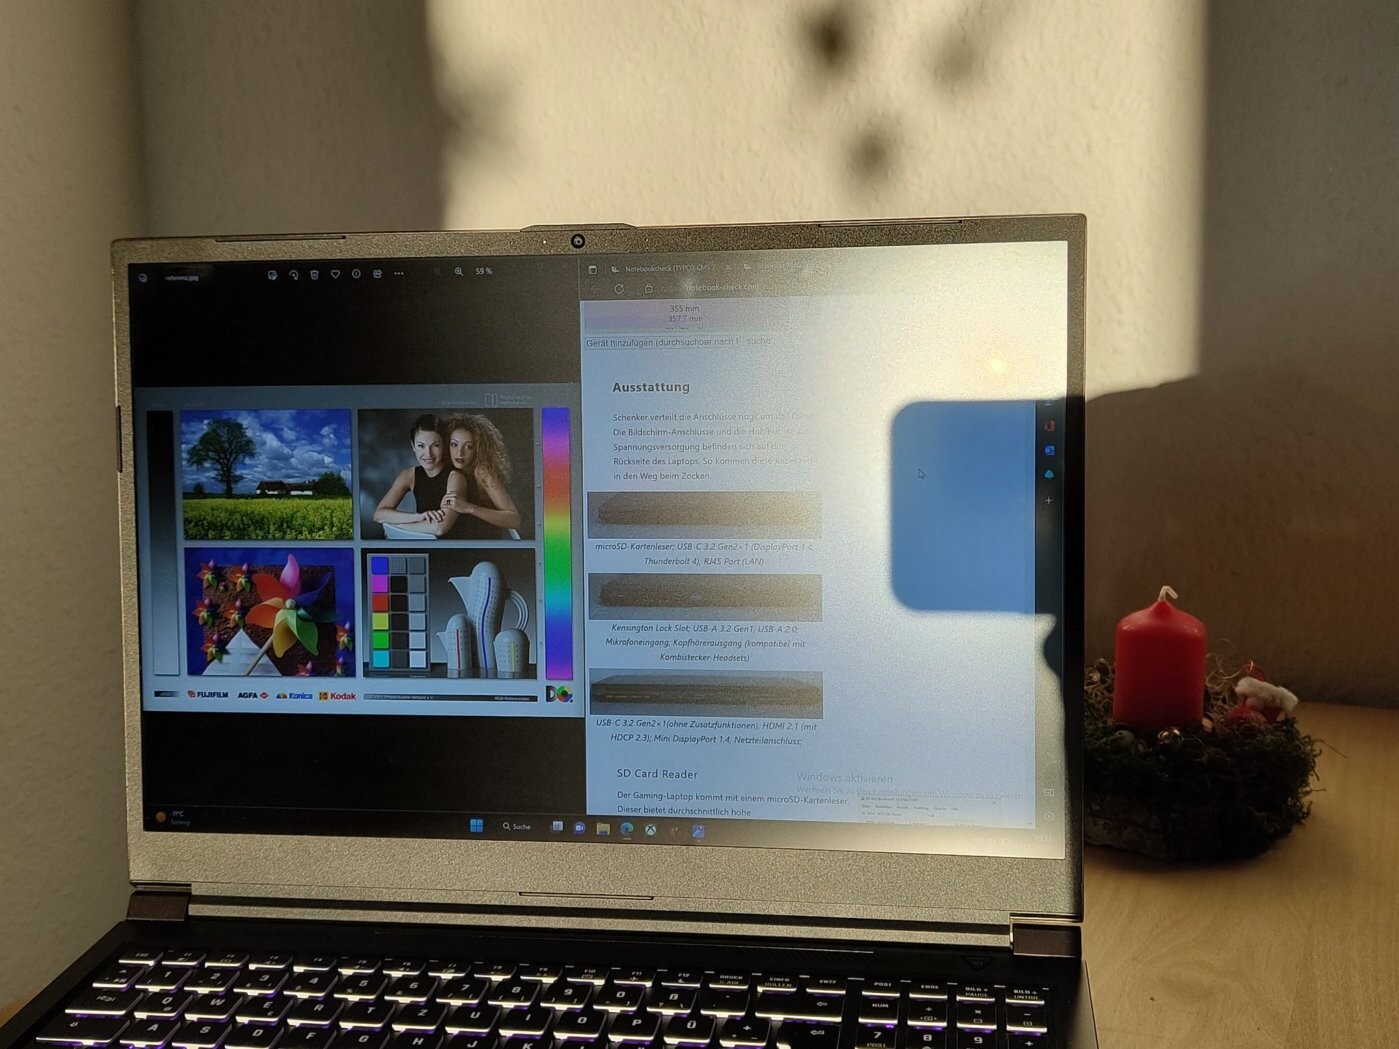
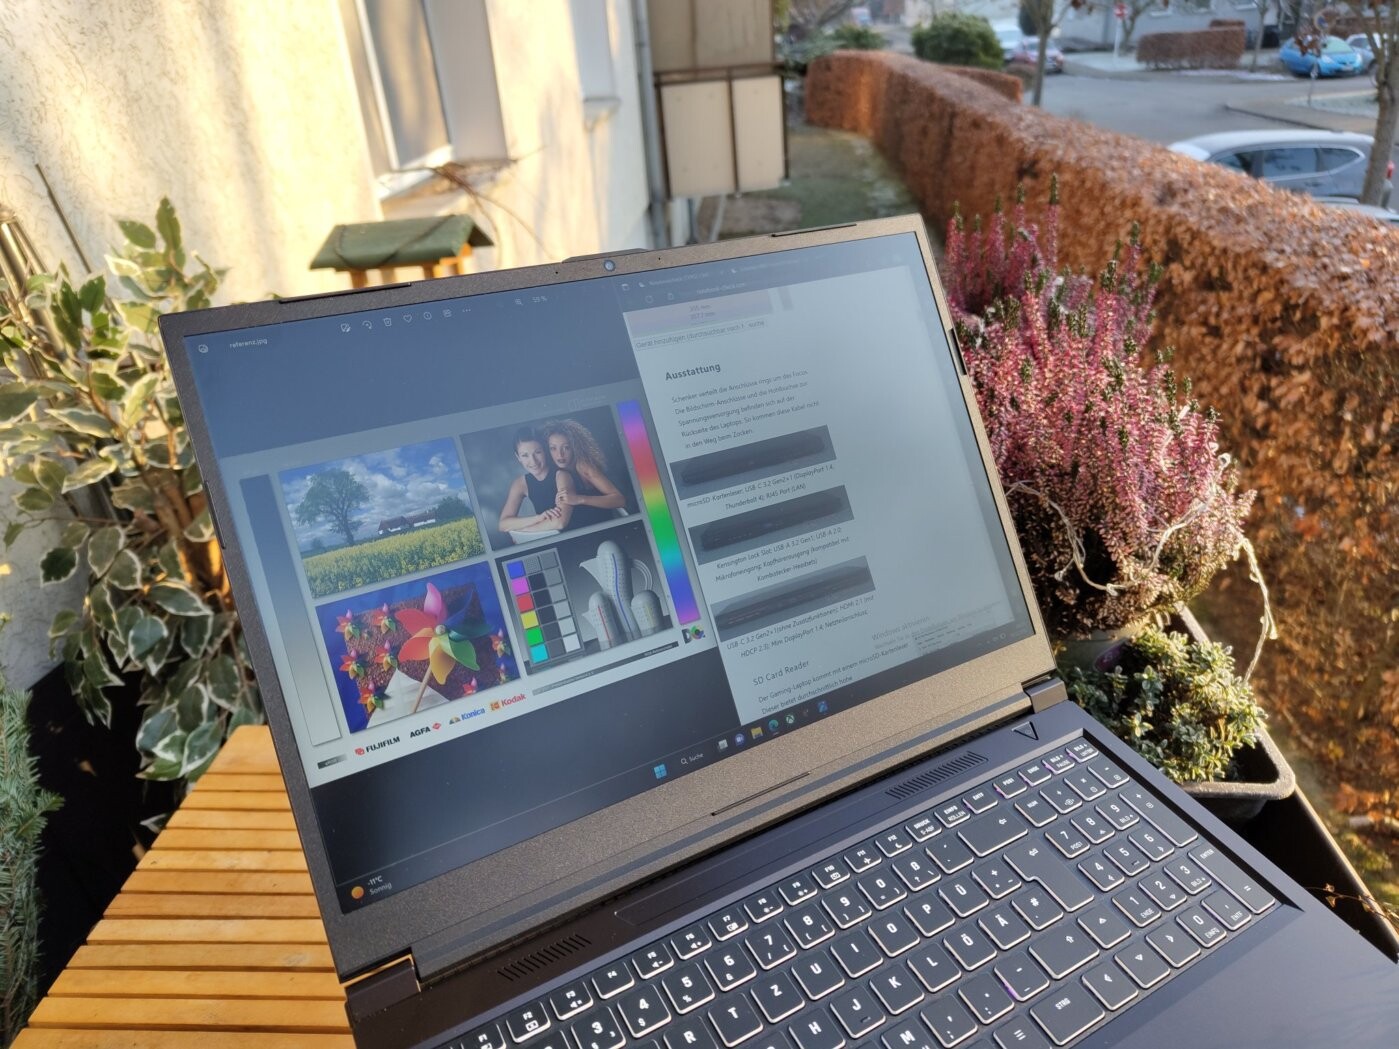
Niemigoczący panel IPS sprawiał dobre wrażenie zarówno podczas użytkowania na zewnątrz, jak i podczas patrzenia pod różnymi kątami. Dopiero gdy słońce padło na matowy wyświetlacz pod niekorzystnym kątem, napotkaliśmy trudności z czytelnością.

Wydajność - trochę powyżej średniej
Podobnie jak wszystkie laptopy Schenkera, XMG Focus 16 jest również bardzo konfigurowalny. Dlatego też istnieje możliwość wyboru pamięci RAM, różnych dysków twardych i innych opcji w XMG Focus 16konfigurator. Obecnie nie ma możliwości wyboru różnych procesorów i układów graficznych. Wszystkie urządzenia XMG Focus 16 wyposażone są w.Intel Core i7-12700HorazNvidia GeForce RTX 3060. Dodatkowo nasze urządzenie recenzenckie było wyposażone w 2×16GB DDR4 RAM i 1TB Samsung NVMe SSD.
Wszystko to oznacza, że mamy laptop, który powinien poradzić sobie z większością współczesnych gier. RTX 3060 nie zawsze jednak udaje się dobić do ponad 60 klatek na sekundę w najwyższych ustawieniach graficznych i w natywnej rozdzielczości urządzenia.
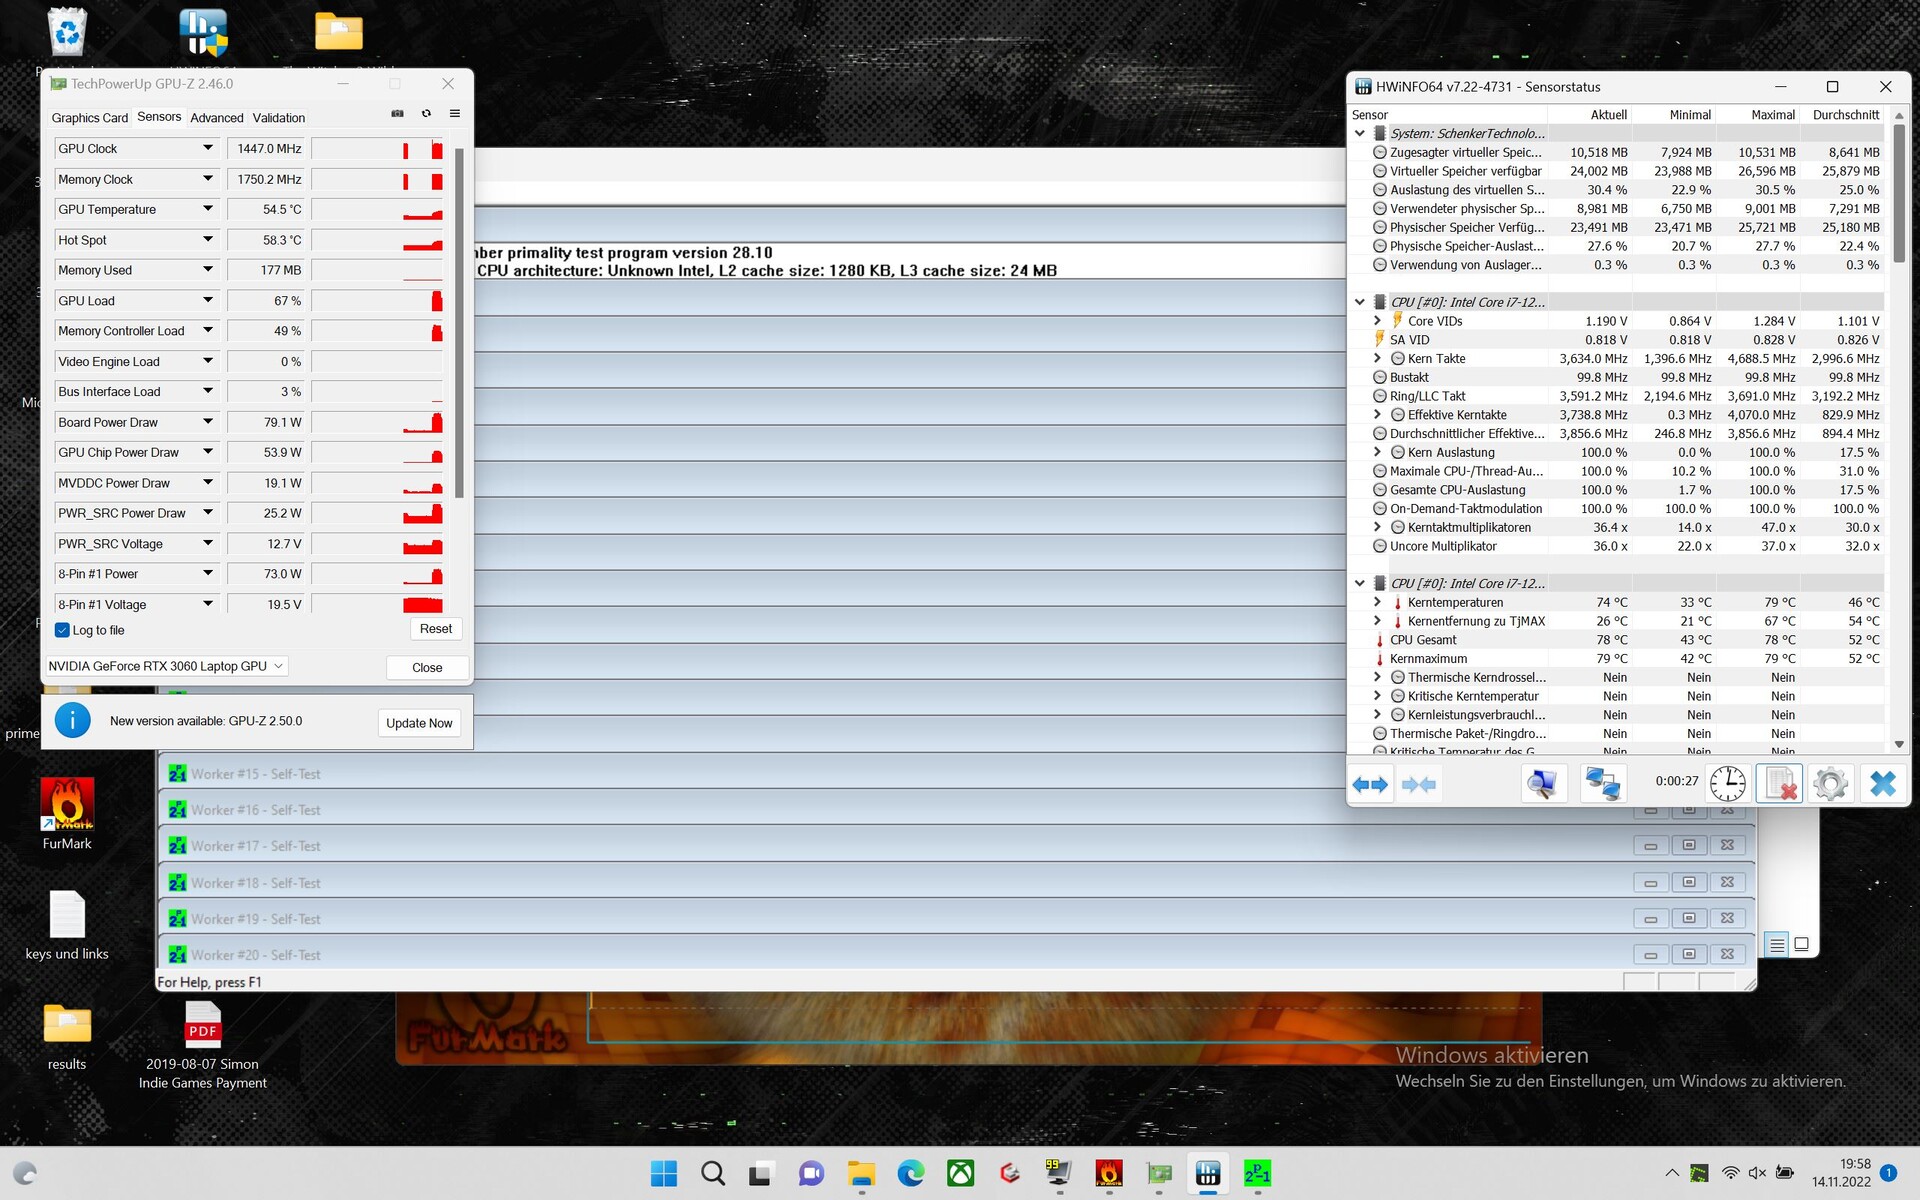
Kontrola działania i warunki badania
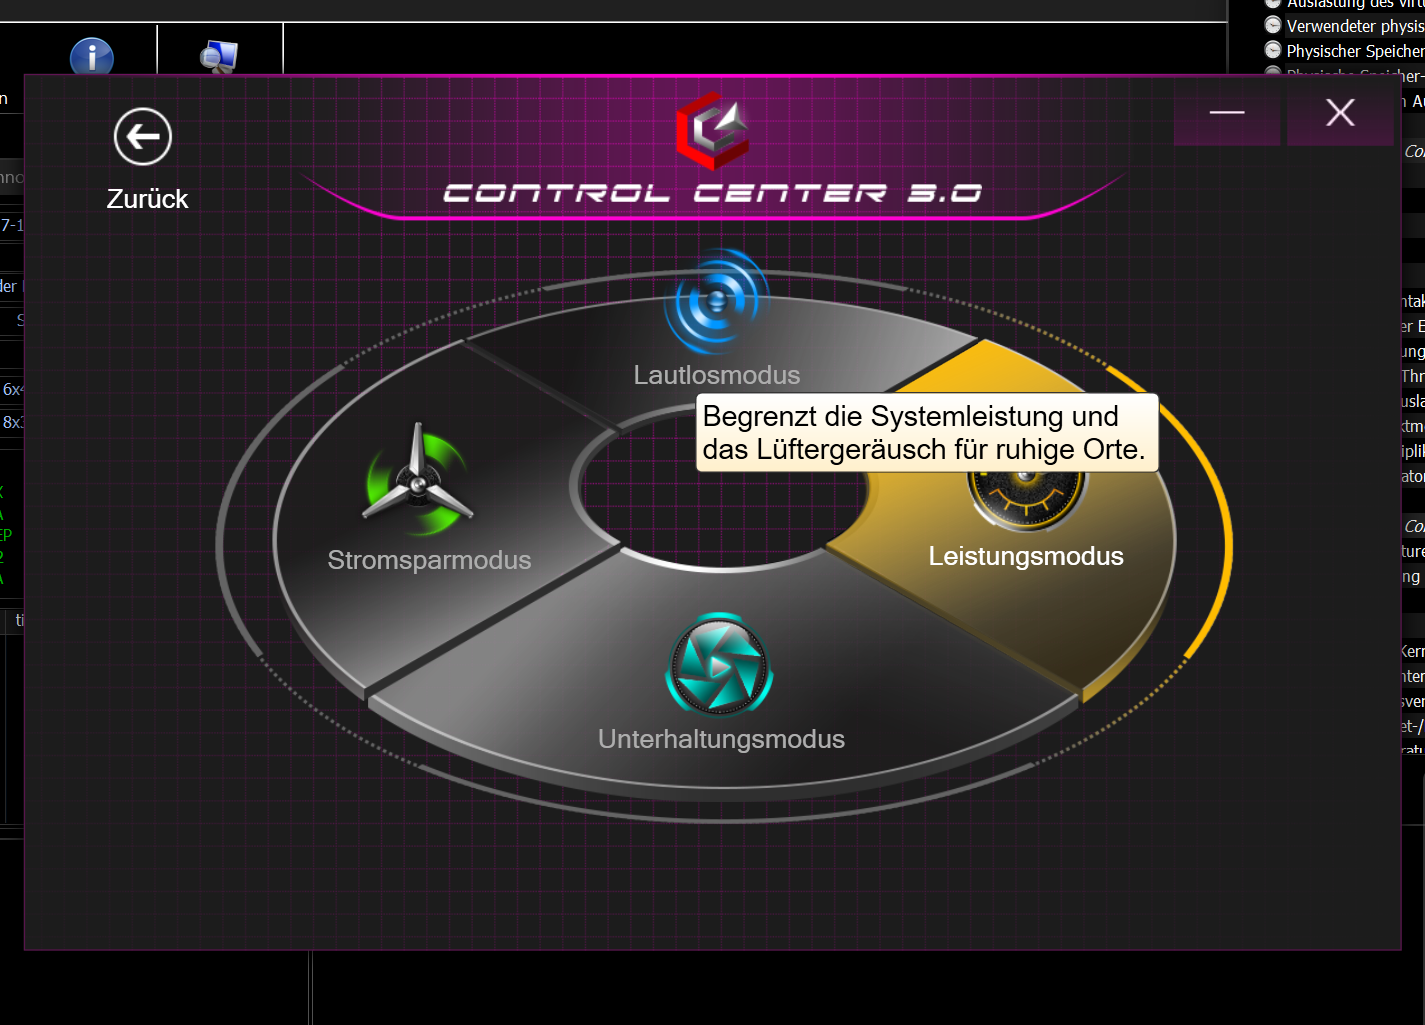
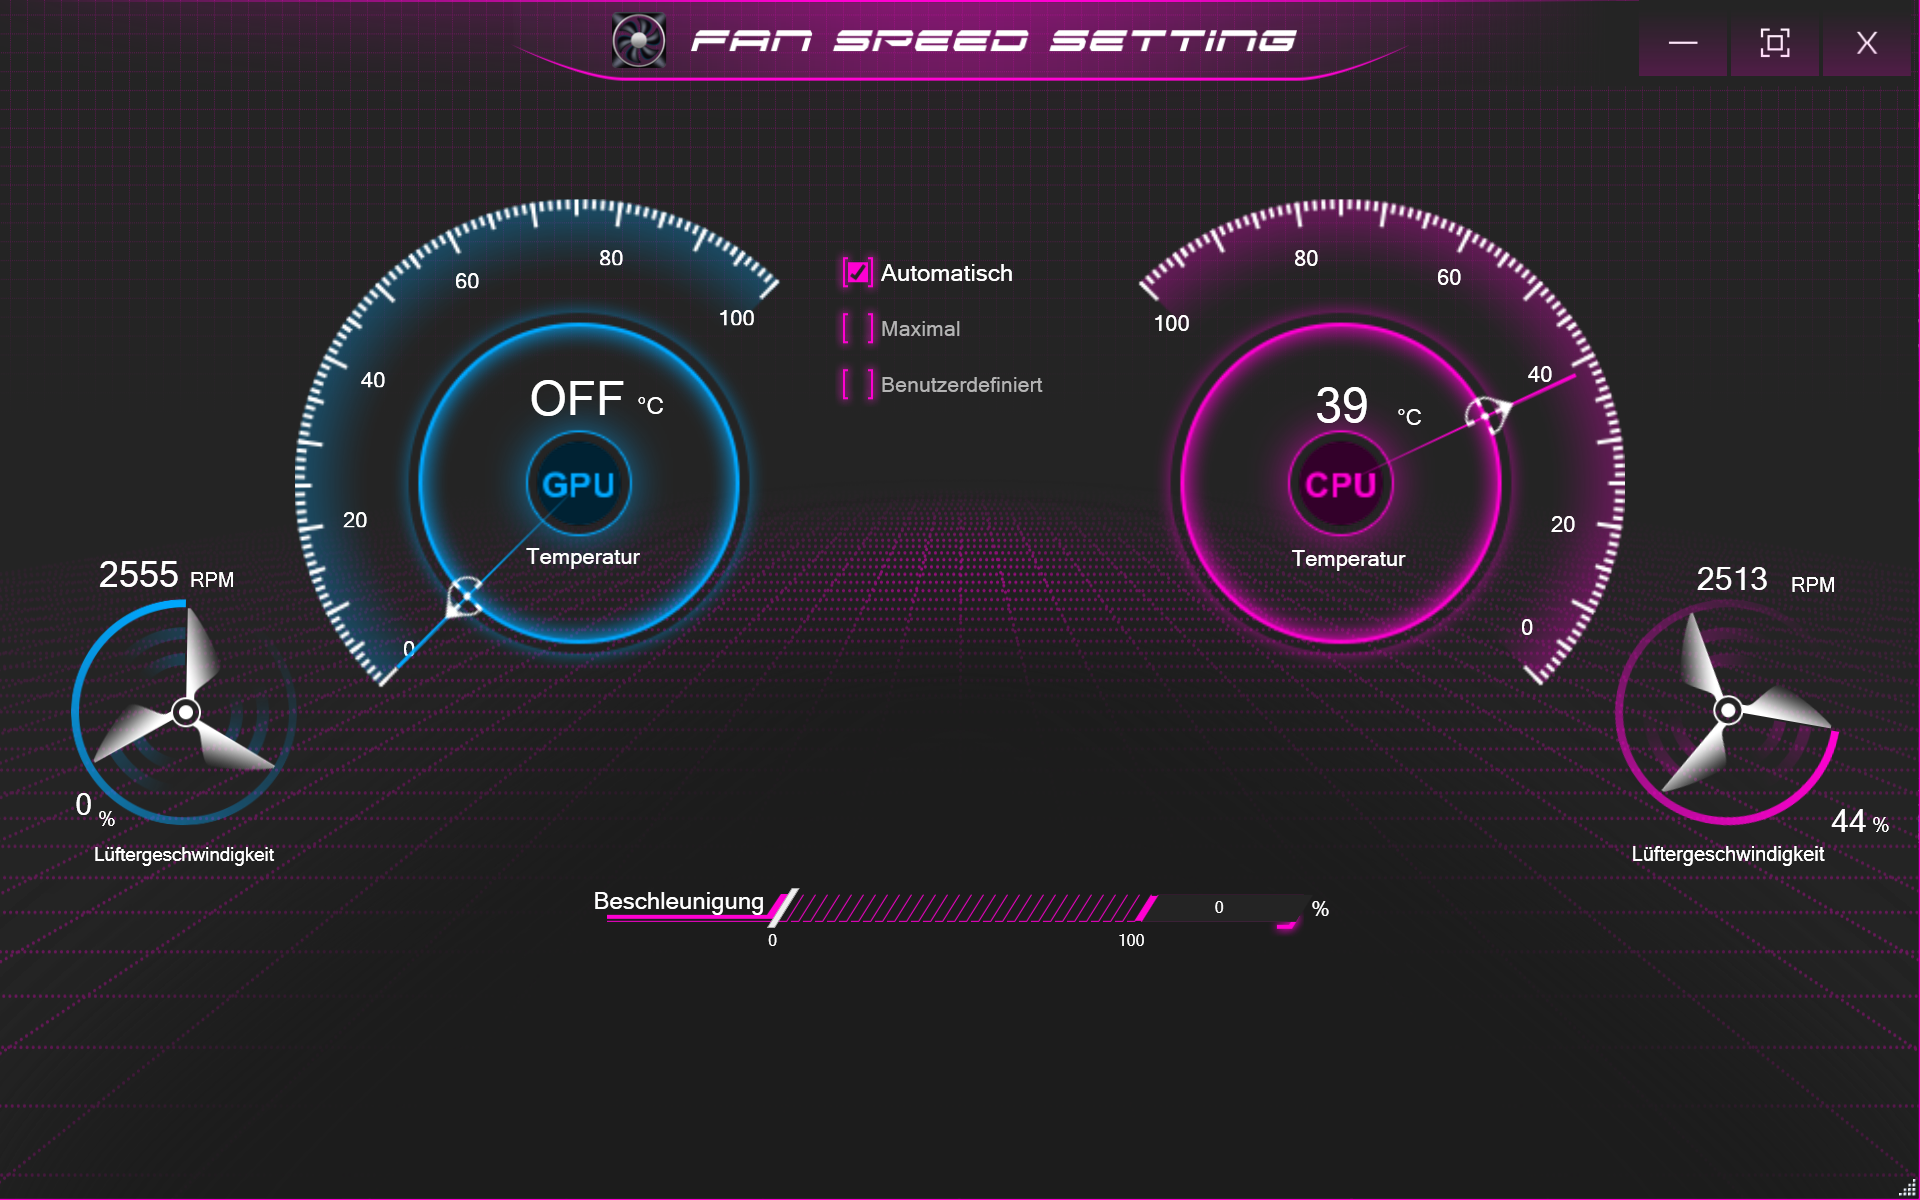
Poziom wydajności w aktualnych laptopach Schenker ustawia się za pomocą Control Center 3.0. Tutaj znajdują się cztery możliwości wyboru wydajności: od trybu szeptania do trybu wydajności. Określane są tu prędkości wentylatorów, limity wydajności oraz temperatury docelowe. Dla tych, którzy lubią się wczuwać w te ustawienia, Control Center oferuje także różne opcje regulacji i monitorowania prędkości wentylatora.
Ma to duży wpływ na wydajność laptopa. W trybie wydajności do dyspozycji CPU i GPU jest 140 W. W trakcie testów zaobserwowaliśmy dynamiczne podbicie mocy o około 25 W. Sam procesor może pracować przy dobrych 65 watach. Podczas pracy w trybie Whisper lub trybie oszczędzania energii łączne zużycie energii przez Intel Core i7 i Nvidia RTX 3060 oscyluje wokół 45 watów. Ze względu na różne opcje ustawienia wentylatora, w trybie energooszczędnym temperatura sprzętu rośnie znacznie wolniej. Podobnie w trybie bateryjnym zmierzyliśmy łączny pobór mocy na poziomie około 25 watów.
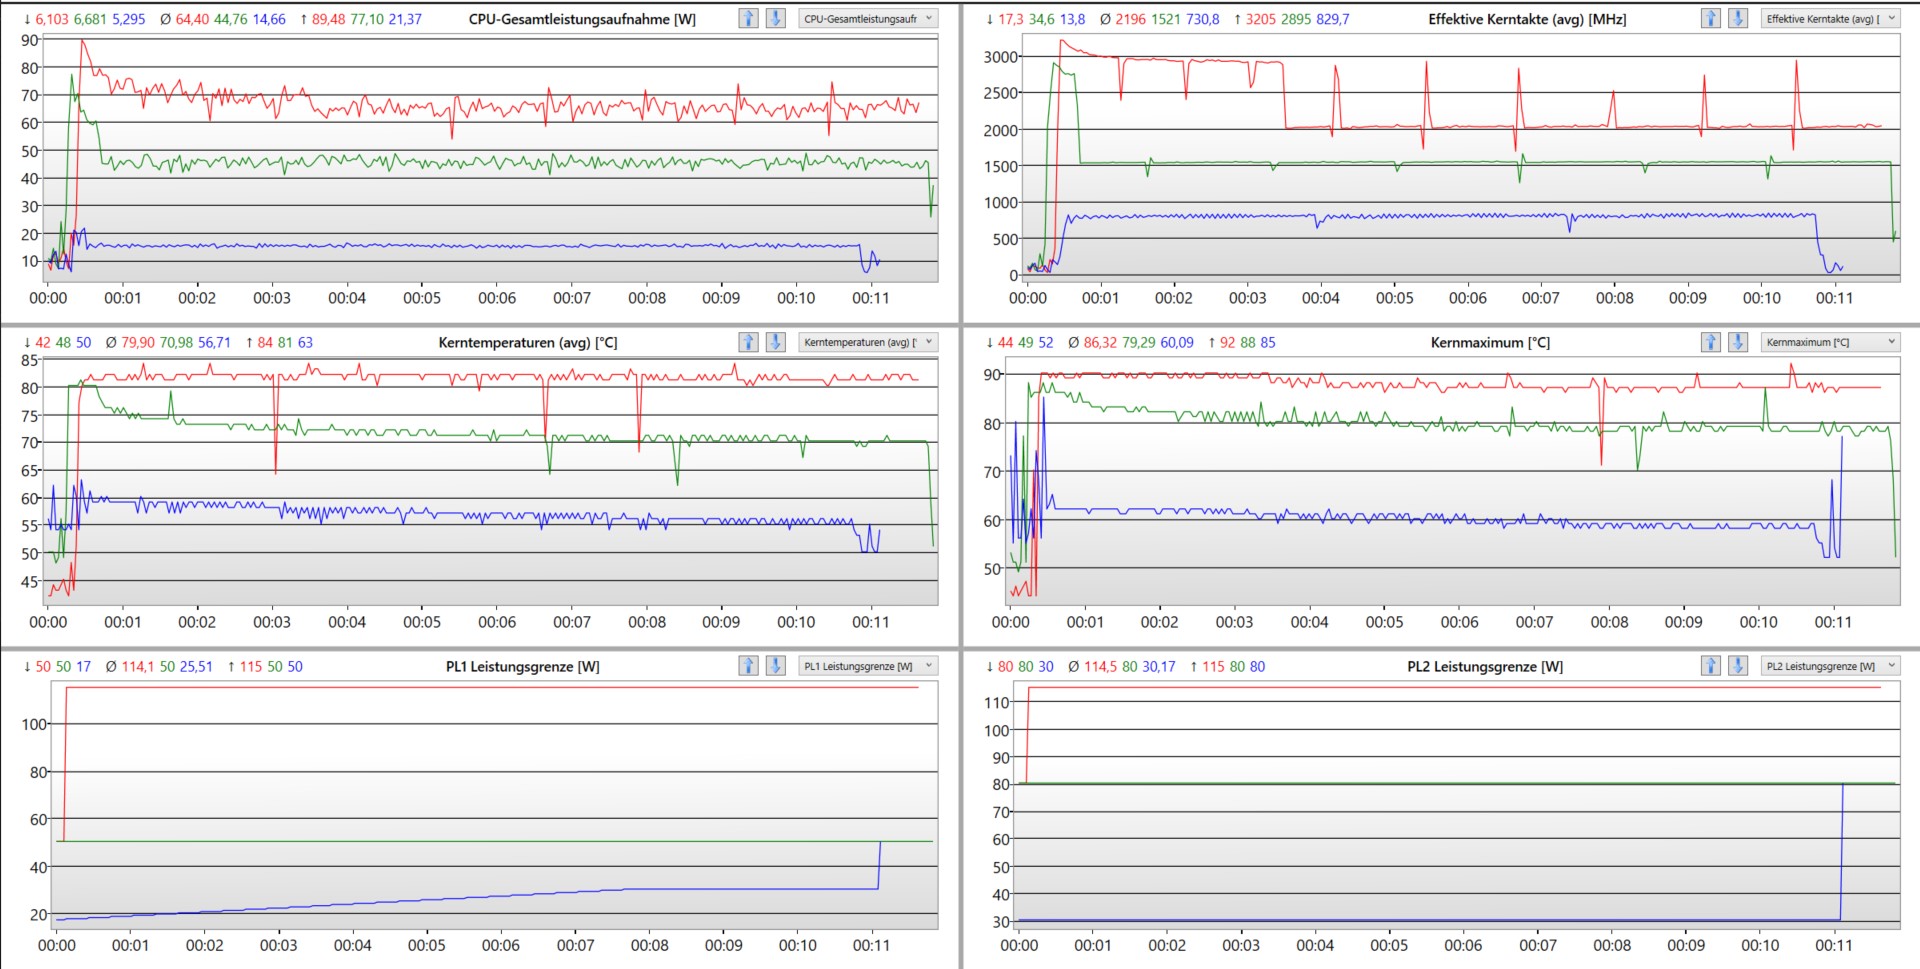
Analiza dziennika
Procesor
StronaIntel Core i7-12700Hnależy do najmocniejszych procesorów Intela z generacji Alder Lake. W teście Schenker XMG Focus 16 procesor ten spisuje się relatywnie dobrze, nie osiągając swoich najlepszych poziomów. W dłuższym okresie czasu laptop nie radził sobie z byciem forsowanym, gdyż wydajność w pętli Cinbench spadła z czasem o ponad 100 pkt.
Dodatkowo wyniki procesora pokazują, że i7 w laptopie do gier plasuje się w środku stawki w porównaniu z konkurentami. Mimo to osiąga on wyniki wyższe od przeciętnej wydajności m.in.Intel Core i7-12700H. Jednak 12700H osiąga najlepsze wyniki w Lenovo Legion 5 Pro. W żadnym z laptopów w naszej bazie danych procesor i7 nie wypada lepiej niż ten występujący w Legion. W laptopie Schenkera określiliśmy stosunkowo wysoką moc 105 W dla PL2, ale tylko 65 W dla PL1.
Cinebench R15 Multi sustained load
Cinebench R23: Multi Core | Single Core
Cinebench R20: CPU (Multi Core) | CPU (Single Core)
Cinebench R15: CPU Multi 64Bit | CPU Single 64Bit
Blender: v2.79 BMW27 CPU
7-Zip 18.03: 7z b 4 | 7z b 4 -mmt1
Geekbench 5.5: Multi-Core | Single-Core
HWBOT x265 Benchmark v2.2: 4k Preset
LibreOffice : 20 Documents To PDF
R Benchmark 2.5: Overall mean
| CPU Performance rating | |
| Średnia w klasie Gaming | |
| Lenovo Legion 5 Pro 16IAH7H | |
| Lenovo ThinkPad X1 Extreme G5-21DE003RGE | |
| Asus ZenBook Pro 16X OLED UX7602ZM-ME115W | |
| Lenovo Legion Slim 7-16IAH 82TF004YGE | |
| Schenker XMG Focus 16 (i7-12700H, RTX 3060) | |
| Dell G16 7620 | |
| Przeciętny Intel Core i7-12700H | |
| Asus ROG Flow X16 GV601RW-M5082W | |
| Cinebench R23 / Multi Core | |
| Średnia w klasie Gaming (10488 - 40970, n=112, ostatnie 2 lata) | |
| Lenovo Legion 5 Pro 16IAH7H | |
| Lenovo Legion Slim 7-16IAH 82TF004YGE | |
| Lenovo ThinkPad X1 Extreme G5-21DE003RGE | |
| Schenker XMG Focus 16 (i7-12700H, RTX 3060) | |
| Dell G16 7620 | |
| Asus ZenBook Pro 16X OLED UX7602ZM-ME115W | |
| Przeciętny Intel Core i7-12700H (4032 - 19330, n=64) | |
| Asus ROG Flow X16 GV601RW-M5082W | |
| Cinebench R23 / Single Core | |
| Średnia w klasie Gaming (1166 - 2356, n=112, ostatnie 2 lata) | |
| Lenovo ThinkPad X1 Extreme G5-21DE003RGE | |
| Schenker XMG Focus 16 (i7-12700H, RTX 3060) | |
| Przeciętny Intel Core i7-12700H (778 - 1826, n=63) | |
| Lenovo Legion Slim 7-16IAH 82TF004YGE | |
| Lenovo Legion 5 Pro 16IAH7H | |
| Dell G16 7620 | |
| Asus ZenBook Pro 16X OLED UX7602ZM-ME115W | |
| Asus ROG Flow X16 GV601RW-M5082W | |
| Cinebench R20 / CPU (Multi Core) | |
| Średnia w klasie Gaming (4029 - 16108, n=111, ostatnie 2 lata) | |
| Lenovo Legion 5 Pro 16IAH7H | |
| Lenovo ThinkPad X1 Extreme G5-21DE003RGE | |
| Lenovo Legion Slim 7-16IAH 82TF004YGE | |
| Dell G16 7620 | |
| Schenker XMG Focus 16 (i7-12700H, RTX 3060) | |
| Asus ZenBook Pro 16X OLED UX7602ZM-ME115W | |
| Przeciętny Intel Core i7-12700H (1576 - 7407, n=64) | |
| Asus ROG Flow X16 GV601RW-M5082W | |
| Cinebench R20 / CPU (Single Core) | |
| Średnia w klasie Gaming (442 - 895, n=111, ostatnie 2 lata) | |
| Lenovo ThinkPad X1 Extreme G5-21DE003RGE | |
| Schenker XMG Focus 16 (i7-12700H, RTX 3060) | |
| Asus ZenBook Pro 16X OLED UX7602ZM-ME115W | |
| Przeciętny Intel Core i7-12700H (300 - 704, n=64) | |
| Lenovo Legion Slim 7-16IAH 82TF004YGE | |
| Lenovo Legion 5 Pro 16IAH7H | |
| Dell G16 7620 | |
| Asus ROG Flow X16 GV601RW-M5082W | |
| Cinebench R15 / CPU Multi 64Bit | |
| Średnia w klasie Gaming (1578 - 6271, n=111, ostatnie 2 lata) | |
| Lenovo Legion 5 Pro 16IAH7H | |
| Lenovo Legion Slim 7-16IAH 82TF004YGE | |
| Lenovo ThinkPad X1 Extreme G5-21DE003RGE | |
| Schenker XMG Focus 16 (i7-12700H, RTX 3060) | |
| Dell G16 7620 | |
| Asus ZenBook Pro 16X OLED UX7602ZM-ME115W | |
| Przeciętny Intel Core i7-12700H (1379 - 2916, n=70) | |
| Asus ROG Flow X16 GV601RW-M5082W | |
| Cinebench R15 / CPU Single 64Bit | |
| Średnia w klasie Gaming (188.8 - 343, n=111, ostatnie 2 lata) | |
| Asus ZenBook Pro 16X OLED UX7602ZM-ME115W | |
| Asus ZenBook Pro 16X OLED UX7602ZM-ME115W | |
| Lenovo ThinkPad X1 Extreme G5-21DE003RGE | |
| Schenker XMG Focus 16 (i7-12700H, RTX 3060) | |
| Lenovo Legion Slim 7-16IAH 82TF004YGE | |
| Przeciętny Intel Core i7-12700H (113 - 263, n=65) | |
| Lenovo Legion 5 Pro 16IAH7H | |
| Dell G16 7620 | |
| Asus ROG Flow X16 GV601RW-M5082W | |
| Blender / v2.79 BMW27 CPU | |
| Przeciętny Intel Core i7-12700H (168 - 732, n=63) | |
| Asus ROG Flow X16 GV601RW-M5082W | |
| Schenker XMG Focus 16 (i7-12700H, RTX 3060) | |
| Lenovo ThinkPad X1 Extreme G5-21DE003RGE | |
| Asus ZenBook Pro 16X OLED UX7602ZM-ME115W | |
| Dell G16 7620 | |
| Lenovo Legion Slim 7-16IAH 82TF004YGE | |
| Lenovo Legion 5 Pro 16IAH7H | |
| Średnia w klasie Gaming (80 - 330, n=109, ostatnie 2 lata) | |
| 7-Zip 18.03 / 7z b 4 | |
| Średnia w klasie Gaming (33491 - 148086, n=110, ostatnie 2 lata) | |
| Asus ZenBook Pro 16X OLED UX7602ZM-ME115W | |
| Lenovo Legion 5 Pro 16IAH7H | |
| Lenovo ThinkPad X1 Extreme G5-21DE003RGE | |
| Lenovo Legion Slim 7-16IAH 82TF004YGE | |
| Dell G16 7620 | |
| Schenker XMG Focus 16 (i7-12700H, RTX 3060) | |
| Asus ROG Flow X16 GV601RW-M5082W | |
| Przeciętny Intel Core i7-12700H (22844 - 73067, n=63) | |
| 7-Zip 18.03 / 7z b 4 -mmt1 | |
| Średnia w klasie Gaming (4199 - 7436, n=110, ostatnie 2 lata) | |
| Lenovo ThinkPad X1 Extreme G5-21DE003RGE | |
| Asus ZenBook Pro 16X OLED UX7602ZM-ME115W | |
| Schenker XMG Focus 16 (i7-12700H, RTX 3060) | |
| Asus ROG Flow X16 GV601RW-M5082W | |
| Przeciętny Intel Core i7-12700H (2743 - 5972, n=63) | |
| Lenovo Legion 5 Pro 16IAH7H | |
| Lenovo Legion Slim 7-16IAH 82TF004YGE | |
| Dell G16 7620 | |
| Geekbench 5.5 / Multi-Core | |
| Średnia w klasie Gaming (6460 - 27010, n=110, ostatnie 2 lata) | |
| Asus ZenBook Pro 16X OLED UX7602ZM-ME115W | |
| Lenovo Legion 5 Pro 16IAH7H | |
| Lenovo Legion Slim 7-16IAH 82TF004YGE | |
| Schenker XMG Focus 16 (i7-12700H, RTX 3060) | |
| Dell G16 7620 | |
| Lenovo ThinkPad X1 Extreme G5-21DE003RGE | |
| Przeciętny Intel Core i7-12700H (5144 - 13745, n=64) | |
| Asus ROG Flow X16 GV601RW-M5082W | |
| Geekbench 5.5 / Single-Core | |
| Średnia w klasie Gaming (986 - 2474, n=110, ostatnie 2 lata) | |
| Asus ZenBook Pro 16X OLED UX7602ZM-ME115W | |
| Lenovo ThinkPad X1 Extreme G5-21DE003RGE | |
| Schenker XMG Focus 16 (i7-12700H, RTX 3060) | |
| Przeciętny Intel Core i7-12700H (803 - 1851, n=64) | |
| Lenovo Legion Slim 7-16IAH 82TF004YGE | |
| Lenovo Legion 5 Pro 16IAH7H | |
| Dell G16 7620 | |
| Asus ROG Flow X16 GV601RW-M5082W | |
| HWBOT x265 Benchmark v2.2 / 4k Preset | |
| Średnia w klasie Gaming (11.5 - 44.3, n=110, ostatnie 2 lata) | |
| Lenovo Legion 5 Pro 16IAH7H | |
| Asus ZenBook Pro 16X OLED UX7602ZM-ME115W | |
| Dell G16 7620 | |
| Lenovo Legion Slim 7-16IAH 82TF004YGE | |
| Schenker XMG Focus 16 (i7-12700H, RTX 3060) | |
| Lenovo ThinkPad X1 Extreme G5-21DE003RGE | |
| Przeciętny Intel Core i7-12700H (4.67 - 21.8, n=64) | |
| Asus ROG Flow X16 GV601RW-M5082W | |
| LibreOffice / 20 Documents To PDF | |
| Asus ROG Flow X16 GV601RW-M5082W | |
| Dell G16 7620 | |
| Średnia w klasie Gaming (19 - 88.8, n=110, ostatnie 2 lata) | |
| Przeciętny Intel Core i7-12700H (34.2 - 95.3, n=63) | |
| Schenker XMG Focus 16 (i7-12700H, RTX 3060) | |
| Lenovo ThinkPad X1 Extreme G5-21DE003RGE | |
| Lenovo Legion 5 Pro 16IAH7H | |
| Lenovo Legion Slim 7-16IAH 82TF004YGE | |
| Asus ZenBook Pro 16X OLED UX7602ZM-ME115W | |
| R Benchmark 2.5 / Overall mean | |
| Dell G16 7620 | |
| Asus ROG Flow X16 GV601RW-M5082W | |
| Lenovo Legion 5 Pro 16IAH7H | |
| Przeciętny Intel Core i7-12700H (0.4441 - 1.052, n=63) | |
| Lenovo Legion Slim 7-16IAH 82TF004YGE | |
| Schenker XMG Focus 16 (i7-12700H, RTX 3060) | |
| Lenovo ThinkPad X1 Extreme G5-21DE003RGE | |
| Asus ZenBook Pro 16X OLED UX7602ZM-ME115W | |
| Średnia w klasie Gaming (0.3439 - 0.759, n=111, ostatnie 2 lata) | |
* ... im mniej tym lepiej
AIDA64: FP32 Ray-Trace | FPU Julia | CPU SHA3 | CPU Queen | FPU SinJulia | FPU Mandel | CPU AES | CPU ZLib | FP64 Ray-Trace | CPU PhotoWorxx
| Performance rating | |
| Średnia w klasie Gaming | |
| Asus ROG Flow X16 GV601RW-M5082W | |
| Lenovo Legion Slim 7-16IAH 82TF004YGE | |
| Asus ZenBook Pro 16X OLED UX7602ZM-ME115W | |
| Schenker XMG Focus 16 (i7-12700H, RTX 3060) | |
| Dell G16 7620 | |
| Lenovo ThinkPad X1 Extreme G5-21DE003RGE | |
| Lenovo Legion 5 Pro 16IAH7H | |
| Przeciętny Intel Core i7-12700H | |
| AIDA64 / FP32 Ray-Trace | |
| Średnia w klasie Gaming (10227 - 85542, n=109, ostatnie 2 lata) | |
| Lenovo Legion Slim 7-16IAH 82TF004YGE | |
| Lenovo ThinkPad X1 Extreme G5-21DE003RGE | |
| Asus ROG Flow X16 GV601RW-M5082W | |
| Schenker XMG Focus 16 (i7-12700H, RTX 3060) | |
| Dell G16 7620 | |
| Lenovo Legion 5 Pro 16IAH7H | |
| Lenovo Legion 5 Pro 16IAH7H | |
| Asus ZenBook Pro 16X OLED UX7602ZM-ME115W | |
| Przeciętny Intel Core i7-12700H (2585 - 17957, n=64) | |
| AIDA64 / FPU Julia | |
| Średnia w klasie Gaming (51376 - 238426, n=109, ostatnie 2 lata) | |
| Asus ROG Flow X16 GV601RW-M5082W | |
| Lenovo Legion Slim 7-16IAH 82TF004YGE | |
| Schenker XMG Focus 16 (i7-12700H, RTX 3060) | |
| Lenovo ThinkPad X1 Extreme G5-21DE003RGE | |
| Dell G16 7620 | |
| Lenovo Legion 5 Pro 16IAH7H | |
| Lenovo Legion 5 Pro 16IAH7H | |
| Asus ZenBook Pro 16X OLED UX7602ZM-ME115W | |
| Przeciętny Intel Core i7-12700H (12439 - 90760, n=64) | |
| AIDA64 / CPU SHA3 | |
| Średnia w klasie Gaming (2180 - 9817, n=109, ostatnie 2 lata) | |
| Lenovo Legion Slim 7-16IAH 82TF004YGE | |
| Schenker XMG Focus 16 (i7-12700H, RTX 3060) | |
| Lenovo ThinkPad X1 Extreme G5-21DE003RGE | |
| Dell G16 7620 | |
| Asus ZenBook Pro 16X OLED UX7602ZM-ME115W | |
| Asus ROG Flow X16 GV601RW-M5082W | |
| Lenovo Legion 5 Pro 16IAH7H | |
| Lenovo Legion 5 Pro 16IAH7H | |
| Przeciętny Intel Core i7-12700H (833 - 4242, n=64) | |
| AIDA64 / CPU Queen | |
| Średnia w klasie Gaming (49785 - 173351, n=100, ostatnie 2 lata) | |
| Asus ZenBook Pro 16X OLED UX7602ZM-ME115W | |
| Asus ROG Flow X16 GV601RW-M5082W | |
| Lenovo Legion Slim 7-16IAH 82TF004YGE | |
| Schenker XMG Focus 16 (i7-12700H, RTX 3060) | |
| Lenovo ThinkPad X1 Extreme G5-21DE003RGE | |
| Dell G16 7620 | |
| Lenovo Legion 5 Pro 16IAH7H | |
| Przeciętny Intel Core i7-12700H (57923 - 103202, n=63) | |
| AIDA64 / FPU SinJulia | |
| Średnia w klasie Gaming (4424 - 33636, n=109, ostatnie 2 lata) | |
| Asus ROG Flow X16 GV601RW-M5082W | |
| Lenovo Legion 5 Pro 16IAH7H | |
| Lenovo Legion 5 Pro 16IAH7H | |
| Dell G16 7620 | |
| Lenovo ThinkPad X1 Extreme G5-21DE003RGE | |
| Lenovo Legion Slim 7-16IAH 82TF004YGE | |
| Schenker XMG Focus 16 (i7-12700H, RTX 3060) | |
| Asus ZenBook Pro 16X OLED UX7602ZM-ME115W | |
| Przeciętny Intel Core i7-12700H (3249 - 9939, n=64) | |
| AIDA64 / FPU Mandel | |
| Średnia w klasie Gaming (25115 - 128721, n=109, ostatnie 2 lata) | |
| Asus ROG Flow X16 GV601RW-M5082W | |
| Lenovo Legion Slim 7-16IAH 82TF004YGE | |
| Lenovo ThinkPad X1 Extreme G5-21DE003RGE | |
| Schenker XMG Focus 16 (i7-12700H, RTX 3060) | |
| Lenovo Legion 5 Pro 16IAH7H | |
| Lenovo Legion 5 Pro 16IAH7H | |
| Asus ZenBook Pro 16X OLED UX7602ZM-ME115W | |
| Dell G16 7620 | |
| Przeciętny Intel Core i7-12700H (7135 - 44760, n=64) | |
| AIDA64 / CPU AES | |
| Asus ROG Flow X16 GV601RW-M5082W | |
| Lenovo Legion Slim 7-16IAH 82TF004YGE | |
| Lenovo Legion 5 Pro 16IAH7H | |
| Lenovo Legion 5 Pro 16IAH7H | |
| Średnia w klasie Gaming (39258 - 247074, n=109, ostatnie 2 lata) | |
| Przeciętny Intel Core i7-12700H (31839 - 144360, n=64) | |
| Lenovo ThinkPad X1 Extreme G5-21DE003RGE | |
| Schenker XMG Focus 16 (i7-12700H, RTX 3060) | |
| Dell G16 7620 | |
| Asus ZenBook Pro 16X OLED UX7602ZM-ME115W | |
| AIDA64 / CPU ZLib | |
| Średnia w klasie Gaming (574 - 2531, n=109, ostatnie 2 lata) | |
| Lenovo Legion 5 Pro 16IAH7H | |
| Lenovo Legion 5 Pro 16IAH7H | |
| Schenker XMG Focus 16 (i7-12700H, RTX 3060) | |
| Lenovo ThinkPad X1 Extreme G5-21DE003RGE | |
| Dell G16 7620 | |
| Asus ZenBook Pro 16X OLED UX7602ZM-ME115W | |
| Lenovo Legion Slim 7-16IAH 82TF004YGE | |
| Przeciętny Intel Core i7-12700H (305 - 1171, n=64) | |
| Asus ROG Flow X16 GV601RW-M5082W | |
| AIDA64 / FP64 Ray-Trace | |
| Średnia w klasie Gaming (5509 - 45446, n=109, ostatnie 2 lata) | |
| Asus ROG Flow X16 GV601RW-M5082W | |
| Lenovo ThinkPad X1 Extreme G5-21DE003RGE | |
| Lenovo Legion Slim 7-16IAH 82TF004YGE | |
| Schenker XMG Focus 16 (i7-12700H, RTX 3060) | |
| Asus ZenBook Pro 16X OLED UX7602ZM-ME115W | |
| Dell G16 7620 | |
| Lenovo Legion 5 Pro 16IAH7H | |
| Lenovo Legion 5 Pro 16IAH7H | |
| Przeciętny Intel Core i7-12700H (1437 - 9692, n=64) | |
| AIDA64 / CPU PhotoWorxx | |
| Asus ZenBook Pro 16X OLED UX7602ZM-ME115W | |
| Średnia w klasie Gaming (12271 - 89891, n=109, ostatnie 2 lata) | |
| Lenovo Legion Slim 7-16IAH 82TF004YGE | |
| Dell G16 7620 | |
| Lenovo Legion 5 Pro 16IAH7H | |
| Lenovo Legion 5 Pro 16IAH7H | |
| Przeciętny Intel Core i7-12700H (12863 - 52207, n=64) | |
| Schenker XMG Focus 16 (i7-12700H, RTX 3060) | |
| Asus ROG Flow X16 GV601RW-M5082W | |
| Lenovo ThinkPad X1 Extreme G5-21DE003RGE | |
Wydajność systemu
O ile laptopowi Schenker nie można zarzucić słabości w normalnym użytkowaniu, o tyle porównanie z innymi mocnymi laptopami do gier pokazuje, że można osiągnąć więcej. Wyniki benchmarków PCMark10 i Crossmark są nieco poniżej średniej. Ponieważ oba programy benchmarkowe nie poddają dysku SSD długotrwałemu stresowi w żadnym z podtestów, winowajcami są raczej nieco wolniejsza pamięć DDR4 i porównywalnie niska wydajność procesora.
CrossMark: Overall | Productivity | Creativity | Responsiveness
| PCMark 10 / Score | |
| Średnia w klasie Gaming (5828 - 11574, n=95, ostatnie 2 lata) | |
| Lenovo Legion 5 Pro 16IAH7H | |
| Asus ZenBook Pro 16X OLED UX7602ZM-ME115W | |
| Lenovo Legion Slim 7-16IAH 82TF004YGE | |
| Lenovo ThinkPad X1 Extreme G5-21DE003RGE | |
| Przeciętny Intel Core i7-12700H, NVIDIA GeForce RTX 3060 Laptop GPU (5986 - 8156, n=12) | |
| Dell G16 7620 | |
| Schenker XMG Focus 16 (i7-12700H, RTX 3060) | |
| Asus ROG Flow X16 GV601RW-M5082W | |
| PCMark 10 / Essentials | |
| Lenovo Legion 5 Pro 16IAH7H | |
| Asus ZenBook Pro 16X OLED UX7602ZM-ME115W | |
| Lenovo Legion Slim 7-16IAH 82TF004YGE | |
| Średnia w klasie Gaming (8810 - 12600, n=99, ostatnie 2 lata) | |
| Przeciętny Intel Core i7-12700H, NVIDIA GeForce RTX 3060 Laptop GPU (9289 - 12144, n=12) | |
| Lenovo ThinkPad X1 Extreme G5-21DE003RGE | |
| Dell G16 7620 | |
| Schenker XMG Focus 16 (i7-12700H, RTX 3060) | |
| Asus ROG Flow X16 GV601RW-M5082W | |
| PCMark 10 / Productivity | |
| Średnia w klasie Gaming (6845 - 18766, n=97, ostatnie 2 lata) | |
| Asus ZenBook Pro 16X OLED UX7602ZM-ME115W | |
| Schenker XMG Focus 16 (i7-12700H, RTX 3060) | |
| Asus ROG Flow X16 GV601RW-M5082W | |
| Lenovo Legion Slim 7-16IAH 82TF004YGE | |
| Lenovo Legion 5 Pro 16IAH7H | |
| Lenovo ThinkPad X1 Extreme G5-21DE003RGE | |
| Przeciętny Intel Core i7-12700H, NVIDIA GeForce RTX 3060 Laptop GPU (6161 - 10362, n=12) | |
| Dell G16 7620 | |
| PCMark 10 / Digital Content Creation | |
| Średnia w klasie Gaming (7602 - 19657, n=97, ostatnie 2 lata) | |
| Lenovo Legion 5 Pro 16IAH7H | |
| Dell G16 7620 | |
| Lenovo Legion Slim 7-16IAH 82TF004YGE | |
| Przeciętny Intel Core i7-12700H, NVIDIA GeForce RTX 3060 Laptop GPU (8950 - 12554, n=12) | |
| Lenovo ThinkPad X1 Extreme G5-21DE003RGE | |
| Asus ZenBook Pro 16X OLED UX7602ZM-ME115W | |
| Schenker XMG Focus 16 (i7-12700H, RTX 3060) | |
| Asus ROG Flow X16 GV601RW-M5082W | |
| CrossMark / Overall | |
| Średnia w klasie Gaming (1366 - 2409, n=97, ostatnie 2 lata) | |
| Lenovo Legion Slim 7-16IAH 82TF004YGE | |
| Przeciętny Intel Core i7-12700H, NVIDIA GeForce RTX 3060 Laptop GPU (1649 - 2017, n=11) | |
| Asus ZenBook Pro 16X OLED UX7602ZM-ME115W | |
| Dell G16 7620 | |
| Lenovo Legion 5 Pro 16IAH7H | |
| Lenovo ThinkPad X1 Extreme G5-21DE003RGE | |
| Asus ROG Flow X16 GV601RW-M5082W | |
| Schenker XMG Focus 16 (i7-12700H, RTX 3060) | |
| CrossMark / Productivity | |
| Średnia w klasie Gaming (1386 - 2254, n=97, ostatnie 2 lata) | |
| Lenovo Legion Slim 7-16IAH 82TF004YGE | |
| Przeciętny Intel Core i7-12700H, NVIDIA GeForce RTX 3060 Laptop GPU (1536 - 1958, n=11) | |
| Lenovo Legion 5 Pro 16IAH7H | |
| Dell G16 7620 | |
| Asus ZenBook Pro 16X OLED UX7602ZM-ME115W | |
| Lenovo ThinkPad X1 Extreme G5-21DE003RGE | |
| Asus ROG Flow X16 GV601RW-M5082W | |
| Schenker XMG Focus 16 (i7-12700H, RTX 3060) | |
| CrossMark / Creativity | |
| Średnia w klasie Gaming (1343 - 2729, n=97, ostatnie 2 lata) | |
| Asus ZenBook Pro 16X OLED UX7602ZM-ME115W | |
| Lenovo Legion Slim 7-16IAH 82TF004YGE | |
| Przeciętny Intel Core i7-12700H, NVIDIA GeForce RTX 3060 Laptop GPU (1816 - 2084, n=11) | |
| Dell G16 7620 | |
| Lenovo ThinkPad X1 Extreme G5-21DE003RGE | |
| Lenovo Legion 5 Pro 16IAH7H | |
| Schenker XMG Focus 16 (i7-12700H, RTX 3060) | |
| Asus ROG Flow X16 GV601RW-M5082W | |
| CrossMark / Responsiveness | |
| Lenovo Legion Slim 7-16IAH 82TF004YGE | |
| Lenovo Legion 5 Pro 16IAH7H | |
| Średnia w klasie Gaming (1226 - 2334, n=97, ostatnie 2 lata) | |
| Przeciętny Intel Core i7-12700H, NVIDIA GeForce RTX 3060 Laptop GPU (1210 - 2207, n=11) | |
| Dell G16 7620 | |
| Asus ZenBook Pro 16X OLED UX7602ZM-ME115W | |
| Lenovo ThinkPad X1 Extreme G5-21DE003RGE | |
| Asus ROG Flow X16 GV601RW-M5082W | |
| Schenker XMG Focus 16 (i7-12700H, RTX 3060) | |
| PCMark 10 Score | 7134 pkt. | |
Pomoc | ||
| AIDA64 / Memory Copy | |
| Średnia w klasie Gaming (21750 - 129946, n=109, ostatnie 2 lata) | |
| Asus ZenBook Pro 16X OLED UX7602ZM-ME115W | |
| Lenovo Legion 5 Pro 16IAH7H | |
| Lenovo Legion 5 Pro 16IAH7H | |
| Dell G16 7620 | |
| Przeciętny Intel Core i7-12700H (25615 - 80511, n=64) | |
| Lenovo Legion Slim 7-16IAH 82TF004YGE | |
| Asus ROG Flow X16 GV601RW-M5082W | |
| Schenker XMG Focus 16 (i7-12700H, RTX 3060) | |
| Lenovo ThinkPad X1 Extreme G5-21DE003RGE | |
| AIDA64 / Memory Read | |
| Średnia w klasie Gaming (22956 - 118858, n=109, ostatnie 2 lata) | |
| Asus ZenBook Pro 16X OLED UX7602ZM-ME115W | |
| Dell G16 7620 | |
| Lenovo Legion 5 Pro 16IAH7H | |
| Lenovo Legion 5 Pro 16IAH7H | |
| Lenovo Legion Slim 7-16IAH 82TF004YGE | |
| Przeciętny Intel Core i7-12700H (25586 - 79442, n=64) | |
| Asus ROG Flow X16 GV601RW-M5082W | |
| Schenker XMG Focus 16 (i7-12700H, RTX 3060) | |
| Lenovo ThinkPad X1 Extreme G5-21DE003RGE | |
| AIDA64 / Memory Write | |
| Średnia w klasie Gaming (22297 - 135096, n=109, ostatnie 2 lata) | |
| Asus ZenBook Pro 16X OLED UX7602ZM-ME115W | |
| Lenovo Legion 5 Pro 16IAH7H | |
| Lenovo Legion 5 Pro 16IAH7H | |
| Lenovo Legion Slim 7-16IAH 82TF004YGE | |
| Dell G16 7620 | |
| Asus ROG Flow X16 GV601RW-M5082W | |
| Przeciętny Intel Core i7-12700H (23679 - 88660, n=64) | |
| Schenker XMG Focus 16 (i7-12700H, RTX 3060) | |
| Lenovo ThinkPad X1 Extreme G5-21DE003RGE | |
| AIDA64 / Memory Latency | |
| Lenovo Legion 5 Pro 16IAH7H | |
| Lenovo Legion 5 Pro 16IAH7H | |
| Asus ZenBook Pro 16X OLED UX7602ZM-ME115W | |
| Średnia w klasie Gaming (75.3 - 259, n=109, ostatnie 2 lata) | |
| Dell G16 7620 | |
| Lenovo Legion Slim 7-16IAH 82TF004YGE | |
| Asus ROG Flow X16 GV601RW-M5082W | |
| Schenker XMG Focus 16 (i7-12700H, RTX 3060) | |
| Lenovo ThinkPad X1 Extreme G5-21DE003RGE | |
| Przeciętny Intel Core i7-12700H (76.2 - 133.9, n=62) | |
* ... im mniej tym lepiej
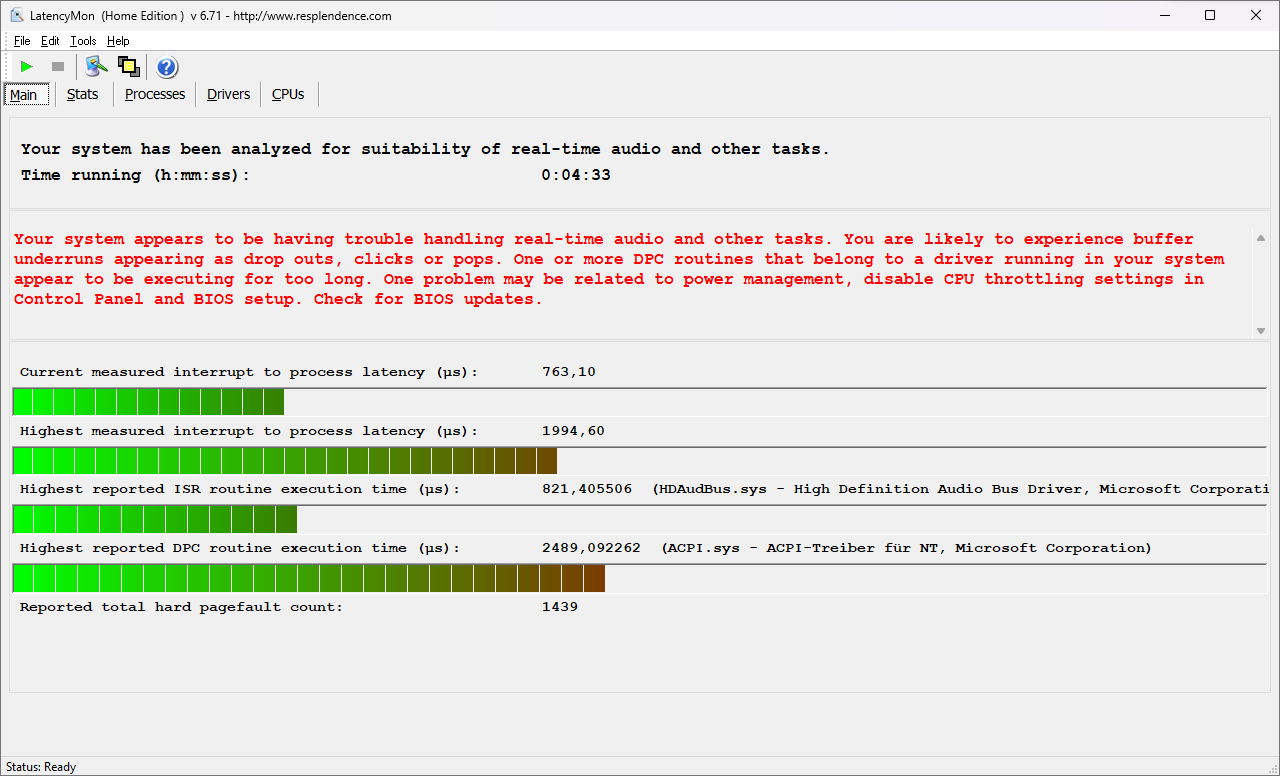
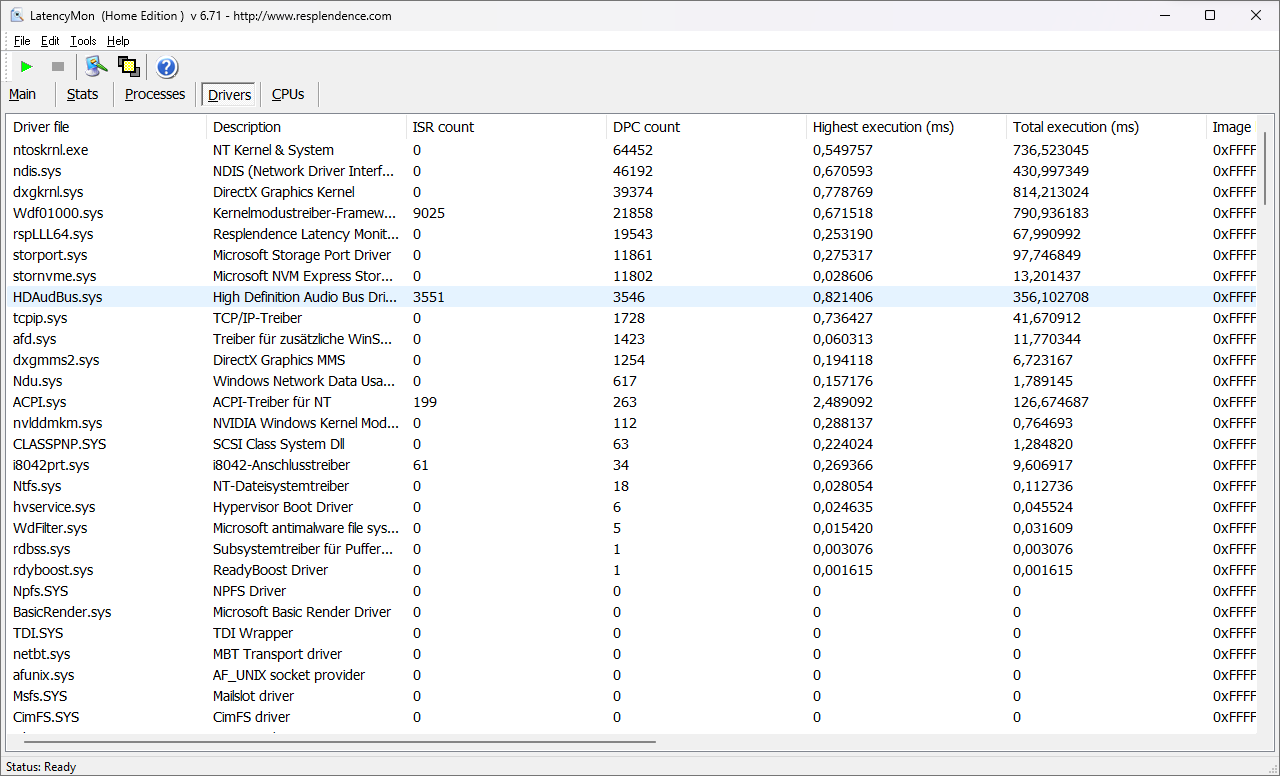
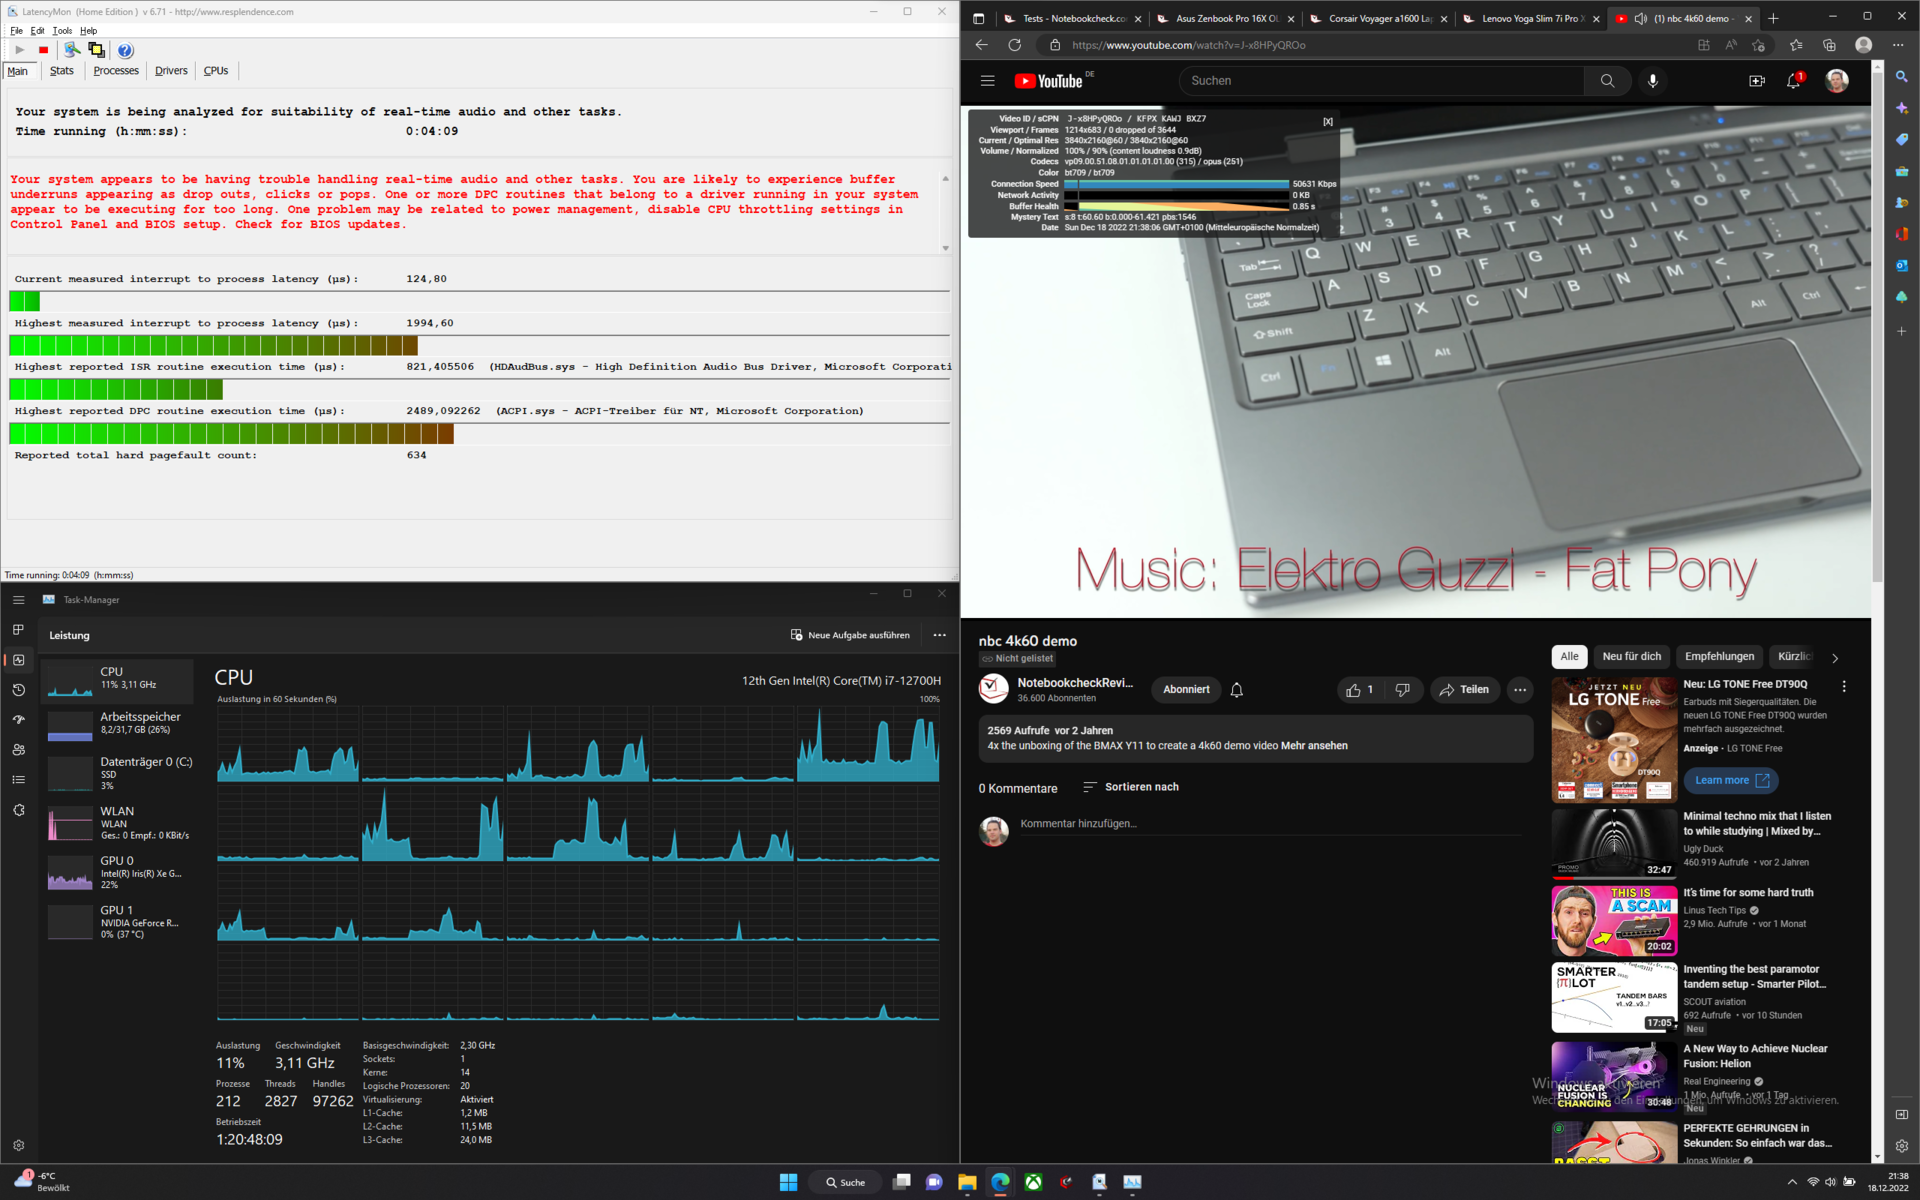
Opóźnienia DPC
XMG Focus 16 nie odstaje pod względem wysokich opóźnień DPC. Przy obecnej kombinacji sterowników laptop do gier odnotował wysokie poziomy i dlatego nie nadaje się do zastosowań w czasie rzeczywistym. Podczas testu YouTube 4K 60Hz nie pominięto żadnej klatki.
| DPC Latencies / LatencyMon - interrupt to process latency (max), Web, Youtube, Prime95 | |
| Schenker XMG Focus 16 (i7-12700H, RTX 3060) | |
| Asus ROG Flow X16 GV601RW-M5082W | |
| Lenovo ThinkPad X1 Extreme G5-21DE003RGE | |
| Dell G16 7620 | |
| Lenovo Legion 5 Pro 16IAH7H | |
| Lenovo Legion Slim 7-16IAH 82TF004YGE | |
| Asus ZenBook Pro 16X OLED UX7602ZM-ME115W | |
* ... im mniej tym lepiej
Pamięć masowa
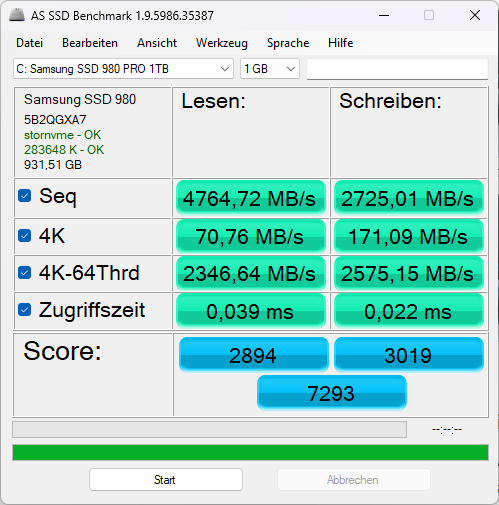
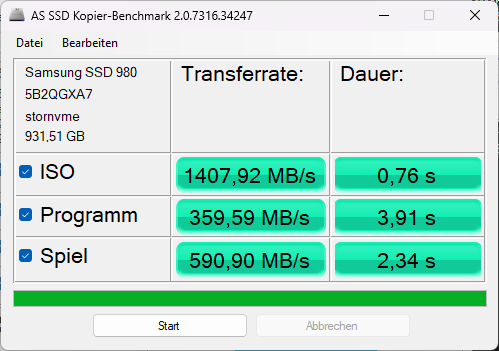
Laptop gamingowy Schenker posiada dysk Samsung SSD 980 Pro o pojemności 1 TB. Ten potężny dysk SSD znajduje się w pobliżu szczytu naszej tabeli benchmarkowej dysków SSD i HDD. Pamięć masowa NVMe laptopa do gier jest również wydajna. Jednak po kilku przebiegach w pętli DiskSpd dysk SSD NVMe był znacznie dławiony. Takie zachowanie wskazuje na słabe odprowadzanie ciepła. Podczas gdy wielu innych producentów zaczęło implementować podkładki termiczne albo na wierzchu, albo pod dyskami SSD, w celu rozproszenia ciepła operacyjnego, jest to coś, czego nie można powiedzieć o laptopie Schenkera.

* ... im mniej tym lepiej
Continuous performance read: DiskSpd Read Loop, Queue Depth 8
Karta graficzna
AnNvidia GeForce RTX 3060wykonuje swoją pracę w XMG Focus 16. W zależności od wymagań jakościowych karta graficzna nadaje się do gier w rozdzielczości Full HD lub QHD. 3060 w laptopie Schenkera powinna być w stanie uruchomić większość obecnych tytułów w ponad 60 klatkach na sekundę w pełnej rozdzielczości ekranu. Tylko nieliczne gry wymagają większej mocy.
Po raczej mało zachęcających wynikach wydajności systemu, karta graficzna urządzenia Schenker zaskoczyła nas świetną wydajnością. W większości benchmarków Schenker's 3060 osiągnął wysokie wyniki. Bardzo wysoki wynik w benchmarku 3DMark Cloud Gate wskazuje na szybki dostęp do pamięci graficznej.
| 3DMark Performance rating - Percent | |
| Średnia w klasie Gaming | |
| Asus ROG Flow X16 GV601RW-M5082W | |
| Schenker XMG Focus 16 (i7-12700H, RTX 3060) | |
| Lenovo Legion 5 Pro 16IAH7H | |
| Dell G16 7620 | |
| Przeciętny NVIDIA GeForce RTX 3060 Laptop GPU | |
| Lenovo Legion Slim 7-16IAH 82TF004YGE | |
| Asus ZenBook Pro 16X OLED UX7602ZM-ME115W | |
| Lenovo ThinkPad X1 Extreme G5-21DE003RGE -1! | |
| 3DMark 11 Performance | 26508 pkt. | |
| 3DMark Ice Storm Standard Score | 147494 pkt. | |
| 3DMark Cloud Gate Standard Score | 57261 pkt. | |
| 3DMark Fire Strike Score | 19951 pkt. | |
| 3DMark Time Spy Score | 8675 pkt. | |
Pomoc | ||
* ... im mniej tym lepiej
Wydajność w grach
Karta graficzna Nvidia GeForce RTX 3060 powinna być wystarczająco wydajna, aby grać w większość obecnych gier w 60 klatkach na najwyższych ustawieniach przy użyciu rozdzielczości QHD wyświetlacza. Wyświetlacz ten oferuje jednak częstotliwość odświeżania 165 Hz. Wyniki benchmarków pokazują, że 165 klatek na sekundę w Full HD można osiągnąć na średnich ustawieniach.
W porównaniu z innymi laptopami do gier XMG Focus 16 osiągnął umiarkowanie dobre wyniki. Jednak.Lenovo Legion 5 ProorazDell G16są nieco wydajniejsze.
| Performance rating - Percent | |
| Średnia w klasie Gaming | |
| Lenovo Legion 5 Pro 16IAH7H | |
| Dell G16 7620 | |
| Schenker XMG Focus 16 (i7-12700H, RTX 3060) | |
| Lenovo Legion Slim 7-16IAH 82TF004YGE | |
| Asus ZenBook Pro 16X OLED UX7602ZM-ME115W | |
| Asus ROG Flow X16 GV601RW-M5082W | |
| Lenovo ThinkPad X1 Extreme G5-21DE003RGE | |
| The Witcher 3 - 1920x1080 Ultra Graphics & Postprocessing (HBAO+) | |
| Średnia w klasie Gaming (95 - 240, n=8, ostatnie 2 lata) | |
| Asus ROG Flow X16 GV601RW-M5082W | |
| Lenovo Legion 5 Pro 16IAH7H | |
| Dell G16 7620 | |
| Schenker XMG Focus 16 (i7-12700H, RTX 3060) | |
| Lenovo Legion Slim 7-16IAH 82TF004YGE | |
| Asus ZenBook Pro 16X OLED UX7602ZM-ME115W | |
| Lenovo ThinkPad X1 Extreme G5-21DE003RGE | |
| GTA V - 1920x1080 Highest AA:4xMSAA + FX AF:16x | |
| Średnia w klasie Gaming (48.3 - 186.9, n=102, ostatnie 2 lata) | |
| Dell G16 7620 | |
| Lenovo Legion 5 Pro 16IAH7H | |
| Lenovo Legion Slim 7-16IAH 82TF004YGE | |
| Asus ZenBook Pro 16X OLED UX7602ZM-ME115W | |
| Schenker XMG Focus 16 (i7-12700H, RTX 3060) | |
| Asus ROG Flow X16 GV601RW-M5082W | |
| Lenovo ThinkPad X1 Extreme G5-21DE003RGE | |
| Final Fantasy XV Benchmark - 1920x1080 High Quality | |
| Średnia w klasie Gaming (41 - 215, n=103, ostatnie 2 lata) | |
| Asus ROG Flow X16 GV601RW-M5082W | |
| Dell G16 7620 | |
| Lenovo Legion 5 Pro 16IAH7H | |
| Schenker XMG Focus 16 (i7-12700H, RTX 3060) | |
| Asus ZenBook Pro 16X OLED UX7602ZM-ME115W | |
| Lenovo Legion Slim 7-16IAH 82TF004YGE | |
| Lenovo ThinkPad X1 Extreme G5-21DE003RGE | |
| Strange Brigade - 1920x1080 ultra AA:ultra AF:16 | |
| Średnia w klasie Gaming (76.3 - 456, n=93, ostatnie 2 lata) | |
| Asus ROG Flow X16 GV601RW-M5082W | |
| Lenovo Legion 5 Pro 16IAH7H | |
| Dell G16 7620 | |
| Schenker XMG Focus 16 (i7-12700H, RTX 3060) | |
| Asus ZenBook Pro 16X OLED UX7602ZM-ME115W | |
| Lenovo Legion Slim 7-16IAH 82TF004YGE | |
| Lenovo ThinkPad X1 Extreme G5-21DE003RGE | |
| Dota 2 Reborn - 1920x1080 ultra (3/3) best looking | |
| Średnia w klasie Gaming (84.8 - 248, n=112, ostatnie 2 lata) | |
| Dell G16 7620 | |
| Lenovo Legion Slim 7-16IAH 82TF004YGE | |
| Lenovo Legion 5 Pro 16IAH7H | |
| Schenker XMG Focus 16 (i7-12700H, RTX 3060) | |
| Asus ZenBook Pro 16X OLED UX7602ZM-ME115W | |
| Lenovo ThinkPad X1 Extreme G5-21DE003RGE | |
| Asus ROG Flow X16 GV601RW-M5082W | |
| X-Plane 11.11 - 1920x1080 high (fps_test=3) | |
| Lenovo Legion 5 Pro 16IAH7H | |
| Lenovo Legion Slim 7-16IAH 82TF004YGE | |
| Dell G16 7620 | |
| Schenker XMG Focus 16 (i7-12700H, RTX 3060) | |
| Średnia w klasie Gaming (52.1 - 143.5, n=115, ostatnie 2 lata) | |
| Asus ZenBook Pro 16X OLED UX7602ZM-ME115W | |
| Lenovo ThinkPad X1 Extreme G5-21DE003RGE | |
| Asus ROG Flow X16 GV601RW-M5082W | |
Witcher 3 liczba klatek na sekundę wyświetlała typowe dla gry zachowanie w dzień i w nocy. Podczas gry liczba klatek na sekundę zmienia się w zależności od zwiększania lub zmniejszania dystansu rysowania.
Witcher 3 fps-diagram
| low | med. | high | ultra | QHD | 4K | |
|---|---|---|---|---|---|---|
| GTA V (2015) | 183.8 | 179.1 | 167.9 | 94.7 | 80.9 | |
| The Witcher 3 (2015) | 80 | |||||
| Dota 2 Reborn (2015) | 165.8 | 151.7 | 143.4 | 135.7 | 103.4 | |
| Final Fantasy XV Benchmark (2018) | 111.4 | 84.5 | 64.3 | 37.8 | ||
| X-Plane 11.11 (2018) | 137.6 | 123.9 | 99.5 | 89 | ||
| Strange Brigade (2018) | 340 | 210 | 171.2 | 150.1 | ||
| F1 22 (2022) | 168 | 166.1 | 141.8 | 53.5 | 34.8 |
Emisja - wentylatory mogą być regulowane dzięki Control Center
Emisja hałasu
W bezpośrednim porównaniu 54 dB(A) pod obciążeniem to nie do końca cichy wynik. Jeżeli laptop naprawdę musi być cichy jak myszka, Control Center 3.0 oferuje tryb cichy.
Hałas
| luz |
| 23 / 23 / 32.07 dB |
| obciążenie |
| 53.7 / 54.58 dB |
 | ||
30 dB cichy 40 dB(A) słyszalny 50 dB(A) irytujący |
||
min: | ||
| Schenker XMG Focus 16 (i7-12700H, RTX 3060) GeForce RTX 3060 Laptop GPU, i7-12700H, Samsung SSD 980 Pro 1TB MZ-V8P1T0BW | Asus ZenBook Pro 16X OLED UX7602ZM-ME115W GeForce RTX 3060 Laptop GPU, i9-12900H, Samsung PM9A1 MZVL21T0HCLR | Dell G16 7620 GeForce RTX 3060 Laptop GPU, i7-12700H, WDC PC SN810 512GB | Asus ROG Flow X16 GV601RW-M5082W GeForce RTX 3070 Ti Laptop GPU, R9 6900HS, Micron 3400 1TB MTFDKBA1T0TFH | Lenovo ThinkPad X1 Extreme G5-21DE003RGE GeForce RTX 3060 Laptop GPU, i7-12700H, Micron 3400 1TB MTFDKBA1T0TFH | Lenovo Legion Slim 7-16IAH 82TF004YGE GeForce RTX 3060 Laptop GPU, i7-12700H, SK Hynix HFS001TEJ9X115N | Lenovo Legion 5 Pro 16IAH7H GeForce RTX 3060 Laptop GPU, i7-12700H, 2x Samsung PM9A1 MZVL21T0HCLR (RAID 0) | |
|---|---|---|---|---|---|---|---|
| Noise | -2% | 4% | -2% | 11% | 8% | -9% | |
| wyłączone / środowisko * (dB) | 23 | 26 -13% | 23.2 -1% | 25.5 -11% | 23.2 -1% | 23 -0% | 24.6 -7% |
| Idle Minimum * (dB) | 23 | 26 -13% | 28.3 -23% | 25.5 -11% | 23.2 -1% | 23 -0% | 28.7 -25% |
| Idle Average * (dB) | 23 | 26 -13% | 28.8 -25% | 25.5 -11% | 23.2 -1% | 23 -0% | 32 -39% |
| Idle Maximum * (dB) | 32.07 | 26 19% | 28.9 10% | 27.4 15% | 23.2 28% | 23 28% | 32 -0% |
| Load Average * (dB) | 53.7 | 48 11% | 32.4 40% | 49.9 7% | 45.5 15% | 43.7 19% | 45.2 16% |
| Witcher 3 ultra * (dB) | 54.58 | 48.3 12% | 45.5 17% | 51.7 5% | |||
| Load Maximum * (dB) | 54.58 | 54.6 -0% | 48.1 12% | 55 -1% | 45.5 17% | 52 5% | 54.4 -0% |
* ... im mniej tym lepiej
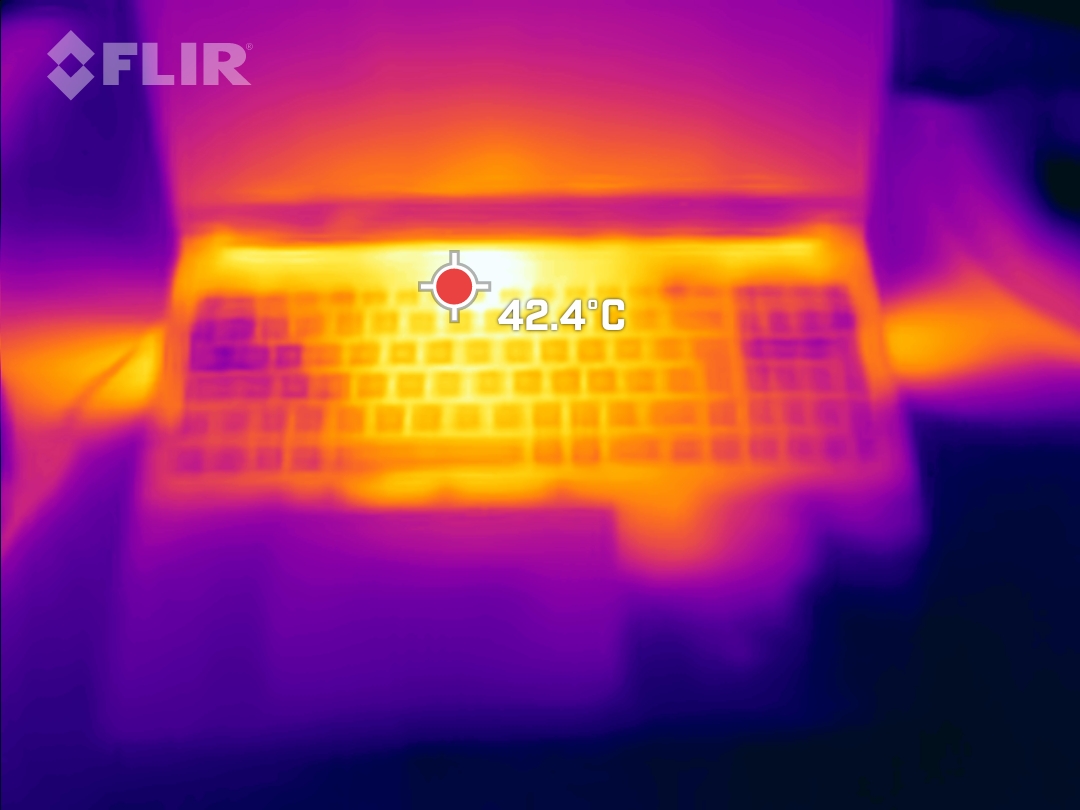
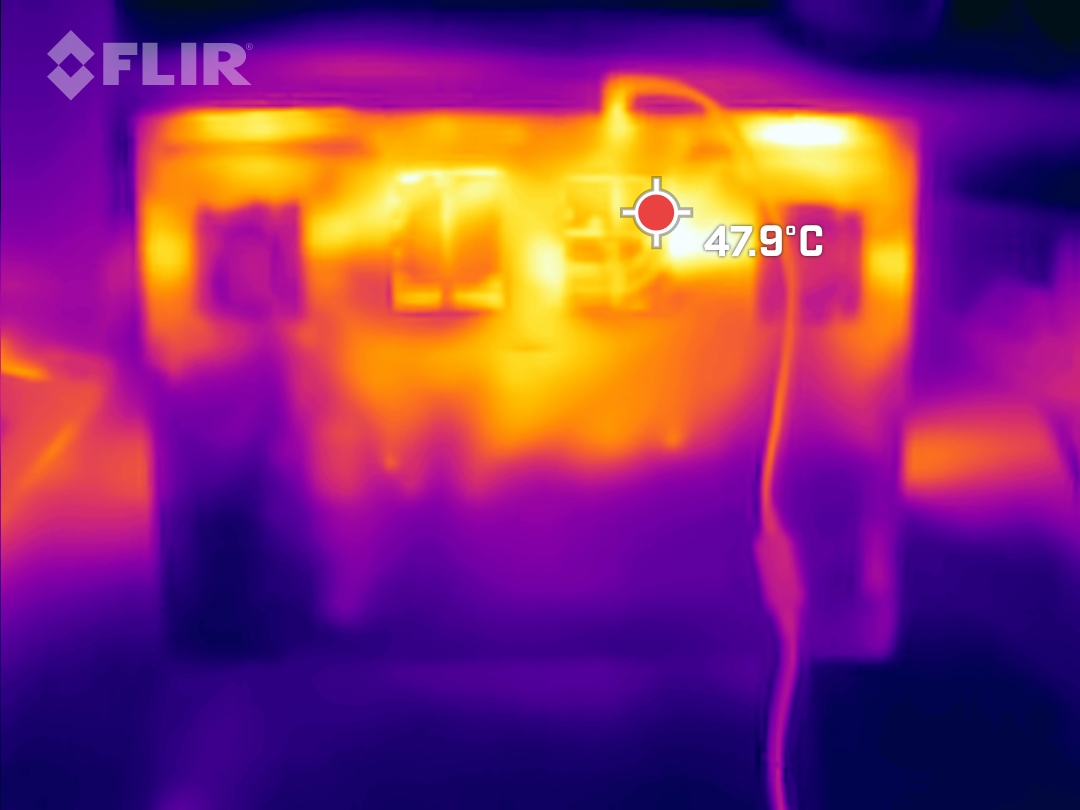
Temperatura
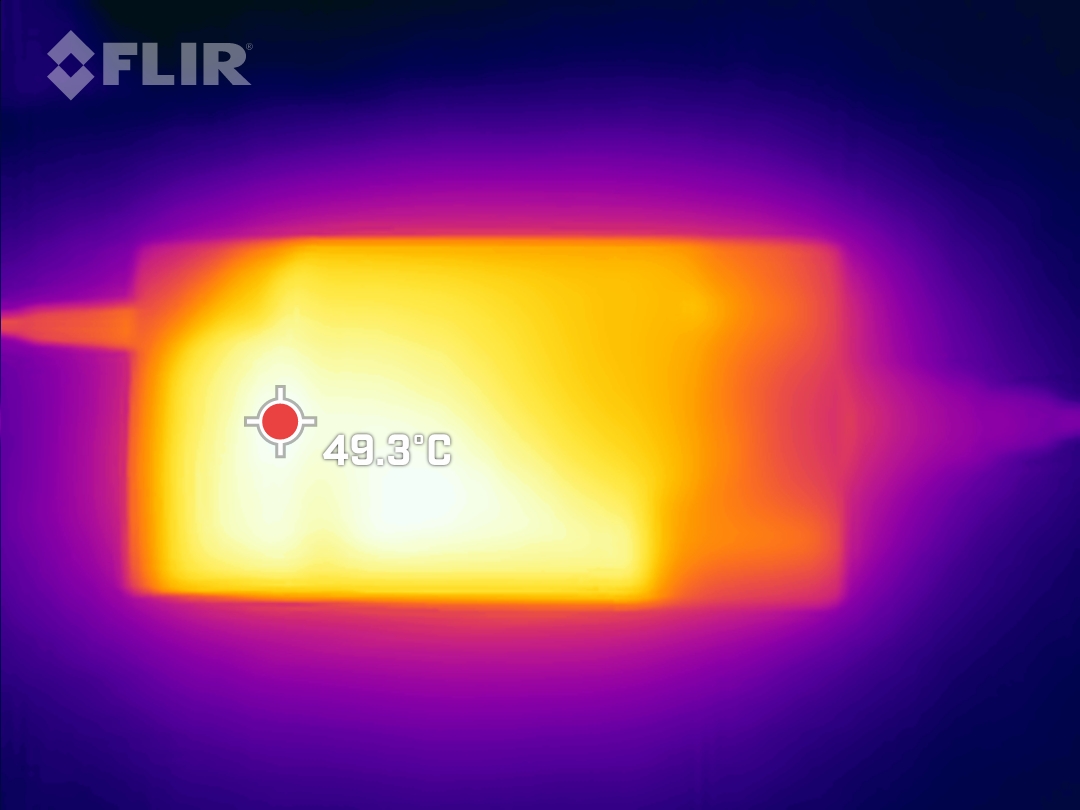
Ostatecznie wysoki poziom wydajności w laptopach do gier zawsze idzie w parze z dużą ilością ciepła. Focus 16 również robi się stosunkowo ciepły, ale bez parzenia palców na klawiaturze. Oprócz samego laptopa podczas pracy nagrzewa się także zasilacz. Może on czasem osiągać temperatury przekraczające 50°C.
(-) Maksymalna temperatura w górnej części wynosi 50 °C / 122 F, w porównaniu do średniej 40.4 °C / 105 F , począwszy od 21.2 do 68.8 °C dla klasy Gaming.
(-) Dno nagrzewa się maksymalnie do 48 °C / 118 F, w porównaniu do średniej 43.2 °C / 110 F
(+) W stanie bezczynności średnia temperatura górnej części wynosi 25.3 °C / 78 F, w porównaniu ze średnią temperaturą urządzenia wynoszącą 33.9 °C / ### class_avg_f### F.
(±) Podczas gry w Wiedźmina 3 średnia temperatura górnej części wynosi 37.1 °C / 99 F, w porównaniu do średniej temperatury urządzenia wynoszącej 33.9 °C / ## #class_avg_f### F.
(+) Podpórki pod nadgarstki i touchpad są chłodniejsze niż temperatura skóry i maksymalnie 30 °C / 86 F i dlatego są chłodne w dotyku.
(±) Średnia temperatura obszaru podparcia dłoni w podobnych urządzeniach wynosiła 28.8 °C / 83.8 F (-1.2 °C / -2.2 F).
| Schenker XMG Focus 16 (i7-12700H, RTX 3060) Intel Core i7-12700H, NVIDIA GeForce RTX 3060 Laptop GPU | Asus ZenBook Pro 16X OLED UX7602ZM-ME115W Intel Core i9-12900H, NVIDIA GeForce RTX 3060 Laptop GPU | Dell G16 7620 Intel Core i7-12700H, NVIDIA GeForce RTX 3060 Laptop GPU | Asus ROG Flow X16 GV601RW-M5082W AMD Ryzen 9 6900HS, NVIDIA GeForce RTX 3070 Ti Laptop GPU | Lenovo ThinkPad X1 Extreme G5-21DE003RGE Intel Core i7-12700H, NVIDIA GeForce RTX 3060 Laptop GPU | Lenovo Legion Slim 7-16IAH 82TF004YGE Intel Core i7-12700H, NVIDIA GeForce RTX 3060 Laptop GPU | Lenovo Legion 5 Pro 16IAH7H Intel Core i7-12700H, NVIDIA GeForce RTX 3060 Laptop GPU | |
|---|---|---|---|---|---|---|---|
| Heat | 5% | 8% | -14% | -0% | -15% | -9% | |
| Maximum Upper Side * (°C) | 50 | 32 36% | 47.6 5% | 55.1 -10% | 52 -4% | 48.3 3% | 45.8 8% |
| Maximum Bottom * (°C) | 48 | 41.6 13% | 54 -13% | 50.3 -5% | 56.4 -18% | 55.3 -15% | 66.3 -38% |
| Idle Upper Side * (°C) | 28 | 32.6 -16% | 23 18% | 35.5 -27% | 26.4 6% | 35.7 -28% | 30.4 -9% |
| Idle Bottom * (°C) | 32 | 36 -13% | 24.6 23% | 36.1 -13% | 27.2 15% | 37.6 -18% | 30.4 5% |
* ... im mniej tym lepiej
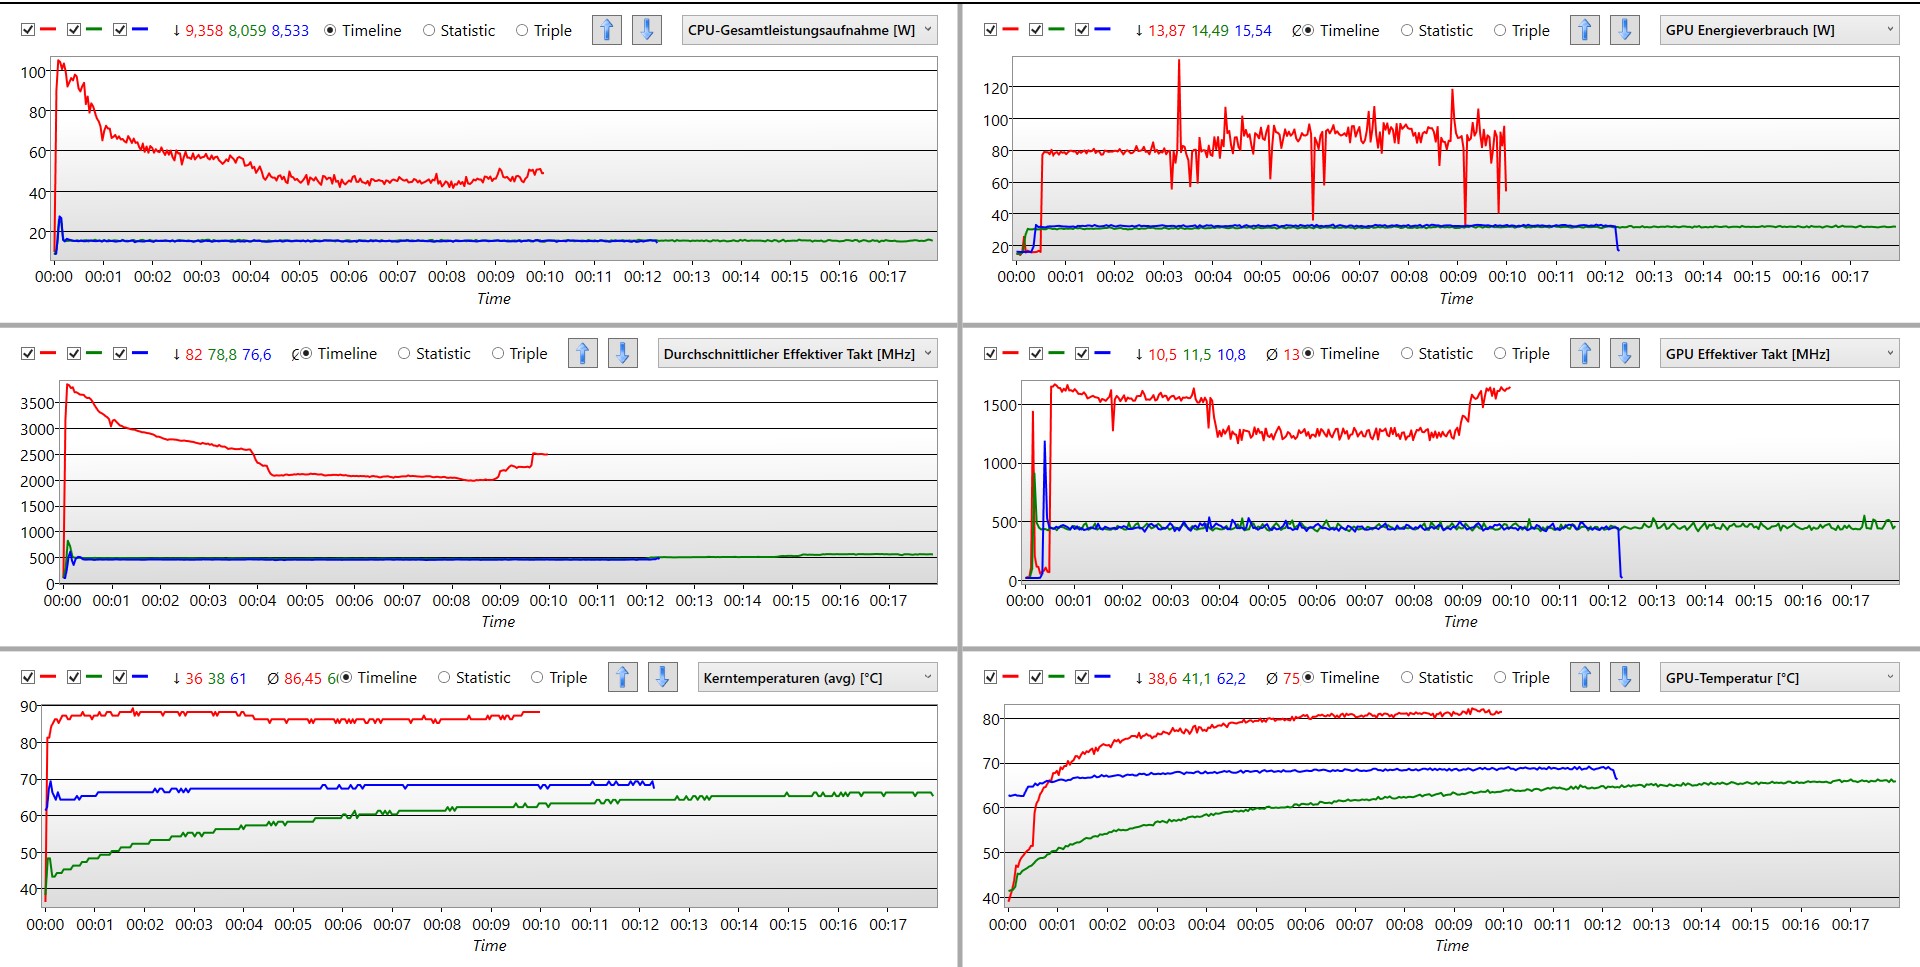
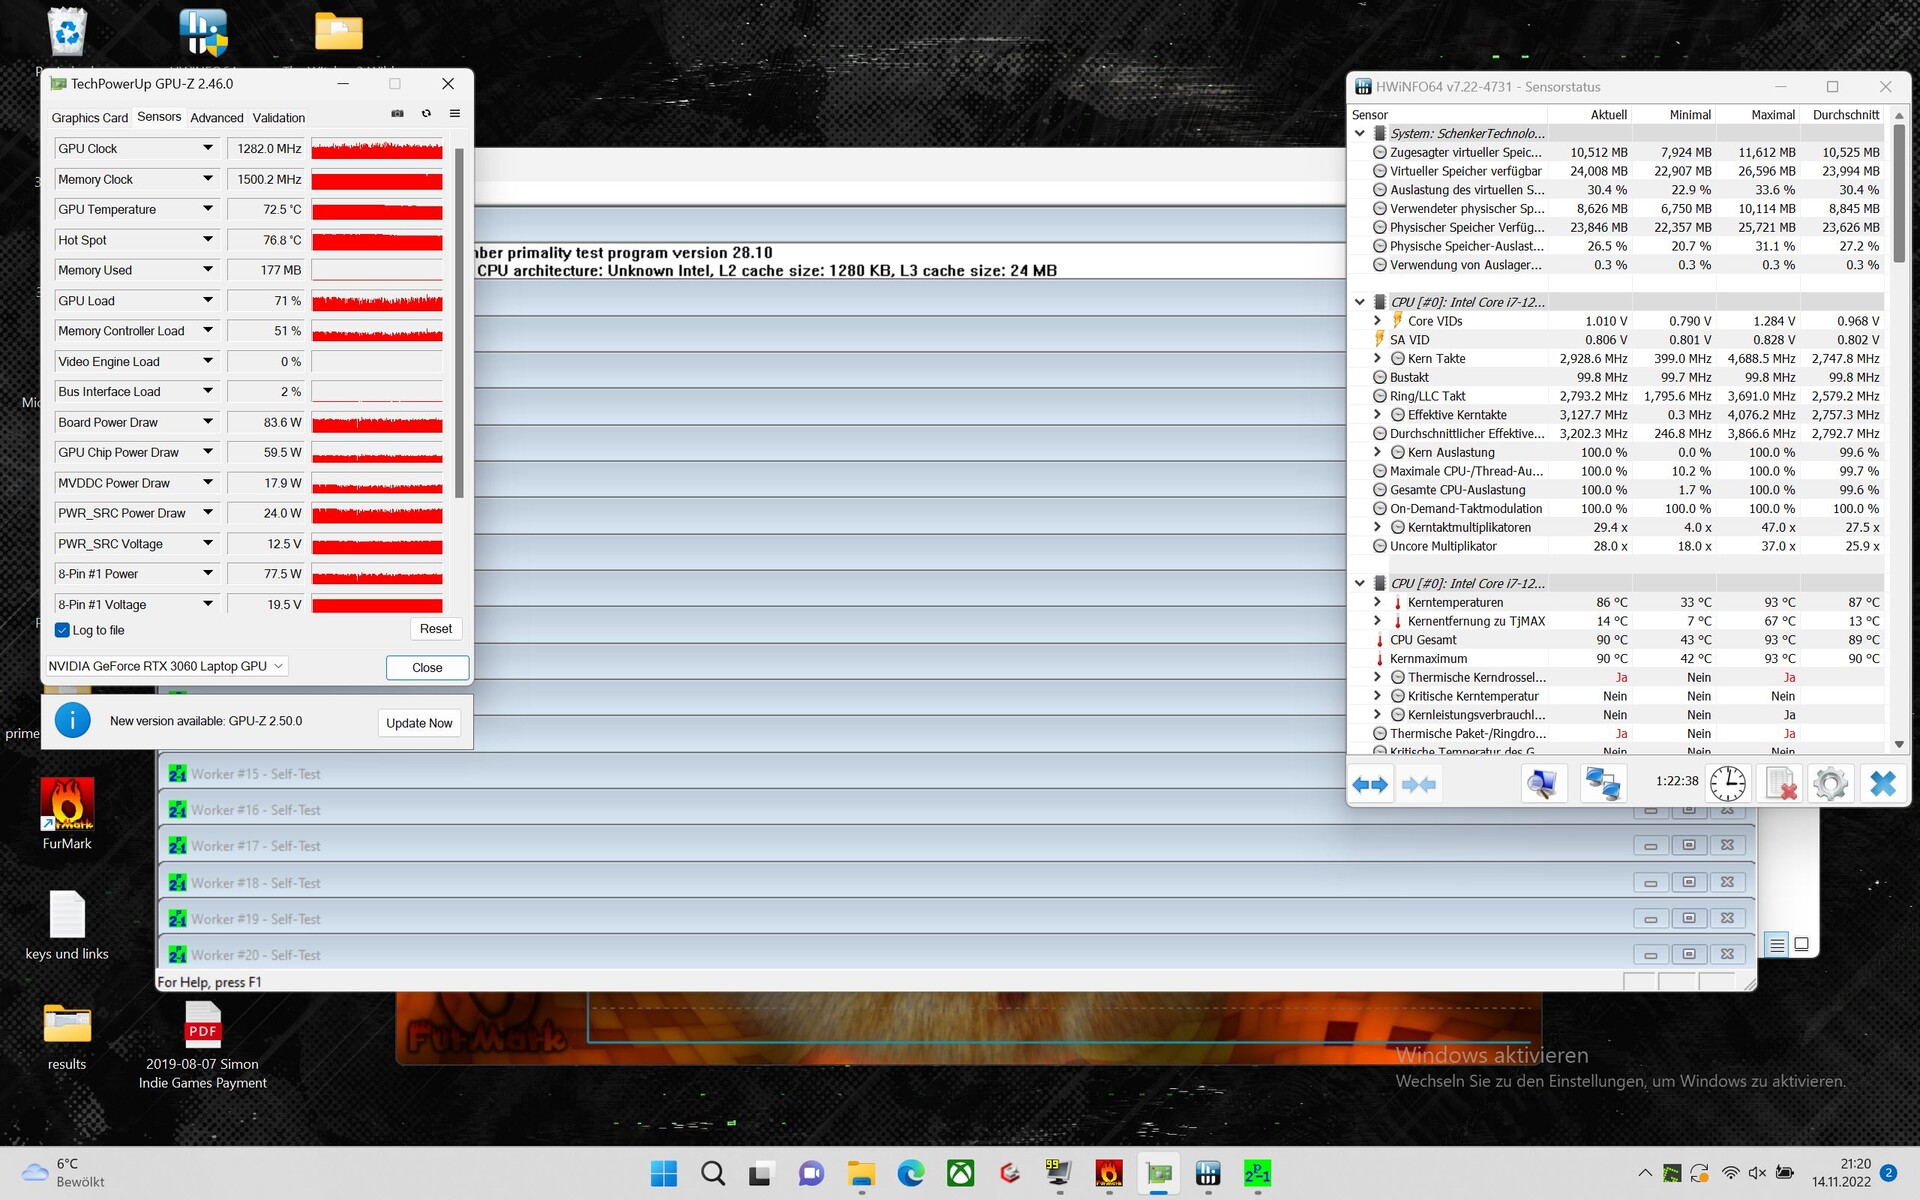
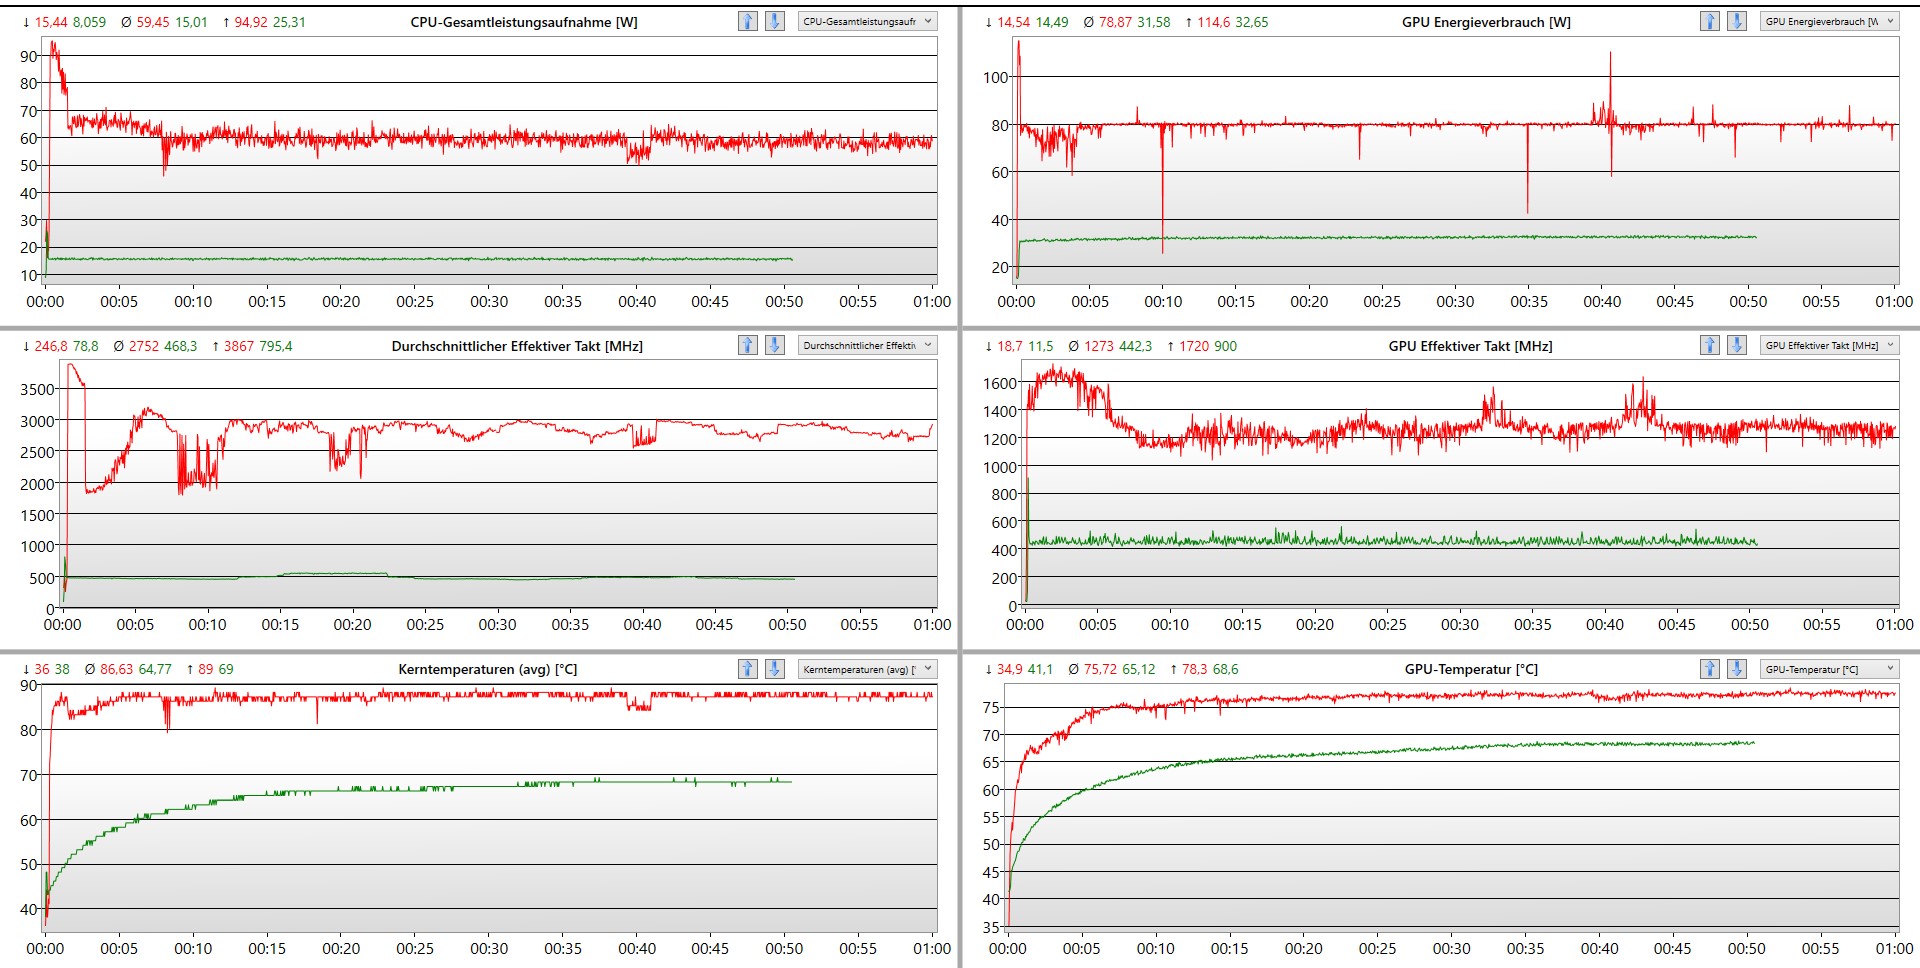
Test na stres
Podczas testu obciążeniowego szybkość działania CPU i GPU Schenkera XMG Focus 16 spada, gdy tylko temperatury osiągną odpowiednio 80° i 90°C.
Mówcy
Schenker XMG Focus 16 ma dwa małe głośniki o niewielkiej dynamice. Głośne są tak naprawdę tylko w środkach i z trudem udaje im się zagłuszyć wentylatory laptopa. Głośniki zewnętrzne podłączone przez gniazdo audio 3,5 mm lub Bluetooth to niemal konieczność. Do laptopa Schenker dołączona jest aplikacja Sound Blaster Cinema 6+. Gwarantuje ona doskonałą jakość dźwięku ze słuchawek.
Schenker XMG Focus 16 (i7-12700H, RTX 3060) analiza dźwięku
(±) | głośność głośnika jest średnia, ale dobra (79.2 dB)
Bas 100 - 315 Hz
(-) | prawie brak basu - średnio 24.4% niższa od mediany
(±) | liniowość basu jest średnia (8.1% delta do poprzedniej częstotliwości)
Średnie 400 - 2000 Hz
(±) | wyższe średnie - średnio 10.6% wyższe niż mediana
(±) | liniowość środka jest średnia (13.1% delta do poprzedniej częstotliwości)
Wysokie 2–16 kHz
(+) | zrównoważone maksima - tylko 4.7% od mediany
(±) | liniowość wysokich wartości jest średnia (10.4% delta do poprzedniej częstotliwości)
Ogólnie 100 - 16.000 Hz
(-) | ogólny dźwięk nie jest liniowy (30.1% różnicy w stosunku do mediany)
W porównaniu do tej samej klasy
» 95% wszystkich testowanych urządzeń w tej klasie było lepszych, 2% podobnych, 3% gorszych
» Najlepszy miał deltę 6%, średnia wynosiła ###średnia###%, najgorsza wynosiła 132%
W porównaniu do wszystkich testowanych urządzeń
» 88% wszystkich testowanych urządzeń było lepszych, 3% podobnych, 9% gorszych
» Najlepszy miał deltę 4%, średnia wynosiła ###średnia###%, najgorsza wynosiła 134%
Asus ROG Flow X16 GV601RW-M5082W analiza dźwięku
(±) | głośność głośnika jest średnia, ale dobra (80.7 dB)
Bas 100 - 315 Hz
(±) | zredukowany bas - średnio 12.7% niższy od mediany
(±) | liniowość basu jest średnia (13.8% delta do poprzedniej częstotliwości)
Średnie 400 - 2000 Hz
(+) | zbalansowane środki średnie - tylko 1.3% od mediany
(+) | średnie są liniowe (4.7% delta do poprzedniej częstotliwości)
Wysokie 2–16 kHz
(±) | wyższe maksima - średnio 6.4% wyższe od mediany
(+) | wzloty są liniowe (6.8% delta do poprzedniej częstotliwości)
Ogólnie 100 - 16.000 Hz
(+) | ogólny dźwięk jest liniowy (12.9% różnicy w stosunku do mediany)
W porównaniu do tej samej klasy
» 17% wszystkich testowanych urządzeń w tej klasie było lepszych, 4% podobnych, 79% gorszych
» Najlepszy miał deltę 6%, średnia wynosiła ###średnia###%, najgorsza wynosiła 132%
W porównaniu do wszystkich testowanych urządzeń
» 12% wszystkich testowanych urządzeń było lepszych, 3% podobnych, 85% gorszych
» Najlepszy miał deltę 4%, średnia wynosiła ###średnia###%, najgorsza wynosiła 134%
Zarządzanie energią - typowe zużycie energii przez laptopa do gier
Pobór mocy
Omawiany laptop jest wyposażony w 180-watowy zasilacz firmy Lite-ON (PA-1181-76). Podczas testu obciążeniowego zmierzyliśmy długotrwały pobór mocy na poziomie 190 W. Ogólnie rzecz biorąc, zasilacz wydaje się słaby, biorąc pod uwagę konfigurację laptopa. Porównawcze urządzenia od Della i Lenovo, o konfiguracji zbliżonej do laptopa Schenkera, są wyposażone w co najmniej 230-watowy zasilacz. I te laptopy to wykorzystują.
Na biegu jałowym laptop zużywa o 3 waty więcej niż urządzenia porównawcze, co stawia go na równi z innymi laptopami do gier pod względem zapotrzebowania na energię. Podsumowując, Schenker XMG Focus 16 mimo małego zasilacza nie jest raczej energooszczędnym cudem.
| wyłączony / stan wstrzymania | |
| luz | |
| obciążenie |
|
Legenda:
min: | |
| Schenker XMG Focus 16 (i7-12700H, RTX 3060) i7-12700H, GeForce RTX 3060 Laptop GPU, Samsung SSD 980 Pro 1TB MZ-V8P1T0BW, IPS, 2560x1600, 16" | Asus ZenBook Pro 16X OLED UX7602ZM-ME115W i9-12900H, GeForce RTX 3060 Laptop GPU, Samsung PM9A1 MZVL21T0HCLR, OLED, 3840x2400, 16" | Dell G16 7620 i7-12700H, GeForce RTX 3060 Laptop GPU, WDC PC SN810 512GB, IPS, 2560x1600, 16" | Asus ROG Flow X16 GV601RW-M5082W R9 6900HS, GeForce RTX 3070 Ti Laptop GPU, Micron 3400 1TB MTFDKBA1T0TFH, Mini LED, 2560x1600, 16.1" | Lenovo ThinkPad X1 Extreme G5-21DE003RGE i7-12700H, GeForce RTX 3060 Laptop GPU, Micron 3400 1TB MTFDKBA1T0TFH, IPS, 3840x2400, 16" | Lenovo Legion Slim 7-16IAH 82TF004YGE i7-12700H, GeForce RTX 3060 Laptop GPU, SK Hynix HFS001TEJ9X115N, IPS LED, 2560x1600, 16" | Lenovo Legion 5 Pro 16IAH7H i7-12700H, GeForce RTX 3060 Laptop GPU, 2x Samsung PM9A1 MZVL21T0HCLR (RAID 0), IPS, 2560x1600, 16" | Przeciętny NVIDIA GeForce RTX 3060 Laptop GPU | Średnia w klasie Gaming | |
|---|---|---|---|---|---|---|---|---|---|
| Power Consumption | 20% | -5% | -21% | 1% | 7% | -44% | 14% | -1% | |
| Idle Minimum * (Watt) | 14.7 | 11.1 24% | 14.4 2% | 12.2 17% | 11.8 20% | 13.3 10% | 22.8 -55% | 10.4 ? 29% | 13.2 ? 10% |
| Idle Average * (Watt) | 18.6 | 11.4 39% | 17.8 4% | 25.5 -37% | 22.4 -20% | 17.5 6% | 26.5 -42% | 14.5 ? 22% | 18.9 ? -2% |
| Idle Maximum * (Watt) | 21.2 | 14.4 32% | 31.5 -49% | 29.8 -41% | 23.1 -9% | 18.4 13% | 41 -93% | 21.4 ? -1% | 24.3 ? -15% |
| Load Average * (Watt) | 121 | 137.4 -14% | 101.2 16% | 183 -51% | 138 -14% | 122.8 -1% | 191 -58% | 109.3 ? 10% | 108 ? 11% |
| Witcher 3 ultra * (Watt) | 174 | 136 22% | 176.9 -2% | 183.6 -6% | 129.9 25% | 154.7 11% | 194.7 -12% | ||
| Load Maximum * (Watt) | 235 | 197 16% | 242.9 -3% | 253 -8% | 225.6 4% | 232.6 1% | 238 -1% | 206 ? 12% | 254 ? -8% |
* ... im mniej tym lepiej
Power consumption Witcher 3 / stress test
Power consumption with an external monitor
Żywotność baterii
Focus 16 pakuje niewielki akumulator o pojemności 54 Wh. Z tego powodu nie powinno dziwić, że czas pracy na baterii jest mniejszy niż połowa urządzeń porównawczych. Niemniej jednak tryb oszczędzania energii Control Center jest bardzo skuteczny. Test surfowania po internecie przez WiFi przy pełnej jasności ekranu przeprowadzono przy ustawieniu trybu rozrywkowego, a test 150 cd/m² przeprowadzono przy ustawieniu energooszczędnym i częstotliwości odświeżania 60Hz. Ustawiony w tym trybie akumulator wytrzymuje znacznie dłużej.
| Schenker XMG Focus 16 (i7-12700H, RTX 3060) i7-12700H, GeForce RTX 3060 Laptop GPU, 54 Wh | Asus ZenBook Pro 16X OLED UX7602ZM-ME115W i9-12900H, GeForce RTX 3060 Laptop GPU, 96 Wh | Dell G16 7620 i7-12700H, GeForce RTX 3060 Laptop GPU, 84 Wh | Asus ROG Flow X16 GV601RW-M5082W R9 6900HS, GeForce RTX 3070 Ti Laptop GPU, 90 Wh | Lenovo ThinkPad X1 Extreme G5-21DE003RGE i7-12700H, GeForce RTX 3060 Laptop GPU, 90 Wh | Lenovo Legion Slim 7-16IAH 82TF004YGE i7-12700H, GeForce RTX 3060 Laptop GPU, 99.99 Wh | Lenovo Legion 5 Pro 16IAH7H i7-12700H, GeForce RTX 3060 Laptop GPU, 80 Wh | Średnia w klasie Gaming | |
|---|---|---|---|---|---|---|---|---|
| Czasy pracy | 86% | -23% | -9% | 31% | 1% | -41% | 26% | |
| WiFi v1.3 (h) | 4.8 | 8.9 85% | 5 4% | 5.7 19% | 6.7 40% | 5.2 8% | 3.6 -25% | 7.02 ? 46% |
| Load (h) | 1.4 | 2.6 86% | 0.7 -50% | 0.9 -36% | 1.7 21% | 1.3 -7% | 0.6 -57% | 1.47 ? 5% |
| Reader / Idle (h) | 12.7 | 7.1 | 8.71 ? | |||||
| Witcher 3 ultra (h) | 0.9 | 1.5 | 2.1 | |||||
| H.264 (h) | 7.3 | 9.5 | 4.1 | 8.26 ? |
Za
Przeciw
Werdykt - przeciętny laptop do gier z ponadprzeciętną obsługą
Schenker XMG Focus 16 dostarczył w testowanych grach konsekwentnie wysokie liczby fps-ów. Ogólnie rzecz biorąc, laptop do gier z kartą Nvidia RTX 3060 oferuje ponadprzeciętną wydajność. Niemniej jednak konkurencja w postaci Dell G16 lub Lenovo Legion 5 Pro dostarcza więcej surowej mocy w niemal identycznej cenie. Mimo to zysk wydajności jest raczej marginalny.
Laptop Schenkera może się jednak pochwalić mocniejszymi kompetencjami miękkimi niż konkurencja ze strony Della i Lenovo. Klawiatura laptopa Schenkera imponuje dużym skokiem klawiszy i dobrym haptycznym sprzężeniem zwrotnym. XMG Focus 16 cieszy się również dobrym wyborem dobrze rozmieszczonych portów. Dodatkowo, wsparcie klienta Schenkera jest również imponujące. Tak jak poprzednio, odpowiedzi na zapytania udzielane są szybko i kompetentnie, często w ciągu kilku godzin. Dzięki temu Schenker po raz trzeci z rzędu zajął pierwsze miejsce w naszym badaniu obsługa klienta w zakresie laptopów i smartfonów. Design XMG Focus 16 to kwestia gustu. Jak na laptop do gier, urządzenie jest niepozorne, czarne i pudełkowate.
XMG Focus 16 czerpie ze sprzętu sporo mocy, nie osiągając przy tym granic jego możliwości.
Ogólnie rzecz biorąc, laptop Schenker jest solidny jak skała, ale nie jest w stanie osiągnąć najwyższej wydajności. W żadnym z obszarów naszych benchmarków i analiz laptop do gier nie był w stanie zdominować konkurencji. Najlepszą wydajność karty graficznej można znaleźć w modelu Asus ROG Flow X16, natomiast Lenovo Legion 5 Pro uzyskał najlepszą wydajność procesora. Dodatkowo, Asus Zenbook Pro 16X OLED ma najbardziej responsywny ekran. W każdym z tych obszarów laptop Schenkera oferuje adekwatną lub ponadprzeciętną wydajność.
Cena i dostępność
Bestware.com to sklep internetowy Schenkera, w którym można skonfigurować i zamówić laptopa gamingowego. W chwili pisania recenzji naszą testową specyfikację XMG Focus 16można mieć za około 1800 dolarów amerykańskich. Z tylko 8 GB RAM i bez dysku SSD NVMe, cena bazowa laptopa wynosi około 1600 dolarów.
Schenker XMG Focus 16 (i7-12700H, RTX 3060)
- 21/12/2022 v7 (old)
Marc Herter
Price comparison

