 Deutsch
 English
 Español
 Français
 Italiano
 Nederlands
 Polski
 Português
 Русский
 Türkçe
 Svenska
 Chinese
 Magyar
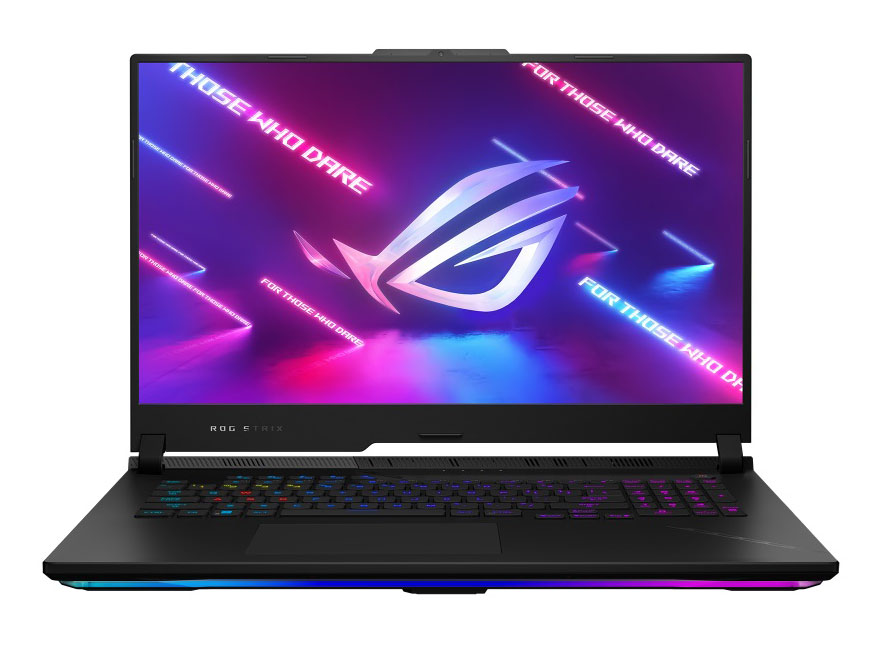
Recenzja laptopa Asus ROG Strix Scar 17 G733PY: Intel nie jest już królem

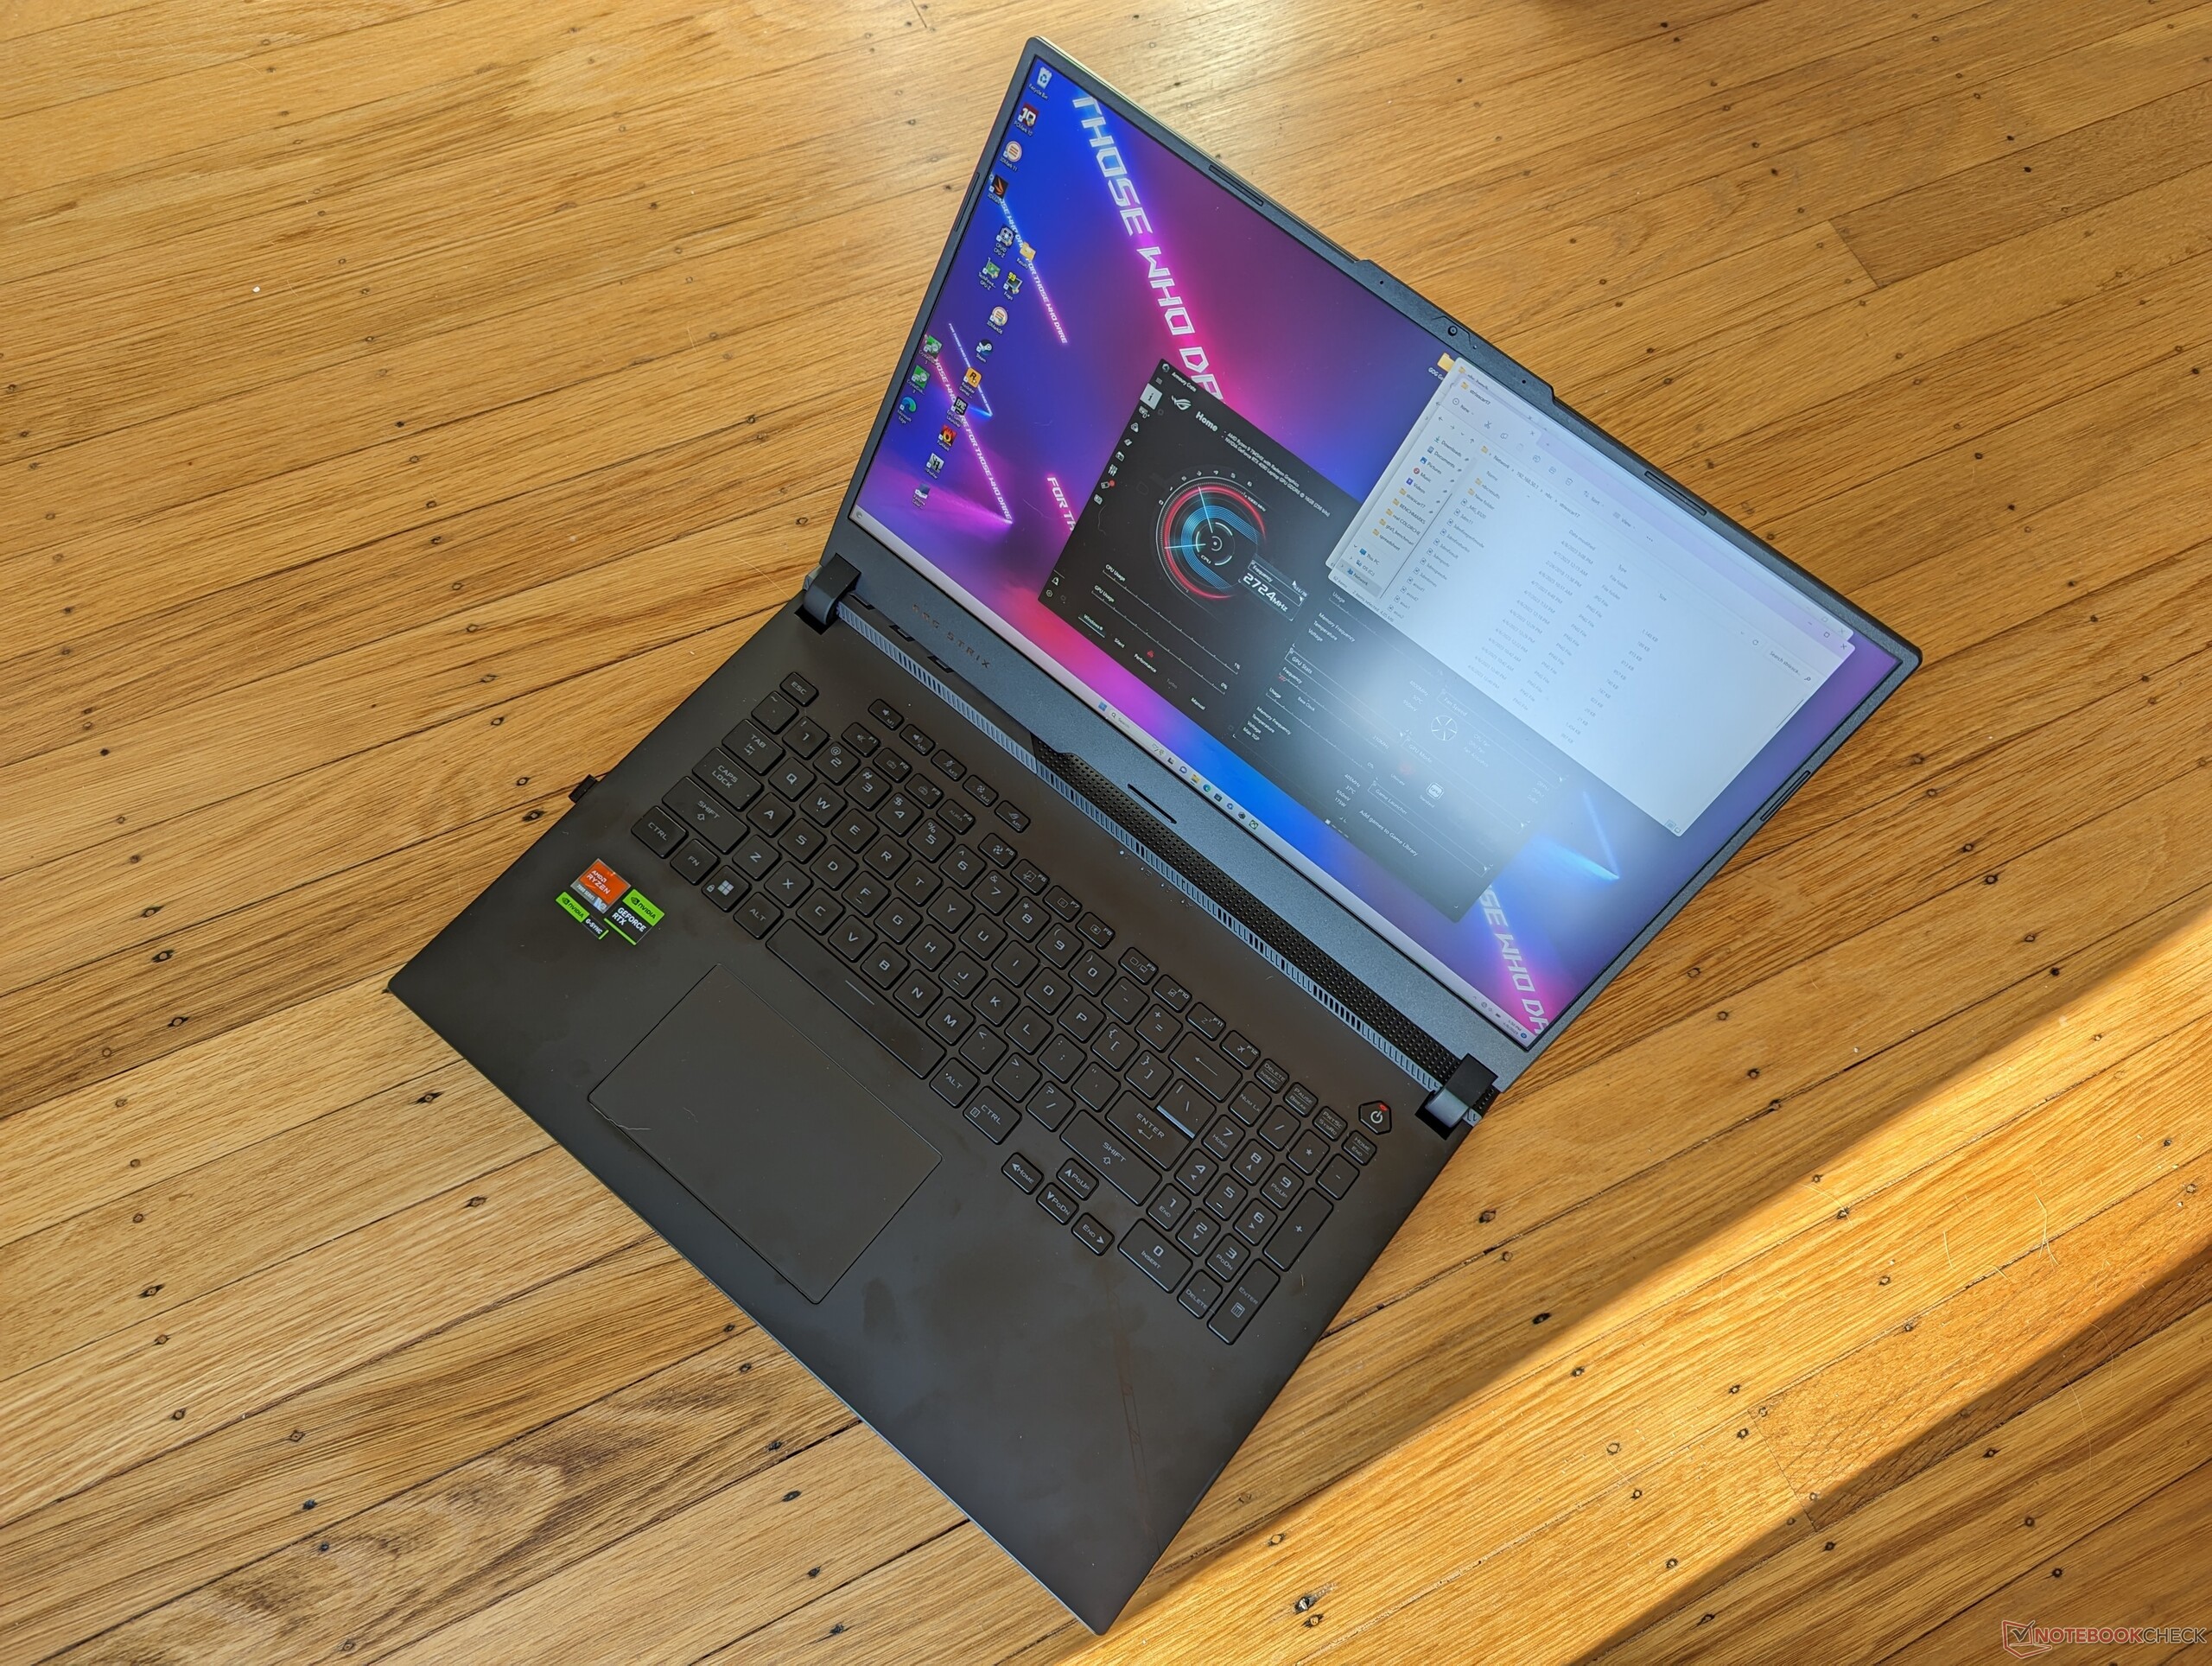
Podczas targów CES 2023 Asus odświeżył swoją topową 17,3-calową serię ROG Strix Scar 17, wyposażając ją w najnowsze procesory 13. generacji Intela, procesory Zen 4 AMD oraz układy graficzne Nvidia Ada Lovelace, które zastąpiły zeszłoroczną linię. Poza tymi wewnętrznymi aktualizacjami, zewnętrzna konstrukcja obudowy pozostaje jednak niemal identyczna rok do roku. Polecamy sprawdzić nasze dotychczasowe recenzje ROG Strix Scar 17 z 2022 roku, aby dowiedzieć się więcej o fizycznych cechach modelu 2023. Wszelkie różnice między nimi zostaną odnotowane poniżej.
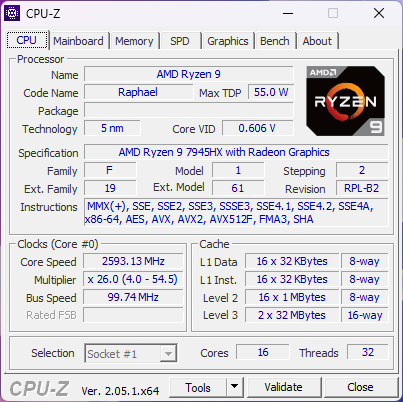
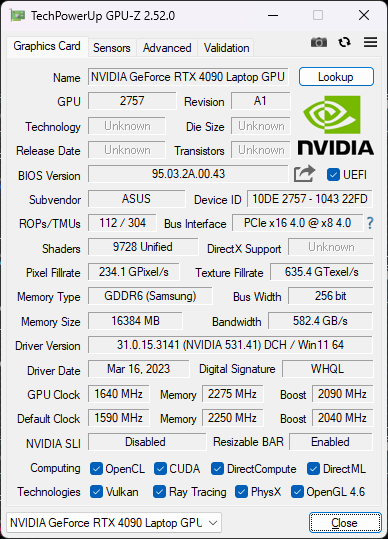
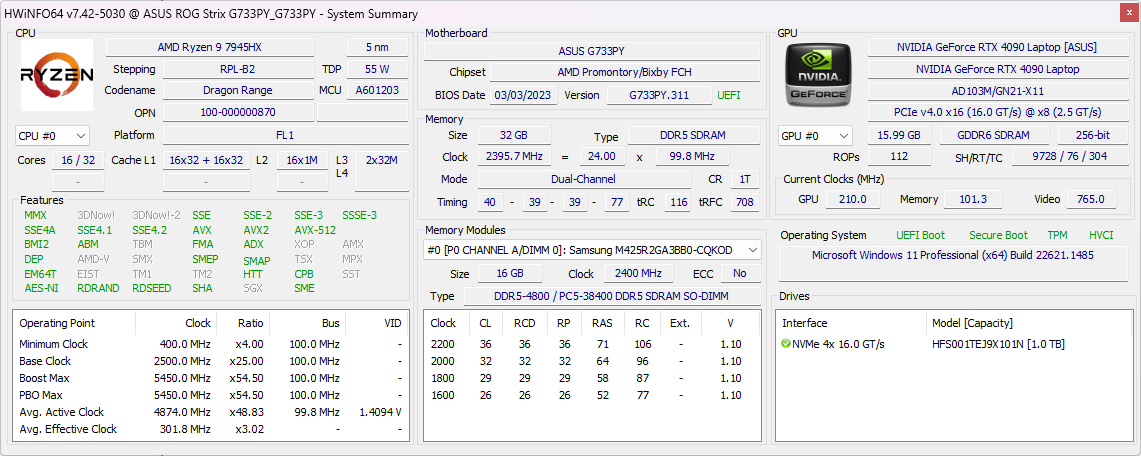
Nasza konfiguracja w recenzji to najwyższy SKU wyposażony w procesor Ryzen 9 7945HX i 175 W GeForce RTX 4090 GPU. Inne jednostki SKU są dostępne w wersji z RTX 4060, ale wszystkie posiadają ten sam panel IPS 240 Hz 1440p.
Do konkurentów Strix Scar 17 należą inne wysokiej klasy 17-calowe laptopy do gier, jak np Razer Blade 17, Alienware m17, MSI GE77lub Aorus 17.
Więcej recenzji Asusa:
Potencjalni konkurenci w porównaniu
Rating | Date | Model | Weight | Height | Size | Resolution | Best Price |
|---|---|---|---|---|---|---|---|
| 88.3 % | 04/2023 | Asus ROG Strix Scar 17 G733PY-XS96 R9 7945HX, NVIDIA GeForce RTX 4090 Laptop GPU | 2.9 kg | 28.3 mm | 17.30" | 2560x1440 | |
| 88.3 % | 03/2023 | MSI GE78HX 13VH-070US i9-13950HX, NVIDIA GeForce RTX 4080 Laptop GPU | 3 kg | 23 mm | 17.00" | 2560x1600 | |
| 89.9 % | 03/2023 | Eluktronics Mech-17 GP2 i9-13900HX, NVIDIA GeForce RTX 4090 Laptop GPU | 2.9 kg | 27 mm | 17.00" | 2560x1600 | |
| 88.4 % | 04/2023 | Asus ROG Strix G17 G713PI R9 7945HX, NVIDIA GeForce RTX 4070 Laptop GPU | 2.8 kg | 30.7 mm | 17.30" | 2560x1440 | |
| 83.7 % | Aorus 17X XES i9-12900HX, GeForce RTX 3070 Ti Laptop GPU | 2.7 kg | 30 mm | 17.30" | 1920x1080 | ||
| 86.1 % | 01/2023 | Alienware m17 R5 (R9 6900HX, RX 6850M XT) R9 6900HX, Radeon RX 6850M XT | 3.4 kg | 26.7 mm | 17.00" | 3840x2160 |
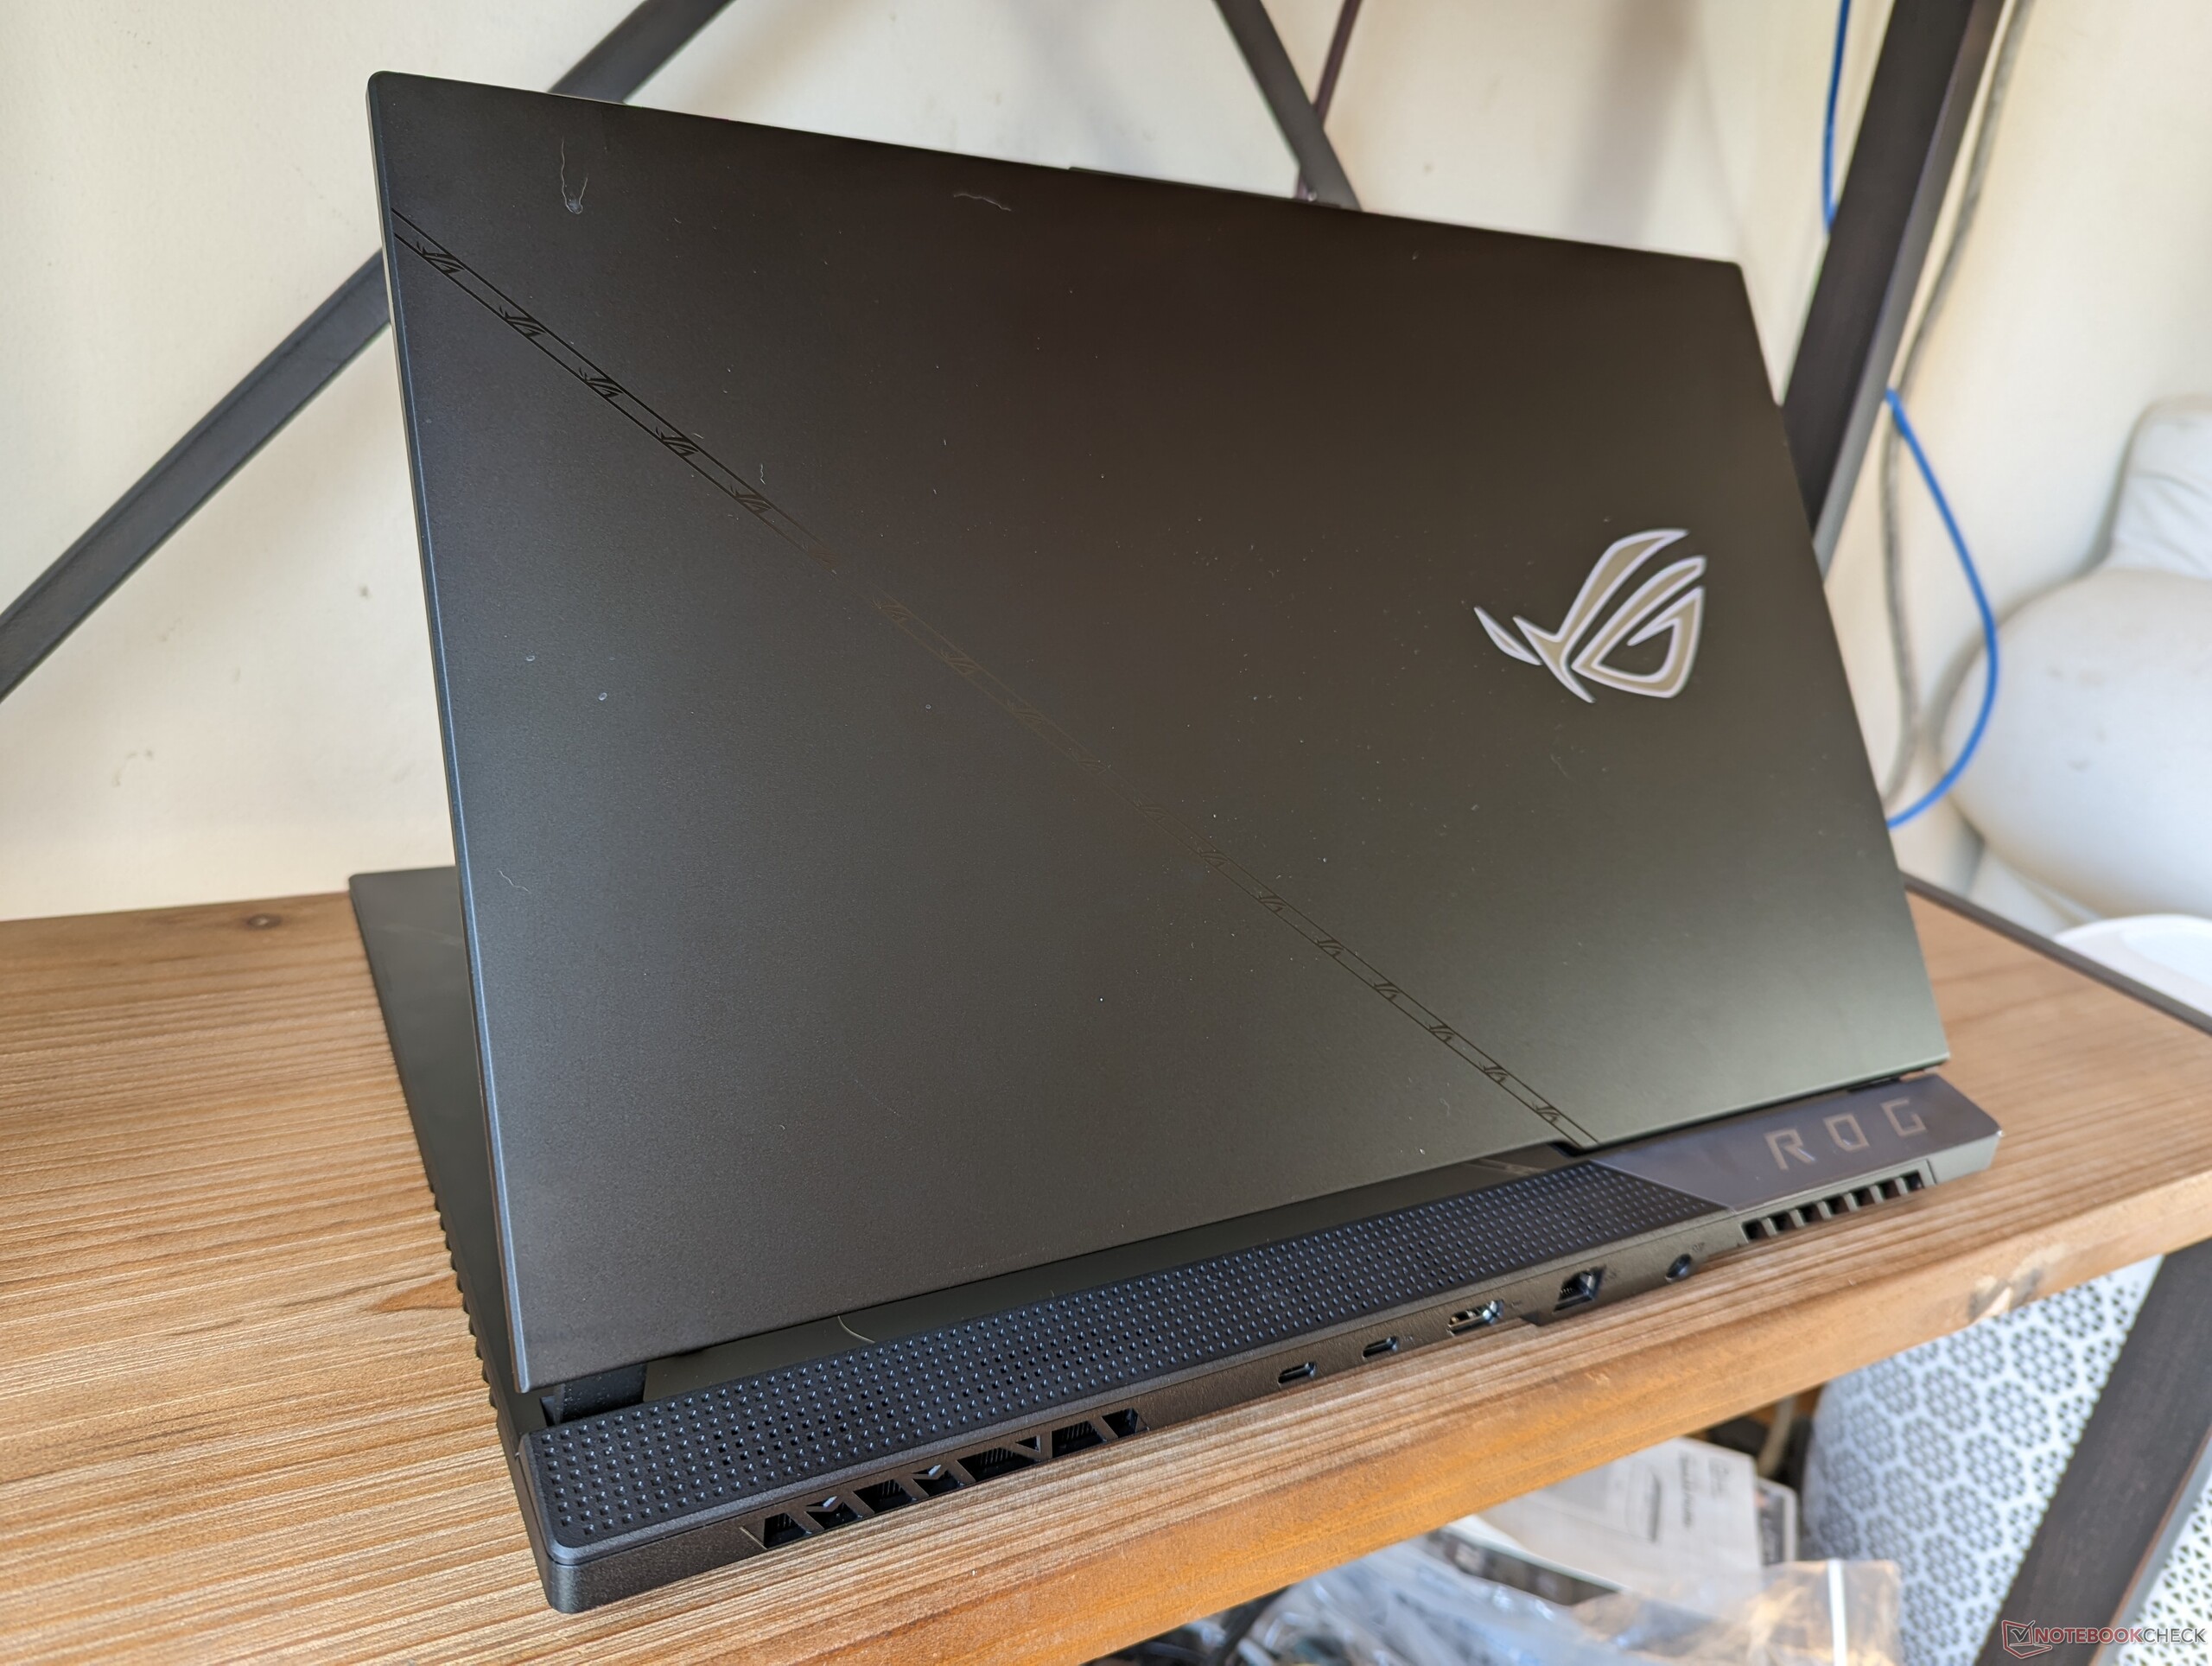
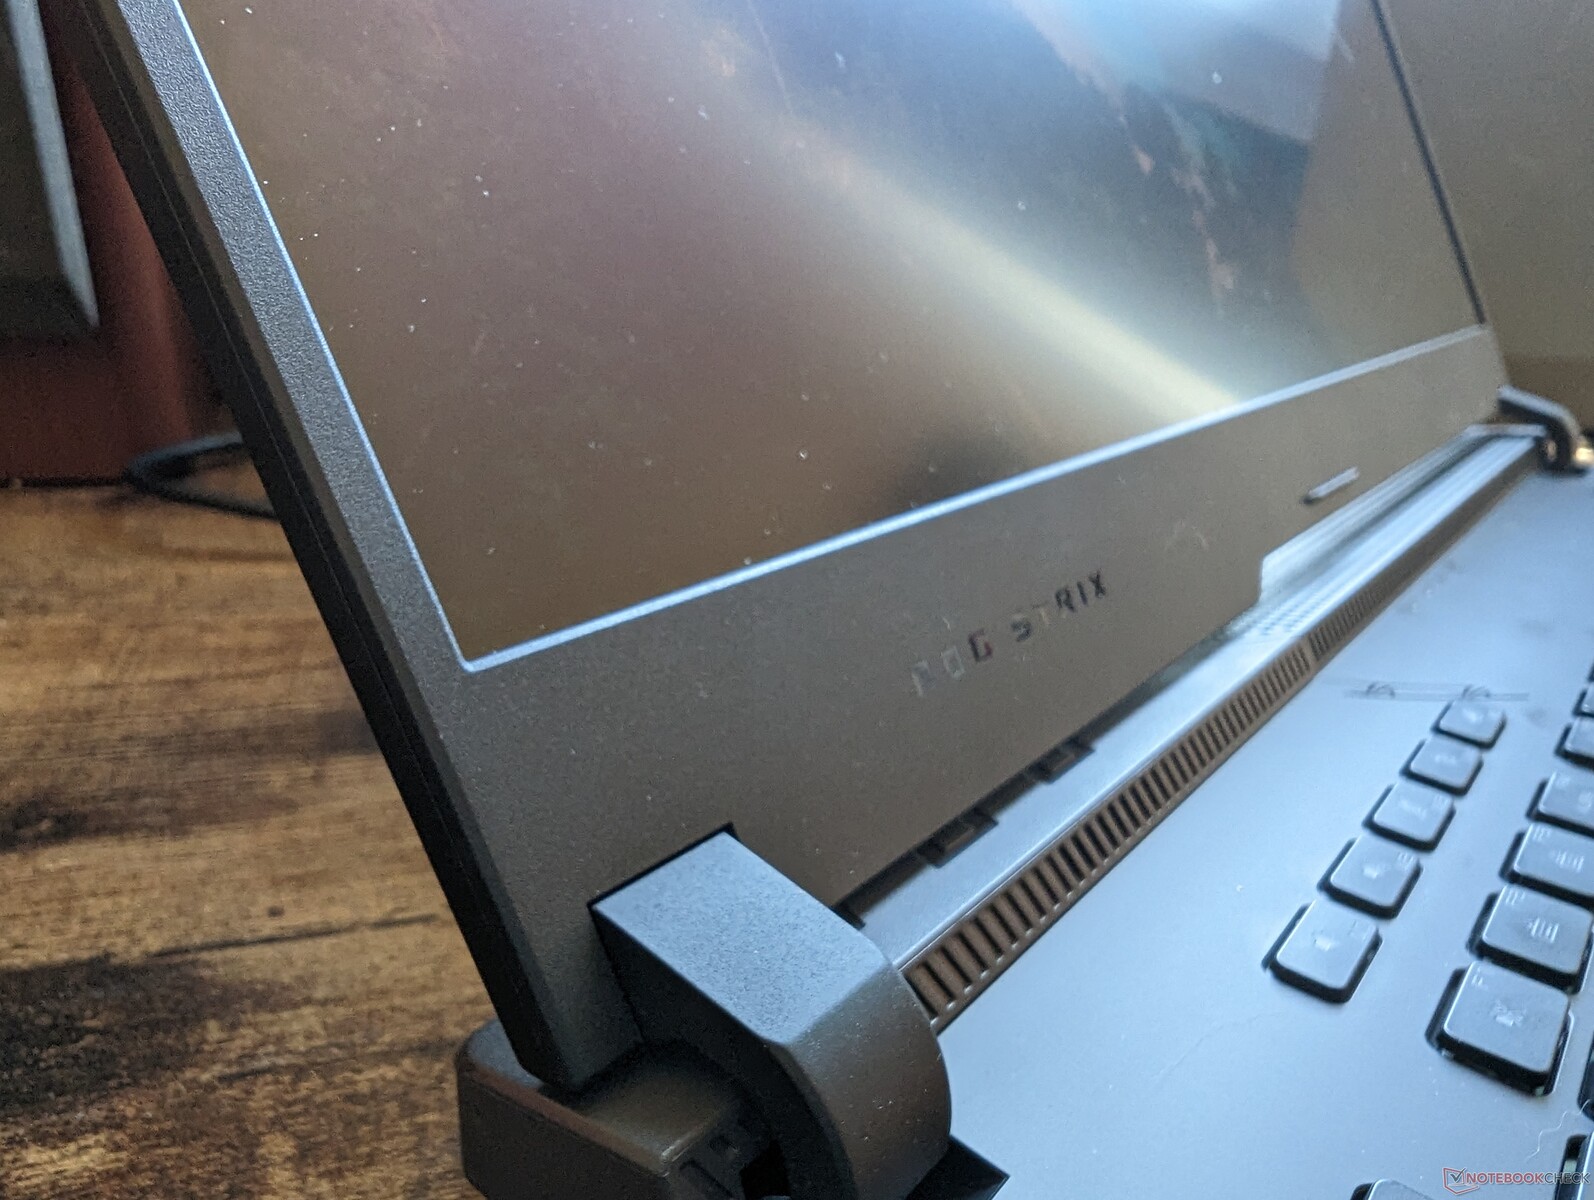
Sprawa - bez zmian... Prawie
Między modelami 2023 i 2022 występują trzy istotne różnice, które przedstawiają się następująco:
- Asus Keystone nie jest już wspierany. Producent prawdopodobnie uznał, że niewielu właścicieli korzystało z tej funkcji w pierwszej kolejności.
- Nowa kamera internetowa. Jest teraz zintegrowana kamerka internetowa, podczas gdy w zeszłorocznym modelu zabrakłoby jej całkowicie.
- Nowe powierzchowne oznaczenia na podkładkach pod dłonie i zewnętrznej pokrywie.
Ogólna obudowa jest poza tym identyczna jak rok wcześniej.
Komunikacja
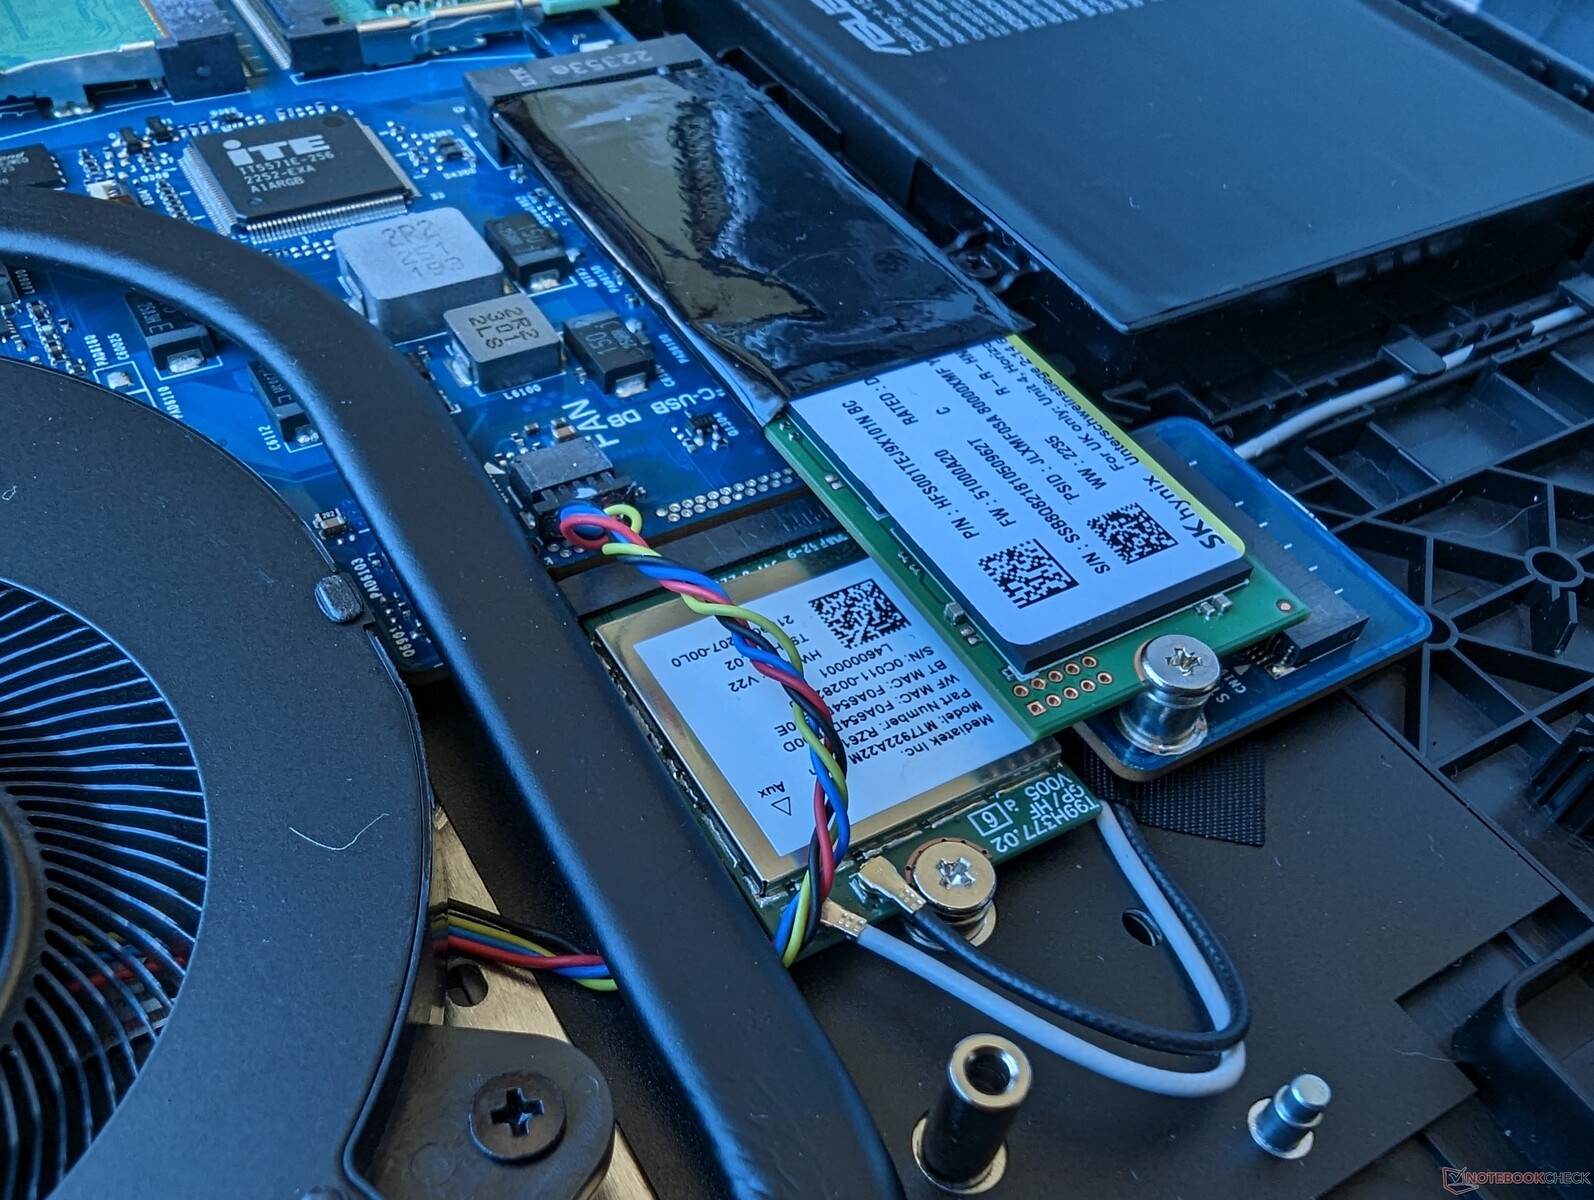
Wi-Fi 6E jest zapewnione przez MediaTek MT7922 zamiast bardziej powszechnego Intel AX211, prawdopodobnie dlatego, że jest to konstrukcja skoncentrowana na AMD-Nvidii. Prędkość transferu i wydajność są jednak stabilne i niezawodne po sparowaniu z naszym routerem testowym Asus AXE11000.
| Networking | |
| iperf3 transmit AXE11000 | |
| Asus ROG Strix G17 G713PI | |
| Eluktronics Mech-17 GP2 | |
| MSI GE78HX 13VH-070US | |
| Alienware m17 R5 (R9 6900HX, RX 6850M XT) | |
| Asus ROG Strix Scar 17 G733PY-XS96 | |
| iperf3 receive AXE11000 | |
| Asus ROG Strix G17 G713PI | |
| Eluktronics Mech-17 GP2 | |
| Asus ROG Strix Scar 17 G733PY-XS96 | |
| MSI GE78HX 13VH-070US | |
| Alienware m17 R5 (R9 6900HX, RX 6850M XT) | |
| iperf3 transmit AXE11000 6GHz | |
| Aorus 17X XES | |
| Asus ROG Strix Scar 17 G733PY-XS96 | |
| MSI GE78HX 13VH-070US | |
| iperf3 receive AXE11000 6GHz | |
| Aorus 17X XES | |
| MSI GE78HX 13VH-070US | |
| Asus ROG Strix Scar 17 G733PY-XS96 | |
Kamera internetowa
Chociaż kamera internetowa jest lepsza niż brak kamery, Asus poszedł z najniższym wspólnym mianownikiem, instalując czujnik 1 MP zamiast czujnika 2 MP lub 5 MP. Inne laptopy do gier, takie jak Alienware m17 R1 lub Razer Blade mają dla porównania kamery internetowe o wyższej rozdzielczości. Asus nie obsługuje podczerwieni.


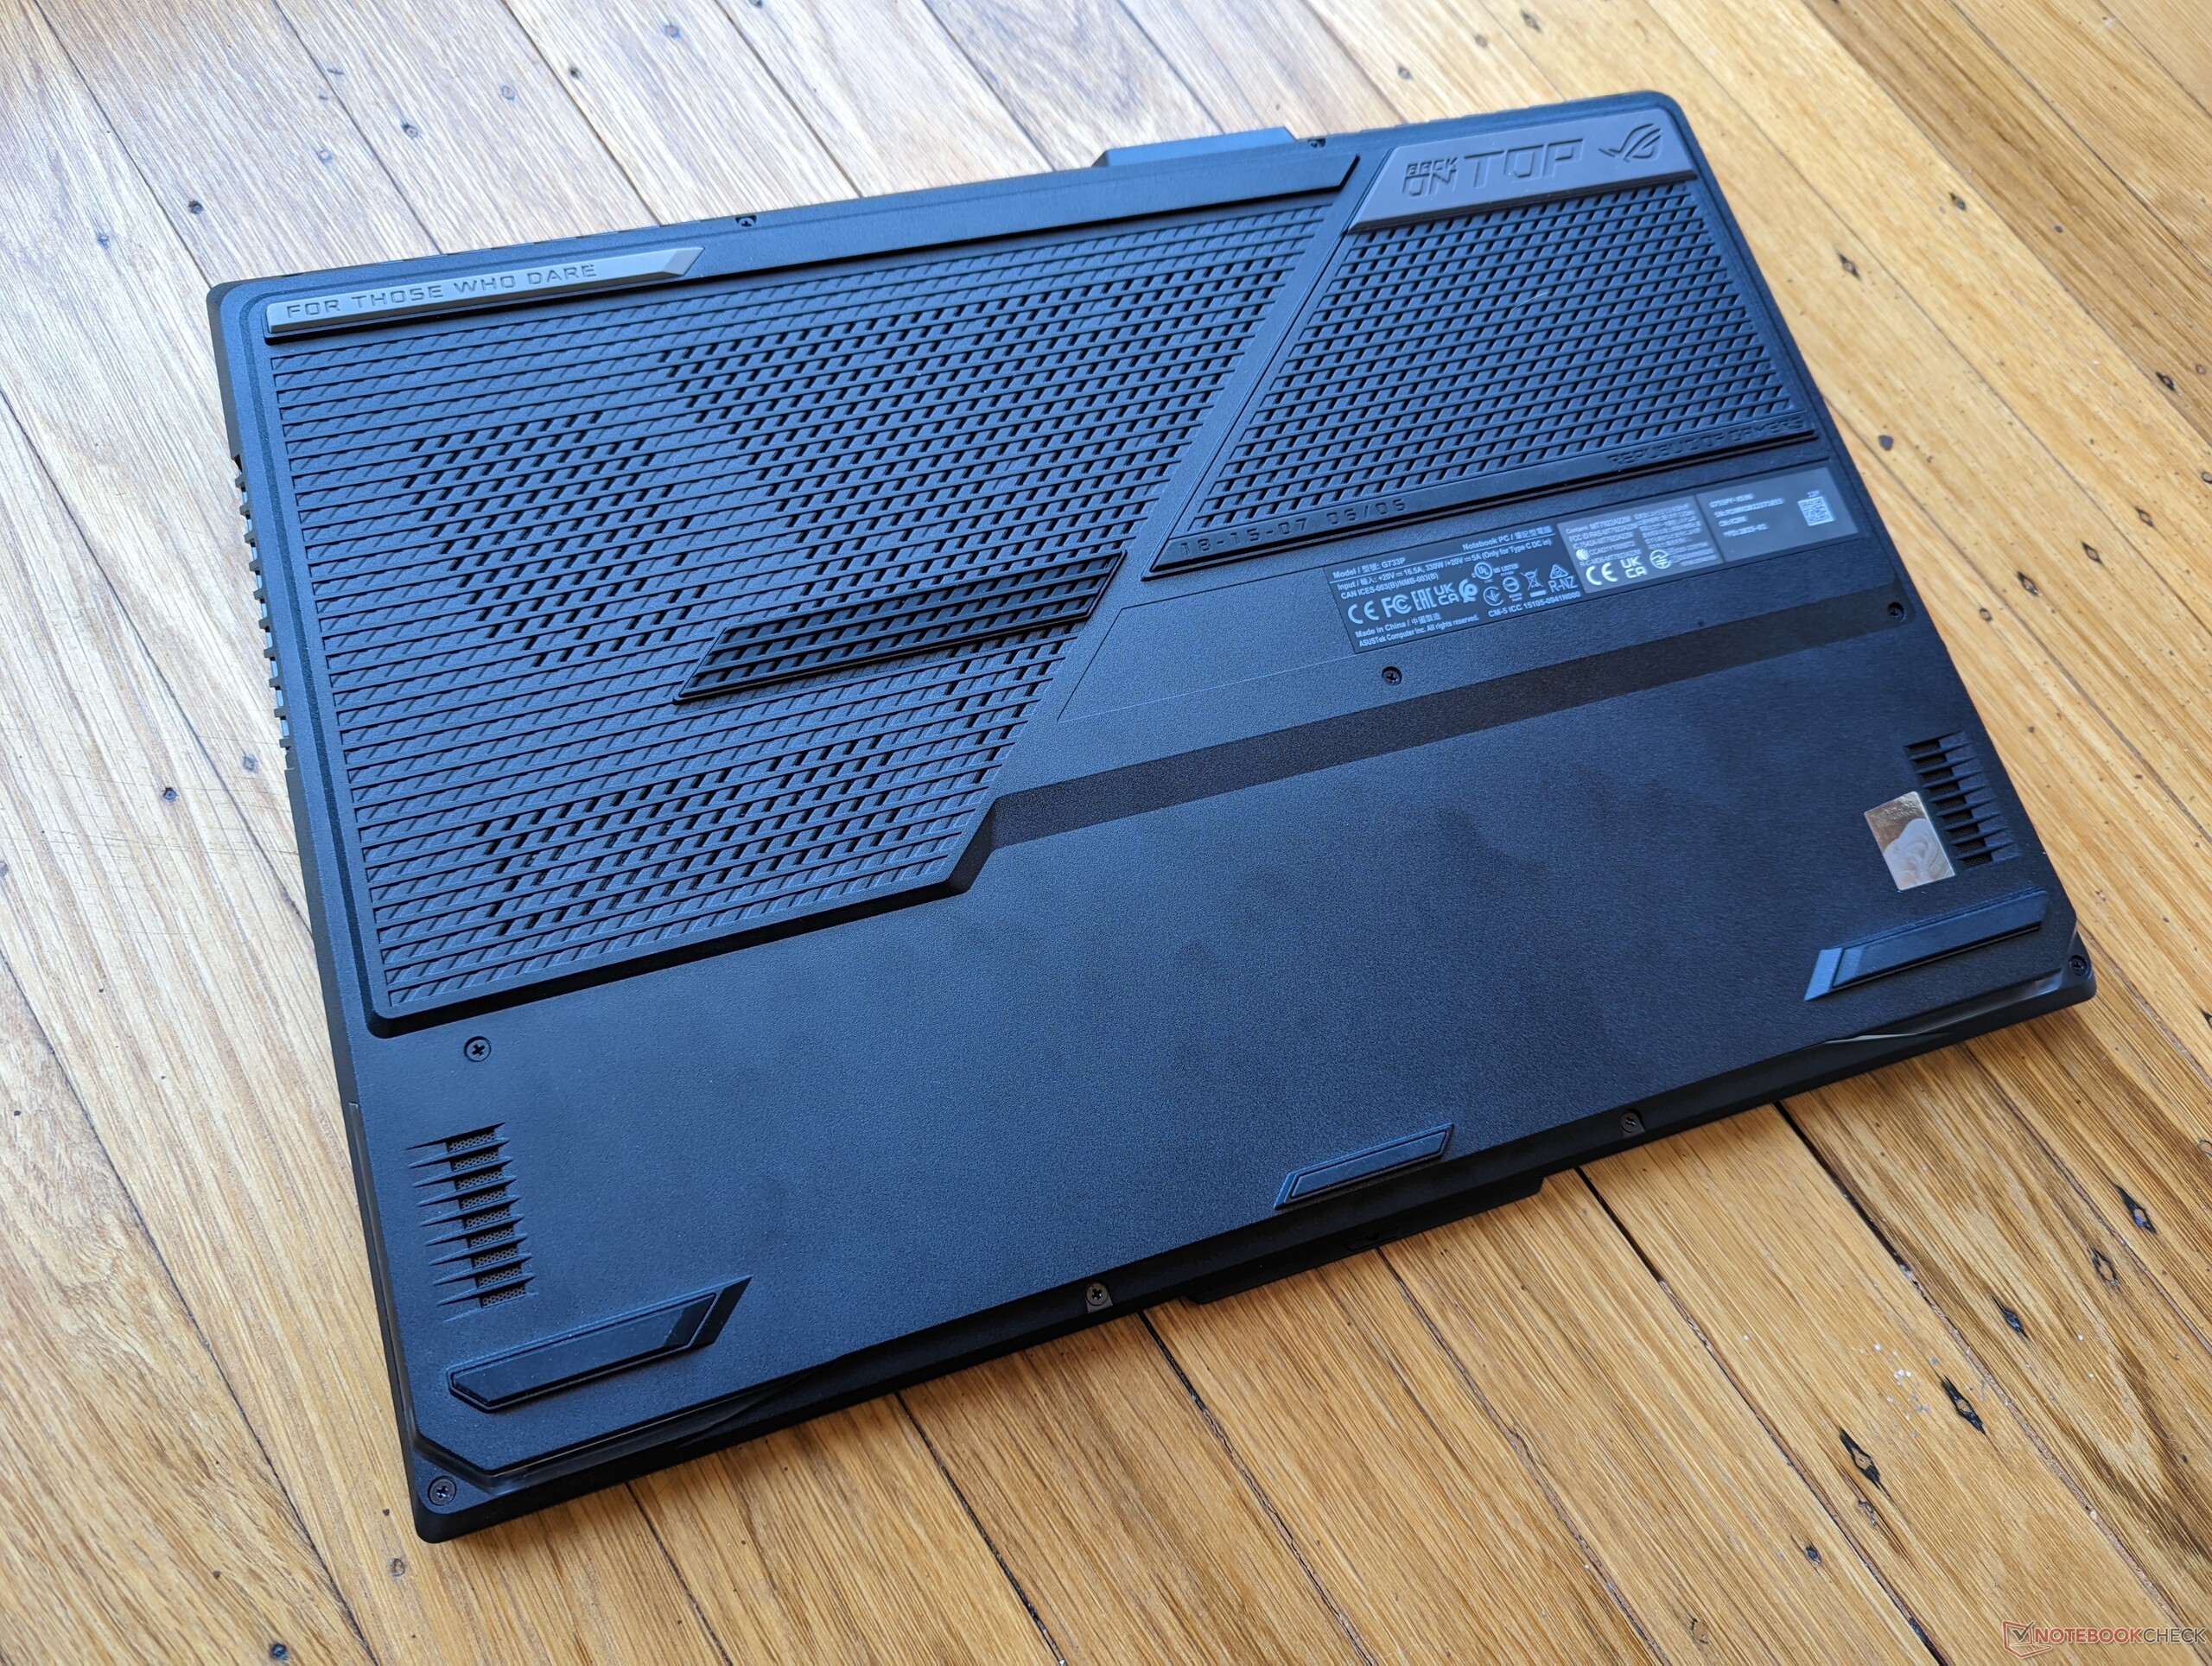
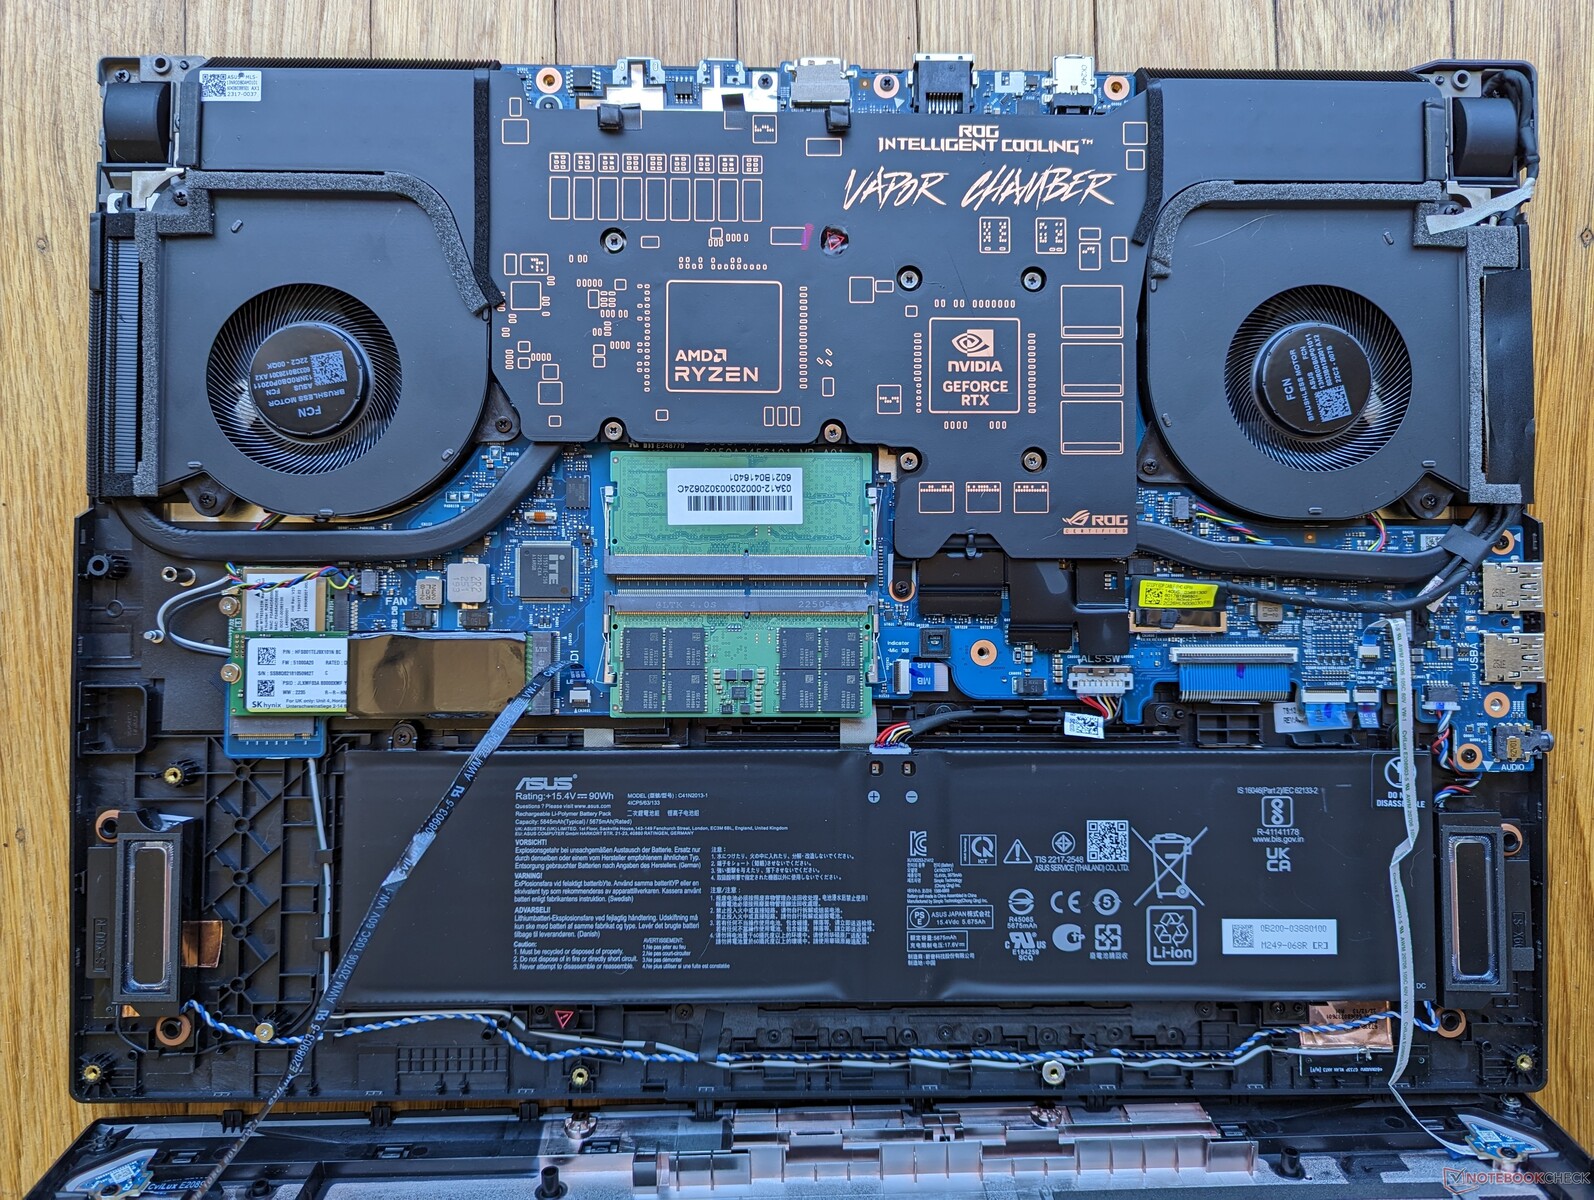
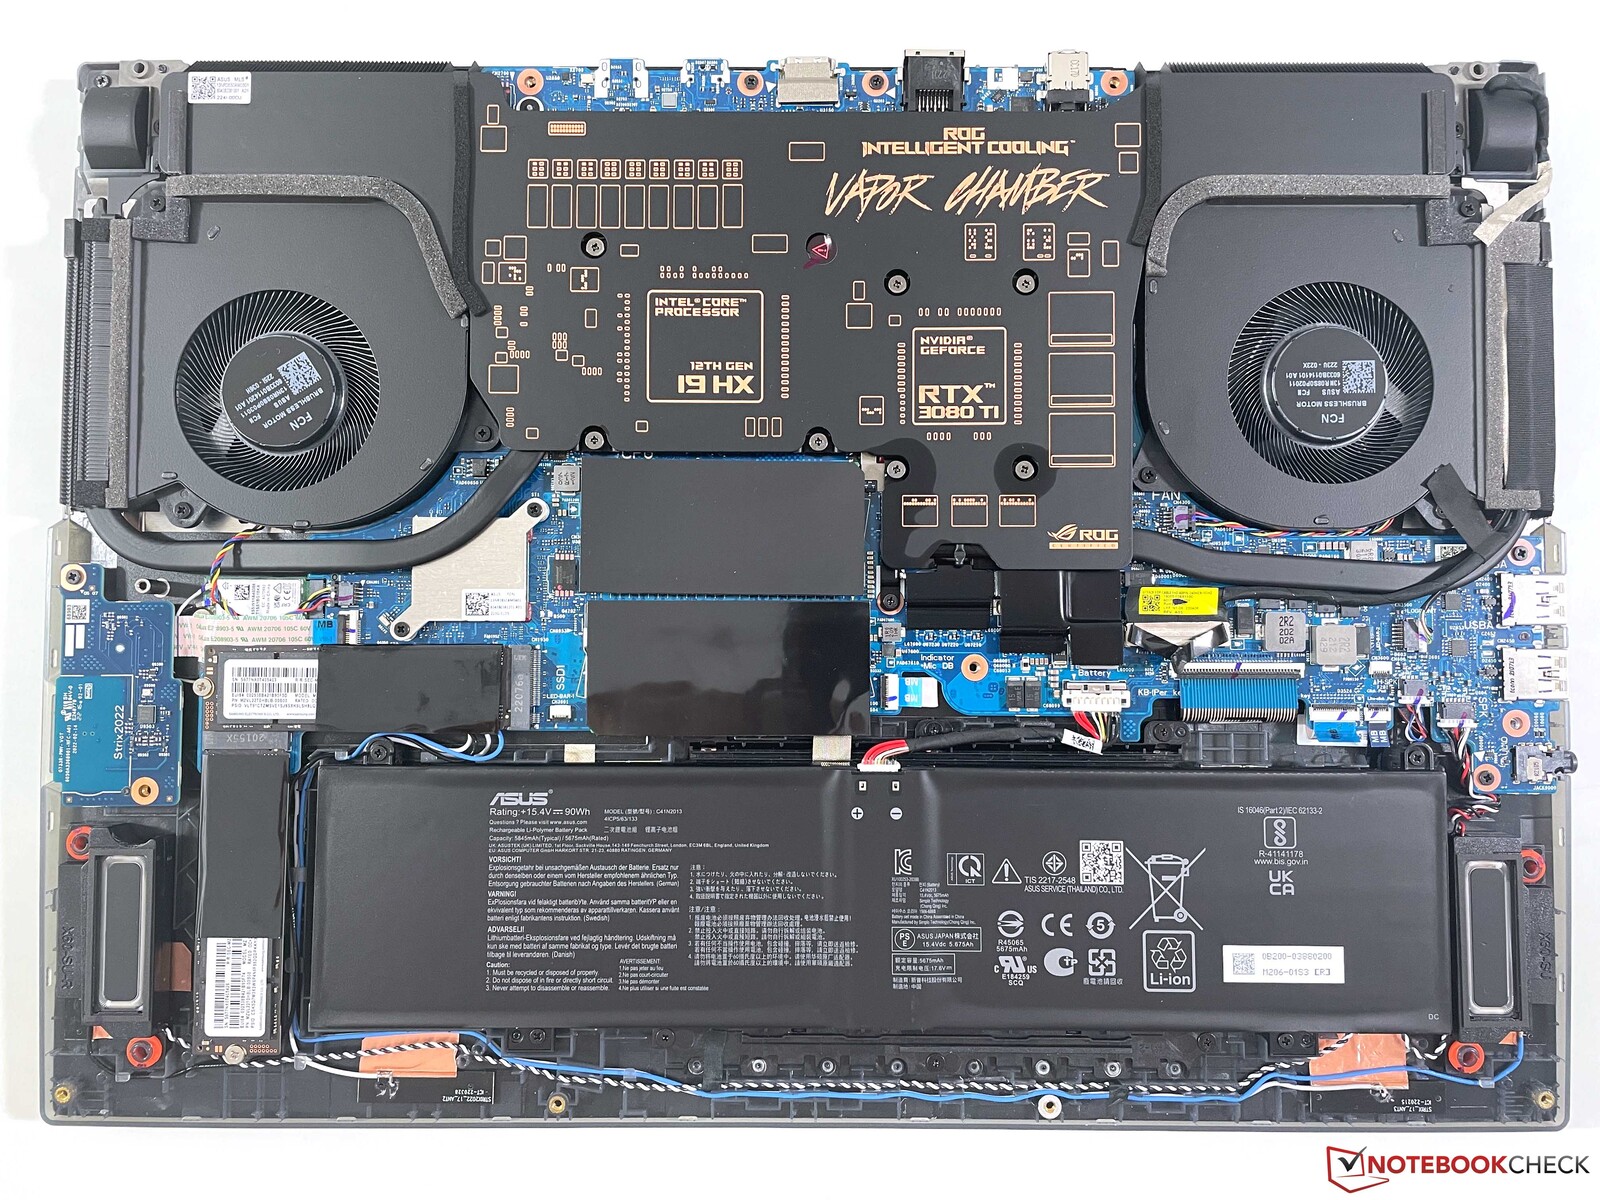
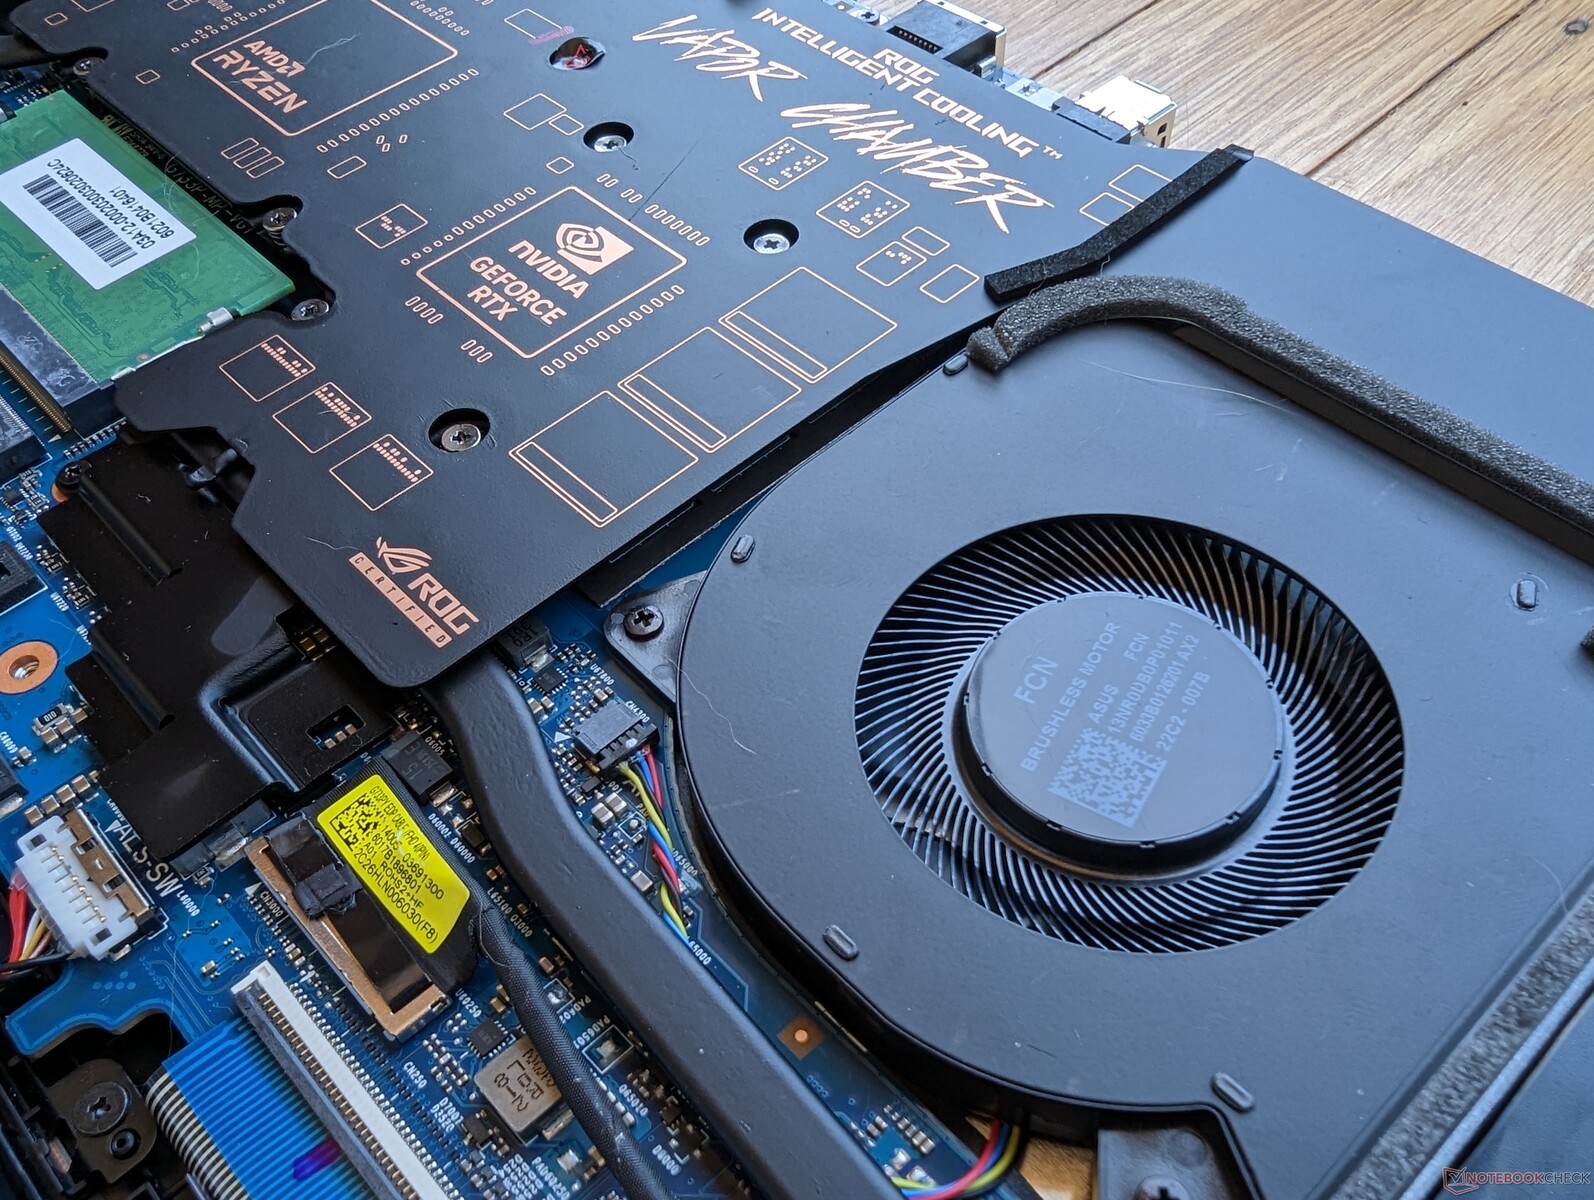
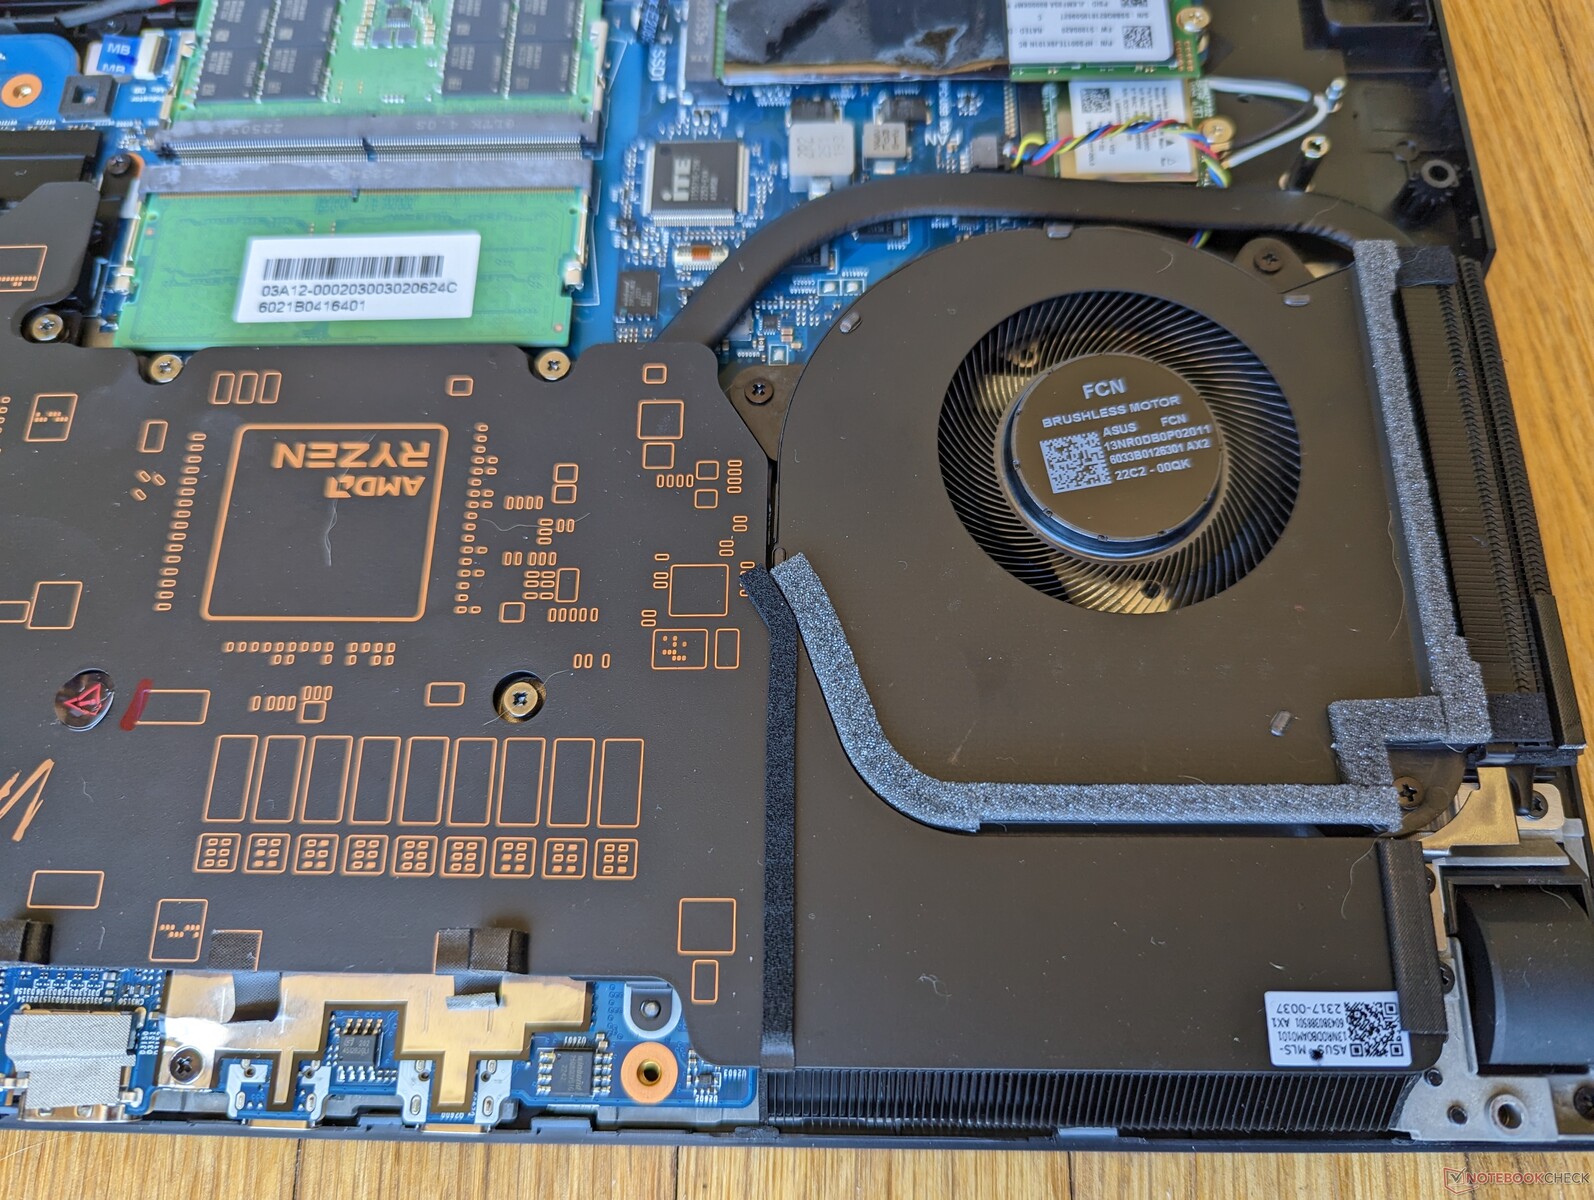
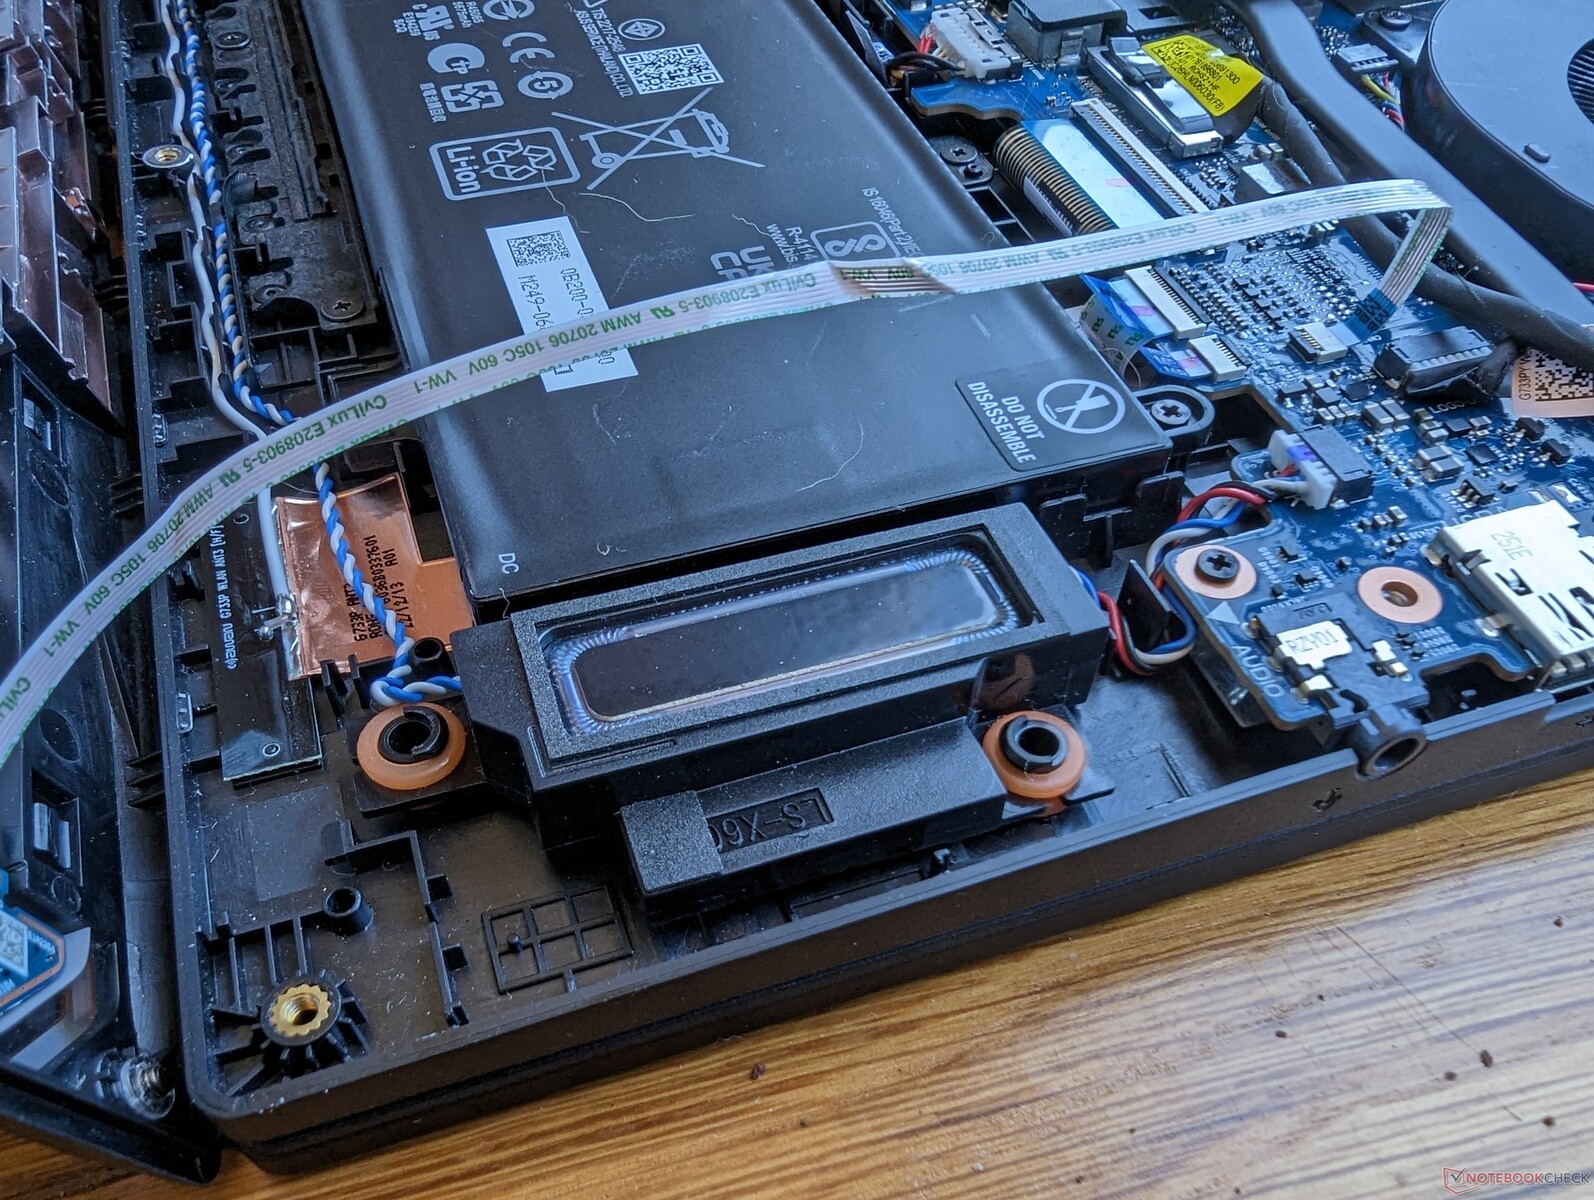
Konserwacja
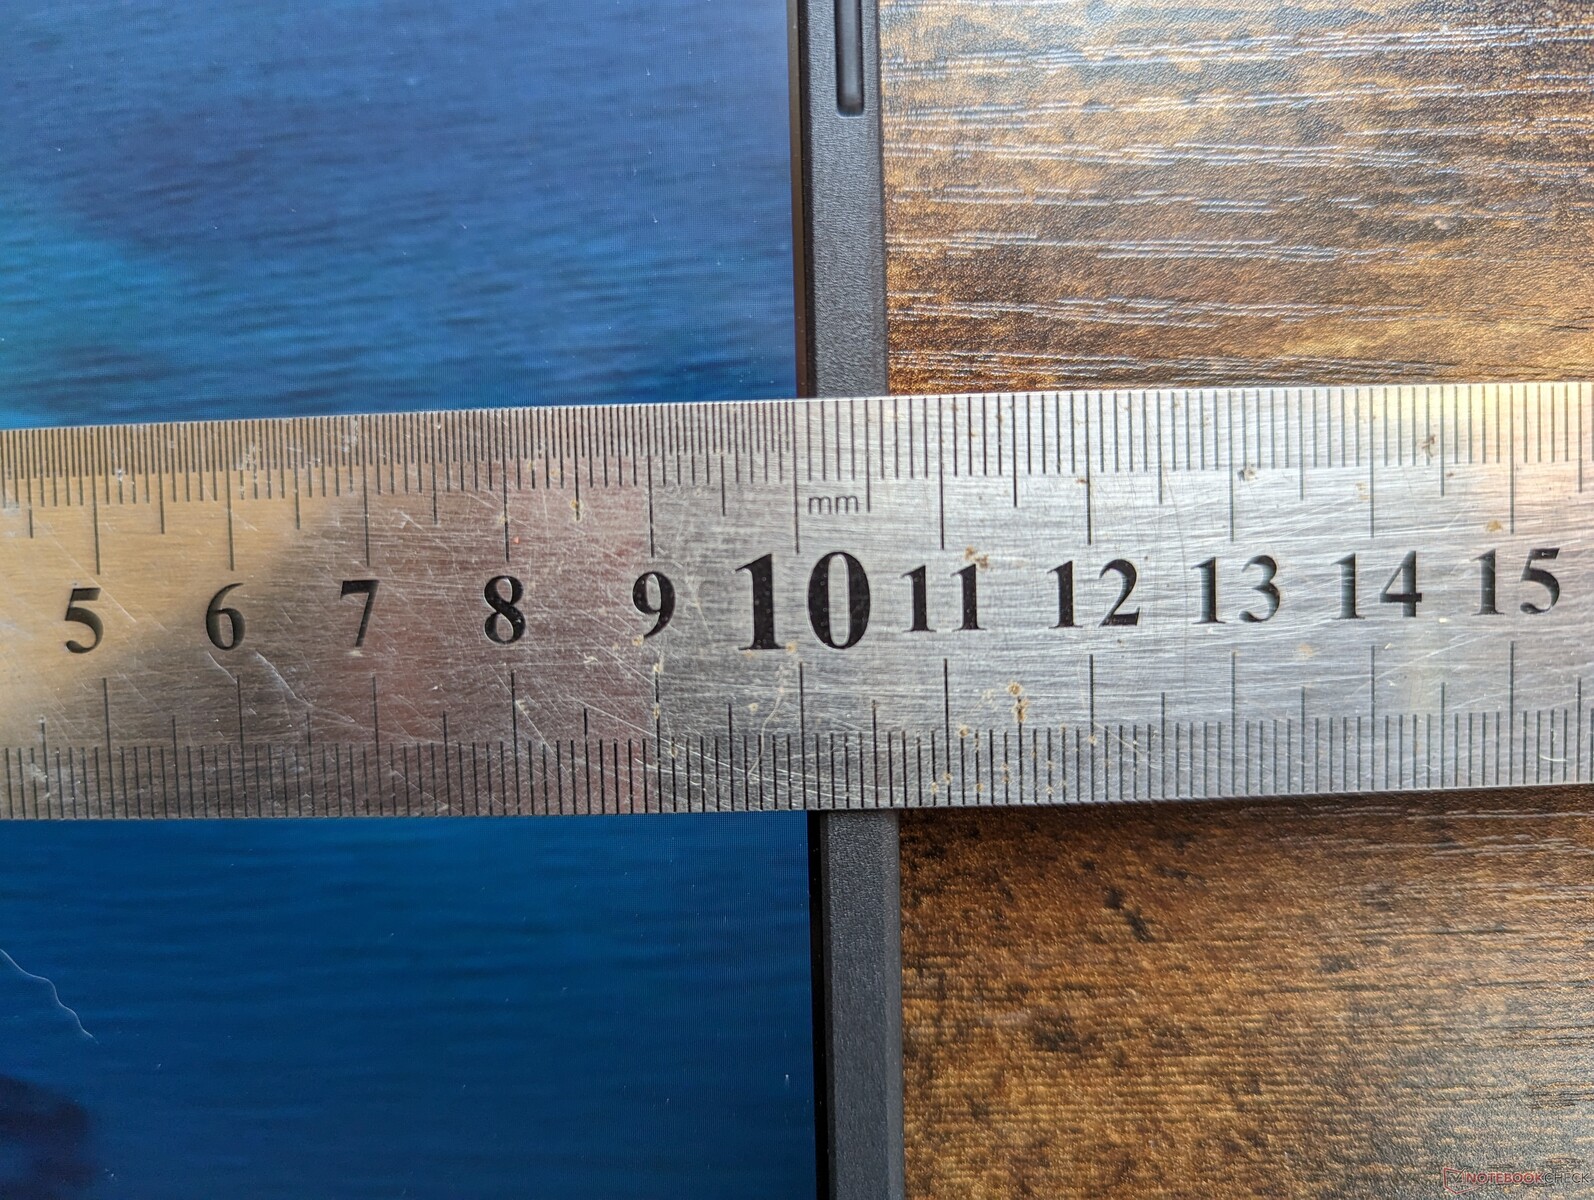
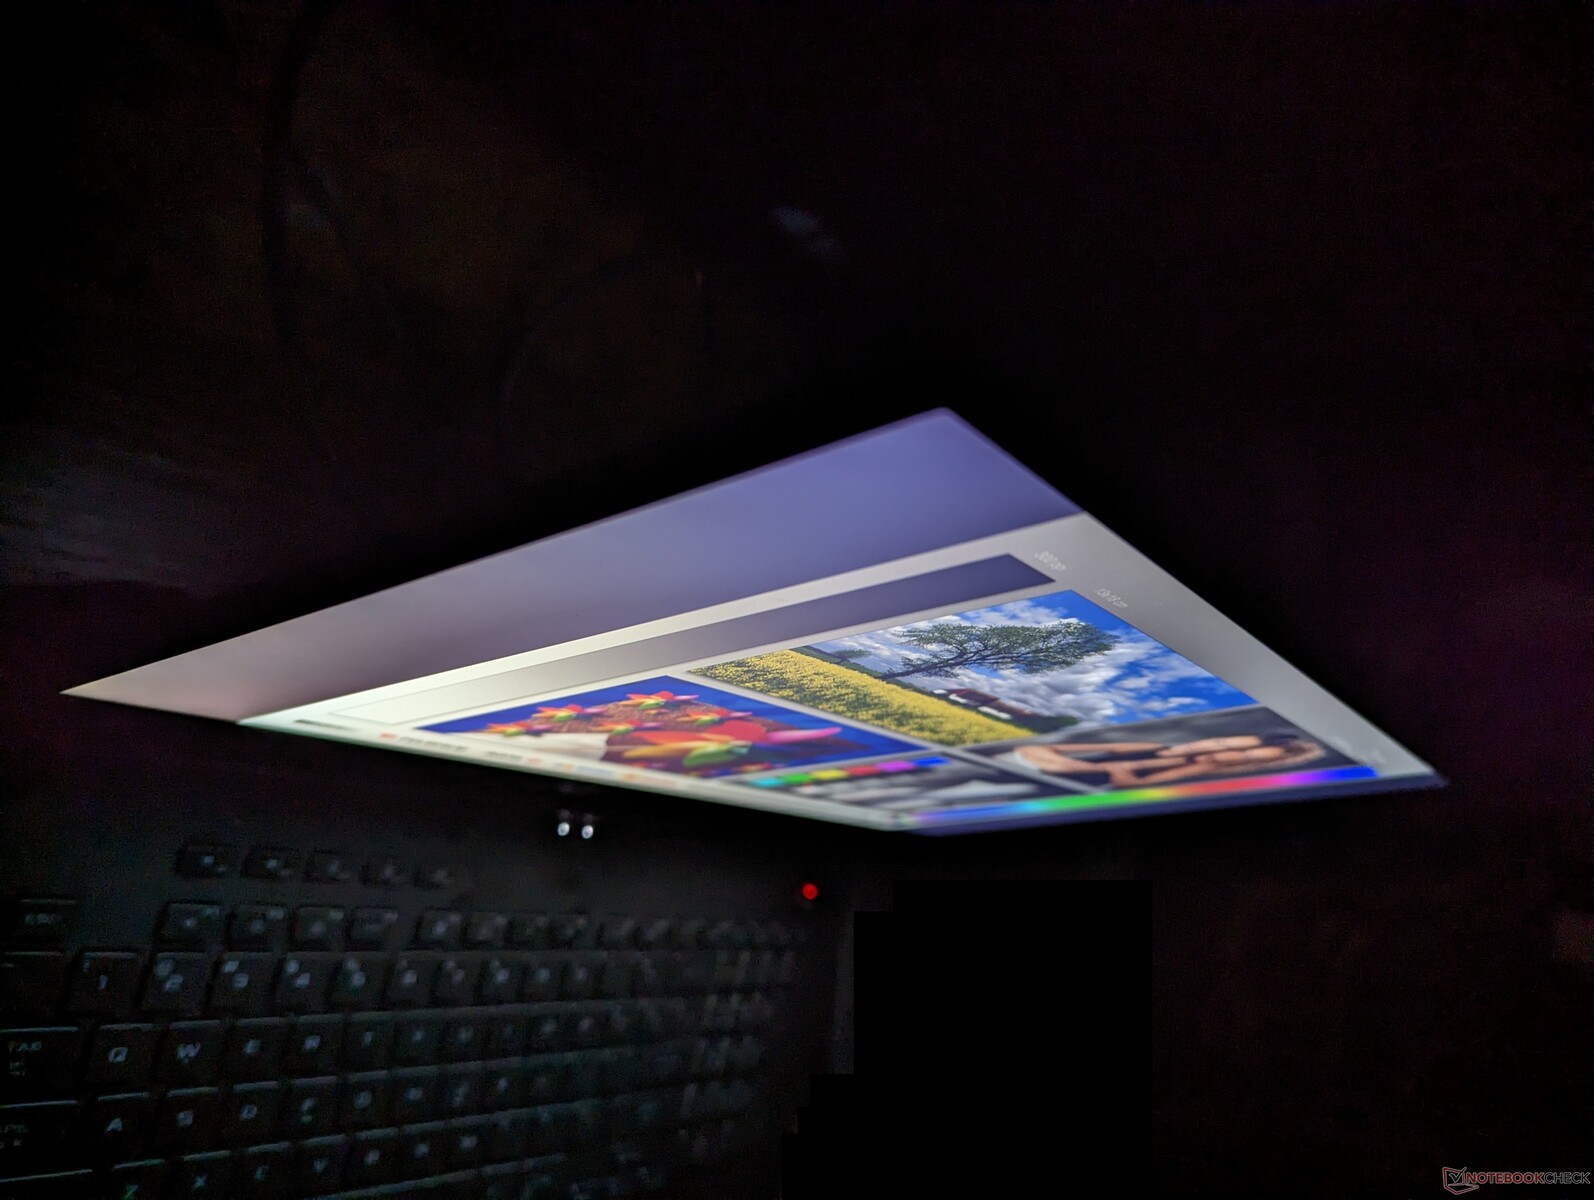
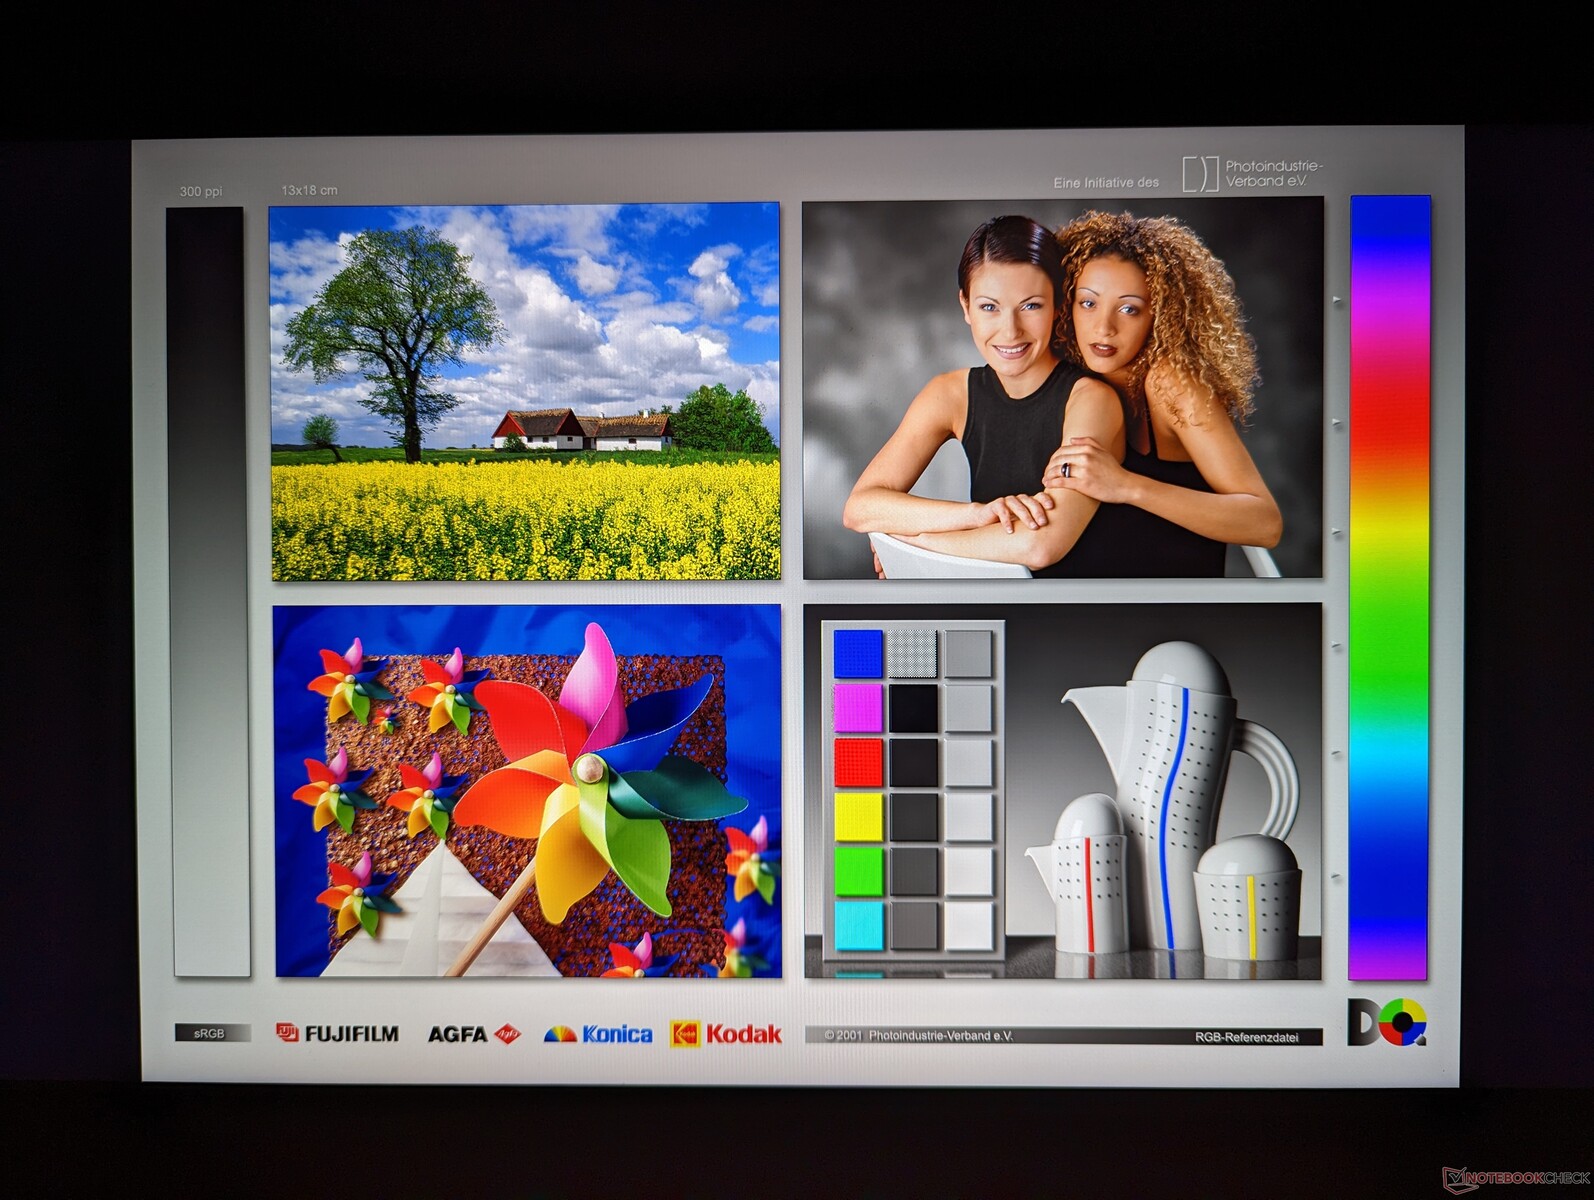
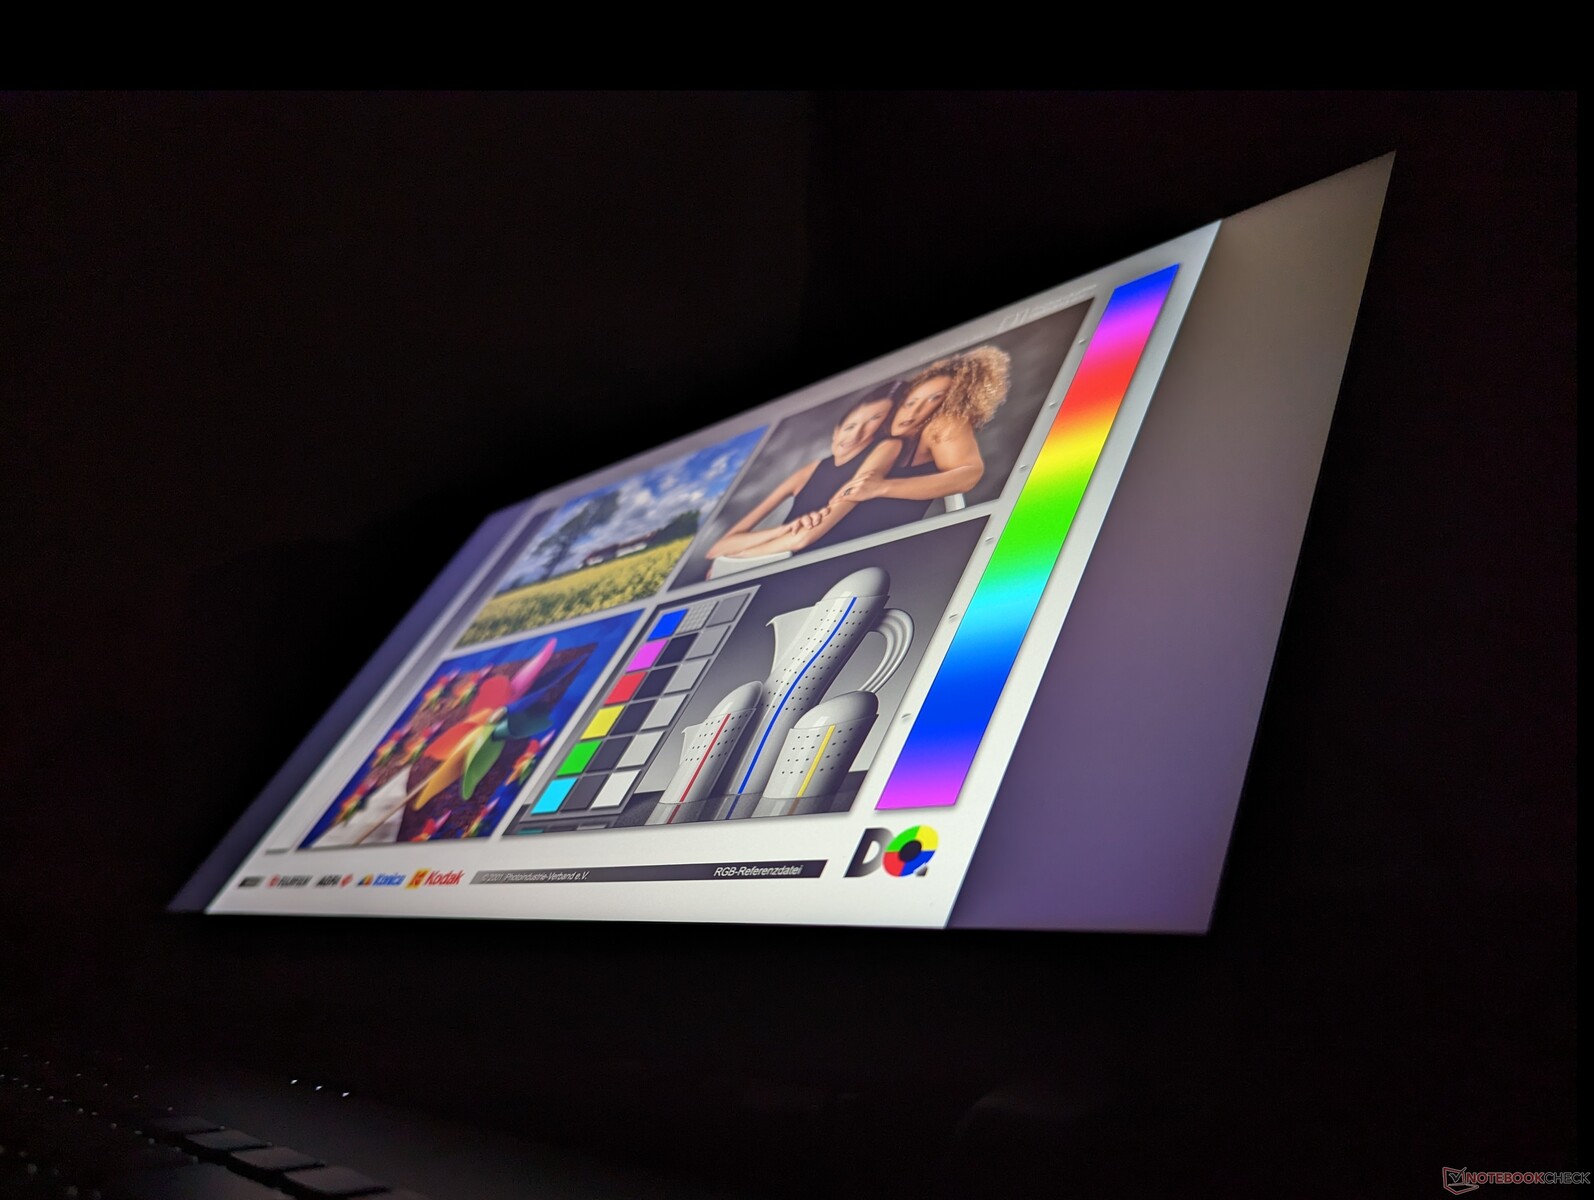
Wyświetlacz - 1440p Sweet Spot
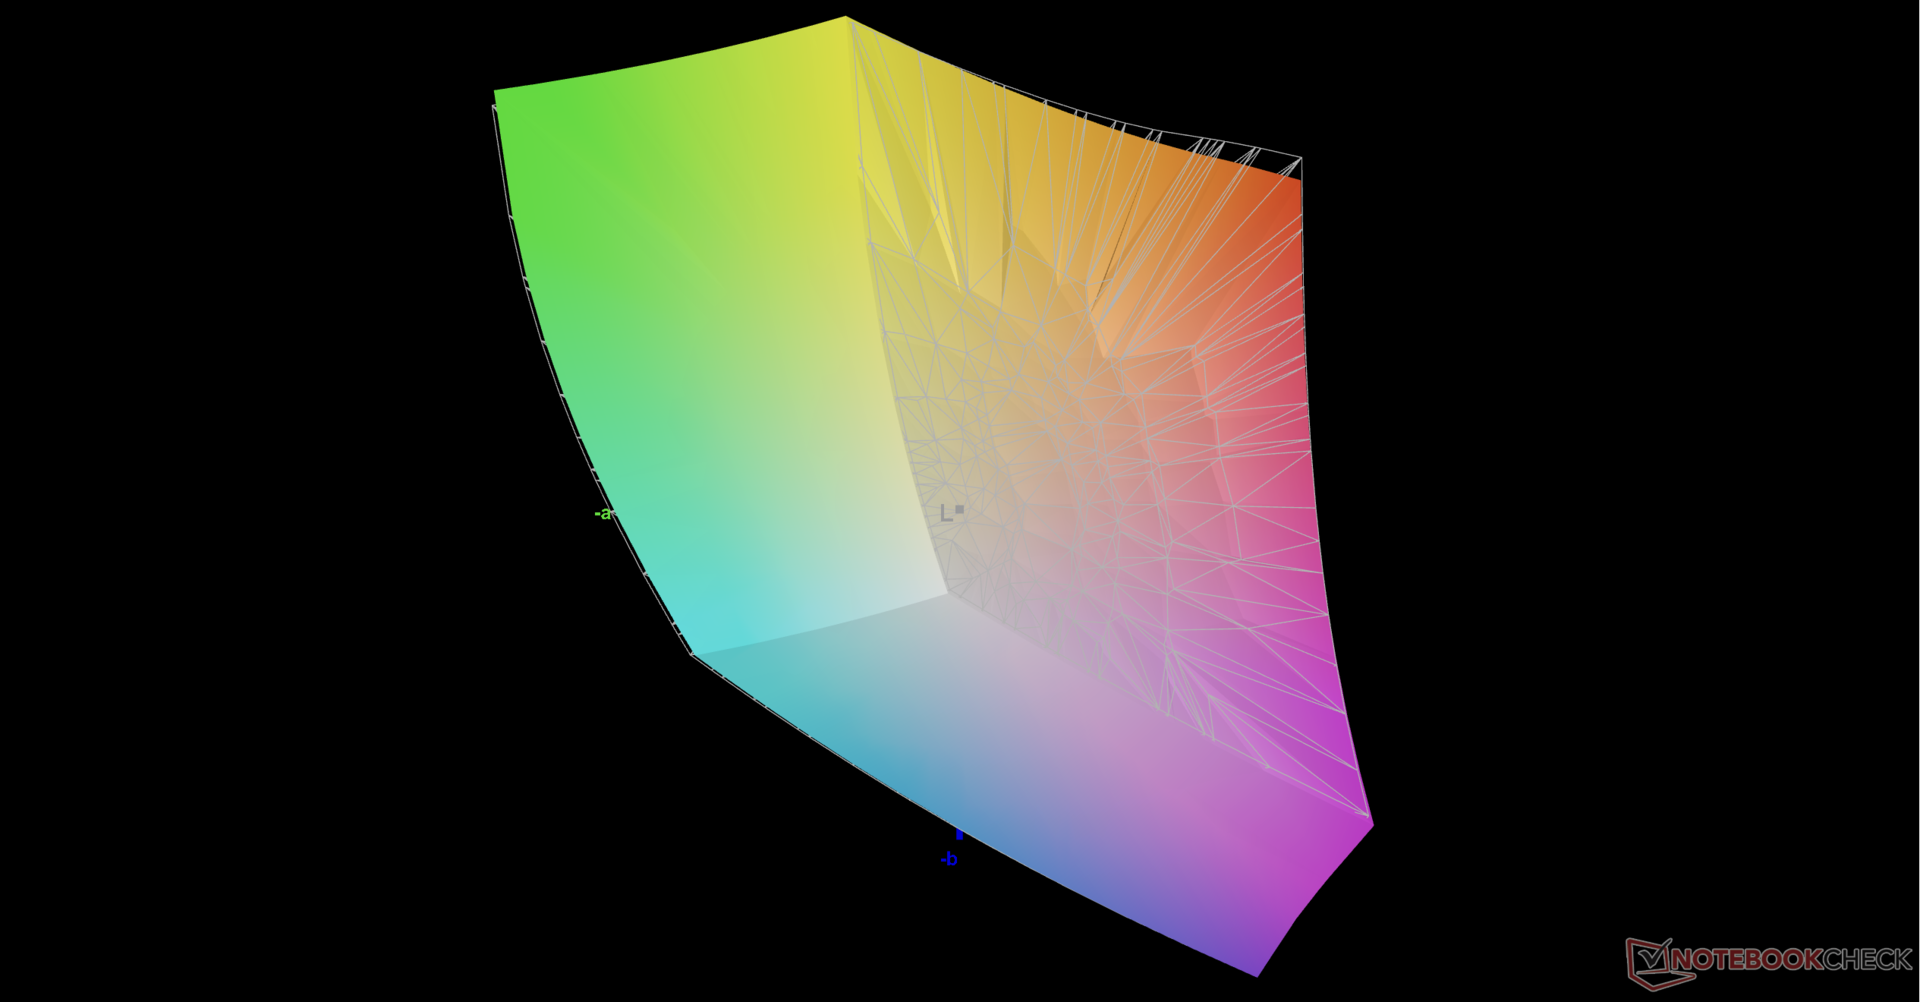
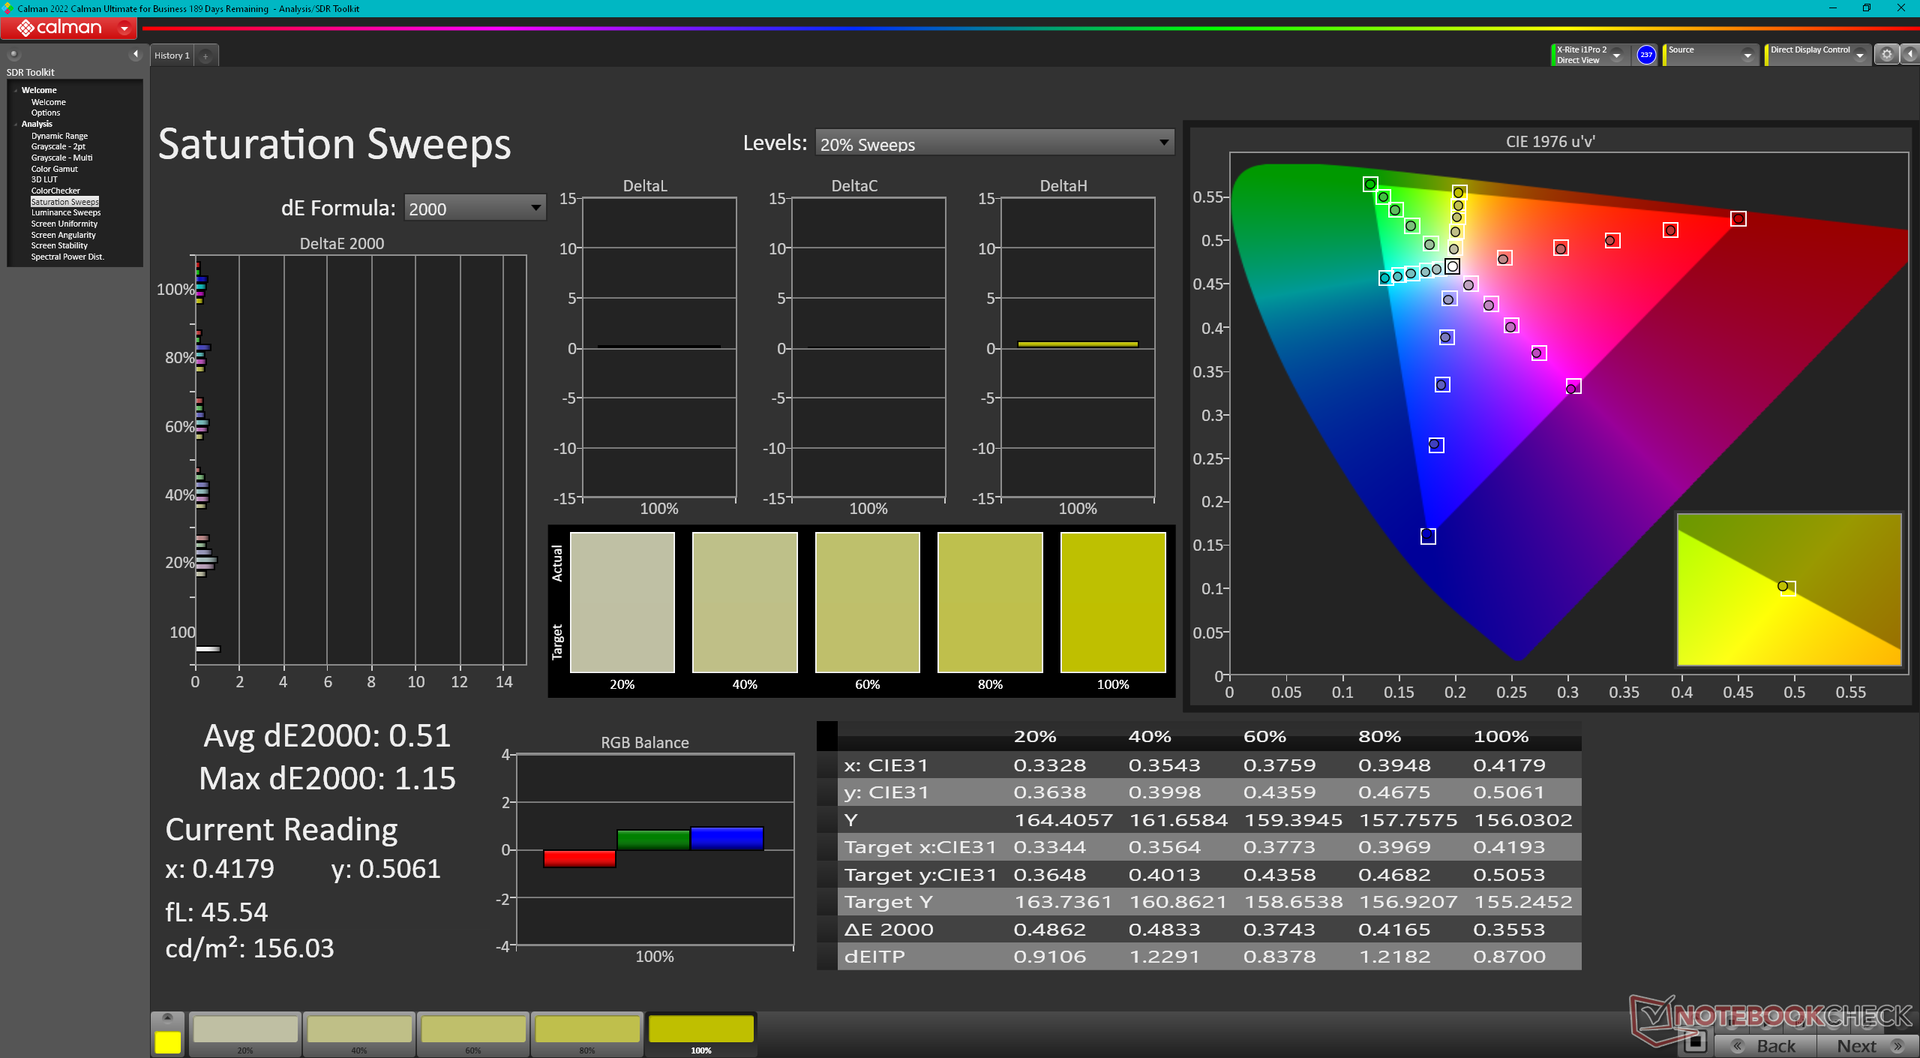
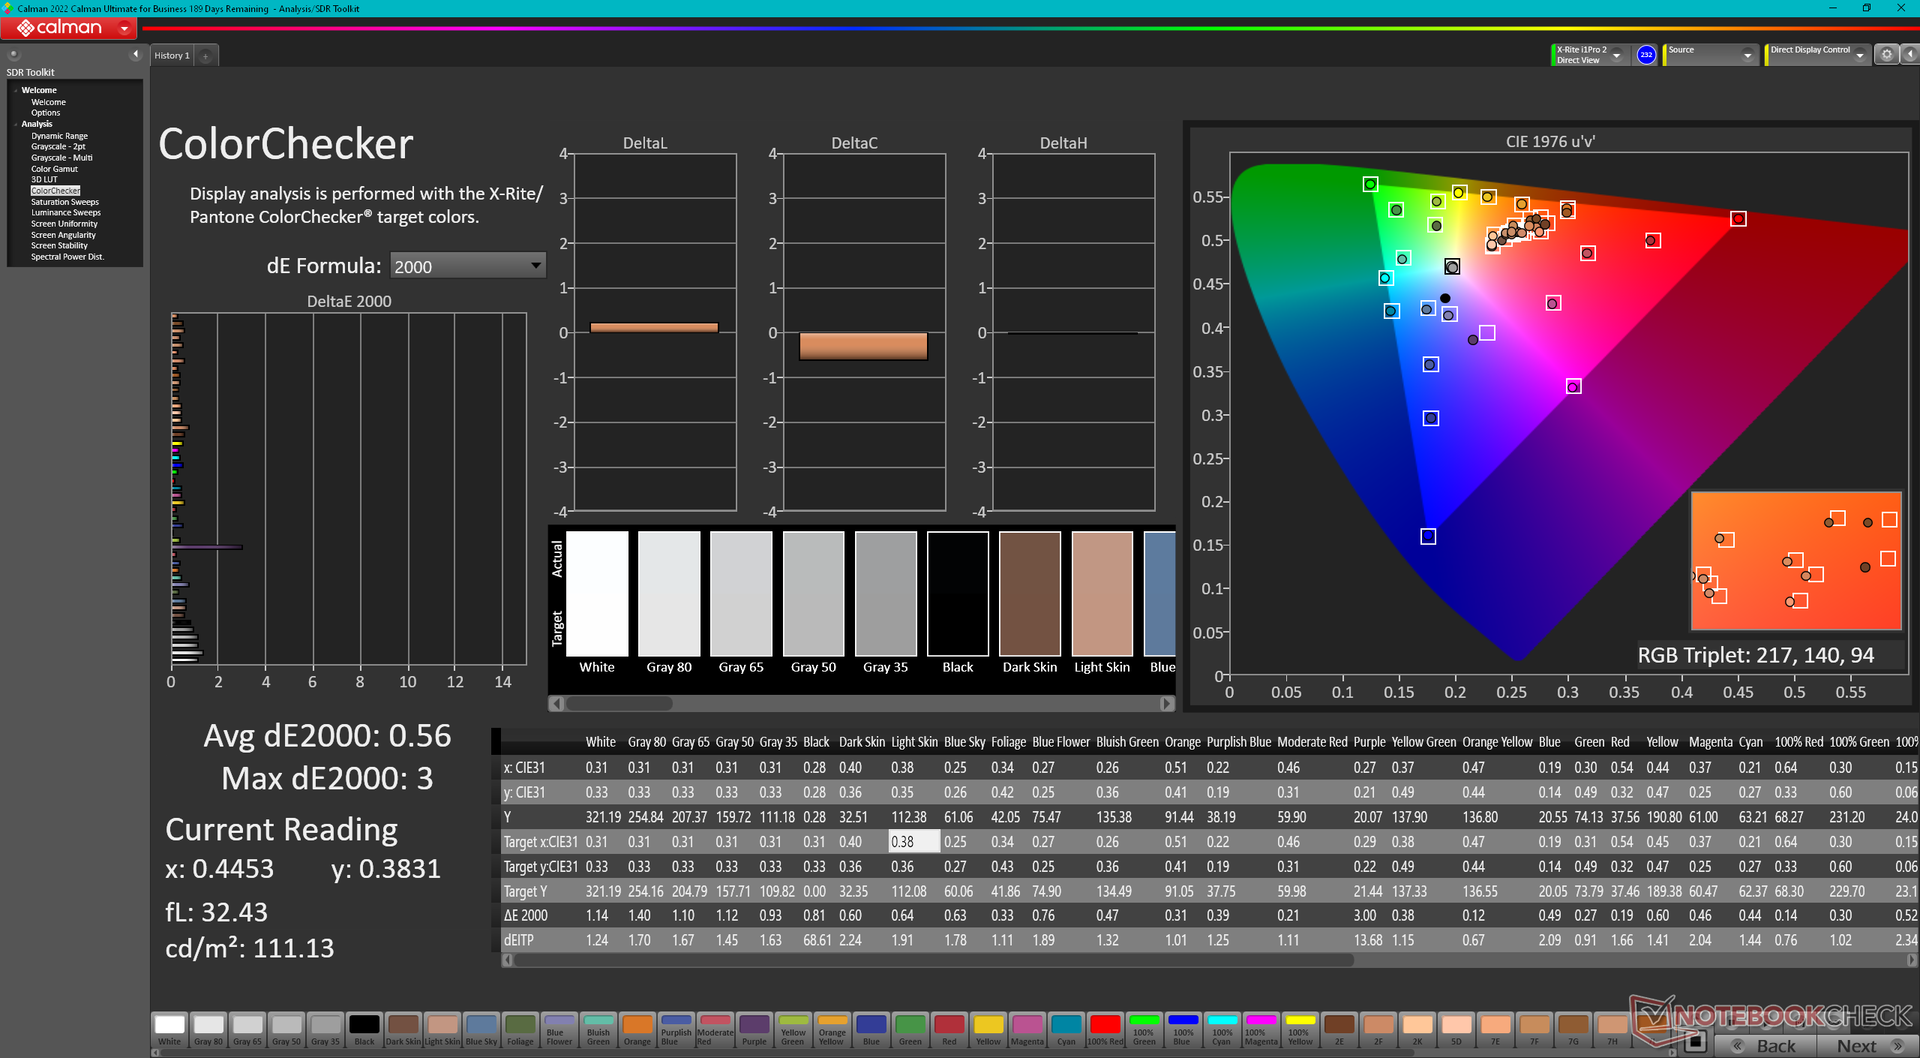
W modelu 2023 zastosowano ten sam panel 240 Hz BOE NE173QHM-NZ2 IPS, co w modelu 2022. Nasze poniższe pomiary są więc niemal identyczne rok do roku. Nie jest to koniecznie zła rzecz, gdyż panel oferuje bardzo szybki czas reakcji, pełną kolorystykę DCI-P3 i przyzwoity współczynnik kontrastu, dzięki czemu nadaje się zarówno do edycji grafiki, jak i do gier. Użytkownicy szukający opcji 4K lub OLED nie mają jednak w tej chwili szczęścia.
| |||||||||||||||||||||||||
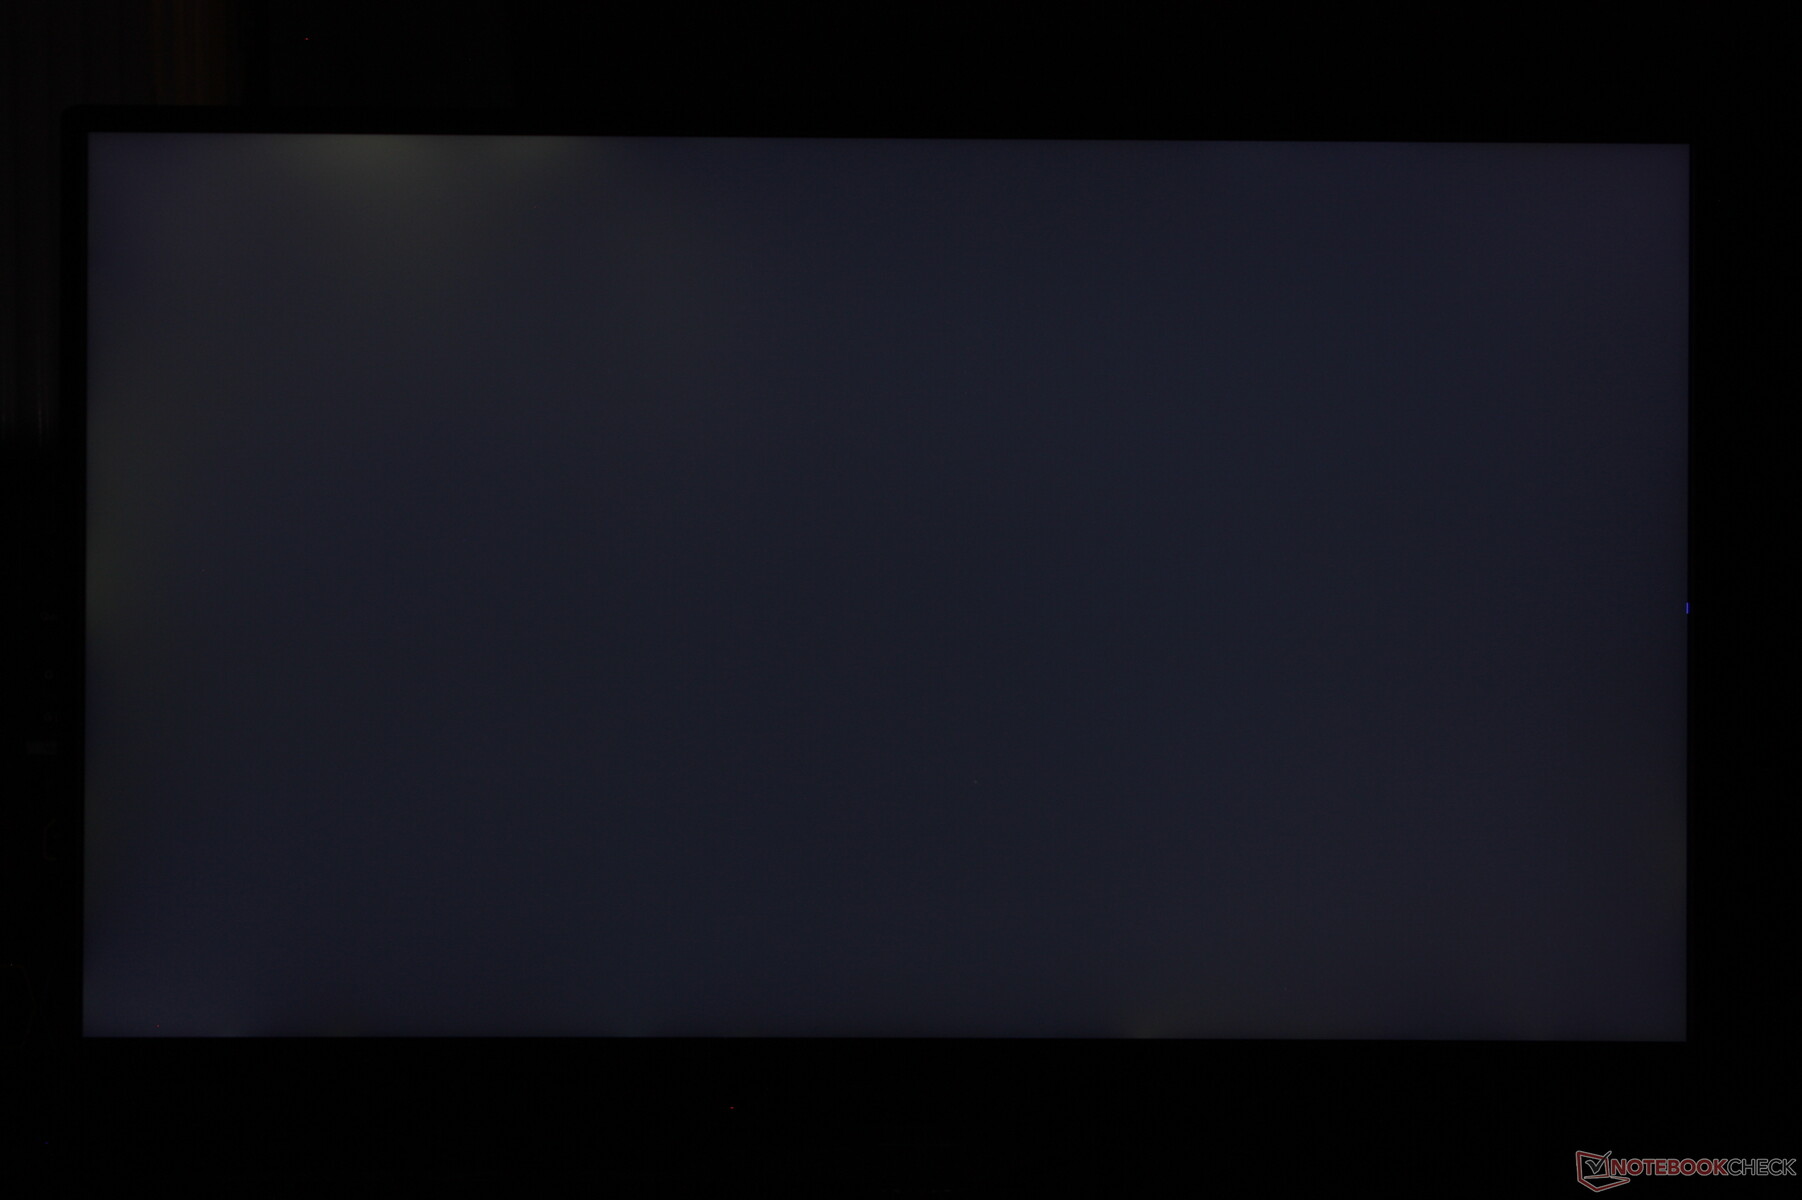
rozświetlenie: 86 %
na akumulatorze: 322.5 cd/m²
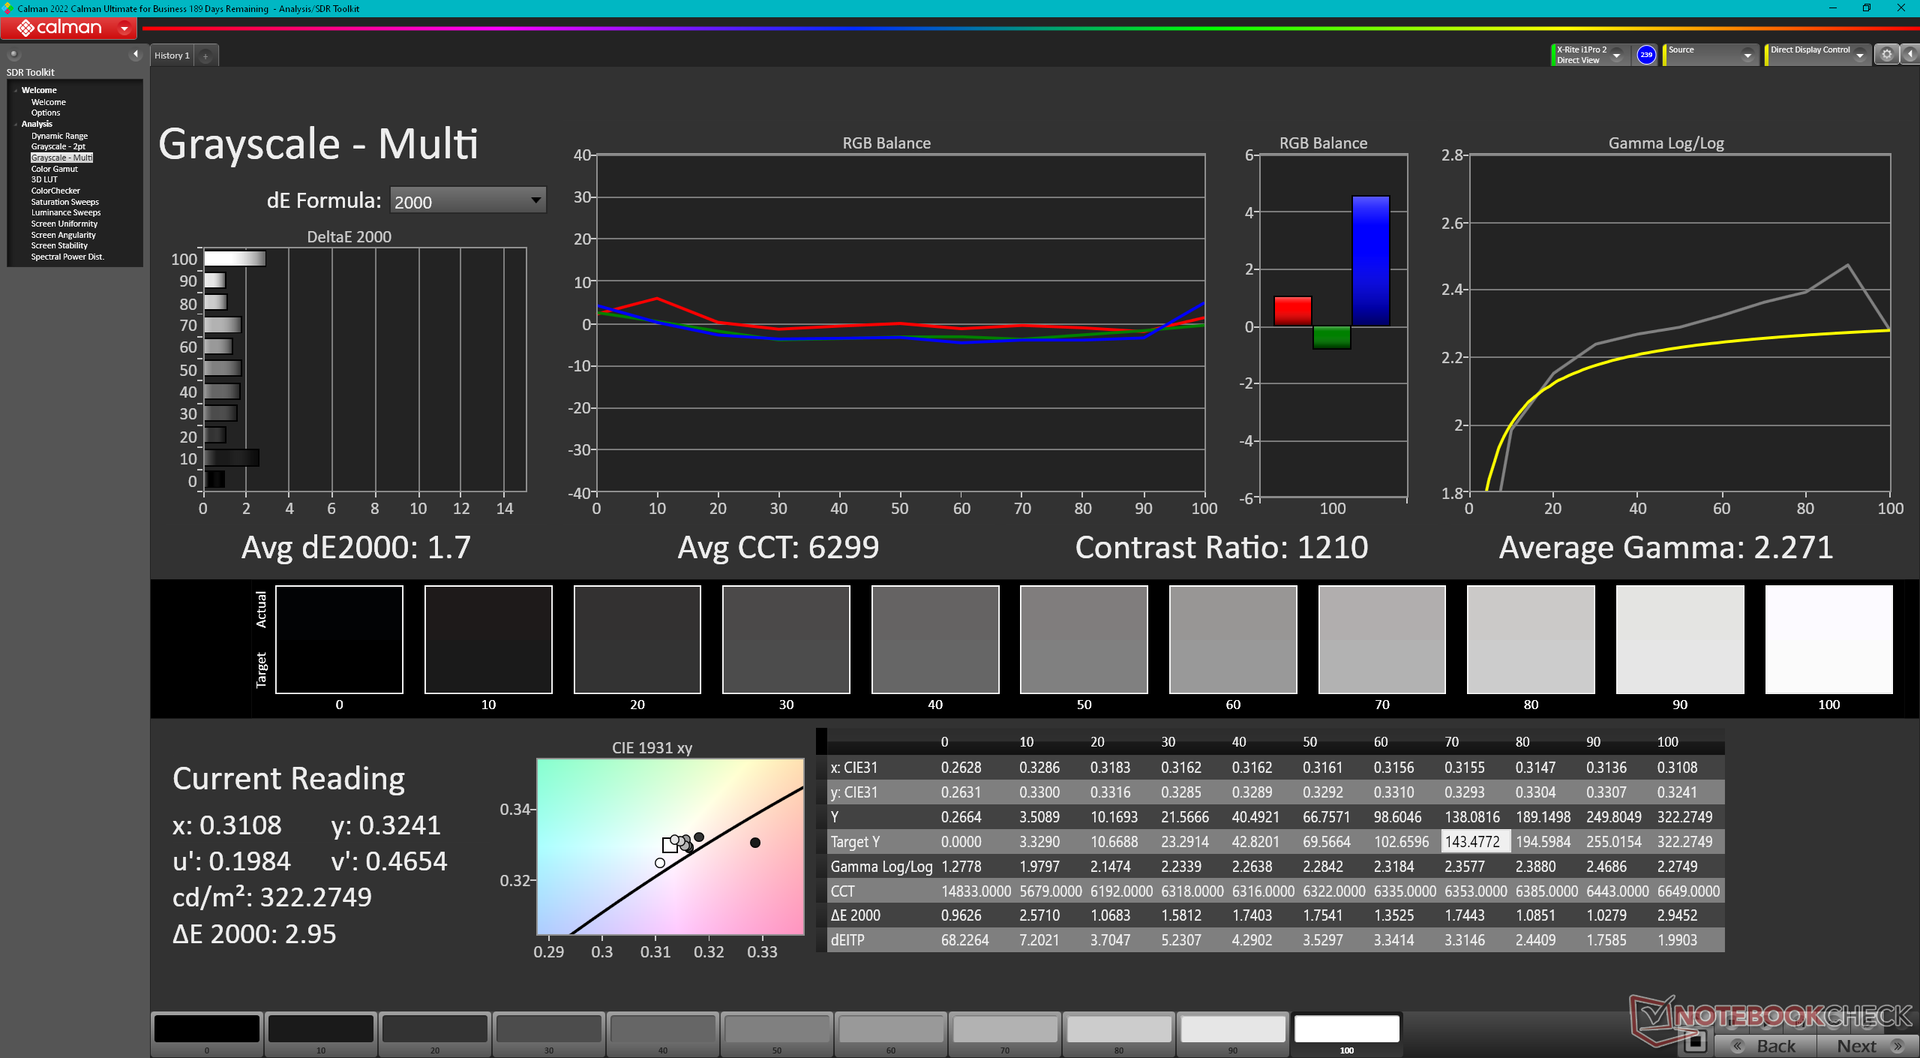
kontrast: 1112:1 (czerń: 0.29 cd/m²)
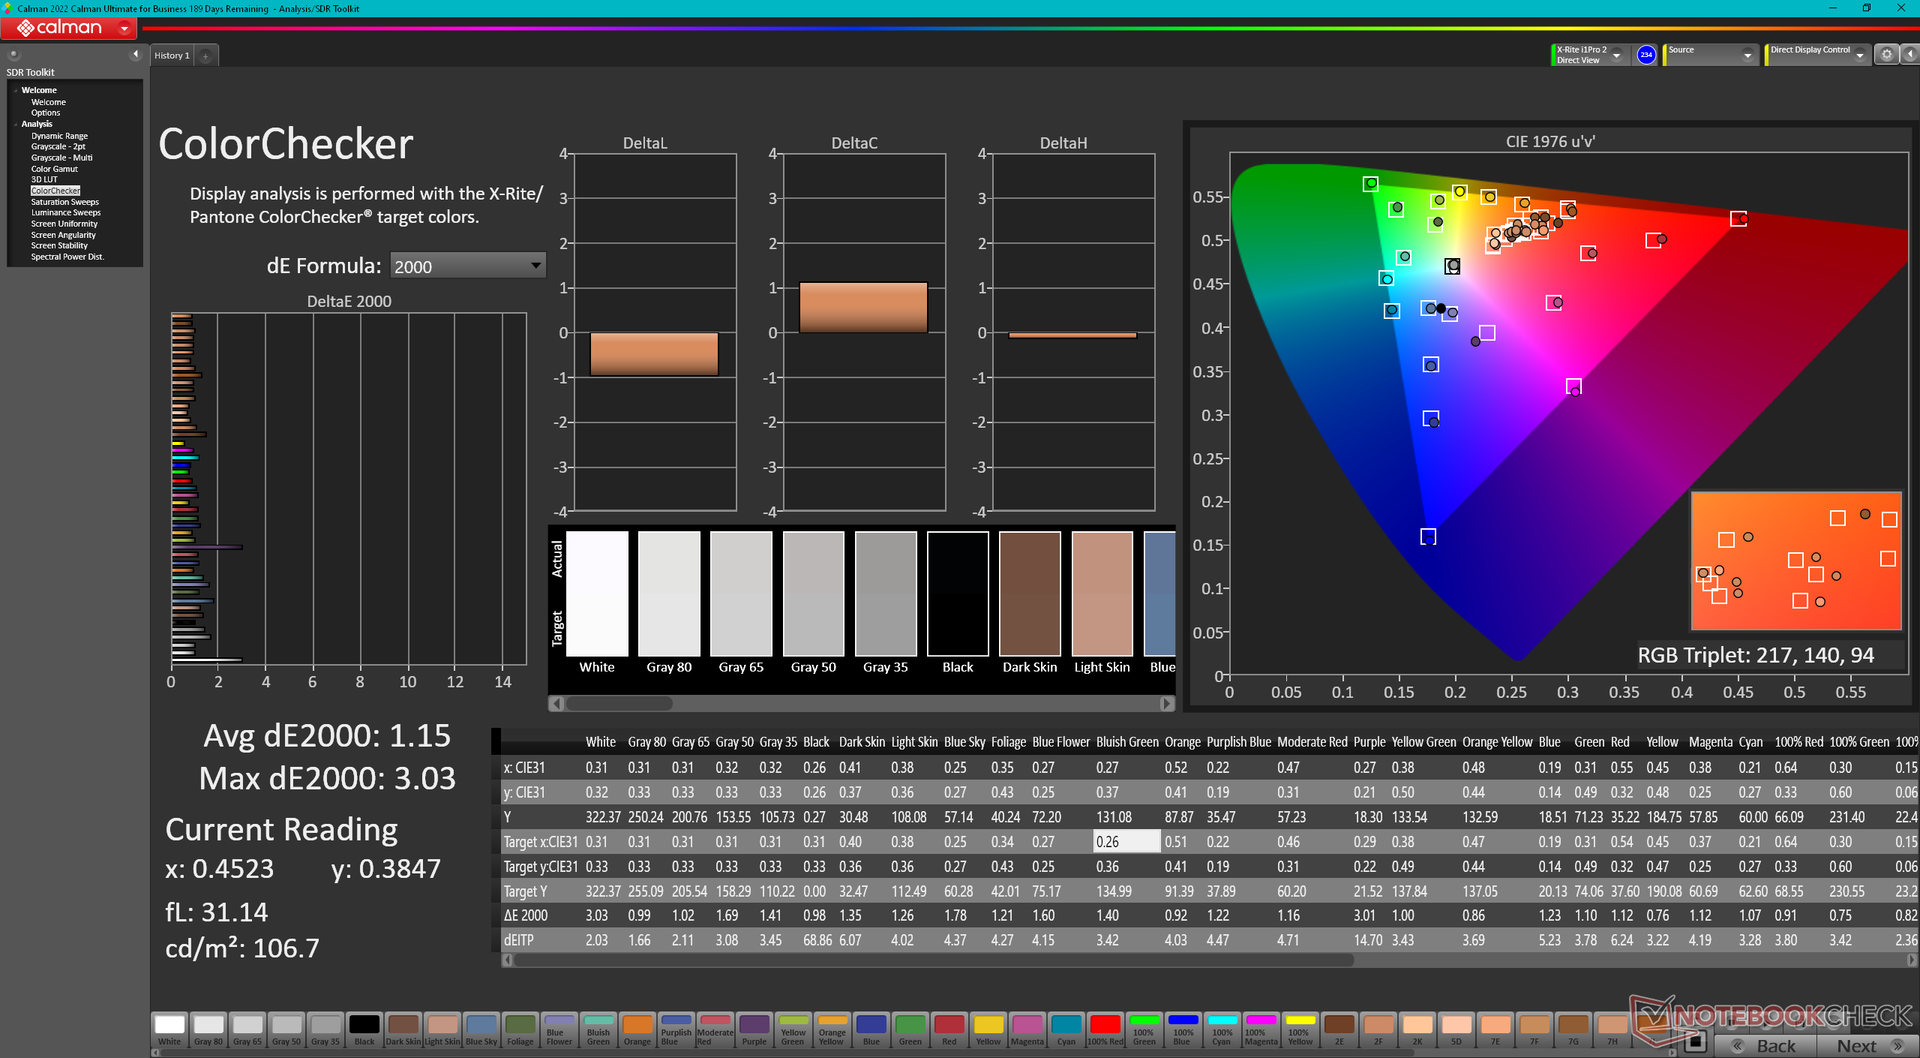
ΔE Color 1.15 | 0.5-29.43 Ø5, calibrated: 0.56
ΔE Greyscale 1.7 | 0.57-98 Ø5.3
85.6% AdobeRGB 1998 (Argyll 2.2.0 3D)
100% sRGB (Argyll 2.2.0 3D)
98% Display P3 (Argyll 2.2.0 3D)
Gamma: 2.27
| Asus ROG Strix Scar 17 G733PY-XS96 NE173QHM-NZ2, IPS, 2560x1440, 17.30 | Asus ROG Strix Scar 17 SE G733CX-LL014W NE173QHM-NZ2, IPS, 2560x1440, 17.30 | MSI GE78HX 13VH-070US AU Optronics B170QAN01.2, IPS, 2560x1600, 17.00 | Eluktronics Mech-17 GP2 BOE NE170QDM-NZ1, IPS, 2560x1600, 17.00 | Aorus 17X XES Sharp SHP1563, IPS, 1920x1080, 17.30 | Alienware m17 R5 (R9 6900HX, RX 6850M XT) AU Optronics AUODBA3, IPS, 3840x2160, 17.00 | |
|---|---|---|---|---|---|---|
| Display | -1% | 0% | -16% | -15% | 1% | |
| Display P3 Coverage | 98 | 97.1 -1% | 97.6 0% | 69.1 -29% | 70.1 -28% | 97.2 -1% |
| sRGB Coverage | 100 | 99.9 0% | 99.9 0% | 99.7 0% | 99.9 0% | 99.6 0% |
| AdobeRGB 1998 Coverage | 85.6 | 84.8 -1% | 86.5 1% | 69.8 -18% | 71.9 -16% | 88.4 3% |
| Response Times | 10% | 38% | -38% | 47% | -84% | |
| Response Time Grey 50% / Grey 80% * | 6.2 ? | 5.7 ? 8% | 4.2 ? 32% | 12 ? -94% | 3.4 ? 45% | 16.4 ? -165% |
| Response Time Black / White * | 11.4 ? | 10.1 ? 11% | 6.4 ? 44% | 9.4 ? 18% | 5.8 ? 49% | 11.6 ? -2% |
| PWM Frequency | ||||||
| Screen | 5% | -93% | -20% | -102% | -161% | |
| Brightness middle | 322.5 | 320 -1% | 398.6 24% | 417.3 29% | 278 -14% | 484 50% |
| Brightness | 317 | 303 -4% | 384 21% | 387 22% | 273 -14% | 449 42% |
| Brightness Distribution | 86 | 87 1% | 89 3% | 87 1% | 79 -8% | 87 1% |
| Black Level * | 0.29 | 0.3 -3% | 0.46 -59% | 0.42 -45% | 0.26 10% | 0.55 -90% |
| Contrast | 1112 | 1067 -4% | 867 -22% | 994 -11% | 1069 -4% | 880 -21% |
| Colorchecker dE 2000 * | 1.15 | 1.1 4% | 4.05 -252% | 2.14 -86% | 3.96 -244% | 4.8 -317% |
| Colorchecker dE 2000 max. * | 3.03 | 2.7 11% | 8.68 -186% | 4.09 -35% | 10.78 -256% | 7.48 -147% |
| Colorchecker dE 2000 calibrated * | 0.56 | 1.02 -82% | 0.42 25% | 1.07 -91% | 4.74 -746% | |
| Greyscale dE 2000 * | 1.7 | 1.1 35% | 6.5 -282% | 3.1 -82% | 6.8 -300% | 5.5 -224% |
| Gamma | 2.27 97% | 2.13 103% | 2.11 104% | 2.19 100% | 2.224 99% | 2.42 91% |
| CCT | 6299 103% | 6599 98% | 7518 86% | 6040 108% | 7651 85% | 6148 106% |
| Total Average (Program / Settings) | 5% /
4% | -18% /
-54% | -25% /
-22% | -23% /
-62% | -81% /
-116% |
* ... im mniej tym lepiej
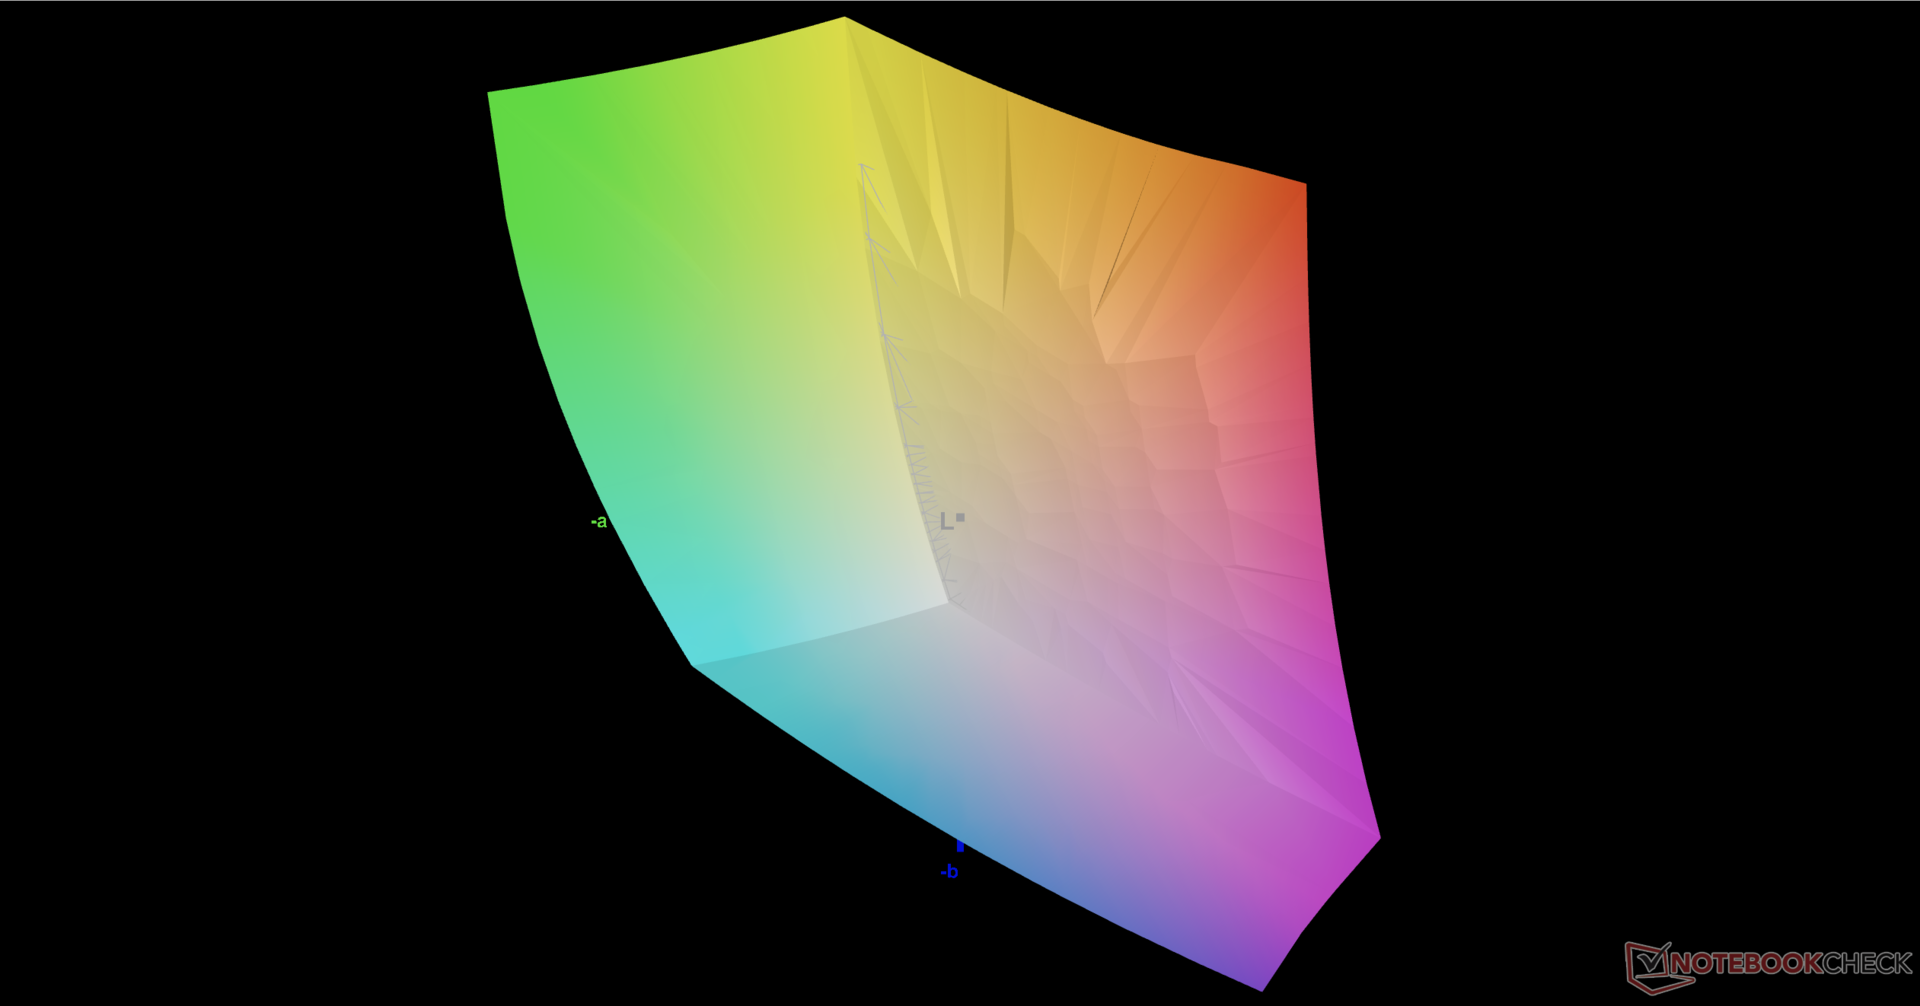
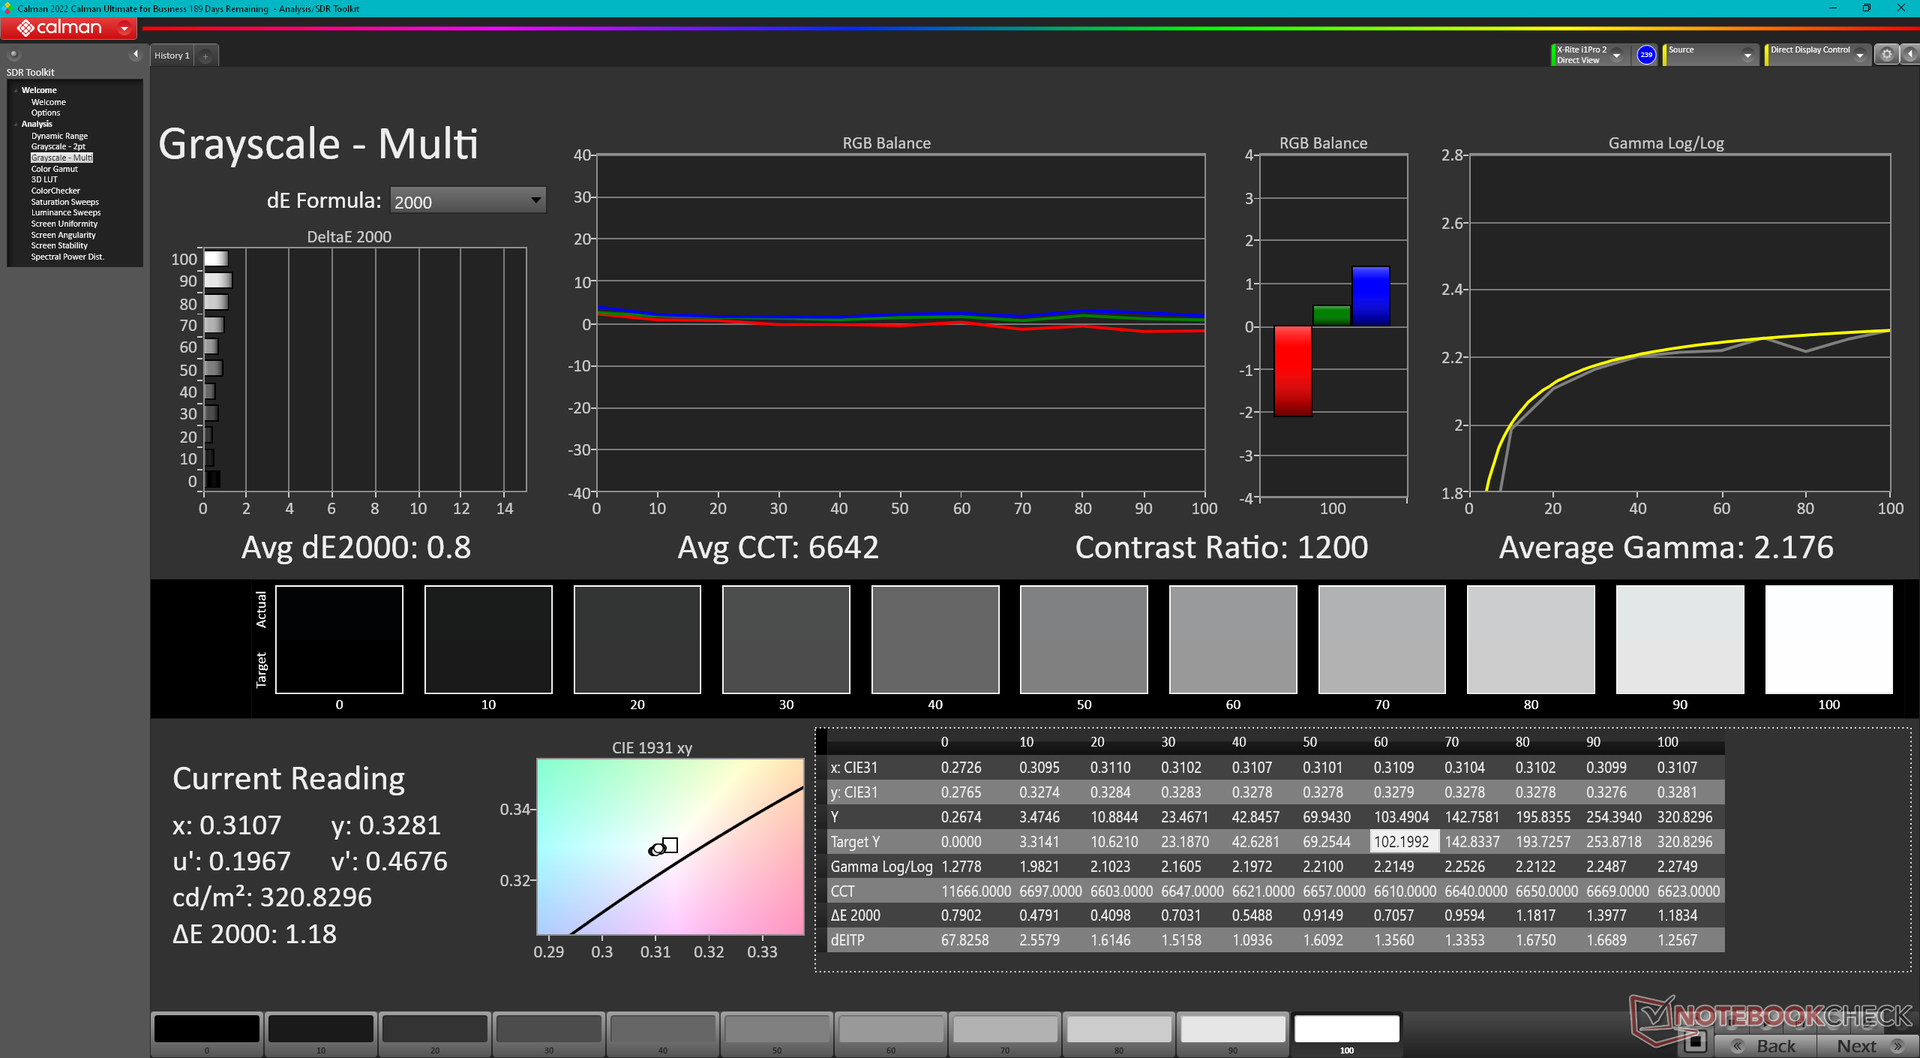
Wyświetlacz jest fabrycznie skalibrowany z bardzo niskimi średnimi wartościami deltaE w skali szarości i kolorze, wynoszącymi odpowiednio 1,7 i 1,15. Kalibracja przez użytkownika końcowego nie jest więc konieczna.

Display Response Times
| ↔ Response Time Black to White | ||
|---|---|---|
| 11.4 ms ... rise ↗ and fall ↘ combined | ↗ 5.9 ms rise | 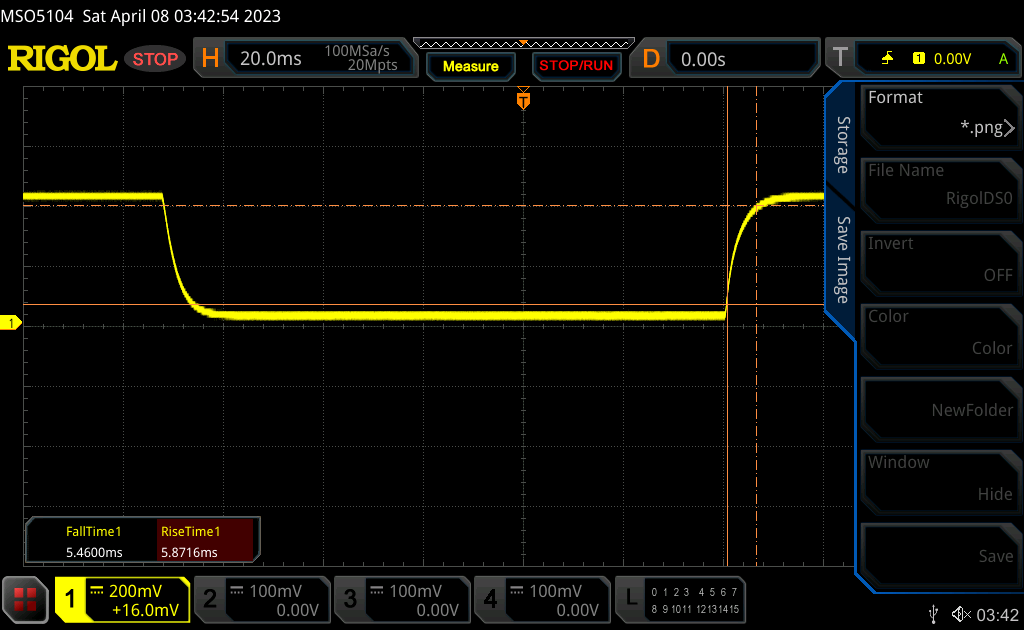 |
| ↘ 5.5 ms fall | ||
| The screen shows good response rates in our tests, but may be too slow for competitive gamers. In comparison, all tested devices range from 0.1 (minimum) to 240 (maximum) ms. » 26 % of all devices are better. This means that the measured response time is better than the average of all tested devices (21.5 ms). | ||
| ↔ Response Time 50% Grey to 80% Grey | ||
| 6.2 ms ... rise ↗ and fall ↘ combined | ↗ 2.8 ms rise | 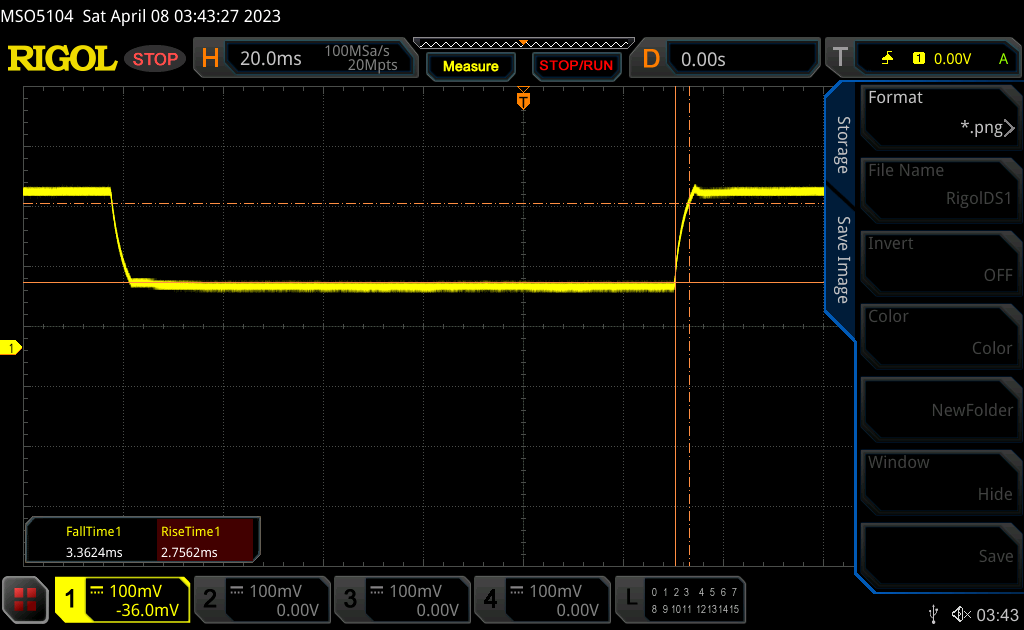 |
| ↘ 3.4 ms fall | ||
| The screen shows very fast response rates in our tests and should be very well suited for fast-paced gaming. In comparison, all tested devices range from 0.2 (minimum) to 636 (maximum) ms. » 14 % of all devices are better. This means that the measured response time is better than the average of all tested devices (33.7 ms). | ||
Screen Flickering / PWM (Pulse-Width Modulation)
| Screen flickering / PWM not detected | 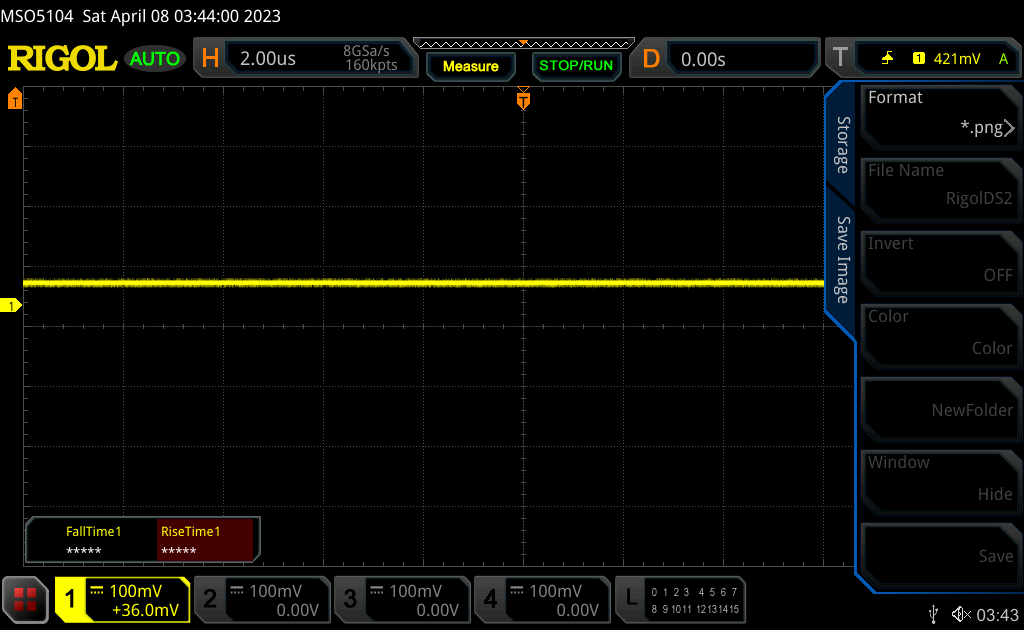 | ||
In comparison: 53 % of all tested devices do not use PWM to dim the display. If PWM was detected, an average of 17903 (minimum: 5 - maximum: 3846000) Hz was measured. | |||
Wydajność - Rising Ryzen
Warunki badania
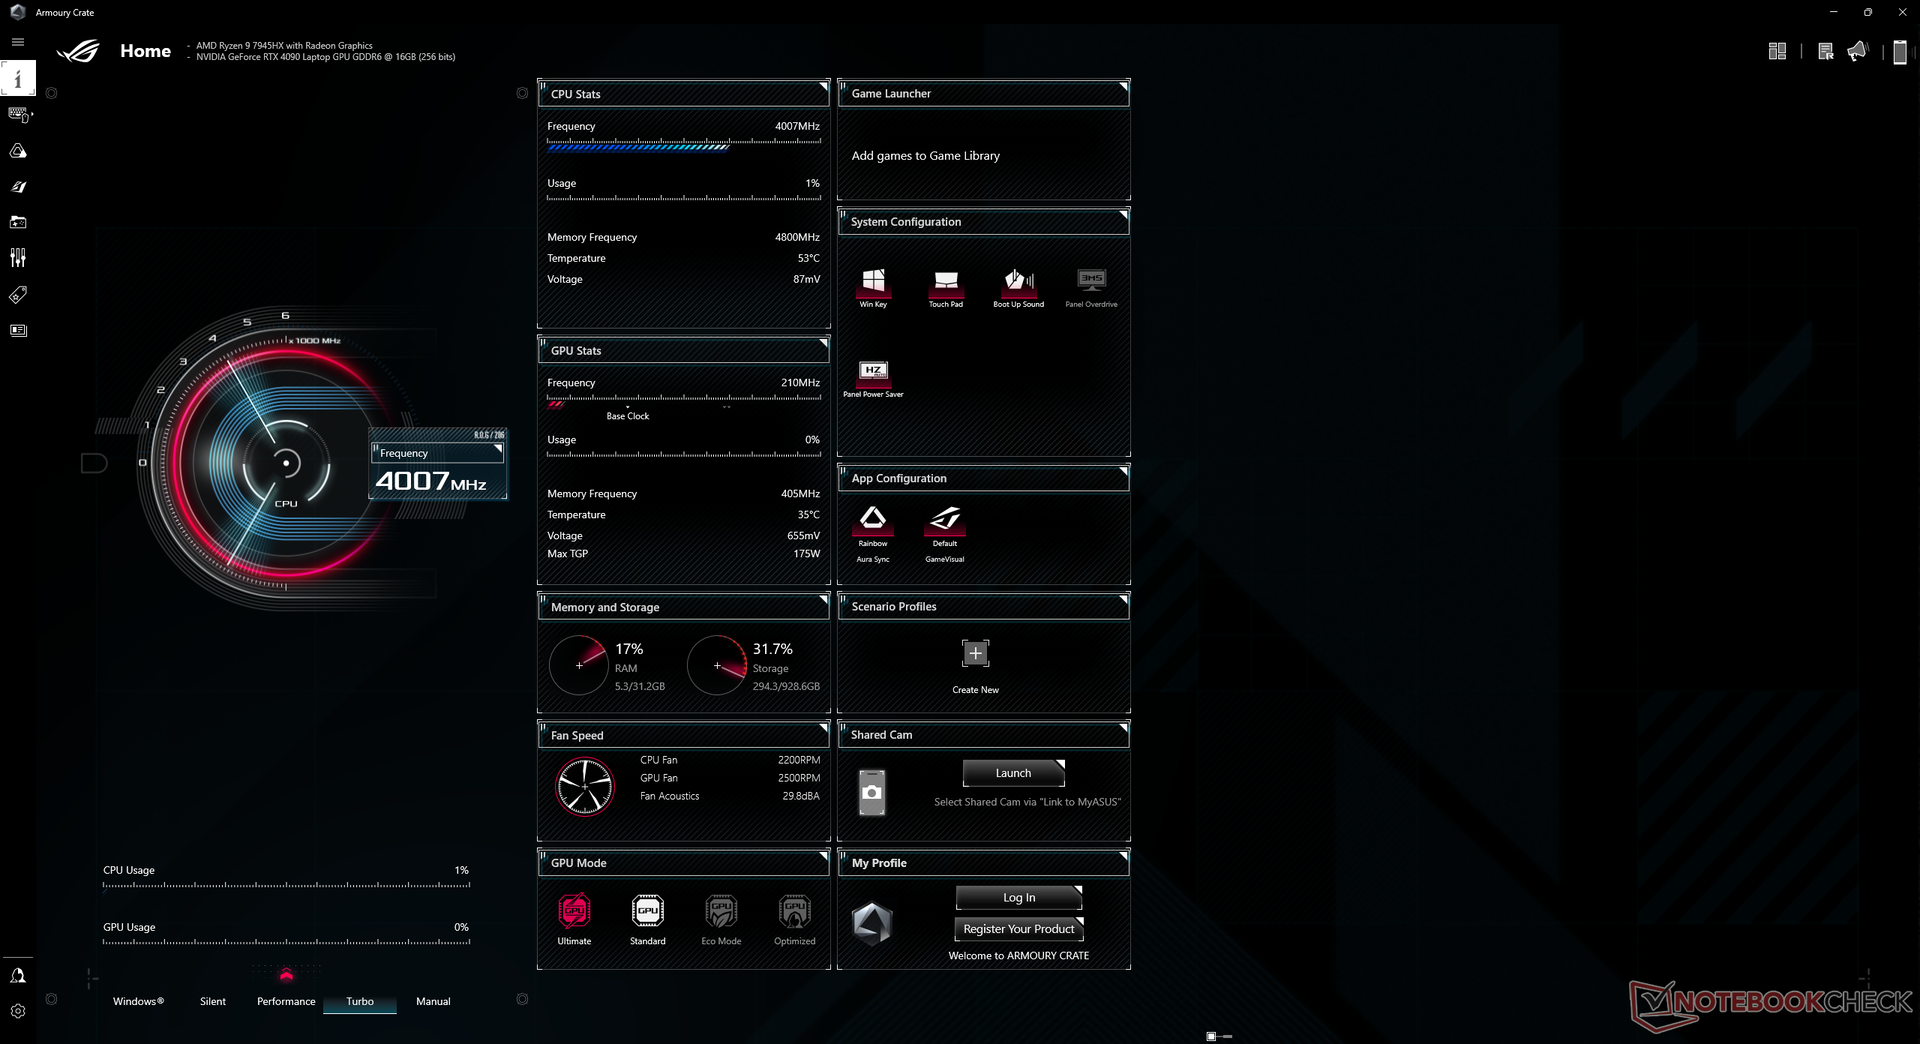
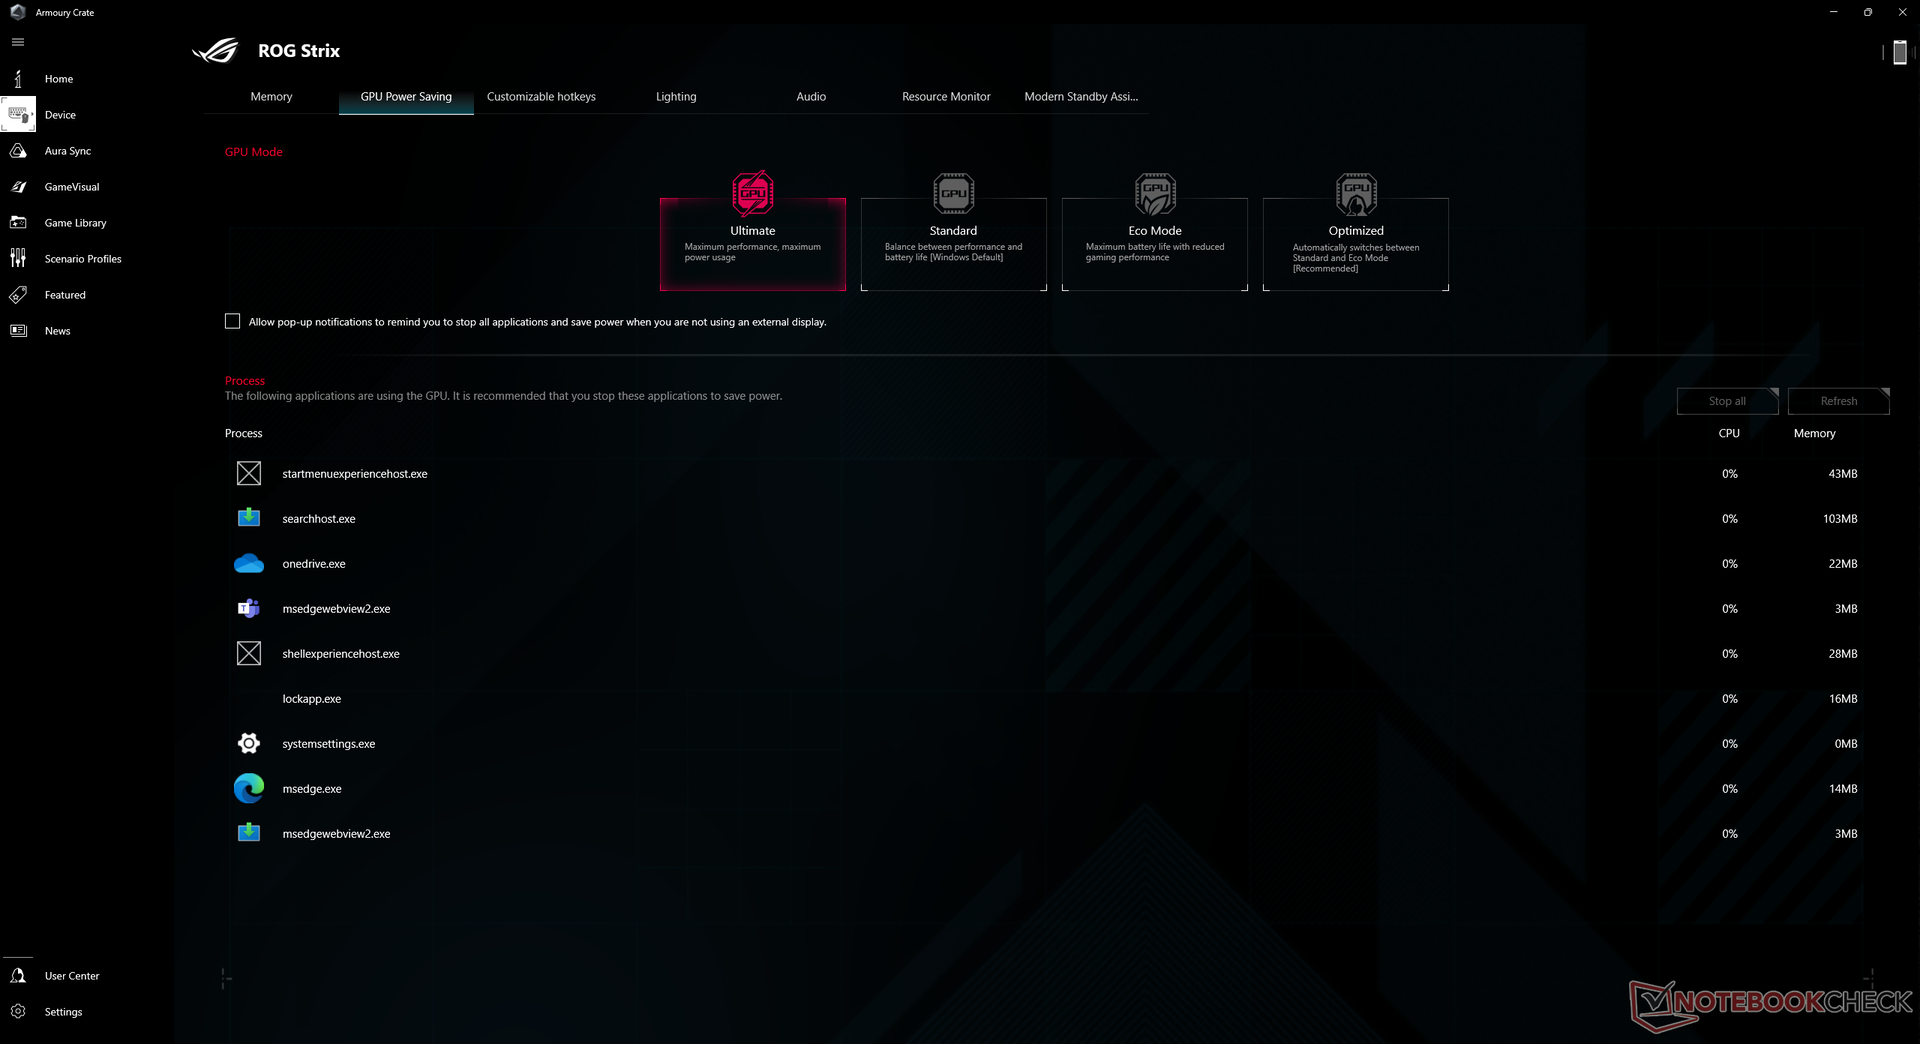
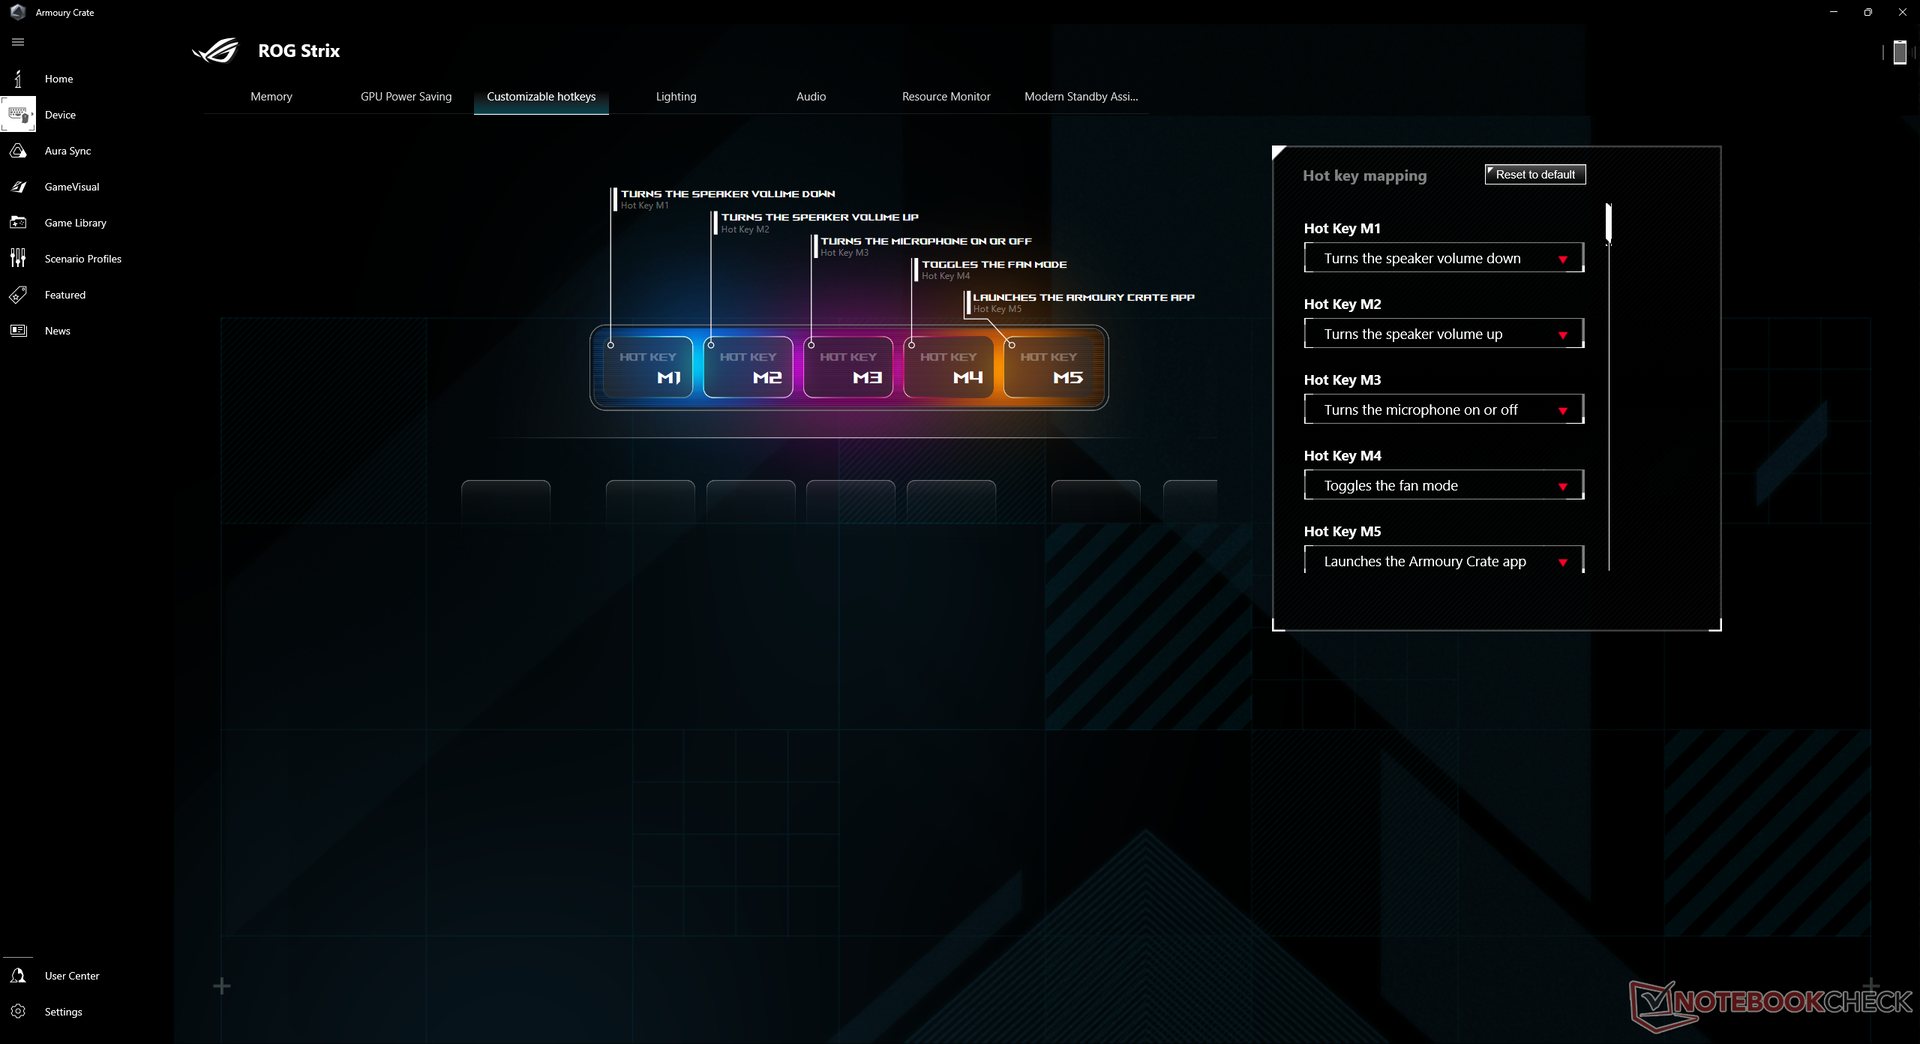
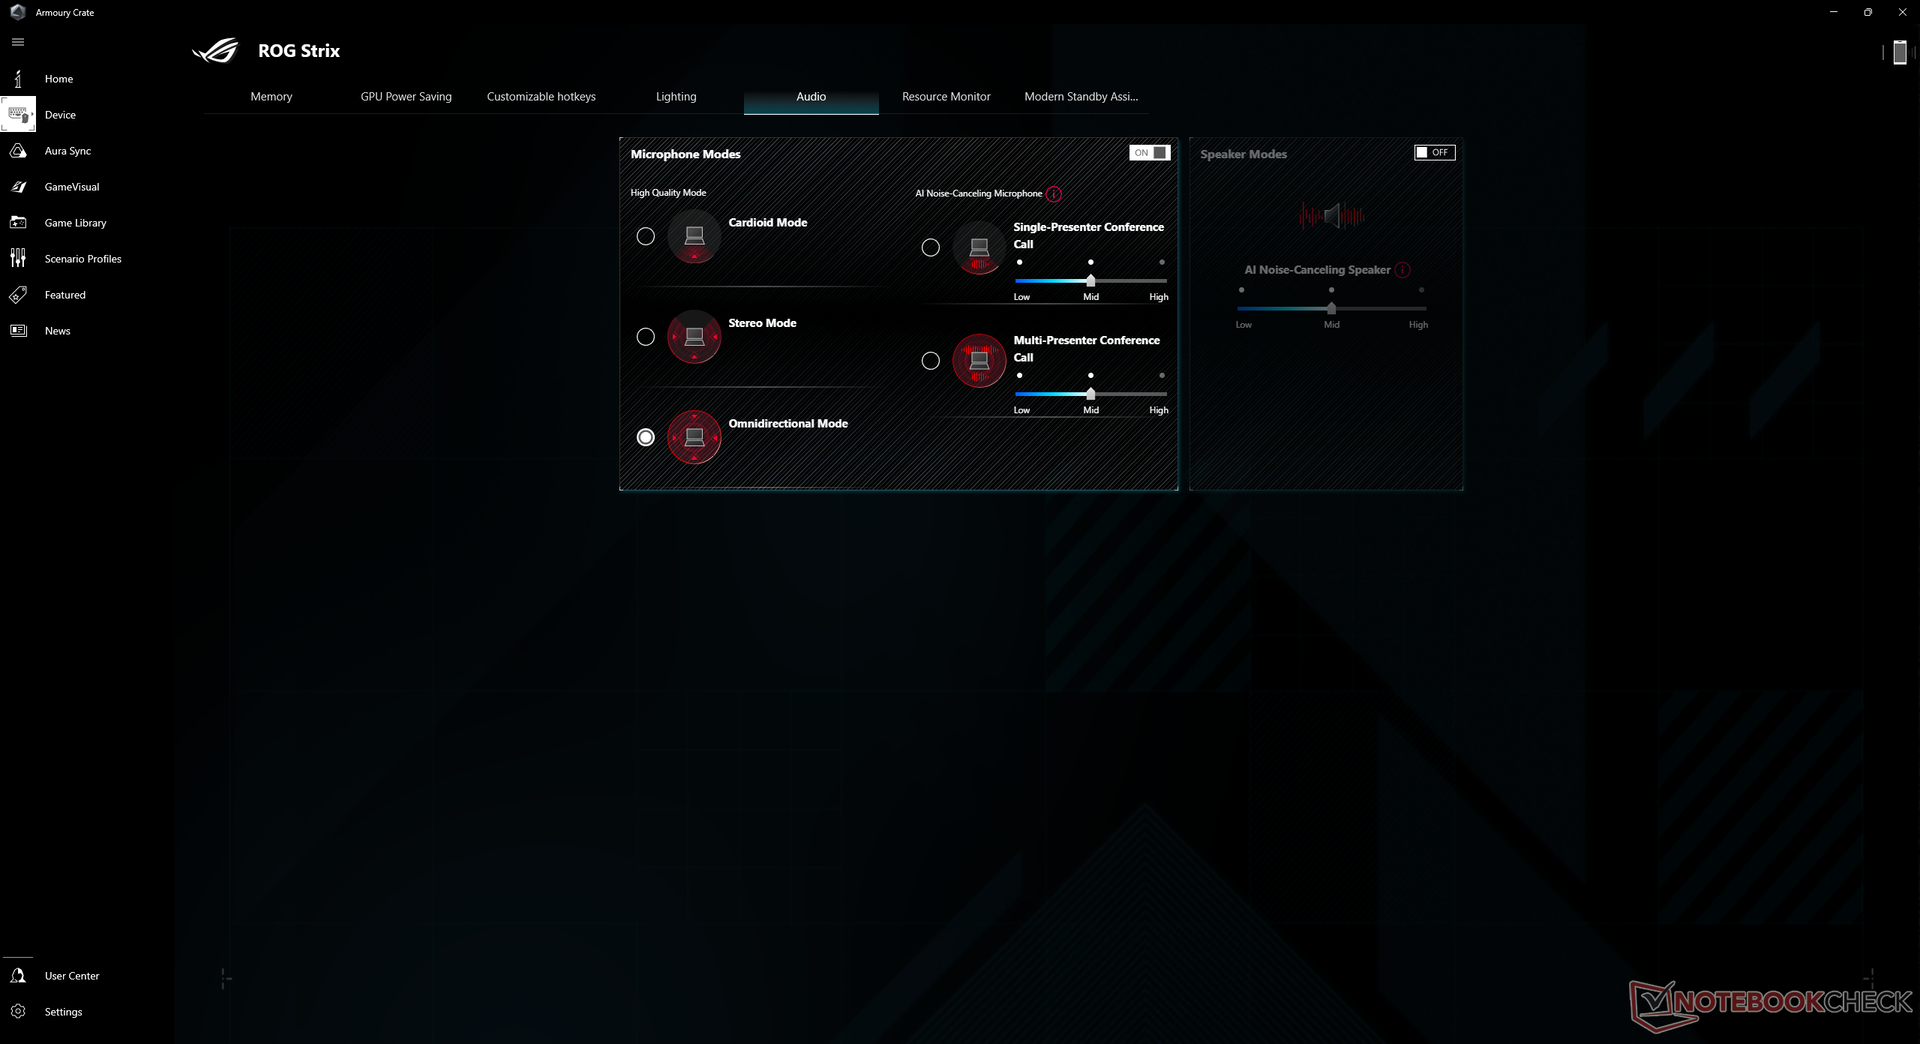
Przed przeprowadzeniem poniższych benchmarków ustawiliśmy nasze urządzenie w tryb Turbo i dyskretny tryb GPU za pośrednictwem Asus Armoury Crate. Właścicieli zachęcamy do zapoznania się z Armoury Crate, ponieważ jest to centrum kontroli trybów zasilania, MUX, Asus Aura i innych funkcji i aktualizacji specyficznych dla danego modelu.
Warto zauważyć, że na naszej testowej jednostce doświadczyliśmy kilku problemów. Podczas przełączania między trybami Optimus i dGPU system czasami nie ładował się podczas ponownego uruchamiania. Wymagany był wtedy twardy restart.
Procesor
Wydajność procesora jest jedną z najszybszych dostępnych w każdym laptopie, co wyszczególniliśmy w w naszej recenzji Ryzen 9 7945HX. Mimo to wciąż pozostaje w tyle za konkurencyjnymCore i9-13950HX lub i9-13900HX tylko nieznacznie, jeśli chodzi o operacje jednowątkowe.
Cinebench R15 Multi Loop
Cinebench R23: Multi Core | Single Core
Cinebench R20: CPU (Multi Core) | CPU (Single Core)
Cinebench R15: CPU Multi 64Bit | CPU Single 64Bit
Blender: v2.79 BMW27 CPU
7-Zip 18.03: 7z b 4 | 7z b 4 -mmt1
Geekbench 5.5: Multi-Core | Single-Core
HWBOT x265 Benchmark v2.2: 4k Preset
LibreOffice : 20 Documents To PDF
R Benchmark 2.5: Overall mean
| CPU Performance Rating | |
| Intel Core i9-13900K @253W | |
| Asus ROG Strix Scar 17 G733PY-XS96 | |
| Eluktronics Mech-17 GP2 | |
| MSI GE78HX 13VH-070US | |
| Average AMD Ryzen 9 7945HX | |
| Uniwill GM6PX7X RTX 4070 | |
| Asus ROG Strix Scar 17 SE G733CX-LL014W | |
| Aorus 17X XES | |
| MSI Pulse GL76 12UGK | |
| Asus ROG Zephyrus S17 GX703HSD | |
| Alienware m17 R5 (R9 6900HX, RX 6850M XT) | |
| MSI Delta 15 A5EFK | |
| Lenovo Legion C7 15IMH05 82EH0030GE | |
| Cinebench R23 / Multi Core | |
| Intel Core i9-13900K @253W | |
| Asus ROG Strix Scar 17 G733PY-XS96 | |
| Average AMD Ryzen 9 7945HX (32379 - 34613, n=5) | |
| MSI GE78HX 13VH-070US | |
| Eluktronics Mech-17 GP2 | |
| Uniwill GM6PX7X RTX 4070 | |
| Asus ROG Strix Scar 17 SE G733CX-LL014W | |
| Aorus 17X XES | |
| MSI Pulse GL76 12UGK | |
| Alienware m17 R5 (R9 6900HX, RX 6850M XT) | |
| Asus ROG Zephyrus S17 GX703HSD | |
| MSI Delta 15 A5EFK | |
| Lenovo Legion C7 15IMH05 82EH0030GE | |
| Cinebench R23 / Single Core | |
| Intel Core i9-13900K @253W | |
| MSI GE78HX 13VH-070US | |
| Eluktronics Mech-17 GP2 | |
| Aorus 17X XES | |
| Average AMD Ryzen 9 7945HX (1863 - 1948, n=5) | |
| Asus ROG Strix Scar 17 SE G733CX-LL014W | |
| Asus ROG Strix Scar 17 G733PY-XS96 | |
| Uniwill GM6PX7X RTX 4070 | |
| MSI Pulse GL76 12UGK | |
| Asus ROG Zephyrus S17 GX703HSD | |
| Alienware m17 R5 (R9 6900HX, RX 6850M XT) | |
| MSI Delta 15 A5EFK | |
| Lenovo Legion C7 15IMH05 82EH0030GE | |
| Cinebench R20 / CPU (Multi Core) | |
| Intel Core i9-13900K @253W | |
| Asus ROG Strix Scar 17 G733PY-XS96 | |
| Average AMD Ryzen 9 7945HX (10025 - 13769, n=5) | |
| MSI GE78HX 13VH-070US | |
| Eluktronics Mech-17 GP2 | |
| Uniwill GM6PX7X RTX 4070 | |
| Asus ROG Strix Scar 17 SE G733CX-LL014W | |
| Aorus 17X XES | |
| MSI Pulse GL76 12UGK | |
| Alienware m17 R5 (R9 6900HX, RX 6850M XT) | |
| Asus ROG Zephyrus S17 GX703HSD | |
| MSI Delta 15 A5EFK | |
| Lenovo Legion C7 15IMH05 82EH0030GE | |
| Cinebench R20 / CPU (Single Core) | |
| Intel Core i9-13900K @253W | |
| MSI GE78HX 13VH-070US | |
| Eluktronics Mech-17 GP2 | |
| Asus ROG Strix Scar 17 SE G733CX-LL014W | |
| Aorus 17X XES | |
| Average AMD Ryzen 9 7945HX (712 - 756, n=5) | |
| Asus ROG Strix Scar 17 G733PY-XS96 | |
| Uniwill GM6PX7X RTX 4070 | |
| MSI Pulse GL76 12UGK | |
| Alienware m17 R5 (R9 6900HX, RX 6850M XT) | |
| Asus ROG Zephyrus S17 GX703HSD | |
| MSI Delta 15 A5EFK | |
| Lenovo Legion C7 15IMH05 82EH0030GE | |
| Cinebench R15 / CPU Multi 64Bit | |
| Intel Core i9-13900K @253W | |
| Asus ROG Strix Scar 17 G733PY-XS96 | |
| Average AMD Ryzen 9 7945HX (5205 - 5663, n=6) | |
| MSI GE78HX 13VH-070US | |
| Eluktronics Mech-17 GP2 | |
| Uniwill GM6PX7X RTX 4070 | |
| Asus ROG Strix Scar 17 SE G733CX-LL014W | |
| Aorus 17X XES | |
| MSI Pulse GL76 12UGK | |
| Alienware m17 R5 (R9 6900HX, RX 6850M XT) | |
| Asus ROG Zephyrus S17 GX703HSD | |
| MSI Delta 15 A5EFK | |
| Lenovo Legion C7 15IMH05 82EH0030GE | |
| Cinebench R15 / CPU Single 64Bit | |
| Intel Core i9-13900K @253W | |
| Asus ROG Strix Scar 17 G733PY-XS96 | |
| MSI GE78HX 13VH-070US | |
| Average AMD Ryzen 9 7945HX (294 - 309, n=6) | |
| Eluktronics Mech-17 GP2 | |
| Aorus 17X XES | |
| Asus ROG Strix Scar 17 SE G733CX-LL014W | |
| Uniwill GM6PX7X RTX 4070 | |
| MSI Pulse GL76 12UGK | |
| Alienware m17 R5 (R9 6900HX, RX 6850M XT) | |
| Asus ROG Zephyrus S17 GX703HSD | |
| MSI Delta 15 A5EFK | |
| Lenovo Legion C7 15IMH05 82EH0030GE | |
| Blender / v2.79 BMW27 CPU | |
| Lenovo Legion C7 15IMH05 82EH0030GE | |
| MSI Delta 15 A5EFK | |
| Asus ROG Zephyrus S17 GX703HSD | |
| Alienware m17 R5 (R9 6900HX, RX 6850M XT) | |
| Aorus 17X XES | |
| MSI Pulse GL76 12UGK | |
| Asus ROG Strix Scar 17 SE G733CX-LL014W | |
| Uniwill GM6PX7X RTX 4070 | |
| Eluktronics Mech-17 GP2 | |
| MSI GE78HX 13VH-070US | |
| Average AMD Ryzen 9 7945HX (87 - 100, n=5) | |
| Asus ROG Strix Scar 17 G733PY-XS96 | |
| Intel Core i9-13900K @253W | |
| 7-Zip 18.03 / 7z b 4 | |
| Intel Core i9-13900K @253W | |
| Asus ROG Strix Scar 17 G733PY-XS96 | |
| Average AMD Ryzen 9 7945HX (123364 - 140932, n=5) | |
| Eluktronics Mech-17 GP2 | |
| MSI GE78HX 13VH-070US | |
| Uniwill GM6PX7X RTX 4070 | |
| Asus ROG Strix Scar 17 SE G733CX-LL014W | |
| Aorus 17X XES | |
| MSI Pulse GL76 12UGK | |
| Alienware m17 R5 (R9 6900HX, RX 6850M XT) | |
| MSI Delta 15 A5EFK | |
| Asus ROG Zephyrus S17 GX703HSD | |
| Lenovo Legion C7 15IMH05 82EH0030GE | |
| 7-Zip 18.03 / 7z b 4 -mmt1 | |
| Asus ROG Strix Scar 17 G733PY-XS96 | |
| Intel Core i9-13900K @253W | |
| Average AMD Ryzen 9 7945HX (7319 - 7581, n=5) | |
| MSI GE78HX 13VH-070US | |
| Eluktronics Mech-17 GP2 | |
| Aorus 17X XES | |
| Asus ROG Strix Scar 17 SE G733CX-LL014W | |
| Uniwill GM6PX7X RTX 4070 | |
| Asus ROG Zephyrus S17 GX703HSD | |
| MSI Delta 15 A5EFK | |
| Alienware m17 R5 (R9 6900HX, RX 6850M XT) | |
| MSI Pulse GL76 12UGK | |
| Lenovo Legion C7 15IMH05 82EH0030GE | |
| Geekbench 5.5 / Multi-Core | |
| Intel Core i9-13900K @253W | |
| MSI GE78HX 13VH-070US | |
| Eluktronics Mech-17 GP2 | |
| Average AMD Ryzen 9 7945HX (18372 - 19954, n=5) | |
| Asus ROG Strix Scar 17 G733PY-XS96 | |
| Uniwill GM6PX7X RTX 4070 | |
| Asus ROG Strix Scar 17 SE G733CX-LL014W | |
| Aorus 17X XES | |
| MSI Pulse GL76 12UGK | |
| Alienware m17 R5 (R9 6900HX, RX 6850M XT) | |
| Asus ROG Zephyrus S17 GX703HSD | |
| MSI Delta 15 A5EFK | |
| Lenovo Legion C7 15IMH05 82EH0030GE | |
| Geekbench 5.5 / Single-Core | |
| Intel Core i9-13900K @253W | |
| MSI GE78HX 13VH-070US | |
| Average AMD Ryzen 9 7945HX (2047 - 2132, n=5) | |
| Eluktronics Mech-17 GP2 | |
| Asus ROG Strix Scar 17 G733PY-XS96 | |
| Aorus 17X XES | |
| Asus ROG Strix Scar 17 SE G733CX-LL014W | |
| Uniwill GM6PX7X RTX 4070 | |
| MSI Pulse GL76 12UGK | |
| Asus ROG Zephyrus S17 GX703HSD | |
| Alienware m17 R5 (R9 6900HX, RX 6850M XT) | |
| MSI Delta 15 A5EFK | |
| Lenovo Legion C7 15IMH05 82EH0030GE | |
| HWBOT x265 Benchmark v2.2 / 4k Preset | |
| Intel Core i9-13900K @253W | |
| Asus ROG Strix Scar 17 G733PY-XS96 | |
| Average AMD Ryzen 9 7945HX (33.8 - 37.6, n=4) | |
| MSI GE78HX 13VH-070US | |
| Eluktronics Mech-17 GP2 | |
| Uniwill GM6PX7X RTX 4070 | |
| Asus ROG Strix Scar 17 SE G733CX-LL014W | |
| Aorus 17X XES | |
| MSI Pulse GL76 12UGK | |
| Alienware m17 R5 (R9 6900HX, RX 6850M XT) | |
| Asus ROG Zephyrus S17 GX703HSD | |
| MSI Delta 15 A5EFK | |
| Lenovo Legion C7 15IMH05 82EH0030GE | |
| LibreOffice / 20 Documents To PDF | |
| Alienware m17 R5 (R9 6900HX, RX 6850M XT) | |
| Lenovo Legion C7 15IMH05 82EH0030GE | |
| MSI Delta 15 A5EFK | |
| MSI GE78HX 13VH-070US | |
| Average AMD Ryzen 9 7945HX (36.8 - 60.4, n=4) | |
| MSI Pulse GL76 12UGK | |
| Asus ROG Zephyrus S17 GX703HSD | |
| Uniwill GM6PX7X RTX 4070 | |
| Aorus 17X XES | |
| Asus ROG Strix Scar 17 G733PY-XS96 | |
| Asus ROG Strix Scar 17 SE G733CX-LL014W | |
| Eluktronics Mech-17 GP2 | |
| Intel Core i9-13900K @253W | |
| R Benchmark 2.5 / Overall mean | |
| Lenovo Legion C7 15IMH05 82EH0030GE | |
| Asus ROG Zephyrus S17 GX703HSD | |
| MSI Delta 15 A5EFK | |
| Alienware m17 R5 (R9 6900HX, RX 6850M XT) | |
| MSI Pulse GL76 12UGK | |
| Uniwill GM6PX7X RTX 4070 | |
| Asus ROG Strix Scar 17 SE G733CX-LL014W | |
| Aorus 17X XES | |
| Average AMD Ryzen 9 7945HX (0.3982 - 0.4159, n=4) | |
| Asus ROG Strix Scar 17 G733PY-XS96 | |
| MSI GE78HX 13VH-070US | |
| Eluktronics Mech-17 GP2 | |
| Intel Core i9-13900K @253W | |
Cinebench R23: Multi Core | Single Core
Cinebench R20: CPU (Multi Core) | CPU (Single Core)
Cinebench R15: CPU Multi 64Bit | CPU Single 64Bit
Blender: v2.79 BMW27 CPU
7-Zip 18.03: 7z b 4 | 7z b 4 -mmt1
Geekbench 5.5: Multi-Core | Single-Core
HWBOT x265 Benchmark v2.2: 4k Preset
LibreOffice : 20 Documents To PDF
R Benchmark 2.5: Overall mean
* ... im mniej tym lepiej
AIDA64: FP32 Ray-Trace | FPU Julia | CPU SHA3 | CPU Queen | FPU SinJulia | FPU Mandel | CPU AES | CPU ZLib | FP64 Ray-Trace | CPU PhotoWorxx
| Performance Rating | |
| Asus ROG Strix Scar 17 G733PY-XS96 | |
| Average AMD Ryzen 9 7945HX | |
| Asus ROG Strix G17 G713PI | |
| Eluktronics Mech-17 GP2 | |
| MSI GE78HX 13VH-070US | |
| Aorus 17X XES | |
| Alienware m17 R5 (R9 6900HX, RX 6850M XT) | |
| AIDA64 / FP32 Ray-Trace | |
| Average AMD Ryzen 9 7945HX (52479 - 60169, n=3) | |
| Asus ROG Strix Scar 17 G733PY-XS96 | |
| Asus ROG Strix G17 G713PI | |
| MSI GE78HX 13VH-070US | |
| Eluktronics Mech-17 GP2 | |
| Alienware m17 R5 (R9 6900HX, RX 6850M XT) | |
| Aorus 17X XES | |
| AIDA64 / FPU Julia | |
| Average AMD Ryzen 9 7945HX (227882 - 252486, n=3) | |
| Asus ROG Strix Scar 17 G733PY-XS96 | |
| Asus ROG Strix G17 G713PI | |
| MSI GE78HX 13VH-070US | |
| Eluktronics Mech-17 GP2 | |
| Alienware m17 R5 (R9 6900HX, RX 6850M XT) | |
| Aorus 17X XES | |
| AIDA64 / CPU SHA3 | |
| Asus ROG Strix Scar 17 G733PY-XS96 | |
| Average AMD Ryzen 9 7945HX (8525 - 10389, n=3) | |
| Asus ROG Strix G17 G713PI | |
| Eluktronics Mech-17 GP2 | |
| MSI GE78HX 13VH-070US | |
| Aorus 17X XES | |
| Alienware m17 R5 (R9 6900HX, RX 6850M XT) | |
| AIDA64 / CPU Queen | |
| Average AMD Ryzen 9 7945HX (180473 - 200651, n=3) | |
| Asus ROG Strix Scar 17 G733PY-XS96 | |
| Asus ROG Strix G17 G713PI | |
| Eluktronics Mech-17 GP2 | |
| MSI GE78HX 13VH-070US | |
| Alienware m17 R5 (R9 6900HX, RX 6850M XT) | |
| Aorus 17X XES | |
| AIDA64 / FPU SinJulia | |
| Average AMD Ryzen 9 7945HX (29598 - 32988, n=3) | |
| Asus ROG Strix Scar 17 G733PY-XS96 | |
| Asus ROG Strix G17 G713PI | |
| Eluktronics Mech-17 GP2 | |
| MSI GE78HX 13VH-070US | |
| Alienware m17 R5 (R9 6900HX, RX 6850M XT) | |
| Aorus 17X XES | |
| AIDA64 / FPU Mandel | |
| Average AMD Ryzen 9 7945HX (118401 - 134044, n=3) | |
| Asus ROG Strix Scar 17 G733PY-XS96 | |
| Asus ROG Strix G17 G713PI | |
| MSI GE78HX 13VH-070US | |
| Eluktronics Mech-17 GP2 | |
| Alienware m17 R5 (R9 6900HX, RX 6850M XT) | |
| Aorus 17X XES | |
| AIDA64 / CPU AES | |
| Eluktronics Mech-17 GP2 | |
| Asus ROG Strix Scar 17 G733PY-XS96 | |
| Asus ROG Strix G17 G713PI | |
| Average AMD Ryzen 9 7945HX (149040 - 178594, n=3) | |
| MSI GE78HX 13VH-070US | |
| Aorus 17X XES | |
| Alienware m17 R5 (R9 6900HX, RX 6850M XT) | |
| AIDA64 / CPU ZLib | |
| Average AMD Ryzen 9 7945HX (2090 - 2409, n=3) | |
| Asus ROG Strix Scar 17 G733PY-XS96 | |
| Asus ROG Strix G17 G713PI | |
| MSI GE78HX 13VH-070US | |
| Eluktronics Mech-17 GP2 | |
| Aorus 17X XES | |
| Alienware m17 R5 (R9 6900HX, RX 6850M XT) | |
| AIDA64 / FP64 Ray-Trace | |
| Average AMD Ryzen 9 7945HX (28105 - 31796, n=3) | |
| Asus ROG Strix Scar 17 G733PY-XS96 | |
| Asus ROG Strix G17 G713PI | |
| MSI GE78HX 13VH-070US | |
| Eluktronics Mech-17 GP2 | |
| Alienware m17 R5 (R9 6900HX, RX 6850M XT) | |
| Aorus 17X XES | |
| AIDA64 / CPU PhotoWorxx | |
| MSI GE78HX 13VH-070US | |
| Eluktronics Mech-17 GP2 | |
| Aorus 17X XES | |
| Asus ROG Strix Scar 17 G733PY-XS96 | |
| Average AMD Ryzen 9 7945HX (31421 - 34957, n=3) | |
| Asus ROG Strix G17 G713PI | |
| Alienware m17 R5 (R9 6900HX, RX 6850M XT) | |
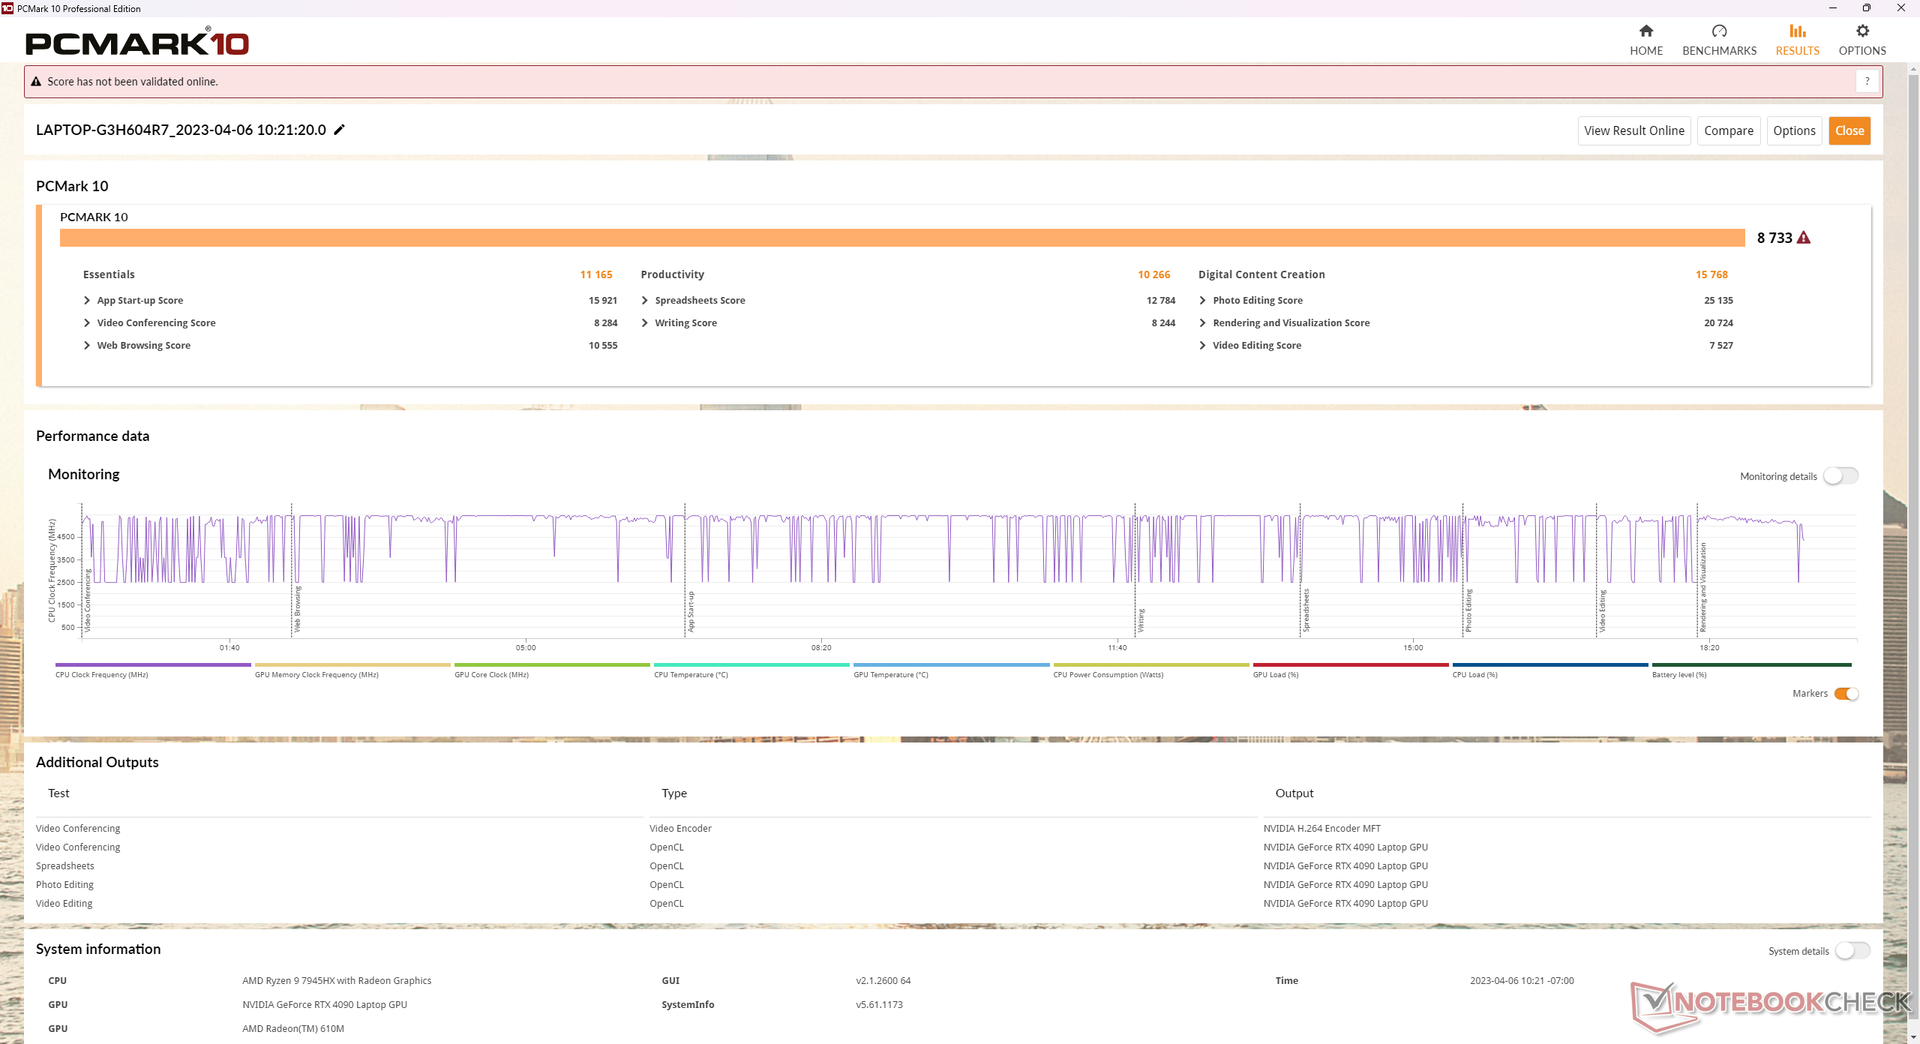
Wydajność systemu
CrossMark: Overall | Productivity | Creativity | Responsiveness
| PCMark 10 / Score | |
| Eluktronics Mech-17 GP2 | |
| Average AMD Ryzen 9 7945HX, NVIDIA GeForce RTX 4090 Laptop GPU (8733 - 9151, n=2) | |
| MSI GE78HX 13VH-070US | |
| Asus ROG Strix Scar 17 G733PY-XS96 | |
| Aorus 17X XES | |
| Asus ROG Strix G17 G713PI | |
| Alienware m17 R5 (R9 6900HX, RX 6850M XT) | |
| Asus ROG Strix Scar 17 SE G733CX-LL014W | |
| PCMark 10 / Essentials | |
| Eluktronics Mech-17 GP2 | |
| Average AMD Ryzen 9 7945HX, NVIDIA GeForce RTX 4090 Laptop GPU (11165 - 12176, n=2) | |
| MSI GE78HX 13VH-070US | |
| Asus ROG Strix G17 G713PI | |
| Asus ROG Strix Scar 17 G733PY-XS96 | |
| Aorus 17X XES | |
| Asus ROG Strix Scar 17 SE G733CX-LL014W | |
| Alienware m17 R5 (R9 6900HX, RX 6850M XT) | |
| PCMark 10 / Productivity | |
| Asus ROG Strix G17 G713PI | |
| Average AMD Ryzen 9 7945HX, NVIDIA GeForce RTX 4090 Laptop GPU (10266 - 11833, n=2) | |
| Eluktronics Mech-17 GP2 | |
| MSI GE78HX 13VH-070US | |
| Asus ROG Strix Scar 17 G733PY-XS96 | |
| Aorus 17X XES | |
| Asus ROG Strix Scar 17 SE G733CX-LL014W | |
| Alienware m17 R5 (R9 6900HX, RX 6850M XT) | |
| PCMark 10 / Digital Content Creation | |
| Asus ROG Strix Scar 17 G733PY-XS96 | |
| Eluktronics Mech-17 GP2 | |
| MSI GE78HX 13VH-070US | |
| Average AMD Ryzen 9 7945HX, NVIDIA GeForce RTX 4090 Laptop GPU (14432 - 15768, n=2) | |
| Aorus 17X XES | |
| Alienware m17 R5 (R9 6900HX, RX 6850M XT) | |
| Asus ROG Strix Scar 17 SE G733CX-LL014W | |
| Asus ROG Strix G17 G713PI | |
| CrossMark / Overall | |
| Eluktronics Mech-17 GP2 | |
| Aorus 17X XES | |
| Asus ROG Strix Scar 17 SE G733CX-LL014W | |
| Asus ROG Strix G17 G713PI | |
| Average AMD Ryzen 9 7945HX, NVIDIA GeForce RTX 4090 Laptop GPU (1993 - 2078, n=2) | |
| Asus ROG Strix Scar 17 G733PY-XS96 | |
| MSI GE78HX 13VH-070US | |
| Alienware m17 R5 (R9 6900HX, RX 6850M XT) | |
| CrossMark / Productivity | |
| Eluktronics Mech-17 GP2 | |
| Aorus 17X XES | |
| Asus ROG Strix Scar 17 SE G733CX-LL014W | |
| Asus ROG Strix G17 G713PI | |
| Average AMD Ryzen 9 7945HX, NVIDIA GeForce RTX 4090 Laptop GPU (1838 - 1946, n=2) | |
| MSI GE78HX 13VH-070US | |
| Asus ROG Strix Scar 17 G733PY-XS96 | |
| Alienware m17 R5 (R9 6900HX, RX 6850M XT) | |
| CrossMark / Creativity | |
| Eluktronics Mech-17 GP2 | |
| Average AMD Ryzen 9 7945HX, NVIDIA GeForce RTX 4090 Laptop GPU (2334 - 2377, n=2) | |
| Asus ROG Strix Scar 17 SE G733CX-LL014W | |
| Asus ROG Strix Scar 17 G733PY-XS96 | |
| Asus ROG Strix G17 G713PI | |
| Aorus 17X XES | |
| MSI GE78HX 13VH-070US | |
| Alienware m17 R5 (R9 6900HX, RX 6850M XT) | |
| CrossMark / Responsiveness | |
| Aorus 17X XES | |
| Asus ROG Strix Scar 17 SE G733CX-LL014W | |
| Eluktronics Mech-17 GP2 | |
| MSI GE78HX 13VH-070US | |
| Asus ROG Strix G17 G713PI | |
| Average AMD Ryzen 9 7945HX, NVIDIA GeForce RTX 4090 Laptop GPU (1584 - 1689, n=2) | |
| Asus ROG Strix Scar 17 G733PY-XS96 | |
| Alienware m17 R5 (R9 6900HX, RX 6850M XT) | |
| PCMark 10 Score | 8733 pkt. | |
Pomoc | ||
| AIDA64 / Memory Copy | |
| MSI GE78HX 13VH-070US | |
| Eluktronics Mech-17 GP2 | |
| Aorus 17X XES | |
| Alienware m17 R5 (R9 6900HX, RX 6850M XT) | |
| Average AMD Ryzen 9 7945HX (48948 - 51423, n=3) | |
| Asus ROG Strix Scar 17 G733PY-XS96 | |
| Asus ROG Strix G17 G713PI | |
| AIDA64 / Memory Read | |
| MSI GE78HX 13VH-070US | |
| Eluktronics Mech-17 GP2 | |
| Aorus 17X XES | |
| Average AMD Ryzen 9 7945HX (59620 - 61564, n=3) | |
| Asus ROG Strix G17 G713PI | |
| Asus ROG Strix Scar 17 G733PY-XS96 | |
| Alienware m17 R5 (R9 6900HX, RX 6850M XT) | |
| AIDA64 / Memory Write | |
| MSI GE78HX 13VH-070US | |
| Eluktronics Mech-17 GP2 | |
| Aorus 17X XES | |
| Average AMD Ryzen 9 7945HX (58602 - 61092, n=3) | |
| Asus ROG Strix Scar 17 G733PY-XS96 | |
| Asus ROG Strix G17 G713PI | |
| Alienware m17 R5 (R9 6900HX, RX 6850M XT) | |
| AIDA64 / Memory Latency | |
| Alienware m17 R5 (R9 6900HX, RX 6850M XT) | |
| Eluktronics Mech-17 GP2 | |
| Aorus 17X XES | |
| Average AMD Ryzen 9 7945HX (82.9 - 91.3, n=3) | |
| Asus ROG Strix G17 G713PI | |
| MSI GE78HX 13VH-070US | |
| Asus ROG Strix Scar 17 G733PY-XS96 | |
* ... im mniej tym lepiej
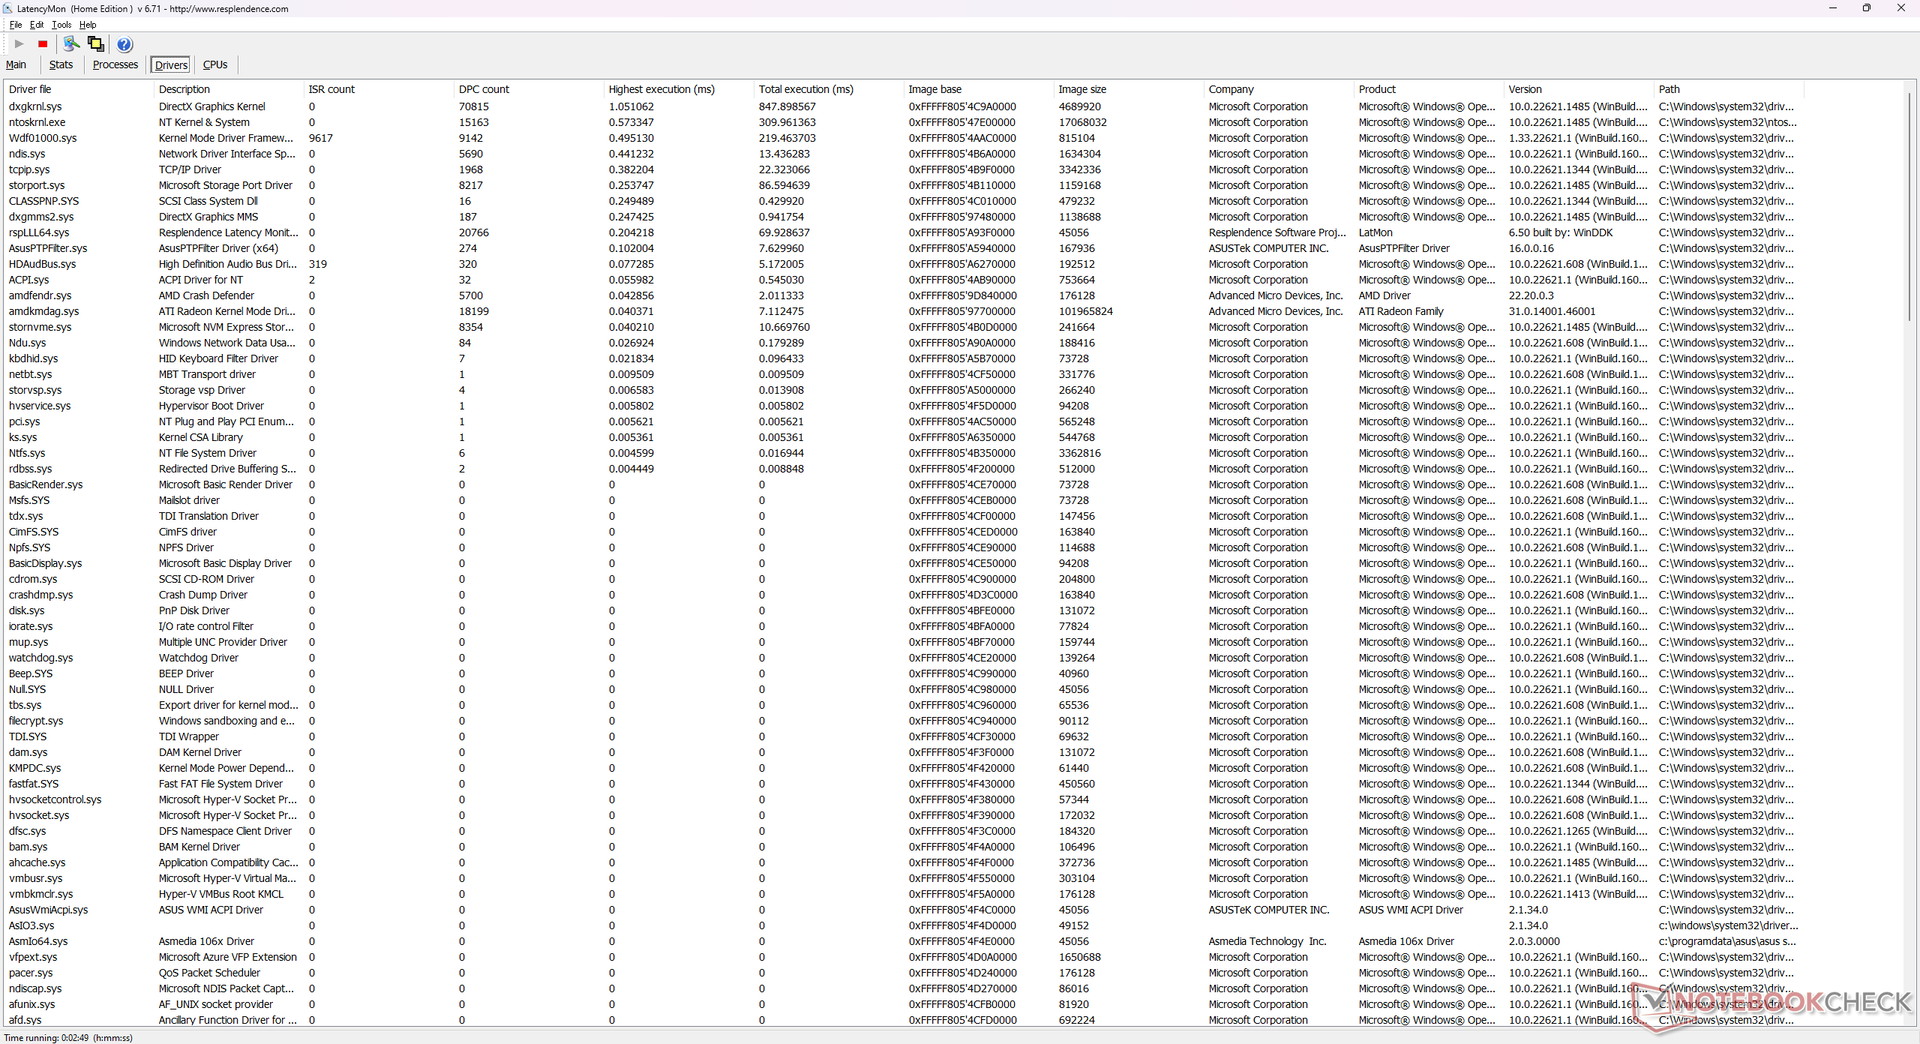
Opóźnienie DPC
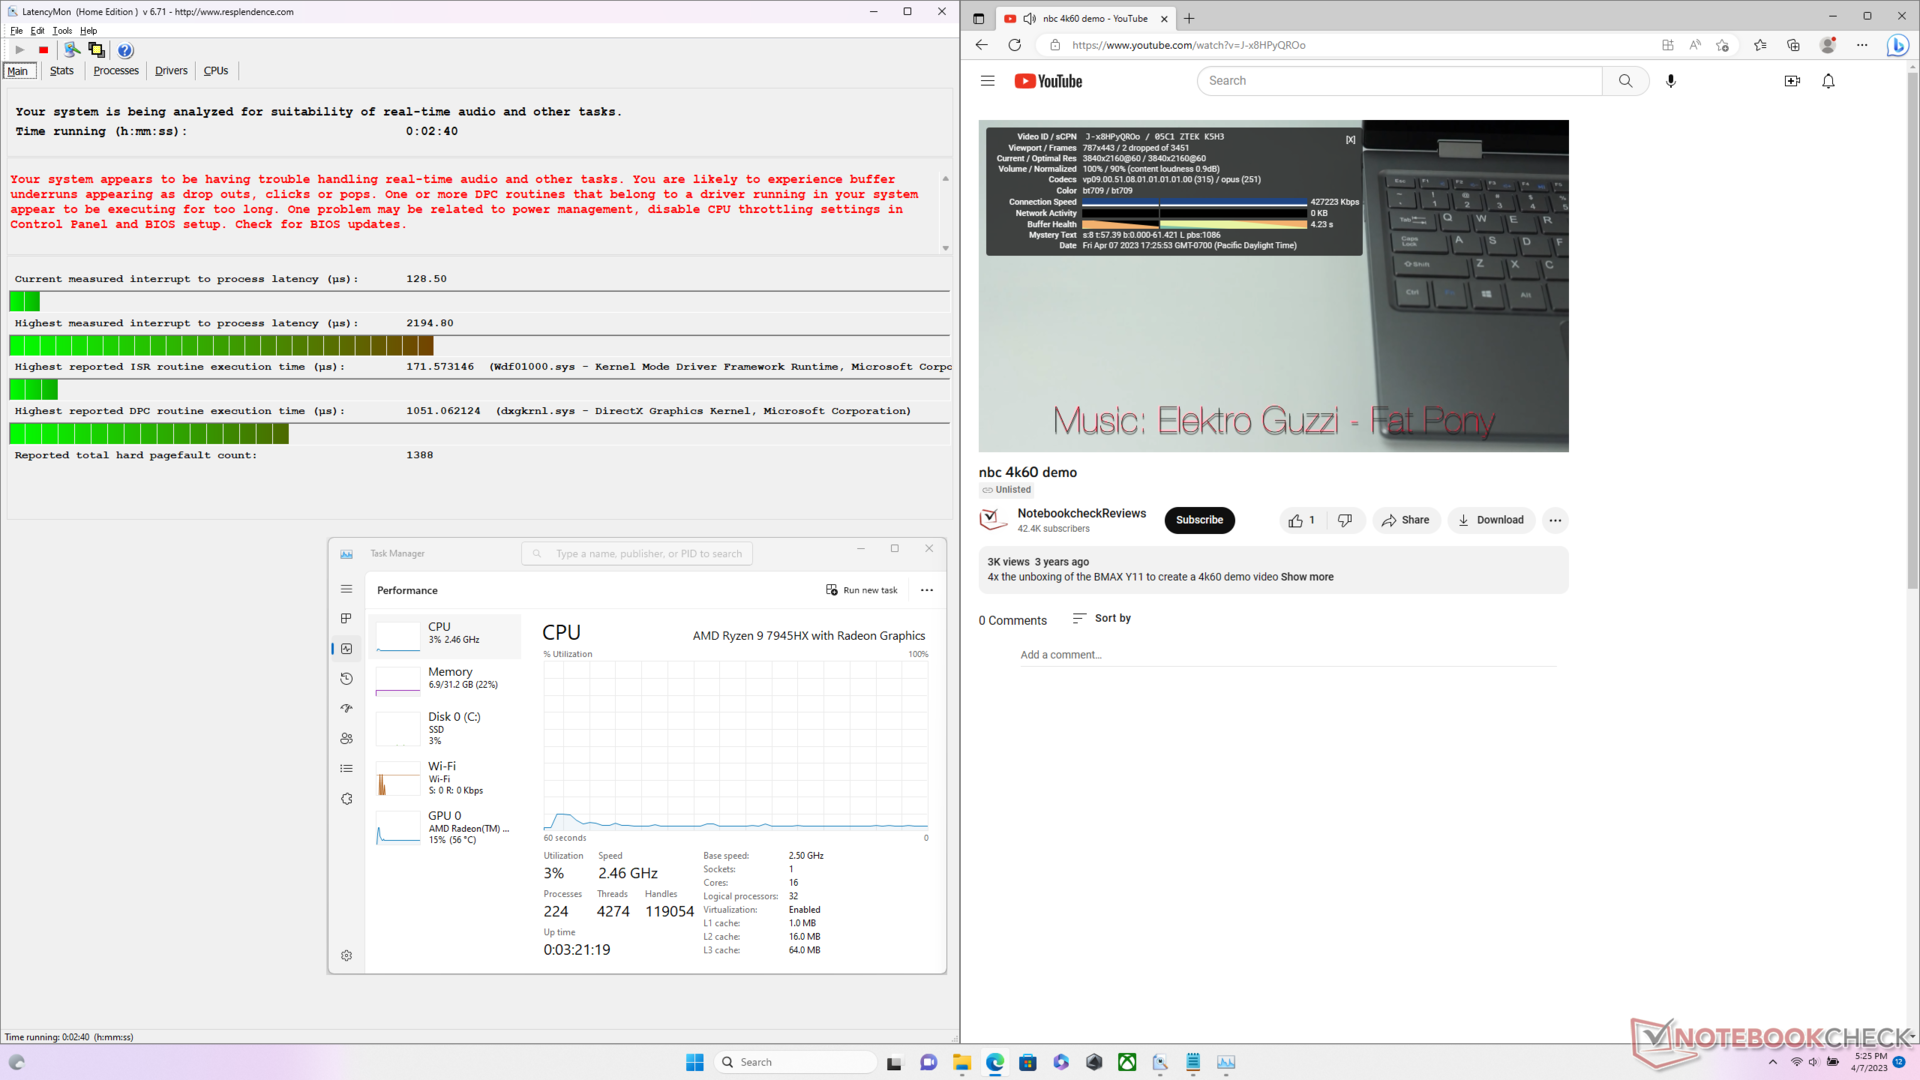
LatencyMon nie wykazałby żadnych problemów z DPC podczas otwierania wielu kart przeglądarki na naszej stronie głównej. Uruchomienie Prime95 spowodowałoby jednak wysoką latencję przerwań. Podczas odtwarzania naszego jednominutowego filmu testowego 4K60 udało nam się zarejestrować 2 zrzucone klatki.
| DPC Latencies / LatencyMon - interrupt to process latency (max), Web, Youtube, Prime95 | |
| MSI GE78HX 13VH-070US | |
| Asus ROG Strix Scar 17 SE G733CX-LL014W | |
| Asus ROG Strix Scar 17 G733PY-XS96 | |
| Asus ROG Strix G17 G713PI | |
| Alienware m17 R5 (R9 6900HX, RX 6850M XT) | |
| Eluktronics Mech-17 GP2 | |
* ... im mniej tym lepiej
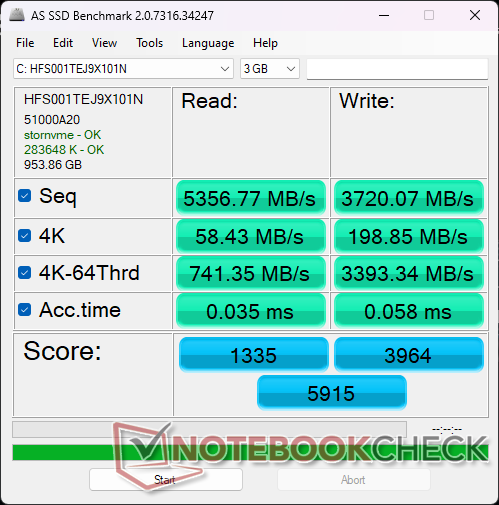
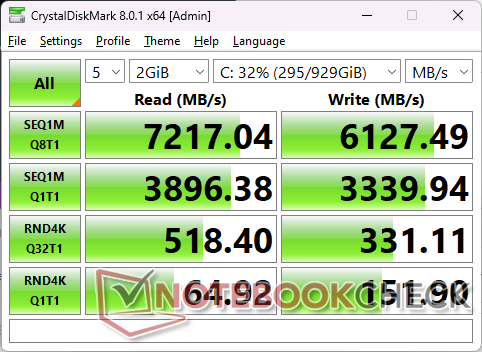
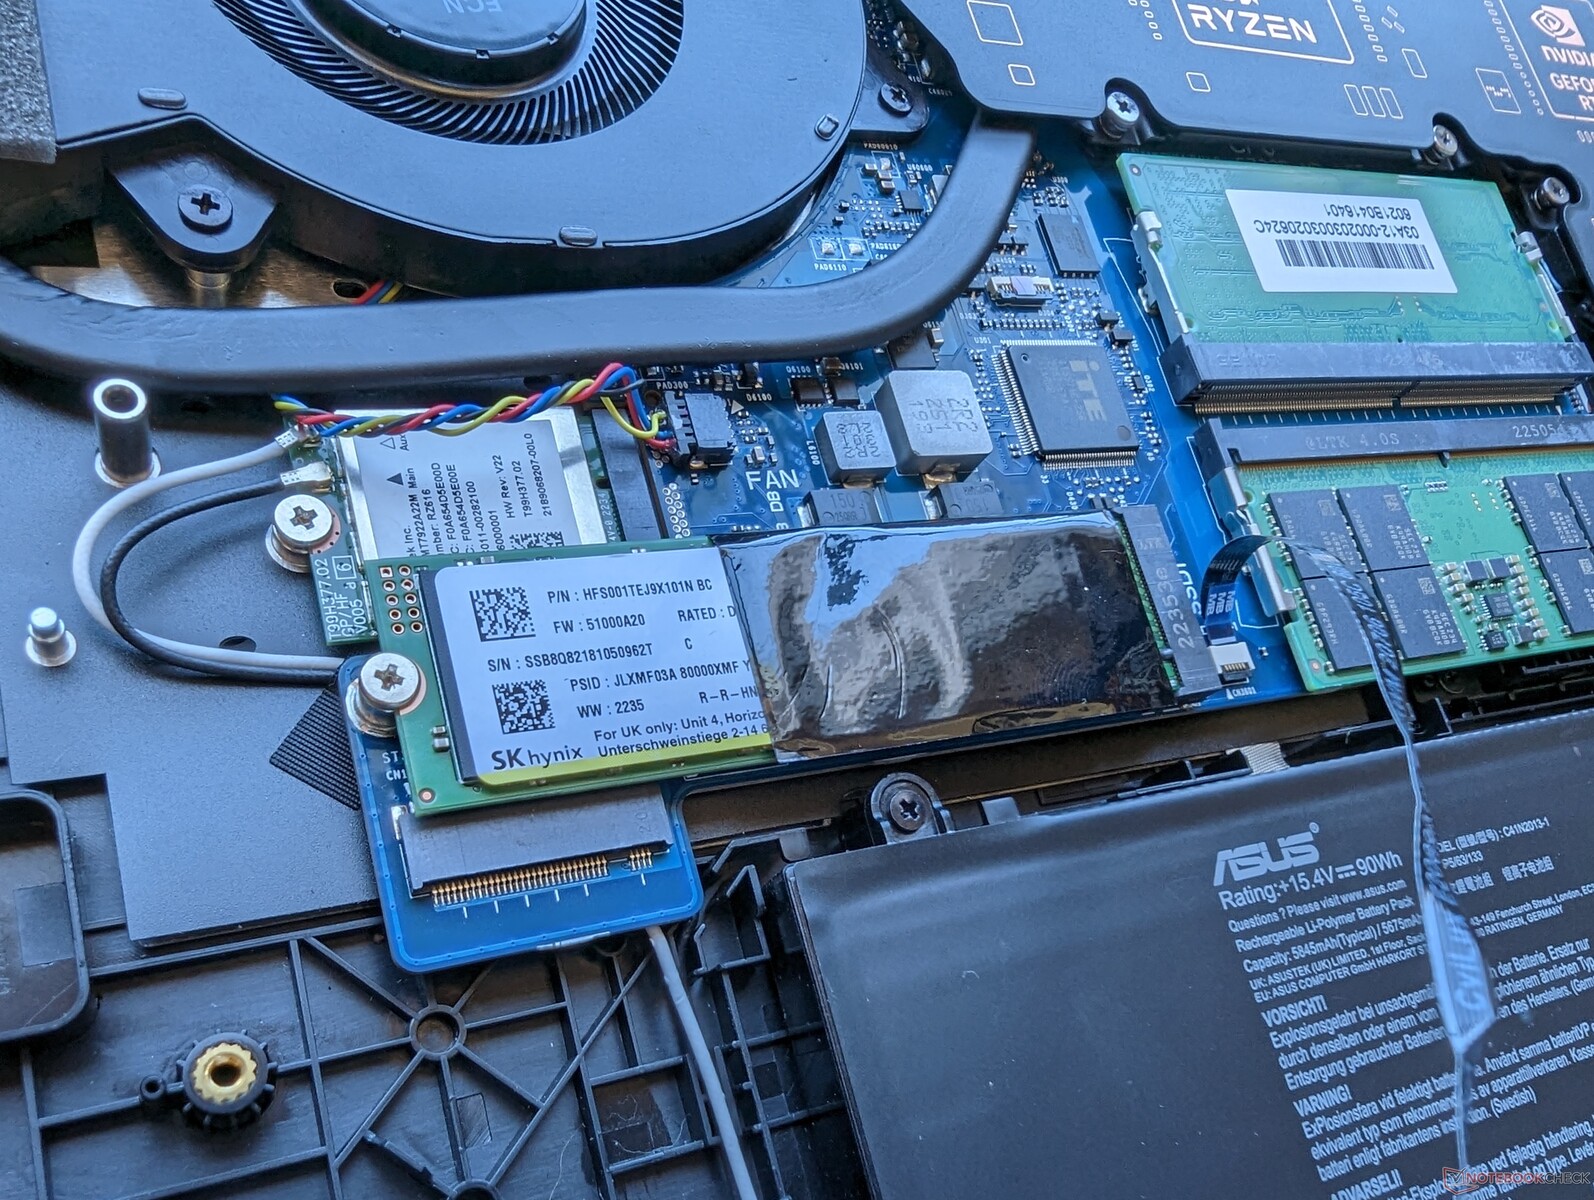
Urządzenia pamięci masowej - wykryto dławienie wydajności
Nasze urządzenie jest dostarczane z 1 TB SK hynix PC801 o prędkości odczytu i zapisu sekwencyjnego wynoszącej odpowiednio około 7200 MB/s i 6200 MB/s. Jednak dysk w naszym urządzeniu wykazywał problemy z wydajnością po około 4 minutach obciążenia, jak pokazuje poniższy wykres. Dyski SSD nie mają rozpraszacza ciepła ani podkładki termicznej, która pomagałaby w odprowadzaniu ciepła.

| Drive Performance Rating - Percent | |
| Aorus 17X XES | |
| MSI GE78HX 13VH-070US | |
| Asus ROG Strix Scar 17 G733PY-XS96 | |
| Eluktronics Mech-17 GP2 | |
| Alienware m17 R5 (R9 6900HX, RX 6850M XT) | |
| Asus ROG Strix G17 G713PI | |
* ... im mniej tym lepiej
Disk Throttling: DiskSpd Read Loop, Queue Depth 8
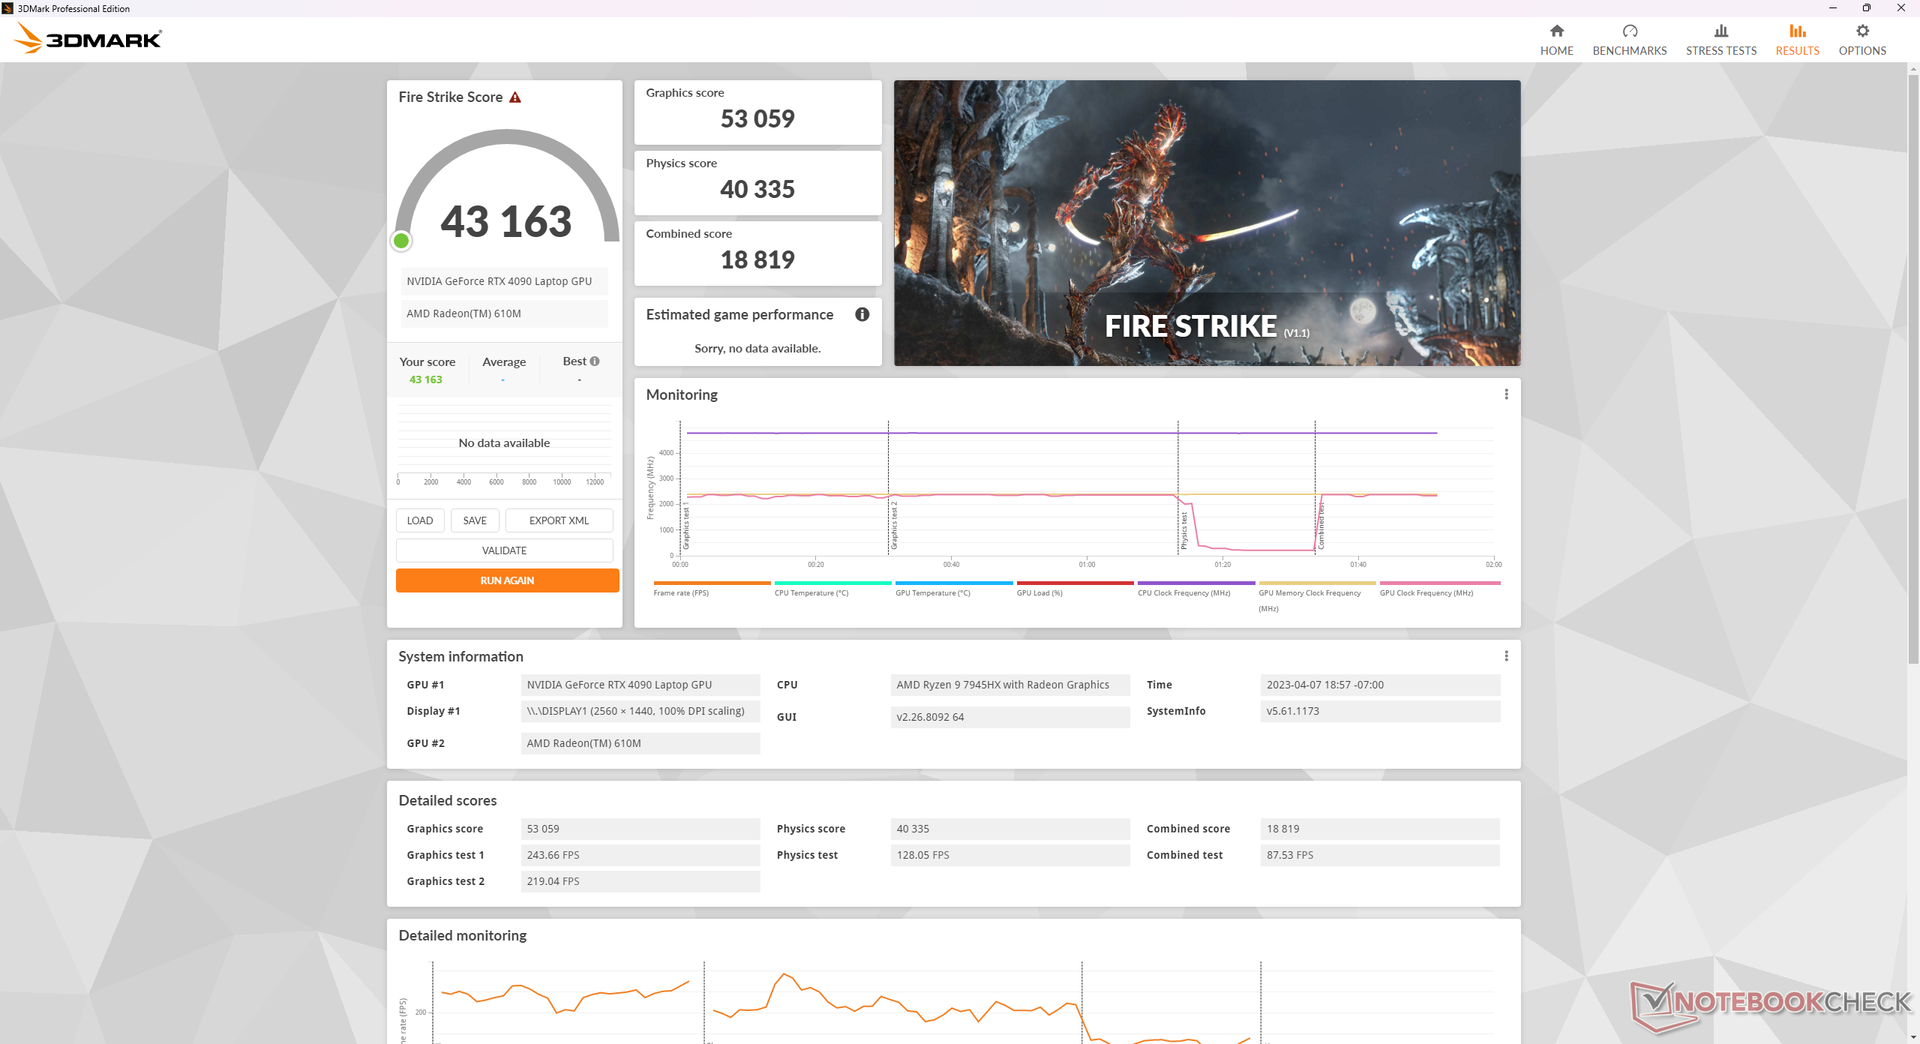
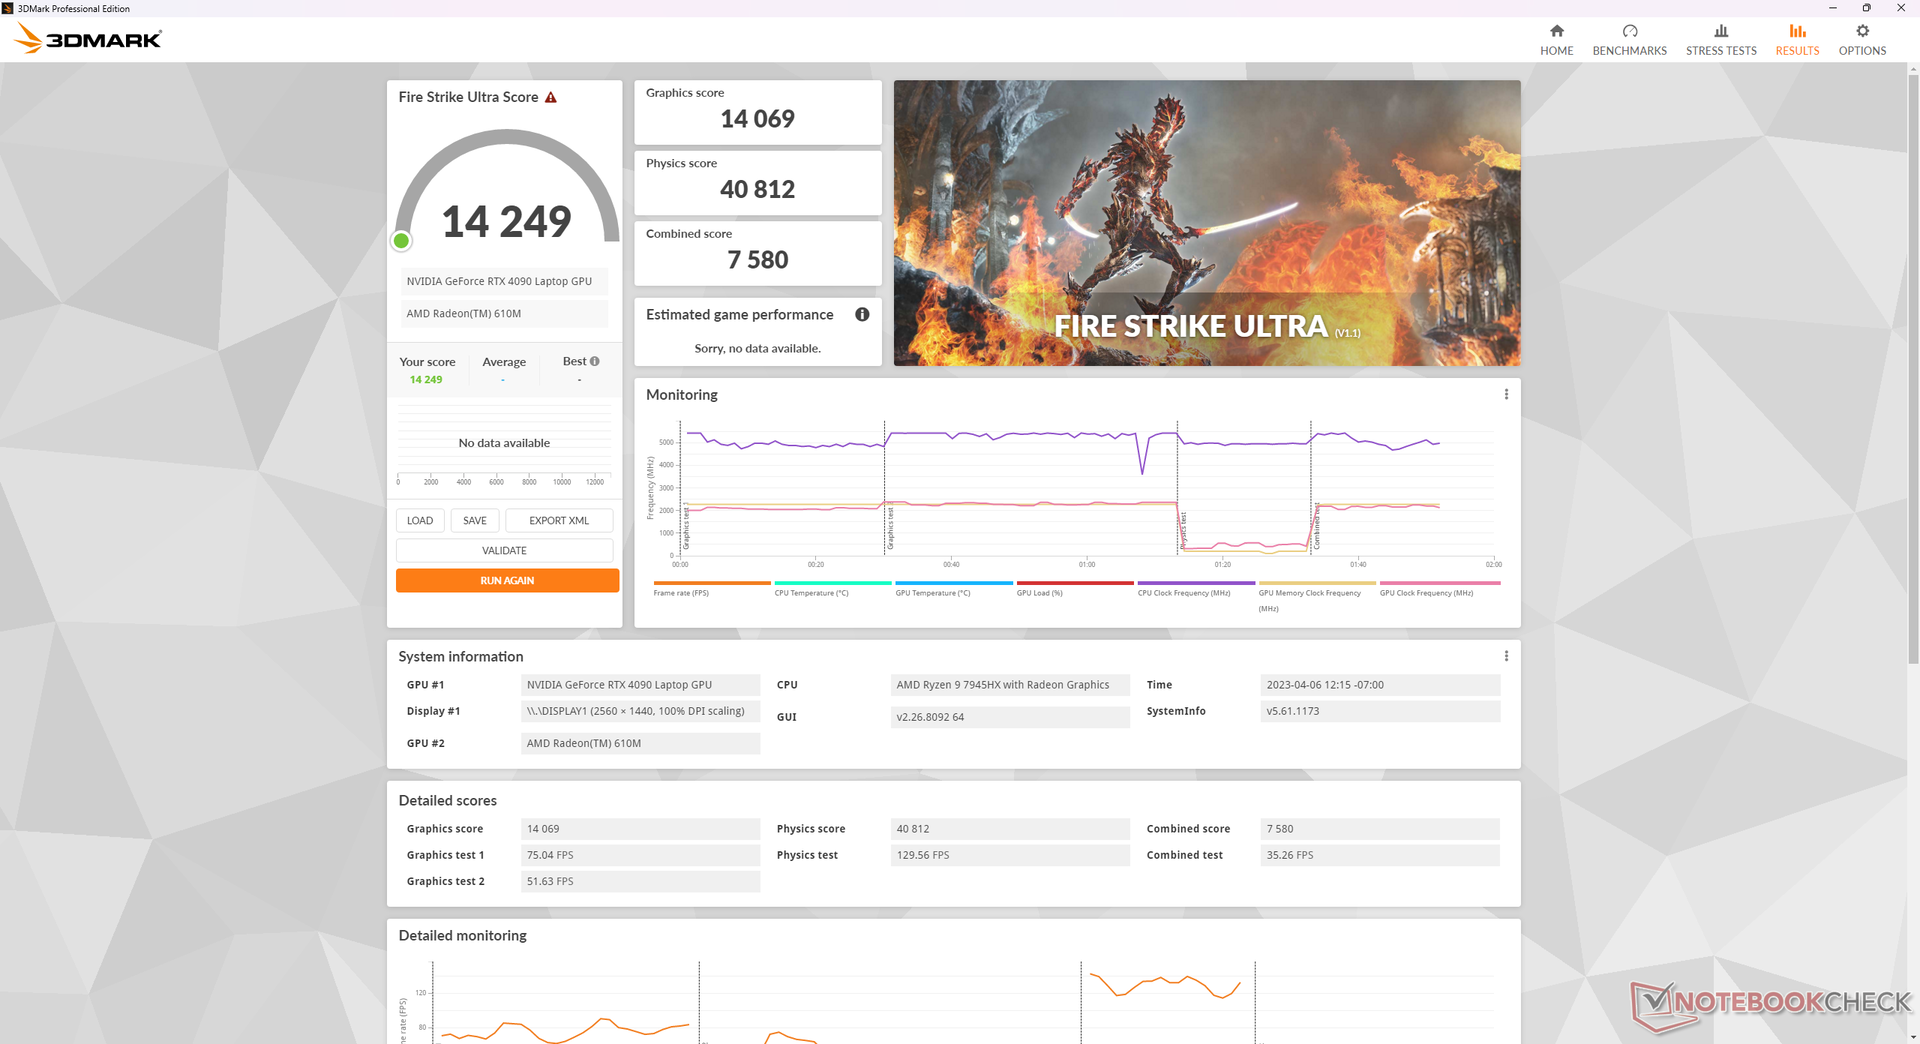
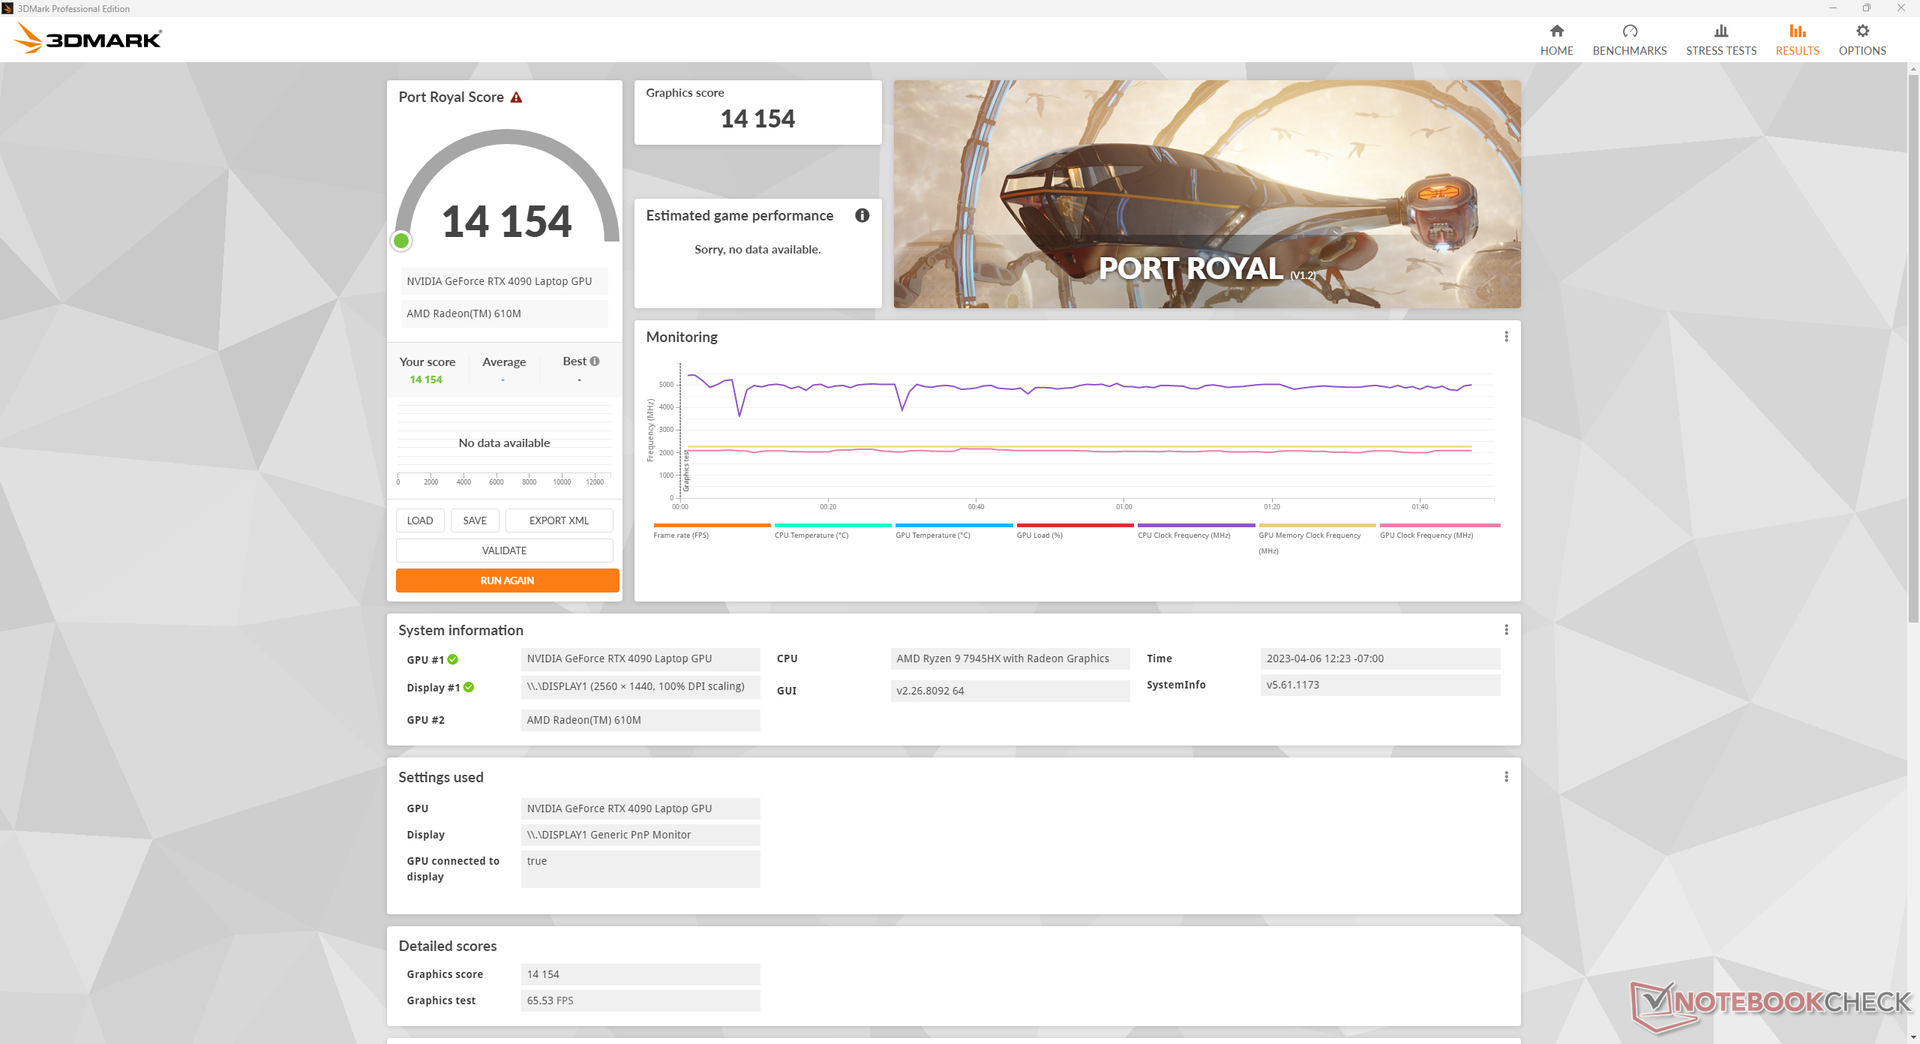
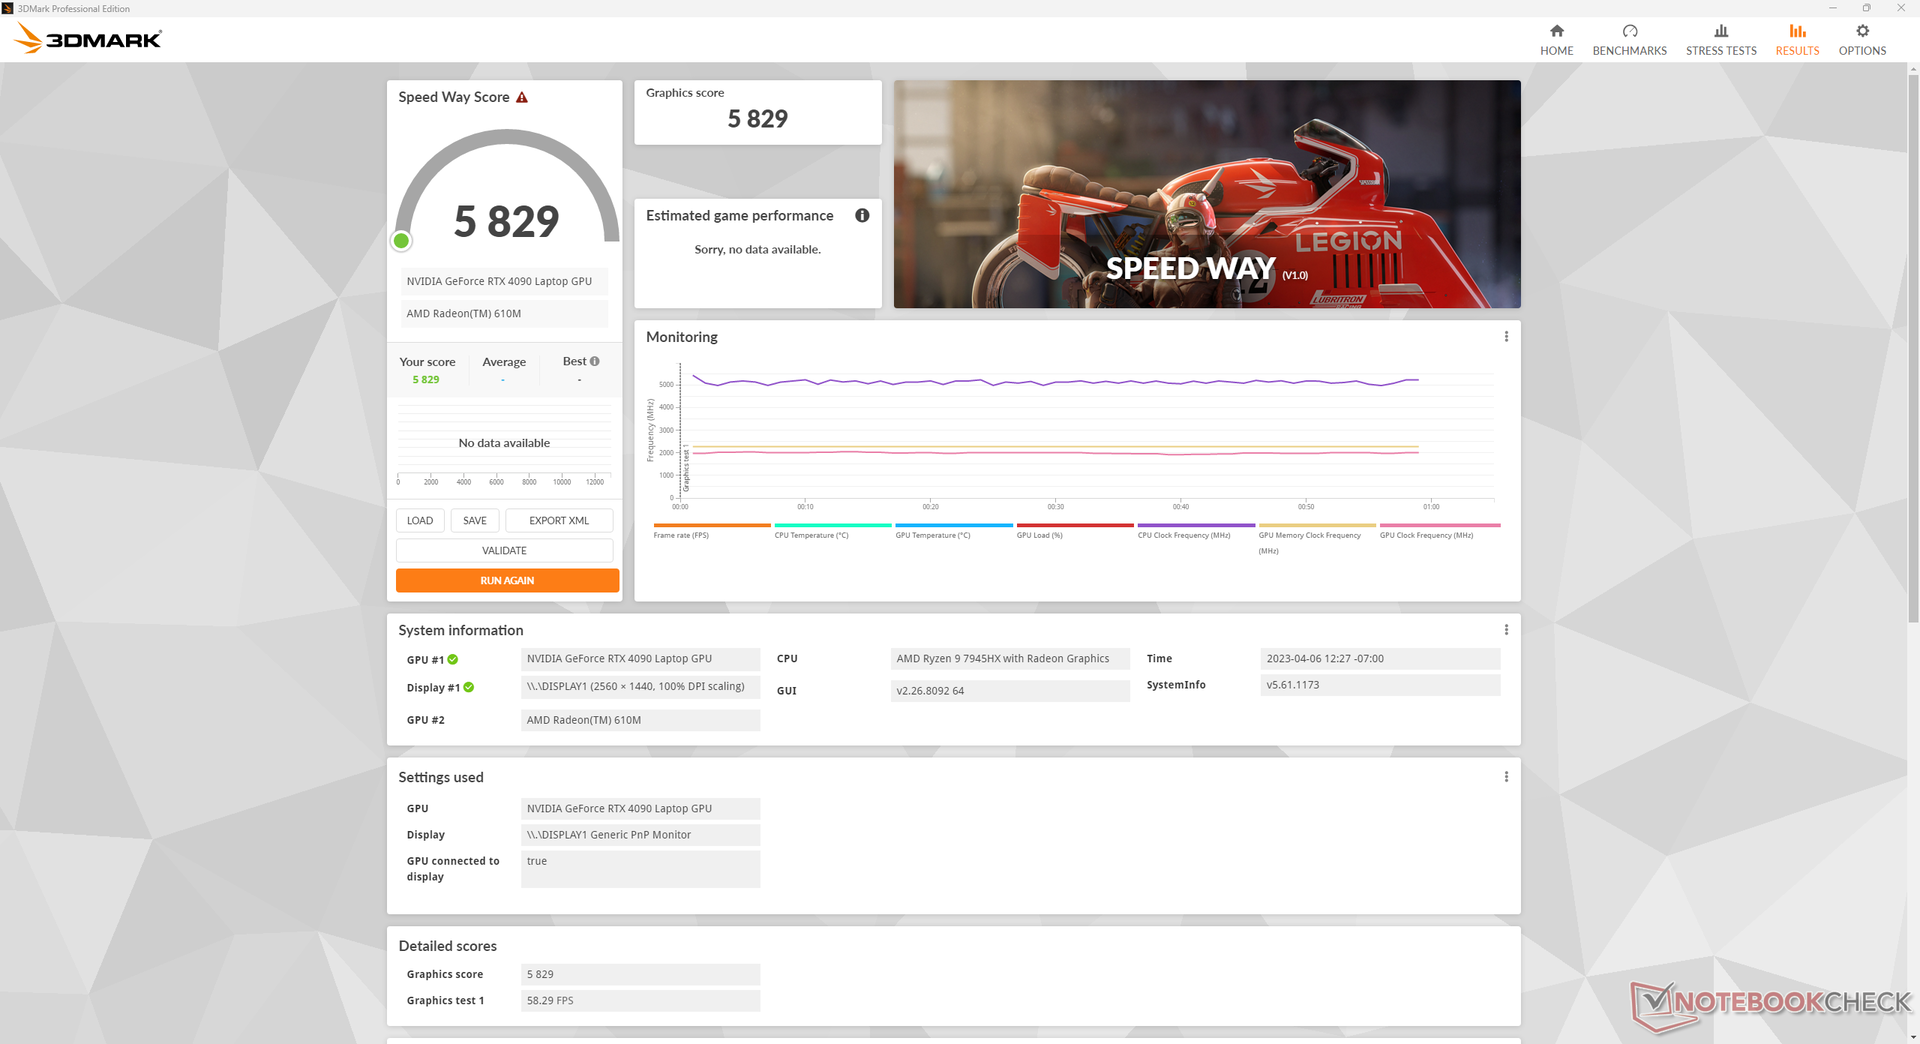
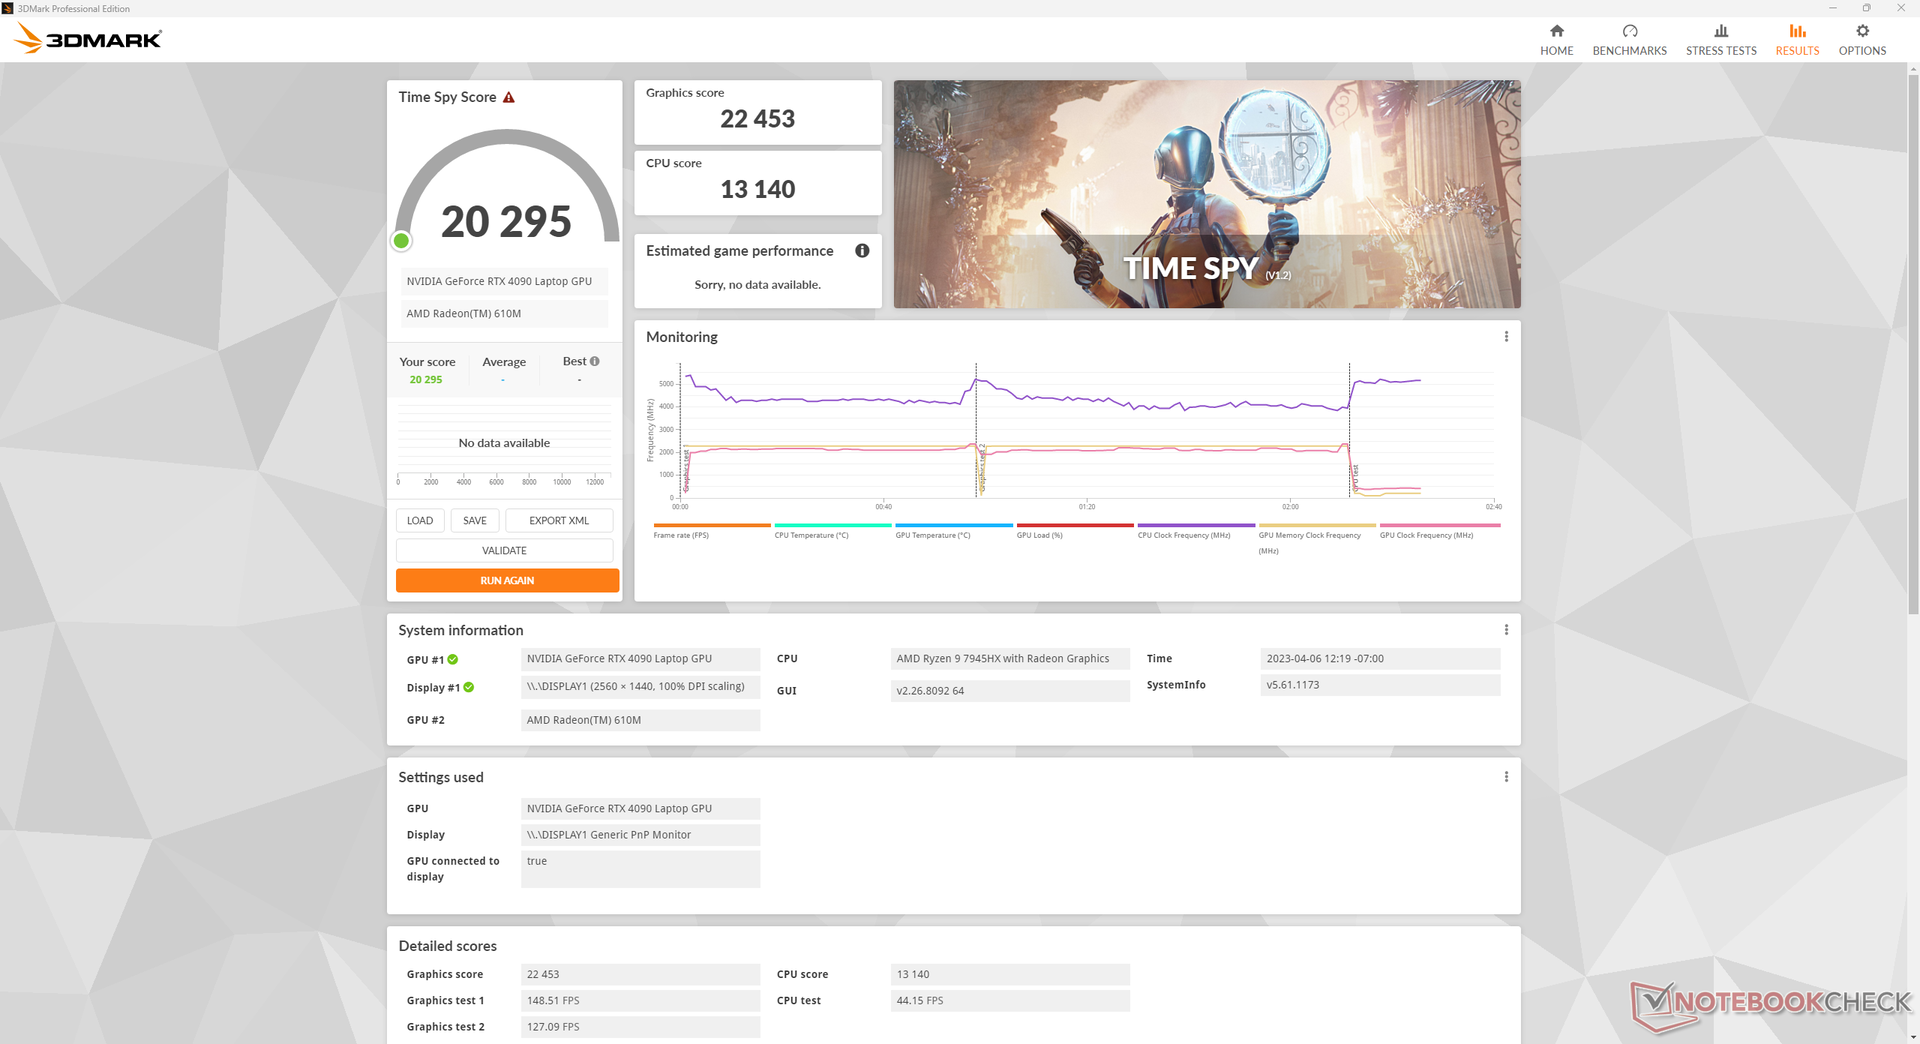
Wydajność GPU - 175 W GeForce RTX 4090
Na stronie mobilny GeForce RTX 4090 oferuje od 60 do 80 procent szybszą wydajność niż mobilny RTX 3080 Ti w zeszłorocznym ROG Strix Scar 17 G733. Różnica w wydajności rok do roku jest więc dość znacząca. Zmniejszenie wydajności do RTX 4080 lub 4070 Może wpłynąć na wydajność GPU odpowiednio o 15-20% i 40-50%. Entuzjaści mogą zatem unikać mobilnego RTX 4070, ponieważ spadek wydajności z mobilnego RTX 4080 do mobilnego RTX 4070 jest znacznie większy niż spadek z mobilnego RTX 4090 do mobilnego RTX 4080.
Uruchomienie trybu Performance zamiast trybu Turbo ma niewielki wpływ na wydajność. Test Fire Strike w trybie Performance spowodowałby spadek wyniku graficznego o 4 do 5 procent. W naszej sekcji Stress Test poniżej opisujemy dokładniej te dwa tryby.

| 3DMark Performance Rating - Percent | |
| KFA2 GeForce RTX 4090 SG | |
| Asus ROG Strix Scar 17 G733PY-XS96 | |
| Average NVIDIA GeForce RTX 4090 Laptop GPU | |
| MSI GE78HX 13VH-070US | |
| Alienware m17 R5 (R9 6900HX, RX 6850M XT) -2! | |
| Asus ROG Strix Scar 17 SE G733CX-LL014W | |
| Uniwill GM6PX7X RTX 4070 | |
| Asus ROG Zephyrus S17 GX703HSD -2! | |
| MSI Delta 15 A5EFK -2! | |
| Aorus 17X XES -2! | |
| MSI Pulse GL76 12UGK | |
| Lenovo Legion C7 15IMH05 82EH0030GE -1! | |
| 3DMark 11 - 1280x720 Performance GPU | |
| KFA2 GeForce RTX 4090 SG | |
| Average NVIDIA GeForce RTX 4090 Laptop GPU (56764 - 73027, n=36) | |
| Asus ROG Strix Scar 17 G733PY-XS96 | |
| MSI GE78HX 13VH-070US | |
| Asus ROG Strix Scar 17 SE G733CX-LL014W | |
| Alienware m17 R5 (R9 6900HX, RX 6850M XT) | |
| Uniwill GM6PX7X RTX 4070 | |
| Asus ROG Zephyrus S17 GX703HSD | |
| MSI Delta 15 A5EFK | |
| MSI Pulse GL76 12UGK | |
| Aorus 17X XES | |
| Lenovo Legion C7 15IMH05 82EH0030GE | |
| 3DMark 11 Performance | 46484 pkt. | |
| 3DMark Fire Strike Score | 43163 pkt. | |
| 3DMark Time Spy Score | 20295 pkt. | |
Pomoc | ||
* ... im mniej tym lepiej
| Performance Rating - Percent | |
| KFA2 GeForce RTX 4090 SG | |
| Asus ROG Strix Scar 17 G733PY-XS96 -1! | |
| MSI GE78HX 13VH-070US | |
| Uniwill GM6PX7X RTX 4070 | |
| Asus ROG Strix Scar 17 SE G733CX-LL014W | |
| Asus ROG Zephyrus S17 GX703HSD -1! | |
| Aorus 17X XES | |
| MSI Pulse GL76 12UGK | |
| Lenovo Legion C7 15IMH05 82EH0030GE -3! | |
| Alienware m17 R5 (R9 6900HX, RX 6850M XT) | |
| MSI Delta 15 A5EFK -1! | |
| The Witcher 3 - 1920x1080 Ultra Graphics & Postprocessing (HBAO+) | |
| KFA2 GeForce RTX 4090 SG | |
| Asus ROG Strix Scar 17 G733PY-XS96 | |
| MSI GE78HX 13VH-070US | |
| Alienware m17 R5 (R9 6900HX, RX 6850M XT) | |
| Uniwill GM6PX7X RTX 4070 | |
| Asus ROG Strix Scar 17 SE G733CX-LL014W | |
| Asus ROG Zephyrus S17 GX703HSD | |
| MSI Delta 15 A5EFK | |
| Aorus 17X XES | |
| MSI Pulse GL76 12UGK | |
| Lenovo Legion C7 15IMH05 82EH0030GE | |
| GTA V - 1920x1080 Highest Settings possible AA:4xMSAA + FX AF:16x | |
| KFA2 GeForce RTX 4090 SG | |
| Asus ROG Strix Scar 17 SE G733CX-LL014W | |
| Uniwill GM6PX7X RTX 4070 | |
| Asus ROG Strix Scar 17 G733PY-XS96 | |
| Asus ROG Zephyrus S17 GX703HSD | |
| Aorus 17X XES | |
| MSI Pulse GL76 12UGK | |
| MSI GE78HX 13VH-070US | |
| Alienware m17 R5 (R9 6900HX, RX 6850M XT) | |
| MSI Delta 15 A5EFK | |
| Final Fantasy XV Benchmark - 1920x1080 High Quality | |
| KFA2 GeForce RTX 4090 SG | |
| Asus ROG Strix Scar 17 G733PY-XS96 | |
| MSI GE78HX 13VH-070US | |
| Uniwill GM6PX7X RTX 4070 | |
| Asus ROG Strix Scar 17 SE G733CX-LL014W | |
| Alienware m17 R5 (R9 6900HX, RX 6850M XT) | |
| Aorus 17X XES | |
| MSI Pulse GL76 12UGK | |
| MSI Delta 15 A5EFK | |
| Strange Brigade - 1920x1080 ultra AA:ultra AF:16 | |
| KFA2 GeForce RTX 4090 SG | |
| MSI GE78HX 13VH-070US | |
| Alienware m17 R5 (R9 6900HX, RX 6850M XT) | |
| Uniwill GM6PX7X RTX 4070 | |
| Asus ROG Strix Scar 17 SE G733CX-LL014W | |
| Asus ROG Zephyrus S17 GX703HSD | |
| MSI Delta 15 A5EFK | |
| MSI Pulse GL76 12UGK | |
| Aorus 17X XES | |
| Dota 2 Reborn - 1920x1080 ultra (3/3) best looking | |
| KFA2 GeForce RTX 4090 SG | |
| Uniwill GM6PX7X RTX 4070 | |
| Asus ROG Strix Scar 17 SE G733CX-LL014W | |
| Aorus 17X XES | |
| MSI GE78HX 13VH-070US | |
| Asus ROG Strix Scar 17 G733PY-XS96 | |
| Asus ROG Zephyrus S17 GX703HSD | |
| MSI Pulse GL76 12UGK | |
| Lenovo Legion C7 15IMH05 82EH0030GE | |
| MSI Delta 15 A5EFK | |
| Alienware m17 R5 (R9 6900HX, RX 6850M XT) | |
| X-Plane 11.11 - 1920x1080 high (fps_test=3) | |
| KFA2 GeForce RTX 4090 SG | |
| Uniwill GM6PX7X RTX 4070 | |
| MSI GE78HX 13VH-070US | |
| Aorus 17X XES | |
| Asus ROG Strix Scar 17 SE G733CX-LL014W | |
| Asus ROG Zephyrus S17 GX703HSD | |
| MSI Pulse GL76 12UGK | |
| Asus ROG Strix Scar 17 G733PY-XS96 | |
| Lenovo Legion C7 15IMH05 82EH0030GE | |
| Alienware m17 R5 (R9 6900HX, RX 6850M XT) | |
| Tiny Tina's Wonderlands | |
| 1920x1080 Low Preset (DX12) | |
| KFA2 GeForce RTX 4090 SG | |
| Average NVIDIA GeForce RTX 4090 Laptop GPU (268 - 378, n=8) | |
| Asus ROG Strix Scar 17 G733PY-XS96 | |
| 1920x1080 Medium Preset (DX12) | |
| KFA2 GeForce RTX 4090 SG | |
| Average NVIDIA GeForce RTX 4090 Laptop GPU (230 - 302, n=8) | |
| Asus ROG Strix Scar 17 G733PY-XS96 | |
| 1920x1080 High Preset (DX12) | |
| KFA2 GeForce RTX 4090 SG | |
| Average NVIDIA GeForce RTX 4090 Laptop GPU (168 - 233, n=9) | |
| Asus ROG Strix Scar 17 G733PY-XS96 | |
| 1920x1080 Badass Preset (DX12) | |
| KFA2 GeForce RTX 4090 SG | |
| Asus ROG Strix Scar 17 G733PY-XS96 | |
| Average NVIDIA GeForce RTX 4090 Laptop GPU (141.1 - 189.4, n=14) | |
| 2560x1440 Badass Preset (DX12) | |
| KFA2 GeForce RTX 4090 SG | |
| Asus ROG Strix Scar 17 G733PY-XS96 | |
| Average NVIDIA GeForce RTX 4090 Laptop GPU (103.4 - 137.8, n=14) | |
| 3840x2160 Badass Preset (DX12) | |
| KFA2 GeForce RTX 4090 SG | |
| Asus ROG Strix Scar 17 G733PY-XS96 | |
| Average NVIDIA GeForce RTX 4090 Laptop GPU (53.3 - 73.7, n=12) | |
Witcher 3 FPS Chart
| low | med. | high | ultra | QHD | 4K | |
| GTA V (2015) | 185 | 180.4 | 175.2 | 112.6 | 114.8 | 170.5 |
| The Witcher 3 (2015) | 490.1 | 405.6 | 370.3 | 203.8 | 154.8 | |
| Dota 2 Reborn (2015) | 165.6 | 150.5 | 154.2 | 139 | 135.4 | |
| Final Fantasy XV Benchmark (2018) | 214 | 205 | 163.9 | 151 | 93.3 | |
| X-Plane 11.11 (2018) | 132.2 | 118 | 94.3 | 78.5 | ||
| Far Cry 5 (2018) | 157 | 145 | 142 | 108 | ||
| Shadow of the Tomb Raider (2018) | 238 | 228 | 190 | 104 | ||
| Assassin´s Creed Valhalla (2020) | 187 | 169 | 135 | 79 | ||
| Far Cry 6 (2021) | 117 | 112 | 109 | 82 | ||
| Cyberpunk 2077 1.6 (2022) | 146.4 | 140.5 | 132.6 | 133.8 | 104.3 | 48.6 |
| Tiny Tina's Wonderlands (2022) | 267.7 | 230 | 194.6 | 176.2 | 134.2 | 71.9 |
| F1 22 (2022) | 266 | 243 | 221 | 116.3 | 92.1 | 45.8 |
| Call of Duty Modern Warfare 2 2022 (2022) | 188 | 180 | 135 | 82 | ||
| Star Wars Jedi Survivor (2023) | 105.6 | 103.1 | 88.4 | 43 |
Emisje - wydajność Ciszej niż Turbo
Szum systemu
Szum wentylatorów wynosi od 23 do 27 dB(A) na tle cichego tła 22,7 dB(A) bez względu na ustawienie wydajności. Na szczęście ten zakres jest wystarczająco cichy, aby być w większości przypadków niezauważalnym, a wentylatory dobrze radzą sobie z utrzymaniem poziomu poniżej 30 dB(A) podczas nieco większych obciążeń, takich jak przeglądanie stron internetowych czy strumieniowanie.
Granie w trybie Performance jest cichsze niż w trybie Turbo. Szum wentylatora podczas pracy Witcher 3 w trybie Performance hałas wentylatora wynosi około 46,4 dB(A), a w trybie Turbo od 51,4 do 54 dB(A). Użytkownicy mogą więc przełknąć 5-procentowy spadek wydajności grafiki za cichszy poziom hałasu w trybie Performance.
Hałas
| luz |
| 23.5 / 27.7 / 27.7 dB |
| obciążenie |
| 30.5 / 54.1 dB |
 | ||
30 dB cichy 40 dB(A) słyszalny 50 dB(A) irytujący |
||
min: | ||
| Asus ROG Strix Scar 17 G733PY-XS96 NVIDIA GeForce RTX 4090 Laptop GPU, R9 7945HX, SK hynix PC801 HFS001TEJ9X101N | MSI GE78HX 13VH-070US NVIDIA GeForce RTX 4080 Laptop GPU, i9-13950HX, Samsung PM9A1 MZVL22T0HBLB | Eluktronics Mech-17 GP2 NVIDIA GeForce RTX 4090 Laptop GPU, i9-13900HX, Samsung PM9A1 MZVL21T0HCLR | Asus ROG Strix G17 G713PI NVIDIA GeForce RTX 4070 Laptop GPU, R9 7945HX, WD PC SN560 SDDPNQE-1T00 | Aorus 17X XES GeForce RTX 3070 Ti Laptop GPU, i9-12900HX, Gigabyte AG470S1TB-SI B10 | Alienware m17 R5 (R9 6900HX, RX 6850M XT) Radeon RX 6850M XT, R9 6900HX, SSSTC CA6-8D1024 | |
|---|---|---|---|---|---|---|
| Noise | -10% | -10% | -9% | -24% | 1% | |
| off / environment * | 22.7 | 23.4 -3% | 25.2 -11% | 25 -10% | 26 -15% | 23 -1% |
| Idle Minimum * | 23.5 | 24.2 -3% | 28 -19% | 26 -11% | 28 -19% | 23 2% |
| Idle Average * | 27.7 | 25.6 8% | 28 -1% | 29 -5% | 32 -16% | 28.11 -1% |
| Idle Maximum * | 27.7 | 31 -12% | 30.4 -10% | 30 -8% | 38 -37% | 28.11 -1% |
| Load Average * | 30.5 | 43.3 -42% | 41 -34% | 46 -51% | 53 -74% | 30.62 -0% |
| Witcher 3 ultra * | 51.4 | 56.3 -10% | 50.7 1% | 46 11% | 54 -5% | 49.75 3% |
| Load Maximum * | 54.1 | 59.1 -9% | 52.6 3% | 47 13% | 55 -2% | 50.17 7% |
* ... im mniej tym lepiej
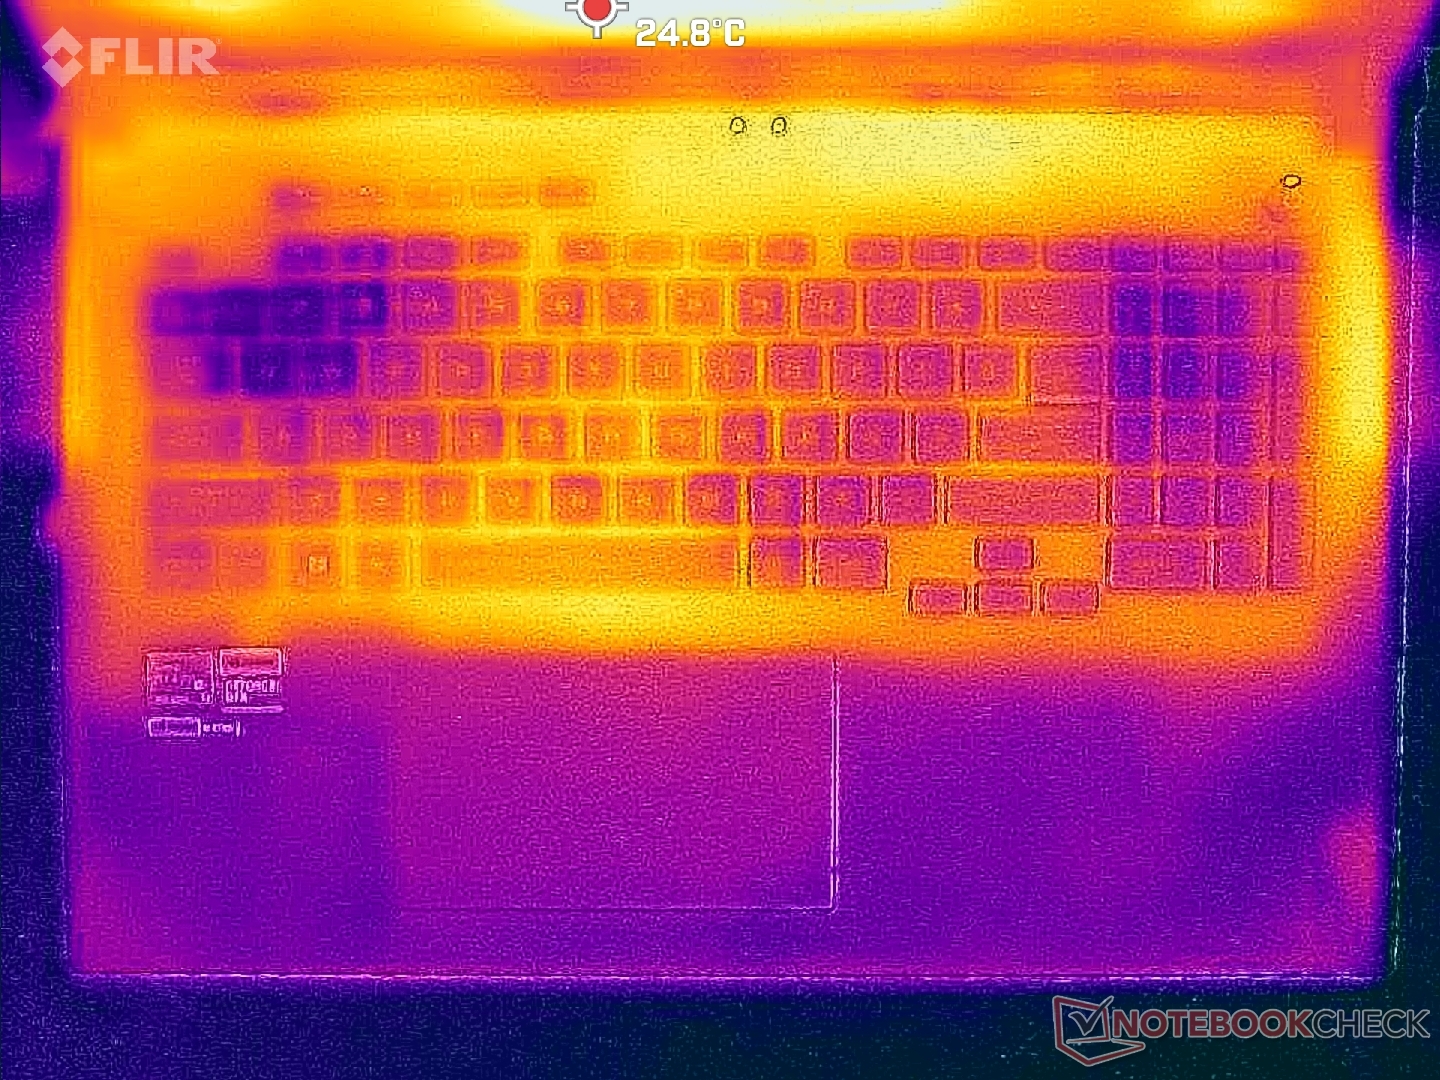
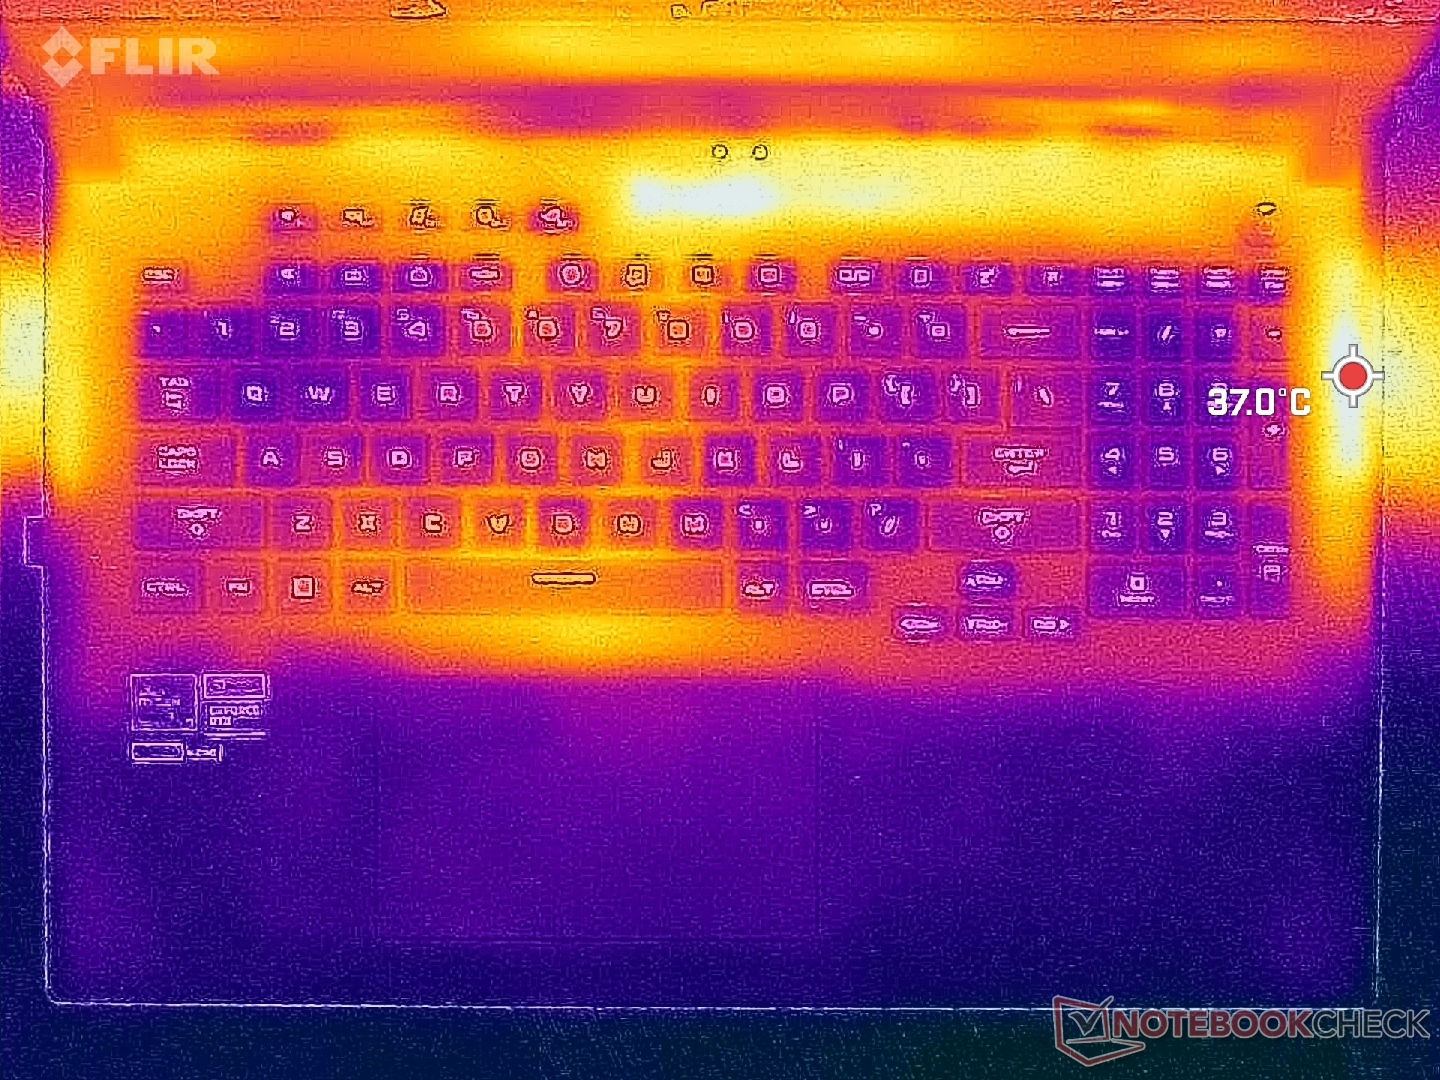
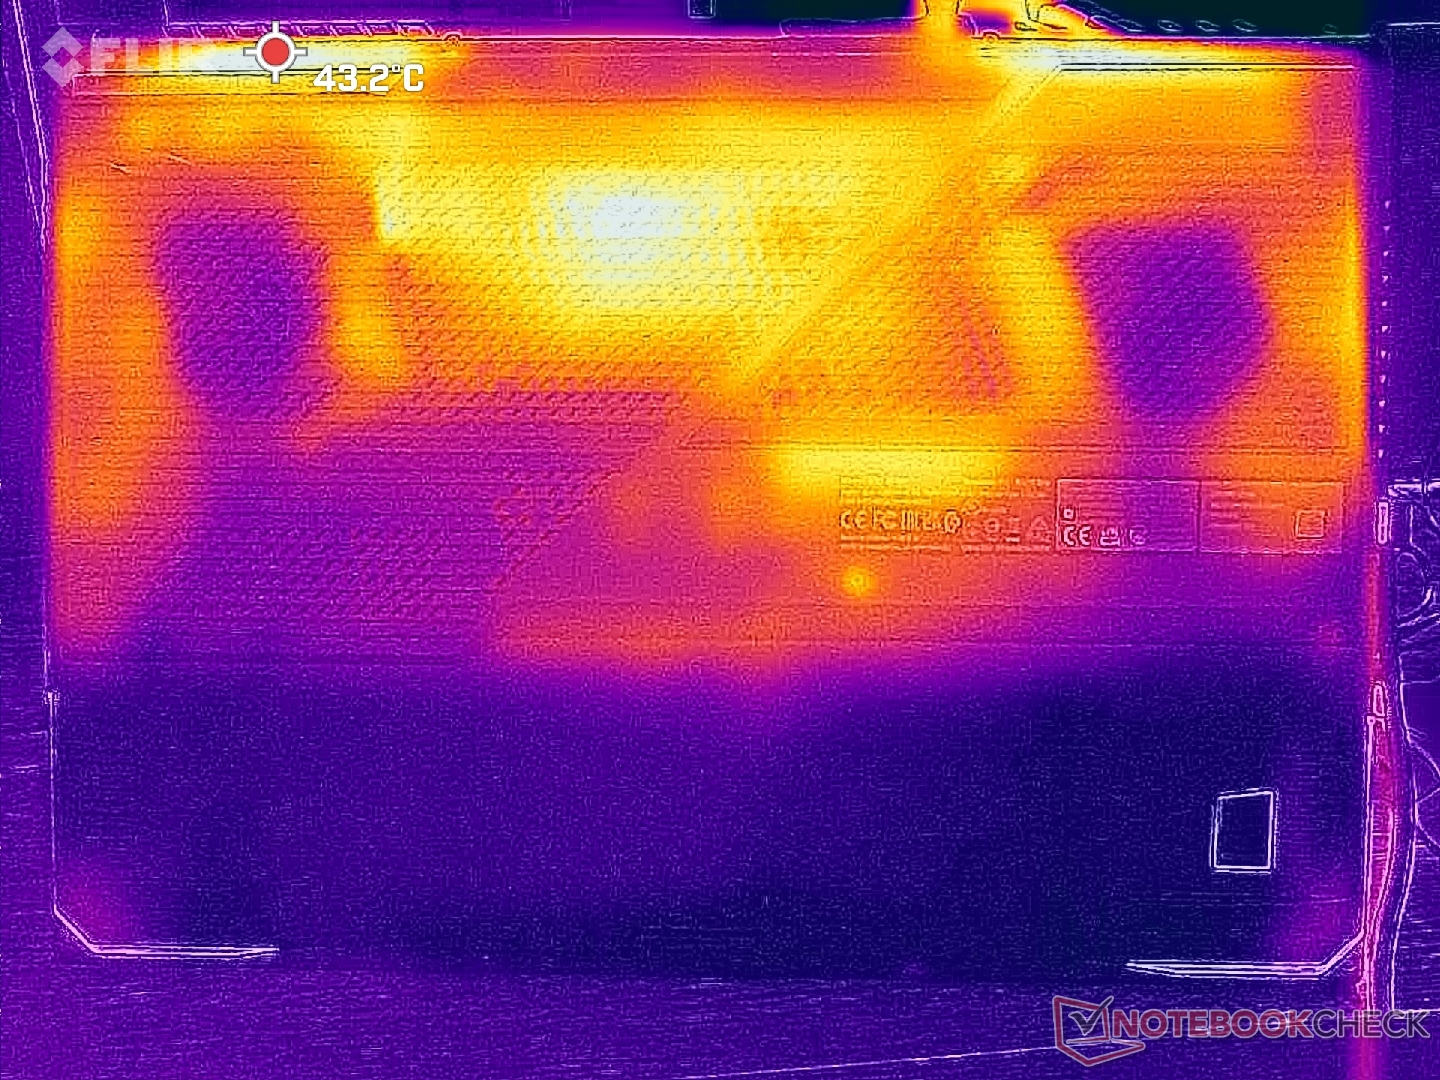
Temperatura
Znaczna część klawiatury i podpórki pod dłonie pozostaje chłodna podczas gry. Gorące punkty znajdują się natomiast wzdłuż krawędzi pulpitu, gdzie palce rzadziej się dotykają.
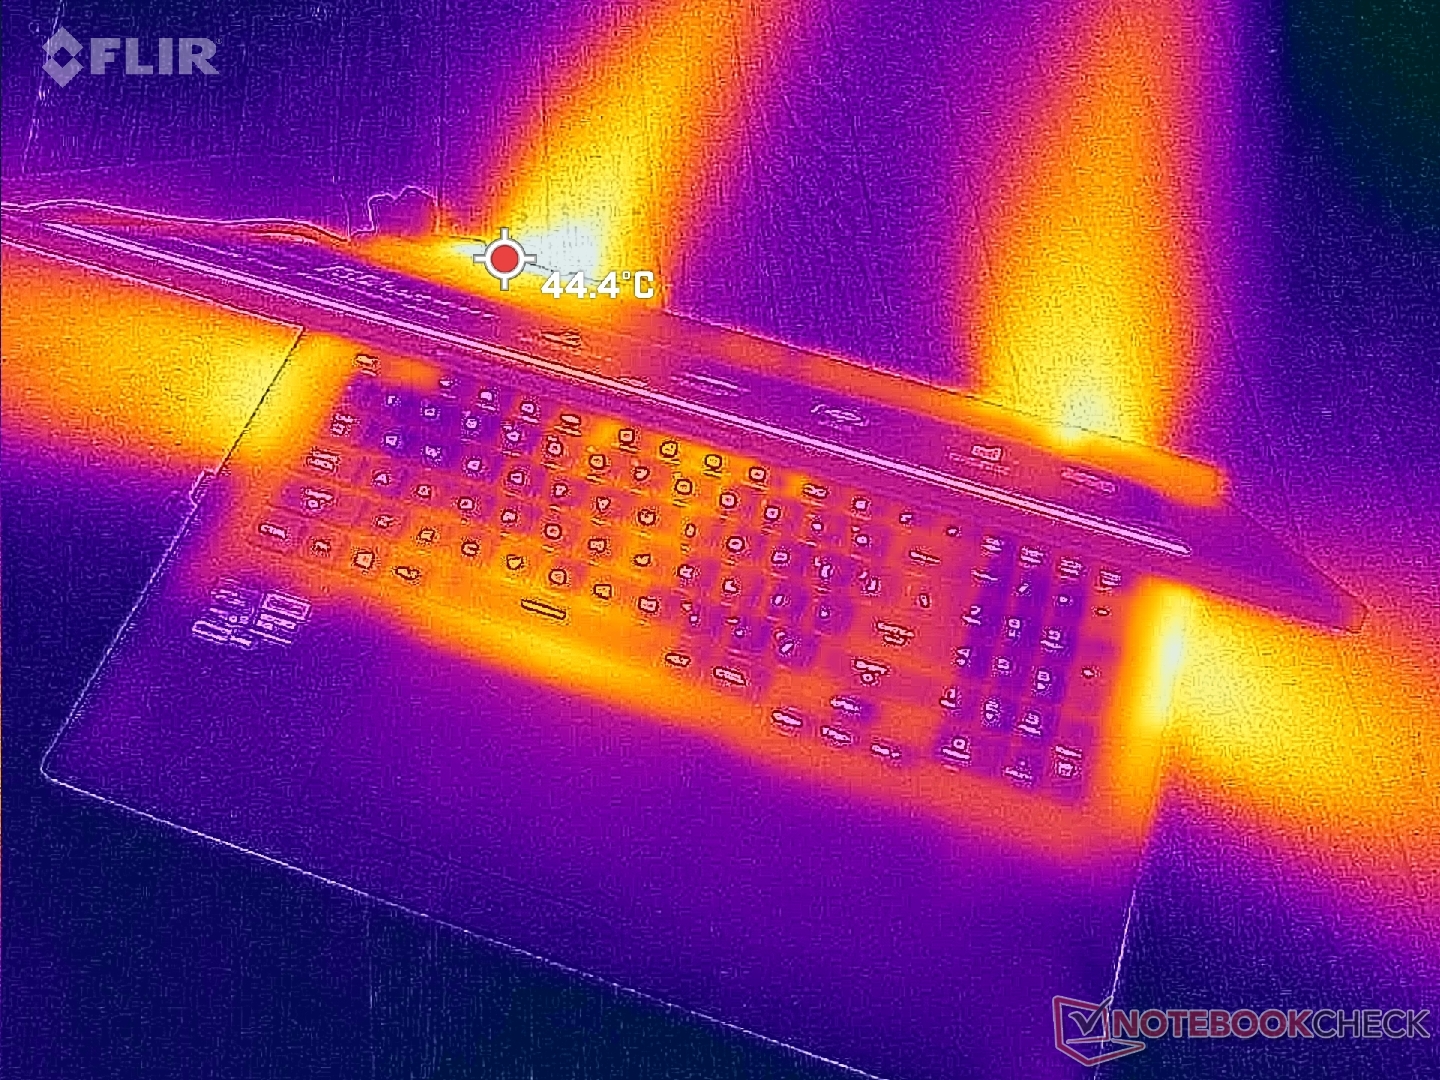
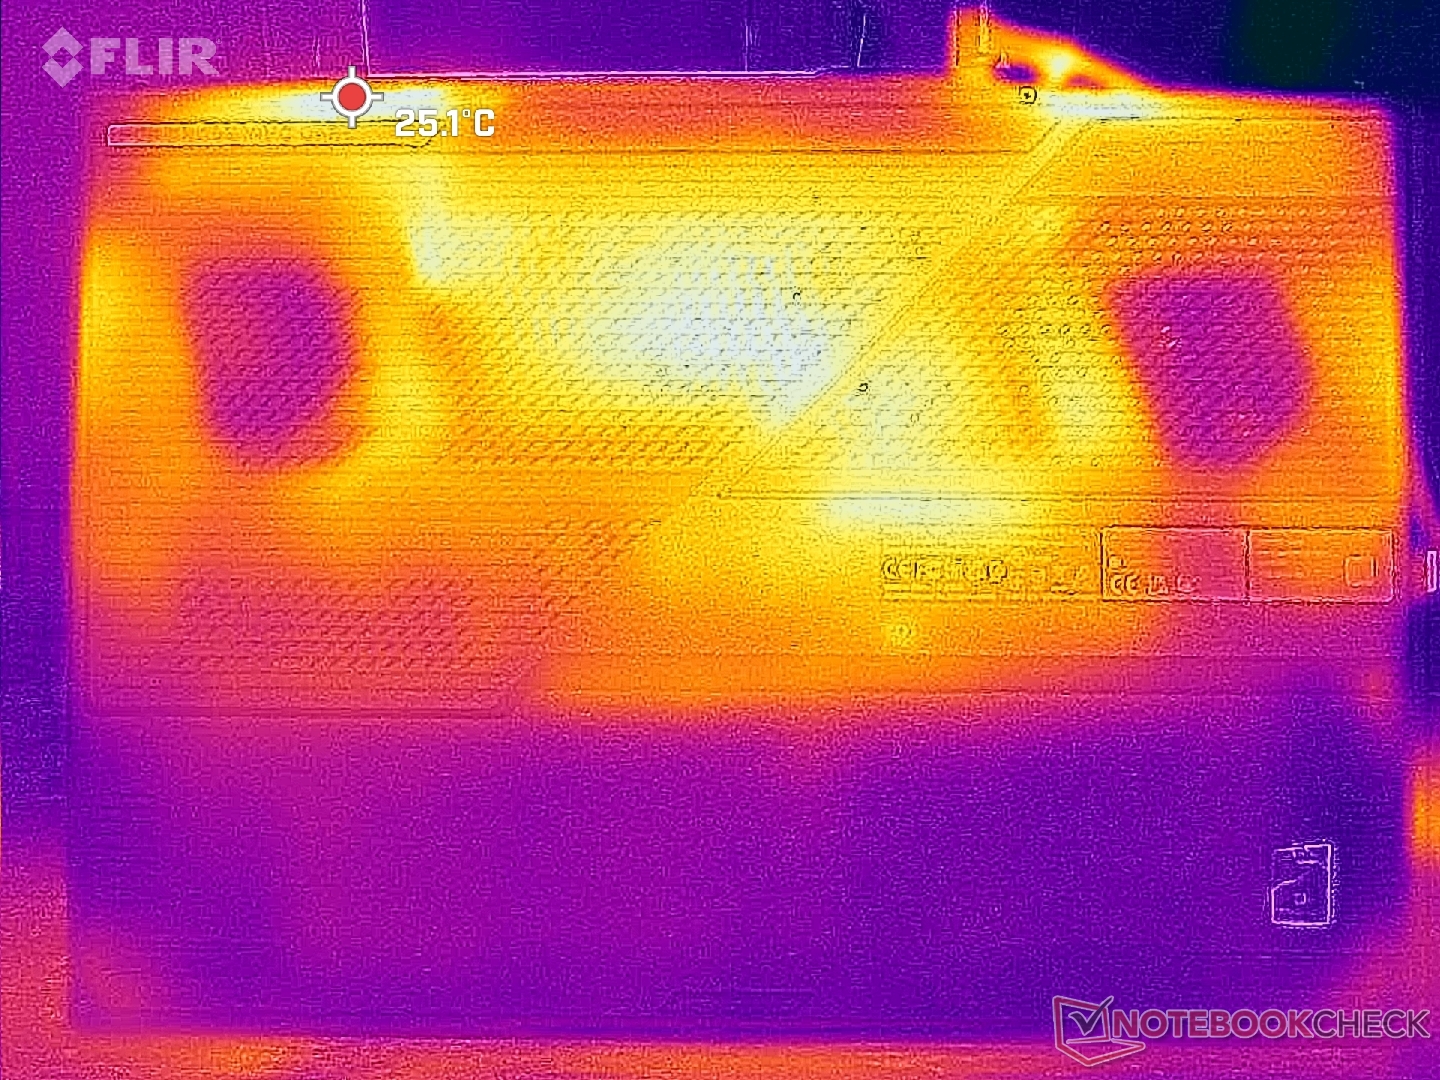
(+) The maximum temperature on the upper side is 34.6 °C / 94 F, compared to the average of 40.4 °C / 105 F, ranging from 21.2 to 68.8 °C for the class Gaming.
(+) The bottom heats up to a maximum of 35.6 °C / 96 F, compared to the average of 43.2 °C / 110 F
(+) In idle usage, the average temperature for the upper side is 23.2 °C / 74 F, compared to the device average of 33.8 °C / 93 F.
(+) Playing The Witcher 3, the average temperature for the upper side is 27.3 °C / 81 F, compared to the device average of 33.8 °C / 93 F.
(+) The palmrests and touchpad are cooler than skin temperature with a maximum of 20.8 °C / 69.4 F and are therefore cool to the touch.
(+) The average temperature of the palmrest area of similar devices was 28.9 °C / 84 F (+8.1 °C / 14.6 F).
| Asus ROG Strix Scar 17 G733PY-XS96 AMD Ryzen 9 7945HX, NVIDIA GeForce RTX 4090 Laptop GPU | MSI GE78HX 13VH-070US Intel Core i9-13950HX, NVIDIA GeForce RTX 4080 Laptop GPU | Eluktronics Mech-17 GP2 Intel Core i9-13900HX, NVIDIA GeForce RTX 4090 Laptop GPU | Asus ROG Strix G17 G713PI AMD Ryzen 9 7945HX, NVIDIA GeForce RTX 4070 Laptop GPU | Aorus 17X XES Intel Core i9-12900HX, NVIDIA GeForce RTX 3070 Ti Laptop GPU | Alienware m17 R5 (R9 6900HX, RX 6850M XT) AMD Ryzen 9 6900HX, AMD Radeon RX 6850M XT | |
|---|---|---|---|---|---|---|
| Heat | -13% | -13% | -18% | -46% | -29% | |
| Maximum Upper Side * | 34.6 | 37.4 -8% | 39 -13% | 42 -21% | 54 -56% | 53 -53% |
| Maximum Bottom * | 35.6 | 45 -26% | 44 -24% | 41 -15% | 58 -63% | 56 -57% |
| Idle Upper Side * | 27.2 | 29.8 -10% | 31 -14% | 33 -21% | 37 -36% | 30 -10% |
| Idle Bottom * | 30 | 32.4 -8% | 29.8 1% | 34 -13% | 39 -30% | 29 3% |
* ... im mniej tym lepiej
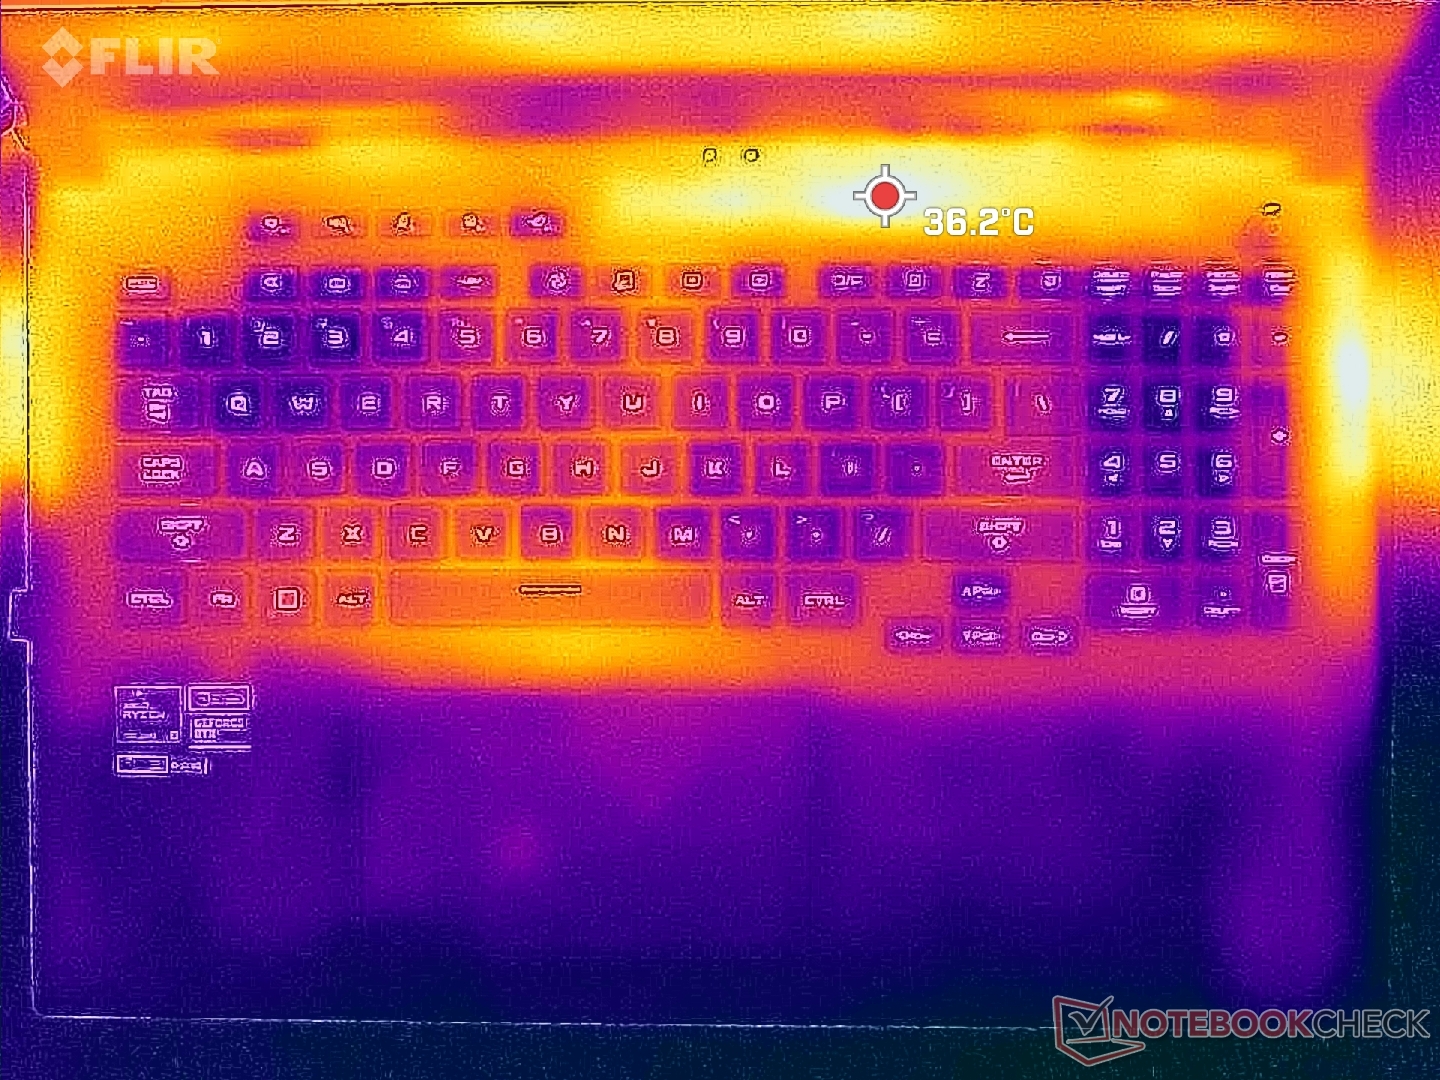
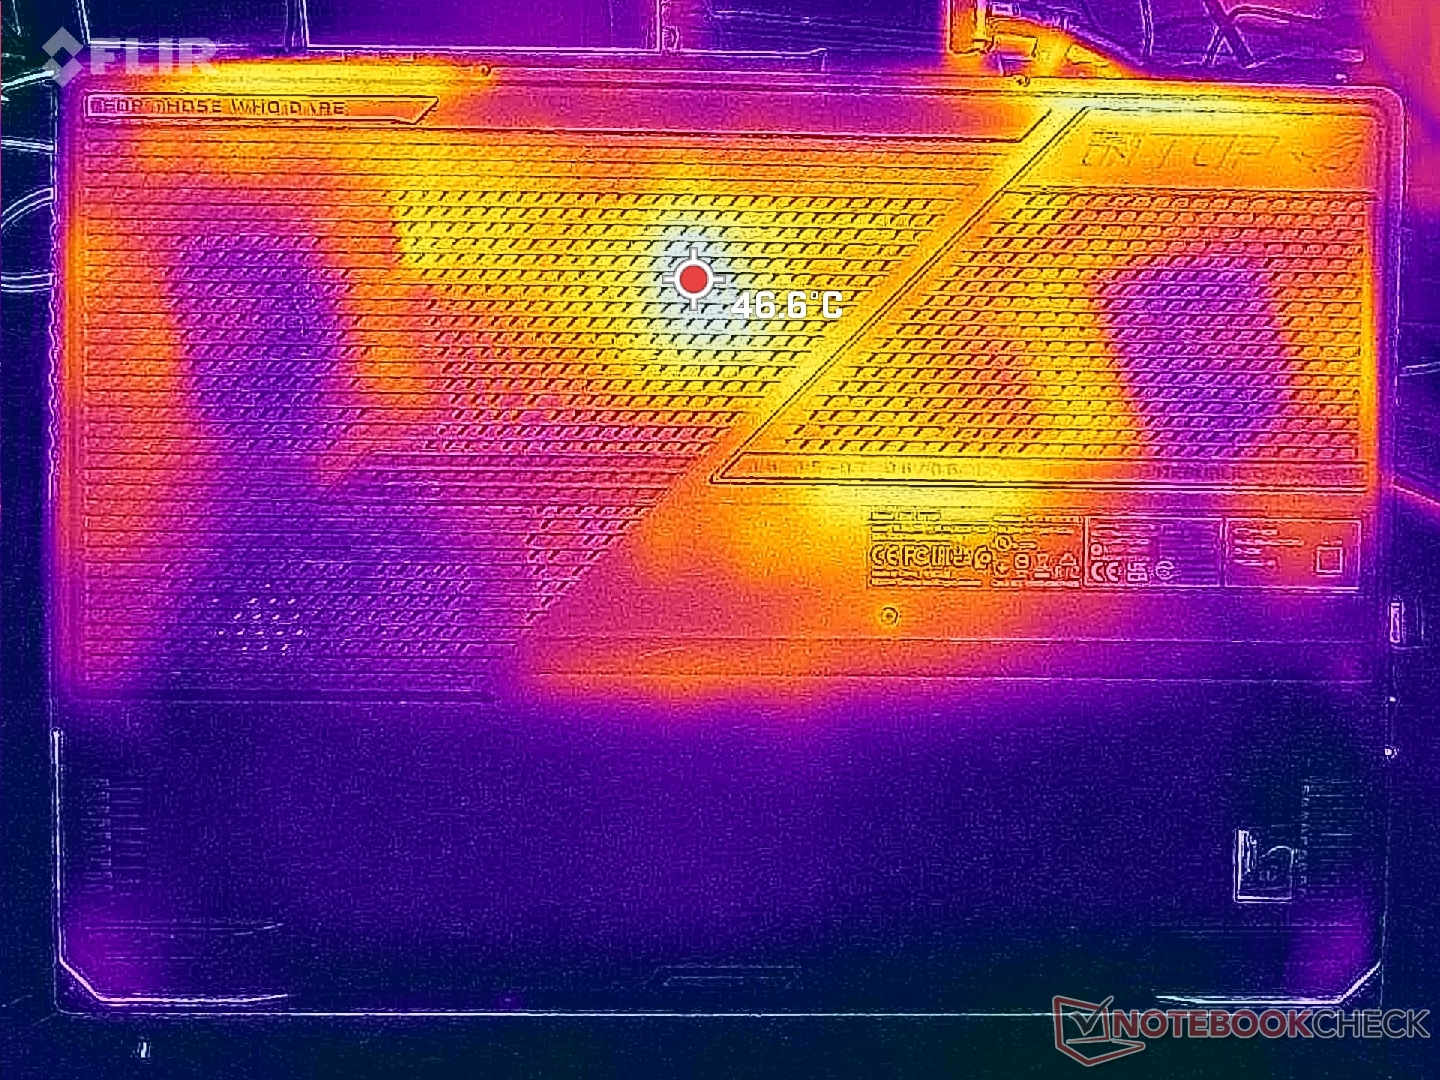
Stress Test - Ciepła temperatura ciała
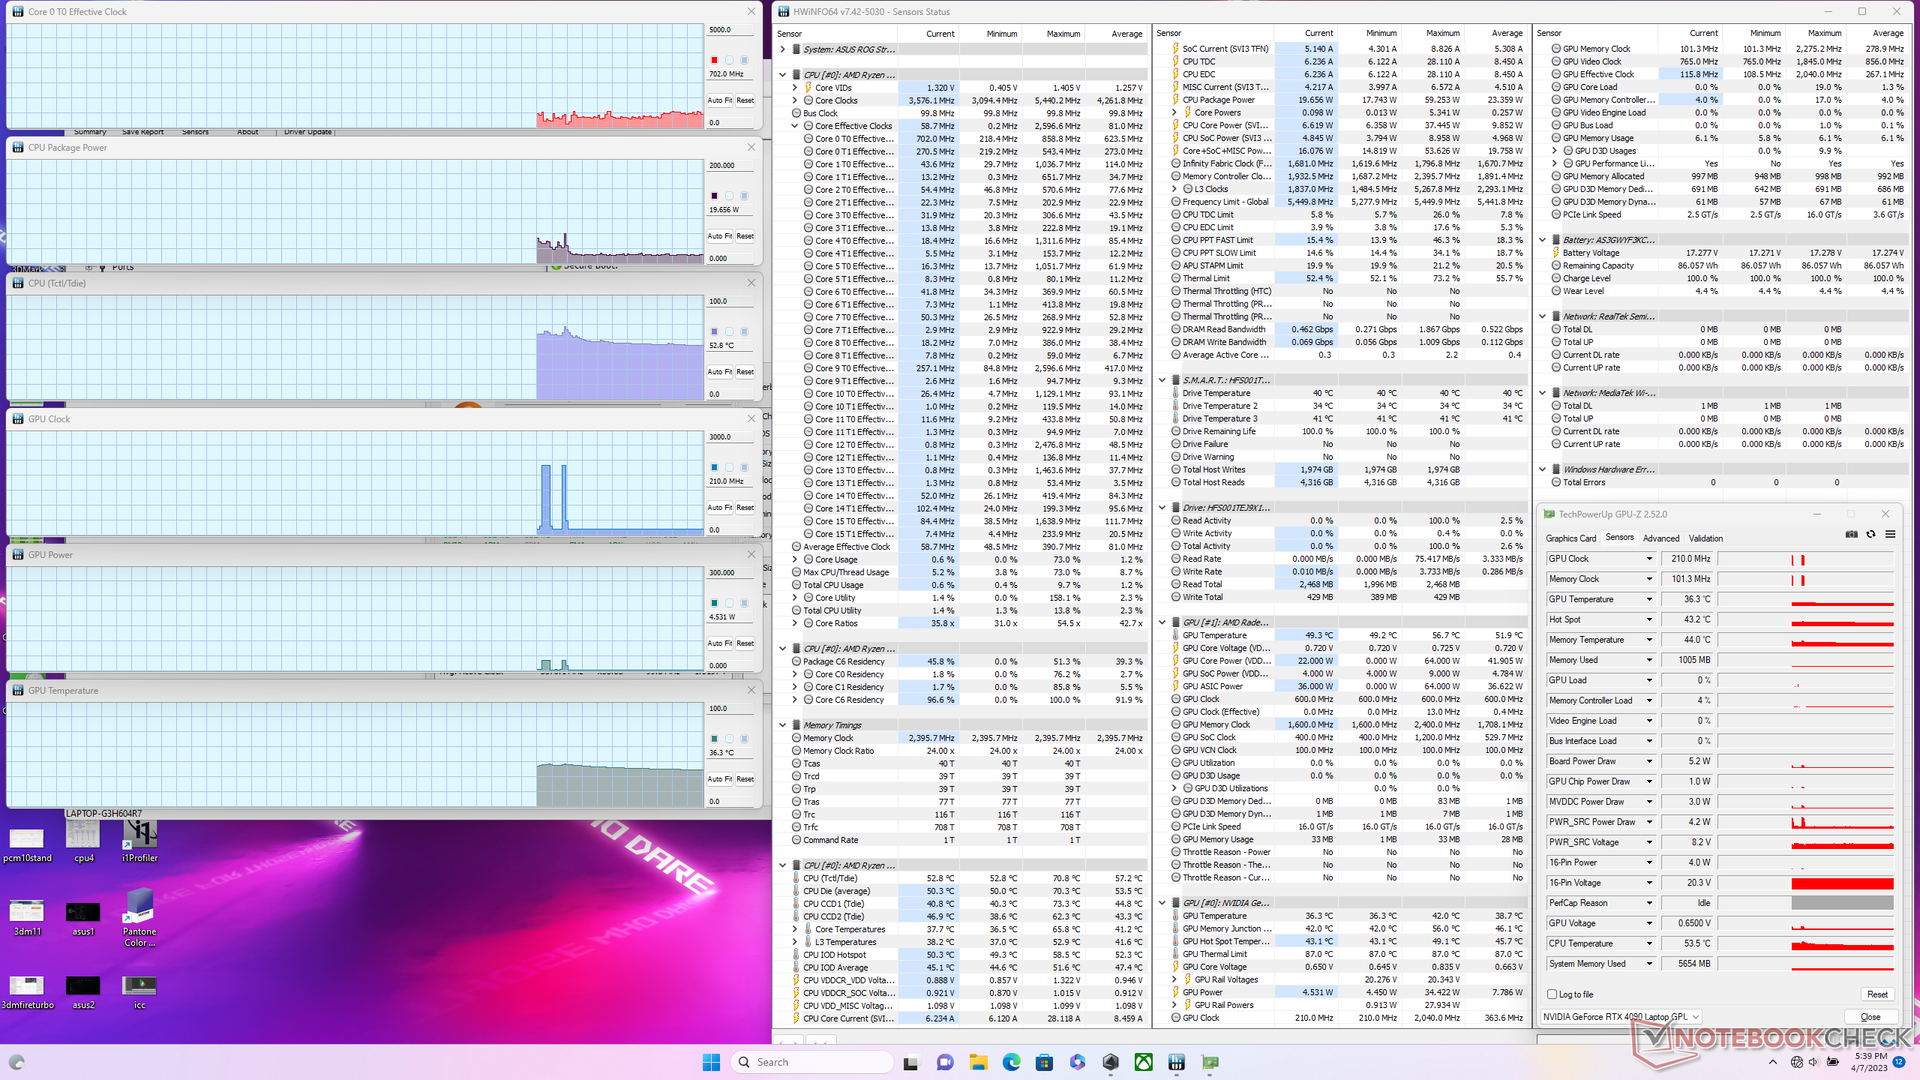
W warunkach obciążenia pod Prime95 procesor pracowałby z częstotliwością od 4,2 do 4,9 GHz, utrzymując moc pakietu CPU na poziomie od 114 do 128 W. Temperatura rdzenia byłaby jednak bardzo wysoka i wynosiłaby ponad 90°C.
Częstotliwość taktowania GPU, taktowanie pamięci, temperatura i pobór mocy na płycie ustabilizowały się odpowiednio na poziomie 2055 MHz, 2250 MHz, 79 C i 149 W podczas pracy w trybie Performance Witcher 3 w trybie Performance. Wartości te zmieniłyby się do 2280 MHz, 2275 MHz, 74 C i 170 W w trybie Turbo. Tryb Turbo jest więc wymagany, jeśli chcemy zbliżyć się do reklamowanego 175 W TGP mobilnego RTX 4090.
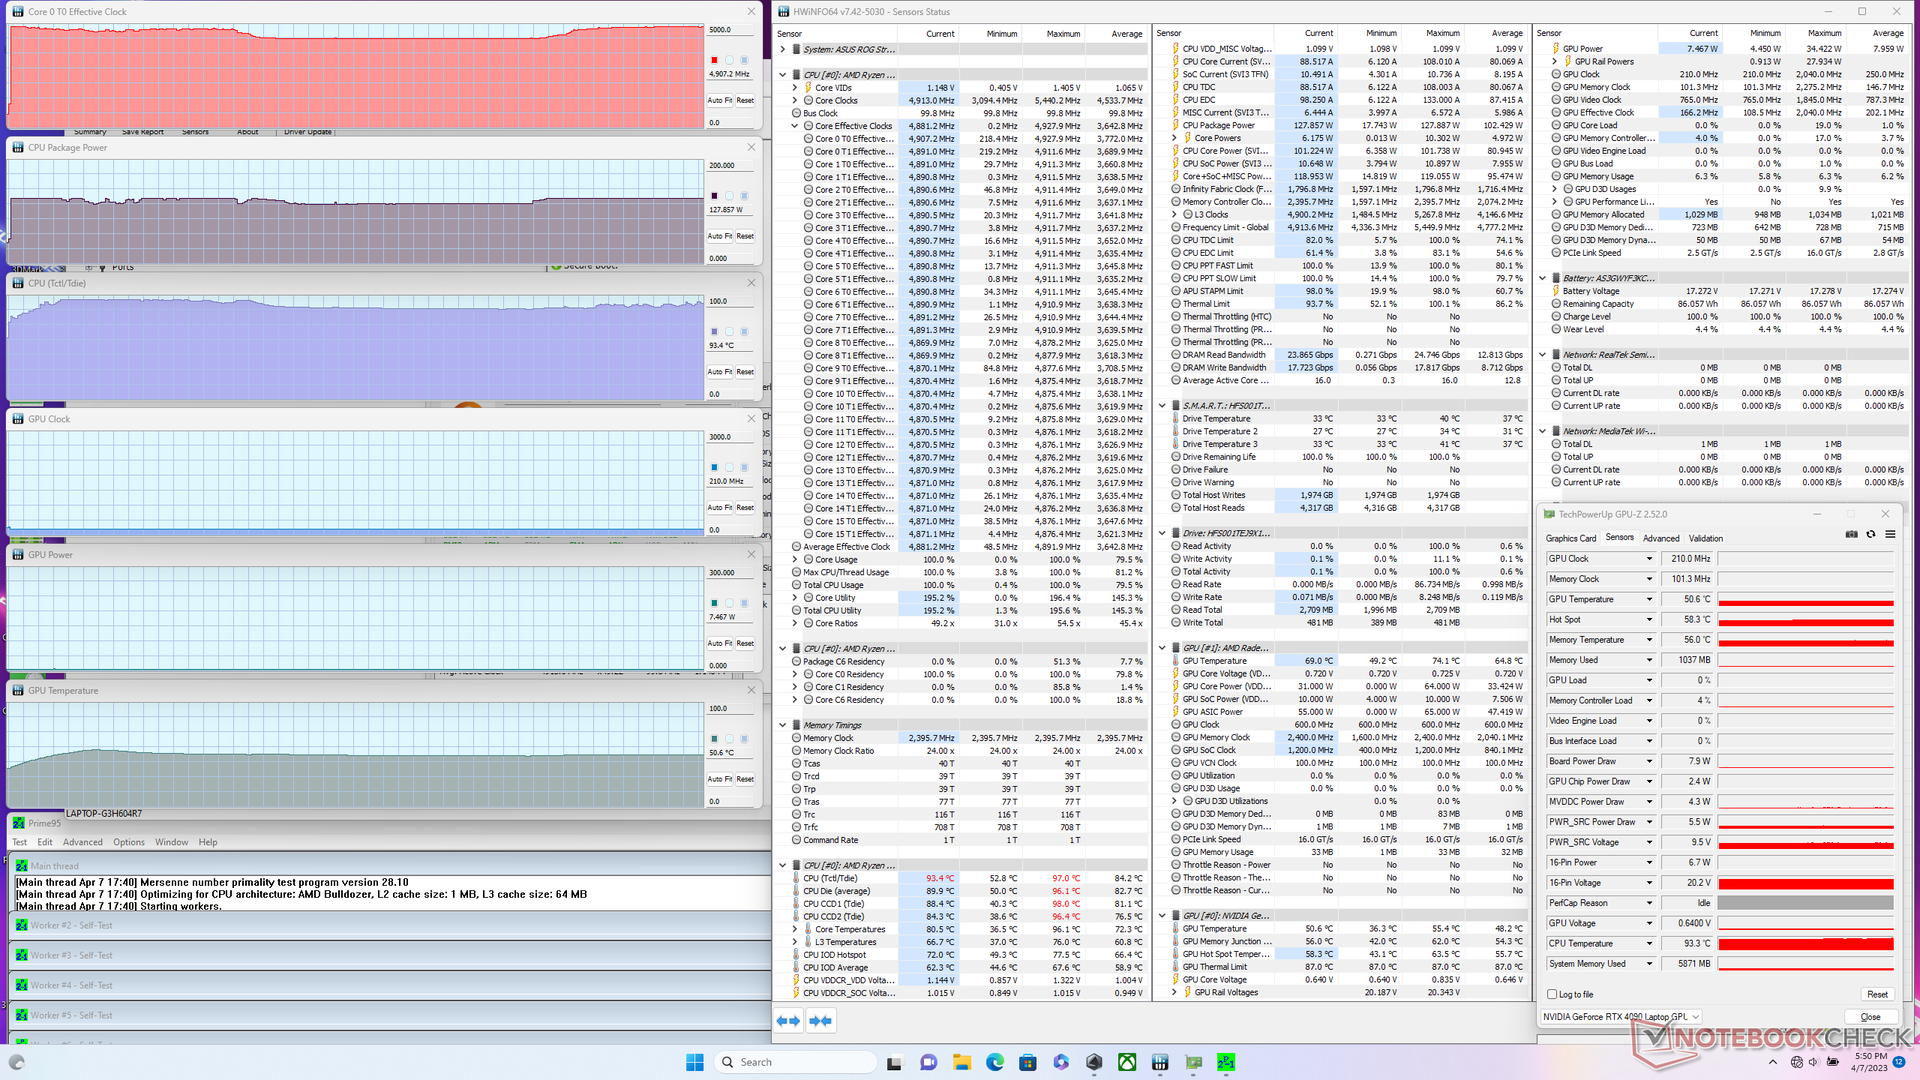
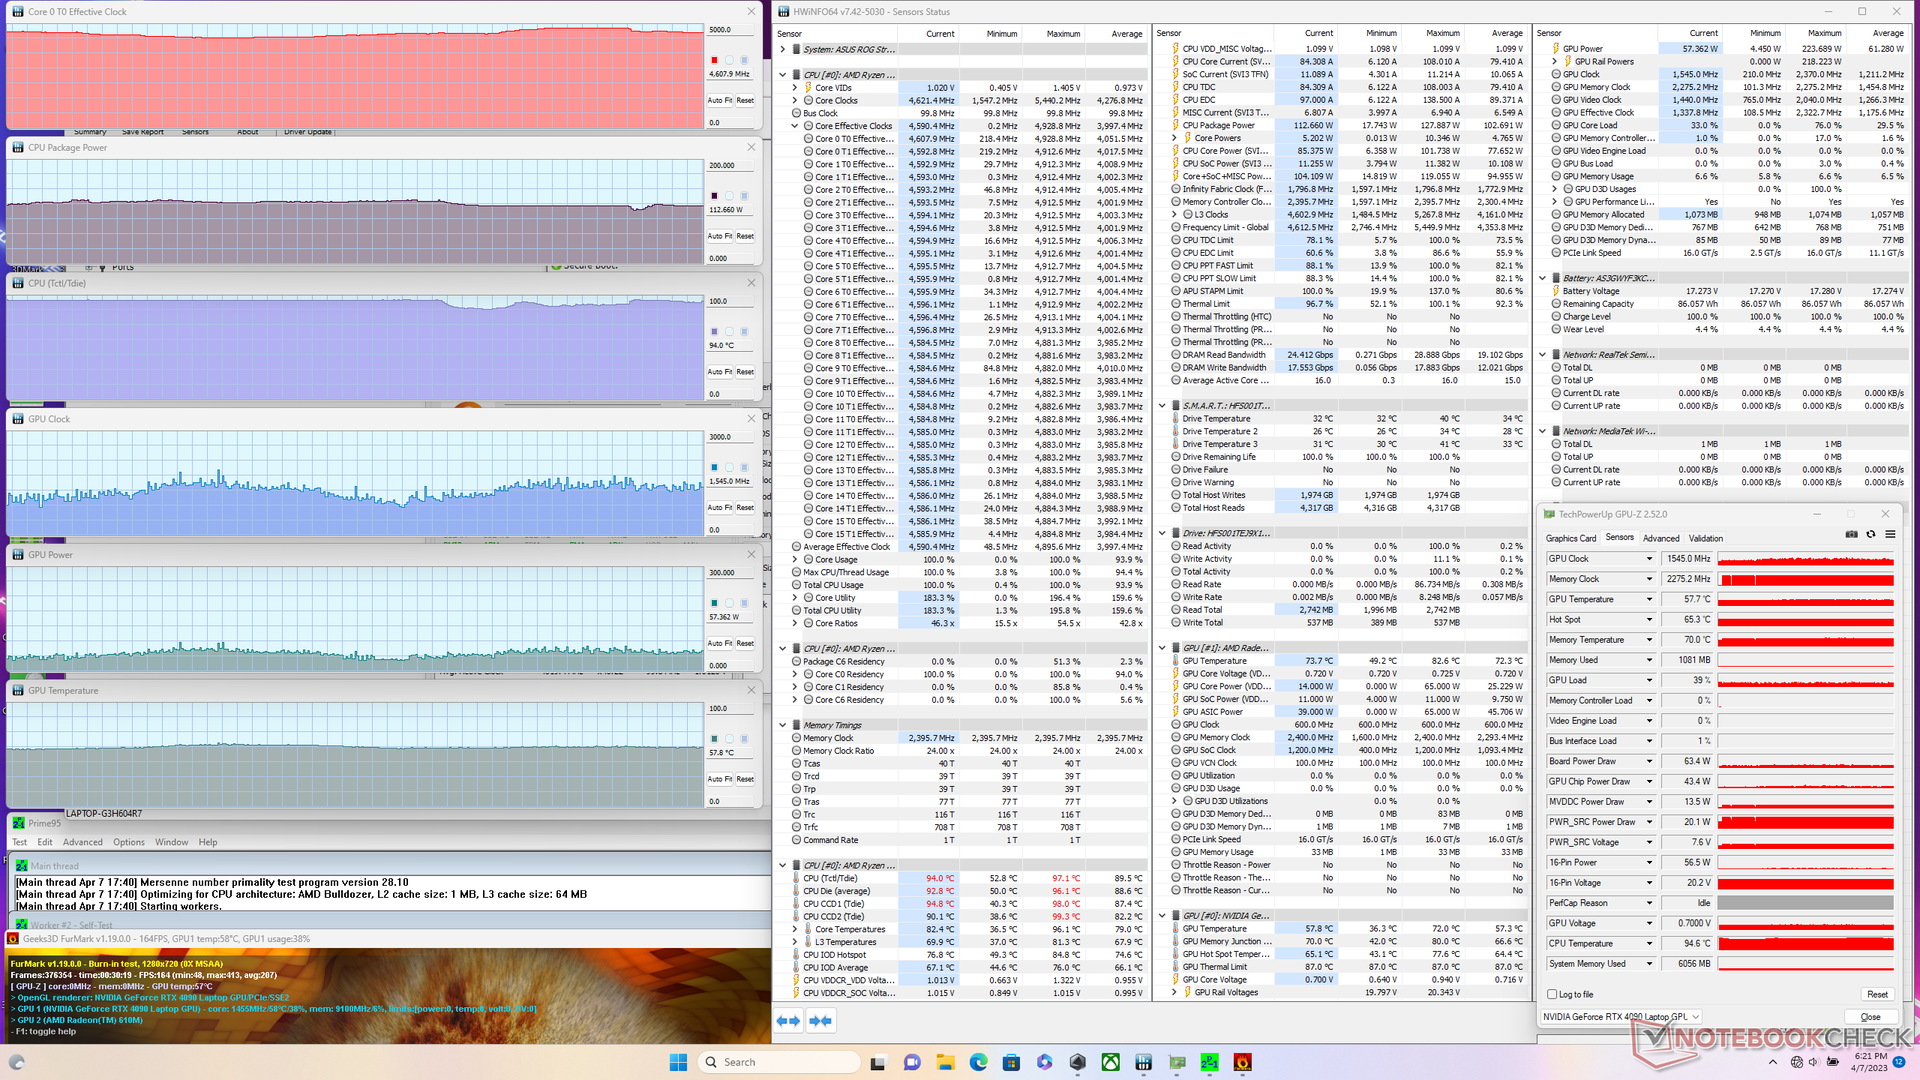
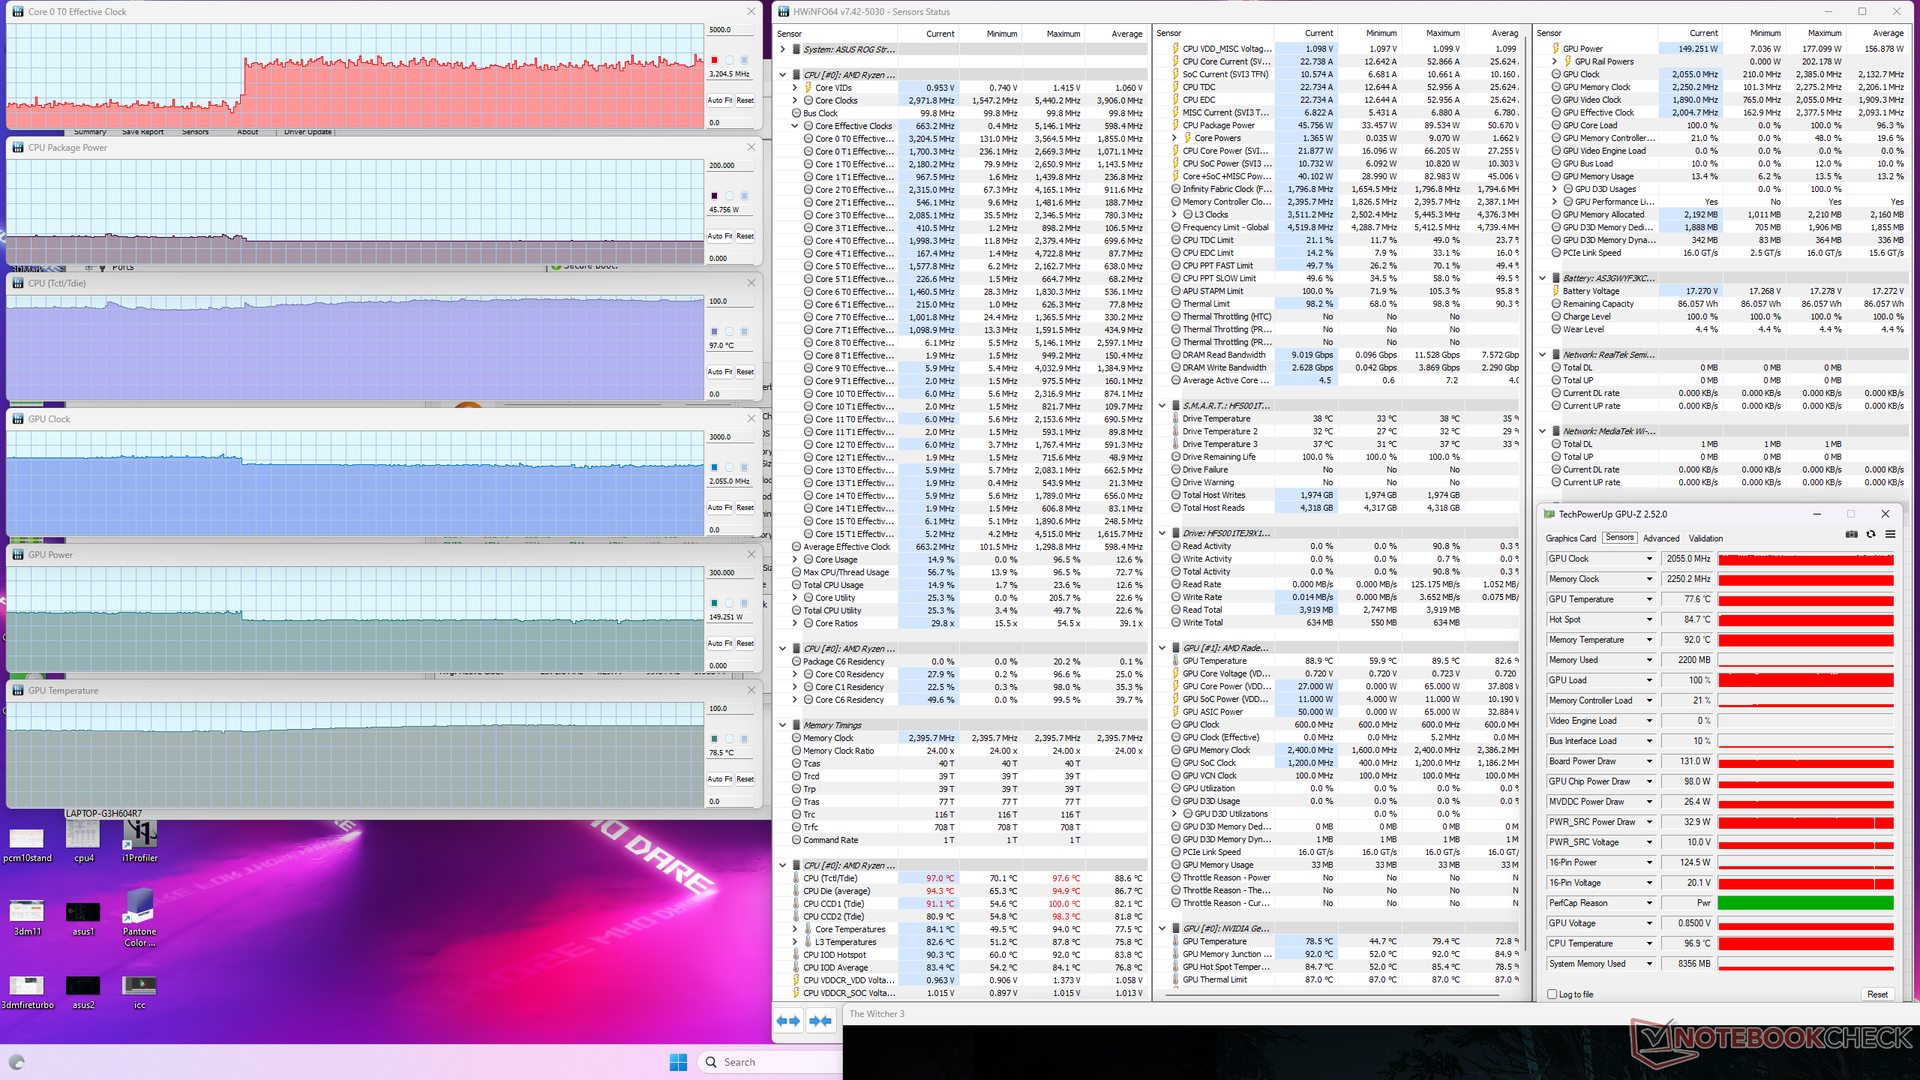
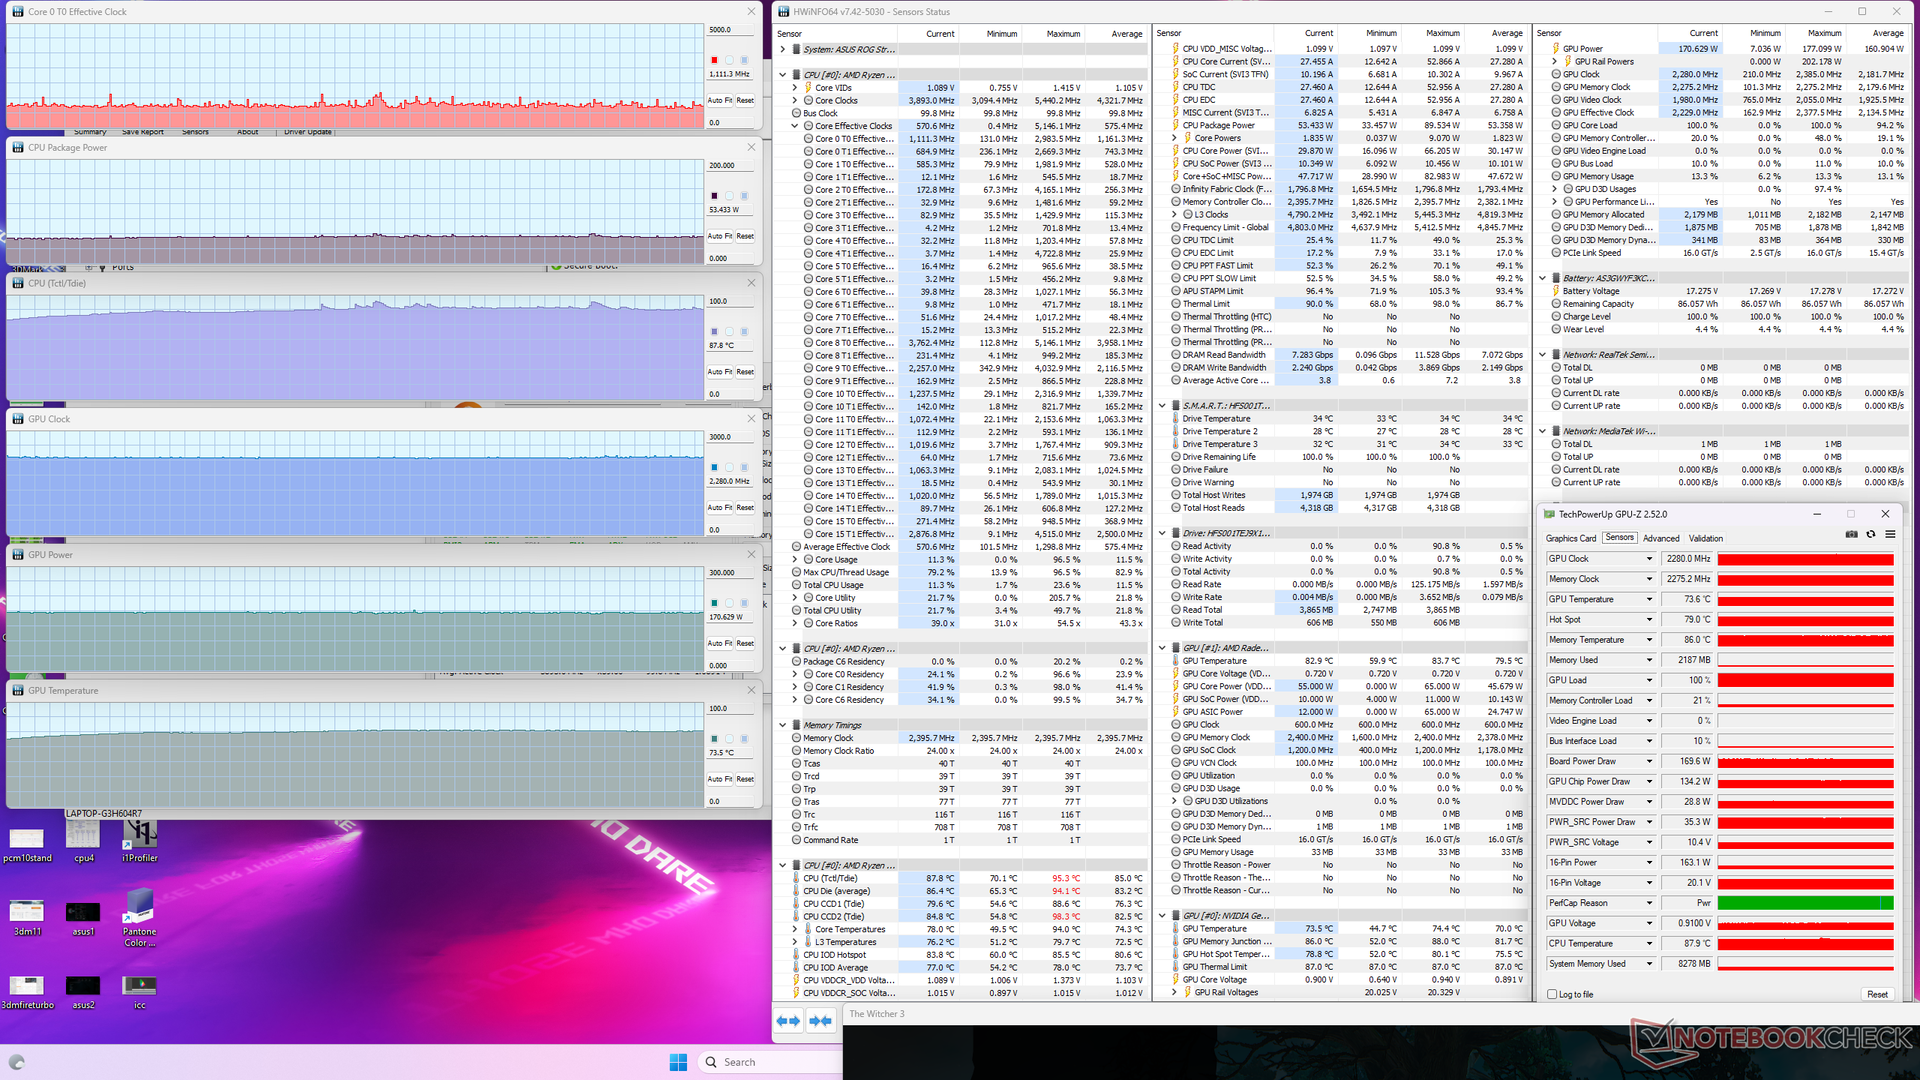
| ZegarCPU (GHz) | Zegar GPU (MHz) | Średnia temperatura CPU (°C) | Średnia temperatura GPU (°C) | |
| System w stanie bezczynności | -- | -- | 53 | 36 |
| Prime95 Stress | 4.2 - 4.9 | -- | 90 - 94 | 51 |
| Prime95 + FurMark Stress | 4.2 - 4.8 | ~850 - 1545 | 94 | 58 |
| Witcher 3 Stress (tryb Performance) | ~3,2 | 2055 | 97 | 79 |
| Witcher 3 Stres(tryb Turbo) | ~1.1 | 2280 | 88 | 74 |
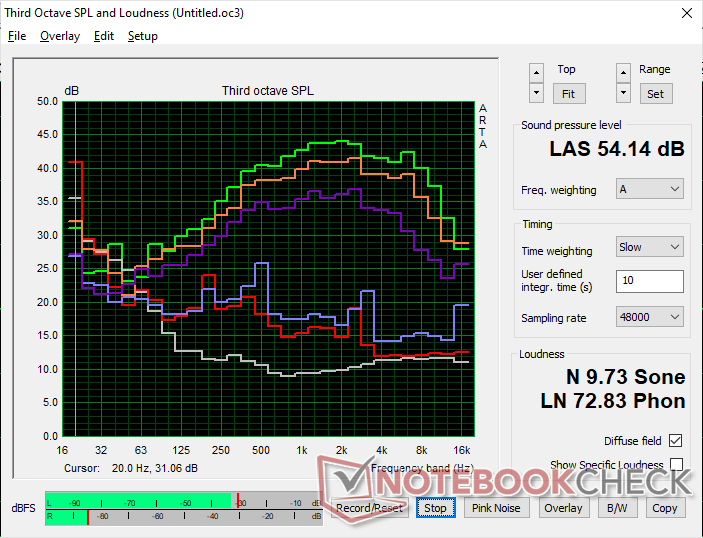
Mówcy
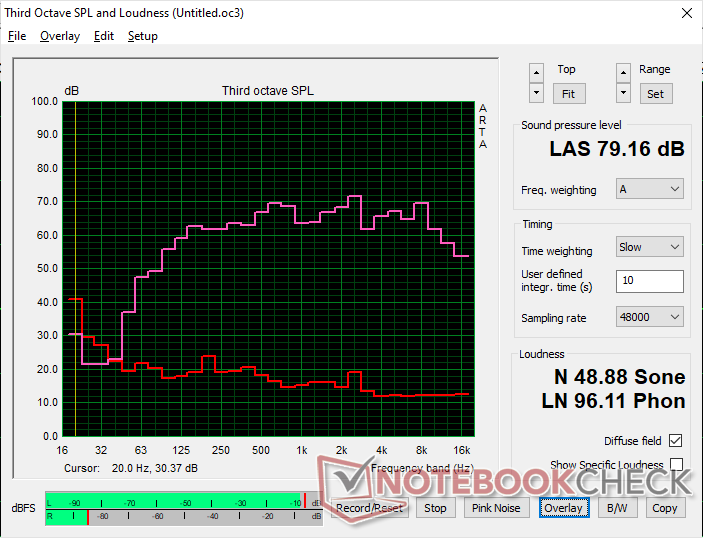
Asus ROG Strix Scar 17 G733PY-XS96 audio analysis
(±) | speaker loudness is average but good (79.2 dB)
Bass 100 - 315 Hz
(+) | good bass - only 2.8% away from median
(+) | bass is linear (5.6% delta to prev. frequency)
Mids 400 - 2000 Hz
(+) | balanced mids - only 2.9% away from median
(+) | mids are linear (4.7% delta to prev. frequency)
Highs 2 - 16 kHz
(+) | balanced highs - only 3.5% away from median
(±) | linearity of highs is average (10% delta to prev. frequency)
Overall 100 - 16.000 Hz
(+) | overall sound is linear (9.3% difference to median)
Compared to same class
» 2% of all tested devices in this class were better, 2% similar, 96% worse
» The best had a delta of 6%, average was 18%, worst was 132%
Compared to all devices tested
» 2% of all tested devices were better, 1% similar, 97% worse
» The best had a delta of 4%, average was 25%, worst was 134%
Apple MacBook Pro 16 2021 M1 Pro audio analysis
(+) | speakers can play relatively loud (84.7 dB)
Bass 100 - 315 Hz
(+) | good bass - only 3.8% away from median
(+) | bass is linear (5.2% delta to prev. frequency)
Mids 400 - 2000 Hz
(+) | balanced mids - only 1.3% away from median
(+) | mids are linear (2.1% delta to prev. frequency)
Highs 2 - 16 kHz
(+) | balanced highs - only 1.9% away from median
(+) | highs are linear (2.7% delta to prev. frequency)
Overall 100 - 16.000 Hz
(+) | overall sound is linear (4.6% difference to median)
Compared to same class
» 0% of all tested devices in this class were better, 0% similar, 100% worse
» The best had a delta of 5%, average was 18%, worst was 45%
Compared to all devices tested
» 0% of all tested devices were better, 0% similar, 100% worse
» The best had a delta of 4%, average was 25%, worst was 134%
Zarządzanie energią - wymagająca maszyna
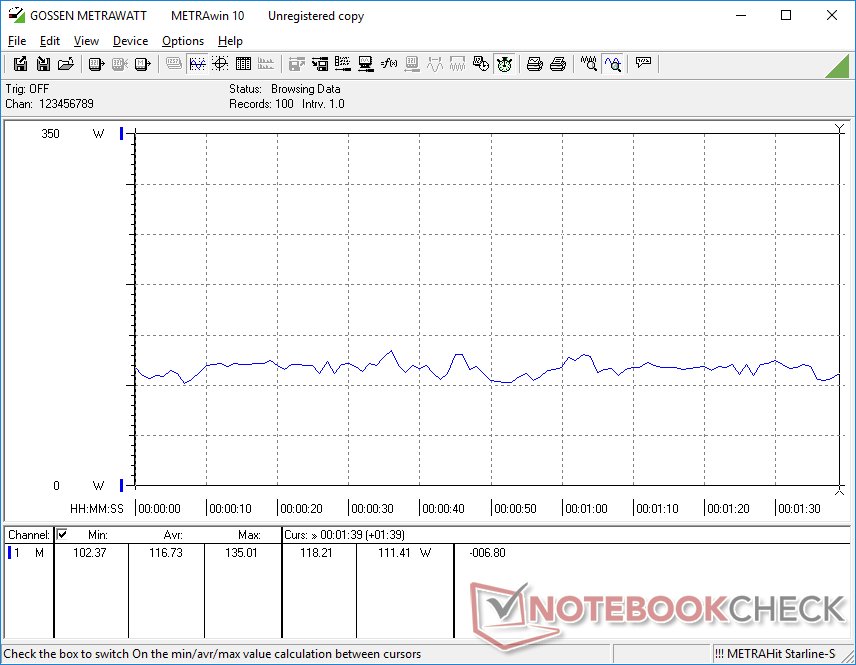
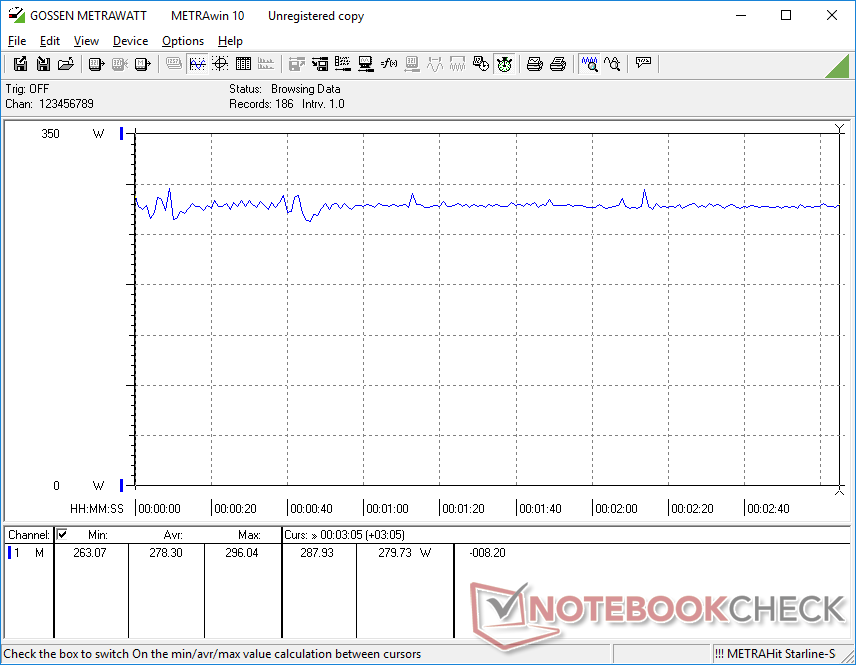
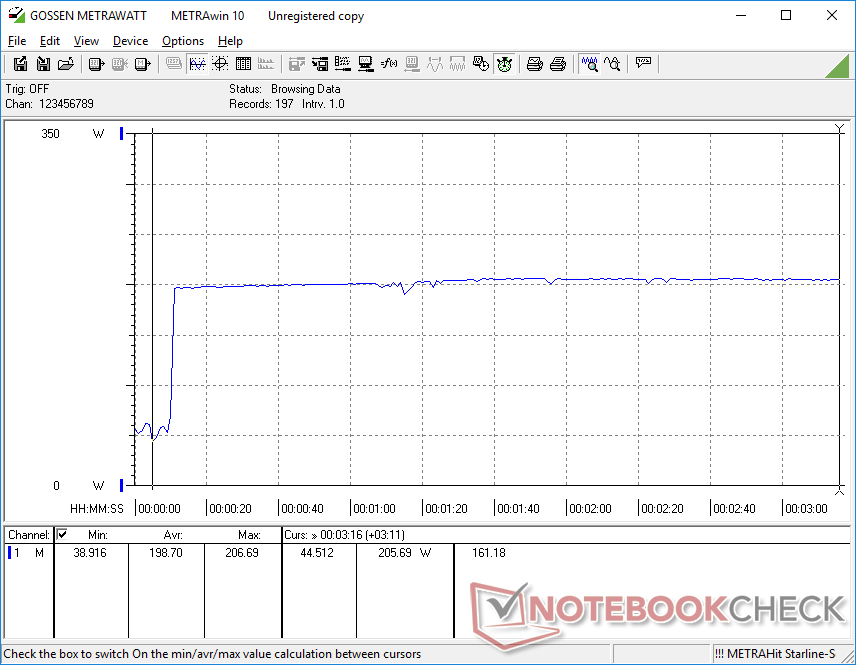
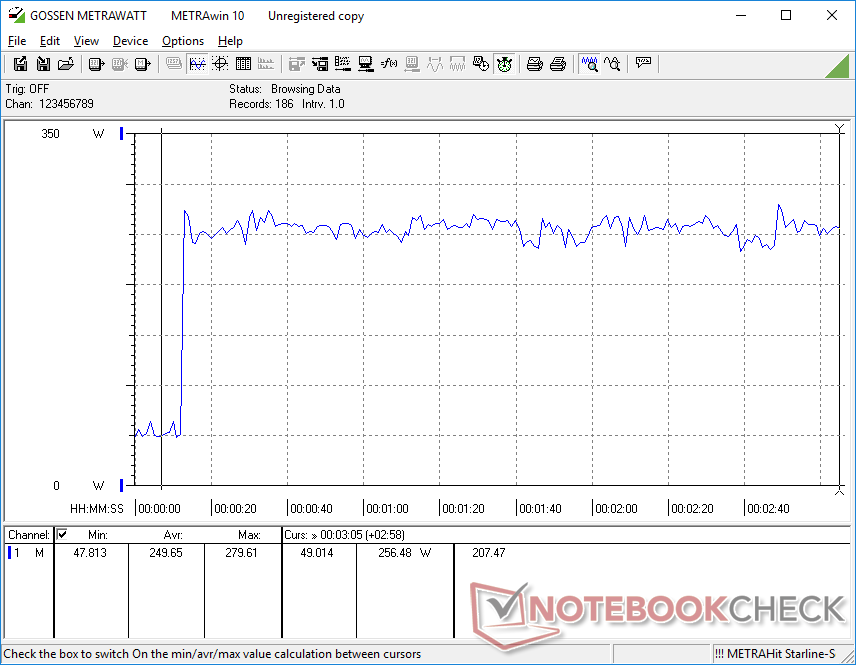
Pobór mocy
Nasz model 2023 jest generalnie bardziej energochłonny niż napędzany przez Intela model 2022. Na przykład podczas uruchamiania Prime95 zużycie energii ustabilizowało się na poziomie 205 W w porównaniu z zaledwie 117 W w zeszłorocznej konfiguracji i9-12950HX. Podobnie, uruchomienie Witcher 3 zużyłoby około 24 procent więcej energii w porównaniu ze starszą konfiguracją RTX 3080 Ti. Wydajność może być szybsza w porównaniu z genami, ale wzrosło też zużycie energii.
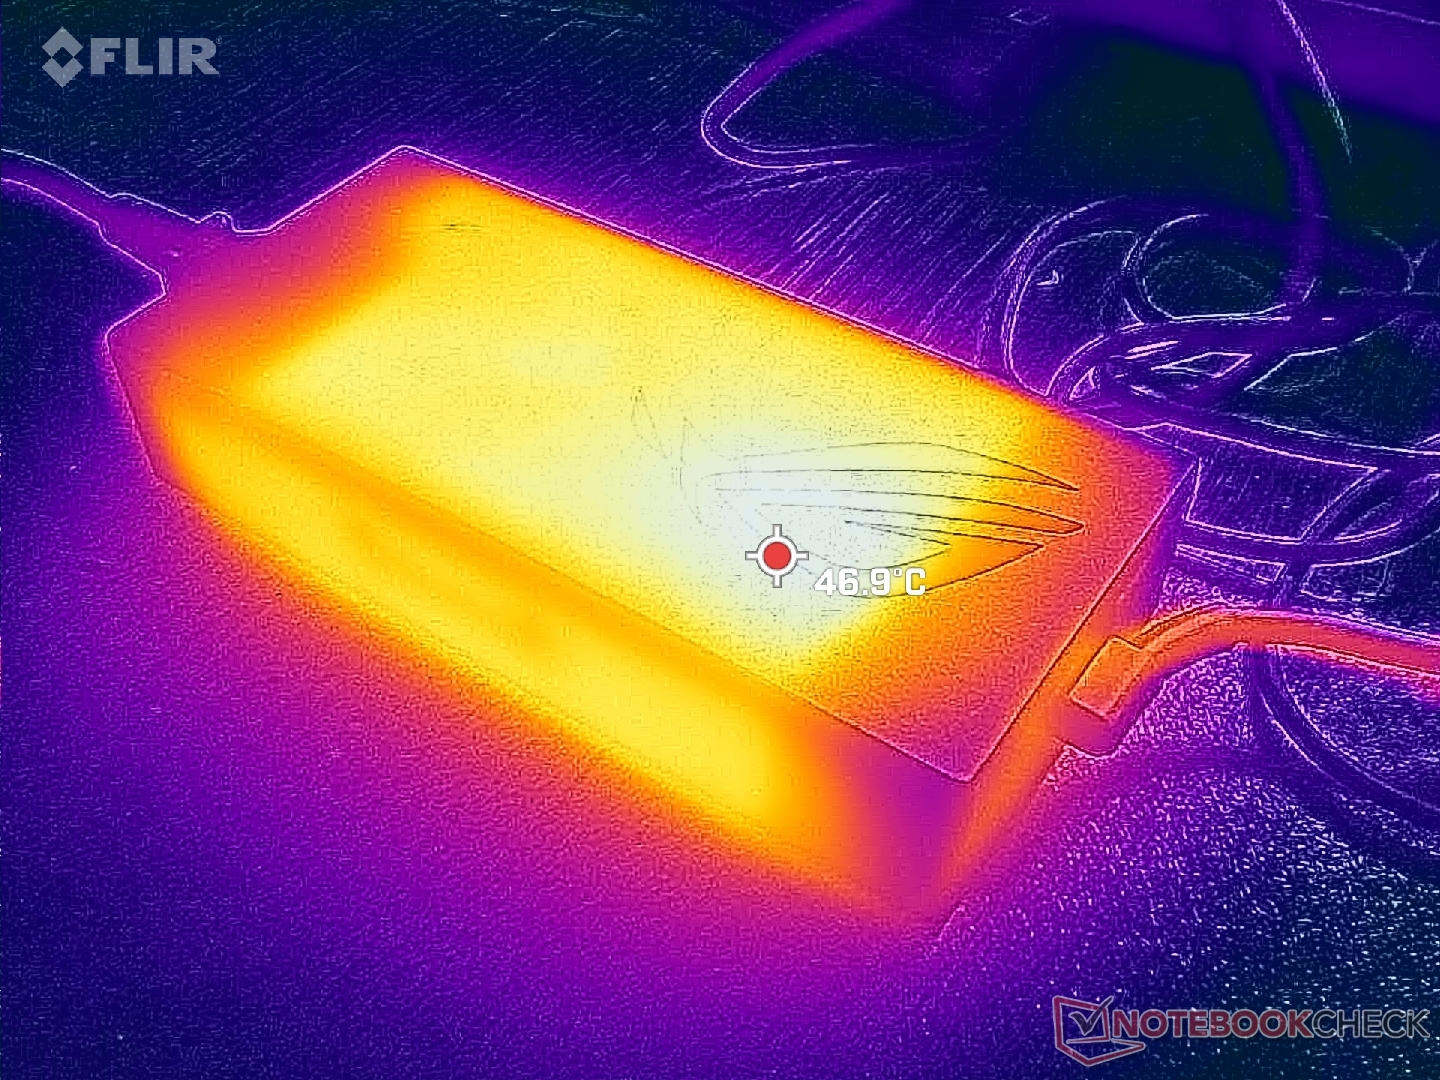
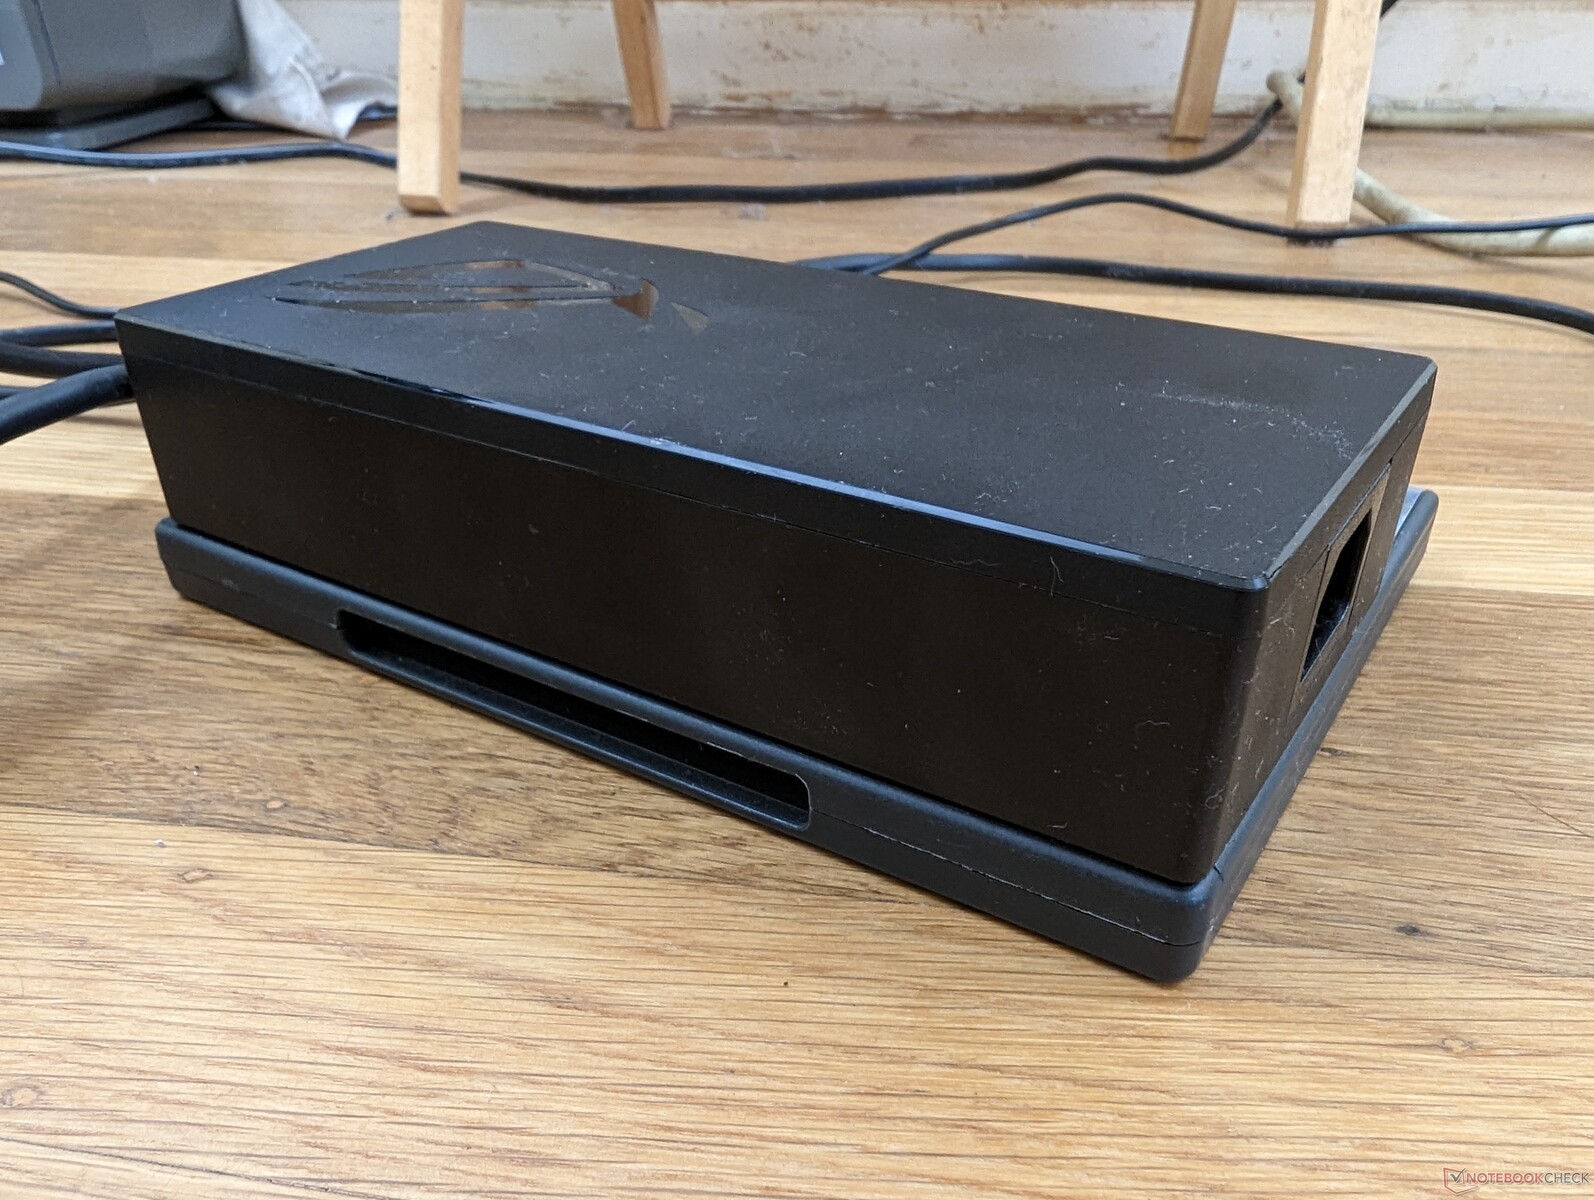
Jesteśmy w stanie zarejestrować maksymalny pobór 280 W z dużego (~18,4 x 8,4 x 3,6 cm) zasilacza AC 330 W.
| wyłączony / stan wstrzymania | |
| luz | |
| obciążenie |
|
| Asus ROG Strix Scar 17 G733PY-XS96 R9 7945HX, NVIDIA GeForce RTX 4090 Laptop GPU, SK hynix PC801 HFS001TEJ9X101N, IPS, 2560x1440, 17.30 | MSI GE78HX 13VH-070US i9-13950HX, NVIDIA GeForce RTX 4080 Laptop GPU, Samsung PM9A1 MZVL22T0HBLB, IPS, 2560x1600, 17.00 | Eluktronics Mech-17 GP2 i9-13900HX, NVIDIA GeForce RTX 4090 Laptop GPU, Samsung PM9A1 MZVL21T0HCLR, IPS, 2560x1600, 17.00 | Asus ROG Strix G17 G713PI R9 7945HX, NVIDIA GeForce RTX 4070 Laptop GPU, WD PC SN560 SDDPNQE-1T00, IPS, 2560x1440, 17.30 | Aorus 17X XES i9-12900HX, GeForce RTX 3070 Ti Laptop GPU, Gigabyte AG470S1TB-SI B10, IPS, 1920x1080, 17.30 | Alienware m17 R5 (R9 6900HX, RX 6850M XT) R9 6900HX, Radeon RX 6850M XT, SSSTC CA6-8D1024, IPS, 3840x2160, 17.00 | |
|---|---|---|---|---|---|---|
| Power Consumption | -3% | -1% | 13% | -9% | 23% | |
| Idle Minimum * | 14.5 | 16.1 -11% | 14 3% | 15 -3% | 18 -24% | 13 10% |
| Idle Average * | 21.1 | 24 -14% | 19.3 9% | 20 5% | 28 -33% | 16.5 22% |
| Idle Maximum * | 42.8 | 34 21% | 36.8 14% | 29 32% | 36 16% | 17 60% |
| Load Average * | 116.7 | 123.6 -6% | 117.2 -0% | 121 -4% | 153 -31% | 93 20% |
| Witcher 3 ultra * | 278 | 286 -3% | 304 -9% | 179.8 35% | 221 21% | 239 14% |
| Load Maximum * | 279.6 | 285.7 -2% | 342.5 -22% | 246 12% | 290 -4% | 251 10% |
* ... im mniej tym lepiej
Power Consumption Witcher 3 / Stresstest
Power Consumption external Monitor
Czas pracy na baterii
Czas pracy w sieci WLAN jest mniej więcej przeciętny i wynosi 4 godziny przy profilu Balanced z aktywnymi Optimusem i iGPU. Inne 17-calowe laptopy do gier, jak np ROG Strix G17 G713PI lubAorus 17X XES zwróciłyby podobne wyniki.
System można ładować za pomocą adapterów USB-C innych firm. Niektóre adaptery mogą jednak nie działać; nasza 135 W ładowarka Lenovo USB-C działała bez problemów, natomiast 130 W ładowarka Dell XPS USB-C w ogóle nie ładowała.
| Asus ROG Strix Scar 17 G733PY-XS96 R9 7945HX, NVIDIA GeForce RTX 4090 Laptop GPU, 90 Wh | MSI GE78HX 13VH-070US i9-13950HX, NVIDIA GeForce RTX 4080 Laptop GPU, 99 Wh | Eluktronics Mech-17 GP2 i9-13900HX, NVIDIA GeForce RTX 4090 Laptop GPU, 99 Wh | Asus ROG Strix G17 G713PI R9 7945HX, NVIDIA GeForce RTX 4070 Laptop GPU, 90 Wh | Aorus 17X XES i9-12900HX, GeForce RTX 3070 Ti Laptop GPU, 99 Wh | Alienware m17 R5 (R9 6900HX, RX 6850M XT) R9 6900HX, Radeon RX 6850M XT, 97 Wh | |
|---|---|---|---|---|---|---|
| Czasy pracy | 46% | 23% | 3% | 7% | 17% | |
| WiFi v1.3 | 248 | 363 46% | 305 23% | 255 3% | 266 7% | 290 17% |
| Reader / Idle | 439 | |||||
| Load | 89 | 58 | 86 | 107 | ||
| H.264 | 166 | 226 | 294 | |||
| Witcher 3 ultra | 64 |
Za
Przeciw
Werdykt - Doskonałe osiągi i starzejący się wygląd
Na rok 2022 AMD i Nvidia wprowadziły serię Zen 3+ oraz mobilną GeForce 30 Ti, które zastąpiły odpowiednio opcje Zen 3 i non Ti z 2021 roku. Aktualizacje okazały się jednak stosunkowo niewielkie, gdyż nowsze opcje nie wniosły nic nowego na poziomie architektury. Na rok 2023, seria Zen 4 i mobilny GeForce RTX 40 przyniosły w końcu znaczący wzrost wydajności, na który czekali gracze laptopowi. Pobór mocy może być wyższy, ale wzrost mocy nadrabia to zwłaszcza, że Ryzen 9 7945HX jest zarówno nieco szybszy, jak i bardziej energooszczędny od konkurencyjnego Core i9-13950HX 13. generacji.
ROG Strix Scar 17 z 2023 roku pokazuje Ryzena 9 7945HX i GeForce RTX 4090 w najlepszym wy
daniu.
Niektóre zewnętrzne cechy konstrukcyjne mogłyby jednak skorzystać z aktualizacji.
Podczas gdy procesory są imponujące w tym roku, ogólnemu zewnętrznemu wzornictwu ROG Strix Scar 17 przydałoby się większe odświeżenie. Temperatura procesora podczas gry jest wyższa niż oczekiwana, a dysk SSD PCIe4 x4 dławi się po kilku minutach intensywnego użytkowania. Mały numpad i klawisze strzałek są nadal ciasne, a niektóre drugorzędne etykiety na klawiszach klawiatury nadal nie świecą, kiedy podświetlenie jest aktywne. Niektóre konkurencyjne modele, jak np. cieńszy MSI GE78 również przeszły na 16:10, podczas gdy seria Strix Scar 17 nadal ma 16:9. Istnieje ryzyko, że model ten będzie wyglądał na przestarzały, nawet jeśli jego wydajność nie jest powolna.
Cena i dostępność
Nazwa cena i dostępność badanego modelu, w razie potrzeby odchylenia odpowiednich wariantów wyposażenia. Affil link do sklepu z listy w oknie linków.
Asus ROG Strix Scar 17 G733PY-XS96
-
10/04/2023 v7
Allen Ngo
Transparency
The present review sample was made available to the author as a loan by the manufacturer or a shop for the purposes of review. The lender had no influence on this review, nor did the manufacturer receive a copy of this review before publication. There was no obligation to publish this review.
Pricecompare

