Recenzja laptopa Acer TravelMate P4: Niedopowiedzenia są dla szefów

Od kilku lat seria TravelMate firmy Acer walczy z fanklubami Dell Latitudes, dobrą reputacją Lenovo ThinkPad oraz biznesową aurą HP ProBooks. Nie jest łatwo przebić się w segmencie laptopów biznesowych głównego nurtu, a najlepiej można to zrobić za pomocą dużej sprzedaży hurtowej dla firm.
Towarzyszyliśmy TravelMates w ich zmaganiach przez lata. Nie poszło im źle, a wraz z modelem TravelMate P6 TMP614P mieliśmy nawet kandydata, który osiągnął 88% w naszym laboratorium, co odpowiada ocenie "bardzo dobry" Ale to samo nigdy nie miało miejsca w przypadku modeli P4, a poprzedni TravelMate P4 osiągnął 86%. W rezultacie nasze rekomendacje zawsze trafiały do ThinkPadów, które często oferowały lepszy stosunek ceny do wydajności i nadal dominują w Top 10.
Czy tak będzie również w tym przypadku, czy też Acer będzie w stanie utrzymać swoją pozycję dzięki TravelMate P4 2024? W cenie od 900 do 1000 euro (~979-1 087 USD), 14-calowy laptop należy do średniej półki, więc musi konkurować z ProBookami, po prostu wyposażonymi Latitudes i ThinkPadami Lenovo z serii E. Chociaż sprzęt nie jest najlepszy z Raptor Lake Core i5512 GB i 8 GB pamięci RAM, powinien przyciągnąć niektórych nabywców zwracających uwagę na cenę. Ponadto Acer całkowicie odświeżył urządzenia wejściowe i pozycje połączeń w porównaniu do TravelMate P4 TMP414-51-59MR poprzednika. Czy to jednak wystarczy?
Potencjalni konkurenci w porównaniu
Ocena | Data | Model | Waga | Wysokość | Rozmiar | Rezolucja | Cena |
|---|---|---|---|---|---|---|---|
| 85.9 % v7 (old) | 01/2024 | Acer TravelMate P4 TMP414-53-58XQ i5-1335U, Iris Xe G7 80EUs | 1.5 kg | 22 mm | 14.00" | 1920x1200 | |
| 90.3 % v7 (old) | 07/2023 | Dell Latitude 7440 i5-1345U, Iris Xe G7 80EUs | 1.2 kg | 17.95 mm | 14.00" | 2560x1600 | |
| 88.3 % v7 (old) | 08/2023 | Lenovo ThinkPad E14 G5-21JSS05C00 R7 7730U, Vega 8 | 1.4 kg | 18 mm | 14.00" | 2240x1400 | |
| 86 % v7 (old) | 10/2023 | Lenovo ThinkPad E14 G5 i7-1355U i7-1355U, Iris Xe G7 96EUs | 1.5 kg | 17.99 mm | 14.00" | 1920x1200 | |
| 85.3 % v7 (old) | 03/2023 | HP ProBook 440 G9-5Y3Z3EA i7-1255U, Iris Xe G7 96EUs | 1.4 kg | 20.4 mm | 14.00" | 1920x1080 | |
| 84.6 % v7 (old) | 10/2023 | HP ProBook 445 G10 R5 7530U, Vega 7 | 1.3 kg | 20 mm | 14.00" | 1920x1080 | |
| 82.1 % v7 (old) | 06/2023 | Fujitsu LifeBook E5412A E542AMHAAMDE R5 PRO 5675U, Vega 7 | 1.4 kg | 19.9 mm | 14.00" | 1920x1080 |
Sprawa
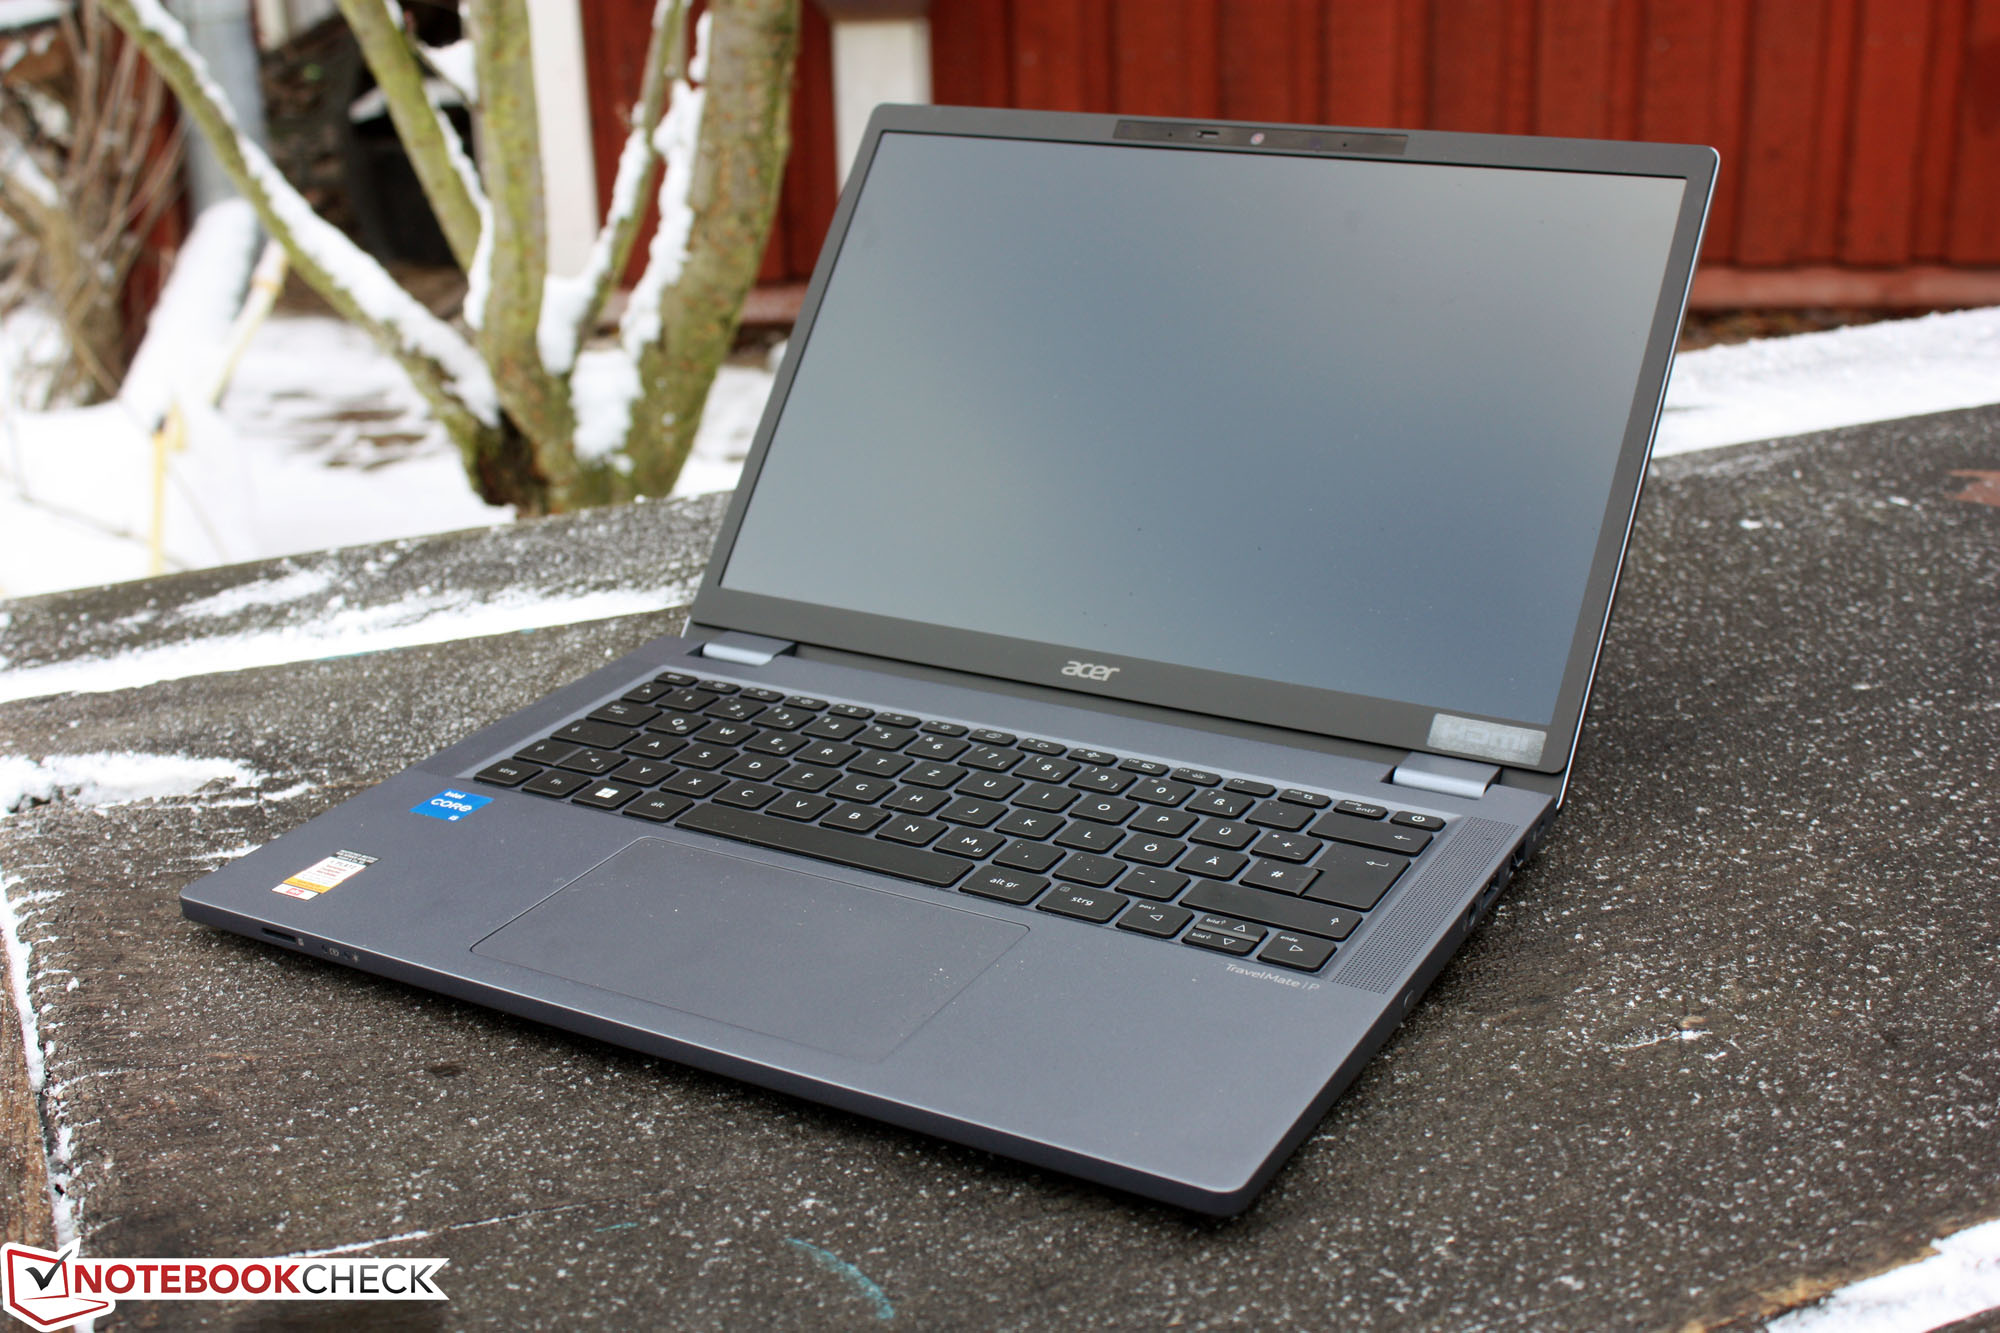
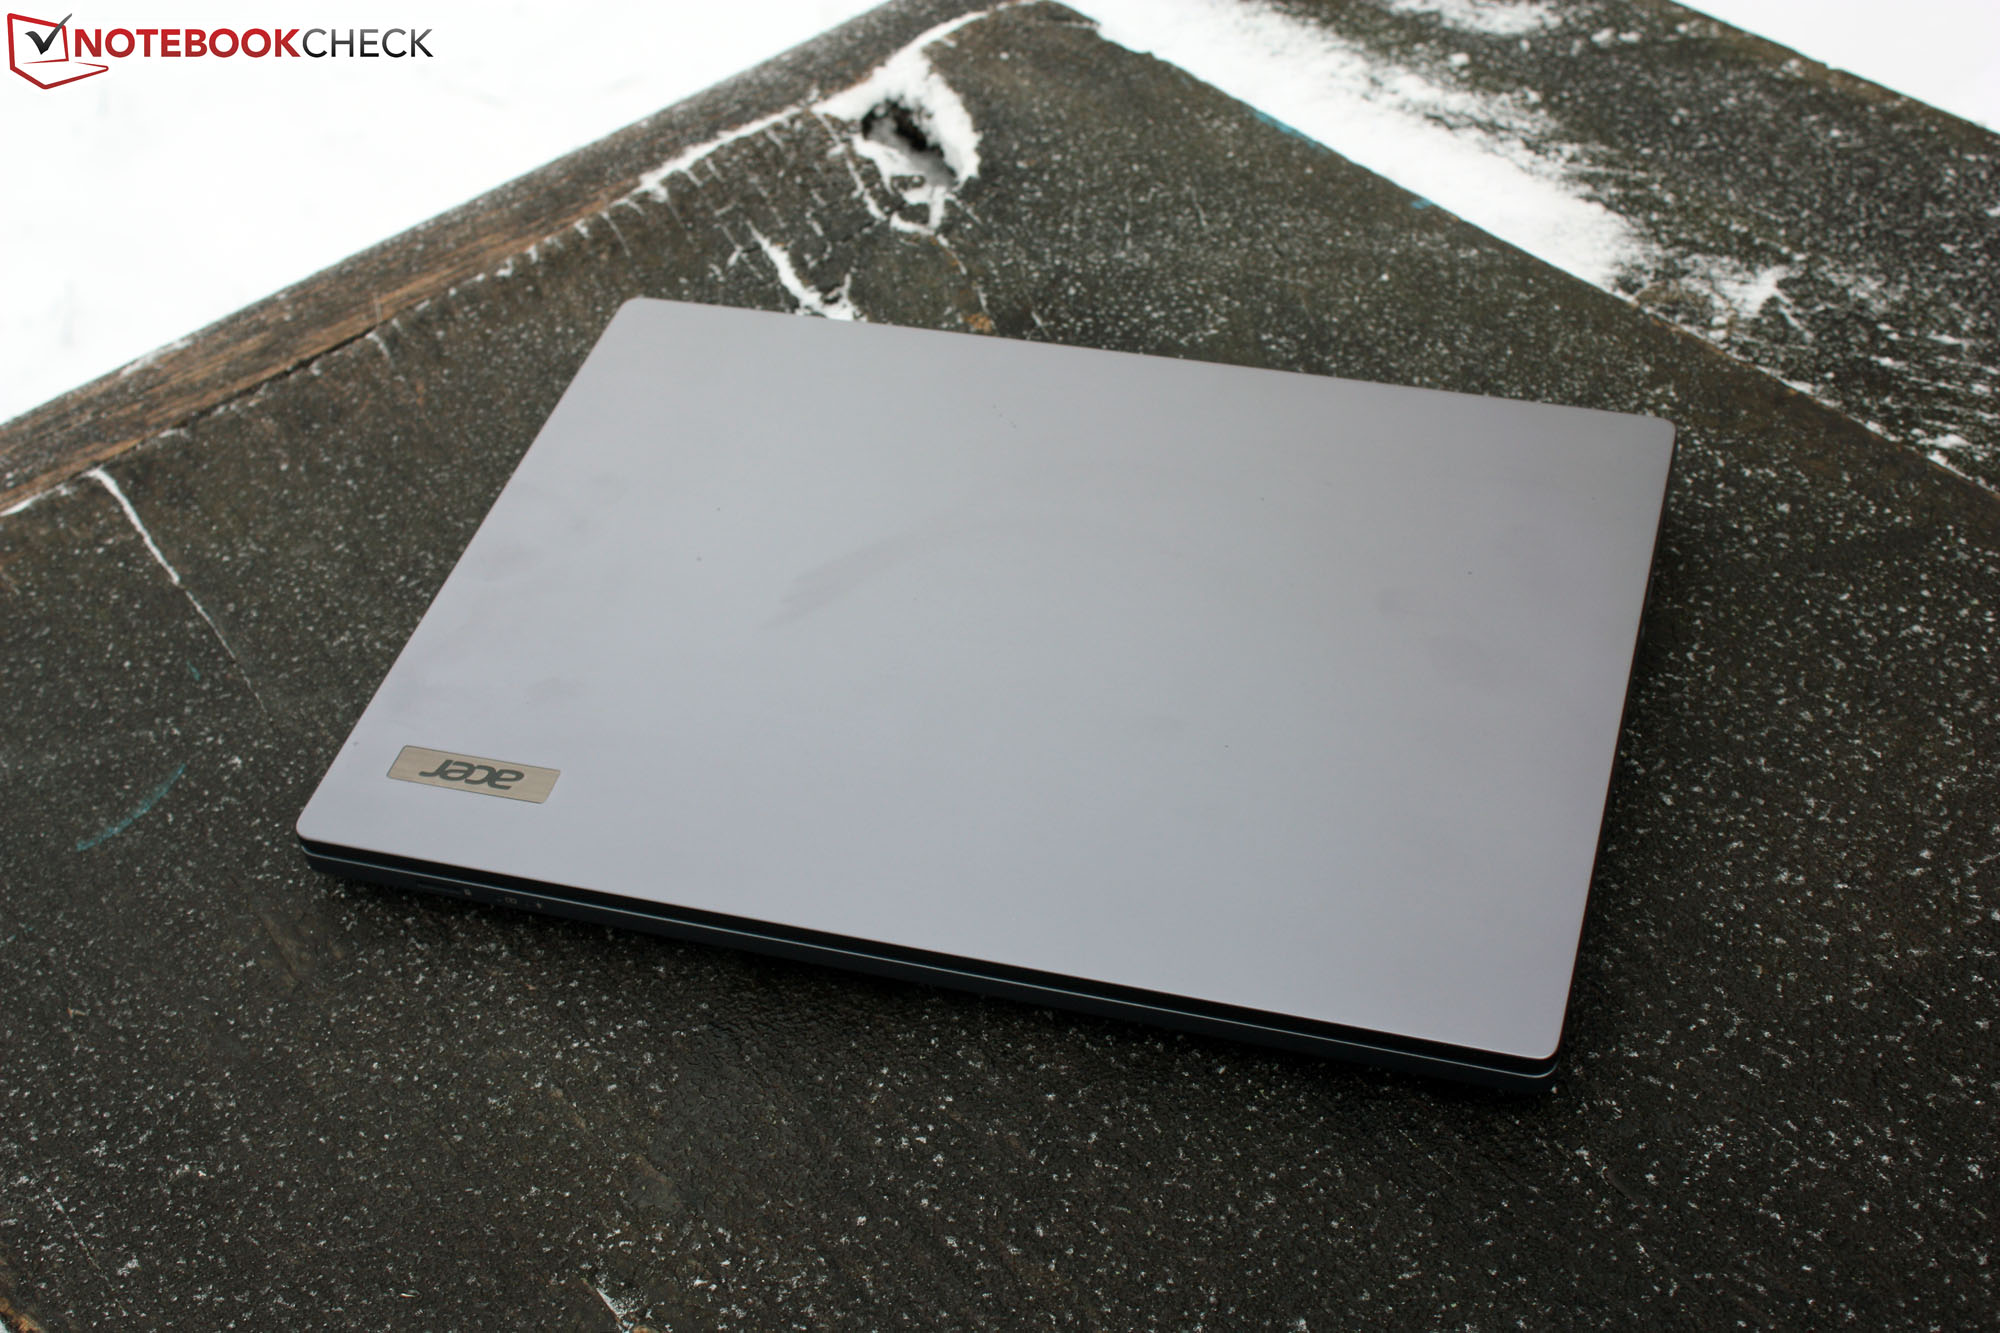
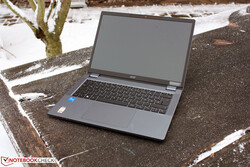
Prosta, myszkowo-szara obudowa może być uważana za ucieleśnienie niepozorności. Osoby podróżujące z TravelMate z pewnością nie będą zwracać na siebie uwagi. Ale to dobrze, ponieważ jako laptop do pracy biurowej potrzebuje innych cech niż ozdobne chromowane paski. Kanciasta 14-calowa obudowa oferuje dobrą, ale nie doskonałą wytrzymałość. Podpórka pod nadgarstki i obszar klawiatury w ogóle się nie uginają, nawet przy zastosowaniu pewnego nacisku. Wyświetlacz o proporcjach 16:10 zapewnia głęboką podpórkę pod nadgarstki, która oferuje również dużo miejsca dla dużych dłoni, aby czuć się komfortowo. Zawiasy utrzymują wyświetlacz w miejscu, dzięki czemu nie przesuwa się on podczas przenoszenia laptopa. Pokrywę wyświetlacza można otworzyć o 180 stopni.

14-calowy laptop jest o 1 cm szerszy i głębszy niż kartka papieru DIN A4, a jego szerokość wynosi 31,9 cm (12,6 cala). Oba ThinkPady są nieco bardziej kompaktowe, mają mniejsze ramki wyświetlacza przy tej samej przekątnej ekranu, co pozwala zaoszczędzić kilka milimetrów pod względem szerokości i głębokości. Chociaż laptopy biurowe średniej klasy nie starają się być tak smukłe, jak to tylko możliwe, grubość nie jest taka sama dla wszystkich z nich: Przy 22 mm (~0,87 cala) z tyłu i 19 mm (~0,75 cala) z przodu, nasza jednostka testowa Acer jest grubsza niż ThinkPad, ProBook, LifeBook i Latitude. Wartości te są zawsze podawane bez nóżek, a dodając ich wysokość, TravelMate osiąga nawet 27 mm (~1,06 cala) z tyłu i 21 mm (~0,83 cala) z przodu.
Sprzęt
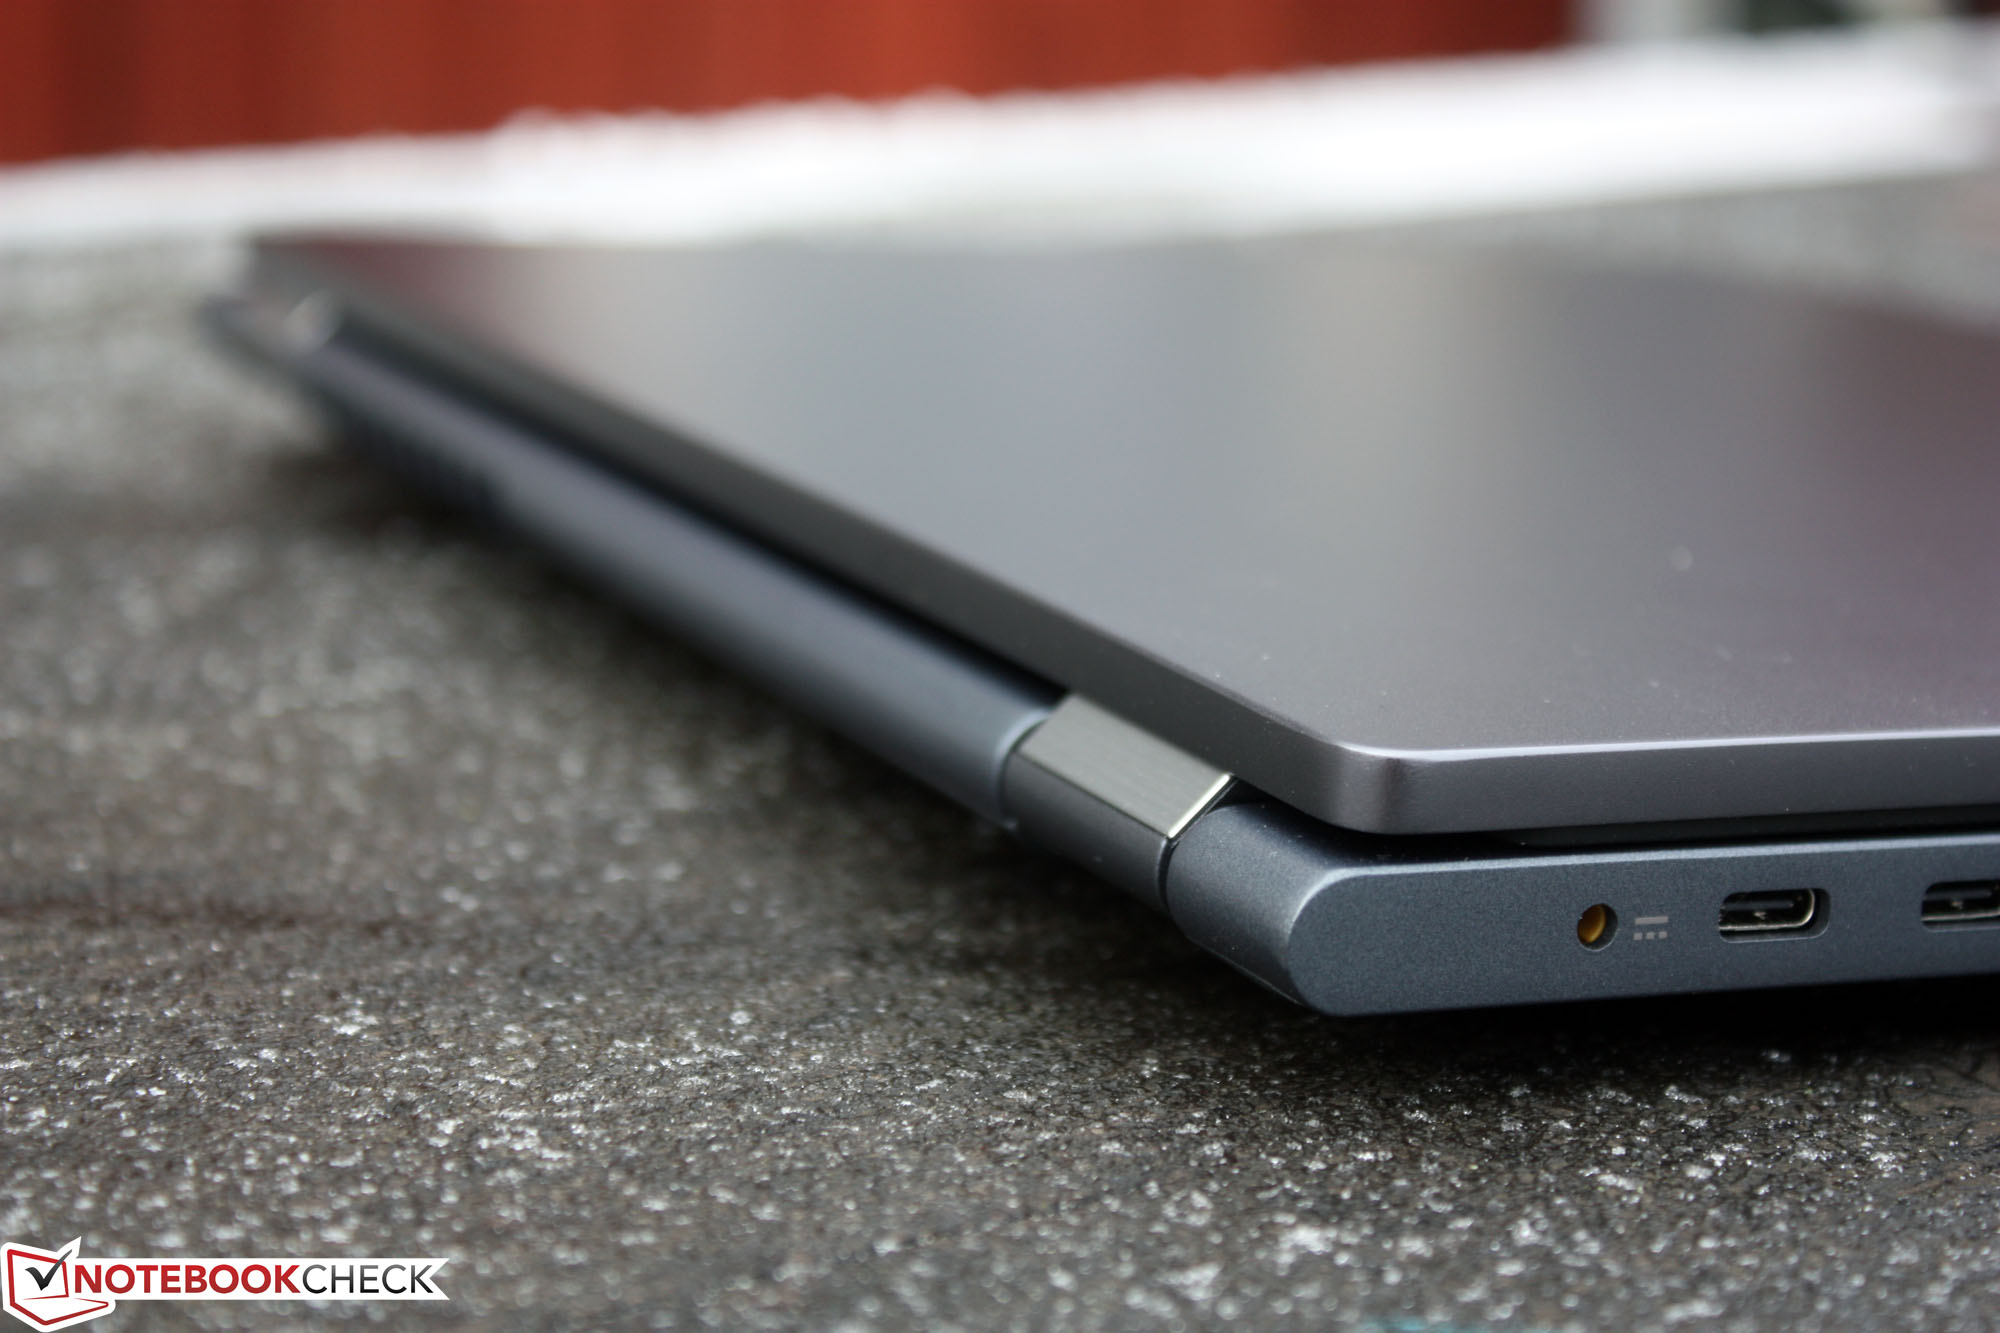
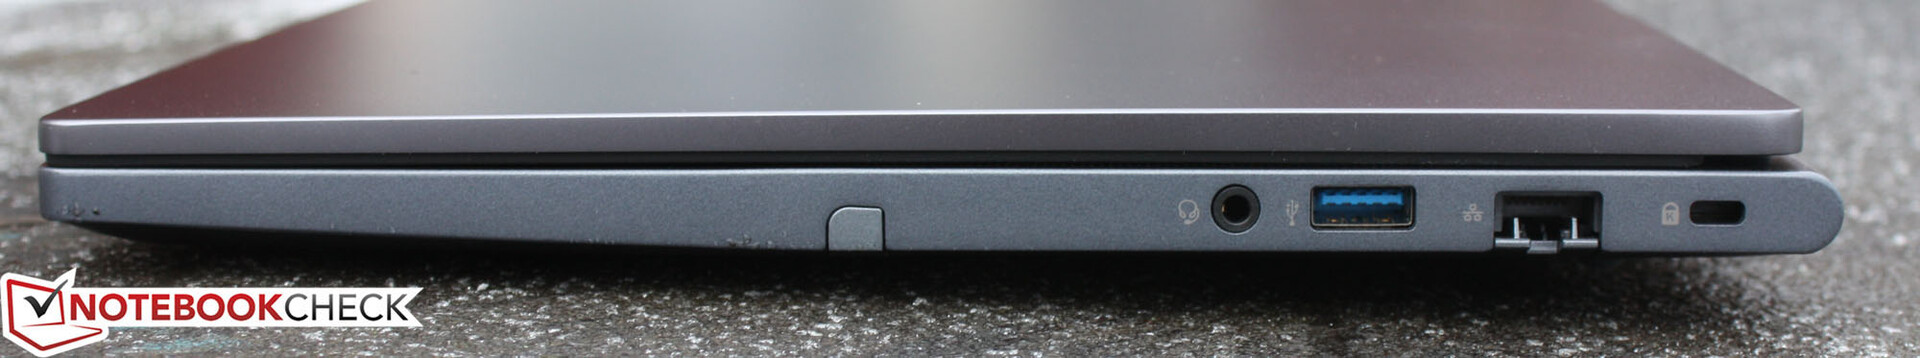
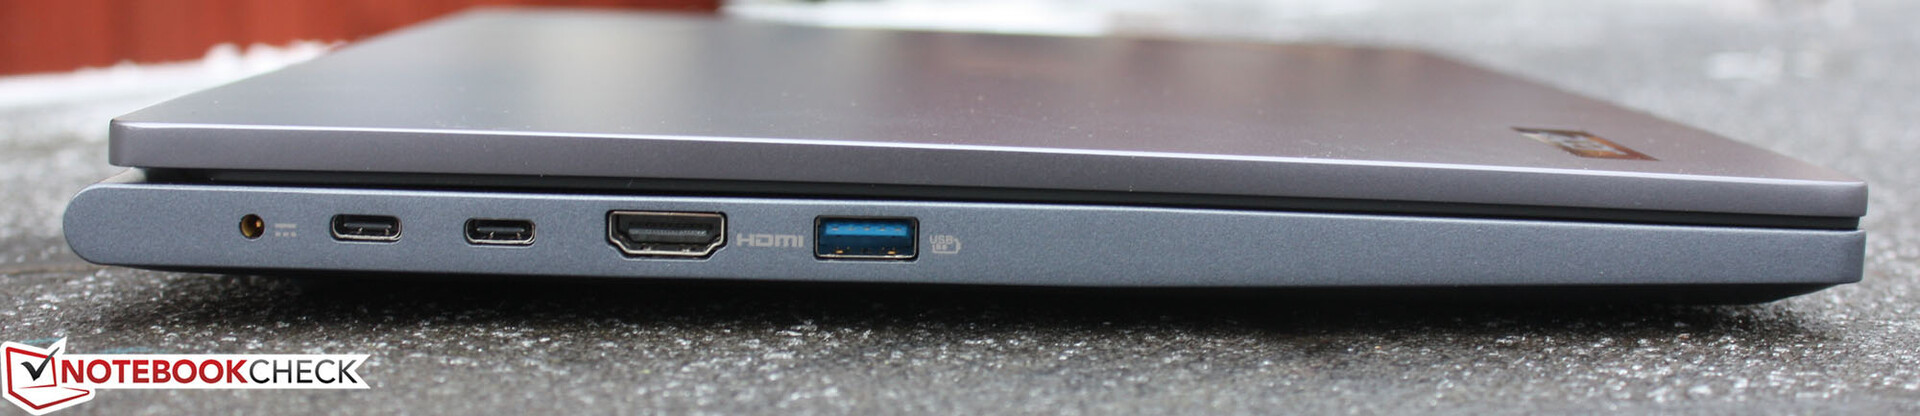
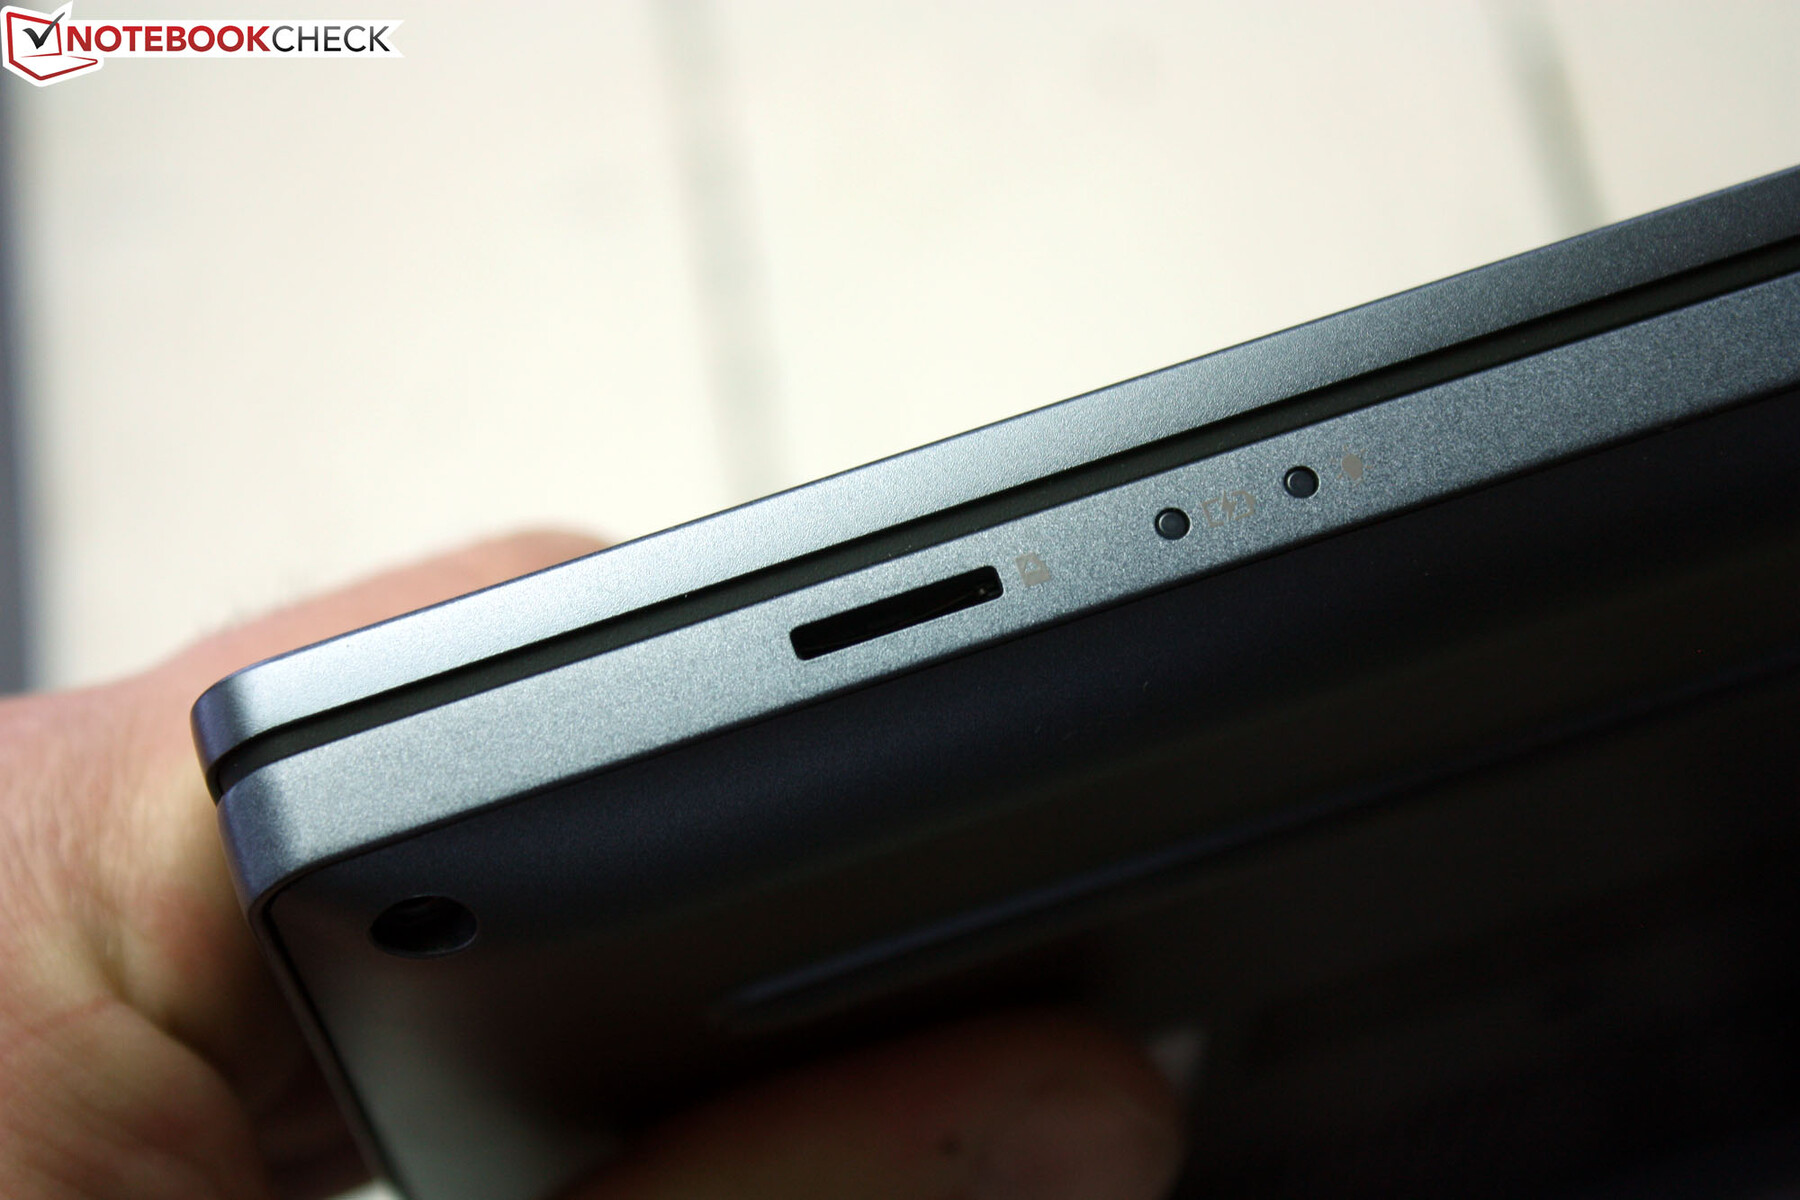
Acer oferuje dwa złącza Thunderbolt w postaci portów USB Type-C, w tym USB 3.2 o przepustowości 50 Mbit. Pozwoli to na korzystanie z niedrogich stacji dokujących Type-C, a także potężnych stacji dokujących Thunderbolt. Porty Thunderbolt obsługują funkcję Power Delivery, a także są w stanie wyprowadzać sygnały DisplayPort. Wraz z portem HDMI laptop oferuje do trzech wyjść wideo. Czytnik kart pamięci znajduje się z przodu laptopa, co jest rzadkością.
Czytnik kart SD
Testujemy czytnik kart z naszą referencyjną kartą microSD AV-PRO 128-GB V60. Zły wynik reprezentuje najniższy z naszych pomiarów.
| SD Card Reader | |
| average JPG Copy Test (av. of 3 runs) | |
| Apple MacBook Pro 16 2023 M3 Max (Angelbird AV Pro V60) | |
| Lenovo ThinkPad P1 G6 21FV001KUS (Toshiba Exceria Pro SDXC 64 GB UHS-II) | |
| Lenovo ThinkBook 16 G6 ABP (Angelbird AV Pro V60) | |
| Średnia w klasie Subnotebook (23.7 - 188, n=9, ostatnie 2 lata) | |
| Fujitsu LifeBook E5412A E542AMHAAMDE (AV Pro V60) | |
| Lenovo ThinkPad P16 G2 21FA000FGE | |
| Acer TravelMate P4 TMP414-53-58XQ (AV Pro SD microSD 128 GB V60) | |
| maximum AS SSD Seq Read Test (1GB) | |
| Apple MacBook Pro 16 2023 M3 Max (Angelbird AV Pro V60) | |
| Średnia w klasie Subnotebook (24.9 - 195, n=8, ostatnie 2 lata) | |
| Lenovo ThinkPad P1 G6 21FV001KUS (Toshiba Exceria Pro SDXC 64 GB UHS-II) | |
| Fujitsu LifeBook E5412A E542AMHAAMDE (AV Pro V60) | |
| Lenovo ThinkBook 16 G6 ABP (Angelbird AV Pro V60) | |
| Lenovo ThinkPad P16 G2 21FA000FGE | |
| Acer TravelMate P4 TMP414-53-58XQ (AV Pro SD microSD 128 GB V60) | |
Komunikacja
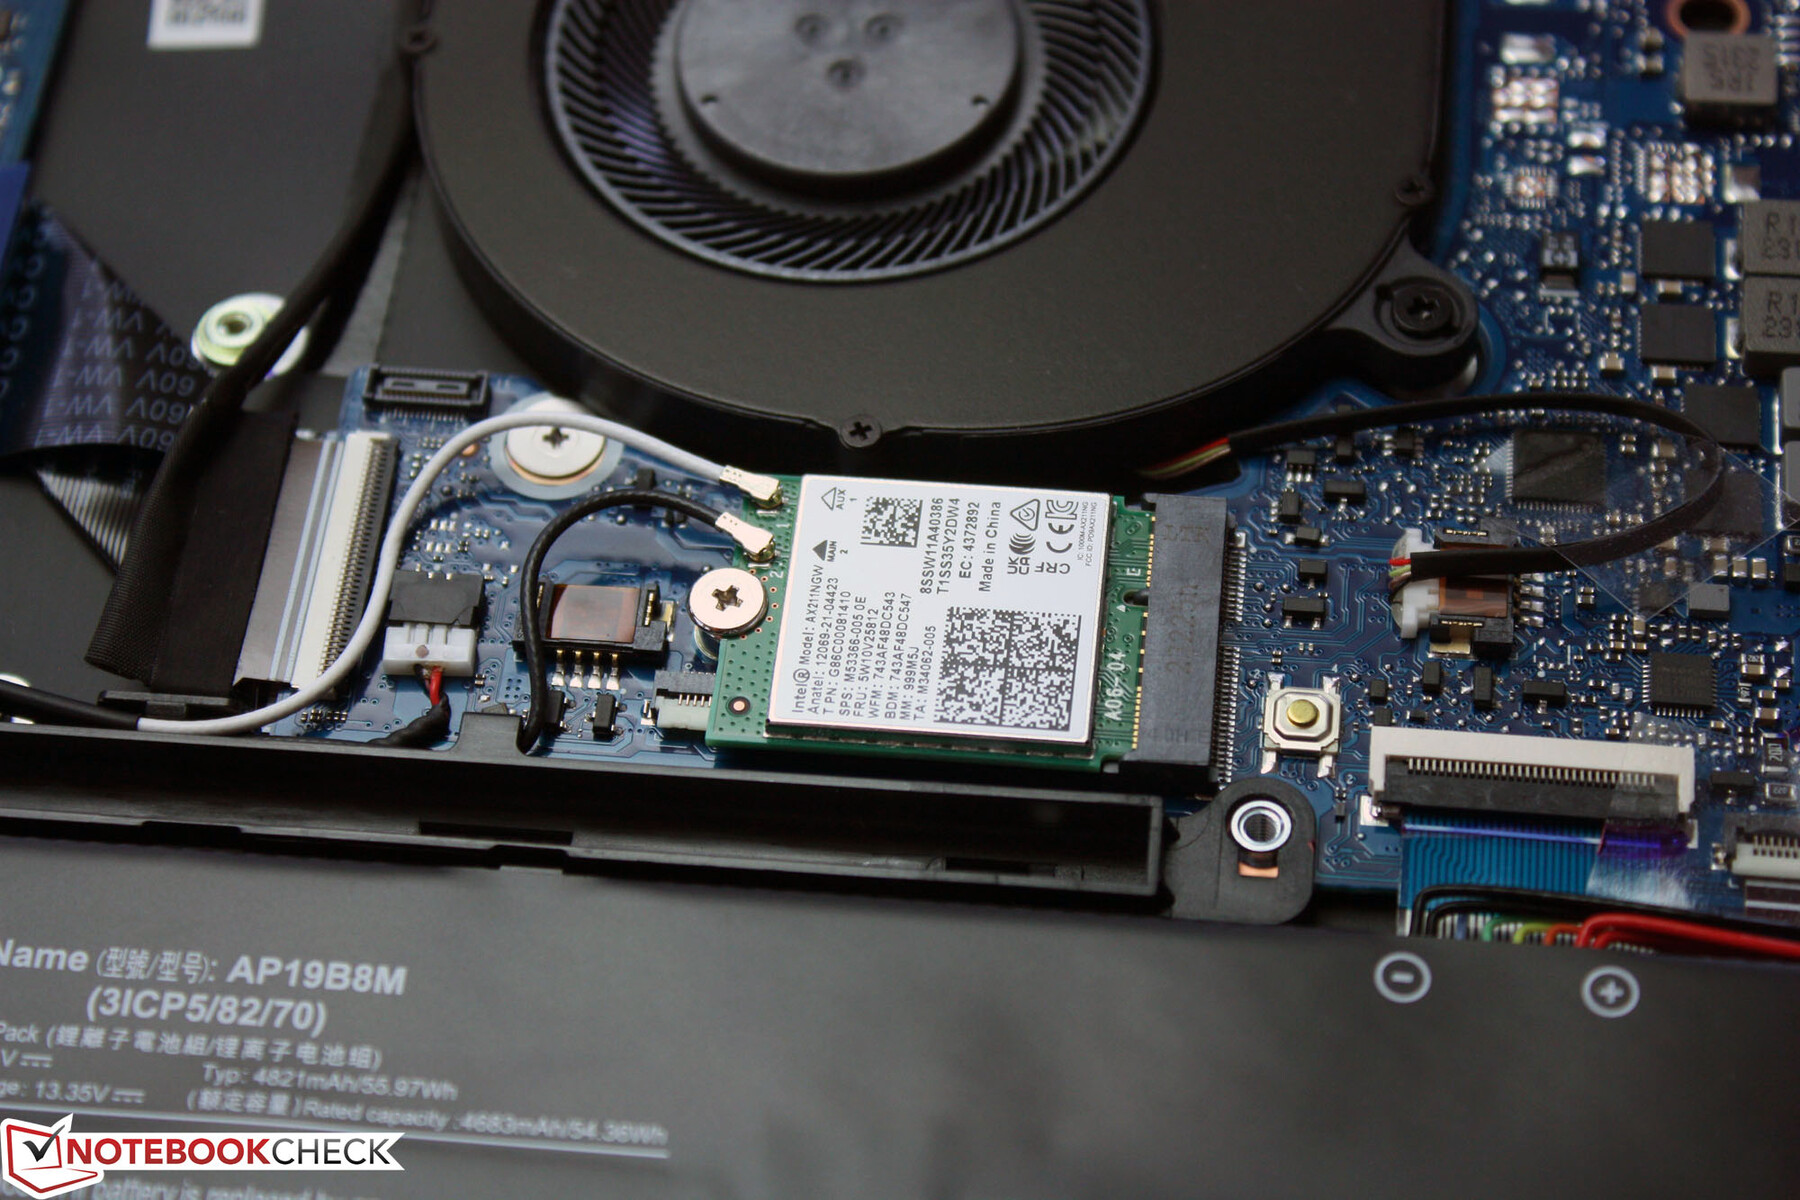
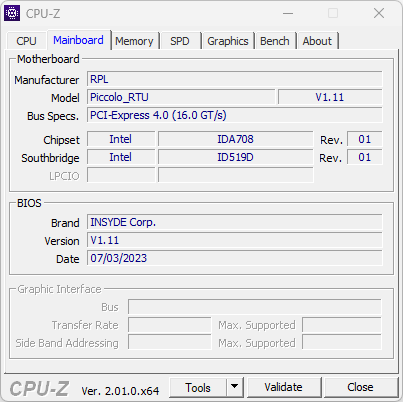
Moduł komunikacyjny to karta M.2-2230 na płycie głównej. Intel Wi-Fi 6 AX211 obejmuje również obsługę Bluetooth 5.3. Według producenta, układ ten powinien być szczególnie wydajny w gęstych sieciach WLAN z dziesiątkami routerów i setkami podłączonych urządzeń, na przykład oferując mniejsze opóźnienia. Bluetooth 5.3 obsługuje sygnały audio o niskim zużyciu energii. TravelMate przeszedł nasz test (z wyłączonymi odgłosami otoczenia Wi-Fi) śpiewająco, grając w najwyższej lidze. Zgodnie z wymaganiami dla laptopa biznesowego, TravelMate zawiera również przewodowe połączenie Ethernet. Gigabitowa karta sieciowa Realtek ma typowy rozkładany port.
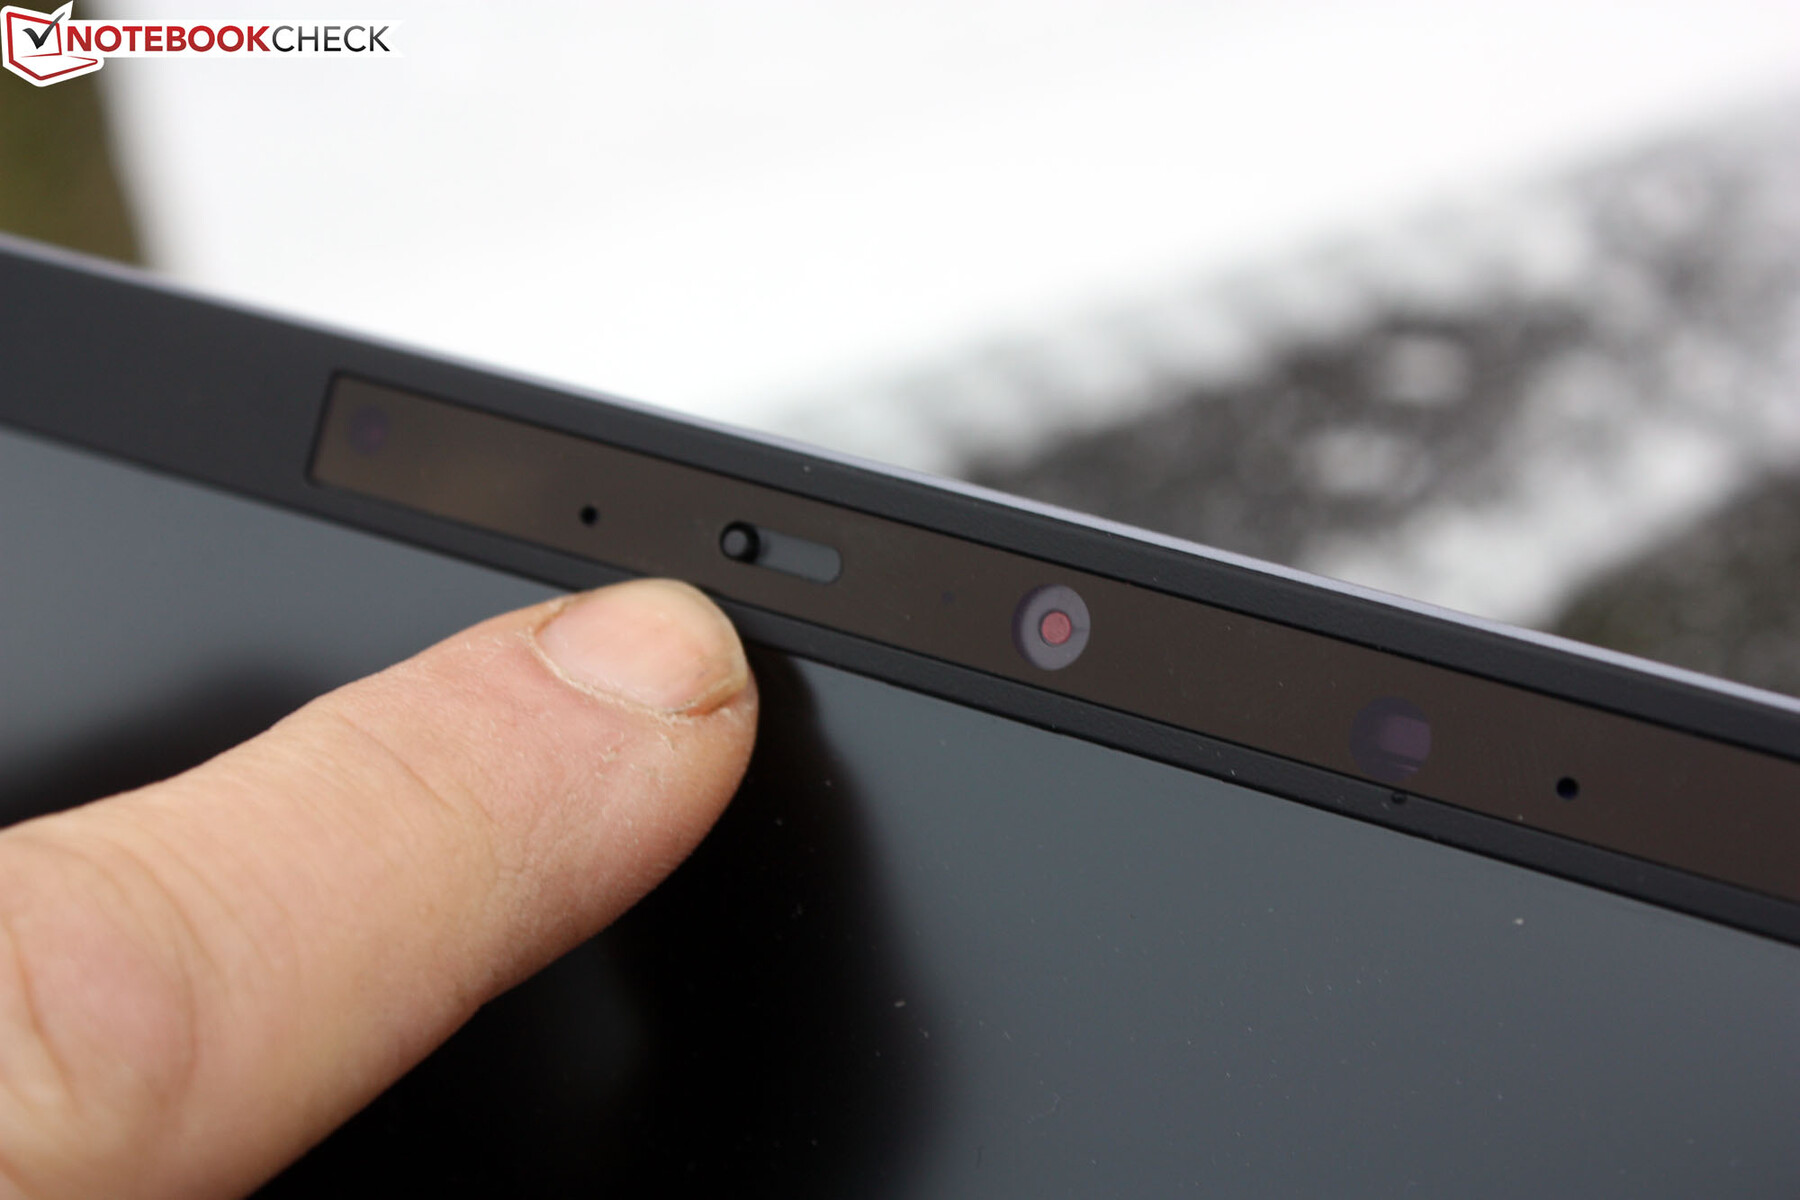
Kamera internetowa
Uważni użytkownicy mogą zablokować kamerę 720p za pomocą ręcznej migawki. Kamera zapewnia akceptowalne kolory, ale tylko w świetle dziennym lub w dobrych warunkach oświetleniowych.


Bezpieczeństwo
Czytnik linii papilarnych jest zintegrowany z przyciskiem zasilania, a w jego pobliżu znajduje się blokada Kensington Lock.
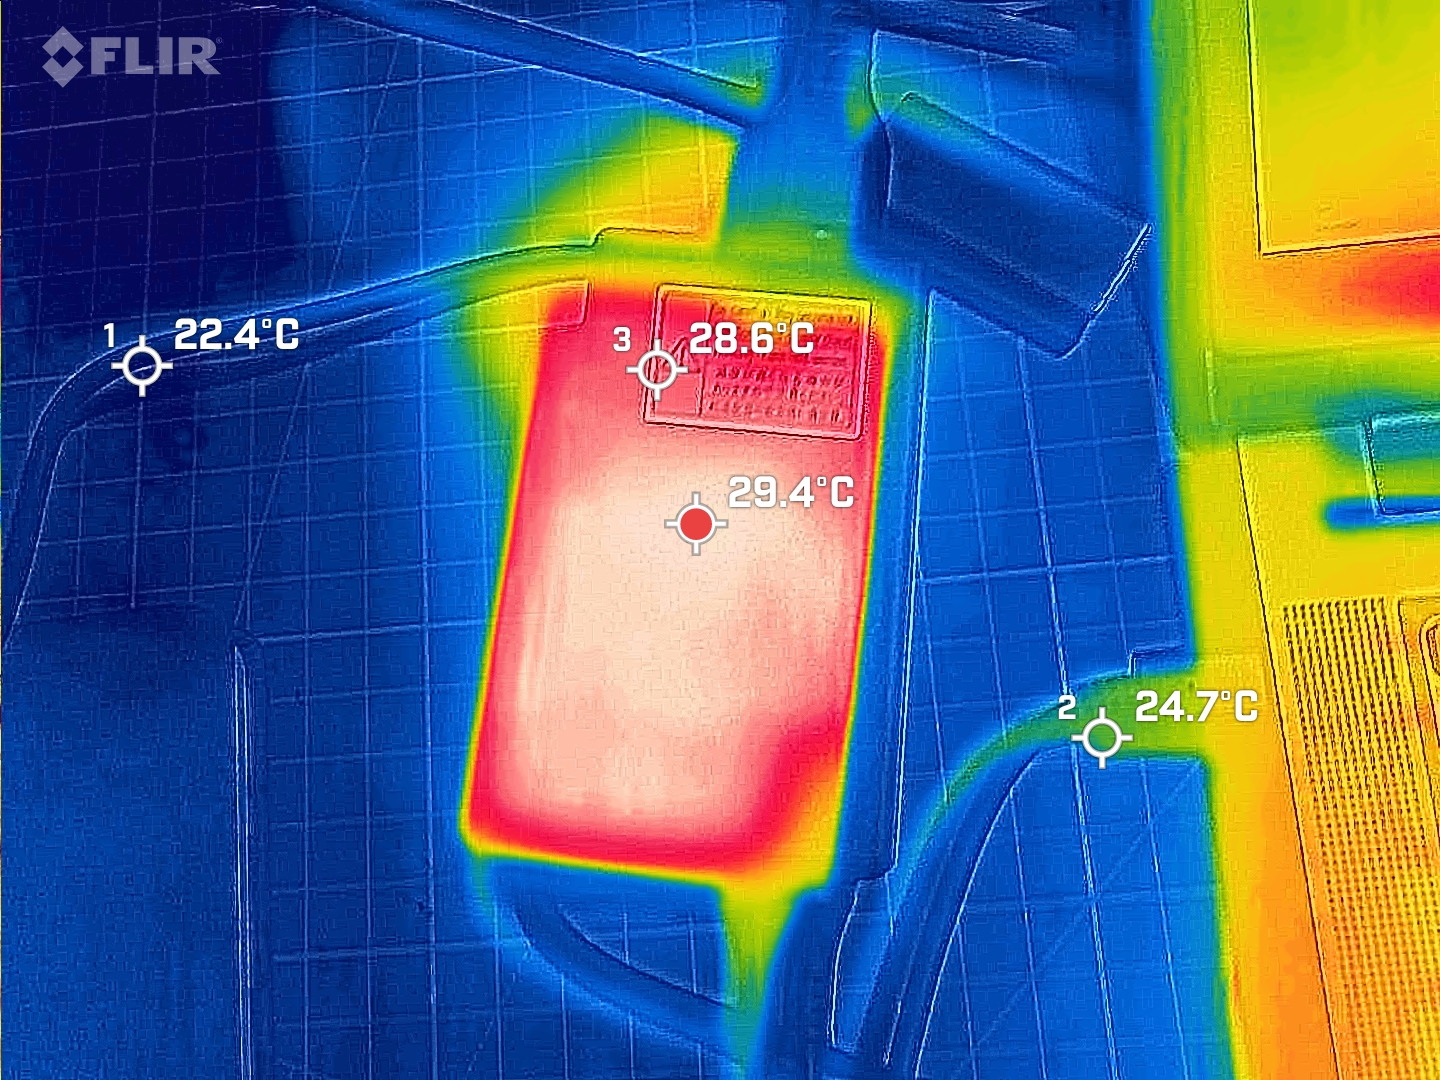
Akcesoria
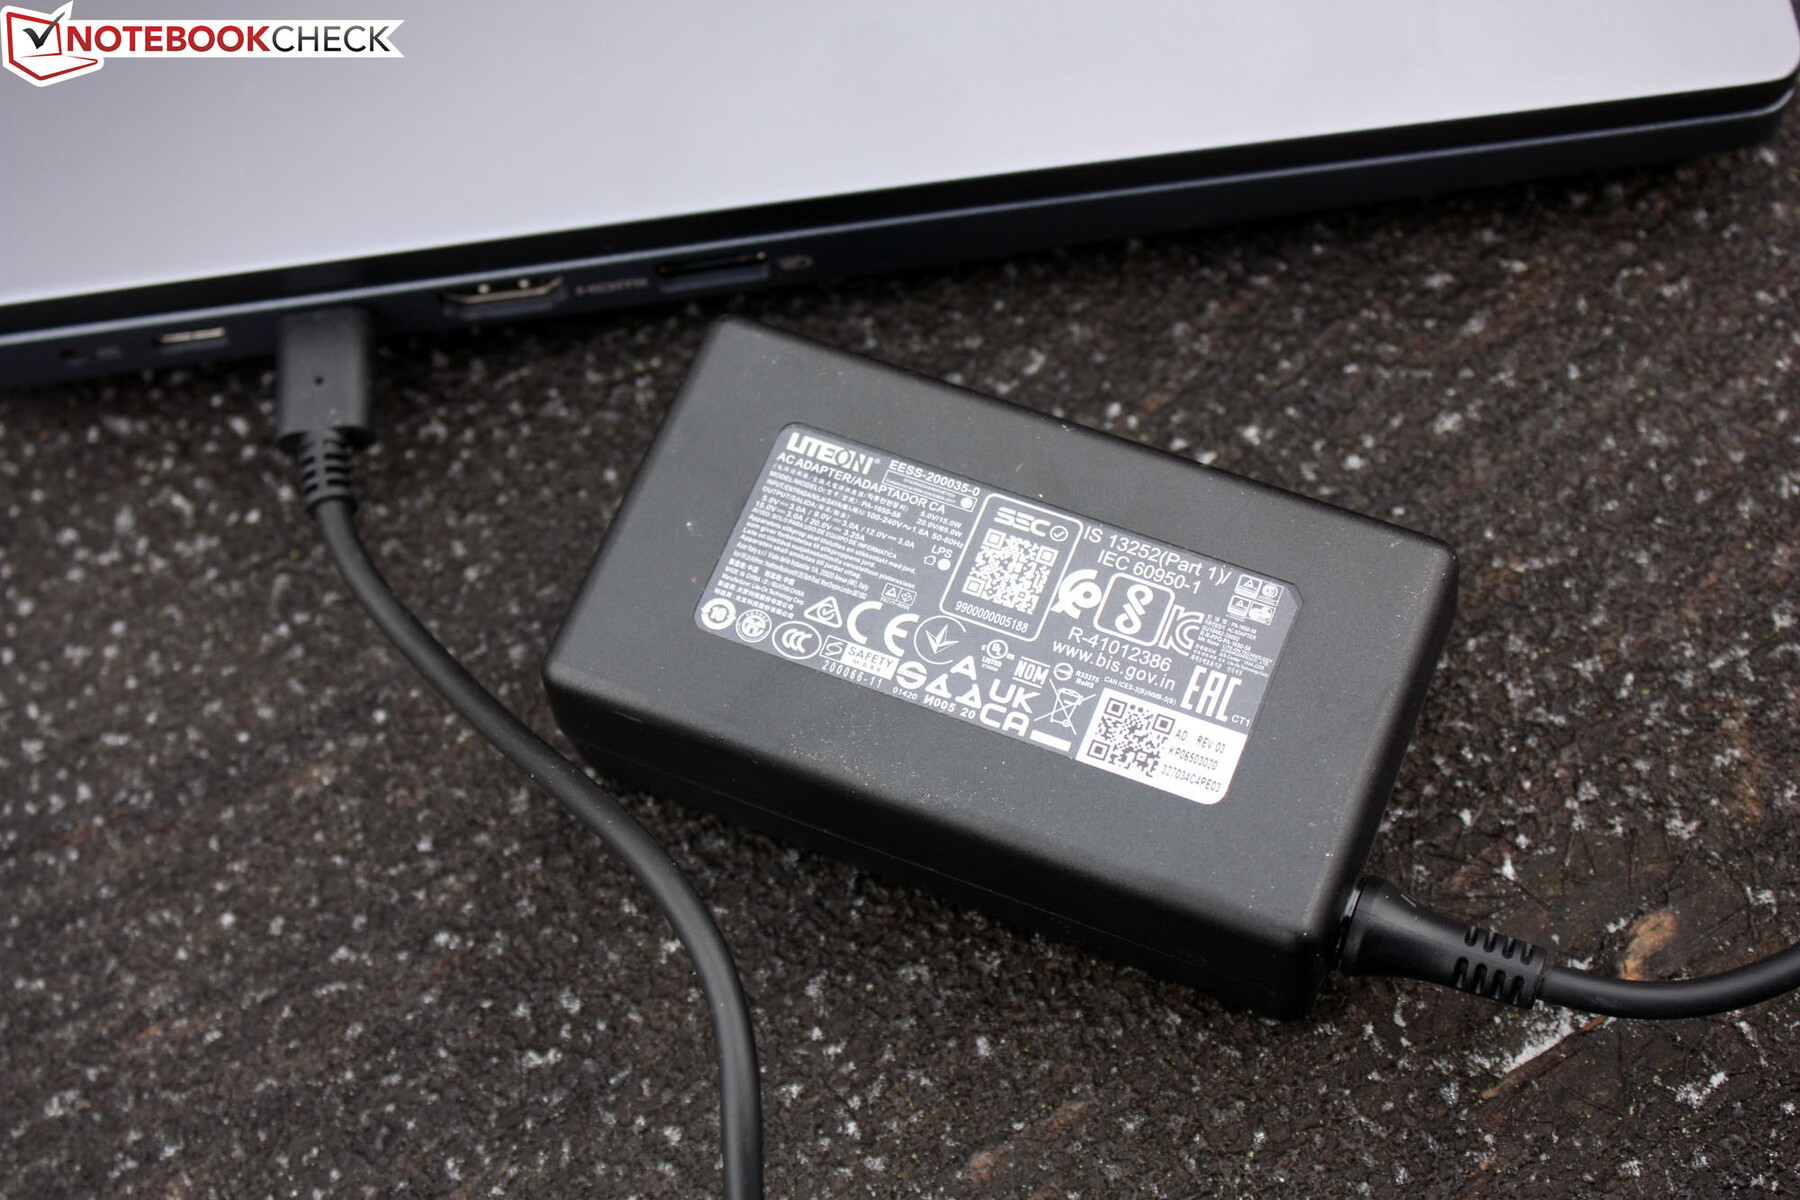
TravelMate może być ładowany i obsługiwany za pomocą własnej ładowarki Acer z mini wtyczką zasilania. W zestawie znajduje się jednak 65-watowa ładowarka USB-C, którą można wykorzystać także do ładowania innych urządzeń. Wprawdzie można również ładować Acer za pomocą słabszej ładowarki USB-C, ale proces ładowania będzie wtedy trwał dłużej, a pod obciążeniem (przy krótkich seriach poboru mocy PL1 wynoszących 55 W!) będzie również pobierał energię z akumulatora.
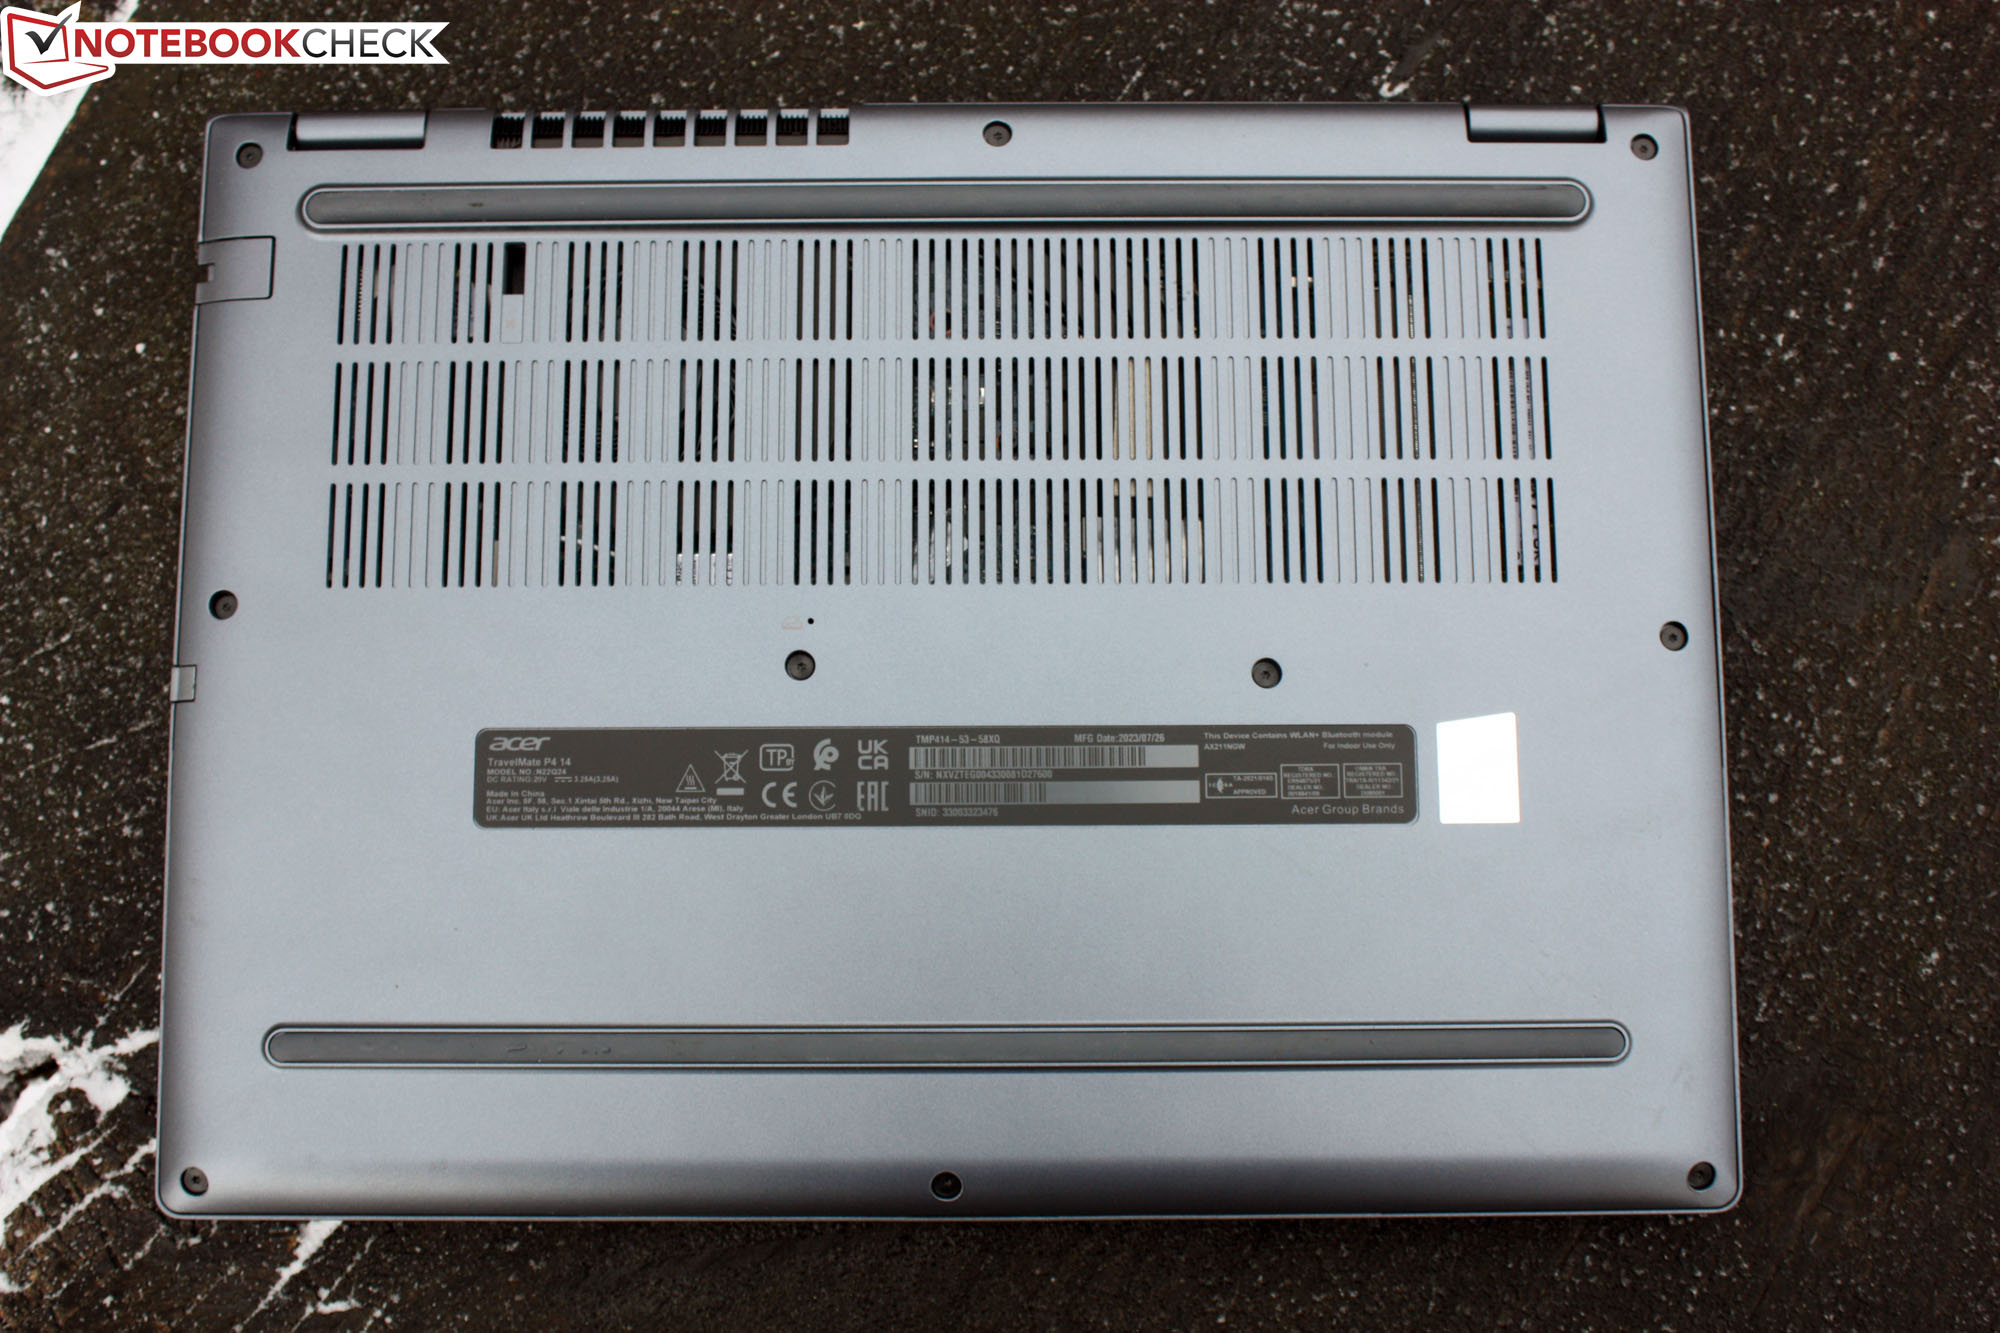
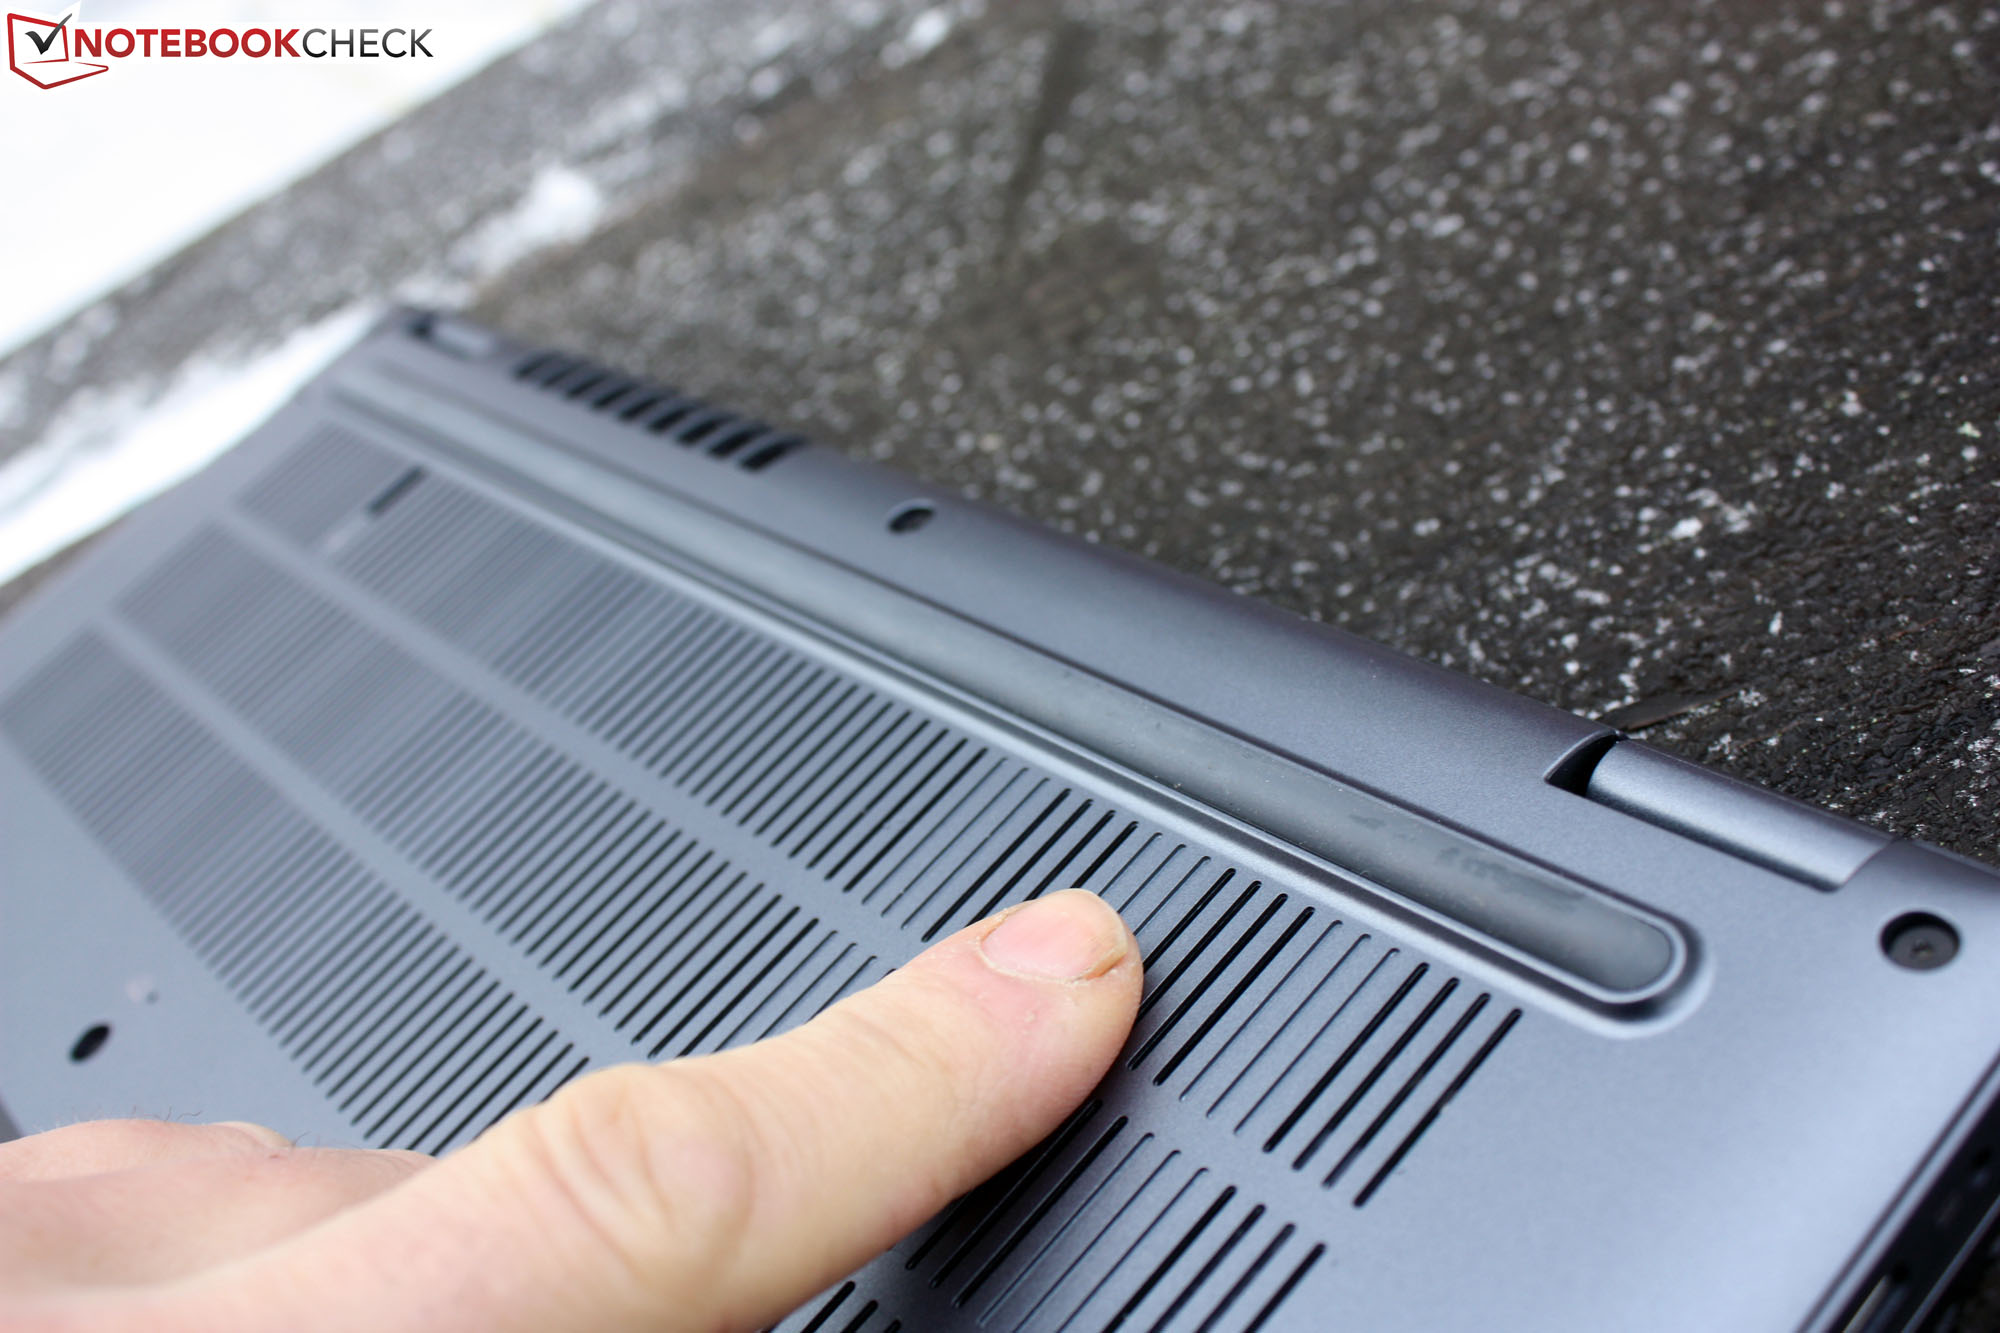
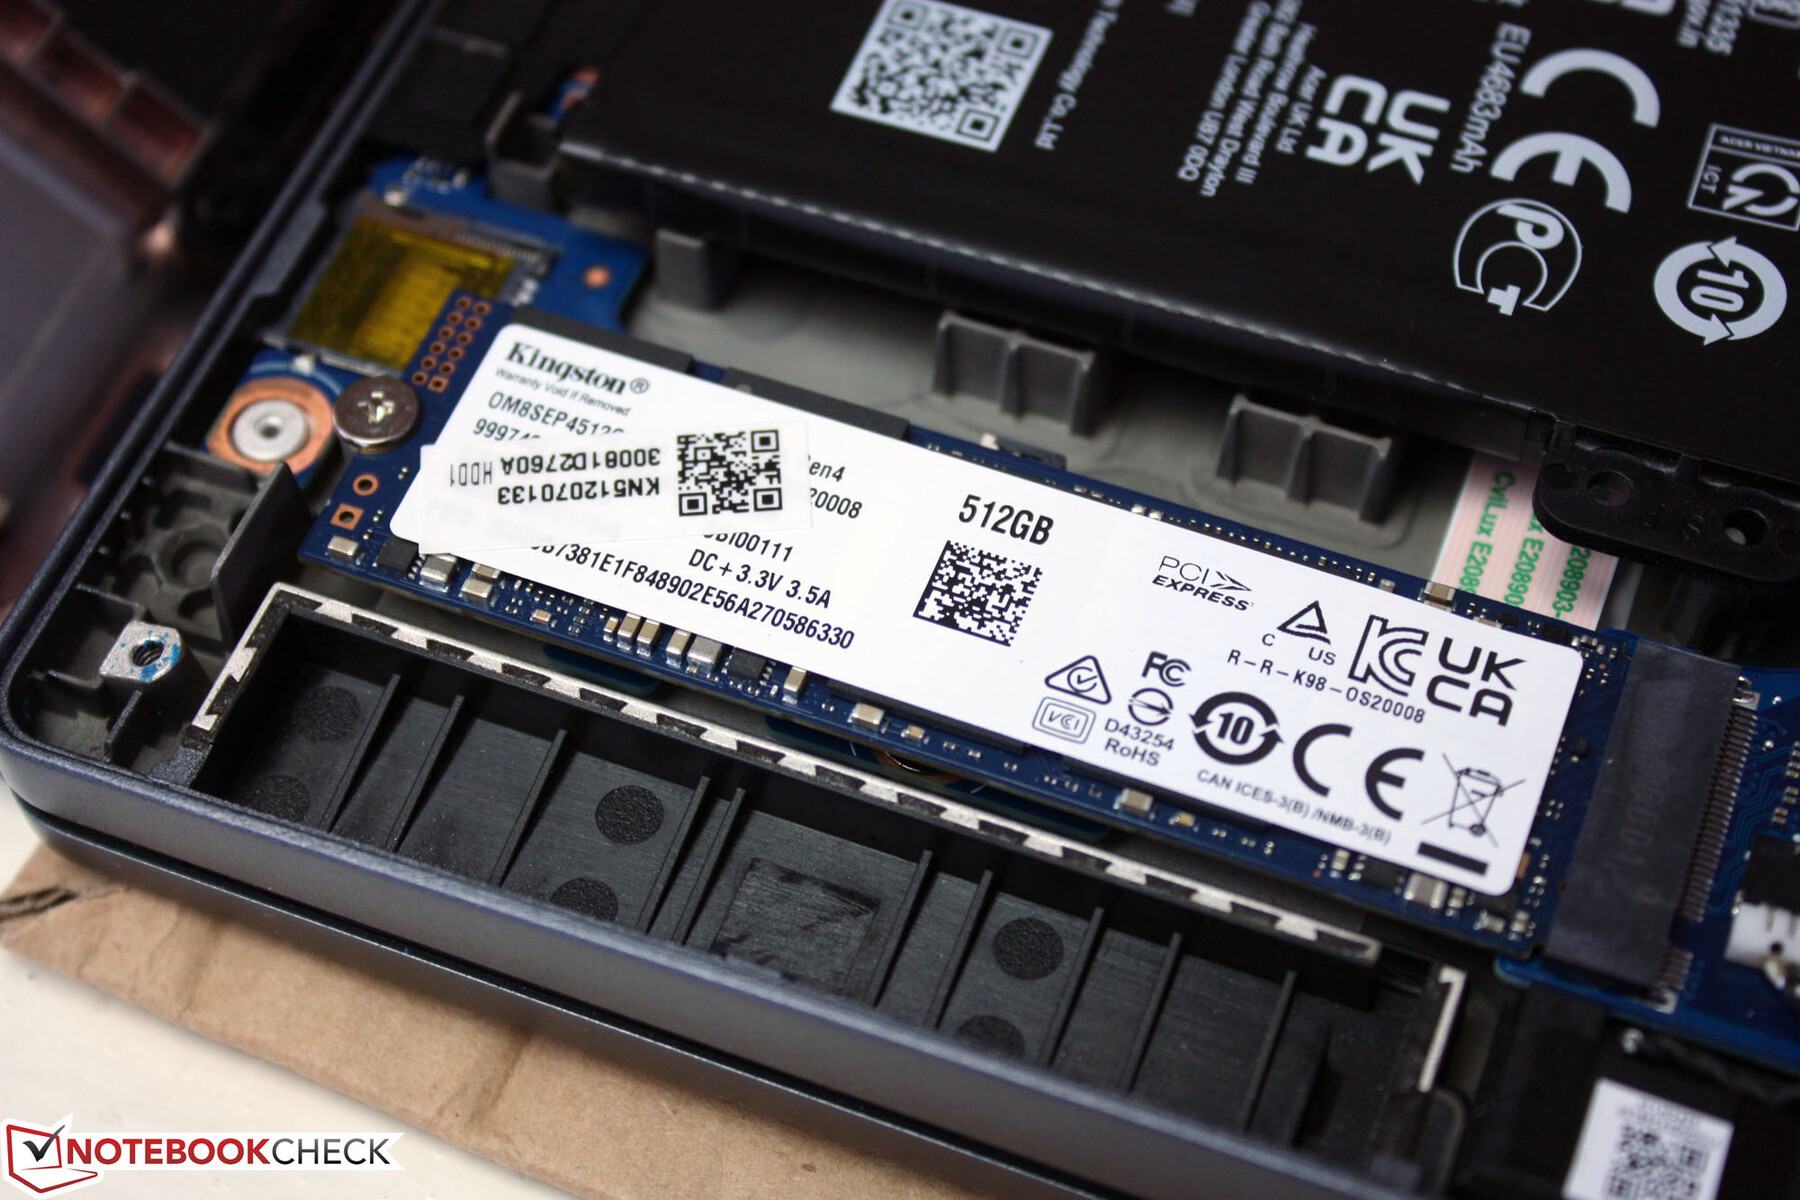
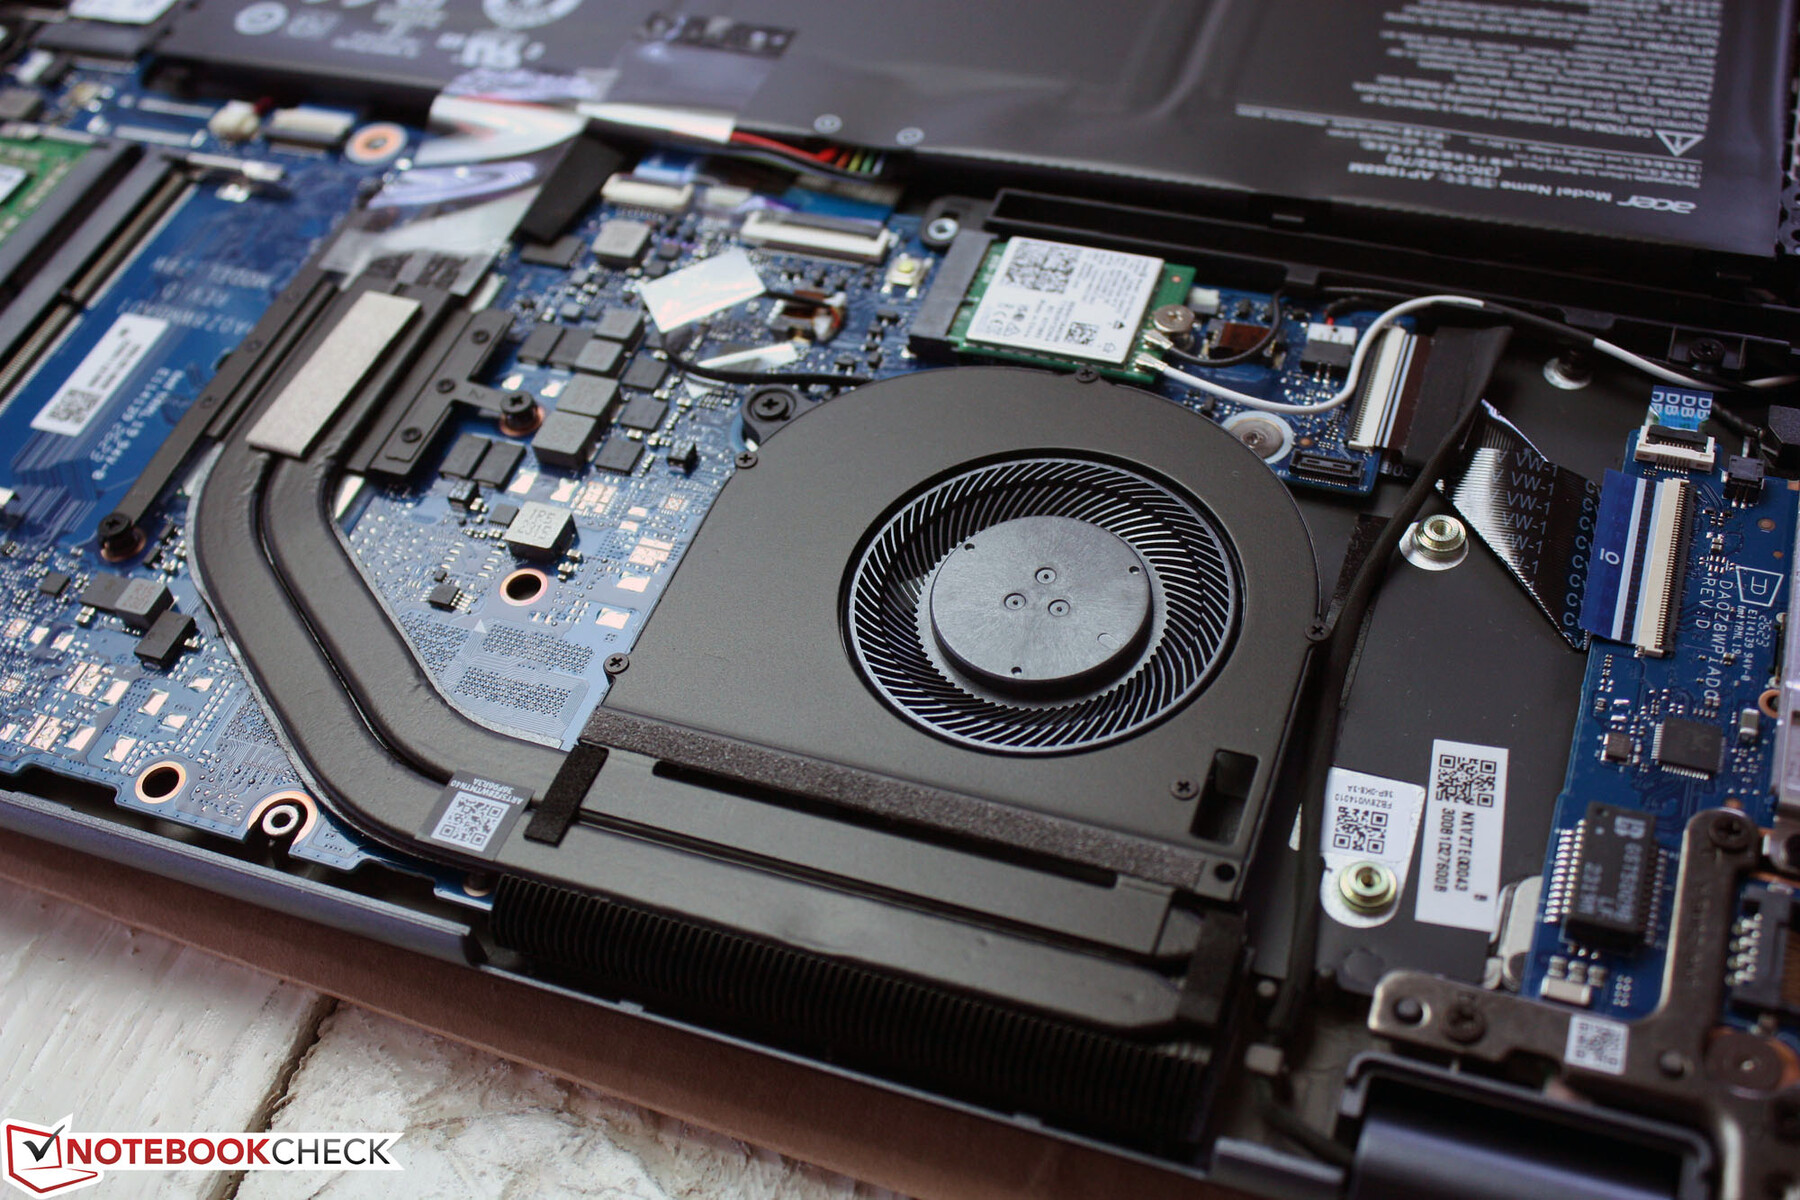
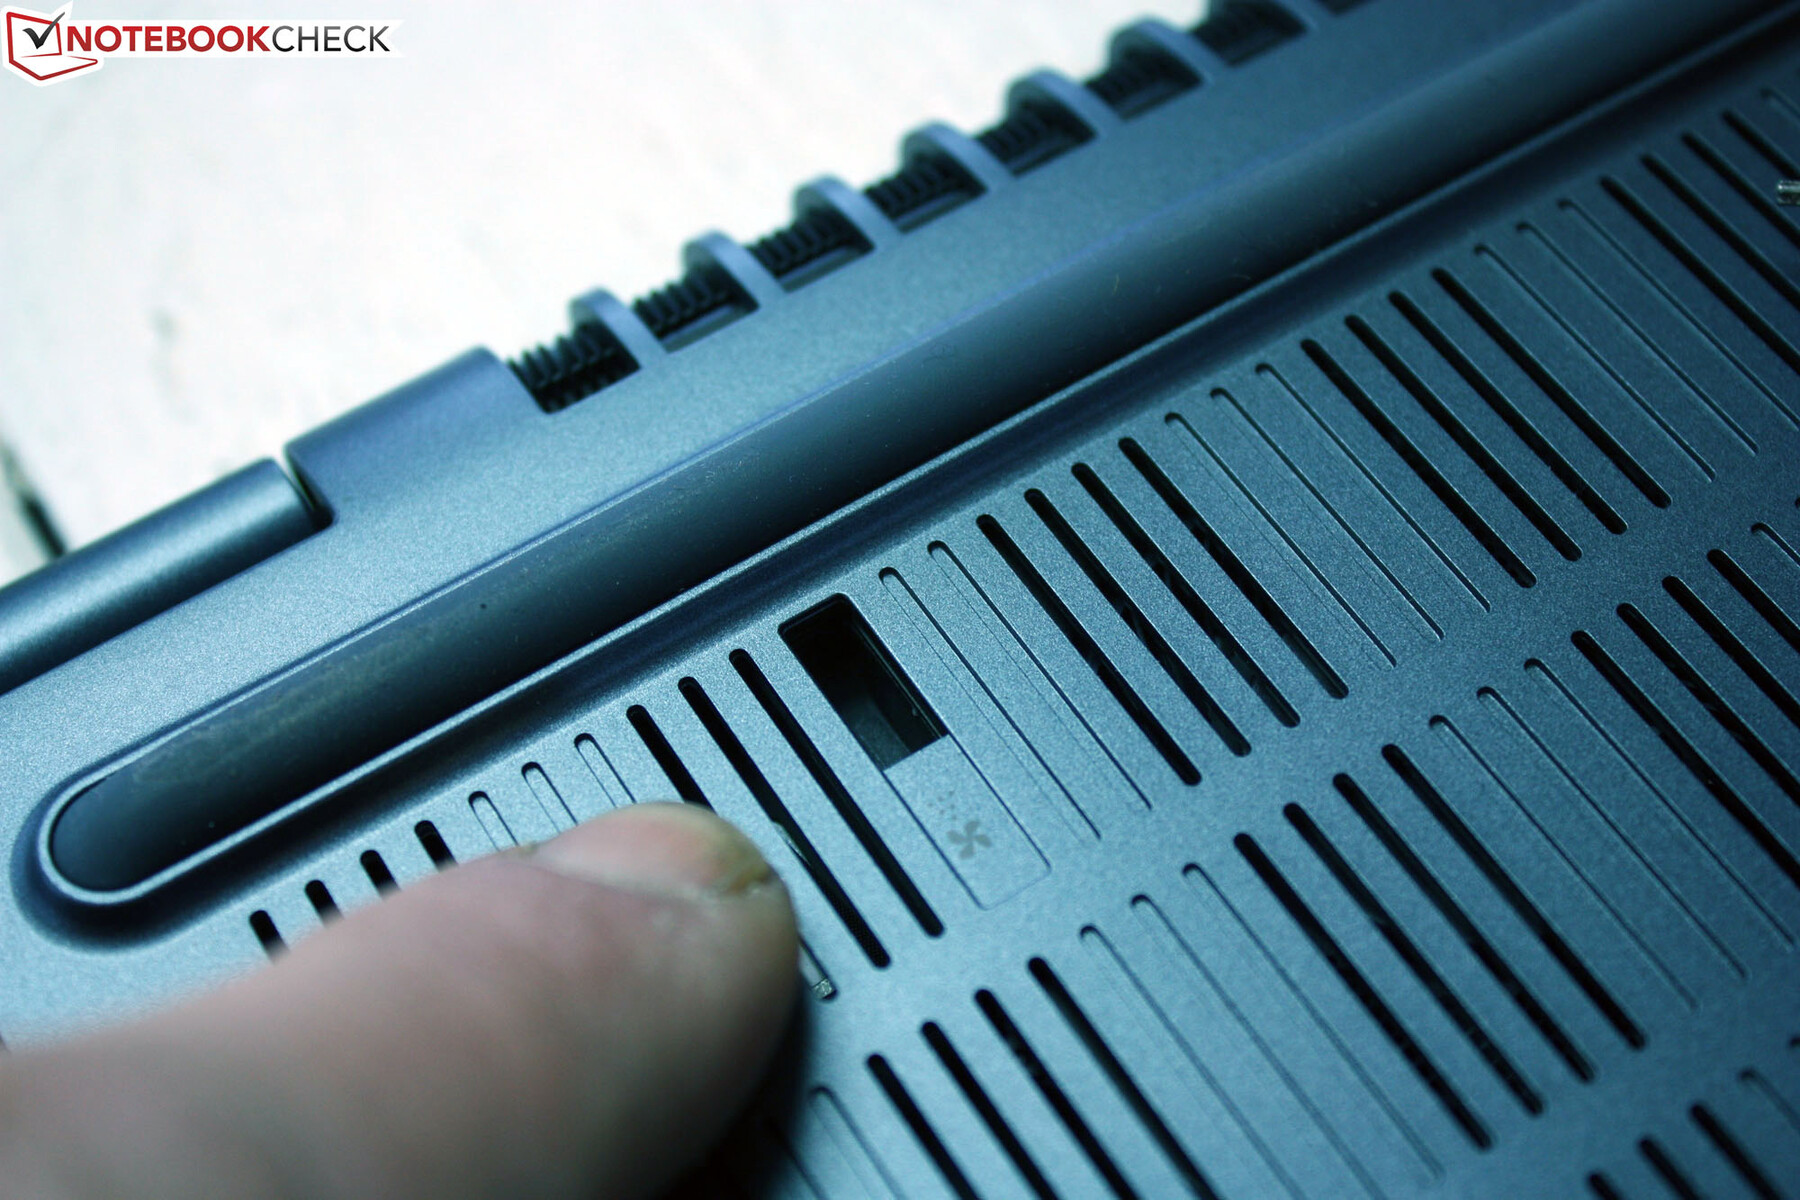
Konserwacja
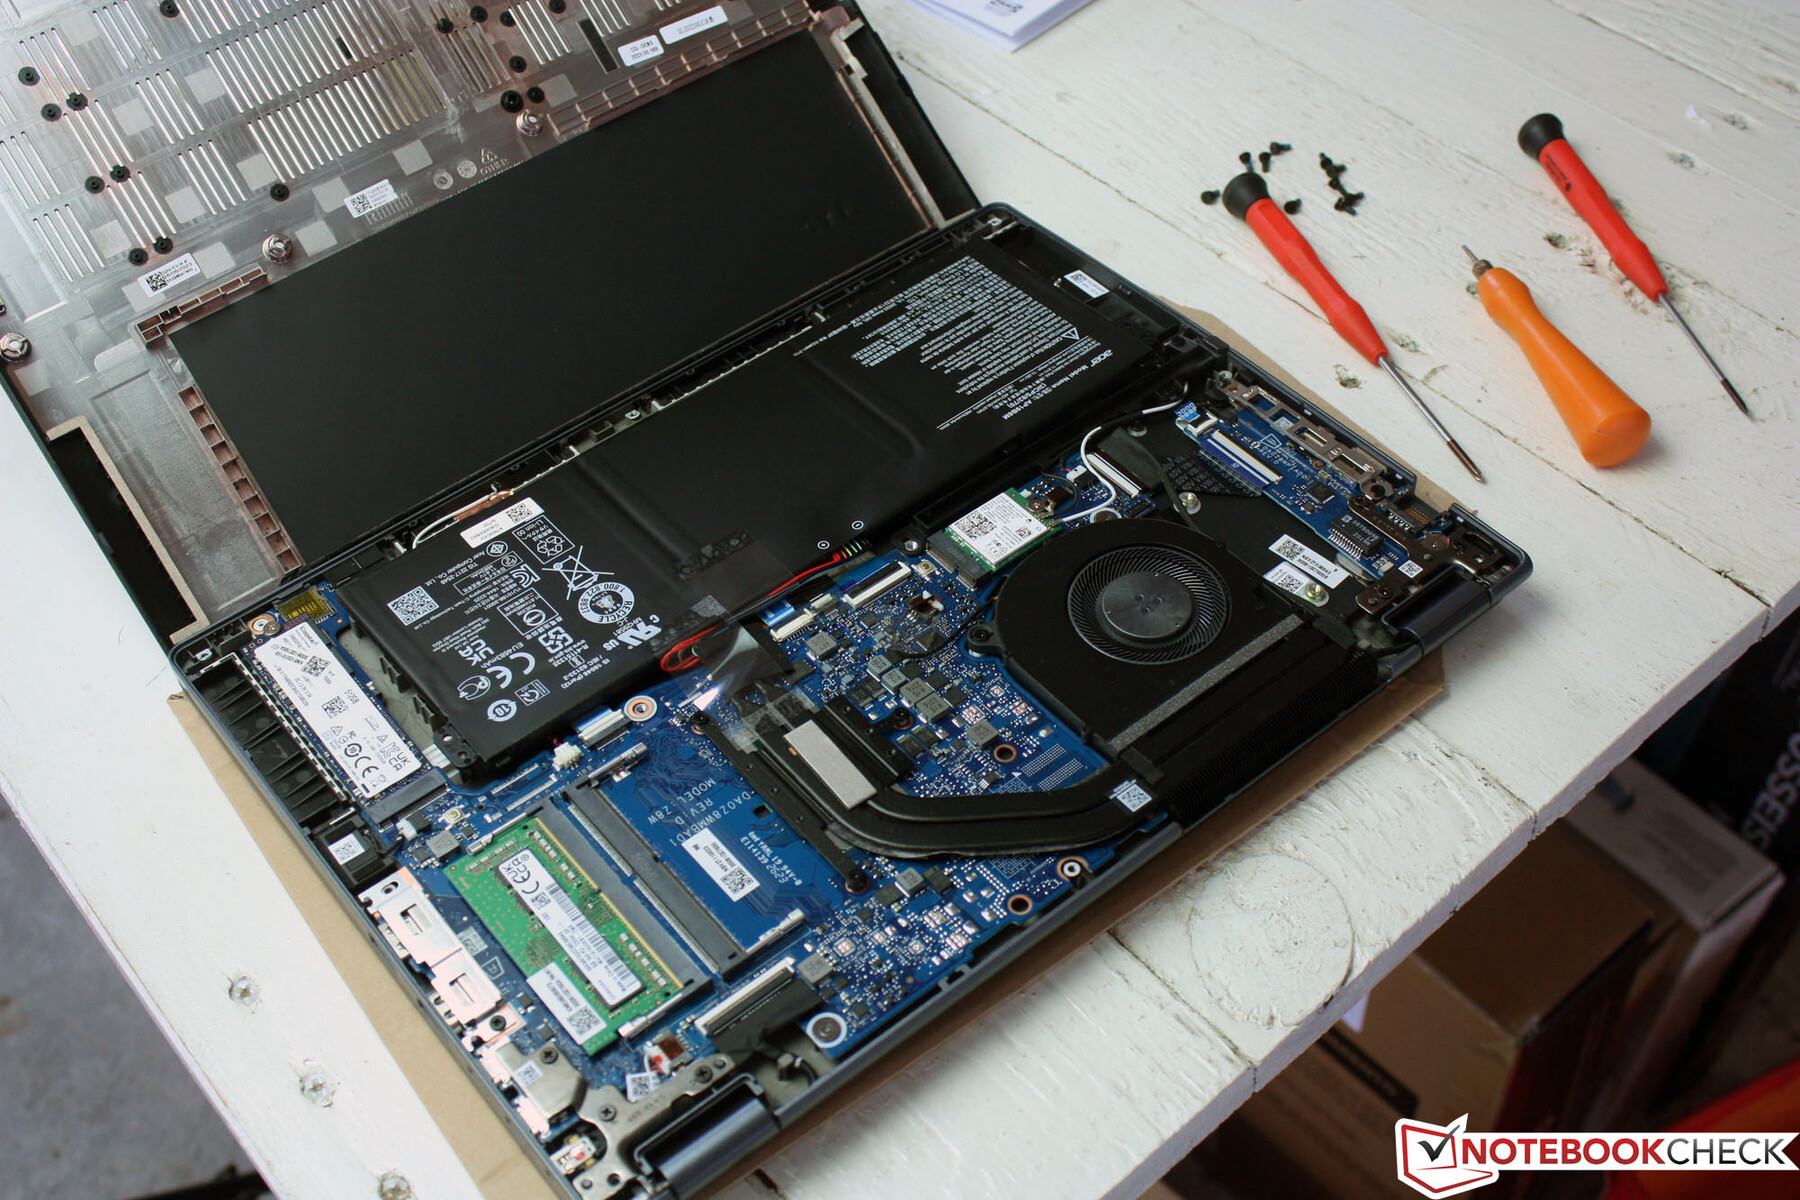
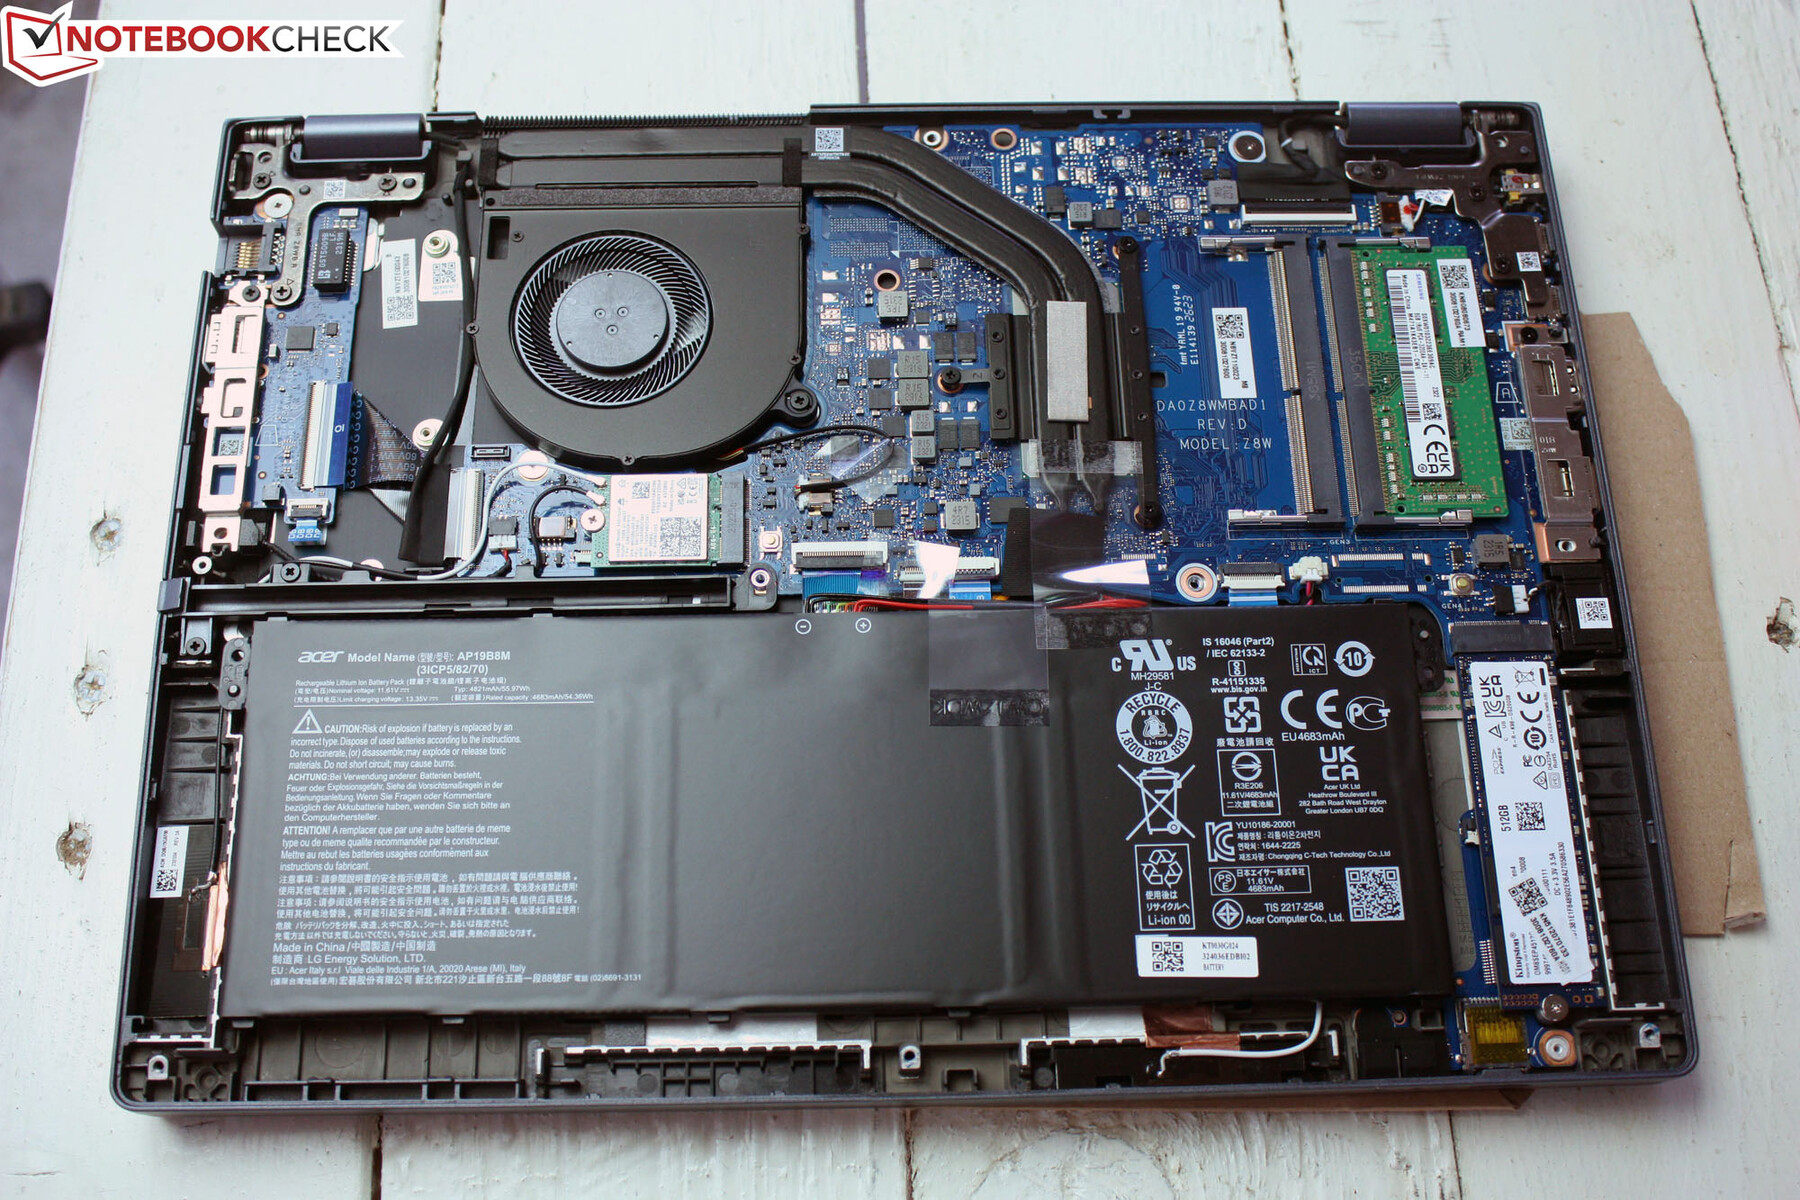
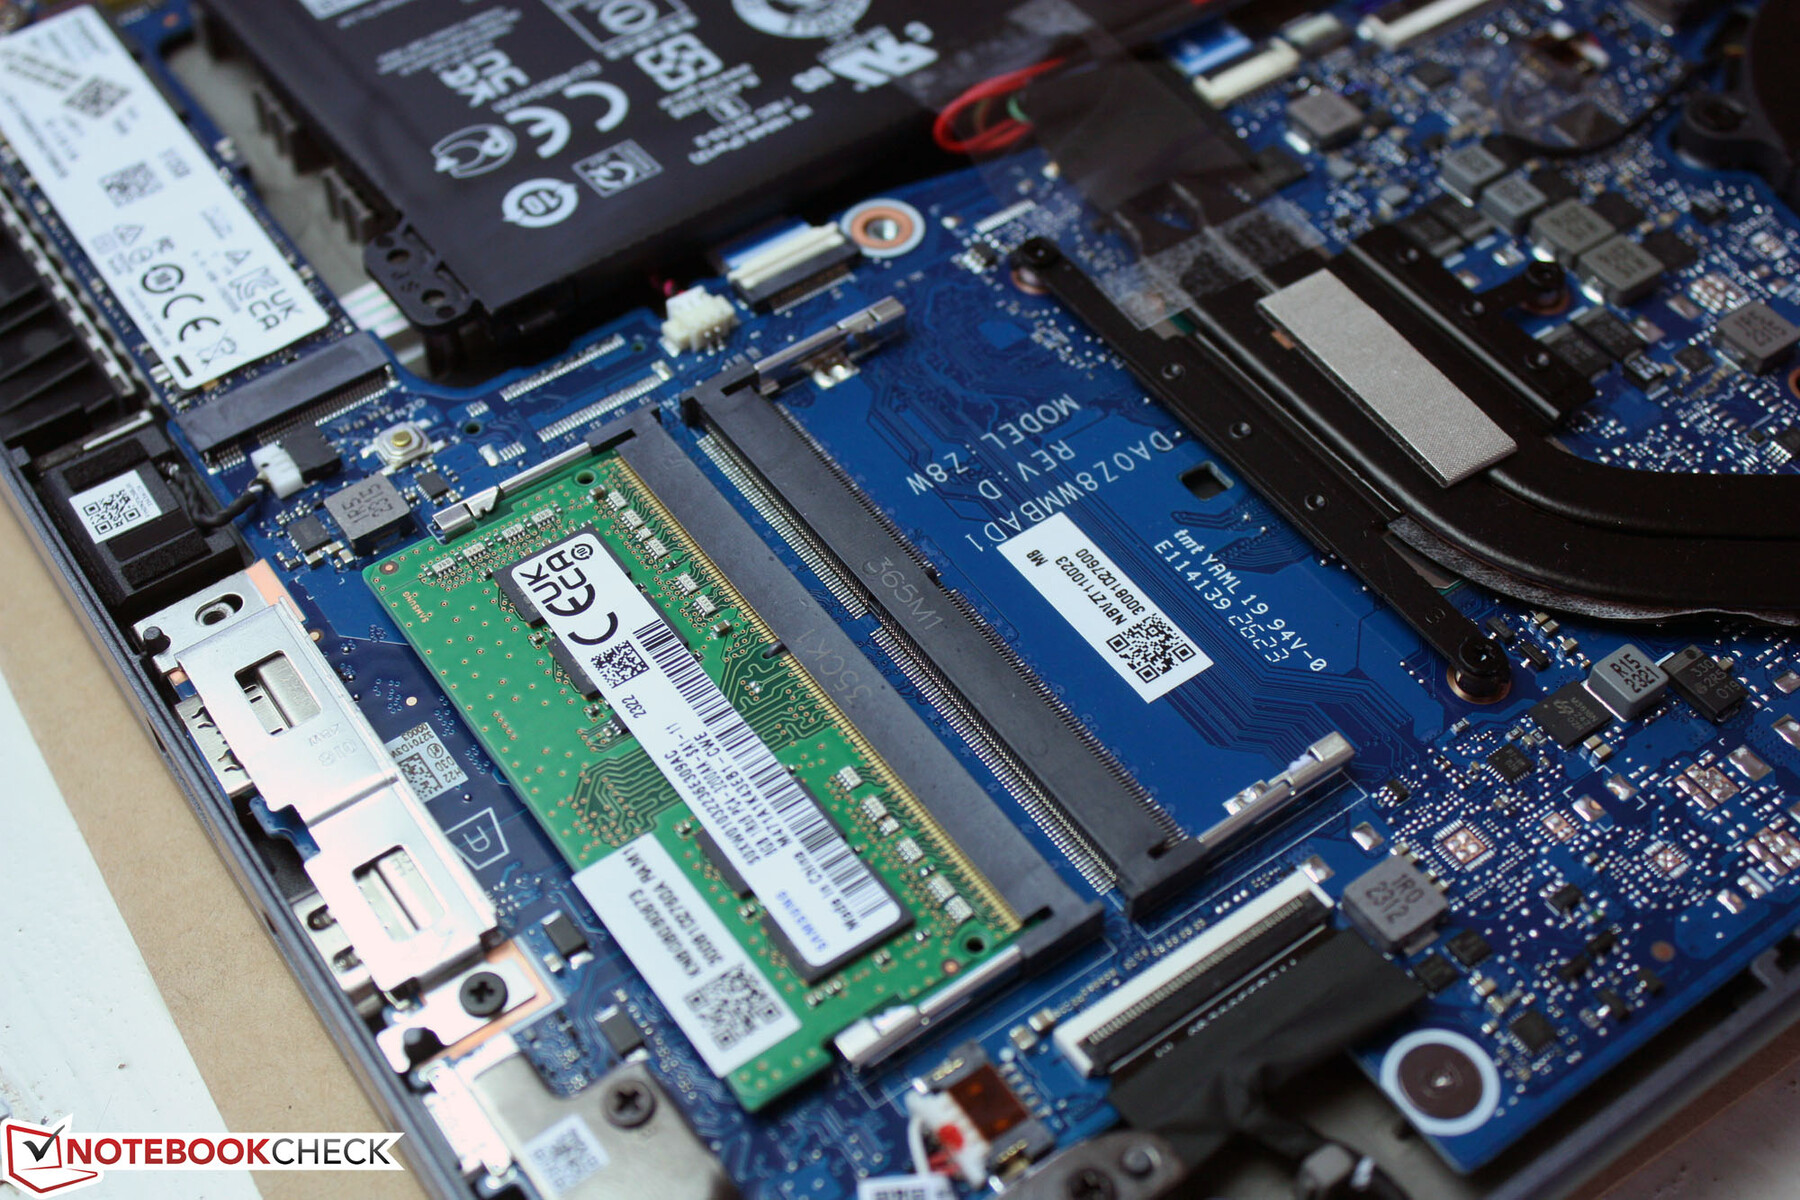
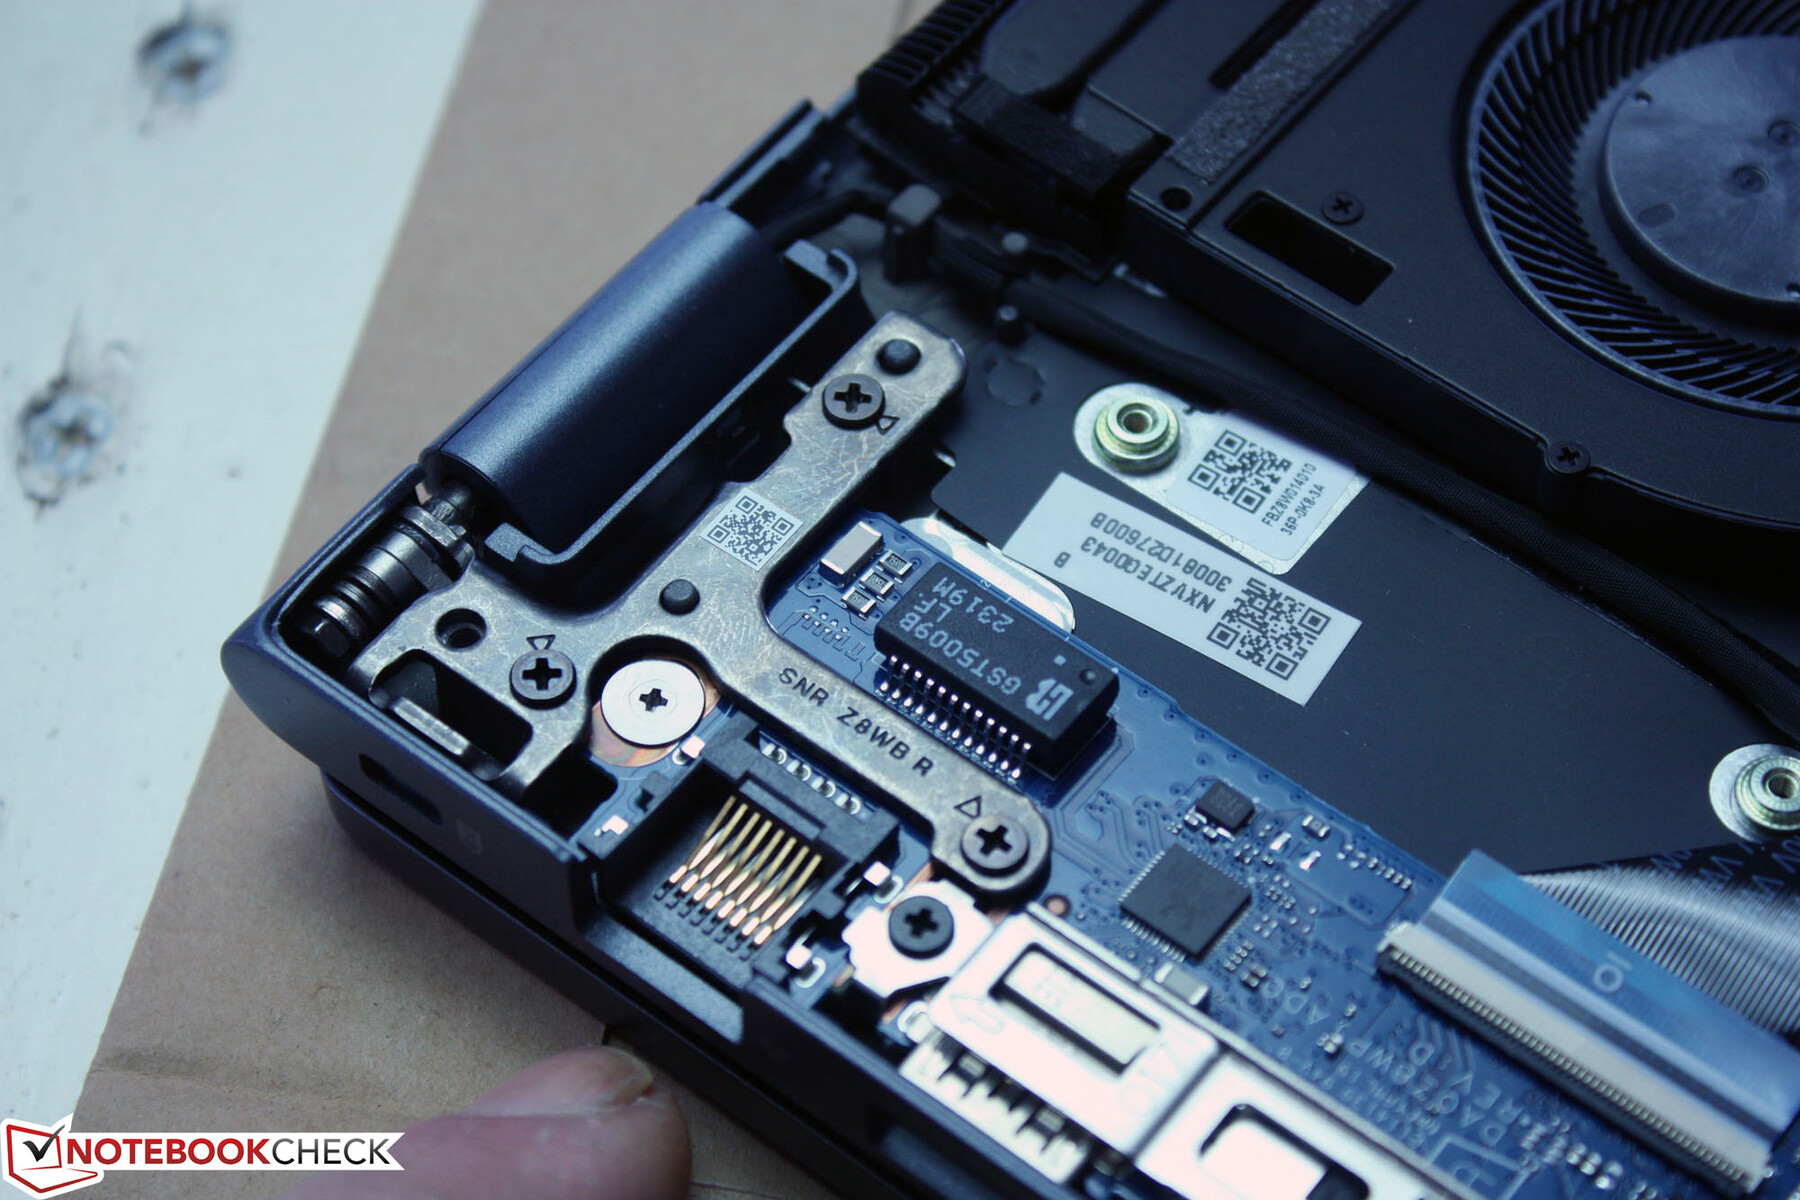
TravelMate wypada bardzo dobrze pod względem konserwacji i modernizacji. W przypadku zabrudzenia żeberek chłodzących rurki cieplnej, istnieje otwór do wdmuchiwania powietrza pod ciśnieniem. Dolną pokrywę można szybko i łatwo zdjąć za pomocą małego śrubokręta Torx. Po odkręceniu śrubek, pokrywę można podnieść bez użycia innych narzędzi. Uzyskujemy wtedy dostęp do dwóch gniazd pamięci RAM, z których jedno jest zajęte przez 8 GB. Bateria jest przykręcona, a dysk SSD znajduje się w gnieździe jako moduł M.2-2280. Nie ma drugiego gniazda na dysk SSD M.2.
Gwarancja
Acer oferuje 3-letnią gwarancję na TravelMates w Niemczech. Okres gwarancji może różnić się w innych krajach.
Urządzenia wejściowe
Napisaliśmy tę recenzję na TravelMate P4 i byliśmy w stanie wydajnie pracować z urządzeniami wejściowymi, bez potrzeby jakiegokolwiek okresu zapoznawania się z klawiaturą. W porównaniu do poprzednika, Acer znacznie powiększył ClickPad.
Klawiatura
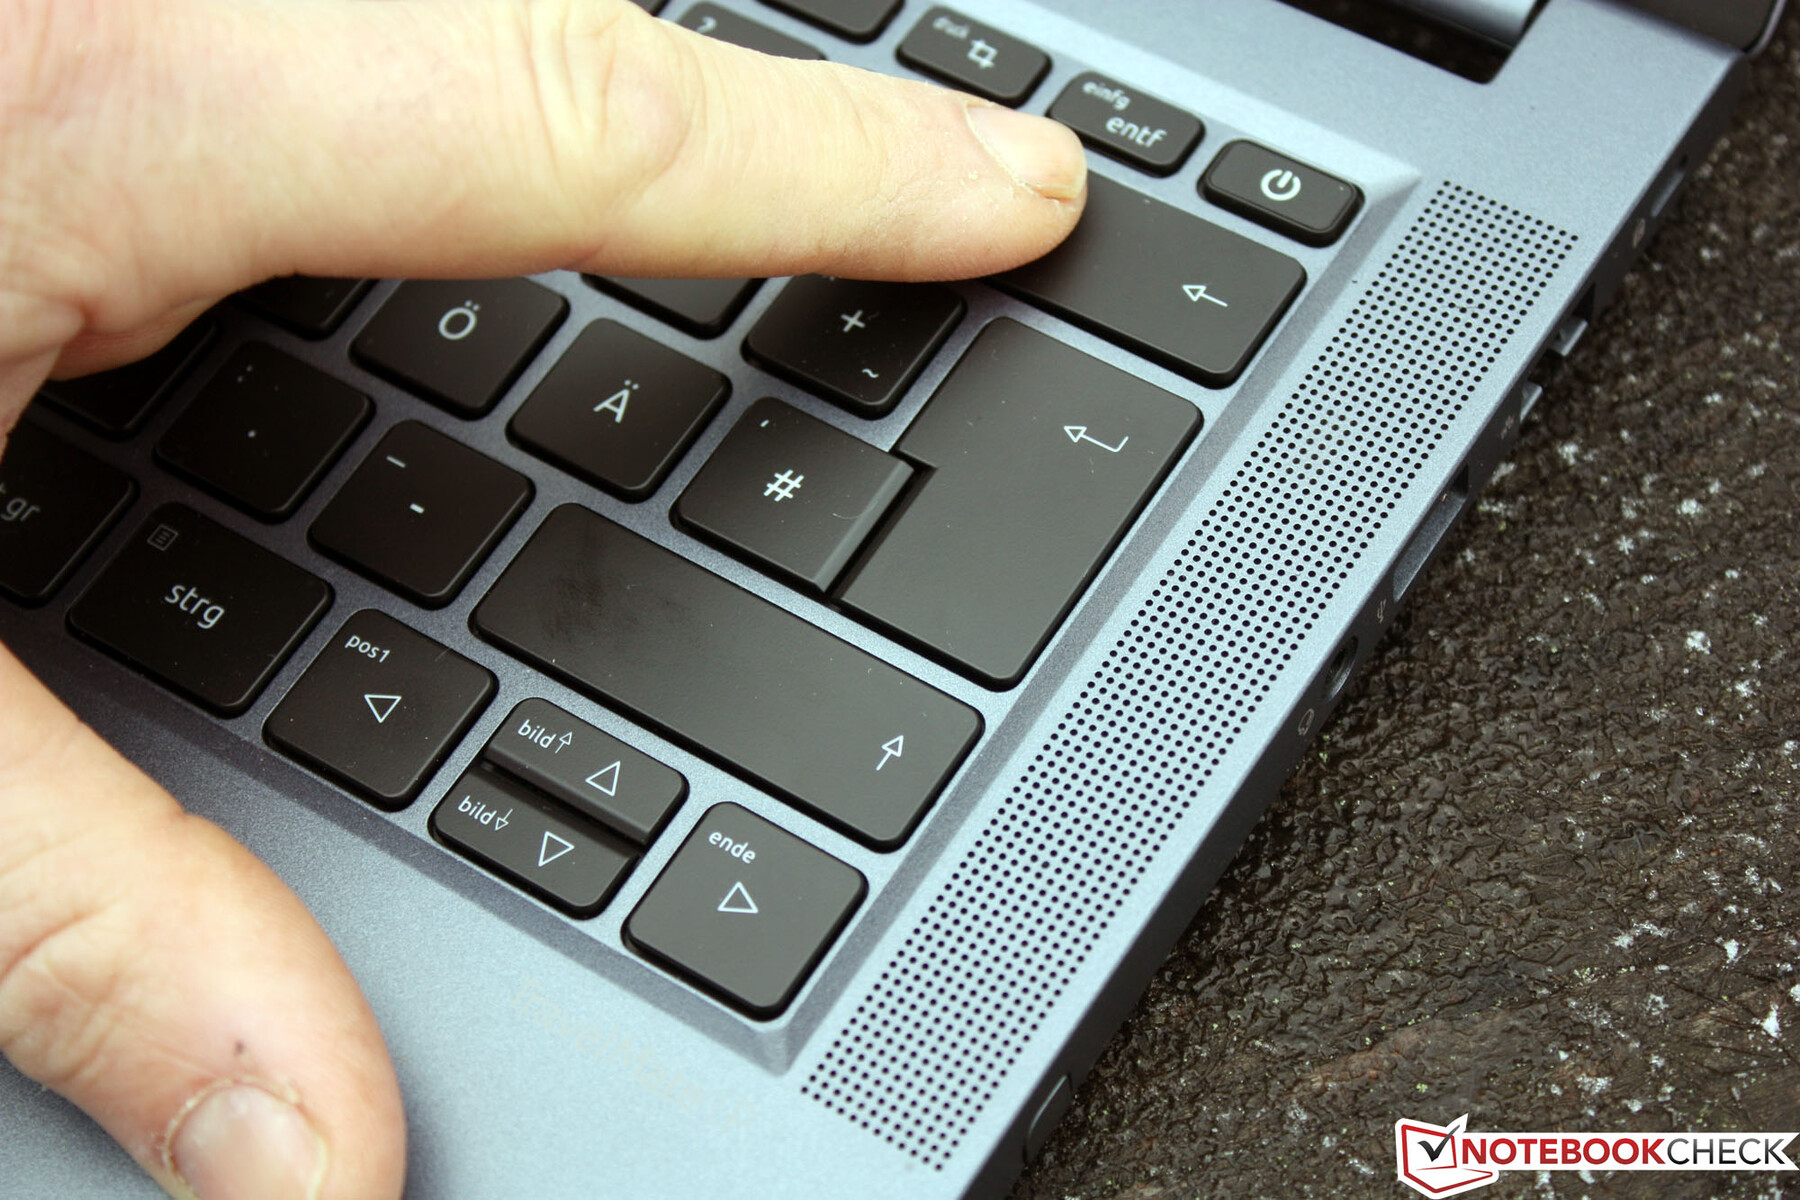
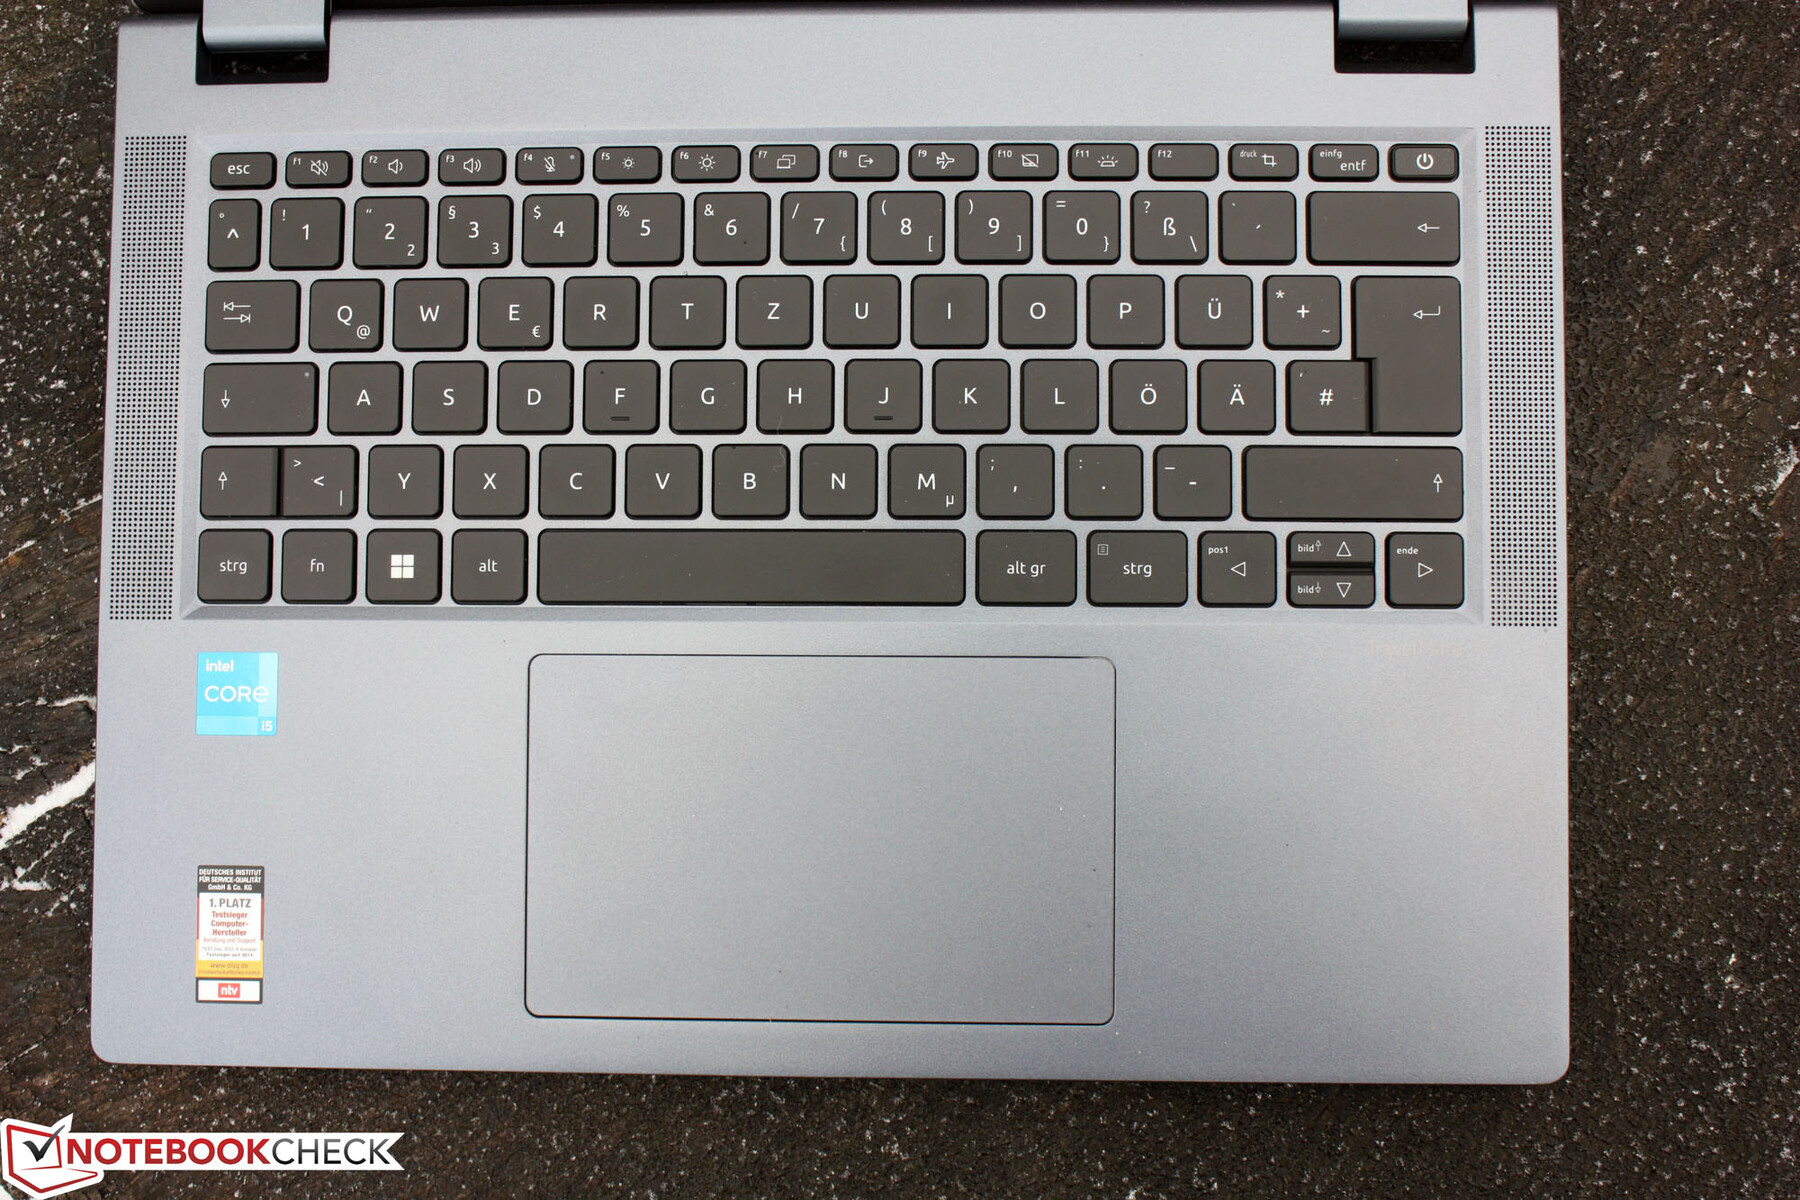
Acer zastosował gumową klawiaturę typu chiclet, którą można podświetlić w dwóch krokach. Zapewnia ona dobrą odległość między klawiszami. Ich wyraźny punkt nacisku w połączeniu z ciasnym skokiem klawiszy zapewnia przyjemne wrażenia z pisania, a klawiatura w żadnym miejscu się nie ugina. Pisanie nie jest całkowicie bezgłośne, ale jest już blisko. Klawisze mają dyskretnie matową powierzchnię, która umożliwia przesuwanie palców. Klawisze F i J są jak zwykle przeznaczone dla osób piszących na klawiaturze dotykowej. Klawisze nie zawierają przypisania drugiego poziomu dla bloku numerycznego, którego już nie ma. Mimo że klawisze góra/dół są mniejsze, nadal można z nich łatwo korzystać. Pozytywnym punktem jest przypisanie Fn do klawiszy strzałek z Home, End, PgUp i PgDn.
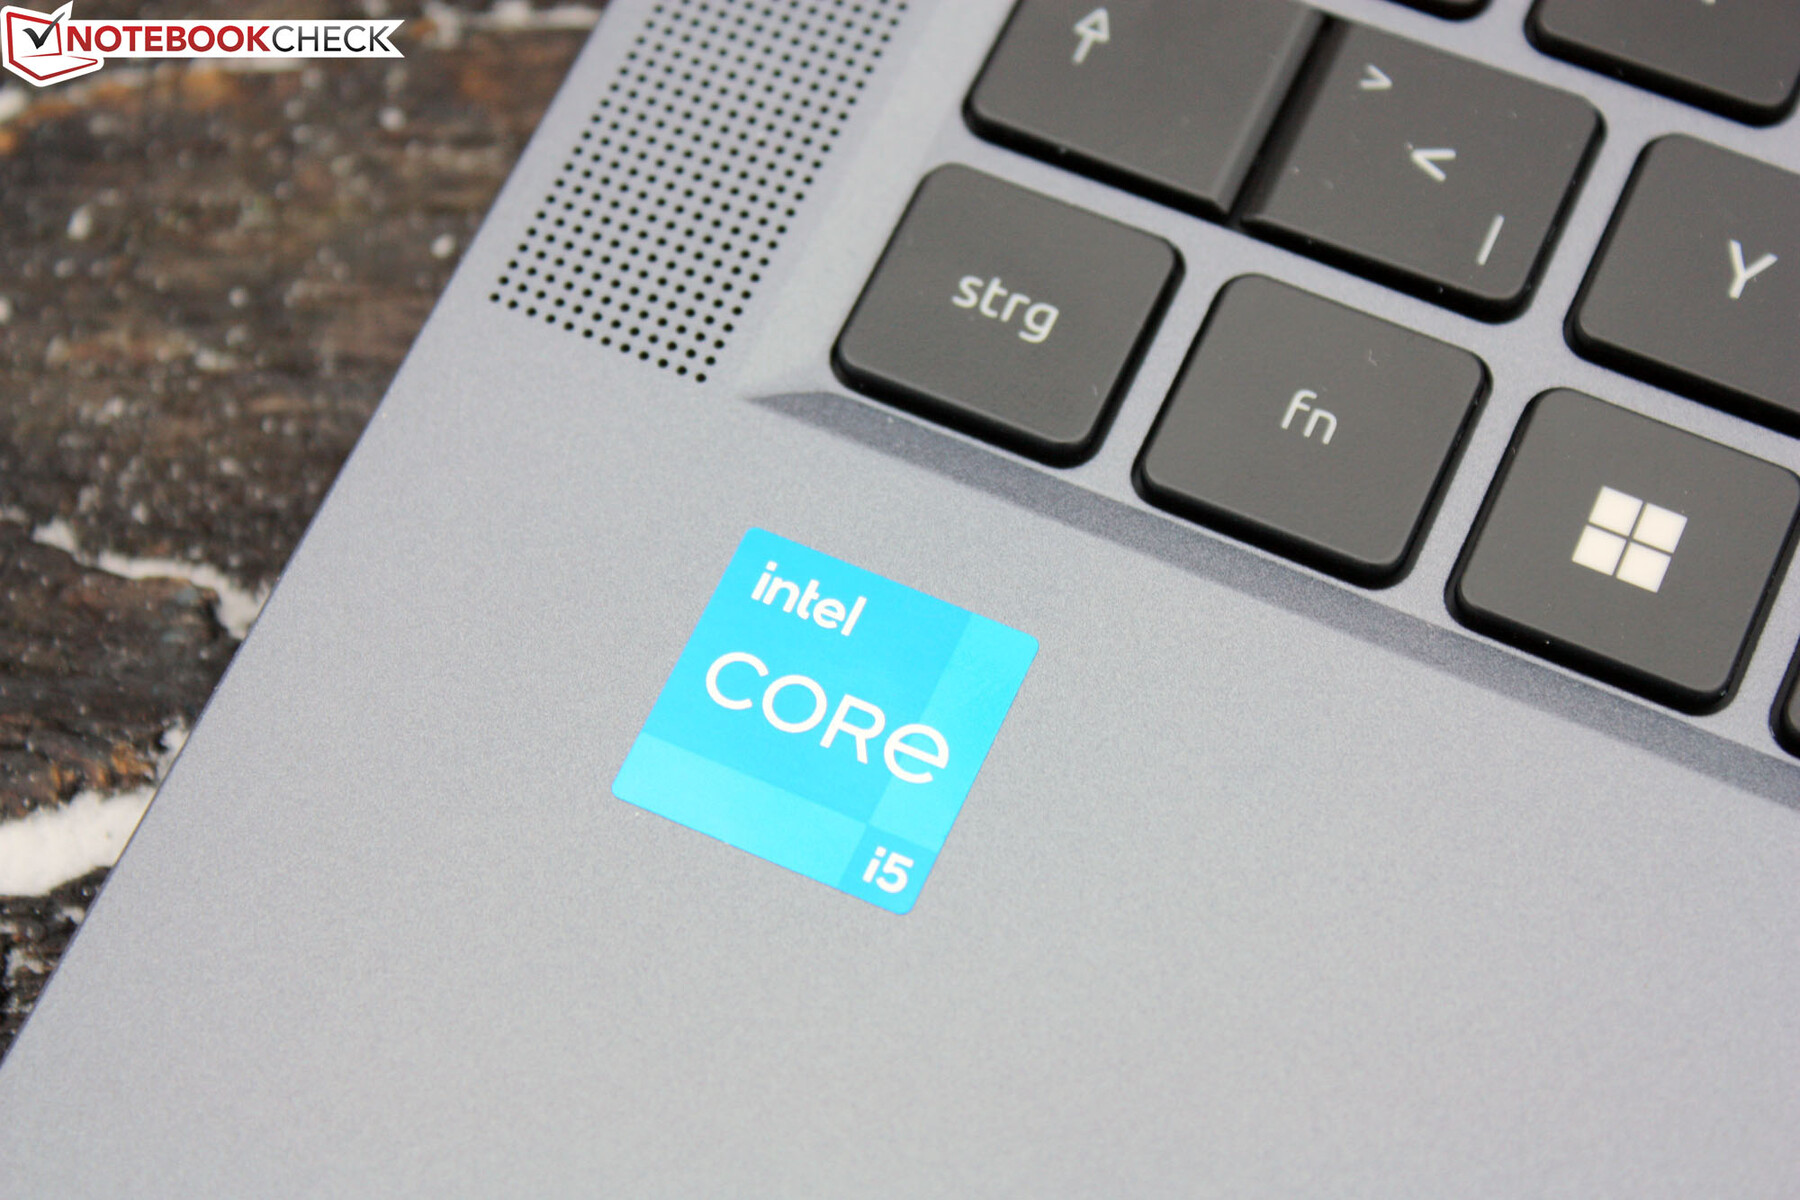
Chociaż niektórym może nie podobać się umieszczenie przycisku włączania/wyłączania w prawym górnym rogu klawiatury, producent dołożył starań, aby zapobiec przypadkowemu uruchomieniu: Przycisk ma specjalną ramkę i prawie nie ma skoku, więc trzeba mocno nacisnąć, aby go uruchomić.
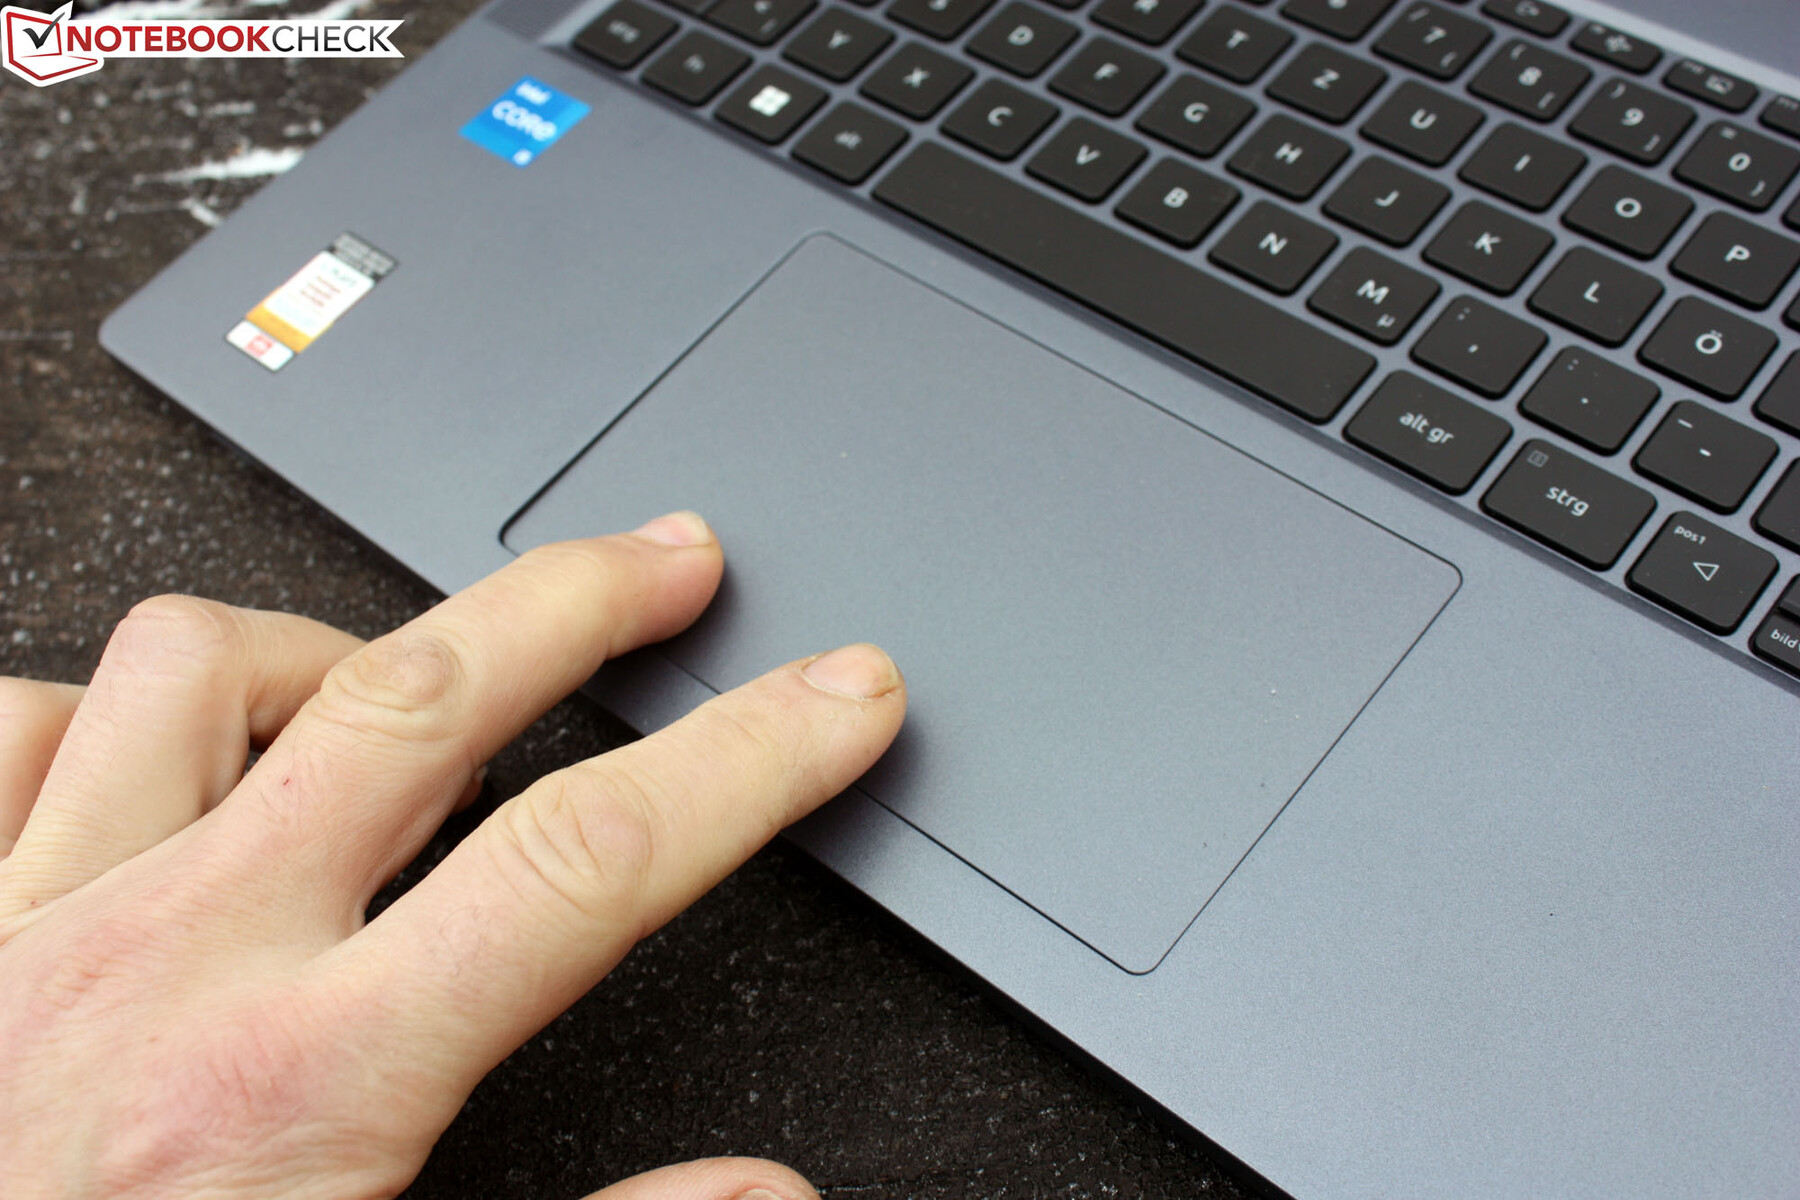
Panel dotykowy
ClickPad mierzy 14,5 cm (~5,7 cala) po przekątnej i jest umieszczony dokładnie pośrodku. Nigdy nie czuliśmy, że musimy go dezaktywować podczas pisania, chociaż nadal można to zrobić za pomocą klawisza Fn. Skok jest krótki i tak naprawdę możemy nacisnąć tylko dolną połowę obszaru, ponieważ powyżej wymagałoby to zbyt dużej siły. Odgłos kliknięcia jest dyskretny, ponieważ jest cichy i tępy. Ze względu na krótki skok, punkt nacisku nie jest wystarczająco wyraźny. Obsługiwane są wszystkie gesty multitouch. Powierzchnia podkładki jest gładsza niż otaczające ją podpórki pod nadgarstki, dzięki czemu palce znajdują drogę wyłącznie za pomocą dotyku.
Wyświetlacz
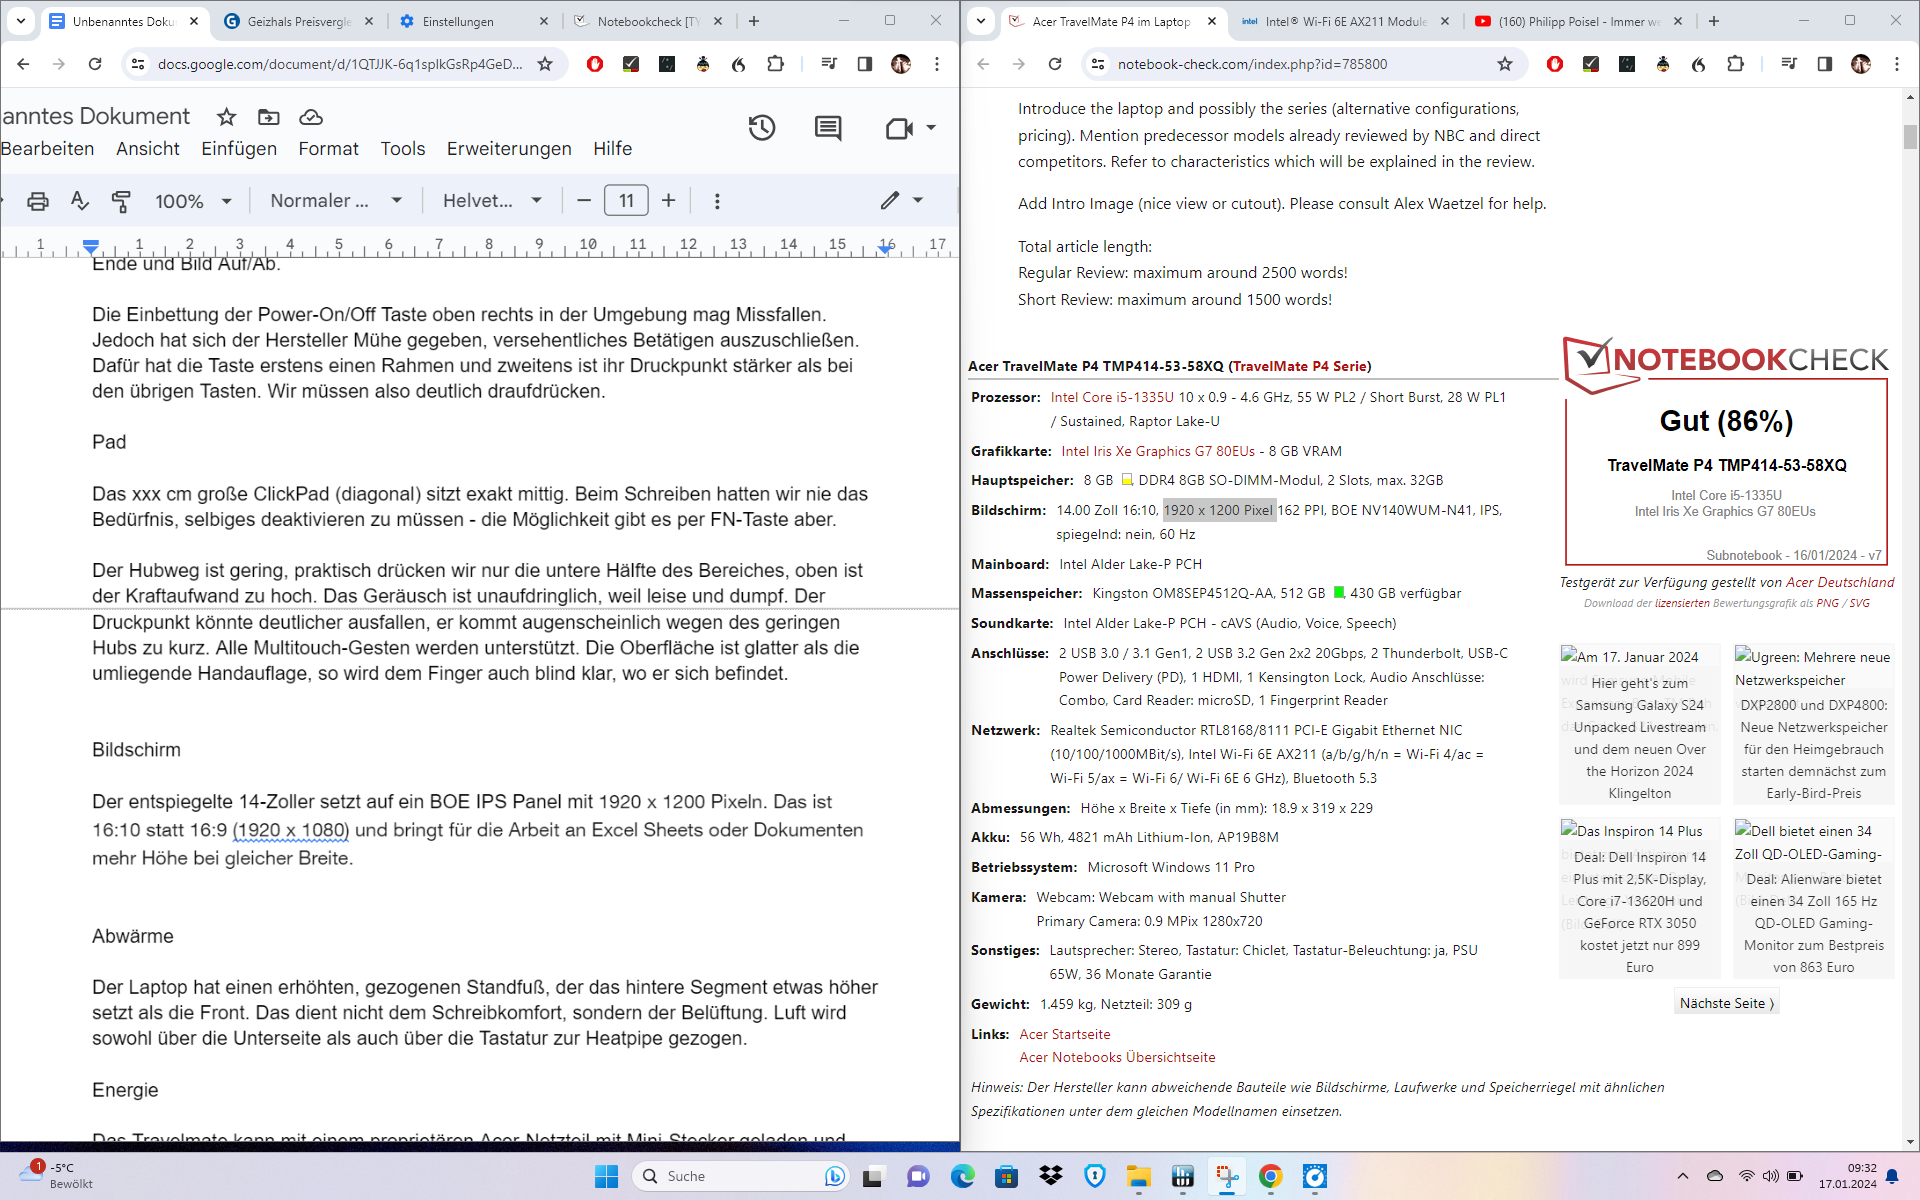
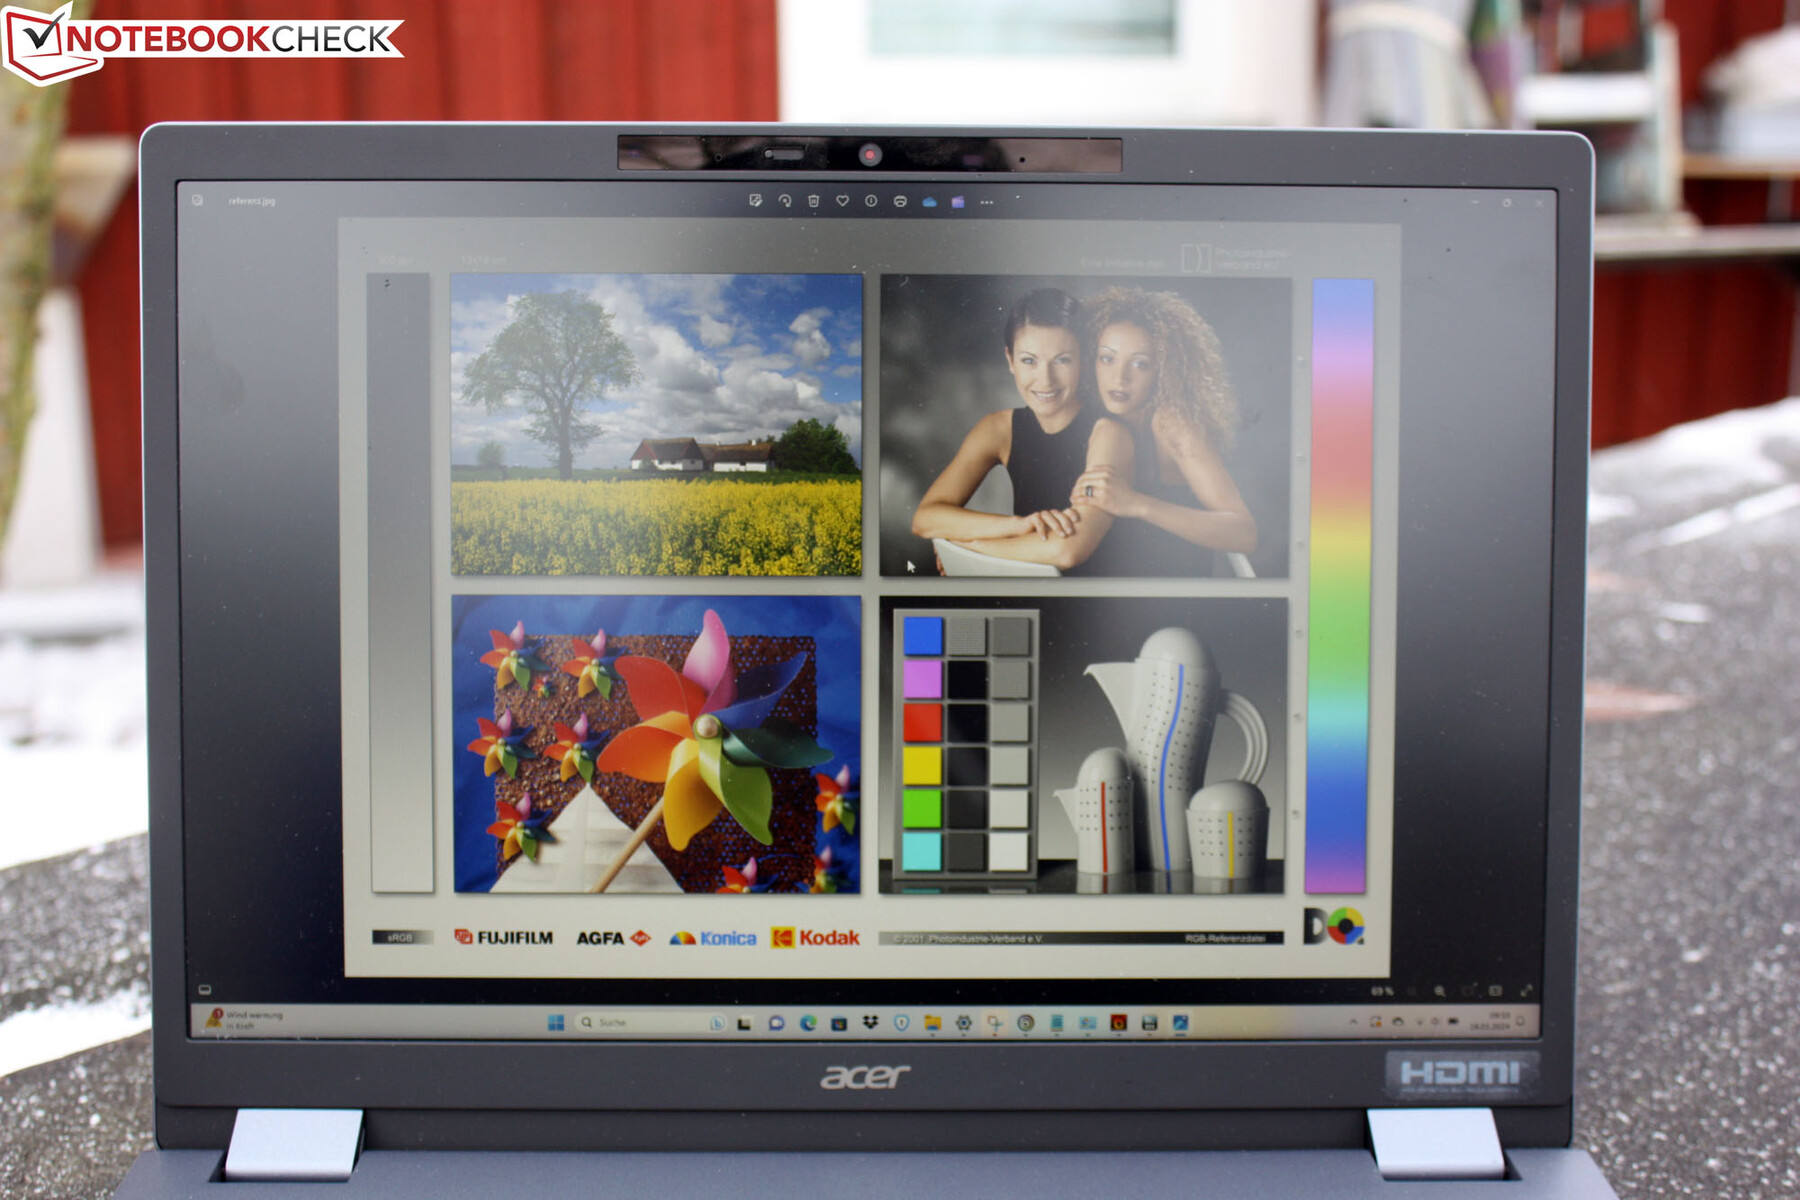
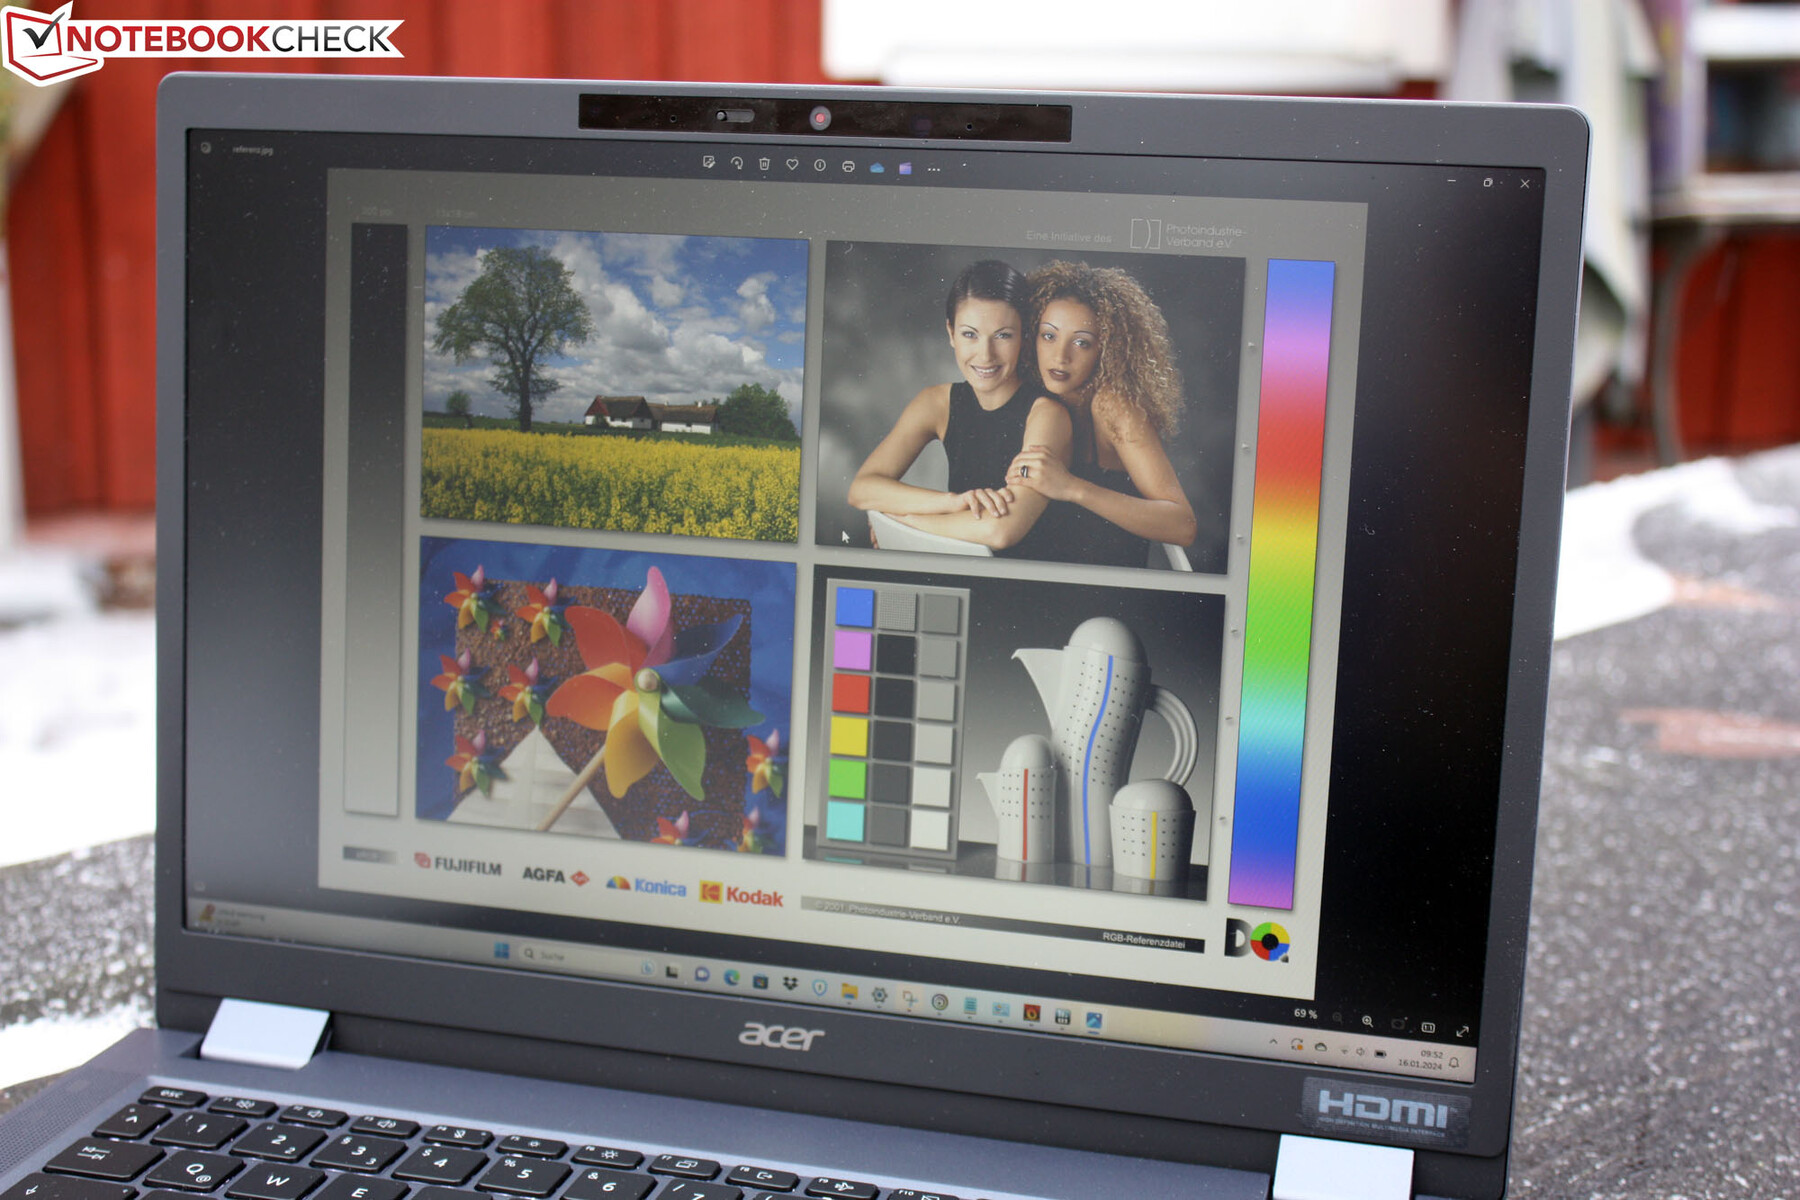
W 14-calowym laptopie zastosowano nieodblaskowy panel BOE IPS o rozdzielczości 1 920 x 1 200 pikseli. Jest to format 16:10 zamiast 16:9 (1,920 x 1,080), który oferuje większą wysokość przy tej samej szerokości, na przykład podczas pracy z arkuszami Excela lub dokumentami. Dwa okna mogą być wygodnie umieszczone obok siebie. Niektórzy konkurenci oferują wyższą rozdzielczość w tym samym segmencie cenowym, np. 2 240 x 1 400 w modelu ThinkPad E14 G5-21JSS05C00. Nawet jeśli pozwoliłoby to na zmieszczenie czterech mniejszych okien na ekranie, pismo byłoby zbyt małe dla oczu wielu użytkowników. Nadal uważamy, że Full HD to odpowiednia rozdzielczość dla 14 cali, a więcej nie jest potrzebne do użytku biurowego.
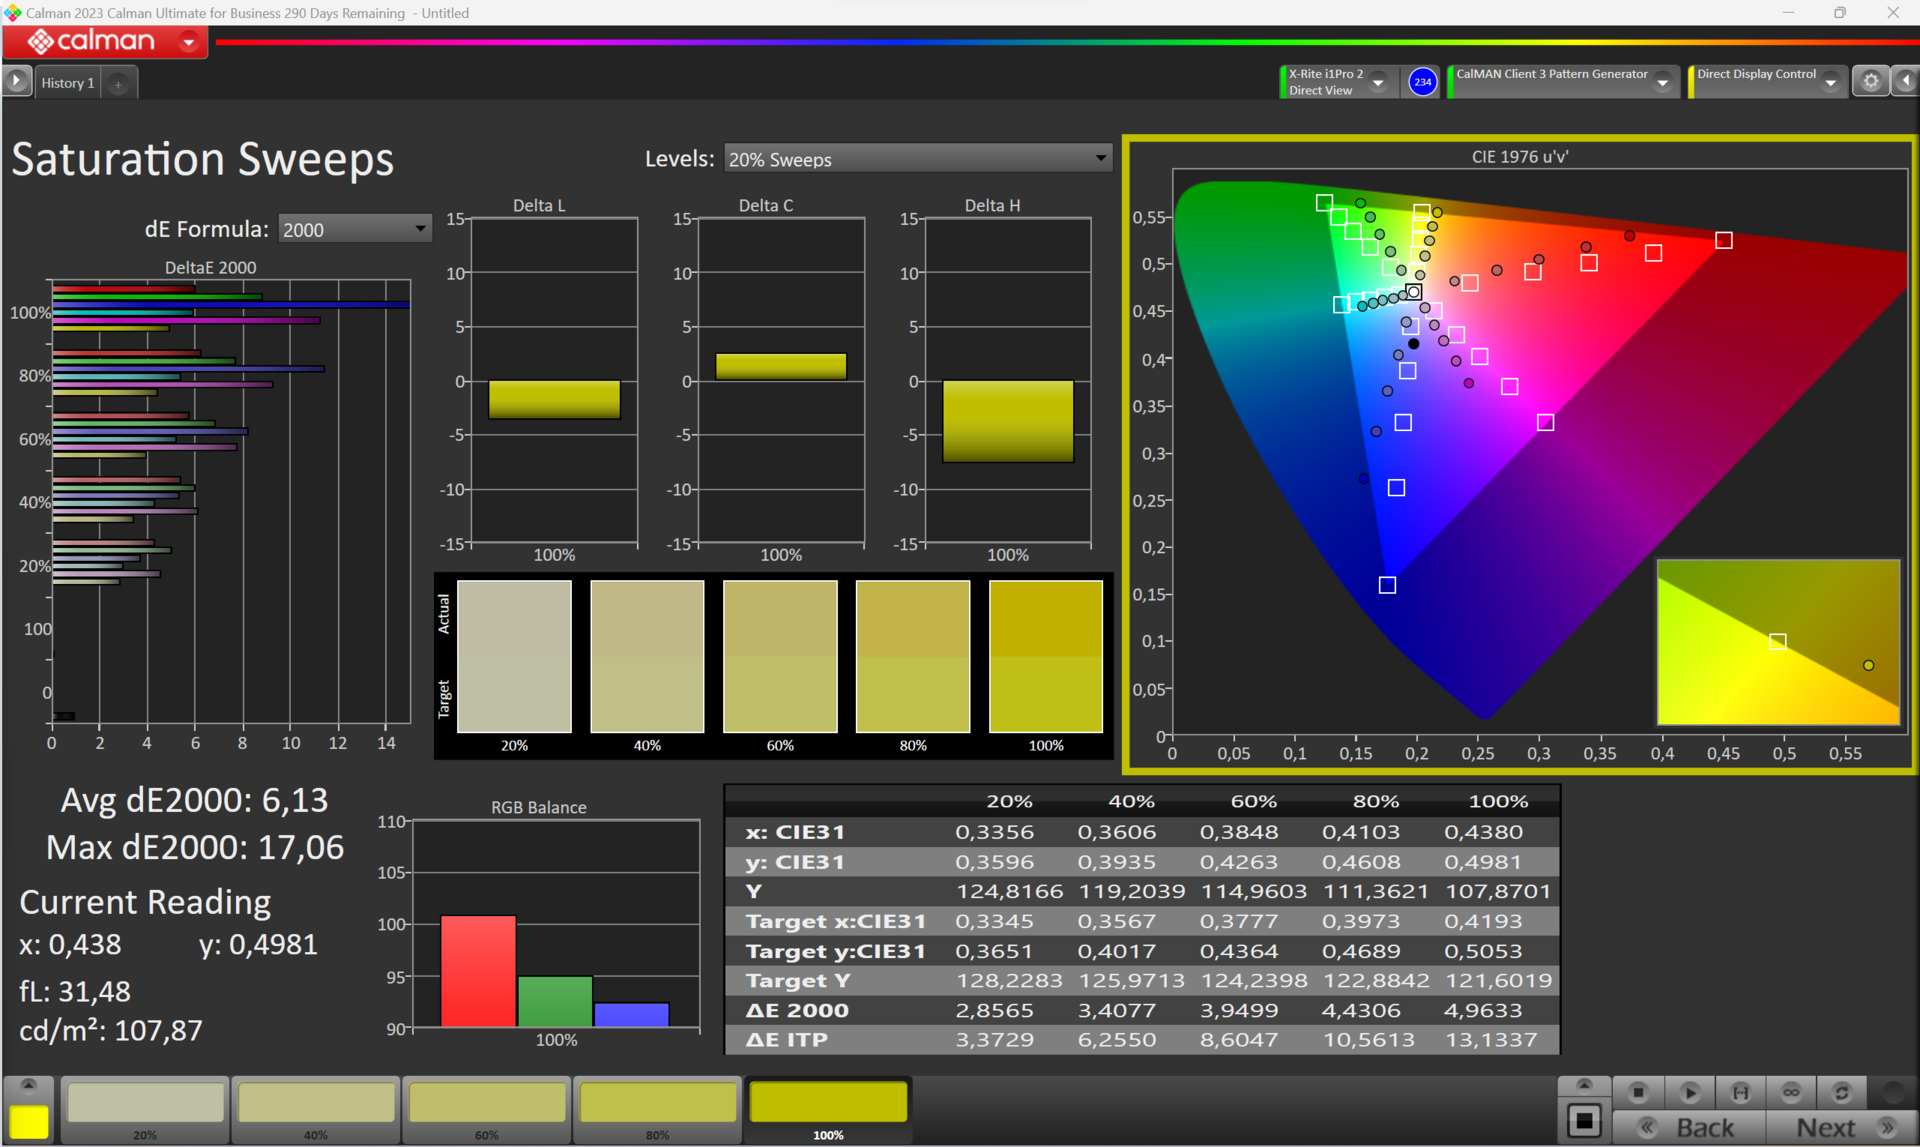
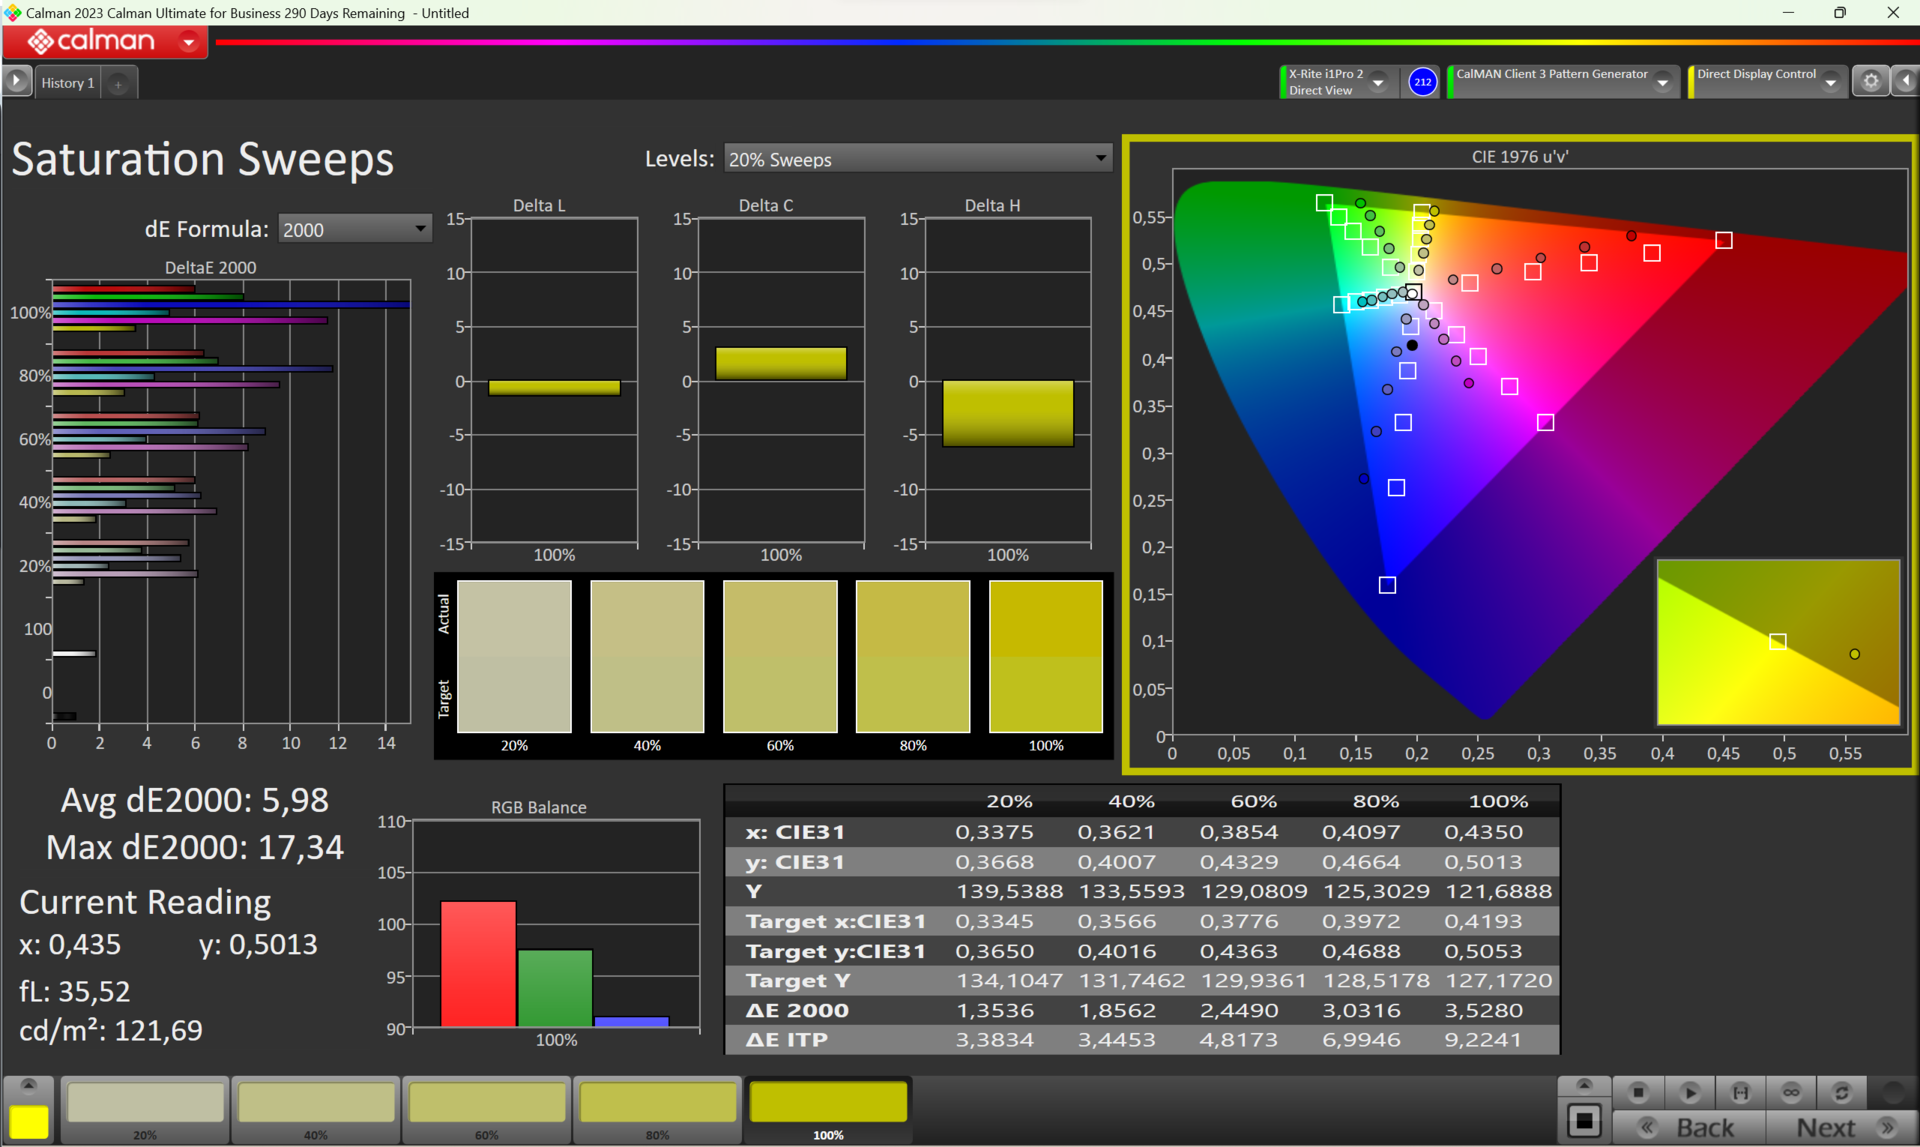
Słabością panelu jest niskie pokrycie przestrzeni barw (59% sRGB). Niezależnie od tego, otrzymujemy wyraźny obraz w biurze, a wysoki kontrast ma pozytywny wpływ. Ze względu na matową powierzchnię, kolory nie są żywe, a raczej blade, ale jest to bardziej przyjazne dla oczu dla zamierzonego celu. PWM nie jest używany do regulacji jasności, co przynosi pewną ulgę wrażliwym użytkownikom. Choć czasy reakcji są powolne, są one całkowicie akceptowalne dla laptopa biurowego.
| |||||||||||||||||||||||||
rozświetlenie: 91 %
na akumulatorze: 213 cd/m²
kontrast: 1406:1 (czerń: 0.18 cd/m²)
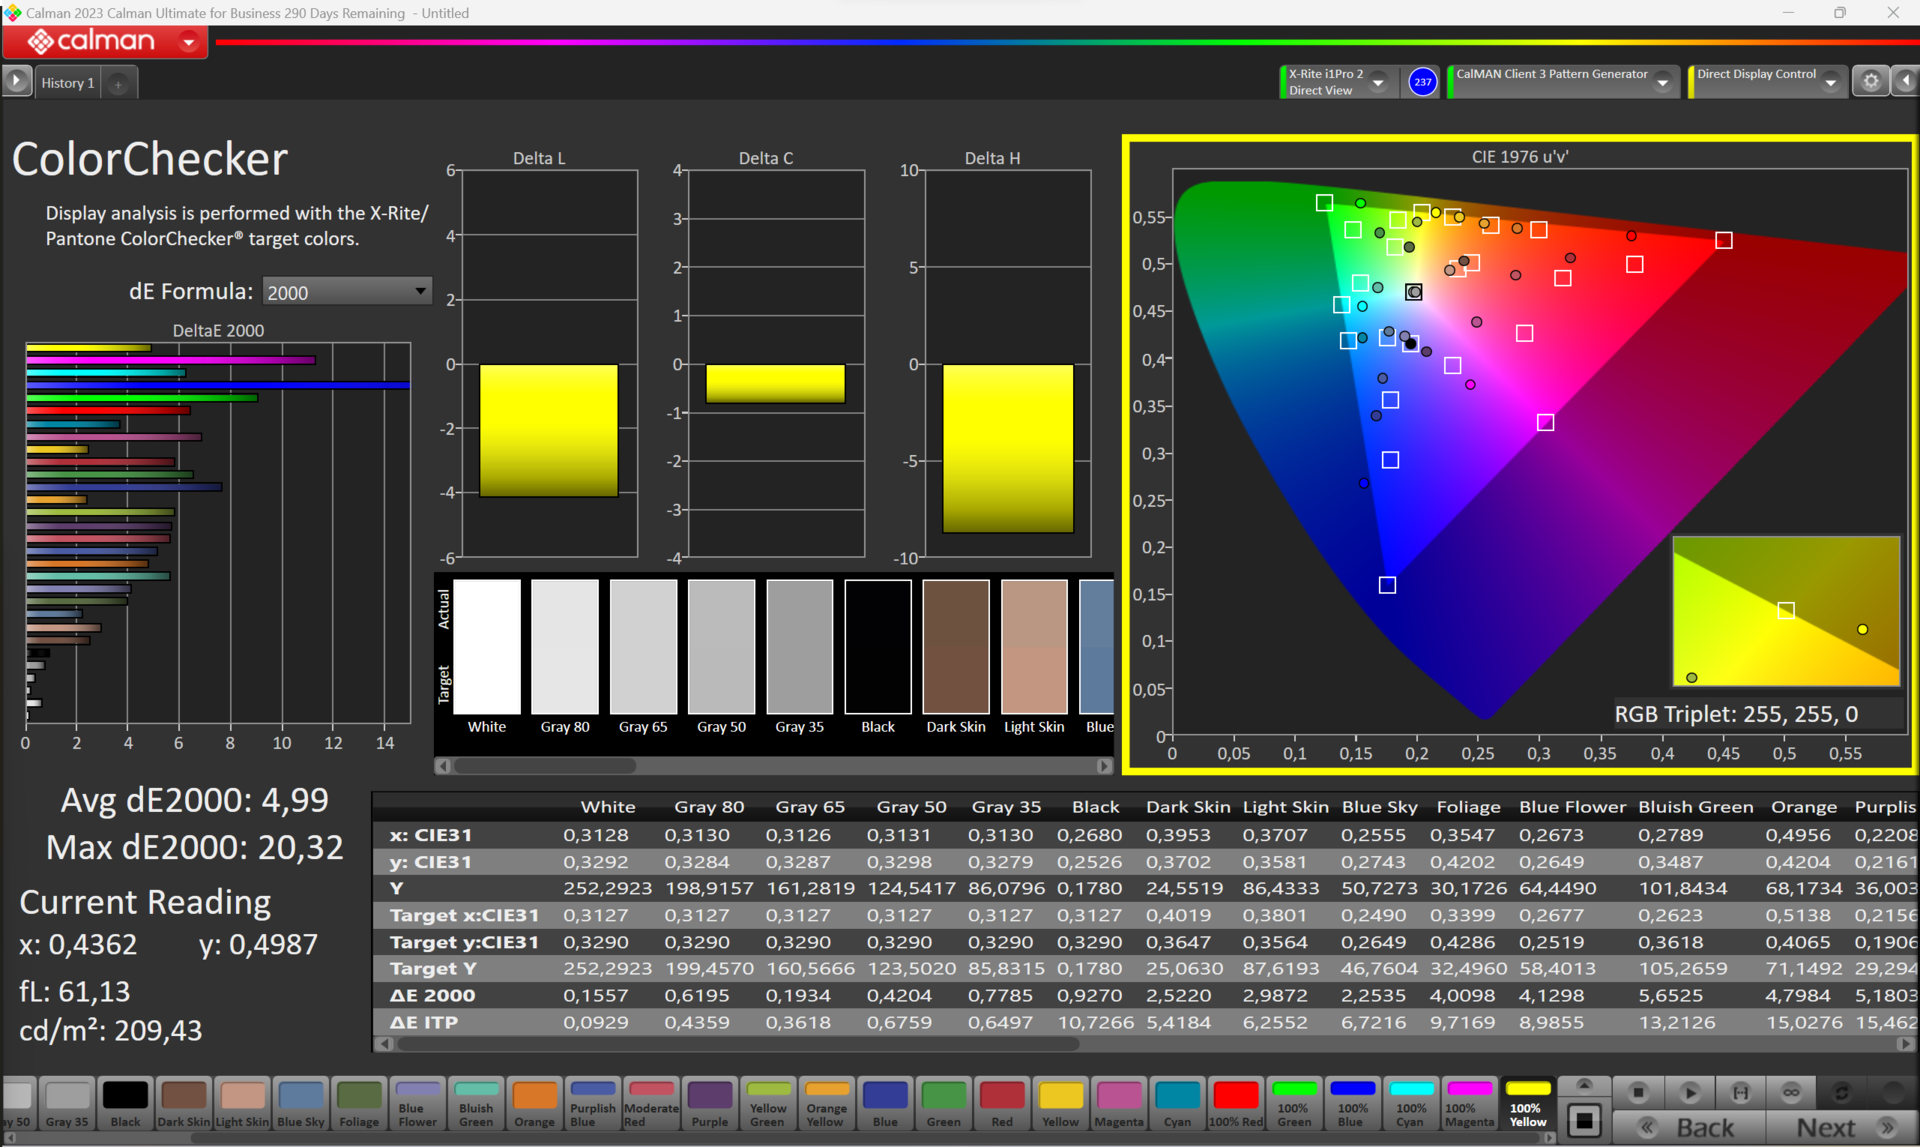
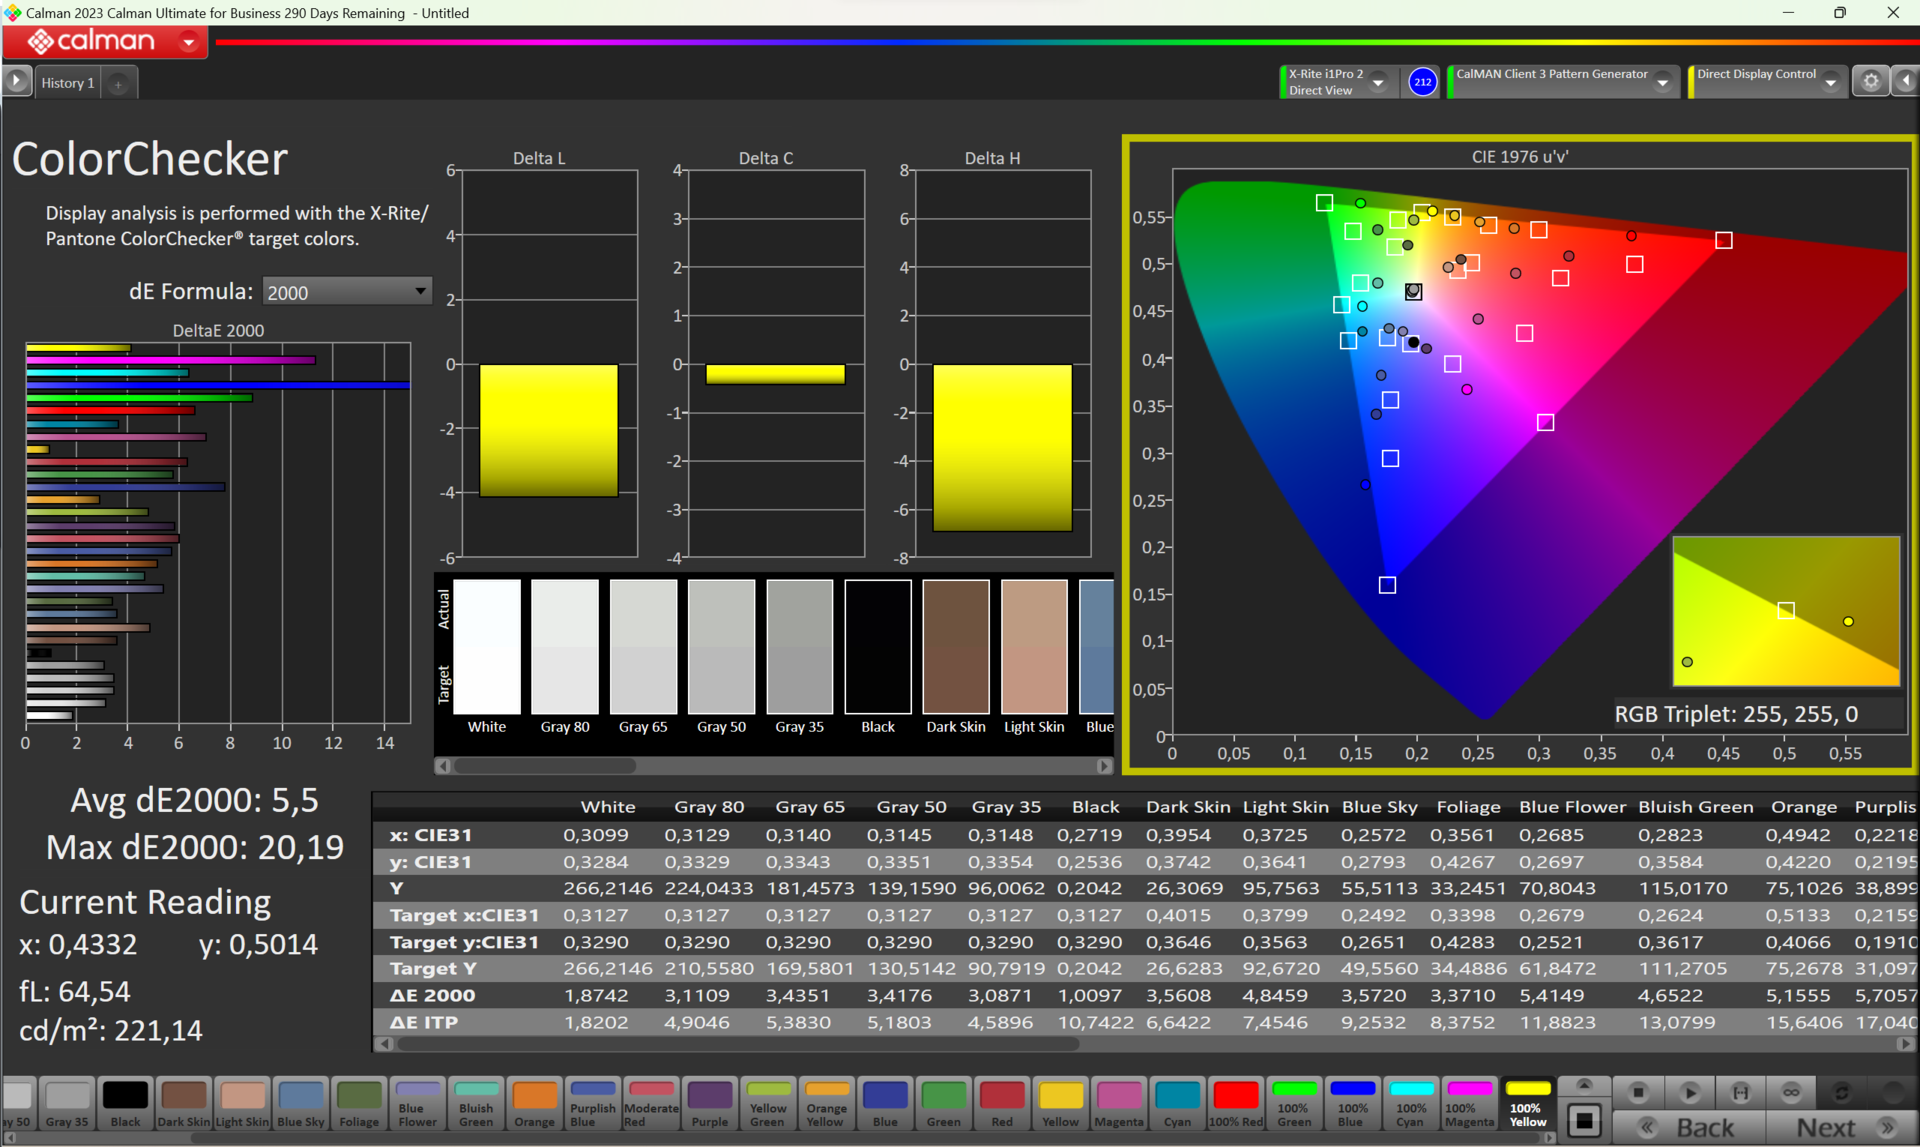
ΔE ColorChecker Calman: 5.5 | ∀{0.5-29.43 Ø4.73}
calibrated: 4.99
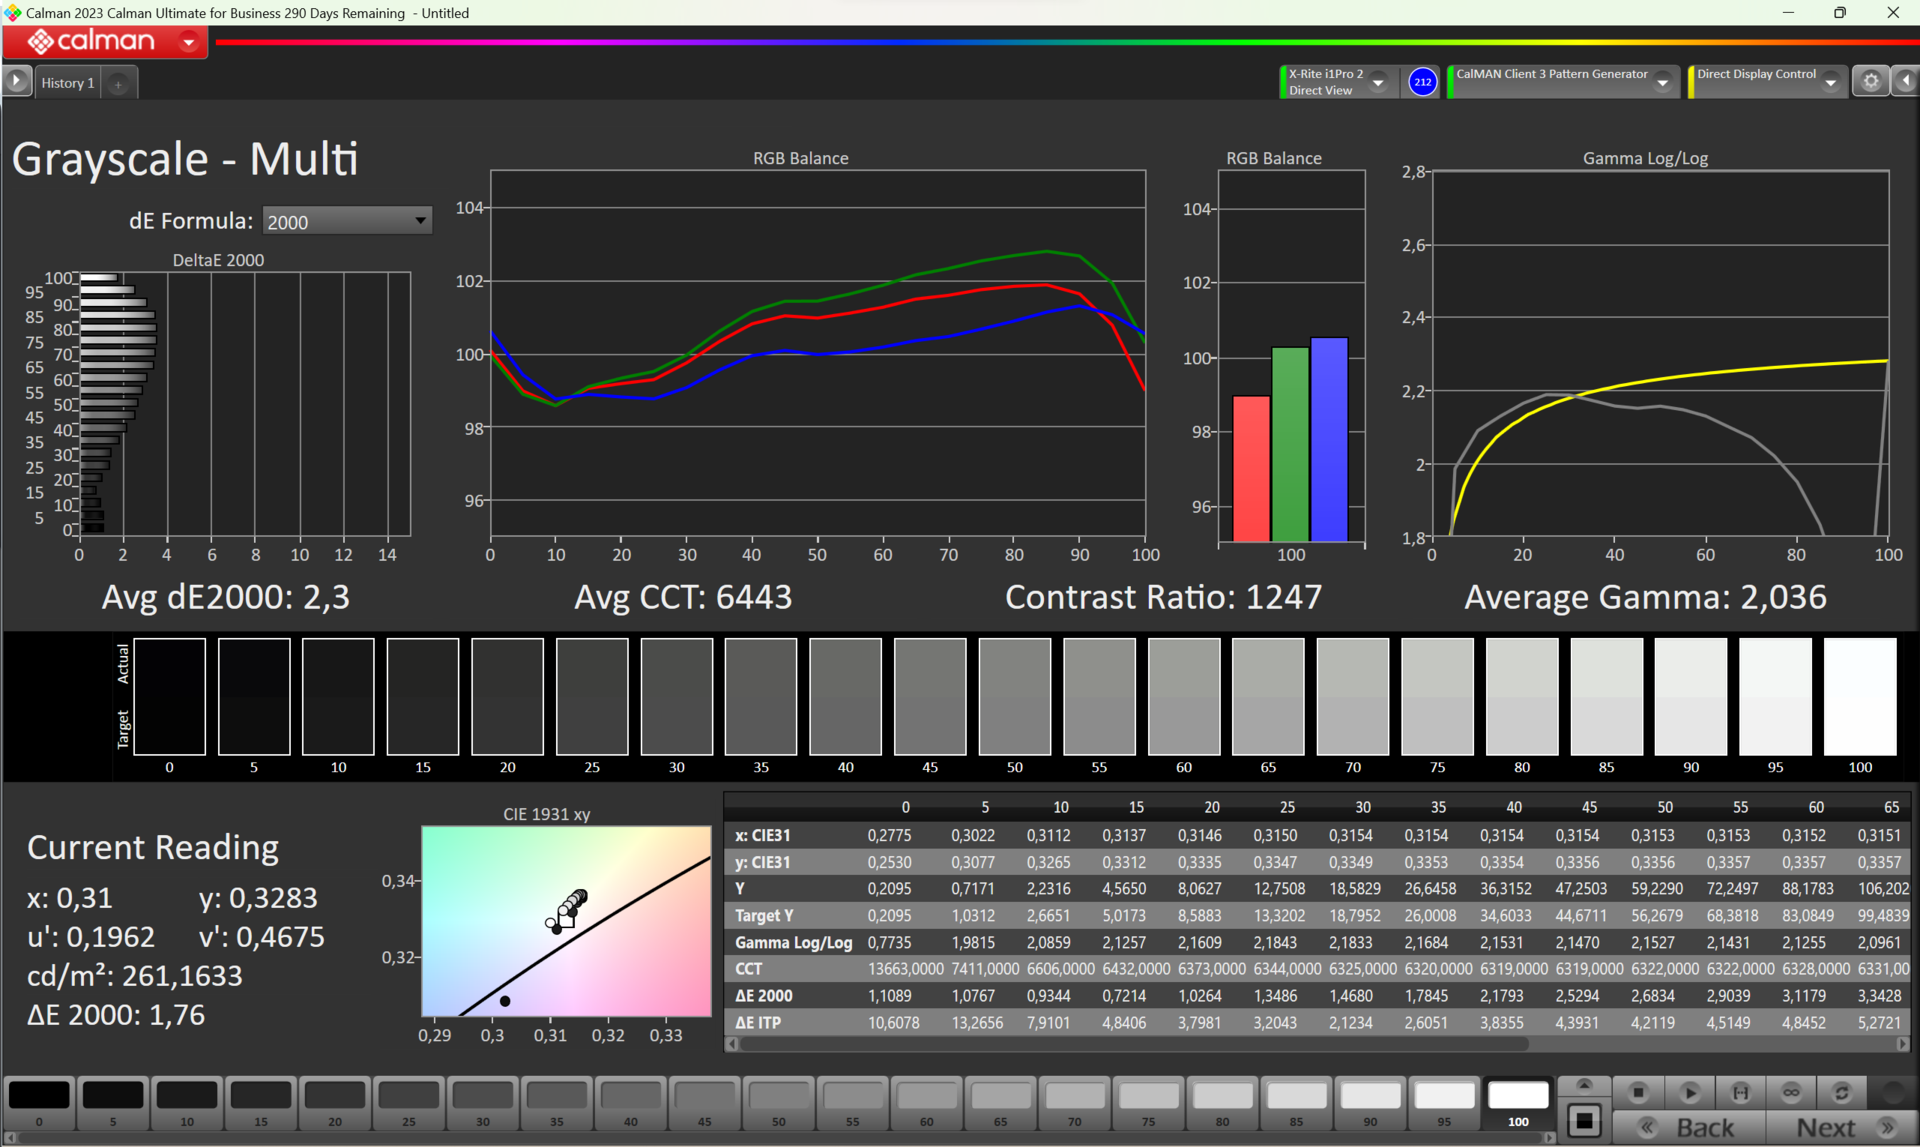
ΔE Greyscale Calman: 2.3 | ∀{0.09-98 Ø4.97}
41.3% AdobeRGB 1998 (Argyll 3D)
58.8% sRGB (Argyll 3D)
39.98% Display P3 (Argyll 3D)
Gamma: 2.036
CCT: 6443 K
| Acer TravelMate P4 TMP414-53-58XQ BOE NV140WUM-N41, IPS, 1920x1200, 14" | Dell Latitude 7440 AU Optronics B140QAX, IPS, 2560x1600, 14" | Lenovo ThinkPad E14 G5-21JSS05C00 M140NWHE R1, IPS, 2240x1400, 14" | Lenovo ThinkPad E14 G5 i7-1355U R140NW4D R5, IPS, 1920x1200, 14" | HP ProBook 440 G9-5Y3Z3EA AUO559C, , 1920x1080, 14" | HP ProBook 445 G10 AUO2FA6, IPS, 1920x1080, 14" | |
|---|---|---|---|---|---|---|
| Display | 81% | 70% | 6% | -7% | 68% | |
| Display P3 Coverage (%) | 39.98 | 75.4 89% | 69.3 73% | 41.9 5% | 37 -7% | 68.4 71% |
| sRGB Coverage (%) | 58.8 | 99.9 70% | 97.6 66% | 63 7% | 55.5 -6% | 95.2 62% |
| AdobeRGB 1998 Coverage (%) | 41.3 | 76.2 85% | 70.4 70% | 43.3 5% | 38.2 -8% | 70.6 71% |
| Response Times | -95% | -25% | -13% | -27% | -68% | |
| Response Time Grey 50% / Grey 80% * (ms) | 22.8 ? | 56 ? -146% | 36.3 ? -59% | 30.7 ? -35% | 42 ? -84% | 53.4 ? -134% |
| Response Time Black / White * (ms) | 21.5 ? | 30.8 ? -43% | 19.5 ? 9% | 19.6 ? 9% | 15 ? 30% | 21.8 ? -1% |
| PWM Frequency (Hz) | ||||||
| Screen | 18% | 34% | -1% | -43% | 35% | |
| Brightness middle (cd/m²) | 253 | 517.3 104% | 362 43% | 352.3 39% | 255 1% | 501 98% |
| Brightness (cd/m²) | 238 | 488 105% | 354 49% | 344 45% | 233 -2% | 464 95% |
| Brightness Distribution (%) | 91 | 88 -3% | 91 0% | 86 -5% | 86 -5% | 87 -4% |
| Black Level * (cd/m²) | 0.18 | 0.34 -89% | 0.18 -0% | 0.27 -50% | 0.26 -44% | |
| Contrast (:1) | 1406 | 1521 8% | 2011 43% | 1305 -7% | 1927 37% | |
| Colorchecker dE 2000 * | 5.5 | 3.3 40% | 2.6 53% | 4.99 9% | 8.41 -53% | 2.64 52% |
| Colorchecker dE 2000 max. * | 20.19 | 7.81 61% | 3.7 82% | 14.84 26% | 13.51 33% | 5.06 75% |
| Colorchecker dE 2000 calibrated * | 4.99 | 1.02 80% | 1.1 78% | 1.87 63% | 1.57 69% | |
| Greyscale dE 2000 * | 2.3 | 5.6 -143% | 3.3 -43% | 5.3 -130% | 7.6 -230% | 3.8 -65% |
| Gamma | 2.036 108% | 2.37 93% | 2.28 96% | 2.2 100% | 3.12 71% | 2.103 105% |
| CCT | 6443 101% | 6804 96% | 6761 96% | 7682 85% | 6233 104% | 6562 99% |
| Całkowita średnia (program / ustawienia) | 1% /
16% | 26% /
33% | -3% /
-1% | -26% /
-30% | 12% /
27% |
* ... im mniej tym lepiej
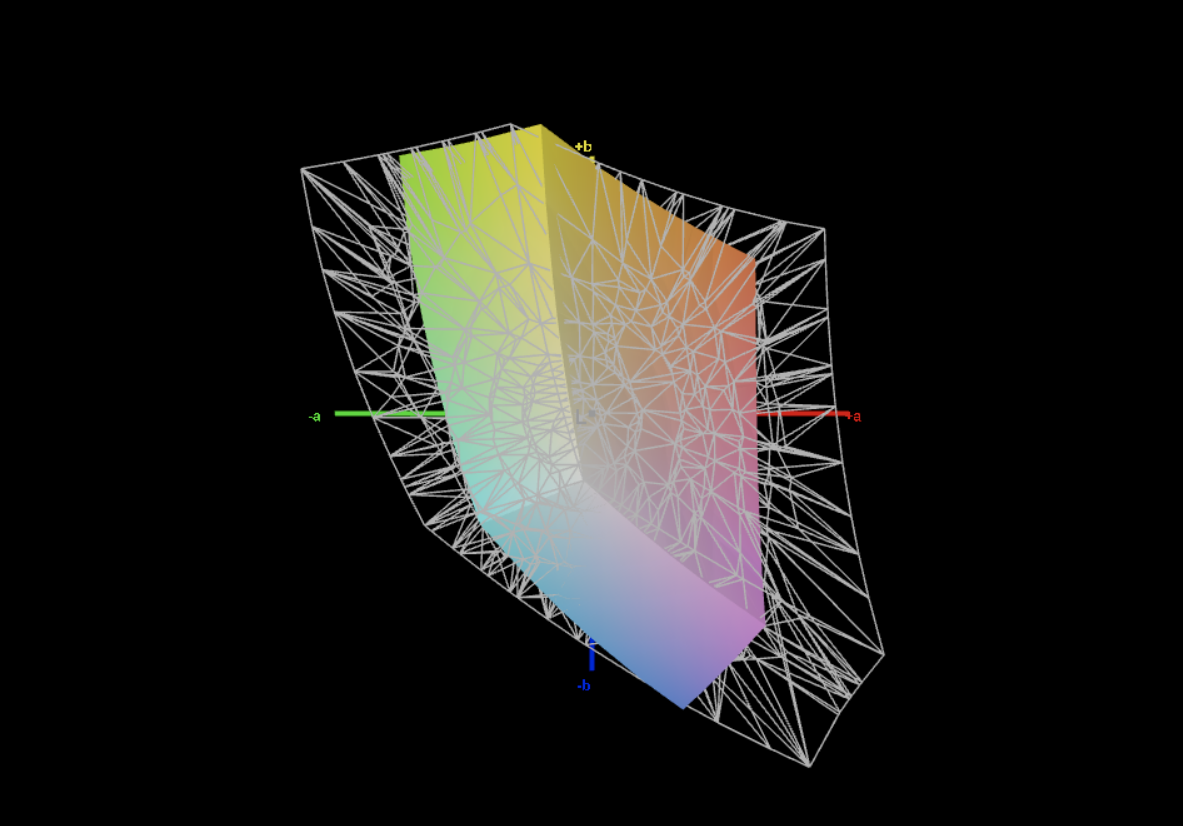
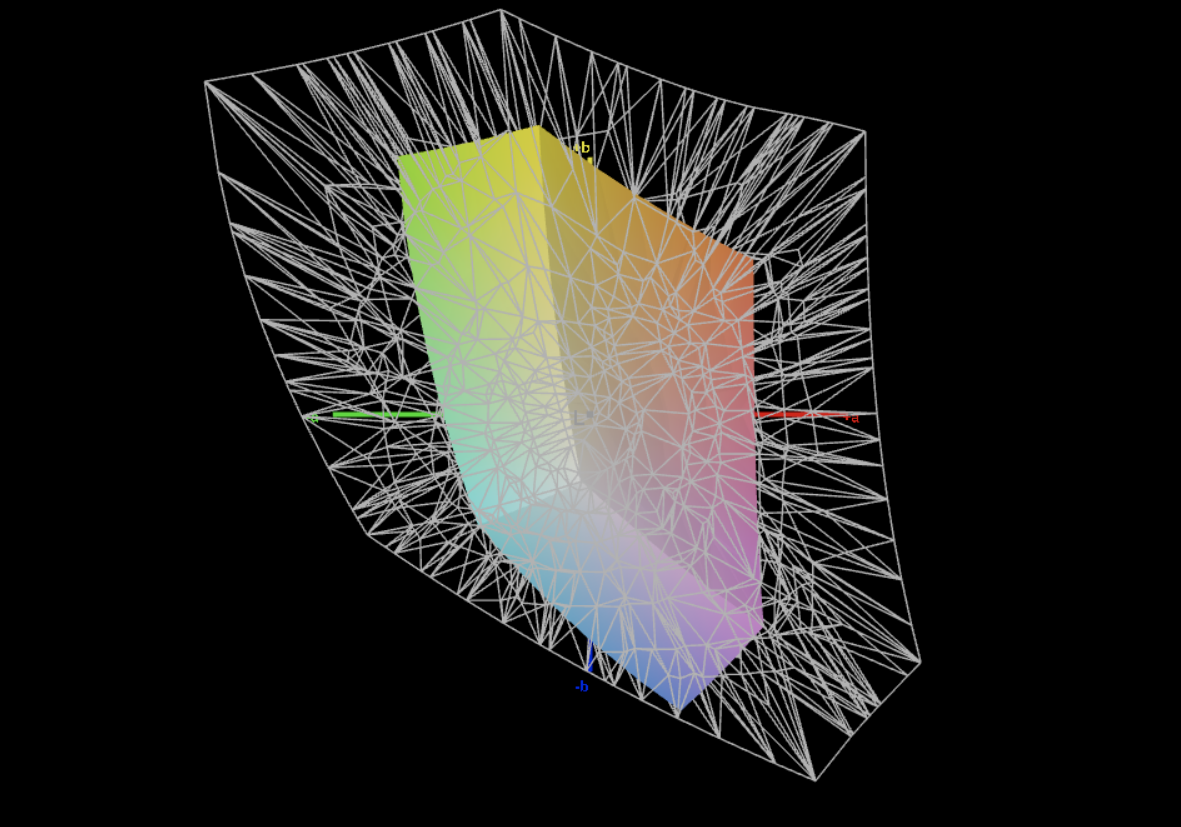
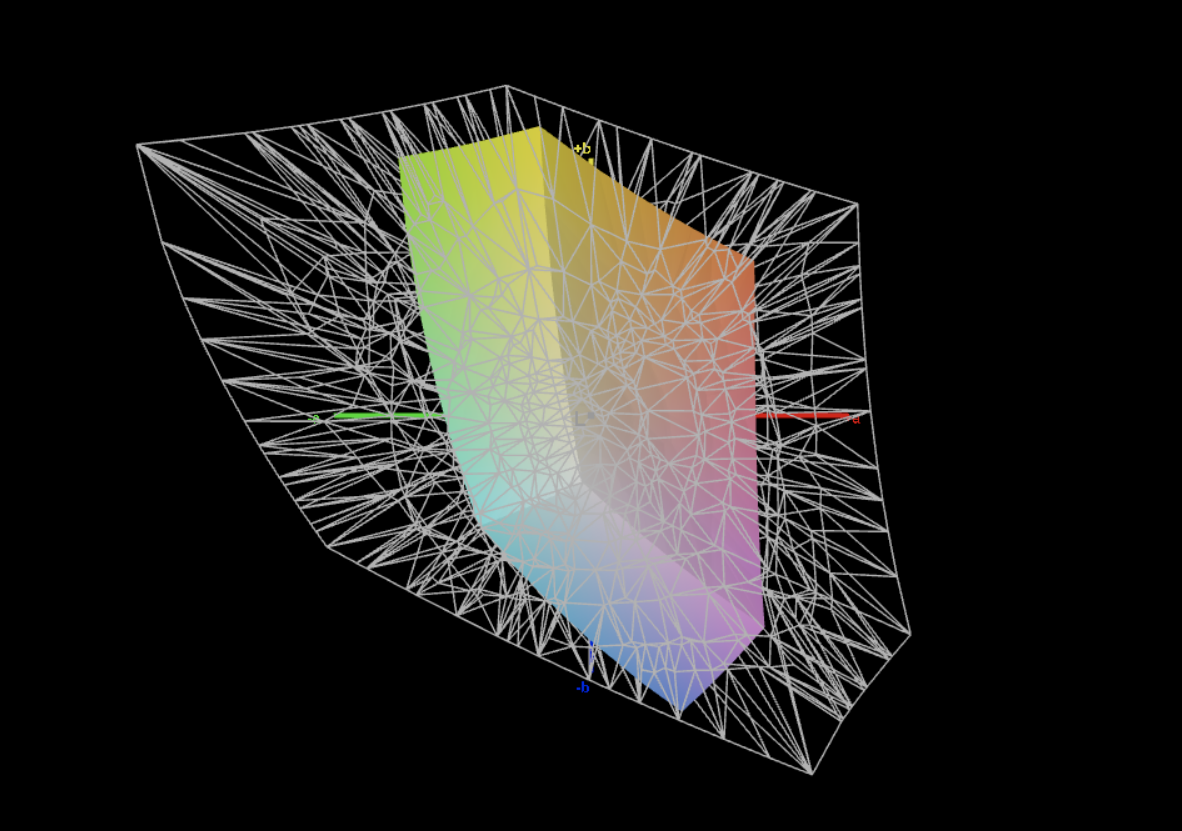
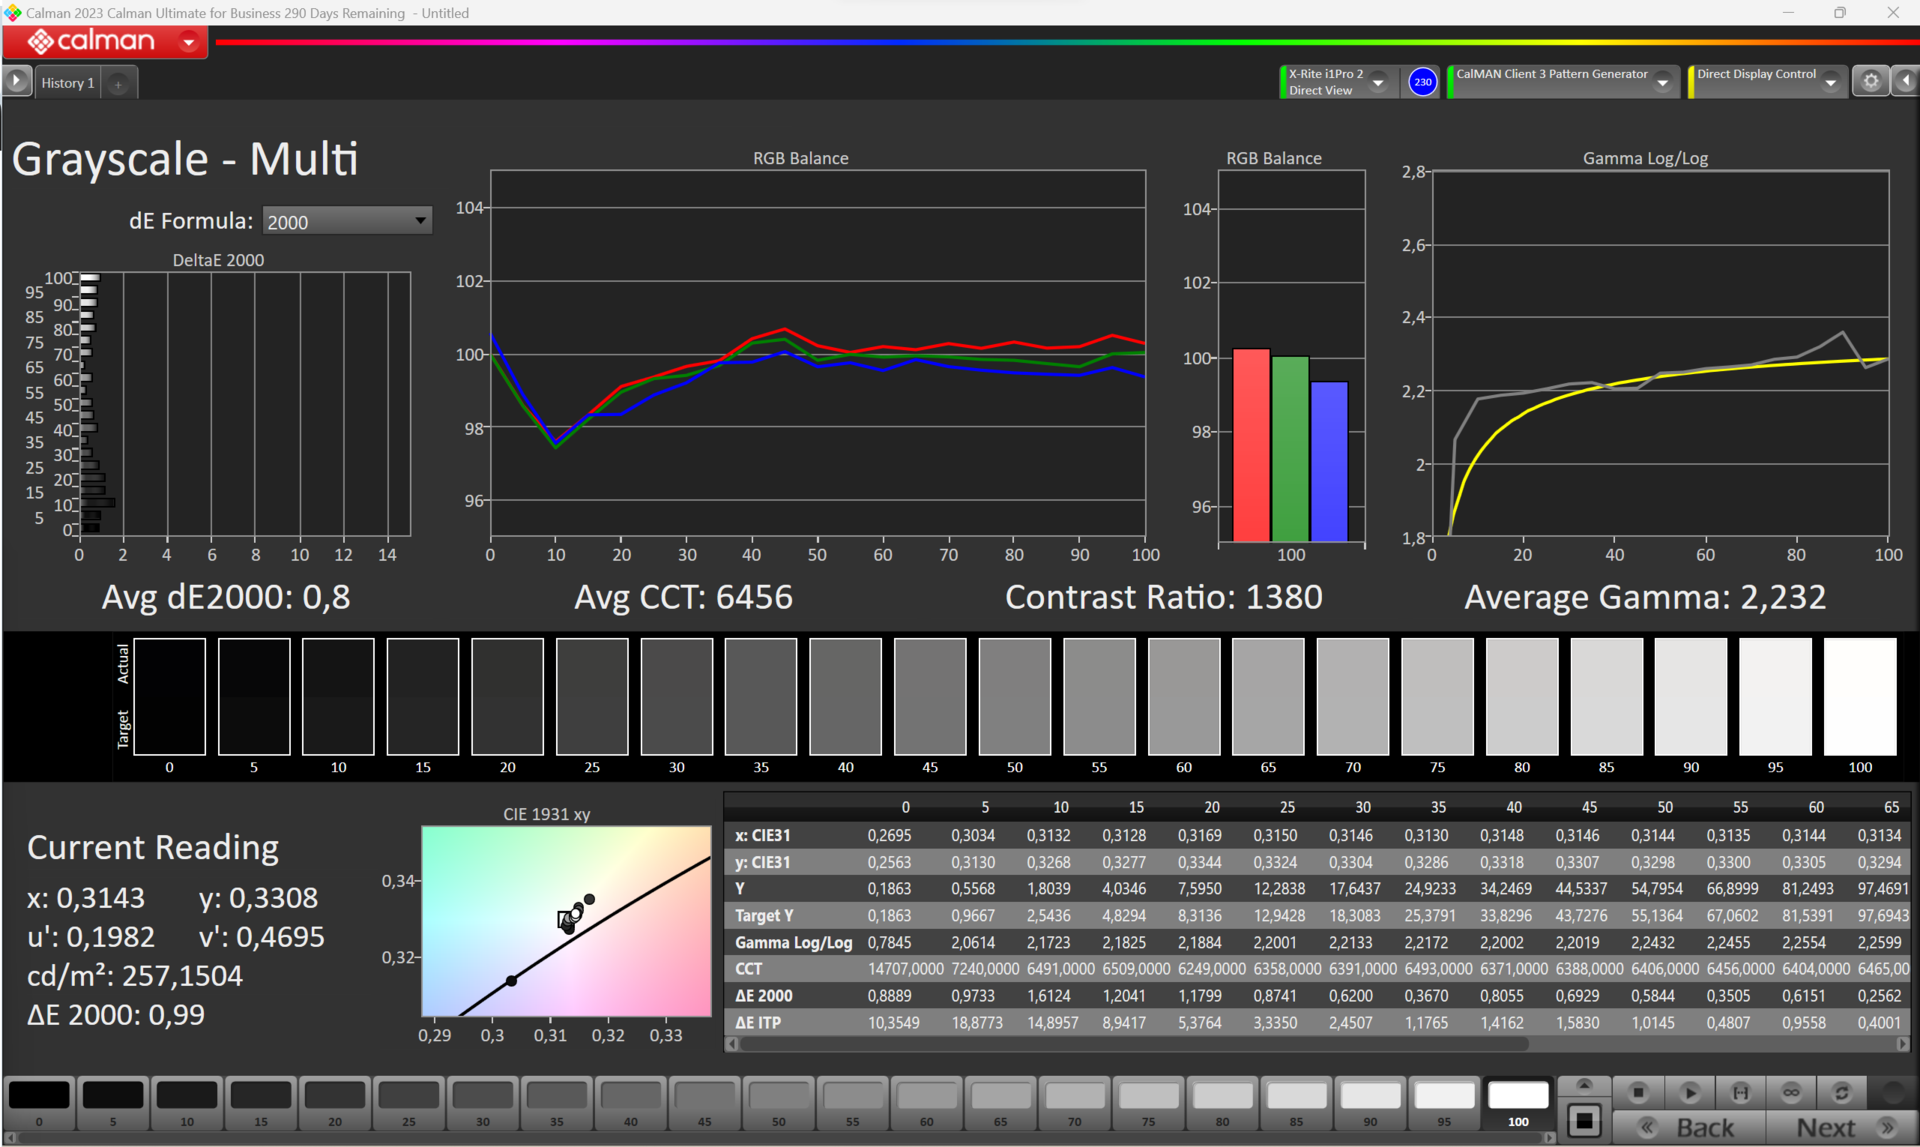
Dodatkowa kalibracja nie jest opłacalna, ponieważ DeltaE skali szarości zmniejsza się tylko z 2,3 do 0,8. Chociaż jest to wciąż poprawa, przez większość czasu nasze oczy nie są w stanie dostrzec żadnej różnicy w stosunku do oryginału przy odchyleniach poniżej 3,0. DeltaE ColorChecker została nieznacznie zmniejszona z 5,5 do 5,0, co jest dalekie od magicznych 3,0. Panel ten nie nadaje się do profesjonalnego przetwarzania obrazu, co pokazuje narzędzie do kalibracji kolorów Calman.
Wyświetl czasy reakcji
| ↔ Czas reakcji od czerni do bieli | ||
|---|---|---|
| 21.5 ms ... wzrost ↗ i spadek ↘ łącznie | ↗ 11 ms wzrost |  |
| ↘ 10.5 ms upadek | ||
| W naszych testach ekran wykazuje dobry współczynnik reakcji, ale może być zbyt wolny dla graczy rywalizujących ze sobą. Dla porównania, wszystkie testowane urządzenia wahają się od 0.1 (minimum) do 240 (maksimum) ms. » 48 % wszystkich urządzeń jest lepszych. Oznacza to, że zmierzony czas reakcji jest zbliżony do średniej wszystkich testowanych urządzeń (19.9 ms). | ||
| ↔ Czas reakcji 50% szarości do 80% szarości | ||
| 22.8 ms ... wzrost ↗ i spadek ↘ łącznie | ↗ 9.7 ms wzrost |  |
| ↘ 13.1 ms upadek | ||
| W naszych testach ekran wykazuje dobry współczynnik reakcji, ale może być zbyt wolny dla graczy rywalizujących ze sobą. Dla porównania, wszystkie testowane urządzenia wahają się od 0.165 (minimum) do 636 (maksimum) ms. » 34 % wszystkich urządzeń jest lepszych. Oznacza to, że zmierzony czas reakcji jest lepszy od średniej wszystkich testowanych urządzeń (31.1 ms). | ||
Migotanie ekranu / PWM (modulacja szerokości impulsu)
| Migotanie ekranu/nie wykryto PWM |  | ||
Dla porównania: 52 % wszystkich testowanych urządzeń nie używa PWM do przyciemniania wyświetlacza. Jeśli wykryto PWM, zmierzono średnio 7794 (minimum: 5 - maksimum: 343500) Hz. | |||
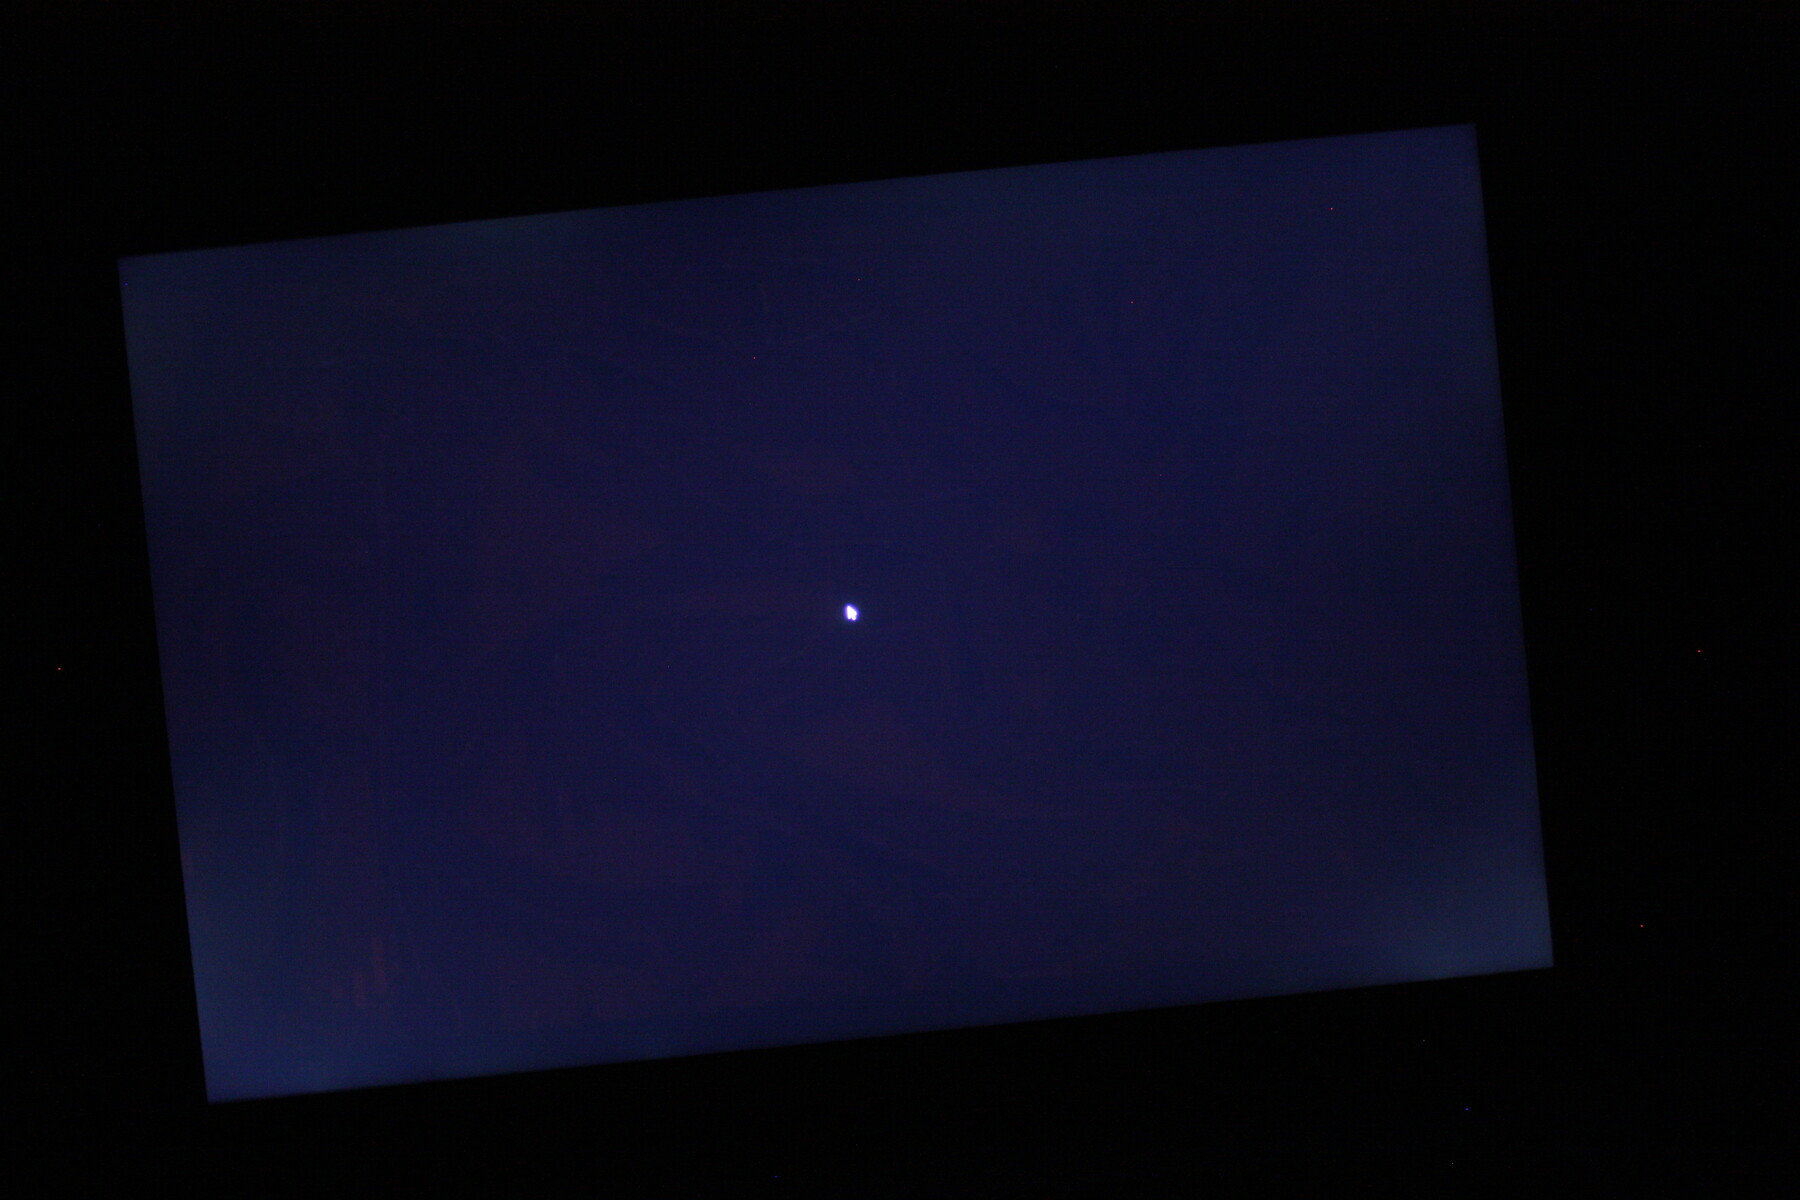
W codziennej pracy największą słabością jest niska jasność maksymalna wynosząca 253 cd/m² (środek). Jest ona wystarczająca w pomieszczeniach, ale latem na balkonie czy w parku będzie utrudniać pracę. Zmniejszenie maksymalnej jasności do 213 cd/m² (środek) podczas pracy na baterii również nie pomaga. Zauważamy pewne zmętnienia w lewym i prawym dolnym rogu, ale tylko przy czarnym obrazie.
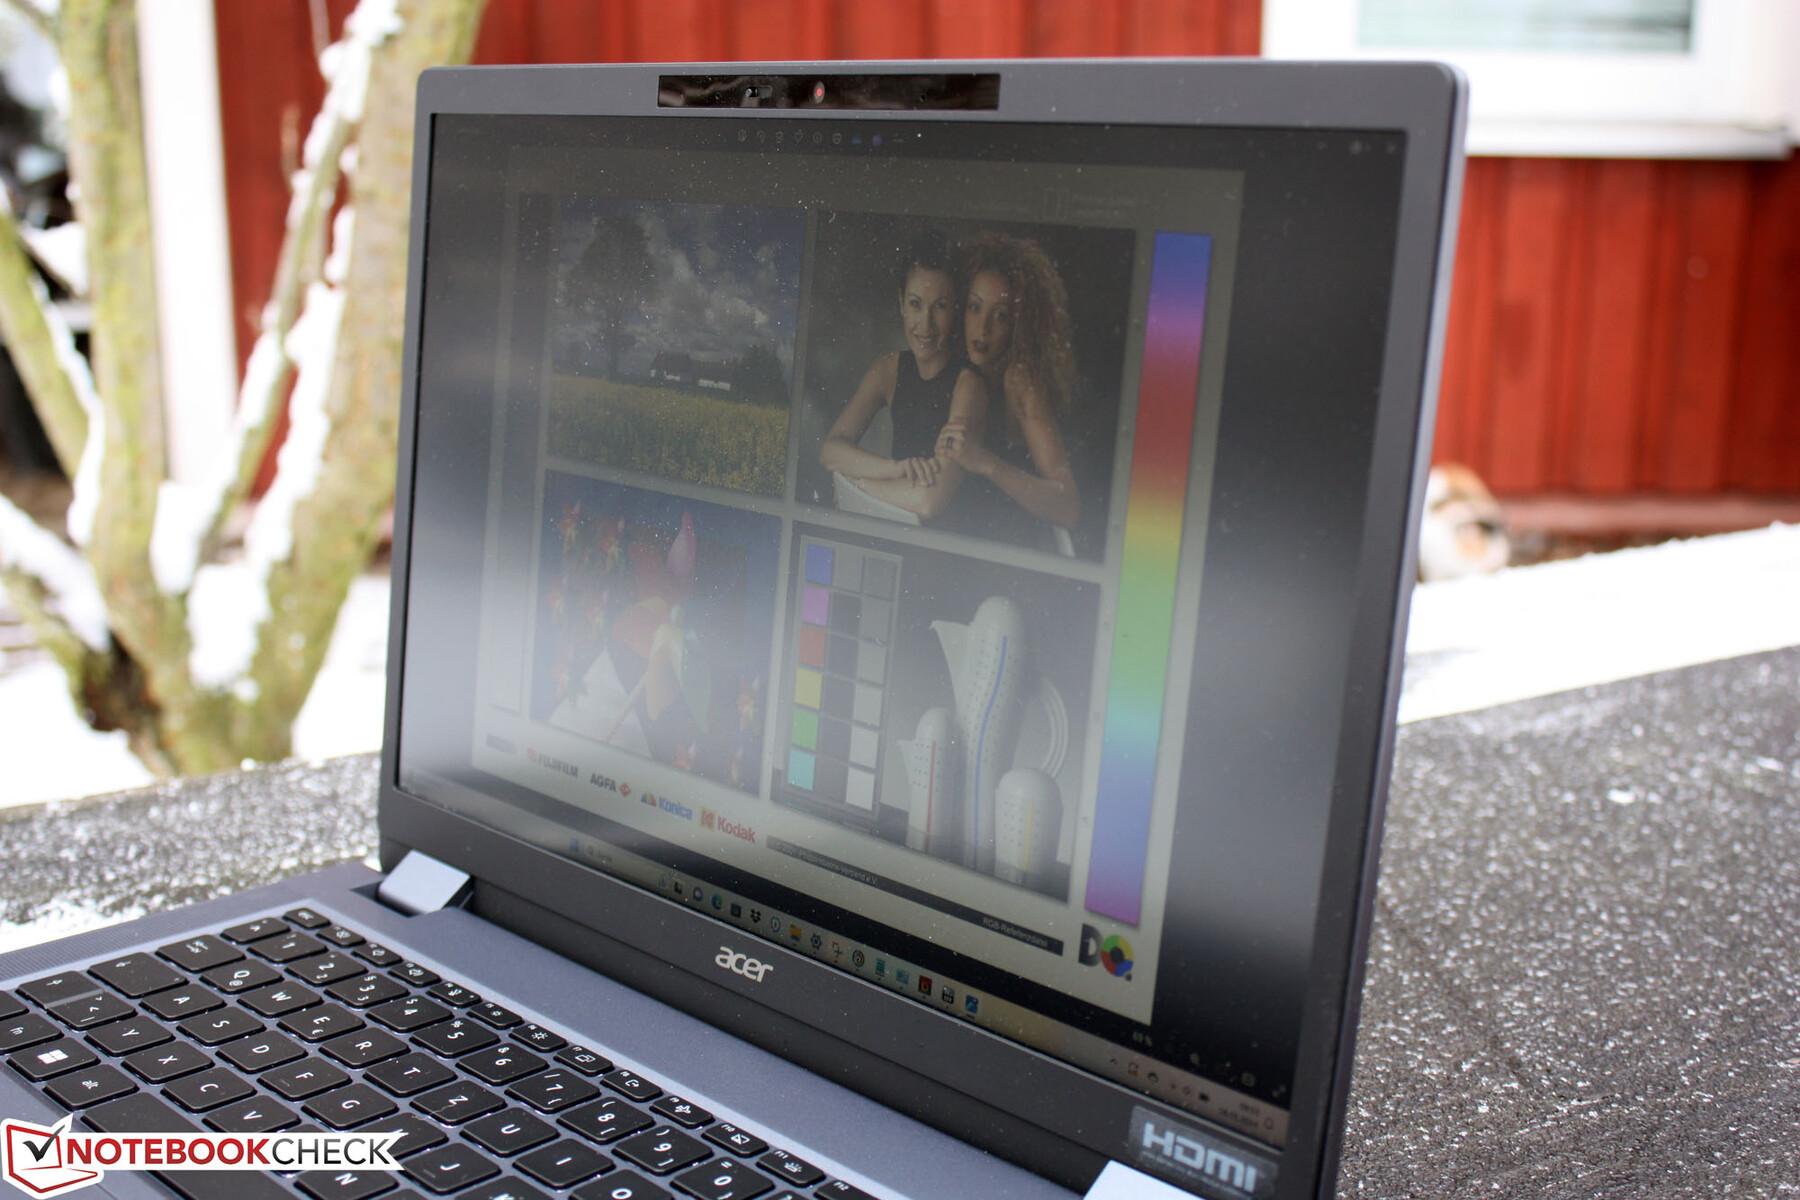
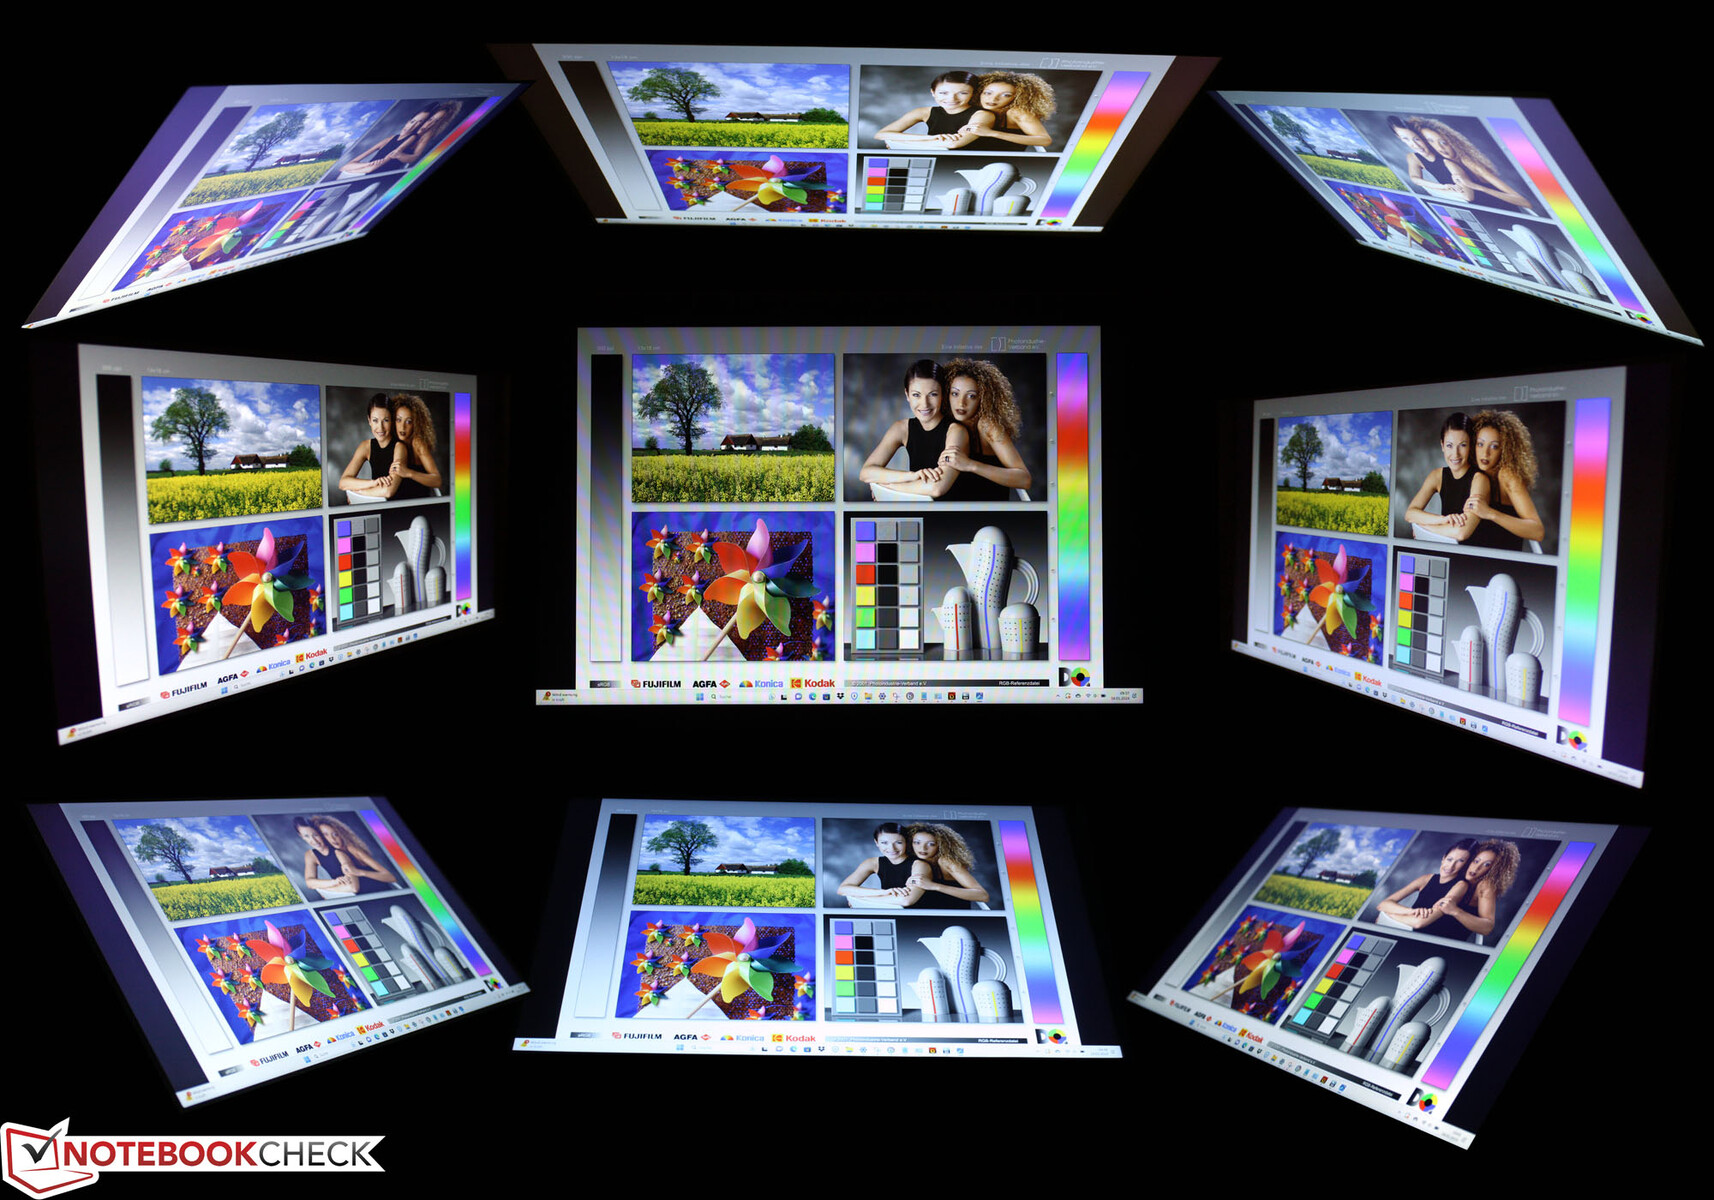
Patrząc na wyświetlacz z boku, staje się on znacznie ciemniejszy - ale nie ma to nic wspólnego ze środkiem ochrony prywatności uniemożliwiającym innym patrzenie na ekran. Pismo jest jednak nadal czytelne.
Wydajność
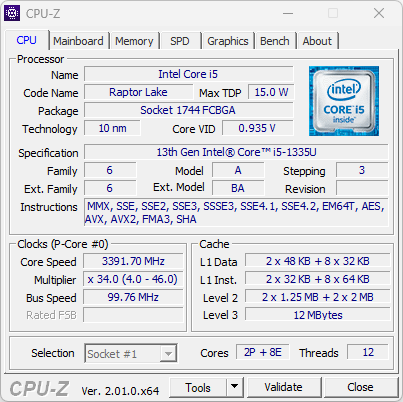
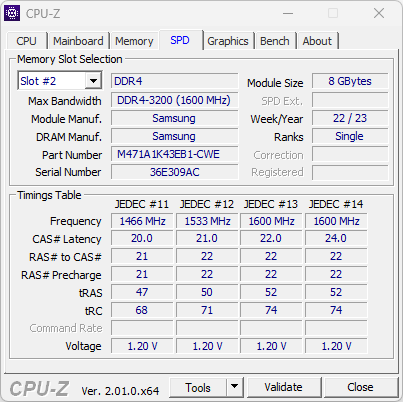
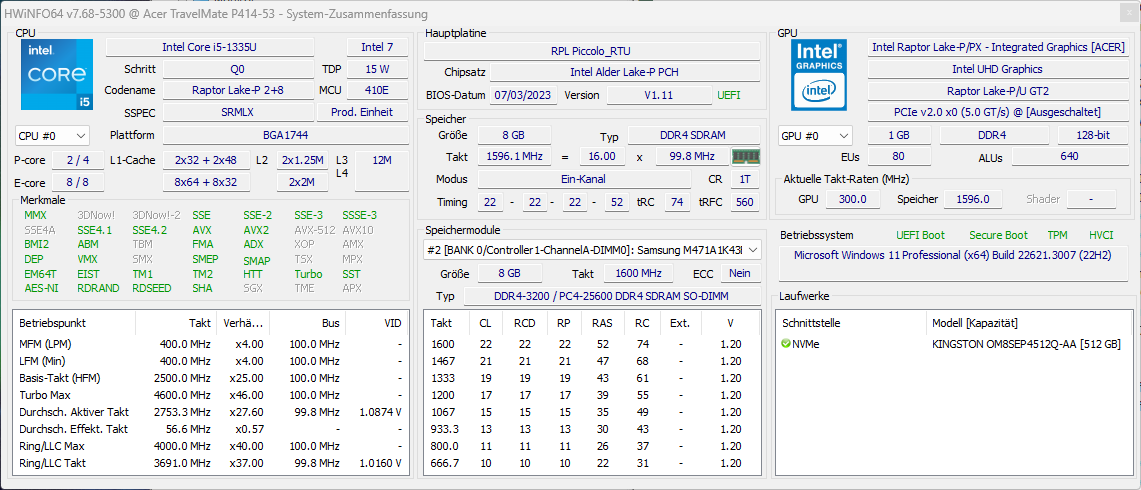
Procesor i5-1335U został wprowadzony w styczniu 2023 roku i jest ukierunkowany na skalowalny rozwój wydajności z dwoma rdzeniami Performance i ośmioma rdzeniami Efficiency. Długi czas pracy na baterii przy niskim zużyciu energii jest tutaj ważniejszy niż stała wydajność na wszystkich rdzeniach, więc wydaje się, że jest to dokładnie odpowiedni SoC dla zaplecza biurowego z godzinami bezczynności. SoC towarzyszy 512 GB dysk SSD firmy Kingston, z czego 433 GB jest nadal dostępne dla użytkownika. Pamięć roboczą zapewnia moduł 8 GB, który można łatwo rozszerzyć o drugi. Maksymalne rozszerzenie to 2x 16 GB.
Warunki testu
Testy wydajności przeprowadziliśmy w trybie "Najlepsza wydajność" systemu Windows.
Procesor
Test stałego obciążenia R15 ocenia zachowanie SoC pod ciągłym maksymalnym obciążeniem. Czy jest on w stanie stale utrzymywać wysokie punkty w benchmarku? Odpowiedź brzmi nie, ponieważ Intel Core i5-1335U zaczyna na poziomie poniżej średniej i na nim pozostaje. Podczas gdy szczytowa wydajność tego SoC może osiągnąć 1547 punktów, TravelMate osiąga tylko 1238 punktów. Procesor i5-1345U i5-1345U zaczyna się wyżej na poziomie 1 541 punktów, ale potem spada do średnio 1 310 punktów. Podsumowując, laptop Acer nie wykorzystuje pełnego potencjału układu, a wydajność rdzeni P pozostaje niewykorzystana.
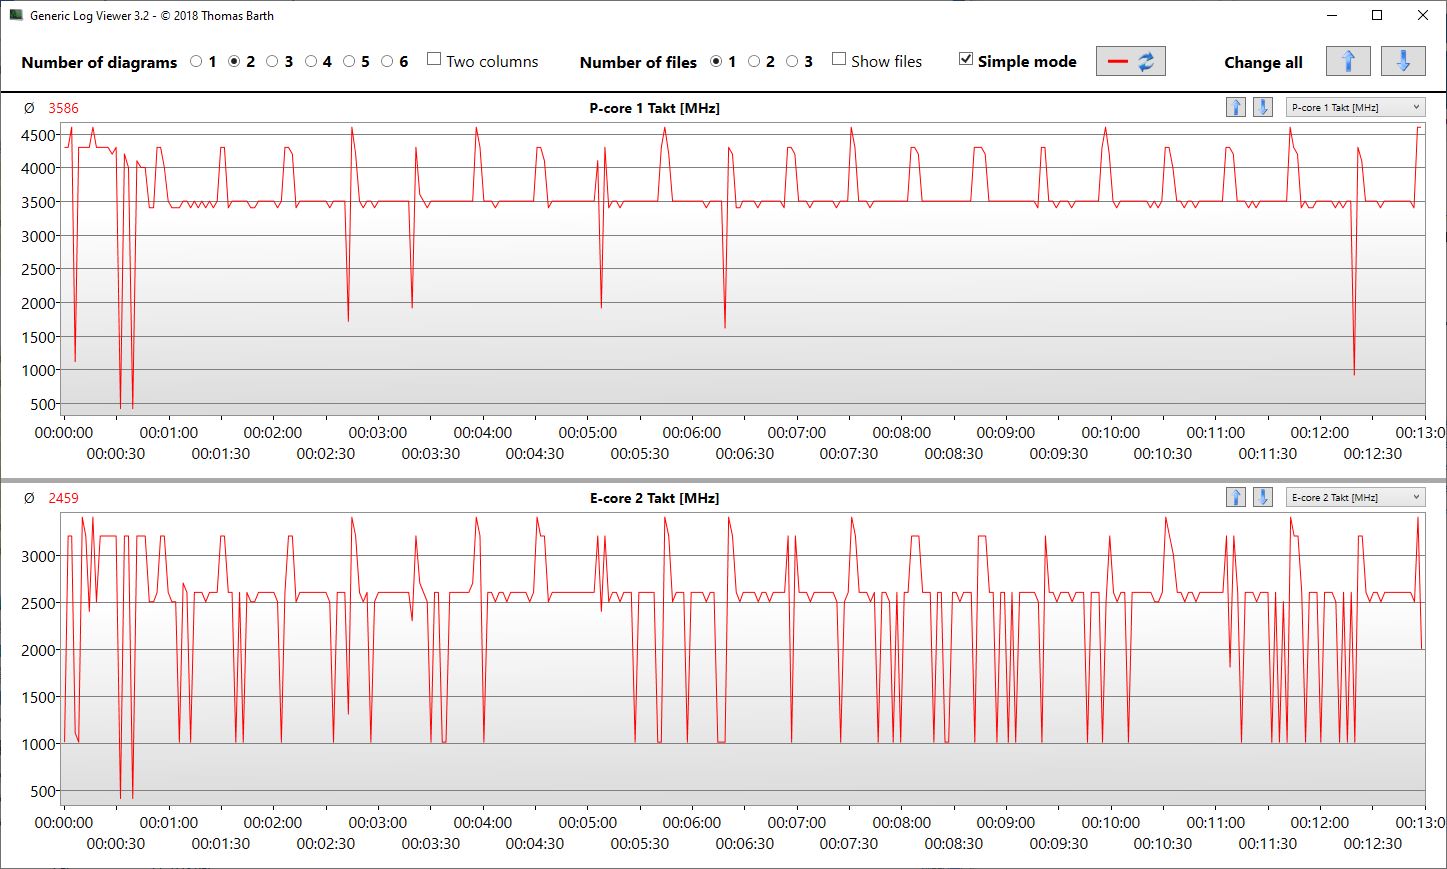
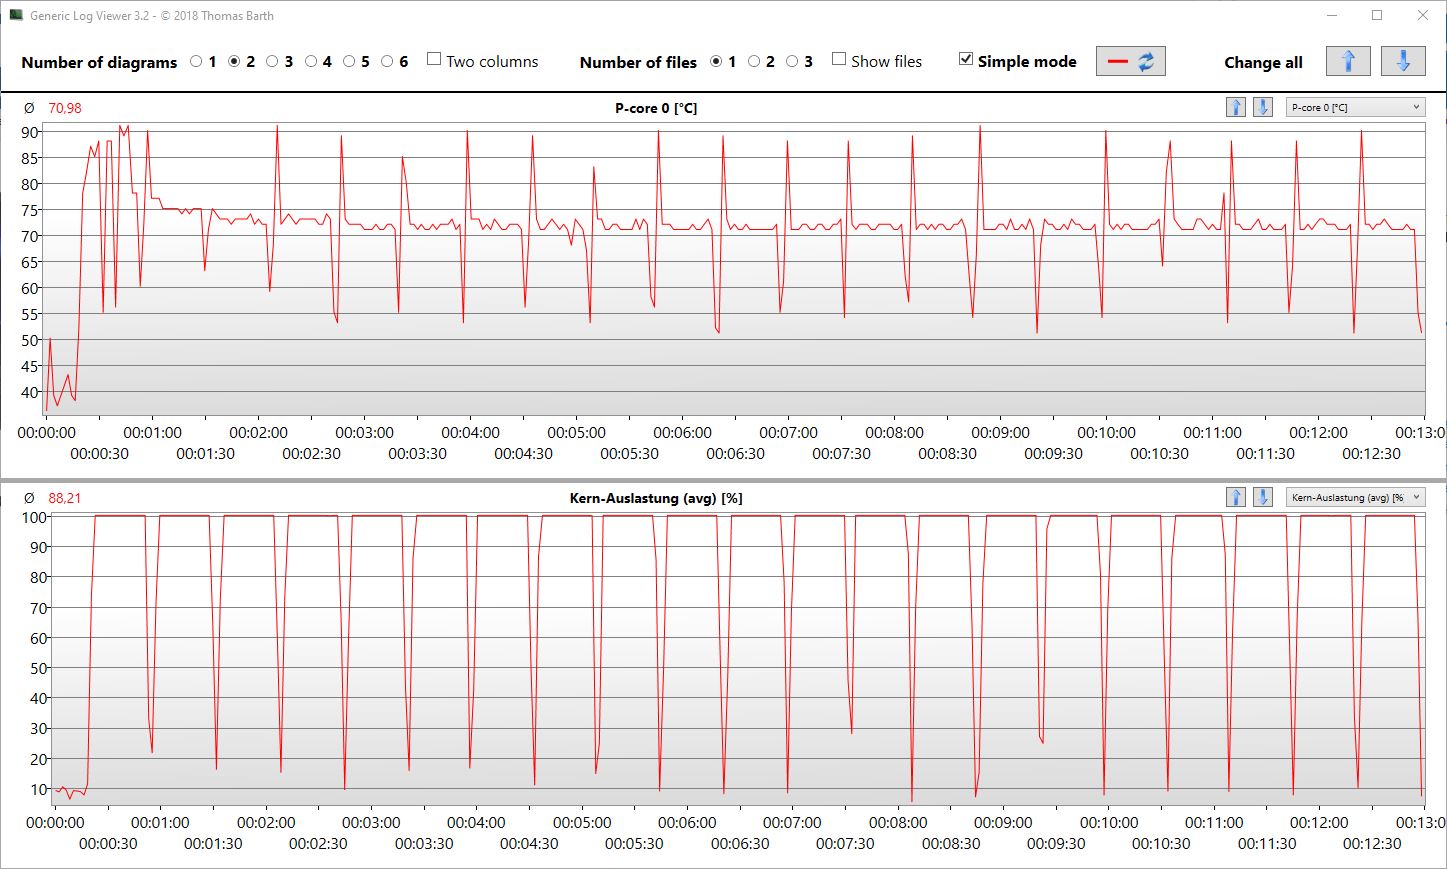
Dlaczego? 4.6 GHz, czyli maksymalne taktowanie dwóch rdzeni P, nie jest osiągane nawet na początku benchmarku, a przeglądarka dziennika pokazuje 4,3 GHz tylko w pierwszych dwóch przebiegach. Średnia rdzeni P w pętli wynosi 3,58 GHz. Rdzenie E działają z częstotliwością 3,3 GHz również tylko na początku, zanim ich średnia spadnie do 2,45 GHz.
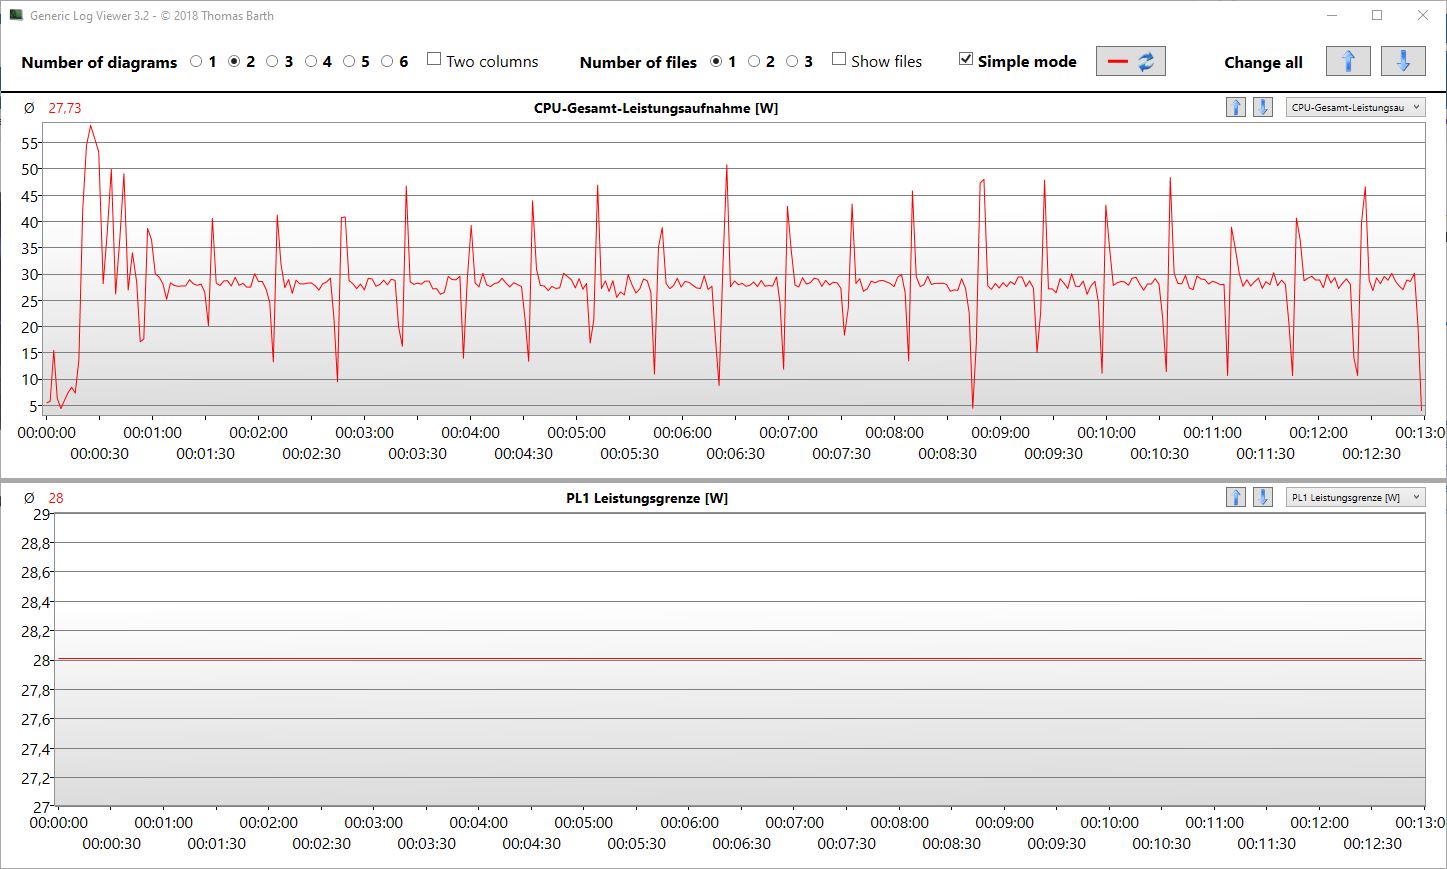
Acer dostosował się do limitów temperatury, aby uzyskać niższe temperatury powierzchni, a gdy tylko 90 ° C (194 ° F) zostanie ledwo dotknięte, prędkość jest znacznie ograniczona. W poborze mocy SoC wyraźnie widzimy 55 watów (krótkoterminowo) i 28 watów (długoterminowo) jako znaczniki.
Nie czyni to jednak Acer TravelMate P4 złym laptopem biurowym. Z drugiej strony, ci, którzy potrzebują najlepszej możliwej szczytowej i stałej wydajności dla swoich aplikacji, będą lepiej obsługiwani z Dell Latitude 7440 lub Lenovo ThinkPad E14 G5.
Cinebench R15 Multi Constant Load Test
Cinebench R23: Multi Core | Single Core
Cinebench R20: CPU (Multi Core) | CPU (Single Core)
Cinebench R15: CPU Multi 64Bit | CPU Single 64Bit
Blender: v2.79 BMW27 CPU
7-Zip 18.03: 7z b 4 | 7z b 4 -mmt1
Geekbench 5.5: Multi-Core | Single-Core
HWBOT x265 Benchmark v2.2: 4k Preset
LibreOffice : 20 Documents To PDF
R Benchmark 2.5: Overall mean
| CPU Performance rating | |
| Średnia w klasie Subnotebook | |
| Lenovo ThinkPad E14 G5-21JSS05C00 | |
| Dell Latitude 7440 | |
| Acer TravelMate P4 TMP414-53-58XQ | |
| Przeciętny Intel Core i5-1335U | |
| HP ProBook 445 G10 | |
| HP ProBook 440 G9-5Y3Z3EA | |
| Lenovo ThinkPad E14 G5 i7-1355U | |
| Fujitsu LifeBook E5412A E542AMHAAMDE | |
| Cinebench R23 / Multi Core | |
| Średnia w klasie Subnotebook (1555 - 21812, n=60, ostatnie 2 lata) | |
| Lenovo ThinkPad E14 G5-21JSS05C00 | |
| Dell Latitude 7440 | |
| Acer TravelMate P4 TMP414-53-58XQ | |
| Acer TravelMate P4 TMP414-53-58XQ | |
| Przeciętny Intel Core i5-1335U (6957 - 9438, n=12) | |
| Lenovo ThinkPad E14 G5 i7-1355U | |
| HP ProBook 445 G10 | |
| HP ProBook 440 G9-5Y3Z3EA | |
| Fujitsu LifeBook E5412A E542AMHAAMDE | |
| Cinebench R23 / Single Core | |
| Lenovo ThinkPad E14 G5 i7-1355U | |
| Dell Latitude 7440 | |
| Acer TravelMate P4 TMP414-53-58XQ | |
| Acer TravelMate P4 TMP414-53-58XQ | |
| Średnia w klasie Subnotebook (358 - 2213, n=61, ostatnie 2 lata) | |
| HP ProBook 440 G9-5Y3Z3EA | |
| Przeciętny Intel Core i5-1335U (1532 - 1733, n=12) | |
| Lenovo ThinkPad E14 G5-21JSS05C00 | |
| HP ProBook 445 G10 | |
| Fujitsu LifeBook E5412A E542AMHAAMDE | |
| Cinebench R20 / CPU (Multi Core) | |
| Średnia w klasie Subnotebook (579 - 8541, n=57, ostatnie 2 lata) | |
| Lenovo ThinkPad E14 G5-21JSS05C00 | |
| Dell Latitude 7440 | |
| Acer TravelMate P4 TMP414-53-58XQ | |
| Przeciętny Intel Core i5-1335U (2602 - 3849, n=11) | |
| HP ProBook 445 G10 | |
| Lenovo ThinkPad E14 G5 i7-1355U | |
| HP ProBook 440 G9-5Y3Z3EA | |
| Fujitsu LifeBook E5412A E542AMHAAMDE | |
| Cinebench R20 / CPU (Single Core) | |
| Lenovo ThinkPad E14 G5 i7-1355U | |
| Dell Latitude 7440 | |
| Średnia w klasie Subnotebook (128 - 832, n=57, ostatnie 2 lata) | |
| HP ProBook 440 G9-5Y3Z3EA | |
| Acer TravelMate P4 TMP414-53-58XQ | |
| Przeciętny Intel Core i5-1335U (593 - 663, n=11) | |
| Lenovo ThinkPad E14 G5-21JSS05C00 | |
| HP ProBook 445 G10 | |
| Fujitsu LifeBook E5412A E542AMHAAMDE | |
| Cinebench R15 / CPU Multi 64Bit | |
| Średnia w klasie Subnotebook (327 - 3345, n=57, ostatnie 2 lata) | |
| Lenovo ThinkPad E14 G5-21JSS05C00 | |
| Dell Latitude 7440 | |
| Lenovo ThinkPad E14 G5 i7-1355U | |
| Przeciętny Intel Core i5-1335U (1109 - 1547, n=11) | |
| HP ProBook 440 G9-5Y3Z3EA | |
| HP ProBook 445 G10 | |
| Fujitsu LifeBook E5412A E542AMHAAMDE | |
| Acer TravelMate P4 TMP414-53-58XQ | |
| Cinebench R15 / CPU Single 64Bit | |
| Średnia w klasie Subnotebook (72.4 - 322, n=57, ostatnie 2 lata) | |
| Lenovo ThinkPad E14 G5 i7-1355U | |
| Dell Latitude 7440 | |
| Acer TravelMate P4 TMP414-53-58XQ | |
| HP ProBook 440 G9-5Y3Z3EA | |
| HP ProBook 440 G9-5Y3Z3EA | |
| Przeciętny Intel Core i5-1335U (222 - 248, n=11) | |
| HP ProBook 445 G10 | |
| Lenovo ThinkPad E14 G5-21JSS05C00 | |
| Fujitsu LifeBook E5412A E542AMHAAMDE | |
| Blender / v2.79 BMW27 CPU | |
| Lenovo ThinkPad E14 G5 i7-1355U | |
| Przeciętny Intel Core i5-1335U (340 - 786, n=12) | |
| HP ProBook 440 G9-5Y3Z3EA | |
| Fujitsu LifeBook E5412A E542AMHAAMDE | |
| HP ProBook 445 G10 | |
| Średnia w klasie Subnotebook (159 - 2271, n=58, ostatnie 2 lata) | |
| Acer TravelMate P4 TMP414-53-58XQ | |
| Dell Latitude 7440 | |
| Lenovo ThinkPad E14 G5-21JSS05C00 | |
| 7-Zip 18.03 / 7z b 4 | |
| Lenovo ThinkPad E14 G5-21JSS05C00 | |
| Średnia w klasie Subnotebook (11668 - 77867, n=57, ostatnie 2 lata) | |
| Dell Latitude 7440 | |
| HP ProBook 445 G10 | |
| Fujitsu LifeBook E5412A E542AMHAAMDE | |
| Acer TravelMate P4 TMP414-53-58XQ | |
| Przeciętny Intel Core i5-1335U (25012 - 38513, n=11) | |
| Lenovo ThinkPad E14 G5 i7-1355U | |
| HP ProBook 440 G9-5Y3Z3EA | |
| 7-Zip 18.03 / 7z b 4 -mmt1 | |
| Lenovo ThinkPad E14 G5 i7-1355U | |
| Acer TravelMate P4 TMP414-53-58XQ | |
| Średnia w klasie Subnotebook (2643 - 6699, n=59, ostatnie 2 lata) | |
| HP ProBook 445 G10 | |
| Lenovo ThinkPad E14 G5-21JSS05C00 | |
| Dell Latitude 7440 | |
| HP ProBook 440 G9-5Y3Z3EA | |
| Przeciętny Intel Core i5-1335U (4872 - 5545, n=11) | |
| Fujitsu LifeBook E5412A E542AMHAAMDE | |
| Geekbench 5.5 / Multi-Core | |
| Średnia w klasie Subnotebook (2557 - 17218, n=48, ostatnie 2 lata) | |
| Dell Latitude 7440 | |
| Lenovo ThinkPad E14 G5 i7-1355U | |
| Przeciętny Intel Core i5-1335U (5459 - 8618, n=11) | |
| Lenovo ThinkPad E14 G5-21JSS05C00 | |
| Acer TravelMate P4 TMP414-53-58XQ | |
| HP ProBook 440 G9-5Y3Z3EA | |
| Fujitsu LifeBook E5412A E542AMHAAMDE | |
| HP ProBook 445 G10 | |
| Geekbench 5.5 / Single-Core | |
| Średnia w klasie Subnotebook (726 - 2224, n=48, ostatnie 2 lata) | |
| Lenovo ThinkPad E14 G5 i7-1355U | |
| Dell Latitude 7440 | |
| Przeciętny Intel Core i5-1335U (1506 - 1700, n=11) | |
| Acer TravelMate P4 TMP414-53-58XQ | |
| HP ProBook 440 G9-5Y3Z3EA | |
| Lenovo ThinkPad E14 G5-21JSS05C00 | |
| HP ProBook 445 G10 | |
| Fujitsu LifeBook E5412A E542AMHAAMDE | |
| HWBOT x265 Benchmark v2.2 / 4k Preset | |
| Lenovo ThinkPad E14 G5-21JSS05C00 | |
| Średnia w klasie Subnotebook (0.97 - 25.1, n=57, ostatnie 2 lata) | |
| Dell Latitude 7440 | |
| Fujitsu LifeBook E5412A E542AMHAAMDE | |
| HP ProBook 445 G10 | |
| Acer TravelMate P4 TMP414-53-58XQ | |
| Przeciętny Intel Core i5-1335U (6.55 - 10.7, n=11) | |
| HP ProBook 440 G9-5Y3Z3EA | |
| Lenovo ThinkPad E14 G5 i7-1355U | |
| LibreOffice / 20 Documents To PDF | |
| Lenovo ThinkPad E14 G5 i7-1355U | |
| Średnia w klasie Subnotebook (39.9 - 220, n=56, ostatnie 2 lata) | |
| Fujitsu LifeBook E5412A E542AMHAAMDE | |
| Acer TravelMate P4 TMP414-53-58XQ | |
| HP ProBook 445 G10 | |
| HP ProBook 440 G9-5Y3Z3EA | |
| Przeciętny Intel Core i5-1335U (45 - 58.7, n=11) | |
| Lenovo ThinkPad E14 G5-21JSS05C00 | |
| Dell Latitude 7440 | |
| R Benchmark 2.5 / Overall mean | |
| Lenovo ThinkPad E14 G5 i7-1355U | |
| Fujitsu LifeBook E5412A E542AMHAAMDE | |
| Średnia w klasie Subnotebook (0.4024 - 1.456, n=58, ostatnie 2 lata) | |
| HP ProBook 445 G10 | |
| Lenovo ThinkPad E14 G5-21JSS05C00 | |
| Acer TravelMate P4 TMP414-53-58XQ | |
| HP ProBook 440 G9-5Y3Z3EA | |
| Przeciętny Intel Core i5-1335U (0.4892 - 0.524, n=10) | |
| Dell Latitude 7440 | |
* ... im mniej tym lepiej
AIDA64: FP32 Ray-Trace | FPU Julia | CPU SHA3 | CPU Queen | FPU SinJulia | FPU Mandel | CPU AES | CPU ZLib | FP64 Ray-Trace | CPU PhotoWorxx
| Performance rating | |
| Średnia w klasie Subnotebook | |
| Lenovo ThinkPad E14 G5-21JSS05C00 | |
| Dell Latitude 7440 | |
| HP ProBook 445 G10 | |
| Fujitsu LifeBook E5412A E542AMHAAMDE | |
| Acer TravelMate P4 TMP414-53-58XQ | |
| Przeciętny Intel Core i5-1335U | |
| Lenovo ThinkPad E14 G5 i7-1355U | |
| HP ProBook 440 G9-5Y3Z3EA | |
| AIDA64 / FP32 Ray-Trace | |
| Średnia w klasie Subnotebook (1135 - 32888, n=58, ostatnie 2 lata) | |
| Lenovo ThinkPad E14 G5-21JSS05C00 | |
| HP ProBook 445 G10 | |
| Fujitsu LifeBook E5412A E542AMHAAMDE | |
| Dell Latitude 7440 | |
| Acer TravelMate P4 TMP414-53-58XQ | |
| Przeciętny Intel Core i5-1335U (5661 - 7809, n=11) | |
| HP ProBook 440 G9-5Y3Z3EA | |
| Lenovo ThinkPad E14 G5 i7-1355U | |
| AIDA64 / FPU Julia | |
| Lenovo ThinkPad E14 G5-21JSS05C00 | |
| Średnia w klasie Subnotebook (5218 - 123315, n=58, ostatnie 2 lata) | |
| HP ProBook 445 G10 | |
| Fujitsu LifeBook E5412A E542AMHAAMDE | |
| Dell Latitude 7440 | |
| Acer TravelMate P4 TMP414-53-58XQ | |
| Przeciętny Intel Core i5-1335U (29483 - 43636, n=11) | |
| HP ProBook 440 G9-5Y3Z3EA | |
| Lenovo ThinkPad E14 G5 i7-1355U | |
| AIDA64 / CPU SHA3 | |
| Średnia w klasie Subnotebook (444 - 5287, n=58, ostatnie 2 lata) | |
| Lenovo ThinkPad E14 G5-21JSS05C00 | |
| Dell Latitude 7440 | |
| Acer TravelMate P4 TMP414-53-58XQ | |
| HP ProBook 445 G10 | |
| Fujitsu LifeBook E5412A E542AMHAAMDE | |
| Przeciętny Intel Core i5-1335U (1515 - 2278, n=11) | |
| HP ProBook 440 G9-5Y3Z3EA | |
| Lenovo ThinkPad E14 G5 i7-1355U | |
| AIDA64 / CPU Queen | |
| Lenovo ThinkPad E14 G5-21JSS05C00 | |
| HP ProBook 445 G10 | |
| Fujitsu LifeBook E5412A E542AMHAAMDE | |
| Lenovo ThinkPad E14 G5 i7-1355U | |
| HP ProBook 440 G9-5Y3Z3EA | |
| Dell Latitude 7440 | |
| Średnia w klasie Subnotebook (10579 - 95002, n=51, ostatnie 2 lata) | |
| Acer TravelMate P4 TMP414-53-58XQ | |
| Przeciętny Intel Core i5-1335U (53839 - 60992, n=11) | |
| AIDA64 / FPU SinJulia | |
| Lenovo ThinkPad E14 G5-21JSS05C00 | |
| HP ProBook 445 G10 | |
| Fujitsu LifeBook E5412A E542AMHAAMDE | |
| Średnia w klasie Subnotebook (744 - 18418, n=58, ostatnie 2 lata) | |
| Dell Latitude 7440 | |
| Acer TravelMate P4 TMP414-53-58XQ | |
| Lenovo ThinkPad E14 G5 i7-1355U | |
| Przeciętny Intel Core i5-1335U (3873 - 5008, n=11) | |
| HP ProBook 440 G9-5Y3Z3EA | |
| AIDA64 / FPU Mandel | |
| Lenovo ThinkPad E14 G5-21JSS05C00 | |
| Średnia w klasie Subnotebook (3341 - 65433, n=58, ostatnie 2 lata) | |
| HP ProBook 445 G10 | |
| Fujitsu LifeBook E5412A E542AMHAAMDE | |
| Dell Latitude 7440 | |
| Acer TravelMate P4 TMP414-53-58XQ | |
| Przeciętny Intel Core i5-1335U (14376 - 20553, n=11) | |
| HP ProBook 440 G9-5Y3Z3EA | |
| Lenovo ThinkPad E14 G5 i7-1355U | |
| AIDA64 / CPU AES | |
| Średnia w klasie Subnotebook (638 - 96917, n=58, ostatnie 2 lata) | |
| Lenovo ThinkPad E14 G5-21JSS05C00 | |
| Dell Latitude 7440 | |
| Acer TravelMate P4 TMP414-53-58XQ | |
| Przeciętny Intel Core i5-1335U (31154 - 65997, n=11) | |
| Lenovo ThinkPad E14 G5 i7-1355U | |
| HP ProBook 440 G9-5Y3Z3EA | |
| HP ProBook 445 G10 | |
| Fujitsu LifeBook E5412A E542AMHAAMDE | |
| AIDA64 / CPU ZLib | |
| Średnia w klasie Subnotebook (164.9 - 1379, n=58, ostatnie 2 lata) | |
| Lenovo ThinkPad E14 G5-21JSS05C00 | |
| Dell Latitude 7440 | |
| Acer TravelMate P4 TMP414-53-58XQ | |
| Przeciętny Intel Core i5-1335U (378 - 676, n=11) | |
| Lenovo ThinkPad E14 G5 i7-1355U | |
| HP ProBook 445 G10 | |
| Fujitsu LifeBook E5412A E542AMHAAMDE | |
| HP ProBook 440 G9-5Y3Z3EA | |
| AIDA64 / FP64 Ray-Trace | |
| Średnia w klasie Subnotebook (610 - 17495, n=58, ostatnie 2 lata) | |
| Lenovo ThinkPad E14 G5-21JSS05C00 | |
| HP ProBook 445 G10 | |
| Fujitsu LifeBook E5412A E542AMHAAMDE | |
| Dell Latitude 7440 | |
| Acer TravelMate P4 TMP414-53-58XQ | |
| HP ProBook 440 G9-5Y3Z3EA | |
| Przeciętny Intel Core i5-1335U (2878 - 4214, n=11) | |
| Lenovo ThinkPad E14 G5 i7-1355U | |
| AIDA64 / CPU PhotoWorxx | |
| Średnia w klasie Subnotebook (6569 - 85600, n=58, ostatnie 2 lata) | |
| Dell Latitude 7440 | |
| Przeciętny Intel Core i5-1335U (13584 - 41123, n=11) | |
| Lenovo ThinkPad E14 G5 i7-1355U | |
| Acer TravelMate P4 TMP414-53-58XQ | |
| Fujitsu LifeBook E5412A E542AMHAAMDE | |
| HP ProBook 440 G9-5Y3Z3EA | |
| Lenovo ThinkPad E14 G5-21JSS05C00 | |
| HP ProBook 445 G10 | |
Wydajność systemu
Benchmarki PCMark 10 i Crossmark oceniają wydajność aplikacji laptopa, testując połączenie pamięci masowej SSD, pamięci RAM, iGPU i procesora. Nasz TravelMate P4 plasuje się tutaj na samym dole, osiągając nawet wyniki poniżej średniej subnotebooków. Wątpliwe jest jednak, czy różnice są zauważalne w praktyce z aplikacjami Word, Excel i przeglądarkami, ponieważ nawet najlepszy wynik w PCMark 10, Lenovo ThinkPad E14 G5ma tylko 8% przewagi (13% w Crossmark).
CrossMark: Overall | Productivity | Creativity | Responsiveness
Mozilla Kraken 1.1: Total
| PCMark 10 / Score | |
| Średnia w klasie Subnotebook (4920 - 9939, n=44, ostatnie 2 lata) | |
| Lenovo ThinkPad E14 G5-21JSS05C00 | |
| Lenovo ThinkPad E14 G5 i7-1355U | |
| HP ProBook 445 G10 | |
| Fujitsu LifeBook E5412A E542AMHAAMDE | |
| Dell Latitude 7440 | |
| Acer TravelMate P4 TMP414-53-58XQ | |
| HP ProBook 440 G9-5Y3Z3EA | |
| Przeciętny Intel Core i5-1335U, Intel Iris Xe Graphics G7 80EUs (5068 - 5600, n=11) | |
| PCMark 10 / Essentials | |
| Lenovo ThinkPad E14 G5 i7-1355U | |
| Dell Latitude 7440 | |
| Acer TravelMate P4 TMP414-53-58XQ | |
| Lenovo ThinkPad E14 G5-21JSS05C00 | |
| Przeciętny Intel Core i5-1335U, Intel Iris Xe Graphics G7 80EUs (9828 - 11912, n=11) | |
| HP ProBook 445 G10 | |
| Średnia w klasie Subnotebook (8552 - 11646, n=44, ostatnie 2 lata) | |
| HP ProBook 440 G9-5Y3Z3EA | |
| Fujitsu LifeBook E5412A E542AMHAAMDE | |
| PCMark 10 / Productivity | |
| Średnia w klasie Subnotebook (5435 - 16606, n=44, ostatnie 2 lata) | |
| HP ProBook 445 G10 | |
| Lenovo ThinkPad E14 G5-21JSS05C00 | |
| Fujitsu LifeBook E5412A E542AMHAAMDE | |
| Lenovo ThinkPad E14 G5 i7-1355U | |
| Acer TravelMate P4 TMP414-53-58XQ | |
| HP ProBook 440 G9-5Y3Z3EA | |
| Dell Latitude 7440 | |
| Przeciętny Intel Core i5-1335U, Intel Iris Xe Graphics G7 80EUs (6196 - 7261, n=11) | |
| PCMark 10 / Digital Content Creation | |
| Średnia w klasie Subnotebook (5722 - 13779, n=44, ostatnie 2 lata) | |
| Lenovo ThinkPad E14 G5 i7-1355U | |
| Lenovo ThinkPad E14 G5-21JSS05C00 | |
| Dell Latitude 7440 | |
| HP ProBook 440 G9-5Y3Z3EA | |
| Acer TravelMate P4 TMP414-53-58XQ | |
| Przeciętny Intel Core i5-1335U, Intel Iris Xe Graphics G7 80EUs (5361 - 6164, n=11) | |
| Fujitsu LifeBook E5412A E542AMHAAMDE | |
| HP ProBook 445 G10 | |
| CrossMark / Overall | |
| Średnia w klasie Subnotebook (365 - 2356, n=60, ostatnie 2 lata) | |
| Lenovo ThinkPad E14 G5 i7-1355U | |
| Przeciętny Intel Core i5-1335U, Intel Iris Xe Graphics G7 80EUs (1339 - 1599, n=11) | |
| Acer TravelMate P4 TMP414-53-58XQ | |
| HP ProBook 440 G9-5Y3Z3EA | |
| Lenovo ThinkPad E14 G5-21JSS05C00 | |
| Fujitsu LifeBook E5412A E542AMHAAMDE | |
| CrossMark / Productivity | |
| Średnia w klasie Subnotebook (364 - 2277, n=60, ostatnie 2 lata) | |
| Lenovo ThinkPad E14 G5 i7-1355U | |
| Przeciętny Intel Core i5-1335U, Intel Iris Xe Graphics G7 80EUs (1337 - 1638, n=11) | |
| Acer TravelMate P4 TMP414-53-58XQ | |
| HP ProBook 440 G9-5Y3Z3EA | |
| Lenovo ThinkPad E14 G5-21JSS05C00 | |
| Fujitsu LifeBook E5412A E542AMHAAMDE | |
| CrossMark / Creativity | |
| Średnia w klasie Subnotebook (372 - 2743, n=60, ostatnie 2 lata) | |
| Lenovo ThinkPad E14 G5 i7-1355U | |
| Przeciętny Intel Core i5-1335U, Intel Iris Xe Graphics G7 80EUs (1315 - 1620, n=11) | |
| HP ProBook 440 G9-5Y3Z3EA | |
| Lenovo ThinkPad E14 G5-21JSS05C00 | |
| Acer TravelMate P4 TMP414-53-58XQ | |
| Fujitsu LifeBook E5412A E542AMHAAMDE | |
| CrossMark / Responsiveness | |
| Średnia w klasie Subnotebook (312 - 1854, n=60, ostatnie 2 lata) | |
| Lenovo ThinkPad E14 G5 i7-1355U | |
| Przeciętny Intel Core i5-1335U, Intel Iris Xe Graphics G7 80EUs (1023 - 1868, n=11) | |
| Acer TravelMate P4 TMP414-53-58XQ | |
| HP ProBook 440 G9-5Y3Z3EA | |
| Lenovo ThinkPad E14 G5-21JSS05C00 | |
| Fujitsu LifeBook E5412A E542AMHAAMDE | |
| Mozilla Kraken 1.1 / Total | |
| Lenovo ThinkPad E14 G5 i7-1355U | |
| Przeciętny Intel Core i5-1335U, Intel Iris Xe Graphics G7 80EUs (545 - 1914, n=12) | |
| Fujitsu LifeBook E5412A E542AMHAAMDE | |
| HP ProBook 440 G9-5Y3Z3EA | |
| Lenovo ThinkPad E14 G5-21JSS05C00 | |
| Acer TravelMate P4 TMP414-53-58XQ | |
| Dell Latitude 7440 | |
| Średnia w klasie Subnotebook (234 - 1104, n=61, ostatnie 2 lata) | |
* ... im mniej tym lepiej
| PCMark 10 Score | 5486 pkt. | |
Pomoc | ||
| AIDA64 / Memory Copy | |
| Średnia w klasie Subnotebook (14554 - 131023, n=58, ostatnie 2 lata) | |
| Dell Latitude 7440 | |
| Przeciętny Intel Core i5-1335U (22417 - 60884, n=11) | |
| Lenovo ThinkPad E14 G5 i7-1355U | |
| Lenovo ThinkPad E14 G5-21JSS05C00 | |
| Fujitsu LifeBook E5412A E542AMHAAMDE | |
| HP ProBook 440 G9-5Y3Z3EA | |
| Acer TravelMate P4 TMP414-53-58XQ | |
| HP ProBook 445 G10 | |
| AIDA64 / Memory Read | |
| Średnia w klasie Subnotebook (15948 - 127174, n=58, ostatnie 2 lata) | |
| Dell Latitude 7440 | |
| Przeciętny Intel Core i5-1335U (23104 - 61555, n=11) | |
| Fujitsu LifeBook E5412A E542AMHAAMDE | |
| Lenovo ThinkPad E14 G5-21JSS05C00 | |
| Lenovo ThinkPad E14 G5 i7-1355U | |
| HP ProBook 445 G10 | |
| Acer TravelMate P4 TMP414-53-58XQ | |
| HP ProBook 440 G9-5Y3Z3EA | |
| AIDA64 / Memory Write | |
| Średnia w klasie Subnotebook (15709 - 135141, n=58, ostatnie 2 lata) | |
| Dell Latitude 7440 | |
| Przeciętny Intel Core i5-1335U (22936 - 72584, n=11) | |
| Lenovo ThinkPad E14 G5 i7-1355U | |
| Fujitsu LifeBook E5412A E542AMHAAMDE | |
| Lenovo ThinkPad E14 G5-21JSS05C00 | |
| HP ProBook 445 G10 | |
| Acer TravelMate P4 TMP414-53-58XQ | |
| HP ProBook 440 G9-5Y3Z3EA | |
| AIDA64 / Memory Latency | |
| Dell Latitude 7440 | |
| Fujitsu LifeBook E5412A E542AMHAAMDE | |
| Przeciętny Intel Core i5-1335U (78.6 - 112.8, n=11) | |
| Średnia w klasie Subnotebook (6.1 - 159.9, n=56, ostatnie 2 lata) | |
| Lenovo ThinkPad E14 G5-21JSS05C00 | |
| HP ProBook 445 G10 | |
| Lenovo ThinkPad E14 G5 i7-1355U | |
| HP ProBook 440 G9-5Y3Z3EA | |
| Acer TravelMate P4 TMP414-53-58XQ | |
* ... im mniej tym lepiej
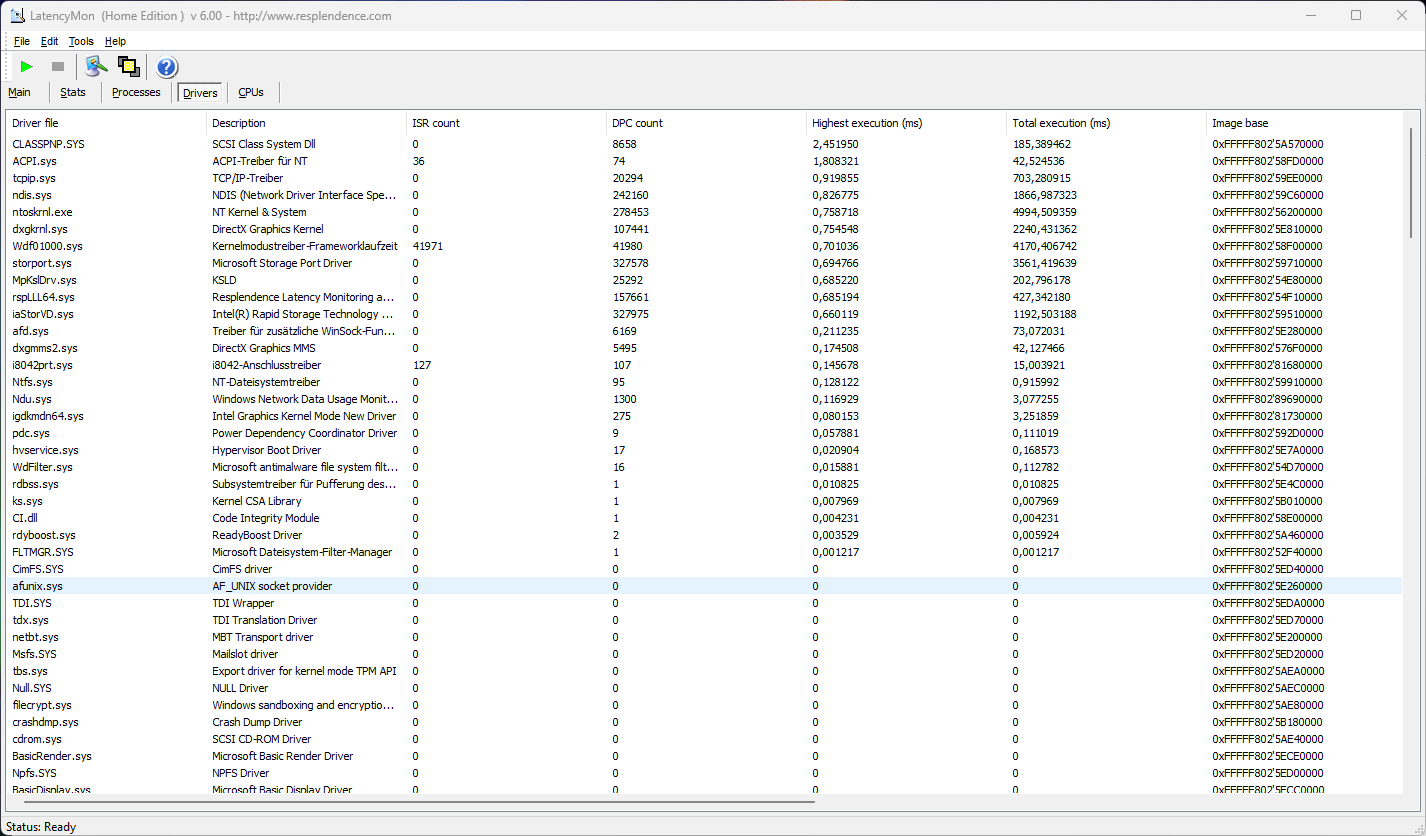
Opóźnienia DPC
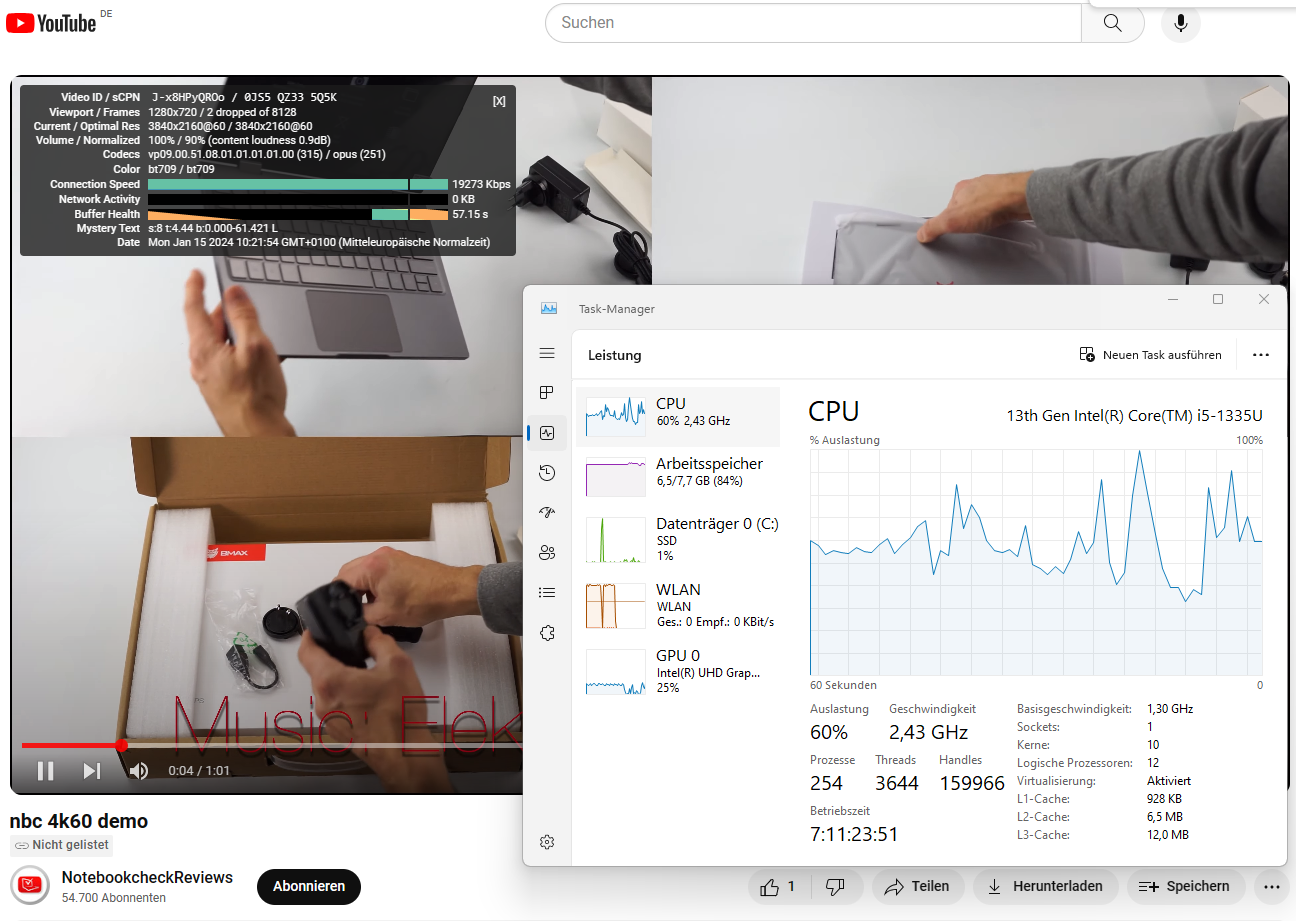
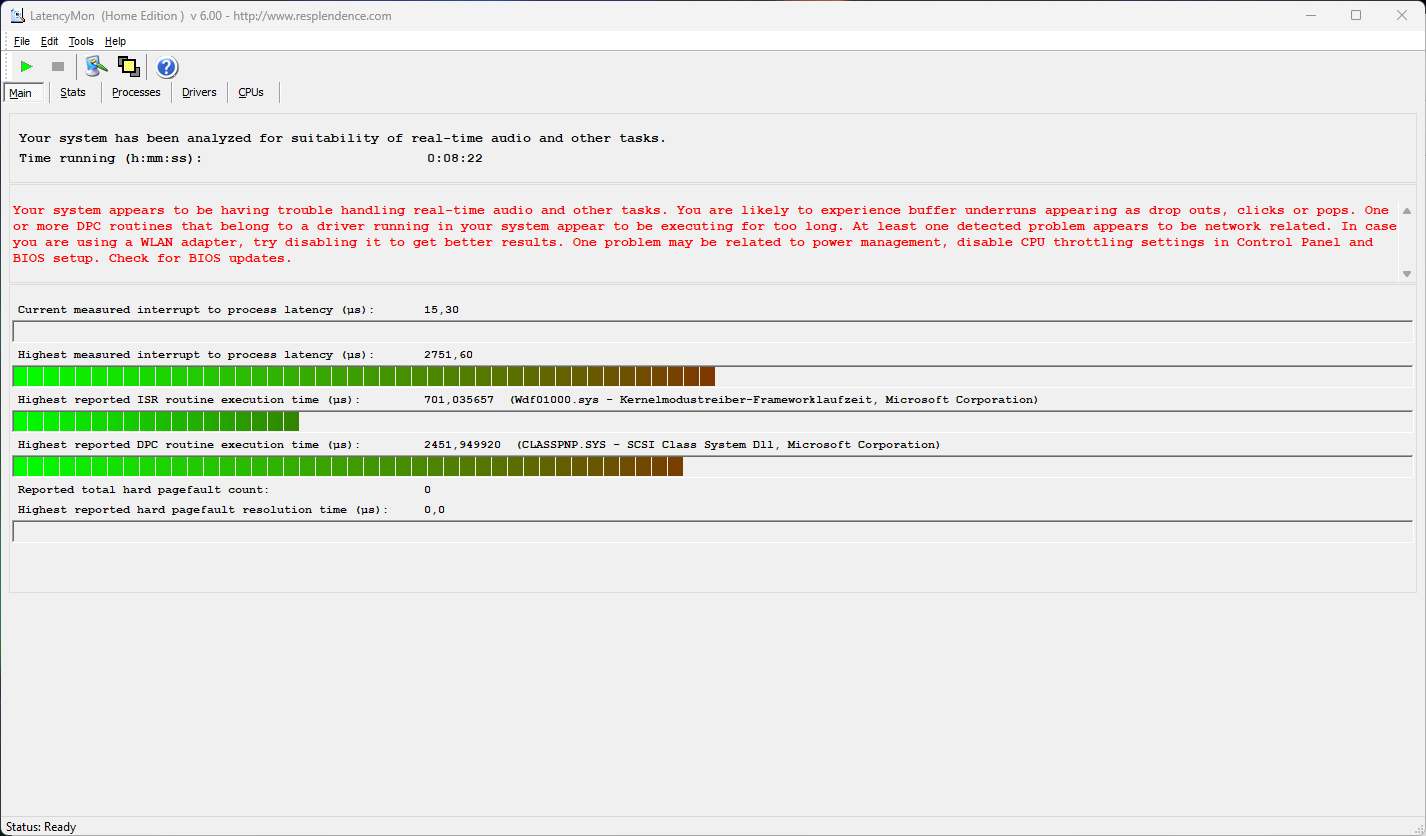
Latencje to opóźnienia wynikające z czasu, jaki system potrzebuje na obsługę zadań sterownika. Dotyczą one współpracy między różnymi urządzeniami, takimi jak audio, touchpad, dysk SSD, czytnik kart lub kontroler pamięci masowej. Jeśli mierzymy wysokie opóźnienia, są one wyrazem - lub migawkami w czasie - nieoptymalnych lub wadliwych sterowników urządzeń. Aktualizacje, w tym aktualizacje BIOS-u, mogą zaradzić opóźnieniom. Podczas produkcji audio, wysokie opóźnienie DPC może prowadzić do zacinania się lub opóźnień w dźwięku. TravelMate wykazuje dość wysokie opóźnienia, gdy otwieramy duże strony internetowe i odtwarzamy filmy 4K z YouTube, a następnie obciążamy procesor.
| DPC Latencies / LatencyMon - interrupt to process latency (max), Web, Youtube, Prime95 | |
| Acer TravelMate P4 TMP414-53-58XQ | |
| HP ProBook 440 G9-5Y3Z3EA | |
| Fujitsu LifeBook E5412A E542AMHAAMDE | |
| HP ProBook 445 G10 | |
| Lenovo ThinkPad E14 G5-21JSS05C00 | |
| Lenovo ThinkPad E14 G5 i7-1355U | |
| Dell Latitude 7440 | |
* ... im mniej tym lepiej
Rozwiązanie pamięci masowej
Dysk SSD Kingston nie jest w stanie konkurować z szeroką konkurencją w postaci pamięci Samsung i Western Digital i pozostaje ograniczony do dolnej połowy pola. Jak to często bywa, stała wydajność znacznie spada wraz z upływem czasu. Tak samo jest w przypadku innych modeli, ale poziom wyjściowy Kingstona jest również niższy niż WD PC SN740 w ThinkPadzie E14 G5 ThinkPad E14 G5na przykład.

* ... im mniej tym lepiej
Disk Throttling: DiskSpd Read Loop, Queue Depth 8
Karta graficzna
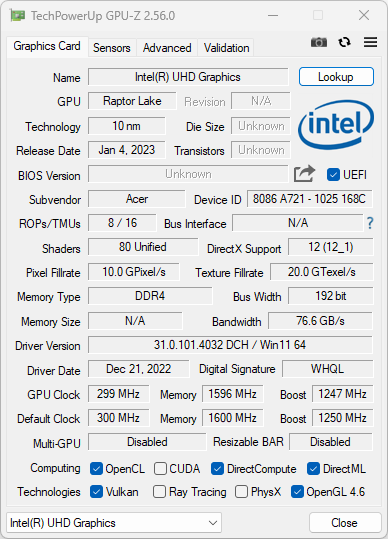
Zintegrowany Intel-Xe ze skromnymi 80 EU jest jednym z najmniejszych i najmniej wydajnych iGPU, jakie można obecnie znaleźć w laptopach. Nie oznacza to jednak, że jest ona zła sama w sobie, ponieważ nie musi robić nic więcej poza wspieraniem zadań dekodowania podczas odtwarzania filmów z YouTube lub gier przeglądarkowych.
| 3DMark 11 Performance | 5149 pkt. | |
| 3DMark Cloud Gate Standard Score | 16881 pkt. | |
| 3DMark Fire Strike Score | 2655 pkt. | |
| 3DMark Time Spy Score | 1139 pkt. | |
Pomoc | ||
* ... im mniej tym lepiej
Wydajność w grach
Ponieważ Intel Xe nie jest przeznaczony do gier, zgodnie z oczekiwaniami wypada słabo we wszystkich starszych grach testowych. To samo dotyczy bardziej aktualnych gier z 2023 roku, takich jak Total War Pharao, w które można grać tylko w ustawieniach Niskie i rozdzielczości Full HD. Wydajność 3D nie spada podczas pracy na baterii, a w przypadku gier przeglądarkowych nie ma powodów do obaw.
| Performance rating - Percent | |
| Średnia w klasie Subnotebook | |
| Dell Latitude 7440 -2! | |
| Lenovo ThinkPad E14 G5-21JSS05C00 -3! | |
| Lenovo ThinkPad E14 G5 i7-1355U -2! | |
| Fujitsu LifeBook E5412A E542AMHAAMDE -2! | |
| HP EliteBook 845 G9 6F6H9EA -2! | |
| Acer TravelMate P4 TMP414-53-58XQ | |
| HP ProBook 440 G9-5Y3Z3EA -6! | |
| HP ProBook 445 G10 -2! | |
| Total War Pharaoh | |
| 1920x1080 Medium Preset | |
| Średnia w klasie Subnotebook (36.4 - 113, n=11, ostatnie 2 lata) | |
| Acer TravelMate P4 TMP414-53-58XQ | |
| 1920x1080 Low Preset | |
| Średnia w klasie Subnotebook (46.1 - 159.5, n=12, ostatnie 2 lata) | |
| Acer TravelMate P4 TMP414-53-58XQ | |
Test gry The Witcher 3 przebiega na bardzo niskim poziomie (8-9 kl./s). Podczas gdy konkurenci z iGPU AMD Vega radzą sobie nieco lepiej, nadal są dalecy od zapewnienia jakichkolwiek grywalnych wartości. Dodaliśmy jedną z najpotężniejszych obecnie zintegrowanych kart graficznych, które można znaleźć w laptopach biznesowych (HP EliteBook 845 G9 6F6H9EA) do ogólnej oceny: Zamiast 70 punktów w ocenie wydajności, karta AMD Radeon 660M również otrzymuje tylko 67 punktów. Podsumowując, takie iGPU AMD może zrobić różnicę w niektórych pojedynczych grach, ale niekoniecznie będzie działać lepiej niż Intel Xe.
The Witcher 3 FPS Chart
| low | med. | high | ultra | |
|---|---|---|---|---|
| GTA V (2015) | 86 | 70 | 13.8 | |
| The Witcher 3 (2015) | 49.9 | 33.4 | 11.2 | 8.5 |
| Dota 2 Reborn (2015) | 98.6 | 70.2 | 37.6 | 34.7 |
| Assassin´s Creed Origins (2017) | 32 | 17 | 11 | |
| Final Fantasy XV Benchmark (2018) | 42 | 22 | 14 | |
| X-Plane 11.11 (2018) | 42.6 | 29.8 | 26.3 | |
| Far Cry 5 (2018) | 41 | 20 | 17 | |
| Strange Brigade (2018) | 48.8 | 19.4 | 17.7 | |
| Total War Pharaoh (2023) | 29.8 | 23.2 | 16.2 |
Emisje
Emisja hałasu
Pojedynczy wentylator wykonuje swoją pracę bez wytwarzania jakiegokolwiek hałasu: przy odrobinie otaczającego hałasu od ludzi lub innych codziennych odgłosów w biurze, jest on ledwo słyszalny. Jednak w trybie zrównoważonym wentylator nigdy nie pozostaje całkowicie cichy, a dziesięć zakładek przeglądarki będzie stale działać nawet przy obciążeniu procesora wynoszącym zaledwie 3-7%. W trybie "Best Power Savings" wentylator wyłącza się od czasu do czasu, ale po krótkim czasie ponownie się rozkręca. Wolelibyśmy, aby działał stale. Pod obciążeniem wentylator wzrasta do 36 lub 48 dB(A), ale dzieje się tak tylko podczas dłuższych procesów kopiowania lub ciągłych zadań obliczeniowych. Ogłuszające 48 dB(A) to raczej teoretyczna możliwość wynikająca z naszego scenariusza testów warunków skrajnych.
Hałas
| luz |
| 25.5 / 25.5 / 30.5 dB |
| obciążenie |
| 36.29 / 48.34 dB |
 | ||
30 dB cichy 40 dB(A) słyszalny 50 dB(A) irytujący |
||
min: | ||
| Acer TravelMate P4 TMP414-53-58XQ Iris Xe G7 80EUs, i5-1335U, Kingston OM8SEP4512Q-AA | Dell Latitude 7440 Iris Xe G7 80EUs, i5-1345U, Samsung MZ9L4512HBLU-00BMV | Lenovo ThinkPad E14 G5-21JSS05C00 Vega 8, R7 7730U, WD PC SN740 SDDPNQD-1T00 | Lenovo ThinkPad E14 G5 i7-1355U Iris Xe G7 96EUs, i7-1355U, WD PC SN740 512GB SDDQMQD-512G | HP ProBook 440 G9-5Y3Z3EA Iris Xe G7 96EUs, i7-1255U, Samsung PM991 MZVLQ512HBLU | HP ProBook 445 G10 Vega 7, R5 7530U, Kioxia BG5 KBG50ZNS512G | Fujitsu LifeBook E5412A E542AMHAAMDE Vega 7, R5 PRO 5675U, WDC PC SN530 SDBQNPZ-512G | |
|---|---|---|---|---|---|---|---|
| Noise | 18% | 9% | 11% | 6% | 10% | 9% | |
| wyłączone / środowisko * (dB) | 25.5 | 22.8 11% | 24.4 4% | 23.2 9% | 27 -6% | 24 6% | 23.6 7% |
| Idle Minimum * (dB) | 25.5 | 22.8 11% | 24.4 4% | 23.2 9% | 27 -6% | 24 6% | 23.6 7% |
| Idle Average * (dB) | 25.5 | 22.8 11% | 24.4 4% | 23.2 9% | 27 -6% | 25 2% | 23.6 7% |
| Idle Maximum * (dB) | 30.5 | 22.8 25% | 25.7 16% | 23.2 24% | 27 11% | 28 8% | 28.7 6% |
| Load Average * (dB) | 36.29 | 26.3 28% | 31.8 12% | 36 1% | 31.5 13% | 33 9% | 36.3 -0% |
| Load Maximum * (dB) | 48.34 | 38.3 21% | 41.2 15% | 41 15% | 34.9 28% | 36 26% | 36.3 25% |
| Witcher 3 ultra * (dB) | 30 | 36.7 | 38.5 | 36 | 36.3 |
* ... im mniej tym lepiej
Temperatury
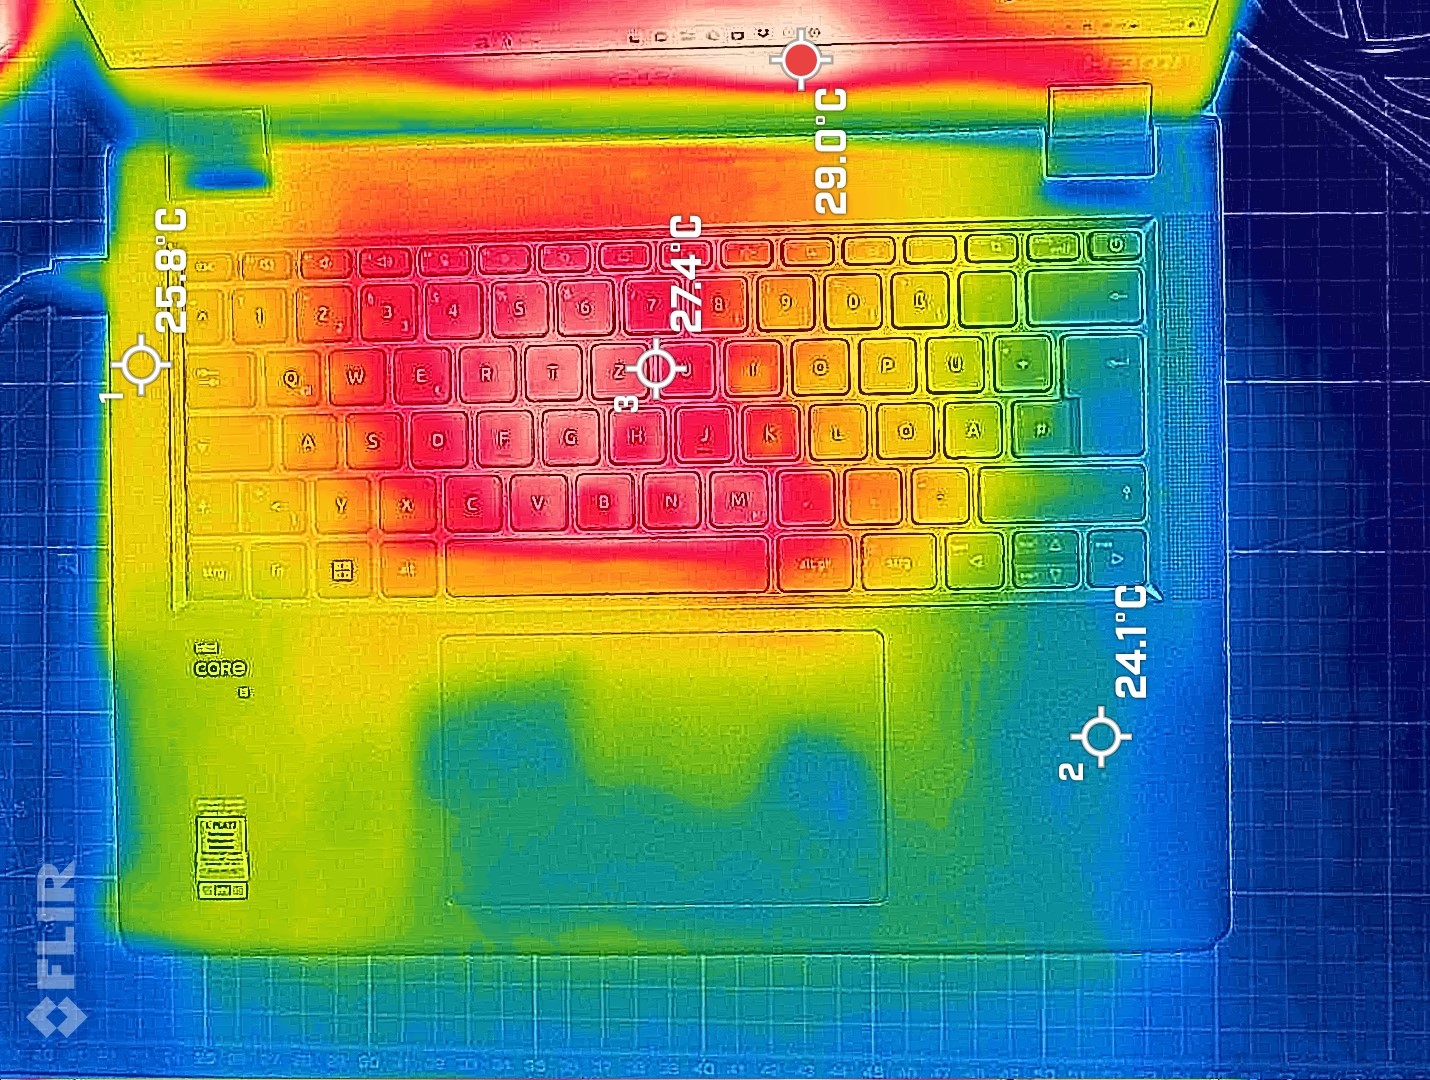
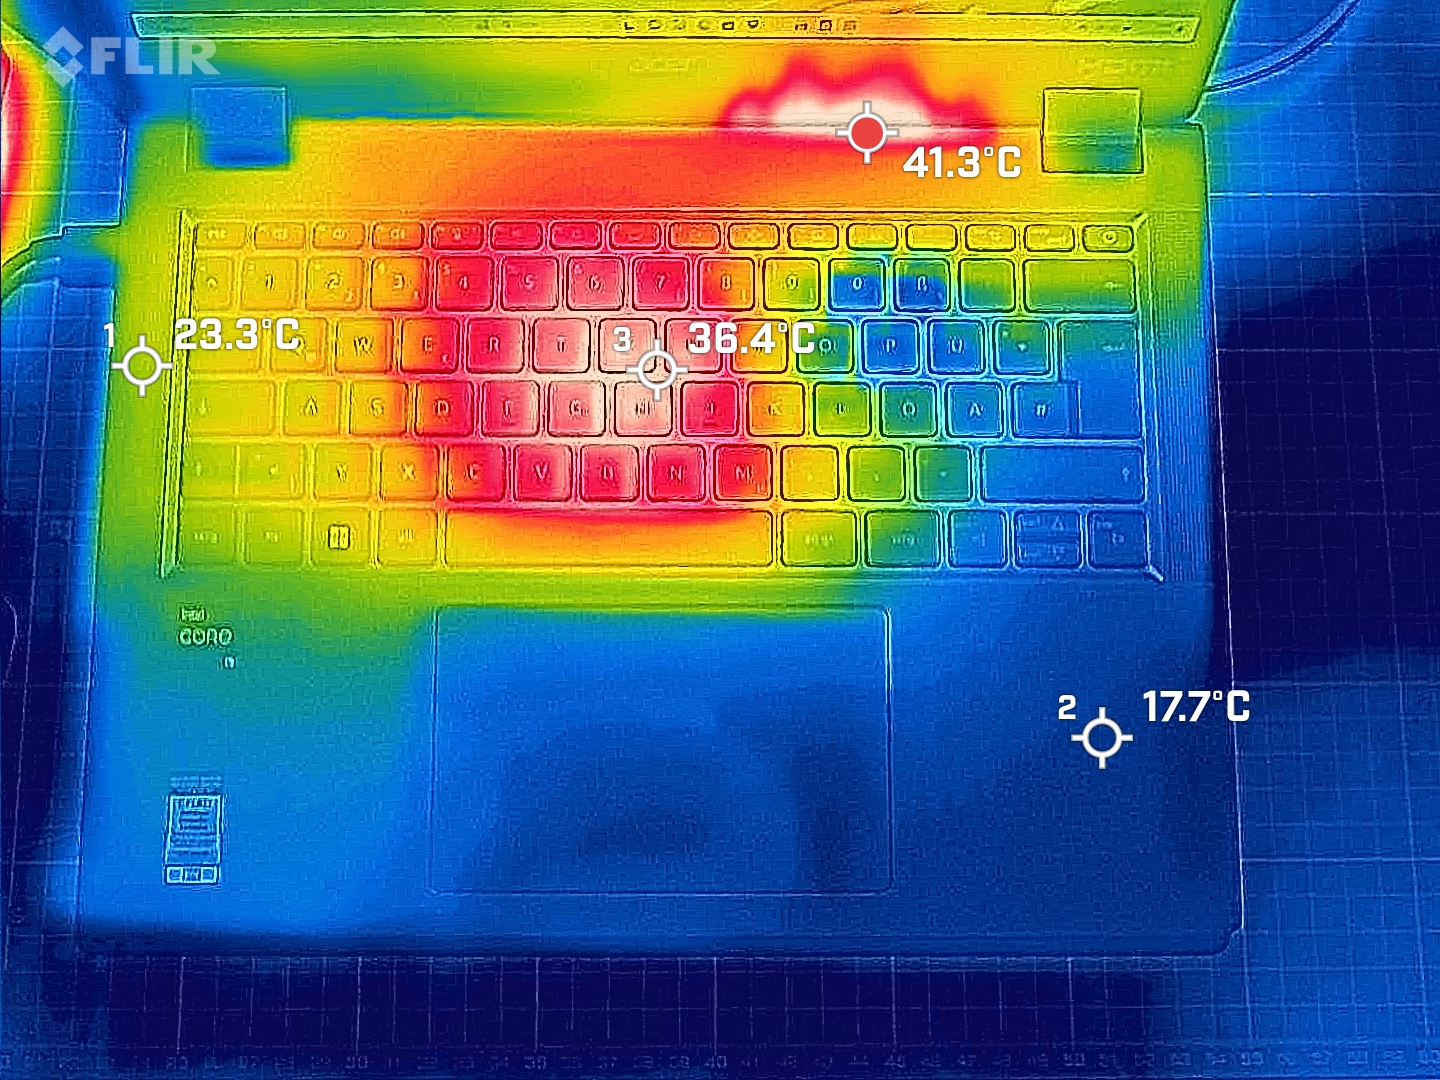
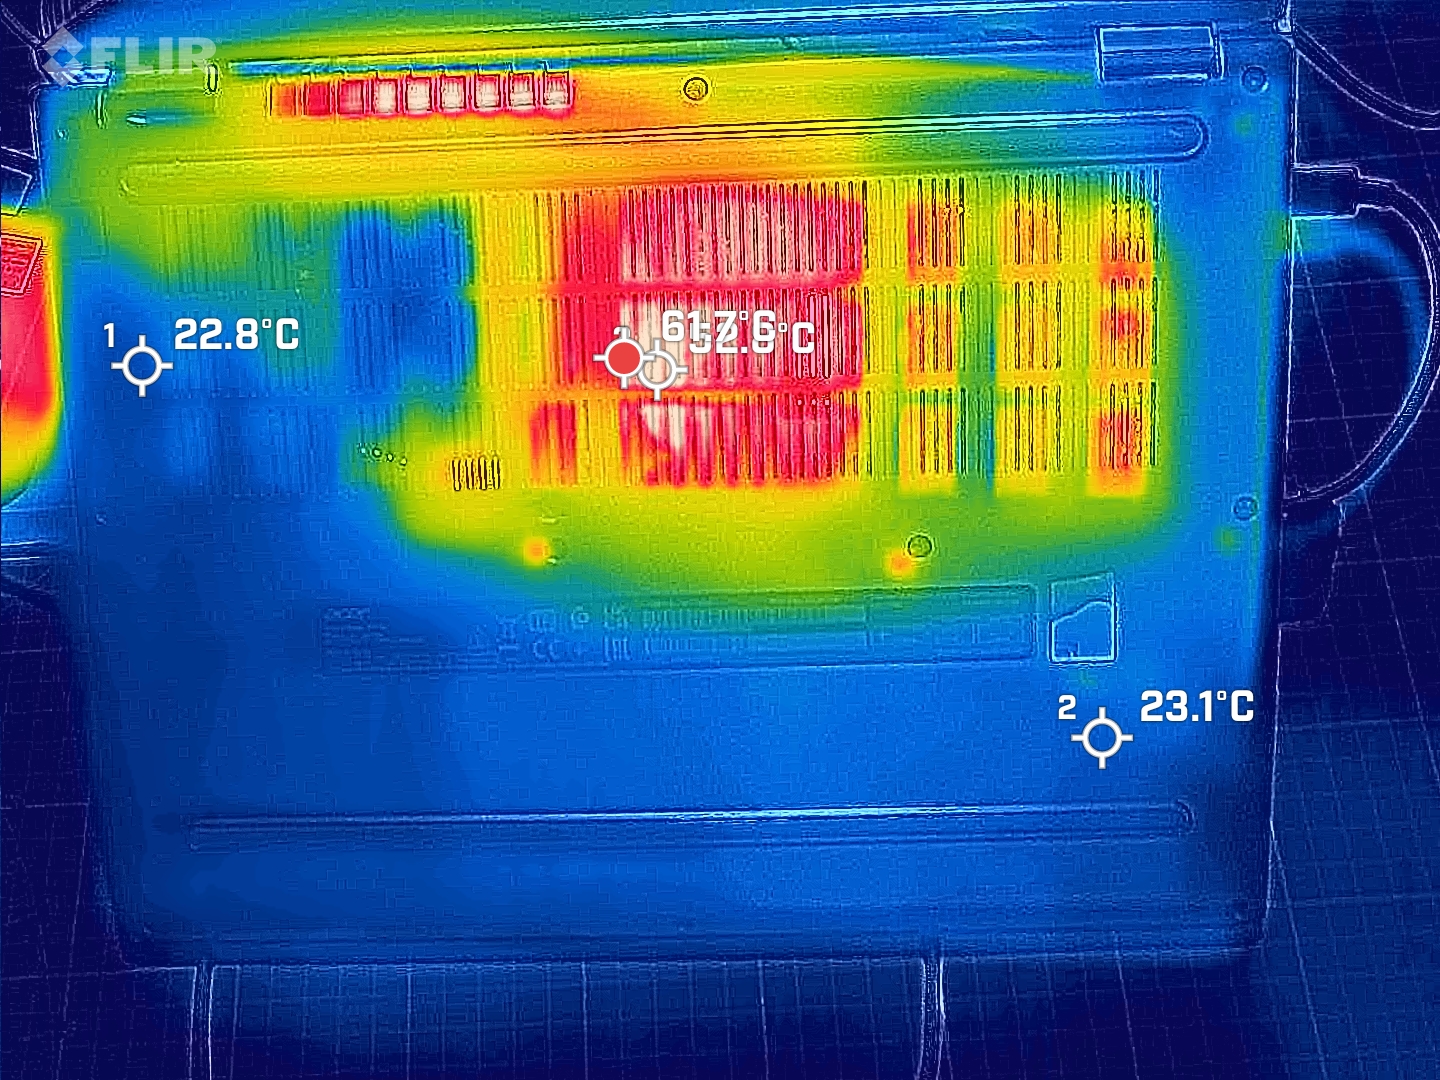
Laptop jest podniesiony przez długi gumowy pasek, który podnosi tył nieco wyżej niż przód. Nie zapewnia to większego komfortu pisania, ale poprawia chłodzenie, a powietrze jest zasysane w kierunku rurki cieplnej zarówno przez spód, jak i klawiaturę.
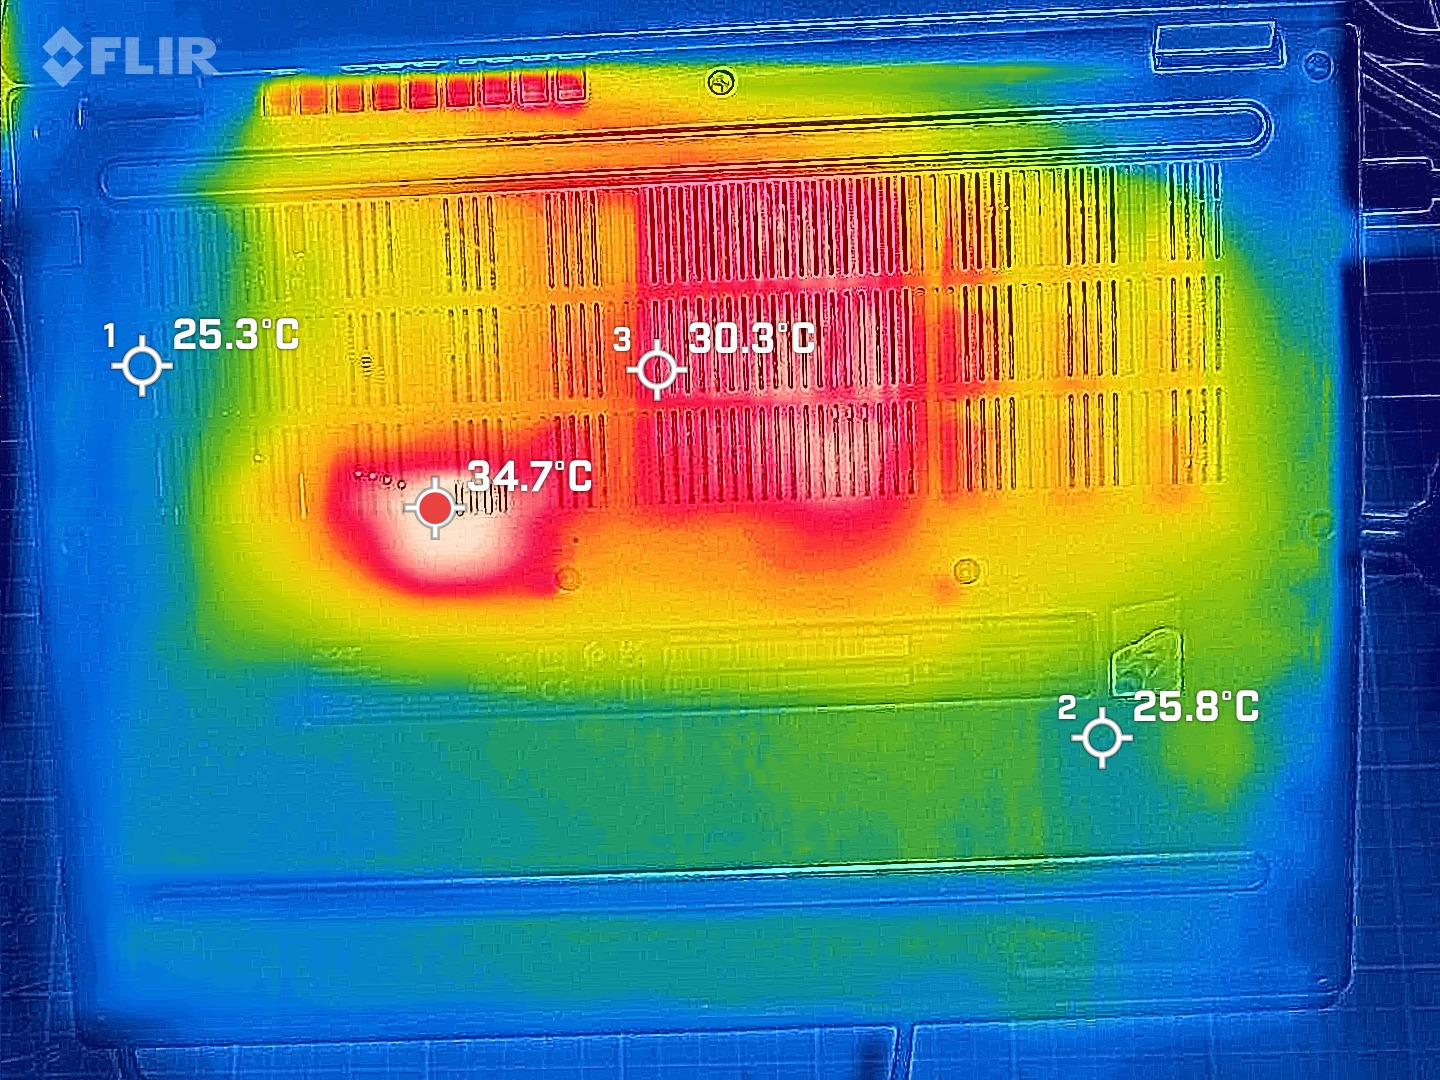
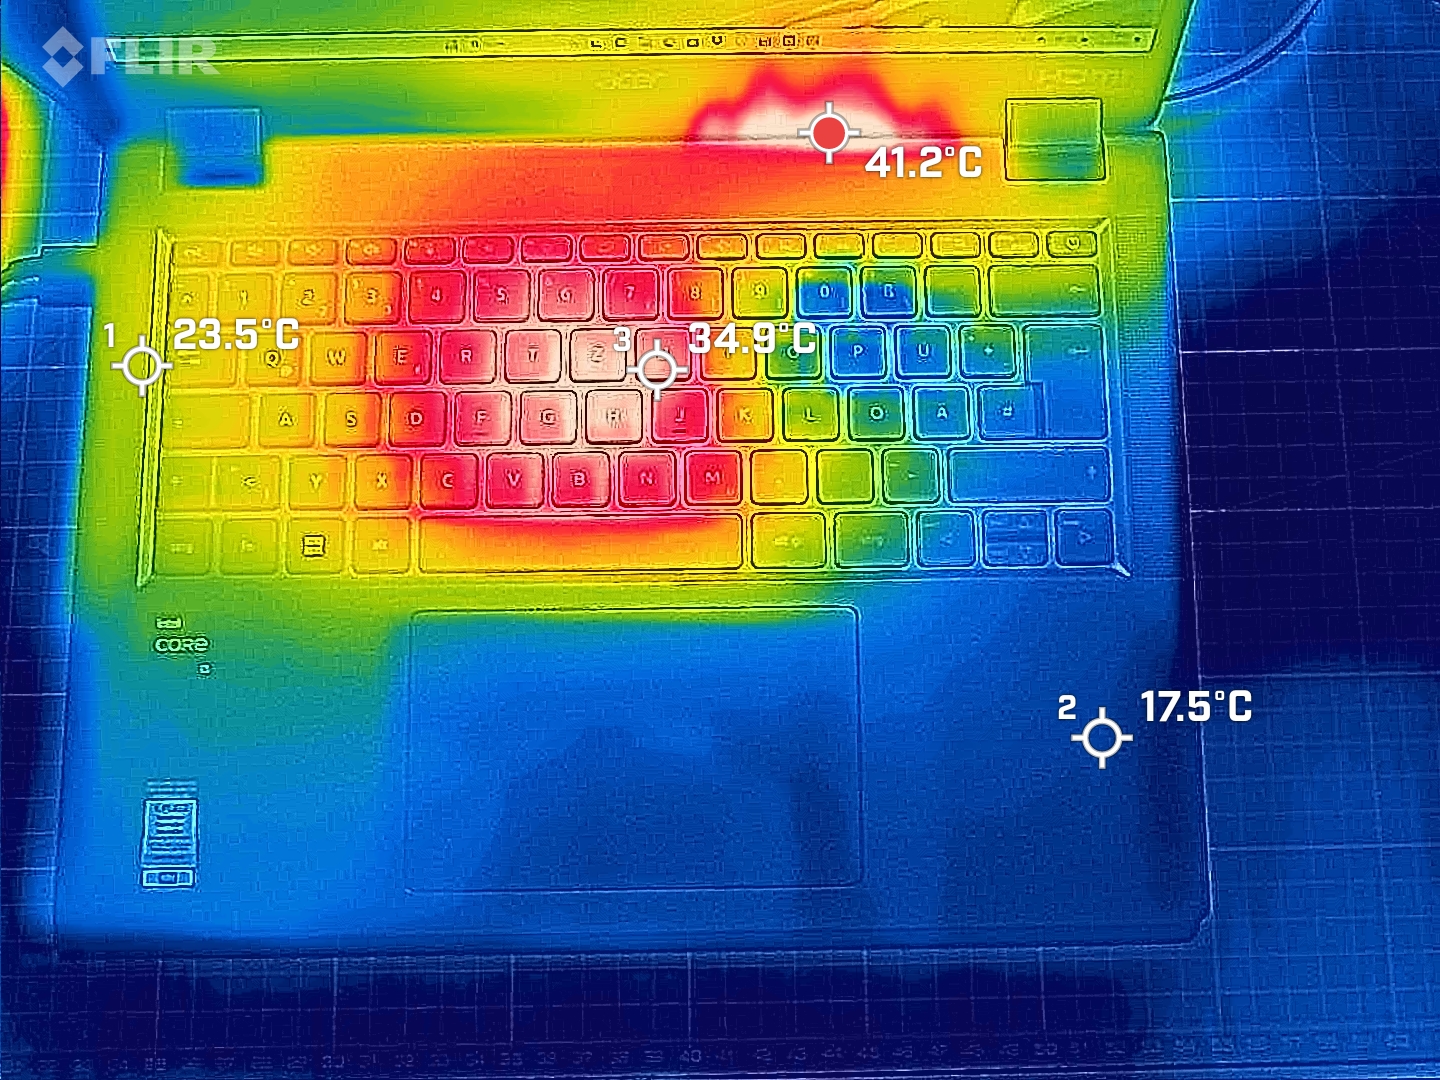
Prawie stale działający wentylator ma pozytywny wpływ: Podczas pisania tej recenzji temperatura utrzymuje się na poziomie 35 ºC (95 ºF) w obszarze klawiatury powyżej SoC i 28 ºC (82 ºF) w obszarach po prawej i poniżej. Pod obciążeniem, środek znacznie się nagrzewa, ale otaczające go obszary nie - lub tylko umiarkowanie. Spojrzenie na konkurencję pokazuje kilka dużych różnic - na korzyść TravelMate. A Thinkpad E14 (wersja AMD) może nagrzać się do 55 ºC (131 ºF) podczas testu warunków skrajnych, ponieważ jego wyższa wydajność ma również swoje koszty.
(+) Maksymalna temperatura w górnej części wynosi 35.8 °C / 96 F, w porównaniu do średniej 35.9 °C / 97 F , począwszy od 21.4 do 59 °C dla klasy Subnotebook.
(±) Dno nagrzewa się maksymalnie do 41.5 °C / 107 F, w porównaniu do średniej 39.2 °C / 103 F
(+) W stanie bezczynności średnia temperatura górnej części wynosi 25.1 °C / 77 F, w porównaniu ze średnią temperaturą urządzenia wynoszącą 30.8 °C / ### class_avg_f### F.
(+) Podpórki pod nadgarstki i touchpad są chłodniejsze niż temperatura skóry i maksymalnie 22.2 °C / 72 F i dlatego są chłodne w dotyku.
(+) Średnia temperatura obszaru podparcia dłoni w podobnych urządzeniach wynosiła 28.2 °C / 82.8 F (+6 °C / 10.8 F).
| Acer TravelMate P4 TMP414-53-58XQ Intel Core i5-1335U, Intel Iris Xe Graphics G7 80EUs | Lenovo ThinkPad E14 G5-21JSS05C00 AMD Ryzen 7 7730U, AMD Radeon RX Vega 8 (Ryzen 4000/5000) | Lenovo ThinkPad E14 G5 i7-1355U Intel Core i7-1355U, Intel Iris Xe Graphics G7 96EUs | HP ProBook 440 G9-5Y3Z3EA Intel Core i7-1255U, Intel Iris Xe Graphics G7 96EUs | HP ProBook 445 G10 AMD Ryzen 5 7530U, AMD Radeon RX Vega 7 | |
|---|---|---|---|---|---|
| Heat | -1% | -7% | 12% | -1% | |
| Maximum Upper Side * (°C) | 35.8 | 42.6 -19% | 45.4 -27% | 38.9 -9% | 43 -20% |
| Maximum Bottom * (°C) | 41.5 | 55.3 -33% | 50.8 -22% | 37.4 10% | 51 -23% |
| Idle Upper Side * (°C) | 35 | 25.8 26% | 30.2 14% | 26.7 24% | 27 23% |
| Idle Bottom * (°C) | 35.7 | 27.4 23% | 33.4 6% | 27.8 22% | 30 16% |
* ... im mniej tym lepiej
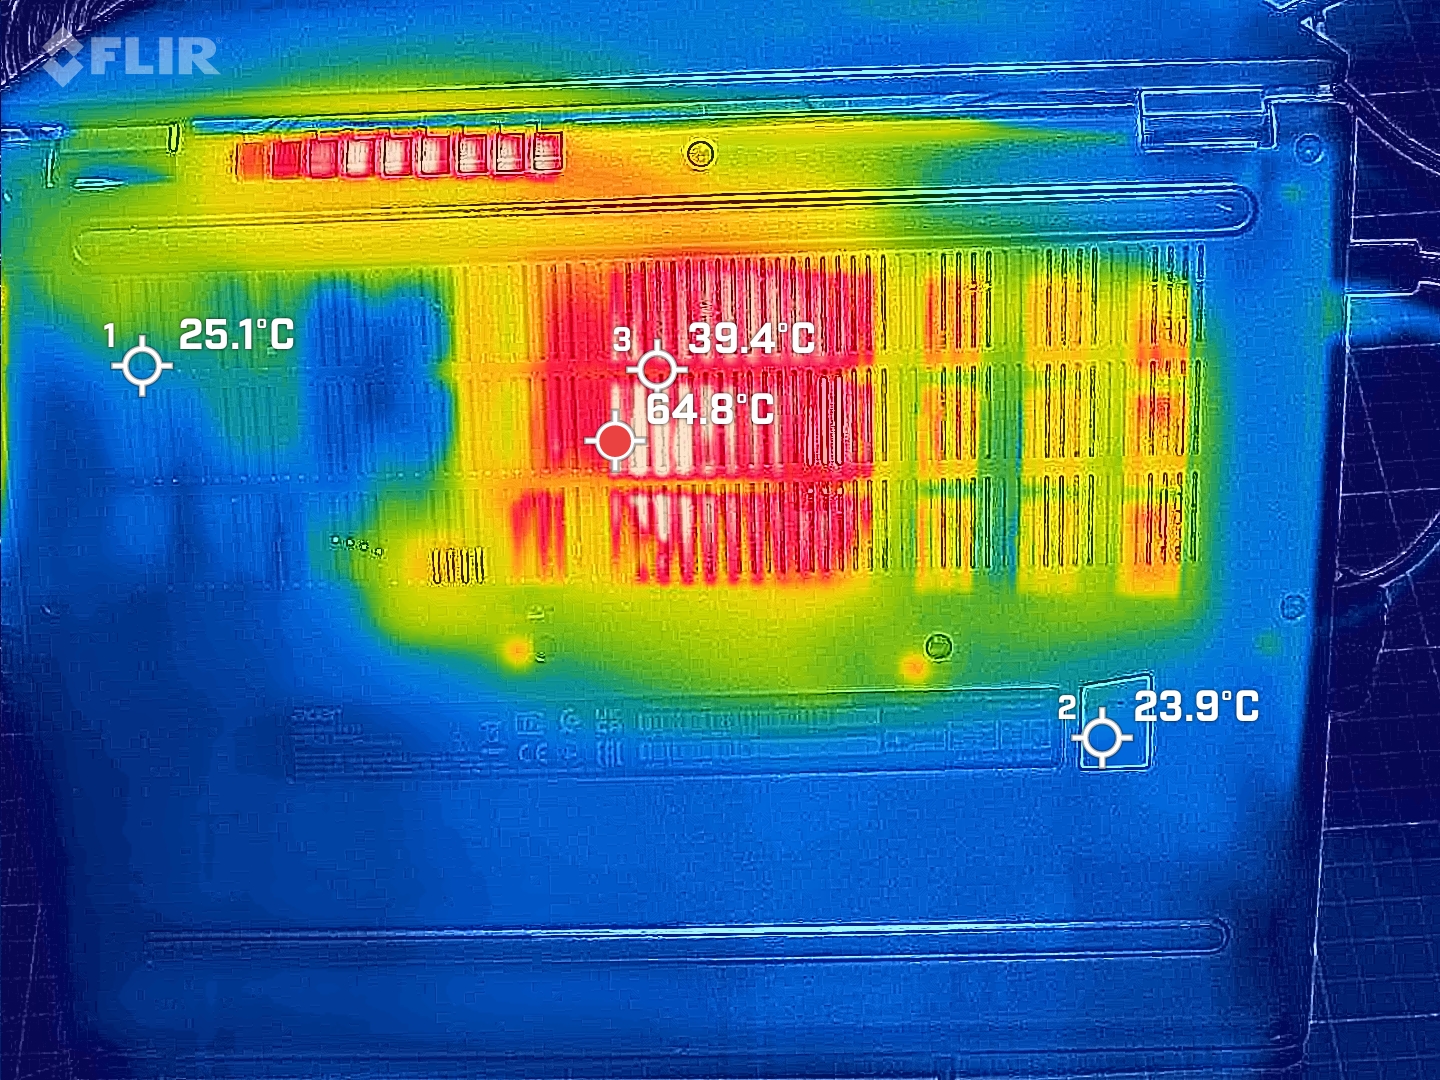
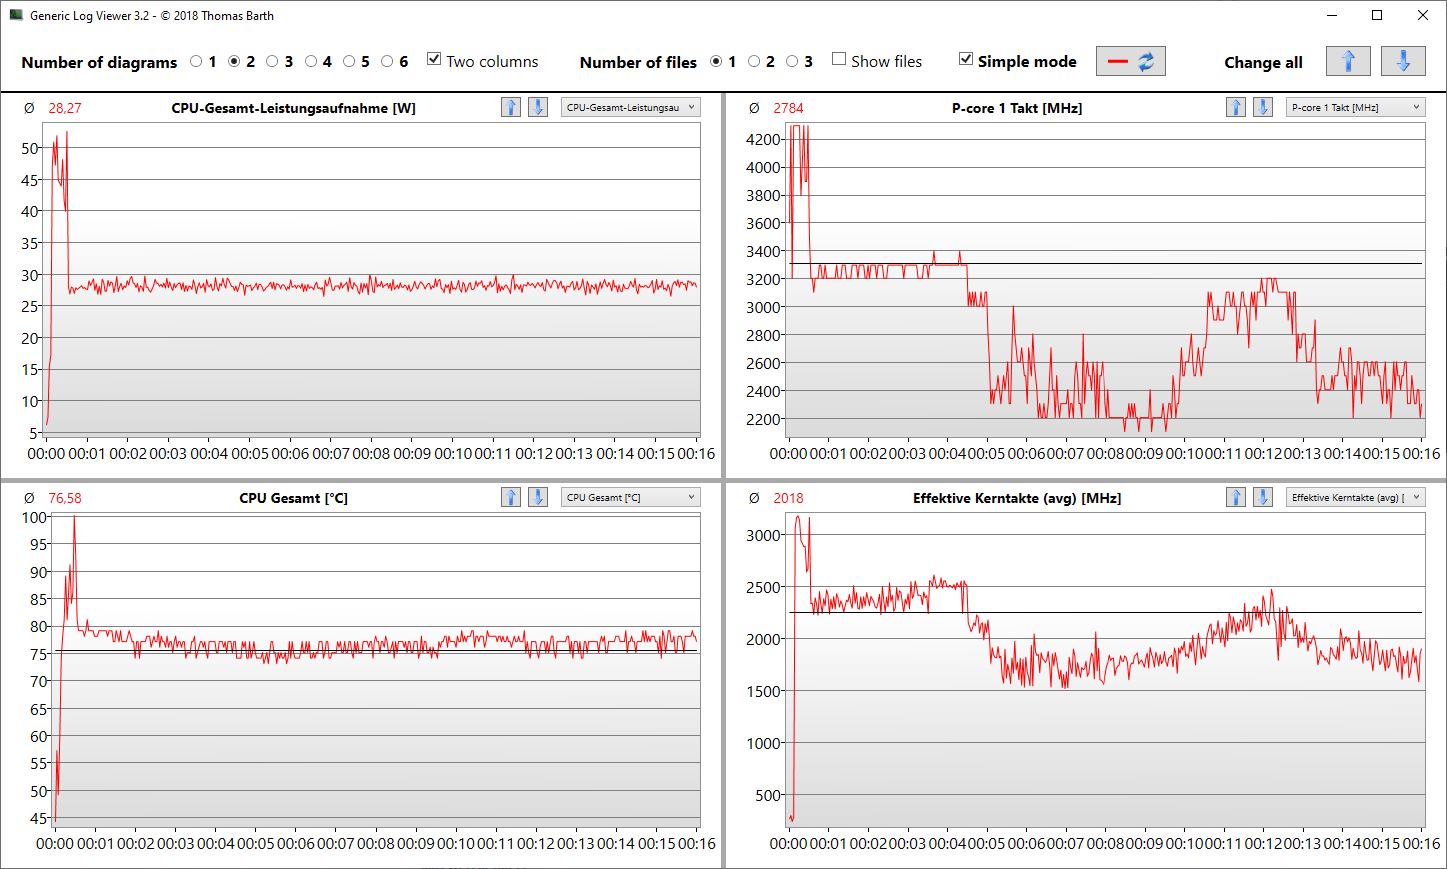
Test warunków skrajnych
TravelMate P4 przechodzi nasz klasyczny test obciążeniowy z początkowo wysokim zużyciem energii wynoszącym 50 watów. Po minucie jest on już ograniczony do 28 watów i pozostaje na tym poziomie przez resztę testu. Rdzenie P pracują przez chwilę z częstotliwością 4,4 GHz, ale następnie są dławione do 3,3 GHz. Po 4 minutach wahają się między 2,4 a 3,0 GHz. Podczas tego scenariusza zmierzyliśmy maksymalne temperatury wspomniane powyżej.
| Taktowanie CPU (GHz) | Taktowanie GPU (MHz) | Średnia temperatura CPU (°C) | Średnia temperatura GPU (°C) | |
| System bezczynności | 0.7 | 300 | 41 | 41 |
| Prime95, Stress | 4.4 | 300 | 60 | 60 |
| Prime95+ FurMark, Stress | 4.3 | 1,100 | 76 | 76 |
| The Witcher 3, Stress | 3.7 | 1,150 | 78 | 78 |
Głośniki
Głośniki stereo są umieszczone po lewej i prawej stronie klawiatury, co pozwala uniknąć tłumienia dźwięków, gdy laptop jest umieszczony na kocu lub na kolanach. Wiele laptopów ma głośniki umieszczone na spodzie. Dźwięk nadal pozostawia wiele do życzenia, zwłaszcza że niższe częstotliwości - nie wspominając o basach - są całkowicie nieobecne. Średnie są nadmiernie podkreślone, a maksymalna głośność jest tylko umiarkowana. Podwójny mikrofon rejestruje nasz głos bardzo wyraźnie (z aktywnym tłumieniem szumów AI), ale dzieje się tak tylko tuż przed laptopem w odległości do metra (co zminimalizuje szumy tła). Konsola Realtek Audio Console pozwala dostosować charakterystykę, przełączając się na przykład między połączeniem osobistym lub konferencyjnym. Podsumowując, TravelMate zapewnia doskonałe warunki do wykonywania połączeń zespołowych, ale zawodzi podczas odtwarzania muzyki lub filmów.
Acer TravelMate P4 TMP414-53-58XQ analiza dźwięku
(±) | głośność głośnika jest średnia, ale dobra (79.3 dB)
Bas 100 - 315 Hz
(-) | prawie brak basu - średnio 31.1% niższa od mediany
(±) | liniowość basu jest średnia (13.7% delta do poprzedniej częstotliwości)
Średnie 400 - 2000 Hz
(+) | zbalansowane środki średnie - tylko 4.5% od mediany
(+) | średnie są liniowe (6.4% delta do poprzedniej częstotliwości)
Wysokie 2–16 kHz
(+) | zrównoważone maksima - tylko 3.9% od mediany
(+) | wzloty są liniowe (2.9% delta do poprzedniej częstotliwości)
Ogólnie 100 - 16.000 Hz
(±) | liniowość ogólnego dźwięku jest średnia (23.3% różnicy w stosunku do mediany)
W porównaniu do tej samej klasy
» 81% wszystkich testowanych urządzeń w tej klasie było lepszych, 3% podobnych, 17% gorszych
» Najlepszy miał deltę 5%, średnia wynosiła ###średnia###%, najgorsza wynosiła 53%
W porównaniu do wszystkich testowanych urządzeń
» 70% wszystkich testowanych urządzeń było lepszych, 5% podobnych, 25% gorszych
» Najlepszy miał deltę 4%, średnia wynosiła ###średnia###%, najgorsza wynosiła 134%
Apple MacBook Pro 16 2021 M1 Pro analiza dźwięku
(+) | głośniki mogą odtwarzać stosunkowo głośno (84.7 dB)
Bas 100 - 315 Hz
(+) | dobry bas - tylko 3.8% od mediany
(+) | bas jest liniowy (5.2% delta do poprzedniej częstotliwości)
Średnie 400 - 2000 Hz
(+) | zbalansowane środki średnie - tylko 1.3% od mediany
(+) | średnie są liniowe (2.1% delta do poprzedniej częstotliwości)
Wysokie 2–16 kHz
(+) | zrównoważone maksima - tylko 1.9% od mediany
(+) | wzloty są liniowe (2.7% delta do poprzedniej częstotliwości)
Ogólnie 100 - 16.000 Hz
(+) | ogólny dźwięk jest liniowy (4.6% różnicy w stosunku do mediany)
W porównaniu do tej samej klasy
» 0% wszystkich testowanych urządzeń w tej klasie było lepszych, 0% podobnych, 100% gorszych
» Najlepszy miał deltę 5%, średnia wynosiła ###średnia###%, najgorsza wynosiła 45%
W porównaniu do wszystkich testowanych urządzeń
» 0% wszystkich testowanych urządzeń było lepszych, 0% podobnych, 100% gorszych
» Najlepszy miał deltę 4%, średnia wynosiła ###średnia###%, najgorsza wynosiła 134%
Zarządzanie energią
Zużycie energii
Niższa od przeciętnej wydajność Core i5 ma też zaletę, którą jest niski pobór mocy. 35 watów pod maksymalnym obciążeniem to efekt throttlingu. U konkurentów nie ma to miejsca w takim samym stopniu i zużywają oni od 57 do 64 watów, przy czym modele Intela plasują się w czołówce. Porównujemy zużycie energii TravelMate z zewnętrznym monitorem do zużycia energii przez AMD ThinkPad E14. Gdy wymagana jest wydajność, ThinkPad zużywa więcej energii, ale potrzebuje nieco mniej podczas bezczynności.
| luz | |
| obciążenie |
|
Legenda:
min: | |
| Acer TravelMate P4 TMP414-53-58XQ i5-1335U, Iris Xe G7 80EUs, Kingston OM8SEP4512Q-AA, IPS, 1920x1200, 14" | Dell Latitude 7440 i5-1345U, Iris Xe G7 80EUs, Samsung MZ9L4512HBLU-00BMV, IPS, 2560x1600, 14" | Lenovo ThinkPad E14 G5-21JSS05C00 R7 7730U, Vega 8, WD PC SN740 SDDPNQD-1T00, IPS, 2240x1400, 14" | Lenovo ThinkPad E14 G5 i7-1355U i7-1355U, Iris Xe G7 96EUs, WD PC SN740 512GB SDDQMQD-512G, IPS, 1920x1200, 14" | HP ProBook 440 G9-5Y3Z3EA i7-1255U, Iris Xe G7 96EUs, Samsung PM991 MZVLQ512HBLU, , 1920x1080, 14" | HP ProBook 445 G10 R5 7530U, Vega 7, Kioxia BG5 KBG50ZNS512G, IPS, 1920x1080, 14" | Przeciętny Intel Iris Xe Graphics G7 80EUs | Średnia w klasie Subnotebook | |
|---|---|---|---|---|---|---|---|---|
| Power Consumption | -36% | -35% | -36% | -45% | -47% | -47% | -35% | |
| Idle Minimum * (Watt) | 3.4 | 4.5 -32% | 3.3 3% | 3.6 -6% | 5.1 -50% | 7 -106% | 4.49 ? -32% | 3.82 ? -12% |
| Idle Average * (Watt) | 5.4 | 6.5 -20% | 7.6 -41% | 6.9 -28% | 7.4 -37% | 8 -48% | 7.4 ? -37% | 6.61 ? -22% |
| Idle Maximum * (Watt) | 6.4 | 7.3 -14% | 8.9 -39% | 7 -9% | 8.4 -31% | 9 -41% | 9.26 ? -45% | 7.99 ? -25% |
| Witcher 3 ultra * (Watt) | 34.2 | 46.2 -35% | 45.1 -32% | 50.5 -48% | 42.3 -24% | 36.2 -6% | ||
| Load Maximum * (Watt) | 35.16 | 63 -79% | 57.8 -64% | 67 -91% | 64 -82% | 47 -34% | 61.7 ? -75% | 64.1 ? -82% |
| Load Average * (Watt) | 52.5 | 47.3 | 42.3 | 42.6 | 34 | 36.6 ? | 41.9 ? |
* ... im mniej tym lepiej
Power Consumption The Witcher 3 / Stress Test
Power Consumption With External Monitor
Żywotność baterii
TravelMate dotrzymuje kroku w testach żywotności baterii, a 8 do 10,5 godziny z baterią 56 Wh to dobre wyniki. Przy zmniejszonej jasności 150 cd/m² osiągamy 10:33 godzin, co pozwala TravelMate z łatwością prześcignąć dwa modele ThinkPad E14. Wciąż jednak nie jest to wartość najwyższa, gdyż Dell Latitude 7440 (57 Wh) wytrzymuje o 2:20 godzin dłużej.
Test Battery Eater Classic Test wykazał minimalny czas pracy wynoszący 143 minuty. Kiedy pisaliśmy tę recenzję na TravelMate (z jasnością zredukowaną do 1/3, Wi-Fi i trybem zrównoważonym), 14-calowy laptop działał prawie 9 godzin.
| Acer TravelMate P4 TMP414-53-58XQ i5-1335U, Iris Xe G7 80EUs, 56 Wh | Dell Latitude 7440 i5-1345U, Iris Xe G7 80EUs, 57 Wh | Lenovo ThinkPad E14 G5-21JSS05C00 R7 7730U, Vega 8, 57 Wh | Lenovo ThinkPad E14 G5 i7-1355U i7-1355U, Iris Xe G7 96EUs, 47 Wh | HP ProBook 440 G9-5Y3Z3EA i7-1255U, Iris Xe G7 96EUs, 42 Wh | HP ProBook 445 G10 R5 7530U, Vega 7, 42 Wh | Fujitsu LifeBook E5412A E542AMHAAMDE R5 PRO 5675U, Vega 7, 60 Wh | Średnia w klasie Subnotebook | |
|---|---|---|---|---|---|---|---|---|
| Czasy pracy | 18% | -29% | -48% | -46% | -10% | -26% | 7% | |
| WiFi v1.3 (h) | 10.6 | 13 23% | 9.9 -7% | 5.5 -48% | 5.7 -46% | 9.5 -10% | 10.4 -2% | 14 ? 32% |
| Load (h) | 2.4 | 2.7 13% | 1.2 -50% | 1.2 -50% | 1.946 ? -19% | |||
| Reader / Idle (h) | 23.8 | 28.6 ? | ||||||
| H.264 (h) | 10.8 | 8.2 | 15.6 ? |
Za
Przeciw
Werdykt
TravelMate P4 zamienia niedomówienia w sprawę dla szefów: niepozorna wydajność, szara jak myszka grafika, prosty wyświetlacz Full HD, najniższe wydzielanie ciepła i cichy dźwięk głośników. Ci, którzy chcą się pochwalić swoim laptopem, powinni zdecydowanie unikać 14-calowego laptopa Acer.
Tam, gdzie używany jest nudny towarzysz back-office, spełnia swoje obowiązki w, powiedzmy, 95%.
Niewielka redukcja dotyczy ogólnej słabej jasności panelu IPS, która jest dodatkowo zmniejszana podczas pracy na baterii. Stworzy to pewne trudności dla domowego biura w słońcu.
Widzimy mocne strony laptopa w dobrym czasie pracy na baterii wynoszącym od 8 do 10,5 godziny, wraz z solidną obudową, która w większości pozostaje chłodna. Niskie wydzielanie ciepła i pobór mocy wynikają z pracy Core i5 poniżej jego możliwości, ale mało kto zauważy to podczas pracy z aplikacjami internetowymi i arkuszami kalkulacyjnymi Excel. Znacznie ważniejsze będą wtedy kwestie praktyczne, takie jak możliwość wyczyszczenia wentylatorów czy np. rozbudowy pamięci operacyjnej. Pod tym względem Acer daje dobry przykład, zapewniając otwór do wymuszonego nadmuchu powietrza do czyszczenia wentylatorów lub oferując łatwy demontaż dolnej płyty.
Acer nie rezygnuje z przewodowego połączenia Ethernet, a także zawiera szybki i bardzo aktualny układ Wi-Fi. Klawiatura, która natychmiast pozwoliła nam pisać w szybkim tempie, oraz duży 14-centymetrowy ClickPad umieszczony pośrodku to tylko niektóre z nowych zalet. Ponadto Acer przerobił konstrukcję. I wreszcie, dwa porty Thunderbolt 4 stają się istotne, jeśli trzeba użyć potężnej stacji dokującej.
Chociaż wyświetlacz nie jest najlepszy, oferuje powiększony obszar roboczy dla dokumentów i programu Excel w formacie 16:10.
Klawiatura oferująca dobre sprzężenie zwrotne i duży ClickPad na solidnej podpórce pod nadgarstki są ważne dla osób często piszących na klawiaturze, a my byliśmy w stanie szybko napisać na niej tę recenzję, nie potrzebując czasu na zapoznanie się.
Jeśli szukają Państwo najlepszego stosunku ceny do wydajności, Lenovo ThinkPad E14 G5 z procesorem Intel lub AMD. Szczególnie model AMD jest lepszą alternatywą dla wymagających użytkowników, jeśli potrzebują czegoś za około 1000 euro (~1087 USD). Zarówno Lenovo ThinkPad E14 G5-21JSS05C00, jak i Lenovo ThinkPad E14 G5 i7-1355U uzyskały identyczne oceny ogólne, ale w zależności od konfiguracji oferują więcej sprzętu za te pieniądze (pod względem pamięci RAM, dysku SSD lub rozdzielczości) i są jeszcze bardziej podatne na aktualizacje (z drugim gniazdem SSD!). Wadą ThinkPada E jest standardowa gwarancja trwająca tylko 12 miesięcy.
Cena i dostępność
Zalecamy porównanie cen różnych konfiguracji. Na przykład, Amazon wymienia Acer TravelMate P4 TMP414-51 z podobną specyfikacją jak nasza konfiguracja testowa za około 740 USD i mocniejszą wersję 12. generacji Core-i7 z dyskiem SSD 1 TB i 16 GB pamięci RAM za ~ 1052 USD.
Acer TravelMate P4 TMP414-53-58XQ
- 16/01/2024 v7 (old)
Sebastian Jentsch
Przezroczystość
Wyboru urządzeń do recenzji dokonuje nasza redakcja. Próbka testowa została udostępniona autorowi jako pożyczka od producenta lub sprzedawcy detalicznego na potrzeby tej recenzji. Pożyczkodawca nie miał wpływu na tę recenzję, producent nie otrzymał też kopii tej recenzji przed publikacją. Nie było obowiązku publikowania tej recenzji. Jako niezależna firma medialna, Notebookcheck nie podlega władzy producentów, sprzedawców detalicznych ani wydawców.
Tak testuje Notebookcheck
Każdego roku Notebookcheck niezależnie sprawdza setki laptopów i smartfonów, stosując standardowe procedury, aby zapewnić porównywalność wszystkich wyników. Od około 20 lat stale rozwijamy nasze metody badawcze, ustanawiając przy tym standardy branżowe. W naszych laboratoriach testowych doświadczeni technicy i redaktorzy korzystają z wysokiej jakości sprzętu pomiarowego. Testy te obejmują wieloetapowy proces walidacji. Nasz kompleksowy system ocen opiera się na setkach uzasadnionych pomiarów i benchmarków, co pozwala zachować obiektywizm.Price comparison

