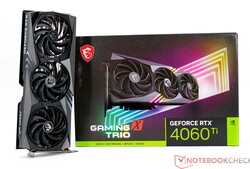
Recenzja karty graficznej MSI GeForce RTX 4060 Ti do komputerów stacjonarnych: GPU średniej klasy, które jest większe niż RTX 4090
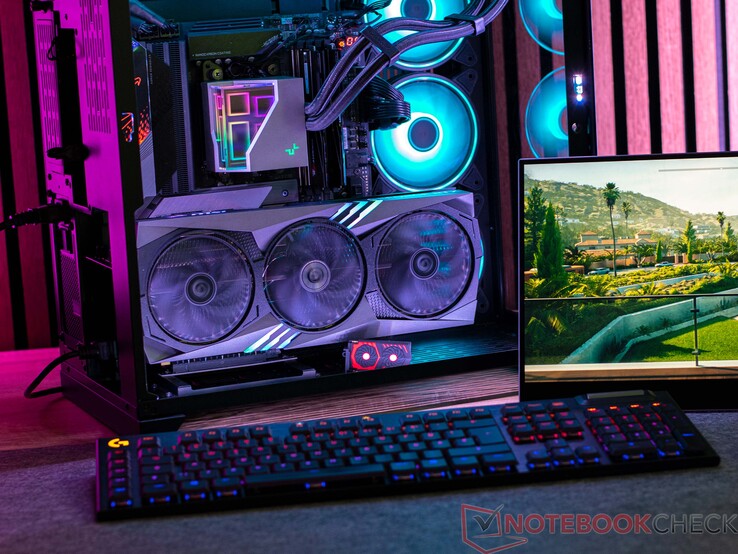
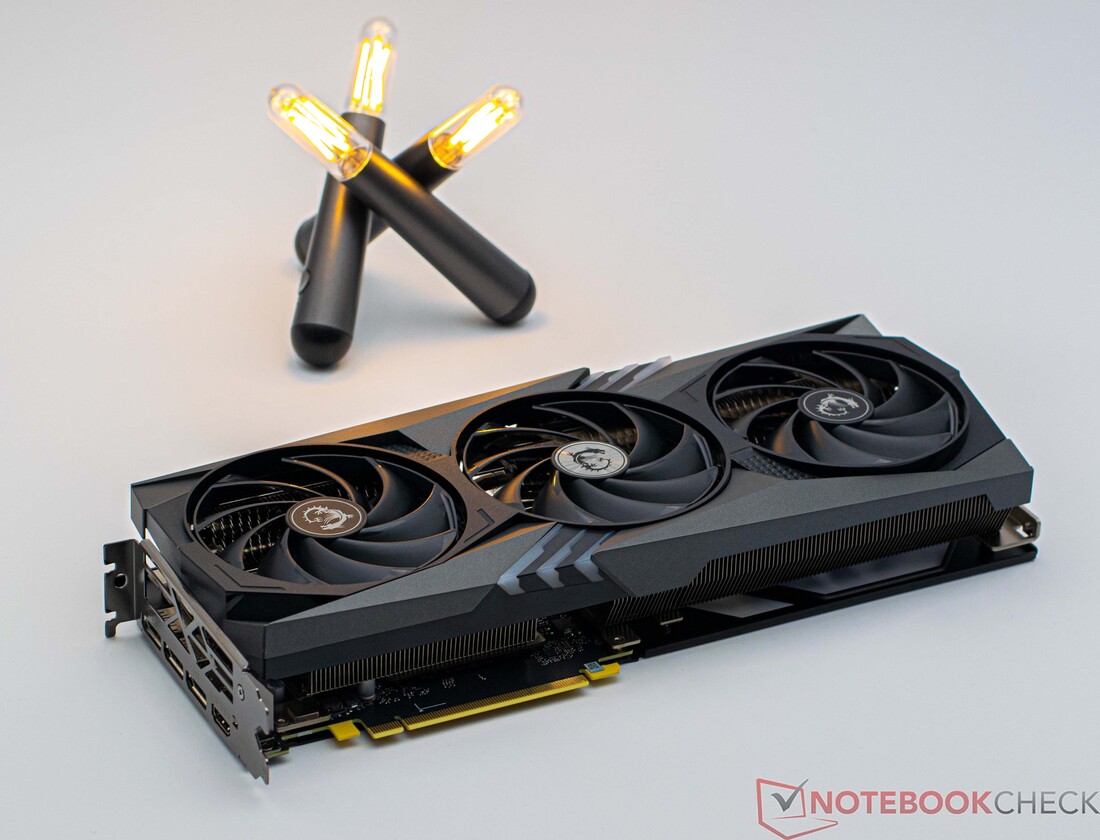
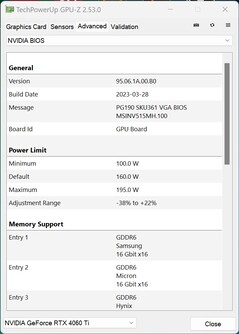
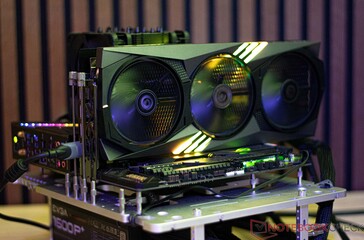
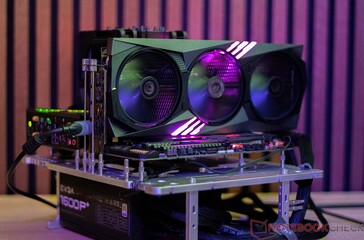
Tym razem nasza próbka testowa GeForce RTX 4060 Ti została wyprodukowana przez MSI. Mówiąc dokładniej, jest to topowy model tego producenta, a mianowicie wersja Gaming X Trio. Pomimo niższego poboru mocy wynoszącego zaledwie 160 W, wbudowany system chłodzenia jest niezwykle duży - co obiecuje bardzo cichą pracę. Jego rozmiar jest w rzeczywistości nawet dłuższy niż nasz GeForce RTX 4090 od Palit. Na szerokość, MSI GeForce RTX 4060 Ti zajmuje 2,5 slotu, a 3 wentylatory zapewniają masywnemu układowi chłodzenia świeże powietrze.
Nie jest tajemnicą, że Nvidia w przeszłości zachowywała się nieco skąpo, jeśli chodzi o pamięć VRAM w swoich kartach średniej klasy. Na przykład karta Nvidia GeForce RTX 3060 Ti miała tylko 8 GB. Teraz GeForce RTX 4060 Ti również ma tylko 8 GB. Zapowiedziano już jednak modele 16 GB i powinny one wkrótce trafić na rynek. Ale jak ważna jest duża pamięć VRAM? W końcu GeForce RTX 4060 Ti ma obsługiwać tylko 1 080p w grach. Obszar 1440p pokrywają modele wyposażone w układ RTX 4070, a dwa modele z najwyższej półki, RTX 4080 i RTX 4090, zajmują się grami UHD.
Jak już wspomniano, jej wymiary wynoszące 33,8 cm są już bardzo duże i będą wymagały odpowiedniej obudowy. Jednocześnie jego PCB (płytka drukowana) jest tylko o połowę krótsza. Niski pobór mocy GPU nie obciąża zasilacza. Nasz testowy egzemplarz wyposażono w złącze zasilania PCIe 6+2 pin. Model Nvidii, Founders Edition, wyposażony jest w złącze 12VHPWR.
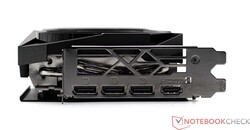
Oba złącza zewnętrzne są zgodne z typowym standardem. Nadal nie jest wyposażony w DisplayPort 2.1. Z drugiej strony ma 1 port HDMI 2.1a i 3 porty DisplayPort 1.4a, co powinno być więcej niż wystarczające dla większości użytkowników.
GeForce porównanie specyfikacji kart graficznych
| Funkcje | RTX 4090 | RTX 4080 | RTX 4070 Ti | RTX 4070 | RTX 4060 Ti | RTX 3070 | RTX 3060 Ti |
| Chip | AD102 | AD103 | AD104 | AD104 | AD106 | GA104 | GA104 |
| Proces FinFET | TSMC 4N | TSMC 4N | TSMC 4N | TSMC 4N | TSMC 4N | 8 nm | 8 nm |
| Rdzenie CUDA | 16,384 | 9,728 | 7,680 | 5,888 | 4,352 | 5,888 | 4,864 |
| Jednostki teksturujące | 512 | 304 | 240 | 184 | 136 | 184 | 152 |
| Rdzenie tensorowe | 512 4. gen. | 304 4. gen. | 240 4. gen. | 184 4. gen. | 136 4. gen. | 184 3. gen. | 152 3. gen. |
| Rdzenie RT | 128 | 76 | 60 | 46 | 34 | 46 | 38 |
| Zegar bazowy GPU | 2,235 MHz | 2,205 MHz | 2,310 MHz | 1,920 MHz | 2,310 MHz | 1,500 MHz | 1,410 MHz |
| GPU boost clock | 2,520 MHz | 2,505 MHz | 2,610 MHz | 2,475 MHz | 2,535 MHz | 1,725 MHz | 1,665 MHz |
| Magistrala pamięci | 384 Bit | 256 Bit | 192 Bit | 192 Bit | 128 Bit | 256 Bit | 256 Bit |
| Przepustowość pamięci | 1 008 GB/s | 716,8 GB/s | 504,2 GB/s | 504,2 GB/s | 288 GB/s | 448 GB/s | 448 GB/s |
| Pamięć wideo | 24 GB GDDR6X | 16 GB GDDR6X | 12 GB GDDR6 | 12 GB GDDR6X | 8 GB GDDR6 | 8 GB GDDR6 | 8 GB GDDR6 |
| Pobór mocy | 450 W | 320 W | 285 W | 215 W | 160 W | 220 W | 200 W |
Infos about our test system
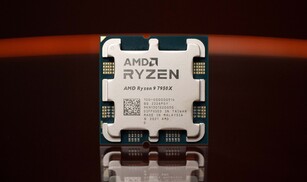
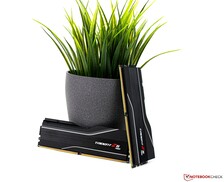
Jako system testowy posłużyła nam aktualna platforma AMD oparta na płycie Gigabyte X670E Aorus Master. Procesor (AMD Ryzen 9 7950X) oferuje doskonałą wydajność, a jako chłodzenia używamy rozwiązania AiO Deepcool LT720. Pamięć RAM o pojemności 32 GB została wyprodukowana przez G.Skill i jest obsługiwana przy użyciu pasującego profilu EXPO. Jako monitora używamy Gigabyte M32U.
System testowy w szczegółach
Wykorzystaliśmy ten system do następujących testów porównawczych i testów:
- Lian-Li O11 Dynamic
- AMD Ryzen 9 7950X
- Gigabyte X670E Aorus Master, BIOS: F11
- Deepcool LT720
- Zasilacz Corsair HX1200i
- G.Skill Trident Z5 Neo DDR5-6000 2x 16 GB, EXPO (DDR5-6000 CL30-38-38-96)
- Corsair MP600, 2 TB
- Crucial MX500, 2 TB
- Microsoft Windows 11 Professional 64-bit (wersja 22H2)
Szczegółowe informacje na temat MSI GeForce RTX 4060 Ti Gaming X Trio 8G
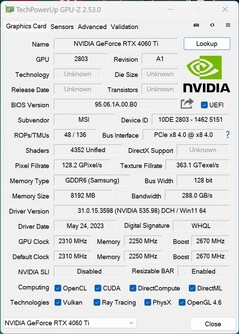
W przeciwieństwie do Founders Edition karty Nvidia GeForce RTX 4060 Ti, MSI GeForce RTX 4060 Ti Gaming X Trio 8G oferuje znacznie wyższe częstotliwości taktowania boost. MSI podaje częstotliwości do 2670 MHz - o 135 MHz więcej niż model referencyjny Nvidii. Nie ma żadnych zmian w pamięci VRAM w porównaniu do Founders Edition. Chociaż jej przepustowość jest teraz o połowę mniejsza w porównaniu do Nvidia GeForce RTX 3060 Tii wynosi 128 bitów. Co za tym idzie, przepustowość pamięci jest teraz również znacznie mniejsza i wynosi 288 GB/s. W naszych testach porównawczych dowiemy się, co to oznacza w praktyce.
Syntetyczne testy porównawcze
W naszych syntetycznych testach porównawczych, karta MSI GeForce RTX 4060 Ti Gaming X Trio 8G wypadła tylko o 8 procent lepiej niż modelNvidia GeForce RTX 3060 Ti. Jeśli chodzi o rzeczywistą wydajność, model ze średniej półki tylko nieznacznie różnił się od poprzedniej generacji. Nie zaobserwowaliśmy takiego samego wzrostu wydajności, jak w przypadkuNvidia GeForce RTX 3090doNvidia GeForce RTX 4090. Mniejsza liczba shaderów, a także mniejsze połączenie z pamięcią masową uniemożliwiły GPU osiągnięcie lepszej wydajności. Jego 30-procentowa różnica w stosunku doGeForce RTX 4070jest dość znaczna, a skok wydajności do poziomuGeForce RTX 3070 Tibyłby znacznie bardziej użytecznym krokiem. W porównaniu do kart AMDSapphire Pulse Radeon RX 6750 XTktóry ma 12 GB pamięci VRAM, nasza próbka testowa była w rzeczywistości tylko o 10 procent wolniejsza.
| Performance rating - Percent | |
| Palit GeForce RTX 4090 GameRock OC | |
| AMD Radeon RX 7900 XTX | |
| KFA2 GeForce RTX 4080 SG | |
| AMD Radeon RX 7900 XT | |
| KFA2 GeForce RTX 4070 Ti EX Gamer | |
| NVIDIA GeForce RTX 3090 Founders Edition | |
| KFA2 GeForce RTX 3080 SG | |
| KFA2 GeForce RTX 4070 EX Gamer | |
| Nvidia Titan RTX | |
| KFA2 GeForce RTX 3070 Ti SG | |
| Sapphire Pulse Radeon RX 6750 XT | |
| MSI GeForce RTX 4060 Ti Gaming X Trio 8G | |
| NVIDIA GeForce RTX 3060 Ti FE | |
| Nvidia GeForce RTX 2070 Super | |
| Sapphire Nitro+ Radeon RX 6650 XT | |
| Nvidia GeForce RTX 2060 Super | |
| KFA2 GeForce GTX 1660 Super | |
| PNY GeForce GTX 1660 | |
| 3DMark | |
| 2560x1440 Time Spy Graphics | |
| Palit GeForce RTX 4090 GameRock OC | |
| AMD Radeon RX 7900 XTX | |
| KFA2 GeForce RTX 4080 SG | |
| AMD Radeon RX 7900 XT | |
| KFA2 GeForce RTX 4070 Ti EX Gamer | |
| NVIDIA GeForce RTX 3090 Founders Edition | |
| KFA2 GeForce RTX 3080 SG | |
| KFA2 GeForce RTX 4070 EX Gamer | |
| Nvidia Titan RTX | |
| KFA2 GeForce RTX 3070 Ti SG | |
| MSI GeForce RTX 4060 Ti Gaming X Trio 8G | |
| Sapphire Pulse Radeon RX 6750 XT | |
| NVIDIA GeForce RTX 3060 Ti FE | |
| Sapphire Nitro+ Radeon RX 6650 XT | |
| Nvidia GeForce RTX 2070 Super | |
| Nvidia GeForce RTX 2060 Super | |
| KFA2 GeForce GTX 1660 Super | |
| PNY GeForce GTX 1660 | |
| Fire Strike Extreme Graphics | |
| Palit GeForce RTX 4090 GameRock OC | |
| AMD Radeon RX 7900 XTX | |
| KFA2 GeForce RTX 4080 SG | |
| AMD Radeon RX 7900 XT | |
| KFA2 GeForce RTX 4070 Ti EX Gamer | |
| NVIDIA GeForce RTX 3090 Founders Edition | |
| KFA2 GeForce RTX 3080 SG | |
| KFA2 GeForce RTX 4070 EX Gamer | |
| KFA2 GeForce RTX 3070 Ti SG | |
| Sapphire Pulse Radeon RX 6750 XT | |
| Nvidia Titan RTX | |
| MSI GeForce RTX 4060 Ti Gaming X Trio 8G | |
| NVIDIA GeForce RTX 3060 Ti FE | |
| Sapphire Nitro+ Radeon RX 6650 XT | |
| Nvidia GeForce RTX 2070 Super | |
| Nvidia GeForce RTX 2060 Super | |
| KFA2 GeForce GTX 1660 Super | |
| PNY GeForce GTX 1660 | |
| 3840x2160 Fire Strike Ultra Graphics | |
| Palit GeForce RTX 4090 GameRock OC | |
| AMD Radeon RX 7900 XTX | |
| KFA2 GeForce RTX 4080 SG | |
| AMD Radeon RX 7900 XT | |
| KFA2 GeForce RTX 4070 Ti EX Gamer | |
| NVIDIA GeForce RTX 3090 Founders Edition | |
| KFA2 GeForce RTX 3080 SG | |
| KFA2 GeForce RTX 4070 EX Gamer | |
| KFA2 GeForce RTX 3070 Ti SG | |
| Sapphire Pulse Radeon RX 6750 XT | |
| Nvidia Titan RTX | |
| MSI GeForce RTX 4060 Ti Gaming X Trio 8G | |
| NVIDIA GeForce RTX 3060 Ti FE | |
| Sapphire Nitro+ Radeon RX 6650 XT | |
| Nvidia GeForce RTX 2070 Super | |
| Nvidia GeForce RTX 2060 Super | |
| KFA2 GeForce GTX 1660 Super | |
| PNY GeForce GTX 1660 | |
| 1920x1080 Fire Strike Graphics | |
| Palit GeForce RTX 4090 GameRock OC | |
| AMD Radeon RX 7900 XTX | |
| KFA2 GeForce RTX 4080 SG | |
| AMD Radeon RX 7900 XT | |
| KFA2 GeForce RTX 4070 Ti EX Gamer | |
| NVIDIA GeForce RTX 3090 Founders Edition | |
| KFA2 GeForce RTX 3080 SG | |
| KFA2 GeForce RTX 4070 EX Gamer | |
| Sapphire Pulse Radeon RX 6750 XT | |
| KFA2 GeForce RTX 3070 Ti SG | |
| Nvidia Titan RTX | |
| MSI GeForce RTX 4060 Ti Gaming X Trio 8G | |
| Sapphire Nitro+ Radeon RX 6650 XT | |
| NVIDIA GeForce RTX 3060 Ti FE | |
| Nvidia GeForce RTX 2070 Super | |
| Nvidia GeForce RTX 2060 Super | |
| KFA2 GeForce GTX 1660 Super | |
| PNY GeForce GTX 1660 | |
| Unigine Superposition | |
| 7680x4320 8k Optimized | |
| Palit GeForce RTX 4090 GameRock OC | |
| AMD Radeon RX 7900 XTX | |
| KFA2 GeForce RTX 4080 SG | |
| NVIDIA GeForce RTX 3090 Founders Edition | |
| AMD Radeon RX 7900 XT | |
| KFA2 GeForce RTX 3080 SG | |
| KFA2 GeForce RTX 4070 Ti EX Gamer | |
| Nvidia Titan RTX | |
| KFA2 GeForce RTX 3070 Ti SG | |
| KFA2 GeForce RTX 4070 EX Gamer | |
| NVIDIA GeForce RTX 3060 Ti FE | |
| Sapphire Pulse Radeon RX 6750 XT | |
| MSI GeForce RTX 4060 Ti Gaming X Trio 8G | |
| Nvidia GeForce RTX 2070 Super | |
| Sapphire Nitro+ Radeon RX 6650 XT | |
| Nvidia GeForce RTX 2060 Super | |
| KFA2 GeForce GTX 1660 Super | |
| PNY GeForce GTX 1660 | |
| 3840x2160 4k Optimized | |
| Palit GeForce RTX 4090 GameRock OC | |
| AMD Radeon RX 7900 XTX | |
| KFA2 GeForce RTX 4080 SG | |
| AMD Radeon RX 7900 XT | |
| KFA2 GeForce RTX 4070 Ti EX Gamer | |
| NVIDIA GeForce RTX 3090 Founders Edition | |
| KFA2 GeForce RTX 3080 SG | |
| KFA2 GeForce RTX 4070 EX Gamer | |
| KFA2 GeForce RTX 3070 Ti SG | |
| Nvidia Titan RTX | |
| Sapphire Pulse Radeon RX 6750 XT | |
| MSI GeForce RTX 4060 Ti Gaming X Trio 8G | |
| NVIDIA GeForce RTX 3060 Ti FE | |
| Nvidia GeForce RTX 2070 Super | |
| Sapphire Nitro+ Radeon RX 6650 XT | |
| Nvidia GeForce RTX 2060 Super | |
| KFA2 GeForce GTX 1660 Super | |
| PNY GeForce GTX 1660 | |
| 1920x1080 1080p Extreme | |
| Palit GeForce RTX 4090 GameRock OC | |
| AMD Radeon RX 7900 XTX | |
| KFA2 GeForce RTX 4080 SG | |
| AMD Radeon RX 7900 XT | |
| KFA2 GeForce RTX 4070 Ti EX Gamer | |
| NVIDIA GeForce RTX 3090 Founders Edition | |
| KFA2 GeForce RTX 3080 SG | |
| KFA2 GeForce RTX 4070 EX Gamer | |
| KFA2 GeForce RTX 3070 Ti SG | |
| Nvidia Titan RTX | |
| MSI GeForce RTX 4060 Ti Gaming X Trio 8G | |
| Sapphire Pulse Radeon RX 6750 XT | |
| NVIDIA GeForce RTX 3060 Ti FE | |
| Nvidia GeForce RTX 2070 Super | |
| Sapphire Nitro+ Radeon RX 6650 XT | |
| Nvidia GeForce RTX 2060 Super | |
| KFA2 GeForce GTX 1660 Super | |
| PNY GeForce GTX 1660 | |
| 1920x1080 1080p High | |
| Palit GeForce RTX 4090 GameRock OC | |
| KFA2 GeForce RTX 4080 SG | |
| AMD Radeon RX 7900 XTX | |
| AMD Radeon RX 7900 XT | |
| KFA2 GeForce RTX 4070 Ti EX Gamer | |
| NVIDIA GeForce RTX 3090 Founders Edition | |
| KFA2 GeForce RTX 3080 SG | |
| KFA2 GeForce RTX 4070 EX Gamer | |
| Nvidia Titan RTX | |
| KFA2 GeForce RTX 3070 Ti SG | |
| Sapphire Pulse Radeon RX 6750 XT | |
| MSI GeForce RTX 4060 Ti Gaming X Trio 8G | |
| NVIDIA GeForce RTX 3060 Ti FE | |
| Nvidia GeForce RTX 2070 Super | |
| Sapphire Nitro+ Radeon RX 6650 XT | |
| Nvidia GeForce RTX 2060 Super | |
| KFA2 GeForce GTX 1660 Super | |
| PNY GeForce GTX 1660 | |
| 1280x720 720p Low | |
| KFA2 GeForce RTX 4070 Ti EX Gamer | |
| Palit GeForce RTX 4090 GameRock OC | |
| Nvidia Titan RTX | |
| NVIDIA GeForce RTX 3090 Founders Edition | |
| KFA2 GeForce RTX 4080 SG | |
| KFA2 GeForce RTX 4070 EX Gamer | |
| KFA2 GeForce RTX 3070 Ti SG | |
| AMD Radeon RX 7900 XTX | |
| MSI GeForce RTX 4060 Ti Gaming X Trio 8G | |
| AMD Radeon RX 7900 XT | |
| Nvidia GeForce RTX 2070 Super | |
| Sapphire Pulse Radeon RX 6750 XT | |
| Nvidia GeForce RTX 2060 Super | |
| NVIDIA GeForce RTX 3060 Ti FE | |
| KFA2 GeForce RTX 3080 SG | |
| KFA2 GeForce GTX 1660 Super | |
| Sapphire Nitro+ Radeon RX 6650 XT | |
| PNY GeForce GTX 1660 | |
| Unigine Heaven 4.0 | |
| Extreme Preset DX11 | |
| Palit GeForce RTX 4090 GameRock OC | |
| KFA2 GeForce RTX 4080 SG | |
| AMD Radeon RX 7900 XTX | |
| AMD Radeon RX 7900 XT | |
| KFA2 GeForce RTX 4070 Ti EX Gamer | |
| NVIDIA GeForce RTX 3090 Founders Edition | |
| KFA2 GeForce RTX 3080 SG | |
| KFA2 GeForce RTX 4070 EX Gamer | |
| Nvidia Titan RTX | |
| KFA2 GeForce RTX 3070 Ti SG | |
| Sapphire Pulse Radeon RX 6750 XT | |
| NVIDIA GeForce RTX 3060 Ti FE | |
| MSI GeForce RTX 4060 Ti Gaming X Trio 8G | |
| Nvidia GeForce RTX 2070 Super | |
| Sapphire Nitro+ Radeon RX 6650 XT | |
| Nvidia GeForce RTX 2060 Super | |
| KFA2 GeForce GTX 1660 Super | |
| PNY GeForce GTX 1660 | |
| Extreme Preset OpenGL | |
| Palit GeForce RTX 4090 GameRock OC | |
| KFA2 GeForce RTX 4080 SG | |
| AMD Radeon RX 7900 XTX | |
| AMD Radeon RX 7900 XT | |
| KFA2 GeForce RTX 4070 Ti EX Gamer | |
| NVIDIA GeForce RTX 3090 Founders Edition | |
| KFA2 GeForce RTX 3080 SG | |
| KFA2 GeForce RTX 4070 EX Gamer | |
| Sapphire Pulse Radeon RX 6750 XT | |
| KFA2 GeForce RTX 3070 Ti SG | |
| Nvidia Titan RTX | |
| MSI GeForce RTX 4060 Ti Gaming X Trio 8G | |
| NVIDIA GeForce RTX 3060 Ti FE | |
| Sapphire Nitro+ Radeon RX 6650 XT | |
| Nvidia GeForce RTX 2070 Super | |
| Nvidia GeForce RTX 2060 Super | |
| KFA2 GeForce GTX 1660 Super | |
| PNY GeForce GTX 1660 | |
| Unigine Valley 1.0 | |
| 1920x1080 Extreme HD DirectX AA:x8 | |
| Palit GeForce RTX 4090 GameRock OC | |
| AMD Radeon RX 7900 XTX | |
| KFA2 GeForce RTX 4080 SG | |
| AMD Radeon RX 7900 XT | |
| NVIDIA GeForce RTX 3090 Founders Edition | |
| KFA2 GeForce RTX 4070 Ti EX Gamer | |
| KFA2 GeForce RTX 3080 SG | |
| KFA2 GeForce RTX 3070 Ti SG | |
| Nvidia Titan RTX | |
| KFA2 GeForce RTX 4070 EX Gamer | |
| Sapphire Pulse Radeon RX 6750 XT | |
| NVIDIA GeForce RTX 3060 Ti FE | |
| MSI GeForce RTX 4060 Ti Gaming X Trio 8G | |
| Nvidia GeForce RTX 2070 Super | |
| Sapphire Nitro+ Radeon RX 6650 XT | |
| Nvidia GeForce RTX 2060 Super | |
| KFA2 GeForce GTX 1660 Super | |
| PNY GeForce GTX 1660 | |
| 1920x1080 Extreme HD Preset OpenGL AA:x8 | |
| Palit GeForce RTX 4090 GameRock OC | |
| AMD Radeon RX 7900 XTX | |
| KFA2 GeForce RTX 4080 SG | |
| AMD Radeon RX 7900 XT | |
| NVIDIA GeForce RTX 3090 Founders Edition | |
| KFA2 GeForce RTX 4070 Ti EX Gamer | |
| KFA2 GeForce RTX 3080 SG | |
| KFA2 GeForce RTX 4070 EX Gamer | |
| Sapphire Pulse Radeon RX 6750 XT | |
| KFA2 GeForce RTX 3070 Ti SG | |
| Nvidia Titan RTX | |
| NVIDIA GeForce RTX 3060 Ti FE | |
| MSI GeForce RTX 4060 Ti Gaming X Trio 8G | |
| Sapphire Nitro+ Radeon RX 6650 XT | |
| Nvidia GeForce RTX 2070 Super | |
| Nvidia GeForce RTX 2060 Super | |
| KFA2 GeForce GTX 1660 Super | |
| PNY GeForce GTX 1660 | |
| 3DMark 11 | |
| 1280x720 Performance GPU | |
| Palit GeForce RTX 4090 GameRock OC | |
| KFA2 GeForce RTX 4080 SG | |
| AMD Radeon RX 7900 XTX | |
| AMD Radeon RX 7900 XT | |
| KFA2 GeForce RTX 4070 Ti EX Gamer | |
| NVIDIA GeForce RTX 3090 Founders Edition | |
| KFA2 GeForce RTX 4070 EX Gamer | |
| KFA2 GeForce RTX 3080 SG | |
| Nvidia Titan RTX | |
| KFA2 GeForce RTX 3070 Ti SG | |
| Sapphire Pulse Radeon RX 6750 XT | |
| MSI GeForce RTX 4060 Ti Gaming X Trio 8G | |
| Sapphire Nitro+ Radeon RX 6650 XT | |
| NVIDIA GeForce RTX 3060 Ti FE | |
| Nvidia GeForce RTX 2070 Super | |
| Nvidia GeForce RTX 2060 Super | |
| KFA2 GeForce GTX 1660 Super | |
| PNY GeForce GTX 1660 | |
| 1280x720 Performance | |
| Palit GeForce RTX 4090 GameRock OC | |
| KFA2 GeForce RTX 4080 SG | |
| AMD Radeon RX 7900 XTX | |
| AMD Radeon RX 7900 XT | |
| KFA2 GeForce RTX 4070 Ti EX Gamer | |
| KFA2 GeForce RTX 4070 EX Gamer | |
| NVIDIA GeForce RTX 3090 Founders Edition | |
| Nvidia Titan RTX | |
| KFA2 GeForce RTX 3070 Ti SG | |
| MSI GeForce RTX 4060 Ti Gaming X Trio 8G | |
| Sapphire Pulse Radeon RX 6750 XT | |
| KFA2 GeForce RTX 3080 SG | |
| Nvidia GeForce RTX 2070 Super | |
| Sapphire Nitro+ Radeon RX 6650 XT | |
| NVIDIA GeForce RTX 3060 Ti FE | |
| Nvidia GeForce RTX 2060 Super | |
| KFA2 GeForce GTX 1660 Super | |
| PNY GeForce GTX 1660 | |
| LuxMark v2.0 64Bit | |
| Room GPUs-only | |
| NVIDIA GeForce RTX 4090 | |
| NVIDIA GeForce RTX 4080 | |
| NVIDIA GeForce RTX 4070 Ti | |
| NVIDIA GeForce RTX 4070 | |
| NVIDIA GeForce RTX 3090 | |
| NVIDIA GeForce RTX 3080 12 GB | |
| AMD Radeon RX 7900 XTX | |
| AMD Radeon RX 6950 XT | |
| NVIDIA Titan RTX | |
| NVIDIA GeForce RTX 4060 Ti 8G | |
| NVIDIA GeForce RTX 3070 Ti | |
| AMD Radeon RX 7900 XT | |
| NVIDIA GeForce RTX 3060 Ti | |
| AMD Radeon RX 6750 XT | |
| AMD Radeon RX 6650 XT | |
| Sala GPUs-only | |
| AMD Radeon RX 6950 XT | |
| NVIDIA GeForce RTX 4090 | |
| NVIDIA GeForce RTX 4080 | |
| NVIDIA GeForce RTX 4070 Ti | |
| AMD Radeon RX 7900 XTX | |
| NVIDIA GeForce RTX 3090 | |
| NVIDIA GeForce RTX 4070 | |
| NVIDIA GeForce RTX 3080 12 GB | |
| AMD Radeon RX 7900 XT | |
| NVIDIA GeForce RTX 4060 Ti 8G | |
| NVIDIA GeForce RTX 3070 Ti | |
| NVIDIA Titan RTX | |
| NVIDIA GeForce RTX 3060 Ti | |
| AMD Radeon RX 6750 XT | |
| AMD Radeon RX 6650 XT | |
| ComputeMark v2.1 | |
| 1024x600 Normal, QJuliaRayTrace | |
| NVIDIA GeForce RTX 4090 | |
| NVIDIA GeForce RTX 4080 | |
| NVIDIA GeForce RTX 4070 Ti | |
| AMD Radeon RX 7900 XTX | |
| NVIDIA GeForce RTX 3090 | |
| NVIDIA GeForce RTX 4070 | |
| AMD Radeon RX 7900 XT | |
| NVIDIA GeForce RTX 3080 12 GB | |
| NVIDIA GeForce RTX 4060 Ti 8G | |
| AMD Radeon RX 6950 XT | |
| NVIDIA GeForce RTX 3070 Ti | |
| NVIDIA Titan RTX | |
| NVIDIA GeForce RTX 3060 Ti | |
| AMD Radeon RX 6750 XT | |
| AMD Radeon RX 6650 XT | |
| NVIDIA GeForce RTX 2070 Super (Desktop) | |
| NVIDIA GeForce RTX 2060 Super (Desktop) | |
| 1024x600 Normal, Score | |
| NVIDIA GeForce RTX 4090 | |
| AMD Radeon RX 7900 XTX | |
| NVIDIA GeForce RTX 4080 | |
| AMD Radeon RX 7900 XT | |
| NVIDIA GeForce RTX 4070 Ti | |
| NVIDIA GeForce RTX 3090 | |
| AMD Radeon RX 6950 XT | |
| NVIDIA GeForce RTX 4070 | |
| NVIDIA GeForce RTX 3080 12 GB | |
| NVIDIA GeForce RTX 3070 Ti | |
| NVIDIA GeForce RTX 4060 Ti 8G | |
| NVIDIA Titan RTX | |
| AMD Radeon RX 6750 XT | |
| NVIDIA GeForce RTX 3060 Ti | |
| AMD Radeon RX 6650 XT | |
| NVIDIA GeForce RTX 2070 Super (Desktop) | |
| NVIDIA GeForce RTX 2060 Super (Desktop) | |
| 1024x600 Normal, Fluid 3DTex | |
| NVIDIA GeForce RTX 4090 | |
| AMD Radeon RX 7900 XTX | |
| AMD Radeon RX 7900 XT | |
| NVIDIA GeForce RTX 4080 | |
| AMD Radeon RX 6950 XT | |
| NVIDIA GeForce RTX 3090 | |
| NVIDIA GeForce RTX 3080 12 GB | |
| NVIDIA Titan RTX | |
| NVIDIA GeForce RTX 4070 Ti | |
| NVIDIA GeForce RTX 3070 Ti | |
| NVIDIA GeForce RTX 4070 | |
| AMD Radeon RX 6750 XT | |
| NVIDIA GeForce RTX 3060 Ti | |
| NVIDIA GeForce RTX 2070 Super (Desktop) | |
| NVIDIA GeForce RTX 2060 Super (Desktop) | |
| NVIDIA GeForce RTX 4060 Ti 8G | |
| AMD Radeon RX 6650 XT | |
| 1024x600 Normal, Fluid 2DTexArr | |
| AMD Radeon RX 7900 XTX | |
| NVIDIA GeForce RTX 4090 | |
| AMD Radeon RX 7900 XT | |
| NVIDIA GeForce RTX 4080 | |
| NVIDIA GeForce RTX 3090 | |
| AMD Radeon RX 6950 XT | |
| NVIDIA GeForce RTX 3080 12 GB | |
| NVIDIA Titan RTX | |
| NVIDIA GeForce RTX 4070 Ti | |
| NVIDIA GeForce RTX 4070 | |
| NVIDIA GeForce RTX 3070 Ti | |
| NVIDIA GeForce RTX 3060 Ti | |
| AMD Radeon RX 6750 XT | |
| NVIDIA GeForce RTX 2070 Super (Desktop) | |
| NVIDIA GeForce RTX 2060 Super (Desktop) | |
| NVIDIA GeForce RTX 4060 Ti 8G | |
| AMD Radeon RX 6650 XT | |
| 1024x600 Normal, Mandel Vector | |
| NVIDIA GeForce RTX 4090 | |
| AMD Radeon RX 7900 XTX | |
| AMD Radeon RX 7900 XT | |
| NVIDIA GeForce RTX 4080 | |
| NVIDIA GeForce RTX 4070 Ti | |
| NVIDIA GeForce RTX 3090 | |
| AMD Radeon RX 6950 XT | |
| NVIDIA GeForce RTX 4070 | |
| NVIDIA GeForce RTX 3080 12 GB | |
| NVIDIA GeForce RTX 4060 Ti 8G | |
| NVIDIA GeForce RTX 3070 Ti | |
| AMD Radeon RX 6750 XT | |
| NVIDIA Titan RTX | |
| AMD Radeon RX 6650 XT | |
| NVIDIA GeForce RTX 3060 Ti | |
| NVIDIA GeForce RTX 2070 Super (Desktop) | |
| NVIDIA GeForce RTX 2060 Super (Desktop) | |
| 1024x600 Normal, Mandel Scalar | |
| NVIDIA GeForce RTX 4090 | |
| AMD Radeon RX 7900 XTX | |
| NVIDIA GeForce RTX 4080 | |
| AMD Radeon RX 7900 XT | |
| NVIDIA GeForce RTX 4070 Ti | |
| AMD Radeon RX 6950 XT | |
| NVIDIA GeForce RTX 3090 | |
| NVIDIA GeForce RTX 4070 | |
| NVIDIA GeForce RTX 3080 12 GB | |
| NVIDIA GeForce RTX 3070 Ti | |
| NVIDIA GeForce RTX 4060 Ti 8G | |
| AMD Radeon RX 6750 XT | |
| NVIDIA Titan RTX | |
| NVIDIA GeForce RTX 3060 Ti | |
| AMD Radeon RX 6650 XT | |
| NVIDIA GeForce RTX 2070 Super (Desktop) | |
| NVIDIA GeForce RTX 2060 Super (Desktop) | |
| Photoshop PugetBench | |
| GPU Score | |
| AMD Radeon RX 6750 XT | |
| AMD Radeon RX 7900 XT | |
| AMD Radeon RX 7900 XTX | |
| NVIDIA GeForce RTX 4080 | |
| NVIDIA GeForce RTX 3070 Ti | |
| NVIDIA GeForce RTX 4090 | |
| NVIDIA GeForce RTX 2060 Super (Desktop) | |
| NVIDIA GeForce RTX 2070 Super (Desktop) | |
| NVIDIA GeForce GTX 1660 (Desktop) | |
| NVIDIA Titan RTX | |
| AMD Radeon RX 6950 XT | |
| AMD Radeon RX 6650 XT | |
| NVIDIA GeForce RTX 4060 Ti 8G | |
| NVIDIA GeForce RTX 4070 | |
| NVIDIA GeForce RTX 4070 Ti | |
| NVIDIA GeForce RTX 3080 12 GB | |
| Overall Score | |
| AMD Radeon RX 7900 XT | |
| AMD Radeon RX 6750 XT | |
| AMD Radeon RX 7900 XTX | |
| NVIDIA GeForce RTX 3070 Ti | |
| NVIDIA GeForce RTX 4080 | |
| NVIDIA GeForce RTX 4090 | |
| NVIDIA GeForce RTX 2060 Super (Desktop) | |
| NVIDIA GeForce RTX 2070 Super (Desktop) | |
| NVIDIA GeForce GTX 1660 (Desktop) | |
| NVIDIA GeForce RTX 4060 Ti 8G | |
| NVIDIA GeForce RTX 4070 | |
| NVIDIA Titan RTX | |
| NVIDIA GeForce RTX 4070 Ti | |
| AMD Radeon RX 6950 XT | |
| AMD Radeon RX 6650 XT | |
| NVIDIA GeForce RTX 3080 12 GB | |
| Premiere Pro PugetBench | |
| GPU 0.9 | |
| NVIDIA GeForce RTX 4090 | |
| NVIDIA GeForce RTX 4080 | |
| NVIDIA GeForce RTX 3080 12 GB | |
| NVIDIA GeForce RTX 4070 Ti | |
| NVIDIA GeForce RTX 4070 | |
| AMD Radeon RX 7900 XTX | |
| NVIDIA GeForce RTX 3070 Ti | |
| NVIDIA Titan RTX | |
| AMD Radeon RX 7900 XT | |
| AMD Radeon RX 6950 XT | |
| NVIDIA GeForce RTX 4060 Ti 8G | |
| NVIDIA GeForce RTX 2070 Super (Desktop) | |
| NVIDIA GeForce RTX 2060 Super (Desktop) | |
| AMD Radeon RX 6750 XT | |
| AMD Radeon RX 6650 XT | |
| NVIDIA GeForce GTX 1660 (Desktop) | |
| Overall Score 0.9 | |
| NVIDIA GeForce RTX 4090 | |
| NVIDIA GeForce RTX 4070 | |
| NVIDIA GeForce RTX 4080 | |
| NVIDIA Titan RTX | |
| NVIDIA GeForce RTX 4070 Ti | |
| NVIDIA GeForce RTX 4060 Ti 8G | |
| NVIDIA GeForce RTX 2060 Super (Desktop) | |
| AMD Radeon RX 7900 XTX | |
| NVIDIA GeForce RTX 2070 Super (Desktop) | |
| NVIDIA GeForce RTX 3070 Ti | |
| AMD Radeon RX 7900 XT | |
| AMD Radeon RX 6750 XT | |
| NVIDIA GeForce GTX 1660 (Desktop) | |
| NVIDIA GeForce RTX 3080 12 GB | |
| AMD Radeon RX 6950 XT | |
| AMD Radeon RX 6650 XT | |
| Affinity Photo 2 - Combined (Single / Multi GPU) | |
| NVIDIA GeForce RTX 4070 | |
| NVIDIA GeForce RTX 4070 Ti | |
| NVIDIA GeForce RTX 4090 | |
| NVIDIA GeForce RTX 4080 | |
| NVIDIA GeForce RTX 2070 Super (Desktop) | |
| NVIDIA GeForce RTX 3070 Ti | |
| NVIDIA GeForce RTX 2060 Super (Desktop) | |
| AMD Radeon RX 6750 XT | |
| NVIDIA GeForce RTX 4060 Ti 8G | |
| NVIDIA Titan RTX | |
| NVIDIA GeForce GTX 1660 (Desktop) | |
| NVIDIA GeForce GTX 1660 Super (Desktop) | |
| AMD Radeon RX 7900 XTX | |
| AMD Radeon RX 7900 XT | |
Zastosowania profesjonalne
W dziedzinie zastosowań profesjonalnych, nasza karta graficzna MSI GeForce RTX 4060 Ti Gaming X Trio może zniwelować różnicę w stosunku do kartNvidia GeForce RTX 3070 Tinieznacznie. Jednak w porównaniu doNvidia GeForce RTX 4070widać znacznie większą przepaść między nimi. TheNvidia Titan RTXjest doskonałym przykładem tego, co może osiągnąć profesjonalna karta graficzna. Model ten osiągnął prawie takie same wyniki testów syntetycznych jak nasza próbka testowa, ale tutaj jest o 200 procent lepszy. W rezultacie nie zalecamy korzystania z kartyNvidia GeForce RTX 4060 Tiw profesjonalnych warunkach.
| NVIDIA GeForce RTX 4060 Ti 8G R9 7950X | NVIDIA GeForce RTX 3060 Ti R9 5950X | NVIDIA GeForce RTX 3070 Ti R9 7950X | NVIDIA GeForce RTX 4070 R9 7950X | NVIDIA GeForce RTX 4070 Ti R9 7950X | NVIDIA GeForce RTX 4080 R9 7950X | NVIDIA GeForce RTX 4090 R9 7950X | AMD Radeon RX 7900 XT R9 7950X | AMD Radeon RX 7900 XTX R9 7950X | NVIDIA GeForce RTX 3080 12 GB R9 5900X | NVIDIA GeForce GTX 1660 (Desktop) R9 7950X | NVIDIA GeForce GTX 1660 Super (Desktop) R9 7950X | NVIDIA GeForce RTX 2060 Super (Desktop) R9 7950X | NVIDIA GeForce RTX 2070 Super (Desktop) R9 7950X | NVIDIA Titan RTX R9 7950X | Średnia w klasie | |
|---|---|---|---|---|---|---|---|---|---|---|---|---|---|---|---|---|
| SPECviewperf 12 | -20% | 8% | 26% | 50% | 74% | 91% | 414% | 462% | -12% | -48% | -43% | -28% | -15% | 262% | 11% | |
| 1900x1060 3ds Max (3dsmax-05) (fps) | 287 | 252 -12% | 330 15% | 382 33% | 436 52% | 502 75% | 571 99% | 502 75% | 553 93% | 334 16% | 153 -47% | 167 -42% | 220 -23% | 247 -14% | 315 10% | 202 ? -30% |
| 1900x1060 Catia (catia-04) (fps) | 128 | 109 -15% | 136 6% | 161 26% | 192 50% | 221 73% | 257 101% | 481 276% | 536 319% | 79.1 -38% | 65.1 -49% | 68 -47% | 84.5 -34% | 114 -11% | 332 159% | 111.2 ? -13% |
| 1900x1060 Creo (creo-01) (fps) | 75.4 | 57.8 -23% | 72.6 -4% | 89.1 18% | 99.4 32% | 110 46% | 115 53% | 176 133% | 187 148% | 74.4 -1% | 46.1 -39% | 45.5 -40% | 58.8 -22% | 65.7 -13% | 197 161% | 66 ? -12% |
| 1900x1060 Energy (energy-01) (fps) | 23 | 13.9 -40% | 18 -22% | 31.7 38% | 48 109% | 58.8 156% | 54.7 138% | 72.4 215% | 85.2 270% | 17.2 -25% | 6.31 -73% | 8.38 -64% | 11.6 -50% | 12.4 -46% | 28.8 25% | 16.4 ? -29% |
| 1900x1060 Maya (maya-04) (fps) | 254 | 197 -22% | 279 10% | 284 12% | 287 13% | 309 22% | 317 25% | 347 37% | 367 44% | 139 -45% | 131 -48% | 149 -41% | 200 -21% | 225 -11% | 260 2% | 114.9 ? -55% |
| 1900x1060 Medical (medical-01) (fps) | 110 | 59.4 -46% | 106 -4% | 132 20% | 157 43% | 171 55% | 119 8% | 288 162% | 347 215% | 40.3 -63% | 36 -67% | 38.2 -65% | 49.5 -55% | 55.9 -49% | 101 -8% | 57.4 ? -48% |
| 1900x1060 Showcase (showcase-01) (fps) | 120 | 144 20% | 199 66% | 190 58% | 244 103% | 333 178% | 457 281% | 278 132% | 322 168% | 226 88% | 65 -46% | 85.2 -29% | 121 1% | 135 13% | 197 64% | 101.1 ? -16% |
| 1900x1060 Siemens NX (snx-02) (fps) | 14.7 | 12.3 -16% | 14.7 0% | 16.4 12% | 19 29% | 21.6 47% | 27.1 84% | 373 2437% | 400 2621% | 12 -18% | 9.41 -36% | 9.38 -36% | 10.1 -31% | 13.9 -5% | 283 1825% | 60.6 ? 312% |
| 1900x1060 Solidworks (sw-03) (fps) | 95.7 | 71.1 -26% | 101 6% | 109 14% | 118 23% | 113 18% | 126 32% | 342 257% | 360 276% | 73.8 -23% | 69.3 -28% | 70.7 -26% | 79.7 -17% | 95.1 -1% | 207 116% | 88.5 ? -8% |
| SPECviewperf 13 | -17% | 6% | 27% | 51% | 80% | 117% | 401% | 452% | 12% | -50% | -46% | -29% | -15% | 247% | 34% | |
| 3ds Max (3dsmax-06) (fps) | 289 | 252 -13% | 330 14% | 381 32% | 433 50% | 497 72% | 563 95% | 506 75% | 564 95% | 334 16% | 153 -47% | 166 -43% | 218 -25% | 247 -15% | 321 11% | 194 ? -33% |
| Catia (catia-05) (fps) | 188 | 161 -14% | 201 7% | 241 28% | 290 54% | 340 81% | 402 114% | 728 287% | 825 339% | 206 10% | 90.3 -52% | 94.9 -50% | 119 -37% | 163 -13% | 534 184% | 208 ? 11% |
| Creo (creo-02) (fps) | 299 | 225 -25% | 286 -4% | 375 25% | 455 52% | 529 77% | 552 85% | 567 90% | 613 105% | 324 8% | 138 -54% | 141 -53% | 203 -32% | 240 -20% | 386 29% | 213 ? -29% |
| Energy (energy-02) (fps) | 45.7 | 25.6 -44% | 30 -34% | 54.2 19% | 72.8 59% | 92.6 103% | 126 176% | 147 222% | 187 309% | 37.6 -18% | 9.93 -78% | 11.3 -75% | 21.9 -52% | 23.8 -48% | 51.8 13% | 38.9 ? -15% |
| Maya (maya-05) (fps) | 396 | 344 -13% | 437 10% | 510 29% | 591 49% | 678 71% | 715 81% | 670 69% | 735 86% | 460 16% | 194 -51% | 214 -46% | 291 -27% | 344 -13% | 499 26% | 273 ? -31% |
| Medical (medical-02) (fps) | 92.9 | 72.2 -22% | 83.6 -10% | 112 21% | 132 42% | 150 61% | 186 100% | 237 155% | 263 183% | 102 10% | 40.5 -56% | 40.7 -56% | 54.2 -42% | 63.7 -31% | 92 -1% | 86.7 ? -7% |
| Showcase (showcase-02) (fps) | 120 | 145 21% | 198 65% | 191 59% | 244 103% | 334 178% | 455 279% | 279 133% | 323 169% | 228 90% | 64.9 -46% | 85.3 -29% | 122 2% | 135 13% | 198 65% | 123.7 ? 3% |
| Siemens NX (snx-03) (fps) | 26.4 | 22.3 -16% | 26.4 0% | 29.5 12% | 34.1 29% | 39 48% | 49.1 86% | 675 2457% | 725 2646% | 26.3 0% | 16.9 -36% | 16.9 -36% | 18.2 -31% | 25 -5% | 512 1839% | 136.9 ? 419% |
| Solidworks (sw-04) (fps) | 137 | 99.6 -27% | 146 7% | 157 15% | 168 23% | 179 31% | 186 36% | 307 124% | 323 136% | 108 -21% | 102 -26% | 104 -24% | 119 -13% | 136 -1% | 218 59% | 123.3 ? -10% |
| SPECviewperf 2020 | -19% | 11% | 31% | 57% | 86% | 140% | 430% | 490% | 20% | -50% | -48% | -30% | -19% | 300% | 58% | |
| 3840x2160 Siemens NX (snx-04) (fps) | 20.3 | 18.2 -10% | 22.2 9% | 23.9 18% | 27.5 35% | 31.9 57% | 41.3 103% | 476 2245% | 514 2432% | 21.8 7% | 12.7 -37% | 12.7 -37% | 14 -31% | 19.8 -2% | 375 1747% | 90.8 ? 347% |
| 3840x2160 Medical (medical-03) (fps) | 17.7 | 11.4 -36% | 16.3 -8% | 22.2 25% | 26.9 52% | 32.2 82% | 45.9 159% | 53.9 205% | 62.3 252% | 18.8 6% | 7.48 -58% | 7.41 -58% | 10.3 -42% | 12 -32% | 16.5 -7% | 23.8 ? 34% |
| 3840x2160 Maya (maya-06) (fps) | 226 | 215 -5% | 290 28% | 305 35% | 372 65% | 447 98% | 498 120% | 401 77% | 481 113% | 314 39% | 106 -53% | 118 -48% | 162 -28% | 185 -18% | 274 21% | 217 ? -4% |
| 3840x2160 Energy (energy-03) (fps) | 44.9 | 14.5 -68% | 39.1 -13% | 57.6 28% | 75.7 69% | 90.4 101% | 141 214% | 99.6 122% | 129 187% | 37.2 -17% | 12.5 -72% | 13.7 -69% | 22.9 -49% | 17.8 -60% | 93.9 109% | 50.2 ? 12% |
| 3840x2160 Creo (creo-03) (fps) | 96.1 | 76.6 -20% | 99.3 3% | 112 17% | 121 26% | 128 33% | 133 38% | 173 80% | 187 95% | 90 -6% | 55.2 -43% | 57.7 -40% | 77.2 -20% | 85.8 -11% | 135 40% | 78.1 ? -19% |
| 3840x2160 CATIA (catia-06) (fps) | 39.2 | 37.9 -3% | 48 22% | 51.6 32% | 61.2 56% | 75.5 93% | 95.3 143% | 113 188% | 127 224% | 53.7 37% | 19.2 -51% | 21 -46% | 30.5 -22% | 36.7 -6% | 90.9 132% | 48.6 ? 24% |
| 3840x2160 3ds Max (3dsmax-07) (fps) | 74.5 | 80.1 8% | 99 33% | 122 64% | 147 97% | 179 140% | 228 206% | 143 92% | 167 124% | 128 72% | 45.5 -39% | 48.3 -35% | 63.1 -15% | 69.7 -6% | 118 58% | 83.4 ? 12% |
| Całkowita średnia (program / ustawienia) | -19% /
-19% | 8% /
8% | 28% /
28% | 53% /
53% | 80% /
80% | 116% /
114% | 415% /
414% | 468% /
466% | 7% /
6% | -49% /
-49% | -46% /
-45% | -29% /
-29% | -16% /
-16% | 270% /
267% | 34% /
33% |
Testy porównawcze gier
Według Nvidii, głównym rynkiem docelowym firmy są gracze, którzy grają głównie w rozdzielczości 1920 x 1080 przy użyciu wysokich lub maksymalnych ustawień szczegółów. Nie jest to całkowicie pokryte przez GeForce RTX 4060 Ti, jeśli przyjrzeć się bliżej przeglądowi wszystkich testowanych przez nas gier. Można się jednak spierać do upadłego, bo co właściwie oznacza wysoka liczba klatek na sekundę? Jeśli ustawimy limit na 60 FPS, to GPU nadal ląduje na zielono. Jeśli jednak ustawimy go na 144 FPS, wyniki są zupełnie inne. Ogólnie rzecz biorąc, wydajność MSI GeForce RTX 4060 Ti Gaming X Trio w grach naprawdę nie jest zła i obecnie dobrze nadaje się do działania jako karta graficzna do gier 1 080p. W naszych testach nie było gier, z którymi MSI GeForce RTX 4060 Ti Gaming X Trio nie mogłaby sobie poradzić. Chociaż od czasu do czasu odnotowaliśmy spadek liczby klatek na sekundę. Przykładem może być A Plague Tale Requiem . Tutaj zmierzyliśmy stosunkowo dobrą średnią 67 FPS w 1 080p i przy ustawieniu Ultra. Jednocześnie zmierzyliśmy również spadki do 37 FPS, co oznacza, że nie można mówić o płynnej rozgrywce. Należy rozróżnić różne gatunki gier, ponieważ nie poradzi sobie tak dobrze z prowadzeniem strzelanek online o wysokiej liczbie klatek na sekundę w porównaniu z bardziej typową grą fabularną.
W porównaniu do swoich konkurentów, MSI GeForce RTX 4060 Ti Gaming X Trio radził sobie porównywalnie dobrze i zawsze konkurował z Sapphire Pulse Radeon RX 6750 XT w szczególności. Nawet w rozdzielczości 1440p, w której 8 GB pamięci VRAM karty GeForce RTX 4060 Ti powoli się wyczerpuje, karta graficzna nadal była w stanie dotrzymać kroku konkurentom AMD, mimo że wykazują oni znacznie więcej miejsca na tekstury dzięki 12 GB pamięci VRAM.
| The Witcher 3 | |
| 1920x1080 Ultra Graphics & Postprocessing (HBAO+) | |
| Palit GeForce RTX 4090 GameRock OC | |
| AMD Radeon RX 7900 XTX | |
| KFA2 GeForce RTX 4080 SG | |
| AMD Radeon RX 7900 XT | |
| KFA2 GeForce RTX 4070 Ti EX Gamer | |
| NVIDIA GeForce RTX 3090 Founders Edition | |
| KFA2 GeForce RTX 4070 EX Gamer | |
| KFA2 GeForce RTX 3080 SG | |
| Nvidia Titan RTX | |
| KFA2 GeForce RTX 3070 Ti SG | |
| Sapphire Pulse Radeon RX 6750 XT | |
| MSI GeForce RTX 4060 Ti Gaming X Trio 8G | |
| Nvidia GeForce RTX 2070 Super | |
| NVIDIA GeForce RTX 3060 Ti FE | |
| Sapphire Nitro+ Radeon RX 6650 XT | |
| Nvidia GeForce RTX 2060 Super | |
| KFA2 GeForce GTX 1660 Super | |
| PNY GeForce GTX 1660 | |
| 1920x1080 High Graphics & Postprocessing (Nvidia HairWorks Off) | |
| Palit GeForce RTX 4090 GameRock OC | |
| KFA2 GeForce RTX 4080 SG | |
| AMD Radeon RX 7900 XTX | |
| AMD Radeon RX 7900 XT | |
| KFA2 GeForce RTX 4070 Ti EX Gamer | |
| NVIDIA GeForce RTX 3090 Founders Edition | |
| KFA2 GeForce RTX 4070 EX Gamer | |
| KFA2 GeForce RTX 3080 SG | |
| Nvidia Titan RTX | |
| KFA2 GeForce RTX 3070 Ti SG | |
| MSI GeForce RTX 4060 Ti Gaming X Trio 8G | |
| Sapphire Pulse Radeon RX 6750 XT | |
| NVIDIA GeForce RTX 3060 Ti FE | |
| Nvidia GeForce RTX 2070 Super | |
| Sapphire Nitro+ Radeon RX 6650 XT | |
| Nvidia GeForce RTX 2060 Super | |
| KFA2 GeForce GTX 1660 Super | |
| PNY GeForce GTX 1660 | |
| Metro Exodus | |
| 2560x1440 Ultra Quality AF:16x | |
| Palit GeForce RTX 4090 GameRock OC | |
| AMD Radeon RX 7900 XTX | |
| KFA2 GeForce RTX 4080 SG | |
| AMD Radeon RX 7900 XT | |
| KFA2 GeForce RTX 4070 Ti EX Gamer | |
| NVIDIA GeForce RTX 3090 Founders Edition | |
| KFA2 GeForce RTX 4070 EX Gamer | |
| KFA2 GeForce RTX 3080 SG | |
| Nvidia Titan RTX | |
| KFA2 GeForce RTX 3070 Ti SG | |
| MSI GeForce RTX 4060 Ti Gaming X Trio 8G | |
| Sapphire Pulse Radeon RX 6750 XT | |
| NVIDIA GeForce RTX 3060 Ti FE | |
| Nvidia GeForce RTX 2070 Super | |
| Nvidia GeForce RTX 2060 Super | |
| KFA2 GeForce GTX 1660 Super | |
| PNY GeForce GTX 1660 | |
| 1920x1080 Ultra Quality AF:16x | |
| Palit GeForce RTX 4090 GameRock OC | |
| AMD Radeon RX 7900 XTX | |
| KFA2 GeForce RTX 4080 SG | |
| AMD Radeon RX 7900 XT | |
| KFA2 GeForce RTX 4070 Ti EX Gamer | |
| NVIDIA GeForce RTX 3090 Founders Edition | |
| KFA2 GeForce RTX 4070 EX Gamer | |
| KFA2 GeForce RTX 3080 SG | |
| Nvidia Titan RTX | |
| KFA2 GeForce RTX 3070 Ti SG | |
| MSI GeForce RTX 4060 Ti Gaming X Trio 8G | |
| Sapphire Pulse Radeon RX 6750 XT | |
| NVIDIA GeForce RTX 3060 Ti FE | |
| Nvidia GeForce RTX 2070 Super | |
| Nvidia GeForce RTX 2060 Super | |
| KFA2 GeForce GTX 1660 Super | |
| PNY GeForce GTX 1660 | |
| Far Cry 6 | |
| 3840x2160 Ultra Graphics Quality + HD Textures AA:T | |
| Palit GeForce RTX 4090 GameRock OC | |
| AMD Radeon RX 7900 XTX | |
| KFA2 GeForce RTX 4080 SG | |
| AMD Radeon RX 7900 XT | |
| KFA2 GeForce RTX 4070 Ti EX Gamer | |
| NVIDIA GeForce RTX 3090 Founders Edition | |
| KFA2 GeForce RTX 4070 EX Gamer | |
| Nvidia Titan RTX | |
| KFA2 GeForce RTX 3080 SG | |
| Sapphire Pulse Radeon RX 6750 XT | |
| MSI GeForce RTX 4060 Ti Gaming X Trio 8G | |
| KFA2 GeForce RTX 3070 Ti SG | |
| Nvidia GeForce RTX 2060 Super | |
| Nvidia GeForce RTX 2070 Super | |
| Sapphire Nitro+ Radeon RX 6650 XT | |
| KFA2 GeForce GTX 1660 Super | |
| PNY GeForce GTX 1660 | |
| 2560x1440 Ultra Graphics Quality + HD Textures AA:T | |
| AMD Radeon RX 7900 XTX | |
| Palit GeForce RTX 4090 GameRock OC | |
| AMD Radeon RX 7900 XT | |
| KFA2 GeForce RTX 4070 Ti EX Gamer | |
| KFA2 GeForce RTX 4080 SG | |
| NVIDIA GeForce RTX 3090 Founders Edition | |
| KFA2 GeForce RTX 4070 EX Gamer | |
| KFA2 GeForce RTX 3070 Ti SG | |
| Nvidia Titan RTX | |
| Sapphire Pulse Radeon RX 6750 XT | |
| MSI GeForce RTX 4060 Ti Gaming X Trio 8G | |
| KFA2 GeForce RTX 3080 SG | |
| Nvidia GeForce RTX 2070 Super | |
| Sapphire Nitro+ Radeon RX 6650 XT | |
| Nvidia GeForce RTX 2060 Super | |
| KFA2 GeForce GTX 1660 Super | |
| PNY GeForce GTX 1660 | |
| 1920x1080 Ultra Graphics Quality + HD Textures AA:T | |
| AMD Radeon RX 7900 XTX | |
| AMD Radeon RX 7900 XT | |
| KFA2 GeForce RTX 4070 Ti EX Gamer | |
| Palit GeForce RTX 4090 GameRock OC | |
| KFA2 GeForce RTX 4070 EX Gamer | |
| NVIDIA GeForce RTX 3090 Founders Edition | |
| KFA2 GeForce RTX 4080 SG | |
| MSI GeForce RTX 4060 Ti Gaming X Trio 8G | |
| KFA2 GeForce RTX 3070 Ti SG | |
| Sapphire Pulse Radeon RX 6750 XT | |
| Nvidia Titan RTX | |
| Sapphire Nitro+ Radeon RX 6650 XT | |
| Nvidia GeForce RTX 2070 Super | |
| KFA2 GeForce RTX 3080 SG | |
| Nvidia GeForce RTX 2060 Super | |
| KFA2 GeForce GTX 1660 Super | |
| PNY GeForce GTX 1660 | |
| F1 2021 | |
| 2560x1440 Ultra High Preset + Raytracing AA:T AF:16x | |
| Palit GeForce RTX 4090 GameRock OC (874931) | |
| KFA2 GeForce RTX 4080 SG (874931) | |
| AMD Radeon RX 7900 XTX (874931) | |
| KFA2 GeForce RTX 4070 Ti EX Gamer (874931) | |
| AMD Radeon RX 7900 XT (874931) | |
| NVIDIA GeForce RTX 3090 Founders Edition (874931) | |
| KFA2 GeForce RTX 4070 EX Gamer (874931) | |
| KFA2 GeForce RTX 3080 SG (874931) | |
| KFA2 GeForce RTX 3070 Ti SG (874931) | |
| MSI GeForce RTX 4060 Ti Gaming X Trio 8G (874931) | |
| Nvidia Titan RTX (874931) | |
| Sapphire Pulse Radeon RX 6750 XT (874931) | |
| Nvidia GeForce RTX 2070 Super (874931) | |
| KFA2 GeForce GTX 1660 Super (874931) | |
| Sapphire Nitro+ Radeon RX 6650 XT (874931) | |
| PNY GeForce GTX 1660 (874931) | |
| Nvidia GeForce RTX 2060 Super (874931) | |
| 1920x1080 Ultra High Preset + Raytracing AA:T AF:16x | |
| Palit GeForce RTX 4090 GameRock OC (874931) | |
| AMD Radeon RX 7900 XTX (874931) | |
| KFA2 GeForce RTX 4080 SG (874931) | |
| KFA2 GeForce RTX 4070 Ti EX Gamer (874931) | |
| AMD Radeon RX 7900 XT (874931) | |
| NVIDIA GeForce RTX 3090 Founders Edition (874931) | |
| KFA2 GeForce RTX 4070 EX Gamer (874931) | |
| KFA2 GeForce RTX 3080 SG (874931) | |
| KFA2 GeForce RTX 3070 Ti SG (874931) | |
| MSI GeForce RTX 4060 Ti Gaming X Trio 8G (874931) | |
| Nvidia Titan RTX (874931) | |
| Sapphire Pulse Radeon RX 6750 XT (874931) | |
| Nvidia GeForce RTX 2070 Super (874931) | |
| Sapphire Nitro+ Radeon RX 6650 XT (874931) | |
| KFA2 GeForce GTX 1660 Super (874931) | |
| Nvidia GeForce RTX 2060 Super (874931) | |
| PNY GeForce GTX 1660 (874931) | |
| F1 22 | |
| 2560x1440 Ultra High Preset AA:T AF:16x | |
| Palit GeForce RTX 4090 GameRock OC (923662) | |
| KFA2 GeForce RTX 4080 SG (939134) | |
| AMD Radeon RX 7900 XTX (939134) | |
| KFA2 GeForce RTX 4070 Ti EX Gamer (959964) | |
| AMD Radeon RX 7900 XT (939134) | |
| NVIDIA GeForce RTX 3090 Founders Edition (923650) | |
| KFA2 GeForce RTX 4070 EX Gamer (959964) | |
| KFA2 GeForce GTX 1660 Super (928484) | |
| PNY GeForce GTX 1660 (928484) | |
| KFA2 GeForce RTX 3070 Ti SG (939134) | |
| Nvidia Titan RTX (923650) | |
| MSI GeForce RTX 4060 Ti Gaming X Trio 8G (959964) | |
| Sapphire Pulse Radeon RX 6750 XT (959964) | |
| Nvidia GeForce RTX 2070 Super (923662) | |
| Nvidia GeForce RTX 2060 Super (923662) | |
| Sapphire Nitro+ Radeon RX 6650 XT | |
| 1920x1080 Ultra High Preset AA:T AF:16x | |
| Palit GeForce RTX 4090 GameRock OC | |
| KFA2 GeForce RTX 4080 SG (939134) | |
| AMD Radeon RX 7900 XTX (939134) | |
| KFA2 GeForce RTX 4070 Ti EX Gamer (959964) | |
| NVIDIA GeForce RTX 3090 Founders Edition (923650) | |
| AMD Radeon RX 7900 XT (939134) | |
| KFA2 GeForce RTX 4070 EX Gamer (959964) | |
| KFA2 GeForce GTX 1660 Super (928484) | |
| KFA2 GeForce RTX 3070 Ti SG (939134) | |
| PNY GeForce GTX 1660 (928484) | |
| Nvidia Titan RTX (923650) | |
| MSI GeForce RTX 4060 Ti Gaming X Trio 8G (959964) | |
| Sapphire Pulse Radeon RX 6750 XT (959964) | |
| Nvidia GeForce RTX 2070 Super (923662) | |
| Nvidia GeForce RTX 2060 Super (923662) | |
| Sapphire Nitro+ Radeon RX 6650 XT | |
| Cyberpunk 2077 1.6 | |
| 2560x1440 Ultra Preset | |
| Palit GeForce RTX 4090 GameRock OC (1.6) | |
| AMD Radeon RX 7900 XTX (1.61) | |
| KFA2 GeForce RTX 4080 SG (1.61) | |
| AMD Radeon RX 7900 XT (1.61) | |
| KFA2 GeForce RTX 4070 Ti EX Gamer | |
| KFA2 GeForce RTX 4070 EX Gamer | |
| KFA2 GeForce RTX 3070 Ti SG (1.61) | |
| Sapphire Pulse Radeon RX 6750 XT | |
| MSI GeForce RTX 4060 Ti Gaming X Trio 8G | |
| Nvidia GeForce RTX 2070 Super (1.6) | |
| Sapphire Nitro+ Radeon RX 6650 XT | |
| Nvidia GeForce RTX 2060 Super (1.6) | |
| KFA2 GeForce GTX 1660 Super (1.6) | |
| PNY GeForce GTX 1660 (1.6) | |
| 1920x1080 Ultra Preset | |
| Palit GeForce RTX 4090 GameRock OC (1.6) | |
| AMD Radeon RX 7900 XTX (1.61) | |
| KFA2 GeForce RTX 4080 SG (1.61) | |
| AMD Radeon RX 7900 XT (1.61) | |
| KFA2 GeForce RTX 4070 Ti EX Gamer | |
| KFA2 GeForce RTX 4070 EX Gamer | |
| KFA2 GeForce RTX 3070 Ti SG (1.61) | |
| MSI GeForce RTX 4060 Ti Gaming X Trio 8G | |
| Sapphire Pulse Radeon RX 6750 XT | |
| Sapphire Nitro+ Radeon RX 6650 XT | |
| Nvidia GeForce RTX 2070 Super (1.6) | |
| Nvidia GeForce RTX 2060 Super (1.6) | |
| KFA2 GeForce GTX 1660 Super (1.6) | |
| PNY GeForce GTX 1660 (1.6) | |
| A Plague Tale Requiem | |
| 2560x1440 Ultra Preset | |
| Palit GeForce RTX 4090 GameRock OC | |
| AMD Radeon RX 7900 XTX | |
| KFA2 GeForce RTX 4080 SG | |
| AMD Radeon RX 7900 XT | |
| KFA2 GeForce RTX 4070 Ti EX Gamer | |
| KFA2 GeForce RTX 4070 EX Gamer | |
| KFA2 GeForce RTX 3070 Ti SG | |
| Nvidia Titan RTX | |
| MSI GeForce RTX 4060 Ti Gaming X Trio 8G | |
| Sapphire Pulse Radeon RX 6750 XT | |
| Nvidia GeForce RTX 2070 Super | |
| Nvidia GeForce RTX 2060 Super | |
| KFA2 GeForce GTX 1660 Super | |
| PNY GeForce GTX 1660 | |
| 1920x1080 Ultra Preset | |
| Palit GeForce RTX 4090 GameRock OC | |
| KFA2 GeForce RTX 4080 SG | |
| AMD Radeon RX 7900 XTX | |
| AMD Radeon RX 7900 XT | |
| KFA2 GeForce RTX 4070 Ti EX Gamer | |
| KFA2 GeForce RTX 4070 EX Gamer | |
| KFA2 GeForce RTX 3070 Ti SG | |
| Nvidia Titan RTX | |
| MSI GeForce RTX 4060 Ti Gaming X Trio 8G | |
| Sapphire Pulse Radeon RX 6750 XT | |
| Nvidia GeForce RTX 2070 Super | |
| Nvidia GeForce RTX 2060 Super | |
| KFA2 GeForce GTX 1660 Super | |
| PNY GeForce GTX 1660 | |
| Need for Speed Unbound | |
| 2560x1440 Ultra Preset | |
| Palit GeForce RTX 4090 GameRock OC | |
| KFA2 GeForce RTX 4080 SG | |
| AMD Radeon RX 7900 XTX | |
| AMD Radeon RX 7900 XT | |
| KFA2 GeForce RTX 3070 Ti SG | |
| Nvidia Titan RTX | |
| Nvidia GeForce RTX 2070 Super | |
| Nvidia GeForce RTX 2060 Super | |
| KFA2 GeForce GTX 1660 Super | |
| PNY GeForce GTX 1660 | |
| 1920x1080 Ultra Preset | |
| Palit GeForce RTX 4090 GameRock OC | |
| AMD Radeon RX 7900 XTX | |
| KFA2 GeForce RTX 4080 SG | |
| AMD Radeon RX 7900 XT | |
| KFA2 GeForce RTX 3070 Ti SG | |
| Nvidia Titan RTX | |
| Nvidia GeForce RTX 2070 Super | |
| Nvidia GeForce RTX 2060 Super | |
| KFA2 GeForce GTX 1660 Super | |
| PNY GeForce GTX 1660 | |
| Spider-Man Miles Morales | |
| 2560x1440 Very High Preset AA:T | |
| KFA2 GeForce RTX 4080 SG | |
| Palit GeForce RTX 4090 GameRock OC | |
| AMD Radeon RX 7900 XTX | |
| KFA2 GeForce RTX 4070 Ti EX Gamer | |
| AMD Radeon RX 7900 XT | |
| KFA2 GeForce RTX 4070 EX Gamer | |
| KFA2 GeForce RTX 3070 Ti SG | |
| Nvidia Titan RTX | |
| MSI GeForce RTX 4060 Ti Gaming X Trio 8G | |
| Sapphire Pulse Radeon RX 6750 XT | |
| Nvidia GeForce RTX 2070 Super | |
| Nvidia GeForce RTX 2060 Super | |
| PNY GeForce GTX 1660 | |
| KFA2 GeForce GTX 1660 Super | |
| 1920x1080 Very High Preset AA:T | |
| Palit GeForce RTX 4090 GameRock OC | |
| KFA2 GeForce RTX 4070 Ti EX Gamer | |
| AMD Radeon RX 7900 XTX | |
| KFA2 GeForce RTX 4070 EX Gamer | |
| KFA2 GeForce RTX 4080 SG | |
| AMD Radeon RX 7900 XT | |
| KFA2 GeForce RTX 3070 Ti SG | |
| Nvidia Titan RTX | |
| MSI GeForce RTX 4060 Ti Gaming X Trio 8G | |
| Sapphire Pulse Radeon RX 6750 XT | |
| Nvidia GeForce RTX 2070 Super | |
| Nvidia GeForce RTX 2060 Super | |
| KFA2 GeForce GTX 1660 Super | |
| PNY GeForce GTX 1660 | |
| Borderlands 3 | |
| 2560x1440 Badass Overall Quality (DX11) | |
| Palit GeForce RTX 4090 GameRock OC | |
| KFA2 GeForce RTX 4080 SG | |
| AMD Radeon RX 7900 XTX | |
| AMD Radeon RX 7900 XT | |
| KFA2 GeForce RTX 4070 Ti EX Gamer | |
| NVIDIA GeForce RTX 3090 Founders Edition | |
| KFA2 GeForce RTX 4070 EX Gamer | |
| KFA2 GeForce RTX 3080 SG | |
| KFA2 GeForce RTX 3070 Ti SG | |
| Nvidia Titan RTX | |
| MSI GeForce RTX 4060 Ti Gaming X Trio 8G | |
| Sapphire Pulse Radeon RX 6750 XT | |
| NVIDIA GeForce RTX 3060 Ti FE | |
| Sapphire Nitro+ Radeon RX 6650 XT | |
| Nvidia GeForce RTX 2070 Super | |
| Nvidia GeForce RTX 2060 Super | |
| KFA2 GeForce GTX 1660 Super | |
| PNY GeForce GTX 1660 | |
| 1920x1080 Badass Overall Quality (DX11) | |
| KFA2 GeForce RTX 4080 SG | |
| Palit GeForce RTX 4090 GameRock OC | |
| AMD Radeon RX 7900 XTX | |
| KFA2 GeForce RTX 4070 Ti EX Gamer | |
| AMD Radeon RX 7900 XT | |
| NVIDIA GeForce RTX 3090 Founders Edition | |
| KFA2 GeForce RTX 4070 EX Gamer | |
| KFA2 GeForce RTX 3070 Ti SG | |
| Nvidia Titan RTX | |
| KFA2 GeForce RTX 3080 SG | |
| MSI GeForce RTX 4060 Ti Gaming X Trio 8G | |
| Sapphire Pulse Radeon RX 6750 XT | |
| NVIDIA GeForce RTX 3060 Ti FE | |
| Sapphire Nitro+ Radeon RX 6650 XT | |
| Nvidia GeForce RTX 2070 Super | |
| Nvidia GeForce RTX 2060 Super | |
| KFA2 GeForce GTX 1660 Super | |
| PNY GeForce GTX 1660 | |
| God of War | |
| 2560x1440 Ultra Preset | |
| Palit GeForce RTX 4090 GameRock OC | |
| AMD Radeon RX 7900 XTX | |
| AMD Radeon RX 7900 XT | |
| KFA2 GeForce RTX 4080 SG | |
| NVIDIA GeForce RTX 3090 Founders Edition | |
| KFA2 GeForce RTX 4070 EX Gamer | |
| Nvidia Titan RTX | |
| KFA2 GeForce RTX 3080 SG | |
| KFA2 GeForce RTX 3070 Ti SG | |
| Sapphire Pulse Radeon RX 6750 XT | |
| MSI GeForce RTX 4060 Ti Gaming X Trio 8G | |
| Nvidia GeForce RTX 2070 Super | |
| Sapphire Nitro+ Radeon RX 6650 XT | |
| Nvidia GeForce RTX 2060 Super | |
| KFA2 GeForce GTX 1660 Super | |
| PNY GeForce GTX 1660 | |
| 1920x1080 Ultra Preset | |
| Palit GeForce RTX 4090 GameRock OC | |
| AMD Radeon RX 7900 XTX | |
| AMD Radeon RX 7900 XT | |
| KFA2 GeForce RTX 4080 SG | |
| NVIDIA GeForce RTX 3090 Founders Edition | |
| KFA2 GeForce RTX 4070 EX Gamer | |
| Nvidia Titan RTX | |
| KFA2 GeForce RTX 3080 SG | |
| KFA2 GeForce RTX 3070 Ti SG | |
| Sapphire Pulse Radeon RX 6750 XT | |
| MSI GeForce RTX 4060 Ti Gaming X Trio 8G | |
| Nvidia GeForce RTX 2070 Super | |
| Sapphire Nitro+ Radeon RX 6650 XT | |
| Nvidia GeForce RTX 2060 Super | |
| KFA2 GeForce GTX 1660 Super | |
| PNY GeForce GTX 1660 | |
| The Quarry | |
| 2560x1440 Ultra Preset | |
| Palit GeForce RTX 4090 GameRock OC | |
| KFA2 GeForce RTX 4080 SG | |
| AMD Radeon RX 7900 XTX | |
| AMD Radeon RX 7900 XT | |
| KFA2 GeForce RTX 4070 Ti EX Gamer | |
| NVIDIA GeForce RTX 3090 Founders Edition | |
| KFA2 GeForce RTX 4070 EX Gamer | |
| KFA2 GeForce RTX 3070 Ti SG | |
| Nvidia Titan RTX | |
| MSI GeForce RTX 4060 Ti Gaming X Trio 8G | |
| Sapphire Pulse Radeon RX 6750 XT | |
| Nvidia GeForce RTX 2070 Super | |
| Sapphire Nitro+ Radeon RX 6650 XT | |
| Nvidia GeForce RTX 2060 Super | |
| KFA2 GeForce GTX 1660 Super | |
| PNY GeForce GTX 1660 | |
| 1920x1080 Ultra Preset | |
| Palit GeForce RTX 4090 GameRock OC | |
| KFA2 GeForce RTX 4080 SG | |
| AMD Radeon RX 7900 XTX | |
| AMD Radeon RX 7900 XT | |
| KFA2 GeForce RTX 4070 Ti EX Gamer | |
| NVIDIA GeForce RTX 3090 Founders Edition | |
| KFA2 GeForce RTX 4070 EX Gamer | |
| KFA2 GeForce RTX 3070 Ti SG | |
| Nvidia Titan RTX | |
| MSI GeForce RTX 4060 Ti Gaming X Trio 8G | |
| Sapphire Pulse Radeon RX 6750 XT | |
| Nvidia GeForce RTX 2070 Super | |
| Sapphire Nitro+ Radeon RX 6650 XT | |
| Nvidia GeForce RTX 2060 Super | |
| KFA2 GeForce GTX 1660 Super | |
| PNY GeForce GTX 1660 | |
| GRID Legends | |
| 2560x1440 Ultra Preset | |
| AMD Radeon RX 7900 XTX (643827) | |
| Palit GeForce RTX 4090 GameRock OC (591708) | |
| AMD Radeon RX 7900 XT (643827) | |
| KFA2 GeForce RTX 4080 SG (643827) | |
| KFA2 GeForce RTX 4070 Ti EX Gamer (712825) | |
| NVIDIA GeForce RTX 3090 Founders Edition (591708) | |
| KFA2 GeForce RTX 3070 Ti SG (643827) | |
| KFA2 GeForce RTX 4070 EX Gamer (712825) | |
| Sapphire Pulse Radeon RX 6750 XT (712825) | |
| Nvidia Titan RTX (591708) | |
| MSI GeForce RTX 4060 Ti Gaming X Trio 8G (800660) | |
| Sapphire Nitro+ Radeon RX 6650 XT | |
| Nvidia GeForce RTX 2070 Super (591708) | |
| Nvidia GeForce RTX 2060 Super (623651) | |
| KFA2 GeForce GTX 1660 Super (623651) | |
| PNY GeForce GTX 1660 (623651) | |
| 1920x1080 Ultra Preset | |
| AMD Radeon RX 7900 XTX (643827) | |
| AMD Radeon RX 7900 XT (643827) | |
| Palit GeForce RTX 4090 GameRock OC (591708) | |
| KFA2 GeForce RTX 4080 SG (643827) | |
| KFA2 GeForce RTX 4070 Ti EX Gamer (712825) | |
| NVIDIA GeForce RTX 3090 Founders Edition (591708) | |
| KFA2 GeForce RTX 4070 EX Gamer (712825) | |
| Sapphire Pulse Radeon RX 6750 XT (712825) | |
| KFA2 GeForce RTX 3070 Ti SG (643827) | |
| Nvidia Titan RTX (591708) | |
| MSI GeForce RTX 4060 Ti Gaming X Trio 8G (800660) | |
| Sapphire Nitro+ Radeon RX 6650 XT | |
| Nvidia GeForce RTX 2070 Super (591708) | |
| Nvidia GeForce RTX 2060 Super (623651) | |
| KFA2 GeForce GTX 1660 Super (623651) | |
| PNY GeForce GTX 1660 (623651) | |
| Final Fantasy XV Benchmark | |
| 1920x1080 High Quality | |
| Palit GeForce RTX 4090 GameRock OC (1.3) | |
| KFA2 GeForce RTX 4080 SG (1.3) | |
| AMD Radeon RX 7900 XTX (1.3) | |
| KFA2 GeForce RTX 4070 Ti EX Gamer (1.3) | |
| AMD Radeon RX 7900 XT (1.3) | |
| NVIDIA GeForce RTX 3090 Founders Edition (1.3) | |
| KFA2 GeForce RTX 4070 EX Gamer (1.3) | |
| KFA2 GeForce RTX 3080 SG (1.3) | |
| Nvidia Titan RTX (1.3) | |
| KFA2 GeForce RTX 3070 Ti SG (1.3) | |
| MSI GeForce RTX 4060 Ti Gaming X Trio 8G (1.3) | |
| Sapphire Pulse Radeon RX 6750 XT (1.3) | |
| Nvidia GeForce RTX 2070 Super (1.3) | |
| Sapphire Nitro+ Radeon RX 6650 XT (1.3) | |
| Nvidia GeForce RTX 2060 Super (1.3) | |
| KFA2 GeForce GTX 1660 Super (1.3) | |
| PNY GeForce GTX 1660 (1.3) | |
| 2560x1440 High Quality | |
| Palit GeForce RTX 4090 GameRock OC (1.3) | |
| KFA2 GeForce RTX 4080 SG (1.3) | |
| AMD Radeon RX 7900 XTX (1.3) | |
| KFA2 GeForce RTX 4070 Ti EX Gamer (1.3) | |
| AMD Radeon RX 7900 XT (1.3) | |
| NVIDIA GeForce RTX 3090 Founders Edition (1.3) | |
| KFA2 GeForce RTX 4070 EX Gamer (1.3) | |
| KFA2 GeForce RTX 3080 SG (1.3) | |
| KFA2 GeForce RTX 3070 Ti SG (1.3) | |
| Nvidia Titan RTX (1.3) | |
| MSI GeForce RTX 4060 Ti Gaming X Trio 8G (1.3) | |
| Sapphire Pulse Radeon RX 6750 XT (1.3) | |
| Nvidia GeForce RTX 2070 Super (1.3) | |
| Sapphire Nitro+ Radeon RX 6650 XT (1.3) | |
| Nvidia GeForce RTX 2060 Super (1.3) | |
| KFA2 GeForce GTX 1660 Super (1.3) | |
| PNY GeForce GTX 1660 (1.3) | |
Śledzenie promieni, DLSS i FG (generowanie klatek)
Wraz z wydaniem Ada Lovelace, Nvidia ulepszyła swoje funkcje ray tracingu i DLSS - trzecią wersję DLSS można obecnie znaleźć wyłącznie w procesorach graficznych RTX 4000. Oznacza to, że MSI GeForce RTX 4060 Ti Gaming X Trio również korzysta z tych nowych funkcji, a funkcja Frame Generation może generować jeszcze wyższą liczbę klatek na sekundę na ekranie. Jednak najpierw musi to zostać zaimplementowane we wszystkich grach, a w przyszłości będą one prawdopodobnie coraz bardziej zoptymalizowane pod kątem tej funkcji. Zdecydowanie jest to funkcja, z której właściciele GeForce RTX 4060 Ti będą mogli skorzystać w przyszłości, aby osiągnąć grywalną liczbę klatek na sekundę. Jeśli moc obliczeniowa karty graficznej nie wystarczy do tego w przyszłości, można użyć DLSS i FG, aby rozwiązać ten problem. Tutaj ponownie możemy użyć A Plague Tale Requiem jako przykładu. Osiągnęliśmy dobre 50 FPS w UHD z aktywowanymi DLSS i FG. Bez tych funkcji udało nam się uzyskać tylko 25 FPS, co zdecydowanie nie wystarcza, by cieszyć się grą.
Funkcje ray tracingu GPU są mniej więcej na tym samym poziomie coNvidia GeForce RTX 2080 Ti. Po włączeniu tej funkcji trzeba jednak liczyć się z większym spadkiem wydajności. Mimo to, często mierzyliśmy średnio 60 FPS. AMD, z ichRadeon RX 6750 XTpo prostu nie nadąża.
| Spider-Man Miles Morales - 1920x0180 Very High Preset + Ray-Tracing AA:T | |
| Palit GeForce RTX 4090 GameRock OC | |
| KFA2 GeForce RTX 4080 SG | |
| KFA2 GeForce RTX 4070 Ti EX Gamer | |
| AMD Radeon RX 7900 XTX | |
| AMD Radeon RX 7900 XT | |
| KFA2 GeForce RTX 4070 EX Gamer | |
| KFA2 GeForce RTX 3070 Ti SG | |
| MSI GeForce RTX 4060 Ti Gaming X Trio 8G | |
| Nvidia Titan RTX | |
| Sapphire Pulse Radeon RX 6750 XT | |
| Nvidia GeForce RTX 2070 Super | |
| Nvidia GeForce RTX 2060 Super | |
| Metro Exodus - 1920x1080 Ultra Quality DXR AF:16x | |
| Palit GeForce RTX 4090 GameRock OC | |
| KFA2 GeForce RTX 4080 SG | |
| AMD Radeon RX 7900 XTX | |
| KFA2 GeForce RTX 4070 Ti EX Gamer | |
| AMD Radeon RX 7900 XT | |
| NVIDIA GeForce RTX 3090 Founders Edition | |
| KFA2 GeForce RTX 4070 EX Gamer | |
| KFA2 GeForce RTX 3080 SG | |
| KFA2 GeForce RTX 3070 Ti SG | |
| Nvidia Titan RTX | |
| MSI GeForce RTX 4060 Ti Gaming X Trio 8G | |
| NVIDIA GeForce RTX 3060 Ti FE | |
| Sapphire Pulse Radeon RX 6750 XT | |
| Nvidia GeForce RTX 2070 Super | |
| Nvidia GeForce RTX 2060 Super | |
| Far Cry 6 - 1920x1080 Ultra Graphics Quality + HD Textures + DXR AA:T | |
| AMD Radeon RX 7900 XTX | |
| AMD Radeon RX 7900 XT | |
| KFA2 GeForce RTX 4070 Ti EX Gamer | |
| Palit GeForce RTX 4090 GameRock OC | |
| KFA2 GeForce RTX 4070 EX Gamer | |
| NVIDIA GeForce RTX 3090 Founders Edition | |
| KFA2 GeForce RTX 4080 SG | |
| Nvidia Titan RTX | |
| Sapphire Pulse Radeon RX 6750 XT | |
| MSI GeForce RTX 4060 Ti Gaming X Trio 8G | |
| KFA2 GeForce RTX 3070 Ti SG | |
| Nvidia GeForce RTX 2070 Super | |
| Nvidia GeForce RTX 2060 Super | |
| Cyberpunk 2077 1.6 | |
| 3840x2160 Ray Tracing Ultra Preset (DLSS off) | |
| Palit GeForce RTX 4090 GameRock OC (1.6) | |
| KFA2 GeForce RTX 4080 SG (1.61) | |
| KFA2 GeForce RTX 4070 Ti EX Gamer | |
| AMD Radeon RX 7900 XTX (1.61) | |
| KFA2 GeForce RTX 4070 EX Gamer | |
| AMD Radeon RX 7900 XT (1.61) | |
| Sapphire Pulse Radeon RX 6750 XT | |
| KFA2 GeForce RTX 3070 Ti SG (1.61) | |
| Nvidia GeForce RTX 2070 Super (1.6) | |
| MSI GeForce RTX 4060 Ti Gaming X Trio 8G | |
| 1920x1080 Ray Tracing Ultra Preset (DLSS off) | |
| Palit GeForce RTX 4090 GameRock OC (1.6) | |
| KFA2 GeForce RTX 4080 SG (1.61) | |
| KFA2 GeForce RTX 4070 Ti EX Gamer | |
| AMD Radeon RX 7900 XTX (1.61) | |
| KFA2 GeForce RTX 4070 EX Gamer | |
| AMD Radeon RX 7900 XT (1.61) | |
| MSI GeForce RTX 4060 Ti Gaming X Trio 8G | |
| KFA2 GeForce RTX 3070 Ti SG (1.61) | |
| Nvidia GeForce RTX 2070 Super (1.6) | |
| Sapphire Pulse Radeon RX 6750 XT | |
| Nvidia GeForce RTX 2060 Super (1.6) | |
| The Callisto Protocol - 1920x1080 Ultra Preset (without FSR Upscaling) + Full Ray-Tracing | |
| AMD Radeon RX 7900 XTX | |
| KFA2 GeForce RTX 4070 Ti EX Gamer | |
| Palit GeForce RTX 4090 GameRock OC | |
| AMD Radeon RX 7900 XT | |
| KFA2 GeForce RTX 4080 SG | |
| KFA2 GeForce RTX 4070 EX Gamer | |
| MSI GeForce RTX 4060 Ti Gaming X Trio 8G | |
| KFA2 GeForce RTX 3070 Ti SG | |
| Nvidia Titan RTX | |
| Nvidia GeForce RTX 2070 Super | |
| Nvidia GeForce RTX 2060 Super | |
| Sapphire Pulse Radeon RX 6750 XT | |
| PNY GeForce GTX 1660 | |
| KFA2 GeForce GTX 1660 Super | |
| Guardians of the Galaxy - 1920x1080 Ultra Preset + Ultra Ray-Tracing | |
| KFA2 GeForce RTX 4070 Ti EX Gamer | |
| AMD Radeon RX 7900 XTX | |
| KFA2 GeForce RTX 4070 EX Gamer | |
| AMD Radeon RX 7900 XT | |
| MSI GeForce RTX 4060 Ti Gaming X Trio 8G | |
| Nvidia Titan RTX | |
| Nvidia GeForce RTX 2070 Super | |
| Sapphire Pulse Radeon RX 6750 XT | |
| Nvidia GeForce RTX 2060 Super | |
| A Plague Tale Requiem | |
| 3840x2160 Ultra DLSS Quality + Frame Generation | |
| KFA2 GeForce RTX 4070 Ti EX Gamer | |
| KFA2 GeForce RTX 4070 EX Gamer | |
| MSI GeForce RTX 4060 Ti Gaming X Trio 8G | |
| 3840x2160 Ultra DLSS Quality | |
| KFA2 GeForce RTX 4070 Ti EX Gamer | |
| KFA2 GeForce RTX 4070 EX Gamer | |
| MSI GeForce RTX 4060 Ti Gaming X Trio 8G | |
| Control | |
| 1920x1080 High Quality Preset & High Ray Tracing Preset (DX12) | |
| Palit GeForce RTX 4090 GameRock OC | |
| KFA2 GeForce RTX 4080 SG | |
| AMD Radeon RX 7900 XTX | |
| KFA2 GeForce RTX 4070 Ti EX Gamer | |
| AMD Radeon RX 7900 XT | |
| KFA2 GeForce RTX 3080 SG | |
| KFA2 GeForce RTX 4070 EX Gamer | |
| Nvidia Titan RTX | |
| MSI GeForce RTX 4060 Ti Gaming X Trio 8G | |
| NVIDIA GeForce RTX 3060 Ti FE | |
| Sapphire Pulse Radeon RX 6750 XT | |
| Nvidia GeForce RTX 2070 Super | |
| Nvidia GeForce RTX 2060 Super | |
| Sapphire Nitro+ Radeon RX 6650 XT | |
| 3840x2160 High Quality Preset & High Ray Tracing Preset (DX12) | |
| KFA2 GeForce RTX 4070 Ti EX Gamer | |
| KFA2 GeForce RTX 4070 EX Gamer | |
| MSI GeForce RTX 4060 Ti Gaming X Trio 8G | |
| Sapphire Pulse Radeon RX 6750 XT | |
| 3840x2160 High Quality, High Ray Tracing, DLSS | |
| KFA2 GeForce RTX 4070 Ti EX Gamer | |
| KFA2 GeForce RTX 4070 EX Gamer | |
| MSI GeForce RTX 4060 Ti Gaming X Trio 8G | |
| The Last of Us - 3840x2160 Ultra Preset + Quality DLSS | |
| Palit GeForce RTX 4090 GameRock OC | |
| KFA2 GeForce RTX 4070 Ti EX Gamer | |
| KFA2 GeForce RTX 4070 EX Gamer | |
| Nvidia Titan RTX | |
| MSI GeForce RTX 4060 Ti Gaming X Trio 8G | |
| Nvidia GeForce RTX 2070 Super | |
| low | med. | high | ultra | QHD | 4K DLSS | 4K | |
|---|---|---|---|---|---|---|---|
| GTA V (2015) | 187.8 | 187.8 | 187.5 | 144.2 | 103.4 | 103.2 | |
| The Witcher 3 (2015) | 706.6 | 475.7 | 276.9 | 140.5 | 78.5 | ||
| Dota 2 Reborn (2015) | 297.3 | 262 | 257.4 | 228.4 | 165.8 | ||
| Final Fantasy XV Benchmark (2018) | 236 | 193.5 | 133.8 | 95.5 | 52.7 | ||
| X-Plane 11.11 (2018) | 218 | 196.2 | 149.1 | 126.2 | |||
| Far Cry 5 (2018) | 238 | 200 | 193 | 180 | 136 | 68 | |
| Strange Brigade (2018) | 697 | 351 | 276 | 239 | 154 | 80.1 | |
| Shadow of the Tomb Raider (2018) | 342 | 225 | 204 | 184 | 121.2 | 58.7 | |
| Far Cry New Dawn (2019) | 197 | 173 | 166 | 147 | 127 | 70 | |
| Metro Exodus (2019) | 311 | 173.6 | 130.8 | 101.8 | 80.1 | 49.3 | |
| Control (2019) | 239.9 | 162.4 | 120.2 | 75.2 | 43.5 | 37.3 | |
| Borderlands 3 (2019) | 241 | 206 | 157.3 | 123.5 | 85.2 | 43.7 | |
| F1 2020 (2020) | 548 | 426 | 342 | 232 | 177.8 | 97 | |
| F1 2021 (2021) | 671 | 471 | 359 | 179.8 | 128.9 | 67.2 | |
| Far Cry 6 (2021) | 233 | 190.4 | 163.2 | 145 | 102.5 | 21.4 | |
| Guardians of the Galaxy (2021) | 201 | 196 | 195 | 187 | 129 | 67 | |
| God of War (2022) | 178.3 | 146.2 | 116.4 | 85 | 69.9 | 46.6 | |
| GRID Legends (2022) | 243 | 218 | 194.6 | 164.2 | 137.3 | 84.7 | |
| Cyberpunk 2077 1.6 (2022) | 176.6 | 137.6 | 115.7 | 100.5 | 60.2 | 25.3 | |
| Ghostwire Tokyo (2022) | 235 | 224 | 221 | 207 | 128.8 | 58.3 | |
| Tiny Tina's Wonderlands (2022) | 303 | 237 | 155.3 | 119.7 | 81.1 | 36.9 | |
| F1 22 (2022) | 358 | 346 | 258 | 89.6 | 56.5 | 28.2 | |
| The Quarry (2022) | 228 | 167.4 | 137.2 | 108.8 | 72.3 | 23 | |
| A Plague Tale Requiem (2022) | 151.5 | 117 | 88.3 | 66.8 | 47.4 | 50.8 | 25.2 |
| Uncharted Legacy of Thieves Collection (2022) | 113.6 | 109.8 | 102.9 | 99.4 | 70.7 | 30.3 | |
| Spider-Man Miles Morales (2022) | 154.4 | 149.1 | 141.9 | 131.7 | 96.6 | 54.8 | |
| The Callisto Protocol (2022) | 232.1 | 178 | 167.8 | 103.6 | 79.5 | 48.8 | |
| High On Life (2023) | 346 | 225 | 167.3 | 139 | 78.3 | 32.3 | |
| The Witcher 3 v4 (2023) | 278 | 226 | 187.3 | 151.8 | 98.9 | 52.4 | |
| Dead Space Remake (2023) | 128.5 | 122.9 | 106.2 | 105.5 | 65.9 | 32 | |
| Hogwarts Legacy (2023) | 177.5 | 135.1 | 108 | 85 | 54.7 | 30.8 | |
| Returnal (2023) | 136 | 129 | 116 | 101 | 73 | 41 | |
| Atomic Heart (2023) | 264 | 202 | 116 | 93.7 | 69.5 | 38.9 | |
| Company of Heroes 3 (2023) | 293.5 | 243.8 | 180.6 | 179.6 | 133.6 | 72.3 | |
| Sons of the Forest (2023) | 118.1 | 109.9 | 105.6 | 103.1 | 81.9 | 49.6 | |
| Resident Evil 4 Remake (2023) | 207 | 135.7 | 150.4 | 98.6 | 69.1 | 37.9 | |
| The Last of Us (2023) | 126.1 | 102.1 | 89.6 | 74.6 | 46.5 | 36.5 | 19.6 |
| Dead Island 2 (2023) | 289 | 263 | 224 | 162.5 | 110.5 | 56.9 | |
| Star Wars Jedi Survivor (2023) | 114.2 | 98.6 | 91.3 | 84.7 | 54.4 | 25.7 | |
| Diablo 4 (2023) | 341 | 290 | 256 | 217 | 138.8 | 92.8 | 66 |
Emisja MSI GeForce RTX 4060 Ti Gaming X Trio 8G
Emisja hałasu
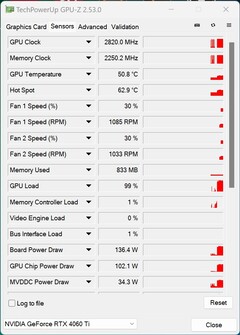
Aby zmierzyć emisję hałasu przez kartę MSI GeForce RTX 4060 Ti Gaming X Trio 8G, używaliśmy jej otwartej i bez dodatkowego chłodzenia procesora lub zasilacza. W trybie bezczynności i pod niskim obciążeniem testowany przez nas model był skutecznie cichy. Nawet gdy 100-milimetrowe wentylatory rozpoczęły swoją pracę, karta graficzna nadal była niezwykle cicha. W naszym teście obciążeniowym zmierzyliśmy tylko 31 dB(A) i prędkość obrotową wentylatora wynoszącą zaledwie 1100 obrotów na minutę. Kiedy podnieśliśmy docelową moc do 121 procent, wentylatory pracowały z prędkością 1310 obrotów na minutę, a emisja hałasu na poziomie 32,5 dB(A) była nadal niewiarygodnie cicha.
Hałas
| luz |
| 30.1 / 30.1 / 30.1 dB |
| obciążenie |
| 30.15 / 31 dB |
 | ||
30 dB cichy 40 dB(A) słyszalny 50 dB(A) irytujący |
||
min: | ||
Temperatury i zużycie energii
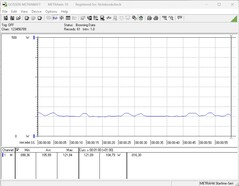
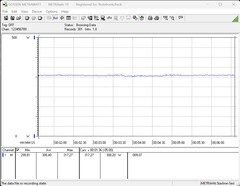
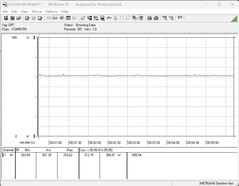
MSI wyposażyło kartę GeForce RTX 4060 Ti Gaming X Trio 8G w wyjątkowo duży cooler z trzema wentylatorami osiowymi. Biorąc pod uwagę pobór mocy wynoszący maksymalnie 160 watów (PT 100 procent), producent mógł nieco przesadzić. MSI nie zmieniło niczego, jeśli chodzi o limit mocy tego topowego modelu i zamiast tego trzymało się wytycznych Nvidii. Można jednak ręcznie zmienić docelową moc nawet o 21 procent, co oznacza, że karta graficzna zużywa do 195 watów. W naszym teście obciążeniowym, a także w naszych testach gier, limit mocy karty graficznej został łatwo osiągnięty. Cały nasz system testowy, z wyłączeniem monitora, zużywa około 300 watów. To sprawia, że MSI GeForce RTX 4060 Ti Gaming X Trio 8G jest o 90 W bardziej oszczędna niżSapphire Pulse Radeon RX 6750 XTw tym samym systemie testowym. To ponownie pokazuje, jak wydajna jest ta karta graficzna. Według producenta wymaga ona jedynie 550-watowego zasilacza.
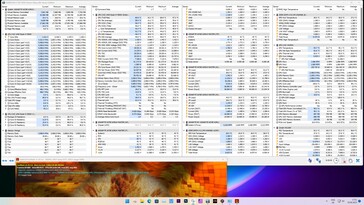
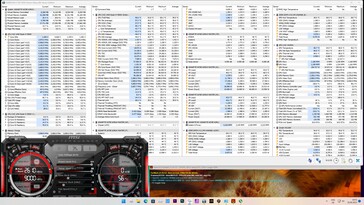
Problemy z temperaturą są obce karcie MSI GeForce RTX 4060 Ti Gaming X Trio 8G, oczywiście ze względu na jej wyjątkowo duży cooler. Zmierzyliśmy tylko temperaturę hotspotu wynoszącą maksymalnie 64 °C, a średnie temperatury układu podczas testu obciążeniowego wyniosły 54,7 °C.
| Power Consumption / The Witcher 3 ultra (external Monitor) | |
| AMD Radeon RX 7900 XTX (Idle: 86.5 W) | |
| NVIDIA GeForce RTX 3090 Founders Edition | |
| Palit GeForce RTX 4090 GameRock OC | |
| KFA2 GeForce RTX 3080 SG | |
| KFA2 GeForce RTX 4080 SG (Idle: 86.4 W) | |
| AMD Radeon RX 7900 XT (Idle: 84.6 W) | |
| KFA2 GeForce RTX 3070 Ti SG (Idle: 88.9 W) | |
| KFA2 GeForce RTX 4070 Ti EX Gamer | |
| Sapphire Pulse Radeon RX 6750 XT | |
| NVIDIA GeForce RTX 3060 Ti Founders Edition (Idle: 111.39 W) | |
| KFA2 GeForce RTX 4070 EX Gamer | |
| Sapphire Nitro+ Radeon RX 6650 XT | |
| MSI GeForce RTX 4060 Ti Gaming X Trio 8G | |
| Power Consumption / FurMark 1.19 GPU Stress Test (external Monitor) | |
| Palit GeForce RTX 4090 GameRock OC | |
| AMD Radeon RX 7900 XTX (Idle: 86.5 W) | |
| NVIDIA GeForce RTX 3090 Founders Edition | |
| AMD Radeon RX 7900 XT (Idle: 84.6 W) | |
| KFA2 GeForce RTX 3080 SG | |
| KFA2 GeForce RTX 3070 Ti SG (Idle: 88.9 W) | |
| KFA2 GeForce RTX 4080 SG (Idle: 86.4 W) | |
| KFA2 GeForce RTX 4070 Ti EX Gamer | |
| Sapphire Pulse Radeon RX 6750 XT | |
| NVIDIA GeForce RTX 3060 Ti Founders Edition (Idle: 111.39 W) | |
| Sapphire Nitro+ Radeon RX 6650 XT | |
| KFA2 GeForce RTX 4070 EX Gamer | |
| MSI GeForce RTX 4060 Ti Gaming X Trio 8G | |
| Power Consumption / Witcher 3 ultra Efficiency (external Monitor) | |
| Palit GeForce RTX 4090 GameRock OC | |
| KFA2 GeForce RTX 4080 SG | |
| AMD Radeon RX 7900 XT | |
| AMD Radeon RX 7900 XTX | |
| KFA2 GeForce RTX 4070 Ti EX Gamer | |
| KFA2 GeForce RTX 4070 EX Gamer | |
| MSI GeForce RTX 4060 Ti Gaming X Trio 8G | |
| Sapphire Pulse Radeon RX 6750 XT | |
| NVIDIA GeForce RTX 3090 Founders Edition | |
| KFA2 GeForce RTX 3070 Ti SG | |
| KFA2 GeForce RTX 3080 SG | |
| Sapphire Nitro+ Radeon RX 6650 XT | |
| NVIDIA GeForce RTX 3060 Ti Founders Edition | |
* ... im mniej tym lepiej
Power consumption with external monitor
Za
Przeciw
Werdykt - Bardzo cichy i bardzo oszczędny
W niniejszej recenzji przyjrzeliśmy się bliżej MSI GeForce RTX 4060 Ti Gaming X Trio 8G, kolejnej karcie graficznej przeznaczonej dla mas. Wzrost wydajności karty graficznej Ada Lovelace był ogromny, ale jej wady w postaci połączenia pamięci masowej i jednostek przetwarzania oznaczają, że GeForce RTX 4060 Ti działa tylko nieznacznie lepiej niżNvidia GeForce RTX 3060 Ti. Widzimy jednak, że cel stworzenia karty graficznej stworzonej do gier w rozdzielczości 1080p został osiągnięty. Jednocześnie Nvidia GeForce RTX 4060 Ti znajduje się sporo za Nvidią GeForce RTX 4070, co rodzi pytanie, czy Nvidia w pewnym momencie wypełni tę lukę kolejnym modelem. Wkrótce pojawią się wersje RTX 4060 Ti z 16 GB pamięci VRAM. Chociaż w tej chwili nie zakładamy, że przyniosą one ogromny wzrost wydajności w porównaniu z modelem 8 GB.
Model MSI zaimponował nam podczas naszych testów doskonałymi wskaźnikami emisji. Karta graficzna konsekwentnie pracuje niemal bezgłośnie, a problemy z temperaturą są temu komponentowi obce. Z kolei karta graficzna wyposażona jest w masywny moduł chłodzenia - o długości większej nawet od naszegoPalit GeForce RTX 4090 Gamerock OC. Trzeba wziąć to pod uwagę przy zakupie, gdyż MSI GeForce RTX 4060 Ti Gaming X Trio 8G nie zmieści się w każdej obudowie PC. Wydajność jest ogólnie dobra, choć od czasu do czasu trzeba sobie radzić z kilkoma spadkami klatek z powodu niskiego FPS, które występują podczas korzystania z ustawienia Ultra.
MSI GeForce RTX 4060 Ti Gaming X Trio 8G jest idealna, jeśli chcesz zbudować wyjątkowo cichy komputer. Niskie zużycie energii przez kartę graficzną będzie łatwe dla portfela, ale obecnie jej 8 GB pamięci RAM jest nieco trudne do wprowadzenia na rynek.
Dla kogo jest to interesująca karta graficzna? To trudne pytanie i przede wszystkim zależy od osobistych preferencji. Tylko częściowo nazwalibyśmy Nvidię GeForce RTX 4060 Ti przyszłościową. Przynajmniej Nvidia nie pozbyła się ekskluzywnych funkcji, takich jak DLSS 3.0 i FG (Frame Generation). Jest to punkt, który przemawia za kartą graficzną, jeśli chodzi o jej żywotność.
Pod względem ceny, MSI GeForce RTX 4060 Ti Gaming X Trio 8G można umieścić w górnej części modeli GeForce RTX 4060 Ti. Nic dziwnego, ponieważ producent zawsze pobierał nieco więcej za swoje modele z najwyższej półki. Obecnie można ją nabyć za około 699 dolarów. Będziesz musiał zainwestować co najmniej kolejne 100 USD wNvidia GeForce RTX 4070a AMD pobiera co najmniej 450 USD za swojeRadeon RX 6750 XT. Można znaleźć alternatywne, tańsze modele Nvidia GeForce RTX 4060 Ti za około 350 USD.
Cena i dostępność
Obecnie kartę MSI GeForce RTX 4060 Ti Gaming X Trio 8G można kupić w wielu sklepach internetowych, takich jak Amazon, w cenie 699 USD.
Przezroczystość
Wyboru urządzeń do recenzji dokonuje nasza redakcja. Próbka testowa została udostępniona autorowi jako pożyczka od producenta lub sprzedawcy detalicznego na potrzeby tej recenzji. Pożyczkodawca nie miał wpływu na tę recenzję, producent nie otrzymał też kopii tej recenzji przed publikacją. Nie było obowiązku publikowania tej recenzji. Jako niezależna firma medialna, Notebookcheck nie podlega władzy producentów, sprzedawców detalicznych ani wydawców.
Tak testuje Notebookcheck
Każdego roku Notebookcheck niezależnie sprawdza setki laptopów i smartfonów, stosując standardowe procedury, aby zapewnić porównywalność wszystkich wyników. Od około 20 lat stale rozwijamy nasze metody badawcze, ustanawiając przy tym standardy branżowe. W naszych laboratoriach testowych doświadczeni technicy i redaktorzy korzystają z wysokiej jakości sprzętu pomiarowego. Testy te obejmują wieloetapowy proces walidacji. Nasz kompleksowy system ocen opiera się na setkach uzasadnionych pomiarów i benchmarków, co pozwala zachować obiektywizm.

