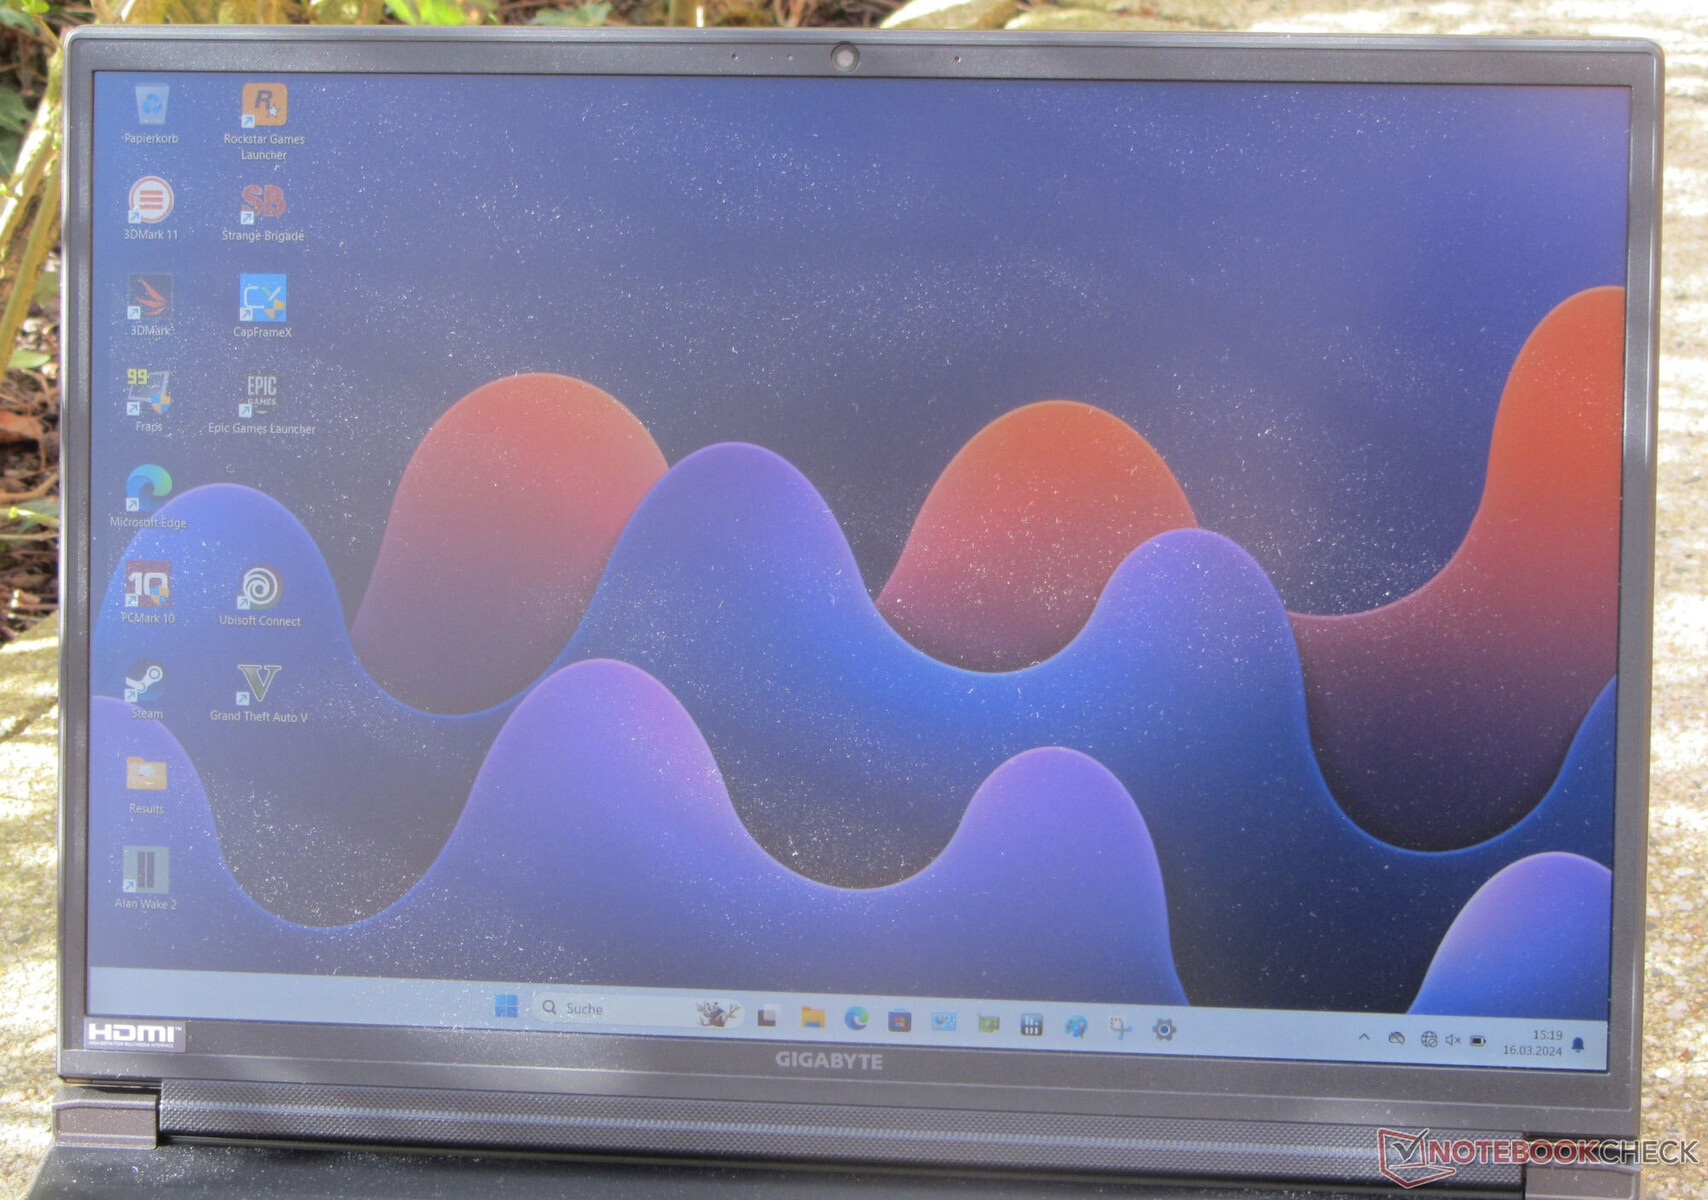
Recenzja Gigabyte G6X 9KG (2024): Niedrogi notebook do gier z RTX 4060

Gigabyte G6X 9KG to jeden z przystępnych cenowo notebooków dla graczy, którego cena wynosi nieco poniżej 1350 euro. Laptop jest zasilany przez Intel Core i7-13650HX Raptor Lake-HX i procesor Nvidia GeForce RTX 4060 Ada Lovelace Laptop GPU.
Konkurencja obejmuje laptopy takie jak Dell G16, Lenovo Legion 5 16IRX G9, MSI Raider GE68HX 13VForaz Asus TUF Gaming A16 FA617XS.
Potencjalni konkurenci w porównaniu
Ocena | Data | Model | Waga | Wysokość | Rozmiar | Rezolucja | Cena |
|---|---|---|---|---|---|---|---|
| 83.2 % v7 (old) | 03/2024 | Gigabyte G6X 9KG (2024) i7-13650HX, GeForce RTX 4060 Laptop GPU | 2.6 kg | 25.1 mm | 16.00" | 1920x1200 | |
| 85.5 % v7 (old) | 02/2024 | Dell G16, i7-13650HX, RTX 4060 i7-13650HX, GeForce RTX 4060 Laptop GPU | 2.8 kg | 25.65 mm | 16.00" | 2560x1600 | |
| 89.1 % v7 (old) | 02/2024 | Lenovo Legion 5 16IRX G9 i7-14650HX, GeForce RTX 4060 Laptop GPU | 2.4 kg | 25.2 mm | 16.00" | 2560x1600 | |
| 86.9 % v7 (old) | 10/2023 | MSI Raider GE68HX 13VF i9-13950HX, GeForce RTX 4060 Laptop GPU | 2.7 kg | 27.9 mm | 16.00" | 1900x1200 | |
| 86.9 % v7 (old) | 06/2023 | Asus TUF Gaming A16 FA617XS R9 7940HS, Radeon RX 7600S | 2.2 kg | 22.1 mm | 16.00" | 1920x1200 |
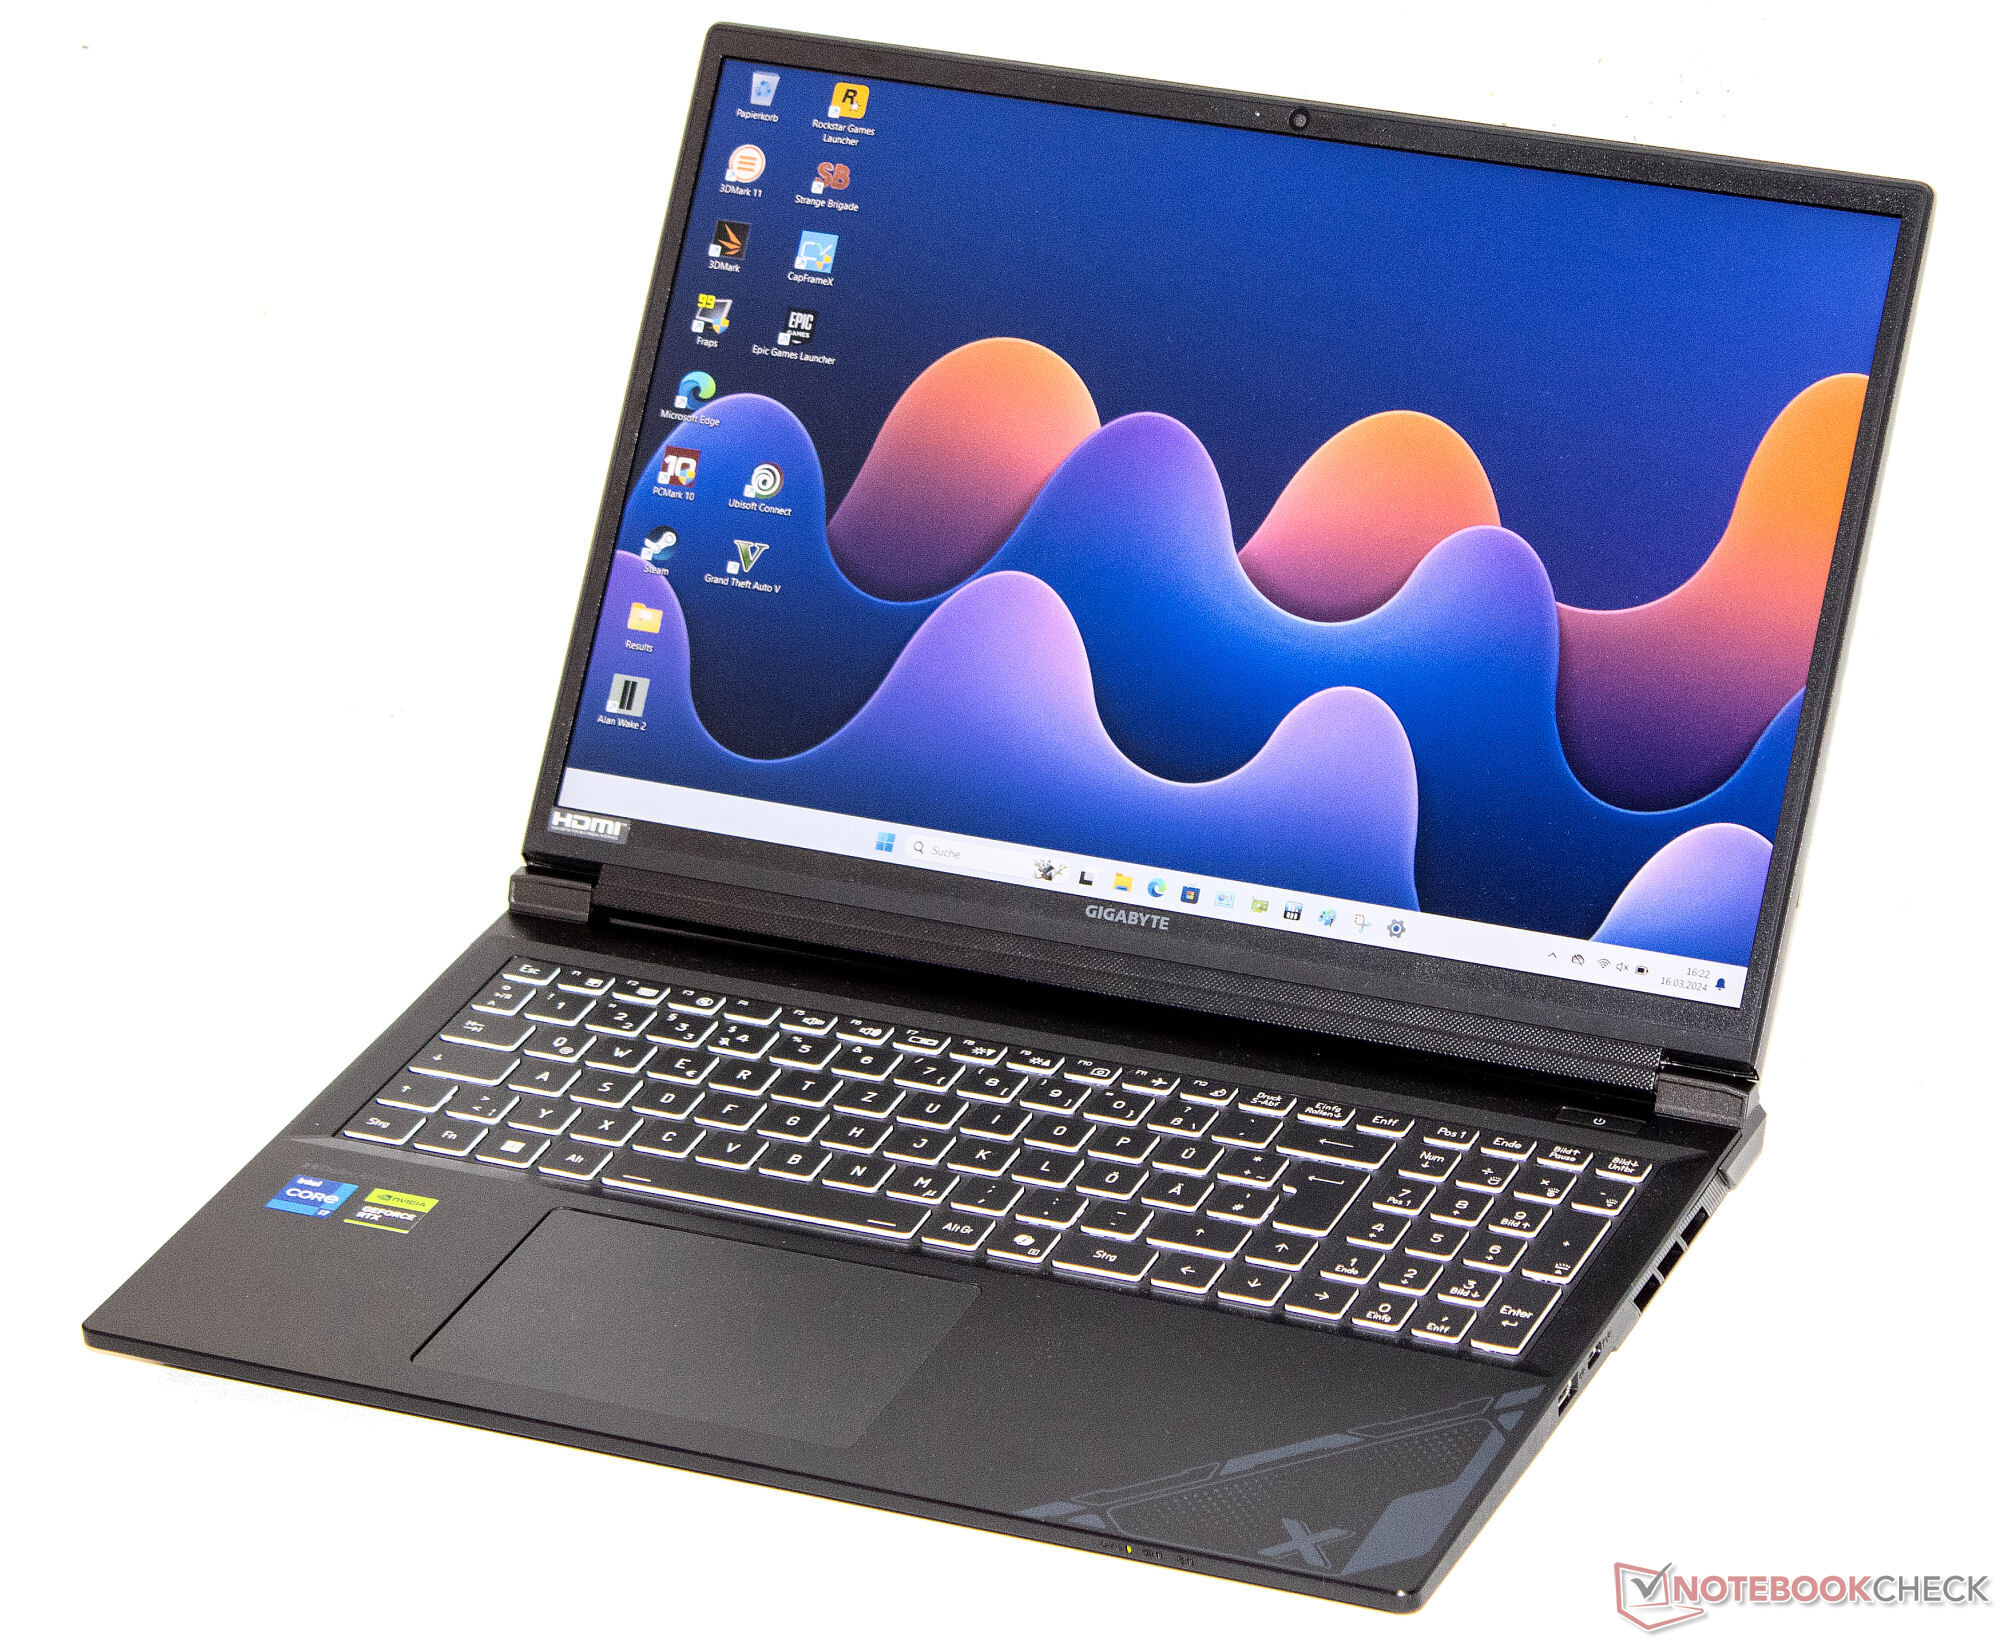
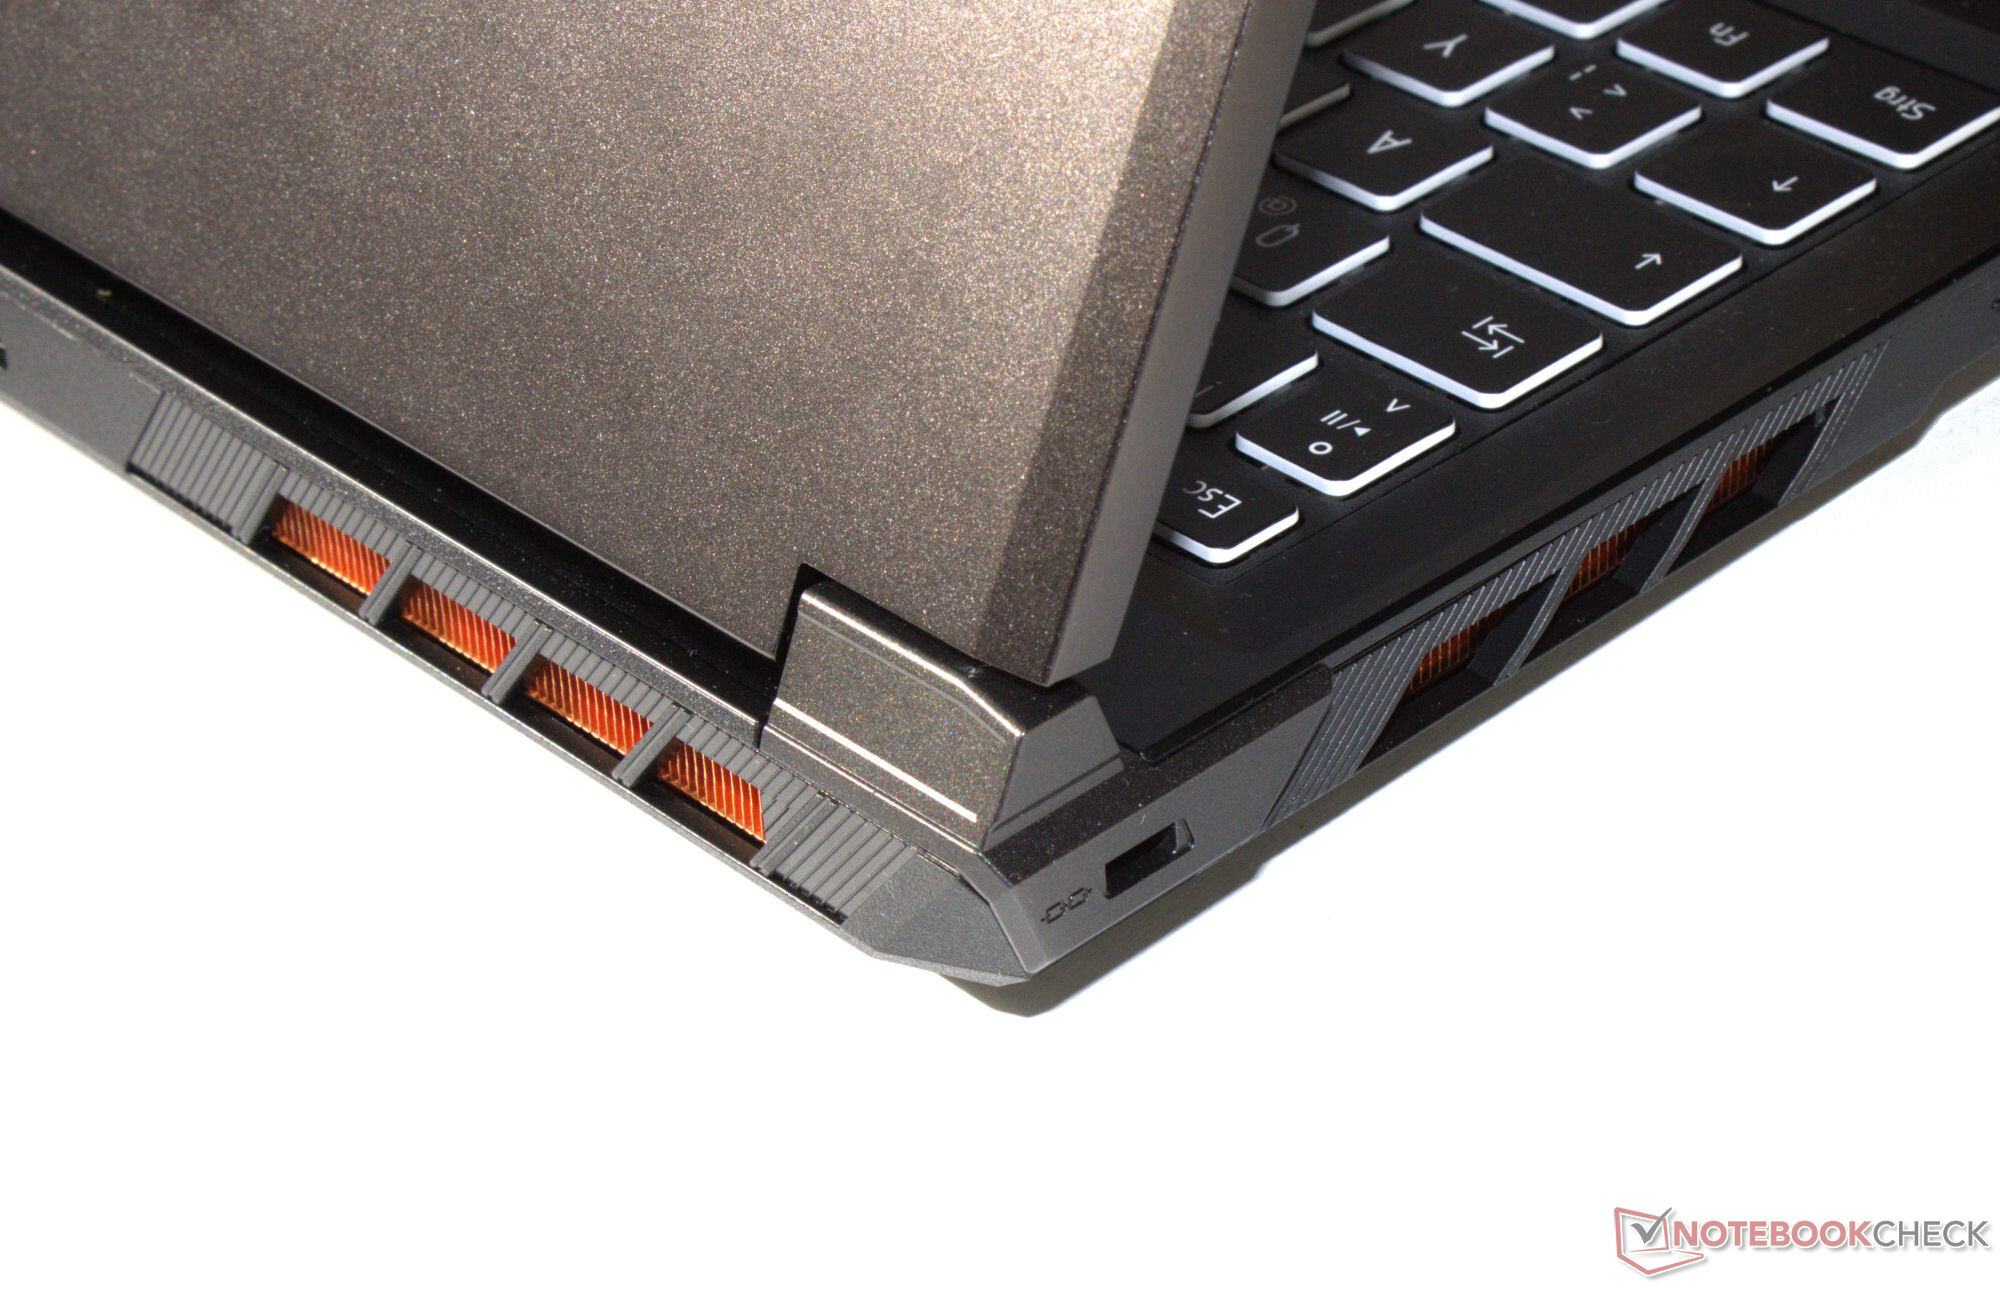
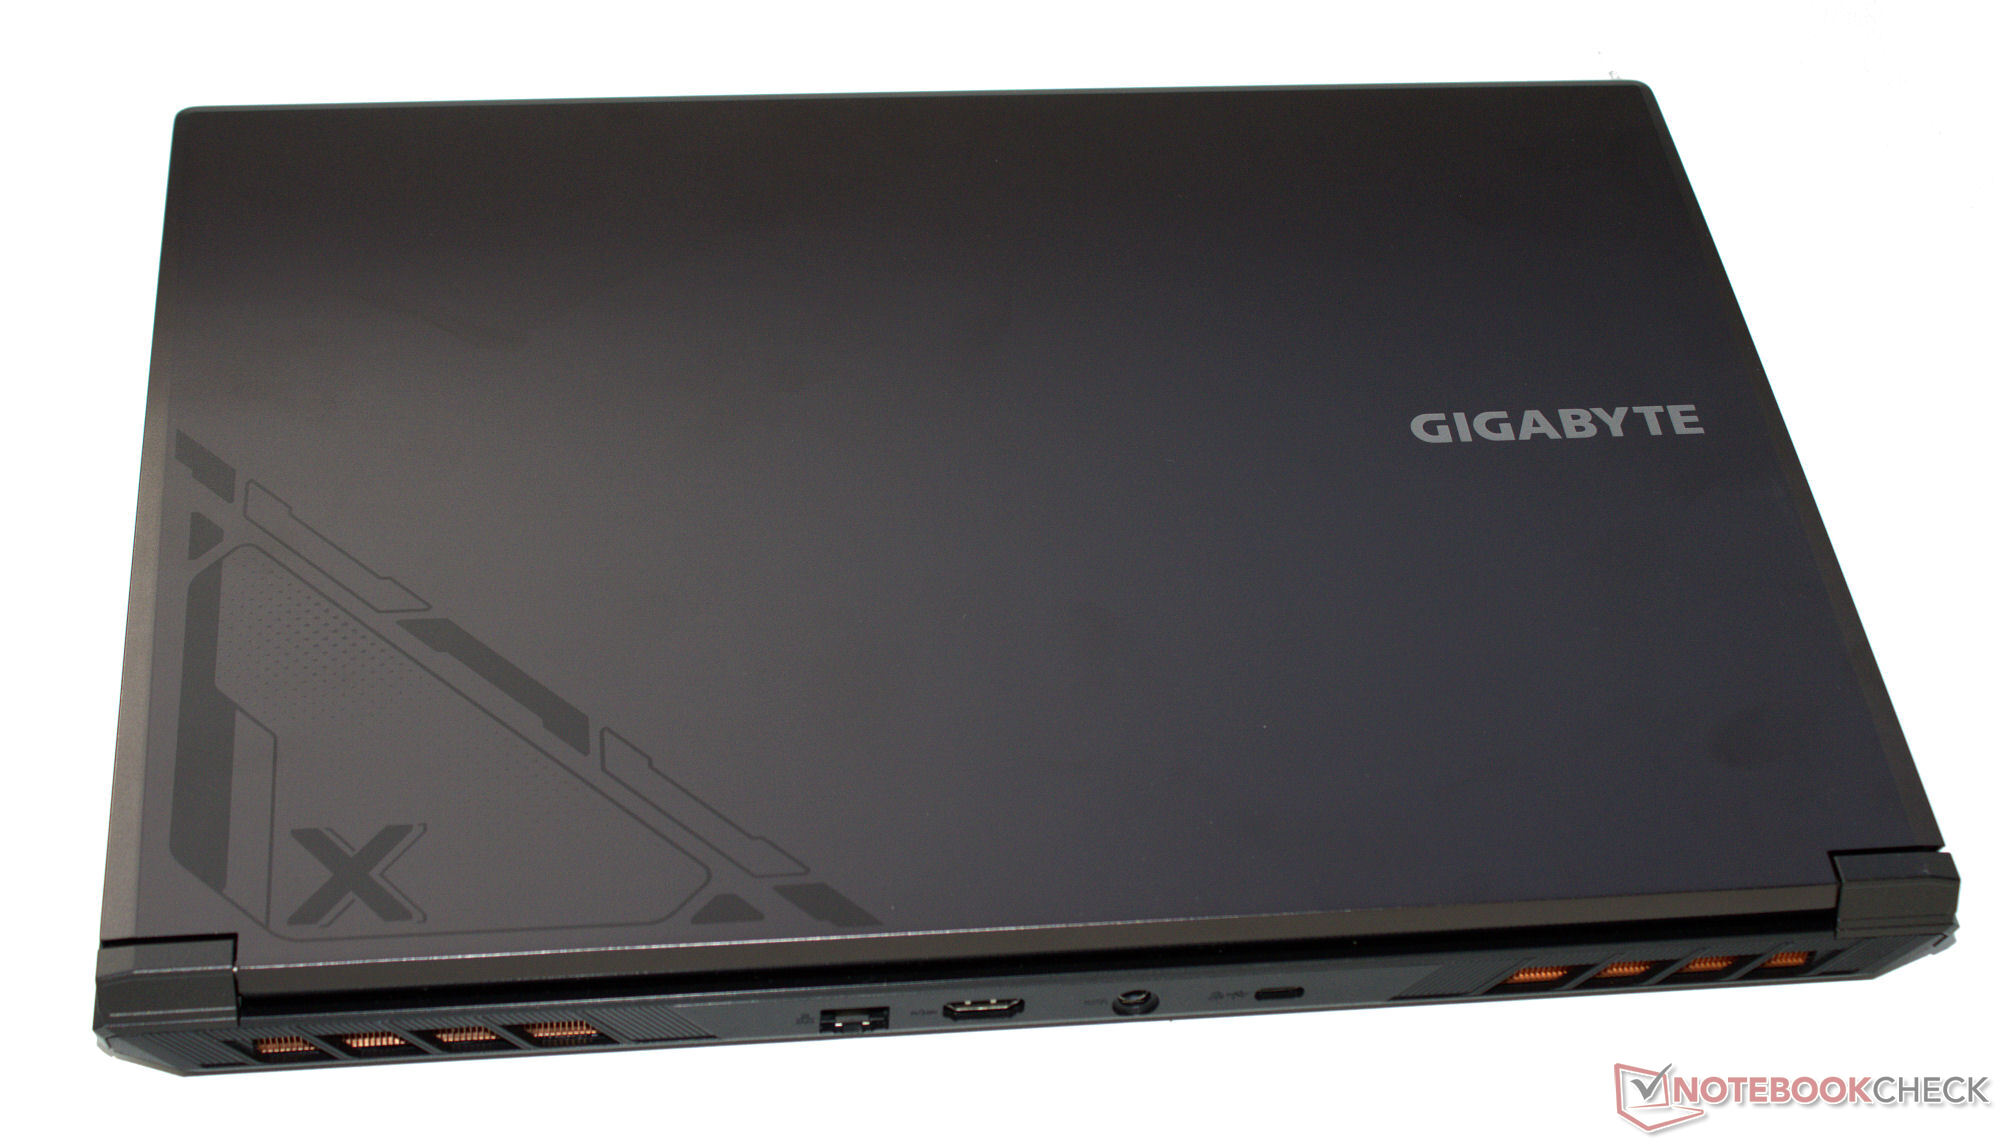
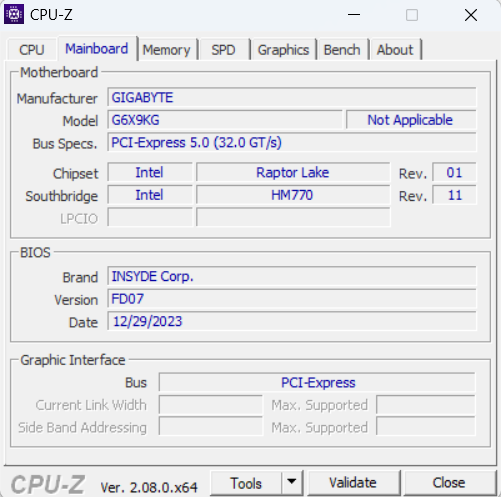
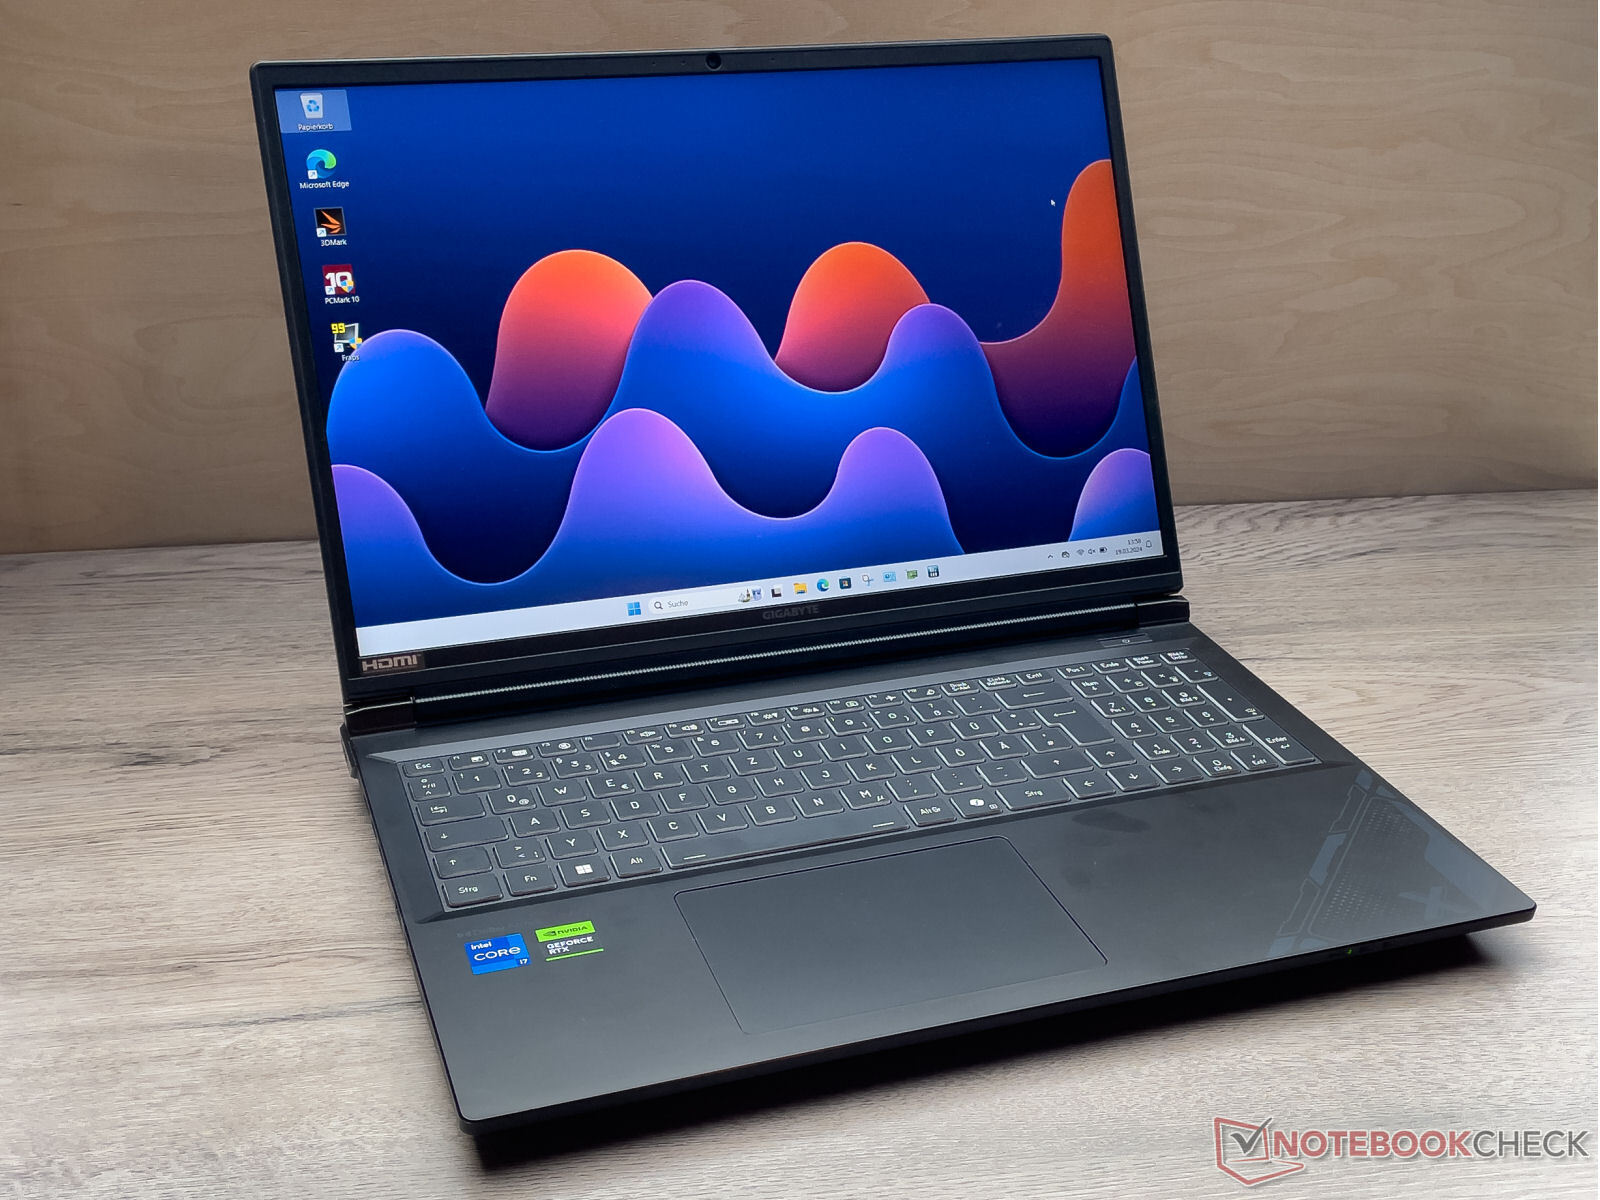
Obudowa i funkcje: G6X nie ma Thunderbolt 4
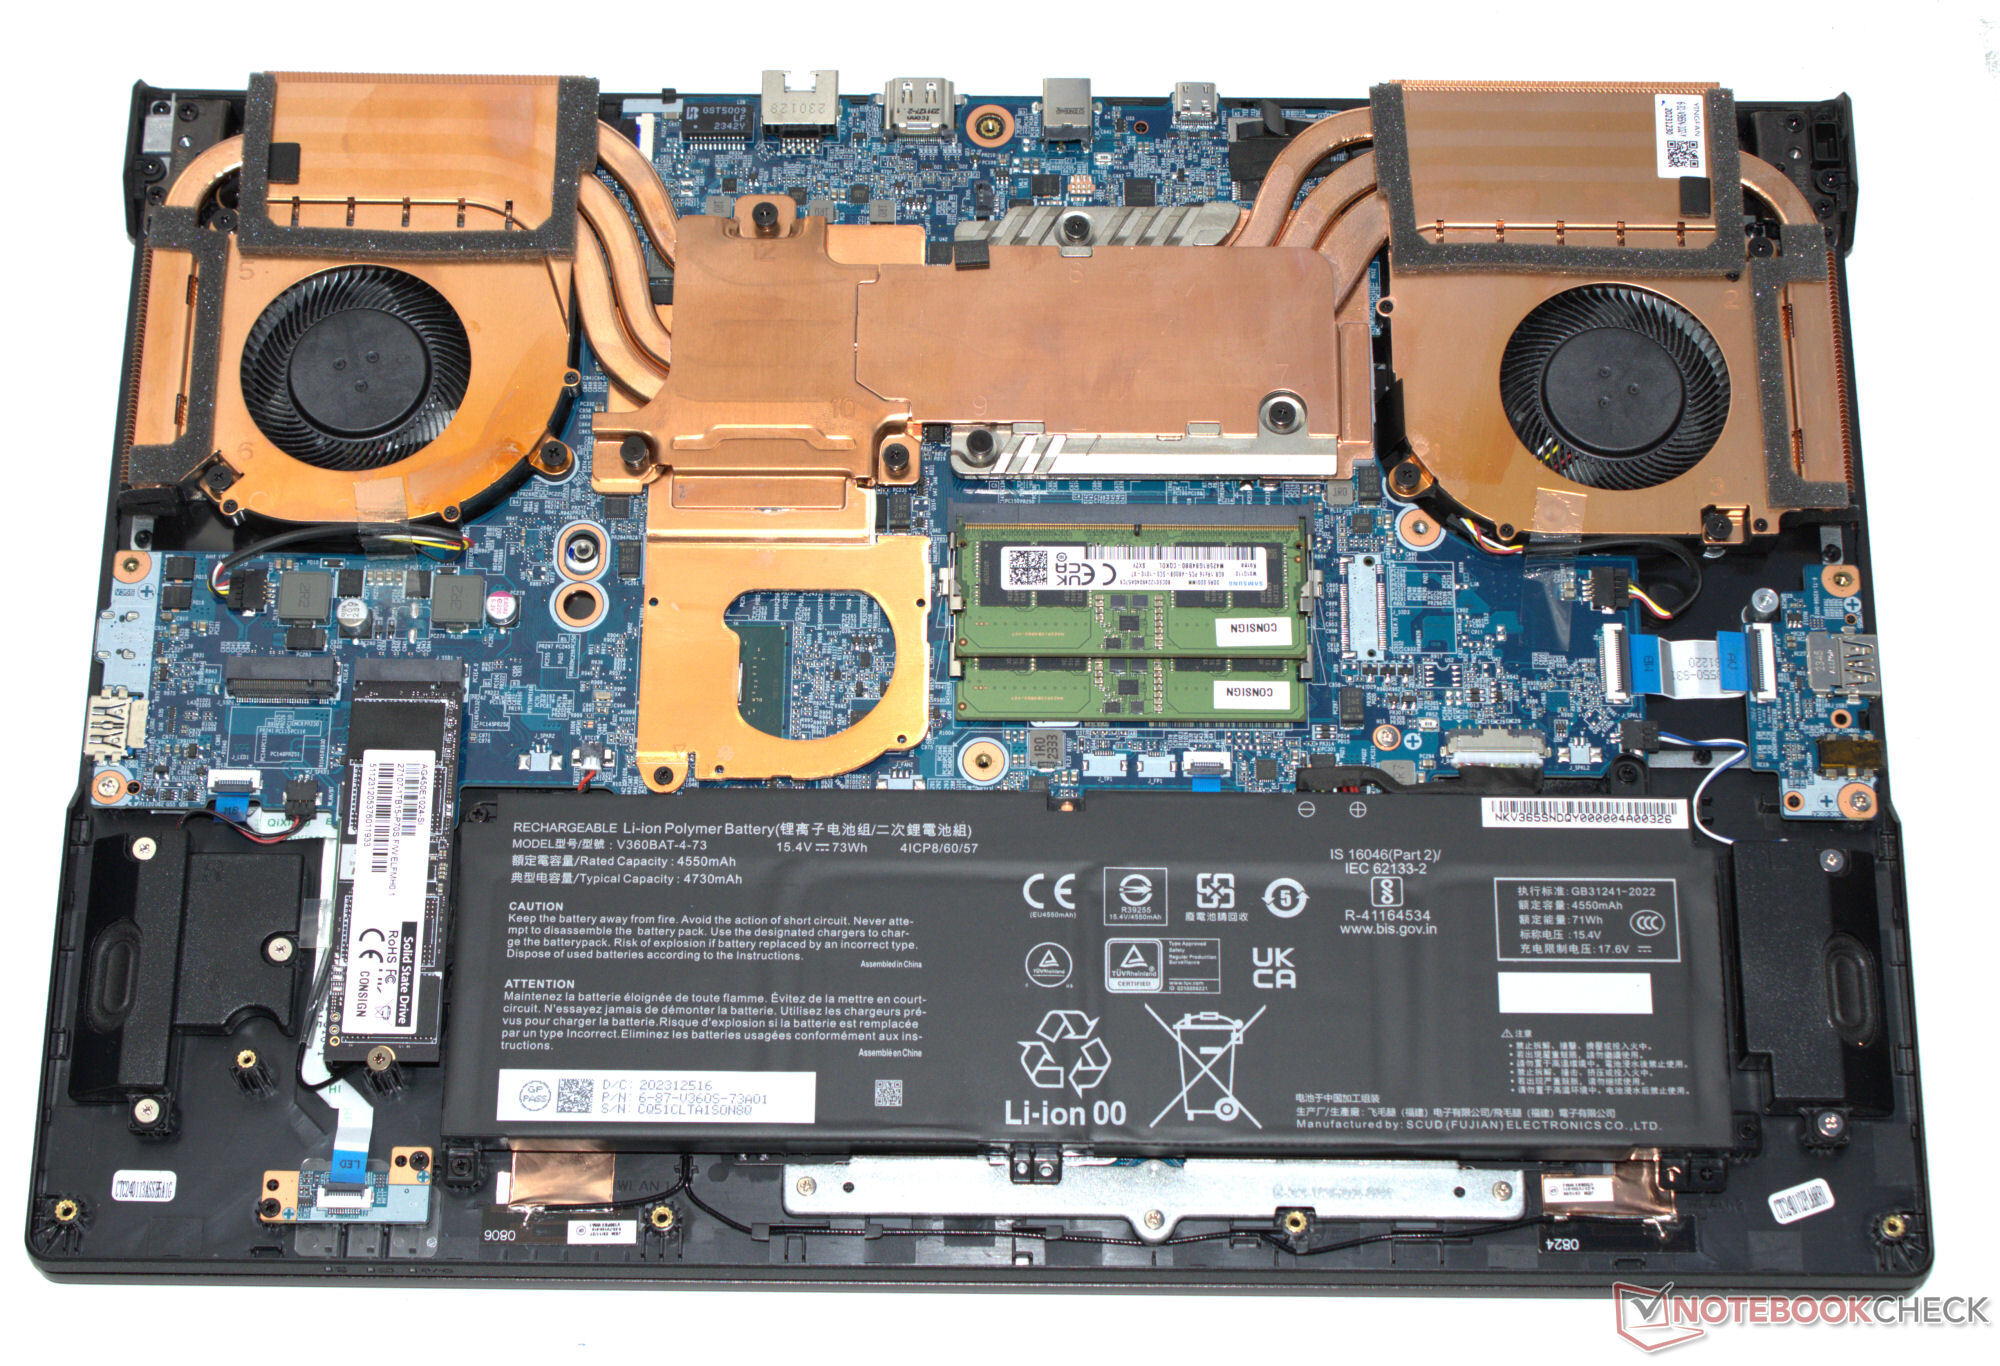
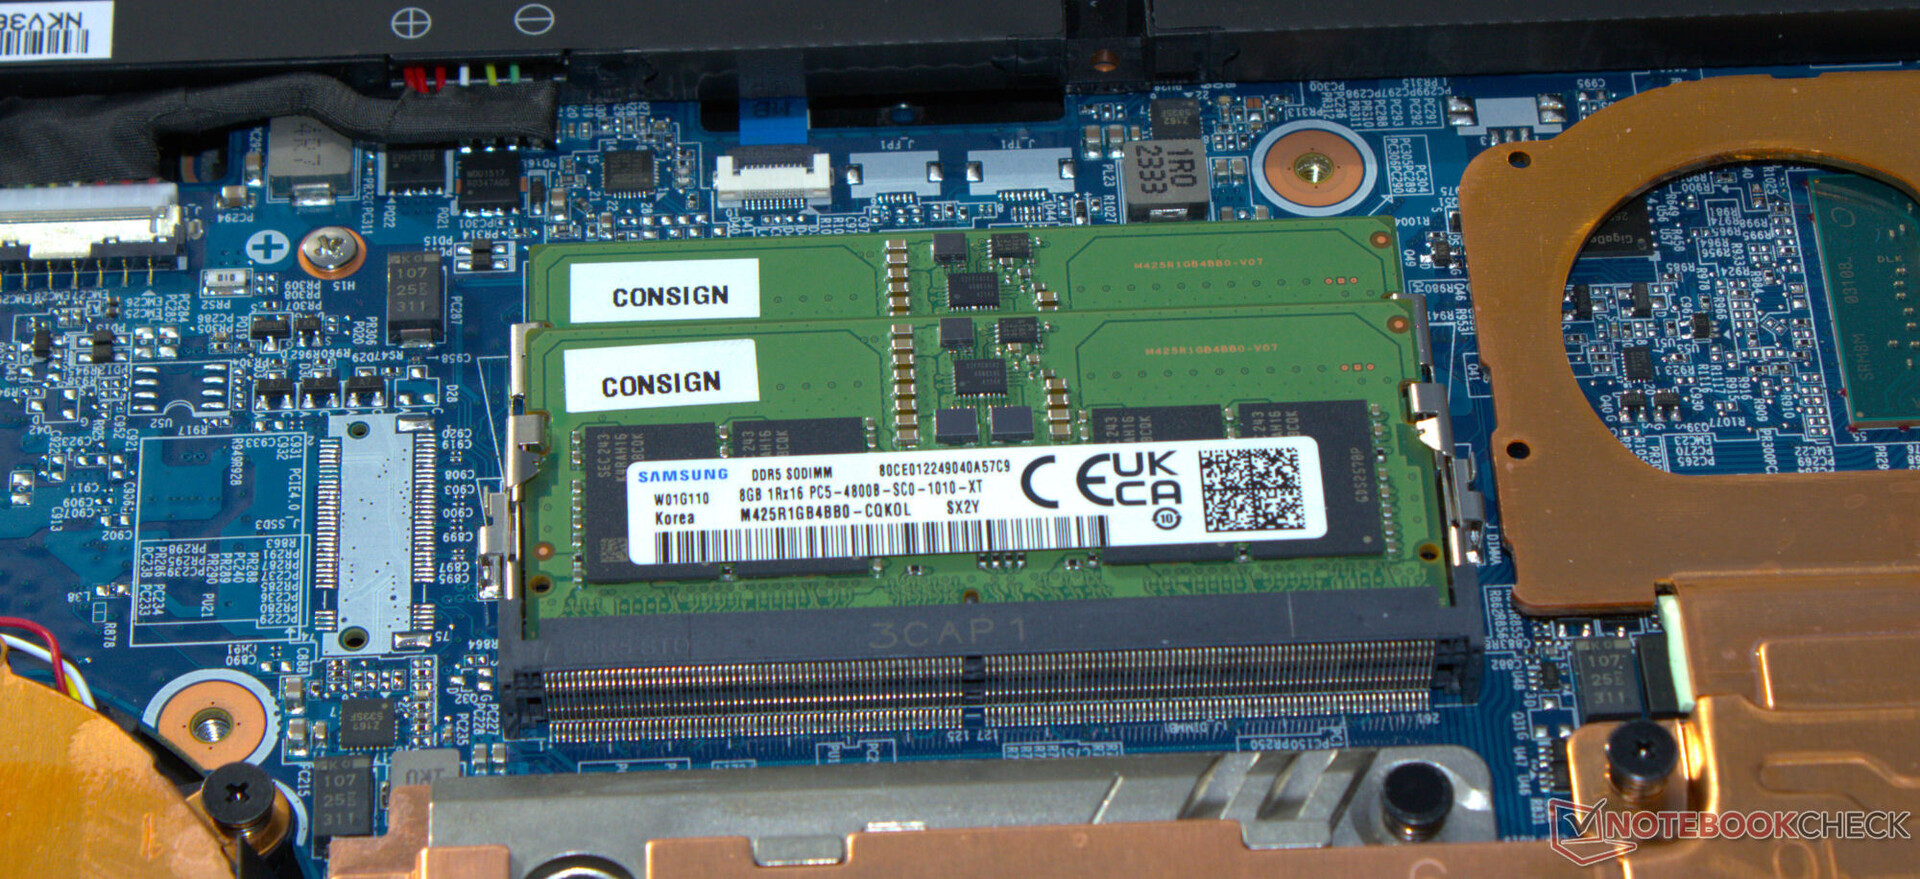
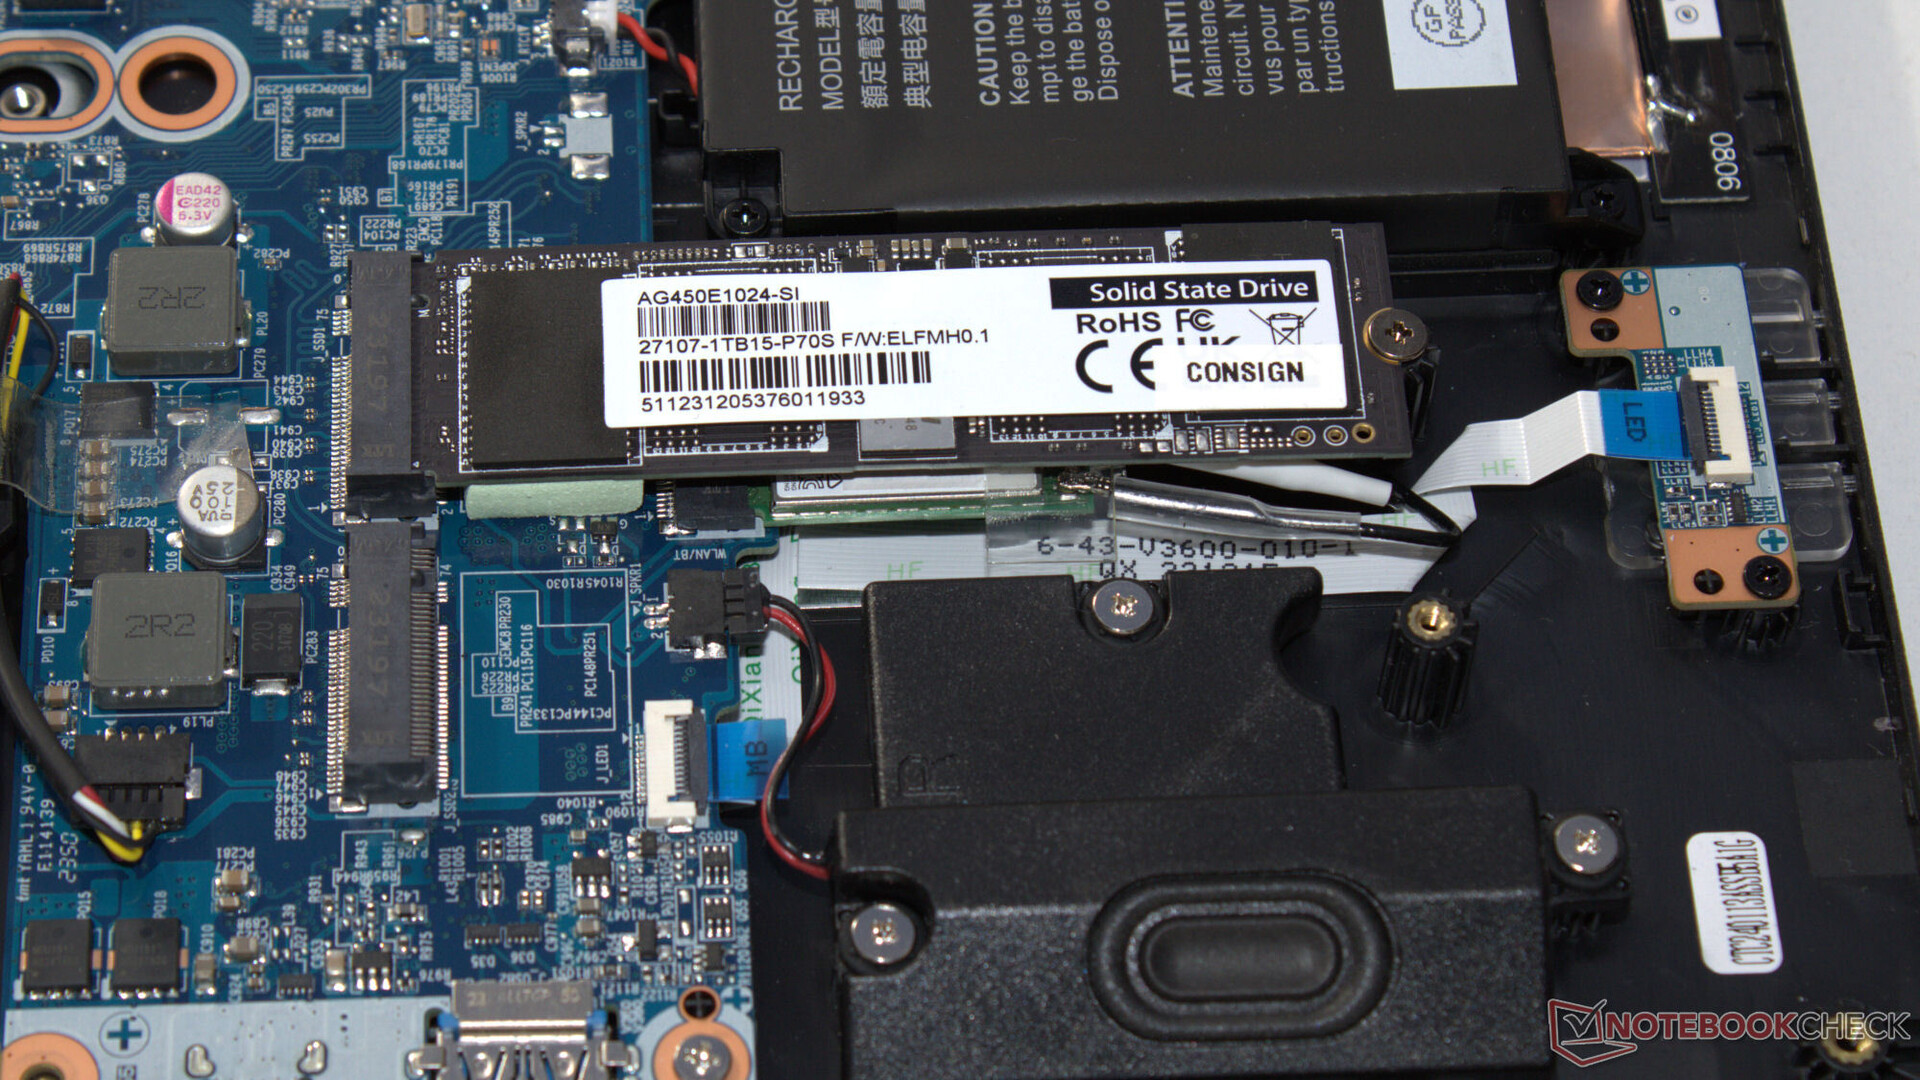
Podstawę obudowy G6X w kolorze matowo-szarym ("Gunmetal Grey") wykonano z tworzywa sztucznego, natomiast tył pokrywy z aluminium. Nie ma żadnych zauważalnych wad wykonania; stabilność i sztywność wydają się w porządku. Bateria i inne wewnętrzne komponenty są dostępne po zdjęciu obudowy.
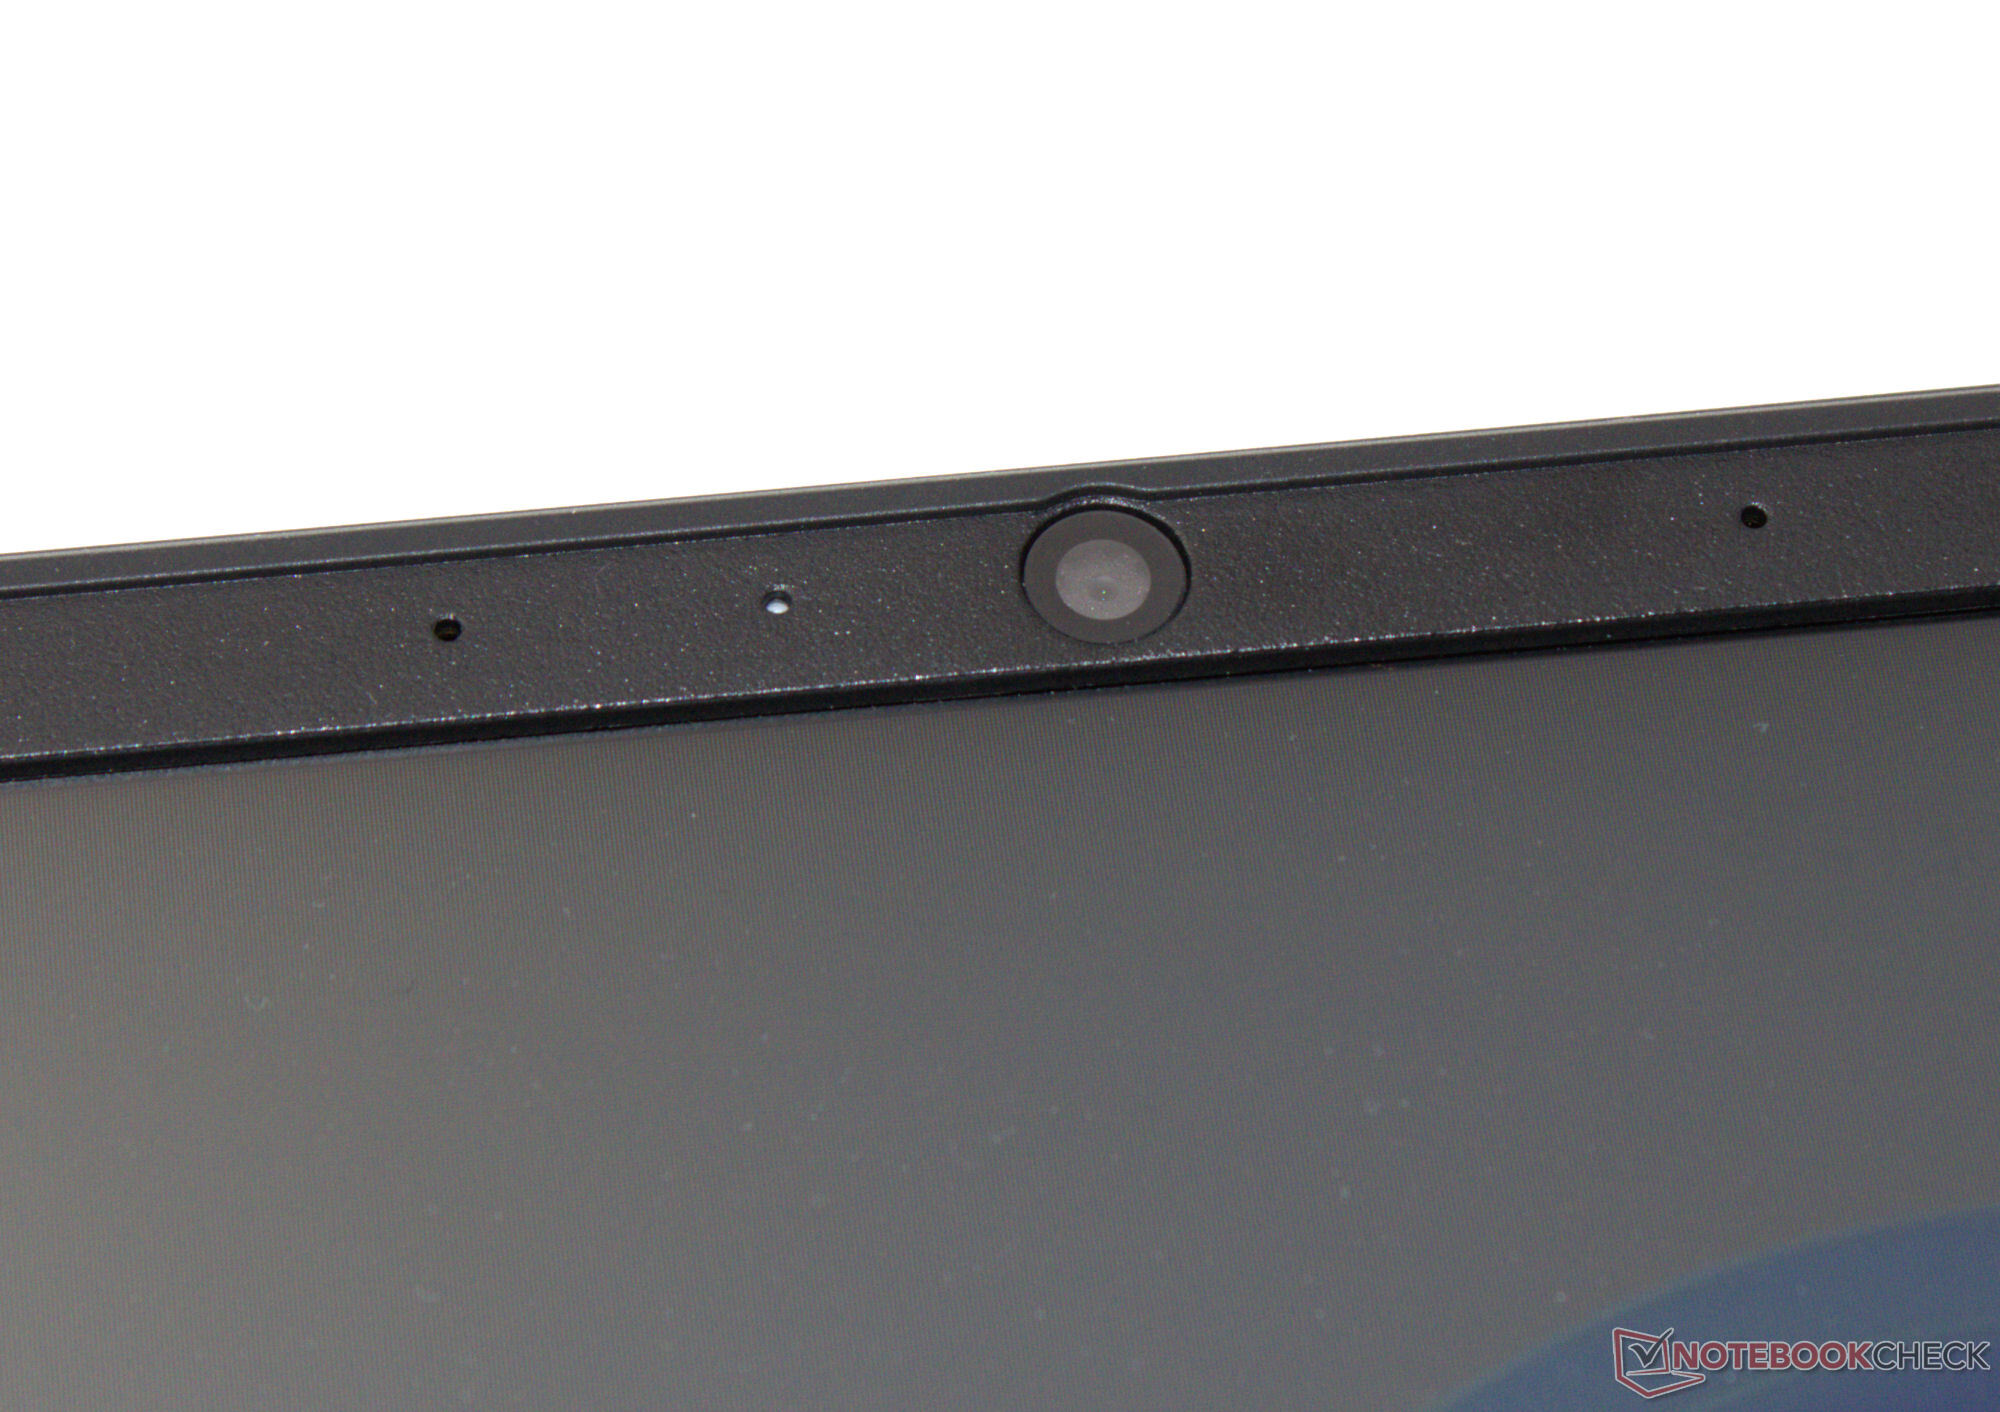
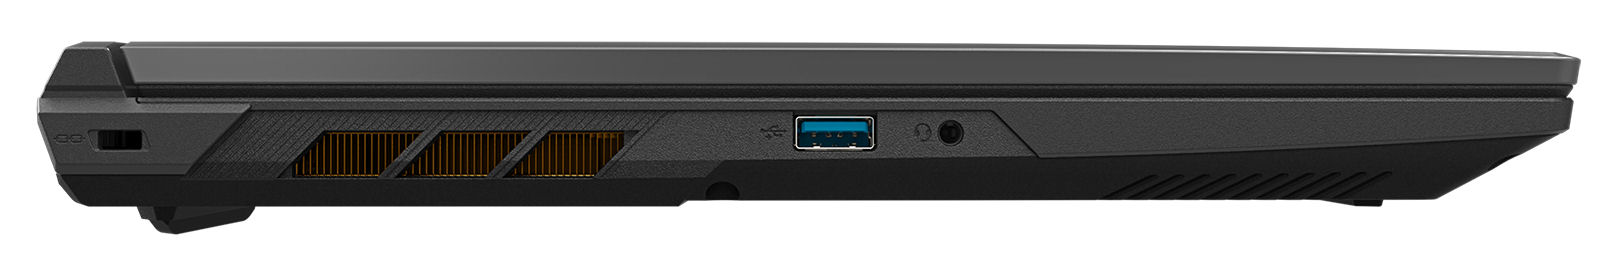
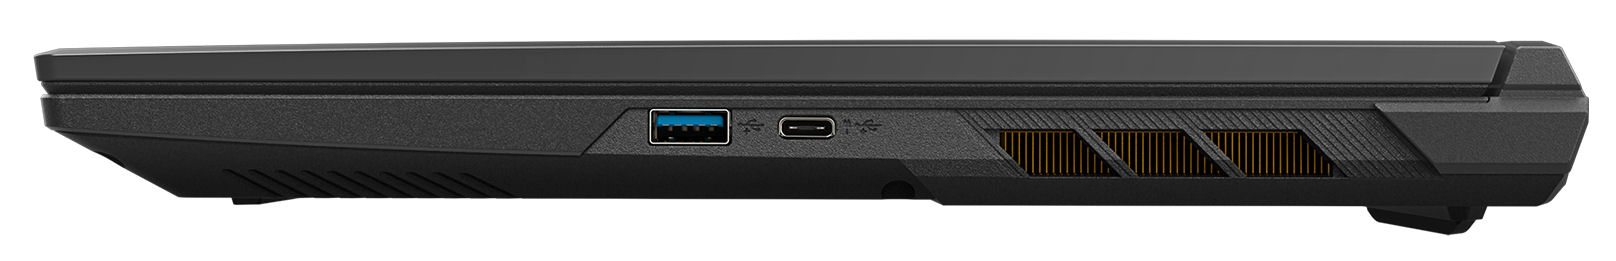
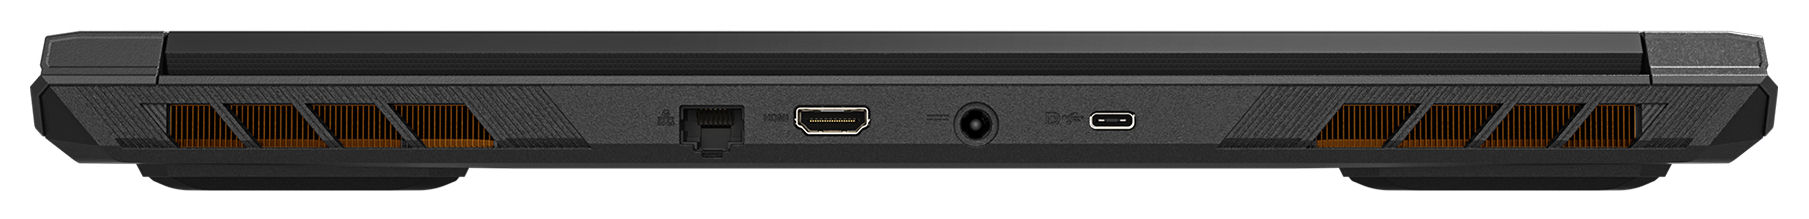
Gigabyte G6X 9KG posiada po jednym porcie USB 3.2 Gen 1 i 1x USB 3.2 Gen 2 Type-A oraz dwa porty USB 3.2 Gen 2 Type-C, które indywidualnie oferują Power Delivery i DisplayPort-out. W sumie G6X ma dwa wyjścia wideo (1x HDMI, 1x DP). Nie ma czytnika kart pamięci. Kamera internetowa 1280 x 720 0,9 MP zapewnia standardowy obraz.
Osiągnęliśmy doskonałą przepustowość danych Wi-Fi w optymalnych warunkach testowych, w których nie ma urządzeń Wi-Fi w bezpośrednim sąsiedztwie i przy niewielkiej odległości 1 m między laptopem a serwerem PC. Notebook wykorzystuje układ Intel AX211 Wi-Fi 6E. Połączenia przewodowe obsługiwane są przez kontroler Realtek RTL8168/8111.

 GeForce RTX 4060 Laptop GPU, i7-13650HX, Gigabyte AG450E1024-SI")
 GeForce RTX 4060 Laptop GPU, i7-13650HX, Gigabyte AG450E1024-SI")
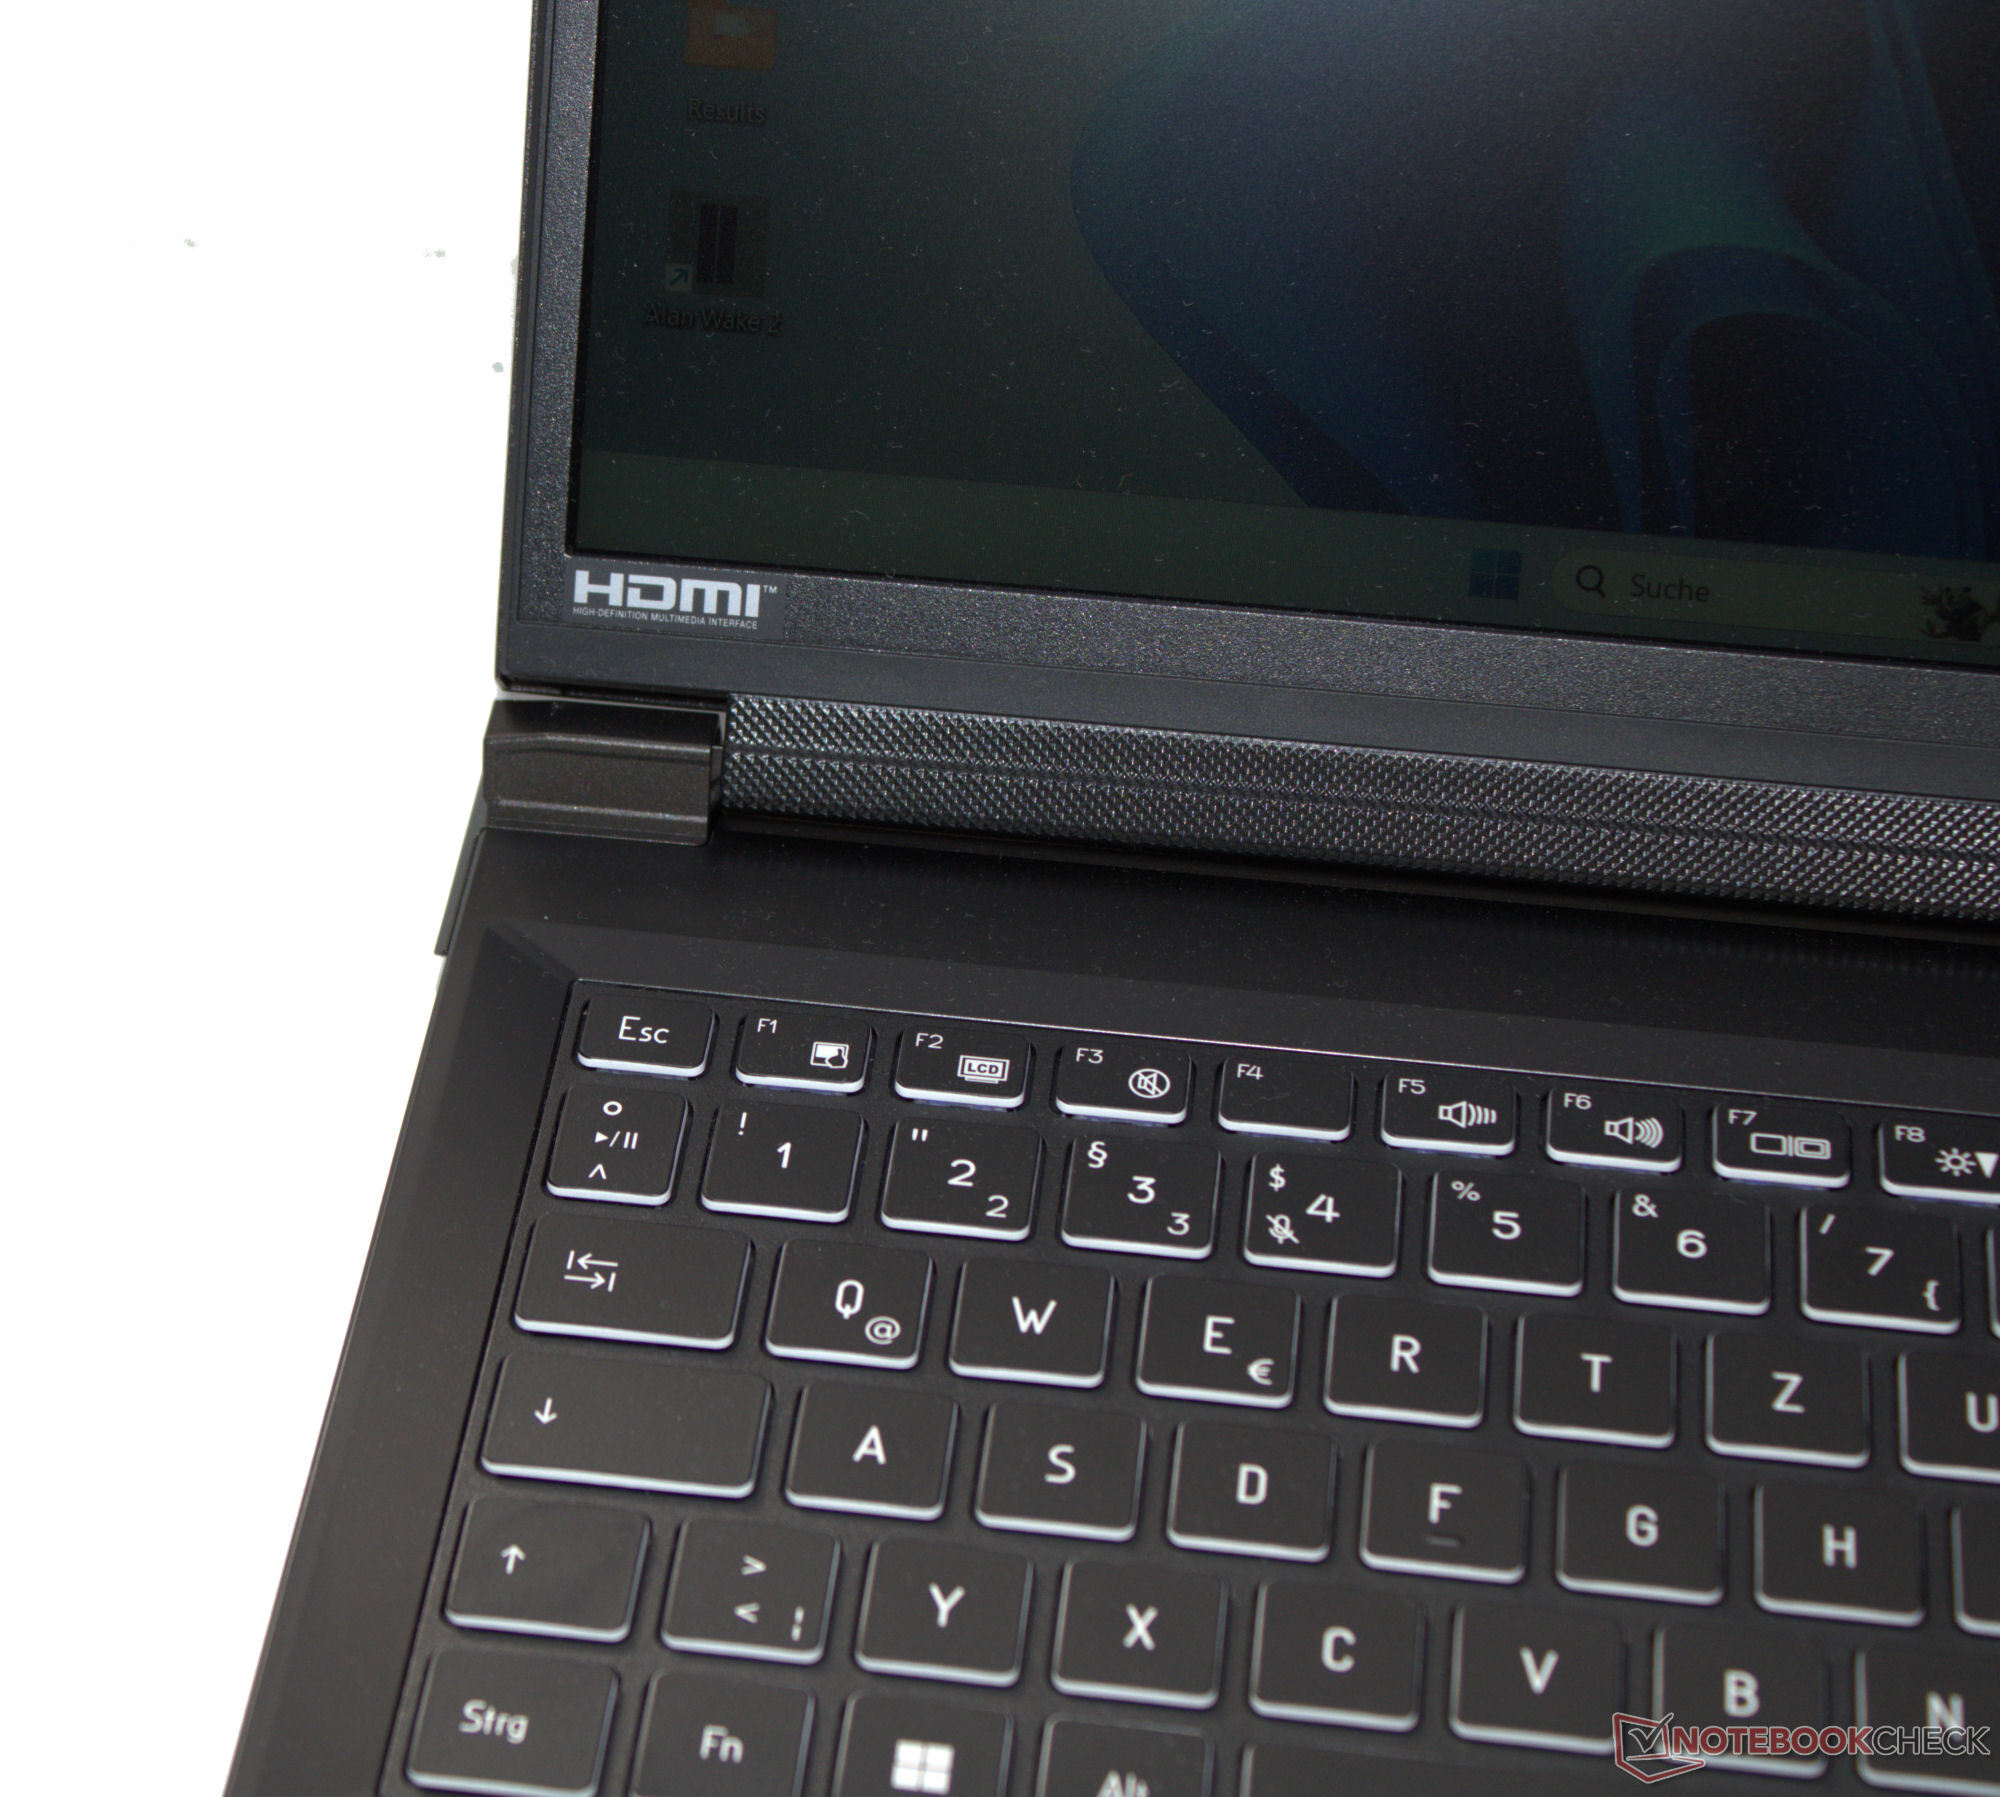
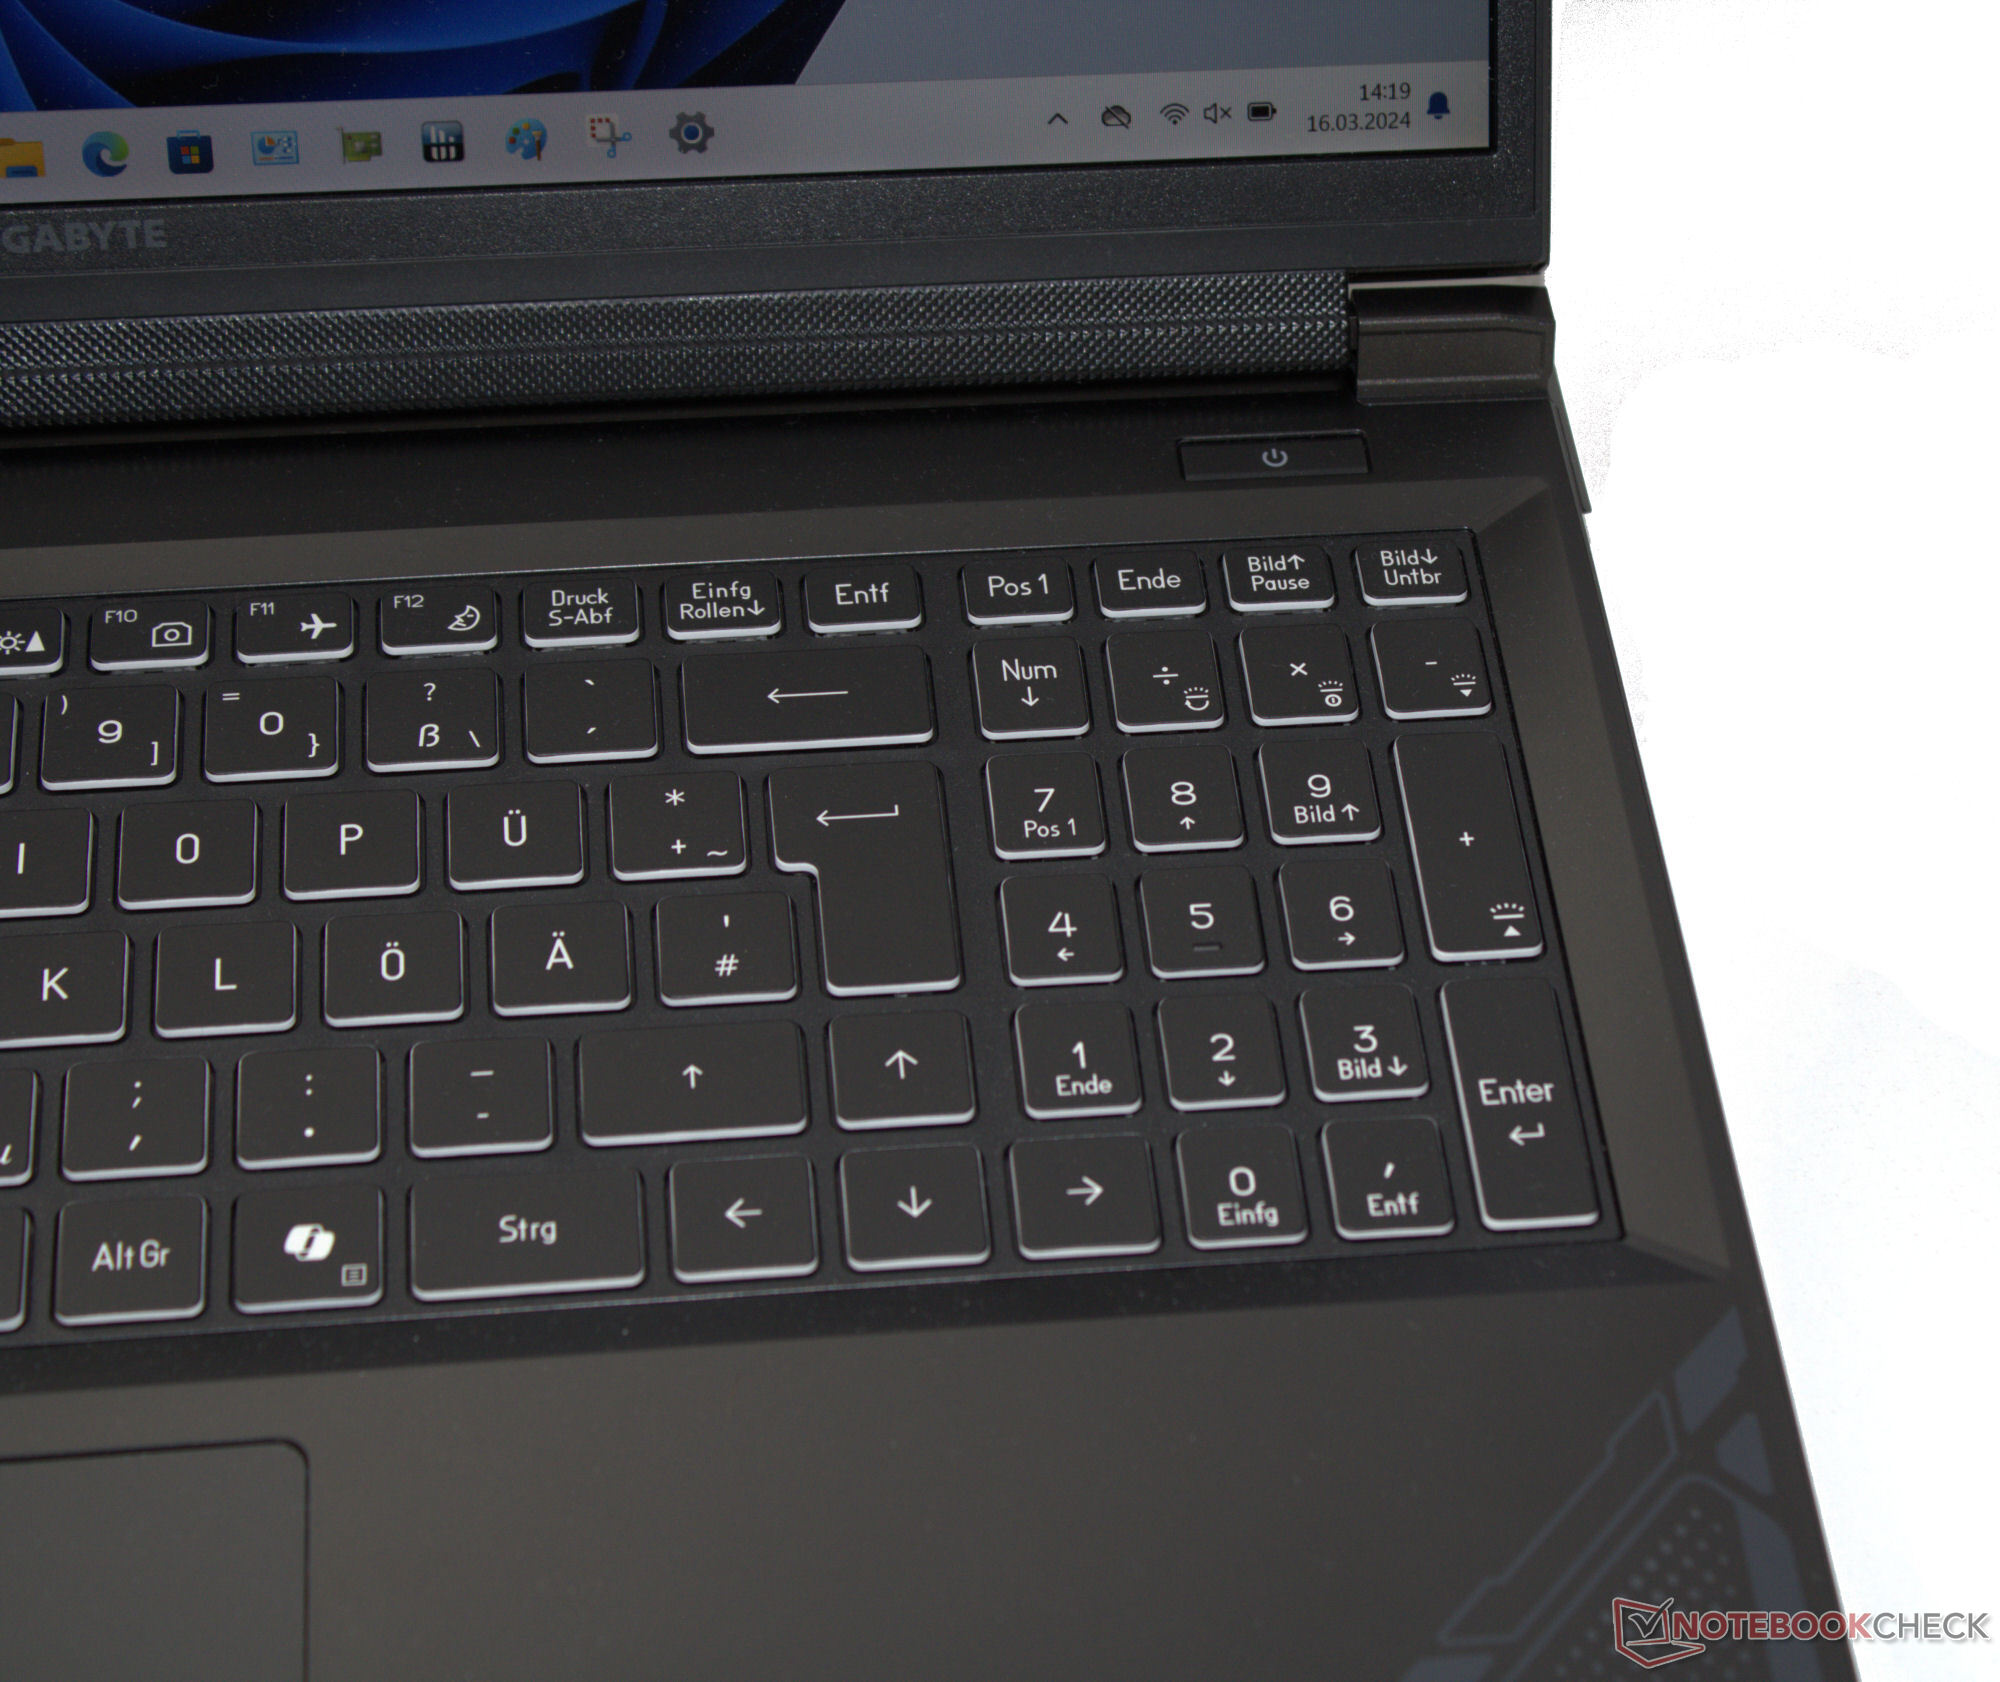
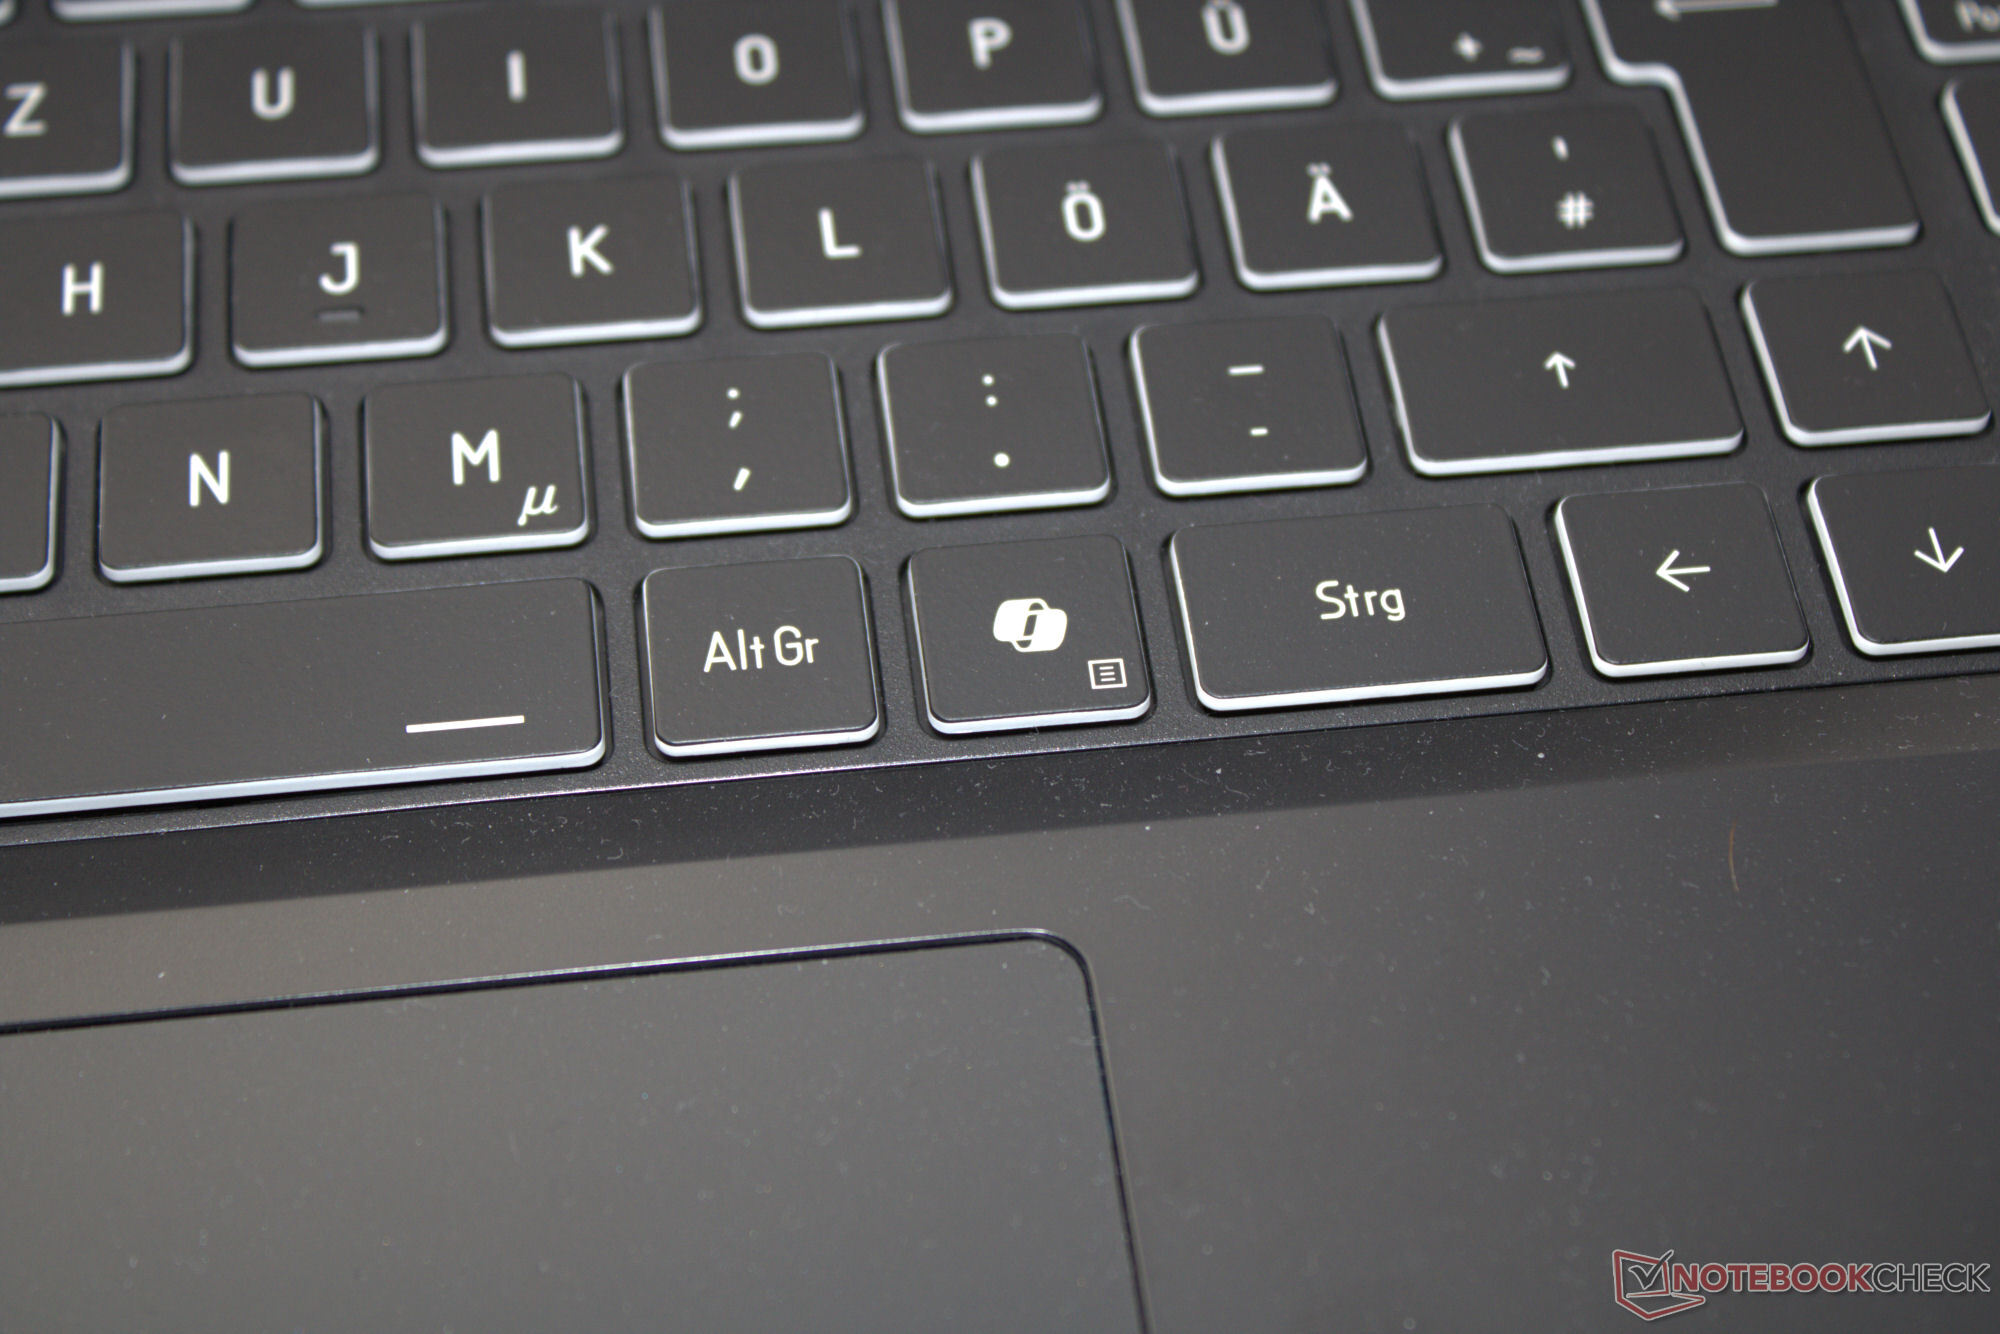
Urządzenia wejściowe: Podświetlana klawiatura odpowiednia do codziennego użytku
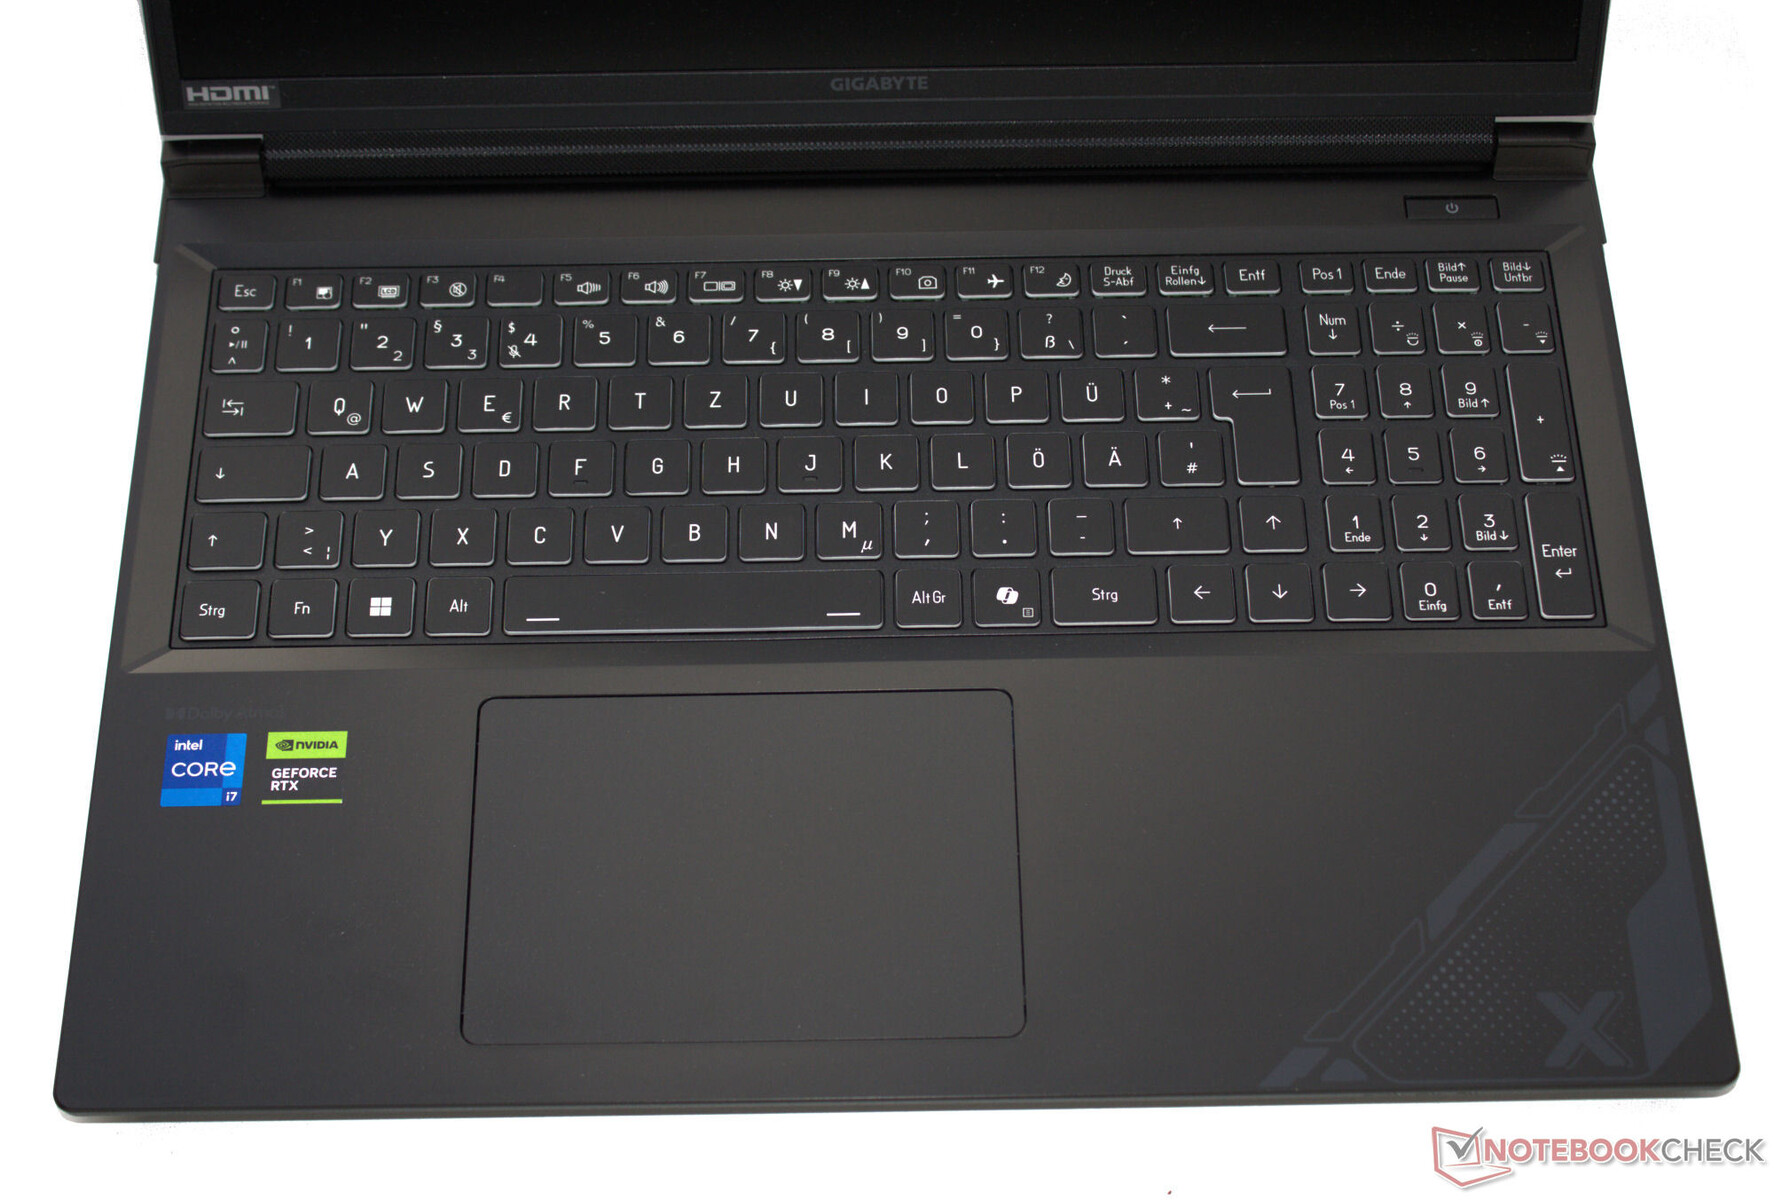
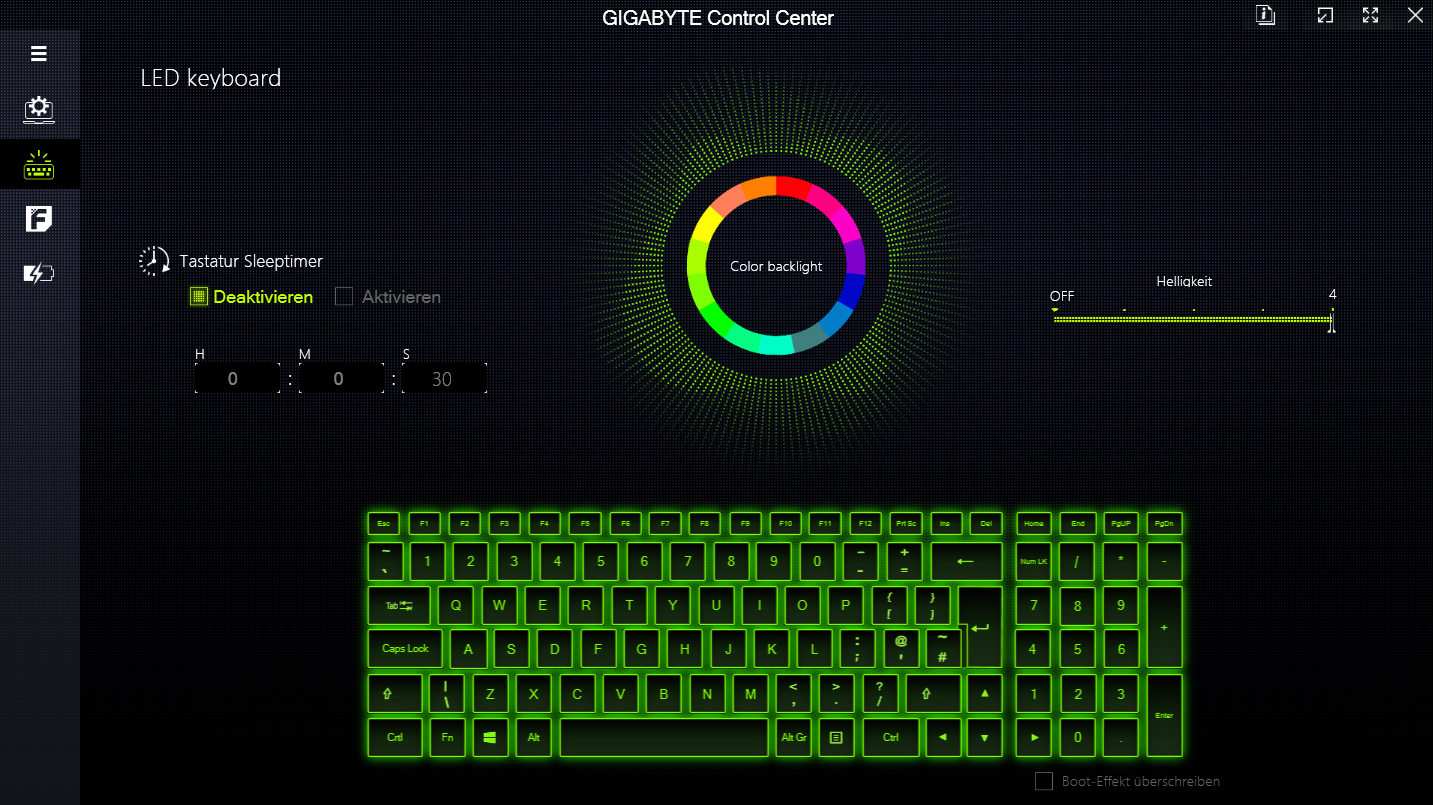
G6X posiada klawiaturę typu chiclet z klawiaturą numeryczną, podświetleniem RGB i płaskimi, gładkimi klawiszami, które są odpowiednie do codziennego pisania. Klawiatura lekko ugina się podczas pisania, ale nie jest to przeszkodą.
Opór klawiszy jest wyraźny. Dobrym aspektem jest to, że klawisze strzałek są pełnowymiarowe.
Wielodotykowy touchpad (12,1 cm x 8,5 cm) o krótkim skoku i wyraźnym punkcie nacisku służy jako zamiennik myszy.
Wyświetlacz: FHD+ 165 Hz bez PWM
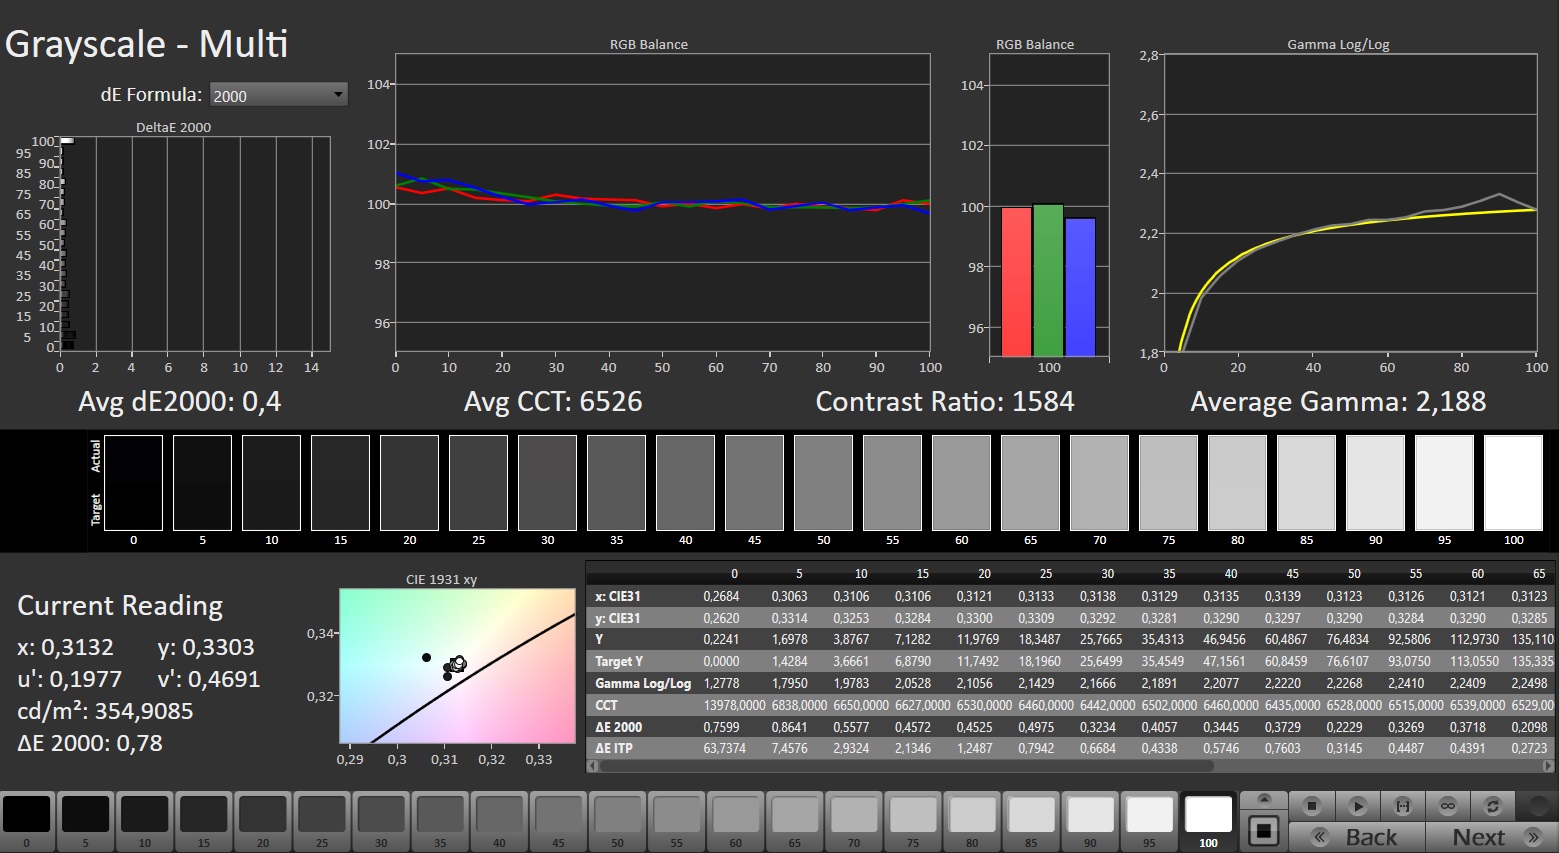
Czuły panel 165 Hz 16:10 o rozdzielczości 1920 x 1200 nie wykazuje migotania PWM przy żadnym ustawieniu jasności.
Jasność i kontrast matowego 16-calowego wyświetlacza spełniają odpowiednie reklamowane cele (> 300 cd/m² i 1000:1). Gigabyte nie oferuje innych opcji wyświetlania dla G6X.
| |||||||||||||||||||||||||
rozświetlenie: 81 %
na akumulatorze: 353 cd/m²
kontrast: 1681:1 (czerń: 0.21 cd/m²)
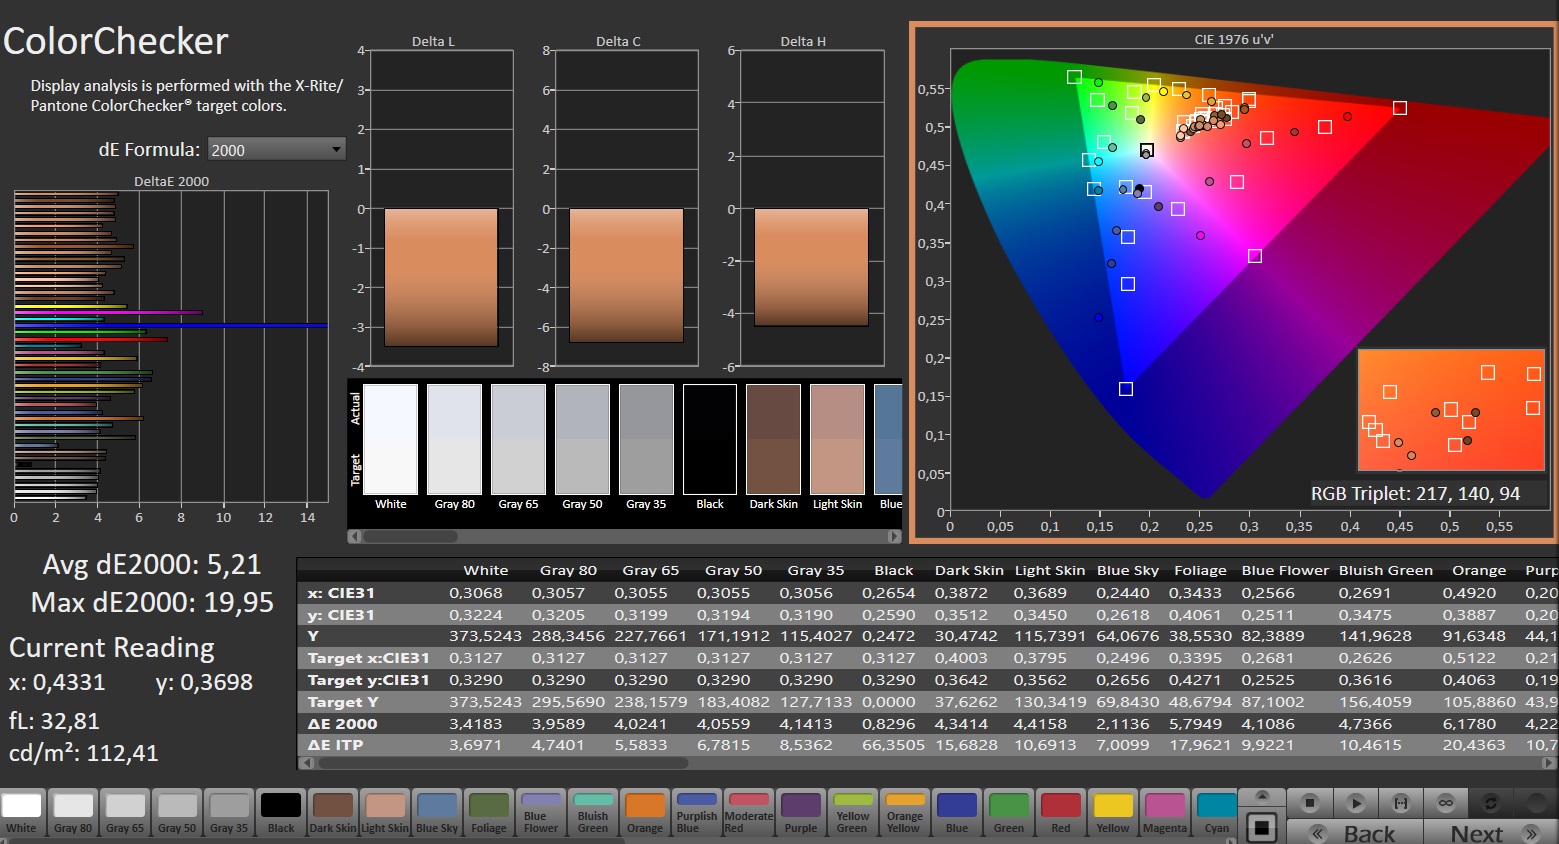
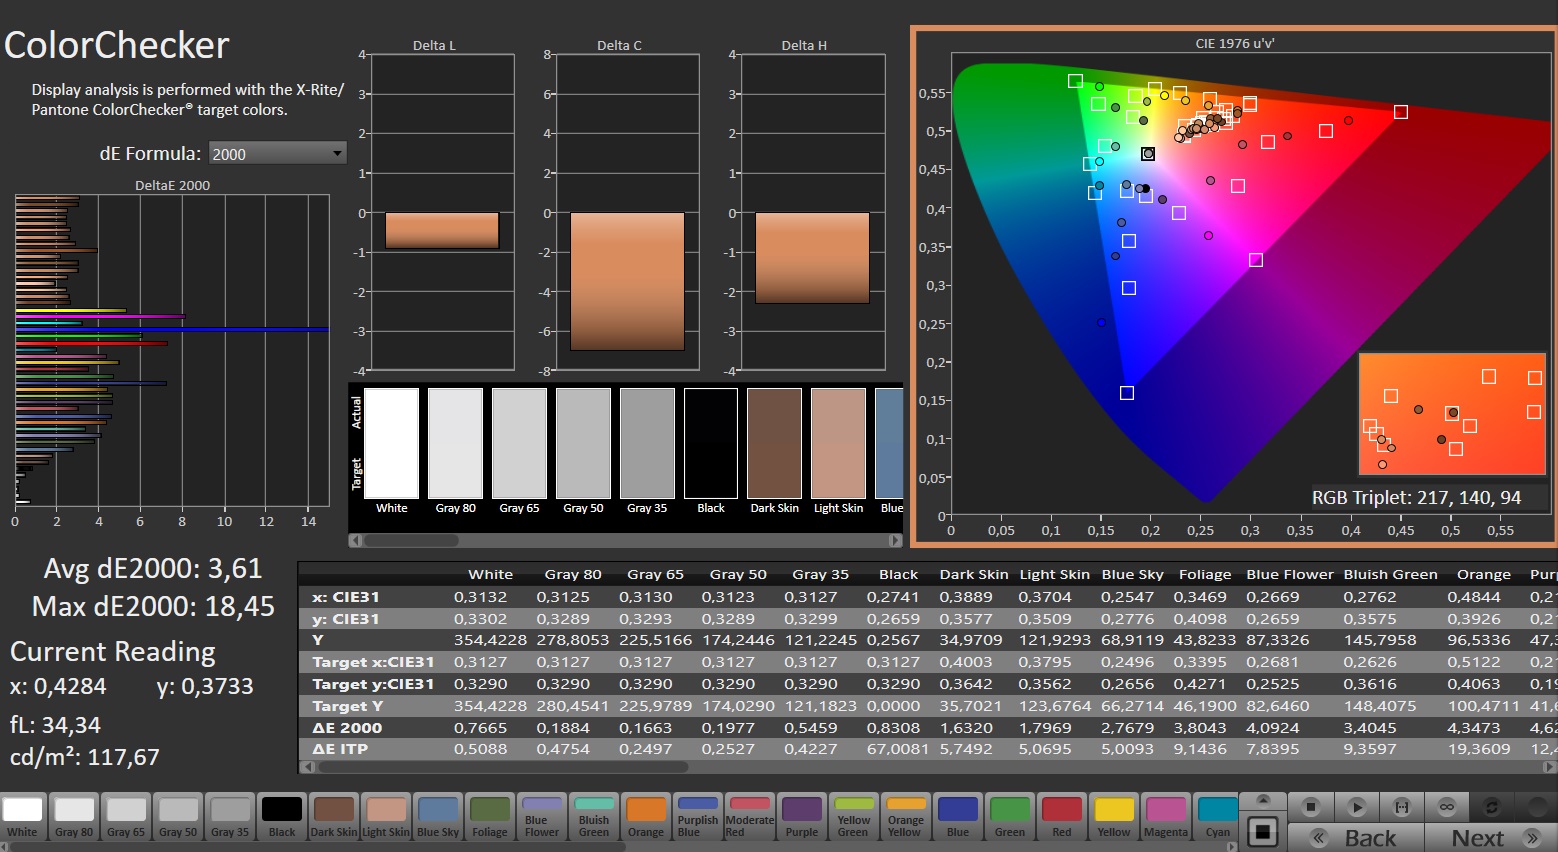
ΔE ColorChecker Calman: 5.21 | ∀{0.5-29.43 Ø4.71}
calibrated: 3.61
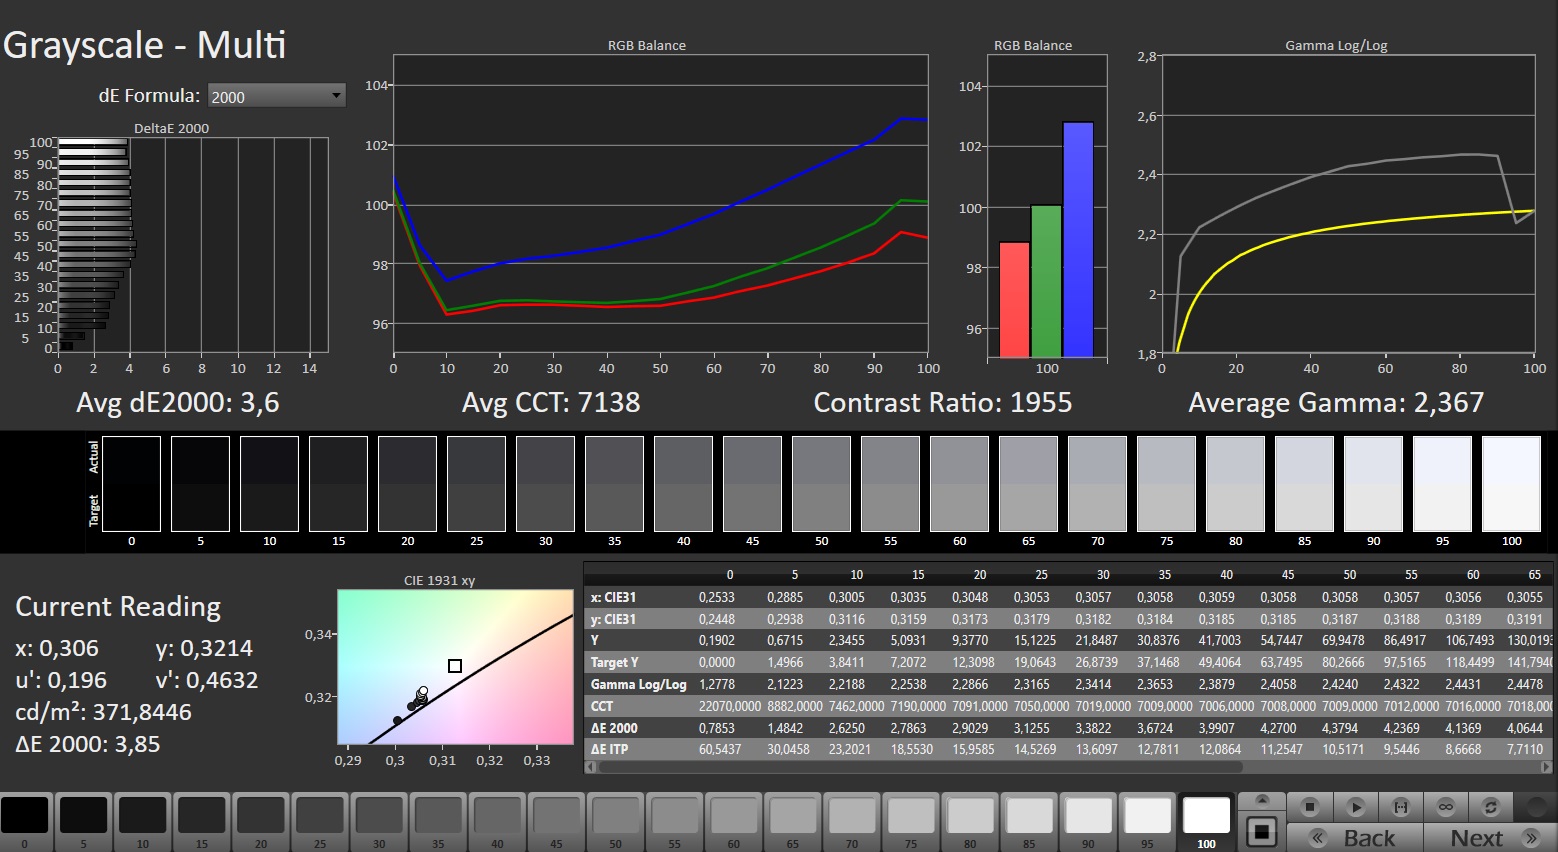
ΔE Greyscale Calman: 3.6 | ∀{0.09-98 Ø4.96}
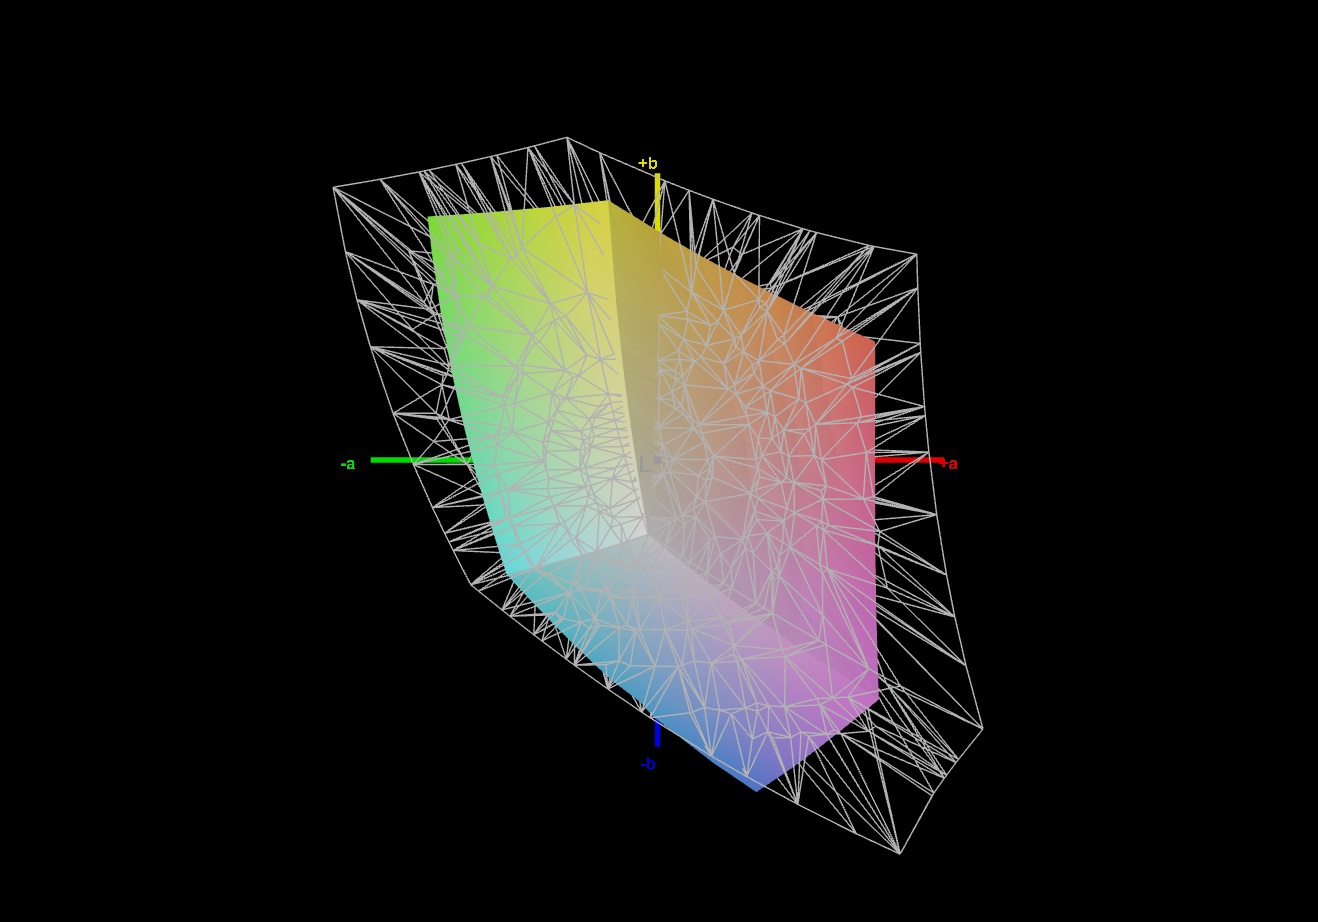
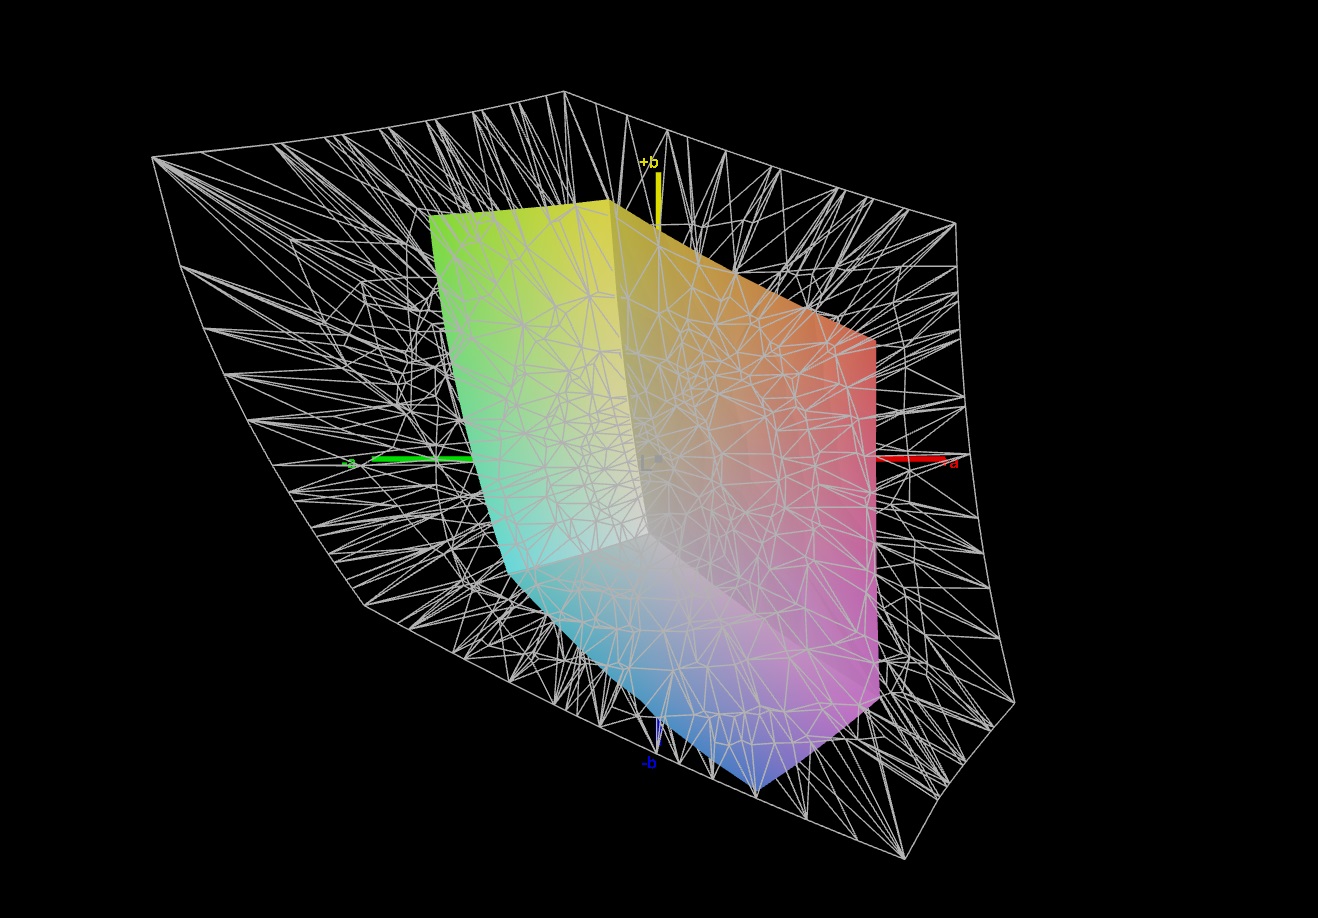
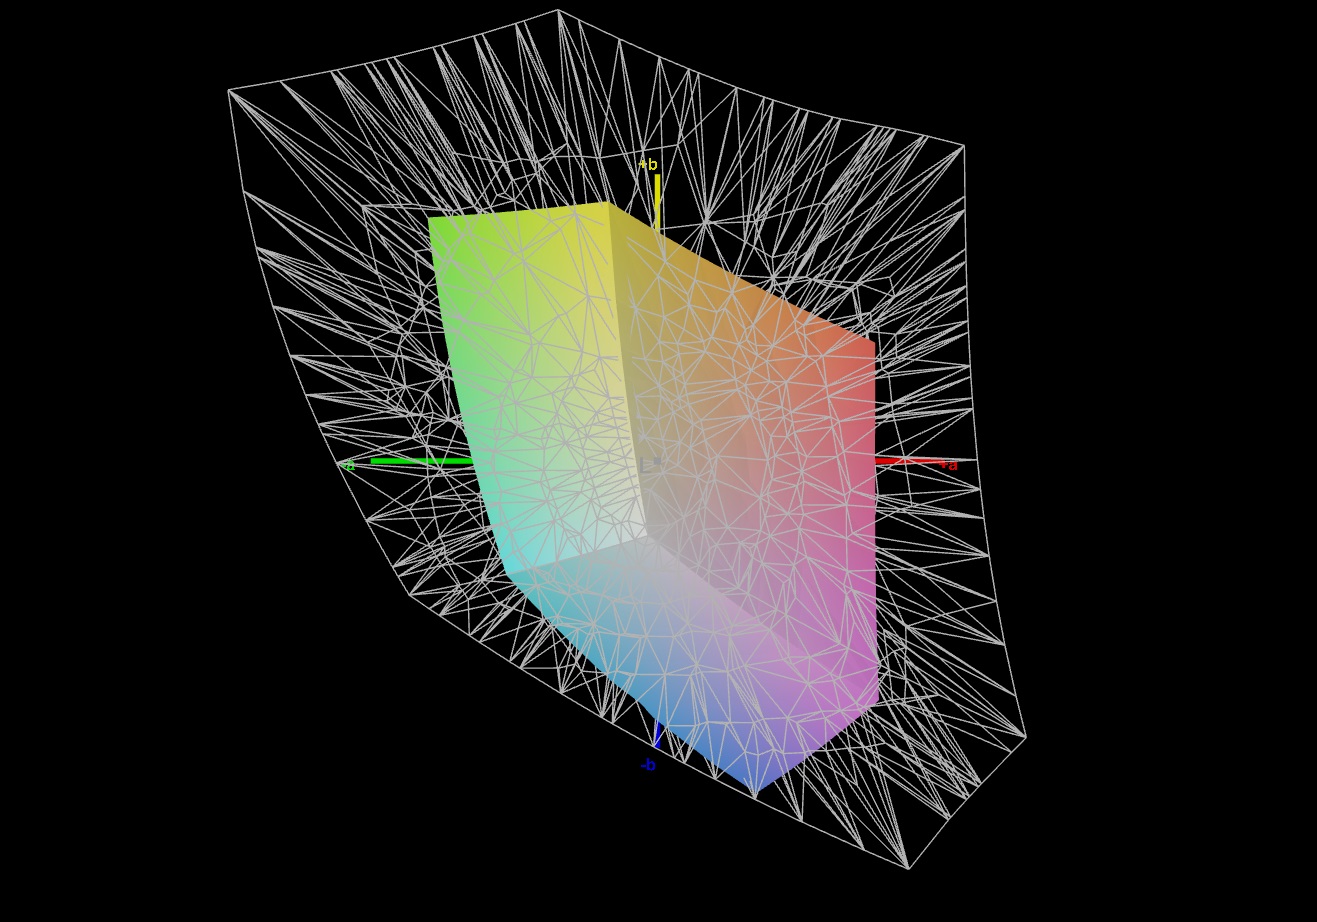
43.3% AdobeRGB 1998 (Argyll 3D)
62.4% sRGB (Argyll 3D)
41.8% Display P3 (Argyll 3D)
Gamma: 2.367
CCT: 7138 K
| Gigabyte G6X 9KG (2024) BOE NE160WUM-NX6, IPS, 1920x1200, 16" | Dell G16, i7-13650HX, RTX 4060 Chi Mei CMN161D (160GME), IPS, 2560x1600, 16" | Lenovo Legion 5 16IRX G9 NE160QDM-NZ3, IPS, 2560x1600, 16" | MSI Raider GE68HX 13VF Chi Mei N160JME-GTK, IPS, 1900x1200, 16" | Asus TUF Gaming A16 FA617XS BOE NE160WUM-NX2, IPS, 1920x1200, 16" | |
|---|---|---|---|---|---|
| Display | 60% | 68% | -0% | 62% | |
| Display P3 Coverage (%) | 41.8 | 67.5 61% | 72.4 73% | 41.6 0% | 69.3 66% |
| sRGB Coverage (%) | 62.4 | 98.5 58% | 100 60% | 62.2 0% | 97.3 56% |
| AdobeRGB 1998 Coverage (%) | 43.3 | 69.3 60% | 74.1 71% | 43 -1% | 70.7 63% |
| Response Times | 67% | 65% | 23% | 58% | |
| Response Time Grey 50% / Grey 80% * (ms) | 40.5 ? | 7.6 ? 81% | 12.5 ? 69% | 17.3 ? 57% | 15.6 ? 61% |
| Response Time Black / White * (ms) | 21.6 ? | 10.4 ? 52% | 8.7 ? 60% | 24.2 ? -12% | 10 ? 54% |
| PWM Frequency (Hz) | |||||
| Screen | 15% | 39% | -2% | 25% | |
| Brightness middle (cd/m²) | 353 | 369 5% | 526 49% | 300.9 -15% | 301 -15% |
| Brightness (cd/m²) | 318 | 344 8% | 500 57% | 302 -5% | 294 -8% |
| Brightness Distribution (%) | 81 | 89 10% | 87 7% | 93 15% | 94 16% |
| Black Level * (cd/m²) | 0.21 | 0.26 -24% | 0.33 -57% | 0.31 -48% | 0.21 -0% |
| Contrast (:1) | 1681 | 1419 -16% | 1594 -5% | 971 -42% | 1433 -15% |
| Colorchecker dE 2000 * | 5.21 | 3.04 42% | 1.2 77% | 4.6 12% | 1.79 66% |
| Colorchecker dE 2000 max. * | 19.95 | 5.56 72% | 2.1 89% | 17.6 12% | 3.48 83% |
| Colorchecker dE 2000 calibrated * | 3.61 | 2.35 35% | 1 72% | 2.04 43% | 1.2 67% |
| Greyscale dE 2000 * | 3.6 | 3.38 6% | 1.3 64% | 3.3 8% | 2.5 31% |
| Gamma | 2.367 93% | 2.47 89% | 2.23 99% | 2.09 105% | 2.265 97% |
| CCT | 7138 91% | 6040 108% | 6391 102% | 7151 91% | 6157 106% |
| Całkowita średnia (program / ustawienia) | 47% /
32% | 57% /
49% | 7% /
2% | 48% /
38% |
* ... im mniej tym lepiej
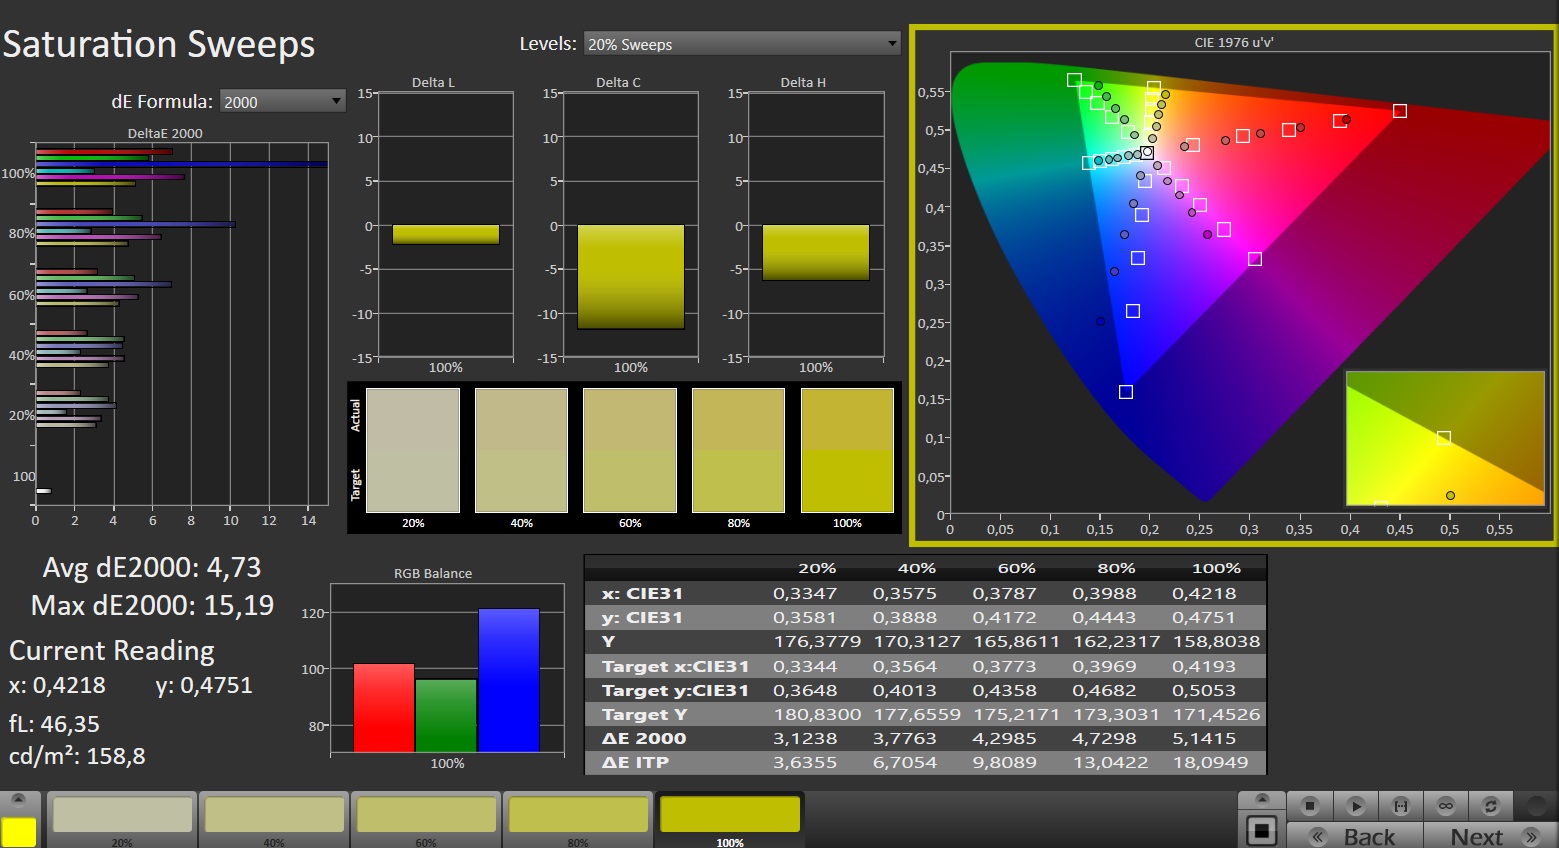
Wyświetlacz fabrycznie wykazuje przeciętne odwzorowanie kolorów: Przy odchyleniu około 5,2, cel deltaE 2000 < 3 nie jest spełniony. Kalibracja zmniejsza odchylenie do 3,6 i zapewnia bardziej zrównoważone odcienie szarości.
Panel nie jest w stanie w pełni odwzorować przestrzeni barw AdobeRGB, sRGB i DCI-P3. Pod tym względem konkurenci G6X oferują lepsze ekrany.

Wyświetl czasy reakcji
| ↔ Czas reakcji od czerni do bieli | ||
|---|---|---|
| 21.6 ms ... wzrost ↗ i spadek ↘ łącznie | ↗ 11.1 ms wzrost | 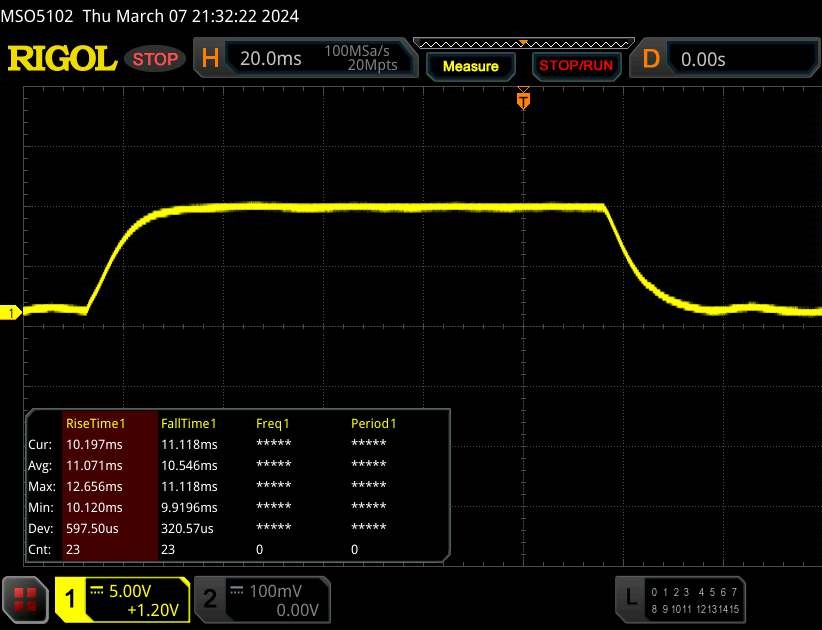 |
| ↘ 10.5 ms upadek | ||
| W naszych testach ekran wykazuje dobry współczynnik reakcji, ale może być zbyt wolny dla graczy rywalizujących ze sobą. Dla porównania, wszystkie testowane urządzenia wahają się od 0.1 (minimum) do 240 (maksimum) ms. » 48 % wszystkich urządzeń jest lepszych. Oznacza to, że zmierzony czas reakcji jest zbliżony do średniej wszystkich testowanych urządzeń (19.8 ms). | ||
| ↔ Czas reakcji 50% szarości do 80% szarości | ||
| 40.5 ms ... wzrost ↗ i spadek ↘ łącznie | ↗ 19 ms wzrost | 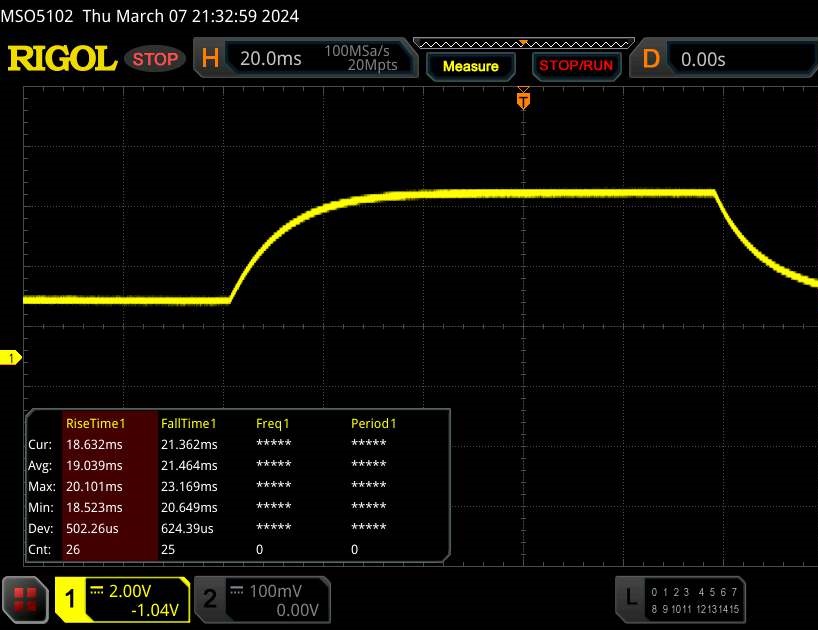 |
| ↘ 21.5 ms upadek | ||
| W naszych testach ekran wykazuje powolne tempo reakcji, co będzie niezadowalające dla graczy. Dla porównania, wszystkie testowane urządzenia wahają się od 0.165 (minimum) do 636 (maksimum) ms. » 64 % wszystkich urządzeń jest lepszych. Oznacza to, że zmierzony czas reakcji jest gorszy od średniej wszystkich testowanych urządzeń (30.9 ms). | ||
Migotanie ekranu / PWM (modulacja szerokości impulsu)
| Migotanie ekranu/nie wykryto PWM |  | ||
Dla porównania: 52 % wszystkich testowanych urządzeń nie używa PWM do przyciemniania wyświetlacza. Jeśli wykryto PWM, zmierzono średnio 7748 (minimum: 5 - maksimum: 343500) Hz. | |||
Panel IPS oferuje stosunkowo stabilne kąty widzenia, które mogą być odczytywane z ekstremalnych pozycji. Możliwe jest korzystanie z wyświetlacza na zewnątrz, jeśli słońce nie jest zbyt jasne.
Wydajność: Raptor Lake i Ada Lovelace napędzają 16-calowy komputer
Gigabyte dostarcza średniej klasy notebook do gier G6X 9KG. Raptor Lake-HX i Ada Lovelace zapewniają niezbędną moc obliczeniową.
Warunki testu
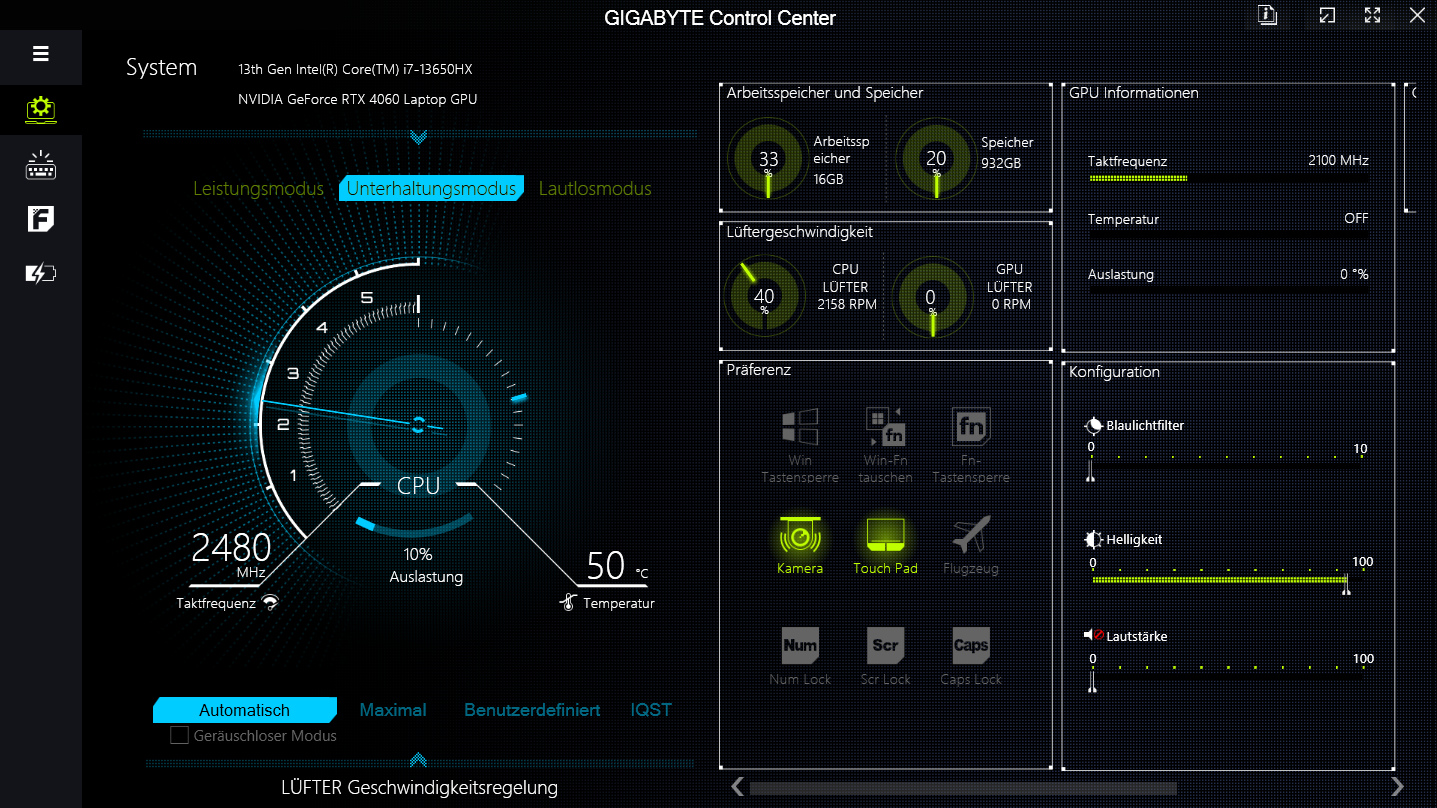
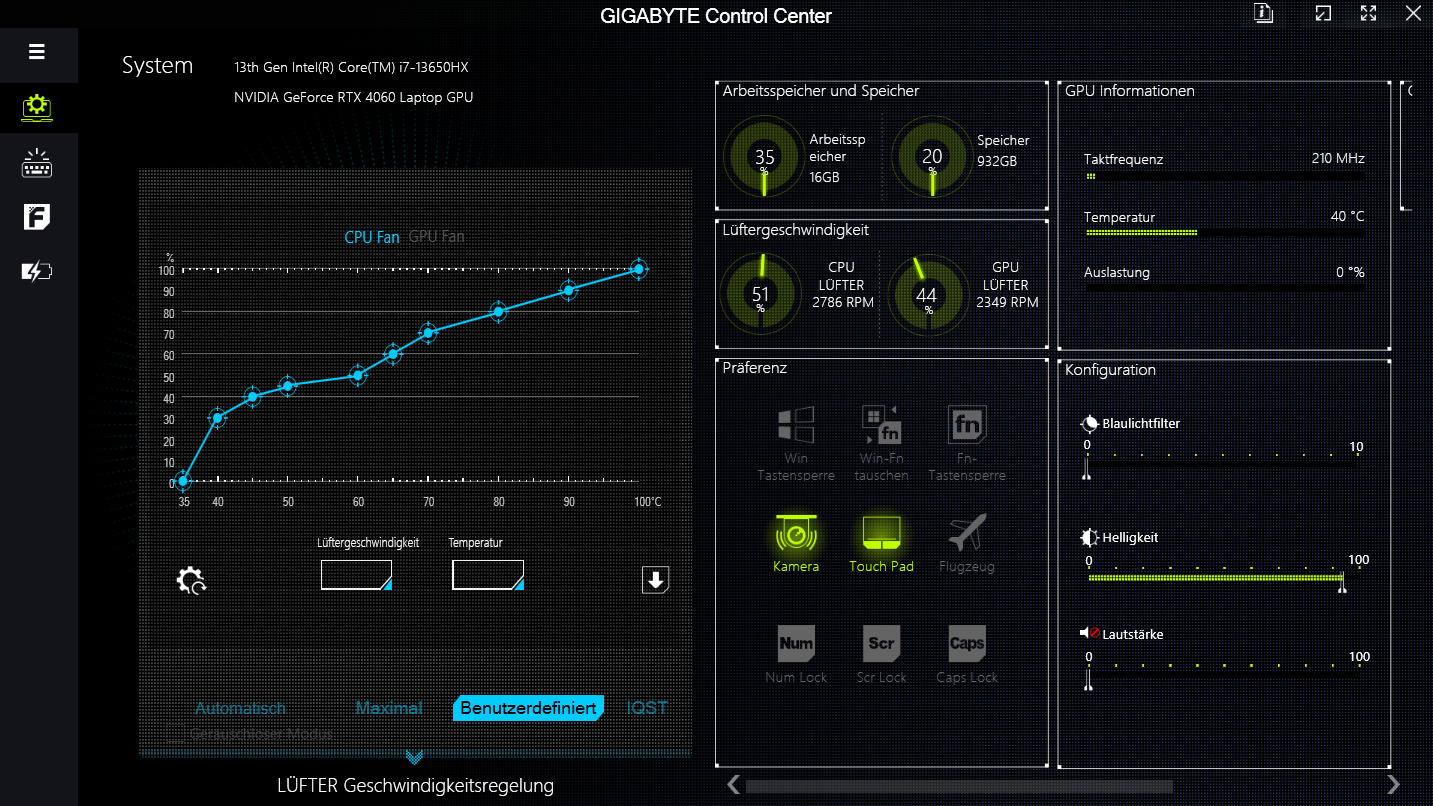
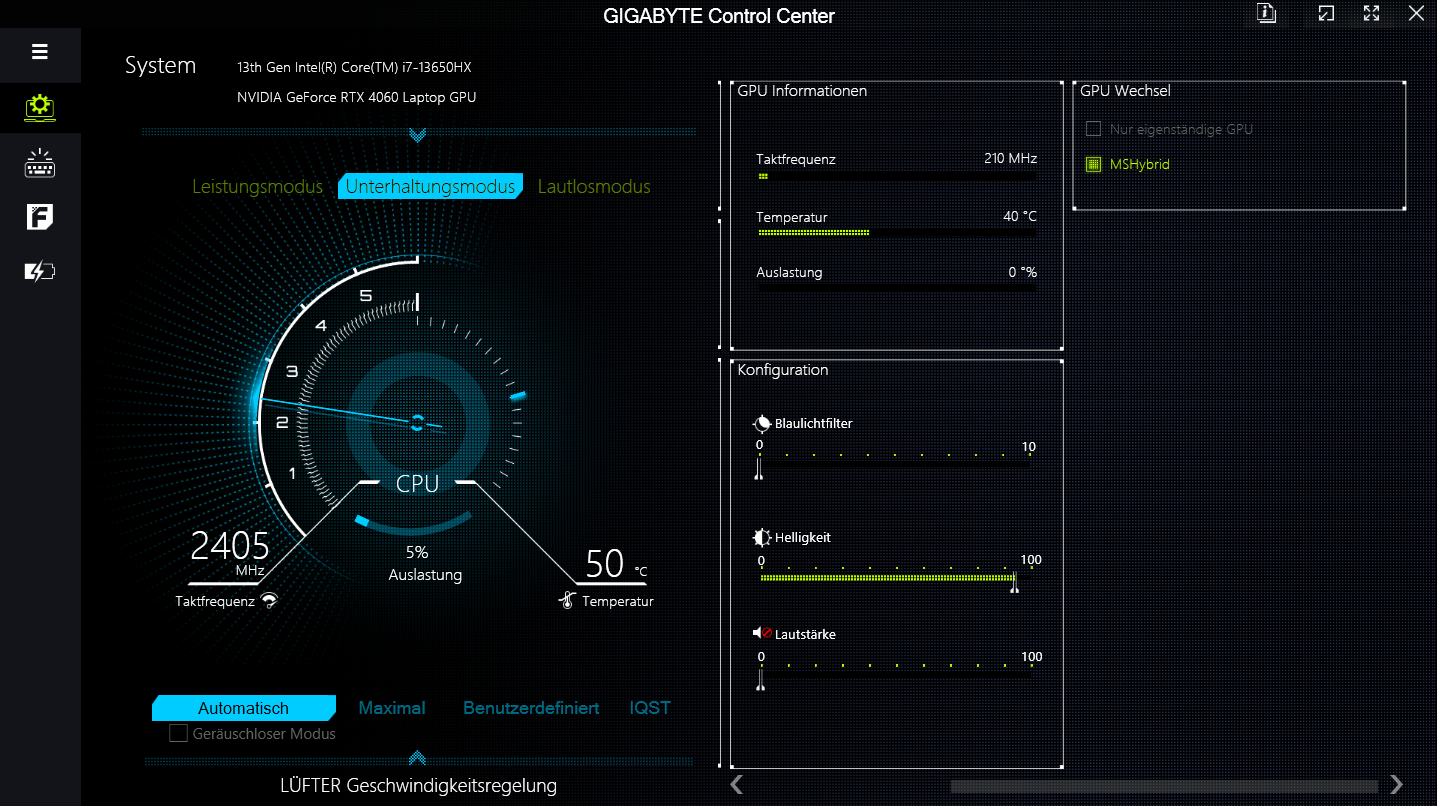
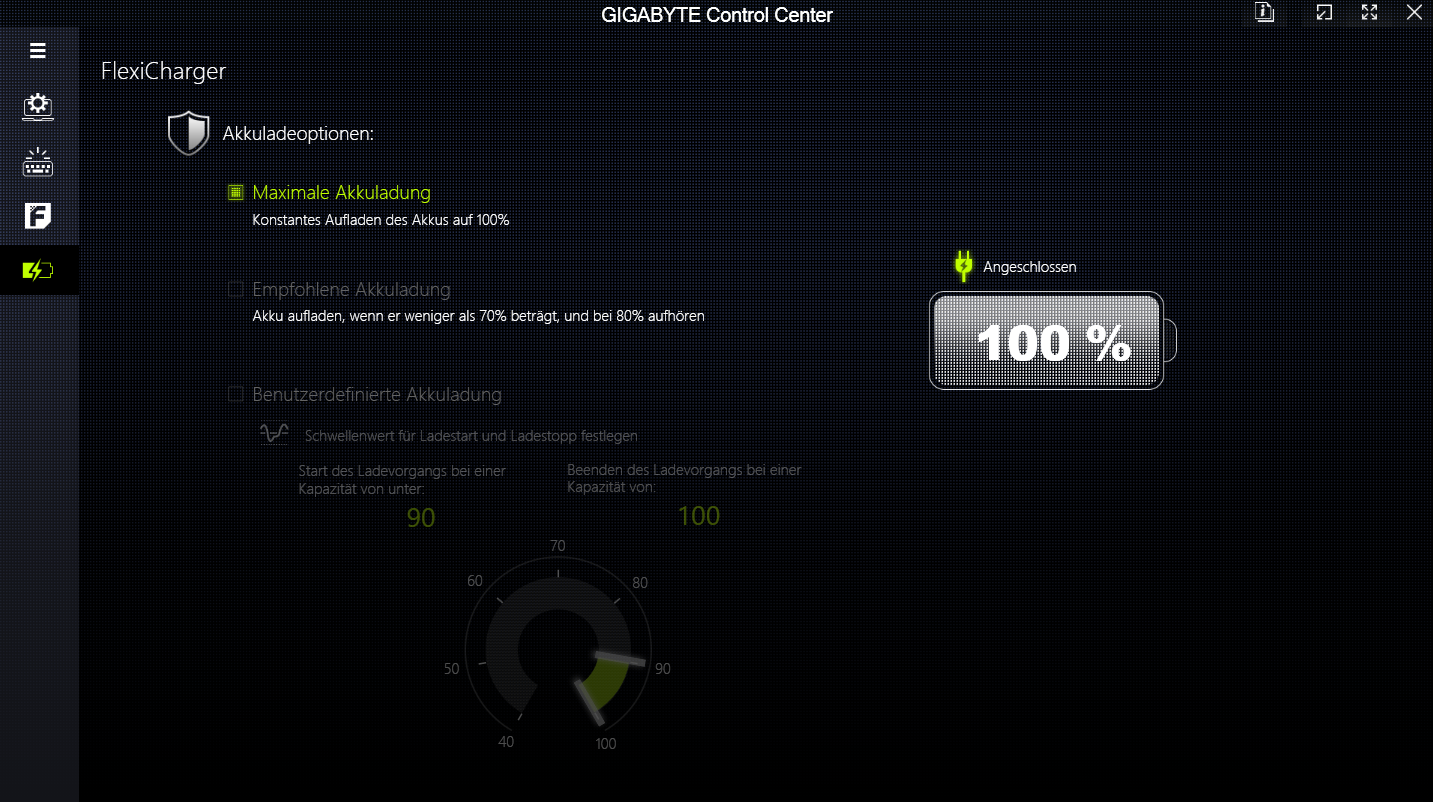
G6X oferuje trzy tryby wydajności specyficzne dla producenta (patrz tabela poniżej), między którymi można przełączać się za pomocą aplikacji Control Center. Tryb "Rozrywka" został wykorzystany do testów porównawczych, podczas gdy "Tryb cichy" został wykorzystany do testów baterii. Oba tryby oferują automatyczną kontrolę wentylatora.
| Tryb wydajności | Tryb rozrywki | Tryb cichy (= dGPU wyłączone) | |
|---|---|---|---|
| Limit mocy 1 (HWInfo) | 135 W | 55 W | 25 W |
| Limit mocy 2 (HWInfo) | 155 W | 115 W | 30 W |
| Hałas ( Witcher 3 1080p Ultra) | 55 dB(A) | 51 dB(A) | 33 dB(A) |
| Wydajność (The Witcher 3 1080p Ultra) | ~102 fps | ~100 fps | 4 fps |
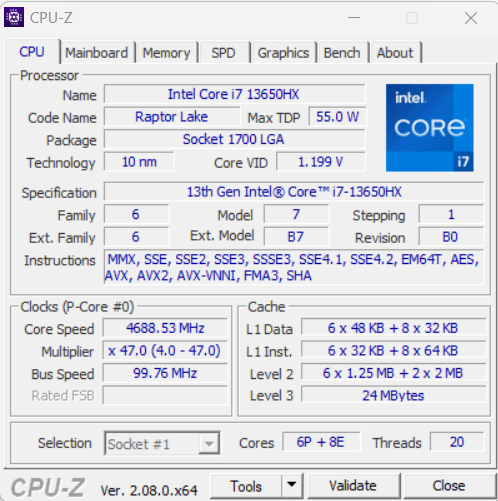
Procesor
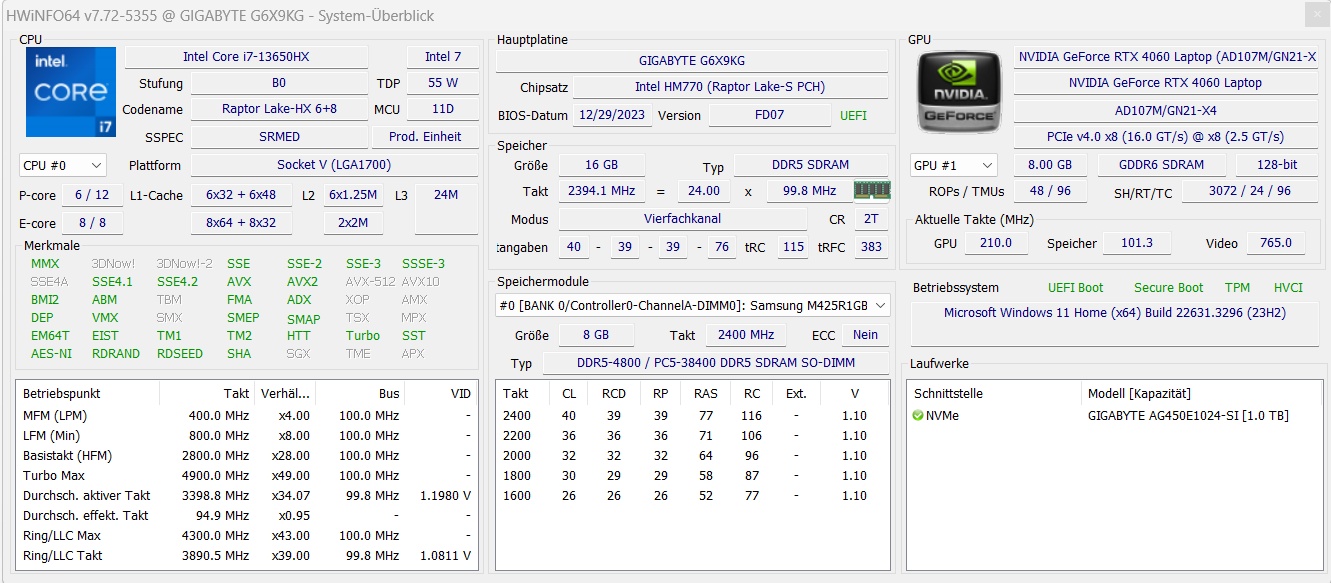
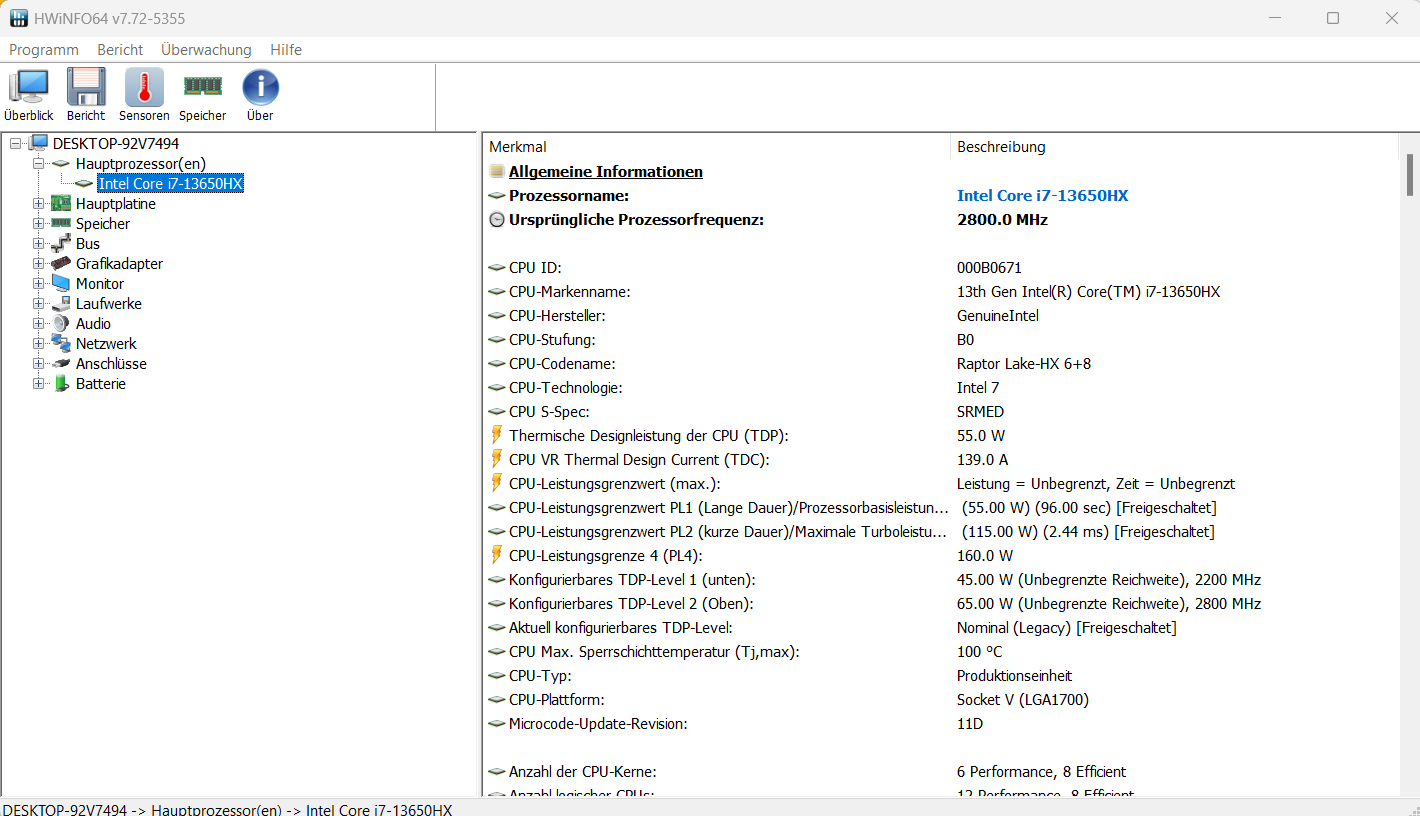
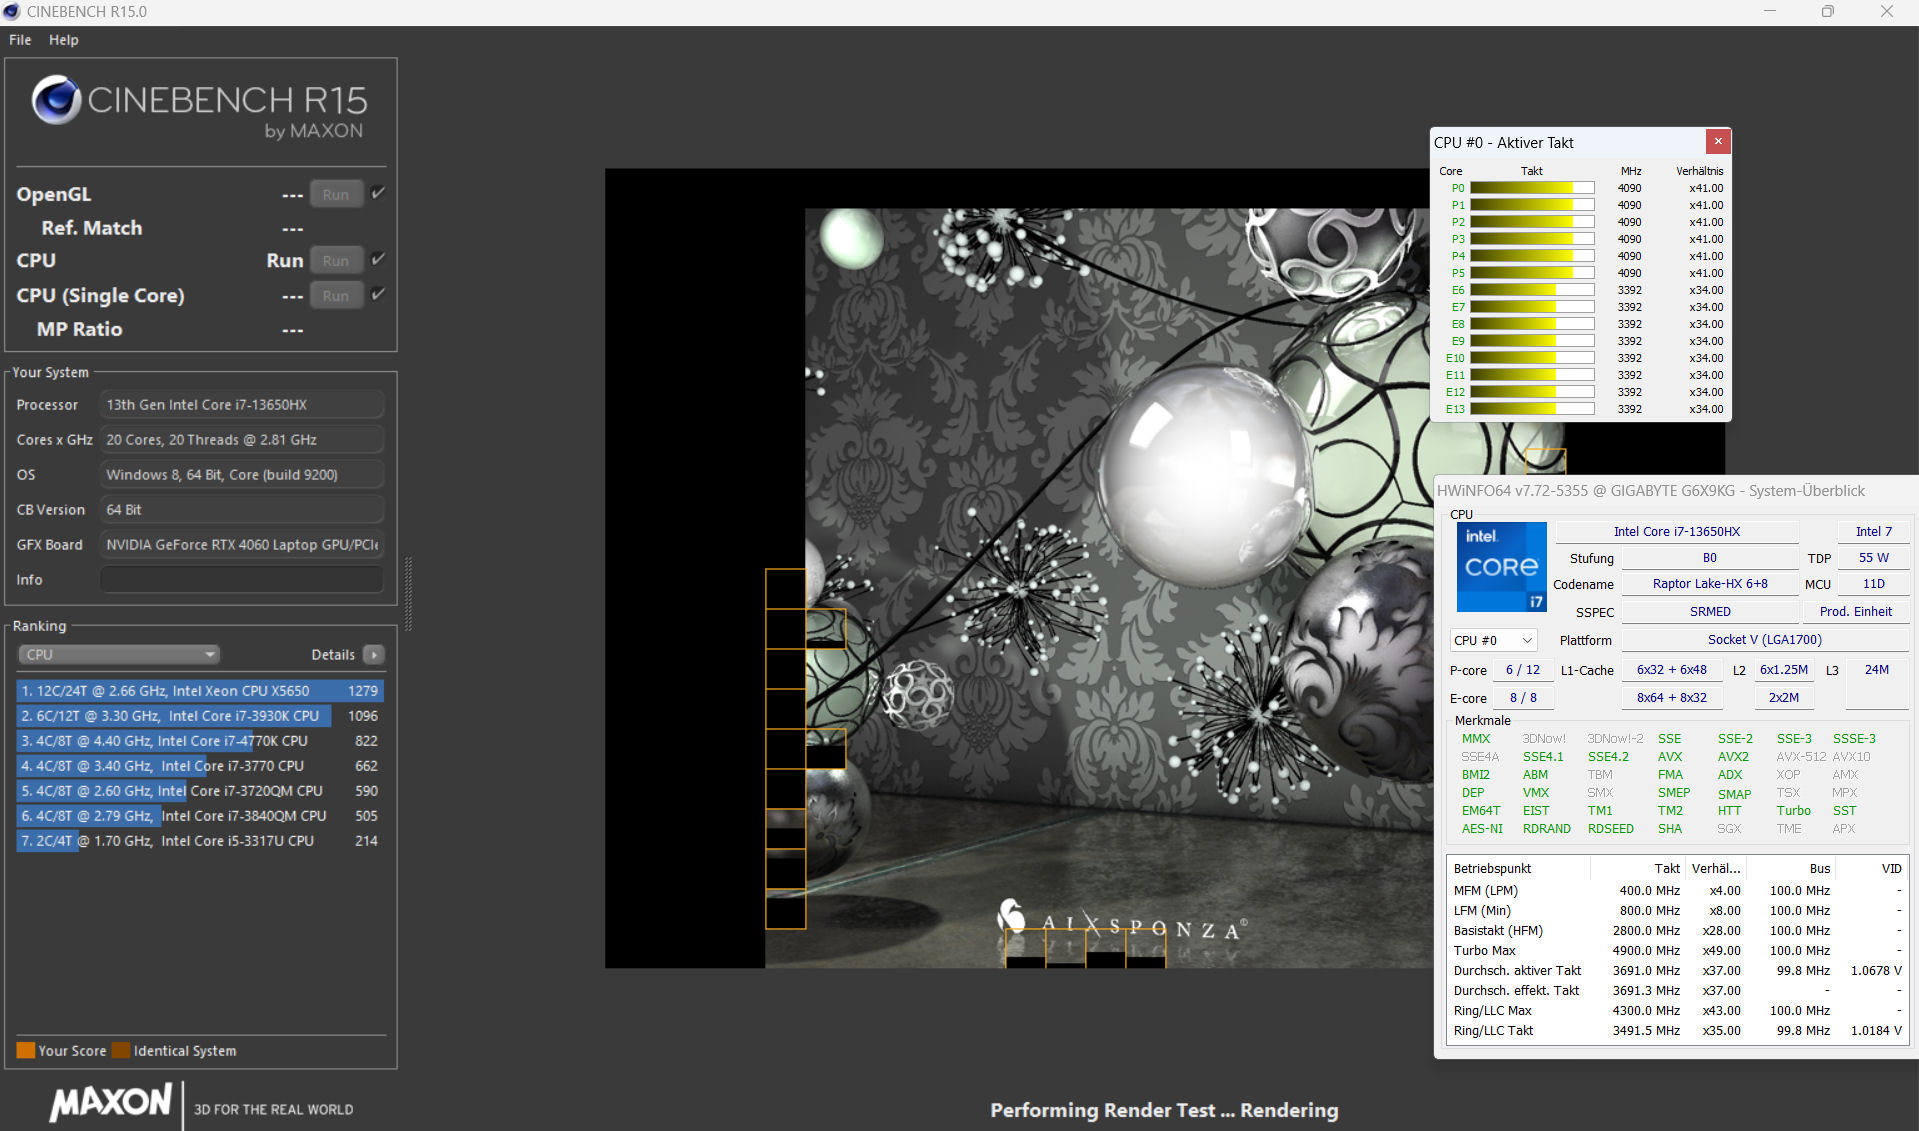
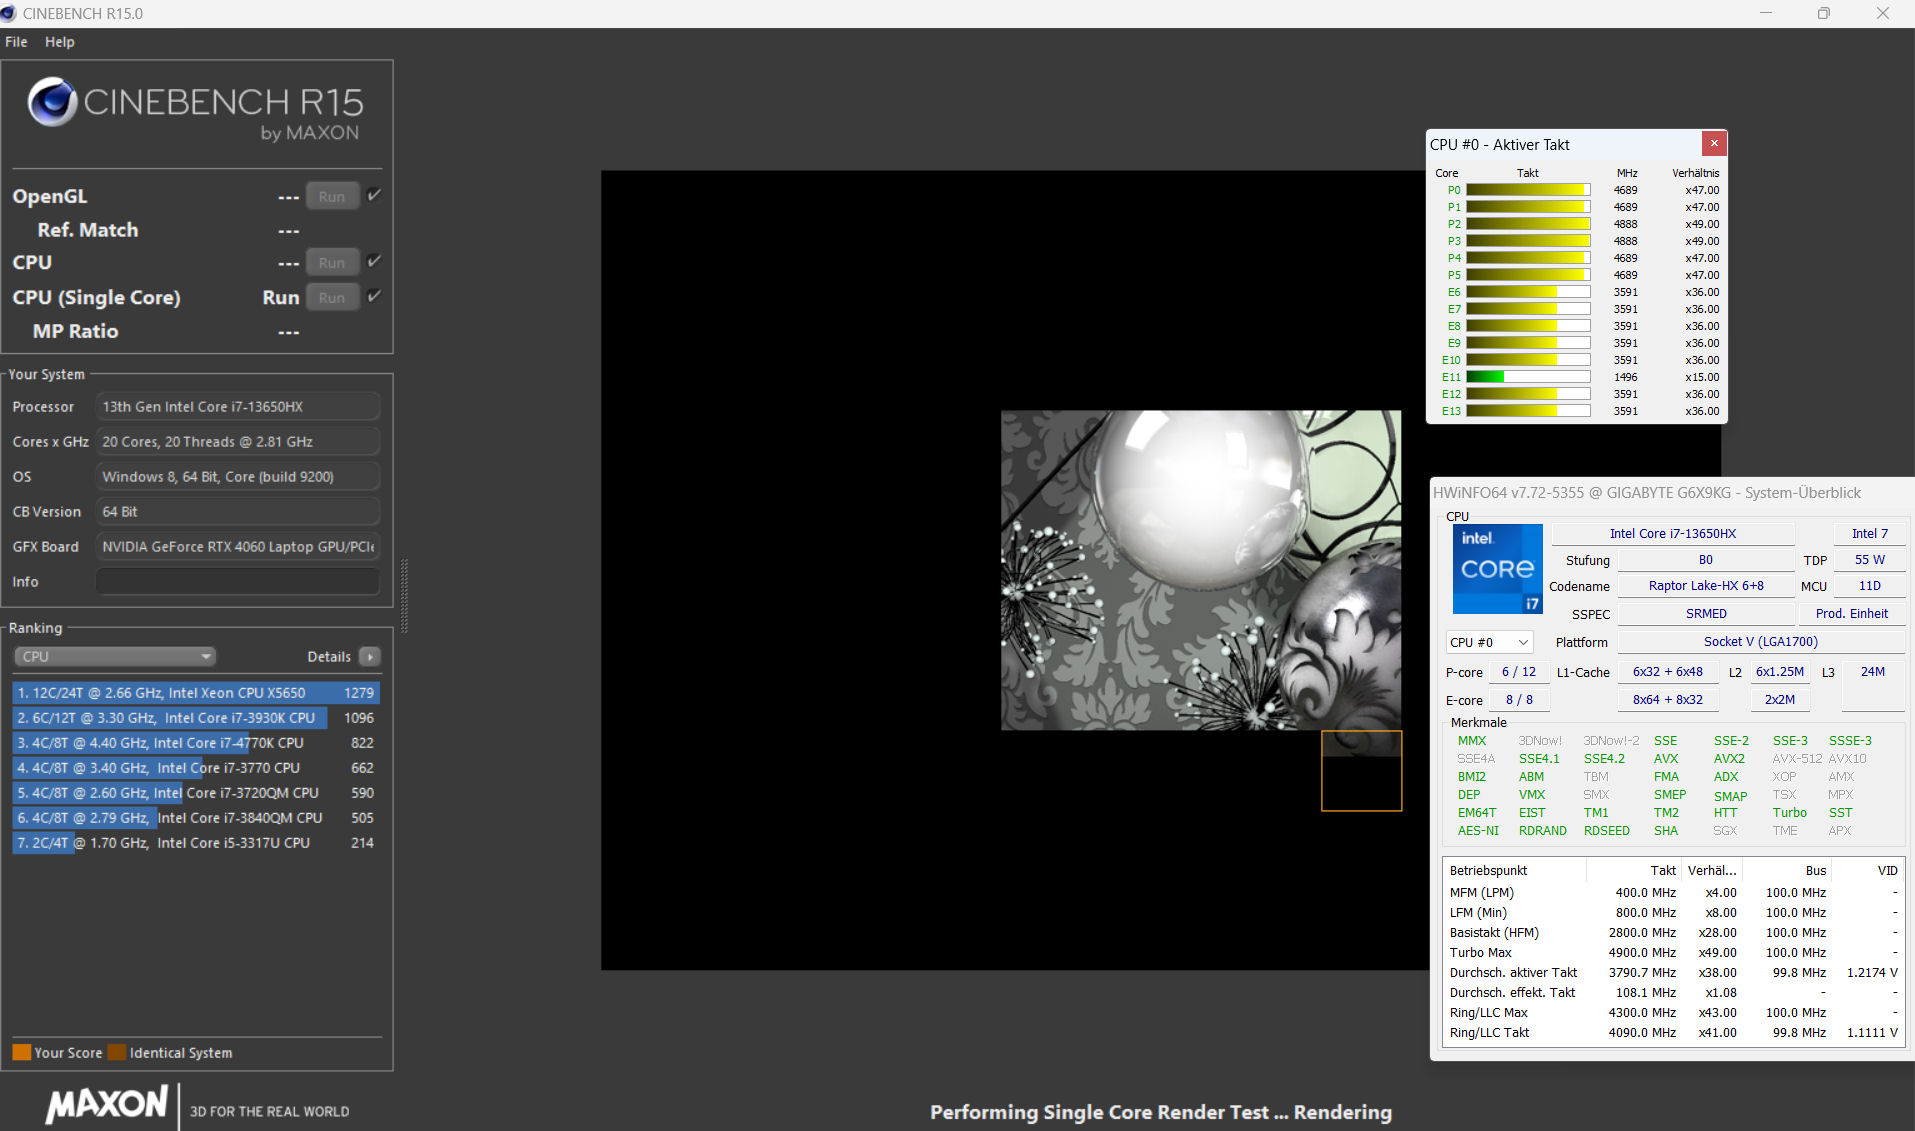
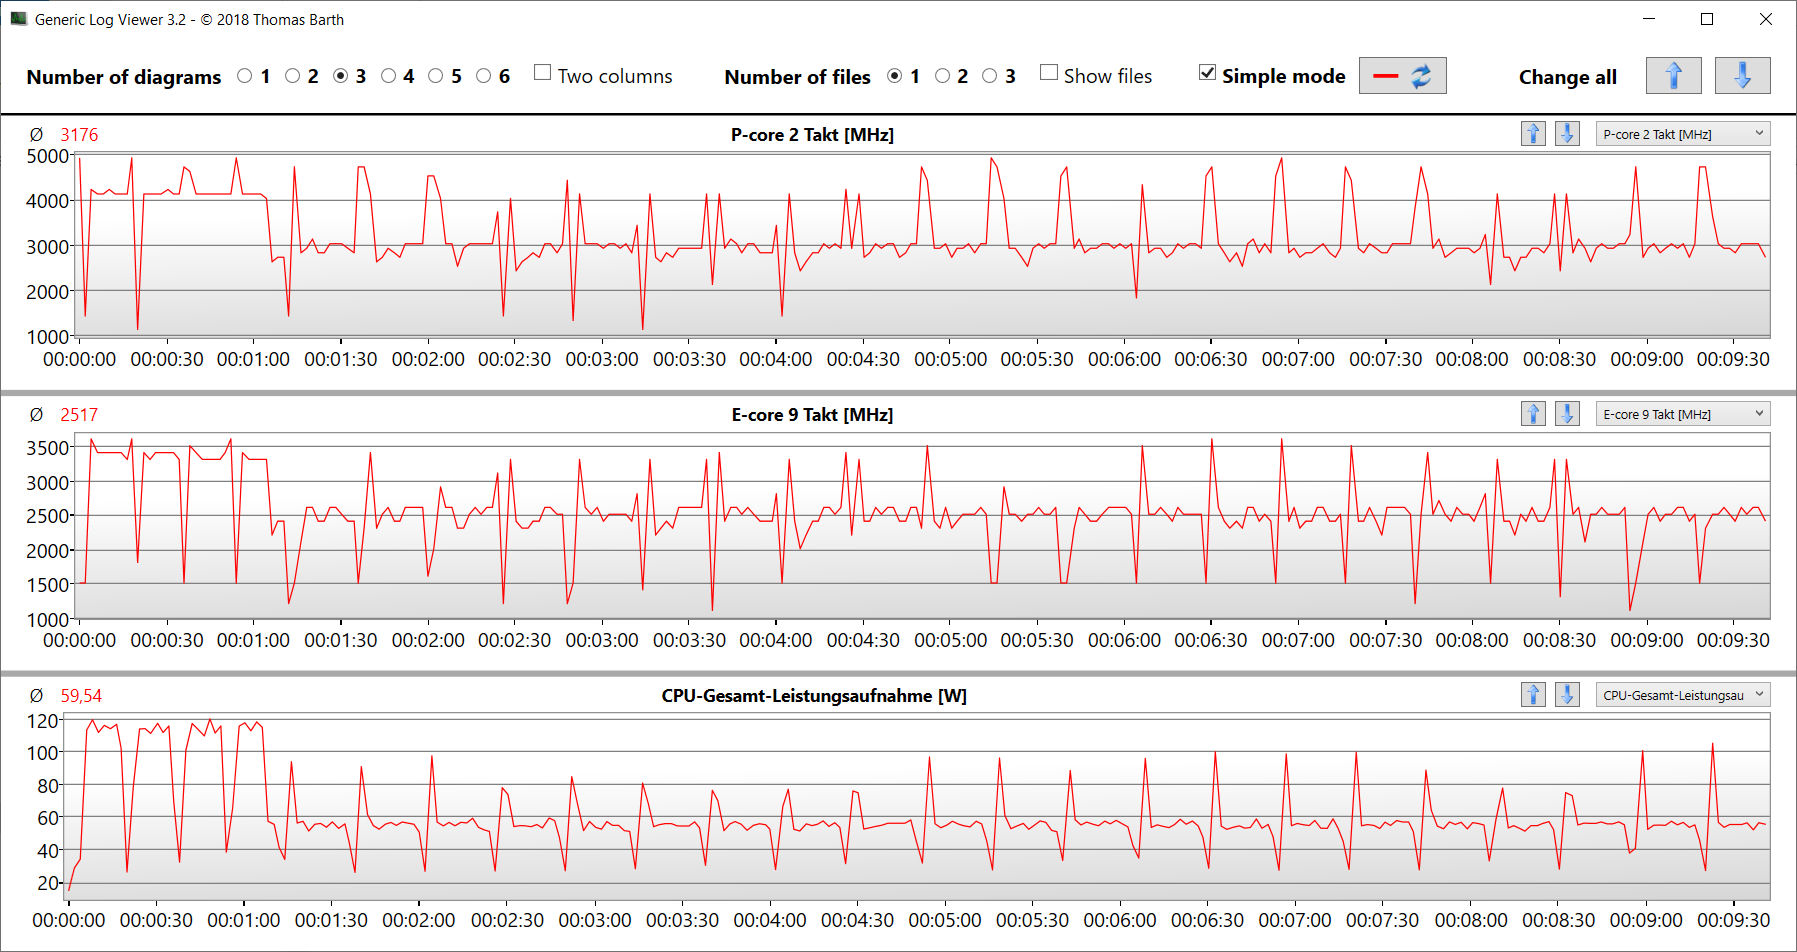
14 rdzeni procesora Core i7-13650HX (6P+8E) osiąga maksymalne taktowania na poziomie 4,9 GHz (P) i 3,6 GHz (E). Ciągłe obciążenie wielowątkowe (pętla wielordzeniowa Cinebench R15) powoduje, że częstotliwość taktowania spada od czwartego do piątego uruchomienia. Następnie utrzymywany jest w miarę stały poziom. Tryb Performance zapewnia stale wyższe wartości.
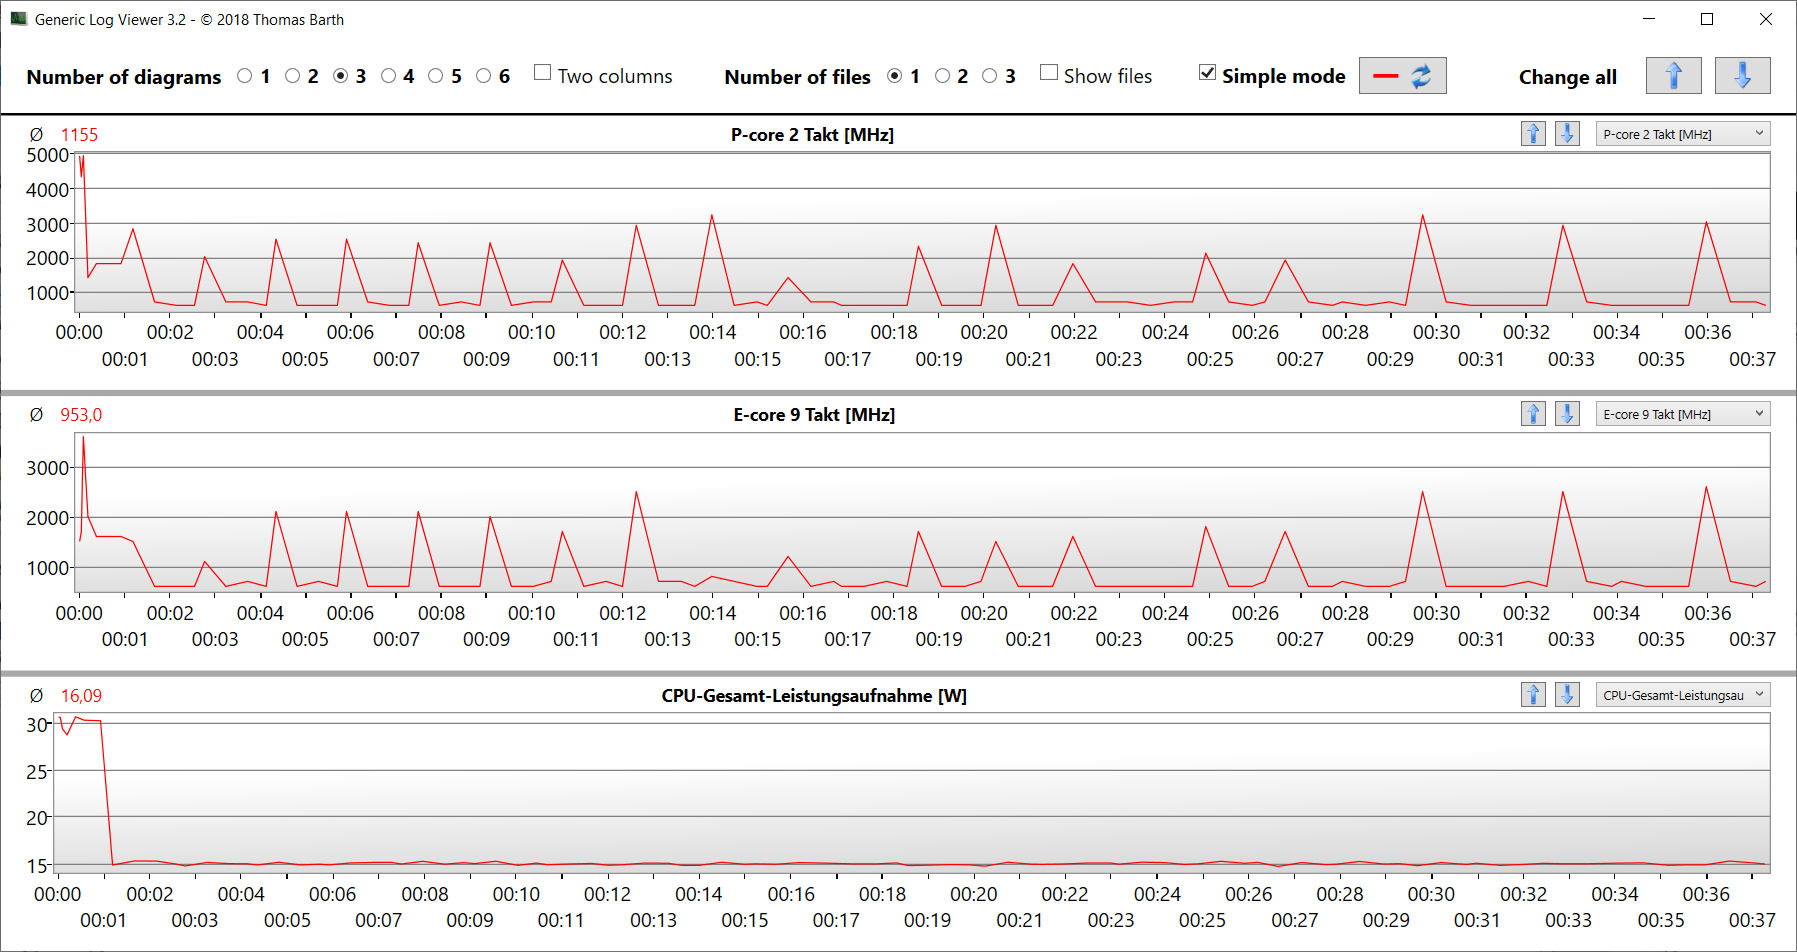
Wartości benchmarków są nieco niższe od średniej CPU, ale tryb Performance skutkuje niewielkimi przyrostami. W trybie baterii bardziej istotna wydajność jednowątkowa w Cinebench R15 spada w mniejszym stopniu (168 punktów) niż wydajność wielowątkowa (1225 punktów).
Cinebench R15 Multi-core loop test
| LibreOffice - 20 Documents To PDF | |
| Dell G16, i7-13650HX, RTX 4060 (6.3.4.2) | |
| Średnia w klasie Gaming (33.2 - 88.8, n=106, ostatnie 2 lata) | |
| Przeciętny Intel Core i7-13650HX (38.9 - 58.8, n=5) | |
| Lenovo Legion 5 16IRX G9 (6.3.4.2) | |
| Asus TUF Gaming A16 FA617XS | |
| Gigabyte G6X 9KG (2024) (6.3.4.2) | |
| MSI Raider GE68HX 13VF | |
* ... im mniej tym lepiej
AIDA64: FP32 Ray-Trace | FPU Julia | CPU SHA3 | CPU Queen | FPU SinJulia | FPU Mandel | CPU AES | CPU ZLib | FP64 Ray-Trace | CPU PhotoWorxx
| Performance rating | |
| MSI Raider GE68HX 13VF | |
| Średnia w klasie Gaming | |
| Asus TUF Gaming A16 FA617XS | |
| Lenovo Legion 5 16IRX G9 | |
| Dell G16, i7-13650HX, RTX 4060 | |
| Przeciętny Intel Core i7-13650HX | |
| Gigabyte G6X 9KG (2024) | |
| AIDA64 / FP32 Ray-Trace | |
| Średnia w klasie Gaming (10227 - 85542, n=106, ostatnie 2 lata) | |
| Asus TUF Gaming A16 FA617XS (v6.75.6100) | |
| MSI Raider GE68HX 13VF (v6.85.6300) | |
| Lenovo Legion 5 16IRX G9 (v6.92.6600) | |
| Dell G16, i7-13650HX, RTX 4060 (v6.92.6600) | |
| Przeciętny Intel Core i7-13650HX (13404 - 20012, n=5) | |
| Gigabyte G6X 9KG (2024) (v6.92.6600) | |
| AIDA64 / FPU Julia | |
| Średnia w klasie Gaming (51376 - 372155, n=106, ostatnie 2 lata) | |
| MSI Raider GE68HX 13VF (v6.85.6300) | |
| Asus TUF Gaming A16 FA617XS (v6.75.6100) | |
| Lenovo Legion 5 16IRX G9 (v6.92.6600) | |
| Dell G16, i7-13650HX, RTX 4060 (v6.92.6600) | |
| Przeciętny Intel Core i7-13650HX (68241 - 97317, n=5) | |
| Gigabyte G6X 9KG (2024) (v6.92.6600) | |
| AIDA64 / CPU SHA3 | |
| MSI Raider GE68HX 13VF (v6.85.6300) | |
| Średnia w klasie Gaming (2180 - 10115, n=106, ostatnie 2 lata) | |
| Asus TUF Gaming A16 FA617XS (v6.75.6100) | |
| Dell G16, i7-13650HX, RTX 4060 (v6.92.6600) | |
| Lenovo Legion 5 16IRX G9 (v6.92.6600) | |
| Przeciętny Intel Core i7-13650HX (3127 - 4487, n=5) | |
| Gigabyte G6X 9KG (2024) (v6.92.6600) | |
| AIDA64 / CPU Queen | |
| MSI Raider GE68HX 13VF (v6.85.6300) | |
| Asus TUF Gaming A16 FA617XS (v6.75.6100) | |
| Średnia w klasie Gaming (49785 - 173351, n=90, ostatnie 2 lata) | |
| Gigabyte G6X 9KG (2024) (v6.92.6600) | |
| Przeciętny Intel Core i7-13650HX (108627 - 110589, n=5) | |
| Dell G16, i7-13650HX, RTX 4060 (v6.92.6600) | |
| Lenovo Legion 5 16IRX G9 (v6.92.6600) | |
| AIDA64 / FPU SinJulia | |
| MSI Raider GE68HX 13VF (v6.85.6300) | |
| Asus TUF Gaming A16 FA617XS (v6.75.6100) | |
| Średnia w klasie Gaming (4424 - 33636, n=106, ostatnie 2 lata) | |
| Lenovo Legion 5 16IRX G9 (v6.92.6600) | |
| Dell G16, i7-13650HX, RTX 4060 (v6.92.6600) | |
| Przeciętny Intel Core i7-13650HX (9134 - 10887, n=5) | |
| Gigabyte G6X 9KG (2024) (v6.92.6600) | |
| AIDA64 / FPU Mandel | |
| Średnia w klasie Gaming (25115 - 196829, n=106, ostatnie 2 lata) | |
| MSI Raider GE68HX 13VF (v6.85.6300) | |
| Asus TUF Gaming A16 FA617XS (v6.75.6100) | |
| Lenovo Legion 5 16IRX G9 (v6.92.6600) | |
| Dell G16, i7-13650HX, RTX 4060 (v6.92.6600) | |
| Przeciętny Intel Core i7-13650HX (33391 - 48323, n=5) | |
| Gigabyte G6X 9KG (2024) (v6.92.6600) | |
| AIDA64 / CPU AES | |
| MSI Raider GE68HX 13VF (v6.85.6300) | |
| Średnia w klasie Gaming (39258 - 247074, n=106, ostatnie 2 lata) | |
| Lenovo Legion 5 16IRX G9 (v6.92.6600) | |
| Asus TUF Gaming A16 FA617XS (v6.75.6100) | |
| Dell G16, i7-13650HX, RTX 4060 (v6.92.6600) | |
| Przeciętny Intel Core i7-13650HX (64436 - 85343, n=5) | |
| Gigabyte G6X 9KG (2024) (v6.92.6600) | |
| AIDA64 / CPU ZLib | |
| MSI Raider GE68HX 13VF (v6.85.6300) | |
| Średnia w klasie Gaming (574 - 2531, n=106, ostatnie 2 lata) | |
| Lenovo Legion 5 16IRX G9 (v6.92.6600) | |
| Dell G16, i7-13650HX, RTX 4060 (v6.92.6600) | |
| Przeciętny Intel Core i7-13650HX (1136 - 1285, n=5) | |
| Gigabyte G6X 9KG (2024) (v6.92.6600) | |
| Asus TUF Gaming A16 FA617XS (v6.75.6100) | |
| AIDA64 / FP64 Ray-Trace | |
| Średnia w klasie Gaming (5509 - 45446, n=106, ostatnie 2 lata) | |
| Asus TUF Gaming A16 FA617XS (v6.75.6100) | |
| MSI Raider GE68HX 13VF (v6.85.6300) | |
| Dell G16, i7-13650HX, RTX 4060 (v6.92.6600) | |
| Lenovo Legion 5 16IRX G9 (v6.92.6600) | |
| Przeciętny Intel Core i7-13650HX (7270 - 10900, n=5) | |
| Gigabyte G6X 9KG (2024) (v6.92.6600) | |
| AIDA64 / CPU PhotoWorxx | |
| MSI Raider GE68HX 13VF (v6.85.6300) | |
| Średnia w klasie Gaming (12271 - 89891, n=106, ostatnie 2 lata) | |
| Przeciętny Intel Core i7-13650HX (36170 - 43289, n=5) | |
| Gigabyte G6X 9KG (2024) (v6.92.6600) | |
| Dell G16, i7-13650HX, RTX 4060 (v6.92.6600) | |
| Lenovo Legion 5 16IRX G9 (v6.92.6600) | |
| Asus TUF Gaming A16 FA617XS (v6.75.6100) | |
Wydajność systemu
Gigabyte G6X działa płynnie i nie brakuje mu mocy obliczeniowej. Notebook bez problemu radzi sobie z grami, streamowaniem i renderowaniem.
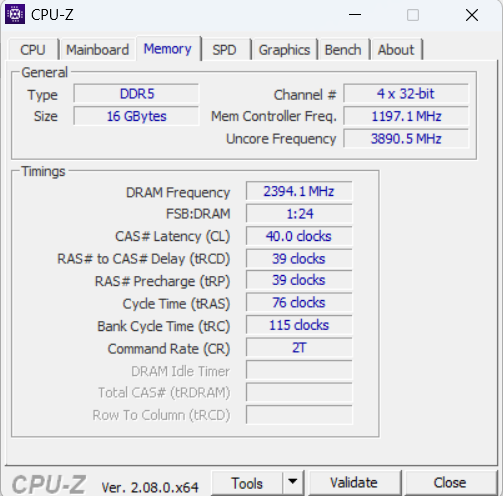
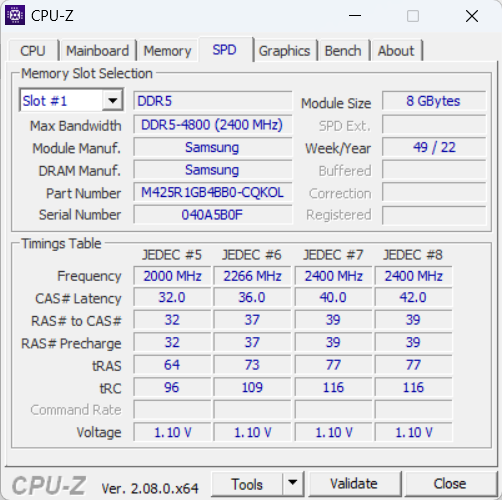
Prędkości transferu pamięci RAM są na normalnym poziomie dla pamięci DDR5-4800 RAM.
CrossMark: Overall | Productivity | Creativity | Responsiveness
WebXPRT 3: Overall
WebXPRT 4: Overall
Mozilla Kraken 1.1: Total
| PCMark 10 / Score | |
| Średnia w klasie Gaming (5828 - 12414, n=94, ostatnie 2 lata) | |
| MSI Raider GE68HX 13VF | |
| Asus TUF Gaming A16 FA617XS | |
| Lenovo Legion 5 16IRX G9 | |
| Gigabyte G6X 9KG (2024) | |
| Dell G16, i7-13650HX, RTX 4060 | |
| Przeciętny Intel Core i7-13650HX, NVIDIA GeForce RTX 4060 Laptop GPU (6984 - 7613, n=3) | |
| PCMark 10 / Essentials | |
| MSI Raider GE68HX 13VF | |
| Asus TUF Gaming A16 FA617XS | |
| Lenovo Legion 5 16IRX G9 | |
| Średnia w klasie Gaming (8810 - 11935, n=98, ostatnie 2 lata) | |
| Przeciętny Intel Core i7-13650HX, NVIDIA GeForce RTX 4060 Laptop GPU (9532 - 11151, n=3) | |
| Gigabyte G6X 9KG (2024) | |
| Dell G16, i7-13650HX, RTX 4060 | |
| PCMark 10 / Productivity | |
| Średnia w klasie Gaming (6845 - 25323, n=96, ostatnie 2 lata) | |
| Asus TUF Gaming A16 FA617XS | |
| Gigabyte G6X 9KG (2024) | |
| Przeciętny Intel Core i7-13650HX, NVIDIA GeForce RTX 4060 Laptop GPU (9961 - 10204, n=3) | |
| Dell G16, i7-13650HX, RTX 4060 | |
| MSI Raider GE68HX 13VF | |
| Lenovo Legion 5 16IRX G9 | |
| PCMark 10 / Digital Content Creation | |
| Średnia w klasie Gaming (7602 - 19954, n=96, ostatnie 2 lata) | |
| MSI Raider GE68HX 13VF | |
| Lenovo Legion 5 16IRX G9 | |
| Asus TUF Gaming A16 FA617XS | |
| Dell G16, i7-13650HX, RTX 4060 | |
| Gigabyte G6X 9KG (2024) | |
| Przeciętny Intel Core i7-13650HX, NVIDIA GeForce RTX 4060 Laptop GPU (8323 - 11686, n=3) | |
| CrossMark / Overall | |
| Lenovo Legion 5 16IRX G9 | |
| Średnia w klasie Gaming (1366 - 2409, n=95, ostatnie 2 lata) | |
| MSI Raider GE68HX 13VF | |
| Gigabyte G6X 9KG (2024) | |
| Przeciętny Intel Core i7-13650HX, NVIDIA GeForce RTX 4060 Laptop GPU (1839 - 1951, n=3) | |
| Dell G16, i7-13650HX, RTX 4060 | |
| Asus TUF Gaming A16 FA617XS | |
| CrossMark / Productivity | |
| Lenovo Legion 5 16IRX G9 | |
| Gigabyte G6X 9KG (2024) | |
| Średnia w klasie Gaming (1386 - 2254, n=95, ostatnie 2 lata) | |
| MSI Raider GE68HX 13VF | |
| Przeciętny Intel Core i7-13650HX, NVIDIA GeForce RTX 4060 Laptop GPU (1730 - 1864, n=3) | |
| Dell G16, i7-13650HX, RTX 4060 | |
| Asus TUF Gaming A16 FA617XS | |
| CrossMark / Creativity | |
| Lenovo Legion 5 16IRX G9 | |
| MSI Raider GE68HX 13VF | |
| Średnia w klasie Gaming (1343 - 2786, n=95, ostatnie 2 lata) | |
| Gigabyte G6X 9KG (2024) | |
| Przeciętny Intel Core i7-13650HX, NVIDIA GeForce RTX 4060 Laptop GPU (2020 - 2063, n=3) | |
| Dell G16, i7-13650HX, RTX 4060 | |
| Asus TUF Gaming A16 FA617XS | |
| CrossMark / Responsiveness | |
| Gigabyte G6X 9KG (2024) | |
| Lenovo Legion 5 16IRX G9 | |
| Przeciętny Intel Core i7-13650HX, NVIDIA GeForce RTX 4060 Laptop GPU (1544 - 1907, n=3) | |
| Średnia w klasie Gaming (1226 - 2334, n=95, ostatnie 2 lata) | |
| Dell G16, i7-13650HX, RTX 4060 | |
| MSI Raider GE68HX 13VF | |
| Asus TUF Gaming A16 FA617XS | |
| WebXPRT 3 / Overall | |
| MSI Raider GE68HX 13VF | |
| Średnia w klasie Gaming (220 - 532, n=99, ostatnie 2 lata) | |
| Lenovo Legion 5 16IRX G9 | |
| Gigabyte G6X 9KG (2024) | |
| Przeciętny Intel Core i7-13650HX, NVIDIA GeForce RTX 4060 Laptop GPU (268 - 302, n=3) | |
| Dell G16, i7-13650HX, RTX 4060 | |
| WebXPRT 4 / Overall | |
| MSI Raider GE68HX 13VF | |
| Średnia w klasie Gaming (165 - 354, n=99, ostatnie 2 lata) | |
| Lenovo Legion 5 16IRX G9 | |
| Przeciętny Intel Core i7-13650HX, NVIDIA GeForce RTX 4060 Laptop GPU (260 - 276, n=2) | |
| Asus TUF Gaming A16 FA617XS | |
| Gigabyte G6X 9KG (2024) | |
| Mozilla Kraken 1.1 / Total | |
| Gigabyte G6X 9KG (2024) | |
| Przeciętny Intel Core i7-13650HX, NVIDIA GeForce RTX 4060 Laptop GPU (507 - 511, n=3) | |
| Dell G16, i7-13650HX, RTX 4060 | |
| Asus TUF Gaming A16 FA617XS | |
| Lenovo Legion 5 16IRX G9 | |
| Średnia w klasie Gaming (391 - 590, n=101, ostatnie 2 lata) | |
| MSI Raider GE68HX 13VF | |
* ... im mniej tym lepiej
| PCMark 10 Score | 7613 pkt. | |
Pomoc | ||
| AIDA64 / Memory Copy | |
| MSI Raider GE68HX 13VF | |
| Średnia w klasie Gaming (21750 - 129946, n=106, ostatnie 2 lata) | |
| Przeciętny Intel Core i7-13650HX (59266 - 66372, n=5) | |
| Gigabyte G6X 9KG (2024) | |
| Lenovo Legion 5 16IRX G9 | |
| Asus TUF Gaming A16 FA617XS | |
| Dell G16, i7-13650HX, RTX 4060 | |
| AIDA64 / Memory Read | |
| MSI Raider GE68HX 13VF | |
| Średnia w klasie Gaming (22956 - 118858, n=106, ostatnie 2 lata) | |
| Lenovo Legion 5 16IRX G9 | |
| Przeciętny Intel Core i7-13650HX (67305 - 71022, n=5) | |
| Gigabyte G6X 9KG (2024) | |
| Dell G16, i7-13650HX, RTX 4060 | |
| Asus TUF Gaming A16 FA617XS | |
| AIDA64 / Memory Write | |
| MSI Raider GE68HX 13VF | |
| Średnia w klasie Gaming (22297 - 135096, n=106, ostatnie 2 lata) | |
| Asus TUF Gaming A16 FA617XS | |
| Przeciętny Intel Core i7-13650HX (58028 - 68225, n=5) | |
| Gigabyte G6X 9KG (2024) | |
| Dell G16, i7-13650HX, RTX 4060 | |
| Lenovo Legion 5 16IRX G9 | |
| AIDA64 / Memory Latency | |
| Średnia w klasie Gaming (75.3 - 259, n=106, ostatnie 2 lata) | |
| Dell G16, i7-13650HX, RTX 4060 | |
| Asus TUF Gaming A16 FA617XS | |
| Gigabyte G6X 9KG (2024) | |
| Lenovo Legion 5 16IRX G9 | |
| Przeciętny Intel Core i7-13650HX (83.7 - 90.8, n=5) | |
| MSI Raider GE68HX 13VF | |
* ... im mniej tym lepiej
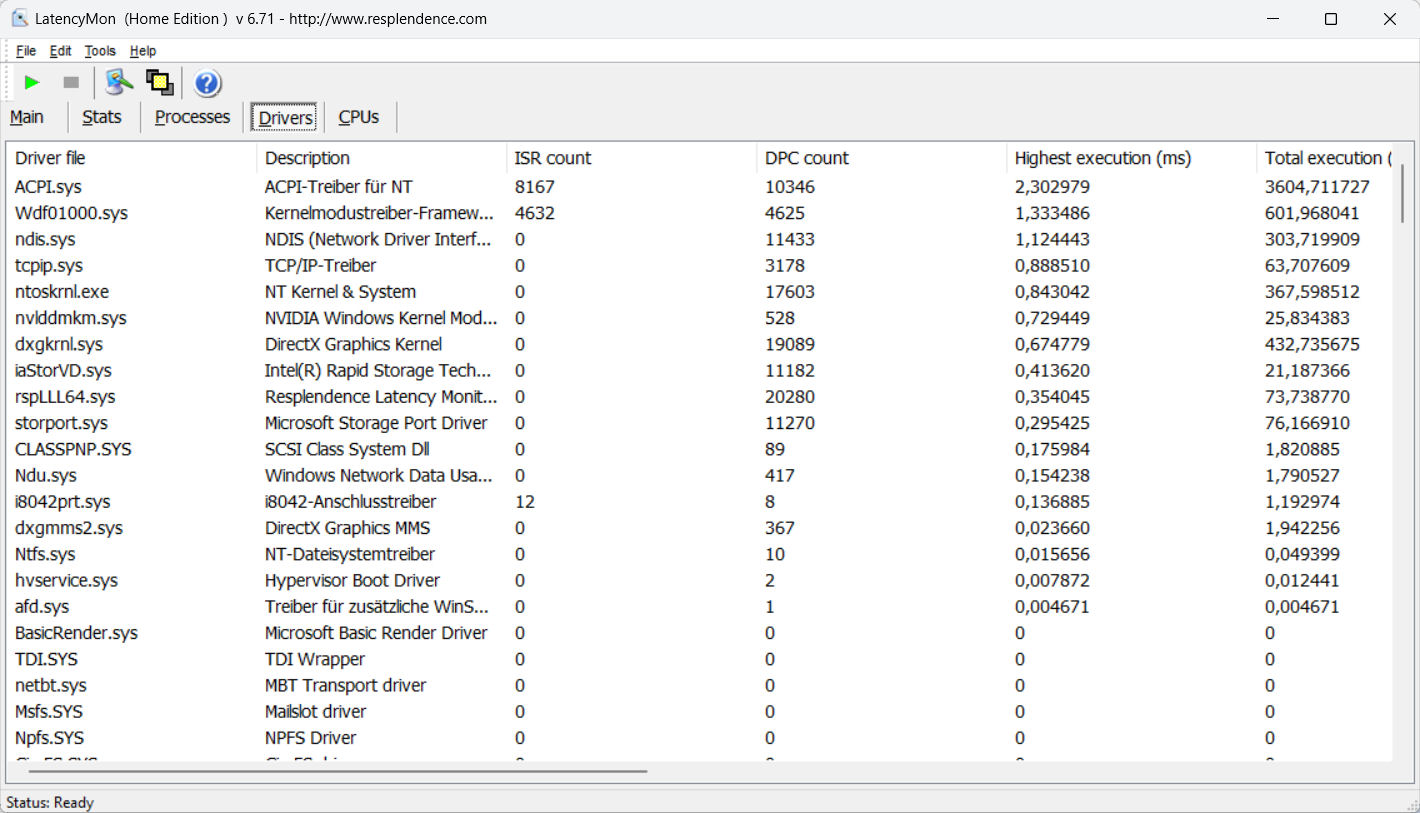
Opóźnienie DPC
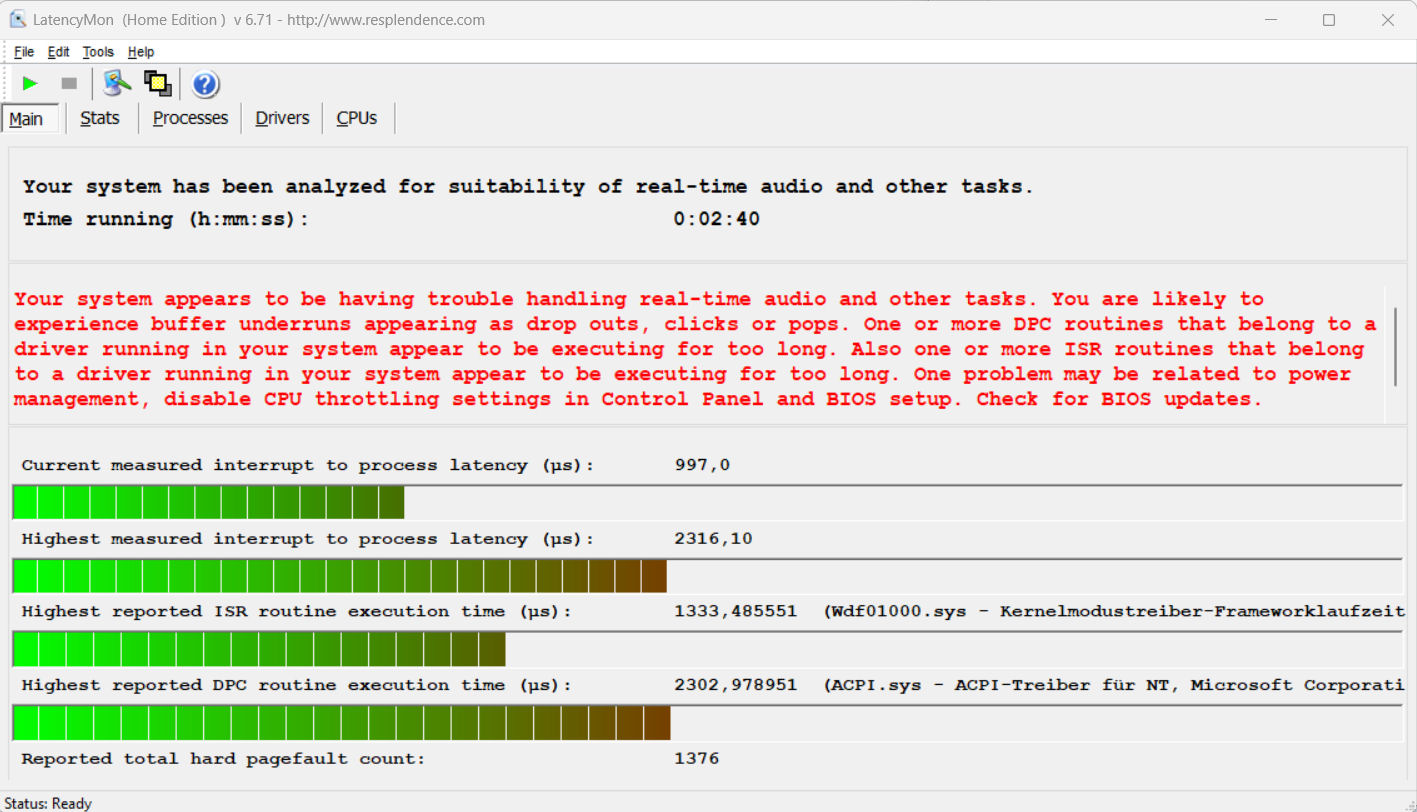
Standardowy test LatencyMon (surfowanie po sieci, odtwarzanie wideo 4k, Prime95 High-Load) ujawnił anomalie. System nie wydaje się być odpowiedni do edycji wideo i audio w czasie rzeczywistym. Przyszłe aktualizacje oprogramowania mogą doprowadzić do poprawy lub nawet pogorszenia wyników.
| DPC Latencies / LatencyMon - interrupt to process latency (max), Web, Youtube, Prime95 | |
| MSI Raider GE68HX 13VF | |
| Gigabyte G6X 9KG (2024) | |
| Lenovo Legion 5 16IRX G9 | |
| Asus TUF Gaming A16 FA617XS | |
| Dell G16, i7-13650HX, RTX 4060 | |
* ... im mniej tym lepiej
Pamięć masowa
G6X może pomieścić łącznie dwa dyski SSD M.2 2280 PCIe Gen 4. RAID nie jest obsługiwany. Dysk Gigabyte SSD o pojemności 1 TB w naszym urządzeniu testowym zapewnia bardzo dobre prędkości przesyłu danych.
Nie zaobserwowaliśmy żadnych problemów z dławieniem termicznym, co jest dobrą rzeczą.

* ... im mniej tym lepiej
Disk Throttling: DiskSpd Read Loop, Queue Depth 8
Karta graficzna
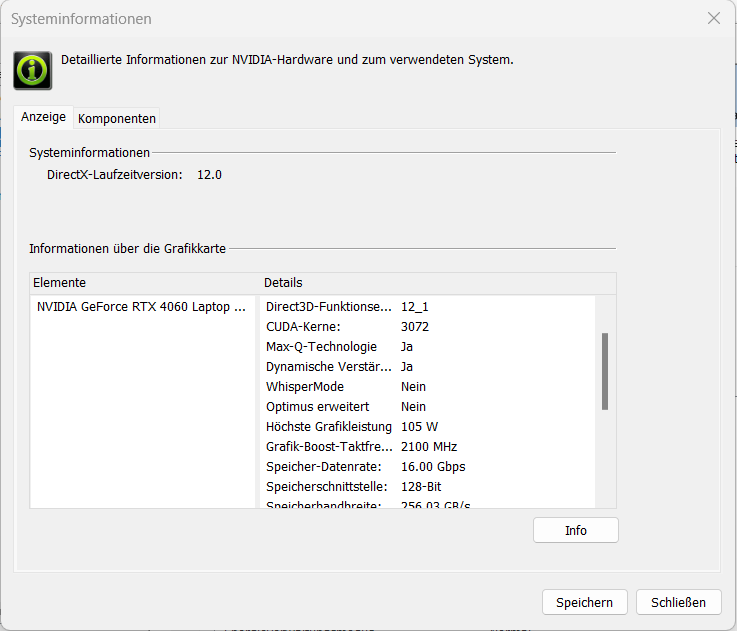
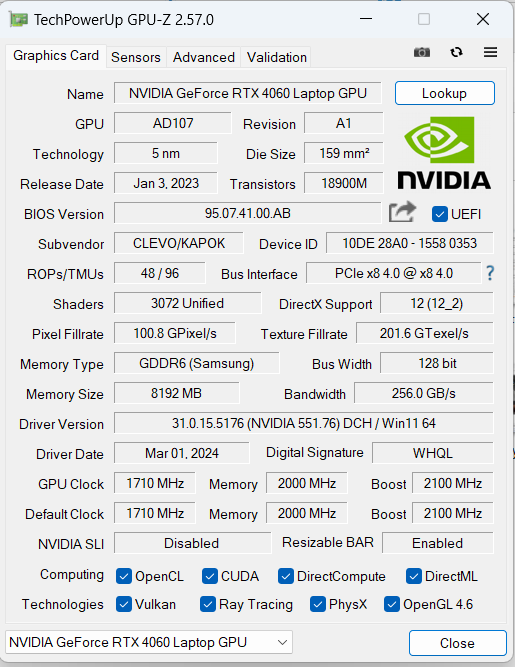
Gigabyte instaluje kartę graficzną 105 W GeForce RTX 4060 Laptop GPU (3424 jednostek cieniujących, 128-bitowa magistrala, 8 GB pamięci GDDR6) w G6X 9KG. RTX 4060 to model średniej klasy z obecnej gamy GPU Nvidii.
Wartości benchmarków i liczba klatek na sekundę są powyżej średniej RTX 4060. Tryb wydajności zapewnia co najwyżej niewielki plus. Przełączanie między trybami dGPU i Optimus wymaga ponownego uruchomienia, ponieważ Advanced Optimus nie jest obsługiwany.
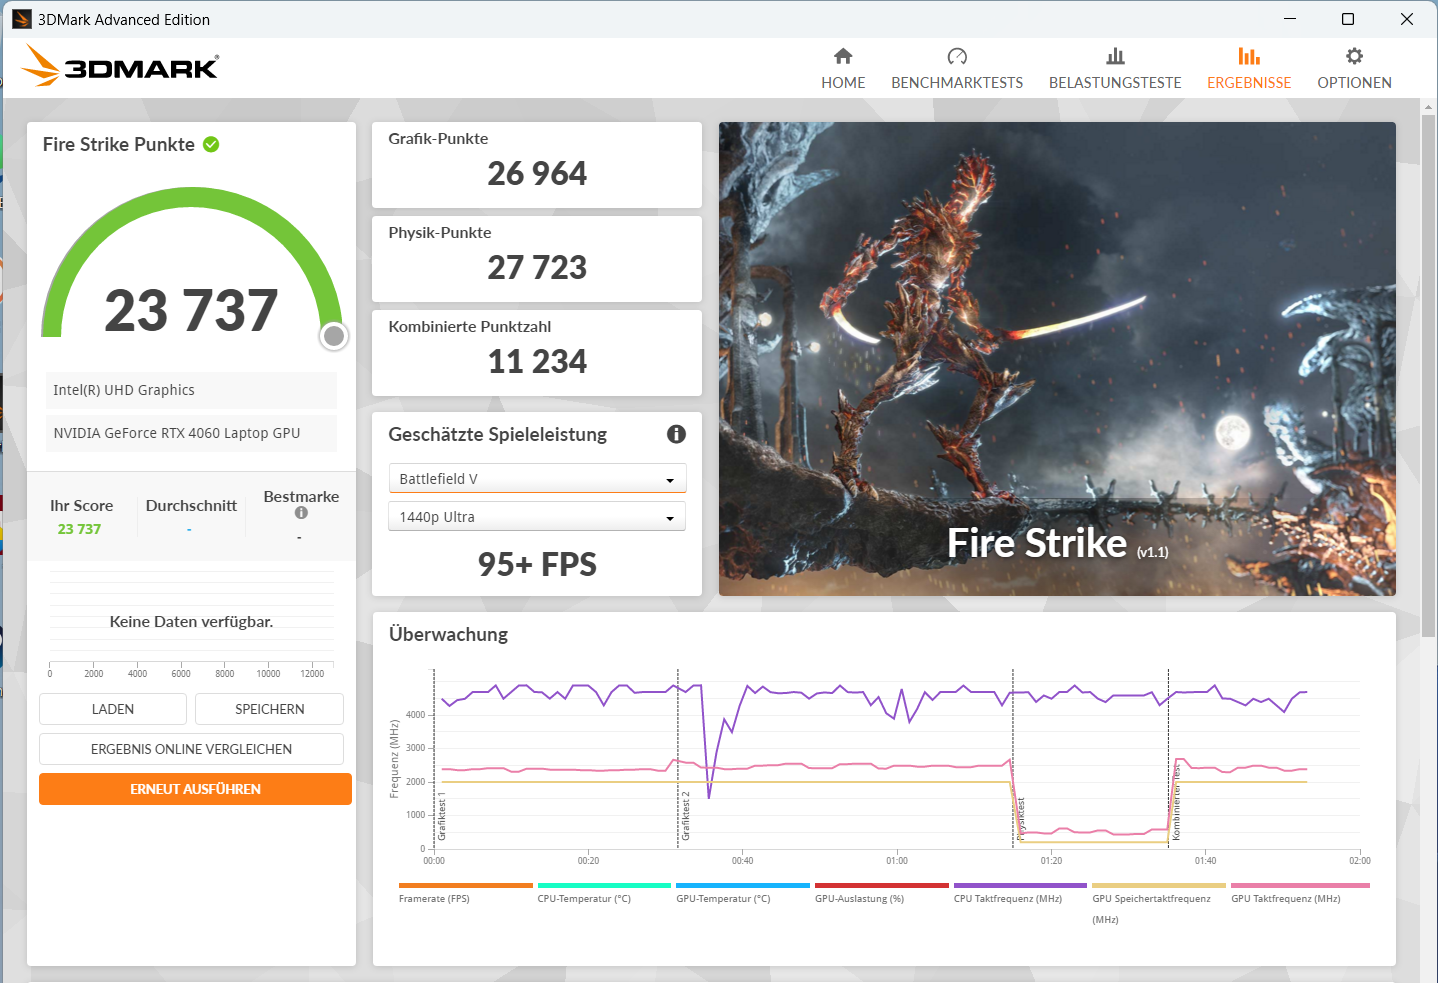
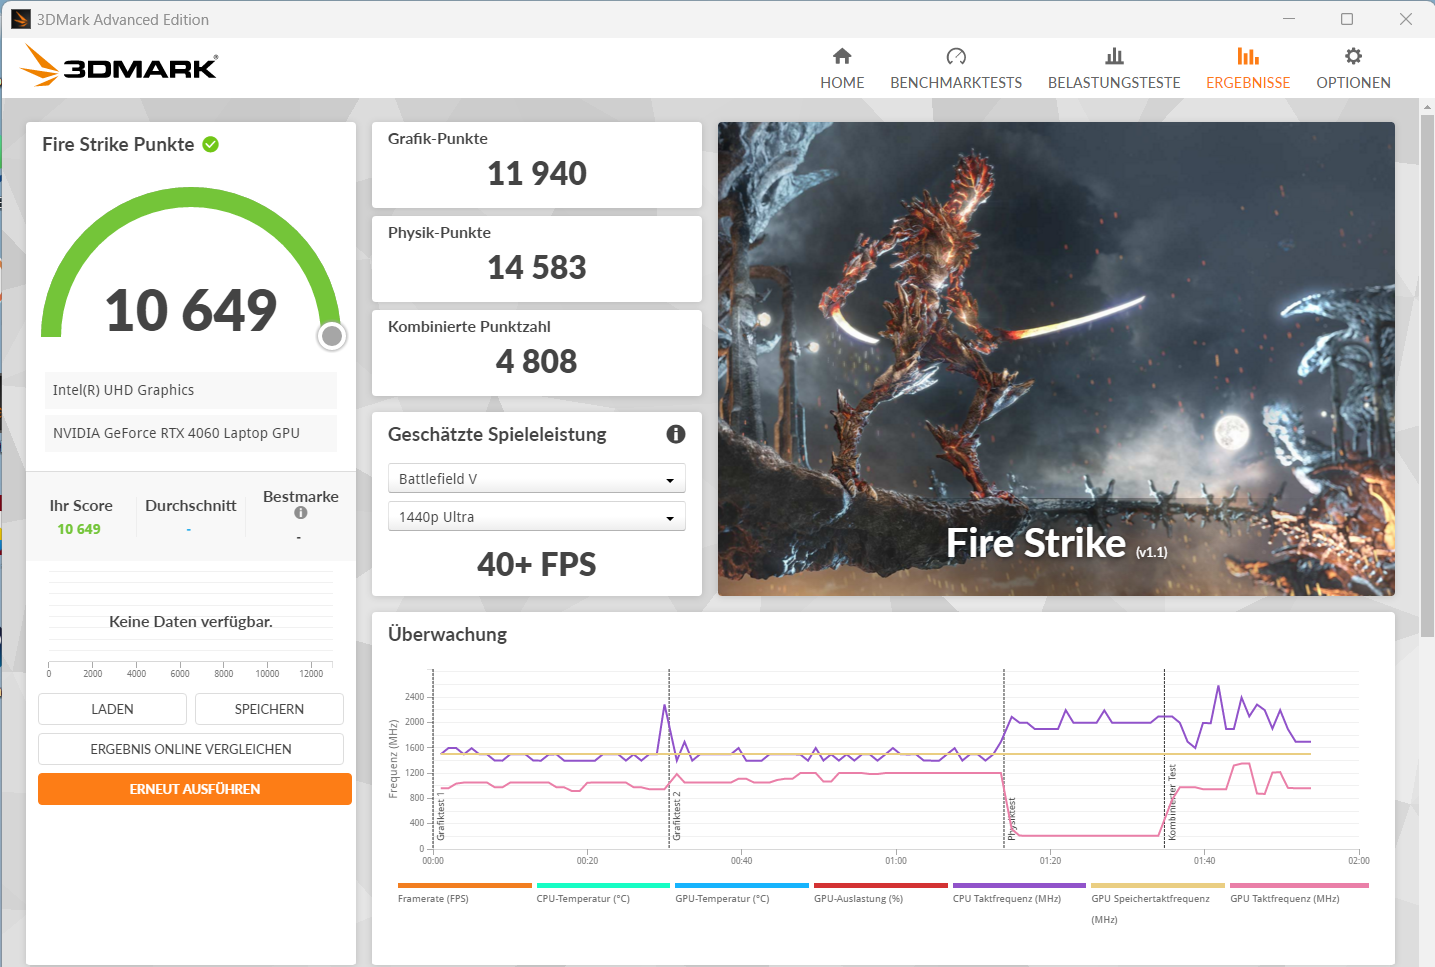
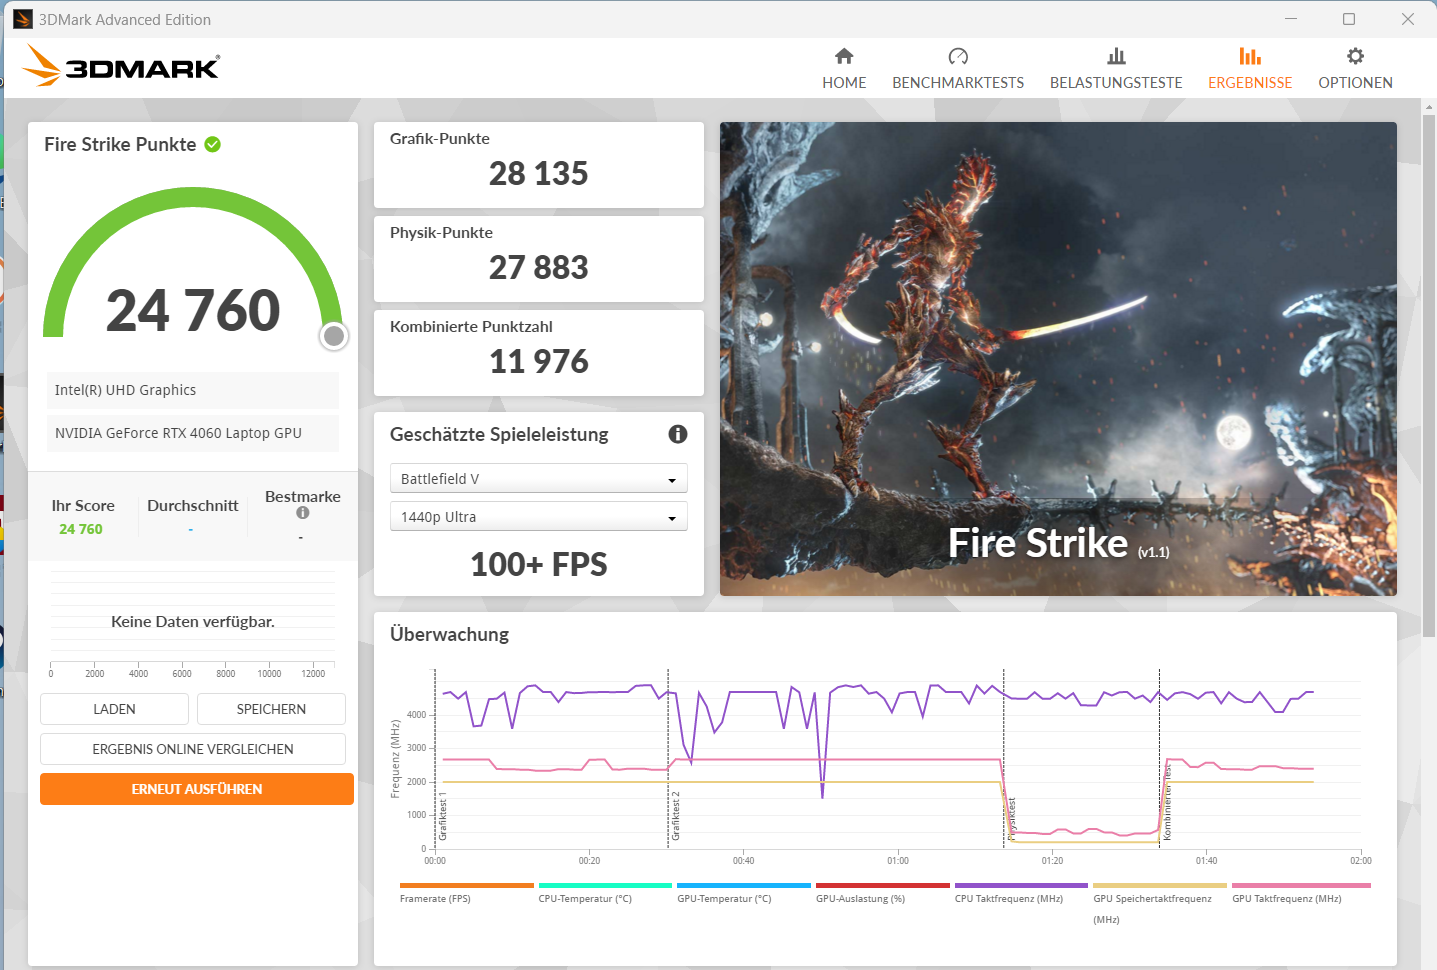
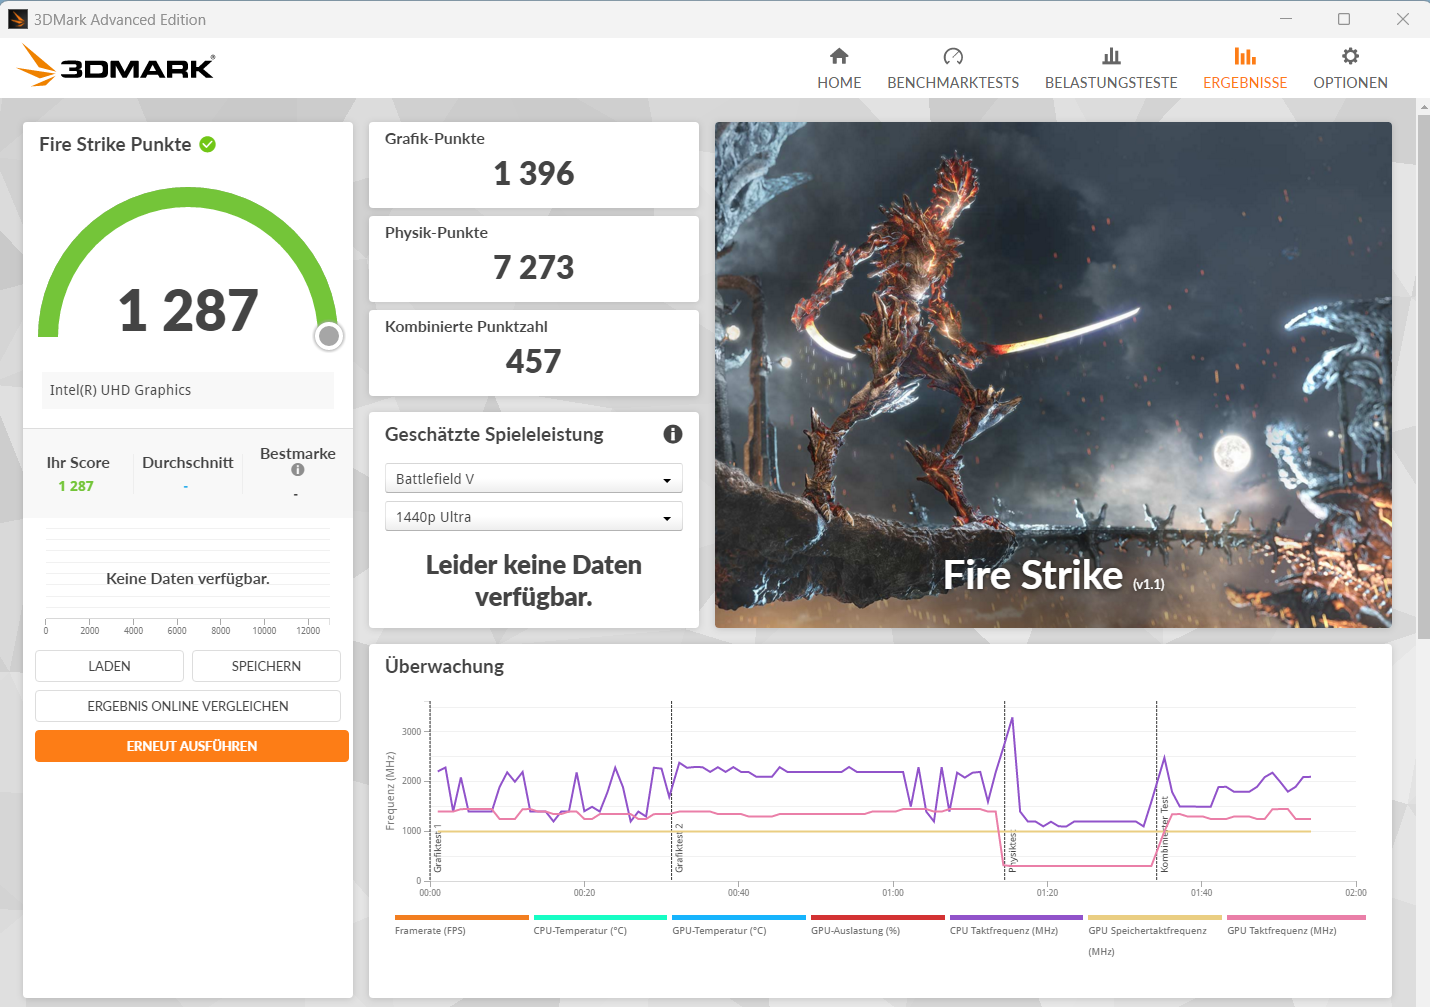
| 3DMark 11 Performance | 30293 pkt. | |
| 3DMark Fire Strike Score | 23737 pkt. | |
| 3DMark Time Spy Score | 10260 pkt. | |
Pomoc | ||
* ... im mniej tym lepiej
| The Witcher 3 - 1920x1080 Ultra Graphics & Postprocessing (HBAO+) | |
| Średnia w klasie Gaming (104.7 - 240, n=7, ostatnie 2 lata) | |
| Dell G16, i7-13650HX, RTX 4060 | |
| MSI Raider GE68HX 13VF | |
| Przeciętny NVIDIA GeForce RTX 4060 Laptop GPU (77 - 159.7, n=42) | |
| Gigabyte G6X 9KG (2024) | |
| Asus TUF Gaming A16 FA617XS (neu) | |
| Lenovo Legion 5 16IRX G9 | |
| Final Fantasy XV Benchmark - 1920x1080 High Quality | |
| Średnia w klasie Gaming (41 - 215, n=95, ostatnie 2 lata) | |
| Lenovo Legion 5 16IRX G9 (1.3) | |
| Dell G16, i7-13650HX, RTX 4060 (1.3) | |
| MSI Raider GE68HX 13VF (1.3) | |
| Gigabyte G6X 9KG (2024) (1.3) | |
| Przeciętny NVIDIA GeForce RTX 4060 Laptop GPU (75.1 - 109.8, n=51) | |
| Asus TUF Gaming A16 FA617XS (1.3) | |
| Strange Brigade - 1920x1080 ultra AA:ultra AF:16 | |
| Średnia w klasie Gaming (76.3 - 458, n=87, ostatnie 2 lata) | |
| Lenovo Legion 5 16IRX G9 | |
| Dell G16, i7-13650HX, RTX 4060 (1.47.22.14 D3D12) | |
| MSI Raider GE68HX 13VF (1.47.22.14 D3D12) | |
| Gigabyte G6X 9KG (2024) (1.47.22.14 D3D12) | |
| Przeciętny NVIDIA GeForce RTX 4060 Laptop GPU (135.3 - 210, n=50) | |
| Asus TUF Gaming A16 FA617XS (1.47.22.14 D3D12) | |
| Cyberpunk 2077 | |
| 1920x1080 Ultra Preset (FSR off) | |
| Średnia w klasie Gaming (17.7 - 169.9, n=116, ostatnie 2 lata) | |
| Lenovo Legion 5 16IRX G9 | |
| Przeciętny NVIDIA GeForce RTX 4060 Laptop GPU (56.4 - 93.1, n=31) | |
| Dell G16, i7-13650HX, RTX 4060 | |
| Gigabyte G6X 9KG (2024) | |
| 1920x1080 Ray Tracing Ultra Preset (DLSS off) | |
| Średnia w klasie Gaming (19.1 - 84.9, n=36, ostatnie 2 lata) | |
| Przeciętny NVIDIA GeForce RTX 4060 Laptop GPU (23.6 - 37.4, n=21) | |
| Gigabyte G6X 9KG (2024) | |
| 1920x1080 Ultra Preset (FSR2 on) | |
| Średnia w klasie Gaming (58 - 173.1, n=7, ostatnie 2 lata) | |
| Gigabyte G6X 9KG (2024) | |
| Przeciętny NVIDIA GeForce RTX 4060 Laptop GPU (68.5 - 92.4, n=4) | |
| Skull & Bones - 1920x1080 Ultra High Preset AA:T | |
| Gigabyte G6X 9KG (2024) | |
| Przeciętny NVIDIA GeForce RTX 4060 Laptop GPU (65 - 73, n=5) | |
| Last Epoch - 1920x1080 Ultra Preset AA:T | |
| Gigabyte G6X 9KG (2024) | |
| Przeciętny NVIDIA GeForce RTX 4060 Laptop GPU (120.4 - 122.8, n=2) | |
| Średnia w klasie Gaming (n=1ostatnie 2 lata) | |
| Helldivers 2 - 1920x1080 Ultra Preset | |
| Średnia w klasie Gaming (18.4 - 153.8, n=5, ostatnie 2 lata) | |
| Gigabyte G6X 9KG (2024) | |
| Przeciętny NVIDIA GeForce RTX 4060 Laptop GPU (82.3 - 85.6, n=2) | |
| Ready or Not - 1920x1080 Epic Preset | |
| Przeciętny NVIDIA GeForce RTX 4060 Laptop GPU (131.5 - 133.7, n=2) | |
| Gigabyte G6X 9KG (2024) | |
The Witcher 3 FPS chart
| low | med. | high | ultra | |
|---|---|---|---|---|
| GTA V (2015) | 183.6 | 180.4 | 174.6 | 115.2 |
| The Witcher 3 (2015) | 400.9 | 306.6 | 186.5 | 100 |
| Dota 2 Reborn (2015) | 183.7 | 164.4 | 157.6 | 142.4 |
| Final Fantasy XV Benchmark (2018) | 186.5 | 139.3 | 101.5 | |
| X-Plane 11.11 (2018) | 155.1 | 132.7 | 107.1 | |
| Strange Brigade (2018) | 473 | 263 | 209 | 182.2 |
| Cyberpunk 2077 (2023) | 118.3 | 94.8 | 81.1 | 69.7 |
| Ready or Not (2023) | 218 | 152.4 | 147.6 | 131.5 |
| Helldivers 2 (2024) | 123.9 | 97.6 | 88.5 | 85.6 |
| Skull & Bones (2024) | 125 | 111 | 97 | 73 |
| Last Epoch (2024) | 195.5 | 184.6 | 164.1 | 122.8 |
Emisje i energia: G6X oferuje dobre czasy pracy
Emisja hałasu
Poziom ciśnienia akustycznego (SPL) wzrasta do 54 dB(A) przy pełnym obciążeniu (tryb rozrywkowy). Poziom SPL może być wyższy w trybie wydajności. Znacznie cichszą pracę można uzyskać w trybie cichym.
Odbywa się to jednak wyraźnie kosztem wydajności, ponieważ dGPU nie działa w ten sposób. Ogólnie rzecz biorąc, tryb Rozrywka jest zalecany do codziennego użytku. Po pełnym obciążeniu hałas pozostaje na umiarkowanym poziomie.
Hałas
| luz |
| 30 / 32 / 35 dB |
| obciążenie |
| 51 / 54 dB |
 | ||
30 dB cichy 40 dB(A) słyszalny 50 dB(A) irytujący |
||
min: | ||
| Gigabyte G6X 9KG (2024) i7-13650HX, GeForce RTX 4060 Laptop GPU | Dell G16, i7-13650HX, RTX 4060 i7-13650HX, GeForce RTX 4060 Laptop GPU | Lenovo Legion 5 16IRX G9 i7-14650HX, GeForce RTX 4060 Laptop GPU | MSI Raider GE68HX 13VF i9-13950HX, GeForce RTX 4060 Laptop GPU | Asus TUF Gaming A16 FA617XS R9 7940HS, Radeon RX 7600S | |
|---|---|---|---|---|---|
| Noise | 21% | 7% | 2% | 11% | |
| wyłączone / środowisko * (dB) | 26 | 23 12% | 24 8% | 23.3 10% | 25 4% |
| Idle Minimum * (dB) | 30 | 23 23% | 24 20% | 25 17% | 25 17% |
| Idle Average * (dB) | 32 | 23 28% | 28.8 10% | 31.3 2% | 26 19% |
| Idle Maximum * (dB) | 35 | 27.96 20% | 32 9% | 37.5 -7% | 28 20% |
| Load Average * (dB) | 51 | 27.96 45% | 45.5 11% | 44 14% | 43 16% |
| Witcher 3 ultra * (dB) | 51 | 47.89 6% | 53.1 -4% | 57 -12% | 51 -0% |
| Load Maximum * (dB) | 54 | 47.89 11% | 55.7 -3% | 60.1 -11% | 53 2% |
* ... im mniej tym lepiej
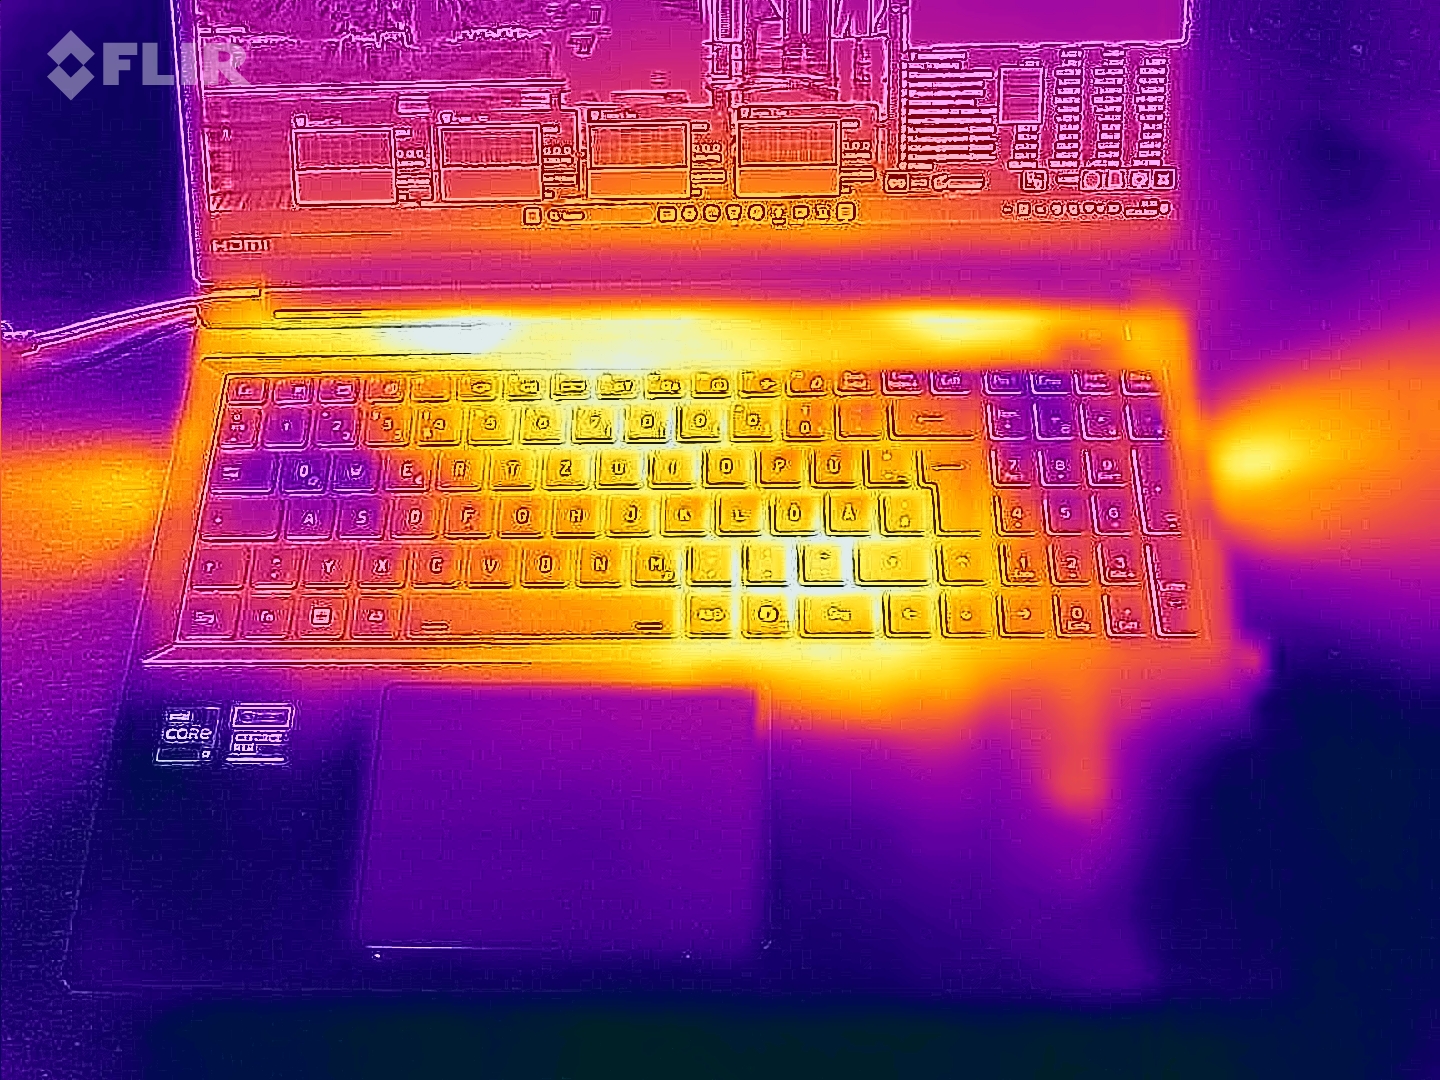
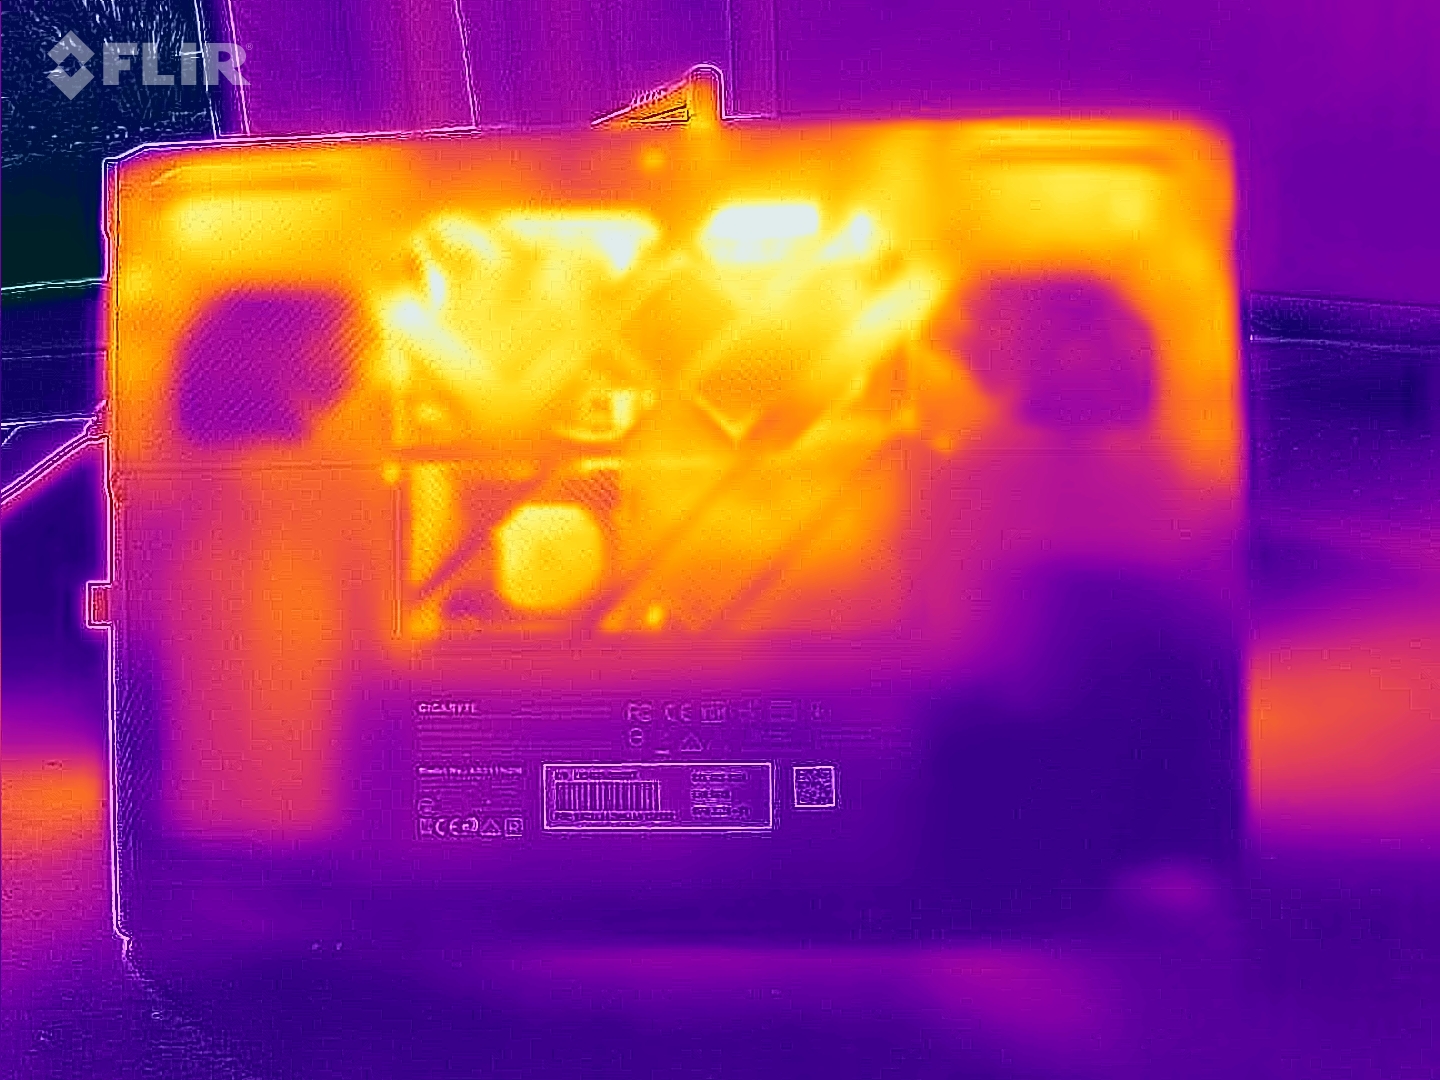
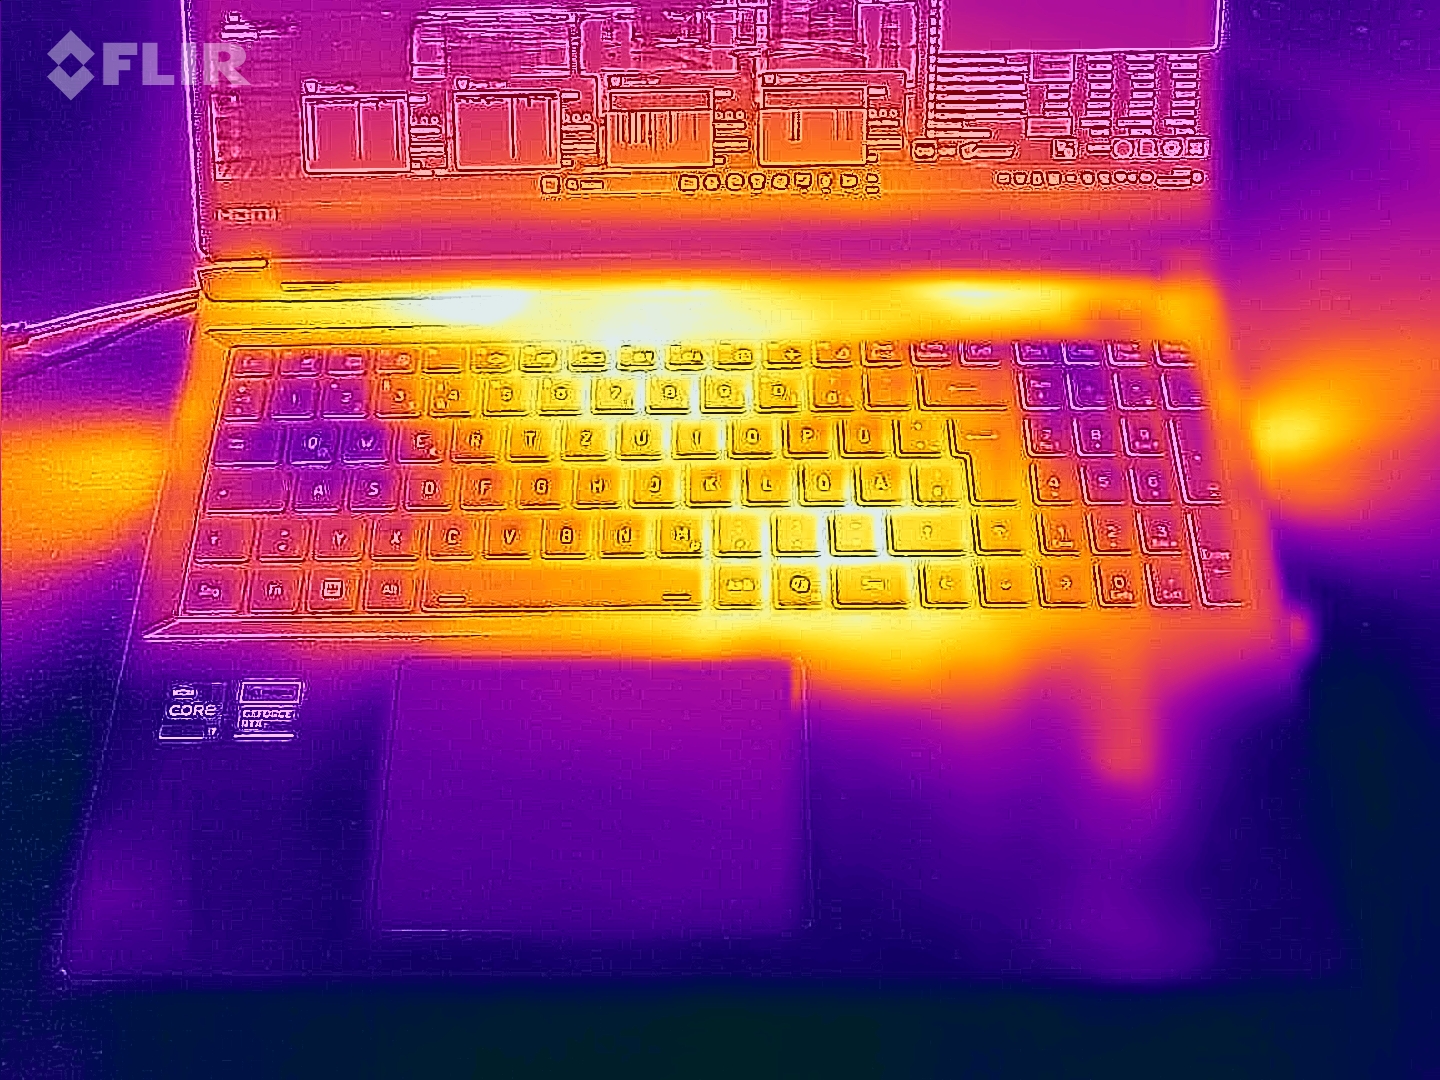
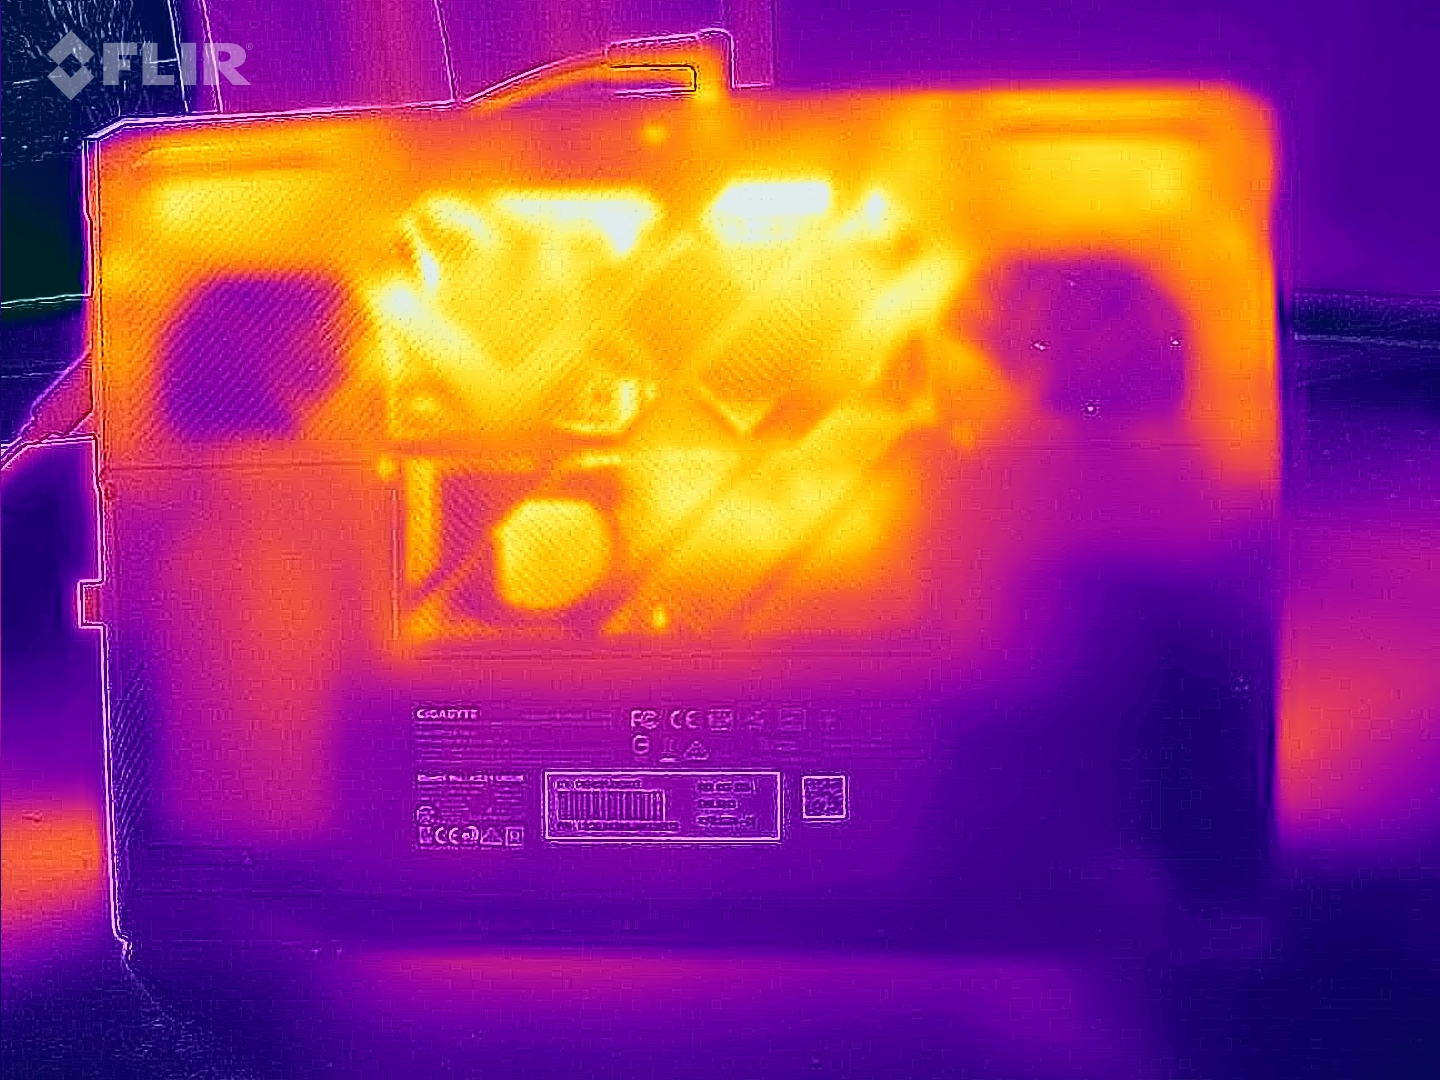
Temperatura
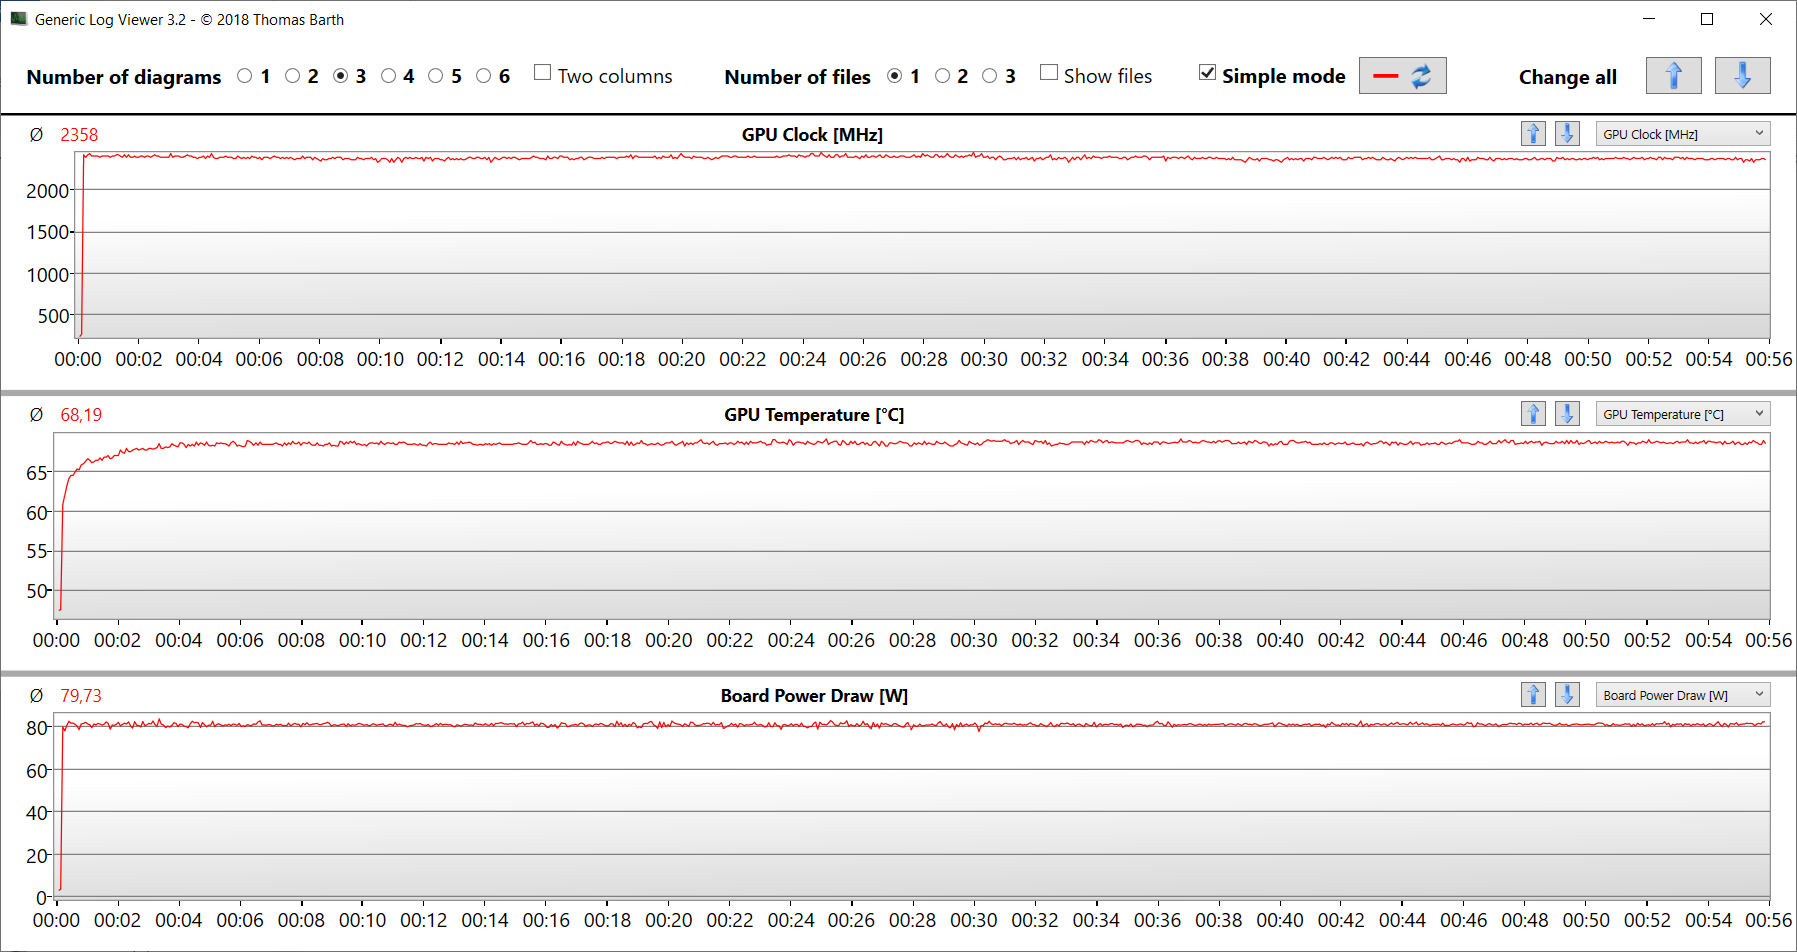
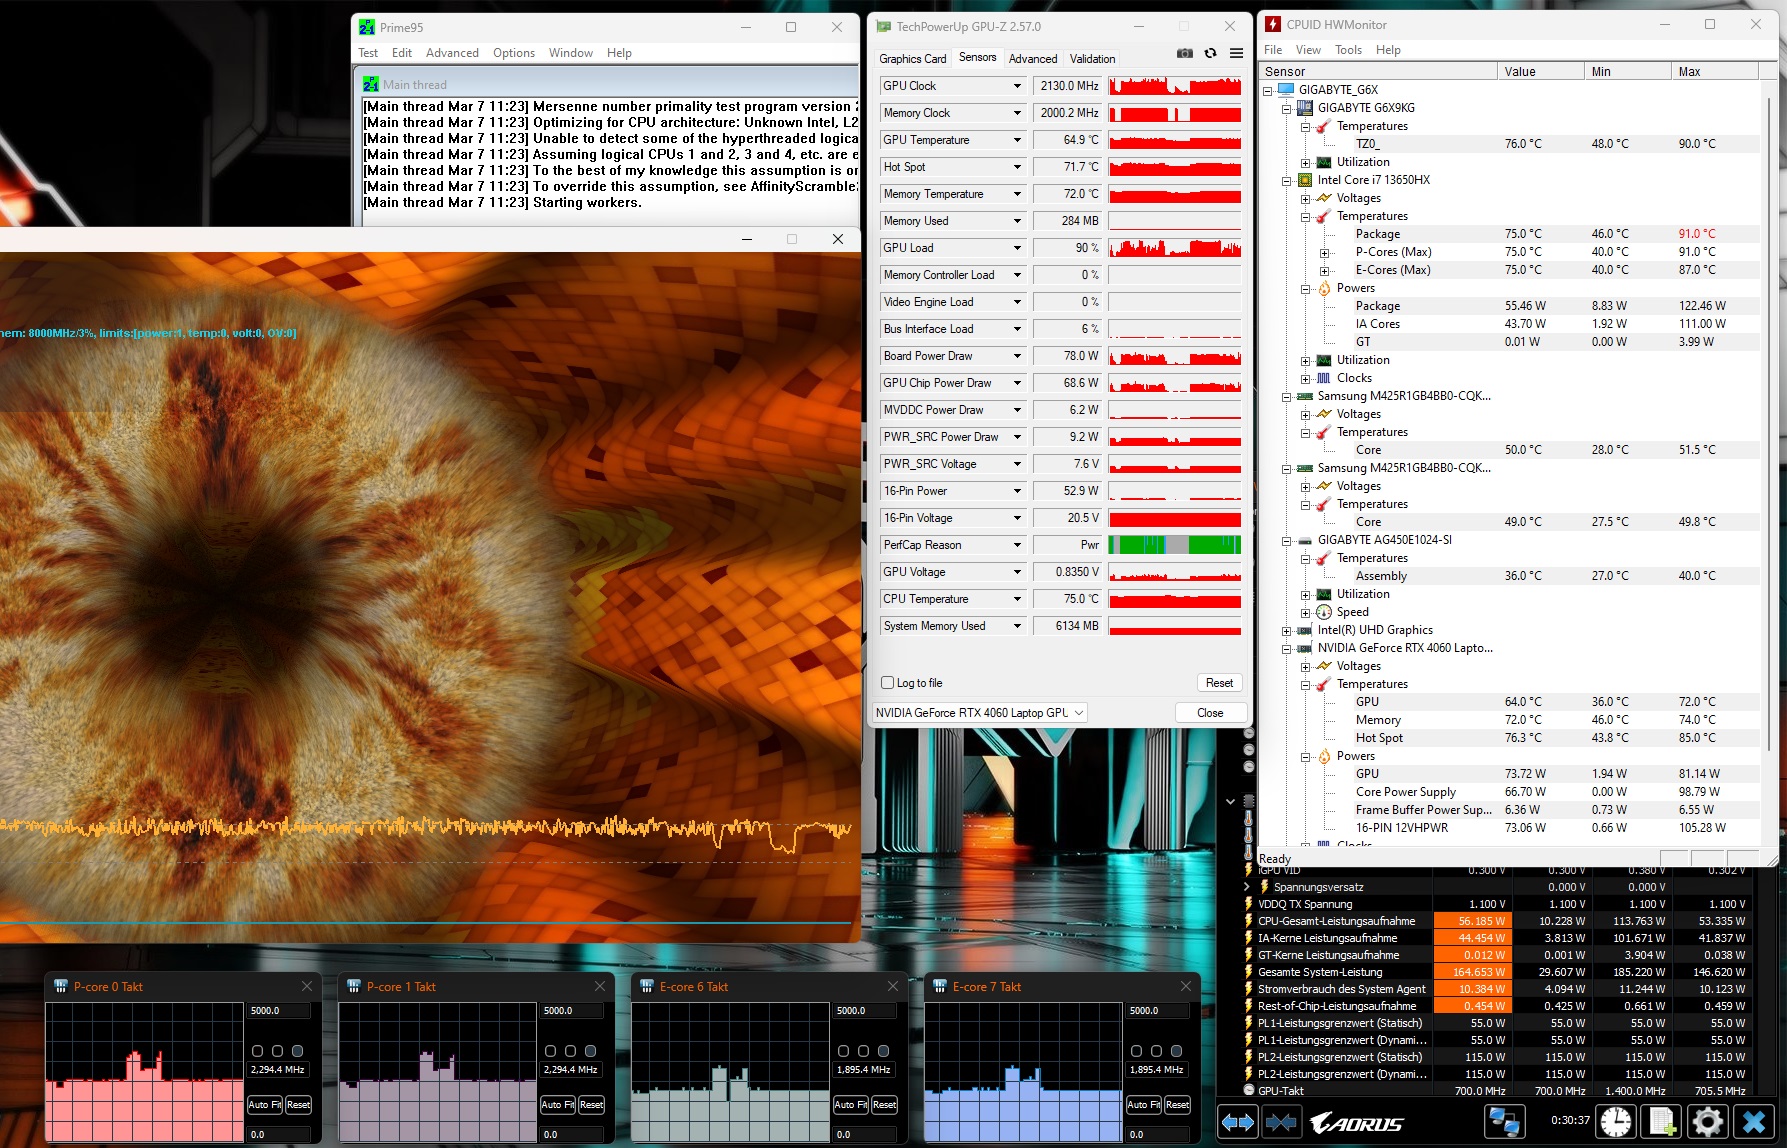
Test obciążeniowy i testy Witcher 3 zapewniają w najlepszym przypadku umiarkowane nagrzewanie się laptopa. Sporadycznie osiągane są wartości w dolnym zakresie 40°C. W codziennym użytkowaniu (Office, przeglądanie Internetu) wartości pozostają w zielonym zakresie.
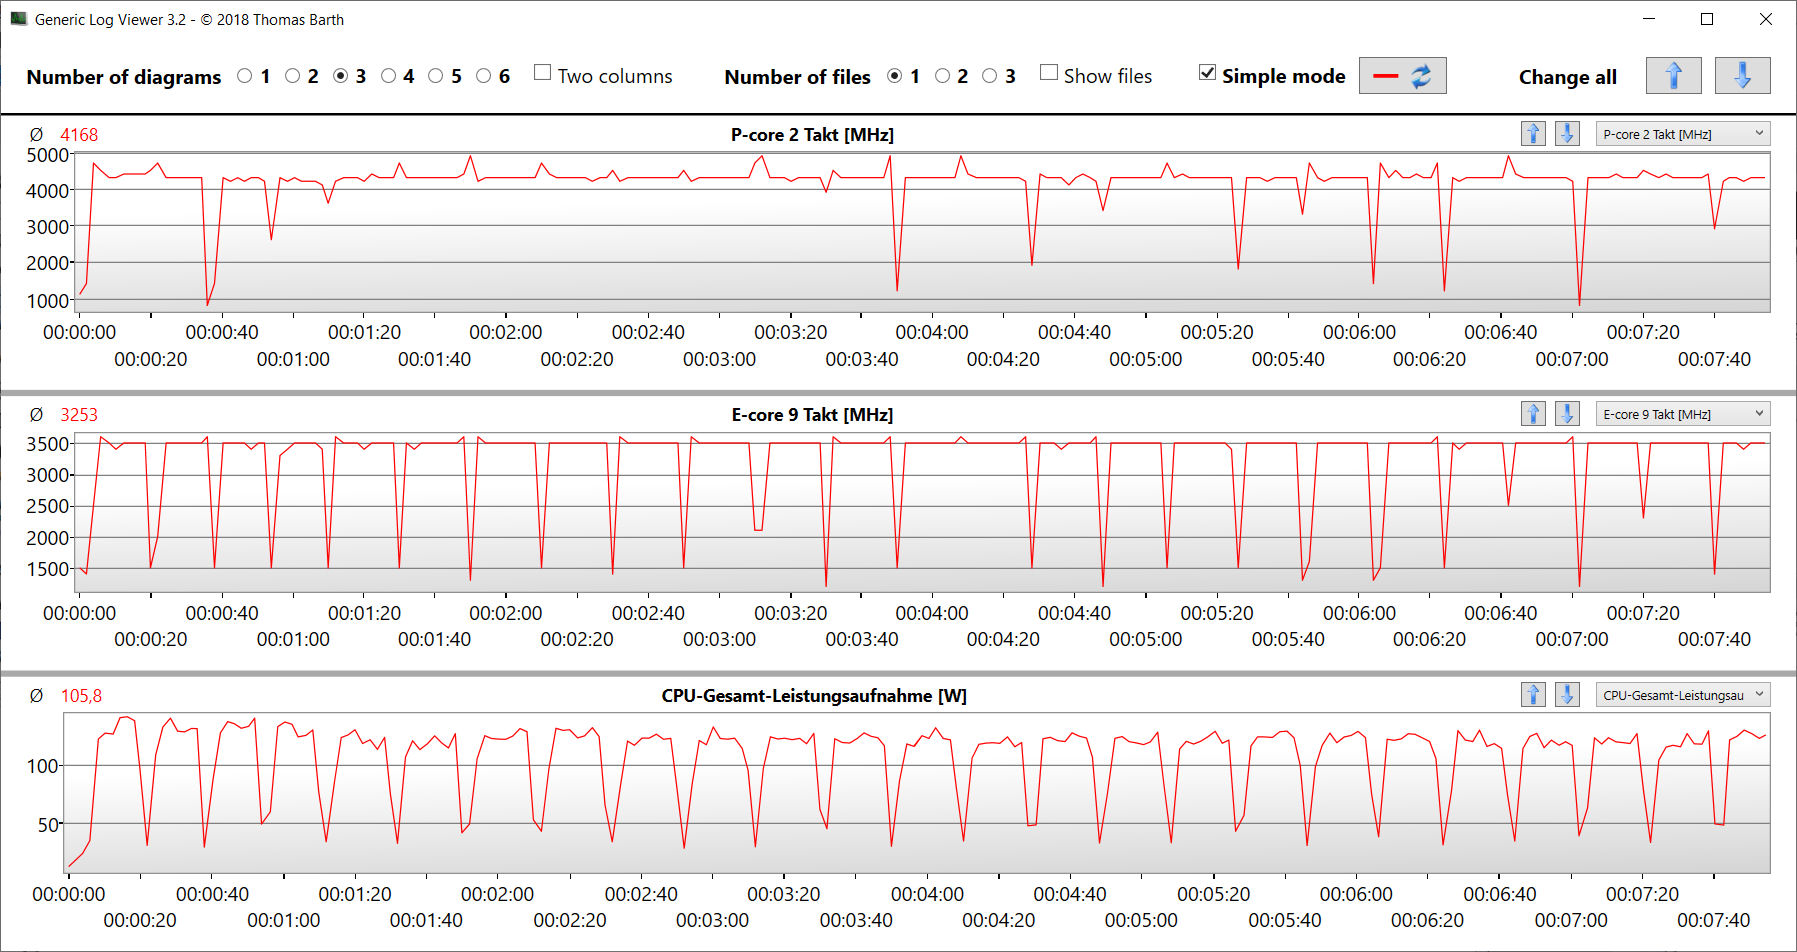
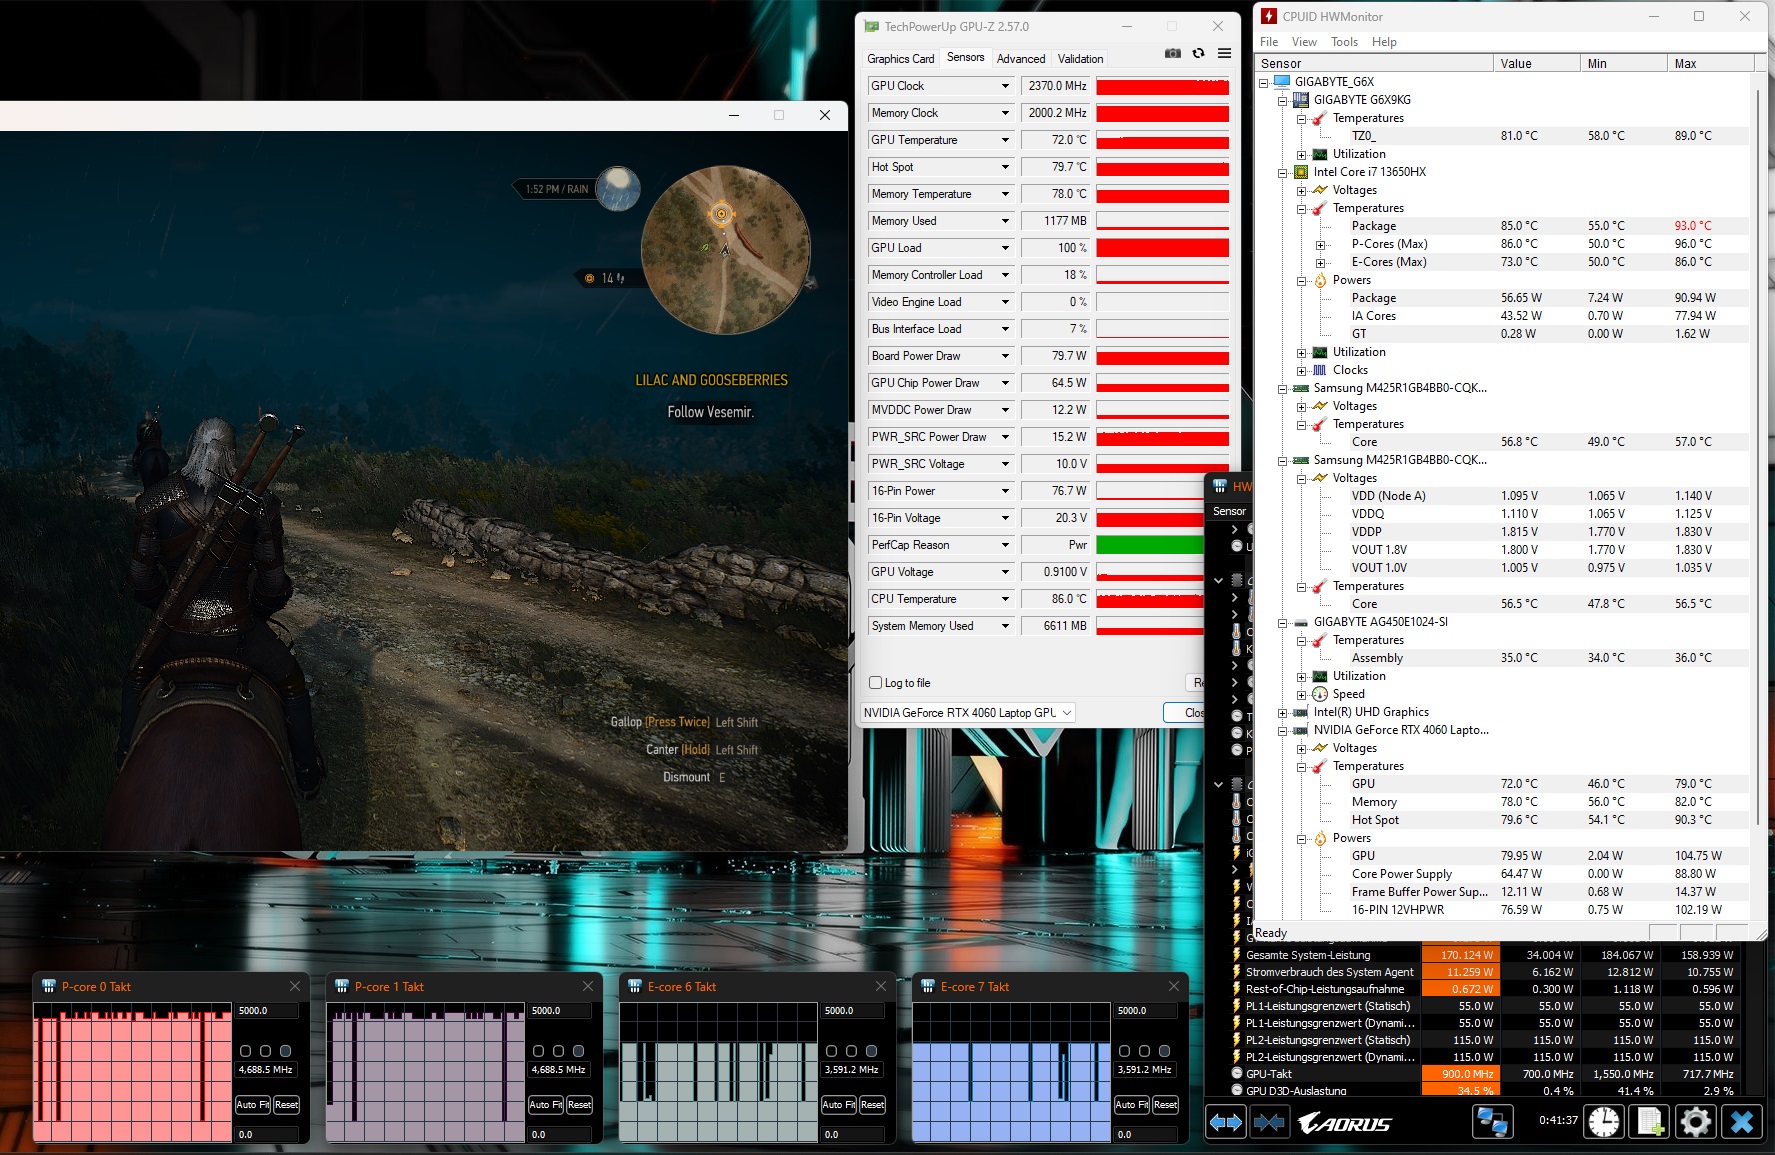
Ekstremalny scenariusz testu obciążeniowego (Prime95 i FurMark w trybie ciągłym) sprawdza stabilność systemu pod pełnym obciążeniem. Procesor G6X początkowo pracuje z pełną mocą, ale szybko obniża taktowanie do poziomu zegara bazowego. Częstotliwość taktowania GPU spada z 2,3 GHz-2,6 GHz do 1,9-2,1 GHz.
(±) Maksymalna temperatura w górnej części wynosi 41 °C / 106 F, w porównaniu do średniej 40.4 °C / 105 F , począwszy od 21.2 do 68.8 °C dla klasy Gaming.
(±) Dno nagrzewa się maksymalnie do 43 °C / 109 F, w porównaniu do średniej 43.2 °C / 110 F
(+) W stanie bezczynności średnia temperatura górnej części wynosi 29.6 °C / 85 F, w porównaniu ze średnią temperaturą urządzenia wynoszącą 33.9 °C / ### class_avg_f### F.
(±) Podczas gry w Wiedźmina 3 średnia temperatura górnej części wynosi 34.9 °C / 95 F, w porównaniu do średniej temperatury urządzenia wynoszącej 33.9 °C / ## #class_avg_f### F.
(+) Podpórki pod nadgarstki i touchpad są chłodniejsze niż temperatura skóry i maksymalnie 28 °C / 82.4 F i dlatego są chłodne w dotyku.
(±) Średnia temperatura obszaru podparcia dłoni w podobnych urządzeniach wynosiła 28.8 °C / 83.8 F (+0.8 °C / 1.4 F).
| Gigabyte G6X 9KG (2024) i7-13650HX, GeForce RTX 4060 Laptop GPU | Dell G16, i7-13650HX, RTX 4060 i7-13650HX, GeForce RTX 4060 Laptop GPU | Lenovo Legion 5 16IRX G9 i7-14650HX, GeForce RTX 4060 Laptop GPU | MSI Raider GE68HX 13VF i9-13950HX, GeForce RTX 4060 Laptop GPU | Asus TUF Gaming A16 FA617XS R9 7940HS, Radeon RX 7600S | |
|---|---|---|---|---|---|
| Heat | -15% | 2% | 4% | -4% | |
| Maximum Upper Side * (°C) | 41 | 49 -20% | 40.4 1% | 41.4 -1% | 53 -29% |
| Maximum Bottom * (°C) | 43 | 58 -35% | 43.8 -2% | 45.4 -6% | 48 -12% |
| Idle Upper Side * (°C) | 32 | 35 -9% | 30.3 5% | 29.8 7% | 30 6% |
| Idle Bottom * (°C) | 37 | 35 5% | 35.3 5% | 31.4 15% | 30 19% |
* ... im mniej tym lepiej
Głośnik
Głośniki stereo generują ogólnie przyzwoity dźwięk. Brakuje jednak basów.
Gigabyte G6X 9KG (2024) analiza dźwięku
(+) | głośniki mogą odtwarzać stosunkowo głośno (82 dB)
Bas 100 - 315 Hz
(-) | prawie brak basu - średnio 24.9% niższa od mediany
(±) | liniowość basu jest średnia (13.7% delta do poprzedniej częstotliwości)
Średnie 400 - 2000 Hz
(+) | zbalansowane środki średnie - tylko 4.1% od mediany
(+) | średnie są liniowe (5.4% delta do poprzedniej częstotliwości)
Wysokie 2–16 kHz
(+) | zrównoważone maksima - tylko 2.2% od mediany
(±) | liniowość wysokich wartości jest średnia (7.4% delta do poprzedniej częstotliwości)
Ogólnie 100 - 16.000 Hz
(±) | liniowość ogólnego dźwięku jest średnia (17.2% różnicy w stosunku do mediany)
W porównaniu do tej samej klasy
» 47% wszystkich testowanych urządzeń w tej klasie było lepszych, 11% podobnych, 42% gorszych
» Najlepszy miał deltę 6%, średnia wynosiła ###średnia###%, najgorsza wynosiła 132%
W porównaniu do wszystkich testowanych urządzeń
» 32% wszystkich testowanych urządzeń było lepszych, 8% podobnych, 60% gorszych
» Najlepszy miał deltę 4%, średnia wynosiła ###średnia###%, najgorsza wynosiła 134%
Dell G16, i7-13650HX, RTX 4060 analiza dźwięku
(±) | głośność głośnika jest średnia, ale dobra (80.55 dB)
Bas 100 - 315 Hz
(-) | prawie brak basu - średnio 25.1% niższa od mediany
(-) | bas nie jest liniowy (18.9% delta do poprzedniej częstotliwości)
Średnie 400 - 2000 Hz
(±) | wyższe średnie - średnio 8% wyższe niż mediana
(+) | średnie są liniowe (5.9% delta do poprzedniej częstotliwości)
Wysokie 2–16 kHz
(+) | zrównoważone maksima - tylko 3.5% od mediany
(±) | liniowość wysokich wartości jest średnia (8.6% delta do poprzedniej częstotliwości)
Ogólnie 100 - 16.000 Hz
(±) | liniowość ogólnego dźwięku jest średnia (23.4% różnicy w stosunku do mediany)
W porównaniu do tej samej klasy
» 85% wszystkich testowanych urządzeń w tej klasie było lepszych, 5% podobnych, 11% gorszych
» Najlepszy miał deltę 6%, średnia wynosiła ###średnia###%, najgorsza wynosiła 132%
W porównaniu do wszystkich testowanych urządzeń
» 70% wszystkich testowanych urządzeń było lepszych, 6% podobnych, 24% gorszych
» Najlepszy miał deltę 4%, średnia wynosiła ###średnia###%, najgorsza wynosiła 134%
Zużycie energii
Zużycie energii jest na normalnym poziomie dla zainstalowanego sprzętu. Podczas gdy test Witcher 3 jest uruchamiany przy stałym zużyciu energii, zapotrzebowanie zmienia się nieznacznie podczas testu warunków skrajnych.
Moc wyjściowa zasilacza jest wyższa od mocy znamionowej (180 W) przez kilka minut, ale następnie jest zmniejszana do poziomu mocy znamionowej.
| wyłączony / stan wstrzymania | |
| luz | |
| obciążenie |
|
Legenda:
min: | |
Energieaufnahme Witcher 3 / Stresstest
Power consumption: External monitor
Żywotność baterii
Gigabyte G6X osiąga czas pracy 7:54 h w praktycznym teście WLAN (mapowanie obciążenia podczas uzyskiwania dostępu do stron internetowych za pomocą skryptu), co jest dobrą wartością i drugim najlepszym czasem pracy w porównaniu.
Za
Przeciw
Werdykt: Dobrze zaokrąglony pakiet ogólny
Gigabyte G6X 9KG jest przeznaczony do gier w rozdzielczości FHD przy ustawieniach od wysokich do maksymalnych Core i7-13650HX i GeForce RTX 4060 powinny poradzić sobie również w innych obszarach, takich jak edycja i renderowanie wideo. Szybki dysk SSD PCIe Gen 4 o pojemności 1 TB zapewnia krótki czas ładowania.
Gigabyte dostarcza spójny notebook do gier średniej klasy z G6X 9KG (2024)"
Laptop nie nagrzewa się zbytnio pod obciążeniem, ale może wytwarzać dużo hałasu. Profil zasilania Silent może temu przeciwdziałać, ale skutkuje to wyłączeniem dGPU. Dobry czas pracy Wi-Fi wynoszący nieco poniżej 8 godzin nie jest zatem zaskoczeniem.
G6X nie posiada żadnych nowoczesnych portów Thunderbolt ani USB4. Dzięki jednemu z USB Type-C obsługującemu Power Delivery, autorski zasilacz może pozostać w domu do regularnej pracy. Dwa porty USB 3.2 Gen 2 Type-C umożliwiają również łatwą integrację z istniejącymi konfiguracjami stacji roboczych.
Matowy, 16-calowy wyświetlacz WUXGA 165 Hz IPS robi ogólnie dobre wrażenie, ale oferuje niewystarczające pokrycie przestrzeni barw.
Alternatywą może być Lenovo Legion 5 16IRX G9 można rozważyć. Oferuje on większą wydajność GPU i jaśniejszy ekran z lepszym pokryciem przestrzeni barw.
Cena i dostępność
W Stanach Zjednoczonych Gigabyte G6X 9KG (2024) jest dostępny w sklepie Amazon za około 1350 USD.
Gigabyte G6X 9KG (2024)
- 22/03/2024 v7 (old)
Sascha Mölck
Przezroczystość
Wyboru urządzeń do recenzji dokonuje nasza redakcja. Próbka testowa została udostępniona autorowi jako pożyczka od producenta lub sprzedawcy detalicznego na potrzeby tej recenzji. Pożyczkodawca nie miał wpływu na tę recenzję, producent nie otrzymał też kopii tej recenzji przed publikacją. Nie było obowiązku publikowania tej recenzji. Jako niezależna firma medialna, Notebookcheck nie podlega władzy producentów, sprzedawców detalicznych ani wydawców.
Tak testuje Notebookcheck
Każdego roku Notebookcheck niezależnie sprawdza setki laptopów i smartfonów, stosując standardowe procedury, aby zapewnić porównywalność wszystkich wyników. Od około 20 lat stale rozwijamy nasze metody badawcze, ustanawiając przy tym standardy branżowe. W naszych laboratoriach testowych doświadczeni technicy i redaktorzy korzystają z wysokiej jakości sprzętu pomiarowego. Testy te obejmują wieloetapowy proces walidacji. Nasz kompleksowy system ocen opiera się na setkach uzasadnionych pomiarów i benchmarków, co pozwala zachować obiektywizm.Price comparison
