Test laptopa Microsoft Surface Laptop 3
Tekst i zdjęcia: Allen Ngo
Tłumaczenie: Sylwester Cyba
15/01/2020
W niniejszej recenzji porównano model Surface Laptop 3 posiadający procesor Core i7 z wersją z procesorem AMD Ryzen 5.
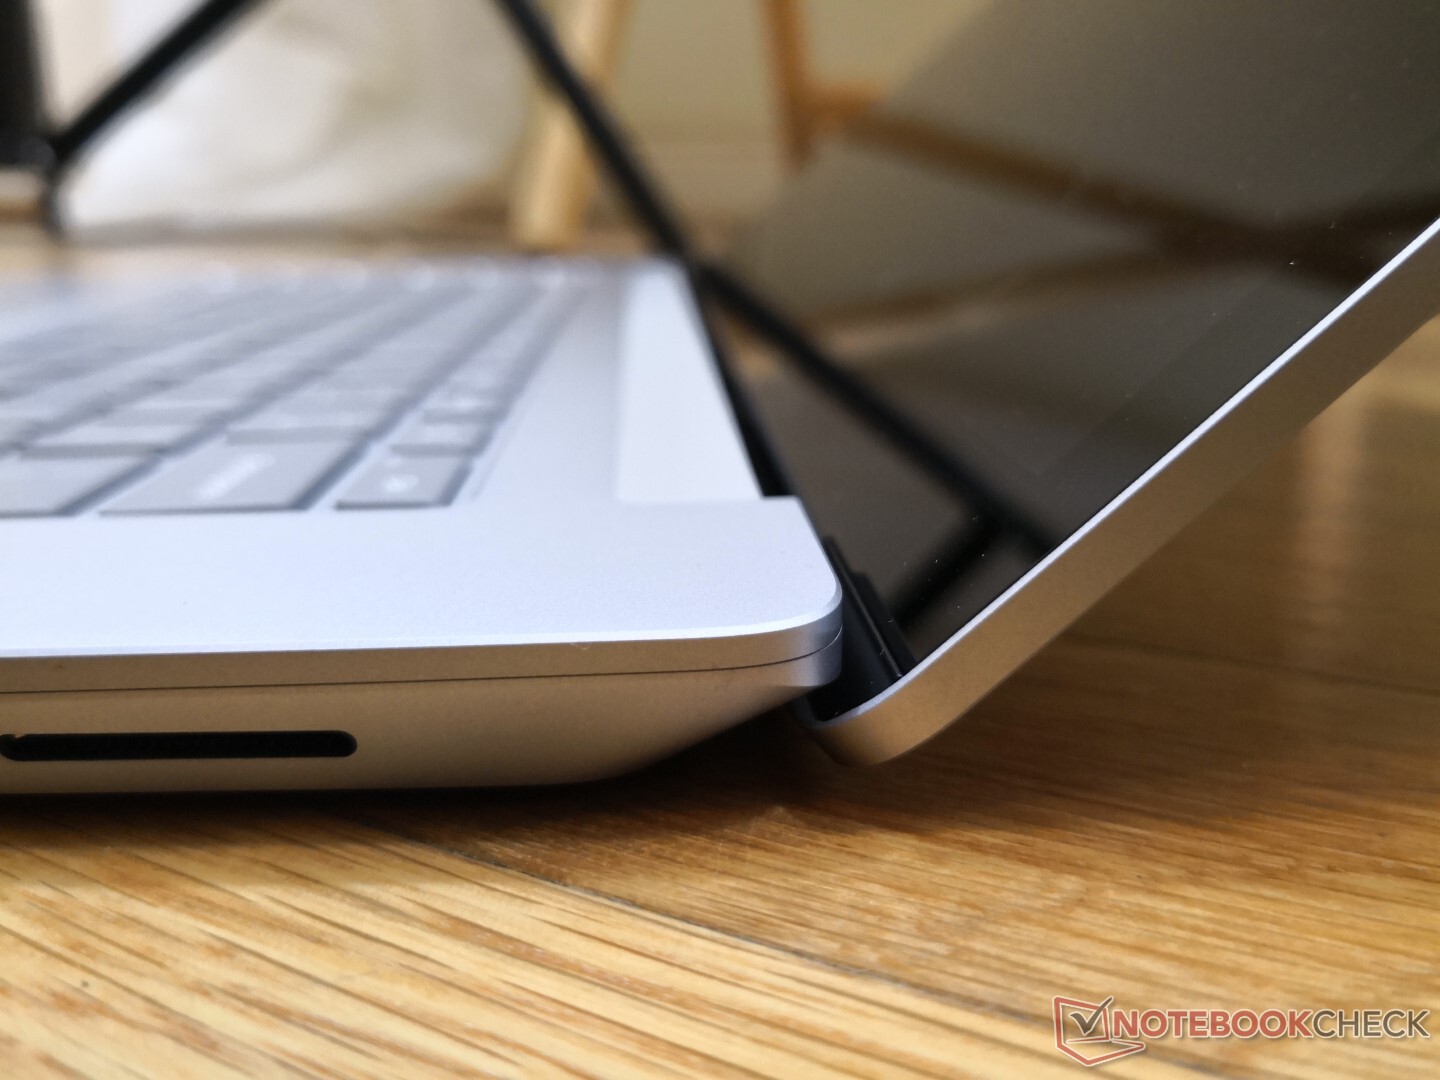
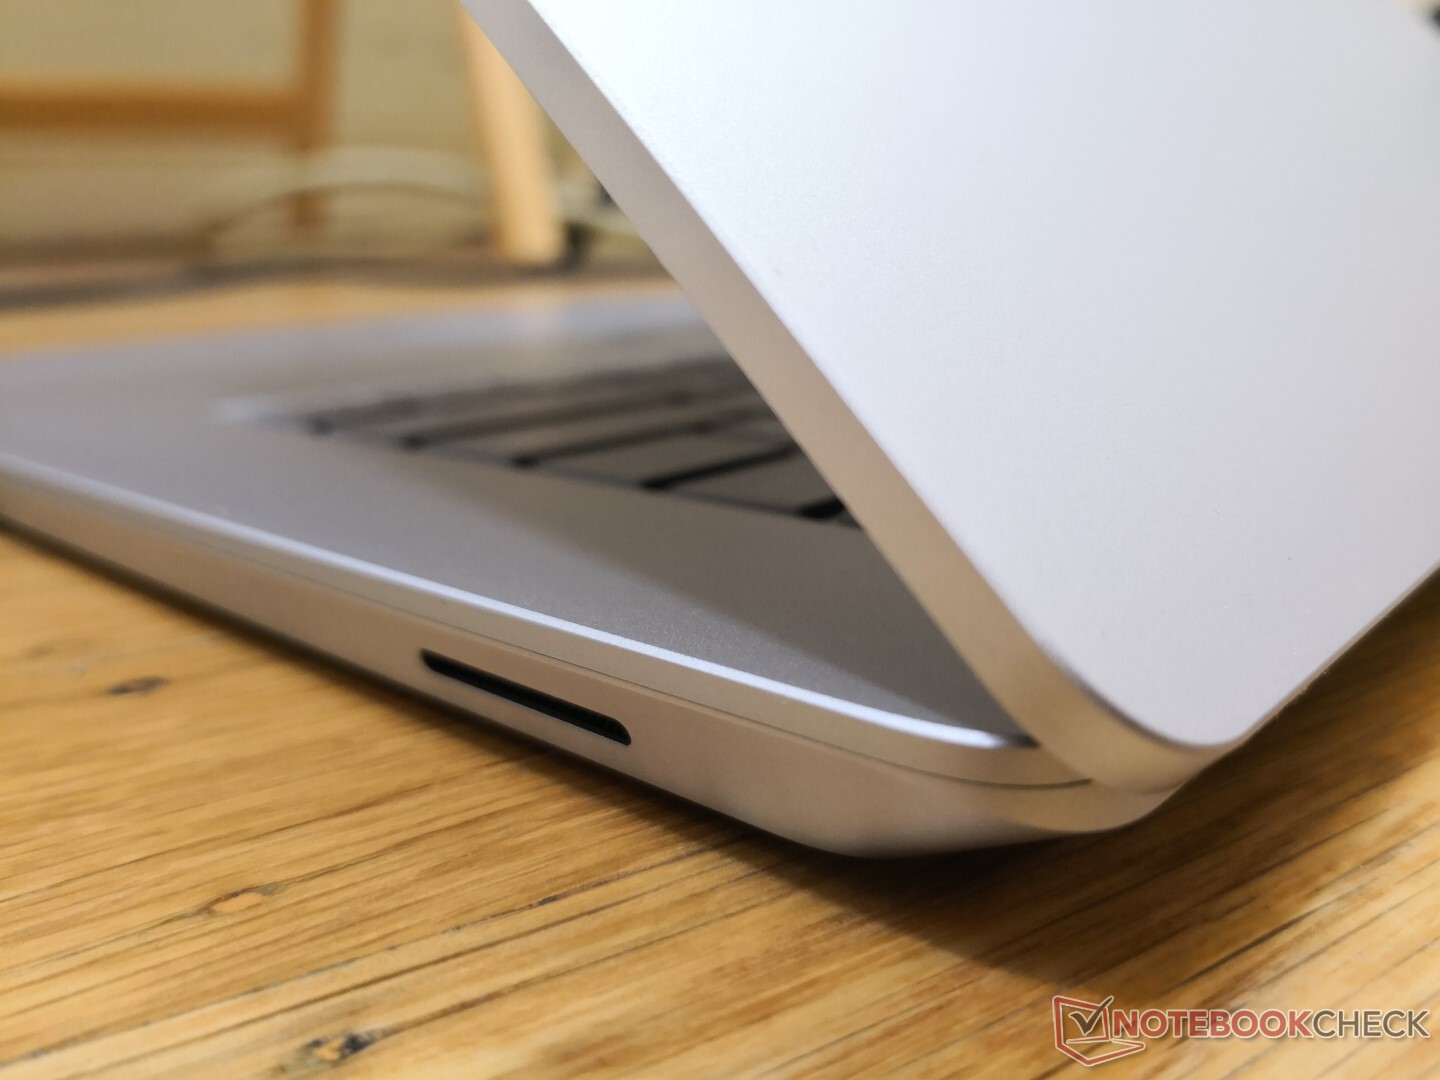
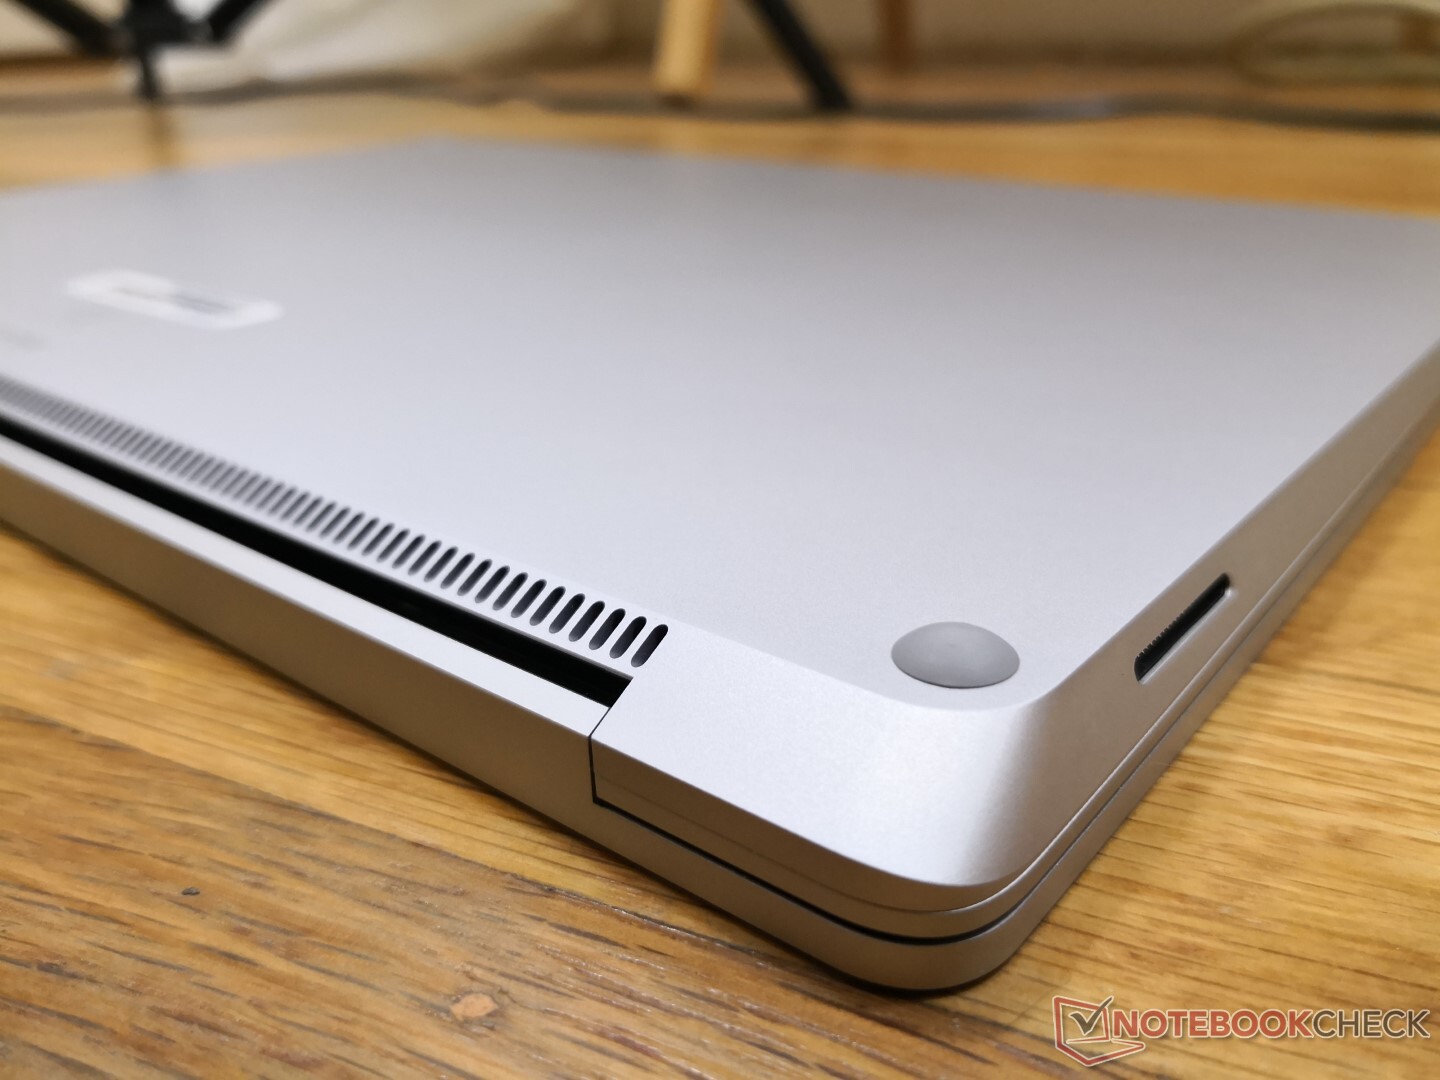
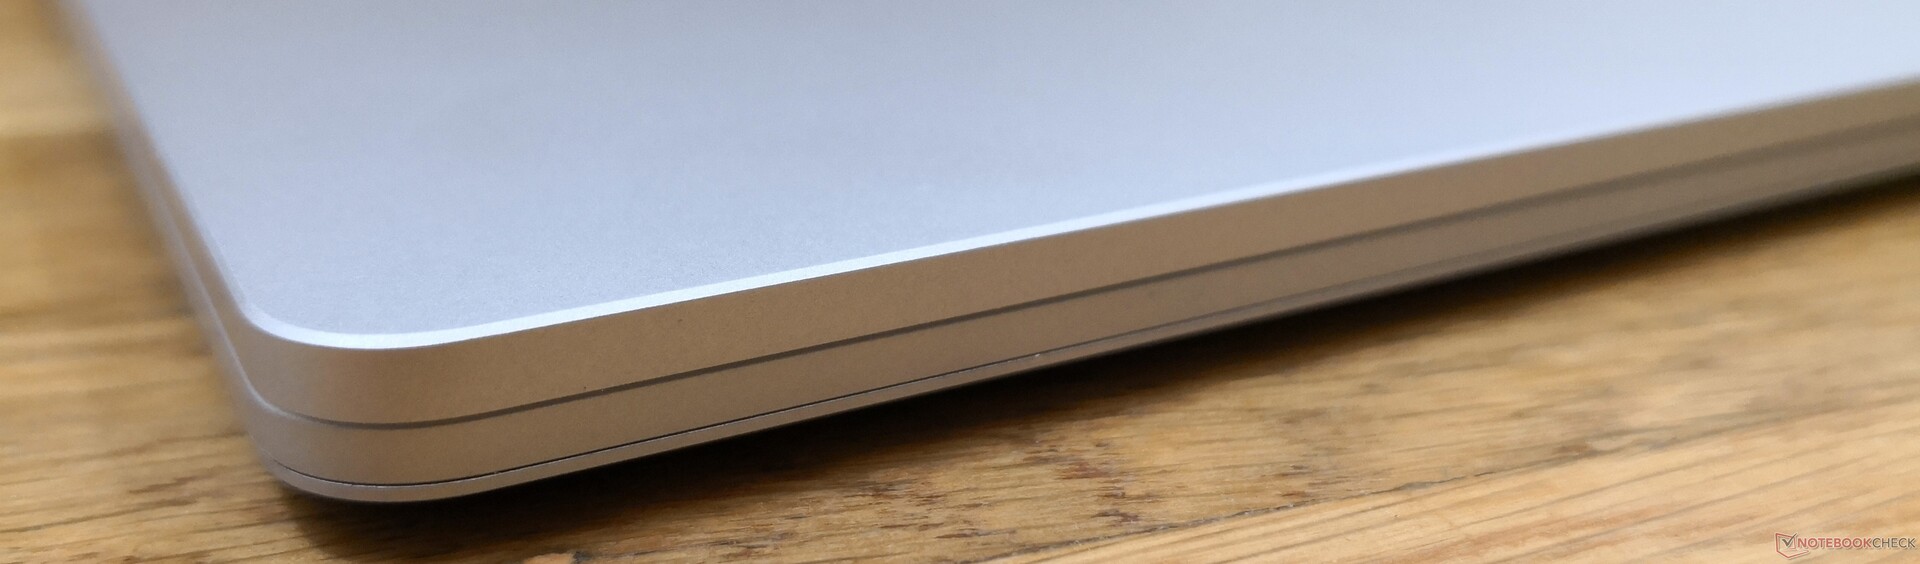
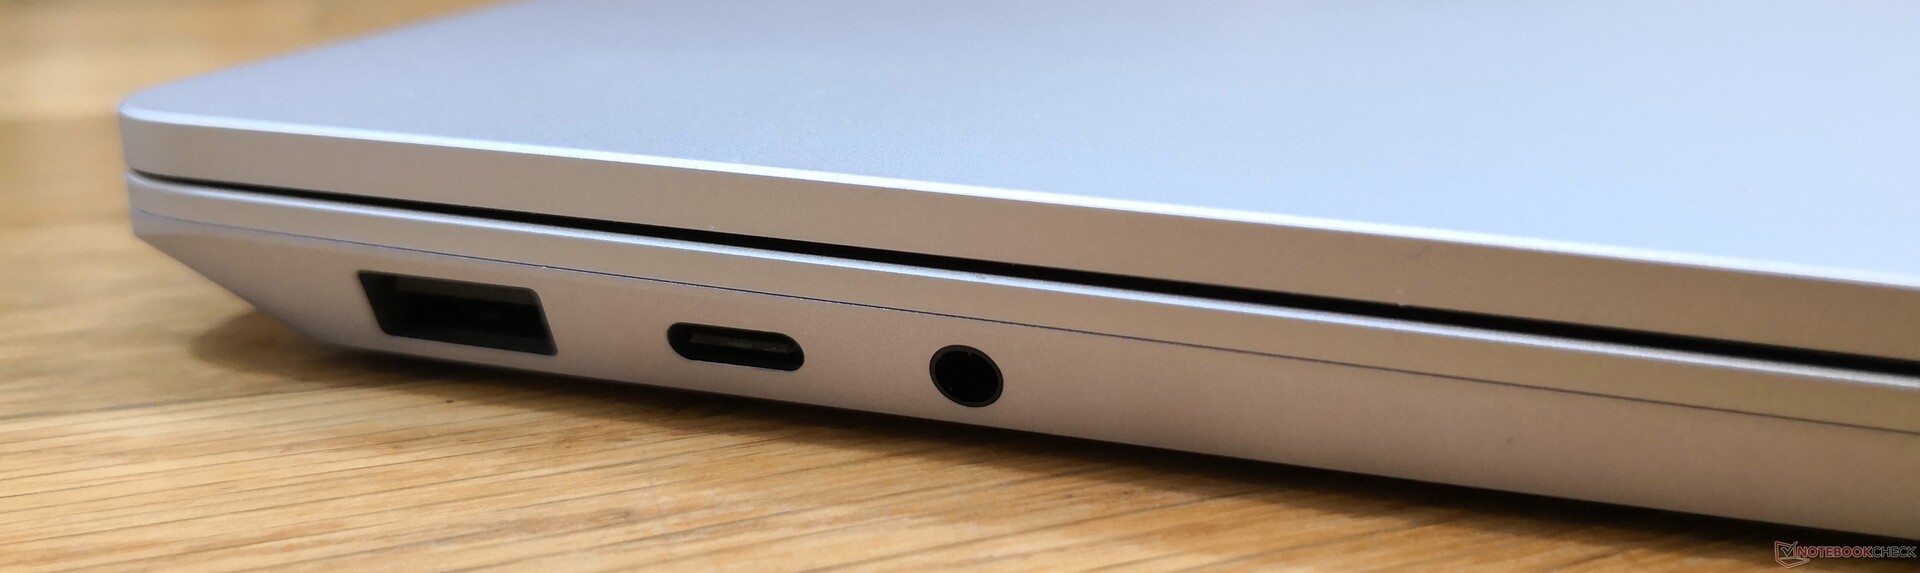
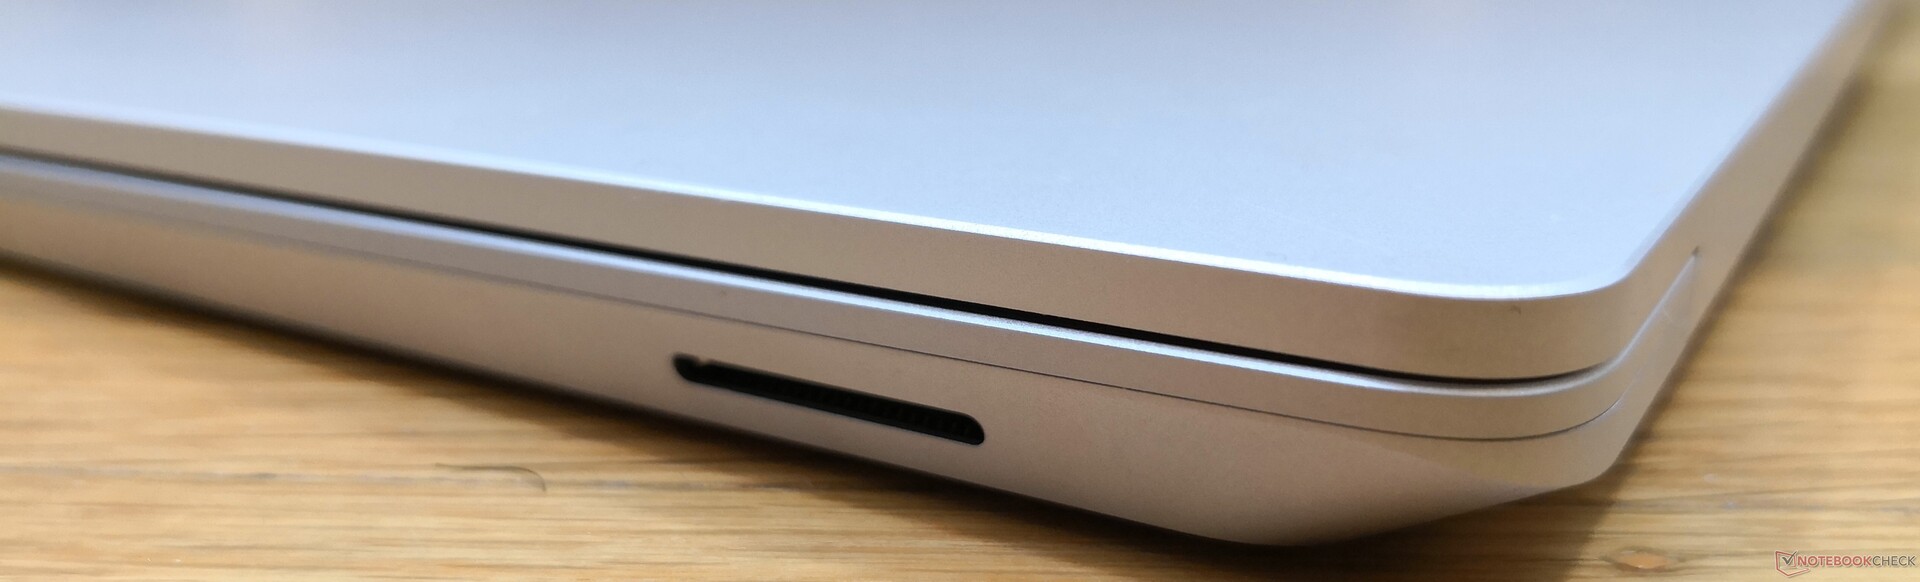
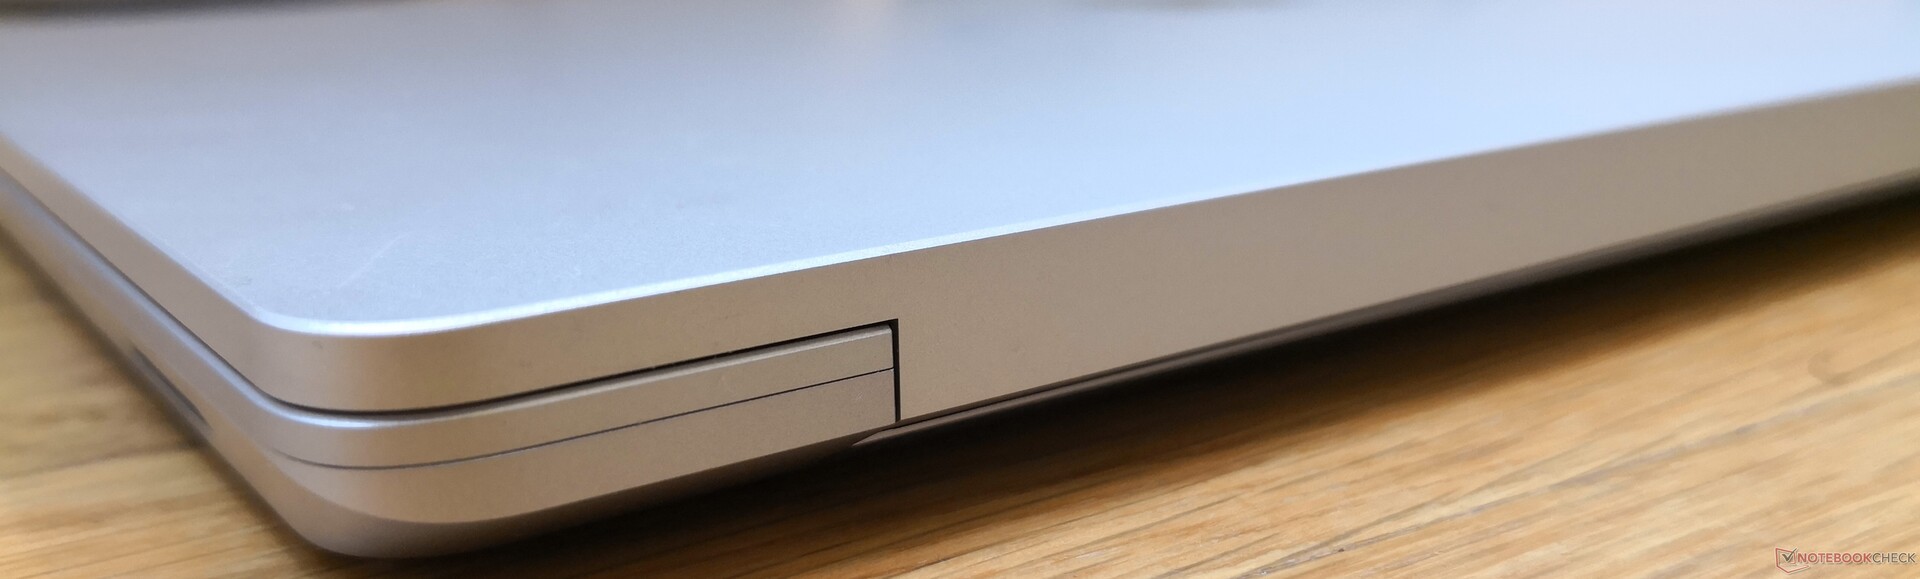
Obudowa
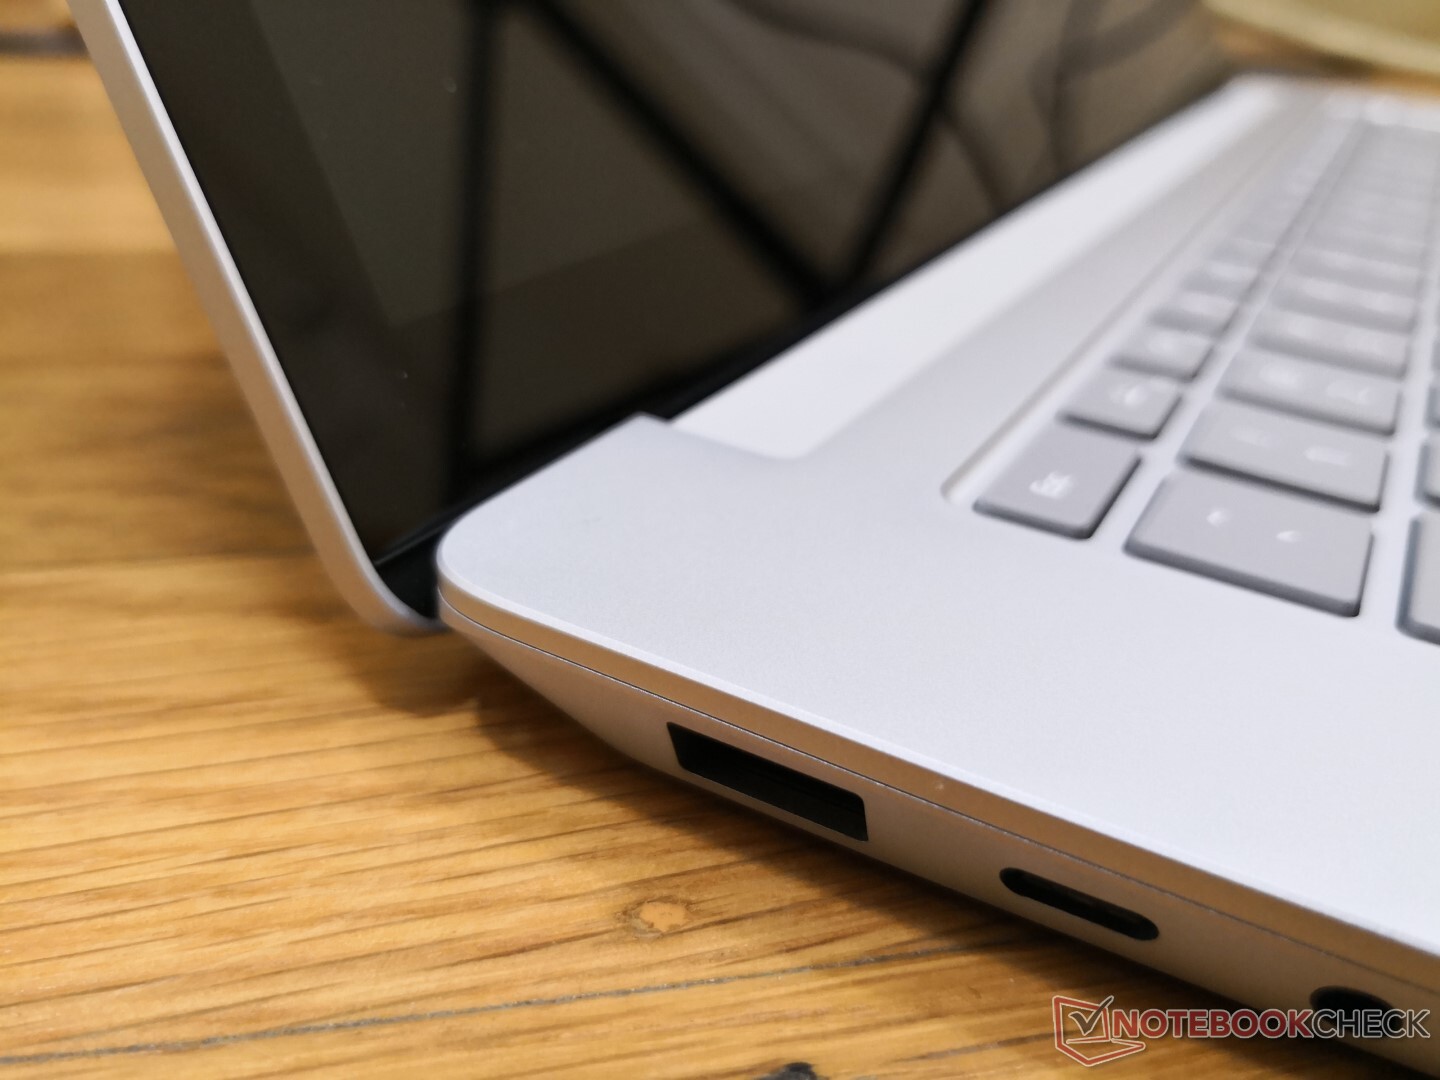
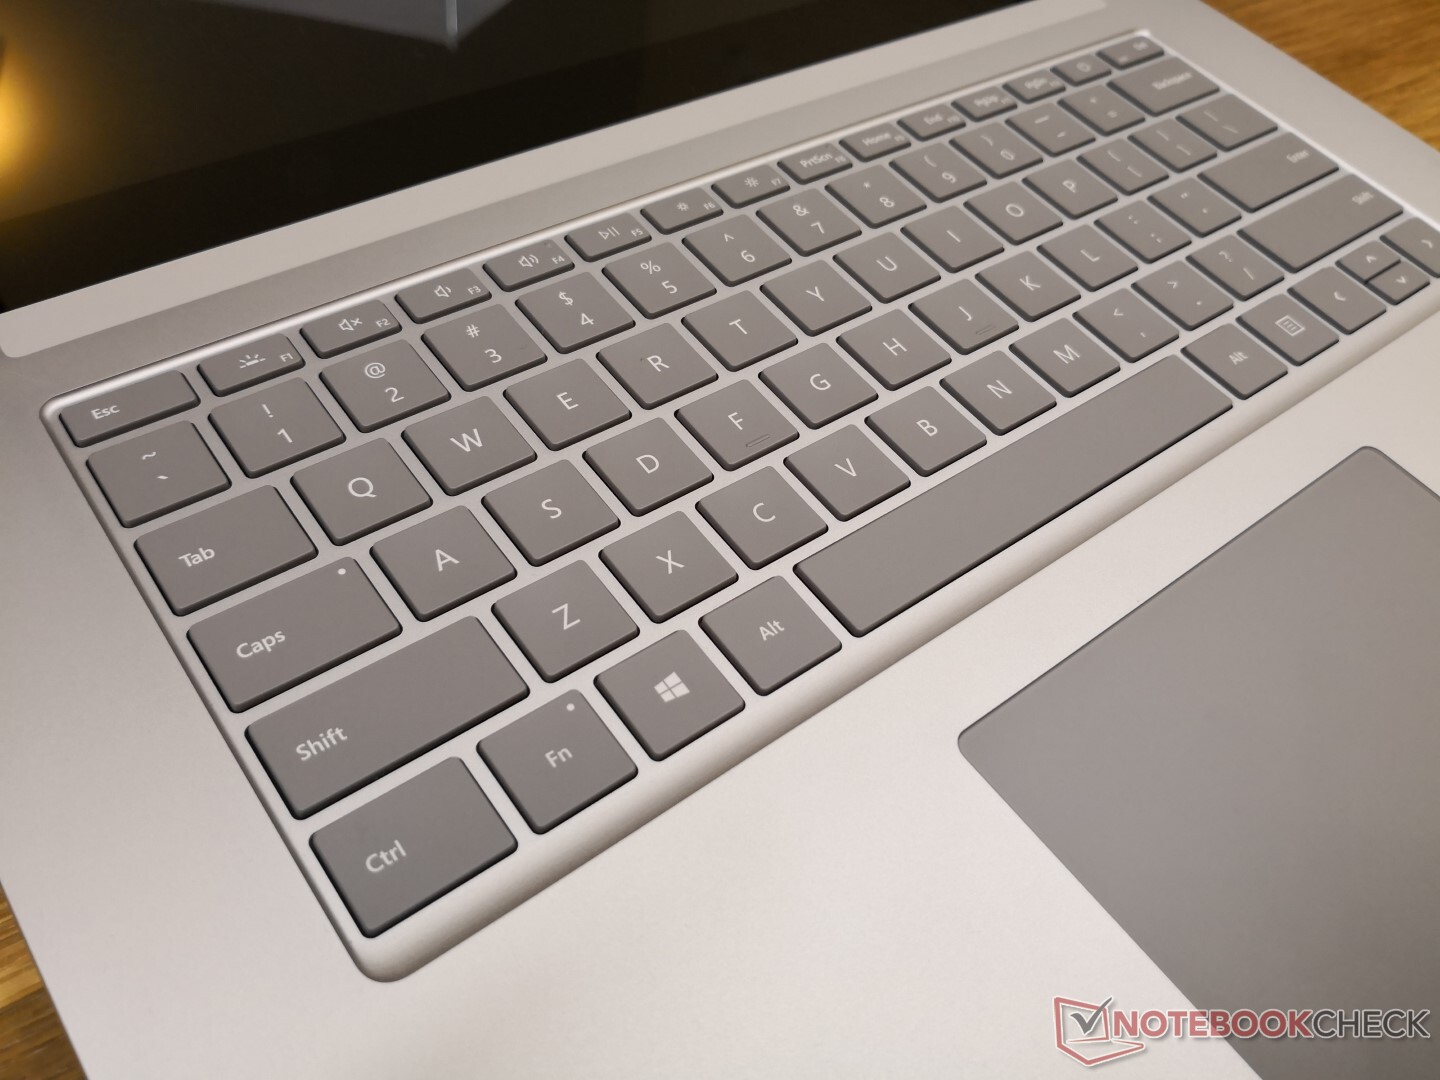
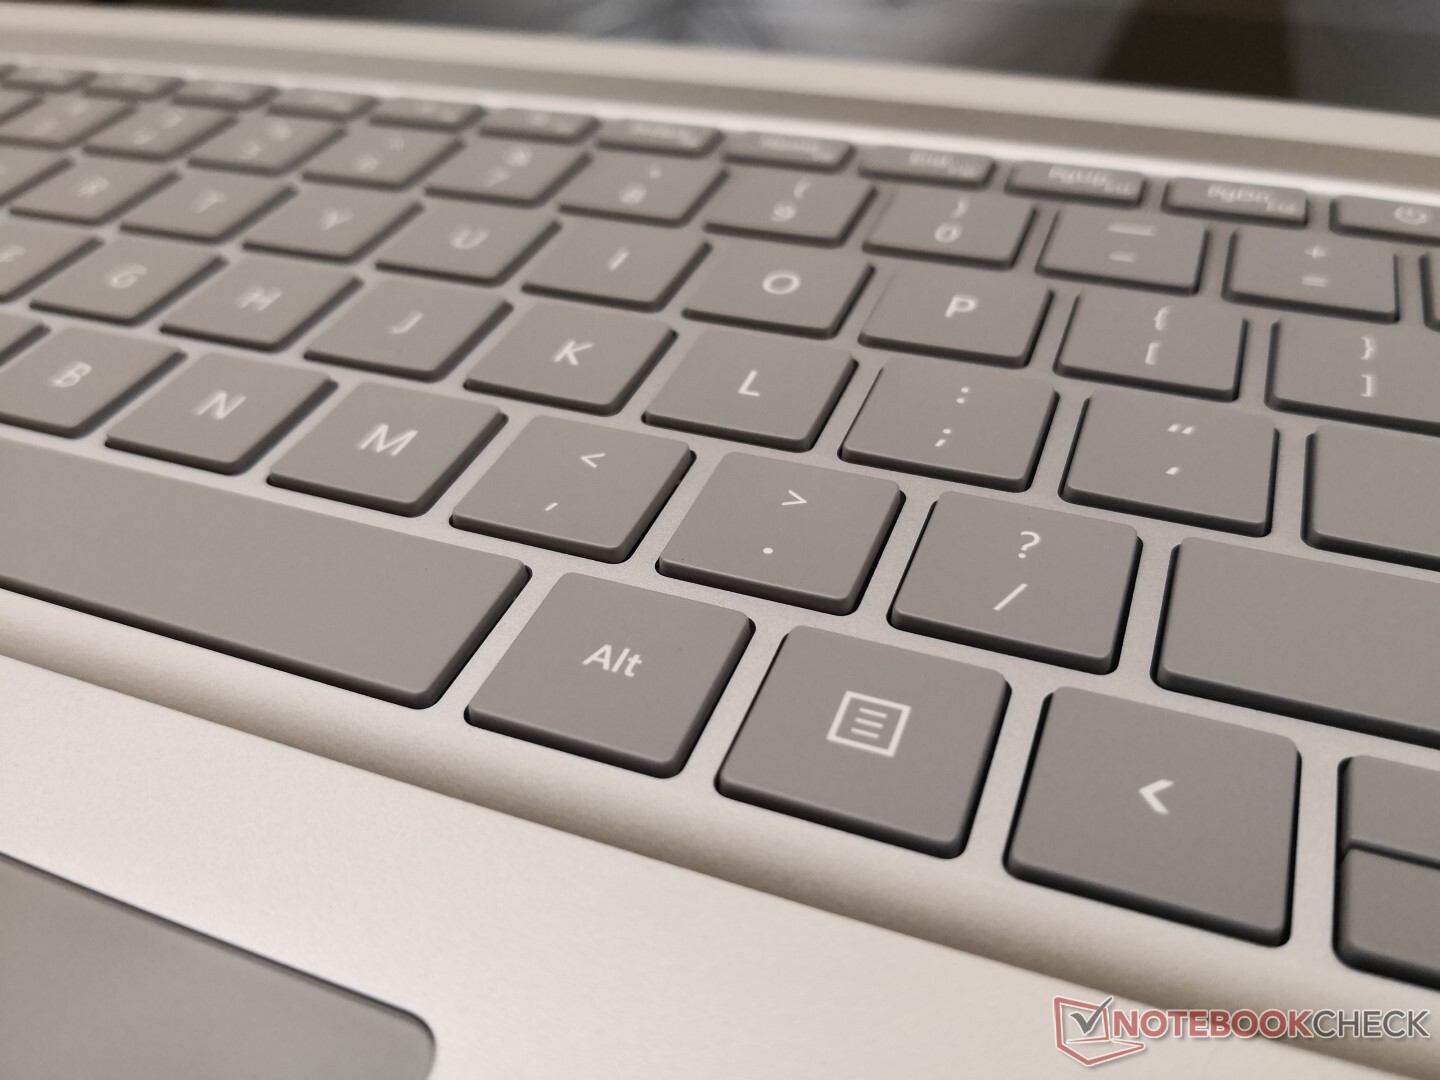
Urządzenia wejścia
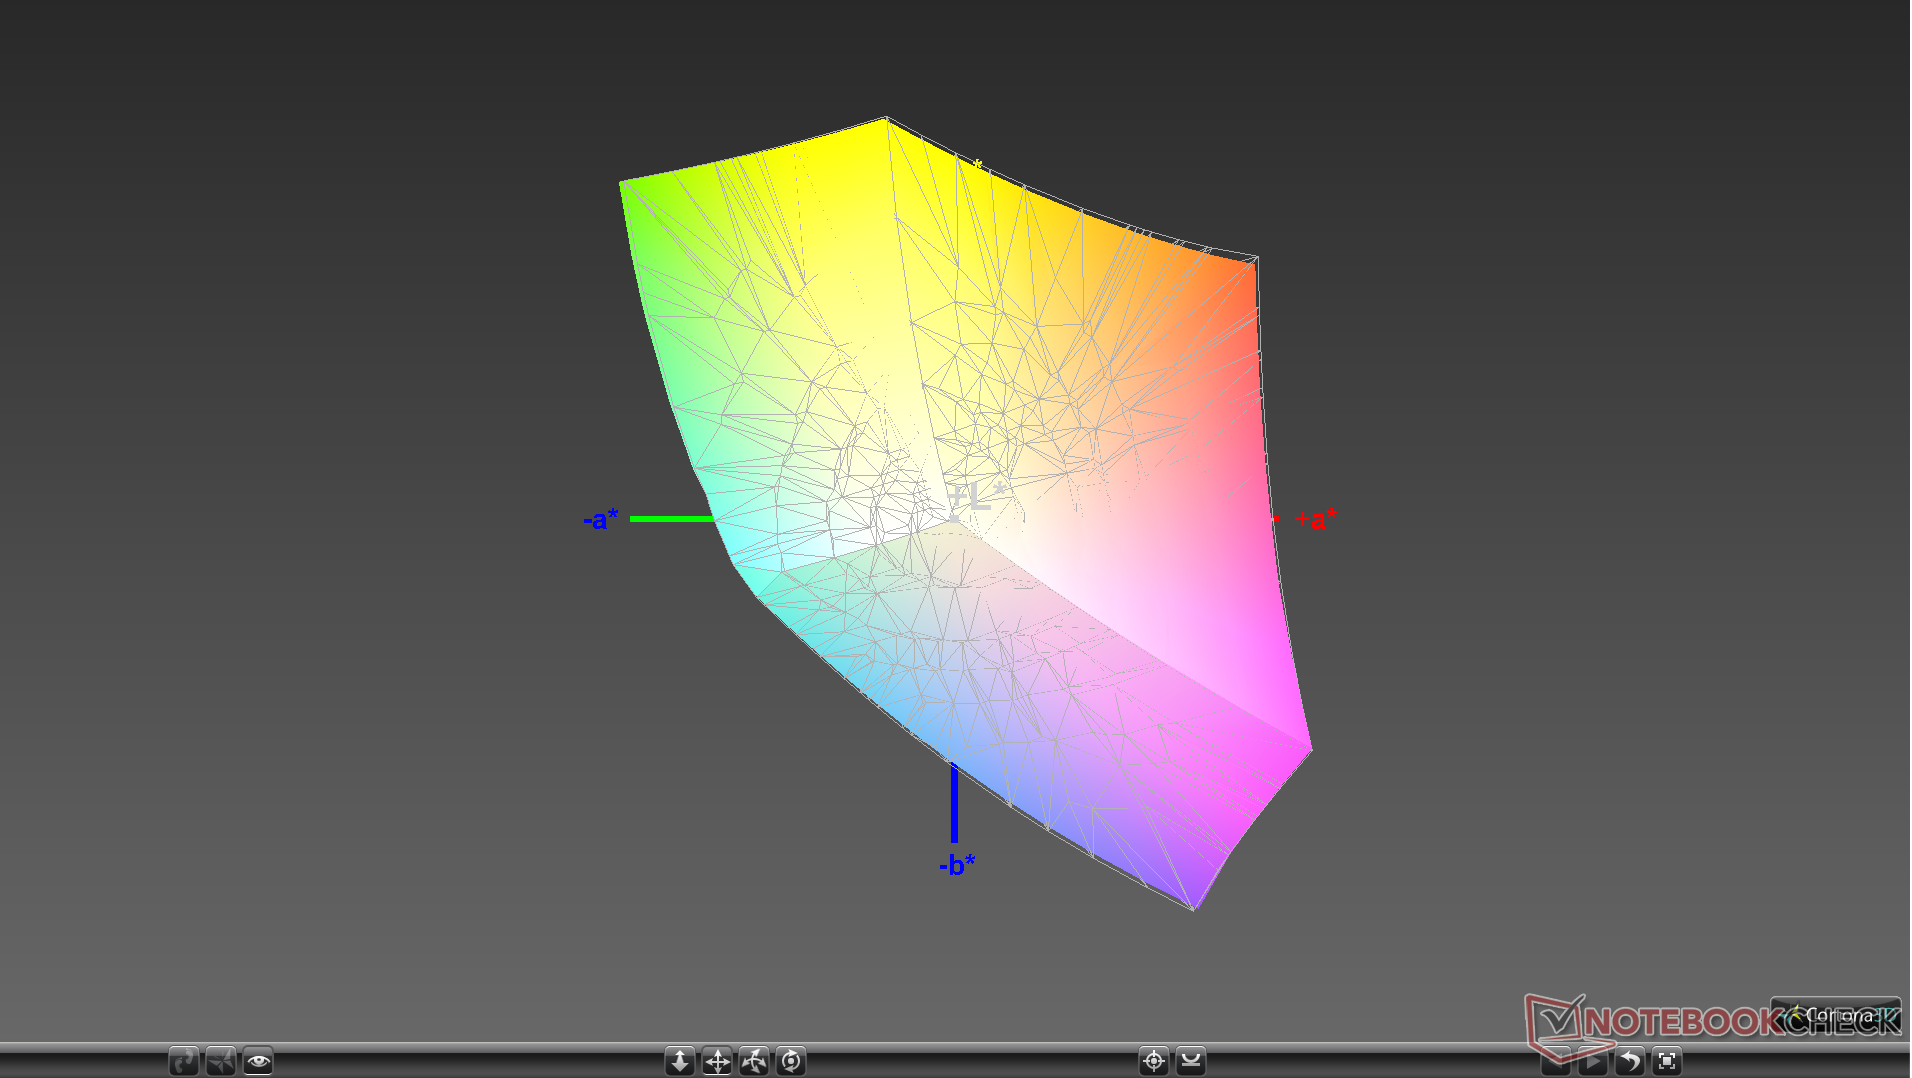
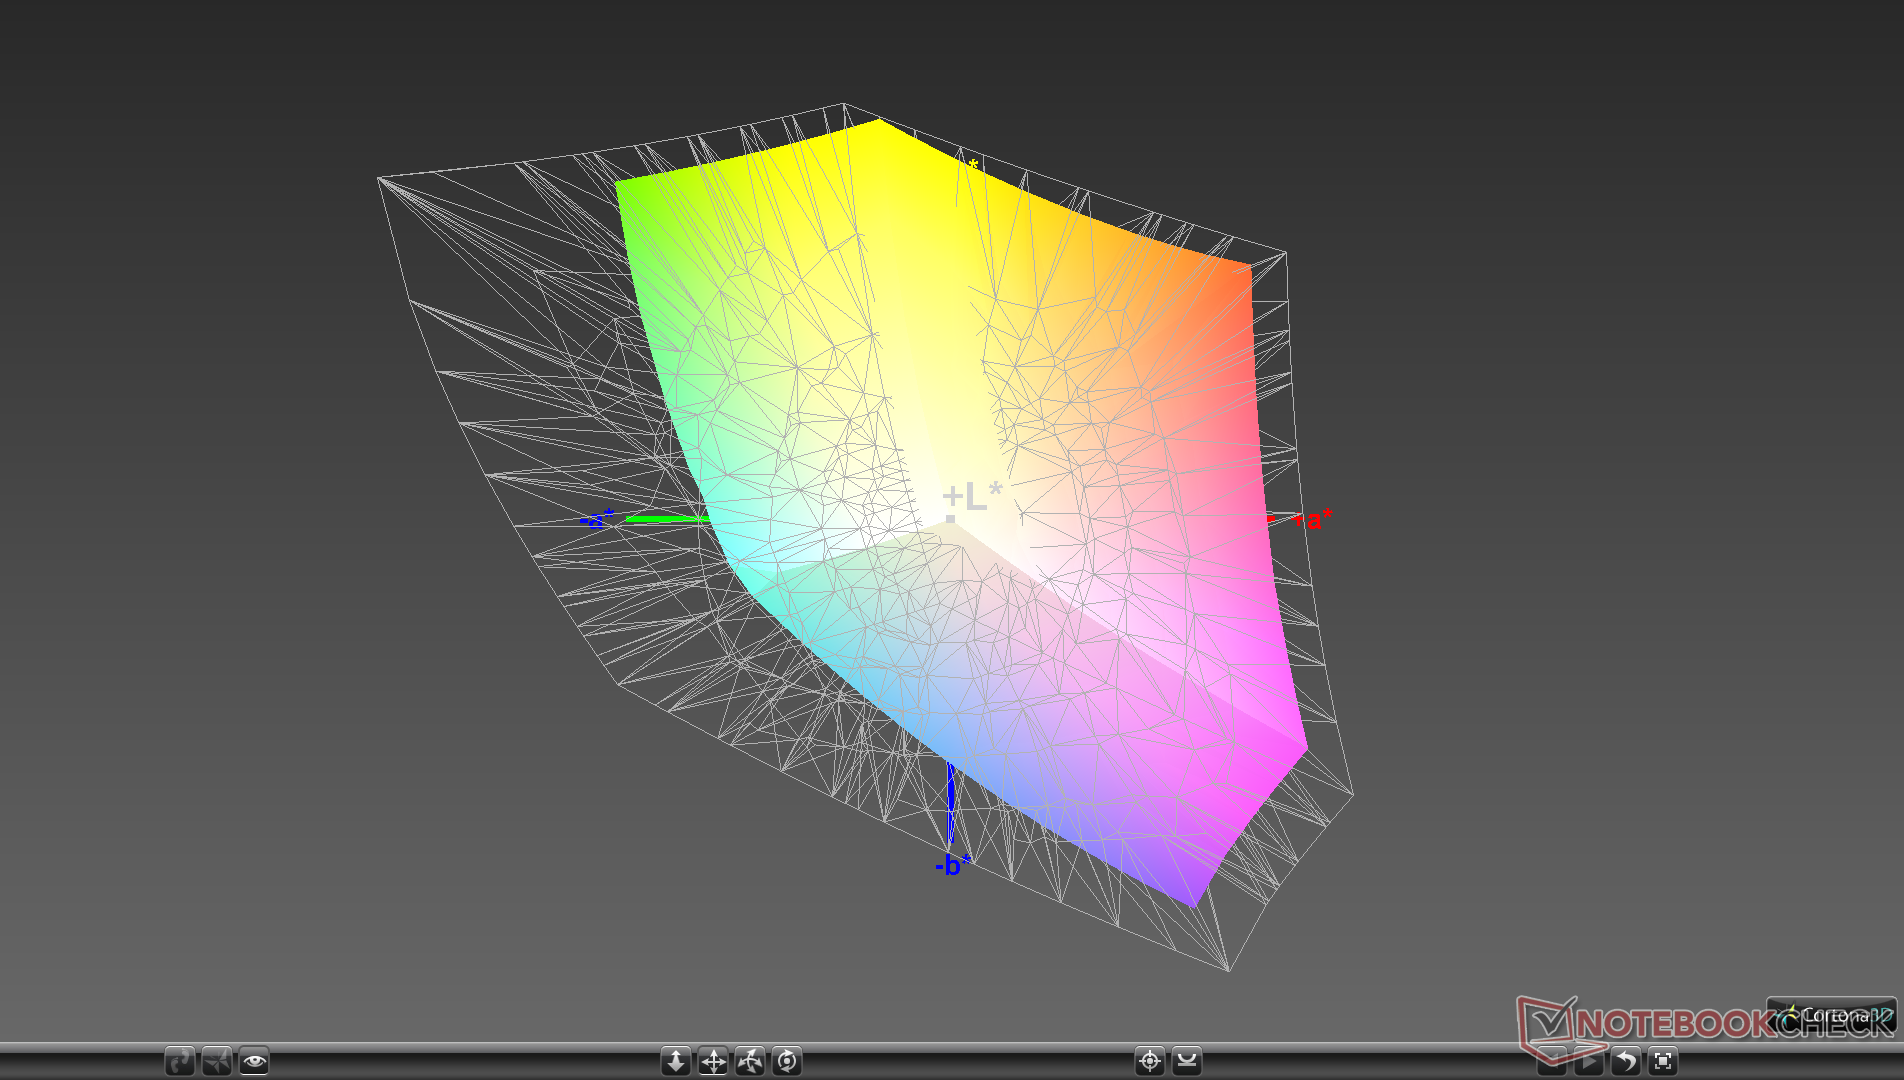
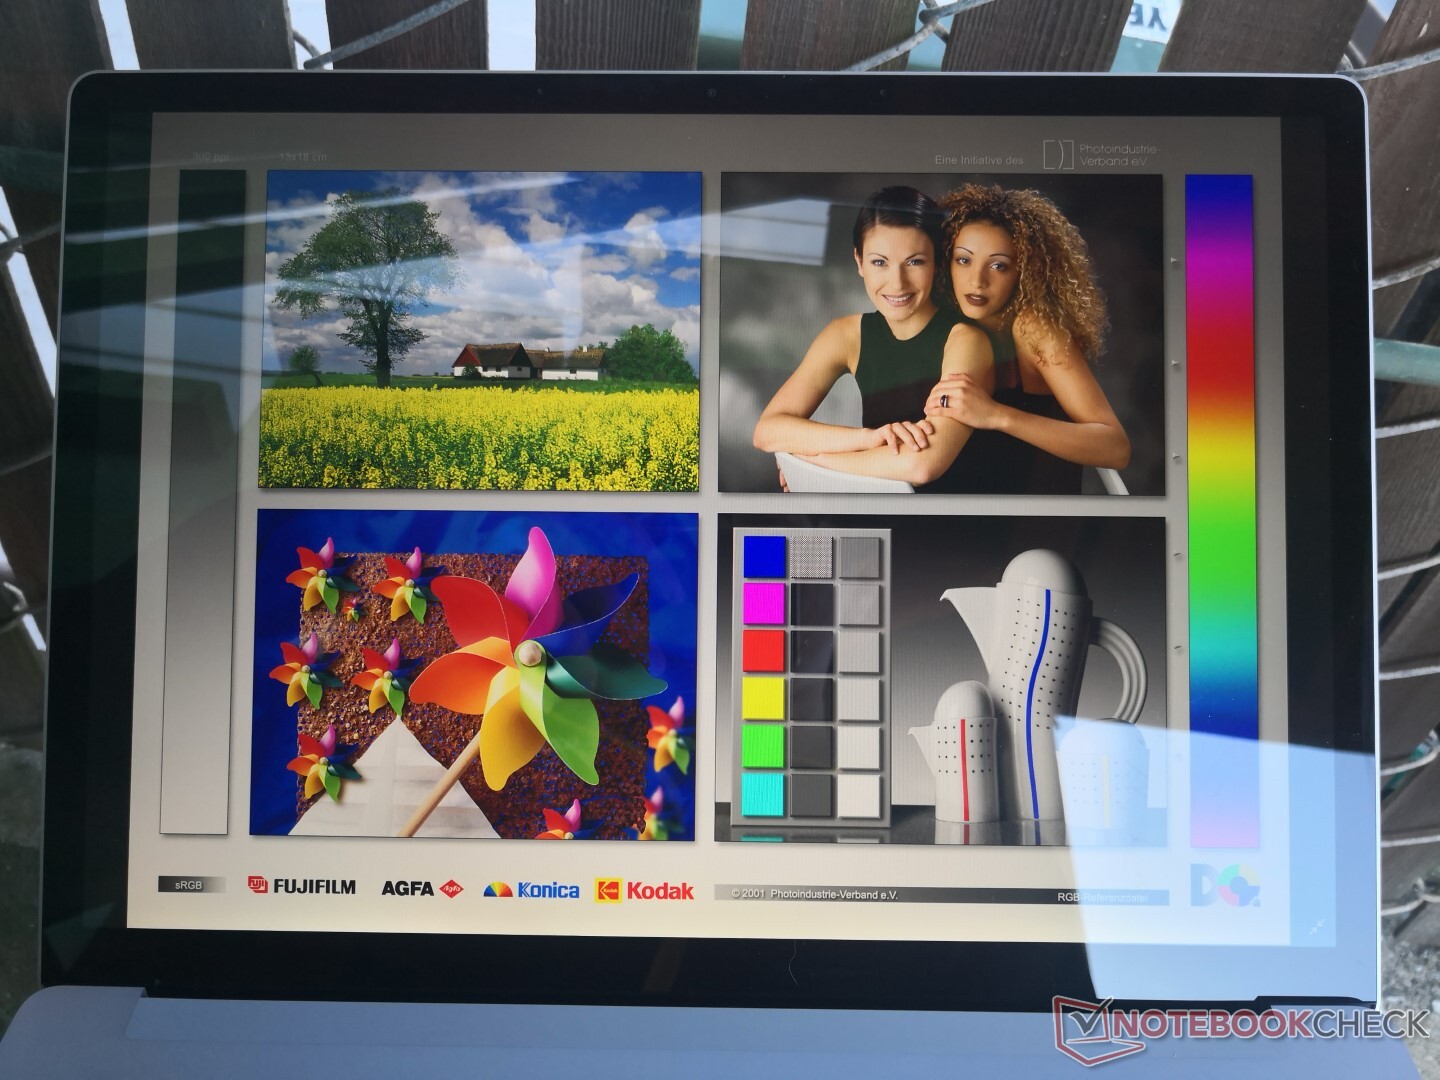
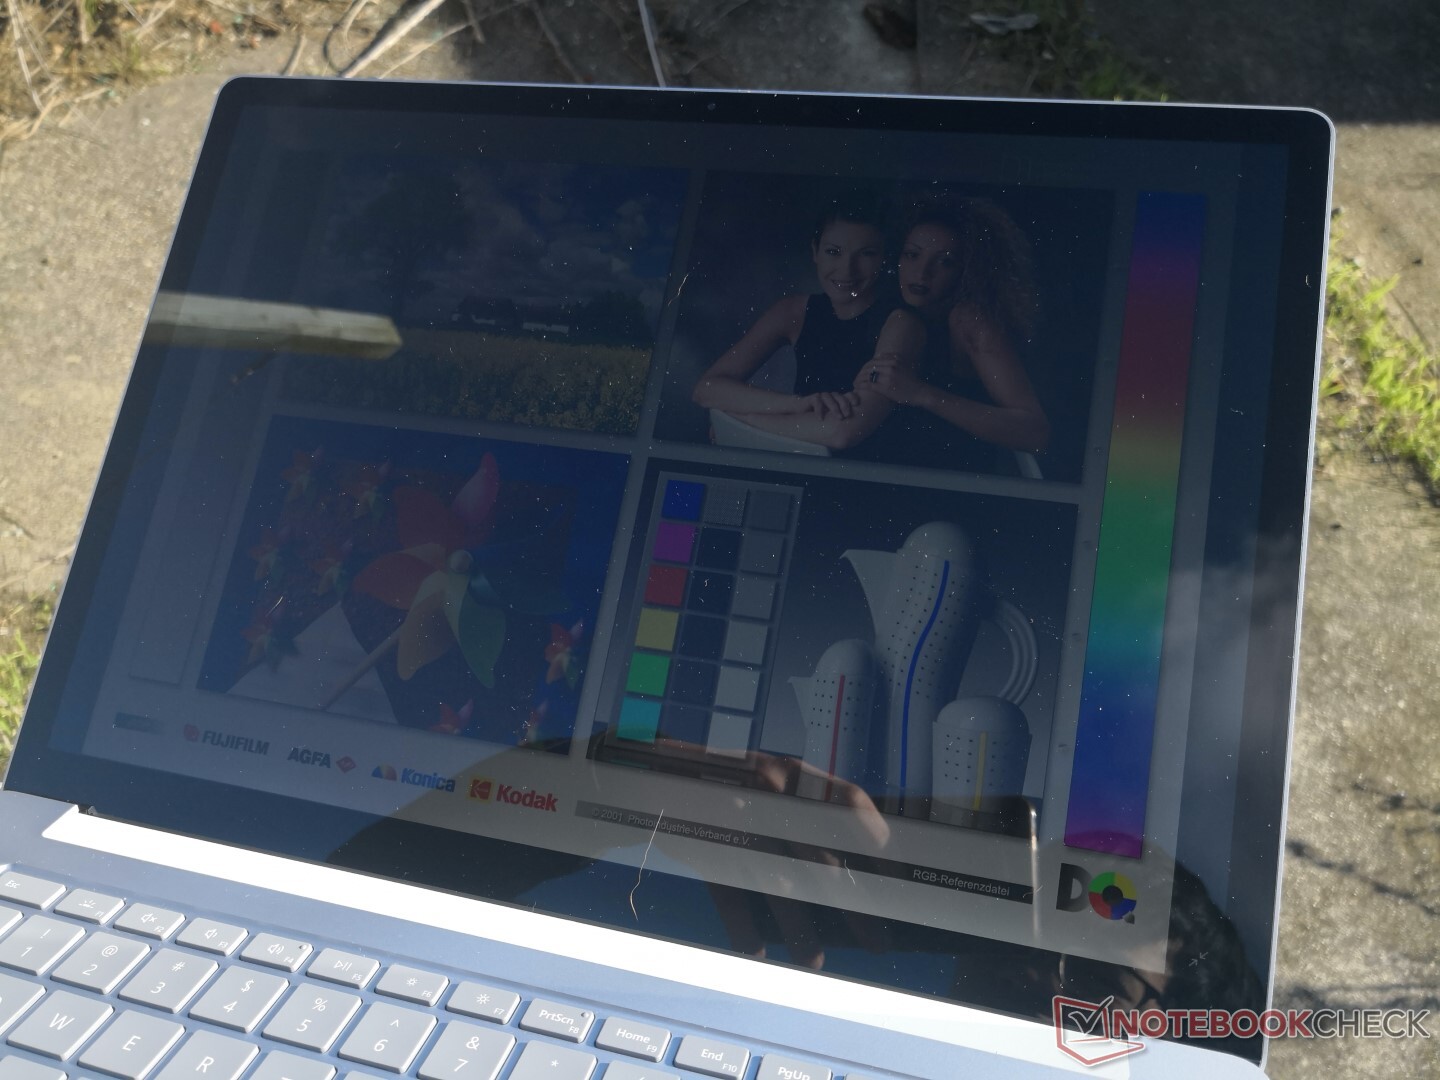
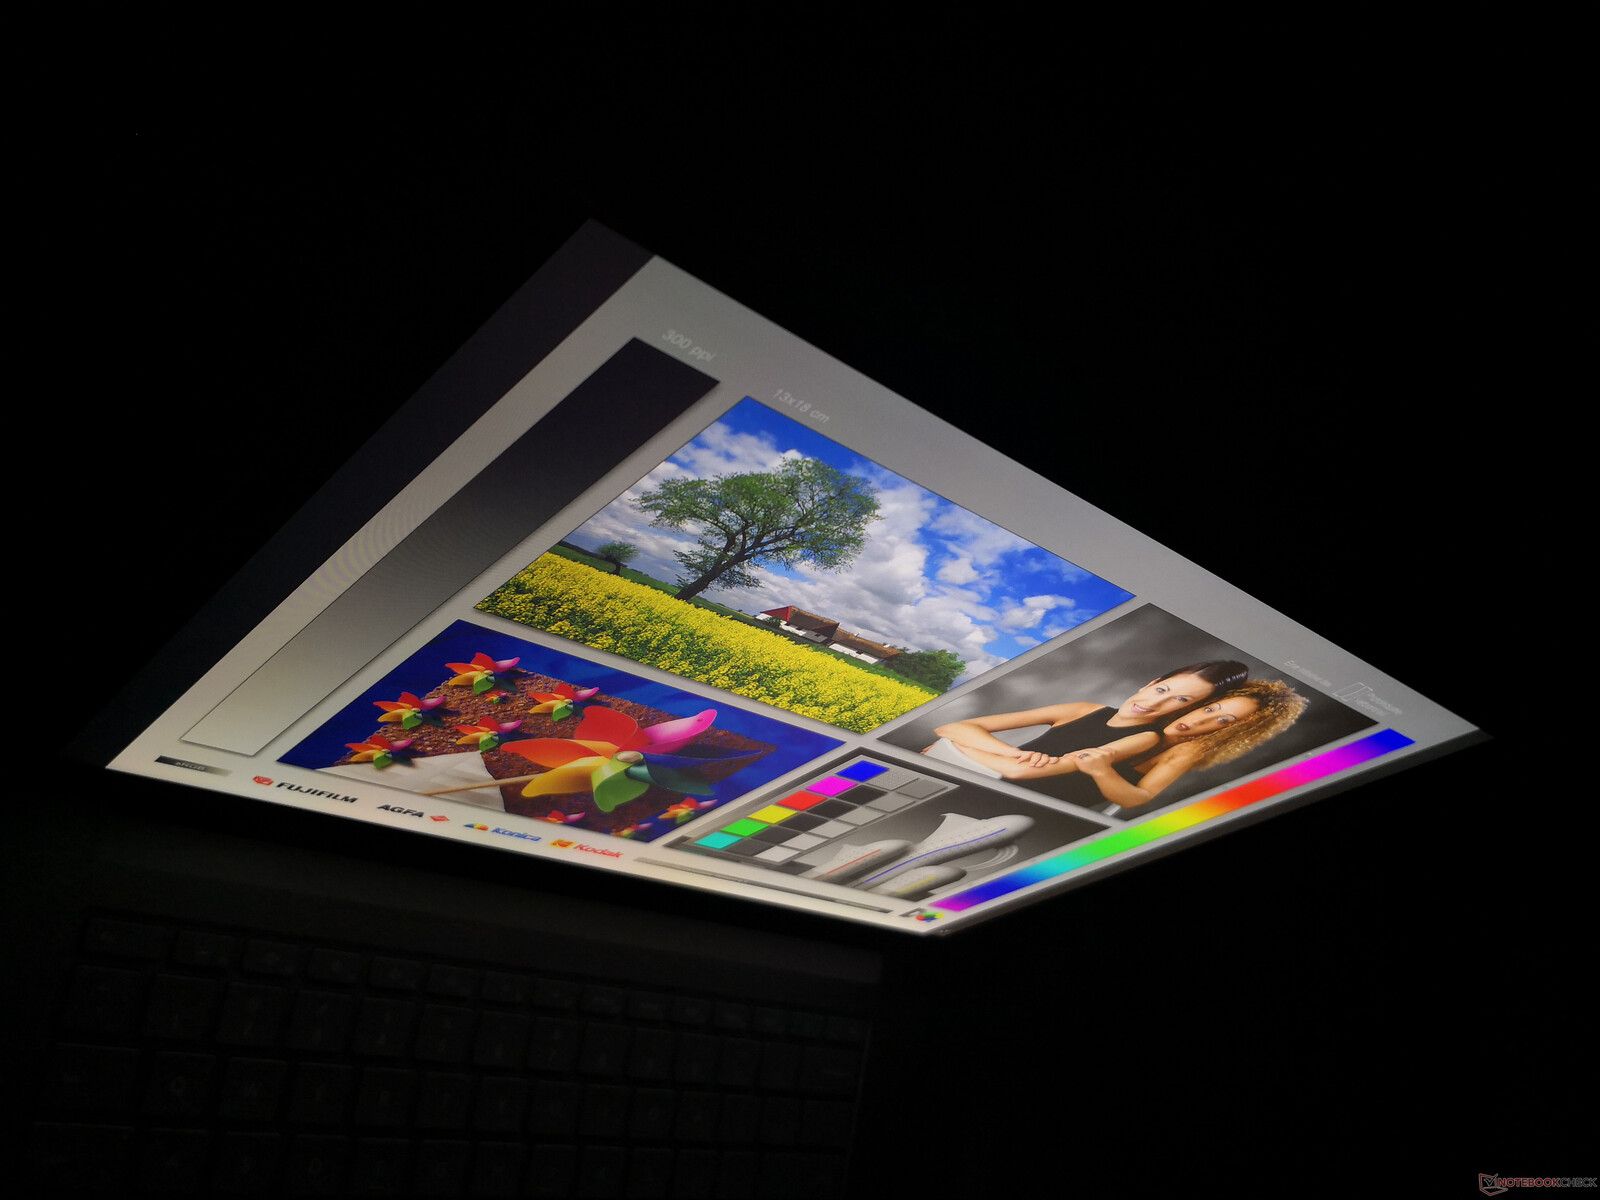
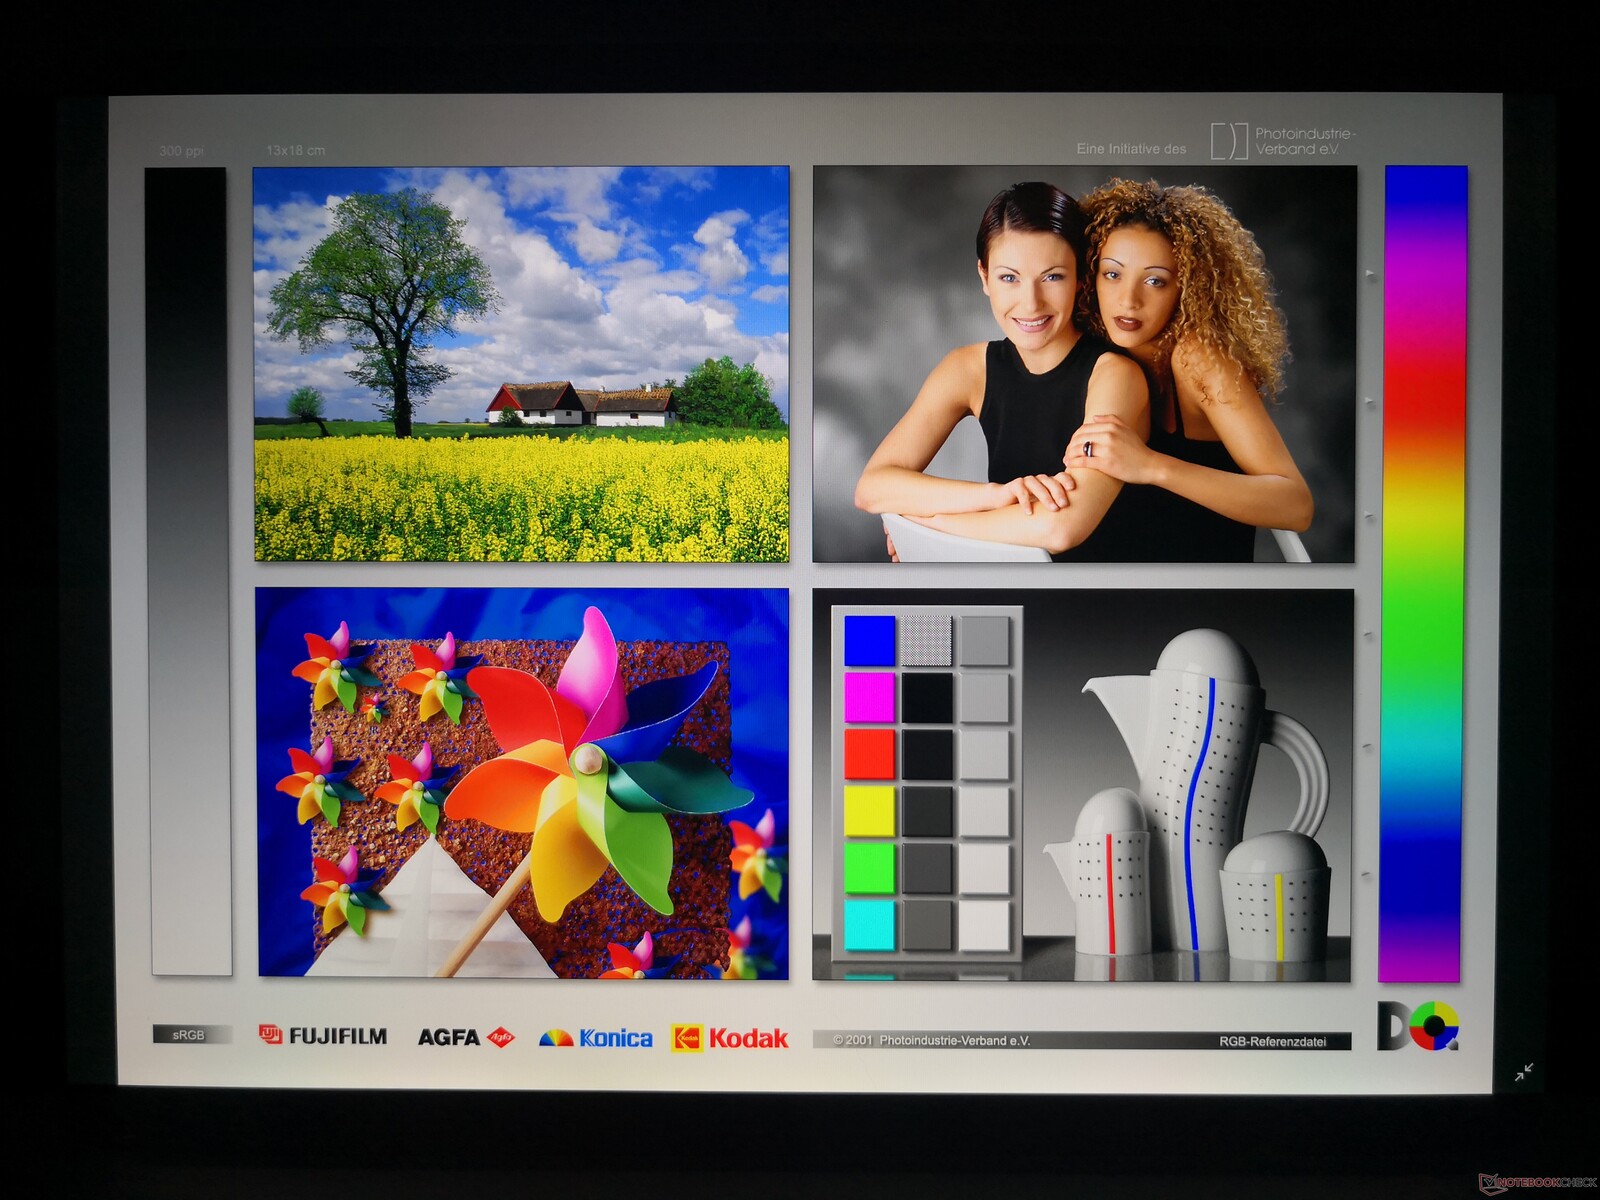
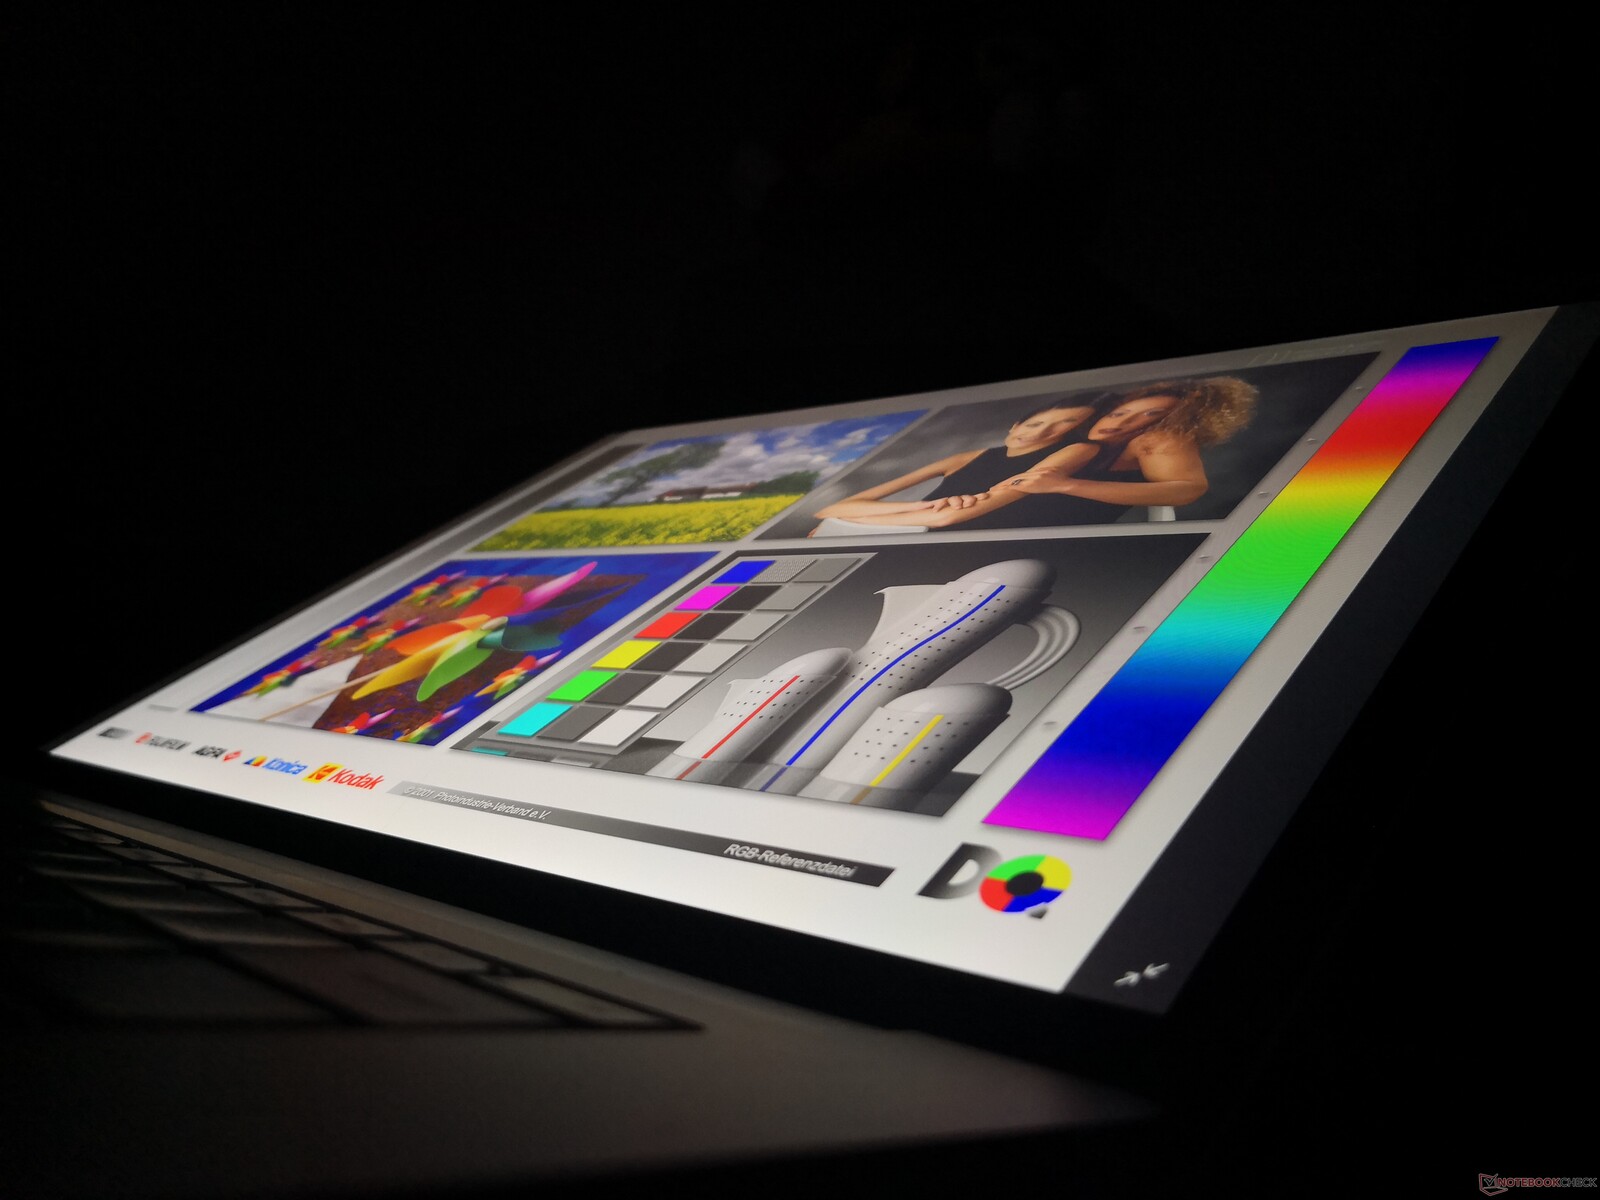
Obraz
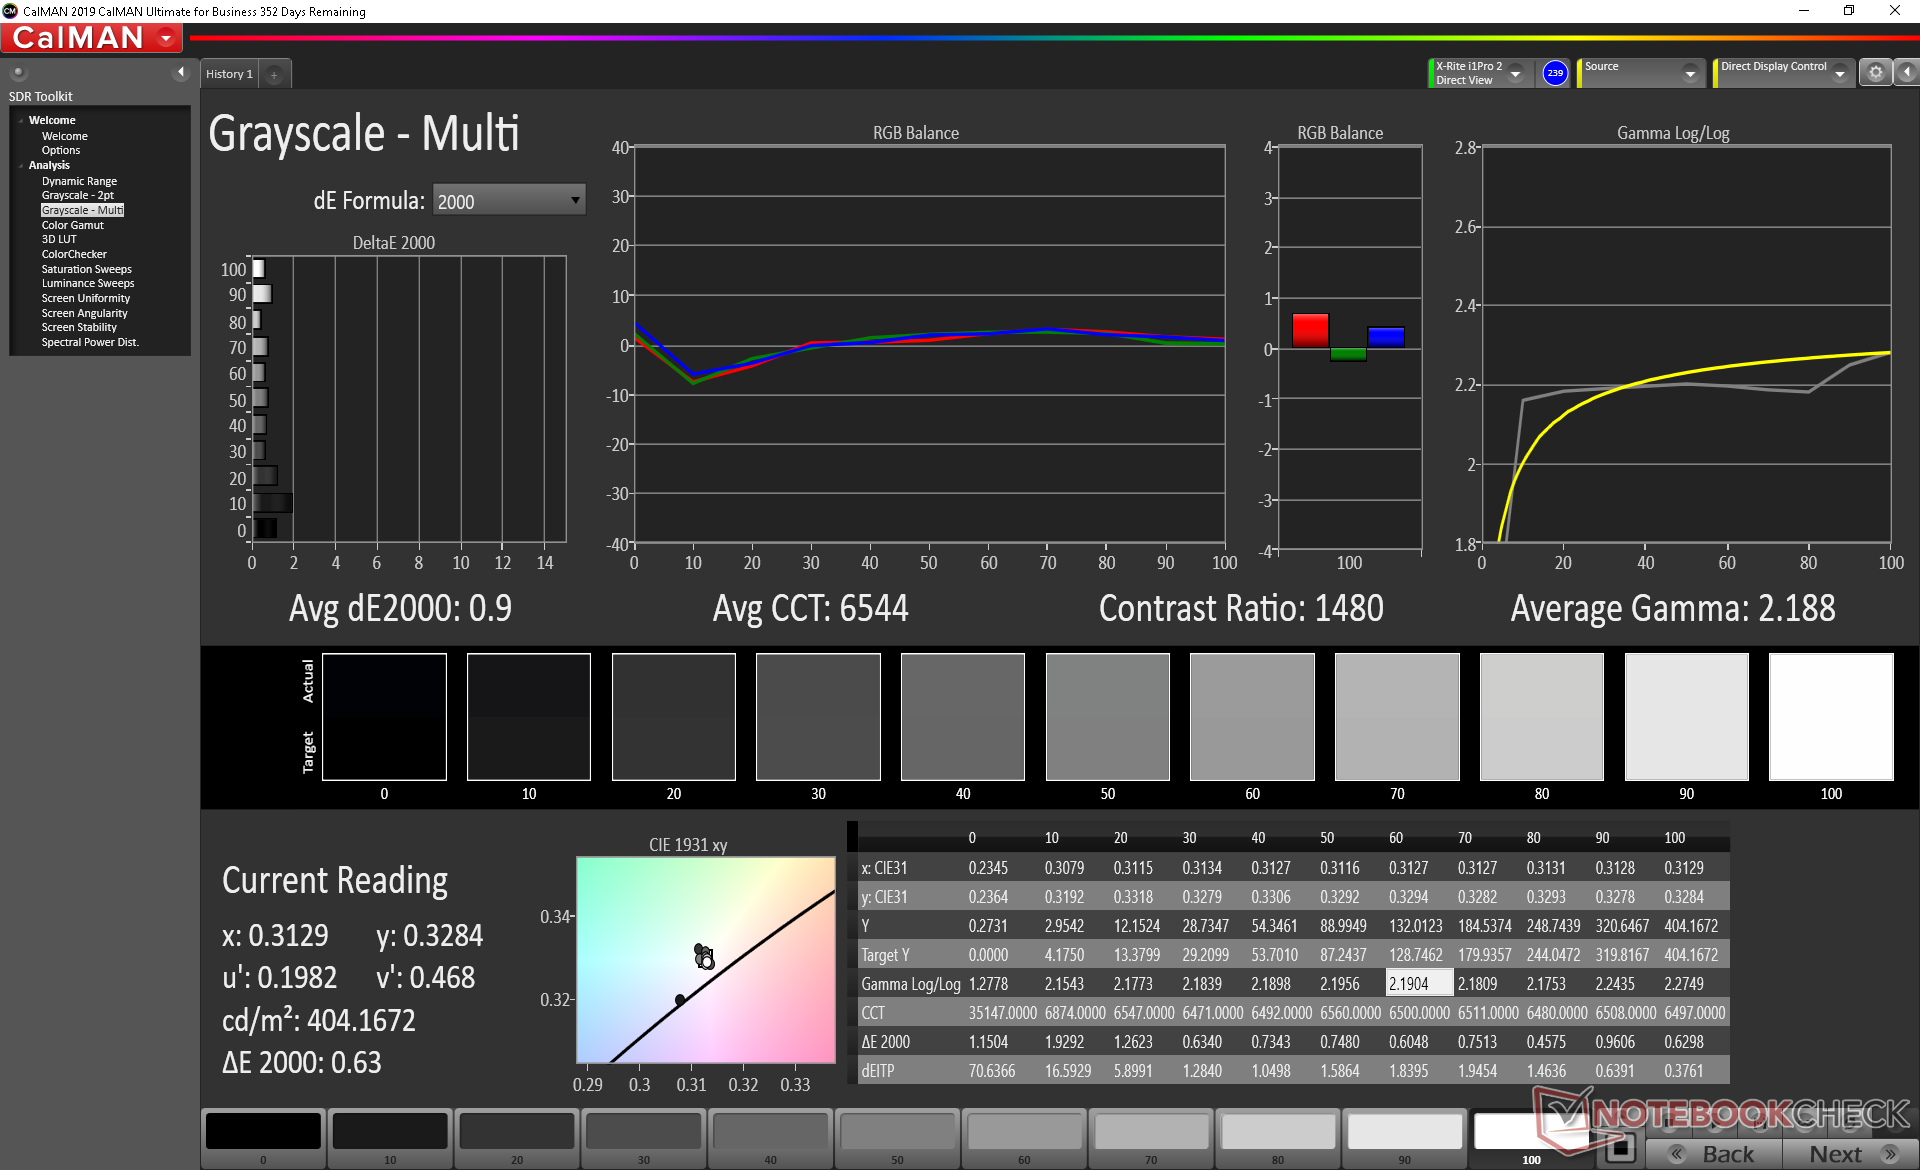
Matryca Sharp LQ150P1JX51 jest montowana we wszystkich konfiguracjach komputera Surface Laptop 3. Prezentuje ona te same parametry (jasność, kontrast, kolory, czas reakcji itp.), bez względu na to, czy obudowa mieści procesor firmy Intel czy AMD.
Konkurencyjne laptopy, Apple MacBook Pro 16 i Dell XPS 15 7590 z matrycą FHD firmy Sharp, radzą sobie lepiej na słońcu ze względu na jaśniejszy obraz.

| |||||||||||||||||||||||||
rozświetlenie: 78 %
na akumulatorze: 412.4 cd/m²
kontrast: 1178:1 (czerń: 0.35 cd/m²)
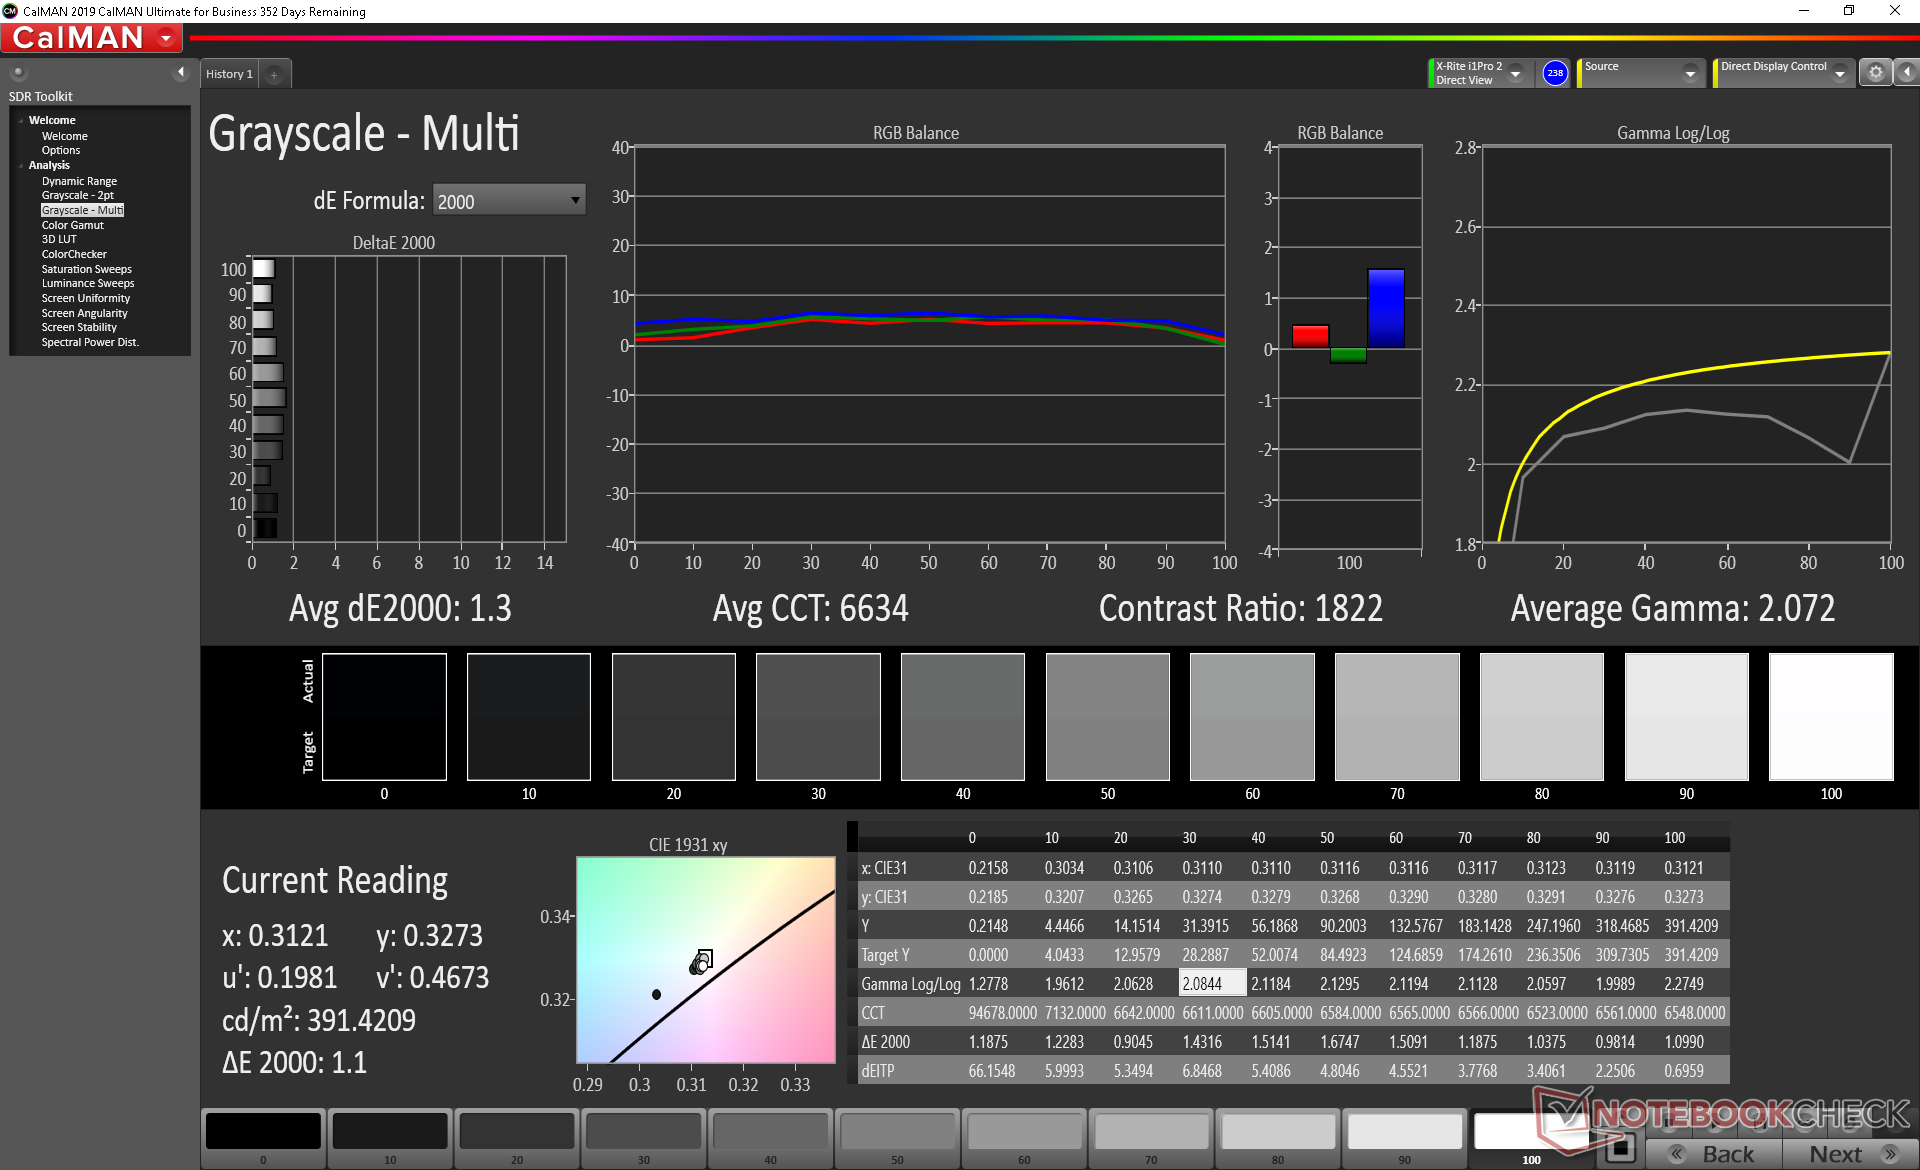
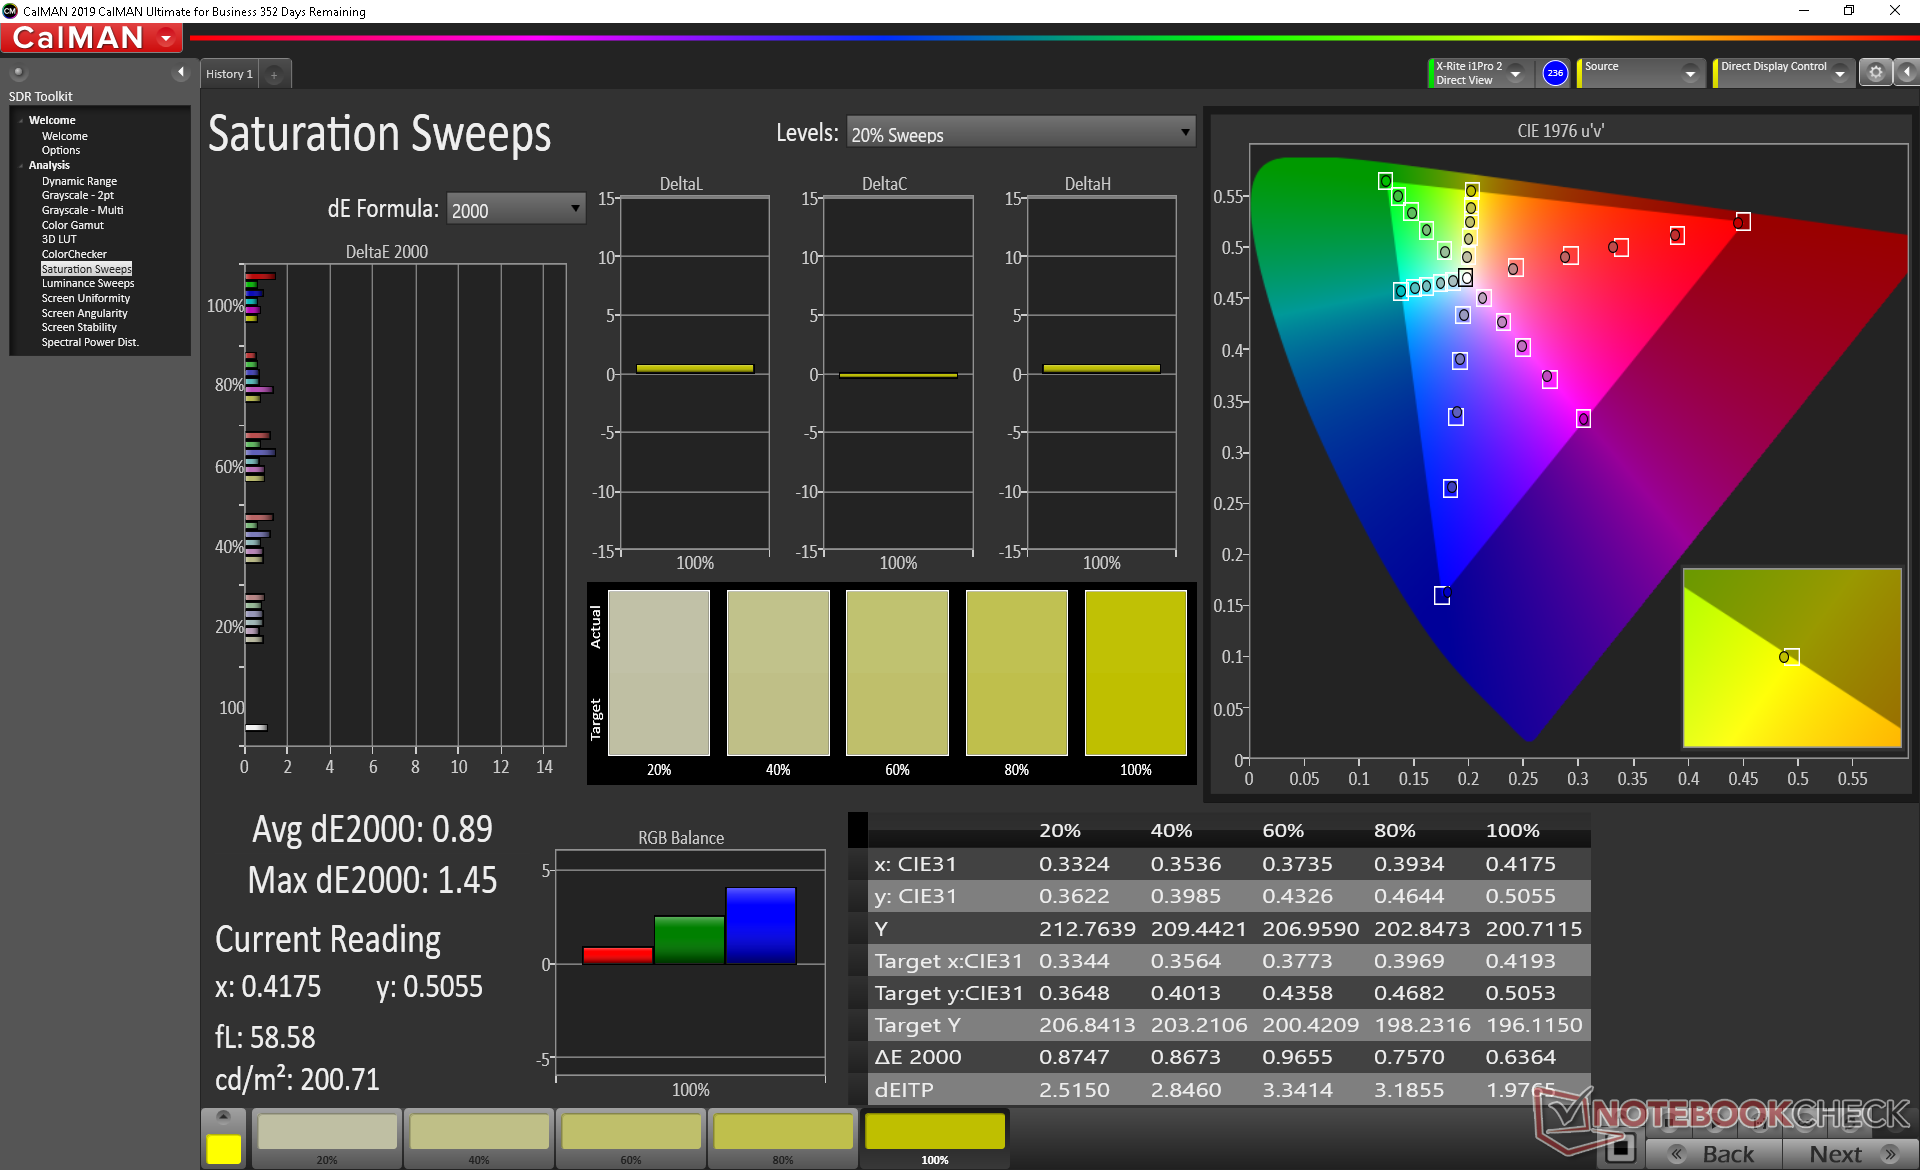
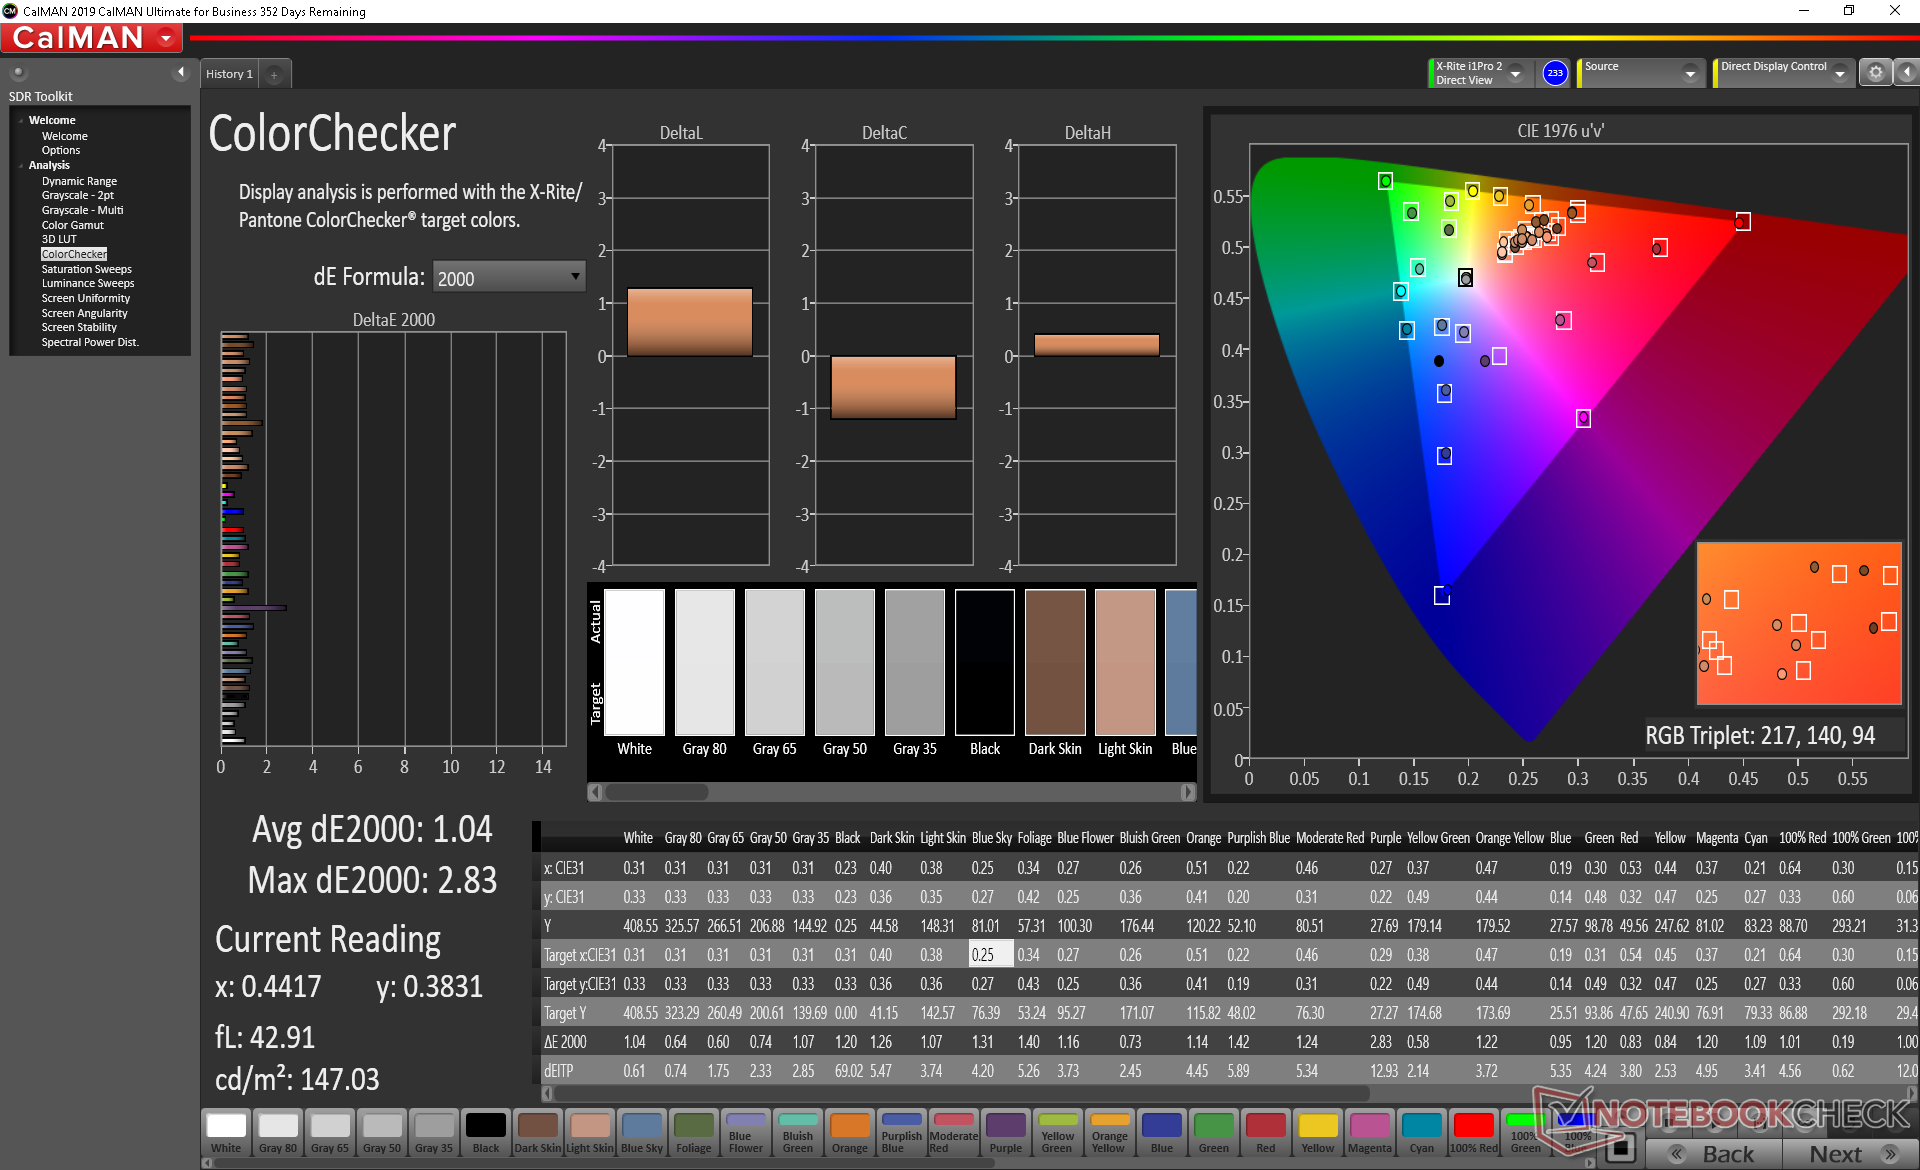
ΔE ColorChecker Calman: 1.04 | ∀{0.5-29.43 Ø4.72}
calibrated: 0.74
ΔE Greyscale Calman: 1.3 | ∀{0.09-98 Ø4.97}
98.4% sRGB (Argyll 1.6.3 3D)
62.4% AdobeRGB 1998 (Argyll 1.6.3 3D)
67.8% AdobeRGB 1998 (Argyll 3D)
98.4% sRGB (Argyll 3D)
65.6% Display P3 (Argyll 3D)
Gamma: 2.07
CCT: 6634 K
Jeśli idzie o paletę kolorów, matryca modelu Surface Laptop 3 zapewnia pełne pokrycie przestrzeni sRGB i w 62% pokrywa się z przestrzenią barw Adobe RGB.
Średnie błędy dla odcieni szarości i kolorów wynoszą tu odpowiednio 1,3 i 0,89. Kalibracja ekranu przynosi minimalną poprawę.
Wyświetl czasy reakcji
| ↔ Czas reakcji od czerni do bieli | ||
|---|---|---|
| 38 ms ... wzrost ↗ i spadek ↘ łącznie | ↗ 21.2 ms wzrost | 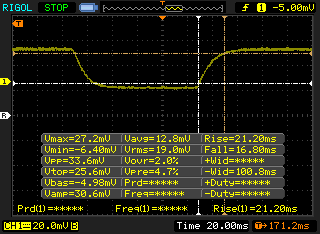 |
| ↘ 16.8 ms upadek | ||
| W naszych testach ekran wykazuje powolne tempo reakcji, co będzie niezadowalające dla graczy. Dla porównania, wszystkie testowane urządzenia wahają się od 0.1 (minimum) do 240 (maksimum) ms. » 96 % wszystkich urządzeń jest lepszych. Oznacza to, że zmierzony czas reakcji jest gorszy od średniej wszystkich testowanych urządzeń (19.8 ms). | ||
| ↔ Czas reakcji 50% szarości do 80% szarości | ||
| 56 ms ... wzrost ↗ i spadek ↘ łącznie | ↗ 27.6 ms wzrost | 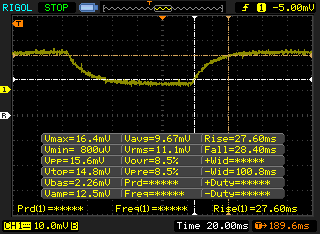 |
| ↘ 28.4 ms upadek | ||
| W naszych testach ekran wykazuje powolne tempo reakcji, co będzie niezadowalające dla graczy. Dla porównania, wszystkie testowane urządzenia wahają się od 0.165 (minimum) do 636 (maksimum) ms. » 93 % wszystkich urządzeń jest lepszych. Oznacza to, że zmierzony czas reakcji jest gorszy od średniej wszystkich testowanych urządzeń (31 ms). | ||
Migotanie ekranu / PWM (modulacja szerokości impulsu)
| Wykryto migotanie ekranu/wykryto PWM | 21370 Hz | ≤ 51 % ustawienia jasności | 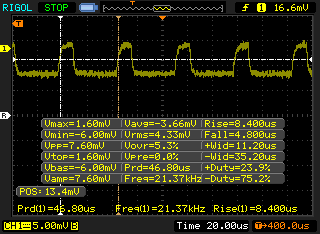 |
Podświetlenie wyświetlacza miga z częstotliwością 21370 Hz (najgorszy przypadek, np. przy użyciu PWM) Wykryto migotanie przy ustawieniu jasności 51 % i poniżej. Powyżej tego ustawienia jasności nie powinno być żadnego migotania ani PWM. Częstotliwość 21370 Hz jest dość wysoka, więc większość użytkowników wrażliwych na PWM nie powinna zauważyć żadnego migotania. Dla porównania: 52 % wszystkich testowanych urządzeń nie używa PWM do przyciemniania wyświetlacza. Jeśli wykryto PWM, zmierzono średnio 7763 (minimum: 5 - maksimum: 343500) Hz. | |||

Osiągi
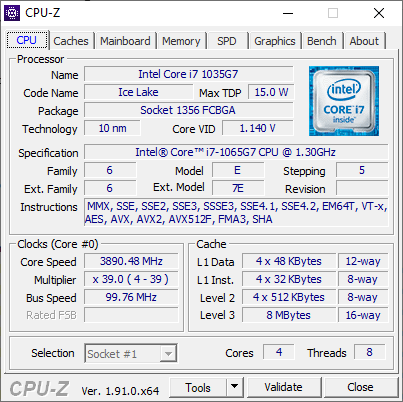
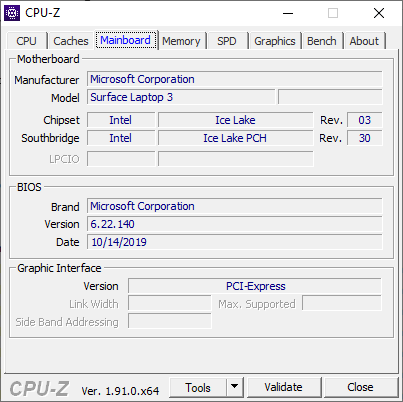
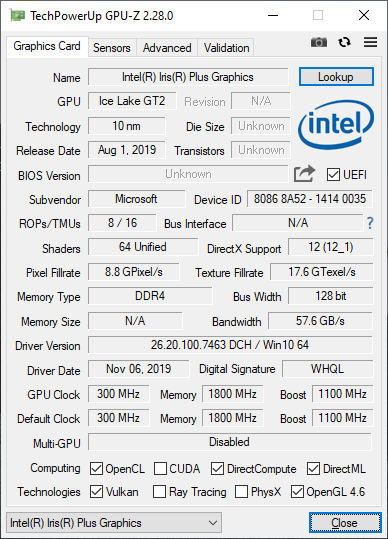
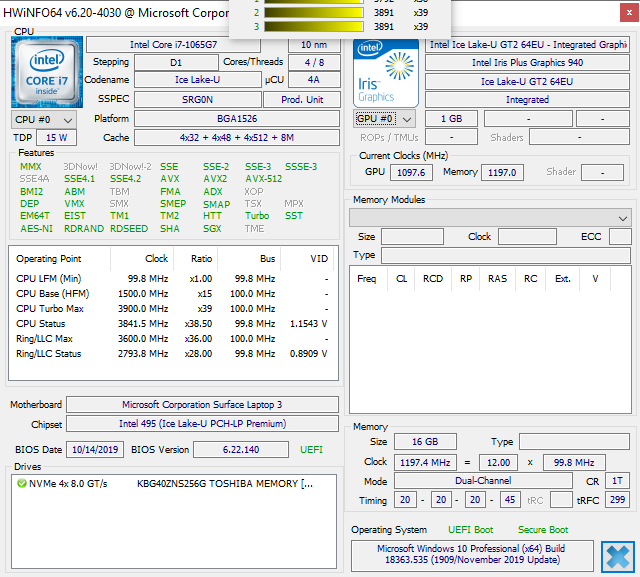
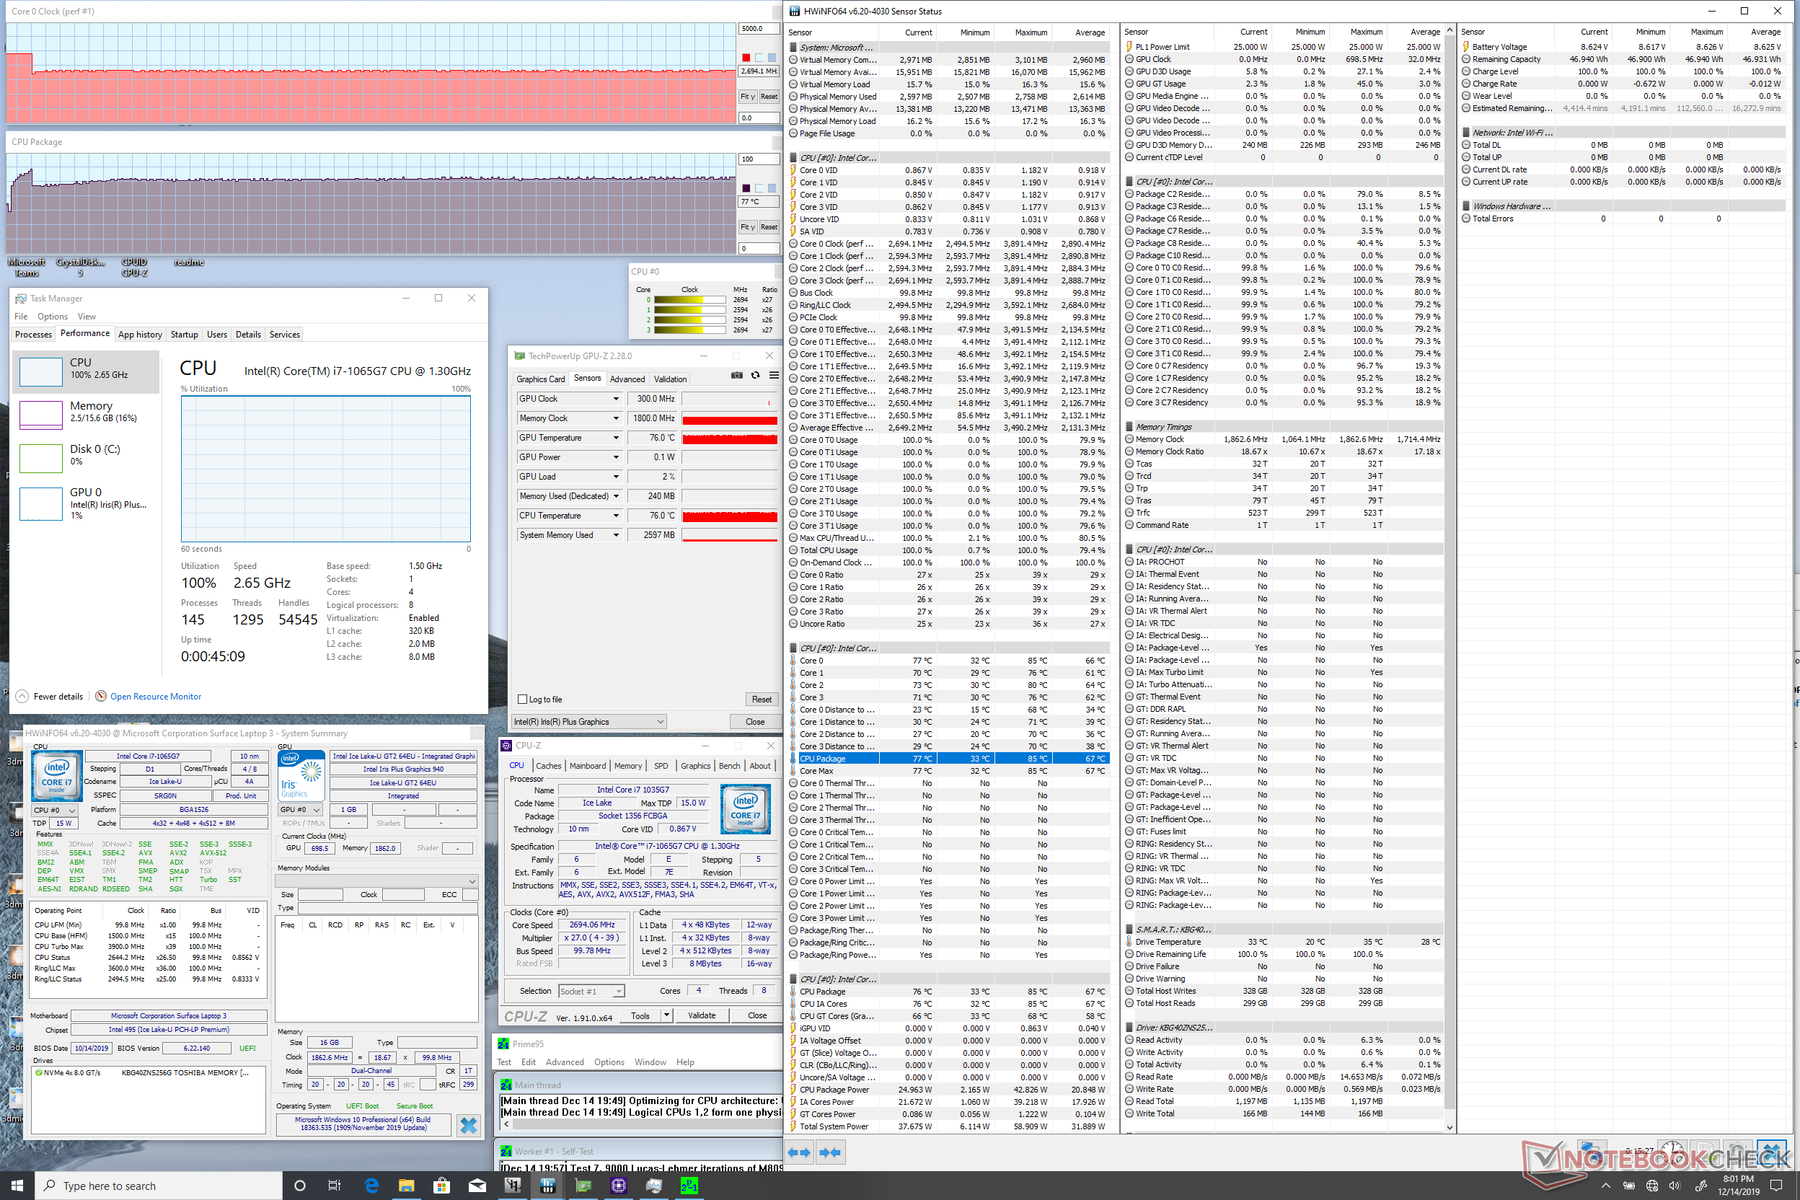
W testowanym egzemplarzu znalazł się procesor Intel Core i7-1065G7, czyli najwydajniejszy z dostępnych do zamówienia wraz z laptopem Microsoft Surface Laptop 3. To bezpośredni rywal procesora AMD Ryzen 7 3780U, tak jak Core i5-1035G7 ma nawiązywać walkę z procesorem Ryzen 5 3580U.
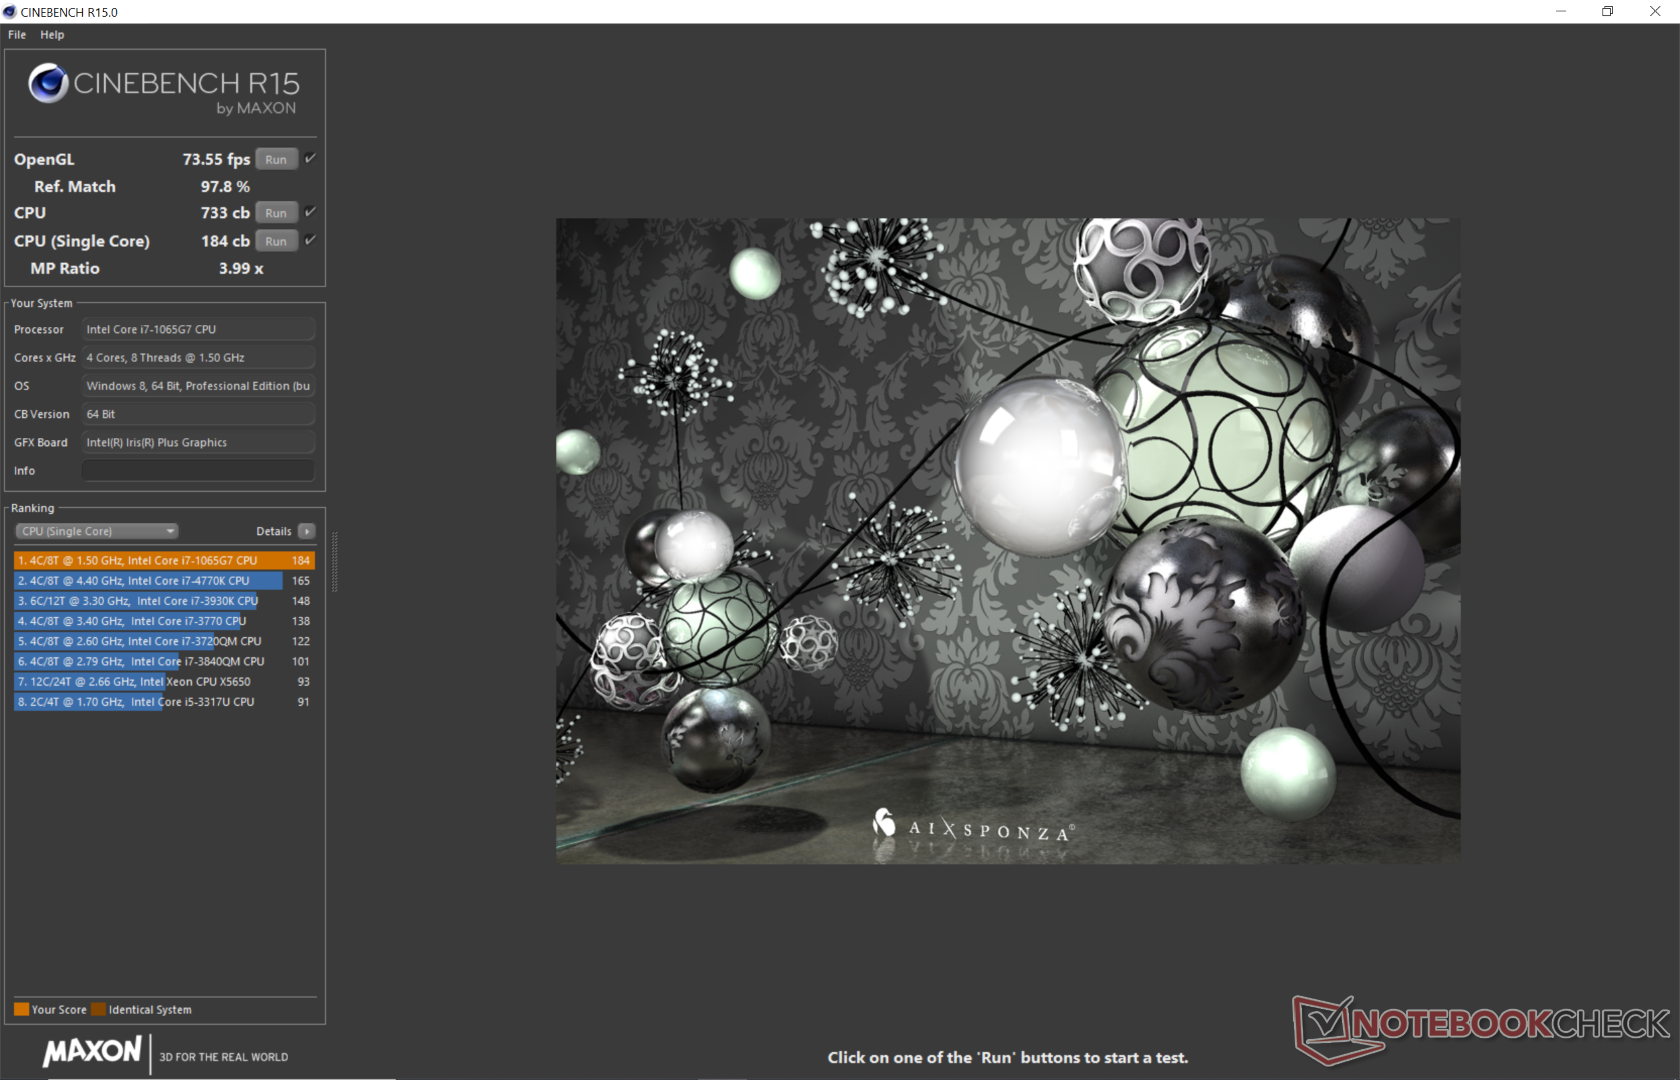
Tytułowy laptop dobrze radził sobie z testami wielowątkowymi wykonanymi oprogramowaniem Cinebench. W teście wielowątkowym CB R20 omawiany laptop z Core i7-1065G7 uzyskał rezultat o 13% lepszy od średniego wyniku innych modeli z tym samym procesorem. Wynik bohatera niniejszej recenzji był o 16% lepszy od osiągnięcia komputera Surface Laptop 3 z procesorem Ryzen 5 3580U. Dysponujący procesorem Core i5-9300H Dell G3 3590 poradził sobie tylko o 4% od omawianego modelu.
Nadspodziewanie dobrze było z utrzymywanie wydajności CPU na dłuższą metę. W zapętlonym teście renderowania wielowątkowego Cinebench R15 stwierdzono spadek wydajności o 7-11% w stosunku do pierwszej próby. Dla porównania w laptopie Lenovo Yoga C940-14IIL z tym samym procesorem (Core i7-1065G7) rezultaty pogorszyły się w porównaniu z początkowym o około 17%.
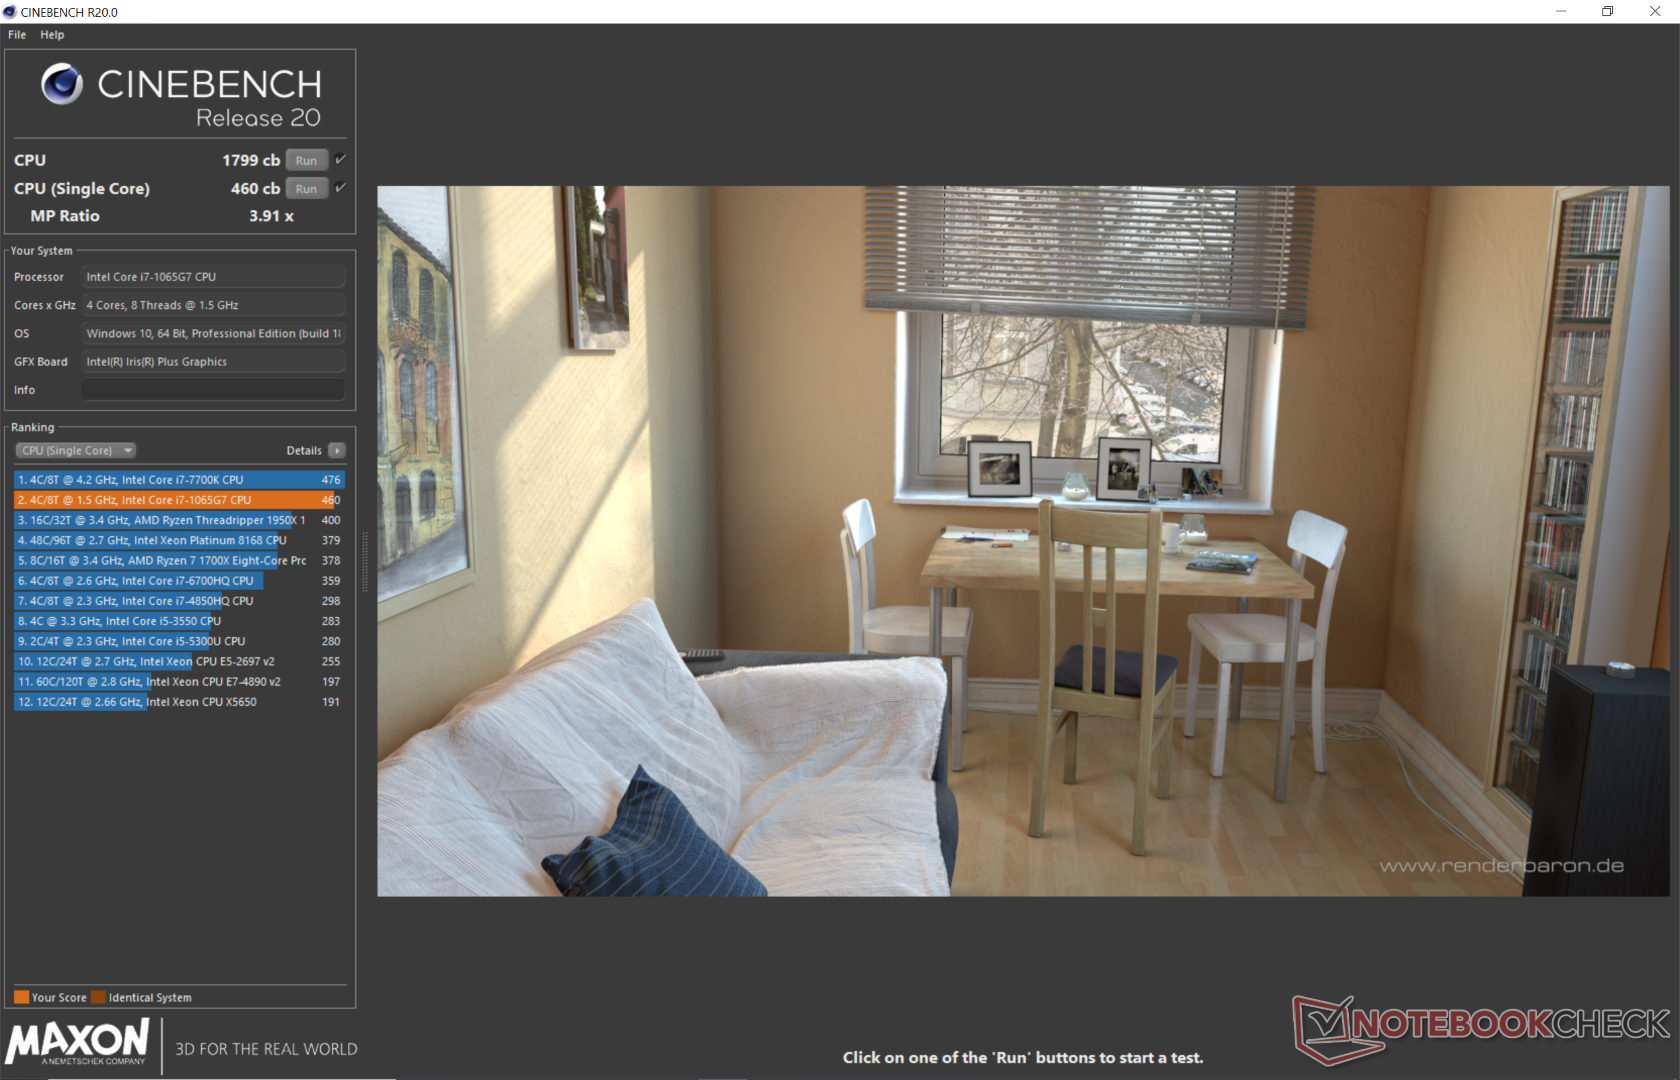
| Cinebench R20 | |
| CPU (Single Core) | |
| MSI Prestige 15 A10SC | |
| Microsoft Surface Laptop 3 15 i7-1065G7 | |
| Walmart EVOO Gaming 17 | |
| Microsoft Surface Pro 7 Core i5-1035G4 | |
| Przeciętny Intel Core i7-1065G7 (358 - 474, n=31) | |
| Dell G3 3590 | |
| Dell XPS 13 7390 2-in-1 Core i3 | |
| HP EliteBook x360 830 G6 | |
| Dynabook Portege A30-E-174 | |
| Microsoft Surface Laptop 3 15 Ryzen 5 3580U | |
| Dell Latitude 13 3390 | |
| Dell Inspiron 15 5000 5585 | |
| Dell Latitude 3400 | |
| CPU (Multi Core) | |
| Walmart EVOO Gaming 17 | |
| MSI Prestige 15 A10SC | |
| Dell G3 3590 | |
| Microsoft Surface Laptop 3 15 i7-1065G7 | |
| Microsoft Surface Laptop 3 15 Ryzen 5 3580U | |
| Przeciętny Intel Core i7-1065G7 (1081 - 2024, n=31) | |
| Dell Inspiron 15 5000 5585 | |
| Microsoft Surface Pro 7 Core i5-1035G4 | |
| HP EliteBook x360 830 G6 | |
| Dynabook Portege A30-E-174 | |
| Dell Latitude 13 3390 | |
| Dell XPS 13 7390 2-in-1 Core i3 | |
| Dell Latitude 3400 | |
| Cinebench R15 | |
| CPU Single 64Bit | |
| MSI Prestige 15 A10SC | |
| Microsoft Surface Laptop 3 15 i7-1065G7 | |
| Walmart EVOO Gaming 17 | |
| Przeciętny Intel Core i7-1065G7 (141 - 190, n=35) | |
| Dell G3 3590 | |
| Microsoft Surface Pro 7 Core i5-1035G4 | |
| HP EliteBook x360 830 G6 | |
| Dell XPS 13 7390 2-in-1 Core i3 | |
| Dynabook Portege A30-E-174 | |
| Dell Latitude 3400 | |
| Dell Latitude 13 3390 | |
| Microsoft Surface Laptop 3 15 Ryzen 5 3580U | |
| Dell Inspiron 15 5000 5585 | |
| CPU Multi 64Bit | |
| Walmart EVOO Gaming 17 | |
| MSI Prestige 15 A10SC | |
| Dell G3 3590 | |
| Microsoft Surface Laptop 3 15 i7-1065G7 | |
| Microsoft Surface Laptop 3 15 Ryzen 5 3580U | |
| Dell Inspiron 15 5000 5585 | |
| Przeciętny Intel Core i7-1065G7 (288 - 836, n=36) | |
| Microsoft Surface Pro 7 Core i5-1035G4 | |
| Dell Latitude 13 3390 | |
| HP EliteBook x360 830 G6 | |
| Dynabook Portege A30-E-174 | |
| Dell XPS 13 7390 2-in-1 Core i3 | |
| Dell Latitude 3400 | |
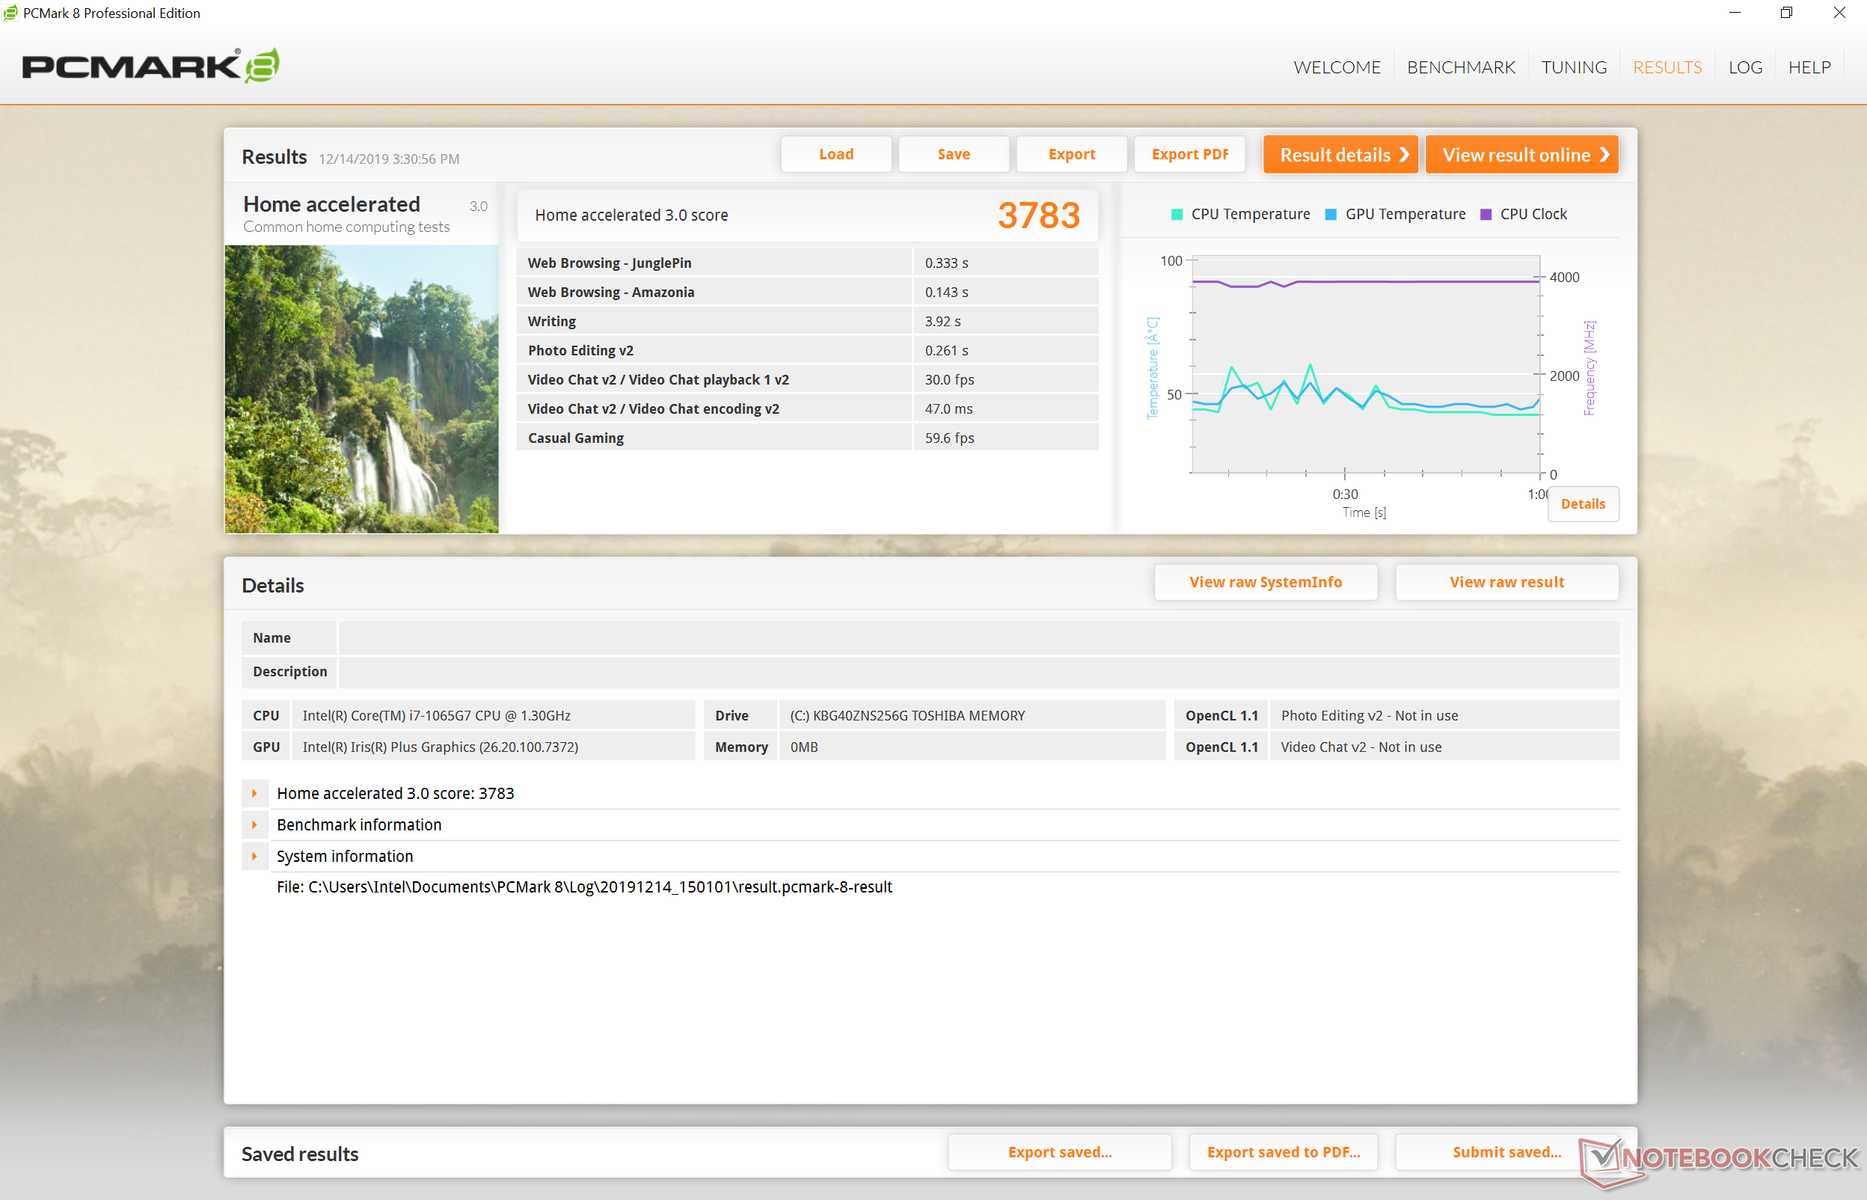
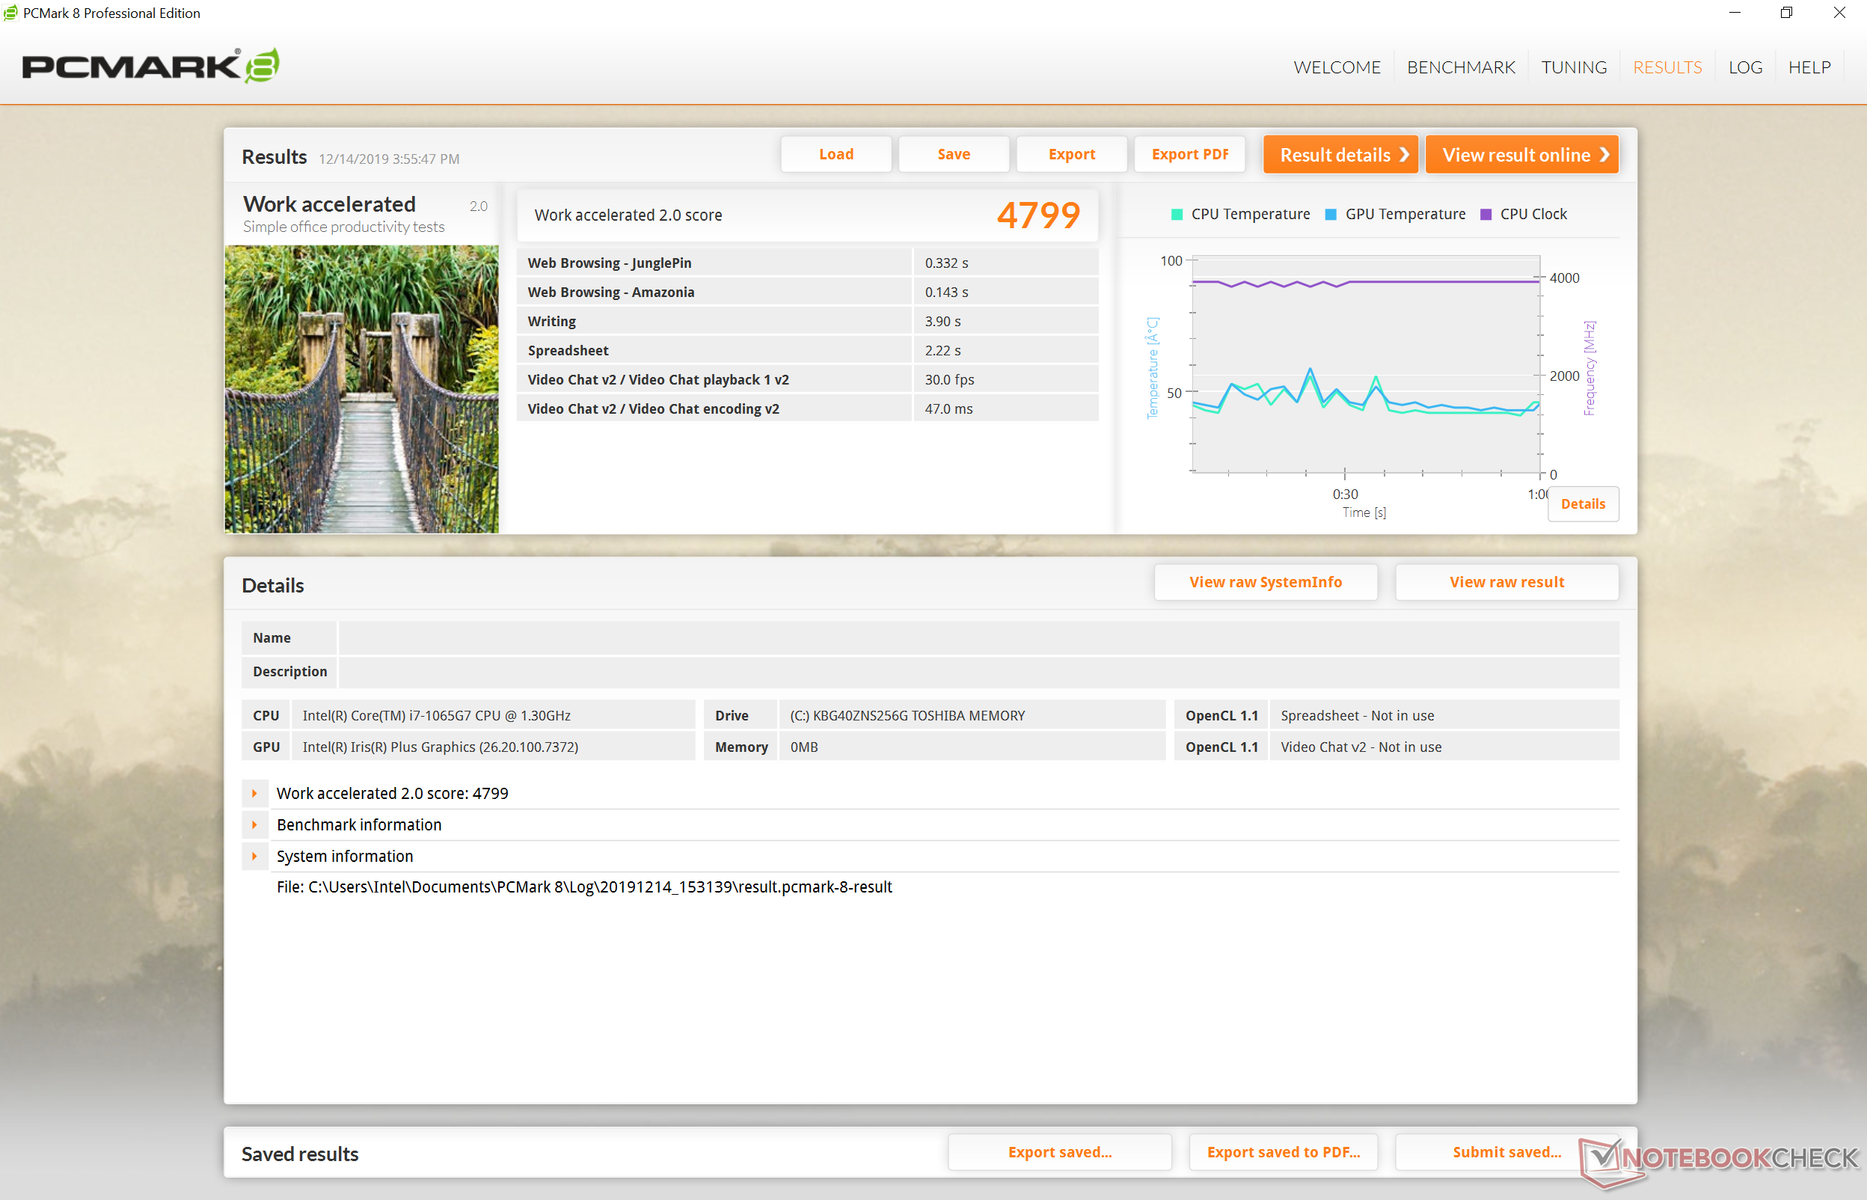
| PCMark 8 | |
| Home Score Accelerated v2 | |
| Dell XPS 15 7590 i5 iGPU FHD | |
| Microsoft Surface Laptop 3 15 i7-1065G7 | |
| Przeciętny Intel Core i7-1065G7, Intel Iris Plus Graphics G7 (Ice Lake 64 EU) (3305 - 4275, n=17) | |
| MSI Prestige 15 A10SC | |
| HP Spectre x360 15-df0126ng | |
| Microsoft Surface Laptop 3 15 Ryzen 5 3580U | |
| Work Score Accelerated v2 | |
| Dell XPS 15 7590 i5 iGPU FHD | |
| Microsoft Surface Laptop 3 15 i7-1065G7 | |
| MSI Prestige 15 A10SC | |
| HP Spectre x360 15-df0126ng | |
| Przeciętny Intel Core i7-1065G7, Intel Iris Plus Graphics G7 (Ice Lake 64 EU) (2460 - 5291, n=17) | |
| Microsoft Surface Laptop 3 15 Ryzen 5 3580U | |
| PCMark 8 Home Score Accelerated v2 | 3783 pkt. | |
| PCMark 8 Work Score Accelerated v2 | 4799 pkt. | |
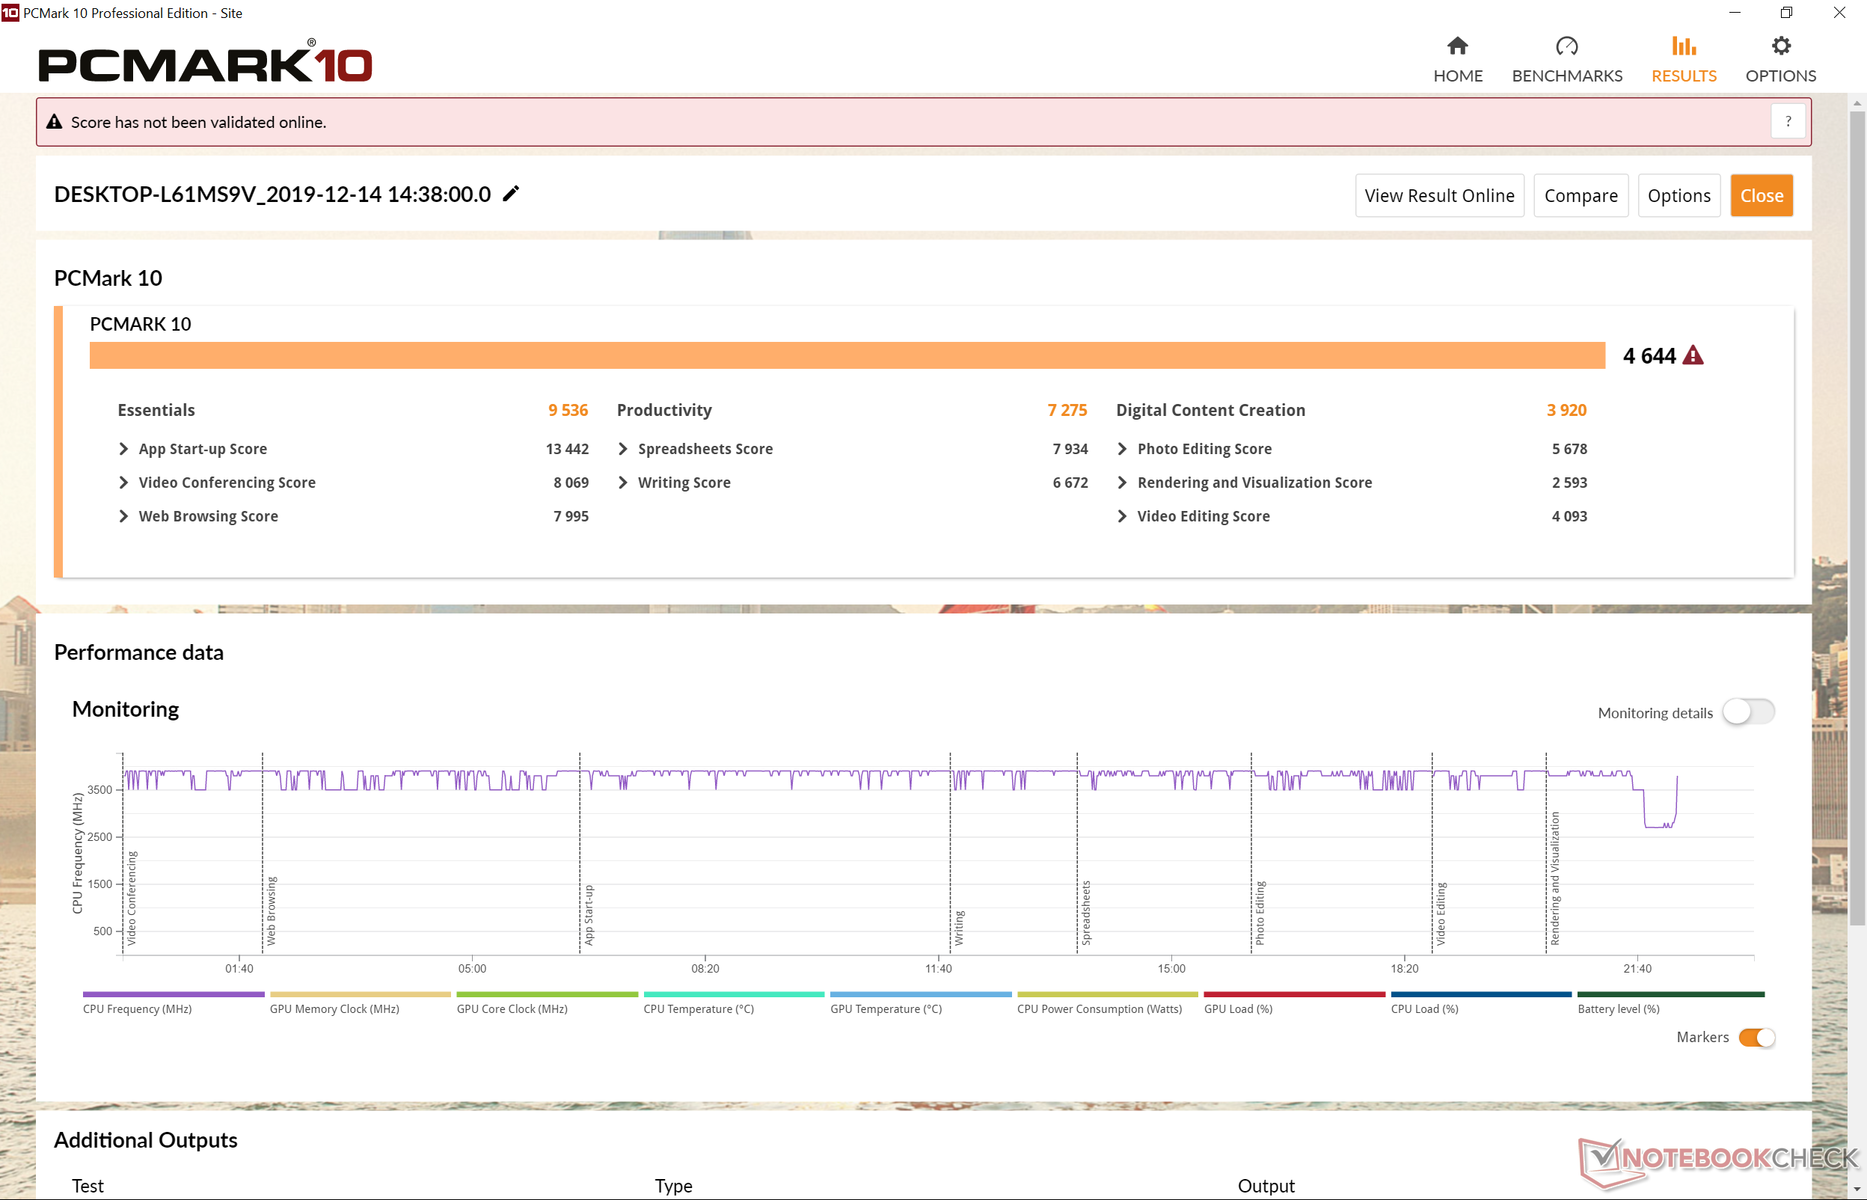
| PCMark 10 Score | 4644 pkt. | |
Pomoc | ||
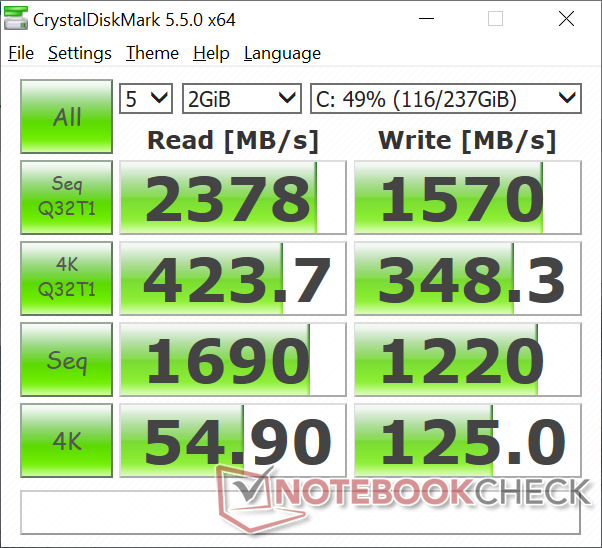
Co ciekawe, testowany sprzęt z procesorem Intela z procesorem Intela był wyposażony w dysk SSD o nazwie Toshiba KBG40ZNS256G (interfejs PCIe NVMe, pojemność 256 GB), podczas gdy w egzemplarzu z procesorem AMD zastosowano dysk SSD SK hynix BC501 (pojemność 256 GB).
W testach AS SSD dysk Toshiby okazał się szybszy. Osiągnął 1755 MB/s (odczyt sekwencyjny) i 818 MB/s (zapis sekwencyjny) wobec 1122 MB/s (odczyt) i 514 MB/s (zapis) w przypadku tego samego laptopa z procesorem AMD i dyskiem SK hynix.
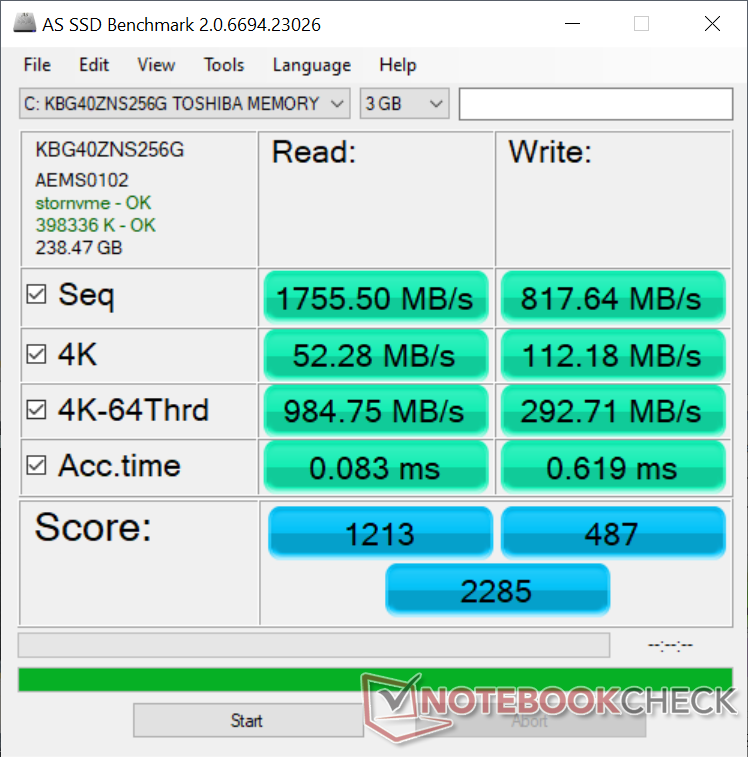
| Microsoft Surface Laptop 3 15 i7-1065G7 Toshiba KBG40ZNS256G NVMe | Apple MacBook Pro 16 2019 i9 5500M Apple SSD AP1024 7171 | Asus ZenBook 15 UX534FT-DB77 Samsung SSD PM981 MZVLB1T0HALR | MSI Prestige 15 A10SC Samsung SSD PM981 MZVLB1T0HALR | Microsoft Surface Laptop 3 15 Ryzen 5 3580U SK hynix BC501 HFM256GDGTNG | Razer Blade Stealth 13, Core i7-1065G7 Lite-On CA3-8D512 | |
|---|---|---|---|---|---|---|
| AS SSD | 82% | 66% | 85% | -21% | 13% | |
| Seq Read (MB/s) | 1756 | 2531 44% | 1887 7% | 1274 -27% | 1122 -36% | 2666 52% |
| Seq Write (MB/s) | 818 | 2289 180% | 1432 75% | 1395 71% | 514 -37% | 1497 83% |
| 4K Read (MB/s) | 52.3 | 15.85 -70% | 52.3 0% | 50.3 -4% | 34.98 -33% | 53.7 3% |
| 4K Write (MB/s) | 112.2 | 39.88 -64% | 146 30% | 119.8 7% | 96.8 -14% | 133.7 19% |
| 4K-64 Read (MB/s) | 985 | 1267 29% | 969 -2% | 1599 62% | 492 -50% | 652 -34% |
| 4K-64 Write (MB/s) | 292.7 | 1749 498% | 1375 370% | 1455 397% | 339.9 16% | 272 -7% |
| Access Time Read * (ms) | 0.083 | 0.122 -47% | 0.034 59% | 0.044 47% | 0.056 33% | 0.075 10% |
| Access Time Write * (ms) | 0.619 | 0.095 85% | 0.075 88% | 0.092 85% | 0.11 82% | 0.032 95% |
| Score Read (Points) | 1213 | 1536 27% | 1210 0% | 1777 46% | 639 -47% | 972 -20% |
| Score Write (Points) | 487 | 2018 314% | 1664 242% | 1714 252% | 488 0% | 555 14% |
| Score Total (Points) | 2285 | 4317 89% | 3483 52% | 4411 93% | 1434 -37% | 1982 -13% |
| Copy ISO MB/s (MB/s) | 1192 | 1995 67% | 1375 15% | 2830 137% | 828 -31% | 1495 25% |
| Copy Program MB/s (MB/s) | 604 | 584 -3% | 468 -23% | 609 1% | 200.5 -67% | 458.4 -24% |
| Copy Game MB/s (MB/s) | 1136 | 1135 0% | 1287 13% | 1424 25% | 387.4 -66% | 964 -15% |
* ... im mniej tym lepiej

| 3DMark | |
| 1280x720 Cloud Gate Standard Graphics | |
| Lenovo Yoga C940-15IRH | |
| Huawei MateBook 14 KLV-W29 | |
| Dell Inspiron 15 5000 5585 | |
| Microsoft Surface Laptop 3 15 Ryzen 5 3580U | |
| Microsoft Surface Laptop 3 15 i7-1065G7 | |
| Xiaomi Mi Notebook Pro i5 | |
| Przeciętny Intel Iris Plus Graphics G7 (Ice Lake 64 EU) (7024 - 18881, n=24) | |
| Walmart Motile M142 | |
| Microsoft Surface Laptop i7 | |
| Schenker Slim 15 L19 | |
| Dell Latitude 7400-8N6DH | |
| 1920x1080 Fire Strike Graphics | |
| Lenovo Yoga C940-15IRH | |
| Huawei MateBook 14 KLV-W29 | |
| Xiaomi Mi Notebook Pro i5 | |
| Microsoft Surface Laptop 3 15 i7-1065G7 | |
| Dell Inspiron 15 5000 5585 | |
| Microsoft Surface Laptop 3 15 Ryzen 5 3580U | |
| Przeciętny Intel Iris Plus Graphics G7 (Ice Lake 64 EU) (1418 - 3156, n=27) | |
| Walmart Motile M142 | |
| Microsoft Surface Laptop i7 | |
| Schenker Slim 15 L19 | |
| Dell Latitude 7400-8N6DH | |
| 2560x1440 Time Spy Graphics | |
| Lenovo Yoga C940-15IRH | |
| Huawei MateBook 14 KLV-W29 | |
| Xiaomi Mi Notebook Pro i5 | |
| Microsoft Surface Laptop 3 15 Ryzen 5 3580U | |
| Dell Inspiron 15 5000 5585 | |
| Microsoft Surface Laptop 3 15 i7-1065G7 | |
| Przeciętny Intel Iris Plus Graphics G7 (Ice Lake 64 EU) (526 - 851, n=23) | |
| Microsoft Surface Pro 7 Core i5-1035G4 | |
| Walmart Motile M142 | |
| Microsoft Surface Laptop i7 | |
| Schenker Slim 15 L19 | |
| Dell Latitude 7400-8N6DH | |
| 1920x1080 Fire Strike Score | |
| Lenovo Yoga C940-15IRH | |
| Huawei MateBook 14 KLV-W29 | |
| Xiaomi Mi Notebook Pro i5 | |
| Microsoft Surface Laptop 3 15 i7-1065G7 | |
| Dell Inspiron 15 5000 5585 | |
| Microsoft Surface Laptop 3 15 Ryzen 5 3580U | |
| Przeciętny Intel Iris Plus Graphics G7 (Ice Lake 64 EU) (1298 - 2925, n=26) | |
| Walmart Motile M142 | |
| Microsoft Surface Laptop i7 | |
| Schenker Slim 15 L19 | |
| Dell Latitude 7400-8N6DH | |
| 3DMark 11 | |
| 1280x720 Performance GPU | |
| Lenovo Yoga C940-15IRH | |
| Microsoft Surface Laptop 3 15 i7-1065G7 | |
| Huawei MateBook 14 KLV-W29 | |
| Microsoft Surface Laptop 3 15 Ryzen 5 3580U | |
| Xiaomi Mi Notebook Pro i5 | |
| Dell Inspiron 15 5000 5585 | |
| Przeciętny Intel Iris Plus Graphics G7 (Ice Lake 64 EU) (2112 - 4630, n=28) | |
| Walmart Motile M142 | |
| Microsoft Surface Pro 7 Core i5-1035G4 | |
| Microsoft Surface Laptop i7 | |
| Microsoft Surface Laptop i7 | |
| Schenker Slim 15 L19 | |
| Dell Latitude 7400-8N6DH | |
| 1280x720 Performance Combined | |
| Lenovo Yoga C940-15IRH | |
| Huawei MateBook 14 KLV-W29 | |
| Microsoft Surface Laptop 3 15 i7-1065G7 | |
| Xiaomi Mi Notebook Pro i5 | |
| Dell Inspiron 15 5000 5585 | |
| Przeciętny Intel Iris Plus Graphics G7 (Ice Lake 64 EU) (1319 - 4163, n=28) | |
| Microsoft Surface Laptop 3 15 Ryzen 5 3580U | |
| Microsoft Surface Pro 7 Core i5-1035G4 | |
| Walmart Motile M142 | |
| Microsoft Surface Laptop i7 | |
| Microsoft Surface Laptop i7 | |
| Schenker Slim 15 L19 | |
| Dell Latitude 7400-8N6DH | |
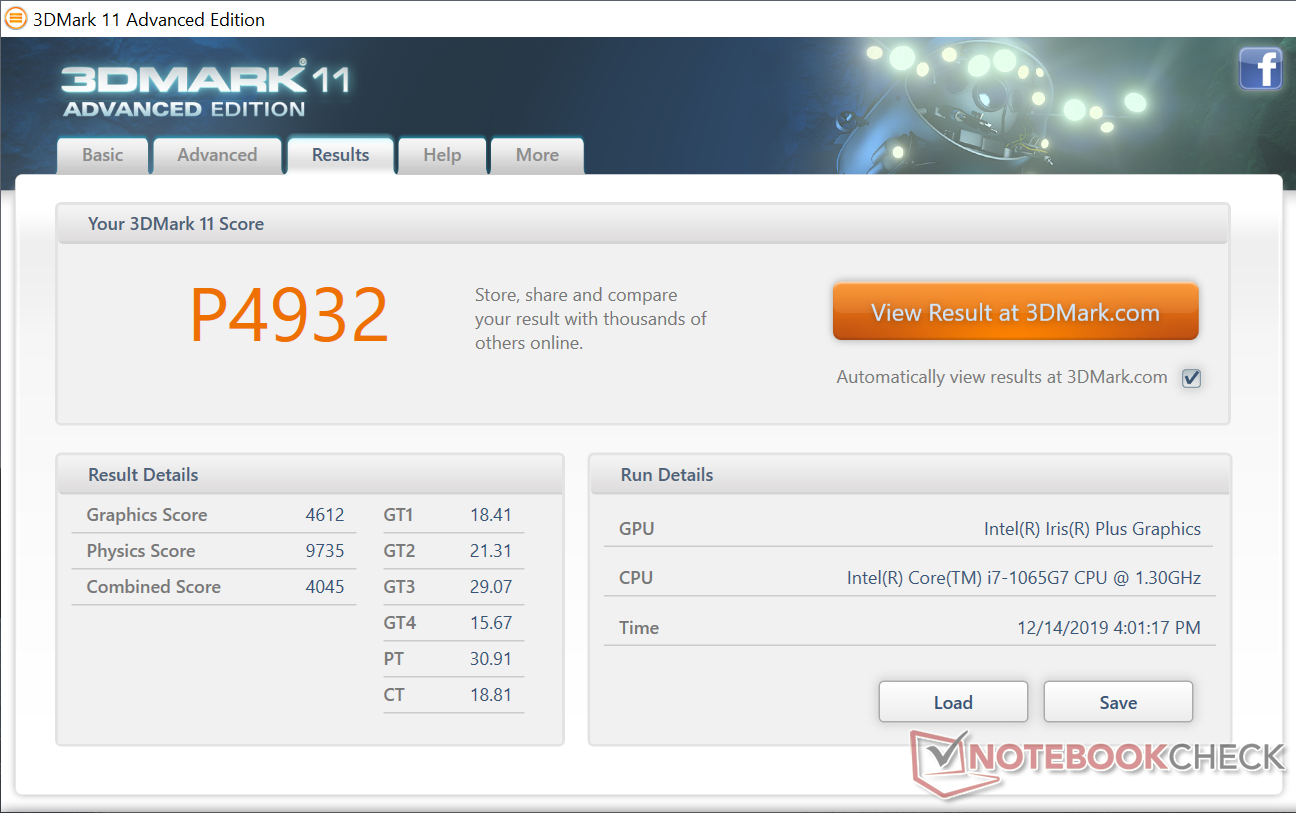
| 3DMark 11 Performance | 4932 pkt. | |
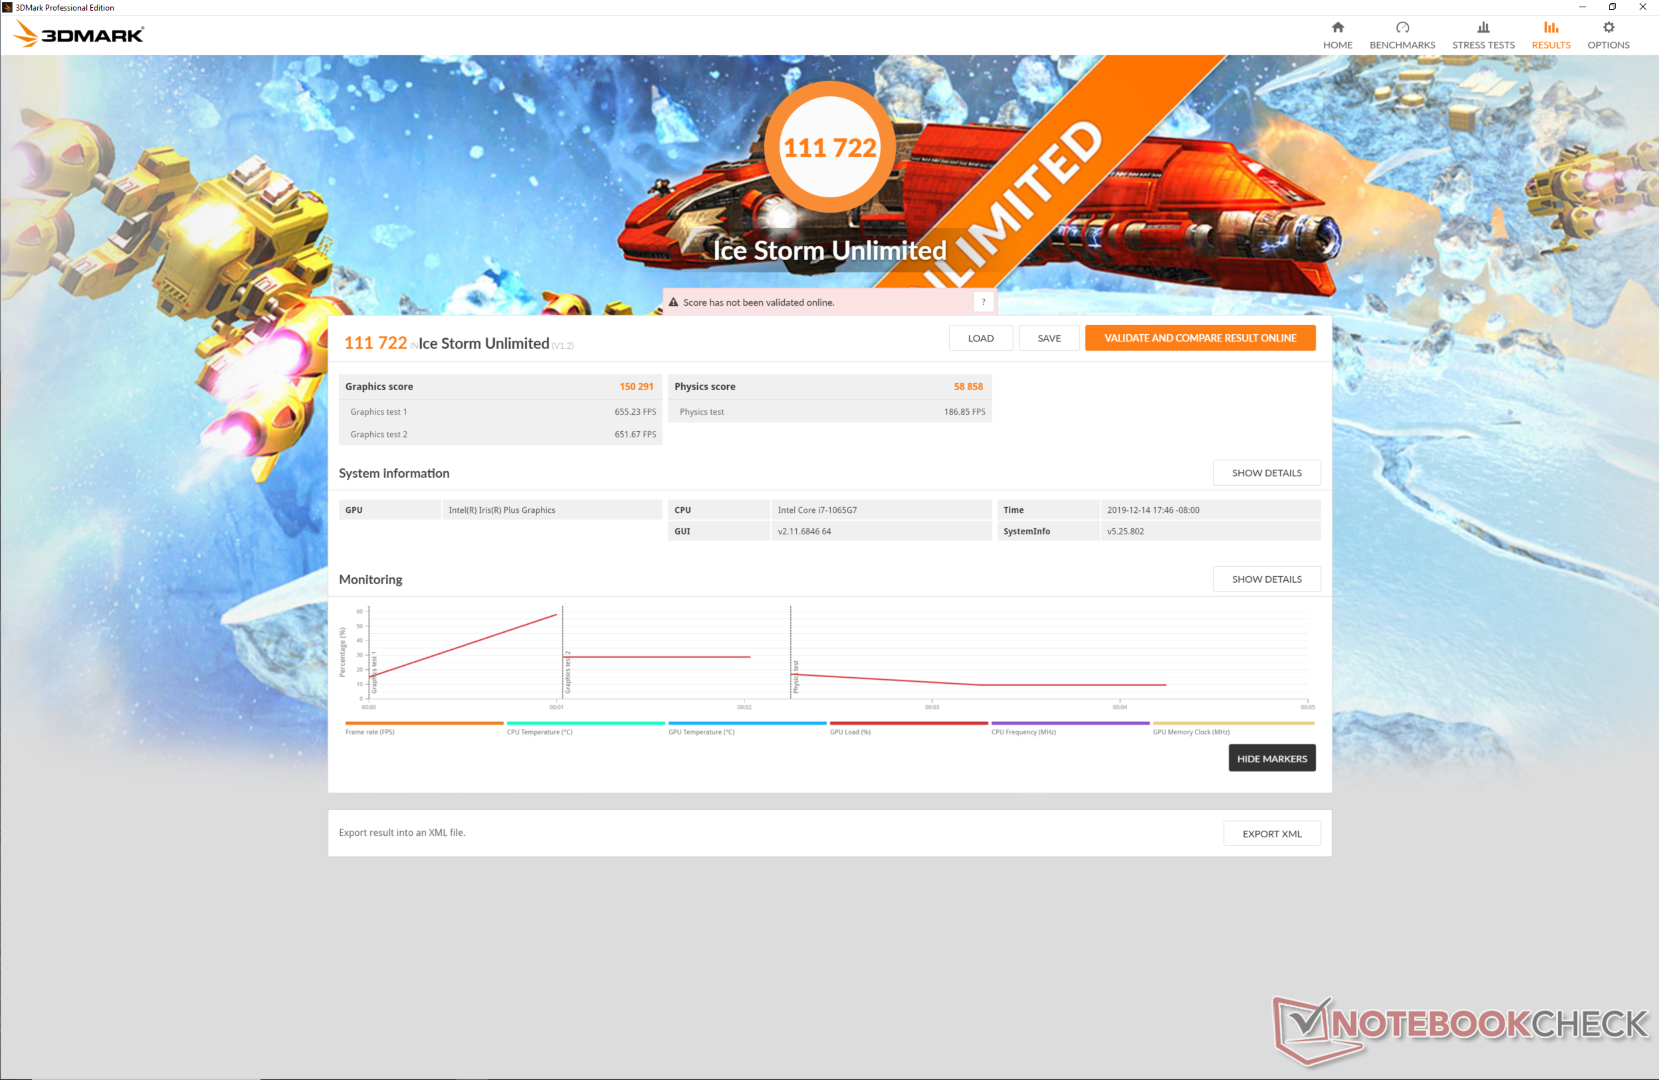
| 3DMark Ice Storm Standard Score | 67987 pkt. | |
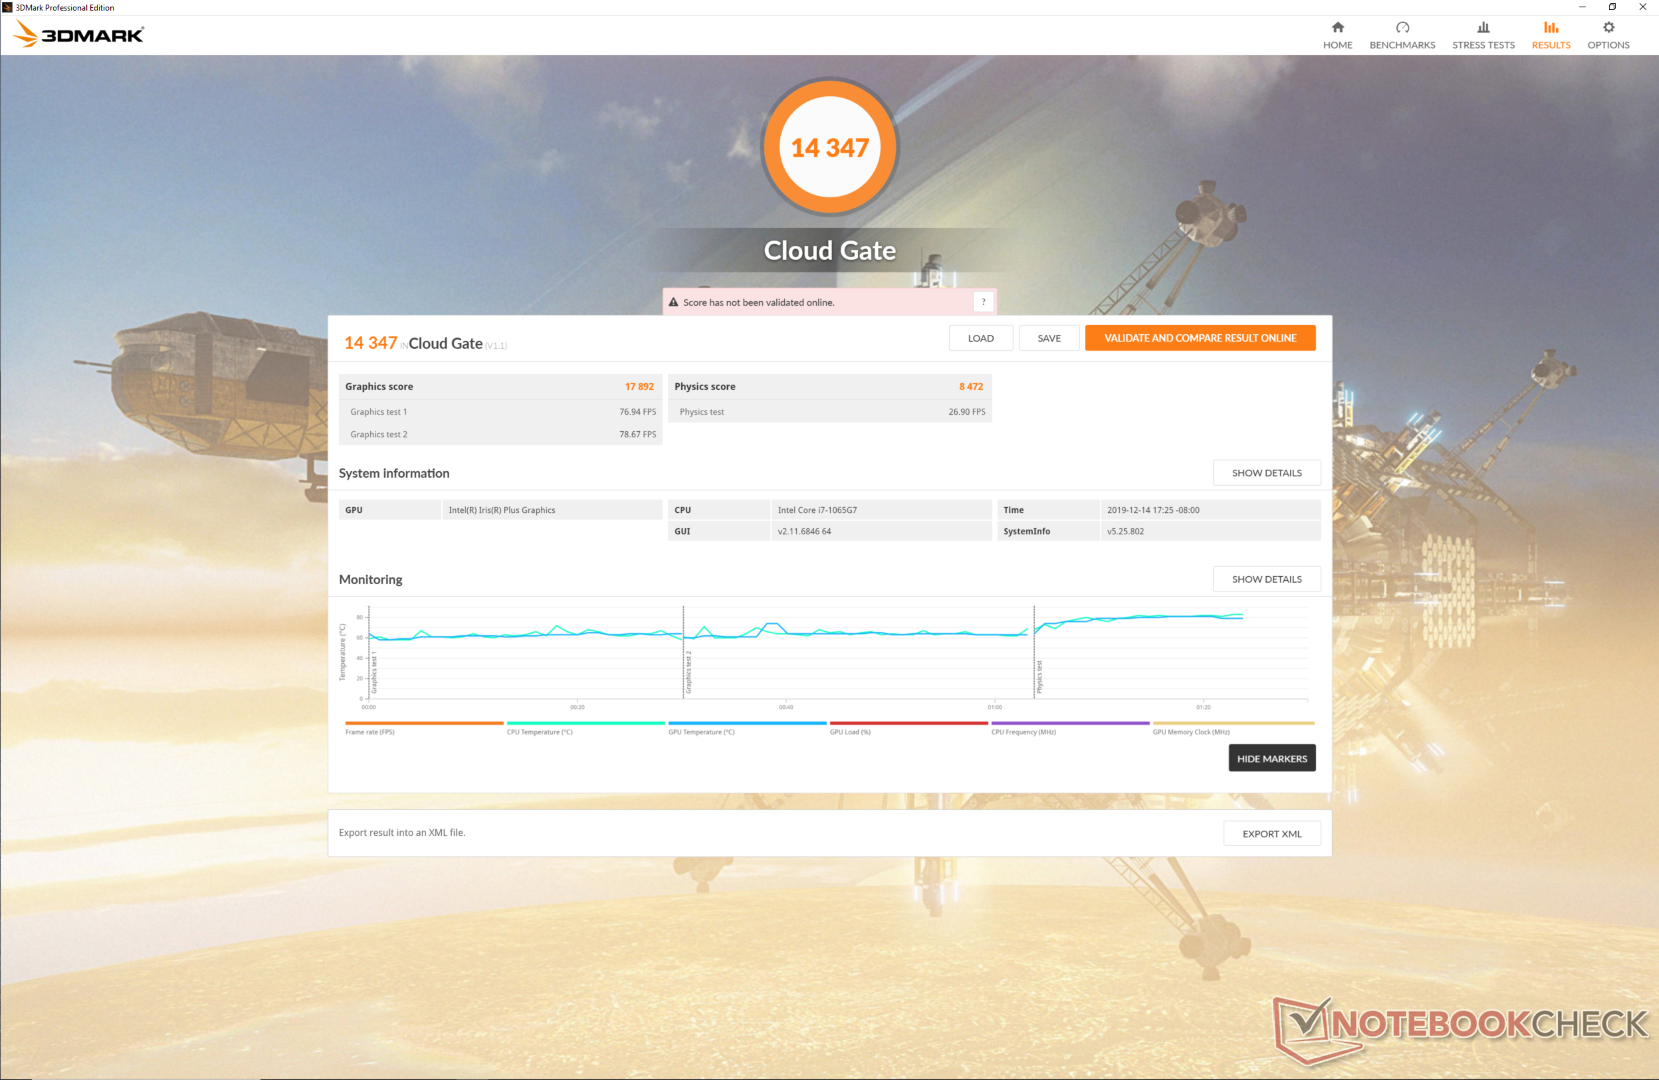
| 3DMark Cloud Gate Standard Score | 14347 pkt. | |
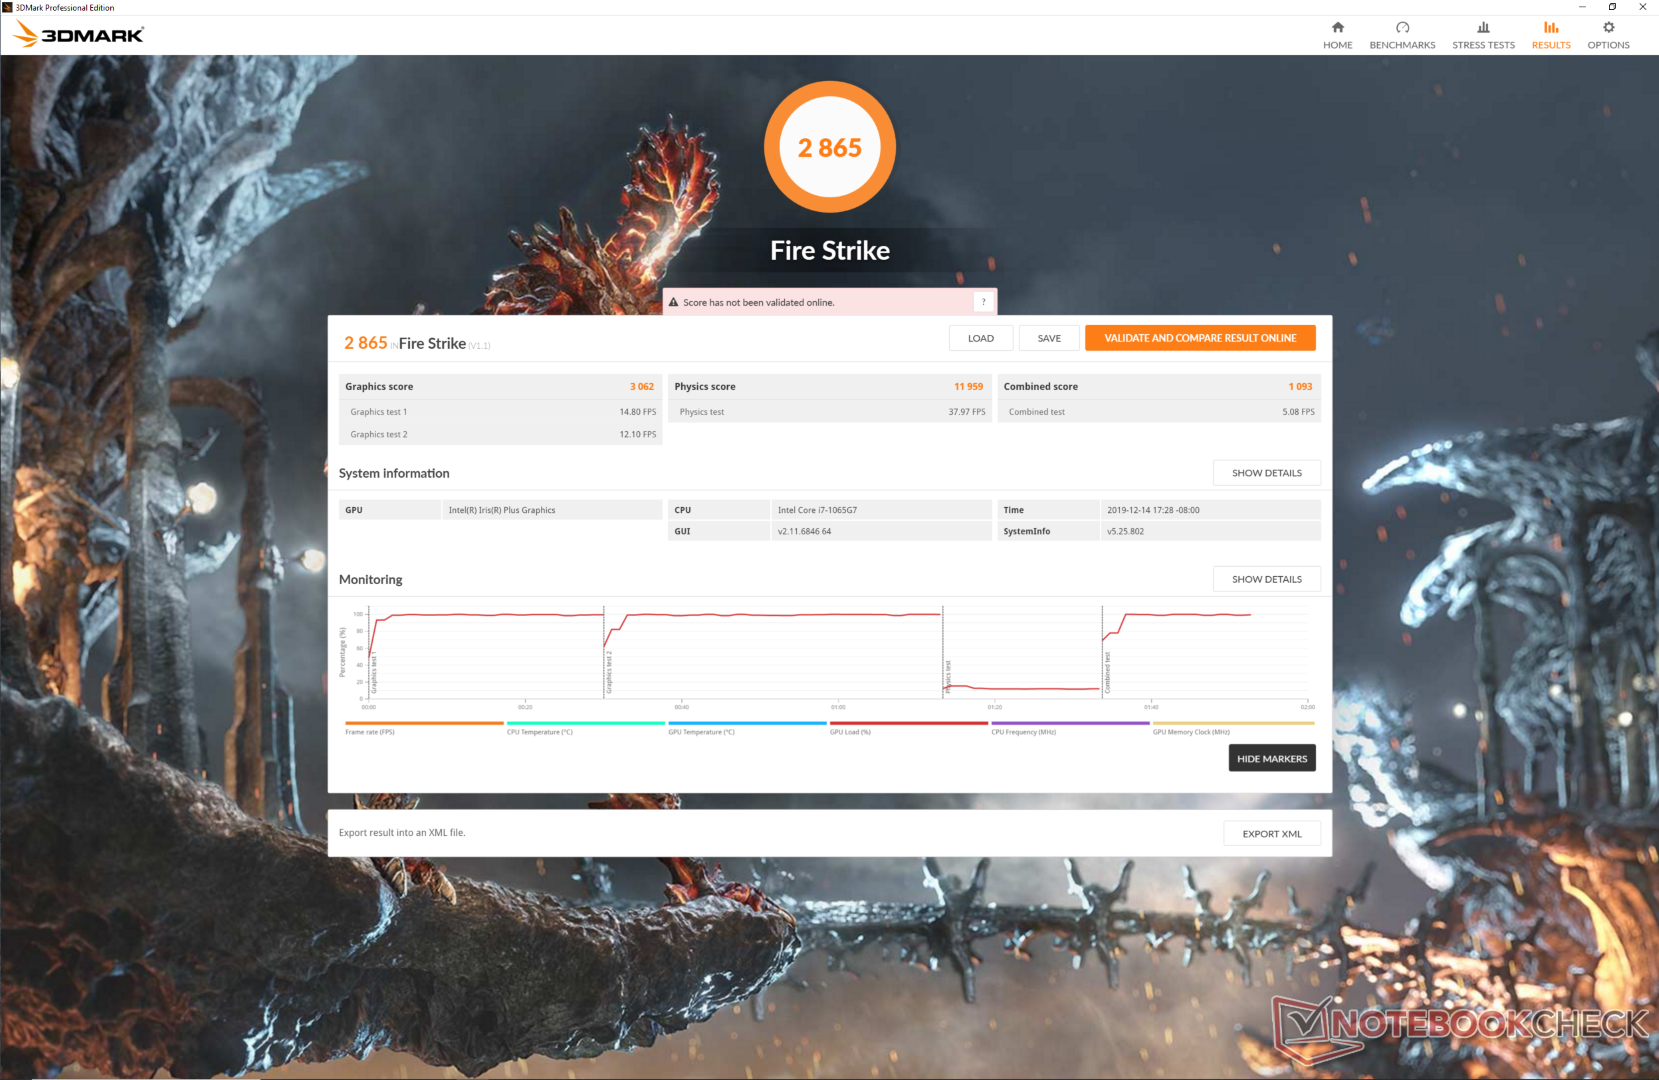
| 3DMark Fire Strike Score | 2865 pkt. | |
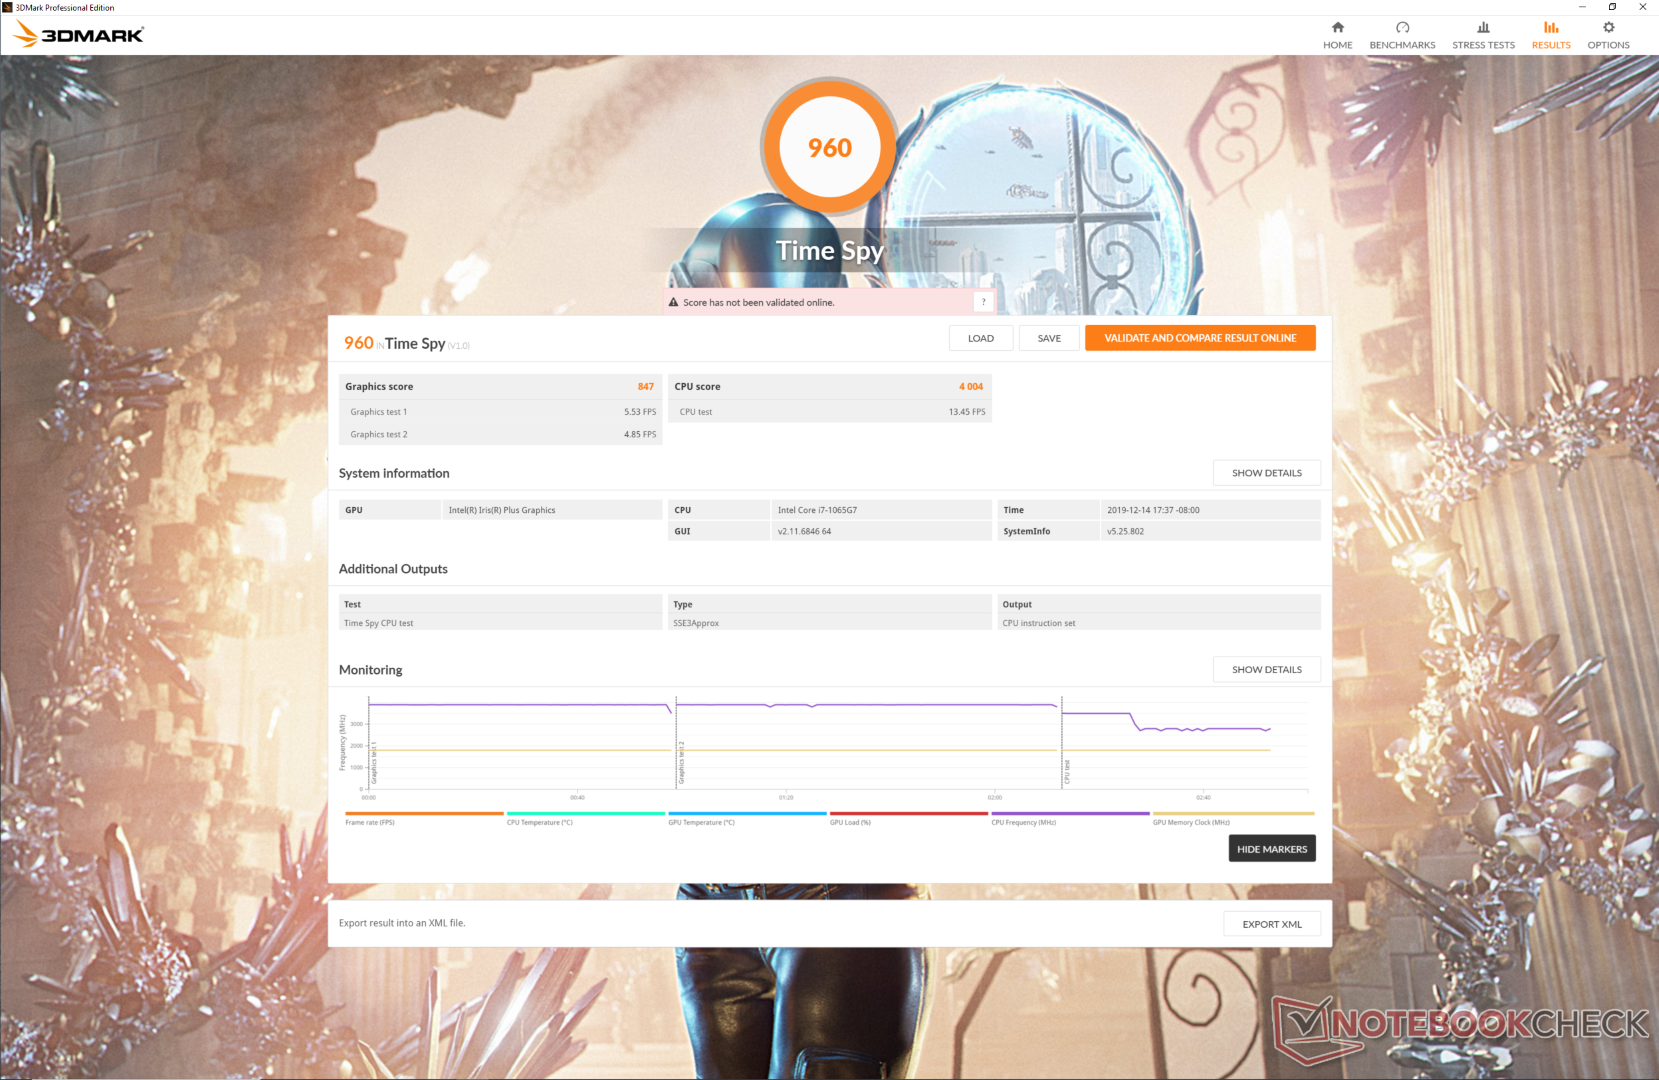
| 3DMark Time Spy Score | 960 pkt. | |
Pomoc | ||
Testy gier
Wyniki zintegrowanego układu graficznego Iris Plus w 3DMarku są porównywalne do rezultatów układu RX Vega 9 z procesora AMD Ryzen 5 3580U, tzn. o kilka procent gorsze lub o góra kilkanaście procent lepsze, w zależności od testu. W praktycznych testach gier natomiast Intel radził sobie dużo lepiej. W grach Rocket League i F1 2019 potrafił uzyskać nawet o ponad 40% lepsze wyniki od tych notowanych przez układ RX Vega 9 z porównywanego egzemplarza laptopa Surface Laptop 3. W innych sprawdzonych grach (np. Overwatch, Shadow of the Tomb Raider) rezultaty rozwiązań Intela i AMD okazały się zbliżone.
| Rocket League | |
| 1280x720 Performance | |
| Acer Aspire 5 A515-52G-723L | |
| Huawei MateBook 13 i7 | |
| Dell Inspiron 15 5000 5585 | |
| Microsoft Surface Laptop 3 15 Ryzen 5 3580U | |
| Acer Swift 3 SF315-41-R4W1 | |
| Microsoft Surface Laptop 3 15 i7-1065G7 | |
| Przeciętny Intel Iris Plus Graphics G7 (Ice Lake 64 EU) (22.1 - 123, n=16) | |
| Dell XPS 13 7390 Core i7-10710U | |
| Dell XPS 13 7390 2-in-1 Core i3 | |
| 1920x1080 Quality AA:Medium FX | |
| Acer Aspire 5 A515-52G-723L | |
| Huawei MateBook 13 i7 | |
| Microsoft Surface Laptop 3 15 i7-1065G7 | |
| Dell Inspiron 15 5000 5585 | |
| Przeciętny Intel Iris Plus Graphics G7 (Ice Lake 64 EU) (24.9 - 71.3, n=16) | |
| Microsoft Surface Laptop 3 15 Ryzen 5 3580U | |
| Acer Swift 3 SF315-41-R4W1 | |
| Dell XPS 13 7390 2-in-1 Core i3 | |
| Dell XPS 13 7390 Core i7-10710U | |
| 1920x1080 High Quality AA:High FX | |
| Acer Aspire 5 A515-52G-723L | |
| Huawei MateBook 13 i7 | |
| Microsoft Surface Laptop 3 15 i7-1065G7 | |
| Dell Inspiron 15 5000 5585 | |
| Przeciętny Intel Iris Plus Graphics G7 (Ice Lake 64 EU) (21.1 - 48.5, n=15) | |
| Microsoft Surface Laptop 3 15 Ryzen 5 3580U | |
| Acer Swift 3 SF315-41-R4W1 | |
| Dell XPS 13 7390 Core i7-10710U | |
| Dell XPS 13 7390 2-in-1 Core i3 | |
| 1920x1080 Performance | |
| Dell Inspiron 15 5000 5585 | |
| Microsoft Surface Laptop 3 15 i7-1065G7 | |
| Przeciętny Intel Iris Plus Graphics G7 (Ice Lake 64 EU) (43.1 - 112.6, n=11) | |
| Microsoft Surface Laptop 3 15 Ryzen 5 3580U | |
| Dell XPS 13 7390 2-in-1 Core i3 | |
| The Witcher 3 | |
| 1024x768 Low Graphics & Postprocessing | |
| Huawei MateBook 13 i7 | |
| Acer Aspire 5 A515-52G-723L | |
| Acer Aspire 5 A515-52G-53PU | |
| Microsoft Surface Laptop 3 15 i7-1065G7 | |
| Dell Inspiron 15 5000 5585 | |
| Przeciętny Intel Iris Plus Graphics G7 (Ice Lake 64 EU) (28.2 - 58, n=20) | |
| Microsoft Surface Laptop 3 15 Ryzen 5 3580U | |
| Acer Swift 3 SF315-41-R4W1 | |
| Dell XPS 13 7390 2-in-1 Core i3 | |
| Dell XPS 13 7390 Core i7-10710U | |
| 1366x768 Medium Graphics & Postprocessing | |
| Huawei MateBook 13 i7 | |
| Acer Aspire 5 A515-52G-723L | |
| Microsoft Surface Laptop 3 15 i7-1065G7 | |
| Acer Aspire 5 A515-52G-53PU | |
| Przeciętny Intel Iris Plus Graphics G7 (Ice Lake 64 EU) (20.8 - 36.8, n=18) | |
| Acer Swift 3 SF315-41-R4W1 | |
| Dell XPS 13 7390 2-in-1 Core i3 | |
| 1920x1080 High Graphics & Postprocessing (Nvidia HairWorks Off) | |
| Huawei MateBook 13 i7 | |
| Acer Aspire 5 A515-52G-723L | |
| Microsoft Surface Laptop 3 15 i7-1065G7 | |
| Acer Aspire 5 A515-52G-53PU | |
| Dell Inspiron 15 5000 5585 | |
| Przeciętny Intel Iris Plus Graphics G7 (Ice Lake 64 EU) (10.9 - 20.1, n=18) | |
| Microsoft Surface Laptop 3 15 Ryzen 5 3580U | |
| Acer Swift 3 SF315-41-R4W1 | |
| Dell XPS 13 7390 2-in-1 Core i3 | |
| 1920x1080 Ultra Graphics & Postprocessing (HBAO+) | |
| Huawei MateBook 13 i7 | |
| Dell Inspiron 15 5000 5585 | |
| Acer Aspire 5 A515-52G-723L | |
| Acer Aspire 5 A515-52G-53PU | |
| Microsoft Surface Laptop 3 15 i7-1065G7 | |
| Przeciętny Intel Iris Plus Graphics G7 (Ice Lake 64 EU) (5.13 - 10, n=13) | |
| Microsoft Surface Laptop 3 15 Ryzen 5 3580U | |
| Dell XPS 13 7390 2-in-1 Core i3 | |
| Shadow of the Tomb Raider - 1280x720 Lowest Preset | |
| Acer Aspire 5 A515-52G-723L | |
| Acer Aspire 5 A515-52G-53PU | |
| Dell Inspiron 15 5000 5585 | |
| Microsoft Surface Laptop 3 15 i7-1065G7 | |
| Microsoft Surface Laptop 3 15 Ryzen 5 3580U | |
| Przeciętny Intel Iris Plus Graphics G7 (Ice Lake 64 EU) (15.6 - 33, n=13) | |
| HP Pavilion 15-cw0003ng | |
| Dell XPS 13 7390 Core i7-10710U | |
| BioShock Infinite | |
| 1280x720 Very Low Preset | |
| Huawei MateBook 13 i7 | |
| Acer Aspire 5 A515-52G-53PU | |
| Acer Aspire 5 A515-52G-723L | |
| Dell Inspiron 15 5000 5585 | |
| Microsoft Surface Laptop 3 15 Ryzen 5 3580U | |
| Microsoft Surface Laptop 3 15 i7-1065G7 | |
| Acer Swift 3 SF315-41-R4W1 | |
| Przeciętny Intel Iris Plus Graphics G7 (Ice Lake 64 EU) (48.6 - 112.6, n=18) | |
| Dell XPS 13 7390 Core i7-10710U | |
| Dell XPS 13 7390 2-in-1 Core i3 | |
| 1366x768 Medium Preset | |
| Huawei MateBook 13 i7 | |
| Acer Aspire 5 A515-52G-723L | |
| Acer Aspire 5 A515-52G-53PU | |
| Microsoft Surface Laptop 3 15 i7-1065G7 | |
| Przeciętny Intel Iris Plus Graphics G7 (Ice Lake 64 EU) (25.8 - 73, n=18) | |
| Dell XPS 13 7390 Core i7-10710U | |
| Dell XPS 13 7390 2-in-1 Core i3 | |
| 1366x768 High Preset | |
| Acer Aspire 5 A515-52G-723L | |
| Huawei MateBook 13 i7 | |
| Acer Aspire 5 A515-52G-53PU | |
| Microsoft Surface Laptop 3 15 i7-1065G7 | |
| Przeciętny Intel Iris Plus Graphics G7 (Ice Lake 64 EU) (21.1 - 61.5, n=18) | |
| Dell XPS 13 7390 Core i7-10710U | |
| Dell XPS 13 7390 2-in-1 Core i3 | |
| 1920x1080 Ultra Preset, DX11 (DDOF) | |
| Acer Aspire 5 A515-52G-723L | |
| Huawei MateBook 13 i7 | |
| Acer Aspire 5 A515-52G-53PU | |
| Microsoft Surface Laptop 3 15 i7-1065G7 | |
| Dell Inspiron 15 5000 5585 | |
| Microsoft Surface Laptop 3 15 Ryzen 5 3580U | |
| Przeciętny Intel Iris Plus Graphics G7 (Ice Lake 64 EU) (7.8 - 22.6, n=18) | |
| Acer Swift 3 SF315-41-R4W1 | |
| Dell XPS 13 7390 2-in-1 Core i3 | |
| Dell XPS 13 7390 Core i7-10710U | |
| Overwatch | |
| 1280x720 Low (Render Scale 100 %) AA:FX AF:1x | |
| Acer Aspire 5 A515-52G-723L | |
| Microsoft Surface Laptop 3 15 Ryzen 5 3580U | |
| Microsoft Surface Laptop 3 15 i7-1065G7 | |
| Przeciętny Intel Iris Plus Graphics G7 (Ice Lake 64 EU) (62.6 - 92.7, n=6) | |
| Dell XPS 13 7390 2-in-1 Core i3 | |
| 1366x768 Medium (Render Scale 100 %) AA:FX AF:2x | |
| Acer Aspire 5 A515-52G-723L | |
| Microsoft Surface Laptop 3 15 i7-1065G7 | |
| Przeciętny Intel Iris Plus Graphics G7 (Ice Lake 64 EU) (44.1 - 67.7, n=6) | |
| Dell XPS 13 7390 2-in-1 Core i3 | |
| 1920x1080 Medium (Render Scale 100 %) AA:FX AF:2x | |
| Microsoft Surface Laptop 3 15 Ryzen 5 3580U | |
| Microsoft Surface Laptop 3 15 i7-1065G7 | |
| Przeciętny Intel Iris Plus Graphics G7 (Ice Lake 64 EU) (28.1 - 46.3, n=5) | |
| Dell XPS 13 7390 2-in-1 Core i3 | |
| 1920x1080 High (Render Scale 100 %) AA:SM AF:4x | |
| Acer Aspire 5 A515-52G-723L | |
| Microsoft Surface Laptop 3 15 Ryzen 5 3580U | |
| Microsoft Surface Laptop 3 15 i7-1065G7 | |
| Przeciętny Intel Iris Plus Graphics G7 (Ice Lake 64 EU) (29.7 - 32.9, n=4) | |
| Dell XPS 13 7390 2-in-1 Core i3 | |
| 1920x1080 Epic (Render Scale 100 %) AA:SM AF:16x | |
| Acer Aspire 5 A515-52G-723L | |
| Microsoft Surface Laptop 3 15 i7-1065G7 | |
| Microsoft Surface Laptop 3 15 Ryzen 5 3580U | |
| Przeciętny Intel Iris Plus Graphics G7 (Ice Lake 64 EU) (18.9 - 19.7, n=3) | |
| F1 2019 | |
| 1280x720 Ultra Low Preset | |
| Microsoft Surface Laptop 3 15 i7-1065G7 | |
| Microsoft Surface Laptop 3 15 Ryzen 5 3580U | |
| Przeciętny Intel Iris Plus Graphics G7 (Ice Lake 64 EU) (35 - 63, n=5) | |
| 1920x1080 Medium Preset AA:T AF:16x | |
| Microsoft Surface Laptop 3 15 i7-1065G7 | |
| Przeciętny Intel Iris Plus Graphics G7 (Ice Lake 64 EU) (22 - 31, n=5) | |
| Microsoft Surface Laptop 3 15 Ryzen 5 3580U | |
| 1920x1080 High Preset AA:T AF:16x | |
| Microsoft Surface Laptop 3 15 i7-1065G7 | |
| Przeciętny Intel Iris Plus Graphics G7 (Ice Lake 64 EU) (19 - 27, n=4) | |
| Microsoft Surface Laptop 3 15 Ryzen 5 3580U | |
| 1920x1080 Ultra High Preset AA:T AF:16x | |
| Microsoft Surface Laptop 3 15 i7-1065G7 | |
| Przeciętny Intel Iris Plus Graphics G7 (Ice Lake 64 EU) (12 - 21, n=4) | |
| Microsoft Surface Laptop 3 15 Ryzen 5 3580U | |
| Borderlands 3 | |
| 1280x720 Very Low Overall Quality (DX11) | |
| Microsoft Surface Laptop 3 15 i7-1065G7 | |
| Przeciętny Intel Iris Plus Graphics G7 (Ice Lake 64 EU) (26.7 - 37, n=4) | |
| Microsoft Surface Laptop 3 15 Ryzen 5 3580U | |
| 1920x1080 Medium Overall Quality (DX11) | |
| Microsoft Surface Laptop 3 15 i7-1065G7 | |
| Przeciętny Intel Iris Plus Graphics G7 (Ice Lake 64 EU) (11.7 - 16, n=3) | |
| Microsoft Surface Laptop 3 15 Ryzen 5 3580U | |
| 1920x1080 High Overall Quality (DX11) | |
| Microsoft Surface Laptop 3 15 i7-1065G7 | |
| Przeciętny Intel Iris Plus Graphics G7 (Ice Lake 64 EU) (7.73 - 10, n=3) | |
| Microsoft Surface Laptop 3 15 Ryzen 5 3580U | |
| low | med. | high | ultra | |
|---|---|---|---|---|
| StarCraft II: Heart of the Swarm (2013) | 358.2 | 100.9 | 64.8 | |
| BioShock Infinite (2013) | 109.6 | 73 | 61.5 | 22.6 |
| The Witcher 3 (2015) | 56.4 | 36.8 | 20.1 | 10 |
| Overwatch (2016) | 90 | 64 | 32.9 | 19.7 |
| Rocket League (2017) | 96.1 | 61 | 42.8 | |
| Shadow of the Tomb Raider (2018) | 31 | |||
| F1 2019 (2019) | 63 | 31 | 27 | 17 |
| Borderlands 3 (2019) | 37 | 16 | 10 |
Wpływ na otoczenie
Hałas
Spodziewałem się różnic w kulturze pracy między wersjami z Intelem i z AMD, ale okazało się, że nie miałem racji. Testy bez obciążenia, 3DMark06, gry Wiedźmin 3 oraz pełnego obciążenia przyniosły wartości natężenia szumu bardzo podobne do tych stwierdzonych w przypadku modelu z Ryzenem. Zasadniczo omawiany laptop jest cichy bez obciążenia i nieprzesadnie głośny pod obciążeniem.
W testowanym egzemplarzu występowało ciche piszczenie cewek.
Hałas
| luz |
| 28.5 / 28.5 / 28.7 dB |
| obciążenie |
| 30 / 41.2 dB |
 | ||
30 dB cichy 40 dB(A) słyszalny 50 dB(A) irytujący |
||
min: | ||
Temperatury
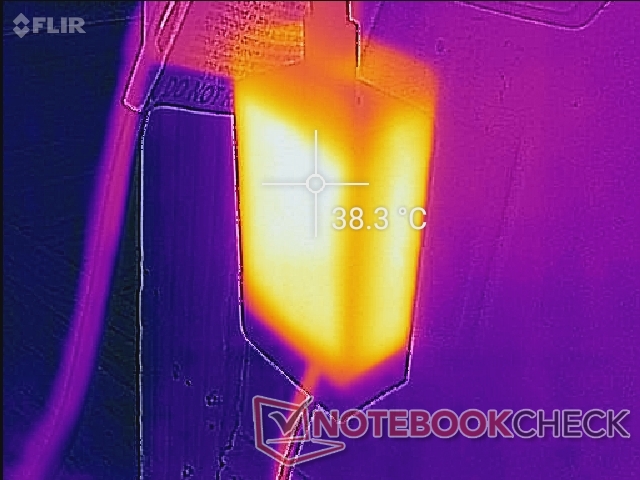
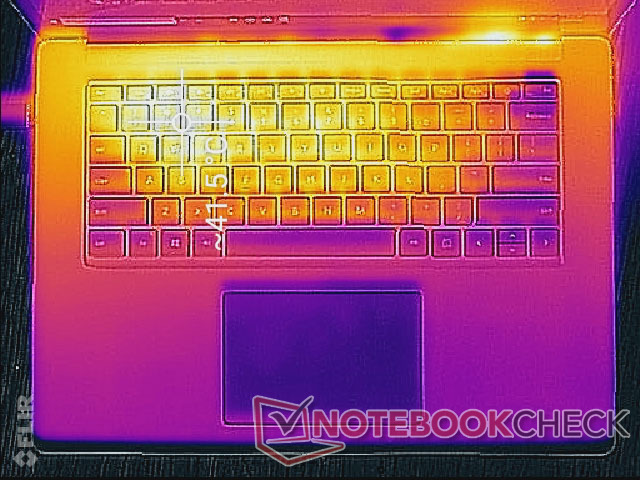
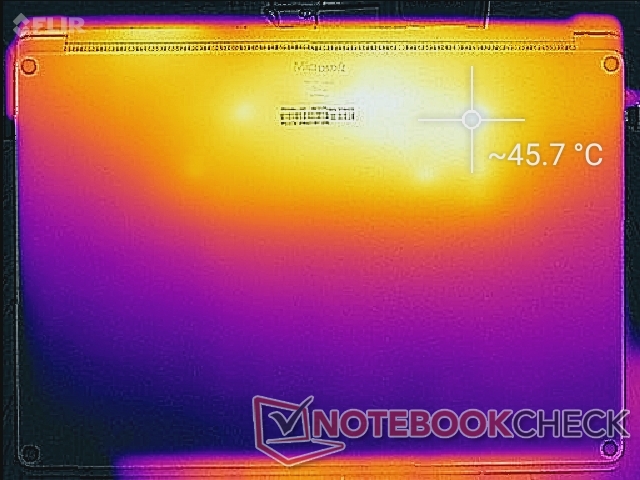
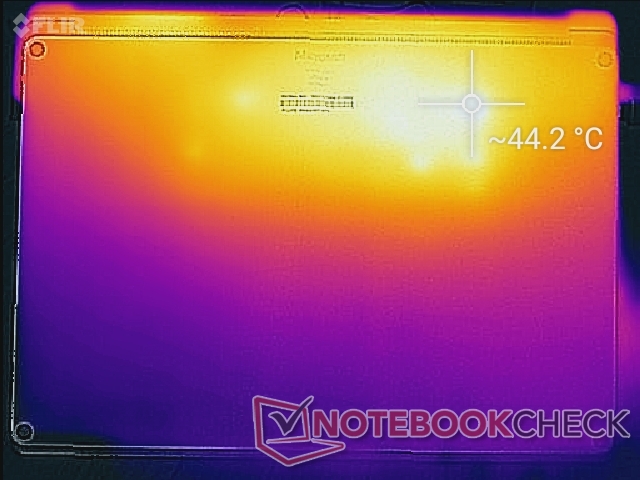
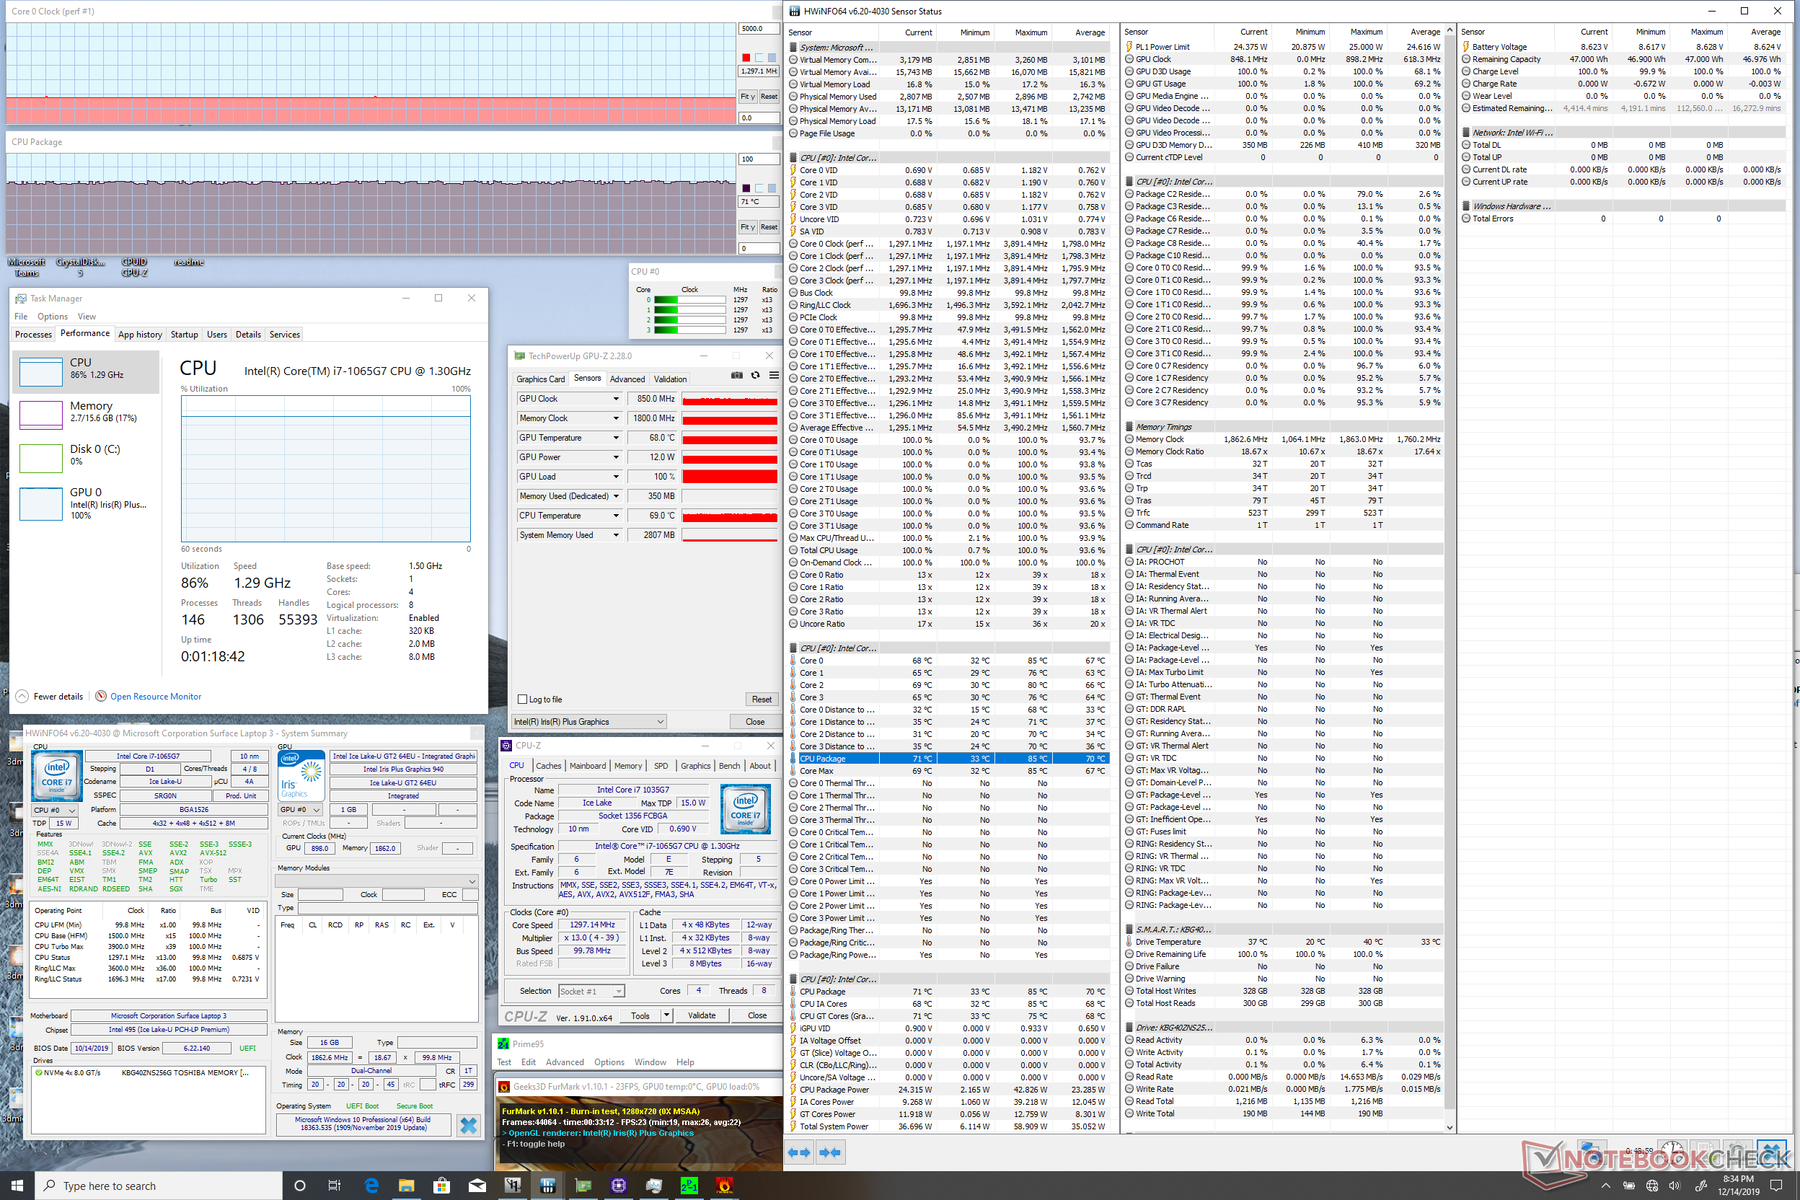
Jeżeli idzie o temperatury obudowy, też nie ma drastycznych różnic między wersjami z Intelem i z AMD, aczkolwiek ta druga nagrzewała się bardziej. W teście pełnego obciążenia (Prime95 plus FurMark) model z Core i7-1065G7 rozgrzał się na spodzie do maksymalnie 45,6°C (średnia z 9 obszarów: 37,6°C) a model z Ryzenem 5 3580U do maksymalnie 49,4°C (średnia: 43°C).
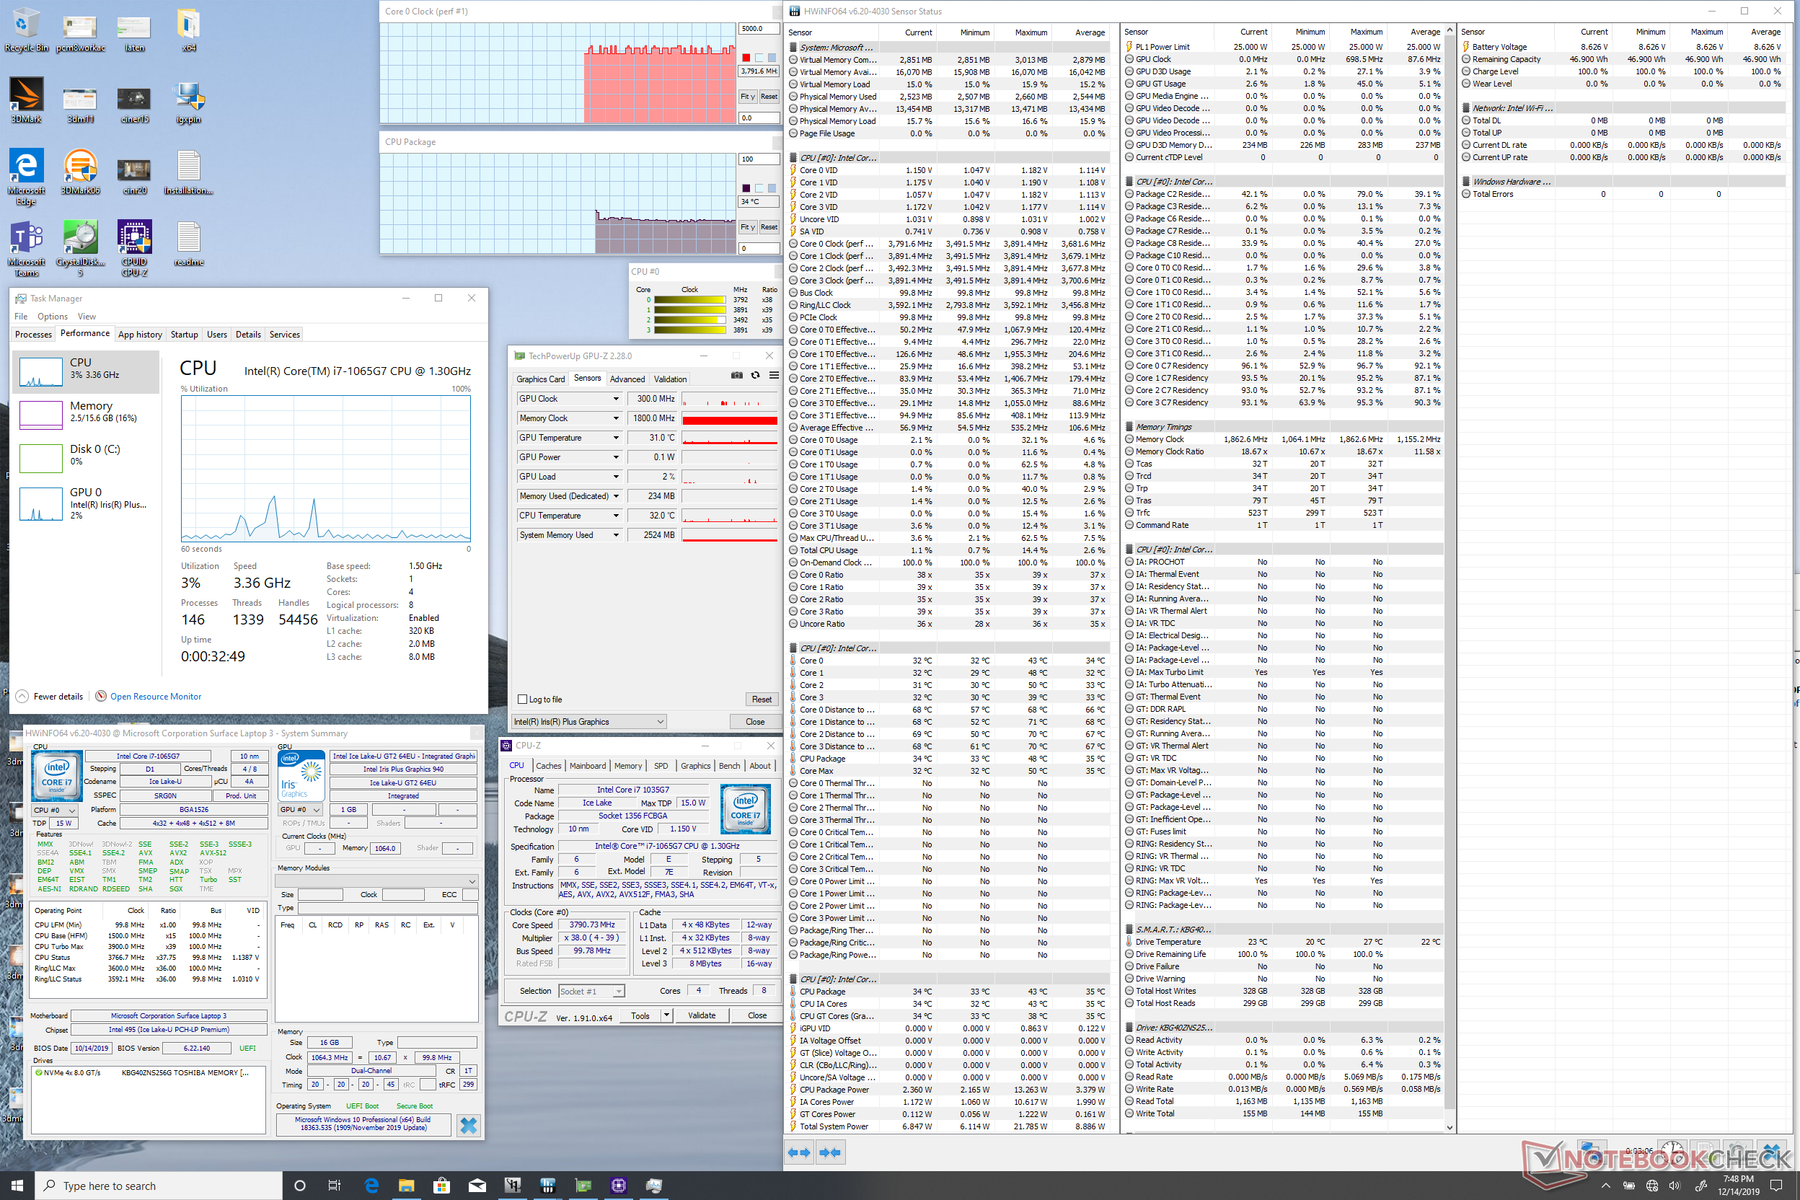
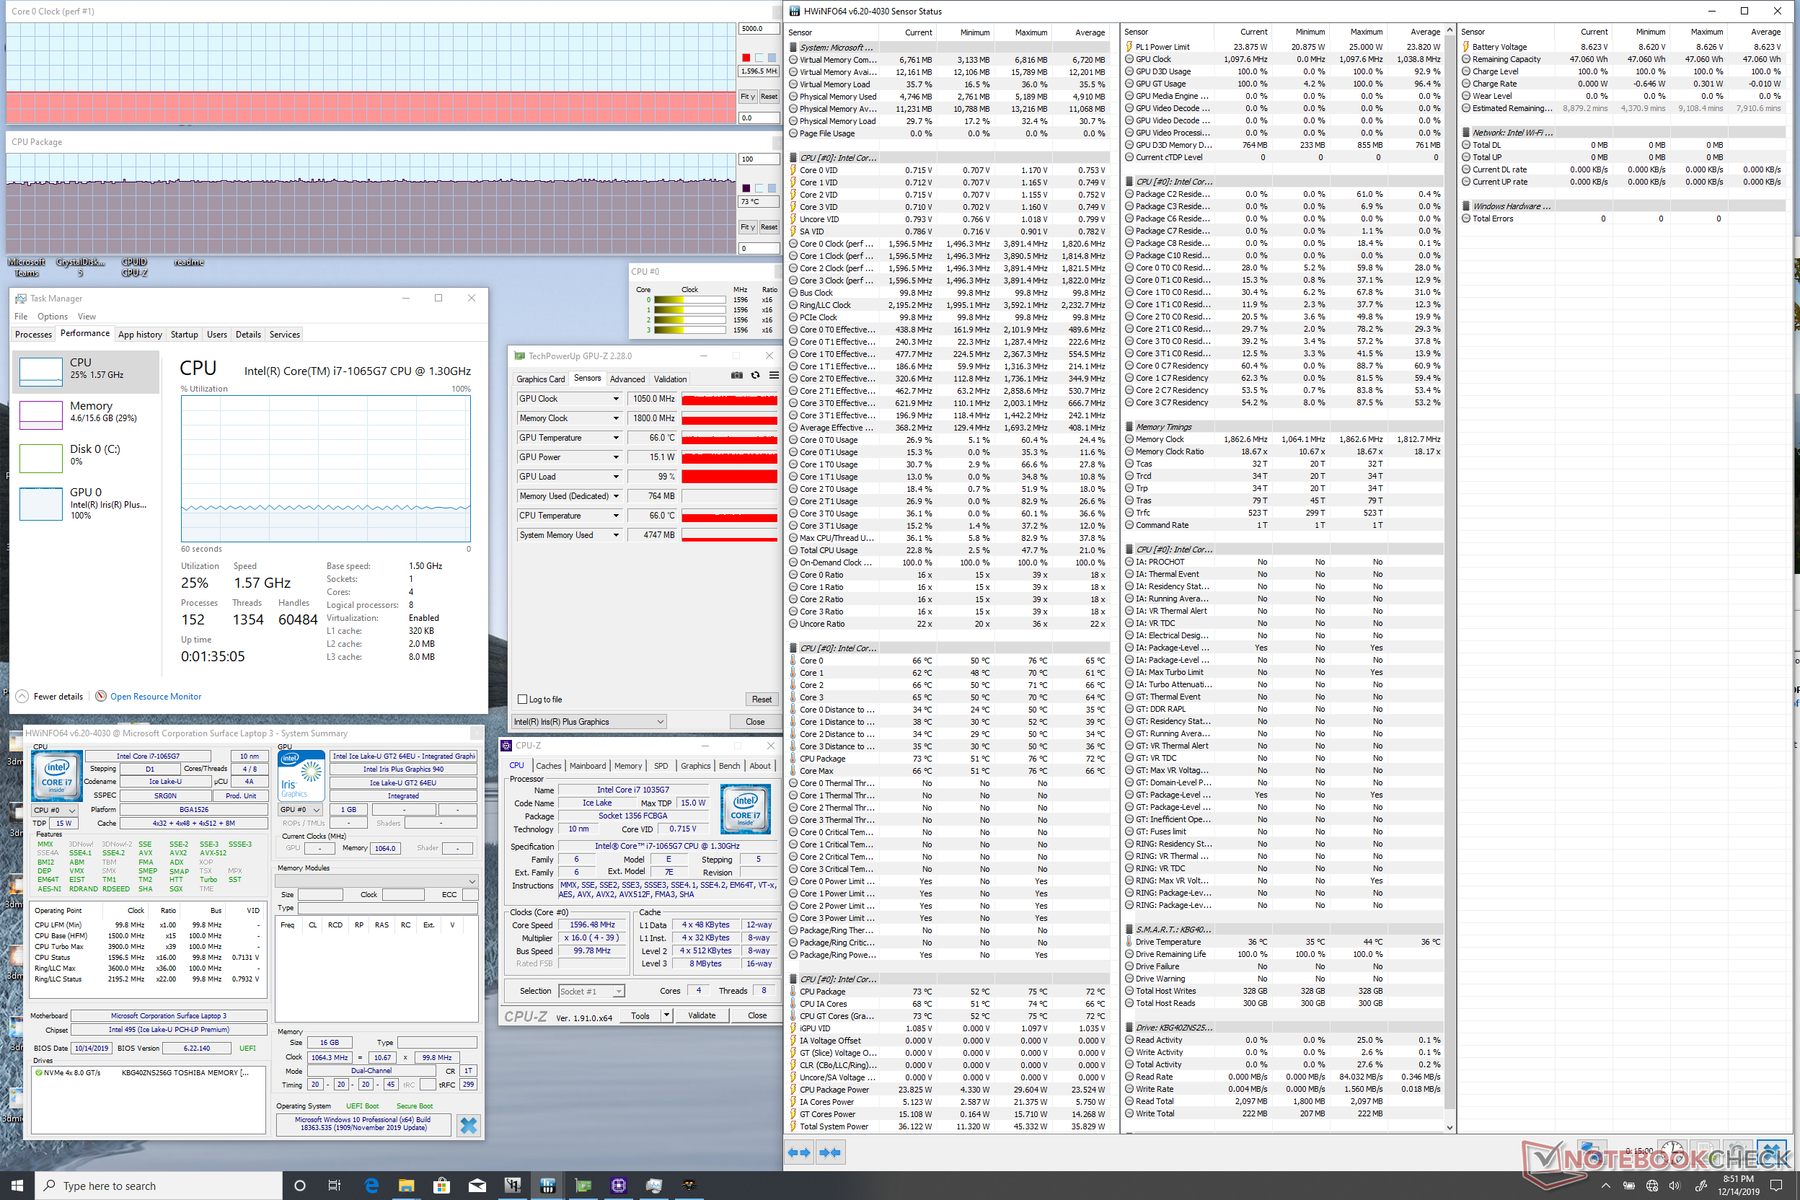
Obciążanie procesora pracą programu Prime95 pozwala zaobserwować taktowanie CPU w wysokości 3,5 GHz przez pierwsze dwadzieścia sekund. Po tym, jak procesor rozgrzał się do 85°C, taktowanie zostało do poziomu 2,6-2,7 GHz. Spowodowało to szybkie ochłodzenie procesora do 75°C.
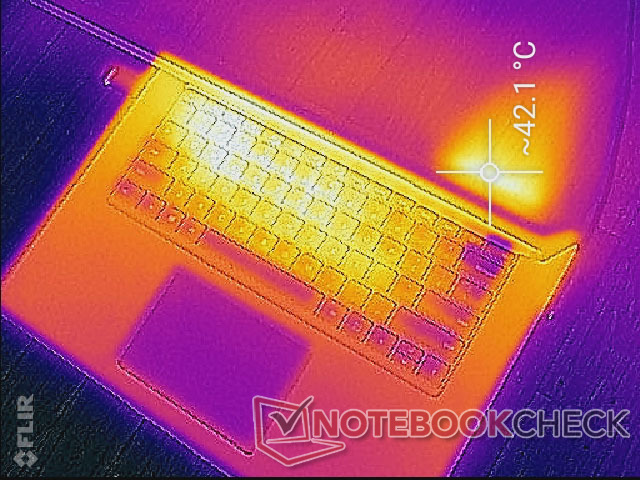
(±) Maksymalna temperatura w górnej części wynosi 41.8 °C / 107 F, w porównaniu do średniej 34.3 °C / 94 F , począwszy od 21.2 do 62.5 °C dla klasy Office.
(-) Dno nagrzewa się maksymalnie do 45.6 °C / 114 F, w porównaniu do średniej 36.8 °C / 98 F
(+) W stanie bezczynności średnia temperatura górnej części wynosi 21.6 °C / 71 F, w porównaniu ze średnią temperaturą urządzenia wynoszącą 29.5 °C / ### class_avg_f### F.
(±) Podczas gry w Wiedźmina 3 średnia temperatura górnej części wynosi 32.2 °C / 90 F, w porównaniu do średniej temperatury urządzenia wynoszącej 29.5 °C / ## #class_avg_f### F.
(+) Podpórki pod nadgarstki i touchpad są chłodniejsze niż temperatura skóry i maksymalnie 29 °C / 84.2 F i dlatego są chłodne w dotyku.
(±) Średnia temperatura obszaru podparcia dłoni w podobnych urządzeniach wynosiła 27.5 °C / 81.5 F (-1.5 °C / -2.7 F).
Wydajność akumulatora
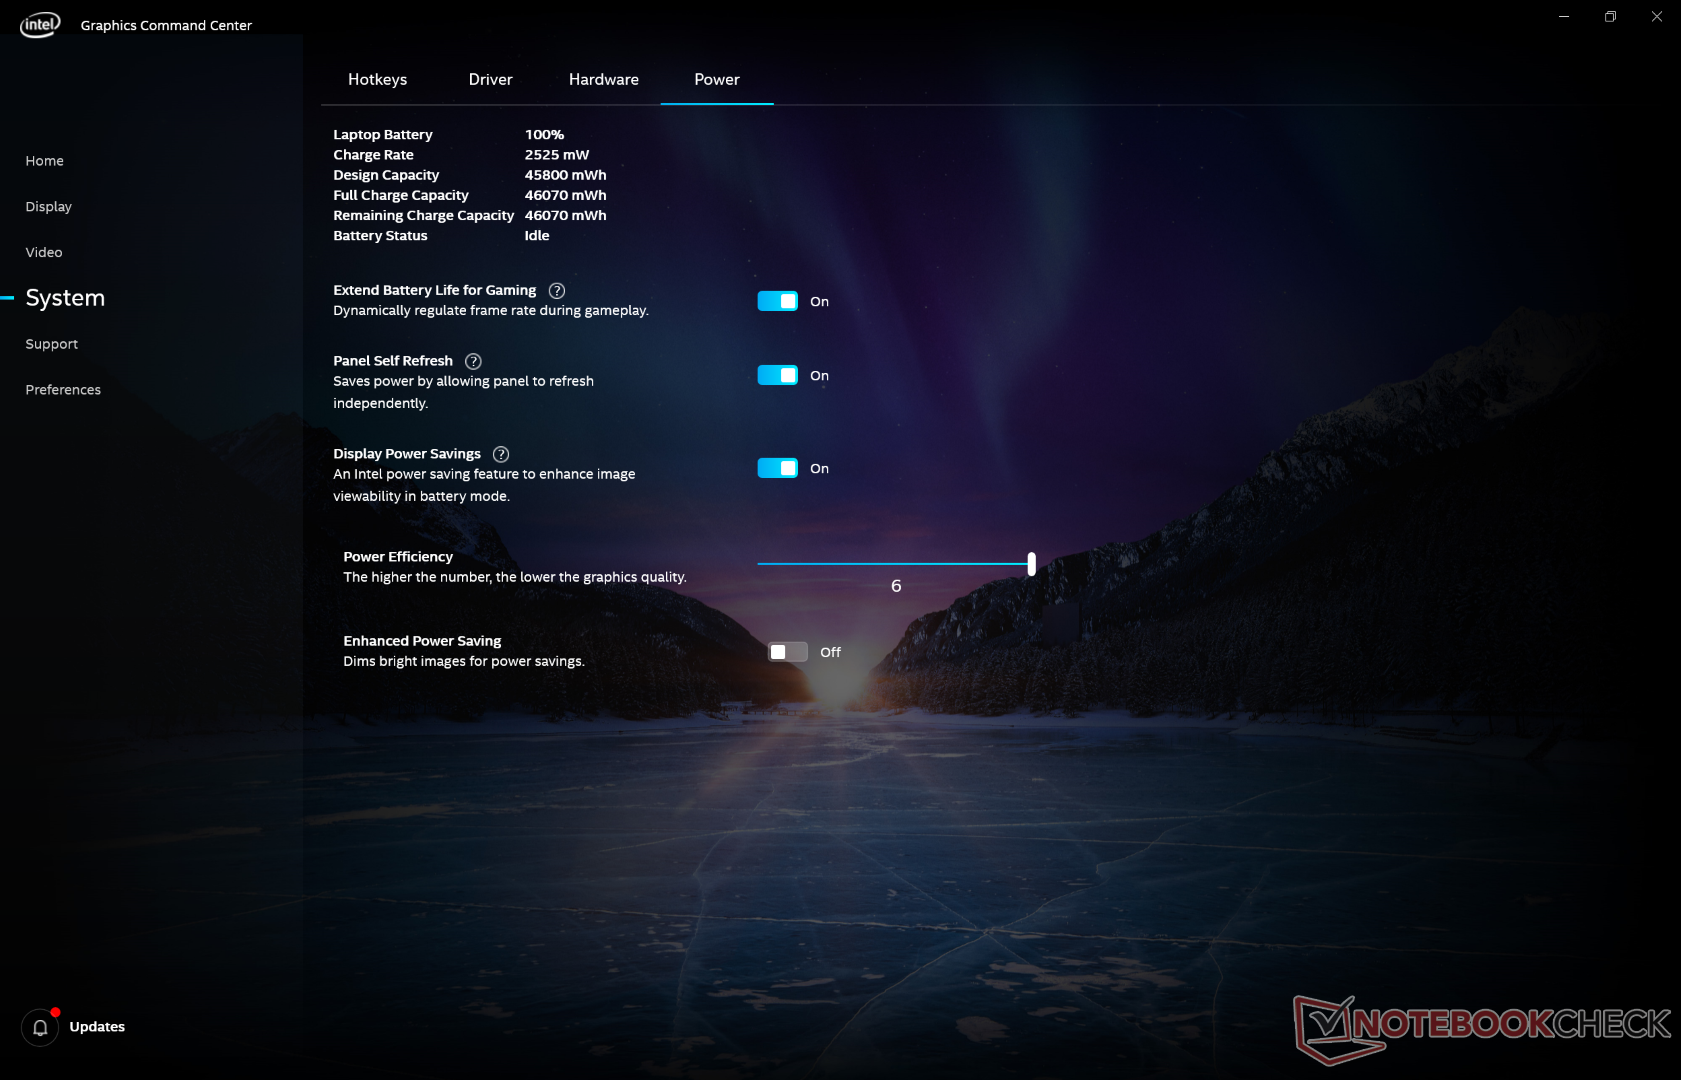
Akumulator ma małą pojemność; 45 Wh dla laptopa z matrycą 15,6" to zdecydowanie za mało. Skromny magazyn energii pozwolił jednak na uzyskanie ponad 8 godzin w teście WiFi. Odpowiednik z Ryzenem 5 osiągnął w tym samym teście rezultat o prawie godzinę lepszy. Jako ciekawostkę można jeszcze podać, że podczas bezczynnego działania przy całkowicie ściemnionym ekranie i ustawionym maksymalnym oszczędzaniu energii bohater niniejszej recenzji wytrzymał około 35 godzin bez konieczności doładowania.
| wyłączony / stan wstrzymania | |
| luz | |
| obciążenie |
|
Legenda:
min: | |
| Microsoft Surface Laptop 3 15 i7-1065G7 i7-1065G7, Iris Plus Graphics G7 (Ice Lake 64 EU), Toshiba KBG40ZNS256G NVMe, IPS, 2496x1664, 15" | Dell XPS 15 7590 i5 iGPU FHD i5-9300H, UHD Graphics 630, Toshiba XG6 KXG60ZNV512G, IPS, 1920x1080, 15.6" | Asus ZenBook 15 UX534FT-DB77 i7-8565U, GeForce GTX 1650 Max-Q, Samsung SSD PM981 MZVLB1T0HALR, IPS, 1920x1080, 15.6" | MSI Prestige 15 A10SC i7-10710U, GeForce GTX 1650 Max-Q, Samsung SSD PM981 MZVLB1T0HALR, IPS, 3840x2160, 15.6" | Razer Blade Stealth i7-8565U i7-8565U, GeForce MX150, Lite-On CA3-8D256-Q11, IPS, 1920x1080, 13.3" | Microsoft Surface Laptop 3 15 Ryzen 5 3580U R5 3580U, Vega 9, SK hynix BC501 HFM256GDGTNG, IPS, 2496x1664, 15" | |
|---|---|---|---|---|---|---|
| Power Consumption | -17% | -74% | -68% | -28% | 10% | |
| Idle Minimum * (Watt) | 4.4 | 3.79 14% | 5 -14% | 6.1 -39% | 6.7 -52% | 3.3 25% |
| Idle Average * (Watt) | 8.3 | 6.9 17% | 13.2 -59% | 13.2 -59% | 8.6 -4% | 7.1 14% |
| Idle Maximum * (Watt) | 8.6 | 9.2 -7% | 24 -179% | 19.2 -123% | 9.4 -9% | 7.2 16% |
| Load Average * (Watt) | 43.6 | 62 -42% | 70 -61% | 75 -72% | 64.1 -47% | 44.8 -3% |
| Witcher 3 ultra * (Watt) | 41.5 | 63.3 -53% | 74 -78% | 63.7 -53% | 45.1 -9% | |
| Load Maximum * (Watt) | 64.4 | 108 -68% | 114 -77% | 89.7 -39% | 64.1 -0% | 53 18% |
* ... im mniej tym lepiej
| Microsoft Surface Laptop 3 15 i7-1065G7 i7-1065G7, Iris Plus Graphics G7 (Ice Lake 64 EU), 45 Wh | Apple MacBook Pro 16 2019 i9 5500M i9-9880H, Radeon Pro 5500M, 99.8 Wh | Dell XPS 15 7590 i5 iGPU FHD i5-9300H, UHD Graphics 630, 97 Wh | Lenovo Yoga C940-15IRH i7-9750H, GeForce GTX 1650 Max-Q, 69 Wh | HP Spectre x360 15-df0126ng i7-8750H, GeForce GTX 1050 Ti Max-Q, 84 Wh | Asus ZenBook 15 UX534FT-DB77 i7-8565U, GeForce GTX 1650 Max-Q, 71 Wh | MSI Prestige 15 A10SC i7-10710U, GeForce GTX 1650 Max-Q, 82 Wh | Microsoft Surface Laptop 3 15 Ryzen 5 3580U R5 3580U, Vega 9, 45 Wh | |
|---|---|---|---|---|---|---|---|---|
| Czasy pracy | -1% | 31% | -26% | -6% | 5% | -14% | -16% | |
| Reader / Idle (h) | 35 | 18.2 -48% | 18.8 -46% | 21.5 -39% | 19.1 -45% | 18.7 -47% | ||
| WiFi v1.3 (h) | 8.2 | 12 46% | 14.1 72% | 9.7 18% | 8.8 7% | 8.4 2% | 7.6 -7% | 9.1 11% |
| Load (h) | 1.9 | 1 -47% | 1.7 -11% | 1 -47% | 2.3 21% | 2.9 53% | 2.1 11% | 1.7 -11% |
| Witcher 3 ultra (h) | 0.9 |
Za
Przeciw
Podsumowanie
Główne zalety wersji z Core i7 w porównaniu z wersją z Ryzenem 5 to WiFi 6, szybszy dysk Toshiby, nieco lepsza wydajność CPU, znacznie lepsze osiągi w (niektórych) grach oraz niższe temperatury. Matryca jest ta sama a kultura pracy jest podobna. Wariant z procesorem AMD nieco dłużej wytrzymał na akumulatorze w teście WiFi.
Trzeba mieć w pamięci, że konfiguracja z procesorem firmy Intel jest droższa.
W skrócie: różnica w wydajności pomiędzy wersją z Intelem a wersją z procesorem AMD jest mniejsza, niż można by się spodziewać, i na pewno nie uzasadnia dużej różnicy w cenie.
