Test laptopa MSI Prestige 15 A10SC
Tekst i zdjęcia: Allen Ngo
Tłumaczenie: Sylwester Cyba
13/01/2020
Połączenie niskonapięciowego procesora Intela z oszczędną kartą Nvidii jest dobrym pomysłem na bardzo smukły laptop o dużej wydajności. O ile tylko MSI zrobi coś z throttlingiem, Prestige 15 dobrze poradzi sobie na tle konkurencji z wyświetlaczami 15,6”. Jak na ultrabook wypada nadspodziewanie dobrze i może być uznany za dobrą alternatywę dla laptopa Dell XPS 15. Choćby ze względu na wydajniejszą, niż w innych ultrabookach, kartę grafiki.

Obudowa
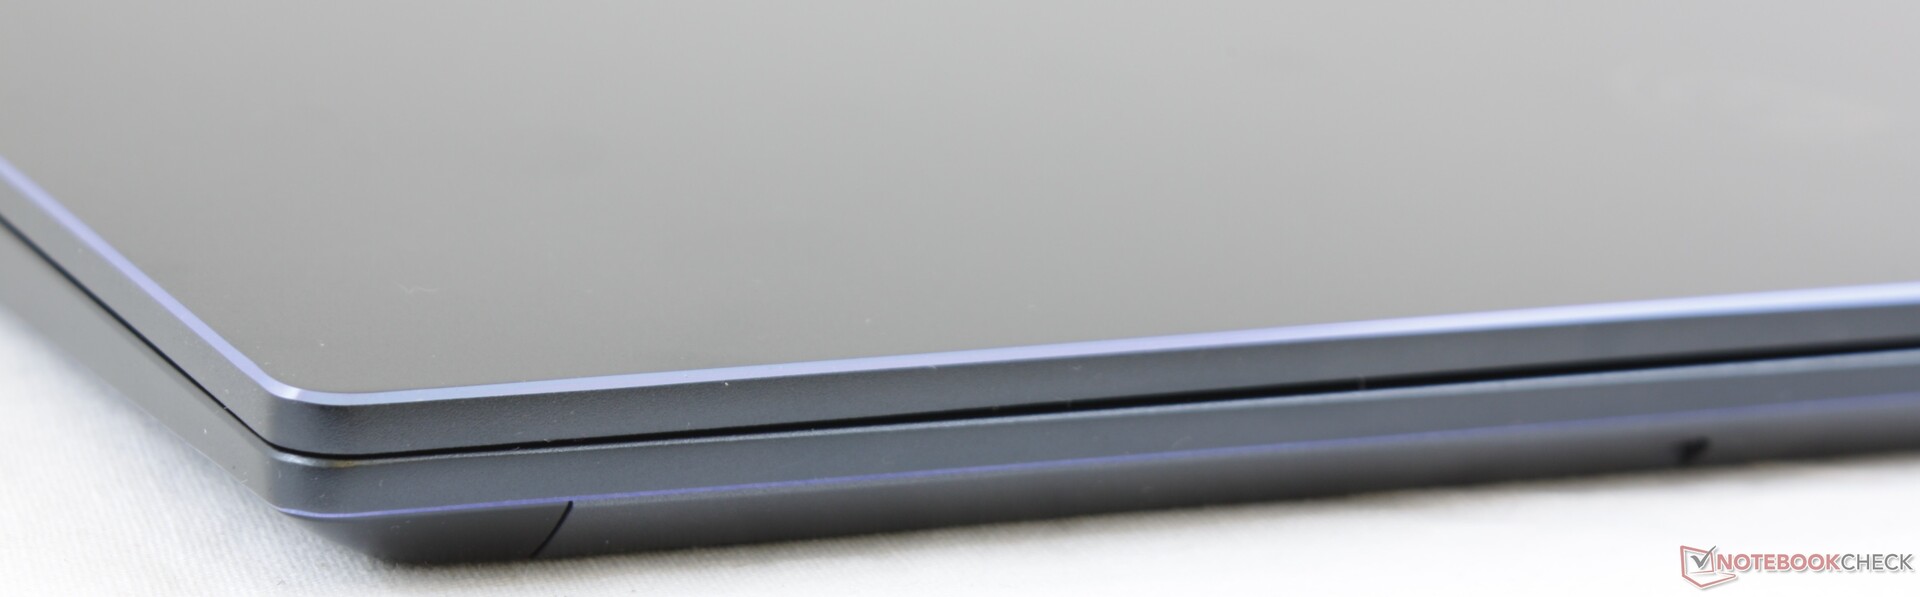
Laptop Prestige 15, w przeciwieństwie do P65 Creator (czyli tak naprawdę przemalowanego GS65), otrzymał zupełnie nową obudowę. W zamyśle ma walczyć o rynek użytkowników biurowych i profesjonalistów mających duże oczekiwania względem komputera. Wzornictwo nie jest krzykliwe a stonowane i minimalistyczne.
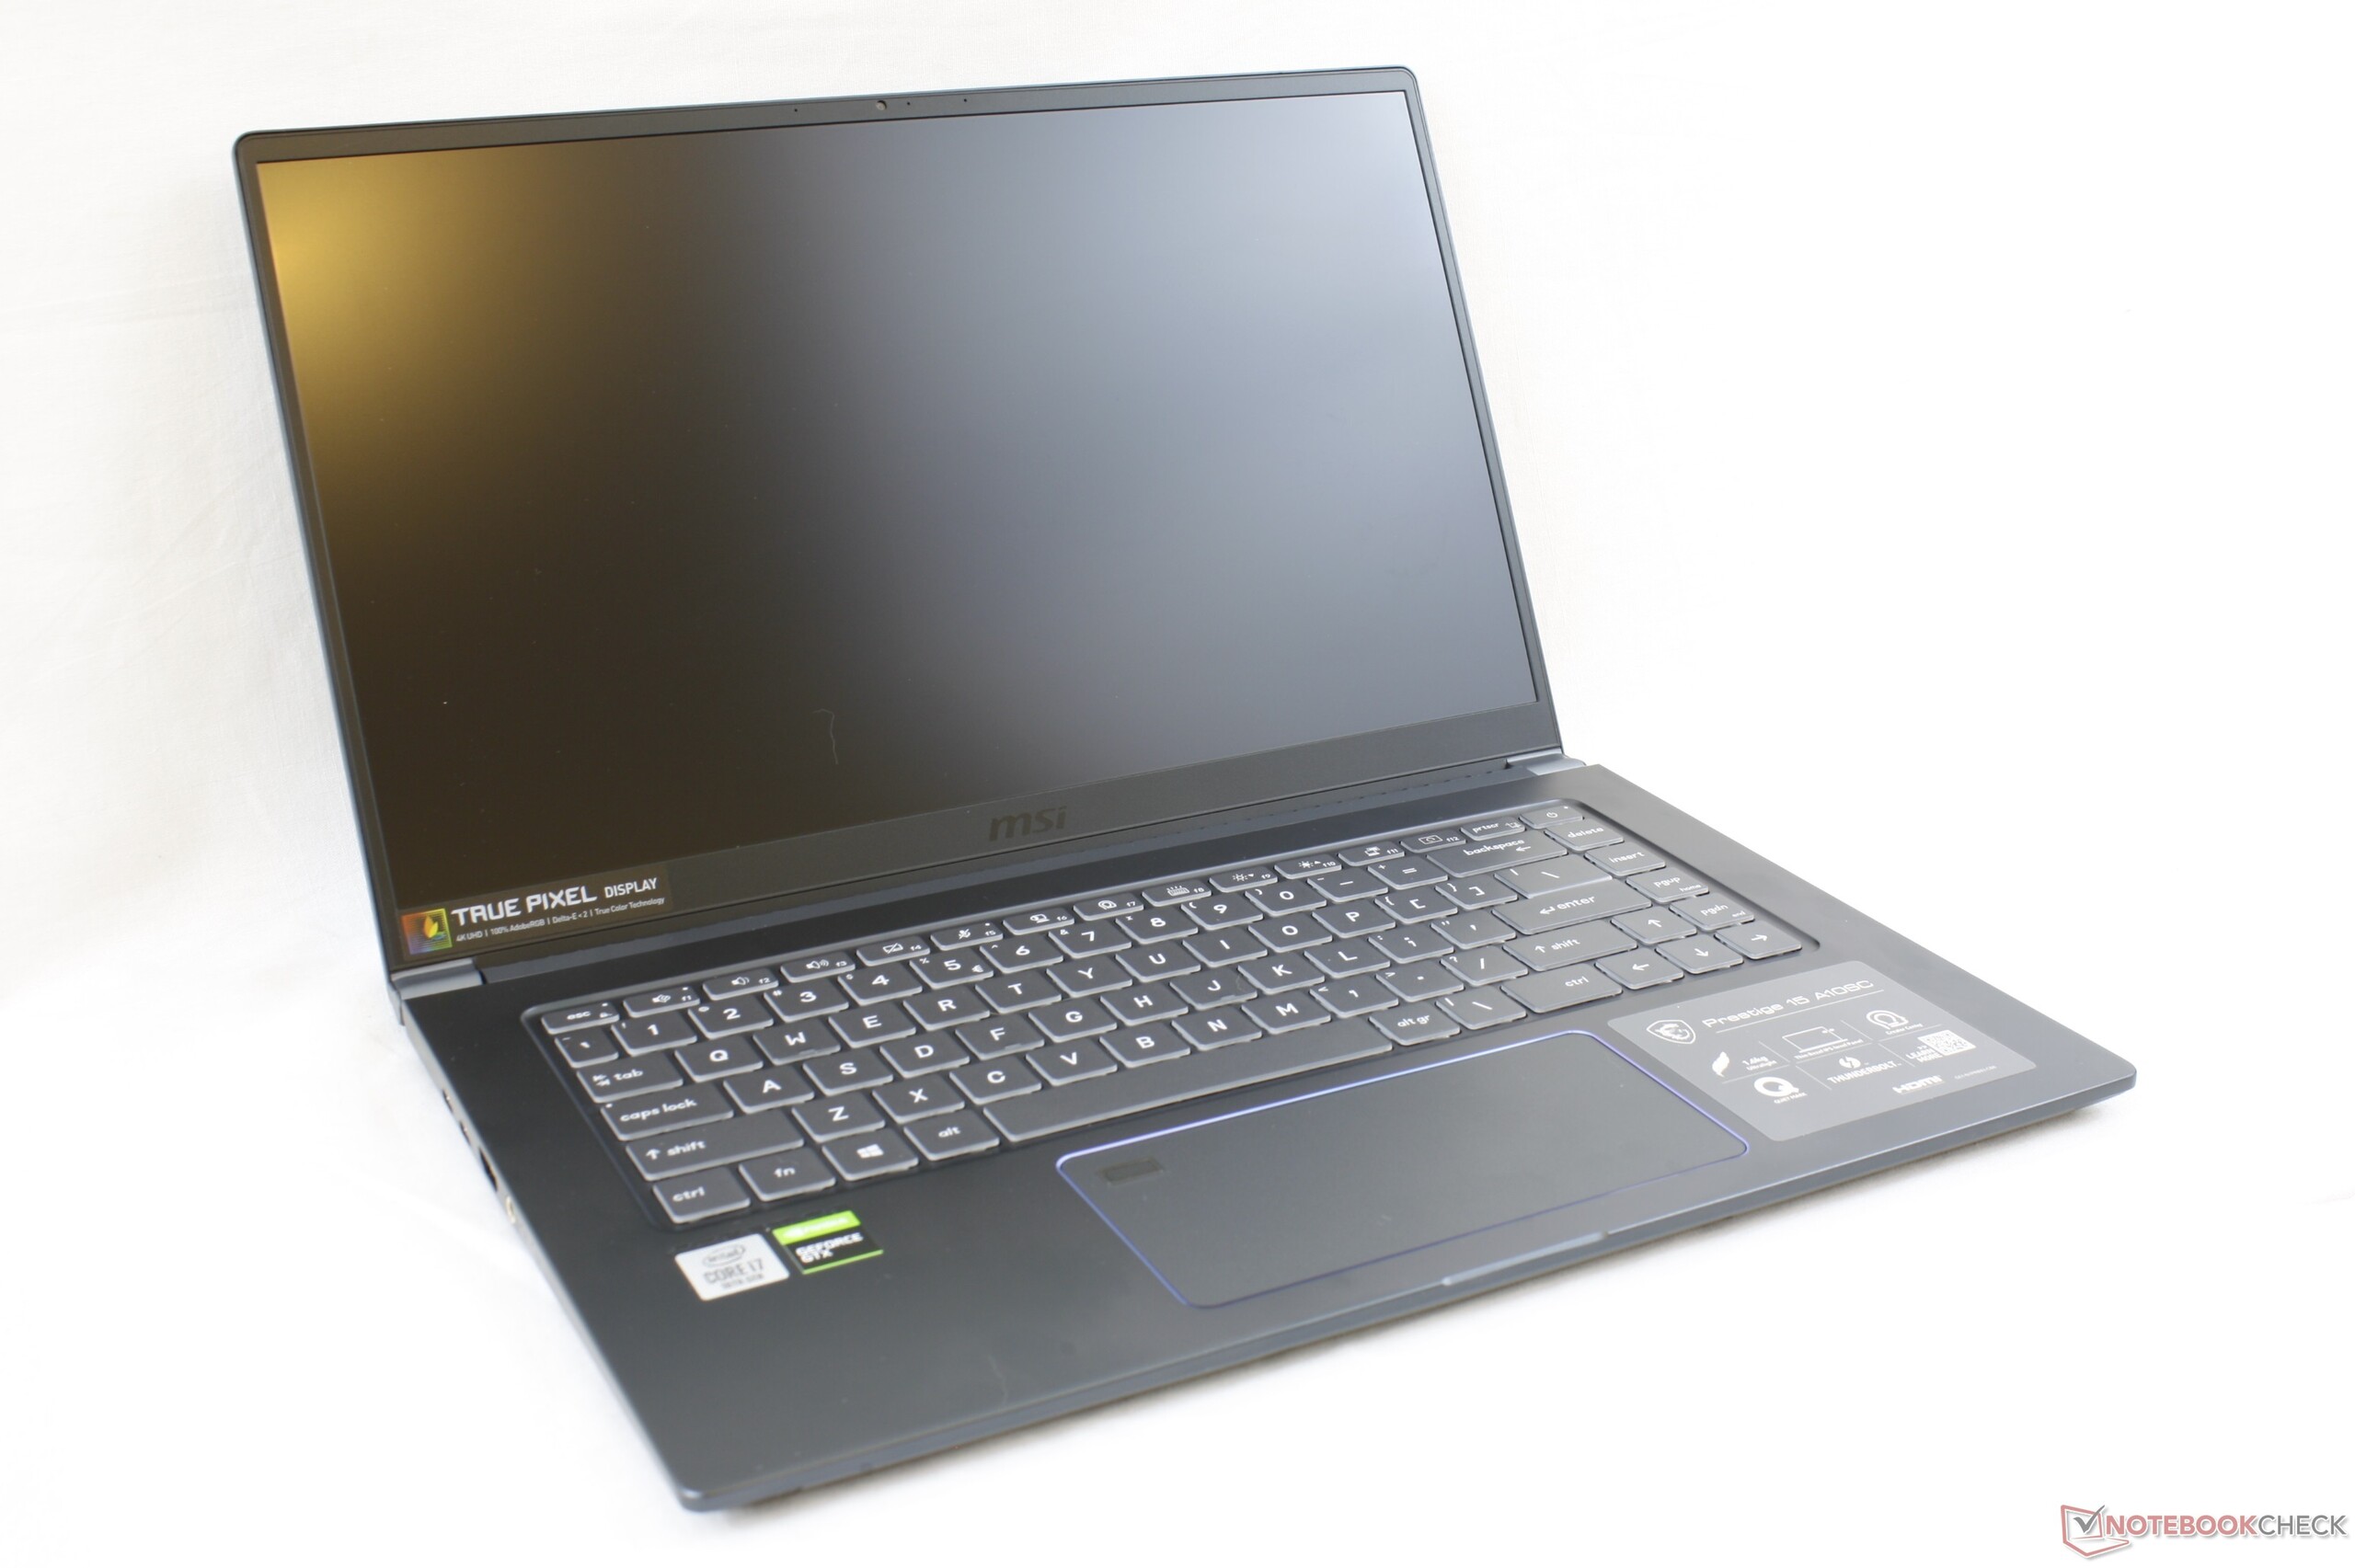

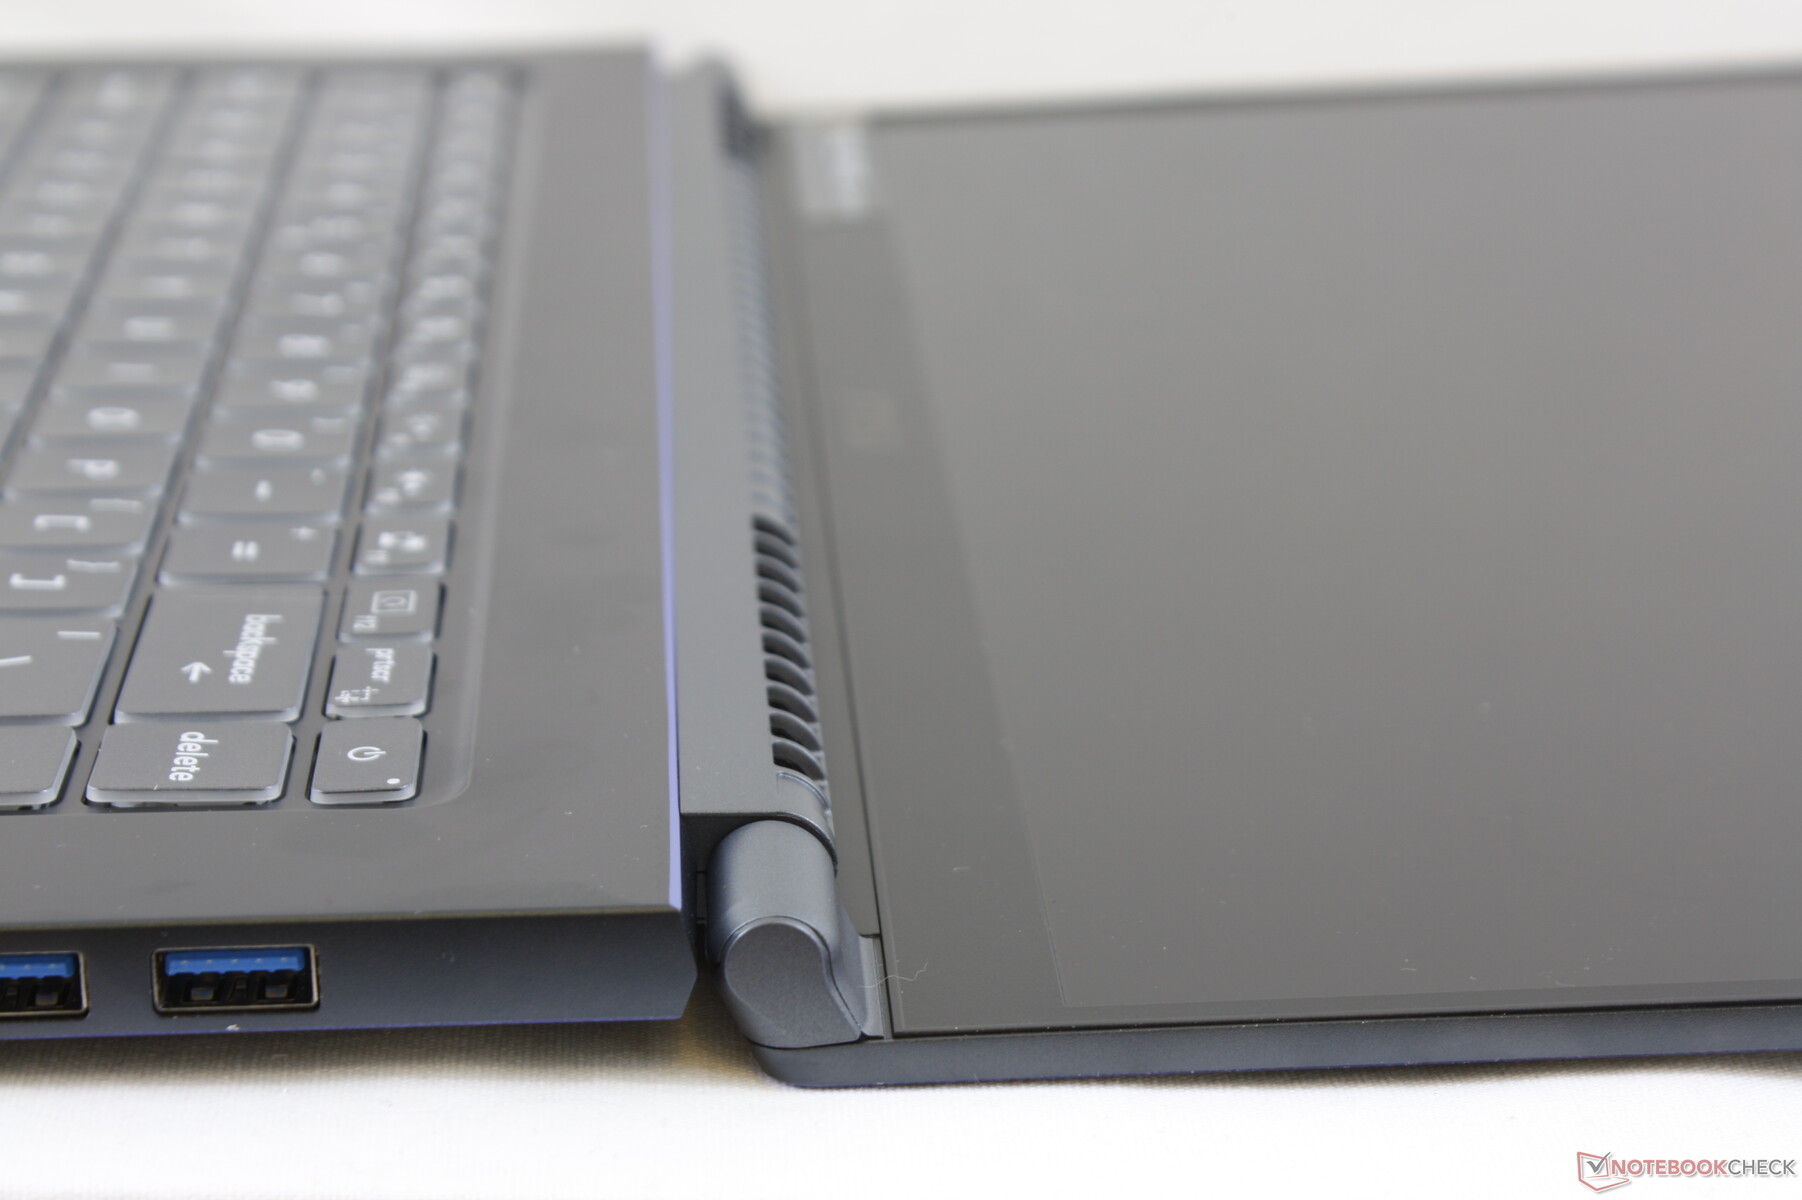
Pod względem urody bohater niniejszej recenzji nie ustępuje laptopom HP Spectre x360 15, Asus ZenBook 15 czy Dell XPS 15, ale sztywność konstrukcji jest o parę półek niżej. Elementy obudowy wydają się cieńsze i nie tak solidne, jak we wspomnianych konkurencyjnych modelach. Próby wykrzywiania pokrywy ekranu i jednostki zasadniczej wykazują wyraźnie większą elastyczność tych elementów. Małe zawiasy nie budzą zaufania i wydają się być mniej trwałe, niż zawiasy wspomnianych modeli firm HP i Dell.
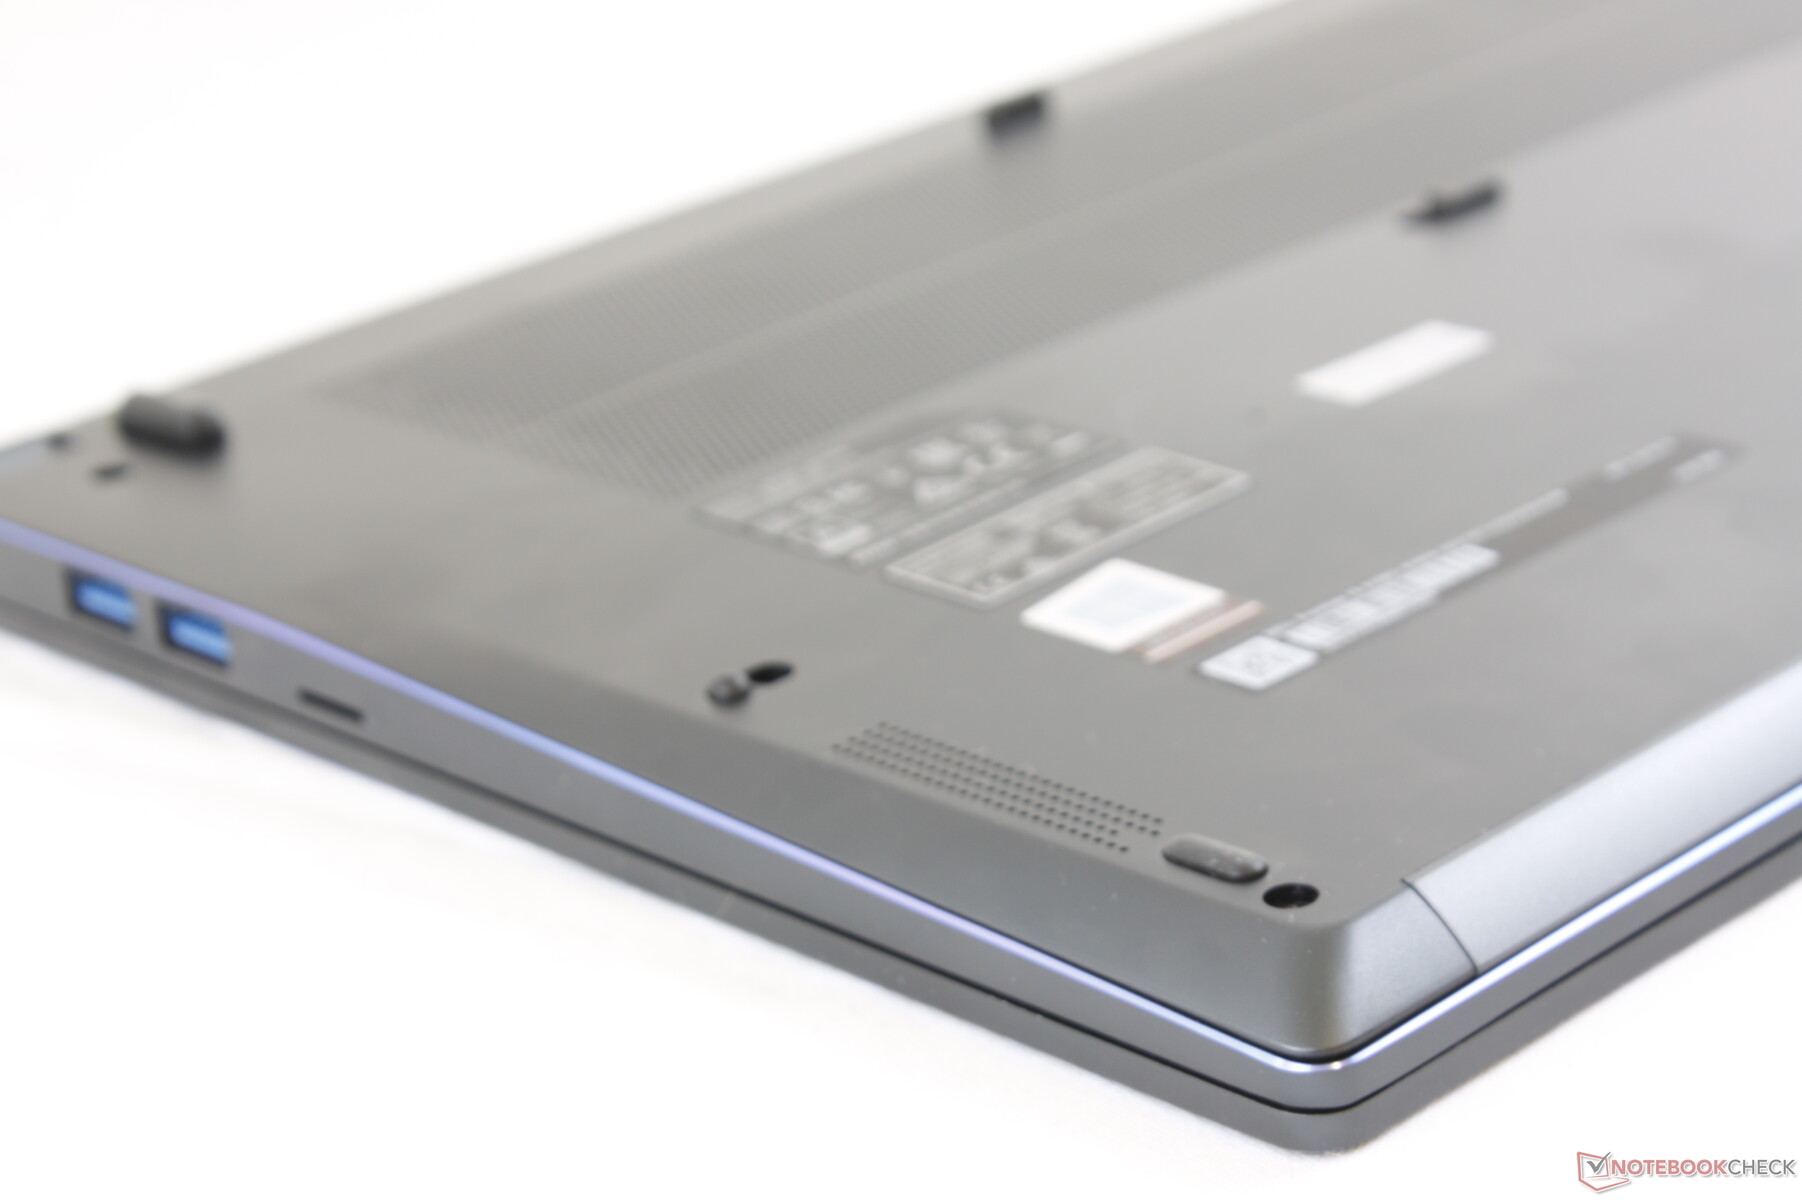
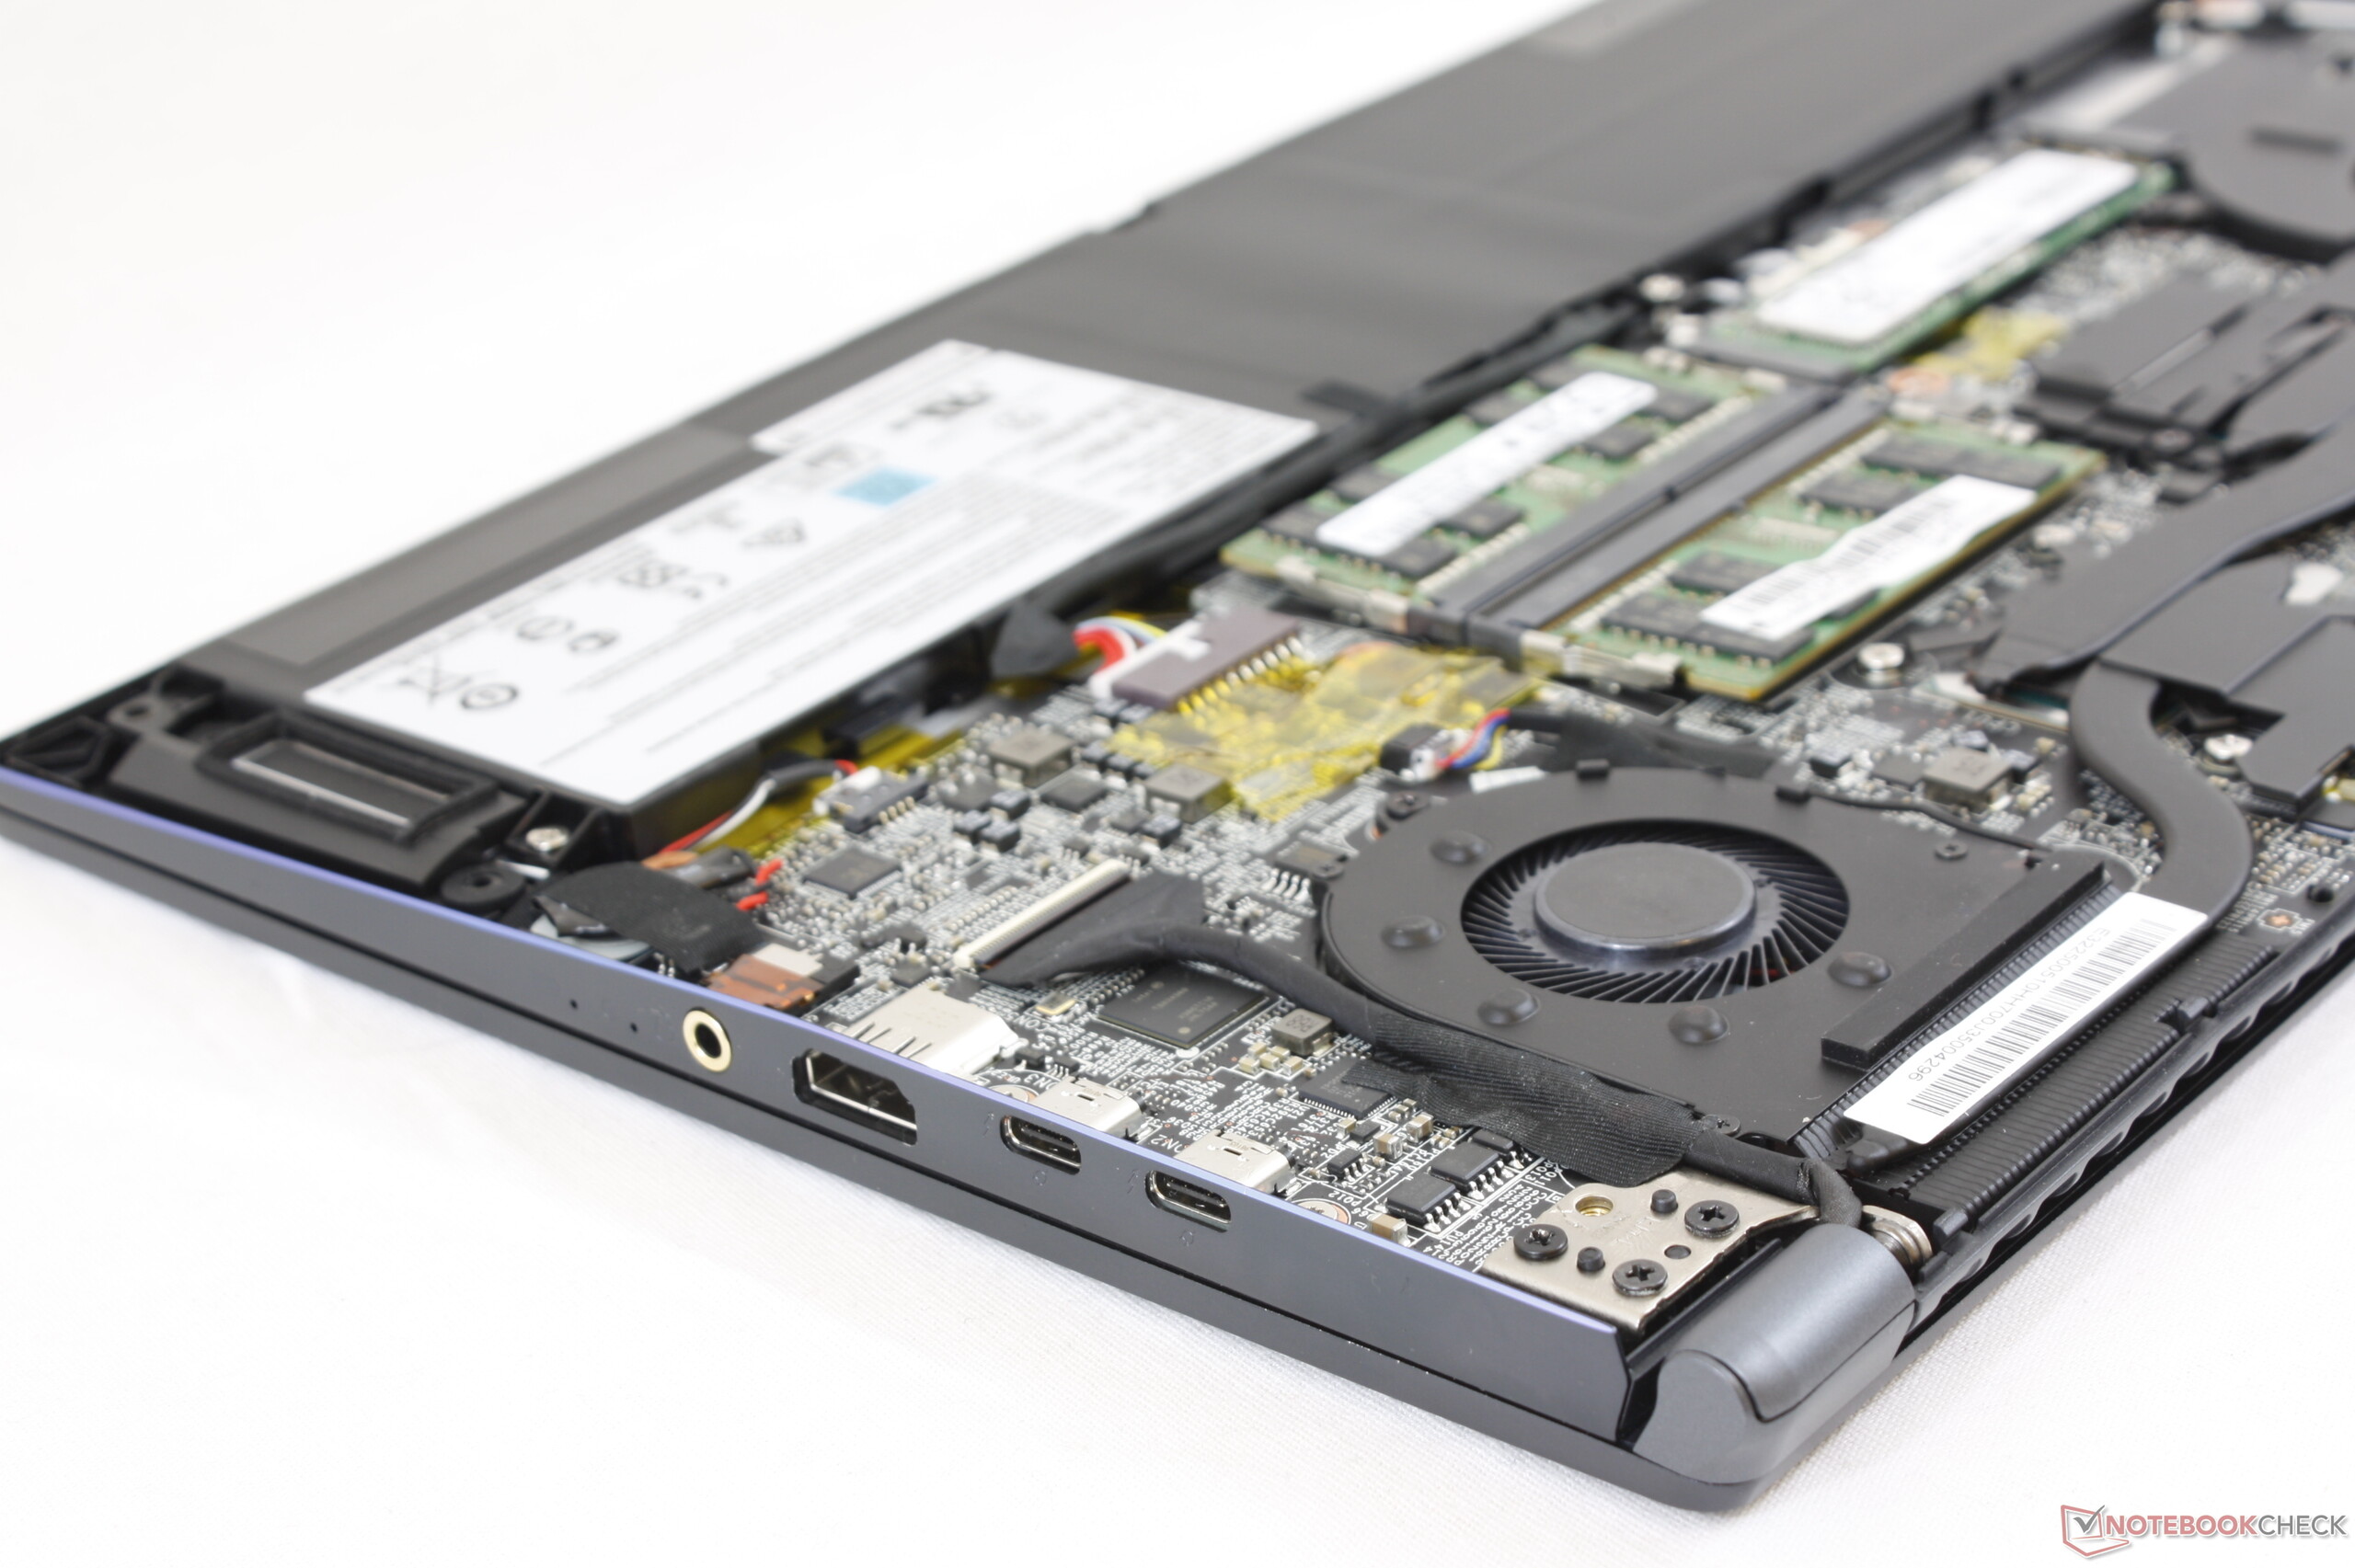
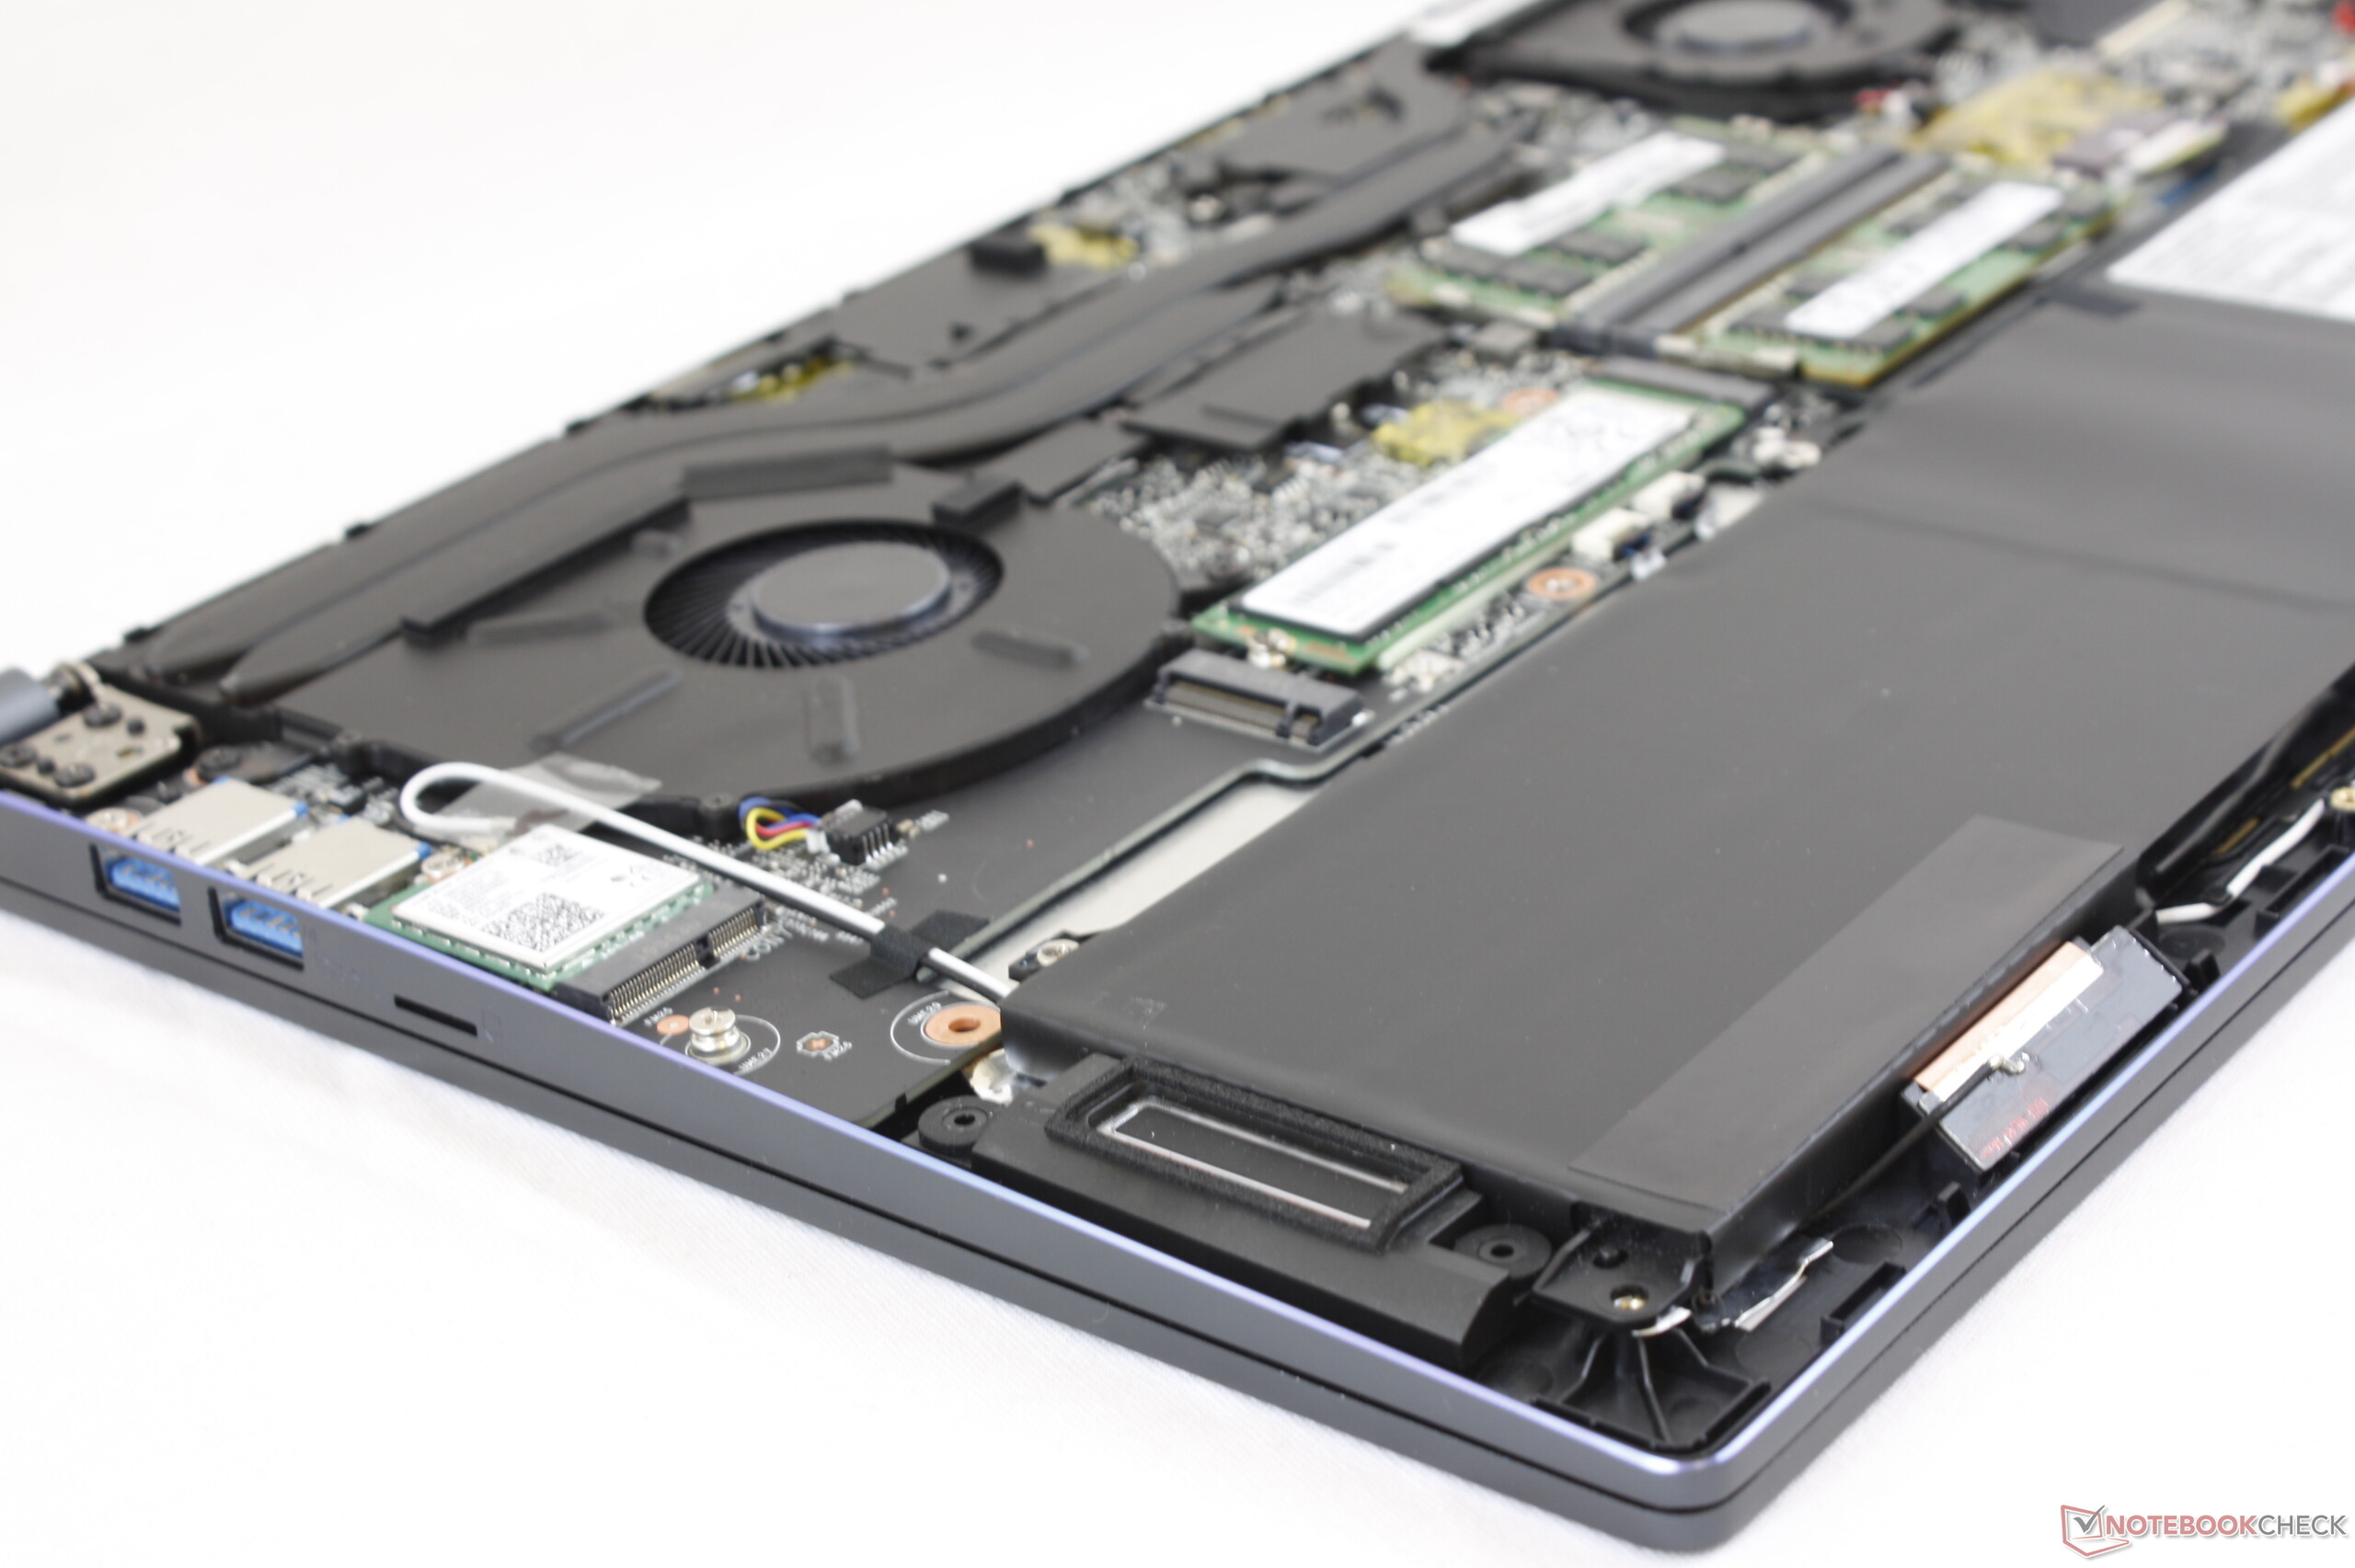
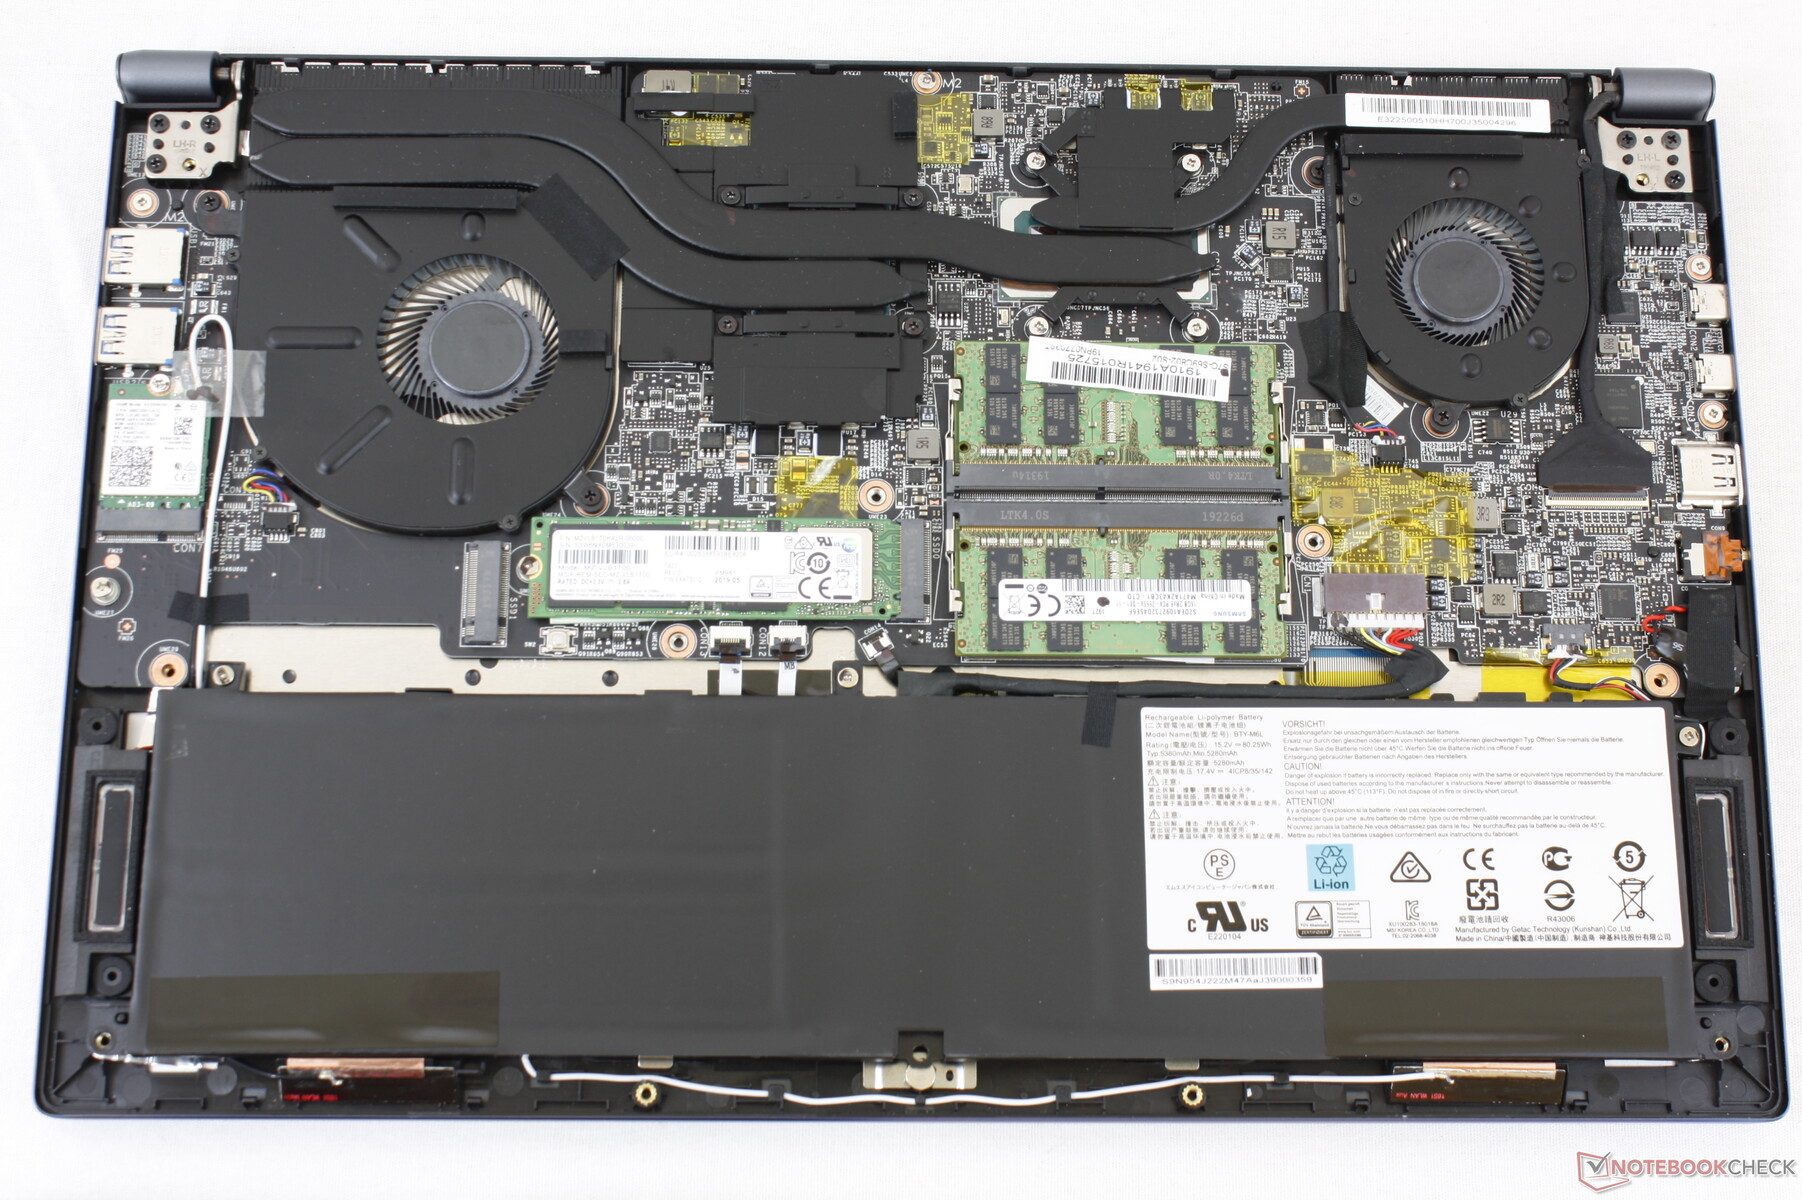
Spodnia pokrywa serwisowa jest zabezpieczona przez 11 śrubek. Jedna z nich mieści się pod plombą producenta. Wymiana podzespołów jest relatywnie łatwa. Otrzymuje się dostęp do pamięci RAM, obu miejsc na nośnik pamięci, modułu WLAN oraz akumulatora.
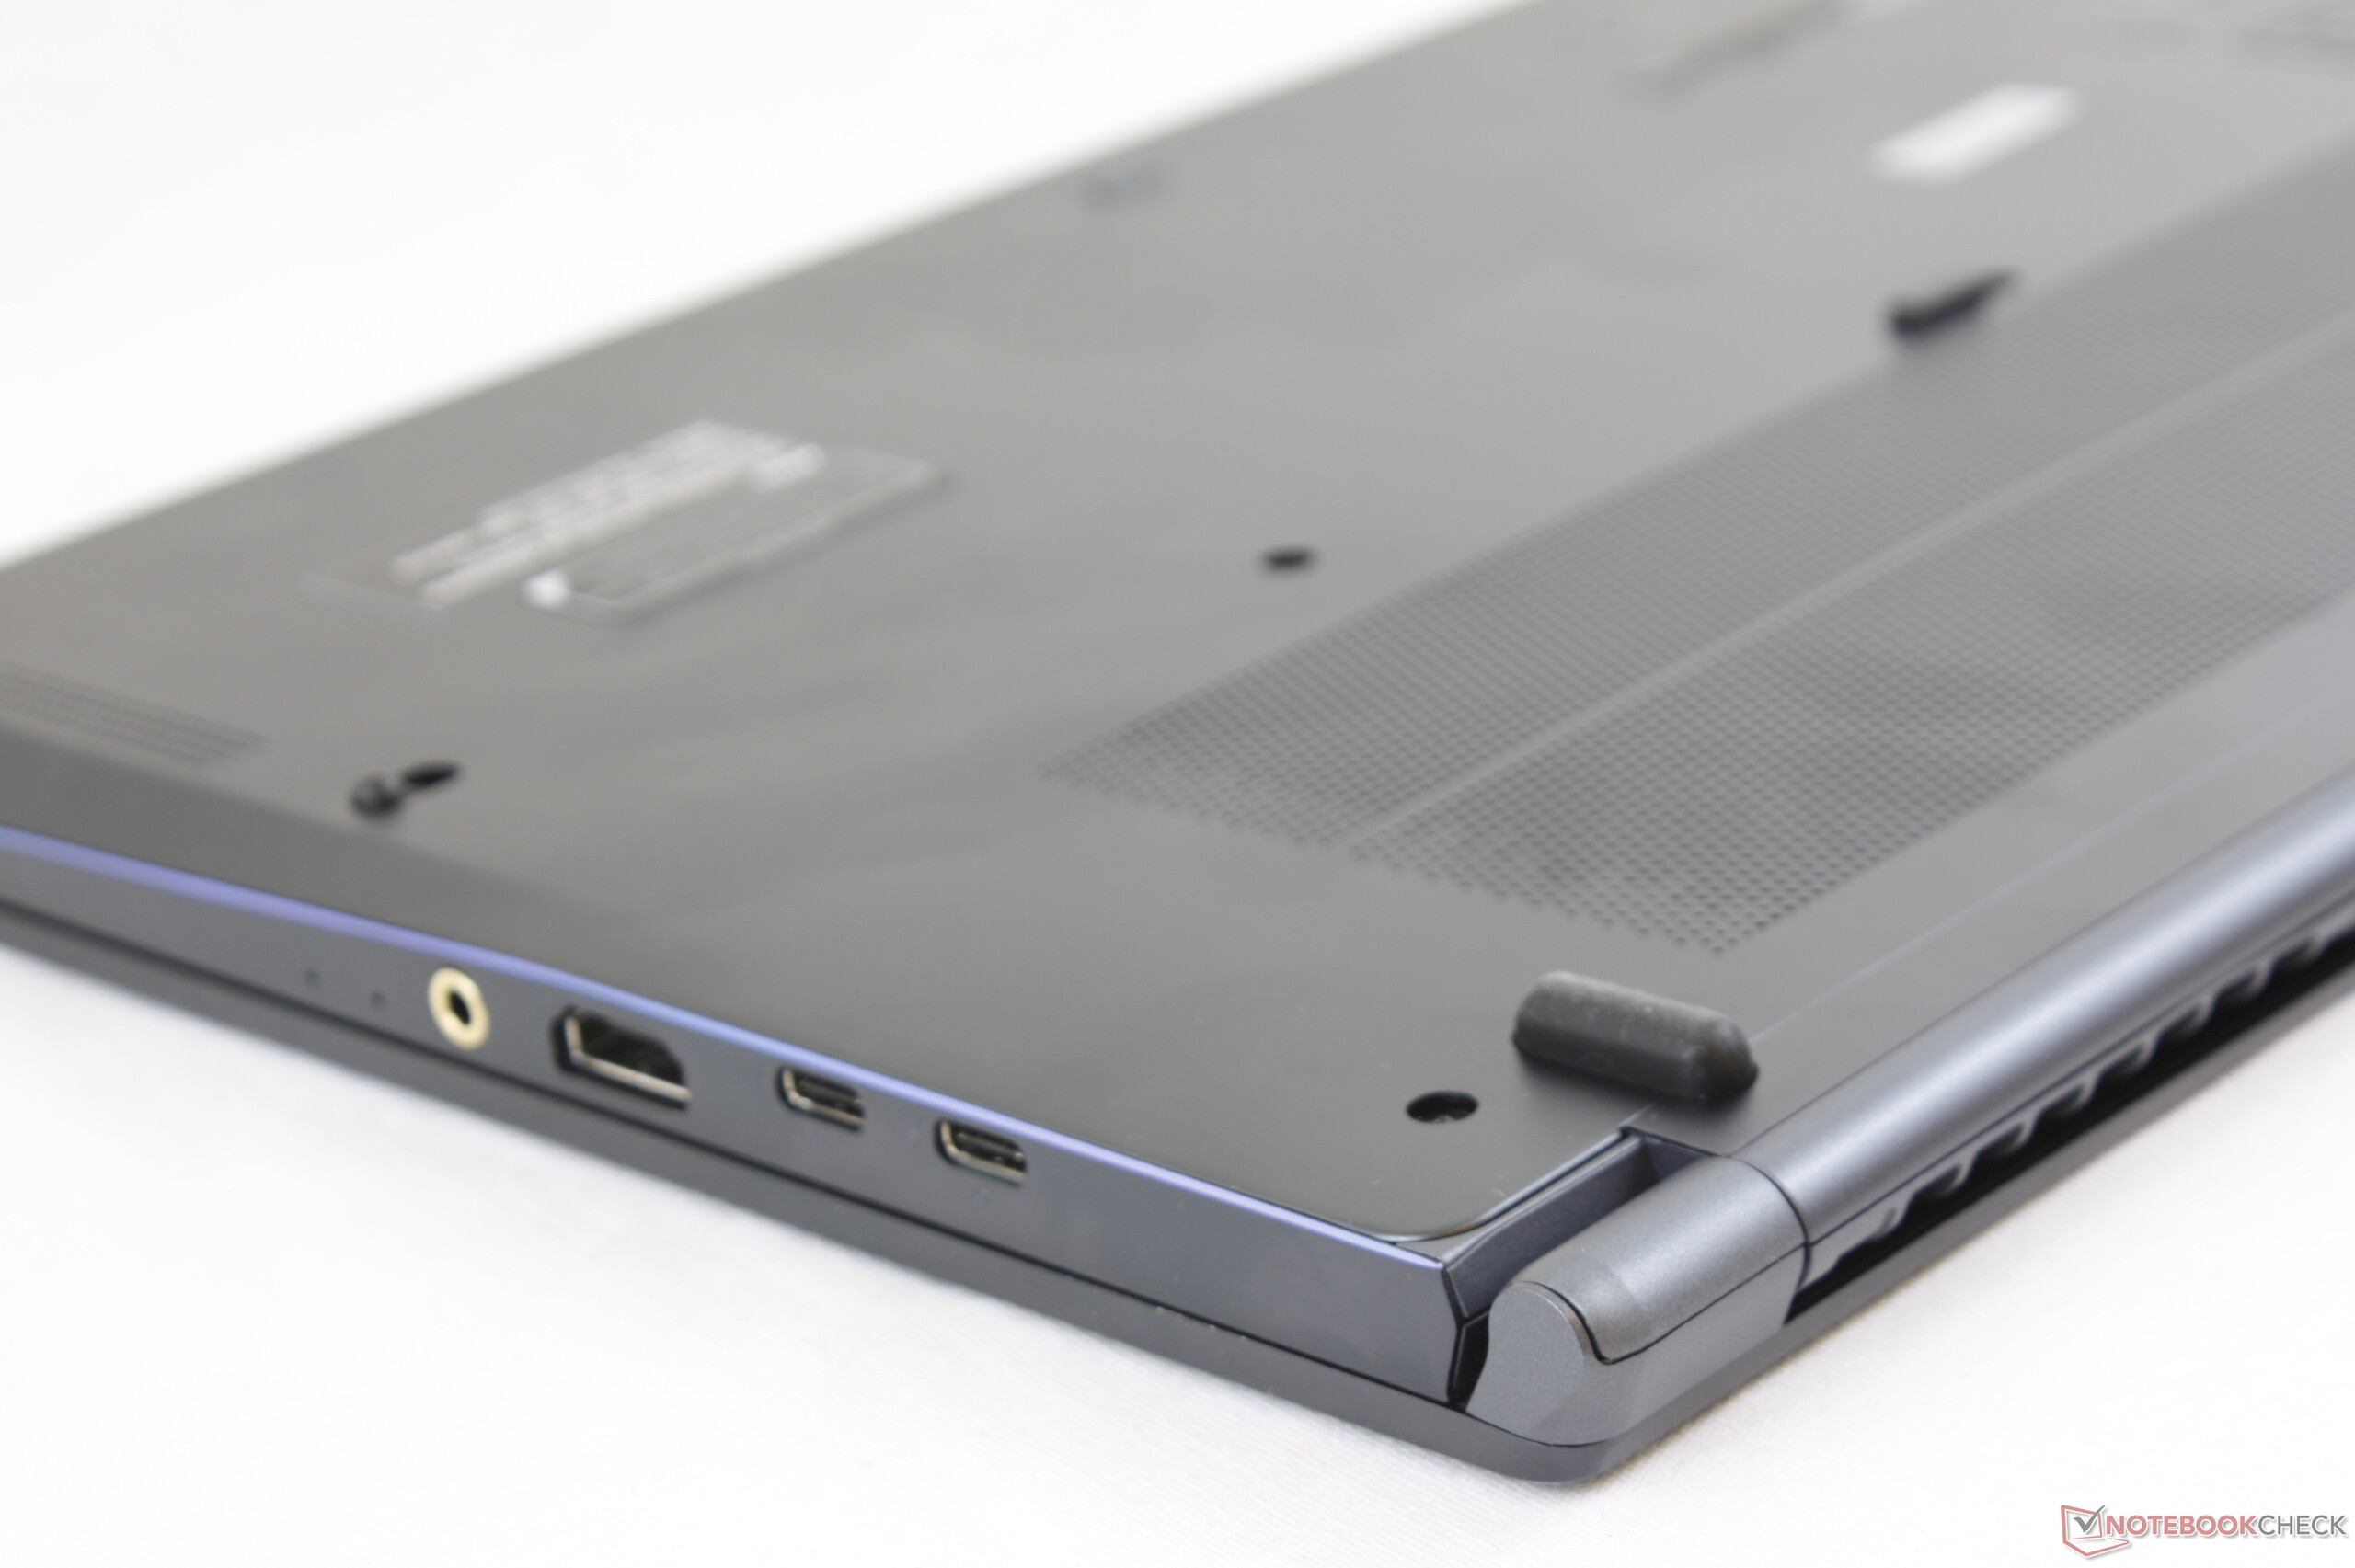
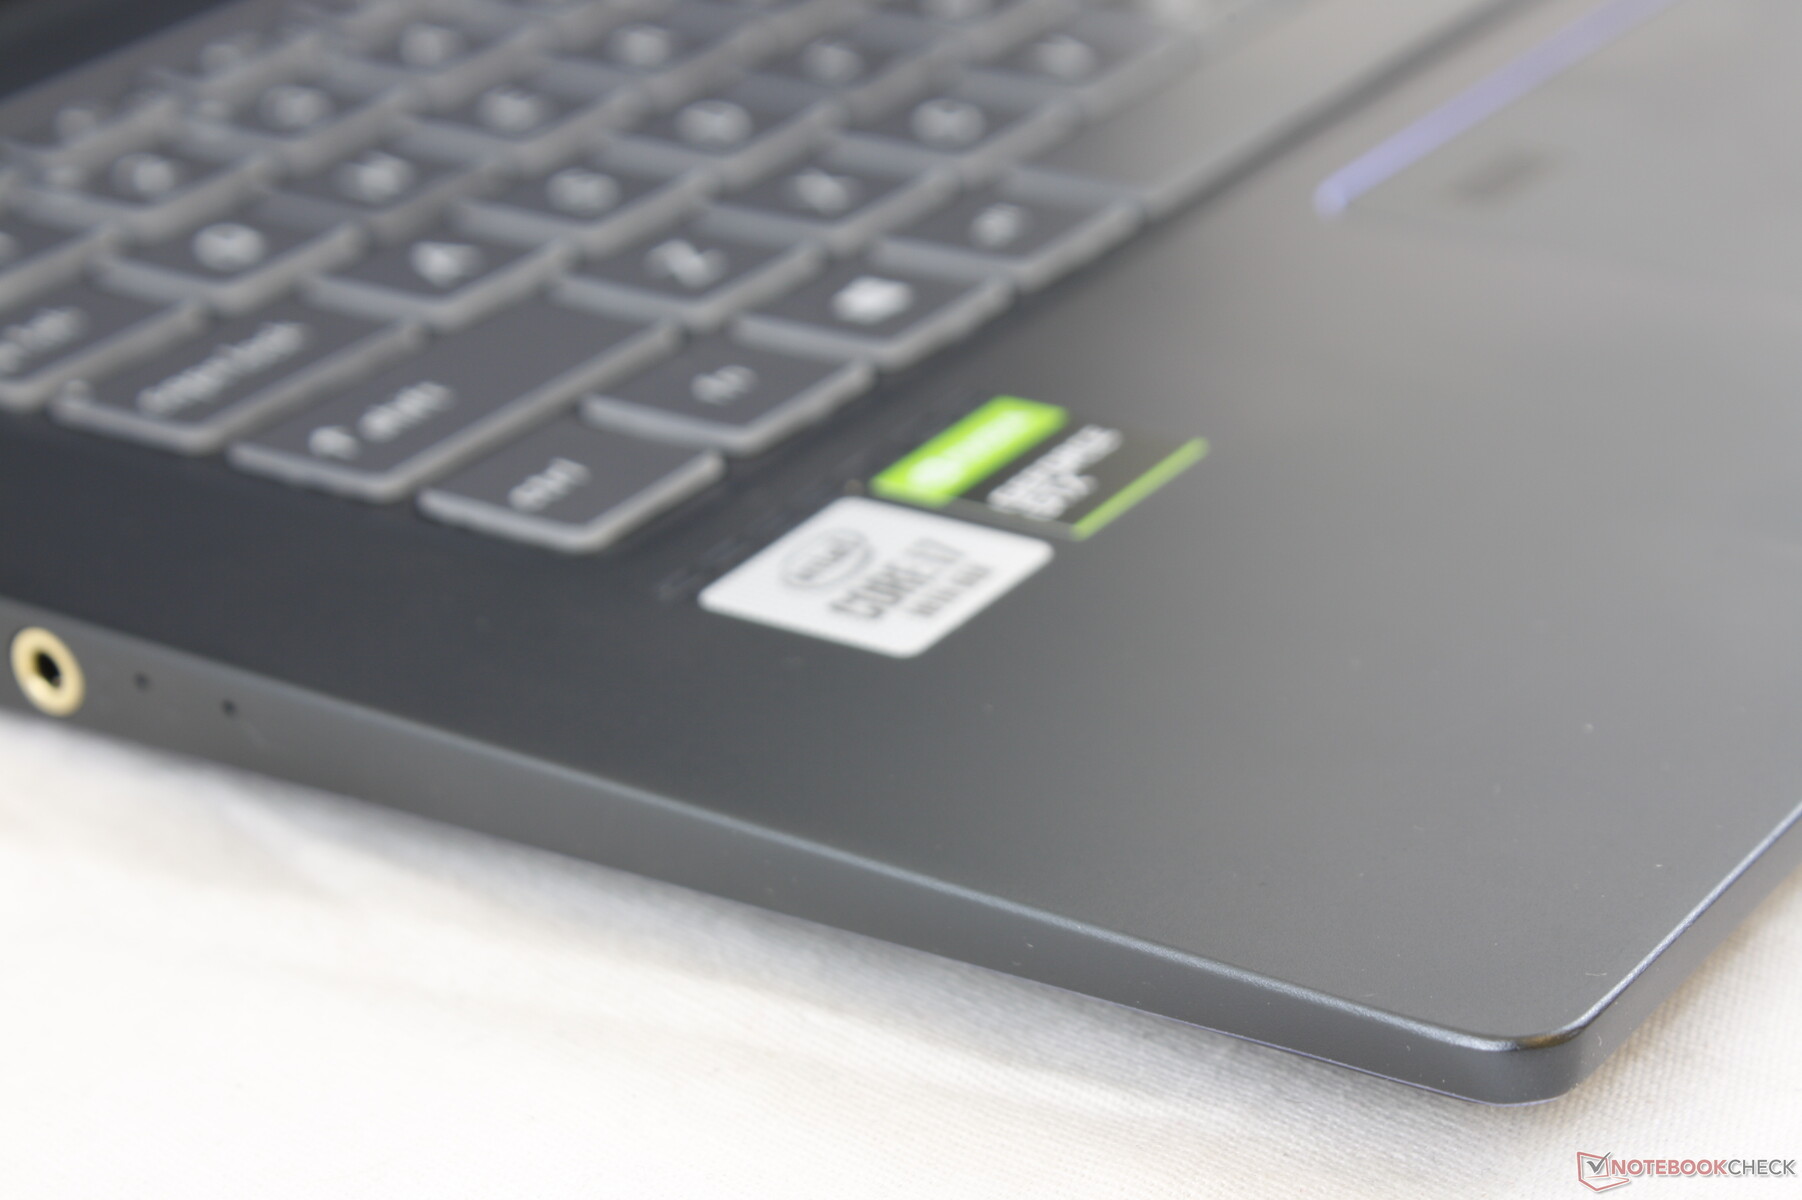
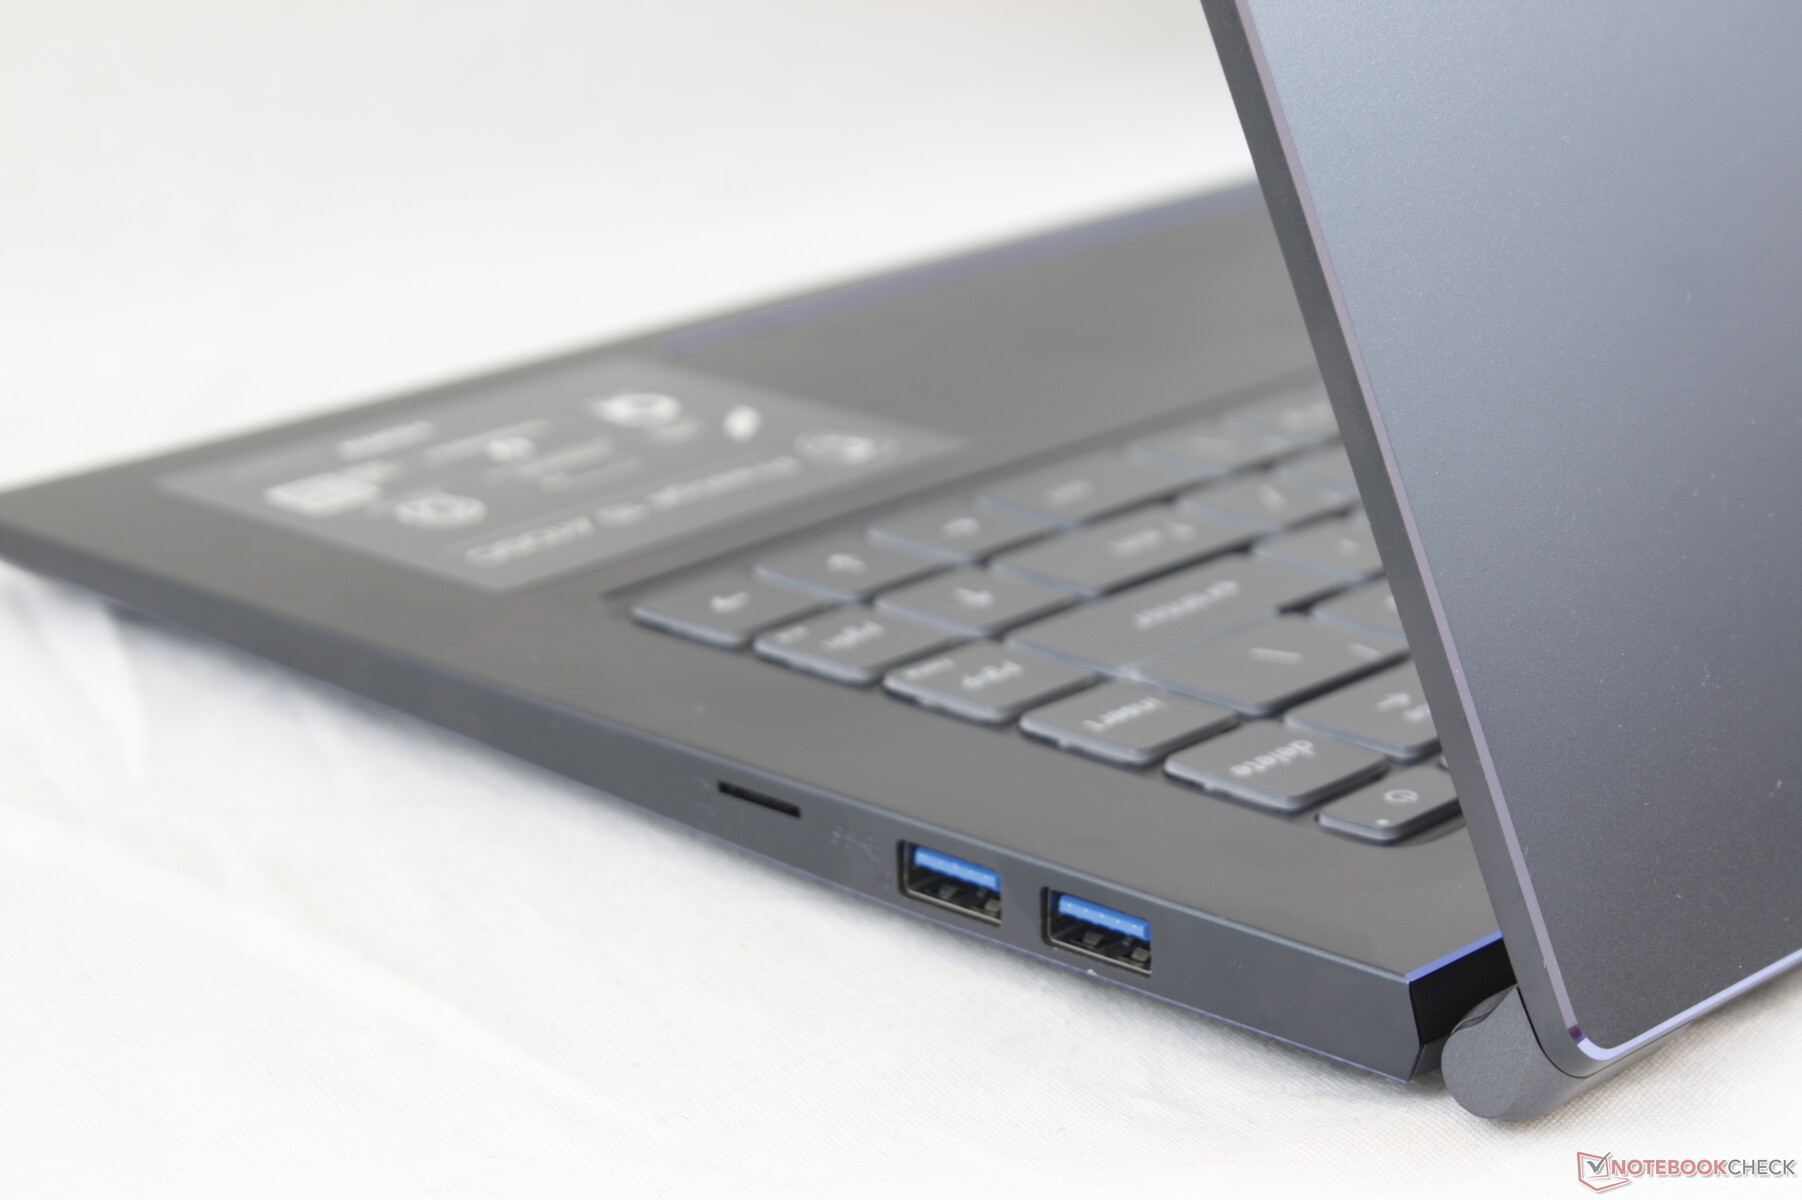
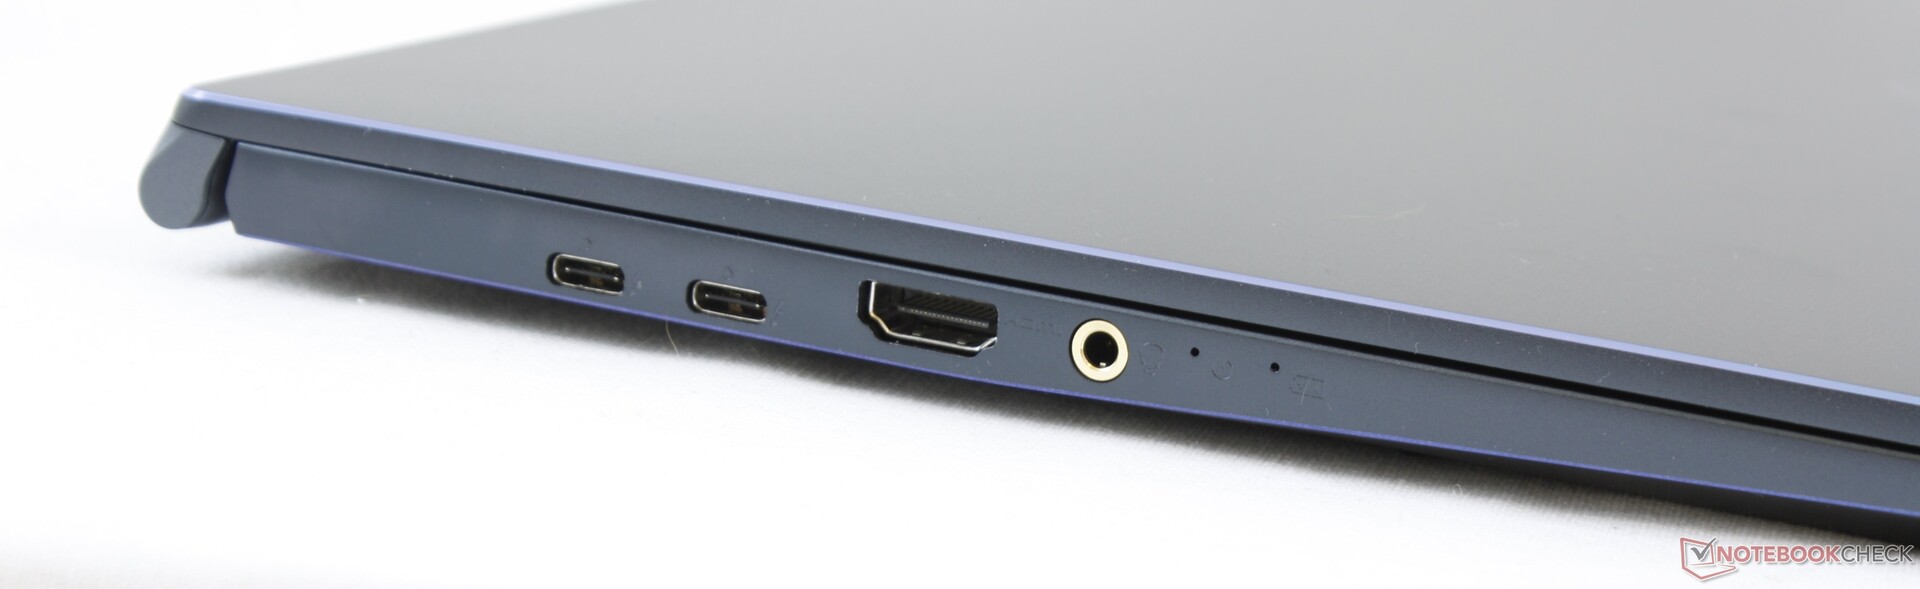
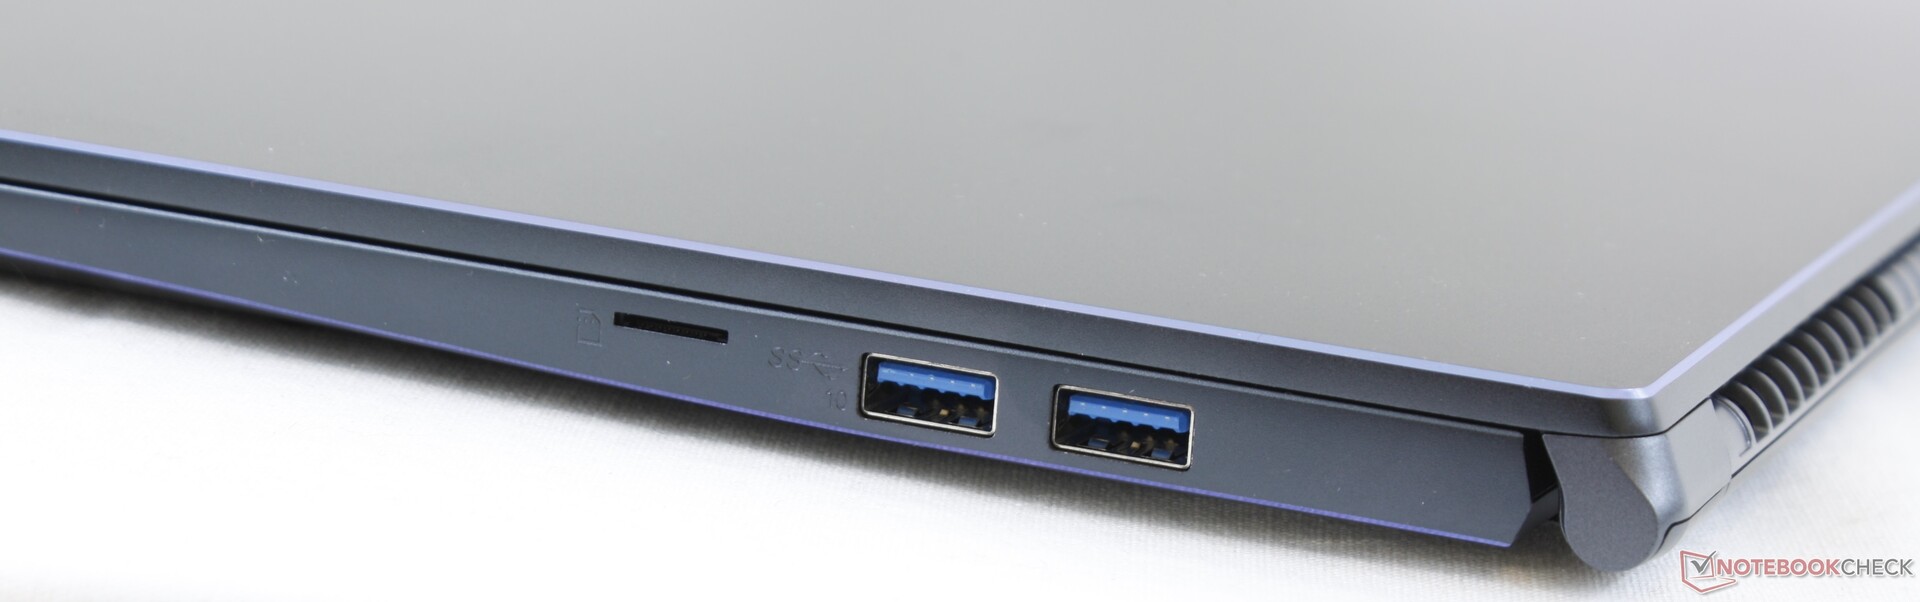
Wszystkie złącza znane z mniejszego laptopa Prestige 14 są dostępne w modelu Prestige 15, przy czym dodano do nich wyjście HDMI. Nie ma zaś zaczepu na blokadę Kensingtona ani niczego podobnego. Można sobie wyobrazić lepszy układ złączy (np. taki, by na lewej ściance było klasyczne gniazdo USB-A).
Urządzenia wejścia
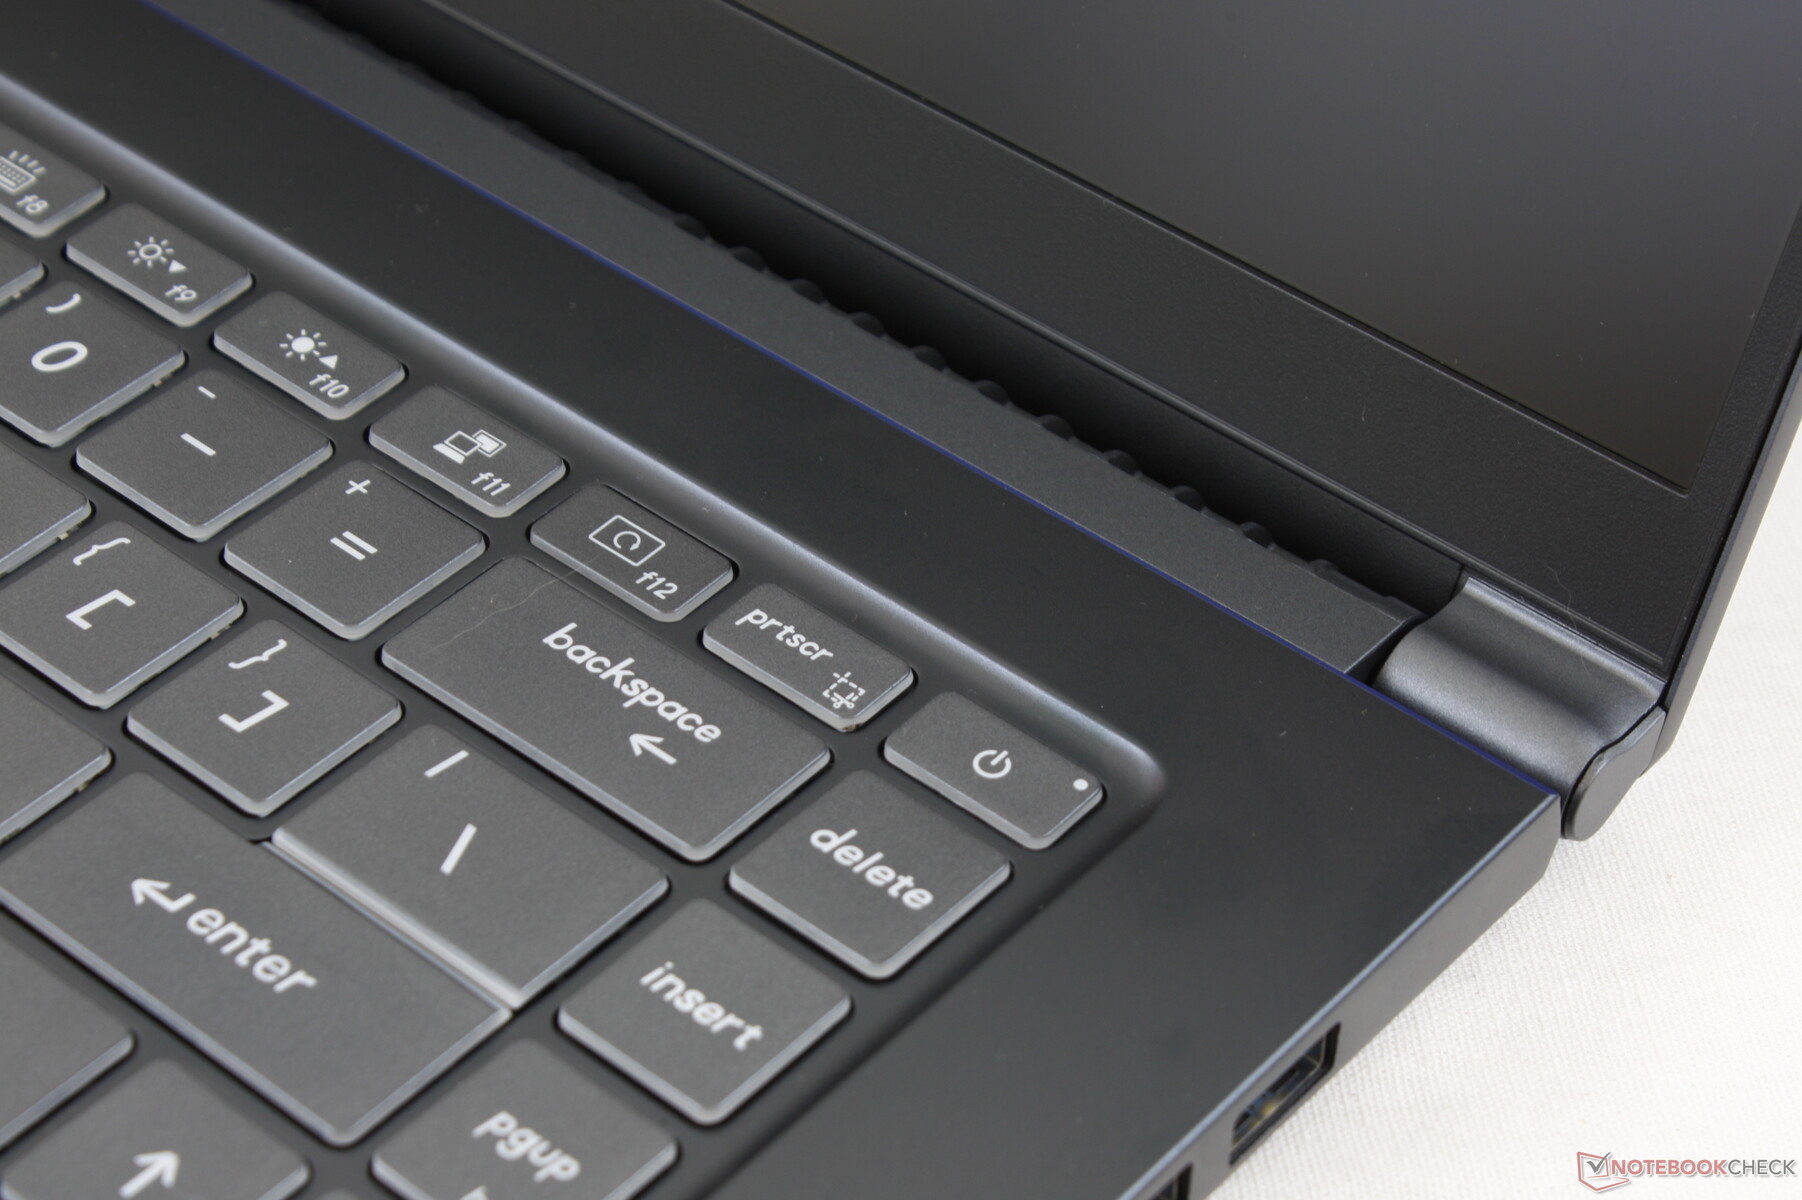
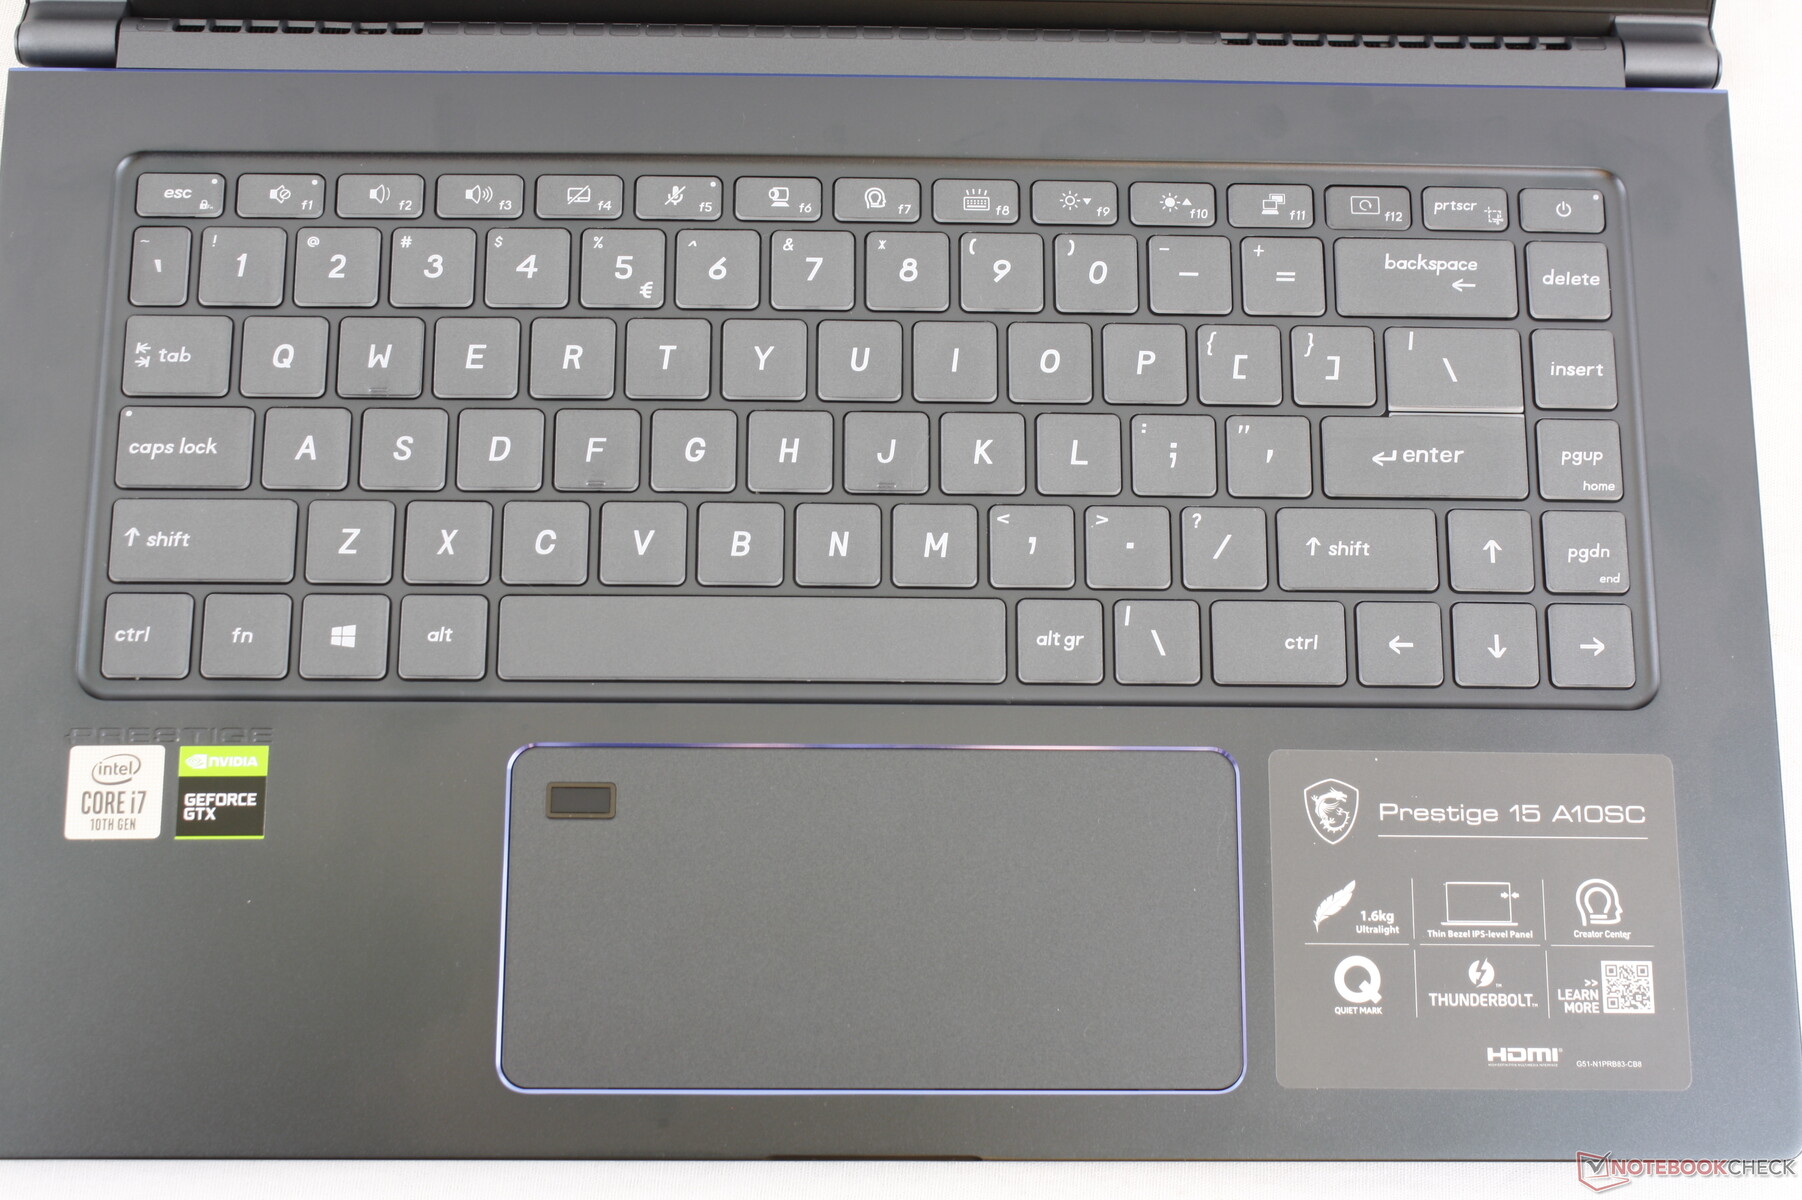
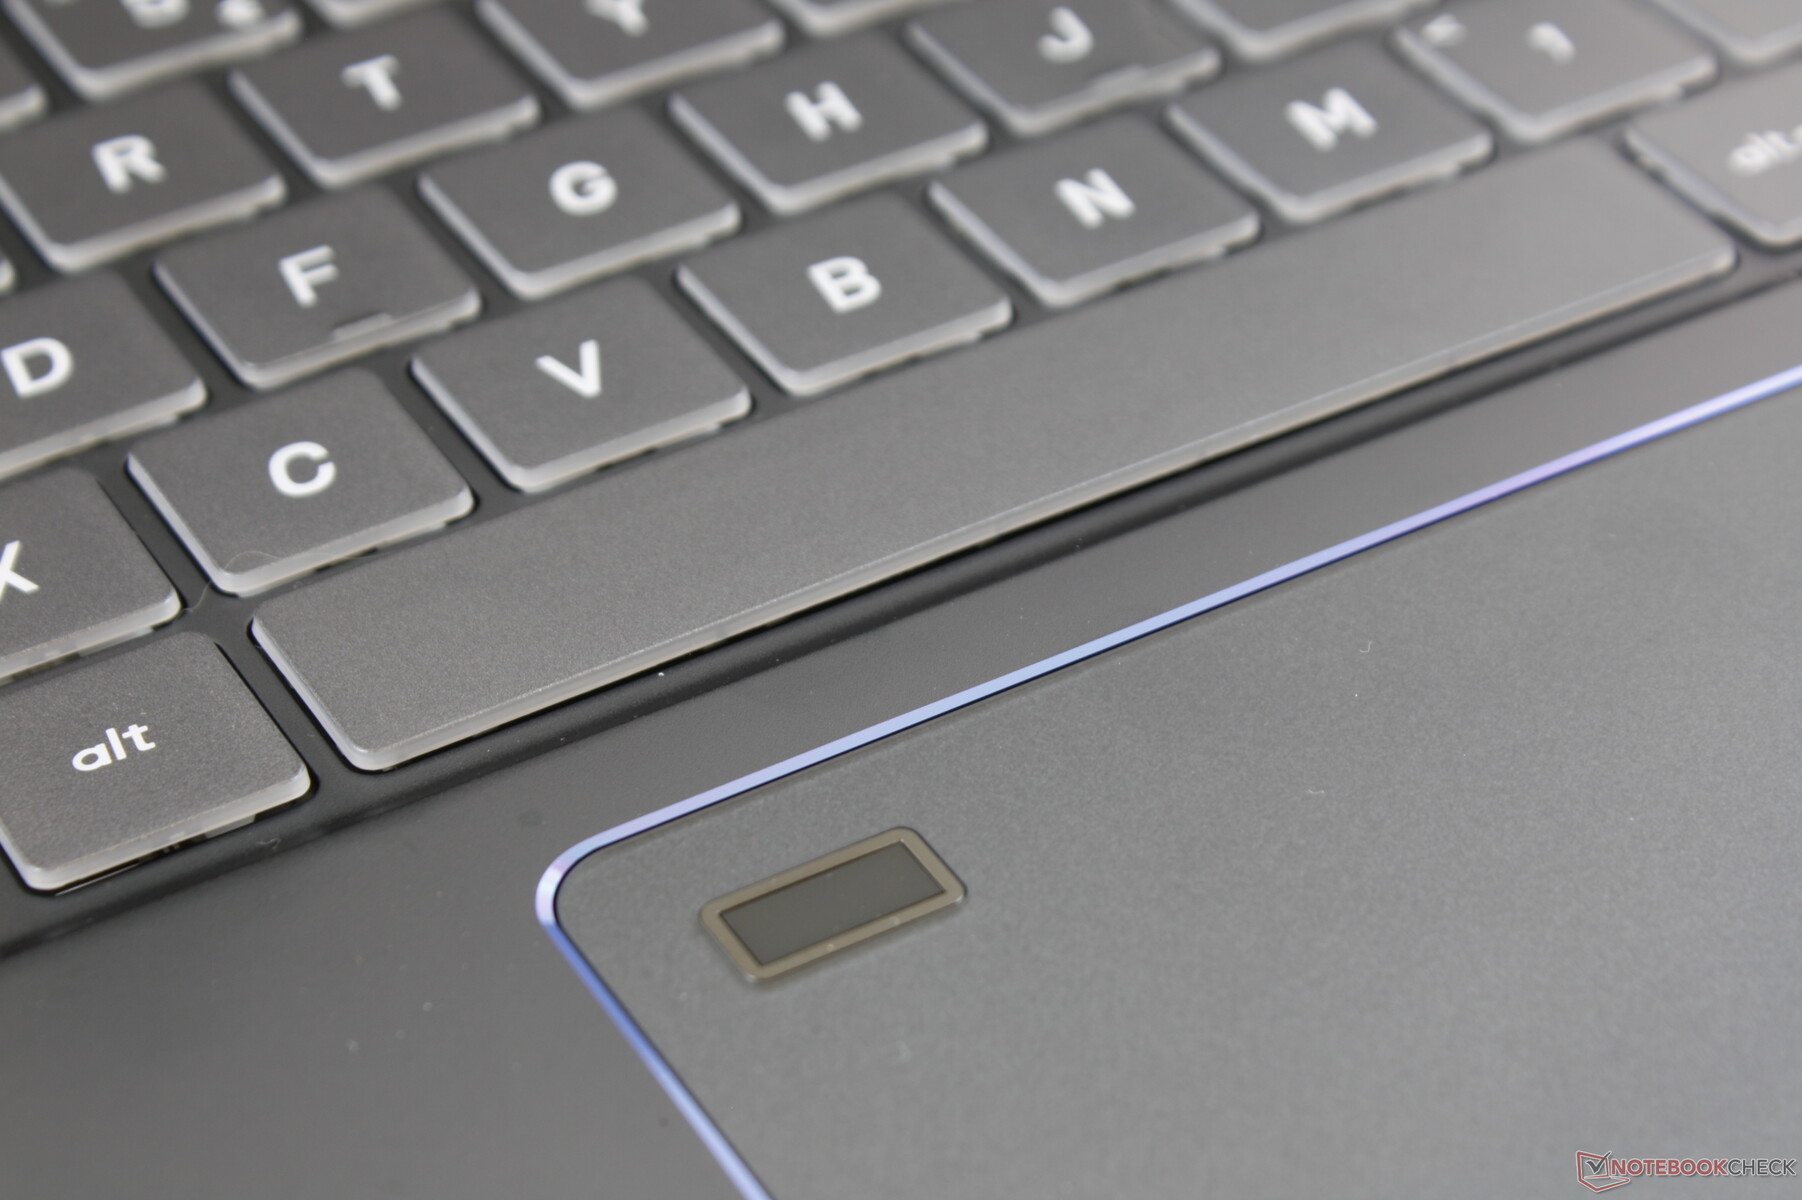
Układ klawiatury i rozmiary klawiszy są podobne, jak w MSI GS65. Czcionka oznaczeń jest nieco inna. Przycisk zasilania umieszczono w prawym górnym narożniku klawiatury. Klawiatura jest zbyt miękka. Na pewno na tle tego, co oferują laptopy Dell XPS 15 i HP Spectre x360 15. Generalnie jednak w ultrabookach mamy do czynienia z podobnymi właściwościami użytkowymi, czyli z krótkim skokiem i małym oporem przy naciskaniu.
Płytka dotykowa ma identyczne rozmiary (14 x 6,5 cm), jak ta zastosowana w MSI GS65. Tak duża powierzchnia umożliwia wykonywanie zadań wieloma palcami. Ma to też swoje wady, czyli może się przyczyniać do interakcji ponad miarę. Na przykład wywoływania przypadkowych ruchów kursora. Zintegrowane z płytką przyciski gładzika są miękkie przy wciskaniu, mają krótki skok i są w miarę ciche. Lepiej byłoby jednak, gdyby omawiany laptop miał oddzielne przyciski (odbiłoby się to pozytywnie na precyzji działania).
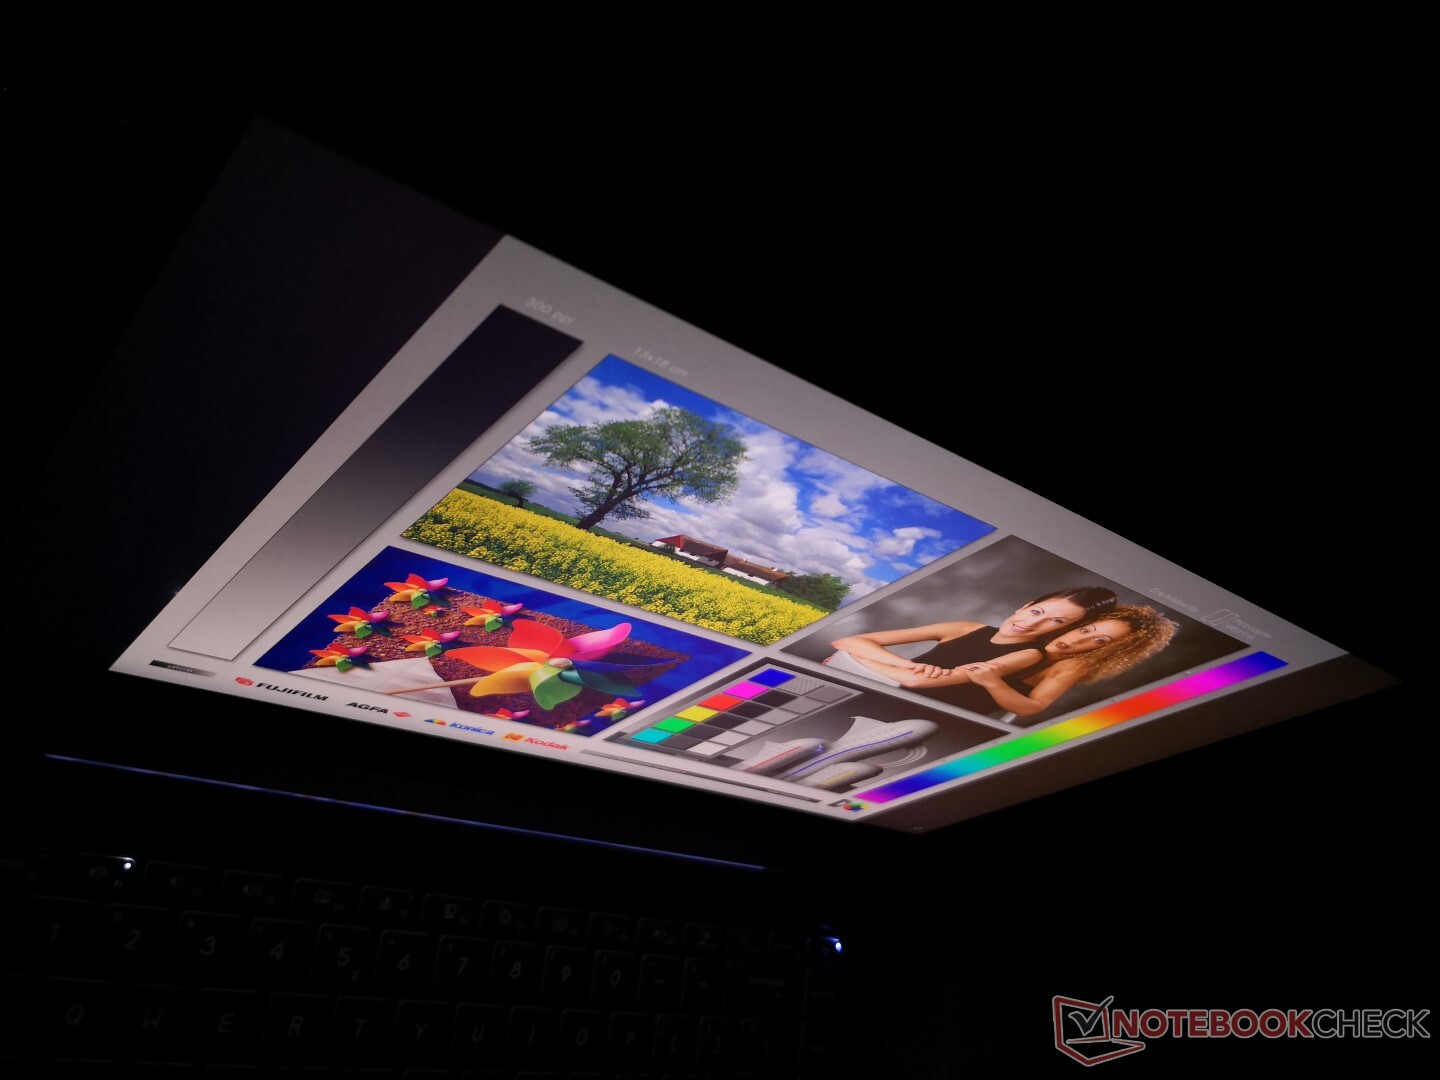
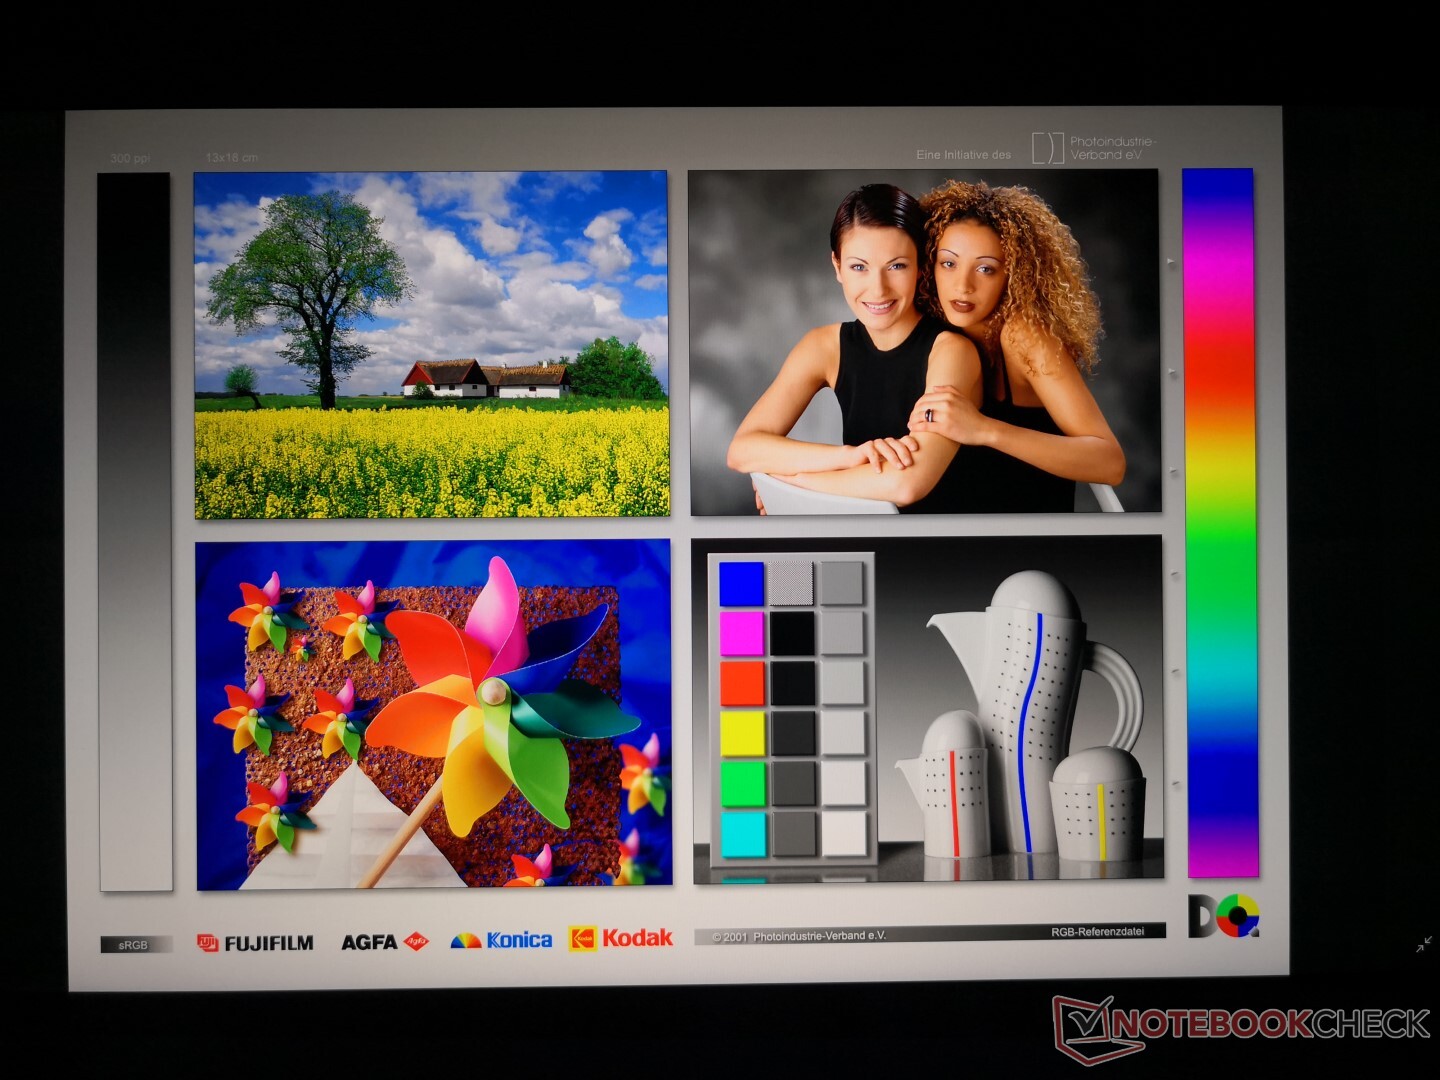
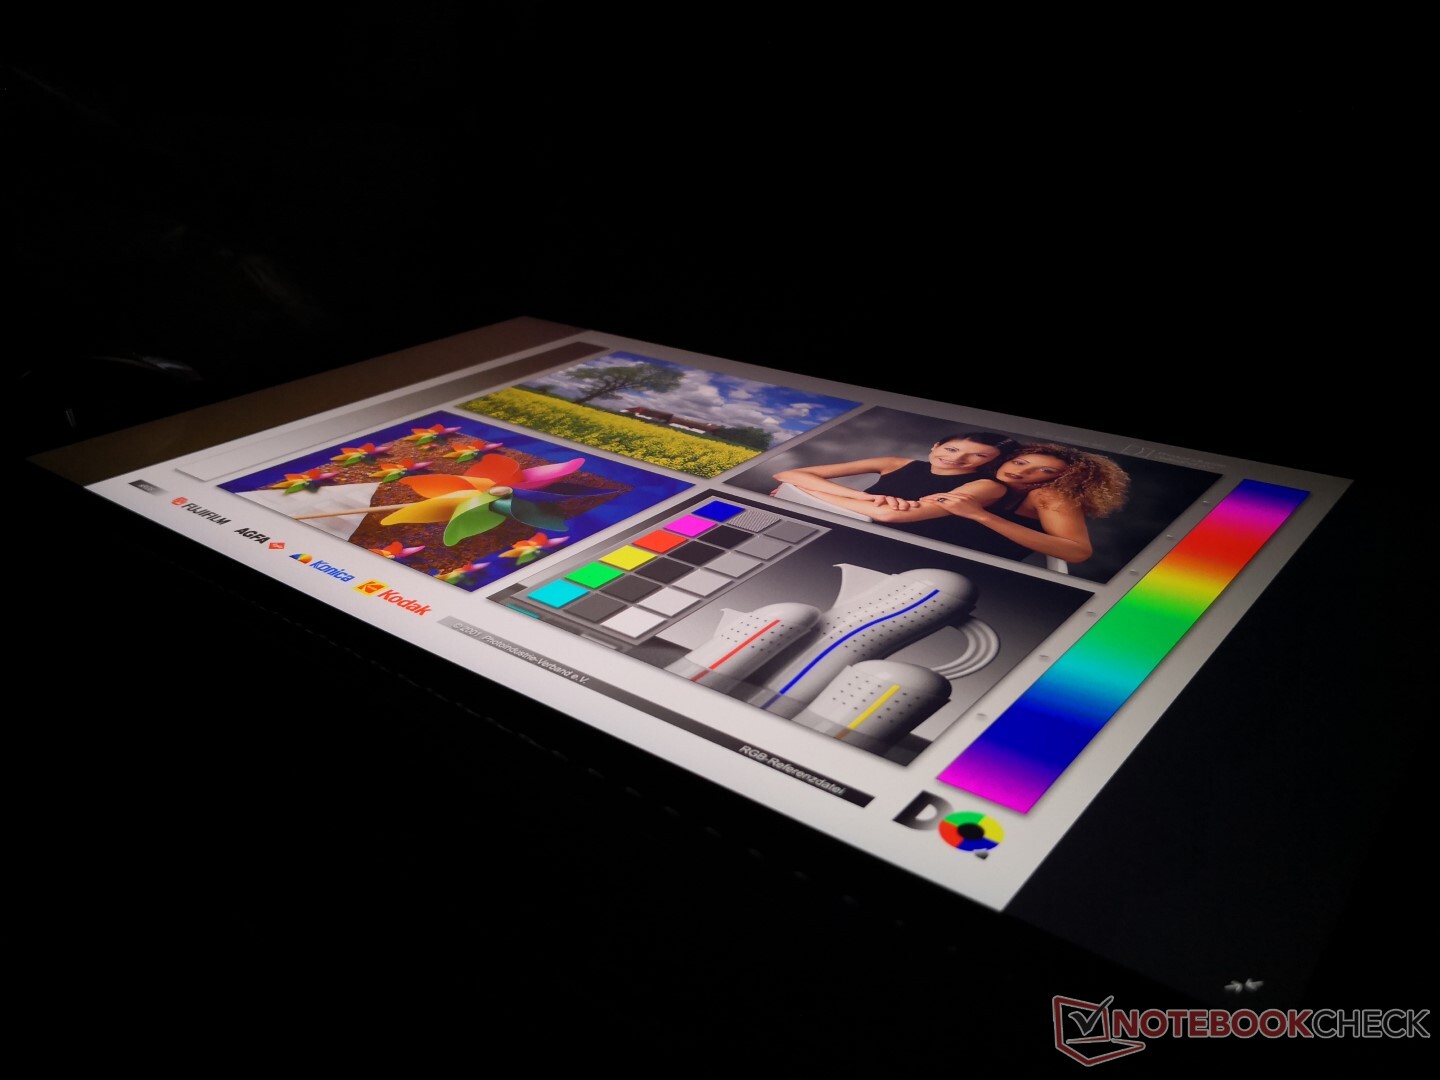
Obraz
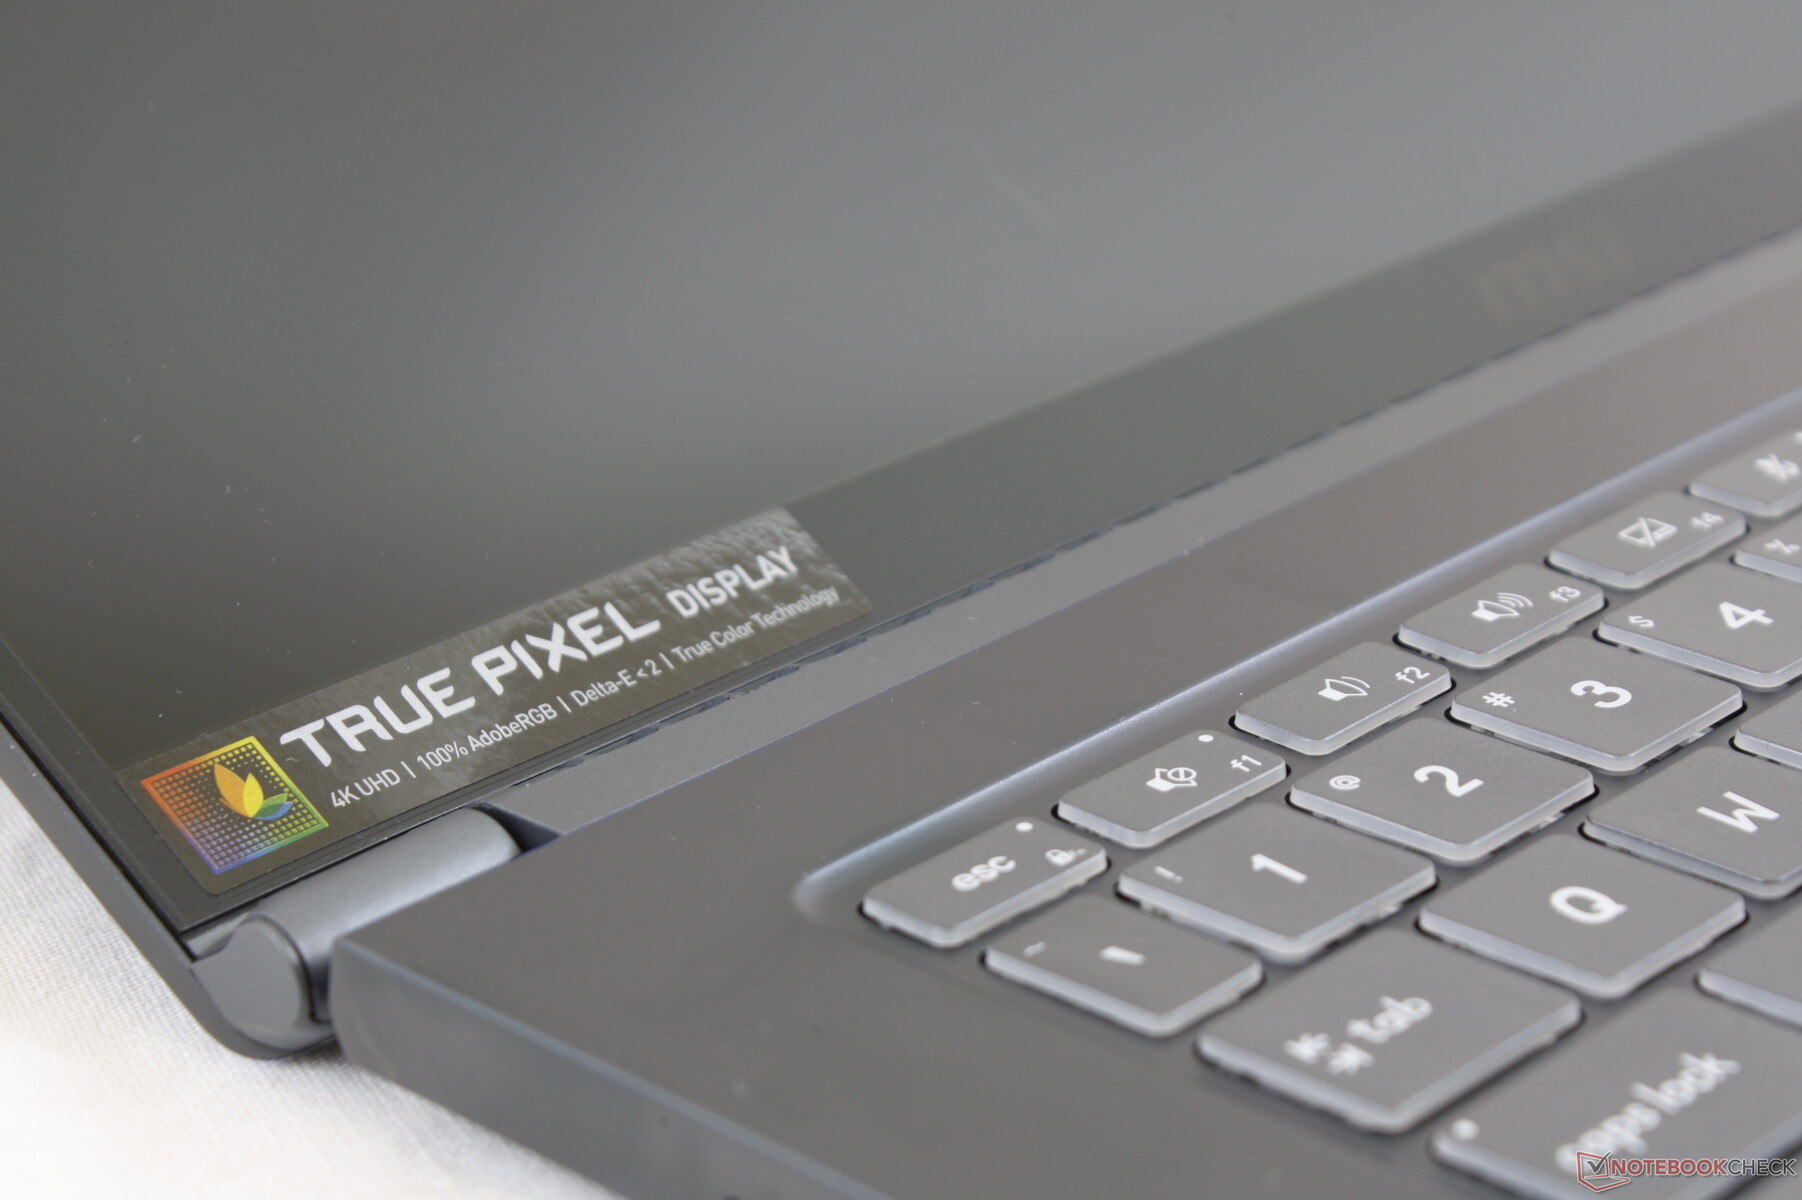
Zamawiając laptop MSI Prestige 15, ma się do wyboru matrycę FHD lub 4K UHD. Testowana jednostka posiadała matrycę IPS o nazwie Sharp LQ156D1JW42, czyli tę o wyższej rozdzielczości. Podobną matrycę, z oznaczeniem Sharp LQ156D1, można znaleźć m.in. w laptopach Lenovo ThinkPad P50 i Dell XPS 15 9570. Po przebadaniu wszystkie wymienione modele cechują się podobnym kontrastem i odwzorowaniem kolorów.


| |||||||||||||||||||||||||
rozświetlenie: 92 %
na akumulatorze: 464.5 cd/m²
kontrast: 929:1 (czerń: 0.5 cd/m²)
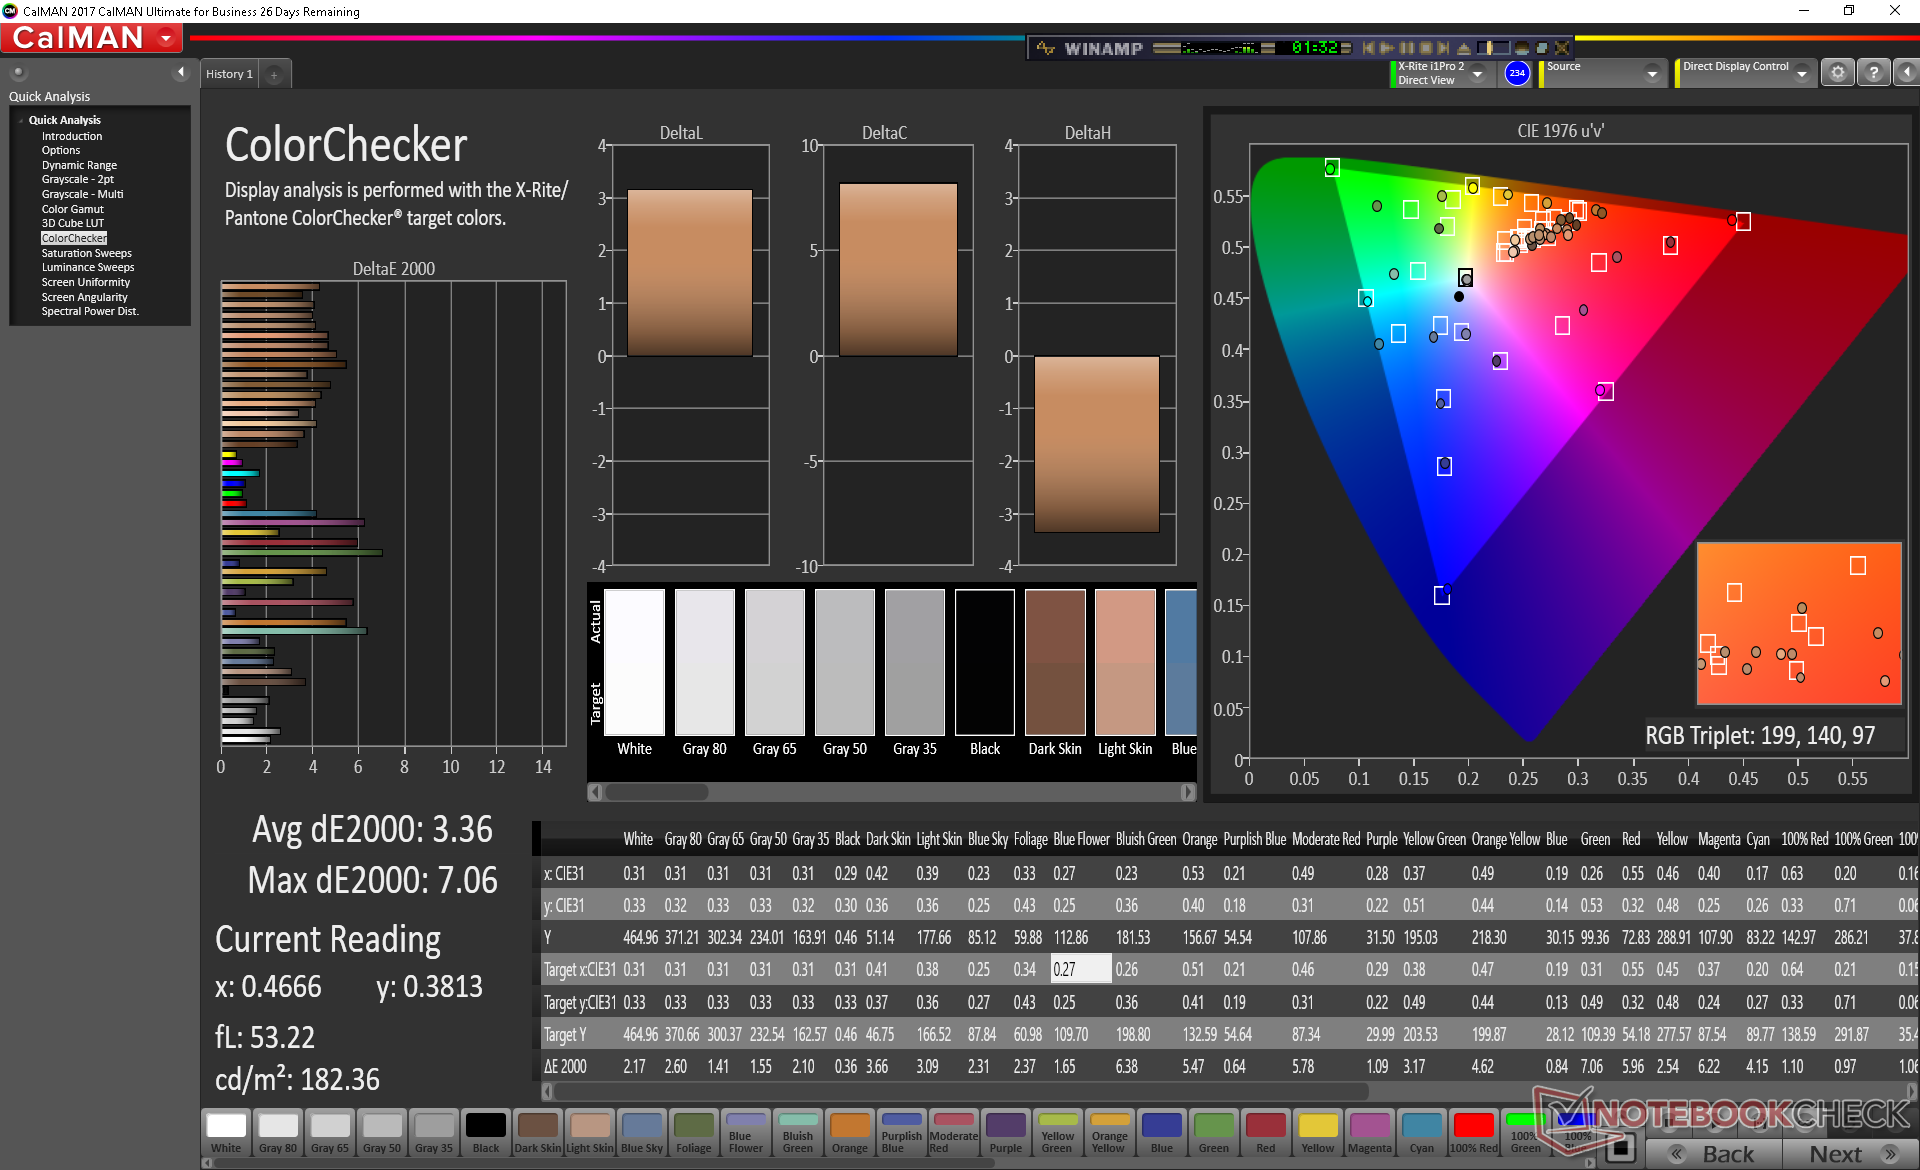
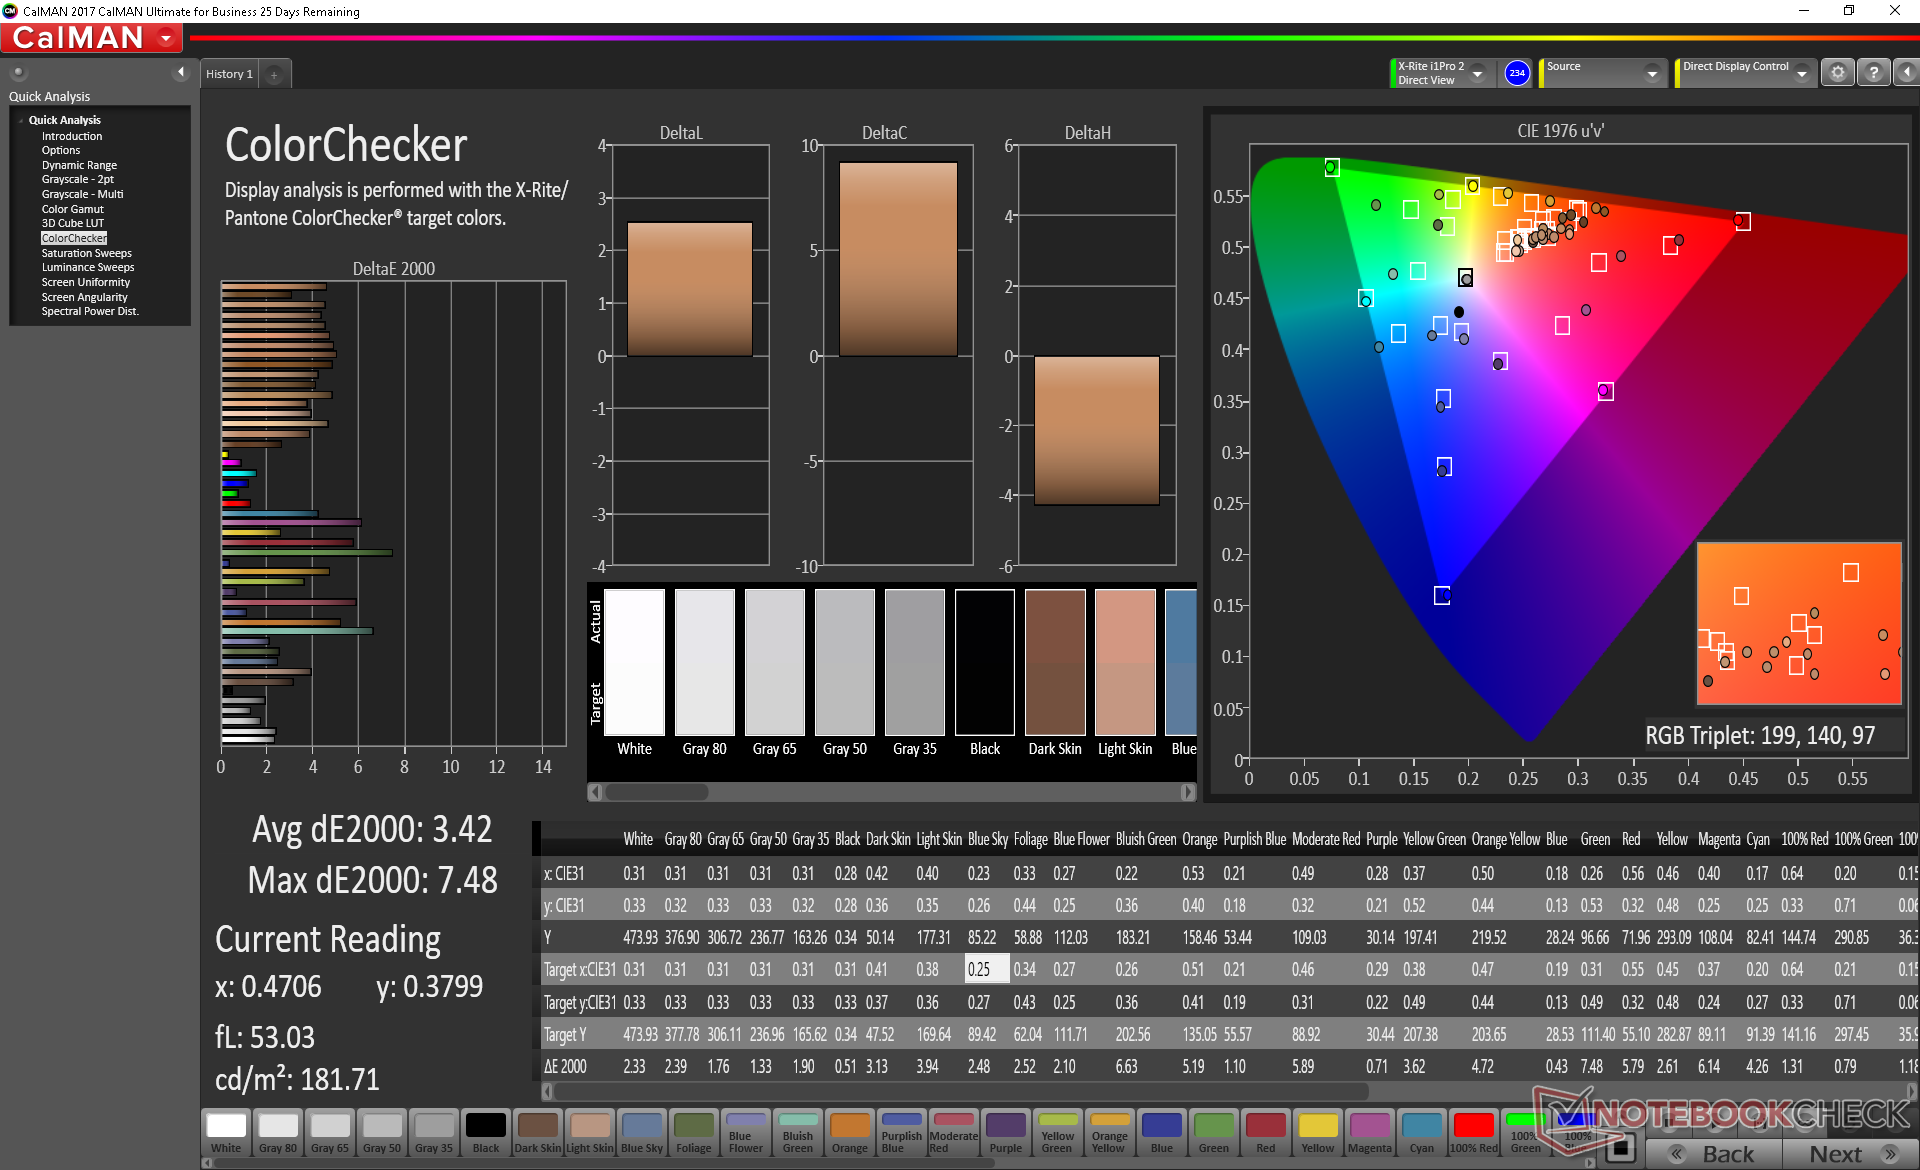
ΔE ColorChecker Calman: 3.36 | ∀{0.5-29.43 Ø4.71}
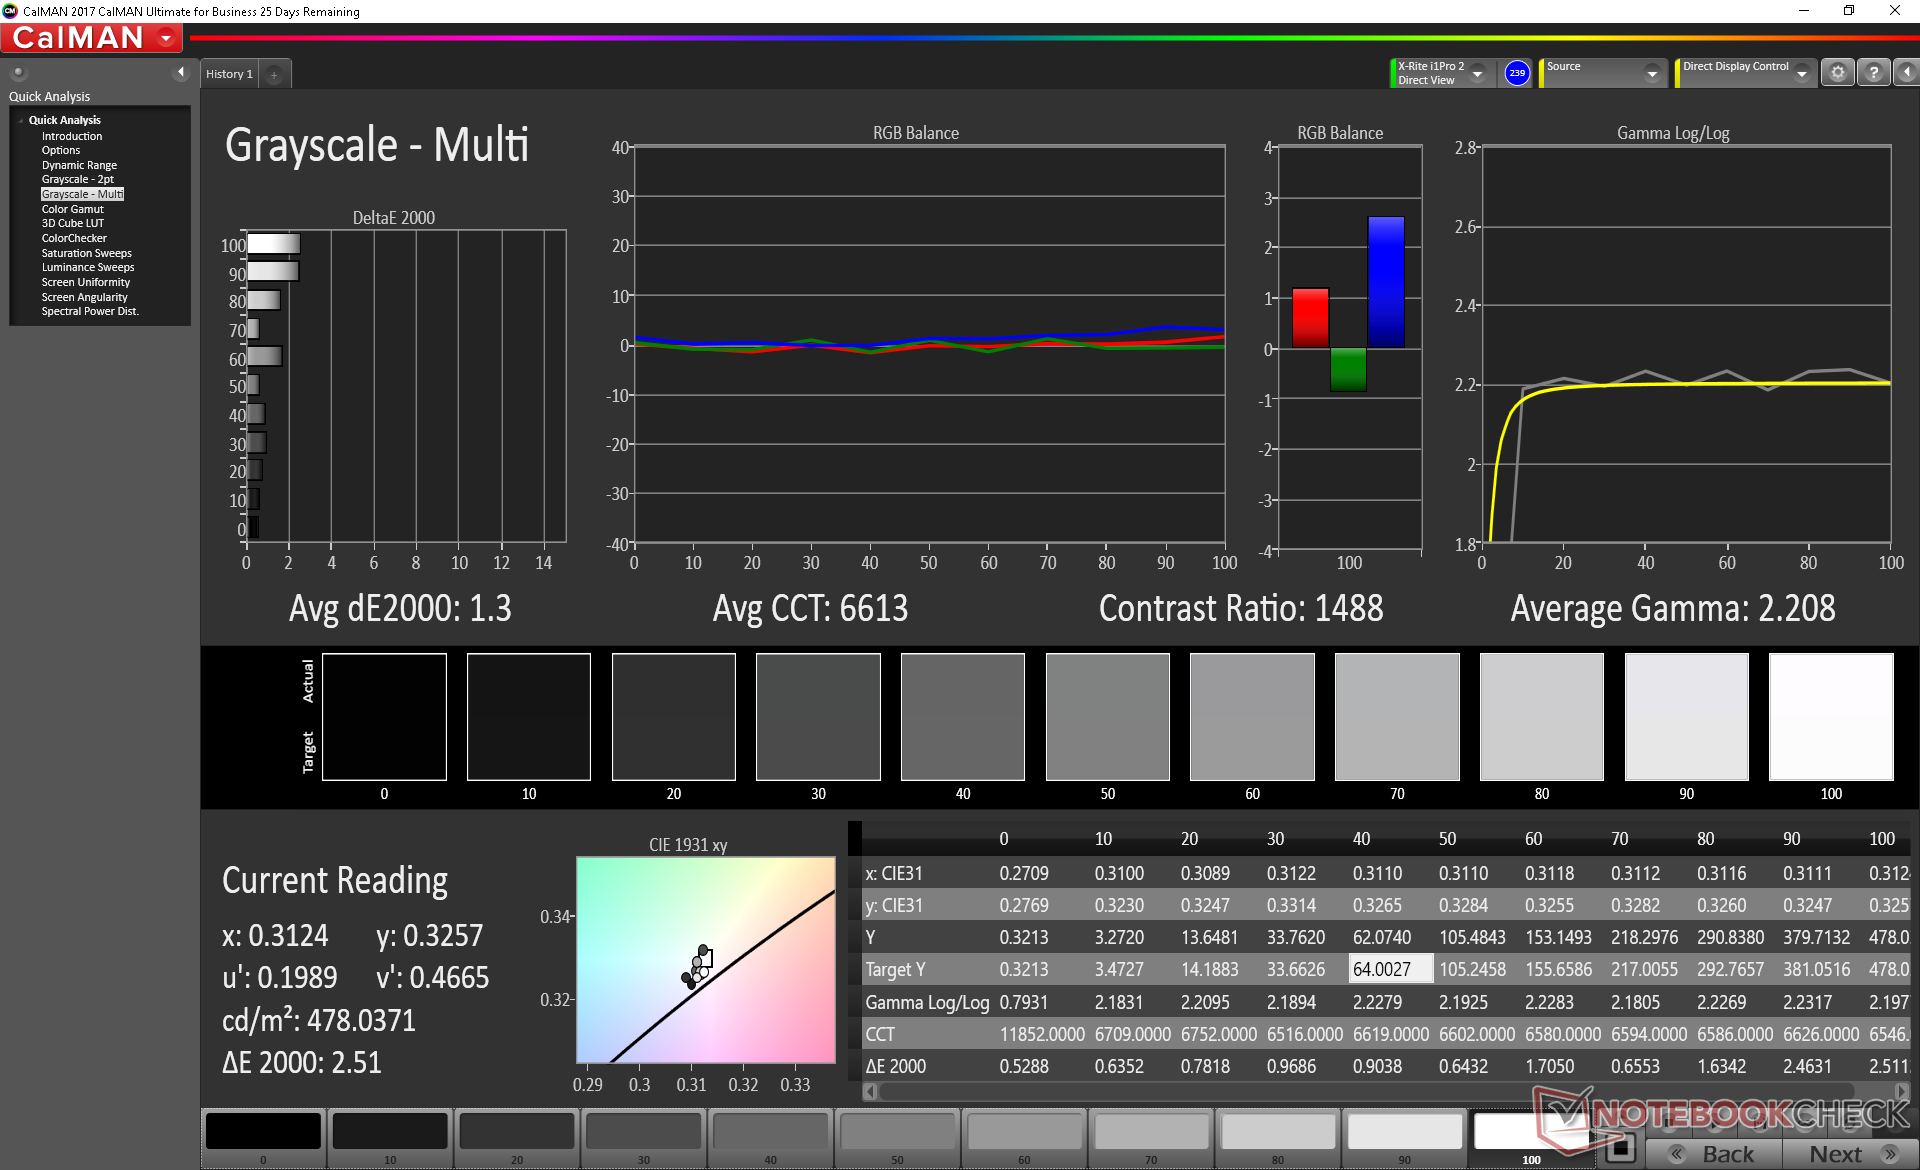
calibrated: 3.42
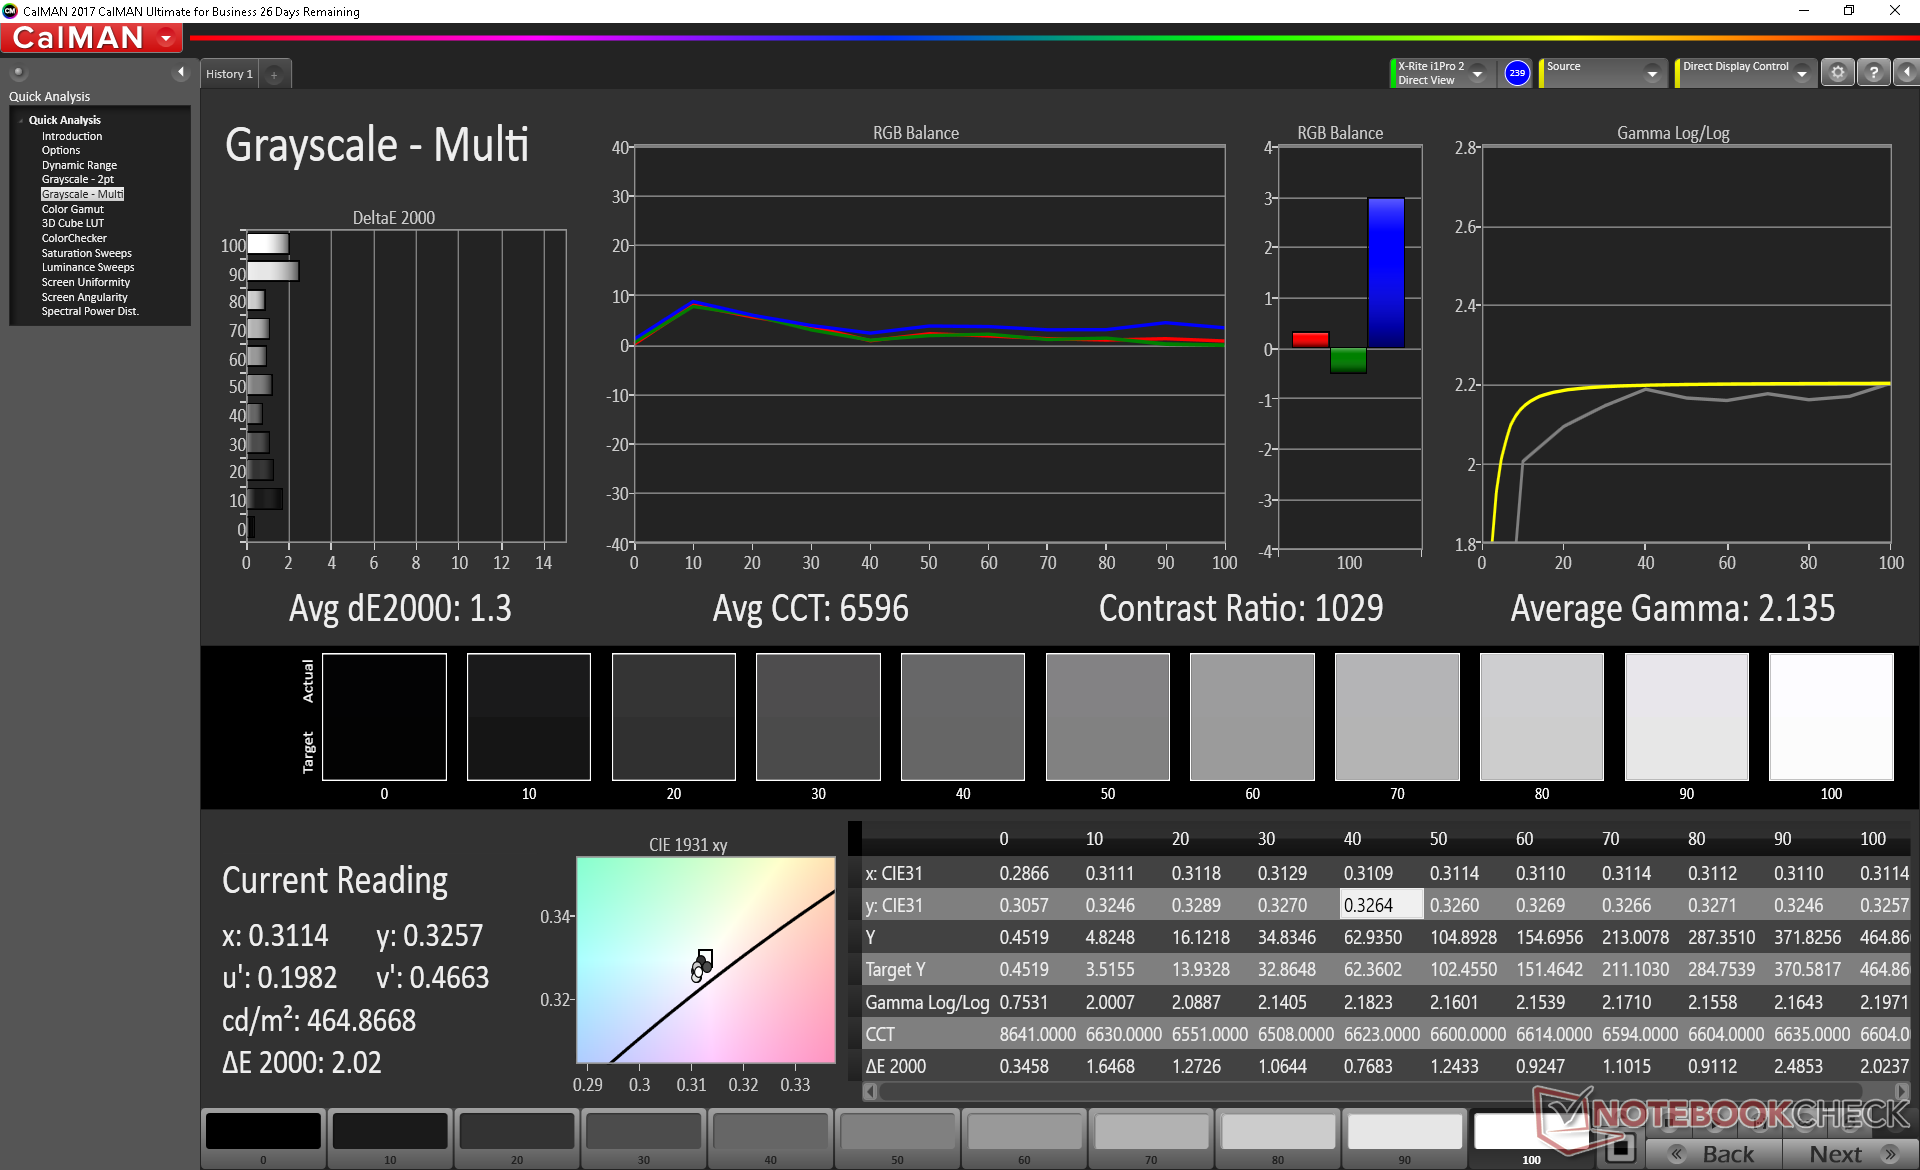
ΔE Greyscale Calman: 1.3 | ∀{0.09-98 Ø4.96}
98.3% sRGB (Argyll 1.6.3 3D)
84.8% AdobeRGB 1998 (Argyll 1.6.3 3D)
96.2% AdobeRGB 1998 (Argyll 3D)
98.3% sRGB (Argyll 3D)
82% Display P3 (Argyll 3D)
Gamma: 2.14
CCT: 6596 K
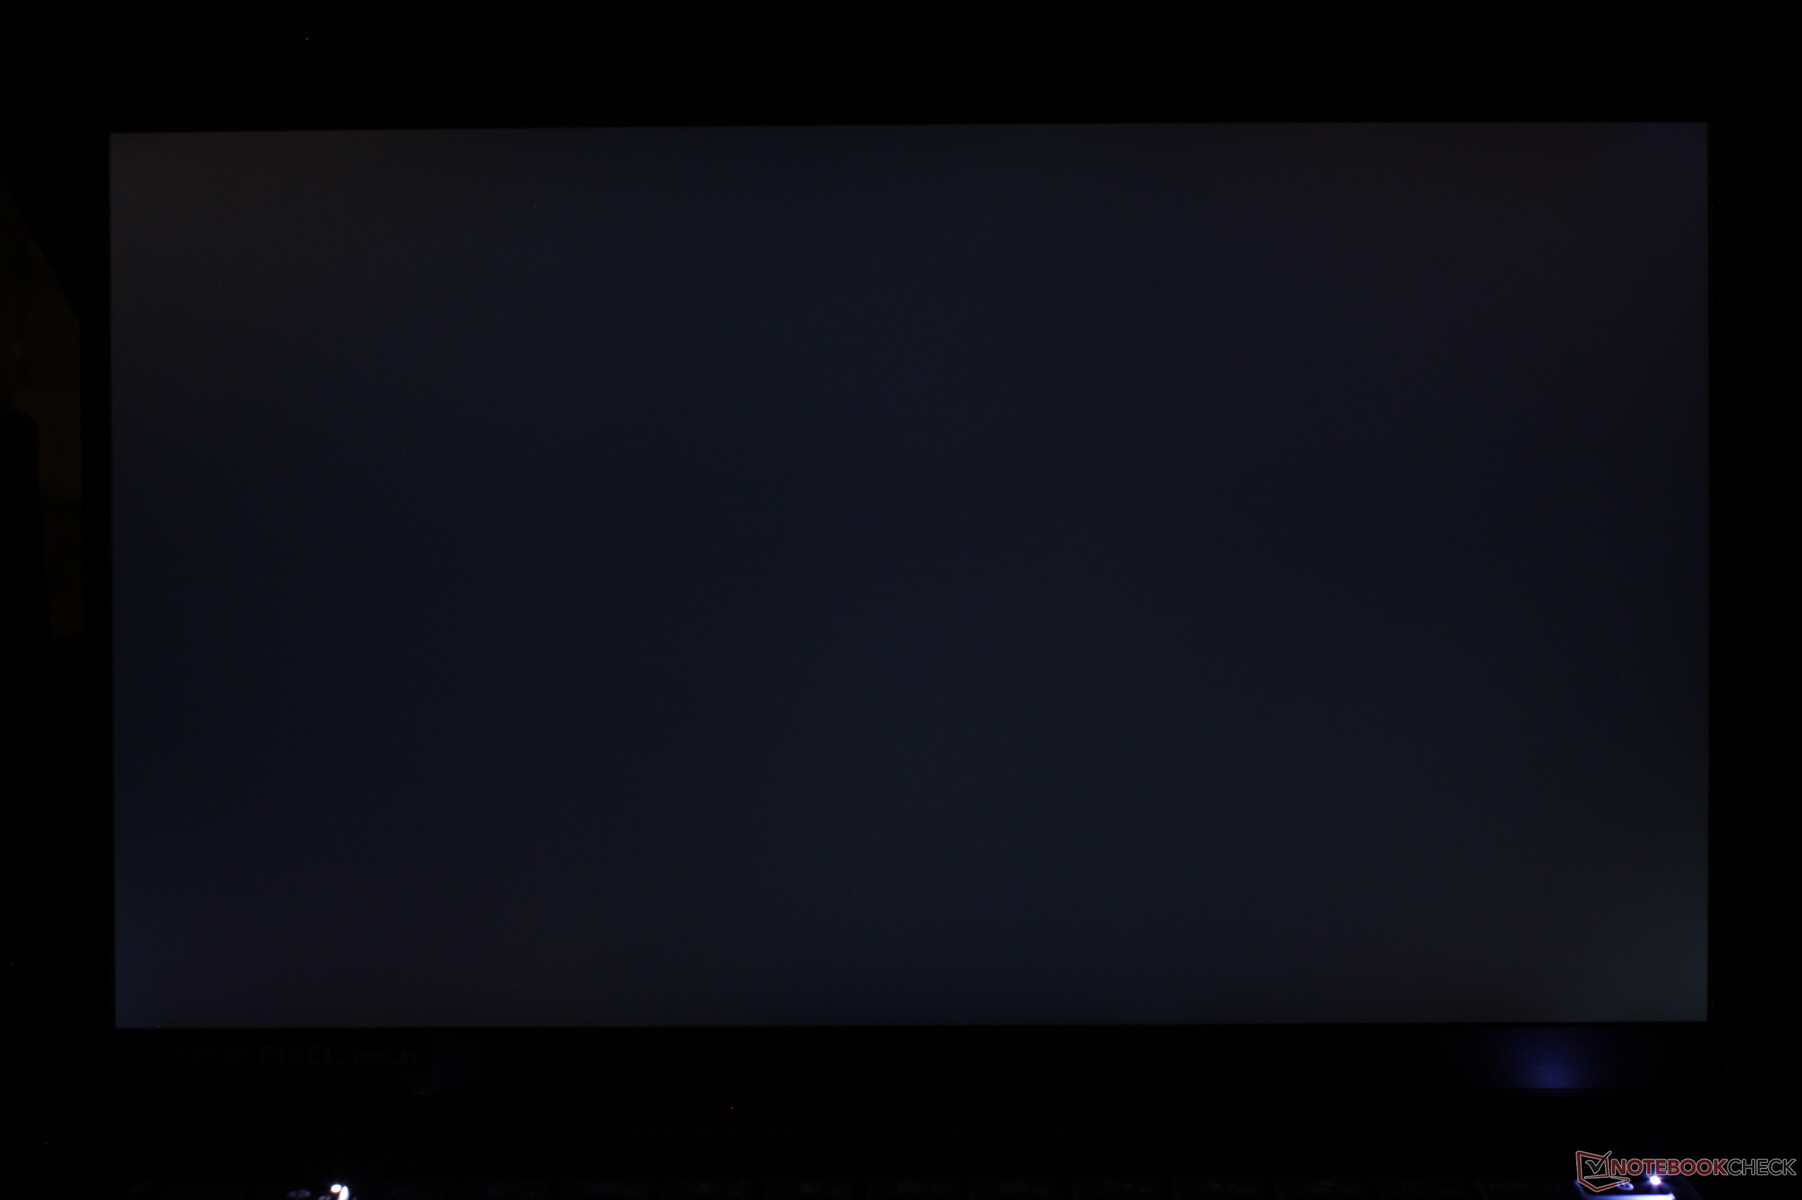
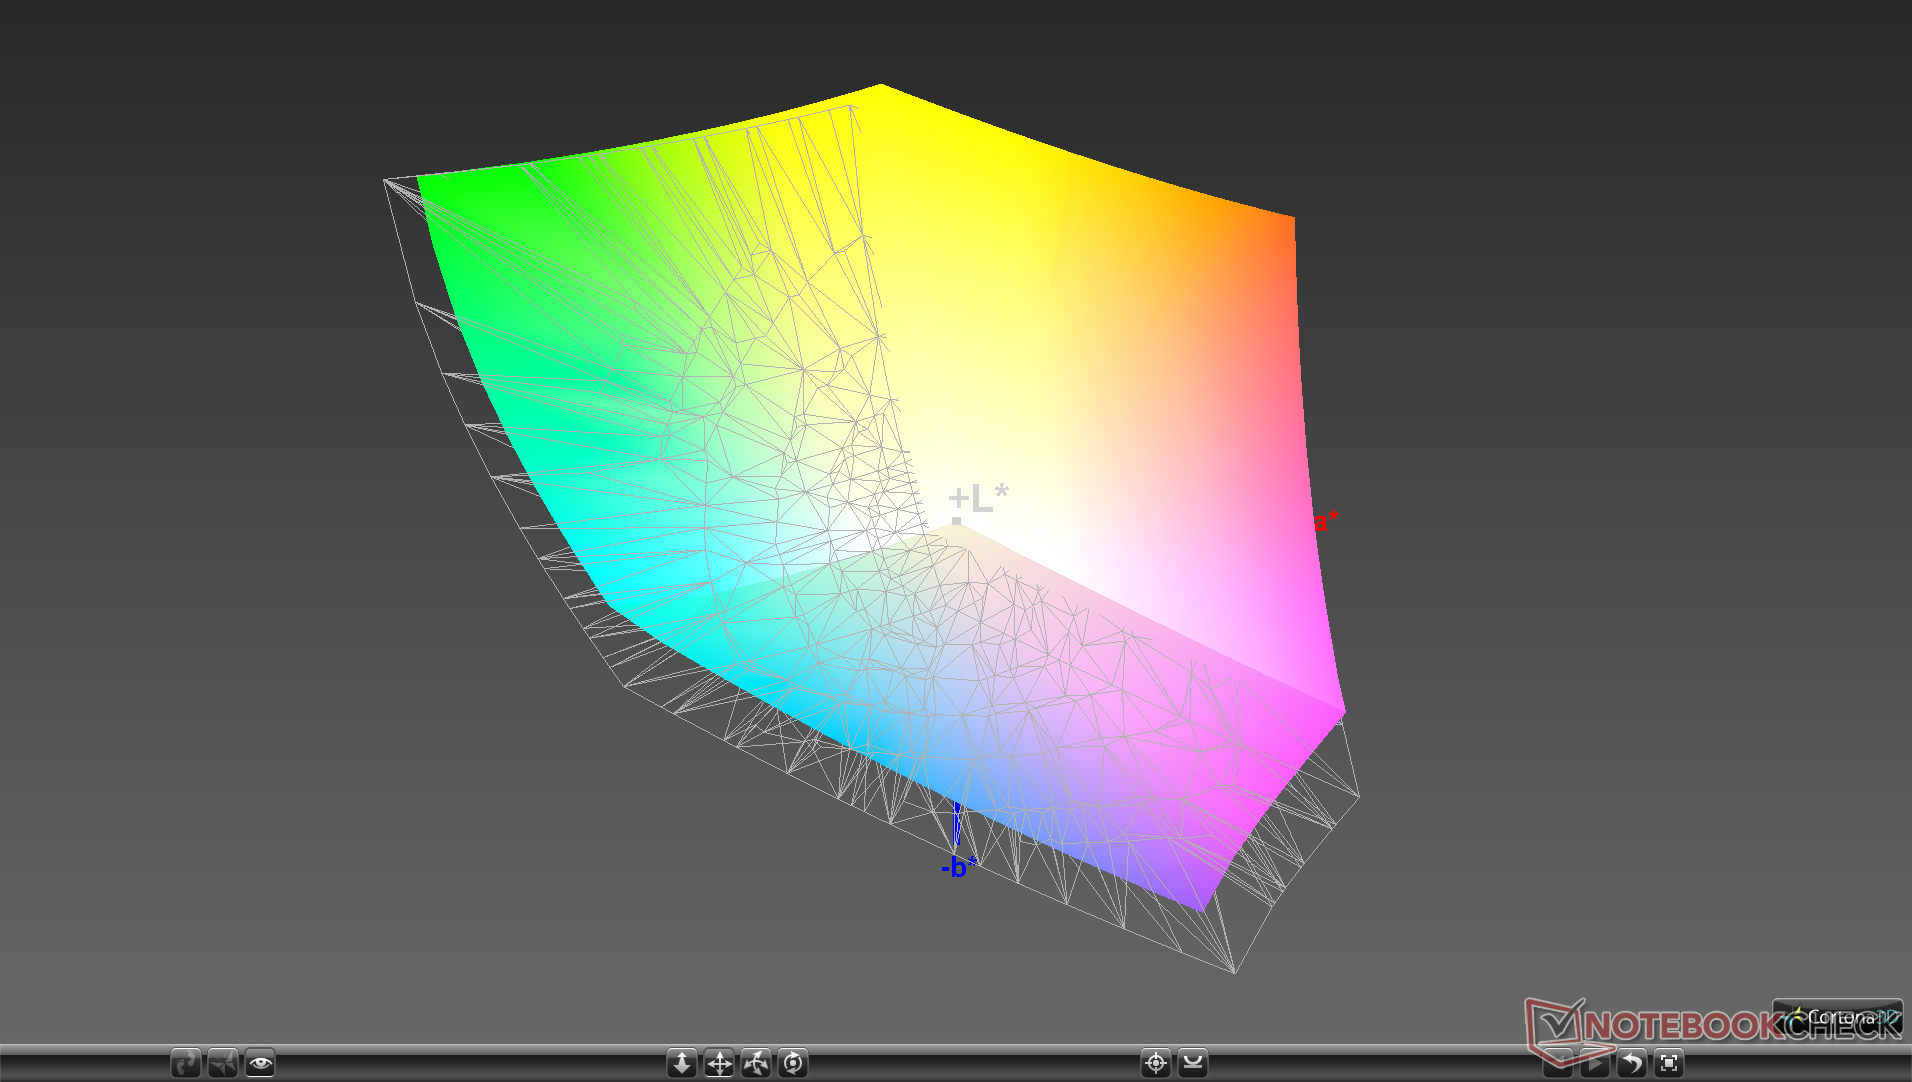
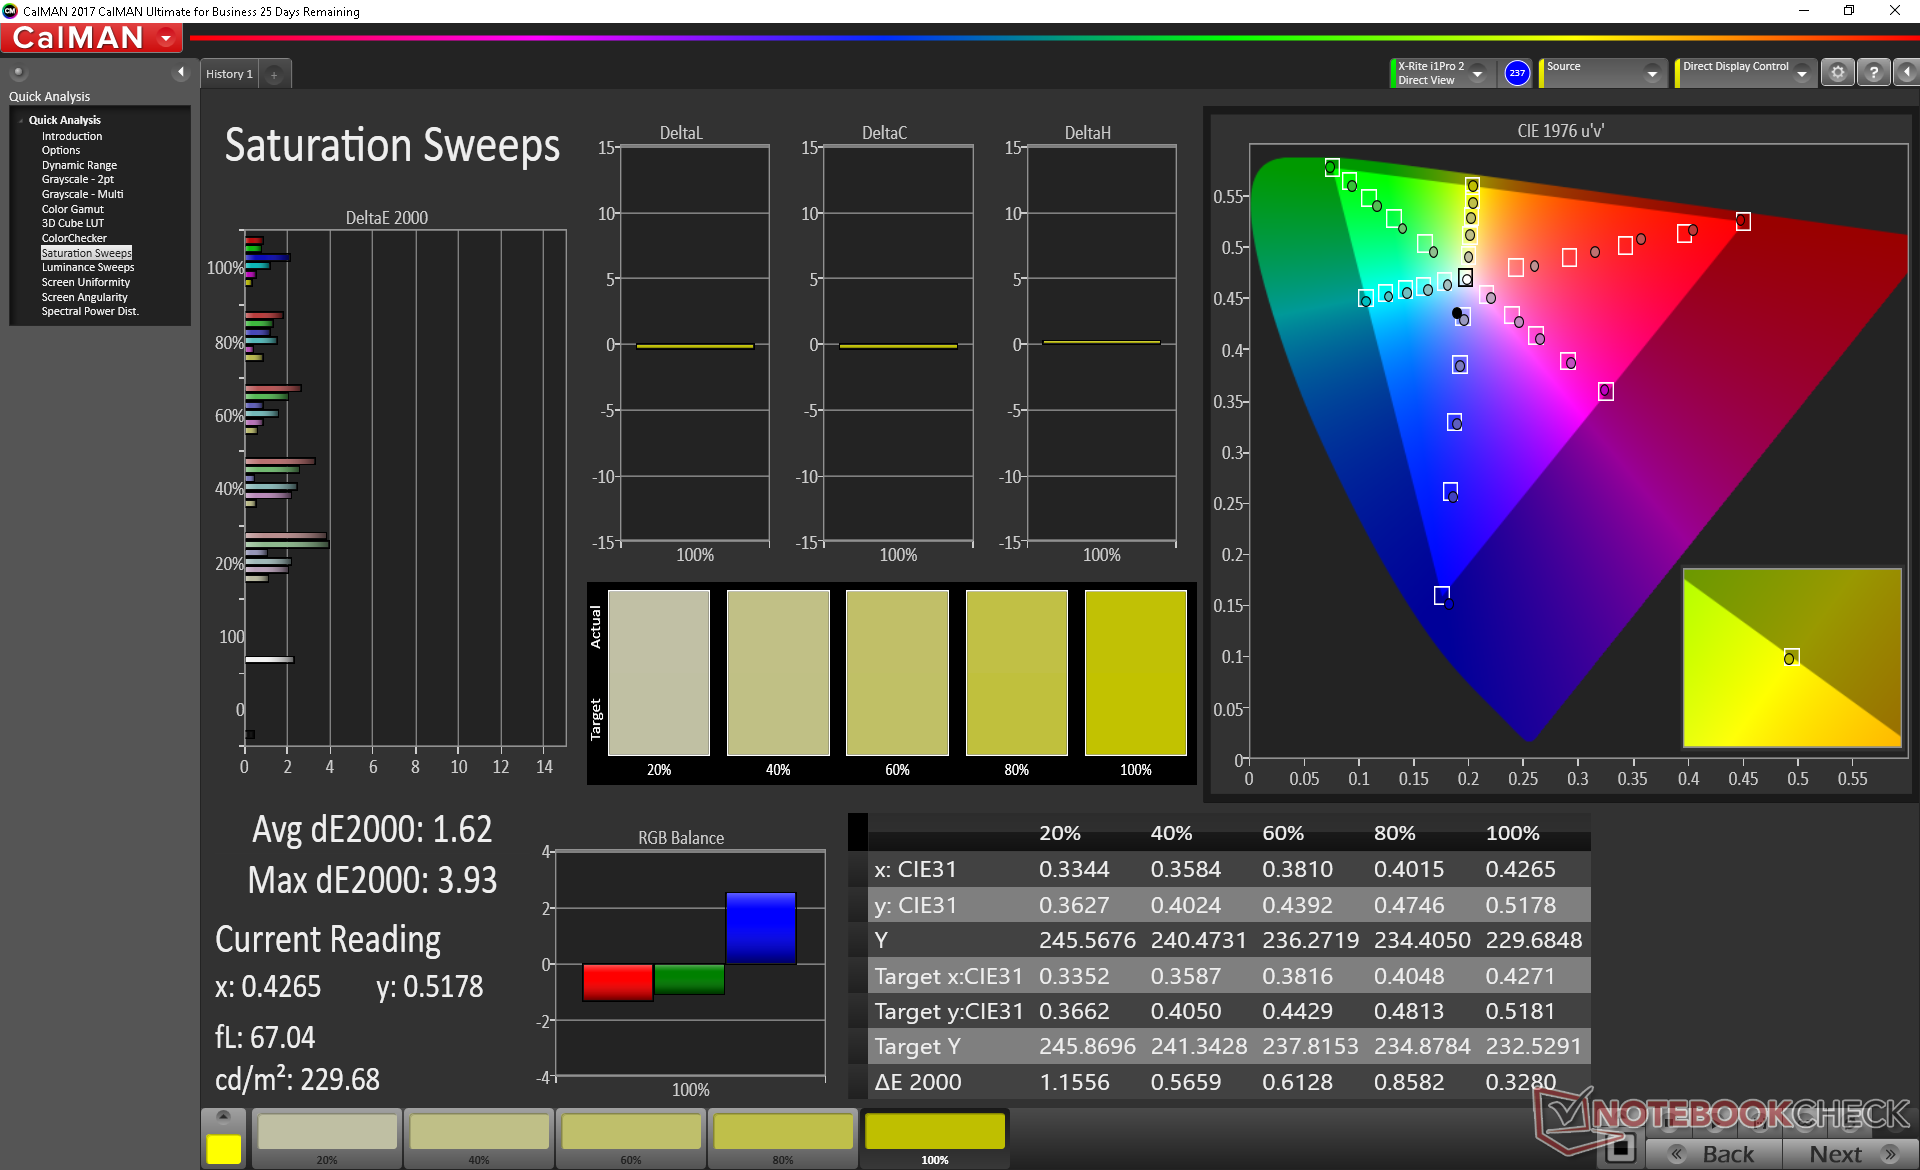
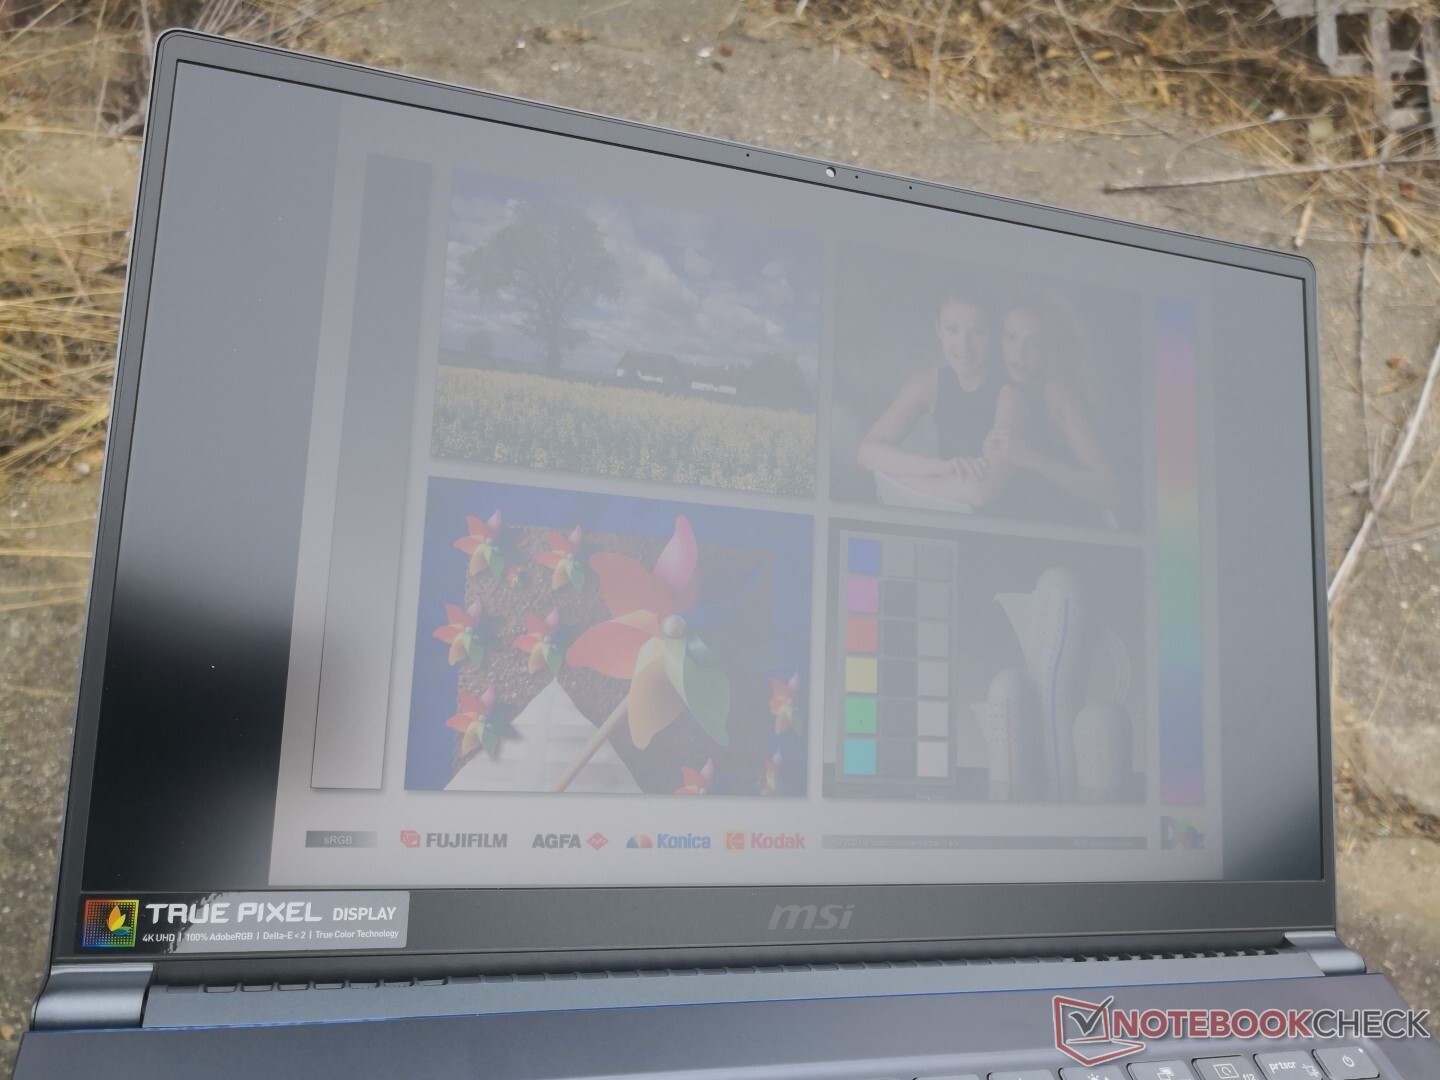
Jakość obrazu można uznać za doskonałą, biorąc na celownik żywe kolory i w małym stopniu występującą ziarnistość matowego ekranu. Jasność obrazu jest większa, niż w laptopie Dell XPS 15 7590 z ekranem OLED, a ten przecież wyróżnia się na plus względem innych ultrabooków. Największą wadą są długie czasy reakcji, czyli wolne przechodzenie między czernią a bielą i między poziomami szarości, powodujące ghosting.
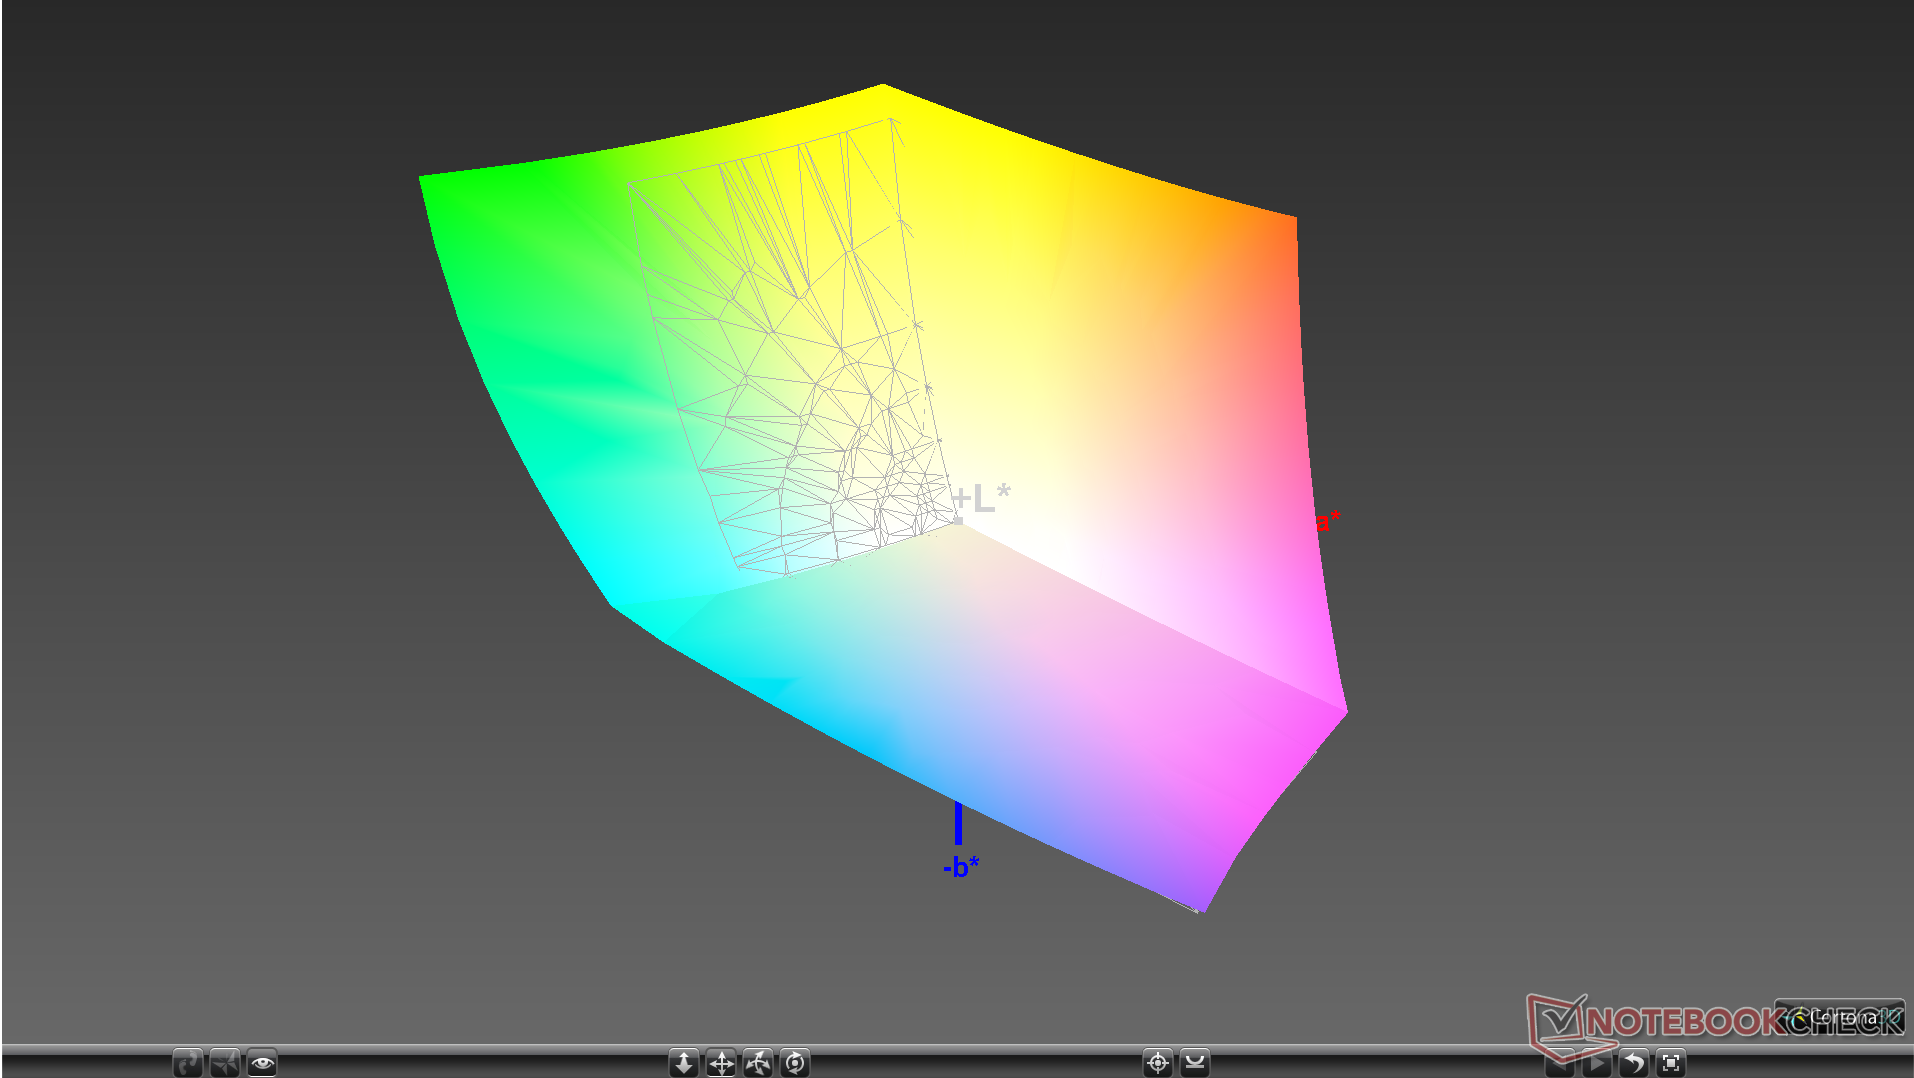
Zmierzona przestrzeń barwna jest niemal identyczna do tej oferowanej przez matrycę w laptopie MSI P65 Creator i przebija to, co oferuje większość matryc o rozdzielczości poniżej 4K.
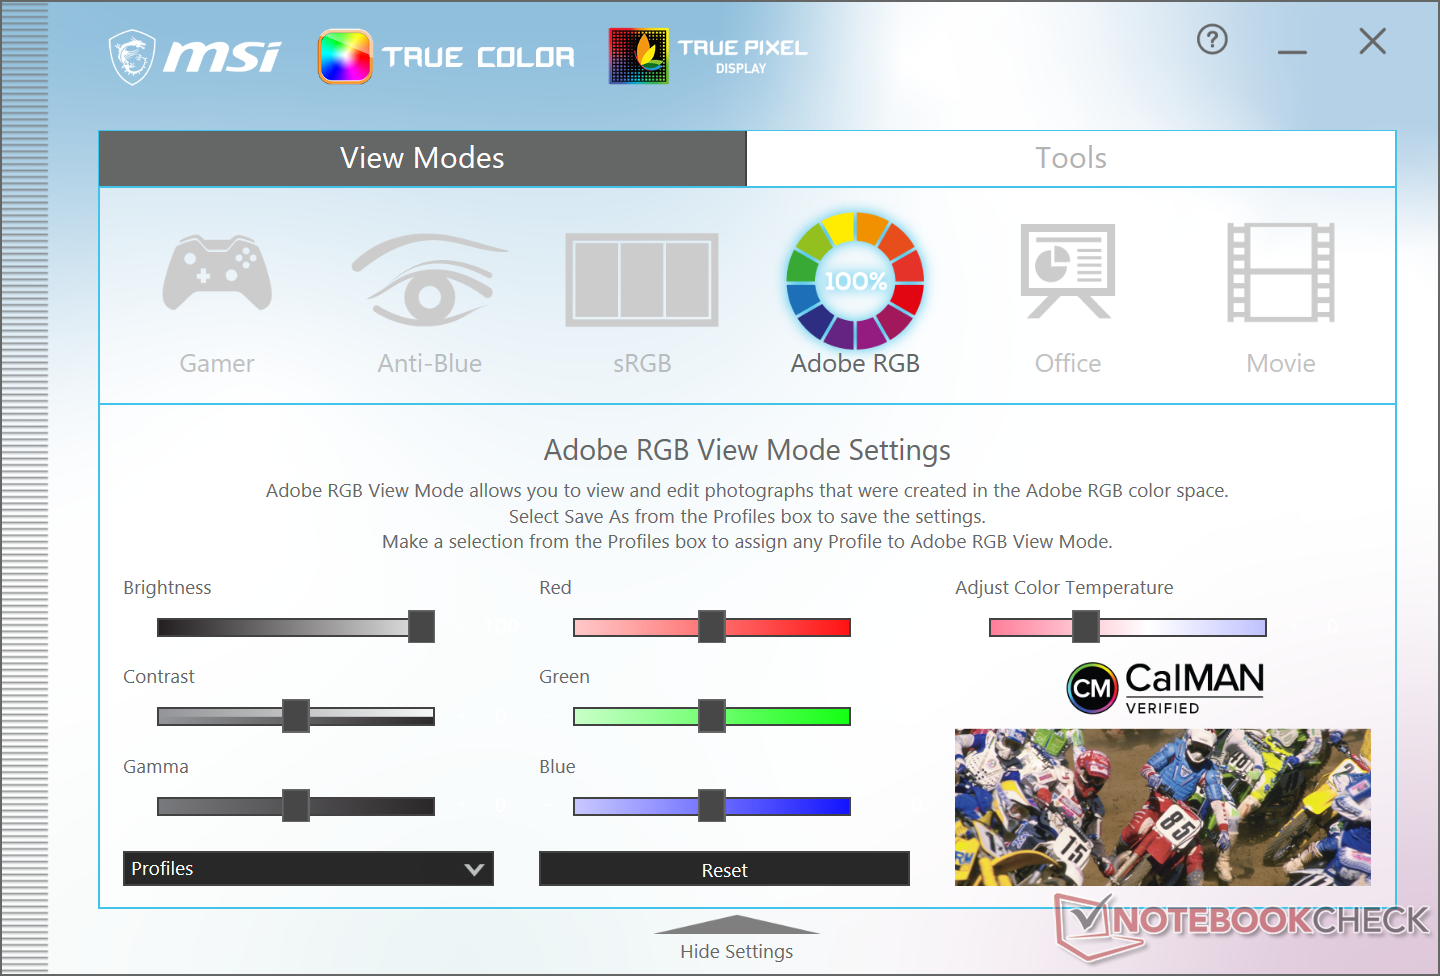
Kalibracja nie jest potrzebna i można zdać się na to, co oferuje fabryka. MSI chwali się parametrem DeltaE poniżej 2 i tak wyszło w pomiarach. Konkretnie stwierdzono średni błąd 1,3 dla odcieni szarości oraz 1,57 dla kolorów.

Wyświetl czasy reakcji
| ↔ Czas reakcji od czerni do bieli | ||
|---|---|---|
| 41.2 ms ... wzrost ↗ i spadek ↘ łącznie | ↗ 22.8 ms wzrost | 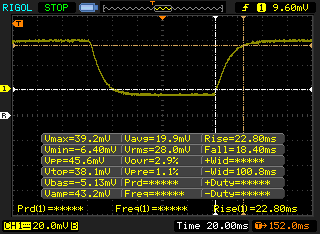 |
| ↘ 18.4 ms upadek | ||
| W naszych testach ekran wykazuje powolne tempo reakcji, co będzie niezadowalające dla graczy. Dla porównania, wszystkie testowane urządzenia wahają się od 0.1 (minimum) do 240 (maksimum) ms. » 98 % wszystkich urządzeń jest lepszych. Oznacza to, że zmierzony czas reakcji jest gorszy od średniej wszystkich testowanych urządzeń (19.8 ms). | ||
| ↔ Czas reakcji 50% szarości do 80% szarości | ||
| 60 ms ... wzrost ↗ i spadek ↘ łącznie | ↗ 29.2 ms wzrost | 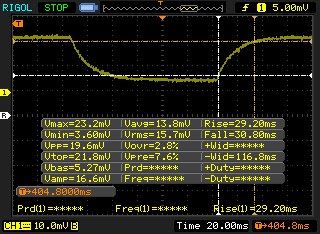 |
| ↘ 30.8 ms upadek | ||
| W naszych testach ekran wykazuje powolne tempo reakcji, co będzie niezadowalające dla graczy. Dla porównania, wszystkie testowane urządzenia wahają się od 0.165 (minimum) do 636 (maksimum) ms. » 96 % wszystkich urządzeń jest lepszych. Oznacza to, że zmierzony czas reakcji jest gorszy od średniej wszystkich testowanych urządzeń (31 ms). | ||
Migotanie ekranu / PWM (modulacja szerokości impulsu)
| Wykryto migotanie ekranu/wykryto PWM | 26040 Hz | ≤ 24 % ustawienia jasności | 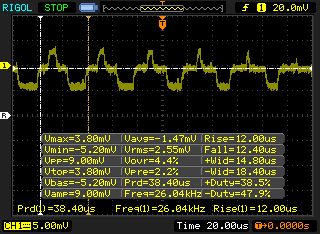 |
Podświetlenie wyświetlacza miga z częstotliwością 26040 Hz (najgorszy przypadek, np. przy użyciu PWM) Wykryto migotanie przy ustawieniu jasności 24 % i poniżej. Powyżej tego ustawienia jasności nie powinno być żadnego migotania ani PWM. Częstotliwość 26040 Hz jest dość wysoka, więc większość użytkowników wrażliwych na PWM nie powinna zauważyć żadnego migotania. Dla porównania: 52 % wszystkich testowanych urządzeń nie używa PWM do przyciemniania wyświetlacza. Jeśli wykryto PWM, zmierzono średnio 7757 (minimum: 5 - maksimum: 343500) Hz. | |||
Osiągi
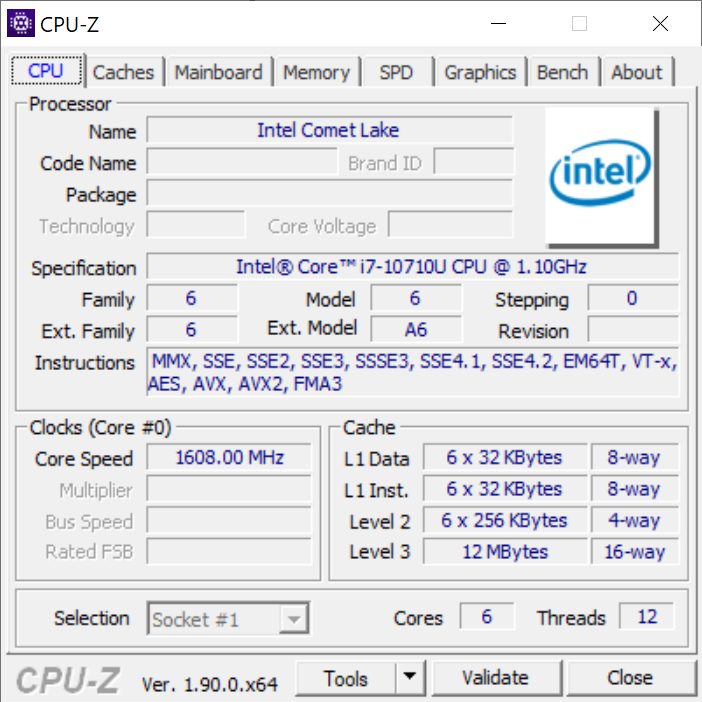
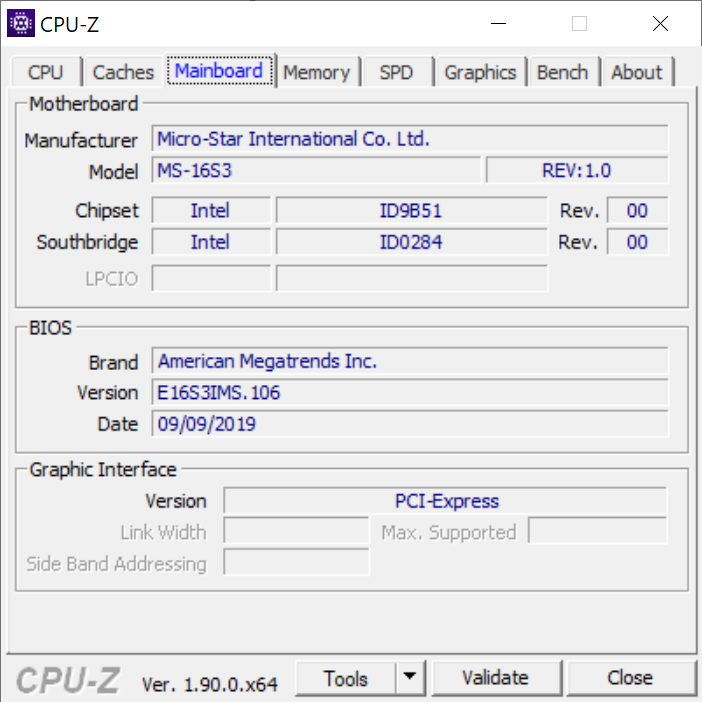
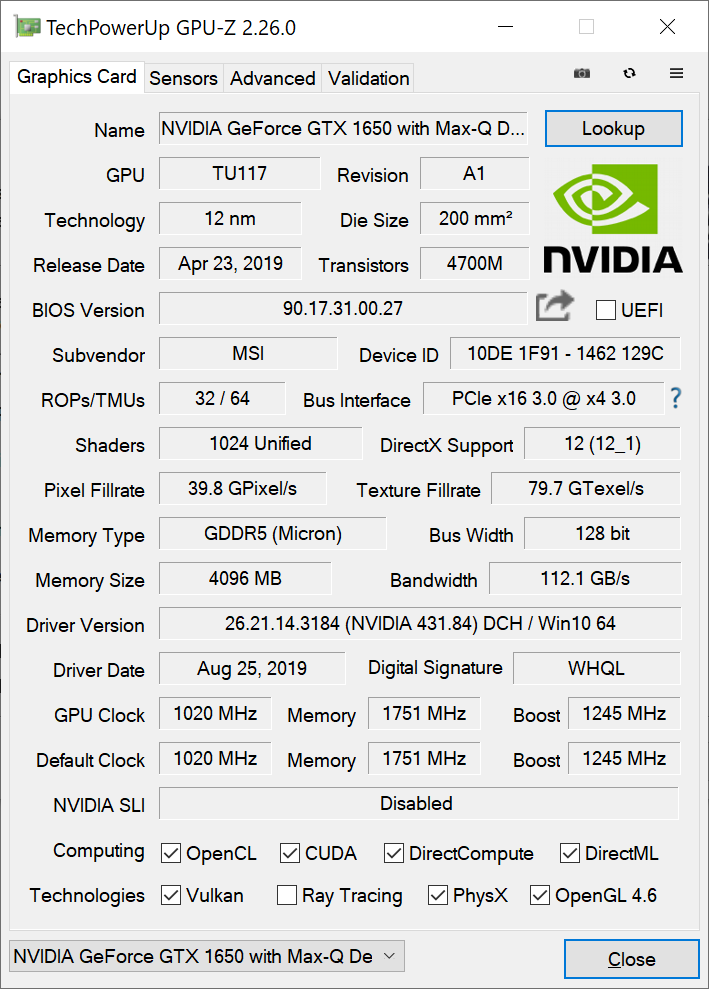
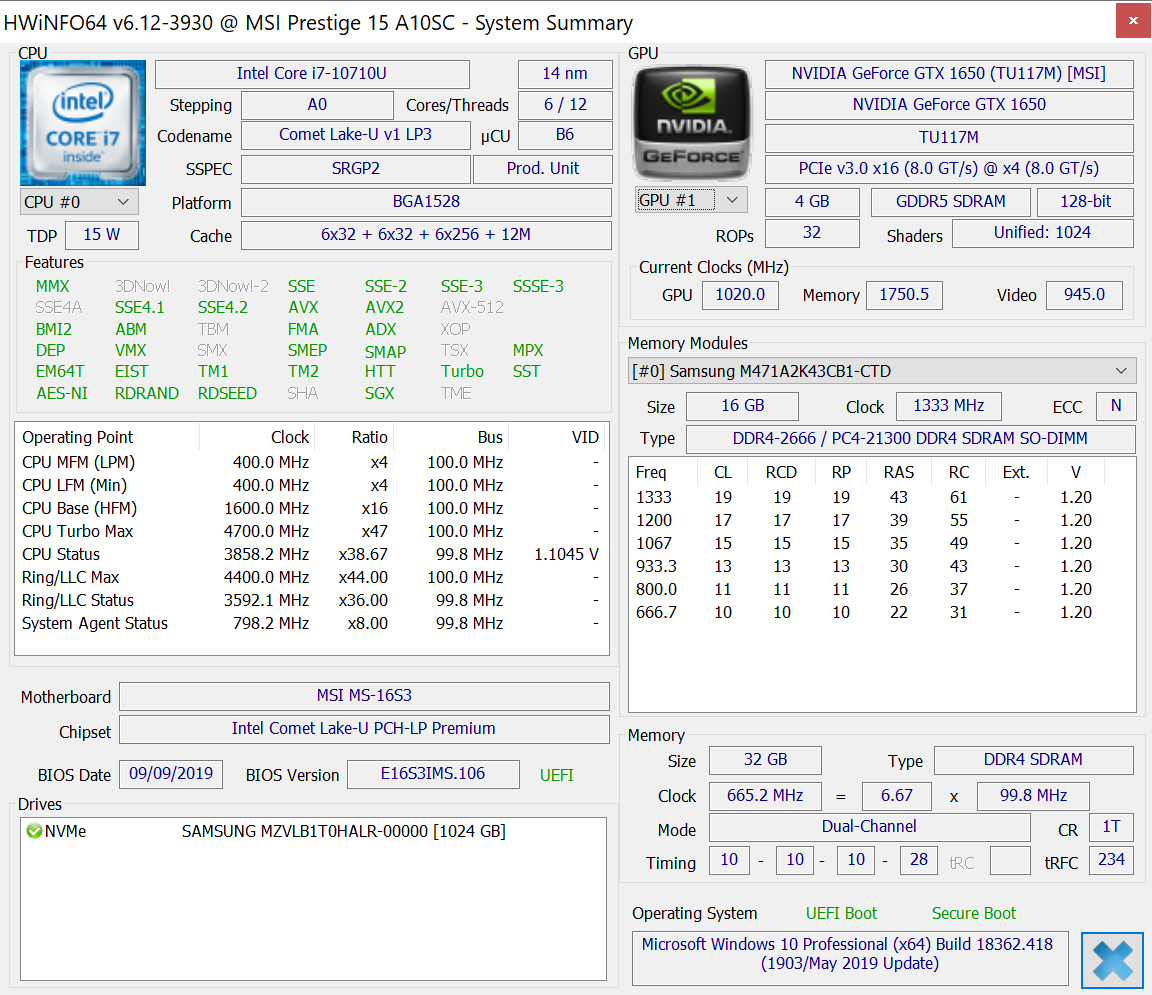
Na testy trafił najlepiej wyposażony laptop MSI Prestige 15. Oznacza to obecność procesora Intel Core i7-10710U (Comet Lake-U), karty grafiki Nvidia GeForce GTX 1650 Max-Q i do tego 32 GB pamięci RAM (DDR4) oraz dysku SSD o pojemności 1 TB.
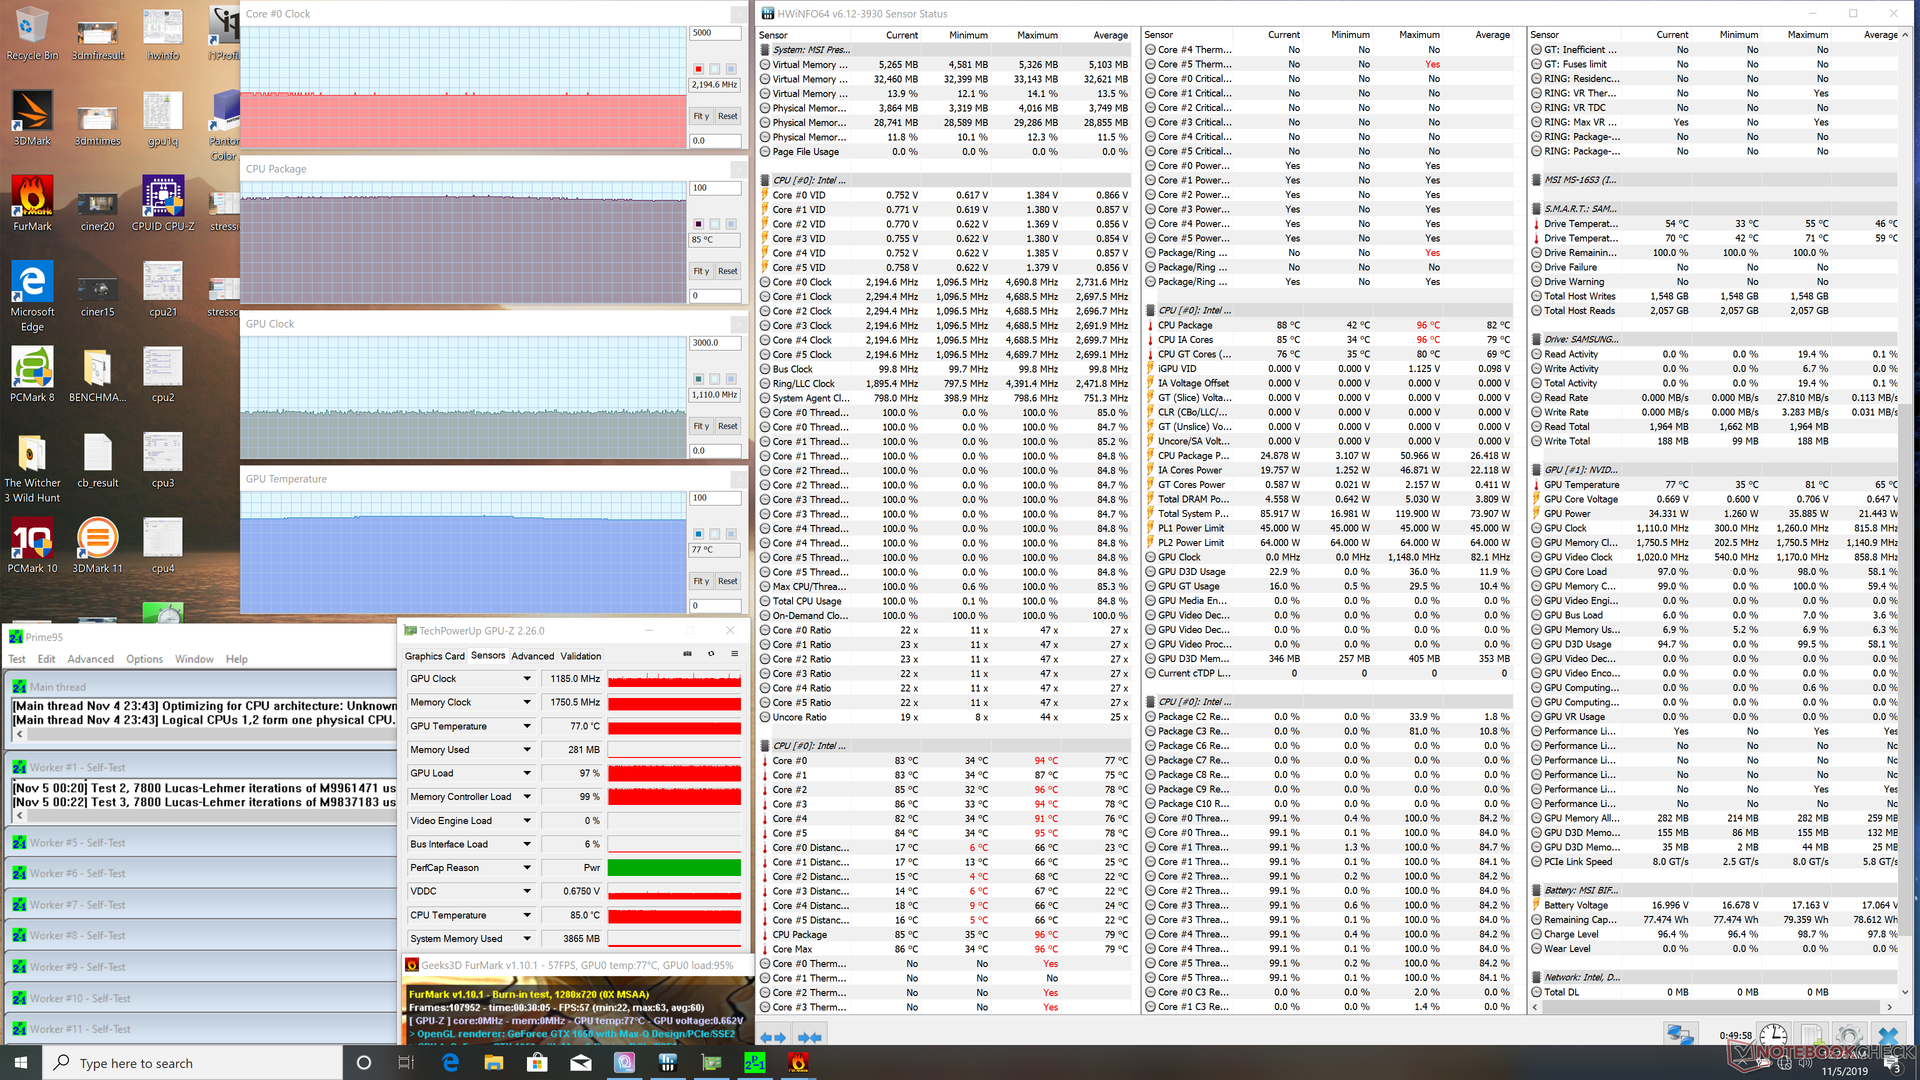
Procesor i7-10710U jest 6-rdzeniowy, więc jego wydajność wielowątkowa jest bardzo dobra - pod tym względem może się równać z 4-rdzeniowymi Core i7-8750H i Core i7-9750H. Do tego utrzymywanie wydajności przez dłuższy czas jest w porządku, czego dowiódł nasz test renderowania wielowątkowego w pętli. Co innego pokazał natomiast test obciążeniowy Prime95, w którym przy ciągłym 100-procentowym obciążeniu procesora występował throttling (obniżanie zegarów CPU poniżej wartości bazowej, czyli 1,1 GHz).
Karta grafiki Nvidia GeForce 1650 Max-Q nie jest często spotykana w laptopach a szkoda. Obniżone zegary, bo to oznacza Max-Q, przekładają się na ok. 15% niższe osiągi, niż te rejestrowane w komputerach z układem GTX 1650 (desktop). Jednocześnie wydajność jest o 15-50% lepsza od tego, co jest w zasięgu karty GeForce GTX 1050 Ti.
| Cinebench R15 | |
| CPU Single 64Bit | |
| Schenker XMG Ultra 15 Turing | |
| Alienware m17 P37E | |
| MSI Prestige 15 A10SC | |
| MSI GE75 9SG | |
| Lenovo ThinkPad P53s-20N6001NGE | |
| Razer Blade Pro 17 4K UHD 120 Hz | |
| Przeciętny Intel Core i7-10710U (138 - 194, n=8) | |
| Dell XPS 13 7390 2-in-1 Core i7 | |
| Dell G3 3590 | |
| Lenovo Legion Y730-15ICH i5-8300H | |
| Dell Inspiron 15 5000 5585 | |
| CPU Multi 64Bit | |
| MSI GE75 9SG | |
| Schenker XMG Ultra 15 Turing | |
| Alienware m17 P37E | |
| MSI Prestige 15 A10SC | |
| Razer Blade Pro 17 4K UHD 120 Hz | |
| Przeciętny Intel Core i7-10710U (513 - 1113, n=8) | |
| Dell XPS 13 7390 2-in-1 Core i7 | |
| Lenovo Legion Y730-15ICH i5-8300H | |
| Dell G3 3590 | |
| Lenovo ThinkPad P53s-20N6001NGE | |
| Dell Inspiron 15 5000 5585 | |
| Cinebench R11.5 | |
| CPU Single 64Bit | |
| Przeciętny Intel Core i7-10710U (2.07 - 2.19, n=3) | |
| Dell XPS 13 7390 2-in-1 Core i7 | |
| Lenovo ThinkPad P53s-20N6001NGE | |
| MSI GE75 9SG | |
| Dell Inspiron 15 5000 5585 | |
| CPU Multi 64Bit | |
| MSI GE75 9SG | |
| Przeciętny Intel Core i7-10710U (10.9 - 12.3, n=3) | |
| Dell XPS 13 7390 2-in-1 Core i7 | |
| Dell Inspiron 15 5000 5585 | |
| Lenovo ThinkPad P53s-20N6001NGE | |
| Cinebench R10 | |
| Rendering Multiple CPUs 32Bit | |
| Schenker XMG Ultra 15 Turing | |
| MSI GE75 9SG | |
| Przeciętny Intel Core i7-10710U (31463 - 31824, n=2) | |
| Dell XPS 13 7390 2-in-1 Core i7 | |
| Lenovo ThinkPad P53s-20N6001NGE | |
| Rendering Single 32Bit | |
| Lenovo ThinkPad P53s-20N6001NGE | |
| Schenker XMG Ultra 15 Turing | |
| Dell XPS 13 7390 2-in-1 Core i7 | |
| Przeciętny Intel Core i7-10710U (6599 - 7345, n=2) | |
| MSI GE75 9SG | |
| wPrime 2.10 - 1024m | |
| Dell XPS 13 7390 2-in-1 Core i7 | |
| Przeciętny Intel Core i7-10710U (171.1 - 177.4, n=2) | |
| MSI GE75 9SG | |
* ... im mniej tym lepiej
| PCMark 10 | |
| Score | |
| MSI P65 Creator 9SF-657 | |
| Dell Precision 5530 Xeon E-2176M | |
| MSI Prestige 15 A10SC | |
| Lenovo ThinkPad T590-20N4002VGE | |
| Dell Latitude 5500 | |
| Microsoft Surface Laptop 3 15 Ryzen 5 3580U | |
| Essentials | |
| Dell Latitude 5500 | |
| MSI Prestige 15 A10SC | |
| MSI P65 Creator 9SF-657 | |
| Lenovo ThinkPad T590-20N4002VGE | |
| Dell Precision 5530 Xeon E-2176M | |
| Microsoft Surface Laptop 3 15 Ryzen 5 3580U | |
| Productivity | |
| Lenovo ThinkPad T590-20N4002VGE | |
| Dell Precision 5530 Xeon E-2176M | |
| Dell Latitude 5500 | |
| MSI Prestige 15 A10SC | |
| Microsoft Surface Laptop 3 15 Ryzen 5 3580U | |
| MSI P65 Creator 9SF-657 | |
| Digital Content Creation | |
| MSI P65 Creator 9SF-657 | |
| Dell Precision 5530 Xeon E-2176M | |
| MSI Prestige 15 A10SC | |
| Lenovo ThinkPad T590-20N4002VGE | |
| Microsoft Surface Laptop 3 15 Ryzen 5 3580U | |
| Dell Latitude 5500 | |
| PCMark 8 | |
| Home Score Accelerated v2 | |
| Dell Latitude 5500 | |
| Lenovo ThinkPad T590-20N4002VGE | |
| Dell Precision 5530 Xeon E-2176M | |
| MSI Prestige 15 A10SC | |
| MSI P65 Creator 9SF-657 | |
| Microsoft Surface Laptop 3 15 Ryzen 5 3580U | |
| Work Score Accelerated v2 | |
| Lenovo ThinkPad T590-20N4002VGE | |
| Dell Precision 5530 Xeon E-2176M | |
| MSI Prestige 15 A10SC | |
| MSI P65 Creator 9SF-657 | |
| Microsoft Surface Laptop 3 15 Ryzen 5 3580U | |
| PCMark 8 Home Score Accelerated v2 | 3546 pkt. | |
| PCMark 8 Work Score Accelerated v2 | 4483 pkt. | |
| PCMark 10 Score | 5009 pkt. | |
Pomoc | ||
| MSI Prestige 15 A10SC Samsung SSD PM981 MZVLB1T0HALR | Microsoft Surface Laptop 3 15 Ryzen 5 3580U SK hynix BC501 HFM256GDGTNG | Lenovo ThinkPad T590-20N4002VGE Toshiba XG6 KXG60ZNV512G | Dell Latitude 5500 Toshiba XG6 KXG60ZNV1T02 | HP EliteBook 755 G5 3UN79EA Toshiba XG5 KXG50ZNV512G | Dell Precision 5530 Xeon E-2176M SK hynix PC400 512 GB | MSI P65 Creator 9SF-657 2x Samsung SSD PM981 MZVLB512HAJQ (RAID 0) | |
|---|---|---|---|---|---|---|---|
| AS SSD | -52% | 13% | 2% | -149% | -18% | 20% | |
| Seq Read (MB/s) | 1274 | 1122 -12% | 2551 100% | 1287 1% | 1810 42% | 2169 70% | 2860 124% |
| Seq Write (MB/s) | 1395 | 514 -63% | 2376 70% | 1280 -8% | 261.4 -81% | 1022 -27% | 2604 87% |
| 4K Read (MB/s) | 50.3 | 34.98 -30% | 52.7 5% | 49.57 -1% | 24.38 -52% | 38.43 -24% | 45.15 -10% |
| 4K Write (MB/s) | 119.8 | 96.8 -19% | 153 28% | 158 32% | 5.77 -95% | 92.8 -23% | 100.2 -16% |
| 4K-64 Read (MB/s) | 1599 | 492 -69% | 1406 -12% | 1043 -35% | 528 -67% | 970 -39% | 1428 -11% |
| 4K-64 Write (MB/s) | 1455 | 339.9 -77% | 1439 -1% | 1415 -3% | 90.7 -94% | 926 -36% | 1401 -4% |
| Access Time Read * (ms) | 0.044 | 0.056 -27% | 0.067 -52% | 0.039 11% | 0.2 -355% | 0.073 -66% | 0.049 -11% |
| Access Time Write * (ms) | 0.092 | 0.11 -20% | 0.027 71% | 0.027 71% | 0.748 -713% | 0.053 42% | 0.037 60% |
| Score Read (Points) | 1777 | 639 -64% | 1714 -4% | 1221 -31% | 733 -59% | 1226 -31% | 1759 -1% |
| Score Write (Points) | 1714 | 488 -72% | 1829 7% | 1701 -1% | 123 -93% | 1121 -35% | 1762 3% |
| Score Total (Points) | 4411 | 1434 -67% | 4418 0% | 3558 -19% | 1157 -74% | 2922 -34% | 4411 0% |
| Copy ISO MB/s (MB/s) | 2830 | 828 -71% | 2625 -7% | ||||
| Copy Program MB/s (MB/s) | 609 | 200.5 -67% | 495.9 -19% | ||||
| Copy Game MB/s (MB/s) | 1424 | 387.4 -73% | 1384 -3% |
* ... im mniej tym lepiej

| 3DMark | |
| 1280x720 Cloud Gate Standard Graphics | |
| Lenovo Legion Y740-17IRH | |
| Razer Blade 15 GTX 1660 Ti | |
| Asus FX503VM-EH73 | |
| MSI GT72S-6QEG16SR421BW | |
| Acer Nitro 5 AN515-54-78TL | |
| Gainward GeForce GTX 1650 4 GB | |
| HP Pavilion Gaming 15-cx0003ng | |
| Przeciętny NVIDIA GeForce GTX 1650 Max-Q (21759 - 53981, n=12) | |
| Lenovo Yoga 730-15IKB | |
| MSI Prestige 15 A10SC | |
| 1920x1080 Fire Strike Graphics | |
| Lenovo Legion Y740-17IRH | |
| Razer Blade 15 GTX 1660 Ti | |
| Asus FX503VM-EH73 | |
| MSI GT72S-6QEG16SR421BW | |
| Acer Nitro 5 AN515-54-78TL | |
| Gainward GeForce GTX 1650 4 GB | |
| Przeciętny NVIDIA GeForce GTX 1650 Max-Q (6985 - 8618, n=12) | |
| MSI Prestige 15 A10SC | |
| HP Pavilion Gaming 15-cx0003ng | |
| Lenovo Yoga 730-15IKB | |
| 2560x1440 Time Spy Graphics | |
| Lenovo Legion Y740-17IRH | |
| Razer Blade 15 GTX 1660 Ti | |
| Asus FX503VM-EH73 | |
| Gainward GeForce GTX 1650 4 GB | |
| Acer Nitro 5 AN515-54-78TL | |
| MSI Prestige 15 A10SC | |
| Przeciętny NVIDIA GeForce GTX 1650 Max-Q (2836 - 3238, n=10) | |
| MSI GT72S-6QEG16SR421BW | |
| HP Pavilion Gaming 15-cx0003ng | |
| Lenovo Yoga 730-15IKB | |
| 3DMark 11 | |
| 1280x720 Performance GPU | |
| Lenovo Legion Y740-17IRH | |
| Razer Blade 15 GTX 1660 Ti | |
| Asus FX503VM-EH73 | |
| Gainward GeForce GTX 1650 4 GB | |
| MSI GT72S-6QEG16SR421BW | |
| MSI Prestige 15 A10SC | |
| Przeciętny NVIDIA GeForce GTX 1650 Max-Q (10248 - 12259, n=14) | |
| HP Pavilion Gaming 15-cx0003ng | |
| Lenovo Yoga 730-15IKB | |
| 1280x720 Performance Combined | |
| Lenovo Legion Y740-17IRH | |
| Gainward GeForce GTX 1650 4 GB | |
| Razer Blade 15 GTX 1660 Ti | |
| MSI Prestige 15 A10SC | |
| MSI GT72S-6QEG16SR421BW | |
| Przeciętny NVIDIA GeForce GTX 1650 Max-Q (6409 - 10846, n=13) | |
| HP Pavilion Gaming 15-cx0003ng | |
| Asus FX503VM-EH73 | |
| Lenovo Yoga 730-15IKB | |
| 3DMark 11 Performance | 11613 pkt. | |
| 3DMark Cloud Gate Standard Score | 17802 pkt. | |
| 3DMark Fire Strike Score | 7103 pkt. | |
| 3DMark Time Spy Score | 3282 pkt. | |
Pomoc | ||
| Shadow of the Tomb Raider | |
| 1280x720 Lowest Preset | |
| MSI GE75 9SG | |
| Gainward GeForce GTX 1650 4 GB | |
| Razer Blade Pro 17 4K UHD 120 Hz | |
| Lenovo Legion Y740-17IRH | |
| Alienware m15 P79F | |
| Przeciętny NVIDIA GeForce GTX 1650 Max-Q (92 - 151, n=5) | |
| Razer Blade 15 GTX 1660 Ti | |
| MSI Prestige 15 A10SC | |
| Dell G3 3590 | |
| Asus GL753VD | |
| Asus TUF FX705GE-EW096T | |
| Dell Inspiron 15 5000 5585 | |
| Microsoft Surface Laptop 3 15 Ryzen 5 3580U | |
| Dell XPS 13 7390 2-in-1 Core i7 | |
| 1920x1080 Highest Preset AA:T | |
| MSI GE75 9SG | |
| Razer Blade Pro 17 4K UHD 120 Hz | |
| Alienware m15 P79F | |
| Lenovo Legion Y740-17IRH | |
| Razer Blade 15 GTX 1660 Ti | |
| Gainward GeForce GTX 1650 4 GB | |
| Przeciętny NVIDIA GeForce GTX 1650 Max-Q (33 - 45, n=6) | |
| MSI Prestige 15 A10SC | |
| Asus TUF FX705GE-EW096T | |
| Asus GL753VD | |
| Rocket League | |
| 1280x720 Performance | |
| Dell Precision 5530 Xeon E-2176M | |
| Dell G3 3590 | |
| Przeciętny NVIDIA GeForce GTX 1650 Max-Q (196 - 249, n=4) | |
| Lenovo Yoga 730-15IKB | |
| MSI Prestige 15 A10SC | |
| Dell Inspiron 15 5000 5585 | |
| Dell XPS 13 7390 2-in-1 Core i7 | |
| Microsoft Surface Laptop 3 15 Ryzen 5 3580U | |
| 1920x1080 High Quality AA:High FX | |
| Asus FX503VM-EH73 | |
| Dell G3 3590 | |
| Dell Precision 5530 Xeon E-2176M | |
| Przeciętny NVIDIA GeForce GTX 1650 Max-Q (86.5 - 145.6, n=5) | |
| MSI Prestige 15 A10SC | |
| Lenovo Yoga 730-15IKB | |
| Dell Inspiron 15 5000 5585 | |
| Dell XPS 13 7390 2-in-1 Core i7 | |
| Microsoft Surface Laptop 3 15 Ryzen 5 3580U | |
| The Witcher 3 | |
| 1024x768 Low Graphics & Postprocessing | |
| Schenker XMG Ultra 15 Turing | |
| Razer Blade Pro 17 4K UHD 120 Hz | |
| MSI P65 Creator 9SF-657 | |
| MSI GE75 9SG | |
| Lenovo Legion Y740-17IRH | |
| Alienware m17 P37E | |
| Alienware m15 P79F | |
| Razer Blade 15 GTX 1660 Ti | |
| Gainward GeForce GTX 1650 4 GB | |
| Dell G3 3590 | |
| Przeciętny NVIDIA GeForce GTX 1650 Max-Q (137.5 - 196, n=10) | |
| MSI Prestige 15 A10SC | |
| Lenovo Legion Y730-15ICH i5-8300H | |
| Asus TUF FX705GE-EW096T | |
| HP Pavilion Gaming 15-cx0003ng | |
| Dell Precision 5530 Xeon E-2176M | |
| Lenovo ThinkPad P53s-20N6001NGE | |
| Dell XPS 13 7390 2-in-1 Core i7 | |
| Dell Inspiron 15 5000 5585 | |
| Lenovo ThinkPad T590-20N4002VGE | |
| Microsoft Surface Laptop 3 15 Ryzen 5 3580U | |
| Apple MacBook 12 (Early 2016) 1.1 GHz | |
| 1366x768 Medium Graphics & Postprocessing | |
| Razer Blade Pro 17 4K UHD 120 Hz | |
| MSI GE75 9SG | |
| Schenker XMG Ultra 15 Turing | |
| Alienware m17 P37E | |
| MSI P65 Creator 9SF-657 | |
| Alienware m15 P79F | |
| Lenovo Legion Y740-17IRH | |
| Razer Blade 15 GTX 1660 Ti | |
| Gainward GeForce GTX 1650 4 GB | |
| Dell G3 3590 | |
| Przeciętny NVIDIA GeForce GTX 1650 Max-Q (83.2 - 119.8, n=9) | |
| MSI Prestige 15 A10SC | |
| Lenovo Legion Y730-15ICH i5-8300H | |
| Asus TUF FX705GE-EW096T | |
| Dell Precision 5530 Xeon E-2176M | |
| HP Pavilion Gaming 15-cx0003ng | |
| Lenovo ThinkPad P53s-20N6001NGE | |
| Lenovo ThinkPad T590-20N4002VGE | |
| Dell XPS 13 7390 2-in-1 Core i7 | |
| 1920x1080 High Graphics & Postprocessing (Nvidia HairWorks Off) | |
| Razer Blade Pro 17 4K UHD 120 Hz | |
| MSI GE75 9SG | |
| Alienware m17 P37E | |
| Schenker XMG Ultra 15 Turing | |
| Alienware m15 P79F | |
| MSI P65 Creator 9SF-657 | |
| Lenovo Legion Y740-17IRH | |
| Razer Blade 15 GTX 1660 Ti | |
| Gainward GeForce GTX 1650 4 GB | |
| Dell G3 3590 | |
| Acer Nitro 5 AN515-54-78TL | |
| MSI Prestige 15 A10SC | |
| Przeciętny NVIDIA GeForce GTX 1650 Max-Q (41.5 - 65.1, n=11) | |
| Lenovo Legion Y730-15ICH i5-8300H | |
| Asus TUF FX705GE-EW096T | |
| HP Pavilion Gaming 15-cx0003ng | |
| Lenovo ThinkPad P53s-20N6001NGE | |
| Dell Precision 5530 Xeon E-2176M | |
| Lenovo ThinkPad T590-20N4002VGE | |
| Dell Inspiron 15 5000 5585 | |
| Dell XPS 13 7390 2-in-1 Core i7 | |
| Microsoft Surface Laptop 3 15 Ryzen 5 3580U | |
| 1920x1080 Ultra Graphics & Postprocessing (HBAO+) | |
| MSI GE75 9SG | |
| Razer Blade Pro 17 4K UHD 120 Hz | |
| MSI P65 Creator 9SF-657 | |
| Alienware m17 P37E | |
| Schenker XMG Ultra 15 Turing | |
| Alienware m15 P79F | |
| Lenovo Legion Y740-17IRH | |
| Razer Blade 15 GTX 1660 Ti | |
| Gainward GeForce GTX 1650 4 GB | |
| Asus FX503VM-EH73 | |
| Dell G3 3590 | |
| Acer Nitro 5 AN515-54-78TL | |
| Przeciętny NVIDIA GeForce GTX 1650 Max-Q (27.5 - 36.5, n=11) | |
| MSI Prestige 15 A10SC | |
| Lenovo Legion Y730-15ICH i5-8300H | |
| Dell Precision 5530 Xeon E-2176M | |
| Asus TUF FX705GE-EW096T | |
| HP Pavilion Gaming 15-cx0003ng | |
| Lenovo ThinkPad T590-20N4002VGE | |
| Dell Inspiron 15 5000 5585 | |
| Lenovo ThinkPad P53s-20N6001NGE | |
| Microsoft Surface Laptop 3 15 Ryzen 5 3580U | |
| Dell XPS 13 7390 2-in-1 Core i7 | |
| low | med. | high | ultra | |
|---|---|---|---|---|
| BioShock Infinite (2013) | 296.3 | 215.1 | 188.4 | 77 |
| The Witcher 3 (2015) | 155.4 | 94.1 | 54.8 | 30.8 |
| Rocket League (2017) | 196 | 128.2 | 88 | |
| Shadow of the Tomb Raider (2018) | 113 | 51 | 42 | 35 |
Wpływ na otoczenie
Hałas
Wiatraki nie cichną nawet w trybie "Silent mode", ale ich szum jest ledwo słyszalny. Wystarczy napisać, że pomiar wskazał, że jest to tylko 30,2 dB(A), czyli niewiele więcej, niż szum tła w cichym otoczeniu (w tym wypadku było to 29,3 dB(A)). Taki poziom utrzymuje się nie tylko w czasie bezczynności, ale i wtedy, kiedy uruchomiona jest przeglądarka internetowa.
Co ciekawe, cicho jest też wtedy, kiedy ładują się cięższe strony internetowe i ma miejsce streaming mediów. Nawet przechodzenie testu referencyjnego 3DMark06 dało tylko 31,5 dB(A), co jest rzadko spotykane. W takim MSI P65 zmierzono wtedy aż 40,9 dB(A). W czasie grania też nie ma problemu i zanotowano 37 dB(A), czyli dużo mniej, niż w niektórych laptopach z wydajną kartą grafiki. W teście pełnego obciążenia (Prime95 + FurMark) stwierdzono 47 dB.
Hałas
| luz |
| 30.1 / 30.2 / 30.2 dB |
| obciążenie |
| 31.5 / 47 dB |
 | ||
30 dB cichy 40 dB(A) słyszalny 50 dB(A) irytujący |
||
min: | ||
Temperatury
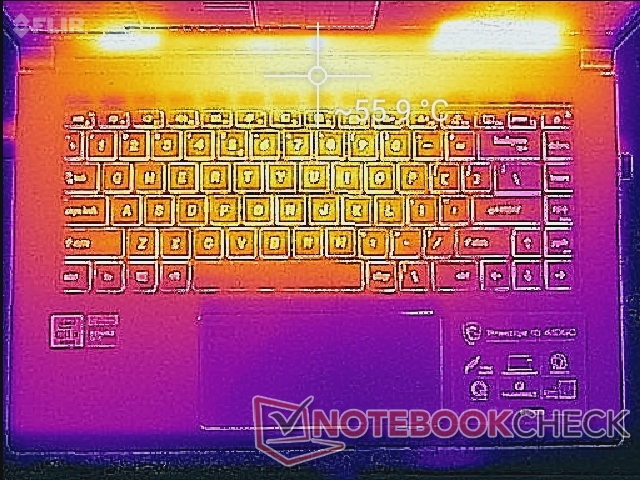
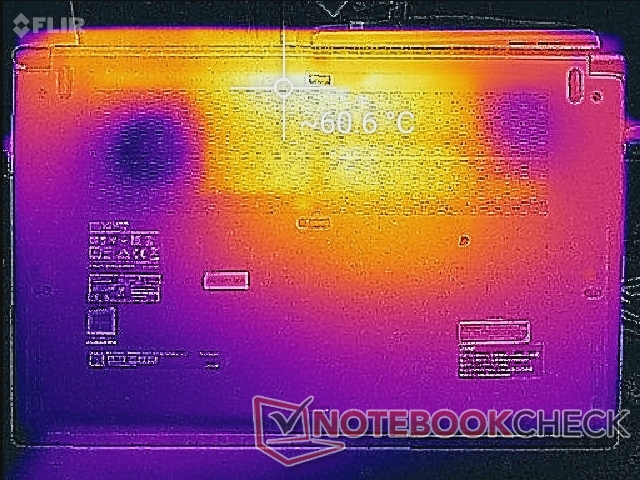
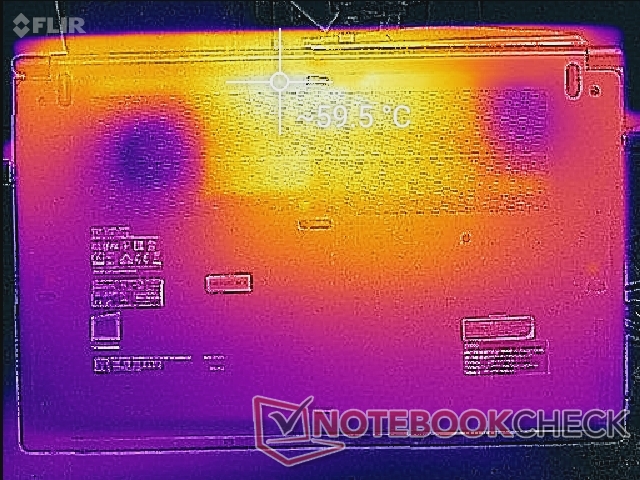
W teście bez obciążenia temperatury obudowy osiągnęły maksymalnie tylko około 31°C. Najcieplejsza była środkowa część jednostki zasadniczej. W teście gry Wiedźmin 3 zmierzono prawie 60°C a w teście pełnego obciążenia - ponad 60°C. To już bardzo gorąco.
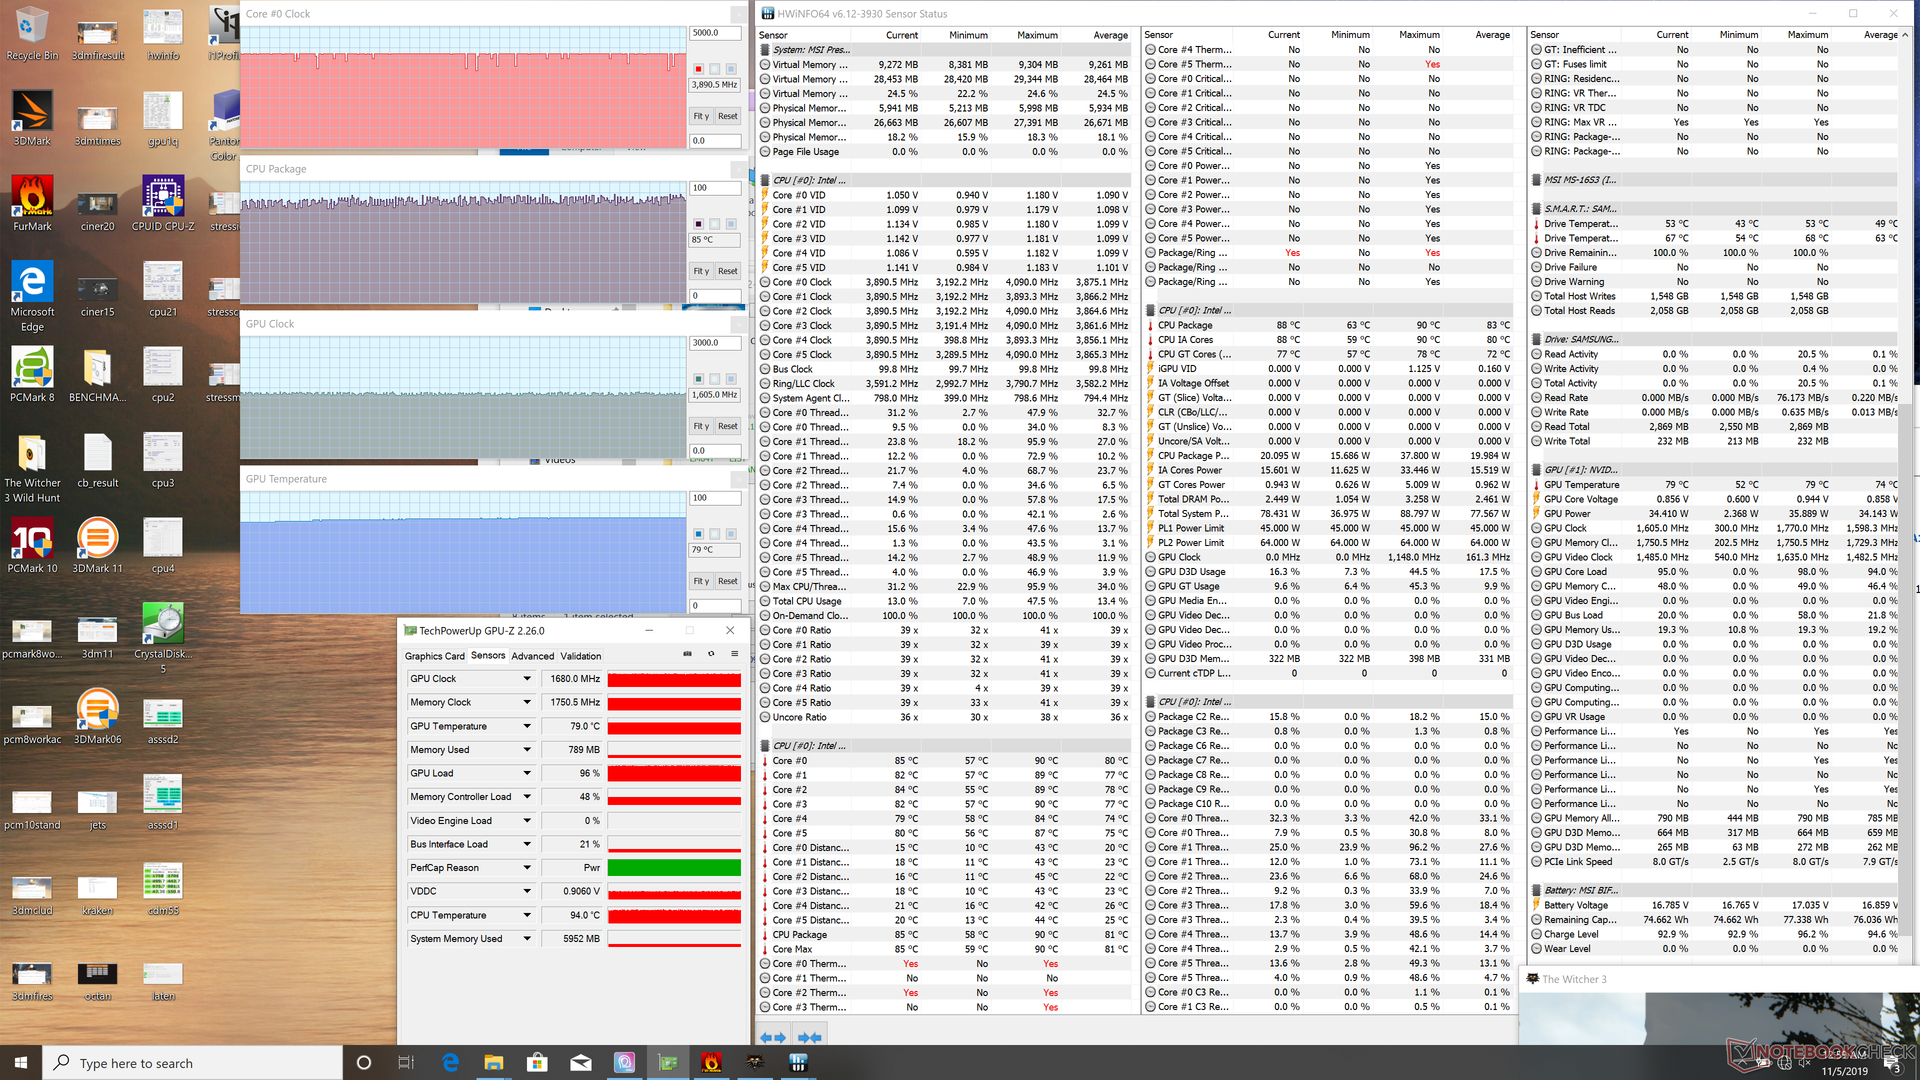
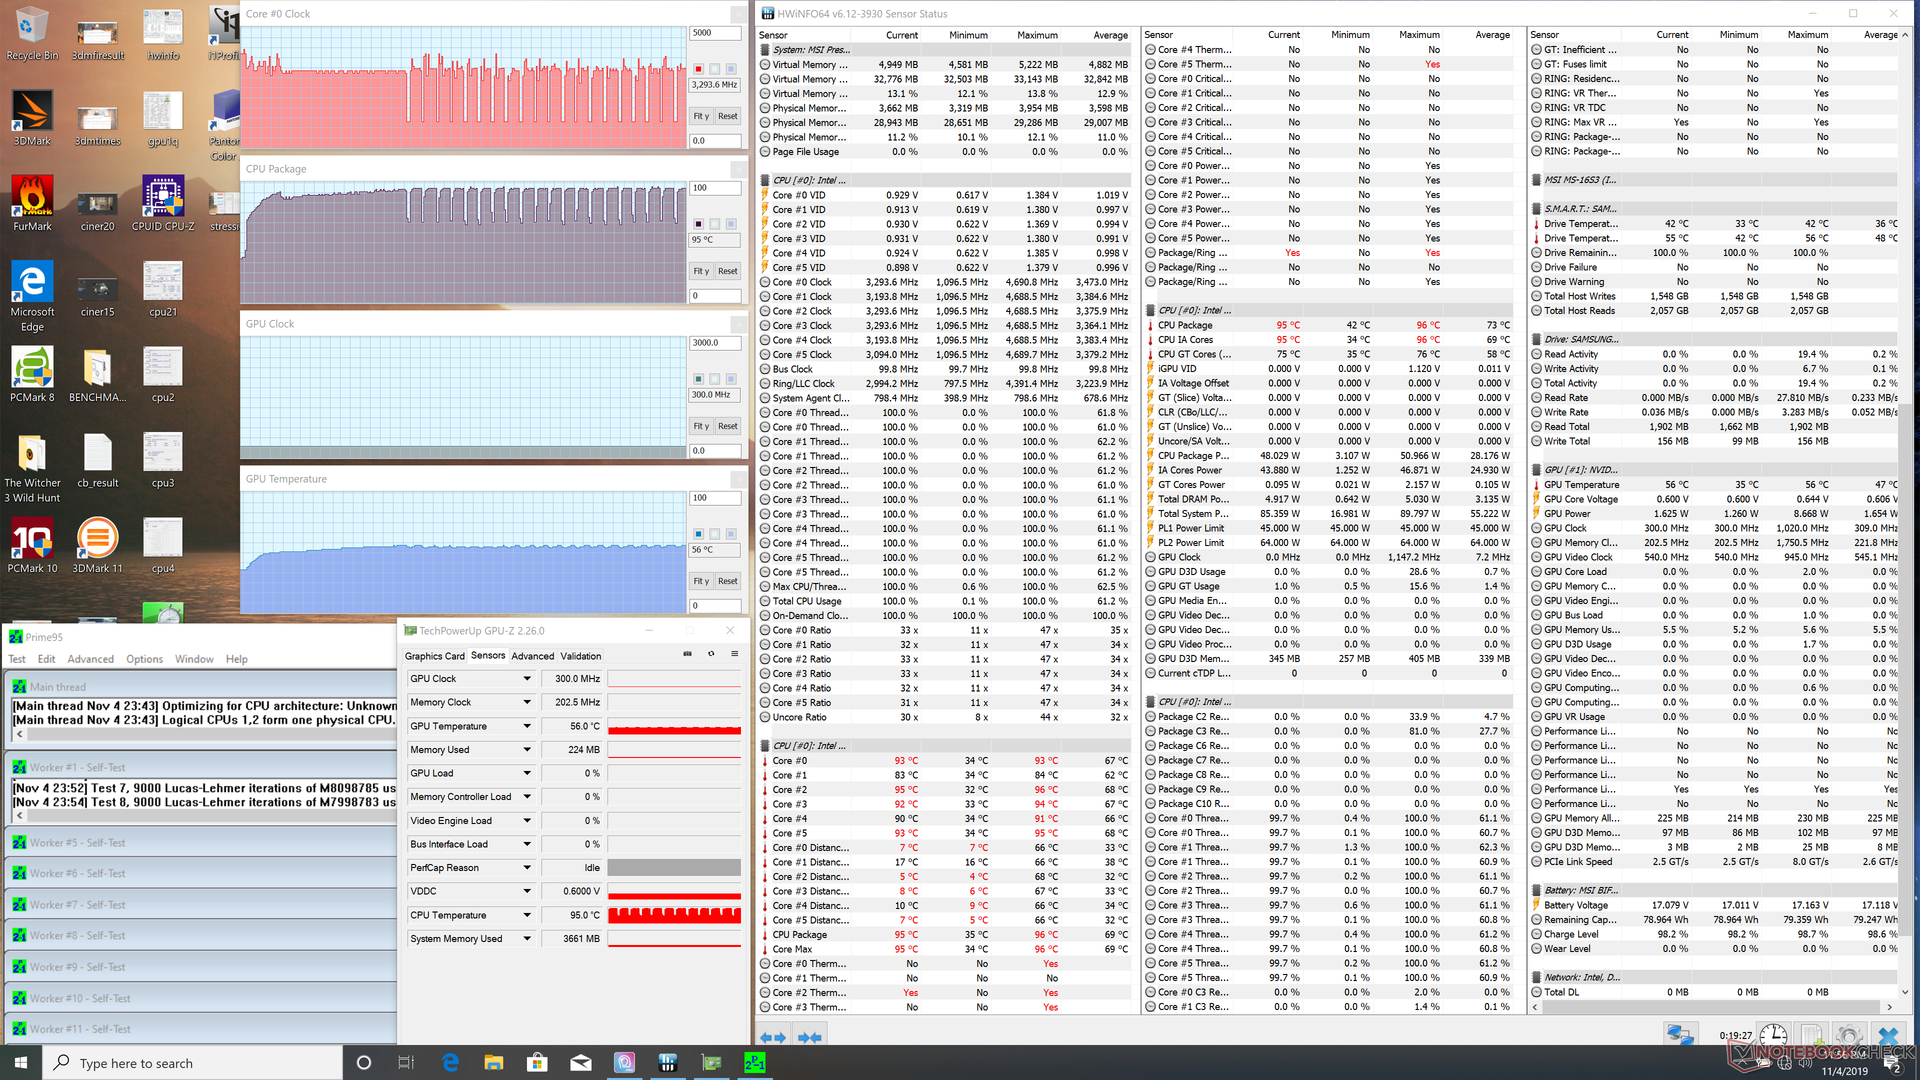
W pierwszym z dostarczonych laptopów (patrz podsumowanie) wystąpił problem z dławieniem CPU. Uruchomiony test Prime95 doprowadził do ustawienia taktowania rdzeni na 3,6 GHz. Ledwie po kilku sekundach rdzenie osiągnęły temperaturę 92°C. To zaś spowodowało obniżenie taktowania do 3 i 3,2 GHz aby utrzymać temperaturę w bezpiecznym przedziale (90-95°C). Po około 5 minutach taktowanie zaczęło skakać między 800 MHz a 3,3 GHz a temperatury zmieniały się, osiągając od 67°C do 95°C. W teście wielowątkowym Cinebench wspomniane zjawisko nie wystąpiło.
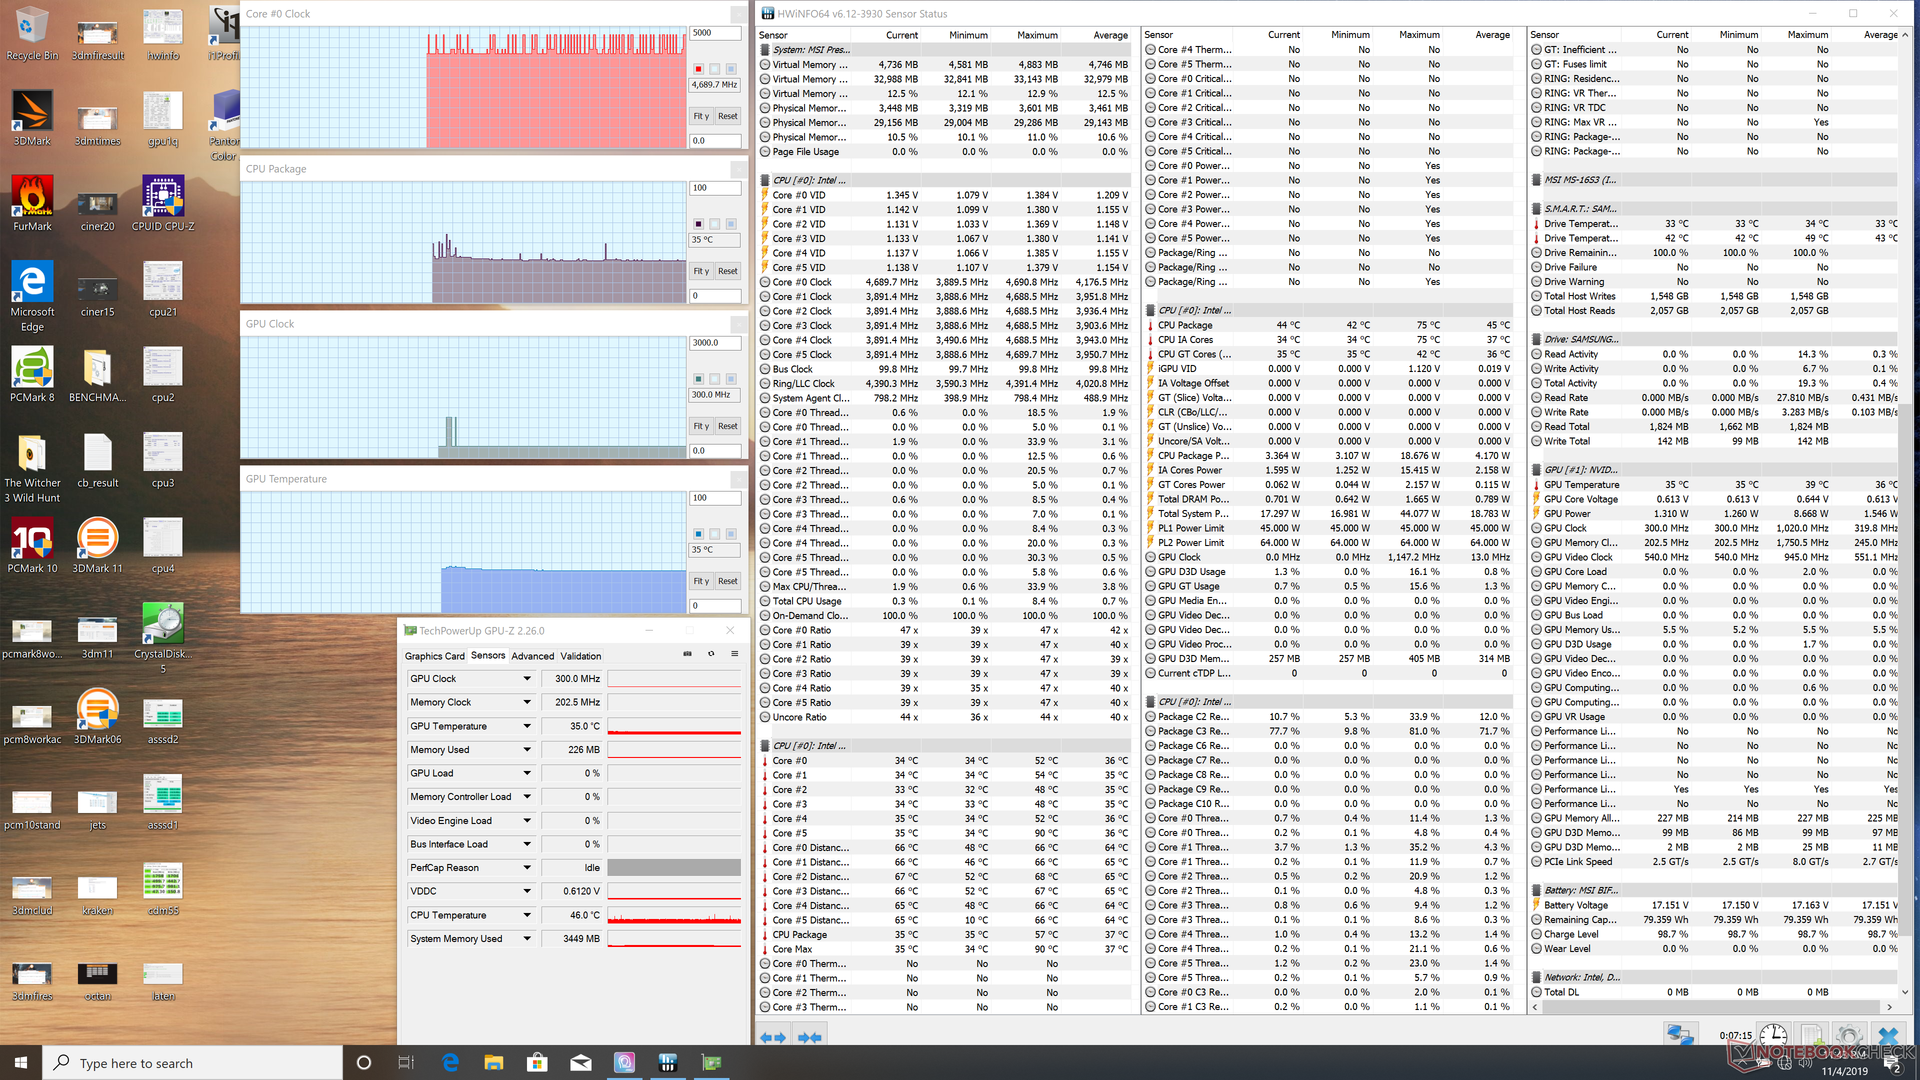
W zetknięciu z grą Wiedźmin 3 temperatury podzespołów osiągnęły maksymalnie 90°C w przypadku CPU i 79°C w przypadku GPU.
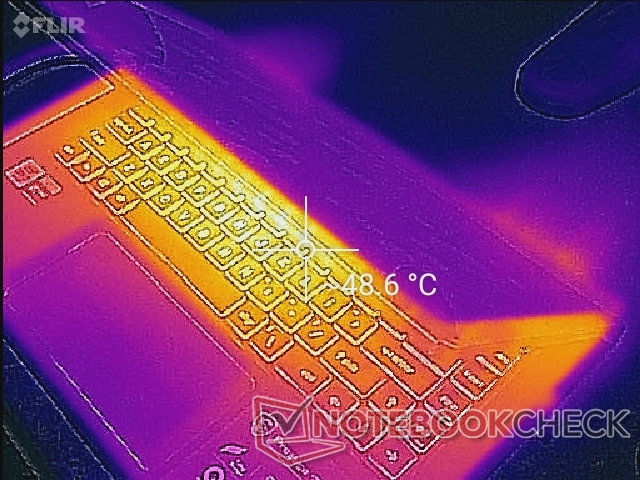
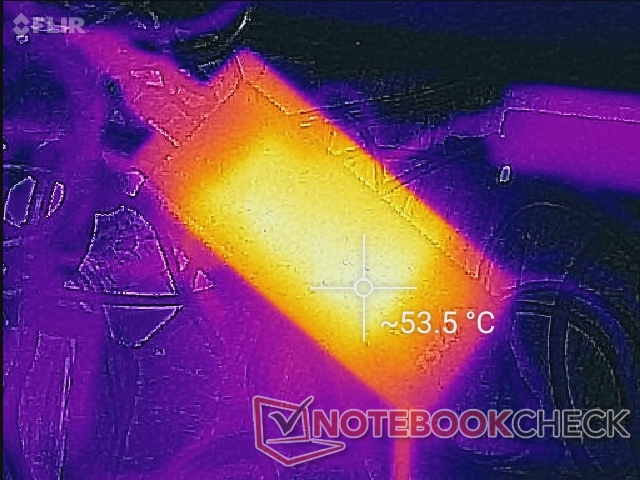
(-) Maksymalna temperatura w górnej części wynosi 56 °C / 133 F, w porównaniu do średniej 36.8 °C / 98 F , począwszy od 21 do 71 °C dla klasy Multimedia.
(-) Dno nagrzewa się maksymalnie do 60.6 °C / 141 F, w porównaniu do średniej 39.1 °C / 102 F
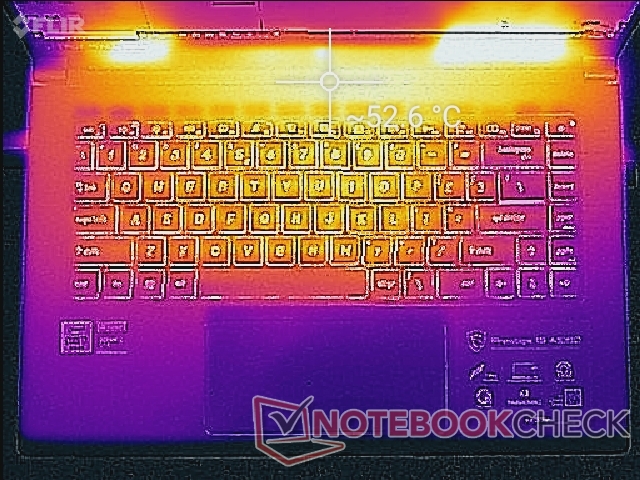
(+) W stanie bezczynności średnia temperatura górnej części wynosi 27.2 °C / 81 F, w porównaniu ze średnią temperaturą urządzenia wynoszącą 31.3 °C / ### class_avg_f### F.
(-) Podczas gry w Wiedźmina 3 średnia temperatura górnej części wynosi 39.4 °C / 103 F, w porównaniu do średniej temperatury urządzenia wynoszącej 31.3 °C / ## #class_avg_f### F.
(+) Podparcia dłoni i touchpad osiągają maksymalną temperaturę skóry (34.6 °C / 94.3 F) i dlatego nie są gorące.
(-) Średnia temperatura obszaru podparcia dłoni w podobnych urządzeniach wynosiła 28.7 °C / 83.7 F (-5.9 °C / -10.6 F).
Wydajność akumulatora
Zastosowany akumulator można spotkać także w laptopie MSI P65 Creator. Ma pojemność 82 Wh i był w stanie zasilać laptop przez około siedem i pół godziny normalnej pracy z WiFi.
| wyłączony / stan wstrzymania | |
| luz | |
| obciążenie |
|
Legenda:
min: | |
| MSI Prestige 15 A10SC i7-10710U, GeForce GTX 1650 Max-Q, Samsung SSD PM981 MZVLB1T0HALR, IPS, 3840x2160, 15.6" | Microsoft Surface Laptop 3 15 Ryzen 5 3580U R5 3580U, Vega 9, SK hynix BC501 HFM256GDGTNG, IPS, 2496x1664, 15" | Lenovo ThinkPad T590-20N4002VGE i7-8565U, GeForce MX250, Toshiba XG6 KXG60ZNV512G, aSi IPS LED, 1920x1080, 15.6" | Dell Latitude 5500 i7-8665U, UHD Graphics 620, Toshiba XG6 KXG60ZNV1T02, IPS, 1920x1080, 15.6" | HP EliteBook 755 G5 3UN79EA R7 2700U, Vega 10, Toshiba XG5 KXG50ZNV512G, IPS, 1920x1080, 15.6" | MSI P65 Creator 9SF-657 i9-9880H, GeForce RTX 2070 Max-Q, 2x Samsung SSD PM981 MZVLB512HAJQ (RAID 0), IPS, 3840x2160, 15.6" | Dell Precision 5530 Xeon E-2176M E-2176M, Quadro P2000, SK hynix PC400 512 GB, IGZO, 3840x2160, 15.6" | |
|---|---|---|---|---|---|---|---|
| Power Consumption | 46% | 29% | 40% | 33% | -53% | -24% | |
| Idle Minimum * (Watt) | 6.1 | 3.3 46% | 4.1 33% | 4.4 28% | 5 18% | 9.4 -54% | 9.8 -61% |
| Idle Average * (Watt) | 13.2 | 7.1 46% | 8.3 37% | 6.9 48% | 10.6 20% | 17.4 -32% | 16.8 -27% |
| Idle Maximum * (Watt) | 19.2 | 7.2 62% | 11.8 39% | 7.7 60% | 12.9 33% | 19.6 -2% | 16.9 12% |
| Load Average * (Watt) | 75 | 44.8 40% | 61.6 18% | 43.6 42% | 40.6 46% | 103 -37% | 102.3 -36% |
| Witcher 3 ultra * (Watt) | 74 | 45.1 39% | 54.4 26% | 76.5 -3% | |||
| Load Maximum * (Watt) | 89.7 | 53 41% | 69.4 23% | 69.1 23% | 46.6 48% | 216 -141% | 114.5 -28% |
* ... im mniej tym lepiej
| MSI Prestige 15 A10SC i7-10710U, GeForce GTX 1650 Max-Q, 82 Wh | Microsoft Surface Laptop 3 15 Ryzen 5 3580U R5 3580U, Vega 9, 45 Wh | Lenovo ThinkPad T590-20N4002VGE i7-8565U, GeForce MX250, 57 Wh | Dell Latitude 5500 i7-8665U, UHD Graphics 620, 68 Wh | HP EliteBook 755 G5 3UN79EA R7 2700U, Vega 10, 56 Wh | MSI P65 Creator 9SF-657 i9-9880H, GeForce RTX 2070 Max-Q, 82 Wh | Dell Precision 5530 Xeon E-2176M E-2176M, Quadro P2000, 97 Wh | |
|---|---|---|---|---|---|---|---|
| Czasy pracy | -0% | 53% | 62% | -16% | -40% | -6% | |
| Reader / Idle (h) | 19.1 | 18.7 -2% | 11.9 -38% | 9.6 -50% | 16.5 -14% | ||
| WiFi v1.3 (h) | 7.6 | 9.1 20% | 10.5 38% | 12.3 62% | 8.3 9% | 6 -21% | 8.4 11% |
| Load (h) | 2.1 | 1.7 -19% | 3.5 67% | 1.7 -19% | 1.1 -48% | 1.8 -14% |
Za
Przeciw
Podsumowanie
Laptop Prestige 15 jest dowodem na to, że firma MSI potrafi wyprodukować coś więcej, niż tylko komputer do gier. Nie jest brzydszy od takich modeli, jak Dell XPS 15, Asus ZenBook 15 czy HP Spectre x360 15. Jednocześnie jest lżejszy i lepiej nada się do przenoszenia dzięki możliwości ładowania przez USB-C. Nowość pod postacią sześciordzeniowego procesora Comet Lake-U jest dobrą alternatywą dla dobrze znanych czterordzeniowych CPU spod znaku Coffee Lake-H wszędzie tam, gdzie oprogramowanie robi użytek z wielu rdzeni.
Kolejny atut testowanej konfiguracji to matryca 4K UHD o przekątnej 15,6", która oferuje to, co najlepsze, wprost ze sklepu (kalibracja fabryczna nie wymaga korekty). Jeszcze ważniejsza może się okazać kultura pracy, czyli hałas trzymany w ryzach aż po średnie obciążenie. Przy dużym obciążeniu poziom szumu nie zmienia się w kółko, co ma miejsce w niektórych innych cienkich laptopach.
Oczywiście nadal można znaleźć pole do poprawy. MSI Prestige 15 nie posiada zaczepu na linkę blokady Kensingtona czy kamerki IR (podczerwień), co może dziwić w wysokiej klasy laptopie do pracy. Obudowę mogłaby być solidniejsza - nie wydaje się tak mocna, jak w ultrabookach Dell i HP z wysokiej półki. Cisza została okupiona nagrzewaniem, i to mimo zastosowania CPU i GPU o ograniczonym poborze mocy. Poza tym przy pełnej zajętości procesora występował throttling CPU. Listę zastrzeżeń zamykają klawiatura i płytka dotykowa, które są zbyt miękkie i w kolejnej generacji powinny zostać udoskonalone.
[Aktualizacja recenzji po przeprowadzeniu dodatkowych testów: w drugim z dostarczonych nam egzemplarzy modelu Prestige 15 problem z throttlingiem CPU nie wystąpił. Zegary procesora utrzymywały się blisko 2,8 GHz a temperatury mierzone oprogramowaniem wynosiły około 95°C. Trzeba stwierdzić, że temperatura CPU była wysoka. Aby uniknąć problemów z dławieniem CPU (obniżeniem wydajności wskutek obniżania taktowania po przegrzaniu), warto upewnić się, że sterowniki i oprogramowanie narzędziowe (jak App Center) są aktualne. Nie zaszkodzi też sprawdzić, czy procesor wchodzi na 100% zajęcia, i dlaczego tak się dzieje.]
