Recenzja podręcznego komputera GPD Win 4: gry w 1080p na Ryzen 7 w dłoni
Ręczny komputer Windows 2023 GPD Win 4 jest bezpośrednim następcą modelu 2021 Win 3. Oprócz wymiany procesora z 11. generacji Intela na bardziej wydajny AMD Zen 3+, jego konstrukcja została również całkowicie odnowiona od podstaw, aby być ogólnie mocniejszą maszyną, jak pokaże nasza recenzja.
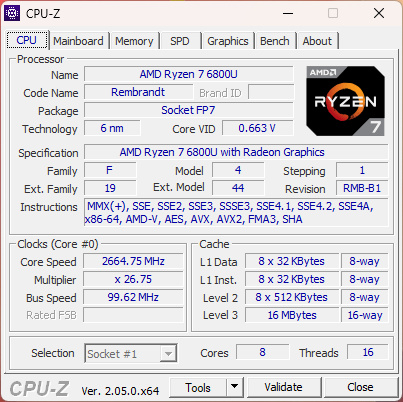
Win 4 wykorzystuje ten sam Ryzen 7 6800U procesor, który można znaleźć we flagowych ultrabookach, takich jak Asus ZenBook S13. Wszystkie konfiguracje na chwilę obecną różnią się jedynie pamięcią RAM (16 lub 32 GB LPDDR5-6400) i pojemnością dysku SSD (1 lub 2 TB), natomiast procesor AMD i 6-calowy ekran dotykowy 1080p IPS pozostają niezmienne. Więcej dostarczonych przez producenta informacji na temat Win 4 można znaleźć na jego stronie Indiegogo.
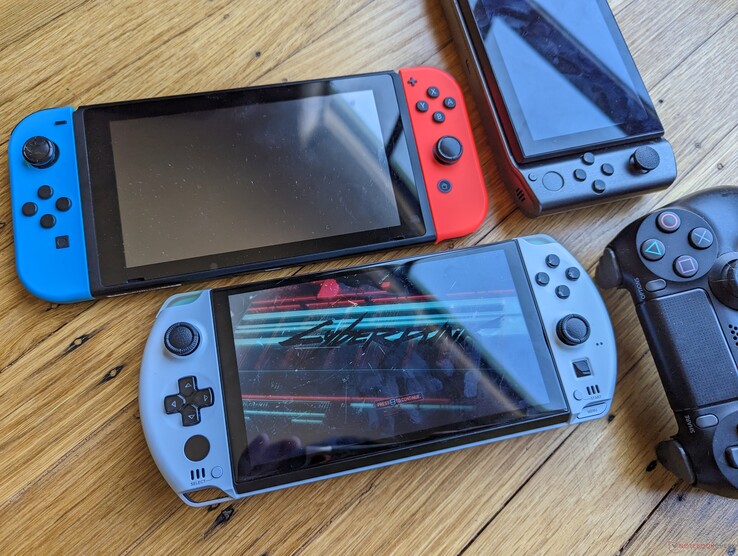
Do konkurentów należą Steam Deck, Nintendo Switch i OneXPlayer. Nasze poniższe porównania obejmują również subnotebooki napędzane serią U.
Więcej recenzji GPD:
Potencjalni konkurenci w porównaniu
Ocena | Data | Model | Waga | Wysokość | Rozmiar | Rezolucja | Cena |
|---|---|---|---|---|---|---|---|
| 80.3 % v7 (old) | 03/2023 | GPD Win 4 R7 6800U, Radeon 680M | 607 g | 28 mm | 6.00" | 1920x1080 | |
| 84.5 % v7 (old) | 11/2024 | GPD Win Max 2 i7-1260P, Iris Xe G7 96EUs | 1 kg | 23 mm | 10.10" | 2560x1600 | |
v (old) | GPD Win 3 i5-1135G7, Iris Xe G7 80EUs | 553 g | 27 mm | 5.50" | 1280x720 | ||
| 85.5 % v7 (old) | Razer Blade Stealth i7-1165G7 GTX 1650 Ti Max-Q i7-1165G7, GeForce GTX 1650 Ti Max-Q | 1.4 kg | 15.3 mm | 13.30" | 1920x1080 | ||
| 90.1 % v7 (old) | 11/2022 | Dell XPS 13 9315 2-in-1 Core i5-1230U i5-1230U, Iris Xe G7 80EUs | 764 g | 7.4 mm | 13.00" | 2880x1920 | |
| 90.1 % v7 (old) | Asus Zenbook S 13 OLED R7 6800U, Radeon 680M | 1.1 kg | 14.9 mm | 13.30" | 2880x1800 |
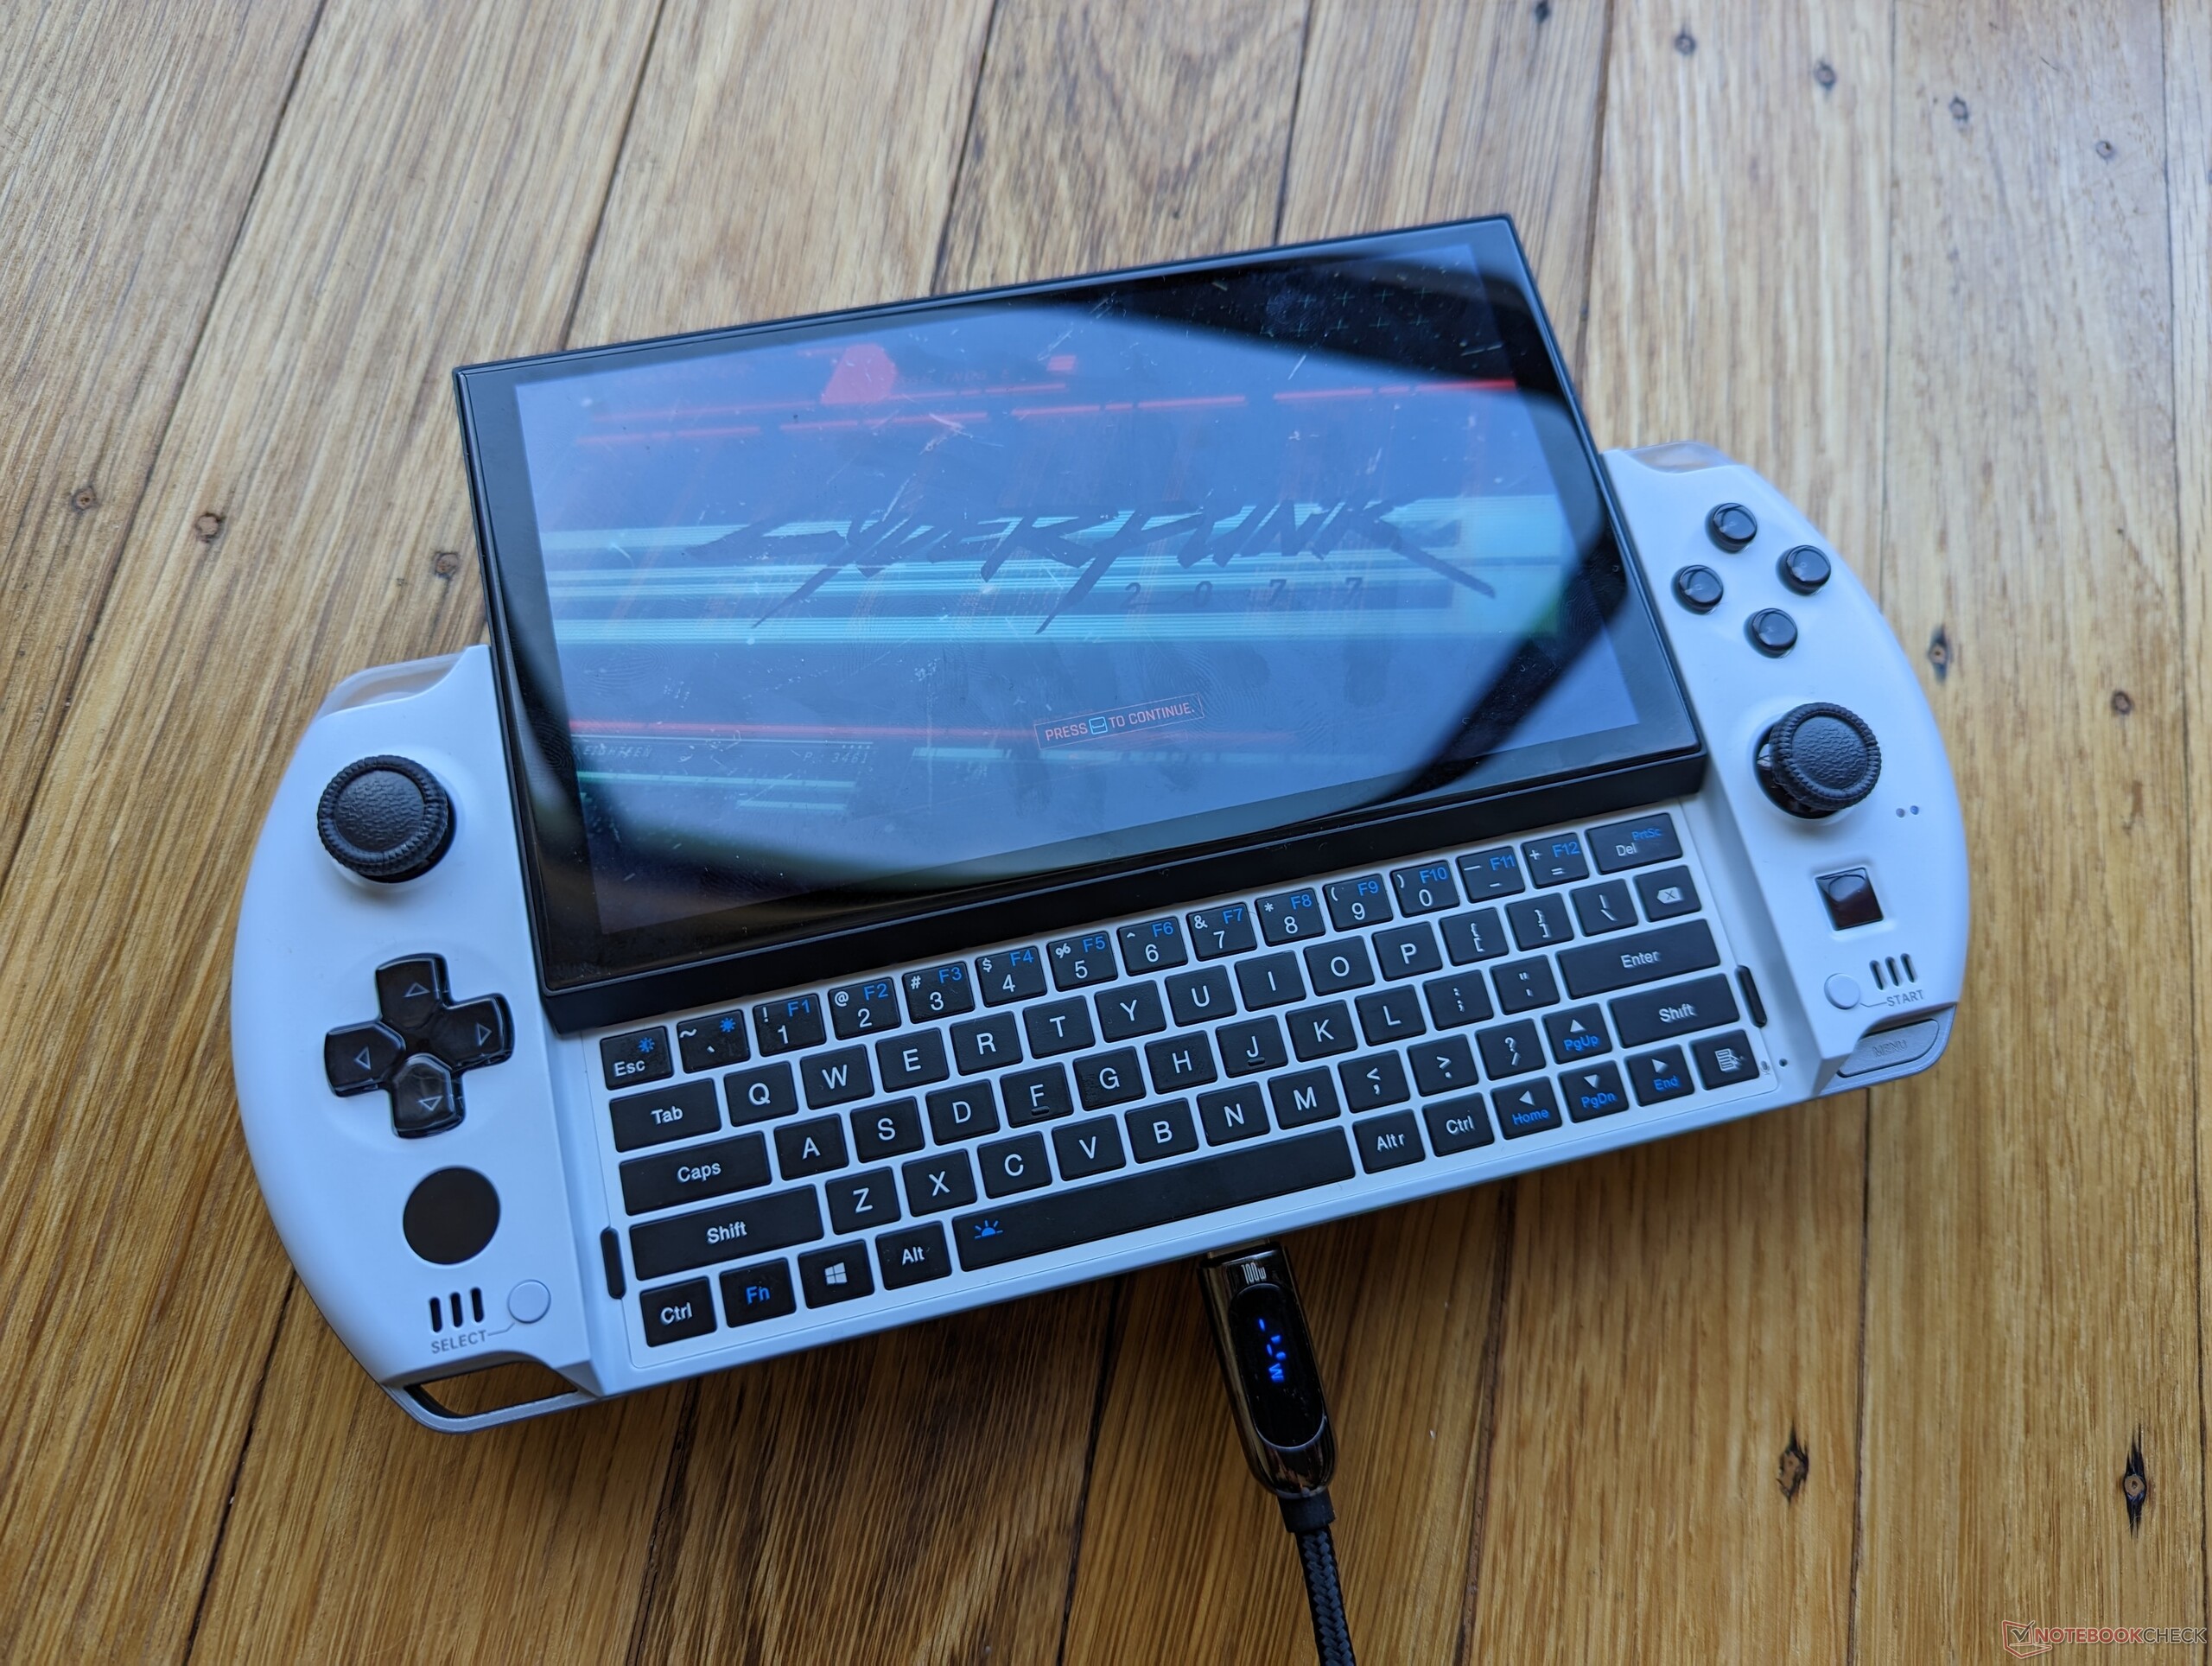
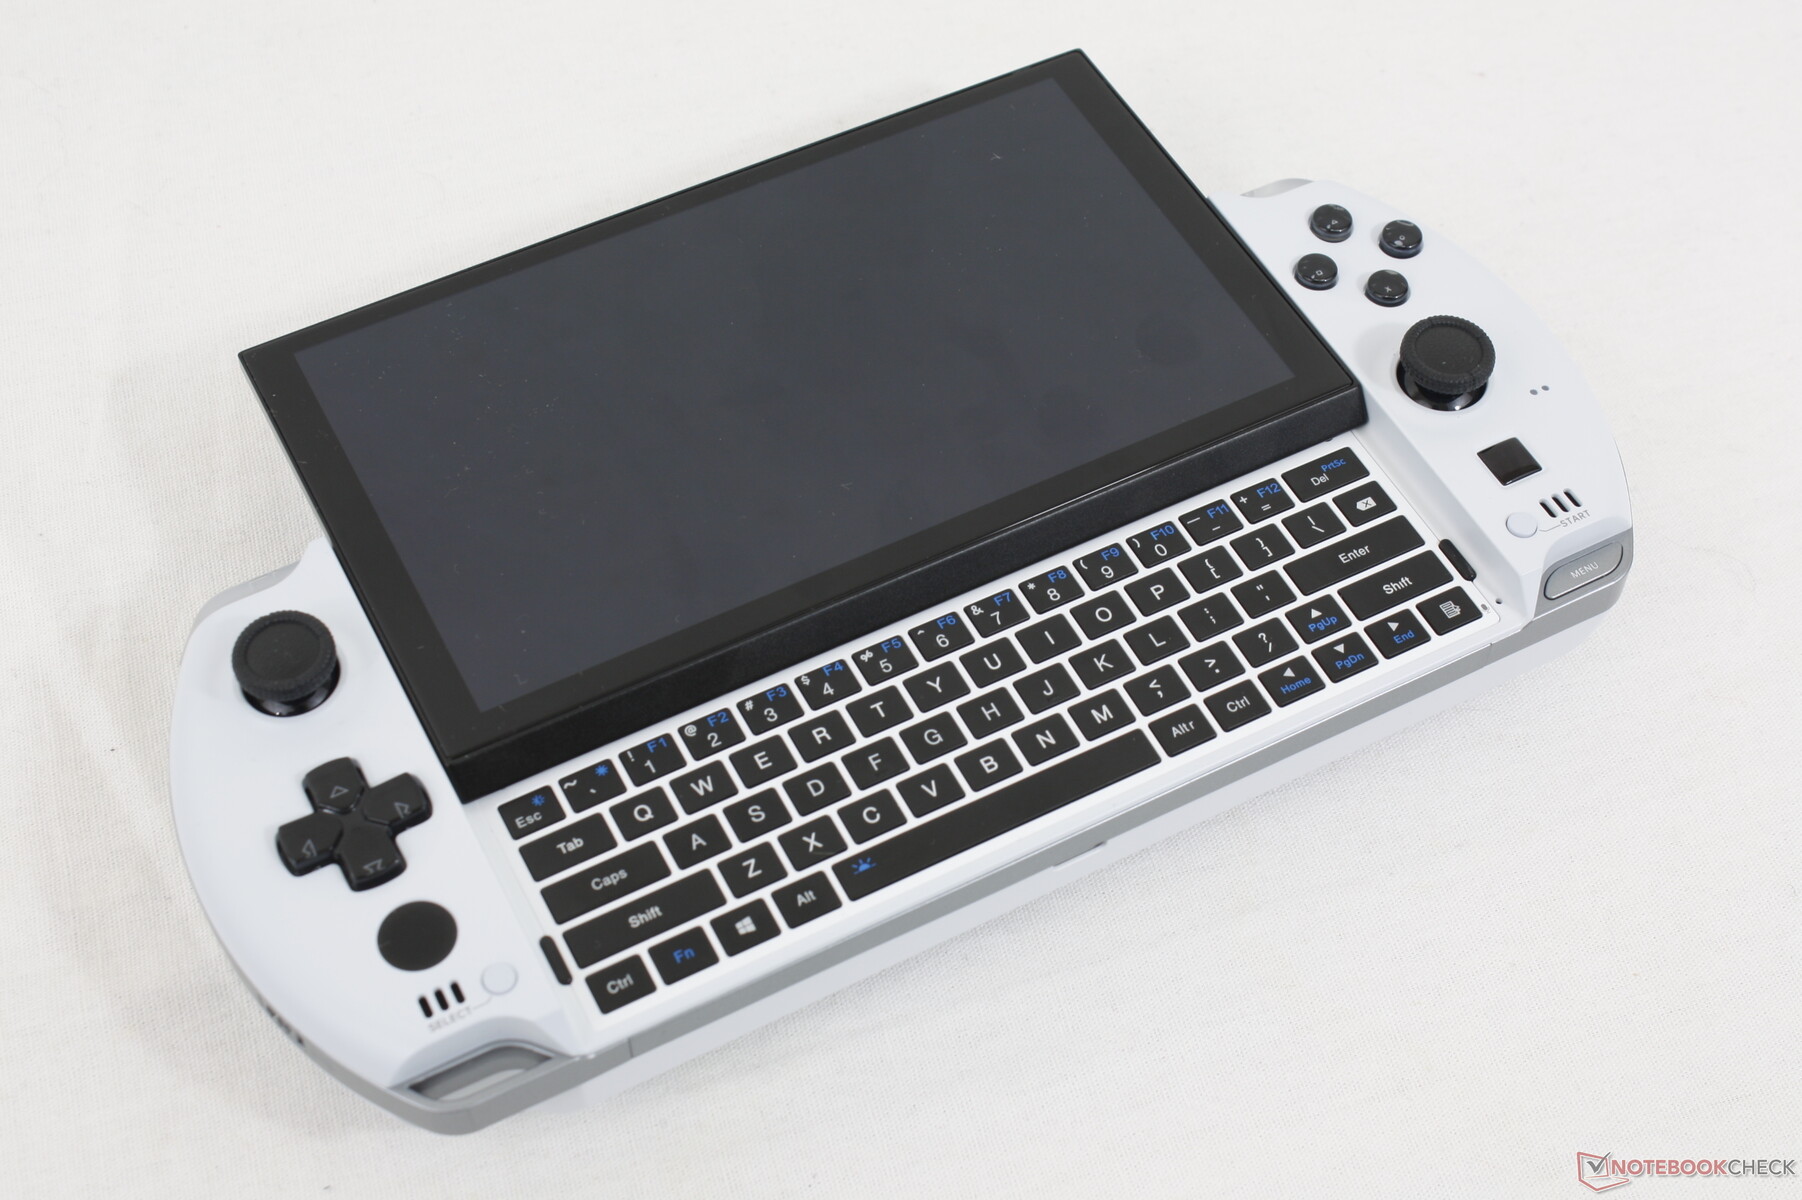
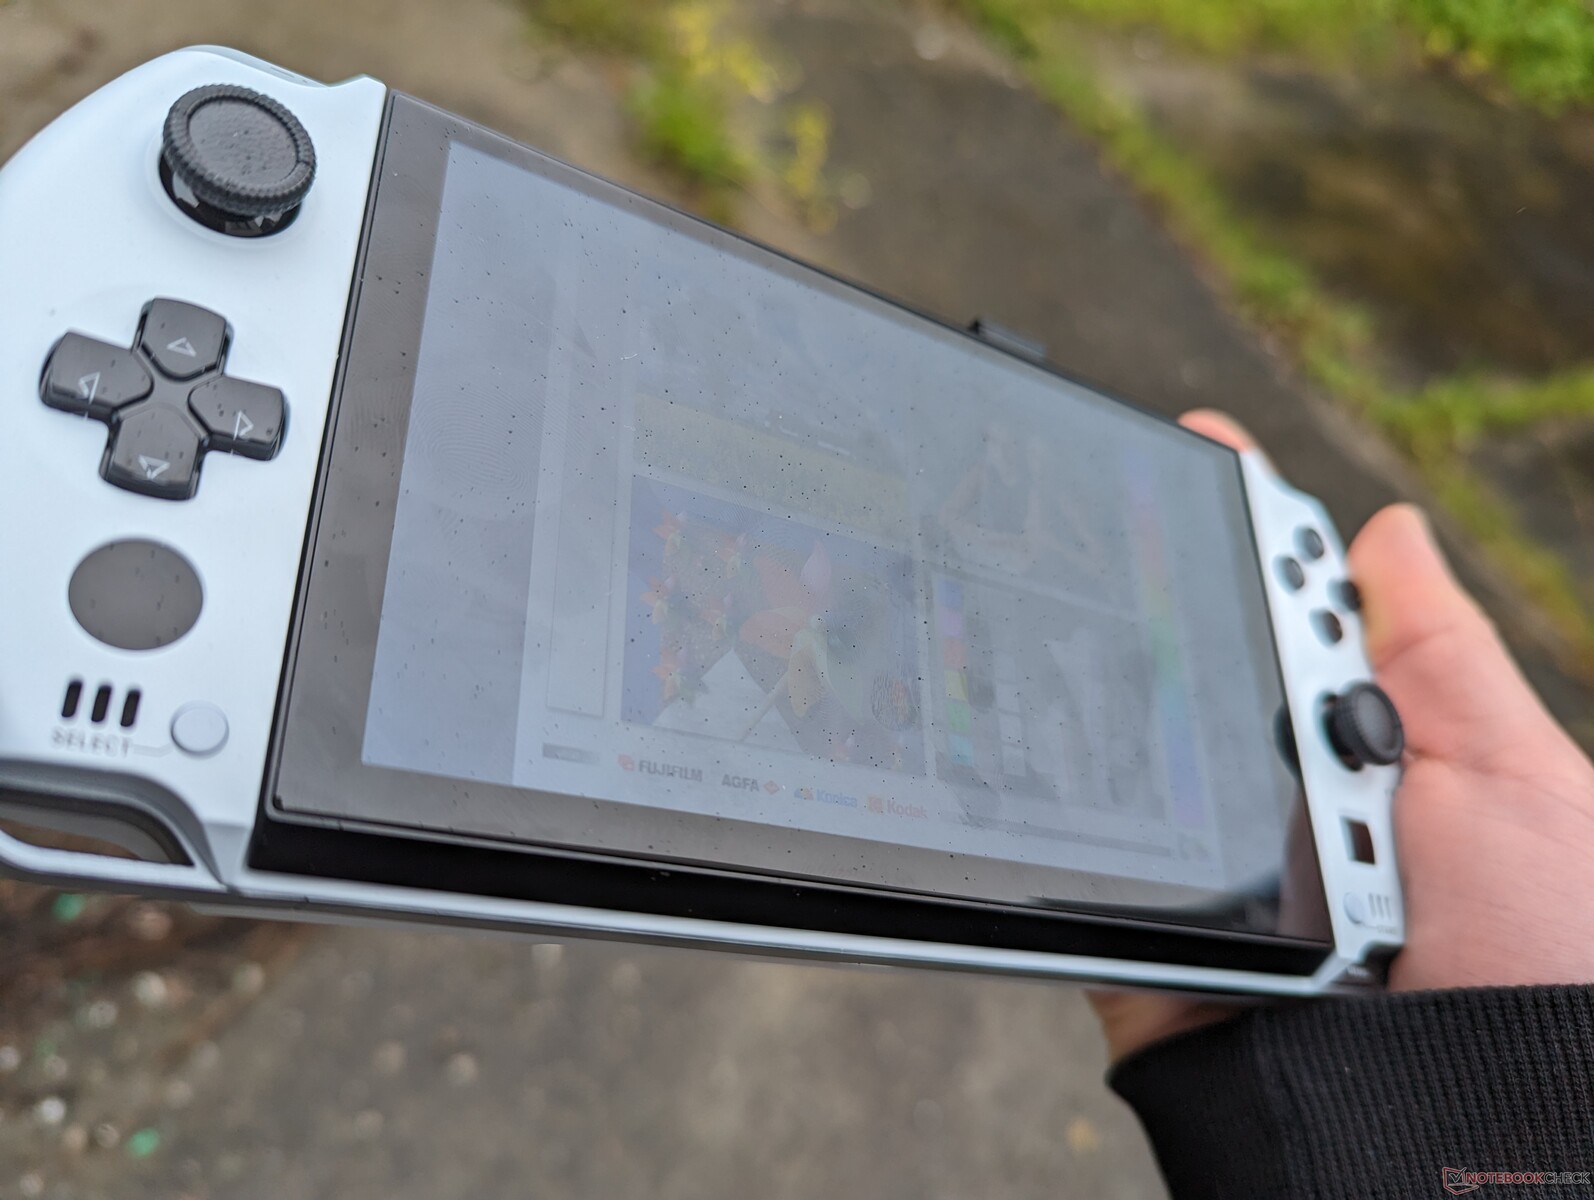
Case - Look Like a Vita, Sting Like a Switch
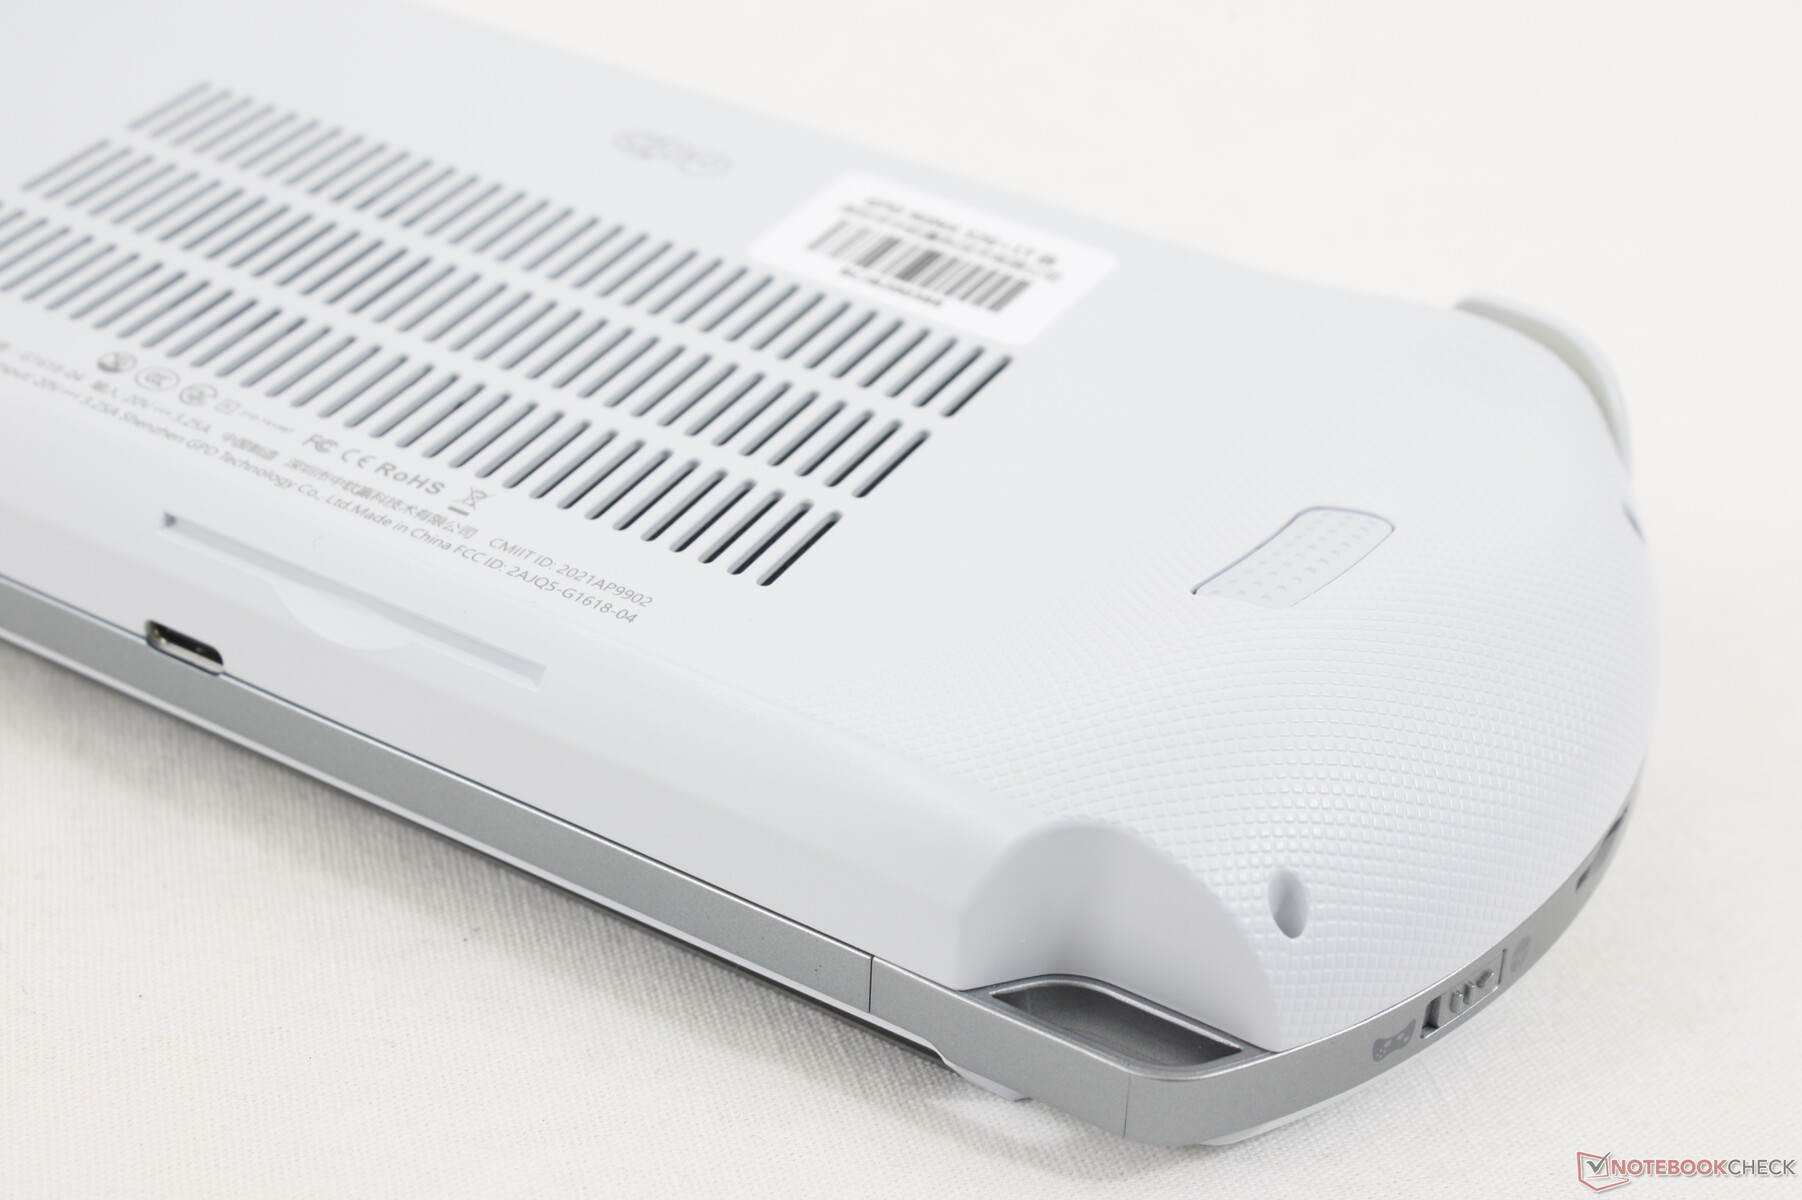
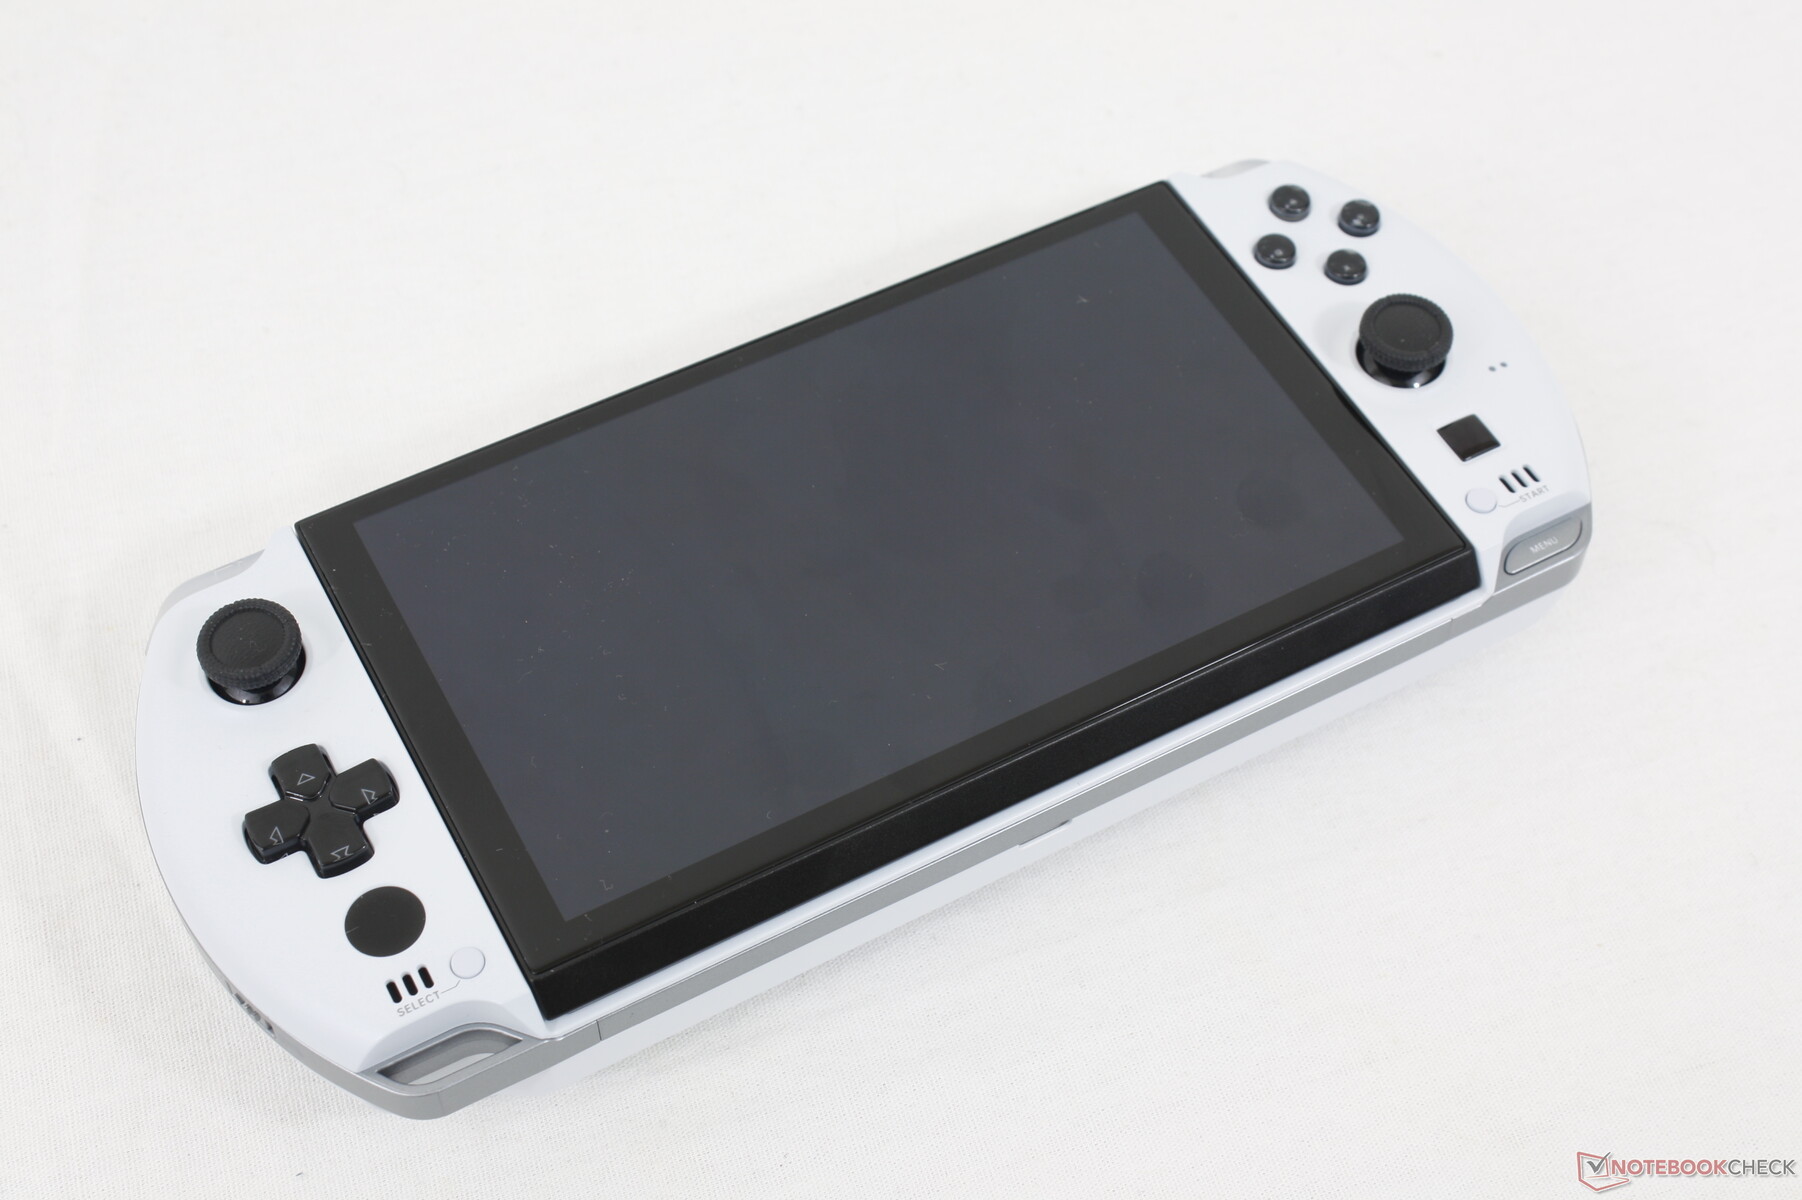
Obudowa składa się z szarego stopu magnezu, plastiku ABS w białym lub czarnym kolorze oraz szkła Gorilla Glass 5 chroniącego ekran dotykowy od krawędzi do krawędzi. Ogólna konstrukcja jest ewolucją modelu Win 3, a jednocześnie zawiera elementy pochodzące z handheldów Sony i Nintendo. Na przykład, kształt i rozmiar gamepada są podobne do PSP i Switch. W efekcie końcowym Win 3 wygląda bardziej atrakcyjnie i bardziej gamingowo niż poprzedni Win 3.
Sztywność obudowy była dobra w Win 3, a teraz jest jeszcze lepsza w Win 4. Nasz egzemplarz wykazywał minimalne ugięcia i skręcenia, nie było żadnych wad montażowych ani szczelin, pomimo wszystkich różnych materiałów i ruchomych części, z których wykonana jest obudowa. Podczas naciskania na tył obudowy słychać pewne słyszalne skrzypienie, ale nie jest to powód do zmartwień. Ogólna jakość wykonania mogłaby przejść jako oficjalny handheld od któregokolwiek z głównych producentów gier.
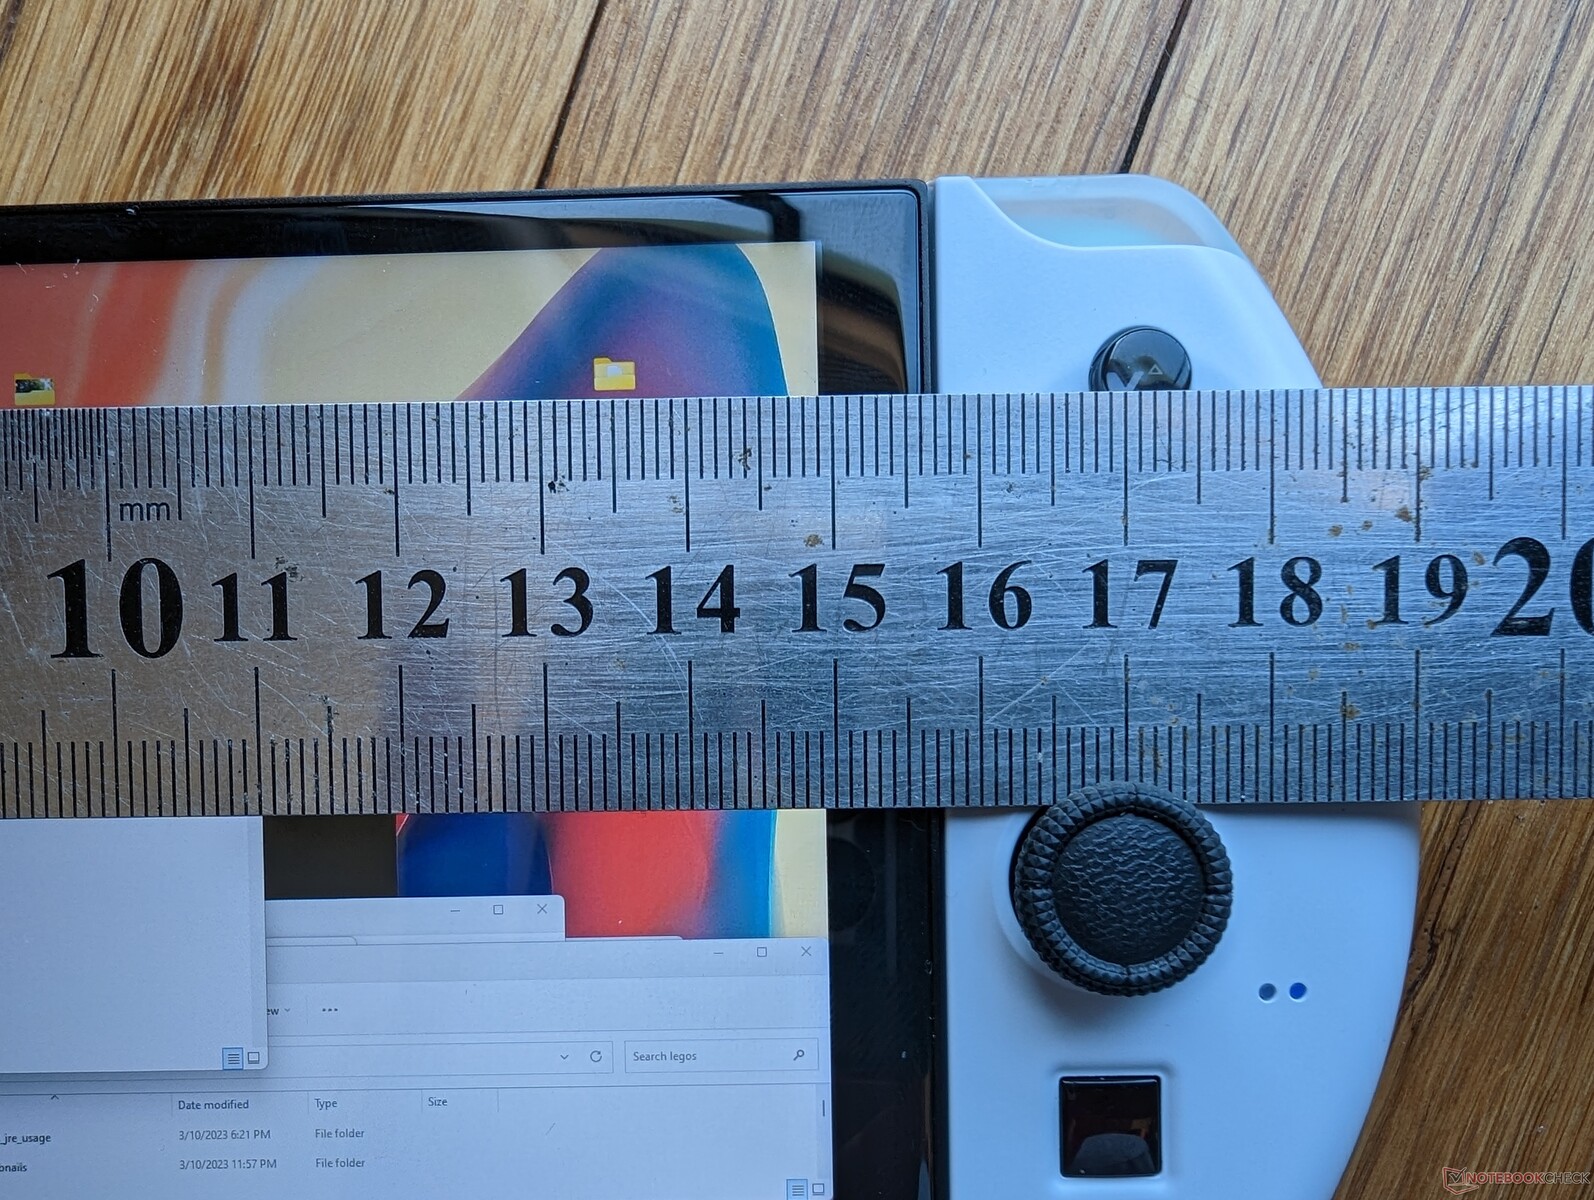
Model ten jest grubszy, większy i cięższy od starszego Win 3, co pokazuje nasza tabela porównania rozmiarów poniżej. W zamian użytkownicy otrzymują większy, 6-calowy ekran, znacznie bardziej wydajny sprzęt, więcej portów i mocniejszą konstrukcję. Jest to z pewnością handheld bardziej pasujący do torby lub torebki niż do kieszeni spodni.
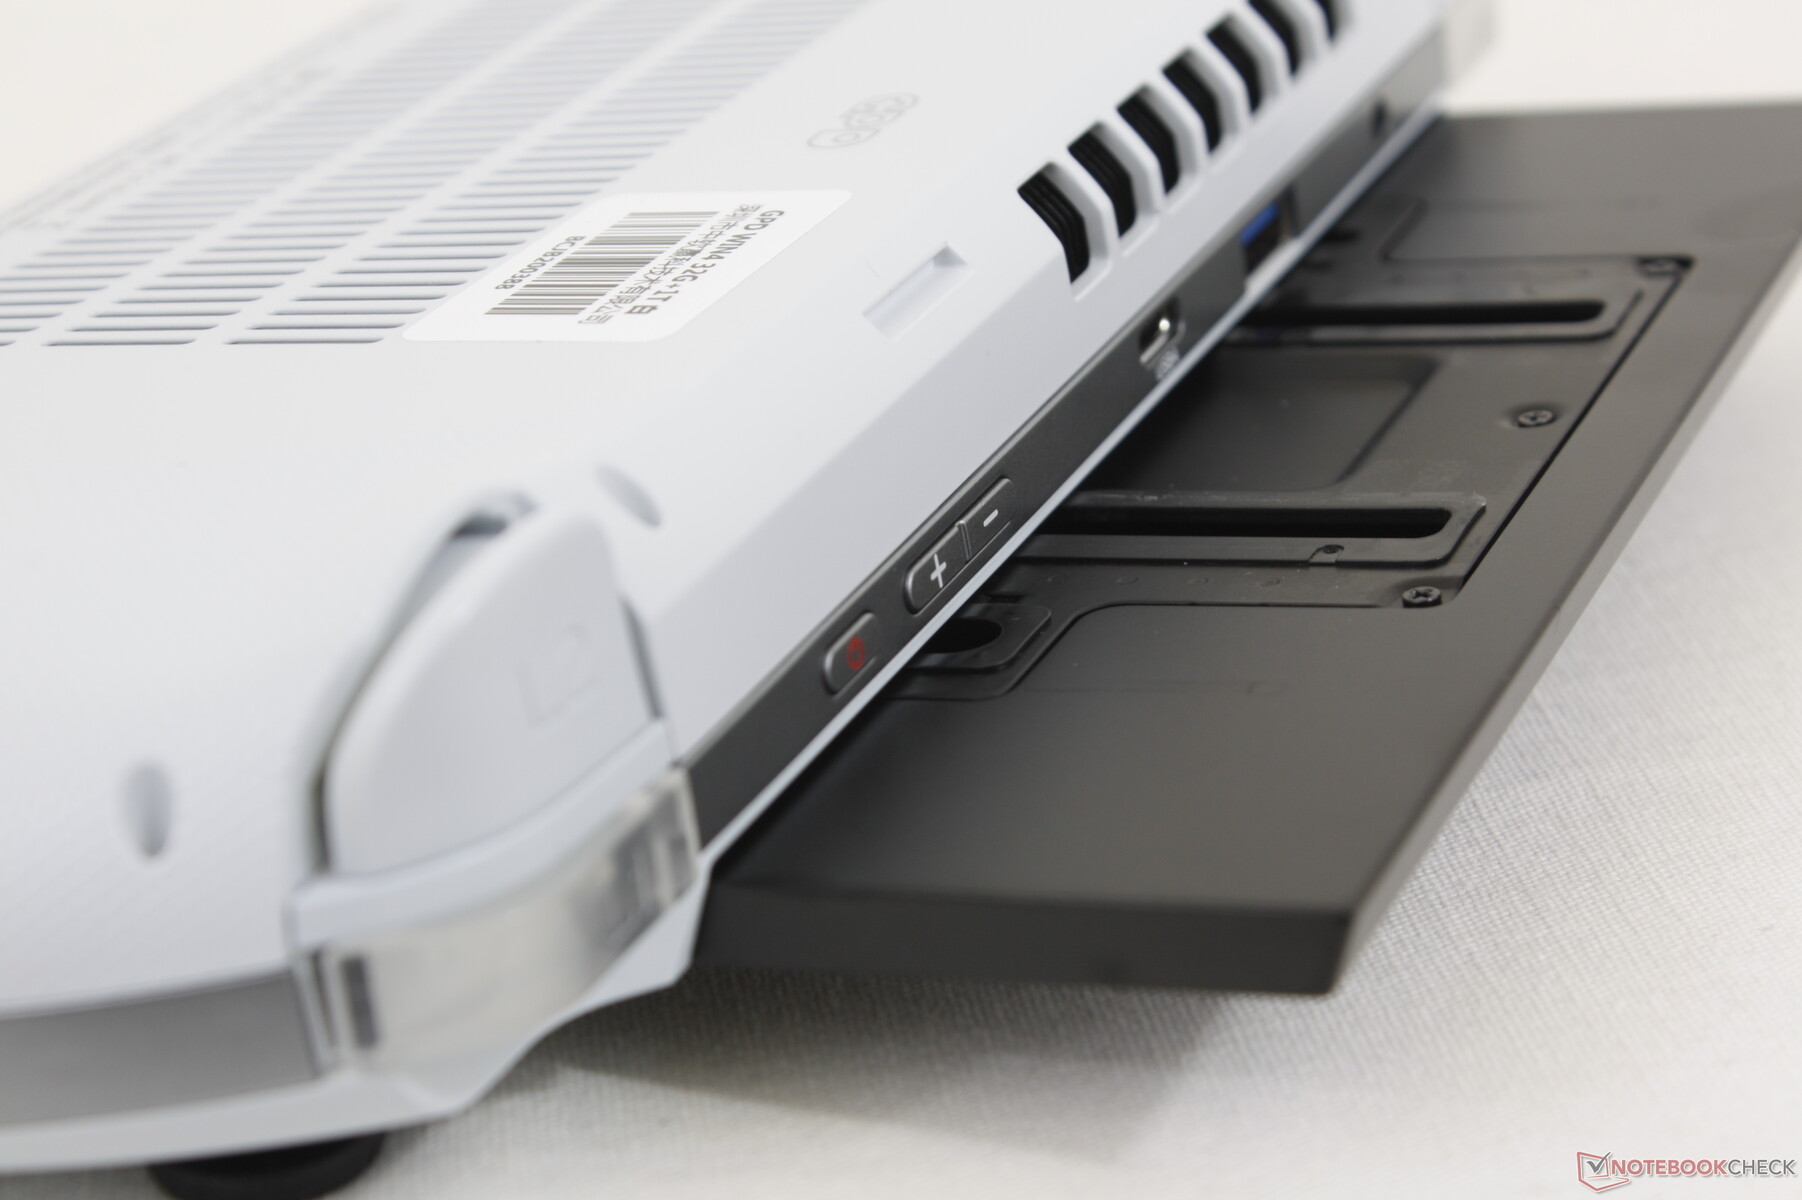
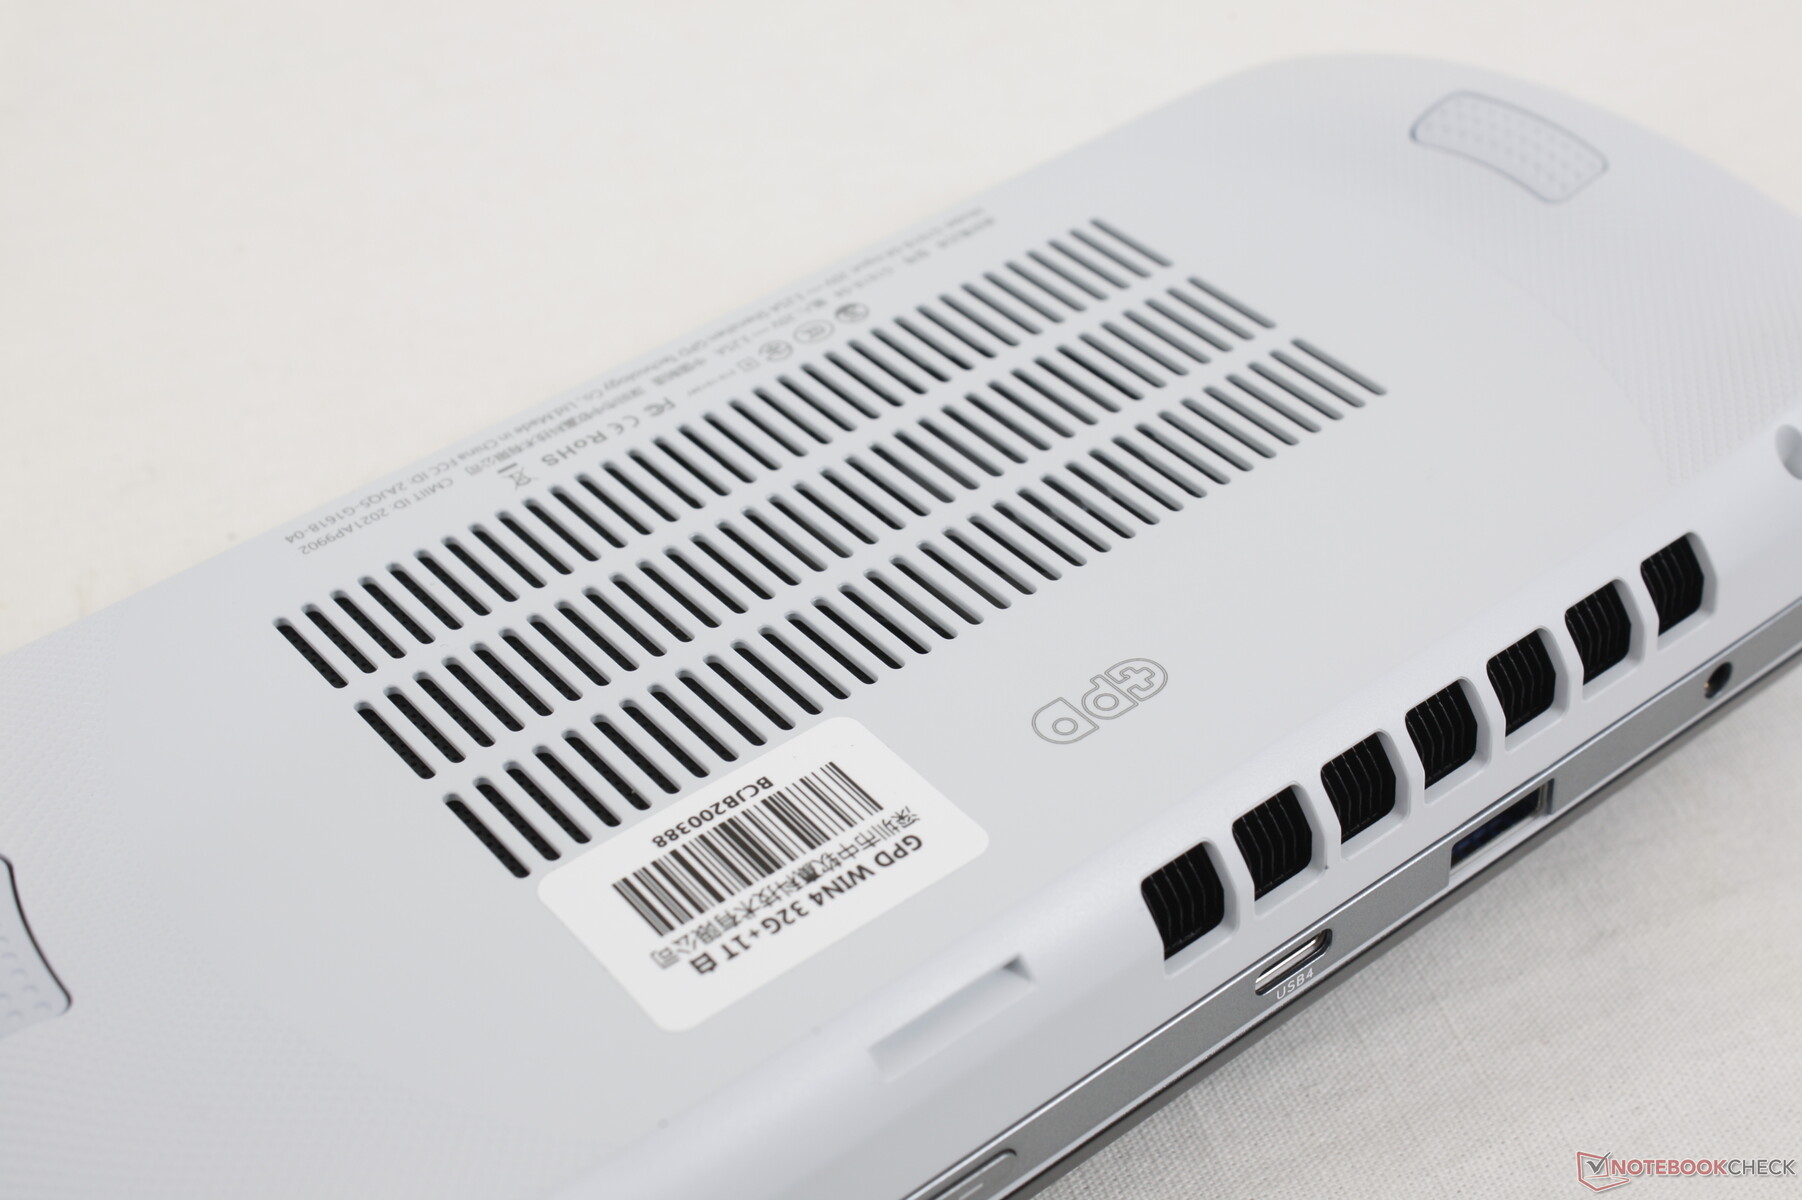
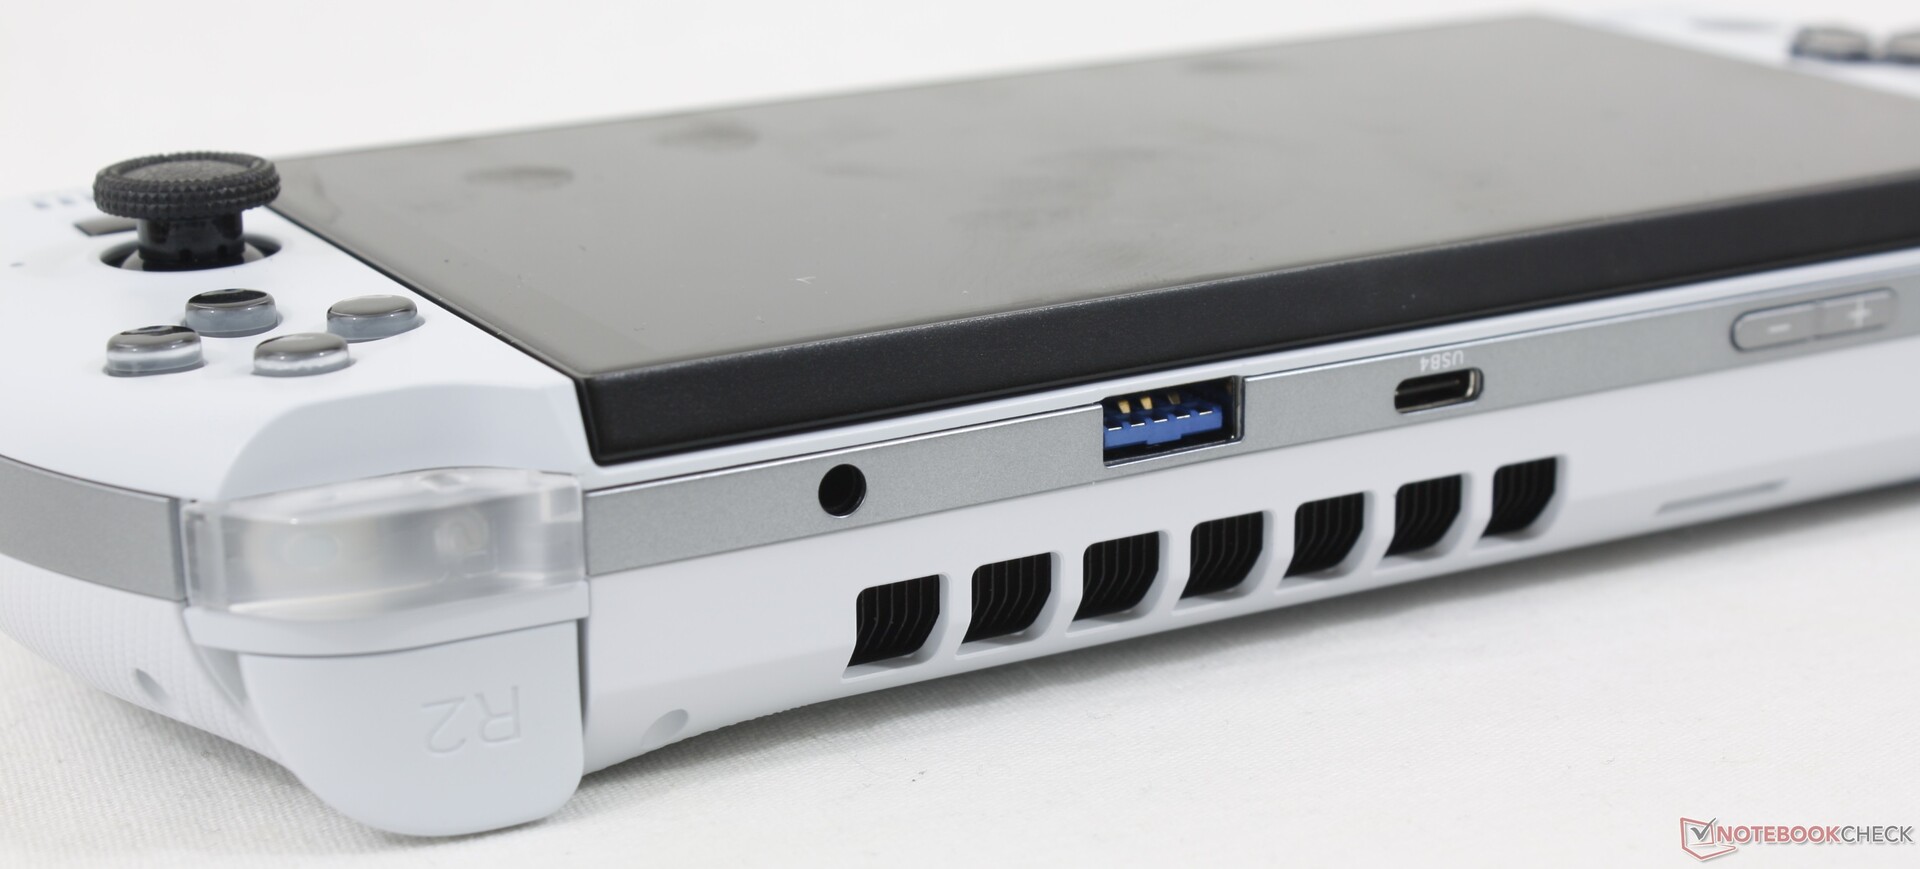
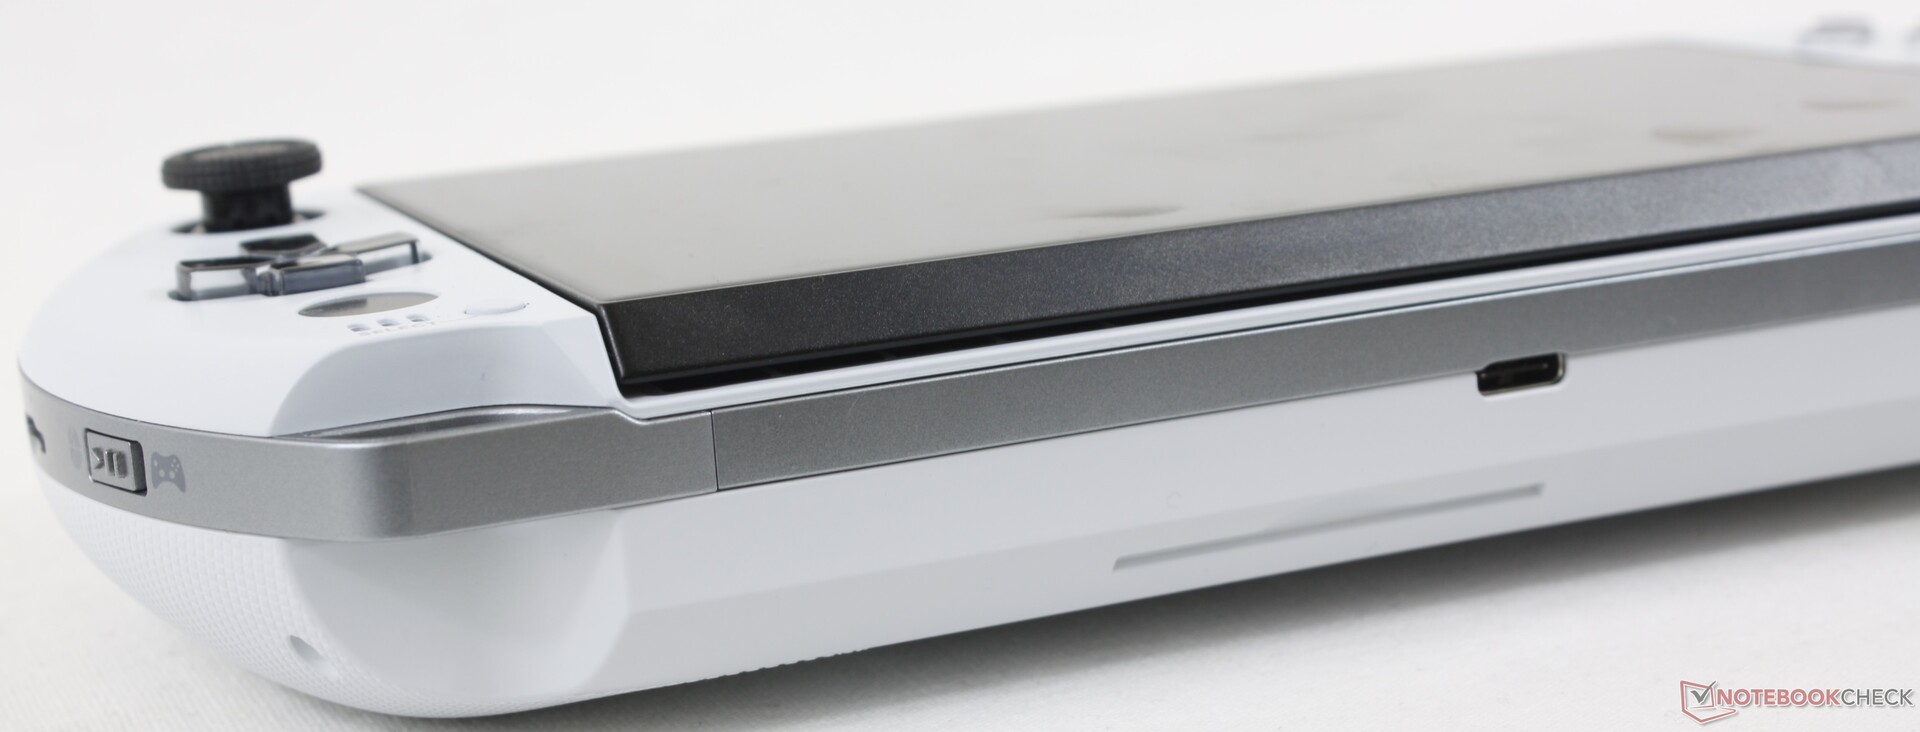
Łączność - Tak, karty eGPU są obsługiwane!
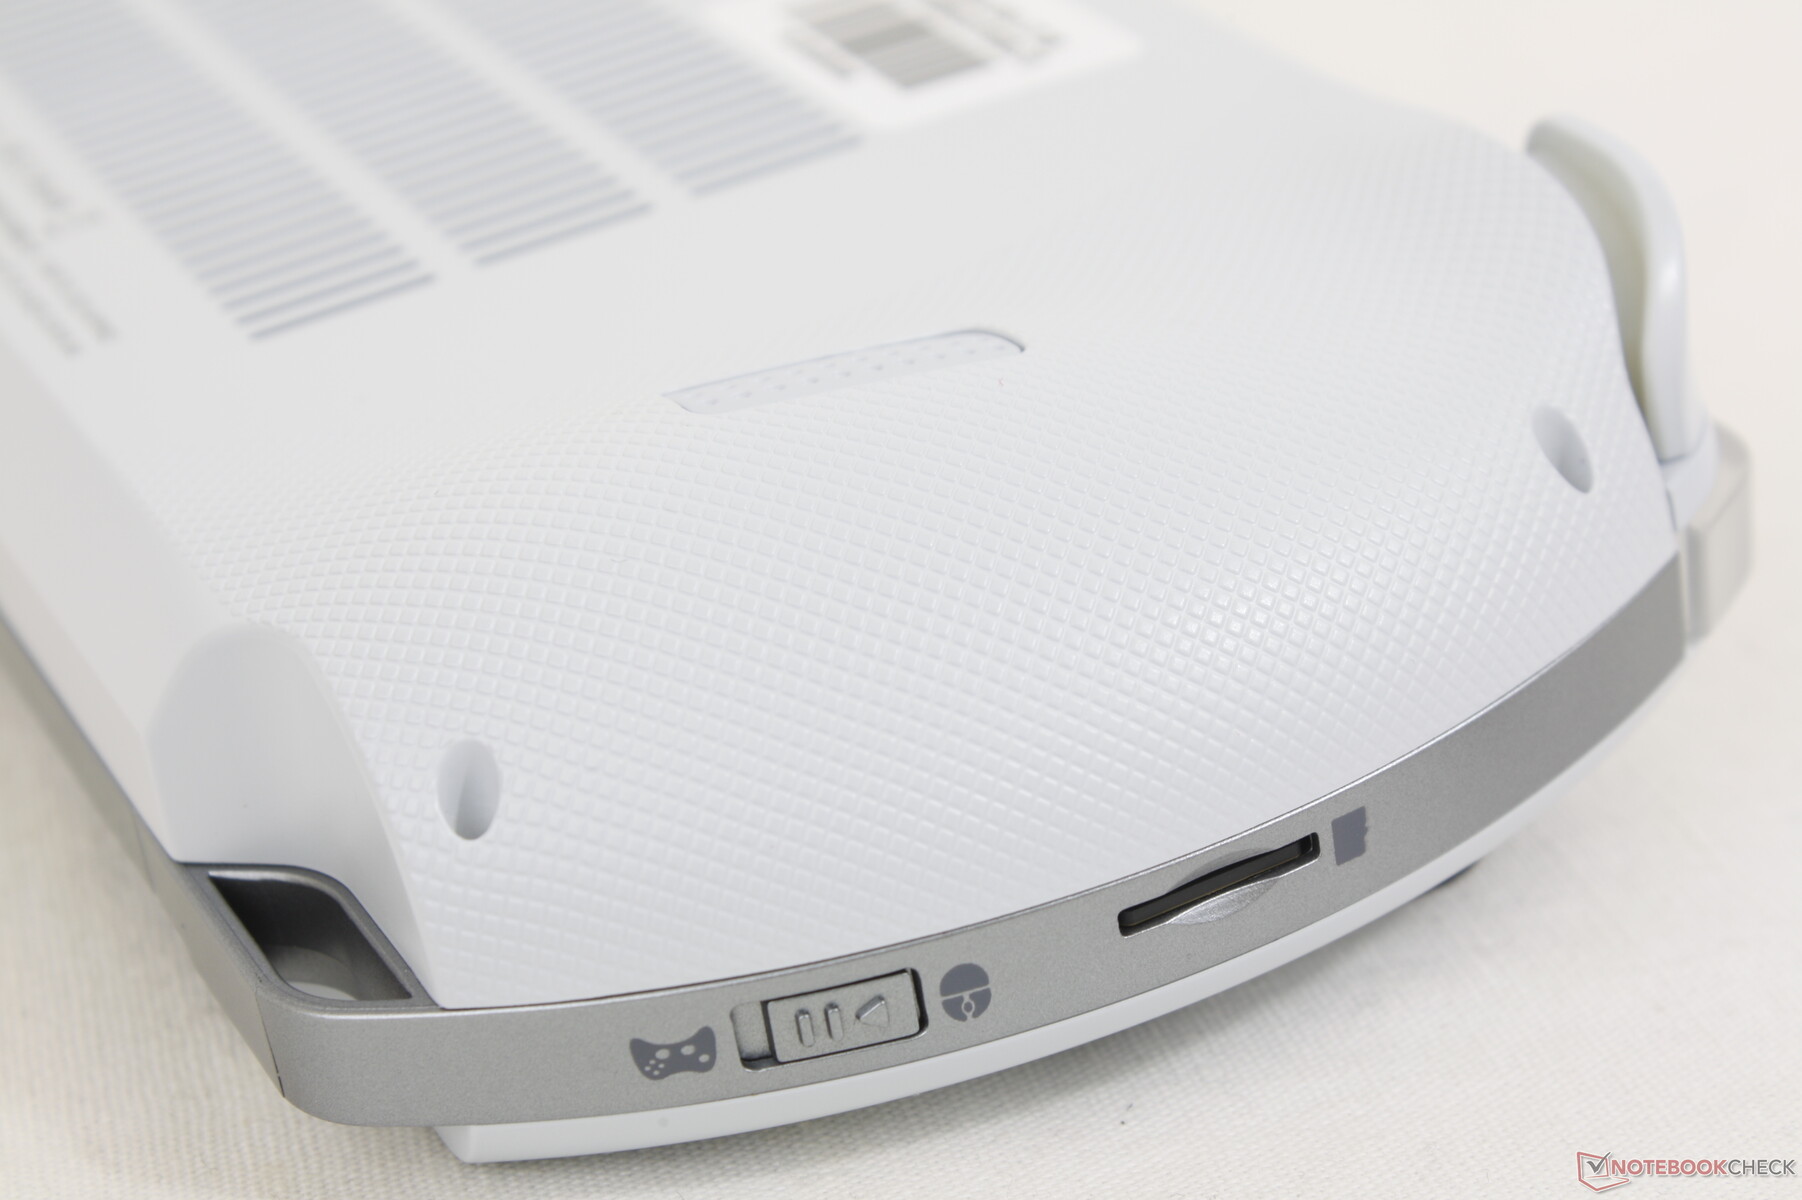
Model ten integruje dwa porty USB-C i jeden USB-A. Górny port USB-C obsługuje USB4, co oznacza, że system jest kompatybilny z zewnętrznymi stacjami dokującymi GPU. W przeciwnym razie oba porty USB-C mogą być używane do ładowania lub podłączania zewnętrznych monitorów, podczas gdy Nintendo Switch może być ładowany tylko przez port USB-C na dole.
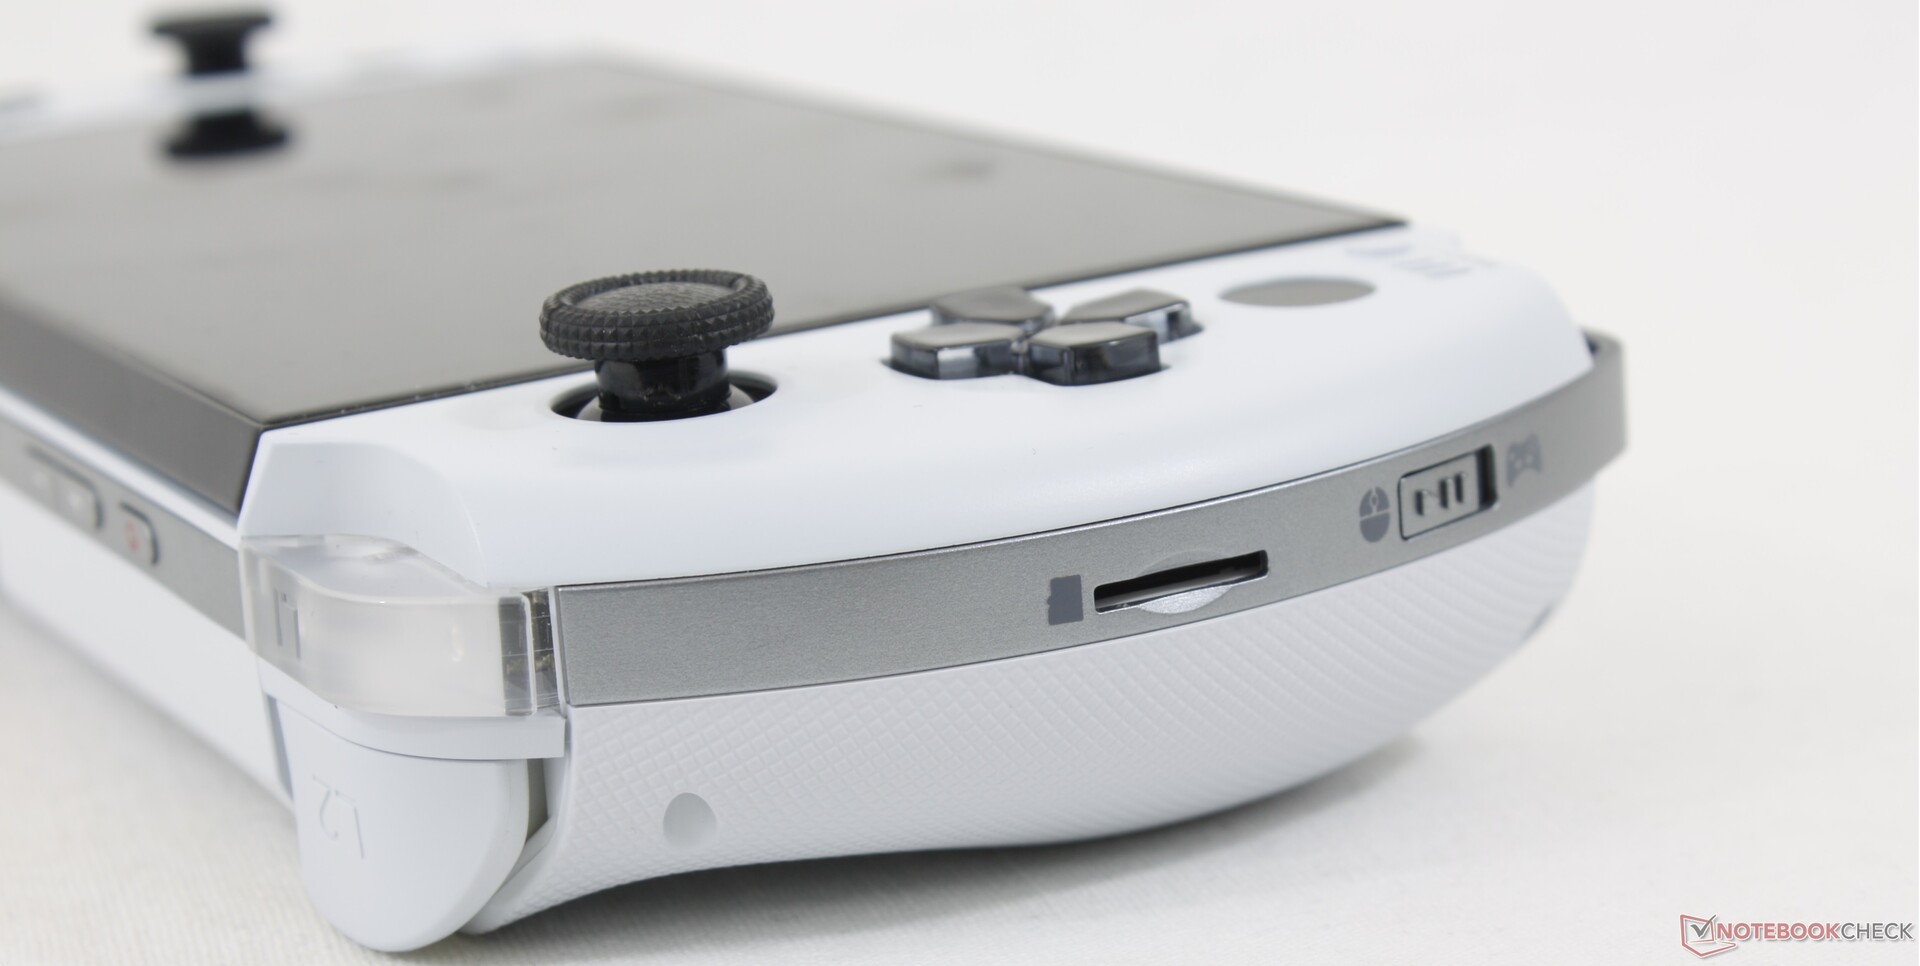
Czytnik kart SD
Sprężynowy czytnik MicroSD powraca z Win 3. Wydajność jest przyzwoita, mimo że jest o połowę szybsza niż czytnika MicroSD w Win MAX 2. Niemniej jednak jest on przydatny do przenoszenia gier na Win 4.
| SD Card Reader | |
| average JPG Copy Test (av. of 3 runs) | |
| GPD Win Max 2 (Toshiba Exceria Pro SDXC 64 GB UHS-II) | |
| GPD Win 3 (Toshiba Exceria Pro M501 32 GB UHS-II) | |
| GPD Win 4 (AV Pro SD microSD 128 GB V60) | |
| maximum AS SSD Seq Read Test (1GB) | |
| GPD Win Max 2 (Toshiba Exceria Pro SDXC 64 GB UHS-II) | |
| GPD Win 4 (AV Pro SD microSD 128 GB V60) | |
| GPD Win 3 (Toshiba Exceria Pro M501 32 GB UHS-II) | |
Komunikacja
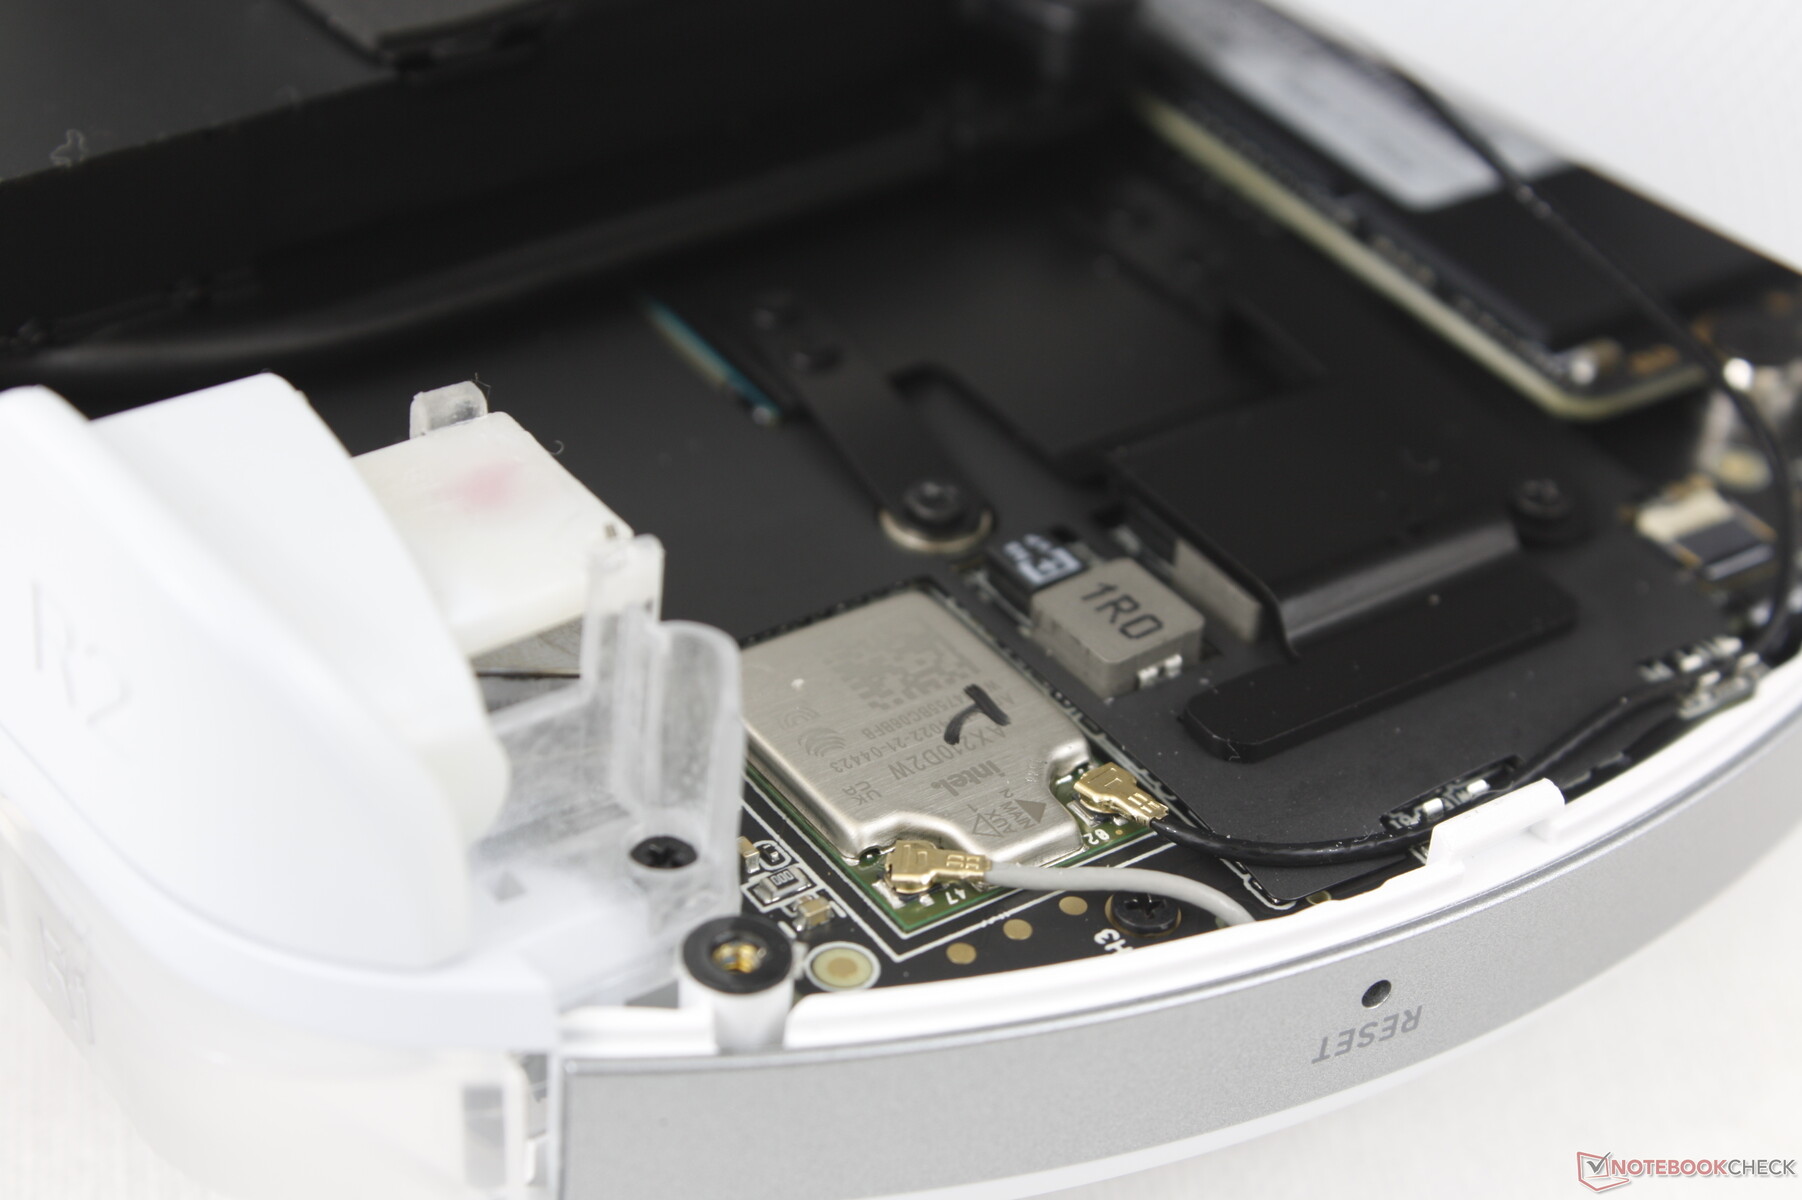
Standardem jest Intel AX210, który zapewnia zgodność z Wi-Fi 6E. Wi-Fi 6E niekoniecznie zawsze jest szybsze od Wi-Fi 6 pod względem rzeczywistych prędkości transferu, ale korzysta ze zmniejszonych opóźnień, co może pomóc podczas strumieniowania gier.
| Networking | |
| iperf3 transmit AX12 | |
| GPD Win 3 | |
| Razer Blade Stealth i7-1165G7 GTX 1650 Ti Max-Q | |
| iperf3 receive AX12 | |
| Razer Blade Stealth i7-1165G7 GTX 1650 Ti Max-Q | |
| GPD Win 3 | |
| iperf3 transmit AXE11000 | |
| Asus Zenbook S 13 OLED | |
| GPD Win 4 | |
| iperf3 receive AXE11000 | |
| Asus Zenbook S 13 OLED | |
| GPD Win 4 | |
| iperf3 transmit AXE11000 6GHz | |
| GPD Win Max 2 | |
| Dell XPS 13 9315 2-in-1 Core i5-1230U | |
| GPD Win 4 | |
| iperf3 receive AXE11000 6GHz | |
| GPD Win Max 2 | |
| Dell XPS 13 9315 2-in-1 Core i5-1230U | |
| GPD Win 4 | |
Konserwacja
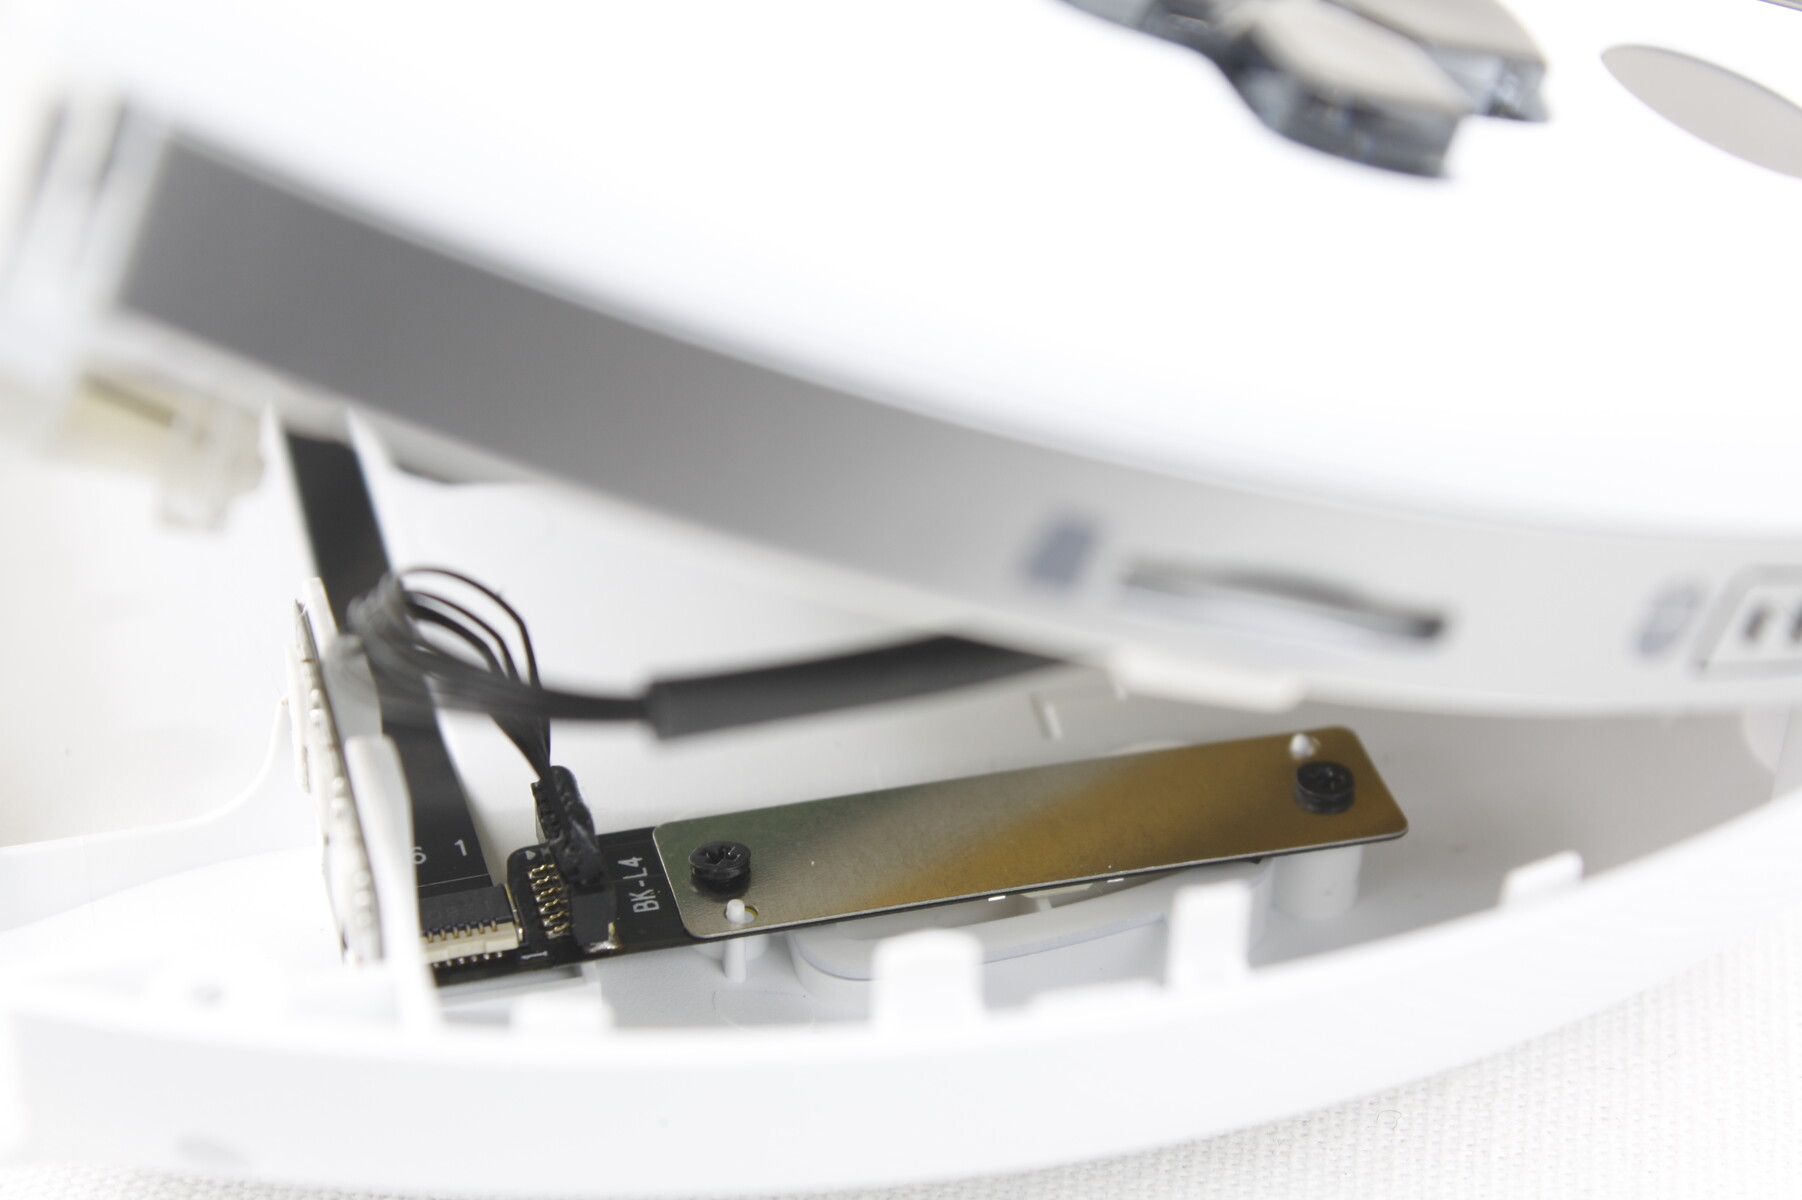
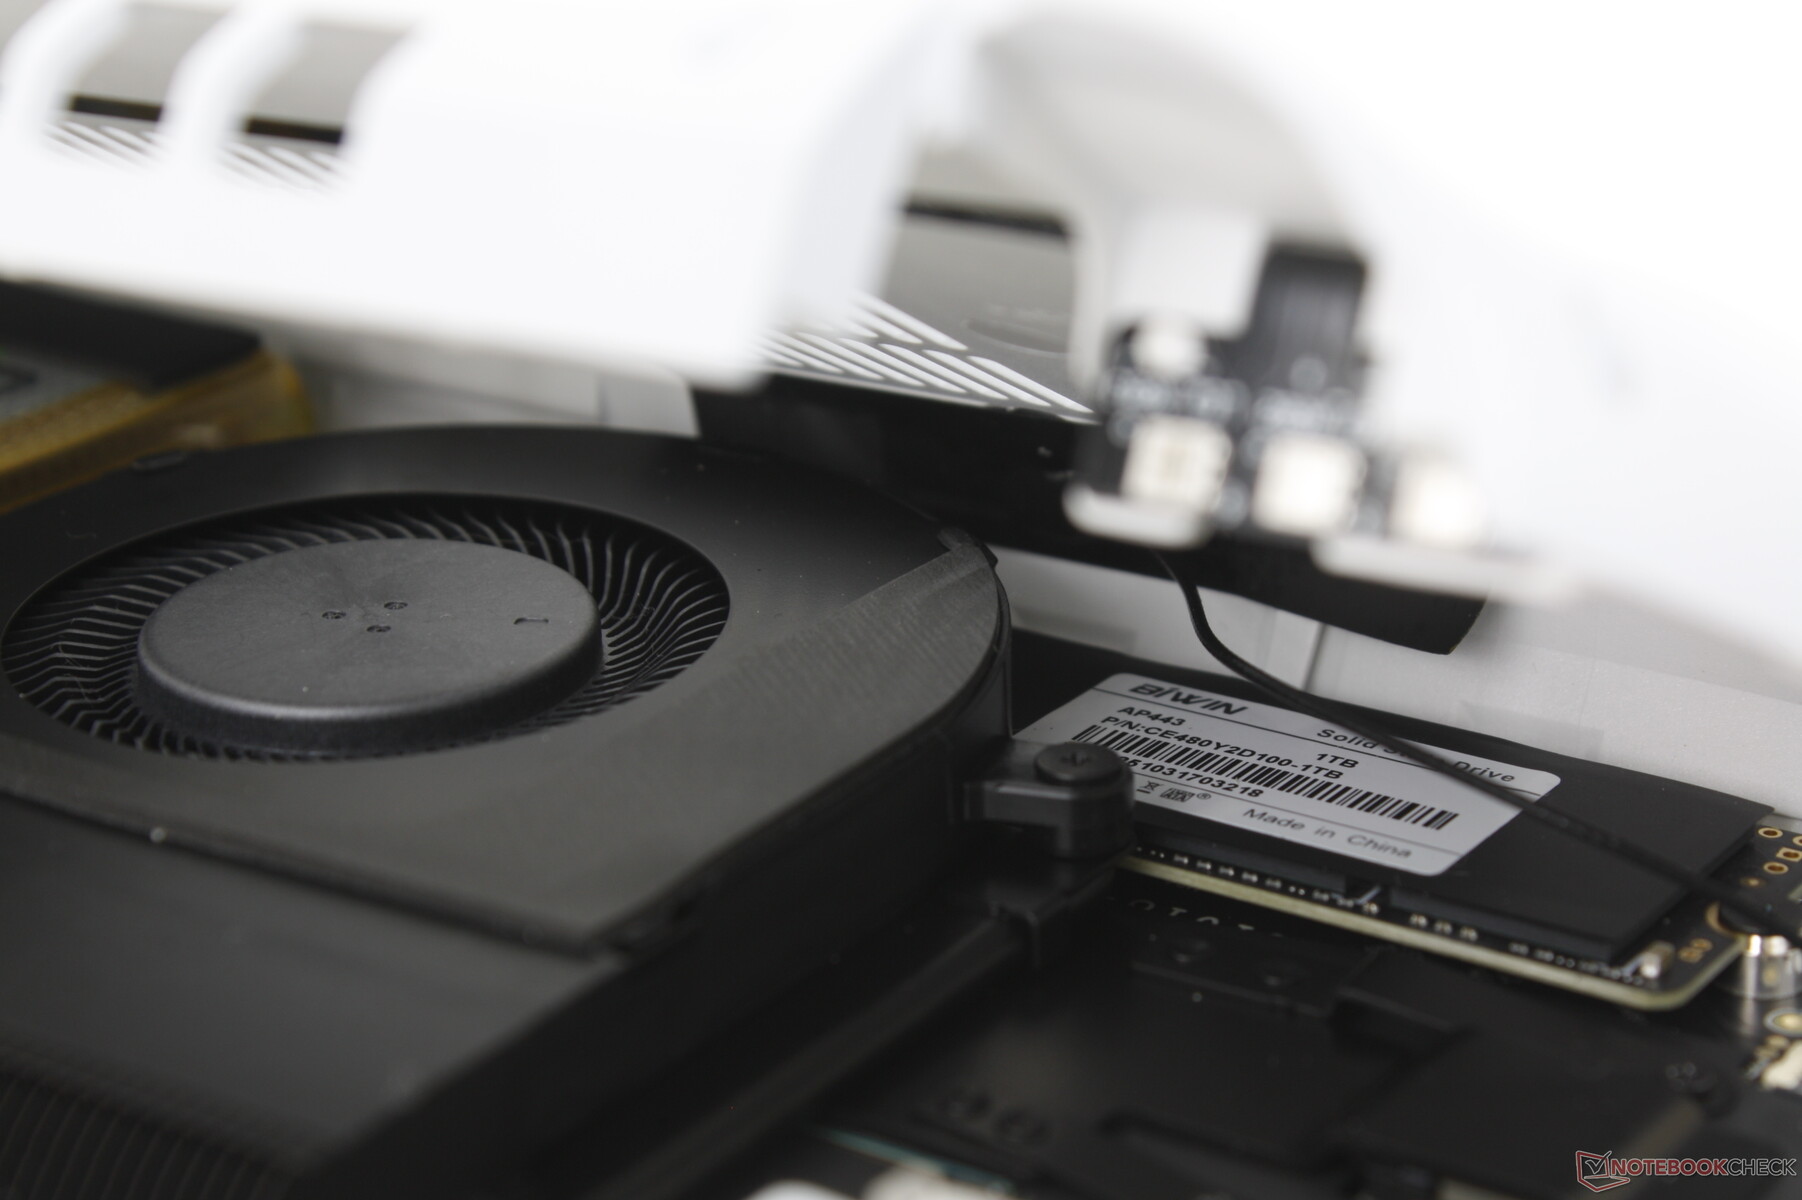
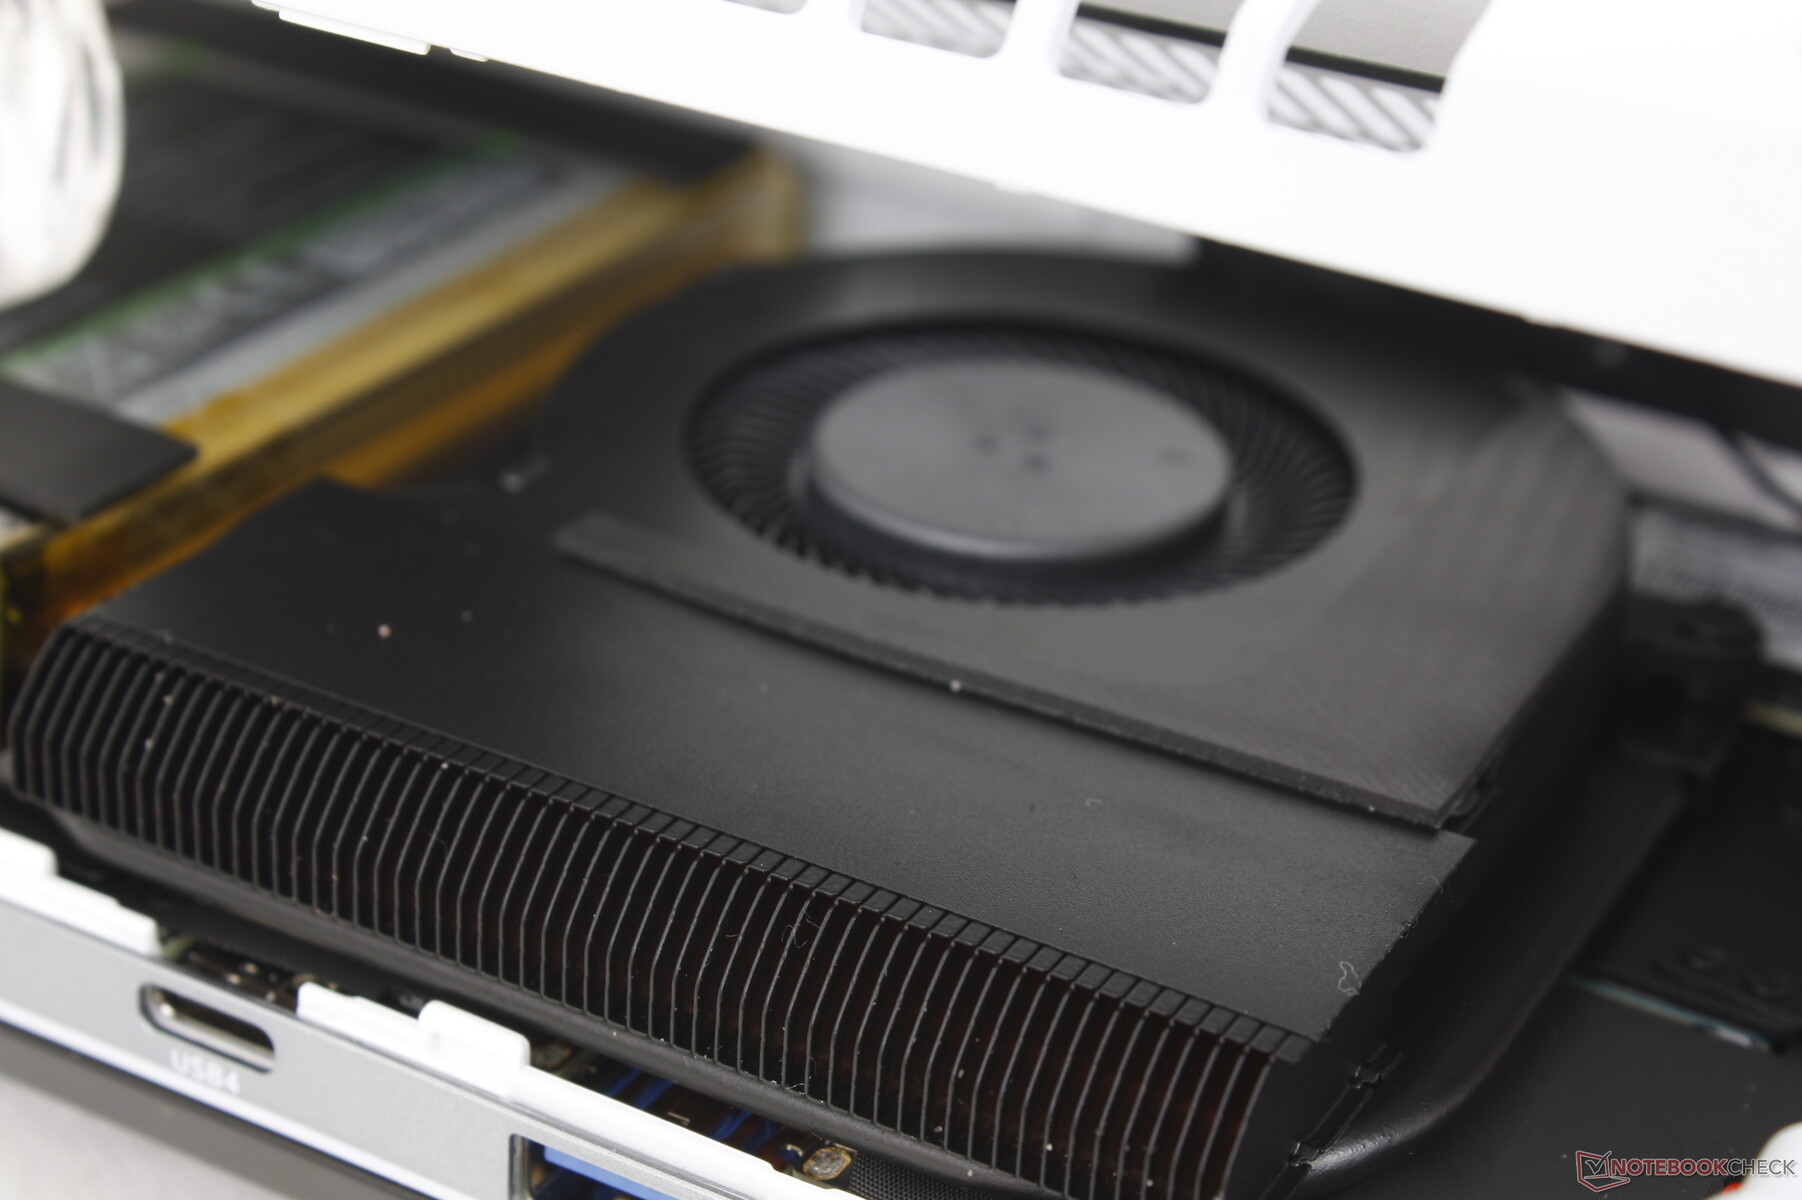
Plastikowy panel tylny jest zabezpieczony sześcioma bardzo małymi śrubkami Philipsa. Niestety w naszym egzemplarzu zatrzaski wokół krawędzi tylnego panelu są bardzo ciasne i trudno je usunąć bez uszkodzenia urządzenia, a szkoda, bo GPD Win 3 był poza tym łatwy w serwisowaniu. Widzimy, że dysk SSD M.2 2280 jest wyjmowany, podczas gdy moduły WLAN i RAM są przylutowane.
Należy pamiętać, że tylny panel jest połączony z płytą główną za pomocą delikatnego kabla taśmowego ze względu na tylne przyciski. Tak więc nadal trzeba by było uważać, aby nie zerwać tylnego panelu lub ryzykować uszkodzenie przycisków.
Akcesoria i gwarancja
W pudełku detalicznym nie ma żadnych dołączonych akcesoriów poza zasilaczem AC i papierami. Opcjonalne dodatki to montowany z tyłu adapter 4G LTE oraz oficjalna stacja dokująca USB-C. Szkoda, że model, który nie jest dostarczany z darmowym etui do przenoszenia lub protektorem ekranu.
W przypadku zakupu w USA obowiązuje standardowa roczna ograniczona gwarancja producenta.
Urządzenia wejściowe
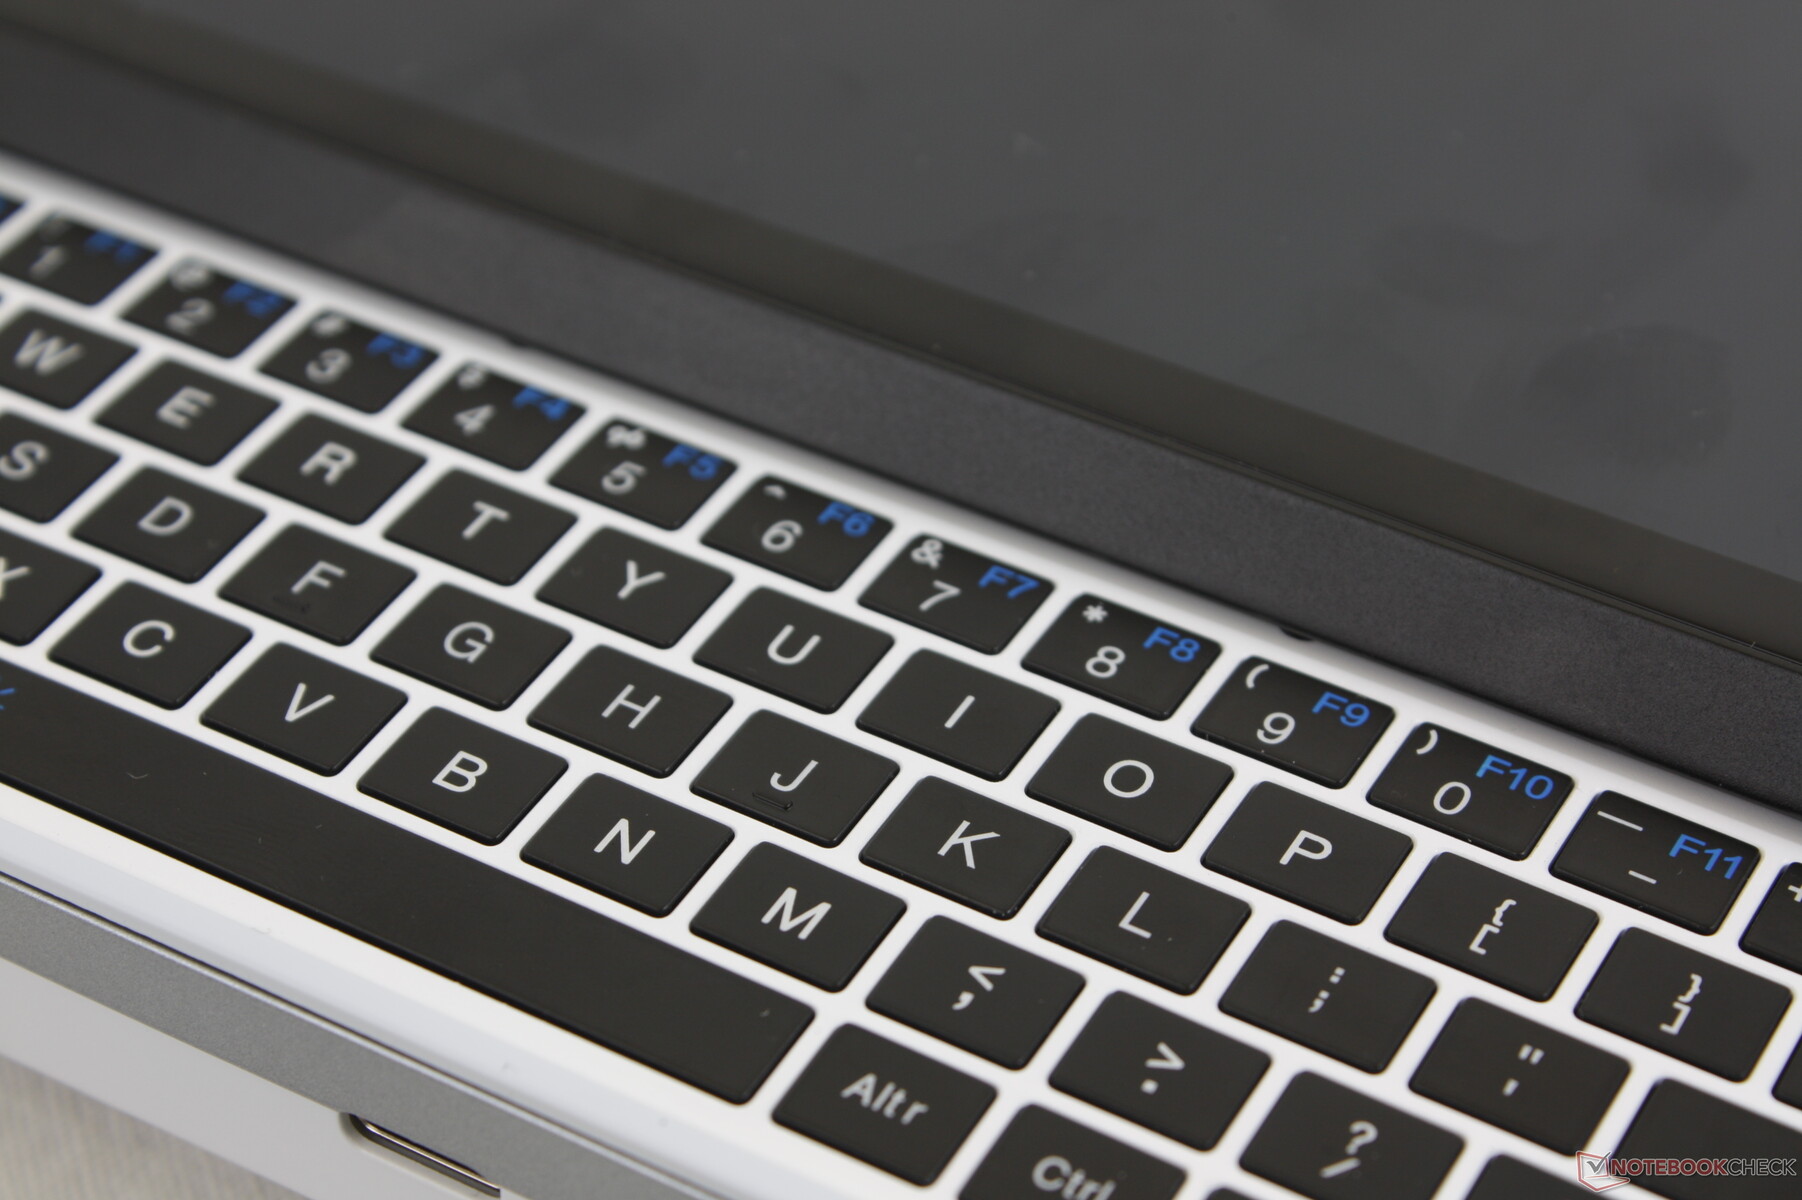
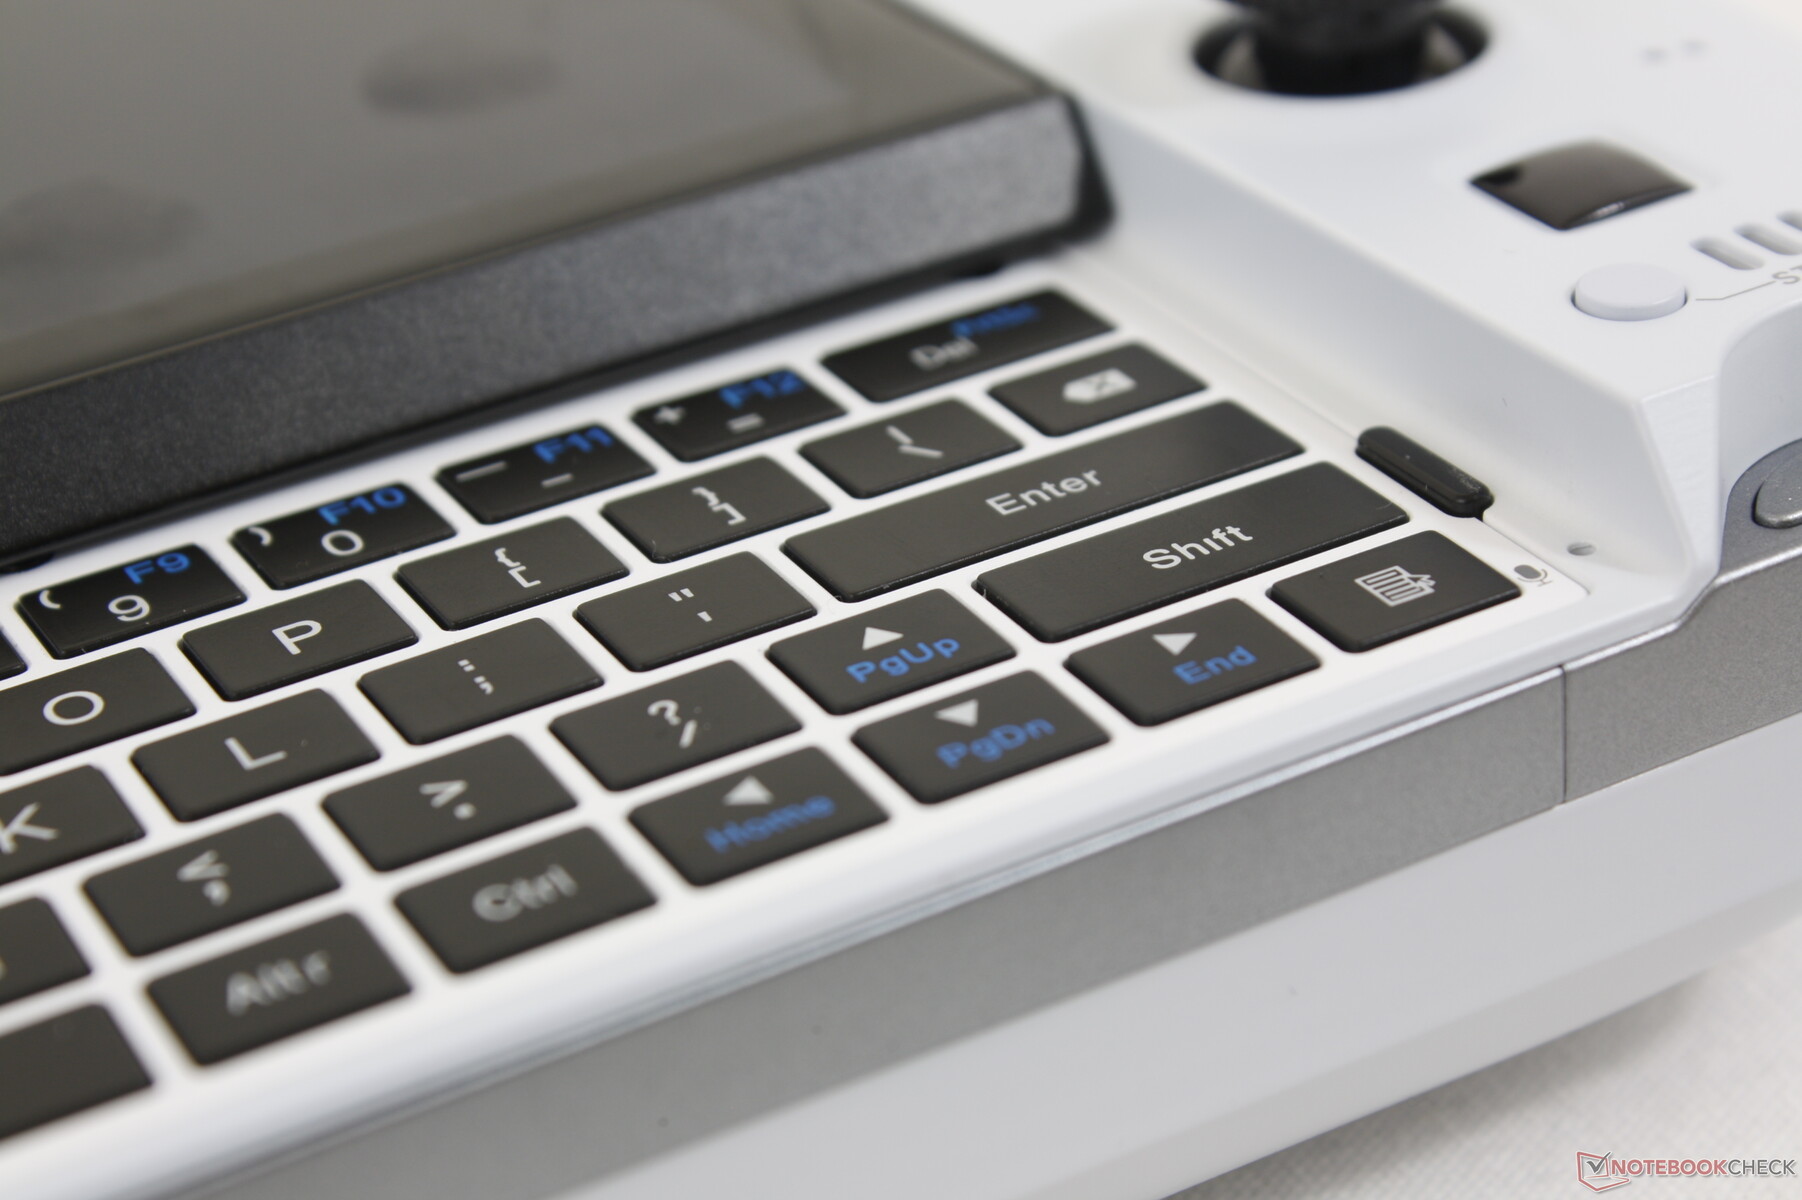
Klawiatura - bardziej niezawodna niż Win 3
Klawiatura została całkowicie odnowiona z dotykowych klawiszy w Win 3 do dotykowych fizycznych klawiszy w Win 4. Są one clicky dla lepszego sprzężenia zwrotnego, ale prędkość pisania jest nadal znacznie wolniejsza niż typowa klawiatura z ekranem dotykowym lub smartfonem. Są one wystarczająco dobre dla okazjonalnych wejść tylko.
Zauważ, że błąd, którego doświadczyliśmy w Win 3 został naprawiony w Win 4; przesuwanie ekranu w górę i w dół nie powoduje już naciskania żadnych przycisków na klawiaturze.
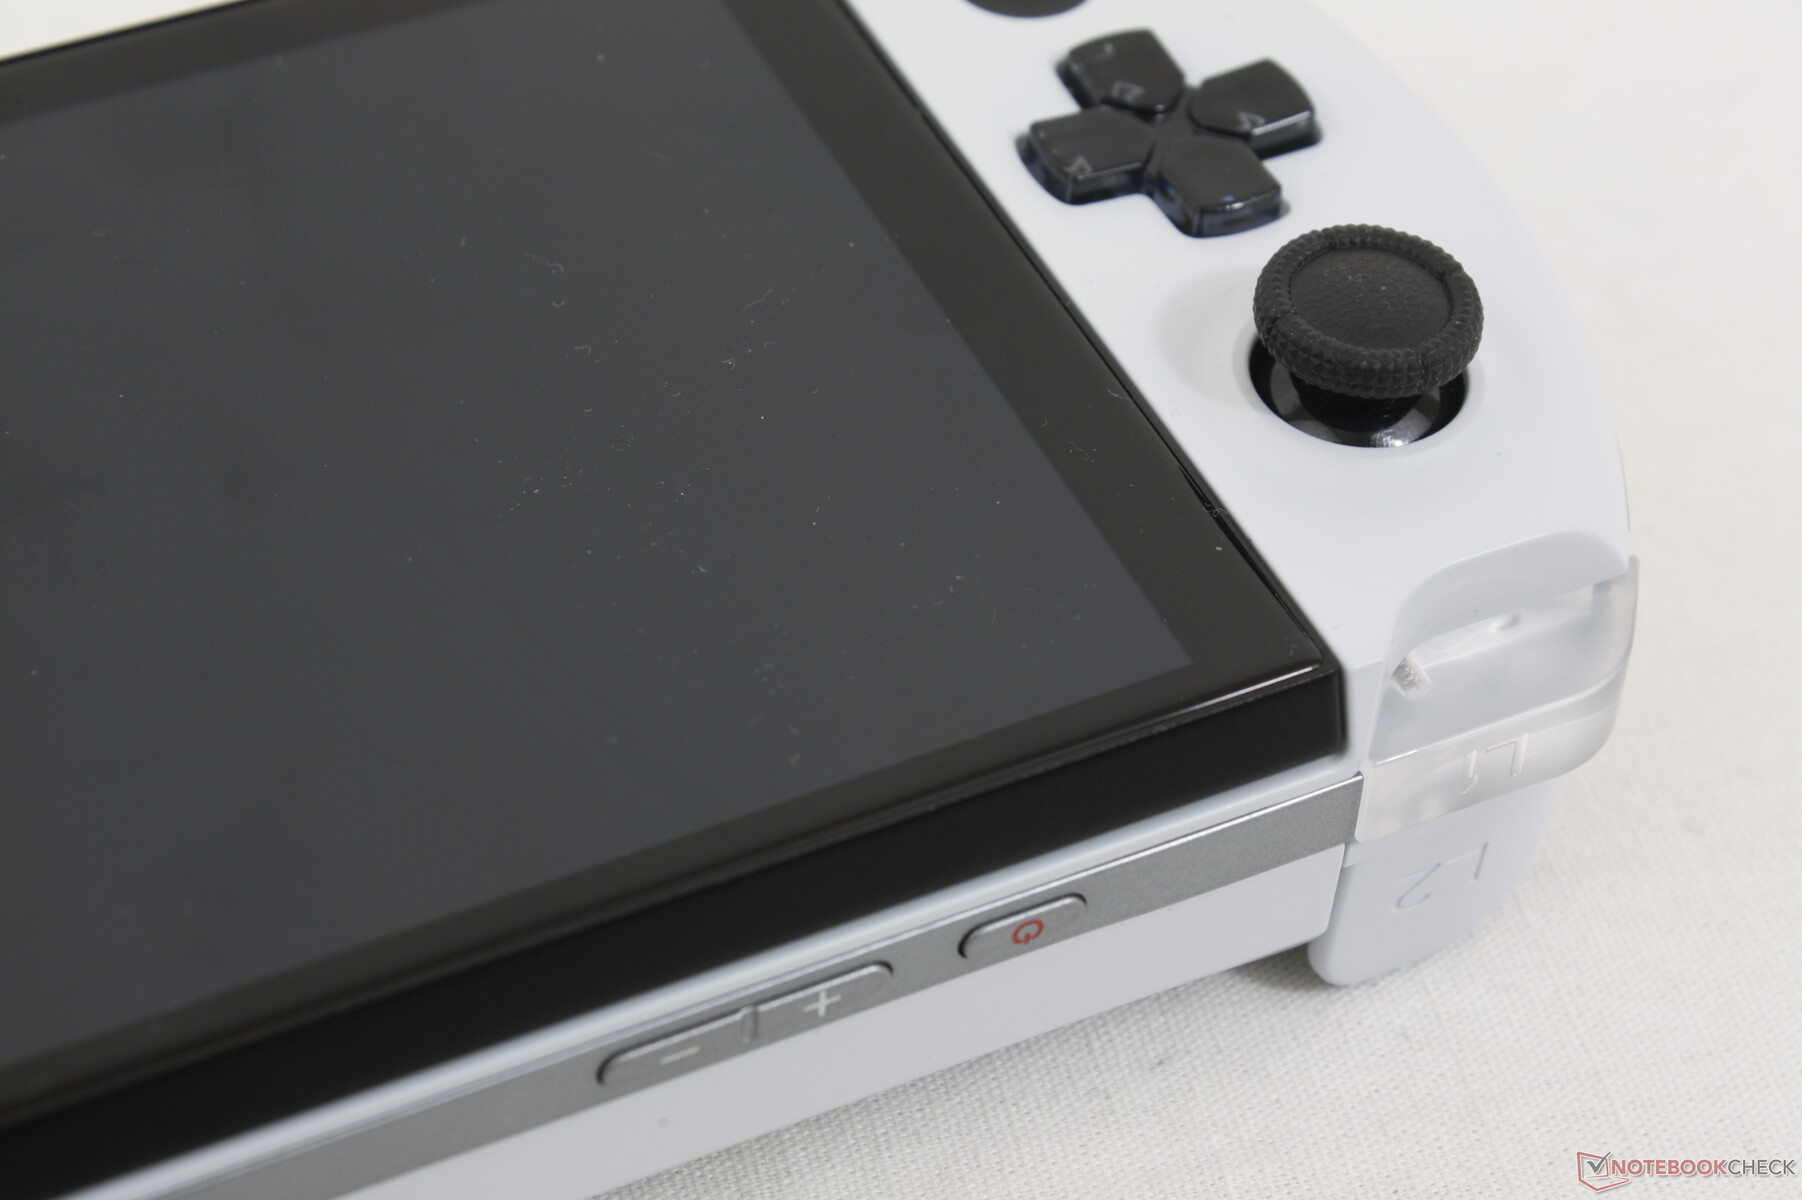
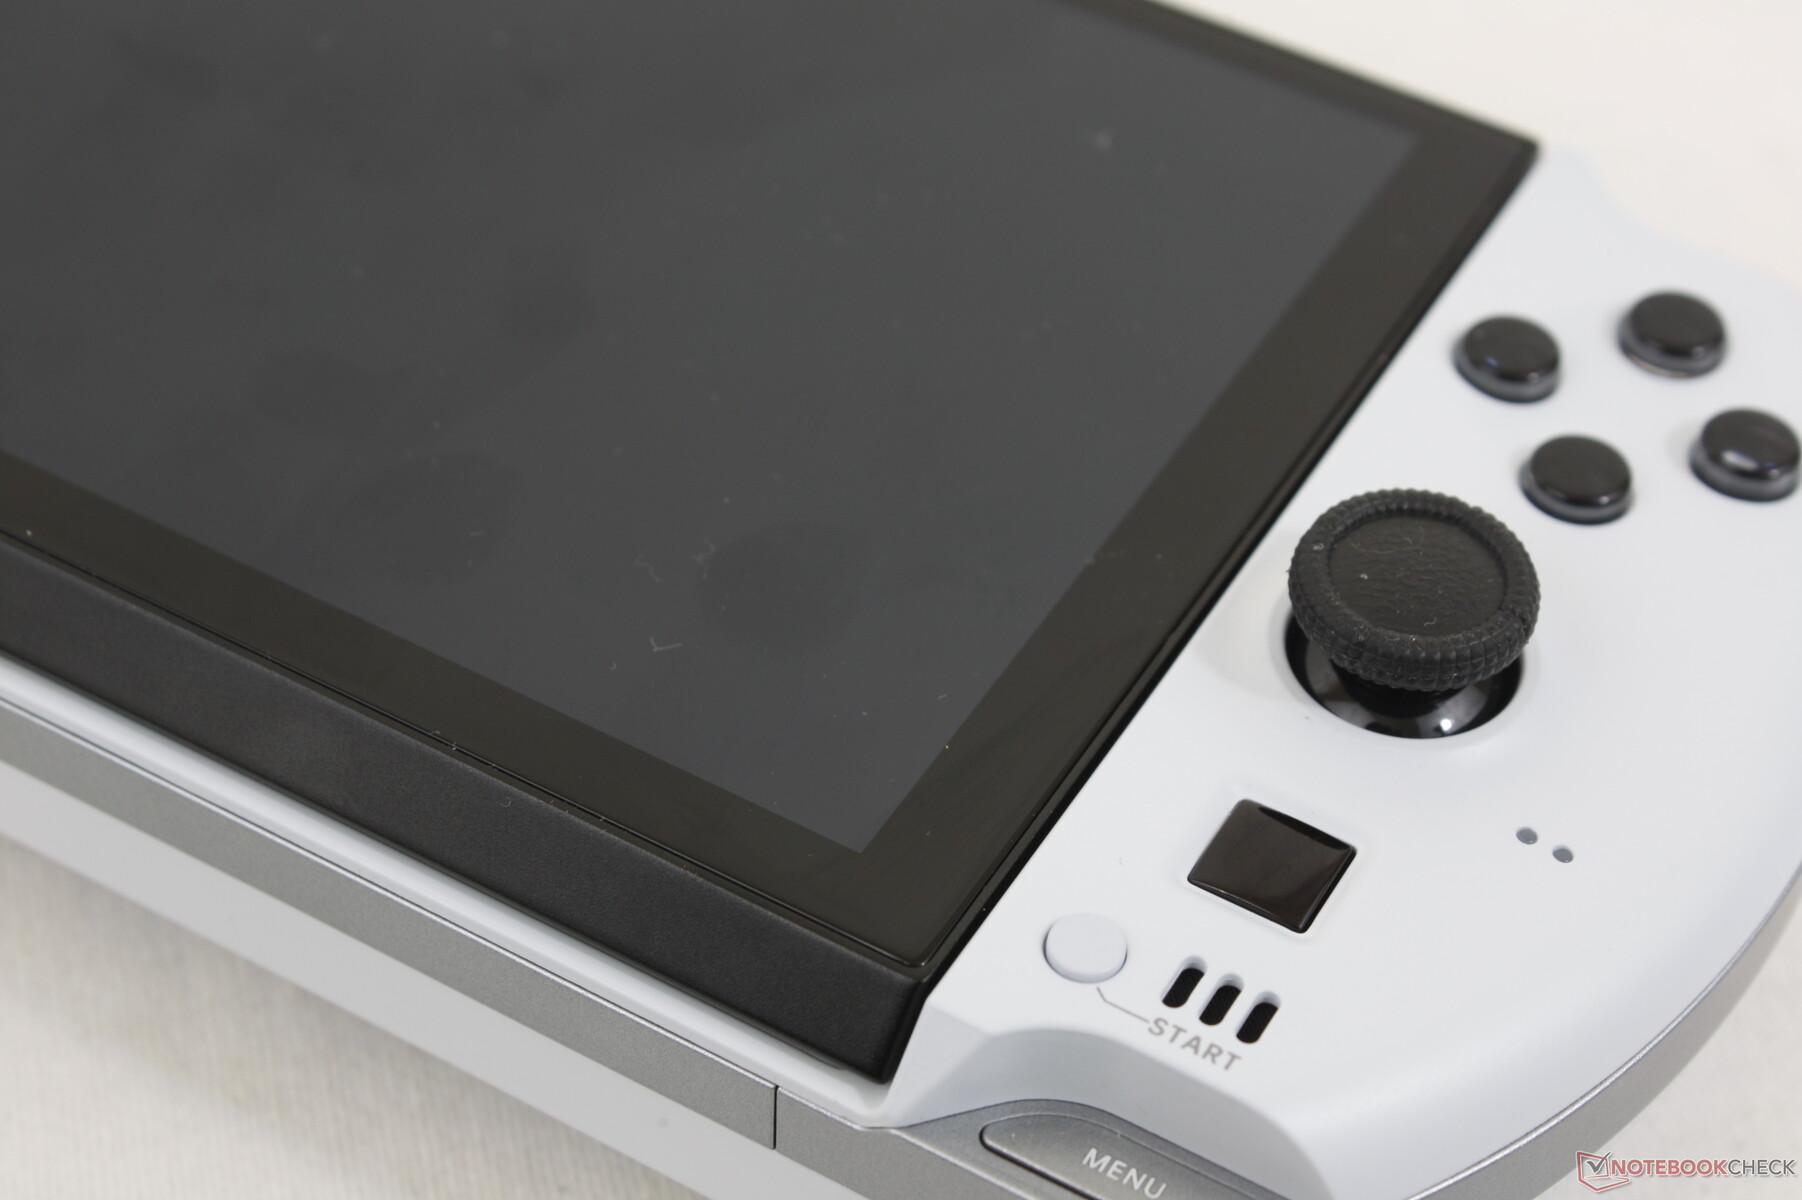
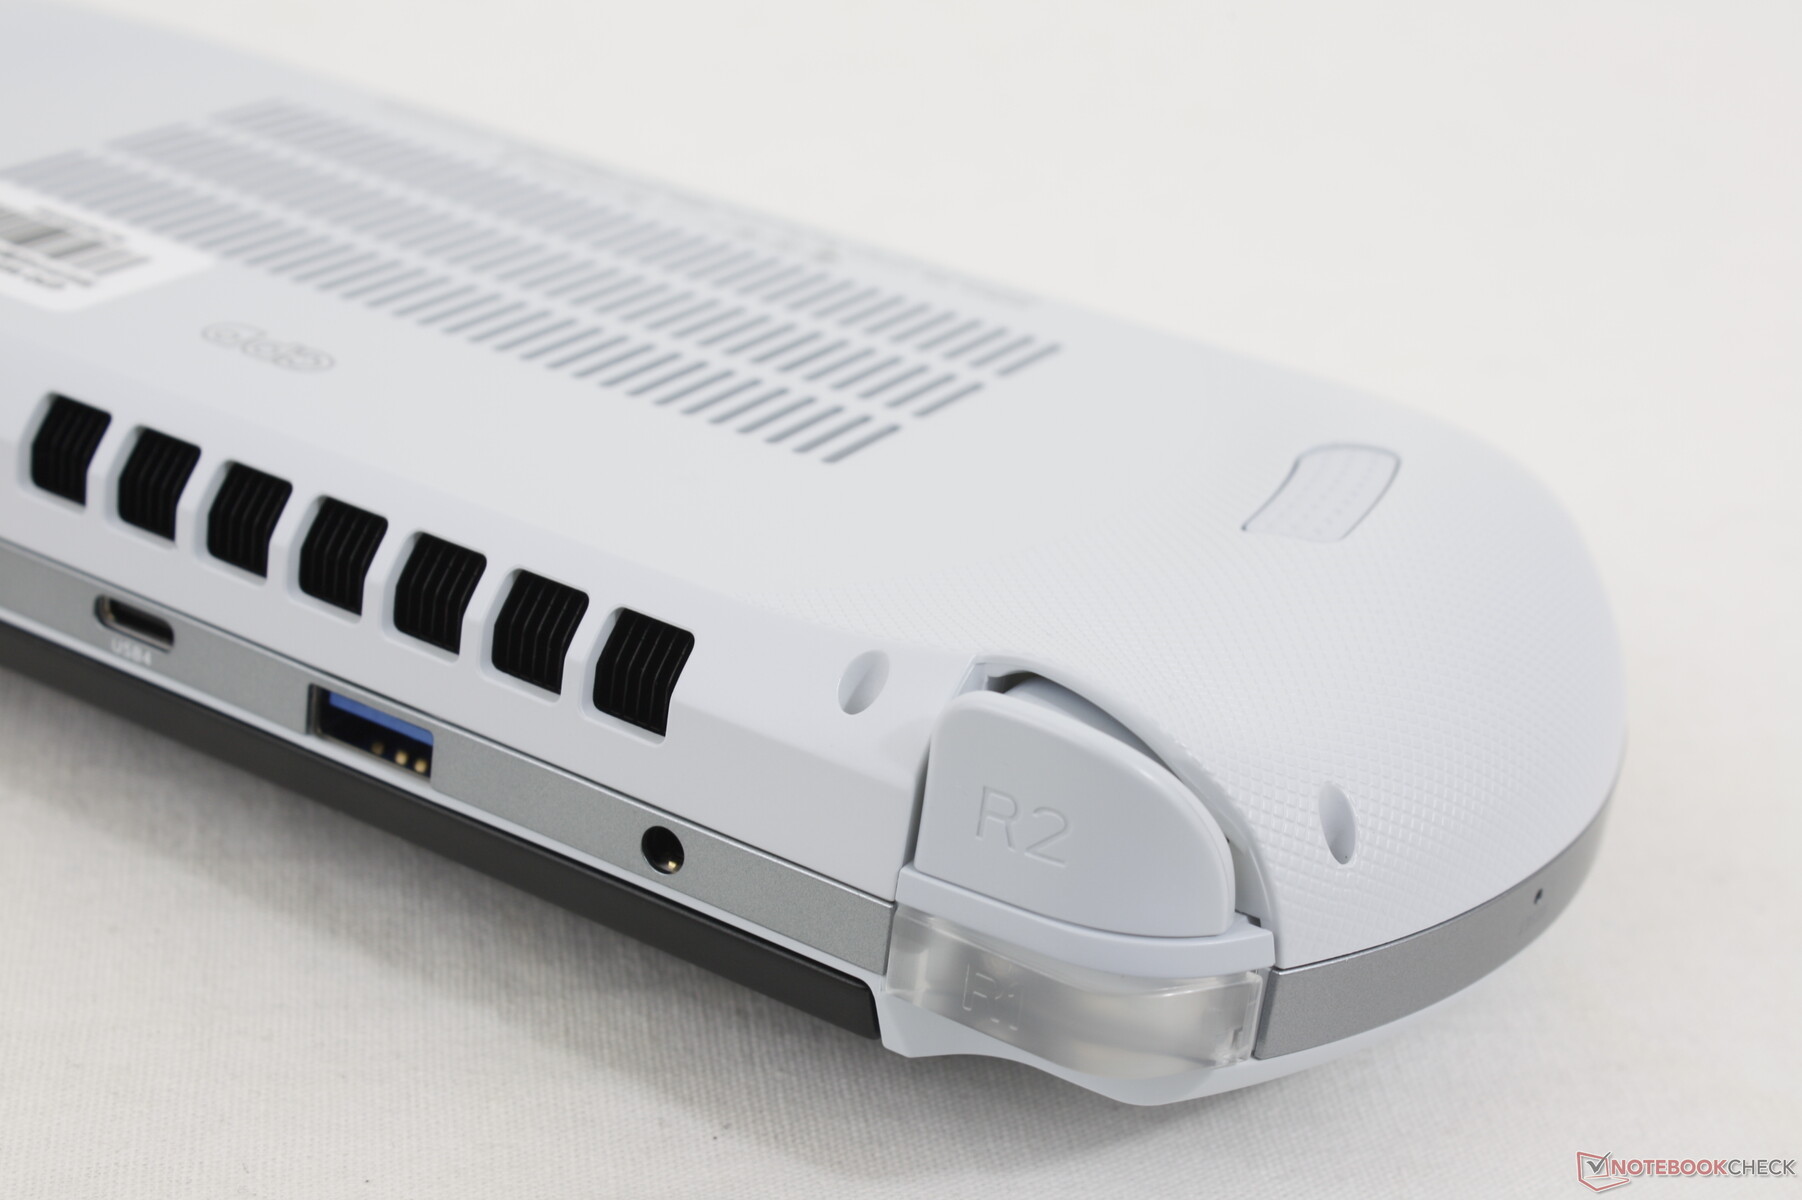
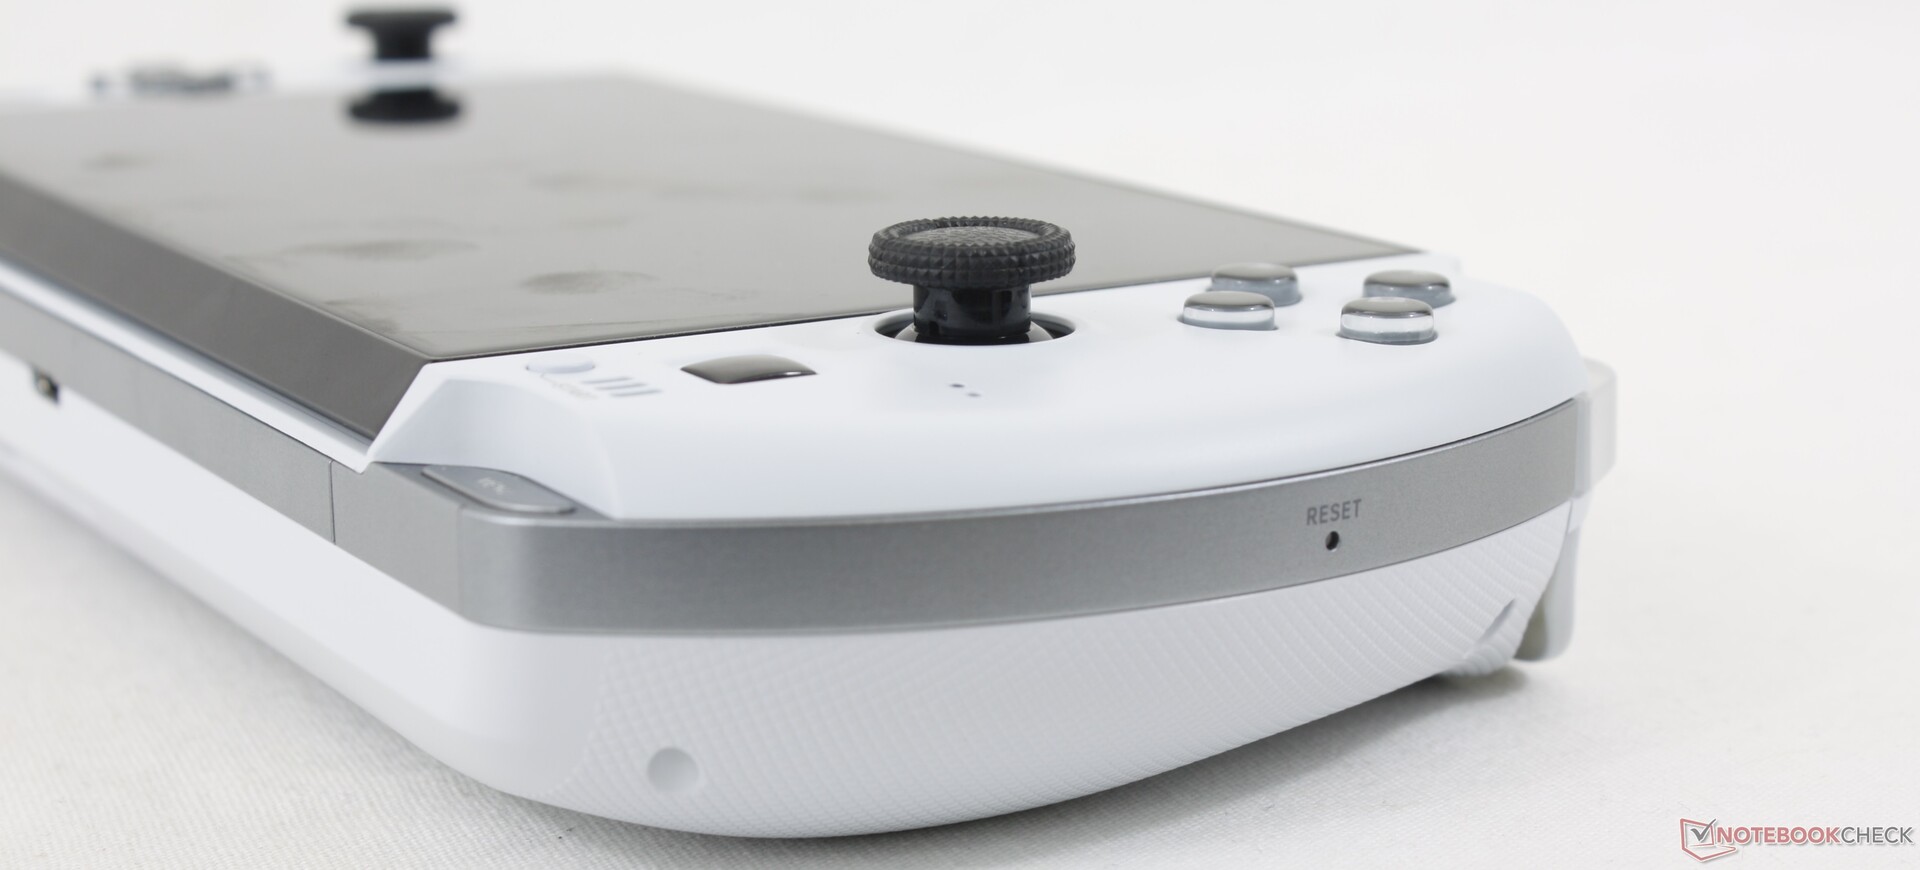
Gamepad - jak gra na Switchu
To nie przypadek, że joysticki i przyciski na Win 4 mają dokładnie taki sam rozmiar jak te na Nintendo Switch. W końcu po co zmieniać coś, co już działa na najpopularniejszej konsoli handheld? Główną zaletą jest tutaj to, że jeśli wygodnie grasz na Switchu, to gamepad Win 4 będzie czuł się bardzo znajomo. Z drugiej strony, użytkownicy, którzy uważają, że przyciski Switcha są zbyt małe lub ciasne, nie znajdą lepszego doświadczenia na Win 4. Zamiast tego, naszym głównym zmartwieniem jest to, że przyciski gamepada nie są zdejmowane, więc wszelkie zużycie z czasem może być trudne do serwisowania, podczas gdy kontrolery konsoli można tanio wymienić.
Dwa tylne przyciski na ramieniu (L2, R2) mają większy skok niż te same przyciski na Switchu. To małe, ale zauważalne ulepszenie, które przybliża nieco wrażenia z użytkowania kontrolera do zwykłego gamepada XBox lub PS.
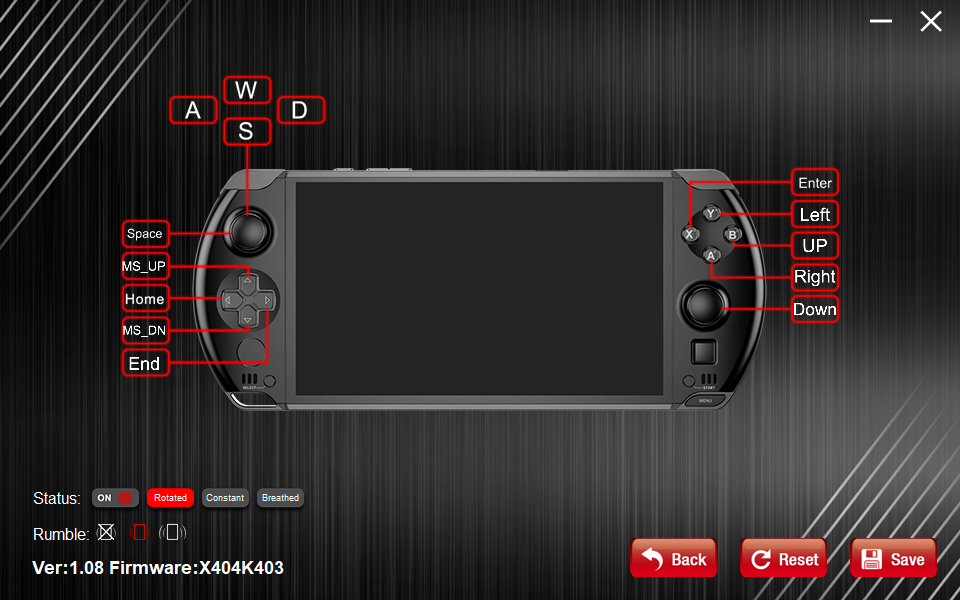
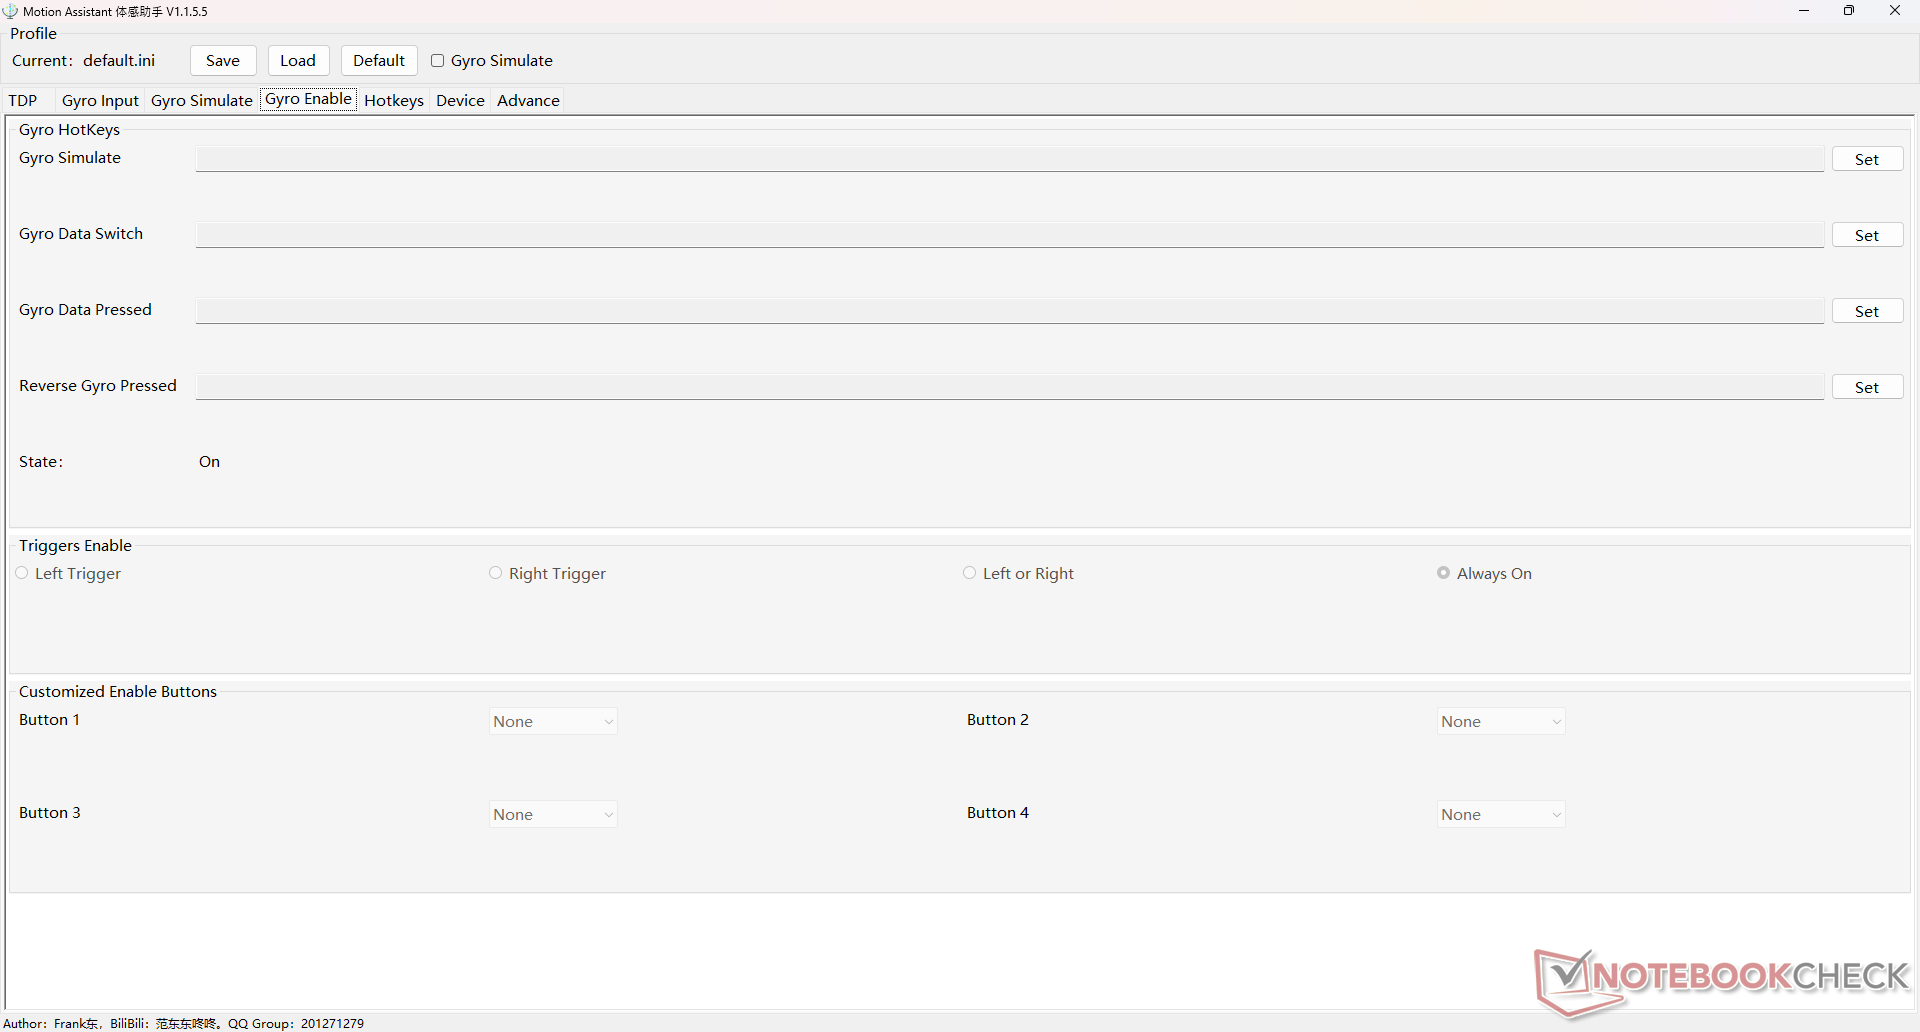
Istnieją dwa tryby dla gamepada, podobnie jak w Win 3: Mouse i Gamepad. W trybie Mouse przyciski gamepada są przypisane do następujących klawiszy, jak widać na poniższym zrzucie ekranu. W trybie Gamepad, Windows rozpozna gamepad jako standardowy kontroler XBox dla automatycznej kompatybilności ze Steam i innymi tytułami. W obu przypadkach, preinstalowane oprogramowanie WinControls pozwala użytkownikom na zmianę przeznaczenia przycisków w zależności od potrzeb.
Żaden z przycisków gamepada nie jest podświetlany, z wyjątkiem przycisków na ramieniu L1 i R1.
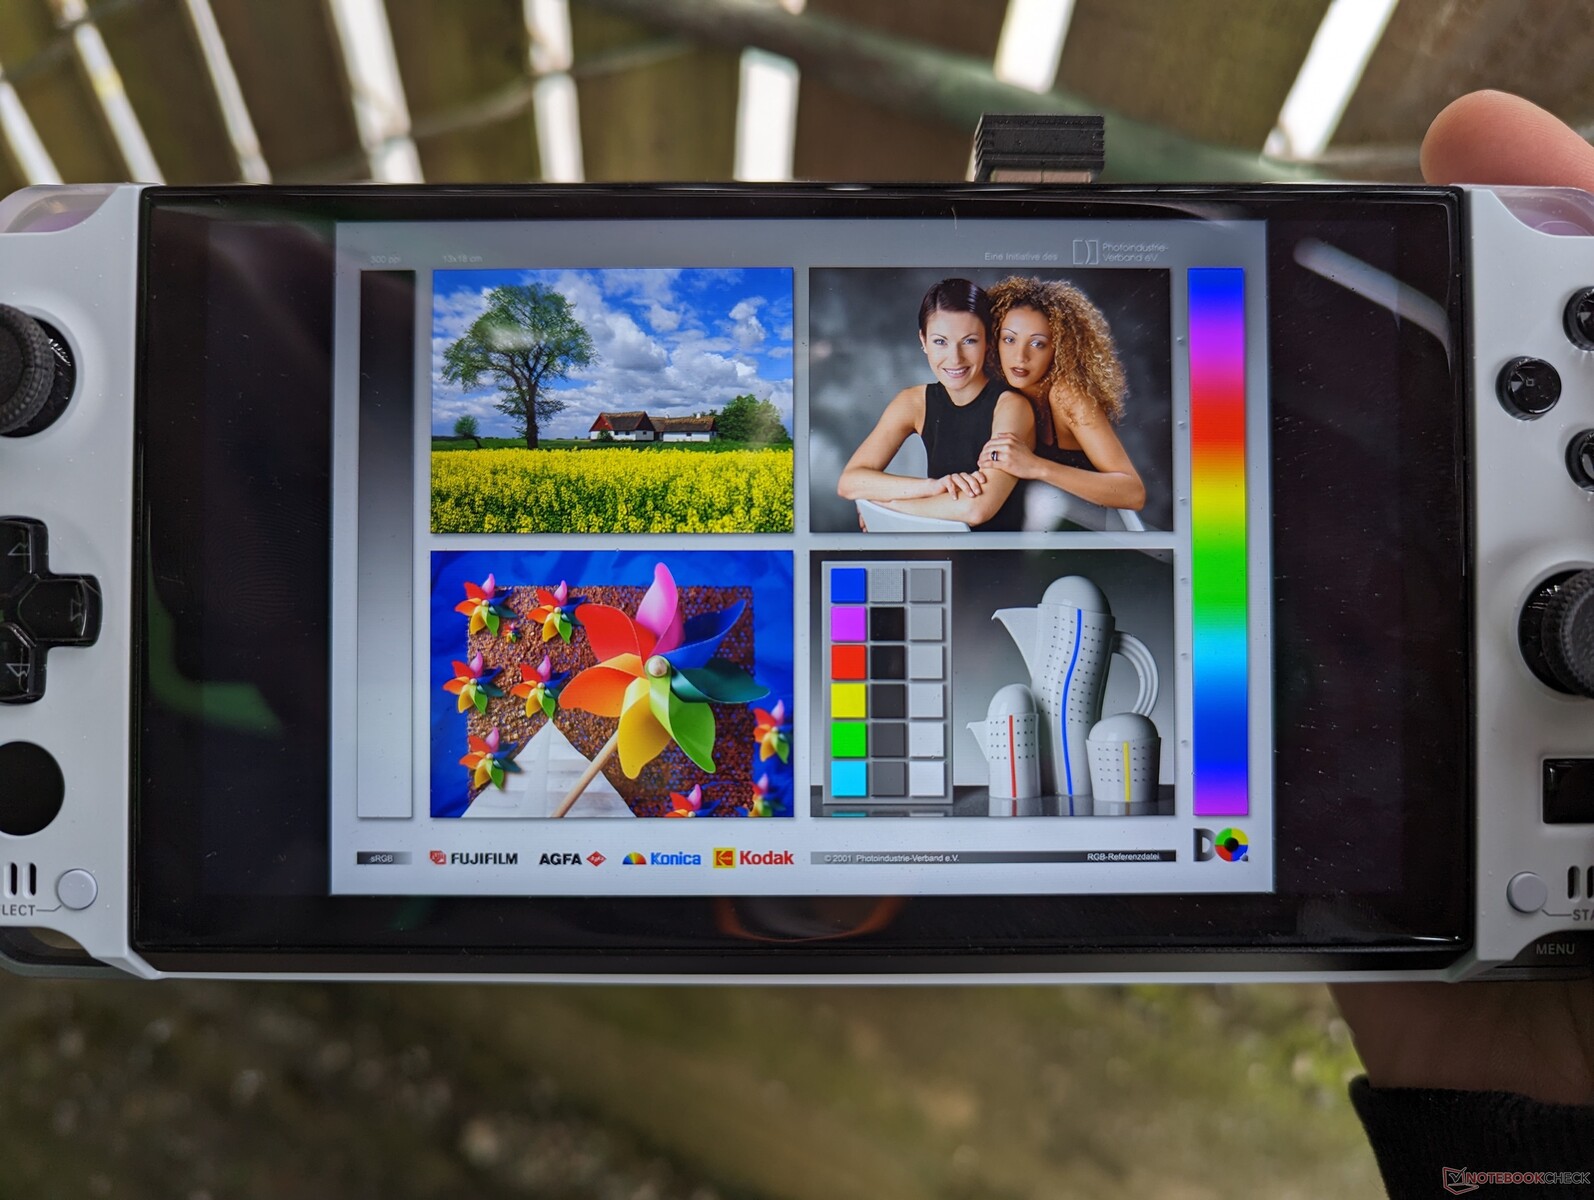
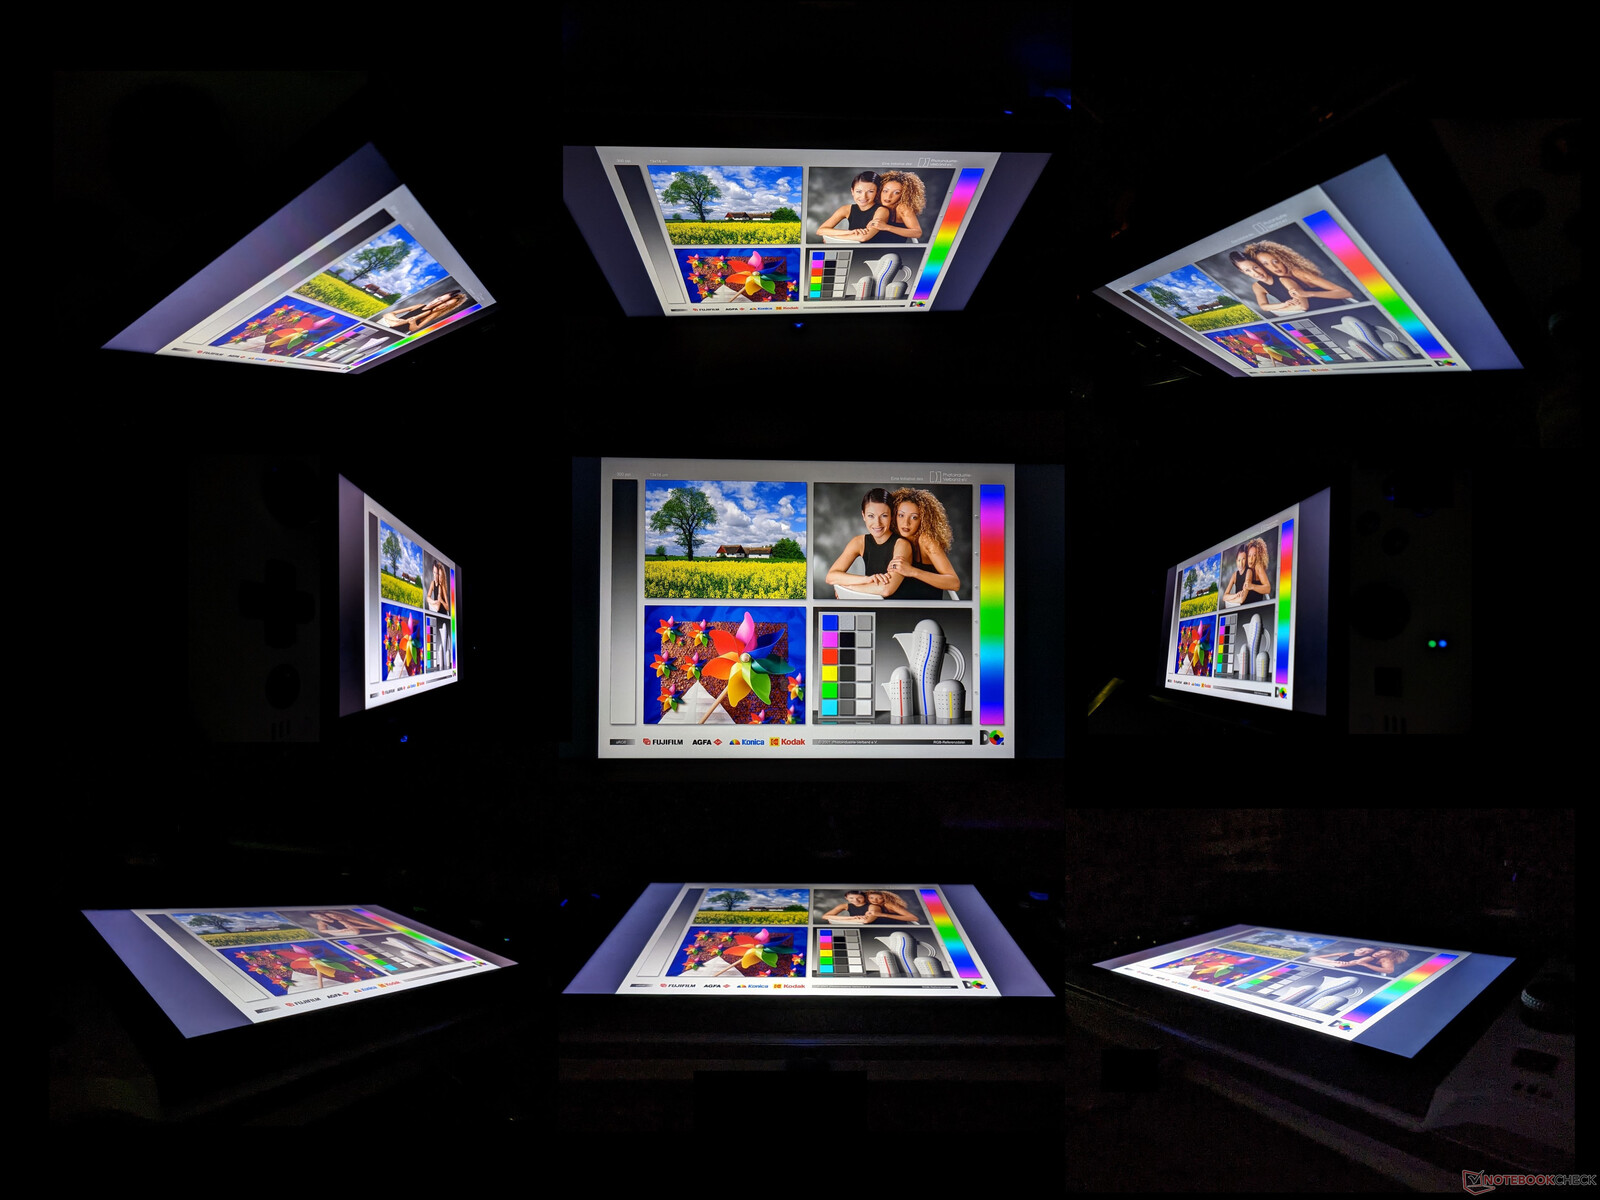
Wyświetlacz - Full 1080p IPS przy 60 Hz
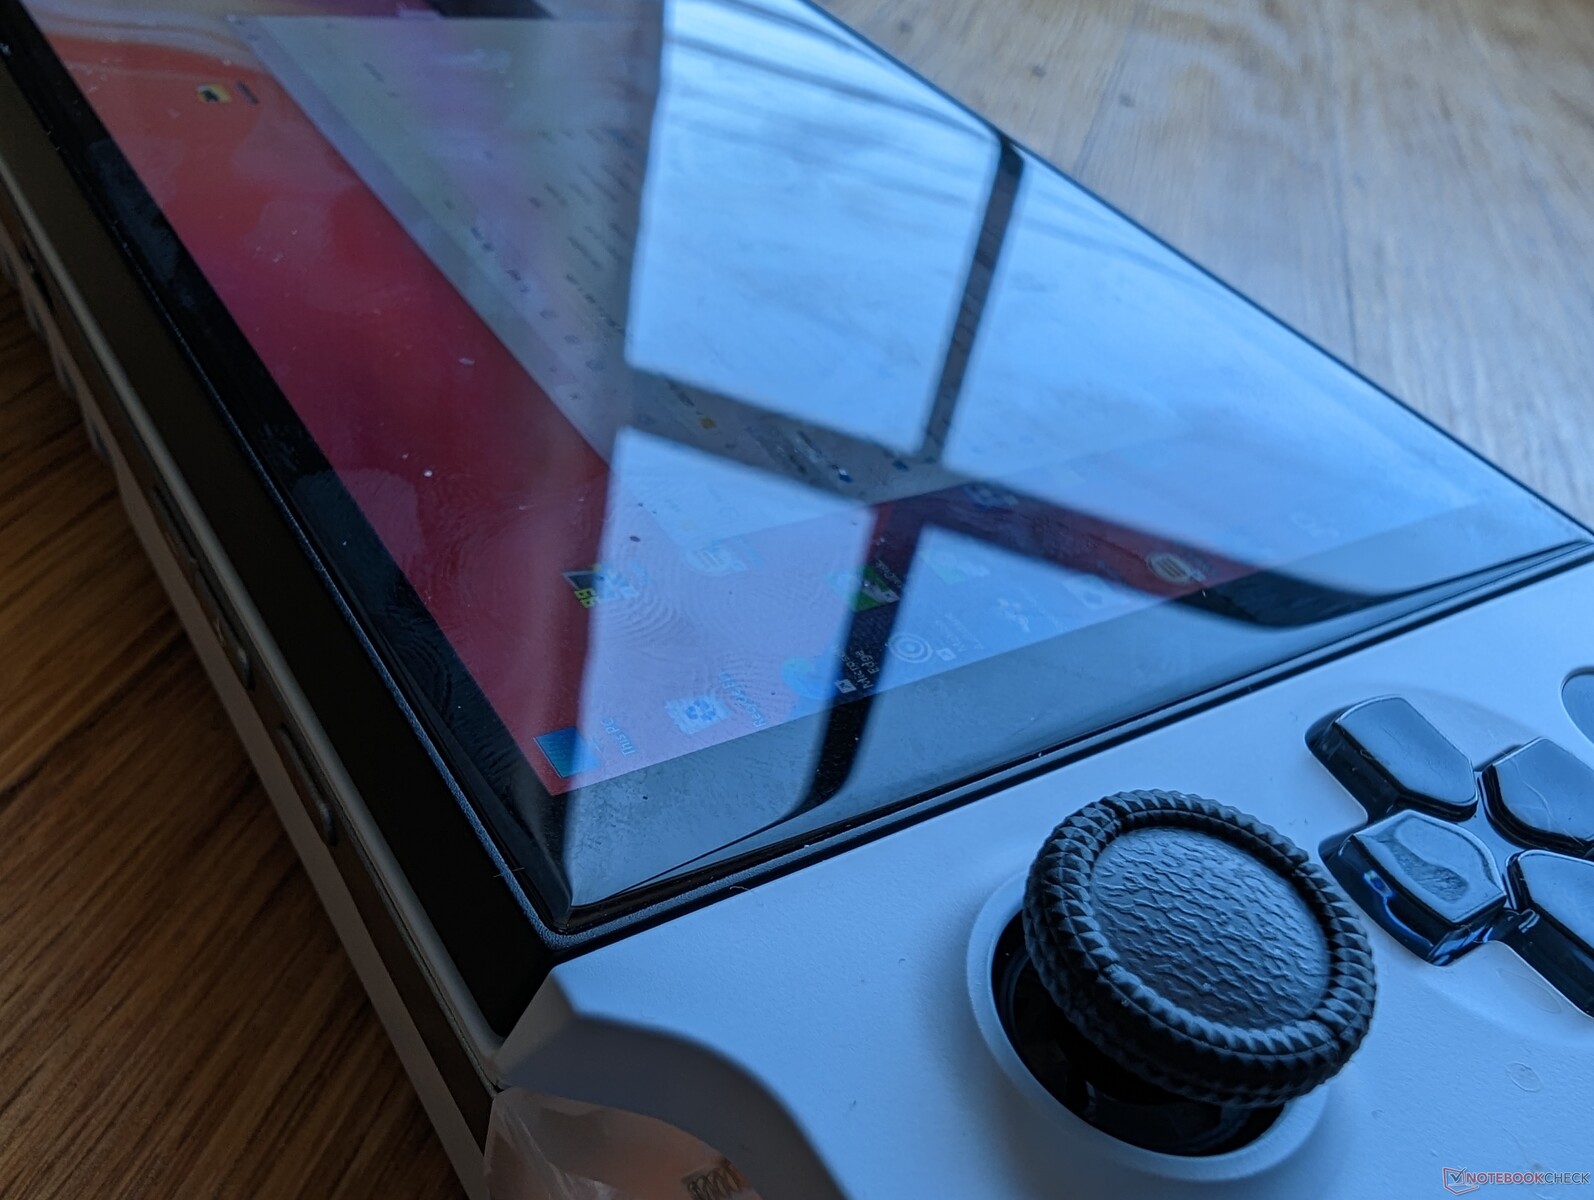
Główną wadą Win 3 był jego mały rozmiar ekranu - zaledwie 5,5 cala. Wiele tytułów na PC nie jest zoptymalizowanych dla tak małych ekranów, więc HUD i ikony UI często wydawały się malutkie. Win 4 rozwiązuje ten problem dzięki większemu, 6-calowemu ekranowi i wyższej rozdzielczości natywnej 1080p. Czasy reakcji czerni i bieli są szybsze, a gama kolorów i współczynnik kontrastu pozostają takie same jak w Win 3. Wyświetlacz IPS nie jest może laminowany jak w iPadzie Pro, ale mimo to jest bardzo ostry i wysokiej jakości.
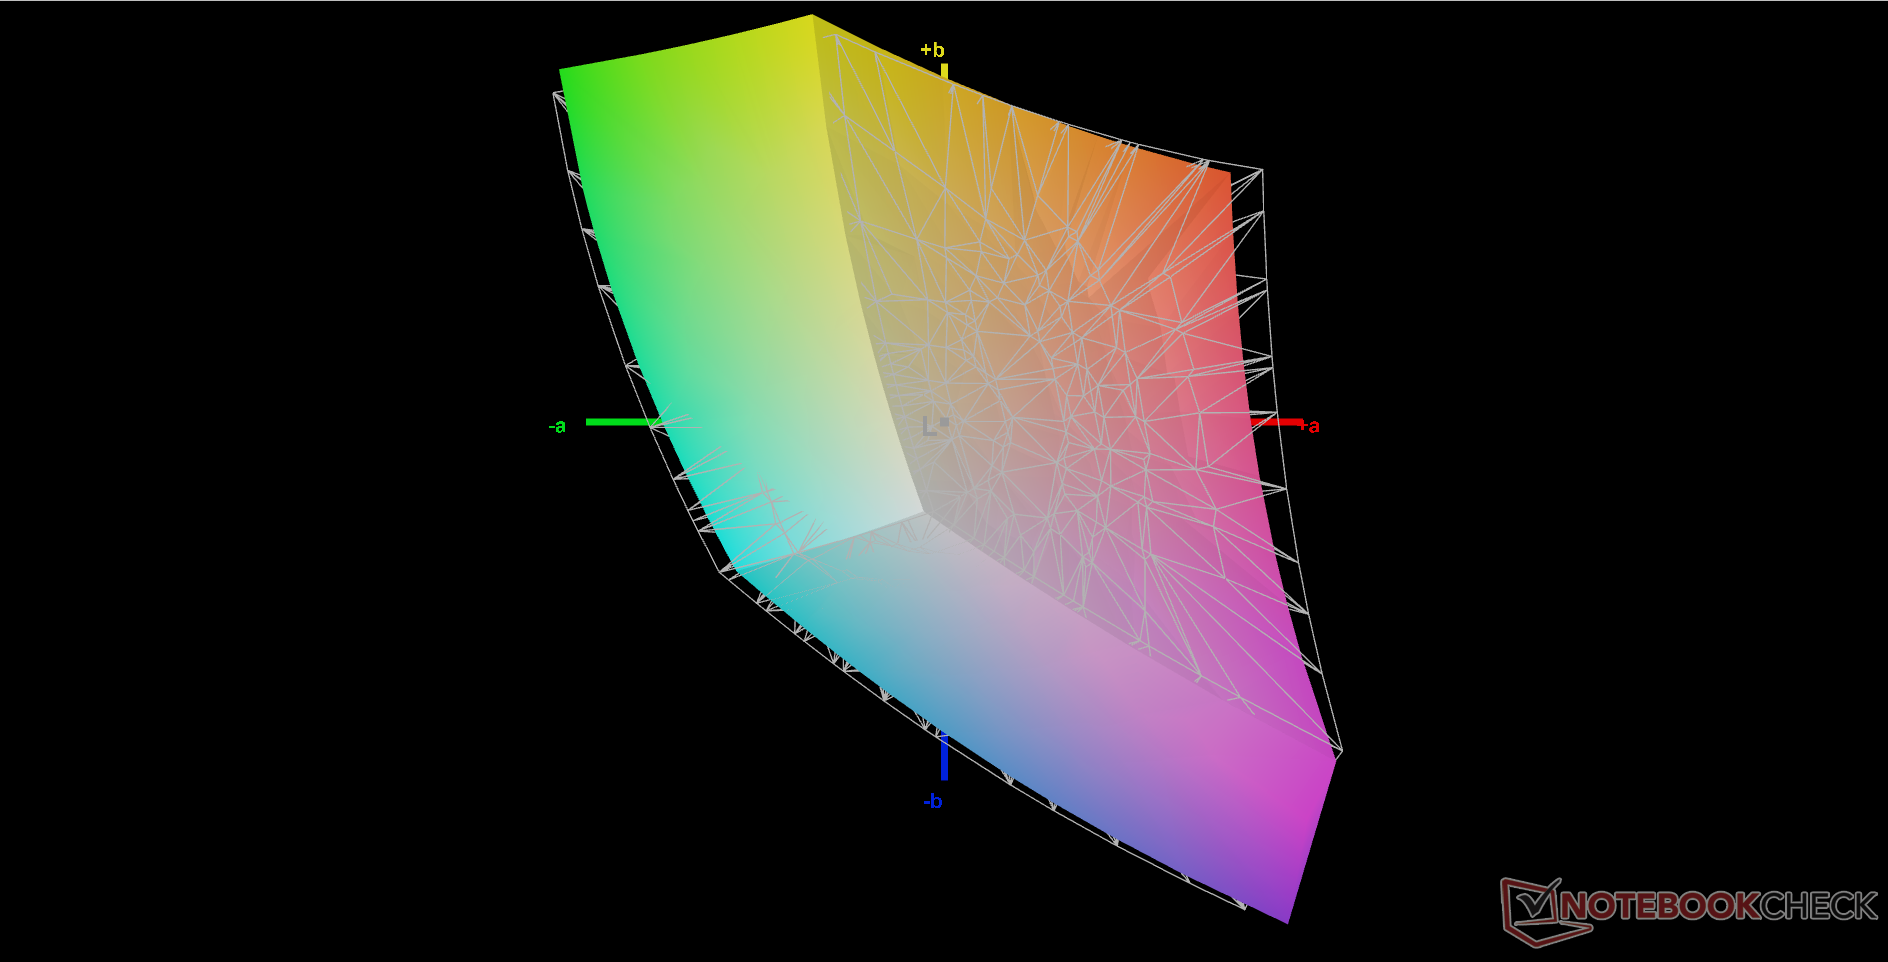
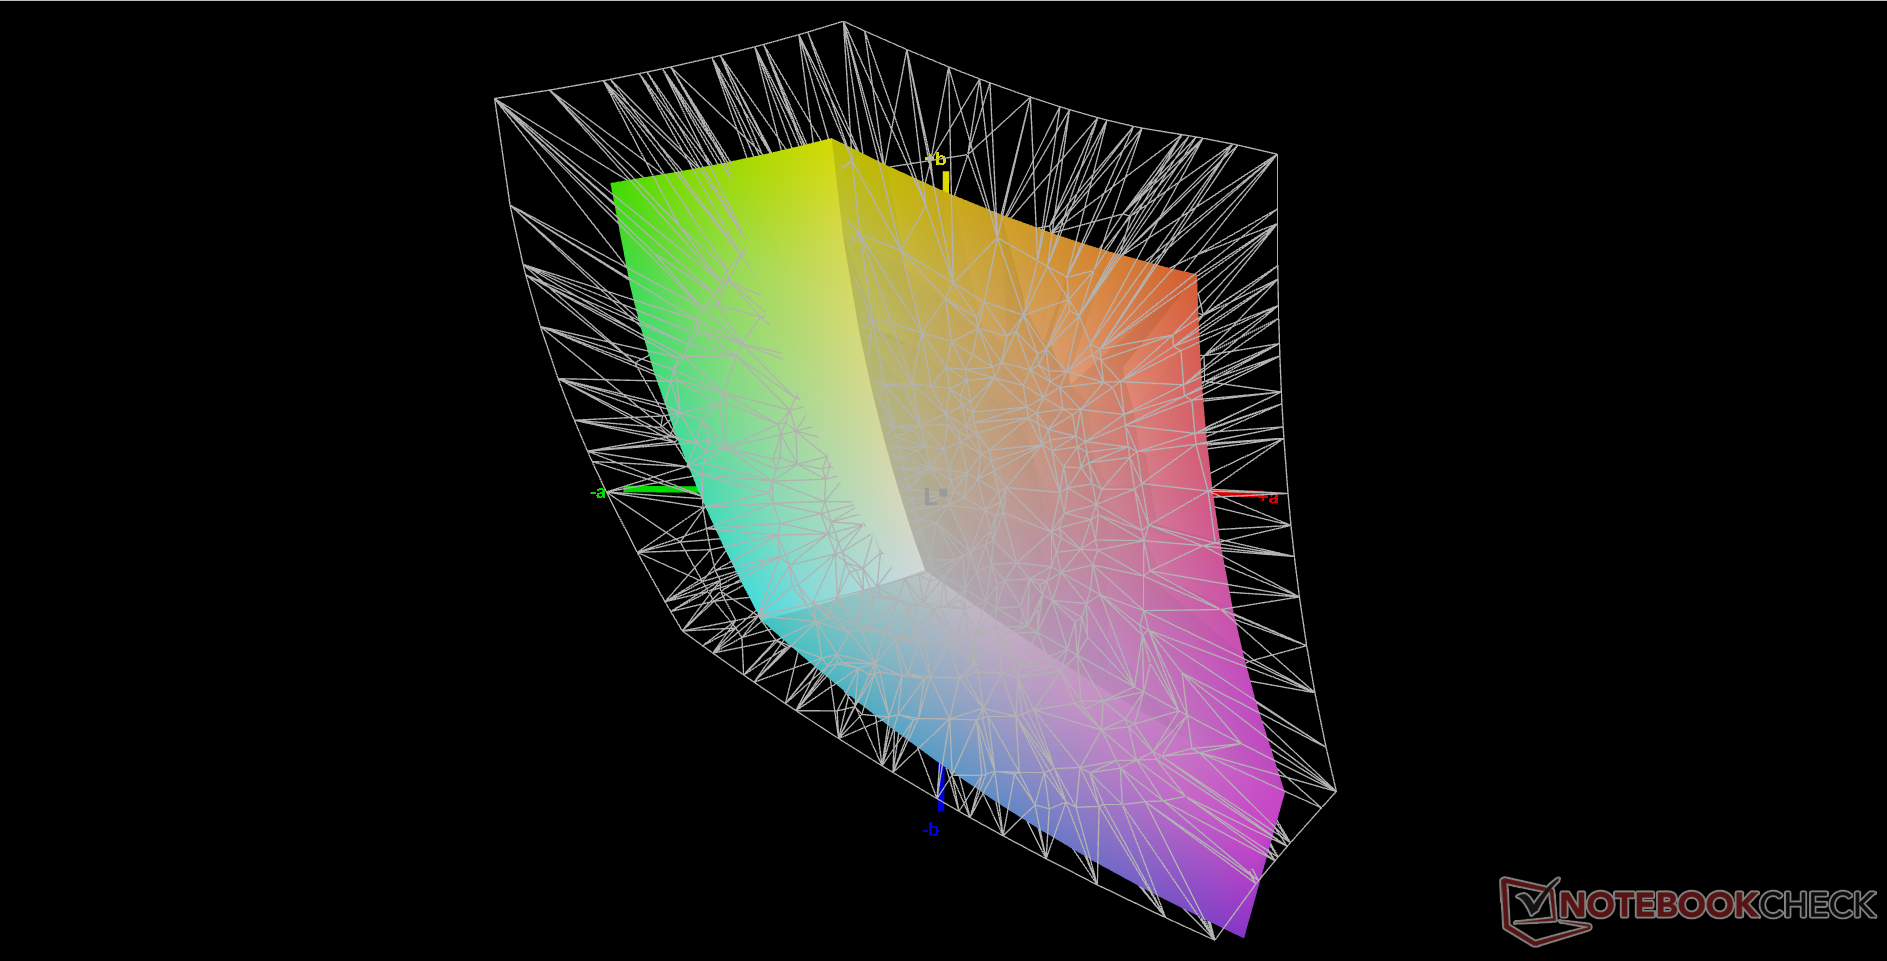
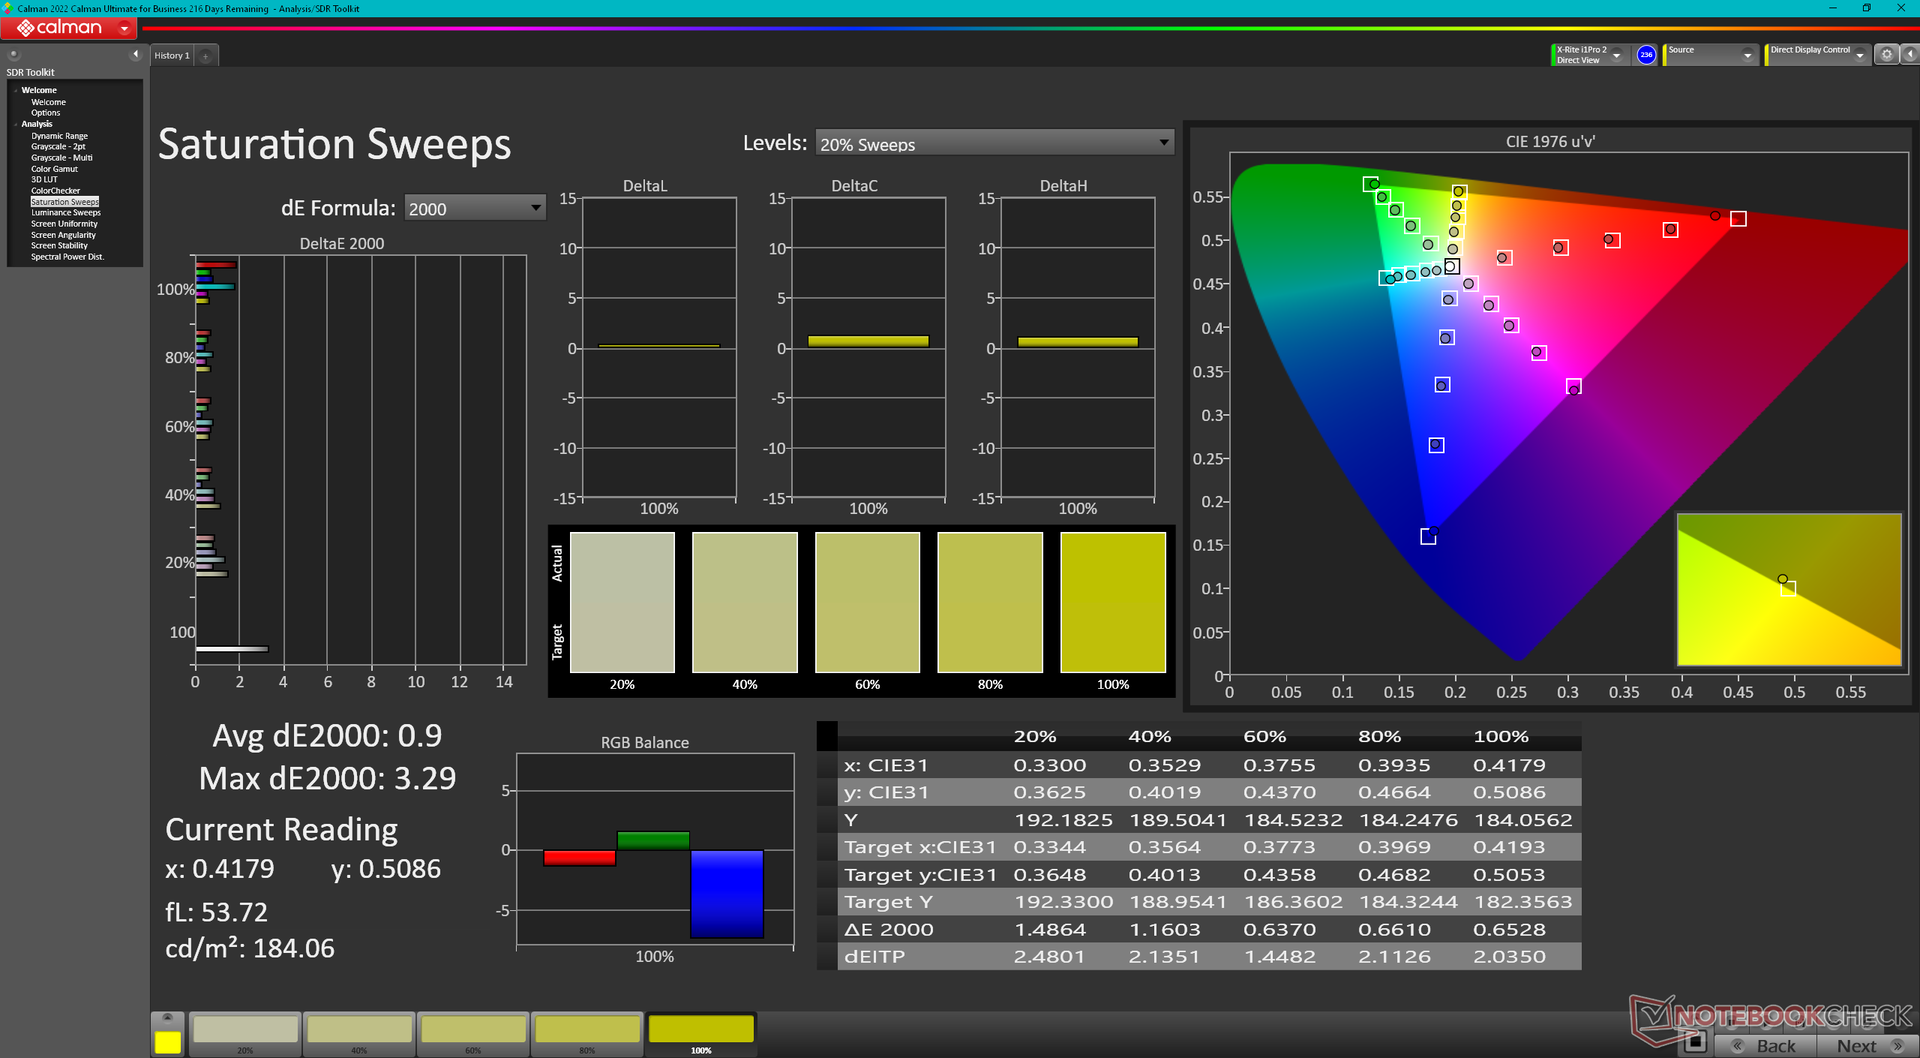
Gamut ~90 procent sRGB pozwala na uzyskanie głębokich kolorów, które rywalizują z wieloma wyświetlaczami laptopów ze średniej i wyższej półki. Nie ma niestety opcji OLED, które jeszcze bardziej rozszerzyłyby kolory, aby pokryć P3.
Warto zauważyć, że wyświetlacz nie obsługuje adaptacyjnej synchronizacji lub FreeSync. Ta funkcja byłaby idealna dla tego systemu, biorąc pod uwagę, że Radeon 680M często osiąga wyniki w zakresie 40-60 FPS w 1080p.

| |||||||||||||||||||||||||
rozświetlenie: 81 %
na akumulatorze: 413.1 cd/m²
kontrast: 1059:1 (czerń: 0.39 cd/m²)
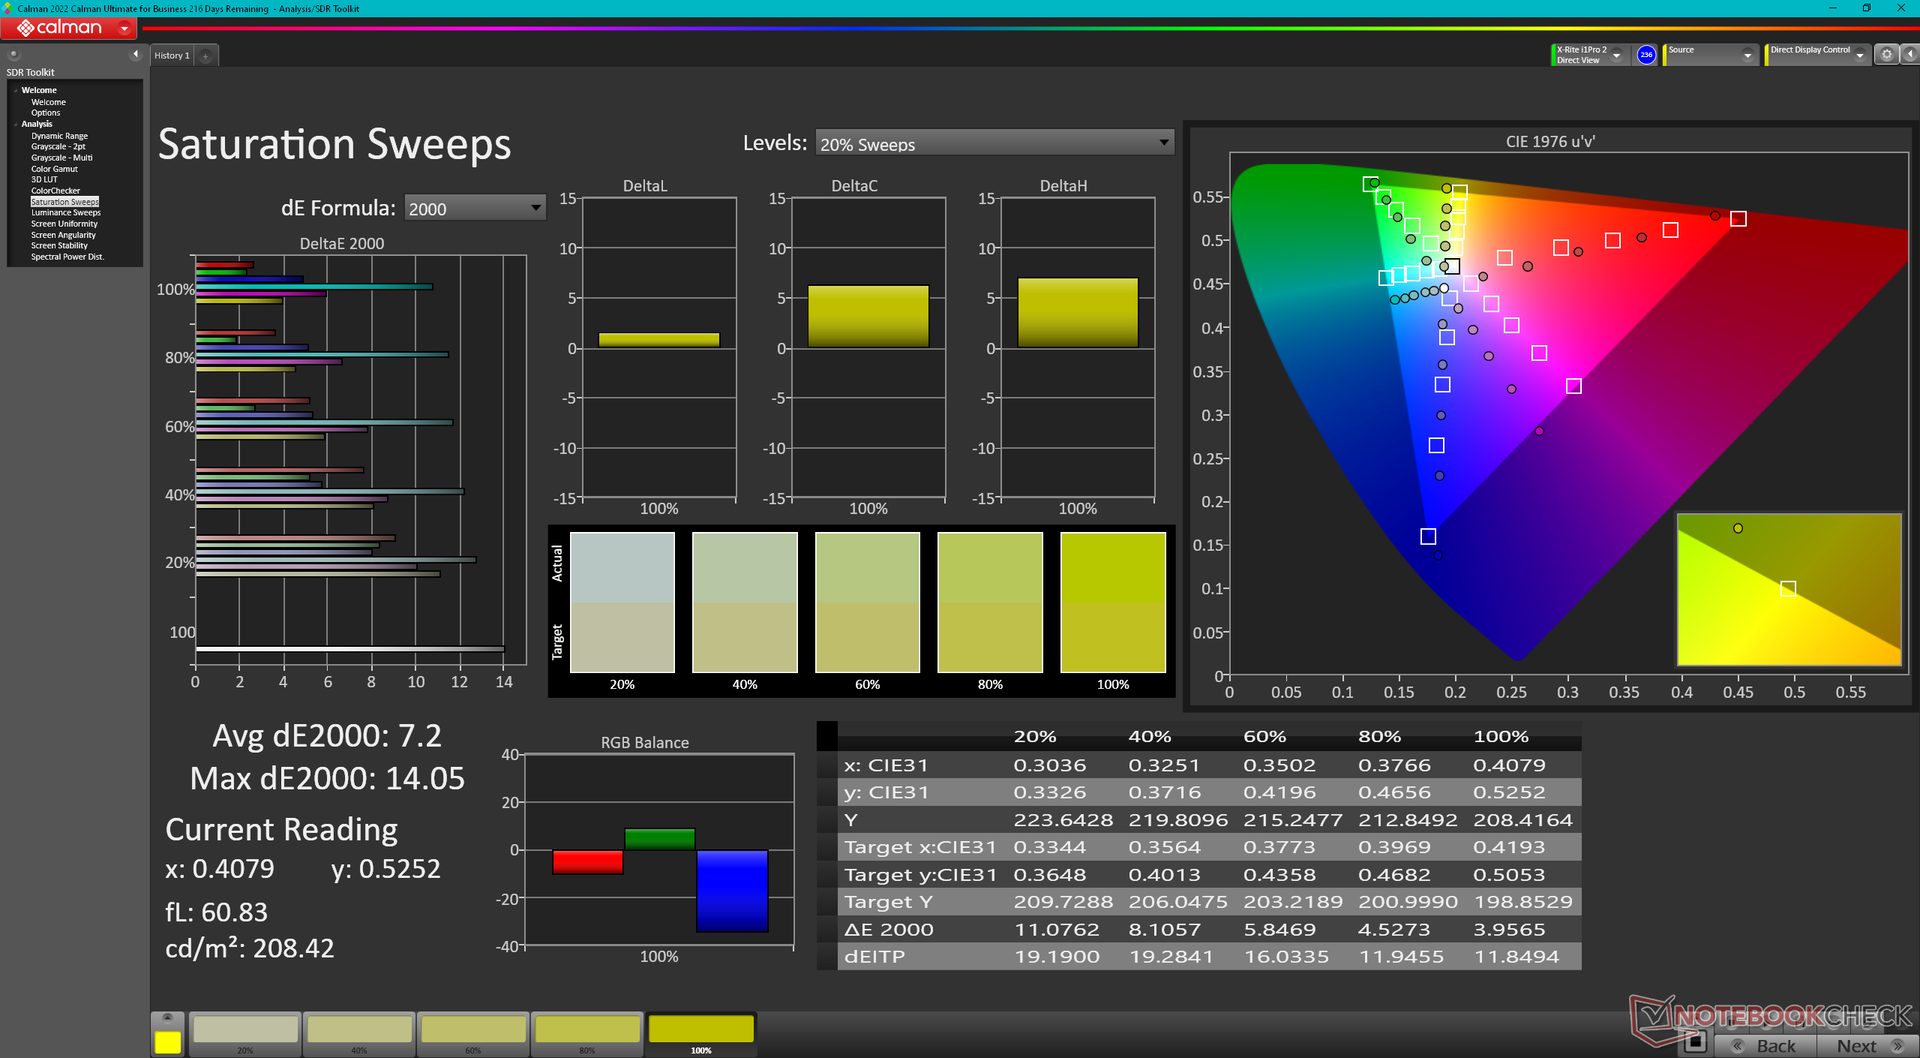
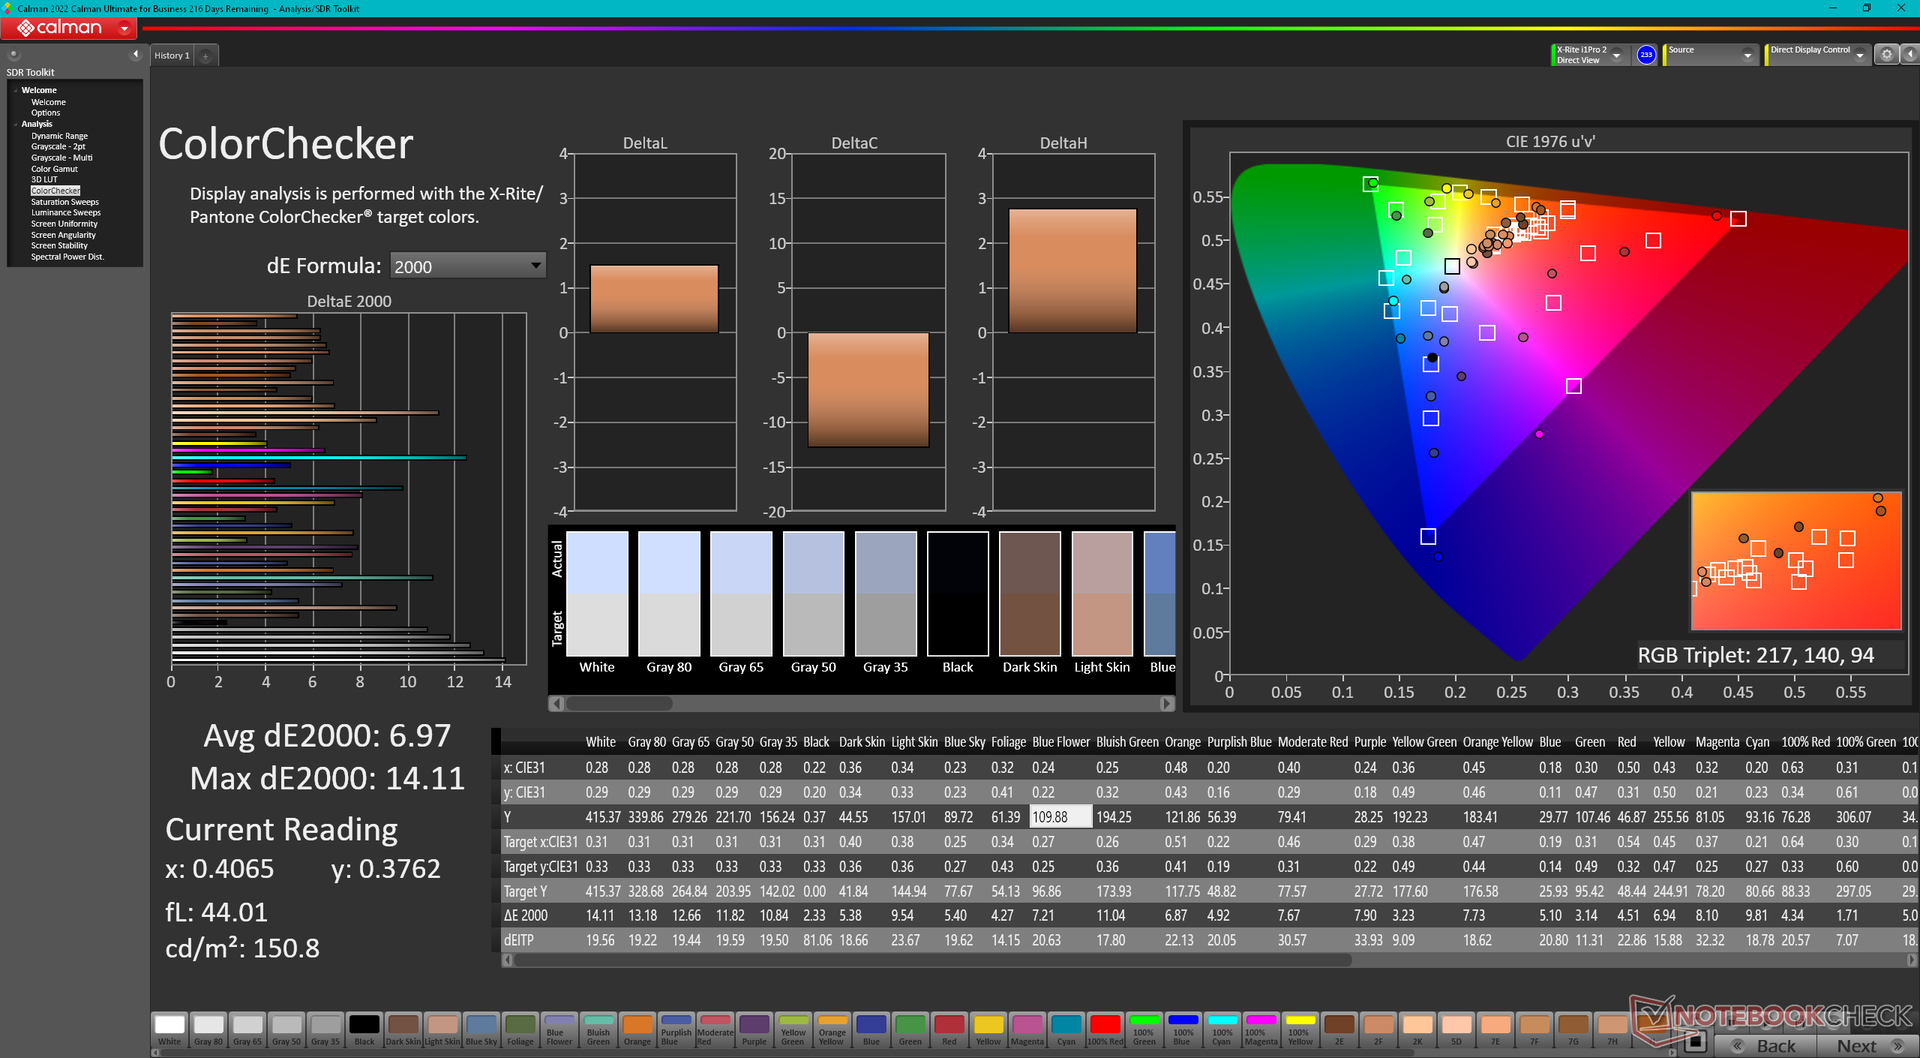
ΔE ColorChecker Calman: 6.97 | ∀{0.5-29.43 Ø4.71}
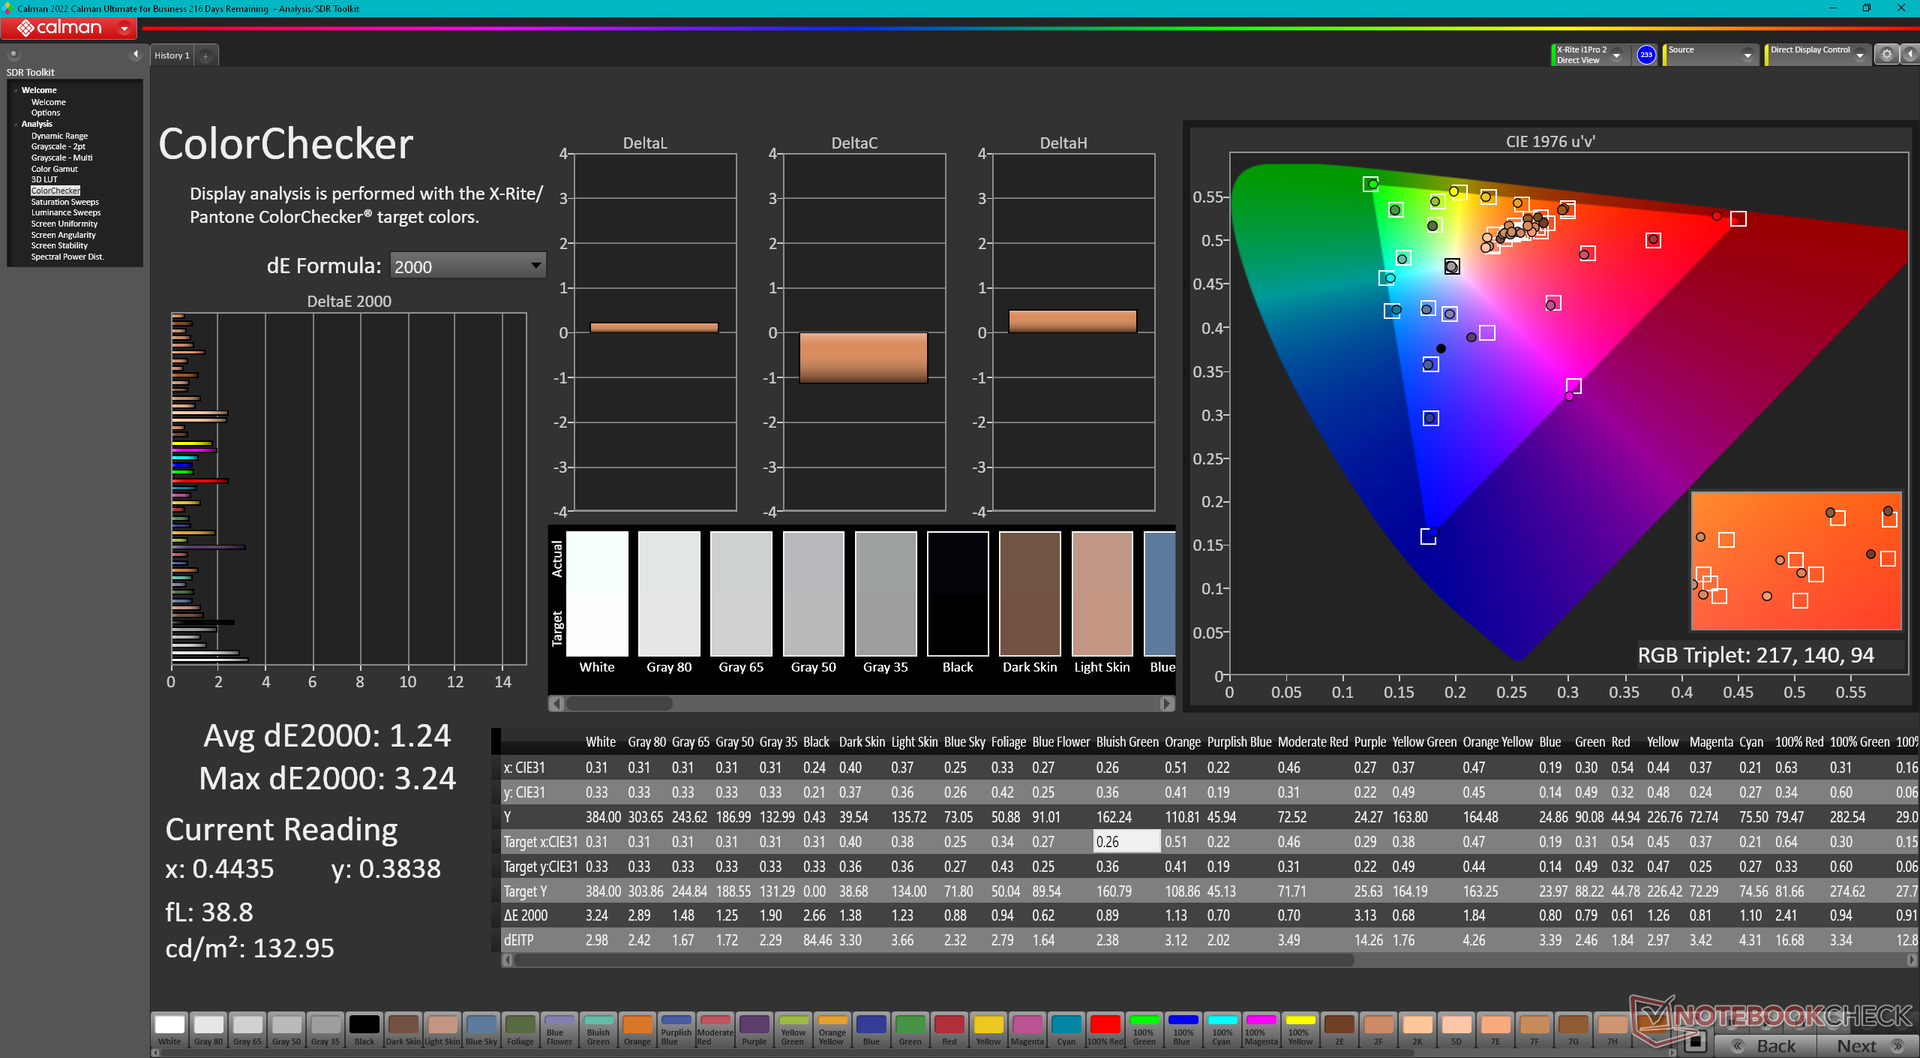
calibrated: 1.24
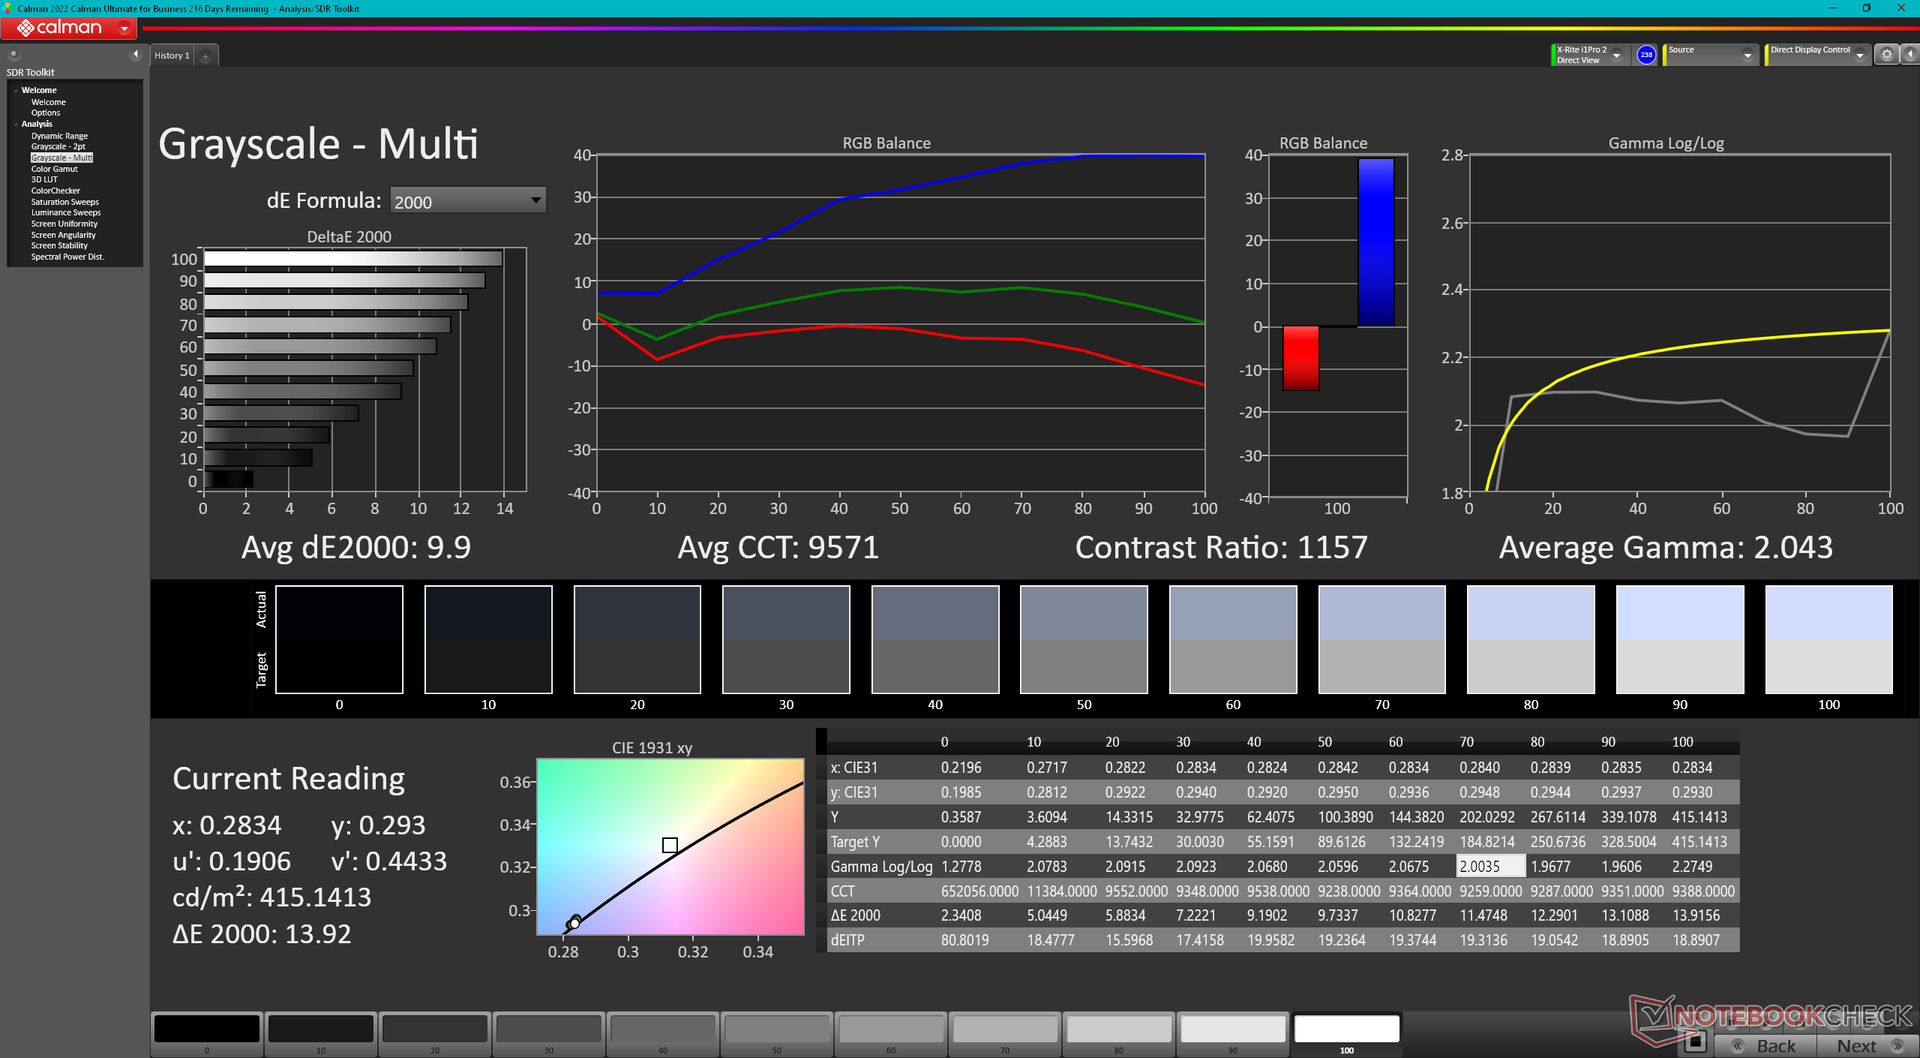
ΔE Greyscale Calman: 9.9 | ∀{0.09-98 Ø4.96}
64.6% AdobeRGB 1998 (Argyll 3D)
92% sRGB (Argyll 3D)
63.1% Display P3 (Argyll 3D)
Gamma: 2.04
CCT: 9571 K
| GPD Win 4 G1618-04, IPS, 1920x1080, 6" | GPD Win Max 2 Toshiba HX_10.1_LCD, IPS, 2560x1600, 10.1" | GPD Win 3 IPS, 1280x720, 5.5" | Razer Blade Stealth i7-1165G7 GTX 1650 Ti Max-Q Sharp LQ133M1JW46, IPS, 1920x1080, 13.3" | Dell XPS 13 9315 2-in-1 Core i5-1230U BOE NE13A1M, IPS, 2880x1920, 13" | Asus Zenbook S 13 OLED SDC4172, OLED, 2880x1800, 13.3" | |
|---|---|---|---|---|---|---|
| Display | 4% | -5% | 5% | 11% | 39% | |
| Display P3 Coverage (%) | 63.1 | 69.8 11% | 59.5 -6% | 66 5% | 70.7 12% | 99.8 58% |
| sRGB Coverage (%) | 92 | 91 -1% | 89.6 -3% | 97.4 6% | 99.8 8% | 100 9% |
| AdobeRGB 1998 Coverage (%) | 64.6 | 66.6 3% | 61.4 -5% | 67.1 4% | 72.6 12% | 97.8 51% |
| Response Times | 16% | -36% | -98% | -42% | 92% | |
| Response Time Grey 50% / Grey 80% * (ms) | 26.8 ? | 21.2 ? 21% | 40 ? -49% | 57.6 ? -115% | 44 ? -64% | 2.1 ? 92% |
| Response Time Black / White * (ms) | 20.9 ? | 18.7 ? 11% | 25.6 ? -22% | 37.6 ? -80% | 24.8 ? -19% | 1.68 ? 92% |
| PWM Frequency (Hz) | 240.4 ? | |||||
| Screen | 8% | -9% | 24% | 41% | 196% | |
| Brightness middle (cd/m²) | 413.1 | 396.7 -4% | 468.8 13% | 356.8 -14% | 507 23% | 336 -19% |
| Brightness (cd/m²) | 407 | 381 -6% | 460 13% | 336 -17% | 486 19% | 338 -17% |
| Brightness Distribution (%) | 81 | 89 10% | 93 15% | 88 9% | 87 7% | 99 22% |
| Black Level * (cd/m²) | 0.39 | 0.36 8% | 0.45 -15% | 0.34 13% | 0.34 13% | 0.02 95% |
| Contrast (:1) | 1059 | 1102 4% | 1042 -2% | 1049 -1% | 1491 41% | 16800 1486% |
| Colorchecker dE 2000 * | 6.97 | 6.31 9% | 9 -29% | 1.63 77% | 2.04 71% | 1.8 74% |
| Colorchecker dE 2000 max. * | 14.11 | 10.23 27% | 15.5 -10% | 5.03 64% | 3.1 78% | 3.8 73% |
| Colorchecker dE 2000 calibrated * | 1.24 | 1.44 -16% | 1.91 -54% | 1.08 13% | 0.86 31% | 1.8 -45% |
| Greyscale dE 2000 * | 9.9 | 5.5 44% | 10.9 -10% | 3 70% | 1.8 82% | 0.9 91% |
| Gamma | 2.04 108% | 2.17 101% | 2.13 103% | 2.23 99% | 2.12 104% | 2.22 99% |
| CCT | 9571 68% | 7502 87% | 10972 59% | 6434 101% | 6561 99% | 6580 99% |
| Color Space (Percent of AdobeRGB 1998) (%) | 56.6 | 62 | ||||
| Color Space (Percent of sRGB) (%) | 89.2 | 97.6 | ||||
| Całkowita średnia (program / ustawienia) | 9% /
9% | -17% /
-12% | -23% /
2% | 3% /
22% | 109% /
147% |
* ... im mniej tym lepiej
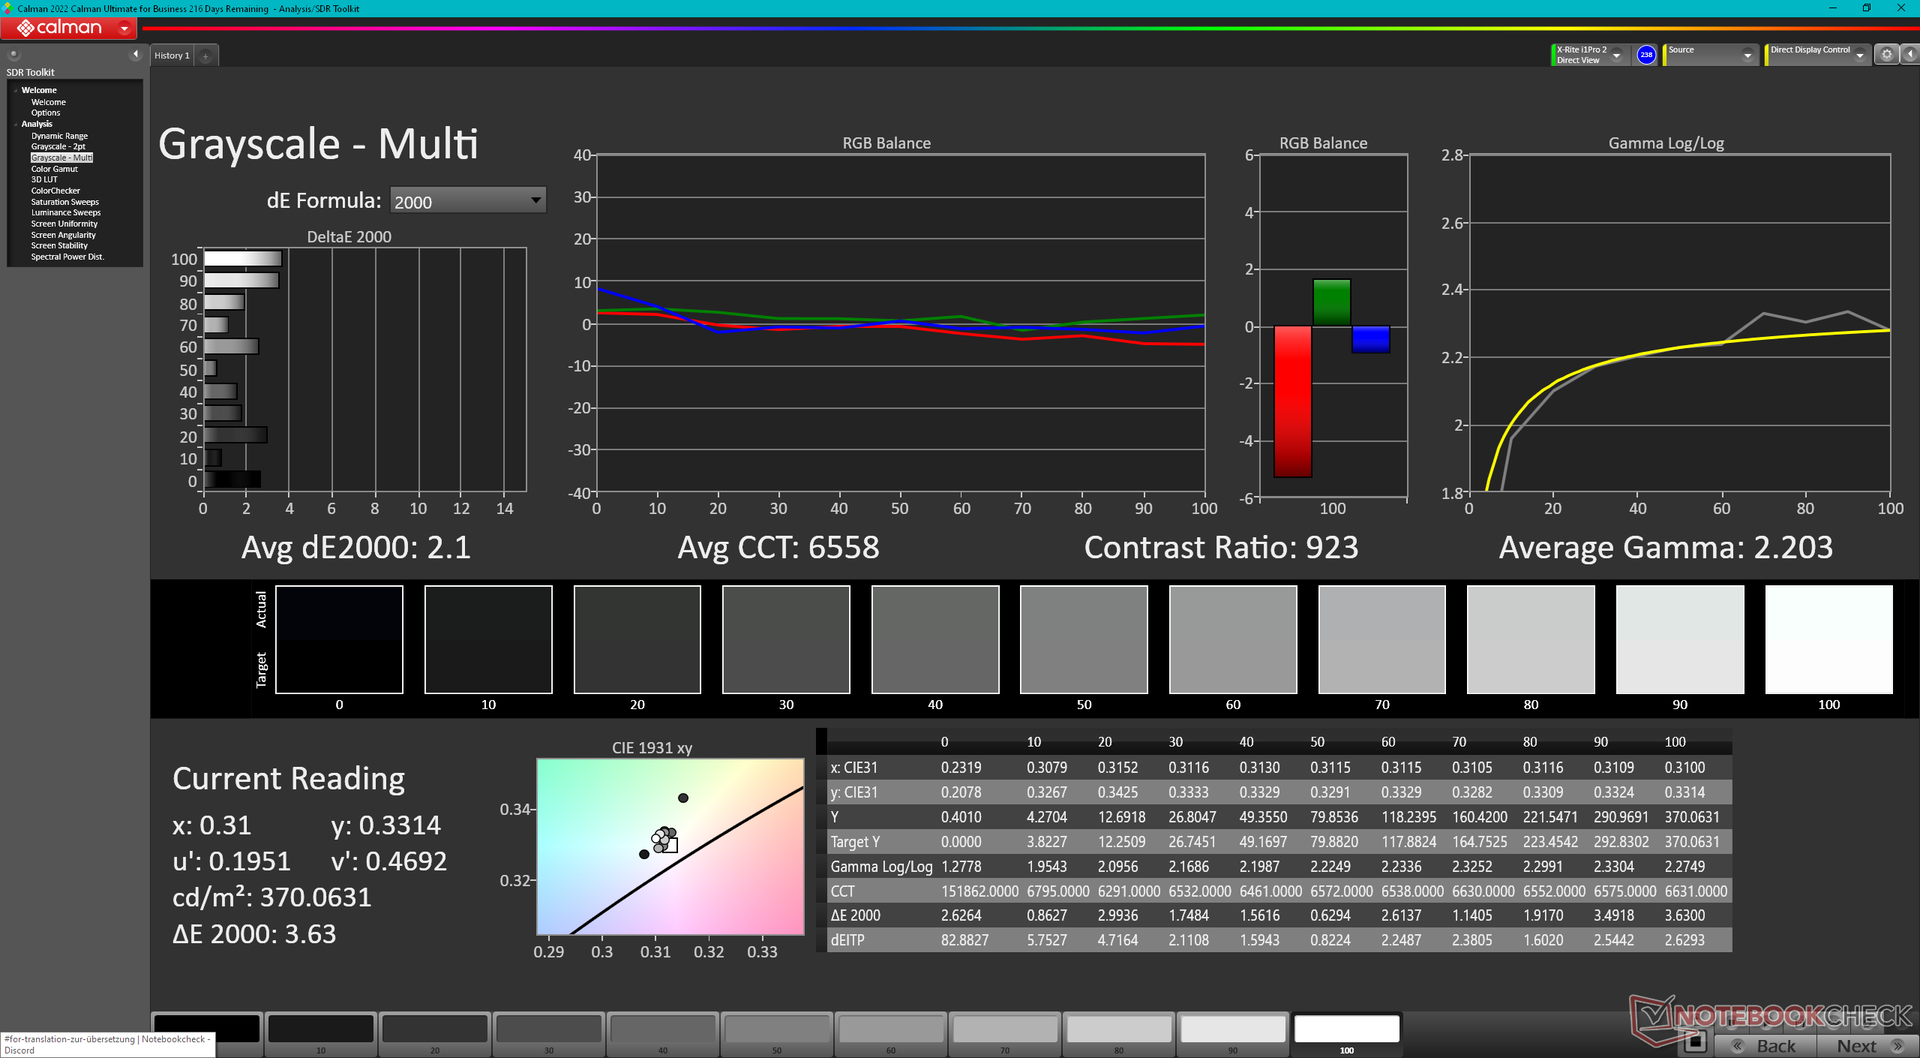
Wyświetlacz jest słabo skalibrowany po wyjęciu z pudełka. Szczególnie temperatura barwowa jest zbyt chłodna i wynosi 9571, przez co ekran wydaje się zbyt niebieski. Kalibracja wyświetlacza za pomocą kolorymetru X-Rite pozwoliłaby znacznie poprawić średnie wartości deltaE w skali szarości i kolorze z 9,9 i 6,97 do odpowiednio 2,1 i 1,24. Zalecamy zastosowanie naszego skalibrowanego profilu ICM powyżej, aby uzyskać bardziej dokładne kolory sRGB z wyświetlacza.
Wyświetl czasy reakcji
| ↔ Czas reakcji od czerni do bieli | ||
|---|---|---|
| 20.9 ms ... wzrost ↗ i spadek ↘ łącznie | ↗ 11.4 ms wzrost | 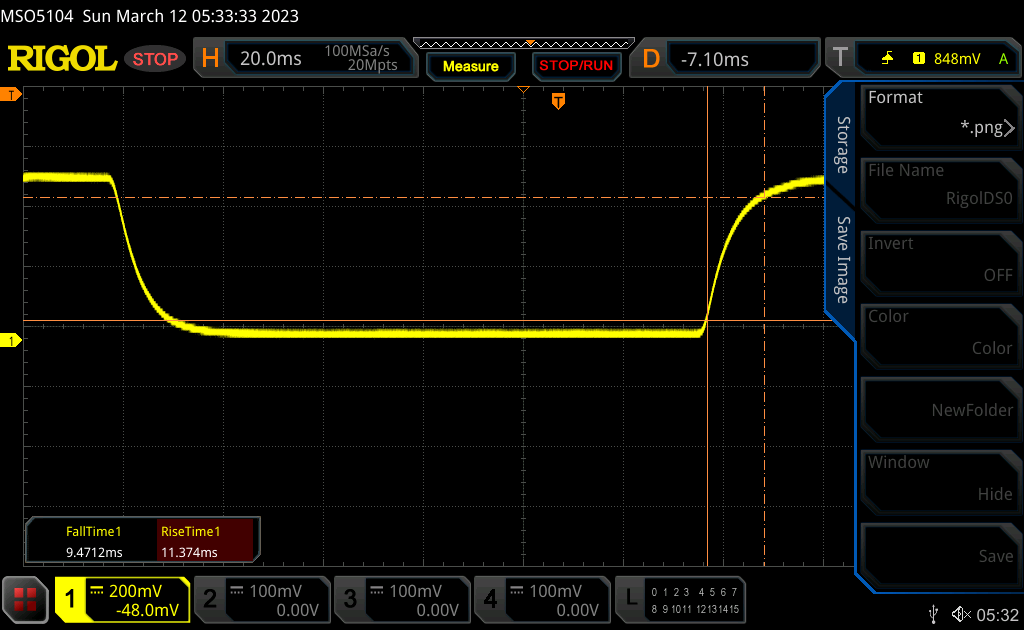 |
| ↘ 9.5 ms upadek | ||
| W naszych testach ekran wykazuje dobry współczynnik reakcji, ale może być zbyt wolny dla graczy rywalizujących ze sobą. Dla porównania, wszystkie testowane urządzenia wahają się od 0.1 (minimum) do 240 (maksimum) ms. » 47 % wszystkich urządzeń jest lepszych. Oznacza to, że zmierzony czas reakcji jest zbliżony do średniej wszystkich testowanych urządzeń (19.8 ms). | ||
| ↔ Czas reakcji 50% szarości do 80% szarości | ||
| 26.8 ms ... wzrost ↗ i spadek ↘ łącznie | ↗ 12.5 ms wzrost | 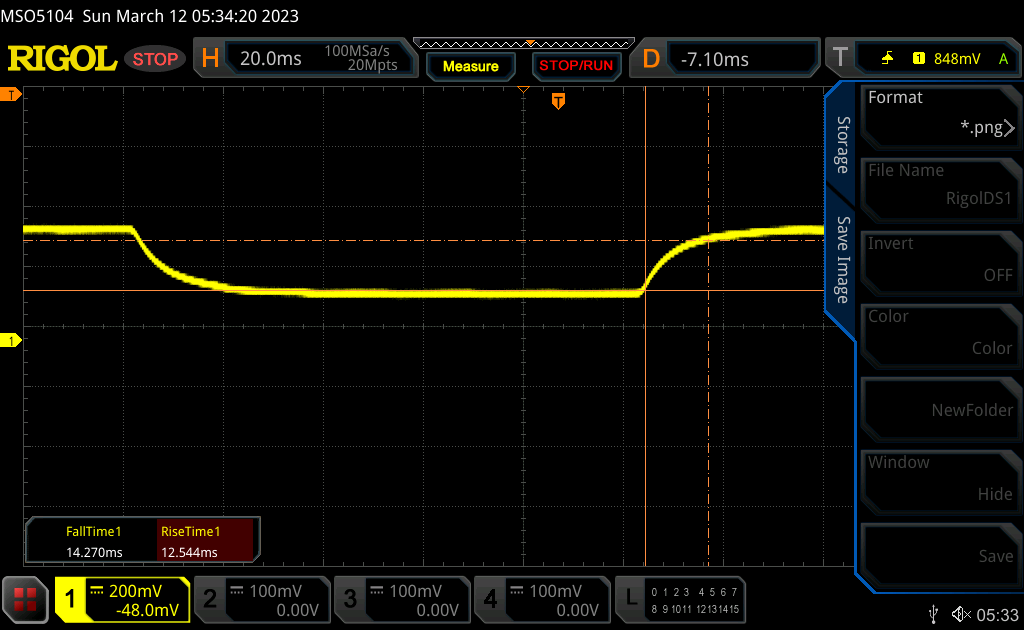 |
| ↘ 14.3 ms upadek | ||
| W naszych testach ekran wykazuje stosunkowo powolne tempo reakcji i może być zbyt wolny dla graczy. Dla porównania, wszystkie testowane urządzenia wahają się od 0.165 (minimum) do 636 (maksimum) ms. » 37 % wszystkich urządzeń jest lepszych. Oznacza to, że zmierzony czas reakcji jest lepszy od średniej wszystkich testowanych urządzeń (30.9 ms). | ||
Migotanie ekranu / PWM (modulacja szerokości impulsu)
| Migotanie ekranu/nie wykryto PWM | 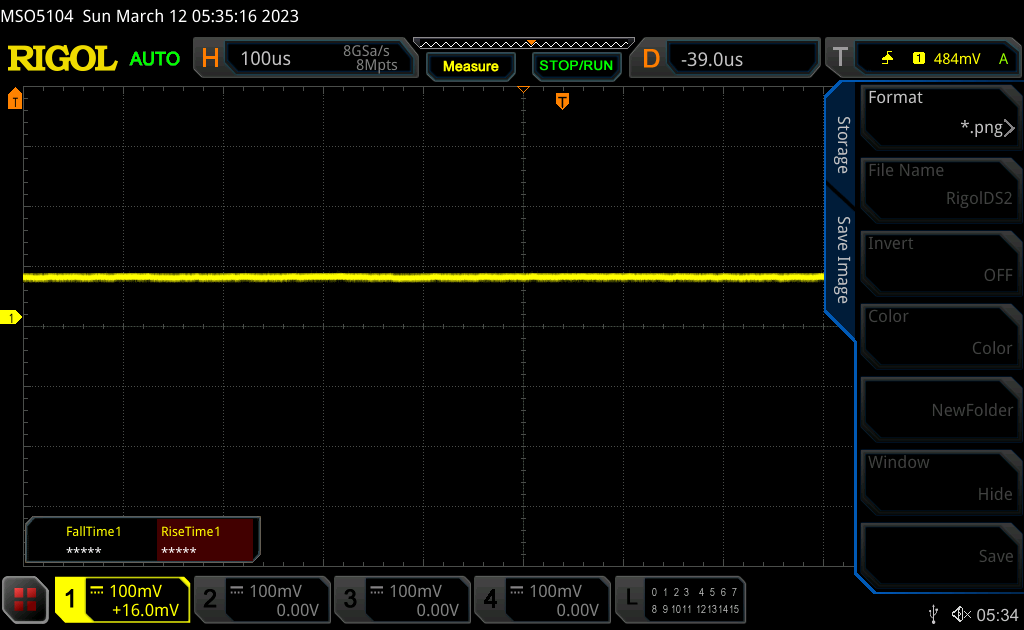 | ||
Dla porównania: 52 % wszystkich testowanych urządzeń nie używa PWM do przyciemniania wyświetlacza. Jeśli wykryto PWM, zmierzono średnio 7741 (minimum: 5 - maksimum: 343500) Hz. | |||
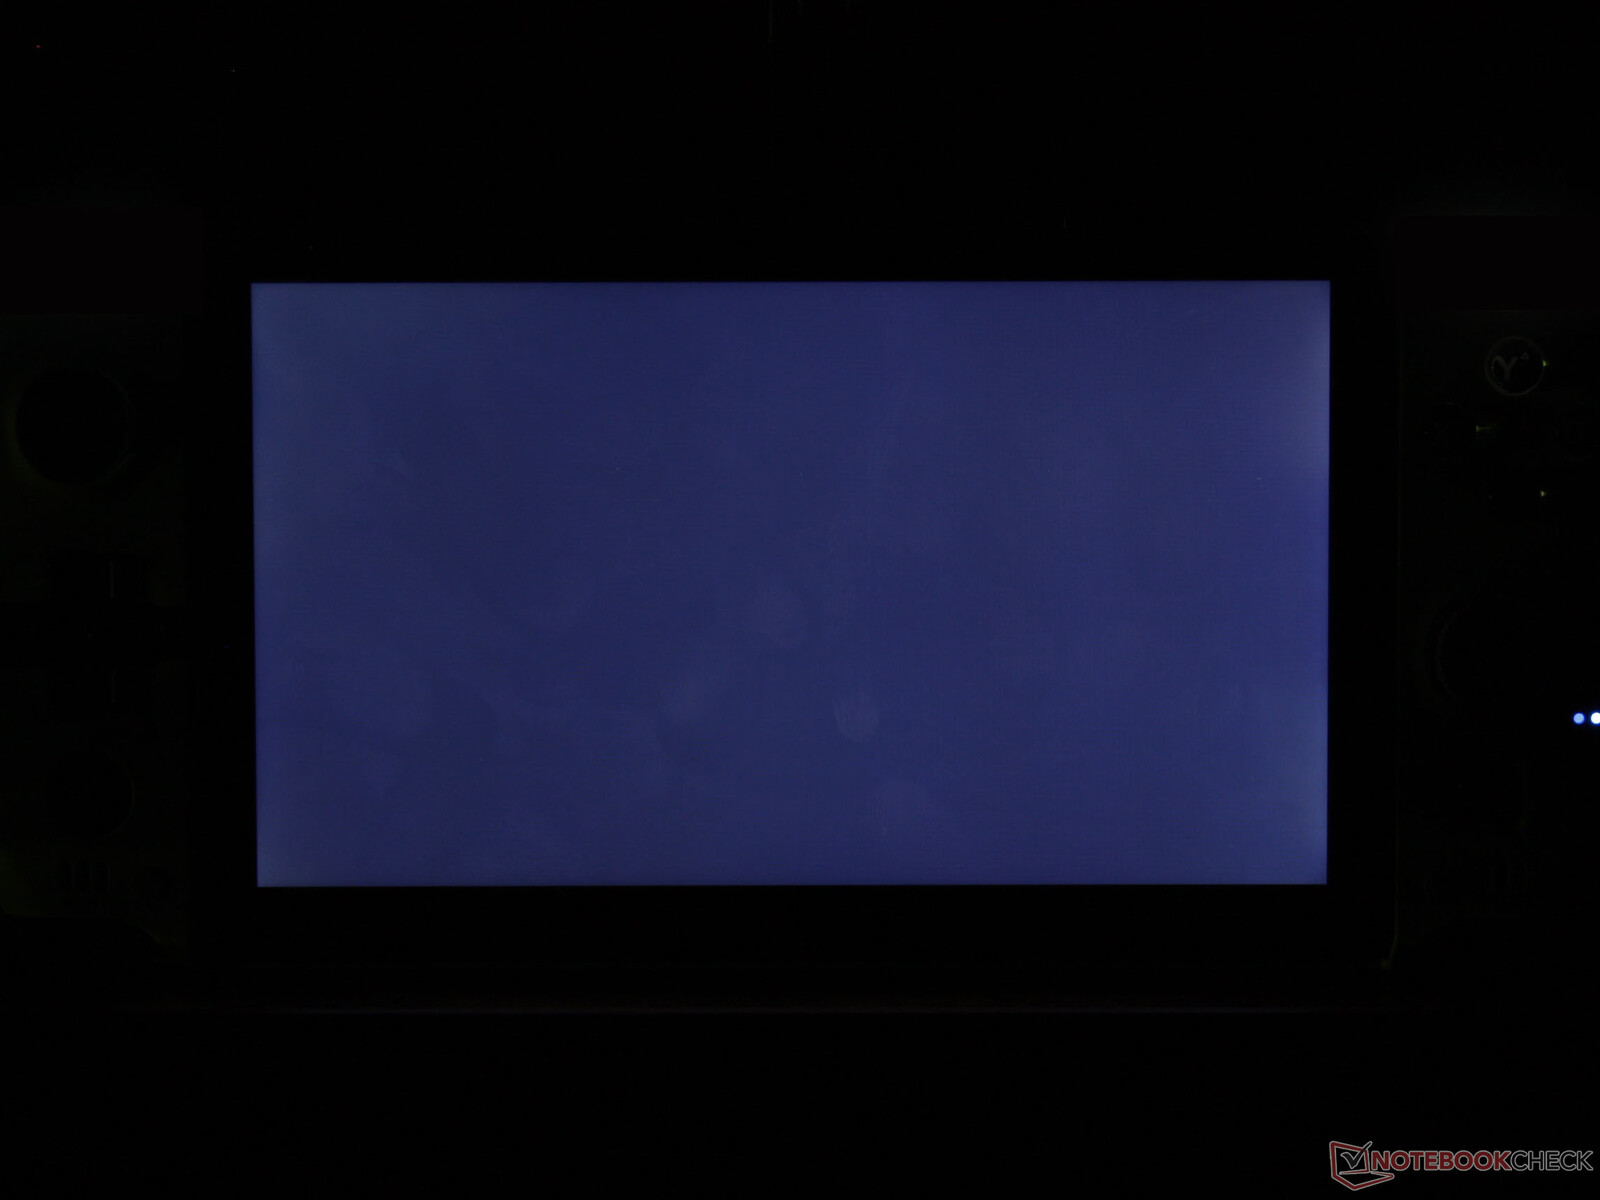
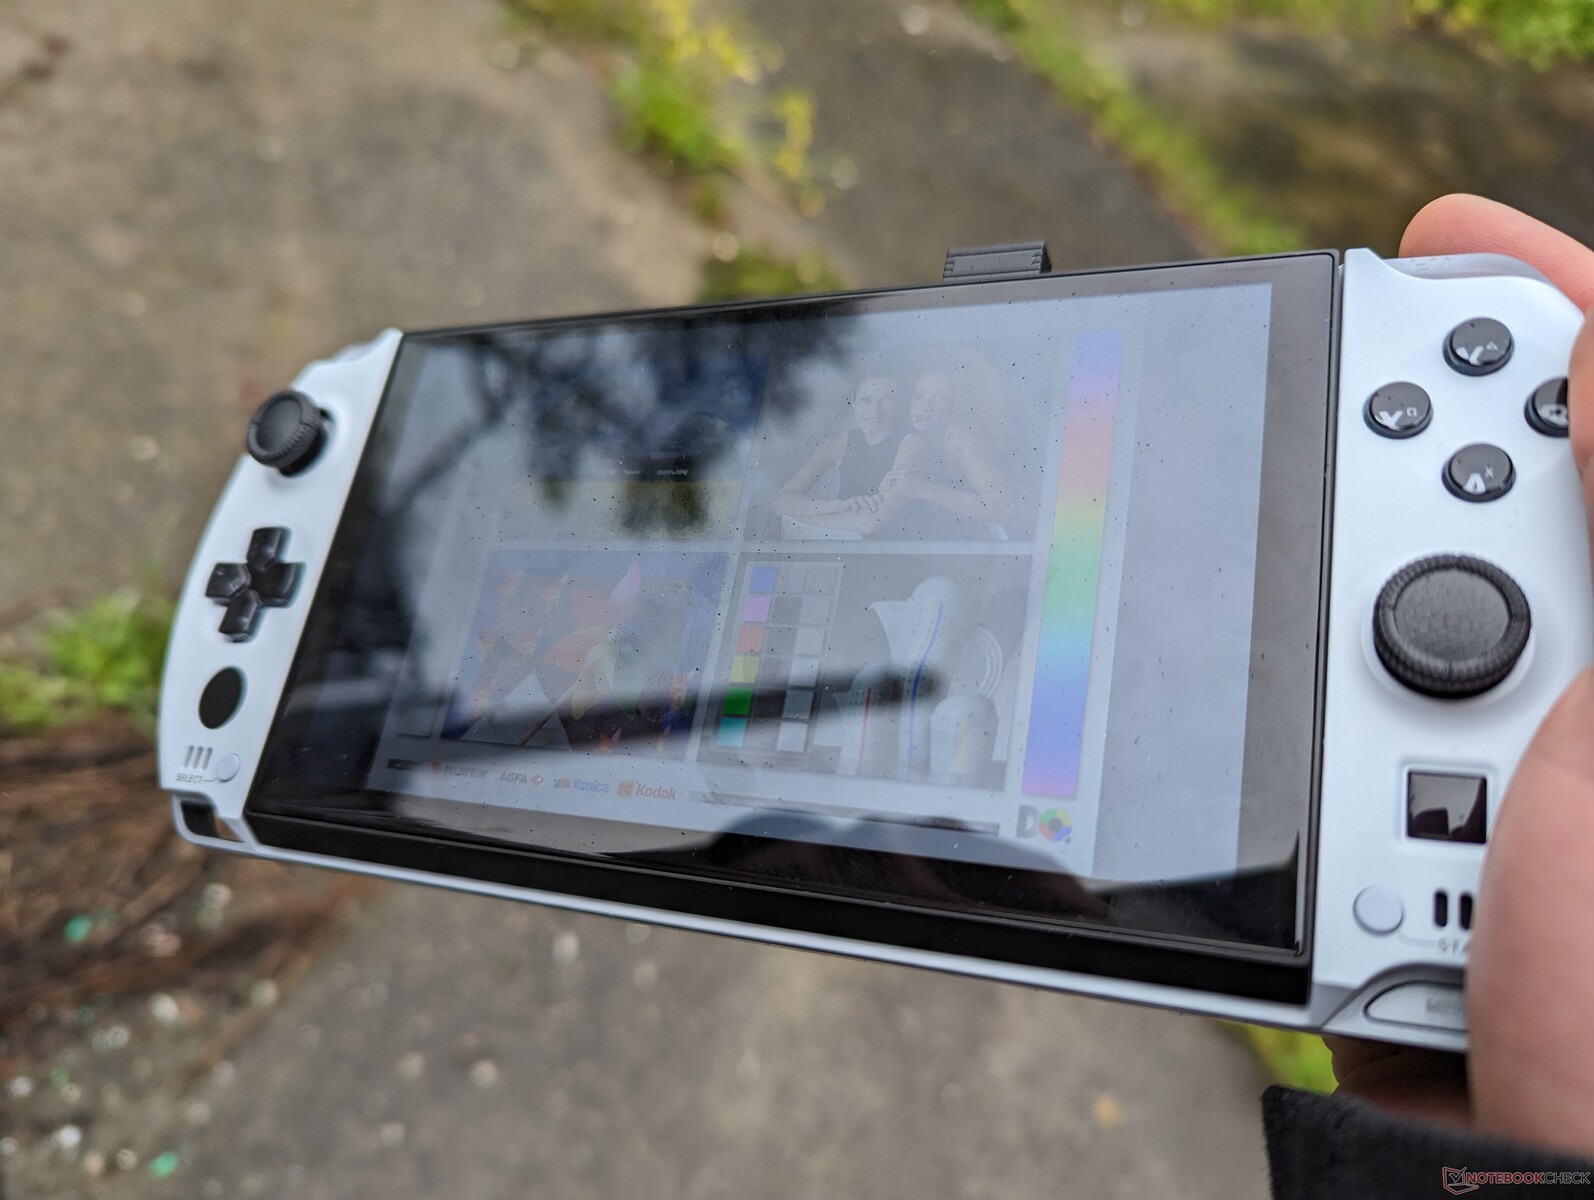
Widoczność na zewnątrz jest całkiem dobra, jeśli znajduje się w cieniu. Jeśli jednak jest jaśniej, to odblaski stają się problemem na błyszczącym ekranie. Ekran o jasności 400 nitów nie jest tak jasny jak w większości popularnych smartfonów, gdzie wyświetlacze osiągają 1000 nitów lub więcej.
Wydajność - taka sama jak w najnowszych ultrabookach
Warunki badania
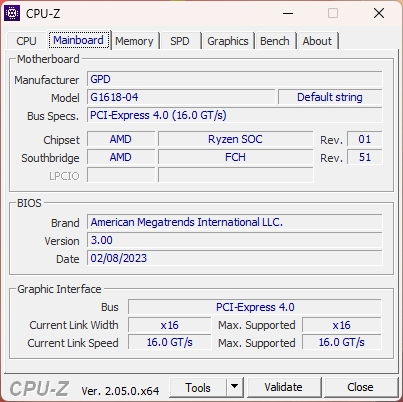
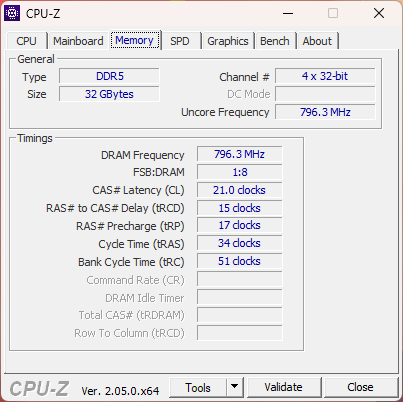
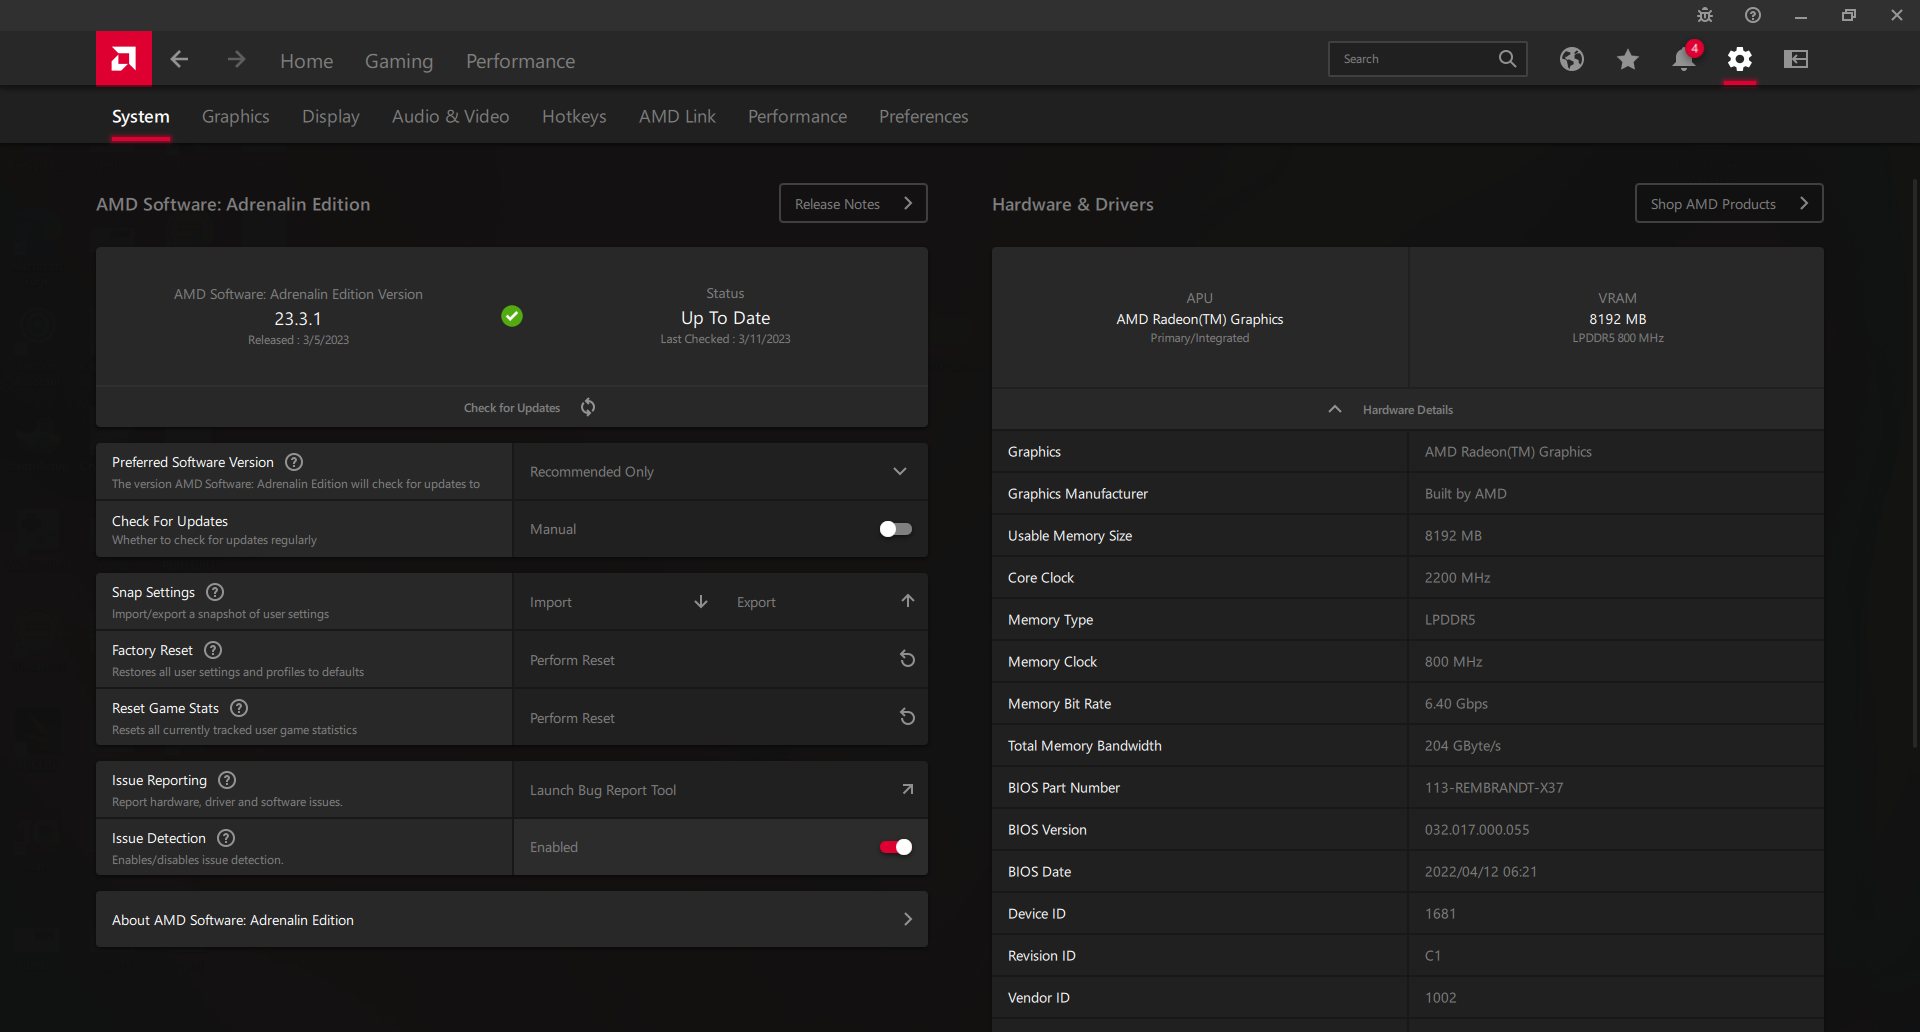
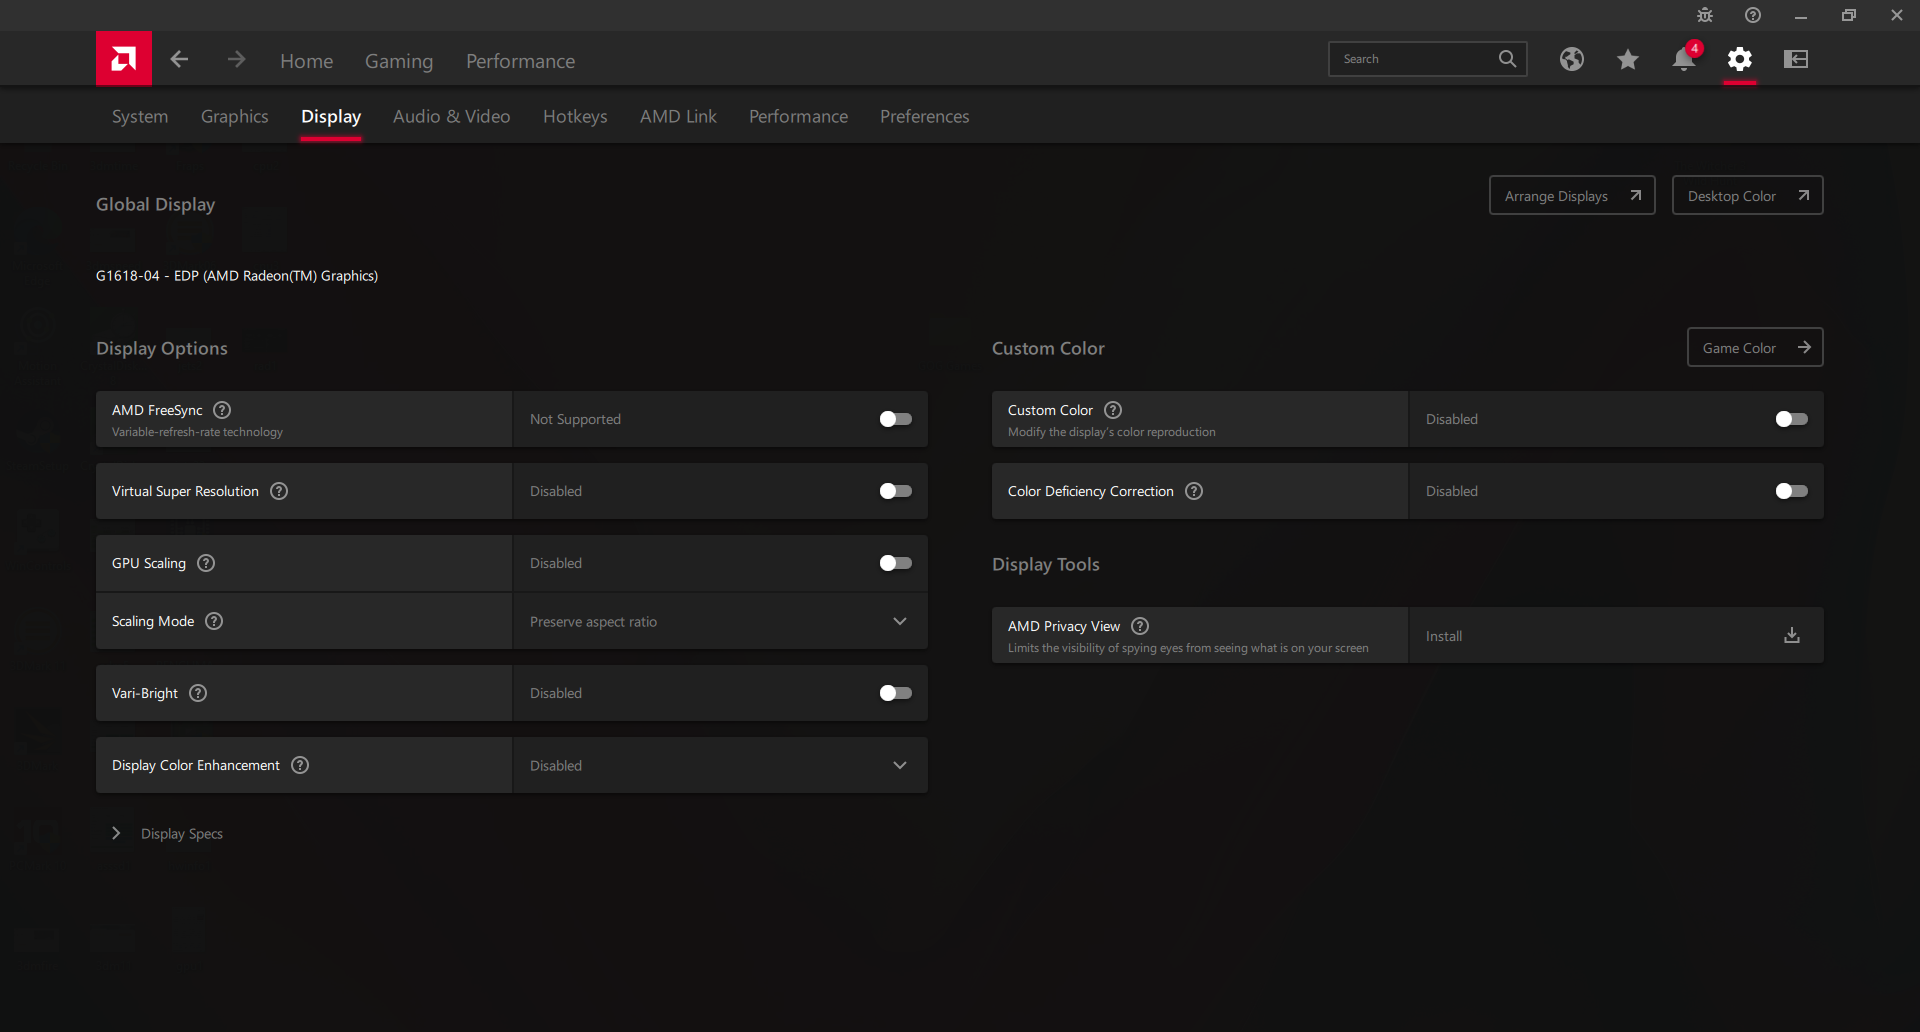
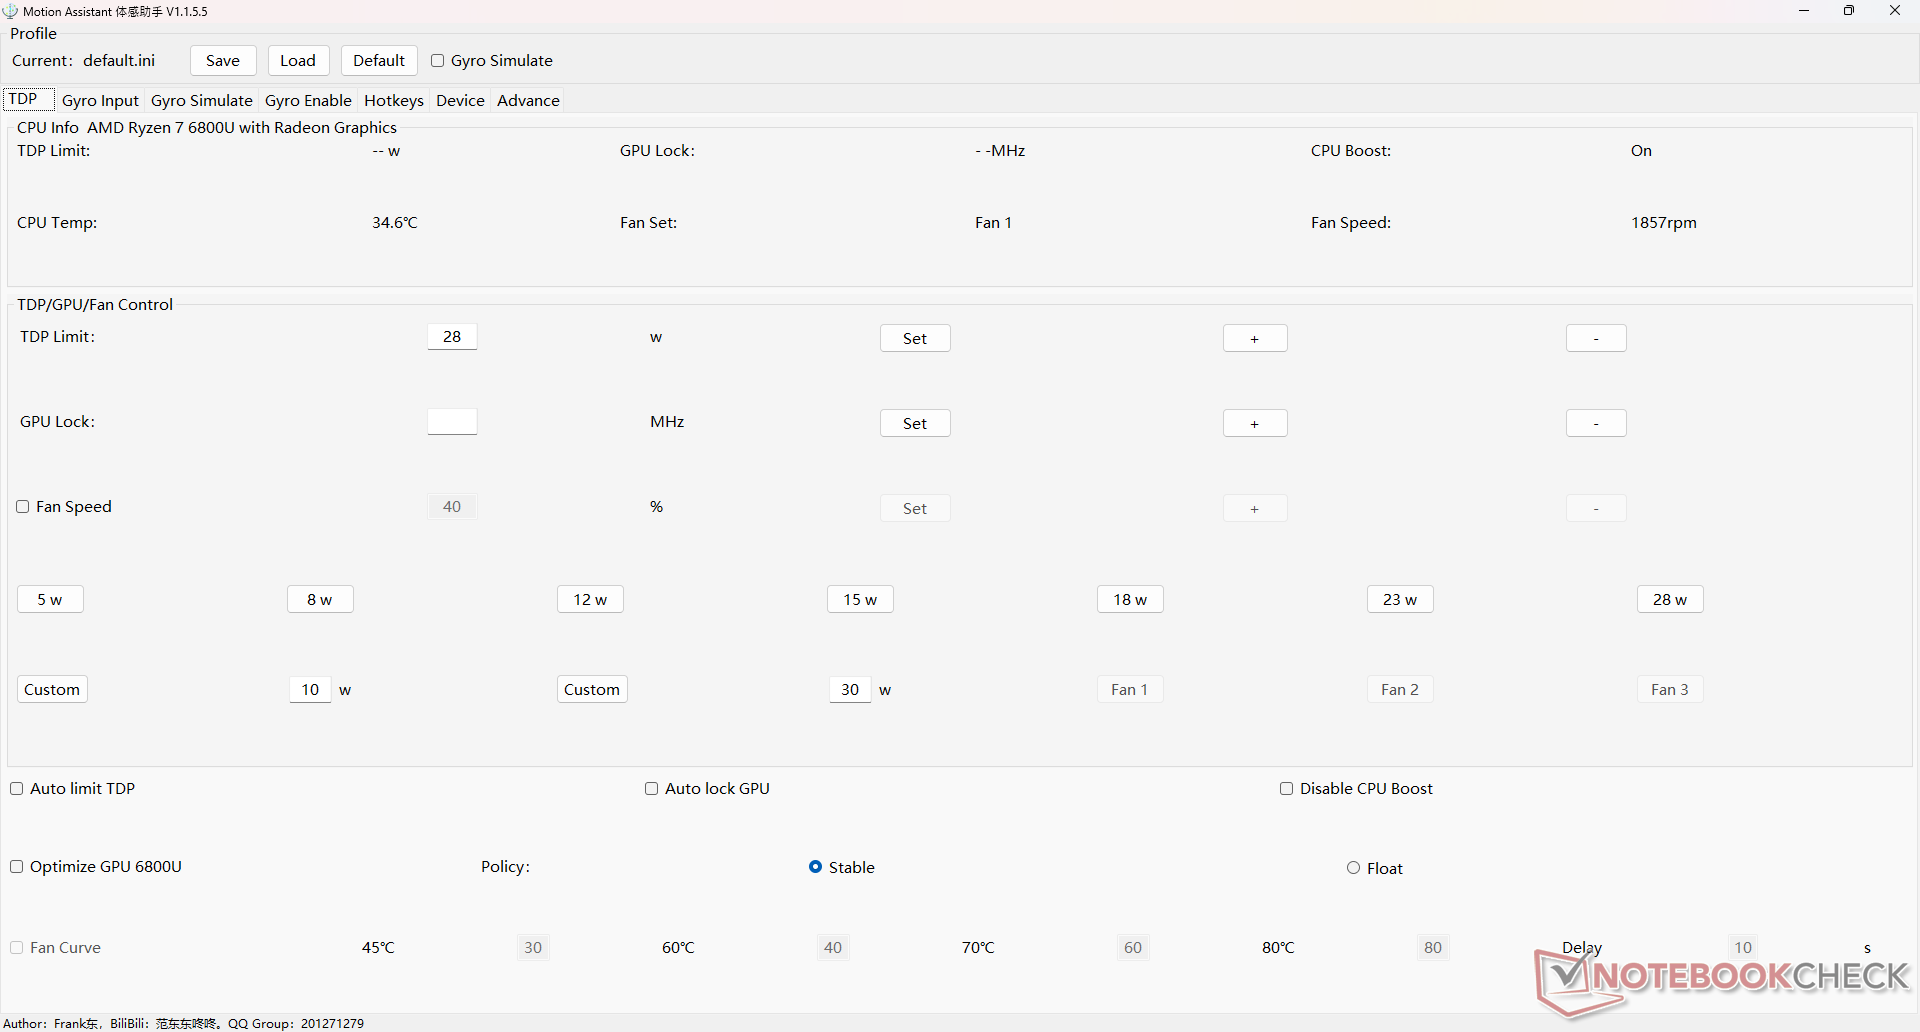
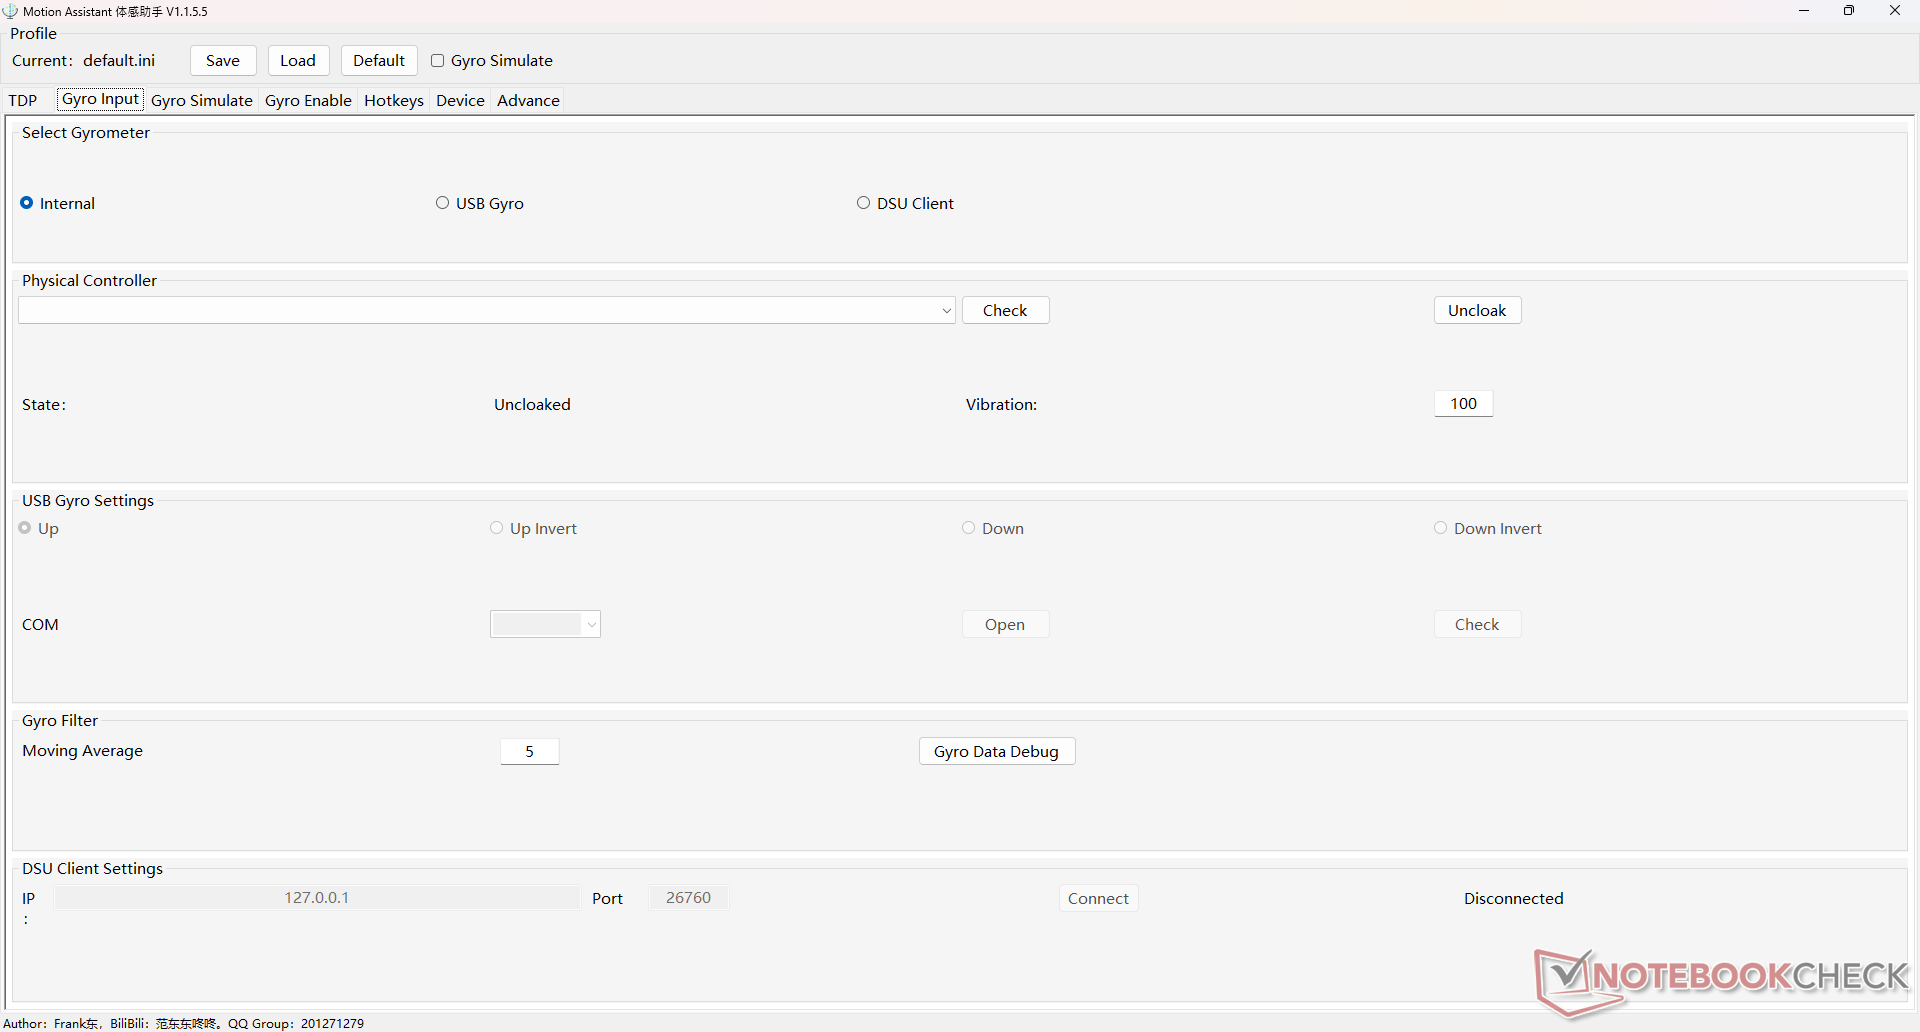
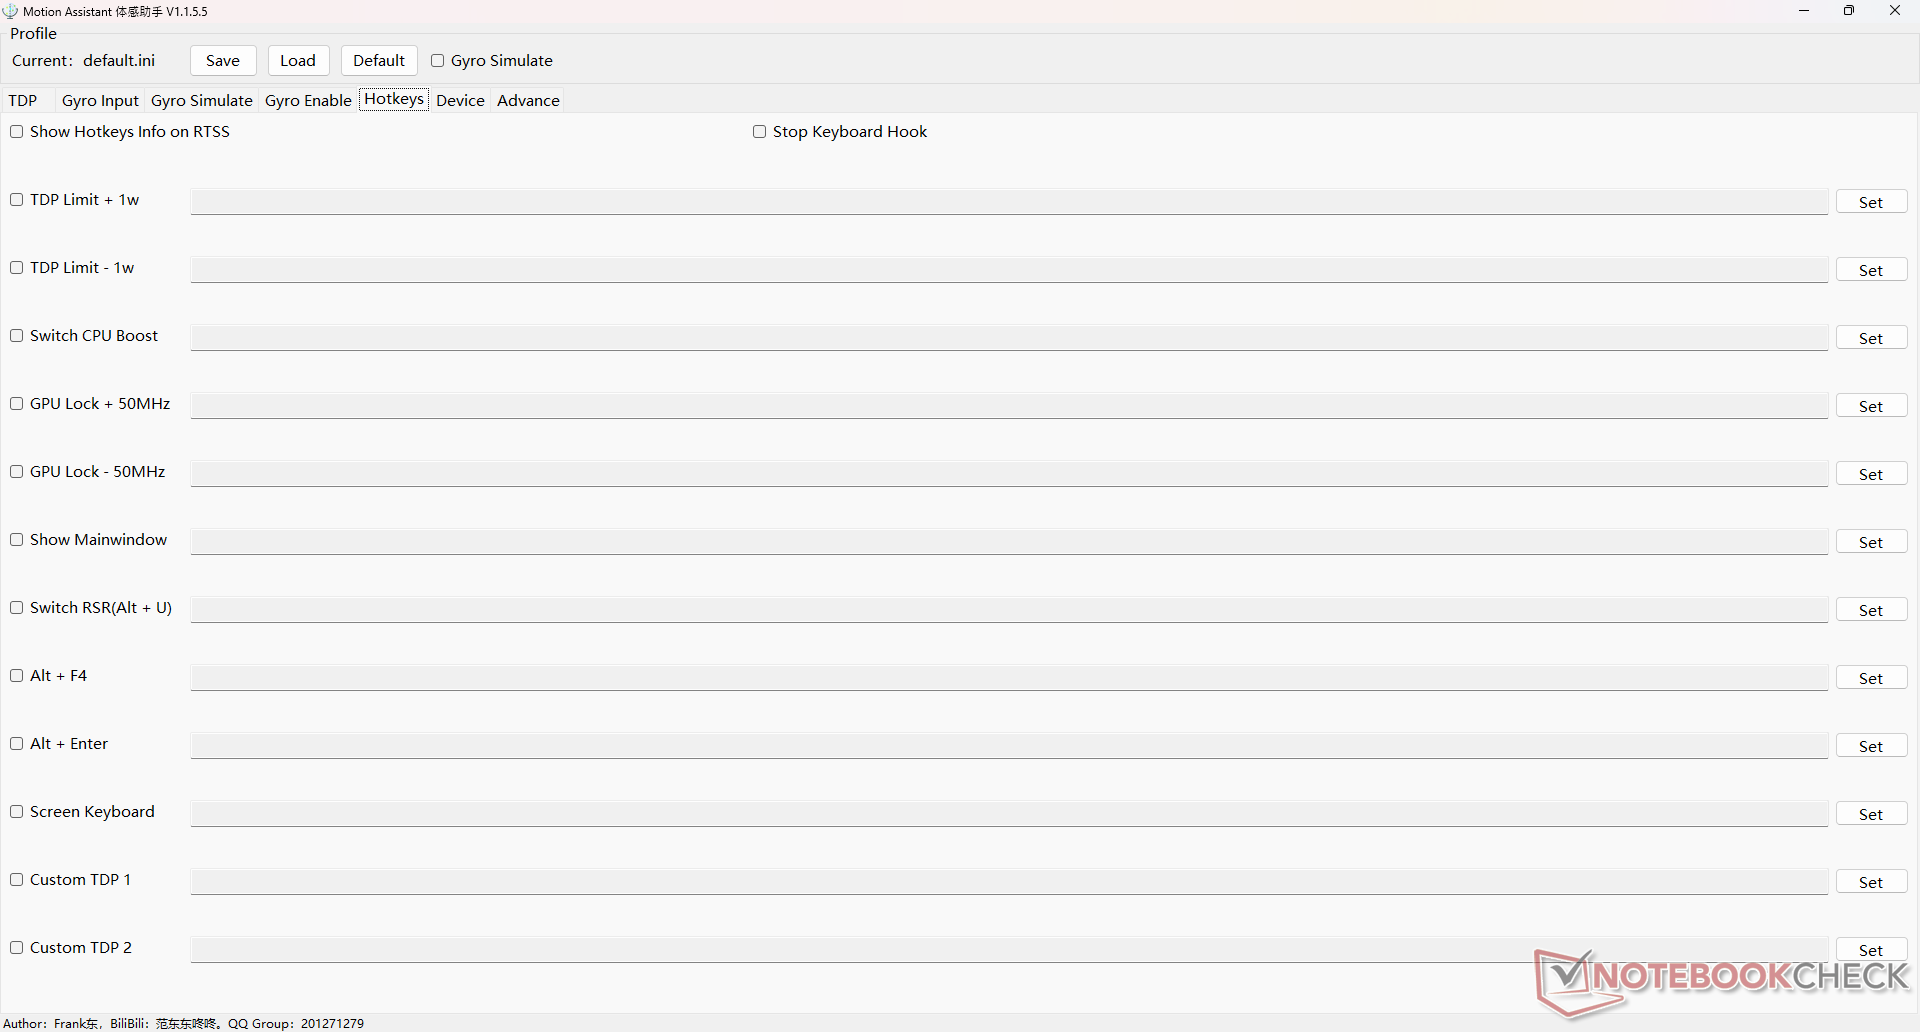
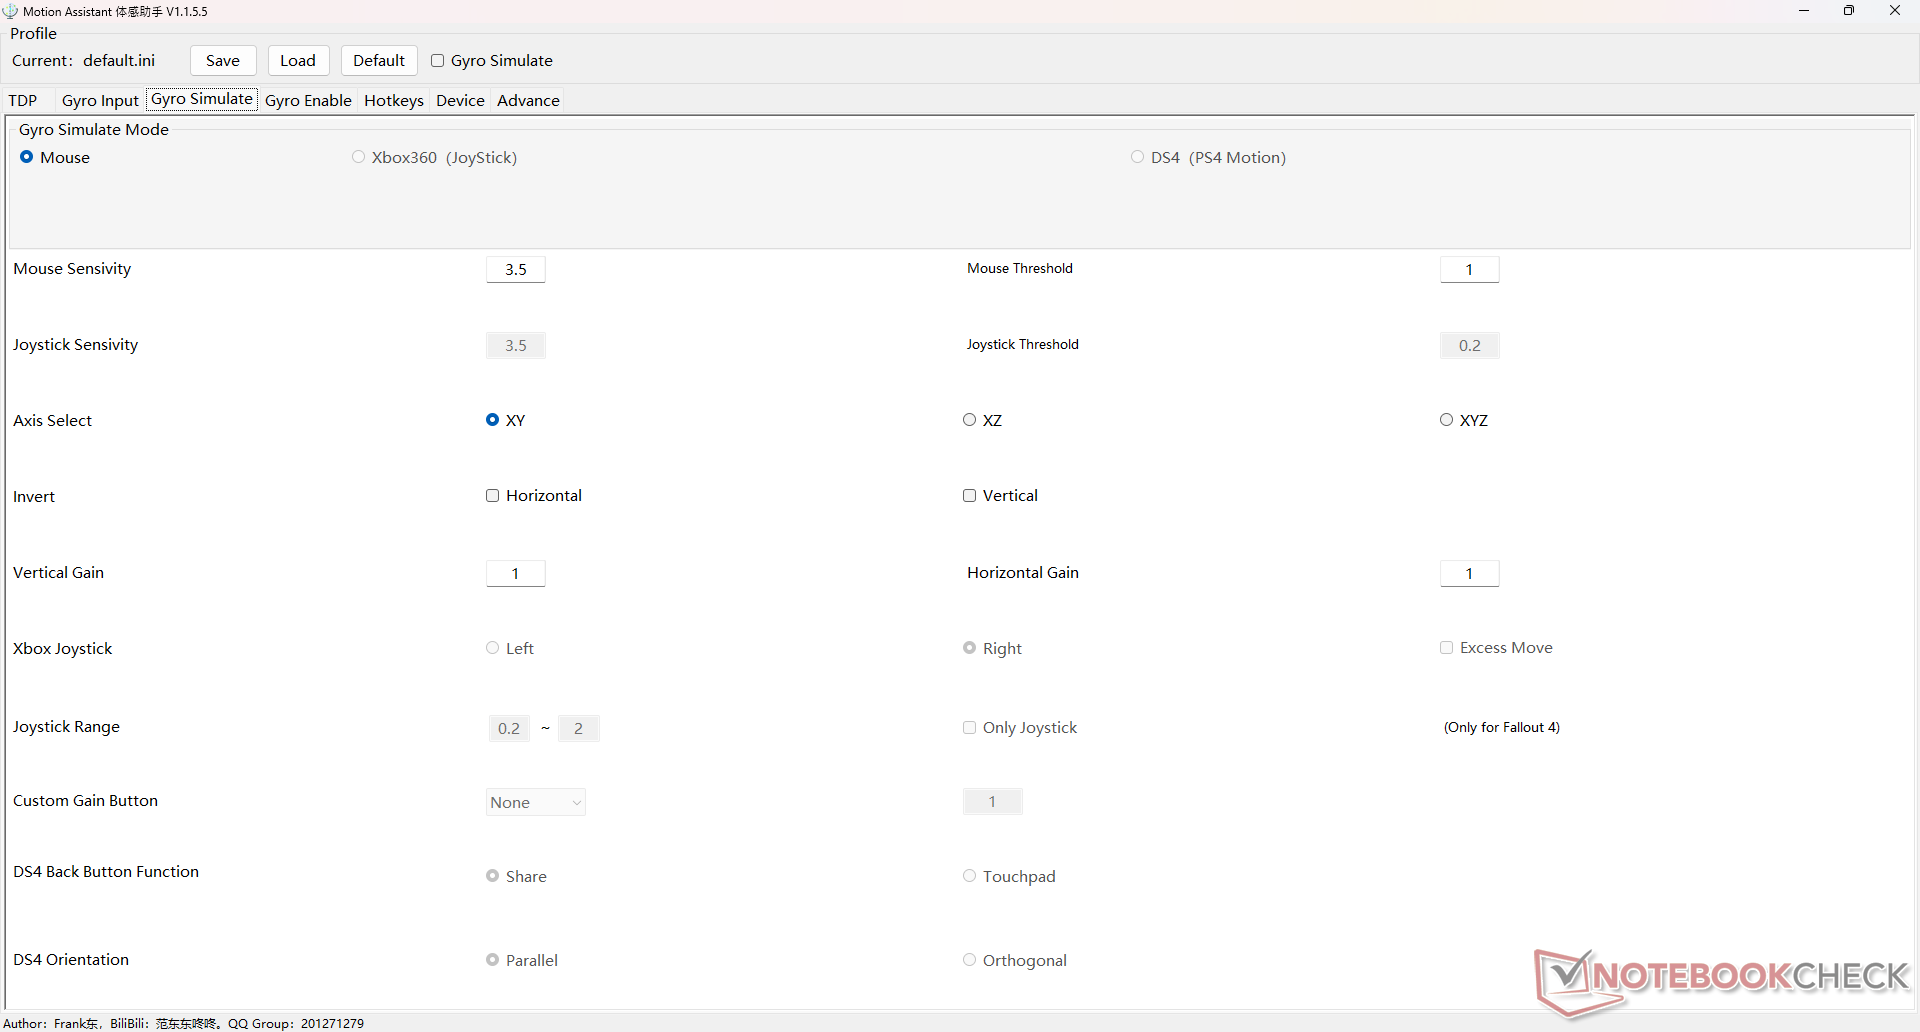
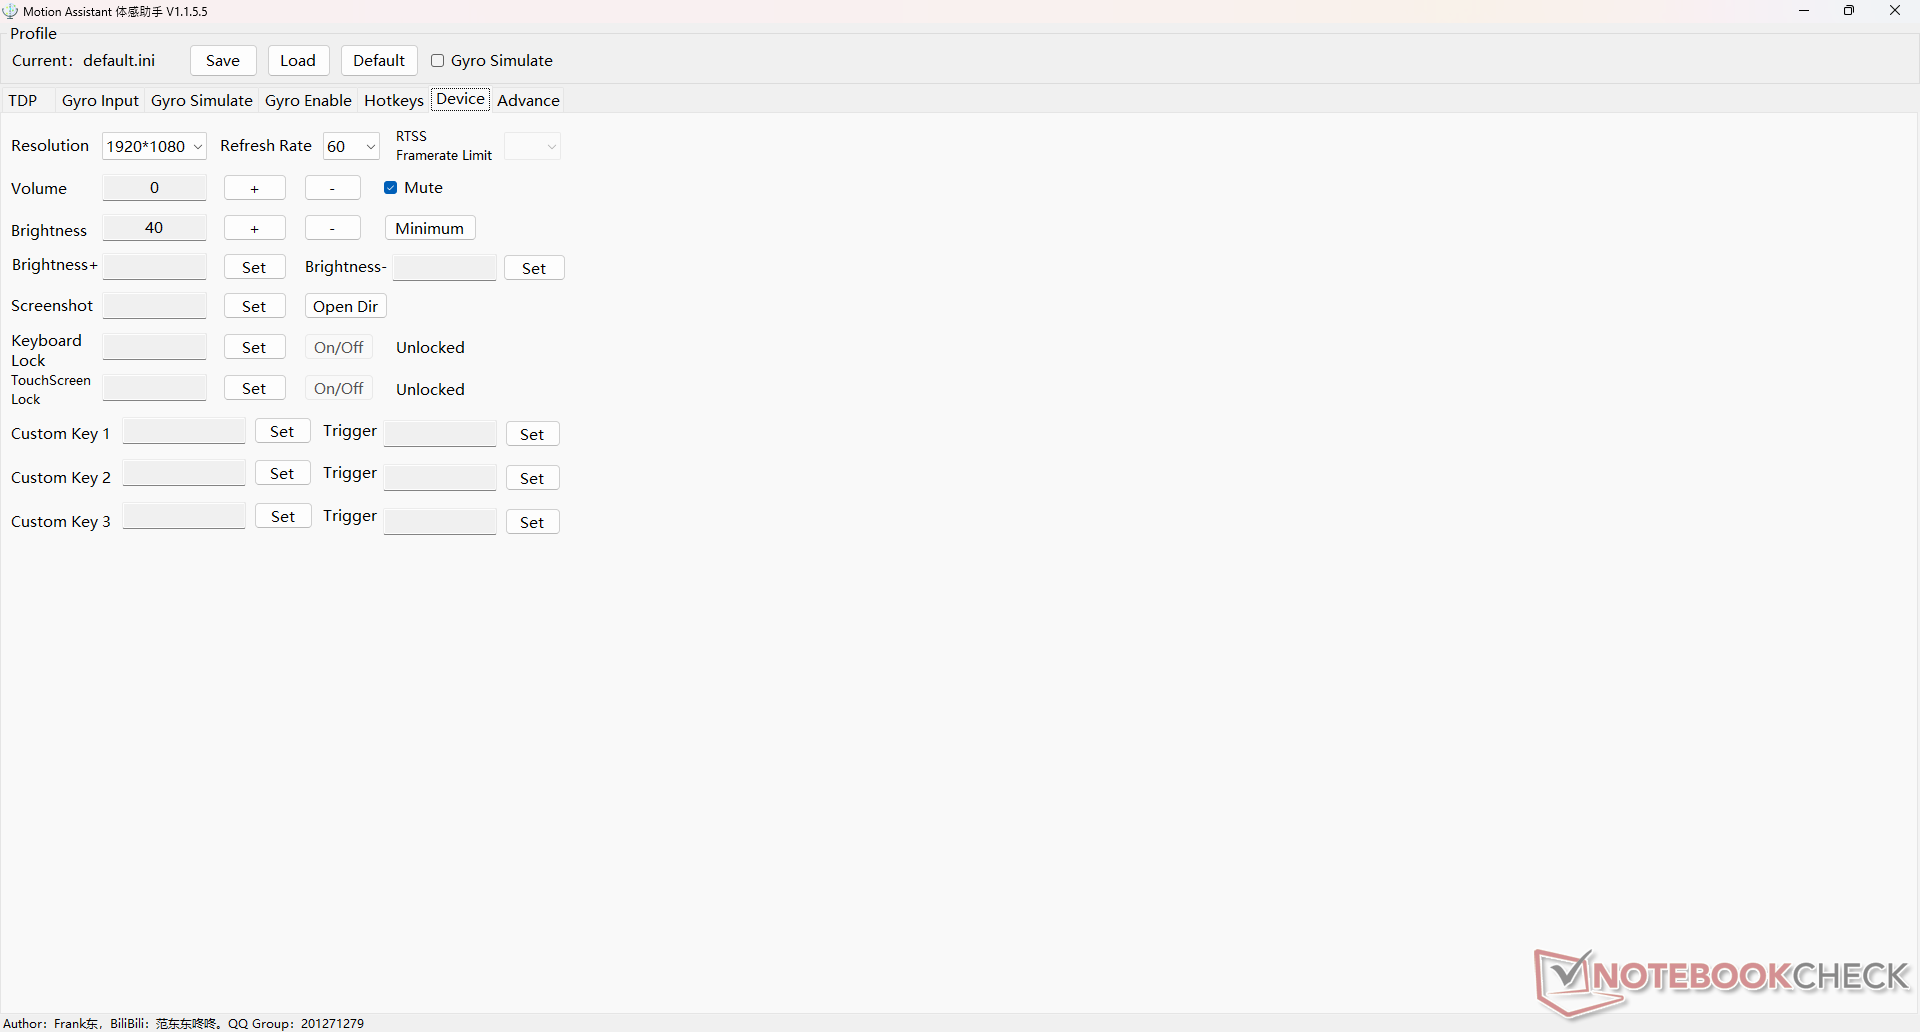
Przed uruchomieniem poniższych benchmarków ustawiliśmy system Windows na tryb Performance, a Motion Assistant na 28 W. Zalecamy, aby użytkownicy przyzwyczaili się do Motion Assistant, ponieważ jest to oprogramowanie centrum sterowania dla Win 4. Poniższe zrzuty ekranu pokazują opcje, które Motion Assistant ma do zaoferowania.
Procesor
Na stronie Ryzen 7 6800U to jeden z najszybszych procesorów z serii U na rynku. Jest to ten sam procesor, który zasila wiele najnowszych ultrabooków, m.in.Lenovo Yoga 7 14 lubHP EliteBook 845 G9. Surowa wydajność wielowątkowa jest ponad 2x szybsza niż w przypadkuCore i5-1135G7 w poprzedniej generacji GPD Win 3.
Zrównoważenie wydajności mogłoby być jednak nieco lepsze. Uruchomienie CineBench R15 xT w pętli spowodowałoby początkowy wynik 1776 punktów, po czym stały spadek i ustabilizowanie się na poziomie 18-procentowego deficytu wydajności. Na stronieAsus Zenbook S13który posiada ten sam procesor, jest w stanie utrzymać wyższe częstotliwości taktowania przez dłuższy czas.
Cinebench R15 Multi Loop
Cinebench R23: Multi Core | Single Core
Cinebench R20: CPU (Multi Core) | CPU (Single Core)
Cinebench R15: CPU Multi 64Bit | CPU Single 64Bit
Blender: v2.79 BMW27 CPU
7-Zip 18.03: 7z b 4 | 7z b 4 -mmt1
Geekbench 5.5: Multi-Core | Single-Core
HWBOT x265 Benchmark v2.2: 4k Preset
LibreOffice : 20 Documents To PDF
R Benchmark 2.5: Overall mean
| CPU Performance rating | |
| Razer Blade 14 Ryzen 9 6900HX | |
| HP Spectre x360 2-in-1 16-f1075ng | |
| MSI Summit E16 Flip A12UDT-031 | |
| Lenovo Slim 7 Pro X 14ARH7 | |
| GPD Win 4 | |
| Asus Zenbook S 13 OLED | |
| HP Spectre x360 13.5 14t-ef000 | |
| Przeciętny AMD Ryzen 7 6800U | |
| GPD Win Max 2 | |
| HP Pavilion Aero 13 be0097nr -2! | |
| Dell XPS 13 9315 2-in-1 Core i5-1230U | |
| Razer Blade Stealth i7-1165G7 GTX 1650 Ti Max-Q -2! | |
| GPD Win 3 | |
| Infinix INBook X2 | |
| Cinebench R23 / Multi Core | |
| MSI Summit E16 Flip A12UDT-031 | |
| Razer Blade 14 Ryzen 9 6900HX | |
| Lenovo Slim 7 Pro X 14ARH7 | |
| HP Spectre x360 2-in-1 16-f1075ng | |
| Przeciętny AMD Ryzen 7 6800U (9130 - 11741, n=7) | |
| GPD Win 4 | |
| Asus Zenbook S 13 OLED | |
| HP Spectre x360 13.5 14t-ef000 | |
| HP Pavilion Aero 13 be0097nr | |
| Dell XPS 13 9315 2-in-1 Core i5-1230U | |
| GPD Win Max 2 | |
| GPD Win 3 | |
| Infinix INBook X2 | |
| Cinebench R23 / Single Core | |
| HP Spectre x360 2-in-1 16-f1075ng | |
| GPD Win Max 2 | |
| HP Spectre x360 13.5 14t-ef000 | |
| MSI Summit E16 Flip A12UDT-031 | |
| Lenovo Slim 7 Pro X 14ARH7 | |
| GPD Win 4 | |
| Razer Blade 14 Ryzen 9 6900HX | |
| Dell XPS 13 9315 2-in-1 Core i5-1230U | |
| Asus Zenbook S 13 OLED | |
| Przeciętny AMD Ryzen 7 6800U (878 - 1534, n=7) | |
| HP Pavilion Aero 13 be0097nr | |
| GPD Win 3 | |
| Infinix INBook X2 | |
| Cinebench R20 / CPU (Multi Core) | |
| Razer Blade 14 Ryzen 9 6900HX | |
| MSI Summit E16 Flip A12UDT-031 | |
| Lenovo Slim 7 Pro X 14ARH7 | |
| HP Spectre x360 2-in-1 16-f1075ng | |
| Przeciętny AMD Ryzen 7 6800U (3529 - 4574, n=8) | |
| GPD Win 4 | |
| Asus Zenbook S 13 OLED | |
| HP Spectre x360 13.5 14t-ef000 | |
| HP Pavilion Aero 13 be0097nr | |
| Dell XPS 13 9315 2-in-1 Core i5-1230U | |
| GPD Win Max 2 | |
| Razer Blade Stealth i7-1165G7 GTX 1650 Ti Max-Q | |
| GPD Win 3 | |
| Infinix INBook X2 | |
| Cinebench R20 / CPU (Single Core) | |
| HP Spectre x360 2-in-1 16-f1075ng | |
| GPD Win Max 2 | |
| HP Spectre x360 13.5 14t-ef000 | |
| MSI Summit E16 Flip A12UDT-031 | |
| Lenovo Slim 7 Pro X 14ARH7 | |
| GPD Win 4 | |
| Razer Blade 14 Ryzen 9 6900HX | |
| Dell XPS 13 9315 2-in-1 Core i5-1230U | |
| Razer Blade Stealth i7-1165G7 GTX 1650 Ti Max-Q | |
| Asus Zenbook S 13 OLED | |
| Przeciętny AMD Ryzen 7 6800U (341 - 602, n=8) | |
| HP Pavilion Aero 13 be0097nr | |
| GPD Win 3 | |
| Infinix INBook X2 | |
| Cinebench R15 / CPU Multi 64Bit | |
| MSI Summit E16 Flip A12UDT-031 | |
| Razer Blade 14 Ryzen 9 6900HX | |
| HP Spectre x360 2-in-1 16-f1075ng | |
| Lenovo Slim 7 Pro X 14ARH7 | |
| GPD Win 4 | |
| Przeciętny AMD Ryzen 7 6800U (1463 - 1979, n=7) | |
| Asus Zenbook S 13 OLED | |
| HP Spectre x360 13.5 14t-ef000 | |
| HP Pavilion Aero 13 be0097nr | |
| Dell XPS 13 9315 2-in-1 Core i5-1230U | |
| GPD Win Max 2 | |
| Razer Blade Stealth i7-1165G7 GTX 1650 Ti Max-Q | |
| GPD Win 3 | |
| Infinix INBook X2 | |
| Cinebench R15 / CPU Single 64Bit | |
| HP Spectre x360 2-in-1 16-f1075ng | |
| GPD Win Max 2 | |
| HP Spectre x360 13.5 14t-ef000 | |
| GPD Win 4 | |
| Razer Blade 14 Ryzen 9 6900HX | |
| MSI Summit E16 Flip A12UDT-031 | |
| Asus Zenbook S 13 OLED | |
| HP Pavilion Aero 13 be0097nr | |
| Przeciętny AMD Ryzen 7 6800U (142.6 - 246, n=6) | |
| Dell XPS 13 9315 2-in-1 Core i5-1230U | |
| Razer Blade Stealth i7-1165G7 GTX 1650 Ti Max-Q | |
| Lenovo Slim 7 Pro X 14ARH7 | |
| GPD Win 3 | |
| Infinix INBook X2 | |
| Blender / v2.79 BMW27 CPU | |
| Infinix INBook X2 | |
| GPD Win 3 | |
| Razer Blade Stealth i7-1165G7 GTX 1650 Ti Max-Q | |
| Dell XPS 13 9315 2-in-1 Core i5-1230U | |
| GPD Win Max 2 | |
| HP Spectre x360 13.5 14t-ef000 | |
| HP Pavilion Aero 13 be0097nr | |
| Asus Zenbook S 13 OLED | |
| MSI Summit E16 Flip A12UDT-031 | |
| GPD Win 4 | |
| Przeciętny AMD Ryzen 7 6800U (272 - 347, n=7) | |
| Lenovo Slim 7 Pro X 14ARH7 | |
| HP Spectre x360 2-in-1 16-f1075ng | |
| Razer Blade 14 Ryzen 9 6900HX | |
| 7-Zip 18.03 / 7z b 4 | |
| Razer Blade 14 Ryzen 9 6900HX | |
| Lenovo Slim 7 Pro X 14ARH7 | |
| GPD Win 4 | |
| Przeciętny AMD Ryzen 7 6800U (40058 - 53934, n=6) | |
| Asus Zenbook S 13 OLED | |
| HP Spectre x360 2-in-1 16-f1075ng | |
| MSI Summit E16 Flip A12UDT-031 | |
| HP Pavilion Aero 13 be0097nr | |
| HP Spectre x360 13.5 14t-ef000 | |
| Dell XPS 13 9315 2-in-1 Core i5-1230U | |
| GPD Win Max 2 | |
| Razer Blade Stealth i7-1165G7 GTX 1650 Ti Max-Q | |
| GPD Win 3 | |
| Infinix INBook X2 | |
| 7-Zip 18.03 / 7z b 4 -mmt1 | |
| HP Spectre x360 2-in-1 16-f1075ng | |
| Razer Blade 14 Ryzen 9 6900HX | |
| GPD Win Max 2 | |
| Lenovo Slim 7 Pro X 14ARH7 | |
| GPD Win 4 | |
| HP Spectre x360 13.5 14t-ef000 | |
| Asus Zenbook S 13 OLED | |
| HP Pavilion Aero 13 be0097nr | |
| Razer Blade Stealth i7-1165G7 GTX 1650 Ti Max-Q | |
| MSI Summit E16 Flip A12UDT-031 | |
| Przeciętny AMD Ryzen 7 6800U (3398 - 5511, n=6) | |
| Dell XPS 13 9315 2-in-1 Core i5-1230U | |
| GPD Win 3 | |
| Infinix INBook X2 | |
| Geekbench 5.5 / Multi-Core | |
| Razer Blade 14 Ryzen 9 6900HX | |
| MSI Summit E16 Flip A12UDT-031 | |
| Lenovo Slim 7 Pro X 14ARH7 | |
| HP Spectre x360 2-in-1 16-f1075ng | |
| HP Spectre x360 13.5 14t-ef000 | |
| GPD Win 4 | |
| Przeciętny AMD Ryzen 7 6800U (6854 - 8935, n=9) | |
| Asus Zenbook S 13 OLED | |
| Dell XPS 13 9315 2-in-1 Core i5-1230U | |
| GPD Win Max 2 | |
| Razer Blade Stealth i7-1165G7 GTX 1650 Ti Max-Q | |
| GPD Win 3 | |
| Infinix INBook X2 | |
| Geekbench 5.5 / Single-Core | |
| HP Spectre x360 2-in-1 16-f1075ng | |
| GPD Win Max 2 | |
| HP Spectre x360 13.5 14t-ef000 | |
| MSI Summit E16 Flip A12UDT-031 | |
| Lenovo Slim 7 Pro X 14ARH7 | |
| Razer Blade 14 Ryzen 9 6900HX | |
| Razer Blade Stealth i7-1165G7 GTX 1650 Ti Max-Q | |
| GPD Win 4 | |
| Dell XPS 13 9315 2-in-1 Core i5-1230U | |
| Asus Zenbook S 13 OLED | |
| Przeciętny AMD Ryzen 7 6800U (926 - 1555, n=9) | |
| GPD Win 3 | |
| Infinix INBook X2 | |
| HWBOT x265 Benchmark v2.2 / 4k Preset | |
| Razer Blade 14 Ryzen 9 6900HX | |
| Lenovo Slim 7 Pro X 14ARH7 | |
| HP Spectre x360 2-in-1 16-f1075ng | |
| Przeciętny AMD Ryzen 7 6800U (11.8 - 14.2, n=6) | |
| GPD Win 4 | |
| Asus Zenbook S 13 OLED | |
| MSI Summit E16 Flip A12UDT-031 | |
| HP Pavilion Aero 13 be0097nr | |
| HP Spectre x360 13.5 14t-ef000 | |
| Dell XPS 13 9315 2-in-1 Core i5-1230U | |
| GPD Win Max 2 | |
| Razer Blade Stealth i7-1165G7 GTX 1650 Ti Max-Q | |
| GPD Win 3 | |
| Infinix INBook X2 | |
| LibreOffice / 20 Documents To PDF | |
| Infinix INBook X2 | |
| Przeciętny AMD Ryzen 7 6800U (50.1 - 84.9, n=6) | |
| Asus Zenbook S 13 OLED | |
| HP Pavilion Aero 13 be0097nr | |
| MSI Summit E16 Flip A12UDT-031 | |
| Dell XPS 13 9315 2-in-1 Core i5-1230U | |
| GPD Win 4 | |
| Razer Blade 14 Ryzen 9 6900HX | |
| Razer Blade Stealth i7-1165G7 GTX 1650 Ti Max-Q | |
| GPD Win 3 | |
| Lenovo Slim 7 Pro X 14ARH7 | |
| HP Spectre x360 13.5 14t-ef000 | |
| GPD Win Max 2 | |
| HP Spectre x360 2-in-1 16-f1075ng | |
| R Benchmark 2.5 / Overall mean | |
| Infinix INBook X2 | |
| GPD Win 3 | |
| Razer Blade Stealth i7-1165G7 GTX 1650 Ti Max-Q | |
| HP Pavilion Aero 13 be0097nr | |
| Asus Zenbook S 13 OLED | |
| Dell XPS 13 9315 2-in-1 Core i5-1230U | |
| GPD Win 4 | |
| Przeciętny AMD Ryzen 7 6800U (0.508 - 0.529, n=5) | |
| MSI Summit E16 Flip A12UDT-031 | |
| Lenovo Slim 7 Pro X 14ARH7 | |
| HP Spectre x360 13.5 14t-ef000 | |
| Razer Blade 14 Ryzen 9 6900HX | |
| HP Spectre x360 2-in-1 16-f1075ng | |
| GPD Win Max 2 | |
Cinebench R23: Multi Core | Single Core
Cinebench R20: CPU (Multi Core) | CPU (Single Core)
Cinebench R15: CPU Multi 64Bit | CPU Single 64Bit
Blender: v2.79 BMW27 CPU
7-Zip 18.03: 7z b 4 | 7z b 4 -mmt1
Geekbench 5.5: Multi-Core | Single-Core
HWBOT x265 Benchmark v2.2: 4k Preset
LibreOffice : 20 Documents To PDF
R Benchmark 2.5: Overall mean
* ... im mniej tym lepiej
AIDA64: FP32 Ray-Trace | FPU Julia | CPU SHA3 | CPU Queen | FPU SinJulia | FPU Mandel | CPU AES | CPU ZLib | FP64 Ray-Trace | CPU PhotoWorxx
| Performance rating | |
| Przeciętny AMD Ryzen 7 6800U | |
| GPD Win 4 | |
| Asus Zenbook S 13 OLED | |
| Dell XPS 13 9315 2-in-1 Core i5-1230U | |
| GPD Win Max 2 | |
| AIDA64 / FP32 Ray-Trace | |
| Przeciętny AMD Ryzen 7 6800U (10902 - 12818, n=6) | |
| GPD Win 4 | |
| Asus Zenbook S 13 OLED | |
| Dell XPS 13 9315 2-in-1 Core i5-1230U | |
| GPD Win Max 2 | |
| AIDA64 / FPU Julia | |
| Przeciętny AMD Ryzen 7 6800U (67503 - 84031, n=6) | |
| GPD Win 4 | |
| Asus Zenbook S 13 OLED | |
| Dell XPS 13 9315 2-in-1 Core i5-1230U | |
| GPD Win Max 2 | |
| AIDA64 / CPU SHA3 | |
| Przeciętny AMD Ryzen 7 6800U (2296 - 2818, n=6) | |
| GPD Win 4 | |
| Asus Zenbook S 13 OLED | |
| Dell XPS 13 9315 2-in-1 Core i5-1230U | |
| GPD Win Max 2 | |
| AIDA64 / CPU Queen | |
| GPD Win 4 | |
| Przeciętny AMD Ryzen 7 6800U (62082 - 96306, n=6) | |
| Asus Zenbook S 13 OLED | |
| GPD Win Max 2 | |
| Dell XPS 13 9315 2-in-1 Core i5-1230U | |
| AIDA64 / FPU SinJulia | |
| GPD Win 4 | |
| Przeciętny AMD Ryzen 7 6800U (7753 - 11982, n=6) | |
| Asus Zenbook S 13 OLED | |
| GPD Win Max 2 | |
| Dell XPS 13 9315 2-in-1 Core i5-1230U | |
| AIDA64 / FPU Mandel | |
| Przeciętny AMD Ryzen 7 6800U (37417 - 45748, n=6) | |
| GPD Win 4 | |
| Asus Zenbook S 13 OLED | |
| Dell XPS 13 9315 2-in-1 Core i5-1230U | |
| GPD Win Max 2 | |
| AIDA64 / CPU AES | |
| GPD Win 4 | |
| Asus Zenbook S 13 OLED | |
| Przeciętny AMD Ryzen 7 6800U (50547 - 115681, n=6) | |
| GPD Win Max 2 | |
| Dell XPS 13 9315 2-in-1 Core i5-1230U | |
| AIDA64 / CPU ZLib | |
| Przeciętny AMD Ryzen 7 6800U (554 - 755, n=6) | |
| GPD Win 4 | |
| Asus Zenbook S 13 OLED | |
| GPD Win Max 2 | |
| Dell XPS 13 9315 2-in-1 Core i5-1230U | |
| AIDA64 / FP64 Ray-Trace | |
| Przeciętny AMD Ryzen 7 6800U (5825 - 6694, n=6) | |
| GPD Win 4 | |
| Asus Zenbook S 13 OLED | |
| Dell XPS 13 9315 2-in-1 Core i5-1230U | |
| GPD Win Max 2 | |
| AIDA64 / CPU PhotoWorxx | |
| Dell XPS 13 9315 2-in-1 Core i5-1230U | |
| GPD Win Max 2 | |
| GPD Win 4 | |
| Przeciętny AMD Ryzen 7 6800U (24728 - 27274, n=6) | |
| Asus Zenbook S 13 OLED | |
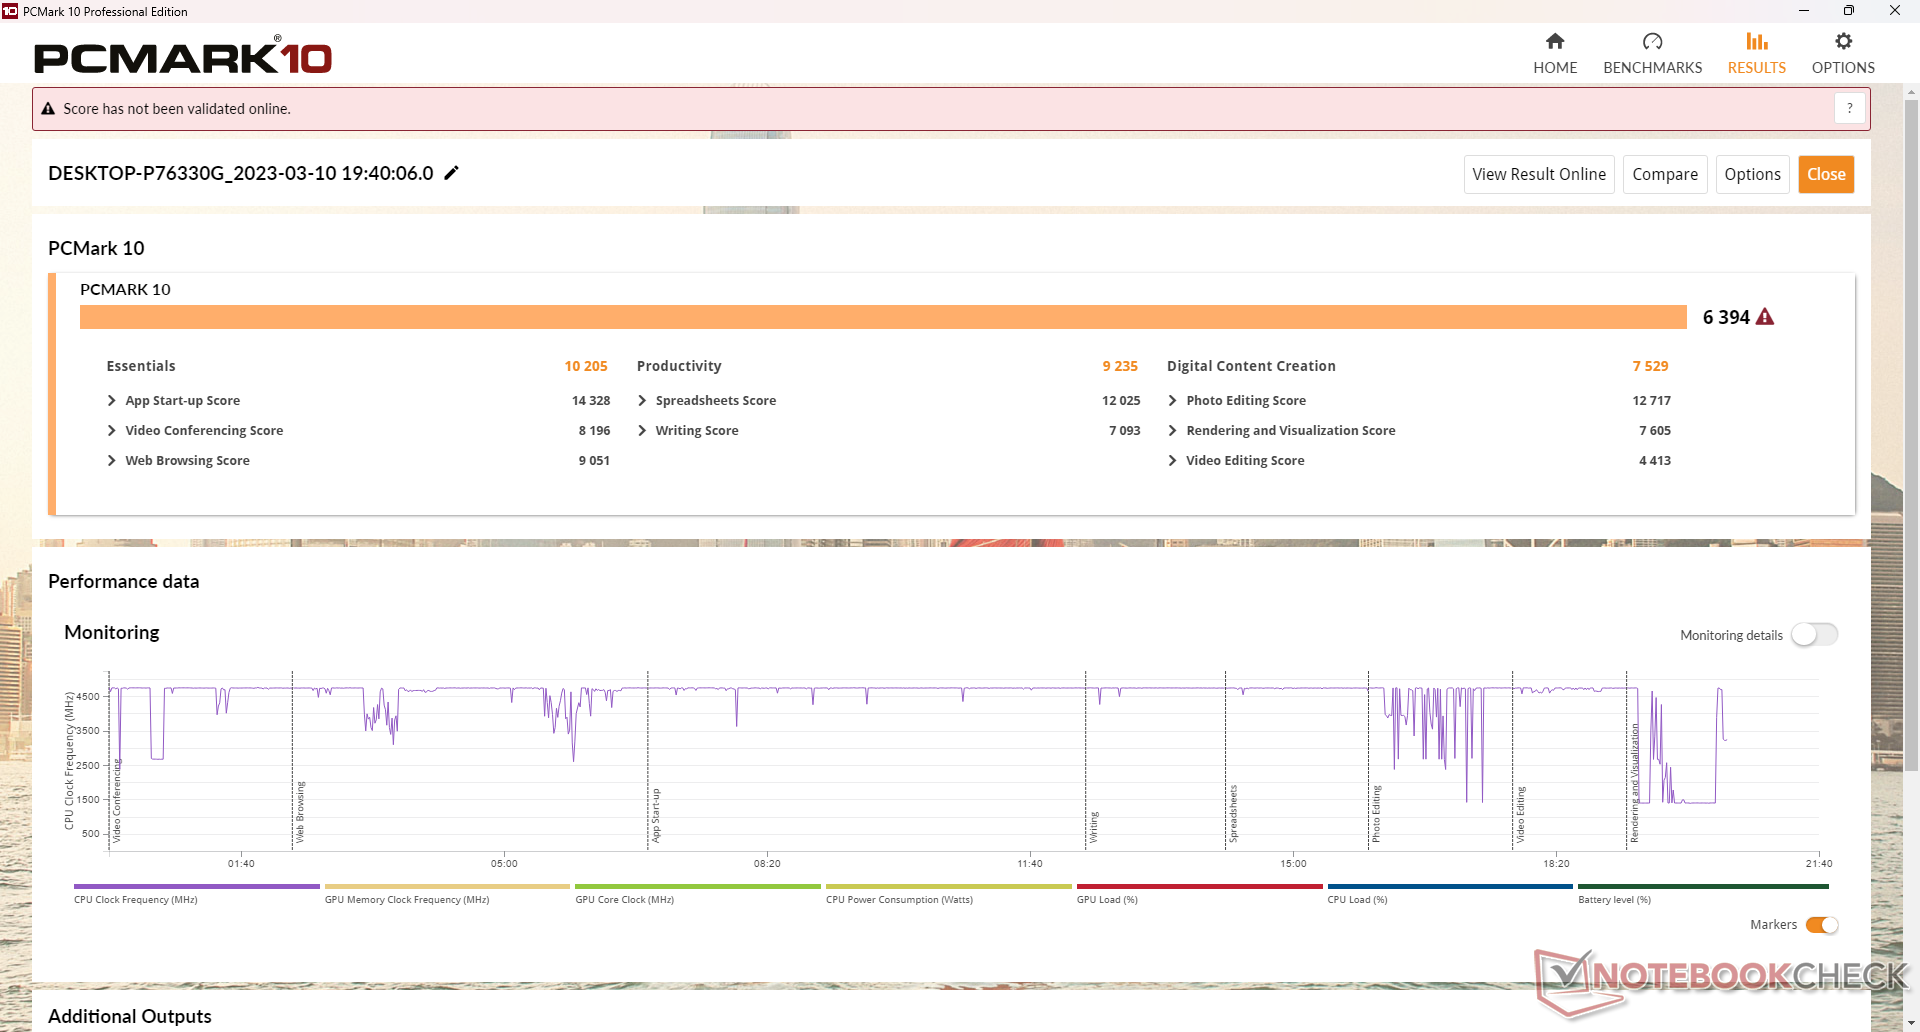
Wydajność systemu
Wyniki PCMark 10 są porównywalne z najnowszymi Ultrabookami napędzanymi serią U, a jednocześnie znacznie wyprzedzają starszego Win 3.
CrossMark: Overall | Productivity | Creativity | Responsiveness
| PCMark 10 / Score | |
| GPD Win 4 | |
| Asus Zenbook S 13 OLED | |
| Przeciętny AMD Ryzen 7 6800U, AMD Radeon 680M (5057 - 6639, n=7) | |
| Razer Blade Stealth i7-1165G7 GTX 1650 Ti Max-Q | |
| GPD Win Max 2 | |
| Dell XPS 13 9315 2-in-1 Core i5-1230U | |
| GPD Win 3 | |
| PCMark 10 / Essentials | |
| GPD Win Max 2 | |
| Asus Zenbook S 13 OLED | |
| GPD Win 4 | |
| Dell XPS 13 9315 2-in-1 Core i5-1230U | |
| Przeciętny AMD Ryzen 7 6800U, AMD Radeon 680M (8143 - 10766, n=6) | |
| GPD Win 3 | |
| Razer Blade Stealth i7-1165G7 GTX 1650 Ti Max-Q | |
| PCMark 10 / Productivity | |
| GPD Win 4 | |
| Asus Zenbook S 13 OLED | |
| Razer Blade Stealth i7-1165G7 GTX 1650 Ti Max-Q | |
| Przeciętny AMD Ryzen 7 6800U, AMD Radeon 680M (6089 - 9328, n=6) | |
| GPD Win Max 2 | |
| Dell XPS 13 9315 2-in-1 Core i5-1230U | |
| GPD Win 3 | |
| PCMark 10 / Digital Content Creation | |
| GPD Win 4 | |
| Przeciętny AMD Ryzen 7 6800U, AMD Radeon 680M (6066 - 8144, n=6) | |
| Asus Zenbook S 13 OLED | |
| Razer Blade Stealth i7-1165G7 GTX 1650 Ti Max-Q | |
| GPD Win Max 2 | |
| Dell XPS 13 9315 2-in-1 Core i5-1230U | |
| GPD Win 3 | |
| CrossMark / Overall | |
| GPD Win Max 2 | |
| GPD Win 4 | |
| Asus Zenbook S 13 OLED | |
| Przeciętny AMD Ryzen 7 6800U, AMD Radeon 680M (1009 - 1575, n=7) | |
| Dell XPS 13 9315 2-in-1 Core i5-1230U | |
| CrossMark / Productivity | |
| GPD Win Max 2 | |
| GPD Win 4 | |
| Asus Zenbook S 13 OLED | |
| Przeciętny AMD Ryzen 7 6800U, AMD Radeon 680M (971 - 1596, n=7) | |
| Dell XPS 13 9315 2-in-1 Core i5-1230U | |
| CrossMark / Creativity | |
| GPD Win Max 2 | |
| GPD Win 4 | |
| Asus Zenbook S 13 OLED | |
| Przeciętny AMD Ryzen 7 6800U, AMD Radeon 680M (1054 - 1686, n=7) | |
| Dell XPS 13 9315 2-in-1 Core i5-1230U | |
| CrossMark / Responsiveness | |
| GPD Win Max 2 | |
| GPD Win 4 | |
| Przeciętny AMD Ryzen 7 6800U, AMD Radeon 680M (994 - 1473, n=7) | |
| Asus Zenbook S 13 OLED | |
| Dell XPS 13 9315 2-in-1 Core i5-1230U | |
| PCMark 10 Score | 6394 pkt. | |
Pomoc | ||
| AIDA64 / Memory Copy | |
| GPD Win Max 2 | |
| Dell XPS 13 9315 2-in-1 Core i5-1230U | |
| GPD Win 4 | |
| Przeciętny AMD Ryzen 7 6800U (47010 - 52159, n=6) | |
| Asus Zenbook S 13 OLED | |
| AIDA64 / Memory Read | |
| GPD Win Max 2 | |
| Dell XPS 13 9315 2-in-1 Core i5-1230U | |
| GPD Win 4 | |
| Przeciętny AMD Ryzen 7 6800U (39197 - 45084, n=6) | |
| Asus Zenbook S 13 OLED | |
| AIDA64 / Memory Write | |
| Dell XPS 13 9315 2-in-1 Core i5-1230U | |
| GPD Win Max 2 | |
| GPD Win 4 | |
| Przeciętny AMD Ryzen 7 6800U (48723 - 51117, n=6) | |
| Asus Zenbook S 13 OLED | |
| AIDA64 / Memory Latency | |
| Asus Zenbook S 13 OLED | |
| Przeciętny AMD Ryzen 7 6800U (106.3 - 123.1, n=6) | |
| GPD Win 4 | |
| GPD Win Max 2 | |
| Dell XPS 13 9315 2-in-1 Core i5-1230U | |
* ... im mniej tym lepiej
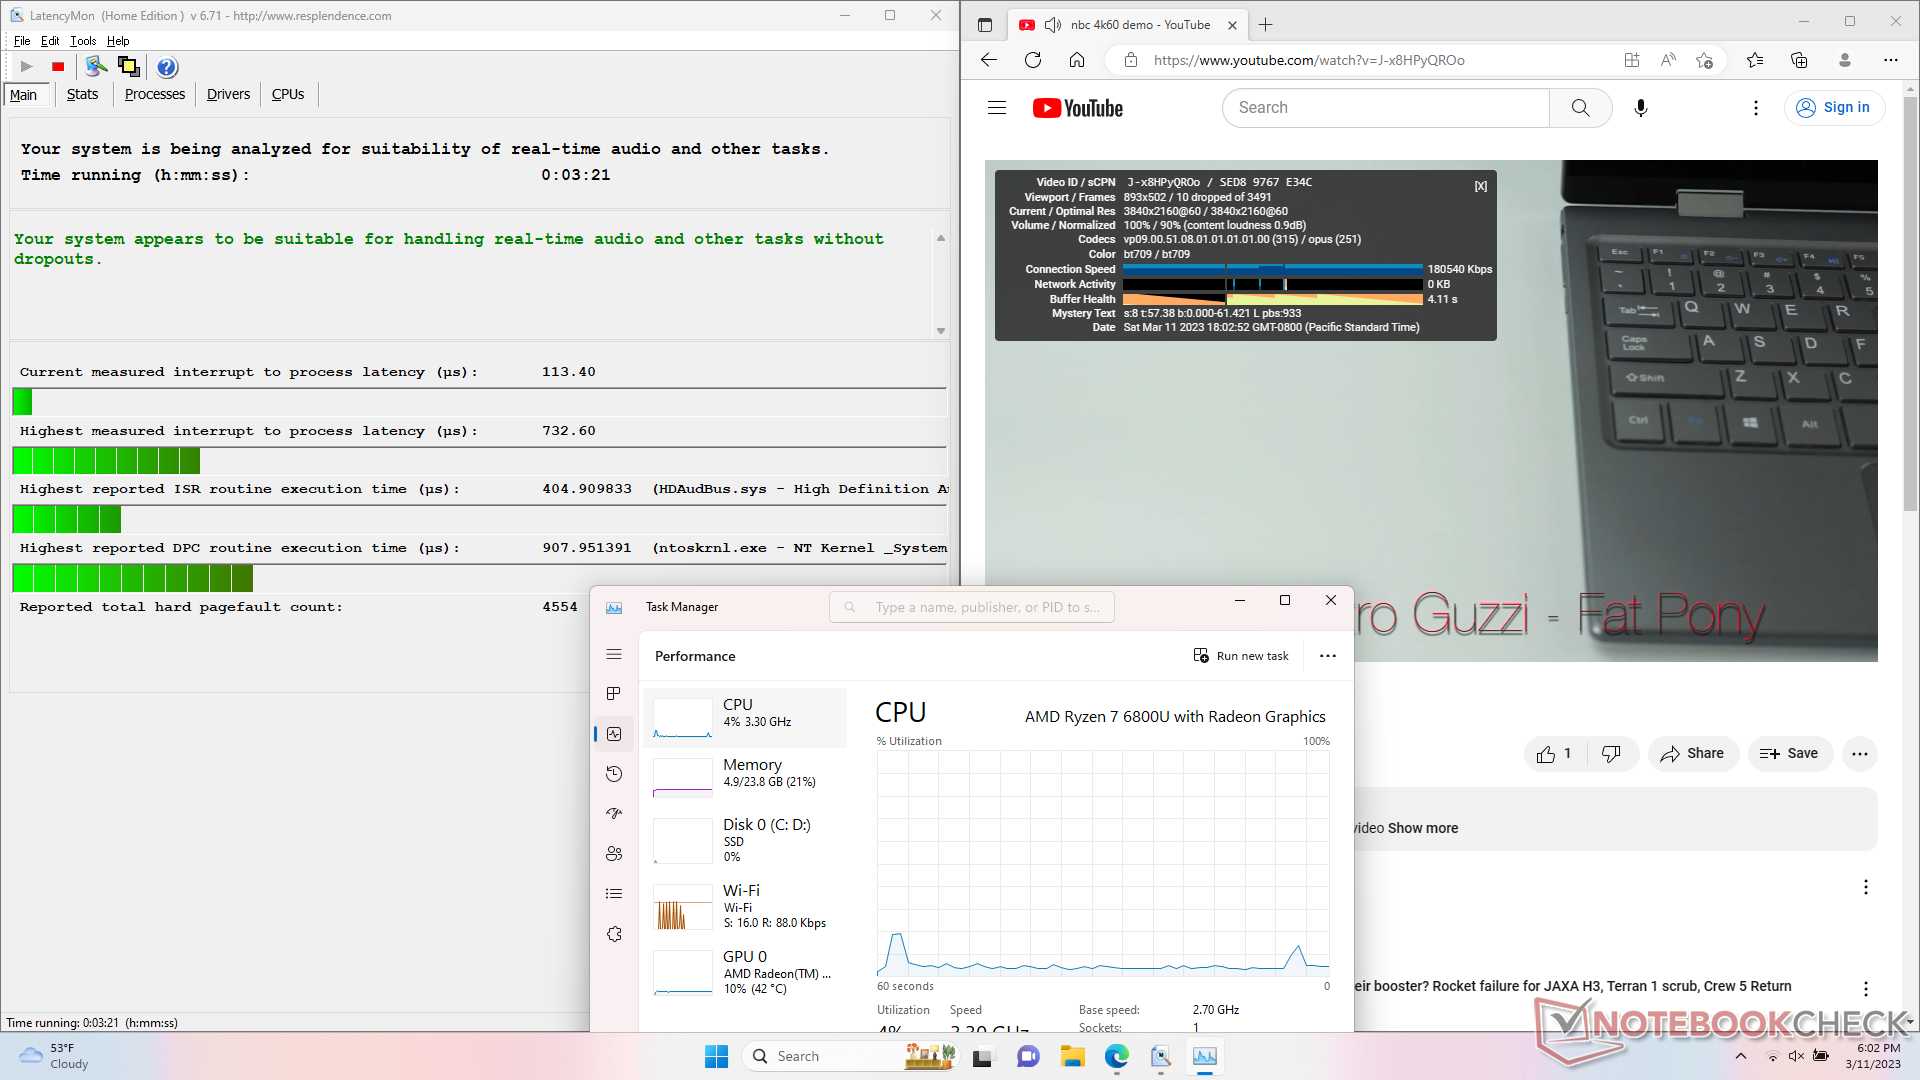
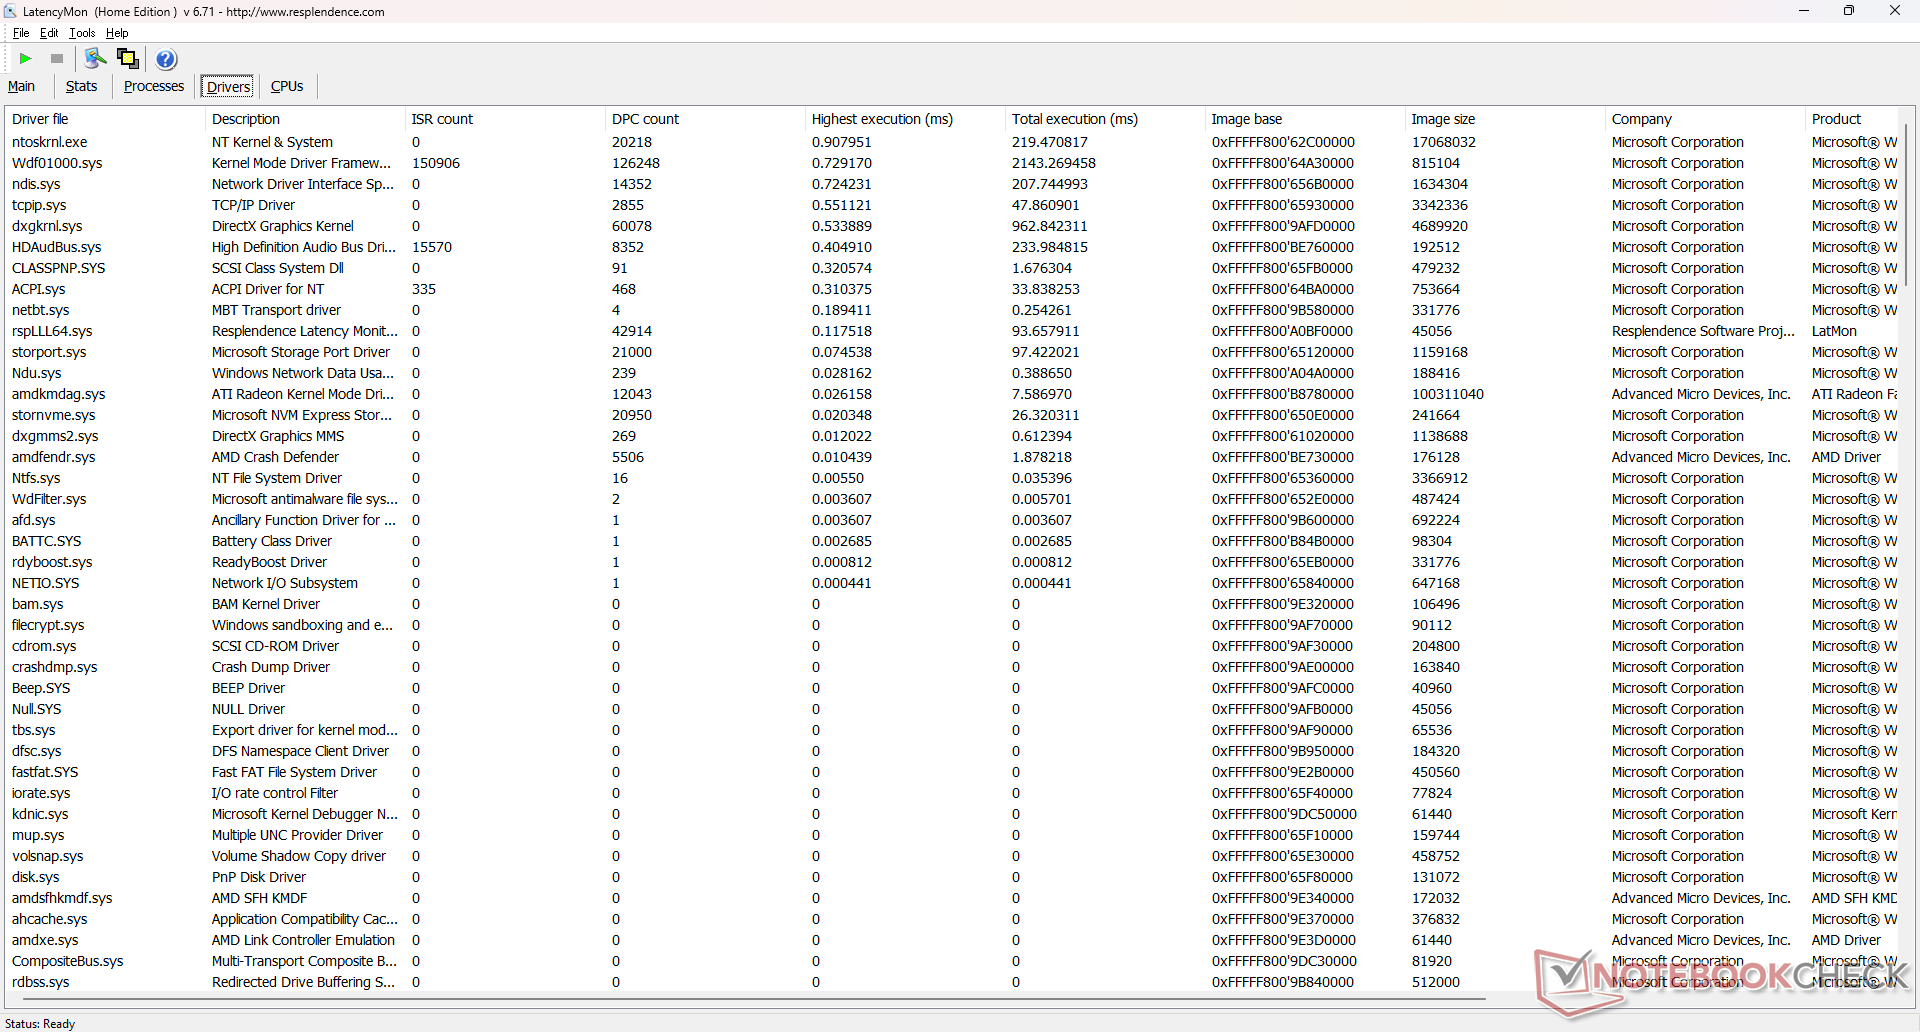
Opóźnienie DPC
LatencyMon nie wykazuje większych problemów z DPC podczas otwierania wielu kart przeglądarki na naszej stronie głównej. Udało nam się jednak zarejestrować kilka spadków klatek podczas testu odtwarzania wideo w rozdzielczości 4K60, nawet po wielokrotnym ponawianiu prób. Spadki są rzadkie i w większości niezauważalne, ale nie powinny mieć miejsca, biorąc pod uwagę sprzęt.
| DPC Latencies / LatencyMon - interrupt to process latency (max), Web, Youtube, Prime95 | |
| Dell XPS 13 9315 2-in-1 Core i5-1230U | |
| Razer Blade Stealth i7-1165G7 GTX 1650 Ti Max-Q | |
| GPD Win 3 | |
| GPD Win 4 | |
| Asus Zenbook S 13 OLED | |
| GPD Win Max 2 | |
* ... im mniej tym lepiej
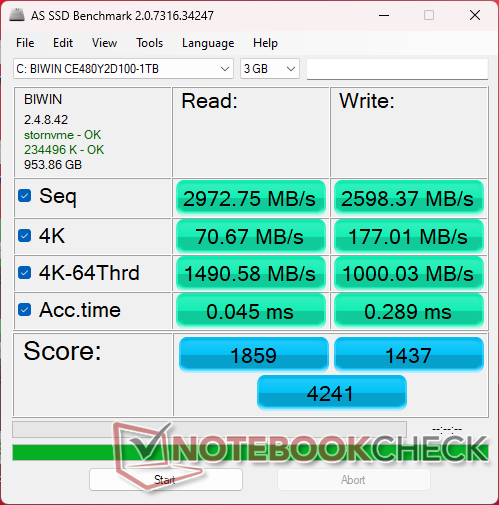
Urządzenia do przechowywania danych
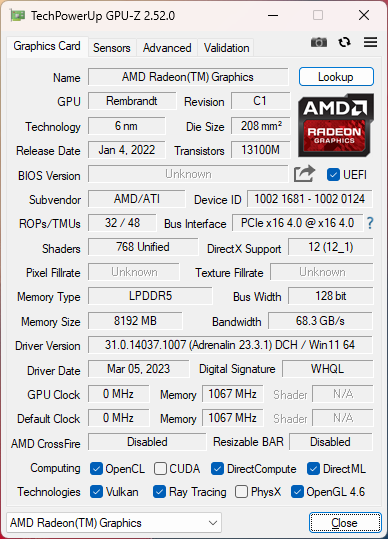
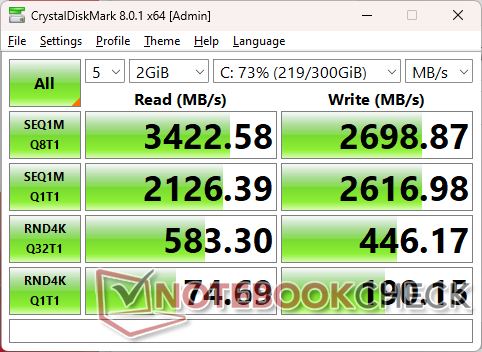
Chociaż chipset płyty głównej obsługuje dyski PCIe4 x4 M.2 2280 NVMe, urządzenie jest dostarczane z wolniejszym dyskiem PCIe3. Nie jest to problem, gdyż model ten nie posiada rozpraszacza ciepła dla dysku SSD, a więc szybki dysk PCIe4 x4 prawdopodobnie i tak dławiłby się pod obciążeniem. Strona 1 TB Biwin PCIe3 SSD w naszym urządzeniu nie wykazuje dławienia wydajności w czasie.

| Drive Performance rating - Percent | |
| Asus Zenbook S 13 OLED | |
| GPD Win Max 2 | |
| GPD Win 4 | |
| GPD Win 3 | |
| Razer Blade Stealth i7-1165G7 GTX 1650 Ti Max-Q | |
| Dell XPS 13 9315 2-in-1 Core i5-1230U | |
| DiskSpd | |
| seq read | |
| Asus Zenbook S 13 OLED | |
| GPD Win Max 2 | |
| Dell XPS 13 9315 2-in-1 Core i5-1230U | |
| Razer Blade Stealth i7-1165G7 GTX 1650 Ti Max-Q | |
| GPD Win 4 | |
| GPD Win 3 | |
| seq write | |
| Asus Zenbook S 13 OLED | |
| GPD Win 4 | |
| GPD Win Max 2 | |
| Razer Blade Stealth i7-1165G7 GTX 1650 Ti Max-Q | |
| GPD Win 3 | |
| Dell XPS 13 9315 2-in-1 Core i5-1230U | |
| seq q8 t1 read | |
| Asus Zenbook S 13 OLED | |
| Razer Blade Stealth i7-1165G7 GTX 1650 Ti Max-Q | |
| Dell XPS 13 9315 2-in-1 Core i5-1230U | |
| GPD Win 4 | |
| GPD Win Max 2 | |
| GPD Win 3 | |
| seq q8 t1 write | |
| Asus Zenbook S 13 OLED | |
| GPD Win Max 2 | |
| Razer Blade Stealth i7-1165G7 GTX 1650 Ti Max-Q | |
| GPD Win 4 | |
| Dell XPS 13 9315 2-in-1 Core i5-1230U | |
| GPD Win 3 | |
| 4k q1 t1 read | |
| GPD Win 4 | |
| GPD Win Max 2 | |
| Asus Zenbook S 13 OLED | |
| GPD Win 3 | |
| Dell XPS 13 9315 2-in-1 Core i5-1230U | |
| Razer Blade Stealth i7-1165G7 GTX 1650 Ti Max-Q | |
| 4k q1 t1 write | |
| GPD Win Max 2 | |
| GPD Win 3 | |
| GPD Win 4 | |
| Asus Zenbook S 13 OLED | |
| Razer Blade Stealth i7-1165G7 GTX 1650 Ti Max-Q | |
| Dell XPS 13 9315 2-in-1 Core i5-1230U | |
| 4k q32 t16 read | |
| GPD Win 4 | |
| GPD Win Max 2 | |
| Asus Zenbook S 13 OLED | |
| GPD Win 3 | |
| Razer Blade Stealth i7-1165G7 GTX 1650 Ti Max-Q | |
| Dell XPS 13 9315 2-in-1 Core i5-1230U | |
| 4k q32 t16 write | |
| GPD Win Max 2 | |
| GPD Win 3 | |
| GPD Win 4 | |
| Asus Zenbook S 13 OLED | |
| Razer Blade Stealth i7-1165G7 GTX 1650 Ti Max-Q | |
| Dell XPS 13 9315 2-in-1 Core i5-1230U | |
| AS SSD | |
| Score Total | |
| Asus Zenbook S 13 OLED | |
| GPD Win Max 2 | |
| Razer Blade Stealth i7-1165G7 GTX 1650 Ti Max-Q | |
| GPD Win 4 | |
| GPD Win 3 | |
| Dell XPS 13 9315 2-in-1 Core i5-1230U | |
| Score Read | |
| GPD Win 4 | |
| Asus Zenbook S 13 OLED | |
| GPD Win Max 2 | |
| Razer Blade Stealth i7-1165G7 GTX 1650 Ti Max-Q | |
| GPD Win 3 | |
| Dell XPS 13 9315 2-in-1 Core i5-1230U | |
| Score Write | |
| Asus Zenbook S 13 OLED | |
| Razer Blade Stealth i7-1165G7 GTX 1650 Ti Max-Q | |
| GPD Win Max 2 | |
| GPD Win 3 | |
| GPD Win 4 | |
| Dell XPS 13 9315 2-in-1 Core i5-1230U | |
| Seq Read | |
| Asus Zenbook S 13 OLED | |
| Dell XPS 13 9315 2-in-1 Core i5-1230U | |
| GPD Win 4 | |
| GPD Win Max 2 | |
| Razer Blade Stealth i7-1165G7 GTX 1650 Ti Max-Q | |
| GPD Win 3 | |
| Seq Write | |
| GPD Win 4 | |
| GPD Win Max 2 | |
| Asus Zenbook S 13 OLED | |
| GPD Win 3 | |
| Razer Blade Stealth i7-1165G7 GTX 1650 Ti Max-Q | |
| Dell XPS 13 9315 2-in-1 Core i5-1230U | |
| 4K Read | |
| GPD Win Max 2 | |
| GPD Win 4 | |
| Asus Zenbook S 13 OLED | |
| GPD Win 3 | |
| Razer Blade Stealth i7-1165G7 GTX 1650 Ti Max-Q | |
| Dell XPS 13 9315 2-in-1 Core i5-1230U | |
| 4K Write | |
| GPD Win Max 2 | |
| GPD Win 3 | |
| Razer Blade Stealth i7-1165G7 GTX 1650 Ti Max-Q | |
| Dell XPS 13 9315 2-in-1 Core i5-1230U | |
| GPD Win 4 | |
| Asus Zenbook S 13 OLED | |
| 4K-64 Read | |
| GPD Win 4 | |
| GPD Win Max 2 | |
| Asus Zenbook S 13 OLED | |
| Razer Blade Stealth i7-1165G7 GTX 1650 Ti Max-Q | |
| GPD Win 3 | |
| Dell XPS 13 9315 2-in-1 Core i5-1230U | |
| 4K-64 Write | |
| Asus Zenbook S 13 OLED | |
| Razer Blade Stealth i7-1165G7 GTX 1650 Ti Max-Q | |
| GPD Win Max 2 | |
| GPD Win 3 | |
| GPD Win 4 | |
| Dell XPS 13 9315 2-in-1 Core i5-1230U | |
| Access Time Read | |
| Dell XPS 13 9315 2-in-1 Core i5-1230U | |
| Razer Blade Stealth i7-1165G7 GTX 1650 Ti Max-Q | |
| GPD Win 4 | |
| GPD Win 3 | |
| GPD Win Max 2 | |
| Asus Zenbook S 13 OLED | |
| Access Time Write | |
| Dell XPS 13 9315 2-in-1 Core i5-1230U | |
| GPD Win 4 | |
| GPD Win 3 | |
| Razer Blade Stealth i7-1165G7 GTX 1650 Ti Max-Q | |
| GPD Win Max 2 | |
| Asus Zenbook S 13 OLED | |
* ... im mniej tym lepiej
Disk Throttling: DiskSpd Read Loop, Queue Depth 8
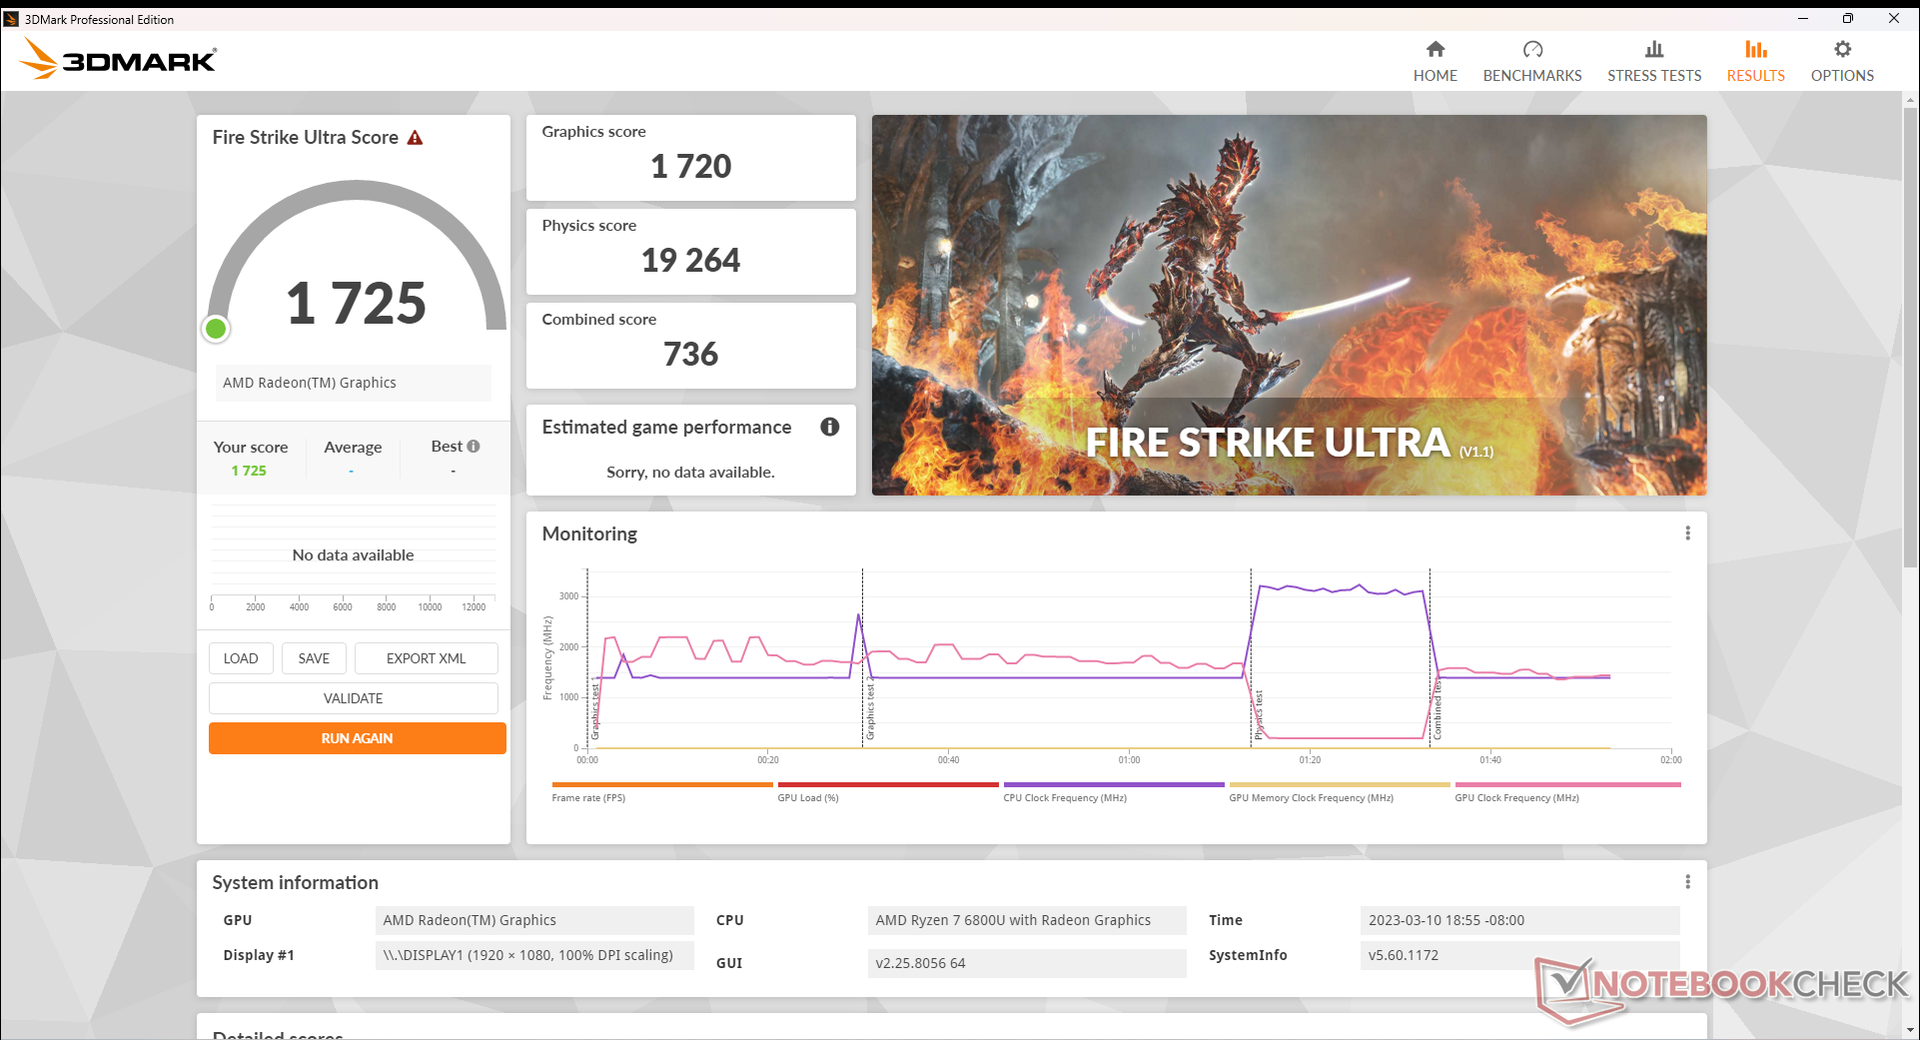
Wydajność układu GPU - Radeon 680M doskonale sprawdza się w grach przenośnych
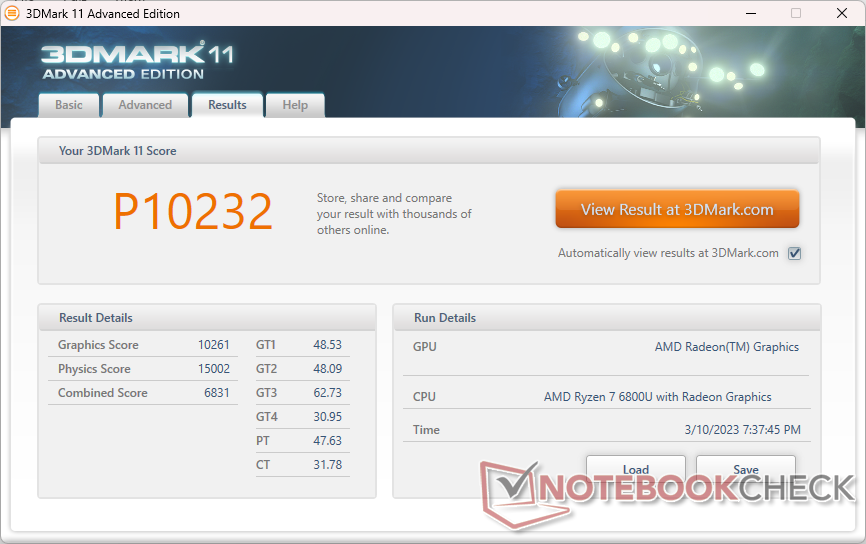
Na stronie Radeon 680M jest obecnie najszybszym zintegrowanym procesorem graficznym na rynku. W porównaniu do konkurencyjnychIris Xe Graphics G7 96EUs, rozwiązanie AMD jest o 40 do 45 procent szybsze lub mniej więcej o 80 procent szybsze od ostatniej generacji Radeon RX Vega z serii "8.
Większość gier jest grywalna (>30 FPS) w natywnej rozdzielczości 1080p, w tym nawet tak wymagające jak Cyberpunk 2077 czy Final Fantasy XV na niższych ustawieniach. Zalecamy obniżenie jakości tekstur i/lub antyaliasingu, aby poprawić liczbę klatek na sekundę, ponieważ te funkcje graficzne mają znacznie mniejszy wpływ na małe ekrany.
| 3DMark 11 - 1280x720 Performance GPU | |
| MSI RTX 2060 Gaming Z 6G | |
| Desktop PC Intel Xeon E5 2680v4 KFA2 GTX 1060 6GB | |
| Lenovo Slim 7 Pro X 14ARH7 | |
| Razer Blade Stealth i7-1165G7 GTX 1650 Ti Max-Q | |
| GPD Win 4 | |
| Przeciętny AMD Radeon 680M (6858 - 11755, n=39) | |
| Asus Zenbook S 13 OLED | |
| GPD Win Max 2 | |
| HP Spectre x360 2-in-1 16-f1075ng | |
| HP Spectre x360 13.5 14t-ef000 | |
| GPD Win 3 | |
| HP Pavilion Aero 13 be0097nr | |
| Infinix INBook X2 | |
| Dell XPS 13 9315 2-in-1 Core i5-1230U | |
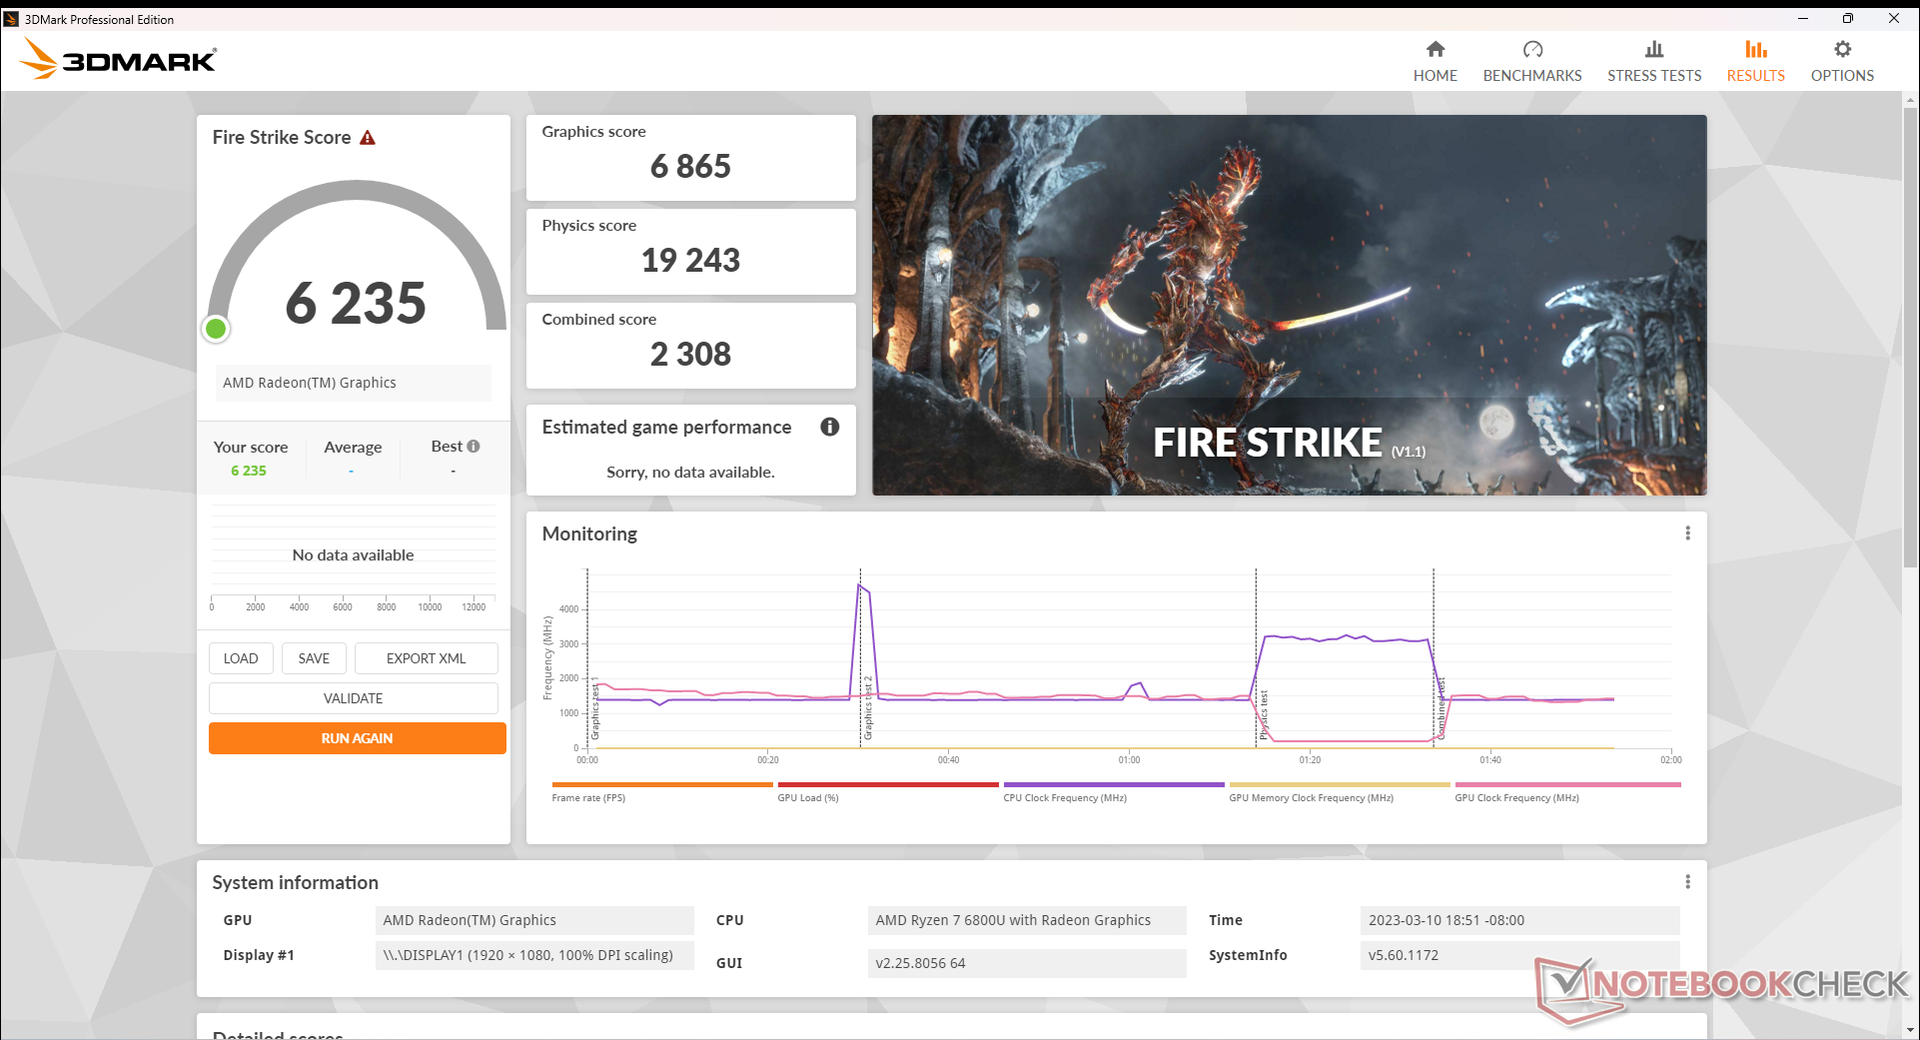
| 3DMark | |
| 1920x1080 Fire Strike Graphics | |
| MSI RTX 2060 Gaming Z 6G | |
| Desktop PC Intel Xeon E5 2680v4 KFA2 GTX 1060 6GB | |
| Lenovo Slim 7 Pro X 14ARH7 | |
| Razer Blade Stealth i7-1165G7 GTX 1650 Ti Max-Q | |
| GPD Win 4 | |
| Asus Zenbook S 13 OLED | |
| Przeciętny AMD Radeon 680M (3791 - 7706, n=41) | |
| GPD Win Max 2 | |
| HP Spectre x360 13.5 14t-ef000 | |
| GPD Win 3 | |
| HP Spectre x360 2-in-1 16-f1075ng | |
| HP Pavilion Aero 13 be0097nr | |
| Dell XPS 13 9315 2-in-1 Core i5-1230U | |
| Infinix INBook X2 | |
| 2560x1440 Time Spy Graphics | |
| MSI RTX 2060 Gaming Z 6G | |
| Lenovo Slim 7 Pro X 14ARH7 | |
| Desktop PC Intel Xeon E5 2680v4 KFA2 GTX 1060 6GB | |
| Razer Blade Stealth i7-1165G7 GTX 1650 Ti Max-Q | |
| GPD Win 4 | |
| Asus Zenbook S 13 OLED | |
| Przeciętny AMD Radeon 680M (1359 - 2607, n=41) | |
| GPD Win Max 2 | |
| HP Spectre x360 13.5 14t-ef000 | |
| HP Spectre x360 2-in-1 16-f1075ng | |
| GPD Win 3 | |
| HP Pavilion Aero 13 be0097nr | |
| Dell XPS 13 9315 2-in-1 Core i5-1230U | |
| Infinix INBook X2 | |
| 2560x1440 Time Spy Score | |
| MSI RTX 2060 Gaming Z 6G | |
| Lenovo Slim 7 Pro X 14ARH7 | |
| Desktop PC Intel Xeon E5 2680v4 KFA2 GTX 1060 6GB | |
| Razer Blade Stealth i7-1165G7 GTX 1650 Ti Max-Q | |
| GPD Win 4 | |
| Asus Zenbook S 13 OLED | |
| Przeciętny AMD Radeon 680M (1546 - 2914, n=41) | |
| GPD Win Max 2 | |
| HP Spectre x360 13.5 14t-ef000 | |
| HP Spectre x360 2-in-1 16-f1075ng | |
| GPD Win 3 | |
| HP Pavilion Aero 13 be0097nr | |
| Dell XPS 13 9315 2-in-1 Core i5-1230U | |
| Infinix INBook X2 | |
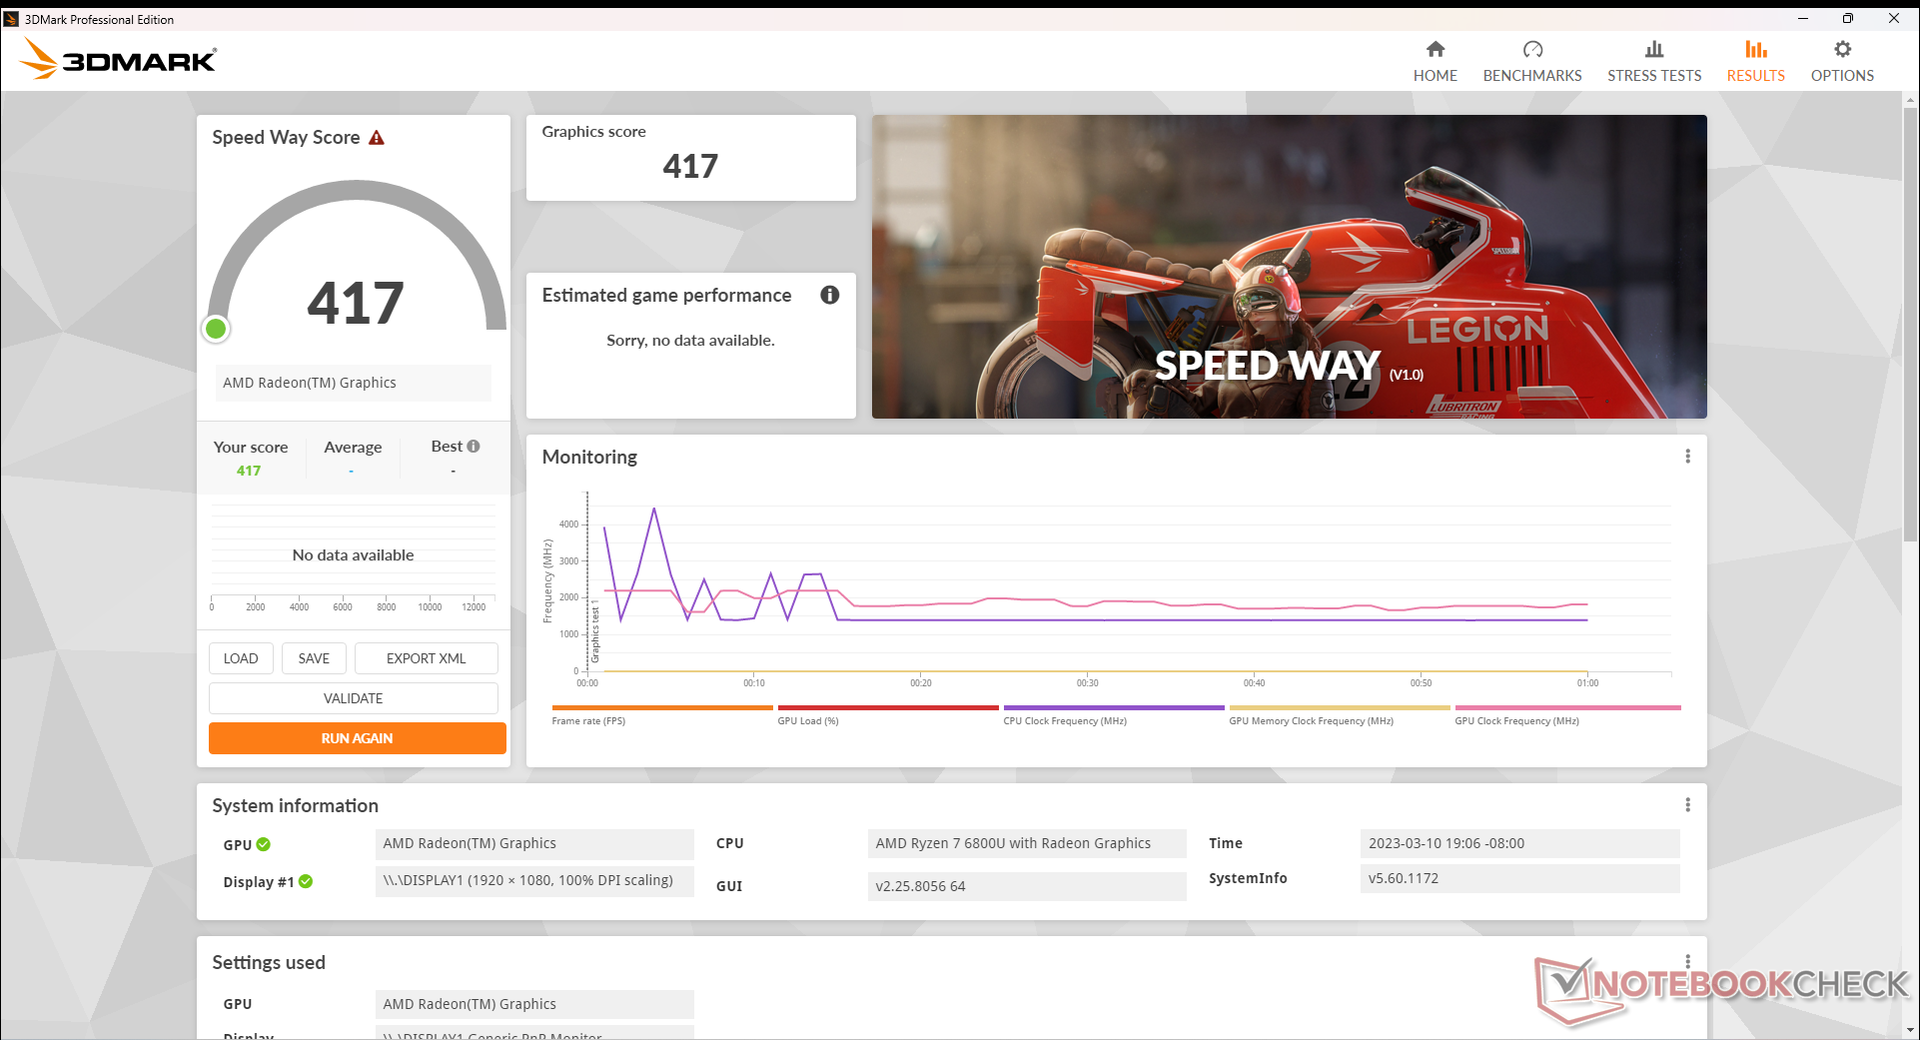
| 2560x1440 Speed Way Score | |
| Lenovo Slim 7 Pro X 14ARH7 | |
| GPD Win 4 | |
| Przeciętny AMD Radeon 680M (296 - 417, n=5) | |
| 3DMark 11 Performance | 10232 pkt. | |
| 3DMark Fire Strike Score | 6235 pkt. | |
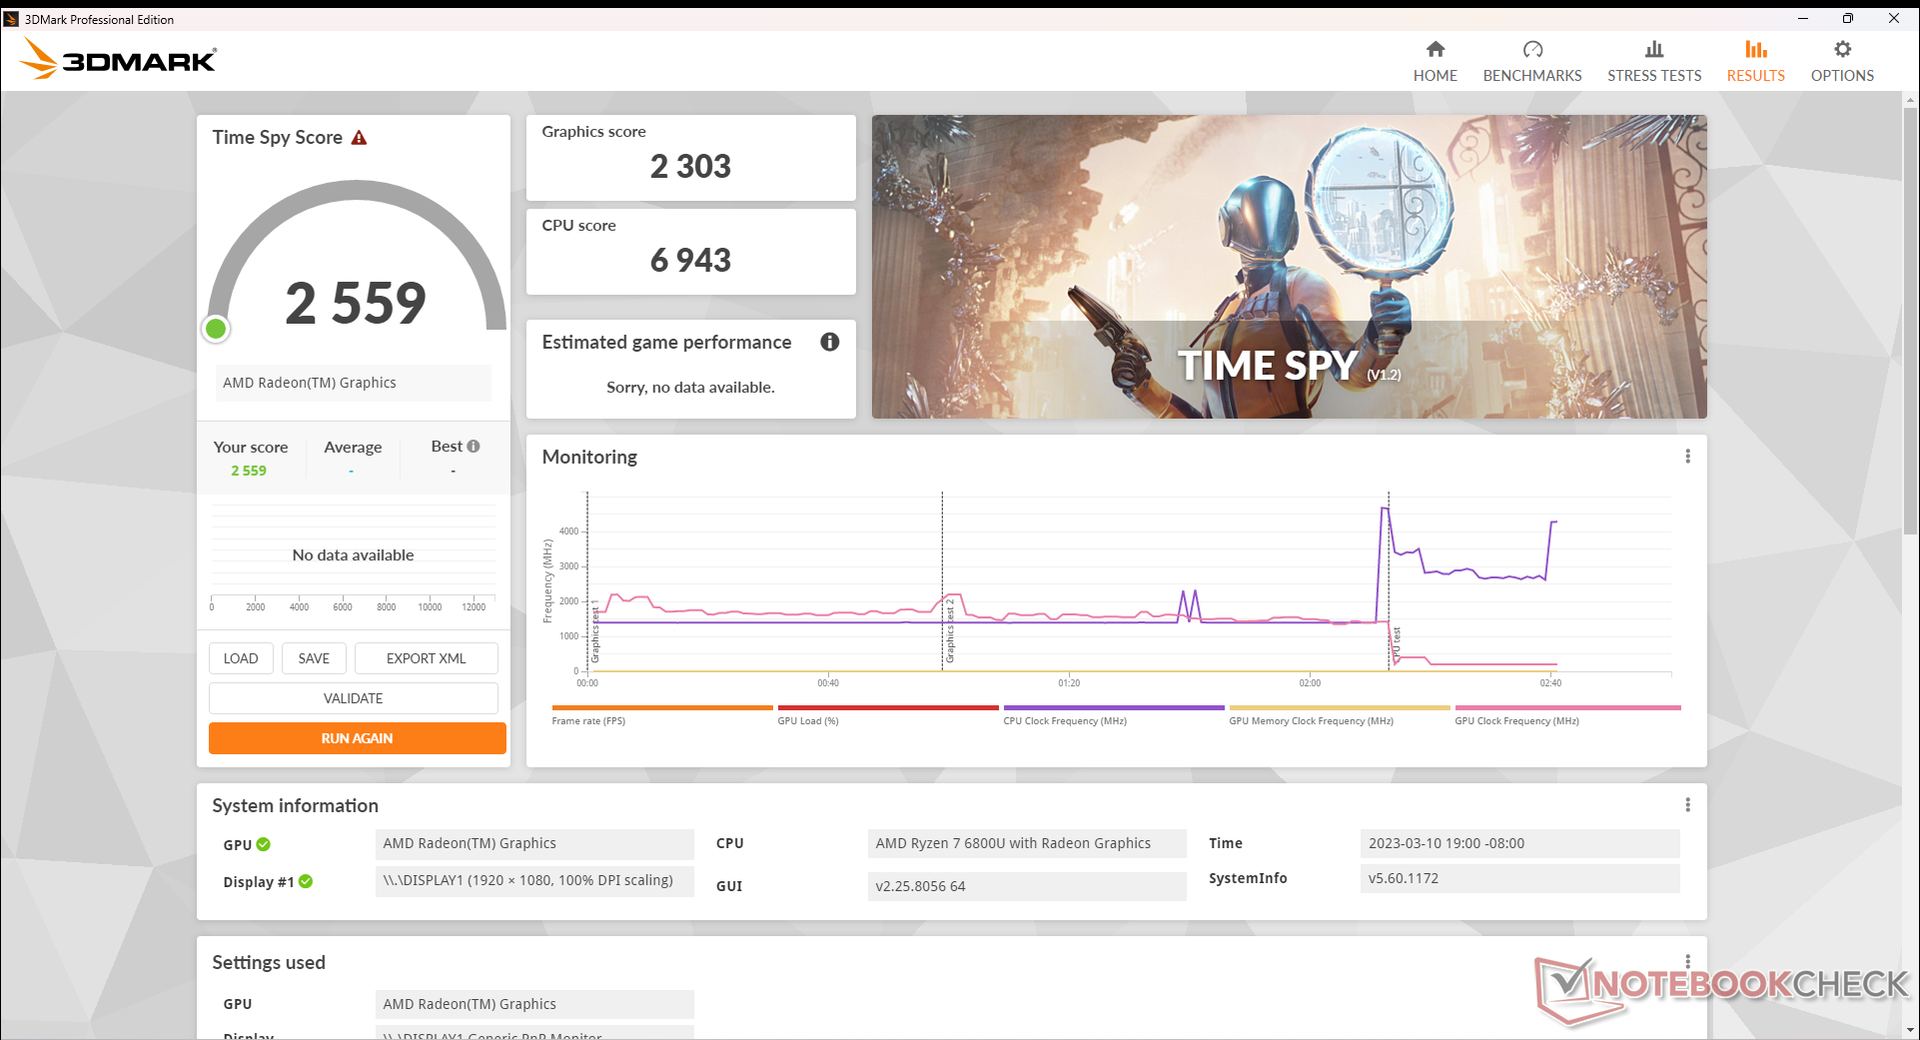
| 3DMark Time Spy Score | 2559 pkt. | |
Pomoc | ||
| Blender | |
| v3.3 Classroom HIP/AMD | |
| Przeciętny AMD Radeon 680M (270 - 555, n=34) | |
| GPD Win 4 | |
| v3.3 Classroom OPTIX/RTX | |
| Lenovo Slim 7 Pro X 14ARH7 | |
| MSI Summit E16 Flip A12UDT-031 | |
| v3.3 Classroom CUDA | |
| Lenovo Slim 7 Pro X 14ARH7 | |
| MSI Summit E16 Flip A12UDT-031 | |
| v3.3 Classroom CPU | |
| Dell XPS 13 9315 2-in-1 Core i5-1230U | |
| HP Spectre x360 13.5 14t-ef000 | |
| MSI Summit E16 Flip A12UDT-031 | |
| GPD Win 4 | |
| Przeciętny AMD Radeon 680M (389 - 980, n=37) | |
| HP Spectre x360 2-in-1 16-f1075ng | |
| Lenovo Slim 7 Pro X 14ARH7 | |
* ... im mniej tym lepiej
| Performance rating - Percent | |
| MSI Summit E16 Flip A12UDT-031 | |
| Lenovo Slim 7 Pro X 14ARH7 | |
| Razer Blade Stealth i7-1165G7 GTX 1650 Ti Max-Q | |
| GPD Win 4 | |
| Asus Zenbook S 13 OLED | |
| HP Spectre x360 13.5 14t-ef000 | |
| GPD Win Max 2 | |
| GPD Win 3 -1! | |
| HP Spectre x360 2-in-1 16-f1075ng | |
| HP Pavilion Aero 13 be0097nr | |
| Infinix INBook X2 -2! | |
| Dell XPS 13 9315 2-in-1 Core i5-1230U -2! | |
| The Witcher 3 - 1920x1080 Ultra Graphics & Postprocessing (HBAO+) | |
| MSI Summit E16 Flip A12UDT-031 | |
| Lenovo Slim 7 Pro X 14ARH7 | |
| Razer Blade Stealth i7-1165G7 GTX 1650 Ti Max-Q | |
| Asus Zenbook S 13 OLED | |
| GPD Win 4 | |
| HP Pavilion Aero 13 be0097nr | |
| HP Spectre x360 13.5 14t-ef000 | |
| GPD Win Max 2 | |
| GPD Win 3 | |
| HP Spectre x360 2-in-1 16-f1075ng | |
| Infinix INBook X2 | |
| Dell XPS 13 9315 2-in-1 Core i5-1230U | |
| GTA V - 1920x1080 Highest AA:4xMSAA + FX AF:16x | |
| MSI Summit E16 Flip A12UDT-031 | |
| Lenovo Slim 7 Pro X 14ARH7 | |
| Razer Blade Stealth i7-1165G7 GTX 1650 Ti Max-Q | |
| GPD Win 4 | |
| Asus Zenbook S 13 OLED | |
| HP Spectre x360 13.5 14t-ef000 | |
| GPD Win Max 2 | |
| HP Pavilion Aero 13 be0097nr | |
| HP Spectre x360 2-in-1 16-f1075ng | |
| Dell XPS 13 9315 2-in-1 Core i5-1230U | |
| Final Fantasy XV Benchmark - 1920x1080 High Quality | |
| MSI Summit E16 Flip A12UDT-031 | |
| Lenovo Slim 7 Pro X 14ARH7 | |
| Razer Blade Stealth i7-1165G7 GTX 1650 Ti Max-Q | |
| GPD Win 4 | |
| Asus Zenbook S 13 OLED | |
| GPD Win Max 2 | |
| HP Spectre x360 13.5 14t-ef000 | |
| GPD Win 3 | |
| HP Spectre x360 2-in-1 16-f1075ng | |
| HP Pavilion Aero 13 be0097nr | |
| Infinix INBook X2 | |
| Strange Brigade - 1920x1080 ultra AA:ultra AF:16 | |
| MSI Summit E16 Flip A12UDT-031 | |
| Lenovo Slim 7 Pro X 14ARH7 | |
| Razer Blade Stealth i7-1165G7 GTX 1650 Ti Max-Q | |
| GPD Win 4 | |
| Asus Zenbook S 13 OLED | |
| GPD Win Max 2 | |
| HP Spectre x360 13.5 14t-ef000 | |
| HP Spectre x360 2-in-1 16-f1075ng | |
| GPD Win 3 | |
| HP Pavilion Aero 13 be0097nr | |
| Dota 2 Reborn - 1920x1080 ultra (3/3) best looking | |
| MSI Summit E16 Flip A12UDT-031 | |
| Razer Blade Stealth i7-1165G7 GTX 1650 Ti Max-Q | |
| Lenovo Slim 7 Pro X 14ARH7 | |
| GPD Win 4 | |
| Asus Zenbook S 13 OLED | |
| HP Spectre x360 13.5 14t-ef000 | |
| GPD Win Max 2 | |
| HP Spectre x360 2-in-1 16-f1075ng | |
| HP Pavilion Aero 13 be0097nr | |
| GPD Win 3 | |
| Dell XPS 13 9315 2-in-1 Core i5-1230U | |
| Infinix INBook X2 | |
| X-Plane 11.11 - 1920x1080 high (fps_test=3) | |
| MSI Summit E16 Flip A12UDT-031 | |
| Razer Blade Stealth i7-1165G7 GTX 1650 Ti Max-Q | |
| Lenovo Slim 7 Pro X 14ARH7 | |
| HP Spectre x360 2-in-1 16-f1075ng | |
| HP Spectre x360 13.5 14t-ef000 | |
| Asus Zenbook S 13 OLED | |
| GPD Win 4 | |
| GPD Win Max 2 | |
| GPD Win 3 | |
| HP Pavilion Aero 13 be0097nr | |
| Dell XPS 13 9315 2-in-1 Core i5-1230U | |
| Infinix INBook X2 | |
| Final Fantasy XV Benchmark | |
| 1280x720 Lite Quality | |
| MSI RTX 2060 Gaming Z 6G | |
| Lenovo Slim 7 Pro X 14ARH7 | |
| Razer Blade Stealth i7-1165G7 GTX 1650 Ti Max-Q | |
| Asus Zenbook S 13 OLED | |
| Przeciętny AMD Radeon 680M (34.4 - 74.7, n=39) | |
| GPD Win 4 | |
| HP Spectre x360 13.5 14t-ef000 | |
| GPD Win Max 2 | |
| GPD Win 3 | |
| HP Spectre x360 2-in-1 16-f1075ng | |
| HP Pavilion Aero 13 be0097nr | |
| Dell XPS 13 9315 2-in-1 Core i5-1230U | |
| Infinix INBook X2 | |
| 1920x1080 Standard Quality | |
| MSI RTX 2060 Gaming Z 6G | |
| Lenovo Slim 7 Pro X 14ARH7 | |
| Razer Blade Stealth i7-1165G7 GTX 1650 Ti Max-Q | |
| GPD Win 4 | |
| Asus Zenbook S 13 OLED | |
| Przeciętny AMD Radeon 680M (18.3 - 36.9, n=40) | |
| GPD Win Max 2 | |
| HP Spectre x360 13.5 14t-ef000 | |
| GPD Win 3 | |
| HP Spectre x360 2-in-1 16-f1075ng | |
| HP Pavilion Aero 13 be0097nr | |
| Infinix INBook X2 | |
| 1920x1080 High Quality | |
| MSI RTX 2060 Gaming Z 6G | |
| Lenovo Slim 7 Pro X 14ARH7 | |
| Razer Blade Stealth i7-1165G7 GTX 1650 Ti Max-Q | |
| GPD Win 4 | |
| Asus Zenbook S 13 OLED | |
| Przeciętny AMD Radeon 680M (12.9 - 26.2, n=40) | |
| GPD Win Max 2 | |
| HP Spectre x360 13.5 14t-ef000 | |
| GPD Win 3 | |
| HP Spectre x360 2-in-1 16-f1075ng | |
| HP Pavilion Aero 13 be0097nr | |
| Infinix INBook X2 | |
| The Witcher 3 | |
| 1024x768 Low Graphics & Postprocessing | |
| MSI RTX 2060 Gaming Z 6G | |
| Lenovo Slim 7 Pro X 14ARH7 | |
| Desktop PC Intel Xeon E5 2680v4 KFA2 GTX 1060 6GB | |
| Razer Blade Stealth i7-1165G7 GTX 1650 Ti Max-Q | |
| Asus Zenbook S 13 OLED | |
| Przeciętny AMD Radeon 680M (67.4 - 150, n=31) | |
| HP Spectre x360 13.5 14t-ef000 | |
| GPD Win 4 | |
| GPD Win 3 | |
| GPD Win Max 2 | |
| HP Spectre x360 2-in-1 16-f1075ng | |
| HP Pavilion Aero 13 be0097nr | |
| Dell XPS 13 9315 2-in-1 Core i5-1230U | |
| Infinix INBook X2 | |
| 1366x768 Medium Graphics & Postprocessing | |
| MSI RTX 2060 Gaming Z 6G | |
| Desktop PC Intel Xeon E5 2680v4 KFA2 GTX 1060 6GB | |
| Lenovo Slim 7 Pro X 14ARH7 | |
| Razer Blade Stealth i7-1165G7 GTX 1650 Ti Max-Q | |
| Przeciętny AMD Radeon 680M (44.5 - 85.3, n=24) | |
| GPD Win 4 | |
| GPD Win Max 2 | |
| GPD Win 3 | |
| HP Spectre x360 2-in-1 16-f1075ng | |
| HP Spectre x360 13.5 14t-ef000 | |
| Dell XPS 13 9315 2-in-1 Core i5-1230U | |
| Infinix INBook X2 | |
| 1920x1080 High Graphics & Postprocessing (Nvidia HairWorks Off) | |
| MSI RTX 2060 Gaming Z 6G | |
| Lenovo Slim 7 Pro X 14ARH7 | |
| Desktop PC Intel Xeon E5 2680v4 KFA2 GTX 1060 6GB | |
| Razer Blade Stealth i7-1165G7 GTX 1650 Ti Max-Q | |
| Asus Zenbook S 13 OLED | |
| Przeciętny AMD Radeon 680M (22.3 - 48, n=33) | |
| GPD Win 4 | |
| HP Spectre x360 13.5 14t-ef000 | |
| GPD Win 3 | |
| GPD Win Max 2 | |
| HP Spectre x360 2-in-1 16-f1075ng | |
| HP Pavilion Aero 13 be0097nr | |
| Dell XPS 13 9315 2-in-1 Core i5-1230U | |
| Infinix INBook X2 | |
| 1920x1080 Ultra Graphics & Postprocessing (HBAO+) | |
| MSI RTX 2060 Gaming Z 6G | |
| Lenovo Slim 7 Pro X 14ARH7 | |
| Desktop PC Intel Xeon E5 2680v4 KFA2 GTX 1060 6GB | |
| Razer Blade Stealth i7-1165G7 GTX 1650 Ti Max-Q | |
| Asus Zenbook S 13 OLED | |
| Przeciętny AMD Radeon 680M (14.3 - 27.1, n=33) | |
| GPD Win 4 | |
| HP Pavilion Aero 13 be0097nr | |
| HP Spectre x360 13.5 14t-ef000 | |
| GPD Win Max 2 | |
| GPD Win 3 | |
| HP Spectre x360 2-in-1 16-f1075ng | |
| Infinix INBook X2 | |
| Dell XPS 13 9315 2-in-1 Core i5-1230U | |
| X-Plane 11.11 | |
| 1280x720 low (fps_test=1) | |
| Lenovo Slim 7 Pro X 14ARH7 | |
| Razer Blade Stealth i7-1165G7 GTX 1650 Ti Max-Q | |
| GPD Win 4 | |
| HP Spectre x360 2-in-1 16-f1075ng | |
| Przeciętny AMD Radeon 680M (26.8 - 66.7, n=41) | |
| GPD Win Max 2 | |
| Asus Zenbook S 13 OLED | |
| HP Pavilion Aero 13 be0097nr | |
| HP Spectre x360 13.5 14t-ef000 | |
| Dell XPS 13 9315 2-in-1 Core i5-1230U | |
| GPD Win 3 | |
| Infinix INBook X2 | |
| 1920x1080 med (fps_test=2) | |
| Razer Blade Stealth i7-1165G7 GTX 1650 Ti Max-Q | |
| Lenovo Slim 7 Pro X 14ARH7 | |
| HP Spectre x360 2-in-1 16-f1075ng | |
| Przeciętny AMD Radeon 680M (21.1 - 53.1, n=41) | |
| GPD Win 4 | |
| HP Spectre x360 13.5 14t-ef000 | |
| Asus Zenbook S 13 OLED | |
| GPD Win 3 | |
| GPD Win Max 2 | |
| HP Pavilion Aero 13 be0097nr | |
| Dell XPS 13 9315 2-in-1 Core i5-1230U | |
| Infinix INBook X2 | |
| 1920x1080 high (fps_test=3) | |
| Razer Blade Stealth i7-1165G7 GTX 1650 Ti Max-Q | |
| Lenovo Slim 7 Pro X 14ARH7 | |
| HP Spectre x360 2-in-1 16-f1075ng | |
| HP Spectre x360 13.5 14t-ef000 | |
| Przeciętny AMD Radeon 680M (16.6 - 44.5, n=41) | |
| Asus Zenbook S 13 OLED | |
| GPD Win 4 | |
| GPD Win Max 2 | |
| GPD Win 3 | |
| HP Pavilion Aero 13 be0097nr | |
| Dell XPS 13 9315 2-in-1 Core i5-1230U | |
| Infinix INBook X2 | |
| Strange Brigade | |
| 1280x720 lowest AF:1 | |
| Lenovo Slim 7 Pro X 14ARH7 | |
| Razer Blade Stealth i7-1165G7 GTX 1650 Ti Max-Q | |
| GPD Win 4 | |
| Przeciętny AMD Radeon 680M (72.9 - 167.5, n=38) | |
| Asus Zenbook S 13 OLED | |
| HP Spectre x360 13.5 14t-ef000 | |
| GPD Win 3 | |
| HP Spectre x360 2-in-1 16-f1075ng | |
| GPD Win Max 2 | |
| HP Pavilion Aero 13 be0097nr | |
| Infinix INBook X2 | |
| 1920x1080 medium AA:medium AF:4 | |
| Lenovo Slim 7 Pro X 14ARH7 | |
| Razer Blade Stealth i7-1165G7 GTX 1650 Ti Max-Q | |
| GPD Win 4 | |
| Asus Zenbook S 13 OLED | |
| Przeciętny AMD Radeon 680M (30 - 63, n=38) | |
| GPD Win Max 2 | |
| HP Spectre x360 13.5 14t-ef000 | |
| GPD Win 3 | |
| HP Spectre x360 2-in-1 16-f1075ng | |
| HP Pavilion Aero 13 be0097nr | |
| Infinix INBook X2 | |
| 1920x1080 high AA:high AF:8 | |
| Lenovo Slim 7 Pro X 14ARH7 | |
| Razer Blade Stealth i7-1165G7 GTX 1650 Ti Max-Q | |
| GPD Win 4 | |
| Asus Zenbook S 13 OLED | |
| Przeciętny AMD Radeon 680M (25.3 - 53.1, n=38) | |
| GPD Win Max 2 | |
| HP Spectre x360 13.5 14t-ef000 | |
| HP Spectre x360 2-in-1 16-f1075ng | |
| GPD Win 3 | |
| HP Pavilion Aero 13 be0097nr | |
| Infinix INBook X2 | |
| 1920x1080 ultra AA:ultra AF:16 | |
| Lenovo Slim 7 Pro X 14ARH7 | |
| Razer Blade Stealth i7-1165G7 GTX 1650 Ti Max-Q | |
| GPD Win 4 | |
| Asus Zenbook S 13 OLED | |
| Przeciętny AMD Radeon 680M (22 - 46, n=38) | |
| GPD Win Max 2 | |
| HP Spectre x360 13.5 14t-ef000 | |
| HP Spectre x360 2-in-1 16-f1075ng | |
| GPD Win 3 | |
| HP Pavilion Aero 13 be0097nr | |
| Dota 2 Reborn | |
| 1280x720 min (0/3) fastest | |
| Razer Blade Stealth i7-1165G7 GTX 1650 Ti Max-Q | |
| Lenovo Slim 7 Pro X 14ARH7 | |
| GPD Win 4 | |
| HP Spectre x360 13.5 14t-ef000 | |
| HP Spectre x360 2-in-1 16-f1075ng | |
| Przeciętny AMD Radeon 680M (34.4 - 146.2, n=41) | |
| Asus Zenbook S 13 OLED | |
| HP Pavilion Aero 13 be0097nr | |
| GPD Win Max 2 | |
| Dell XPS 13 9315 2-in-1 Core i5-1230U | |
| Infinix INBook X2 | |
| GPD Win 3 | |
| 1366x768 med (1/3) | |
| Razer Blade Stealth i7-1165G7 GTX 1650 Ti Max-Q | |
| Lenovo Slim 7 Pro X 14ARH7 | |
| GPD Win 4 | |
| Asus Zenbook S 13 OLED | |
| Przeciętny AMD Radeon 680M (33.3 - 121.4, n=41) | |
| HP Spectre x360 13.5 14t-ef000 | |
| HP Pavilion Aero 13 be0097nr | |
| HP Spectre x360 2-in-1 16-f1075ng | |
| GPD Win Max 2 | |
| Dell XPS 13 9315 2-in-1 Core i5-1230U | |
| GPD Win 3 | |
| Infinix INBook X2 | |
| 1920x1080 high (2/3) | |
| Razer Blade Stealth i7-1165G7 GTX 1650 Ti Max-Q | |
| Lenovo Slim 7 Pro X 14ARH7 | |
| GPD Win 4 | |
| Asus Zenbook S 13 OLED | |
| Przeciętny AMD Radeon 680M (33.2 - 89.1, n=41) | |
| HP Spectre x360 13.5 14t-ef000 | |
| GPD Win Max 2 | |
| HP Spectre x360 2-in-1 16-f1075ng | |
| HP Pavilion Aero 13 be0097nr | |
| GPD Win 3 | |
| Dell XPS 13 9315 2-in-1 Core i5-1230U | |
| Infinix INBook X2 | |
| 1920x1080 ultra (3/3) best looking | |
| Razer Blade Stealth i7-1165G7 GTX 1650 Ti Max-Q | |
| Lenovo Slim 7 Pro X 14ARH7 | |
| GPD Win 4 | |
| Przeciętny AMD Radeon 680M (33.2 - 84.9, n=41) | |
| Asus Zenbook S 13 OLED | |
| HP Spectre x360 13.5 14t-ef000 | |
| GPD Win Max 2 | |
| HP Spectre x360 2-in-1 16-f1075ng | |
| HP Pavilion Aero 13 be0097nr | |
| GPD Win 3 | |
| Dell XPS 13 9315 2-in-1 Core i5-1230U | |
| Infinix INBook X2 | |
| GTA V | |
| 1024x768 Lowest Settings possible | |
| MSI RTX 2060 Gaming Z 6G | |
| Razer Blade Stealth i7-1165G7 GTX 1650 Ti Max-Q | |
| Lenovo Slim 7 Pro X 14ARH7 | |
| GPD Win 4 | |
| Asus Zenbook S 13 OLED | |
| Przeciętny AMD Radeon 680M (67.7 - 155.4, n=35) | |
| HP Spectre x360 13.5 14t-ef000 | |
| GPD Win Max 2 | |
| HP Spectre x360 2-in-1 16-f1075ng | |
| HP Pavilion Aero 13 be0097nr | |
| GPD Win 3 | |
| Dell XPS 13 9315 2-in-1 Core i5-1230U | |
| 1920x1080 Lowest Settings possible | |
| Razer Blade Stealth i7-1165G7 GTX 1650 Ti Max-Q | |
| Lenovo Slim 7 Pro X 14ARH7 | |
| GPD Win 4 | |
| Przeciętny AMD Radeon 680M (56.9 - 115.8, n=27) | |
| HP Spectre x360 13.5 14t-ef000 | |
| GPD Win Max 2 | |
| HP Spectre x360 2-in-1 16-f1075ng | |
| HP Pavilion Aero 13 be0097nr | |
| GPD Win 3 | |
| Dell XPS 13 9315 2-in-1 Core i5-1230U | |
| 1366x768 Normal/Off AF:4x | |
| MSI RTX 2060 Gaming Z 6G | |
| Razer Blade Stealth i7-1165G7 GTX 1650 Ti Max-Q | |
| Lenovo Slim 7 Pro X 14ARH7 | |
| GPD Win 4 | |
| Asus Zenbook S 13 OLED | |
| Przeciętny AMD Radeon 680M (60.7 - 143.9, n=32) | |
| HP Spectre x360 13.5 14t-ef000 | |
| GPD Win Max 2 | |
| HP Spectre x360 2-in-1 16-f1075ng | |
| GPD Win 3 | |
| Dell XPS 13 9315 2-in-1 Core i5-1230U | |
| 1920x1080 Normal/Off AF:4x | |
| Razer Blade Stealth i7-1165G7 GTX 1650 Ti Max-Q | |
| Lenovo Slim 7 Pro X 14ARH7 | |
| GPD Win 4 | |
| Przeciętny AMD Radeon 680M (54.9 - 117.3, n=27) | |
| HP Spectre x360 13.5 14t-ef000 | |
| GPD Win Max 2 | |
| HP Spectre x360 2-in-1 16-f1075ng | |
| HP Pavilion Aero 13 be0097nr | |
| GPD Win 3 | |
| Dell XPS 13 9315 2-in-1 Core i5-1230U | |
| 1920x1080 High/On (Advanced Graphics Off) AA:2xMSAA + FX AF:8x | |
| MSI RTX 2060 Gaming Z 6G | |
| Lenovo Slim 7 Pro X 14ARH7 | |
| Razer Blade Stealth i7-1165G7 GTX 1650 Ti Max-Q | |
| GPD Win 4 | |
| Przeciętny AMD Radeon 680M (25.9 - 99.1, n=37) | |
| Asus Zenbook S 13 OLED | |
| HP Spectre x360 13.5 14t-ef000 | |
| HP Pavilion Aero 13 be0097nr | |
| GPD Win 3 | |
| GPD Win Max 2 | |
| HP Spectre x360 2-in-1 16-f1075ng | |
| Dell XPS 13 9315 2-in-1 Core i5-1230U | |
| 1920x1080 Highest AA:4xMSAA + FX AF:16x | |
| MSI RTX 2060 Gaming Z 6G | |
| Lenovo Slim 7 Pro X 14ARH7 | |
| Razer Blade Stealth i7-1165G7 GTX 1650 Ti Max-Q | |
| GPD Win 4 | |
| Asus Zenbook S 13 OLED | |
| Przeciętny AMD Radeon 680M (11.3 - 25.3, n=37) | |
| HP Spectre x360 13.5 14t-ef000 | |
| GPD Win Max 2 | |
| HP Pavilion Aero 13 be0097nr | |
| HP Spectre x360 2-in-1 16-f1075ng | |
| Dell XPS 13 9315 2-in-1 Core i5-1230U | |
| F1 22 | |
| 1280x720 Ultra Low Preset AA:T AF:16x | |
| GPD Win 4 | |
| Przeciętny AMD Radeon 680M (75.5 - 147.3, n=19) | |
| HP Spectre x360 2-in-1 16-f1075ng | |
| 1920x1080 Low Preset AA:T AF:16x | |
| GPD Win 4 | |
| Przeciętny AMD Radeon 680M (44.1 - 85.4, n=25) | |
| HP Spectre x360 2-in-1 16-f1075ng | |
| 1920x1080 Medium Preset AA:T AF:16x | |
| GPD Win 4 | |
| Przeciętny AMD Radeon 680M (38 - 75.1, n=25) | |
| HP Spectre x360 2-in-1 16-f1075ng | |
| 1920x1080 High Preset AA:T AF:16x | |
| GPD Win 4 | |
| Przeciętny AMD Radeon 680M (30 - 56.2, n=25) | |
| HP Spectre x360 2-in-1 16-f1075ng | |
| 1920x1080 Ultra High Preset AA:T AF:16x | |
| HP Spectre x360 2-in-1 16-f1075ng | |
| GPD Win 4 | |
| Przeciętny AMD Radeon 680M (7.85 - 14.7, n=22) | |
| Cyberpunk 2077 1.6 | |
| 1280x720 Low Preset | |
| Lenovo Slim 7 Pro X 14ARH7 | |
| Przeciętny AMD Radeon 680M (46.1 - 77.6, n=14) | |
| GPD Win 4 | |
| Asus Zenbook S 13 OLED | |
| GPD Win Max 2 | |
| 1920x1080 Low Preset | |
| Lenovo Slim 7 Pro X 14ARH7 | |
| Przeciętny AMD Radeon 680M (26 - 50.6, n=15) | |
| GPD Win 4 | |
| Asus Zenbook S 13 OLED | |
| HP Spectre x360 13.5 14t-ef000 | |
| GPD Win Max 2 | |
| 1920x1080 Medium Preset | |
| Lenovo Slim 7 Pro X 14ARH7 | |
| Przeciętny AMD Radeon 680M (20.1 - 41.8, n=15) | |
| GPD Win 4 | |
| Asus Zenbook S 13 OLED | |
| HP Spectre x360 13.5 14t-ef000 | |
| GPD Win Max 2 | |
| 1920x1080 High Preset | |
| Lenovo Slim 7 Pro X 14ARH7 | |
| GPD Win 4 | |
| Przeciętny AMD Radeon 680M (16.3 - 33.6, n=15) | |
| Asus Zenbook S 13 OLED | |
| HP Spectre x360 13.5 14t-ef000 | |
| GPD Win Max 2 | |
| 1920x1080 Ultra Preset | |
| Lenovo Slim 7 Pro X 14ARH7 | |
| Przeciętny AMD Radeon 680M (14 - 23.8, n=15) | |
| GPD Win 4 | |
| Asus Zenbook S 13 OLED | |
| HP Spectre x360 13.5 14t-ef000 | |
| GPD Win Max 2 | |
Włączenie biegu jałowego Witcher 3 w celu przetestowania stabilności liczby klatek na sekundę ujawniło znaczące problemy. Jak widać na poniższym wykresie, wydajność zaczynała się od wysokiego poziomu ponad 80 FPS, po czym stale spadała do 65 FPS z ciągłymi wahaniami. Podczas gdy spadek wydajności w czasie nie jest niczym niezwykłym, wahania są nienormalne i skutkują okresowym mikrostutteringiem podczas rozgrywki. Przetestowaliśmy to dwukrotnie dla pewności i wyniki nie uległy poprawie. Niezoptymalizowane wykorzystanie procesora przez zadania w tle lub aplikacje jest zazwyczaj przyczyną takiego zachowania podczas gry.
Witcher 3 FPS Chart
| low | med. | high | ultra | |
|---|---|---|---|---|
| GTA V (2015) | 140.3 | 127.6 | 51.4 | 24.8 |
| The Witcher 3 (2015) | 94.3 | 63.8 | 37.5 | 22.8 |
| Dota 2 Reborn (2015) | 120.2 | 100.1 | 76.4 | 67.2 |
| Final Fantasy XV Benchmark (2018) | 57.1 | 32.7 | 23.9 | |
| X-Plane 11.11 (2018) | 56.2 | 41.4 | 33.5 | |
| Strange Brigade (2018) | 145.7 | 57.5 | 47.8 | 41.5 |
| Cyberpunk 2077 1.6 (2022) | 37.7 | 28.9 | 21.6 | 16.7 |
| F1 22 (2022) | 78.1 | 70.4 | 51.5 | 12.6 |
Emisje - prawie zawsze słyszalne
Szum systemu
Wewnętrzny wentylator działa zawsze, niezależnie od obciążenia ekranu. Na przykład podczas pracy na pulpicie szum wentylatora wynosi około 31 dB(A) na tle 24 dB(A), czyli jest głośniejszy od wielu laptopów w podobnych warunkach. Użytkownicy powinni spodziewać się cichego, ale odczuwalnego szumu podczas przeglądania stron internetowych lub oglądania filmów.
Przy większym obciążeniu, takim jak gry, szum wentylatora będzie wynosił niecałe 49 dB(A). Jeśli weźmiemy pod uwagę, że większość ultrabooków i laptopów do gier osiąga odpowiednio 40 dB(A) i 50 dB(A), Win 4 jest niestety bliższy pod względem hałasu laptopowi do gier niż ultrabookowi. Nie polecamy więc podkradania sobie sesji gier z Win 4 podczas zajęć.
Hałas
| luz |
| 31.2 / 31.2 / 33.5 dB |
| obciążenie |
| 45.5 / 49 dB |
 | ||
30 dB cichy 40 dB(A) słyszalny 50 dB(A) irytujący |
||
min: | ||
| GPD Win 4 Radeon 680M, R7 6800U, BiWin CE480Y2D100-1TB | GPD Win Max 2 Iris Xe G7 96EUs, i7-1260P, BiWin NQ200 1TB CNF82GS1D00-1TB | GPD Win 3 Iris Xe G7 80EUs, i5-1135G7, BIWIN NS200 1TB CNF82GS1G02-1TB | Razer Blade Stealth i7-1165G7 GTX 1650 Ti Max-Q GeForce GTX 1650 Ti Max-Q, i7-1165G7, Samsung SSD PM981a MZVLB512HBJQ | Dell XPS 13 9315 2-in-1 Core i5-1230U Iris Xe G7 80EUs, i5-1230U | Asus Zenbook S 13 OLED Radeon 680M, R7 6800U, Samsung PM9A1 MZVL21T0HCLR | |
|---|---|---|---|---|---|---|
| Noise | 18% | 6% | 11% | 19% | ||
| wyłączone / środowisko * (dB) | 24 | 22.6 6% | 27.4 -14% | 25.3 -5% | 24 -0% | |
| Idle Minimum * (dB) | 31.2 | 23.7 24% | 29.1 7% | 25.3 19% | 24 23% | |
| Idle Average * (dB) | 31.2 | 23.7 24% | 29.1 7% | 25.3 19% | 24 23% | |
| Idle Maximum * (dB) | 33.5 | 28.5 15% | 29.1 13% | 27 19% | 24 28% | |
| Load Average * (dB) | 45.5 | 36.5 20% | 40.7 11% | 47.9 -5% | 33.1 27% | |
| Witcher 3 ultra * (dB) | 48.6 | 39.8 18% | 42.8 12% | 38.4 21% | 40.2 17% | |
| Load Maximum * (dB) | 49 | 40.5 17% | 46.3 6% | 45.9 6% | 41.7 15% |
* ... im mniej tym lepiej
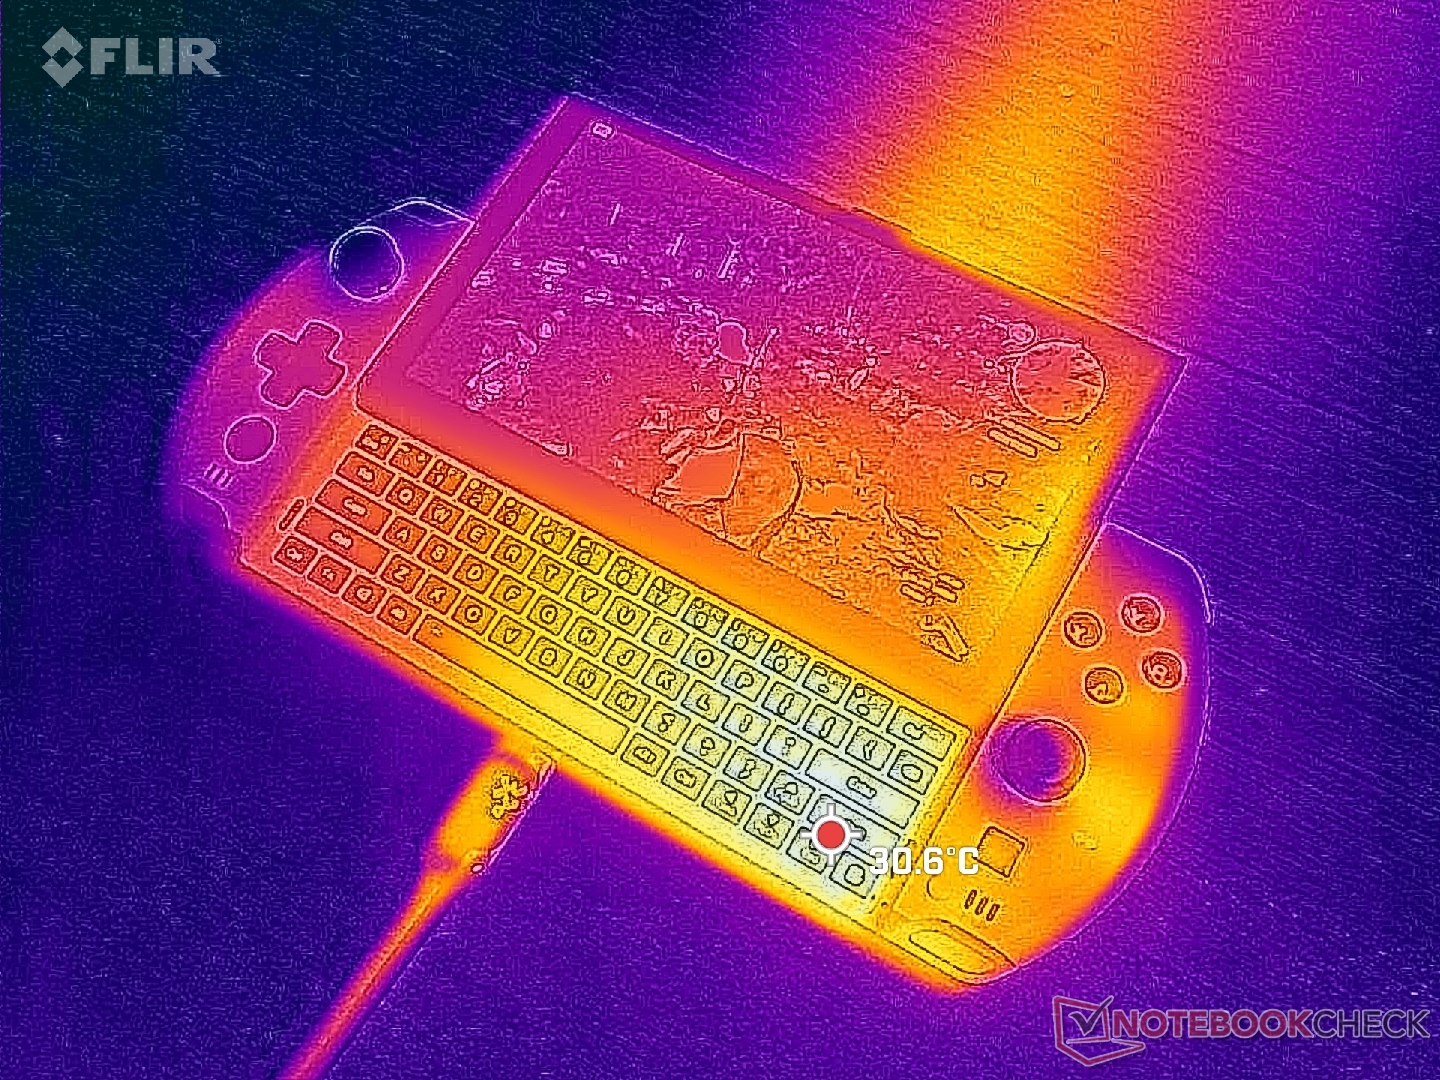
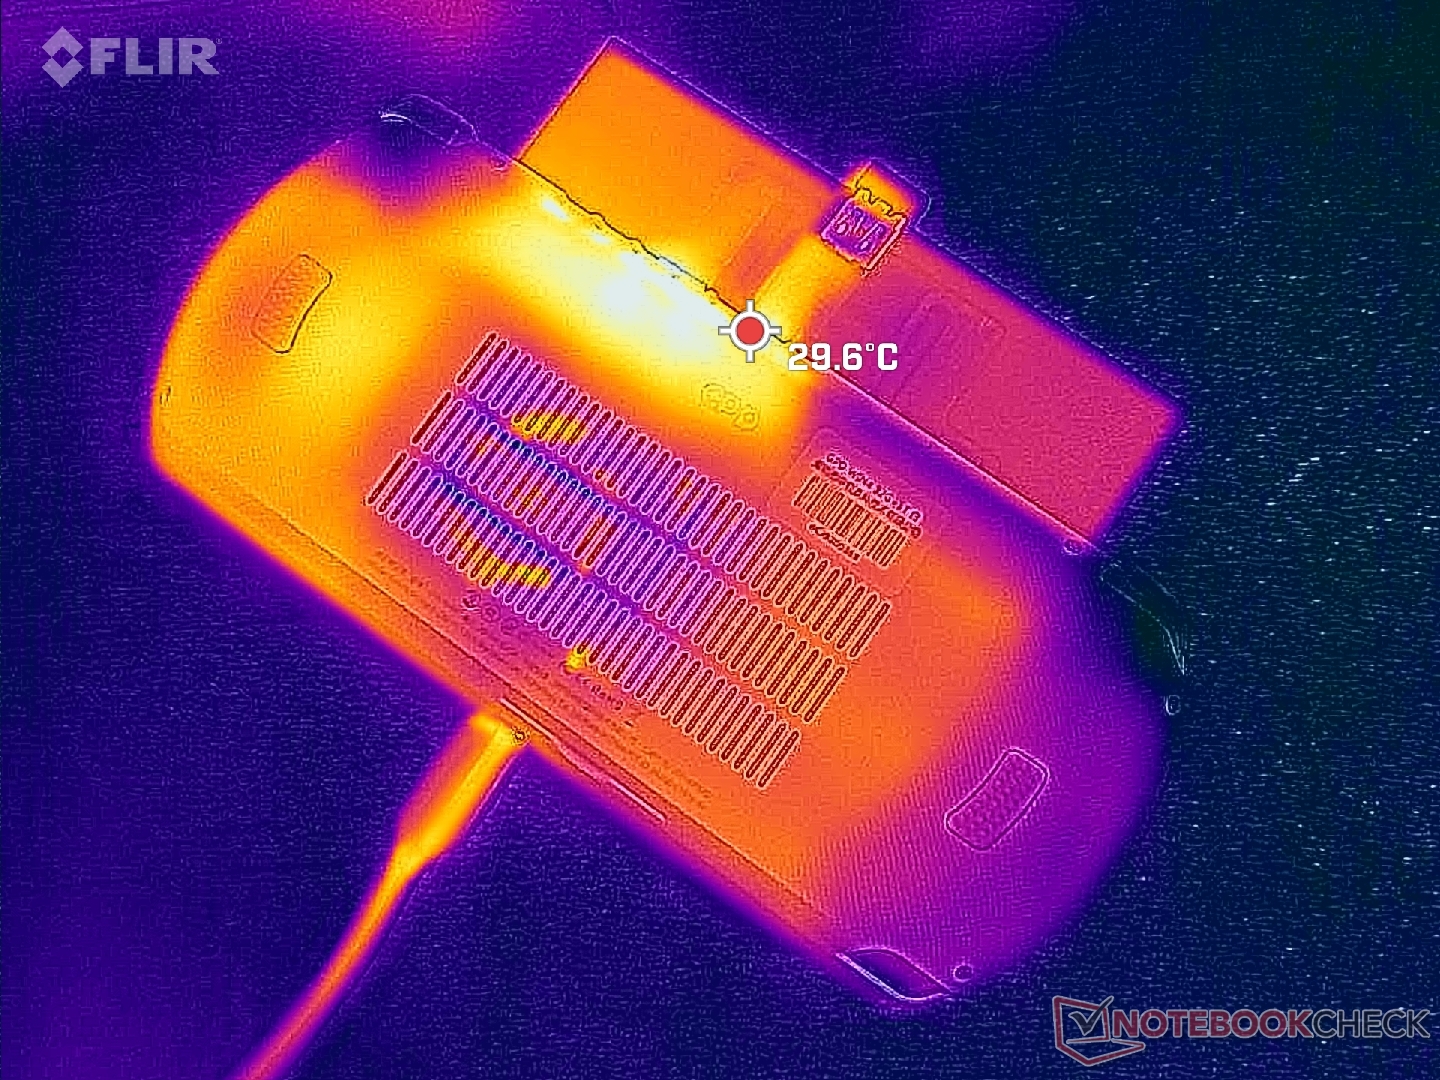
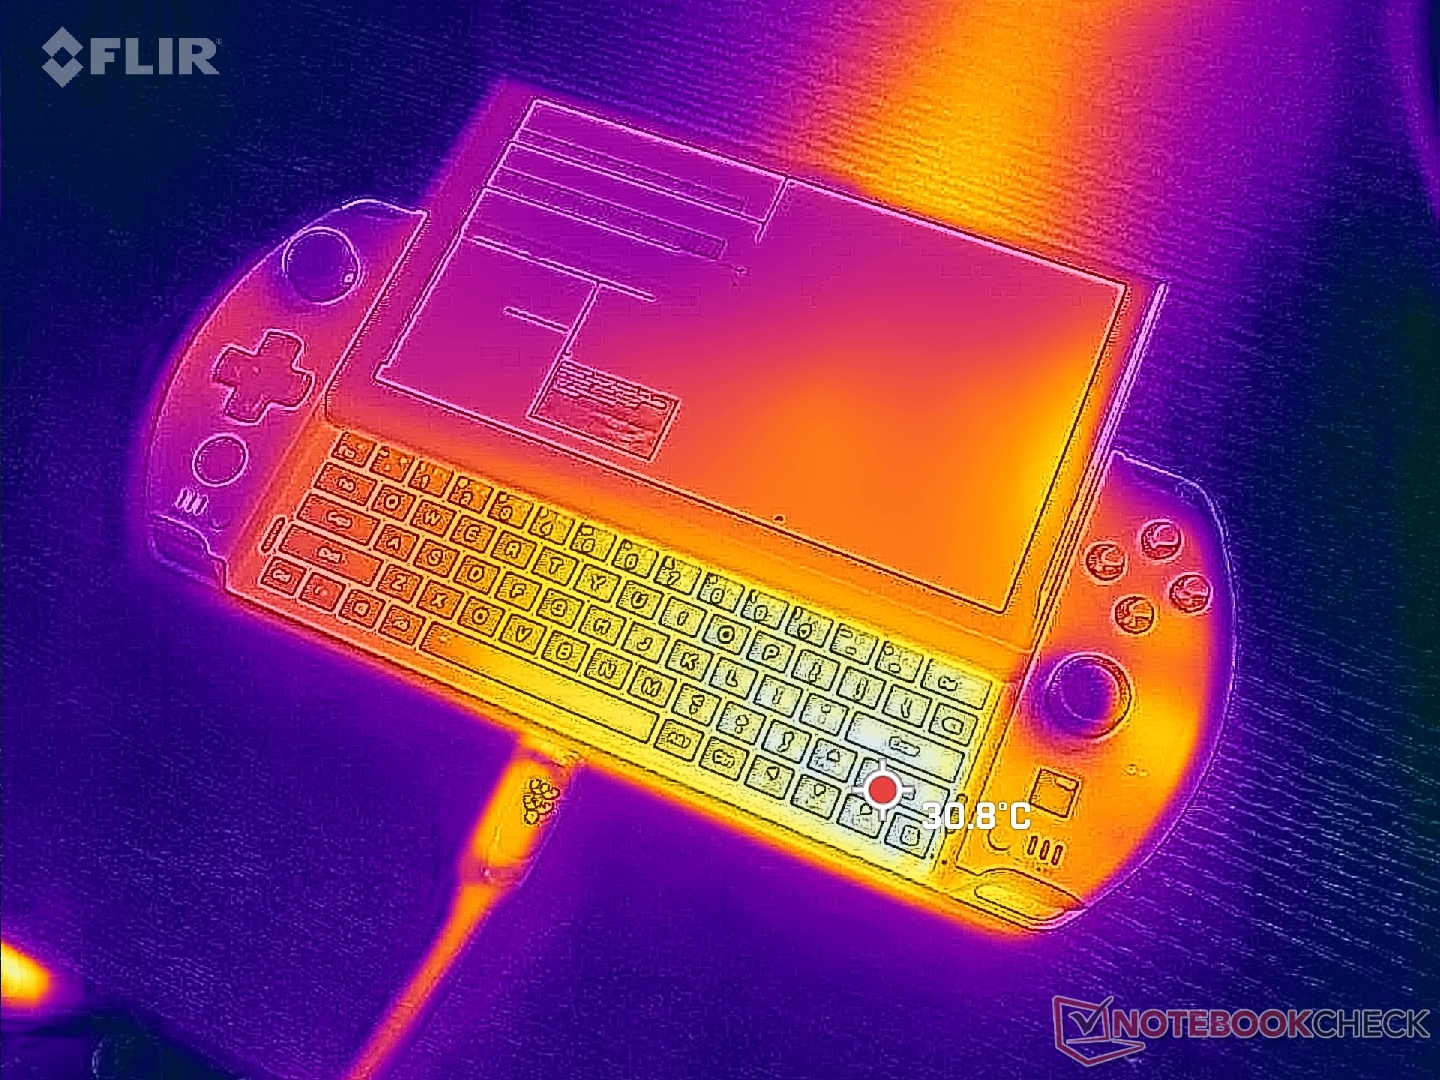
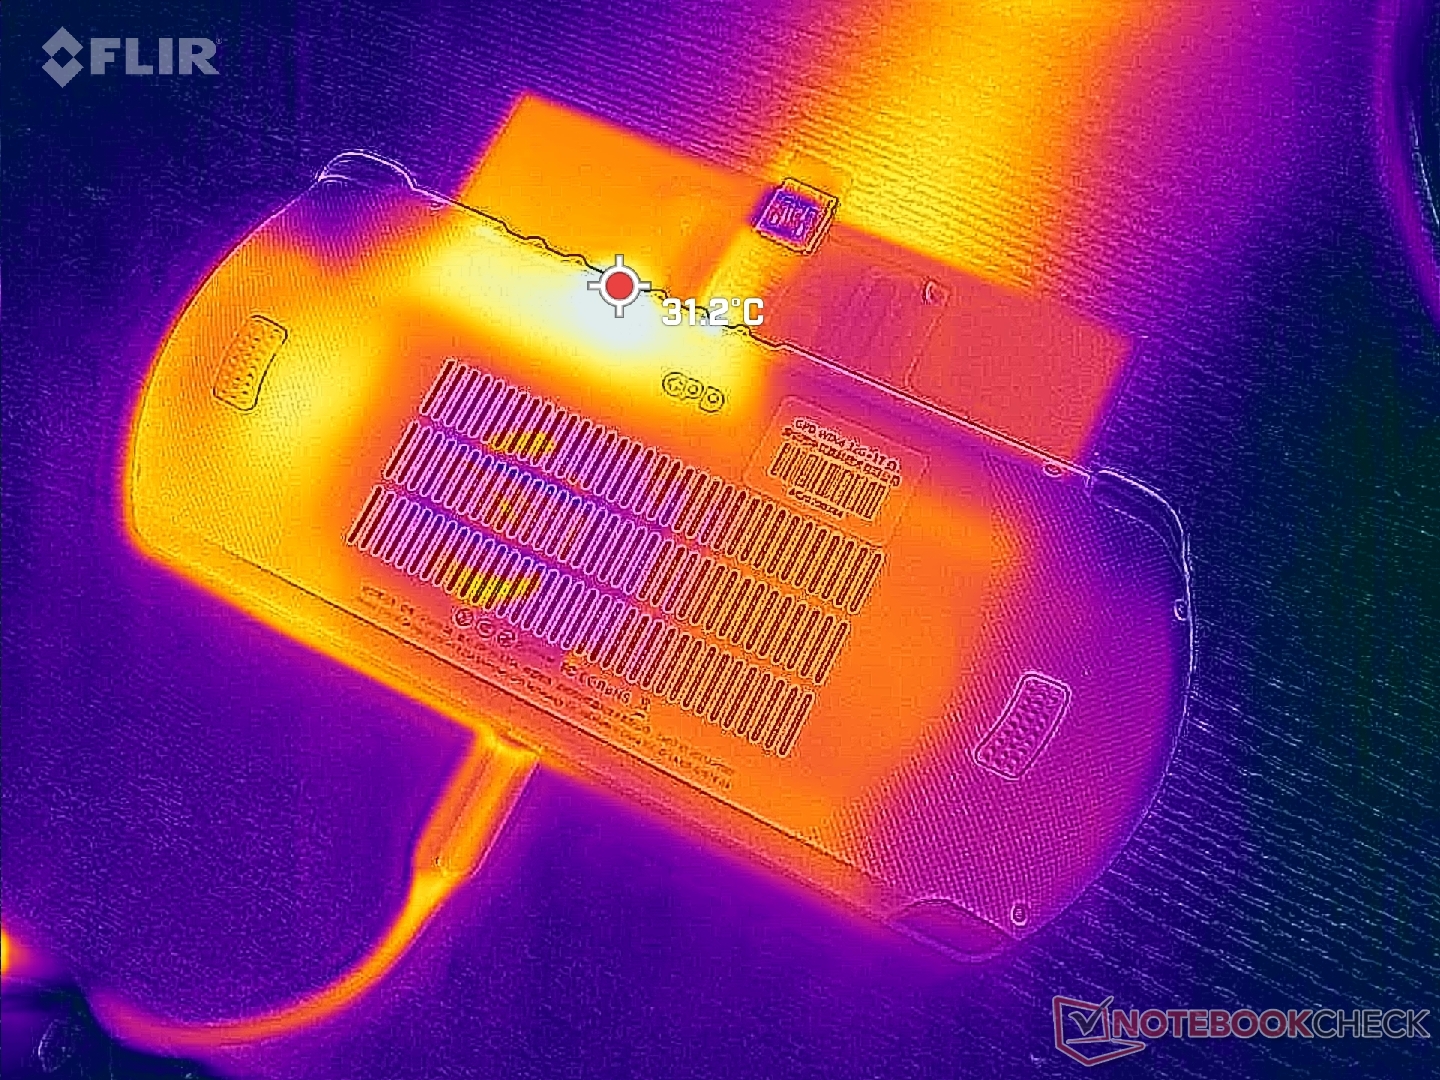
Temperatura
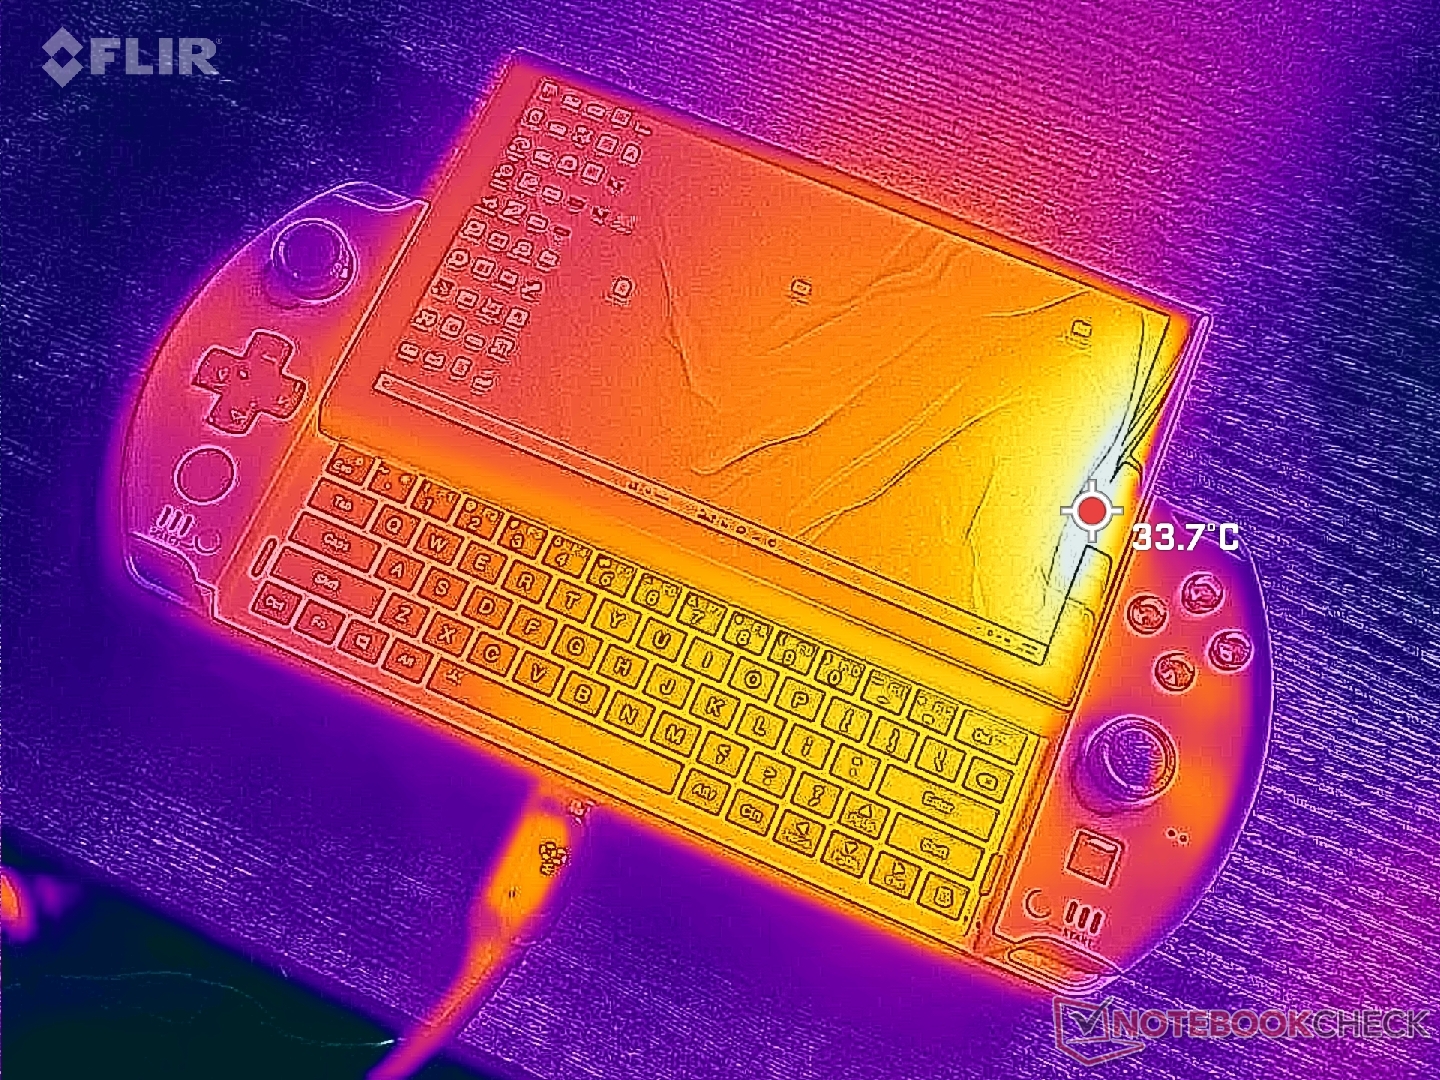
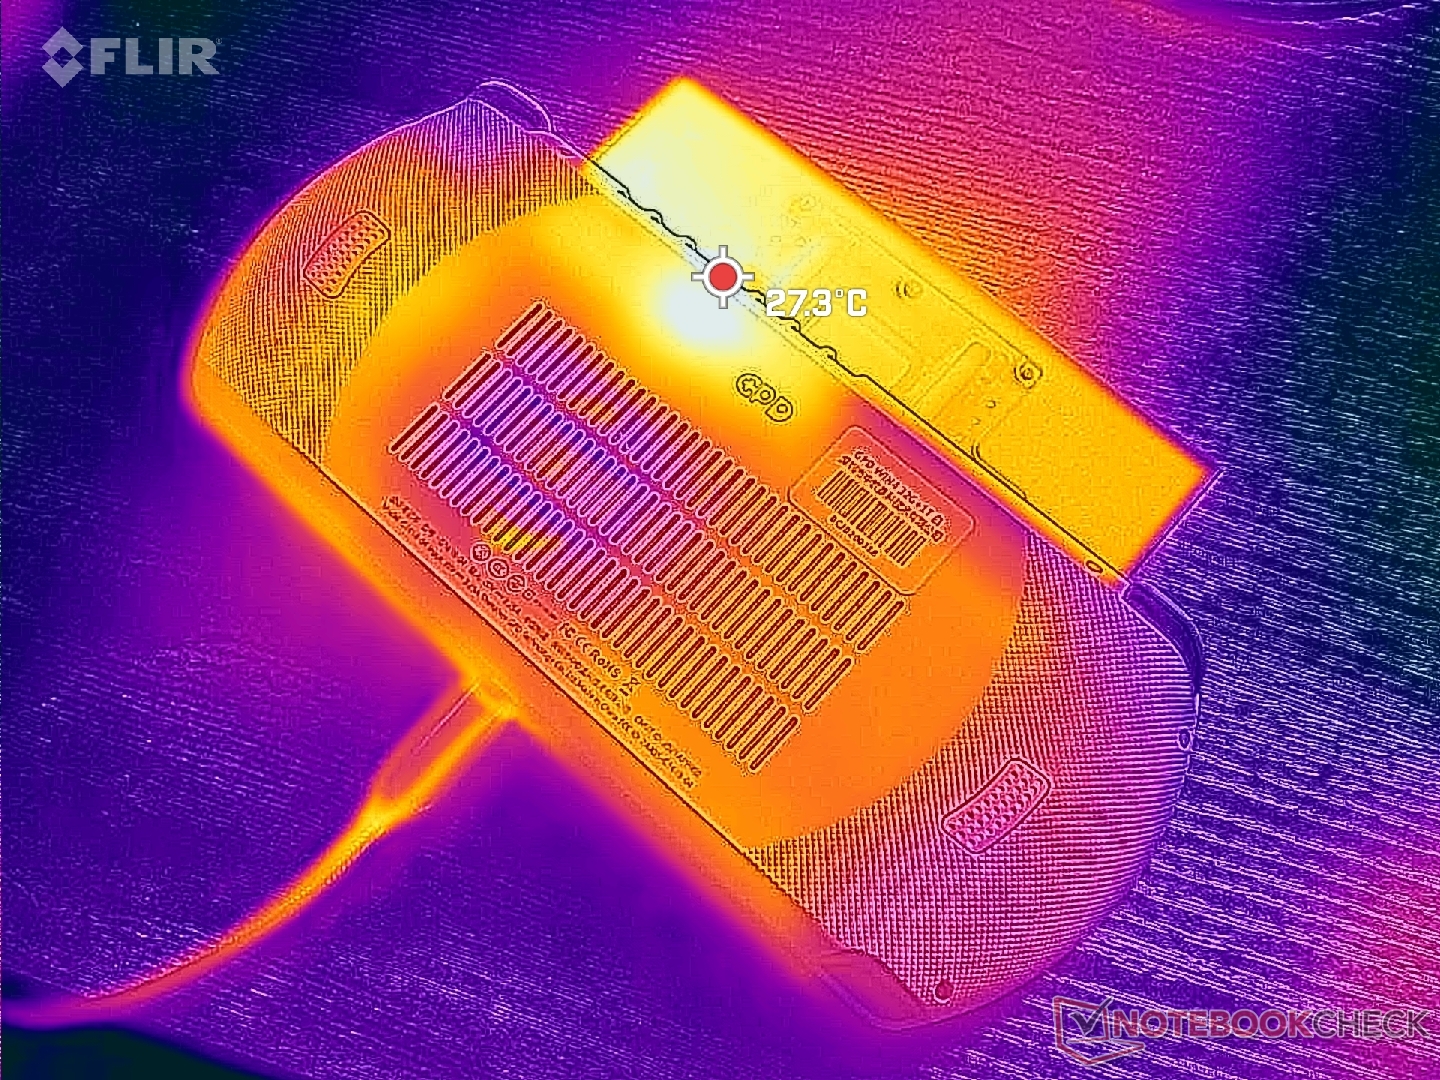
Temperatury powierzchni nigdy nie są niekomfortowo ciepłe pomimo wysokiej wydajności na objętość. Choć system jest mniejszy od tradycyjnego laptopa, to nadal jest dość gruby, więc temperatury powierzchni nie są tak ciepłe, jak można by się spodziewać.
Prawa strona urządzenia jest zawsze cieplejsza od lewej o kilka stopni C. Nie jest to uciążliwe, ale mimo wszystko zauważalne podczas rozgrywki. Nadmiar ciepła wydostaje się z górnej krawędzi urządzenia, podobnie jak w Switchu.
(+) Maksymalna temperatura w górnej części wynosi 35 °C / 95 F, w porównaniu do średniej 35.9 °C / 97 F , począwszy od 21.4 do 59 °C dla klasy Subnotebook.
(+) Dno nagrzewa się maksymalnie do 26.8 °C / 80 F, w porównaniu do średniej 39.2 °C / 103 F
(+) W stanie bezczynności średnia temperatura górnej części wynosi 26 °C / 79 F, w porównaniu ze średnią temperaturą urządzenia wynoszącą 30.8 °C / ### class_avg_f### F.
(+) Podczas gry w Wiedźmina 3 średnia temperatura górnej części wynosi 28.1 °C / 83 F, w porównaniu do średniej temperatury urządzenia wynoszącej 30.8 °C / ## #class_avg_f### F.
(+) Podparcia dłoni i touchpad osiągają maksymalną temperaturę skóry (32.2 °C / 90 F) i dlatego nie są gorące.
(-) Średnia temperatura obszaru podparcia dłoni w podobnych urządzeniach wynosiła 28.2 °C / 82.8 F (-4 °C / -7.2 F).
| GPD Win 4 AMD Ryzen 7 6800U, AMD Radeon 680M | GPD Win Max 2 Intel Core i7-1260P, Intel Iris Xe Graphics G7 96EUs | Razer Blade Stealth i7-1165G7 GTX 1650 Ti Max-Q Intel Core i7-1165G7, NVIDIA GeForce GTX 1650 Ti Max-Q | Dell XPS 13 9315 2-in-1 Core i5-1230U Intel Core i5-1230U, Intel Iris Xe Graphics G7 80EUs | Asus Zenbook S 13 OLED AMD Ryzen 7 6800U, AMD Radeon 680M | |
|---|---|---|---|---|---|
| Heat | -1% | -40% | -17% | -37% | |
| Maximum Upper Side * (°C) | 35 | 28.6 18% | 44 -26% | 41.8 -19% | 47.9 -37% |
| Maximum Bottom * (°C) | 26.8 | 33 -23% | 47.4 -77% | 38.2 -43% | 56.1 -109% |
| Idle Upper Side * (°C) | 28.4 | 24.6 13% | 32.2 -13% | 27.4 4% | 26.8 6% |
| Idle Bottom * (°C) | 25 | 27.6 -10% | 36 -44% | 27.2 -9% | 27.3 -9% |
* ... im mniej tym lepiej
Stress Test
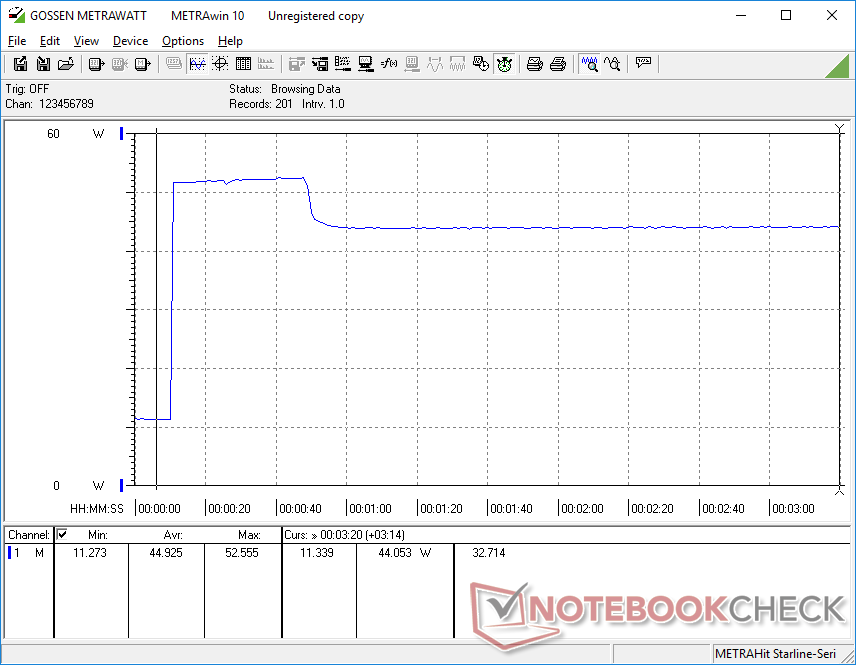
Po uruchomieniu Prime95 w celu obciążenia CPU, częstotliwości taktowania zegara i pobór mocy na płycie wzrosły do 2,9 GHz i 28 W, utrzymując się przez około 30 sekund lub do momentu, kiedy temperatura rdzenia osiągnie 63 C. Następnie częstotliwości taktowania zegara i pobór mocy na płycie systematycznie spadały, zanim ustabilizowały się na poziomie odpowiednio 2,3 GHz i 18 W. Temperatura rdzenia jest relatywnie niska i wynosi 57 C pomimo wysokiego poziomu stresu; powtarzając ten test na zasilanym przez Intela Lenovo IdeaPad Flex 7i 14 przyniosłoby wyższą stabilną temperaturę rdzenia, wynoszącą 71 C.
Częstotliwości taktowania GPU i temperatura ustabilizowałyby się na poziomie odpowiednio 1316 MHz i 55 C podczas pracy Witcher 3. Temperatury rdzenia są zaskakująco konserwatywne nawet w przypadku ustawienia trybu Performance.
Praca na zasilaniu akumulatorowym nie ogranicza wydajności. Test 3DMark 11 na zasilaniu akumulatorowym przyniósłby zasadniczo takie same wyniki CPU i GPU, jak w przypadku zasilania z sieci.
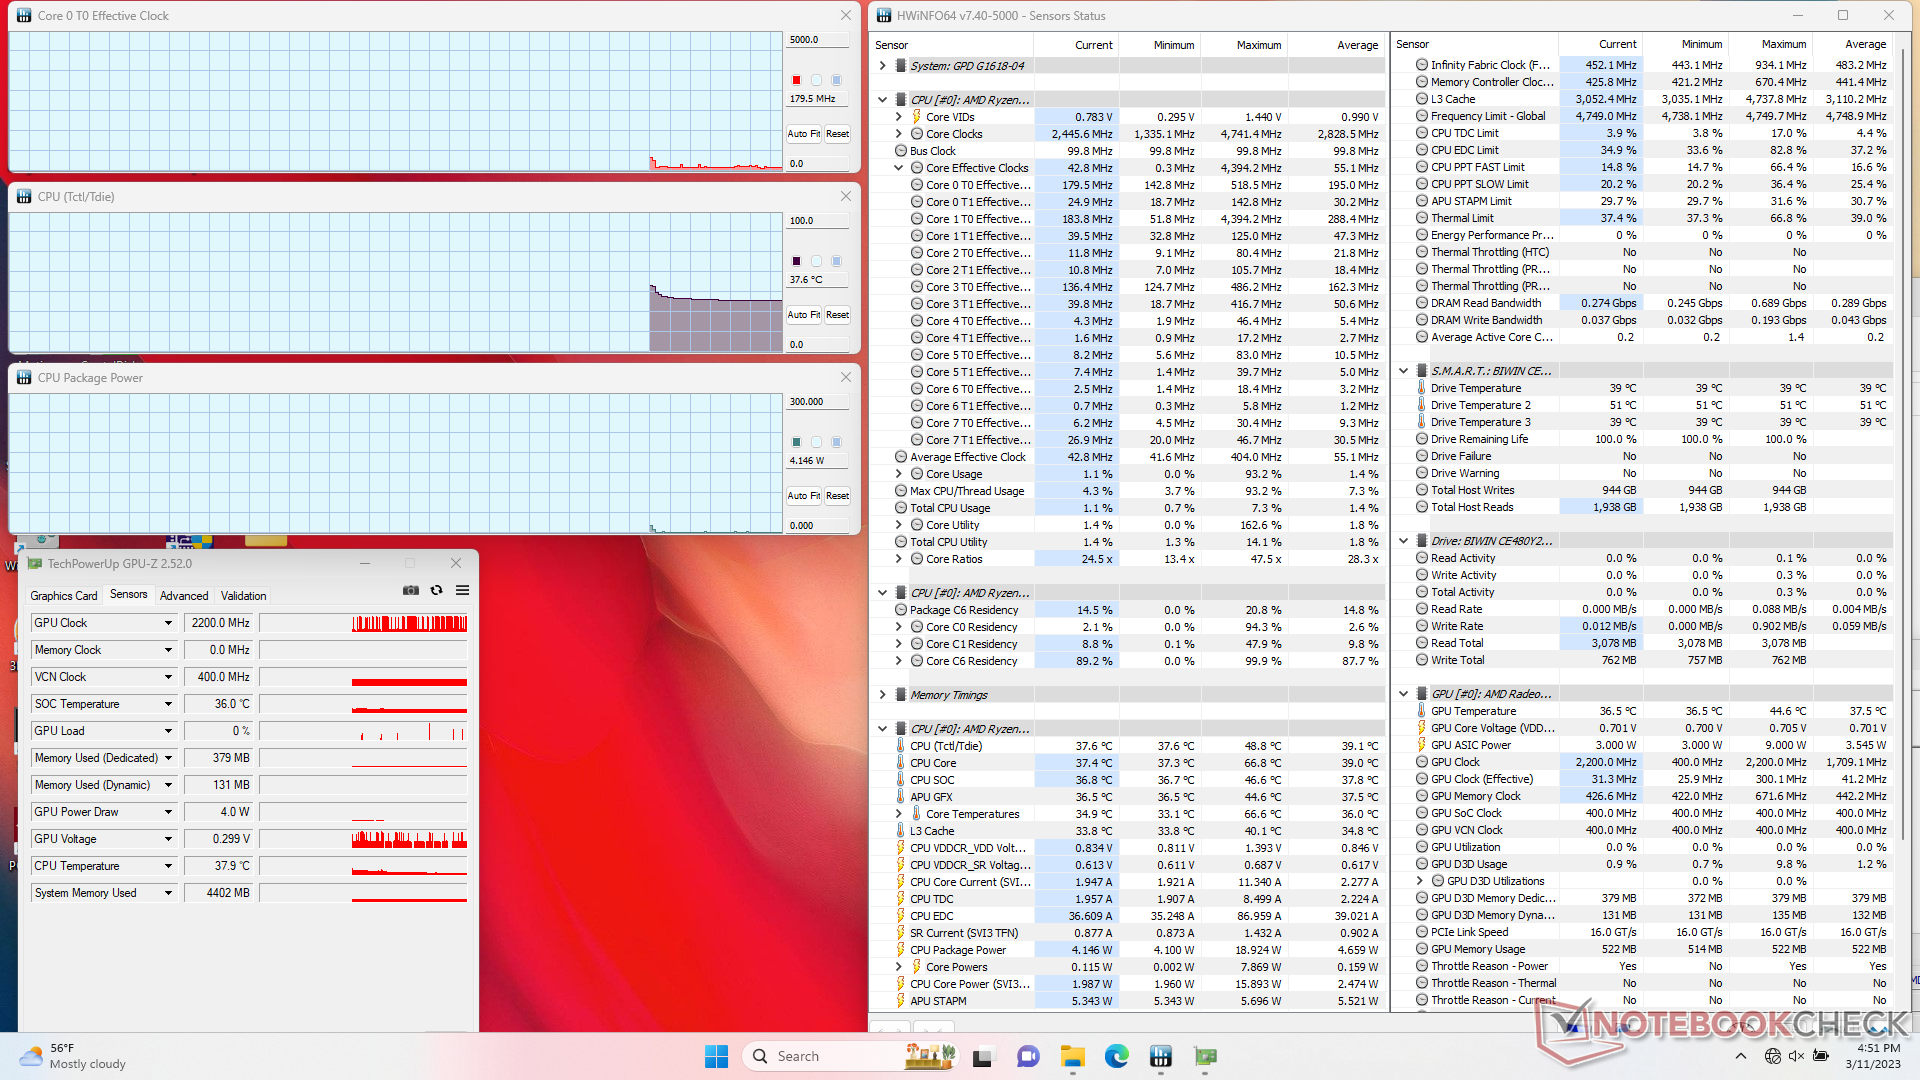
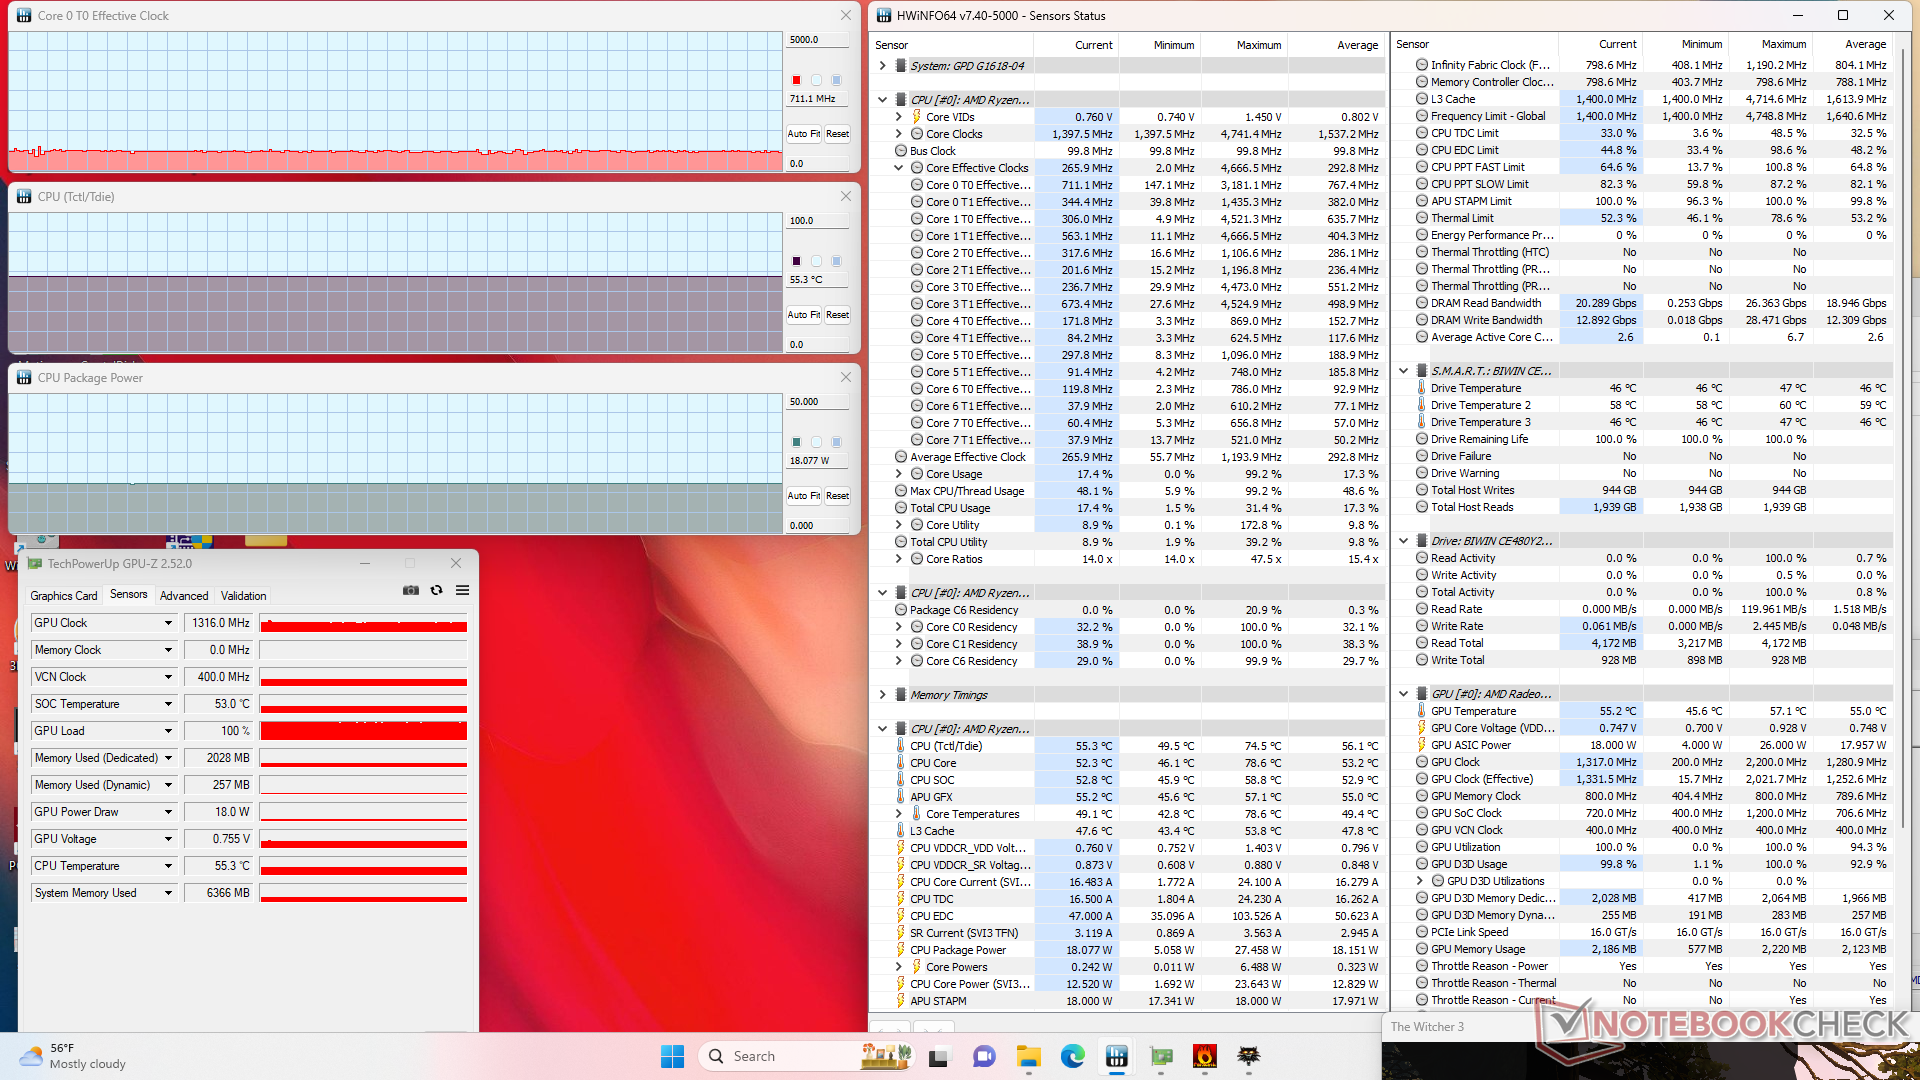
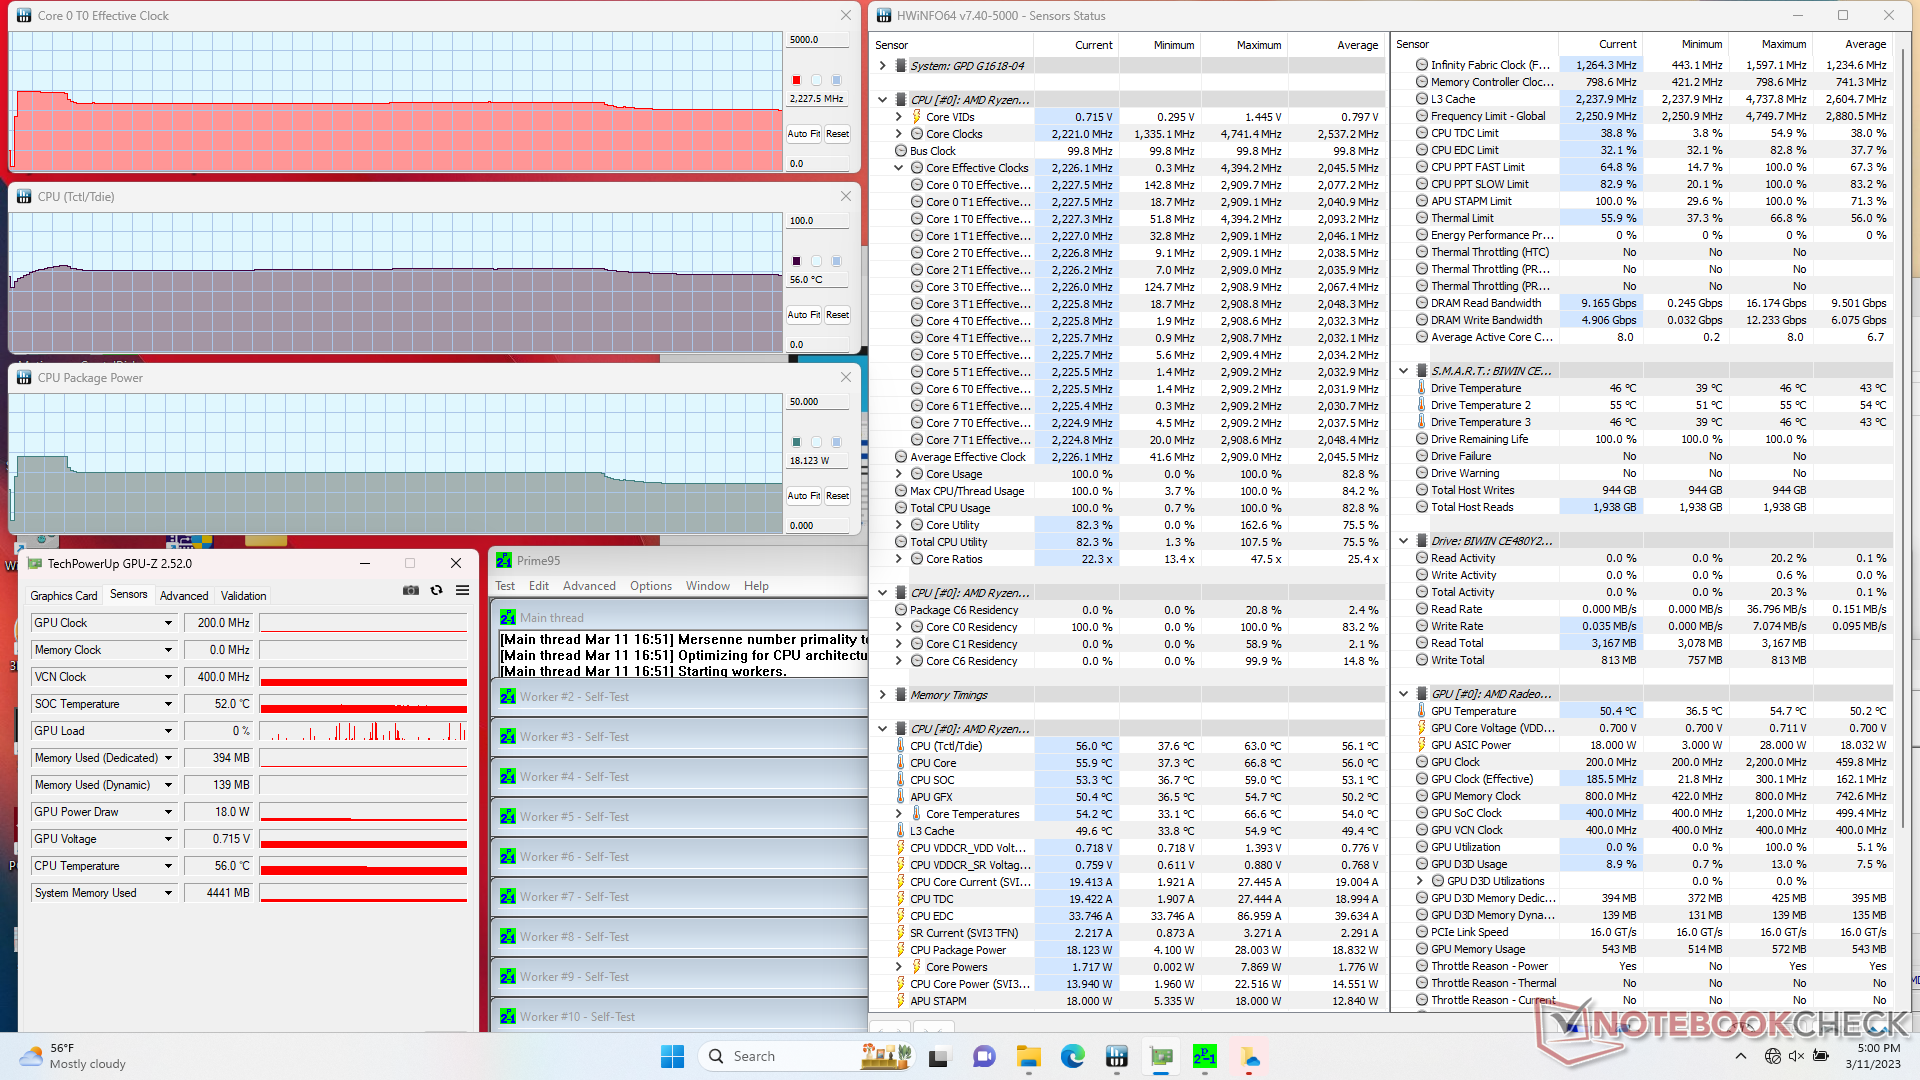
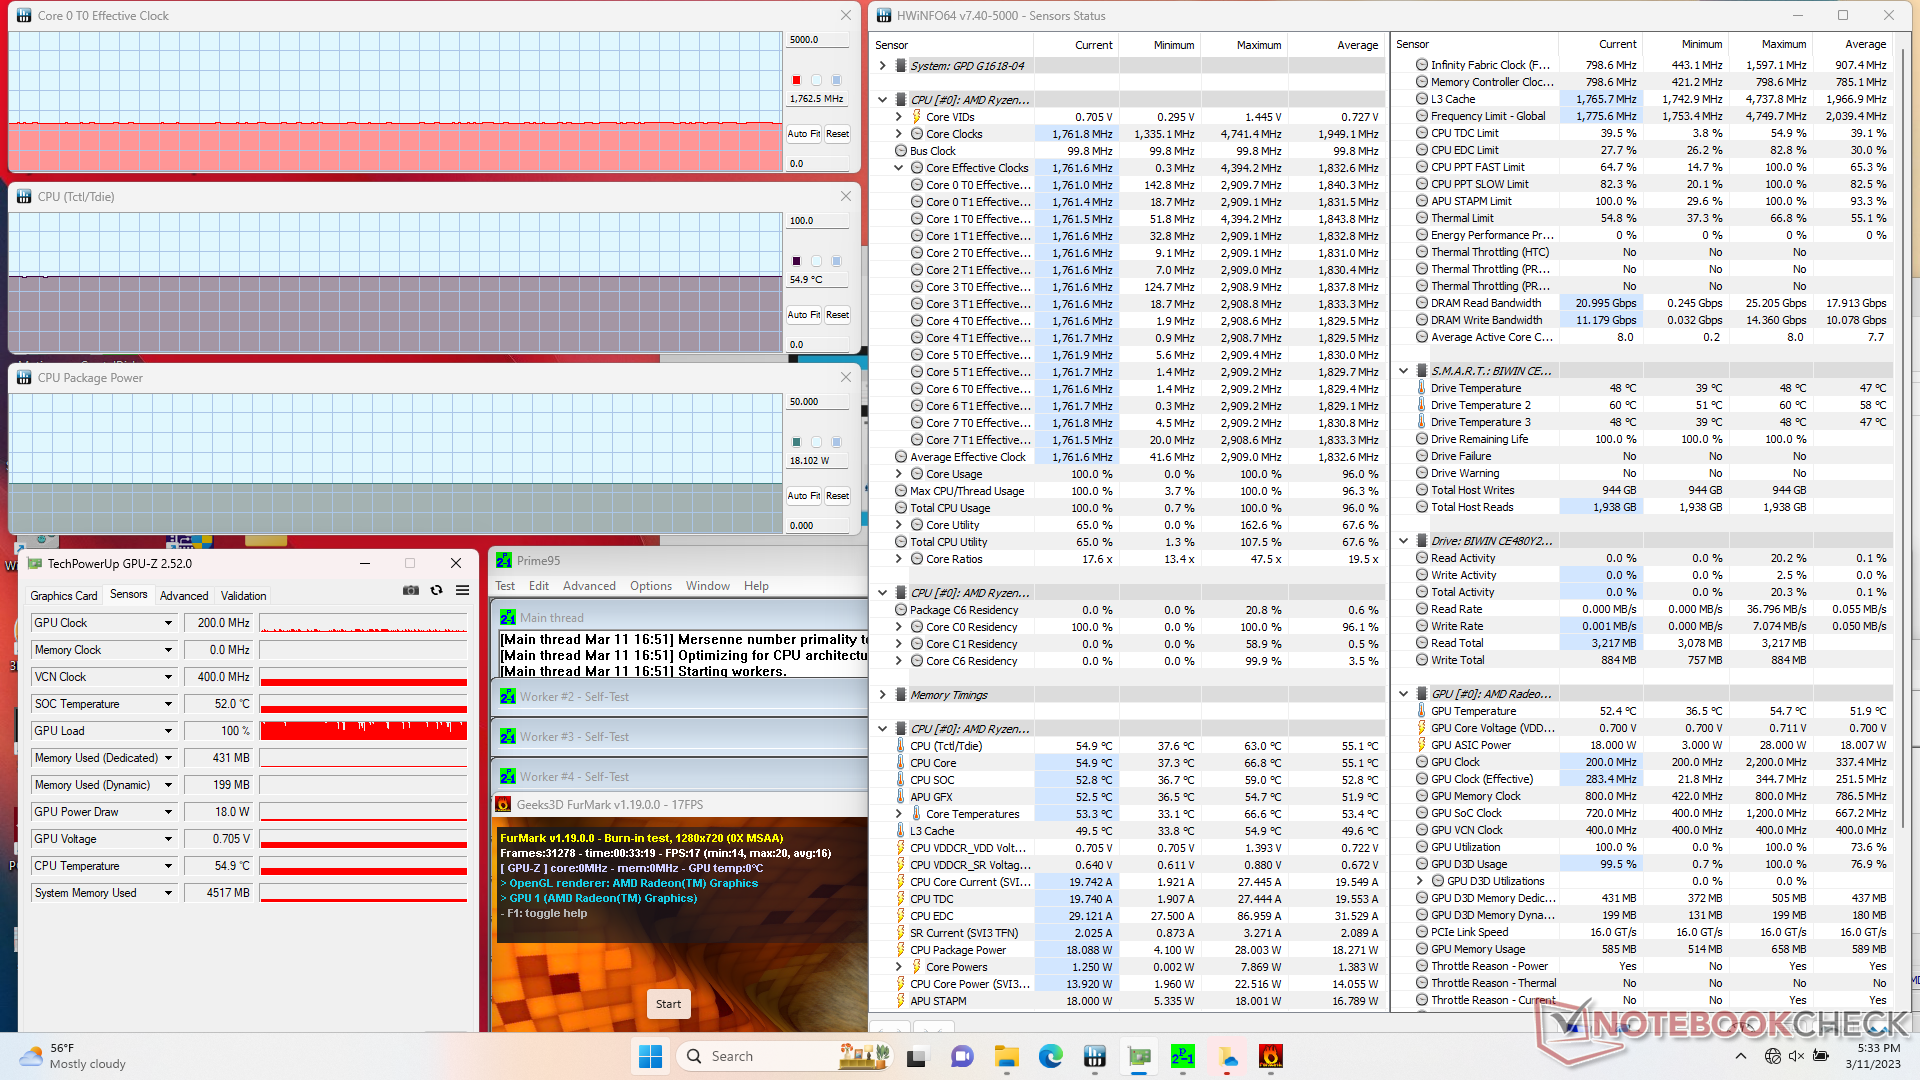
| Taktowanie CPU (GHz) | Taktowanie GPU (MHz) | Średnia temperatura CPU (°C) | |
| System w stanie bezczynności | -- | -- | 38 |
| Prime95 Stress | 2.2 | -- | 56 |
| Prime95 + FurMark Stress | 1.8 | 200 | 55 |
| Witcher 3 Stress | 0,7 | 1316 | 55 |
Mówcy
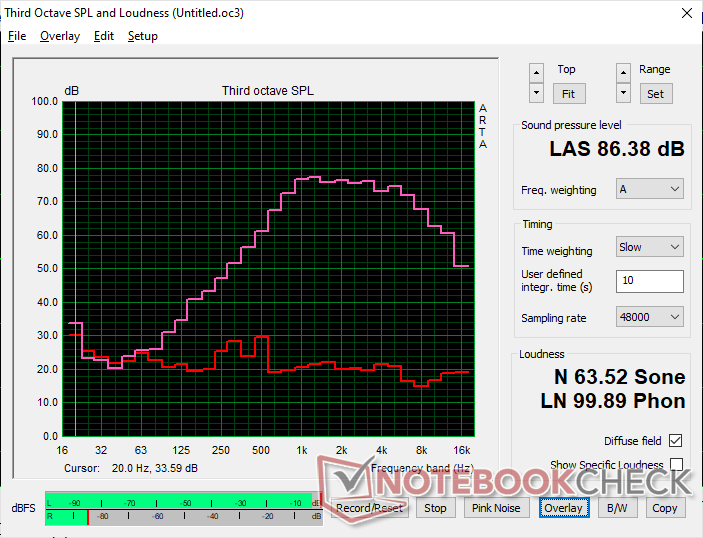
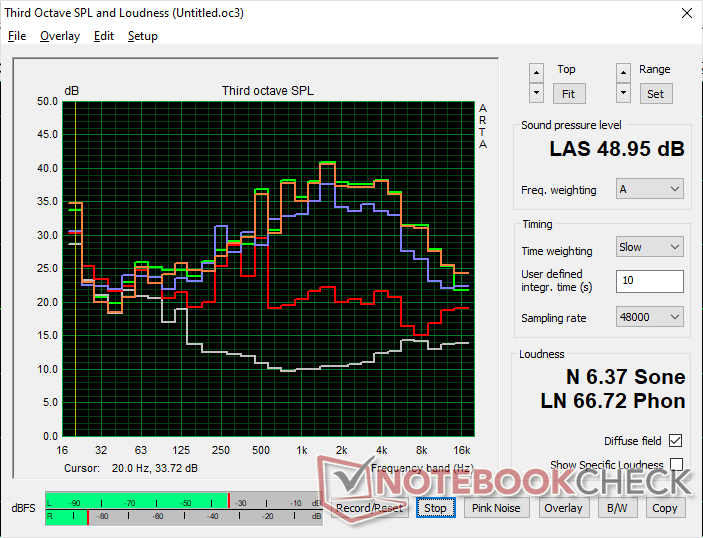
GPD Win 4 analiza dźwięku
(+) | głośniki mogą odtwarzać stosunkowo głośno (86.4 dB)
Bas 100 - 315 Hz
(-) | prawie brak basu - średnio 26.1% niższa od mediany
(±) | liniowość basu jest średnia (9.1% delta do poprzedniej częstotliwości)
Średnie 400 - 2000 Hz
(±) | wyższe średnie - średnio 7.3% wyższe niż mediana
(±) | liniowość środka jest średnia (7.4% delta do poprzedniej częstotliwości)
Wysokie 2–16 kHz
(±) | wyższe maksima - średnio 5.6% wyższe od mediany
(+) | wzloty są liniowe (5.4% delta do poprzedniej częstotliwości)
Ogólnie 100 - 16.000 Hz
(±) | liniowość ogólnego dźwięku jest średnia (25.6% różnicy w stosunku do mediany)
W porównaniu do tej samej klasy
» 86% wszystkich testowanych urządzeń w tej klasie było lepszych, 3% podobnych, 11% gorszych
» Najlepszy miał deltę 5%, średnia wynosiła ###średnia###%, najgorsza wynosiła 53%
W porównaniu do wszystkich testowanych urządzeń
» 79% wszystkich testowanych urządzeń było lepszych, 4% podobnych, 17% gorszych
» Najlepszy miał deltę 4%, średnia wynosiła ###średnia###%, najgorsza wynosiła 134%
Apple MacBook Pro 16 2021 M1 Pro analiza dźwięku
(+) | głośniki mogą odtwarzać stosunkowo głośno (84.7 dB)
Bas 100 - 315 Hz
(+) | dobry bas - tylko 3.8% od mediany
(+) | bas jest liniowy (5.2% delta do poprzedniej częstotliwości)
Średnie 400 - 2000 Hz
(+) | zbalansowane środki średnie - tylko 1.3% od mediany
(+) | średnie są liniowe (2.1% delta do poprzedniej częstotliwości)
Wysokie 2–16 kHz
(+) | zrównoważone maksima - tylko 1.9% od mediany
(+) | wzloty są liniowe (2.7% delta do poprzedniej częstotliwości)
Ogólnie 100 - 16.000 Hz
(+) | ogólny dźwięk jest liniowy (4.6% różnicy w stosunku do mediany)
W porównaniu do tej samej klasy
» 0% wszystkich testowanych urządzeń w tej klasie było lepszych, 0% podobnych, 100% gorszych
» Najlepszy miał deltę 5%, średnia wynosiła ###średnia###%, najgorsza wynosiła 45%
W porównaniu do wszystkich testowanych urządzeń
» 0% wszystkich testowanych urządzeń było lepszych, 0% podobnych, 100% gorszych
» Najlepszy miał deltę 4%, średnia wynosiła ###średnia###%, najgorsza wynosiła 134%
Zarządzanie energią - zapotrzebowanie na energię w stosunku do wielkości
Pobór mocy
Ogólne zużycie energii jest wyższe niż w Win 3 i wielu ultrabookach z serii U, głównie ze względu na procesor Ryzen 7 i większy ekran dotykowy o wyższej rozdzielczości. Na przykład w grach zapotrzebowanie na energię jest o 20-55% wyższe, niż w Win 3 z procesorem Core i5, ale jest to rekompensowane przez 2x wyższą wydajność CPU i 1,5x wyższą wydajność GPU w porównaniu z i5-1135G7. W stanie spoczynku na pulpicie komputer pobiera od 7 do 13 W, czyli podobnie jak wiele ultrabooków.
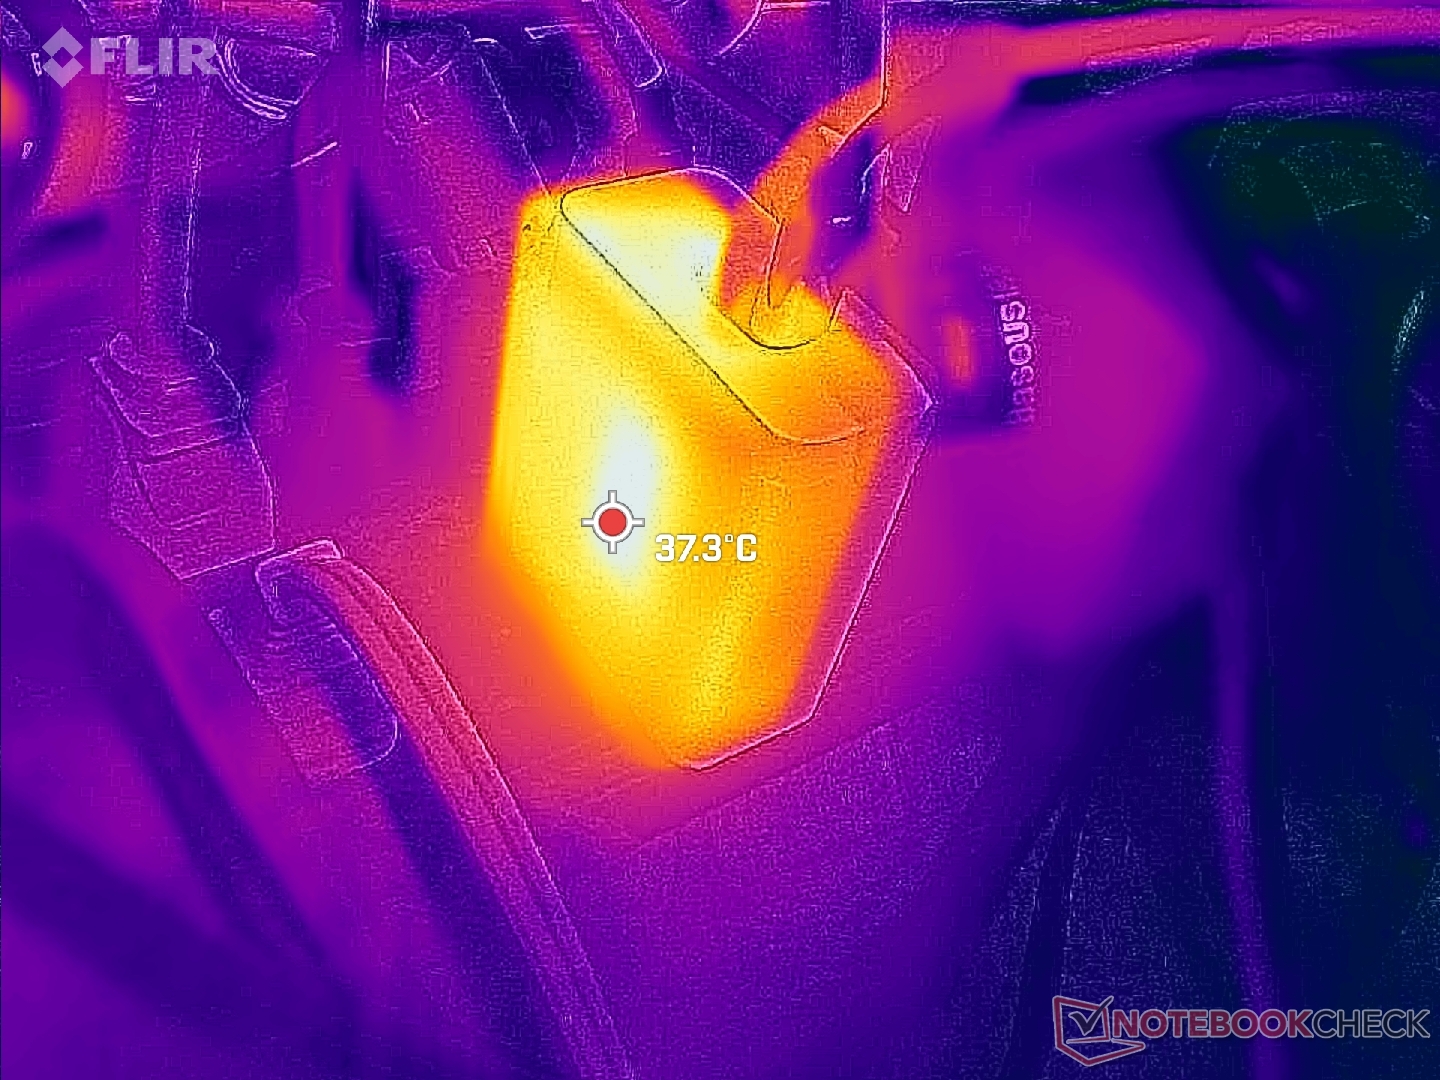
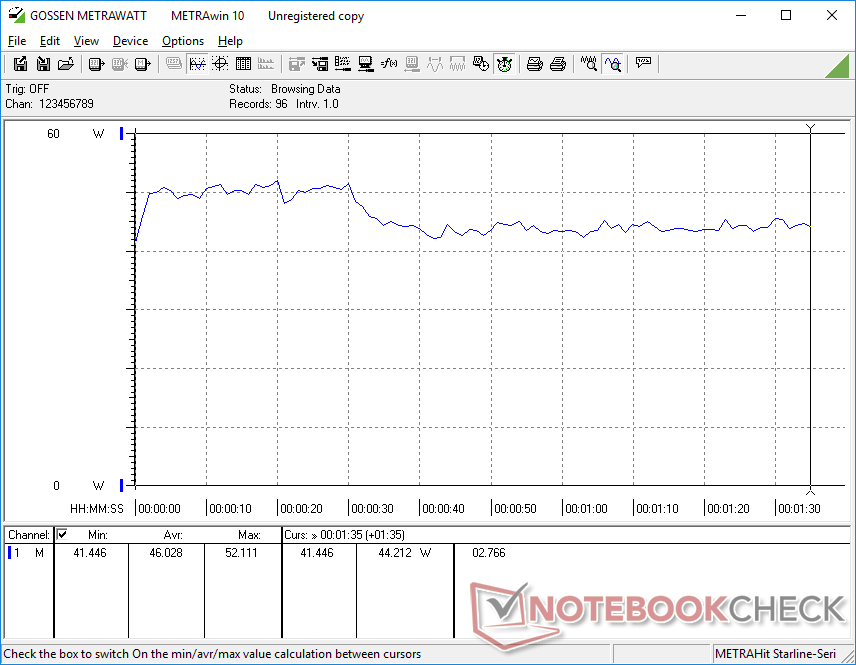
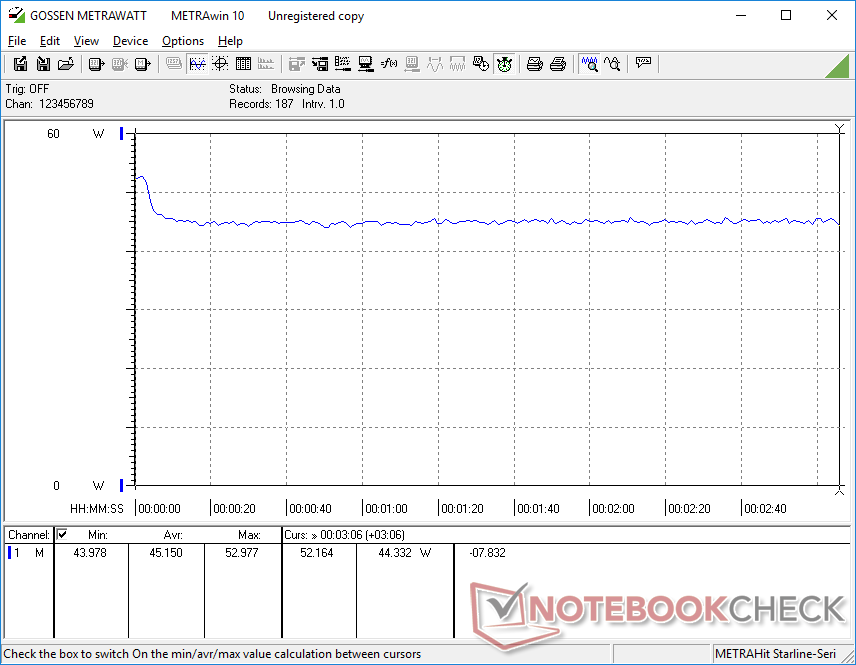
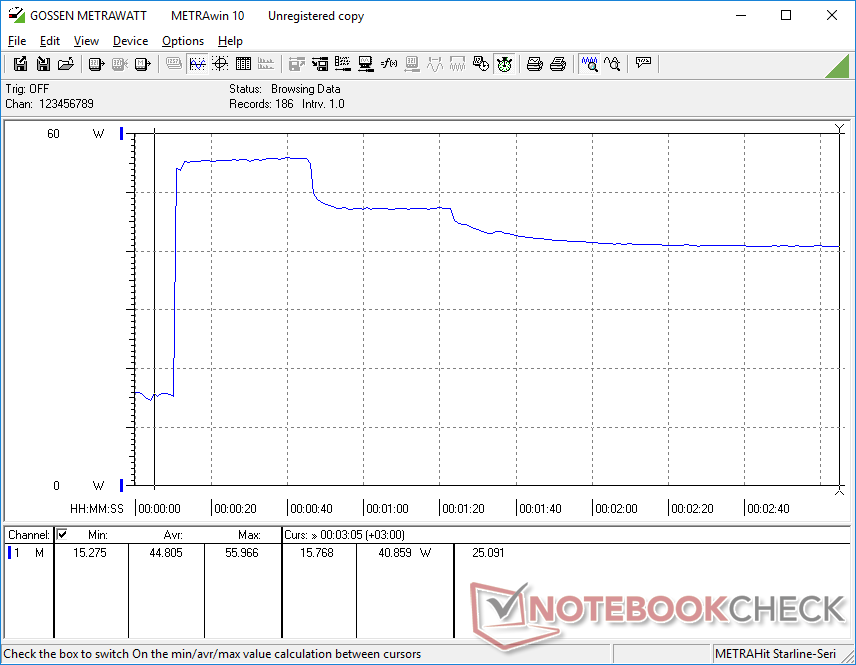
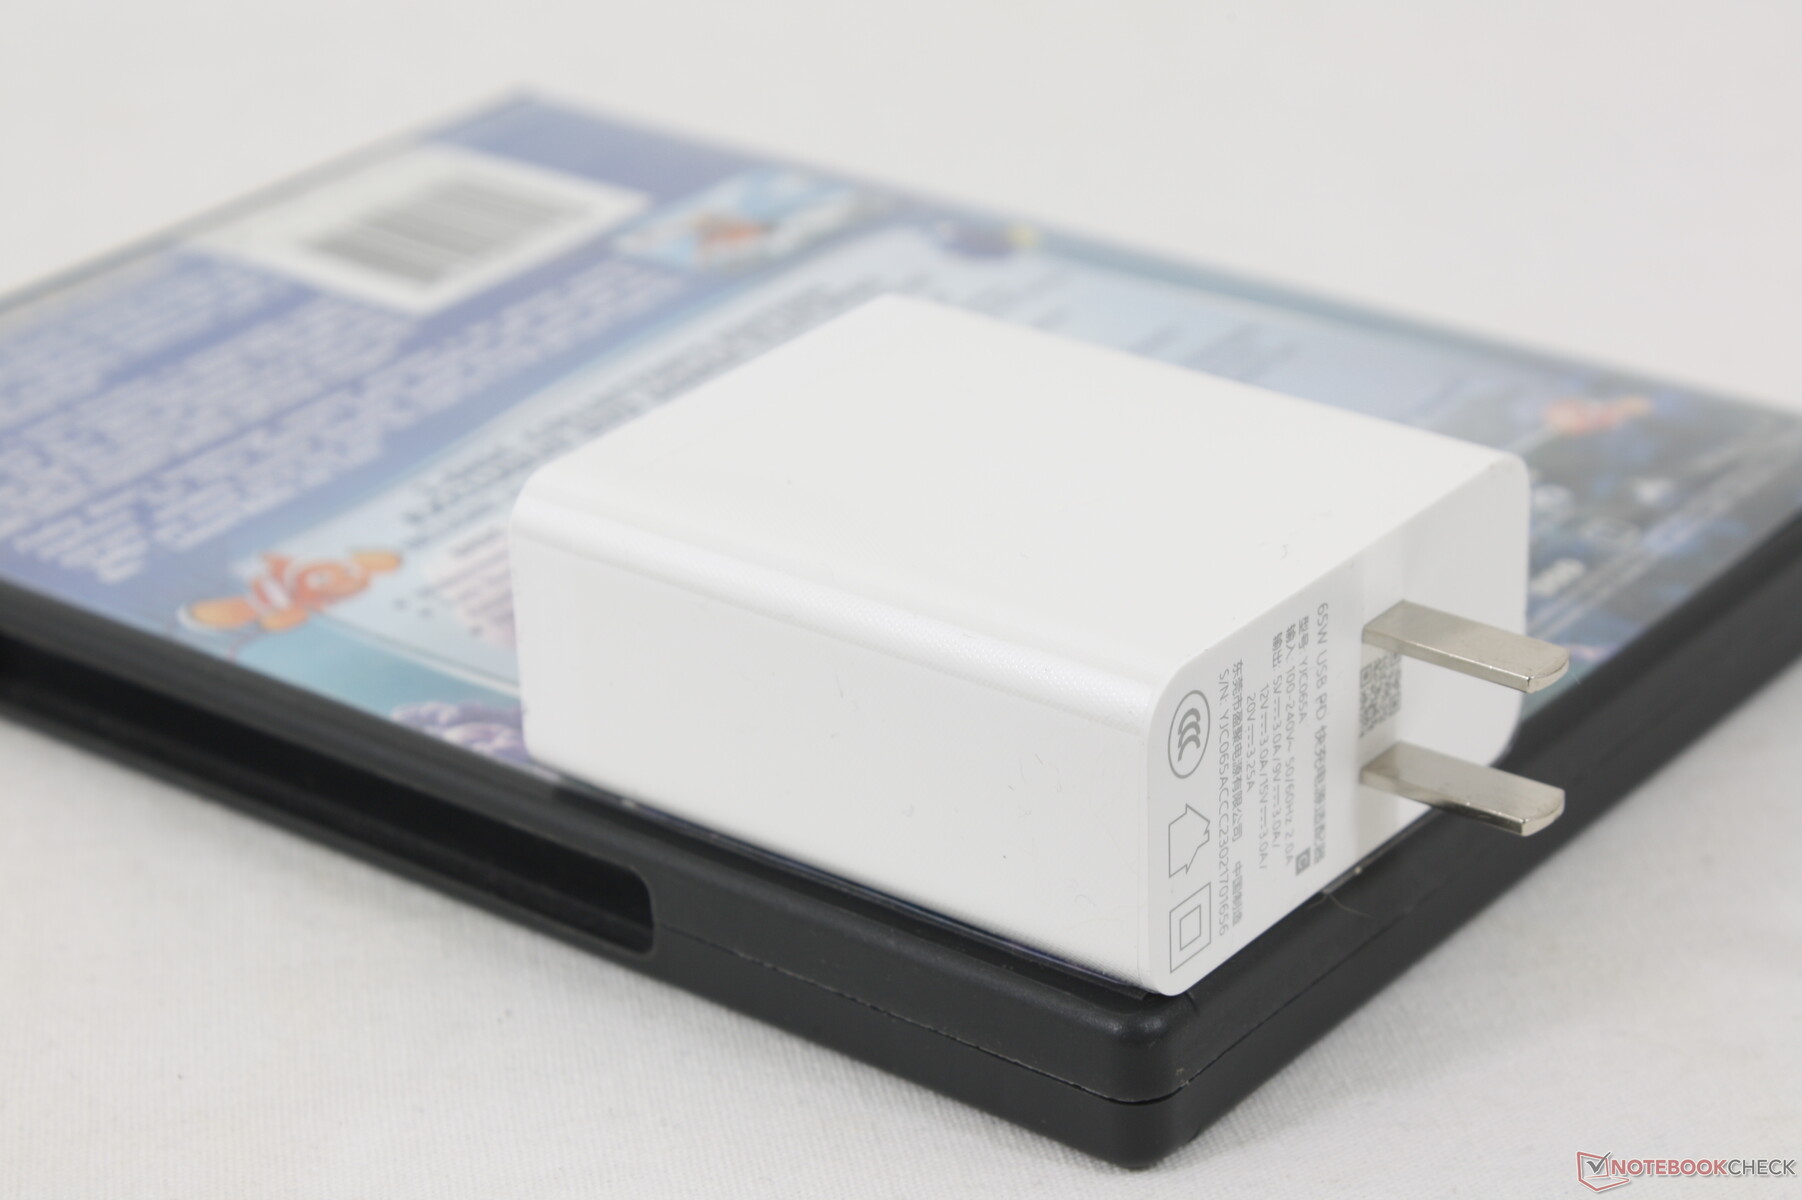
Kiedy procesor jest wykorzystywany w 100 procentach, z małego (~6,4 x 5,5 x 2,8 cm) zasilacza sieciowego USB-C o mocy 65 W udało nam się zmierzyć chwilowy maksymalny pobór mocy 56 W. Wskaźnik ten spada po kilku sekundach. Wskaźnik ten spada po kilku sekundach stresu, co pokazują poniższe wykresy, ze względu na ograniczony potencjał CPU Boost tego modelu. Wtyki na zasilaczu AC nie są niestety chowane.
| wyłączony / stan wstrzymania | |
| luz | |
| obciążenie |
|
Legenda:
min: | |
| GPD Win 4 R7 6800U, Radeon 680M, BiWin CE480Y2D100-1TB, IPS, 1920x1080, 6" | GPD Win Max 2 i7-1260P, Iris Xe G7 96EUs, BiWin NQ200 1TB CNF82GS1D00-1TB, IPS, 2560x1600, 10.1" | GPD Win 3 i5-1135G7, Iris Xe G7 80EUs, BIWIN NS200 1TB CNF82GS1G02-1TB, IPS, 1280x720, 5.5" | Razer Blade Stealth i7-1165G7 GTX 1650 Ti Max-Q i7-1165G7, GeForce GTX 1650 Ti Max-Q, Samsung SSD PM981a MZVLB512HBJQ, IPS, 1920x1080, 13.3" | Dell XPS 13 9315 2-in-1 Core i5-1230U i5-1230U, Iris Xe G7 80EUs, , IPS, 2880x1920, 13" | Asus Zenbook S 13 OLED R7 6800U, Radeon 680M, Samsung PM9A1 MZVL21T0HCLR, OLED, 2880x1800, 13.3" | |
|---|---|---|---|---|---|---|
| Power Consumption | 2% | 45% | -20% | 32% | 18% | |
| Idle Minimum * (Watt) | 7.5 | 5.8 23% | 2.9 61% | 4 47% | 5.2 31% | 4.8 36% |
| Idle Average * (Watt) | 12.4 | 10.2 18% | 4.5 64% | 6.3 49% | 7.9 36% | 8.7 30% |
| Idle Maximum * (Watt) | 13 | 11.5 12% | 4.5 65% | 14.5 -12% | 8 38% | 10.1 22% |
| Load Average * (Watt) | 46 | 47.7 -4% | 38.5 16% | 79.2 -72% | 31.2 32% | 45.6 1% |
| Witcher 3 ultra * (Watt) | 45.2 | 45.6 -1% | 28.9 36% | 68.2 -51% | 28.2 38% | 42.4 6% |
| Load Maximum * (Watt) | 56 | 76.8 -37% | 41.4 26% | 99.4 -78% | 47.6 15% | 49.5 12% |
* ... im mniej tym lepiej
Power Consumption Witcher 3 / Stresstest
Power Consumption external Monitor
Czas pracy na baterii
Pojemność baterii pozostaje niemal identyczna jak w Win 3, pomimo szybszej wydajności i większych rozmiarów Win 4. Nie jest więc zaskoczeniem, że czas pracy na baterii w Win 4 jest o kilka godzin krótszy. Udało nam się zarejestrować całkowity czas pracy 7,5 godziny podczas przeglądania stron internetowych przy jasności 150 nitów i tylko 77 minut podczas uruchamiania wymagających gier przy maksymalnym ustawieniu jasności.
Ładowanie od stanu pustego do pełnego trwa około 90 minut, podobnie jak w większości ultrabooków. Należy pamiętać, że szybkość ładowania spada w przypadku jednoczesnego grania.
| GPD Win 4 R7 6800U, Radeon 680M, 46 Wh | GPD Win Max 2 i7-1260P, Iris Xe G7 96EUs, 70 Wh | GPD Win 3 i5-1135G7, Iris Xe G7 80EUs, 44 Wh | Razer Blade Stealth i7-1165G7 GTX 1650 Ti Max-Q i7-1165G7, GeForce GTX 1650 Ti Max-Q, 53.1 Wh | Dell XPS 13 9315 2-in-1 Core i5-1230U i5-1230U, Iris Xe G7 80EUs, 49.5 Wh | Asus Zenbook S 13 OLED R7 6800U, Radeon 680M, 67 Wh | |
|---|---|---|---|---|---|---|
| Czasy pracy | 35% | 26% | 66% | 38% | 54% | |
| Reader / Idle (h) | 9.7 | 15.4 59% | 20.6 112% | 13.6 40% | ||
| WiFi v1.3 (h) | 7.5 | 8.7 16% | 11.3 51% | 9 20% | 9 20% | 9.2 23% |
| Load (h) | 1.3 | 1.7 31% | 1.3 0% | 2 54% | 2.4 85% | |
| H.264 (h) | 15.2 |
Za
Przeciw
Werdykt - sprawia, że Steam Deck wygląda na przestarzały

Win 4 jest ogromnym ulepszeniem w stosunku do Win 3 w prawie każdym aspekcie. Wyświetlacz jest większy, elementy sterujące są bardziej dotykowe, design jest mocniejszy i bardziej atrakcyjny, klawiatura jest bardziej niezawodna, a wydajność jest wyraźnie szybsza. Możesz umieścić logo PS na froncie i prawdopodobnie oszukałoby to więcej niż kilka oczu.
Nowy ekran, wydajność i zintegrowana klawiatura fizyczna przyczyniają się do większej wagi, grubszego profilu i głośniejszego szumu wentylatora w Win 4, które są trzema głównymi wadami tego modelu. Może być solidnie zbudowany, ale inne handheldy do gier, takie jak Switch lub OneXPlayer są cieńsze i lżejsze dla łatwiejszego czasu gry w podróży. Mimo to, nadal ma nogę w górę przed Steam Deck, który jest zarówno wolniejszy i bardziej nieporęczny niż rozwiązanie GPD.
GPD Win 4 łączy w sobie potężny procesor graficzny AMD Radeon 680M z najwyższą jakością wykonania, tworząc handhelda, który przyćmiewa Steam Deck w niemal każdym aspekcie.
Dwie brakujące cechy Win 4 to słabe możliwości serwisowe dla użytkownika końcowego i brak obsługi FreeSync. Gęsto upakowana konstrukcja utrudnia wymianę wewnętrznego dysku SSD lub potencjalnie uszkodzonych przycisków, podczas gdy FreeSync poprawiłby wrażenia z gry bez dodatkowego sprzętu. Dla tego, co jest warte, wyświetlacz ma natywny tryb 40 Hz, jeśli użytkownicy chcą celować w 40 FPS dla rzadszego rozdzierania ekranu.
Coś, co powinno być absolutnie naprawione, to słaba stabilność liczby klatek na sekundę lub mikro-stuttering podczas gry. Większość Ultrabooków, a zwłaszcza laptopów do gier, nie wykazuje tego problemu i tego samego oczekujemy od handhelda, w którym gra jest kluczowym punktem sprzedaży.
W przyszłych modelach chcielibyśmy zobaczyć, jak GPD włącza jeszcze więcej technologii z obecnej generacji laptopów do gier, aby zminimalizować grubość i potencjalnie wagę. Na przykład przejście na pastę termiczną z ciekłego metalu, chłodzenie w komorze parowej oraz wewnętrzny wentylator o większej średnicy mogłyby pozwolić na większą wydajność w stosunku do objętości. Do tego czasu, GPD Win 4 jest łatwo jednym z najlepszych i najszybszych opartych na Windowsie handheldów do gier obecnie dostępnych.
Cena i dostępność
Strona Indiegogo dla Win 4 jest już na żywo z początkowymi dostawami rozpoczynającymi się w marcu 2023 roku. Konfiguracje zaczynają się od niespełna 1000 USD za 16 GB RAM i 1 TB SSD, aż do 1300 USD za podwójną ilość RAM i pamięci masowej.
Przezroczystość
Wyboru urządzeń do recenzji dokonuje nasza redakcja. Próbka testowa została udostępniona autorowi jako pożyczka od producenta lub sprzedawcy detalicznego na potrzeby tej recenzji. Pożyczkodawca nie miał wpływu na tę recenzję, producent nie otrzymał też kopii tej recenzji przed publikacją. Nie było obowiązku publikowania tej recenzji. Jako niezależna firma medialna, Notebookcheck nie podlega władzy producentów, sprzedawców detalicznych ani wydawców.
Tak testuje Notebookcheck
Każdego roku Notebookcheck niezależnie sprawdza setki laptopów i smartfonów, stosując standardowe procedury, aby zapewnić porównywalność wszystkich wyników. Od około 20 lat stale rozwijamy nasze metody badawcze, ustanawiając przy tym standardy branżowe. W naszych laboratoriach testowych doświadczeni technicy i redaktorzy korzystają z wysokiej jakości sprzętu pomiarowego. Testy te obejmują wieloetapowy proces walidacji. Nasz kompleksowy system ocen opiera się na setkach uzasadnionych pomiarów i benchmarków, co pozwala zachować obiektywizm.Price comparison

