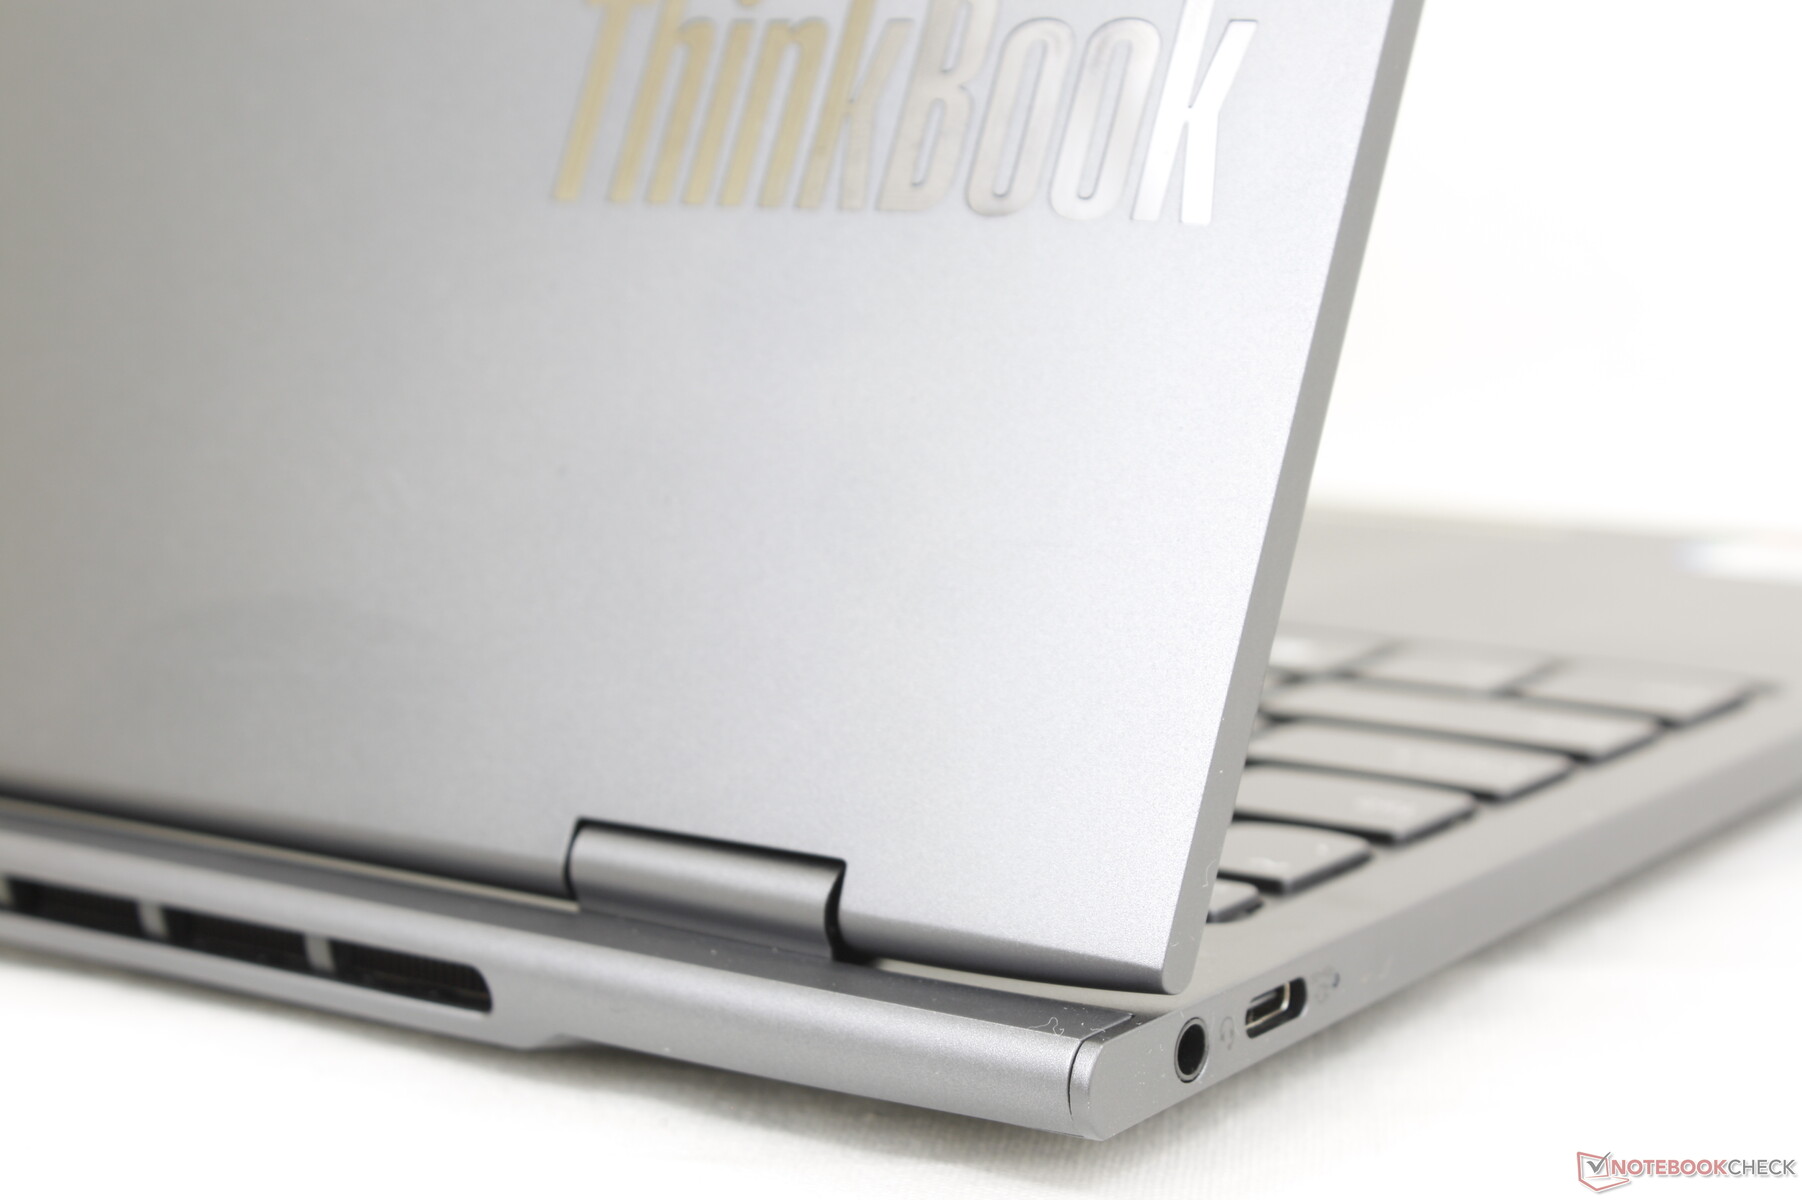
Recenzja laptopa Lenovo ThinkBook Plus Gen 3: 21:10 ultrawide productivity booster
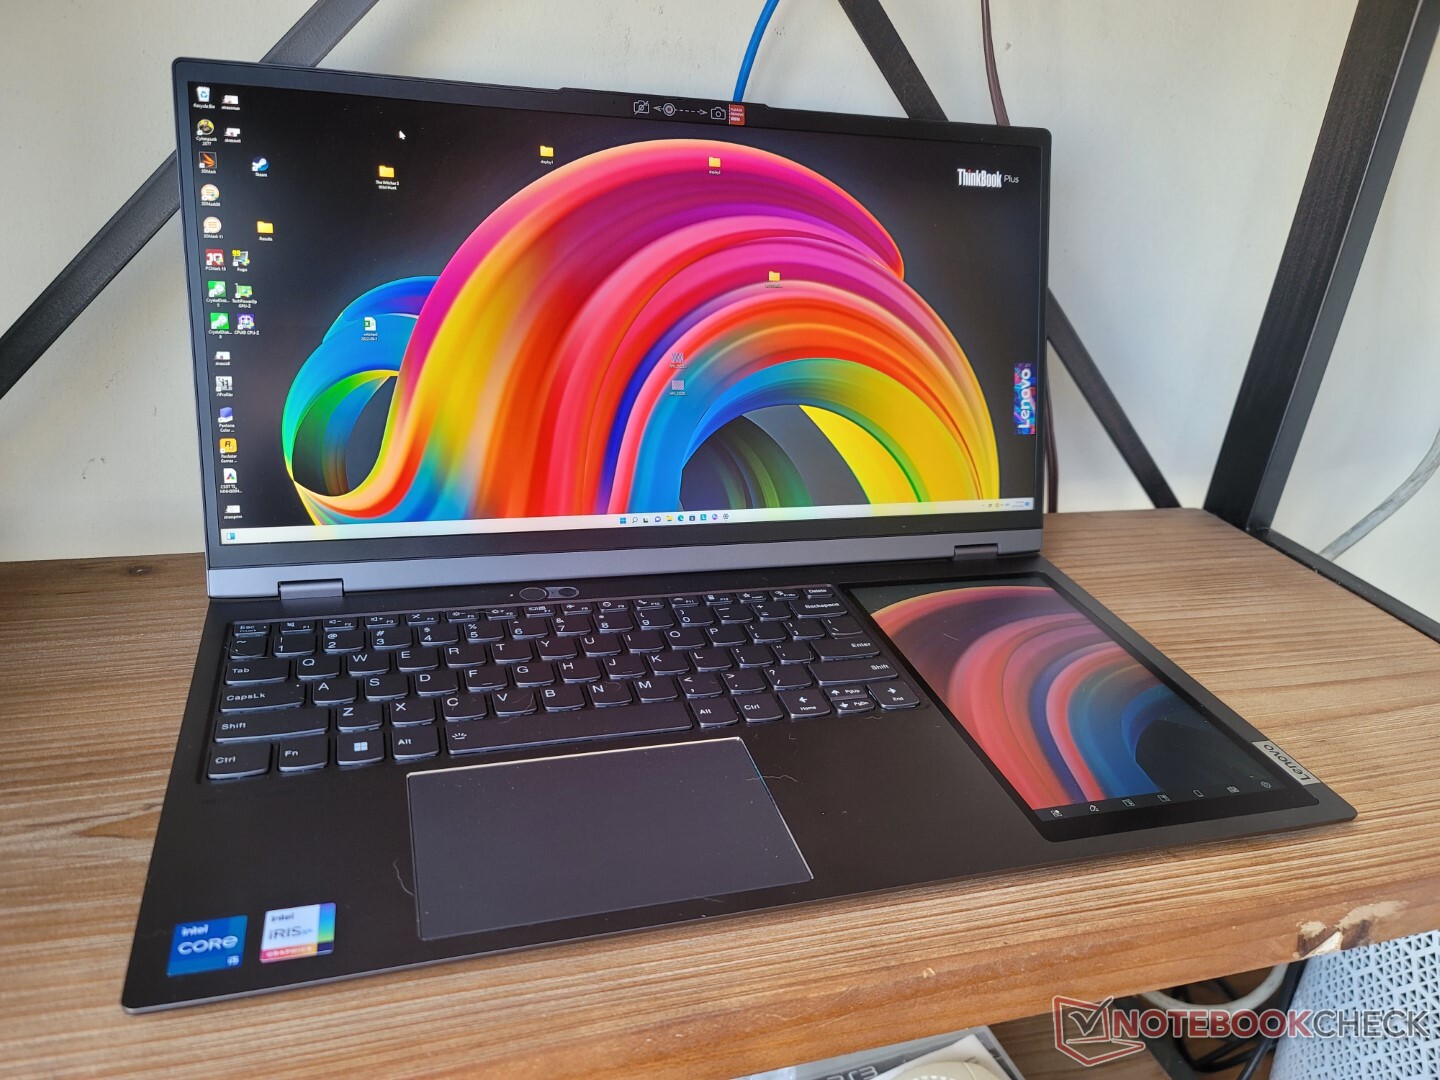
Lenovo ThinkBook Plus Gen 3 jest bezpośrednim następcą ubiegłorocznego ThinkBook Plus Gen 2. Choć nie da się tego stwierdzić po samej nazwie, model Gen 3 jest znaczącą zmianą w stosunku do poprzednika pod wieloma względami niż większość innych laptopów. Podczas gdy model Gen 2 to 13,3-calowy kabriolet o proporcjach 16:10 z dodatkowym 12-calowym ekranem dotykowym E-Ink, model Gen 3 to 17,3-calowy clamshell o proporcjach 21:10 z dodatkowym 8-calowym ekranem dotykowym IPS. Oba modele są tak różne, że można by się spierać o nazewnictwo modelu Gen 3 w stosunku do Gen 2, gdyż oba służą do zupełnie innych celów.
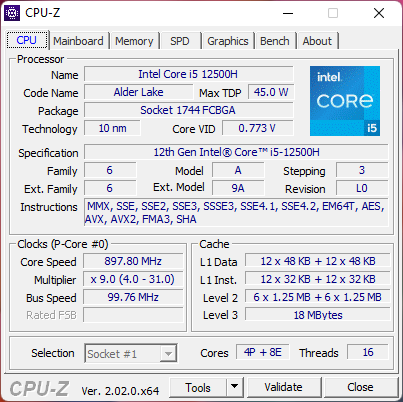
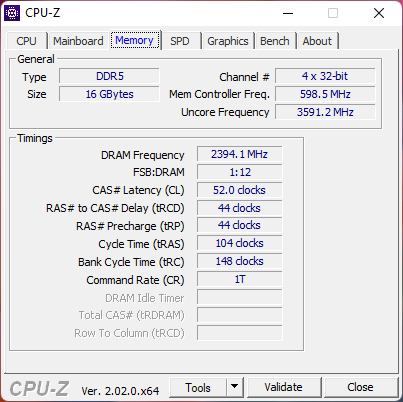
Nasza konfiguracja recenzencka Gen 3 obejmuje procesor Core i7-12700H 12. generacji z 16 GB wlutowanej pamięci RAM i 512 GB pamięci masowej PCIe4 za około 1600 USD. Dostępny jest również SKU Core i5-12500H, ale wszystkie opcje są wyposażone w dokładnie taki sam główny ekran dotykowy 3072 x 1440 matowy IPS, drugorzędny 8-calowy ekran dotykowy 800 x 1280 IPS oraz zintegrowaną grafikę Iris Xe.
Alternatywą dla ThinkBooka Plus Gen 3 są 15-calowe Asus ZenBook Pro Duo oraz inne 17-calowe laptopy przeznaczone dla twórców treści lub do pracy biurowej, jak np.LG Gram 17 lub Dell XPS 17.
Więcej recenzji Lenovo:
Potencjalni konkurenci w porównaniu
Ocena | Data | Model | Waga | Wysokość | Rozmiar | Rezolucja | Cena |
|---|---|---|---|---|---|---|---|
| 85.6 % v7 (old) | 09/2022 | Lenovo ThinkBook Plus Gen3 i7-12700H, Iris Xe G7 96EUs | 2 kg | 17.9 mm | 17.30" | 3072x1440 | |
| 86.1 % v7 (old) | Lenovo ThinkBook Plus Gen2 Core i5 i5-1130G7, Iris Xe G7 80EUs | 1.2 kg | 13.9 mm | 13.30" | 2560x1600 | ||
| 86.4 % v7 (old) | Asus ProArt StudioBook Pro 17 W700G3T i7-9750H, Quadro RTX 3000 Max-Q | 2.5 kg | 18.4 mm | 17.00" | 1920x1200 | ||
| 87.3 % v7 (old) | LG Gram 17 (2022) i5-1240P, Iris Xe G7 80EUs | 1.4 kg | 17.7 mm | 17.00" | 2560x1600 | ||
| 89.3 % v7 (old) | 02/2023 | Dell XPS 17 9720 i7-12700H, GeForce RTX 3050 4GB Laptop GPU | 2.5 kg | 19.5 mm | 17.00" | 3840x2400 | |
| 88 % v7 (old) | Gigabyte Aero 17 HDR YD i9-11980HK, GeForce RTX 3080 Laptop GPU | 2.8 kg | 22 mm | 17.30" | 3840x2160 |
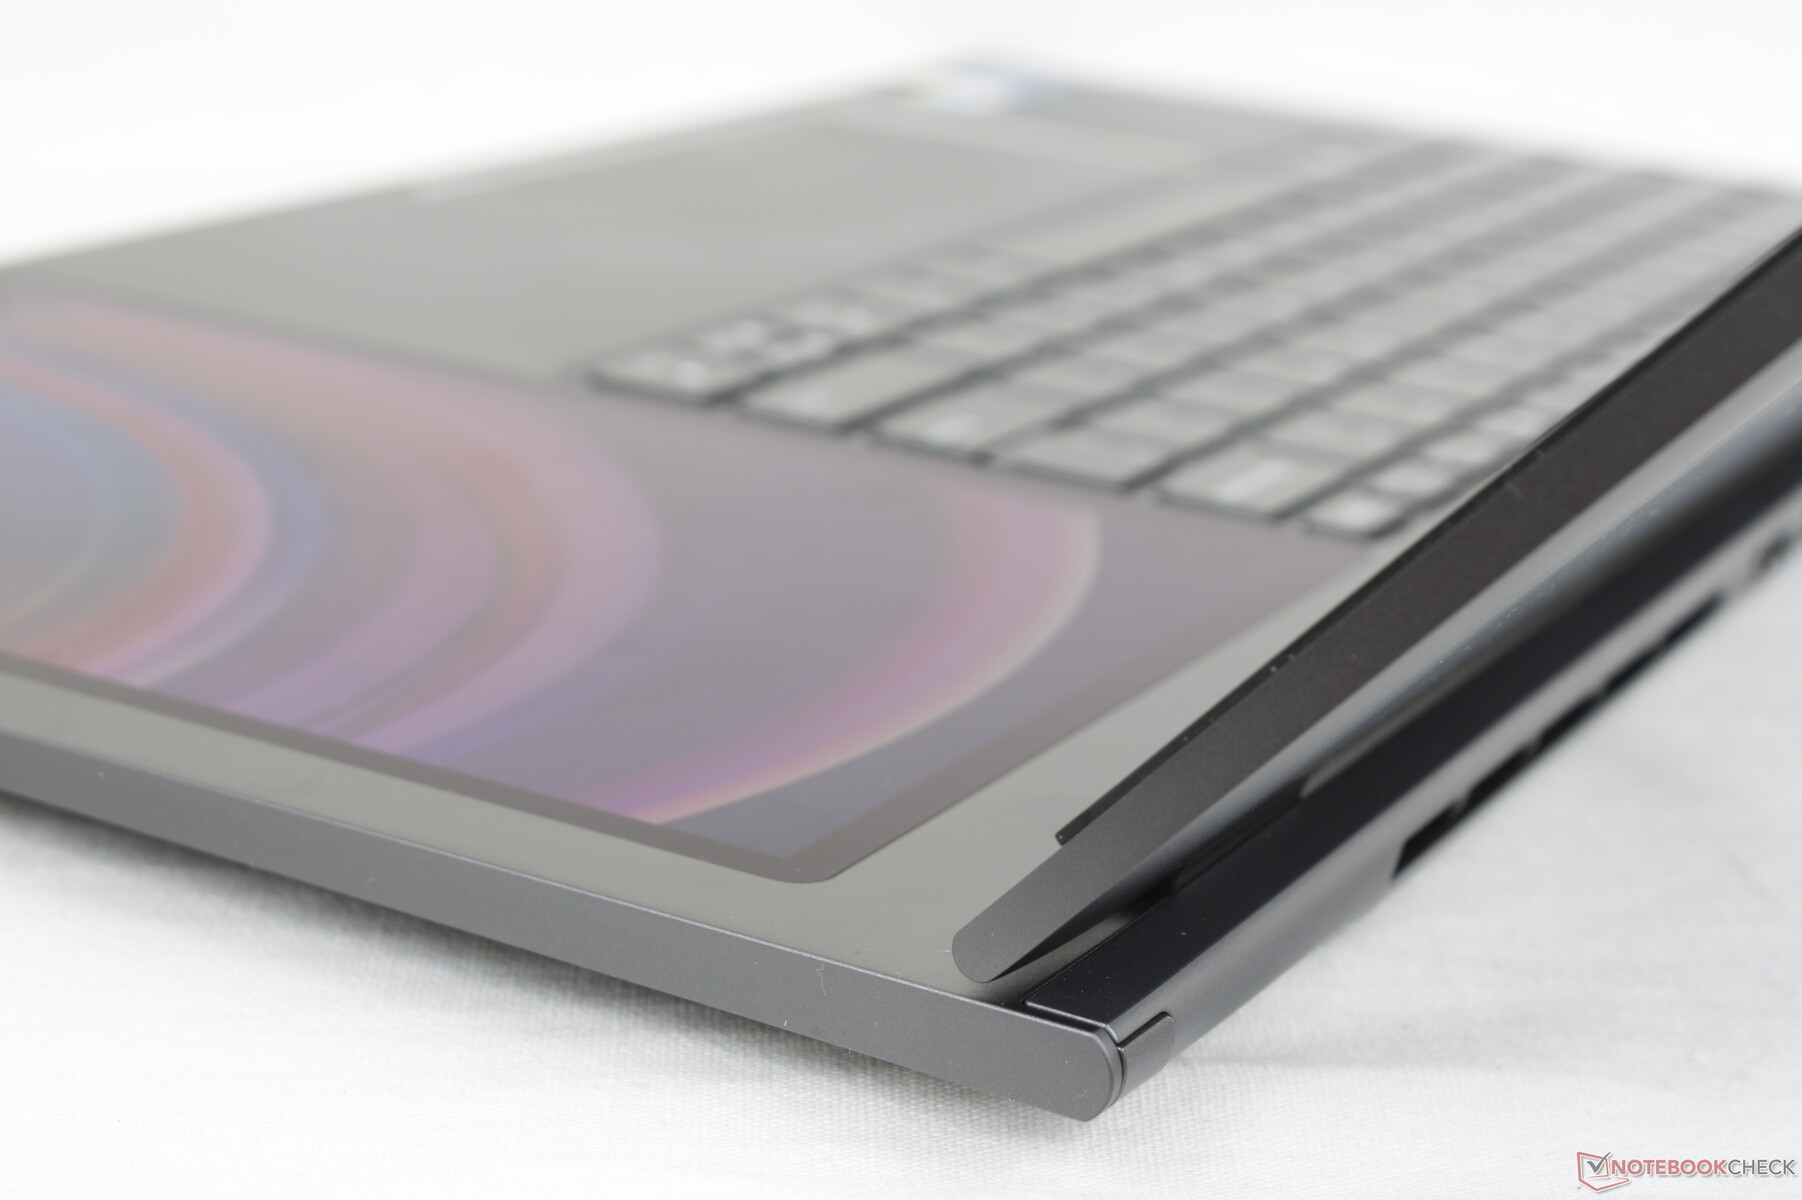
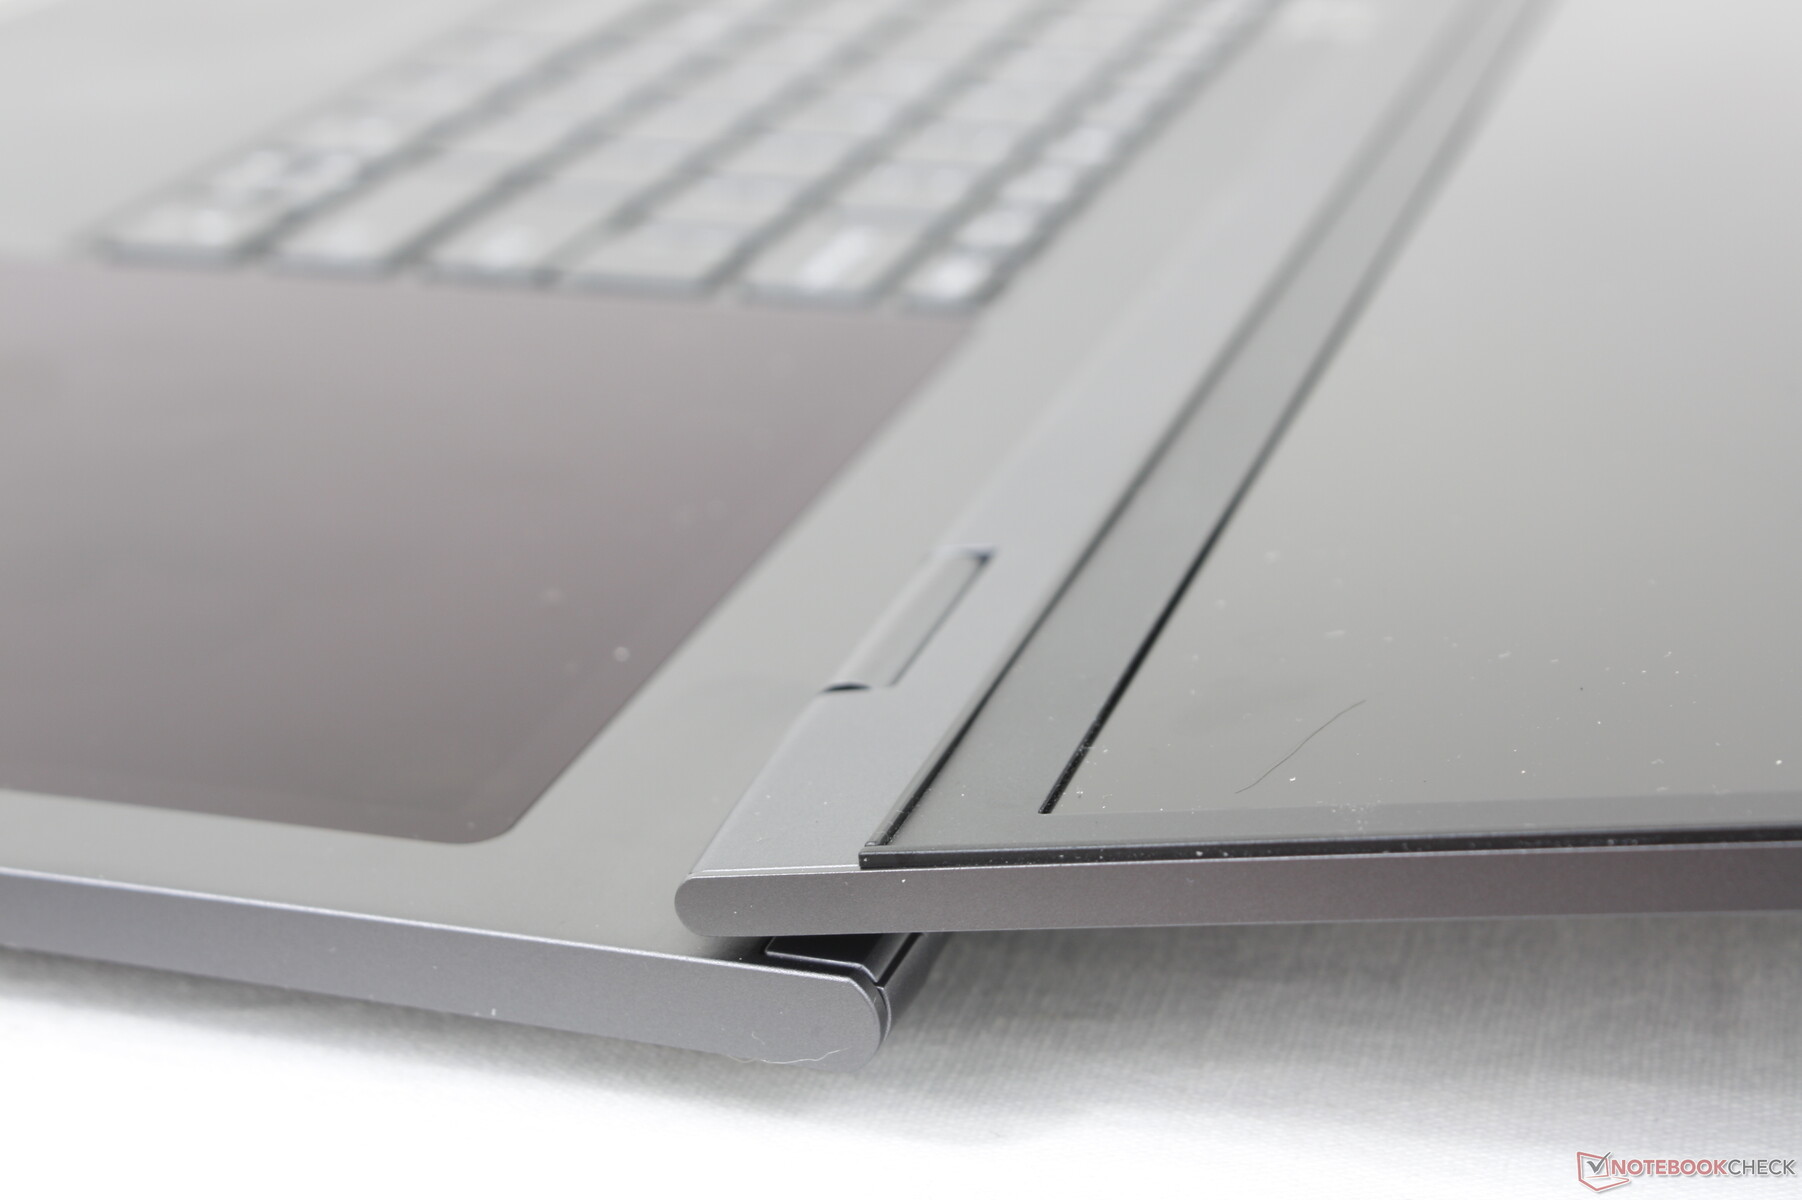
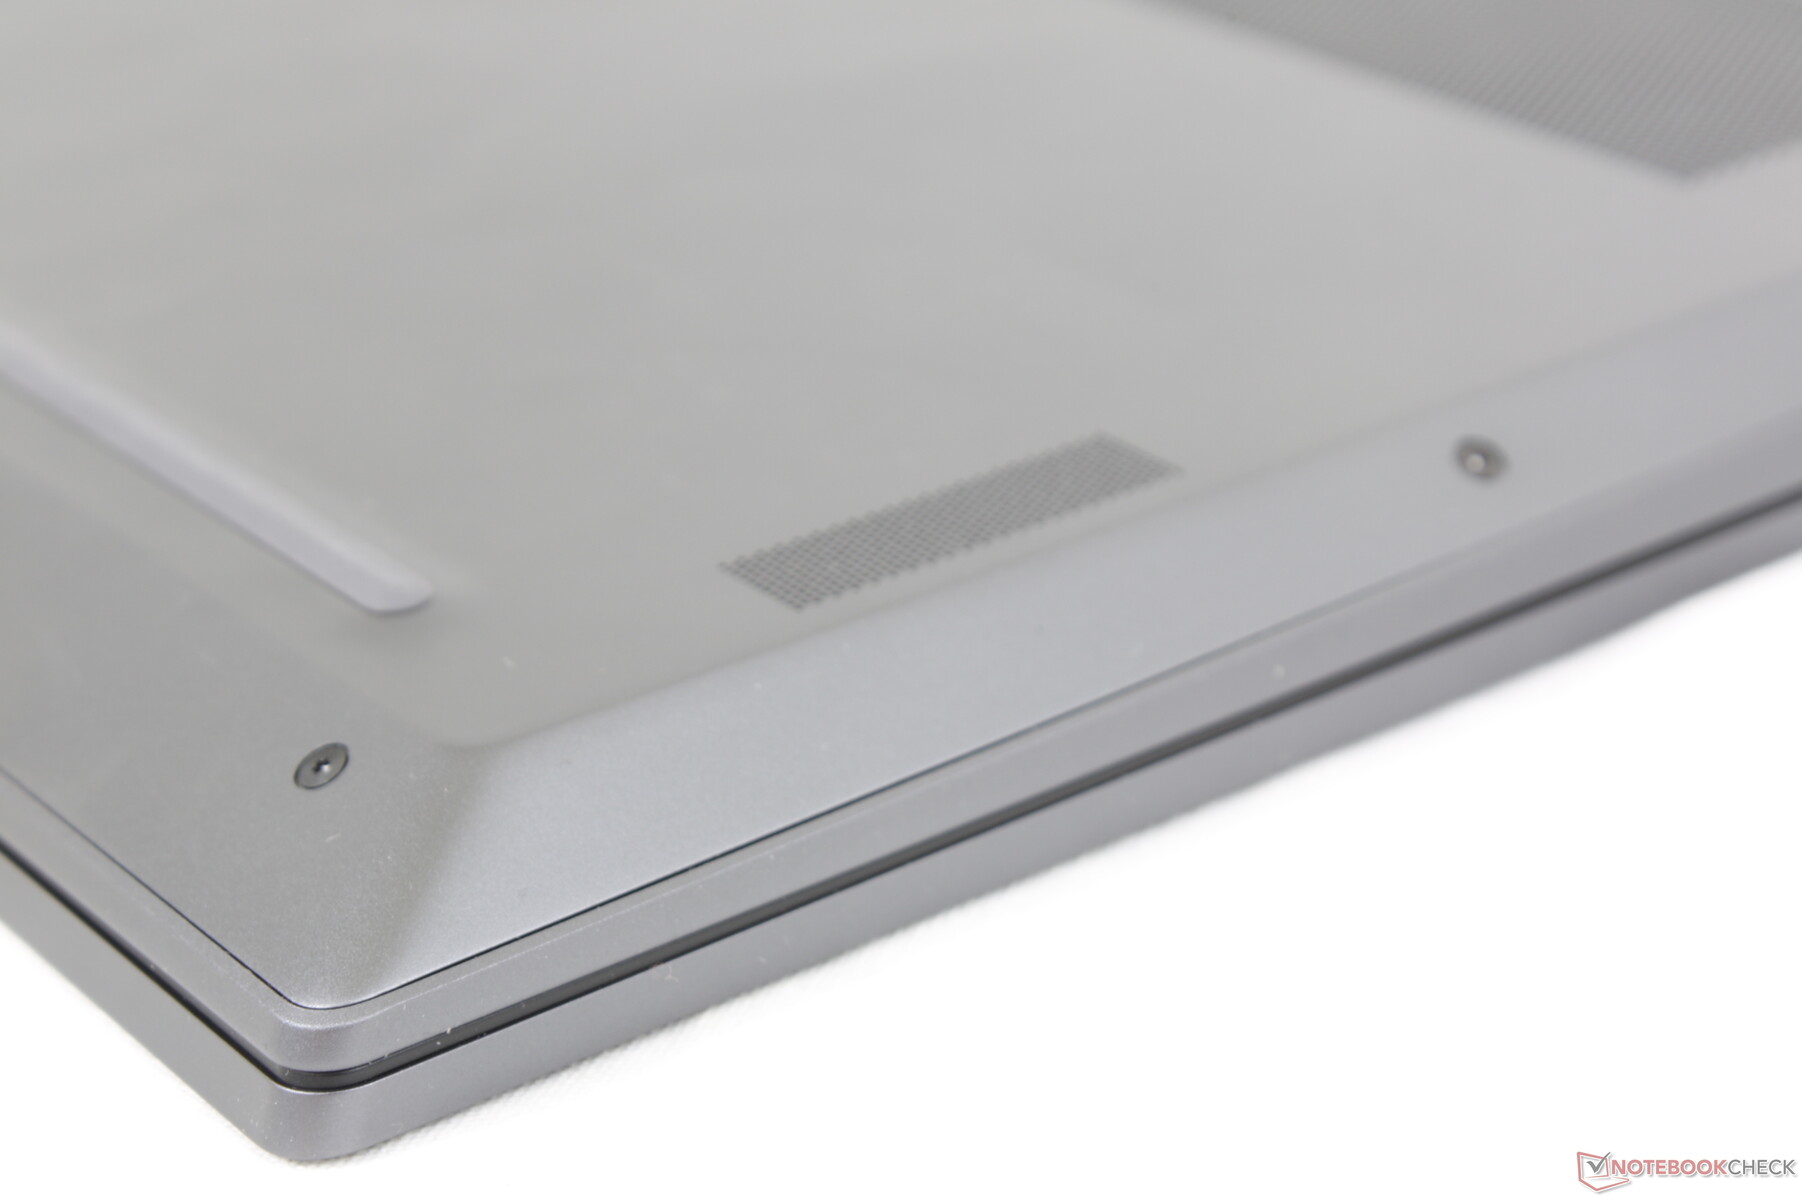
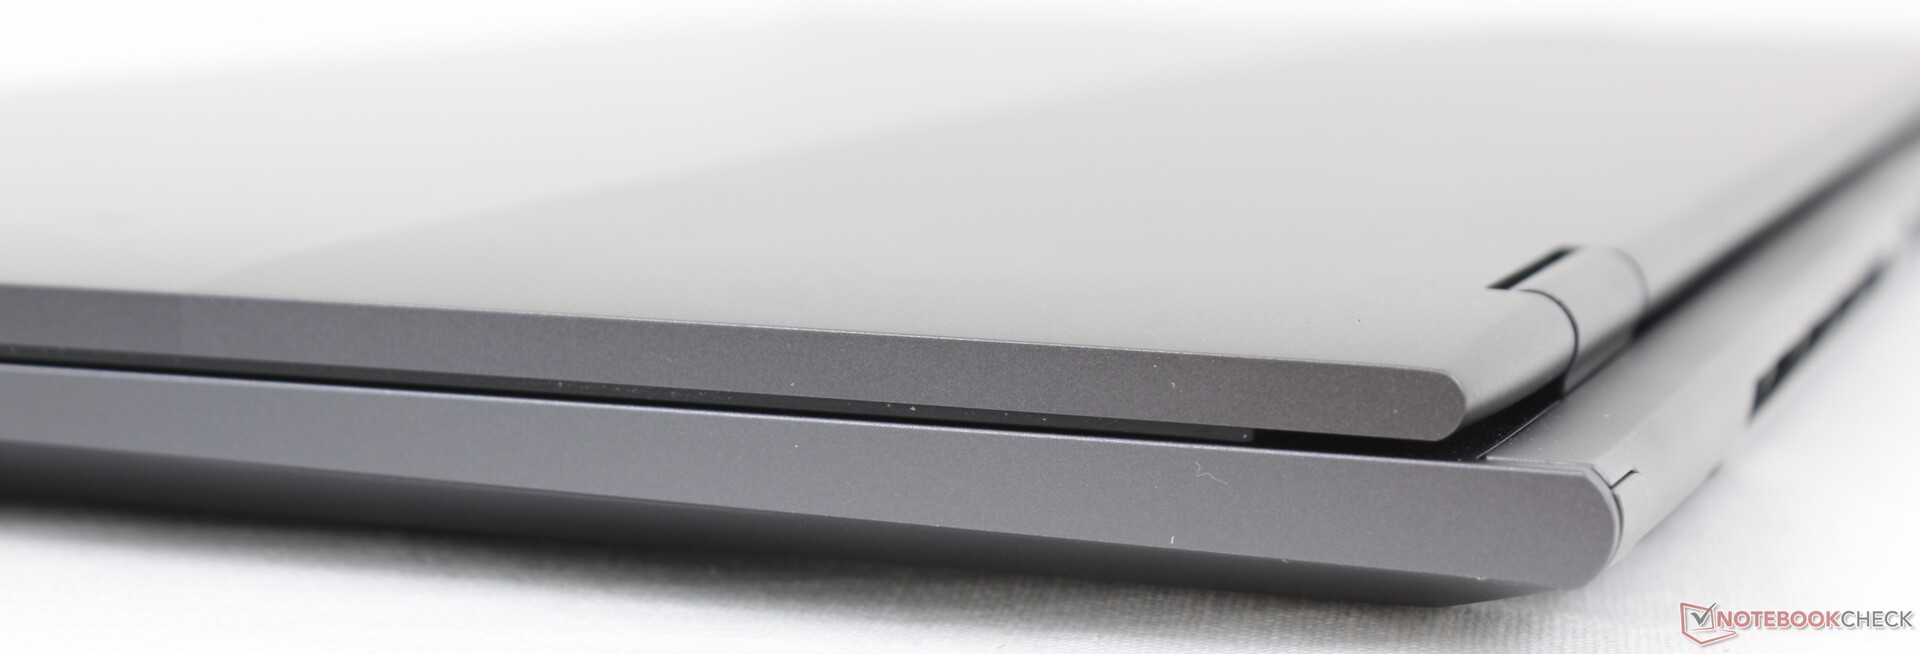
Case - Long And Thin
Obudowa wykorzystuje te same materiały ze stopu aluminium, co w innych modelach ThinkBooków, np. w niedawnym ThinkBook 16 G4 Plus. Jeśli więc w przeszłości trzymałeś w ręku jakiś model ThinkBooka, to gładkie ciemnoszare powierzchnie ThinkBooka Plus Gen 3 wydadzą Ci się znajome. Konstrukcja jest skierowana do zwykłych biur i małych i średnich przedsiębiorstw, a więc do miejsc pomiędzy konsumenckimi modelami Yoga i bardziej tradycyjnymi ThinkPadami.
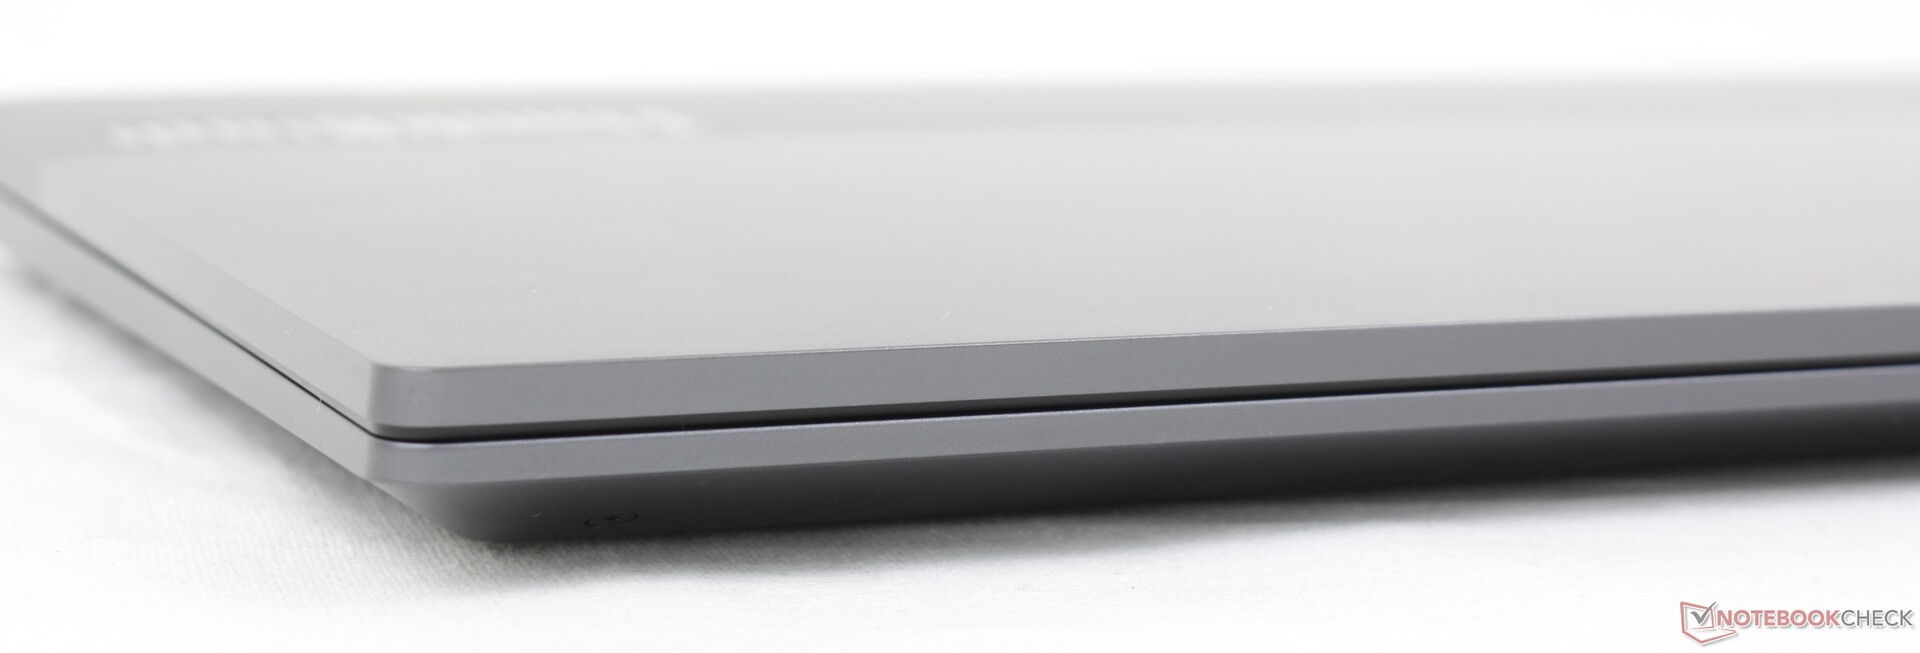
Jakość wykonania jest nieco niższa niż w przypadku modeli Yoga lub ThinkPad serii X serii X. Pokrywa i podstawa są nieco bardziej podatne na skręcanie i skrzypienie, co wynika prawdopodobnie z większej, 17,3-calowej obudowy i stosunkowo cienkiego szkieletu. Alternatywy, takie jak mniejszy ZenBook Duo czy cięższy XPS 17, sprawiają wrażenie twardszych i solidniejszych, zwłaszcza jeśli chodzi o zawiasy.
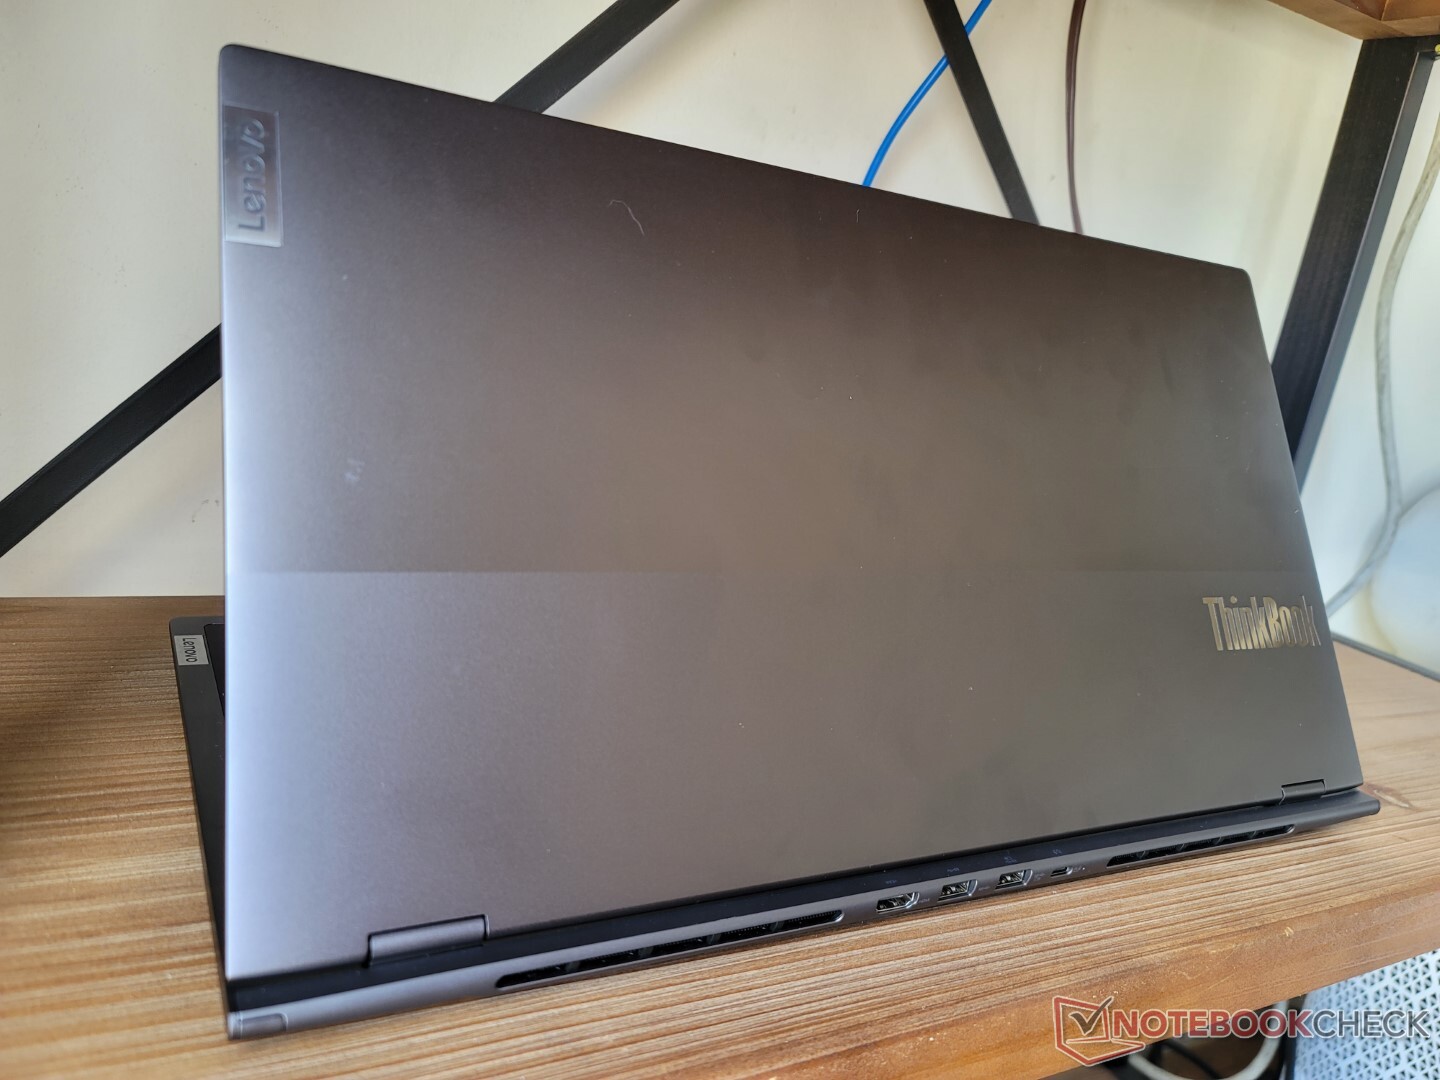
Wydłużony współczynnik proporcji zaowocował obudową, która jest zarówno szersza, jak i krótsza od innych 17-calowych laptopów. Na szczęście jest ona nadal cienka i lekka, jeśli wziąć pod uwagę kategorię wielkości. Na przykład XPS 17 jest o pół kilograma cięższy.
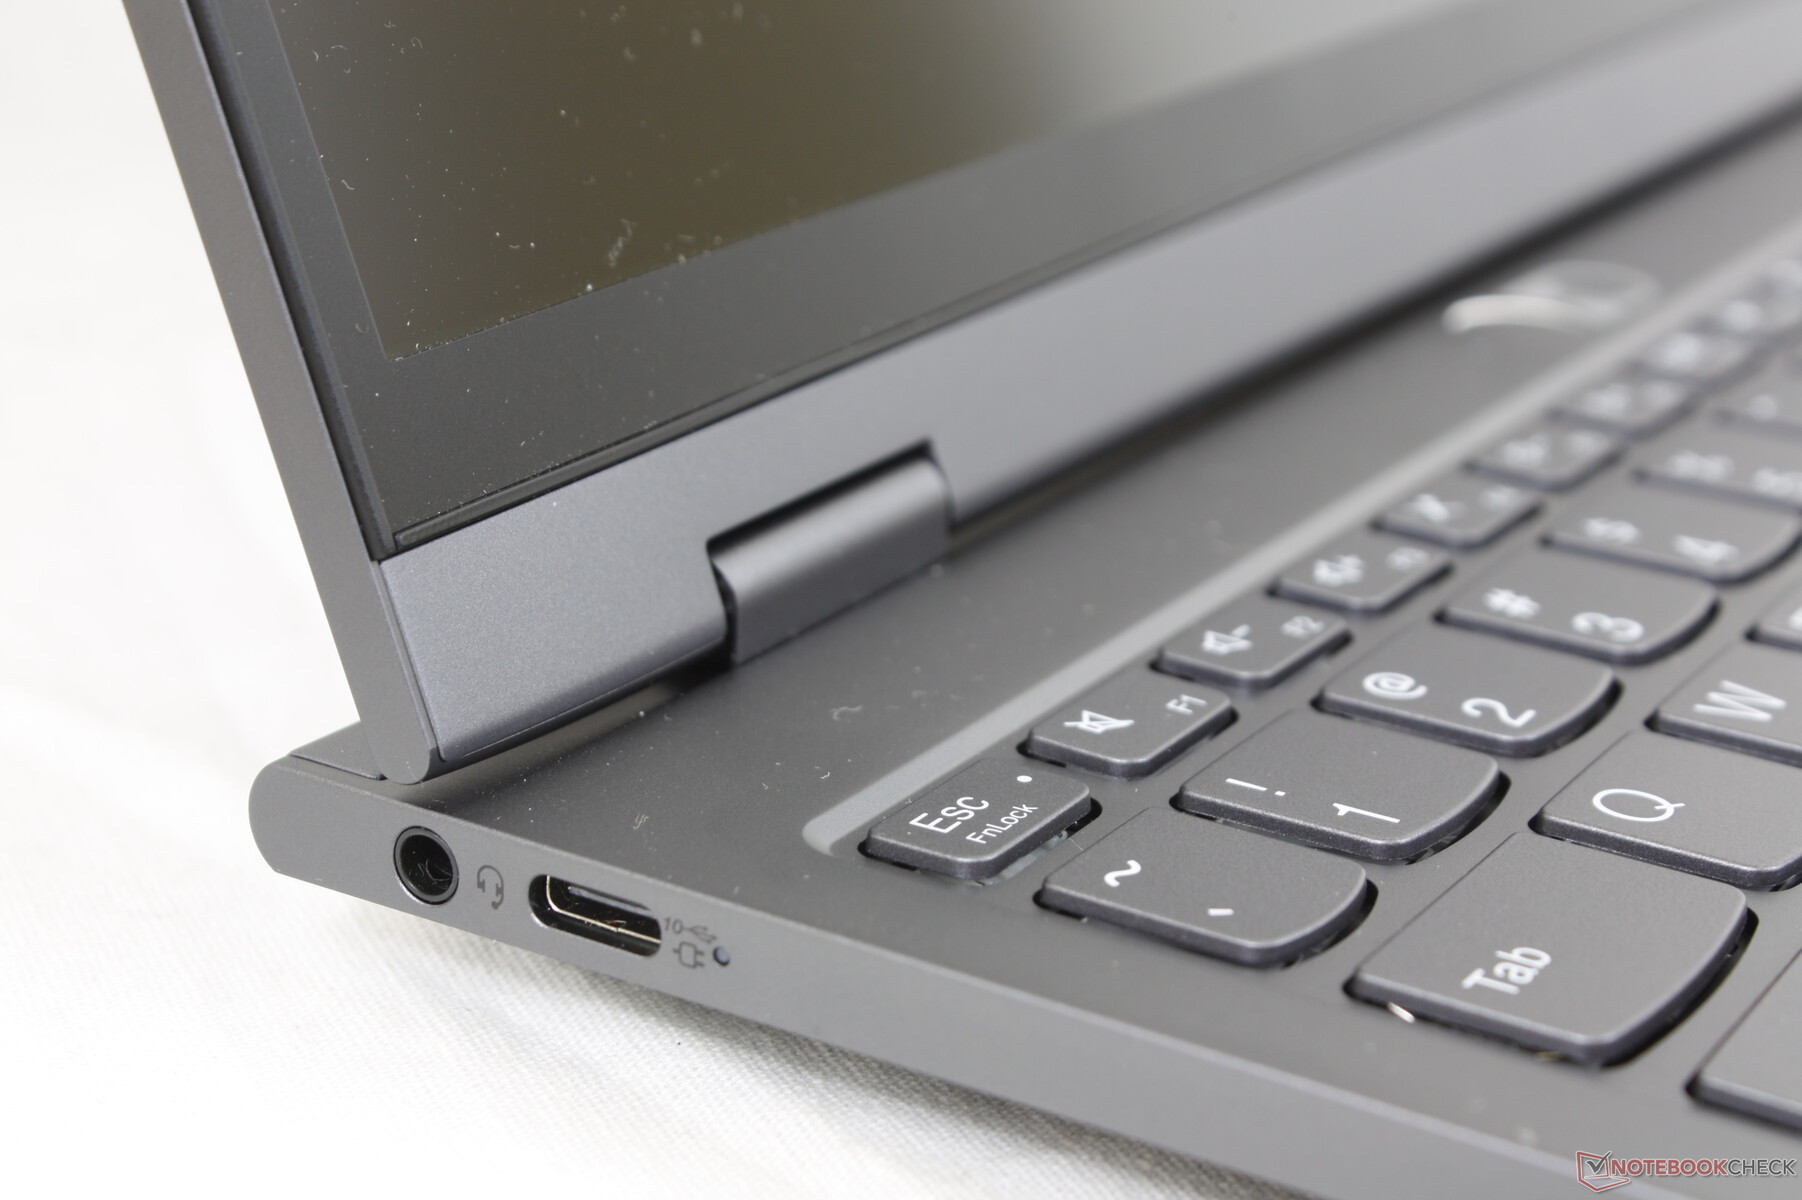
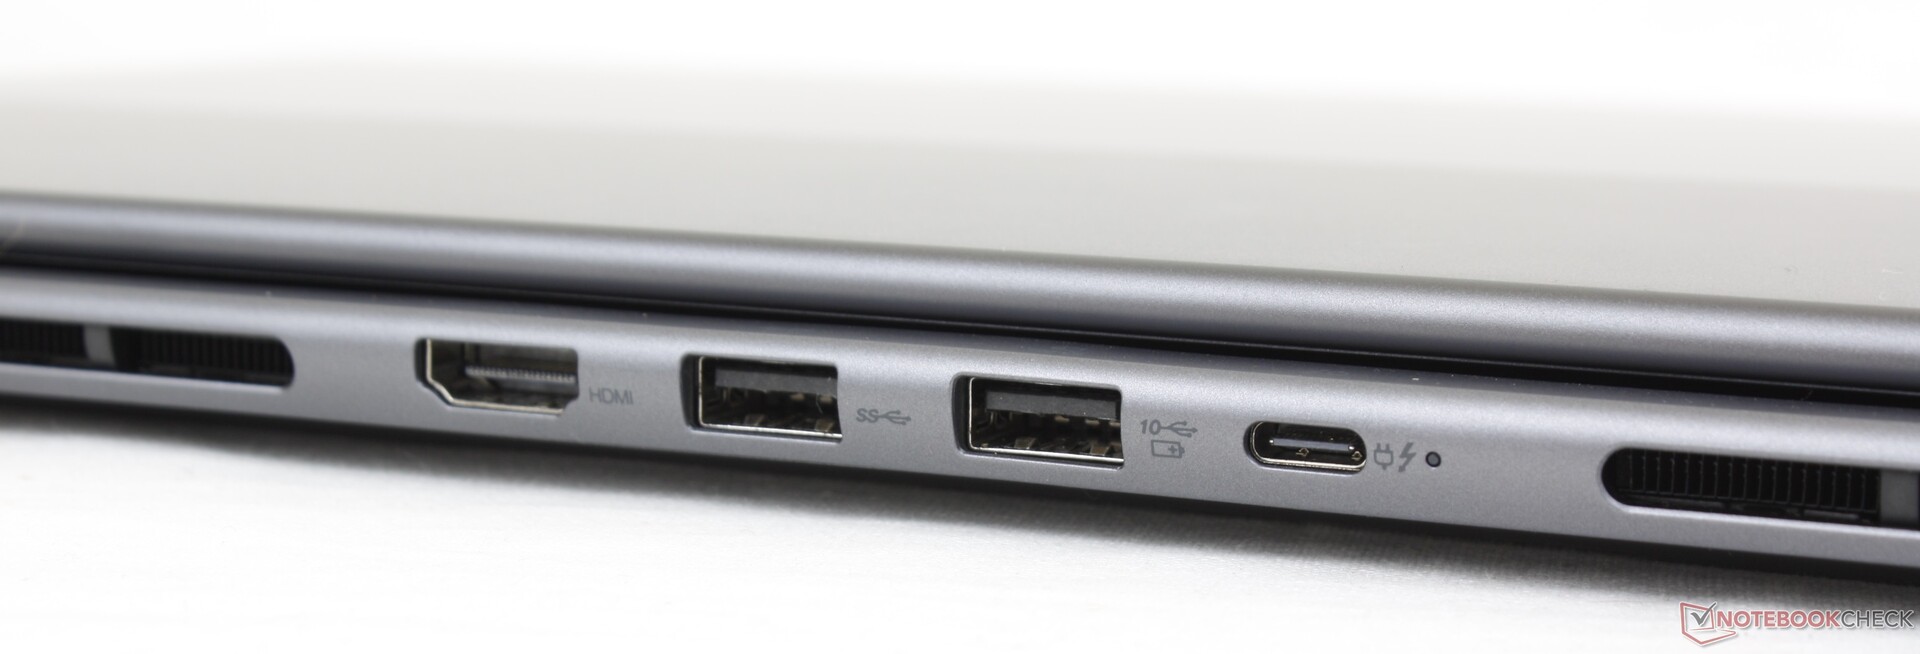
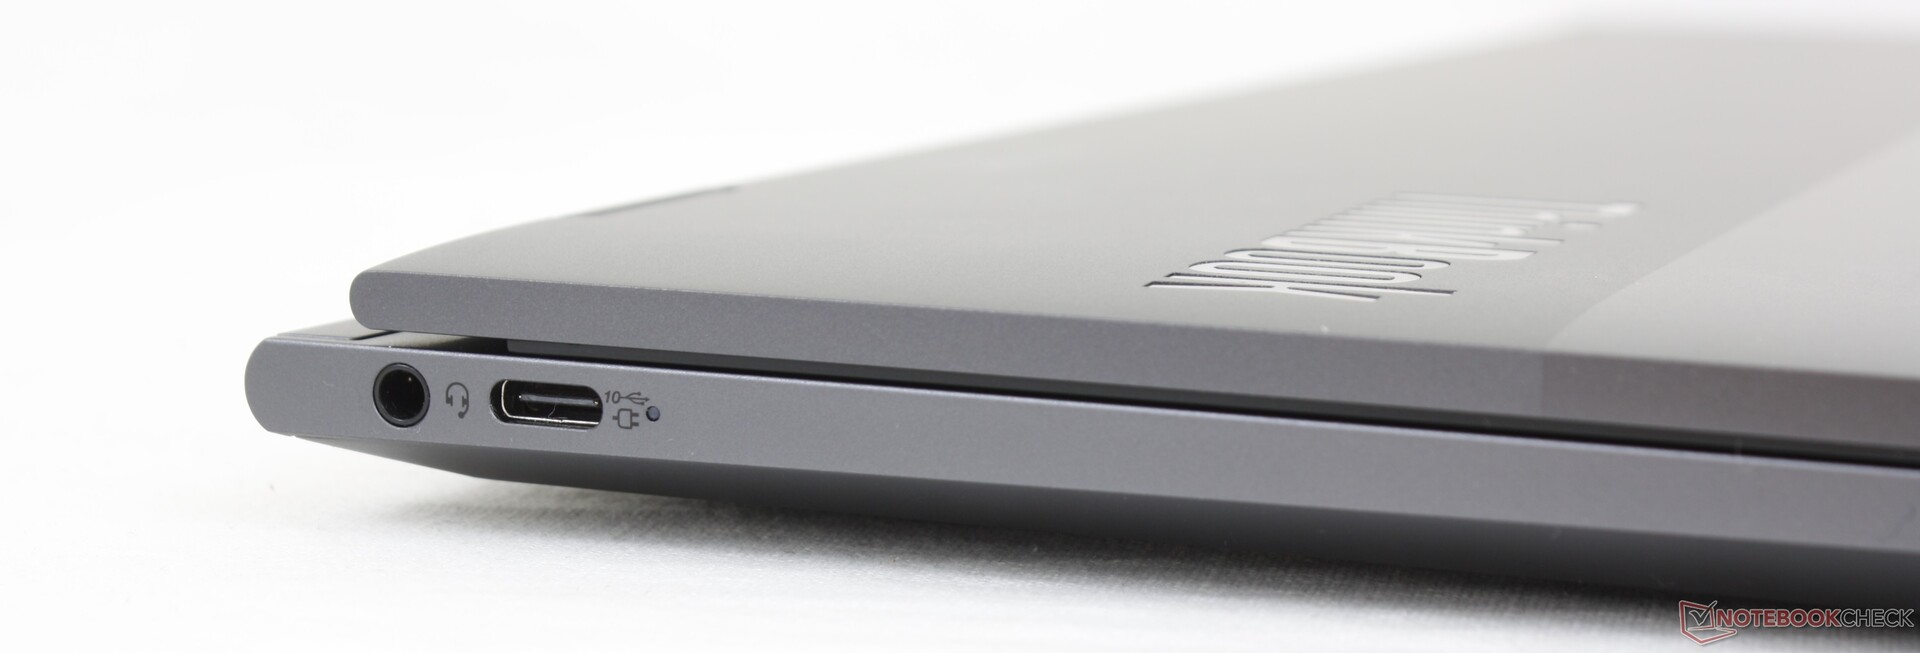
Łączność - Obsługa Thunderbolt 4
Byłoby zbrodnią, gdyby model Gen 3 miał mniej portów niż znacznie mniejszy model ostatniej generacji. System integruje dwa porty USB-C, podobnie jak jego poprzednik, plus nowe porty USB-A i HDMI wzdłuż tyłu, aby zapewnić szerszy zakres opcji. Warto zauważyć, że tylko jeden z dwóch portów USB-C jest kompatybilny z Thunderbolt, ale każdy z nich może być użyty do ładowania lub DisplayPort.
Nie ma czytnika kart SD, co jest trochę rozczarowujące, biorąc pod uwagę dużą obudowę i skupienie się na zadaniach biurowych/edycyjnych.
Komunikacja
Intel AX211 standardowo zapewnia łączność Wi-Fi 6E i Bluetooth 5.2. Doświadczyliśmy stabilnych prędkości transferu po sparowaniu z naszą siecią 6 GHz.
| Networking | |
| iperf3 transmit AX12 | |
| Gigabyte Aero 17 HDR YD | |
| Asus ProArt StudioBook Pro 17 W700G3T | |
| Lenovo ThinkBook Plus Gen2 Core i5 | |
| iperf3 receive AX12 | |
| Asus ProArt StudioBook Pro 17 W700G3T | |
| Lenovo ThinkBook Plus Gen2 Core i5 | |
| Gigabyte Aero 17 HDR YD | |
| iperf3 receive AXE11000 6GHz | |
| Lenovo ThinkBook Plus Gen3 | |
| iperf3 receive AXE11000 | |
| LG Gram 17 (2022) | |
| Dell XPS 17 9720 | |
| iperf3 transmit AXE11000 6GHz | |
| Lenovo ThinkBook Plus Gen3 | |
| iperf3 transmit AXE11000 | |
| Dell XPS 17 9720 | |
| LG Gram 17 (2022) | |
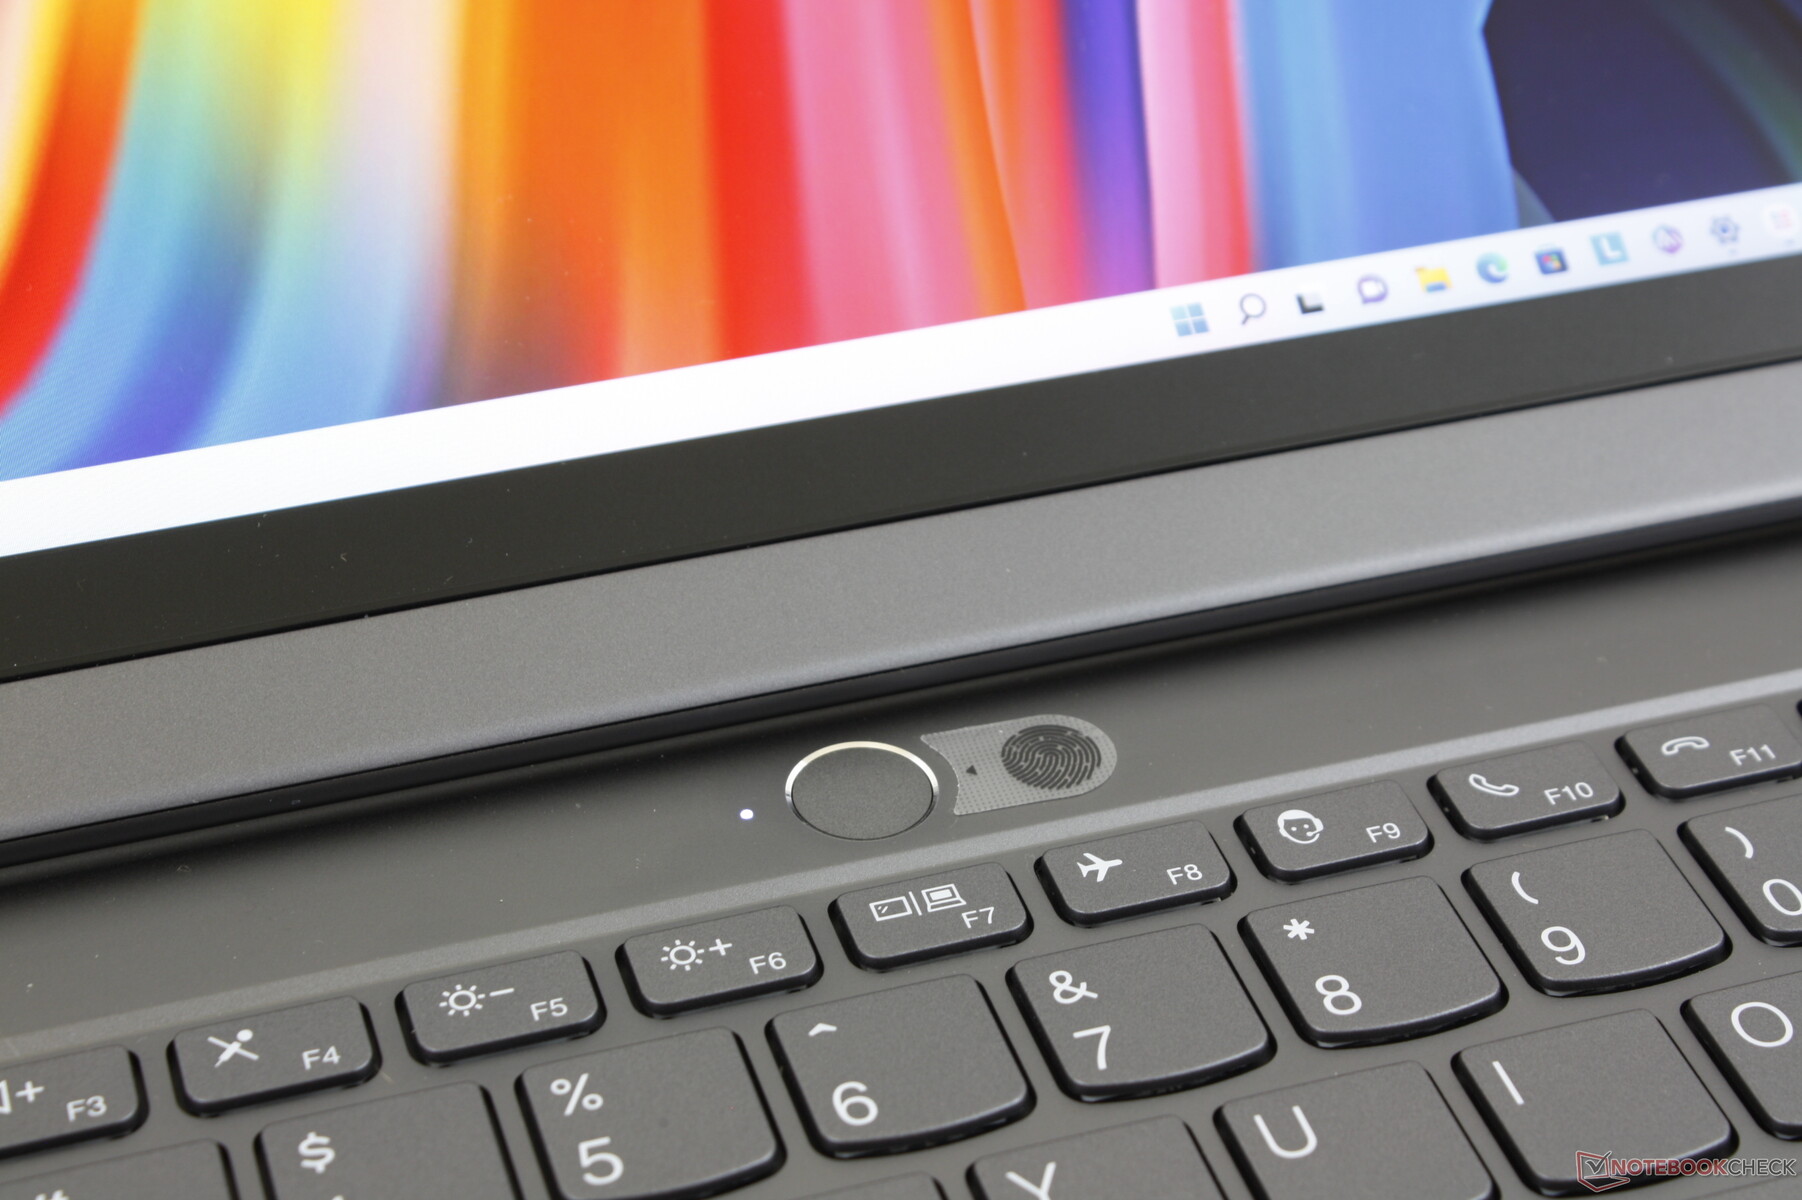
Kamera internetowa
Aparat 2 MP jest ostrzejszy niż w serii XPS, ale wciąż nie tak dobry jak aparaty 5 MP w wielu nowych modelach HP wielu nowszych modelach HP. Zarówno czujnik IR i migawka są obecne dla wsparcia Hello i prywatności, odpowiednio.


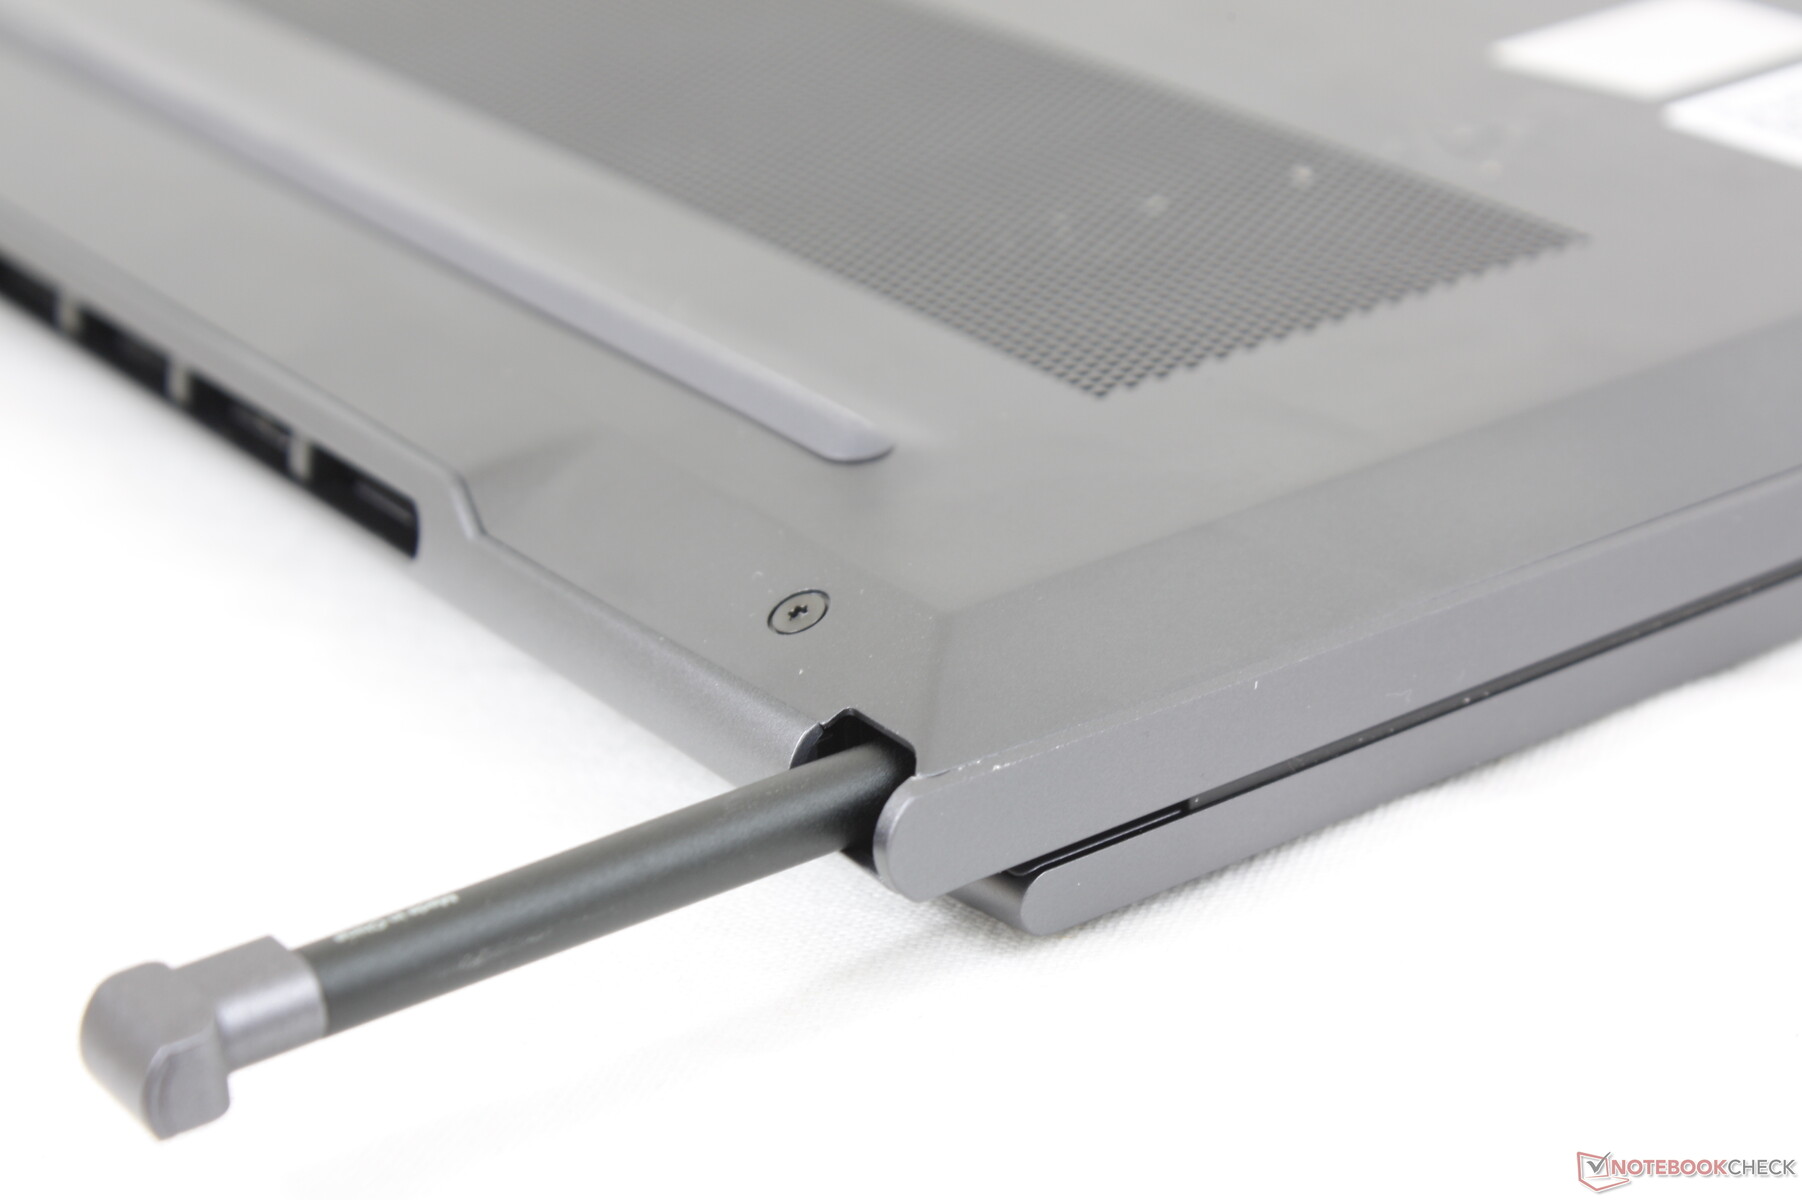
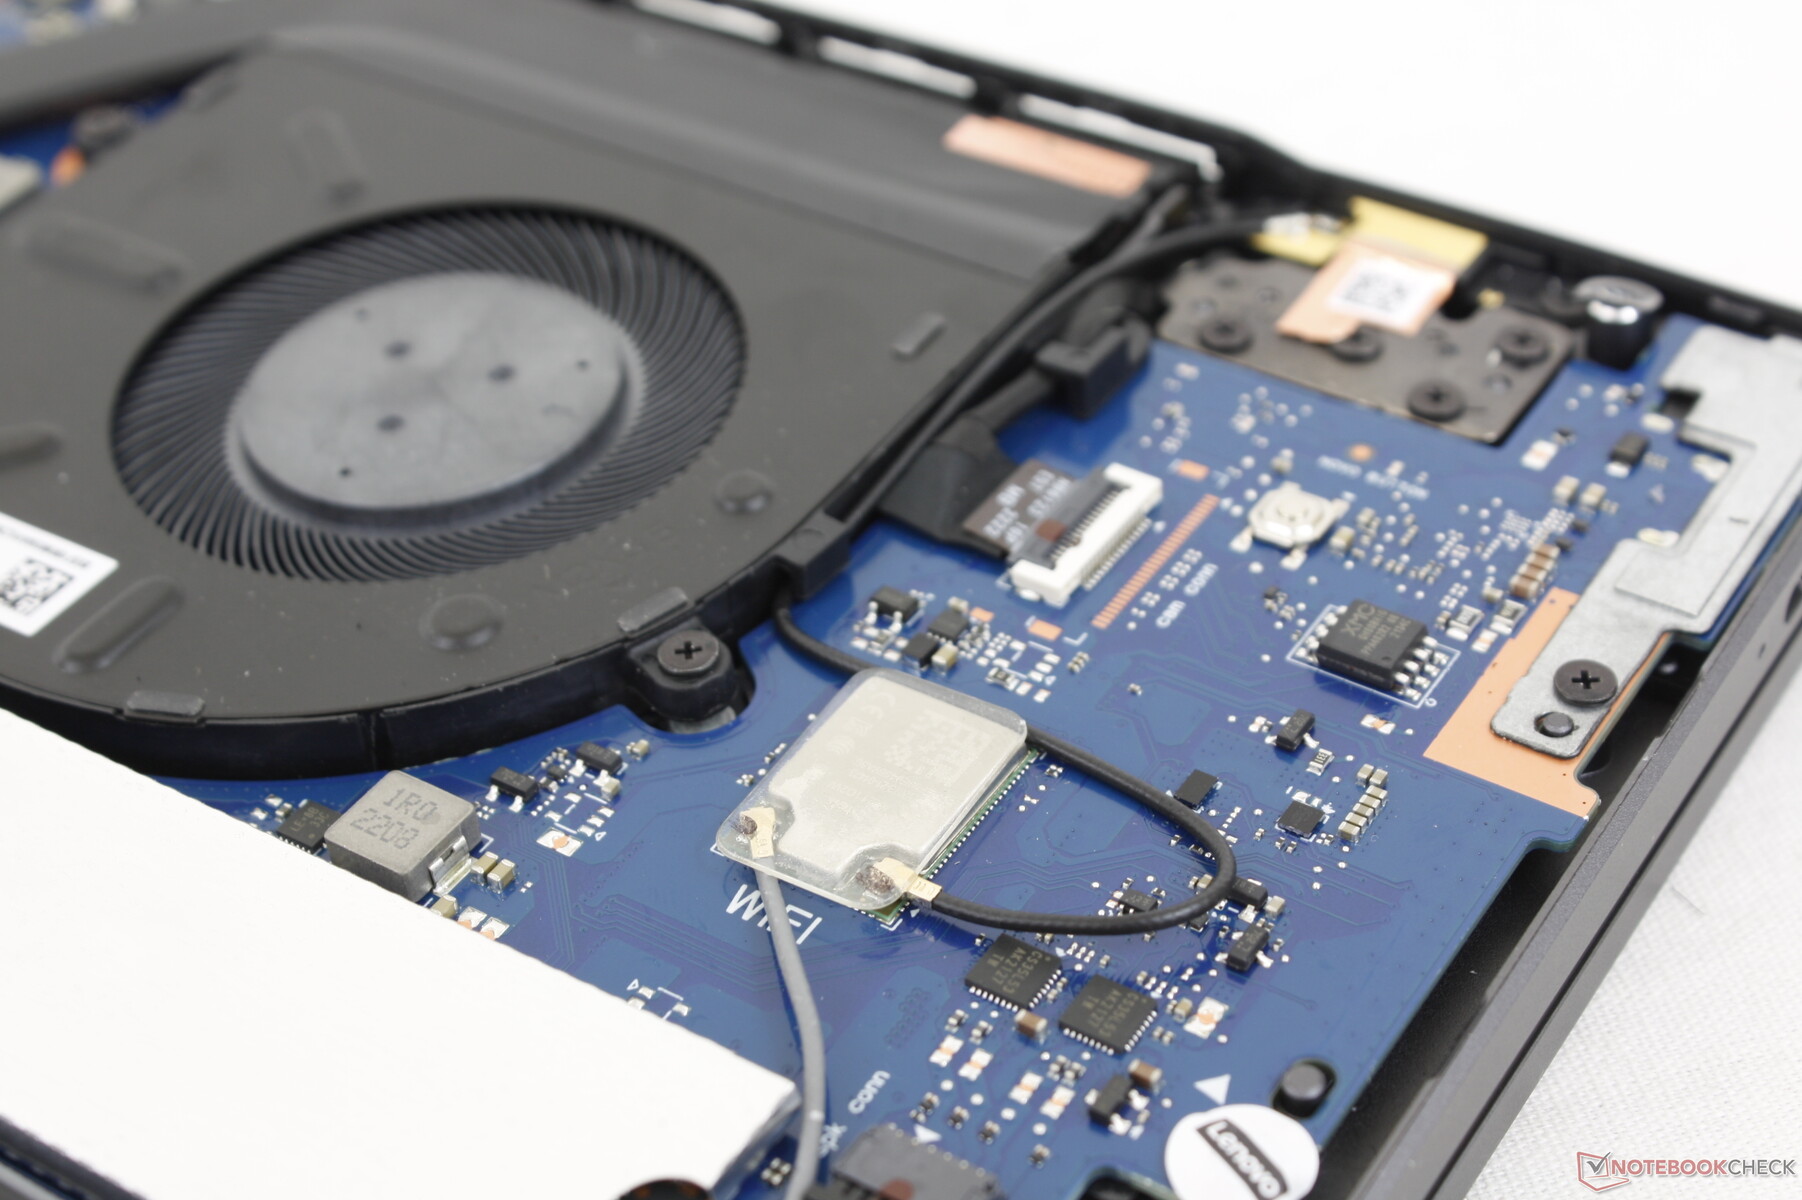
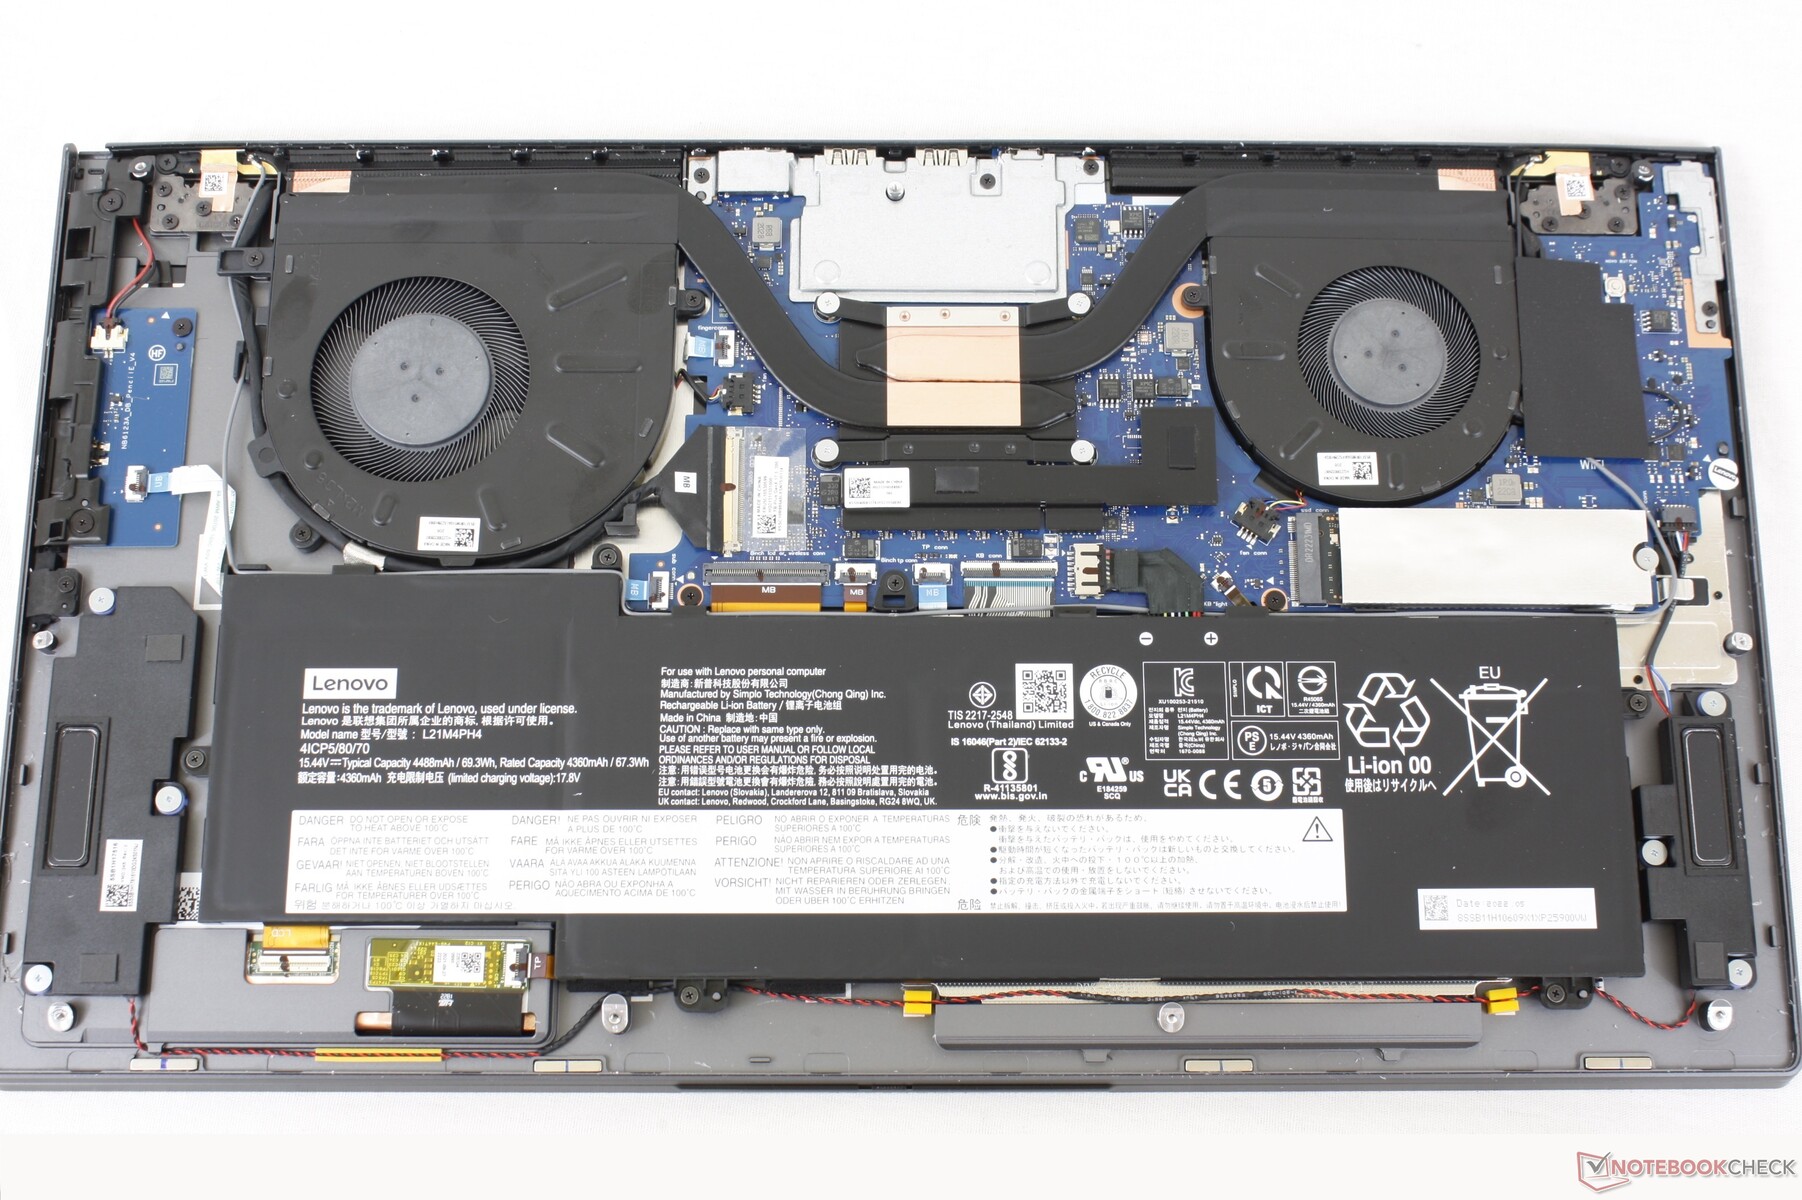
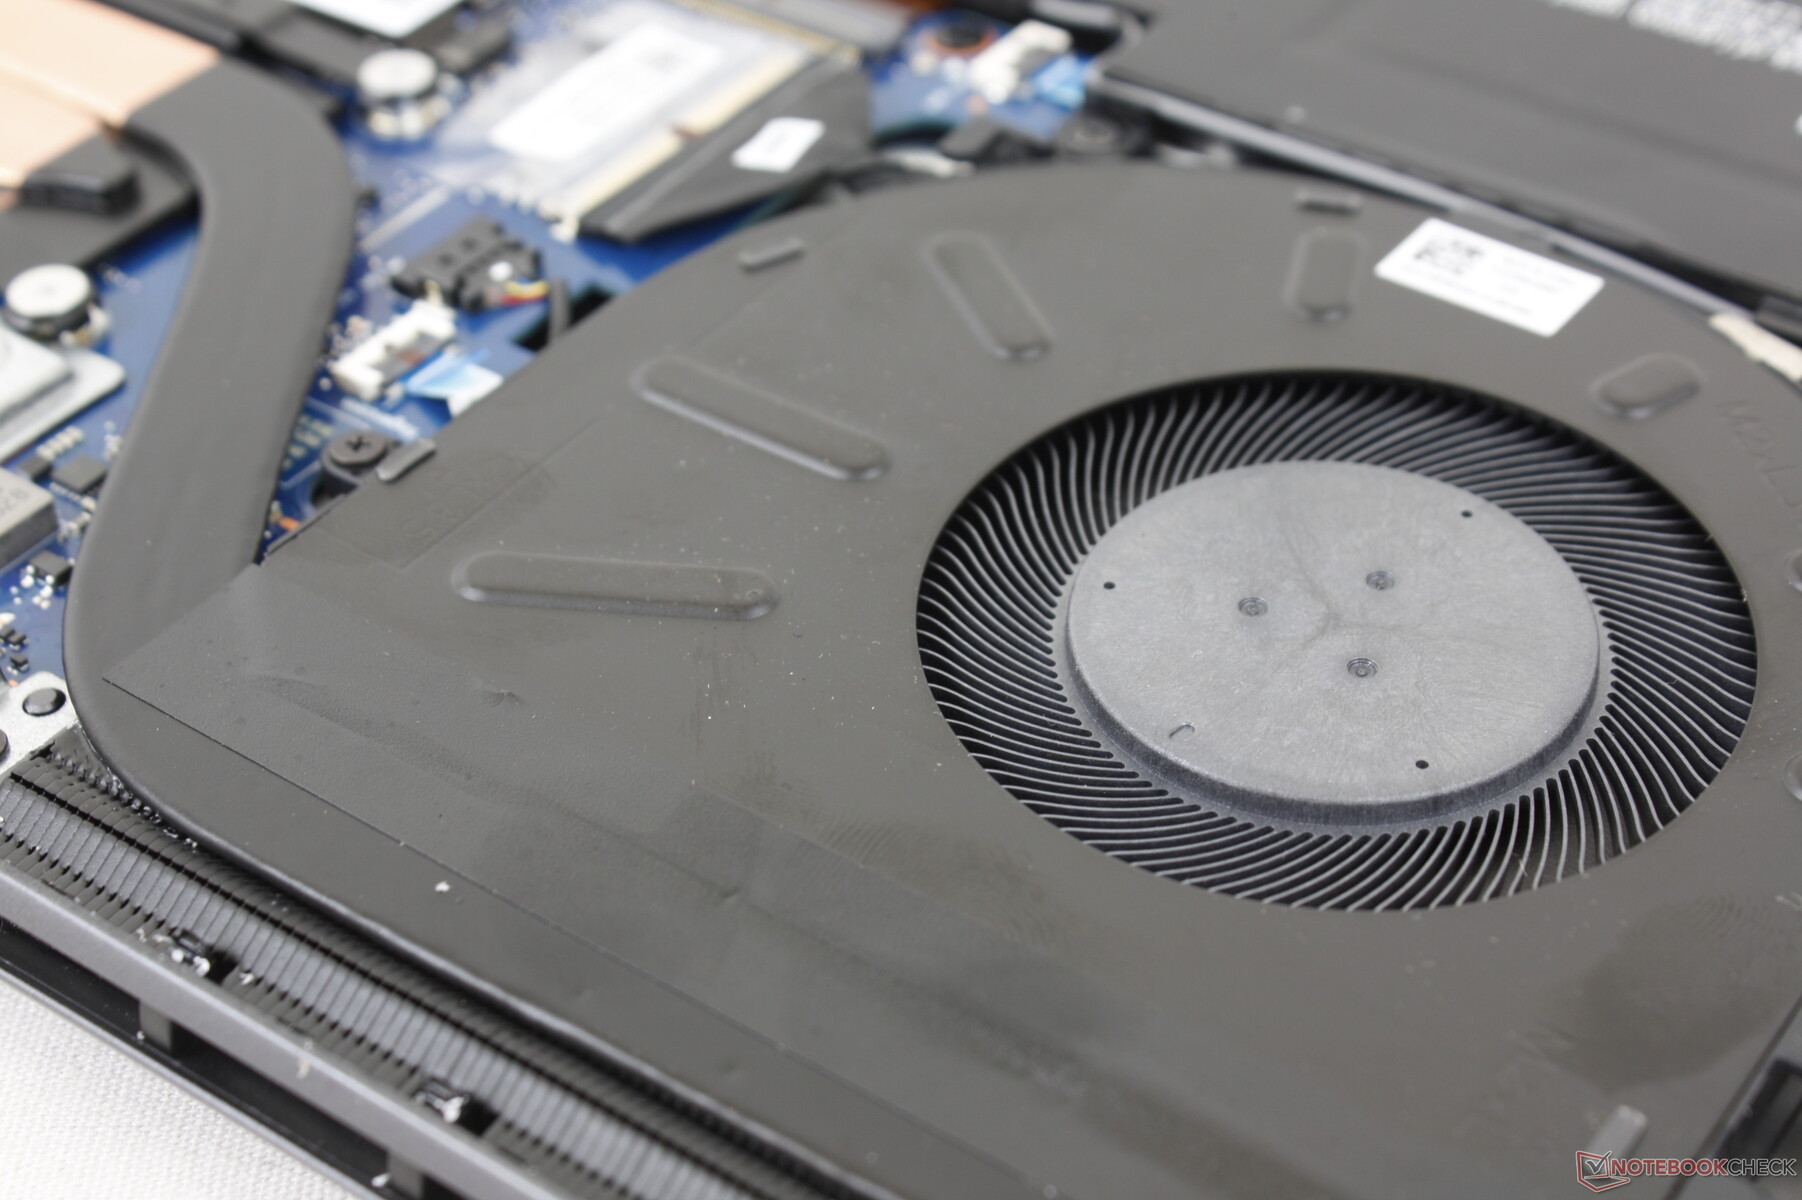
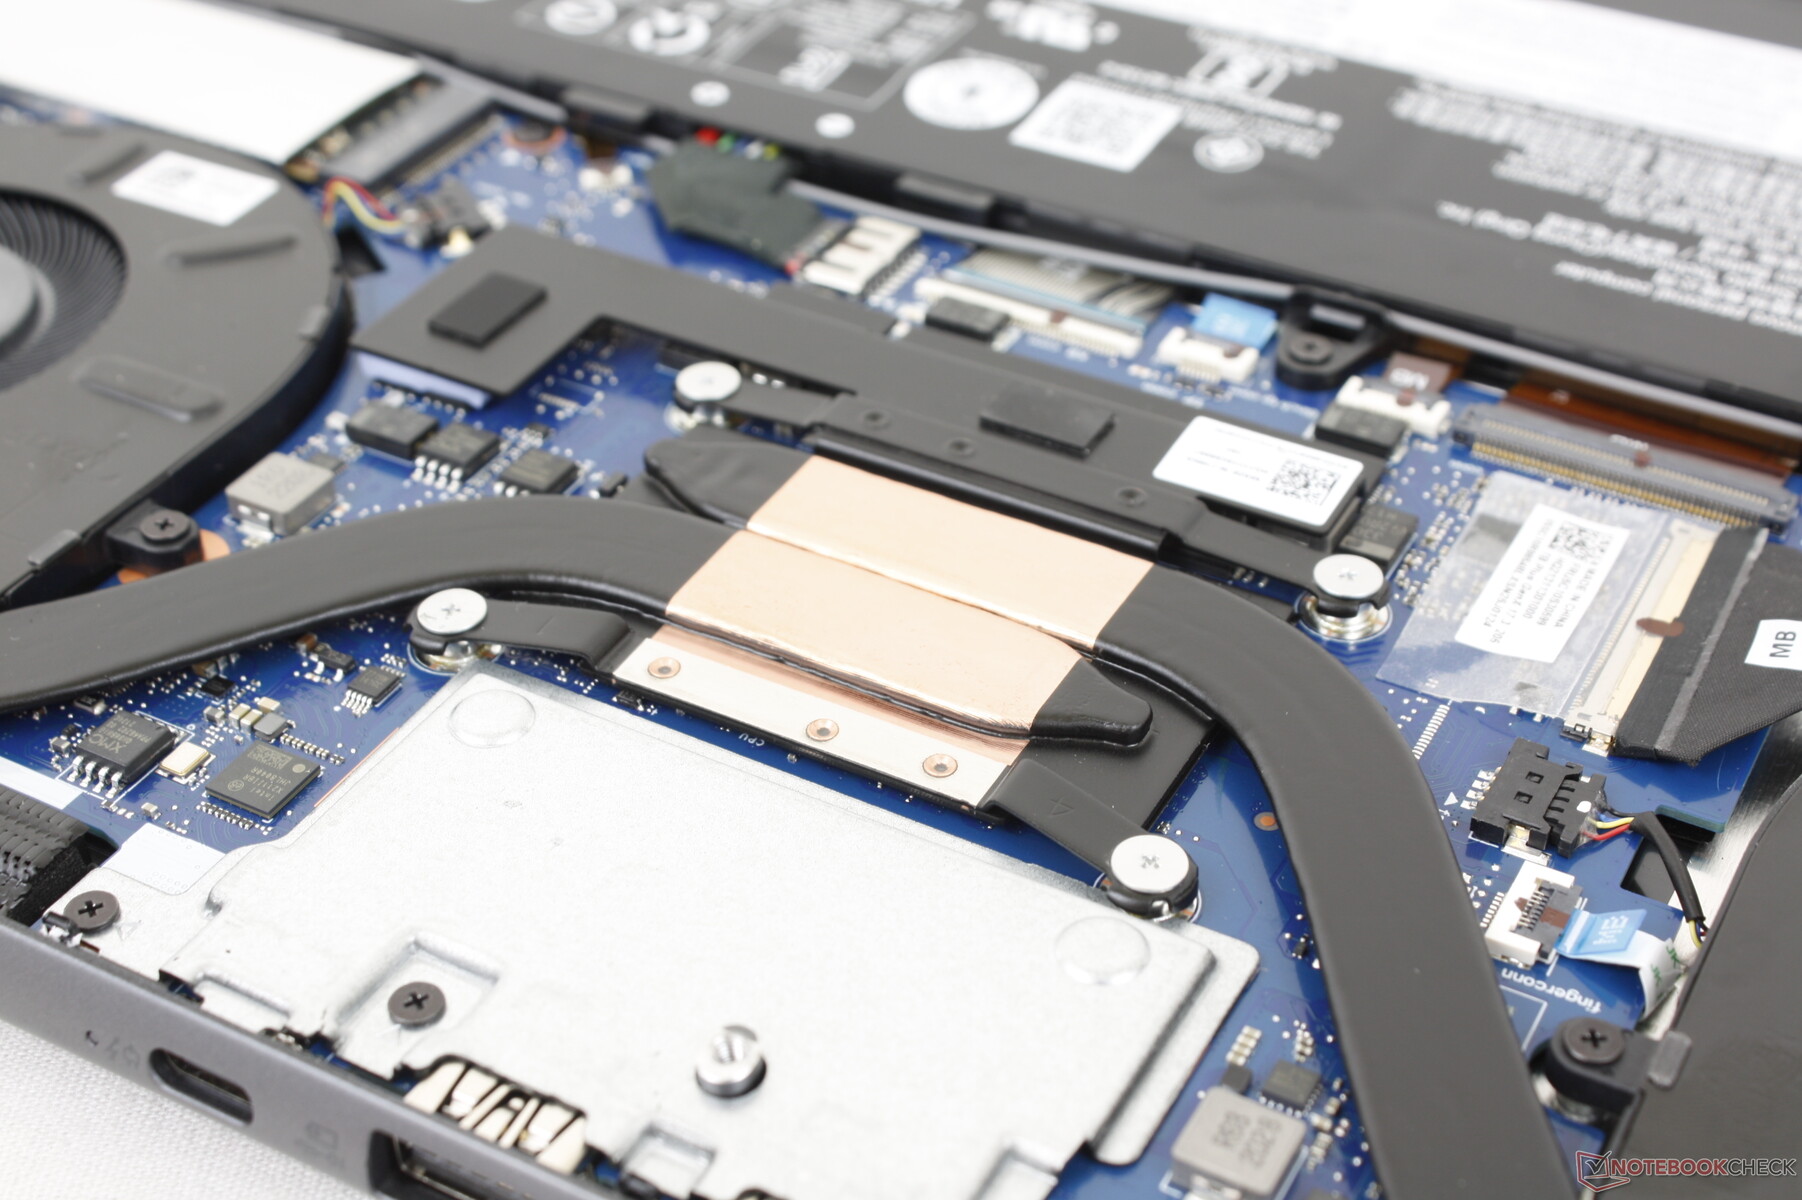
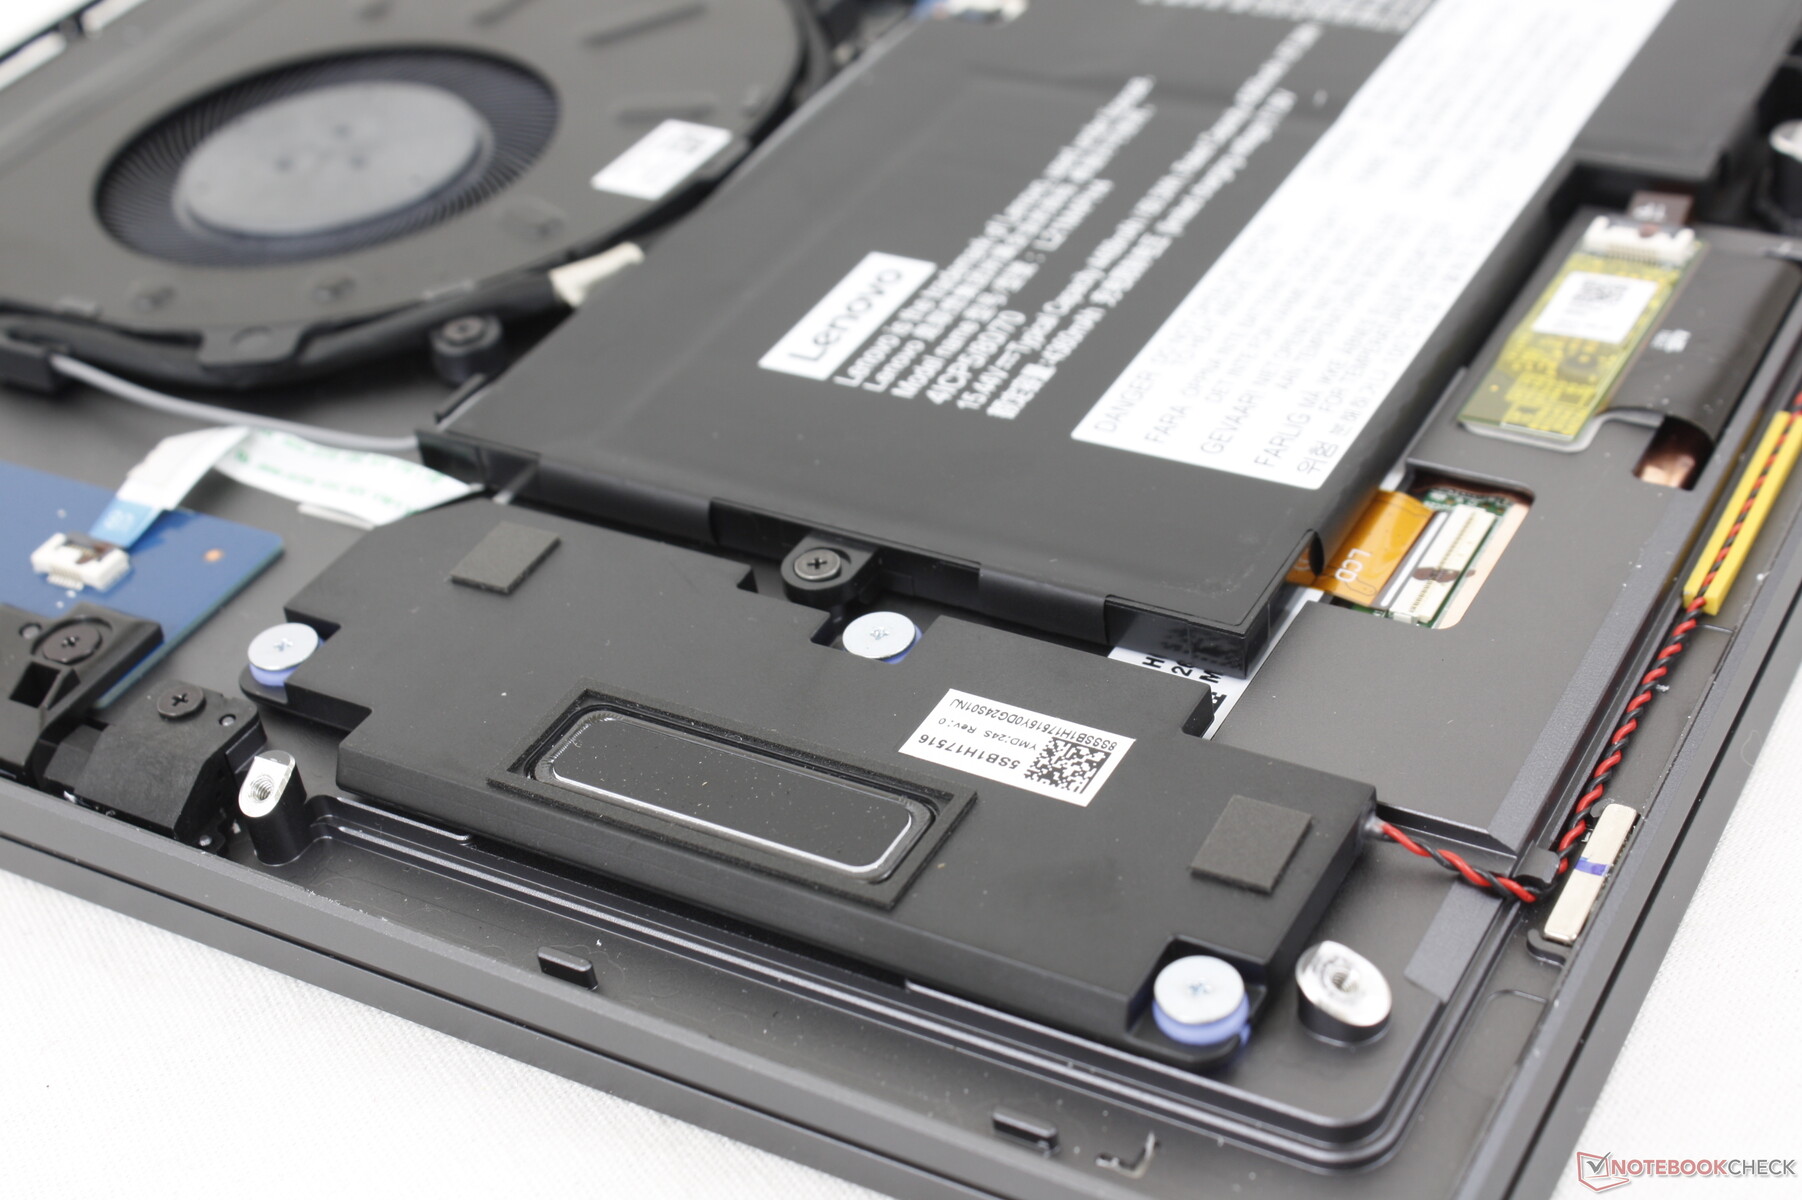
Konserwacja
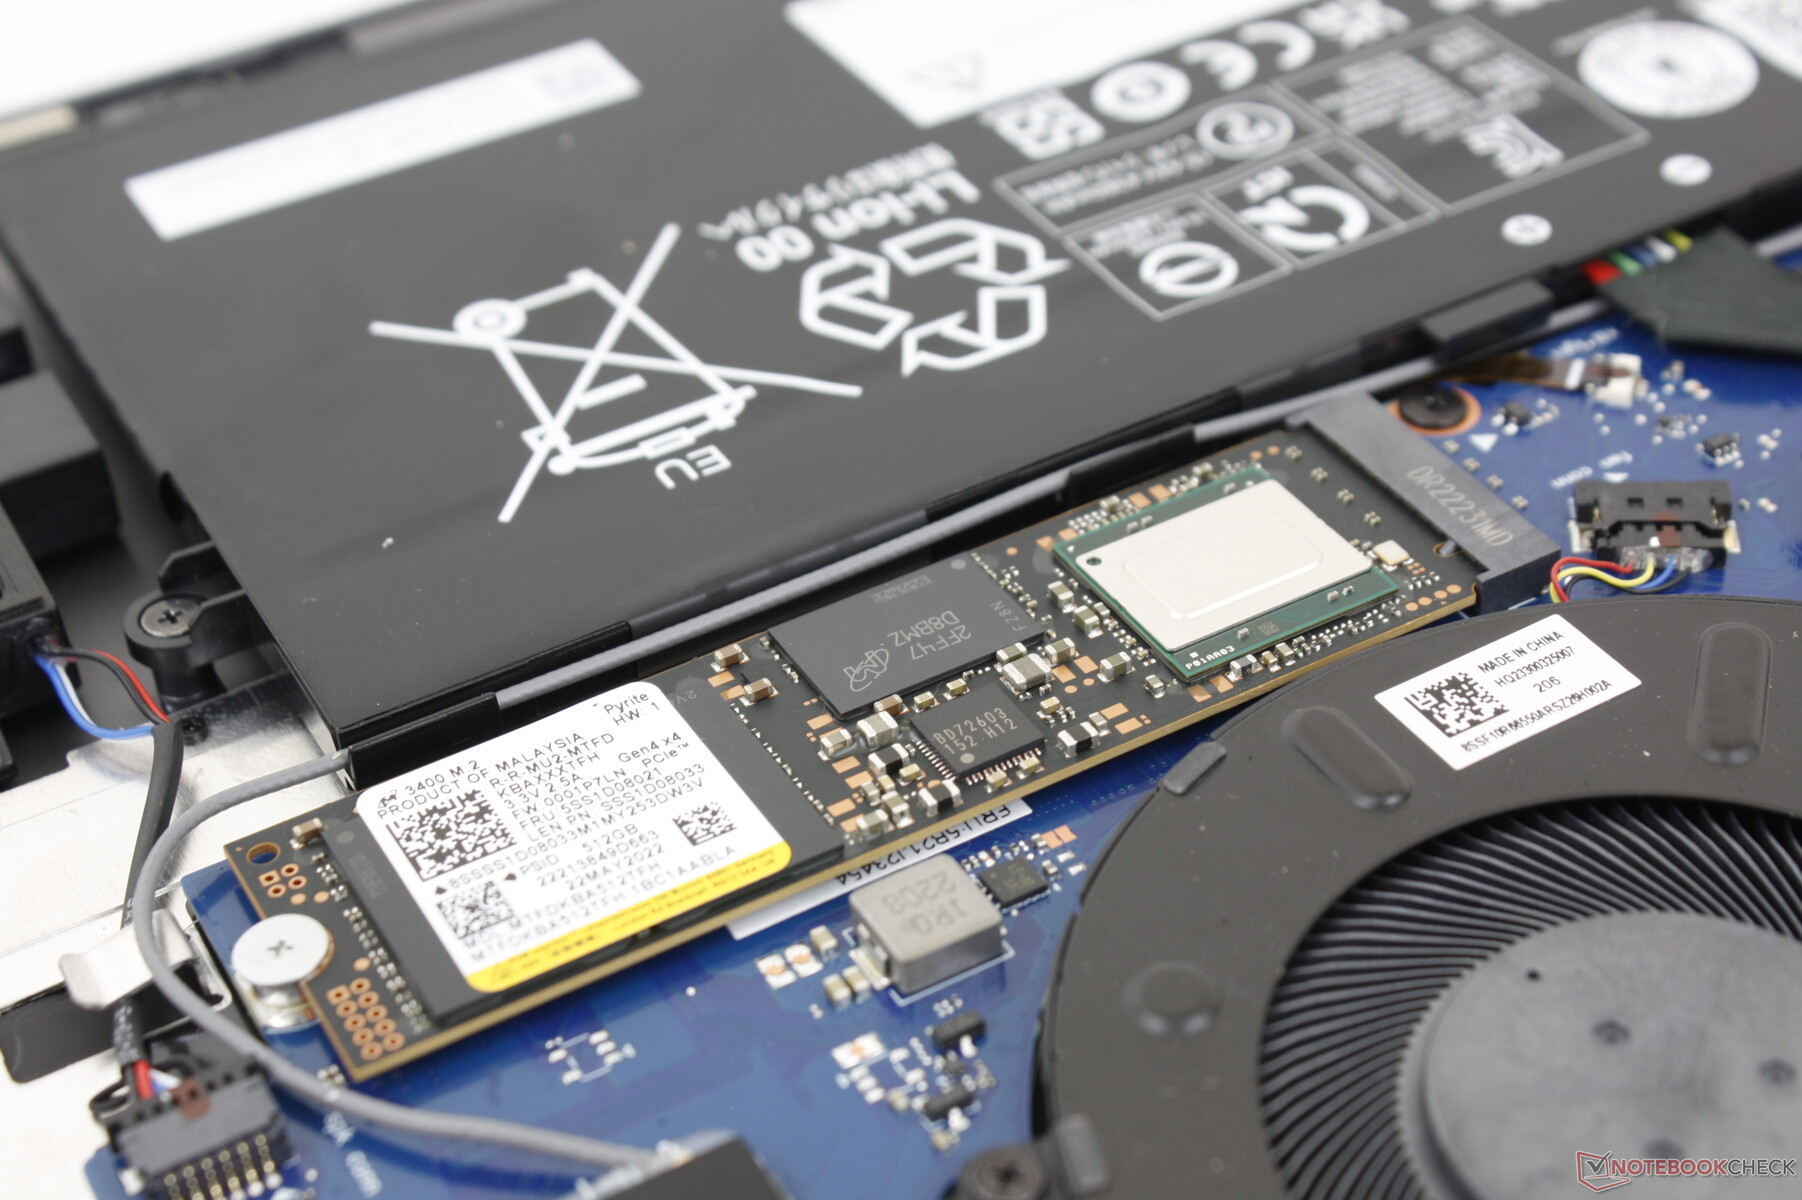
Dolny panel jest zabezpieczony dziewięcioma śrubami T5 Torx. Zalecamy najpierw zdjąć pióro z tyłu, a następnie wykorzystać ten otwór do łatwiejszego odłączenia panelu od podstawy.
W środku nie ma zbyt wielu możliwości rozbudowy, gdyż zarówno moduł WLAN jak i RAM są wlutowane.
Akcesoria i gwarancja
System integruje aktywny rysik, podobnie jak w zeszłorocznym modelu Gen 2. W przypadku zakupu w USA obowiązuje standardowa roczna ograniczona gwarancja producenta.
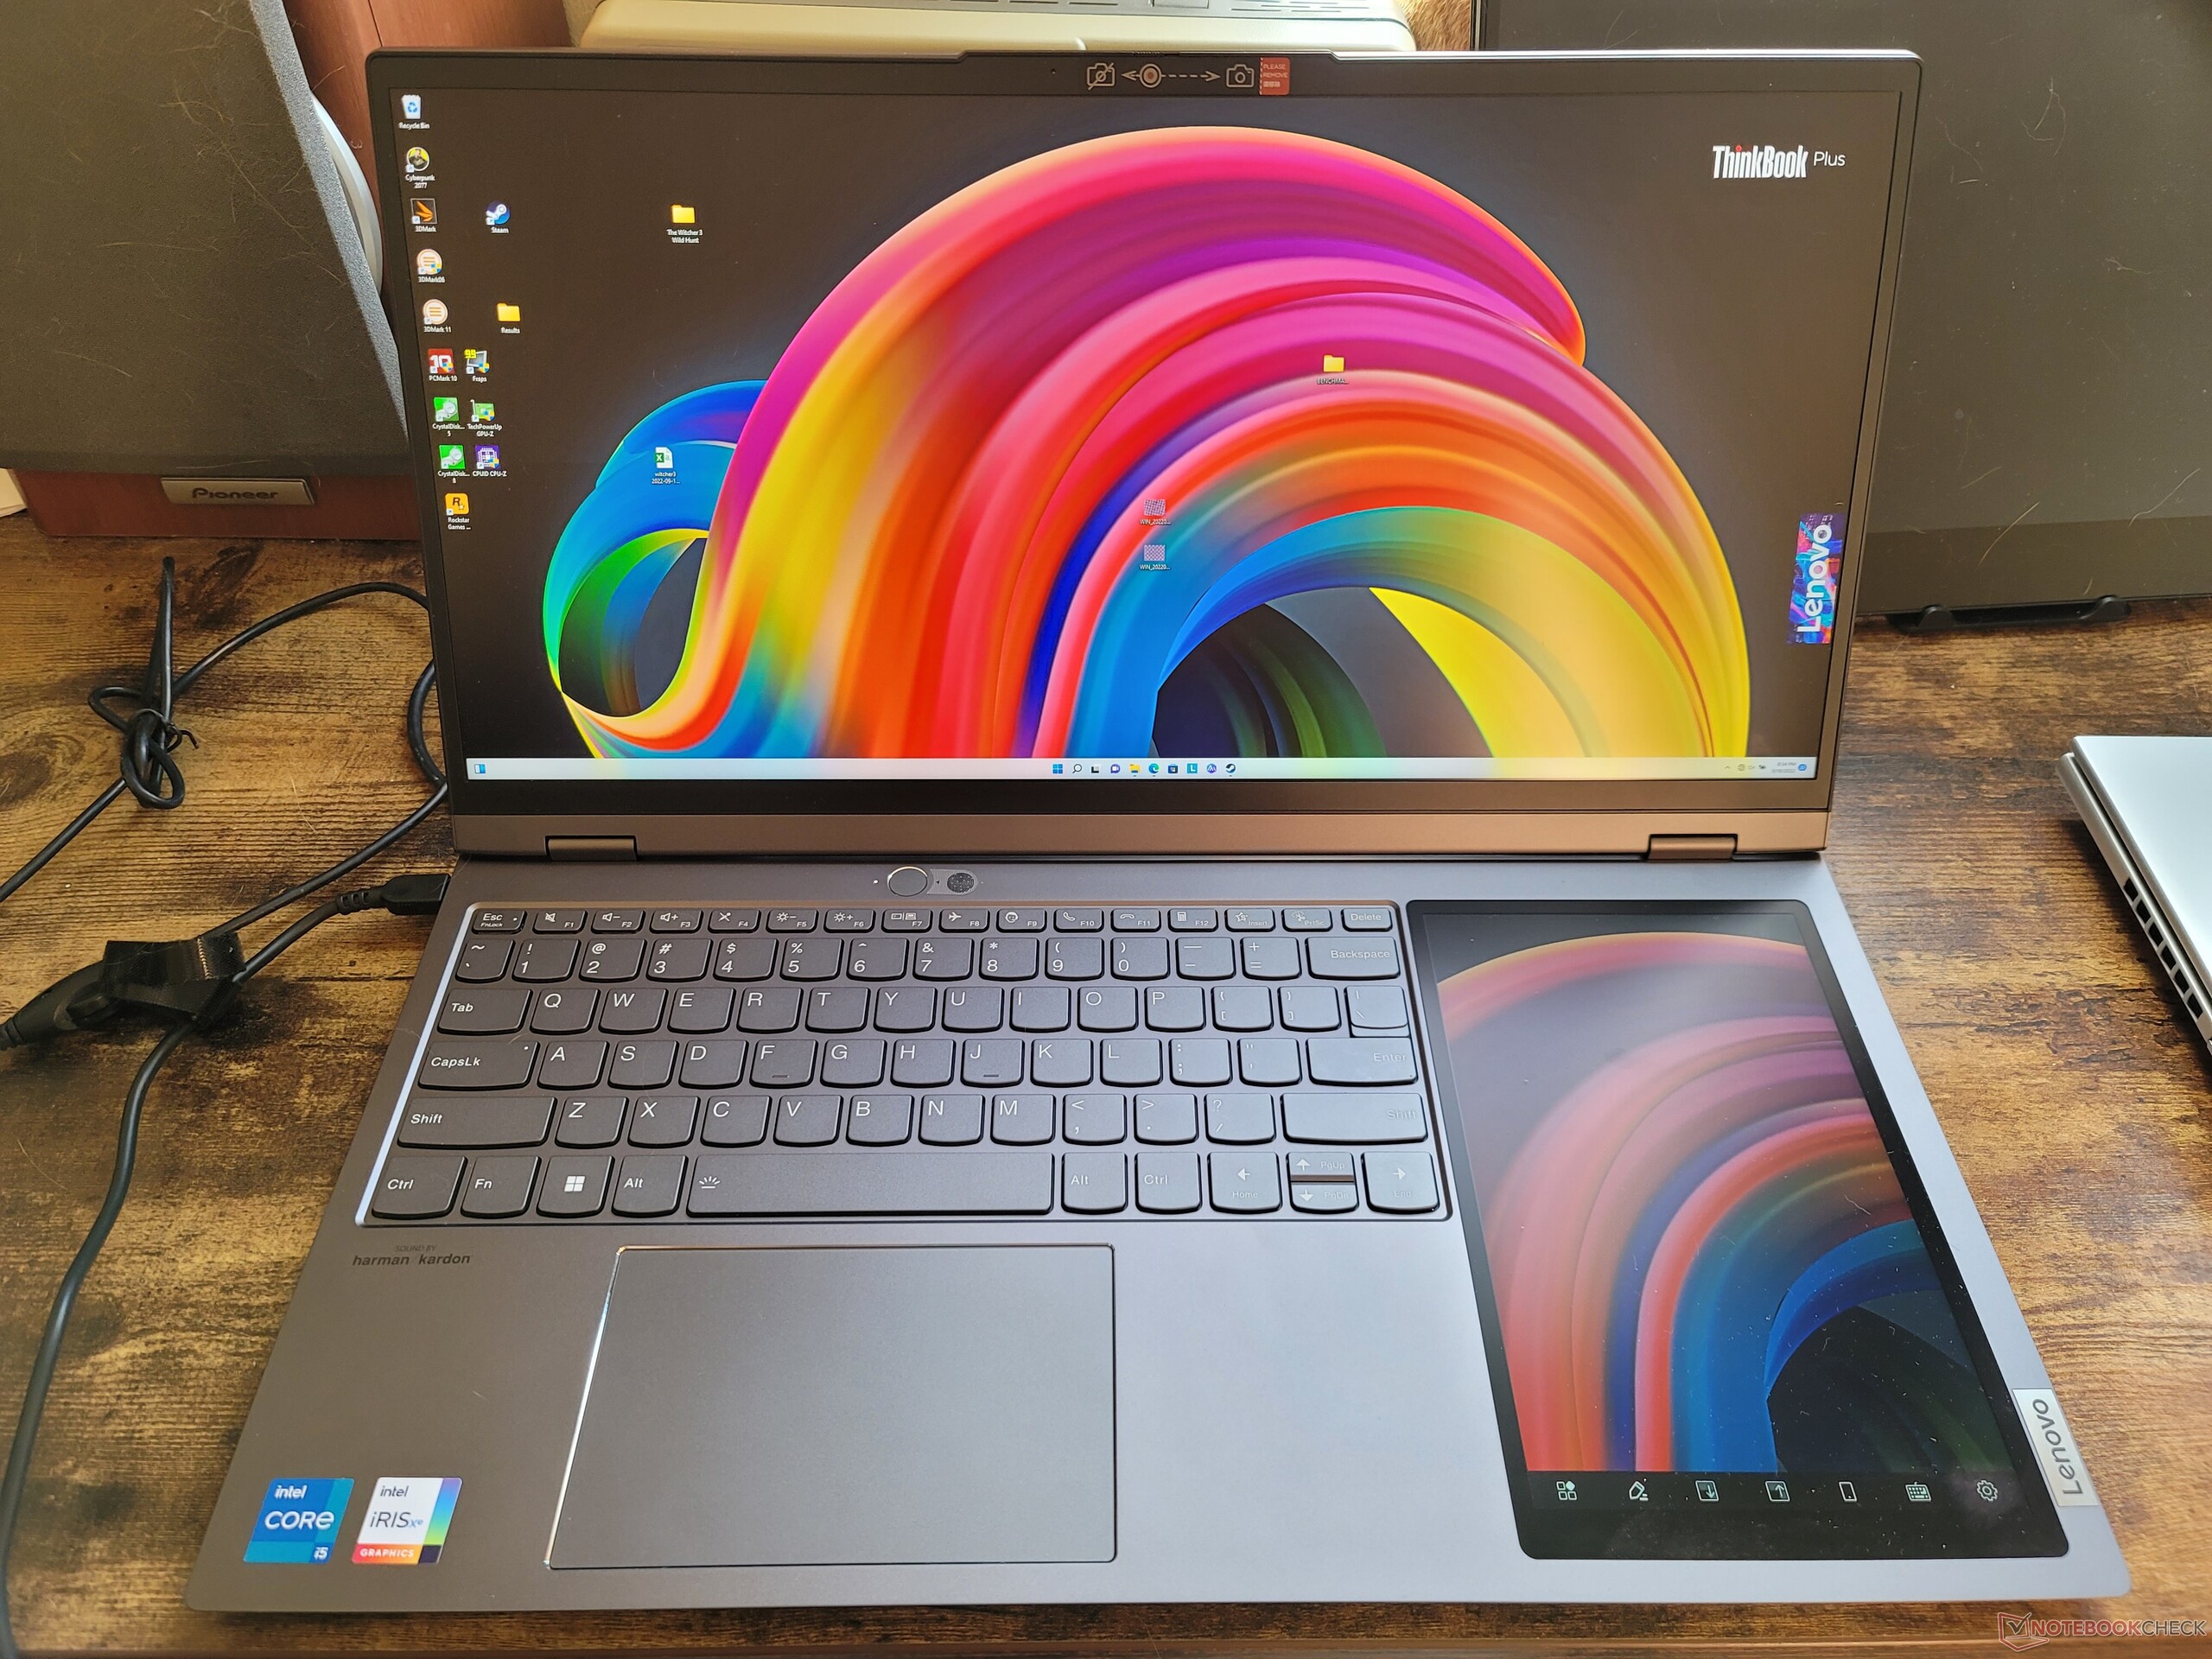
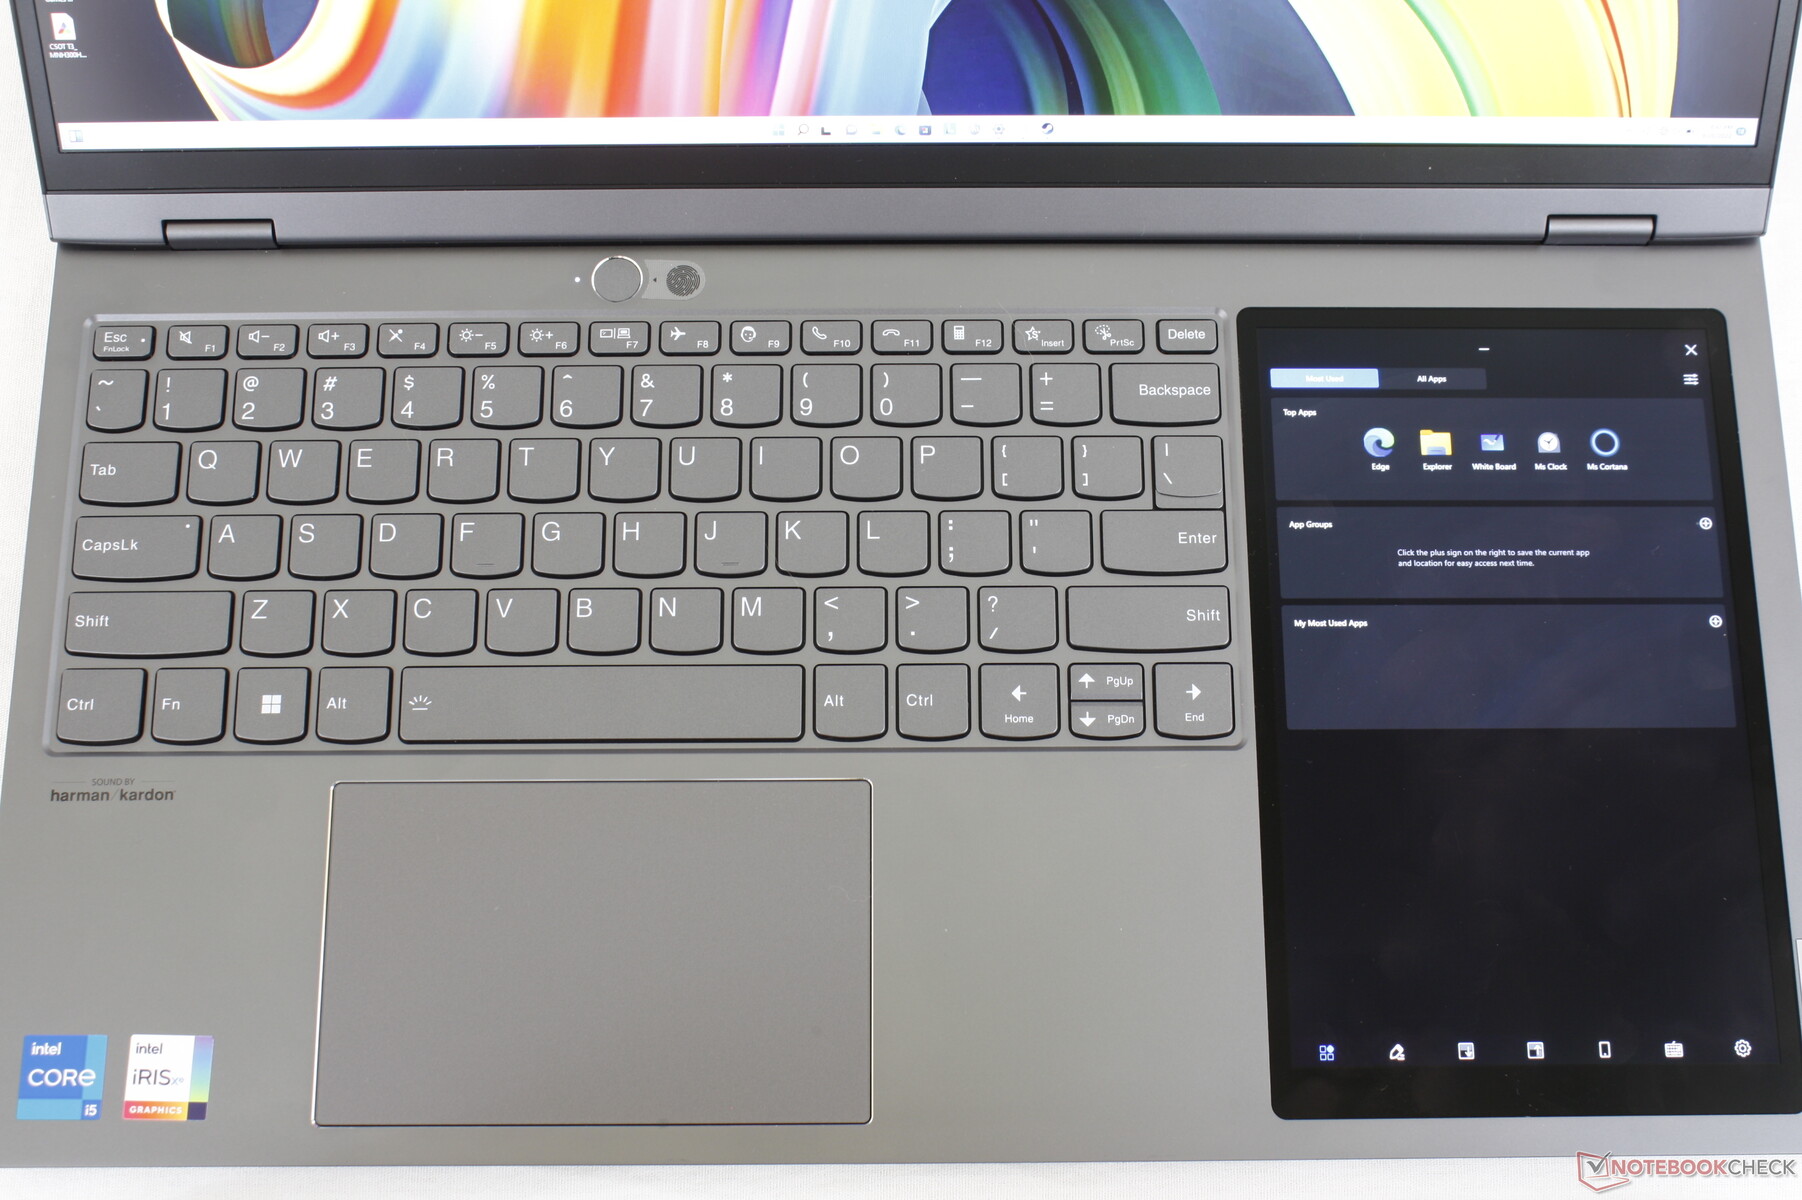
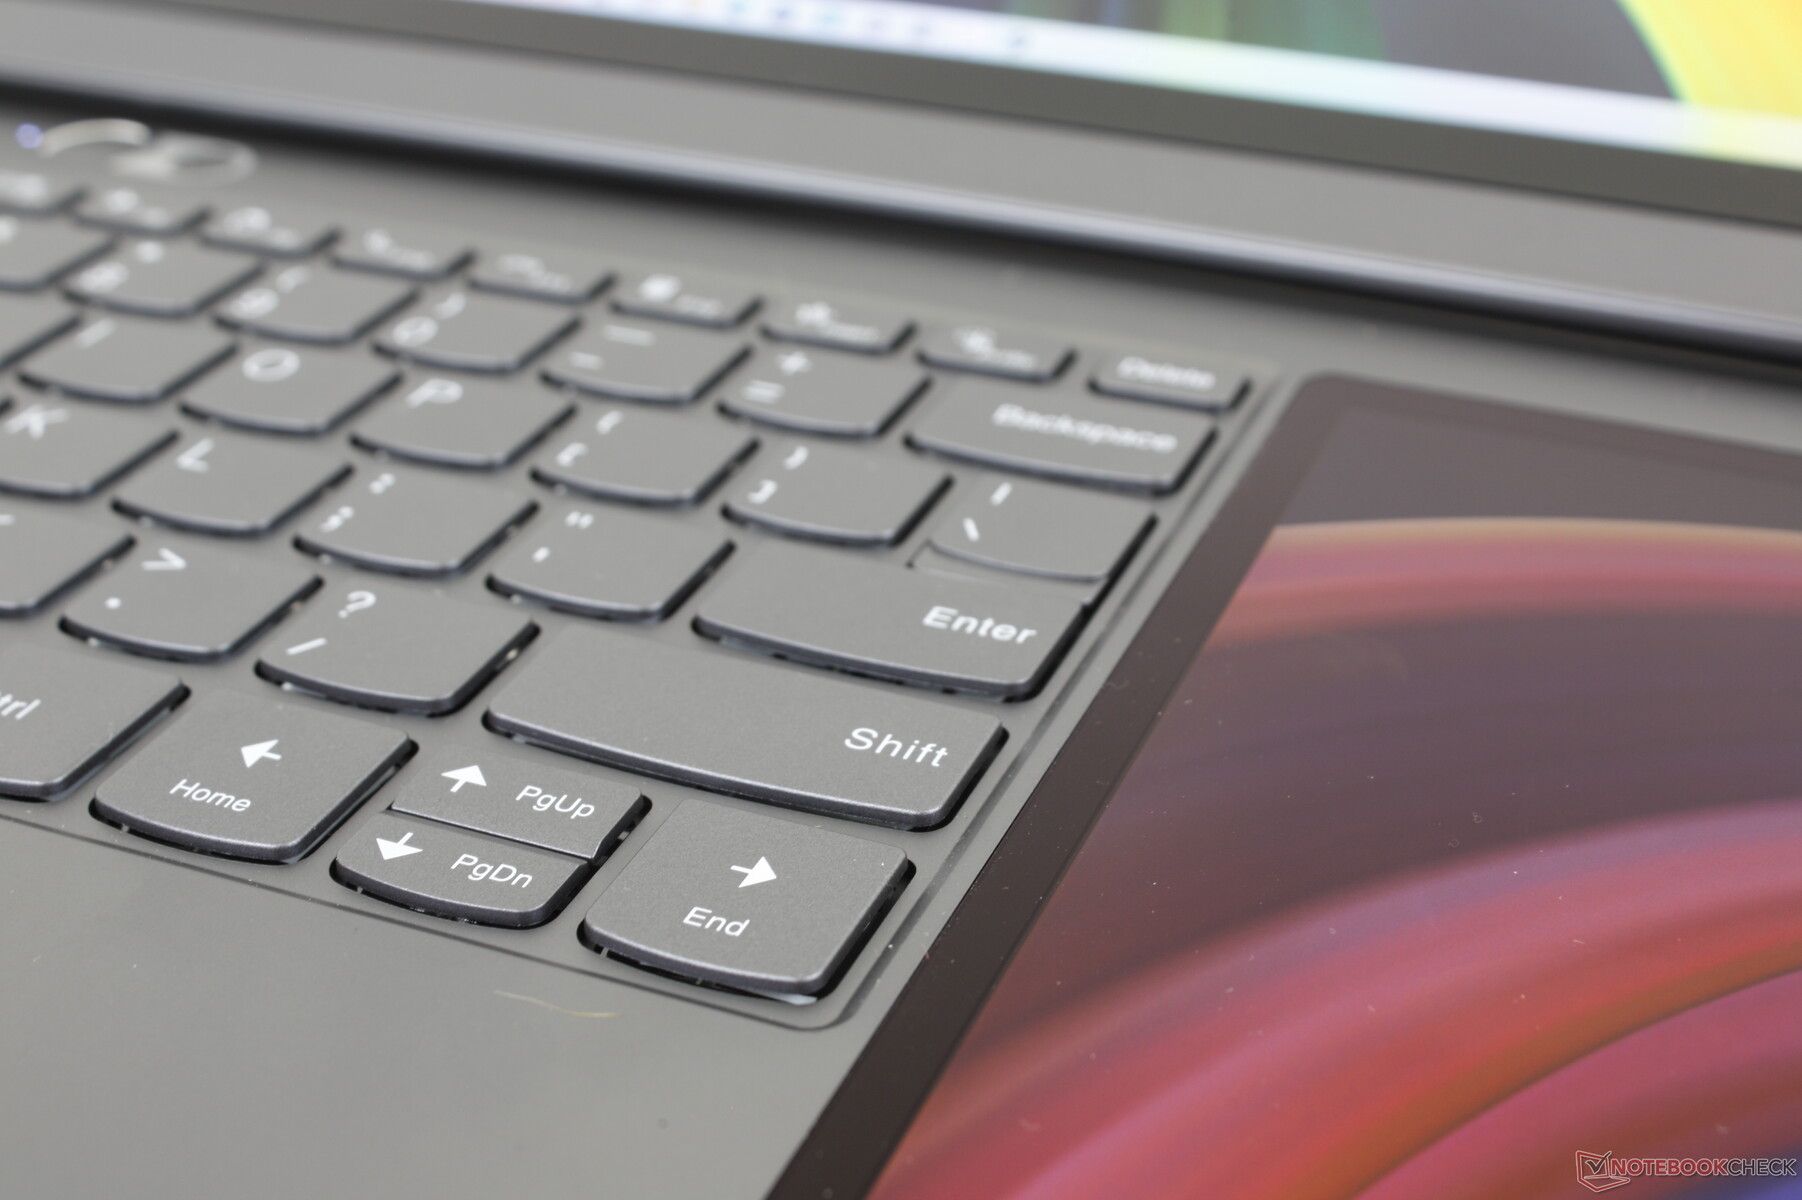
Urządzenia wejściowe - Obszerny pokład klawiatury
Klawiatura
Wrażenia z pisania pozostają identyczne jak w innych laptopach ThinkBook, m.in ThinkBook 14 G4 mimo obecności drugiego ekranu dotykowego. Szersza stopa pozwala na stosunkowo przestronny clickpad, ekran dotykowy i klawiaturę w jednym laptopie, podczas gdy w mniejszych 14- lub 15-calowych ZenBookach mogą one sprawiać wrażenie ciasnych.
Sprzężenie zwrotne klawiszy jest płytkie i lekkie, nie tak jak w klawiaturach wielu modeli Yoga, IdeaPad czy średniej klasy ultrabooków. Klawiatury ThinkPad są na ogół twardsze i mają głębszy skok.
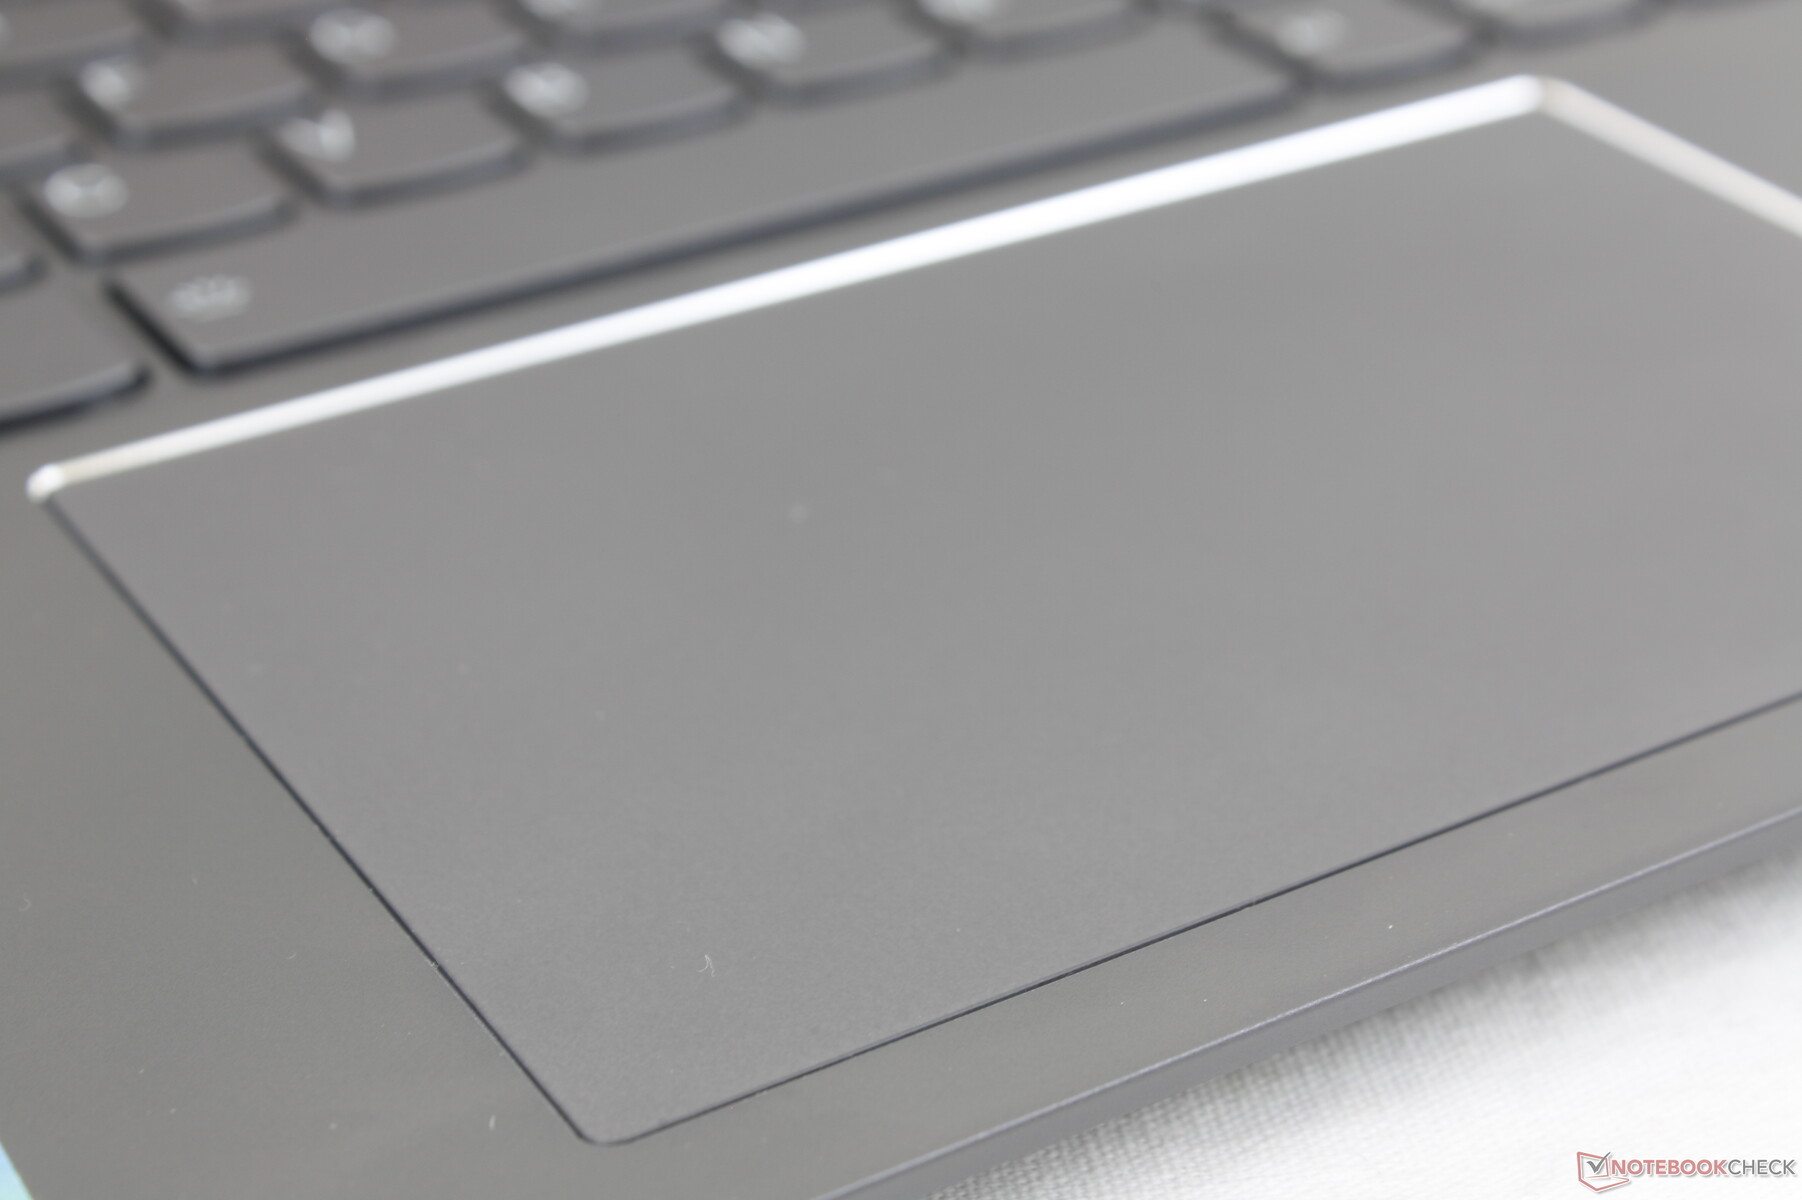
Touchpad
Gładzik jest przyzwoitej wielkości w przeciwieństwie do malutkiego w ZenBooku Duo UX481 (12 x 7,5 cm vs. 5,5 x 7 cm). Ślizganie się po ekranie jest płynne i responsywne, częściowo dzięki szybszej natywnej częstotliwości odświeżania 120 Hz głównego wyświetlacza. Kliknięcie na klawiaturze jest pewne i głośne, co daje satysfakcjonującą informację zwrotną.

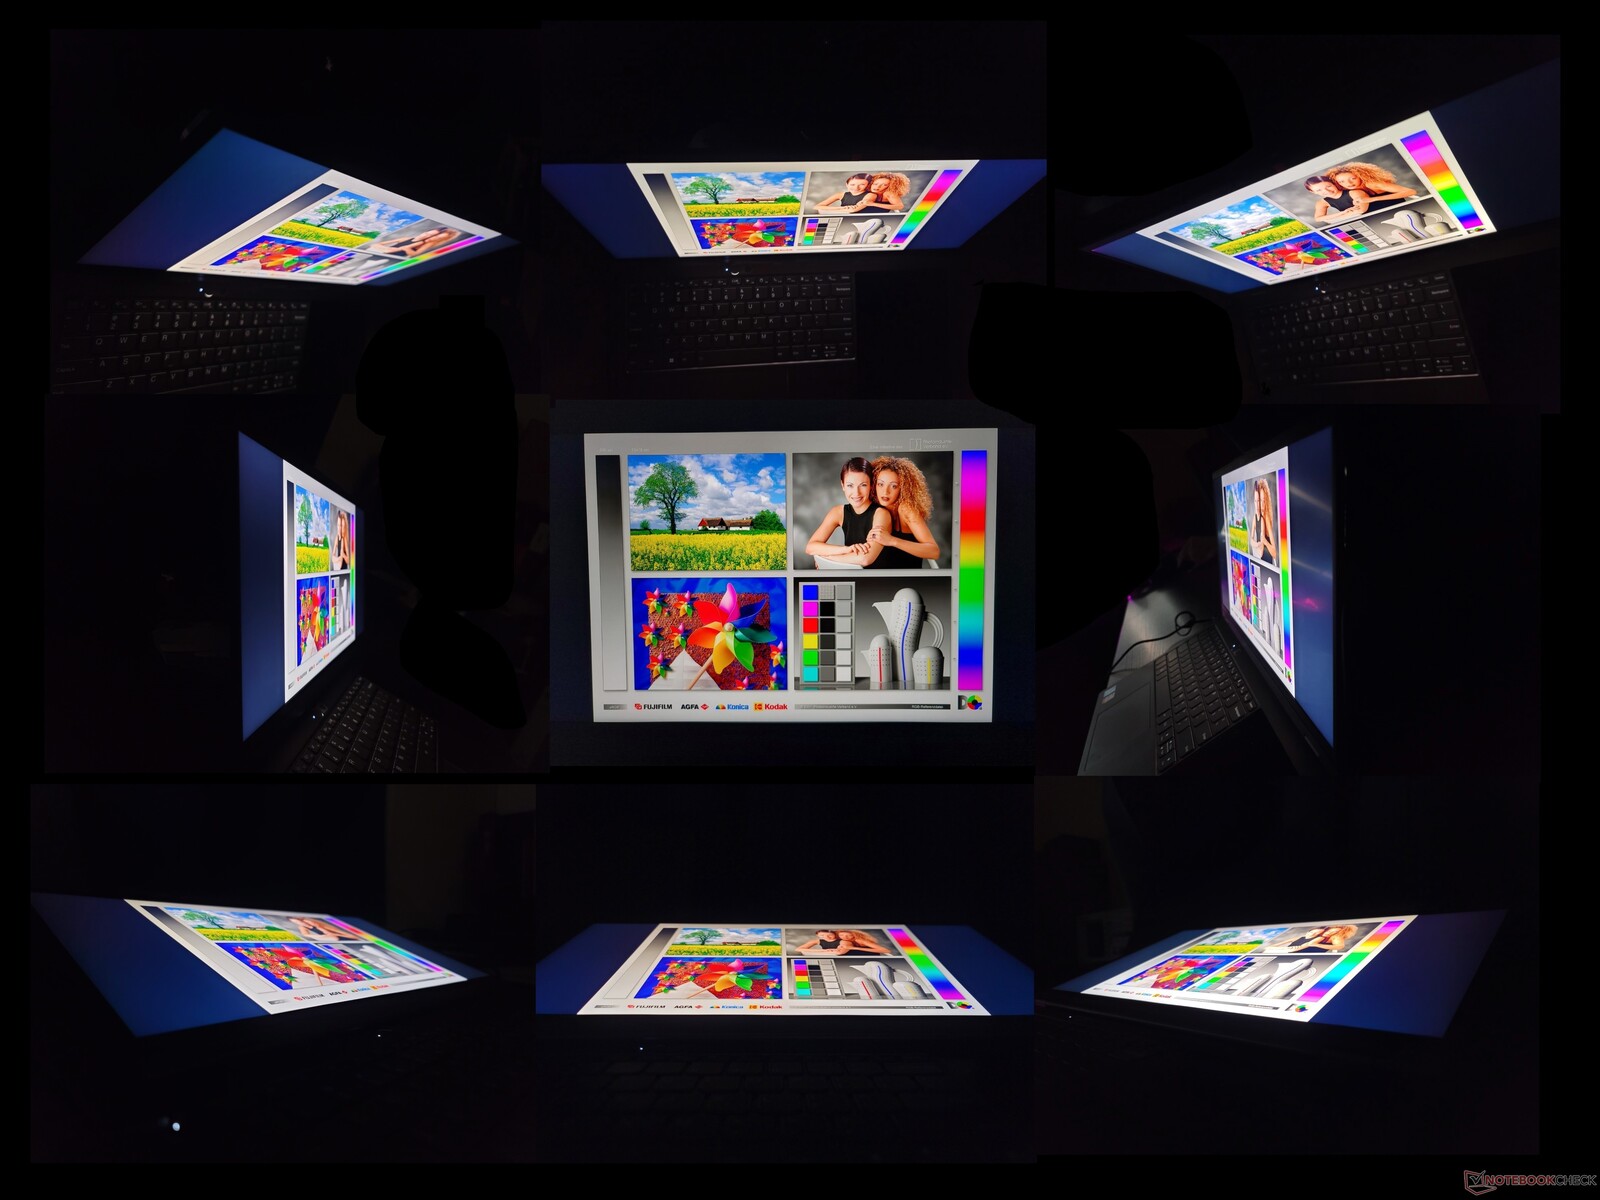
Wyświetlacz główny - P3, 120 Hz, oraz IPS 21:10
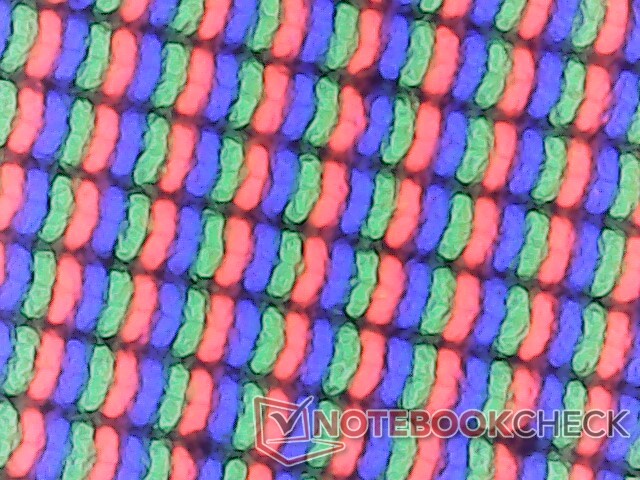
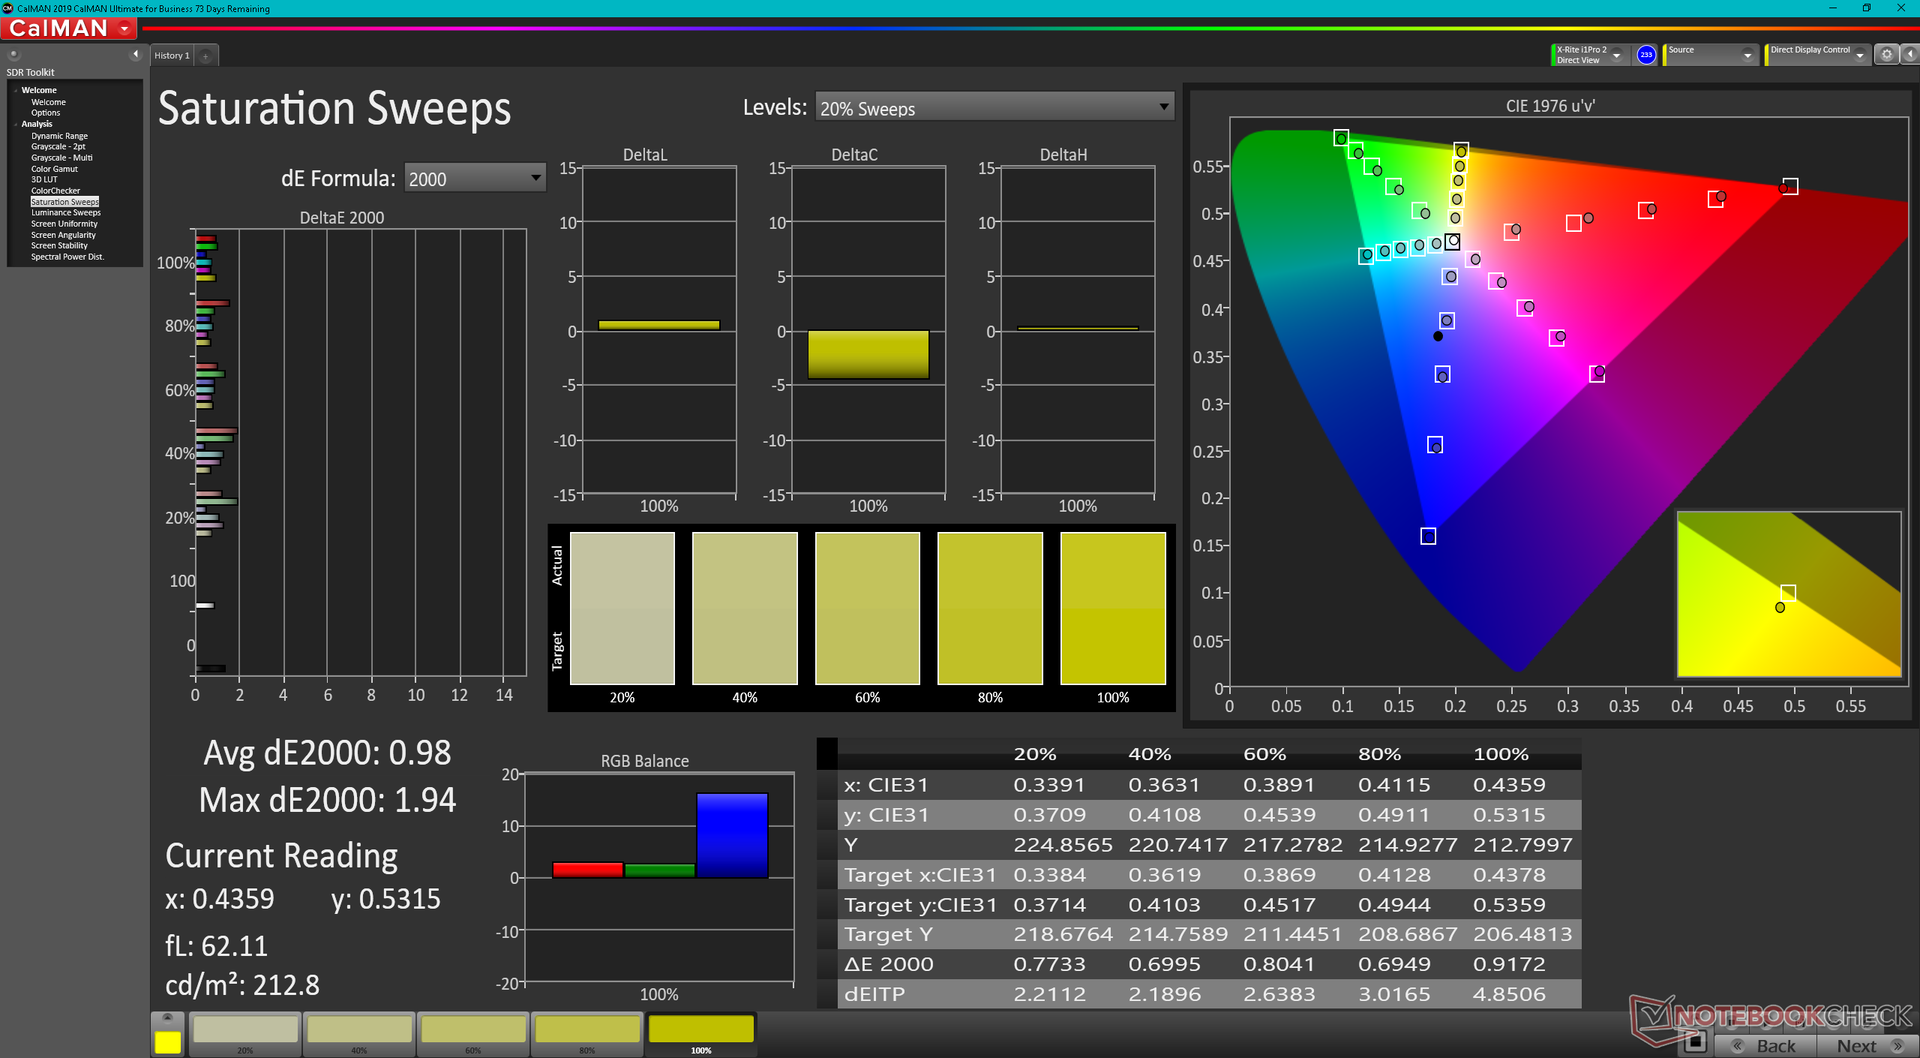
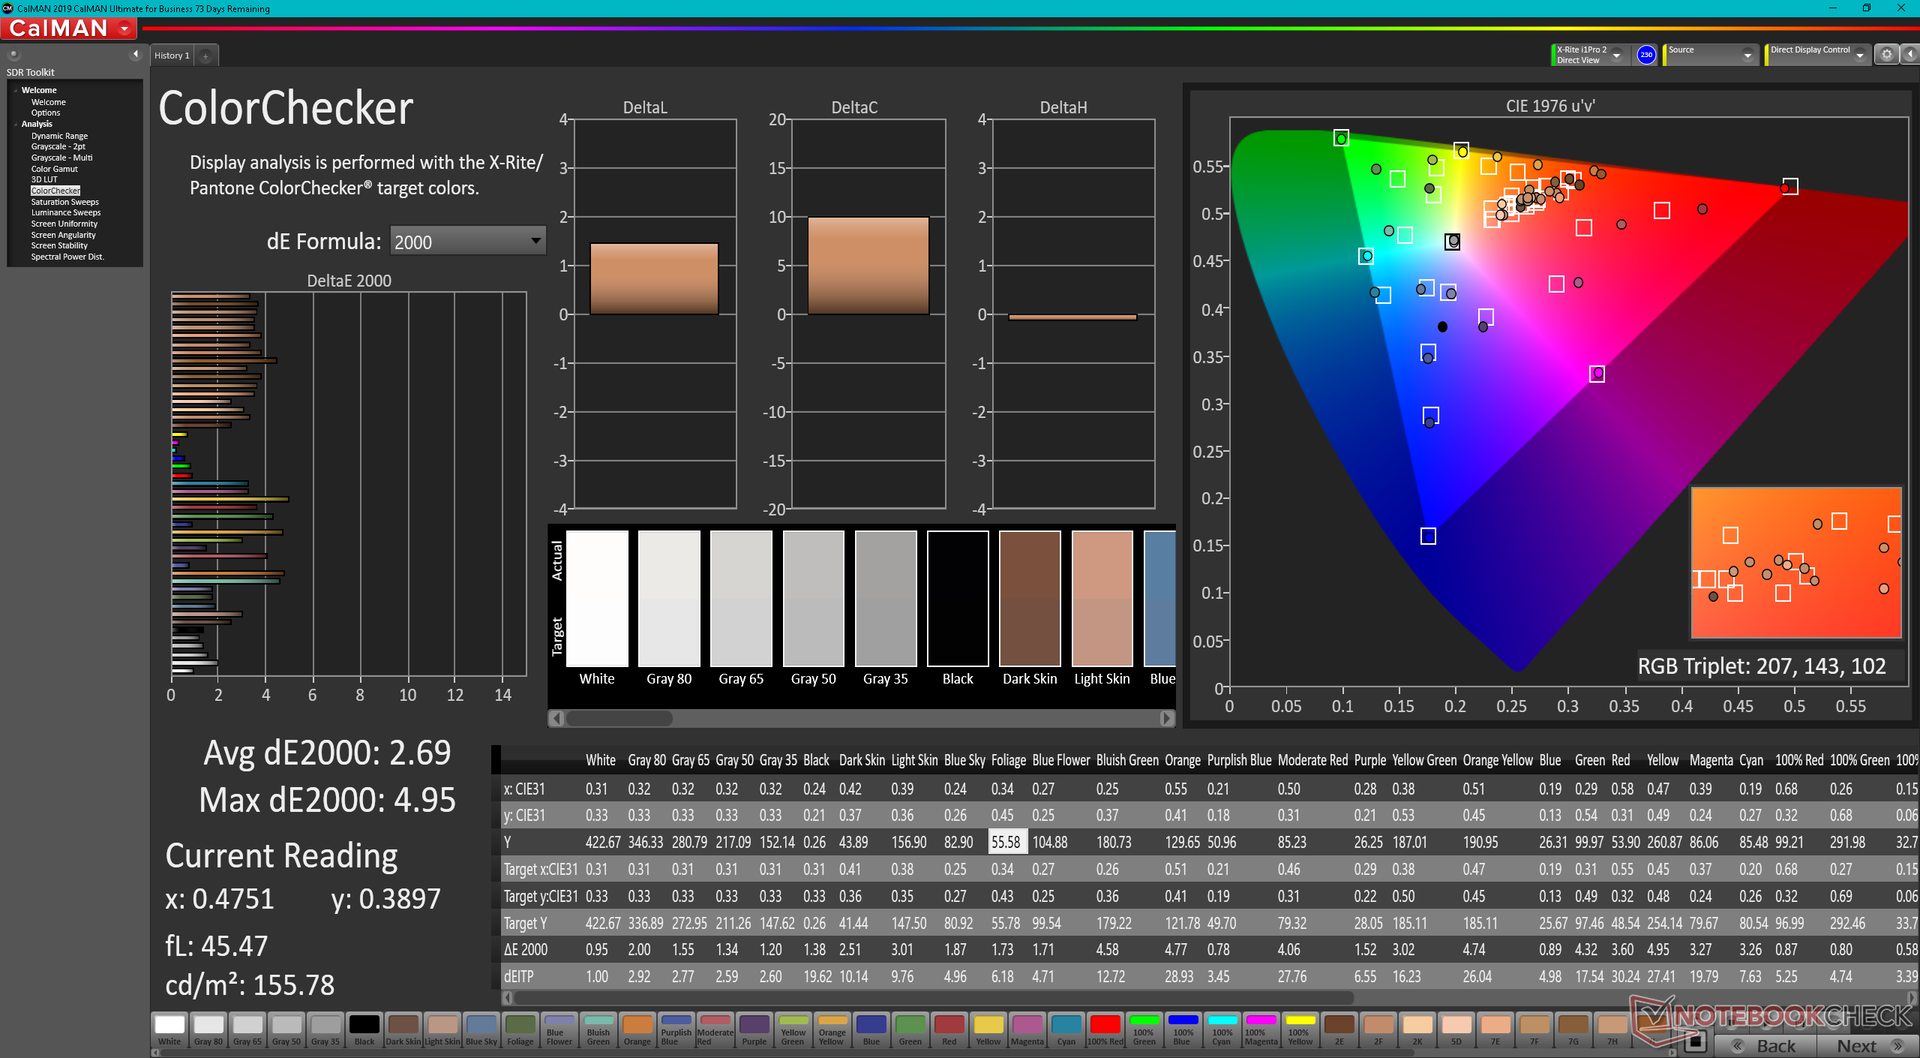
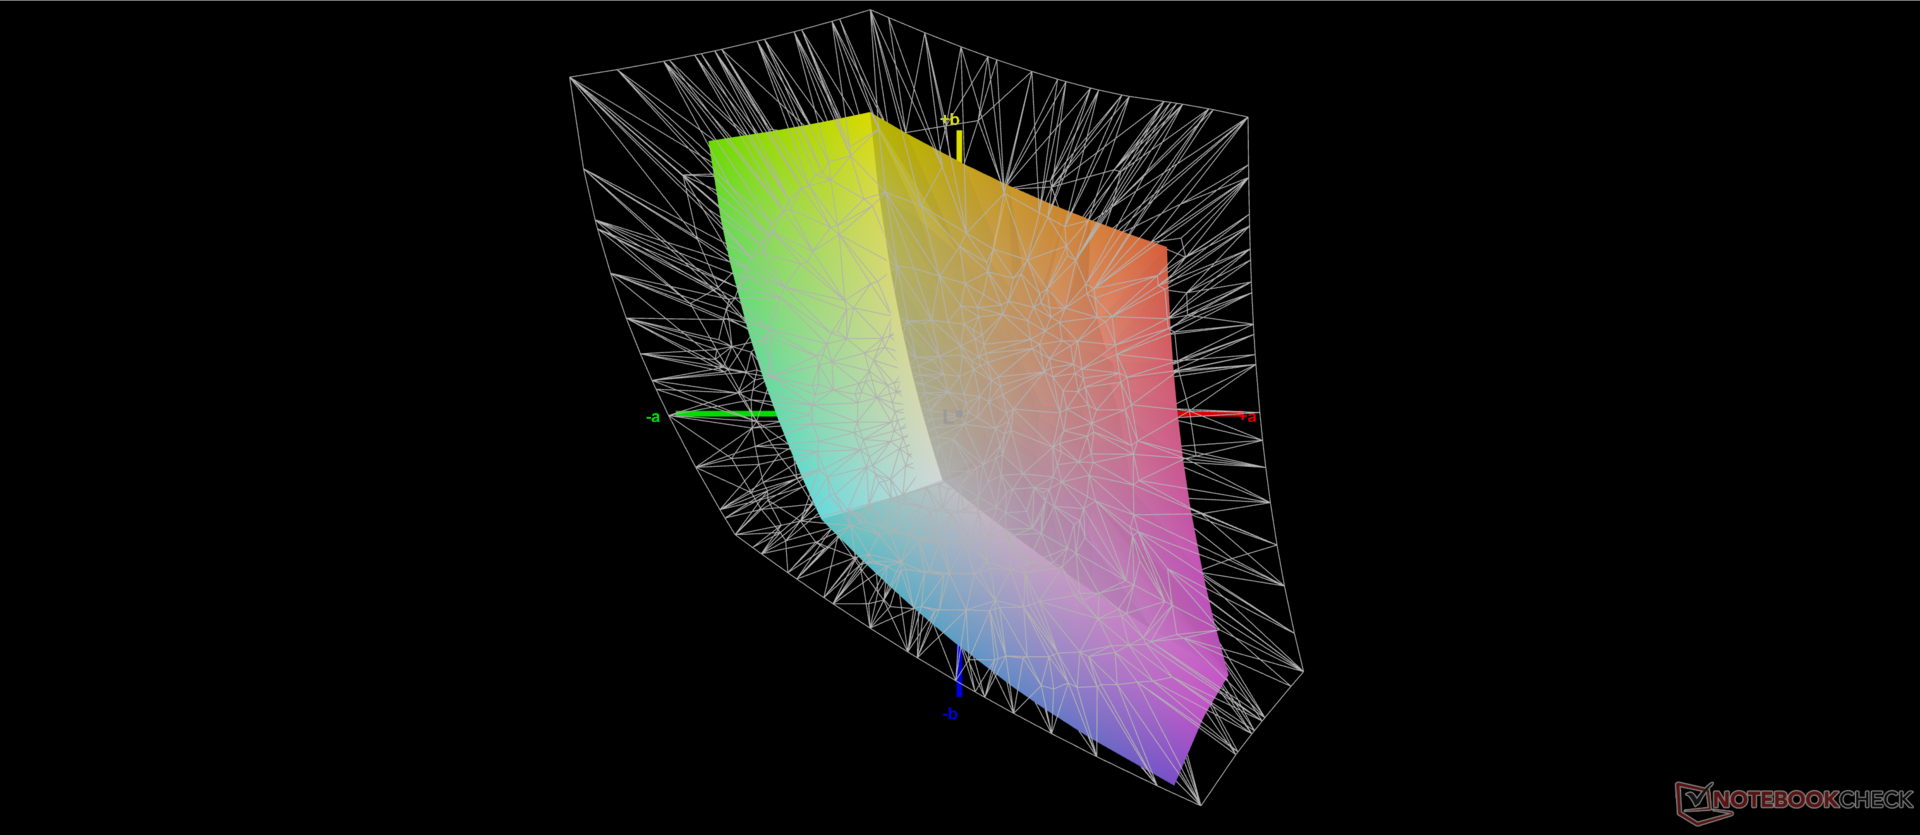
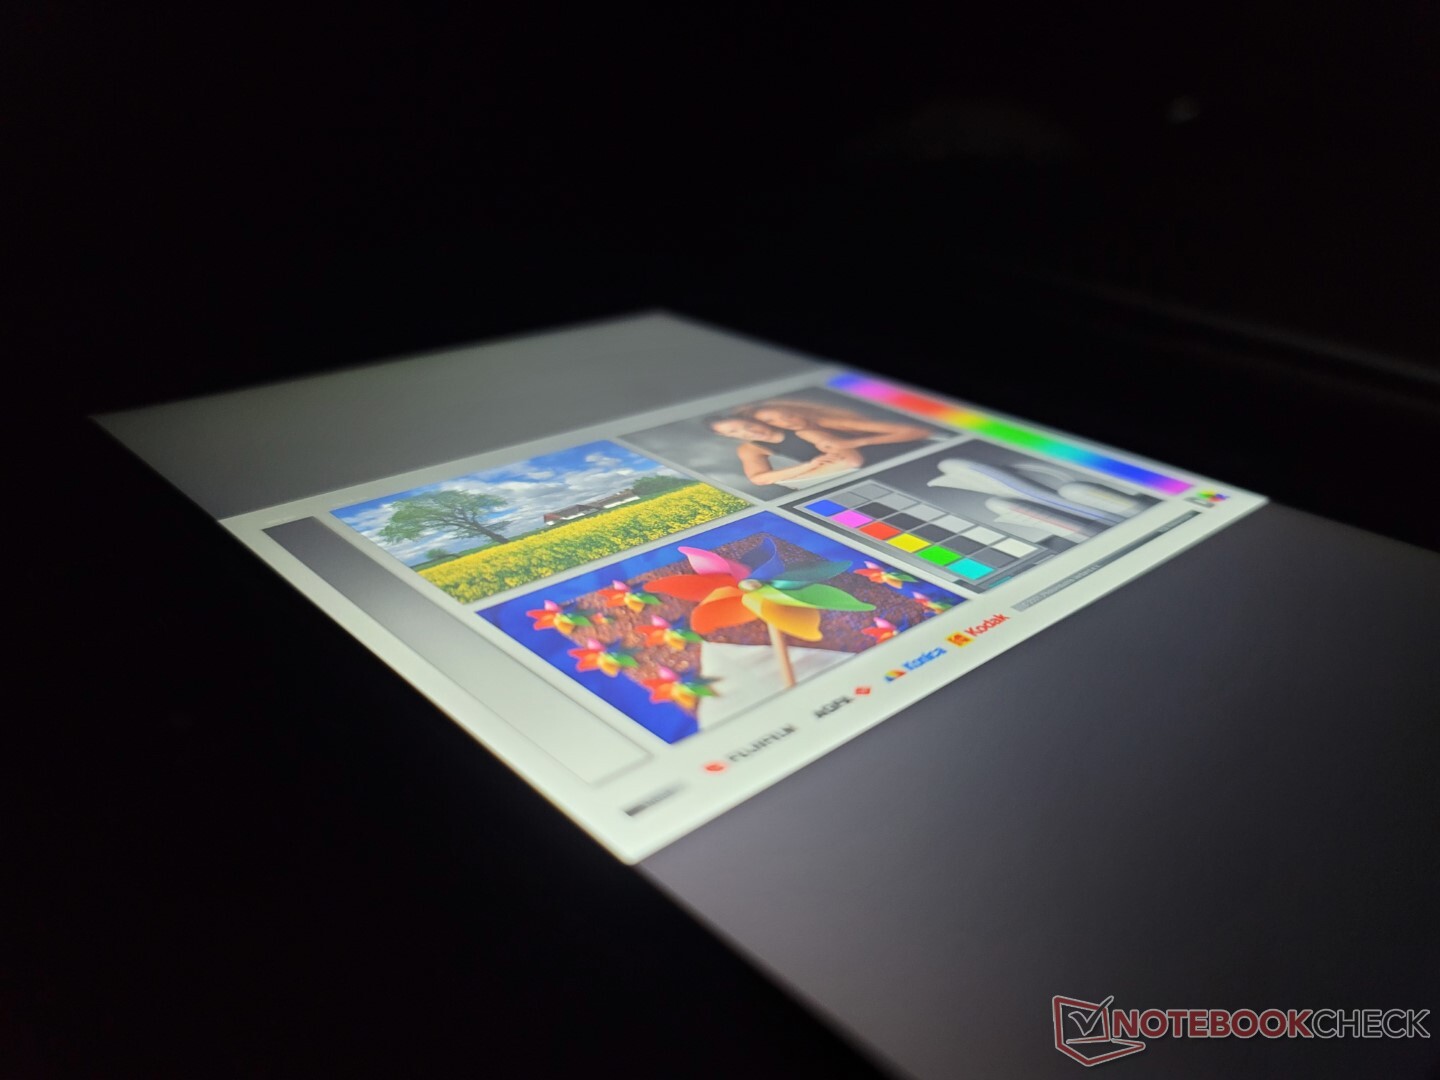
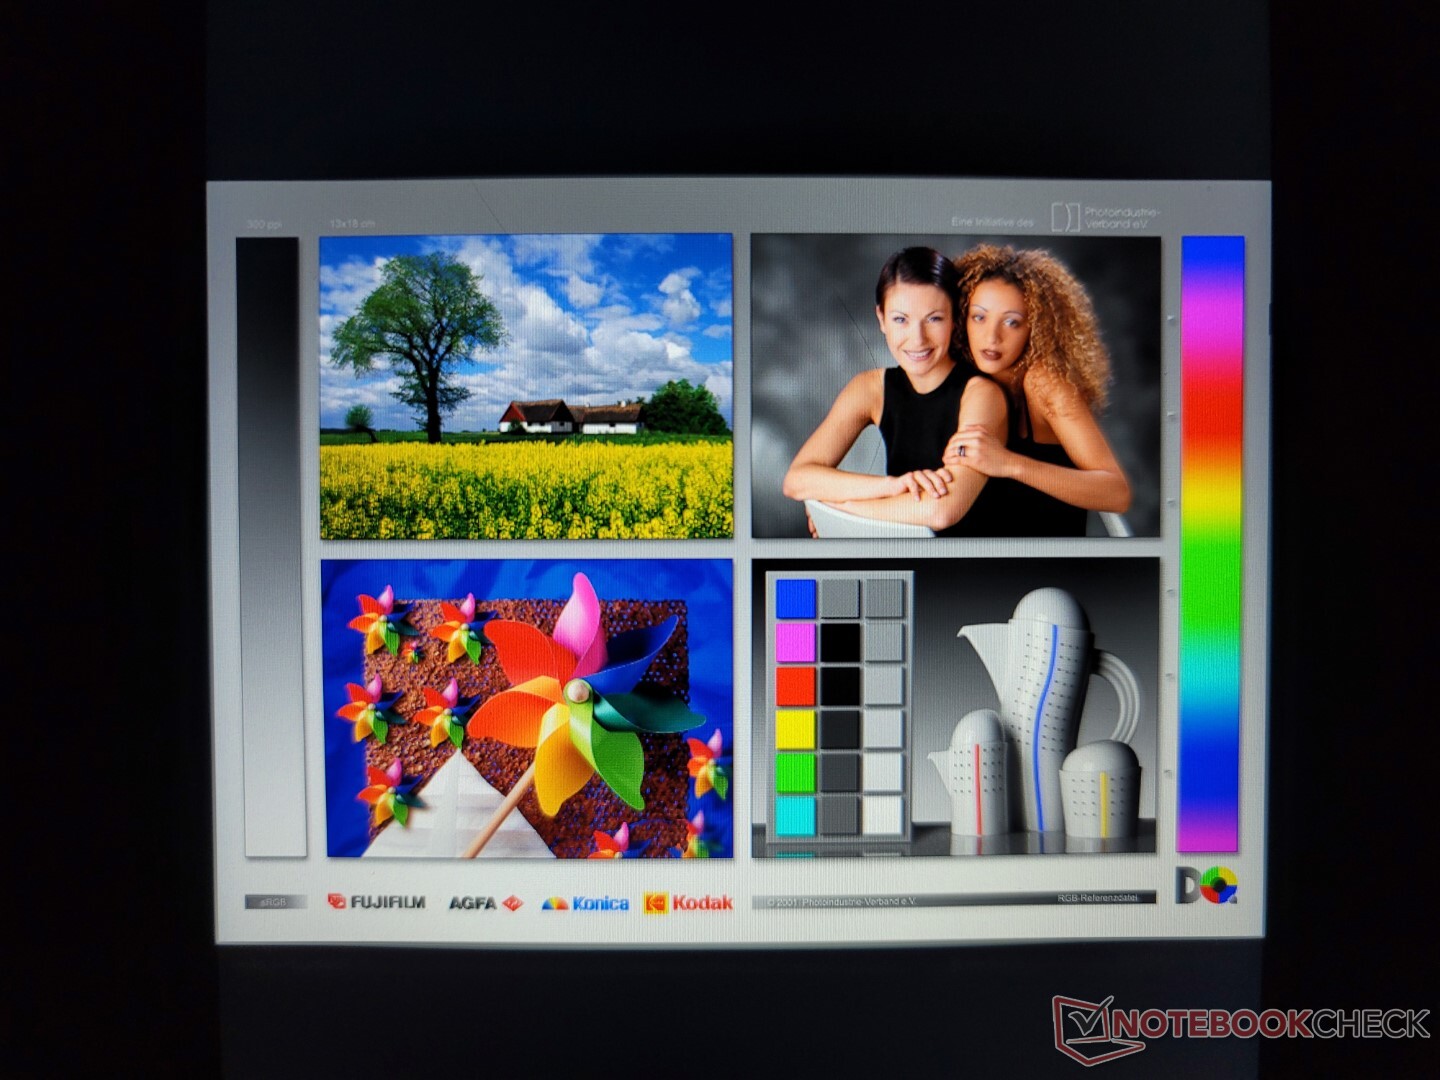
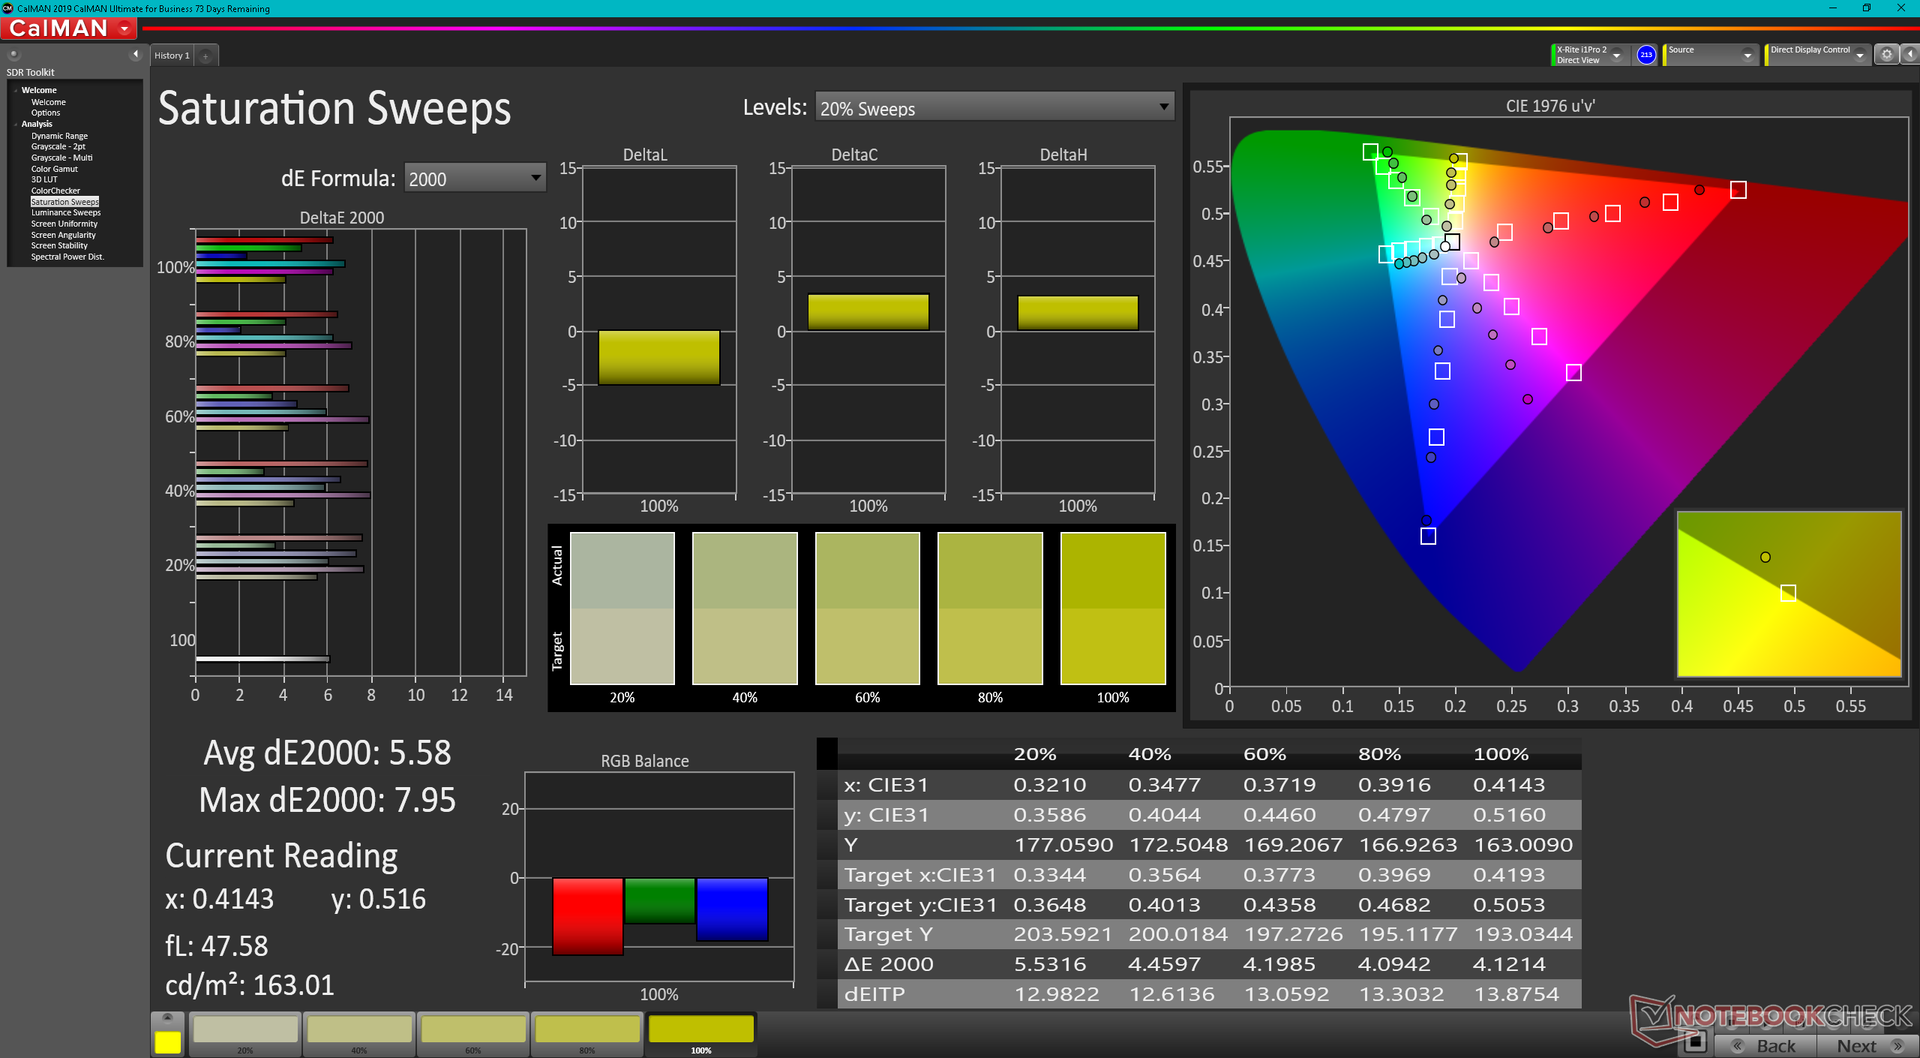
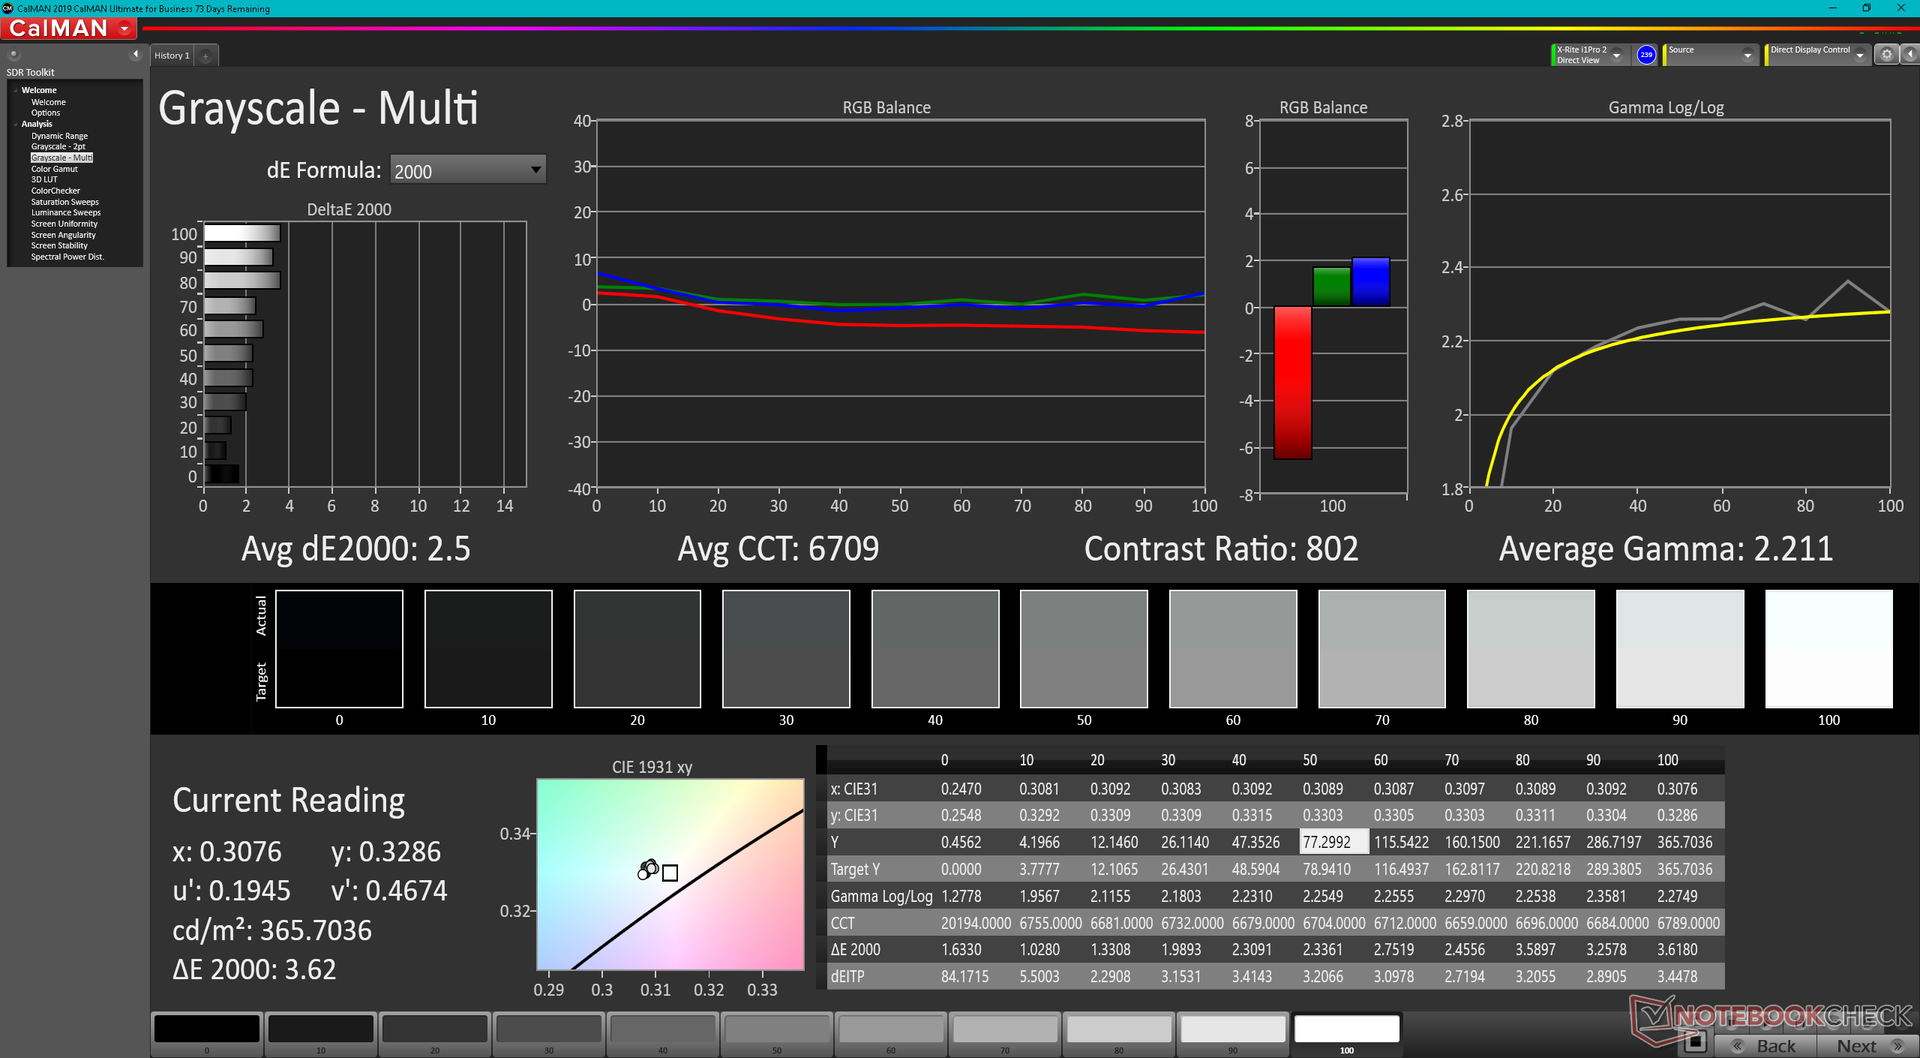
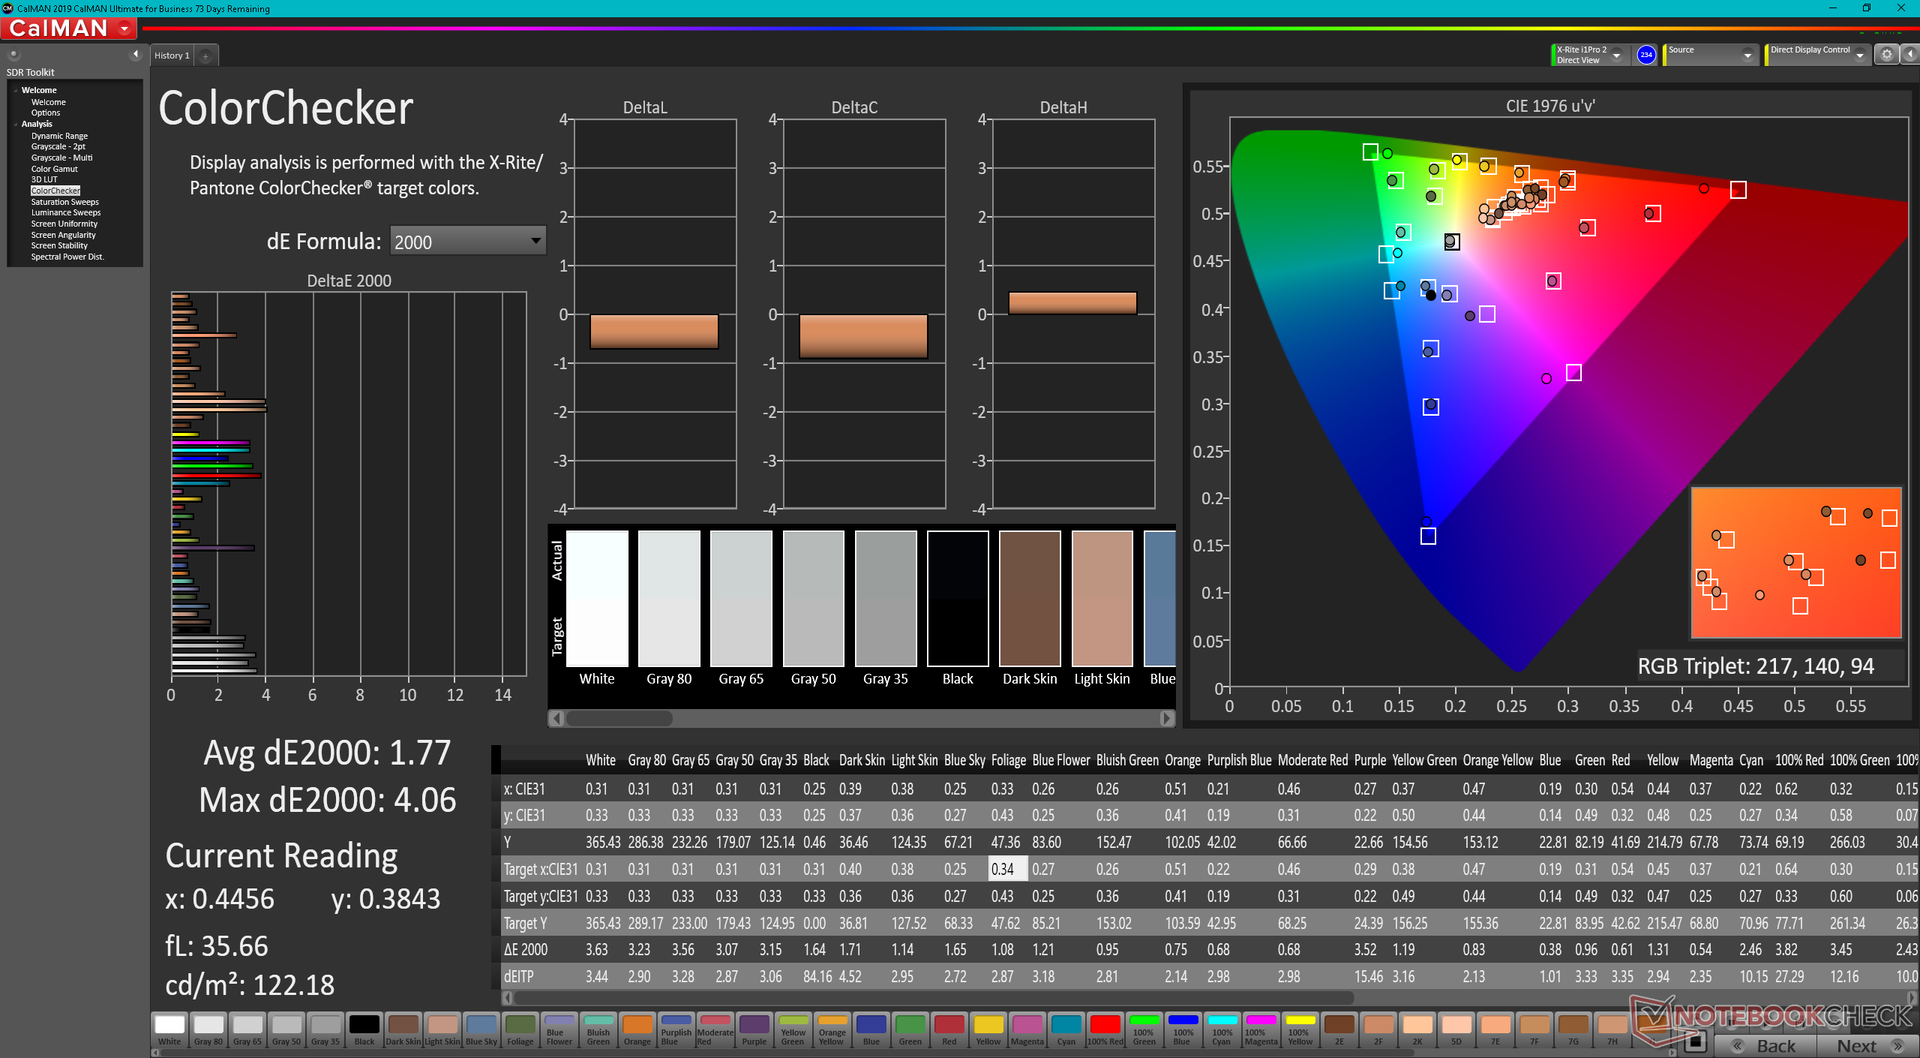
Główny wyświetlacz IPS może mieć nietypowe proporcje, ale posiada te same cechy, co większość innych wysokiej klasy paneli IPS. Współczynnik kontrastu ~1000:1, dość szybkie czasy reakcji w czerni i bieli, szybka natywna częstotliwość odświeżania 120 Hz oraz >95% pokrycie kolorów P3 sprawiają, że wyświetlacz jest zaskakująco dobry zarówno do grafiki, edycji, jak i wszystkiego pomiędzy. Zarówno kolory, jak i czasy reakcji są odpowiednio głębsze i szybsze niż w przypadku panelu w modelu ThinkBook Plus Gen 2 podczas gdy maksymalna jasność pozostaje mniej więcej taka sama.


| |||||||||||||||||||||||||
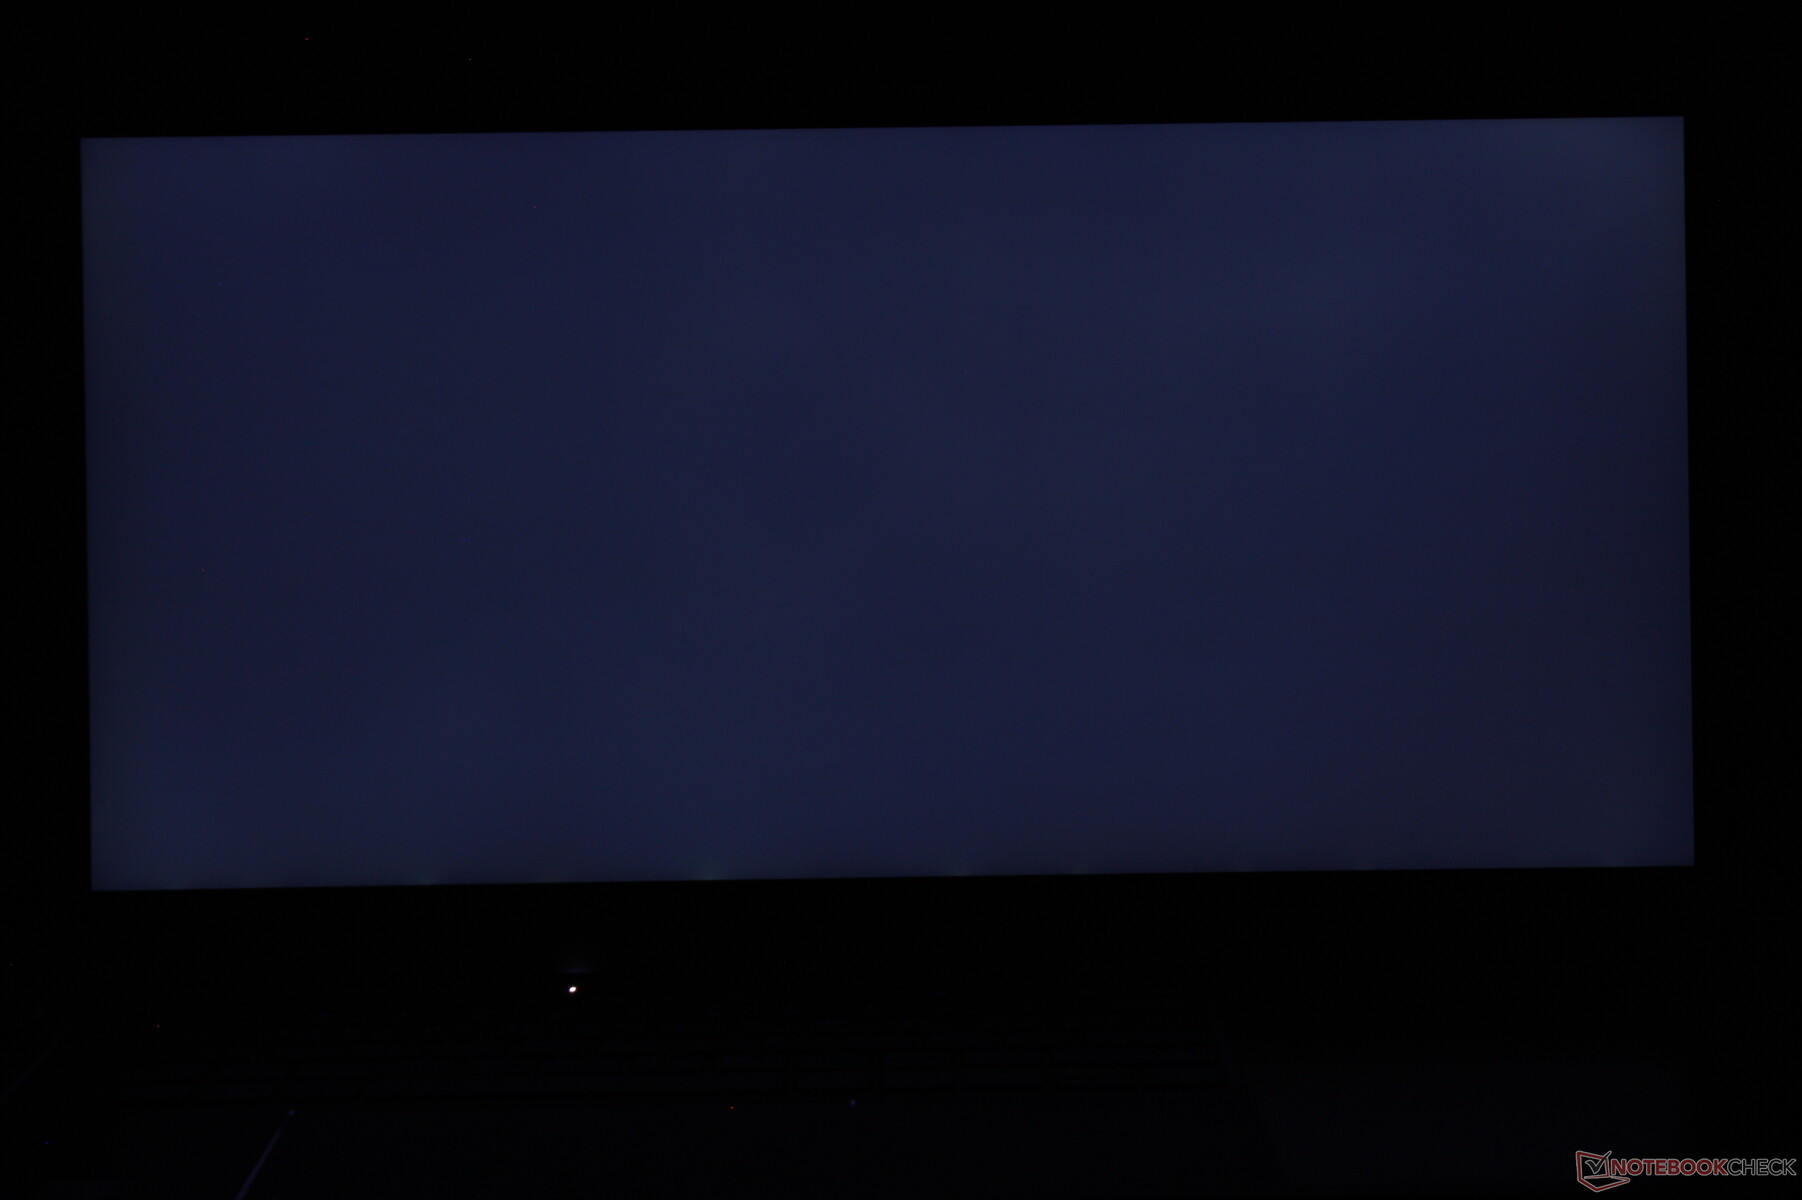
rozświetlenie: 84 %
na akumulatorze: 405 cd/m²
kontrast: 1191:1 (czerń: 0.34 cd/m²)
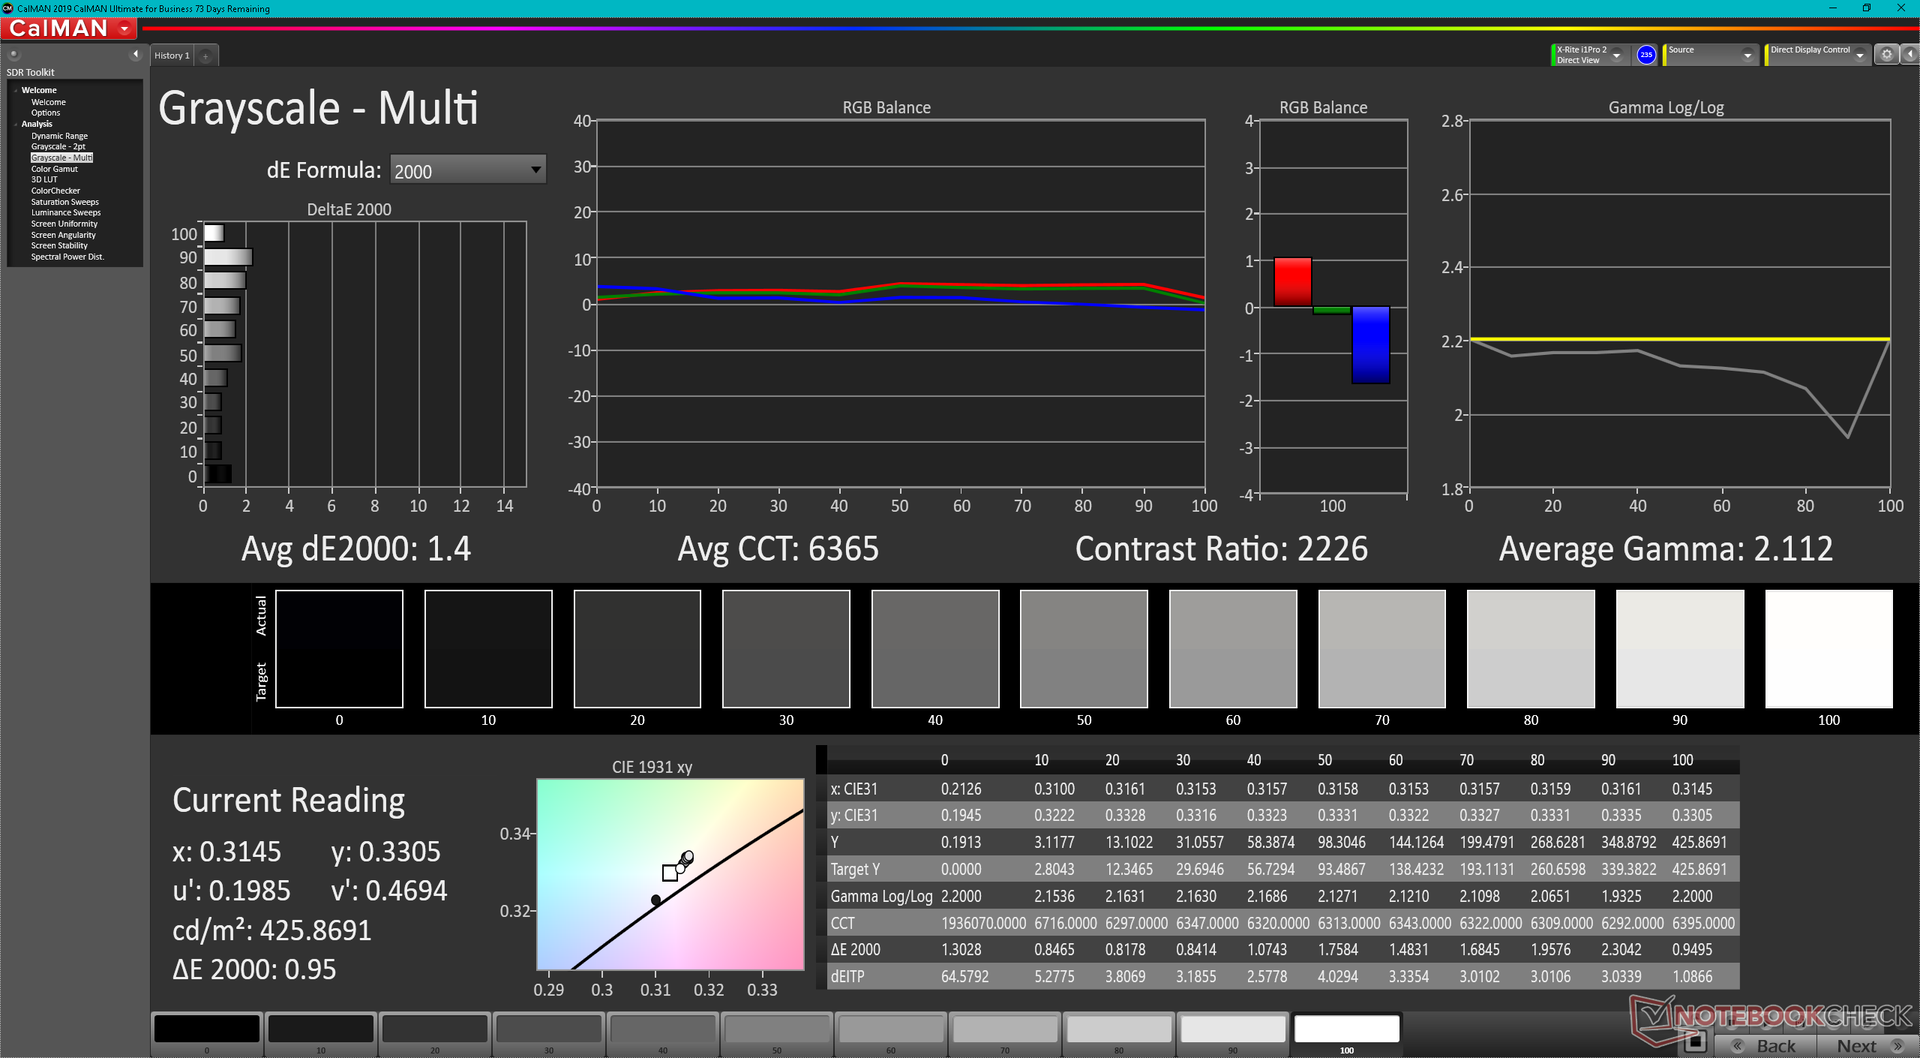
ΔE ColorChecker Calman: 2.69 | ∀{0.5-29.43 Ø4.72}
ΔE Greyscale Calman: 1.4 | ∀{0.09-98 Ø4.97}
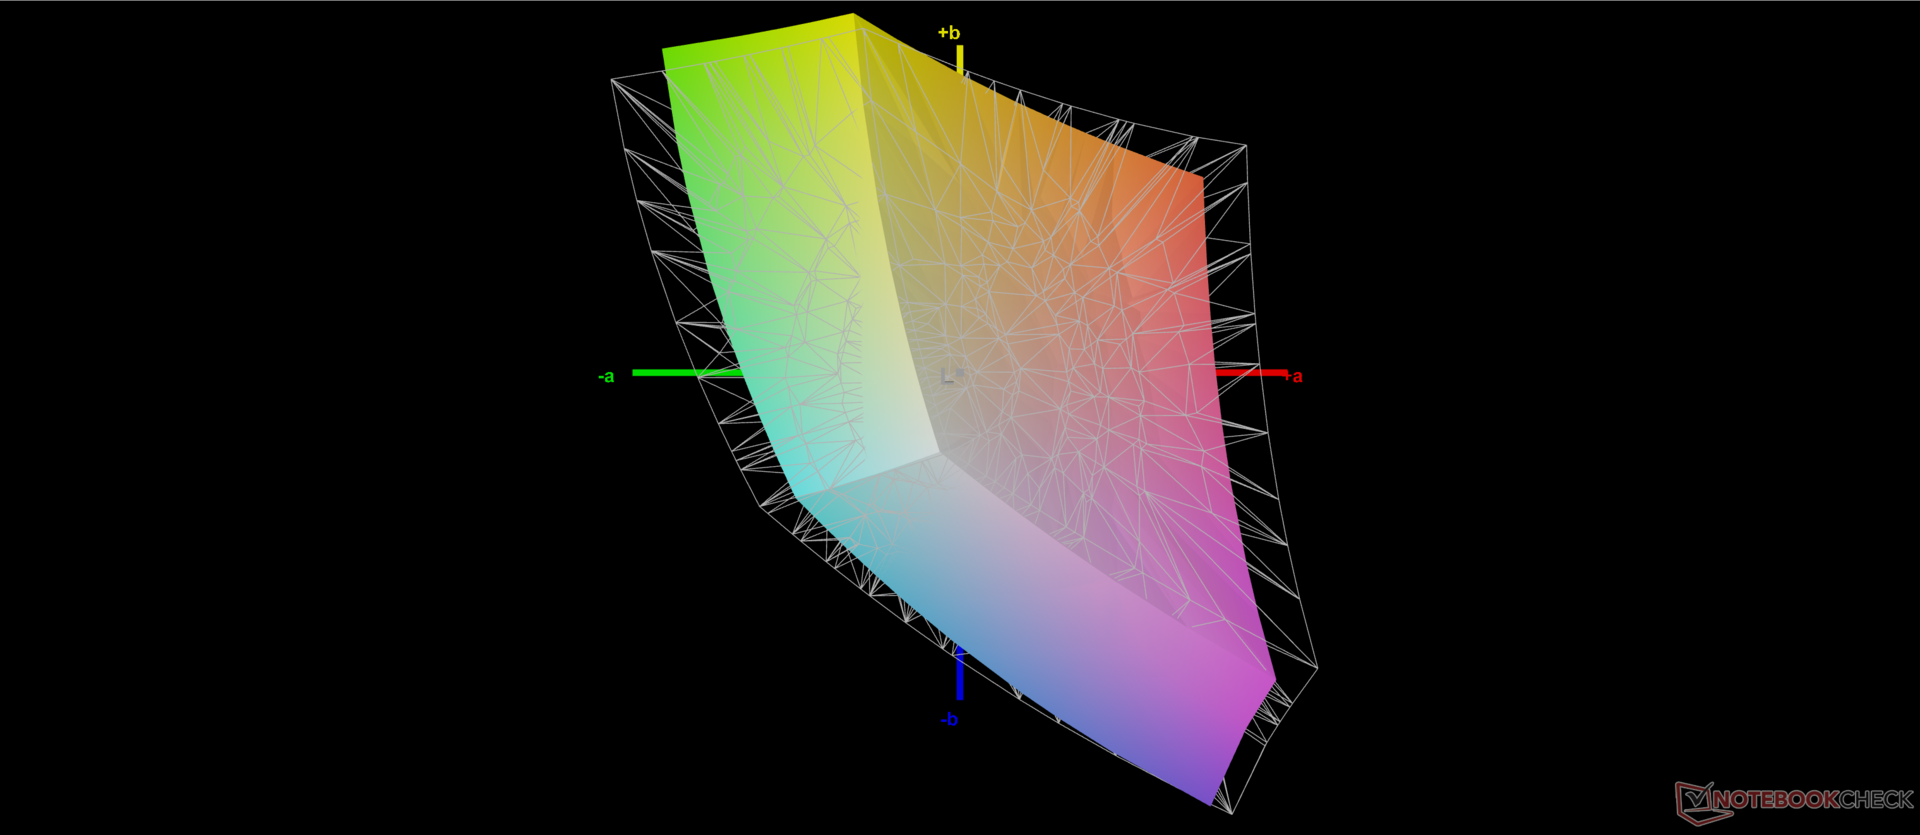
87.8% AdobeRGB 1998 (Argyll 3D)
100% sRGB (Argyll 3D)
96.8% Display P3 (Argyll 3D)
Gamma: 2.1
CCT: 6365 K
| Lenovo ThinkBook Plus Gen3 MNH300HB1-1 CSOT T3, IPS, 3072x1440, 17.3" | Lenovo ThinkBook Plus Gen2 Core i5 CSOT T3 MND307DA1-5 (LCD), IPS, E-Ink, 2560x1600, 13.3" | Asus ProArt StudioBook Pro 17 W700G3T 170PUW1-A00, IPS, 1920x1200, 17" | LG Gram 17 (2022) LG Philips LP170WQ1-SPF2, IPS, 2560x1600, 17" | Dell XPS 17 9720 Sharp LQ170R1, IPS, 3840x2400, 17" | Gigabyte Aero 17 HDR YD AU Optronics AUO329B, IPS, 3840x2160, 17.3" | |
|---|---|---|---|---|---|---|
| Display | -16% | -2% | -0% | 4% | 1% | |
| Display P3 Coverage (%) | 96.8 | 70.1 -28% | 96.2 -1% | 98.1 1% | 94.8 -2% | 86.9 -10% |
| sRGB Coverage (%) | 100 | 98 -2% | 99.8 0% | 99.9 0% | 100 0% | 100 0% |
| AdobeRGB 1998 Coverage (%) | 87.8 | 72.2 -18% | 84.7 -4% | 85.9 -2% | 100 14% | 99.6 13% |
| Response Times | -44% | -45% | -28% | -64% | -56% | |
| Response Time Grey 50% / Grey 80% * (ms) | 28 ? | 42.8 ? -53% | 41.2 ? -47% | 46 ? -64% | 53.2 ? -90% | 52 ? -86% |
| Response Time Black / White * (ms) | 20.8 ? | 28 ? -35% | 29.6 ? -42% | 19 ? 9% | 28.4 ? -37% | 26 ? -25% |
| PWM Frequency (Hz) | 17990 ? | |||||
| Screen | -17% | 9% | -28% | -18% | 20% | |
| Brightness middle (cd/m²) | 405 | 404 0% | 323 -20% | 400 -1% | 438 8% | 488 20% |
| Brightness (cd/m²) | 389 | 388 0% | 308 -21% | 353 -9% | 411 6% | 467 20% |
| Brightness Distribution (%) | 84 | 94 12% | 88 5% | 81 -4% | 86 2% | 86 2% |
| Black Level * (cd/m²) | 0.34 | 0.24 29% | 0.36 -6% | 0.3 12% | 0.27 21% | 0.33 3% |
| Contrast (:1) | 1191 | 1683 41% | 897 -25% | 1333 12% | 1622 36% | 1479 24% |
| Colorchecker dE 2000 * | 2.69 | 3.1 -15% | 1.1 59% | 3.15 -17% | 2.5 7% | 1.23 54% |
| Colorchecker dE 2000 max. * | 4.95 | 6.9 -39% | 3.3 33% | 6.54 -32% | 6.3 -27% | 2.94 41% |
| Greyscale dE 2000 * | 1.4 | 3.7 -164% | 0.8 43% | 4 -186% | 4.2 -200% | 1.5 -7% |
| Gamma | 2.1 105% | 2.26 97% | 2.23 99% | 2.14 103% | 2.22 99% | 2.169 101% |
| CCT | 6365 102% | 5936 110% | 6479 100% | 7278 89% | 7034 92% | 6614 98% |
| Colorchecker dE 2000 calibrated * | 1.3 | 0.8 | 1.44 | 0.8 | 0.77 | |
| Color Space (Percent of AdobeRGB 1998) (%) | 75.7 | 99 | ||||
| Color Space (Percent of sRGB) (%) | 99.8 | 99 | ||||
| Całkowita średnia (program / ustawienia) | -26% /
-21% | -13% /
-2% | -19% /
-22% | -26% /
-20% | -12% /
4% |
* ... im mniej tym lepiej

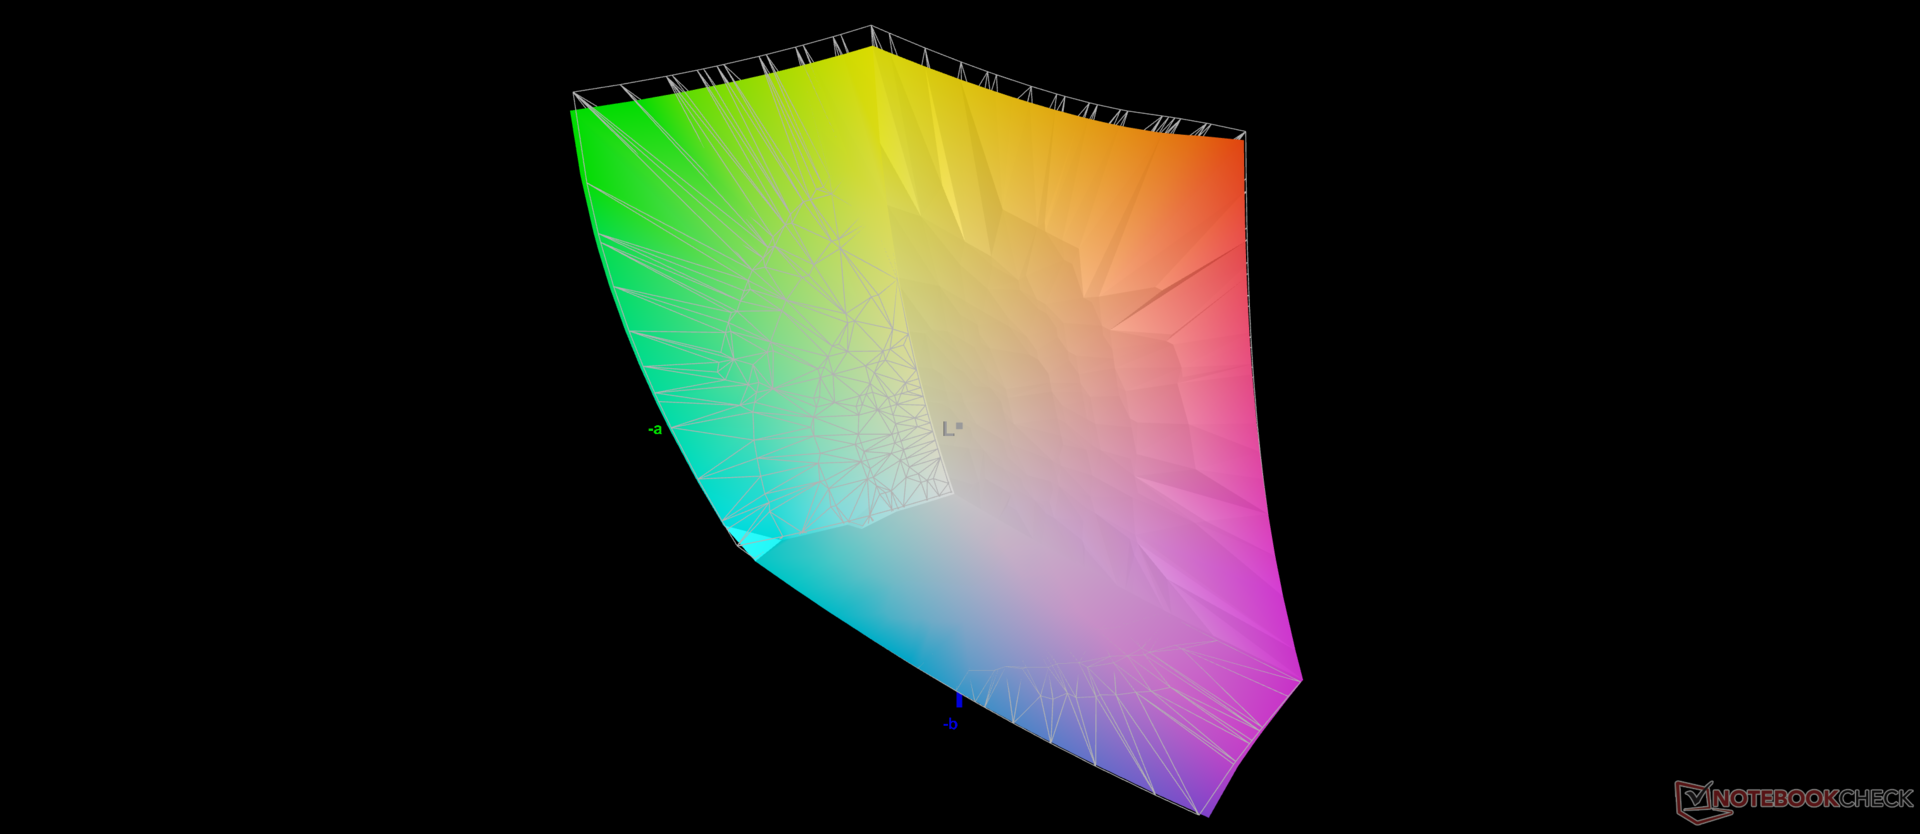
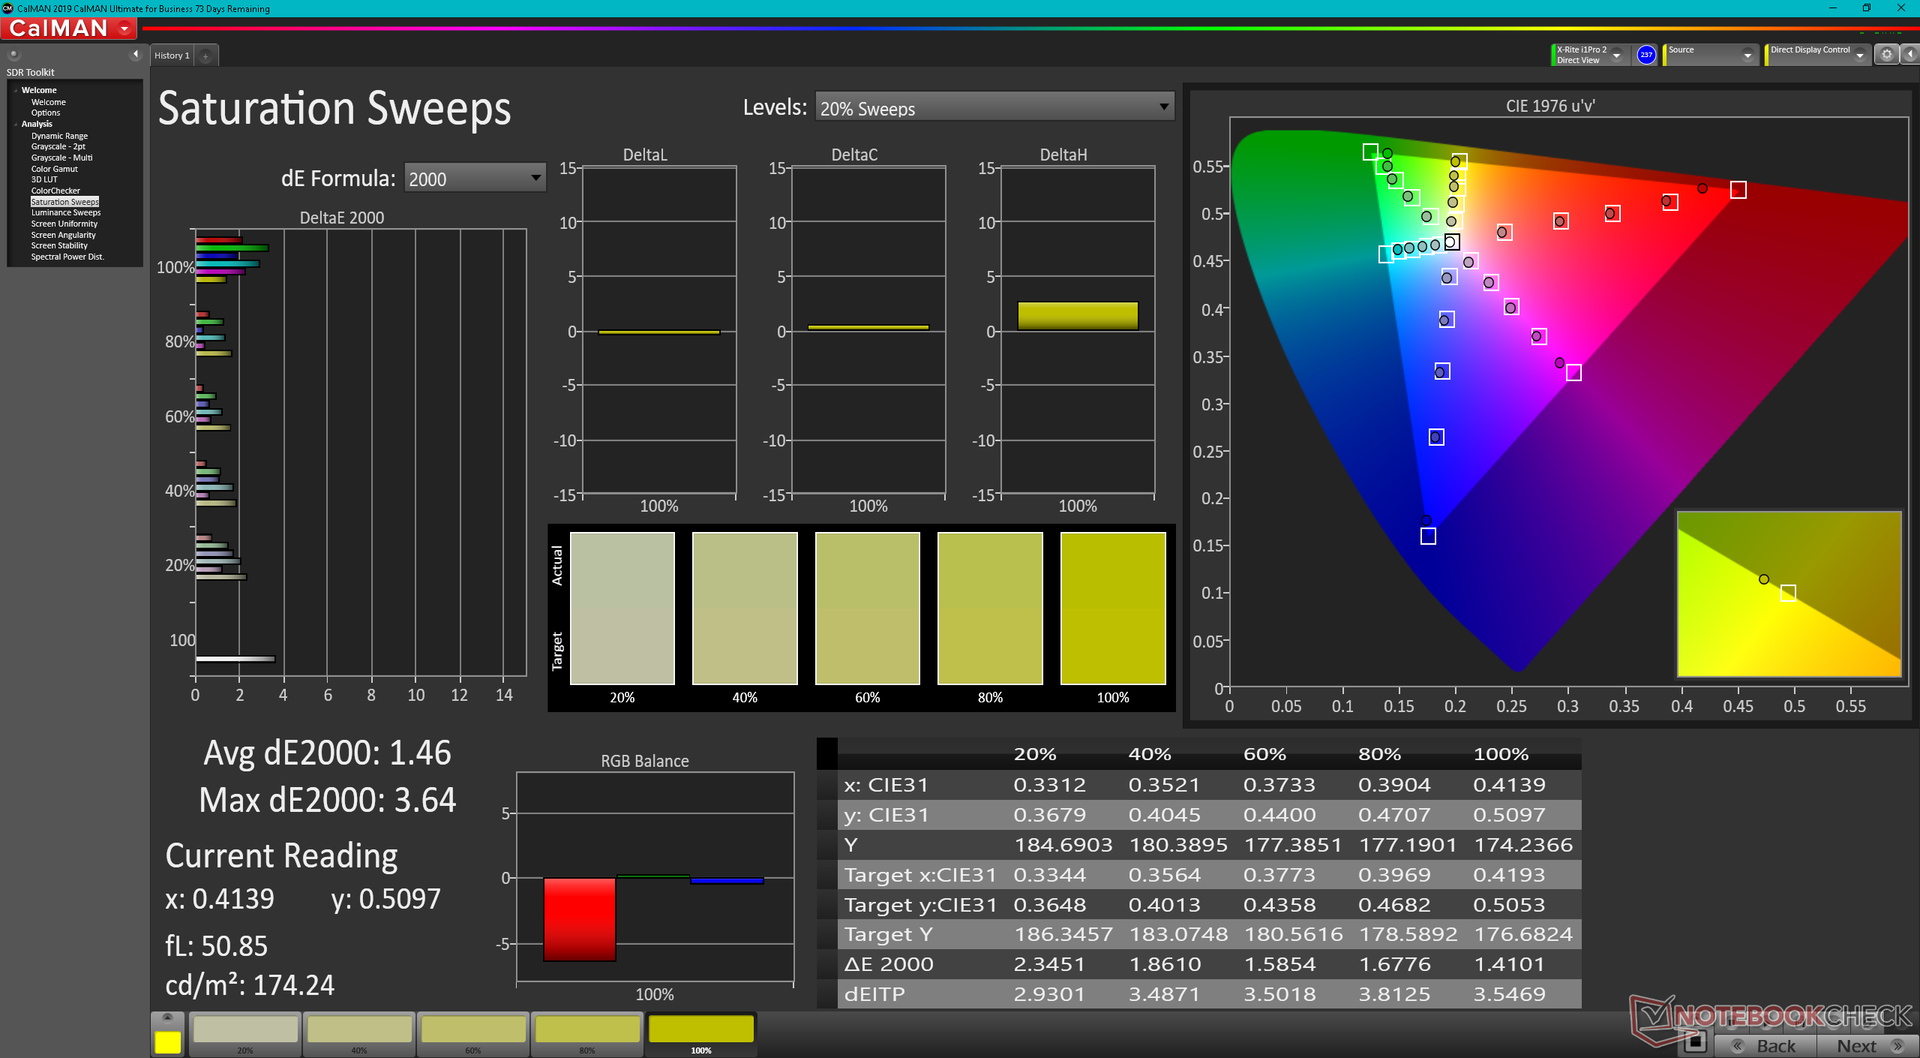
Wyświetlacz jest dobrze skalibrowany względem standardu P3, a średnie wartości DeltaE w skali szarości i kolorze wynoszą odpowiednio 1,4 i 2,69. Kalibracja przez użytkownika końcowego nie jest konieczna.
Wyświetl czasy reakcji
| ↔ Czas reakcji od czerni do bieli | ||
|---|---|---|
| 20.8 ms ... wzrost ↗ i spadek ↘ łącznie | ↗ 10.8 ms wzrost | 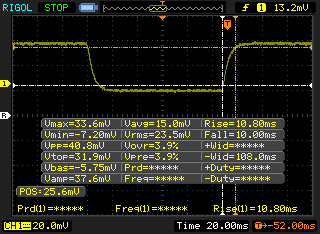 |
| ↘ 10 ms upadek | ||
| W naszych testach ekran wykazuje dobry współczynnik reakcji, ale może być zbyt wolny dla graczy rywalizujących ze sobą. Dla porównania, wszystkie testowane urządzenia wahają się od 0.1 (minimum) do 240 (maksimum) ms. » 46 % wszystkich urządzeń jest lepszych. Oznacza to, że zmierzony czas reakcji jest zbliżony do średniej wszystkich testowanych urządzeń (19.8 ms). | ||
| ↔ Czas reakcji 50% szarości do 80% szarości | ||
| 28 ms ... wzrost ↗ i spadek ↘ łącznie | ↗ 13.2 ms wzrost | 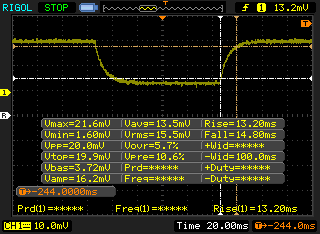 |
| ↘ 14.8 ms upadek | ||
| W naszych testach ekran wykazuje stosunkowo powolne tempo reakcji i może być zbyt wolny dla graczy. Dla porównania, wszystkie testowane urządzenia wahają się od 0.165 (minimum) do 636 (maksimum) ms. » 38 % wszystkich urządzeń jest lepszych. Oznacza to, że zmierzony czas reakcji jest zbliżony do średniej wszystkich testowanych urządzeń (31 ms). | ||
Migotanie ekranu / PWM (modulacja szerokości impulsu)
| Migotanie ekranu/nie wykryto PWM |  | ||
Dla porównania: 52 % wszystkich testowanych urządzeń nie używa PWM do przyciemniania wyświetlacza. Jeśli wykryto PWM, zmierzono średnio 7781 (minimum: 5 - maksimum: 343500) Hz. | |||
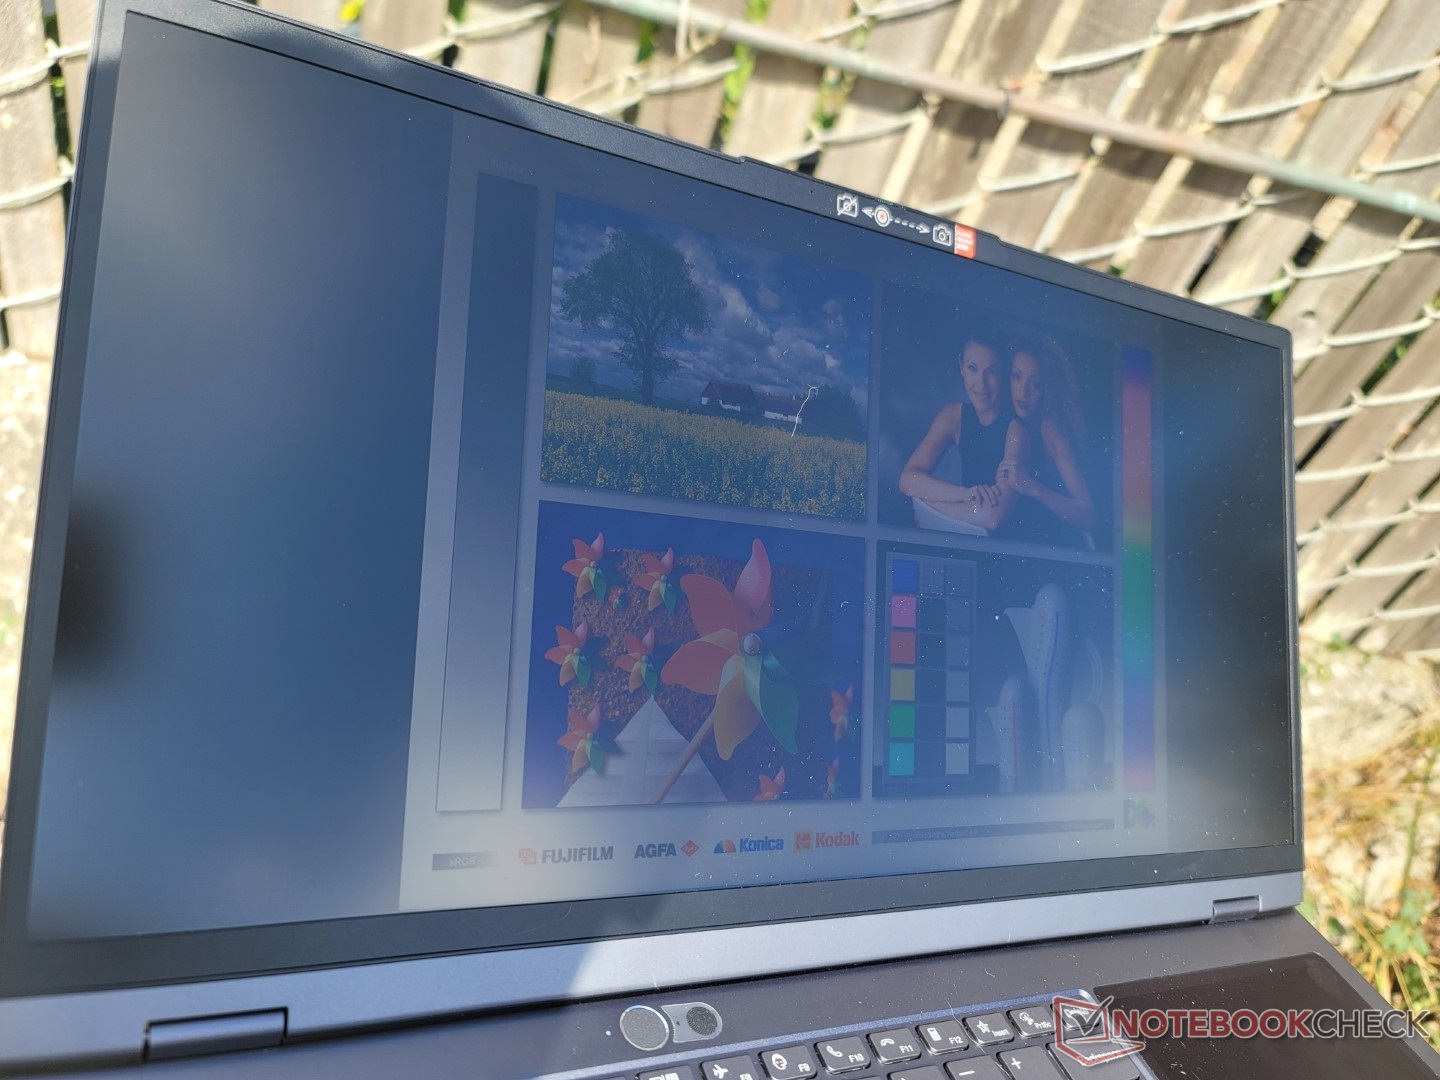
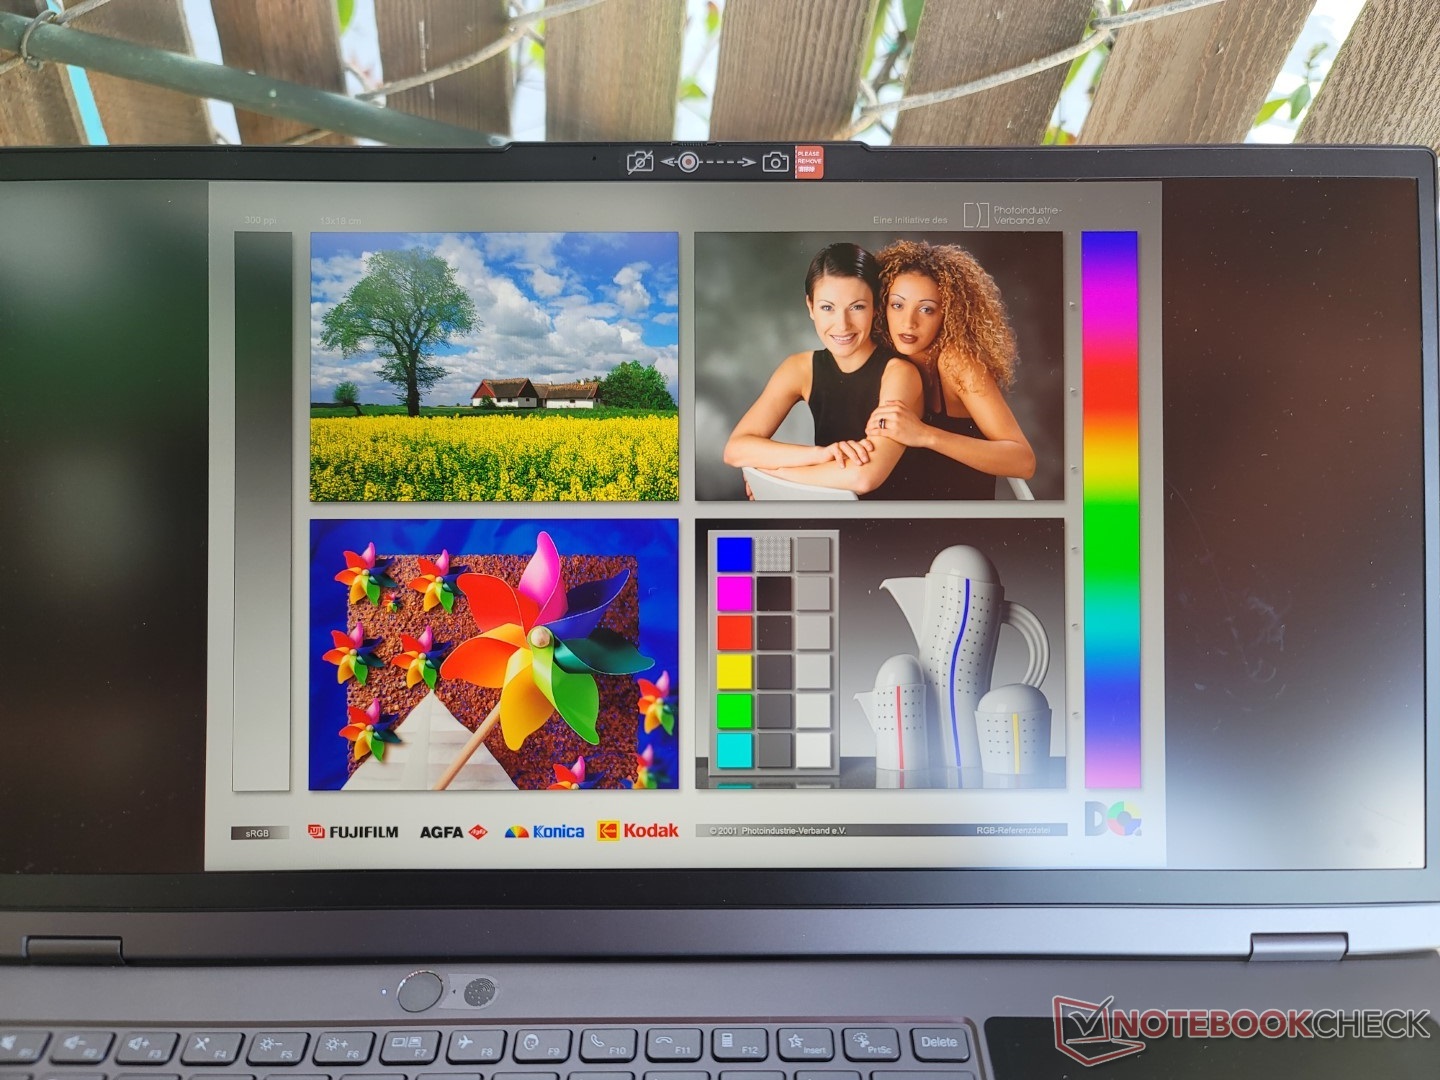
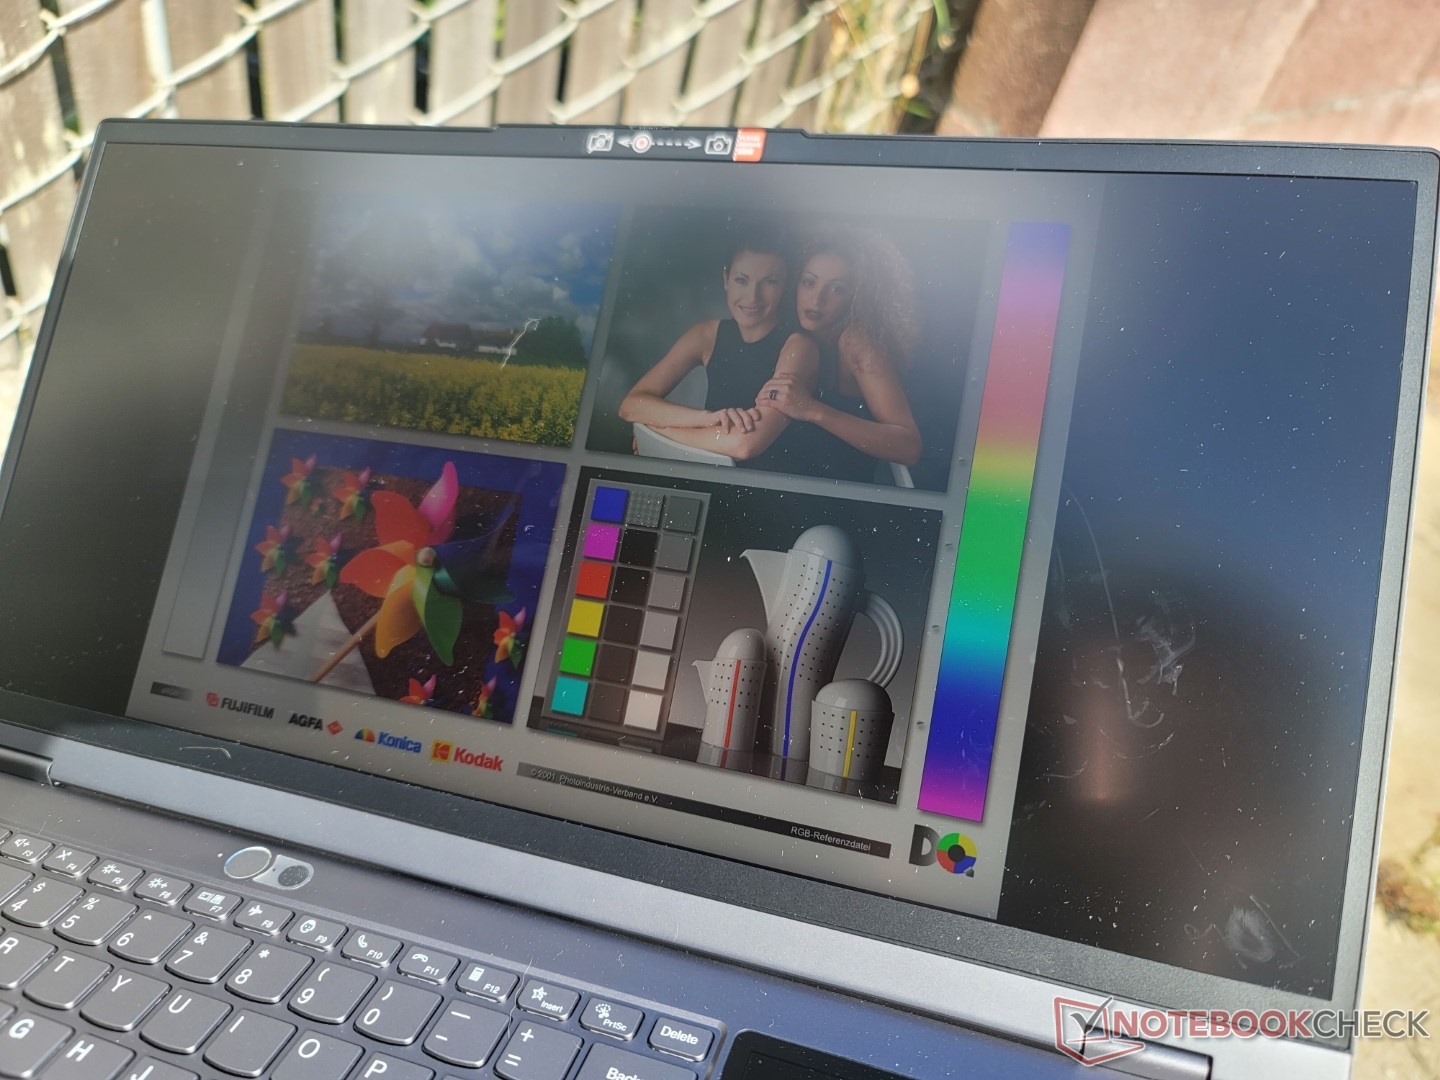
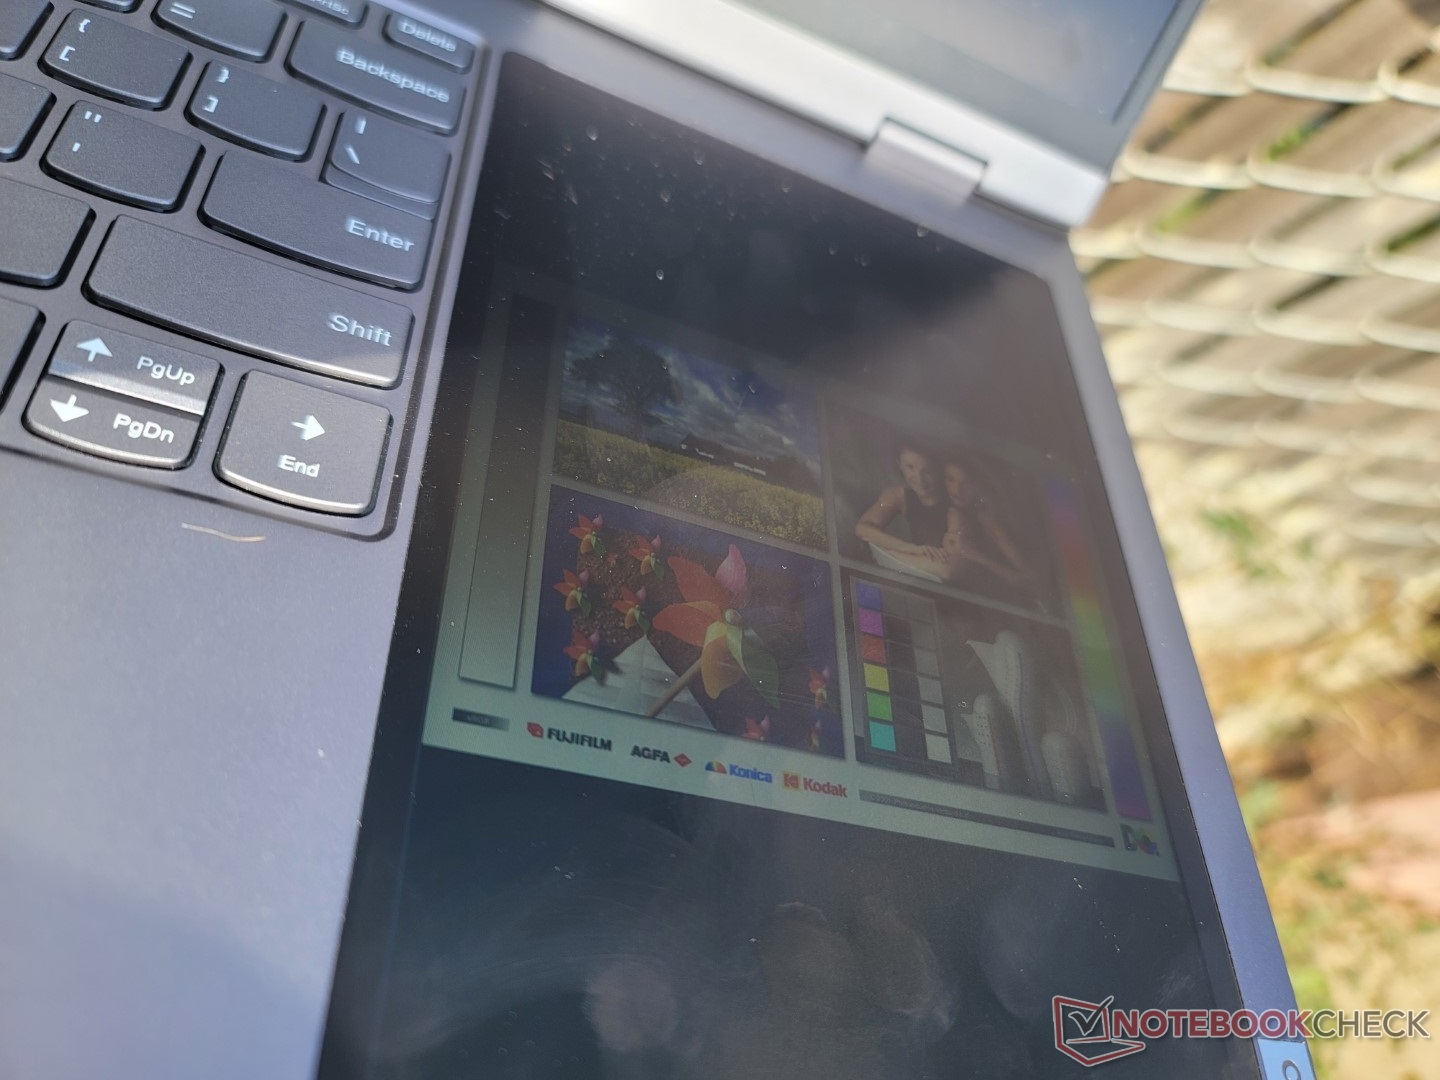
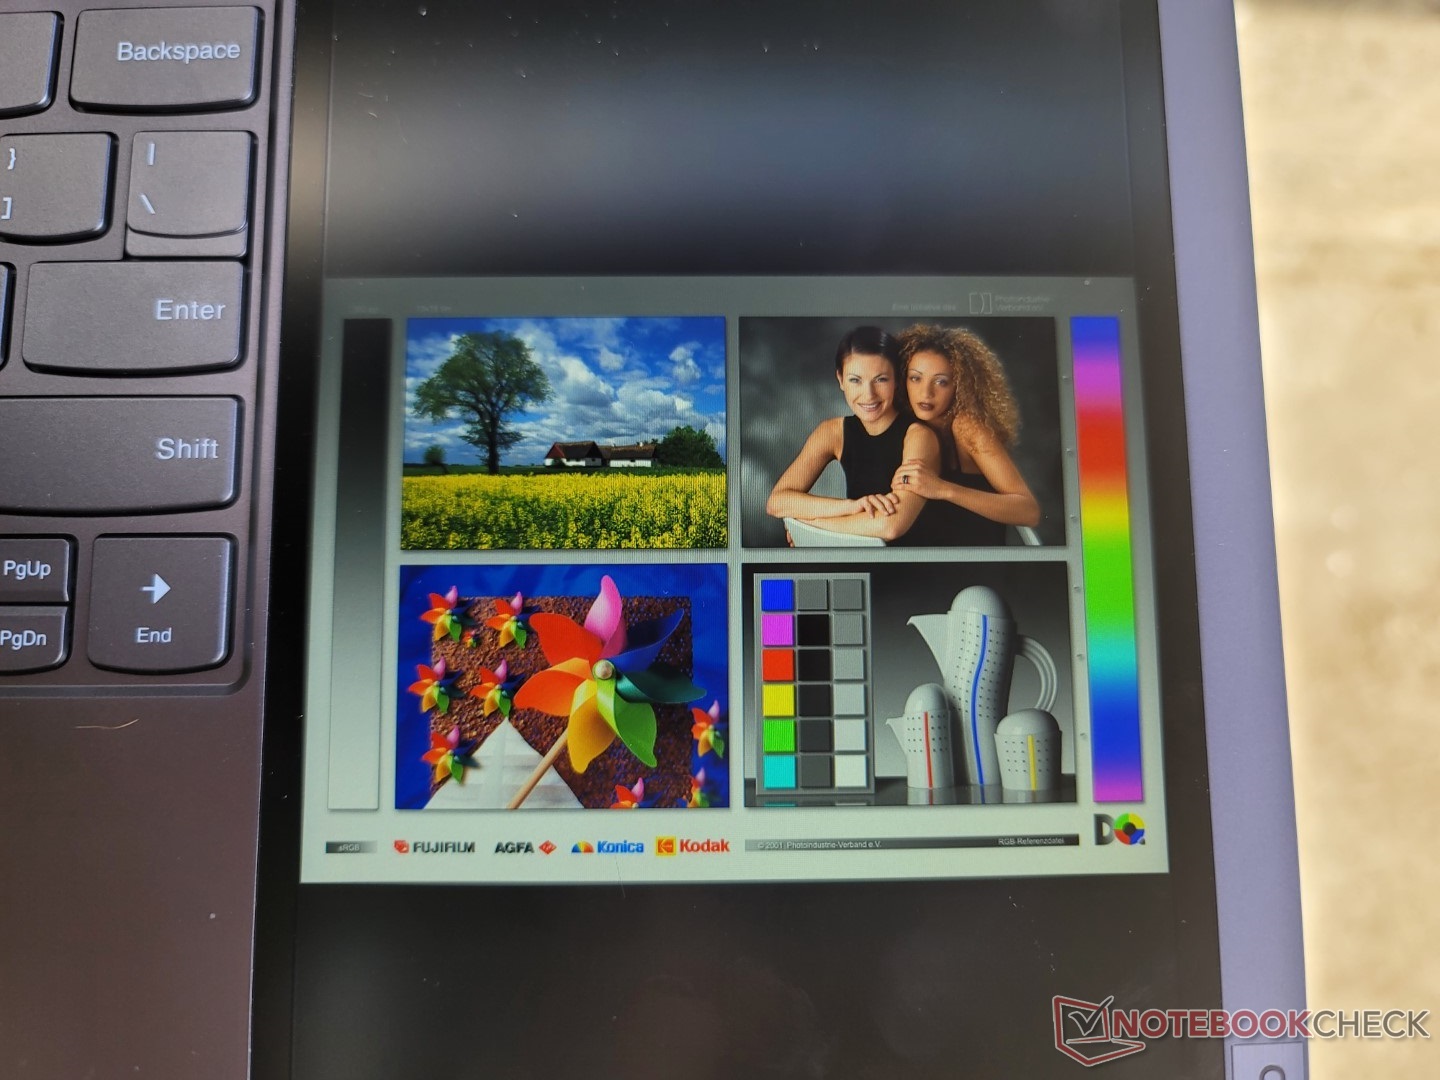
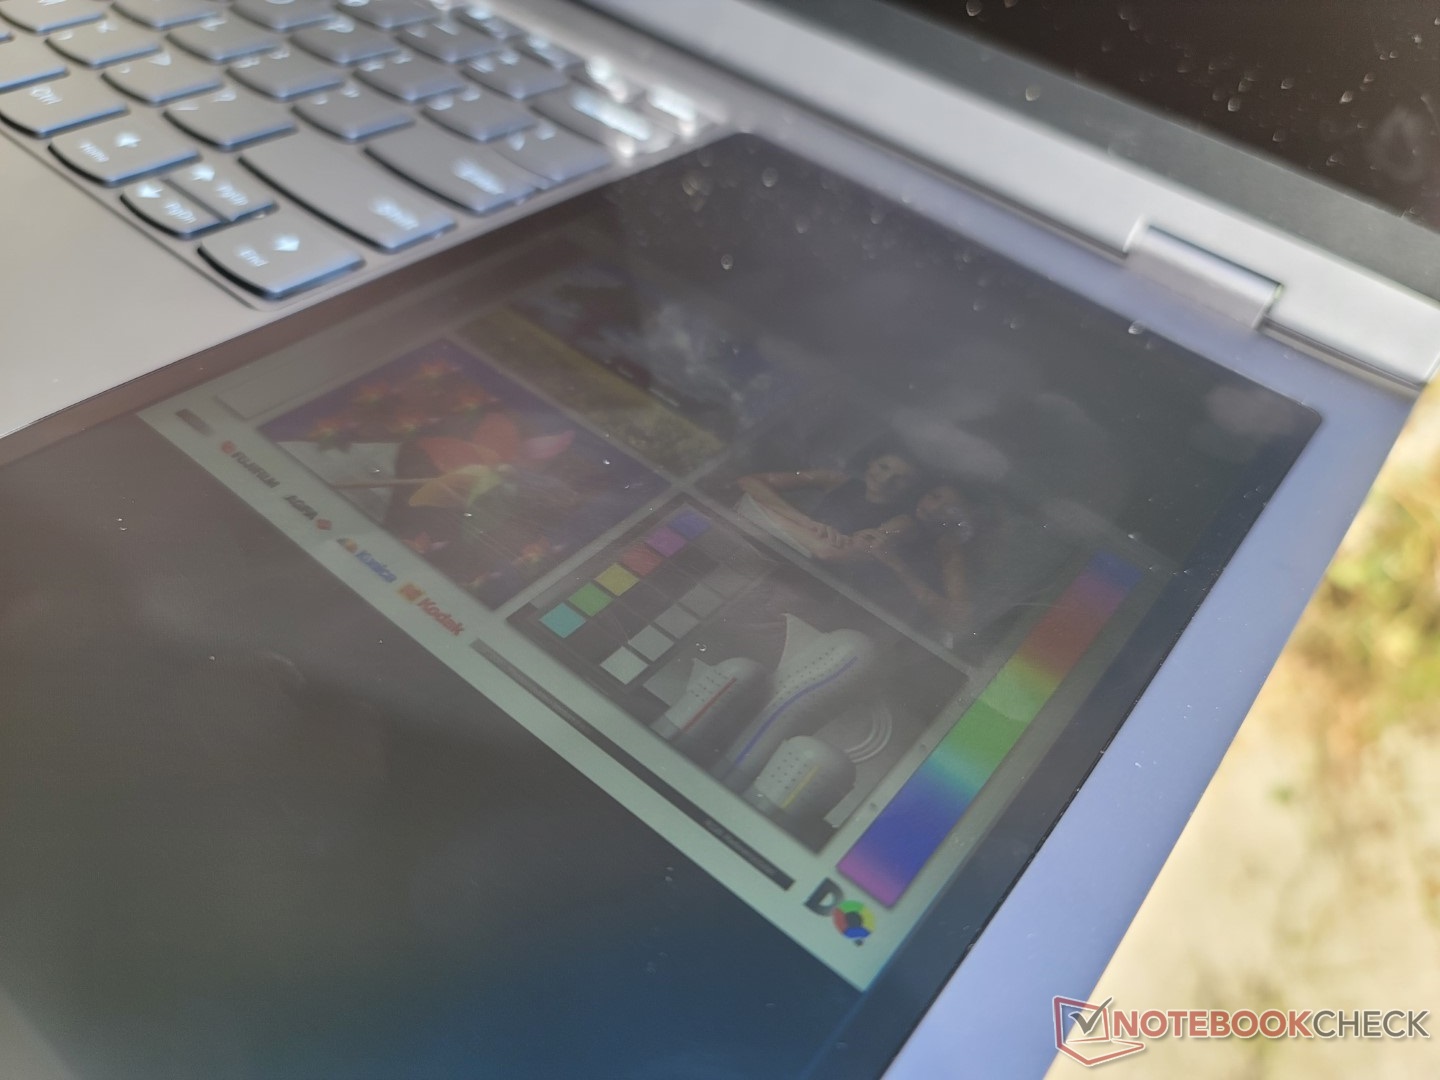
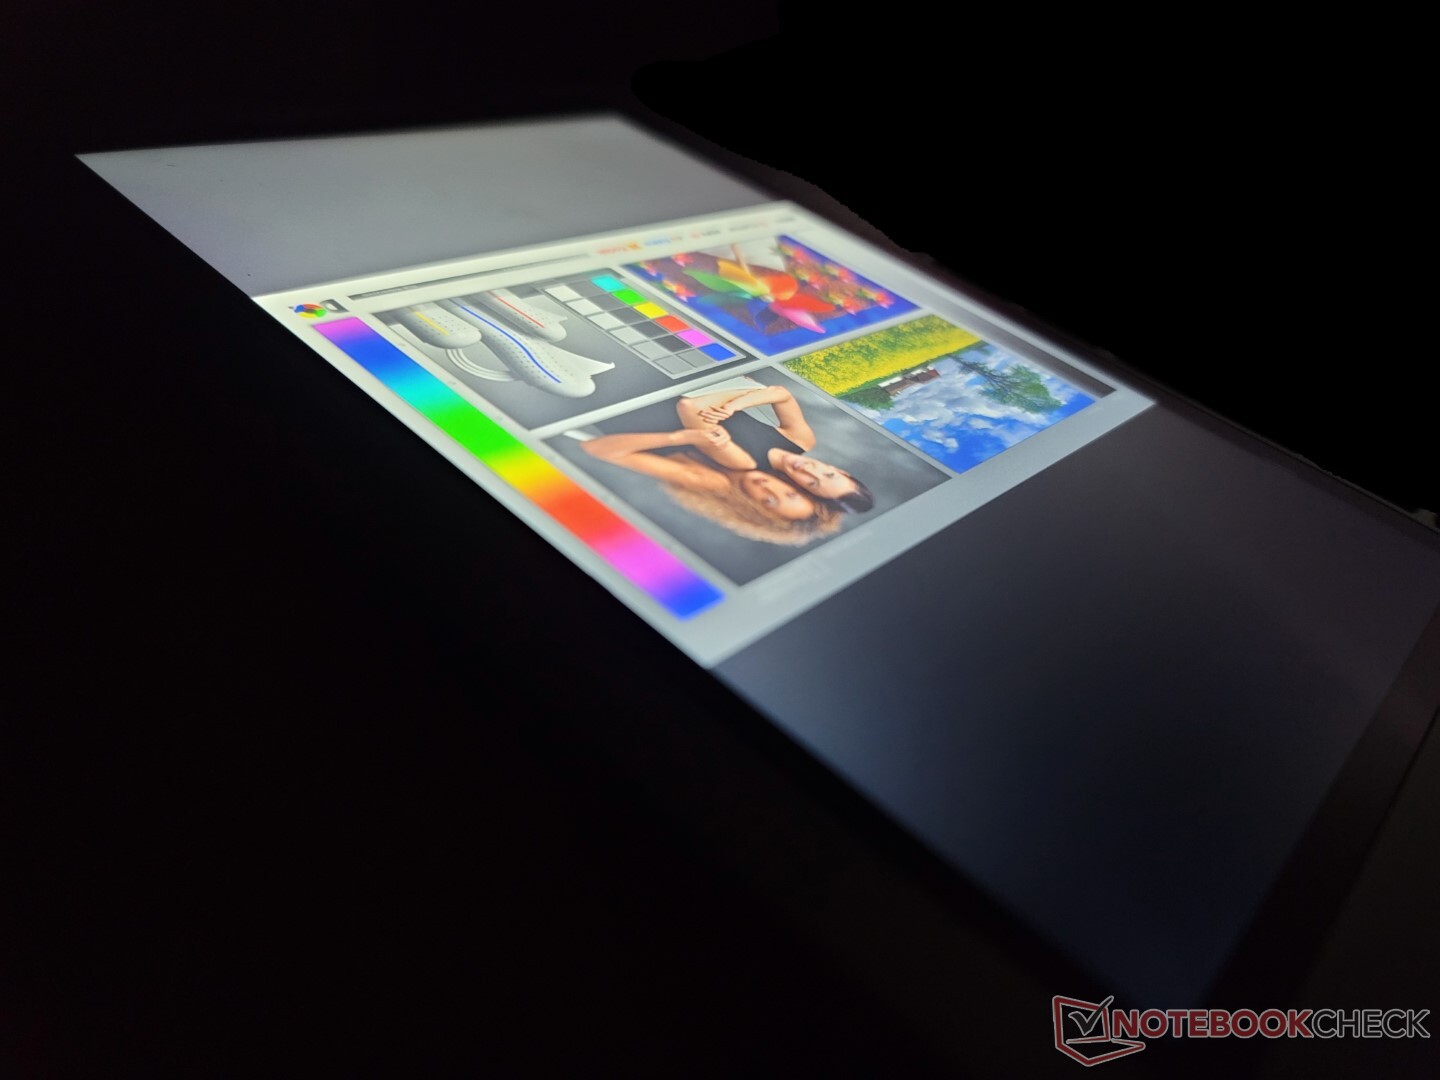
Widoczność na zewnątrz jest podobna jak w przypadku LG Gram 17 czy XPS 17, gdyż wszystkie one mają podobne maksymalne poziomy jasności. W Lenovo jednak odblaski są bardziej zauważalne wzdłuż boków ekranu ze względu na jego większe niż zwykle proporcje. Nadal warto pracować w cieniu, kiedy tylko jest to możliwe, by zmaksymalizować widoczność.
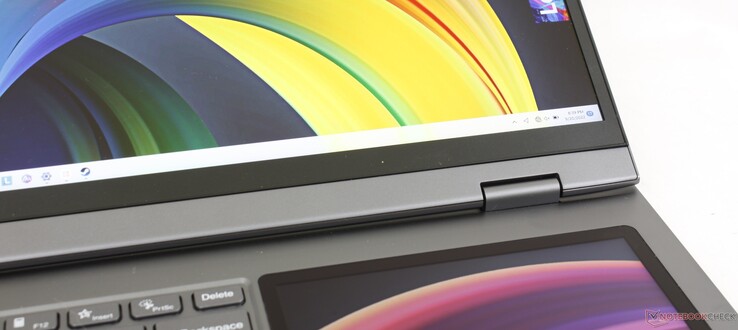
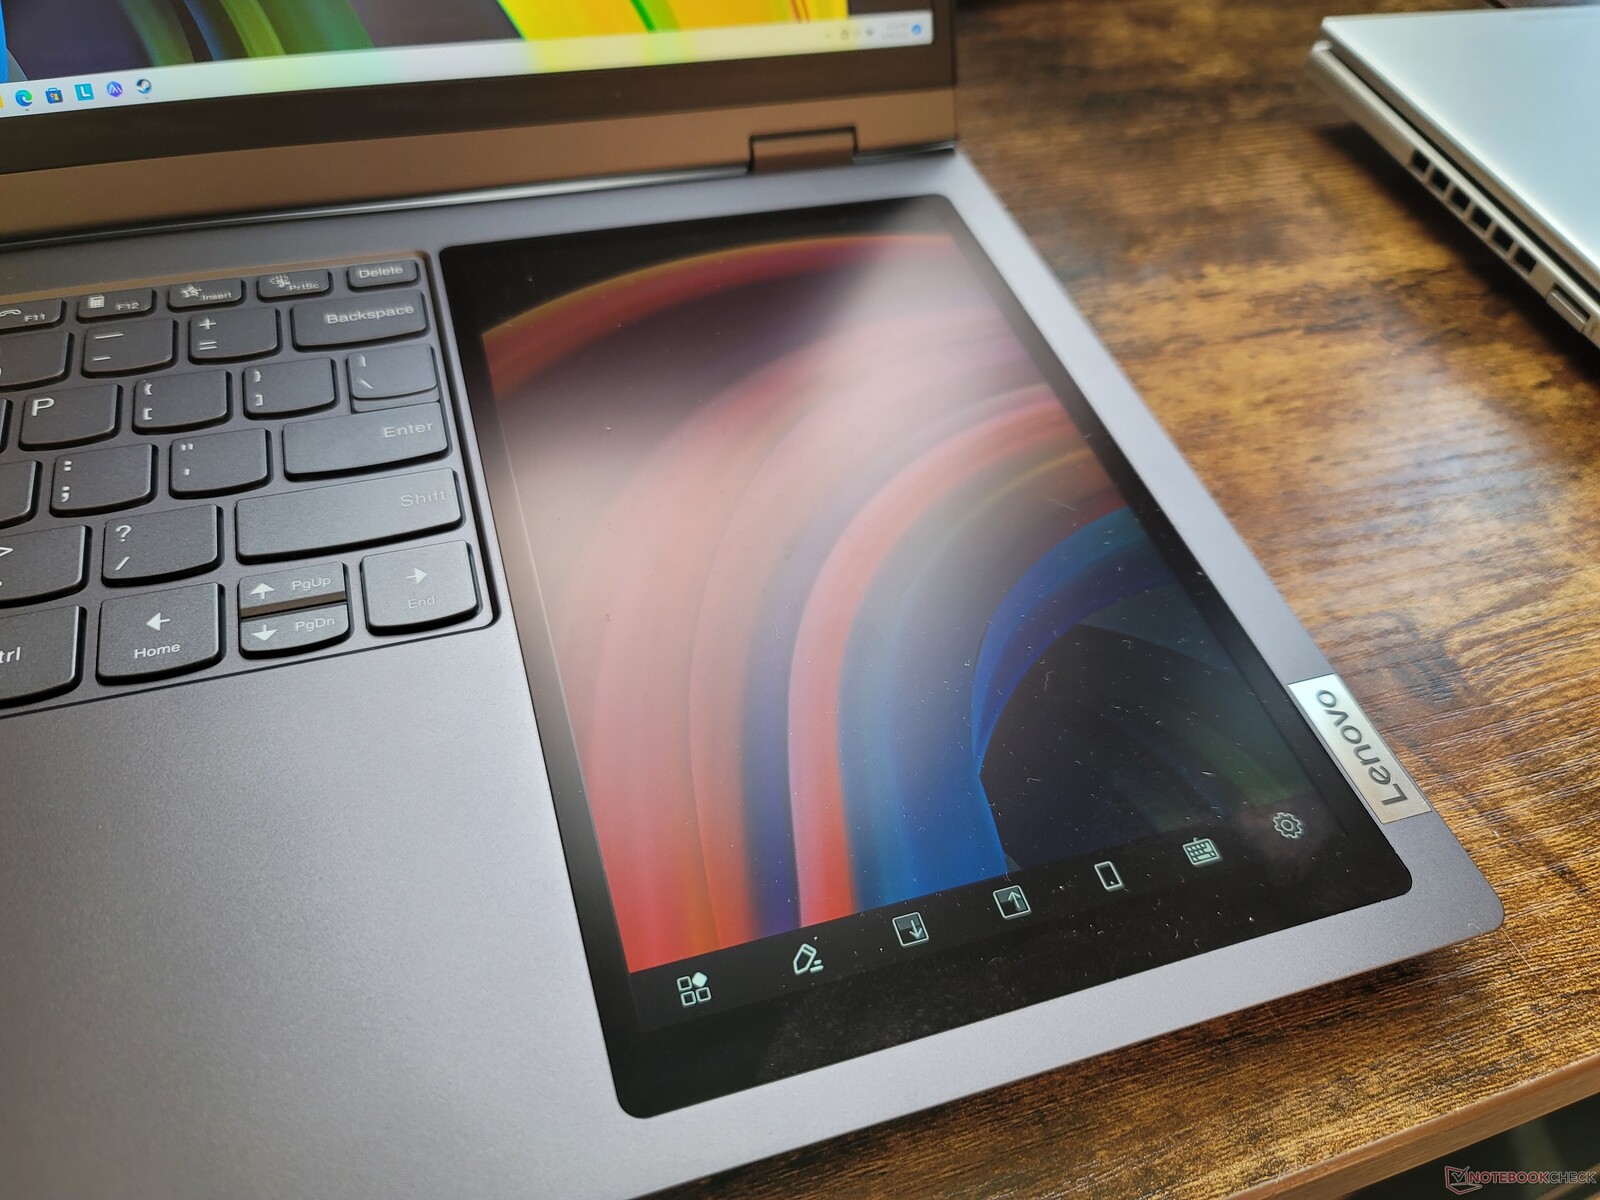
Secondary Display - tyle dodatkowego miejsca na ekranie
Z użytkowego punktu widzenia drugi ekran działa płynnie i doskonale nadaje się do przenoszenia różnych okien z powrotem na główny wyświetlacz. Zwłaszcza proporcje 10:16 lepiej sprawdzają się w przypadku szerszej gamy aplikacji i programów w porównaniu z węższymi wyświetlaczami pomocniczymi w konkurencyjnej serii Asus ZenBook Duo.
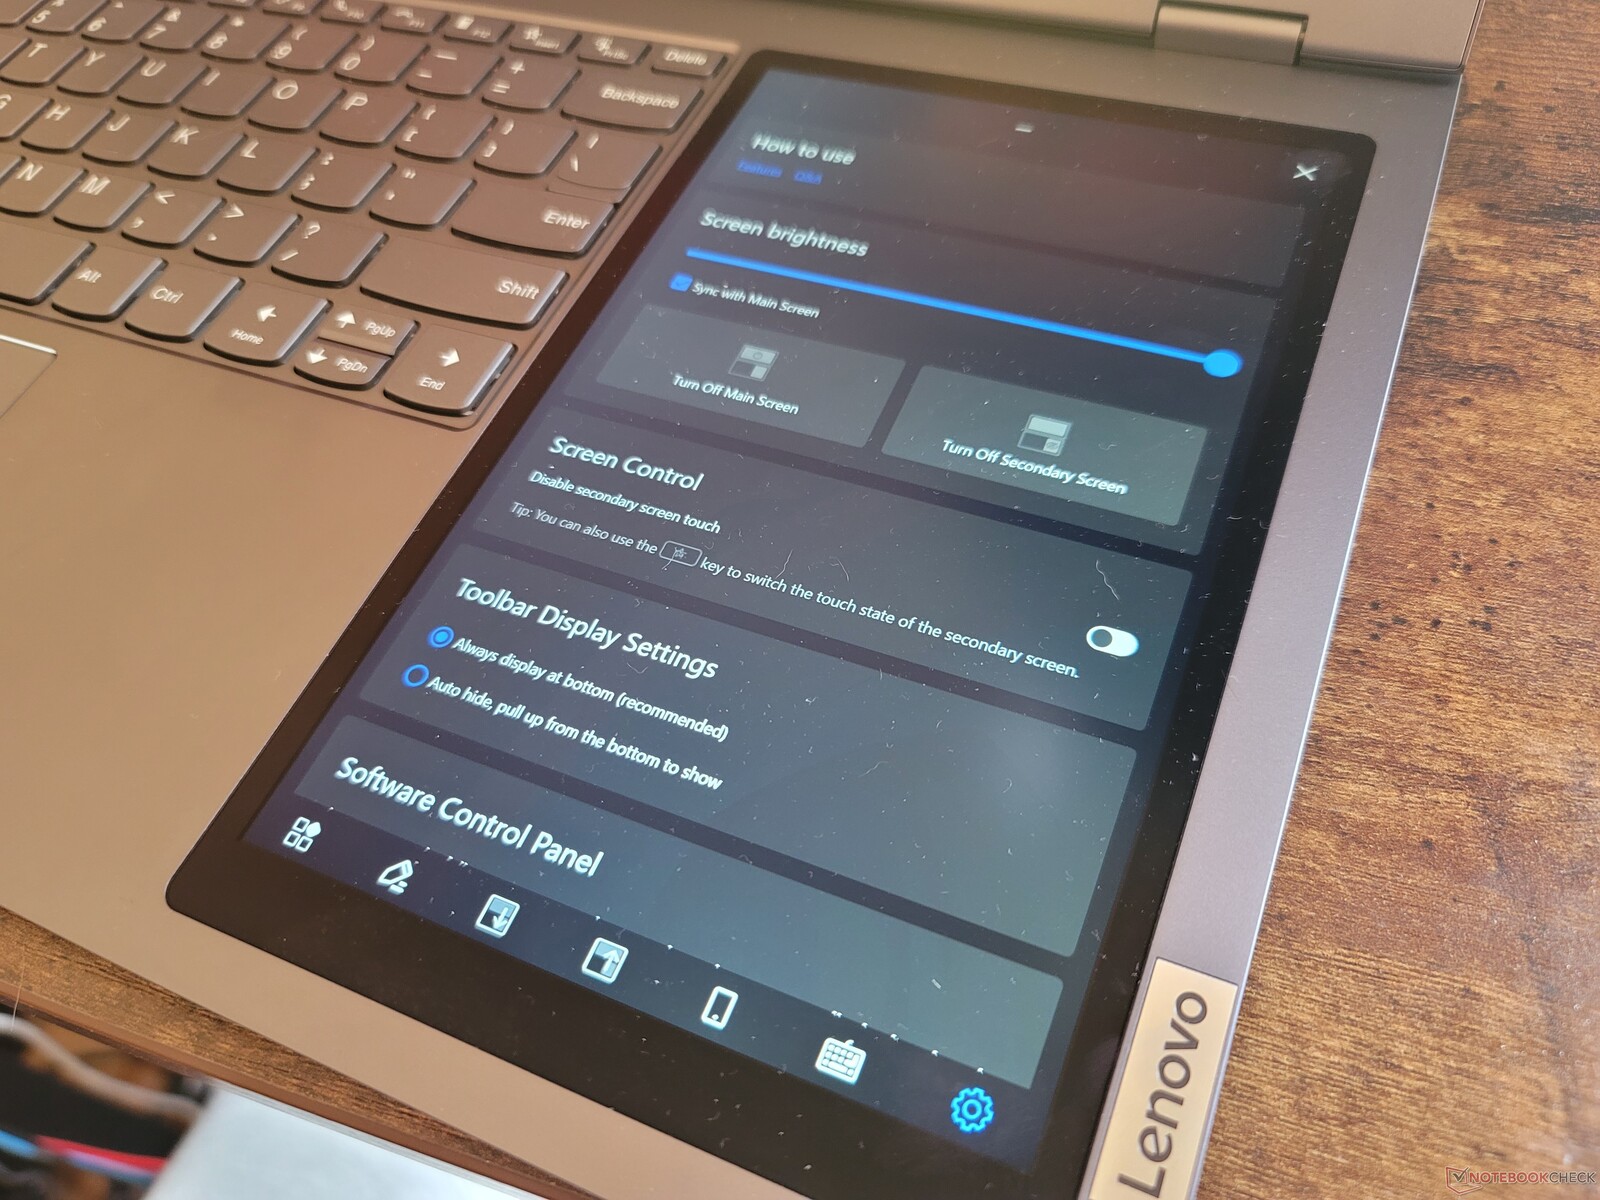
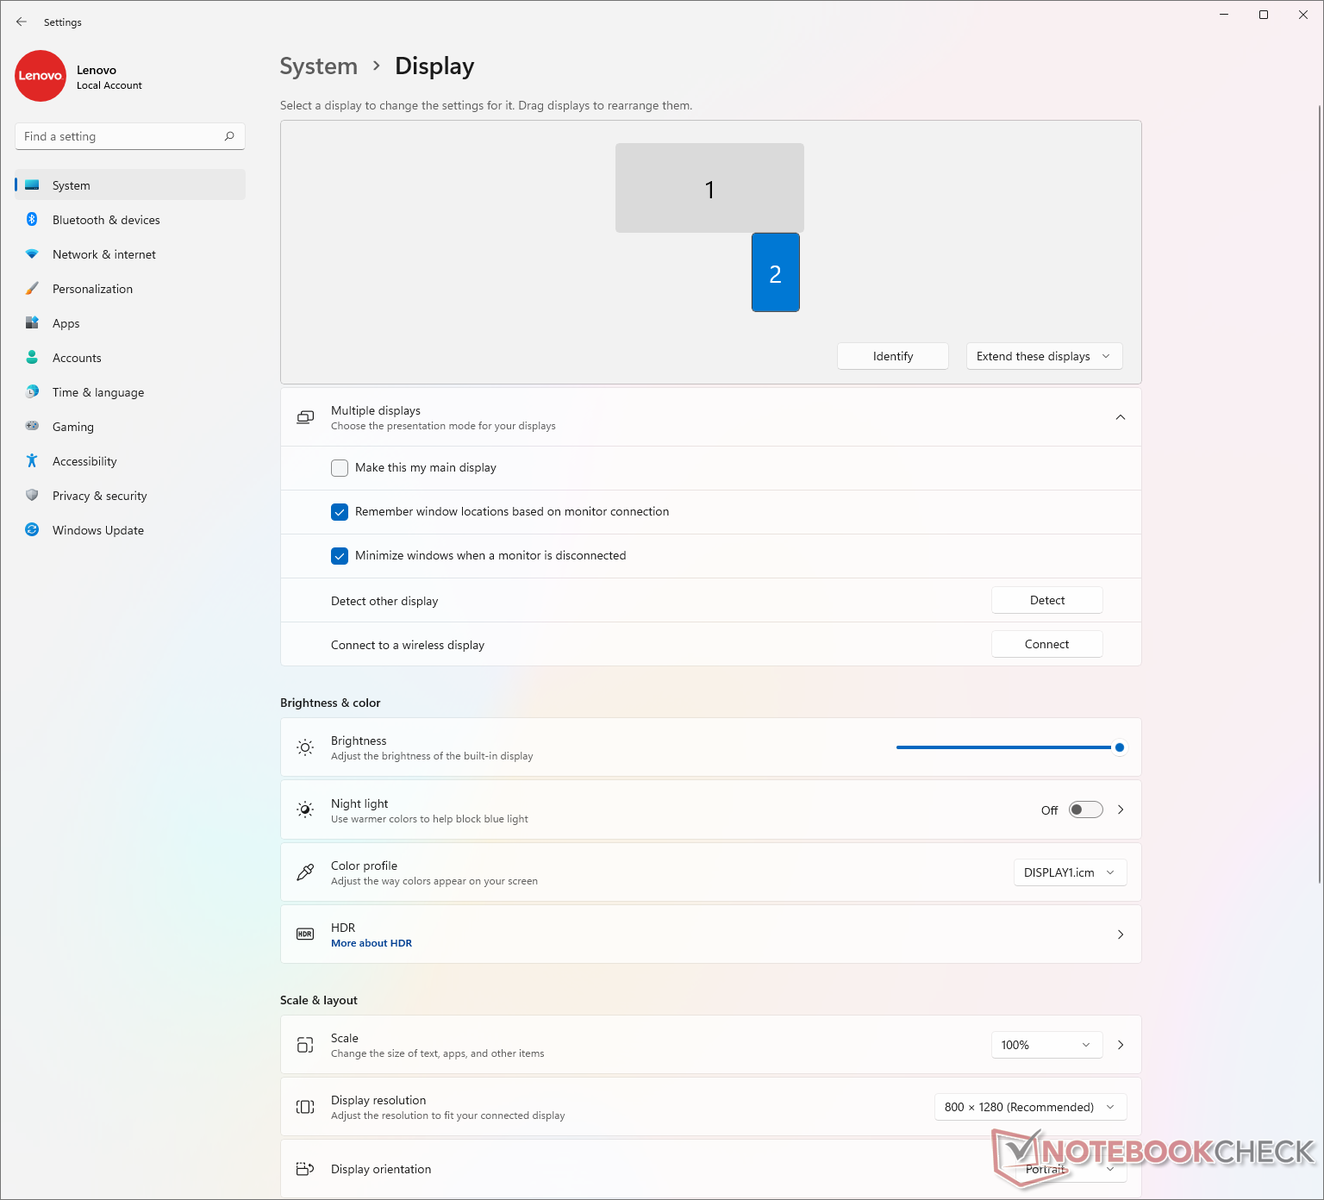
Ekran posiada również unikalne funkcje pomocnicze, których nie znajdziemy w modelach Asusa. Na przykład istnieje możliwość zsynchronizowania jasności z wyświetlaczem głównym lub odzwierciedlenia tylko określonego fragmentu wyświetlacza głównego o rozdzielczości 800 x 1280 pikseli.


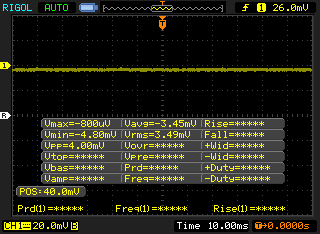
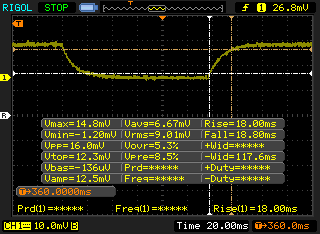
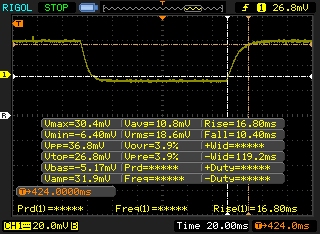
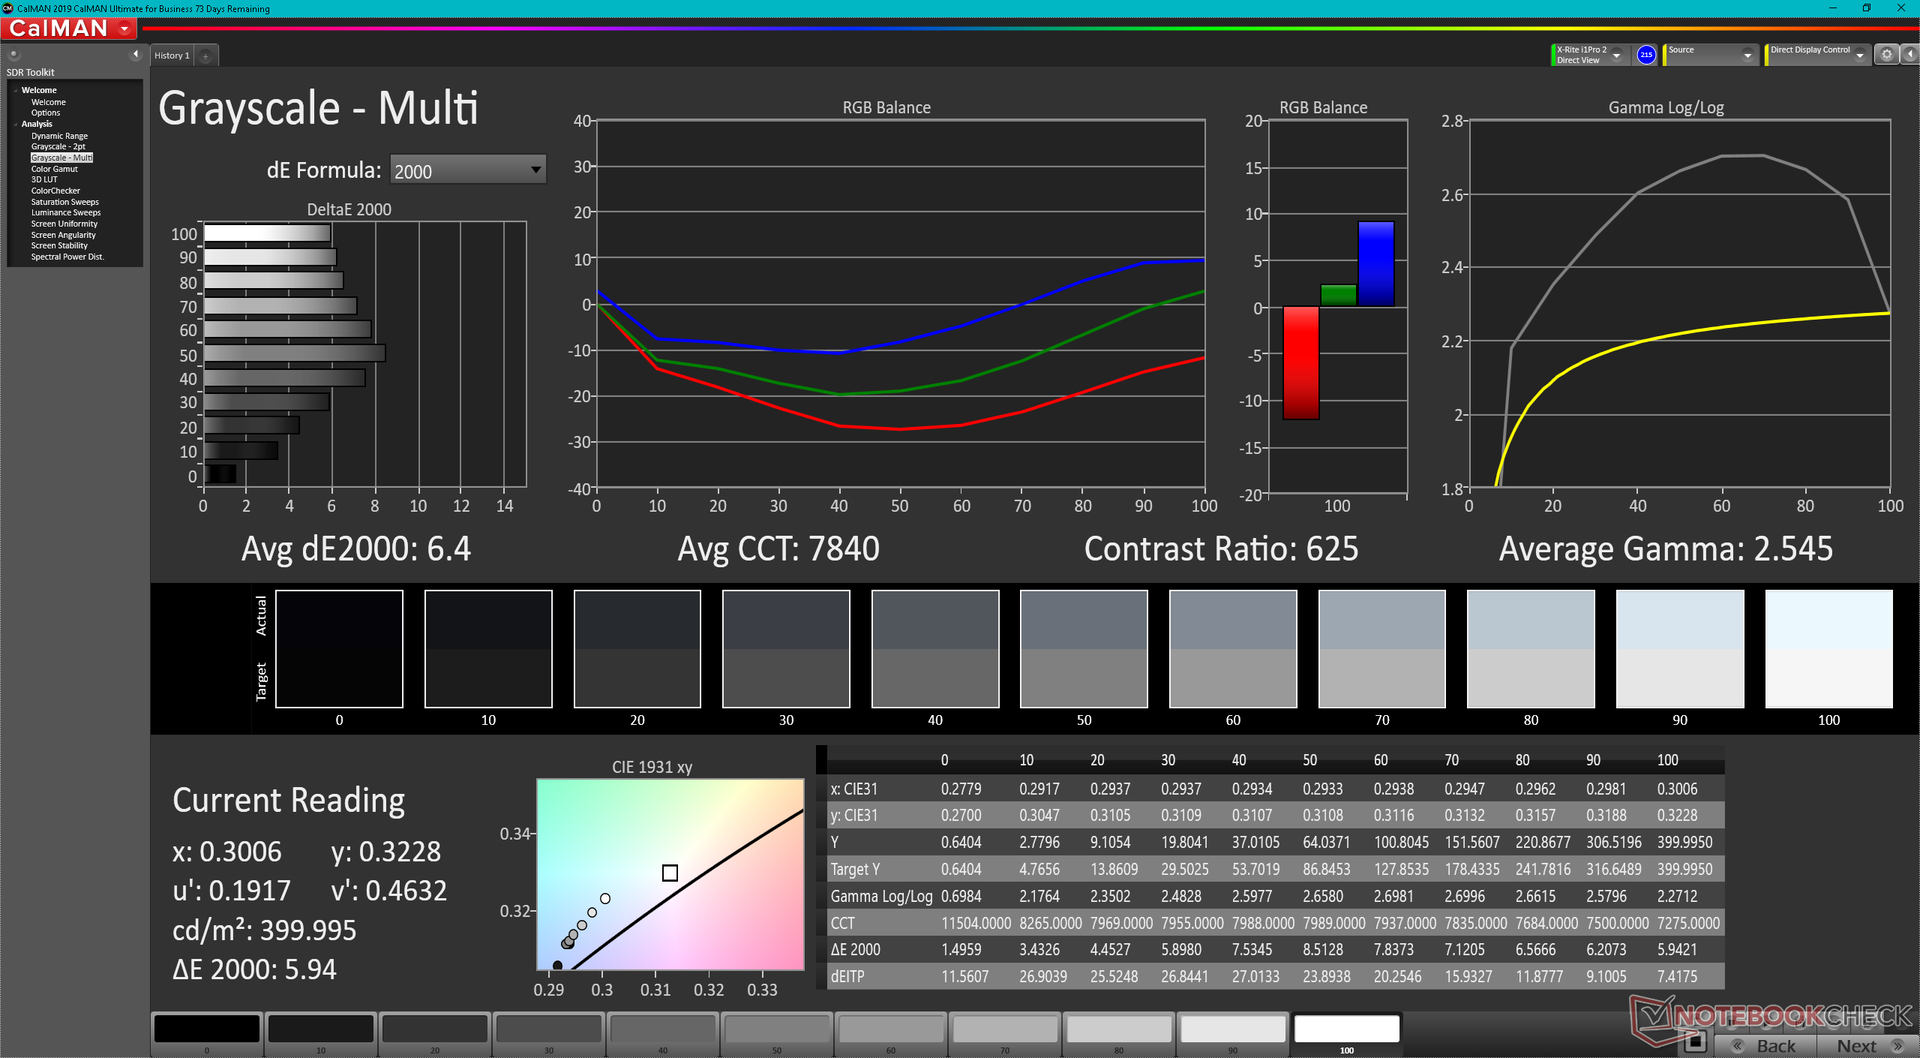
| 8-calowy ekran dotykowy IPS Secondary | Rozdzielczość 800 x 1280 |
|---|---|
| Częstotliwość odświeżania | 60 Hz |
| Maksymalna jasność | 393,6 nitów |
| Czas reakcji w czerni do bieli | 16,8 ms wzrost, 10,4 ms spadek |
| Czas reakcji od szarości do szarości | 18,0 ms wzrost, 18,8 ms spadek |
| Współczynnik kontrastu | 579:1 |
| pokrycie sRGB | 80,6 procent |
| Gamma | 2,55 |
| CCT | 7840 |
| Średnia DeltaE2000 w skali szarości | 6,4 |
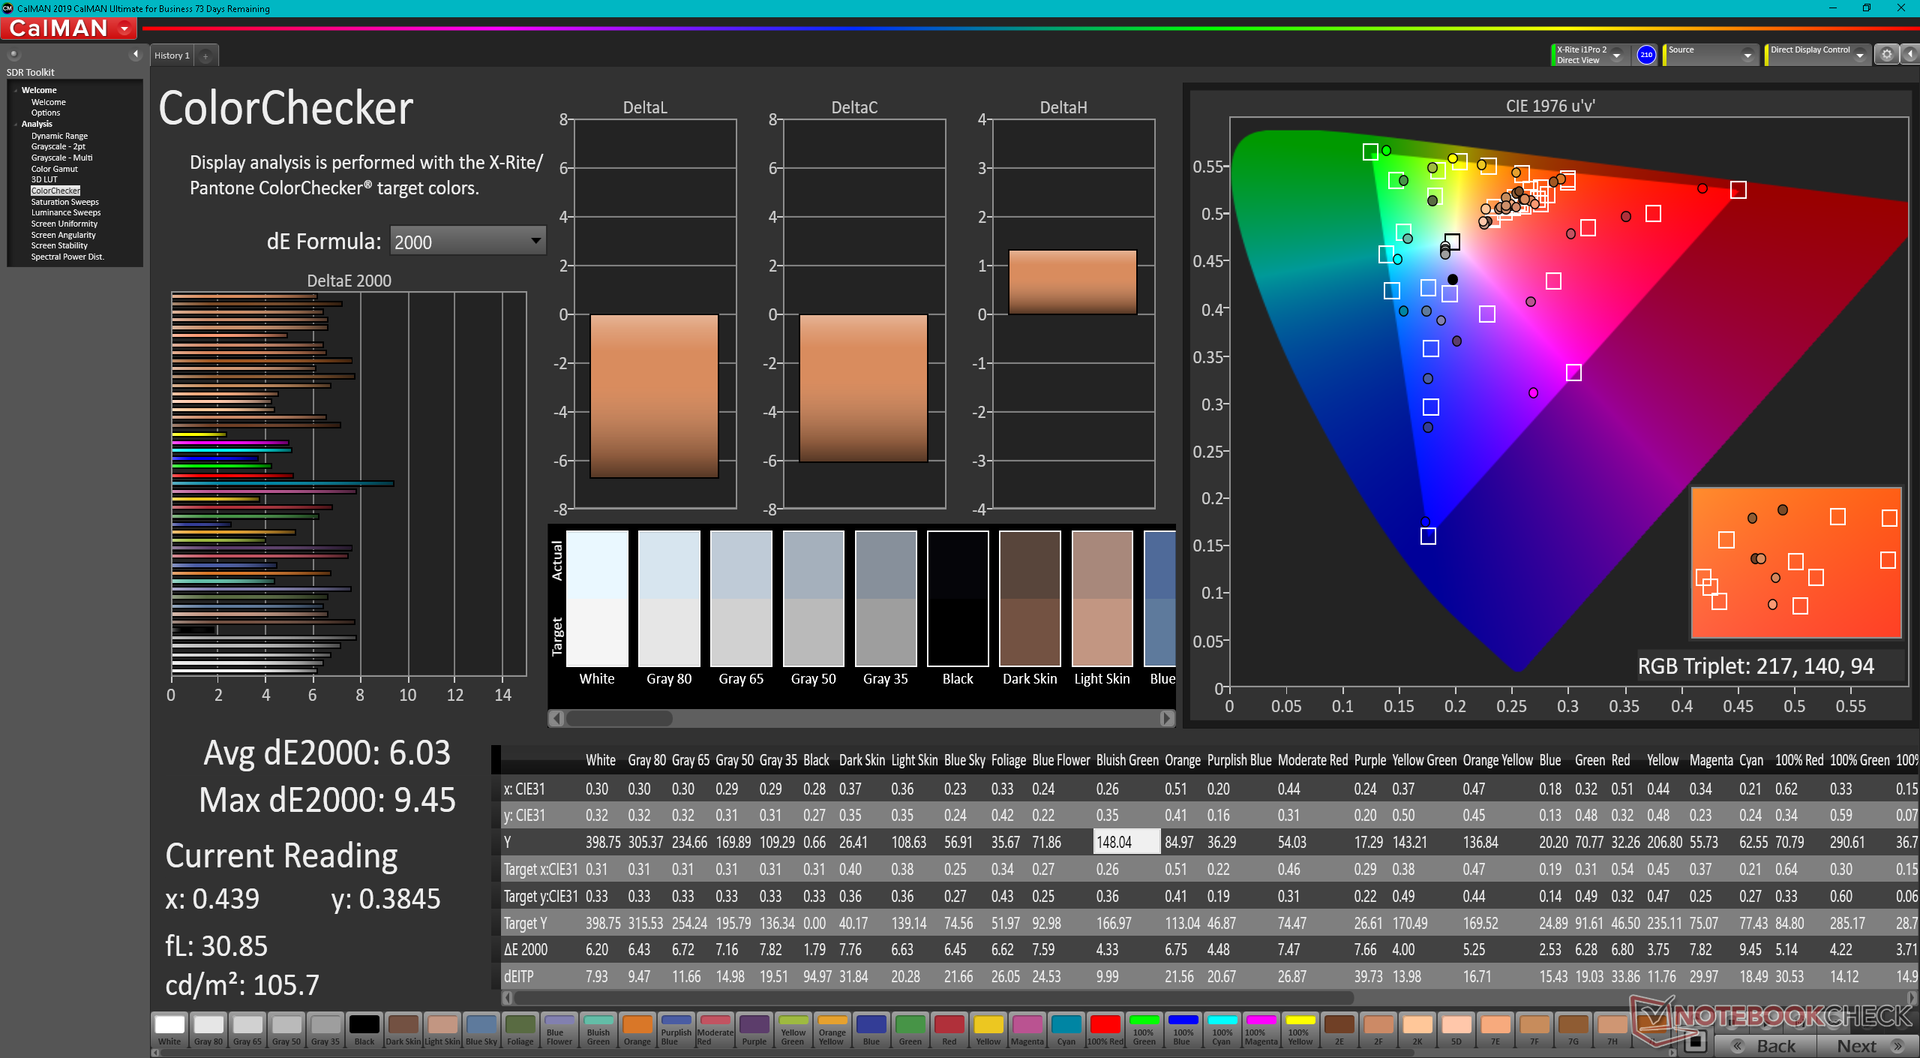
| Colorchecker dE 2000 | 6.03 |
| Colorchecker dE 2000 Max | 9.45 |
Niestety, drugi wyświetlacz ma podobne wady jak niektóre wczesne modele ZenBook Duo. Zwłaszcza jego kolory, częstotliwość odświeżania, współczynnik kontrastu, ziarnistość i odblaski pod kątem widzenia są zauważalnie gorsze od wyświetlacza głównego. Jakość obrazu jest bardziej zbliżona do taniego 8-calowego tabletu Android niż do iPada czy Samsunga Galaxy Tab S. Jeśli reprodukcja jakości obrazu 1:1 między głównym a dodatkowym wyświetlaczem jest ważna dla Twoich zadań, to najlepszym rozwiązaniem będą dwa zewnętrzne wyświetlacze
Doświadczyliśmy też kilku błędów na drugim ekranie. Po pierwsze, jego jasność czasami nie była synchronizowana z głównym wyświetlaczem. Po drugie, główny wyświetlacz był często wyłączany po przebudzeniu z trybu uśpienia, pozostawiając tylko drugi wyświetlacz włączony, nawet jeśli oba wyświetlacze były aktywne przed wejściem w tryb uśpienia. Po trzecie, ekran będzie reagował na dotyk, nawet jeśli jest on wyłączony przez system Windows, co może prowadzić do wielu przypadkowych wejść na główny wyświetlacz. Użytkownicy muszą pamiętać, aby ręcznie nacisnąć klawisz "S Star" (lub klawisz Insert) na klawiaturze, aby przełączyć czułość na dotyk. I wreszcie, wiele wejść nie jest rejestrowanych na drugim ekranie, co może być frustrujące podczas użytkowania. Wiele z tych funkcji jest obiecujących, ale z pewnością przydałoby się im więcej czasu na rozwój.
Wydajność - Intel 12th Gen Alder Lake-H
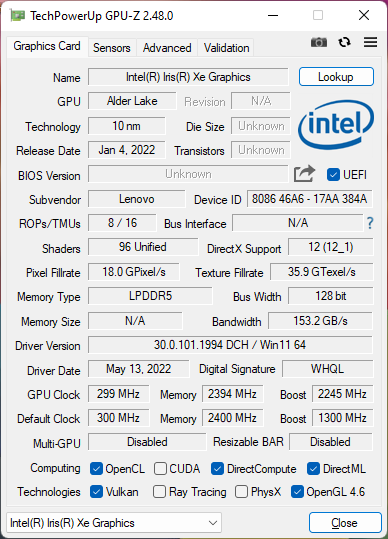
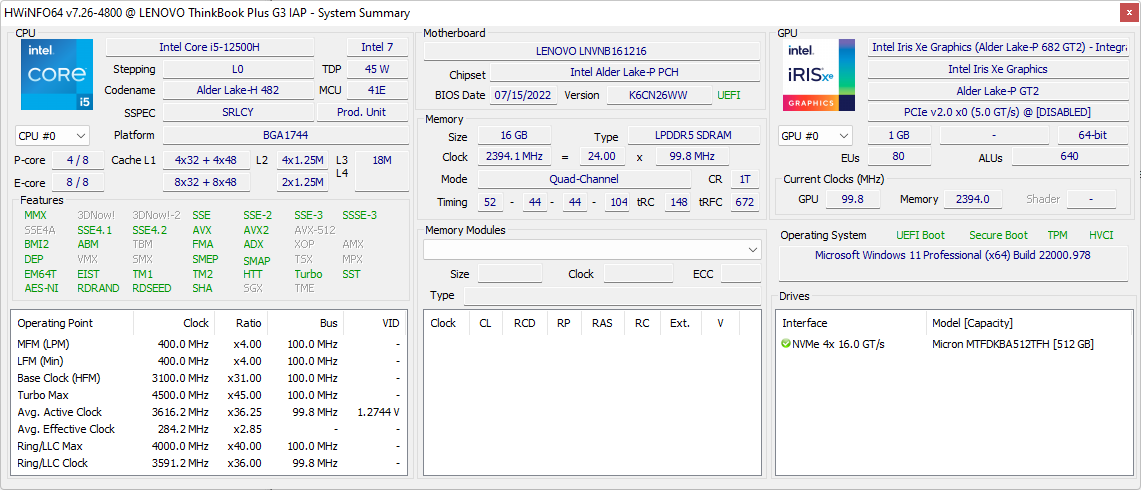
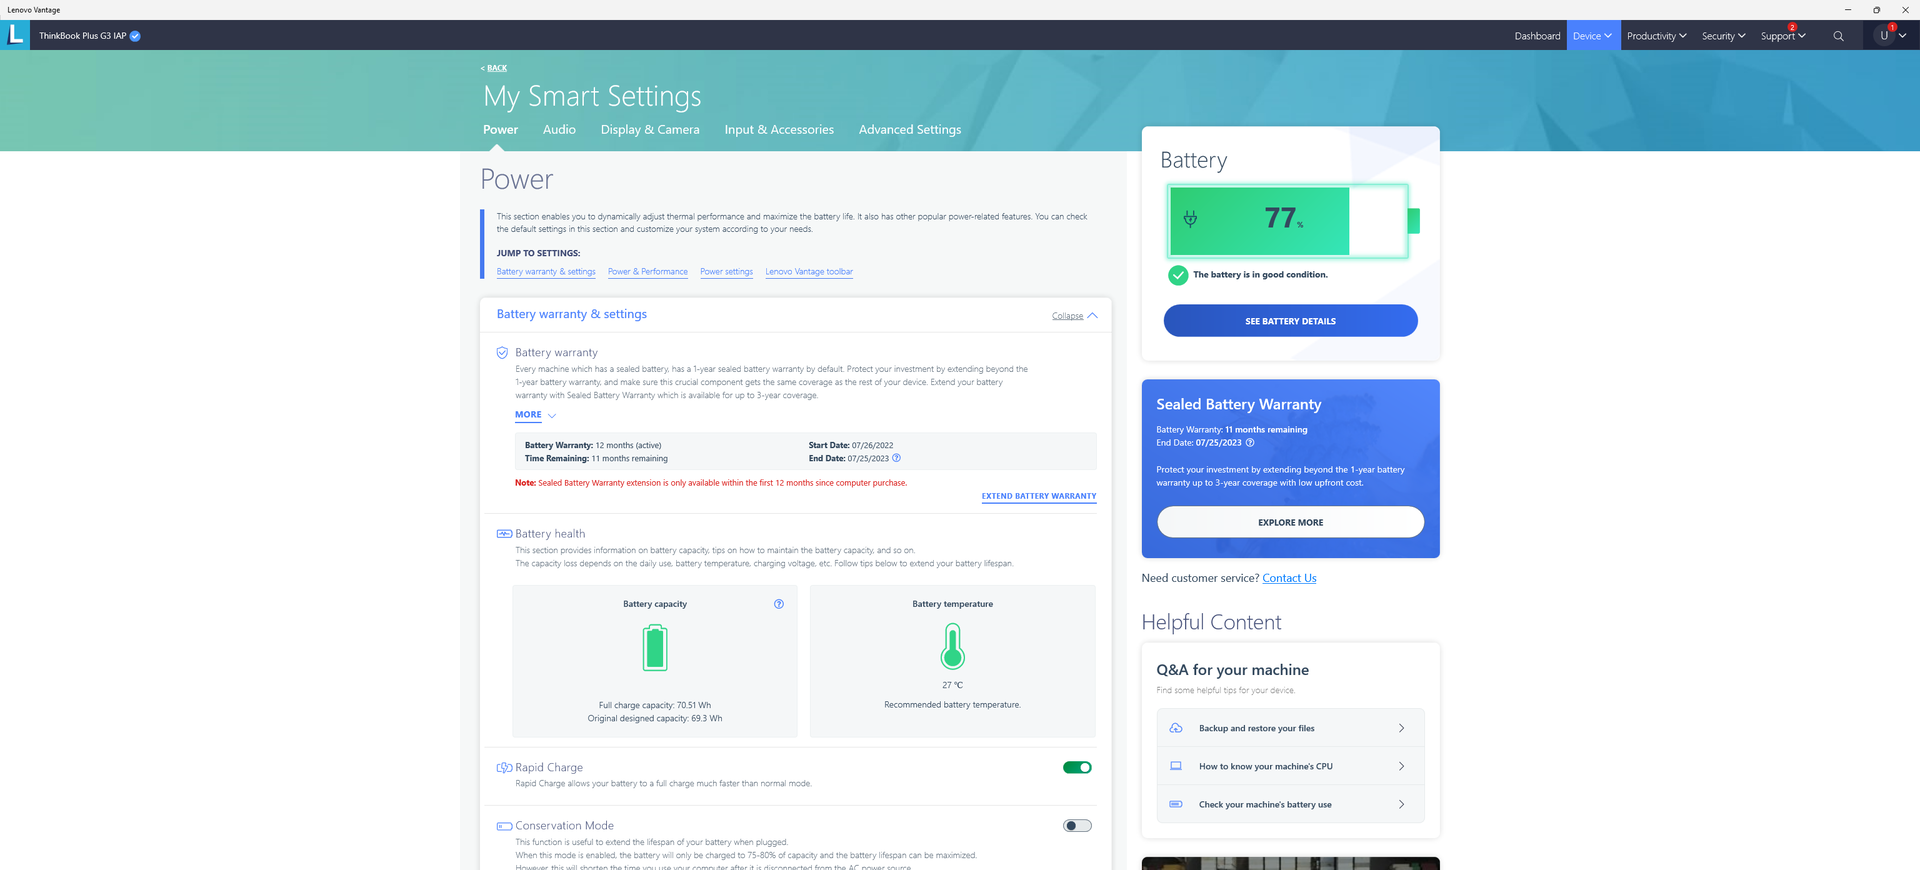
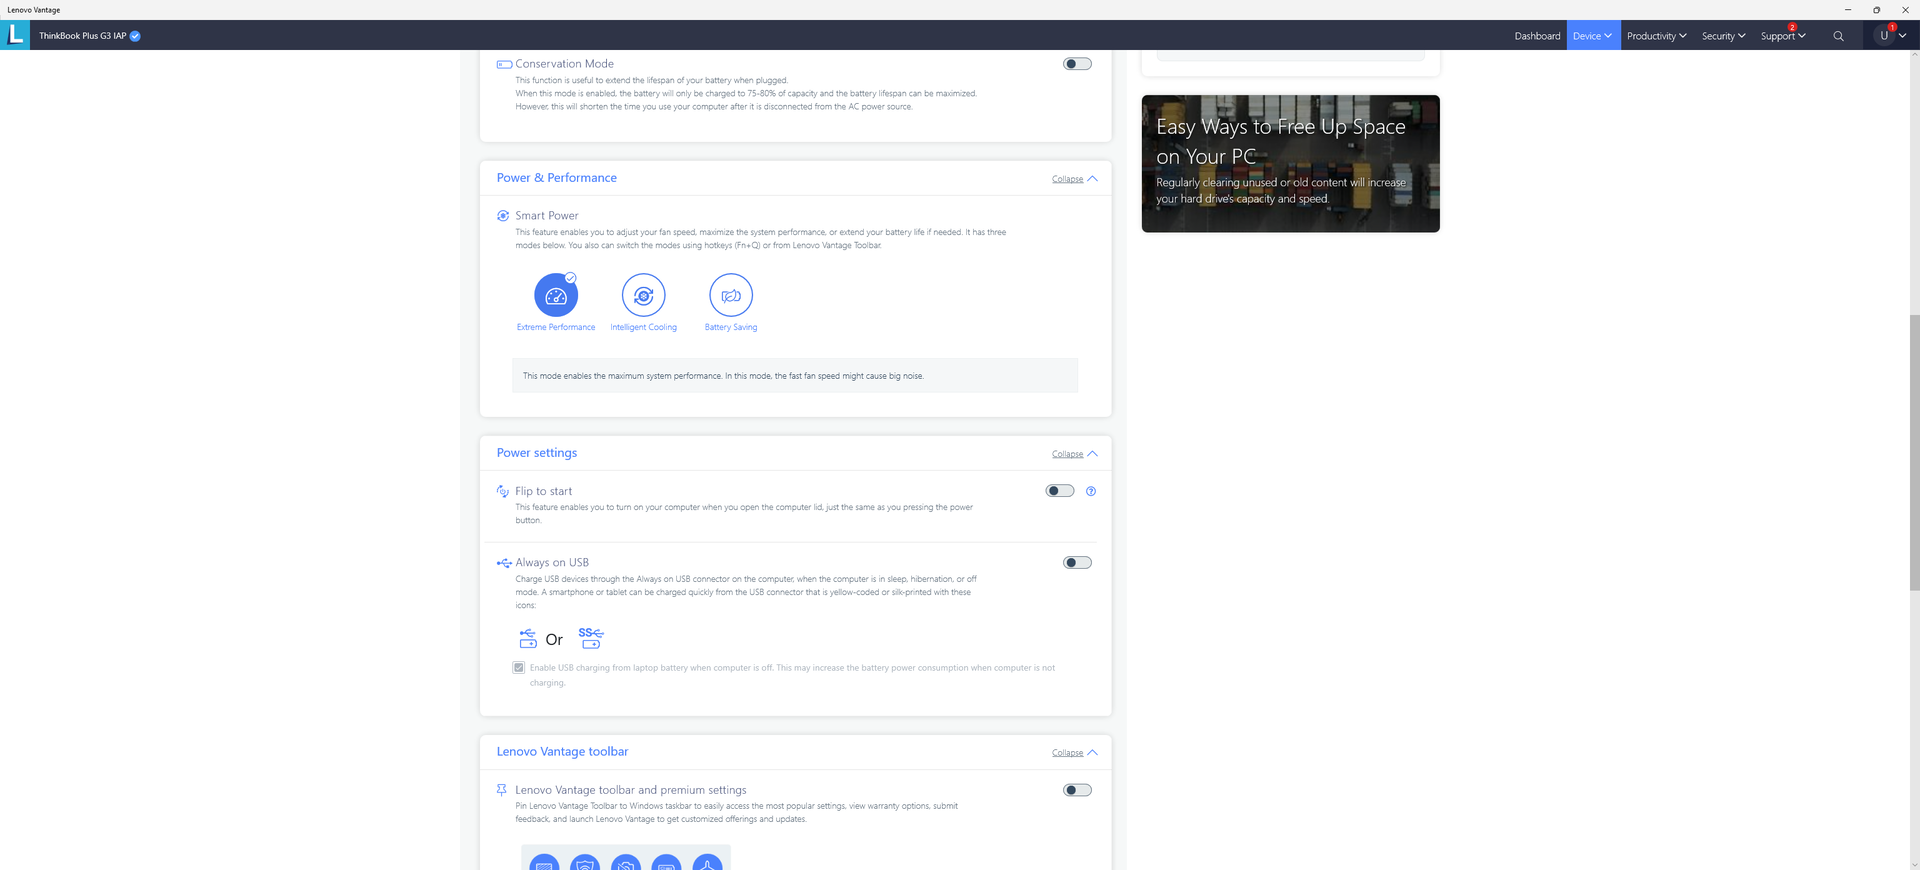
Warunki badania
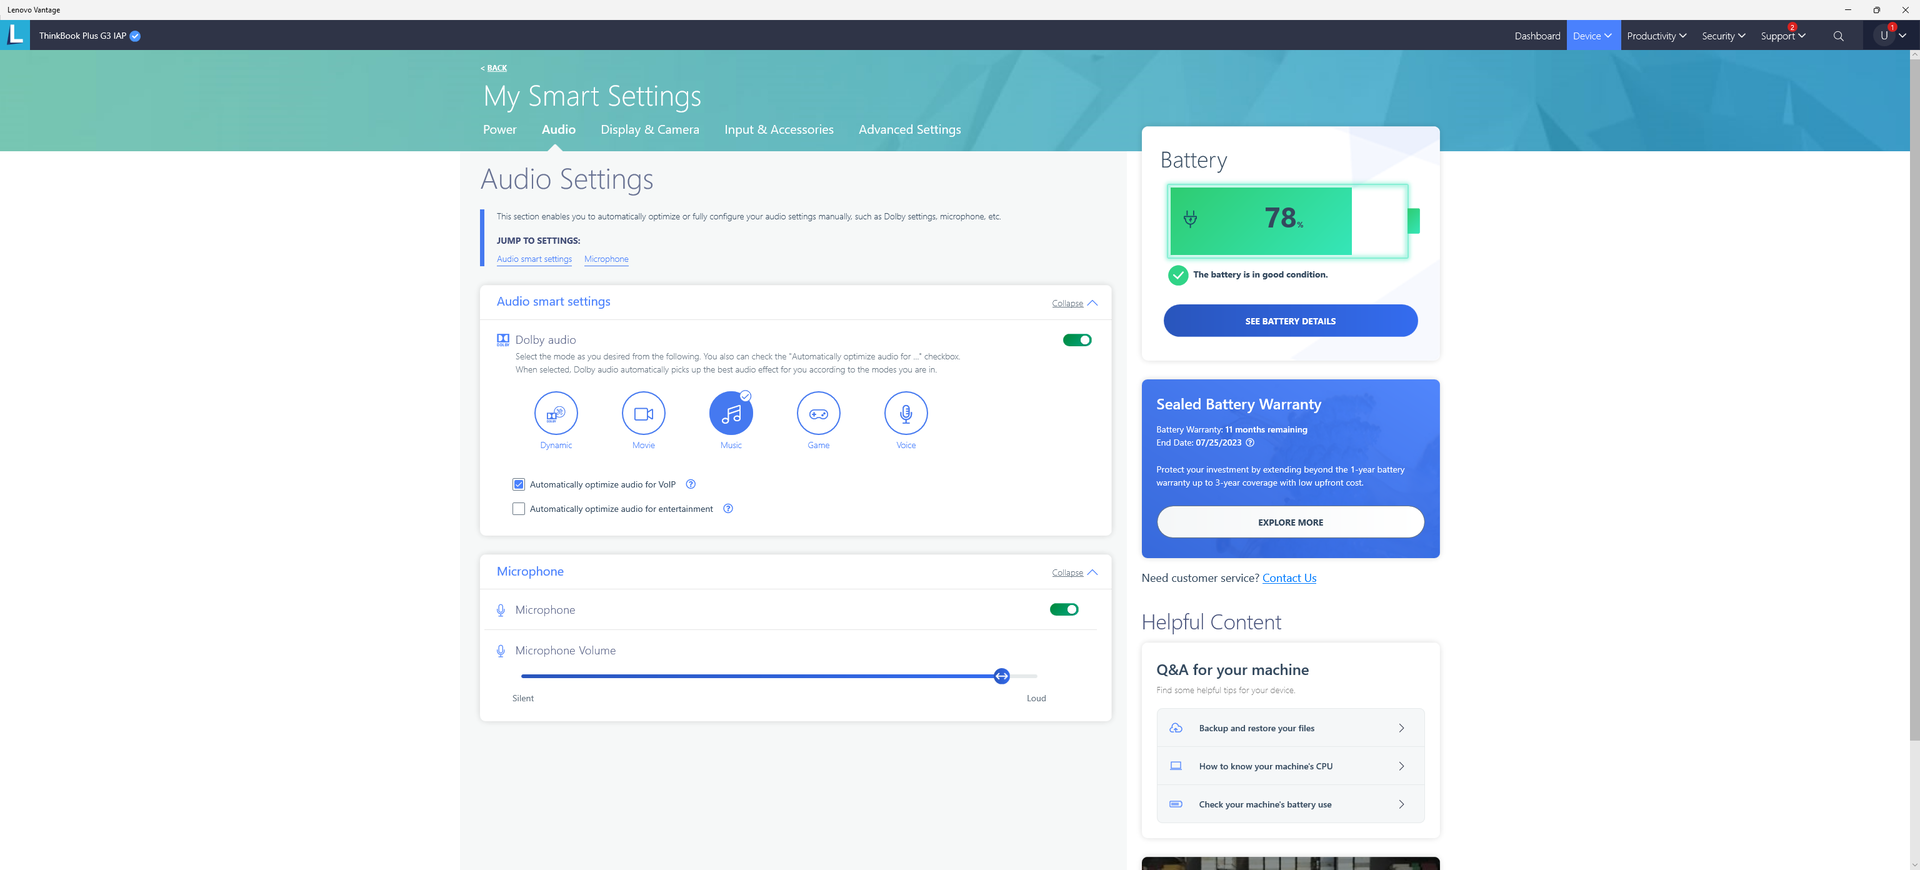
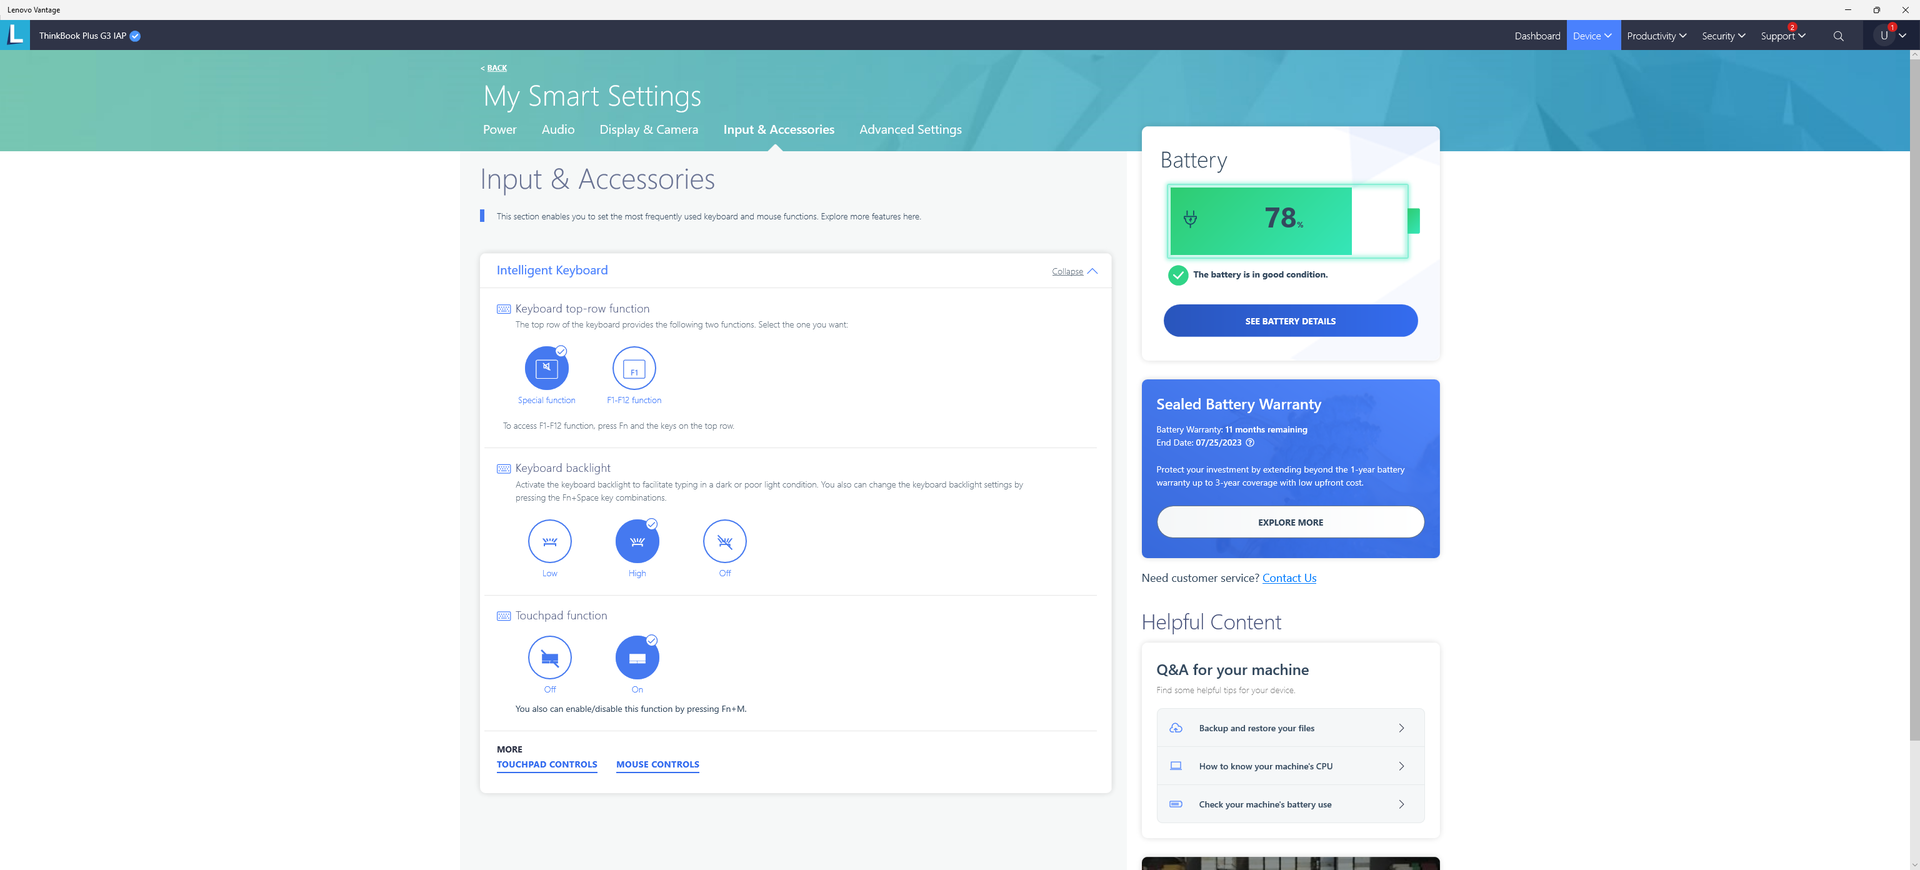
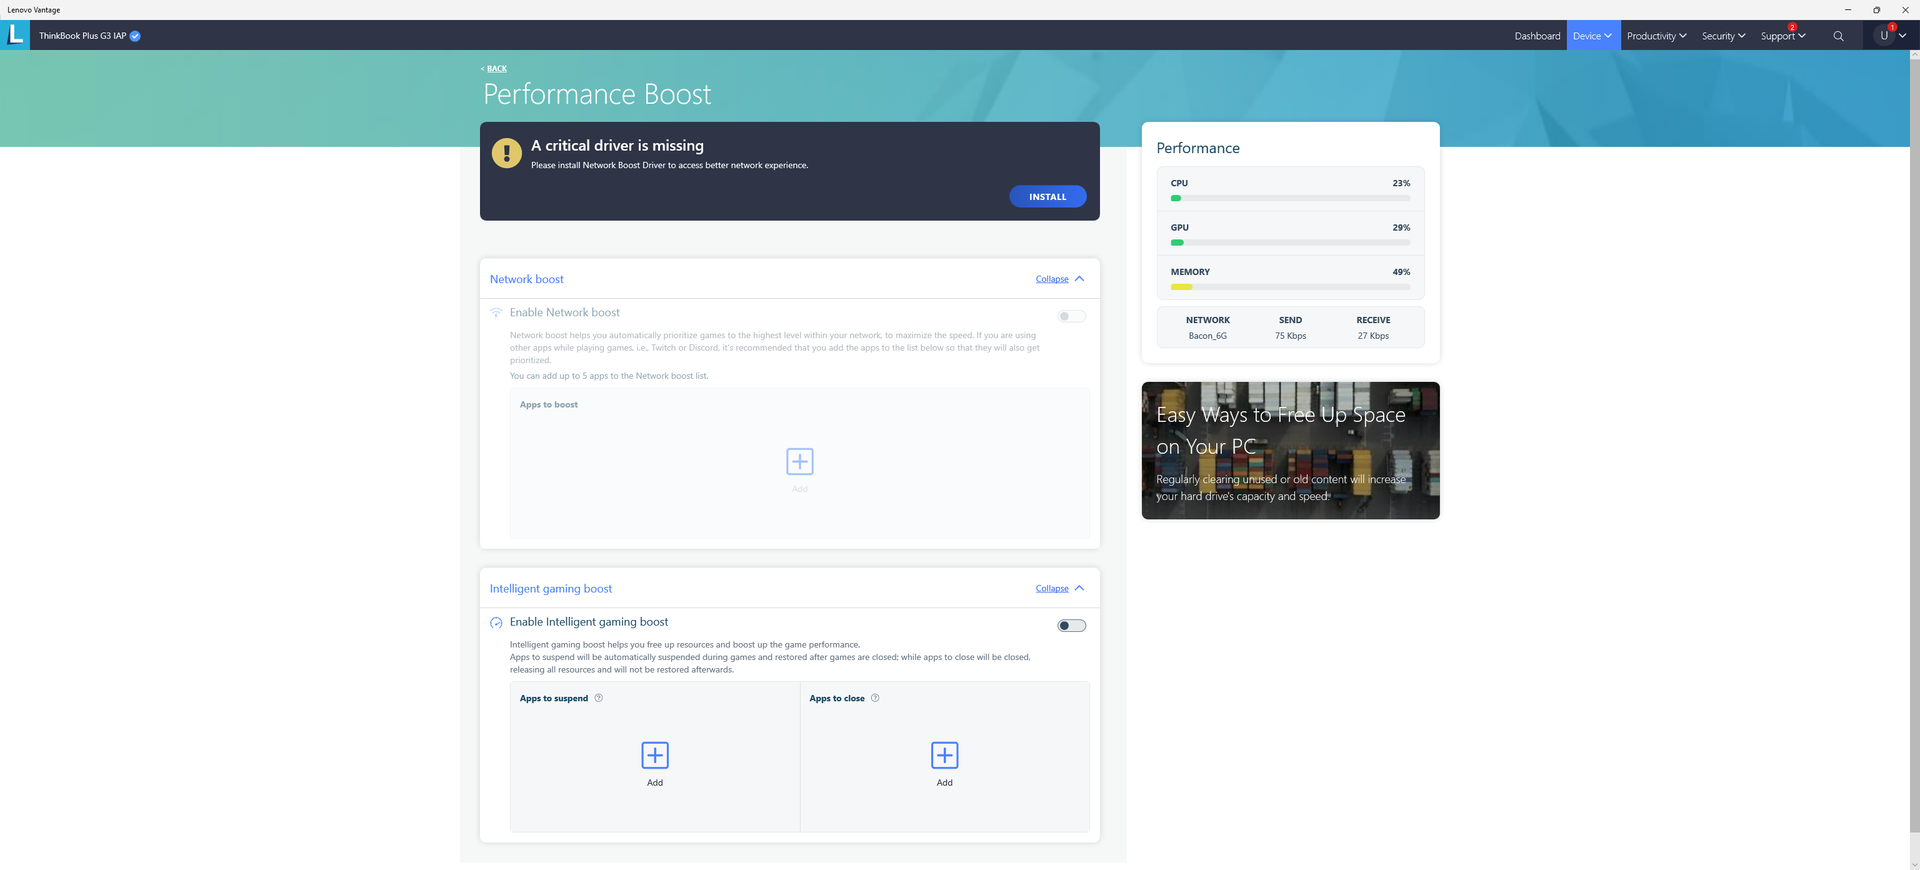
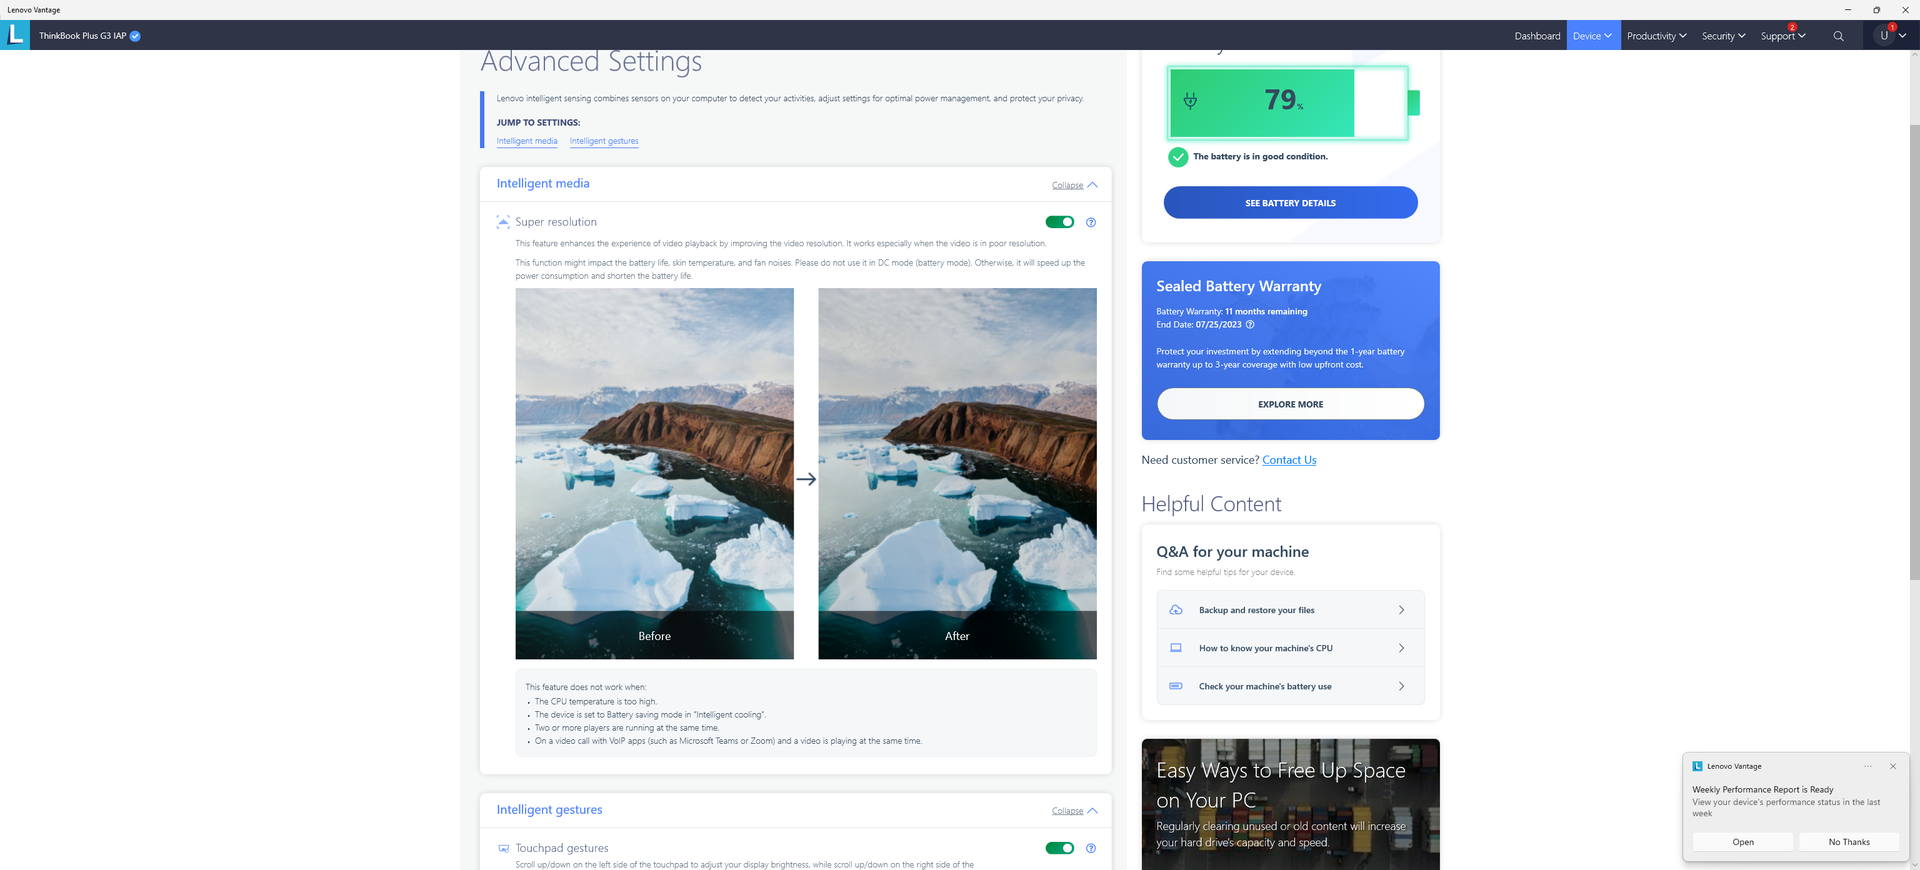
Przed uruchomieniem któregokolwiek z poniższych benchmarków ustawiliśmy nasze urządzenie w trybie Extreme Performance za pośrednictwem Lenovo Vantage i w trybie Performance w systemie Windows. Właściciele powinni zapoznać się z preinstalowanym oprogramowaniem Vantage, ponieważ stanowi ono centrum kontroli aktualizacji, wydajności i funkcji pomocniczych laptopa. Poniższe zrzuty ekranu pokazują niektóre z funkcji dostępnych w oprogramowaniu.
Procesor
Wydajność procesora jest o 20 do 25 procent wolniejsza od przeciętnej Core i7-12700H w naszej bazie danych. Deficyt wydajności jest na tyle duży, że nawet laptopy z "wolniejszym" Core i5-12500H jak np Honor MagicBook 15 mogą dorównać lub przewyższyć nasze Lenovo. Niemniej jednak wydajność procesora jest wciąż szybsza od słabszego Core i7-1260P lub Core i7-1165G7. Przewaga jest szczególnie szeroka w porównaniu do.Core i5-1130G7 który napędzał zeszłoroczny model ThinkBook Plus Gen 2.
Cinebench R15 Multi Loop
Cinebench R23: Multi Core | Single Core
Cinebench R15: CPU Multi 64Bit | CPU Single 64Bit
Blender: v2.79 BMW27 CPU
7-Zip 18.03: 7z b 4 | 7z b 4 -mmt1
Geekbench 5.5: Multi-Core | Single-Core
HWBOT x265 Benchmark v2.2: 4k Preset
LibreOffice : 20 Documents To PDF
R Benchmark 2.5: Overall mean
| Cinebench R20 / CPU (Multi Core) | |
| Przeciętny Intel Core i7-12700H (1576 - 7407, n=64) | |
| Schenker XMG Neo 17 M22 | |
| Gigabyte Aero 17 HDR YD | |
| Dell XPS 17 9720 | |
| Gigabyte A7 X1 | |
| Honor MagicBook 14 2022 | |
| Acer Nitro 5 AN517-41-R9S5 | |
| Lenovo ThinkBook Plus Gen3 | |
| Lenovo Legion 5 17ACH6H-82JY0003GE | |
| Samsung Galaxy Book2 15 | |
| Asus ProArt StudioBook Pro 17 W700G3T | |
| LG Gram 17 (2022) | |
| Acer Aspire 5 A517-52G-79Z5 | |
| Lenovo ThinkBook Plus Gen2 Core i5 | |
| Cinebench R20 / CPU (Single Core) | |
| Samsung Galaxy Book2 15 | |
| Przeciętny Intel Core i7-12700H (300 - 704, n=64) | |
| Lenovo ThinkBook Plus Gen3 | |
| Dell XPS 17 9720 | |
| Honor MagicBook 14 2022 | |
| Schenker XMG Neo 17 M22 | |
| Gigabyte Aero 17 HDR YD | |
| Gigabyte A7 X1 | |
| Acer Aspire 5 A517-52G-79Z5 | |
| Acer Nitro 5 AN517-41-R9S5 | |
| Lenovo Legion 5 17ACH6H-82JY0003GE | |
| LG Gram 17 (2022) | |
| Lenovo ThinkBook Plus Gen2 Core i5 | |
| Asus ProArt StudioBook Pro 17 W700G3T | |
| Cinebench R23 / Multi Core | |
| Dell XPS 17 9720 | |
| Przeciętny Intel Core i7-12700H (4032 - 19330, n=64) | |
| Schenker XMG Neo 17 M22 | |
| Gigabyte A7 X1 | |
| Honor MagicBook 14 2022 | |
| Acer Nitro 5 AN517-41-R9S5 | |
| Lenovo ThinkBook Plus Gen3 | |
| Lenovo Legion 5 17ACH6H-82JY0003GE | |
| Samsung Galaxy Book2 15 | |
| LG Gram 17 (2022) | |
| Acer Aspire 5 A517-52G-79Z5 | |
| Lenovo ThinkBook Plus Gen2 Core i5 | |
| Cinebench R23 / Single Core | |
| Samsung Galaxy Book2 15 | |
| Przeciętny Intel Core i7-12700H (778 - 1826, n=63) | |
| Dell XPS 17 9720 | |
| Lenovo ThinkBook Plus Gen3 | |
| Honor MagicBook 14 2022 | |
| Schenker XMG Neo 17 M22 | |
| Acer Aspire 5 A517-52G-79Z5 | |
| Gigabyte A7 X1 | |
| Acer Nitro 5 AN517-41-R9S5 | |
| LG Gram 17 (2022) | |
| Lenovo Legion 5 17ACH6H-82JY0003GE | |
| Lenovo ThinkBook Plus Gen2 Core i5 | |
| Cinebench R15 / CPU Multi 64Bit | |
| Dell XPS 17 9720 | |
| Dell XPS 17 9720 | |
| Przeciętny Intel Core i7-12700H (1379 - 2916, n=70) | |
| Schenker XMG Neo 17 M22 | |
| Honor MagicBook 14 2022 | |
| Honor MagicBook 14 2022 | |
| Gigabyte A7 X1 | |
| Gigabyte Aero 17 HDR YD | |
| Acer Nitro 5 AN517-41-R9S5 | |
| Lenovo ThinkBook Plus Gen3 | |
| Lenovo Legion 5 17ACH6H-82JY0003GE | |
| LG Gram 17 (2022) | |
| Samsung Galaxy Book2 15 | |
| Asus ProArt StudioBook Pro 17 W700G3T | |
| Asus ProArt StudioBook Pro 17 W700G3T | |
| Acer Aspire 5 A517-52G-79Z5 | |
| Lenovo ThinkBook Plus Gen2 Core i5 | |
| Lenovo ThinkBook Plus Gen2 Core i5 | |
| Cinebench R15 / CPU Single 64Bit | |
| Dell XPS 17 9720 | |
| Przeciętny Intel Core i7-12700H (113 - 263, n=65) | |
| Schenker XMG Neo 17 M22 | |
| Lenovo ThinkBook Plus Gen3 | |
| Samsung Galaxy Book2 15 | |
| Gigabyte A7 X1 | |
| Honor MagicBook 14 2022 | |
| Gigabyte Aero 17 HDR YD | |
| Acer Nitro 5 AN517-41-R9S5 | |
| Lenovo Legion 5 17ACH6H-82JY0003GE | |
| Acer Aspire 5 A517-52G-79Z5 | |
| Asus ProArt StudioBook Pro 17 W700G3T | |
| Lenovo ThinkBook Plus Gen2 Core i5 | |
| Lenovo ThinkBook Plus Gen2 Core i5 | |
| LG Gram 17 (2022) | |
| Blender / v2.79 BMW27 CPU | |
| Lenovo ThinkBook Plus Gen2 Core i5 | |
| Acer Aspire 5 A517-52G-79Z5 | |
| LG Gram 17 (2022) | |
| Asus ProArt StudioBook Pro 17 W700G3T | |
| Samsung Galaxy Book2 15 | |
| Lenovo Legion 5 17ACH6H-82JY0003GE | |
| Lenovo ThinkBook Plus Gen3 | |
| Honor MagicBook 14 2022 | |
| Acer Nitro 5 AN517-41-R9S5 | |
| Gigabyte A7 X1 | |
| Dell XPS 17 9720 | |
| Gigabyte Aero 17 HDR YD | |
| Przeciętny Intel Core i7-12700H (168 - 732, n=63) | |
| Schenker XMG Neo 17 M22 | |
| 7-Zip 18.03 / 7z b 4 | |
| Schenker XMG Neo 17 M22 | |
| Przeciętny Intel Core i7-12700H (22844 - 73067, n=63) | |
| Dell XPS 17 9720 | |
| Acer Nitro 5 AN517-41-R9S5 | |
| Gigabyte Aero 17 HDR YD | |
| Gigabyte A7 X1 | |
| Honor MagicBook 14 2022 | |
| Lenovo ThinkBook Plus Gen3 | |
| Lenovo Legion 5 17ACH6H-82JY0003GE | |
| Samsung Galaxy Book2 15 | |
| Asus ProArt StudioBook Pro 17 W700G3T | |
| LG Gram 17 (2022) | |
| Acer Aspire 5 A517-52G-79Z5 | |
| Lenovo ThinkBook Plus Gen2 Core i5 | |
| 7-Zip 18.03 / 7z b 4 -mmt1 | |
| Schenker XMG Neo 17 M22 | |
| Dell XPS 17 9720 | |
| Gigabyte A7 X1 | |
| Gigabyte Aero 17 HDR YD | |
| Przeciętny Intel Core i7-12700H (2743 - 5972, n=63) | |
| Acer Nitro 5 AN517-41-R9S5 | |
| Samsung Galaxy Book2 15 | |
| Acer Aspire 5 A517-52G-79Z5 | |
| Lenovo Legion 5 17ACH6H-82JY0003GE | |
| Honor MagicBook 14 2022 | |
| Lenovo ThinkBook Plus Gen3 | |
| Asus ProArt StudioBook Pro 17 W700G3T | |
| LG Gram 17 (2022) | |
| Lenovo ThinkBook Plus Gen2 Core i5 | |
| Geekbench 5.5 / Multi-Core | |
| Dell XPS 17 9720 | |
| Przeciętny Intel Core i7-12700H (5144 - 13745, n=64) | |
| Honor MagicBook 14 2022 | |
| Lenovo ThinkBook Plus Gen3 | |
| Schenker XMG Neo 17 M22 | |
| Gigabyte Aero 17 HDR YD | |
| Acer Nitro 5 AN517-41-R9S5 | |
| LG Gram 17 (2022) | |
| Gigabyte A7 X1 | |
| Samsung Galaxy Book2 15 | |
| Lenovo Legion 5 17ACH6H-82JY0003GE | |
| Asus ProArt StudioBook Pro 17 W700G3T | |
| Acer Aspire 5 A517-52G-79Z5 | |
| Lenovo ThinkBook Plus Gen2 Core i5 | |
| Geekbench 5.5 / Single-Core | |
| Dell XPS 17 9720 | |
| Samsung Galaxy Book2 15 | |
| Przeciętny Intel Core i7-12700H (803 - 1851, n=64) | |
| Honor MagicBook 14 2022 | |
| Lenovo ThinkBook Plus Gen3 | |
| Gigabyte Aero 17 HDR YD | |
| Schenker XMG Neo 17 M22 | |
| LG Gram 17 (2022) | |
| Acer Aspire 5 A517-52G-79Z5 | |
| Gigabyte A7 X1 | |
| Acer Nitro 5 AN517-41-R9S5 | |
| Lenovo Legion 5 17ACH6H-82JY0003GE | |
| Lenovo ThinkBook Plus Gen2 Core i5 | |
| Asus ProArt StudioBook Pro 17 W700G3T | |
| HWBOT x265 Benchmark v2.2 / 4k Preset | |
| Schenker XMG Neo 17 M22 | |
| Przeciętny Intel Core i7-12700H (4.67 - 21.8, n=64) | |
| Gigabyte Aero 17 HDR YD | |
| Acer Nitro 5 AN517-41-R9S5 | |
| Gigabyte A7 X1 | |
| Dell XPS 17 9720 | |
| Honor MagicBook 14 2022 | |
| Lenovo ThinkBook Plus Gen3 | |
| Lenovo Legion 5 17ACH6H-82JY0003GE | |
| Samsung Galaxy Book2 15 | |
| Asus ProArt StudioBook Pro 17 W700G3T | |
| LG Gram 17 (2022) | |
| Acer Aspire 5 A517-52G-79Z5 | |
| LibreOffice / 20 Documents To PDF | |
| Acer Nitro 5 AN517-41-R9S5 | |
| Asus ProArt StudioBook Pro 17 W700G3T | |
| Lenovo ThinkBook Plus Gen2 Core i5 | |
| Gigabyte A7 X1 | |
| Schenker XMG Neo 17 M22 | |
| LG Gram 17 (2022) | |
| Lenovo Legion 5 17ACH6H-82JY0003GE | |
| Acer Aspire 5 A517-52G-79Z5 | |
| Lenovo ThinkBook Plus Gen3 | |
| Przeciętny Intel Core i7-12700H (34.2 - 95.3, n=63) | |
| Dell XPS 17 9720 | |
| Samsung Galaxy Book2 15 | |
| Honor MagicBook 14 2022 | |
| Gigabyte Aero 17 HDR YD | |
| R Benchmark 2.5 / Overall mean | |
| Lenovo ThinkBook Plus Gen2 Core i5 | |
| Asus ProArt StudioBook Pro 17 W700G3T | |
| Acer Aspire 5 A517-52G-79Z5 | |
| LG Gram 17 (2022) | |
| Gigabyte Aero 17 HDR YD | |
| Lenovo Legion 5 17ACH6H-82JY0003GE | |
| Gigabyte A7 X1 | |
| Honor MagicBook 14 2022 | |
| Lenovo ThinkBook Plus Gen3 | |
| Schenker XMG Neo 17 M22 | |
| Przeciętny Intel Core i7-12700H (0.4441 - 1.052, n=63) | |
| Samsung Galaxy Book2 15 | |
| Dell XPS 17 9720 | |
Cinebench R23: Multi Core | Single Core
Cinebench R15: CPU Multi 64Bit | CPU Single 64Bit
Blender: v2.79 BMW27 CPU
7-Zip 18.03: 7z b 4 | 7z b 4 -mmt1
Geekbench 5.5: Multi-Core | Single-Core
HWBOT x265 Benchmark v2.2: 4k Preset
LibreOffice : 20 Documents To PDF
R Benchmark 2.5: Overall mean
* ... im mniej tym lepiej
AIDA64: FP32 Ray-Trace | FPU Julia | CPU SHA3 | CPU Queen | FPU SinJulia | FPU Mandel | CPU AES | CPU ZLib | FP64 Ray-Trace | CPU PhotoWorxx
| Performance rating | |
| Przeciętny Intel Core i7-12700H | |
| Lenovo ThinkBook Plus Gen3 | |
| Dell XPS 17 9720 | |
| Asus ProArt StudioBook Pro 17 W700G3T | |
| LG Gram 17 (2022) | |
| Lenovo ThinkBook Plus Gen2 Core i5 | |
| Gigabyte Aero 17 HDR YD -9! | |
| AIDA64 / FP32 Ray-Trace | |
| Lenovo ThinkBook Plus Gen3 | |
| Przeciętny Intel Core i7-12700H (2585 - 17957, n=64) | |
| Asus ProArt StudioBook Pro 17 W700G3T | |
| Dell XPS 17 9720 | |
| LG Gram 17 (2022) | |
| Lenovo ThinkBook Plus Gen2 Core i5 | |
| AIDA64 / FPU Julia | |
| Lenovo ThinkBook Plus Gen3 | |
| Przeciętny Intel Core i7-12700H (12439 - 90760, n=64) | |
| Asus ProArt StudioBook Pro 17 W700G3T | |
| Dell XPS 17 9720 | |
| LG Gram 17 (2022) | |
| Lenovo ThinkBook Plus Gen2 Core i5 | |
| AIDA64 / CPU SHA3 | |
| Przeciętny Intel Core i7-12700H (833 - 4242, n=64) | |
| Lenovo ThinkBook Plus Gen3 | |
| Dell XPS 17 9720 | |
| Asus ProArt StudioBook Pro 17 W700G3T | |
| Lenovo ThinkBook Plus Gen2 Core i5 | |
| LG Gram 17 (2022) | |
| AIDA64 / CPU Queen | |
| Dell XPS 17 9720 | |
| Przeciętny Intel Core i7-12700H (57923 - 103202, n=63) | |
| Lenovo ThinkBook Plus Gen3 | |
| Asus ProArt StudioBook Pro 17 W700G3T | |
| LG Gram 17 (2022) | |
| Lenovo ThinkBook Plus Gen2 Core i5 | |
| AIDA64 / FPU SinJulia | |
| Przeciętny Intel Core i7-12700H (3249 - 9939, n=64) | |
| Dell XPS 17 9720 | |
| Lenovo ThinkBook Plus Gen3 | |
| Asus ProArt StudioBook Pro 17 W700G3T | |
| LG Gram 17 (2022) | |
| Lenovo ThinkBook Plus Gen2 Core i5 | |
| AIDA64 / FPU Mandel | |
| Lenovo ThinkBook Plus Gen3 | |
| Przeciętny Intel Core i7-12700H (7135 - 44760, n=64) | |
| Asus ProArt StudioBook Pro 17 W700G3T | |
| Dell XPS 17 9720 | |
| LG Gram 17 (2022) | |
| Lenovo ThinkBook Plus Gen2 Core i5 | |
| AIDA64 / CPU AES | |
| Przeciętny Intel Core i7-12700H (31839 - 144360, n=64) | |
| Dell XPS 17 9720 | |
| Lenovo ThinkBook Plus Gen3 | |
| Lenovo ThinkBook Plus Gen2 Core i5 | |
| LG Gram 17 (2022) | |
| Asus ProArt StudioBook Pro 17 W700G3T | |
| AIDA64 / CPU ZLib | |
| Przeciętny Intel Core i7-12700H (305 - 1171, n=64) | |
| Dell XPS 17 9720 | |
| Lenovo ThinkBook Plus Gen3 | |
| Asus ProArt StudioBook Pro 17 W700G3T | |
| LG Gram 17 (2022) | |
| Lenovo ThinkBook Plus Gen2 Core i5 | |
| Gigabyte Aero 17 HDR YD | |
| AIDA64 / FP64 Ray-Trace | |
| Lenovo ThinkBook Plus Gen3 | |
| Przeciętny Intel Core i7-12700H (1437 - 9692, n=64) | |
| Asus ProArt StudioBook Pro 17 W700G3T | |
| Dell XPS 17 9720 | |
| LG Gram 17 (2022) | |
| Lenovo ThinkBook Plus Gen2 Core i5 | |
| AIDA64 / CPU PhotoWorxx | |
| Dell XPS 17 9720 | |
| Lenovo ThinkBook Plus Gen3 | |
| Lenovo ThinkBook Plus Gen2 Core i5 | |
| LG Gram 17 (2022) | |
| Przeciętny Intel Core i7-12700H (12863 - 52207, n=64) | |
| Asus ProArt StudioBook Pro 17 W700G3T | |
Wydajność systemu
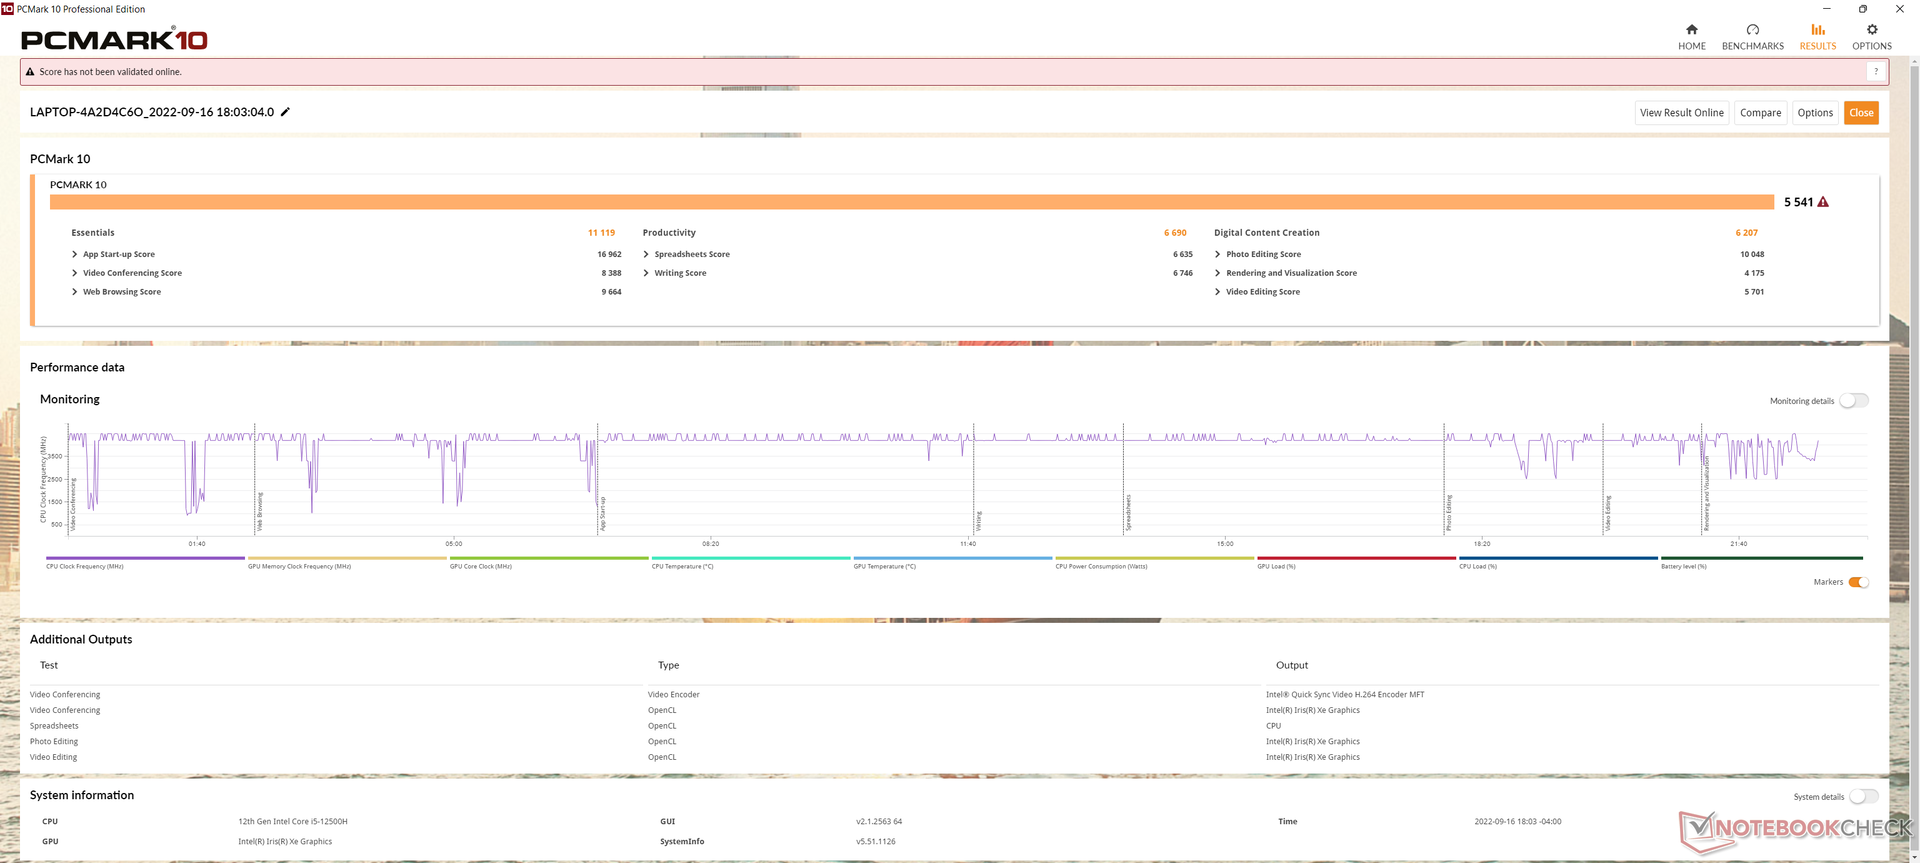
Wyniki PCMark 10 są wyższe od wielu laptopów pracujących na procesorach Core serii U lub starszych serii H, a jednocześnie niższe od tych z dedykowanymi układami graficznymi, jak np.XPS 17 9720.
CrossMark: Overall | Productivity | Creativity | Responsiveness
| PCMark 10 / Score | |
| Gigabyte Aero 17 HDR YD | |
| Dell XPS 17 9720 | |
| Przeciętny Intel Core i7-12700H, Intel Iris Xe Graphics G7 96EUs (5541 - 6281, n=8) | |
| Lenovo ThinkBook Plus Gen3 | |
| LG Gram 17 (2022) | |
| Asus ProArt StudioBook Pro 17 W700G3T | |
| Lenovo ThinkBook Plus Gen2 Core i5 | |
| PCMark 10 / Essentials | |
| Lenovo ThinkBook Plus Gen3 | |
| Przeciętny Intel Core i7-12700H, Intel Iris Xe Graphics G7 96EUs (9991 - 11699, n=8) | |
| Dell XPS 17 9720 | |
| Lenovo ThinkBook Plus Gen2 Core i5 | |
| Gigabyte Aero 17 HDR YD | |
| LG Gram 17 (2022) | |
| Asus ProArt StudioBook Pro 17 W700G3T | |
| PCMark 10 / Productivity | |
| Dell XPS 17 9720 | |
| Gigabyte Aero 17 HDR YD | |
| Asus ProArt StudioBook Pro 17 W700G3T | |
| Przeciętny Intel Core i7-12700H, Intel Iris Xe Graphics G7 96EUs (6690 - 8038, n=8) | |
| Lenovo ThinkBook Plus Gen3 | |
| LG Gram 17 (2022) | |
| Lenovo ThinkBook Plus Gen2 Core i5 | |
| PCMark 10 / Digital Content Creation | |
| Gigabyte Aero 17 HDR YD | |
| Dell XPS 17 9720 | |
| Przeciętny Intel Core i7-12700H, Intel Iris Xe Graphics G7 96EUs (6207 - 7401, n=8) | |
| Lenovo ThinkBook Plus Gen3 | |
| LG Gram 17 (2022) | |
| Asus ProArt StudioBook Pro 17 W700G3T | |
| Lenovo ThinkBook Plus Gen2 Core i5 | |
| CrossMark / Overall | |
| Dell XPS 17 9720 | |
| Przeciętny Intel Core i7-12700H, Intel Iris Xe Graphics G7 96EUs (1492 - 1907, n=8) | |
| Lenovo ThinkBook Plus Gen3 | |
| LG Gram 17 (2022) | |
| CrossMark / Productivity | |
| Dell XPS 17 9720 | |
| Przeciętny Intel Core i7-12700H, Intel Iris Xe Graphics G7 96EUs (1499 - 1832, n=8) | |
| Lenovo ThinkBook Plus Gen3 | |
| LG Gram 17 (2022) | |
| CrossMark / Creativity | |
| Dell XPS 17 9720 | |
| Lenovo ThinkBook Plus Gen3 | |
| Przeciętny Intel Core i7-12700H, Intel Iris Xe Graphics G7 96EUs (1507 - 2016, n=8) | |
| LG Gram 17 (2022) | |
| CrossMark / Responsiveness | |
| Dell XPS 17 9720 | |
| Przeciętny Intel Core i7-12700H, Intel Iris Xe Graphics G7 96EUs (1384 - 1831, n=8) | |
| LG Gram 17 (2022) | |
| Lenovo ThinkBook Plus Gen3 | |
| PCMark 10 Score | 5541 pkt. | |
Pomoc | ||
| AIDA64 / Memory Copy | |
| Dell XPS 17 9720 | |
| Lenovo ThinkBook Plus Gen3 | |
| LG Gram 17 (2022) | |
| Lenovo ThinkBook Plus Gen2 Core i5 | |
| Przeciętny Intel Core i7-12700H (25615 - 80511, n=64) | |
| Asus ProArt StudioBook Pro 17 W700G3T | |
| AIDA64 / Memory Read | |
| Lenovo ThinkBook Plus Gen3 | |
| Dell XPS 17 9720 | |
| LG Gram 17 (2022) | |
| Lenovo ThinkBook Plus Gen2 Core i5 | |
| Przeciętny Intel Core i7-12700H (25586 - 79442, n=64) | |
| Asus ProArt StudioBook Pro 17 W700G3T | |
| AIDA64 / Memory Write | |
| Dell XPS 17 9720 | |
| Lenovo ThinkBook Plus Gen2 Core i5 | |
| LG Gram 17 (2022) | |
| Lenovo ThinkBook Plus Gen3 | |
| Przeciętny Intel Core i7-12700H (23679 - 88660, n=64) | |
| Asus ProArt StudioBook Pro 17 W700G3T | |
| AIDA64 / Memory Latency | |
| Lenovo ThinkBook Plus Gen3 | |
| LG Gram 17 (2022) | |
| Lenovo ThinkBook Plus Gen2 Core i5 | |
| Dell XPS 17 9720 | |
| Przeciętny Intel Core i7-12700H (76.2 - 133.9, n=62) | |
| Asus ProArt StudioBook Pro 17 W700G3T | |
| Gigabyte Aero 17 HDR YD | |
* ... im mniej tym lepiej
Opóźnienie DPC
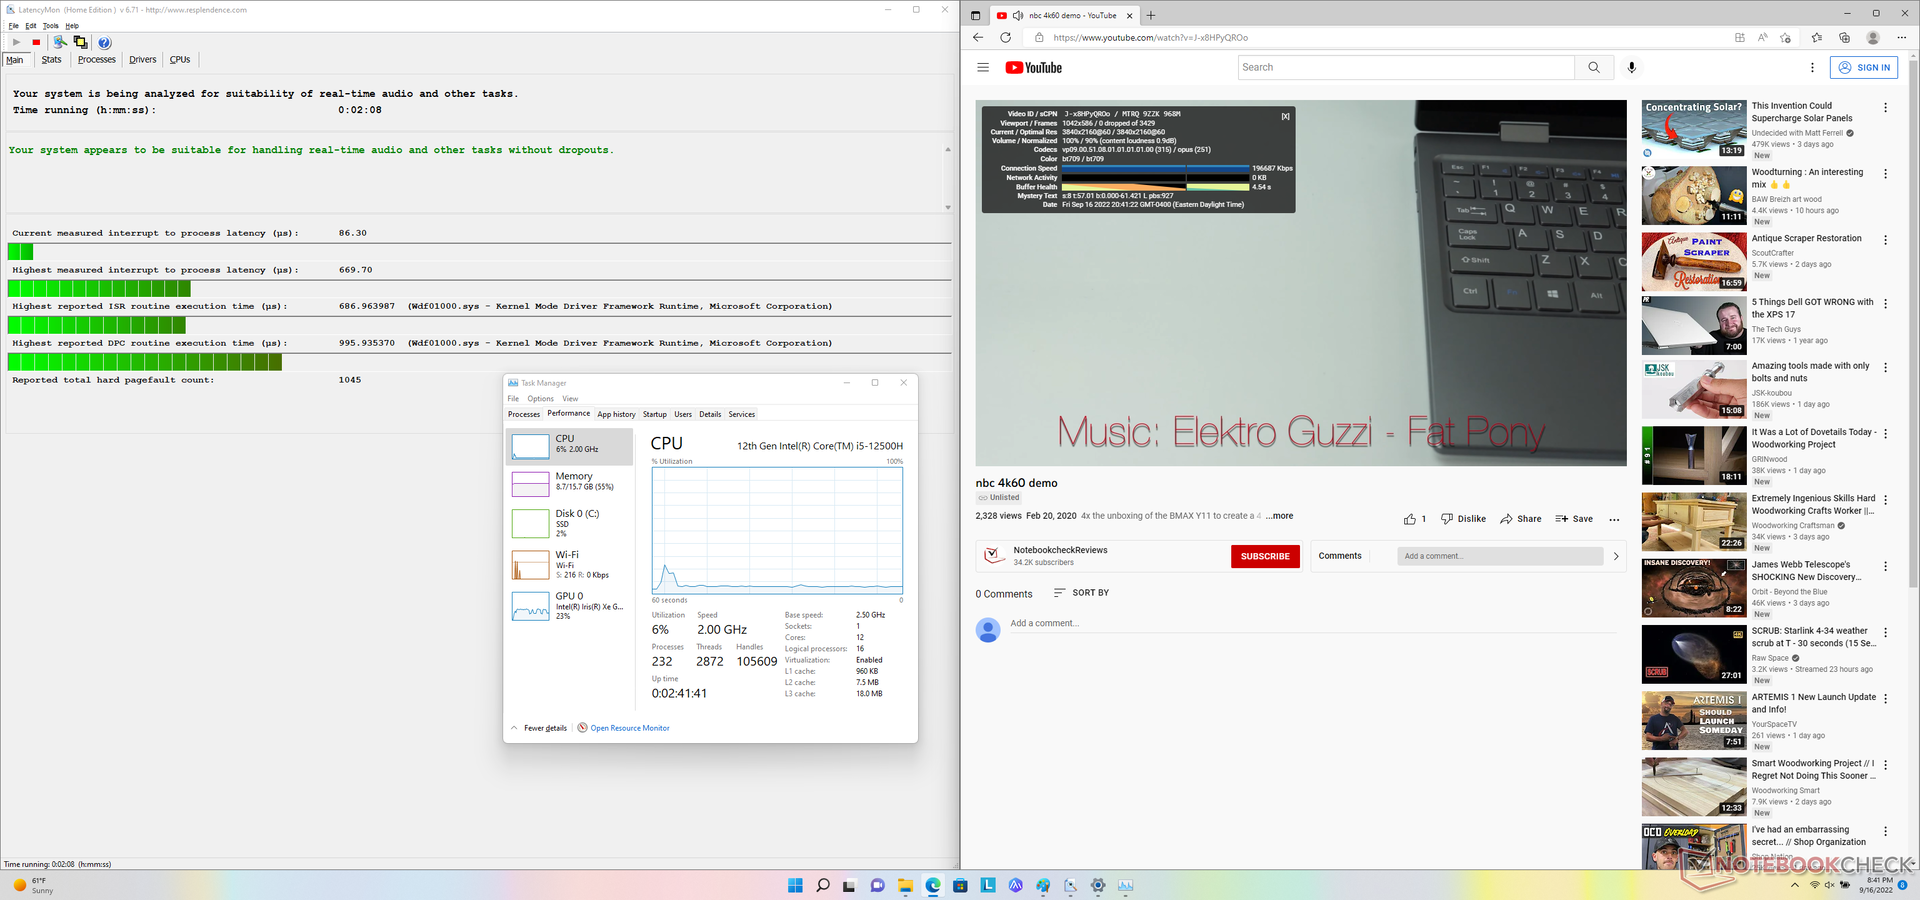
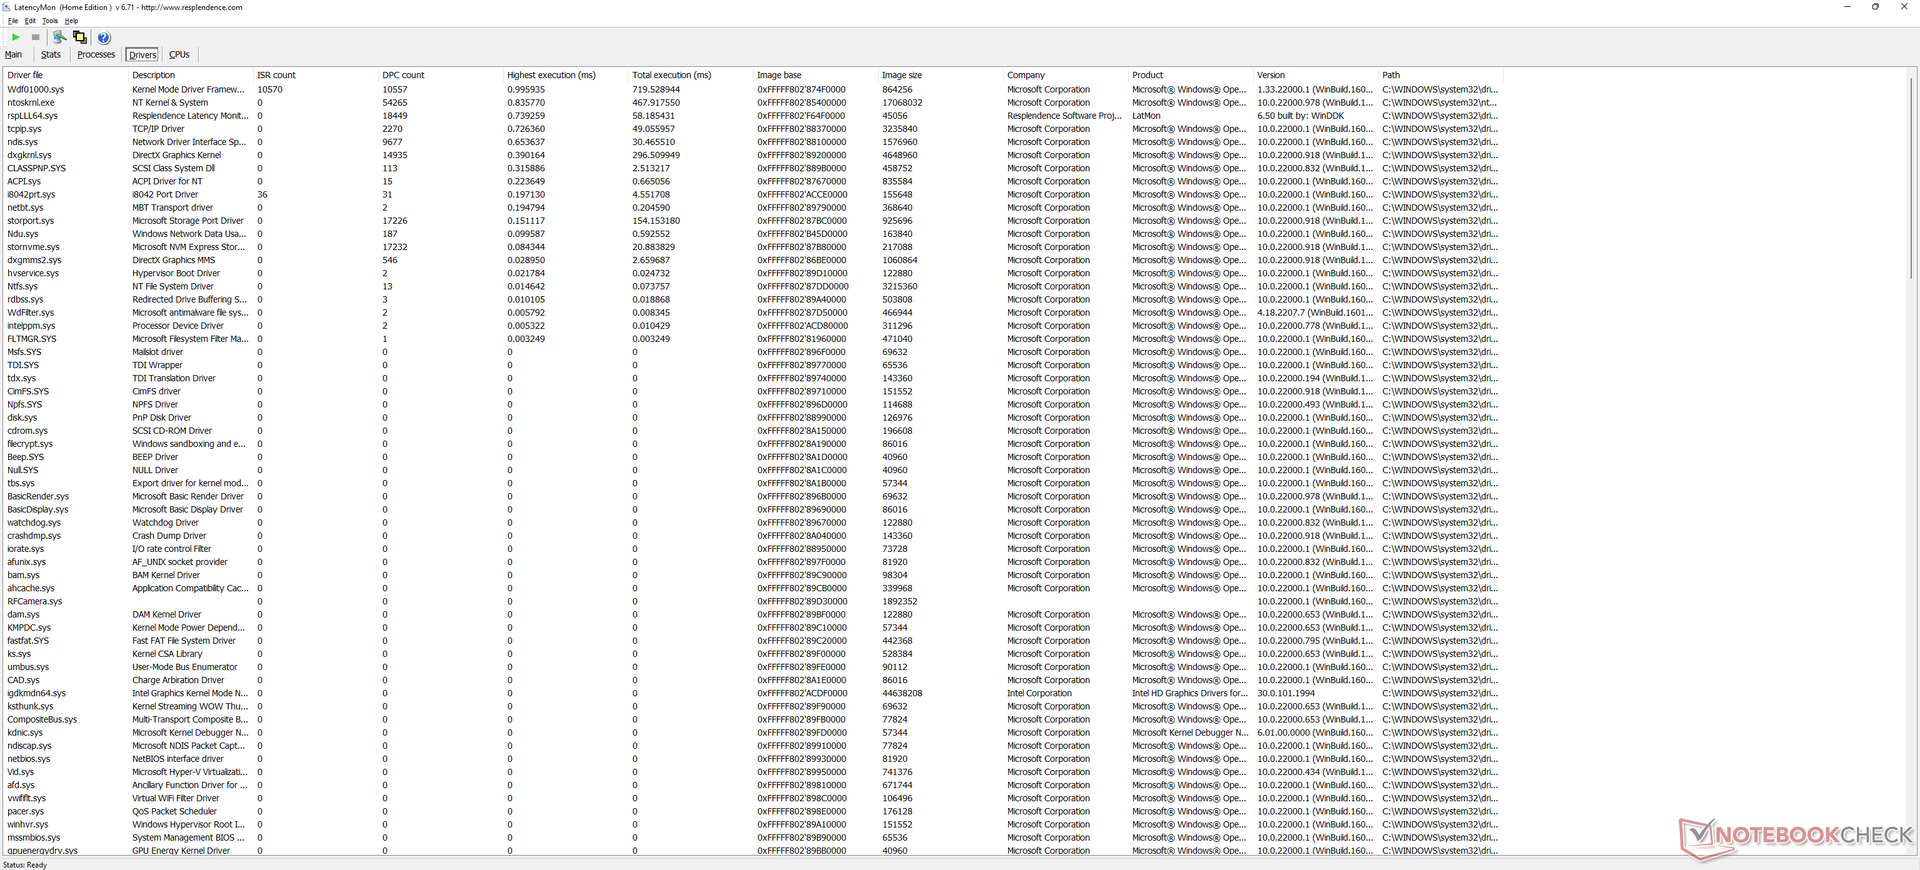
LatencyMon nie ujawnia żadnych większych problemów z DPC podczas otwierania wielu kart przeglądarki na naszej stronie głównej lub podczas uruchamiania Prime95 w stresie przez 30 sekund. odtwarzanie wideo 4K przy 60 FPS jest również perfekcyjne i nie ma żadnych opuszczonych klatek.
| DPC Latencies / LatencyMon - interrupt to process latency (max), Web, Youtube, Prime95 | |
| Gigabyte Aero 17 HDR YD | |
| Lenovo ThinkBook Plus Gen2 Core i5 | |
| Dell XPS 17 9720 | |
| Lenovo ThinkBook Plus Gen3 | |
| LG Gram 17 (2022) | |
* ... im mniej tym lepiej
Urządzenia do przechowywania danych
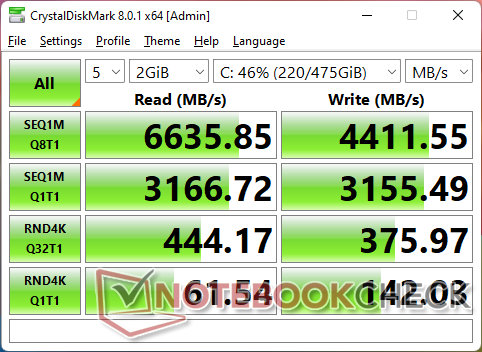
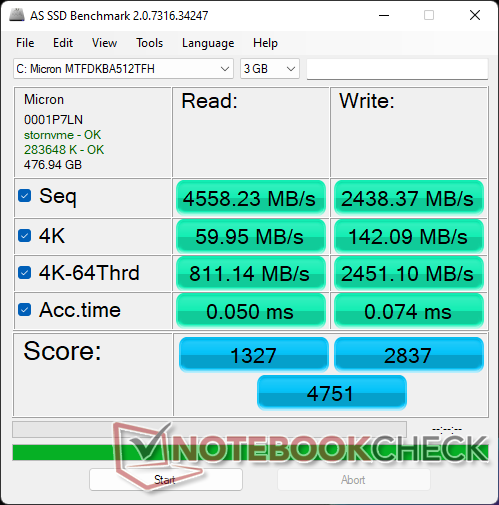
Nasz testowy egzemplarz jest wyposażony w ten sam dysk 512 GBMicron 3400 MTFDKBA512TFH SSD, który znajduje się w Dell XPS 17 9720. Choć nie jest tak szybki jak Samsung PM9A1, dysk nie wykazuje problemów z dławieniem, zapewniając stały poziom wydajności nawet pod obciążeniem.

| Drive Performance rating - Percent | |
| Gigabyte Aero 17 HDR YD | |
| LG Gram 17 (2022) | |
| Lenovo ThinkBook Plus Gen2 Core i5 | |
| Dell XPS 17 9720 | |
| Lenovo ThinkBook Plus Gen3 | |
| Asus ProArt StudioBook Pro 17 W700G3T | |
| DiskSpd | |
| seq read | |
| Lenovo ThinkBook Plus Gen2 Core i5 | |
| Gigabyte Aero 17 HDR YD | |
| LG Gram 17 (2022) | |
| Dell XPS 17 9720 | |
| Lenovo ThinkBook Plus Gen3 | |
| Asus ProArt StudioBook Pro 17 W700G3T | |
| seq write | |
| Lenovo ThinkBook Plus Gen2 Core i5 | |
| Gigabyte Aero 17 HDR YD | |
| LG Gram 17 (2022) | |
| Dell XPS 17 9720 | |
| Lenovo ThinkBook Plus Gen3 | |
| Asus ProArt StudioBook Pro 17 W700G3T | |
| seq q8 t1 read | |
| LG Gram 17 (2022) | |
| Lenovo ThinkBook Plus Gen2 Core i5 | |
| Gigabyte Aero 17 HDR YD | |
| Lenovo ThinkBook Plus Gen3 | |
| Dell XPS 17 9720 | |
| Asus ProArt StudioBook Pro 17 W700G3T | |
| seq q8 t1 write | |
| Lenovo ThinkBook Plus Gen2 Core i5 | |
| LG Gram 17 (2022) | |
| Gigabyte Aero 17 HDR YD | |
| Lenovo ThinkBook Plus Gen3 | |
| Dell XPS 17 9720 | |
| Asus ProArt StudioBook Pro 17 W700G3T | |
| 4k q1 t1 read | |
| Lenovo ThinkBook Plus Gen2 Core i5 | |
| LG Gram 17 (2022) | |
| Gigabyte Aero 17 HDR YD | |
| Dell XPS 17 9720 | |
| Asus ProArt StudioBook Pro 17 W700G3T | |
| Lenovo ThinkBook Plus Gen3 | |
| 4k q1 t1 write | |
| Lenovo ThinkBook Plus Gen2 Core i5 | |
| LG Gram 17 (2022) | |
| Gigabyte Aero 17 HDR YD | |
| Asus ProArt StudioBook Pro 17 W700G3T | |
| Dell XPS 17 9720 | |
| Lenovo ThinkBook Plus Gen3 | |
| 4k q32 t16 read | |
| Gigabyte Aero 17 HDR YD | |
| LG Gram 17 (2022) | |
| Lenovo ThinkBook Plus Gen2 Core i5 | |
| Asus ProArt StudioBook Pro 17 W700G3T | |
| Dell XPS 17 9720 | |
| Lenovo ThinkBook Plus Gen3 | |
| 4k q32 t16 write | |
| Gigabyte Aero 17 HDR YD | |
| Asus ProArt StudioBook Pro 17 W700G3T | |
| LG Gram 17 (2022) | |
| Lenovo ThinkBook Plus Gen2 Core i5 | |
| Dell XPS 17 9720 | |
| Lenovo ThinkBook Plus Gen3 | |
| AS SSD | |
| Score Total | |
| Gigabyte Aero 17 HDR YD | |
| LG Gram 17 (2022) | |
| Lenovo ThinkBook Plus Gen2 Core i5 | |
| Dell XPS 17 9720 | |
| Asus ProArt StudioBook Pro 17 W700G3T | |
| Lenovo ThinkBook Plus Gen3 | |
| Score Read | |
| Gigabyte Aero 17 HDR YD | |
| LG Gram 17 (2022) | |
| Lenovo ThinkBook Plus Gen2 Core i5 | |
| Asus ProArt StudioBook Pro 17 W700G3T | |
| Dell XPS 17 9720 | |
| Lenovo ThinkBook Plus Gen3 | |
| Score Write | |
| Gigabyte Aero 17 HDR YD | |
| LG Gram 17 (2022) | |
| Dell XPS 17 9720 | |
| Lenovo ThinkBook Plus Gen3 | |
| Lenovo ThinkBook Plus Gen2 Core i5 | |
| Asus ProArt StudioBook Pro 17 W700G3T | |
| Seq Read | |
| Gigabyte Aero 17 HDR YD | |
| Lenovo ThinkBook Plus Gen2 Core i5 | |
| LG Gram 17 (2022) | |
| Dell XPS 17 9720 | |
| Lenovo ThinkBook Plus Gen3 | |
| Asus ProArt StudioBook Pro 17 W700G3T | |
| Seq Write | |
| Gigabyte Aero 17 HDR YD | |
| Lenovo ThinkBook Plus Gen2 Core i5 | |
| LG Gram 17 (2022) | |
| Lenovo ThinkBook Plus Gen3 | |
| Asus ProArt StudioBook Pro 17 W700G3T | |
| Dell XPS 17 9720 | |
| 4K Read | |
| Lenovo ThinkBook Plus Gen2 Core i5 | |
| LG Gram 17 (2022) | |
| Dell XPS 17 9720 | |
| Lenovo ThinkBook Plus Gen3 | |
| Asus ProArt StudioBook Pro 17 W700G3T | |
| Gigabyte Aero 17 HDR YD | |
| 4K Write | |
| Dell XPS 17 9720 | |
| Lenovo ThinkBook Plus Gen2 Core i5 | |
| LG Gram 17 (2022) | |
| Gigabyte Aero 17 HDR YD | |
| Lenovo ThinkBook Plus Gen3 | |
| Asus ProArt StudioBook Pro 17 W700G3T | |
| 4K-64 Read | |
| Gigabyte Aero 17 HDR YD | |
| LG Gram 17 (2022) | |
| Asus ProArt StudioBook Pro 17 W700G3T | |
| Lenovo ThinkBook Plus Gen2 Core i5 | |
| Dell XPS 17 9720 | |
| Lenovo ThinkBook Plus Gen3 | |
| 4K-64 Write | |
| Gigabyte Aero 17 HDR YD | |
| LG Gram 17 (2022) | |
| Lenovo ThinkBook Plus Gen3 | |
| Dell XPS 17 9720 | |
| Lenovo ThinkBook Plus Gen2 Core i5 | |
| Asus ProArt StudioBook Pro 17 W700G3T | |
| Access Time Read | |
| Asus ProArt StudioBook Pro 17 W700G3T | |
| Gigabyte Aero 17 HDR YD | |
| Lenovo ThinkBook Plus Gen3 | |
| LG Gram 17 (2022) | |
| Lenovo ThinkBook Plus Gen2 Core i5 | |
| Dell XPS 17 9720 | |
| Access Time Write | |
| Lenovo ThinkBook Plus Gen3 | |
| Asus ProArt StudioBook Pro 17 W700G3T | |
| Gigabyte Aero 17 HDR YD | |
| LG Gram 17 (2022) | |
| Lenovo ThinkBook Plus Gen2 Core i5 | |
| Dell XPS 17 9720 | |
* ... im mniej tym lepiej
Disk Throttling: DiskSpd Read Loop, Queue Depth 8
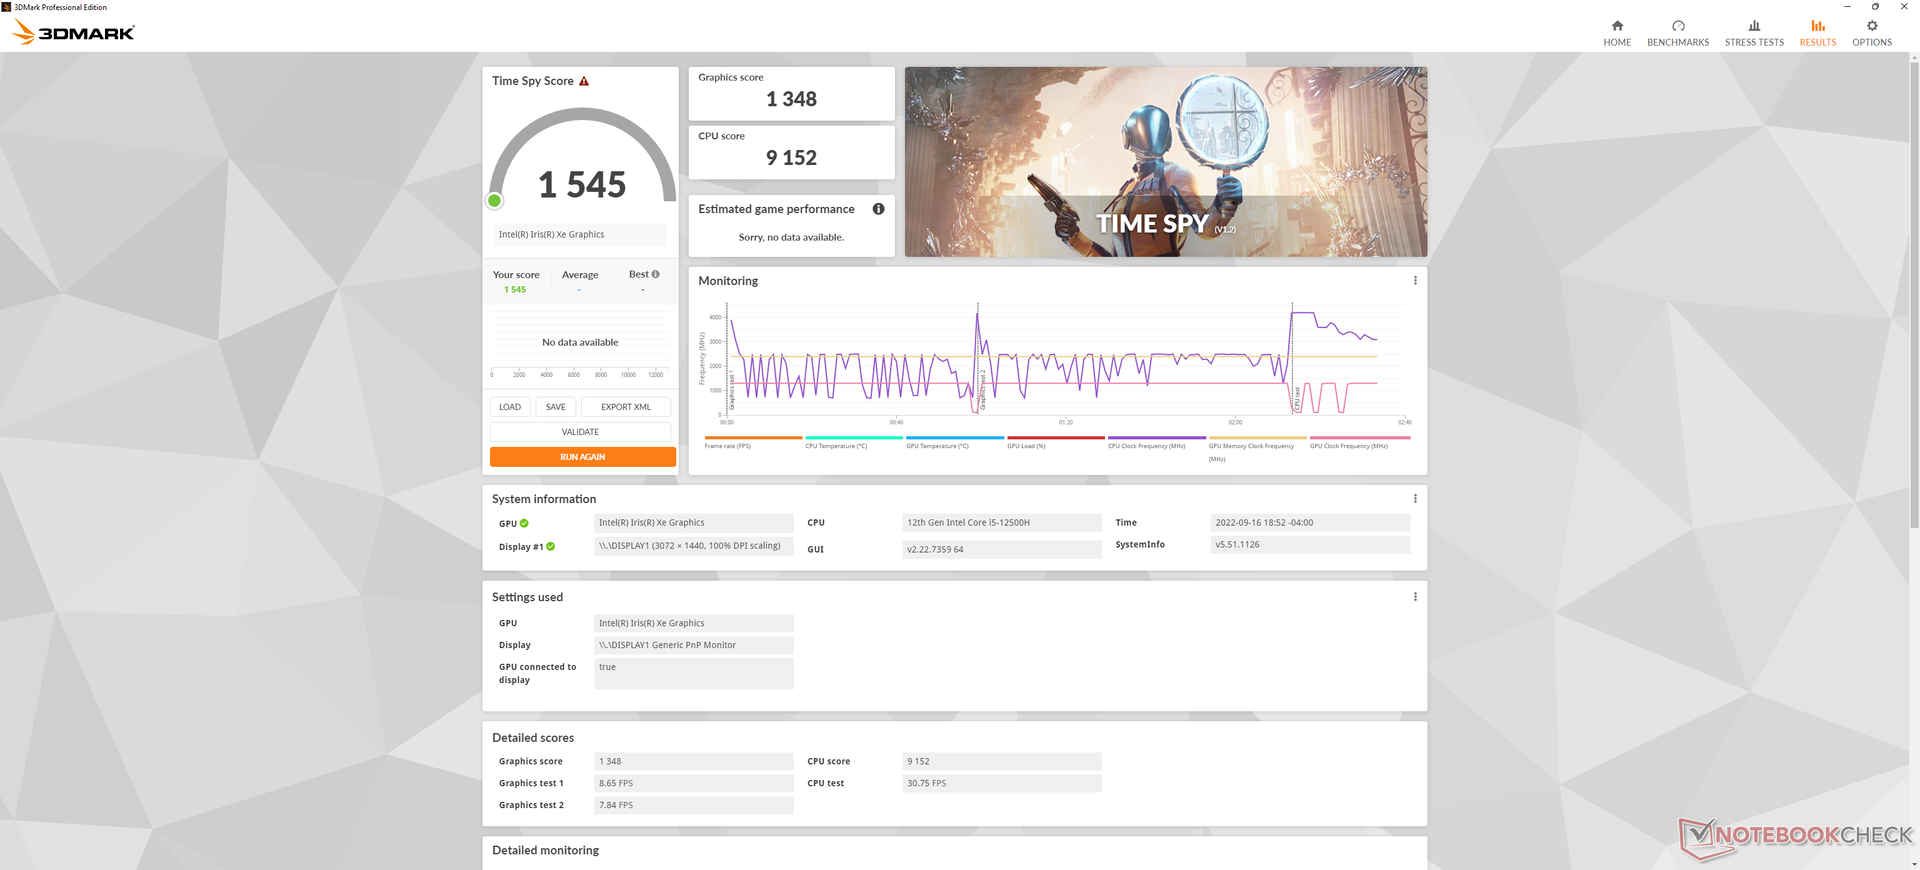
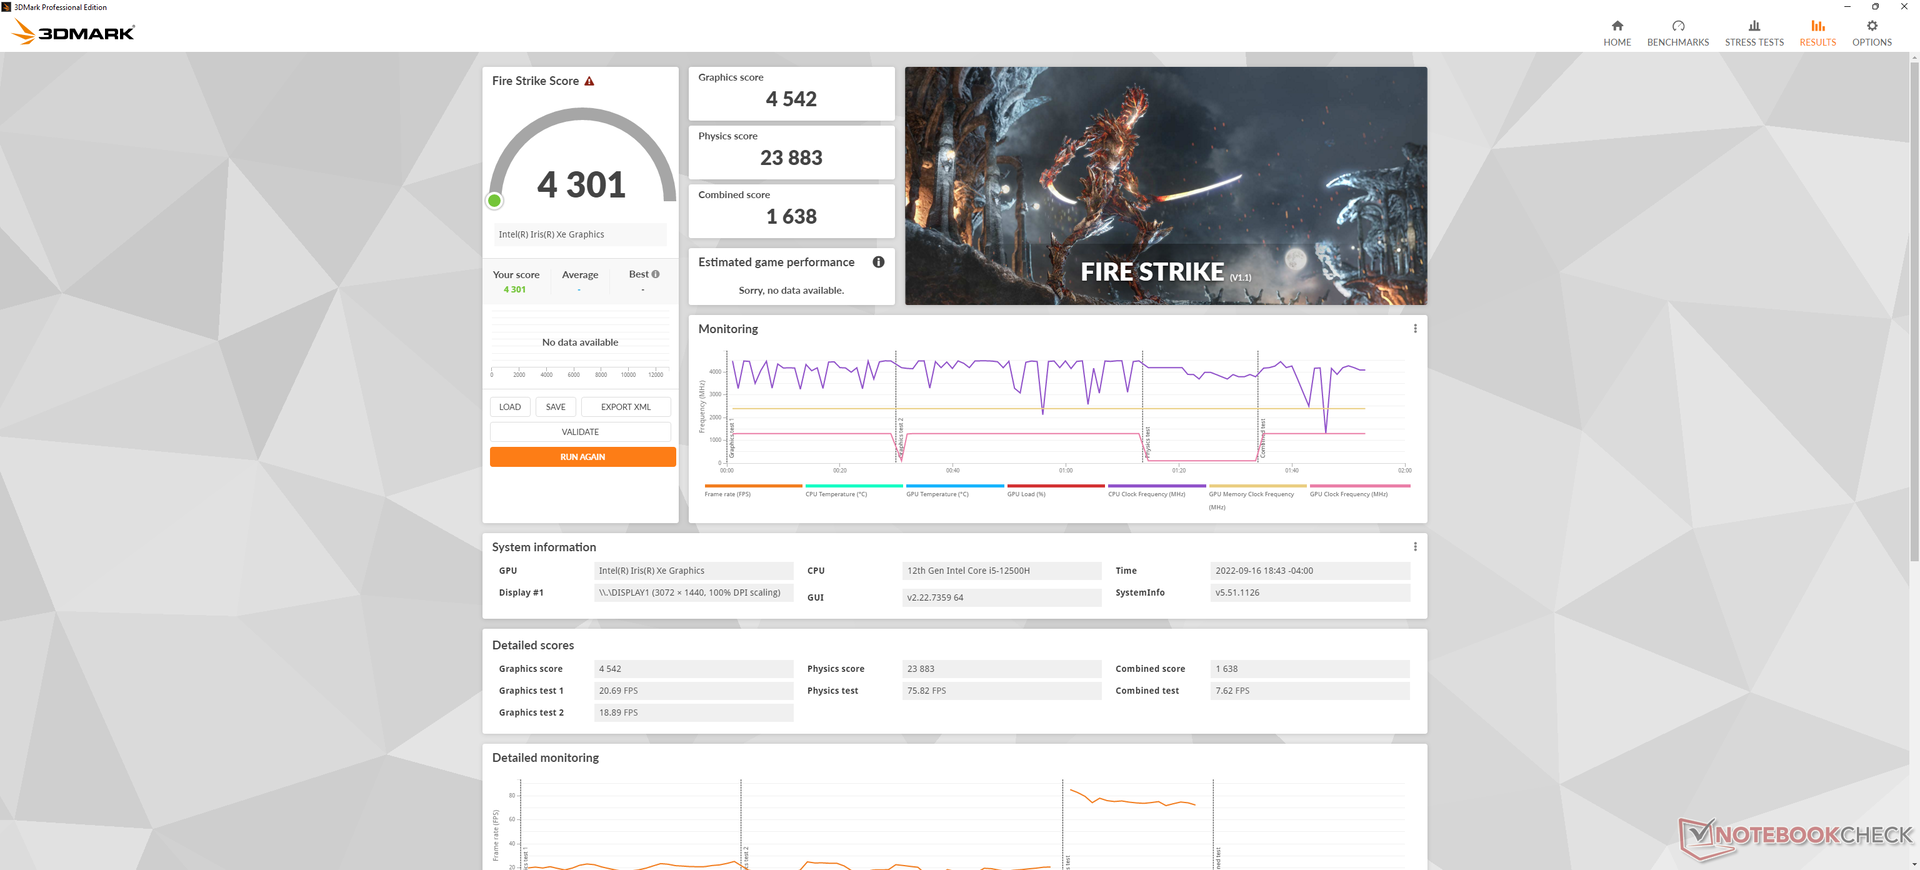
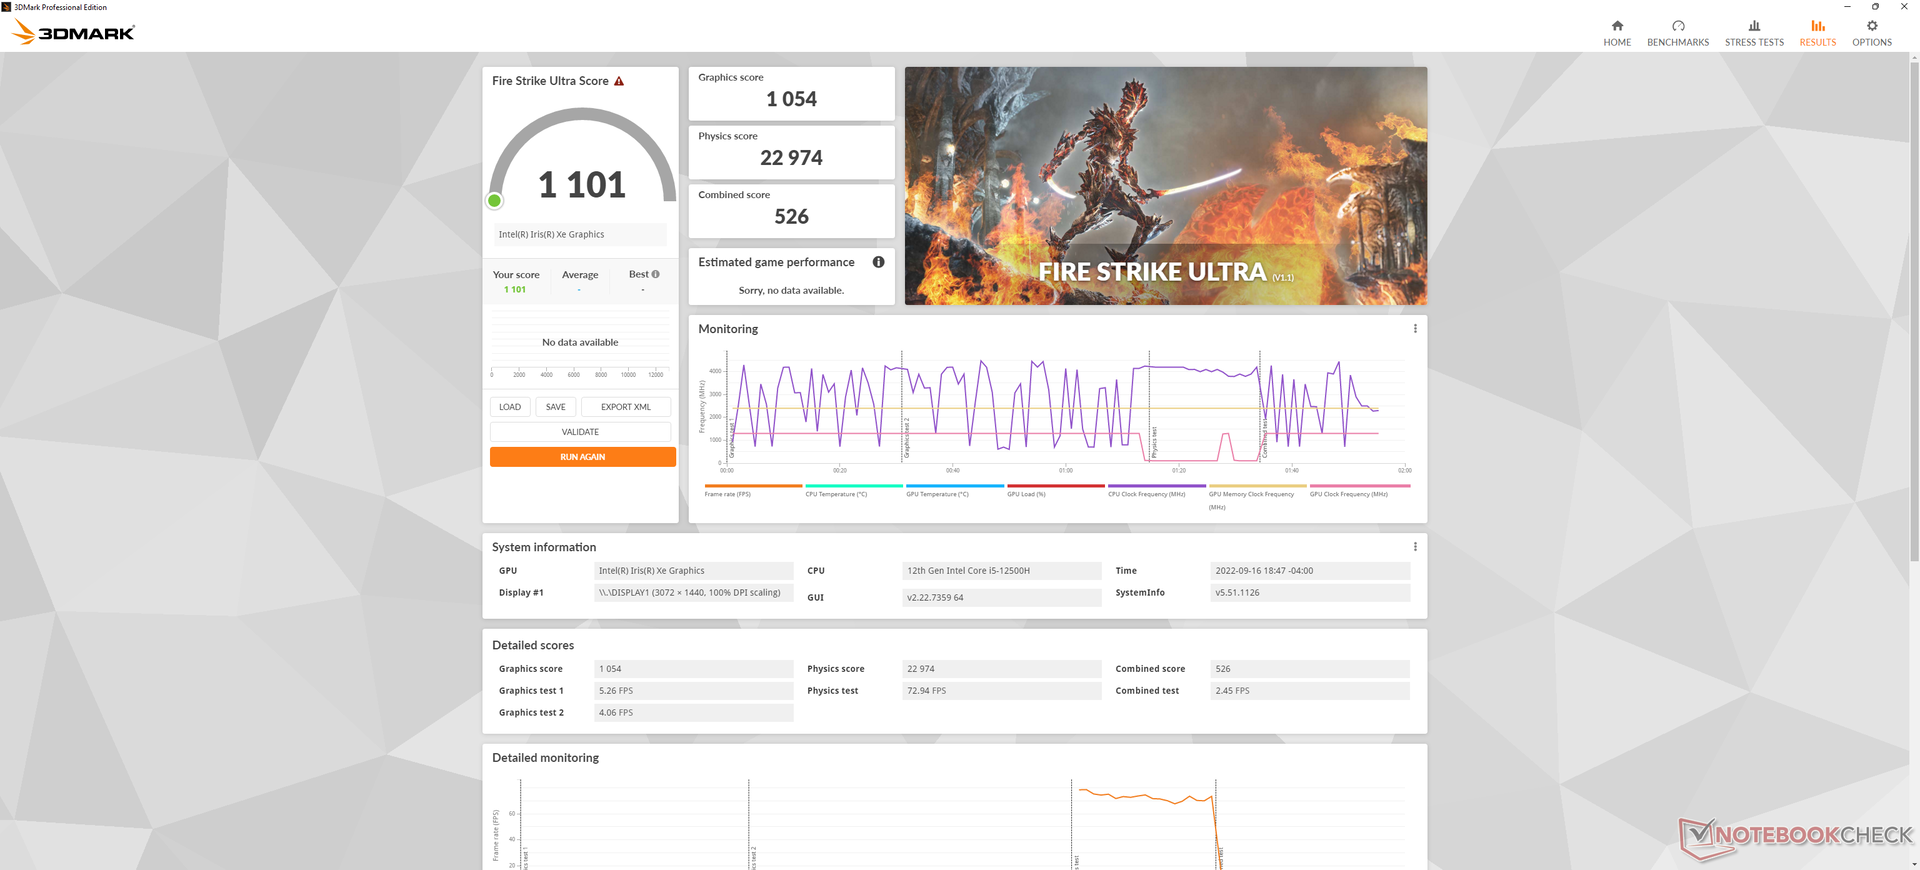
Wydajność GPU - tylko zintegrowana Iris Xe
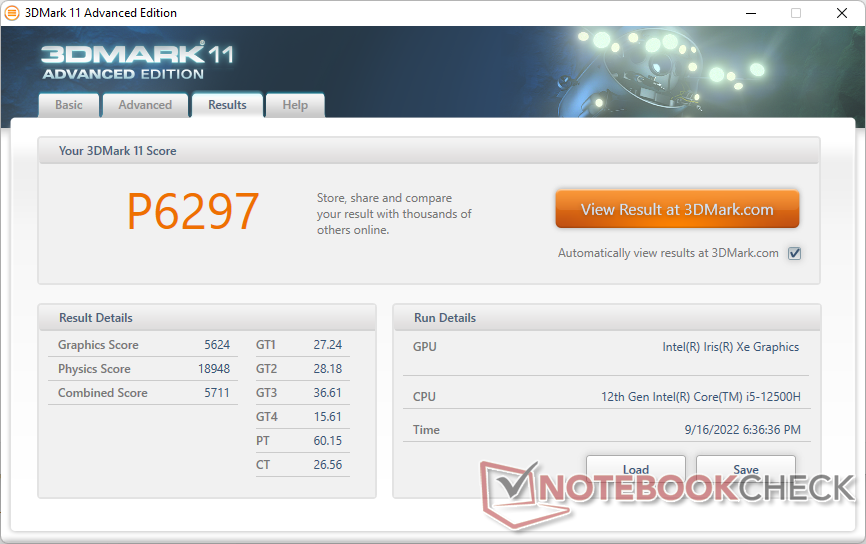
Wydajność surowej grafiki jest o kilka punktów procentowych wolniejsza od przeciętnego laptopa w naszej bazie danych z tym samym zintegrowanym Iris Xe 96 EUs GPU. Szkoda, że nie ma do wyboru dyskretnych opcji GeForce GTX/RTX czy nawet MX, które mogłyby znacznie podnieść wydajność grafiki. Zintegrowane rozwiązanie Intela jest po wolniejszej stronie, jeśli wziąć pod uwagę kategorię dużych 17-calówek.
| 3DMark | |
| 1920x1080 Fire Strike Graphics | |
| Asus ProArt StudioBook Pro 17 W700G3T | |
| Dell XPS 17 9720 | |
| Honor MagicBook 14 2022 | |
| Lenovo IdeaCentre AIO 3 24IAP7 | |
| Lenovo IdeaPad 5 Pro 16IHU6 | |
| Przeciętny Intel Iris Xe Graphics G7 96EUs (2286 - 6624, n=222) | |
| Lenovo ThinkBook Plus Gen3 | |
| Asus Vivobook 15 K513EQ | |
| LG Gram 17 (2022) | |
| Lenovo ThinkBook Plus Gen2 Core i5 | |
| 2560x1440 Time Spy Graphics | |
| Dell XPS 17 9720 | |
| Asus ProArt StudioBook Pro 17 W700G3T | |
| Honor MagicBook 14 2022 | |
| Lenovo IdeaCentre AIO 3 24IAP7 | |
| Lenovo IdeaPad 5 Pro 16IHU6 | |
| Przeciętny Intel Iris Xe Graphics G7 96EUs (707 - 1890, n=218) | |
| LG Gram 17 (2022) | |
| Lenovo ThinkBook Plus Gen3 | |
| Asus Vivobook 15 K513EQ | |
| Lenovo ThinkBook Plus Gen2 Core i5 | |
| 2560x1440 Time Spy Score | |
| Dell XPS 17 9720 | |
| Asus ProArt StudioBook Pro 17 W700G3T | |
| Honor MagicBook 14 2022 | |
| Lenovo IdeaCentre AIO 3 24IAP7 | |
| Lenovo IdeaPad 5 Pro 16IHU6 | |
| Przeciętny Intel Iris Xe Graphics G7 96EUs (789 - 2159, n=215) | |
| Lenovo ThinkBook Plus Gen3 | |
| LG Gram 17 (2022) | |
| Asus Vivobook 15 K513EQ | |
| Lenovo ThinkBook Plus Gen2 Core i5 | |
| 3DMark 11 - 1280x720 Performance GPU | |
| Dell XPS 17 9720 | |
| Asus ProArt StudioBook Pro 17 W700G3T | |
| Honor MagicBook 14 2022 | |
| Lenovo IdeaCentre AIO 3 24IAP7 | |
| Lenovo IdeaPad 5 Pro 16IHU6 | |
| Przeciętny Intel Iris Xe Graphics G7 96EUs (2867 - 7676, n=209) | |
| Asus Vivobook 15 K513EQ | |
| Lenovo ThinkBook Plus Gen3 | |
| LG Gram 17 (2022) | |
| Lenovo ThinkBook Plus Gen2 Core i5 | |
| 3DMark 11 Performance | 6297 pkt. | |
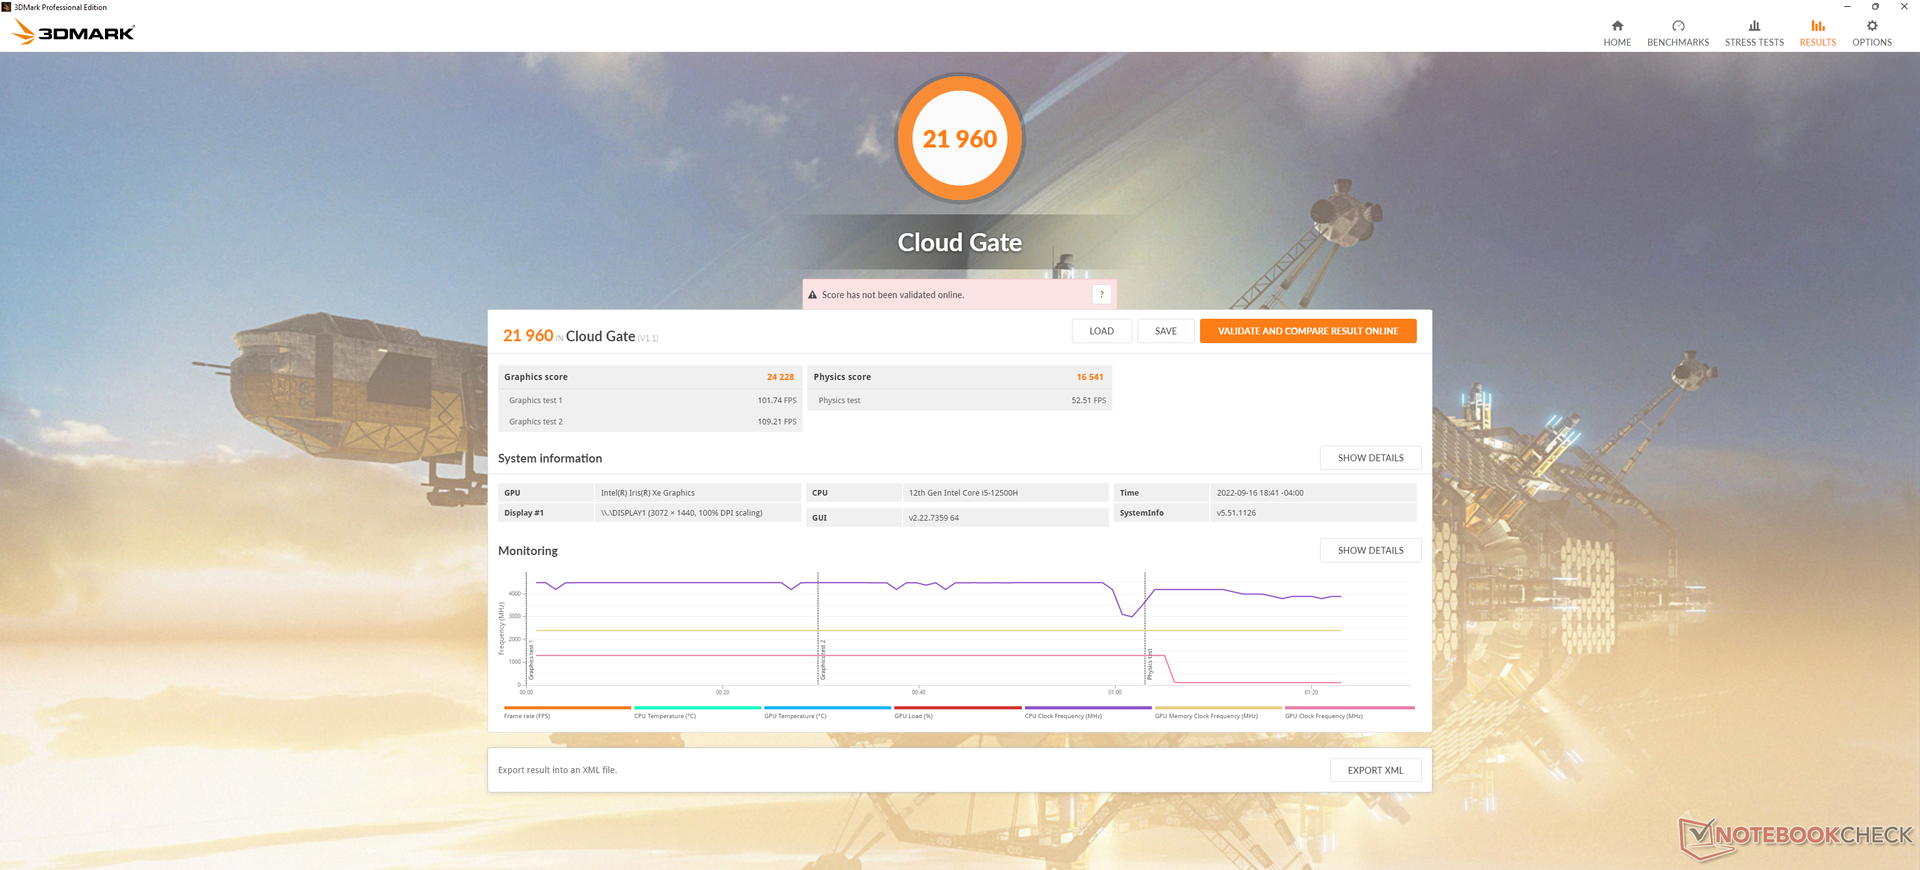
| 3DMark Cloud Gate Standard Score | 21960 pkt. | |
| 3DMark Fire Strike Score | 4301 pkt. | |
| 3DMark Time Spy Score | 1545 pkt. | |
Pomoc | ||
| The Witcher 3 | |
| 1024x768 Low Graphics & Postprocessing | |
| Dell XPS 17 9720 | |
| Asus ProArt StudioBook Pro 17 W700G3T | |
| Honor MagicBook 14 2022 | |
| Lenovo IdeaCentre AIO 3 24IAP7 | |
| Lenovo IdeaPad 5 Pro 16IHU6 | |
| Lenovo ThinkBook Plus Gen3 | |
| Asus Vivobook 15 K513EQ | |
| Przeciętny Intel Iris Xe Graphics G7 96EUs (28.9 - 117.2, n=188) | |
| LG Gram 17 (2022) | |
| Lenovo ThinkBook Plus Gen2 Core i5 | |
| 1366x768 Medium Graphics & Postprocessing | |
| Dell XPS 17 9720 | |
| Asus ProArt StudioBook Pro 17 W700G3T | |
| Honor MagicBook 14 2022 | |
| Lenovo IdeaCentre AIO 3 24IAP7 | |
| Lenovo IdeaPad 5 Pro 16IHU6 | |
| Przeciętny Intel Iris Xe Graphics G7 96EUs (21.4 - 77.8, n=185) | |
| Lenovo ThinkBook Plus Gen3 | |
| Asus Vivobook 15 K513EQ | |
| LG Gram 17 (2022) | |
| Lenovo ThinkBook Plus Gen2 Core i5 | |
| 1920x1080 High Graphics & Postprocessing (Nvidia HairWorks Off) | |
| Dell XPS 17 9720 | |
| Asus ProArt StudioBook Pro 17 W700G3T | |
| Honor MagicBook 14 2022 | |
| Lenovo IdeaCentre AIO 3 24IAP7 | |
| Lenovo IdeaPad 5 Pro 16IHU6 | |
| Lenovo ThinkBook Plus Gen3 | |
| Asus Vivobook 15 K513EQ | |
| Przeciętny Intel Iris Xe Graphics G7 96EUs (10.6 - 45.9, n=191) | |
| LG Gram 17 (2022) | |
| Lenovo ThinkBook Plus Gen2 Core i5 | |
| 1920x1080 Ultra Graphics & Postprocessing (HBAO+) | |
| Dell XPS 17 9720 | |
| Asus ProArt StudioBook Pro 17 W700G3T | |
| Honor MagicBook 14 2022 | |
| Lenovo IdeaCentre AIO 3 24IAP7 | |
| Lenovo IdeaPad 5 Pro 16IHU6 | |
| Asus Vivobook 15 K513EQ | |
| Przeciętny Intel Iris Xe Graphics G7 96EUs (8.79 - 20.1, n=181) | |
| Lenovo ThinkBook Plus Gen3 | |
| Lenovo ThinkBook Plus Gen2 Core i5 | |
| LG Gram 17 (2022) | |
| Final Fantasy XV Benchmark | |
| 1280x720 Lite Quality | |
| Dell XPS 17 9720 | |
| Honor MagicBook 14 2022 | |
| Lenovo IdeaCentre AIO 3 24IAP7 | |
| Lenovo IdeaPad 5 Pro 16IHU6 | |
| Asus Vivobook 15 K513EQ | |
| Przeciętny Intel Iris Xe Graphics G7 96EUs (14.9 - 56.5, n=189) | |
| Lenovo ThinkBook Plus Gen3 | |
| LG Gram 17 (2022) | |
| 1920x1080 Standard Quality | |
| Dell XPS 17 9720 | |
| Honor MagicBook 14 2022 | |
| Lenovo IdeaCentre AIO 3 24IAP7 | |
| Lenovo IdeaPad 5 Pro 16IHU6 | |
| Asus Vivobook 15 K513EQ | |
| Przeciętny Intel Iris Xe Graphics G7 96EUs (10.5 - 31.2, n=185) | |
| Lenovo ThinkBook Plus Gen3 | |
| LG Gram 17 (2022) | |
| 1920x1080 High Quality | |
| Dell XPS 17 9720 | |
| Honor MagicBook 14 2022 | |
| Lenovo IdeaCentre AIO 3 24IAP7 | |
| Lenovo IdeaPad 5 Pro 16IHU6 | |
| Lenovo ThinkBook Plus Gen3 | |
| Przeciętny Intel Iris Xe Graphics G7 96EUs (8.15 - 27.8, n=178) | |
| Asus Vivobook 15 K513EQ | |
| LG Gram 17 (2022) | |
| X-Plane 11.11 | |
| 1280x720 low (fps_test=1) | |
| Dell XPS 17 9720 | |
| Honor MagicBook 14 2022 | |
| Asus ProArt StudioBook Pro 17 W700G3T | |
| Lenovo IdeaCentre AIO 3 24IAP7 | |
| Lenovo IdeaPad 5 Pro 16IHU6 | |
| Asus Vivobook 15 K513EQ | |
| Lenovo ThinkBook Plus Gen3 | |
| Przeciętny Intel Iris Xe Graphics G7 96EUs (13.4 - 88.4, n=213) | |
| LG Gram 17 (2022) | |
| Lenovo ThinkBook Plus Gen2 Core i5 | |
| 1920x1080 med (fps_test=2) | |
| Dell XPS 17 9720 | |
| Honor MagicBook 14 2022 | |
| Asus ProArt StudioBook Pro 17 W700G3T | |
| Lenovo IdeaCentre AIO 3 24IAP7 | |
| Lenovo IdeaPad 5 Pro 16IHU6 | |
| Asus Vivobook 15 K513EQ | |
| Przeciętny Intel Iris Xe Graphics G7 96EUs (11.6 - 69.5, n=214) | |
| Lenovo ThinkBook Plus Gen3 | |
| LG Gram 17 (2022) | |
| Lenovo ThinkBook Plus Gen2 Core i5 | |
| 1920x1080 high (fps_test=3) | |
| Dell XPS 17 9720 | |
| Honor MagicBook 14 2022 | |
| Asus ProArt StudioBook Pro 17 W700G3T | |
| Lenovo IdeaCentre AIO 3 24IAP7 | |
| Lenovo IdeaPad 5 Pro 16IHU6 | |
| Asus Vivobook 15 K513EQ | |
| Przeciętny Intel Iris Xe Graphics G7 96EUs (11.1 - 59.8, n=213) | |
| Lenovo ThinkBook Plus Gen3 | |
| LG Gram 17 (2022) | |
| Lenovo ThinkBook Plus Gen2 Core i5 | |
| Dota 2 Reborn | |
| 1280x720 min (0/3) fastest | |
| Dell XPS 17 9720 | |
| Honor MagicBook 14 2022 | |
| Lenovo IdeaCentre AIO 3 24IAP7 | |
| Asus ProArt StudioBook Pro 17 W700G3T | |
| Asus Vivobook 15 K513EQ | |
| Lenovo ThinkBook Plus Gen3 | |
| Lenovo IdeaPad 5 Pro 16IHU6 | |
| LG Gram 17 (2022) | |
| Przeciętny Intel Iris Xe Graphics G7 96EUs (36 - 148, n=221) | |
| Lenovo ThinkBook Plus Gen2 Core i5 | |
| 1366x768 med (1/3) | |
| Dell XPS 17 9720 | |
| Honor MagicBook 14 2022 | |
| Lenovo IdeaCentre AIO 3 24IAP7 | |
| Asus ProArt StudioBook Pro 17 W700G3T | |
| Asus Vivobook 15 K513EQ | |
| Lenovo IdeaPad 5 Pro 16IHU6 | |
| Lenovo ThinkBook Plus Gen3 | |
| Przeciętny Intel Iris Xe Graphics G7 96EUs (31.6 - 108.5, n=221) | |
| LG Gram 17 (2022) | |
| Lenovo ThinkBook Plus Gen2 Core i5 | |
| 1920x1080 high (2/3) | |
| Dell XPS 17 9720 | |
| Honor MagicBook 14 2022 | |
| Asus ProArt StudioBook Pro 17 W700G3T | |
| Lenovo IdeaCentre AIO 3 24IAP7 | |
| Lenovo IdeaPad 5 Pro 16IHU6 | |
| Asus Vivobook 15 K513EQ | |
| Przeciętny Intel Iris Xe Graphics G7 96EUs (23.2 - 88.1, n=221) | |
| Lenovo ThinkBook Plus Gen3 | |
| Lenovo ThinkBook Plus Gen2 Core i5 | |
| LG Gram 17 (2022) | |
| 1920x1080 ultra (3/3) best looking | |
| Dell XPS 17 9720 | |
| Honor MagicBook 14 2022 | |
| Asus ProArt StudioBook Pro 17 W700G3T | |
| Lenovo IdeaCentre AIO 3 24IAP7 | |
| Lenovo IdeaPad 5 Pro 16IHU6 | |
| Asus Vivobook 15 K513EQ | |
| Przeciętny Intel Iris Xe Graphics G7 96EUs (20.6 - 78.5, n=221) | |
| Lenovo ThinkBook Plus Gen3 | |
| Lenovo ThinkBook Plus Gen2 Core i5 | |
| LG Gram 17 (2022) | |
| GTA V | |
| 1024x768 Lowest Settings possible | |
| Dell XPS 17 9720 | |
| Honor MagicBook 14 2022 | |
| Lenovo IdeaCentre AIO 3 24IAP7 | |
| Lenovo IdeaPad 5 Pro 16IHU6 | |
| Asus ProArt StudioBook Pro 17 W700G3T | |
| Asus Vivobook 15 K513EQ | |
| Lenovo ThinkBook Plus Gen3 | |
| Przeciętny Intel Iris Xe Graphics G7 96EUs (52 - 166.4, n=168) | |
| LG Gram 17 (2022) | |
| Lenovo ThinkBook Plus Gen2 Core i5 | |
| 1920x1080 Lowest Settings possible | |
| Lenovo IdeaPad 5 Pro 16IHU6 | |
| Asus Vivobook 15 K513EQ | |
| Przeciętny Intel Iris Xe Graphics G7 96EUs (34.7 - 132.1, n=141) | |
| LG Gram 17 (2022) | |
| Lenovo ThinkBook Plus Gen3 | |
| Lenovo ThinkBook Plus Gen2 Core i5 | |
| 1366x768 Normal/Off AF:4x | |
| Dell XPS 17 9720 | |
| Honor MagicBook 14 2022 | |
| Lenovo IdeaCentre AIO 3 24IAP7 | |
| Lenovo IdeaPad 5 Pro 16IHU6 | |
| Asus ProArt StudioBook Pro 17 W700G3T | |
| Asus Vivobook 15 K513EQ | |
| Przeciętny Intel Iris Xe Graphics G7 96EUs (24.1 - 152.7, n=169) | |
| LG Gram 17 (2022) | |
| Lenovo ThinkBook Plus Gen3 | |
| Lenovo ThinkBook Plus Gen2 Core i5 | |
| 1920x1080 Normal/Off AF:4x | |
| Lenovo IdeaPad 5 Pro 16IHU6 | |
| Asus Vivobook 15 K513EQ | |
| Przeciętny Intel Iris Xe Graphics G7 96EUs (20 - 119.3, n=142) | |
| LG Gram 17 (2022) | |
| Lenovo ThinkBook Plus Gen3 | |
| Lenovo ThinkBook Plus Gen2 Core i5 | |
| 1920x1080 High/On (Advanced Graphics Off) AA:2xMSAA + FX AF:8x | |
| Dell XPS 17 9720 | |
| Asus ProArt StudioBook Pro 17 W700G3T | |
| Honor MagicBook 14 2022 | |
| Lenovo IdeaCentre AIO 3 24IAP7 | |
| Lenovo IdeaPad 5 Pro 16IHU6 | |
| Asus Vivobook 15 K513EQ | |
| Przeciętny Intel Iris Xe Graphics G7 96EUs (9.39 - 51.6, n=162) | |
| Lenovo ThinkBook Plus Gen3 | |
| Lenovo ThinkBook Plus Gen2 Core i5 | |
| LG Gram 17 (2022) | |
| 1920x1080 Highest AA:4xMSAA + FX AF:16x | |
| Dell XPS 17 9720 | |
| Asus ProArt StudioBook Pro 17 W700G3T | |
| Honor MagicBook 14 2022 | |
| Lenovo IdeaCentre AIO 3 24IAP7 | |
| Lenovo IdeaPad 5 Pro 16IHU6 | |
| Asus Vivobook 15 K513EQ | |
| Przeciętny Intel Iris Xe Graphics G7 96EUs (4.13 - 22.9, n=156) | |
| Lenovo ThinkBook Plus Gen3 | |
| Lenovo ThinkBook Plus Gen2 Core i5 | |
| LG Gram 17 (2022) | |
| Strange Brigade | |
| 1280x720 lowest AF:1 | |
| Dell XPS 17 9720 | |
| Honor MagicBook 14 2022 | |
| Lenovo IdeaCentre AIO 3 24IAP7 | |
| Lenovo IdeaPad 5 Pro 16IHU6 | |
| Asus Vivobook 15 K513EQ | |
| Przeciętny Intel Iris Xe Graphics G7 96EUs (48.5 - 115.1, n=172) | |
| Lenovo ThinkBook Plus Gen3 | |
| LG Gram 17 (2022) | |
| Lenovo ThinkBook Plus Gen2 Core i5 | |
| 1920x1080 medium AA:medium AF:4 | |
| Dell XPS 17 9720 | |
| Honor MagicBook 14 2022 | |
| Lenovo IdeaCentre AIO 3 24IAP7 | |
| Lenovo IdeaPad 5 Pro 16IHU6 | |
| Przeciętny Intel Iris Xe Graphics G7 96EUs (18.2 - 51.4, n=170) | |
| Asus Vivobook 15 K513EQ | |
| Lenovo ThinkBook Plus Gen3 | |
| Lenovo ThinkBook Plus Gen2 Core i5 | |
| LG Gram 17 (2022) | |
| 1920x1080 high AA:high AF:8 | |
| Dell XPS 17 9720 | |
| Honor MagicBook 14 2022 | |
| Lenovo IdeaCentre AIO 3 24IAP7 | |
| Lenovo IdeaPad 5 Pro 16IHU6 | |
| Przeciętny Intel Iris Xe Graphics G7 96EUs (15.4 - 39.8, n=169) | |
| Lenovo ThinkBook Plus Gen3 | |
| Asus Vivobook 15 K513EQ | |
| Lenovo ThinkBook Plus Gen2 Core i5 | |
| LG Gram 17 (2022) | |
| 1920x1080 ultra AA:ultra AF:16 | |
| Dell XPS 17 9720 | |
| Honor MagicBook 14 2022 | |
| Lenovo IdeaCentre AIO 3 24IAP7 | |
| Lenovo IdeaPad 5 Pro 16IHU6 | |
| Przeciętny Intel Iris Xe Graphics G7 96EUs (13.2 - 31.7, n=167) | |
| Lenovo ThinkBook Plus Gen3 | |
| LG Gram 17 (2022) | |
| Asus Vivobook 15 K513EQ | |
| Lenovo ThinkBook Plus Gen2 Core i5 | |
Witcher 3 FPS Chart
| low | med. | high | ultra | |
|---|---|---|---|---|
| GTA V (2015) | 100.1 | 60.9 | 20 | 8.96 |
| The Witcher 3 (2015) | 87.1 | 51.2 | 30.4 | 13.4 |
| Dota 2 Reborn (2015) | 126 | 94.1 | 48.6 | 44.9 |
| Final Fantasy XV Benchmark (2018) | 39 | 21.3 | 16.8 | |
| X-Plane 11.11 (2018) | 43.5 | 34 | 30.4 | |
| Strange Brigade (2018) | 74.6 | 32 | 25.5 | 20.2 |
| Cyberpunk 2077 1.6 (2022) | 16 | 13.4 | 10.6 | 8.6 |
Emisje
Hałas systemu - głośny pod obciążeniem
Szum wentylatorów na biegu jałowym na pulpicie wynosi od 26 do 28 dB(A) w zależności od profilu zasilania na tle cichego tła o wartości 22,7 dB(A). W większości przypadków wentylatory wewnętrzne nie są więc naprawdę ciche, co być może jest konsekwencją zastosowania procesora z serii Core H zamiast wolniejszej, ale bardziej wydajnej opcji Core U. W trybie Extreme Performance wentylatory osiągają nawet 35 dB(A) podczas przeglądania stron internetowych lub przetwarzania tekstu, dlatego też zalecamy tryb zrównoważony lub "Intelligent Cooling" podczas uruchamiania niewymagających aplikacji.
Przy większych obciążeniach, takich jak gry, szum wentylatora wynosi od 39 do 43 dB(A), czyli znacznie głośniej, niż w mniejszym ThinkBooku Plus Gen 2.
Hałas
| luz |
| 26.3 / 26.3 / 27.9 dB |
| obciążenie |
| 42.2 / 46.5 dB |
 | ||
30 dB cichy 40 dB(A) słyszalny 50 dB(A) irytujący |
||
min: | ||
| Lenovo ThinkBook Plus Gen3 Iris Xe G7 96EUs, i7-12700H, Micron 3400 MTFDKBA512TFH 512GB | Lenovo ThinkBook Plus Gen2 Core i5 Iris Xe G7 80EUs, i5-1130G7, Samsung PM9A1 MZVL2512HCJQ | Asus ProArt StudioBook Pro 17 W700G3T Quadro RTX 3000 Max-Q, i7-9750H, Samsung SSD PM981 MZVLB1T0HALR | LG Gram 17 (2022) Iris Xe G7 80EUs, i5-1240P, Samsung PM9A1 MZVL2512HCJQ | Dell XPS 17 9720 GeForce RTX 3050 4GB Laptop GPU, i7-12700H, Micron 3400 MTFDKBA512TFH 512GB | Gigabyte Aero 17 HDR YD GeForce RTX 3080 Laptop GPU, i9-11980HK, Samsung PM9A1 MZVL2512HCJQ | |
|---|---|---|---|---|---|---|
| Noise | 6% | 2% | 6% | -1% | -21% | |
| wyłączone / środowisko * (dB) | 22.7 | 25.4 -12% | 29.4 -30% | 25.1 -11% | 24 -6% | 25 -10% |
| Idle Minimum * (dB) | 26.3 | 25.4 3% | 29.4 -12% | 25.12 4% | 24 9% | 30 -14% |
| Idle Average * (dB) | 26.3 | 27.4 -4% | 29.9 -14% | 25.15 4% | 24 9% | 32 -22% |
| Idle Maximum * (dB) | 27.9 | 32.2 -15% | 29.9 -7% | 26 7% | 24 14% | 41 -47% |
| Load Average * (dB) | 42.2 | 32.2 24% | 31.6 25% | 36.9 13% | 43.9 -4% | 43 -2% |
| Witcher 3 ultra * (dB) | 39.8 | 32.2 19% | 31.6 21% | 48.4 -22% | 51 -28% | |
| Load Maximum * (dB) | 46.5 | 34.5 26% | 31.6 32% | 37.2 20% | 48.4 -4% | 59 -27% |
* ... im mniej tym lepiej
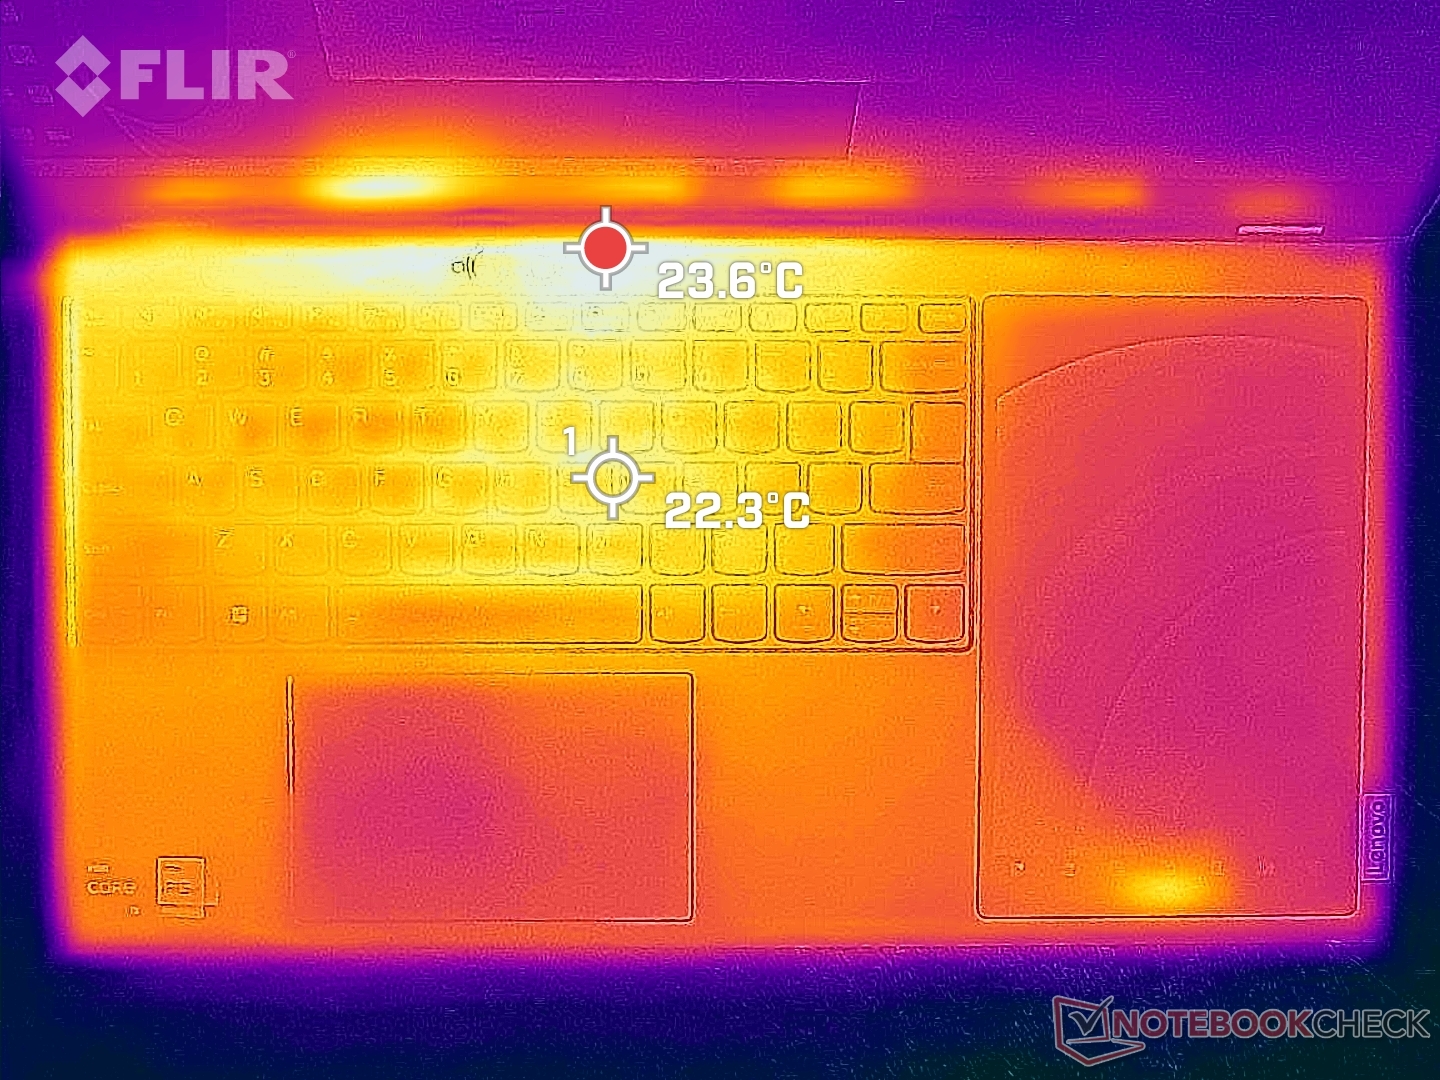
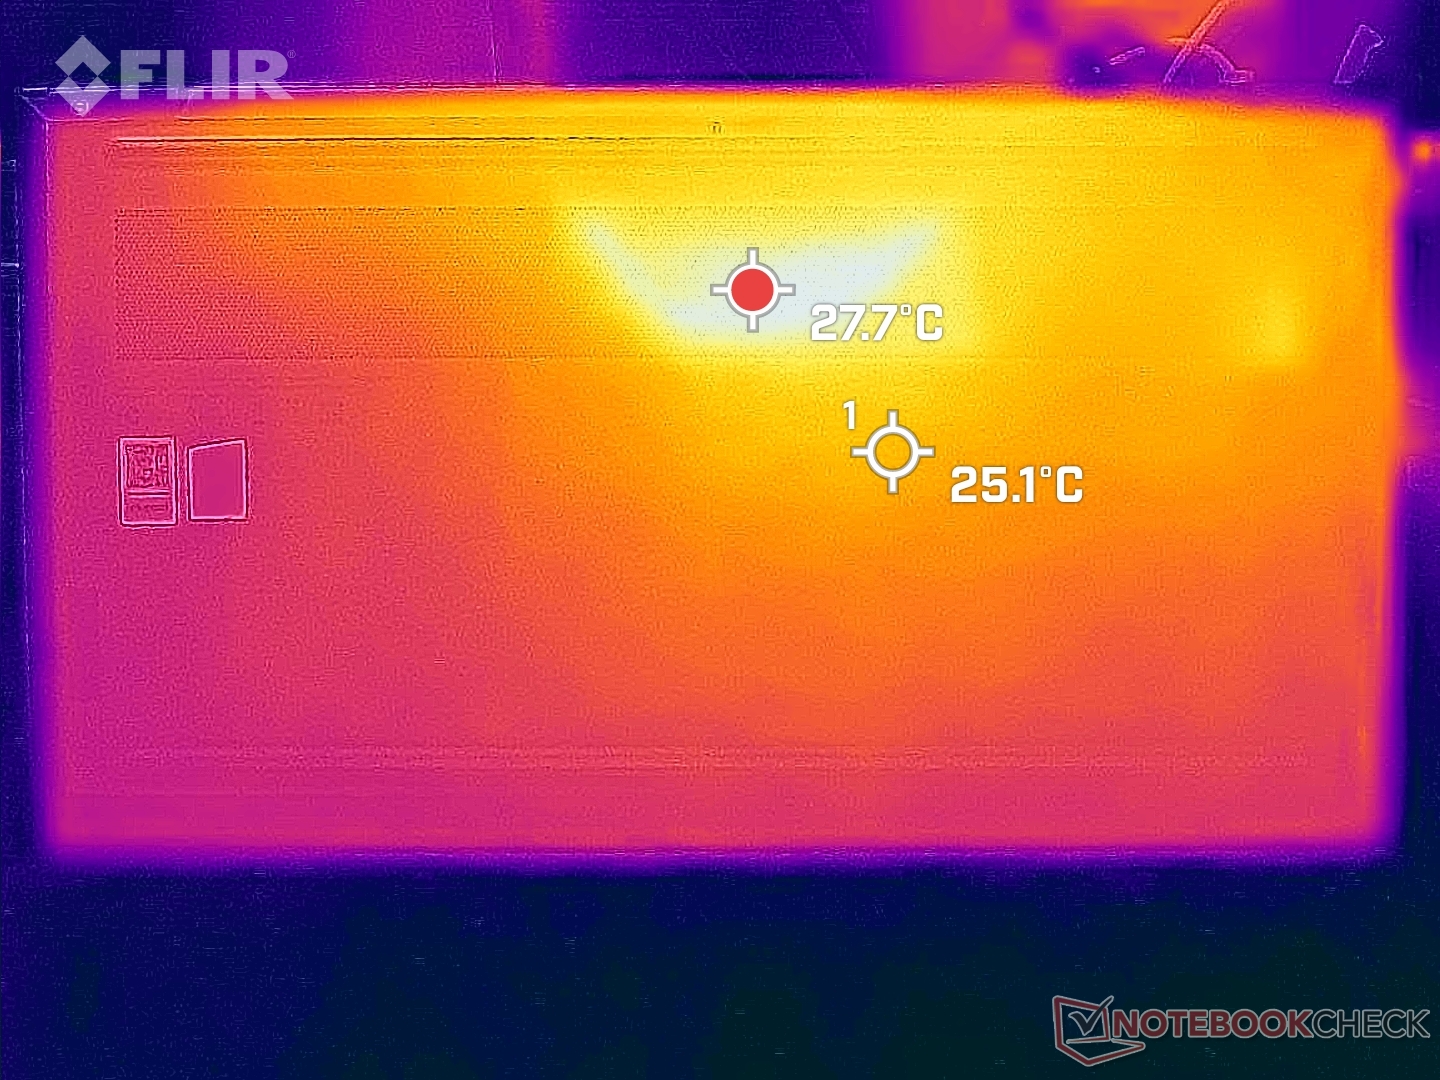
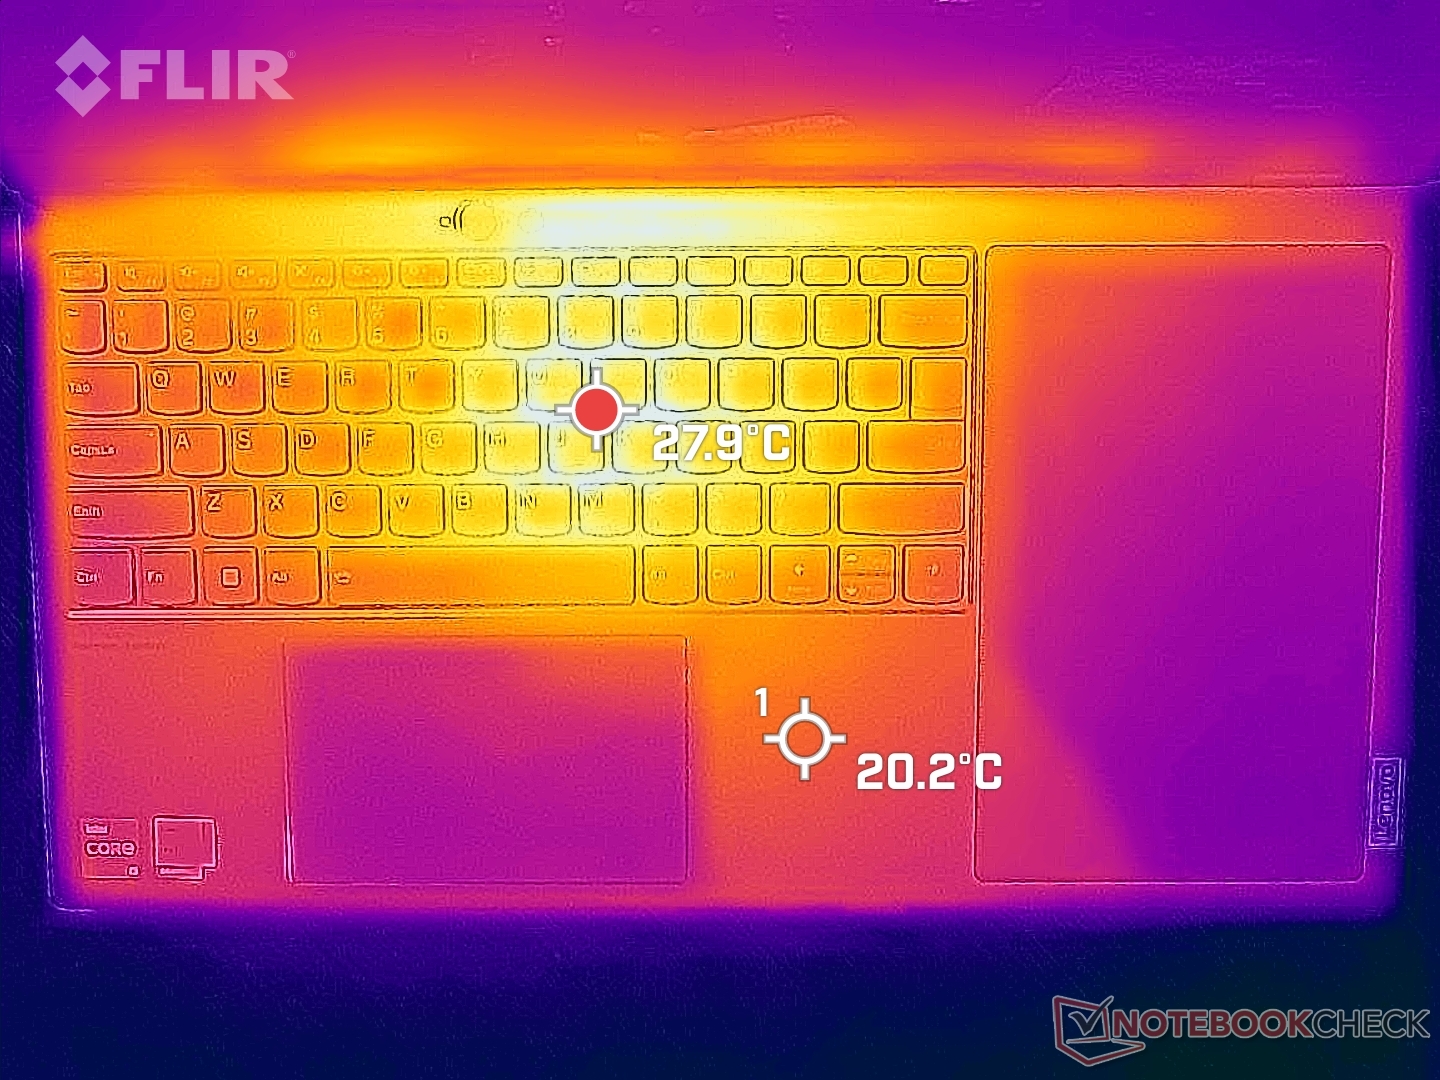
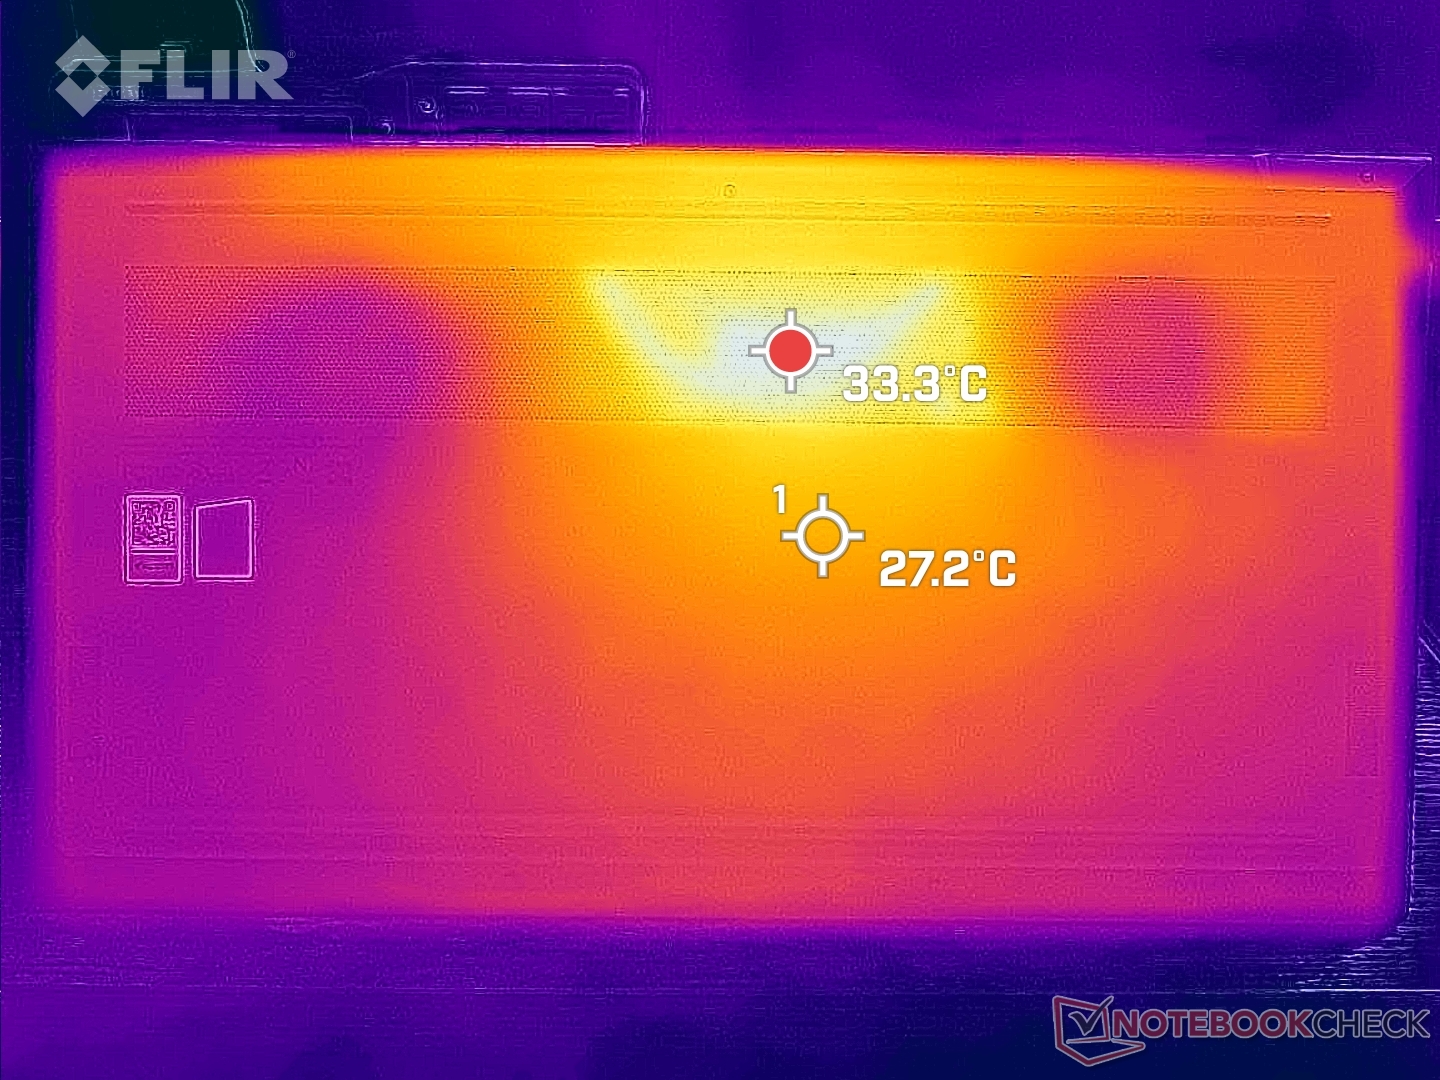
Temperatura - Pretty Cool
Temperatury powierzchni są chłodniejsze niż oczekiwano, nawet przy dużym obciążeniu. Gorące punkty mają tylko około 33 C odpowiednio na górze i na dole, w porównaniu do 50 C lub cieplej na LG Gram 17 w podobnych warunkach. Większa powierzchnia o szerokich proporcjach 21:10 ma pozytywny wpływ na ogólny rozwój temperatury.
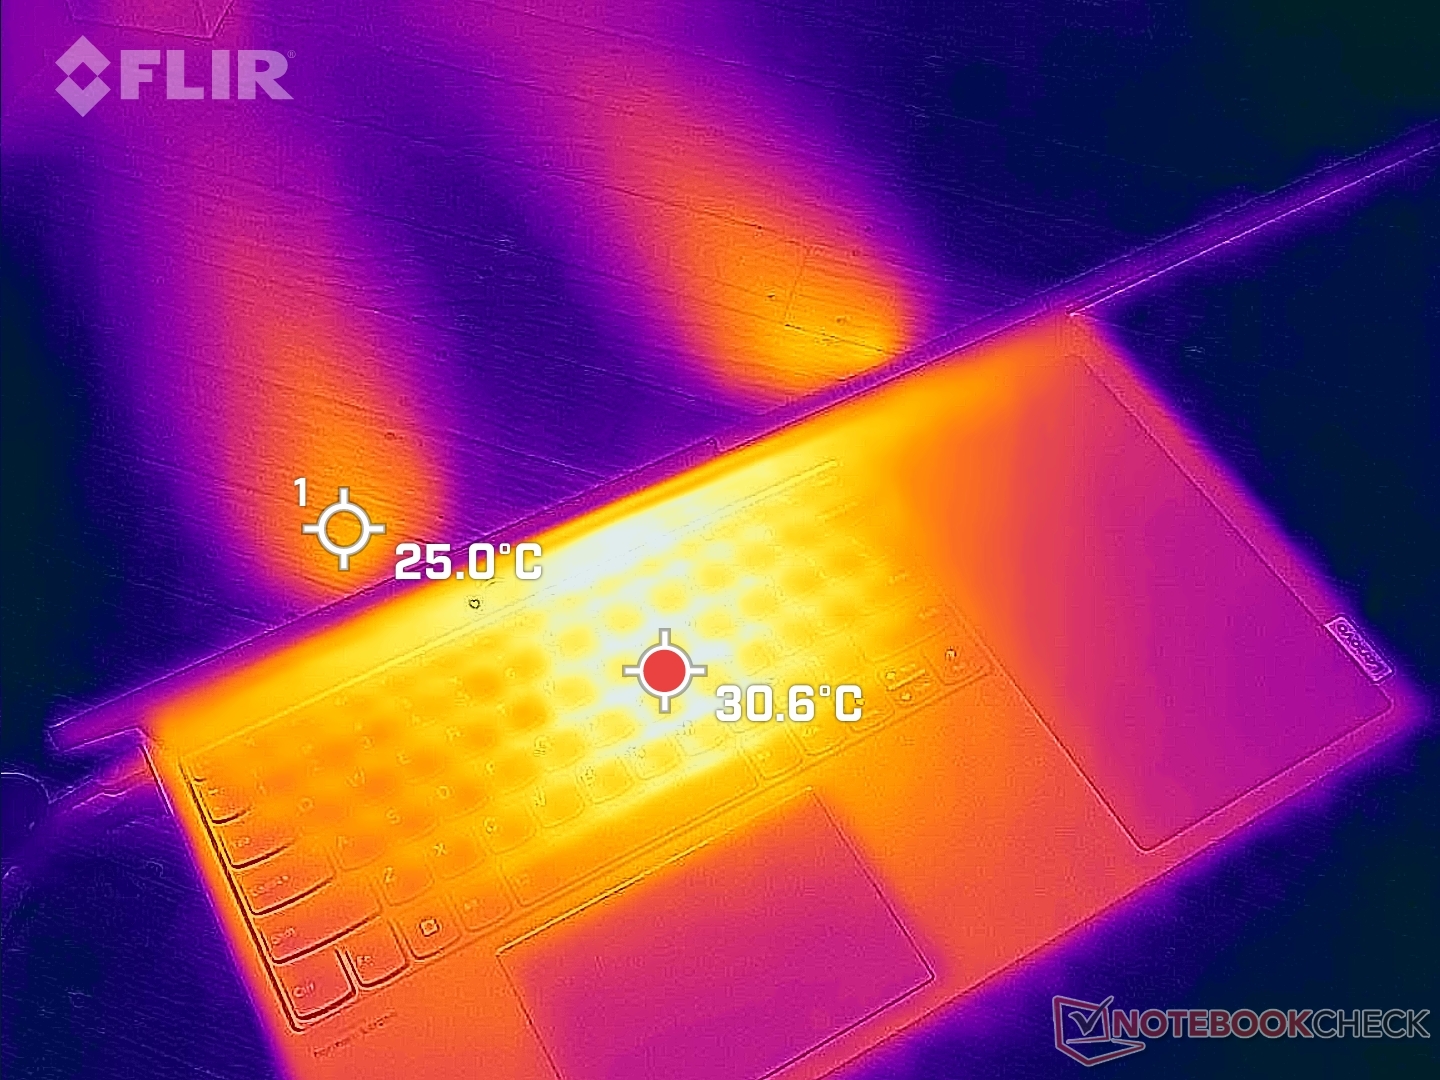
(+) Maksymalna temperatura w górnej części wynosi 33.2 °C / 92 F, w porównaniu do średniej 34.3 °C / 94 F , począwszy od 21.2 do 62.5 °C dla klasy Office.
(+) Dno nagrzewa się maksymalnie do 32.8 °C / 91 F, w porównaniu do średniej 36.8 °C / 98 F
(+) W stanie bezczynności średnia temperatura górnej części wynosi 27.2 °C / 81 F, w porównaniu ze średnią temperaturą urządzenia wynoszącą 29.5 °C / ### class_avg_f### F.
(+) Podpórki pod nadgarstki i touchpad są chłodniejsze niż temperatura skóry i maksymalnie 26.4 °C / 79.5 F i dlatego są chłodne w dotyku.
(±) Średnia temperatura obszaru podparcia dłoni w podobnych urządzeniach wynosiła 27.5 °C / 81.5 F (+1.1 °C / 2 F).
| Lenovo ThinkBook Plus Gen3 Intel Core i7-12700H, Intel Iris Xe Graphics G7 96EUs | Lenovo ThinkBook Plus Gen2 Core i5 Intel Core i5-1130G7, Intel Iris Xe Graphics G7 80EUs | Asus ProArt StudioBook Pro 17 W700G3T Intel Core i7-9750H, NVIDIA Quadro RTX 3000 Max-Q | LG Gram 17 (2022) Intel Core i5-1240P, Intel Iris Xe Graphics G7 80EUs | Dell XPS 17 9720 Intel Core i7-12700H, NVIDIA GeForce RTX 3050 4GB Laptop GPU | Gigabyte Aero 17 HDR YD Intel Core i9-11980HK, NVIDIA GeForce RTX 3080 Laptop GPU | |
|---|---|---|---|---|---|---|
| Heat | -17% | -12% | -30% | -13% | -32% | |
| Maximum Upper Side * (°C) | 33.2 | 42 -27% | 45.4 -37% | 50 -51% | 49.5 -49% | 44 -33% |
| Maximum Bottom * (°C) | 32.8 | 44.5 -36% | 53.7 -64% | 50 -52% | 38.4 -17% | 56 -71% |
| Idle Upper Side * (°C) | 29.8 | 29.8 -0% | 22.2 26% | 31.5 -6% | 28 6% | 32 -7% |
| Idle Bottom * (°C) | 30.4 | 31.9 -5% | 21.8 28% | 33.5 -10% | 27.8 9% | 35 -15% |
* ... im mniej tym lepiej
Stress Test
Po uruchomieniu Prime95 w celu obciążenia CPU częstotliwości taktowania i pobór mocy na płycie skoczyły odpowiednio do 3,6 GHz i 80 W, utrzymując się tylko przez kilka sekund i osiągając temperaturę rdzenia 98 C. Częstotliwości taktowania i pobór mocy na płycie spadłyby następnie szybko do 3 GHz i 60 W, by w końcu ustabilizować się na poziomie 2,8 GHz i 52 W, odpowiednio, by utrzymać temperaturę rdzenia nieco poniżej 90 C. Powtórzenie tego testu na XPS-ie 17 z tym samym procesorem Core i7-12700H dałoby podobne częstotliwości taktowania, ale przy chłodniejszej temperaturze rdzenia wynoszącej 75 C.
Częstotliwości taktowania GPU i temperatura podczas pracy Witcher 3 ustabilizowały się odpowiednio na poziomie 1297 MHz i 85 C, co jest częstym zakresem dla cienkich laptopów multimedialnych z Core H, takich jak np Dell Inspiron 16 Plus 7620.
Praca na zasilaniu akumulatorowym wpływa na wydajność. Test 3DMark 11 przeprowadzony na akumulatorze przyniósł wyniki z dziedziny fizyki i grafiki w wysokości odpowiednio 16704 i 5421 pkt. w porównaniu z 18948 i 6524 pkt. na zasilaniu z sieci.
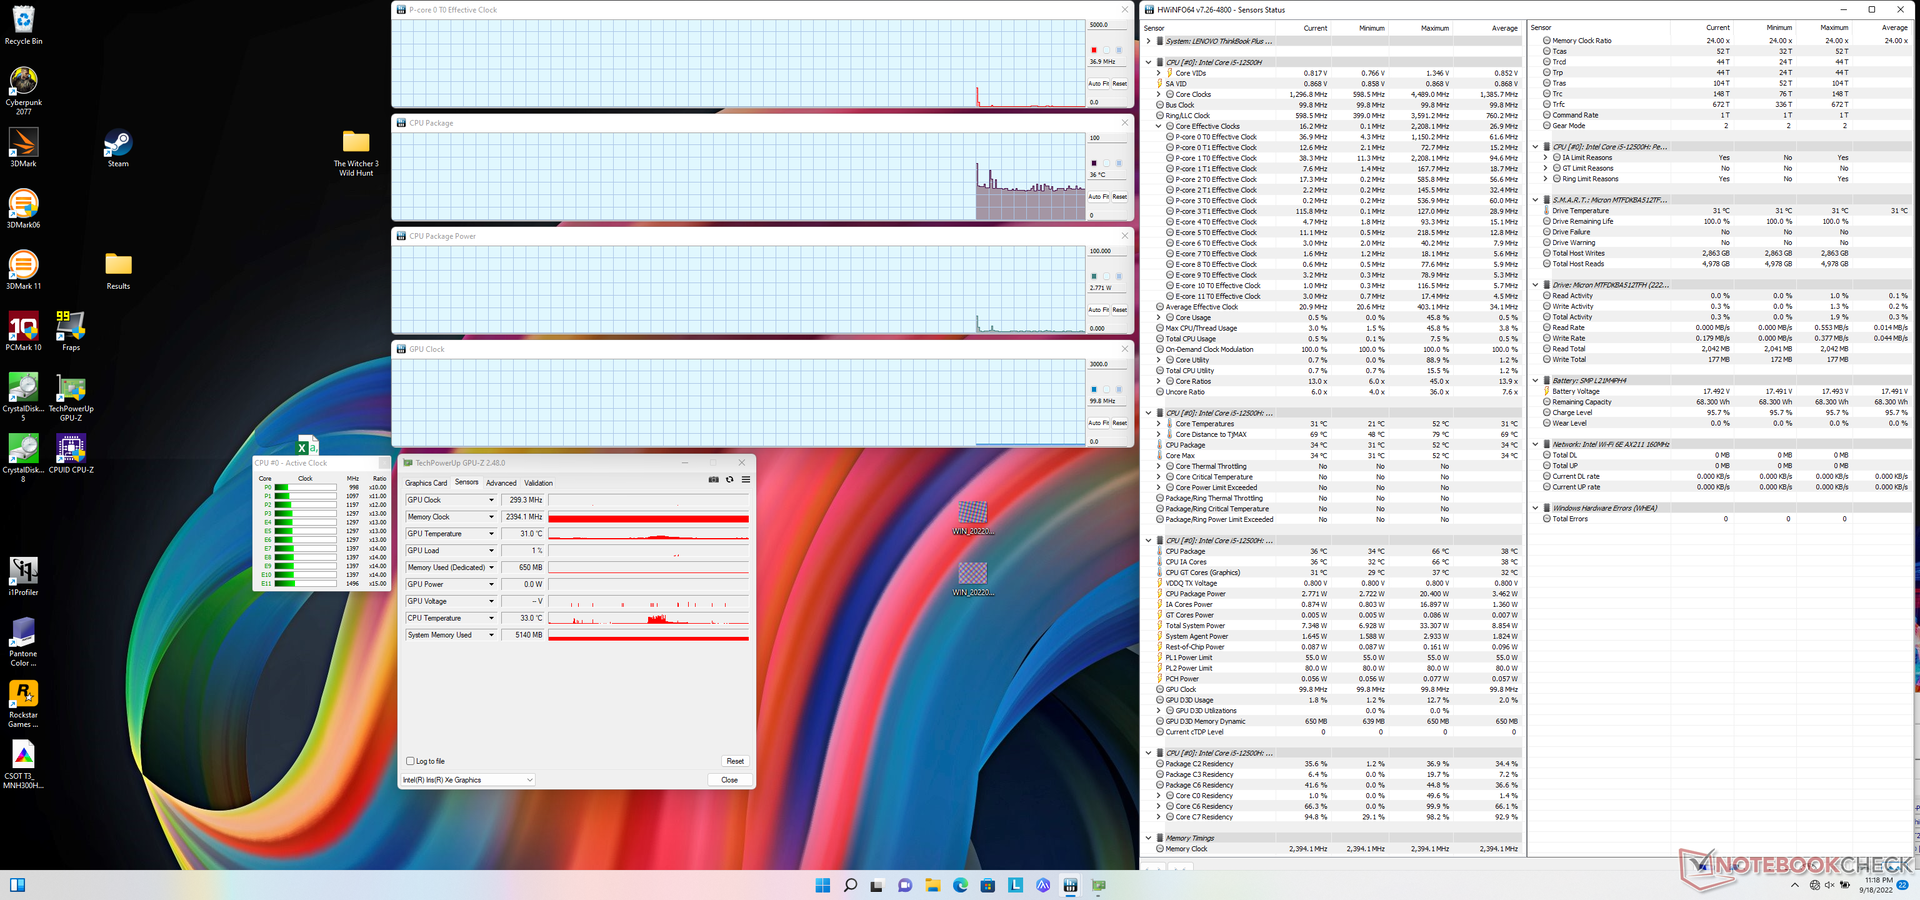
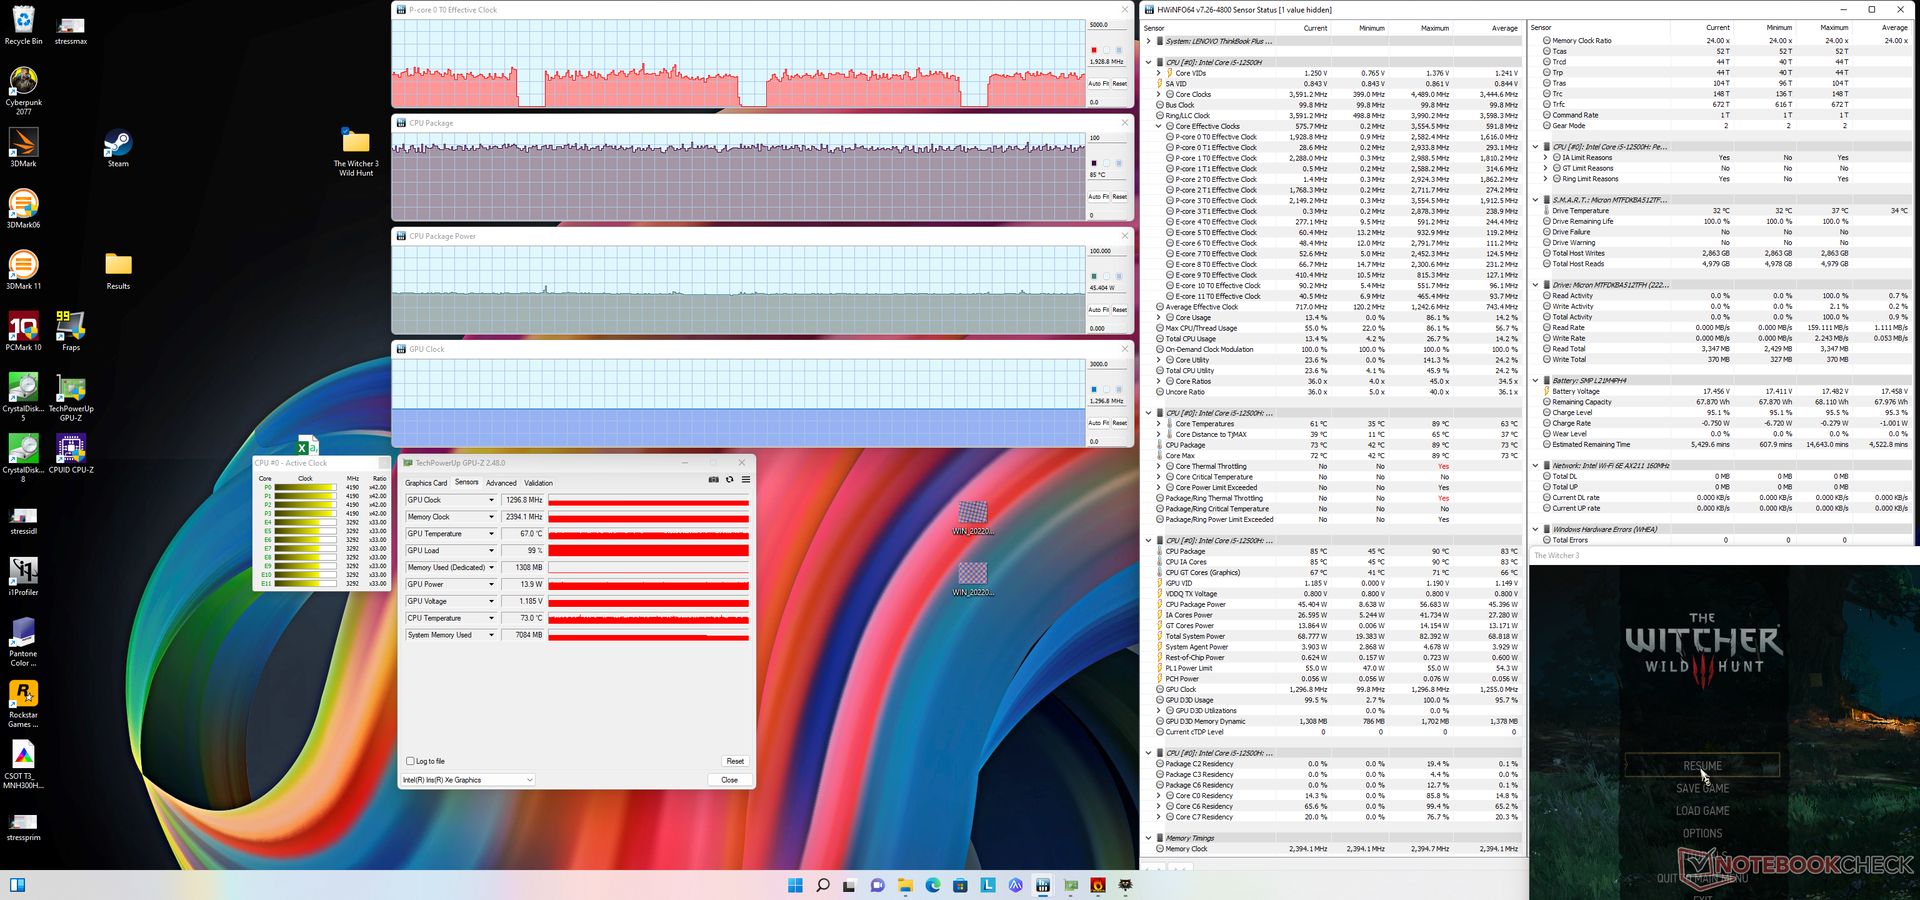
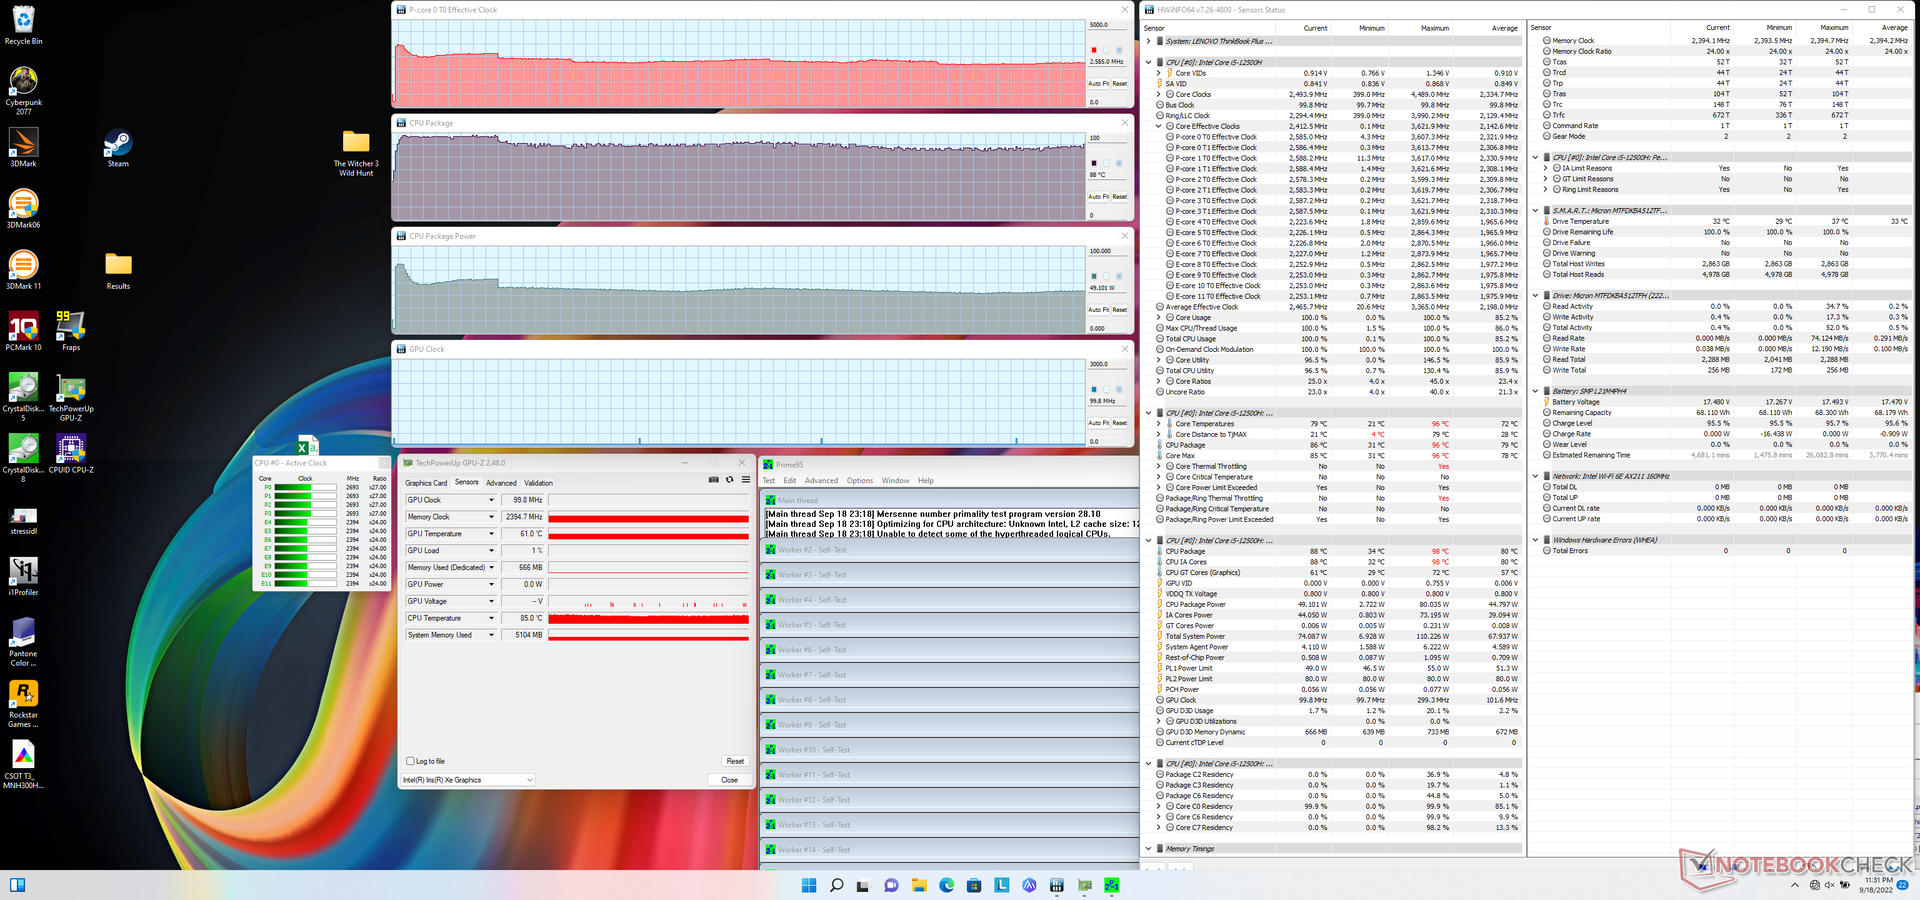
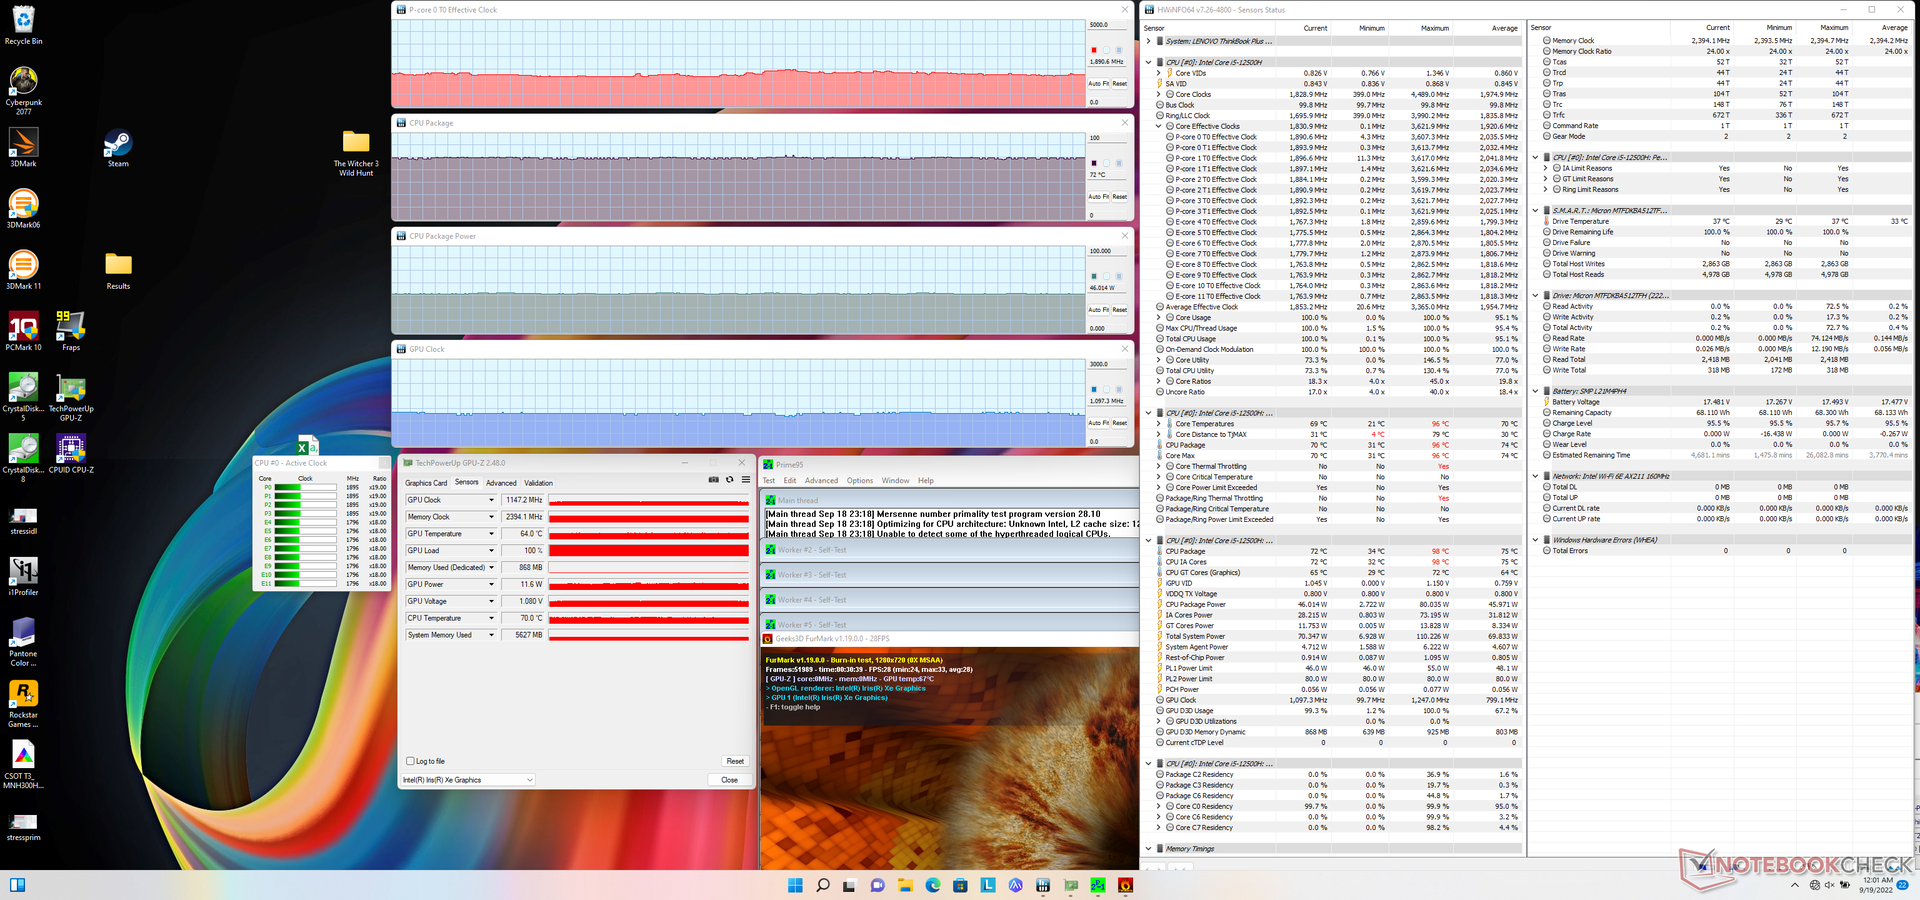
| ZegarCPU (GHz) | Zegar GPU (MHz) | Średnia temperatura CPU (°C) | |
| System w stanie bezczynności | -- | -- | 36 |
| Prime95 Stress | 2.6 | -- | 88 |
| Prime95 + FurMark Stress | 1.9 | 1147 | 72 |
| Witcher 3 Stress | ~1.9 | 1297 | 85 |
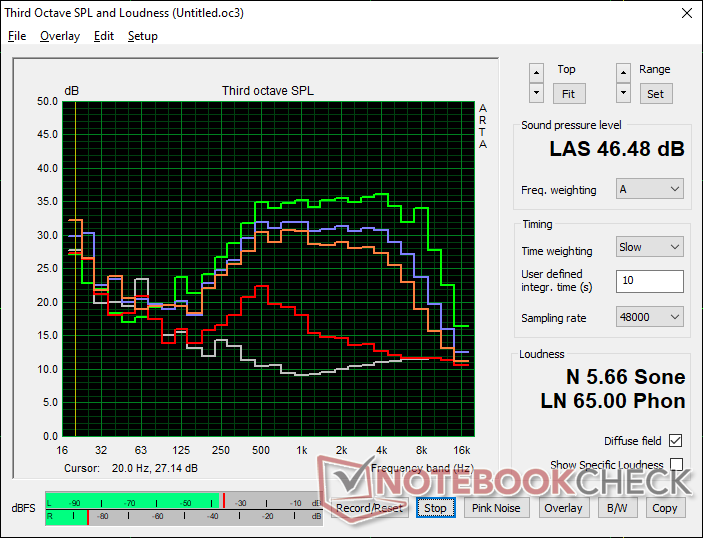
Mówcy
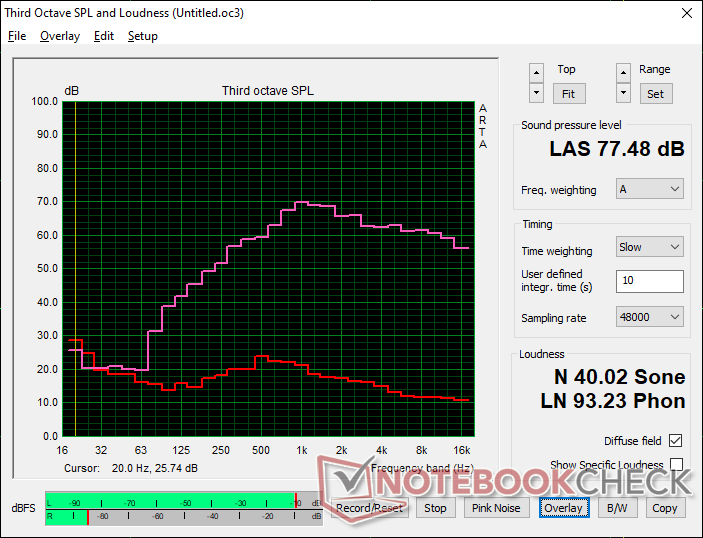
Lenovo ThinkBook Plus Gen3 analiza dźwięku
(±) | głośność głośnika jest średnia, ale dobra (77.5 dB)
Bas 100 - 315 Hz
(±) | zredukowany bas - średnio 14% niższy od mediany
(±) | liniowość basu jest średnia (9.4% delta do poprzedniej częstotliwości)
Średnie 400 - 2000 Hz
(±) | wyższe średnie - średnio 5% wyższe niż mediana
(+) | średnie są liniowe (5% delta do poprzedniej częstotliwości)
Wysokie 2–16 kHz
(+) | zrównoważone maksima - tylko 1.4% od mediany
(+) | wzloty są liniowe (2.5% delta do poprzedniej częstotliwości)
Ogólnie 100 - 16.000 Hz
(±) | liniowość ogólnego dźwięku jest średnia (16% różnicy w stosunku do mediany)
W porównaniu do tej samej klasy
» 18% wszystkich testowanych urządzeń w tej klasie było lepszych, 6% podobnych, 76% gorszych
» Najlepszy miał deltę 7%, średnia wynosiła ###średnia###%, najgorsza wynosiła 53%
W porównaniu do wszystkich testowanych urządzeń
» 25% wszystkich testowanych urządzeń było lepszych, 5% podobnych, 70% gorszych
» Najlepszy miał deltę 4%, średnia wynosiła ###średnia###%, najgorsza wynosiła 134%
Apple MacBook Pro 16 2021 M1 Pro analiza dźwięku
(+) | głośniki mogą odtwarzać stosunkowo głośno (84.7 dB)
Bas 100 - 315 Hz
(+) | dobry bas - tylko 3.8% od mediany
(+) | bas jest liniowy (5.2% delta do poprzedniej częstotliwości)
Średnie 400 - 2000 Hz
(+) | zbalansowane środki średnie - tylko 1.3% od mediany
(+) | średnie są liniowe (2.1% delta do poprzedniej częstotliwości)
Wysokie 2–16 kHz
(+) | zrównoważone maksima - tylko 1.9% od mediany
(+) | wzloty są liniowe (2.7% delta do poprzedniej częstotliwości)
Ogólnie 100 - 16.000 Hz
(+) | ogólny dźwięk jest liniowy (4.6% różnicy w stosunku do mediany)
W porównaniu do tej samej klasy
» 0% wszystkich testowanych urządzeń w tej klasie było lepszych, 0% podobnych, 100% gorszych
» Najlepszy miał deltę 5%, średnia wynosiła ###średnia###%, najgorsza wynosiła 45%
W porównaniu do wszystkich testowanych urządzeń
» 0% wszystkich testowanych urządzeń było lepszych, 0% podobnych, 100% gorszych
» Najlepszy miał deltę 4%, średnia wynosiła ###średnia###%, najgorsza wynosiła 134%
Zarządzanie energią
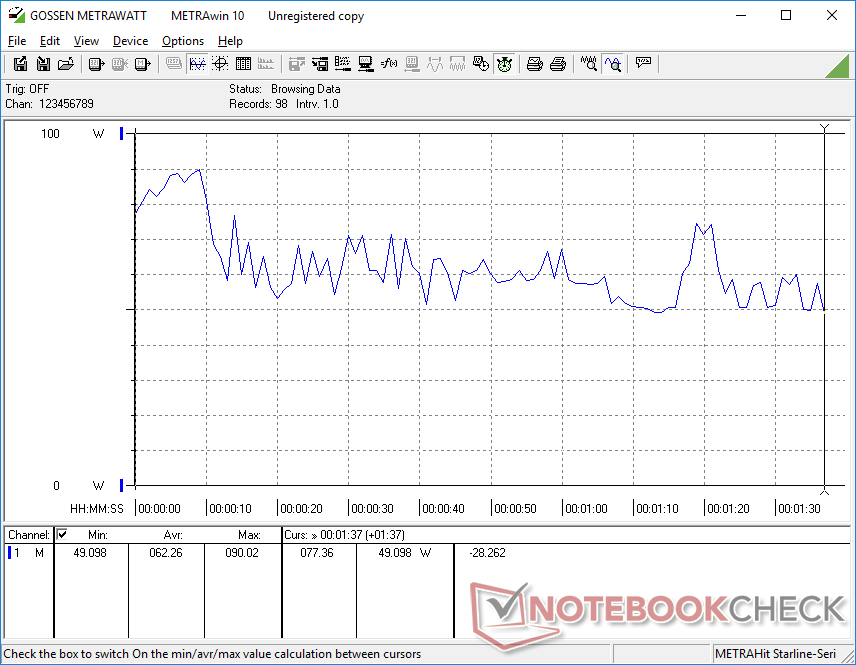
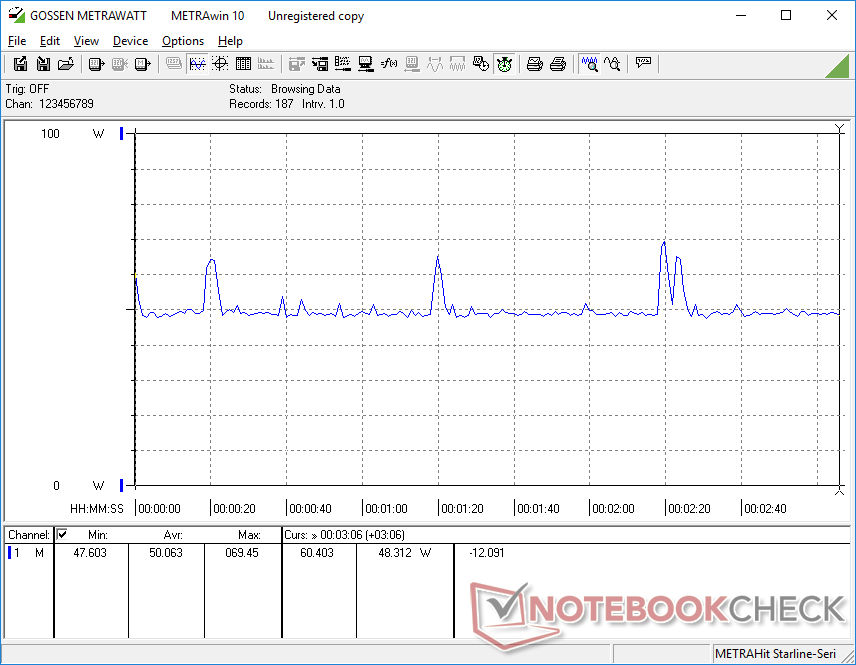
Pobór mocy
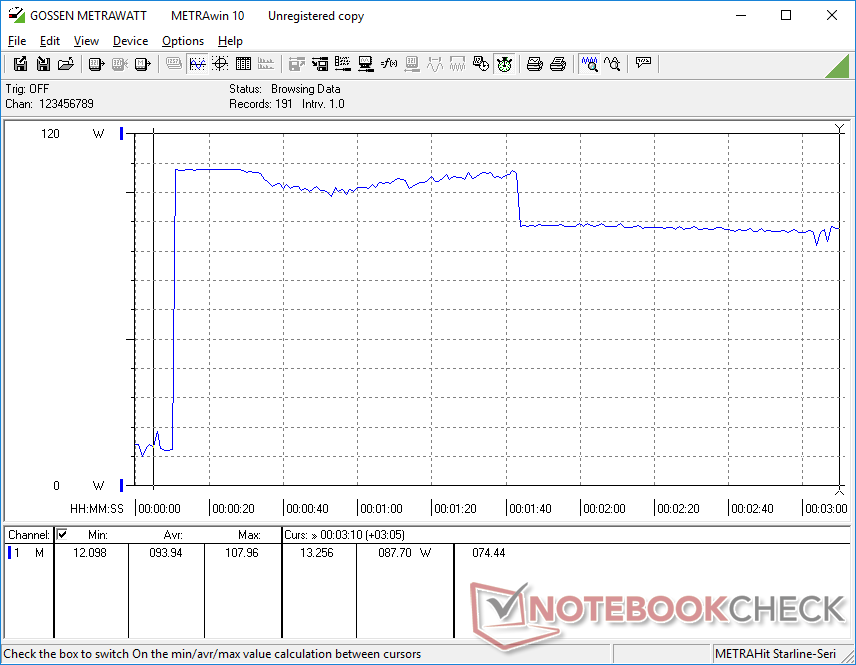
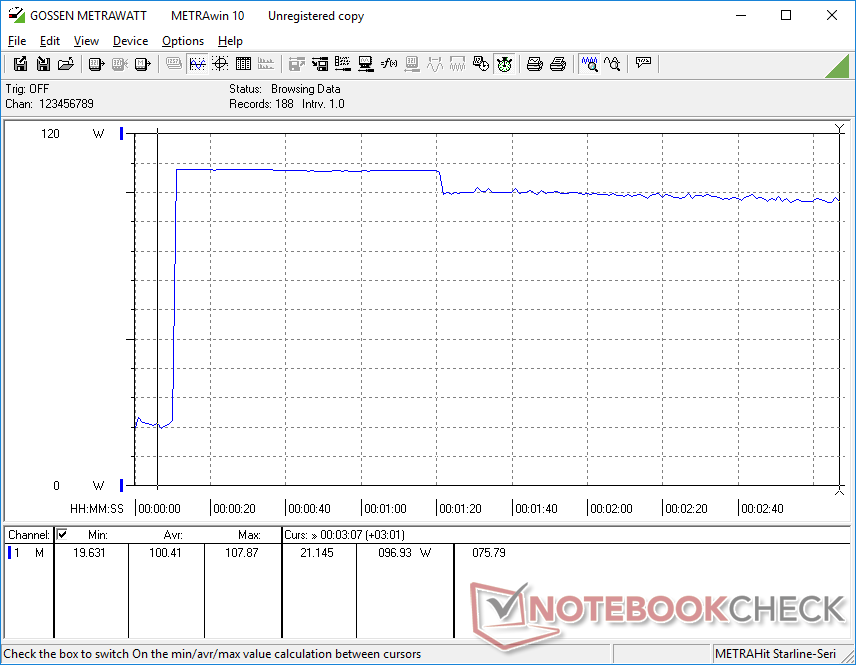
Praca na biegu jałowym na pulpicie w trybie oszczędzania energii pobiera zaledwie 7 W przy minimalnym poziomie jasności i wyłączonym ekranie dodatkowym. Jeśli drugi ekran jest włączony i ustawiony na maksymalną jasność, zużycie będzie o około 2,8 W wyższe. Praca na biegu jałowym w trybie pulpitu z obydwoma ekranami ustawionymi na maksymalną jasność i w trybie Extreme Performance wymaga niecałych 17 W i dorównuje szybszym 17-calowym laptopom z dyskretnymi układami GPU.
Większe obciążenia, takie jak gry, wymagają od 50 do 65 W, podczas gdy w większości laptopów z procesorami Core U- lub P ze zintegrowanym procesorem graficznym Iris Xe 96 EUs, takich jak np LG Gram 17.
Ogólny pobór mocy jest w większości przypadków około 2x wyższy od ThinkBooka Plus Gen 2 poprzedniej generacji ze względu na wzrost rozmiaru i wydajności oraz dodatkową użyteczność drugiego wyświetlacza.
| wyłączony / stan wstrzymania | |
| luz | |
| obciążenie |
|
Legenda:
min: | |
| Lenovo ThinkBook Plus Gen3 i7-12700H, Iris Xe G7 96EUs, Micron 3400 MTFDKBA512TFH 512GB, IPS, 3072x1440, 17.3" | Lenovo ThinkBook Plus Gen2 Core i5 i5-1130G7, Iris Xe G7 80EUs, Samsung PM9A1 MZVL2512HCJQ, IPS, E-Ink, 2560x1600, 13.3" | Asus ProArt StudioBook Pro 17 W700G3T i7-9750H, Quadro RTX 3000 Max-Q, Samsung SSD PM981 MZVLB1T0HALR, IPS, 1920x1200, 17" | LG Gram 17 (2022) i5-1240P, Iris Xe G7 80EUs, Samsung PM9A1 MZVL2512HCJQ, IPS, 2560x1600, 17" | Dell XPS 17 9720 i7-12700H, GeForce RTX 3050 4GB Laptop GPU, Micron 3400 MTFDKBA512TFH 512GB, IPS, 3840x2400, 17" | Gigabyte Aero 17 HDR YD i9-11980HK, GeForce RTX 3080 Laptop GPU, Samsung PM9A1 MZVL2512HCJQ, IPS, 3840x2160, 17.3" | |
|---|---|---|---|---|---|---|
| Power Consumption | 46% | -48% | 33% | -40% | -150% | |
| Idle Minimum * (Watt) | 7.4 | 5 32% | 11.3 -53% | 4 46% | 7.8 -5% | 25 -238% |
| Idle Average * (Watt) | 16.4 | 7.9 52% | 16 2% | 12.2 26% | 15.1 8% | 28 -71% |
| Idle Maximum * (Watt) | 16.8 | 8.3 51% | 16.8 -0% | 13.2 21% | 17 -1% | 40 -138% |
| Load Average * (Watt) | 62.3 | 30.9 50% | 93.6 -50% | 34 45% | 114 -83% | 114 -83% |
| Witcher 3 ultra * (Watt) | 50 | 25.2 50% | 106 -112% | 39.4 21% | 115.2 -130% | 176 -252% |
| Load Maximum * (Watt) | 107.9 | 66.8 38% | 186.6 -73% | 65.9 39% | 135.6 -26% | 236 -119% |
* ... im mniej tym lepiej
Power Consumption Witcher 3 / Stresstest
Power Consumption external Monitor
Czas pracy na baterii - nie tak długi
Czasy pracy są w najlepszym wypadku przeciętne jak na laptop 17-calowy. Pojemność akumulatora jest mniejsza, niż w LG Gram 17 lub Dell XPS 17, a czas pracy w sieci WLAN jest o kilka godzin krótszy. Udało nam się uzyskać nieco poniżej 5,5 godziny rzeczywistego korzystania z sieci WLAN z aktywnym drugim wyświetlaczem w porównaniu z ponad 9 godzinami w przypadku wspomnianych Asusa i Della.
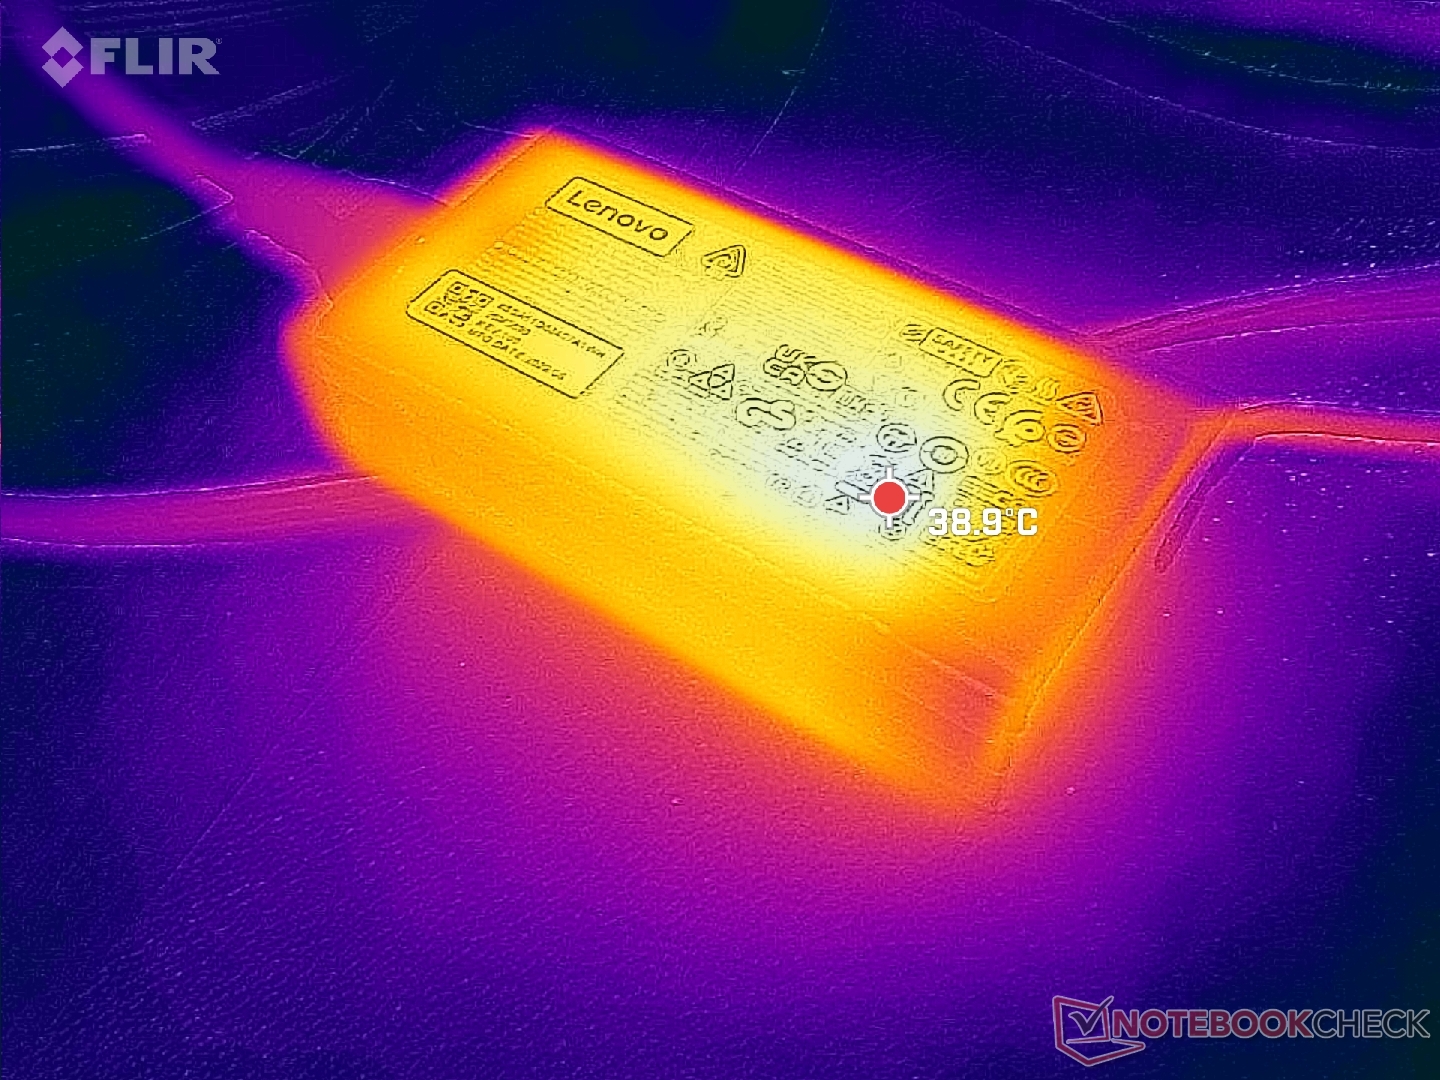
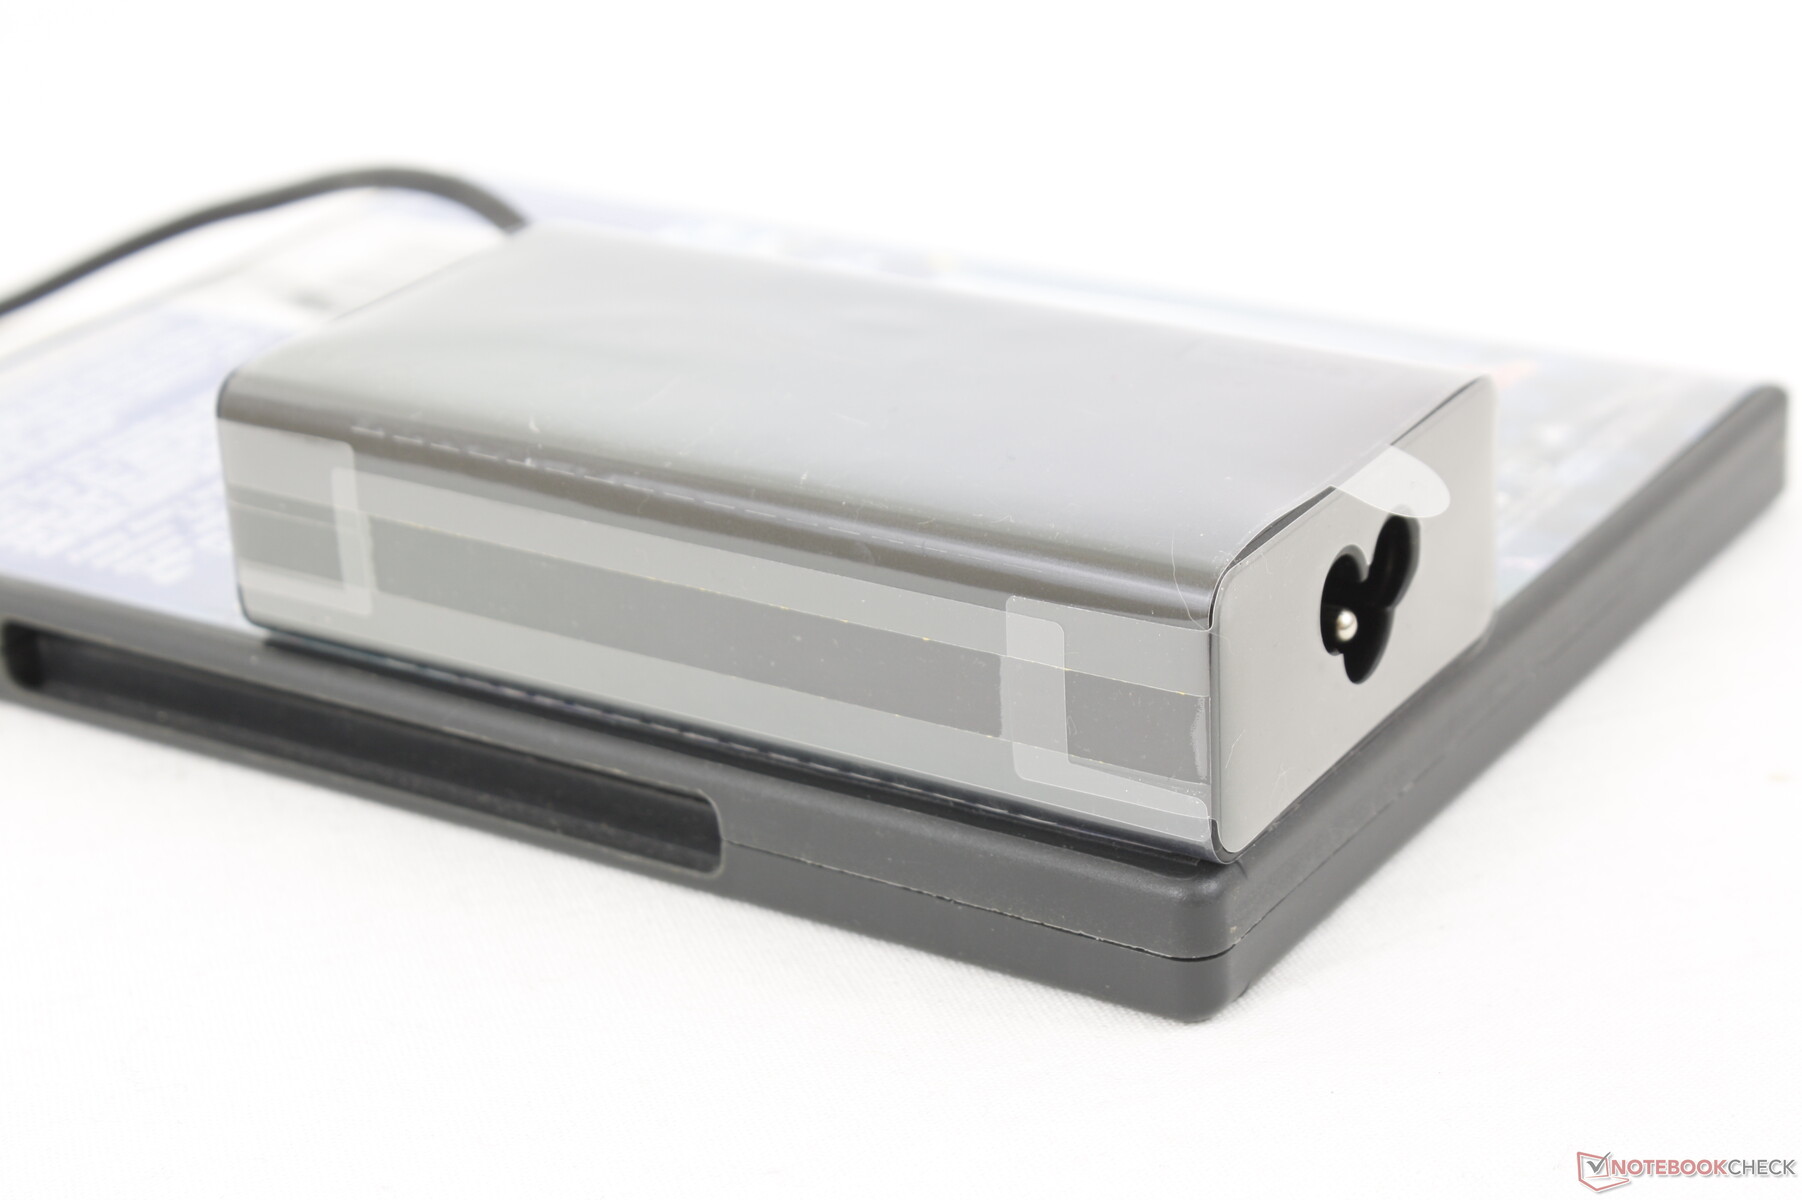
Ładowanie od pustej baterii do pełnej trwa od 1 do 1,5 godziny, gdy włączona jest funkcja Rapid Charge.
| Lenovo ThinkBook Plus Gen3 i7-12700H, Iris Xe G7 96EUs, 70 Wh | Lenovo ThinkBook Plus Gen2 Core i5 i5-1130G7, Iris Xe G7 80EUs, 53 Wh | Asus ProArt StudioBook Pro 17 W700G3T i7-9750H, Quadro RTX 3000 Max-Q, 57 Wh | LG Gram 17 (2022) i5-1240P, Iris Xe G7 80EUs, 80 Wh | Dell XPS 17 9720 i7-12700H, GeForce RTX 3050 4GB Laptop GPU, 97 Wh | Gigabyte Aero 17 HDR YD i9-11980HK, GeForce RTX 3080 Laptop GPU, 99 Wh | |
|---|---|---|---|---|---|---|
| Czasy pracy | 43% | 41% | 186% | 47% | 13% | |
| Reader / Idle (h) | 8.1 | 28.2 248% | ||||
| WiFi v1.3 (h) | 5.3 | 7.6 43% | 5.9 11% | 11.2 111% | 9.2 74% | 5.6 6% |
| Load (h) | 1 | 1.7 70% | 3 200% | 1.2 20% | 1.2 20% | |
| H.264 (h) | 6.9 | 14.1 | 11.2 | |||
| Witcher 3 ultra (h) | 1.7 |
Za
Przeciw
Werdykt - Świetne rozwiązanie dla ciasnych miejsc pracy
ThinkBook Plus Gen 3 jest wyjątkowy w swojej kategorii wielkości i to nie tylko ze względu na 8-calowy wyświetlacz pomocniczy czy współczynnik kształtu 21:10. Dokładniej mówiąc, jest to jeden z niewielu 17-calowych laptopów, które dostarczane są z procesorem Intel Core H 12. generacji i absolutnie żadnymi opcjami dyskretnej grafiki. Takie podejście pozwoliło na uzyskanie stosunkowo smukłej i lekkiej konstrukcji obudowy pomimo drugiego wyświetlacza i dłuższych wymiarów obudowy.
Kluczową wadą modelu jest to, że dla niektórych użytkowników może być on zbyt mało wydajny. Wydajność procesora jest wolniejsza od wielu innych 17-calowych laptopów z tym samym procesorem Core i7-12700H, a brak dGPU prawdopodobnie odrzuci większość użytkowników mocy. To ostatnie to szkoda, bo główny wyświetlacz ma kolory i funkcje do edycji grafiki, a drugi wyświetlacz może być z natury przydatny do ciężkiej pracy wielozadaniowej. Jeśli tylko Twoje zadania nie są szczególnie obciążające dla GPU, ta wada nie powinna być zbyt dużym problemem.
ThinkBook Plus Gen 3 optymalizuje produktywność, dając użytkownikom więcej powierzchni ekranu niż większość innych laptopów na rynku. Trzeba jednak przy tym zrezygnować z odrobiny wydajności graficznej.
Jeśli chodzi o zintegrowany wyświetlacz dodatkowy, jest on najbardziej przydatny w przypadku okien eksploratora plików, tekstów, wierszy poleceń i innych aplikacji, w których dokładność odwzorowania kolorów nie jest dużym problemem. Funkcjonalność ekranu dotykowego nie jest jednak tak niezawodna jak w przypadku smartfonów czy tabletów, dlatego naszym zdaniem najłatwiej jest korzystać z wyświetlacza za pomocą myszy
Jeśli masz miejsce na biurku na dodatkowy monitor zewnętrzny, taki jak Lepow C2wtedy ThinkBook Plus Gen 3 staje się znacznie mniej atrakcyjny. Użytkownicy, którzy są w ciągłym ruchu lub nie mają miejsca na zewnętrzne monitory, uznają ten komputer Lenovo za zaskakująco przestronny w porównaniu z innymi 17-calowymi modelami.
Cena i dostępność
ThinkBook Plus Gen 3 nie jest jeszcze dostępny u głównych resellerów, takich jak Amazon, Best Buy czy Newegg. Użytkownicy mogą kupić go bezpośrednio od Lenovo od 1500 USD za opcję z procesorem Core i5 lub 1600 USD za naszą konfigurację z procesorem Core i7.
Lenovo ThinkBook Plus Gen3
- 21/09/2022 v7 (old)
Allen Ngo
Price comparison

