 Deutsch
 English
 Español
 Français
 Italiano
 Nederlands
 Polski
 Português
 Русский
 Türkçe
 Svenska
 Chinese
 Magyar
Recenzja mini PC Maxtang MTN-FP750: AMD Ryzen 7 7735HS spowolniony przez źle przemyślaną konfigurację

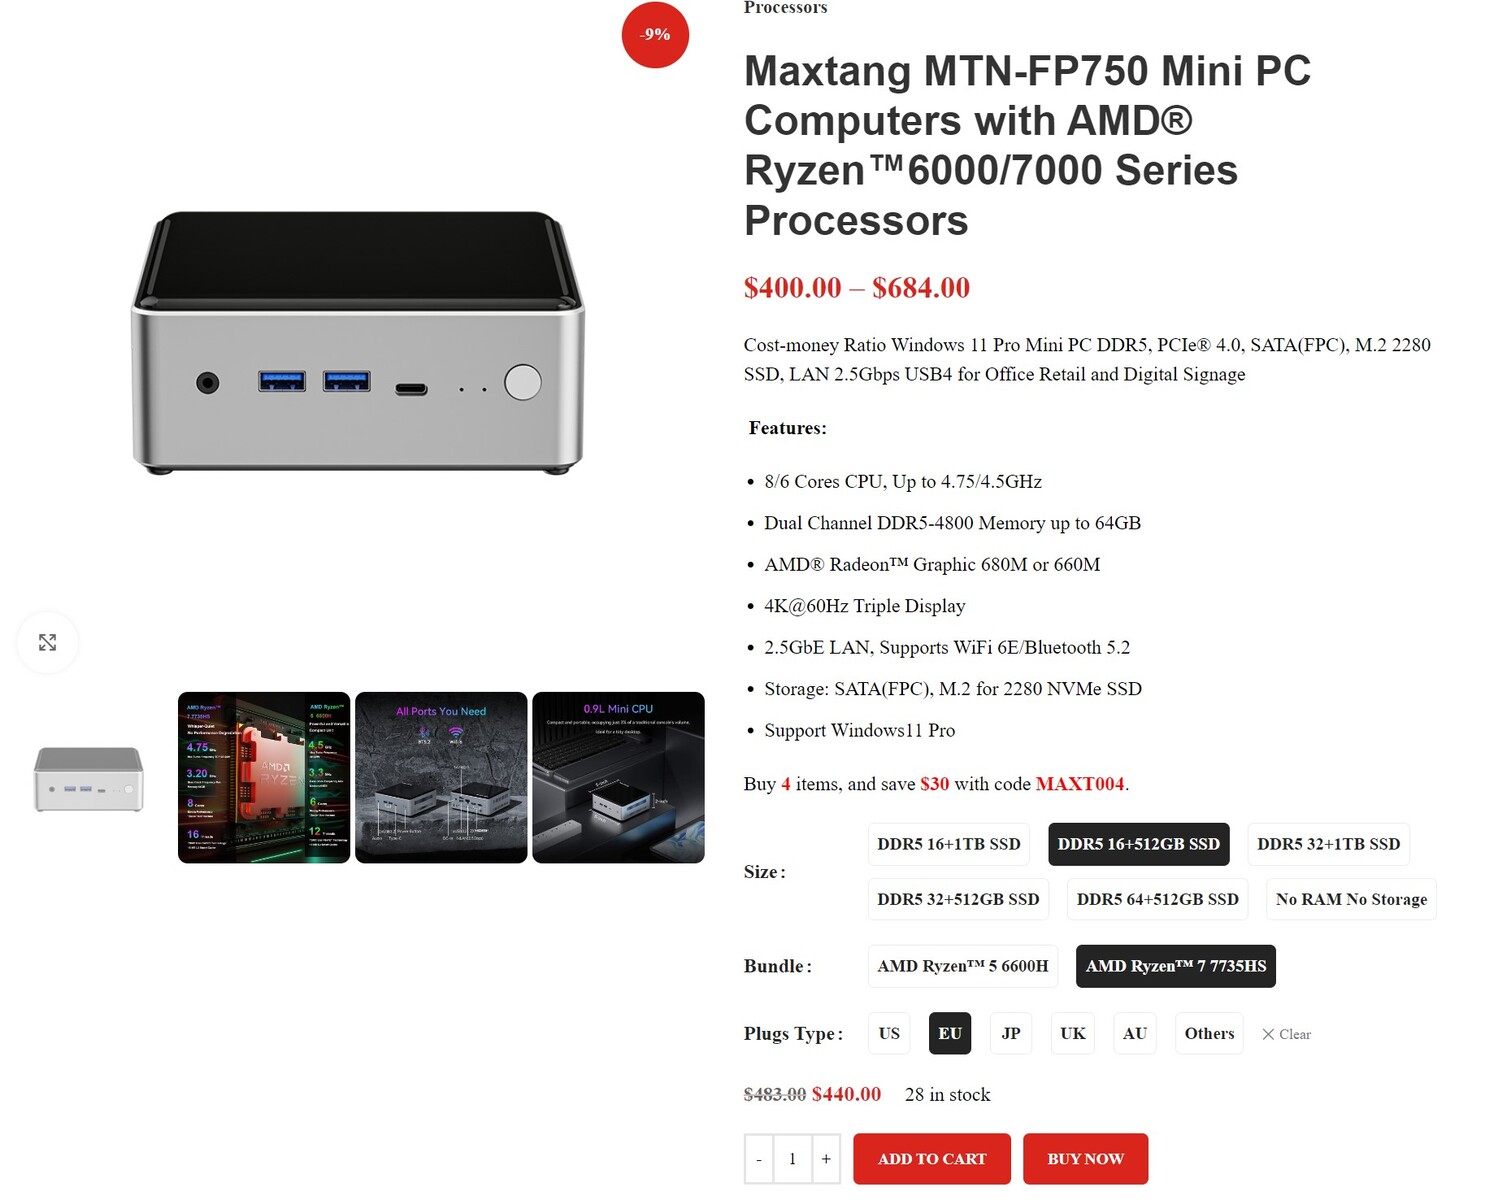
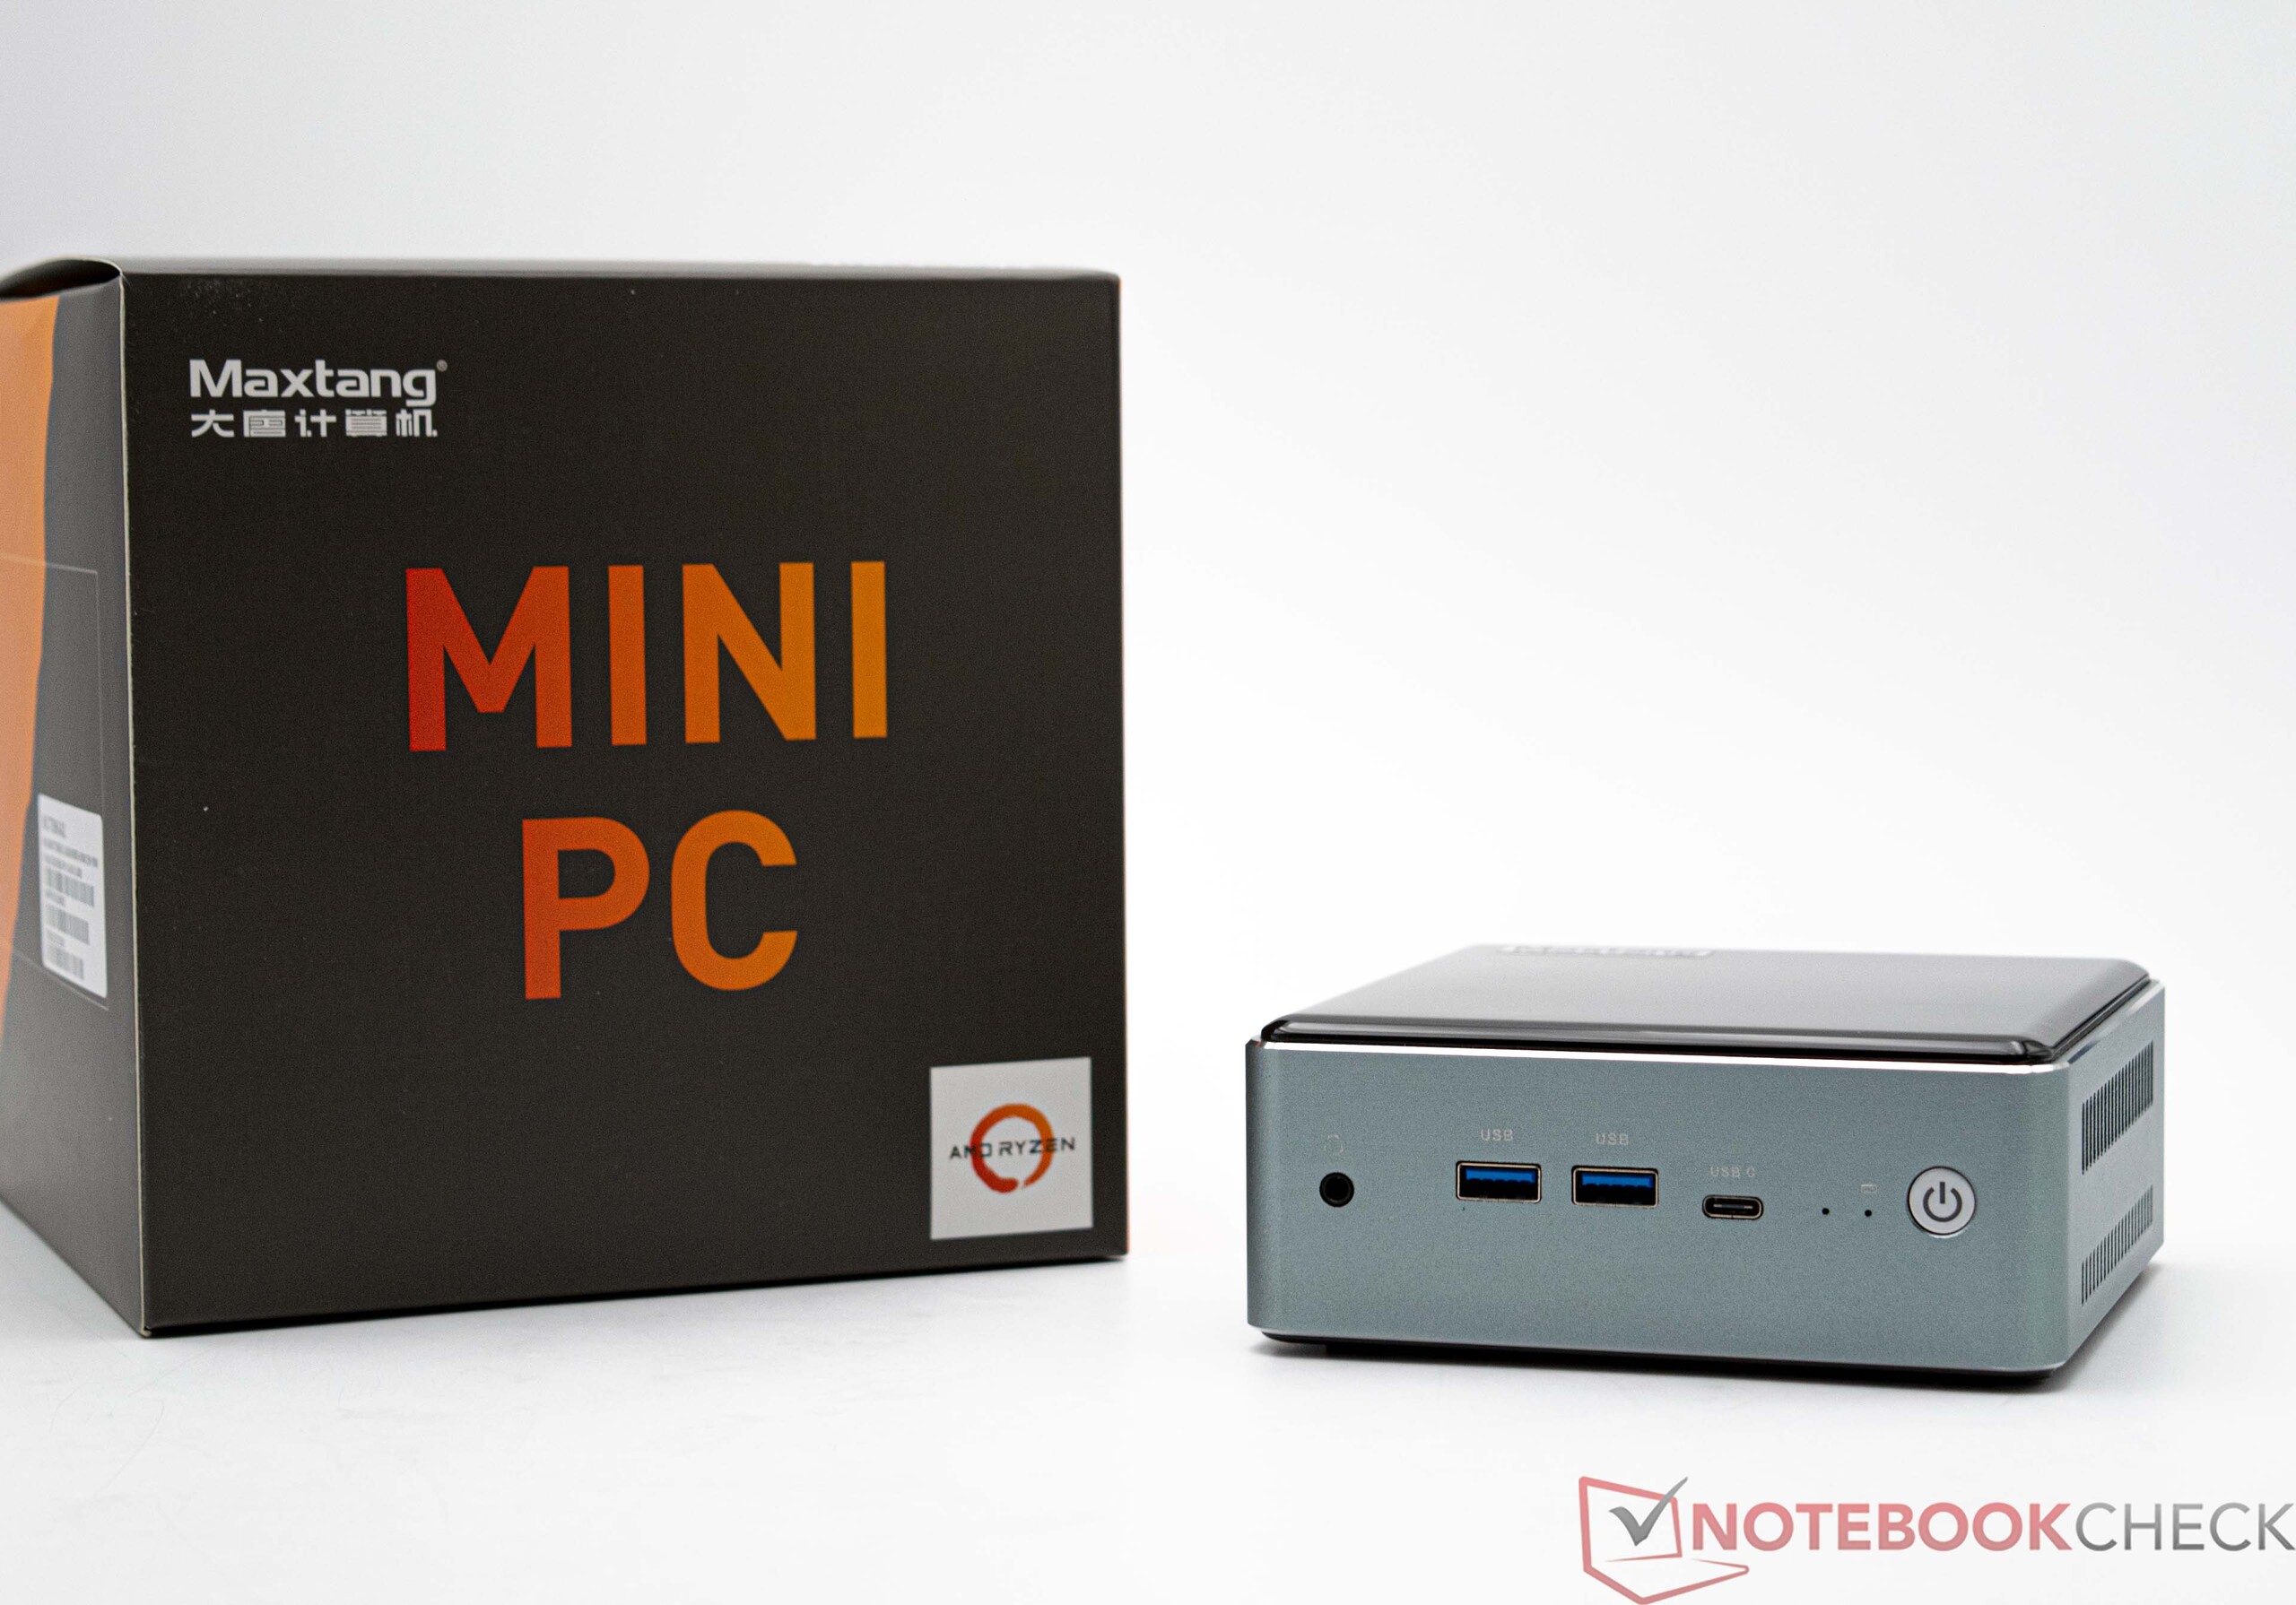
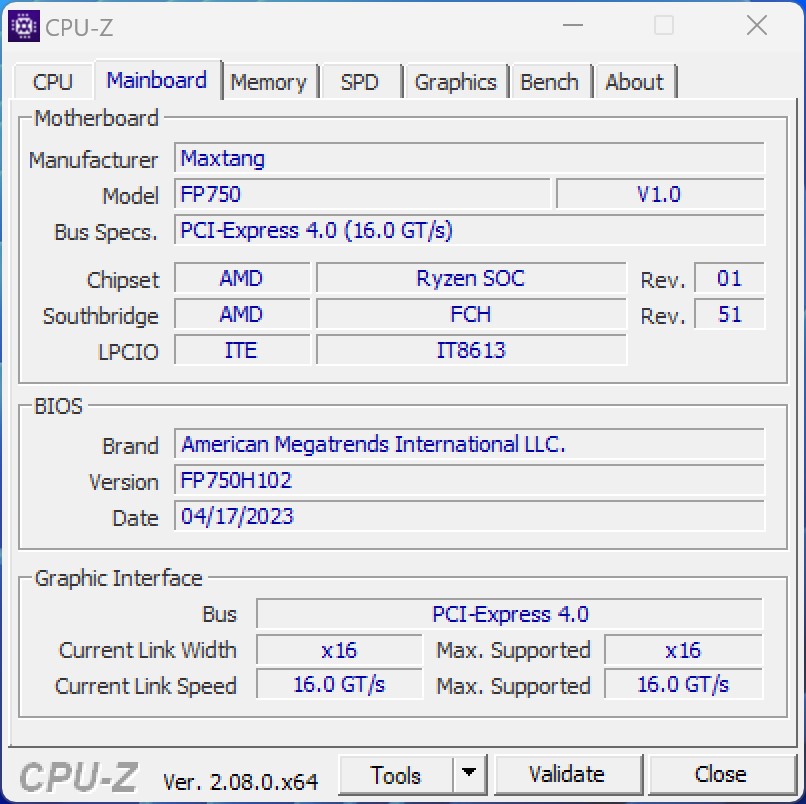
Maxtang to chiński producent systemów, który sprzedaje specjalne rozwiązania przemysłowe w postaci systemów wbudowanych, a także mini PC przeznaczone do użytku biurowego. W tej recenzji skupiamy się na Maxtang MTN-FP750, który kosztuje 440 USD. System składa się z procesora AMD Ryzen 7 7735HS i 16 GB pamięci RAM DDR5, a także dysk SSD o pojemności 512 GB. Alternatywnym rozwiązaniem jest AMD Ryzen 5 6600H jest również dostępny. Ponadto mini PC można zamówić z dodatkową pamięcią RAM i większym dyskiem SSD. Maxtang oferuje również opcję barebones, jednak jest ona dostępna tylko z procesorem AMD Ryzen 7 7735HS.
W tej recenzji Maxtang MTN-FP750 porównuje się z obecnymi mini PC. Bardziej szczegółowa lista urządzeń porównawczych znalezionych w tej recenzji została podsumowana w poniższej tabeli.
Potencjalni konkurenci w porównaniu
Rating | Date | Model | Weight | Height | Best Price |
|---|---|---|---|---|---|
| 79.5 % | 02/2024 | Maxtang MTN-FP750 R7 7735HS, Radeon 680M | 601 g | 52 mm | |
| 85.1 % | 01/2023 | Minisforum Neptune Series NAD9 i9-12900H, Iris Xe G7 96EUs | 1.2 kg | 66 mm | |
| 82.8 % | 07/2023 | Geekom AS 6, R9 6900HX R9 6900HX, Radeon 680M | 753 g | 58 mm | |
| 82.3 % | 05/2023 | Geekom Mini IT12 i7-1260P, Iris Xe G7 96EUs | 572 g | 45.6 mm | |
| 81.2 % | 10/2023 | Geekom A5 R7 5800H, Vega 8 | 555 g | 49.2 mm | |
| 81.9 % | 05/2023 | Minisforum Venus Series NAB6 i7-12650H, UHD Graphics 64EUs | 616 g | 55 mm | |
| 78.4 % | 01/2024 | NiPoGi AD08 i7-12650H, UHD Graphics 64EUs | 878 g | 188.5 mm |
Maxtang MTN-FP750 w szczegółach
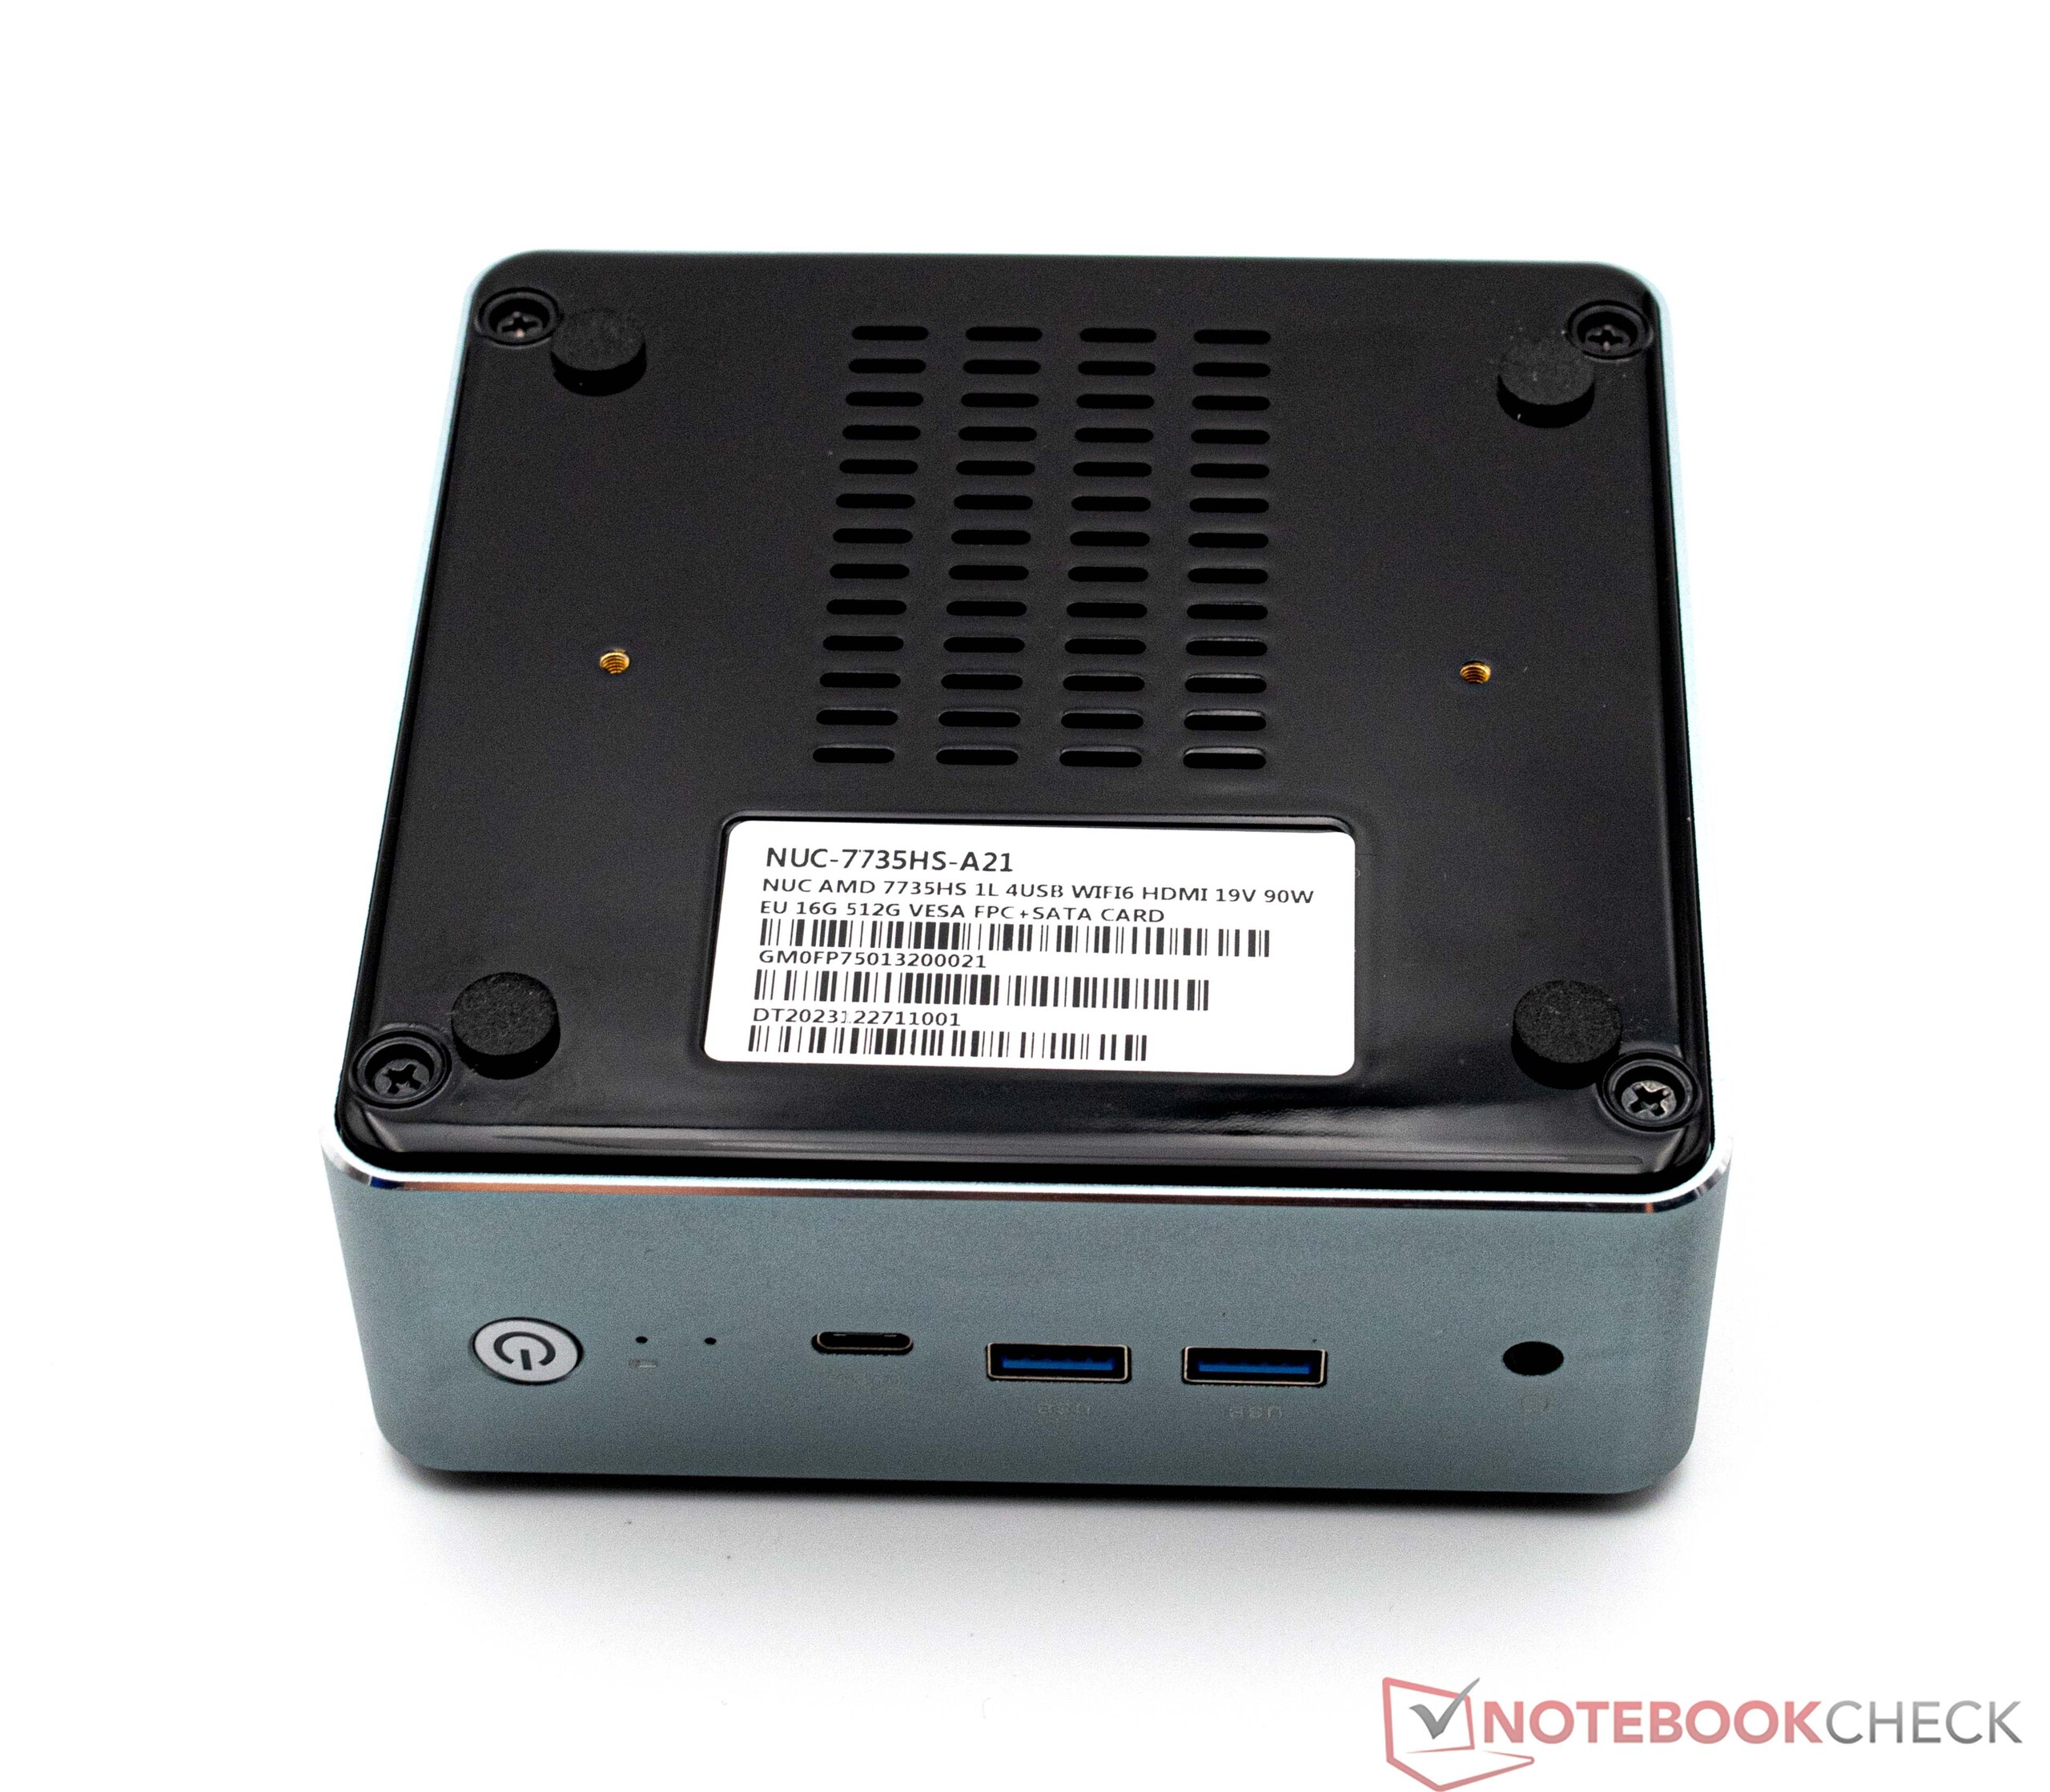

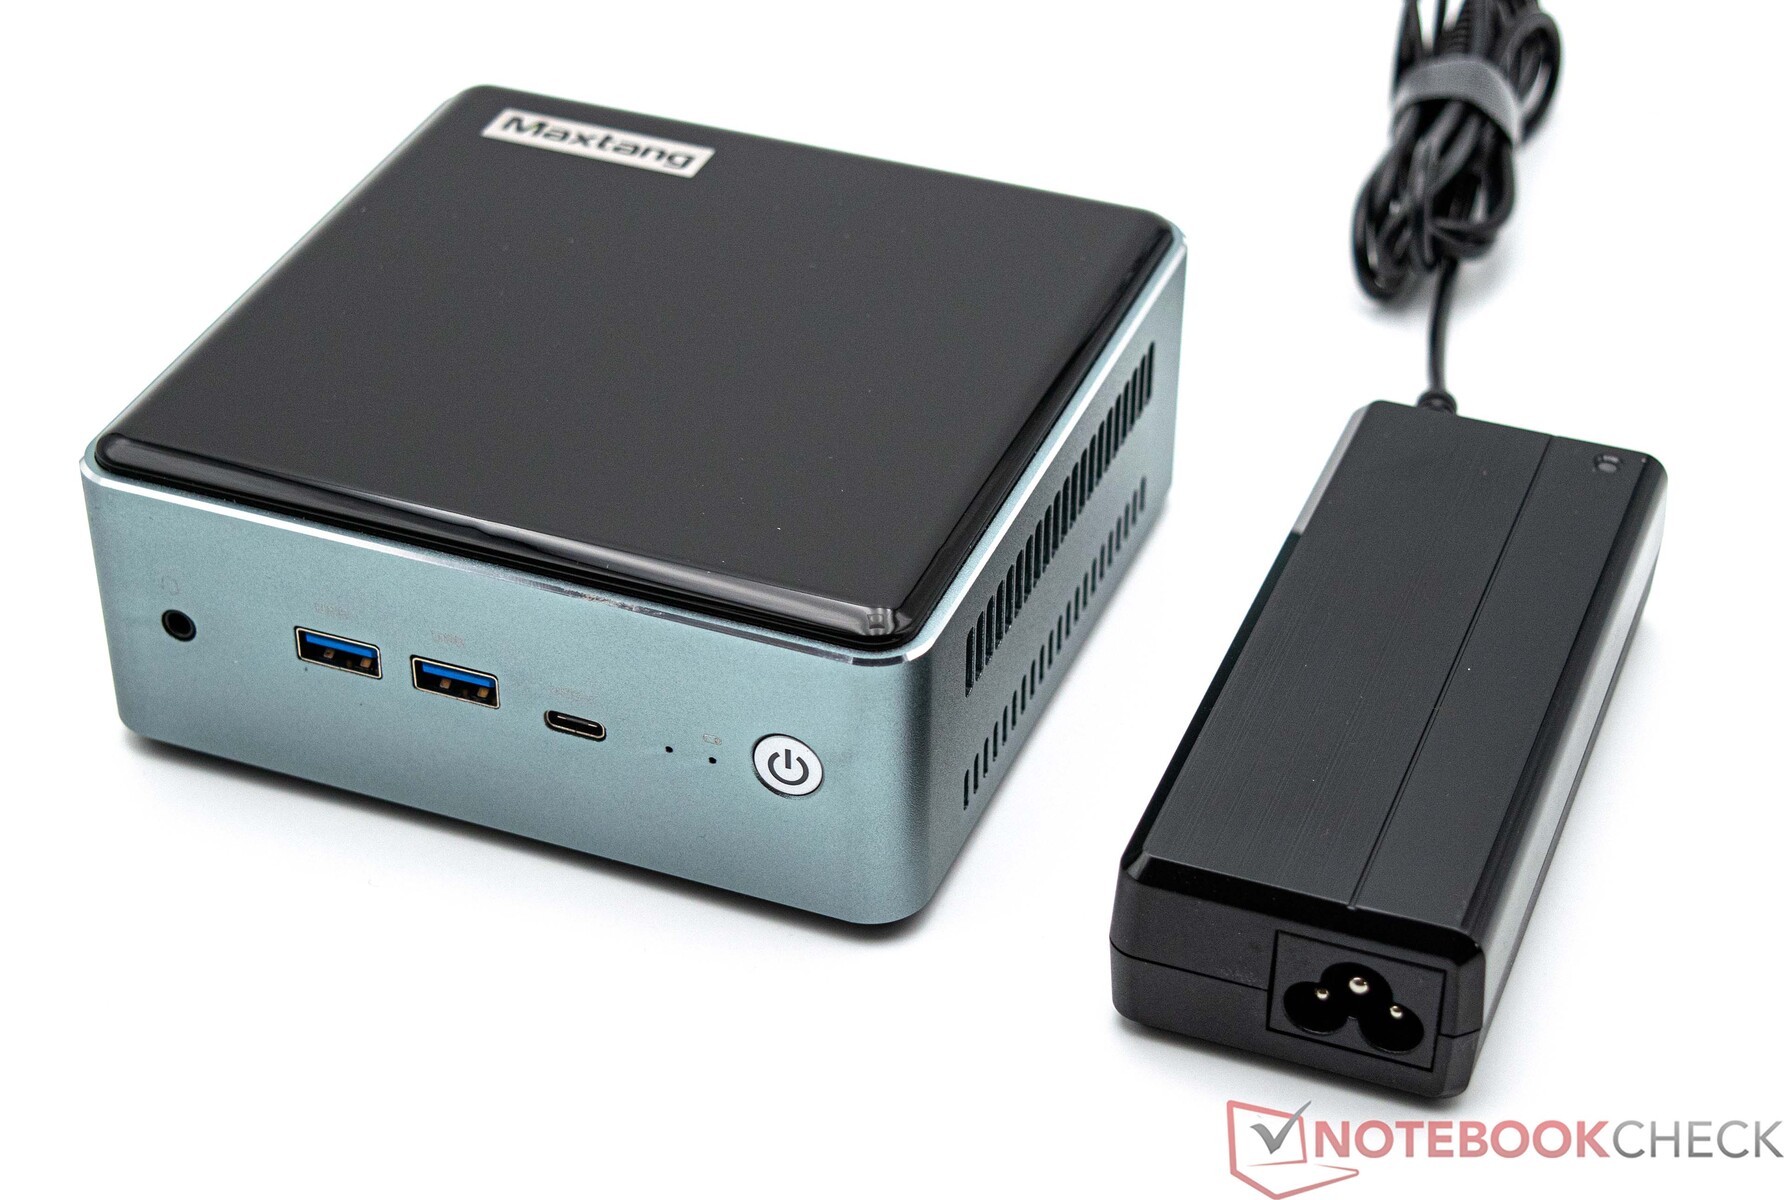
Obudowa - metal i tworzywo sztuczne w kolorze fortepianowej czerni
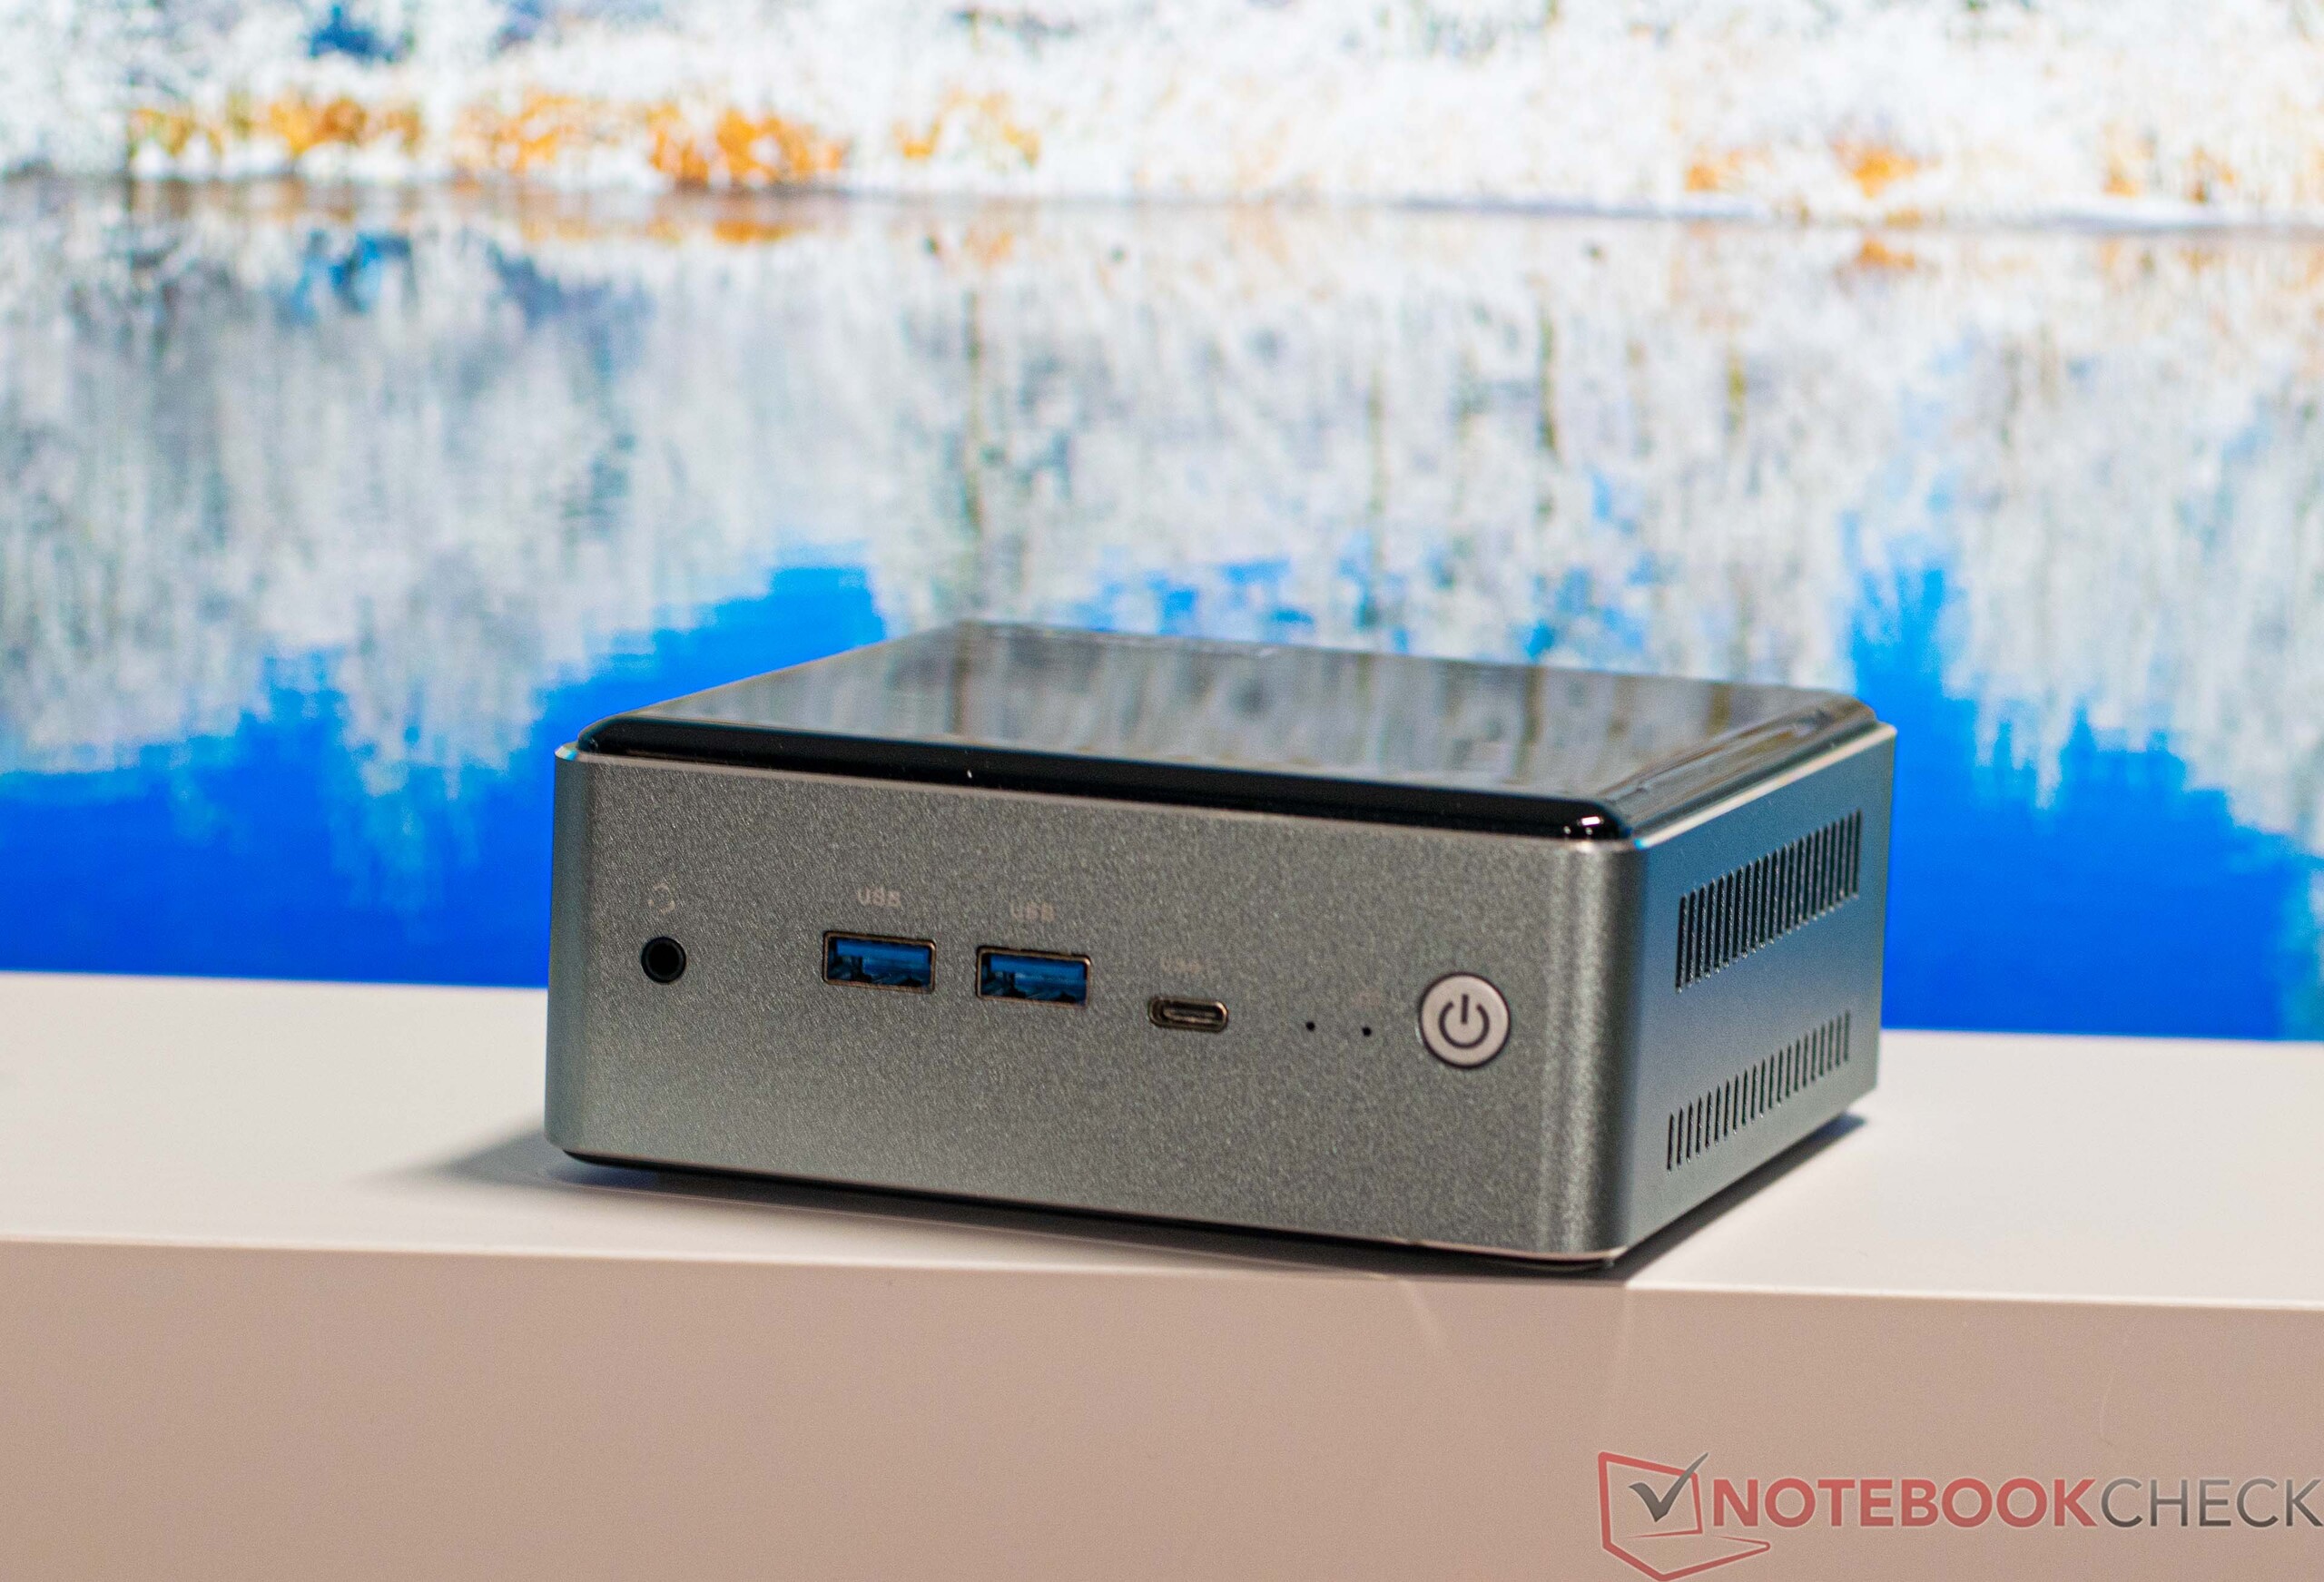
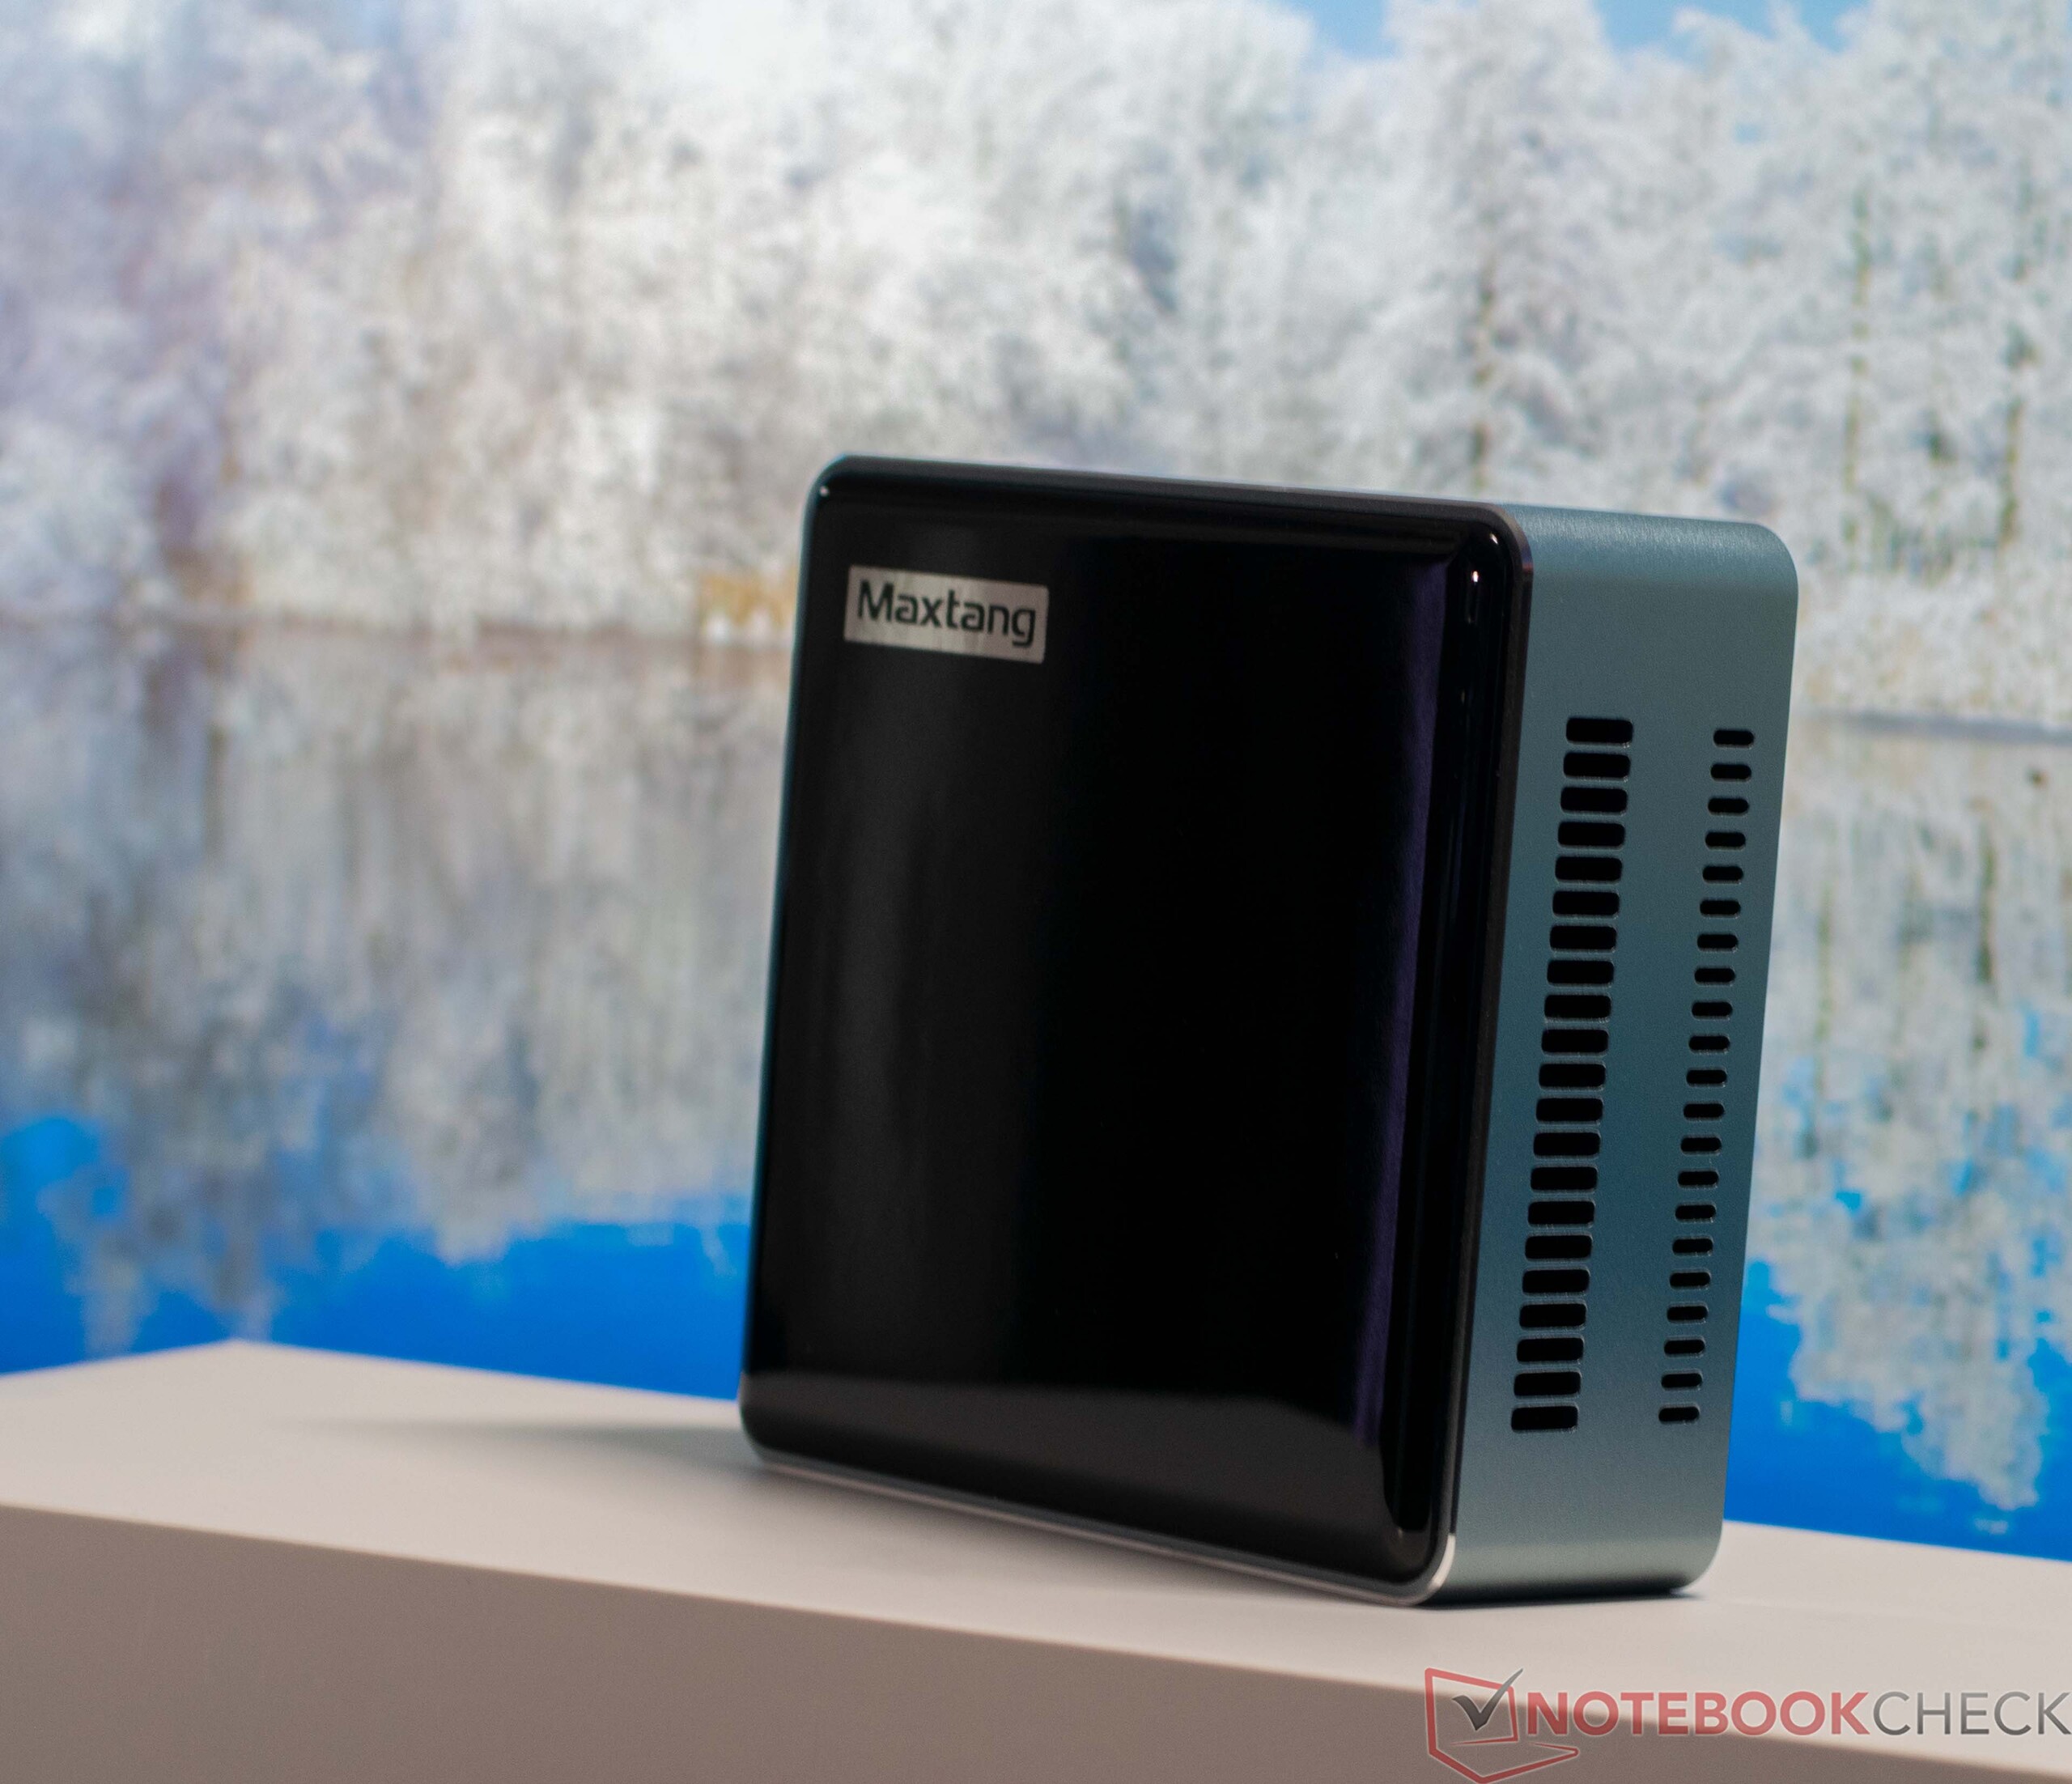
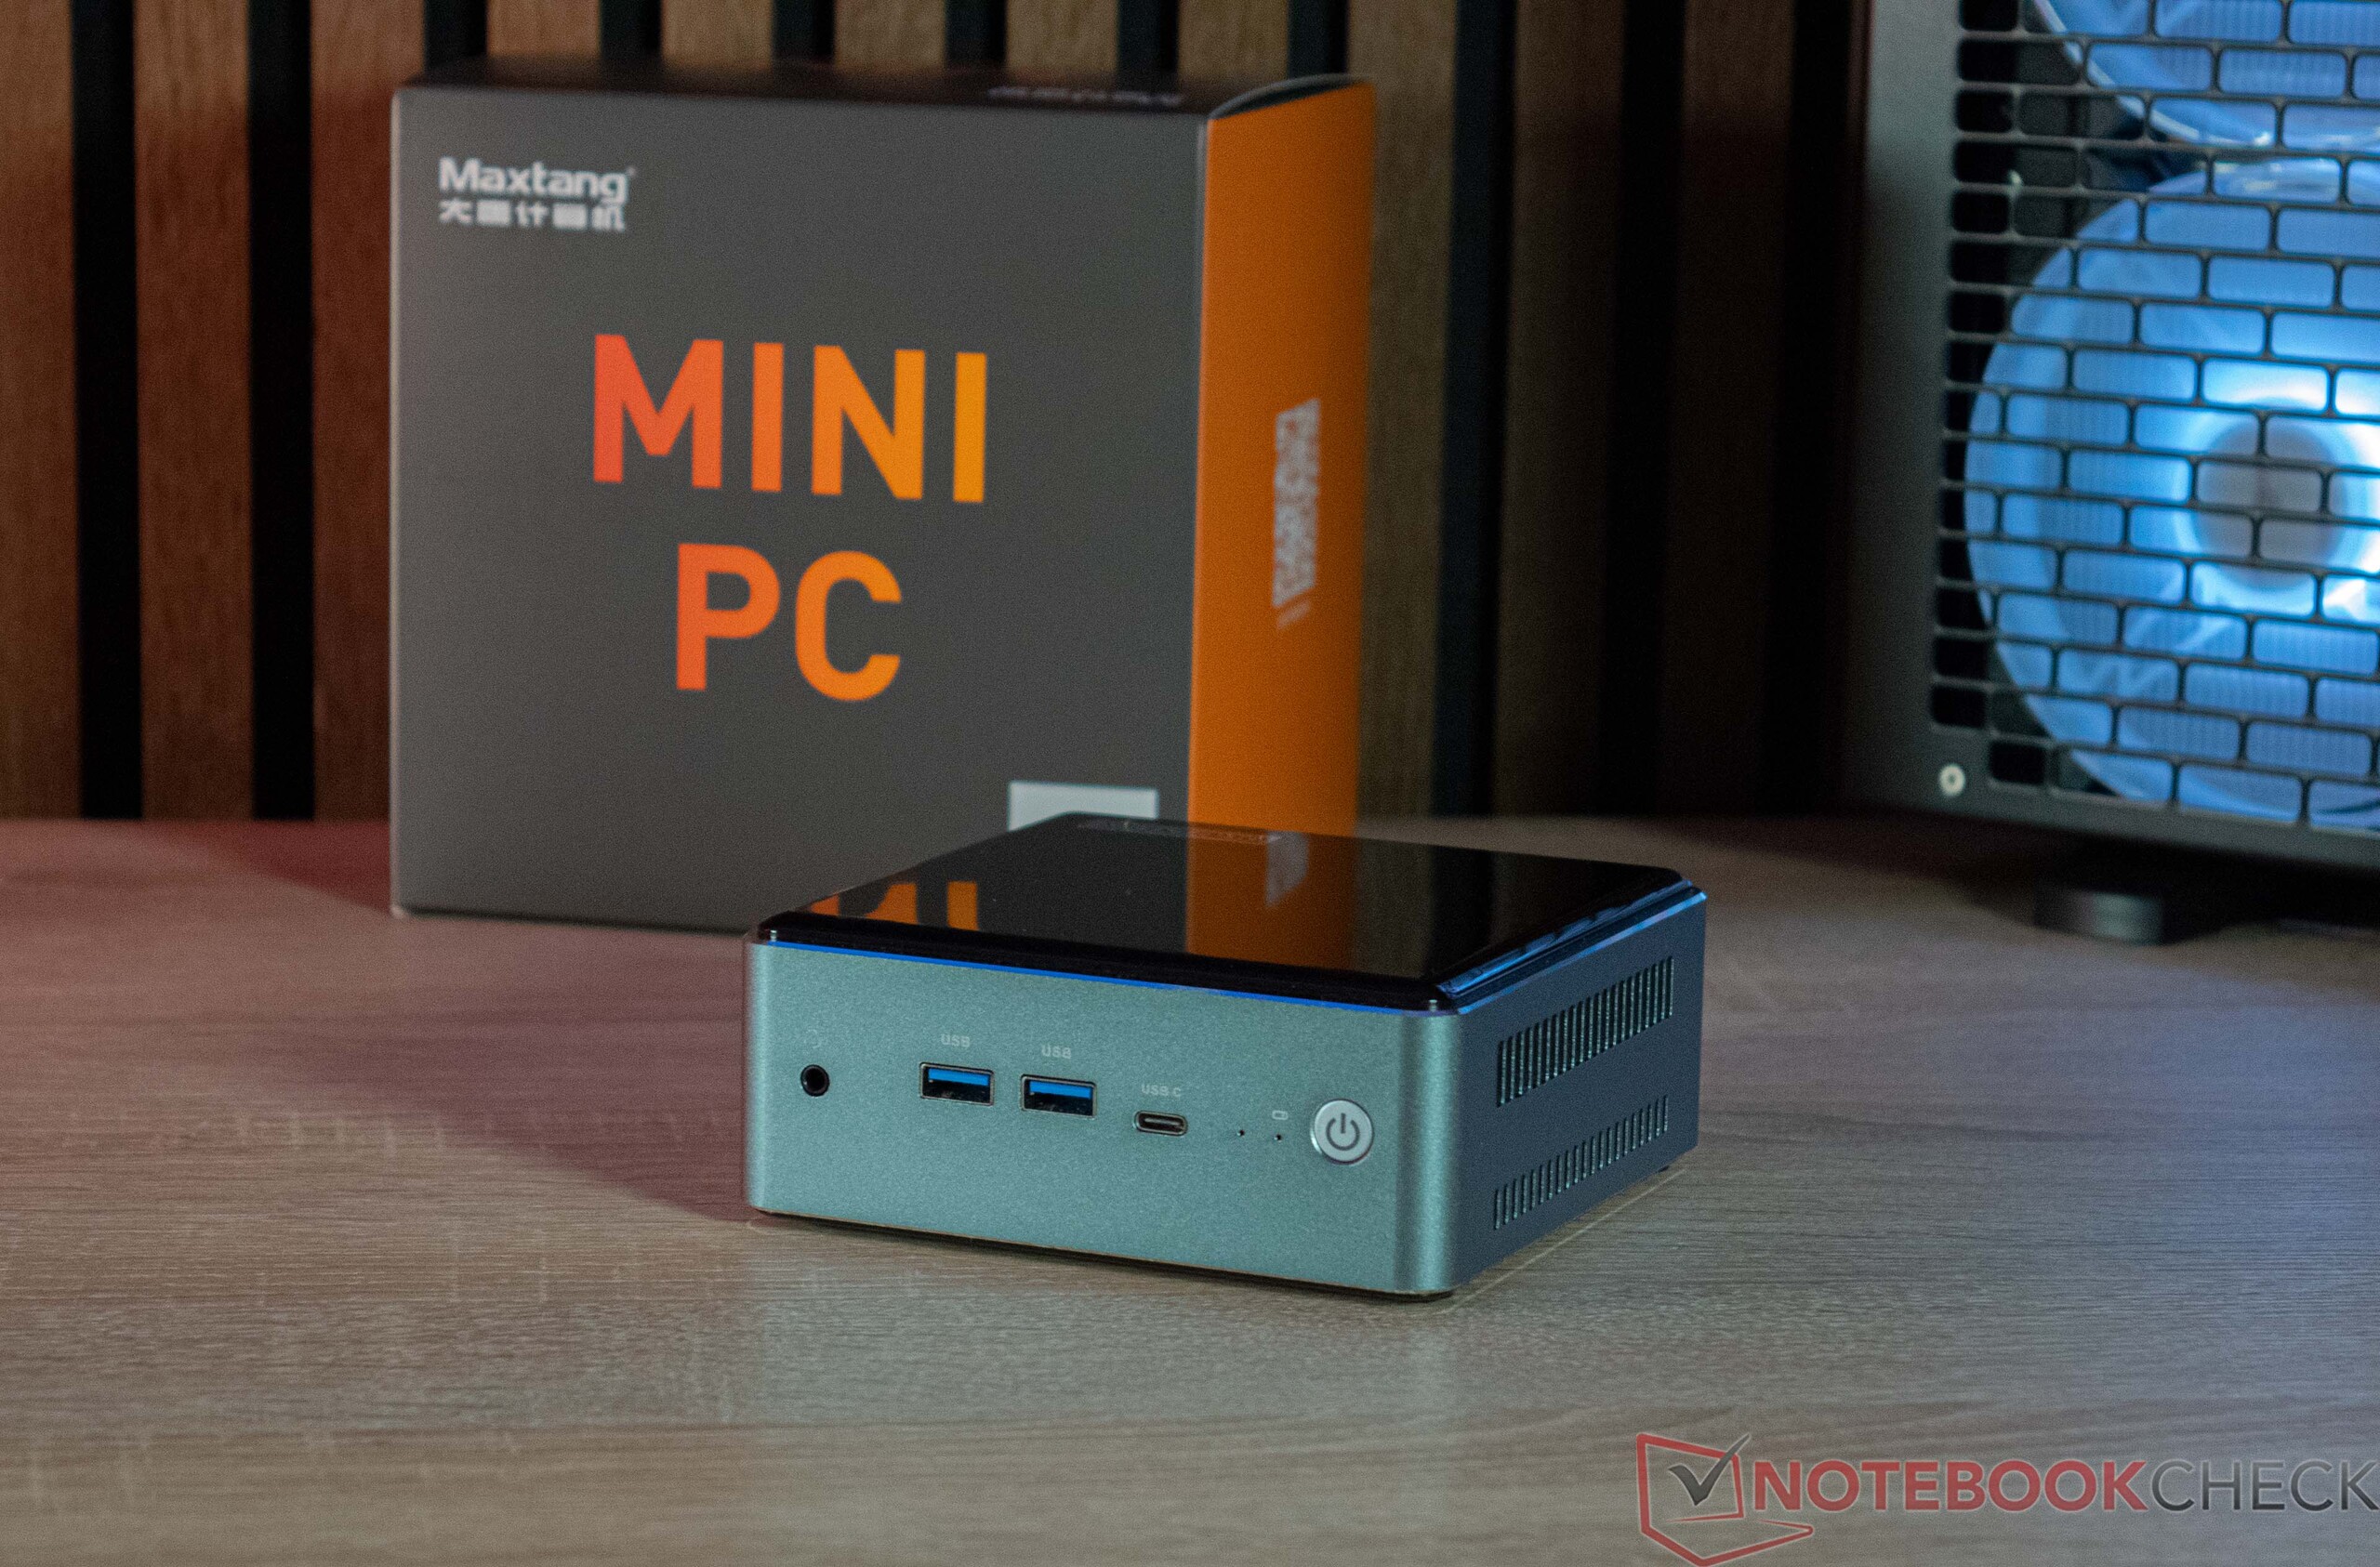
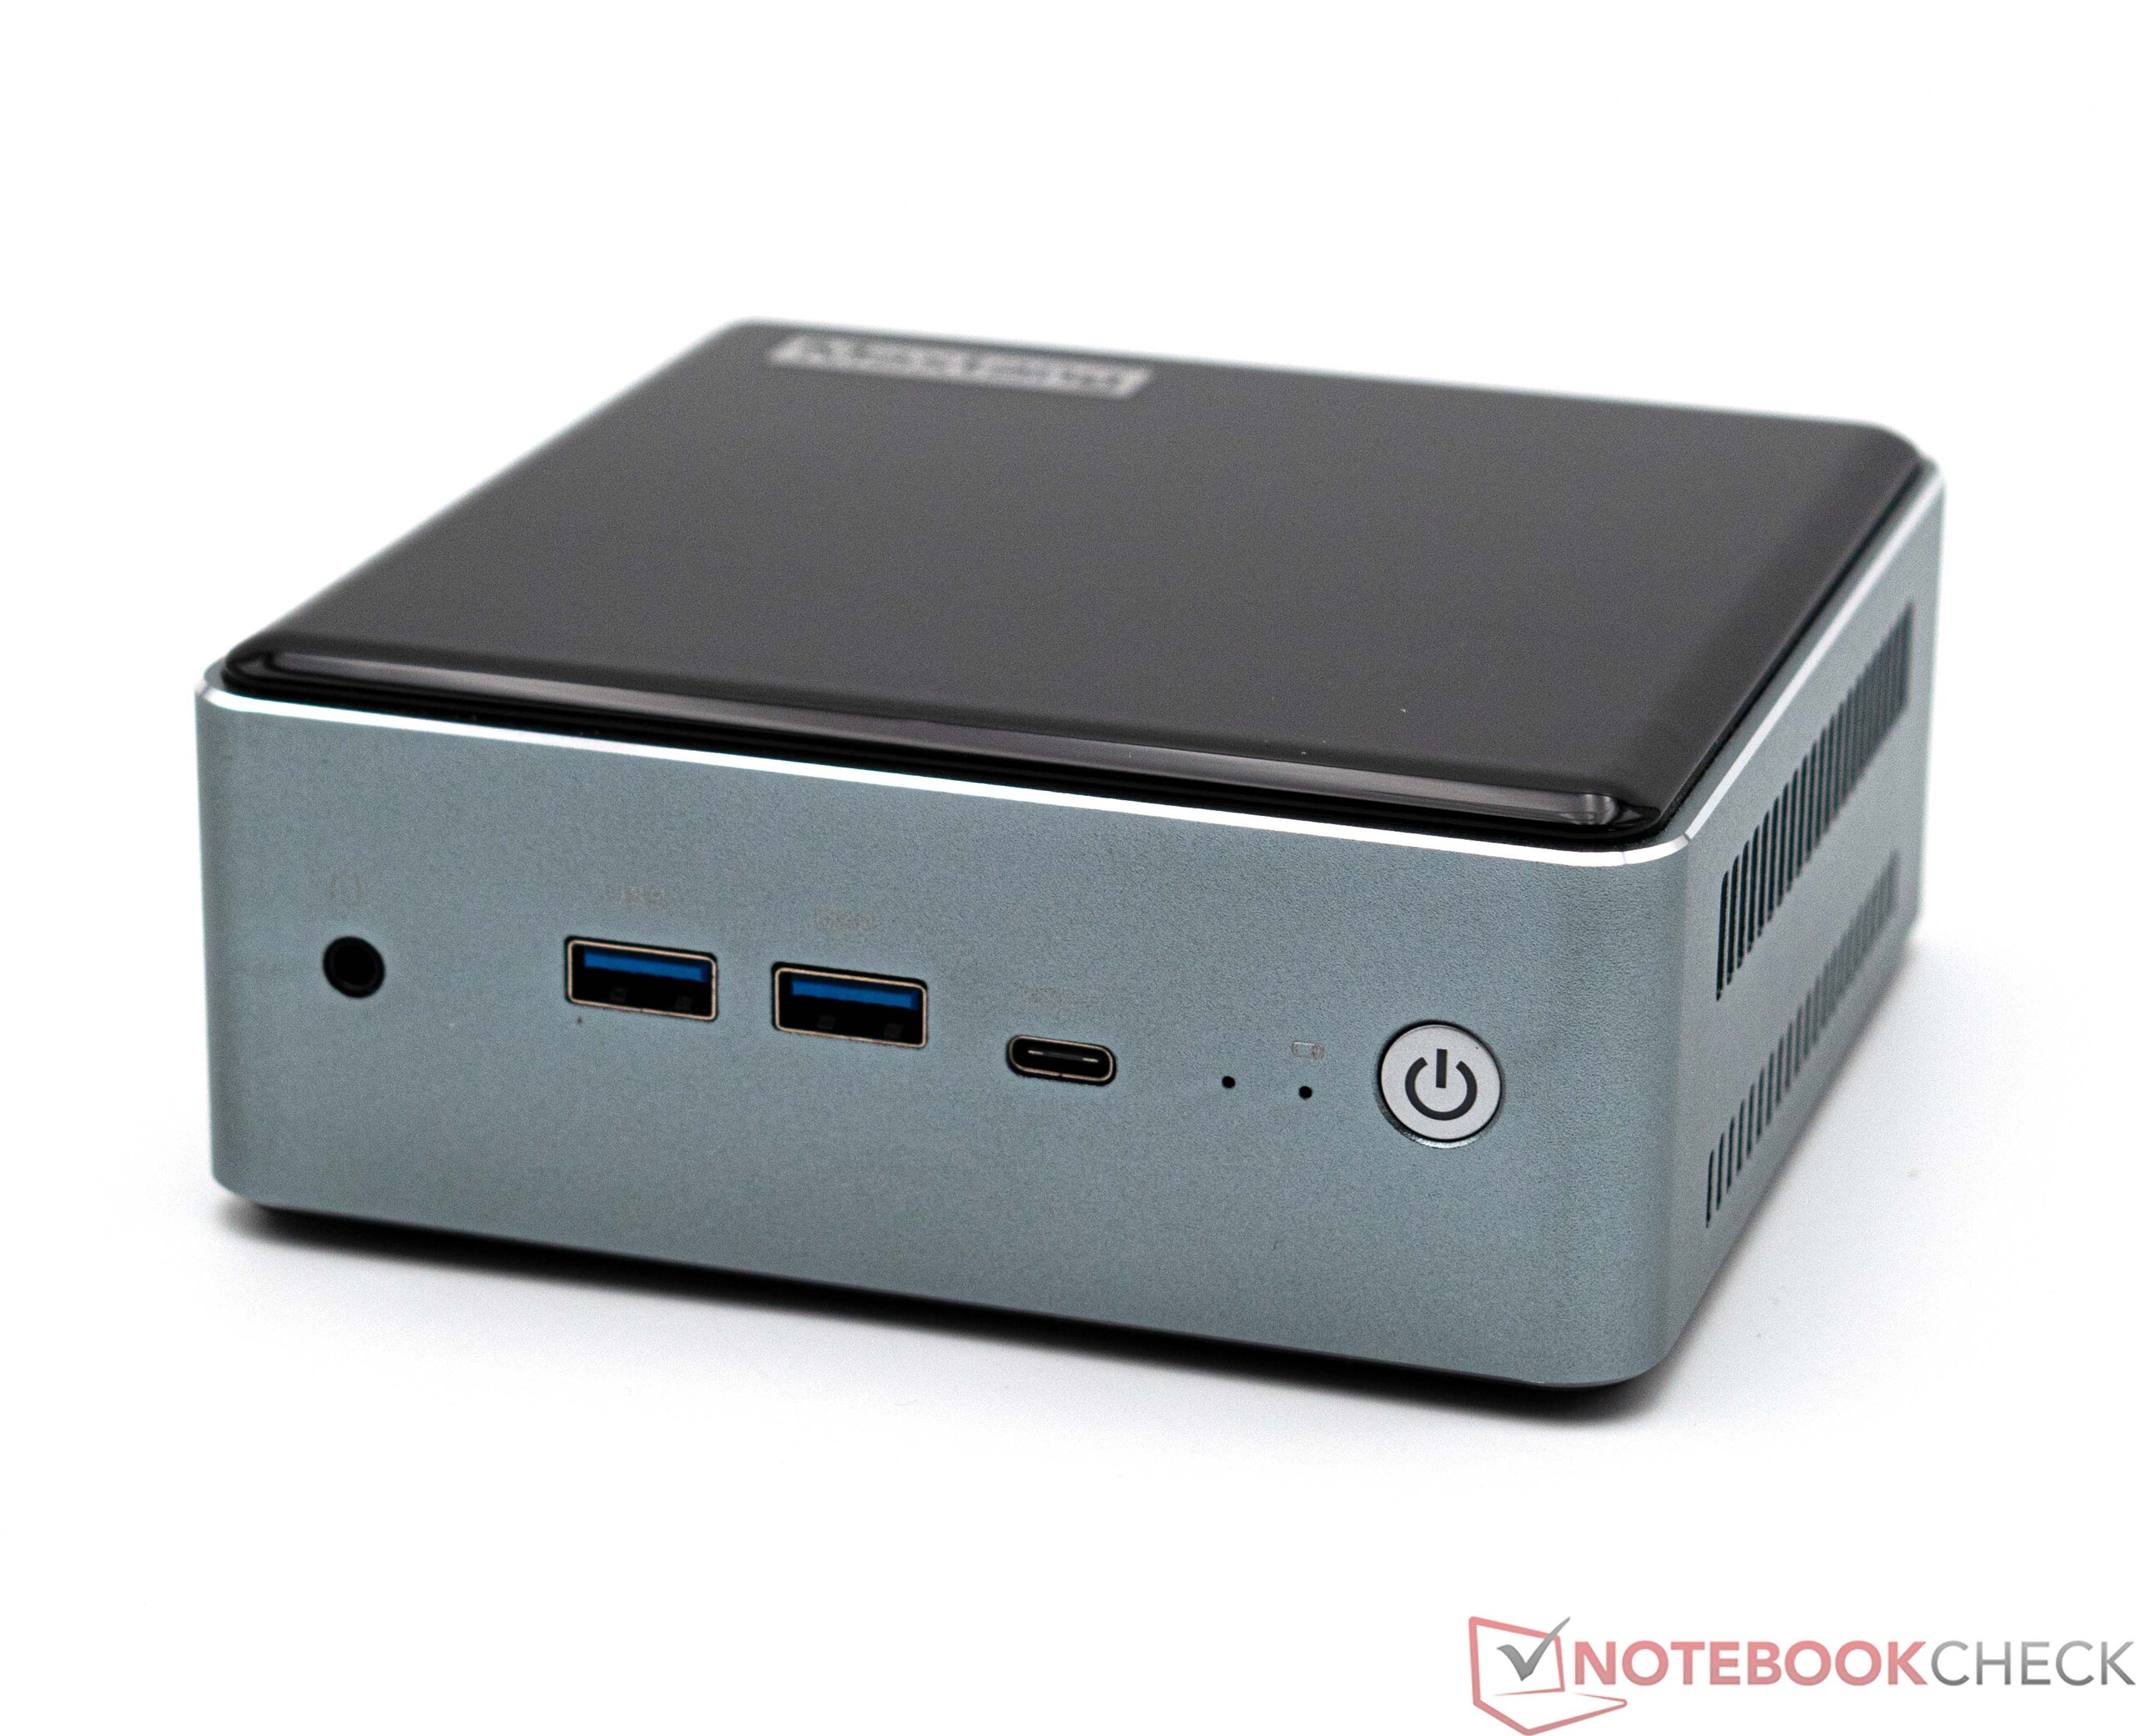
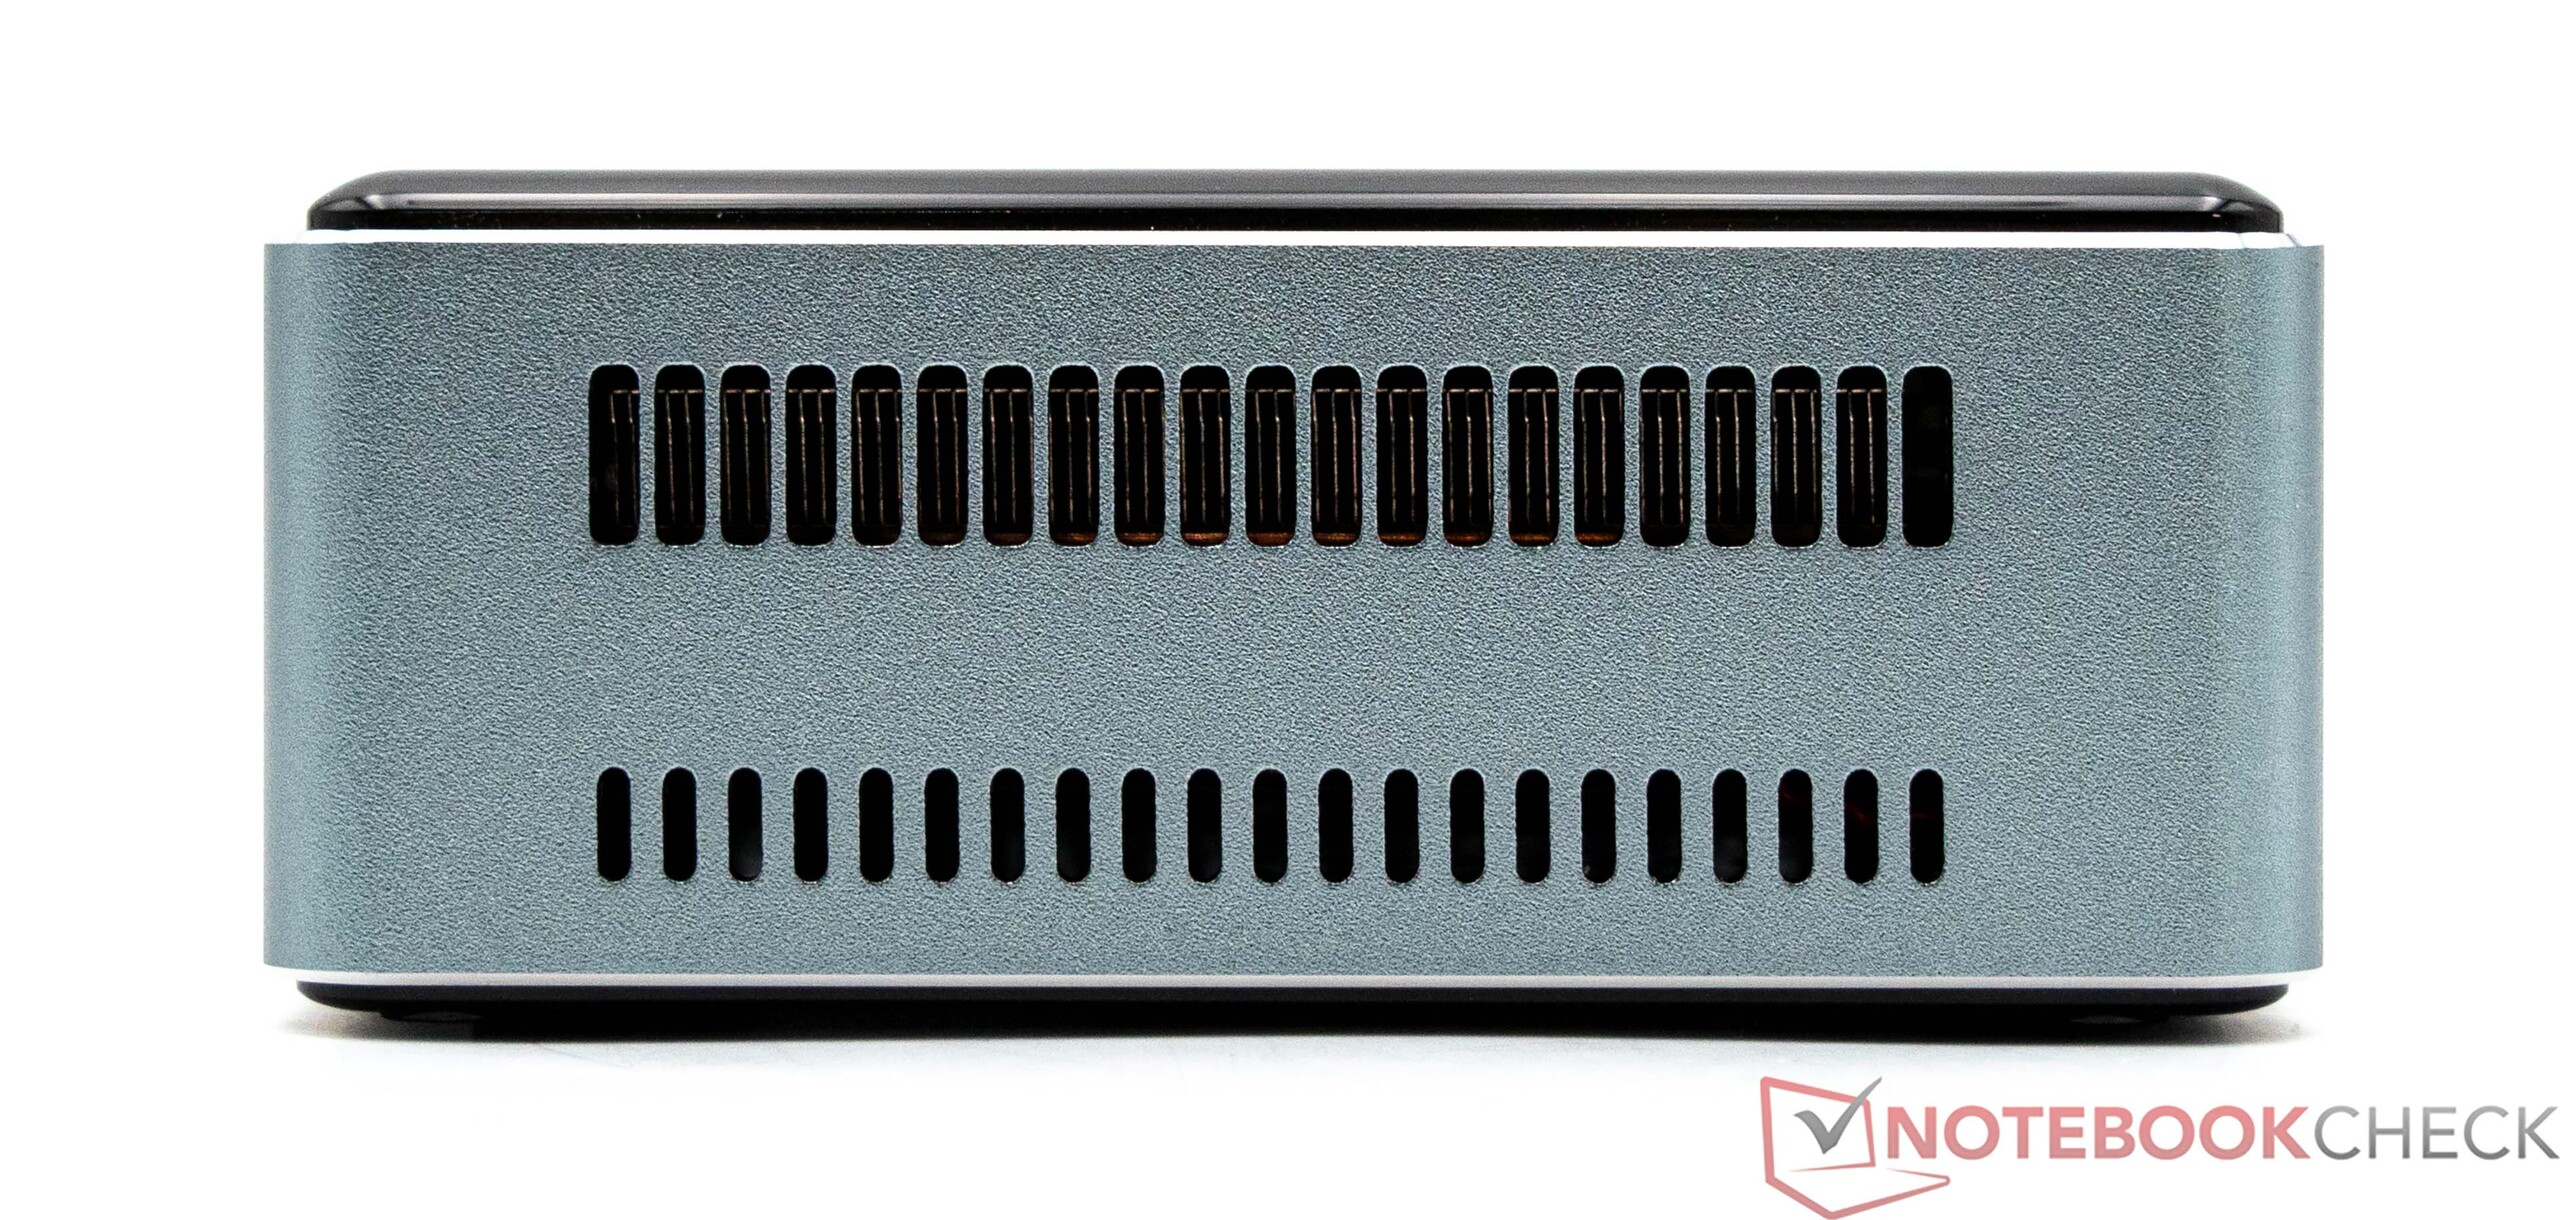
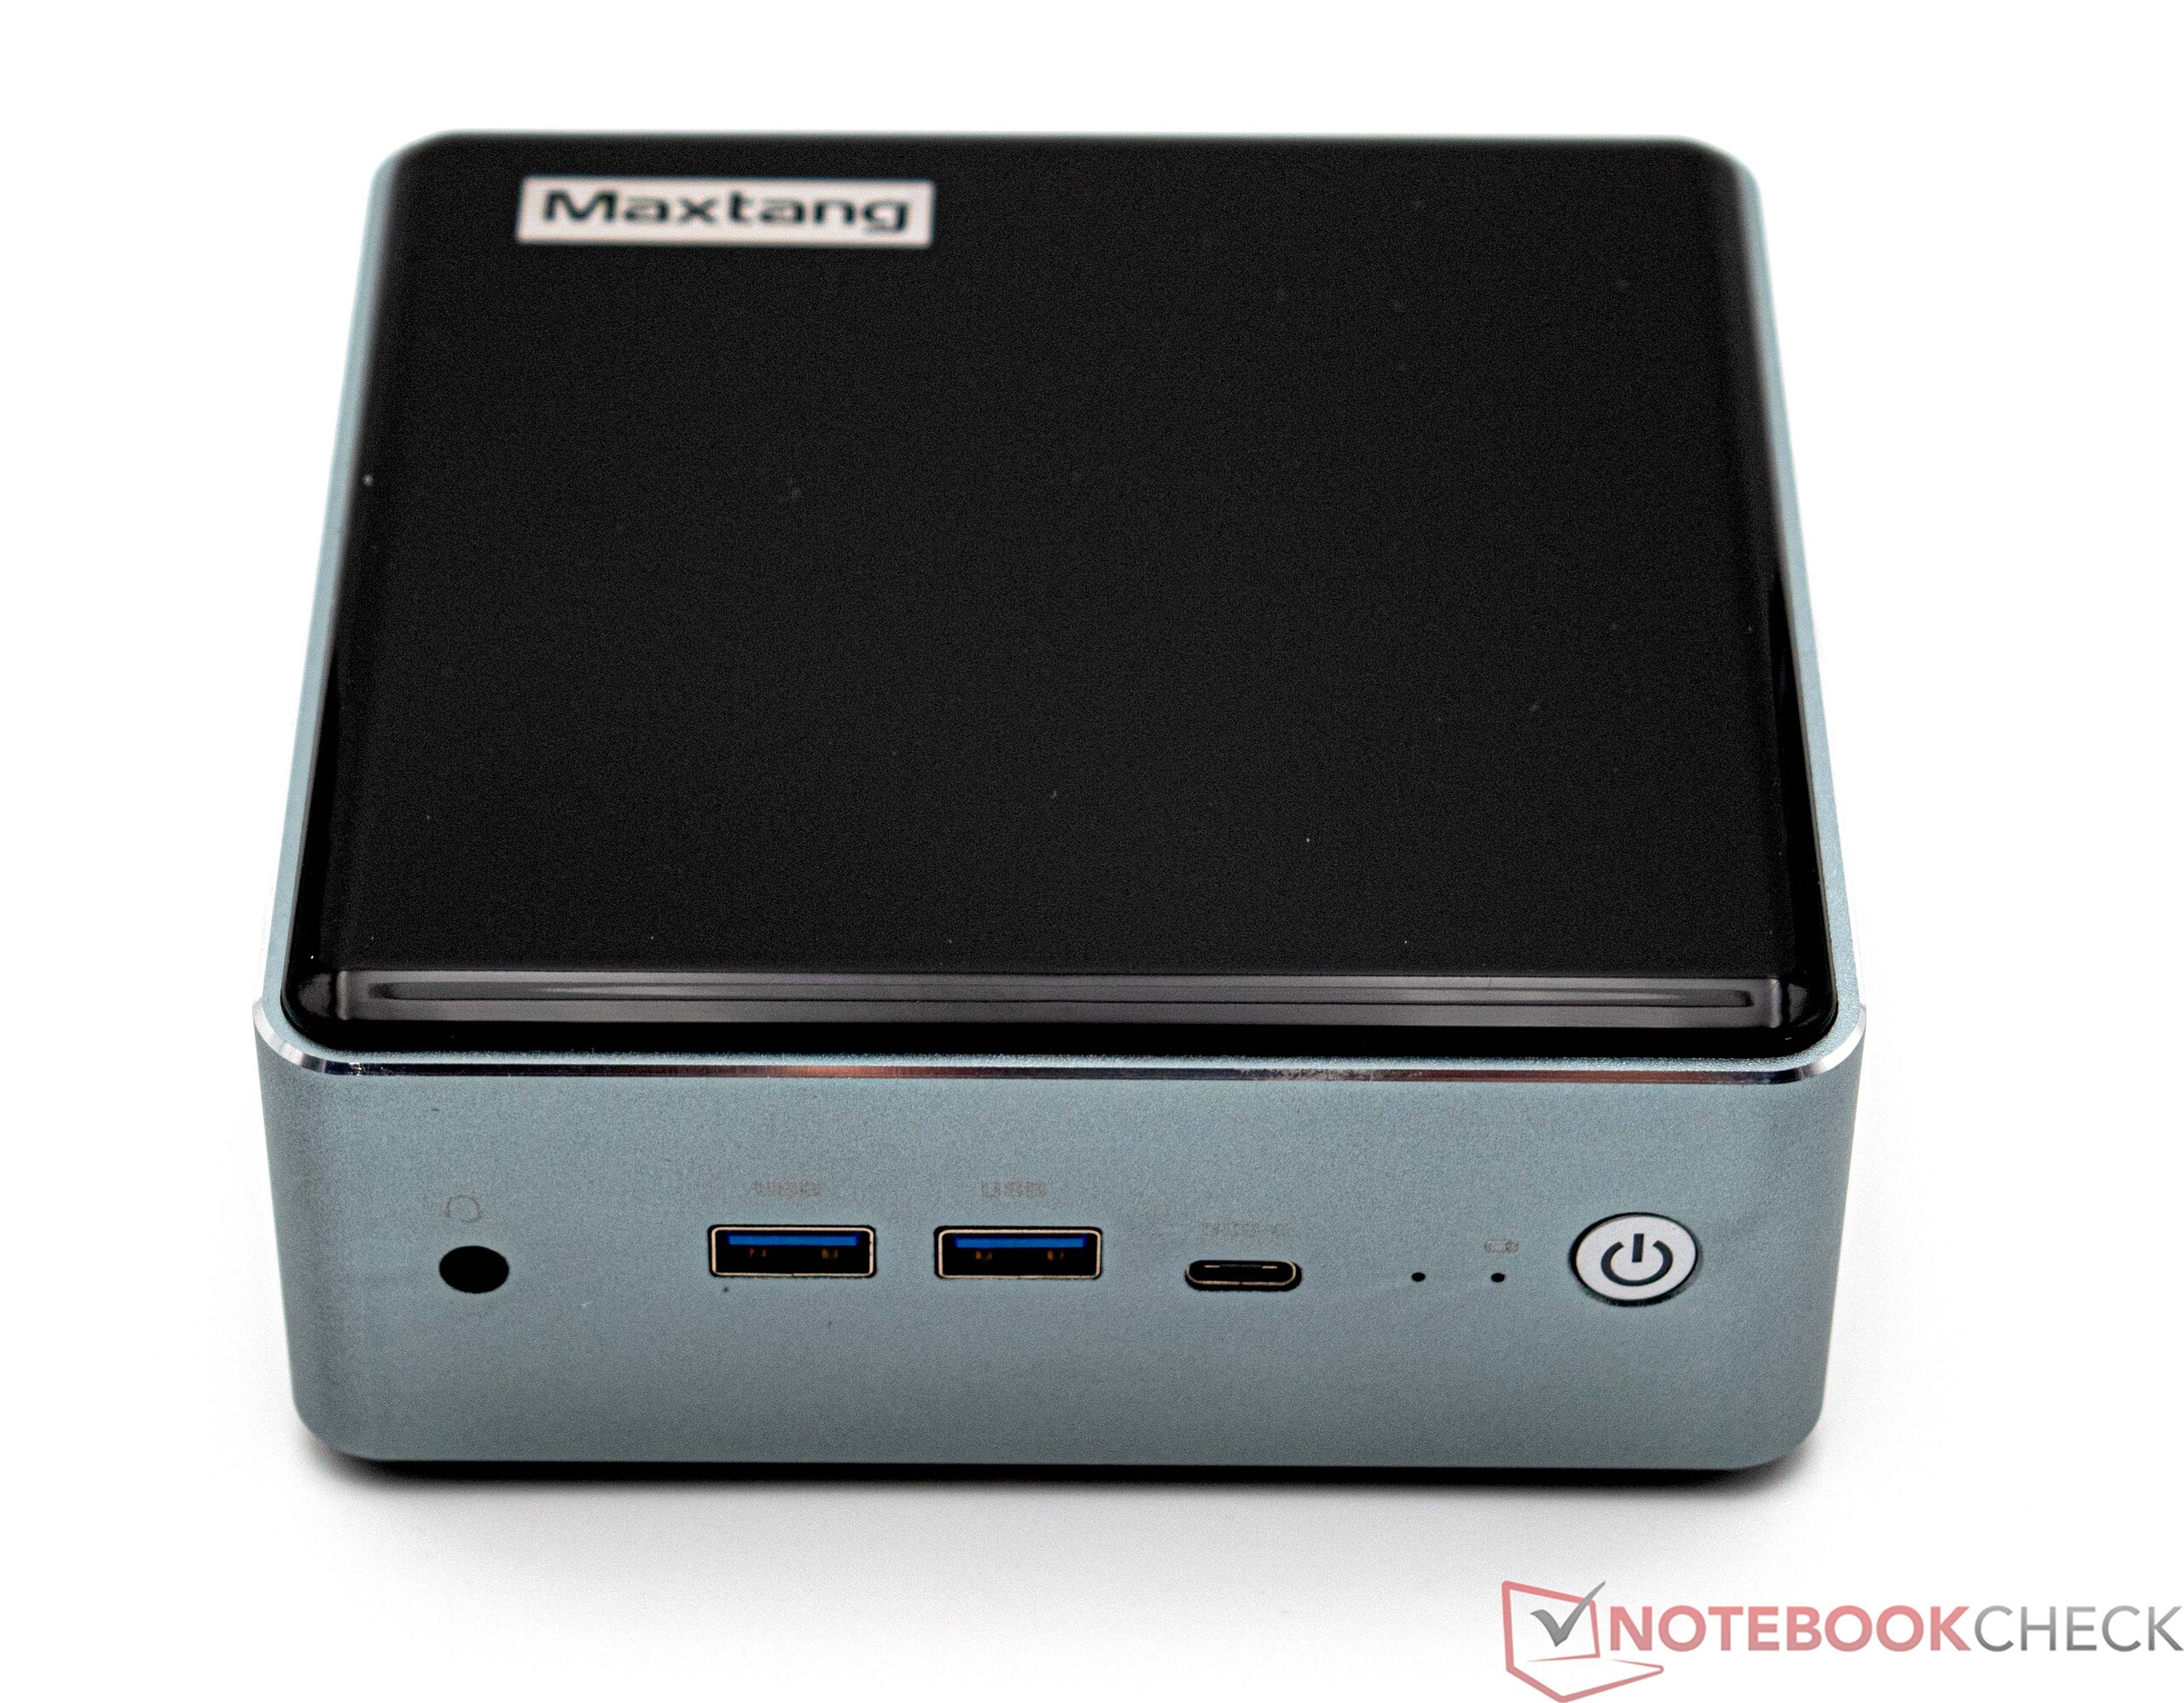
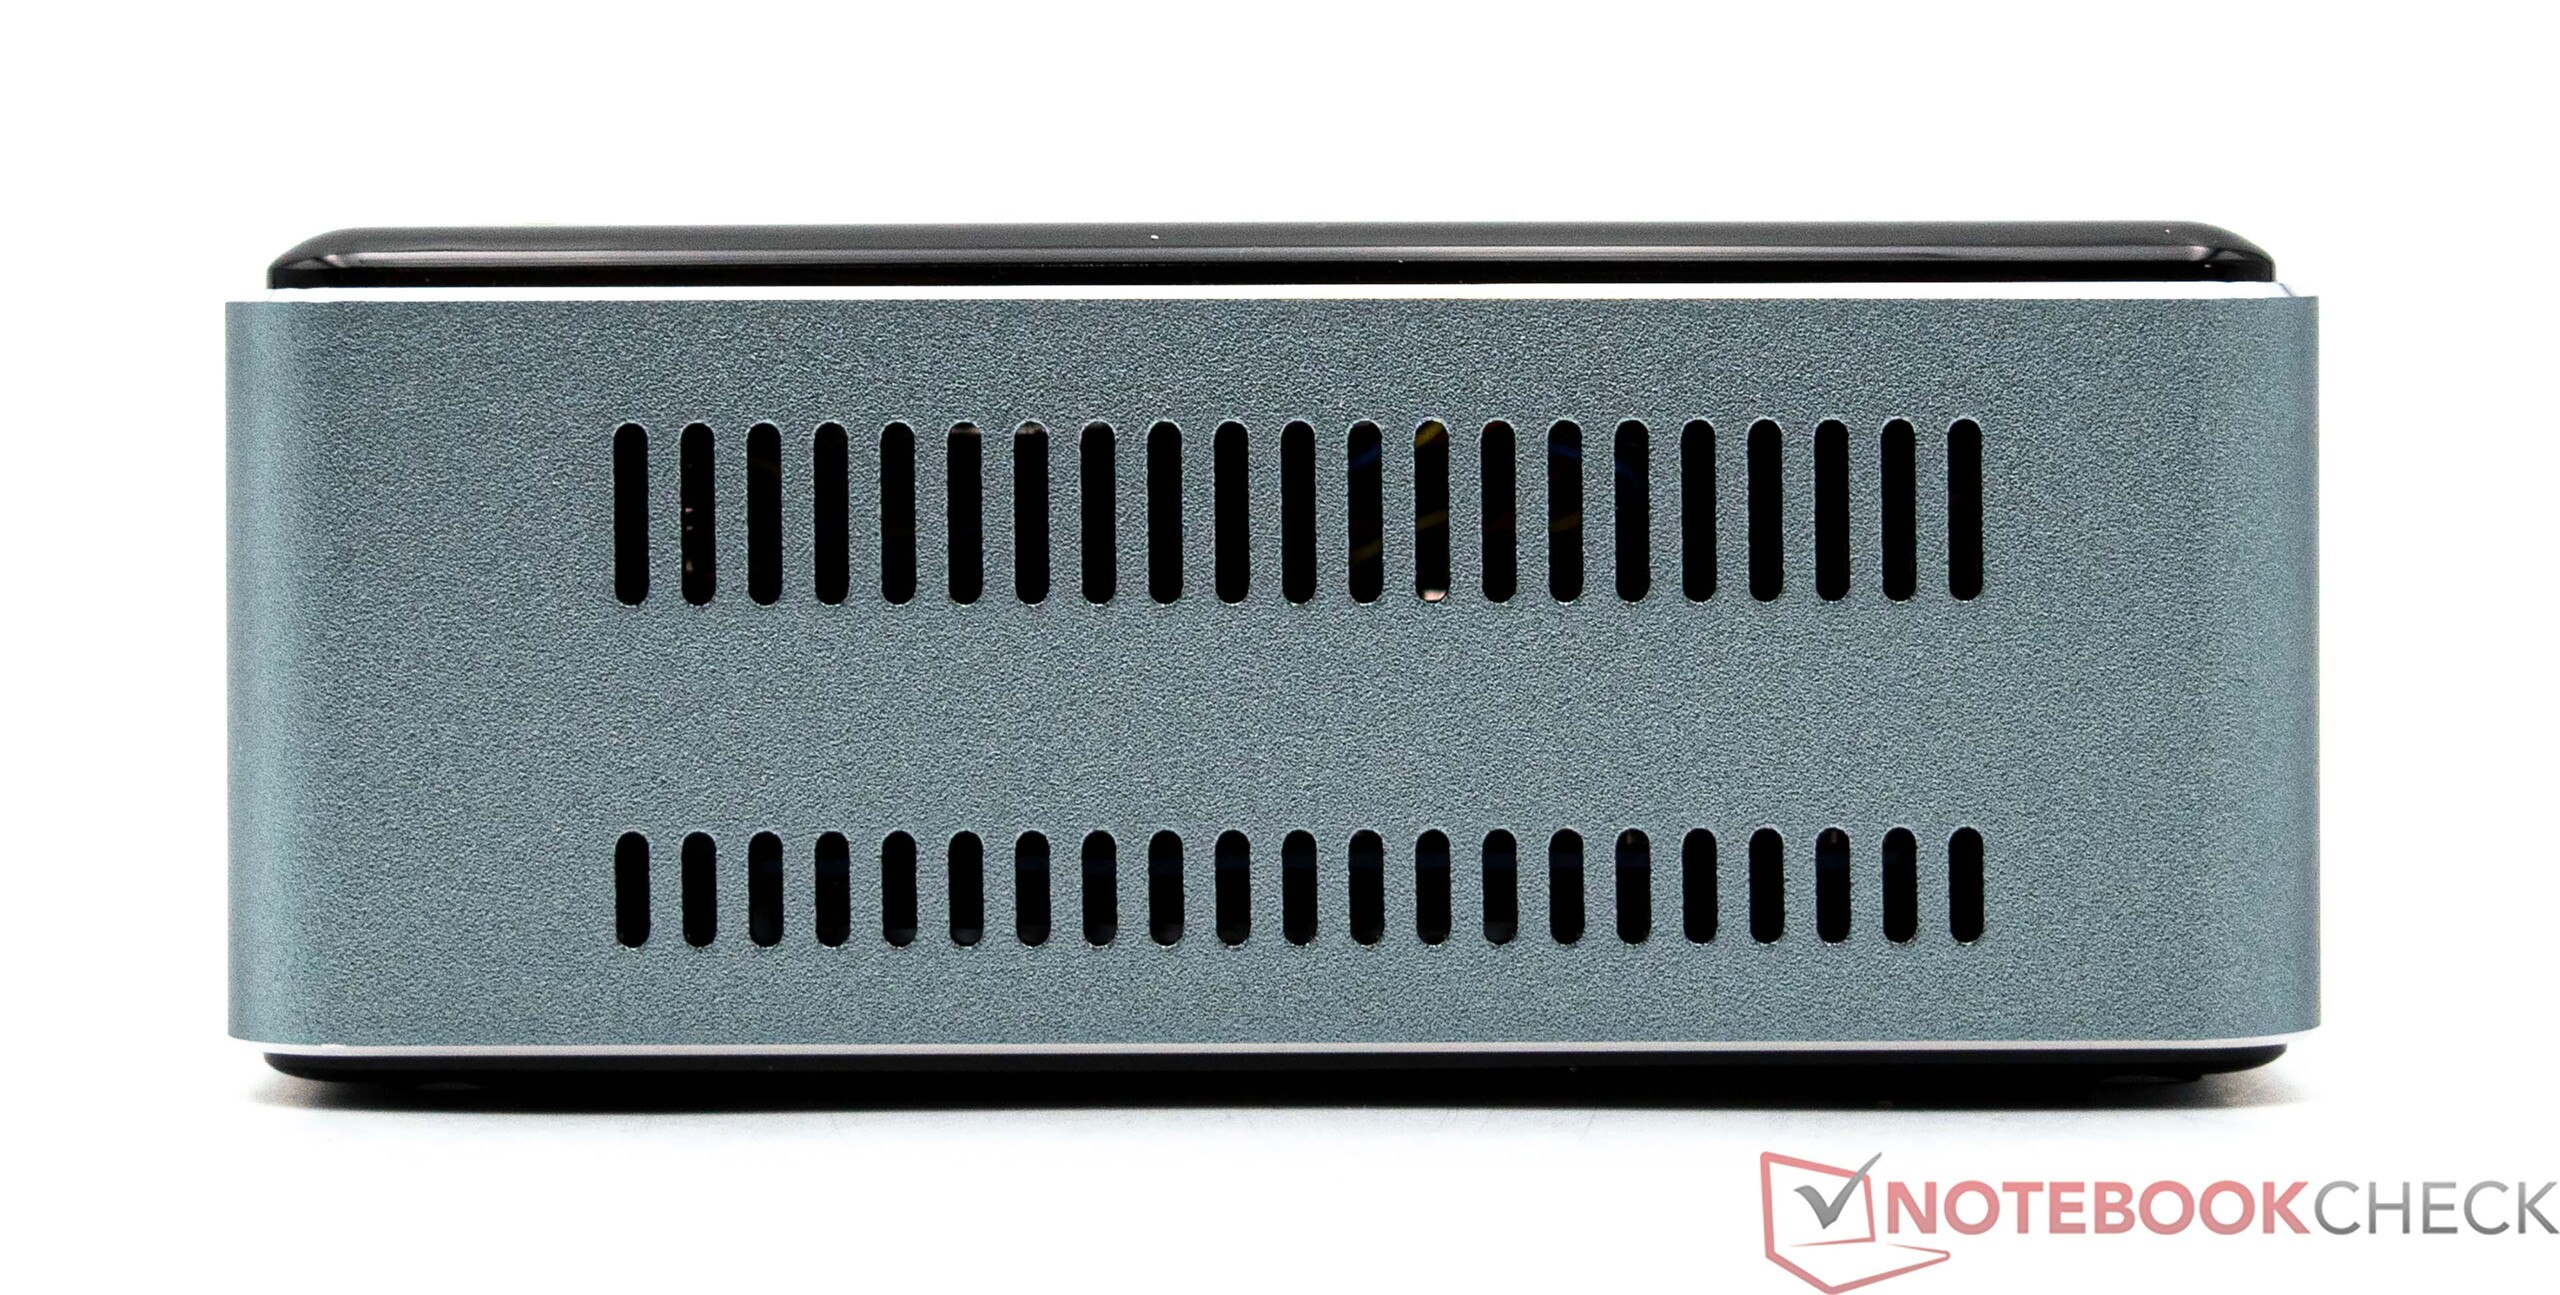
Maxtang MTN-FP750 ma solidną metalową obudowę, którą uzupełniają czarne błyszczące plastikowe powierzchnie na górze i na dole urządzenia. Bardzo szybko widoczne stają się odciski palców, a prędzej czy później zarysowania są nieuniknione. Pod względem stabilności, urządzenie nie wydaje się cierpieć z powodu posiadania plastikowych osłon. Na górnej części mini PC znajduje się logo Maxtang.
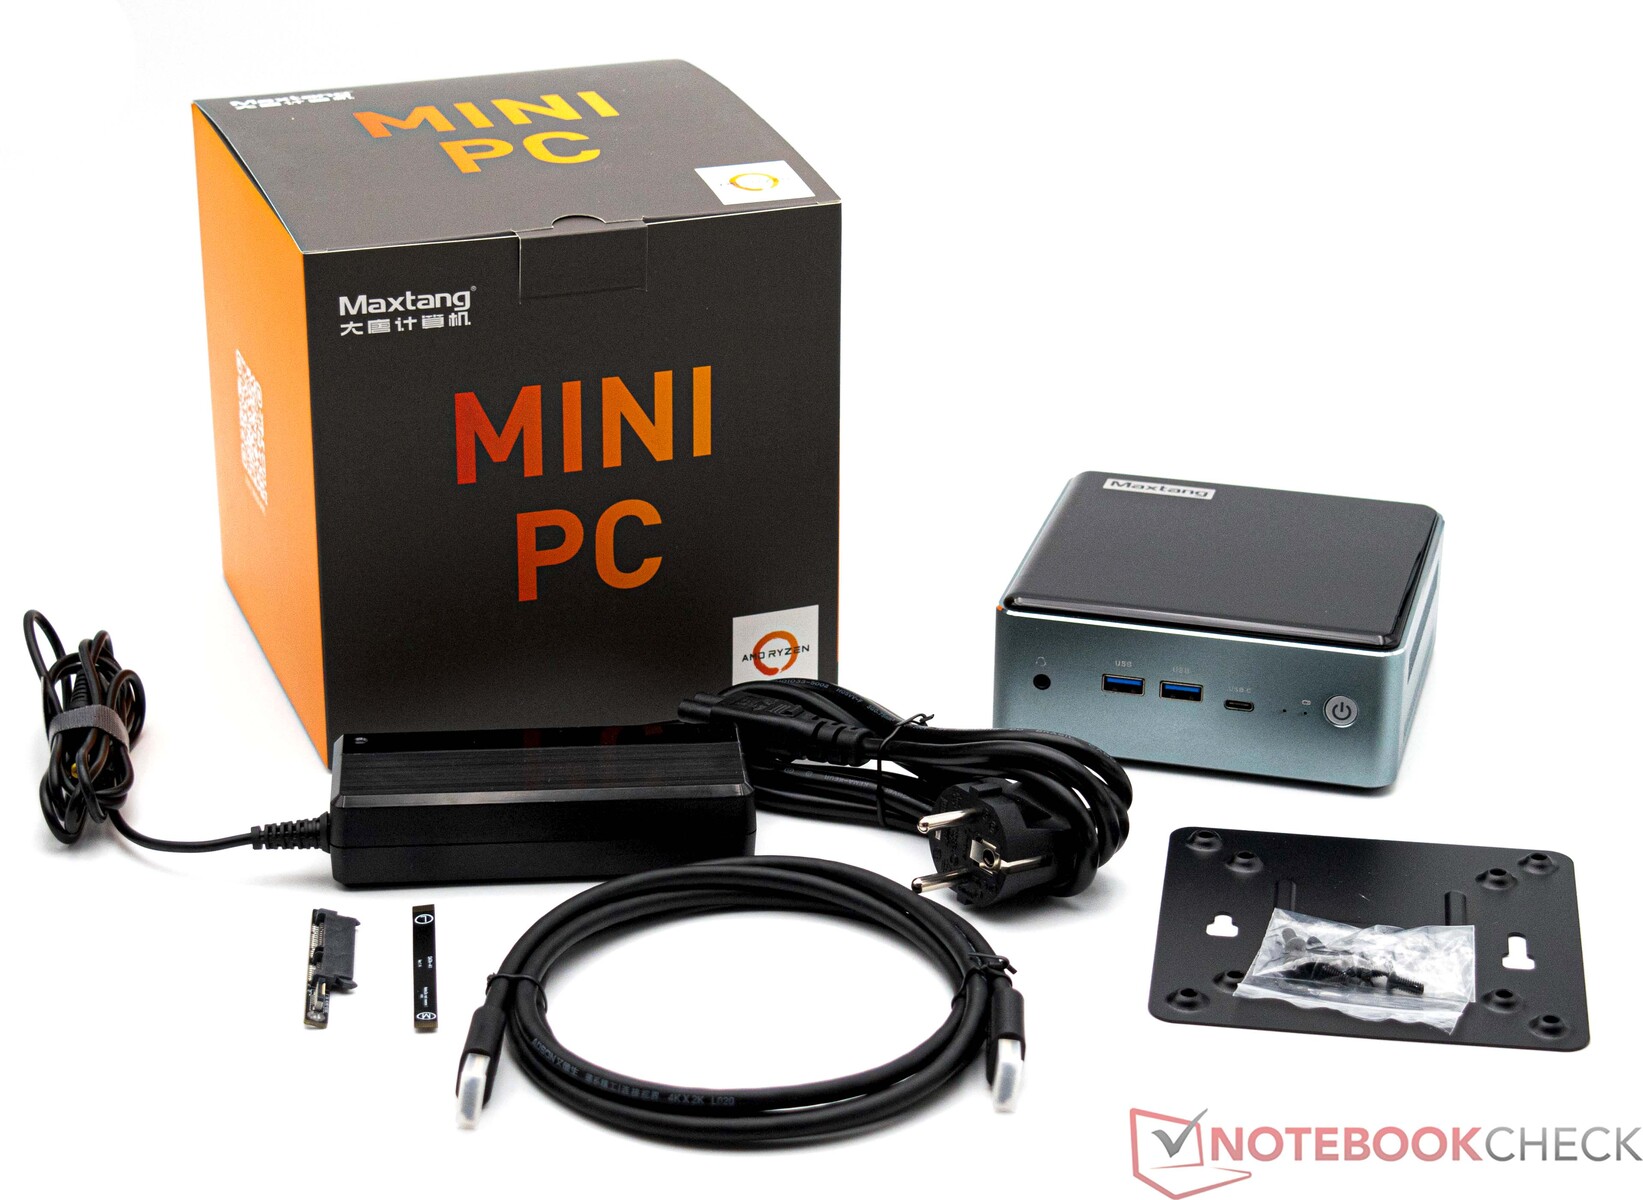
Przy wymiarach około 13 x 13 centymetrów, urządzenie zajmuje nieco więcej miejsca na biurku niż konkurencja, a przy wadze 600 gramów Maxtang MTN-FP750 jest stosunkowo lekki. Zasilacz waży zaledwie 290 gramów. Maxtang MTN-FP750 można również przymocować do monitora, a uchwyt VESA znajduje się w pudełku.
Cechy
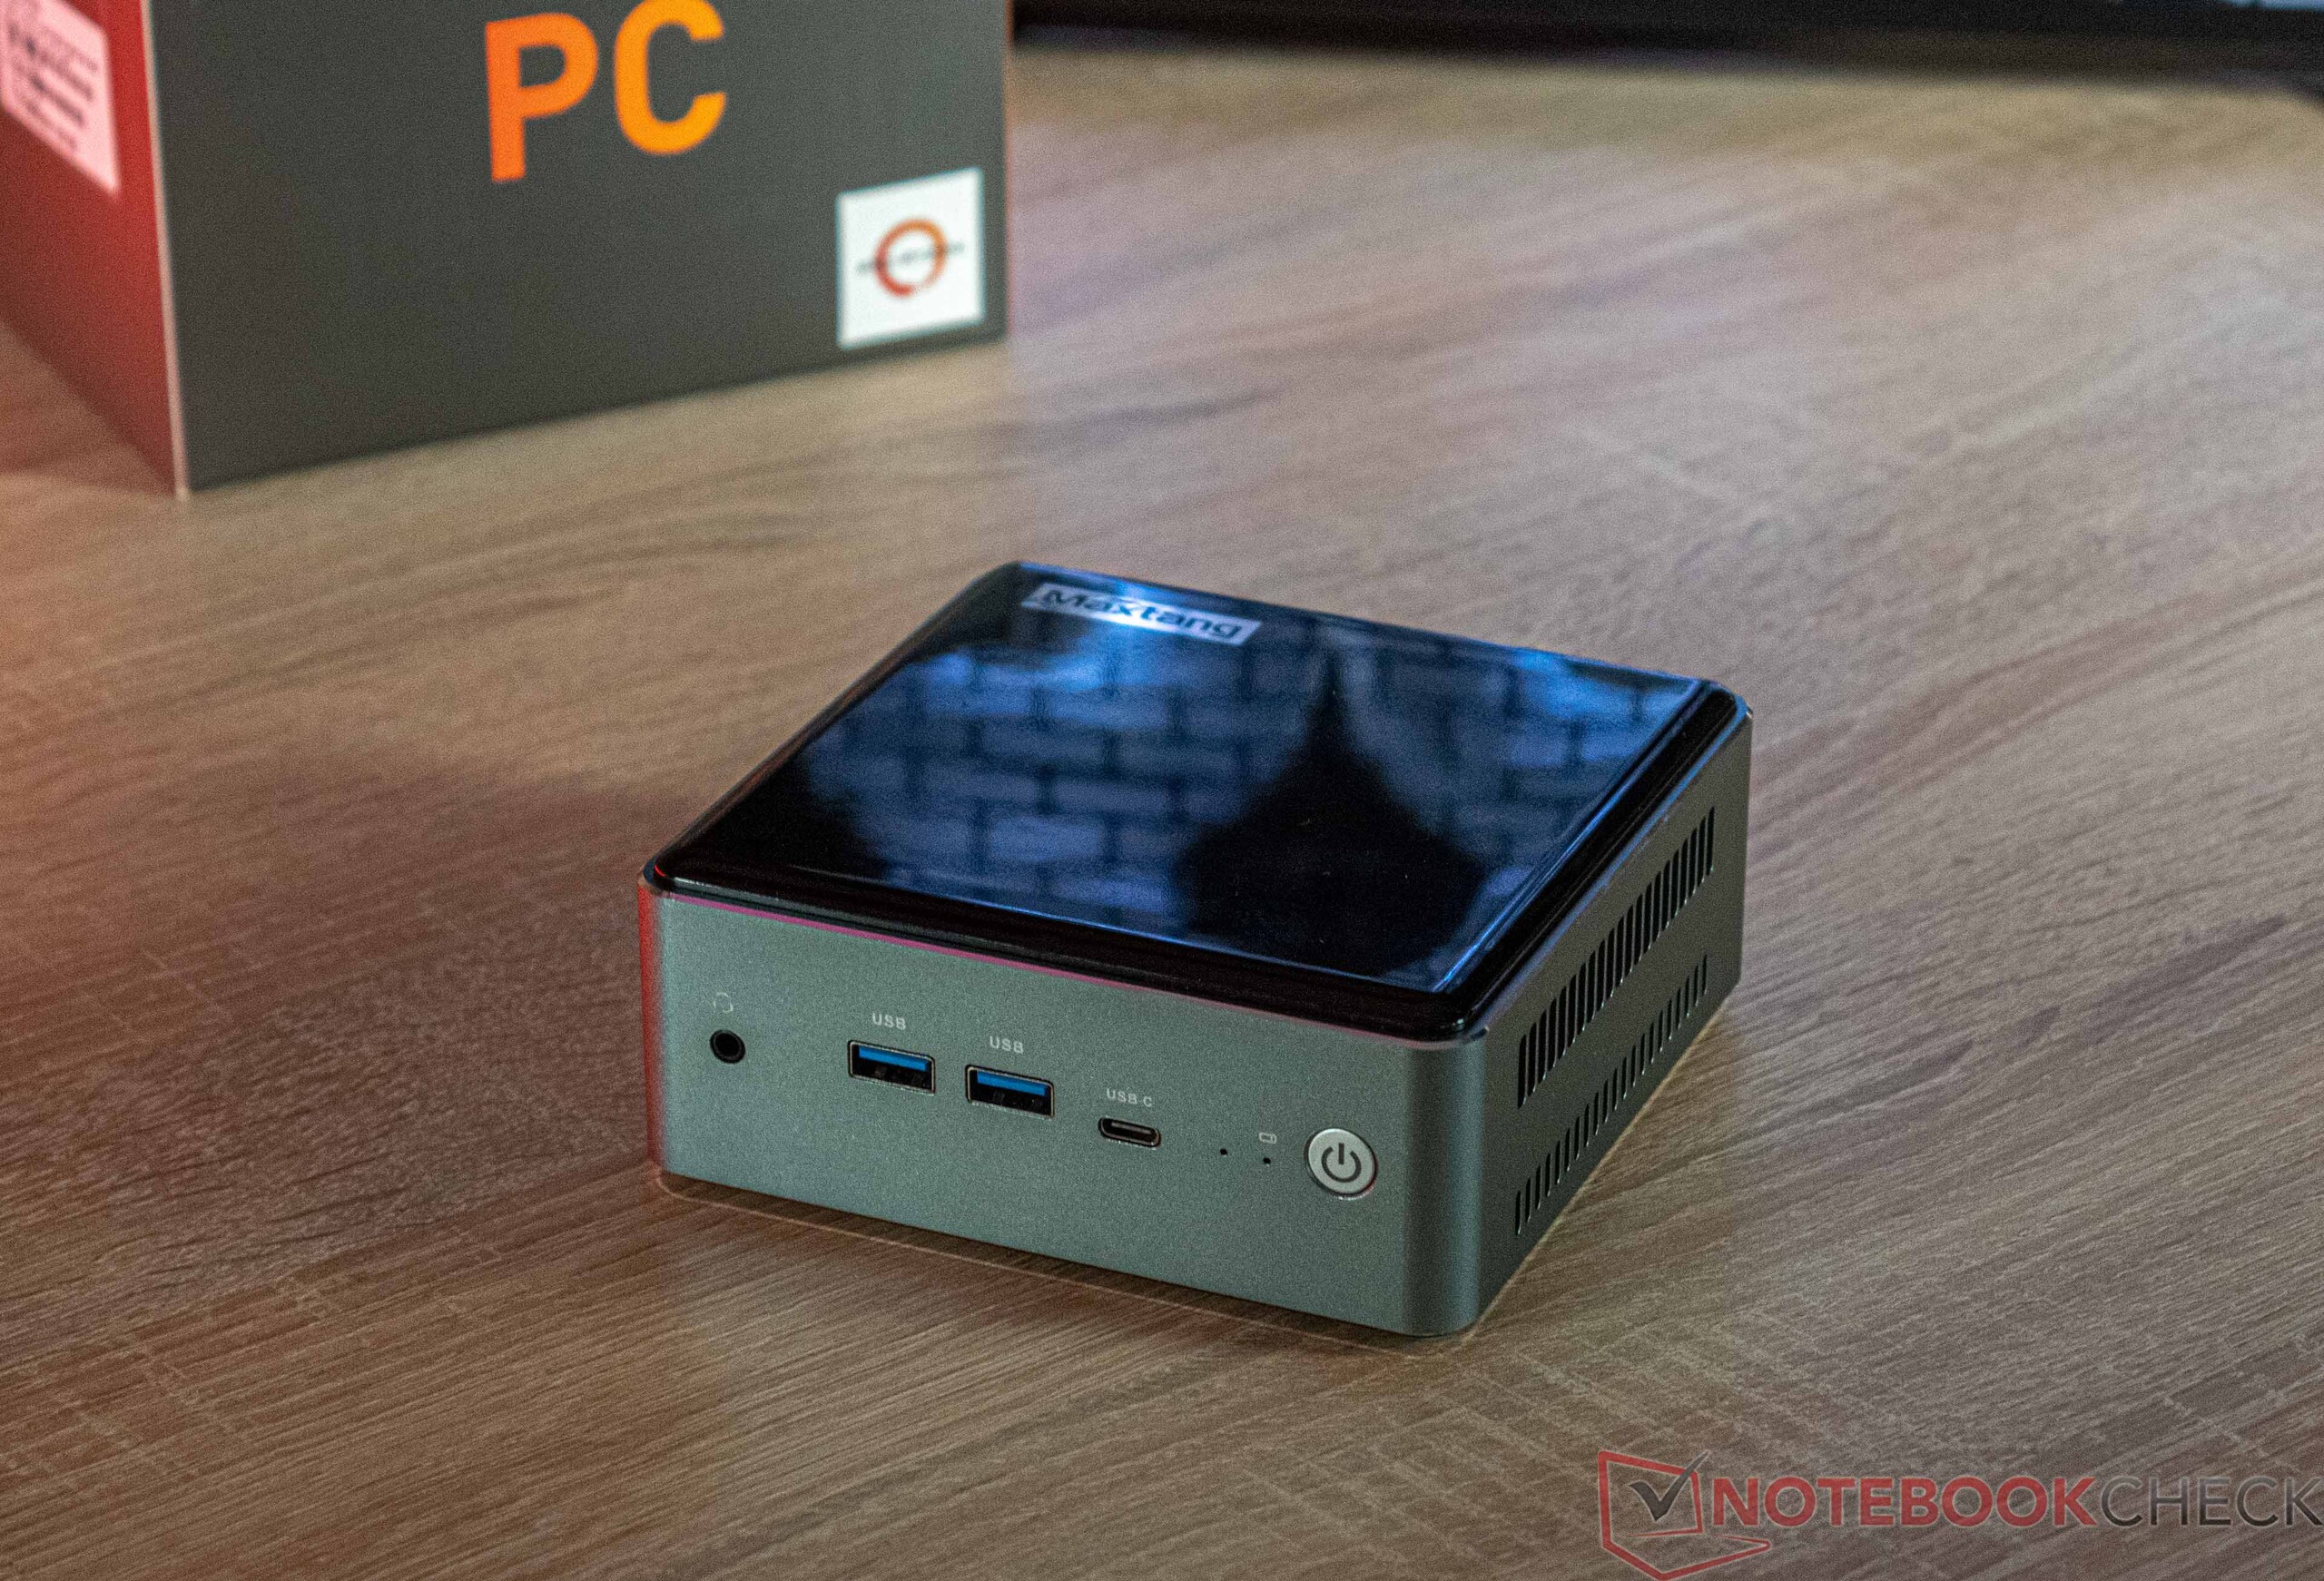
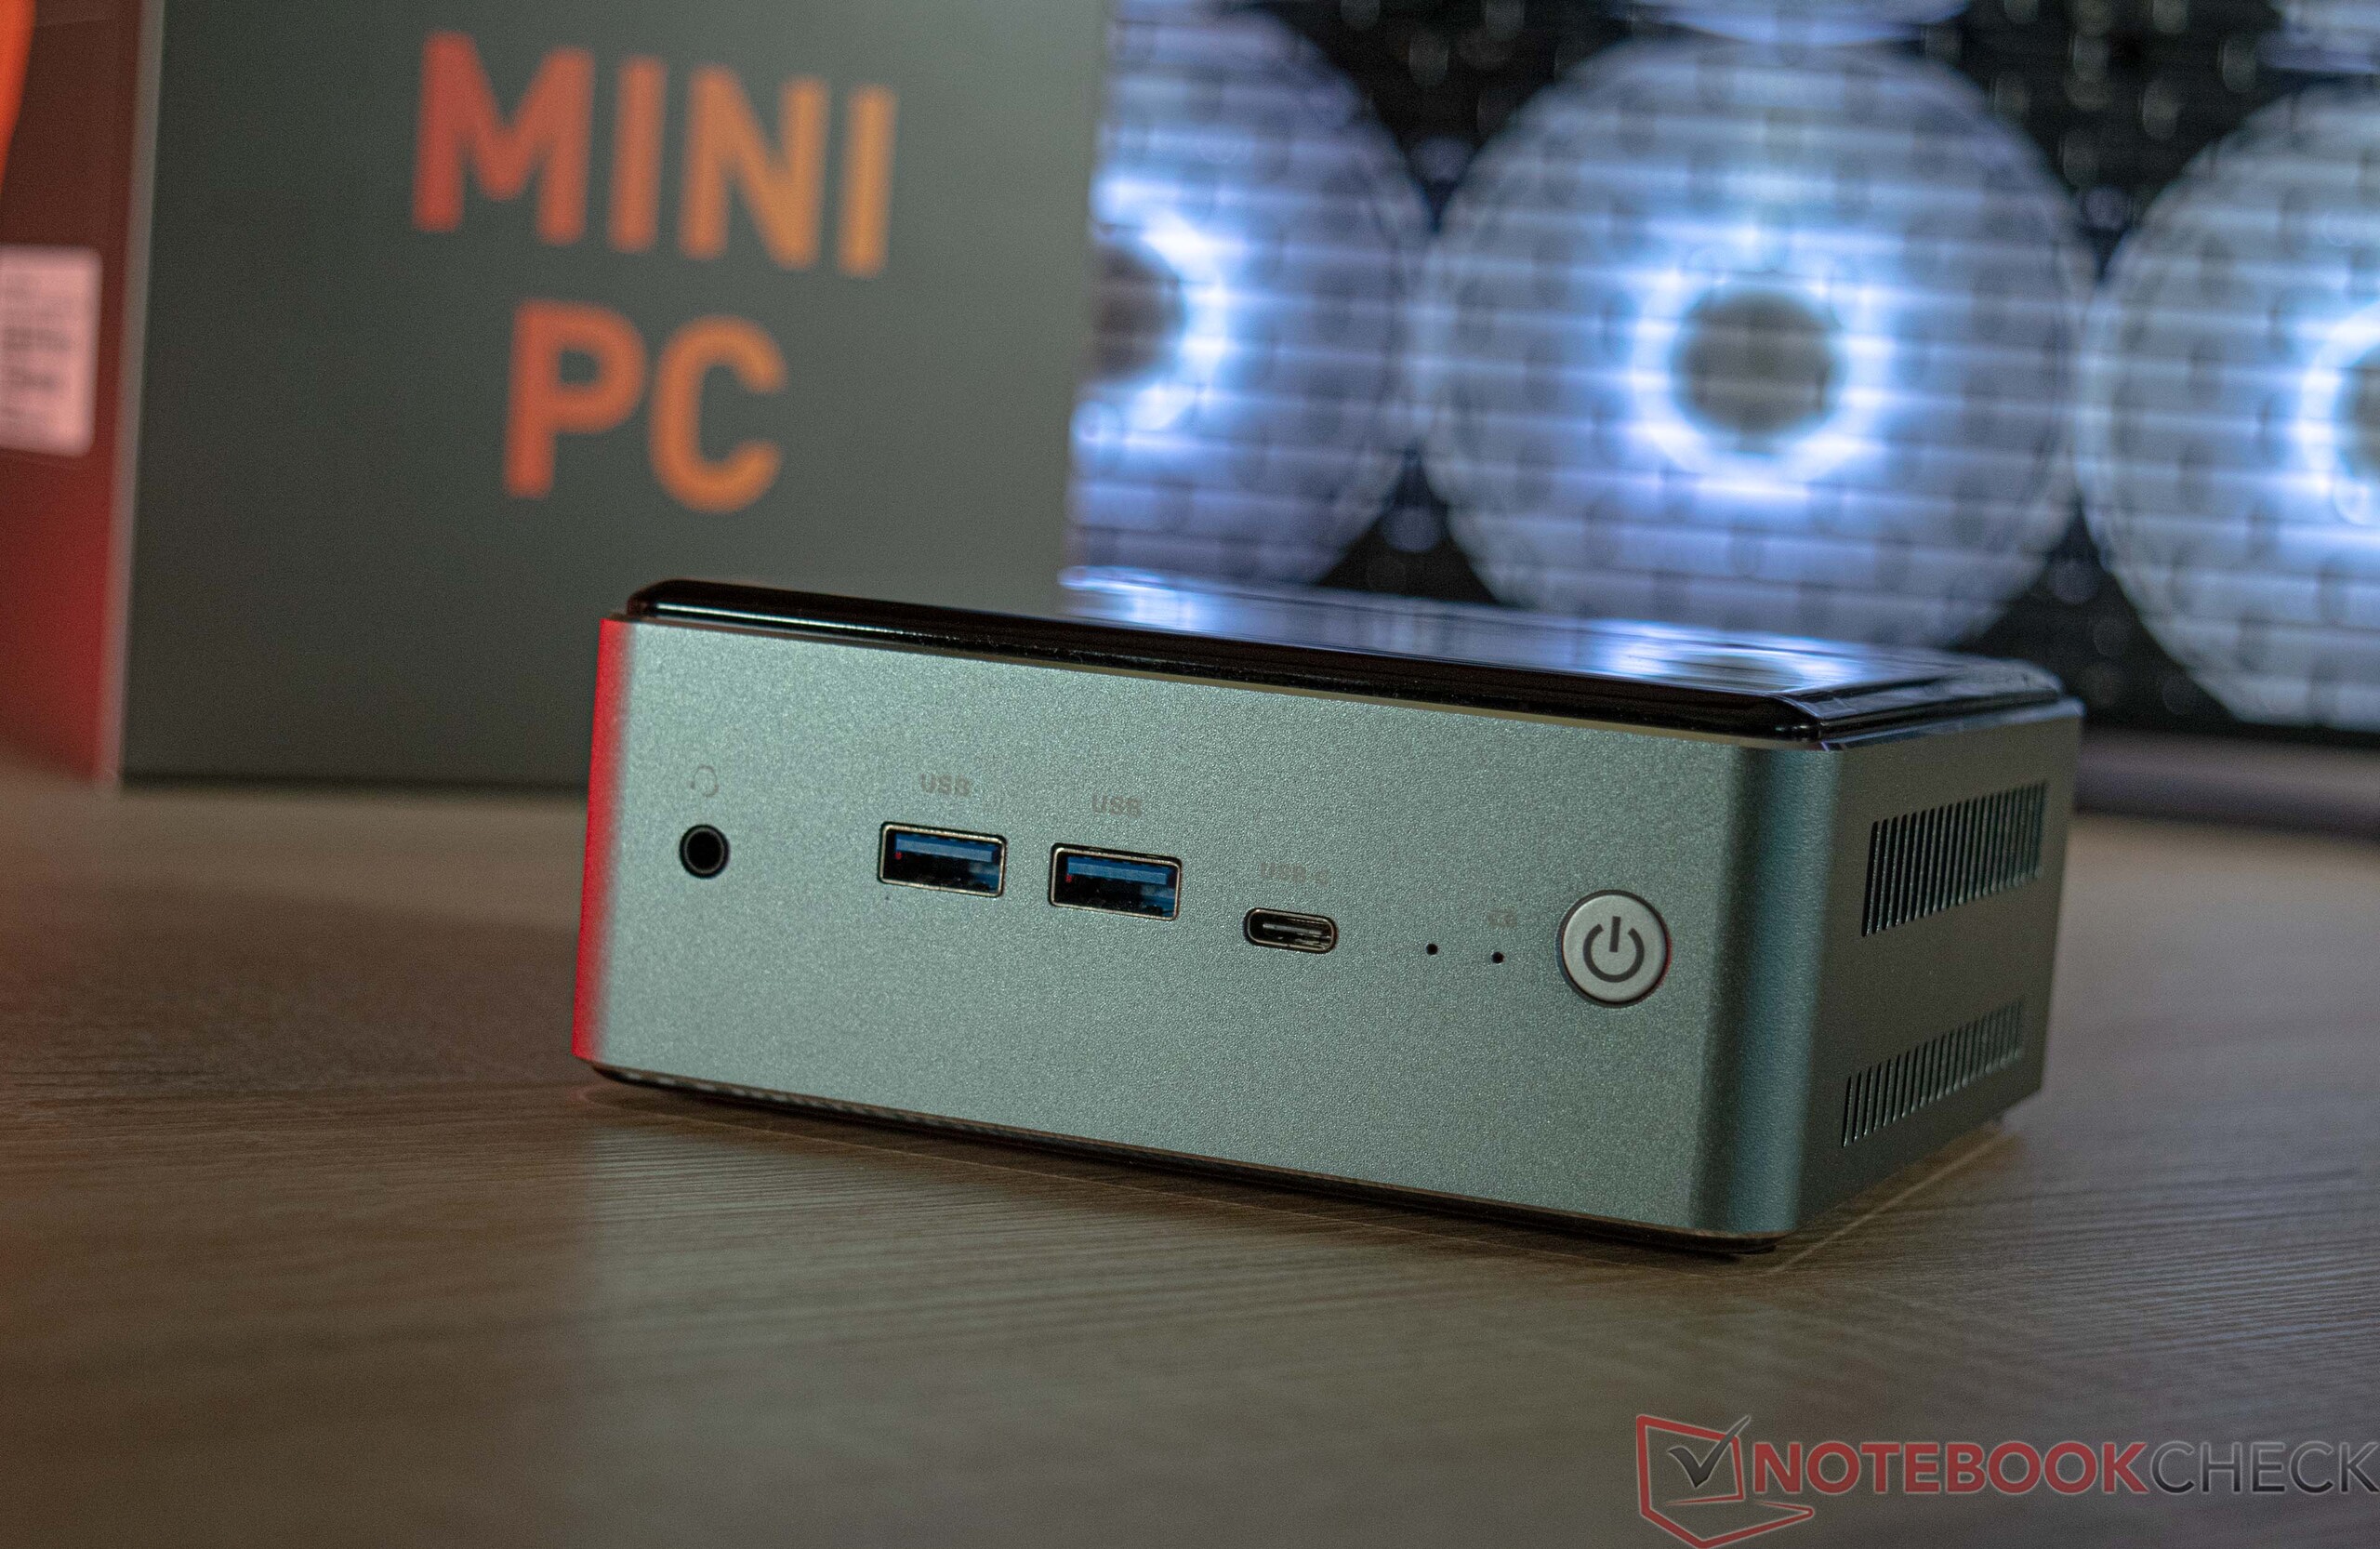
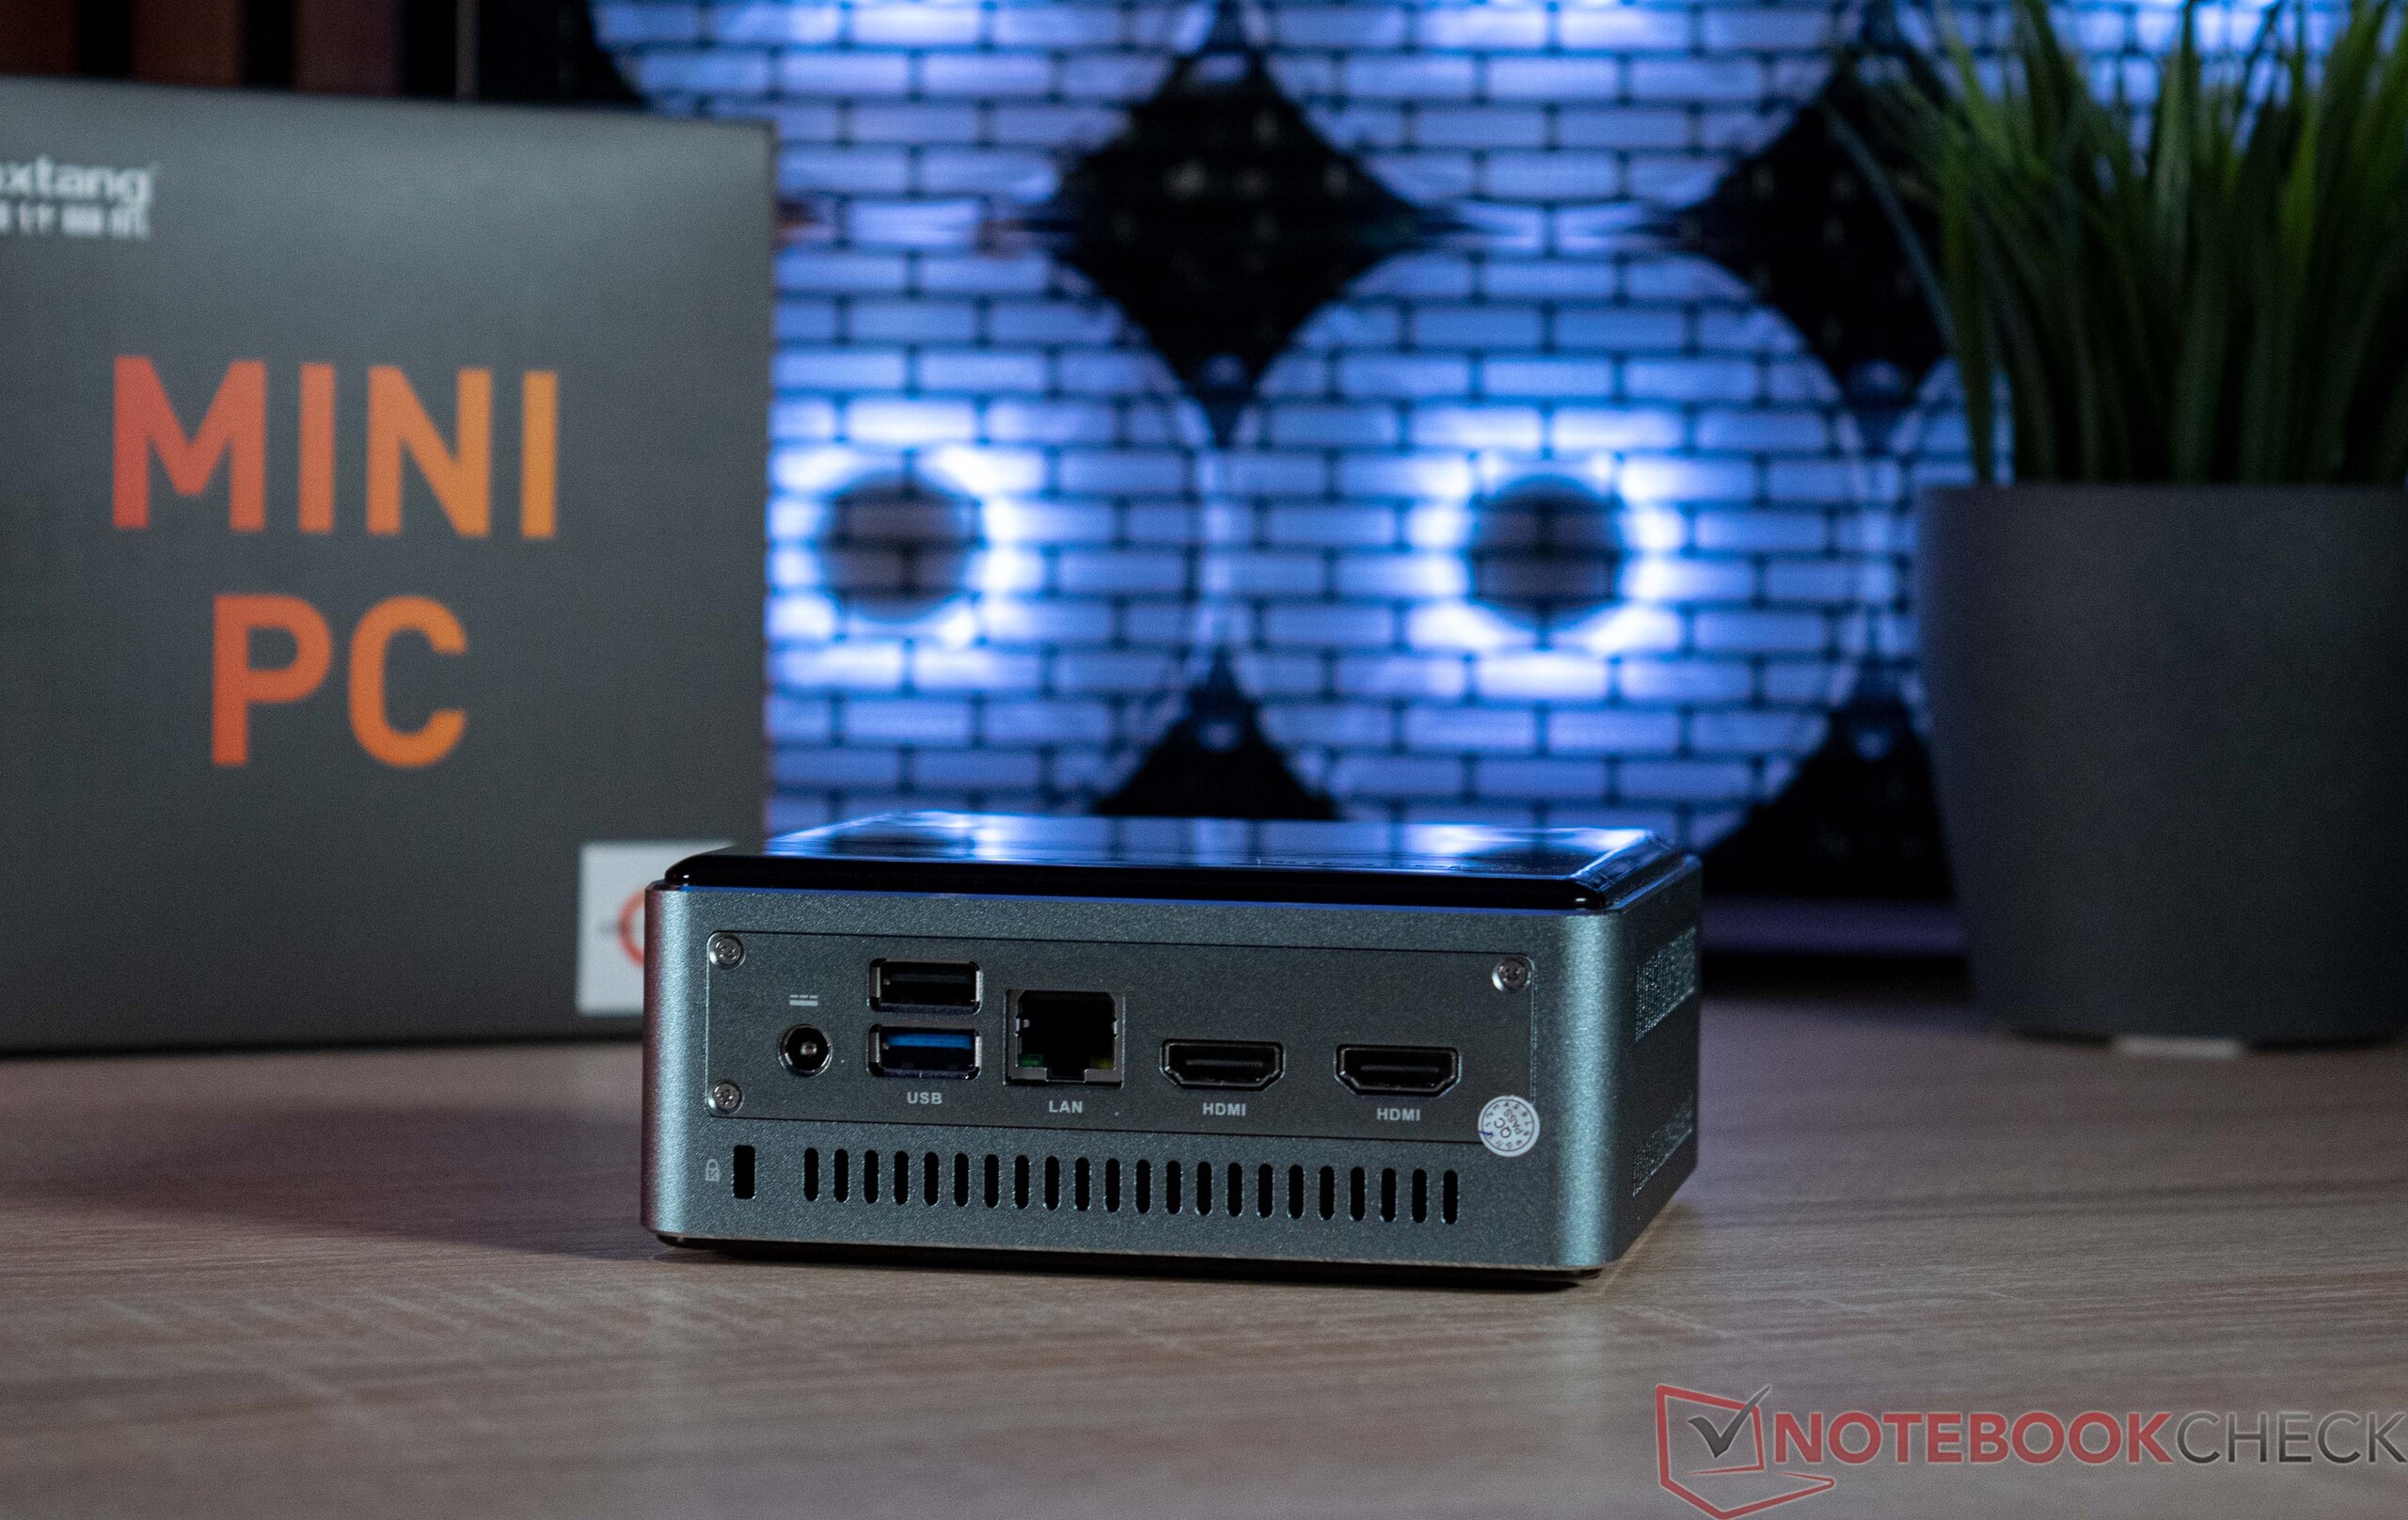
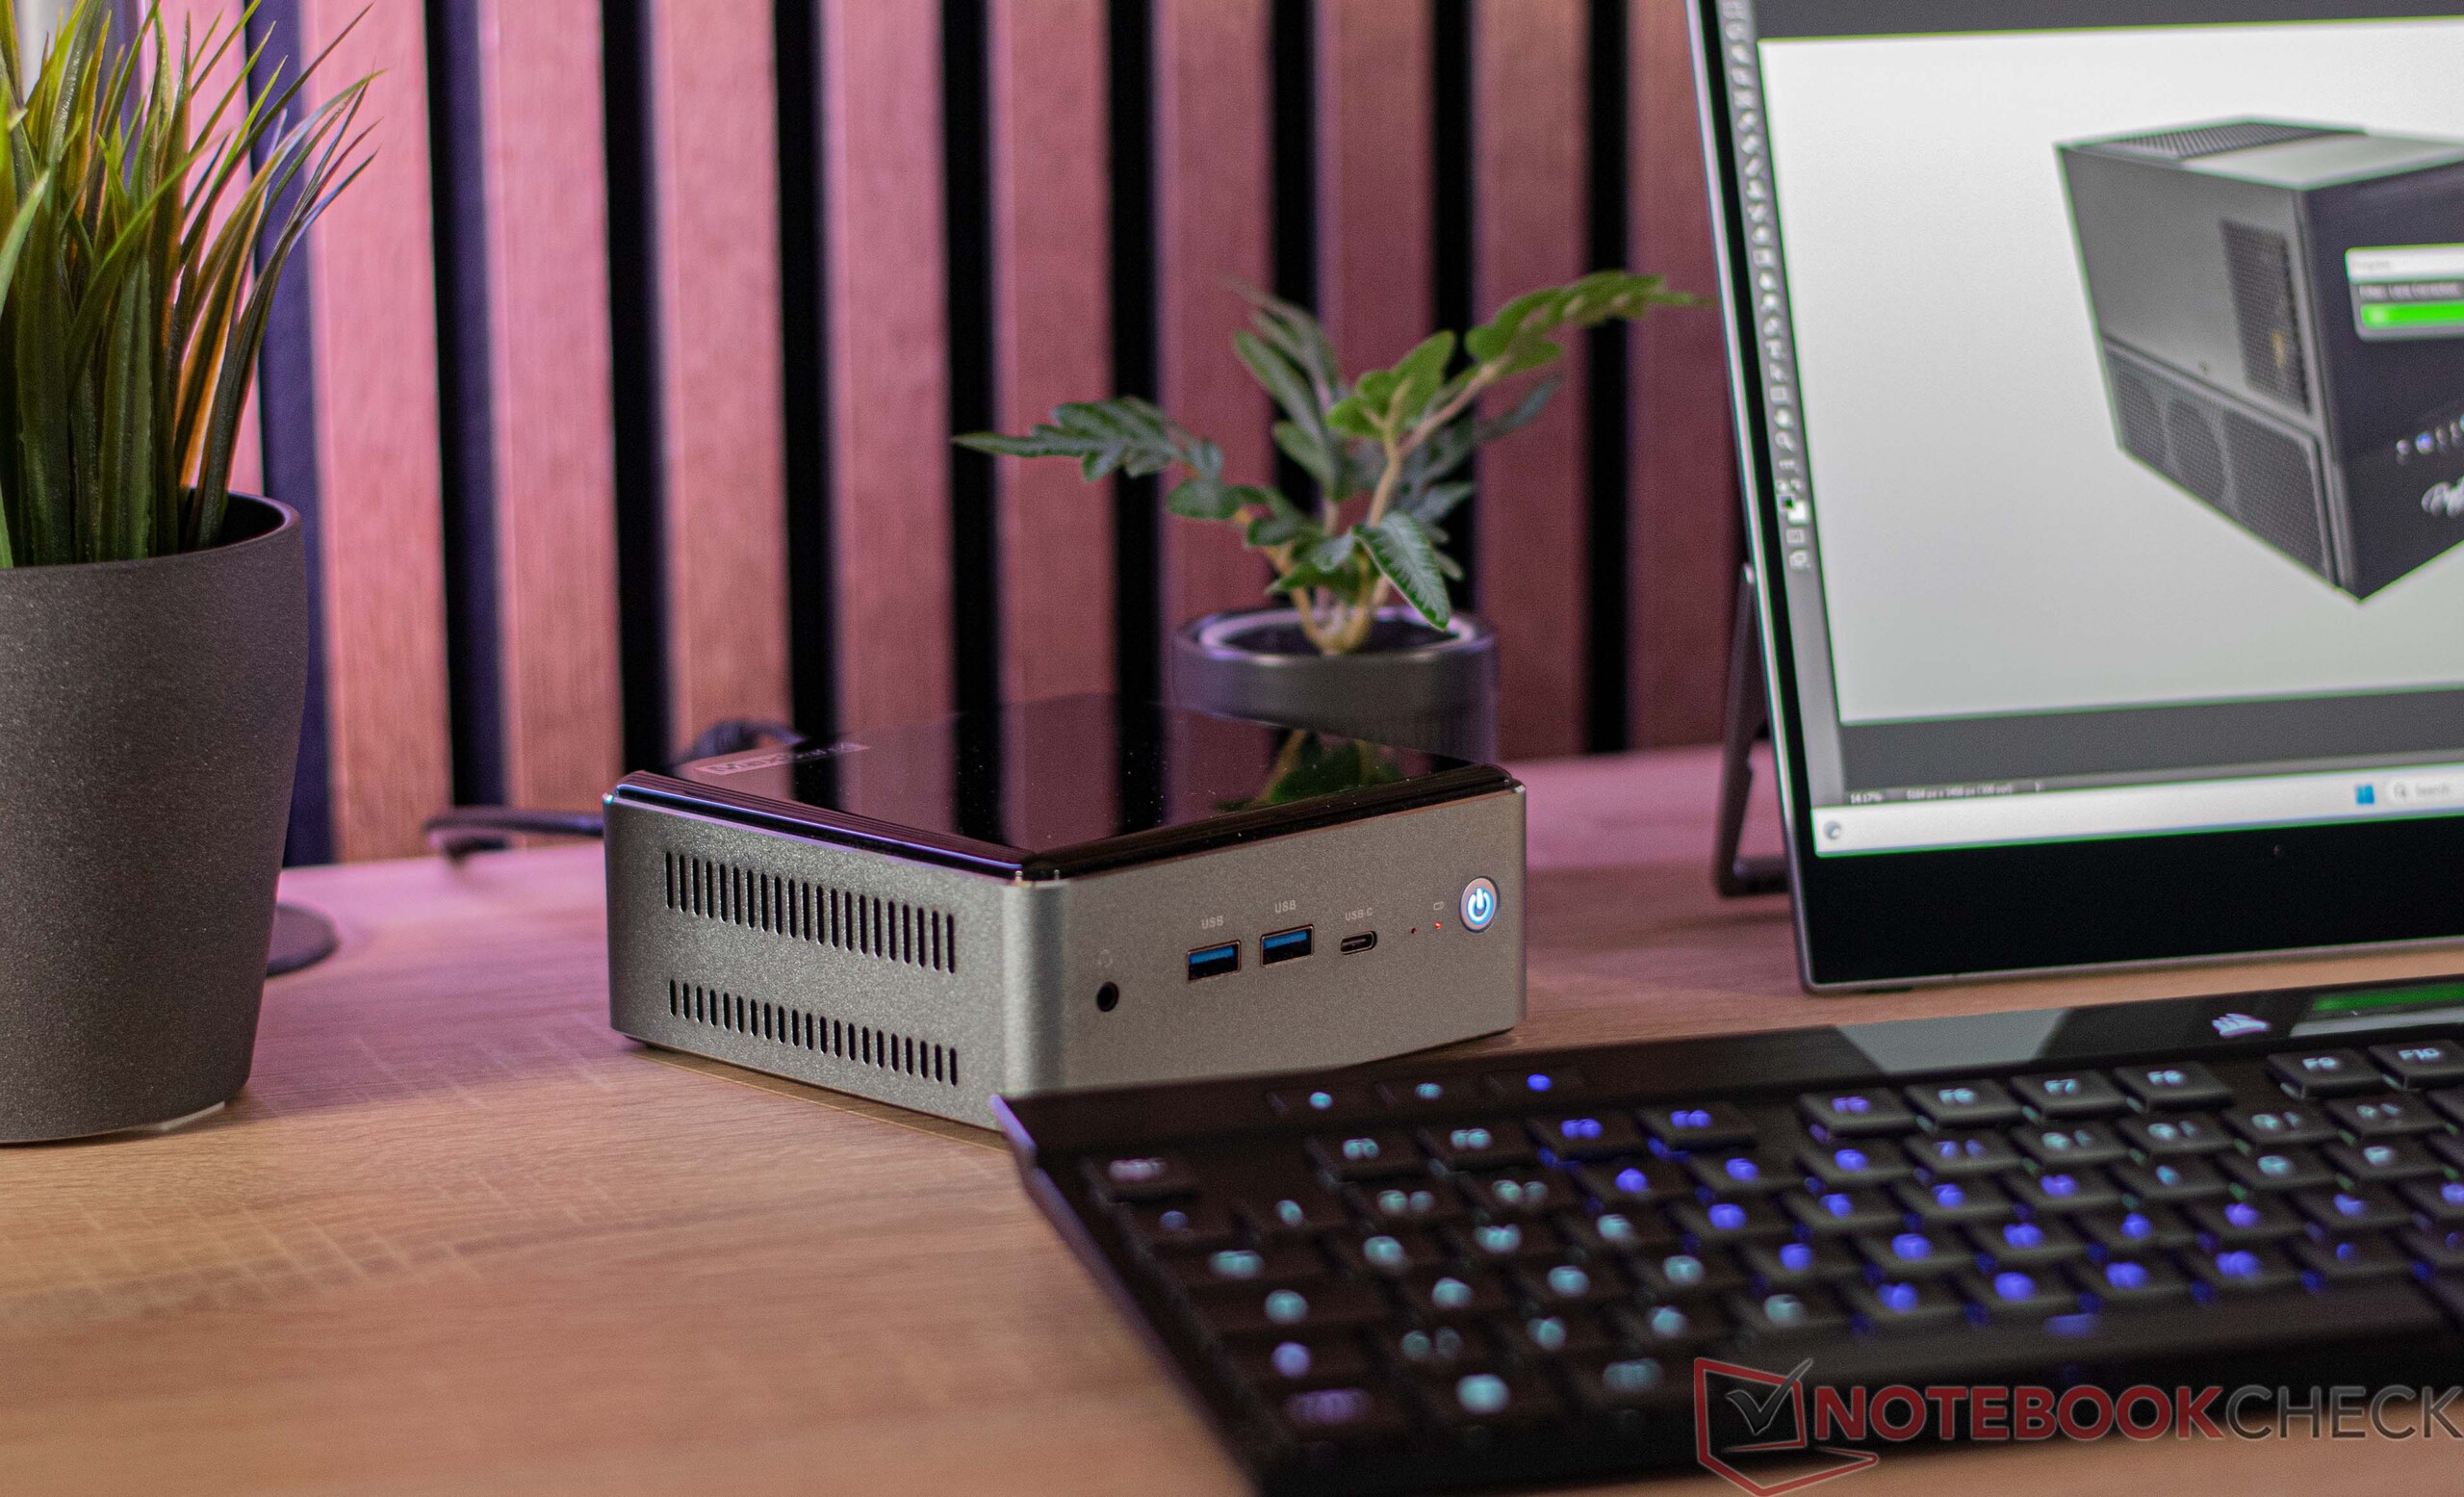
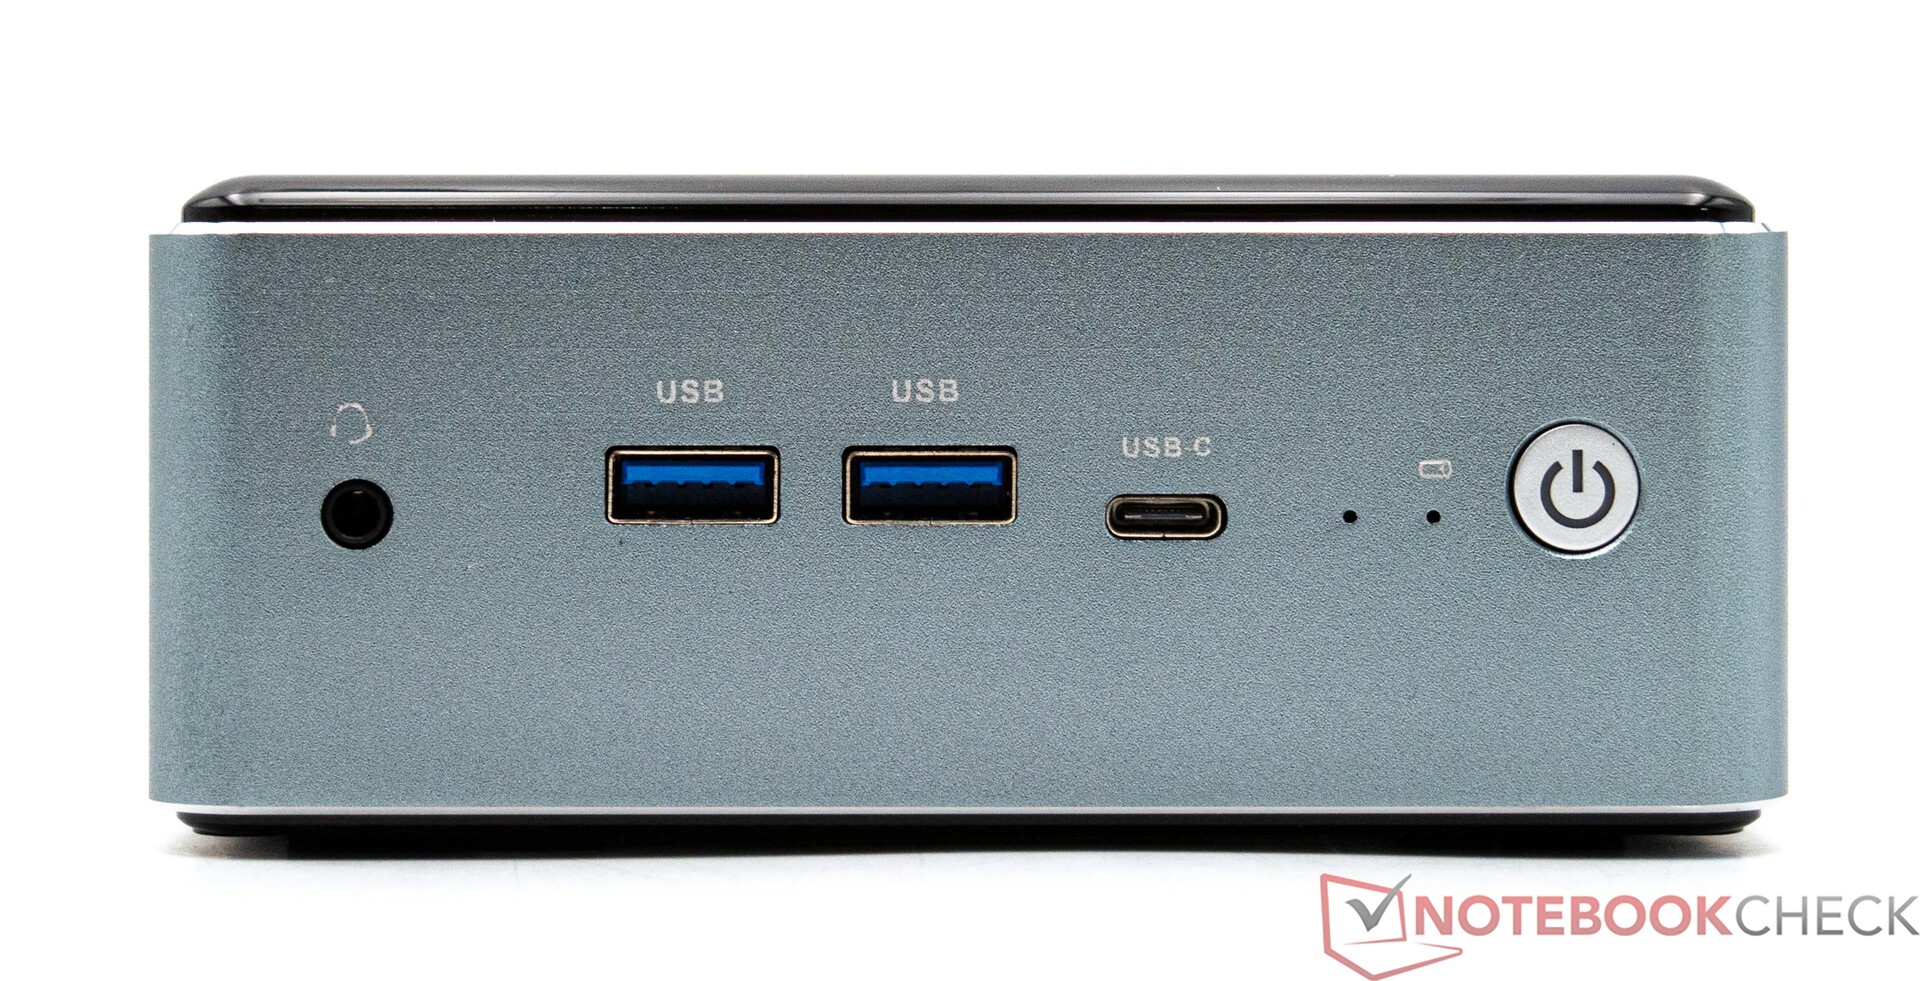
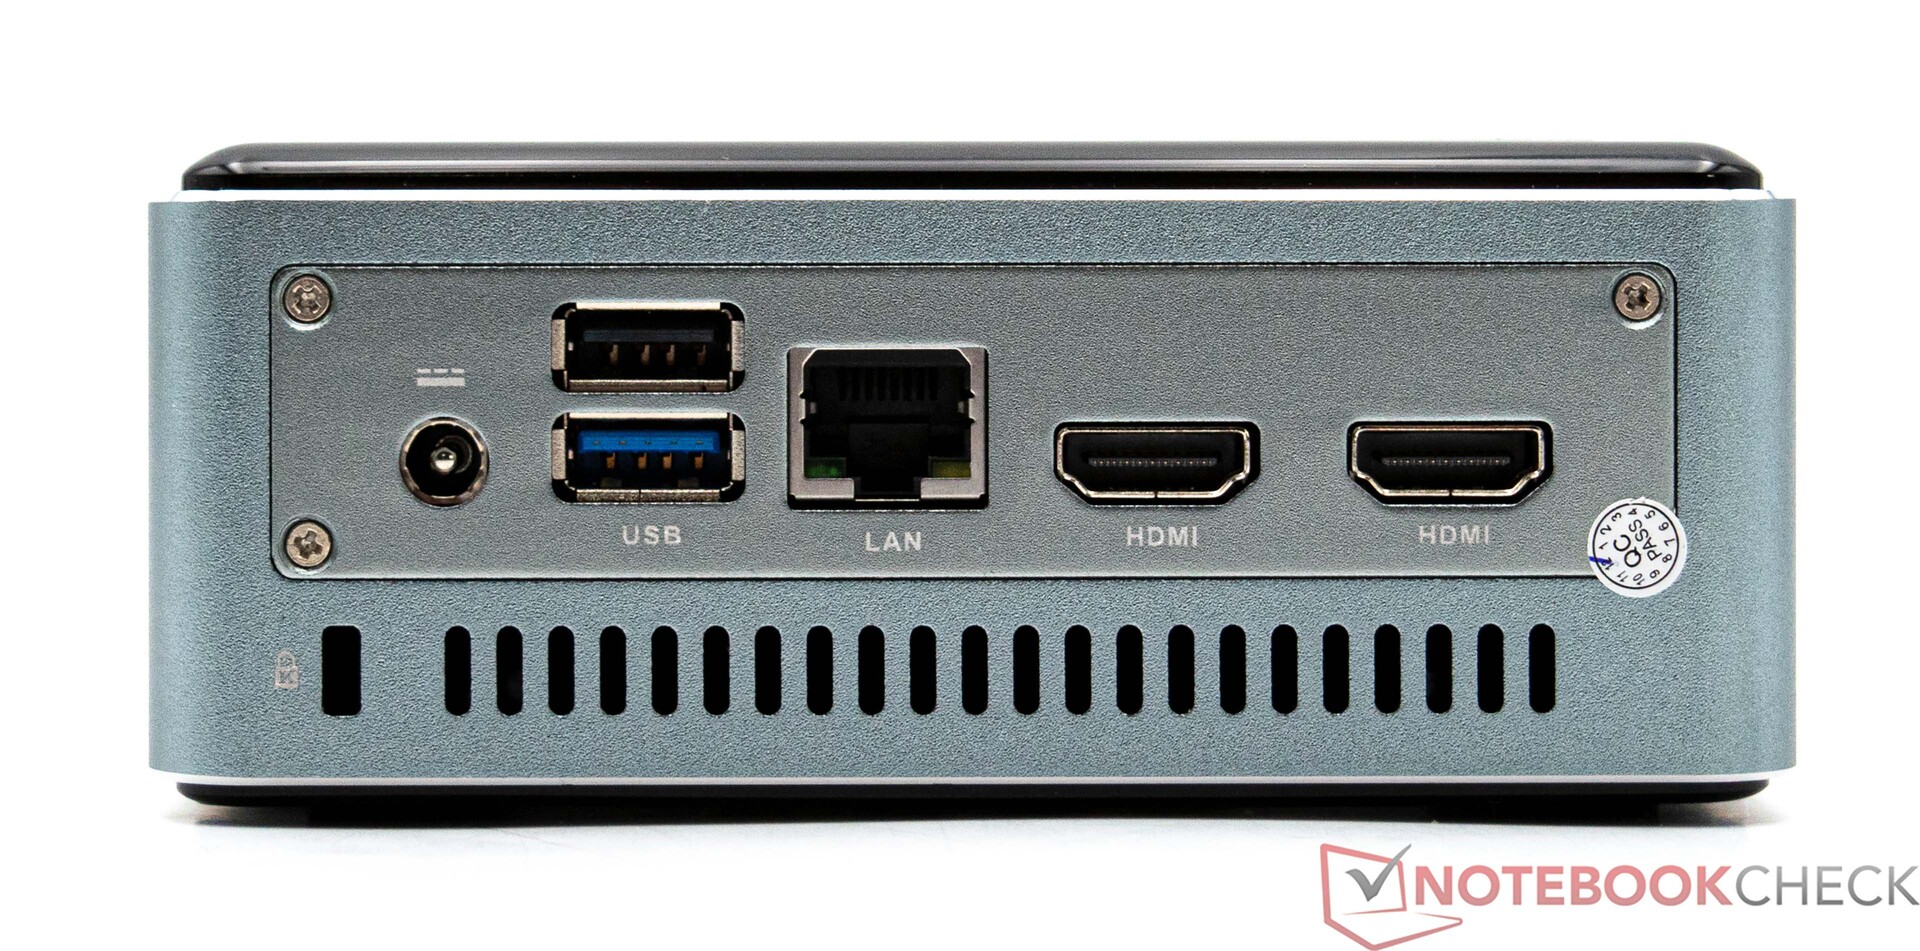
Jeśli chodzi o porty, Maxtang MTN-FP750 oferuje podstawy. Wszystkie z nich można znaleźć z przodu i z tyłu. Łącznie dostępnych jest pięć portów USB, z których jeden (USB typu C) może być również używany jako złącze wyświetlacza. Wraz z dwoma wyjściami HDMI z tyłu, oznacza to, że w sumie trzy monitory mogą być obsługiwane jednocześnie. Ponadto z tyłu urządzenia znajduje się również port 2.5G LAN.
Komunikacja
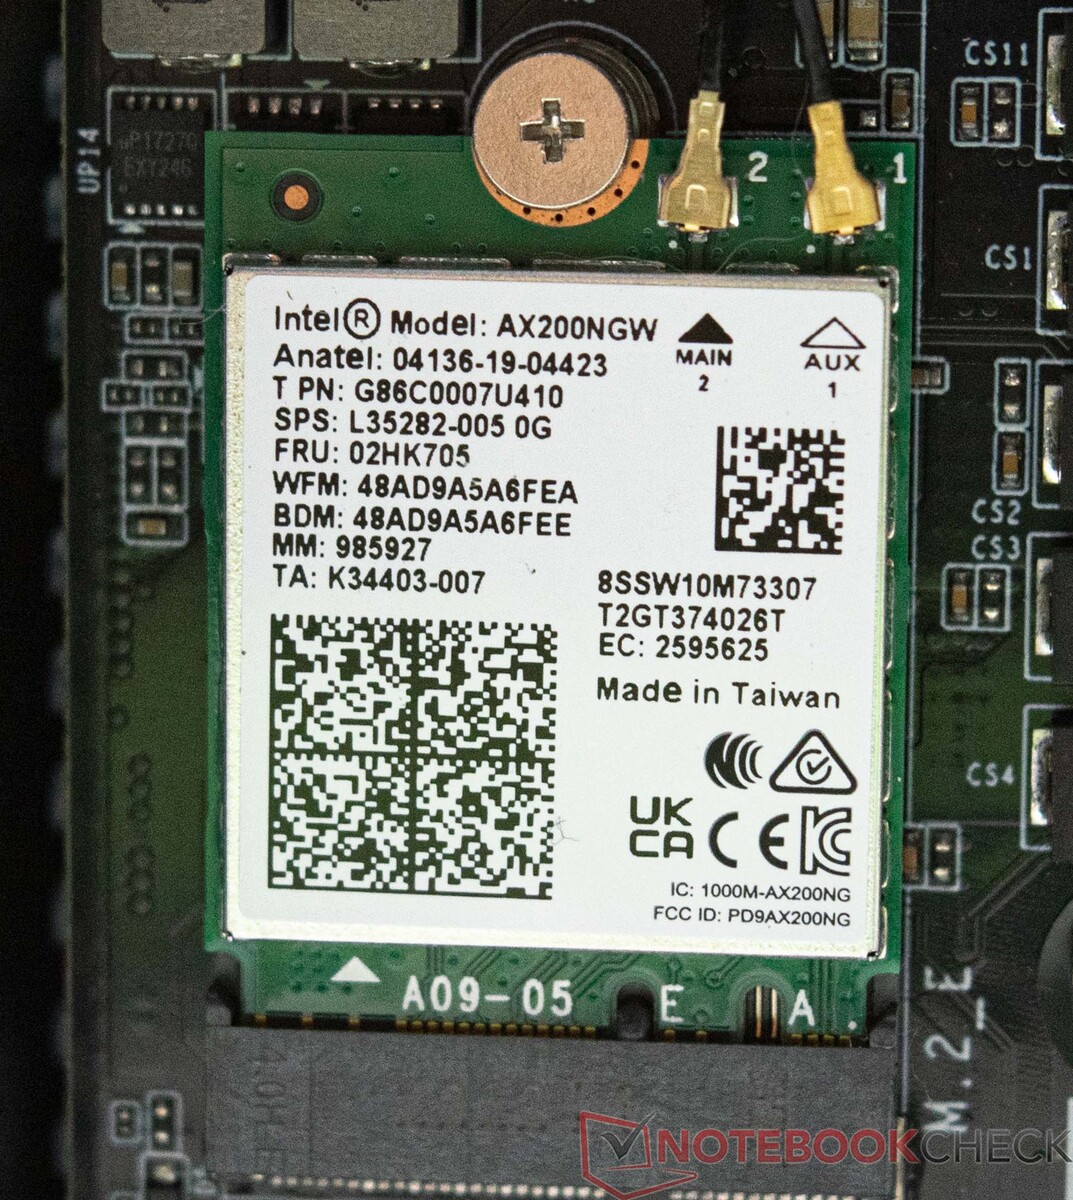
Maxtang MTN-FP750 jest domem dla modułu bezprzewodowego Intel Wi-Fi 6 AX200, który może obsługiwać częstotliwości 2,4 i 5 GHz. W testach nasza próbka testowa nie zachwyciła nas imponującymi wynikami. Do testu użyliśmy karty Asus ROG Rapture GT-AXE11000. Alternatywnie, można również podłączyć Maxtang mini PC do sieci poprzez port ethernet. Możliwe są prędkości transferu do 2,5 Gbit/s.
Akcesoria
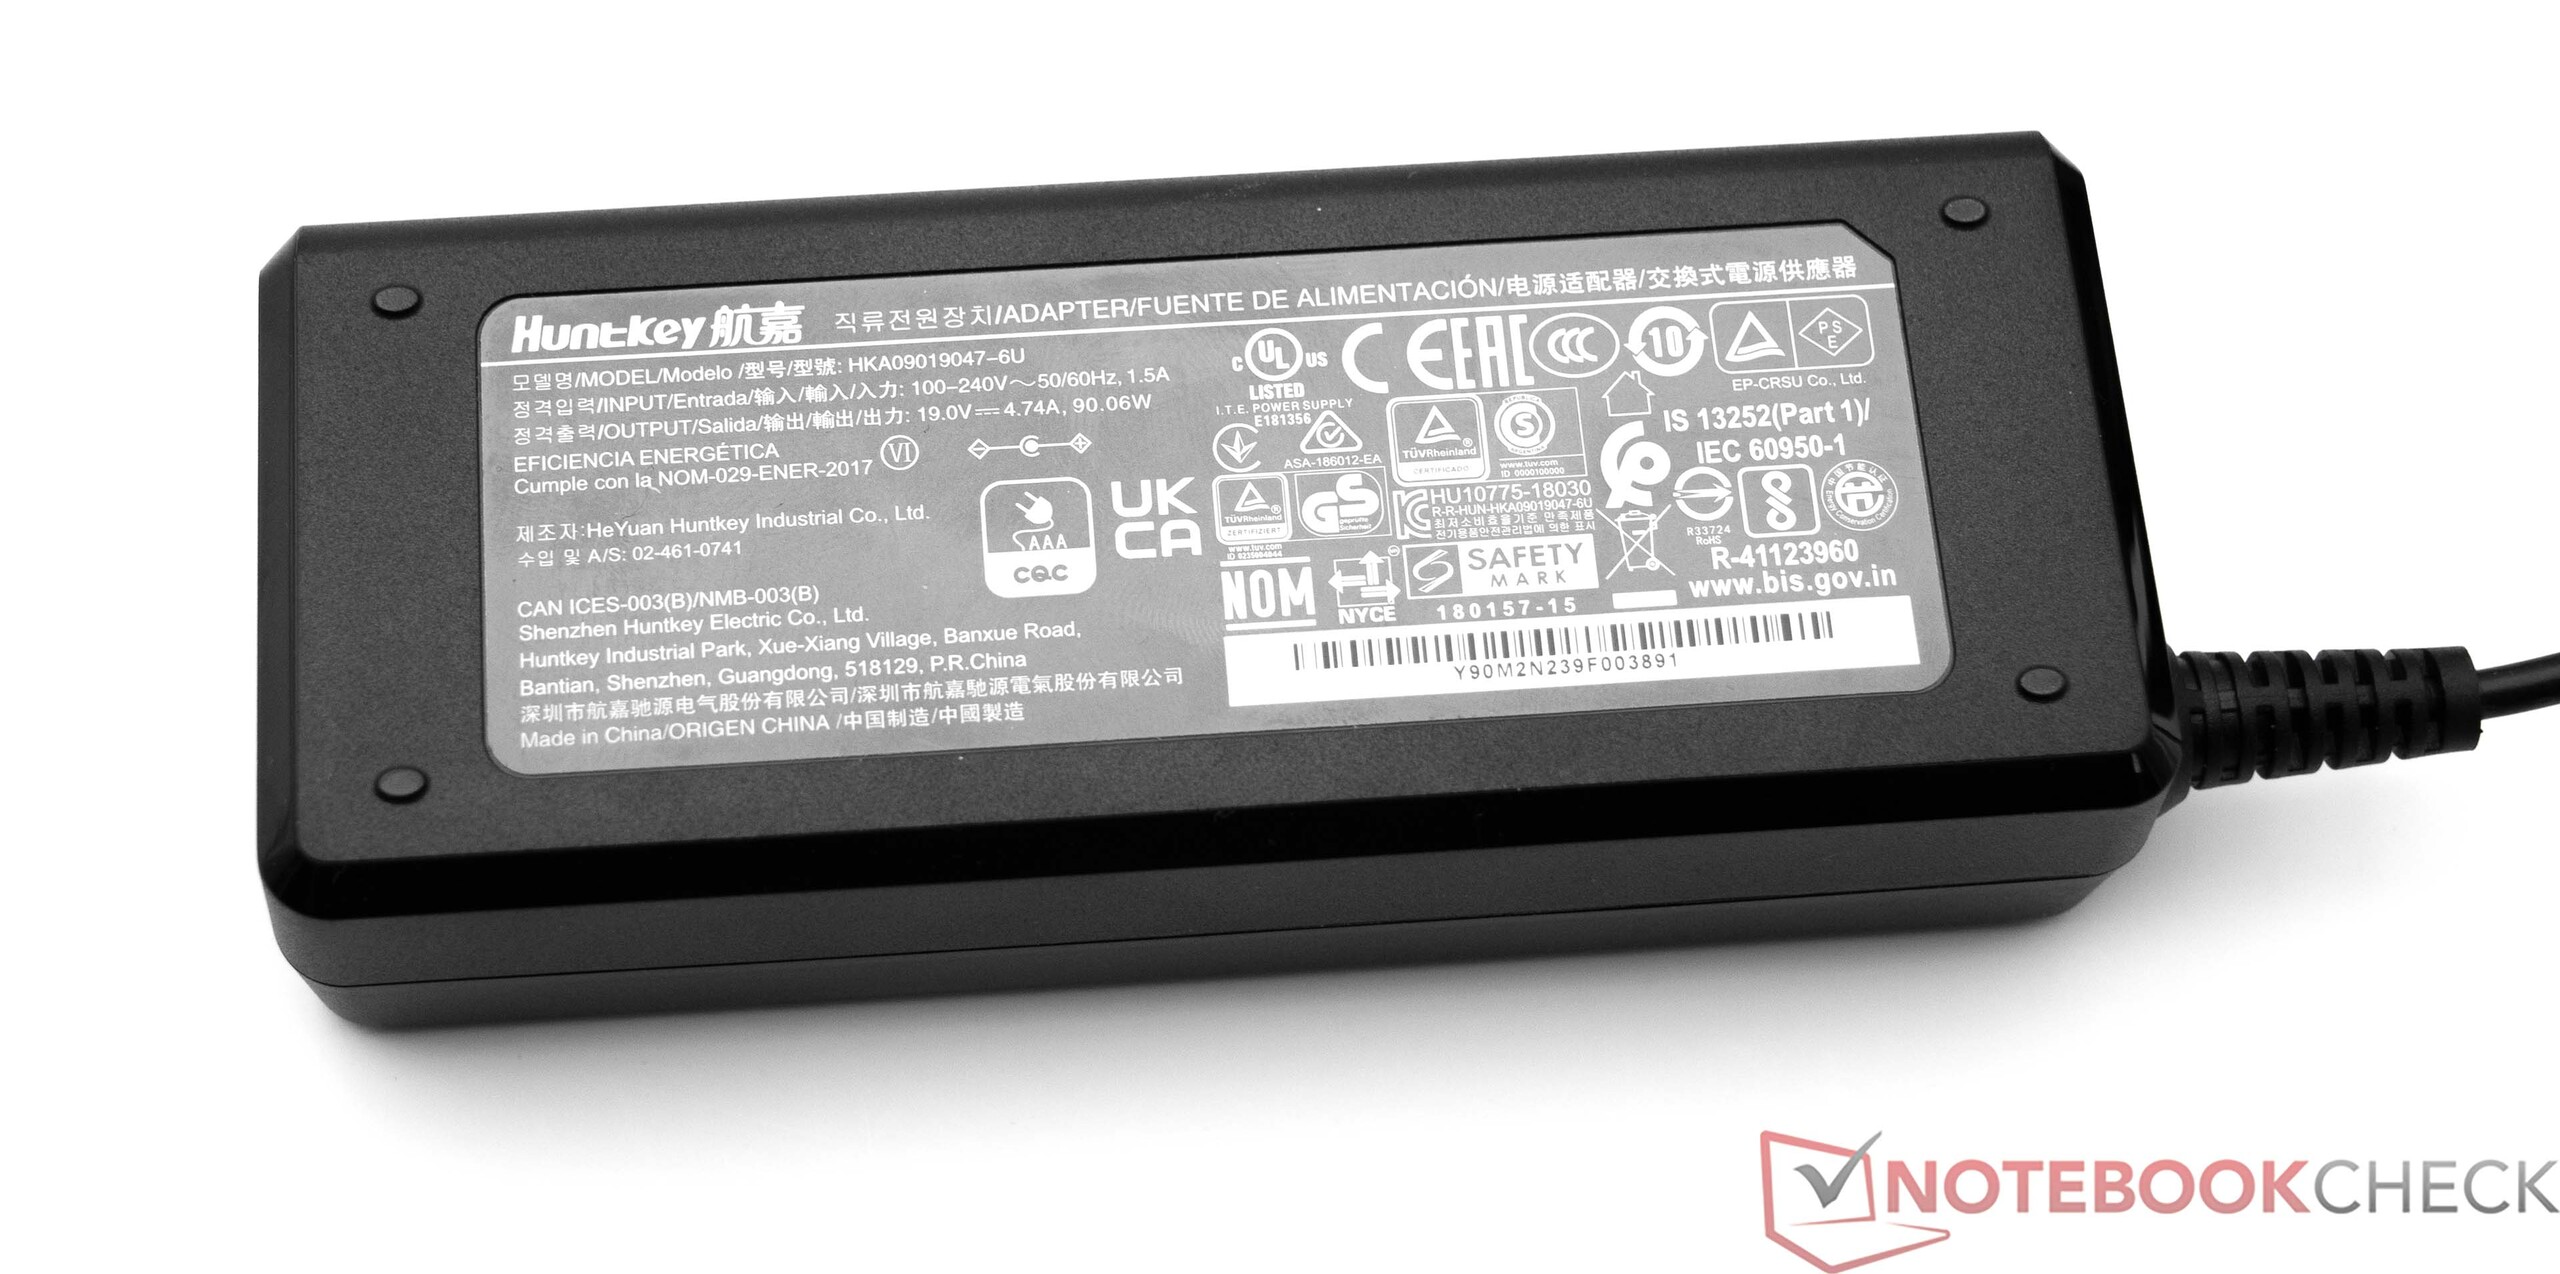
Maxtang MTN-FP750 jest dostarczany ze wszystkimi najważniejszymi komponentami do uruchomienia urządzenia. Oprócz samej maszyny, w pudełku znajduje się 90-watowy zasilacz (19 V; 4,74 A), a także płyta montażowa do montażu VESA. Podobnie, kabel HDMI i skrócona instrukcja konfiguracji są również częścią pakietu.
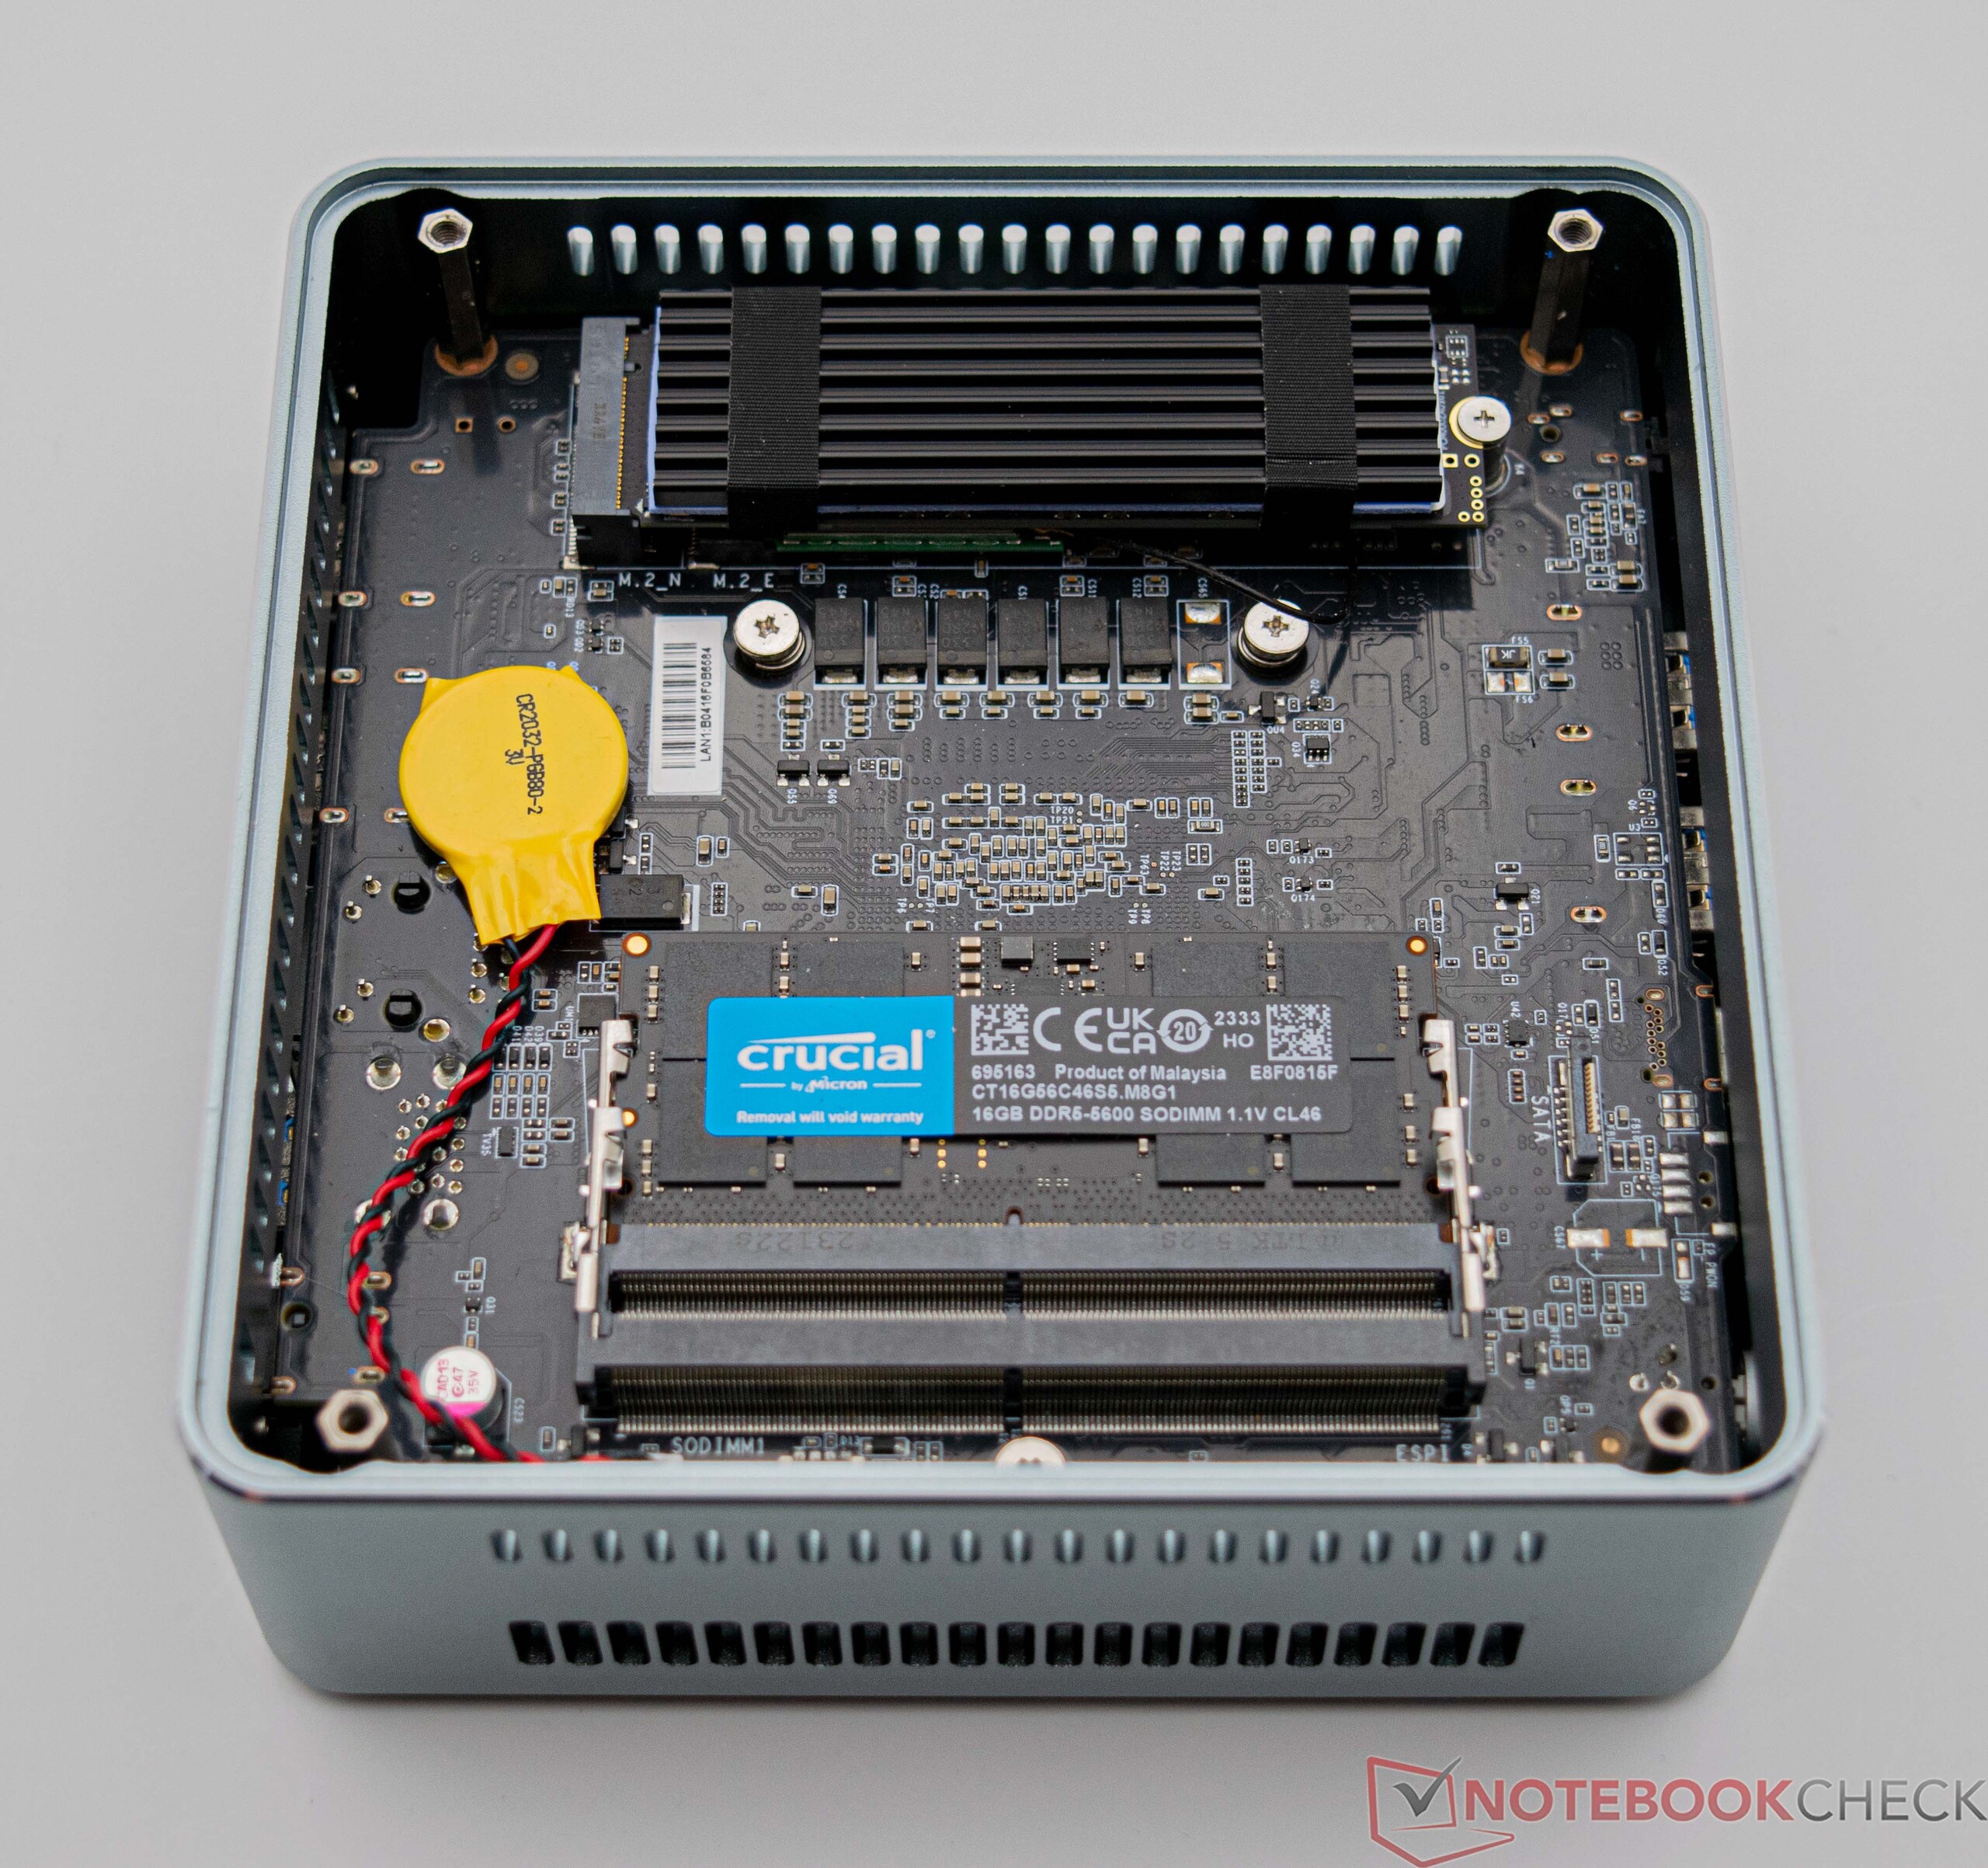
Konserwacja
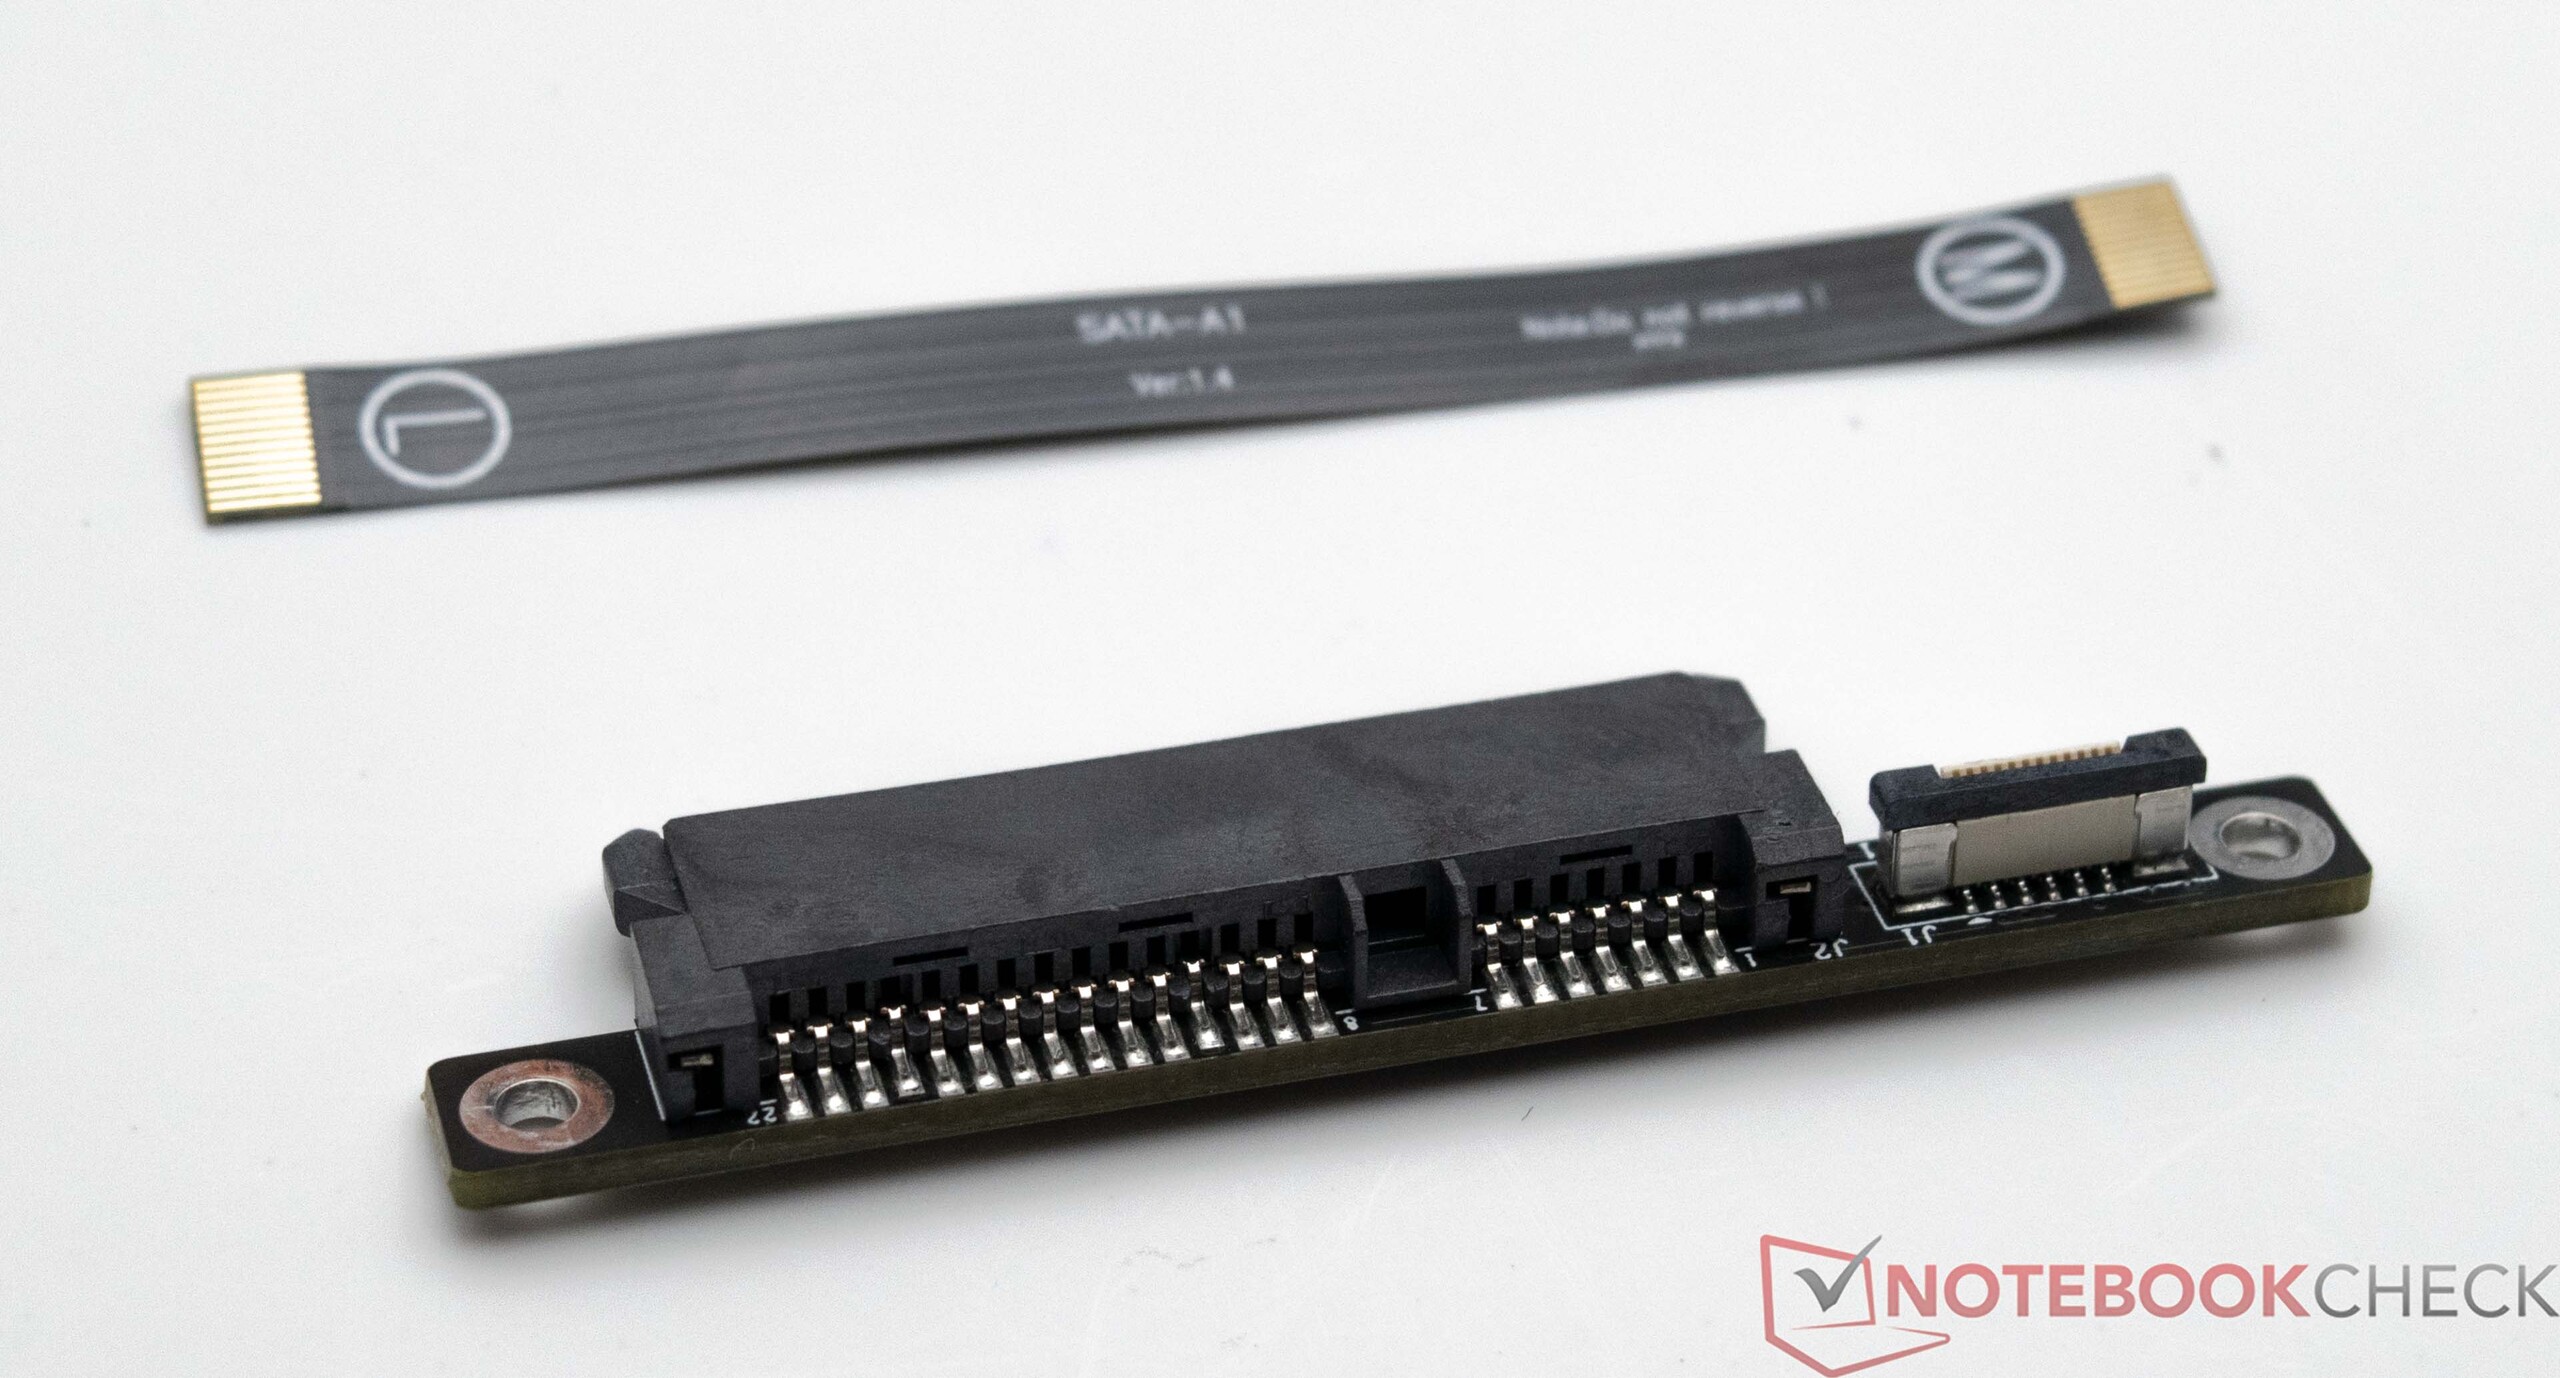
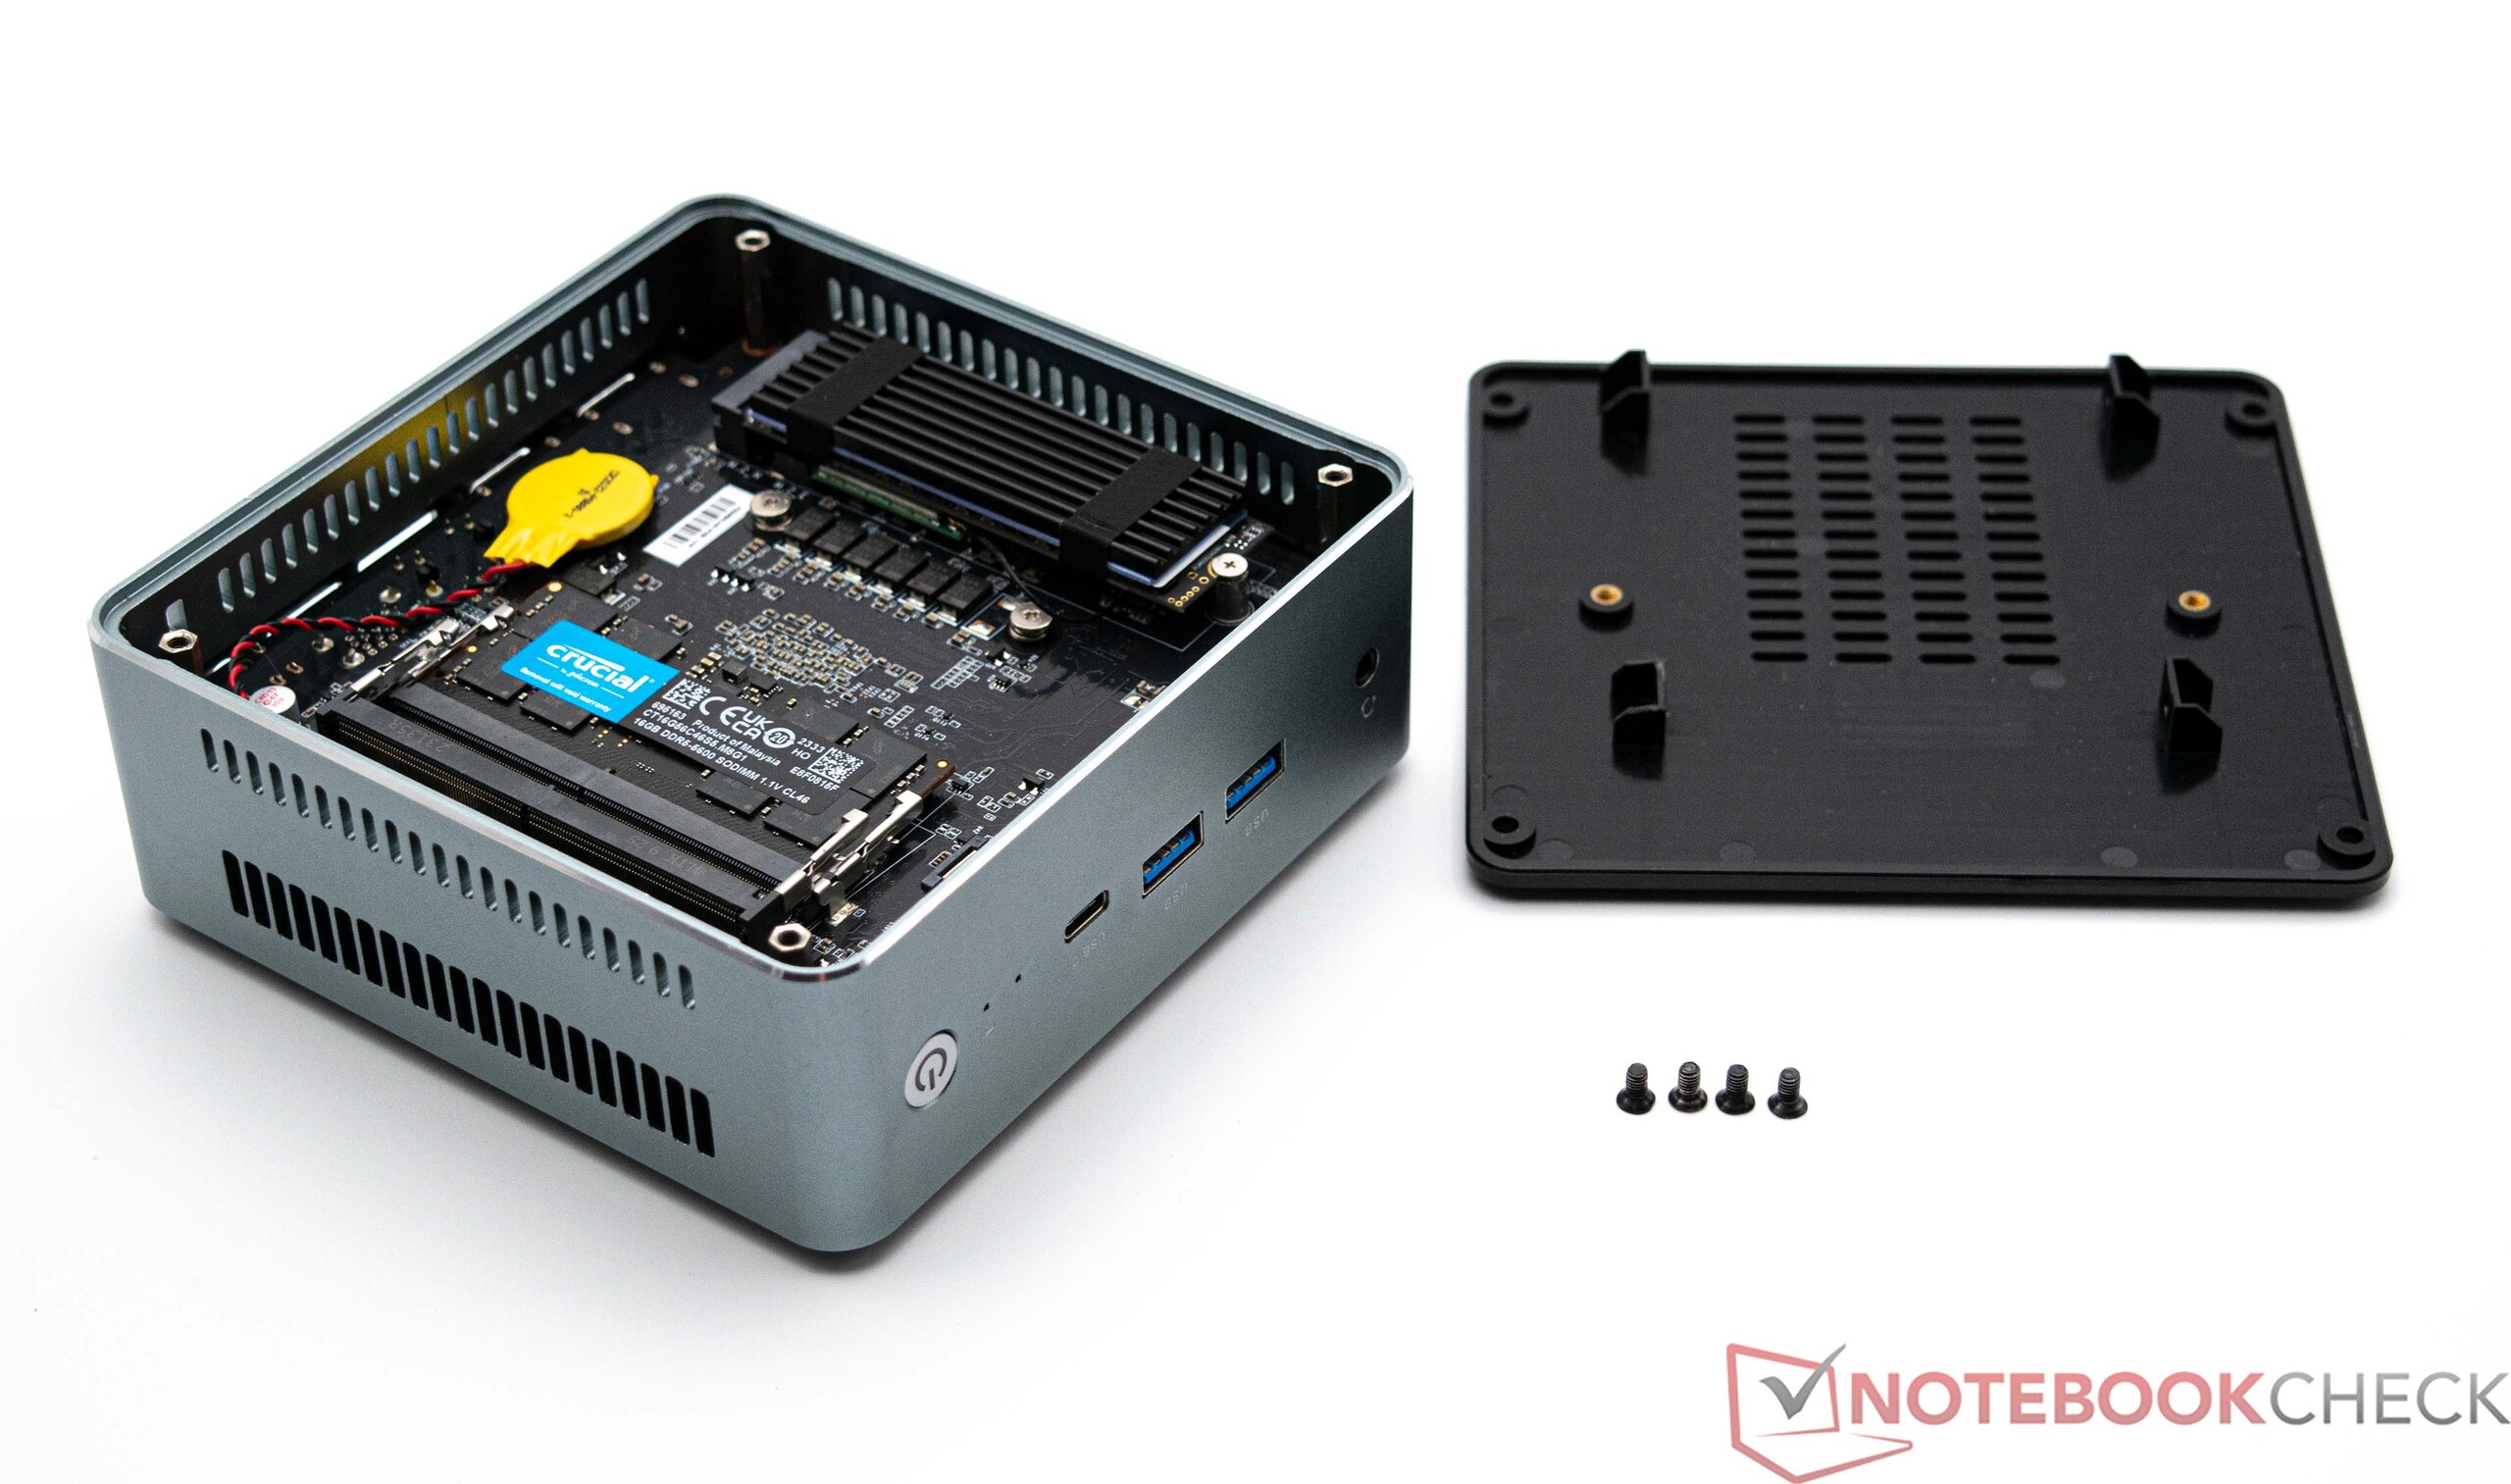
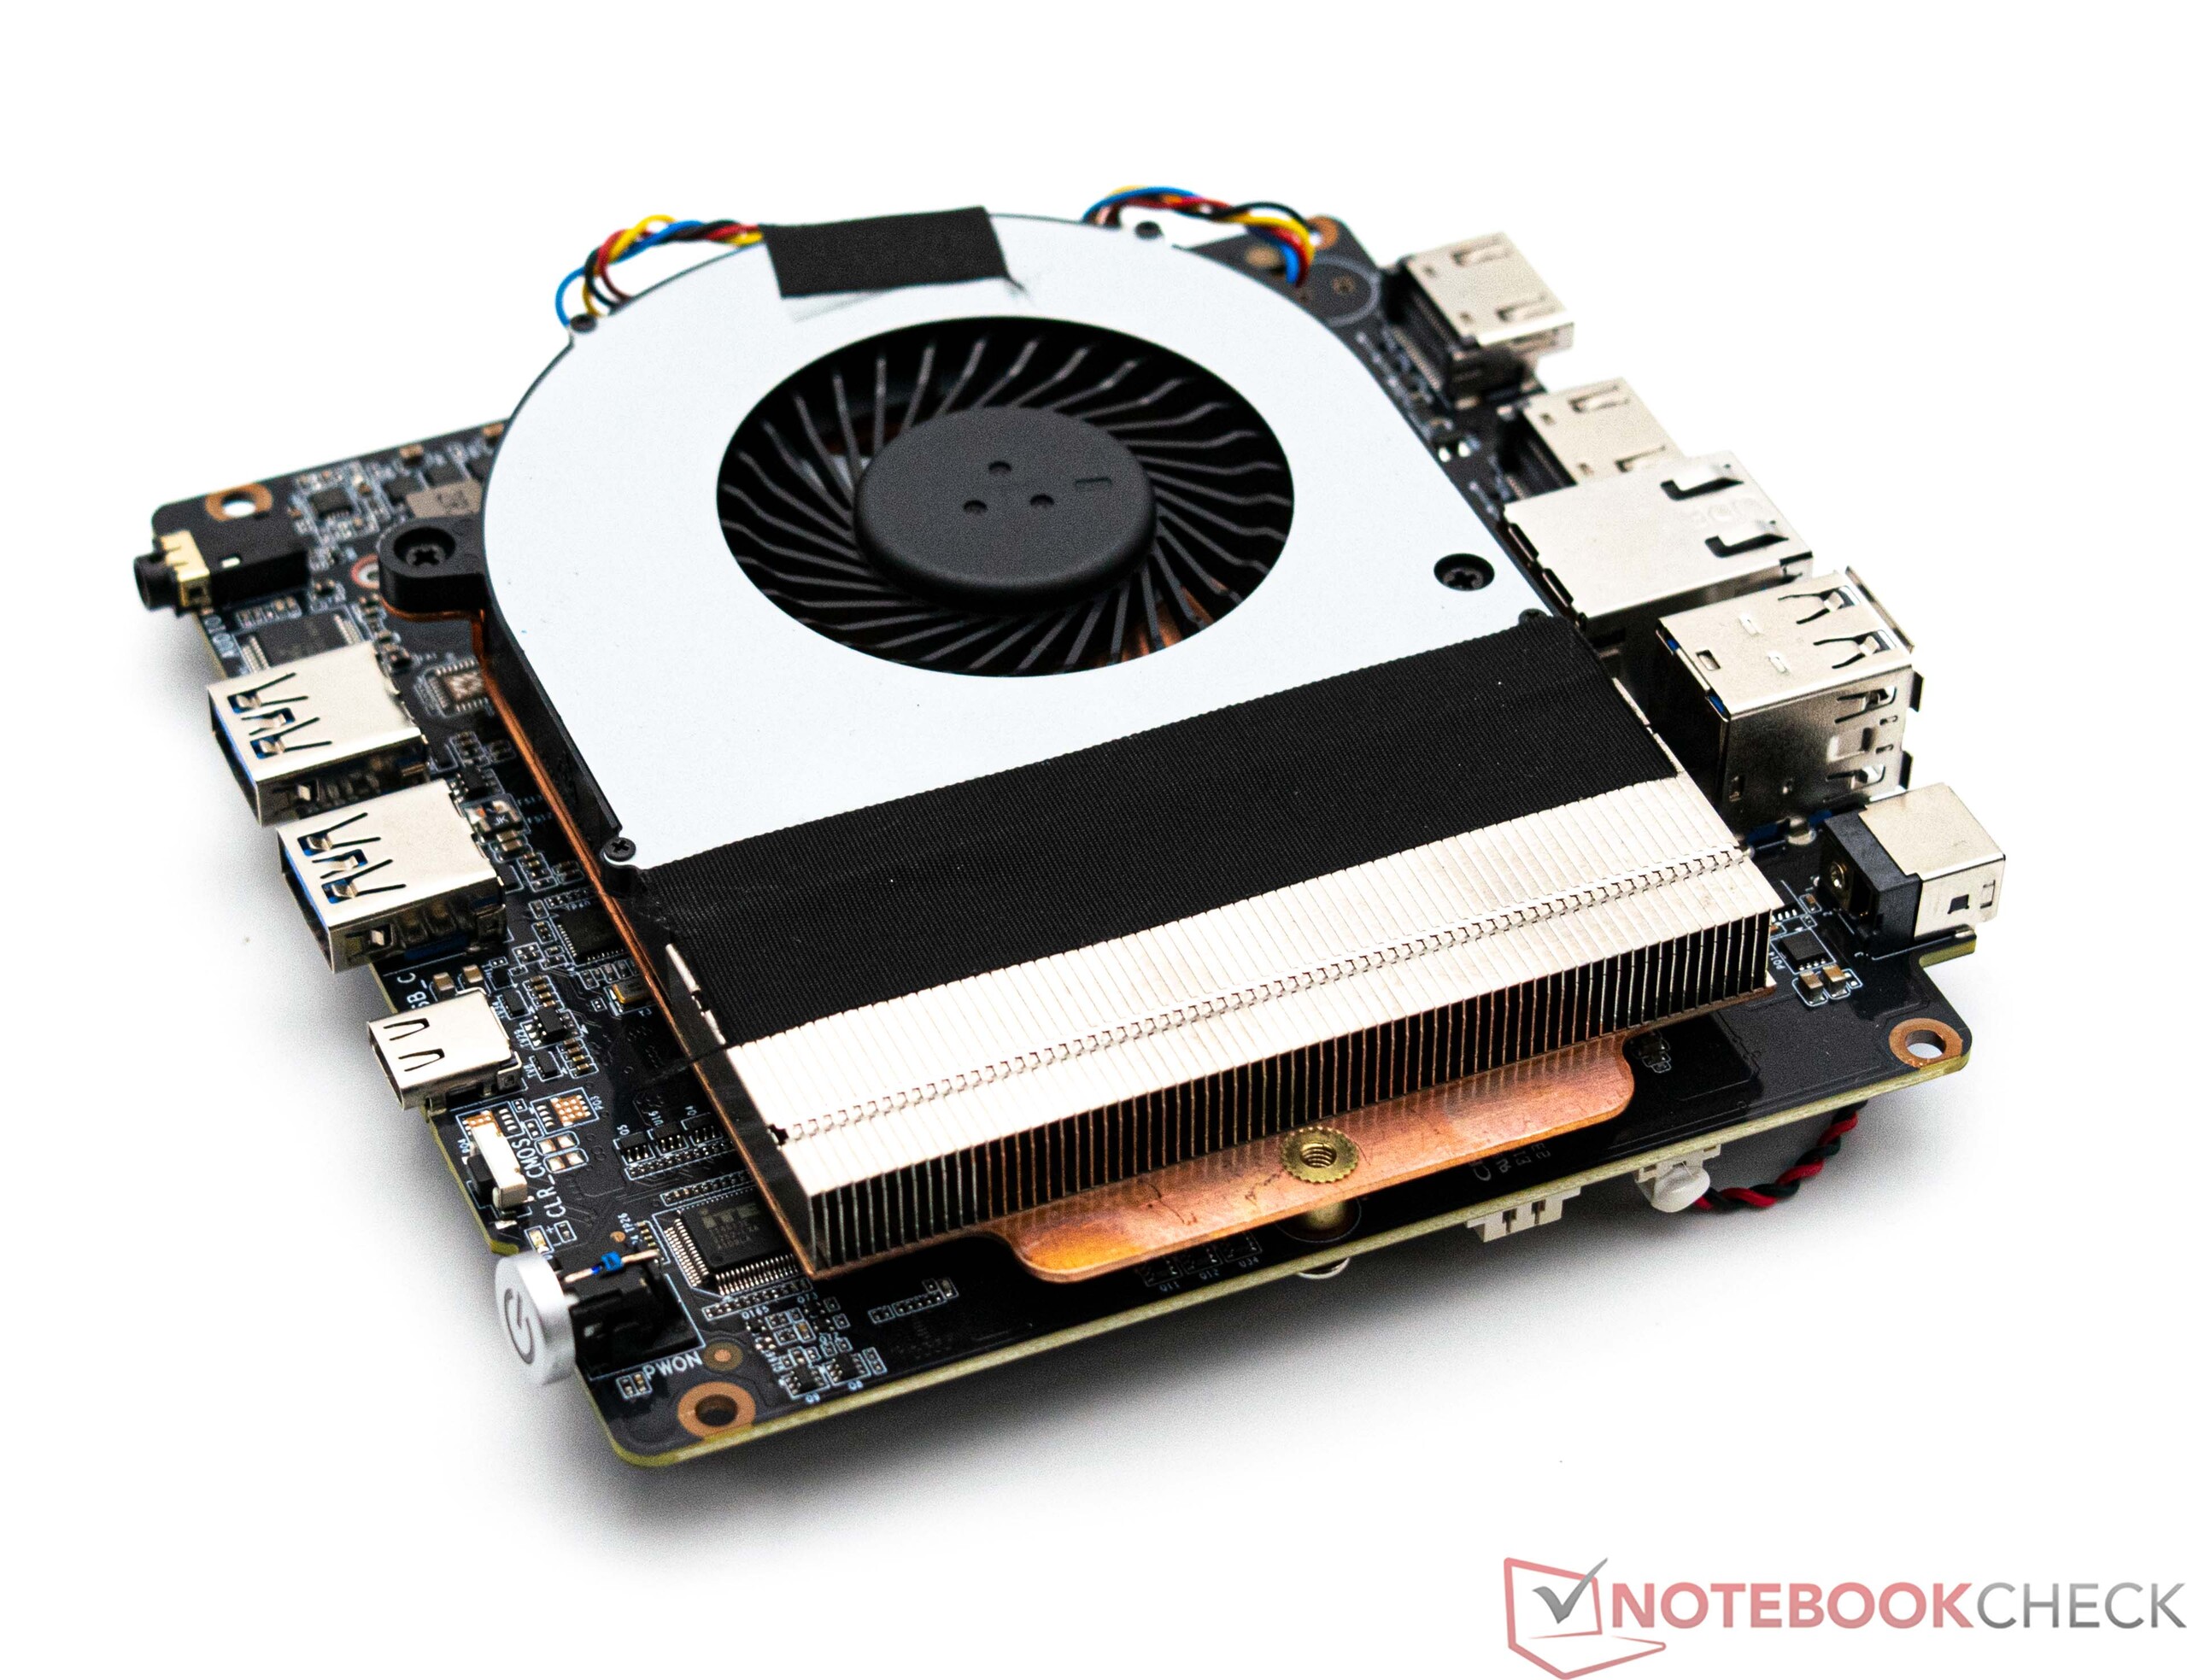
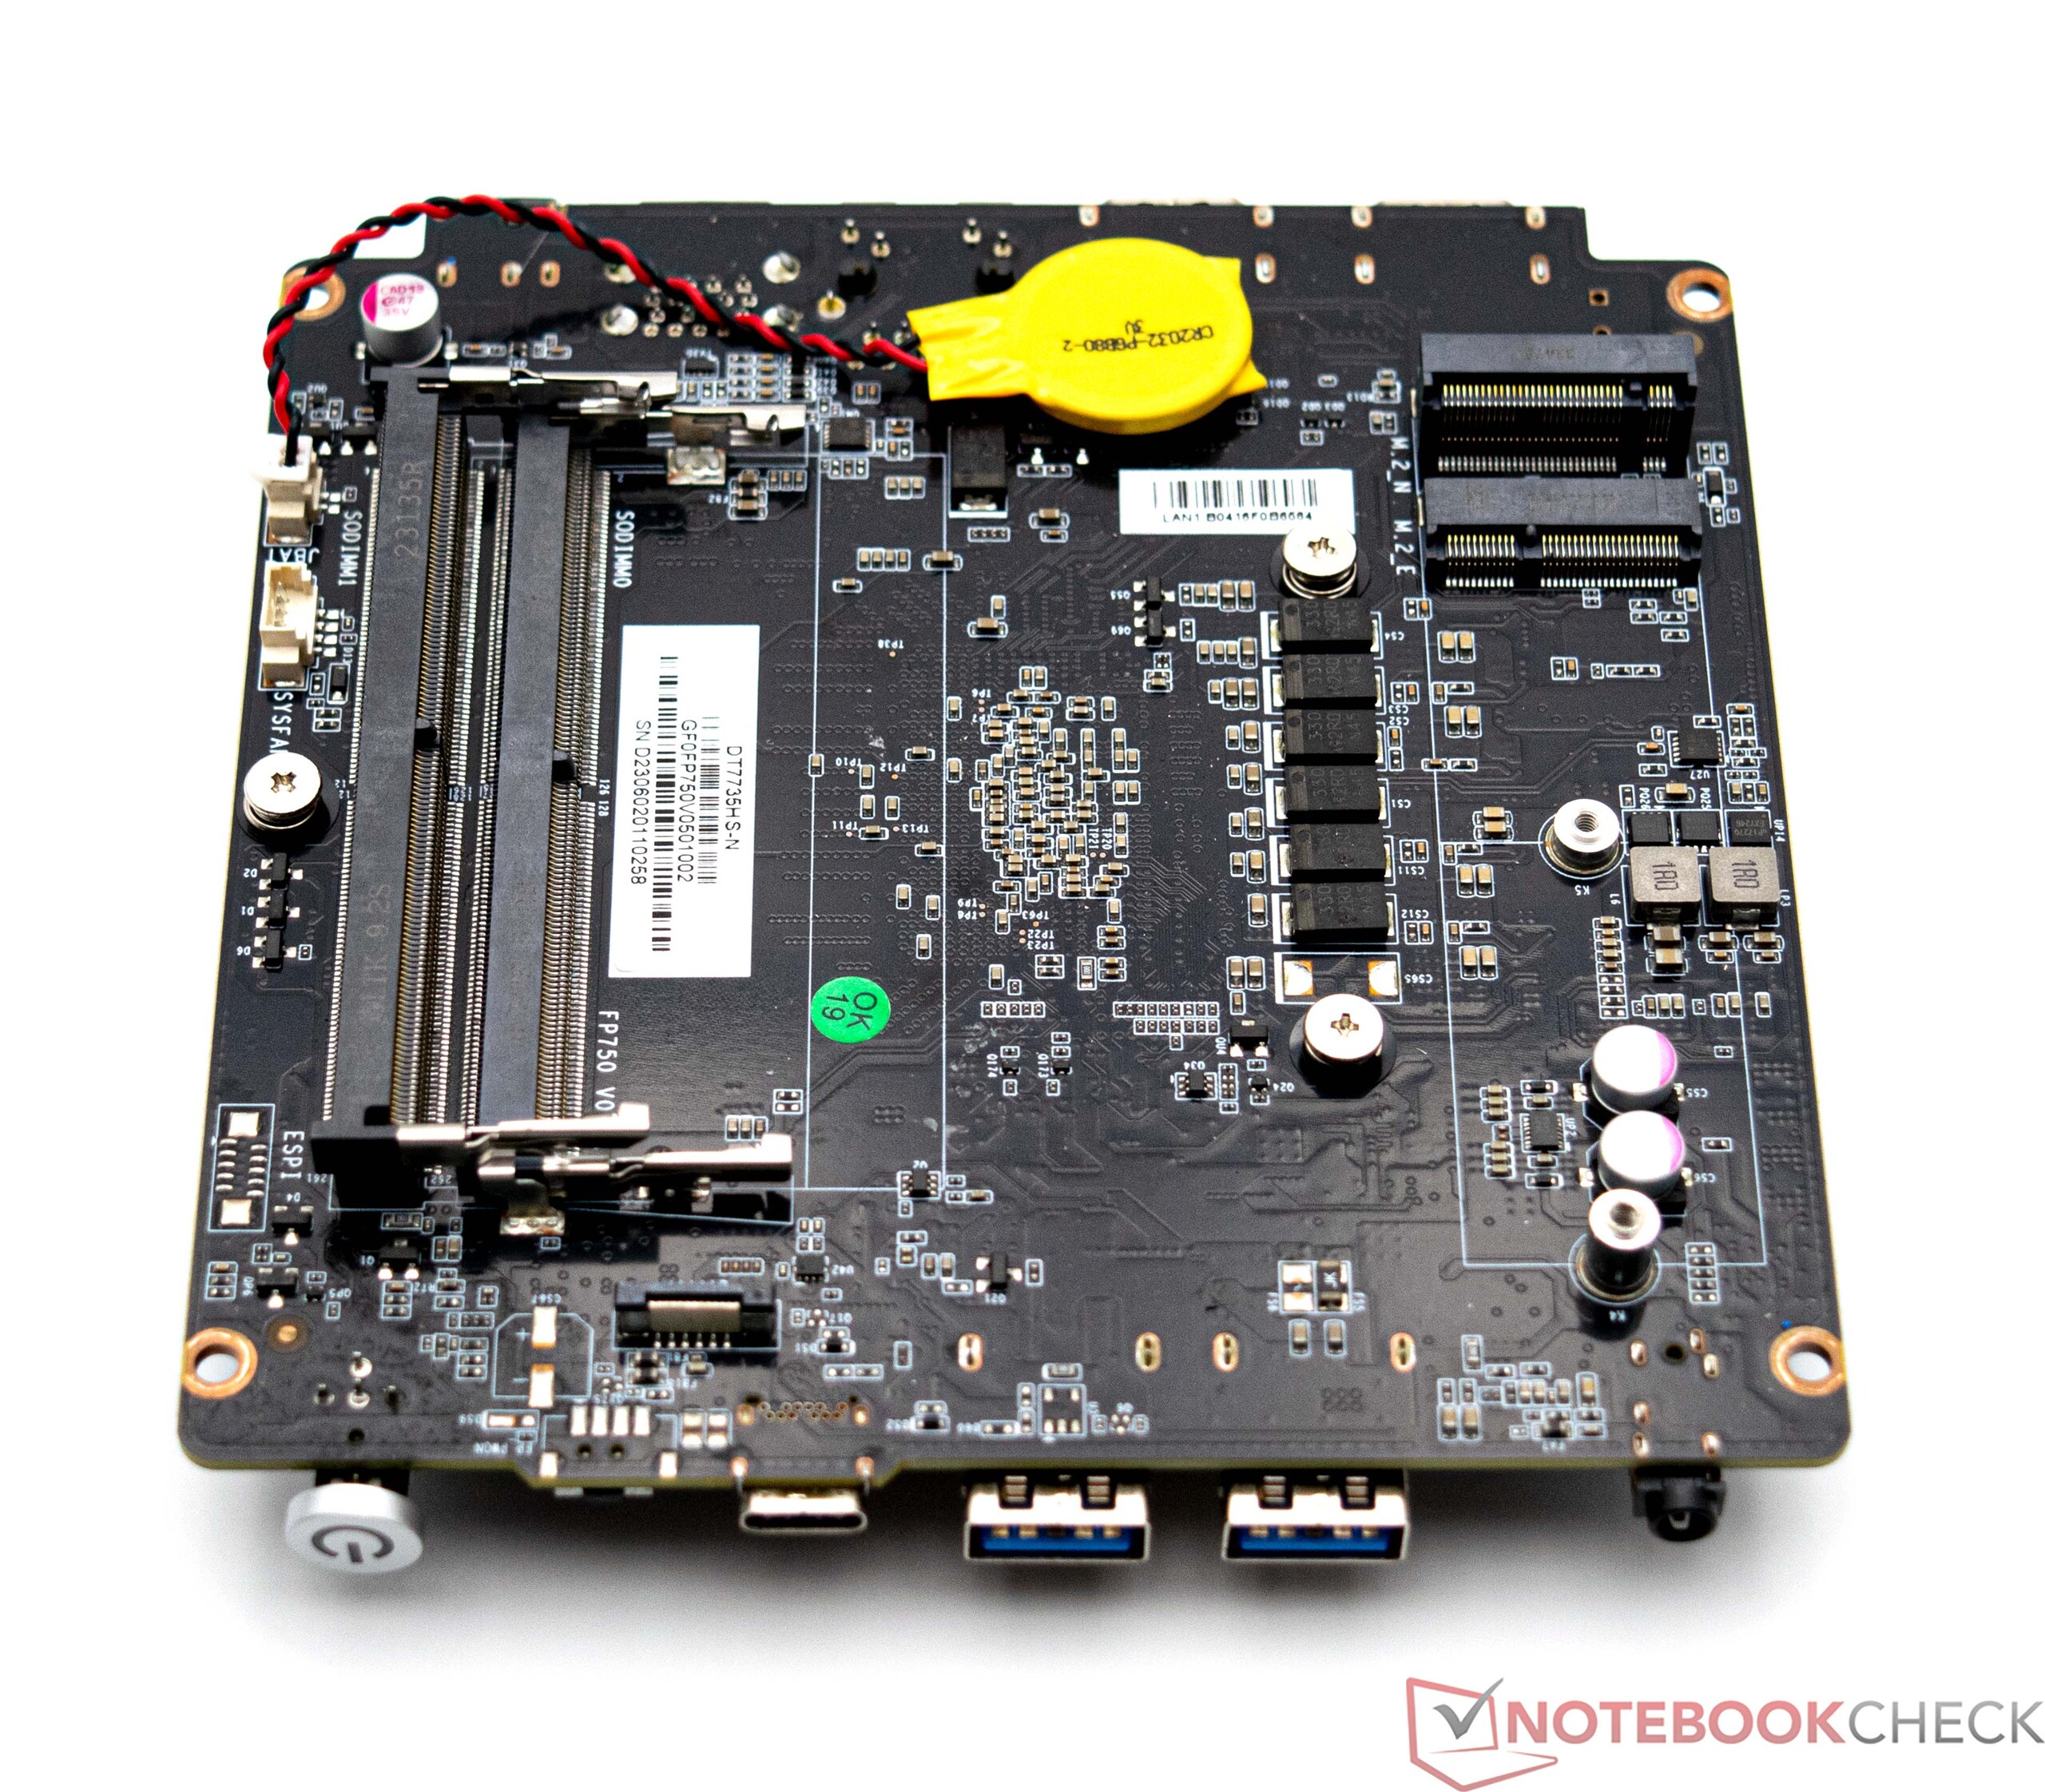
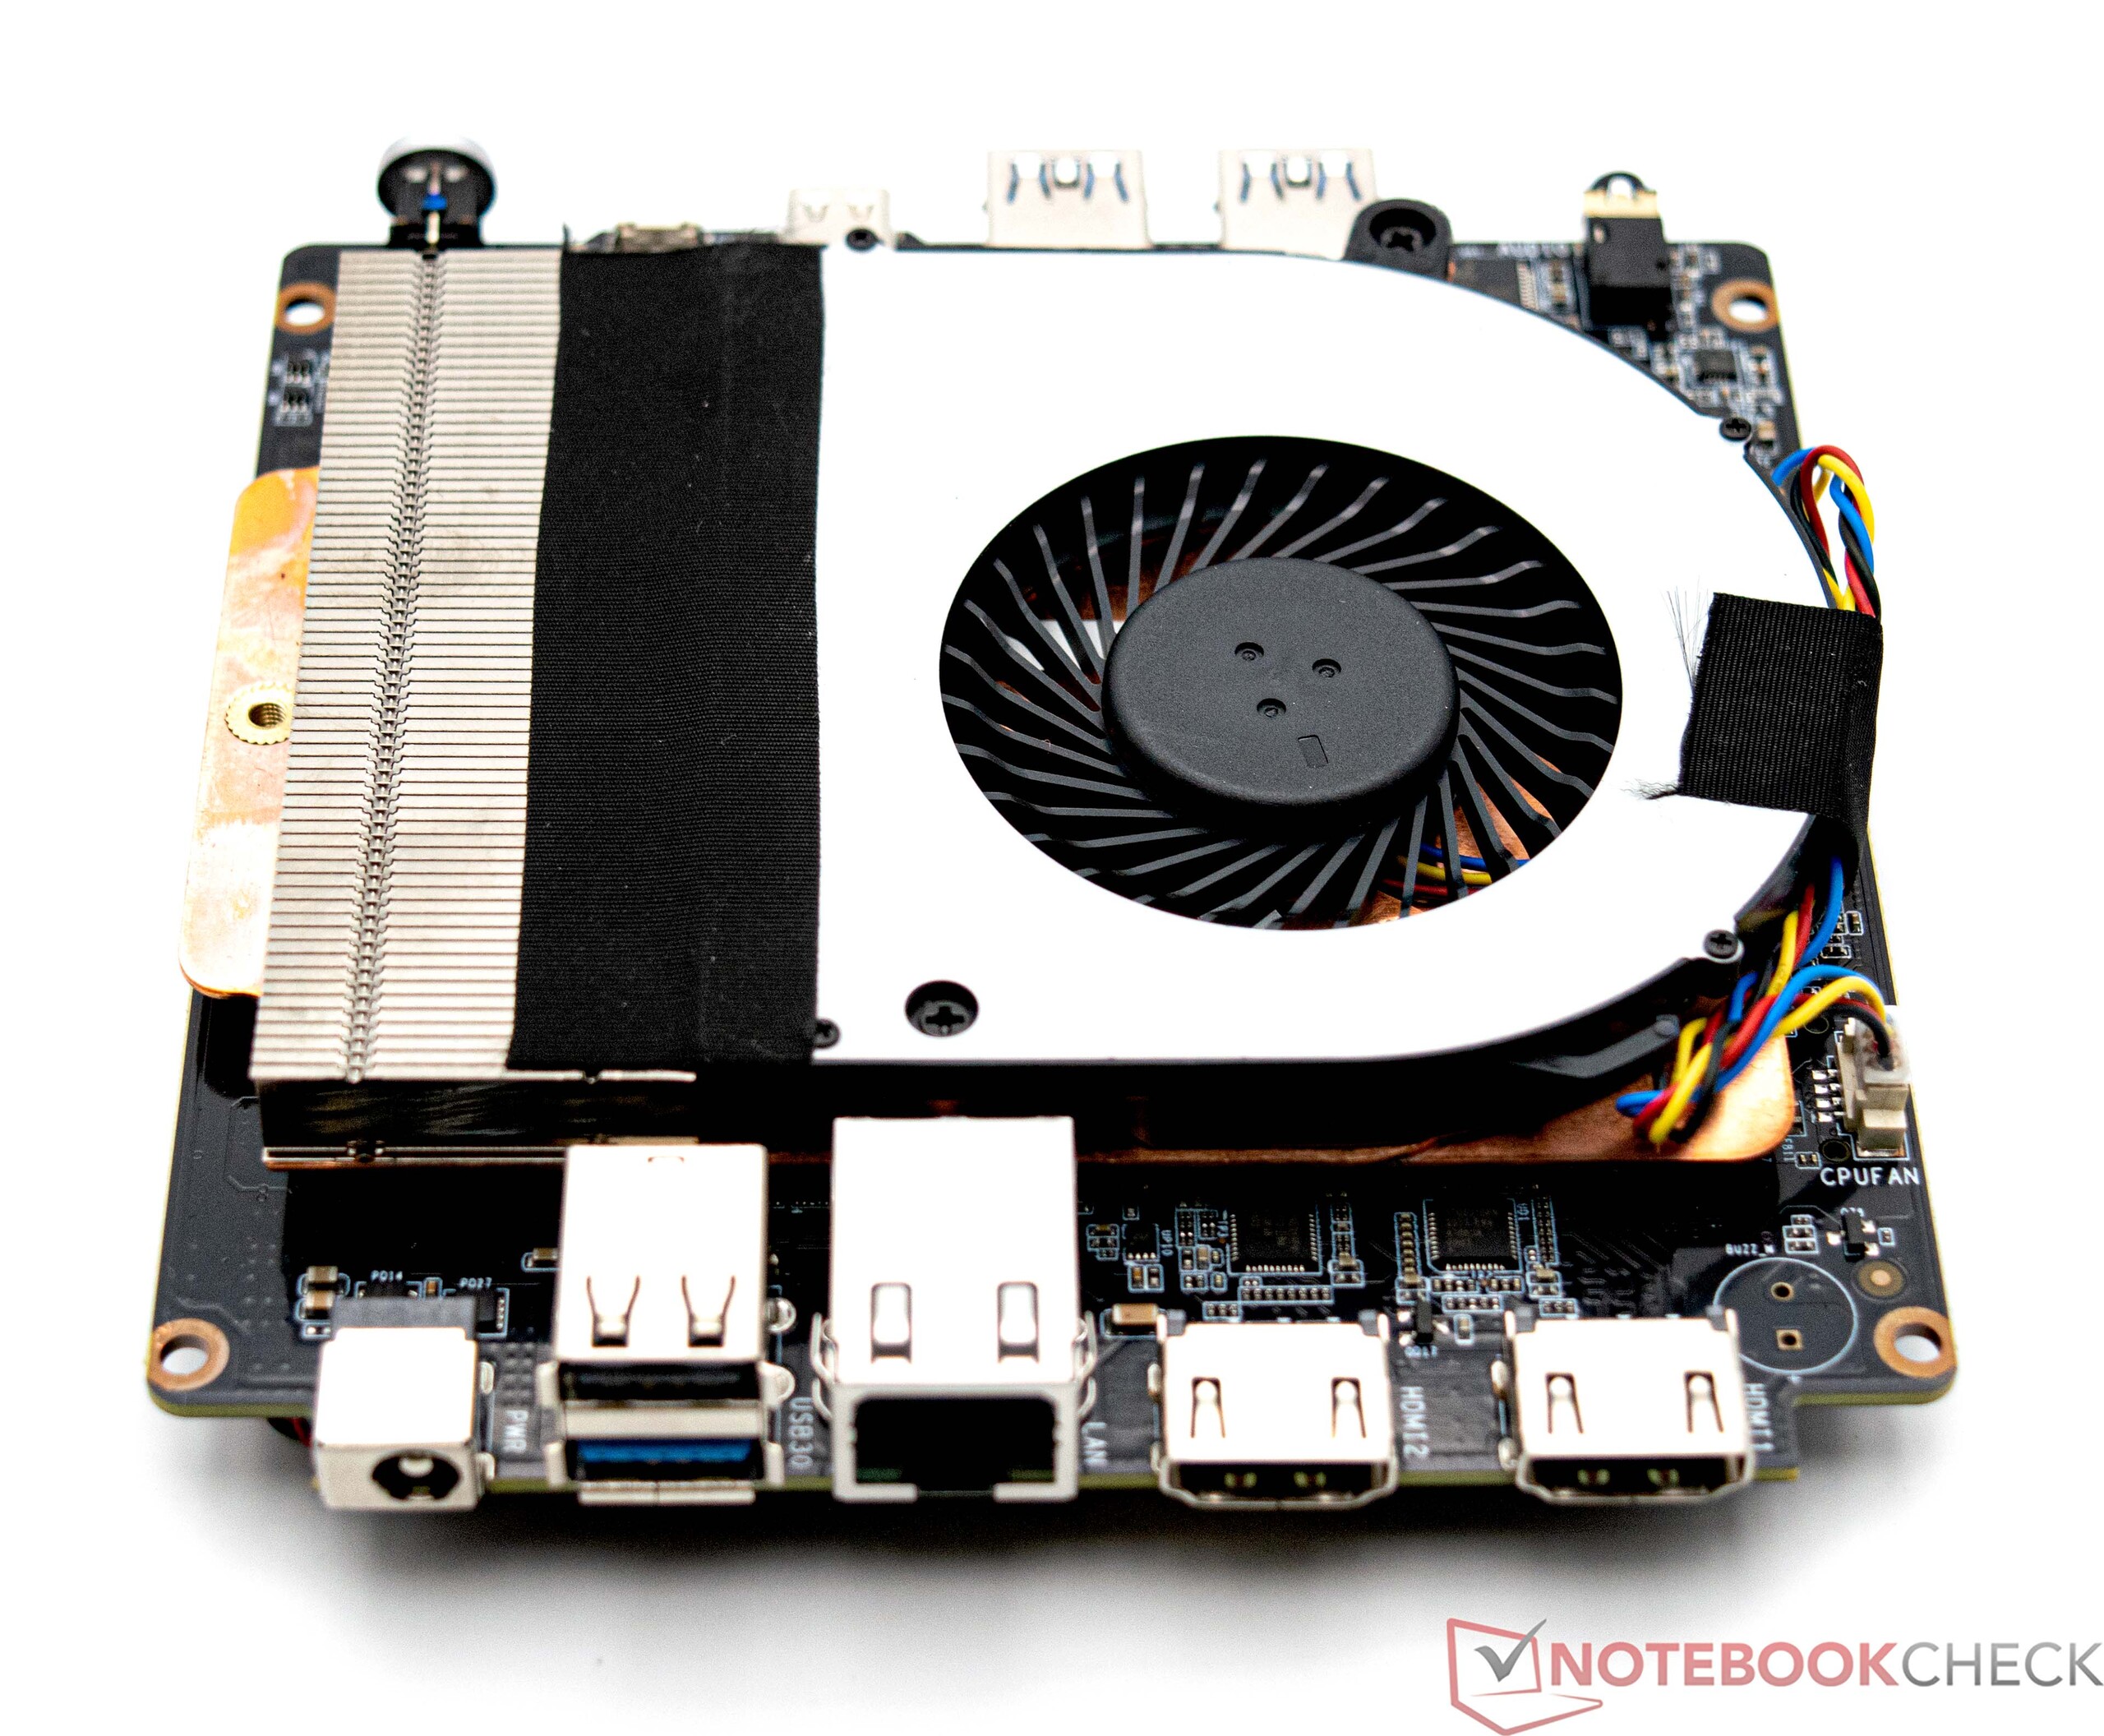
Maxtang mini PC można stosunkowo łatwo otworzyć. Podstawa jest zabezpieczona czterema śrubami, które są ukryte za przyklejonymi gumowymi nóżkami. Pod płytą bazową dostęp do pamięci RAM lub dysku SSD M.2 jest dość prosty. W naszym przypadku jest jeszcze miejsce na zainstalowanie dodatkowego modułu pamięci RAM i drugiego urządzenia pamięci masowej (format 2,5 cala). Aby uzyskać dostęp do wentylatora, urządzenie musi zostać dodatkowo zdemontowane, co uniemożliwia szybkie czyszczenie.
Wydajność - AMD Ryzen 7 7735HS z 8 rdzeniami i 16 wątkami
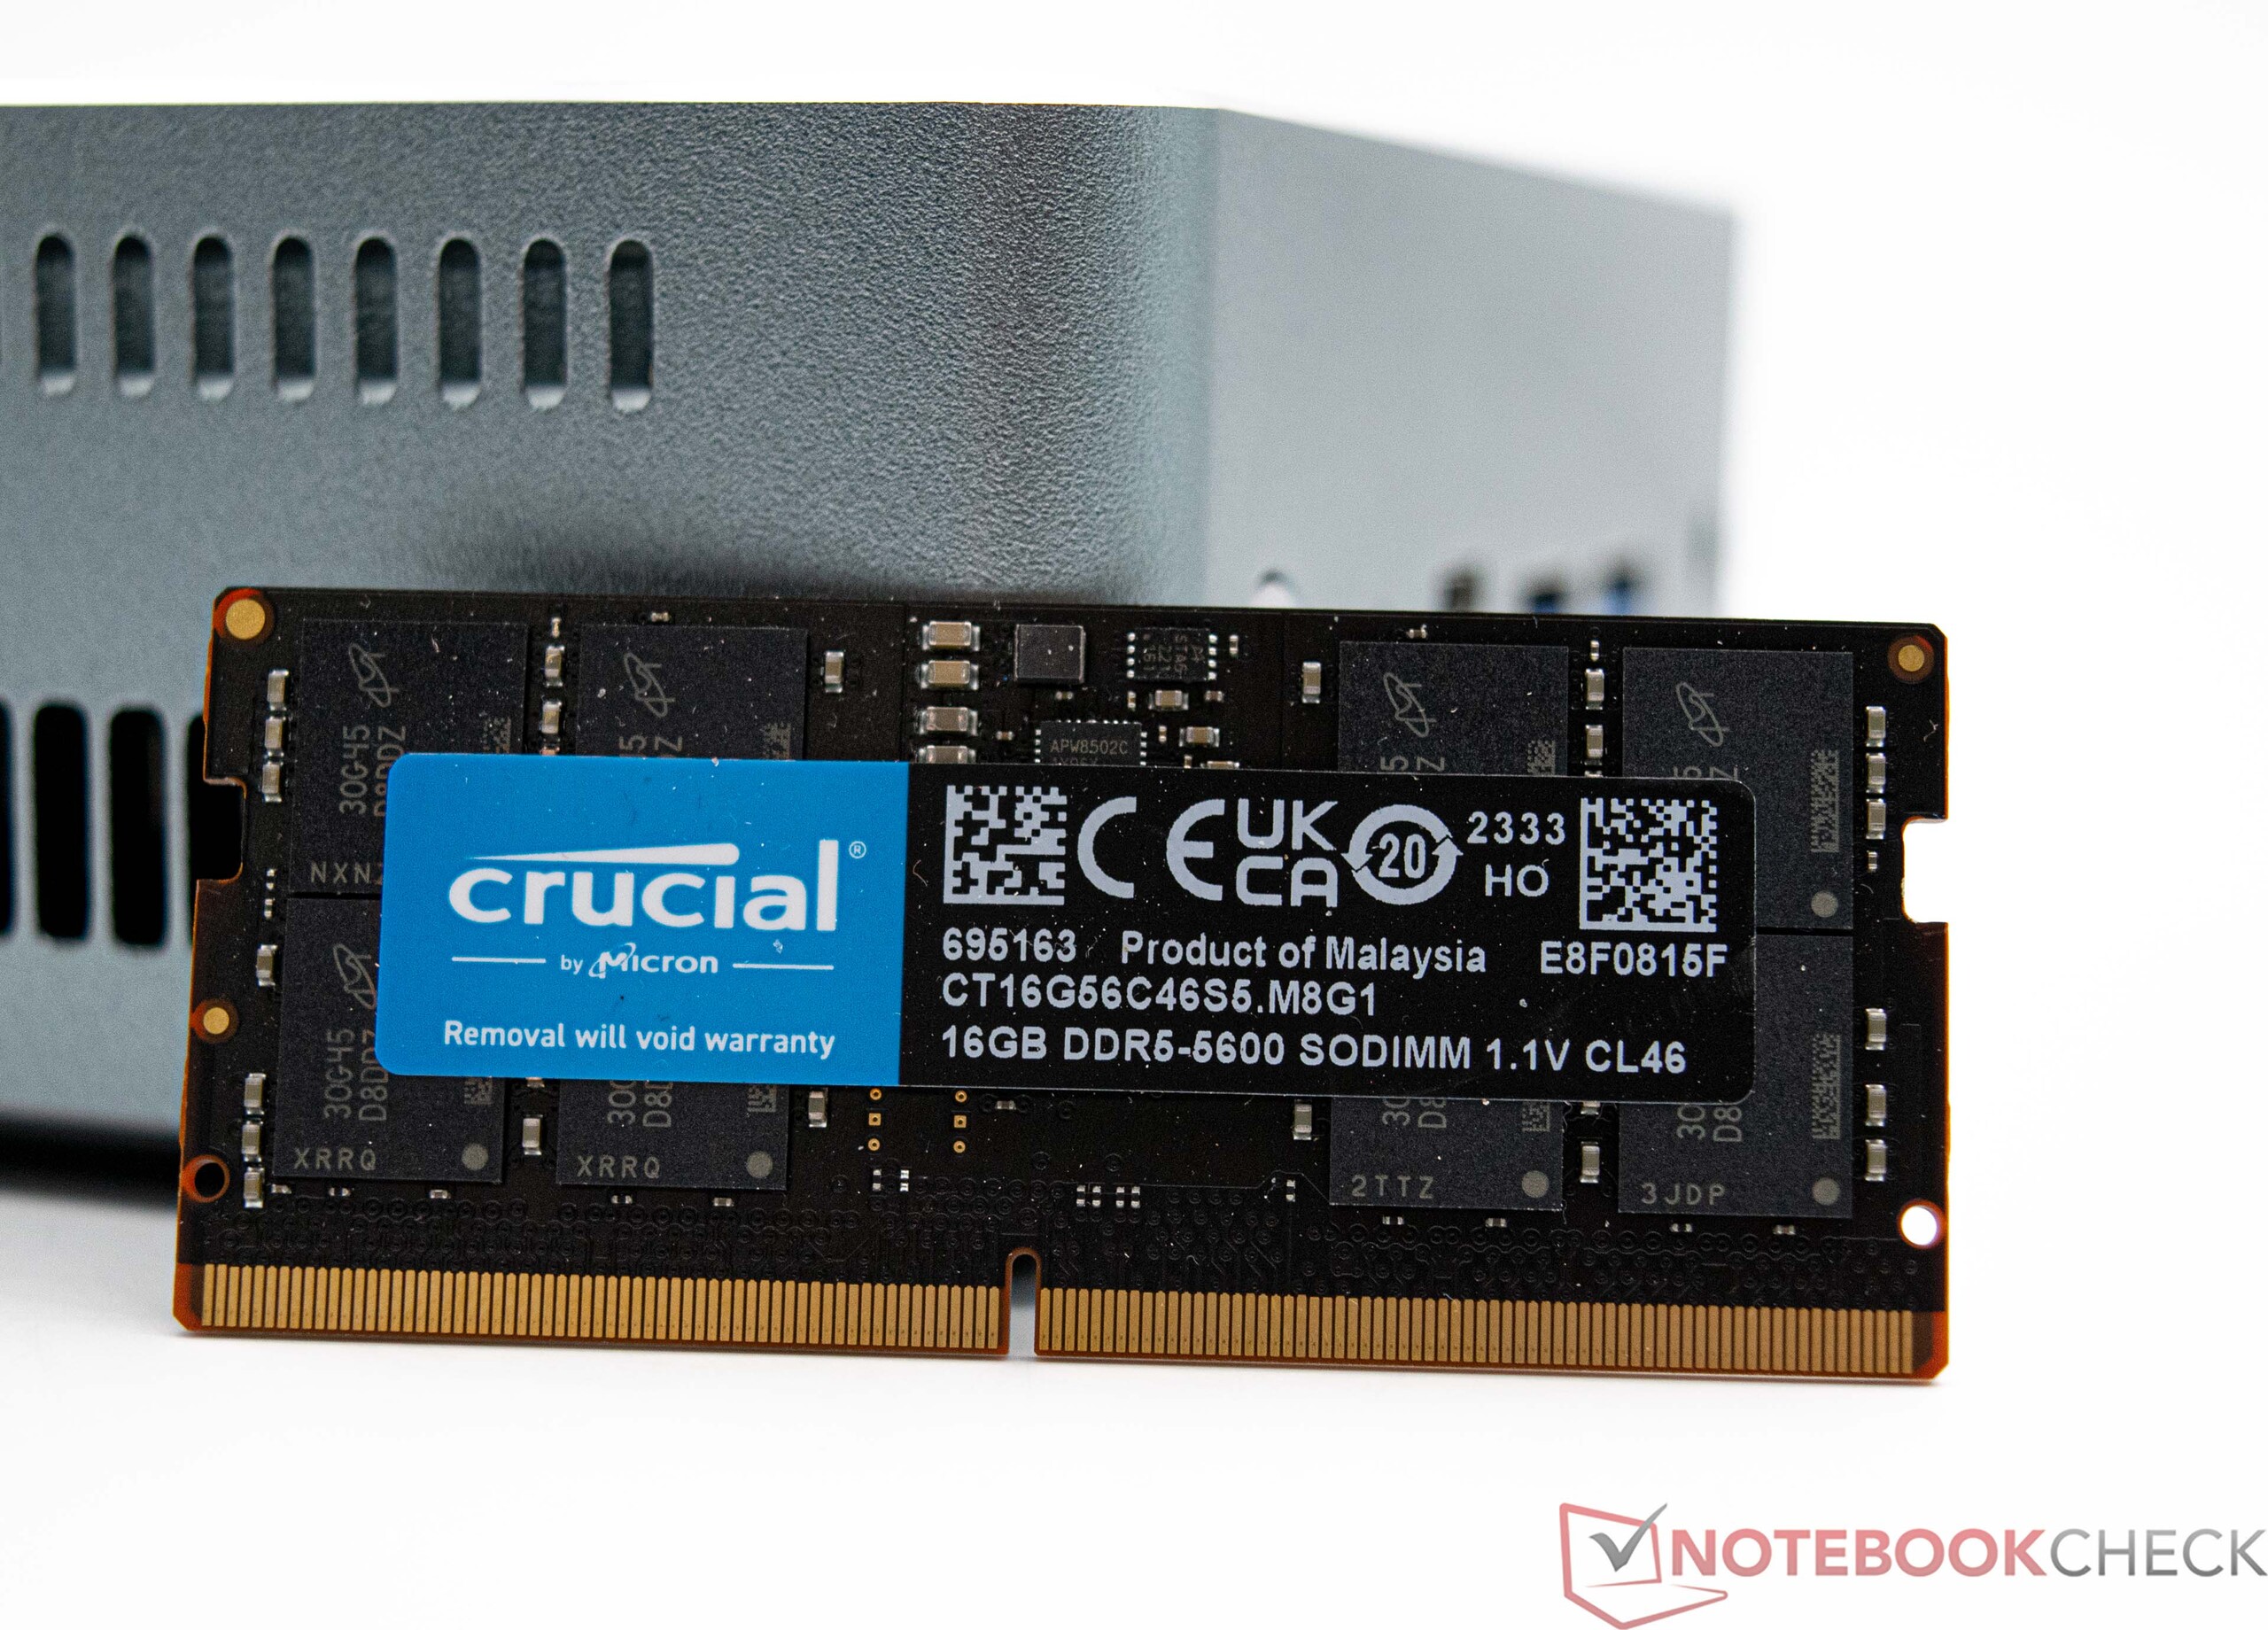
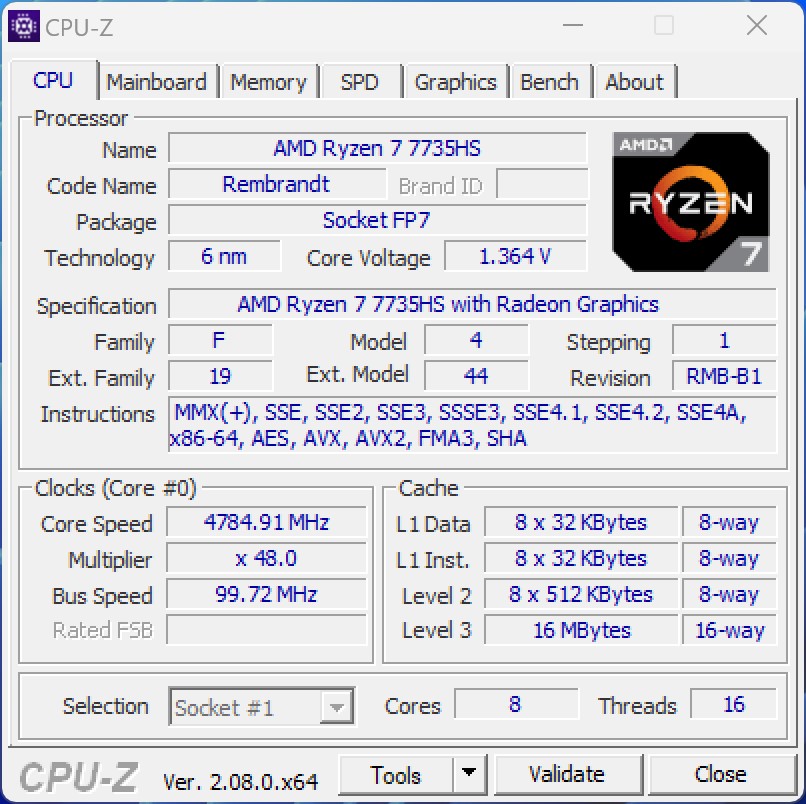
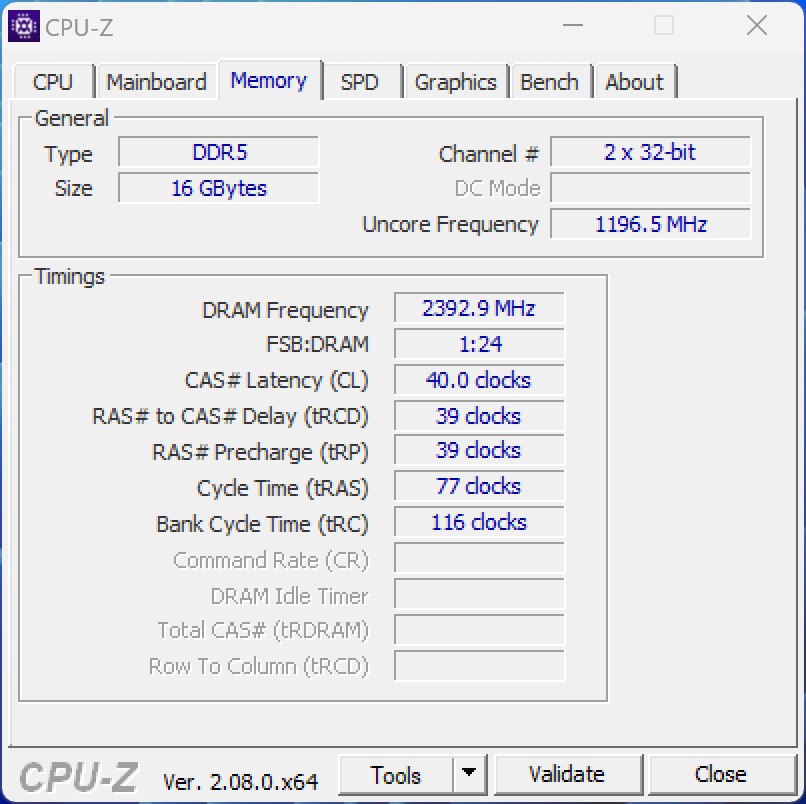
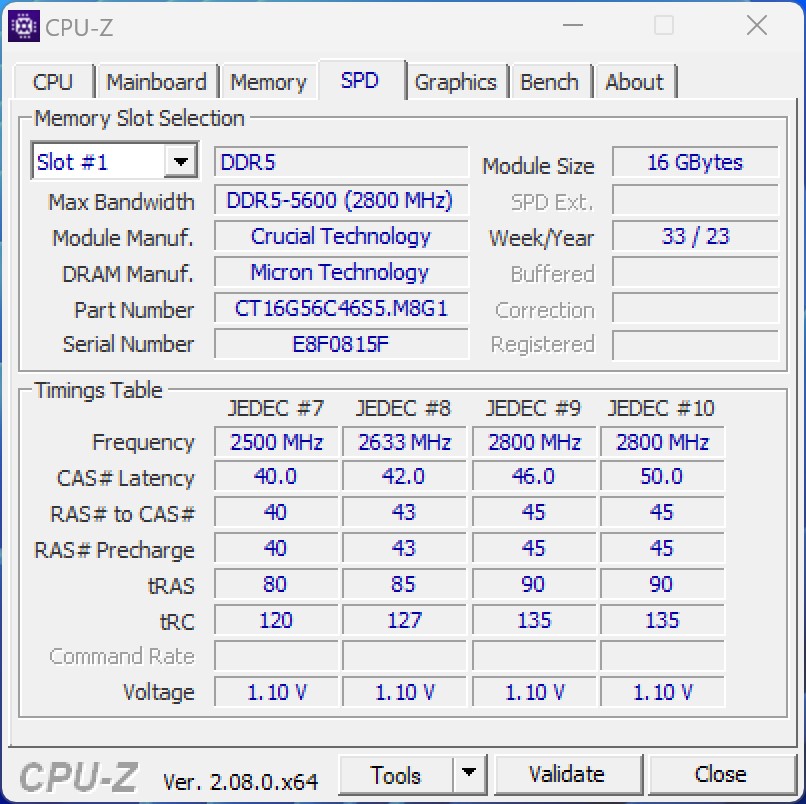
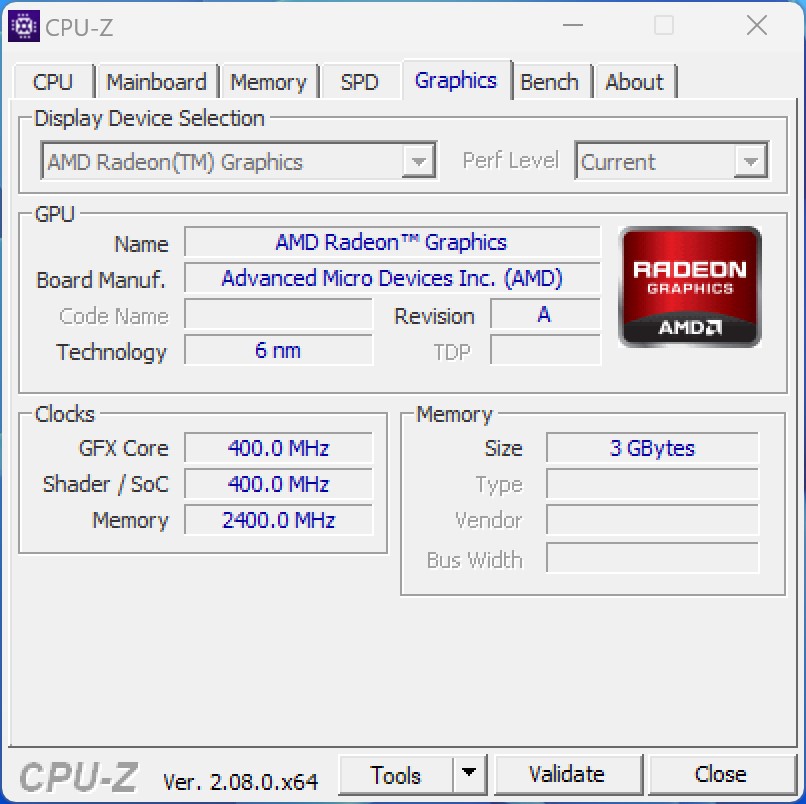
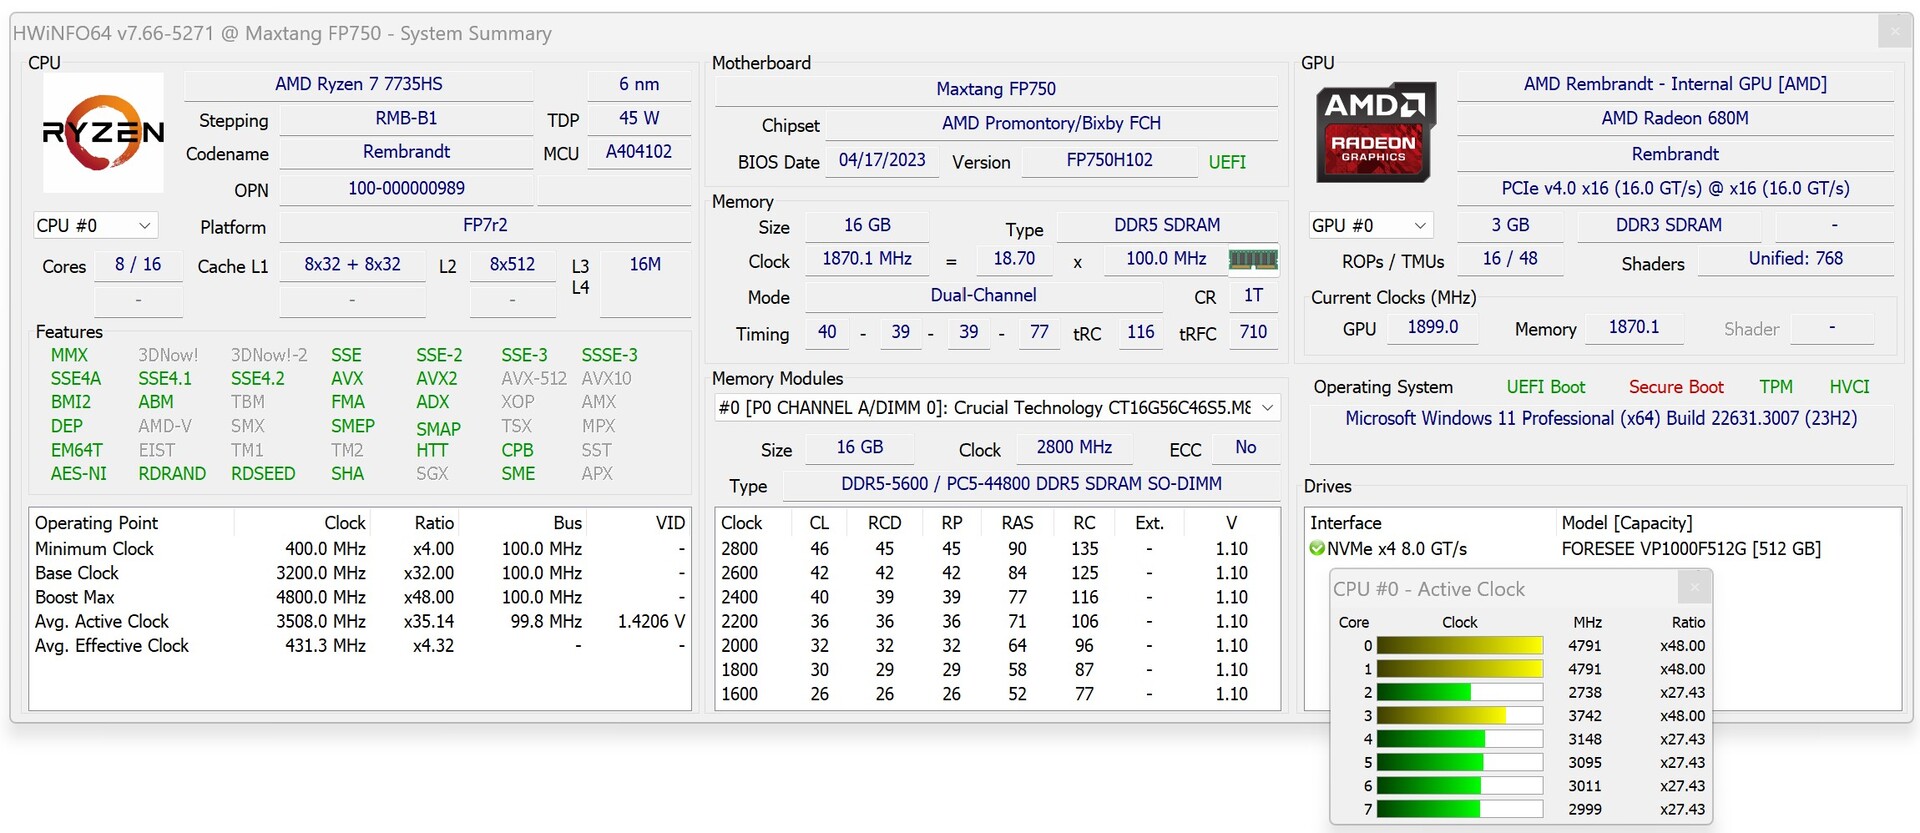
Nasze recenzowane urządzenie Maxtang MTN-FP750 jest wyposażone w AMD Ryzen 7 7735HS. W AMD Radeon 680MsoC ma również do dyspozycji potężną iGPU. Jeśli jednak chodzi o pamięć RAM, producent zdecydował się wyposażyć mini PC w pojedynczy moduł DDR5-5600 o pojemności 16 GB, mimo że w praktyce można zastosować tylko DDR5-4800.
Warunki testu
Wszystkie testy wydajności przeprowadziliśmy przy użyciu profilu energetycznego "najwyższa wydajność". Wydajność SoC nie została zmieniona ani zmodyfikowana w BIOS-ie, a urządzenie zachowało ustawienia fabryczne.
Procesor
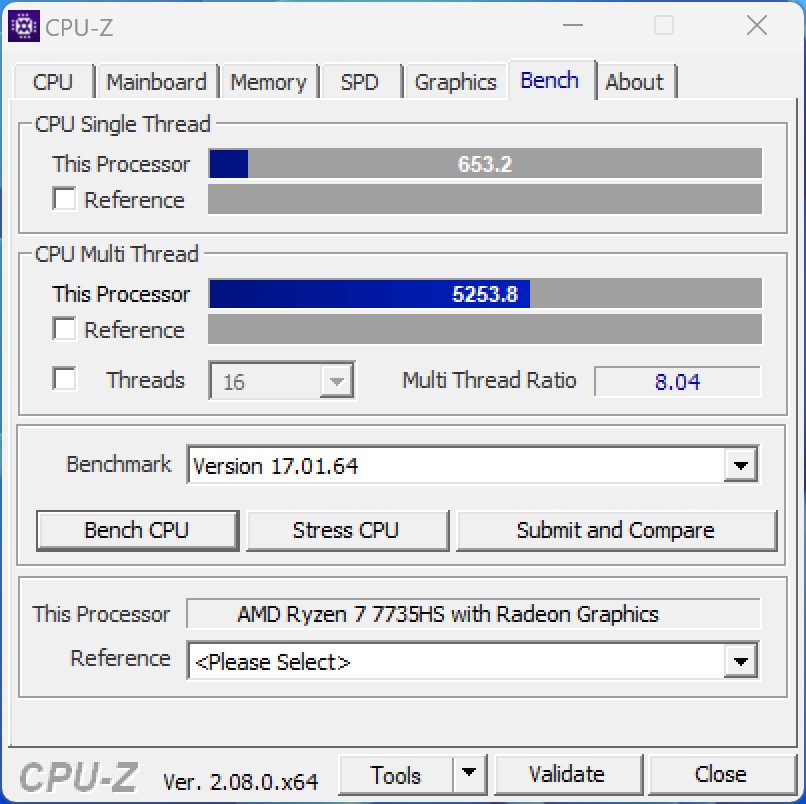
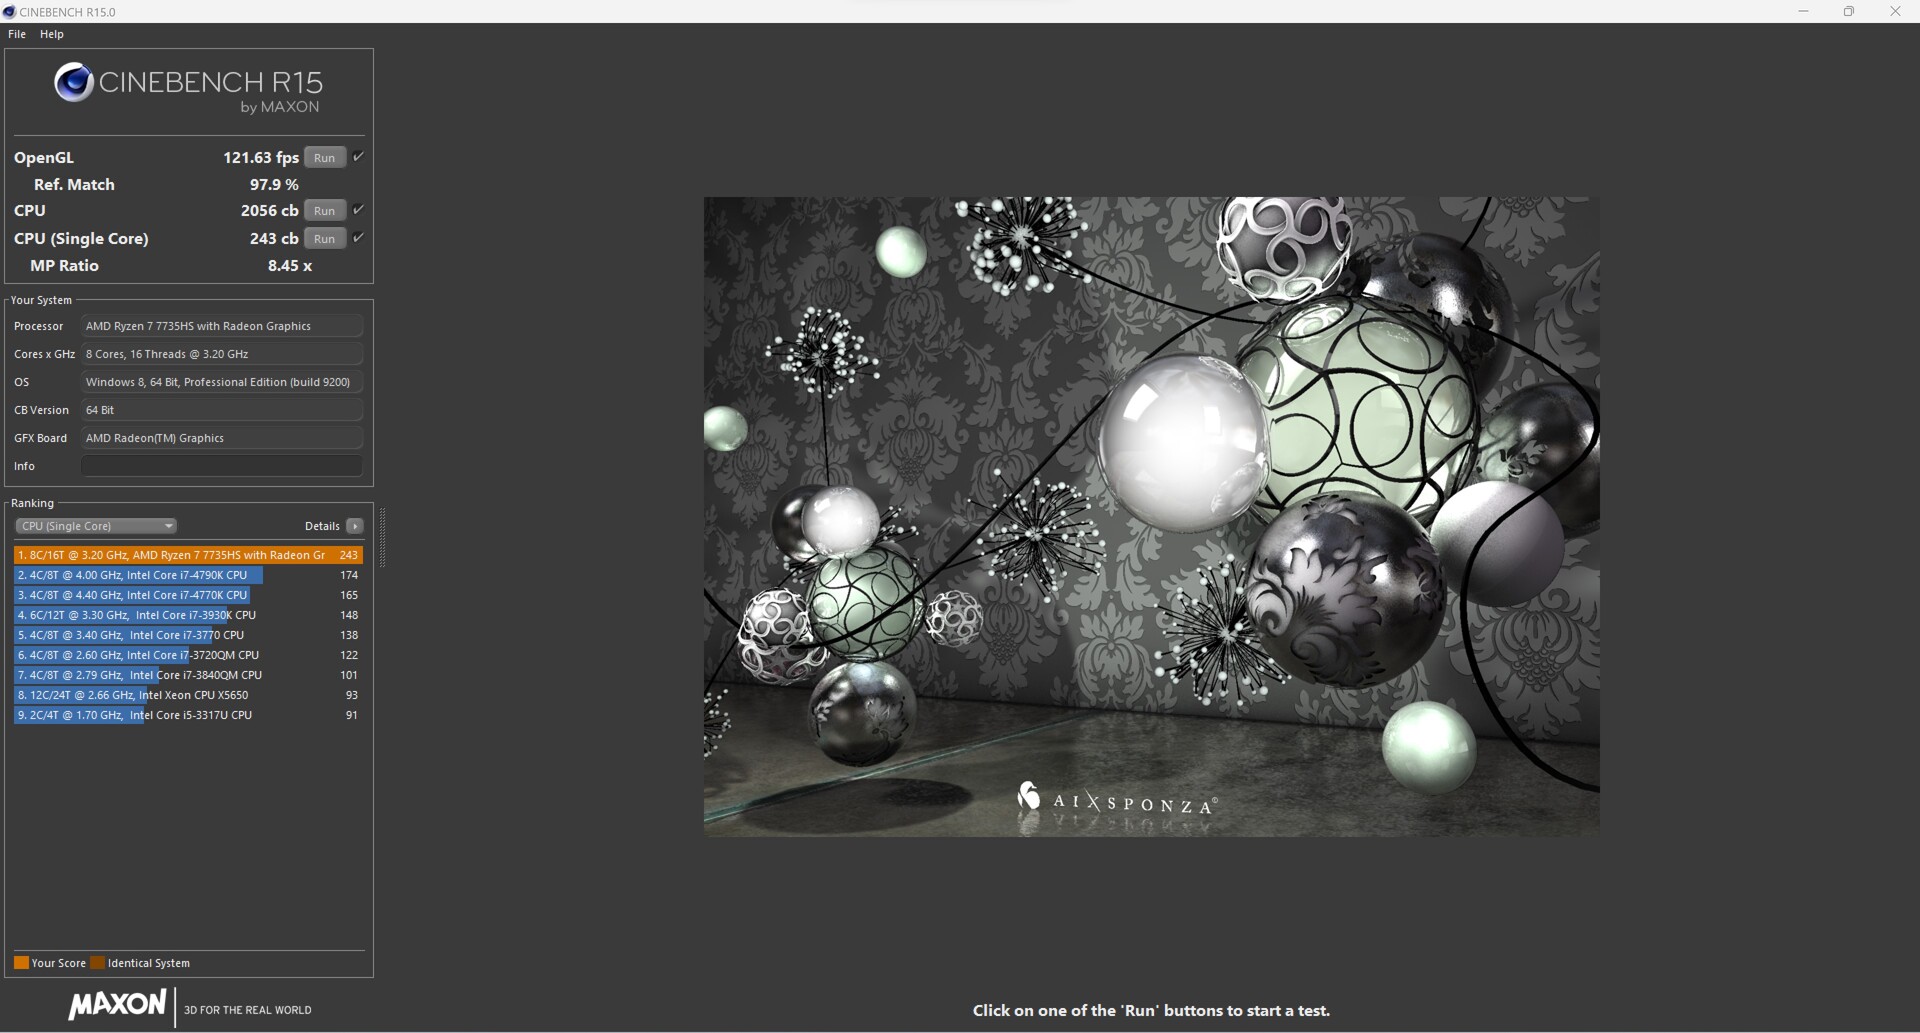
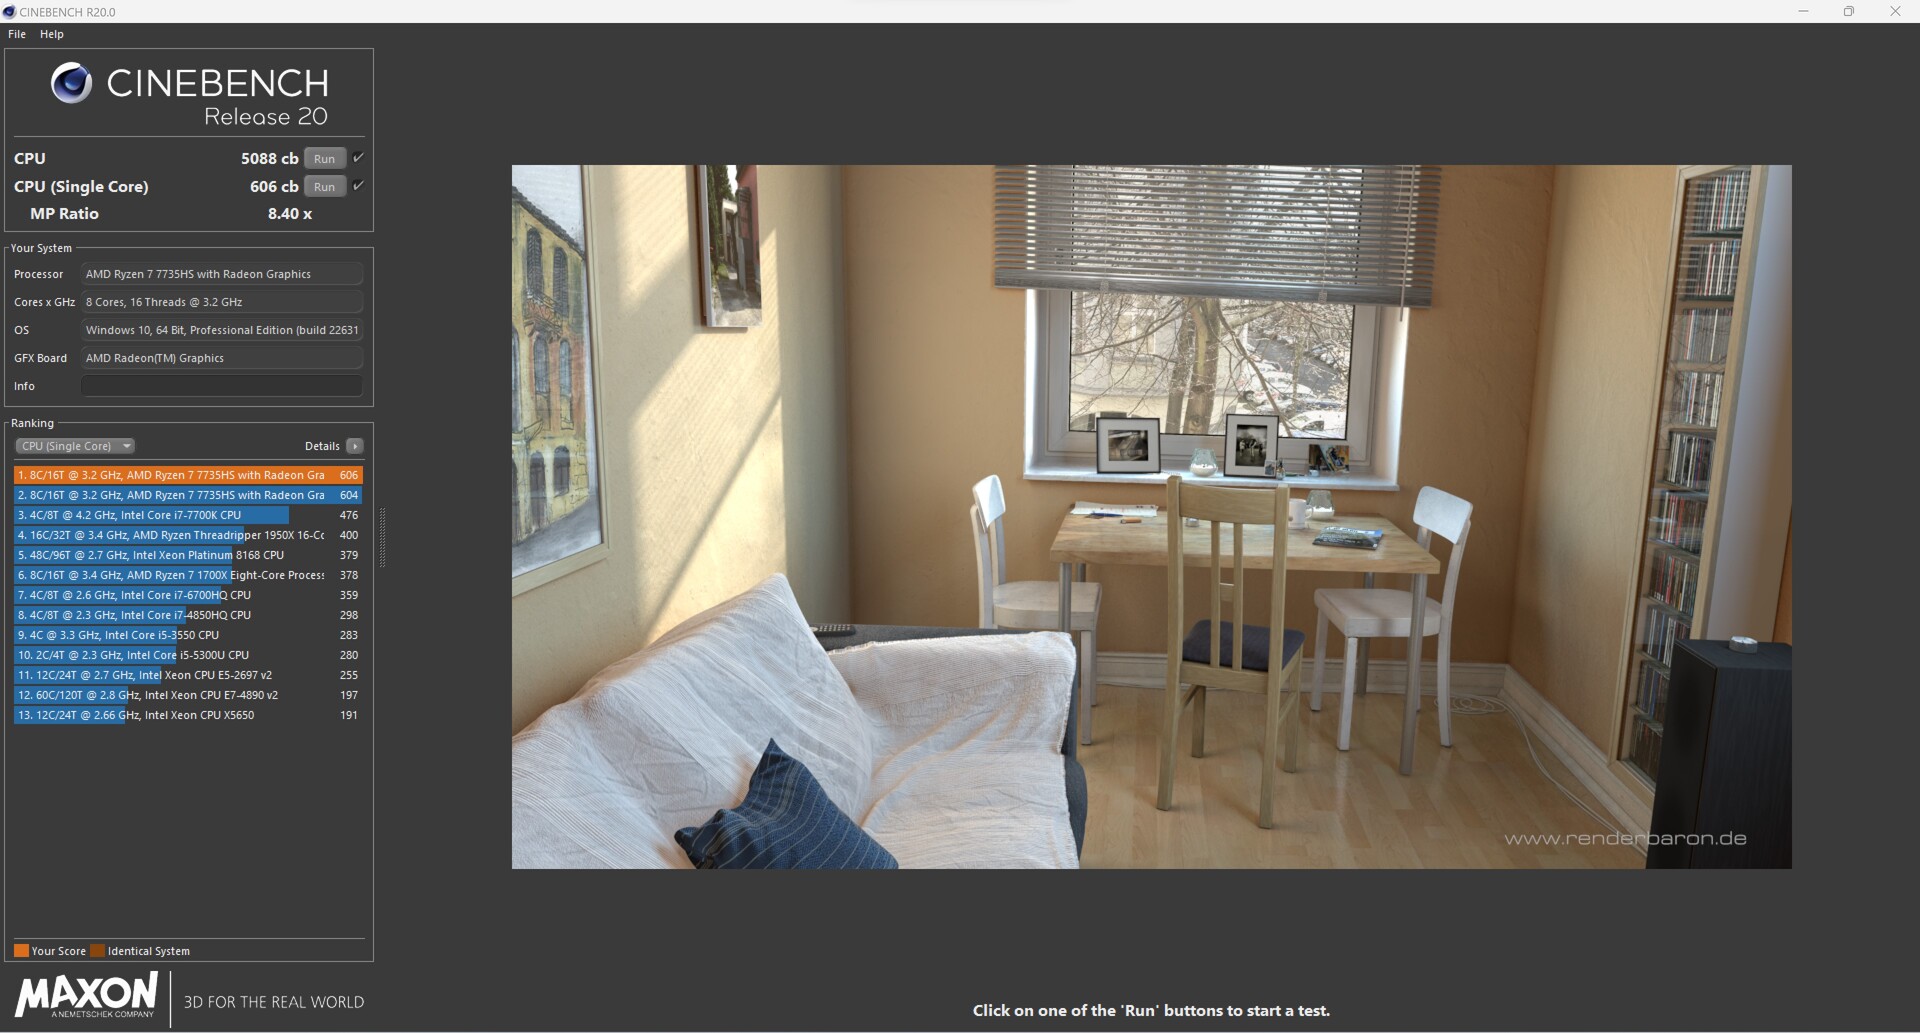
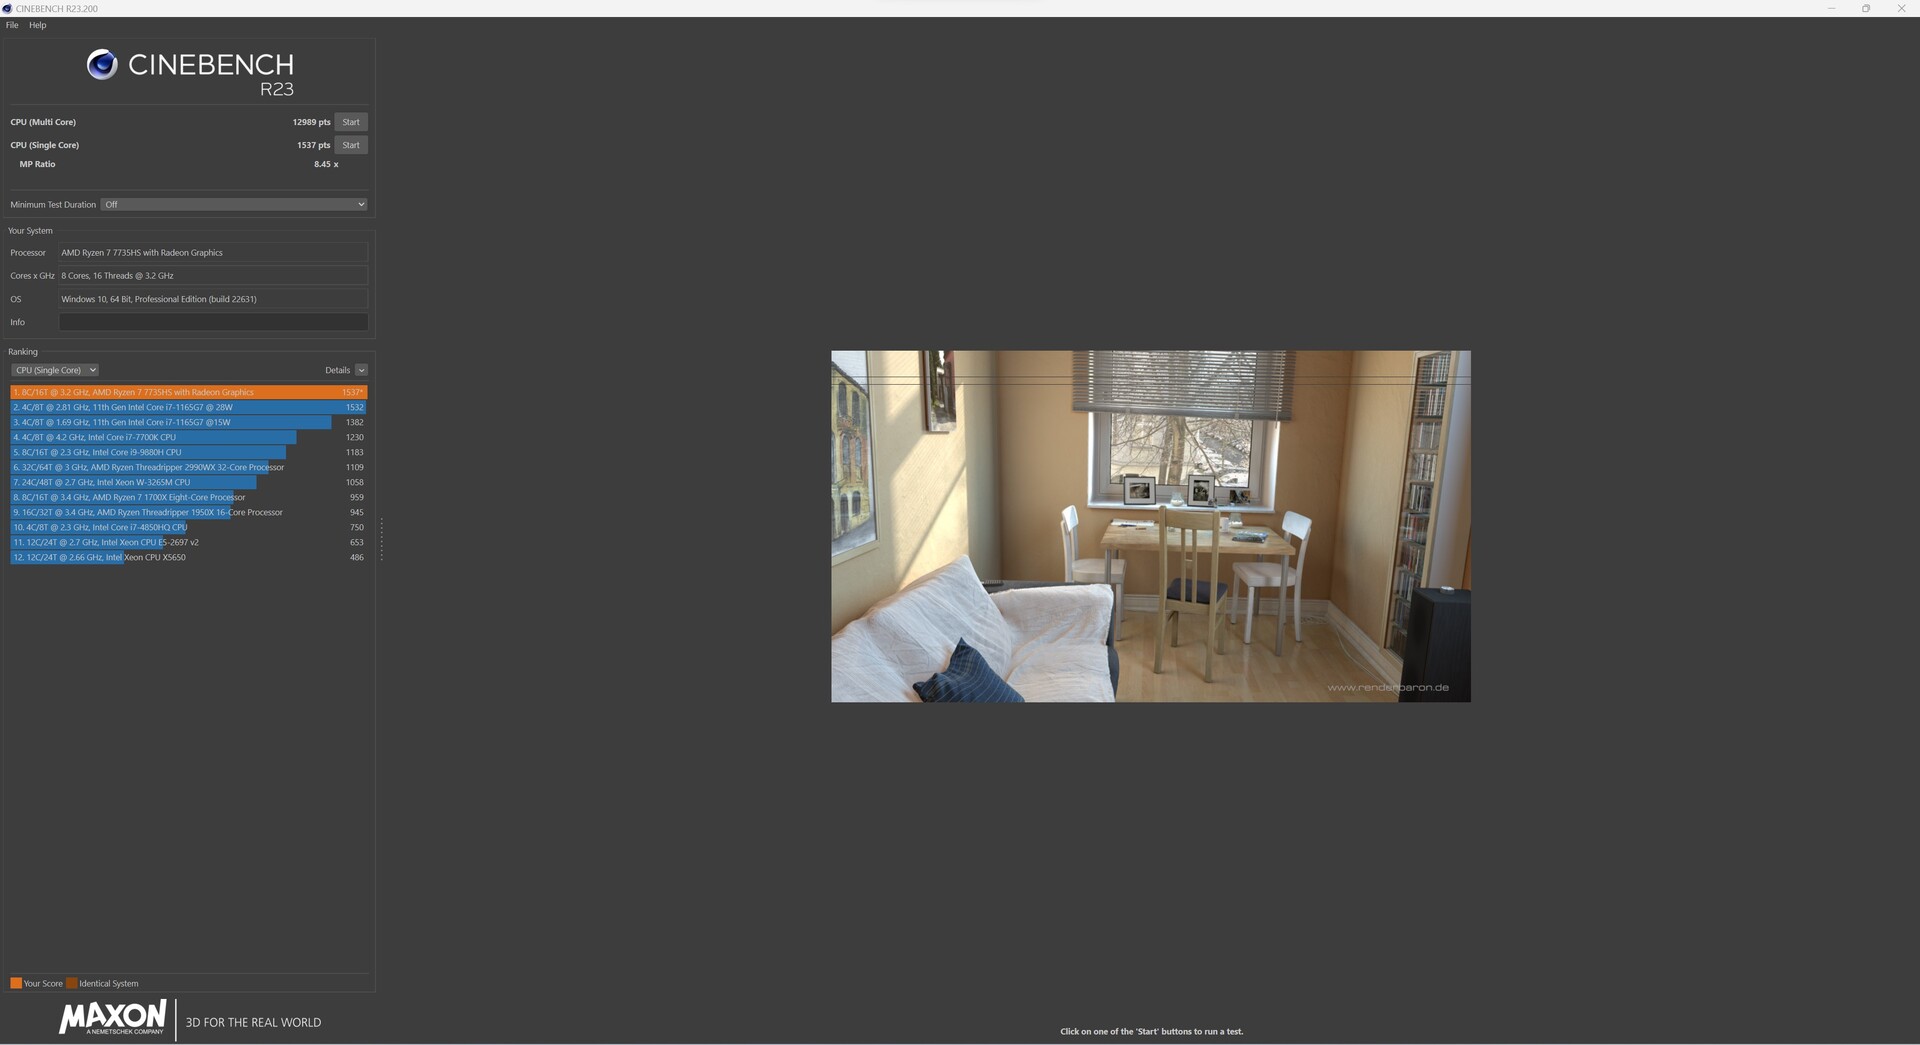
AMD Ryzen 7 7735HS AMD Ryzen 7 7735HS to stosunkowo nowoczesny 8-rdzeniowy procesor z serii Rembrandt. Jednak SoC AMD Zen3 nie może być już uważany za jedno z nowych dzieci w bloku. Pomimo tego, procesor może przetwarzać 16 wątków równolegle, co stanowi dobrą wydajność wielowątkową. W porównaniu wydajności, nasz Maxtang MTN-FP750 zajął dopiero drugie miejsce. Powodem tego jest 35-watowy limit mocy AMD Ryzen 7 7735HS.
Dodatkowe testy porównawcze procesorów można znaleźć tutaj.
Wyniki Cinebench przy ustawieniach fabrycznych (PL1 i PL2 = 35 W)

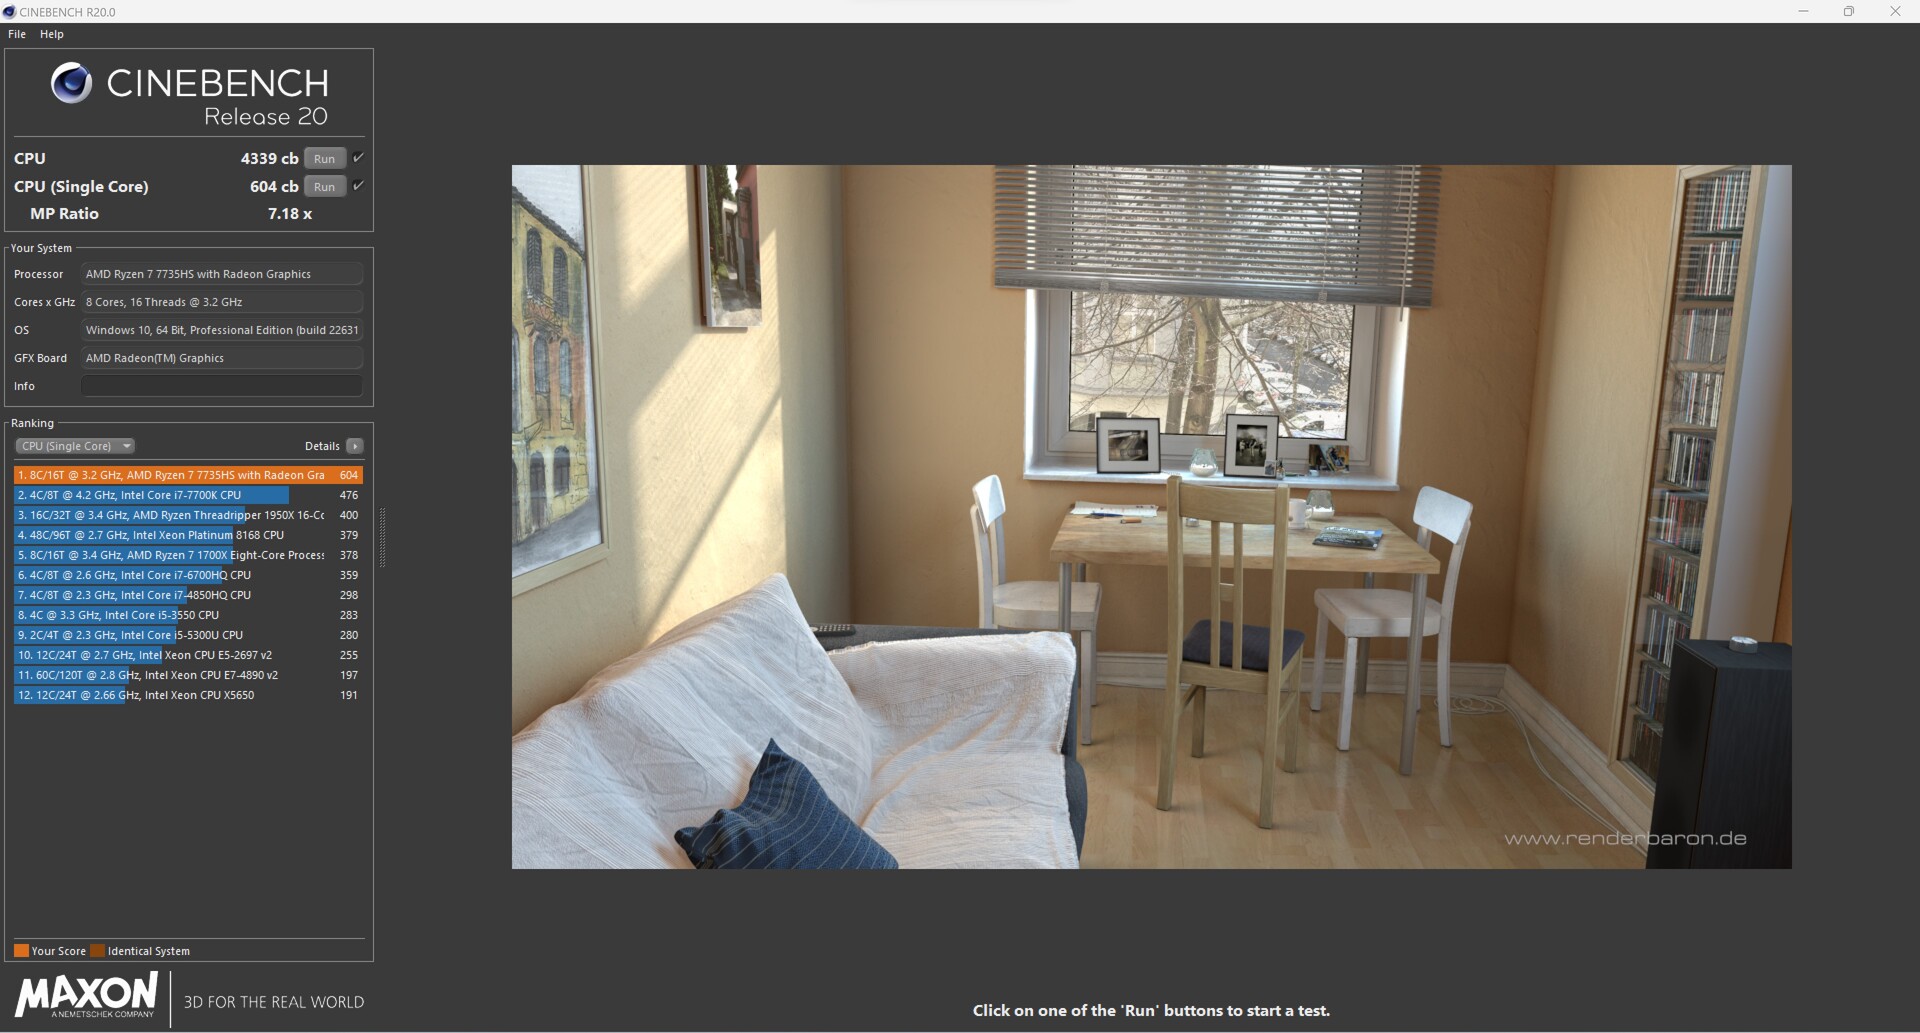
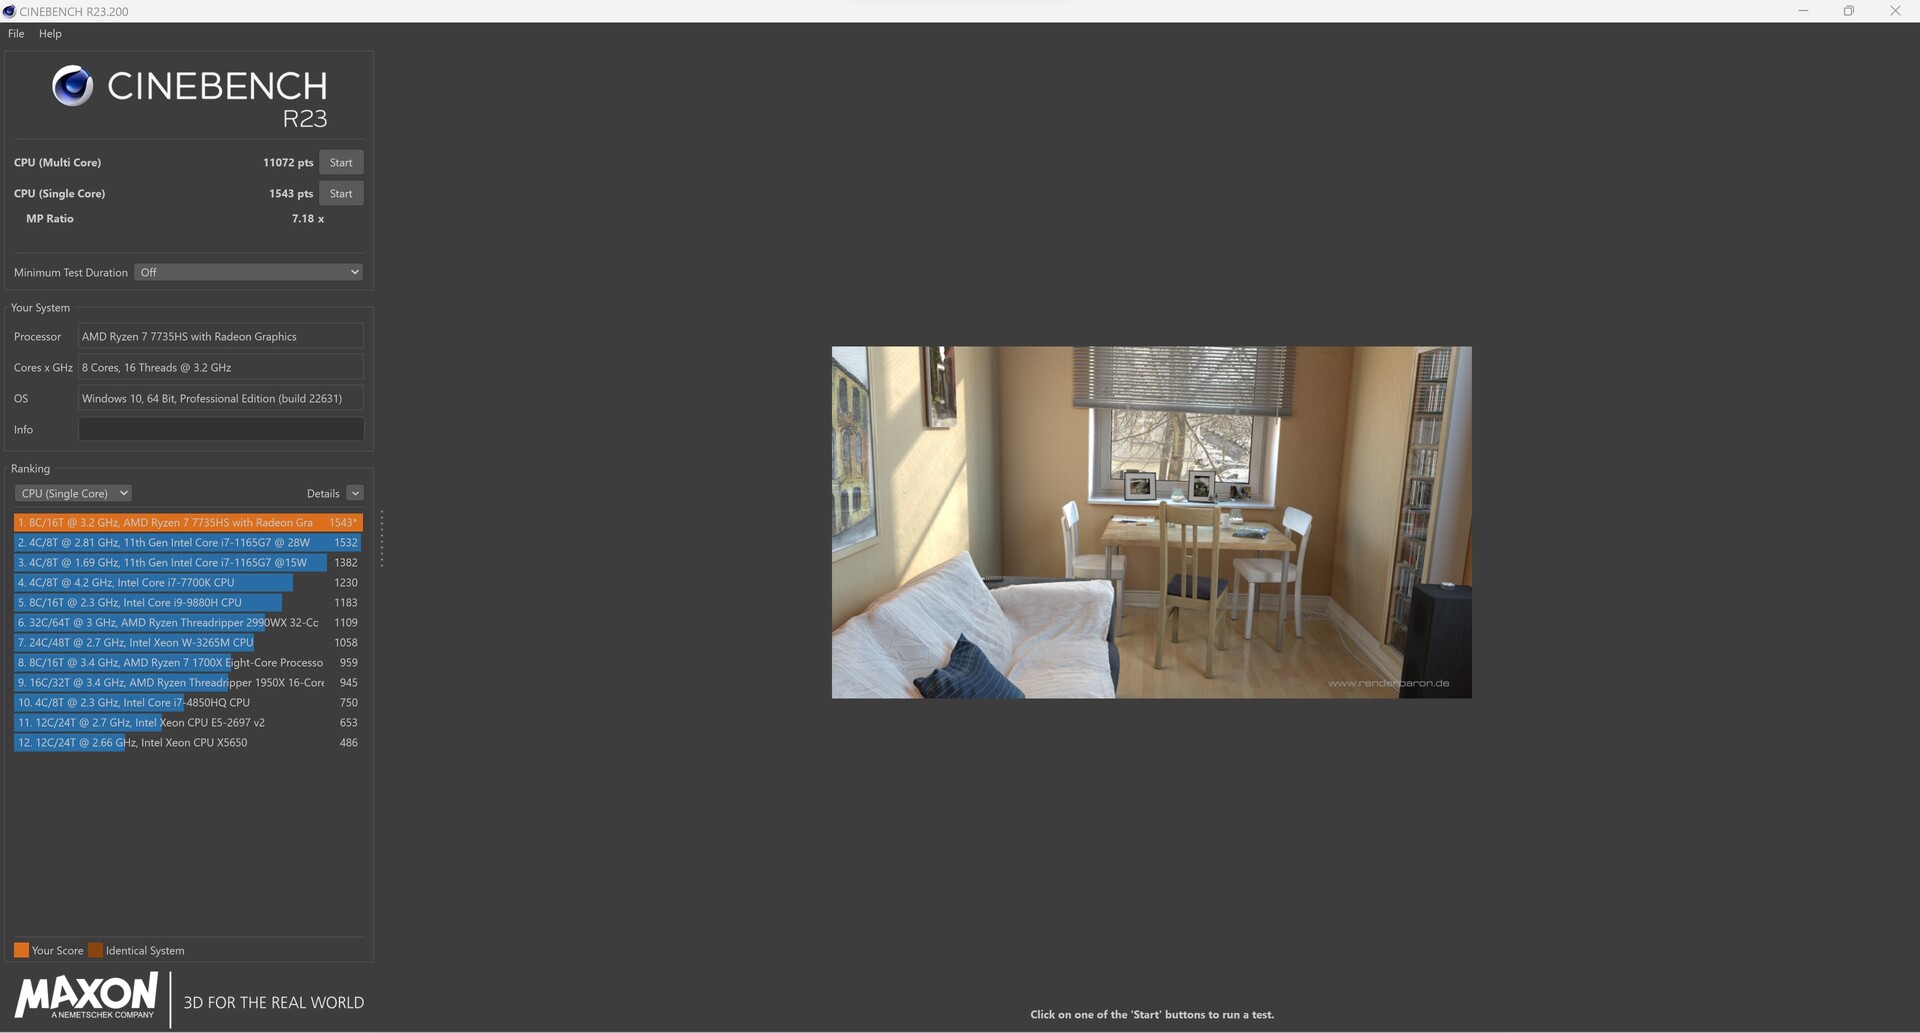
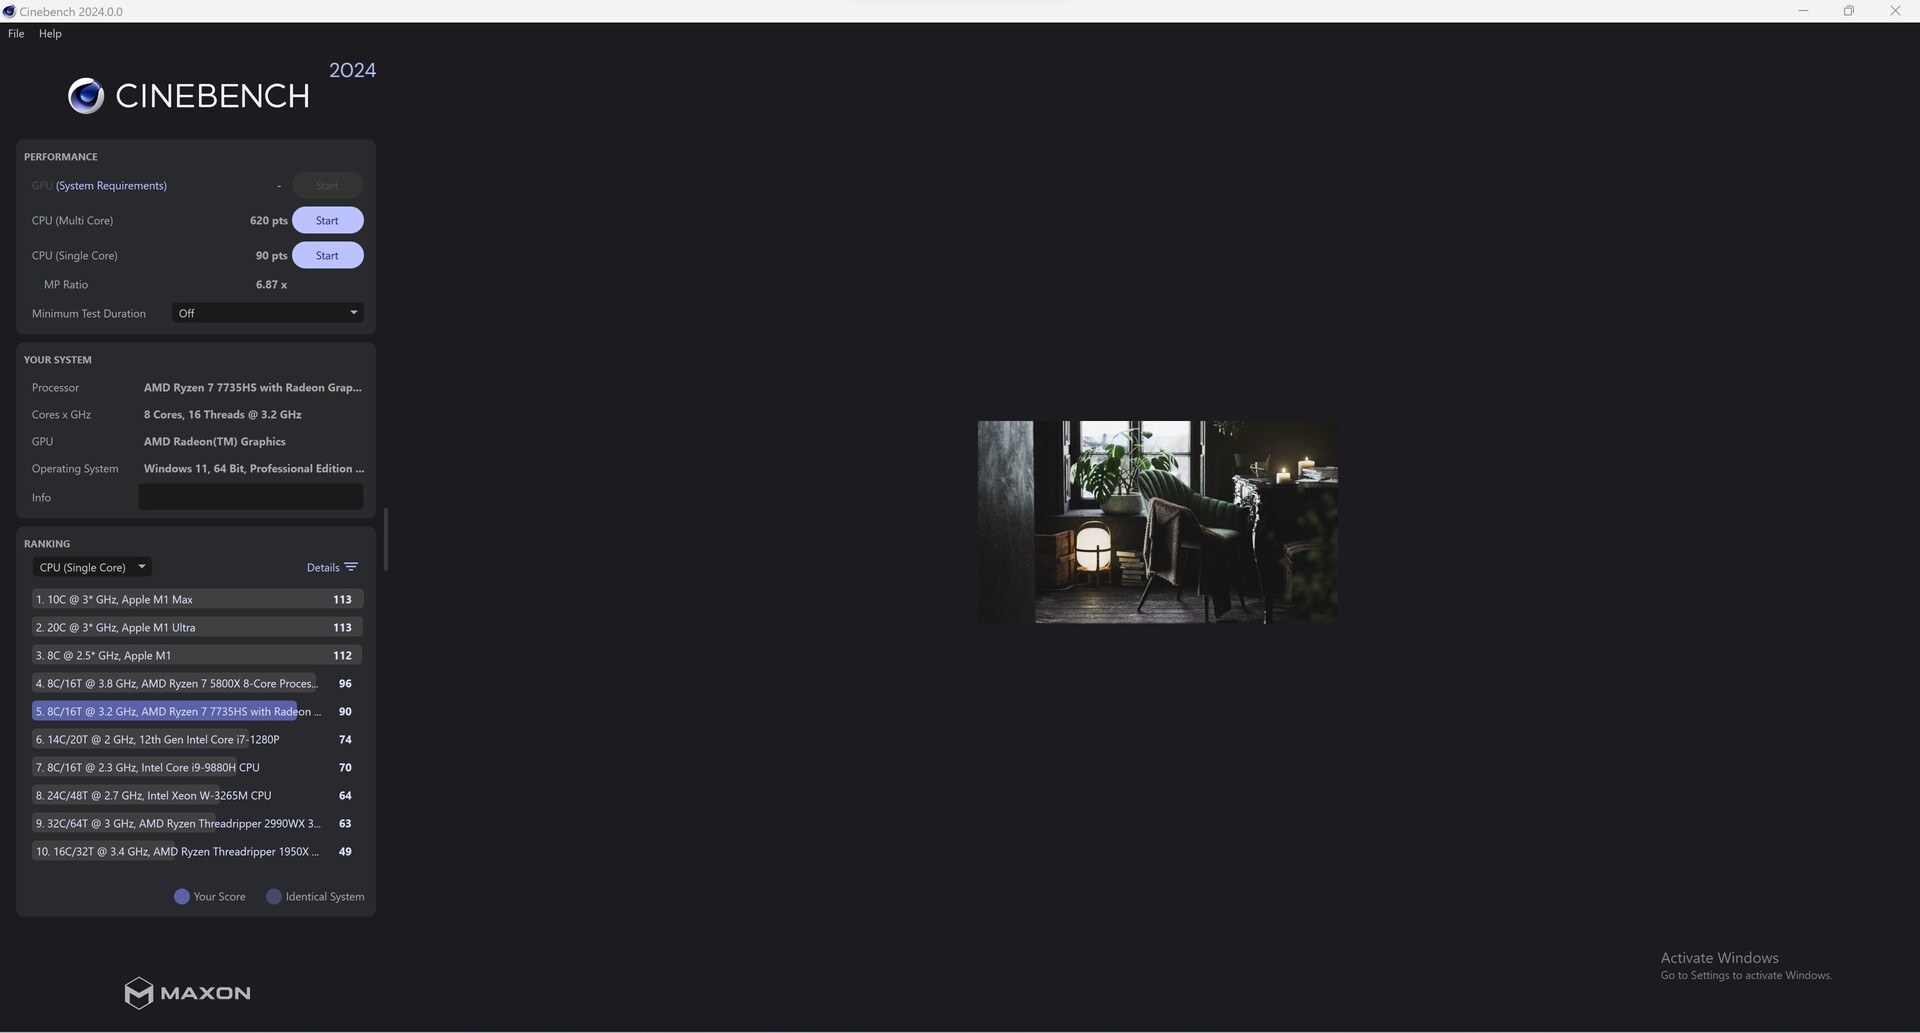
Wyniki Cinebench przy wyższej docelowej mocy (PL1 = 54 W, PL2 = 65 W)

| Performance Rating - Percent | |
| Minisforum Neptune Series NAD9 | |
| Minisforum Venus Series NAB6 | |
| Geekom AS 6, R9 6900HX | |
| NiPoGi AD08 | |
| Geekom A5 | |
| Maxtang MTN-FP750 | |
| Geekom Mini IT12 | |
| Cinebench R10 | |
| Rendering Single CPUs 64Bit | |
| Minisforum Venus Series NAB6 | |
| Geekom Mini IT12 | |
| NiPoGi AD08 | |
| Minisforum Neptune Series NAD9 | |
| Maxtang MTN-FP750 | |
| Geekom AS 6, R9 6900HX | |
| Geekom A5 | |
| Rendering Multiple CPUs 64Bit | |
| Minisforum Neptune Series NAD9 | |
| Minisforum Venus Series NAB6 | |
| Geekom AS 6, R9 6900HX | |
| Geekom A5 | |
| Maxtang MTN-FP750 | |
| NiPoGi AD08 | |
| Geekom Mini IT12 | |
| Blender - v2.79 BMW27 CPU | |
| NiPoGi AD08 | |
| Geekom A5 | |
| Minisforum Venus Series NAB6 | |
| Geekom Mini IT12 | |
| Maxtang MTN-FP750 | |
| Minisforum Neptune Series NAD9 | |
| Geekom AS 6, R9 6900HX | |
| WinRAR - Result | |
| Minisforum Venus Series NAB6 | |
| Minisforum Neptune Series NAD9 | |
| NiPoGi AD08 | |
| Geekom A5 | |
| Geekom AS 6, R9 6900HX | |
| Geekom Mini IT12 | |
| Maxtang MTN-FP750 | |
| 3DMark 11 - 1280x720 Performance Physics | |
| Minisforum Neptune Series NAD9 | |
| Minisforum Venus Series NAB6 | |
| Geekom AS 6, R9 6900HX | |
| Geekom A5 | |
| NiPoGi AD08 | |
| Maxtang MTN-FP750 | |
| Geekom Mini IT12 | |
| HWBOT x265 Benchmark v2.2 - 4k Preset | |
| Geekom AS 6, R9 6900HX | |
| Minisforum Neptune Series NAD9 | |
| Minisforum Venus Series NAB6 | |
| Geekom A5 | |
| Maxtang MTN-FP750 | |
| NiPoGi AD08 | |
| Geekom Mini IT12 | |
| R Benchmark 2.5 - Overall mean | |
| Geekom A5 | |
| Maxtang MTN-FP750 | |
| Geekom AS 6, R9 6900HX | |
| NiPoGi AD08 | |
| Geekom Mini IT12 | |
| Minisforum Neptune Series NAD9 | |
| Minisforum Venus Series NAB6 | |
| LibreOffice - 20 Documents To PDF | |
| Maxtang MTN-FP750 | |
| Geekom A5 | |
| Geekom Mini IT12 | |
| NiPoGi AD08 | |
| Geekom AS 6, R9 6900HX | |
| Minisforum Venus Series NAB6 | |
| Minisforum Neptune Series NAD9 | |
| WebXPRT 3 - Overall | |
| Minisforum Neptune Series NAD9 | |
| Minisforum Venus Series NAB6 | |
| NiPoGi AD08 | |
| Geekom Mini IT12 | |
| Maxtang MTN-FP750 | |
| Geekom A5 | |
| Geekom AS 6, R9 6900HX | |
| Mozilla Kraken 1.1 - Total | |
| Geekom A5 | |
| Geekom AS 6, R9 6900HX | |
| Maxtang MTN-FP750 | |
| Minisforum Neptune Series NAD9 | |
| Geekom Mini IT12 | |
| NiPoGi AD08 | |
| Minisforum Venus Series NAB6 | |
* ... im mniej tym lepiej
AIDA64: FP32 Ray-Trace | FPU Julia | CPU SHA3 | CPU Queen | FPU SinJulia | FPU Mandel | CPU AES | CPU ZLib | FP64 Ray-Trace | CPU PhotoWorxx
| Performance Rating | |
| Geekom AS 6, R9 6900HX | |
| Geekom A5 | |
| Maxtang MTN-FP750 | |
| Minisforum Neptune Series NAD9 | |
| Minisforum Venus Series NAB6 | |
| Average of class Mini PC | |
| NiPoGi AD08 | |
| Geekom Mini IT12 | |
| AIDA64 / FP32 Ray-Trace | |
| Geekom AS 6, R9 6900HX | |
| Maxtang MTN-FP750 | |
| Geekom A5 | |
| Minisforum Neptune Series NAD9 | |
| Minisforum Venus Series NAB6 | |
| Average of class Mini PC (561 - 27538, n=98, last 2 years) | |
| NiPoGi AD08 | |
| Geekom Mini IT12 | |
| AIDA64 / FPU Julia | |
| Geekom AS 6, R9 6900HX | |
| Maxtang MTN-FP750 | |
| Geekom A5 | |
| Minisforum Neptune Series NAD9 | |
| Minisforum Venus Series NAB6 | |
| Average of class Mini PC (3604 - 116903, n=98, last 2 years) | |
| NiPoGi AD08 | |
| Geekom Mini IT12 | |
| AIDA64 / CPU SHA3 | |
| Geekom AS 6, R9 6900HX | |
| Maxtang MTN-FP750 | |
| Geekom A5 | |
| Minisforum Neptune Series NAD9 | |
| Minisforum Venus Series NAB6 | |
| Average of class Mini PC (225 - 5096, n=98, last 2 years) | |
| NiPoGi AD08 | |
| Geekom Mini IT12 | |
| AIDA64 / CPU Queen | |
| Geekom AS 6, R9 6900HX | |
| Geekom A5 | |
| Maxtang MTN-FP750 | |
| Minisforum Neptune Series NAD9 | |
| Minisforum Venus Series NAB6 | |
| Geekom Mini IT12 | |
| NiPoGi AD08 | |
| Average of class Mini PC (8172 - 119569, n=98, last 2 years) | |
| AIDA64 / FPU SinJulia | |
| Maxtang MTN-FP750 | |
| Geekom AS 6, R9 6900HX | |
| Geekom A5 | |
| Minisforum Neptune Series NAD9 | |
| Minisforum Venus Series NAB6 | |
| Average of class Mini PC (408 - 15525, n=98, last 2 years) | |
| NiPoGi AD08 | |
| Geekom Mini IT12 | |
| AIDA64 / FPU Mandel | |
| Geekom AS 6, R9 6900HX | |
| Maxtang MTN-FP750 | |
| Geekom A5 | |
| Minisforum Neptune Series NAD9 | |
| Average of class Mini PC (1958 - 62378, n=98, last 2 years) | |
| Minisforum Venus Series NAB6 | |
| NiPoGi AD08 | |
| Geekom Mini IT12 | |
| AIDA64 / CPU AES | |
| Geekom AS 6, R9 6900HX | |
| Geekom A5 | |
| Minisforum Neptune Series NAD9 | |
| Minisforum Venus Series NAB6 | |
| Average of class Mini PC (3691 - 177158, n=98, last 2 years) | |
| Geekom Mini IT12 | |
| Maxtang MTN-FP750 | |
| NiPoGi AD08 | |
| AIDA64 / CPU ZLib | |
| Geekom AS 6, R9 6900HX | |
| Minisforum Neptune Series NAD9 | |
| Geekom A5 | |
| NiPoGi AD08 | |
| Minisforum Venus Series NAB6 | |
| Maxtang MTN-FP750 | |
| Average of class Mini PC (74.8 - 1183, n=98, last 2 years) | |
| Geekom Mini IT12 | |
| AIDA64 / FP64 Ray-Trace | |
| Geekom AS 6, R9 6900HX | |
| Maxtang MTN-FP750 | |
| Geekom A5 | |
| Minisforum Neptune Series NAD9 | |
| Minisforum Venus Series NAB6 | |
| Average of class Mini PC (308 - 14722, n=98, last 2 years) | |
| NiPoGi AD08 | |
| Geekom Mini IT12 | |
| AIDA64 / CPU PhotoWorxx | |
| Geekom AS 6, R9 6900HX | |
| Geekom Mini IT12 | |
| Minisforum Venus Series NAB6 | |
| Geekom A5 | |
| Average of class Mini PC (4408 - 44347, n=98, last 2 years) | |
| NiPoGi AD08 | |
| Minisforum Neptune Series NAD9 | |
| Maxtang MTN-FP750 | |
Maxtang MTN-FP750 vs. Cinebench R15 Multi-Loop
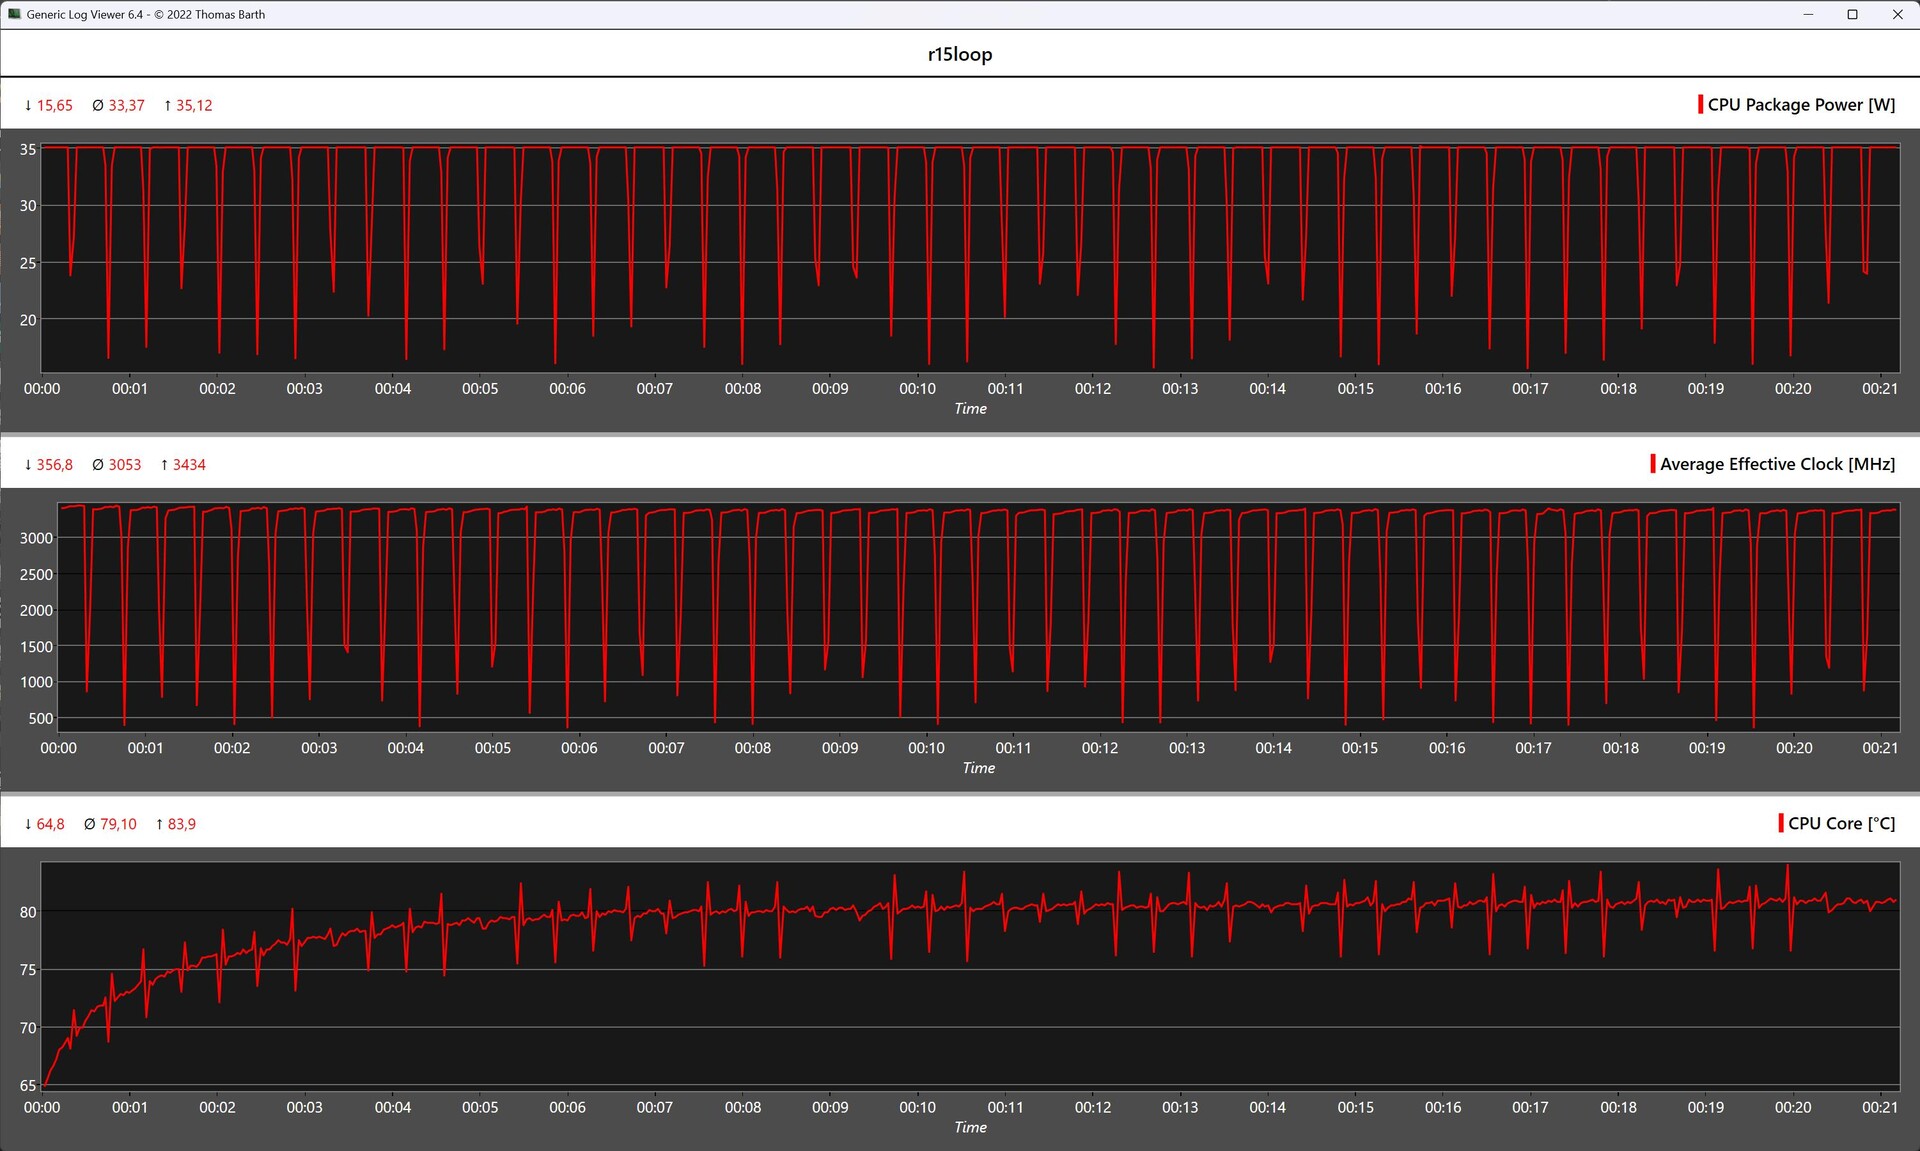
Wielopętlowy test Cinebench R15 pokazał nam, jak dobrze układ chłodzenia działa pod obciążeniem. Jednostka chłodząca nie osiąga swoich limitów ze względu na niskie maksymalne TDP wynoszące zaledwie 35 watów, dzięki czemu urządzenie było w stanie osiągnąć niezmiennie stabilną wydajność procesora. W porównaniu, nasz testowy egzemplarz zdołał nawet zająć drugie miejsce za Geekom AS 6 Geekom AS 6.
Wydajność systemu
Po raz kolejny, w testach syntetycznych wydajności systemu, nasze recenzowane urządzenie również znalazło się z tyłu. W codziennych zadaniach podczas testów i z subiektywnego punktu widzenia, Maxtang MTN-FP750 był w stanie zapewnić dobrą wydajność systemu, o ile system nie był zmuszony do obsługi zbyt wielu zadań jednocześnie. Pamięć RAM wydaje się być wąskim gardłem, ponieważ po odjęciu pamięci graficznej dostępnych jest tylko 12 z 16 GB.
| AIDA64 / Memory Copy | |
| Geekom AS 6, R9 6900HX | |
| Minisforum Venus Series NAB6 | |
| Minisforum Neptune Series NAD9 | |
| Geekom Mini IT12 | |
| NiPoGi AD08 | |
| Geekom A5 | |
| Average of class Mini PC (6481 - 70620, n=98, last 2 years) | |
| Maxtang MTN-FP750 | |
| AIDA64 / Memory Read | |
| Geekom AS 6, R9 6900HX | |
| Minisforum Venus Series NAB6 | |
| Minisforum Neptune Series NAD9 | |
| Geekom Mini IT12 | |
| NiPoGi AD08 | |
| Geekom A5 | |
| Average of class Mini PC (6914 - 71285, n=98, last 2 years) | |
| Maxtang MTN-FP750 | |
| AIDA64 / Memory Write | |
| Geekom AS 6, R9 6900HX | |
| Minisforum Venus Series NAB6 | |
| Minisforum Neptune Series NAD9 | |
| Geekom Mini IT12 | |
| Average of class Mini PC (6862 - 89318, n=98, last 2 years) | |
| Geekom A5 | |
| NiPoGi AD08 | |
| Maxtang MTN-FP750 | |
| AIDA64 / Memory Latency | |
| NiPoGi AD08 | |
| Minisforum Neptune Series NAD9 | |
| Geekom AS 6, R9 6900HX | |
| Average of class Mini PC (44.9 - 154.6, n=98, last 2 years) | |
| Geekom A5 | |
| Geekom Mini IT12 | |
| Maxtang MTN-FP750 | |
| Minisforum Venus Series NAB6 | |
* ... im mniej tym lepiej
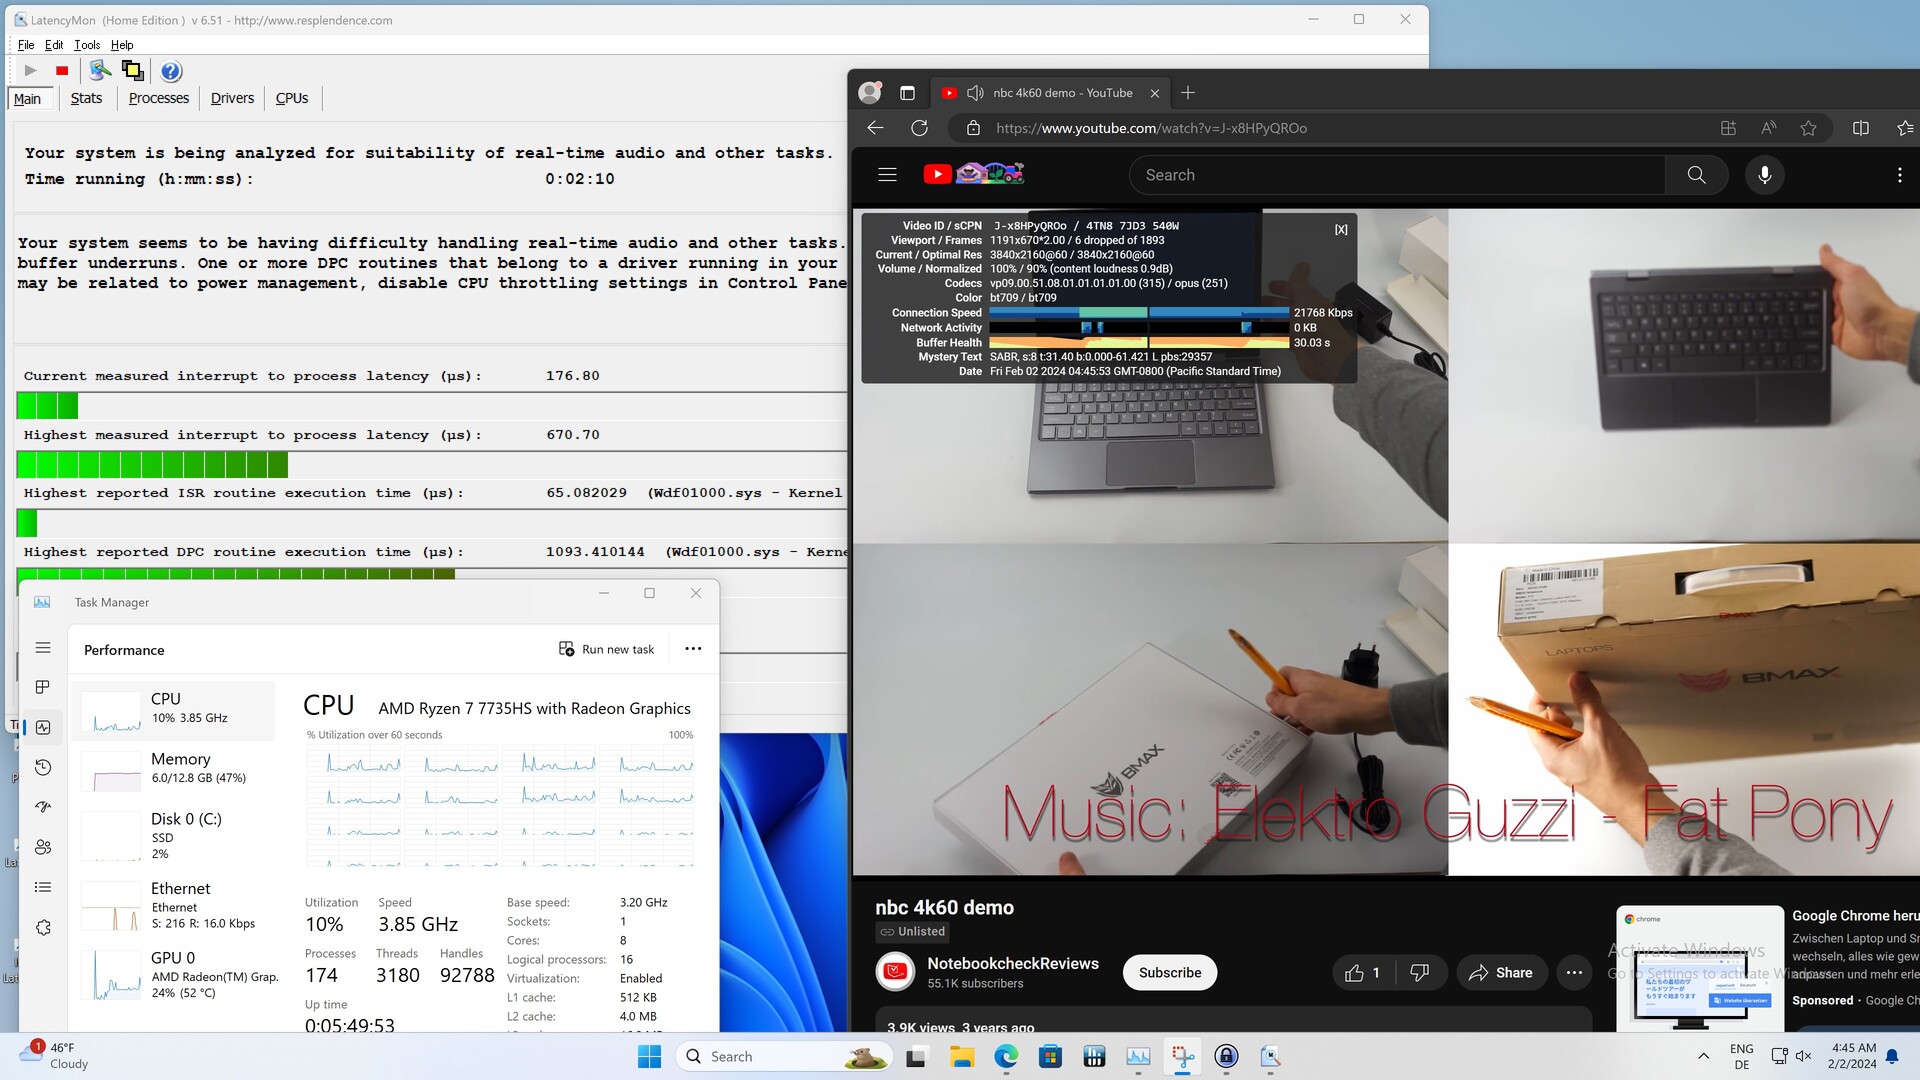
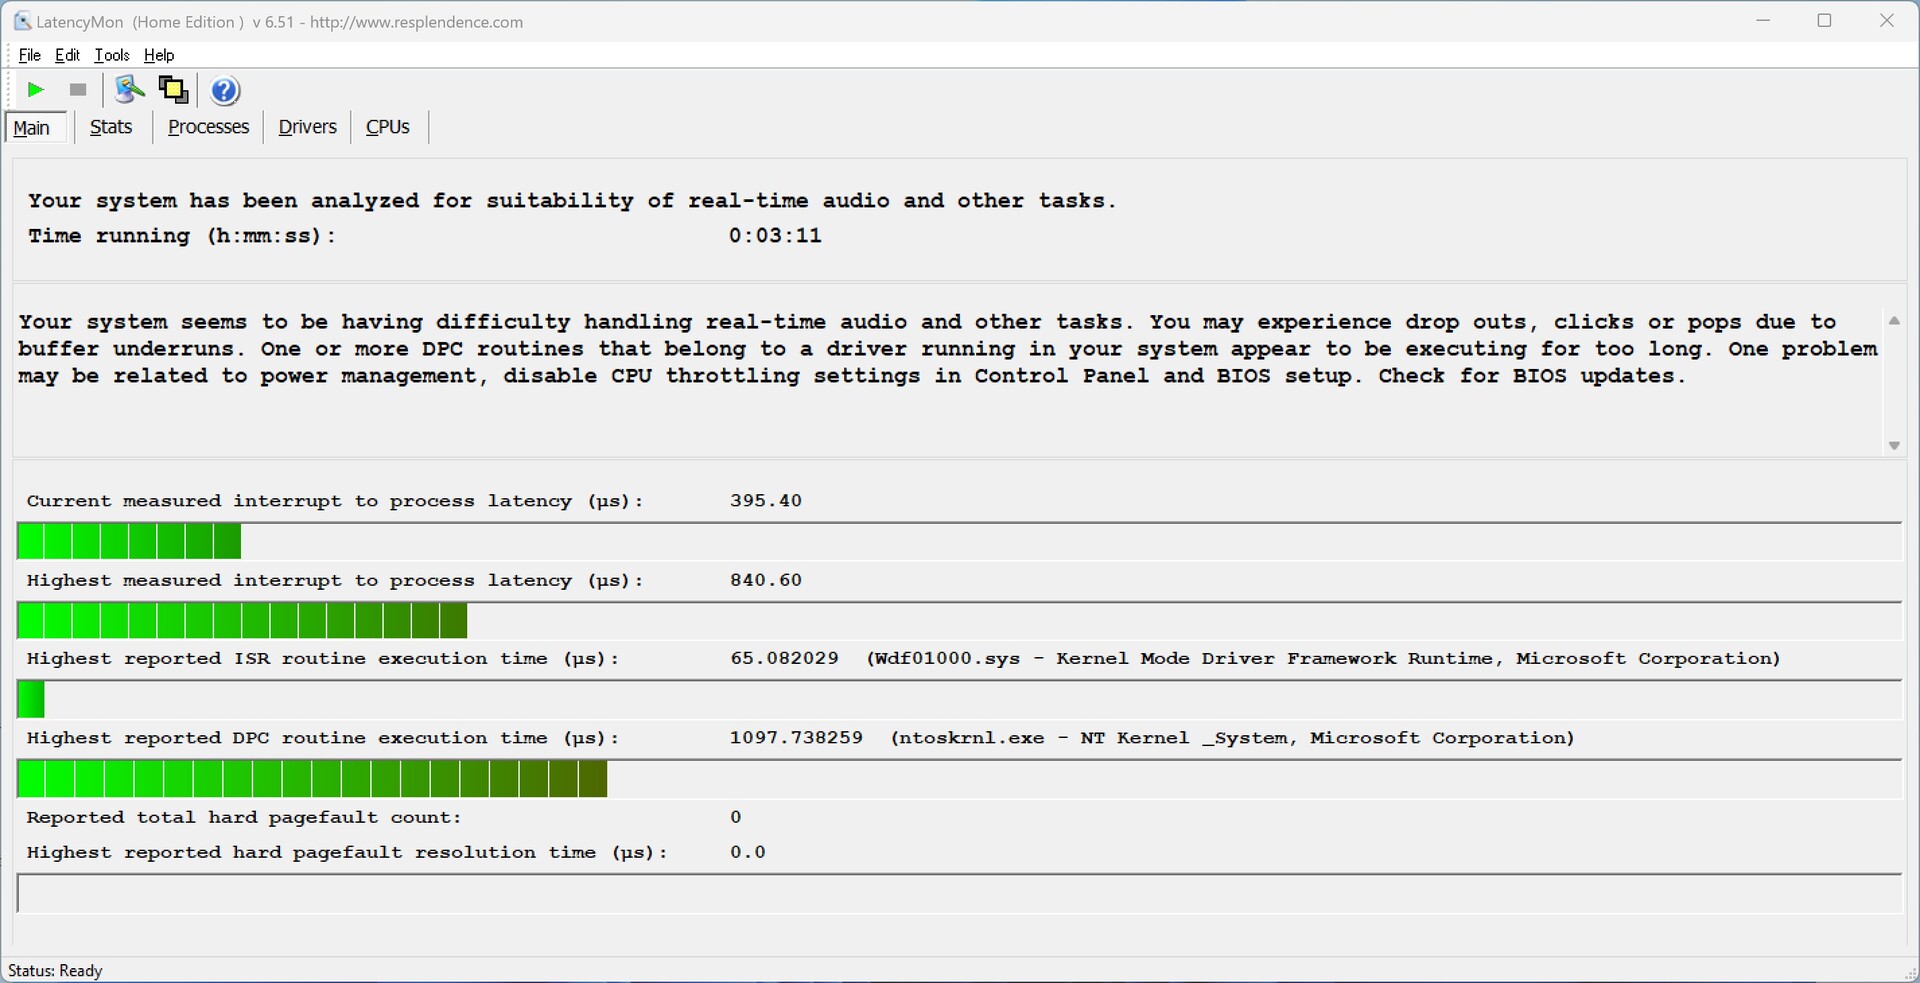
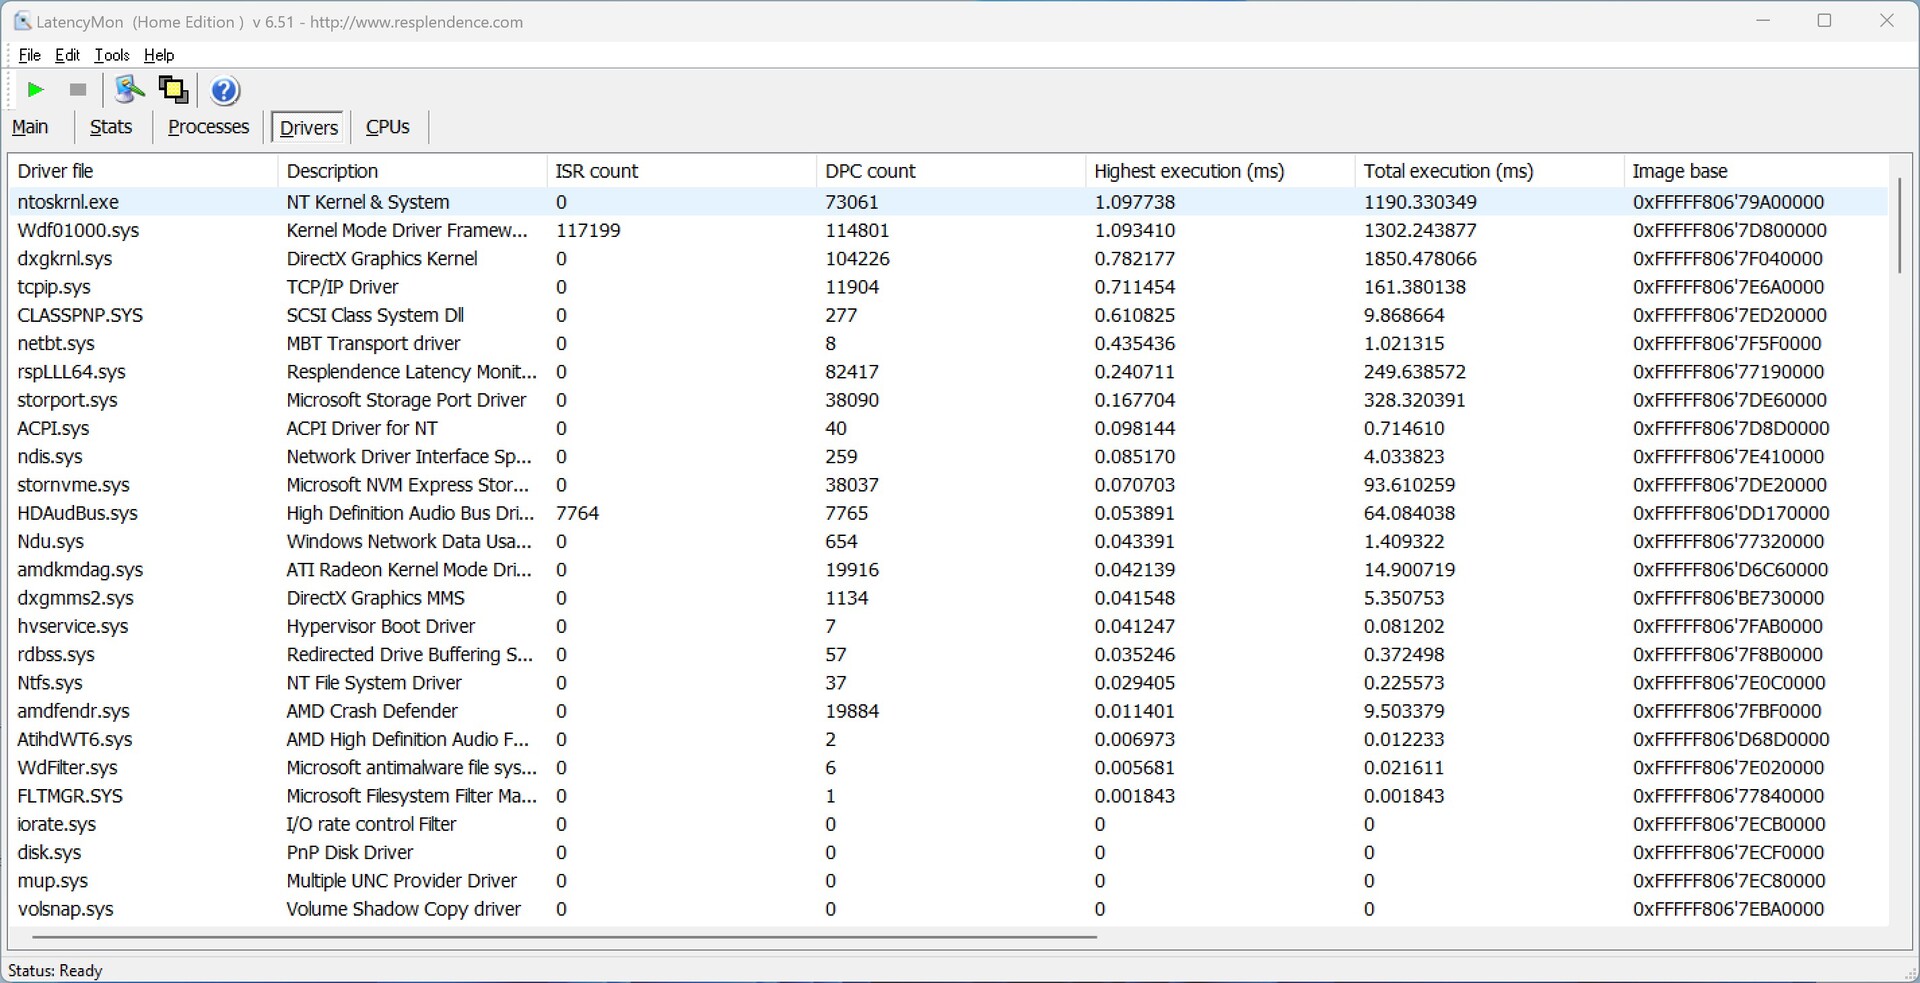
Opóźnienia DPC
Odnotowaliśmy już nieznacznie zwiększone opóźnienia podczas otwierania wielu kart za pomocą przeglądarki Edge. Nie wzrosły one jednak w miarę kontynuowania testu. Podczas odtwarzania naszego testowego wideo 4K, iGPU było obciążone do około 24 procent swojej wydajności.
| DPC Latencies / LatencyMon - interrupt to process latency (max), Web, Youtube, Prime95 | |
| Geekom AS 6, R9 6900HX | |
| Geekom A5 | |
| Minisforum Neptune Series NAD9 | |
| Maxtang MTN-FP750 | |
| NiPoGi AD08 | |
| Geekom Mini IT12 | |
| Minisforum Venus Series NAB6 | |
* ... im mniej tym lepiej
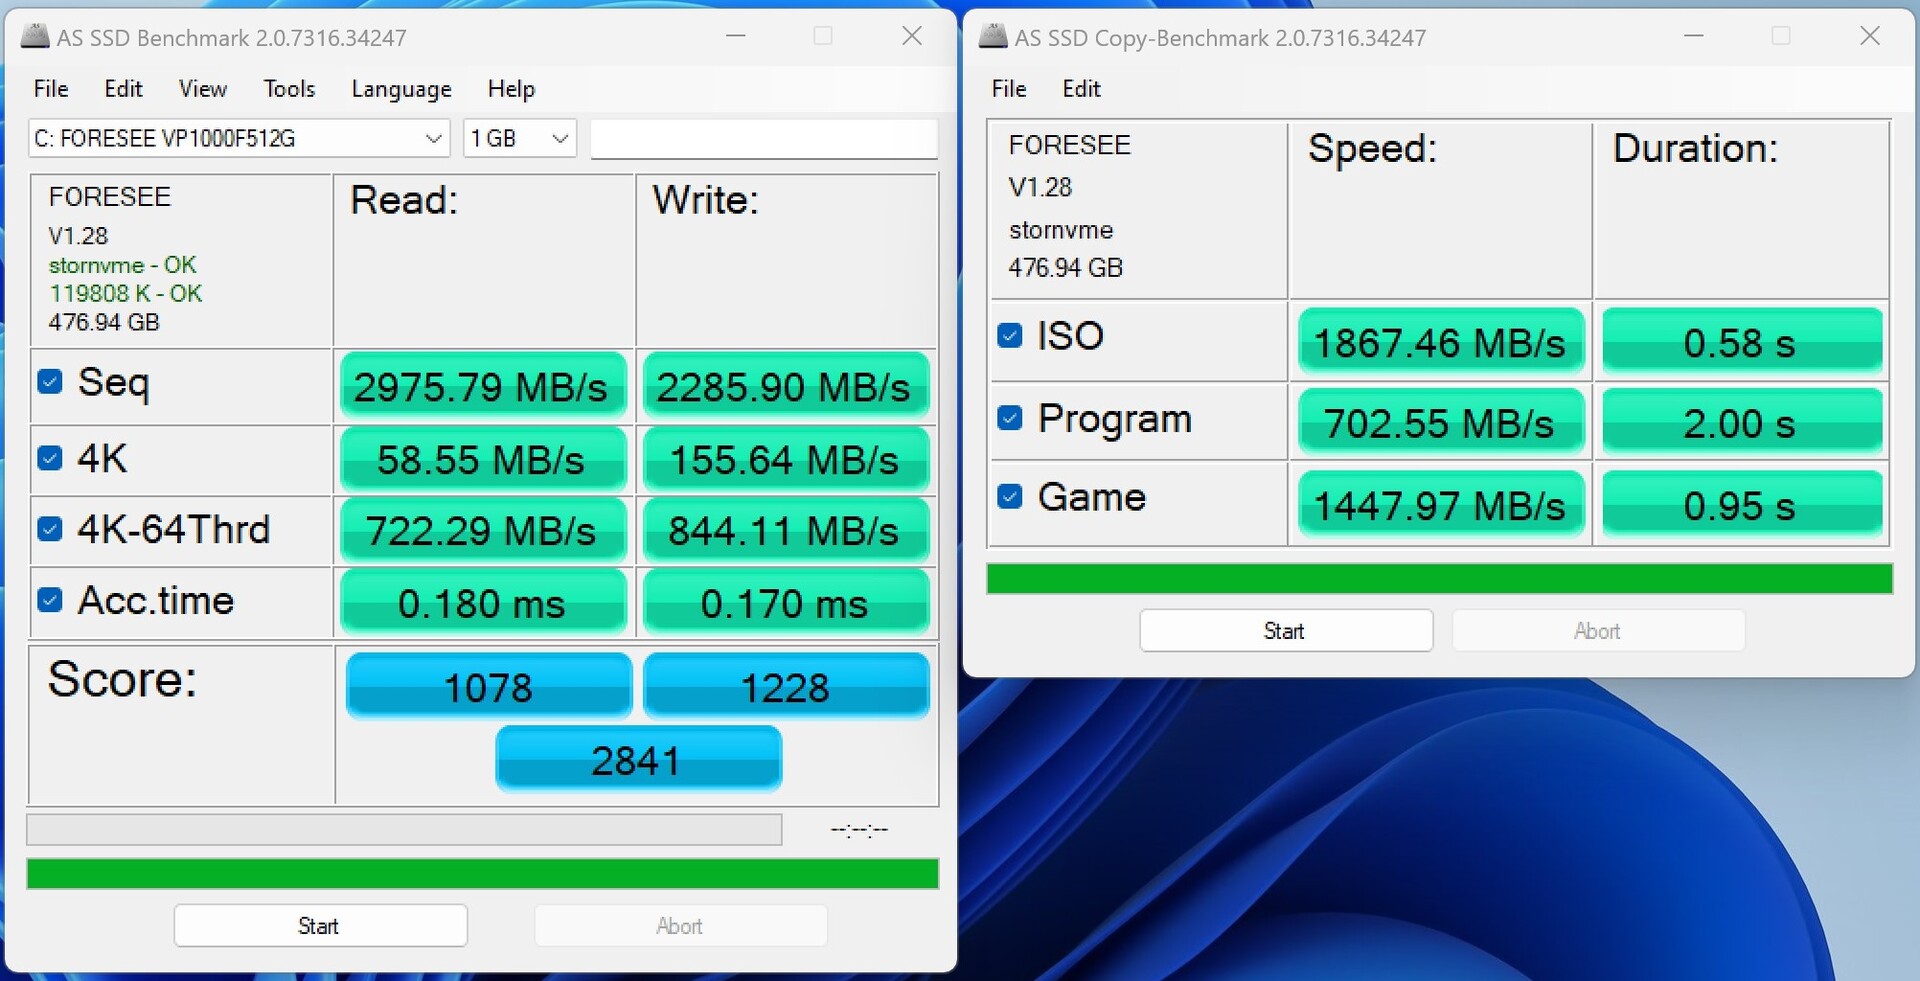
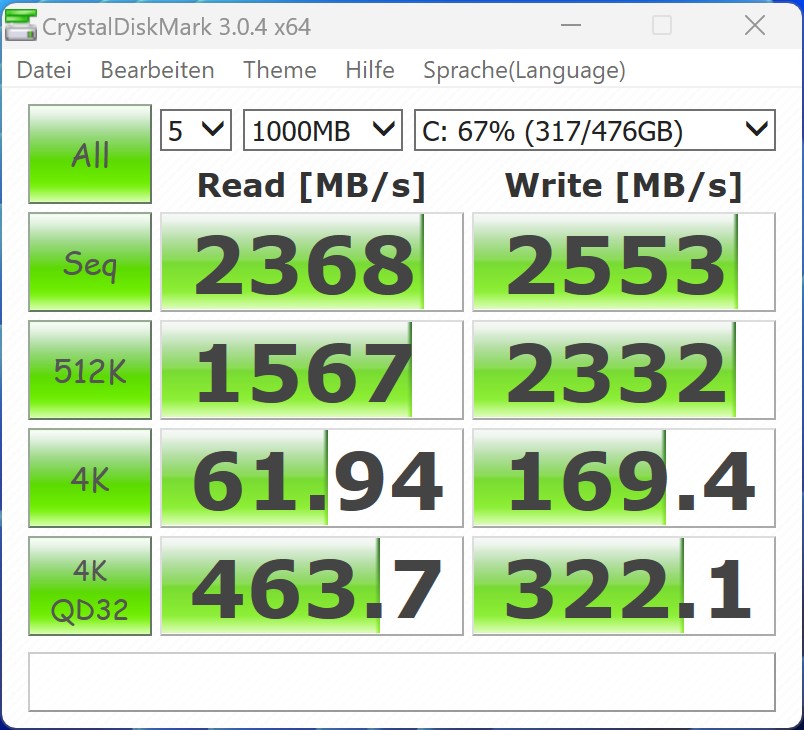
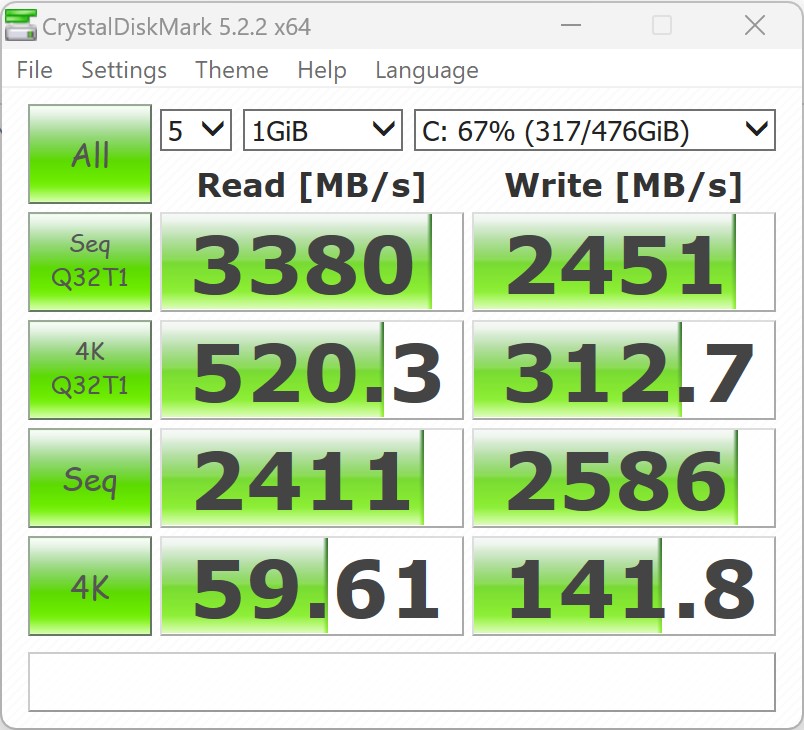
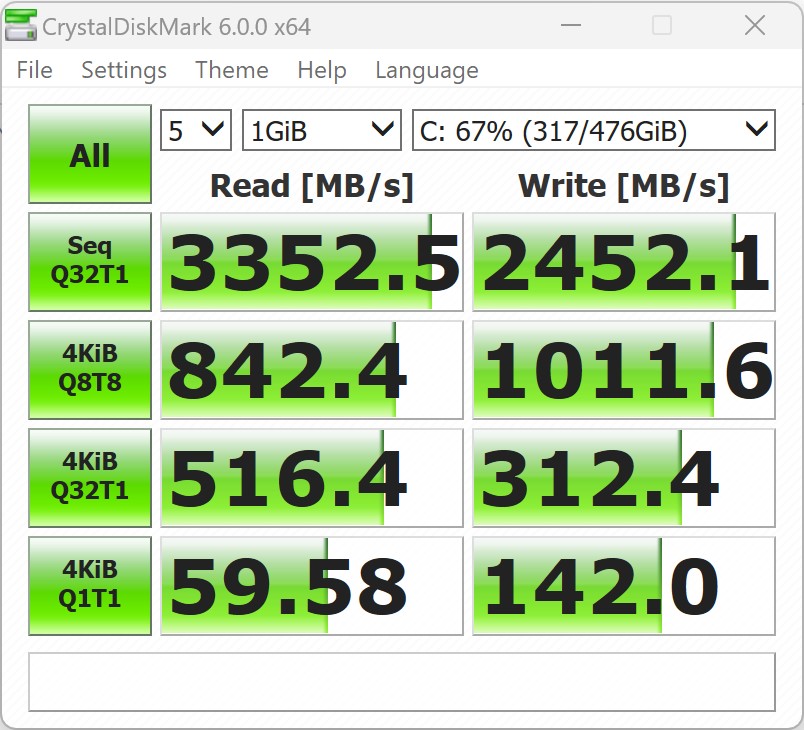
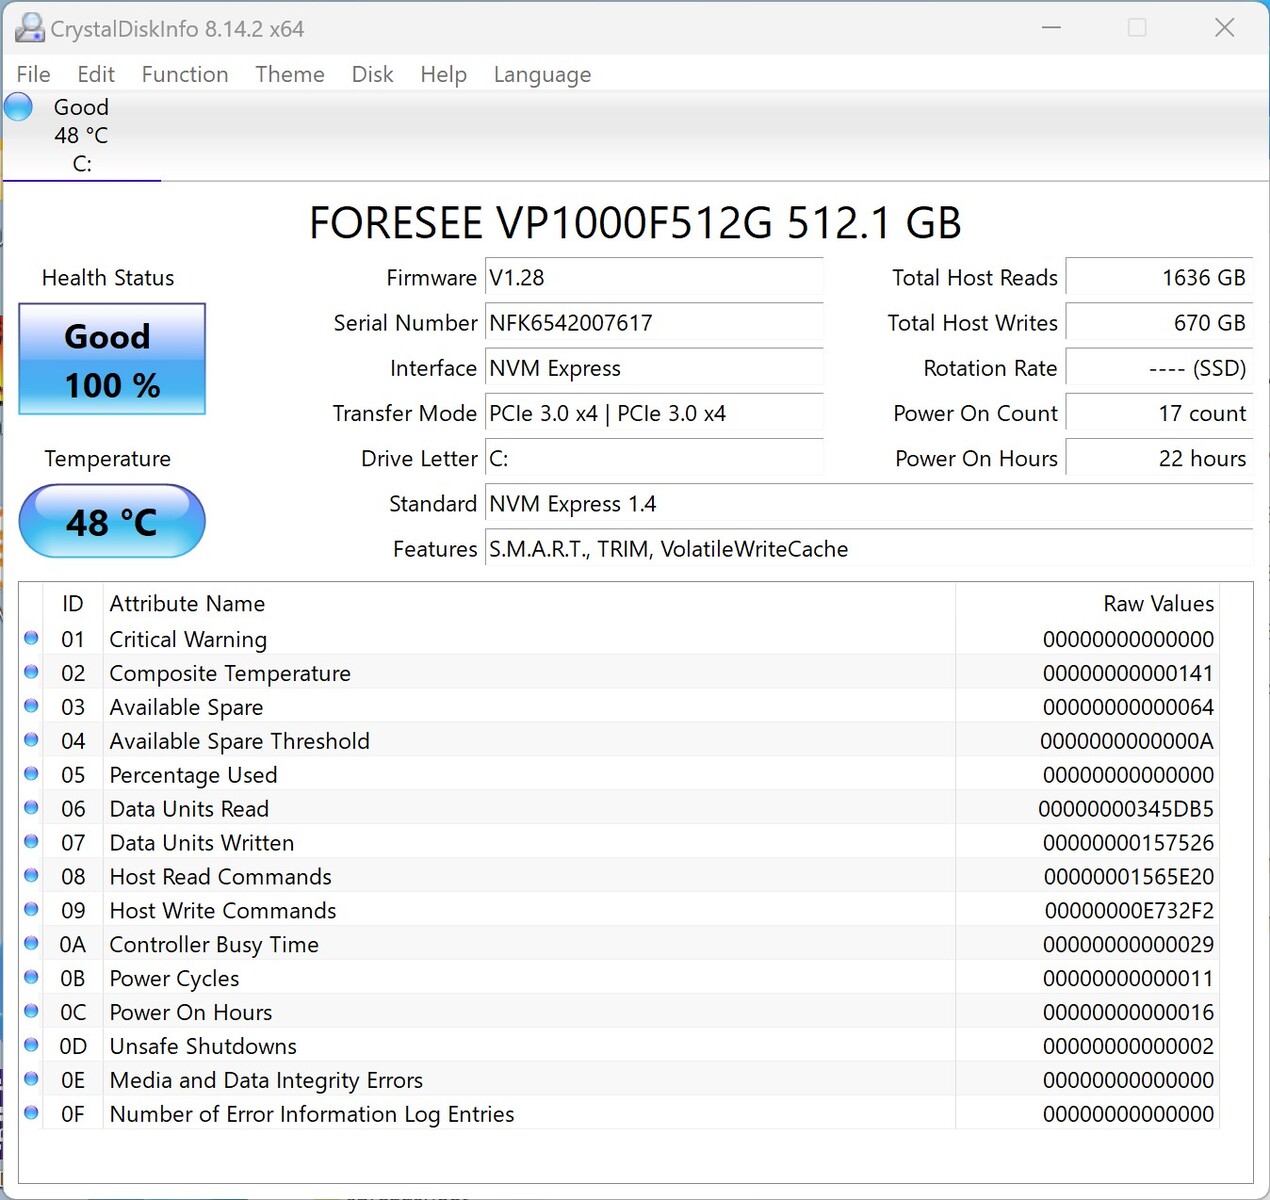
Pamięć masowa
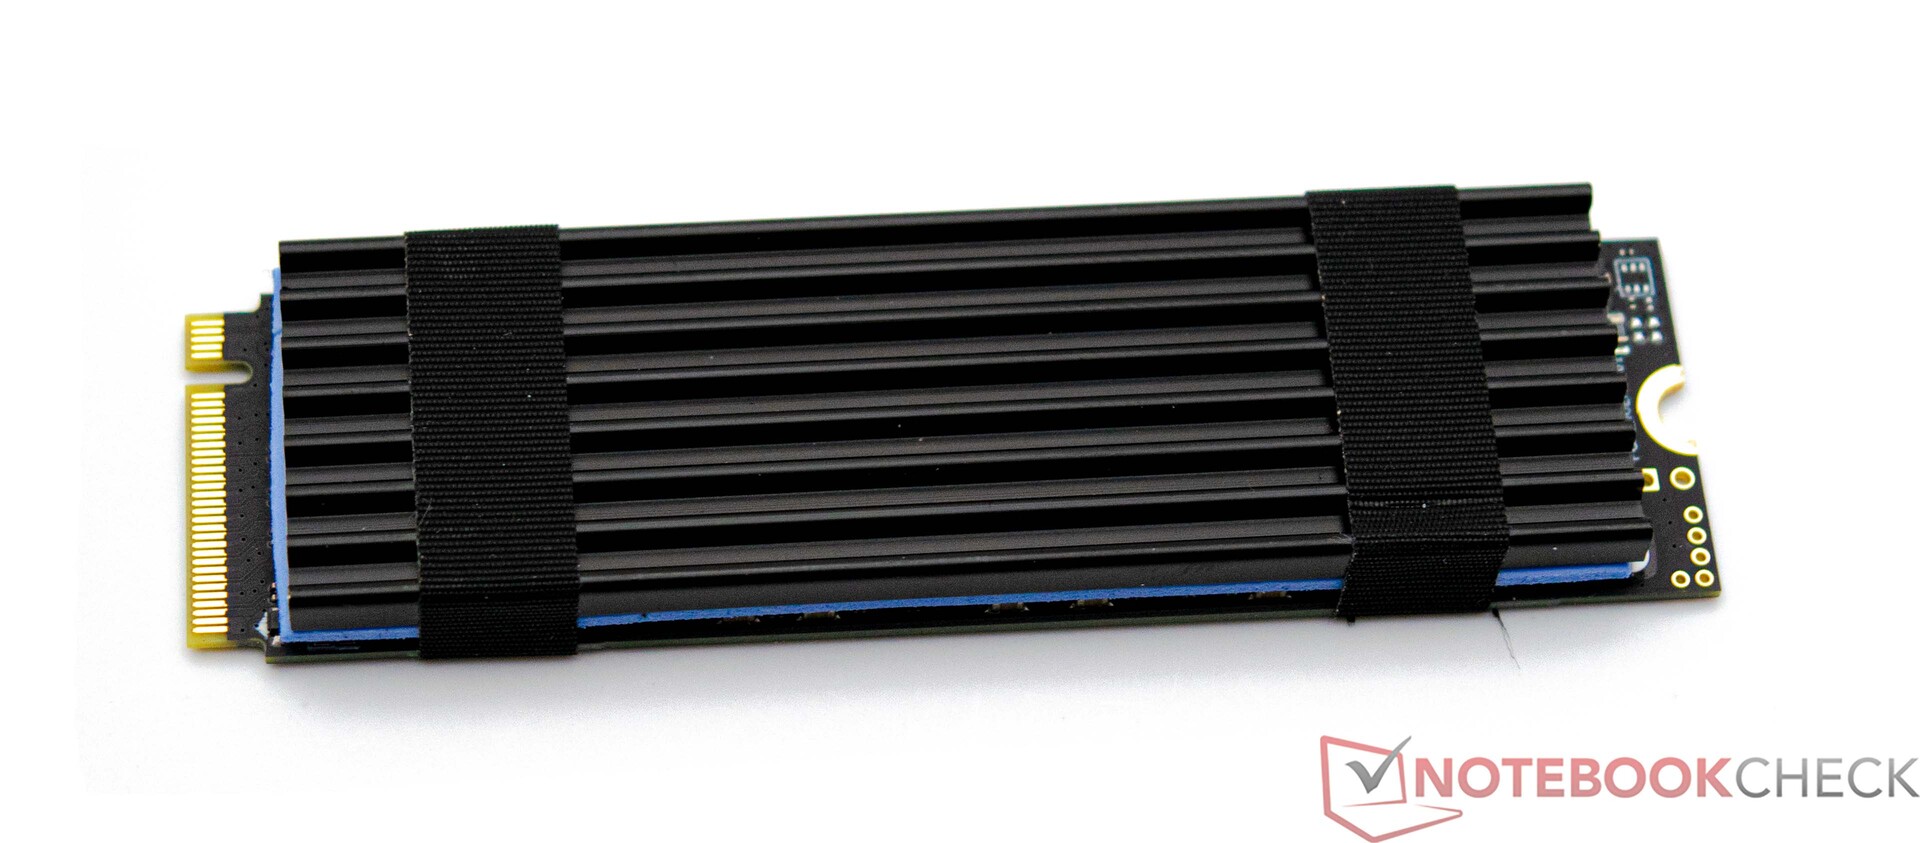
Maxtang wyposażył naszą próbkę testową MTN-FP750 w dysk SSD Foresee 512 GB. Dysk SSD PCIe 3.0 wykorzystuje interfejs M.2 z maksymalną możliwą przepustowością i nie jest sztucznie hamowany przez powolny interfejs. Pomimo tego, nasze recenzowane urządzenie było w stanie zasłużyć jedynie na miejsce w połowie tabeli. Można zainstalować dodatkowe 2,5-calowe urządzenie pamięci masowej. Proszę zobaczyć naszą tabela porównawcza aby zapoznać się z dalszymi porównaniami i testami porównawczymi.

| Drive Performance Rating - Percent | |
| Minisforum Neptune Series NAD9 | |
| Minisforum Venus Series NAB6 | |
| Geekom A5 | |
| Average of class Mini PC | |
| NiPoGi AD08 | |
| Geekom Mini IT12 | |
| Maxtang MTN-FP750 | |
| Geekom AS 6, R9 6900HX | |
* ... im mniej tym lepiej
Continuous Performance Read: DiskSpd Read Loop, Queue Depth 8
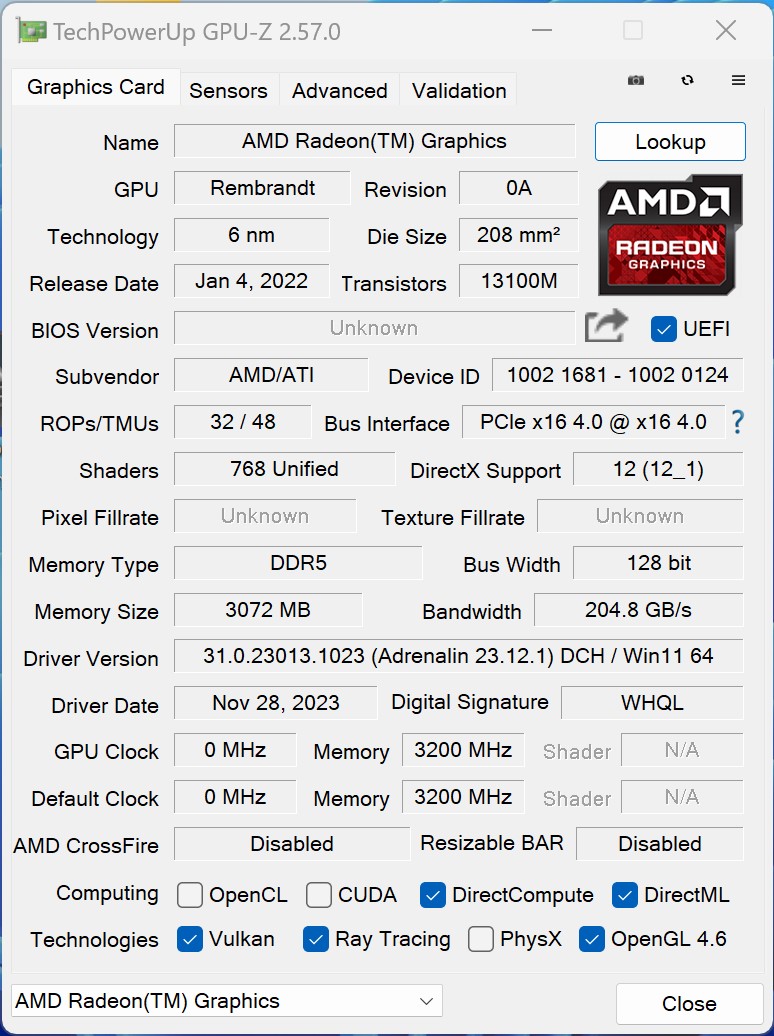
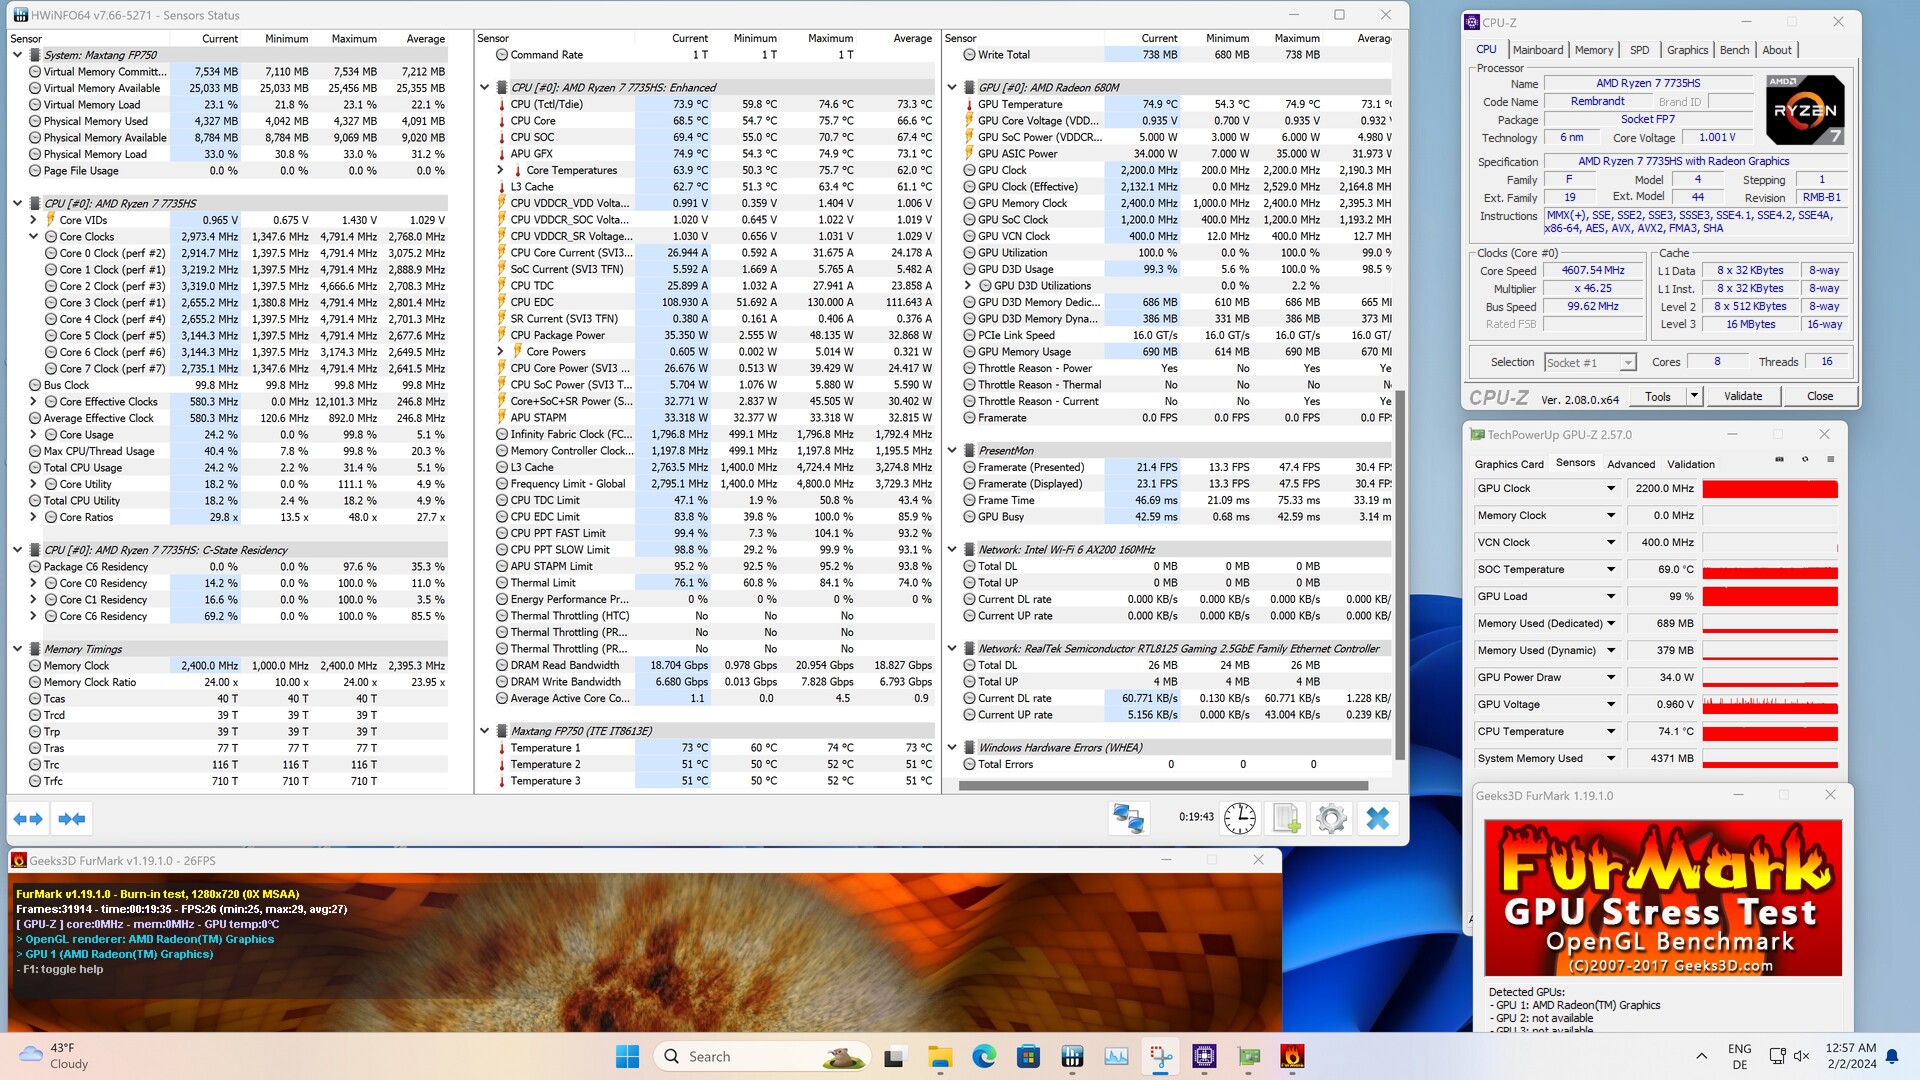
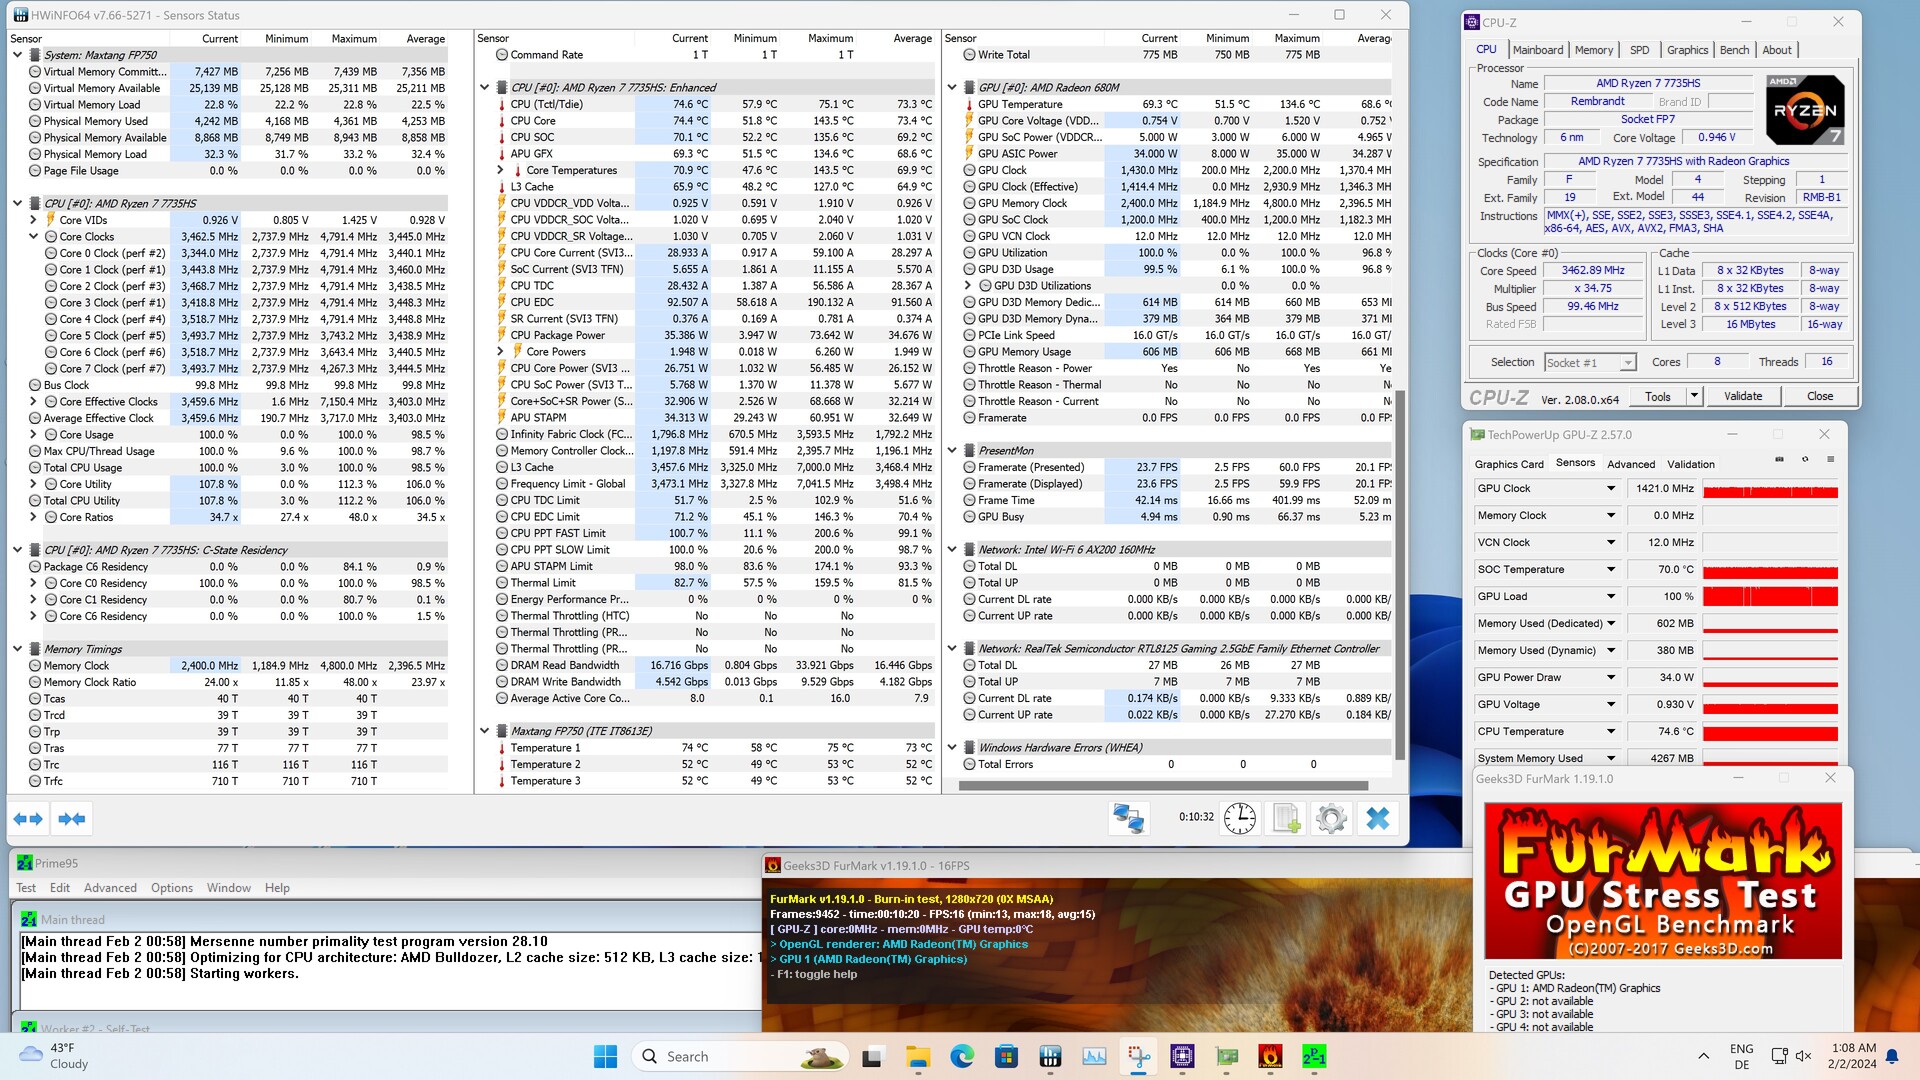
Karta graficzna
Wyjście graficzne jest obsługiwane przez AMD Radeon 680MiGPU, który zapewnia dobrą wydajność w większości sytuacji. W przypadku Maxtang MTN-FP750 jest jednak nieco inaczej, a powodem jest zainstalowana pamięć RAM. Producent wyposażył nasze recenzowane urządzenie tylko w jeden moduł RAM. W takiej konfiguracji karta graficzna AMD Radeon 680M jest niewiele szybszy od Intel Iris Xe Graphics G7 z 96 EU. Nawet Geekom A5 ze starszą kartą AMD Radeon RX Vega 8 ma nos przed naszą recenzowaną próbką.
Aby dotrzeć do sedna słabej wydajności, wzięliśmy inny moduł pamięci RAM z naszych zapasów i przeprowadziliśmy kilka testów porównawczych. Doprowadziło to do wyników mniej więcej na równi z Geekom AS 6 tym samym Maxtang MTN-FP750 w żaden sposób nie ustępuje swoim konkurentom.
Dodatkowe testy porównawcze AMD Radeon 680M można znaleźć tutaj.
| 3DMark Performance Rating - Percent | |
| Average AMD Radeon 680M | |
| Geekom AS 6, R9 6900HX | |
| Minisforum Neptune Series NAD9 | |
| Geekom A5 | |
| Geekom Mini IT12 | |
| Maxtang MTN-FP750 | |
| Minisforum Venus Series NAB6 | |
| NiPoGi AD08 | |
| Performance Rating - Percent | |
| Geekom AS 6, R9 6900HX | |
| Geekom A5 | |
| Maxtang MTN-FP750 | |
| Minisforum Neptune Series NAD9 | |
| Geekom Mini IT12 | |
| Minisforum Venus Series NAB6 | |
| NiPoGi AD08 | |
| Unigine Valley 1.0 | |
| 1920x1080 Extreme HD DirectX AA:x8 | |
| Geekom AS 6, R9 6900HX | |
| Minisforum Neptune Series NAD9 | |
| Geekom A5 | |
| Geekom Mini IT12 | |
| Minisforum Venus Series NAB6 | |
| NiPoGi AD08 | |
| Maxtang MTN-FP750 | |
| 1920x1080 Extreme HD Preset OpenGL AA:x8 | |
| Geekom AS 6, R9 6900HX | |
| Geekom Mini IT12 | |
| Minisforum Neptune Series NAD9 | |
| Minisforum Venus Series NAB6 | |
| Geekom A5 | |
| Maxtang MTN-FP750 | |
| NiPoGi AD08 | |
| Maxtang MTN-FP750, AMD Radeon 680M R7 7735HS | Minisforum Neptune Series NAD9, Intel Iris Xe Graphics G7 96EUs i9-12900H | Geekom AS 6, R9 6900HX, AMD Radeon 680M R9 6900HX | Geekom Mini IT12, Intel Iris Xe Graphics G7 96EUs i7-1260P | Geekom A5, AMD Radeon RX Vega 8 (Ryzen 4000/5000) R7 5800H | Minisforum Venus Series NAB6, Intel UHD Graphics 64EUs (Alder Lake 12th Gen) i7-12650H | NiPoGi AD08, Intel UHD Graphics 64EUs (Alder Lake 12th Gen) i7-12650H | Average of class Mini PC | |
|---|---|---|---|---|---|---|---|---|
| SPECviewperf 12 | -26% | 58% | -31% | 2% | -37% | -34% | 36% | |
| 1900x1060 3ds Max (3dsmax-05) | 46.9 | 40.9 -13% | 75.3 61% | 38.7 -17% | 51.7 10% | 36.2 -23% | 34.4 -27% | 71 ? 51% |
| 1900x1060 Catia (catia-04) | 51.5 | 41.2 -20% | 70.3 37% | 38.5 -25% | 44.2 -14% | 34.5 -33% | 30.3 -41% | 62.6 ? 22% |
| 1900x1060 Creo (creo-01) | 33.2 | 9.64 -71% | 45.2 36% | 7.52 -77% | 36.3 9% | 6.44 -81% | 21.1 -36% | 34.7 ? 5% |
| 1900x1060 Energy (energy-01) | 0.41 | 76.1 | 0.41 | 0.35 | 0.77 | 13 ? | ||
| 1900x1060 Maya (maya-04) | 45.2 | 39.9 -12% | 58.3 29% | 36.5 -19% | 40.3 -11% | 33.4 -26% | 32.5 -28% | 61 ? 35% |
| 1900x1060 Medical (medical-01) | 17.9 | 12.3 -31% | 44 146% | 11.2 -37% | 18.2 2% | 9.12 -49% | 8.41 -53% | 26.2 ? 46% |
| 1900x1060 Showcase (showcase-01) | 17.5 | 17.9 2% | 30.1 72% | 16.7 -5% | 21.7 24% | 15.9 -9% | 15.2 -13% | 34.9 ? 99% |
| 1900x1060 Solidworks (sw-03) | 72.1 | 47.2 -35% | 88.8 23% | 43.7 -39% | 68.3 -5% | 44.5 -38% | 43.4 -40% | 69.7 ? -3% |
| SPECviewperf 13 | -27% | 51% | -30% | 2% | -37% | -40% | 43% | |
| 3ds Max (3dsmax-06) | 48.3 | 40.5 -16% | 76.7 59% | 37.9 -22% | 51.6 7% | 36 -25% | 34.1 -29% | 70.9 ? 47% |
| Catia (catia-05) | 73.9 | 59.4 -20% | 105 42% | 56.3 -24% | 62.1 -16% | 49.6 -33% | 43.2 -42% | 91.5 ? 24% |
| Creo (creo-02) | 44.9 | 38.8 -14% | 78.4 75% | 36.8 -18% | 50.6 13% | 33 -27% | 33.1 -26% | 70.1 ? 56% |
| Energy (energy-02) | 11.4 | 4.27 -63% | 13.9 22% | 4.29 -62% | 10.6 -7% | 2.82 -75% | 2.62 -77% | 17.7 ? 55% |
| Maya (maya-05) | 58.3 | 44.2 -24% | 99 70% | 42.9 -26% | 56.5 -3% | 38.2 -34% | 41.3 -29% | 94.7 ? 62% |
| Medical (medical-02) | 32.8 | 14.5 -56% | 44.9 37% | 14 -57% | 31 -5% | 10.9 -67% | 8.63 -74% | 33 ? 1% |
| Showcase (showcase-02) | 17.4 | 17.9 3% | 30.4 75% | 16.8 -3% | 21.5 24% | 15.7 -10% | 15.1 -13% | 34.5 ? 98% |
| Solidworks (sw-04) | 72.9 | 55.8 -23% | 95 30% | 54.1 -26% | 72.4 -1% | 53.9 -26% | 51.9 -29% | 74.4 ? 2% |
| SPECviewperf 2020 | -35% | 84% | -24% | 2% | -43% | 70% | ||
| 3840x2160 Medical (medical-03) | 4.72 | 2.57 -46% | 8.59 82% | 3.37 -29% | 4.82 2% | 2.54 -46% | 7.2 ? 53% | |
| 3840x2160 Energy (energy-03) | 6.6 | 3.02 -54% | 16.9 156% | 7.39 12% | 5.33 -19% | 1.9 -71% | 11 ? 67% | |
| 3840x2160 Creo (creo-03) | 17.5 | 15.3 -13% | 28.9 65% | 15.1 -14% | 19.1 9% | 12.7 -27% | 29.8 ? 70% | |
| 3840x2160 CATIA (catia-06) | 13.1 | 8.2 -37% | 20.4 56% | 8.23 -37% | 13.1 0% | 7.63 -42% | 19 ? 45% | |
| 3840x2160 3ds Max (3dsmax-07) | 9.26 | 9.67 4% | 17.5 89% | 9.65 4% | 11.3 22% | 8.65 -7% | 21.4 ? 131% | |
| 3840x2160 Siemens NX (snx-04) | 33 | 6.69 -80% | 58.5 77% | 6.23 -81% | 38 15% | 6.61 -80% | 42.7 ? 29% | |
| 3840x2160 Maya (maya-06) | 29.5 | 24 -19% | 47.4 61% | 23.7 -20% | 25.8 -13% | 21.2 -28% | 57.9 ? 96% | |
| Total Average (Program / Settings) | -29% /
-29% | 64% /
64% | -28% /
-28% | 2% /
2% | -39% /
-39% | -37% /
-37% | 50% /
50% |
| 3DMark 06 Score 1366x768 | 25274 pkt. | |
| 3DMark Vantage P Result | 24874 pkt. | |
| 3DMark 11 Performance | 6723 pkt. | |
| 3DMark Ice Storm Standard Score | 127954 pkt. | |
| 3DMark Cloud Gate Standard Score | 21960 pkt. | |
| 3DMark Fire Strike Score | 4002 pkt. | |
| 3DMark Fire Strike Extreme Score | 2090 pkt. | |
| 3DMark Time Spy Score | 1591 pkt. | |
Pomoc | ||
Wydajność w grach
Nasza recenzja specyfikacji Maxtang MTN-FP750 tylko w ograniczonym stopniu nadaje się do gier. Stosunkowo mocna karta graficzna AMD Radeon 680M nie jest w stanie dostarczyć pełnej mocy. Dlatego zalecamy instalację dwóch modułów pamięci RAM, aby osiągnąć najwyższą wydajność. Przybliżone wytyczne dotyczące wydajności w grach można znaleźć w formularzu Geekom AS 6.
Aby uzyskać więcej porównań i testów porównawczych, proszę spojrzeć na naszą Listę gier na GPU.
| The Witcher 3 | |
| 1024x768 Low Graphics & Postprocessing | |
| Geekom AS 6, R9 6900HX | |
| Minisforum Neptune Series NAD9 | |
| Geekom Mini IT12 | |
| Geekom A5 | |
| Minisforum Venus Series NAB6 | |
| NiPoGi AD08 | |
| Maxtang MTN-FP750 | |
| 1920x1080 High Graphics & Postprocessing (Nvidia HairWorks Off) | |
| Geekom AS 6, R9 6900HX | |
| Minisforum Neptune Series NAD9 | |
| NiPoGi AD08 | |
| Geekom Mini IT12 | |
| Minisforum Venus Series NAB6 | |
| Geekom A5 | |
| Maxtang MTN-FP750 | |
| Borderlands 3 | |
| 1280x720 Very Low Overall Quality (DX11) | |
| Geekom A5 | |
| Geekom AS 6, R9 6900HX | |
| Minisforum Neptune Series NAD9 | |
| Maxtang MTN-FP750 | |
| Geekom Mini IT12 | |
| Minisforum Venus Series NAB6 | |
| NiPoGi AD08 | |
| 1920x1080 High Overall Quality (DX11) | |
| Geekom AS 6, R9 6900HX | |
| Geekom A5 | |
| Minisforum Neptune Series NAD9 | |
| Maxtang MTN-FP750 | |
| Geekom Mini IT12 | |
| Minisforum Venus Series NAB6 | |
| NiPoGi AD08 | |
| GTA V | |
| 1024x768 Lowest Settings possible | |
| Geekom A5 | |
| Minisforum Neptune Series NAD9 | |
| Minisforum Venus Series NAB6 | |
| Geekom AS 6, R9 6900HX | |
| Geekom Mini IT12 | |
| NiPoGi AD08 | |
| Maxtang MTN-FP750 | |
| 1920x1080 High/On (Advanced Graphics Off) AA:2xMSAA + FX AF:8x | |
| Geekom AS 6, R9 6900HX | |
| Geekom A5 | |
| Maxtang MTN-FP750 | |
| Minisforum Neptune Series NAD9 | |
| Geekom Mini IT12 | |
| Minisforum Venus Series NAB6 | |
| NiPoGi AD08 | |
| low | med. | high | ultra | |
| GTA V (2015) | 95.5 | 85.7 | 28.2 | 12.7 |
| The Witcher 3 (2015) | 73 | 46.7 | 23.7 | 14.9 |
| Dota 2 Reborn (2015) | 115.8 | 87.4 | 60.5 | 53.1 |
| Final Fantasy XV Benchmark (2018) | 39.2 | 20.5 | 14.6 | |
| X-Plane 11.11 (2018) | 49.8 | 39.8 | 33.8 | |
| Far Cry 5 (2018) | 46 | 25 | 22 | 21 |
| Strange Brigade (2018) | 78.4 | 31.4 | 26.7 | 23.1 |
| Shadow of the Tomb Raider (2018) | 53.3 | 21.8 | 19.8 | 16.4 |
| Far Cry New Dawn (2019) | 40 | 23 | 21 | 20 |
| Metro Exodus (2019) | 43.1 | 17.6 | 13.8 | 11.7 |
| Borderlands 3 (2019) | 58.2 | 24.8 | 15.7 | 12.5 |
| F1 2020 (2020) | 96.9 | 49.8 | 39.1 | 27.5 |
| F1 2021 (2021) | 97 | 49.8 | 36.4 | 16.7 |
| God of War (2022) | 19.5 | 15.9 | 11.7 | |
| GRID Legends (2022) | 58.2 | 45 | 34.2 | 26.6 |
| Tiny Tina's Wonderlands (2022) | 37.7 | 28.2 | 20.2 | 16.2 |
| F1 22 (2022) | 45.6 | 40.6 | 32.1 | 9.25 |
| F1 23 (2023) | 45.3 | 40.1 | 29.1 | |
| Total War Pharaoh (2023) | 43.3 | 33.3 | 21.6 | 16.9 |
| Prince of Persia The Lost Crown (2024) | 89.3 | 58.8 | 58.4 |
Emisje - oszczędne, ale nie niesłyszalne
Emisja hałasu
Bez stresu, Maxtang MTN-FP750 jest w większości cichy. Jednak pod obciążeniem szybko osiągnęliśmy 45 dB(A) i byliśmy w stanie dostrzec tylko minimalną różnicę między średnim a pełnym obciążeniem. Możemy to jednak uznać za mieszczące się w granicach tolerancji pomiarowej. Szkoda, że są tylko dwa poziomy wentylatorów. Rzut oka na tabelę pokazuje, że zarówno Geekom A5 i NiPoGi AD08 były jeszcze głośniejsze w tym samym scenariuszu.
Hałas
| luz |
| 25.3 / 25.3 / 25.4 dB |
| obciążenie |
| 45.1 / 45.3 dB |
 | ||
30 dB cichy 40 dB(A) słyszalny 50 dB(A) irytujący |
||
min: | ||
| Maxtang MTN-FP750 R7 7735HS, Radeon 680M | Minisforum Neptune Series NAD9 i9-12900H, Iris Xe G7 96EUs | Geekom AS 6, R9 6900HX R9 6900HX, Radeon 680M | Geekom Mini IT12 i7-1260P, Iris Xe G7 96EUs | Geekom A5 R7 5800H, Vega 8 | Minisforum Venus Series NAB6 i7-12650H, UHD Graphics 64EUs | NiPoGi AD08 i7-12650H, UHD Graphics 64EUs | |
|---|---|---|---|---|---|---|---|
| Noise | -3% | -14% | -3% | -7% | -4% | -14% | |
| off / environment * | 25 | 30.2 -21% | 30 -20% | 29.8 -19% | 25 -0% | 29.4 -18% | 25 -0% |
| Idle Minimum * | 25.3 | 30.5 -21% | 33.2 -31% | 29.9 -18% | 28.2 -11% | 29.4 -16% | 31.1 -23% |
| Idle Average * | 25.3 | 30.5 -21% | 33.6 -33% | 30.1 -19% | 28.2 -11% | 29.5 -17% | 31.2 -23% |
| Idle Maximum * | 25.4 | 30.5 -20% | 33.6 -32% | 30.2 -19% | 28.2 -11% | 29.7 -17% | 31.3 -23% |
| Load Average * | 45.1 | 30.5 32% | 36.8 18% | 32.1 29% | 47.8 -6% | 34.6 23% | 51.7 -15% |
| Load Maximum * | 45.3 | 30.5 33% | 39.8 12% | 32.5 28% | 47.4 -5% | 36.1 20% | 45.8 -1% |
* ... im mniej tym lepiej
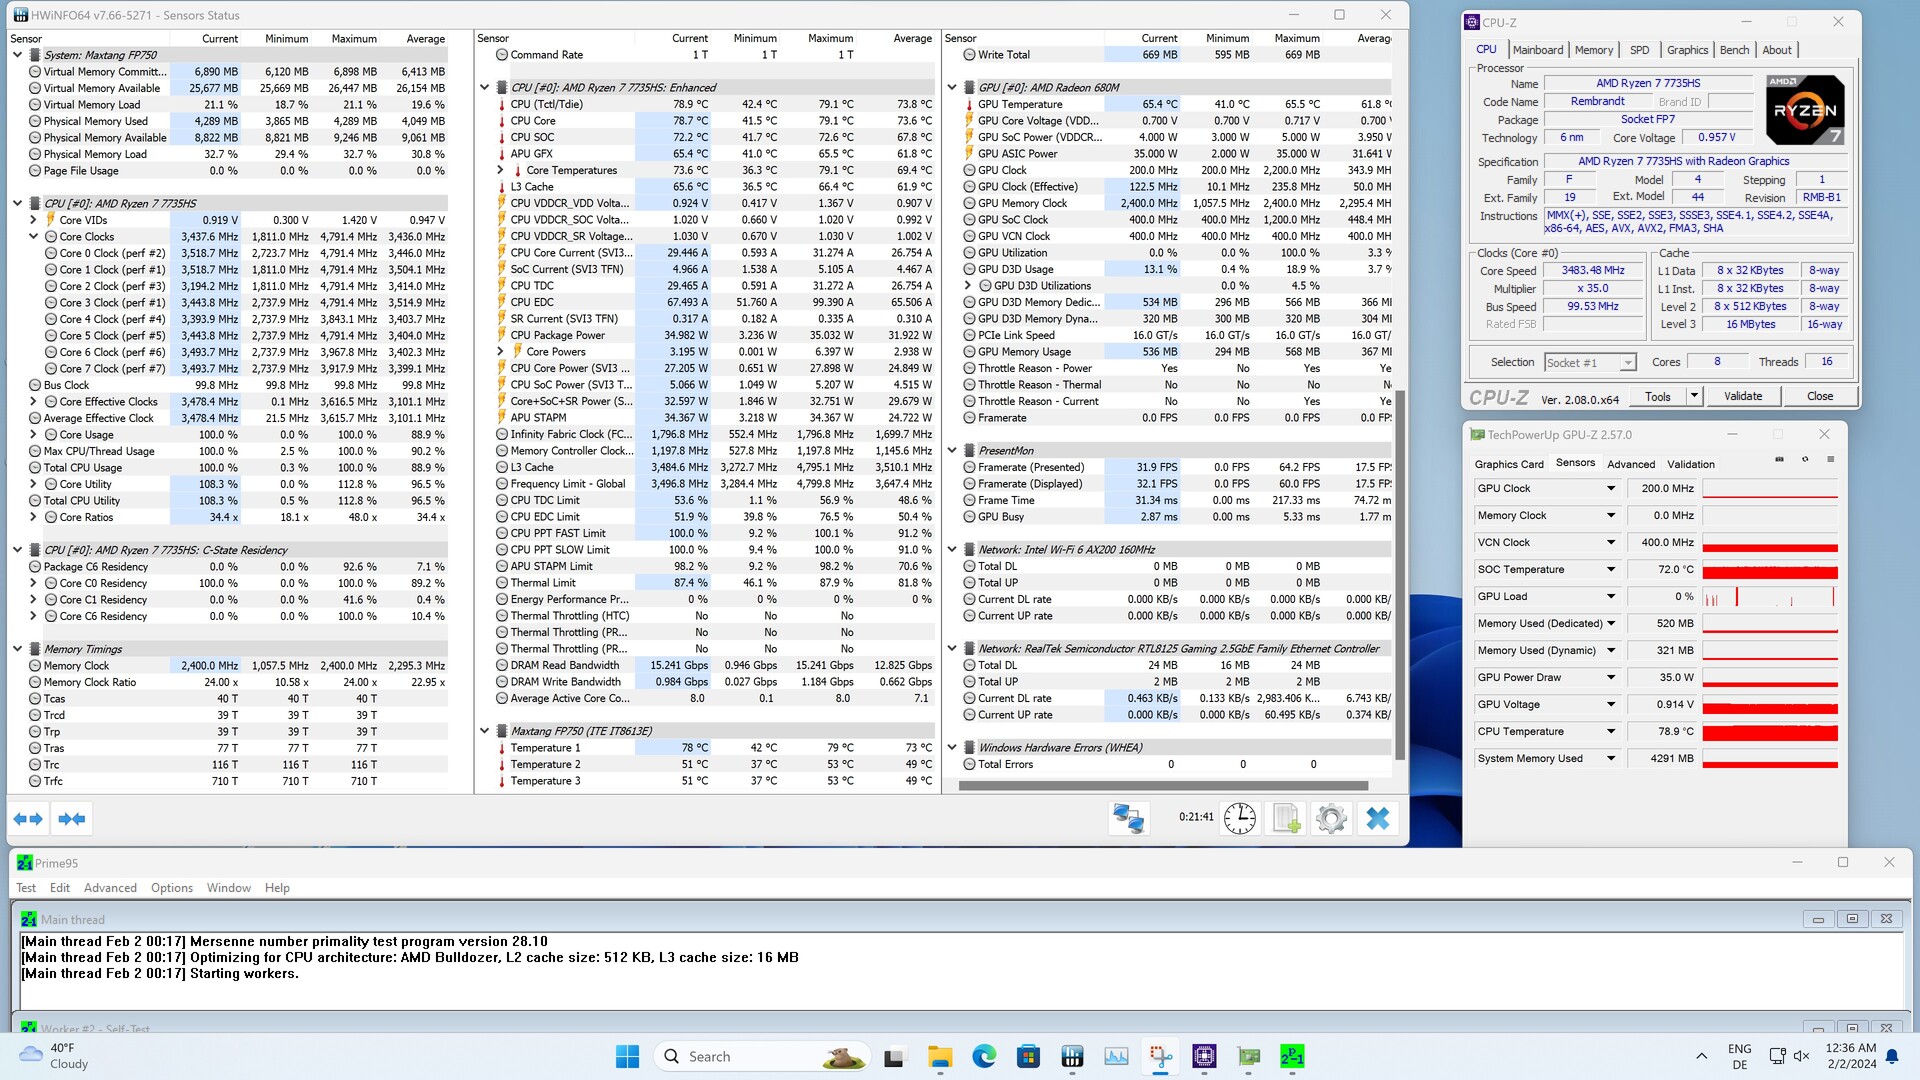
Temperatura
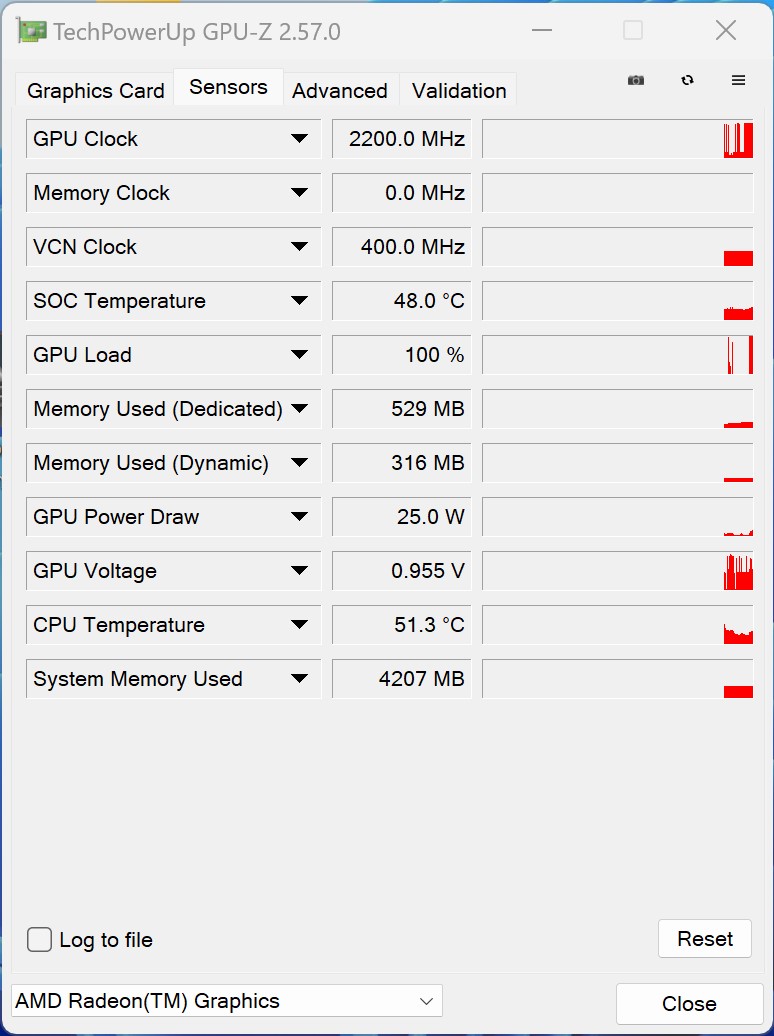
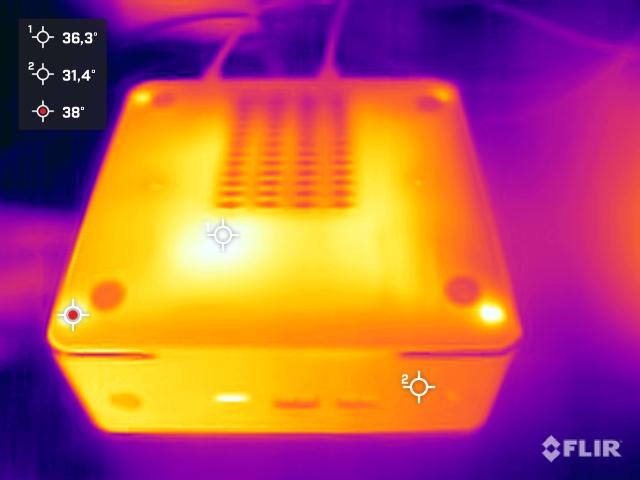
Obudowa Maxtang MTN-FP750 nagrzewa się tylko minimalnie podczas pracy bez obciążenia lub pod obciążeniem. Zaobserwowaliśmy hotspot na górnej części urządzenia, mierząc tylko nieco poniżej 40 ° C, podczas gdy dolna część urządzenia nie osiągnęła nawet 35 ° C. SoC staje się jednak znacznie cieplejszy, chociaż przy prawie 80 °C wciąż znajdowaliśmy się w zielonej strefie. Ponadto producent ustawił w BIOS-ie maksymalną temperaturę na 90 °C. Nadal nie byliśmy w stanie tego osiągnąć przy ustawionym limicie mocy 35 watów.
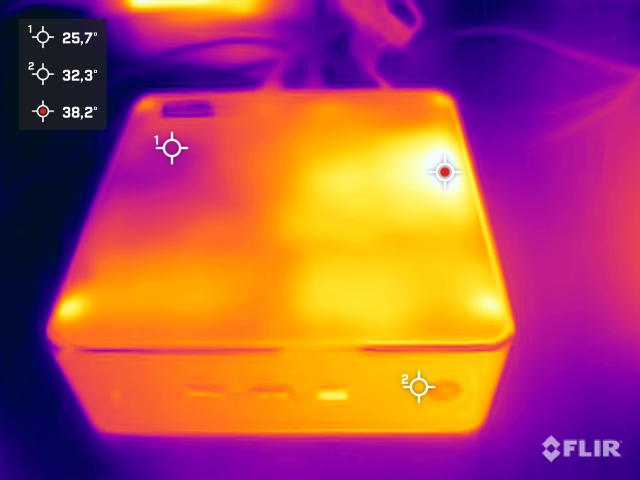
(+) The maximum temperature on the upper side is 39.7 °C / 103 F, compared to the average of 35.5 °C / 96 F, ranging from 26 to 69.5 °C for the class Mini PC.
(+) The bottom heats up to a maximum of 34.3 °C / 94 F, compared to the average of 36.9 °C / 98 F
(+) In idle usage, the average temperature for the upper side is 29.4 °C / 85 F, compared to the device average of 32.2 °C / 90 F.
Zużycie energii
W naszym porównaniu Maxtang MTN-FP750 należy do najbardziej oszczędnych urządzeń. Już w trybie bezczynności odnotowaliśmy bardzo niskie zużycie energii, wynoszące zaledwie od 7 do 8,4 wata. Tylko Geekom A5 i Geekom Mini IT12 mogą dotrzymać kroku z podobnie niskimi wynikami. Pod obciążeniem nasza recenzowana próbka nadal pozostawała stosunkowo oszczędna, a nasze urządzenie pomiarowe zarejestrowało szczytową wartość zaledwie 61,4 wata. Biorąc pod uwagę ograniczone limity mocy procesora, nie jest to szczególnie zaskakujące zapotrzebowanie na energię pod obciążeniem.
Oznacza to, że 90-watowy zasilacz nigdy nie ma żadnych problemów z niezawodnym dostarczaniem wystarczającej ilości energii do mini PC. Zasilacz bez trudu radzi sobie nawet z ręczną regulacją poboru mocy.

| wyłączony / stan wstrzymania | |
| luz | |
| obciążenie |
|
| Maxtang MTN-FP750 R7 7735HS, Radeon 680M | Minisforum Neptune Series NAD9 i9-12900H, Iris Xe G7 96EUs | Geekom AS 6, R9 6900HX R9 6900HX, Radeon 680M | Geekom Mini IT12 i7-1260P, Iris Xe G7 96EUs | Geekom A5 R7 5800H, Vega 8 | Minisforum Venus Series NAB6 i7-12650H, UHD Graphics 64EUs | NiPoGi AD08 i7-12650H, UHD Graphics 64EUs | Average AMD Radeon 680M | Average of class Mini PC | |
|---|---|---|---|---|---|---|---|---|---|
| Power Consumption | -73% | -23% | -2% | -12% | -50% | -107% | -7% | -39% | |
| Idle Minimum * | 7 | 12.1 -73% | 6.8 3% | 5 29% | 6.9 1% | 10.4 -49% | 14.2 -103% | 6.75 ? 4% | 9.75 ? -39% |
| Idle Average * | 8.1 | 13 -60% | 9.4 -16% | 7 14% | 7.9 2% | 12.3 -52% | 15.1 -86% | 8.75 ? -8% | 11.7 ? -44% |
| Idle Maximum * | 8.4 | 18.2 -117% | 13.7 -63% | 10.7 -27% | 8.9 -6% | 12.4 -48% | 28.7 -242% | 10.3 ? -23% | 14.7 ? -75% |
| Load Average * | 54.2 | 70.6 -30% | 45.3 16% | 50.3 7% | 60.8 -12% | 72.9 -35% | 76.9 -42% | 52.8 ? 3% | 51.9 ? 4% |
| Load Maximum * | 61.4 | 113 -84% | 94.8 -54% | 82 -34% | 89.7 -46% | 101.2 -65% | 100.2 -63% | 69.4 ? -13% | 86 ? -40% |
* ... im mniej tym lepiej
Power consumption with an external monitor
Za
Przeciw
Werdykt - Lepsza wydajność, ale tylko po optymalizacji

Maxtang MTN-FP750 to stosunkowo prosty mini PC do użytku biurowego w domu lub w miejscu pracy. Procesor AMD Ryzen 7 7735HS oferuje wystarczającą moc, by poradzić sobie z większością zadań. Jego 8 rdzeni i 16 wątków sprawia, że mini PC nadaje się do aplikacji wymagających dużej wydajności. Zainstalowana pamięć RAM obejmuje 16 GB, co na razie nie stanowi żadnego problemu. Jednak gdy przychodzi co do czego, zastosowanie pojedynczego modułu RAM opłaciło się, mimo że Maxtang MTN-FP750 pozwala na instalację modułów SO-DIMM. Oznaczało to, że w testach Maxtang MTN-FP750 nie zapewnił takiej wydajności, jakiej byśmy oczekiwali. Najbardziej zauważalne różnice w wydajności można znaleźć w benchmarkach 3D. Problemowi temu można zapobiec, instalując dodatkowy moduł pamięci RAM i jest to bez wątpienia coś, na co klienci powinni zwrócić uwagę.
Według arkusza danych Maxtang MTN-FP750 oferuje doskonałą wydajność. Jednak w testach mini PC nie dostarczył obiecanej mocy.
Największą zaletą Maxtang MTN-FP750 jest jego niska cena w porównaniu do konkurencji przedstawionej tutaj w naszym porównaniu. Wydajność jest nieco gorsza, o ile nie weźmiemy sprawy w swoje ręce, a limity mocy SoC nie mogą być regulowane. Naszym zdaniem zdefiniowany 35-watowy limit mocy jest nieco zbyt konserwatywny. Przy 45 watach producent mógł osiągnąć dobry kompromis. To samo dotyczy pamięci RAM, którą można rozszerzyć za pomocą drugiego modułu. Jeśli wziąć pod uwagę oba te punkty, pod względem wydajności jest to zupełnie inny Maxtang MTN-FP750 niż ten, który testowaliśmy.
Wybór portów można określić jako solidny. Wszystkie najważniejsze są na pokładzie - ale to wszystko. Thunderbolt i USB4 są nieobecne, co nieco ogranicza liczbę przypadków użycia. Pozytywnym efektem ubocznym posiadania procesora z ograniczeniami wydajności jest zapotrzebowanie Maxtang MTN-FP750 na energię. W testach urządzenie to okazało się znacznie oszczędniejsze od swoich konkurentów. Niestety nie wpłynęło to pozytywnie na stosunkowo głośną pracę wentylatora. Nieco lepsza koncepcja chłodzenia zaowocowałaby lepszymi wynikami w tym obszarze.
Cena i dostępność
W konfiguracji z naszej recenzji, Maxtang MTN-FP750 można nabyć za 440 dolarów amerykańskich bezpośrednio od producenta.
Maxtang MTN-FP750
-
27/02/2024 v7
Sebastian Bade
Transparency
The present review sample was given to the author by the manufacturer free of charge for the purposes of review. There was no third-party influence on this review, nor did the manufacturer receive a copy of this review before publication. There was no obligation to publish this review.

