Test laptopa Dell G5 15 5587
Tekst i zdjęcia: Sebastian Bade
Wstęp i tłumaczenie: Tomasz Cyba
26/06/2018
Dell G5 15 5587 to przede wszystkim nowy procesor Coffee Lake-H (w tym konkretnym przypadku 4-rdzeniowy Core i5-8300H). Poza tym ten laptop jest podobny do starszego Inspirona 7577 (karta GTX 1060 Max-Q ma również w nim wydajność zbliżoną do normalnego GTX-a 1060).
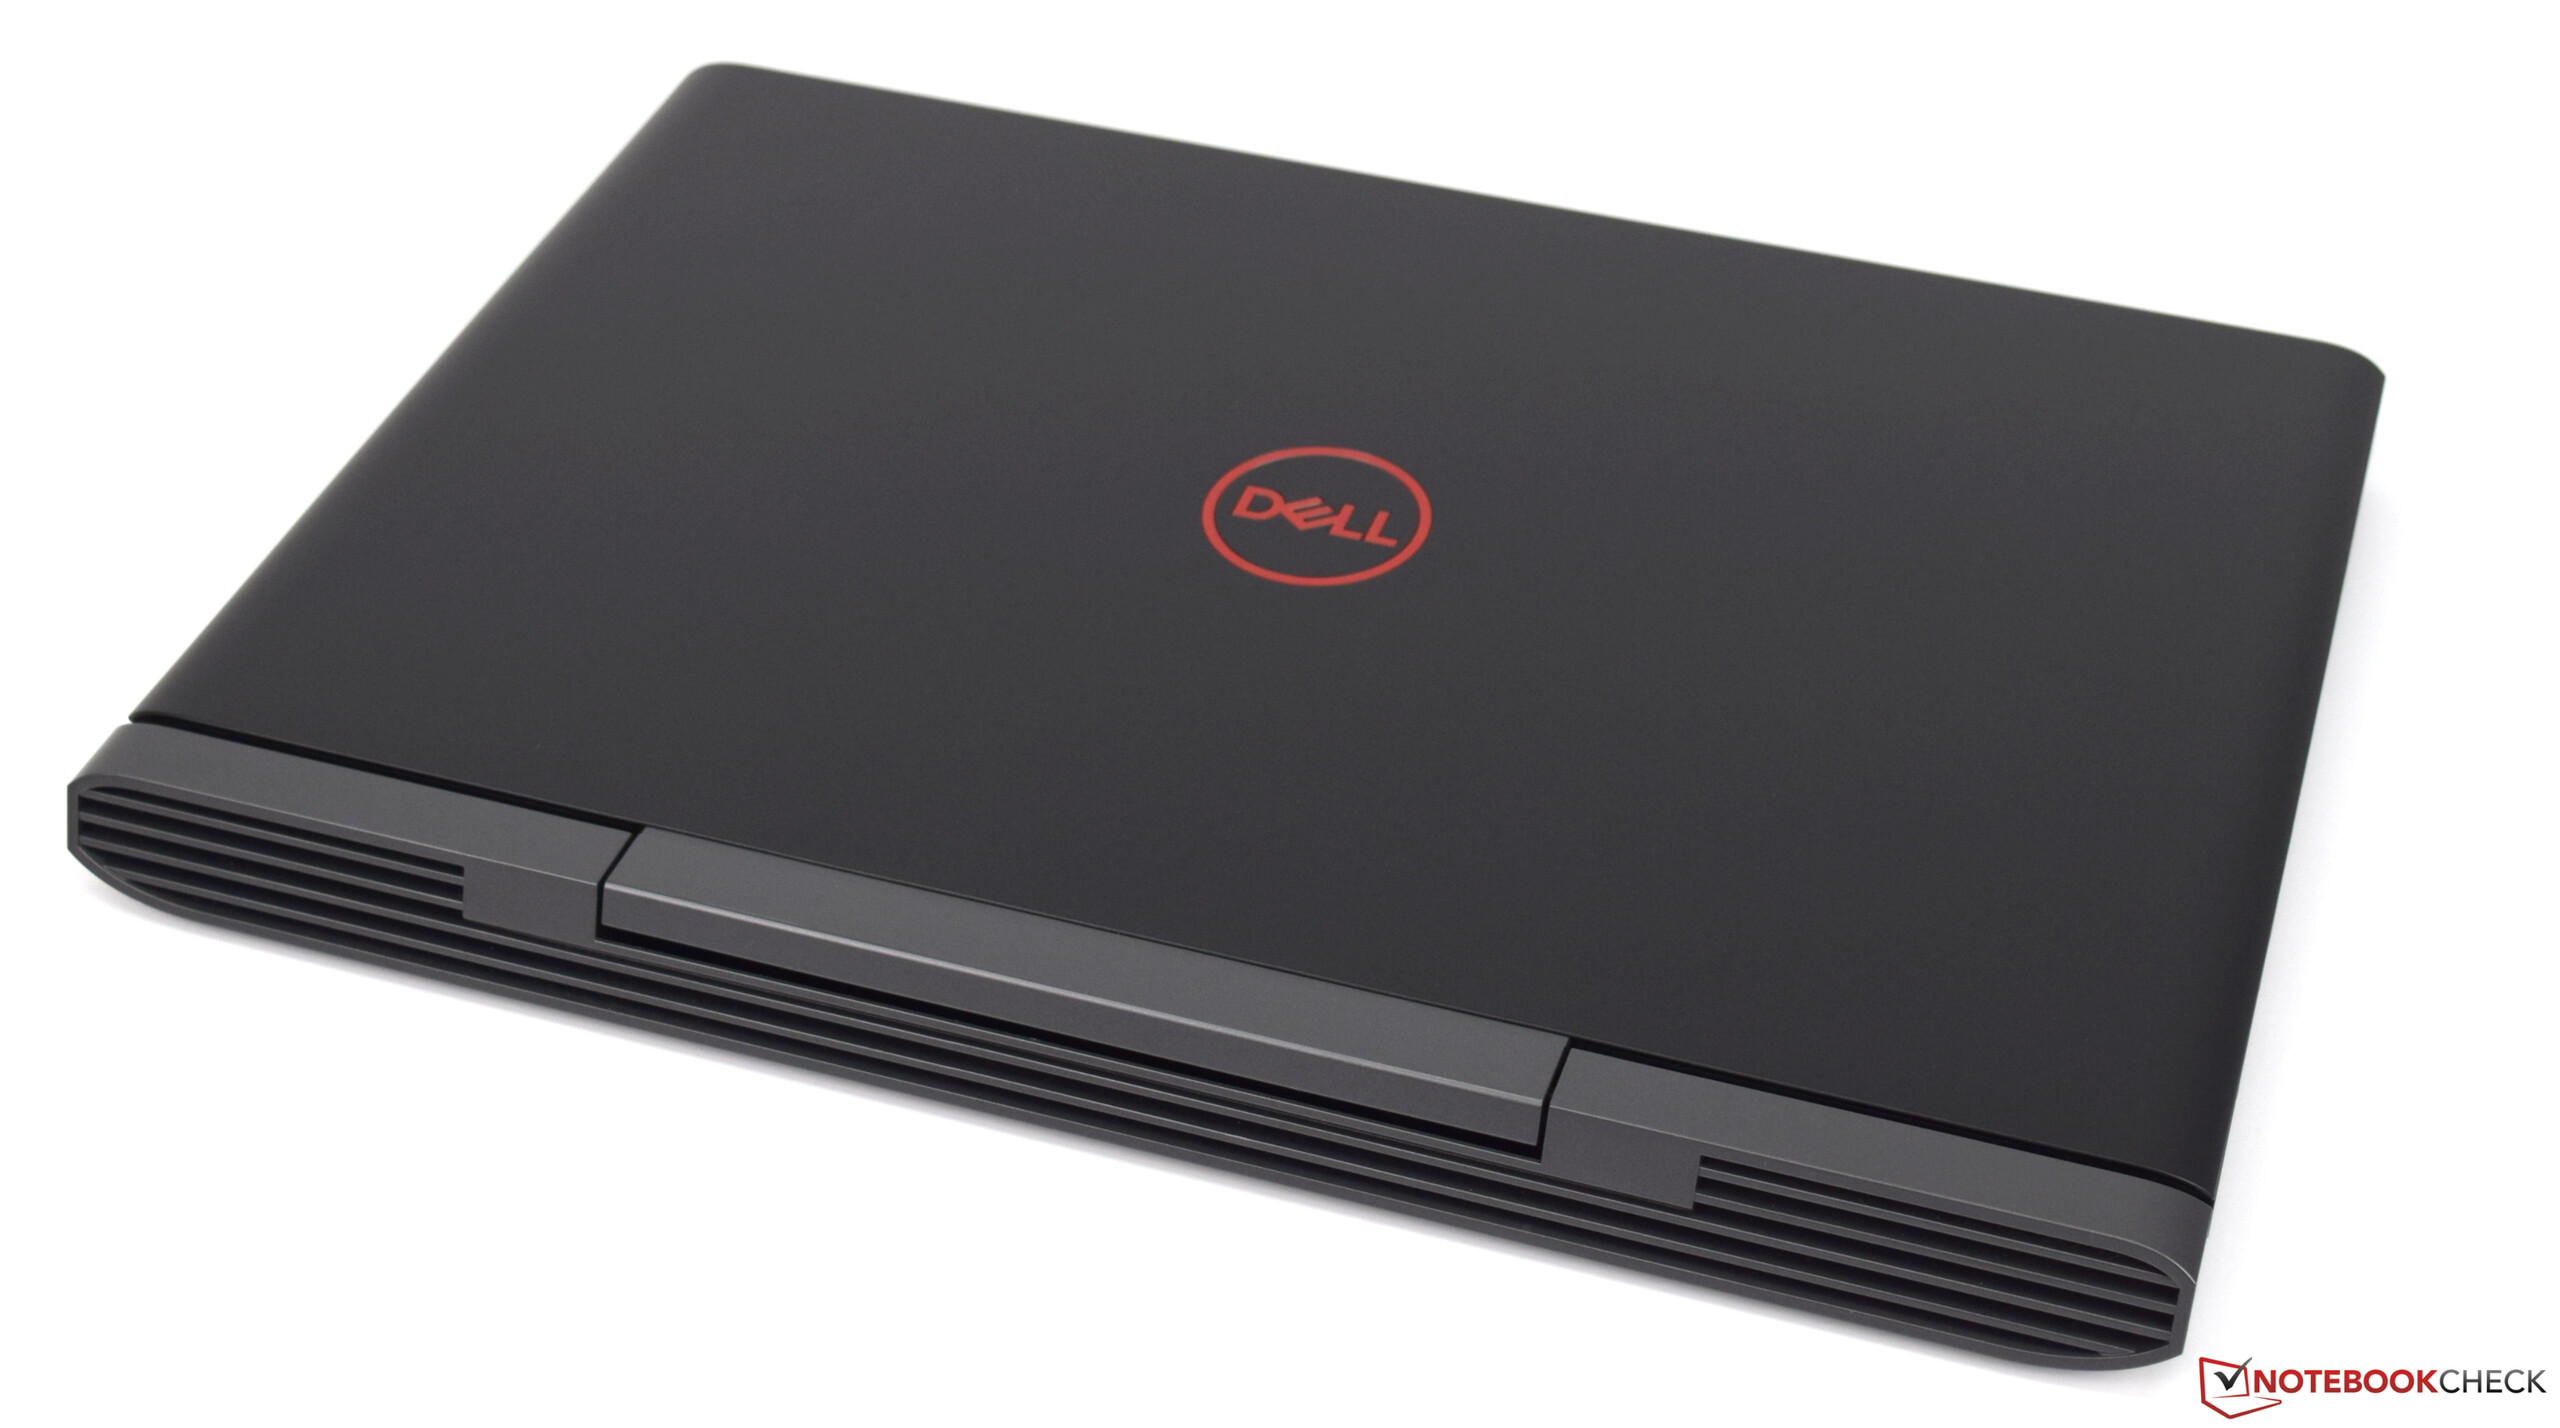
Obudowa
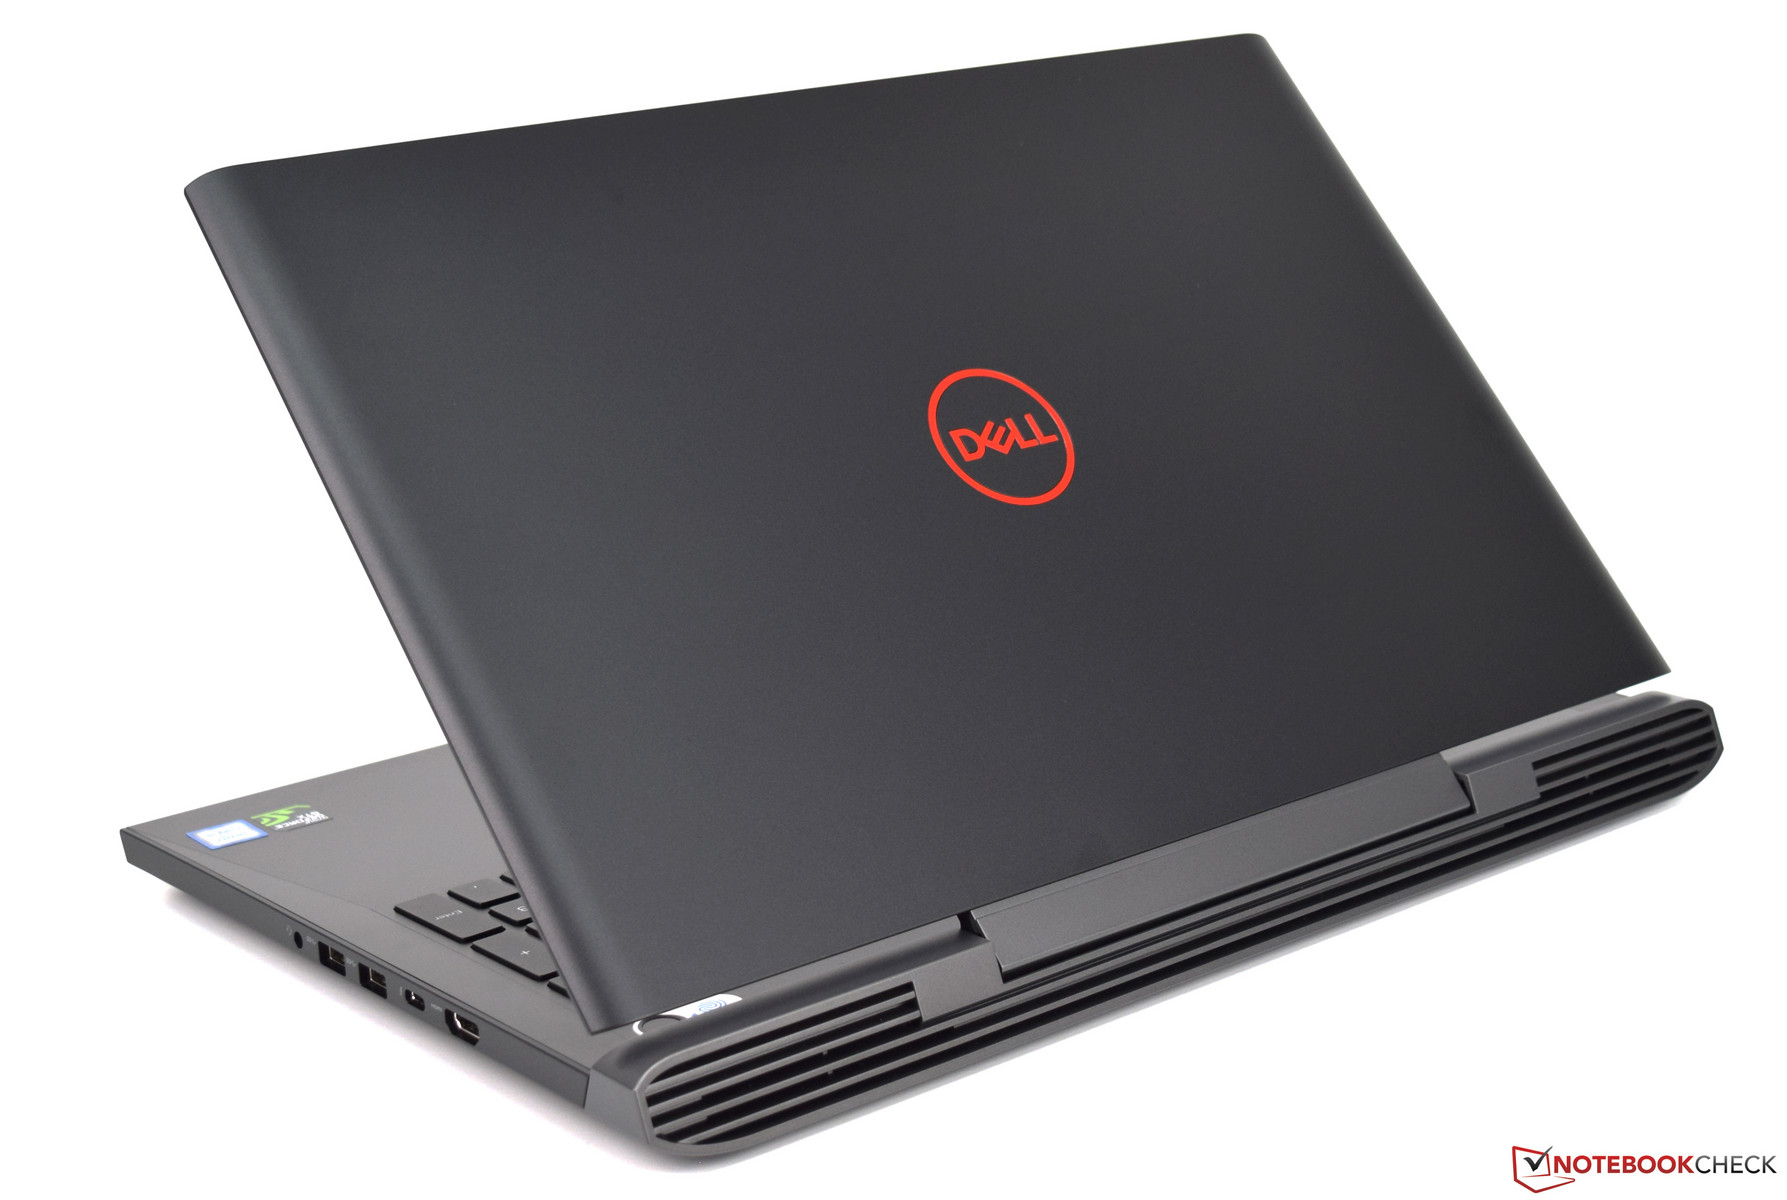
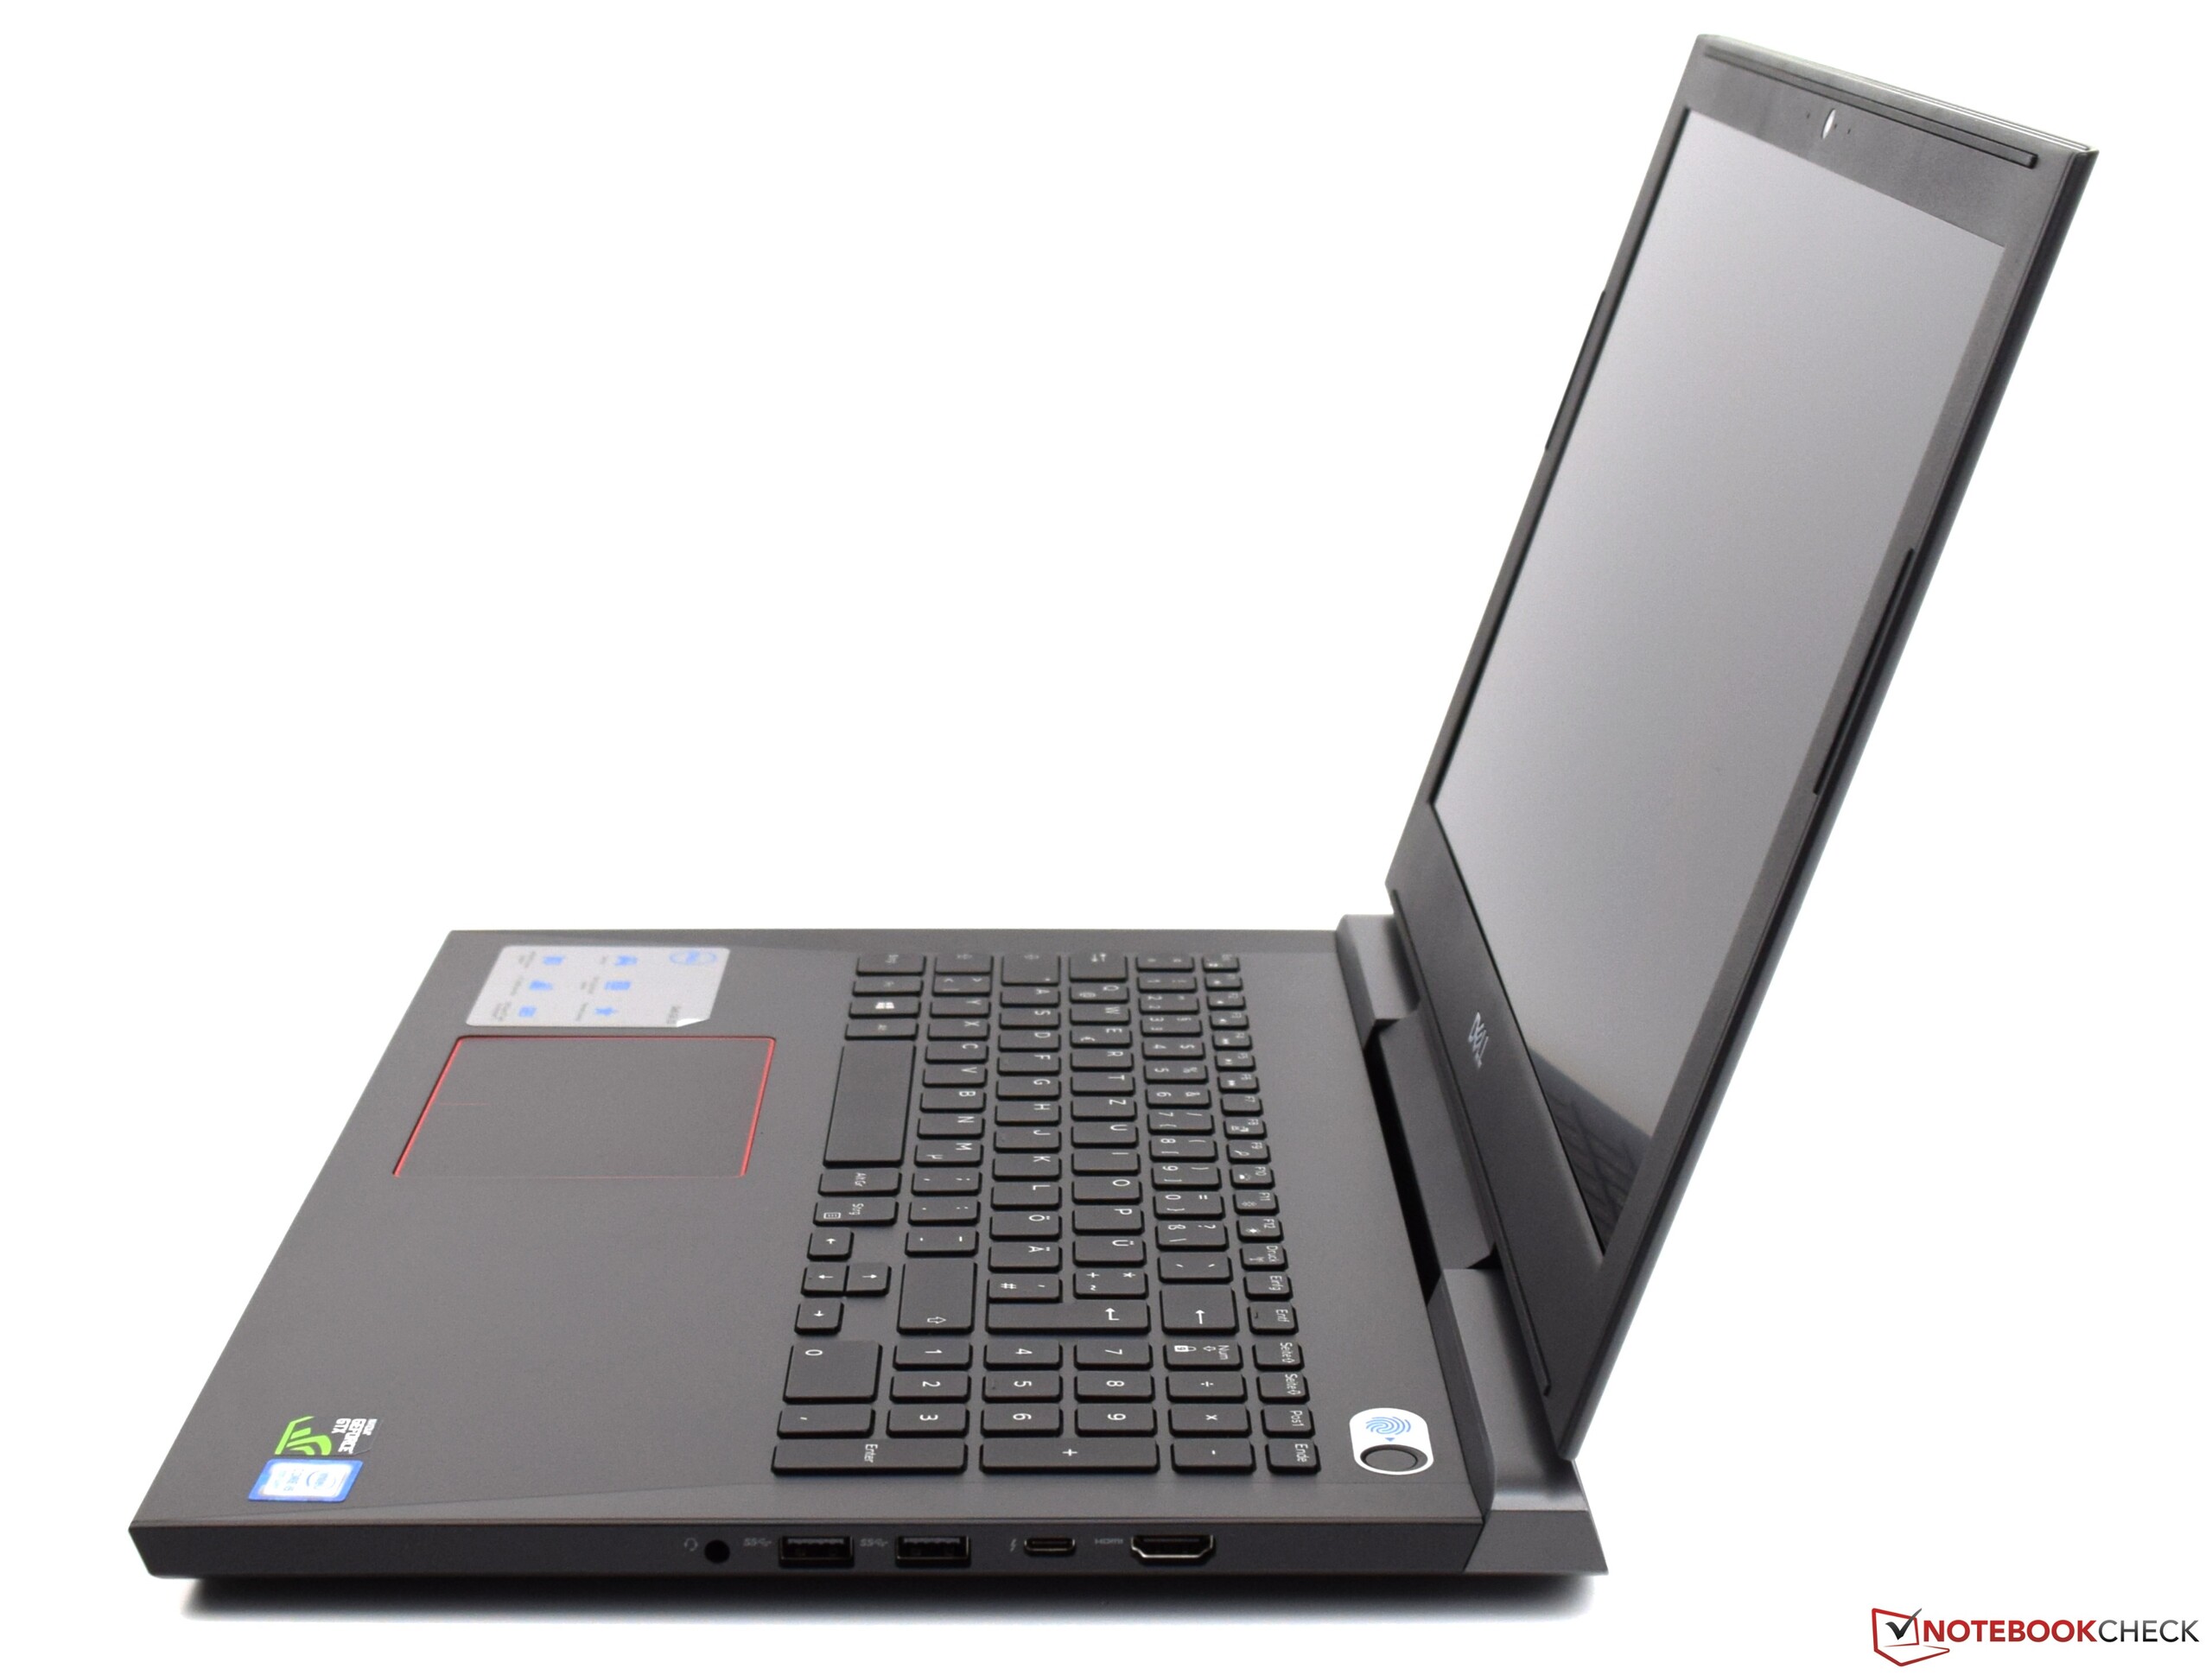
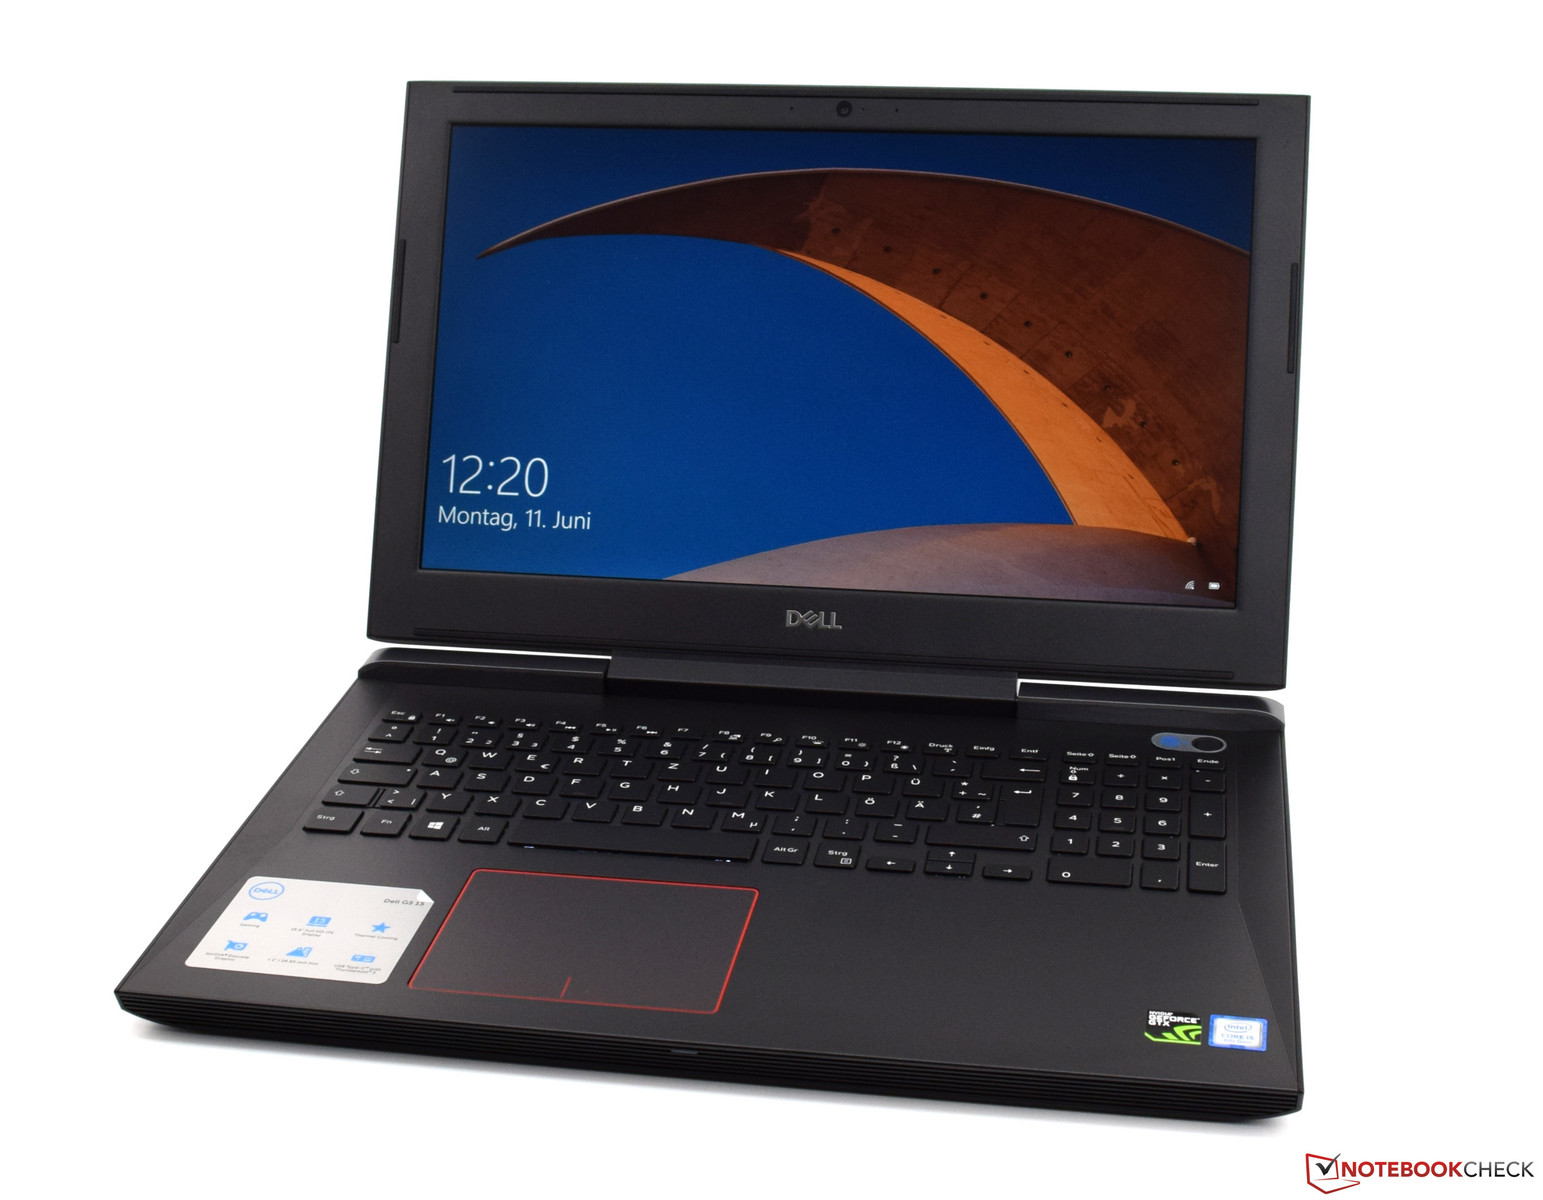
Dell G5 15 5587 ma dokładnie taką samą obudowę, jak Dell Inspiron 7577. Tym samym odziedziczył po poprzedniku wady i zalety konstrukcji. Na gładkich powierzchniach obudowy bardzo szybko uwidaczniają się odciski palców. Przednia krawędź obudowy jest zaś dość ostra.
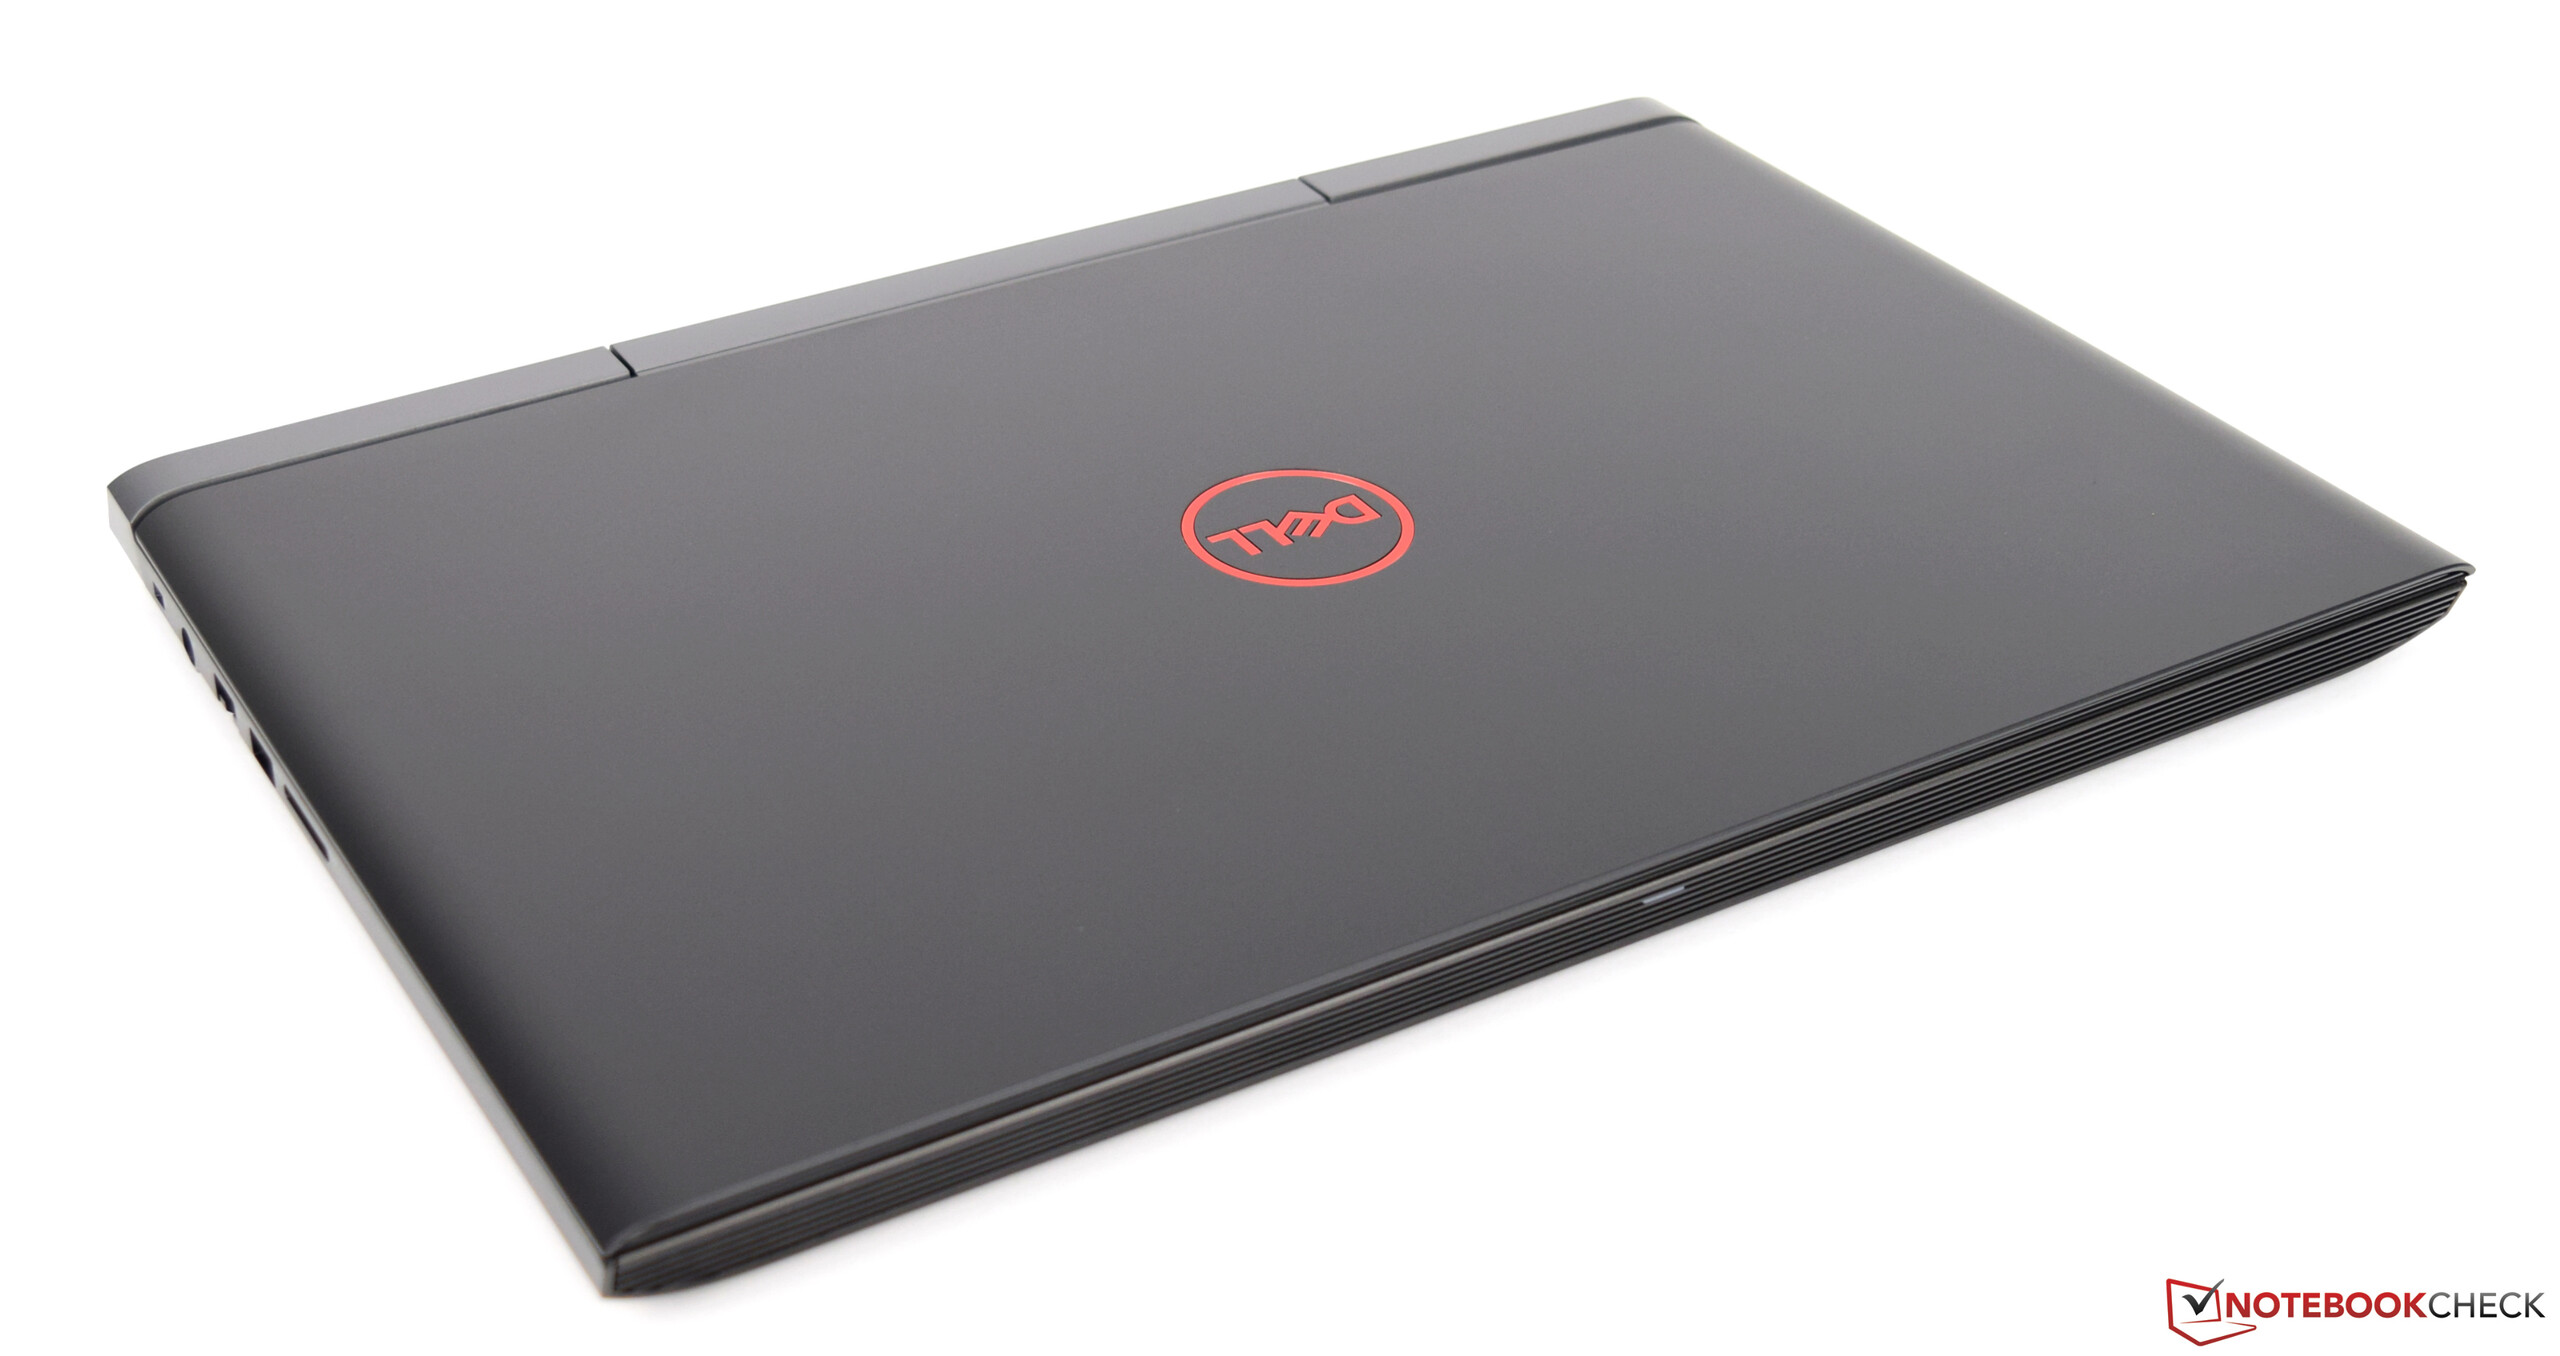
Jeżeli chodzi o wygląd, omawiany model trochę wyróżnia się z grona tańszych laptopów do gier. Jest oferowany w dwóch wersjach kolorystycznych, czarnej i czerwonej.
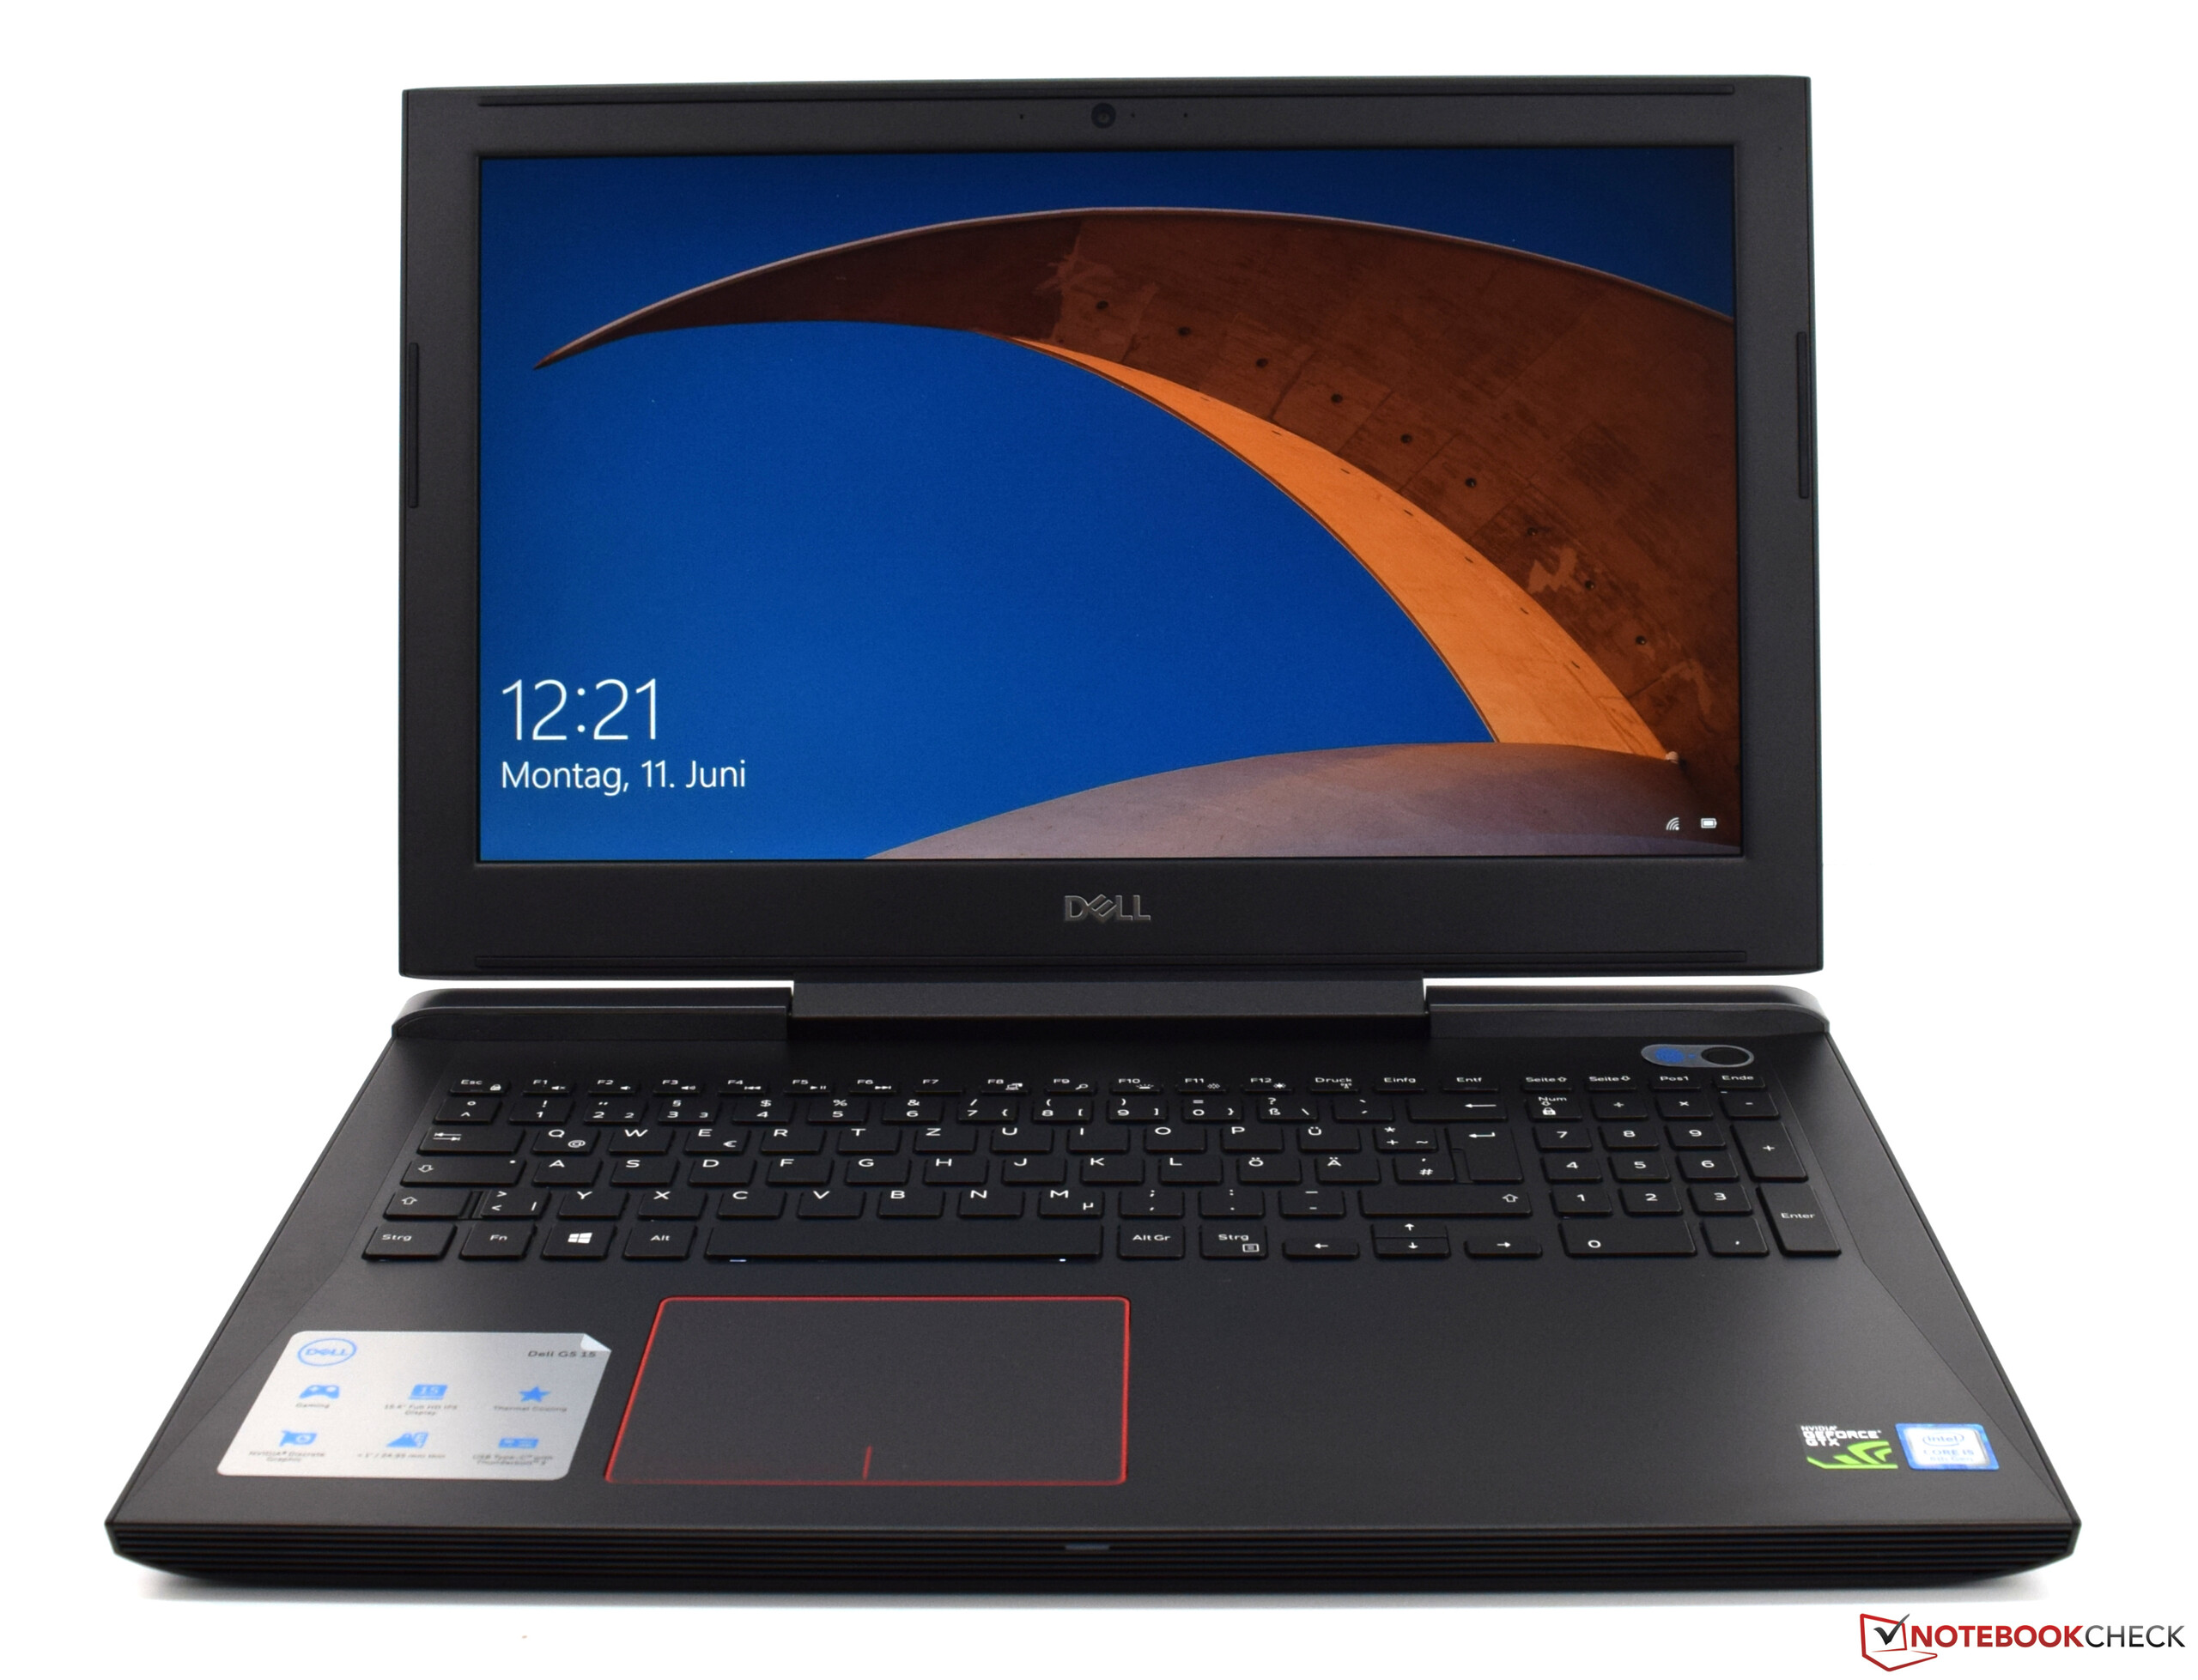
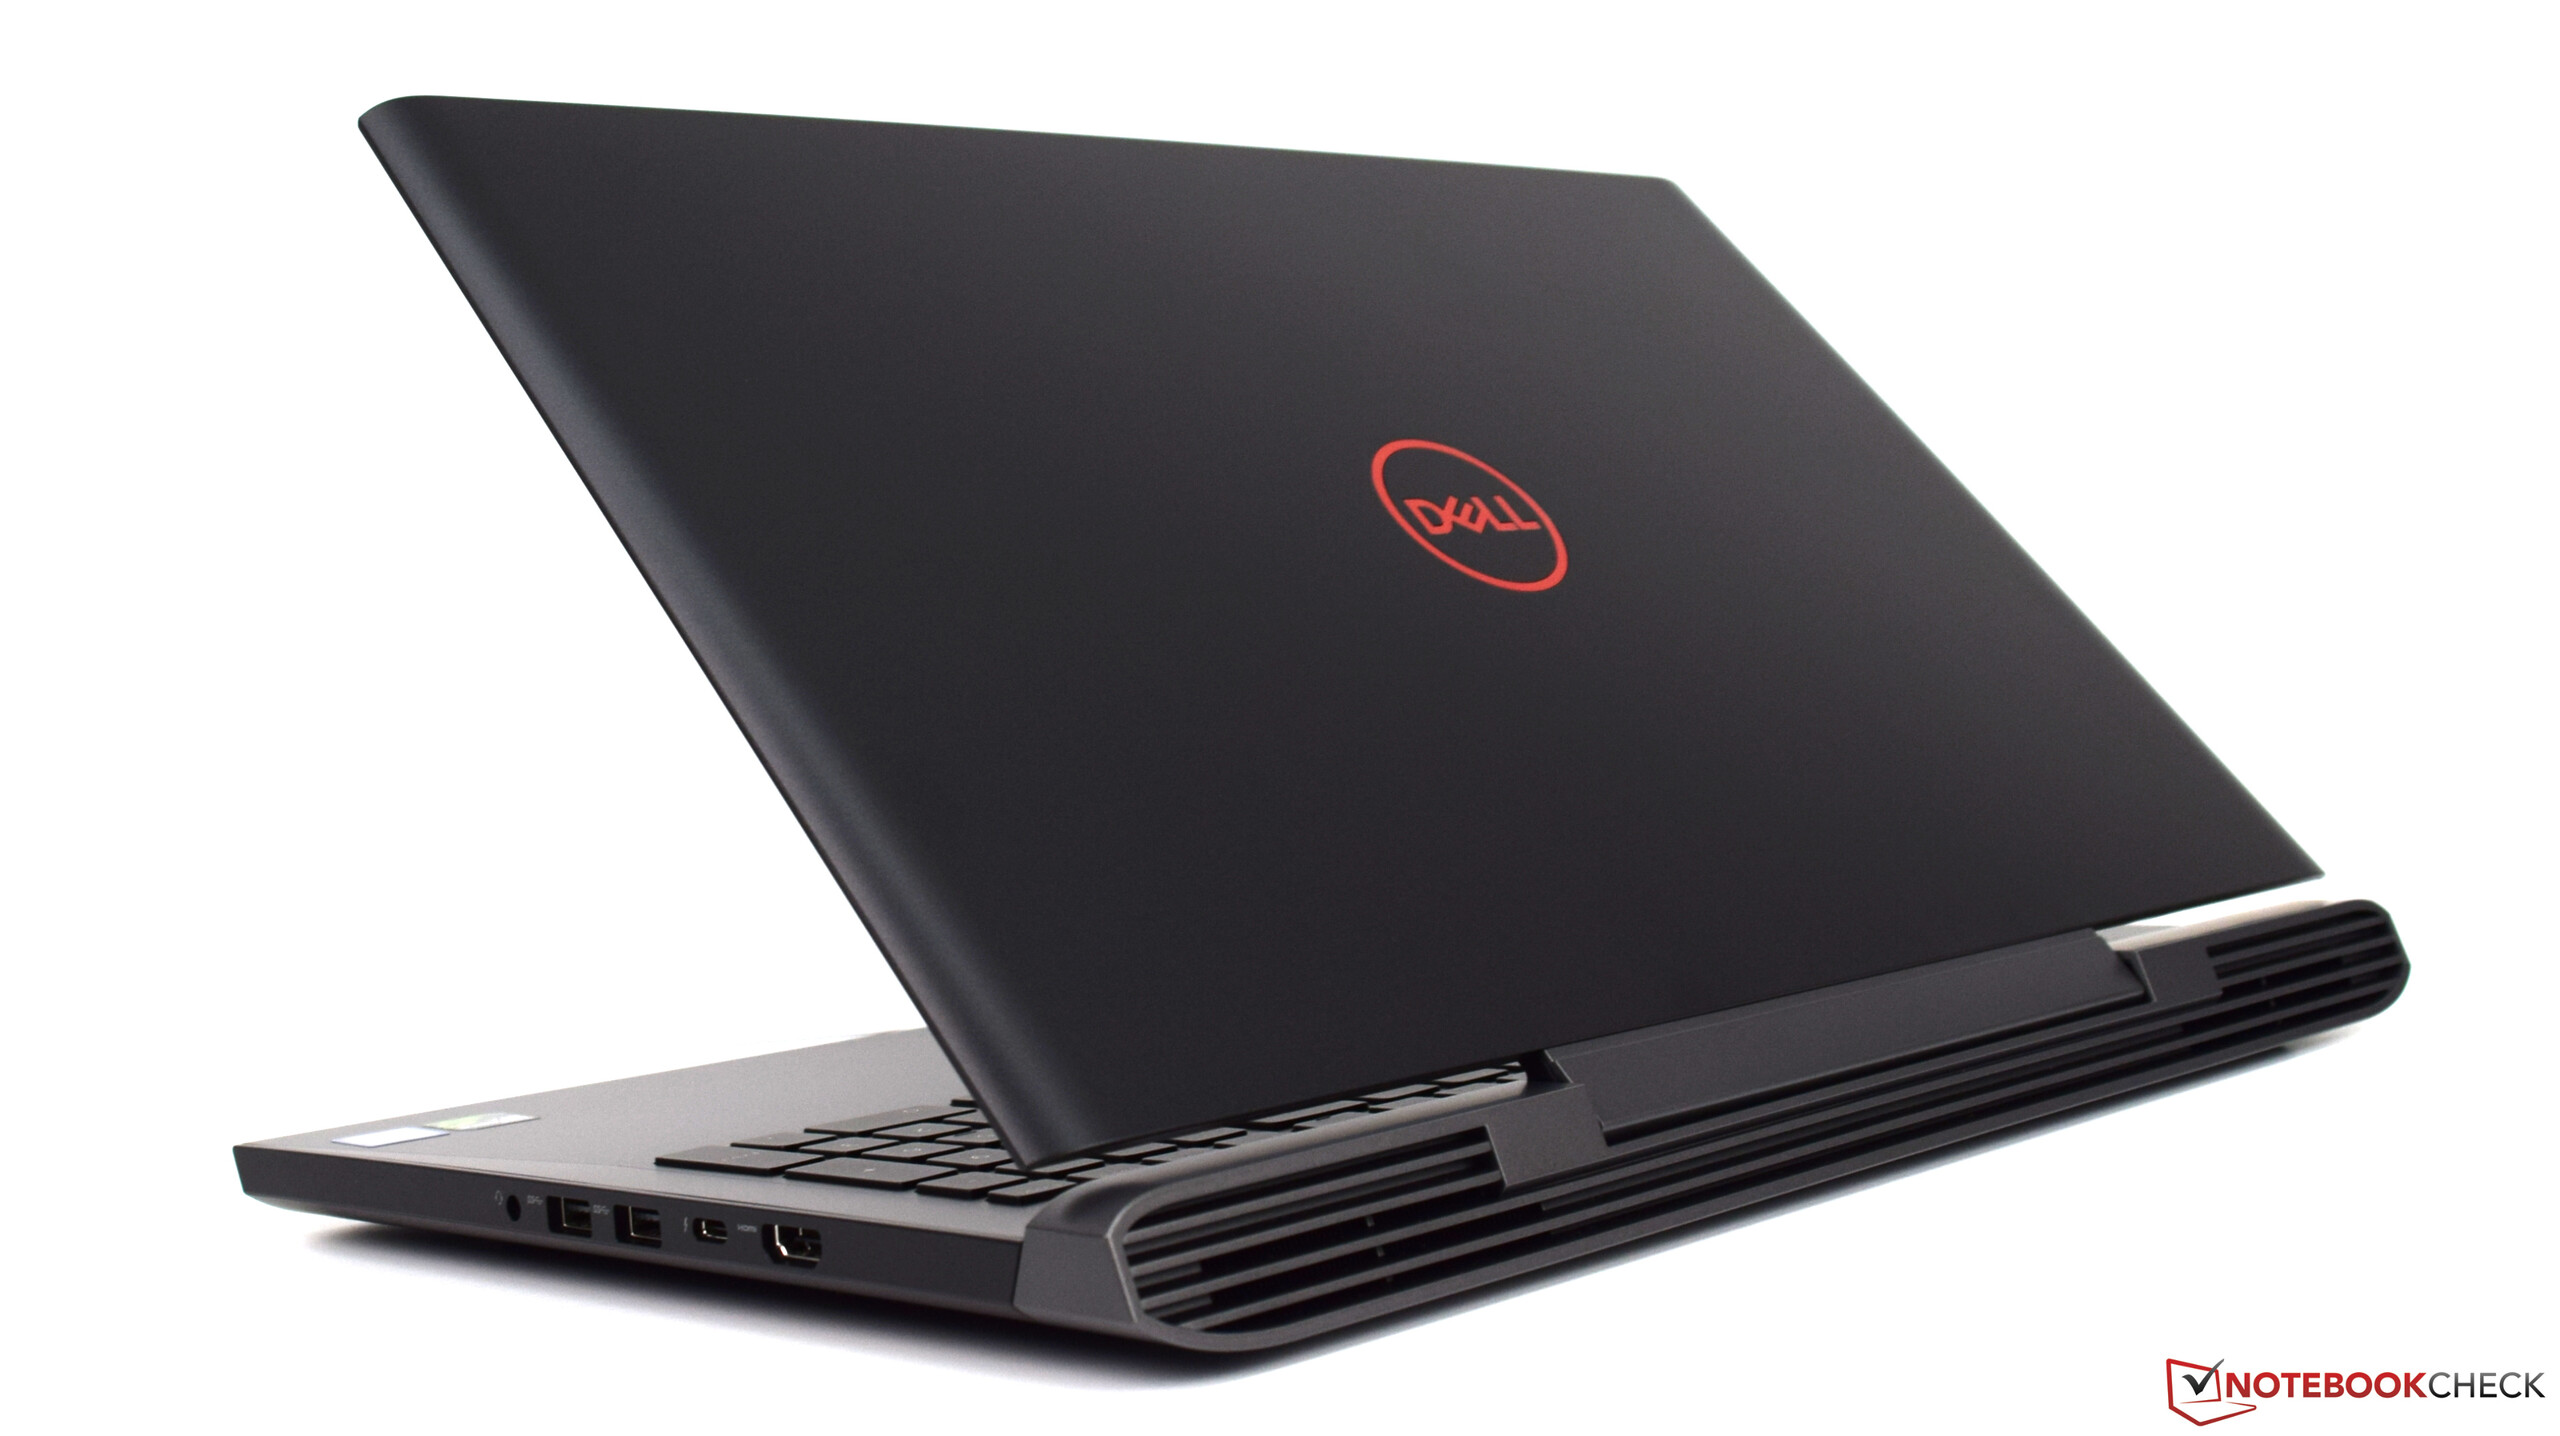
Pod względem sztywności konstrukcji Dell G5 15 wypada bardzo dobrze. Jednostka zasadnicza nie ugina się pod naciskiem.
Oparty na centralnym zawiasie ekran zachowuje się stabilnie. Podczas pisania na klawiaturze ekran się nie chybocze. Maksymalny kąt odchylenia ekranu to 140 stopni.
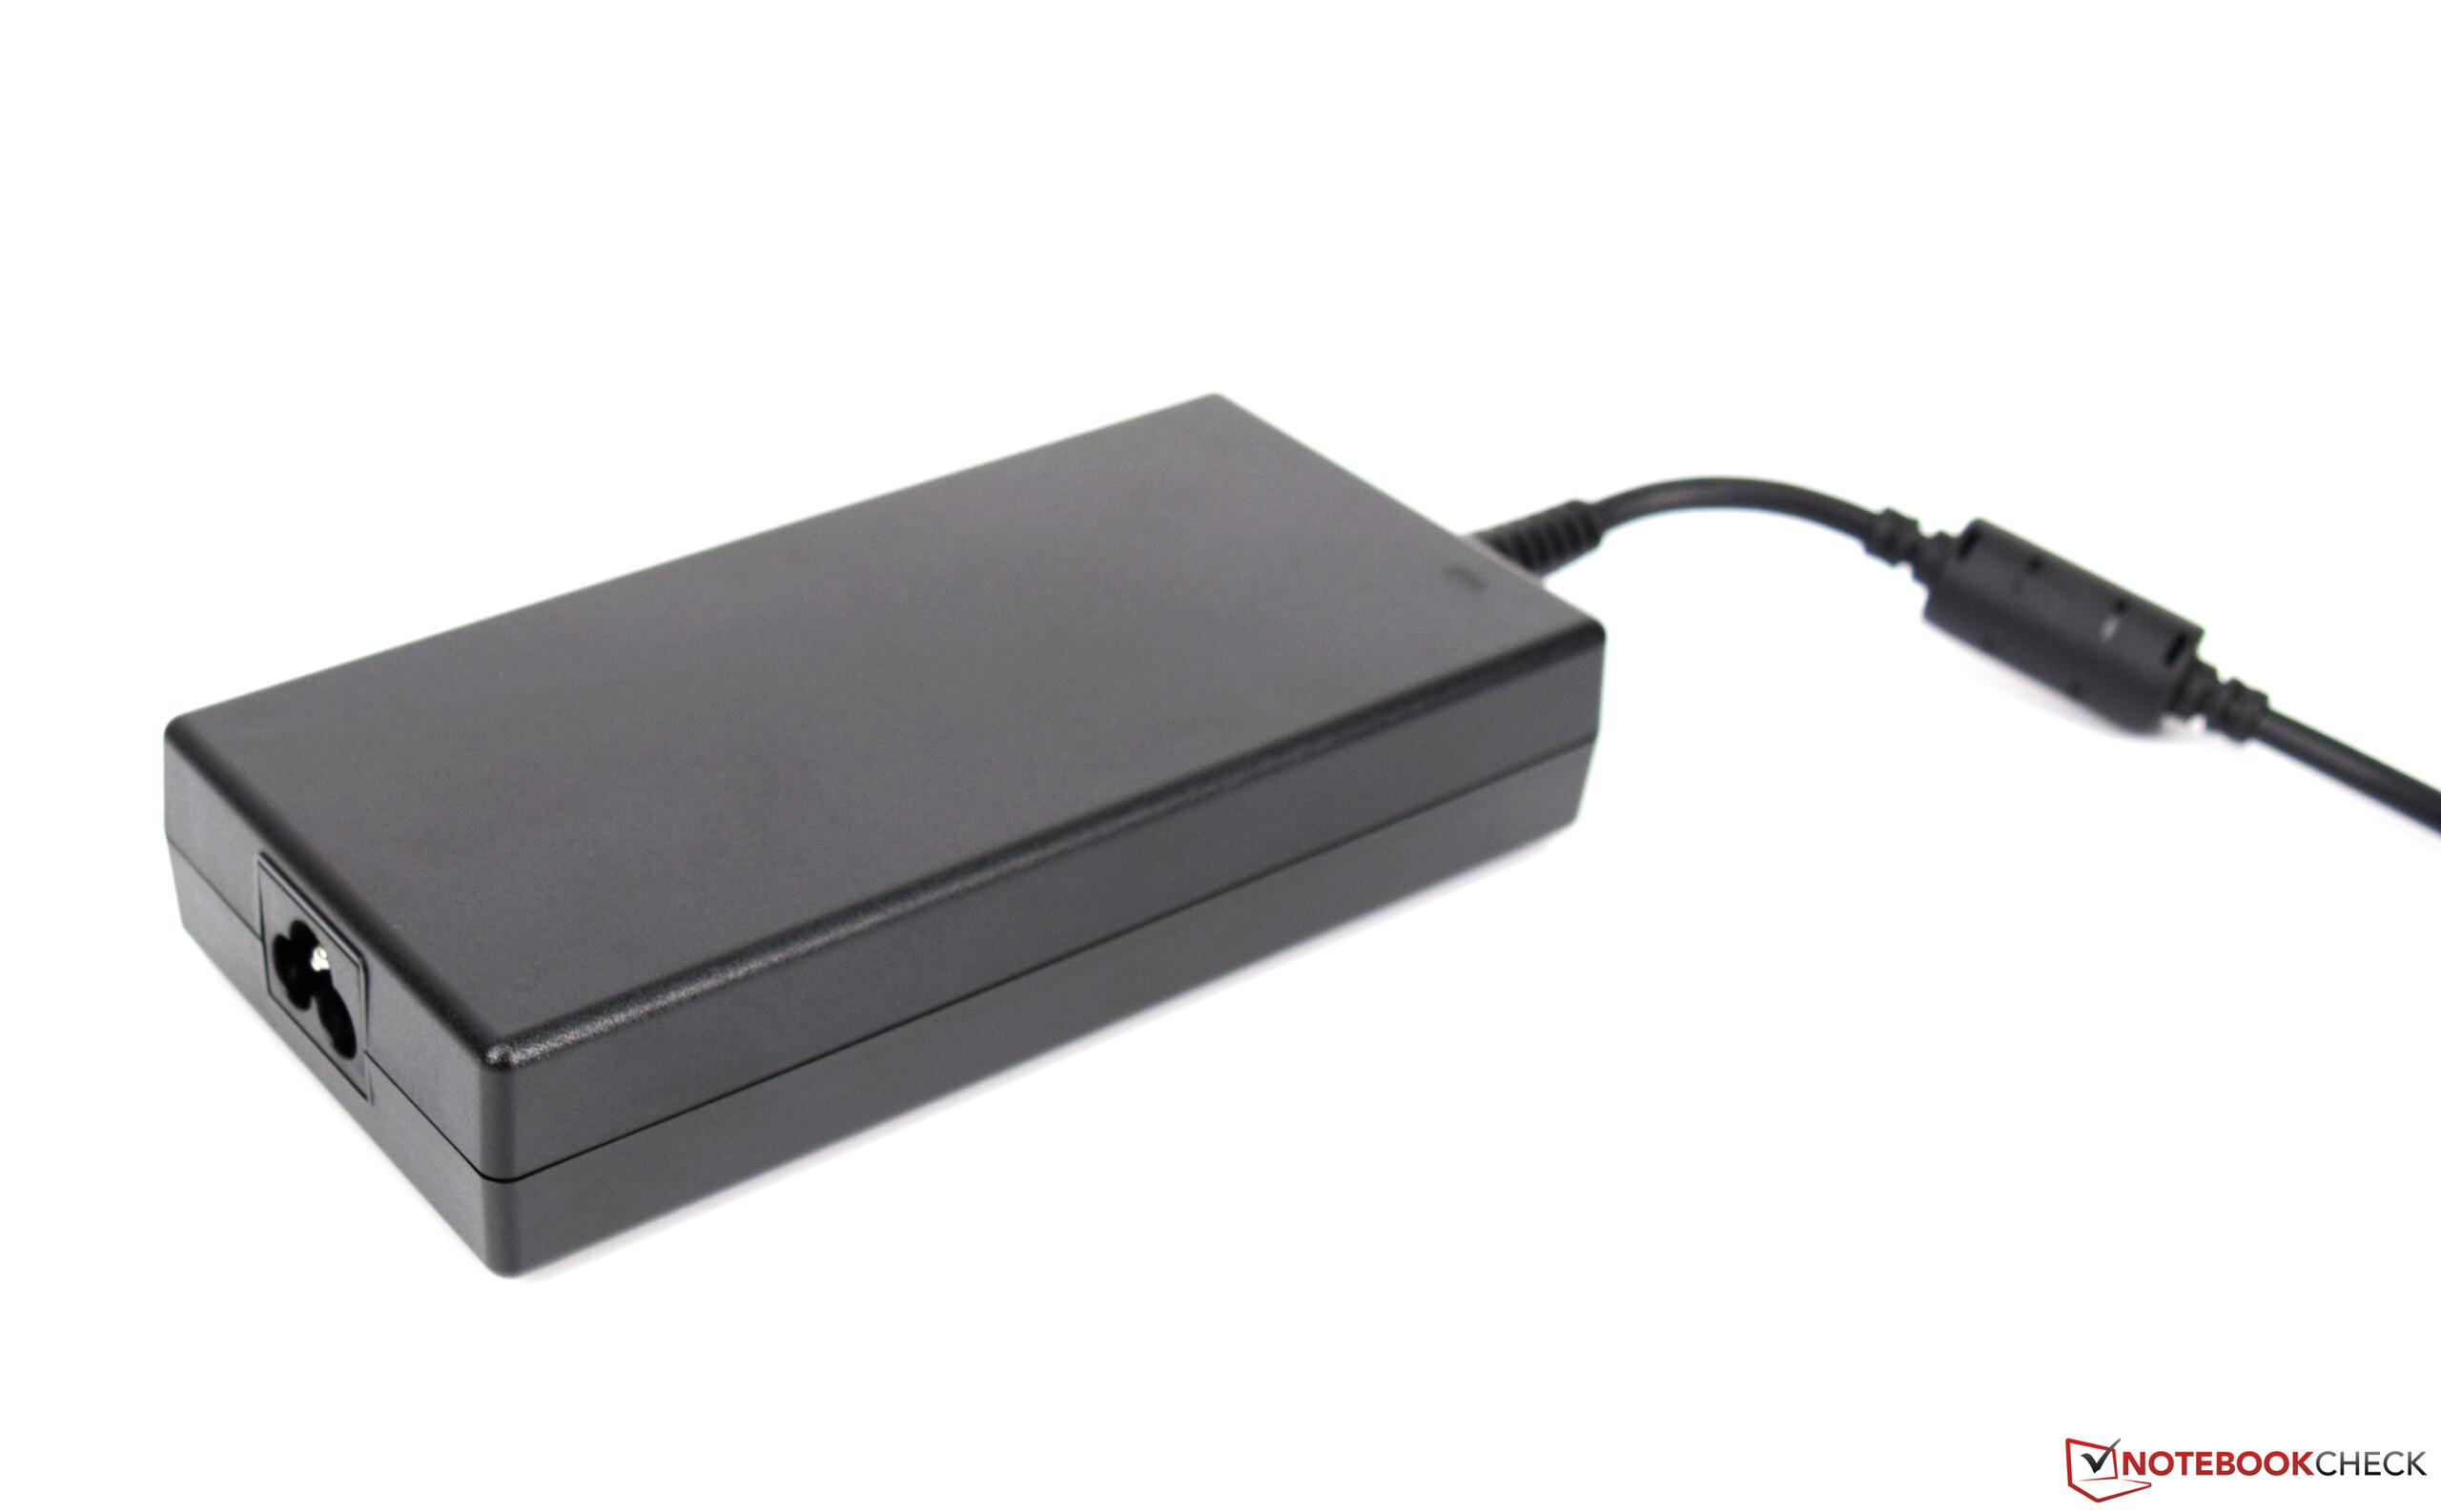
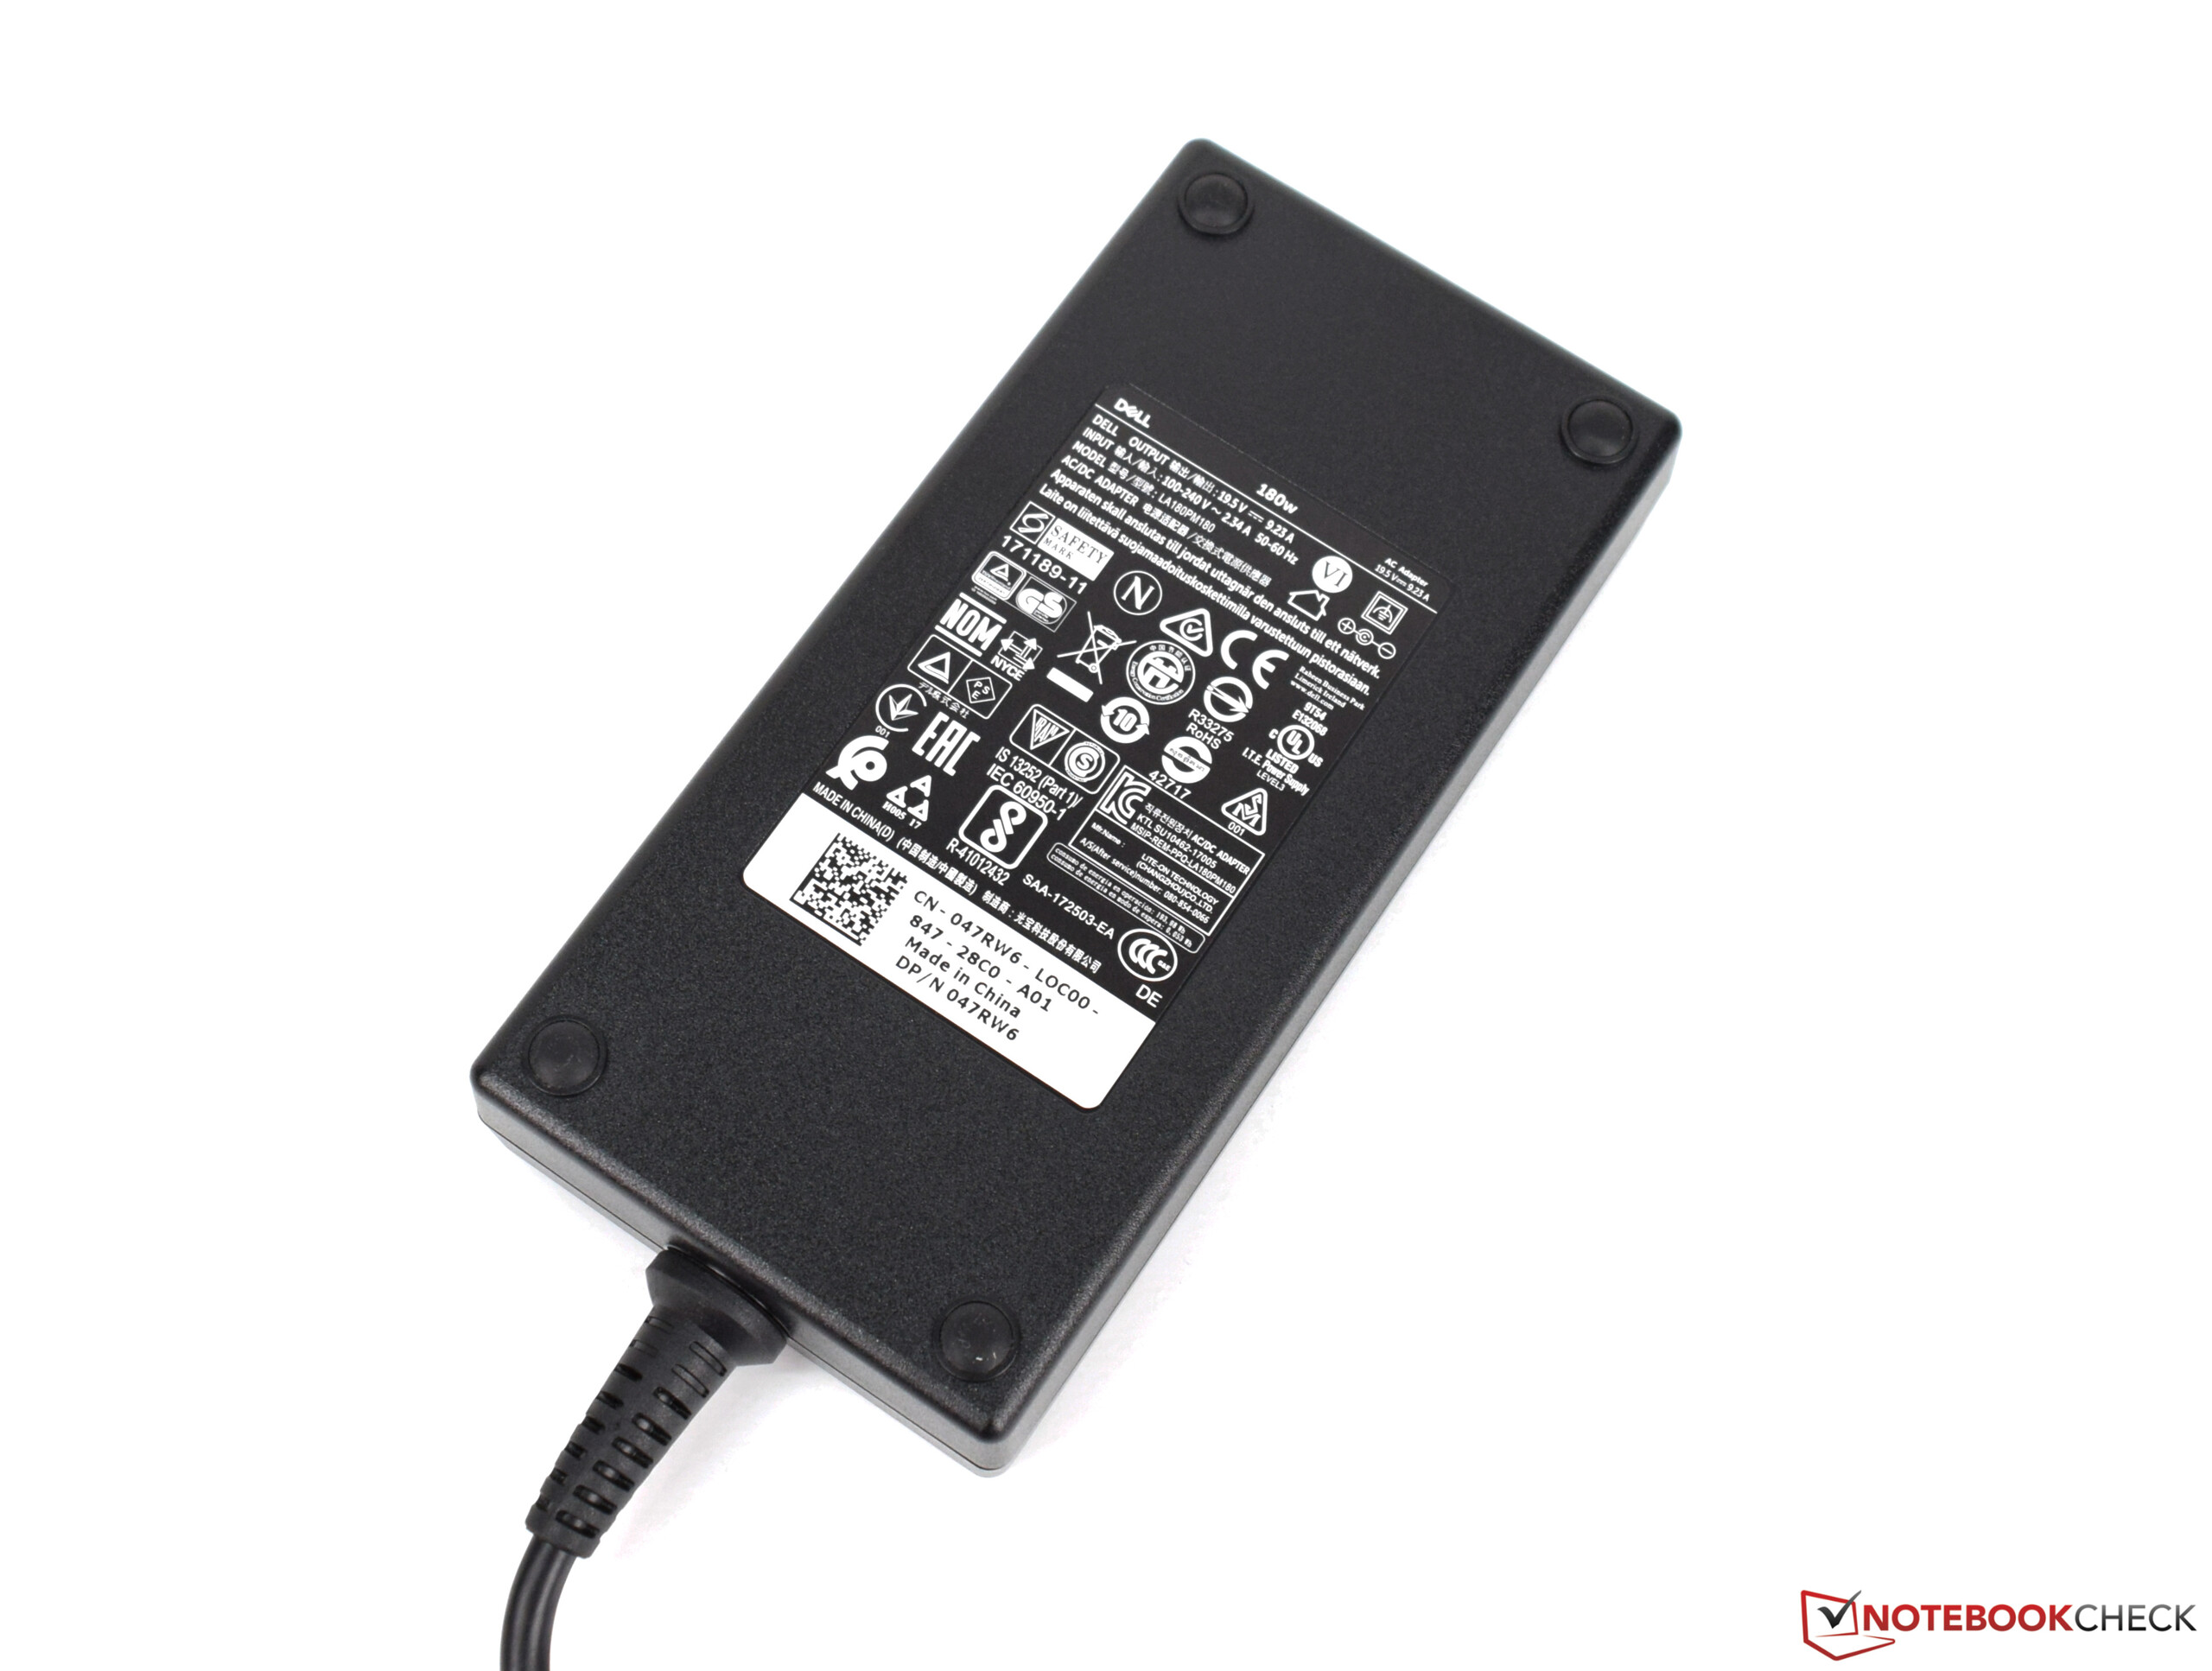
Ważący 2,85 kg Dell 5587 nie zalicza się do lekkich laptopów tego typu. Do tego 180-watowy zasilacz waży 699 g.
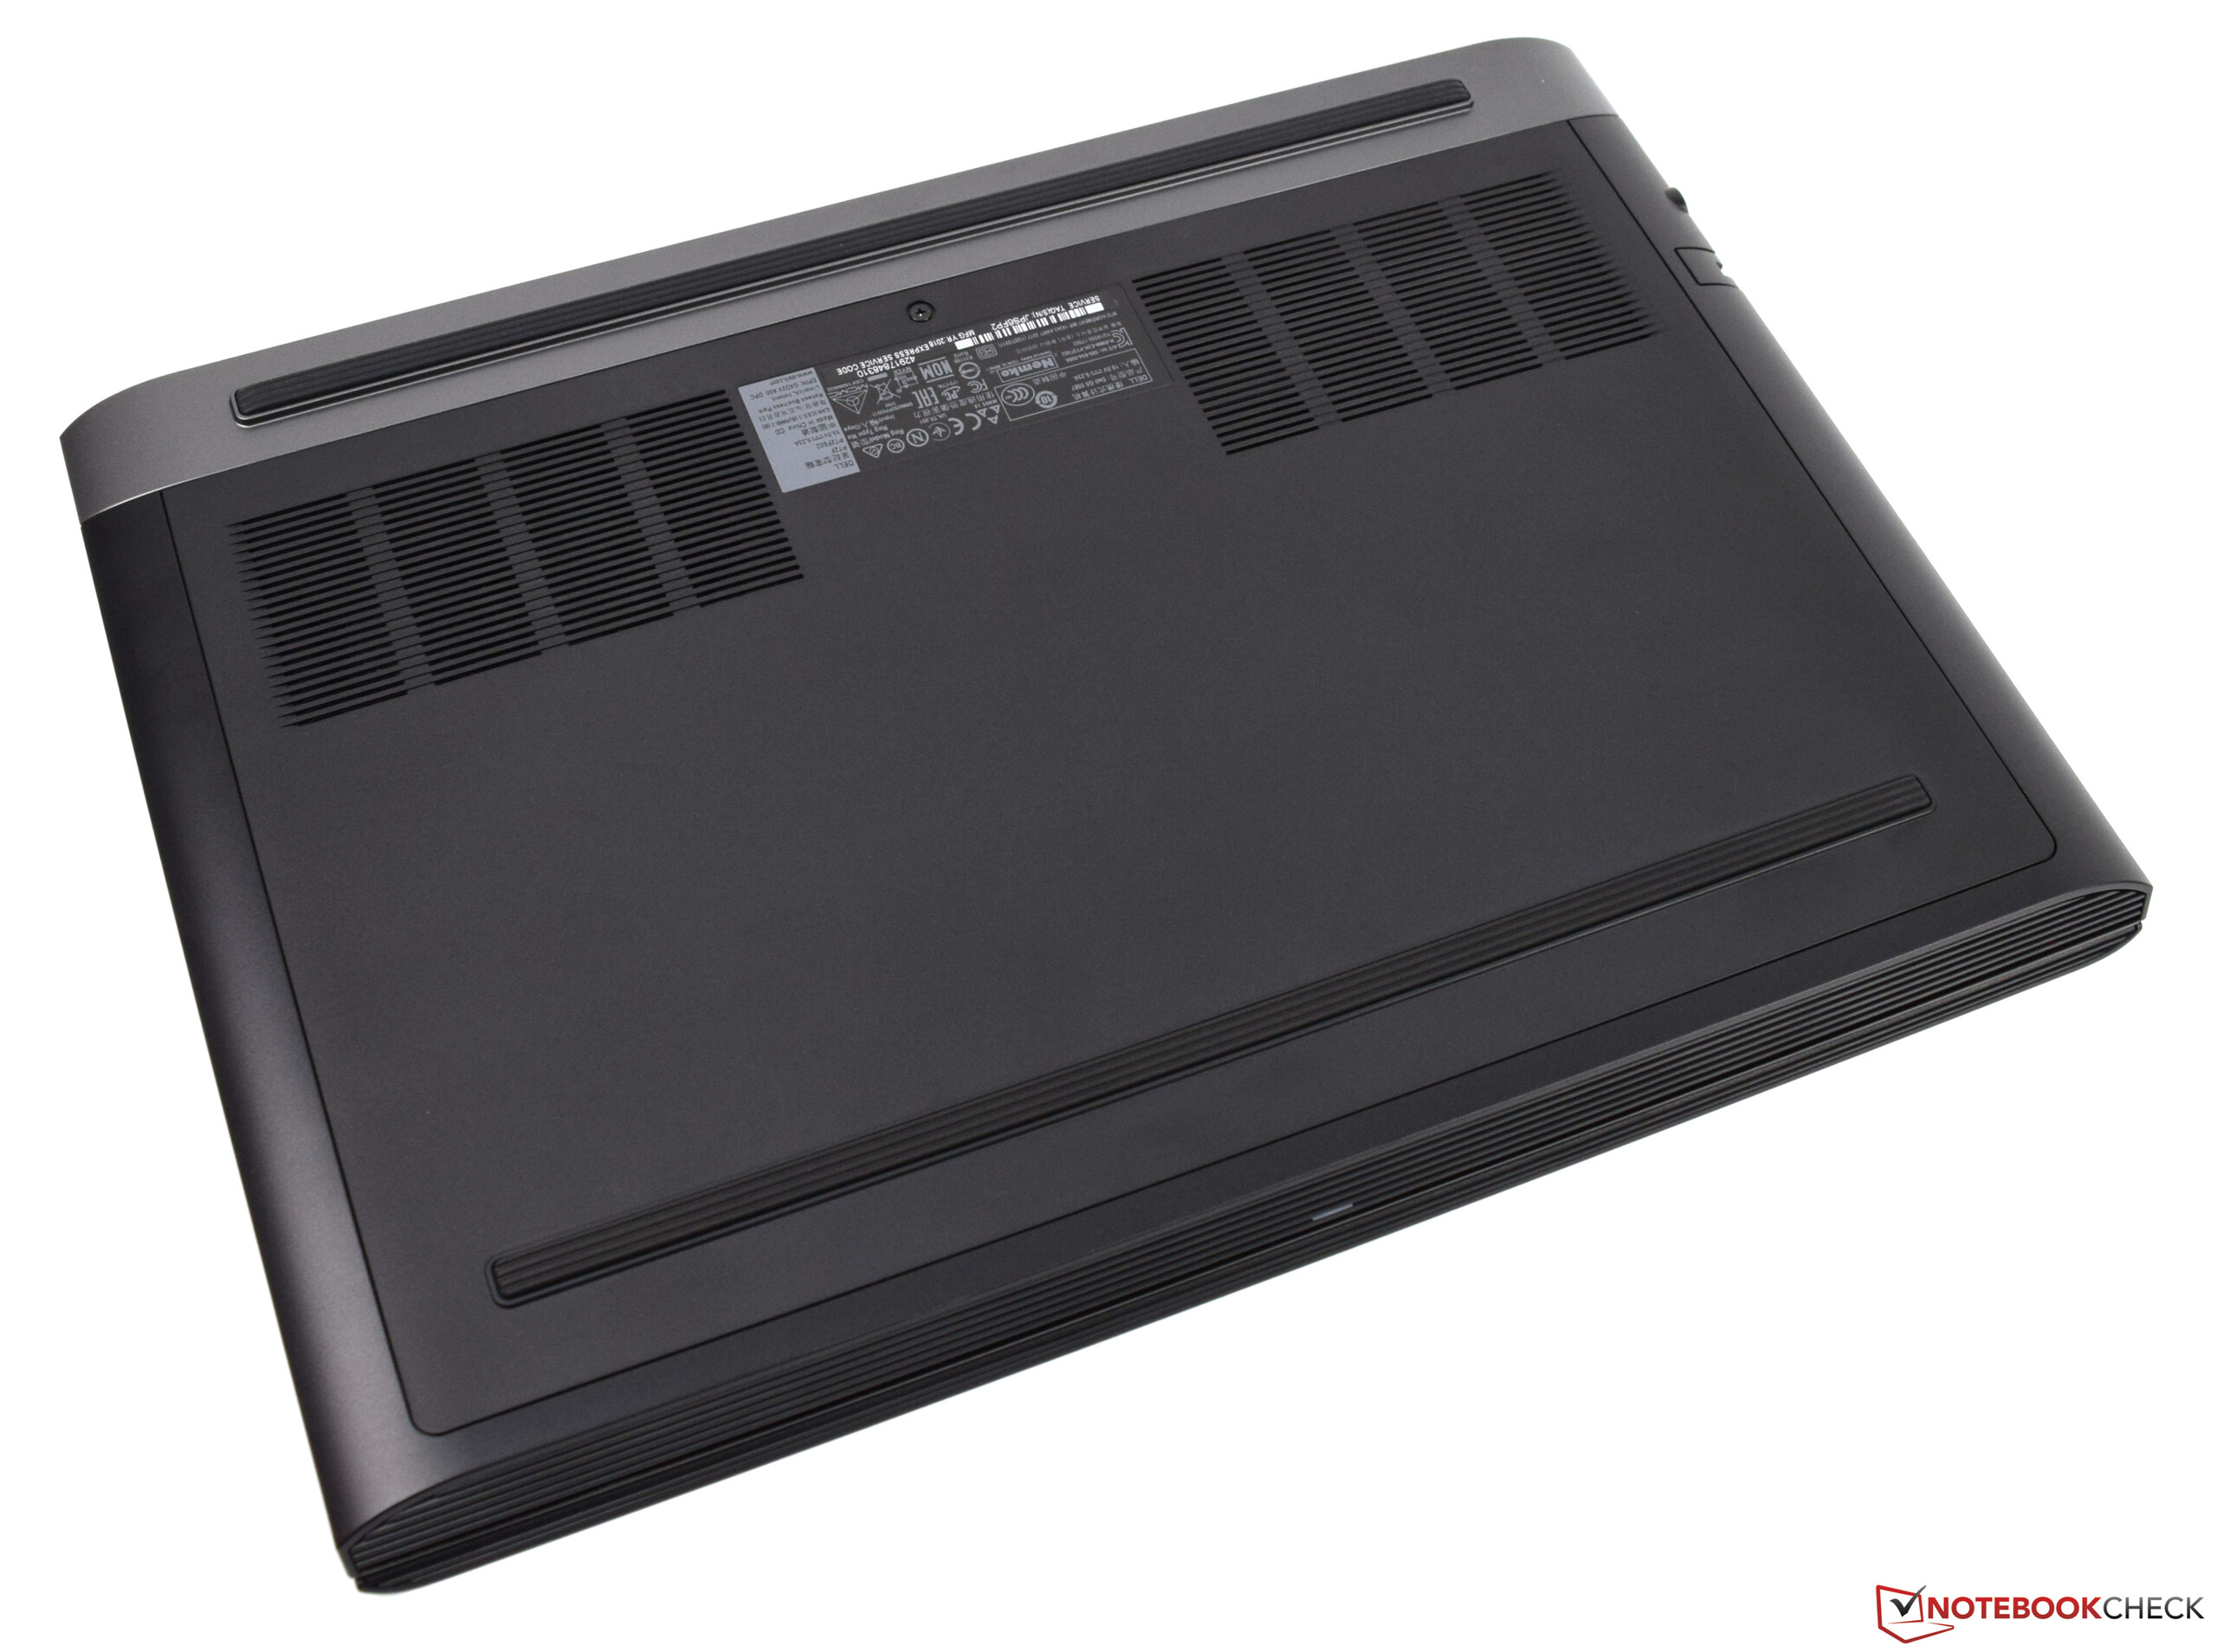
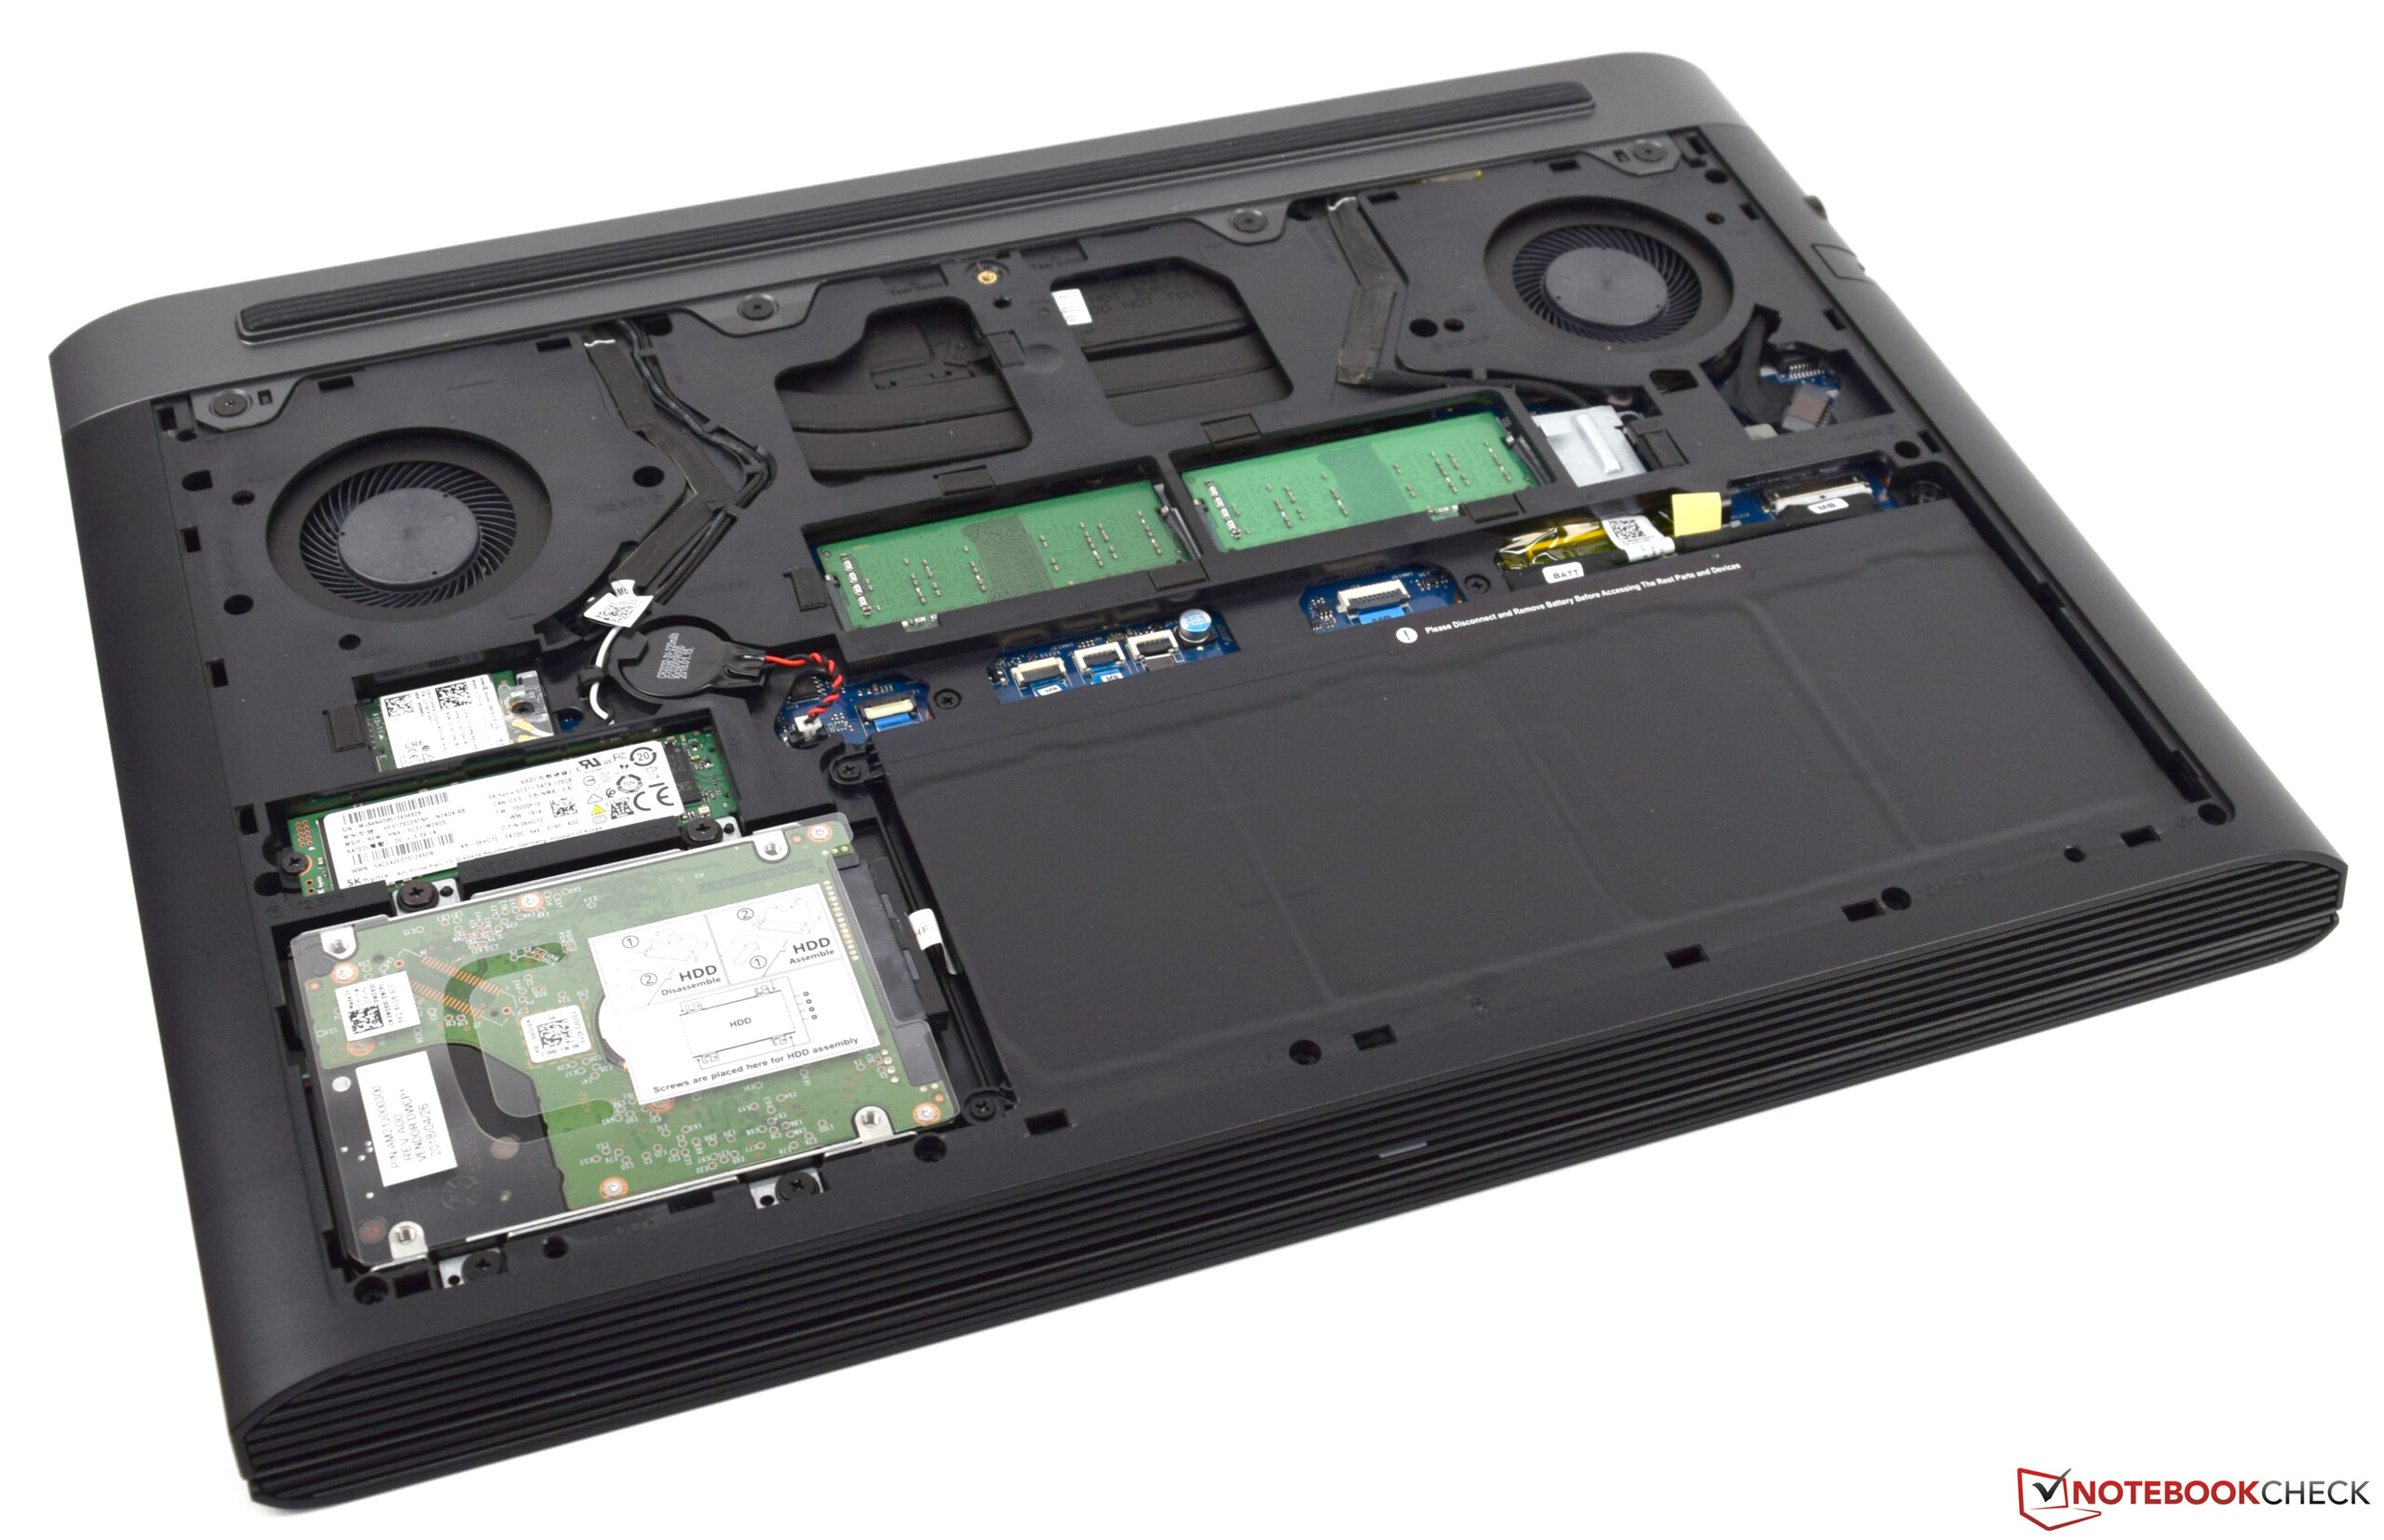
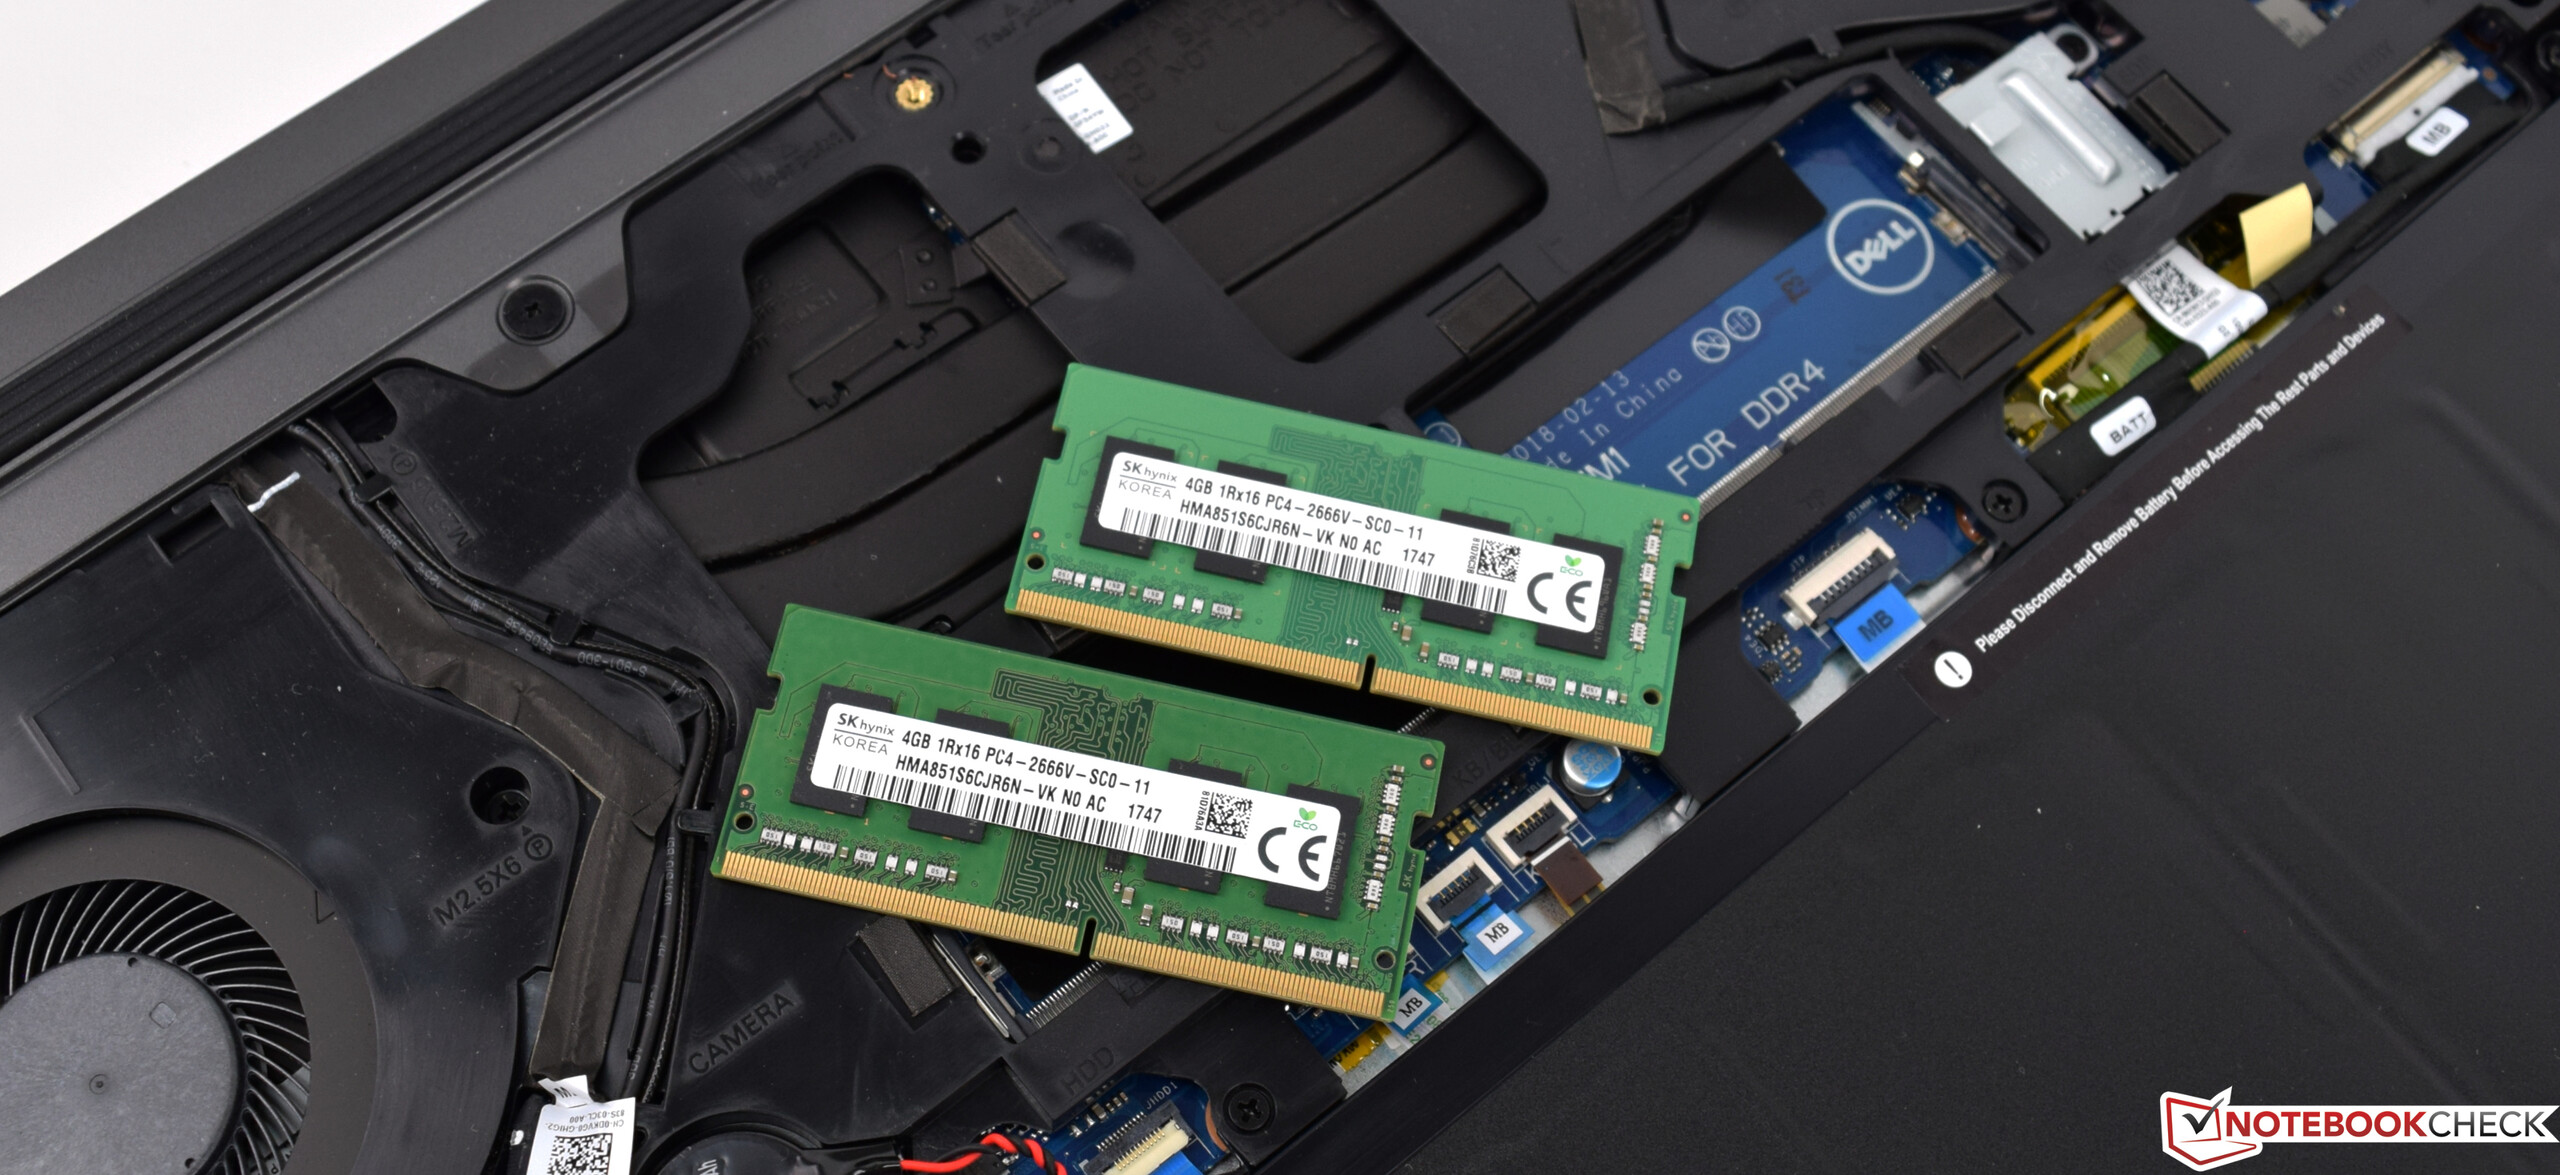
Dell 5587 posiada jedną dużą pokrywę serwisową, która obejmuje prawie cały spód jednostki zasadniczej. By ją zdjąć, trzeba odkręcić tylko jedną śrubkę. Należy ją zdejmować ostrożnie, gdyż trzyma się ona na licznych plastikowych zaczepach.
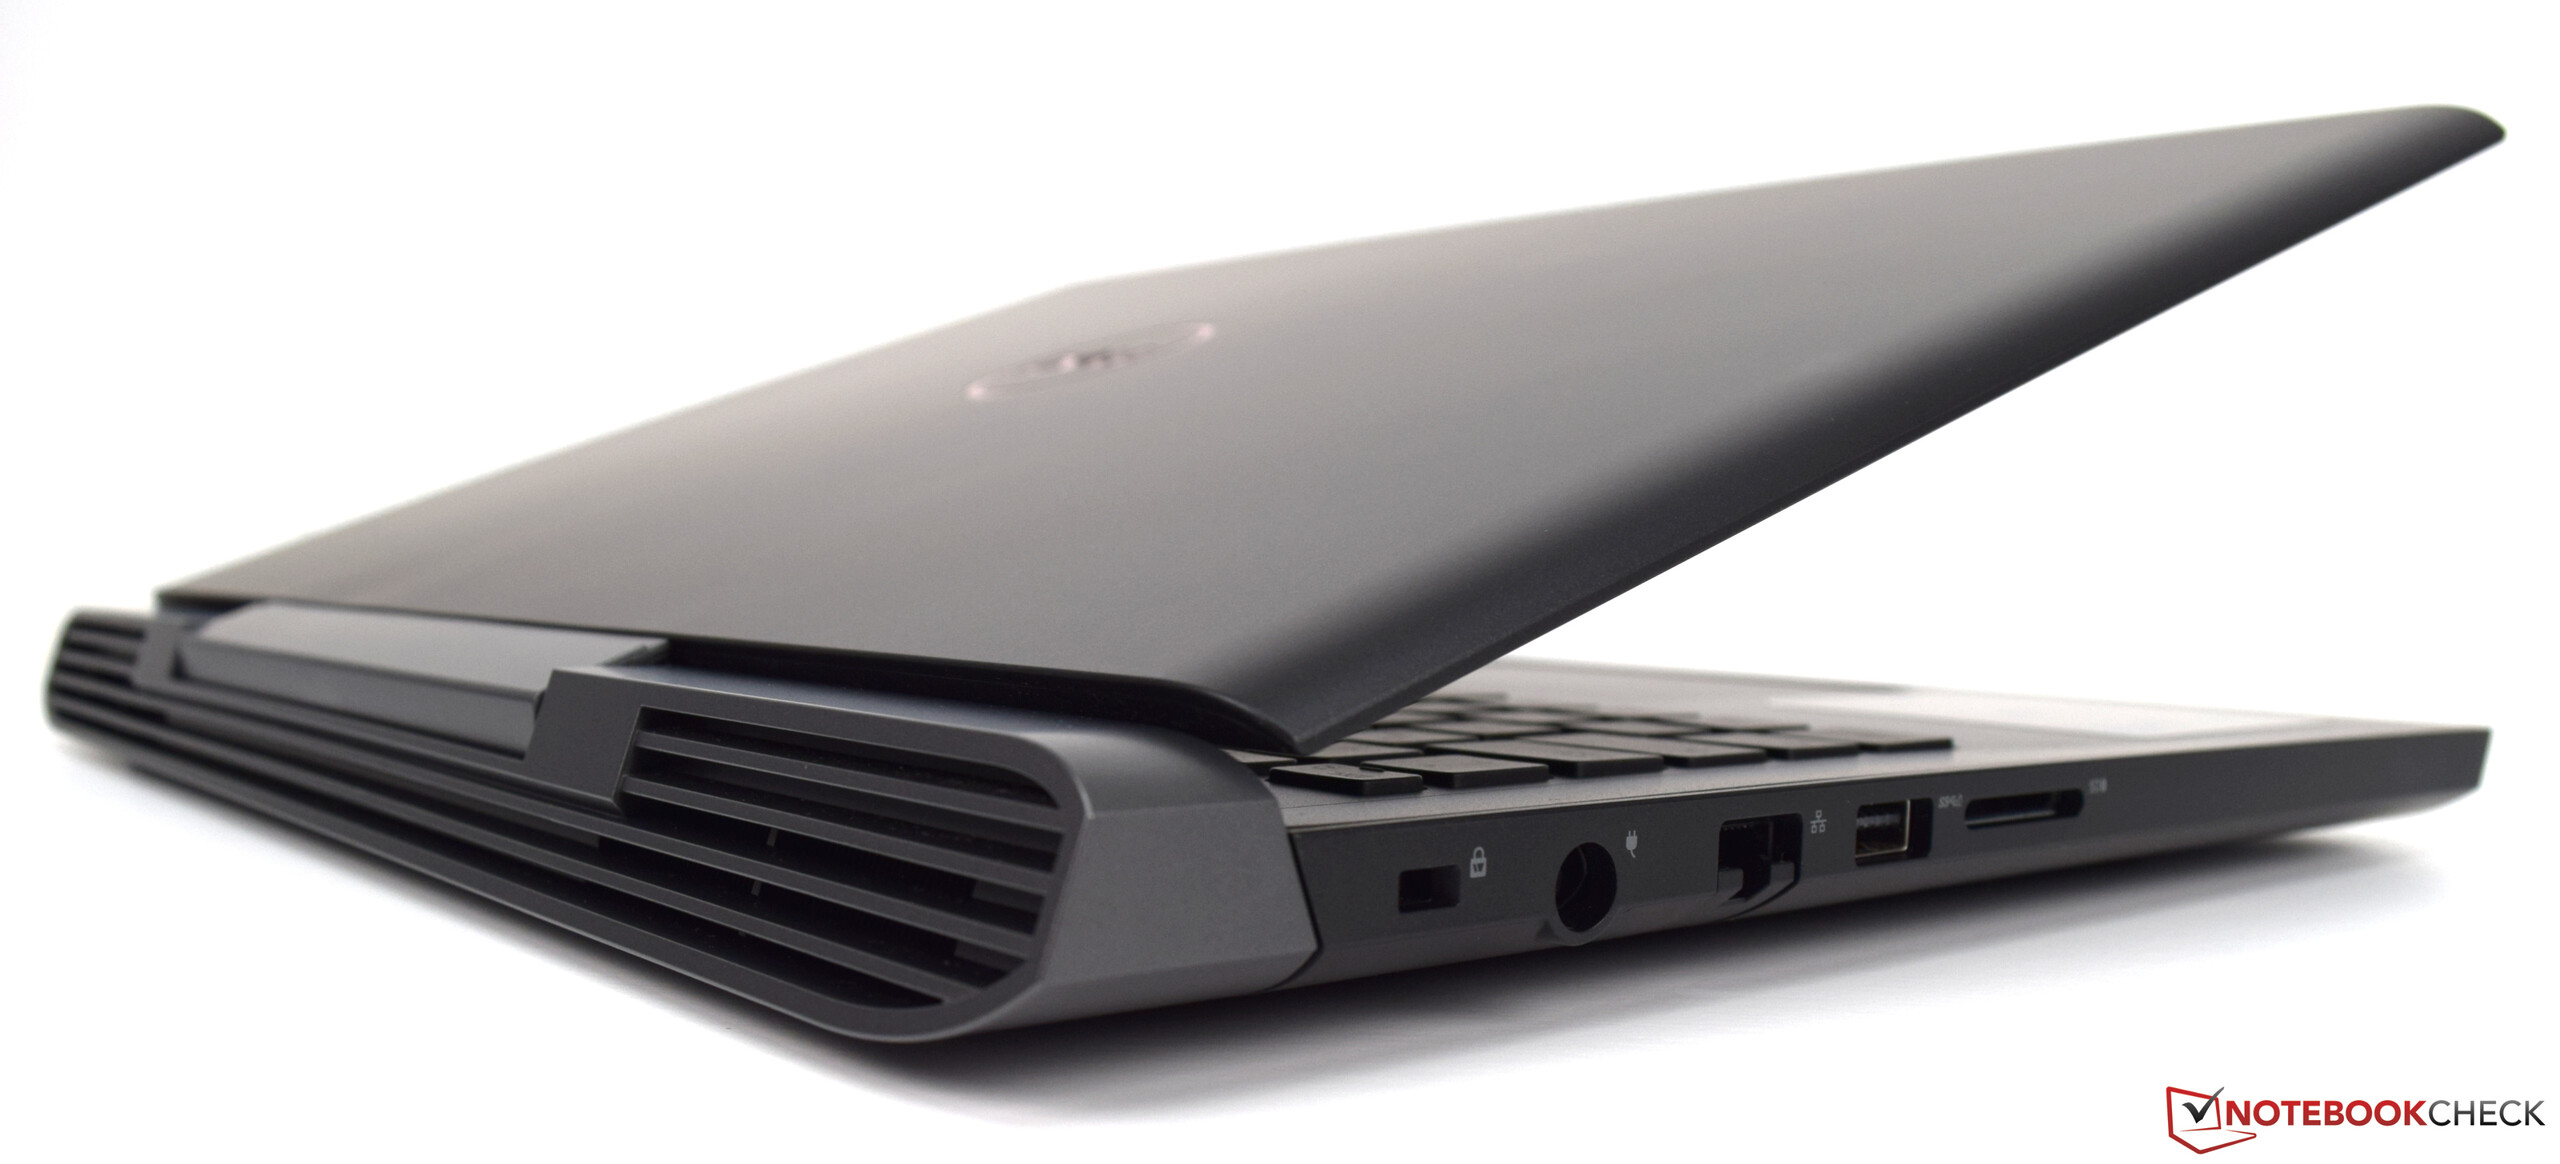
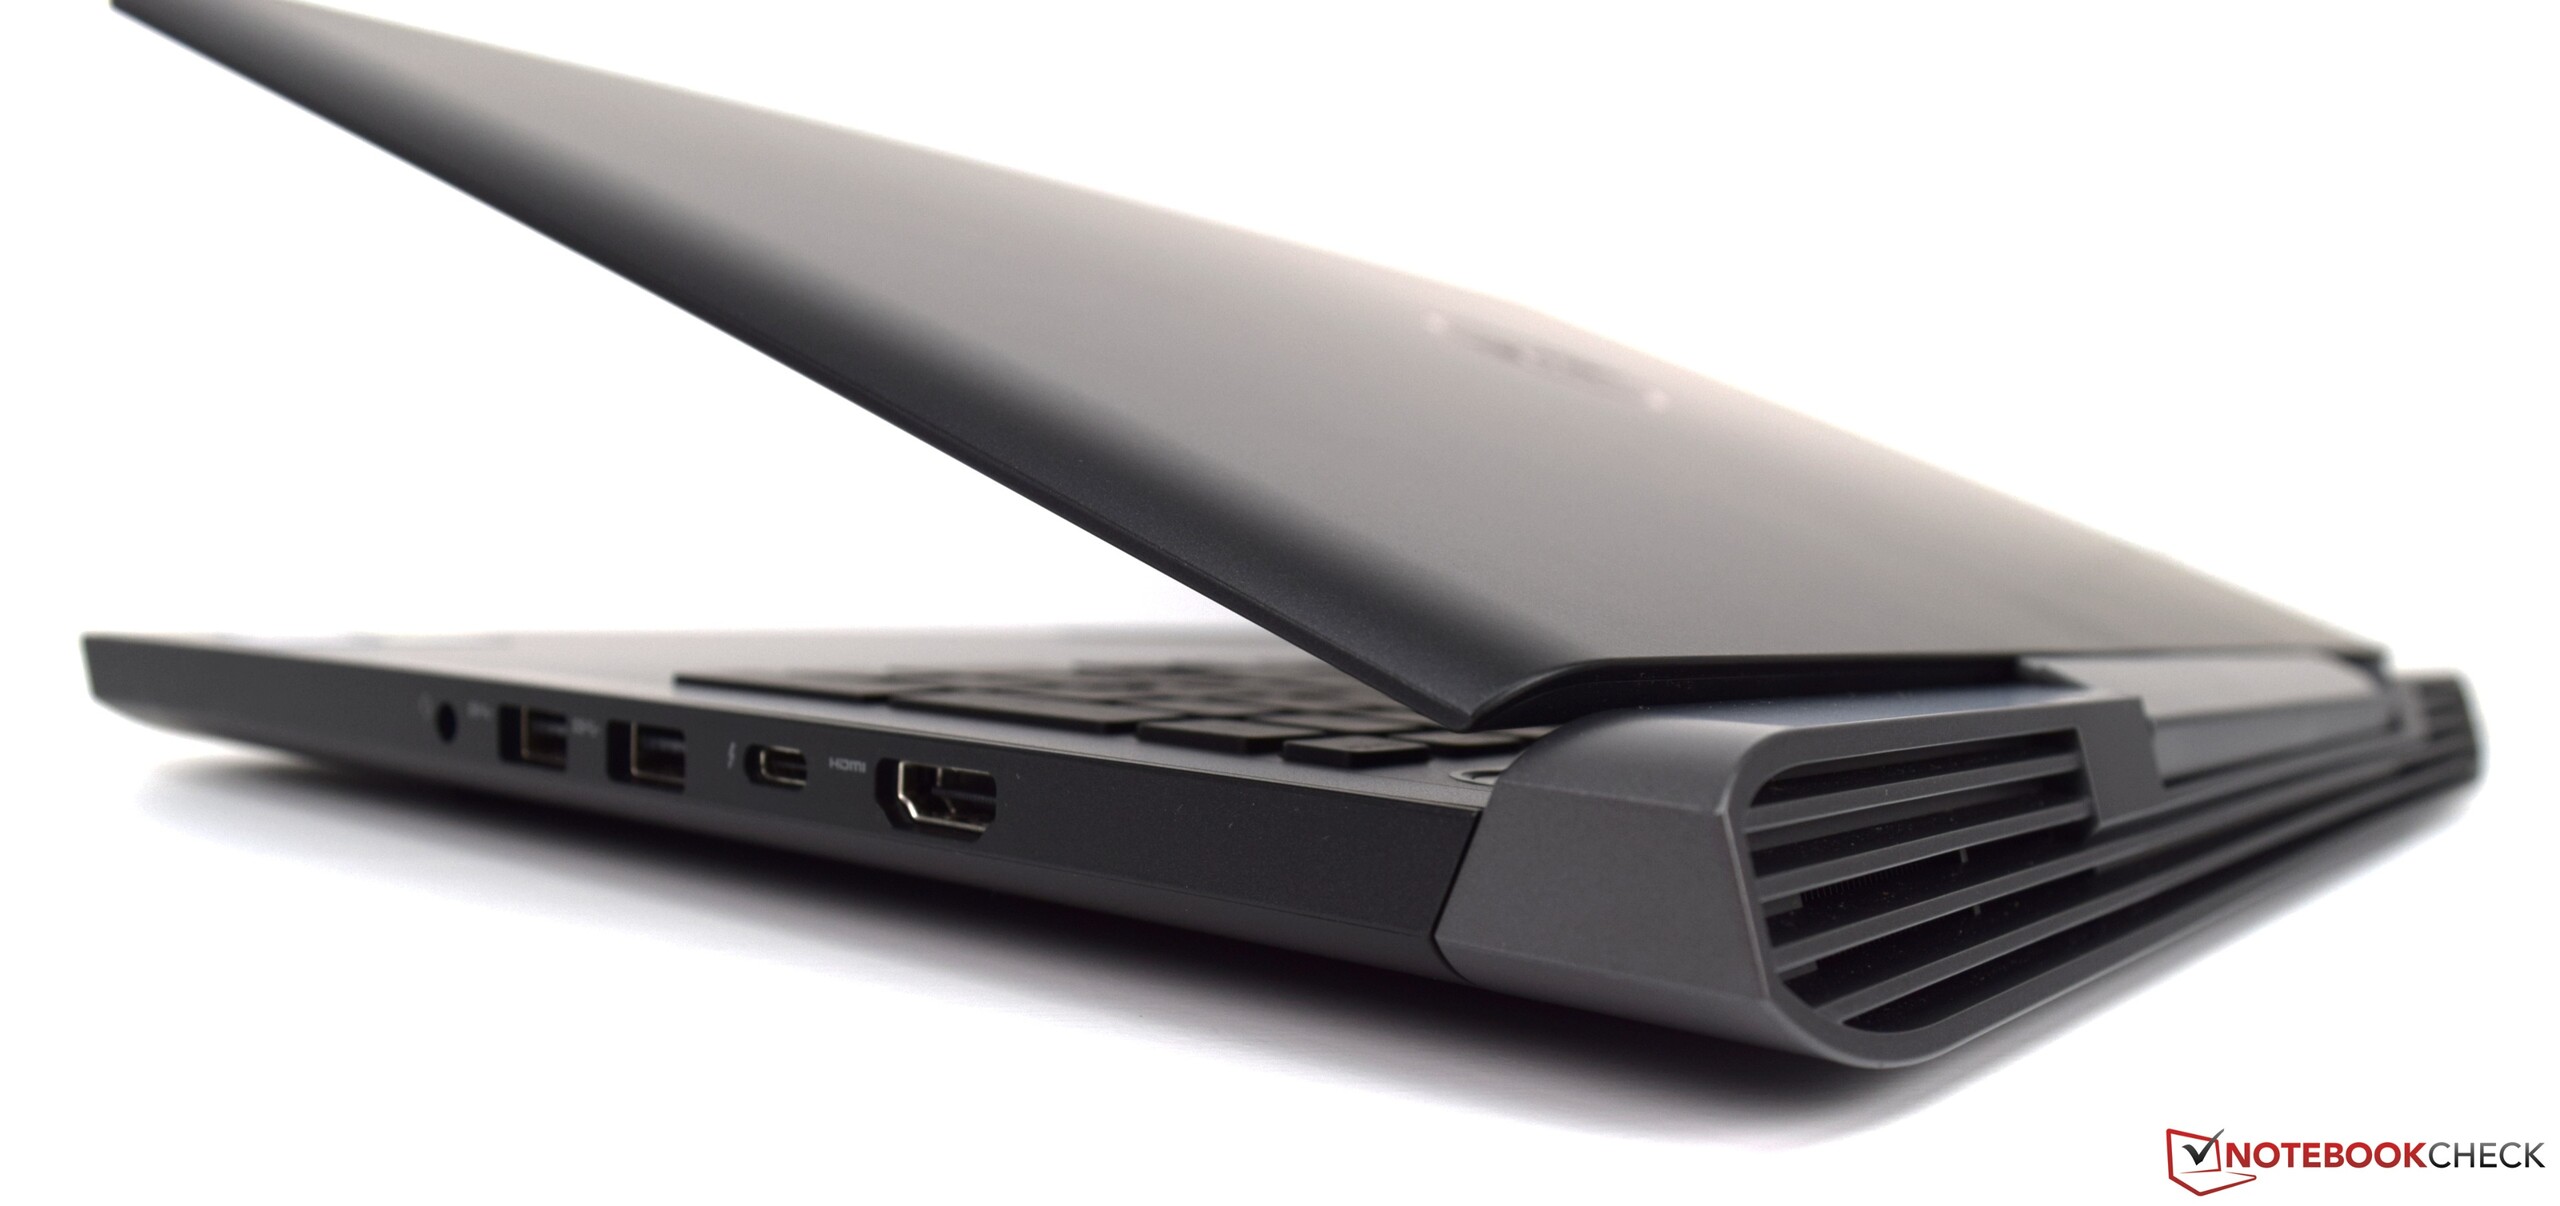
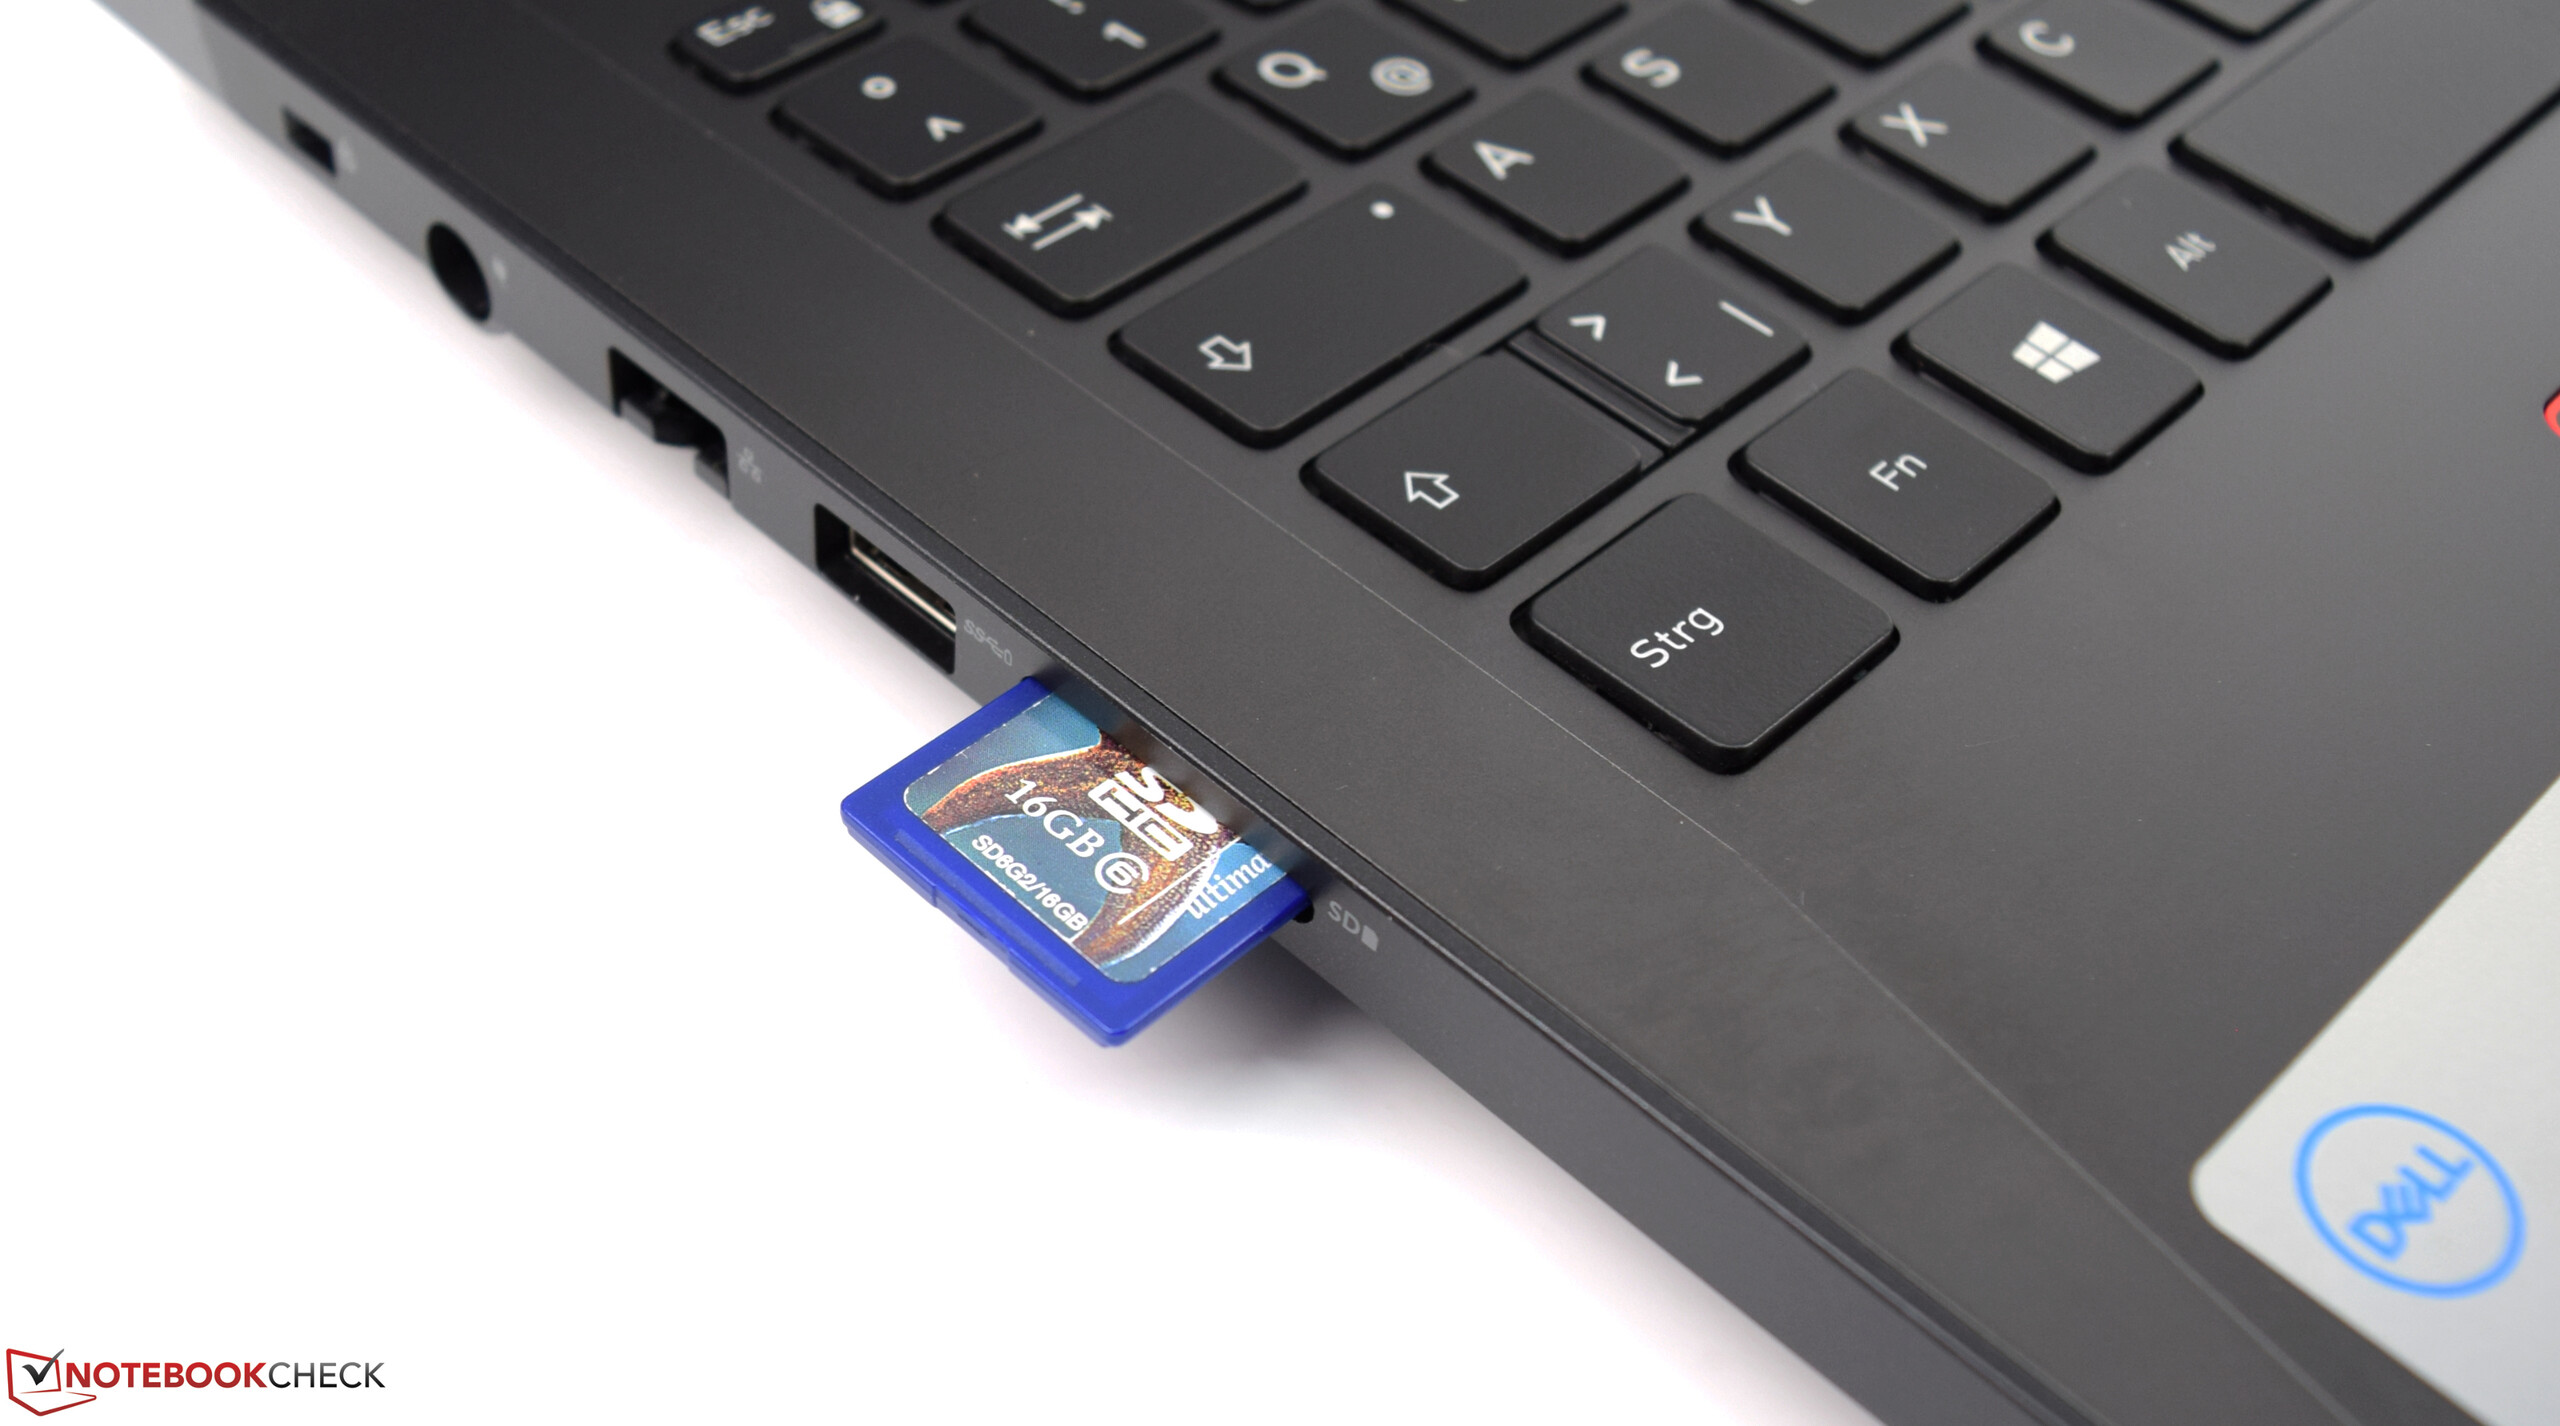
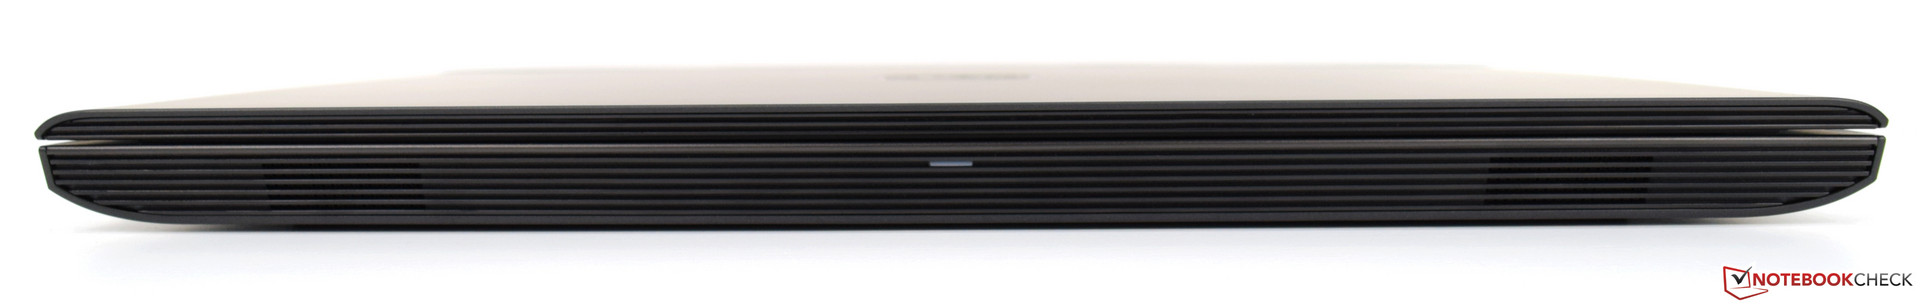
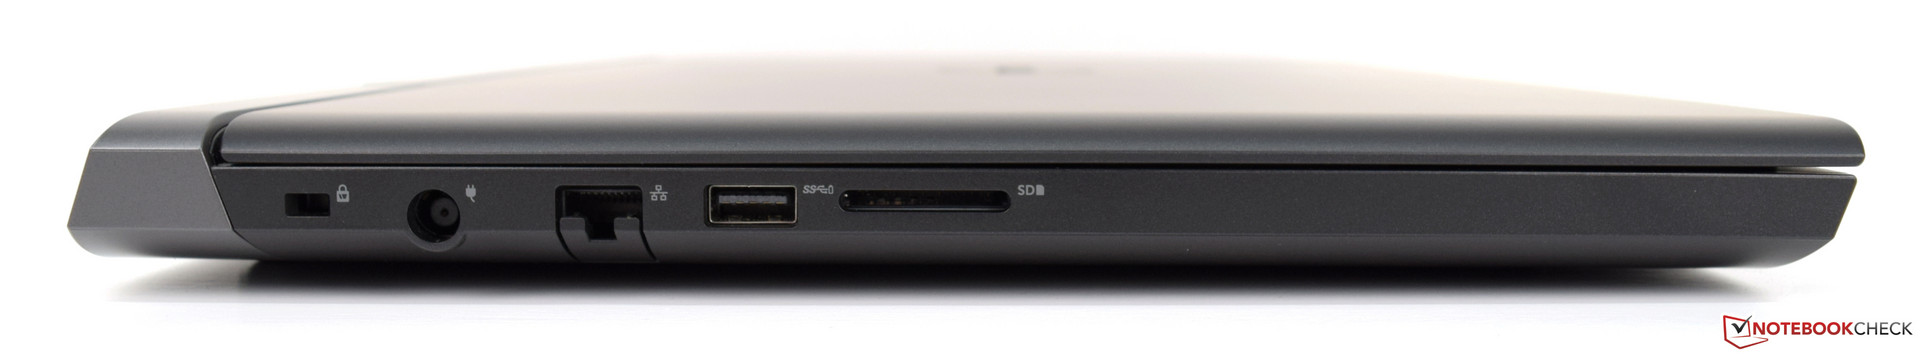
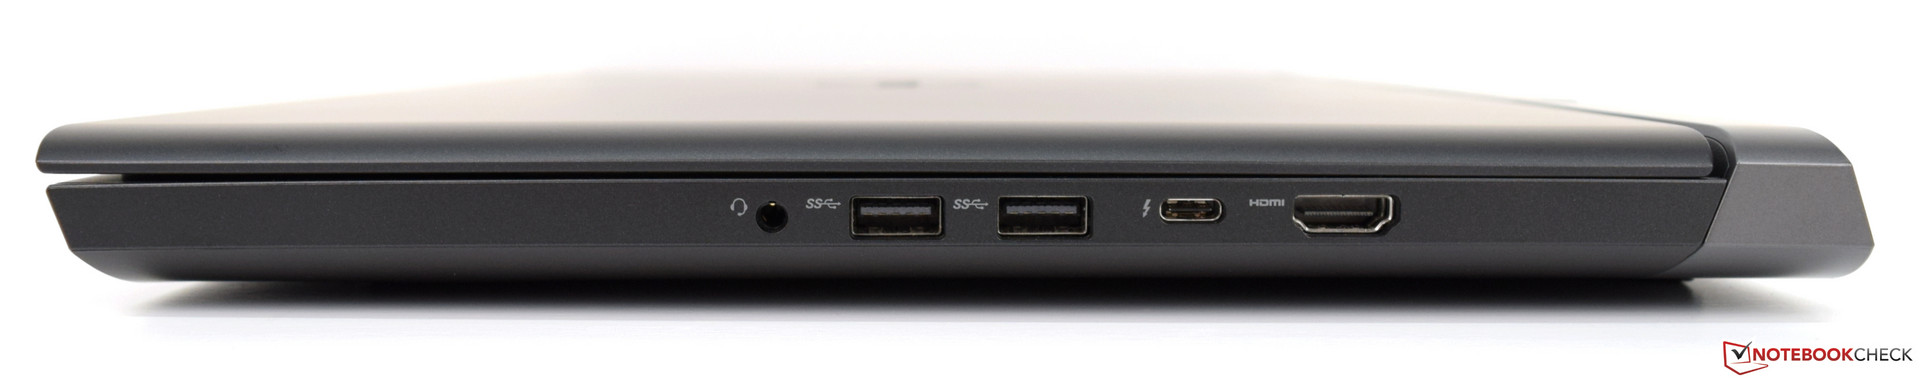
Wyposażenie w złącza zewnętrzne jest jednym z mocnych punktów omawianego laptopa. Posiada on trzy porty USB typu A oraz port USB typu C wspierający standard Thunderbolt 3. Jest też także wyjście HDMI 2.0. Rozmieszczenie złączy jest dobre - wszystkie znajdują się w tylnych częściach ścianek bocznych.
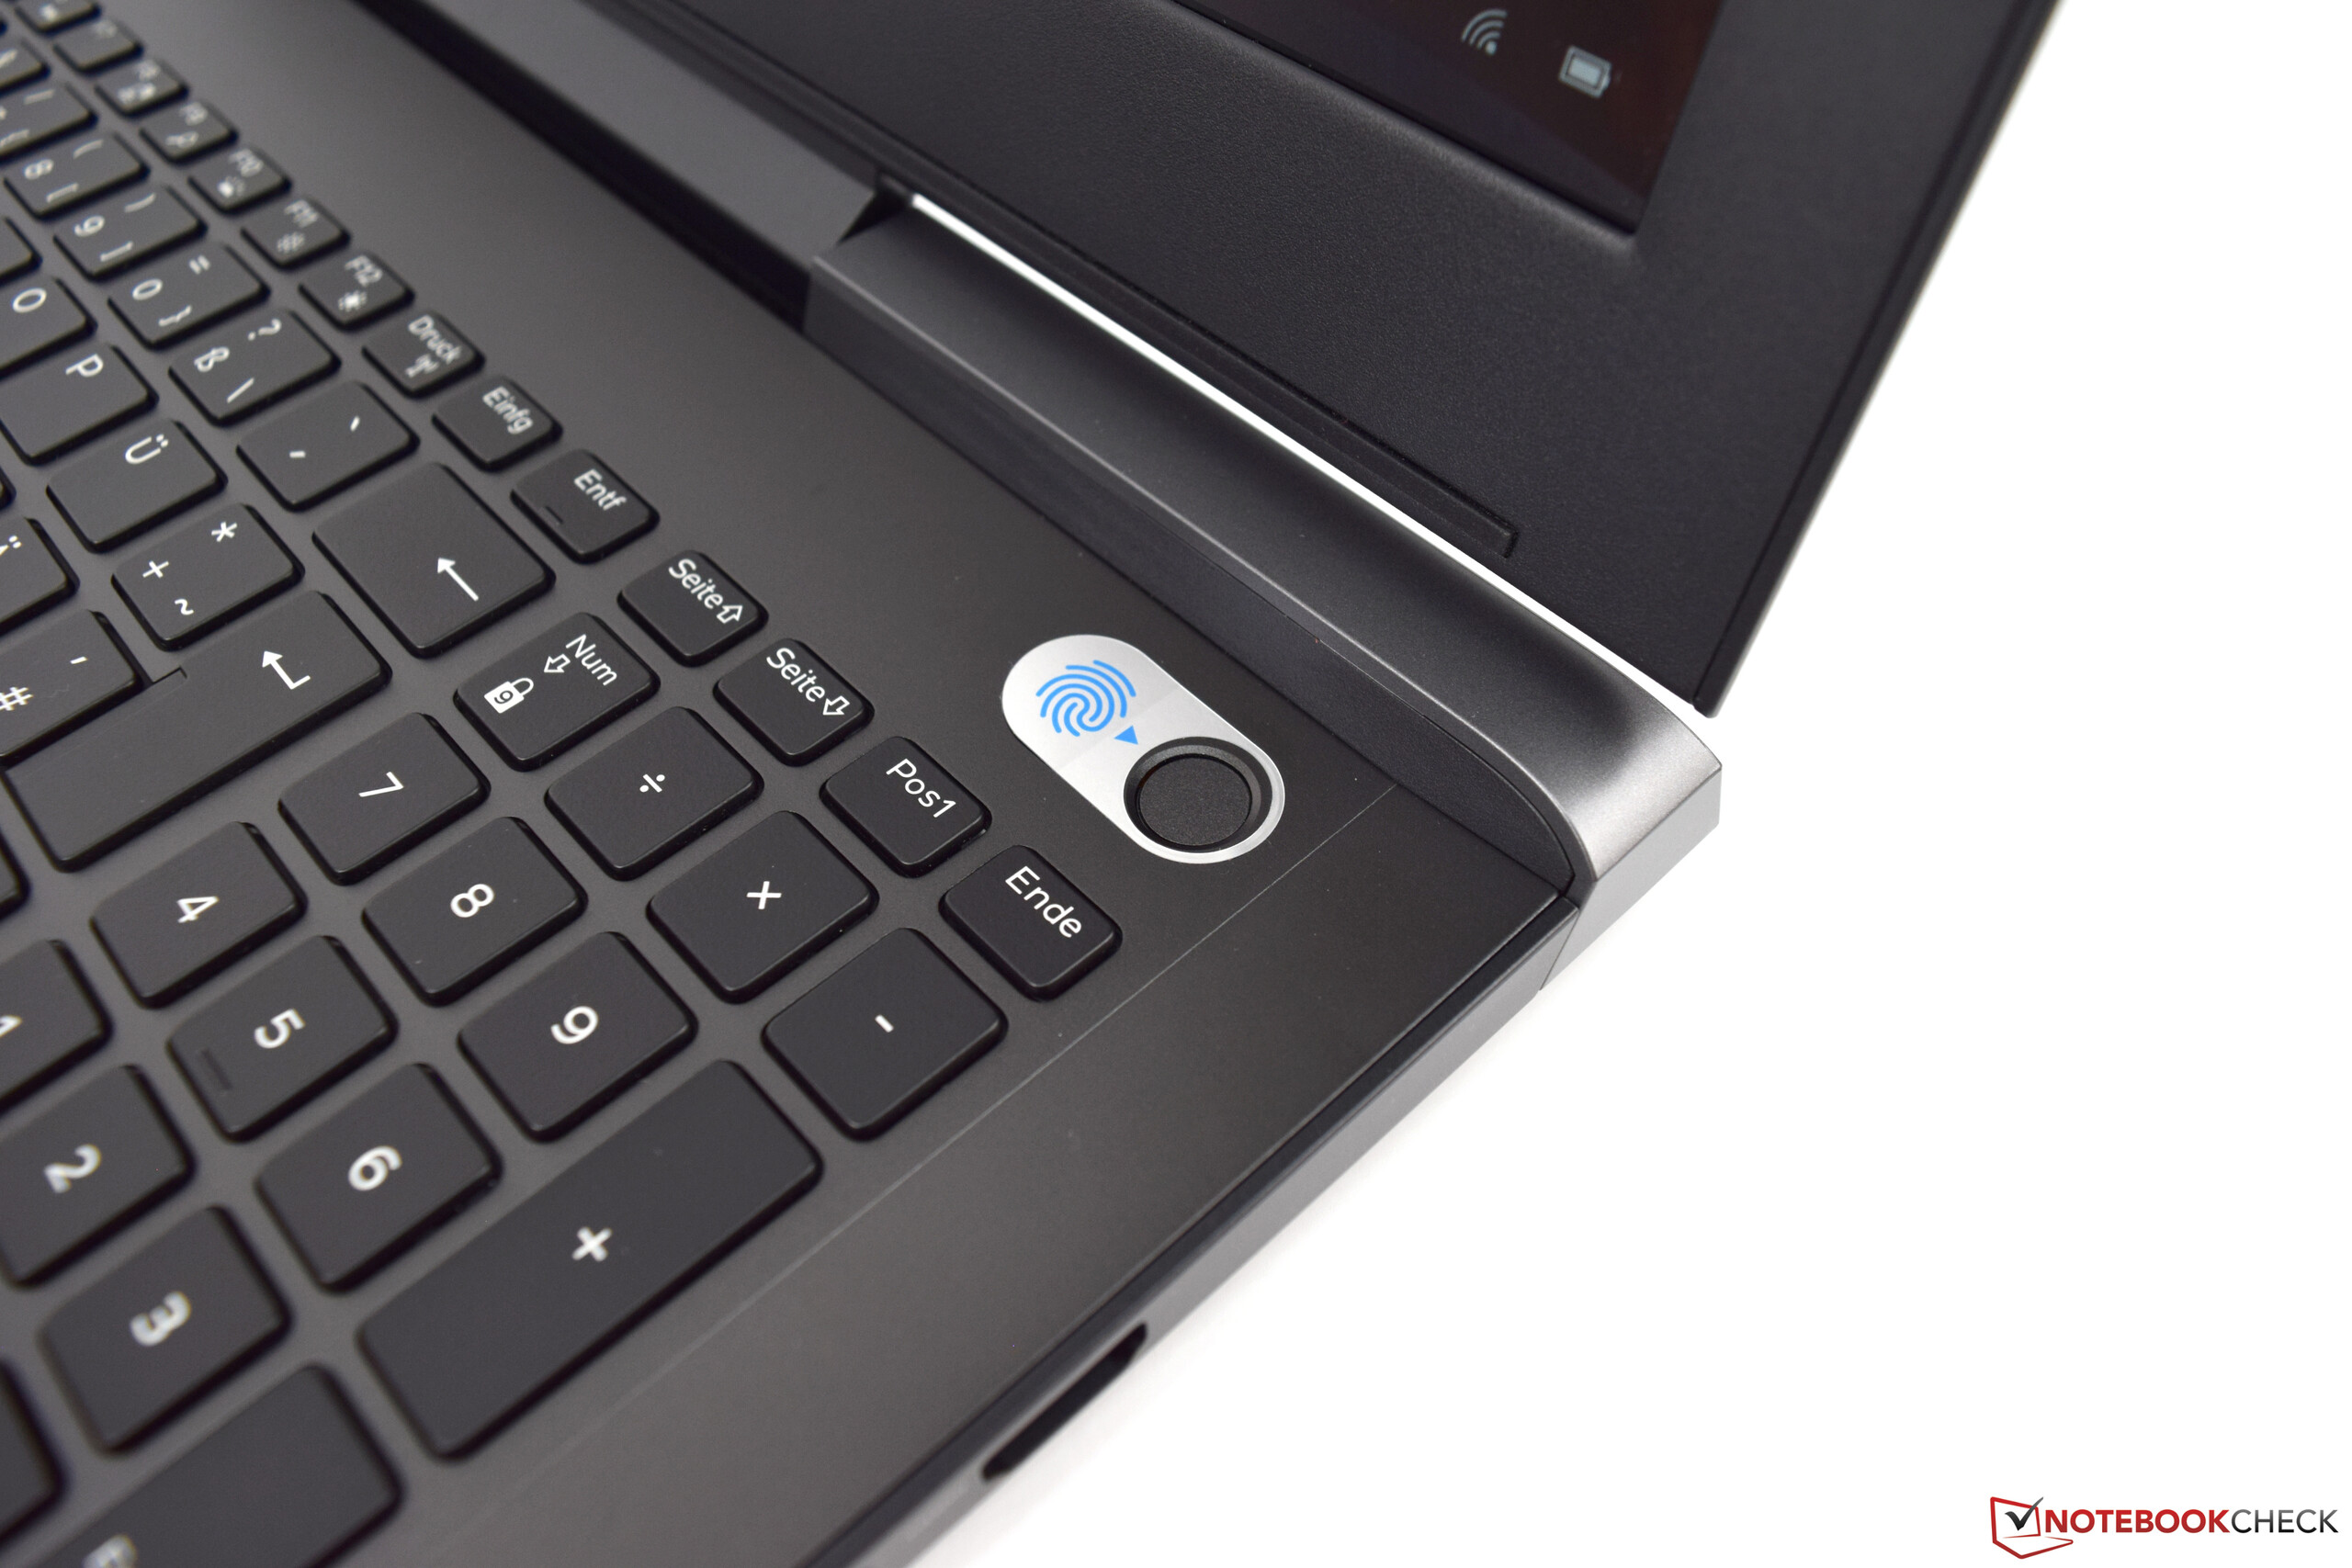
Jeżeli chodzi o rozwiązania służące bezpieczeństwu, Dell G5 15 5587 posiada moduł TPM oraz czytnik linii papilarnych zespolony z przyciskiem zasilania.
Osprzęt
G5 15 5587 posiada klawiaturę wyspową o sześciu rzędach klawiszy. Klawisze z bloku alfanumerycznego mierzą 15 x 15 mm. Skok klawiszy jest krótki. Klawisze są ciche... no, poza spacją. Ta ostatnia trochę klekocze. Klawiatura ma białe, dwustopniowe podświetlenie. Klawisze kierunkowe są nieco za małe, co wynika z takiego a nie innego układu klawiatury. Są one bardziej miękkie w działaniu, niż pozostałe klawisze.
Płytka dotykowa ma matową powierzchnię o wymiarach 10,5 x 8,1 cm. Zintegrowane przyciski mają krótki skok i cechują się cichym klikiem. Warto odnotować, że lewy przycisk był cichszy i bardziej miękki od prawego przy naciskaniu.
Obraz
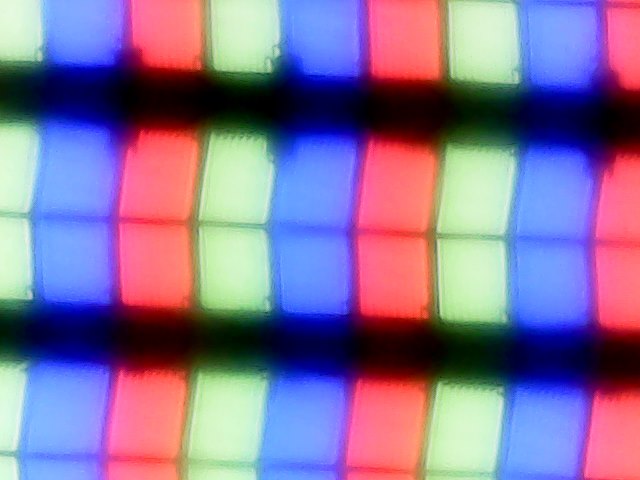
Dell G5 15 5587 został wyposażony w tę samą matrycę LG Display, z którą mieliśmy do czynienia w modelu Inspiron 7577. Ma ona przekątną 15,6" i rozdzielczość 1920 x 1080 pikseli. Jest to wyświetlacz typu IPS. W omawianym laptopie jest też stosowany ekran 4K.

| |||||||||||||||||||||||||
rozświetlenie: 87 %
na akumulatorze: 229 cd/m²
kontrast: 818:1 (czerń: 0.28 cd/m²)
ΔE ColorChecker Calman: 6.1 | ∀{0.5-29.43 Ø4.71}
calibrated: 6.12
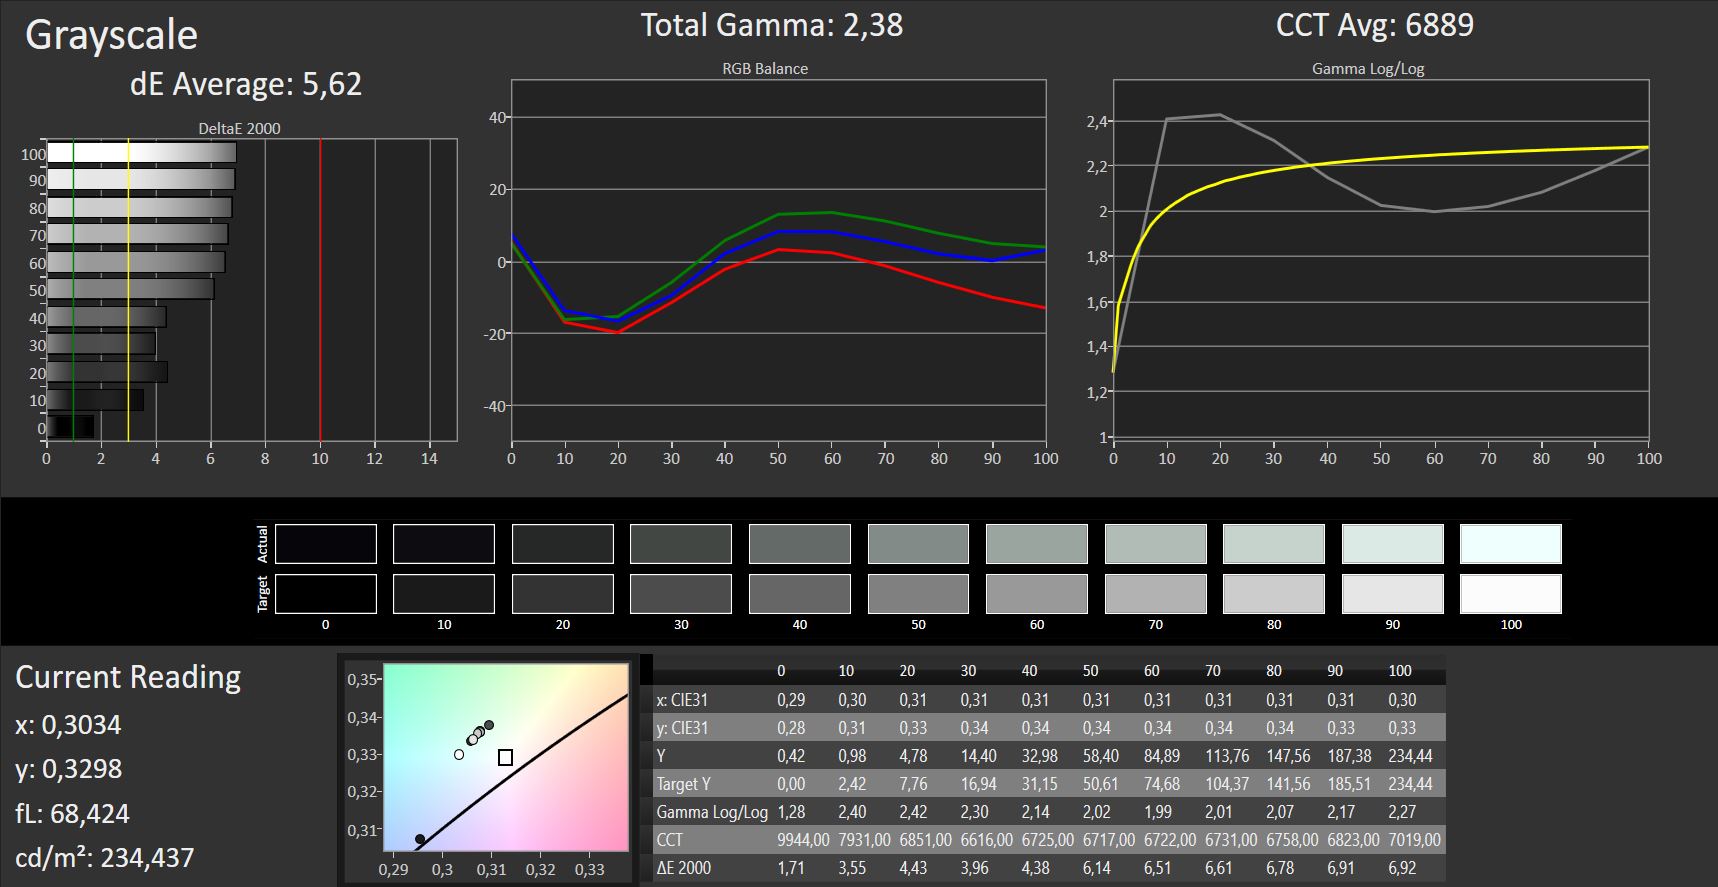
ΔE Greyscale Calman: 5.68 | ∀{0.09-98 Ø4.96}
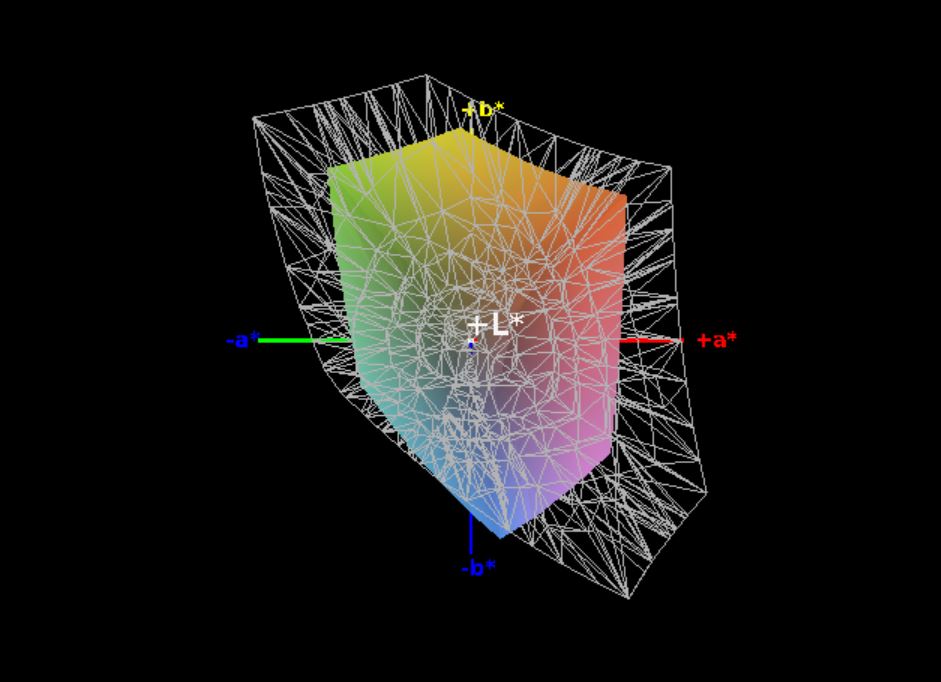
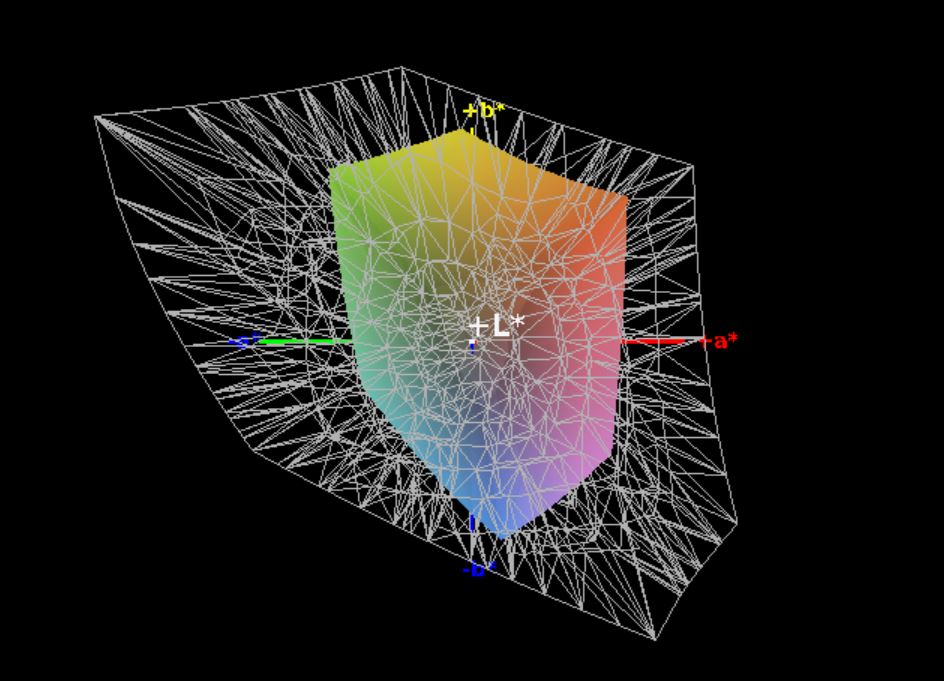
57% sRGB (Argyll 1.6.3 3D)
36% AdobeRGB 1998 (Argyll 1.6.3 3D)
39.47% AdobeRGB 1998 (Argyll 3D)
56.8% sRGB (Argyll 3D)
38.13% Display P3 (Argyll 3D)
Gamma: 2.4
CCT: 6989 K
Niestety średnia luminancja okazała się dość niska. Miała ona wartość 224 cd/m² a dla porównania w modelu Acer Nitro 5 Spin zmierzono średnio 332 cd/m².
Niestety pewne mankamenty objawiły się przy wyświetleniu jednolicie czarnego obrazu. W lewym dolnym narożniku było mianowicie widać niewielkie uloty światła. Poza tym czerń nie jest idealnej jakości - jest ona trochę zszarzała. Pozytywne jest natomiast to, że nie stwierdzono migotania PWM.
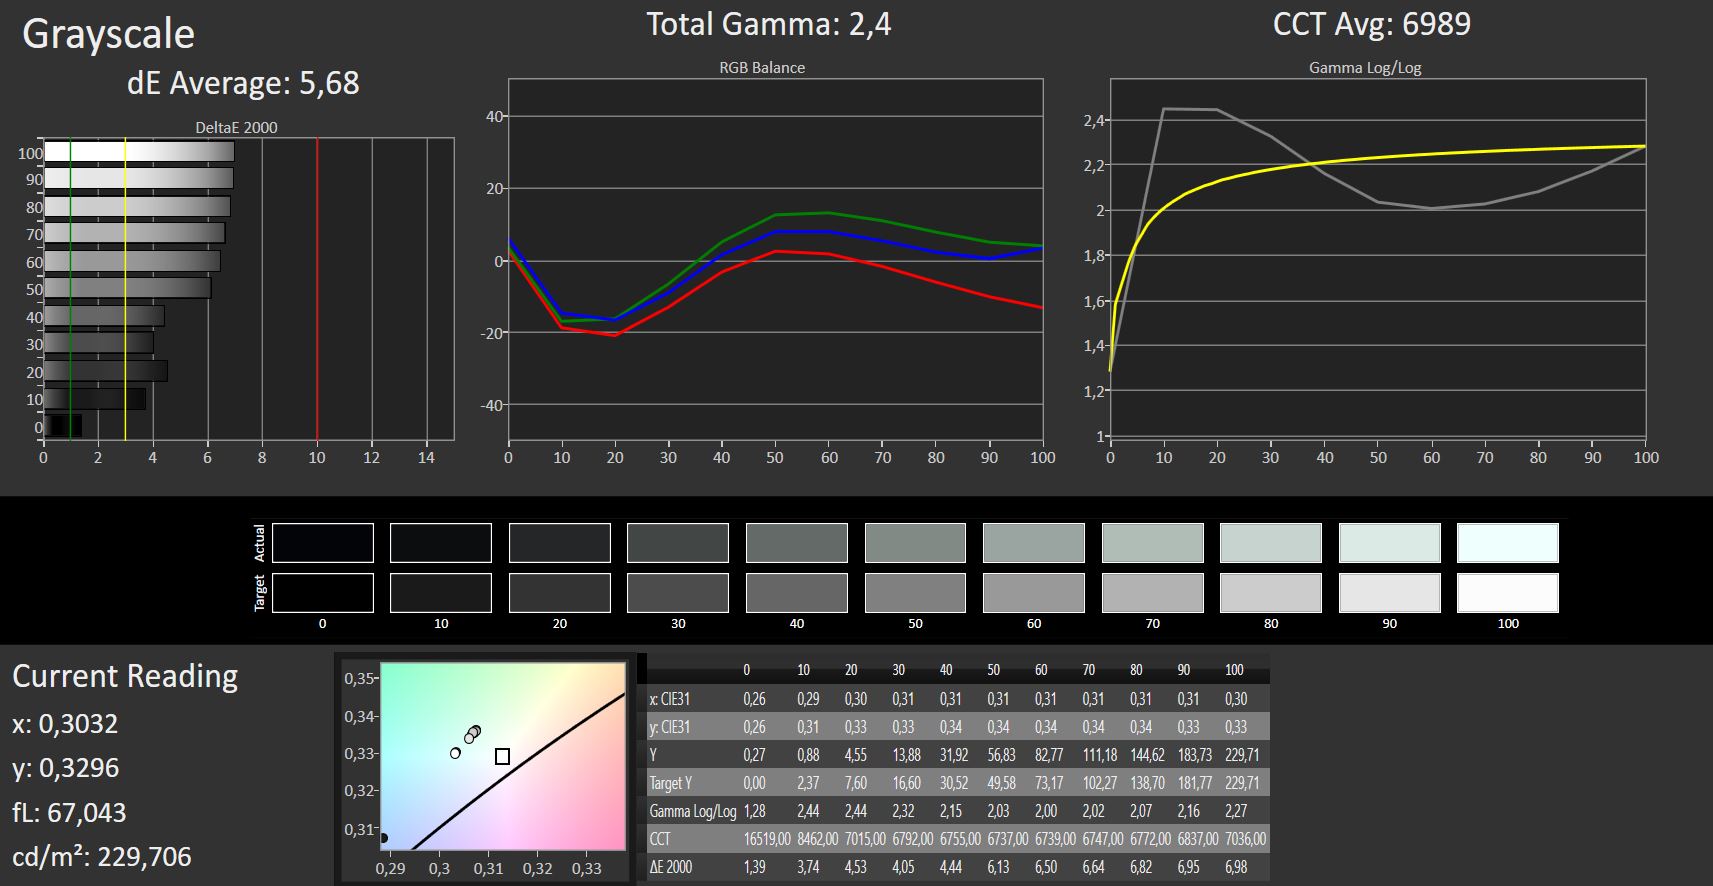
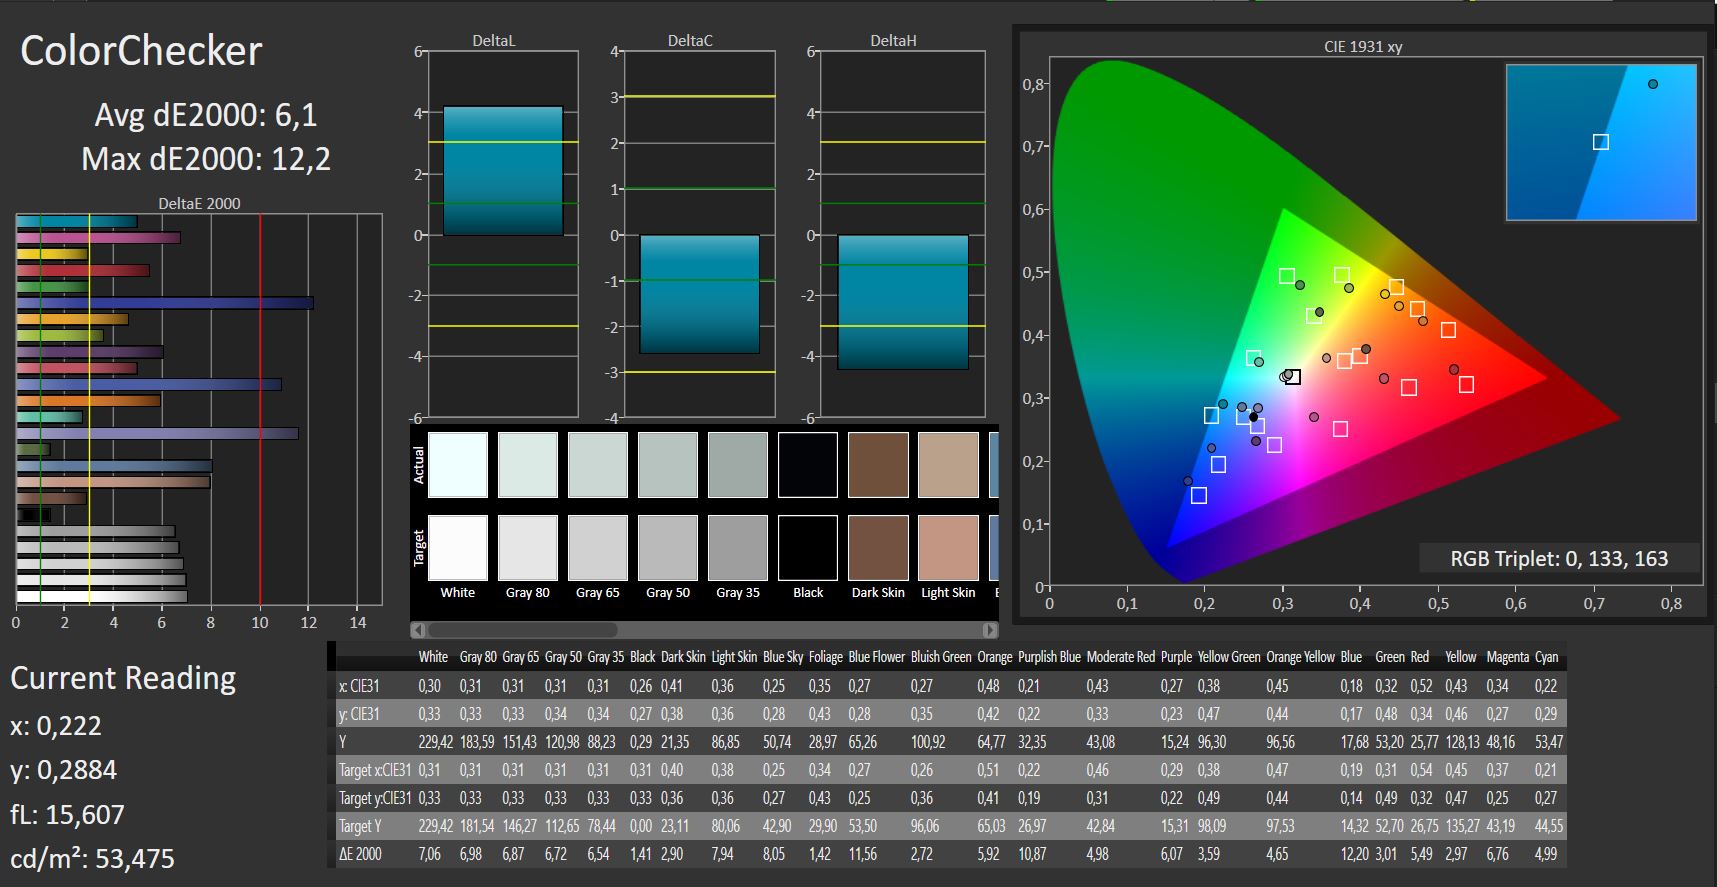
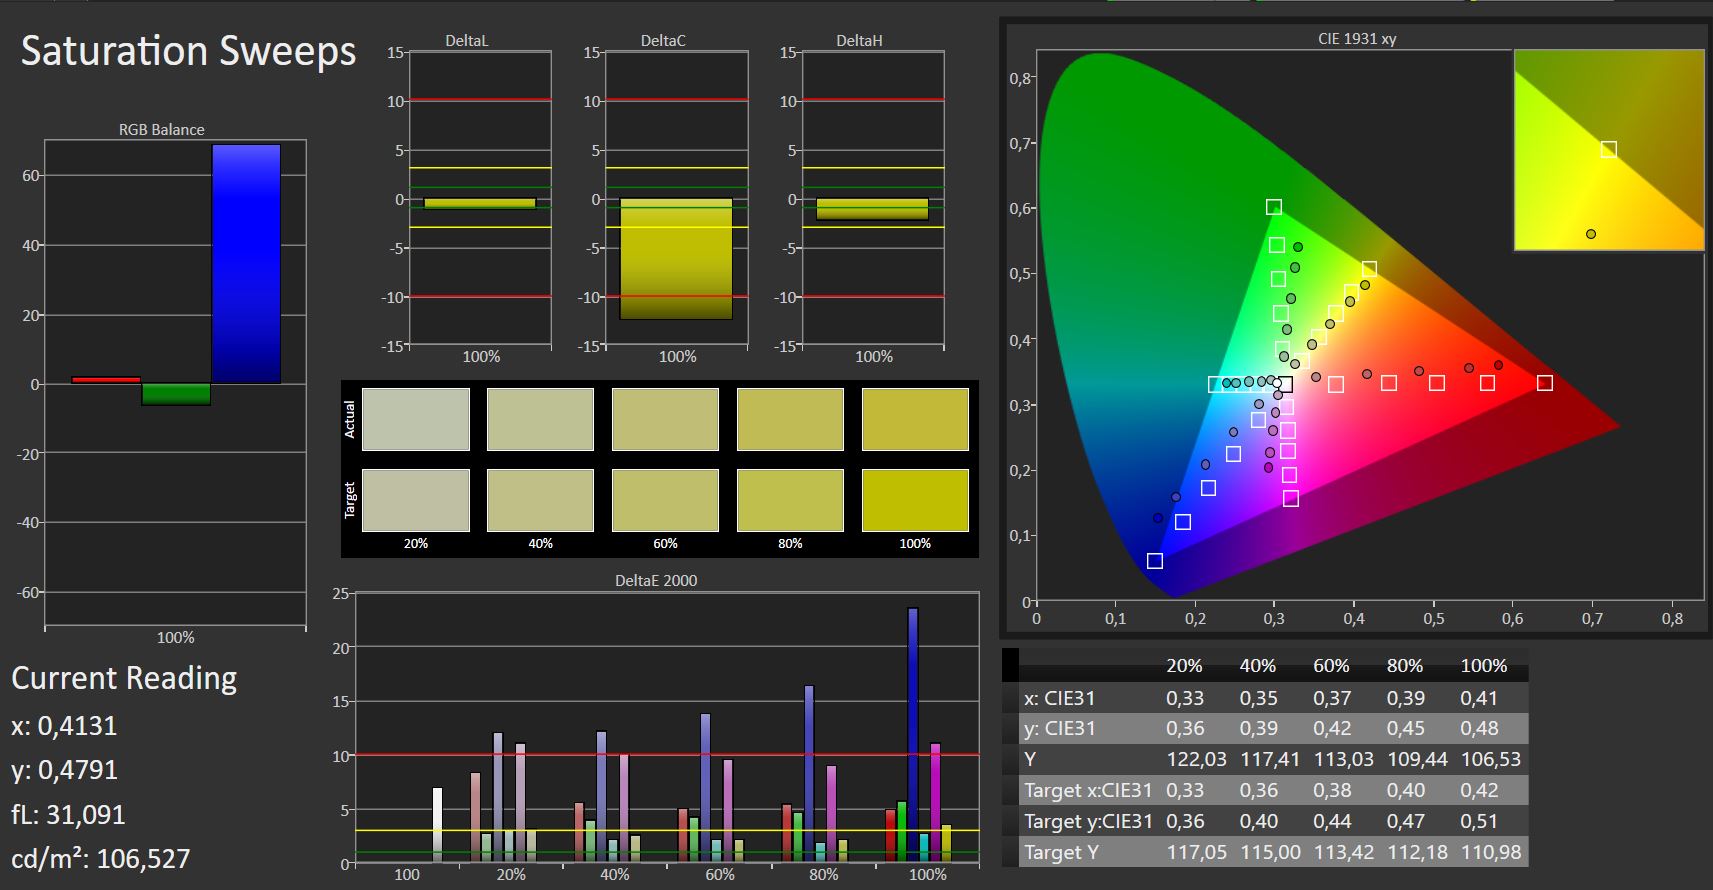


W stanie fabrycznym błędy dE2000 w odwzorowaniu kolorów były zbyt duże. Kalibracja matrycy przyniosła tylko minimalną poprawę w tym aspekcie. Również paleta barw nie jest imponująca. Pokrywa się ona z przestrzenią kolorów sRGB tylko w 57% a z przestrzenią Adobe RGB - w 36%. Dla porównania w laptopie Acer Nitro 5 Spin NP515-51 pokrycie przestrzeni sRGB to 93% a Adobe RGB - 60%.
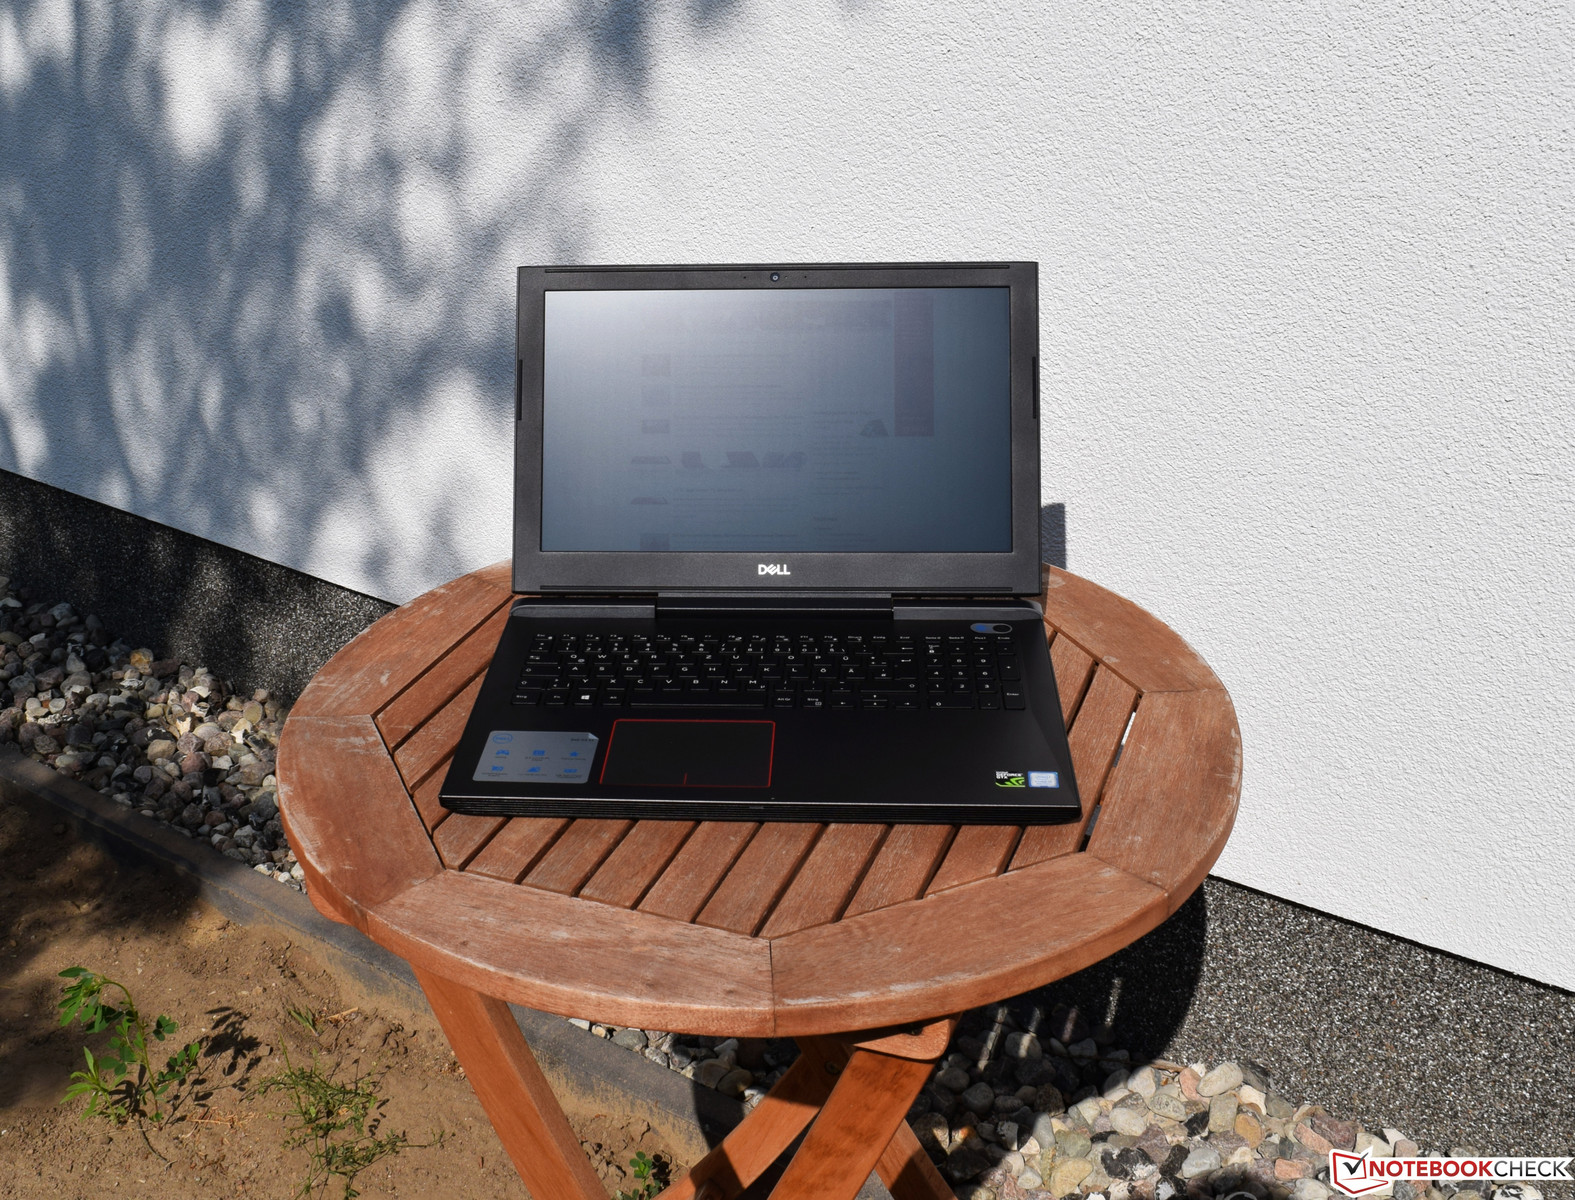
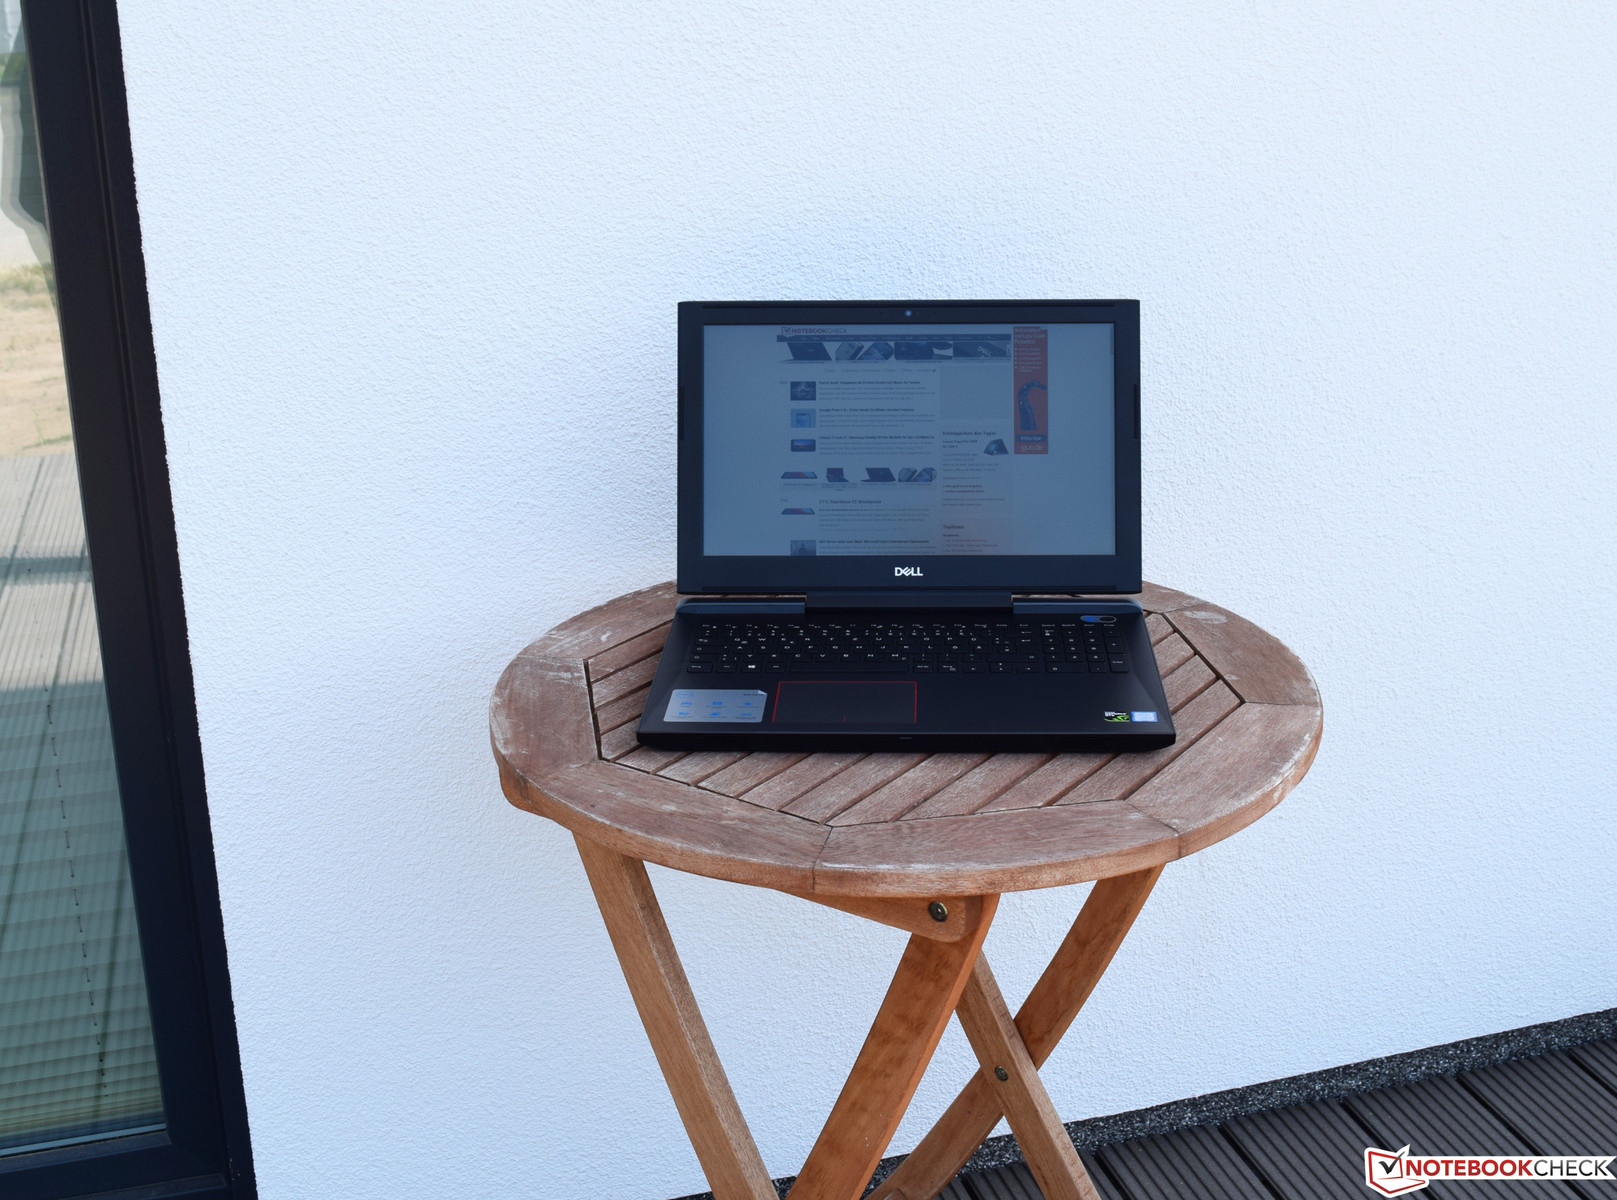
Mimo że matryca jest matowa, na dworze trzeba szukać miejsca w cieniu. Kiedy laptop znajdzie się w nasłonecznionym miejscy, jasność obrazu nie jest wystarczająca, by praca na komputerze była komfortowa.
Wyświetl czasy reakcji
| ↔ Czas reakcji od czerni do bieli | ||
|---|---|---|
| 24 ms ... wzrost ↗ i spadek ↘ łącznie | ↗ 14 ms wzrost | 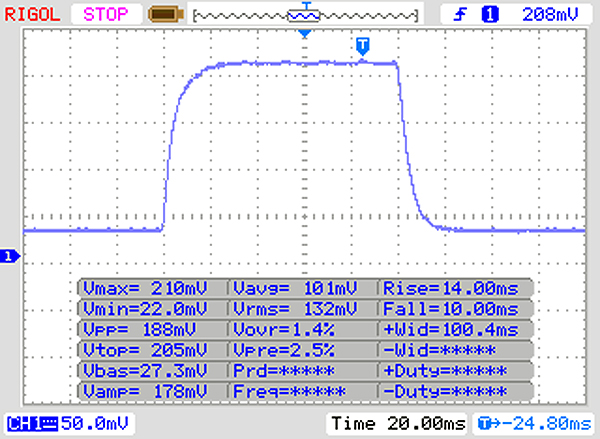 |
| ↘ 10 ms upadek | ||
| W naszych testach ekran wykazuje dobry współczynnik reakcji, ale może być zbyt wolny dla graczy rywalizujących ze sobą. Dla porównania, wszystkie testowane urządzenia wahają się od 0.1 (minimum) do 240 (maksimum) ms. » 54 % wszystkich urządzeń jest lepszych. Oznacza to, że zmierzony czas reakcji jest gorszy od średniej wszystkich testowanych urządzeń (19.8 ms). | ||
| ↔ Czas reakcji 50% szarości do 80% szarości | ||
| 33 ms ... wzrost ↗ i spadek ↘ łącznie | ↗ 16 ms wzrost | 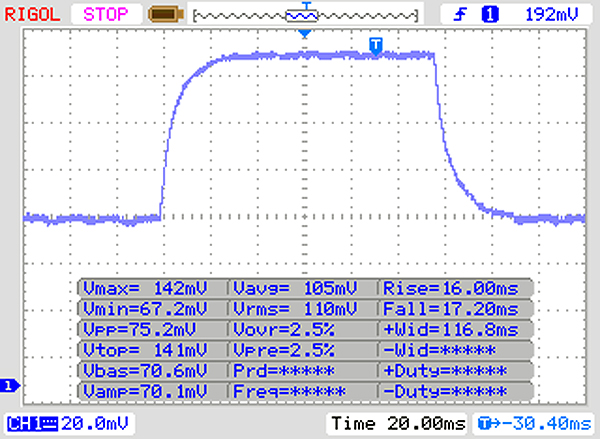 |
| ↘ 17 ms upadek | ||
| W naszych testach ekran wykazuje powolne tempo reakcji, co będzie niezadowalające dla graczy. Dla porównania, wszystkie testowane urządzenia wahają się od 0.165 (minimum) do 636 (maksimum) ms. » 45 % wszystkich urządzeń jest lepszych. Oznacza to, że zmierzony czas reakcji jest zbliżony do średniej wszystkich testowanych urządzeń (31 ms). | ||
Migotanie ekranu / PWM (modulacja szerokości impulsu)
| Migotanie ekranu/nie wykryto PWM | 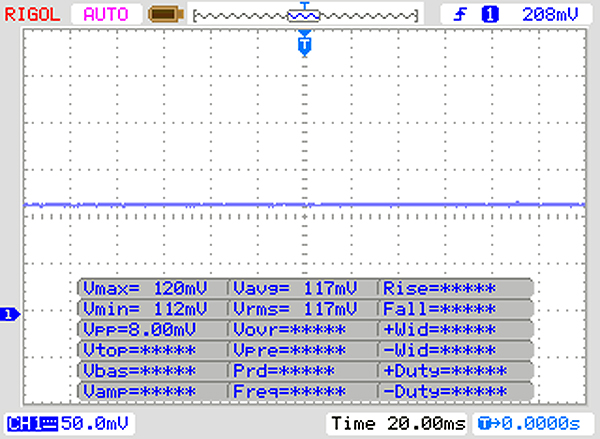 | ||
Dla porównania: 52 % wszystkich testowanych urządzeń nie używa PWM do przyciemniania wyświetlacza. Jeśli wykryto PWM, zmierzono średnio 7757 (minimum: 5 - maksimum: 343500) Hz. | |||
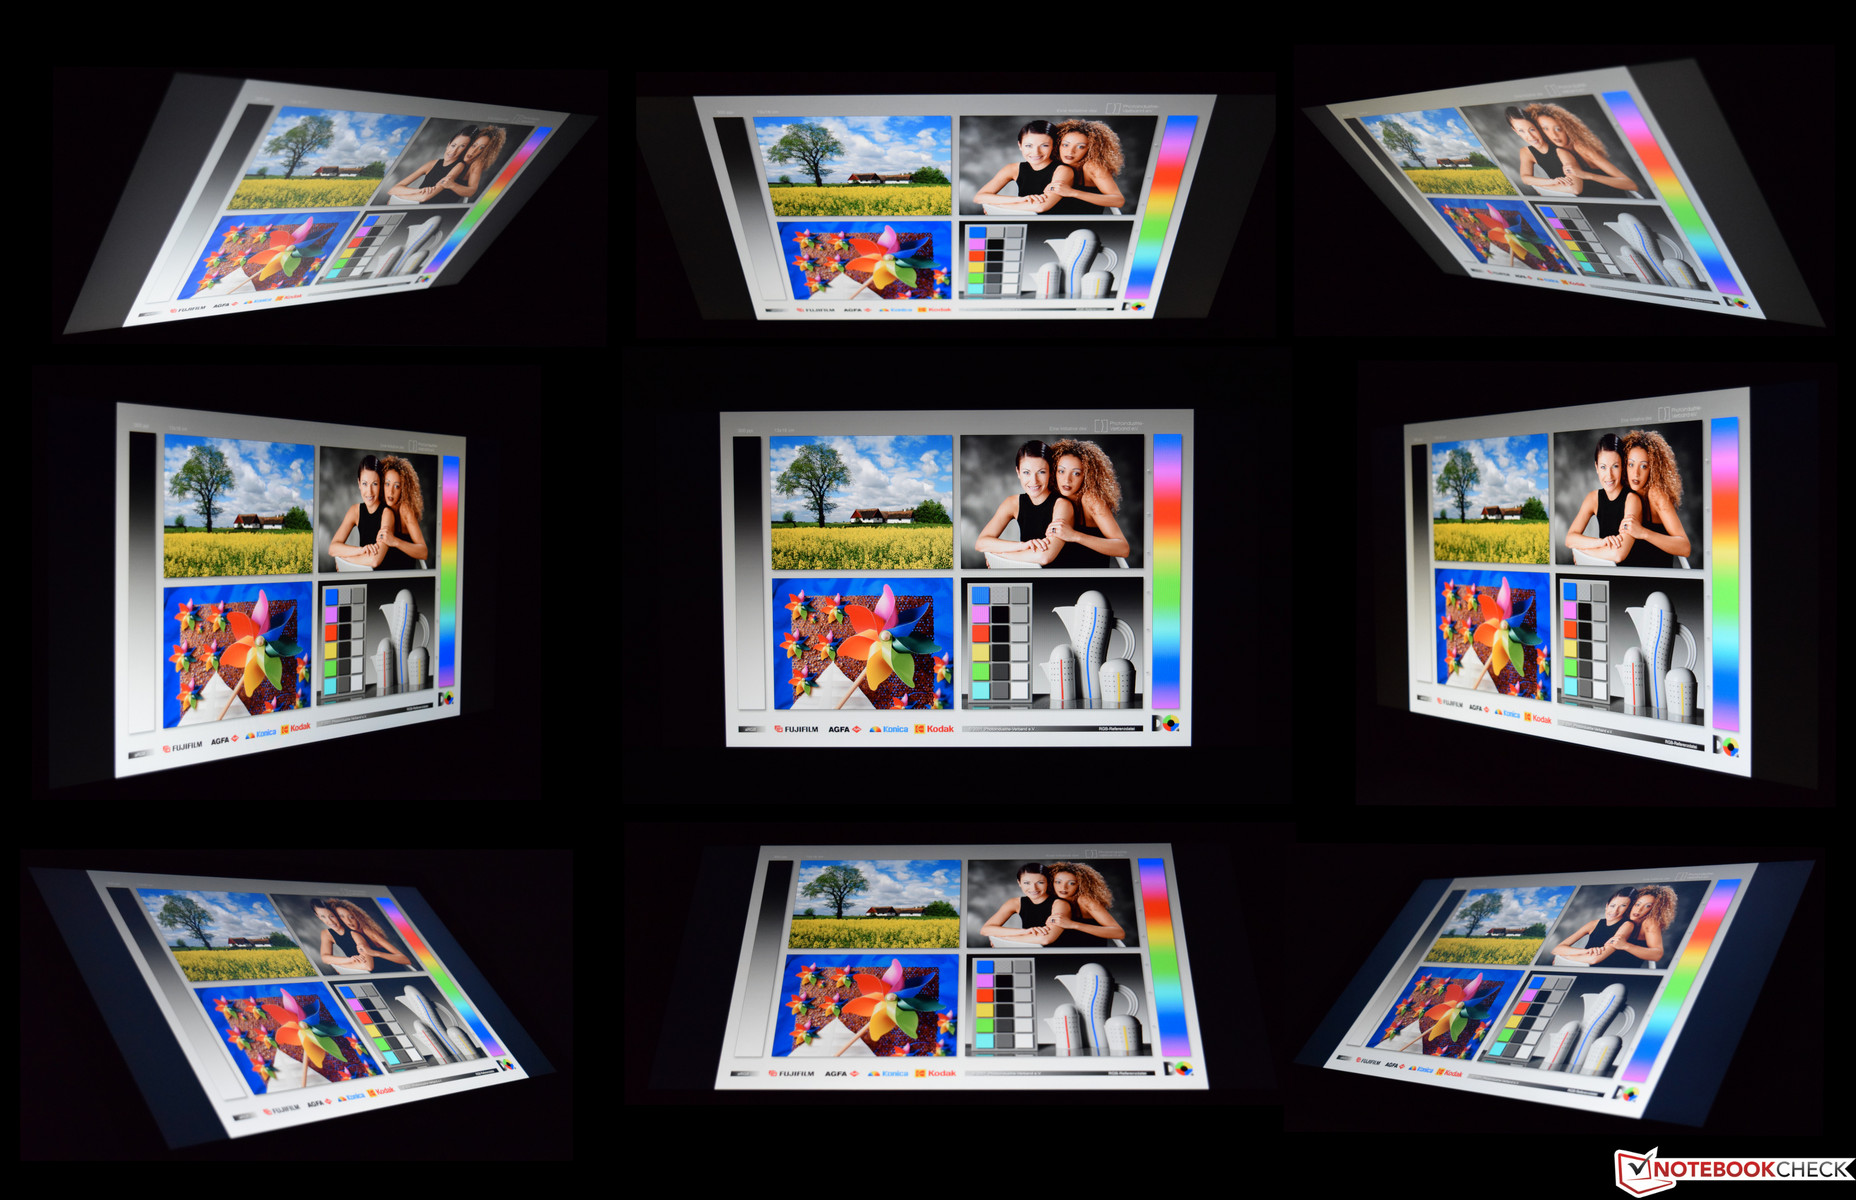
Kąty widzenia zasługują na pochwałę, bo są bardzo szerokie. Nawet pod ostrym kątem w obrazie kontrolnym nie było widać istotnych przekłamań kolorów.
Osiągi
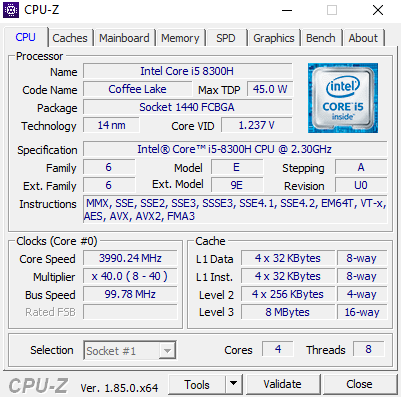
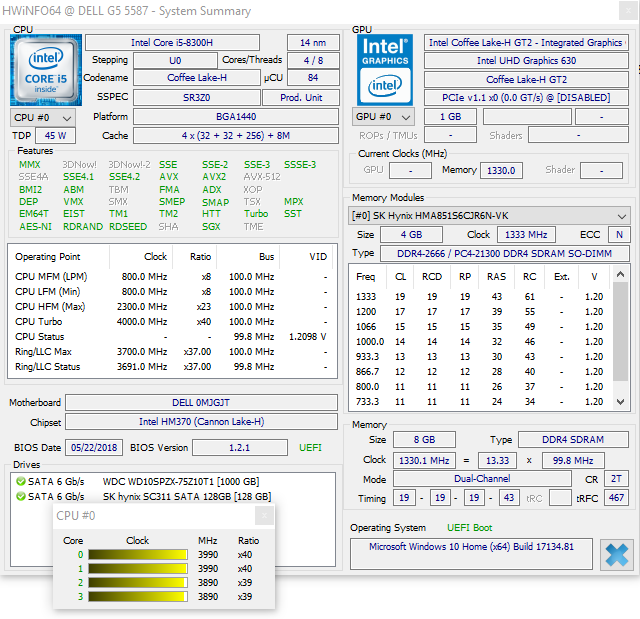
Testowany Inspiron 5587 otrzymał czterordzeniowy procesor Intel Core i5-8300H oraz kartę grafiki GeForce GTX 1060 Max-Q. Omawiany laptop może być także wyposażony w 6-rdzeniowy procesor Core i7-8750H. Nie przewidziano wydajniejszej karty grafiki od tej z testowanego egzemplarza [można natomiast wybrać wersję z kartą GTX 1050 lub GTX 1050 Ti - przyp. tłum.].
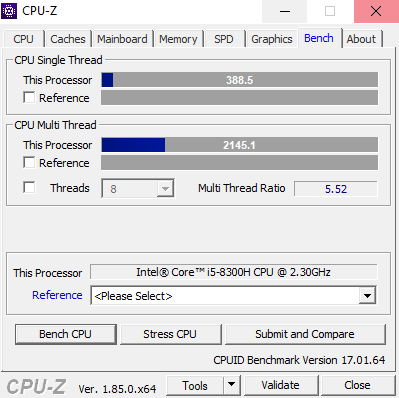
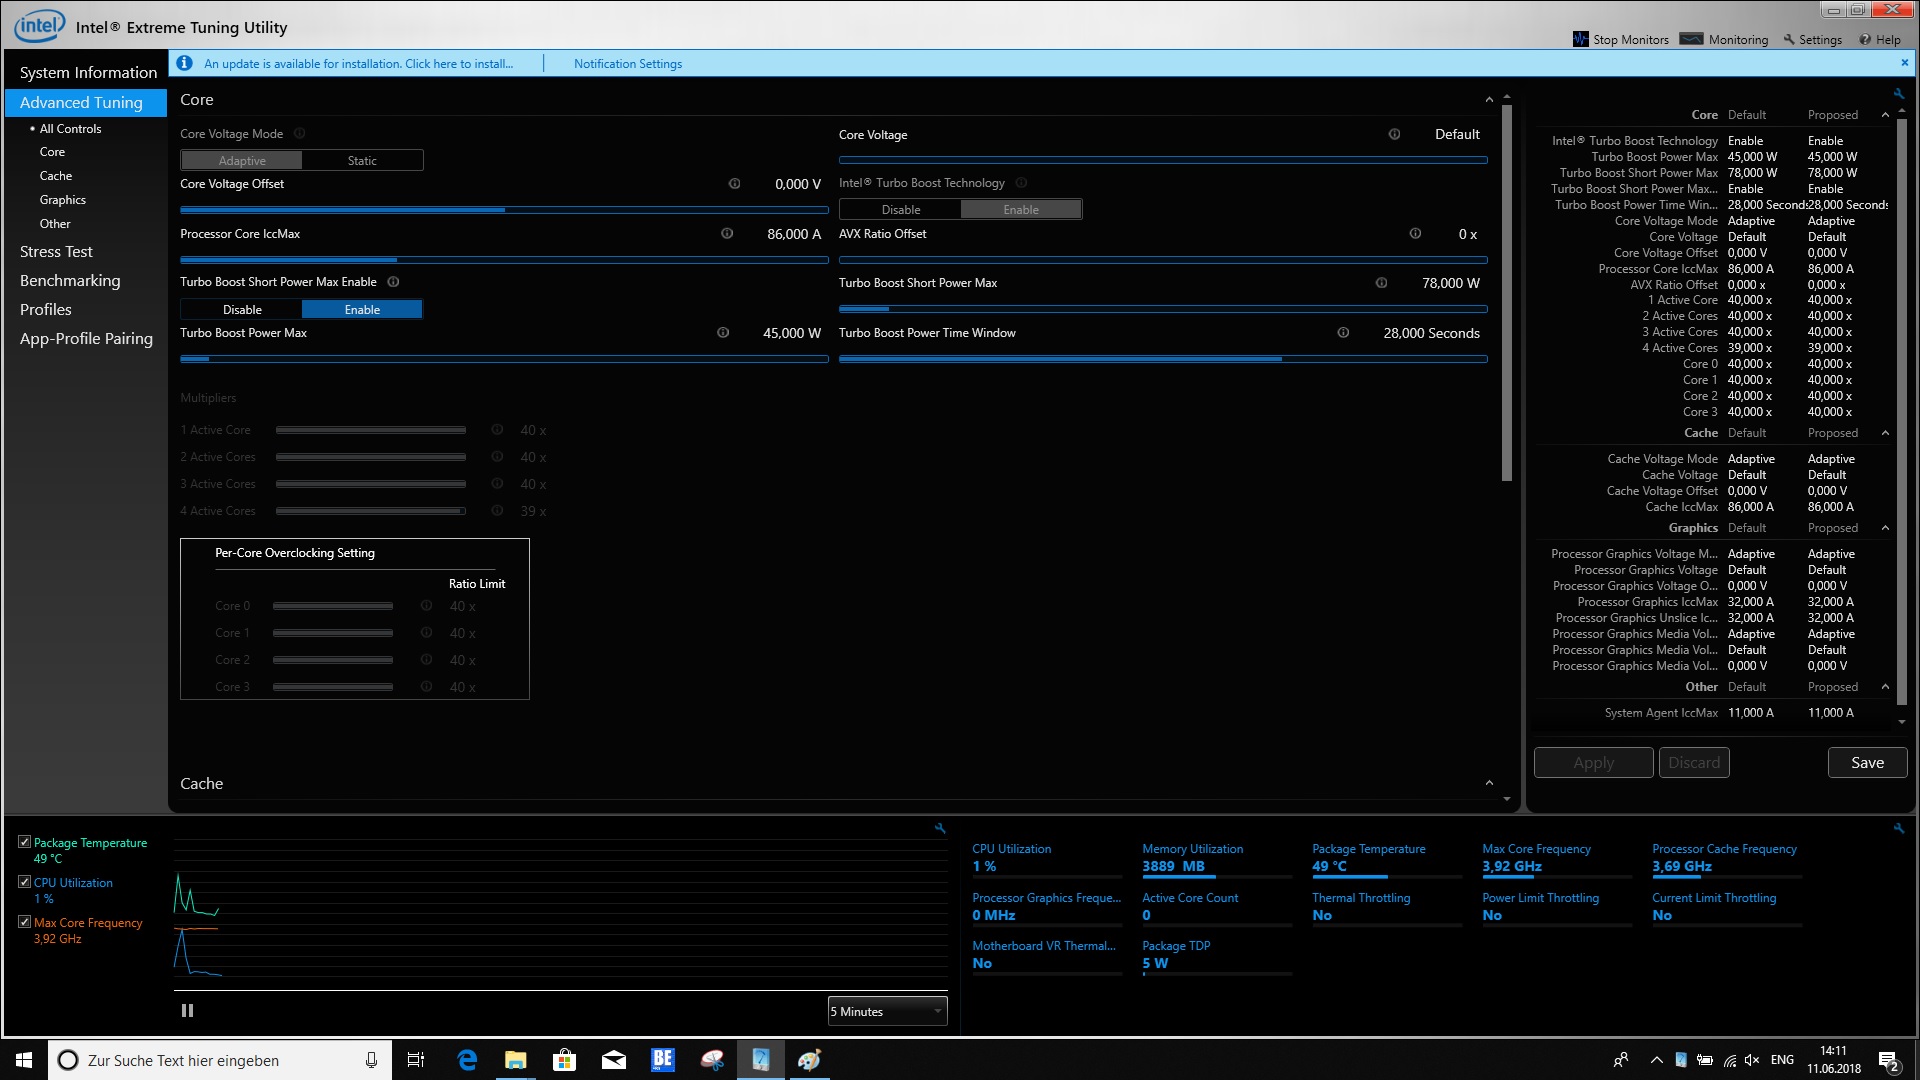
Core i5-8300H to procesor z rodziny Coffee Lake-H. Jego bazowe taktowanie to 2,3 GHz a taktowanie maksymalne wynosi 4 GHz. TDP tego procesora ma wartość 45 W. Jest to procesor 8-wątkowy.
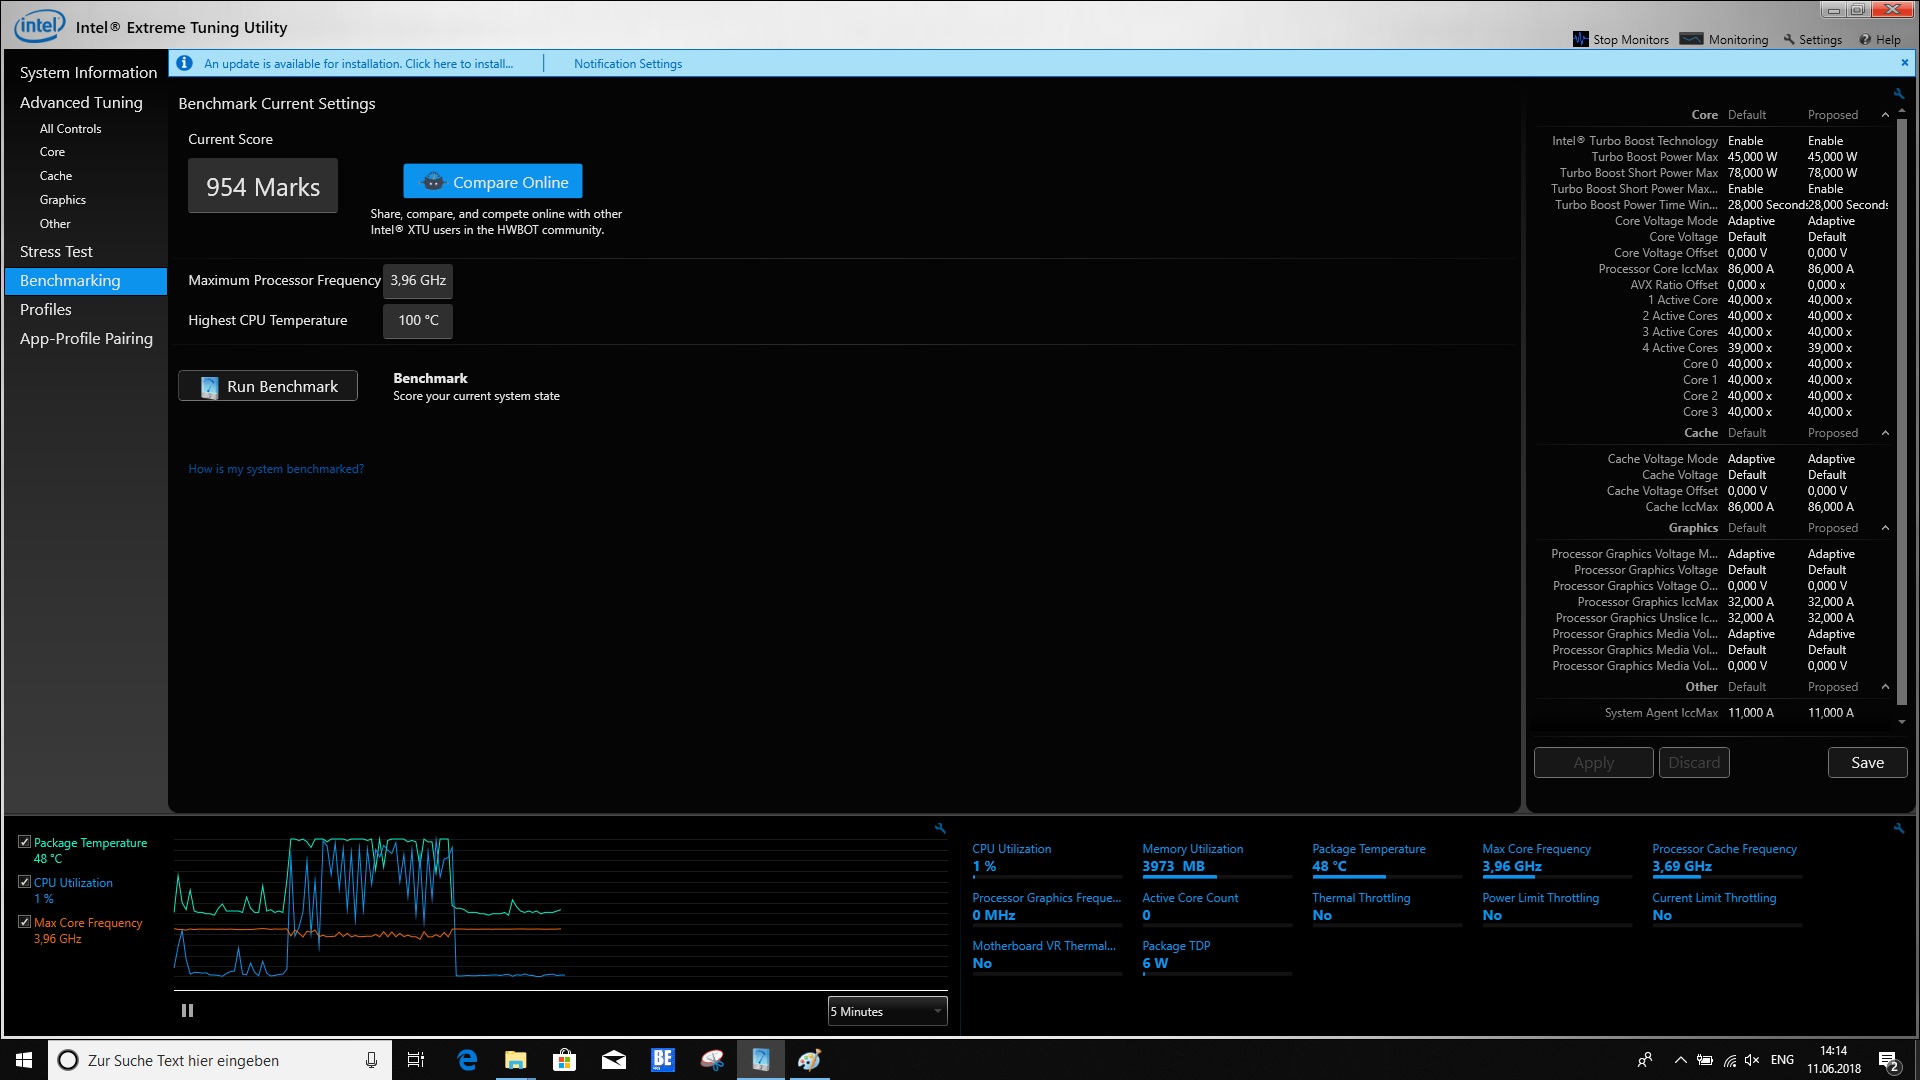
W teście jednowątkowym Cinebench R15 procesor z omawianego laptopa uzyskał rezultat o 10% lepszy od Core i7-7700HQ z Asusa FX503VM. W teście wielowątkowym tej samej aplikacji uzyskał on niemal taki sam wynik, jak i7-7700HQ.
W teście wielowątkowym Cinebench R15 w pętli rezultat pierwszej próby okazał się najlepszy a kolejne były nieco gorsze, ale pogorszenie wydajności nie było duże.
Na zasilaniu akumulatorowym częstotliwość taktowania procesora była ograniczona do 800 MHz.
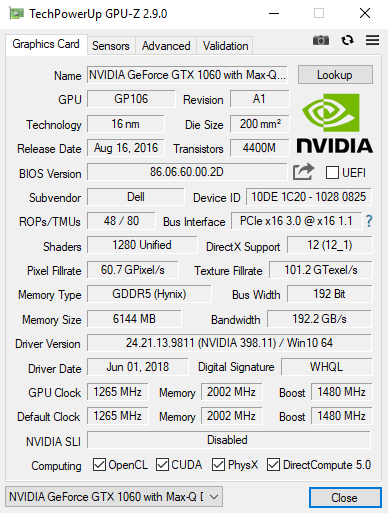
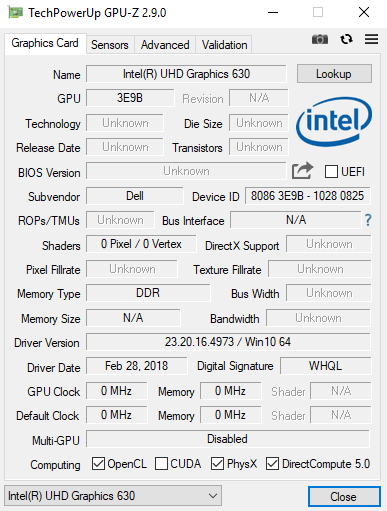
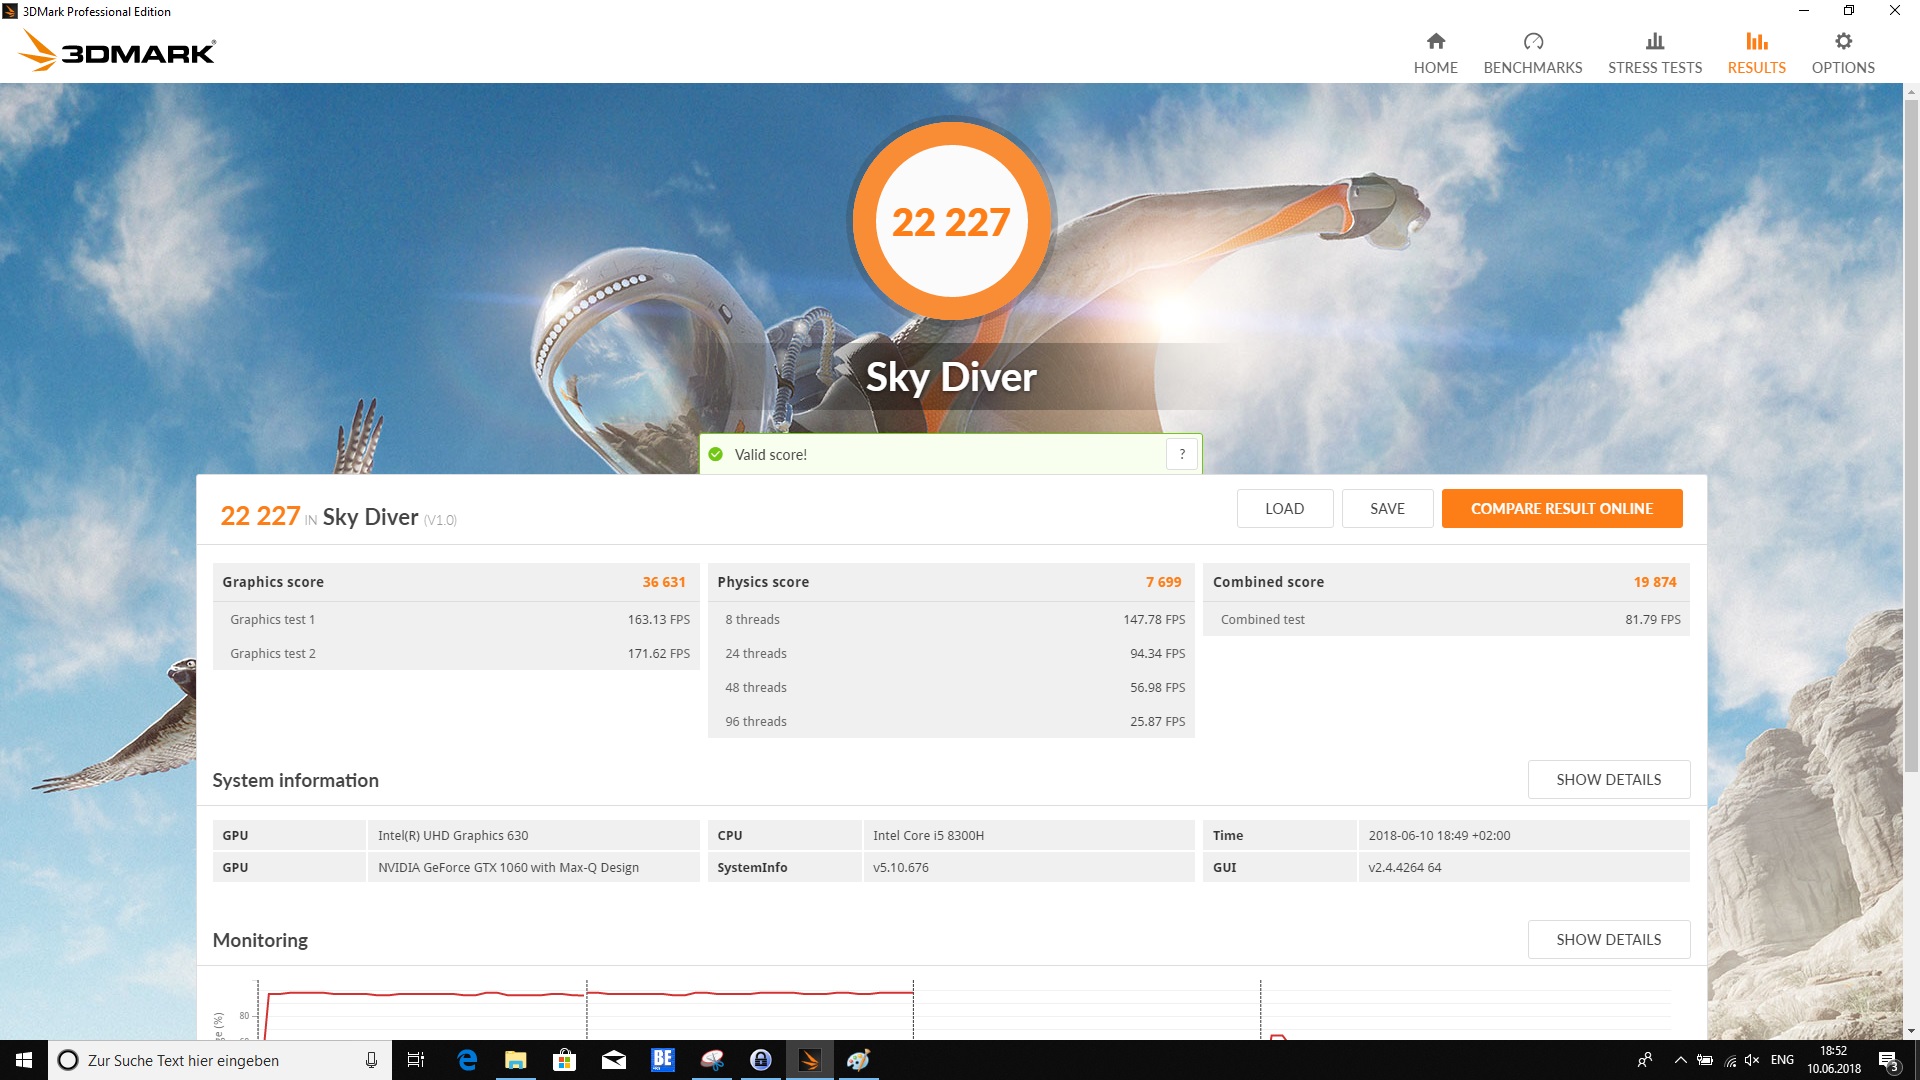
Dell Inspiron 5587 posiada technologię Nvidia Optimus, więc jest w nim wykorzystywany zintegrowany z procesorem układ grafiki UHD Graphics 630. Drugim rozwiązaniem graficznym jest dużo wydajniejsza karta GeForce GTX 1060 Max-Q. Posiada ona 6 GB pamięci VRAM GDDR5. Bazowe taktowanie GPU to 1265 MHz a taktowanie maksymalne wynosi 1480 MHz.
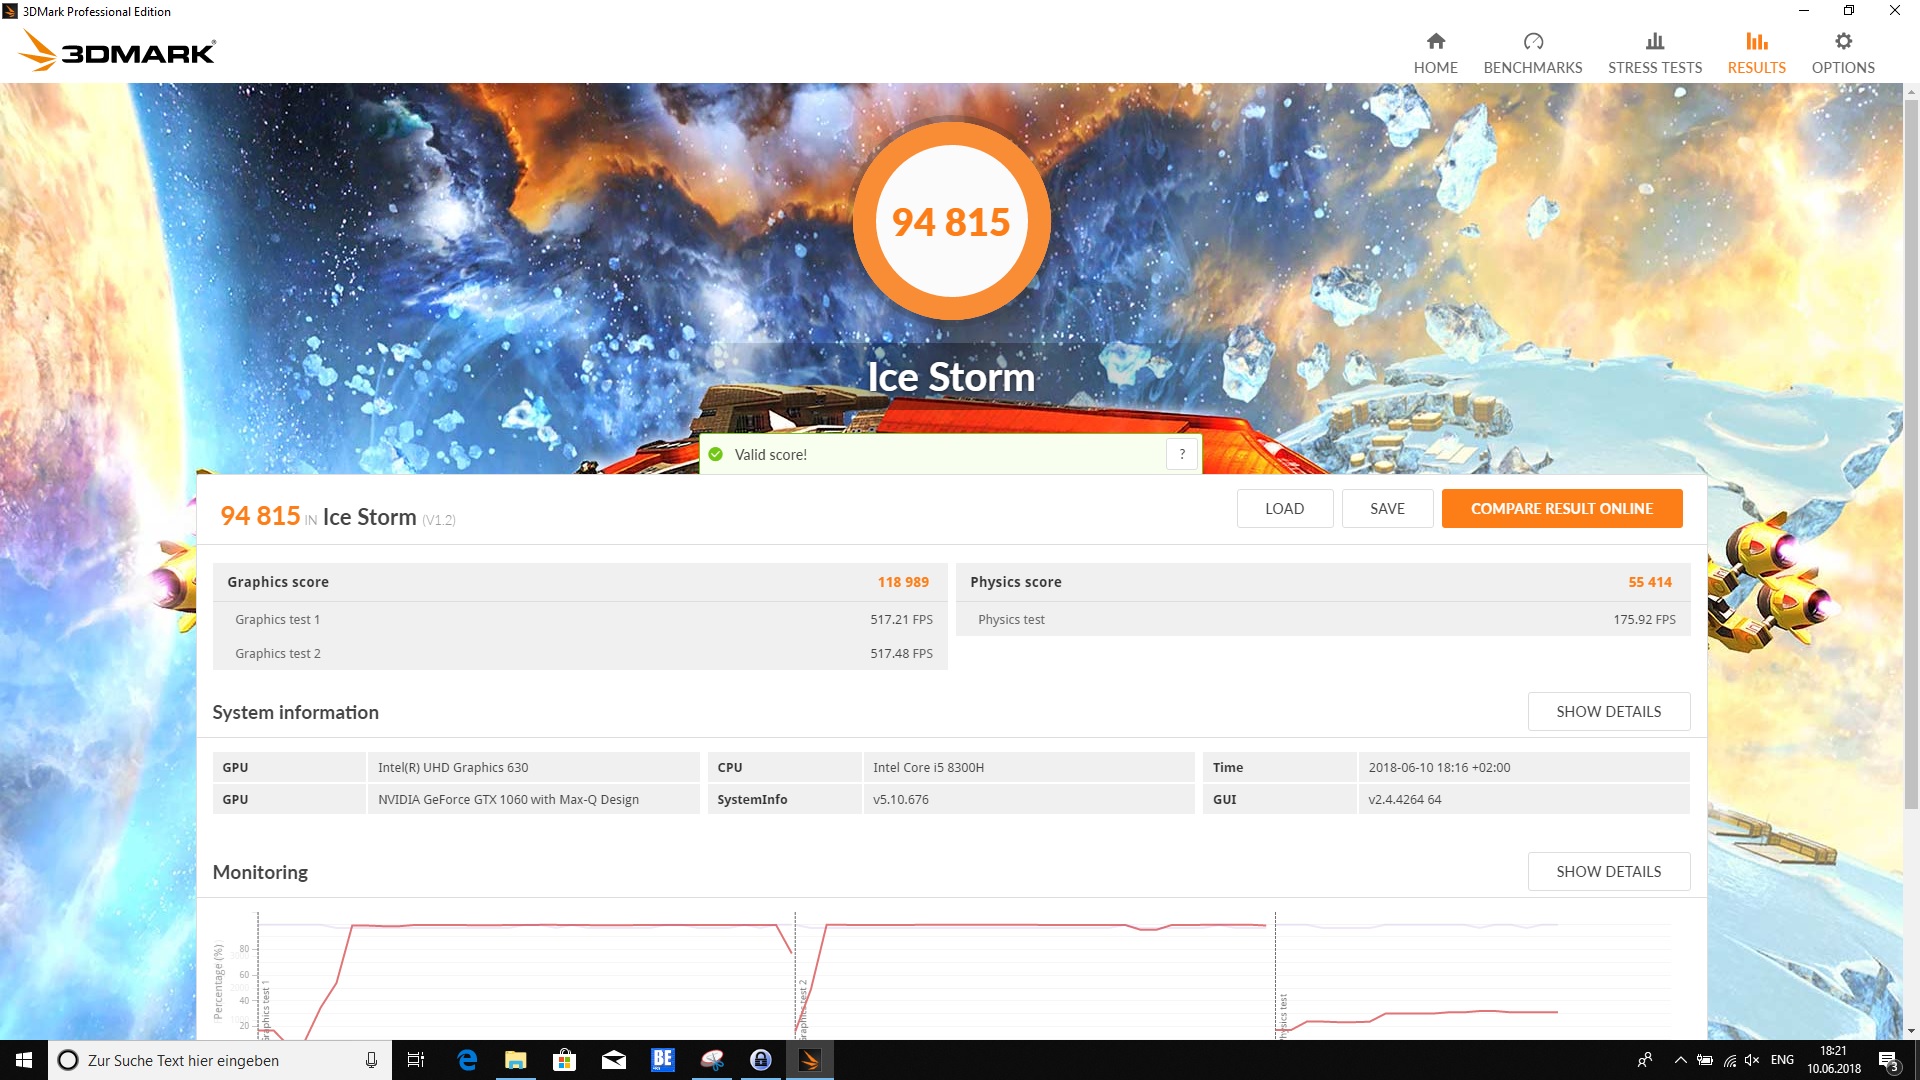
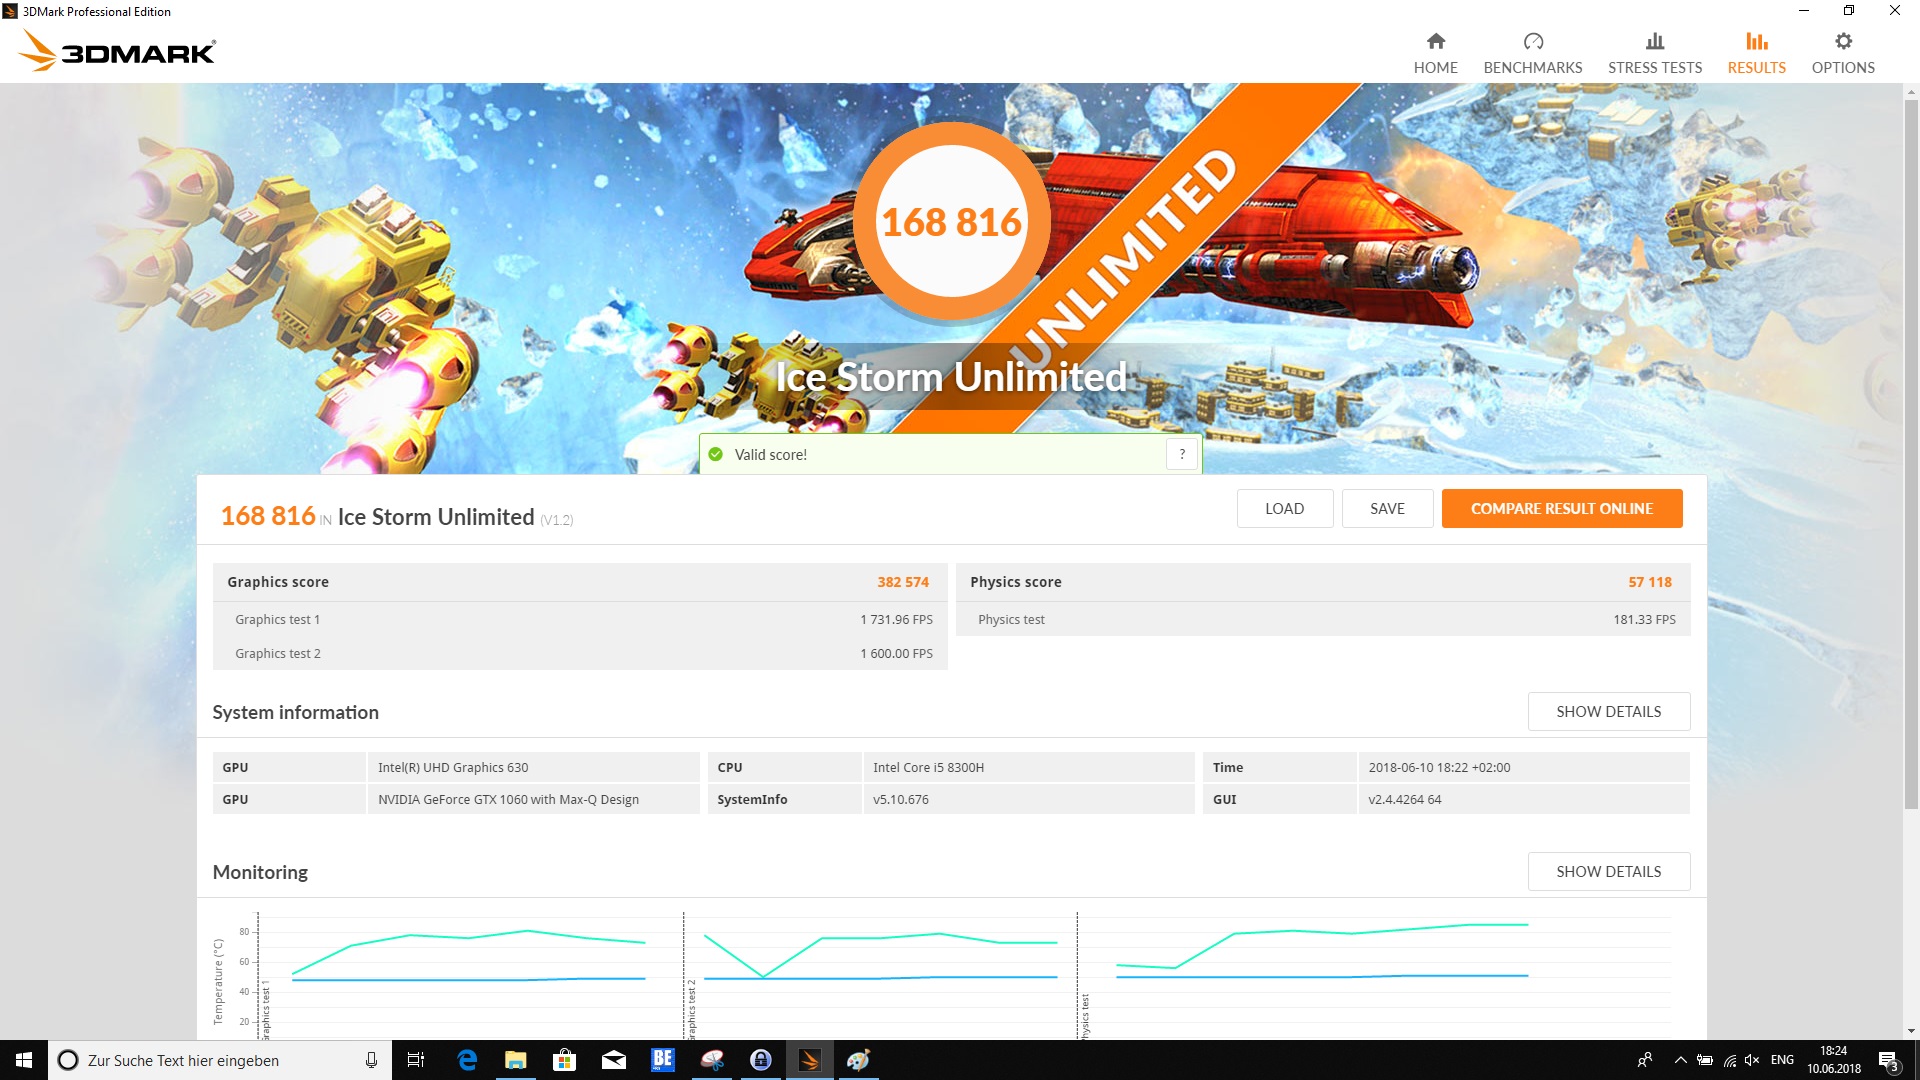
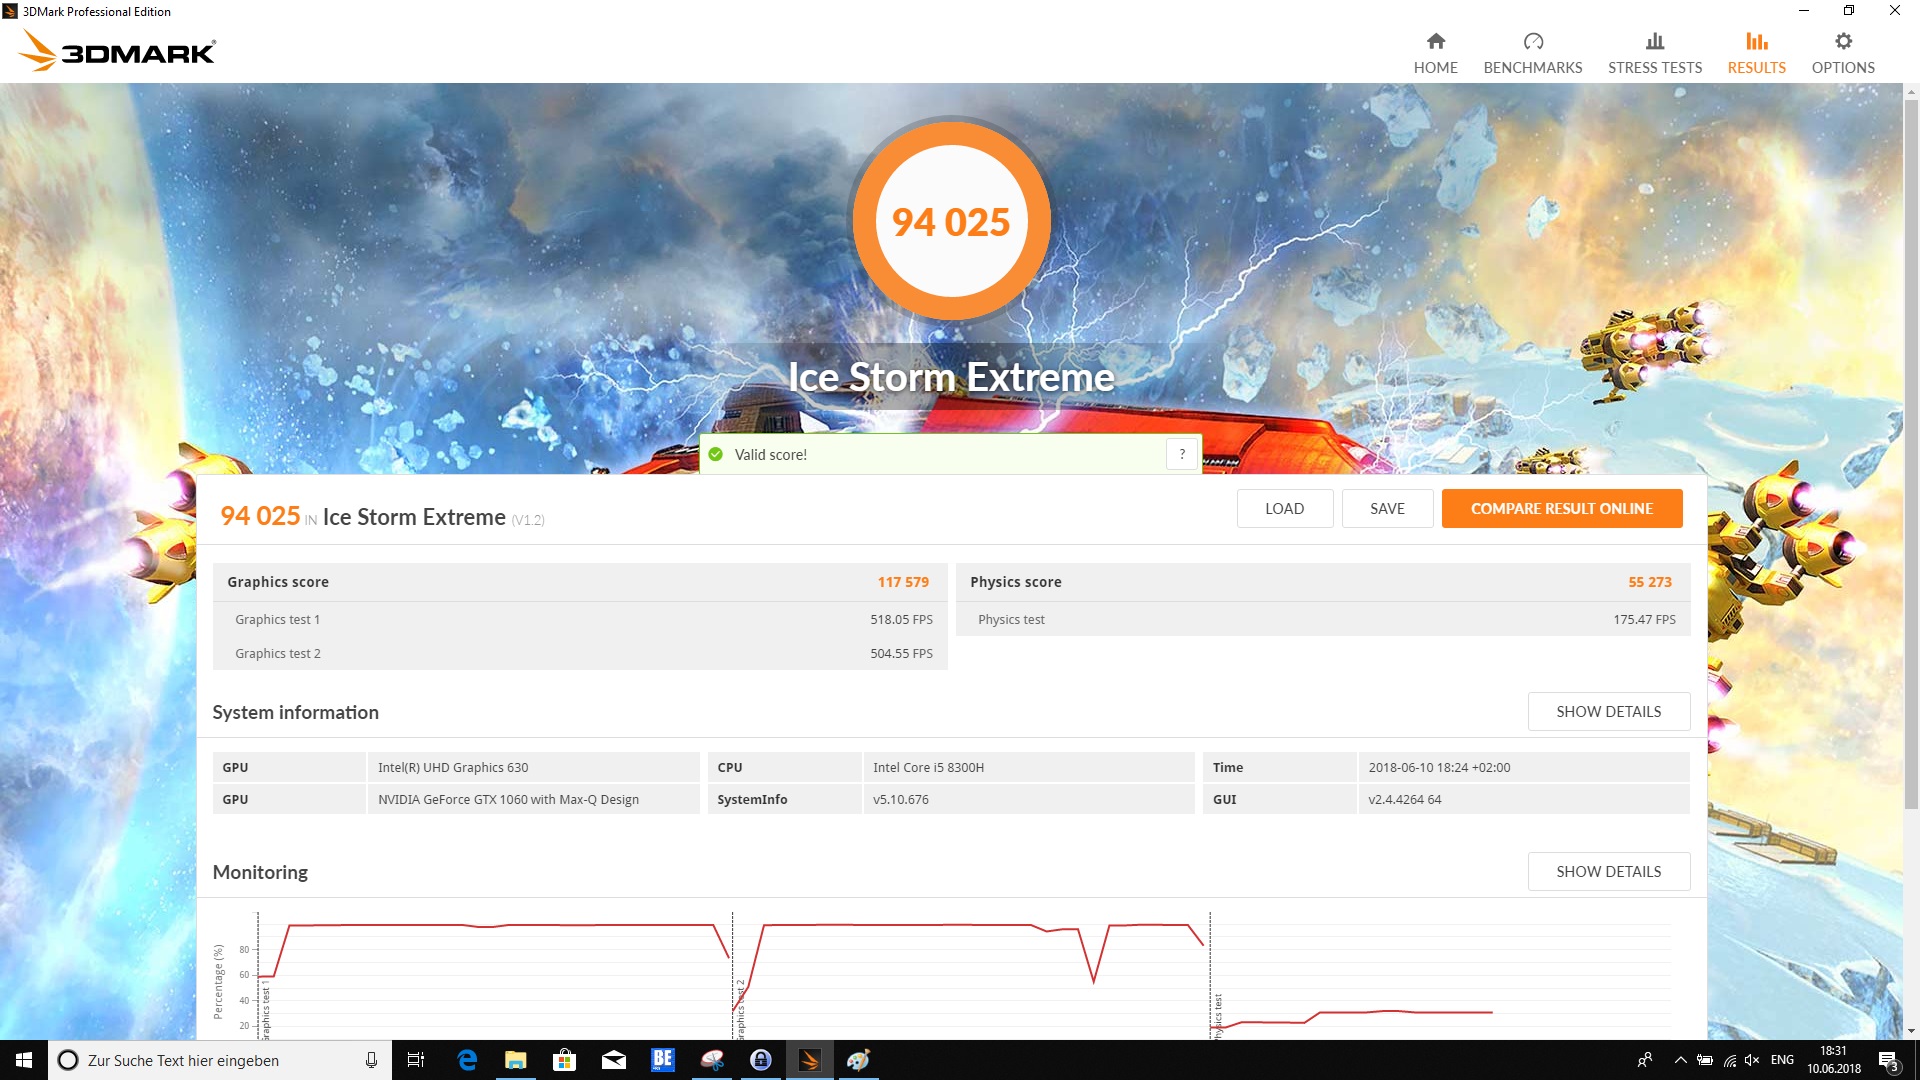
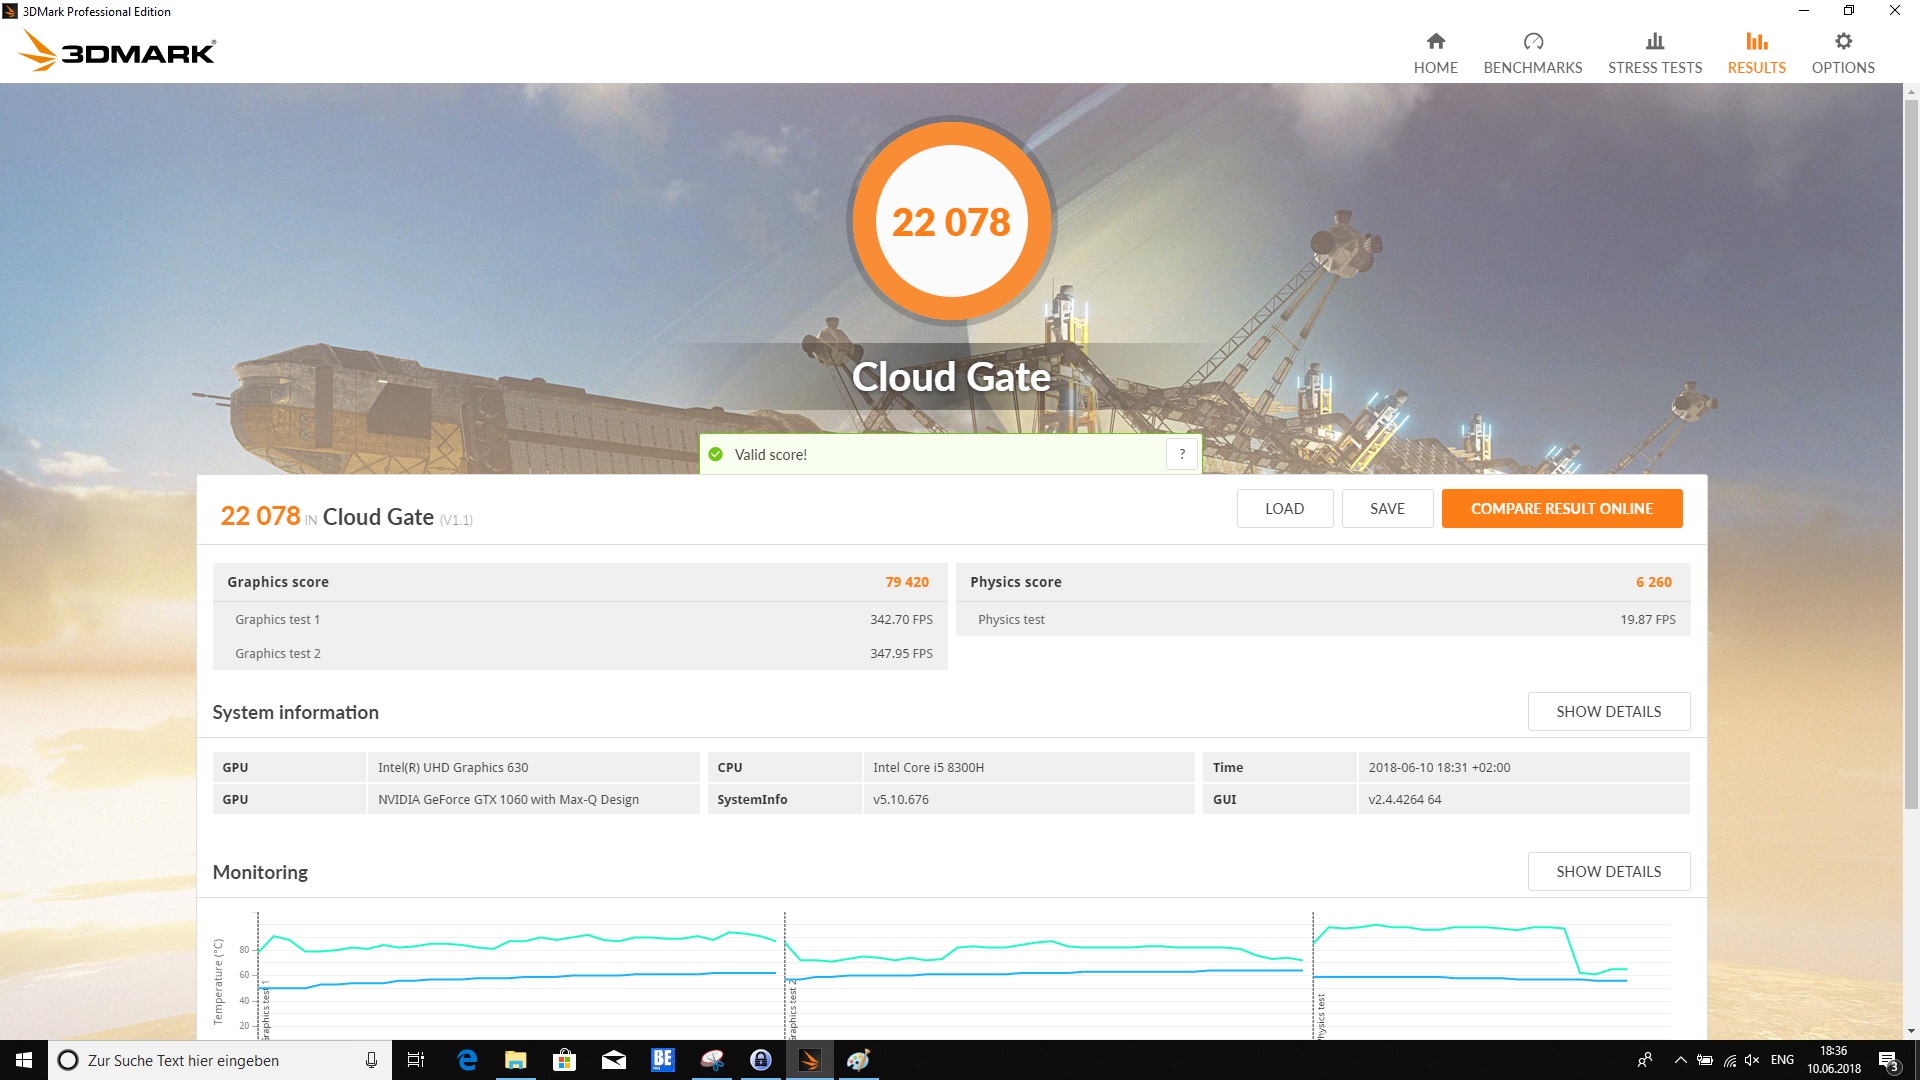
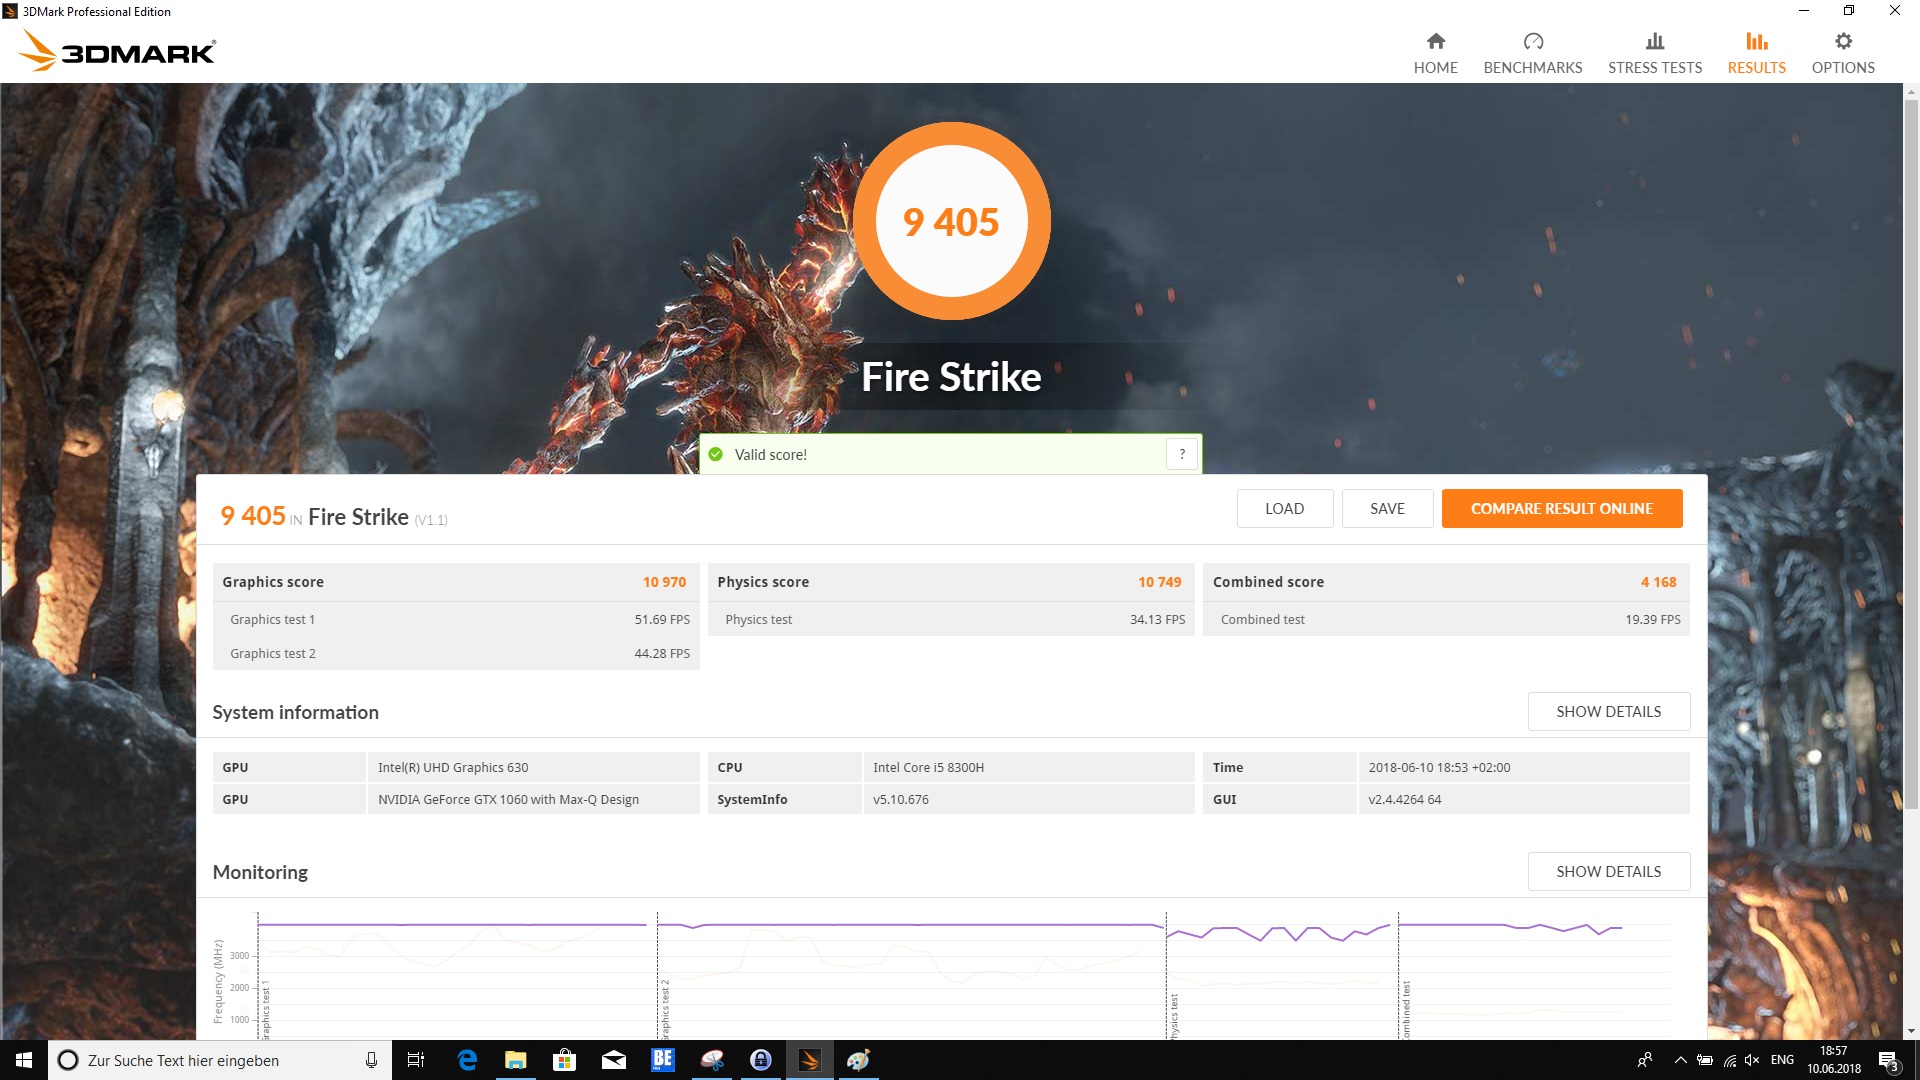
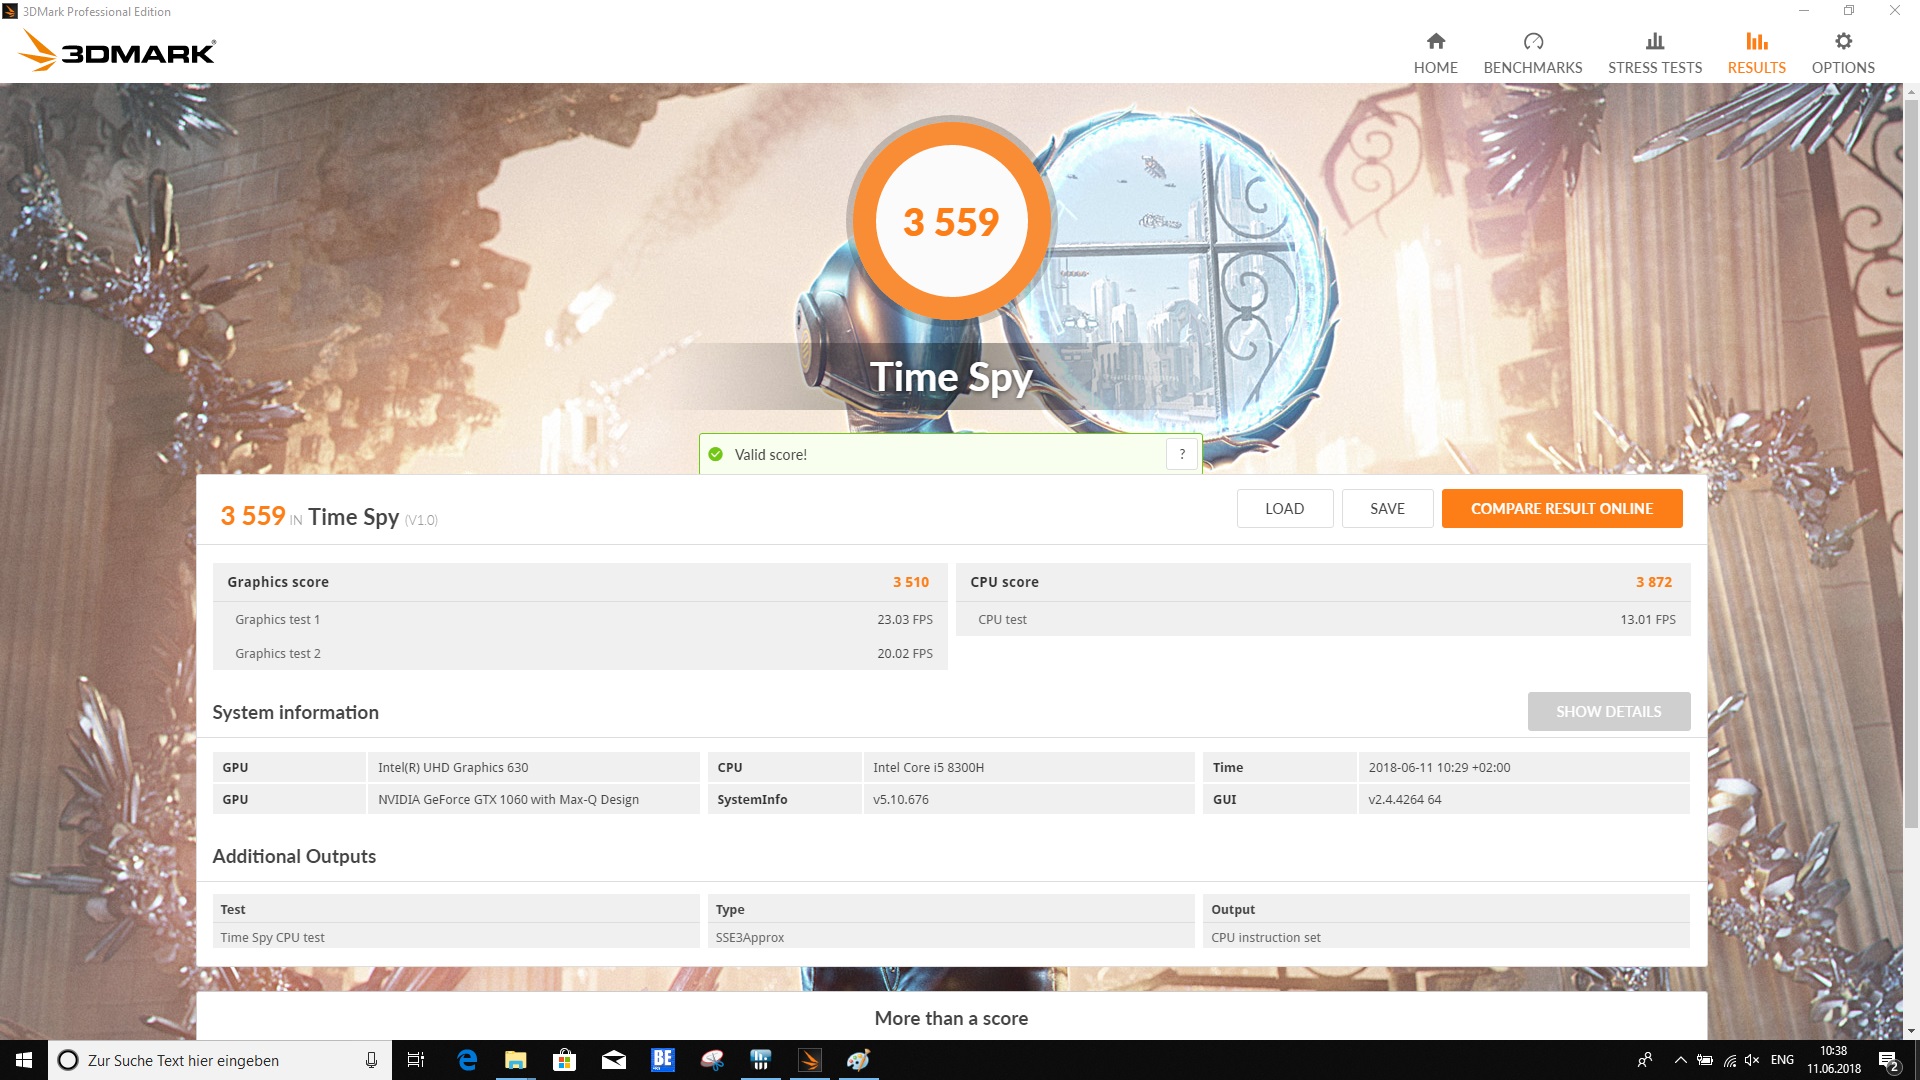
W testach 3DMark omawiany laptop uzyskał rezultaty o kilka procent lepsze od wyników Inspirona 7577 z tą samą kartą grafiki. Asus FX503VM z normalną kartą GTX 1060 osiągnął w tych testach rezultaty tylko nieznacznie lepsze. W porównaniu z Inspironem 7577 wyposażonym w kartę GTX 1050 bohater niniejszej recenzji był o 72-101% lepszy.
| Cinebench R15 | |
| CPU Single 64Bit | |
| Średnia w klasie Gaming (188.8 - 350, n=106, ostatnie 2 lata) | |
| Acer Predator Helios 300 PH317-52-51M6 | |
| Dell G5 15 5587 | |
| Przeciętny Intel Core i5-8300H (151 - 174, n=17) | |
| Acer Nitro 5 Spin NP515-51-86CX | |
| Asus FX503VM-EH73 | |
| PC Zentrum Proteus V | |
| Dell Inspiron 15 7000 7577 | |
| Dell Inspiron 15 7000 7577 | |
| CPU Multi 64Bit | |
| Średnia w klasie Gaming (1578 - 6330, n=105, ostatnie 2 lata) | |
| Acer Predator Helios 300 PH317-52-51M6 | |
| Przeciętny Intel Core i5-8300H (609 - 850, n=17) | |
| Dell G5 15 5587 | |
| PC Zentrum Proteus V | |
| Asus FX503VM-EH73 | |
| Acer Nitro 5 Spin NP515-51-86CX | |
| Dell Inspiron 15 7000 7577 | |
| Dell Inspiron 15 7000 7577 | |
| Cinebench R11.5 | |
| CPU Multi 64Bit | |
| Średnia w klasie Gaming (29.8 - 76.7, n=9, ostatnie 2 lata) | |
| Acer Predator Helios 300 PH317-52-51M6 | |
| Asus FX503VM-EH73 | |
| PC Zentrum Proteus V | |
| Przeciętny Intel Core i5-8300H (6.2 - 8.79, n=7) | |
| Dell G5 15 5587 | |
| Dell Inspiron 15 7000 7577 | |
| Dell Inspiron 15 7000 7577 | |
| Acer Nitro 5 Spin NP515-51-86CX | |
| CPU Single 64Bit | |
| Średnia w klasie Gaming (3.3 - 4.16, n=9, ostatnie 2 lata) | |
| Acer Predator Helios 300 PH317-52-51M6 | |
| Dell G5 15 5587 | |
| Przeciętny Intel Core i5-8300H (1.72 - 1.96, n=7) | |
| Acer Nitro 5 Spin NP515-51-86CX | |
| Asus FX503VM-EH73 | |
| PC Zentrum Proteus V | |
| Dell Inspiron 15 7000 7577 | |
| Dell Inspiron 15 7000 7577 | |
| Cinebench R10 | |
| Rendering Single CPUs 64Bit | |
| Średnia w klasie Gaming (17067 - 19487, n=3, ostatnie 2 lata) | |
| Dell G5 15 5587 | |
| Przeciętny Intel Core i5-8300H (8277 - 8506, n=2) | |
| Dell Inspiron 15 7000 7577 | |
| Rendering Multiple CPUs 64Bit | |
| Średnia w klasie Gaming (14159 - 165835, n=3, ostatnie 2 lata) | |
| Przeciętny Intel Core i5-8300H (28616 - 32021, n=2) | |
| Dell G5 15 5587 | |
| Dell Inspiron 15 7000 7577 | |
| JetStream 1.1 - 1.1 Total | |
| Średnia w klasie Gaming (549 - 647, n=3, ostatnie 2 lata) | |
| Dell G5 15 5587 | |
| Przeciętny Intel Core i5-8300H (208 - 251, n=10) | |
| Dell Inspiron 15 7000 7577 | |
| Acer Nitro 5 Spin NP515-51-86CX | |
| Asus FX503VM-EH73 | |
| Octane V2 - Total Score | |
| Średnia w klasie Gaming (93292 - 139447, n=27, ostatnie 2 lata) | |
| Dell G5 15 5587 | |
| Przeciętny Intel Core i5-8300H (30806 - 34659, n=10) | |
| Dell Inspiron 15 7000 7577 | |
| Asus FX503VM-EH73 | |
| Mozilla Kraken 1.1 - Total | |
| Asus FX503VM-EH73 | |
| Przeciętny Intel Core i5-8300H (1095 - 1209, n=9) | |
| Acer Nitro 5 Spin NP515-51-86CX | |
| Dell Inspiron 15 7000 7577 | |
| Dell G5 15 5587 | |
| Średnia w klasie Gaming (391 - 590, n=100, ostatnie 2 lata) | |
* ... im mniej tym lepiej
| PCMark 8 | |
| Home Score Accelerated v2 | |
| Średnia w klasie Gaming (n=1ostatnie 2 lata) | |
| Asus FX503VM-EH73 | |
| PC Zentrum Proteus V | |
| Dell G5 15 5587 | |
| Przeciętny Intel Core i5-8300H, NVIDIA GeForce GTX 1060 Max-Q (n=1) | |
| Acer Predator Helios 300 PH317-52-51M6 | |
| Acer Nitro 5 Spin NP515-51-86CX | |
| Dell Inspiron 15 7000 7577 | |
| Dell Inspiron 15 7000 7577 | |
| Work Score Accelerated v2 | |
| Acer Predator Helios 300 PH317-52-51M6 | |
| Dell G5 15 5587 | |
| Przeciętny Intel Core i5-8300H, NVIDIA GeForce GTX 1060 Max-Q (n=1) | |
| Acer Nitro 5 Spin NP515-51-86CX | |
| Asus FX503VM-EH73 | |
| Dell Inspiron 15 7000 7577 | |
| Dell Inspiron 15 7000 7577 | |
| Średnia w klasie Gaming (n=1ostatnie 2 lata) | |
| PCMark 10 | |
| Score | |
| Średnia w klasie Gaming (5828 - 12414, n=93, ostatnie 2 lata) | |
| Dell G5 15 5587 | |
| Przeciętny Intel Core i5-8300H, NVIDIA GeForce GTX 1060 Max-Q (n=1) | |
| Asus FX503VM-EH73 | |
| Dell Inspiron 15 7000 7577 | |
| PC Zentrum Proteus V | |
| Acer Nitro 5 Spin NP515-51-86CX | |
| Dell Inspiron 15 7000 7577 | |
| Essentials | |
| Średnia w klasie Gaming (8810 - 11935, n=97, ostatnie 2 lata) | |
| PC Zentrum Proteus V | |
| Asus FX503VM-EH73 | |
| Dell G5 15 5587 | |
| Przeciętny Intel Core i5-8300H, NVIDIA GeForce GTX 1060 Max-Q (n=1) | |
| Acer Nitro 5 Spin NP515-51-86CX | |
| Dell Inspiron 15 7000 7577 | |
| Dell Inspiron 15 7000 7577 | |
| PCMark 8 Home Score Accelerated v2 | 4331 pkt. | |
| PCMark 8 Work Score Accelerated v2 | 5339 pkt. | |
| PCMark 10 Score | 5483 pkt. | |
Pomoc | ||
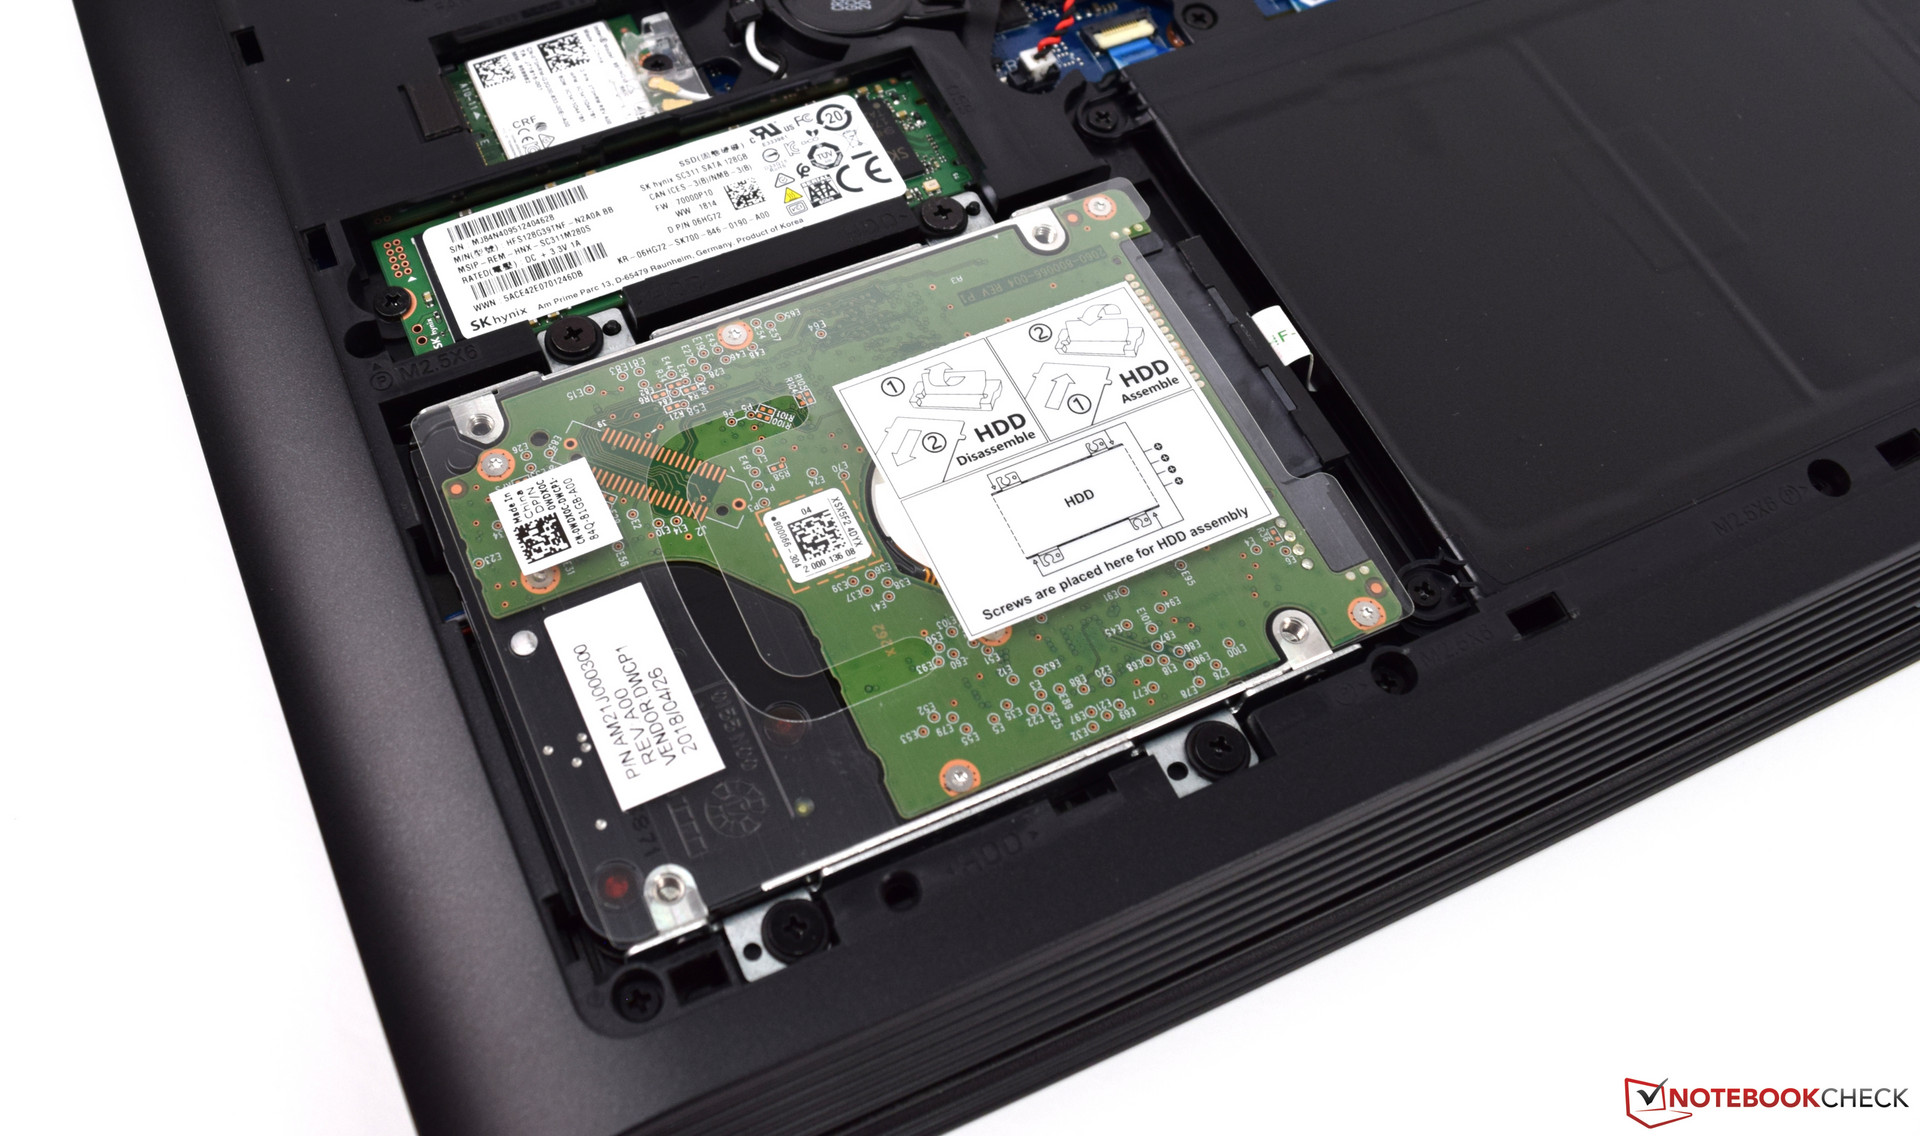
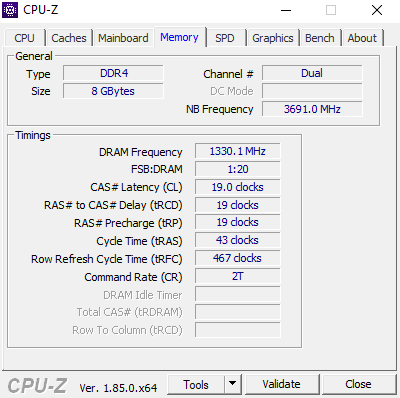
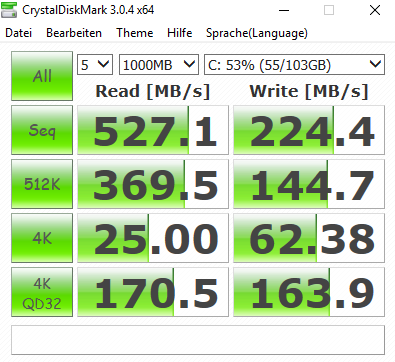
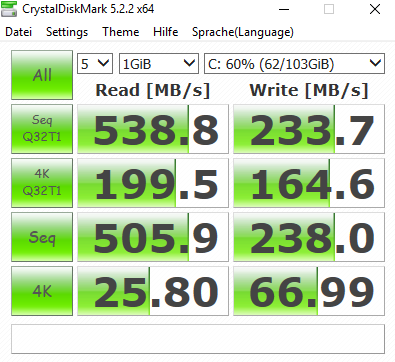
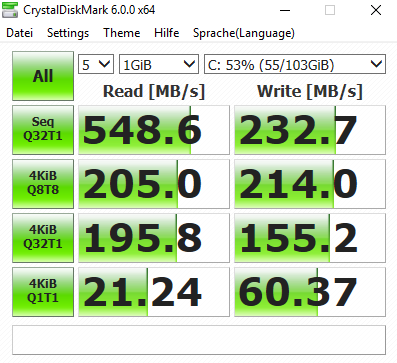
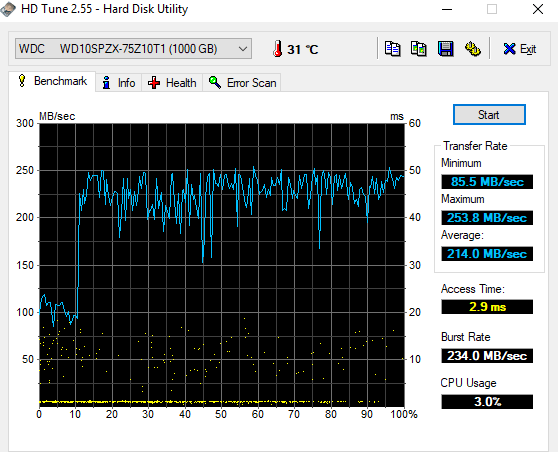
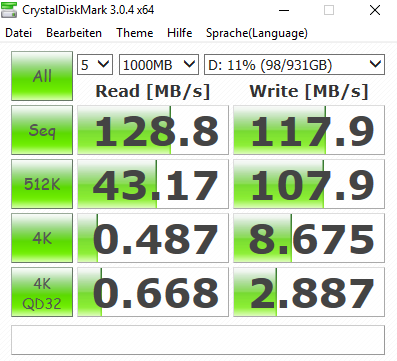
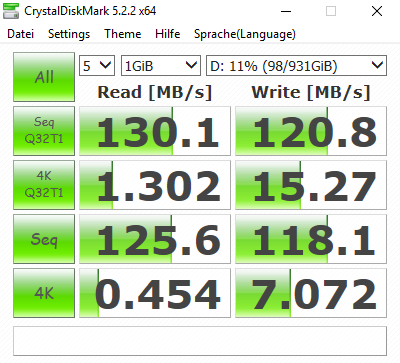
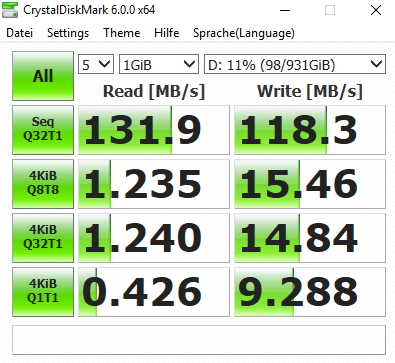
W testowanej konfiguracji mieliśmy dysk SSD o pojemności 128 GB oraz dysk twardy o pojemności 1 TB. Dysk SSD to SK Hynix SC311 (M.2, SATA 3). Jest on wolniejszy od dysków SSD wykorzystujących interfejs PCIe, ale szybszy od dysku twardego. Jeżeli chodzi o dysk twardy, był nim Western Digital z serii Blue o prędkości 5400 obr/min. W teście HD Tune średni odczyt sekwencyjny osiągnął 214 MB/s, co jest nadspodziewanie dobrym wynikiem [ten dysk ma 128 MB pamięci podręcznej i tu kryje się przyczyna takiego a nie innego rezultatu - przyp. tłum.]. W testach aplikacji CrystalDiskMark odczyt sekwencyjny osiągał około 130 MB/s i ich rezultaty są bardziej wiarygodne.
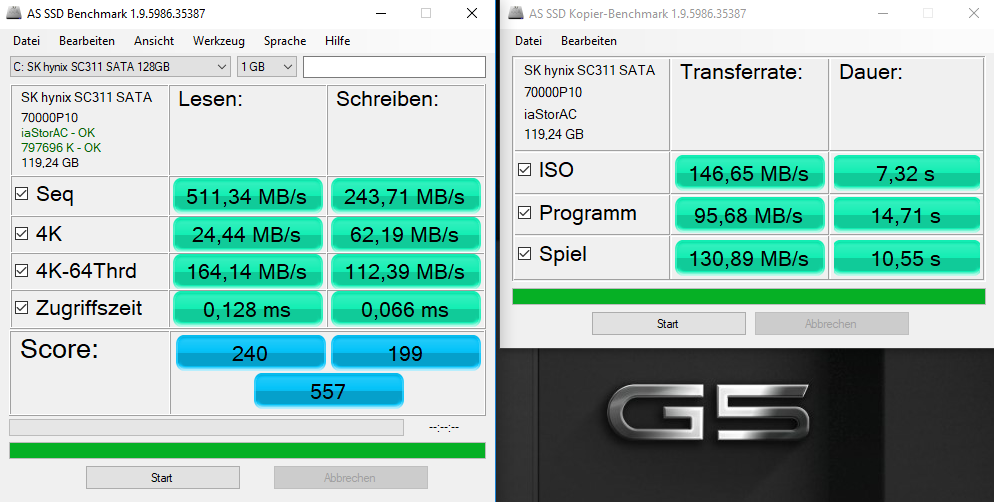
| Dell G5 15 5587 SK hynix SC311 M.2 | Dell Inspiron 15 7000 7577 Samsung PM961 MZVLW256HEHP | PC Zentrum Proteus V Samsung PM961 MZVLW256HEHP | Asus FX503VM-EH73 SanDisk SD8SN8U128G1002 | Acer Nitro 5 Spin NP515-51-86CX Micron 1100 MTFDDAV256TBN | Acer Predator Helios 300 PH317-52-51M6 Hynix HFS128G39TND | |
|---|---|---|---|---|---|---|
| AS SSD | 198% | 220% | -6% | 22% | -47% | |
| Seq Read (MB/s) | 511 | 2652 419% | 2541 397% | 476.3 -7% | 490.1 -4% | 513 0% |
| Seq Write (MB/s) | 243.7 | 1181 385% | 1180 384% | 328.4 35% | 335.2 38% | 128.2 -47% |
| 4K Read (MB/s) | 24.44 | 46.95 92% | 51 109% | 20.44 -16% | 25.86 6% | 26.5 8% |
| 4K Write (MB/s) | 62.2 | 100.2 61% | 136.4 119% | 46.48 -25% | 78.1 26% | 62.7 1% |
| Access Time Read * (ms) | 0.128 | 0.058 55% | 0.045 65% | 0.17 -33% | 0.085 34% | |
| Access Time Write * (ms) | 0.066 | 0.037 44% | 0.028 58% | 0.09 -36% | 0.065 2% | 0.259 -292% |
| Score Total (Points) | 557 | 2405 332% | 2842 410% | 798 43% | 835 50% | 811 46% |
* ... im mniej tym lepiej

| 3DMark | |
| 1280x720 Cloud Gate Standard Graphics | |
| Średnia w klasie Gaming (86886 - 223650, n=60, ostatnie 2 lata) | |
| PC Zentrum Proteus V | |
| Asus FX503VM-EH73 | |
| Dell G5 15 5587 | |
| Dell Inspiron 15 7000 7577 | |
| Przeciętny NVIDIA GeForce GTX 1060 Max-Q (42781 - 81720, n=10) | |
| Acer Predator Helios 300 PH317-52-51M6 | |
| Dell Inspiron 15 7000 7577 | |
| Acer Nitro 5 Spin NP515-51-86CX | |
| 1920x1080 Fire Strike Graphics | |
| Średnia w klasie Gaming (12242 - 62849, n=115, ostatnie 2 lata) | |
| PC Zentrum Proteus V | |
| Asus FX503VM-EH73 | |
| Dell G5 15 5587 | |
| Przeciętny NVIDIA GeForce GTX 1060 Max-Q (9992 - 11366, n=10) | |
| Dell Inspiron 15 7000 7577 | |
| Acer Predator Helios 300 PH317-52-51M6 | |
| Dell Inspiron 15 7000 7577 | |
| Acer Nitro 5 Spin NP515-51-86CX | |
| 3DMark 11 - 1280x720 Performance GPU | |
| Średnia w klasie Gaming (21841 - 80022, n=104, ostatnie 2 lata) | |
| PC Zentrum Proteus V | |
| Asus FX503VM-EH73 | |
| Dell G5 15 5587 | |
| Przeciętny NVIDIA GeForce GTX 1060 Max-Q (12970 - 14487, n=10) | |
| Dell Inspiron 15 7000 7577 | |
| Acer Predator Helios 300 PH317-52-51M6 | |
| Dell Inspiron 15 7000 7577 | |
| Acer Nitro 5 Spin NP515-51-86CX | |
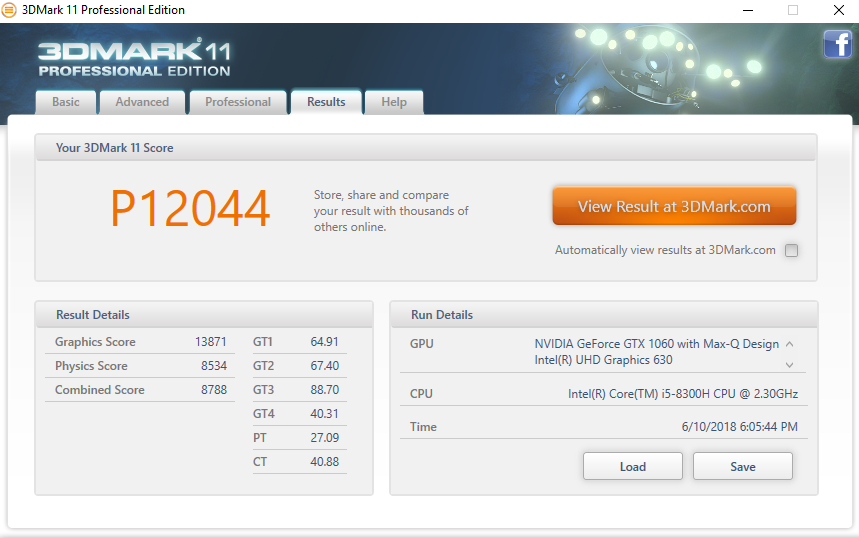
| 3DMark 11 Performance | 12044 pkt. | |
| 3DMark Ice Storm Standard Score | 94815 pkt. | |
| 3DMark Cloud Gate Standard Score | 22078 pkt. | |
| 3DMark Fire Strike Score | 9405 pkt. | |
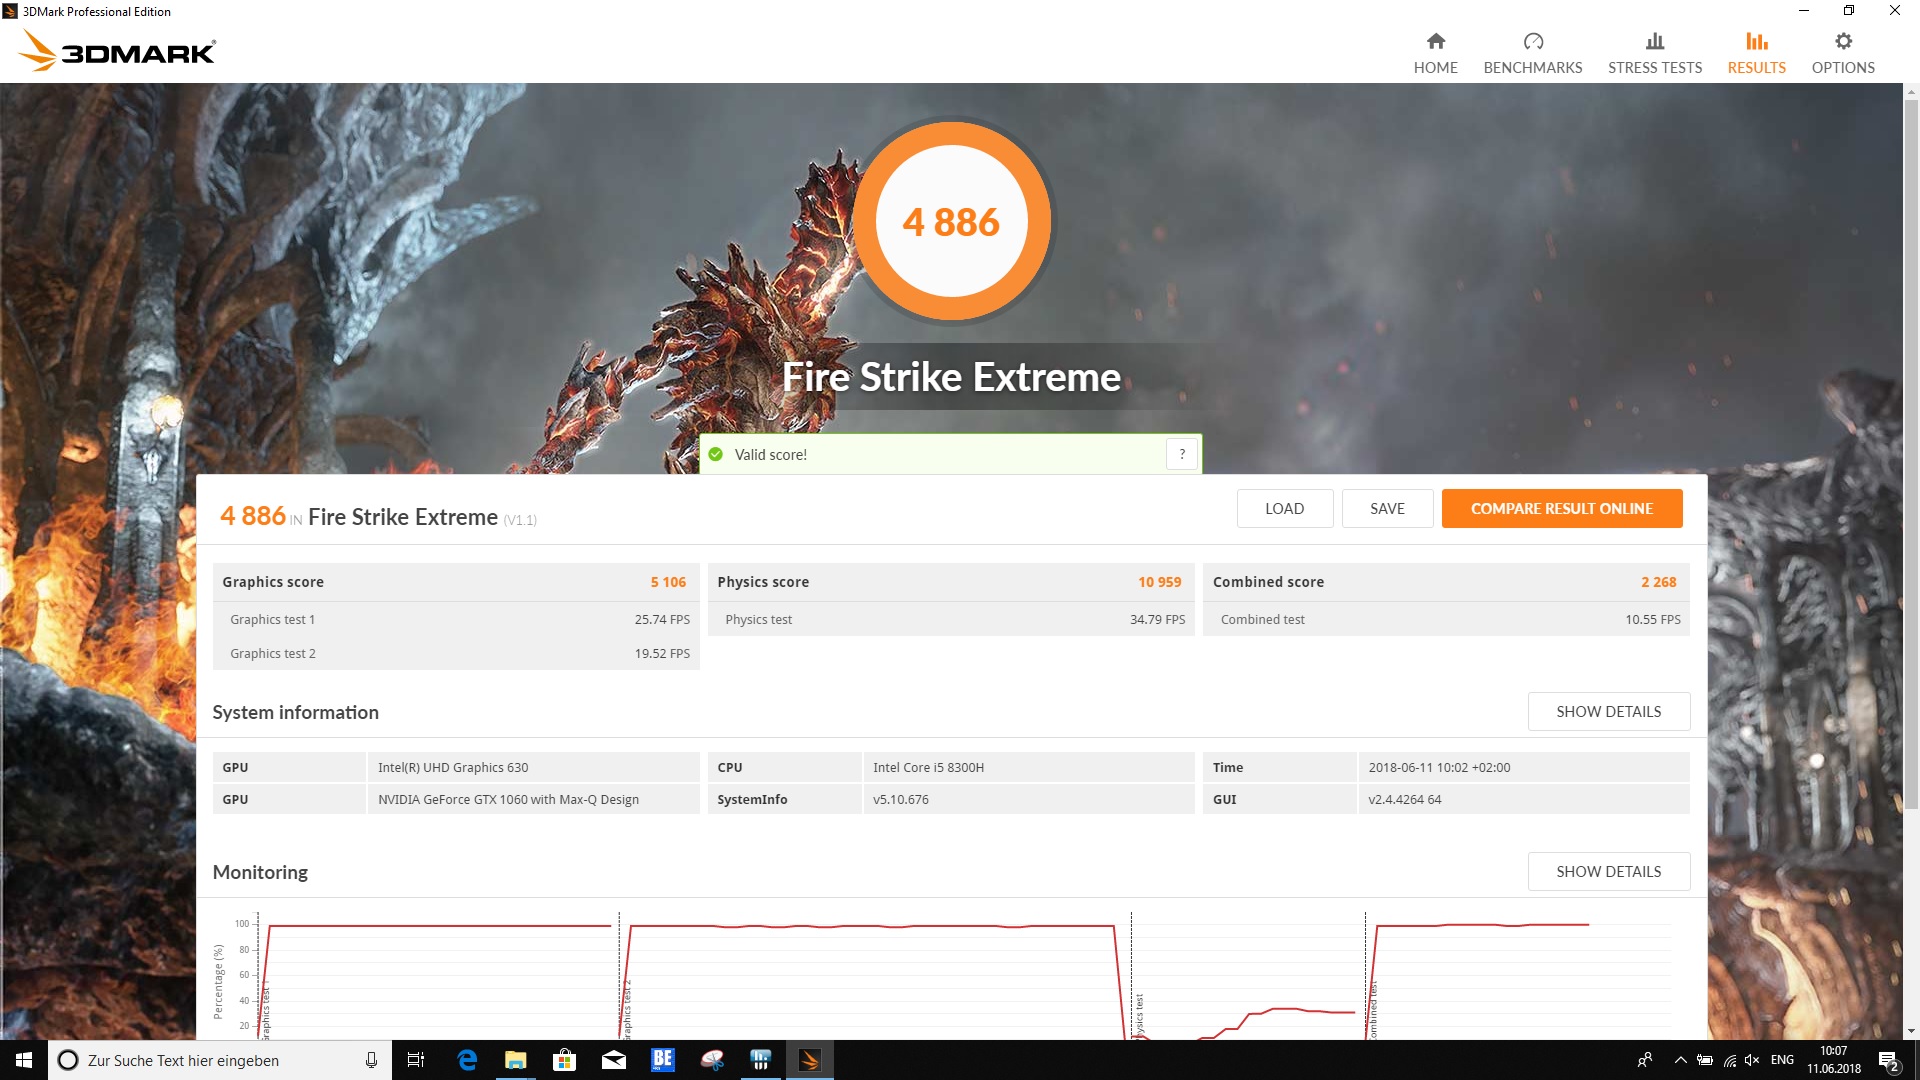
| 3DMark Fire Strike Extreme Score | 4886 pkt. | |
| 3DMark Time Spy Score | 3559 pkt. | |
Pomoc | ||
Testy gier
Dzięki karcie grafiki GeForce GTX 1060 Max-Q wydajność Della G5 15 5587 w grach jest zadowalająca. Nie wszystkie gry chodzą płynnie na najwyższych ustawieniach w natywnej rozdzielczości matrycy, ale nie jest źle. Test gry Wiedźmin 3 wykazał, że możliwości karty grafiki nie są nieograniczone. W teście Rise of the Tomb Raider uzyskano natomiast płynność rozgrywki na najwyższych ustawieniach.
| BioShock Infinite - 1920x1080 Ultra Preset, DX11 (DDOF) | |
| Dell G5 15 5587 | |
| Przeciętny NVIDIA GeForce GTX 1060 Max-Q (87.2 - 112, n=8) | |
| Dell Inspiron 15 7000 7577 | |
| Dell Inspiron 15 7000 7577 | |
| Rise of the Tomb Raider - 1920x1080 Very High Preset AA:FX AF:16x | |
| Dell G5 15 5587 | |
| Asus FX503VM-EH73 | |
| Przeciętny NVIDIA GeForce GTX 1060 Max-Q (45.3 - 66.4, n=8) | |
| Dell Inspiron 15 7000 7577 | |
| Dell Inspiron 15 7000 7577 | |
| Acer Nitro 5 Spin NP515-51-86CX | |
| The Witcher 3 - 1920x1080 Ultra Graphics & Postprocessing (HBAO+) | |
| Średnia w klasie Gaming (104.7 - 240, n=7, ostatnie 2 lata) | |
| PC Zentrum Proteus V | |
| Asus FX503VM-EH73 | |
| Przeciętny NVIDIA GeForce GTX 1060 Max-Q (34.6 - 38.5, n=9) | |
| Dell Inspiron 15 7000 7577 | |
| Dell G5 15 5587 | |
| Acer Predator Helios 300 PH317-52-51M6 | |
| Dell Inspiron 15 7000 7577 | |
| low | med. | high | ultra | 4K | |
|---|---|---|---|---|---|
| BioShock Infinite (2013) | 264 | 233.1 | 213.3 | 107.5 | |
| GTA V (2015) | 156.8 | 151.6 | 106.5 | 61.8 | 53.7 |
| The Witcher 3 (2015) | 172.2 | 122.3 | 58.3 | 34.9 | 23.3 |
| Rise of the Tomb Raider (2016) | 160.9 | 128.1 | 72.7 | 60.5 | 24.6 |
| Playerunknown's Battlegrounds (PUBG) (2017) | 141.9 | 92.5 | 85.6 | 63.3 | 12.9 |
| FIFA 18 (2017) | 290.6 | 277.9 | 252.3 | 245.7 | 130 |
| Assassin´s Creed Origins (2017) | 77 | 67 | 62 | 52 | 21 |
| Call of Duty WWII (2017) | 174.9 | 163.3 | 91.9 | 70.9 | 31.3 |
| Need for Speed Payback (2017) | 117.9 | 89.1 | 78.5 | 66.6 | 23.8 |
| Star Wars Battlefront 2 (2017) | 135.5 | 93.4 | 81.5 | 62.2 | |
| Fortnite (2018) | 178 | 132.6 | 115.7 | 72.8 | |
| Kingdom Come: Deliverance (2018) | 110 | 66.8 | 52.7 | 38 | 12 |
| Far Cry 5 (2018) | 110 | 70 | 65 | 48 | 20 |
Wpływ na otoczenie
Hałas
Podczas pracy bez obciążenia nie da się uzyskać ciszy. Oba wentylatory działają cały czas. Zmierzone natężenie hałasu nie było jednak bardzo duże (31,1-34,2 dB). Najwyższą wartością stwierdzoną pod pełnym obciążeniem były 44 dB. W teście gry zmierzono natomiast 42,7 dB. Poza tym omawiany laptop wydawał z siebie ciche piszczenie.
Hałas
| luz |
| 31.1 / 31.1 / 34.2 dB |
| obciążenie |
| 34.9 / 44 dB |
 | ||
30 dB cichy 40 dB(A) słyszalny 50 dB(A) irytujący |
||
min: | ||
Temperatury
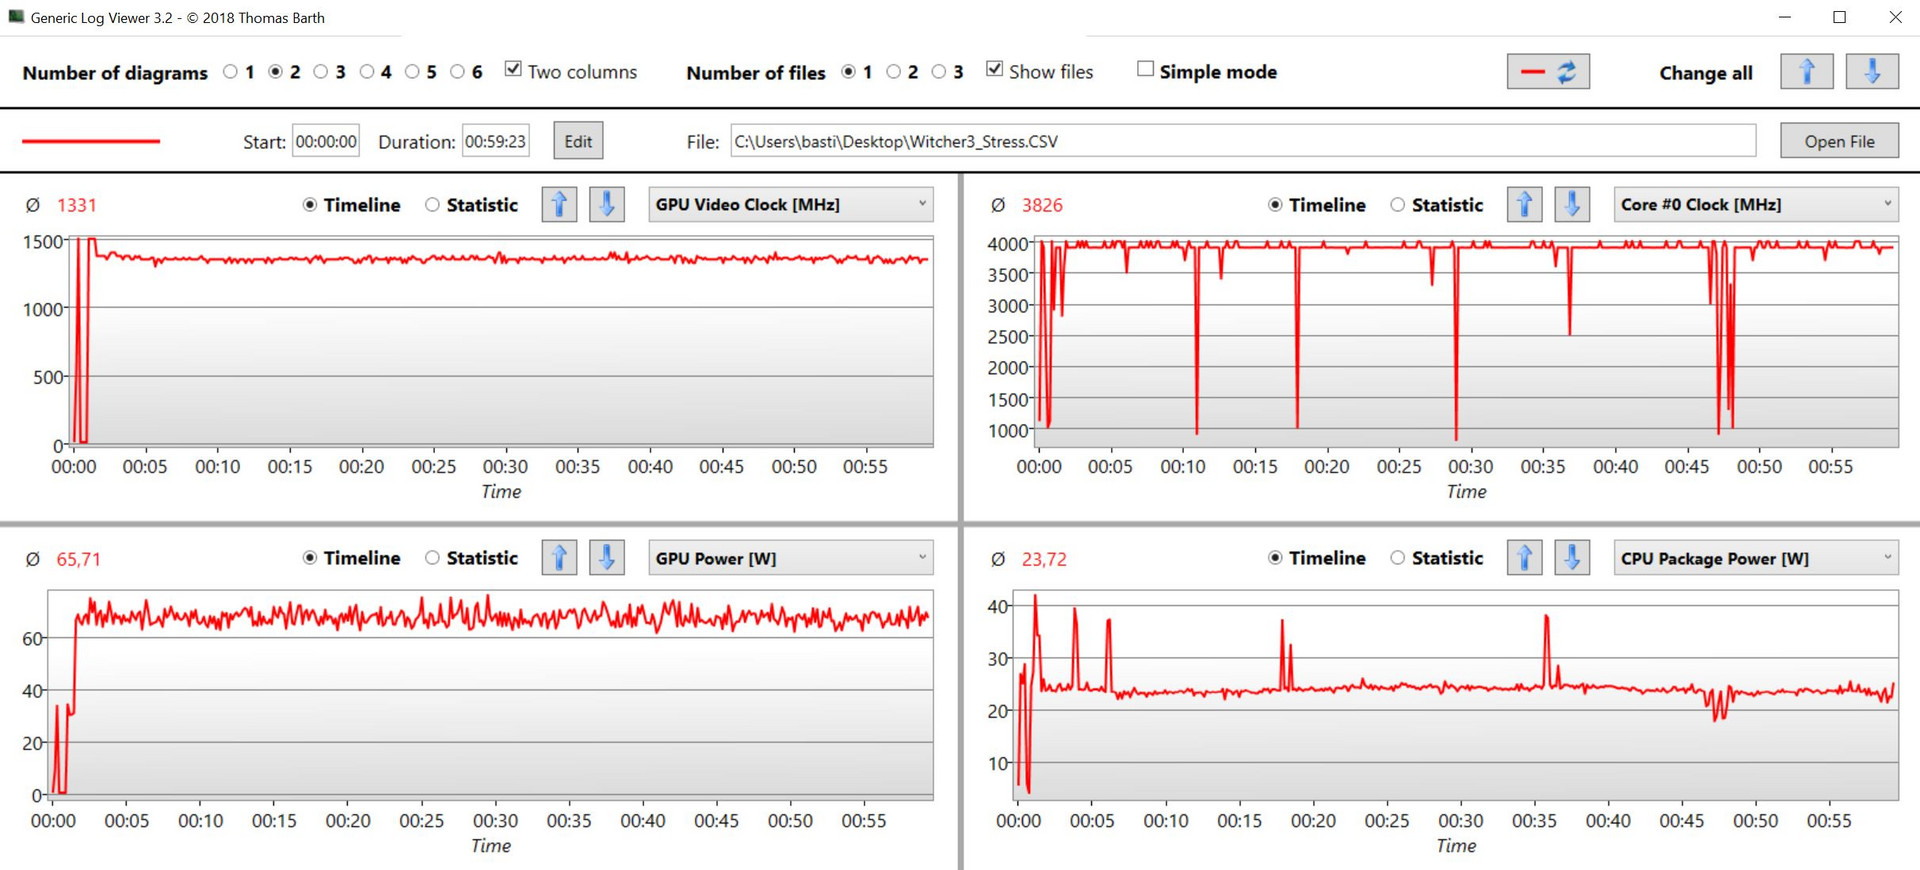
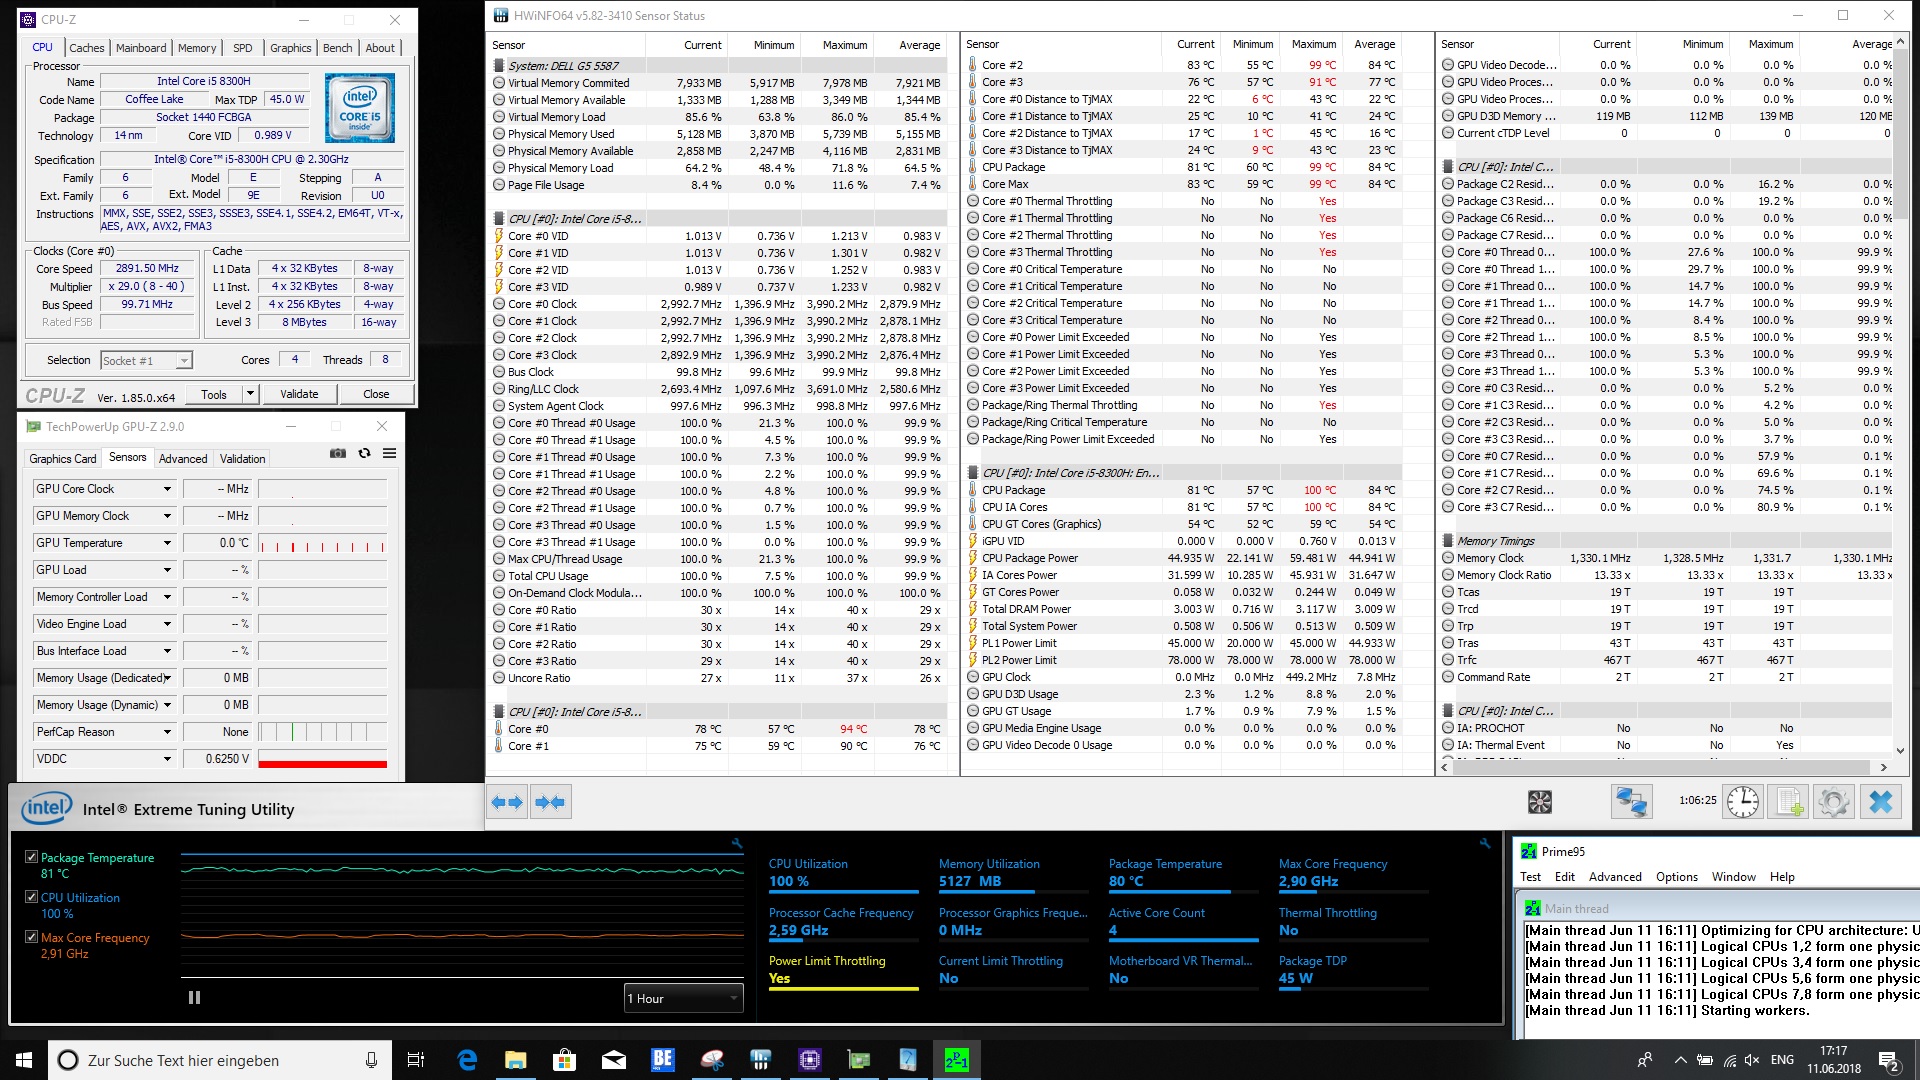
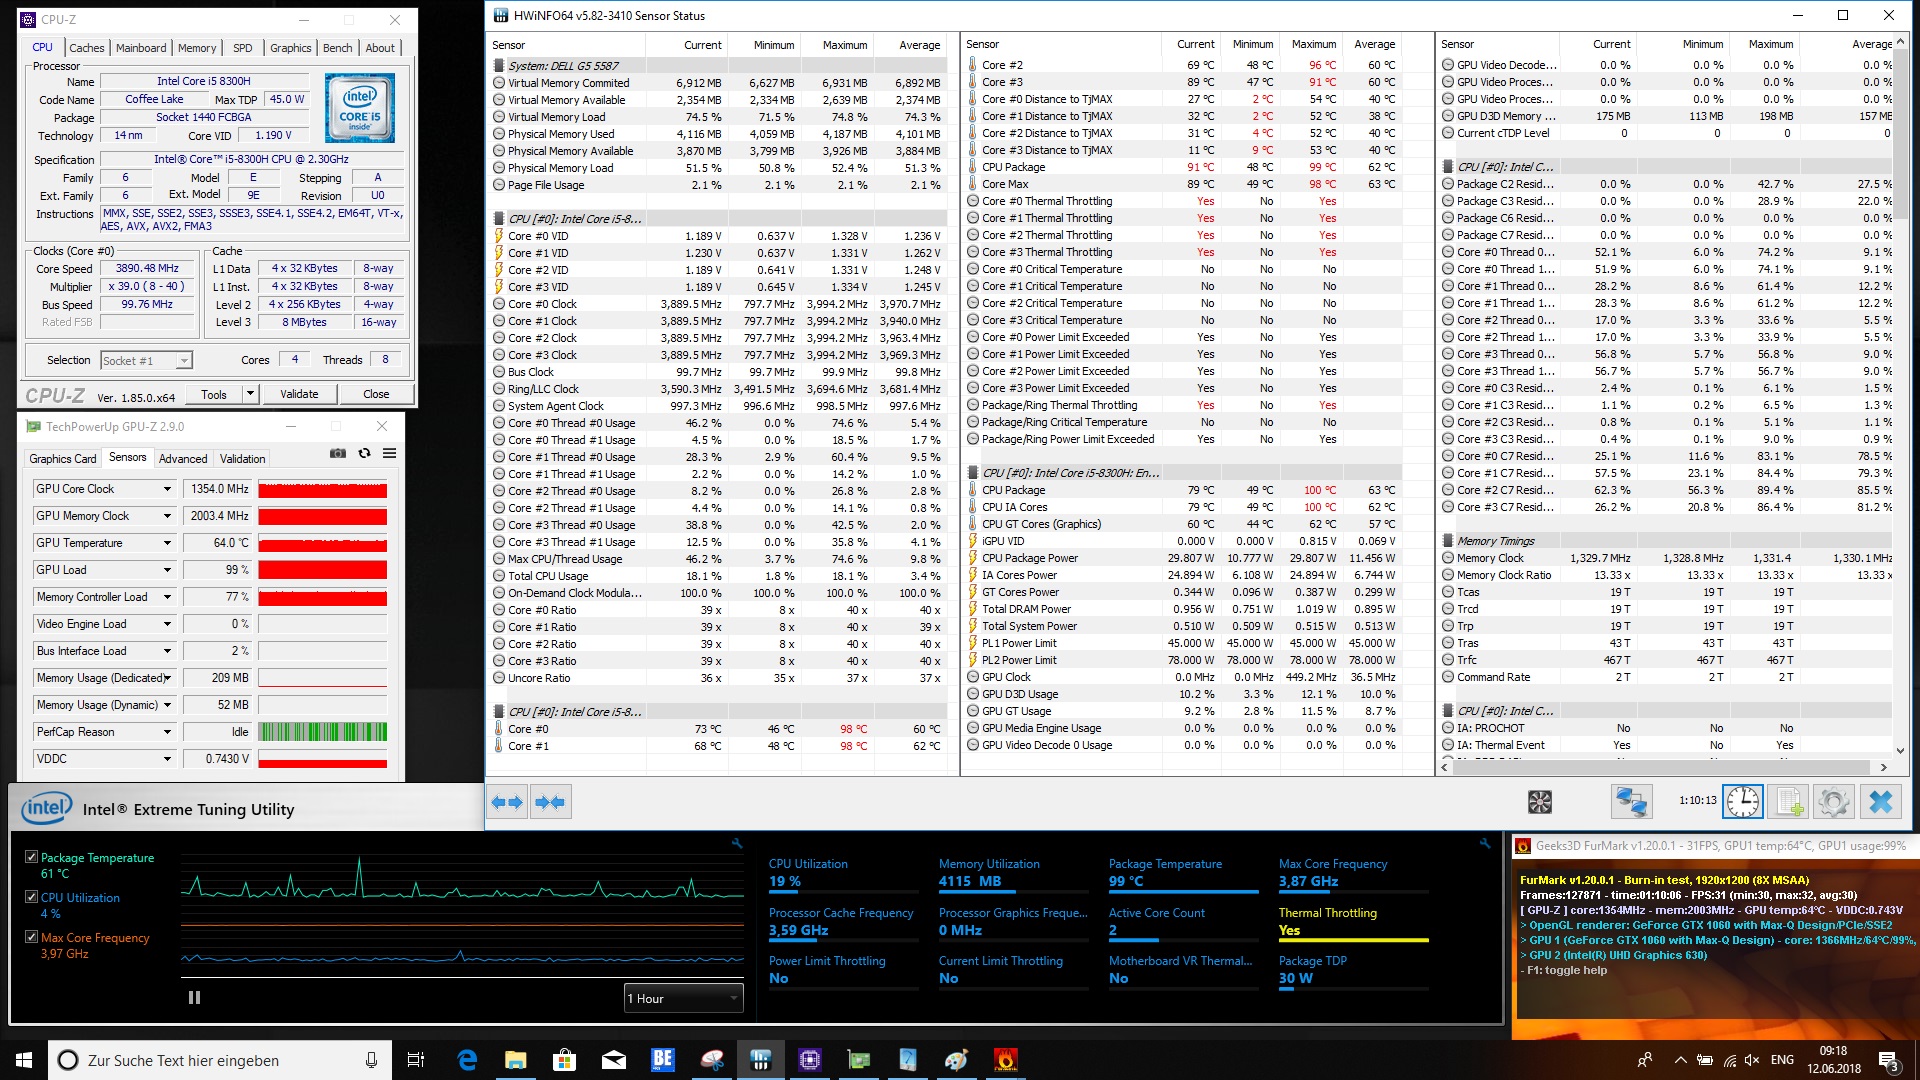
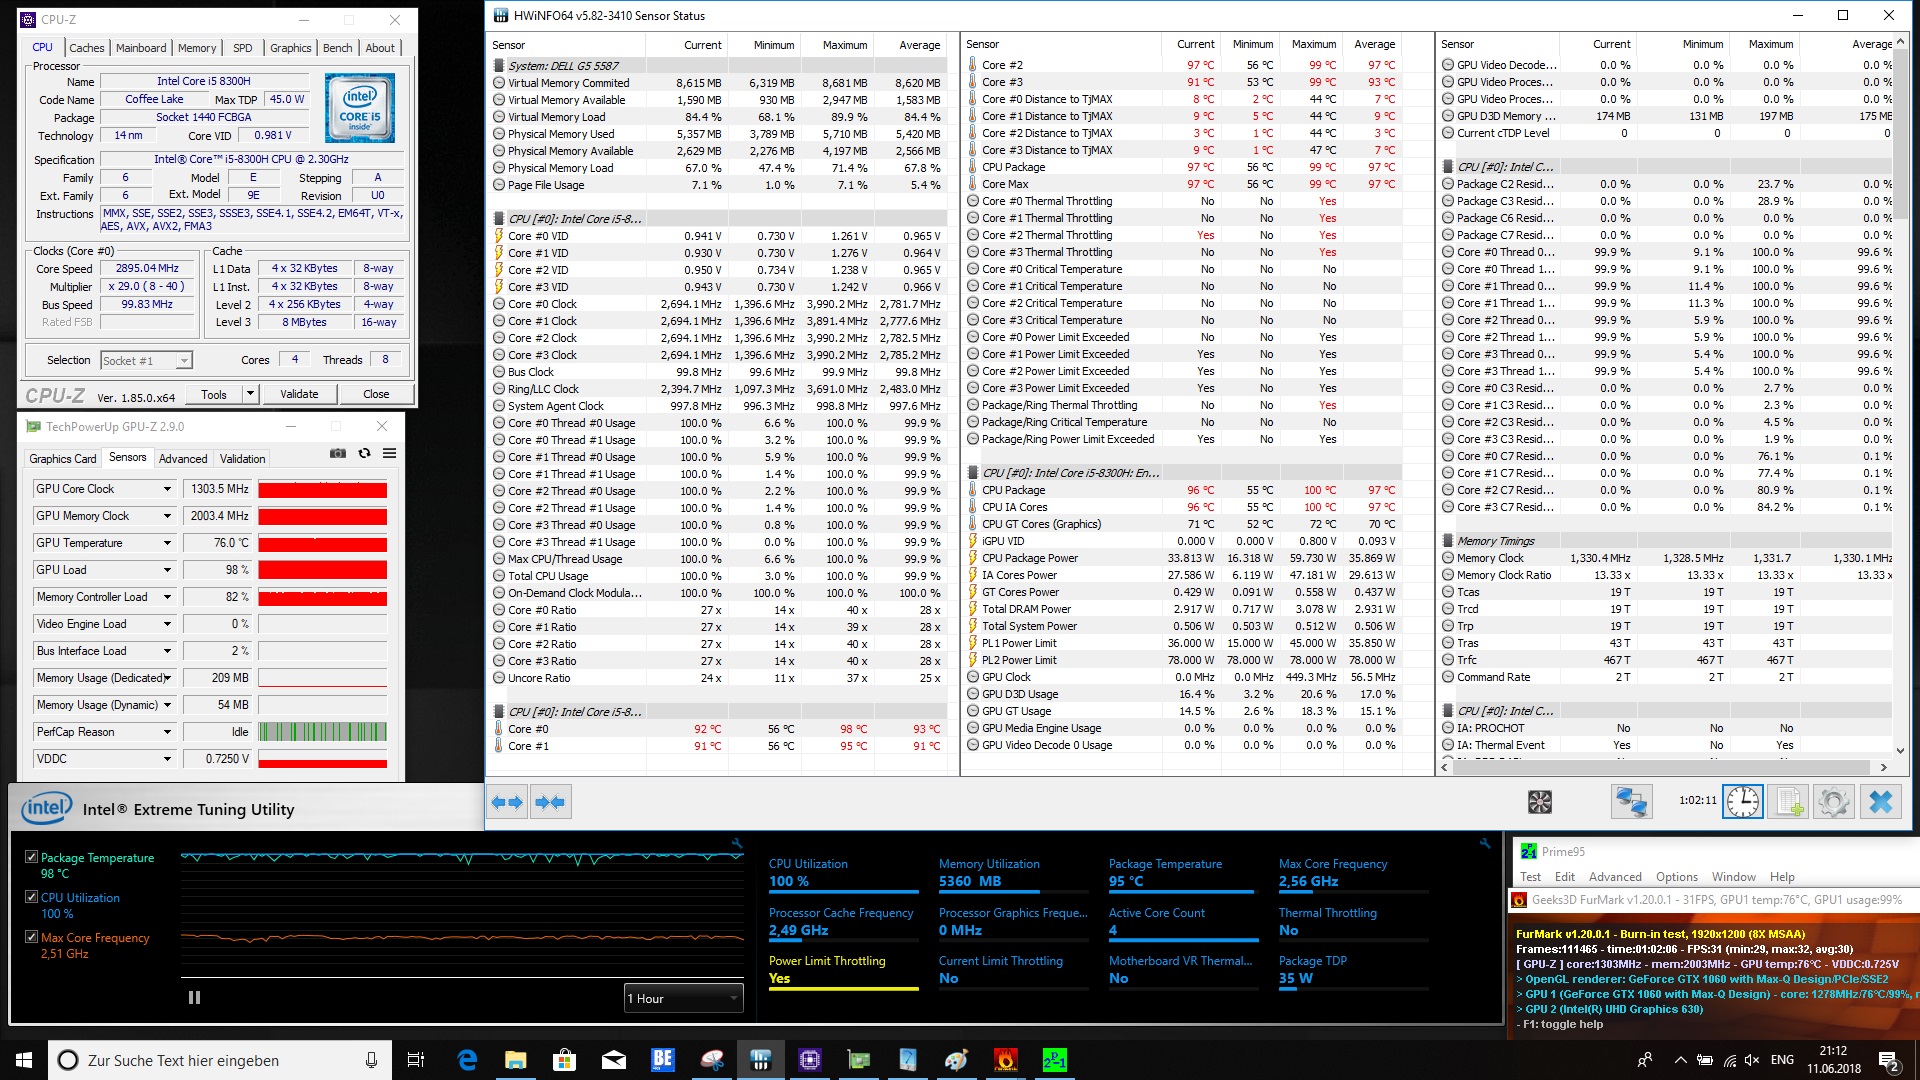
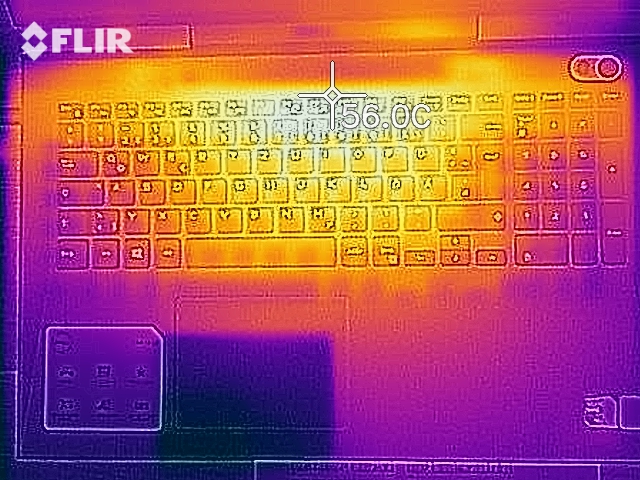
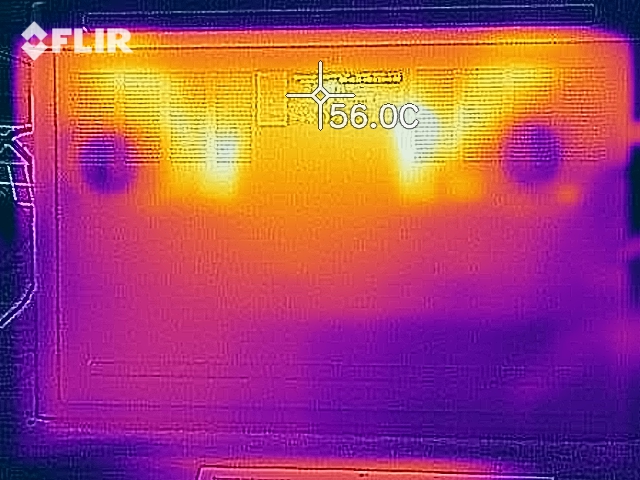
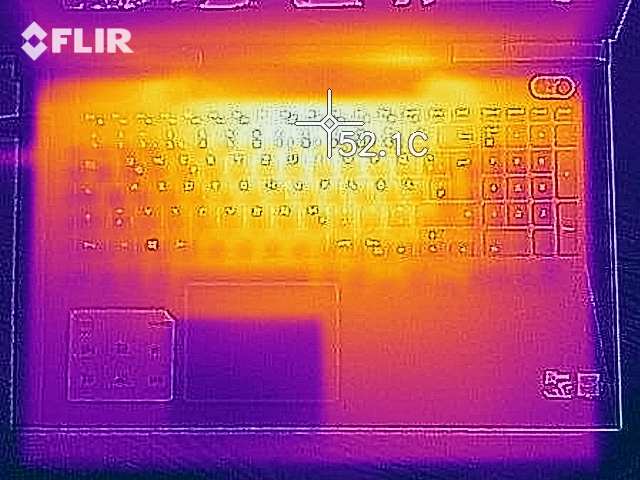
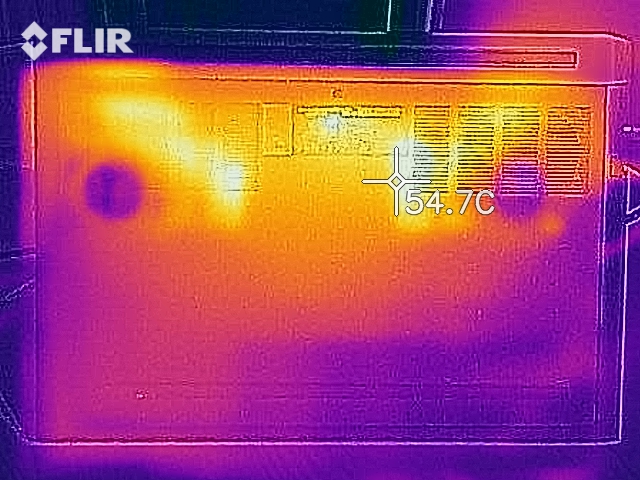
W teście pełnego obciążenia obudowa rozgrzała się na spodzie do 57°C, co jest wartością bardzo wysoką. W teście Asusa FX503VM stwierdzono jeszcze wyższą temperaturę maksymalną, 59,6°C [w dodatku przy dużo niższej temperaturze otoczenia - przyp. tłum.], ale to marna pociecha. W teście Prime95 temperatura procesora osiągnęła 99°C, co oznacza, że jego taktowanie musiało zostać obniżone. Średnia częstotliwość taktowania CPU wyniosła w tym godzinnym teście około 2,9 GHz. W obciążającym kartę grafiki teście FurMark temperatura GPU wyniosła 64°C, czyli nie była wysoka. W teście Prime95 plus FurMark temperatura CPU osiągnęła 100°C a temperatura GPU doszła do 76°C.
(-) Maksymalna temperatura w górnej części wynosi 50.2 °C / 122 F, w porównaniu do średniej 40.4 °C / 105 F , począwszy od 21.2 do 68.8 °C dla klasy Gaming.
(-) Dno nagrzewa się maksymalnie do 57 °C / 135 F, w porównaniu do średniej 43.2 °C / 110 F
(+) W stanie bezczynności średnia temperatura górnej części wynosi 27.3 °C / 81 F, w porównaniu ze średnią temperaturą urządzenia wynoszącą 33.9 °C / ### class_avg_f### F.
(-) Podczas gry w Wiedźmina 3 średnia temperatura górnej części wynosi 38.5 °C / 101 F, w porównaniu do średniej temperatury urządzenia wynoszącej 33.9 °C / ## #class_avg_f### F.
(+) Podparcia dłoni i touchpad osiągają maksymalną temperaturę skóry (33.7 °C / 92.7 F) i dlatego nie są gorące.
(-) Średnia temperatura obszaru podparcia dłoni w podobnych urządzeniach wynosiła 28.8 °C / 83.8 F (-4.9 °C / -8.9 F).
Głośniki
Głośniki znajdują się pod miejscami oparcia dłoni. Są one zwrócone w stronę użytkownika, więc dźwięk nie jest tłumiony, kiedy laptop spoczywa na miękkim podłożu. Z powodu braku subwoofera przeważają tony średnie i wysokie. Głośność maksymalna dźwięku z głośników okazała się niezbyt wysoka (68,5 dB). Podczas testów nie stwierdzono występowania szumów.
Wydajność akumulatora
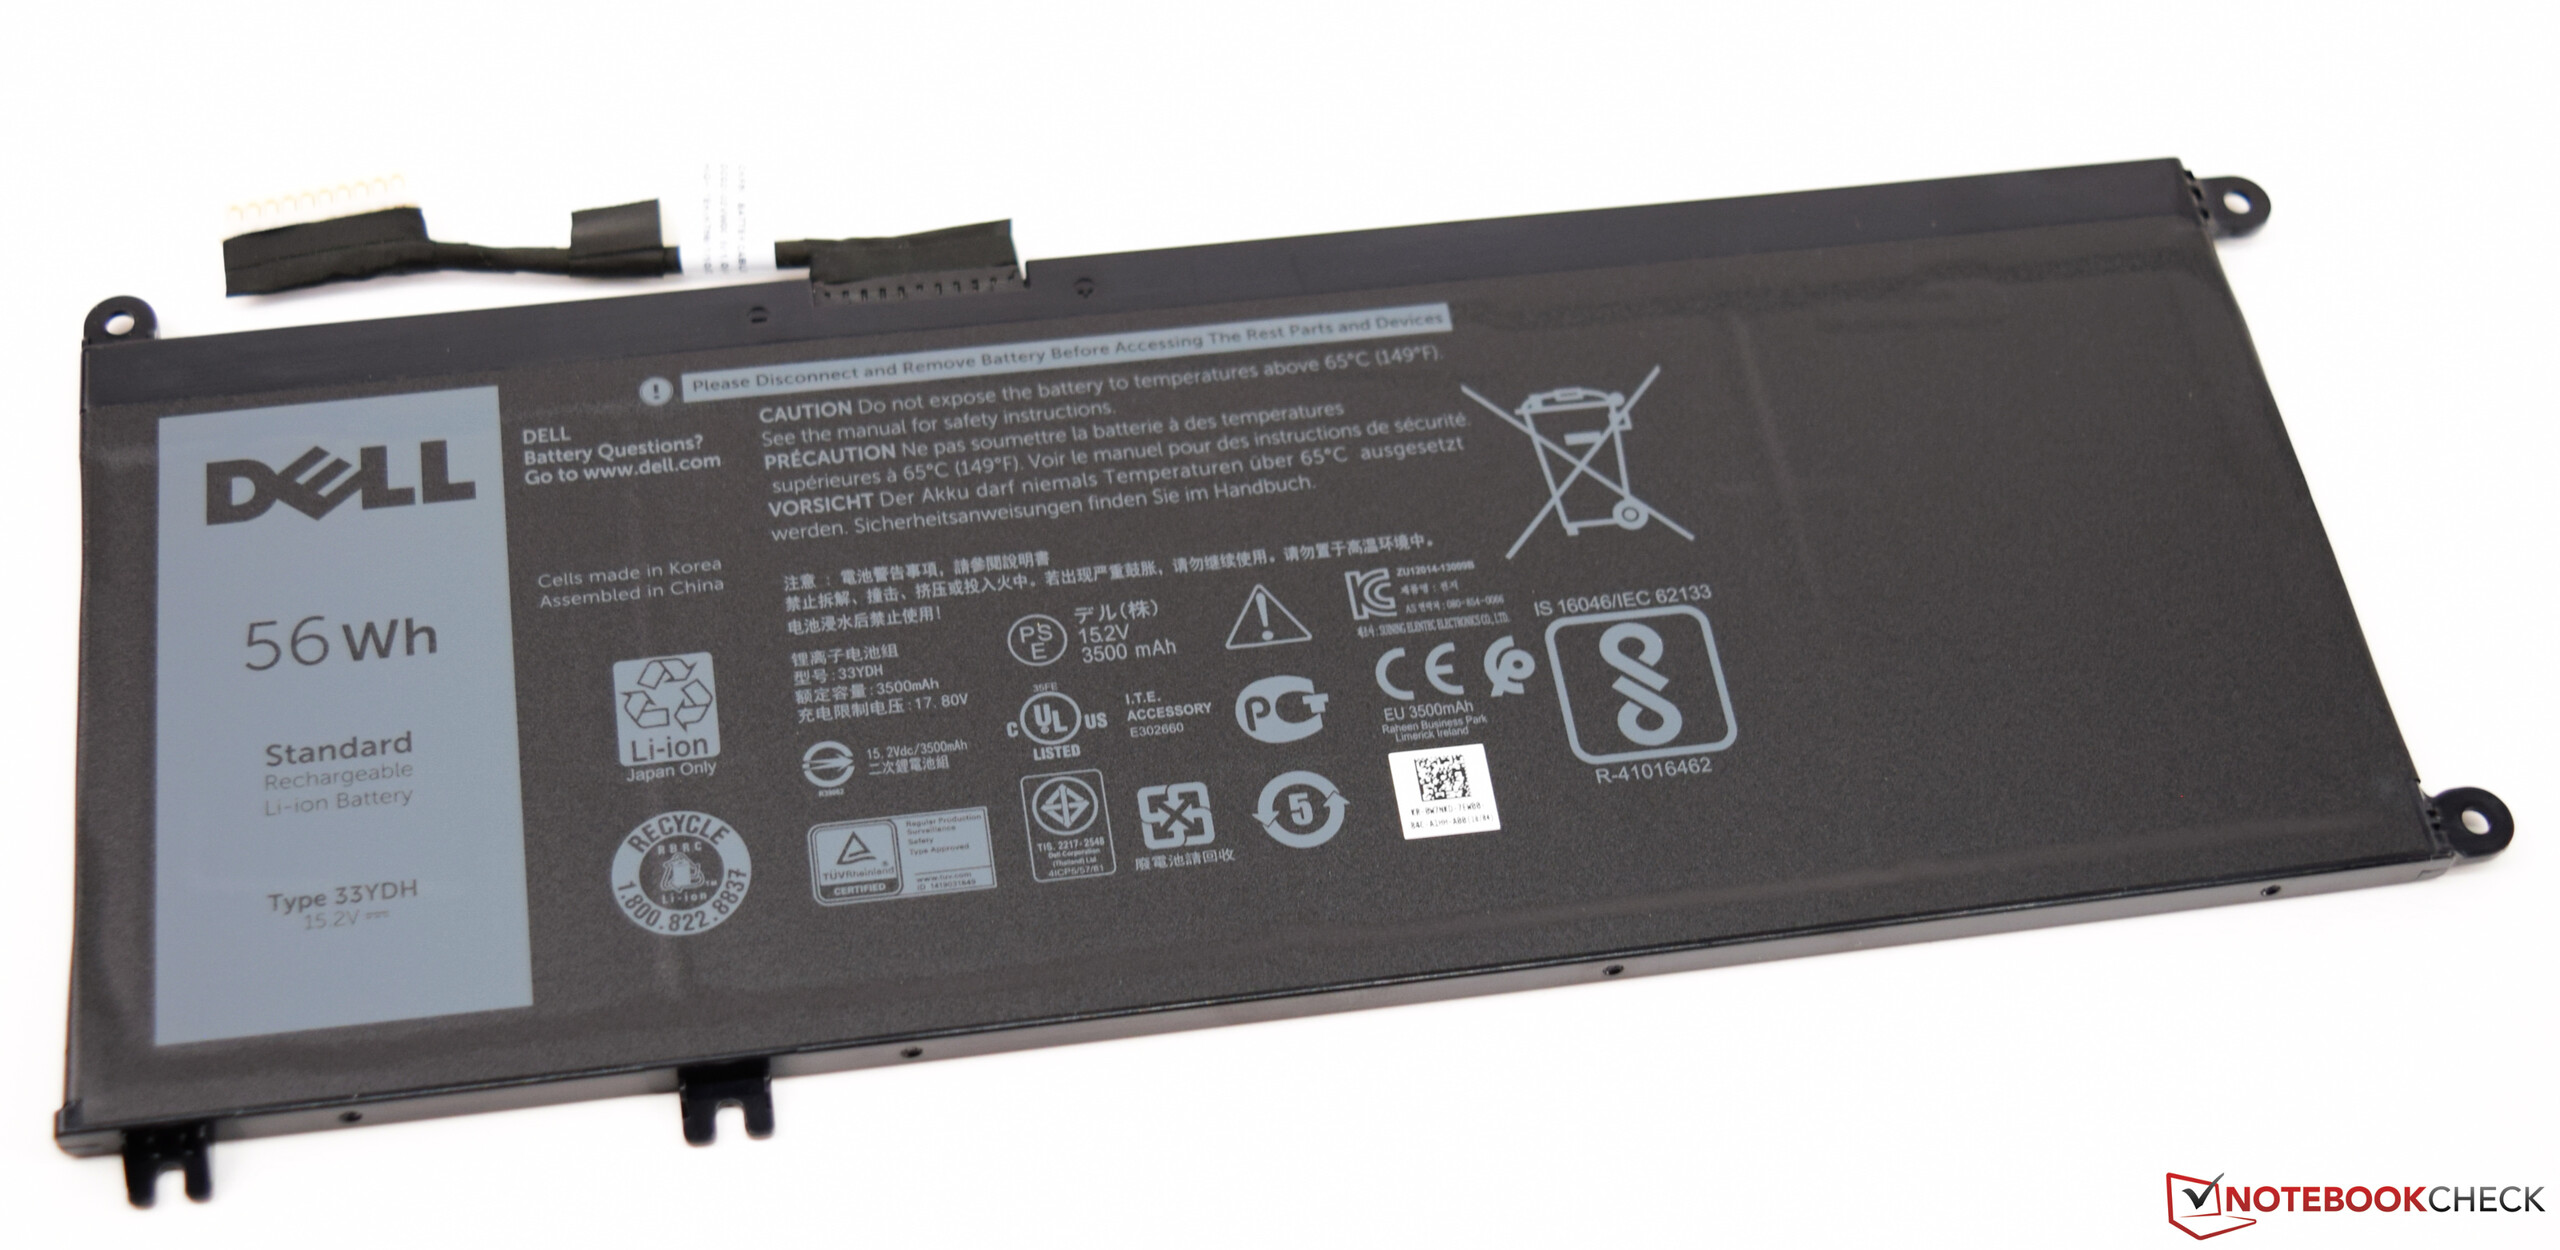
W teście czytelnika Battery Eater akumulator o pojemności 56 Wh był w stanie zasilać omawiany laptop przez 11 godzin i 45 minut. W teście symulującym korzystanie z internetu przez Wi-Fi udało się osiągnąć 6,5 godziny.
| wyłączony / stan wstrzymania | |
| luz | |
| obciążenie |
|
Legenda:
min: | |
| Dell G5 15 5587 i5-8300H, GeForce GTX 1060 Max-Q, 56 Wh | Dell Inspiron 15 7000 7577 i5-7300HQ, GeForce GTX 1050 Mobile, 56 Wh | Dell Inspiron 15 7000 7577 i5-7300HQ, GeForce GTX 1060 Max-Q, 56 Wh | PC Zentrum Proteus V i7-7700HQ, GeForce GTX 1060 Mobile, Wh | Asus FX503VM-EH73 i7-7700HQ, GeForce GTX 1060 Mobile, 64 Wh | Acer Nitro 5 Spin NP515-51-86CX i5-8550U, GeForce GTX 1050 Mobile, 48 Wh | Acer Predator Helios 300 PH317-52-51M6 i5-8300H, GeForce GTX 1050 Ti Mobile, 48 Wh | Średnia w klasie Gaming | |
|---|---|---|---|---|---|---|---|---|
| Czasy pracy | -6% | -9% | -47% | -44% | 2% | -11% | 0% | |
| Reader / Idle (h) | 11.8 | 11.1 -6% | 11 -7% | 3.7 -69% | 5.7 -52% | 12.5 6% | 11.8 0% | 8.27 ? -30% |
| H.264 (h) | 5.4 | 5.2 -4% | 3.3 -39% | 6.2 15% | 8.32 ? 54% | |||
| WiFi v1.3 (h) | 6.5 | 6.8 5% | 6.9 6% | 3.3 -49% | 4.6 -29% | 6.6 2% | 5.9 -9% | 7.11 ? 9% |
| Load (h) | 2.2 | 1.8 -18% | 1.6 -27% | 1.5 -32% | 1.1 -50% | 1.9 -14% | 1.7 -23% | 1.502 ? -32% |
Za
Przeciw
Podsumowanie
Dell G5 15 5587 to dość dobry laptop do gier. Autorowi spodobała się sztywna obudowa z centralnym zawiasem zapewniającym stabilność ekranowi. Procesor Core i5-8300H okazał się dużo wydajniejszy od procesora Core i5-7300HQ. Osiąga on jednak w tym laptopie bardzo wysokie temperatury. Throttling termiczny pod obciążeniem nie jest jednak bardzo dotkliwy. GeForce GTX 1060 Max-Q w Dellu 5587 ma wydajność niewiele gorszą od wydajności normalnej karty GTX 1060. Na dość niską notę zasługuje matryca, której zaletami są brak PWM, szerokie kąty widzenia i matowa powierzchnia ekranu. To jednak niewiele w obliczu jej mankamentów, którymi są m.in. dość słaby kontrast i niska jasność obrazu. Przepustowość czytnika kart pamięci jest w tym laptopie ograniczona przepustowością interfejsu USB 2.0. Narzekać można także na słabą jakość dźwięku z głośników.
