Microsoft Surface Laptop Go 3 w recenzji - Przeceniony subnotebook bez podświetlenia klawiatury
Wraz z nowym Surface Laptop Studio 2 (tutaj w recenzji), Microsoft wprowadził również nową wersję Surface Laptop Go. W trzeciej generacji producent z Redmond zamienia stary procesor Tiger Lake na zeszłoroczny układ Alder Lake i opcjonalnie oferuje 16 GB pamięci RAM. Podczas gdy w Surface Laptop Studio zmieniono co najmniej kilka innych rzeczy (np. więcej portów), Surface Laptop Go 3 jest dokładnie taki sam jak jego poprzednik we wszystkich innych aspektach, w tym w brakującym podświetleniu klawiatury. W zamian jednak wyeliminowano tańsze modele, a bazowy model z procesorem Core i5-1235U8 GB RAM i dyskiem SSD o pojemności 256 GB będzie kosztował 899 euro. Jeśli chcesz 16 GB pamięci RAM, będziesz musiał zapłacić 1149 euro (~ 5000 USD) w tej samej konfiguracji.
Ostatecznie Apple MacBook Air M1który jest nadal dostępny w sklepach za około 900 euro (~ 900 USD), jest największym konkurentem dla kompaktowego komputera Microsoft. W obozie Windows znajduje się Dell XPS 13 jest już dostępny za mniej niż 1000 euro, a 13,3-calowy kabriolet Lenovo Yoga 6 również mieści się w tym przedziale cenowym.
Potencjalni konkurenci w porównaniu
Ocena | Data | Model | Waga | Wysokość | Rozmiar | Rezolucja | Cena |
|---|---|---|---|---|---|---|---|
| 83.3 % v7 (old) | 10/2023 | Microsoft Surface Laptop Go 3 i5-1235U, Iris Xe G7 80EUs | 1.1 kg | 15.7 mm | 12.40" | 1536x1024 | |
| 91.1 % v7 (old) | 07/2024 | Apple MacBook Air 2020 M1 Entry M1, M1 7-Core GPU | 1.3 kg | 16.1 mm | 13.30" | 2560x1600 | |
| 88.2 % v7 (old) | Dell XPS 13 9315, i5-1230U i5-1230U, Iris Xe G7 80EUs | 1.2 kg | 14 mm | 13.40" | 1920x1200 | ||
| 88 % v7 (old) | 03/2023 | Lenovo Yoga 6 13 83B2001SGE R7 7730U, Vega 8 | 1.4 kg | 18.6 mm | 13.30" | 1920x1200 |
Walizka i sprzęt
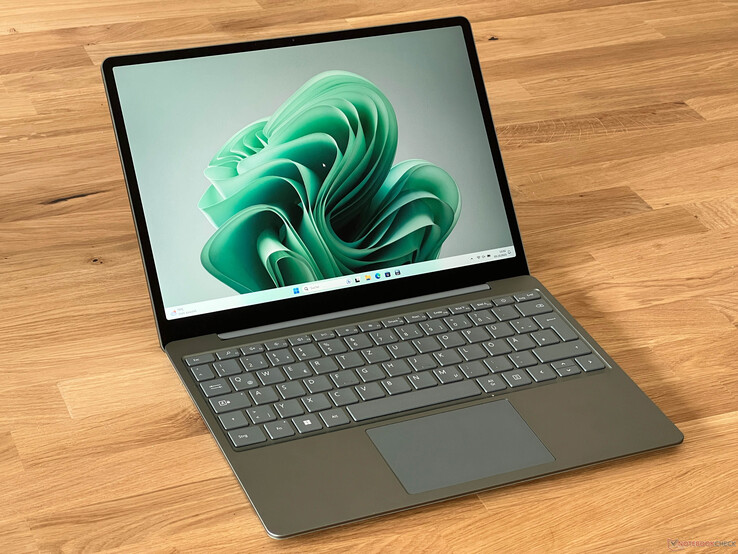
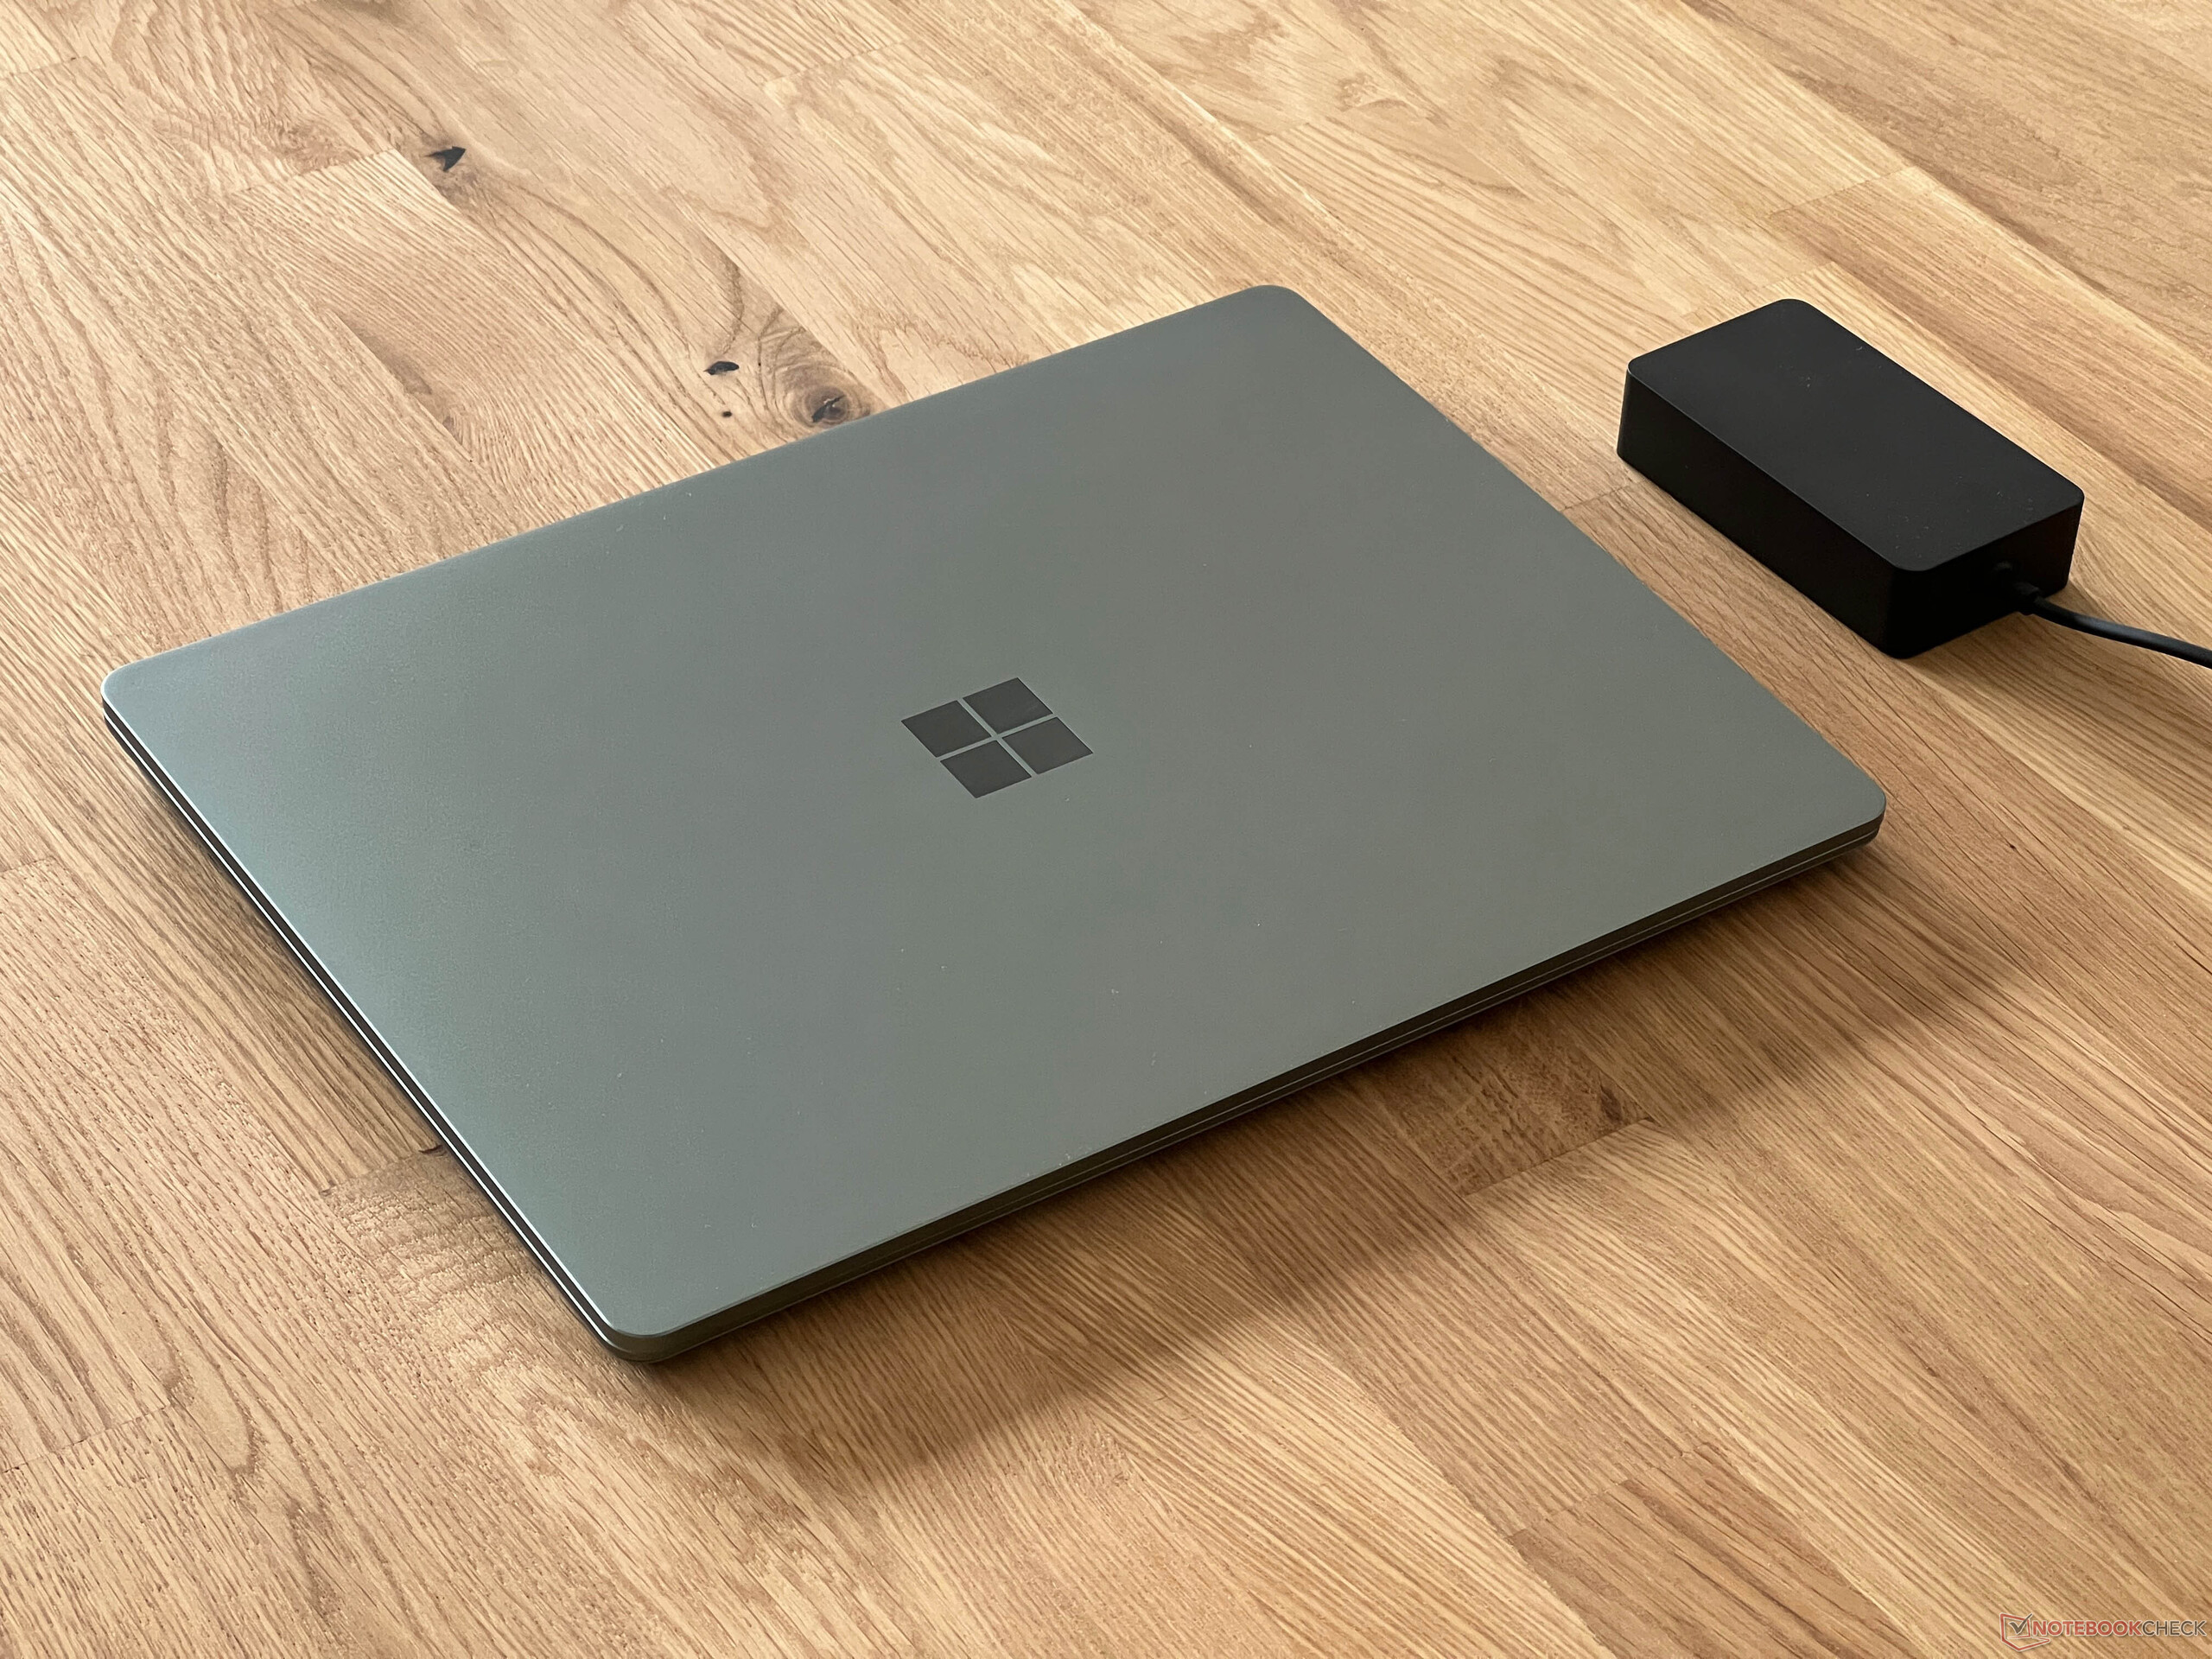
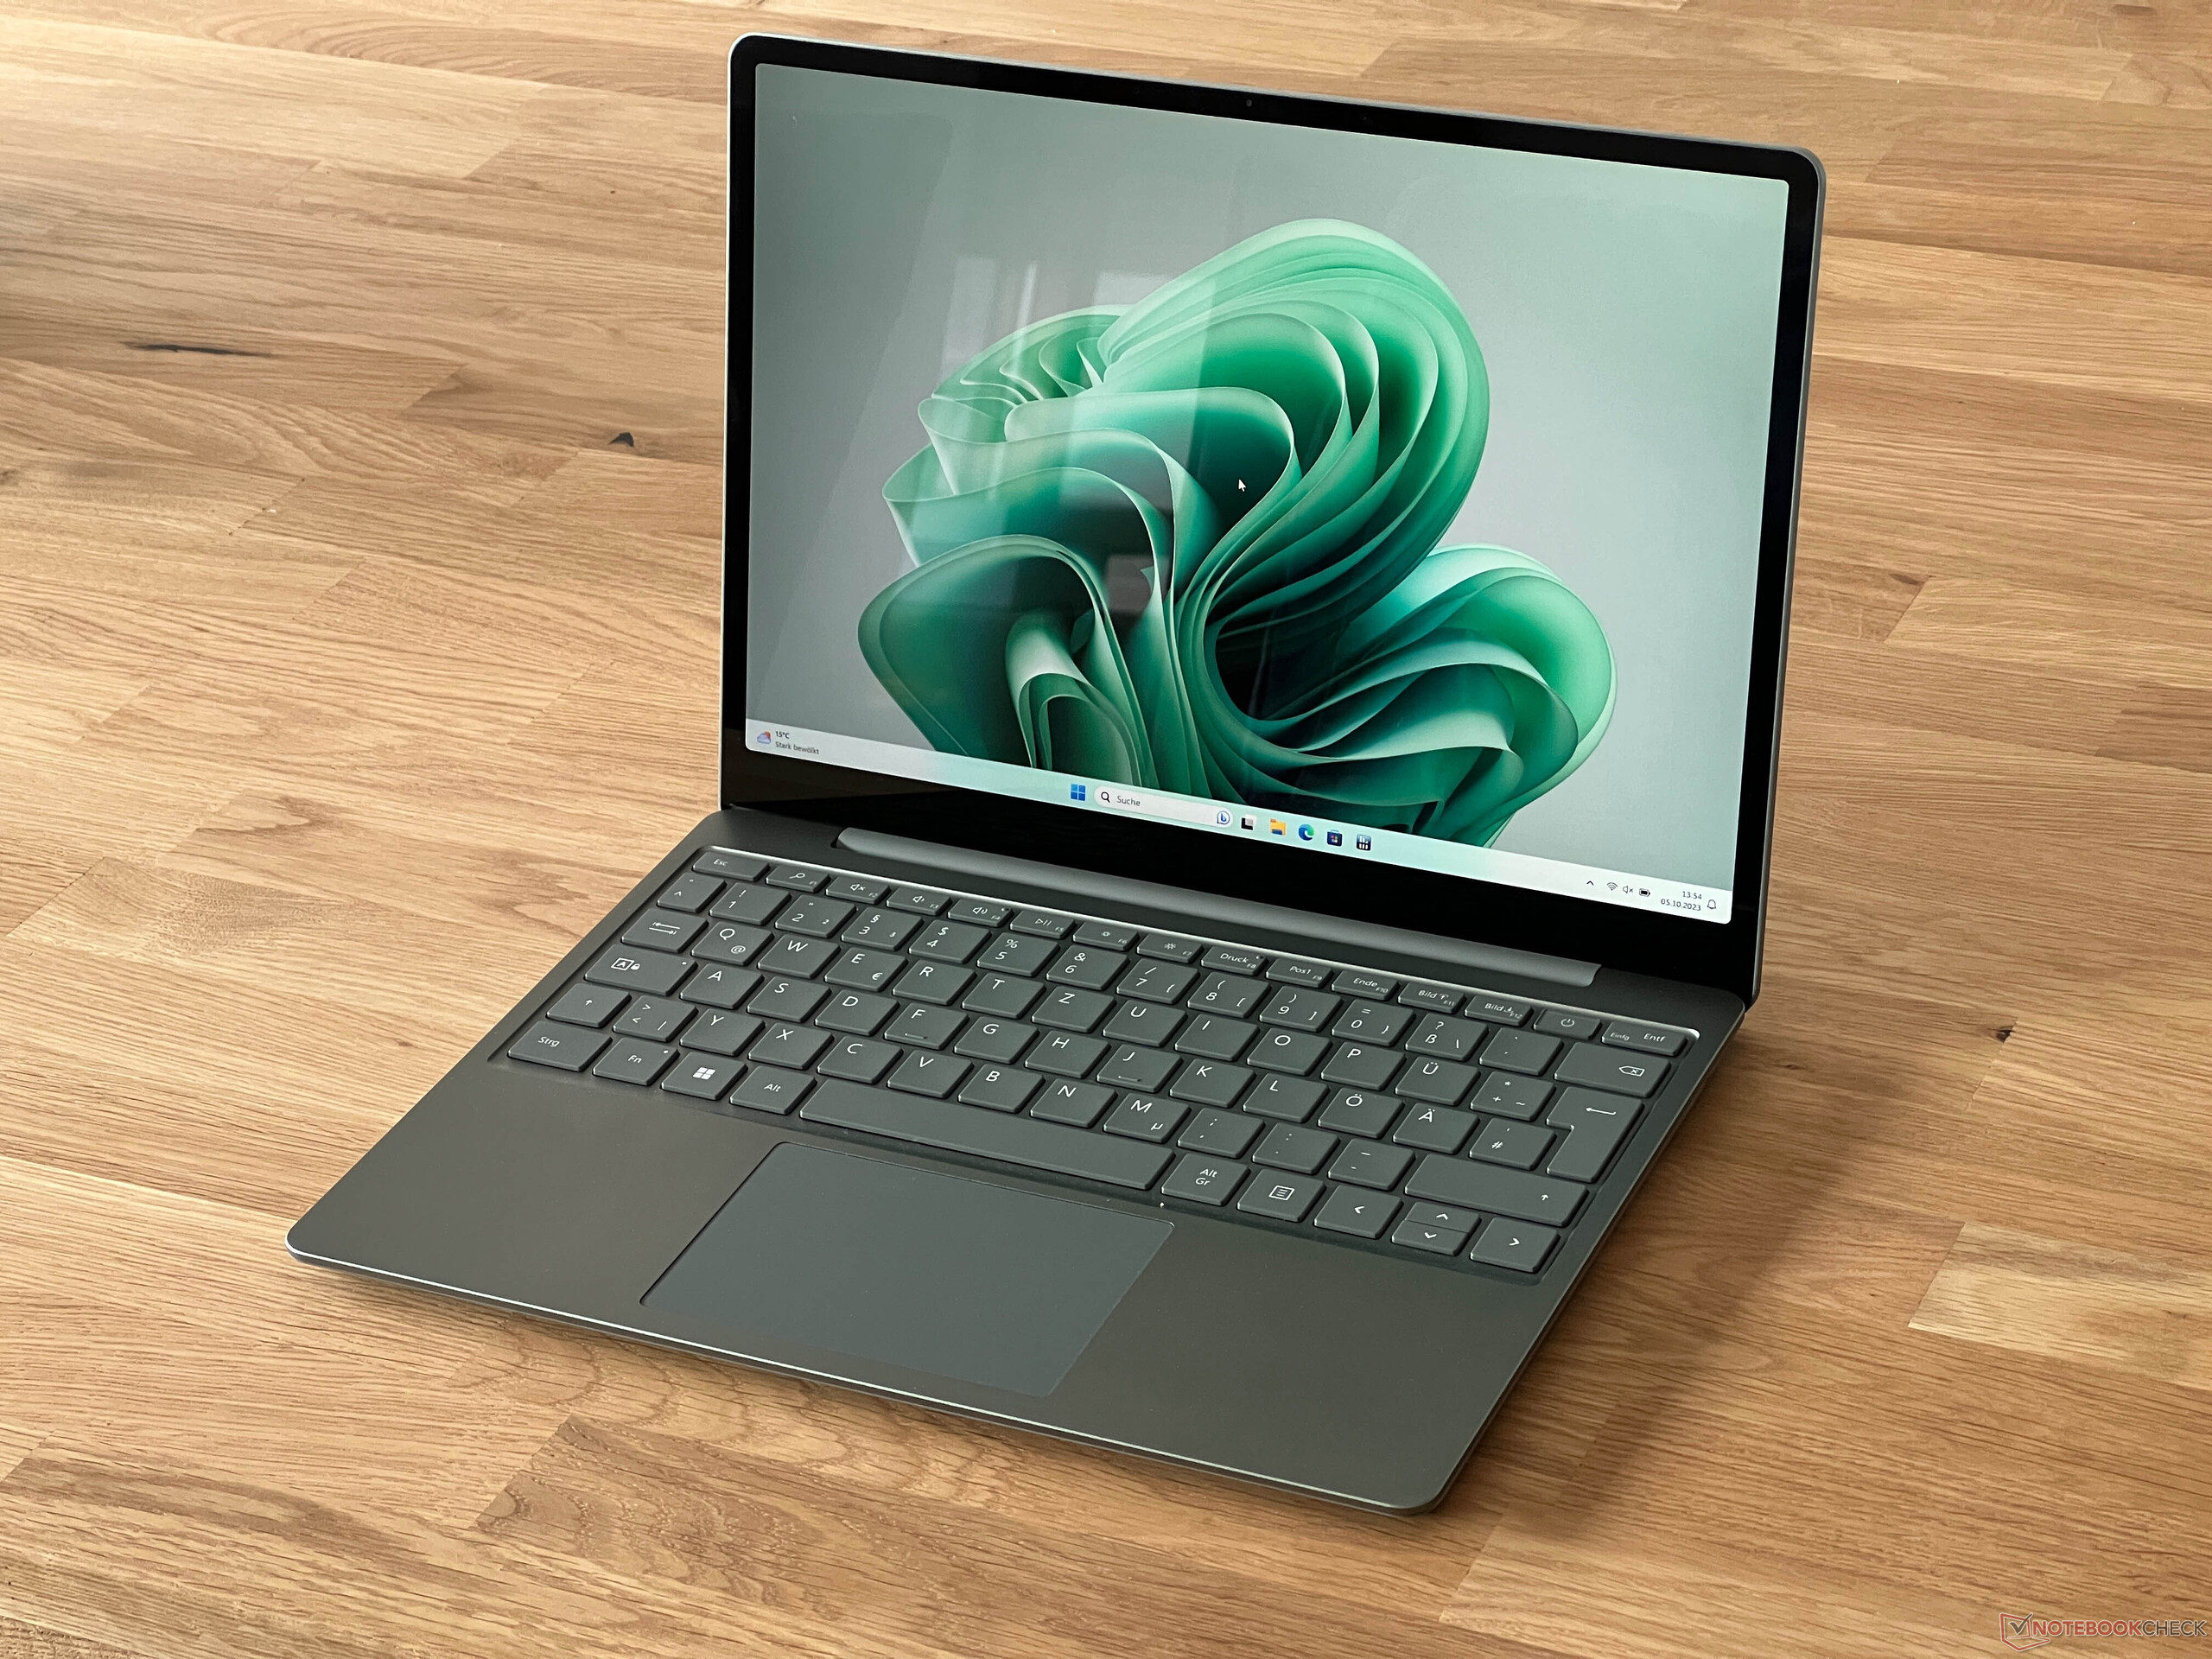
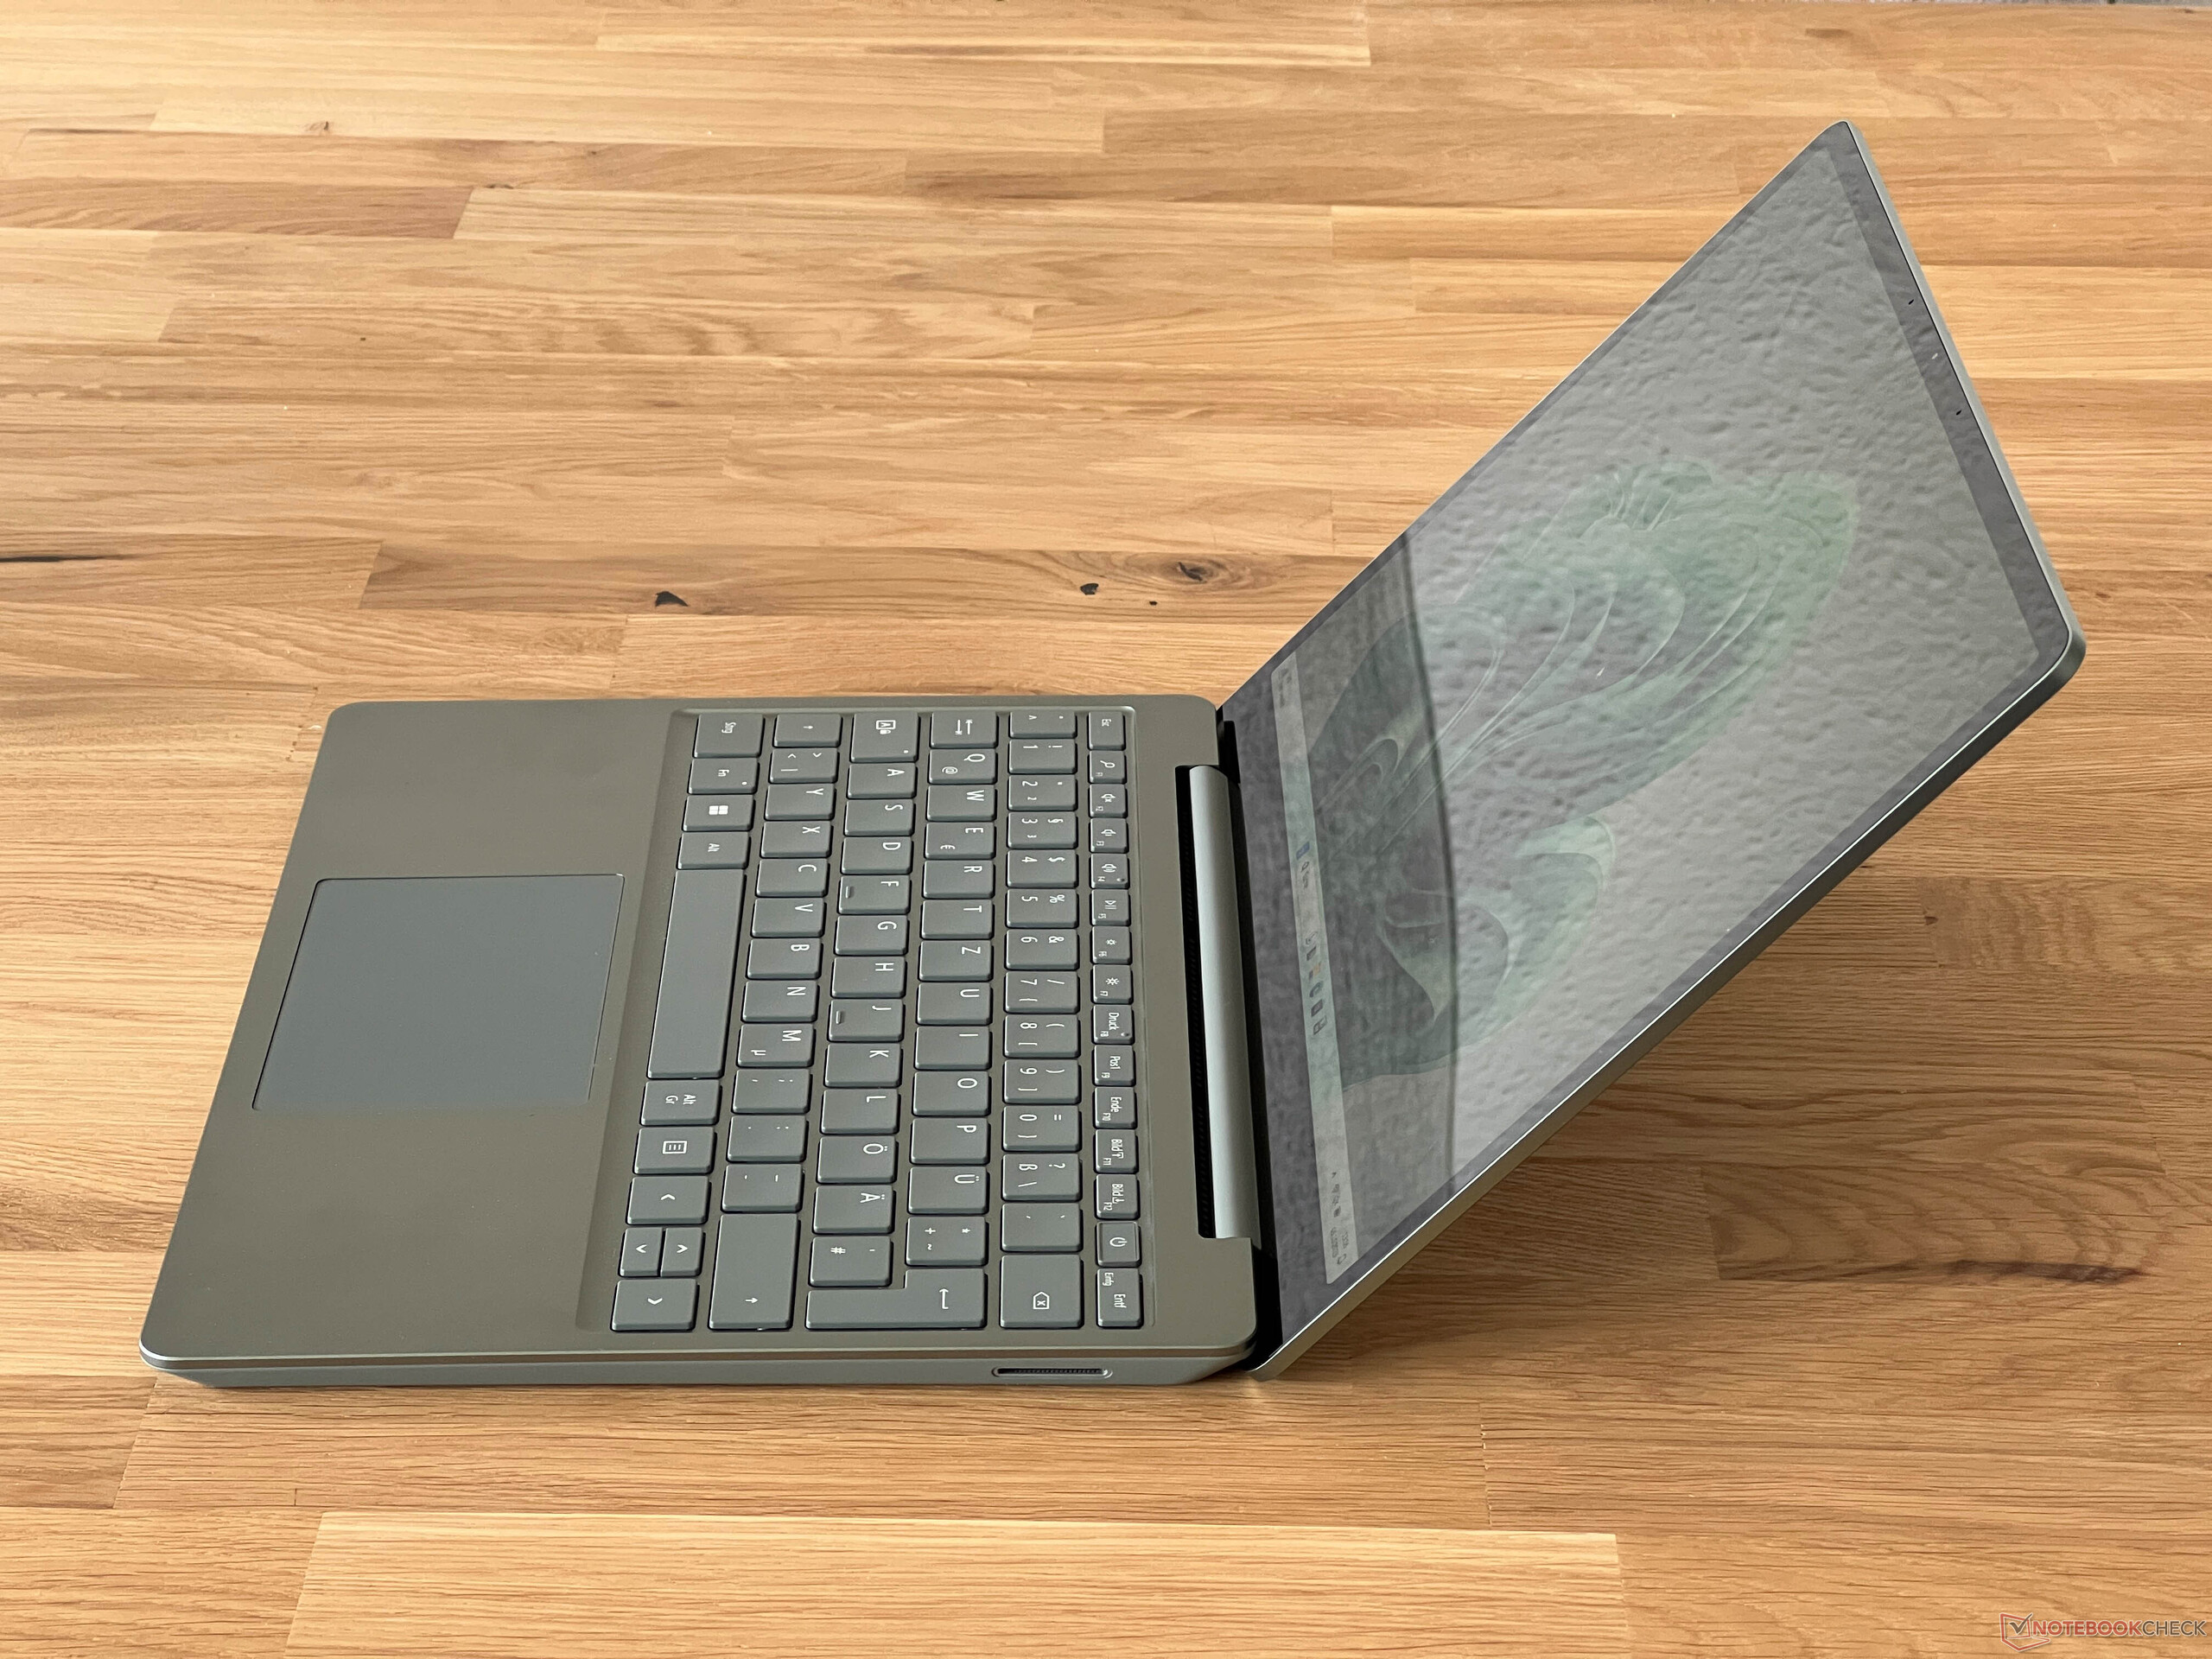
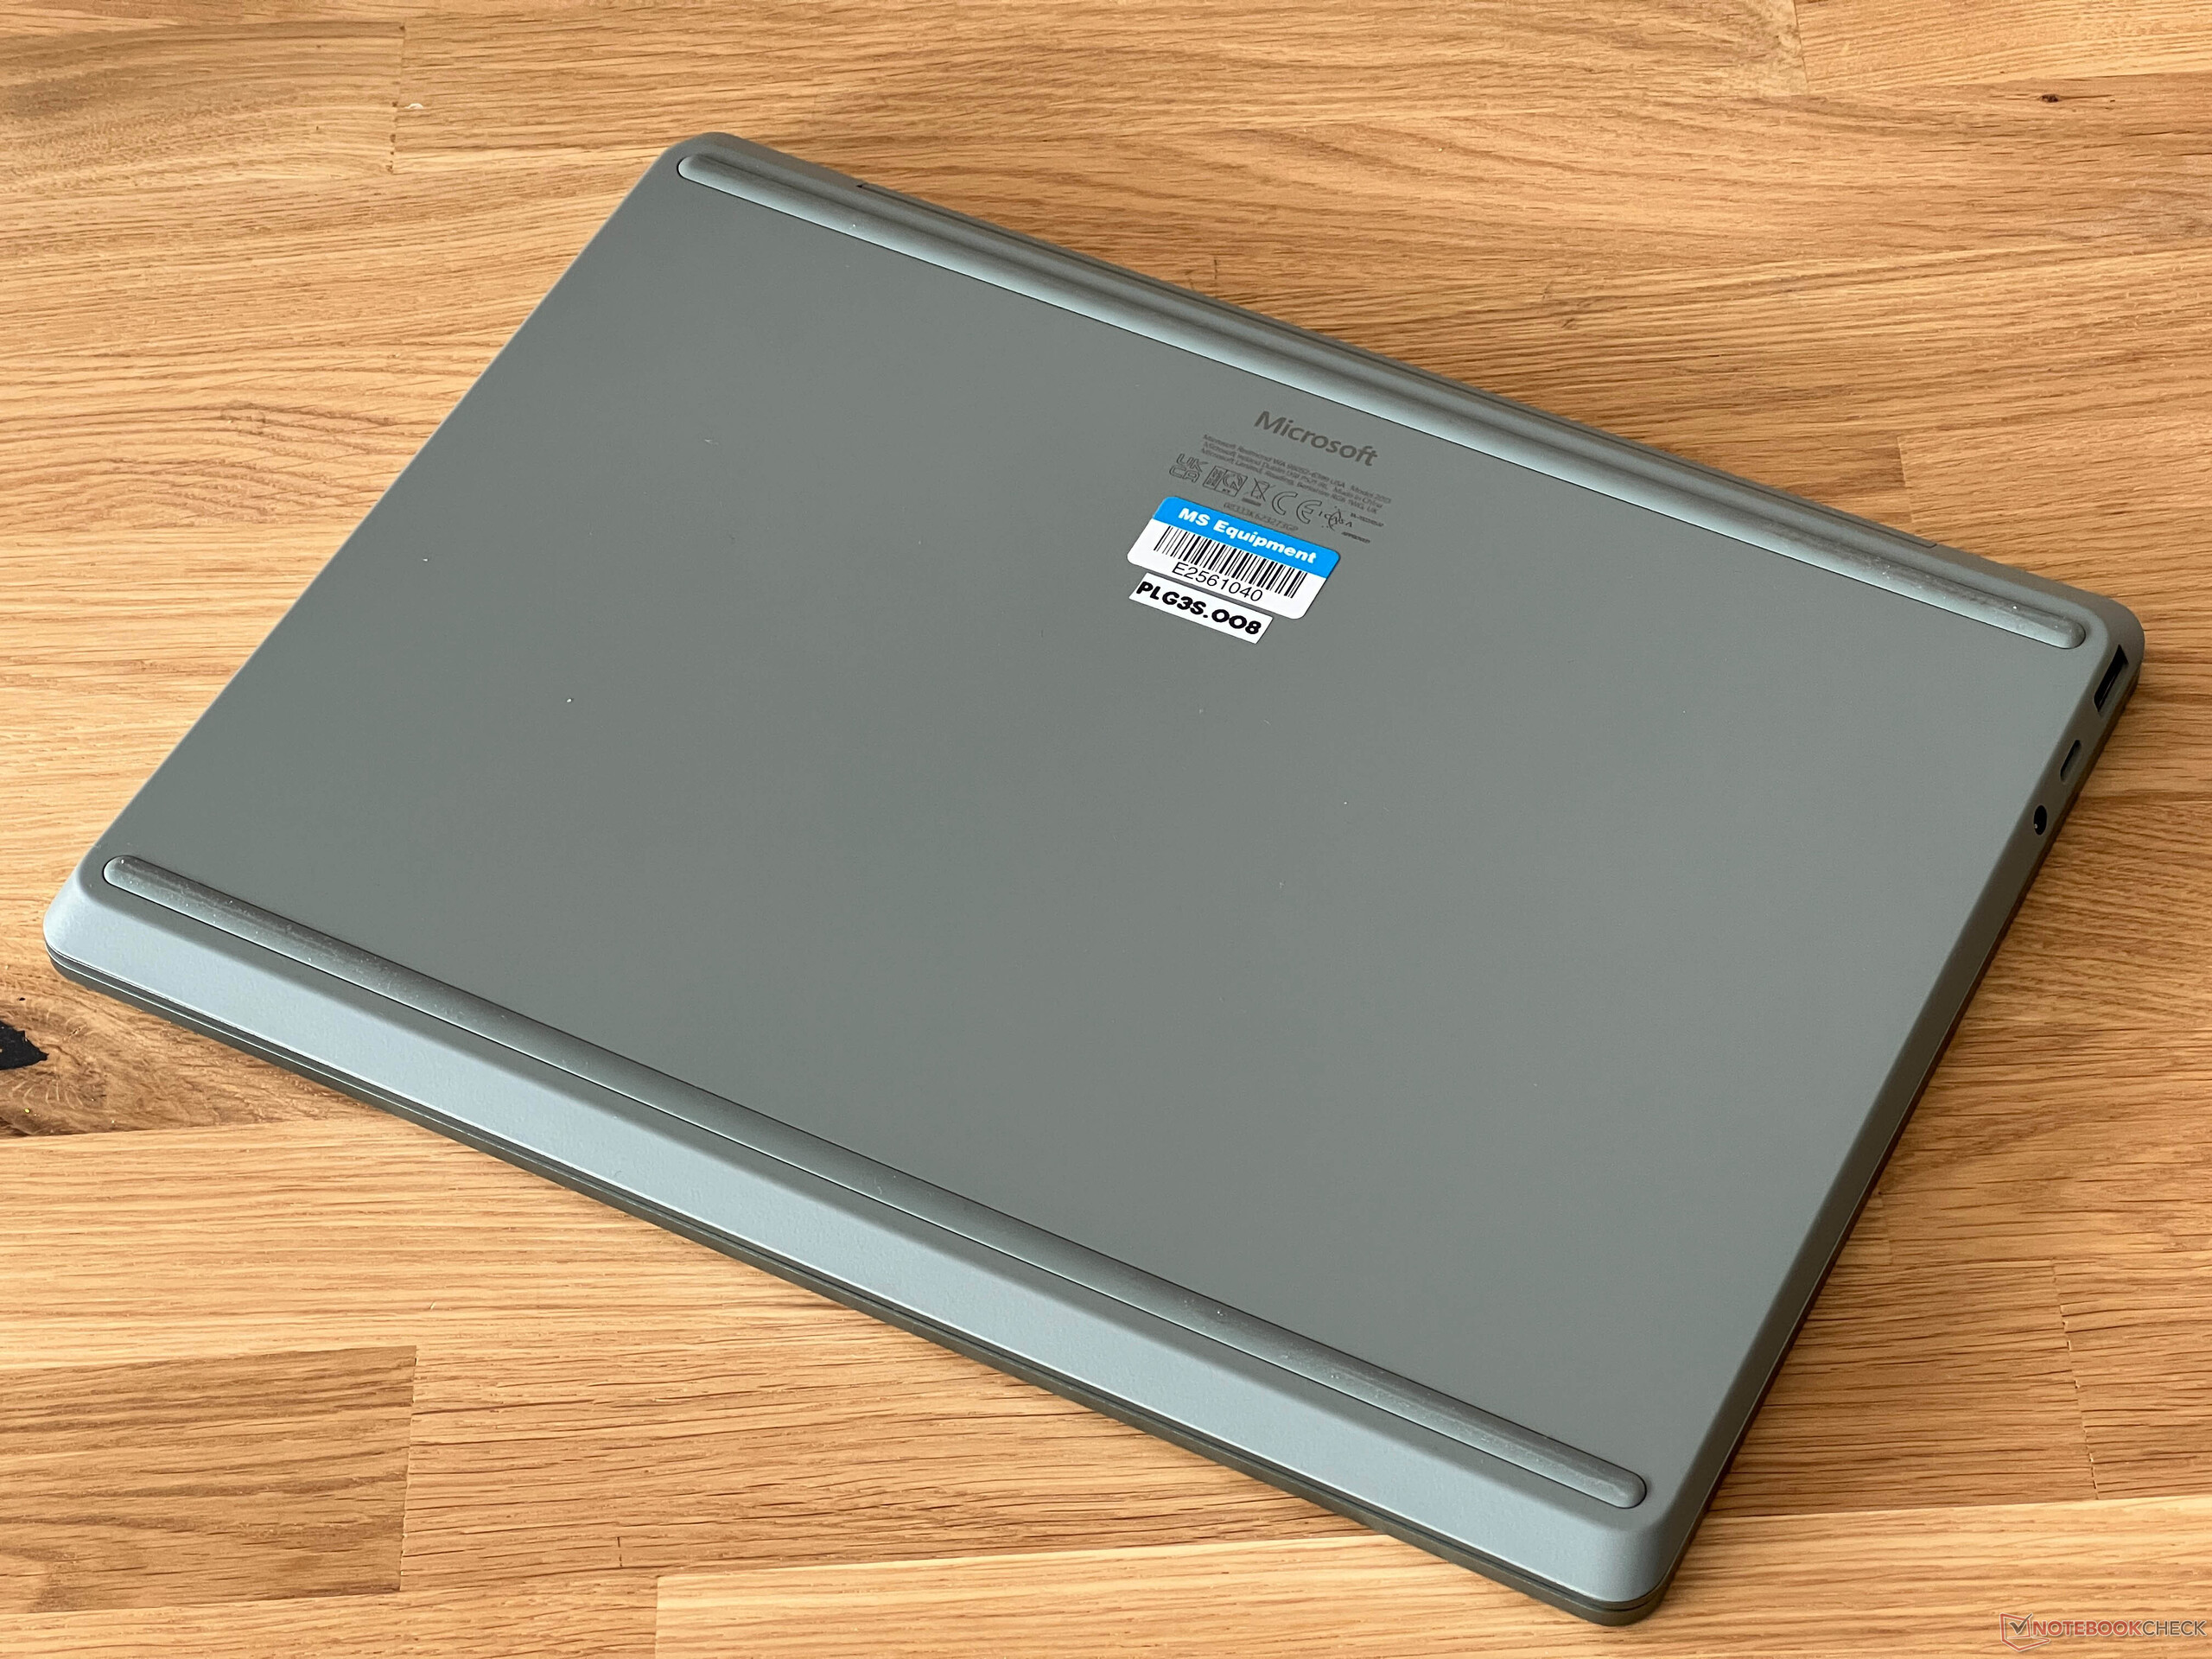
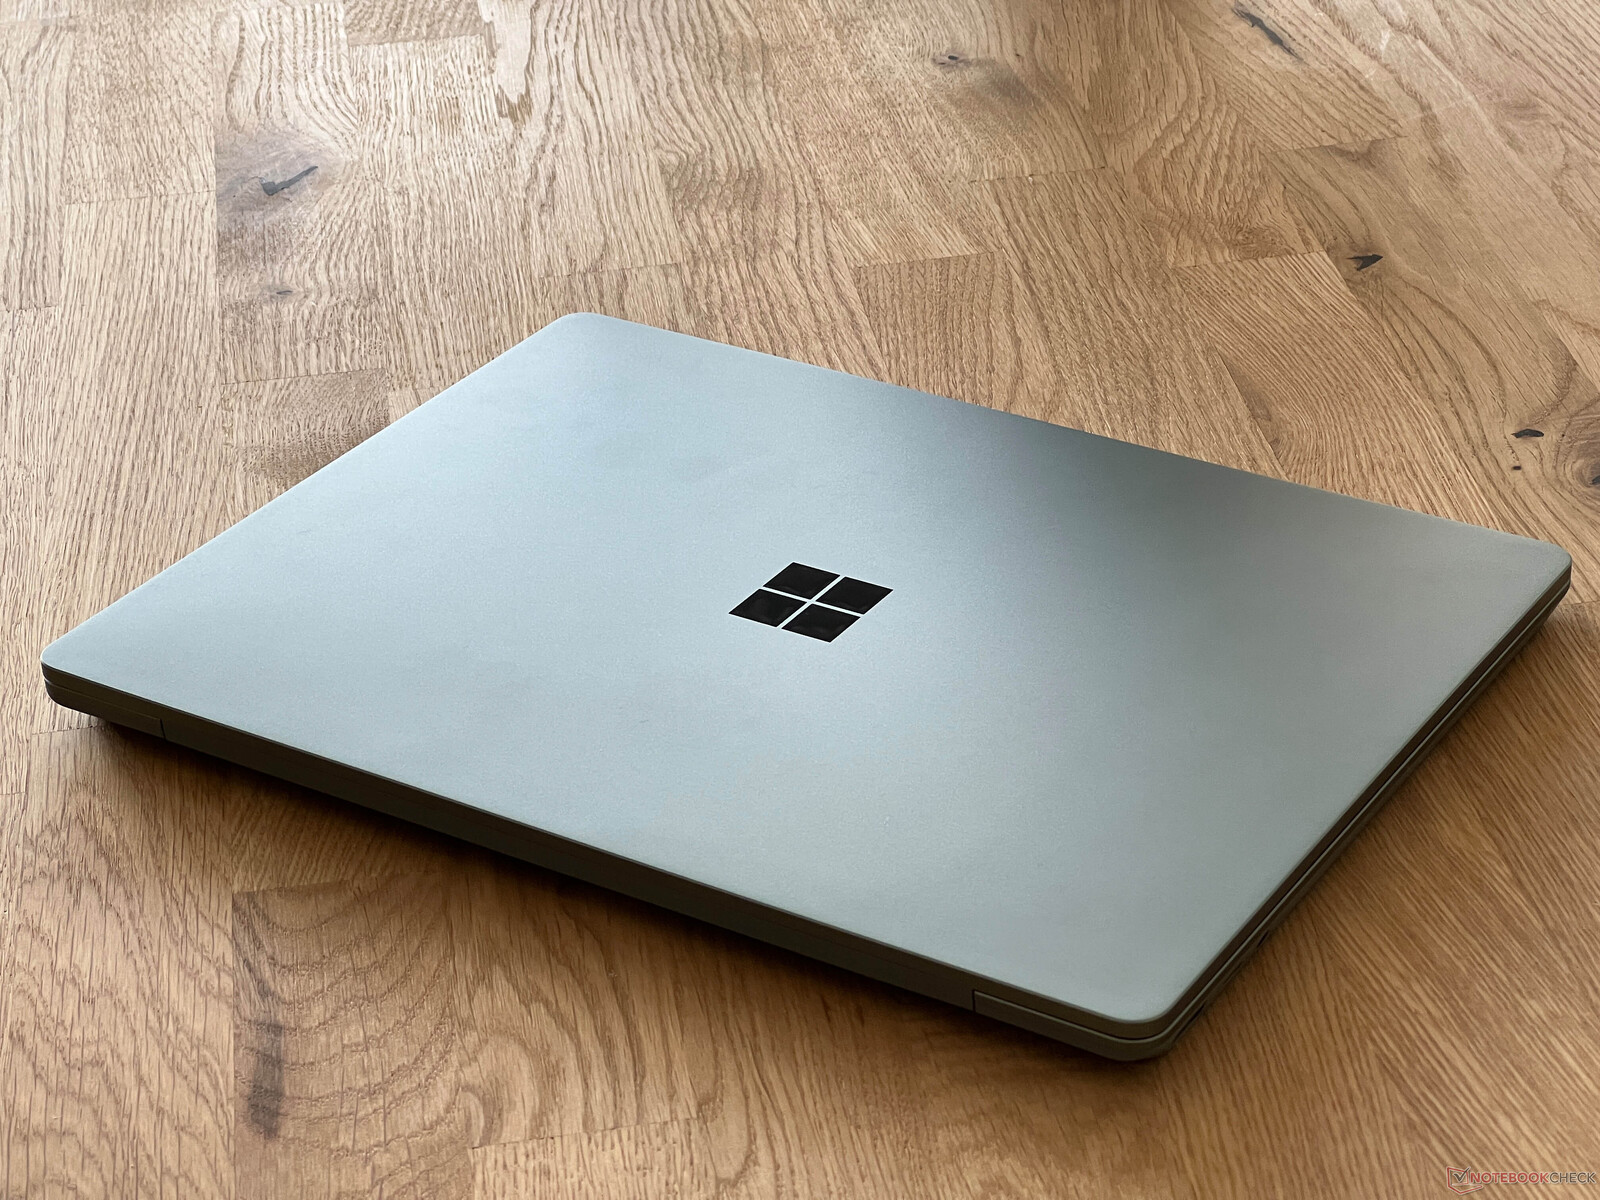
Nie ma żadnych zmian w obudowie, więc klienci nadal mają do wyboru cztery różne kolory: Platinum, Sage, Ice Blue i Sandstone. Jakość obudowy jest nadal główną zaletą tego kompaktowego urządzenia, ponieważ obudowa wykonana z połączenia aluminium i tworzywa sztucznego wygląda bardzo dobrze i stabilnie. Maksymalny kąt otwarcia wyświetlacza wynosi 135 stopni i ostatecznie są tu tylko dwa punkty krytyki: krawędzie ekranu są dość szerokie i nie ma opcji konserwacji, co oznacza brak dostępu do wentylatora.
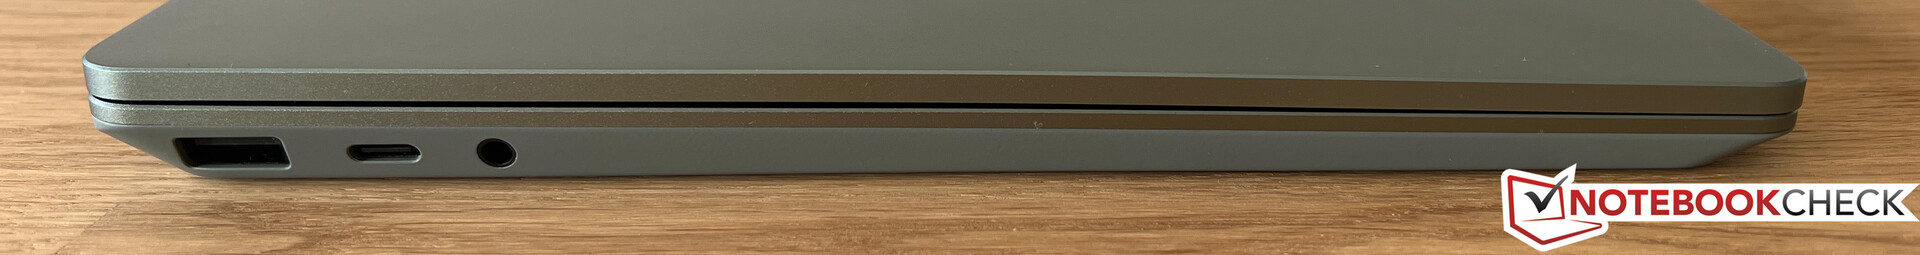
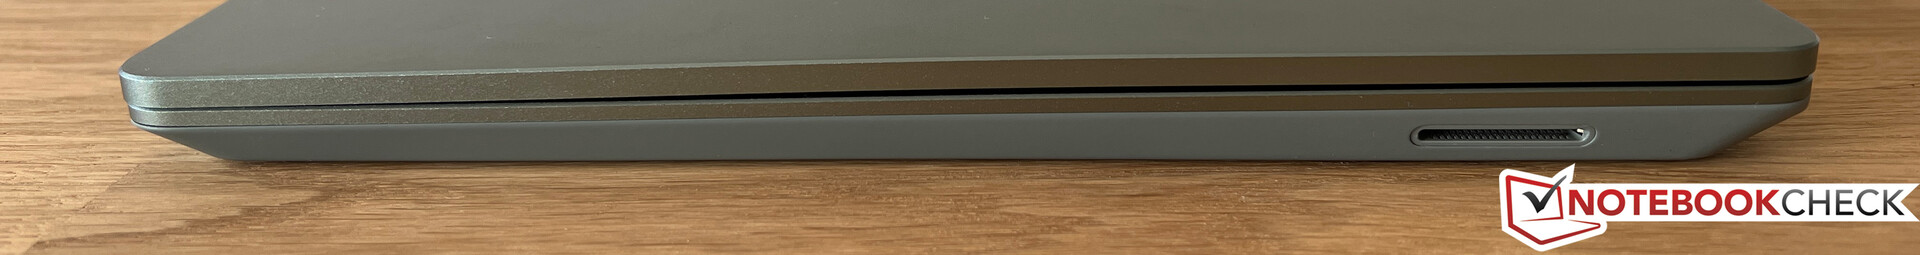
Reszta wyposażenia jest taka sama jak zwykle, więc otrzymujesz najważniejsze porty i opcje łączności do codziennego użytku, ale stare standardy i kamera internetowa 720p są wątpliwe w świetle sugerowanej ceny detalicznej wynoszącej 1 149 euro.
| Networking | |
| Microsoft Surface Laptop Go 3 | |
| iperf3 transmit AXE11000 | |
| iperf3 receive AXE11000 | |
| Apple MacBook Air 2020 M1 Entry | |
| iperf3 transmit AX12 | |
| iperf3 receive AX12 | |
| Dell XPS 13 9315, i5-1230U | |
| iperf3 transmit AXE11000 6GHz | |
| iperf3 receive AXE11000 6GHz | |
| Lenovo Yoga 6 13 83B2001SGE | |
| iperf3 transmit AXE11000 | |
| iperf3 receive AXE11000 | |
| Microsoft Surface Laptop Go 2 Core i5 | |
| iperf3 transmit AXE11000 | |
| iperf3 receive AXE11000 | |


Urządzenia wejściowe - Nadal brak podświetlenia klawiatury
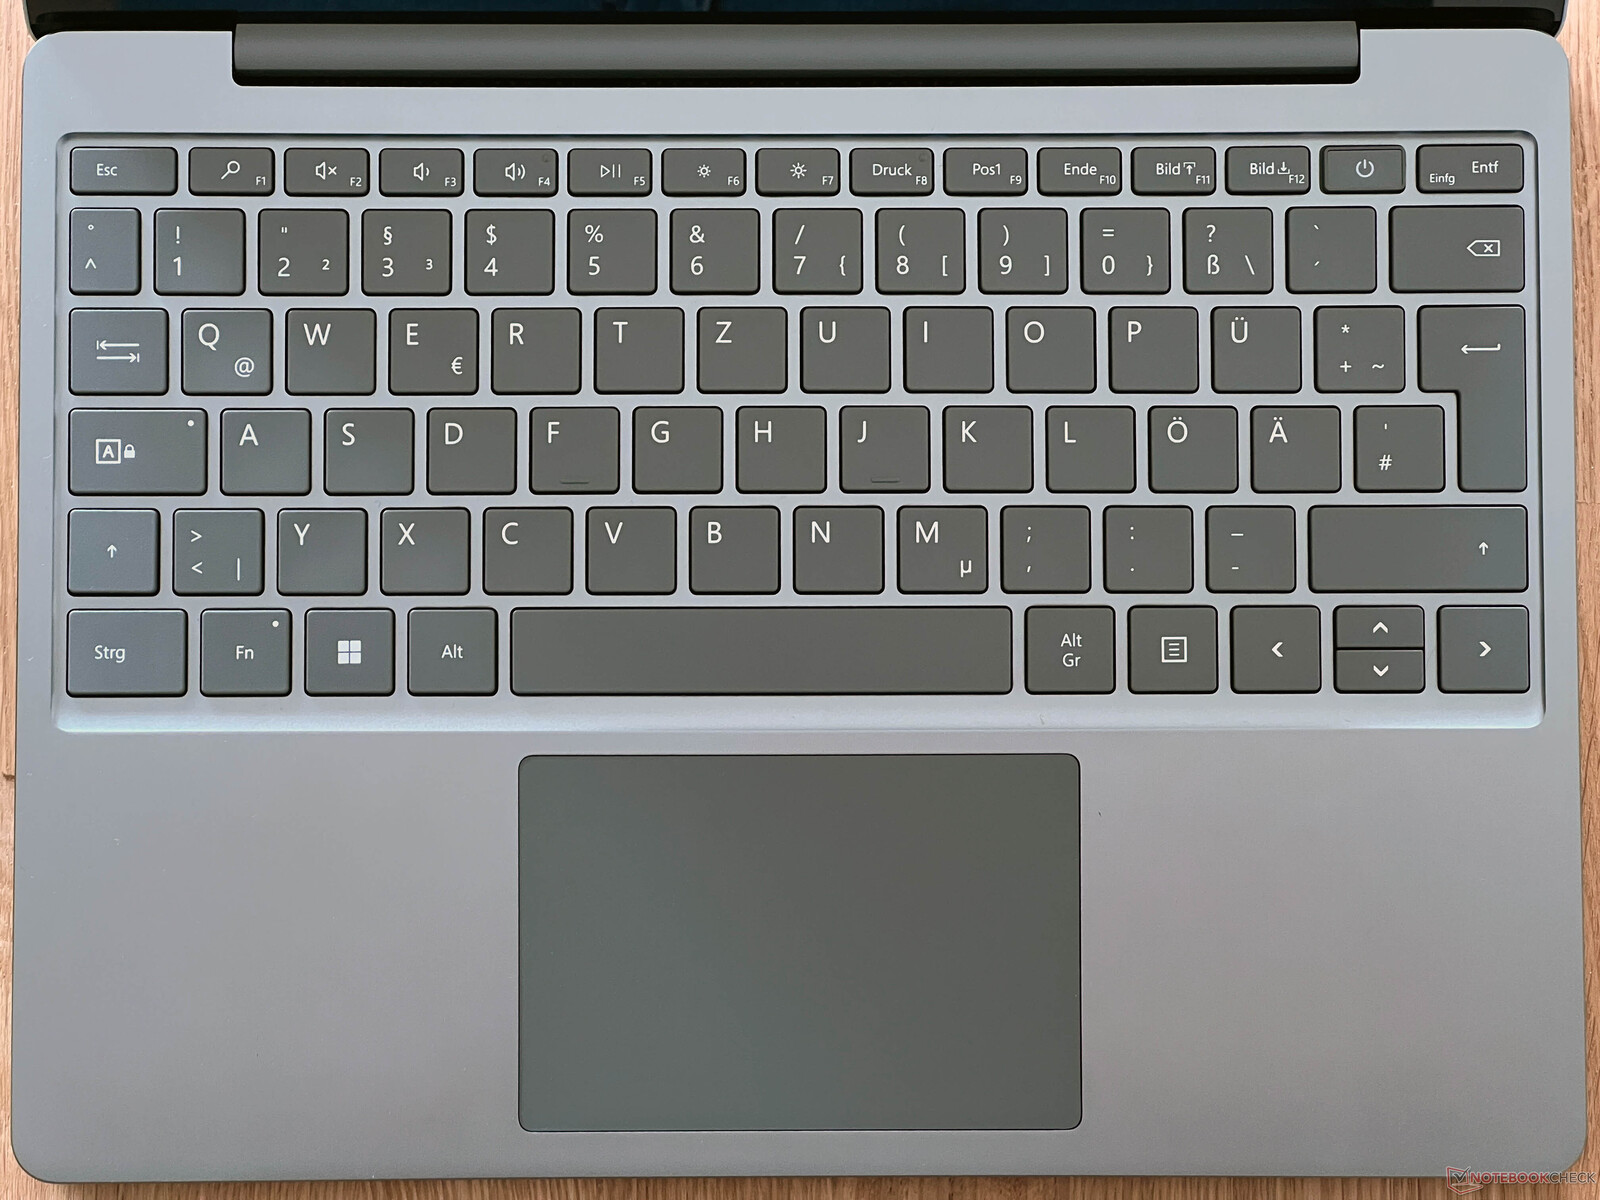
Zasadniczo urządzenia wejściowe Surface Laptop Go 3 są bardzo dobre. Klawiatura zapewnia precyzyjne i wyraźne pisanie, a ClickPad jest również w pełni przekonujący, z wyjątkiem nieco głośnego klikania w codziennym użytkowaniu. Co więcej, przycisk zasilania oferuje wbudowany skaner linii papilarnych. Wciąż jednak nie możemy zrozumieć, dlaczego Microsoft ostatecznie nie wyposażył kompaktowego laptopa w podświetlenie klawiatury.
Wyświetlacz - 12,4-calowy ekran dotykowy

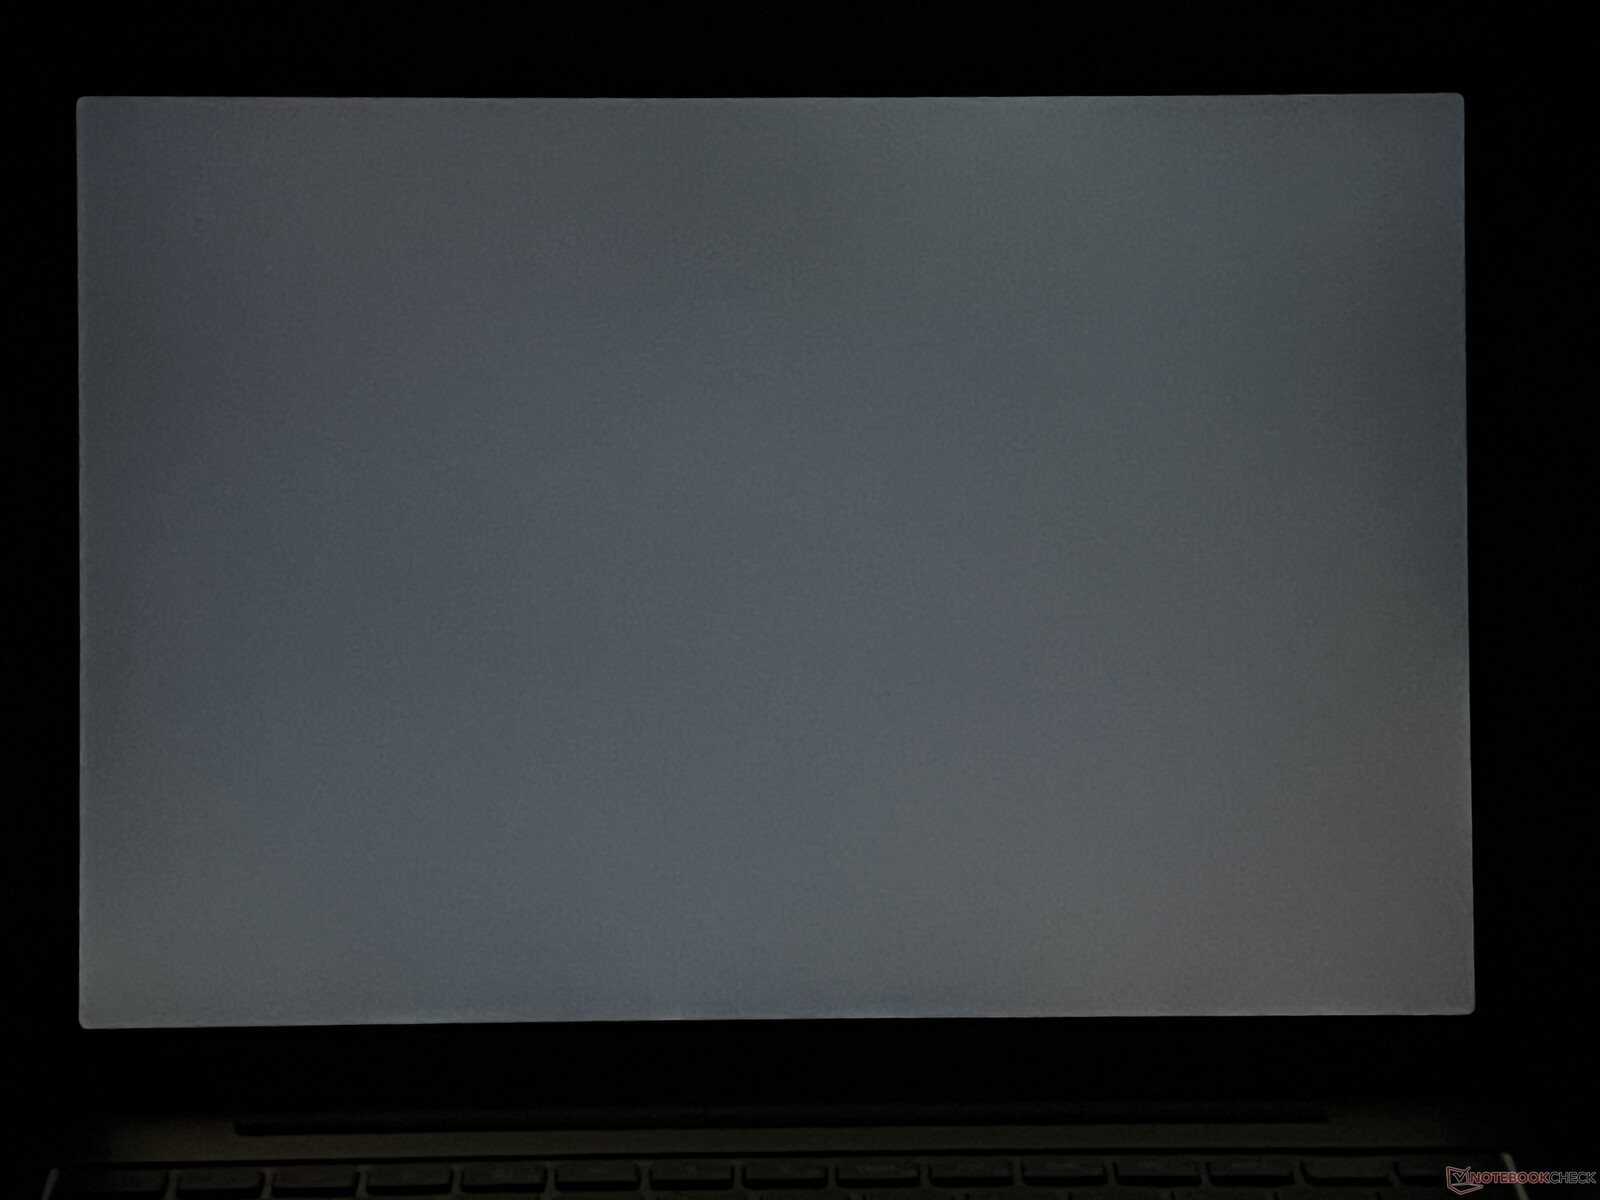
12,4-calowy ekran dotykowy IPS pozostał w zasadzie niezmieniony i oferuje przyzwoitą jakość obrazu pomimo niskiej rozdzielczości (1536 x 1024 pikseli, format 3:2). Treści nadal wyglądają wystarczająco ostro na małej przekątnej ekranu, a kolory są również żywe. Nie ma problemów z aureolą, ale zmierzyliśmy migotanie przy 60 kHz. Nie jest to jednak klasyczny PWM i wysoka częstotliwość nie powinna sprawiać problemów większości użytkowników.
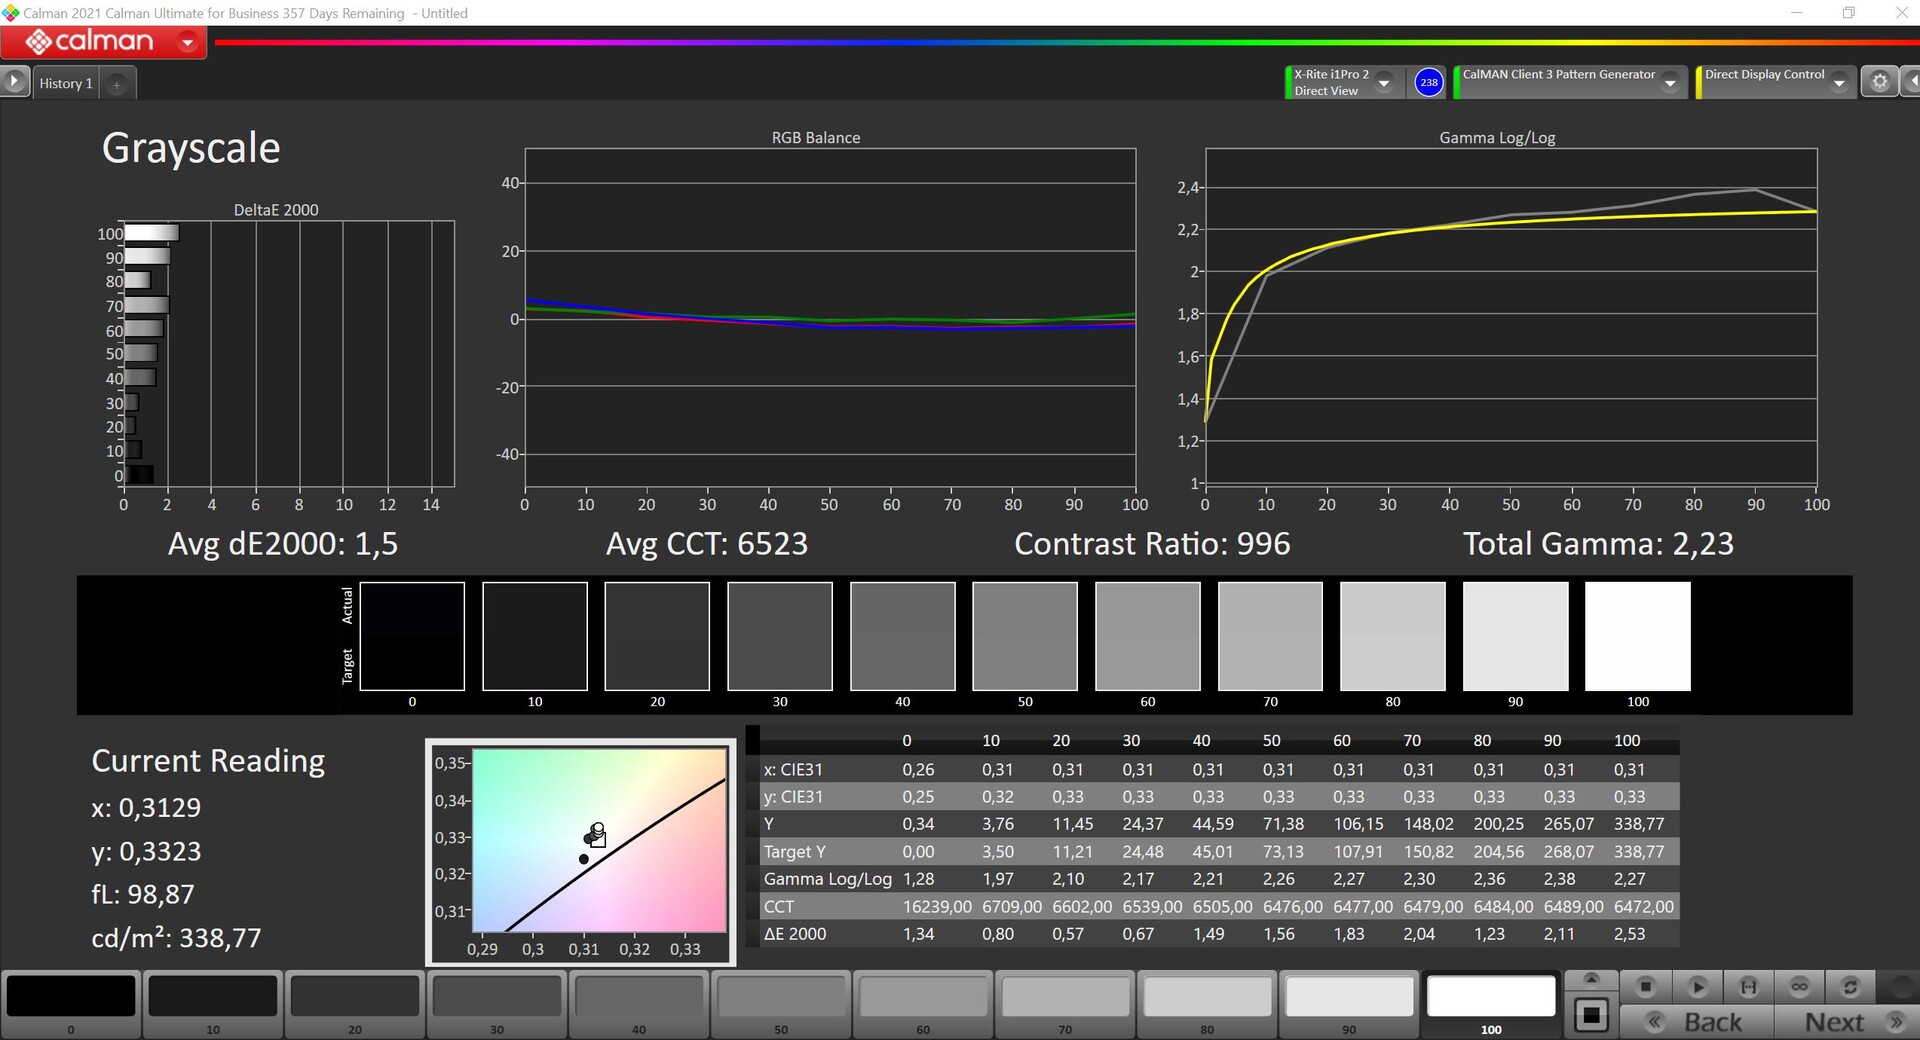
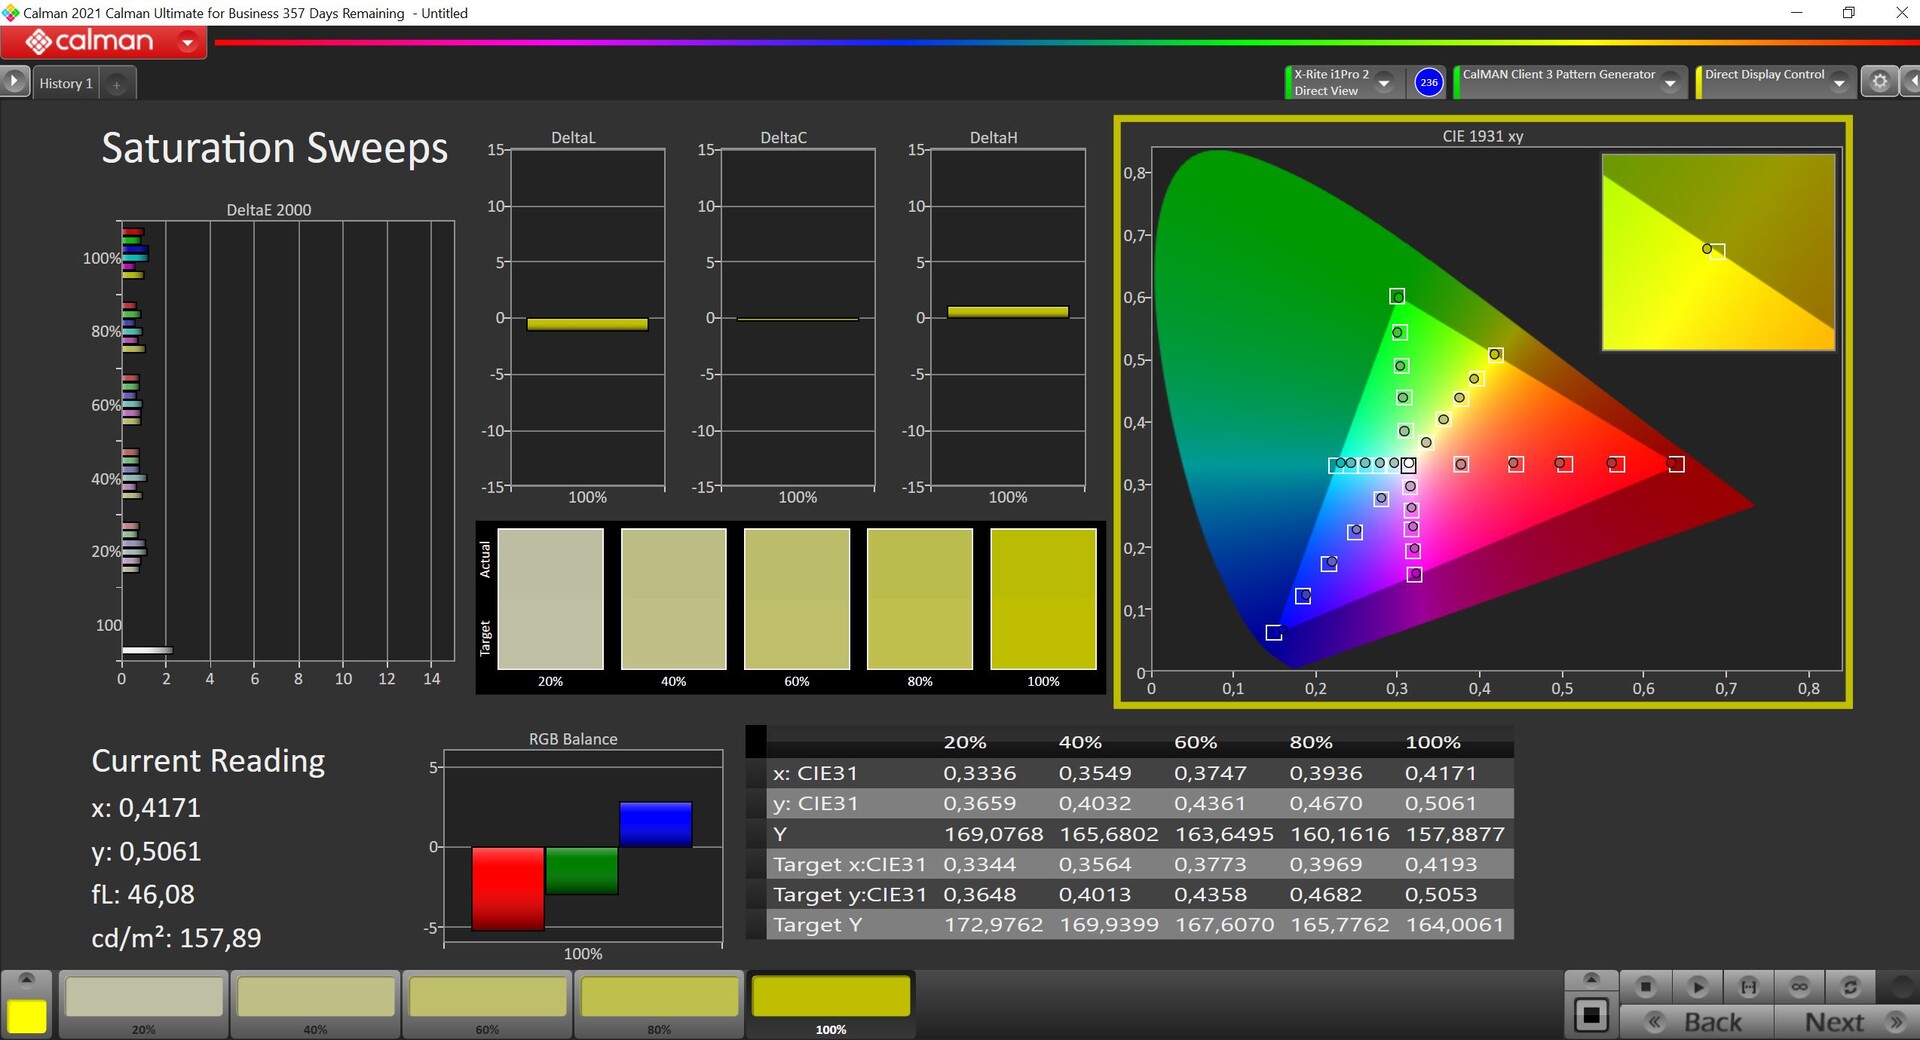
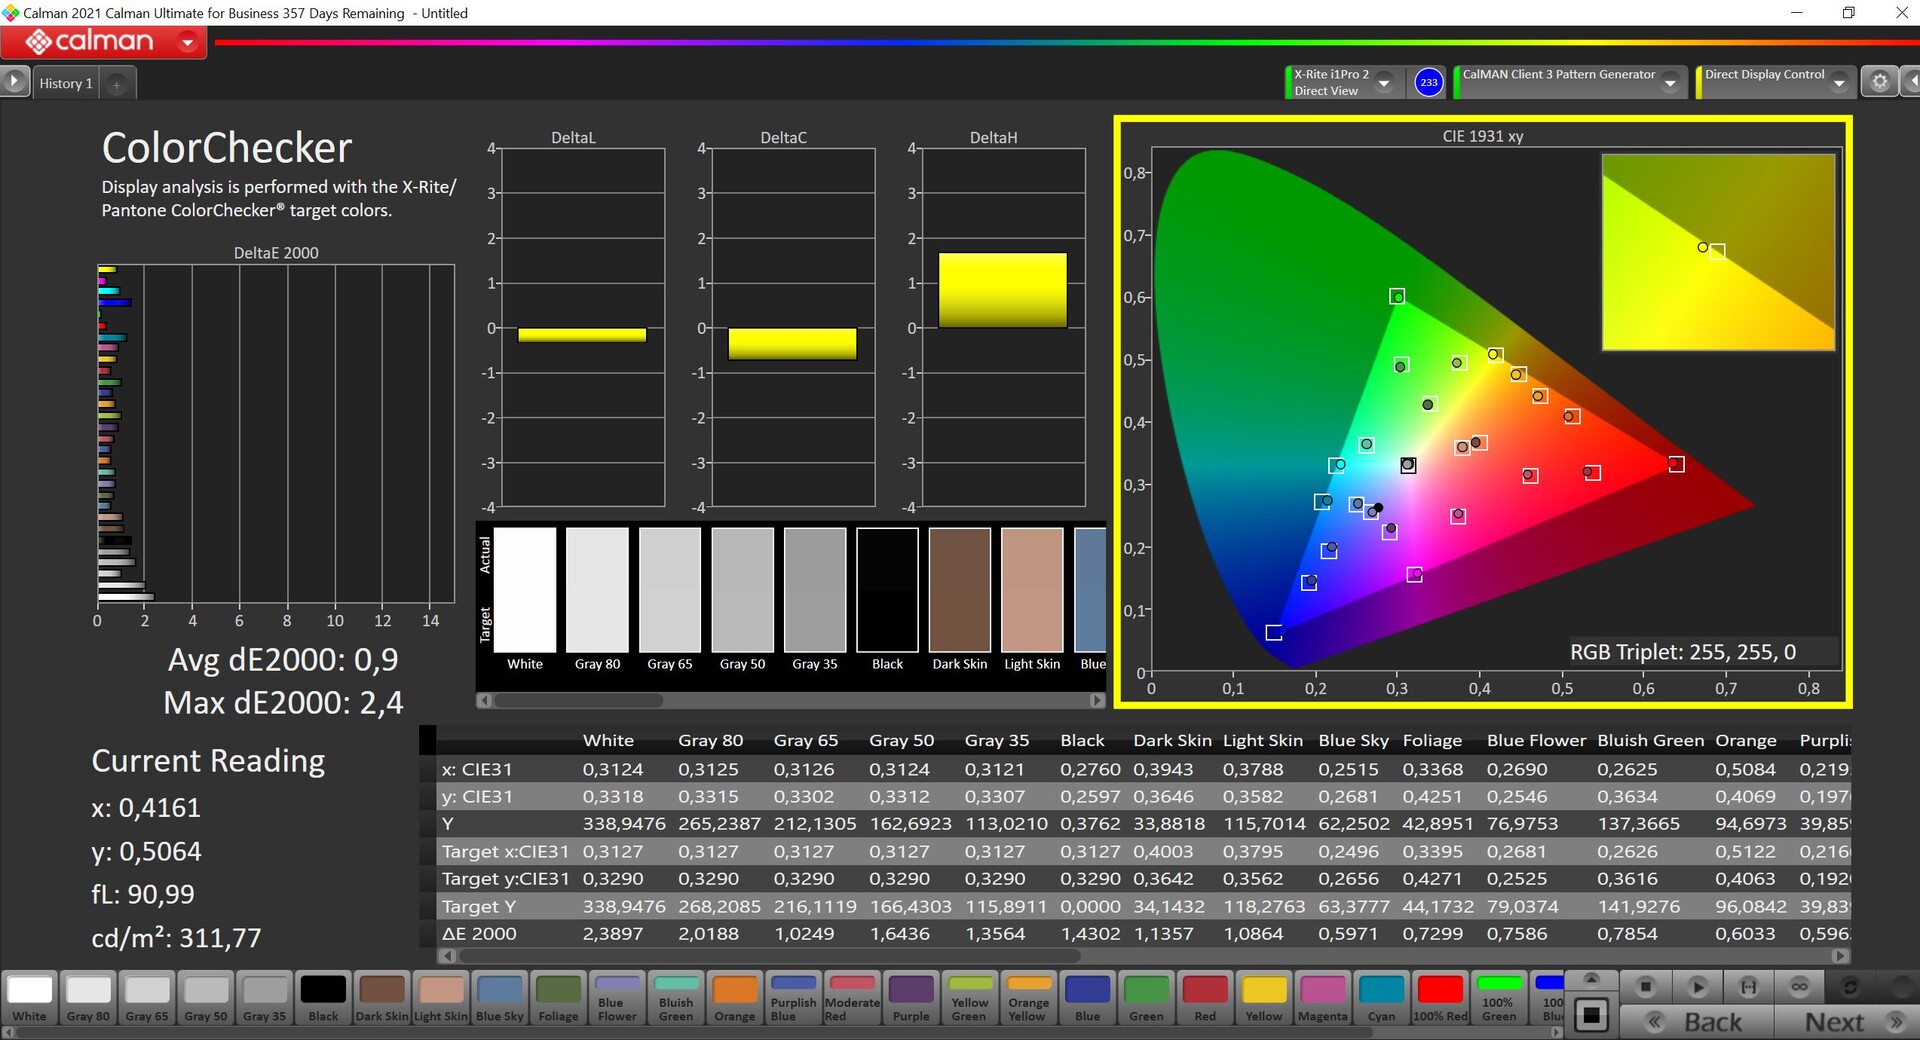
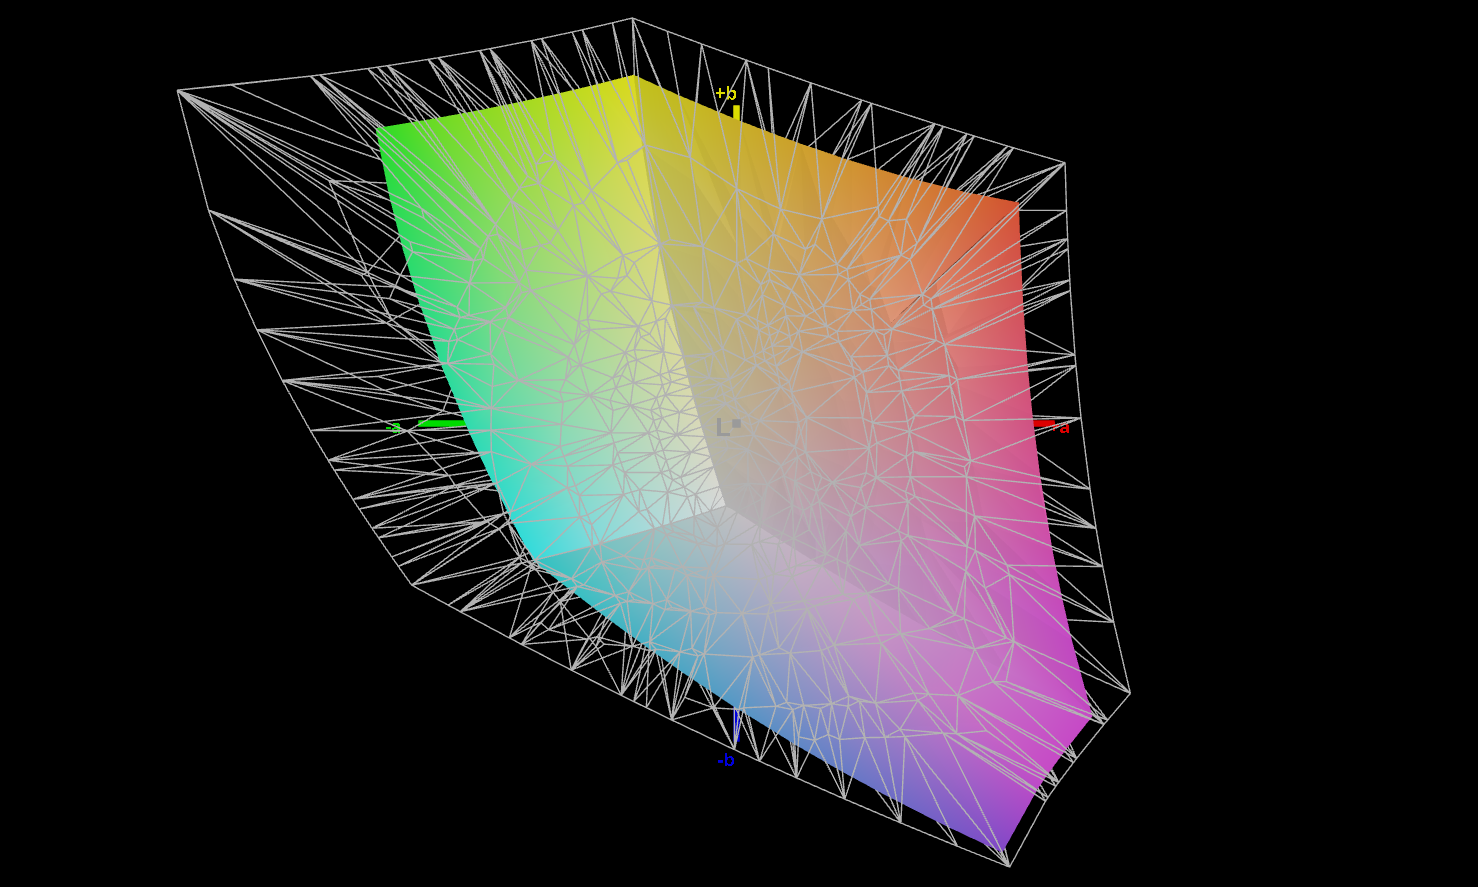
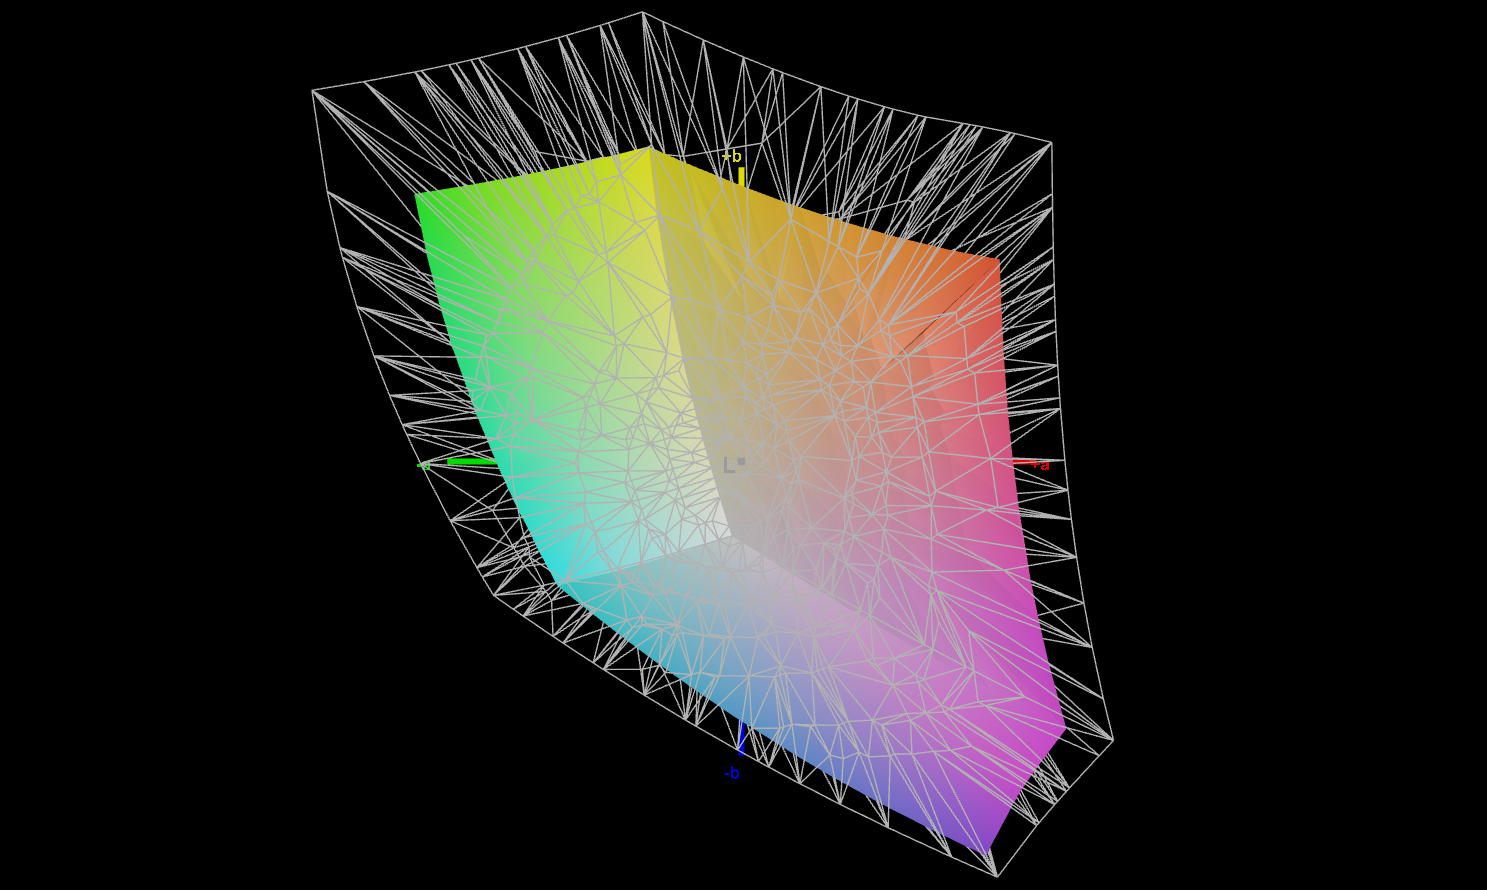
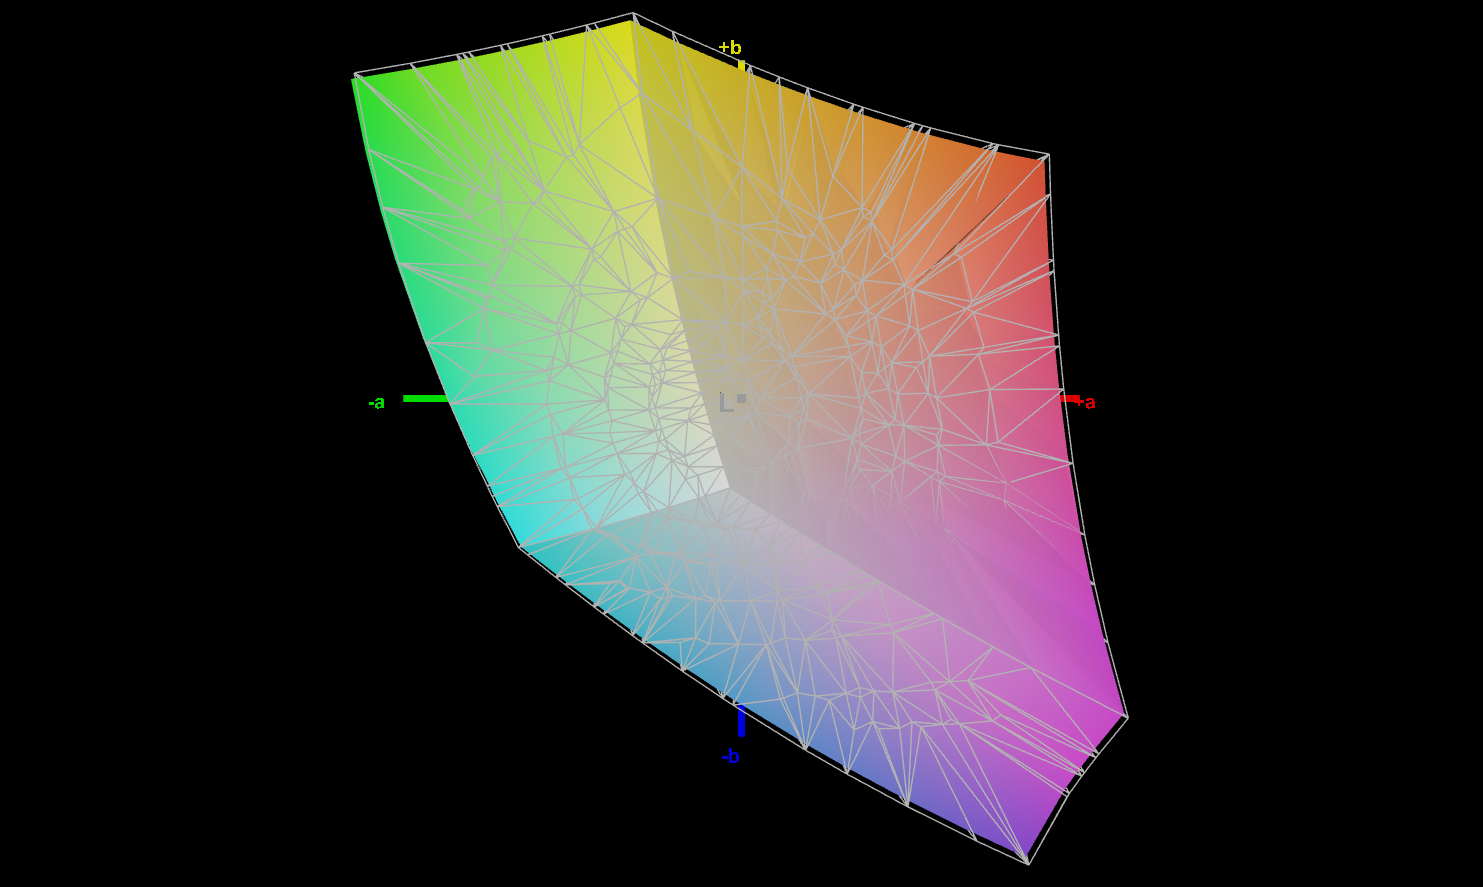
Microsoft podaje jasność na poziomie 320 cd/m², którą ekran również przekracza ze średnią prawie 340 cd/m². Jednak stary model był tutaj nieco jaśniejszy z około 400 cd/m², a z wyjątkiem Lenovo Yoga 6, rywale są również jaśniejsi. Wartość czerni jest nieco wyższa i wynosi 0,34 cd/m², co "tylko" skutkuje współczynnikiem kontrastu nieco poniżej 1000:1. Dostępne są dwa profile kolorów, przy czym domyślnie aktywny jest Enhanced. Tutaj kolory są nieco przesycone, co prowadzi do nieco bardziej jaskrawego obrazu w codziennym użytkowaniu. Nasze pomiary przeprowadziliśmy za pomocą profesjonalnego oprogramowania CalMAN, korzystając z profilu sRGB, w którym dokładność kolorów jest już bardzo dobra. Tak więc, wraz z prawie pełnym pokryciem sRGB, zdecydowanie można edytować niektóre zdjęcia. Nasza własna kalibracja nie poprawiła odwzorowania, dlatego też nie oferujemy odpowiedniego profilu do pobrania.
| |||||||||||||||||||||||||
rozświetlenie: 96 %
na akumulatorze: 339 cd/m²
kontrast: 997:1 (czerń: 0.34 cd/m²)
ΔE ColorChecker Calman: 0.9 | ∀{0.5-29.43 Ø4.72}
ΔE Greyscale Calman: 1.5 | ∀{0.09-98 Ø4.97}
66.6% AdobeRGB 1998 (Argyll 3D)
96.9% sRGB (Argyll 3D)
64.5% Display P3 (Argyll 3D)
Gamma: 2.23
CCT: 6523 K
| Microsoft Surface Laptop Go 3 LP125WX172403, IPS, 1536x1024, 12.4" | Apple MacBook Air 2020 M1 Entry IPS, 2560x1600, 13.3" | Dell XPS 13 9315, i5-1230U Sharp SHP1548 LQ134N1, IPS, 1920x1200, 13.4" | Lenovo Yoga 6 13 83B2001SGE LEN133WUXGA, IPS, 1920x1200, 13.3" | Microsoft Surface Laptop Go 2 Core i5 LP125WX112403, IPS, 1536x1024, 12.4" | |
|---|---|---|---|---|---|
| Display | 28% | 6% | 5% | -2% | |
| Display P3 Coverage (%) | 64.5 | 98.6 53% | 69 7% | 69.9 8% | 63.6 -1% |
| sRGB Coverage (%) | 96.9 | 100 3% | 100 3% | 99.5 3% | 93.8 -3% |
| AdobeRGB 1998 Coverage (%) | 66.6 | 85.9 29% | 71 7% | 70 5% | 65 -2% |
| Response Times | 10% | 5% | 66% | -3% | |
| Response Time Grey 50% / Grey 80% * (ms) | 36.7 ? | 31 ? 16% | 40 ? -9% | 14 ? 62% | 39 ? -6% |
| Response Time Black / White * (ms) | 27.1 ? | 26.1 ? 4% | 22 ? 19% | 8 ? 70% | 26.9 ? 1% |
| PWM Frequency (Hz) | 60000 ? | 118000 ? | 9700 ? | ||
| Screen | -3% | -58% | -87% | -13% | |
| Brightness middle (cd/m²) | 339 | 417 23% | 466 37% | 278 -18% | 406 20% |
| Brightness (cd/m²) | 337 | 395 17% | 442 31% | 271 -20% | 401 19% |
| Brightness Distribution (%) | 96 | 91 -5% | 89 -7% | 94 -2% | 95 -1% |
| Black Level * (cd/m²) | 0.34 | 0.39 -15% | 0.4 -18% | 0.25 26% | 0.41 -21% |
| Contrast (:1) | 997 | 1069 7% | 1165 17% | 1112 12% | 990 -1% |
| Colorchecker dE 2000 * | 0.9 | 1.12 -24% | 3.03 -237% | 3 -233% | 1.8 -100% |
| Colorchecker dE 2000 max. * | 2.4 | 2.71 -13% | 6.68 -178% | 7.86 -228% | 3.3 -38% |
| Greyscale dE 2000 * | 1.5 | 1.7 -13% | 3.12 -108% | 5.04 -236% | 1.2 20% |
| Gamma | 2.23 99% | 2207 0% | 2.41 91% | 2.46 89% | 2.29 96% |
| CCT | 6523 100% | 6870 95% | 6418 101% | 6068 107% | 6662 98% |
| Colorchecker dE 2000 calibrated * | 0.77 | 2.34 | 0.62 | 1.3 | |
| Całkowita średnia (program / ustawienia) | 12% /
6% | -16% /
-34% | -5% /
-42% | -6% /
-9% |
* ... im mniej tym lepiej
Wyświetl czasy reakcji
| ↔ Czas reakcji od czerni do bieli | ||
|---|---|---|
| 27.1 ms ... wzrost ↗ i spadek ↘ łącznie | ↗ 16.2 ms wzrost | 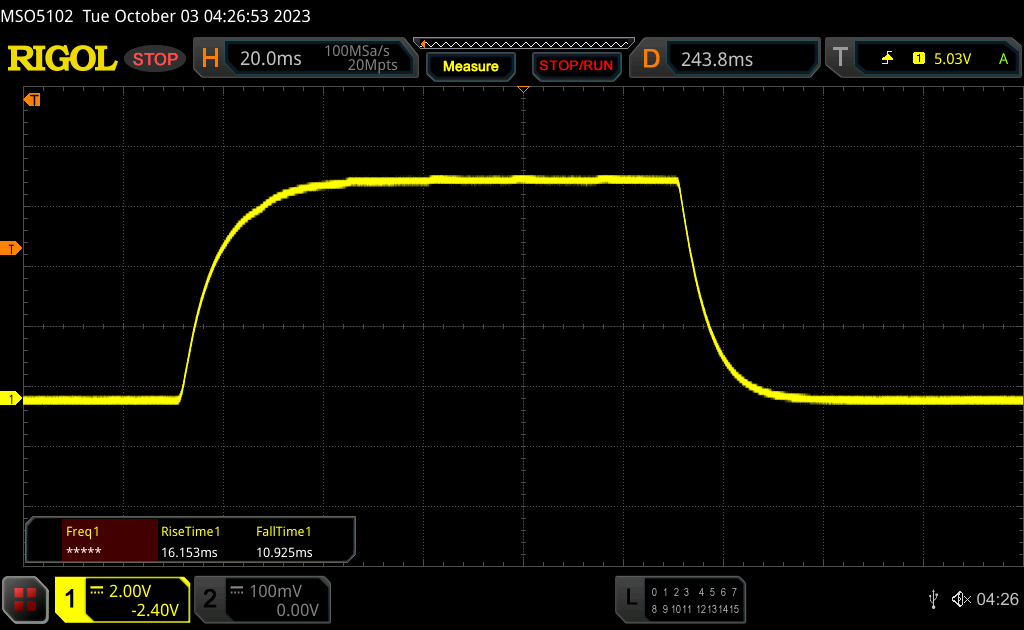 |
| ↘ 10.9 ms upadek | ||
| W naszych testach ekran wykazuje stosunkowo powolne tempo reakcji i może być zbyt wolny dla graczy. Dla porównania, wszystkie testowane urządzenia wahają się od 0.1 (minimum) do 240 (maksimum) ms. » 69 % wszystkich urządzeń jest lepszych. Oznacza to, że zmierzony czas reakcji jest gorszy od średniej wszystkich testowanych urządzeń (19.8 ms). | ||
| ↔ Czas reakcji 50% szarości do 80% szarości | ||
| 36.7 ms ... wzrost ↗ i spadek ↘ łącznie | ↗ 18.1 ms wzrost | 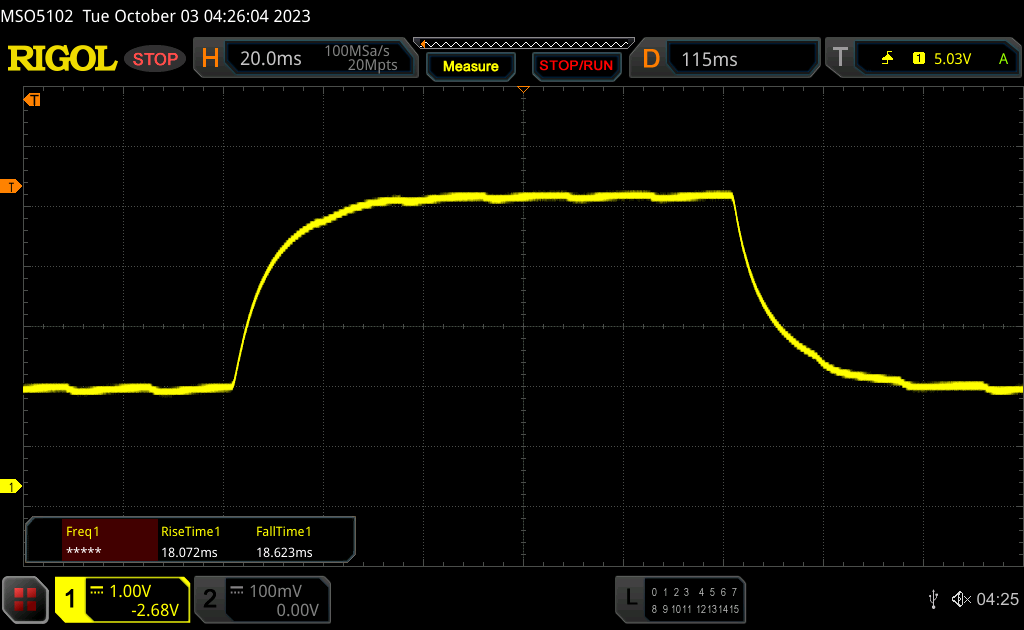 |
| ↘ 18.6 ms upadek | ||
| W naszych testach ekran wykazuje powolne tempo reakcji, co będzie niezadowalające dla graczy. Dla porównania, wszystkie testowane urządzenia wahają się od 0.165 (minimum) do 636 (maksimum) ms. » 53 % wszystkich urządzeń jest lepszych. Oznacza to, że zmierzony czas reakcji jest gorszy od średniej wszystkich testowanych urządzeń (31 ms). | ||
Migotanie ekranu / PWM (modulacja szerokości impulsu)
| Wykryto migotanie ekranu/wykryto PWM | 60000 Hz | ≤ 100 % ustawienia jasności | 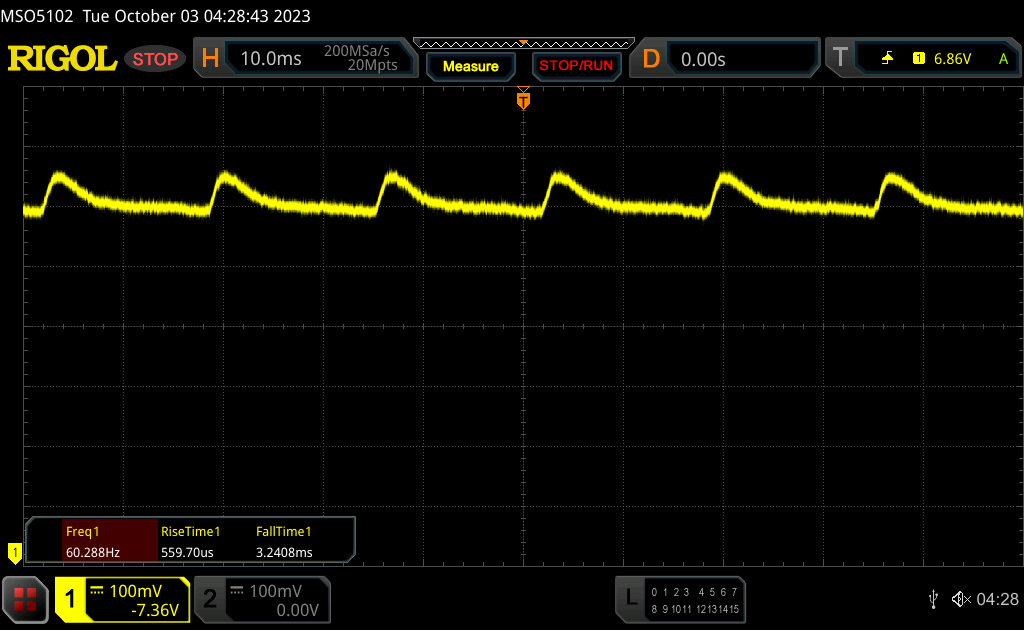 |
Podświetlenie wyświetlacza miga z częstotliwością 60000 Hz (najgorszy przypadek, np. przy użyciu PWM) Wykryto migotanie przy ustawieniu jasności 100 % i poniżej. Powyżej tego ustawienia jasności nie powinno być żadnego migotania ani PWM. Częstotliwość 60000 Hz jest dość wysoka, więc większość użytkowników wrażliwych na PWM nie powinna zauważyć żadnego migotania. Dla porównania: 52 % wszystkich testowanych urządzeń nie używa PWM do przyciemniania wyświetlacza. Jeśli wykryto PWM, zmierzono średnio 7772 (minimum: 5 - maksimum: 343500) Hz. | |||

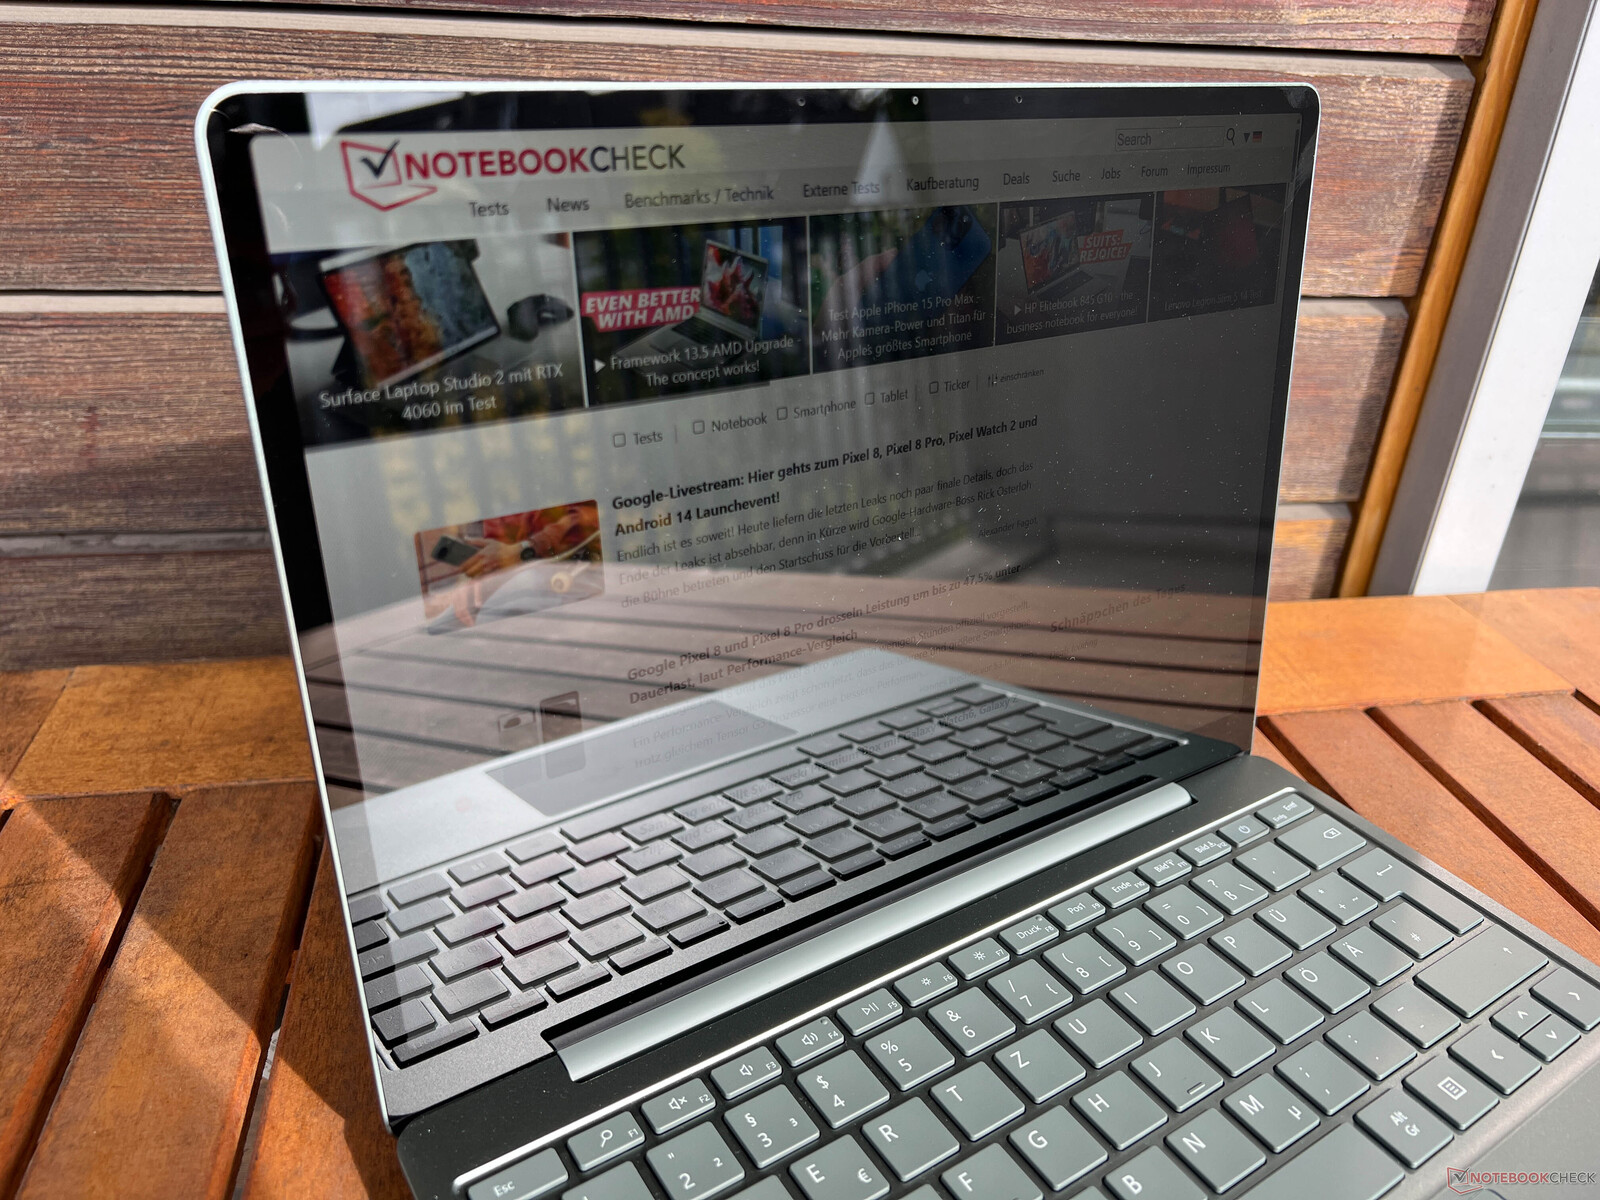
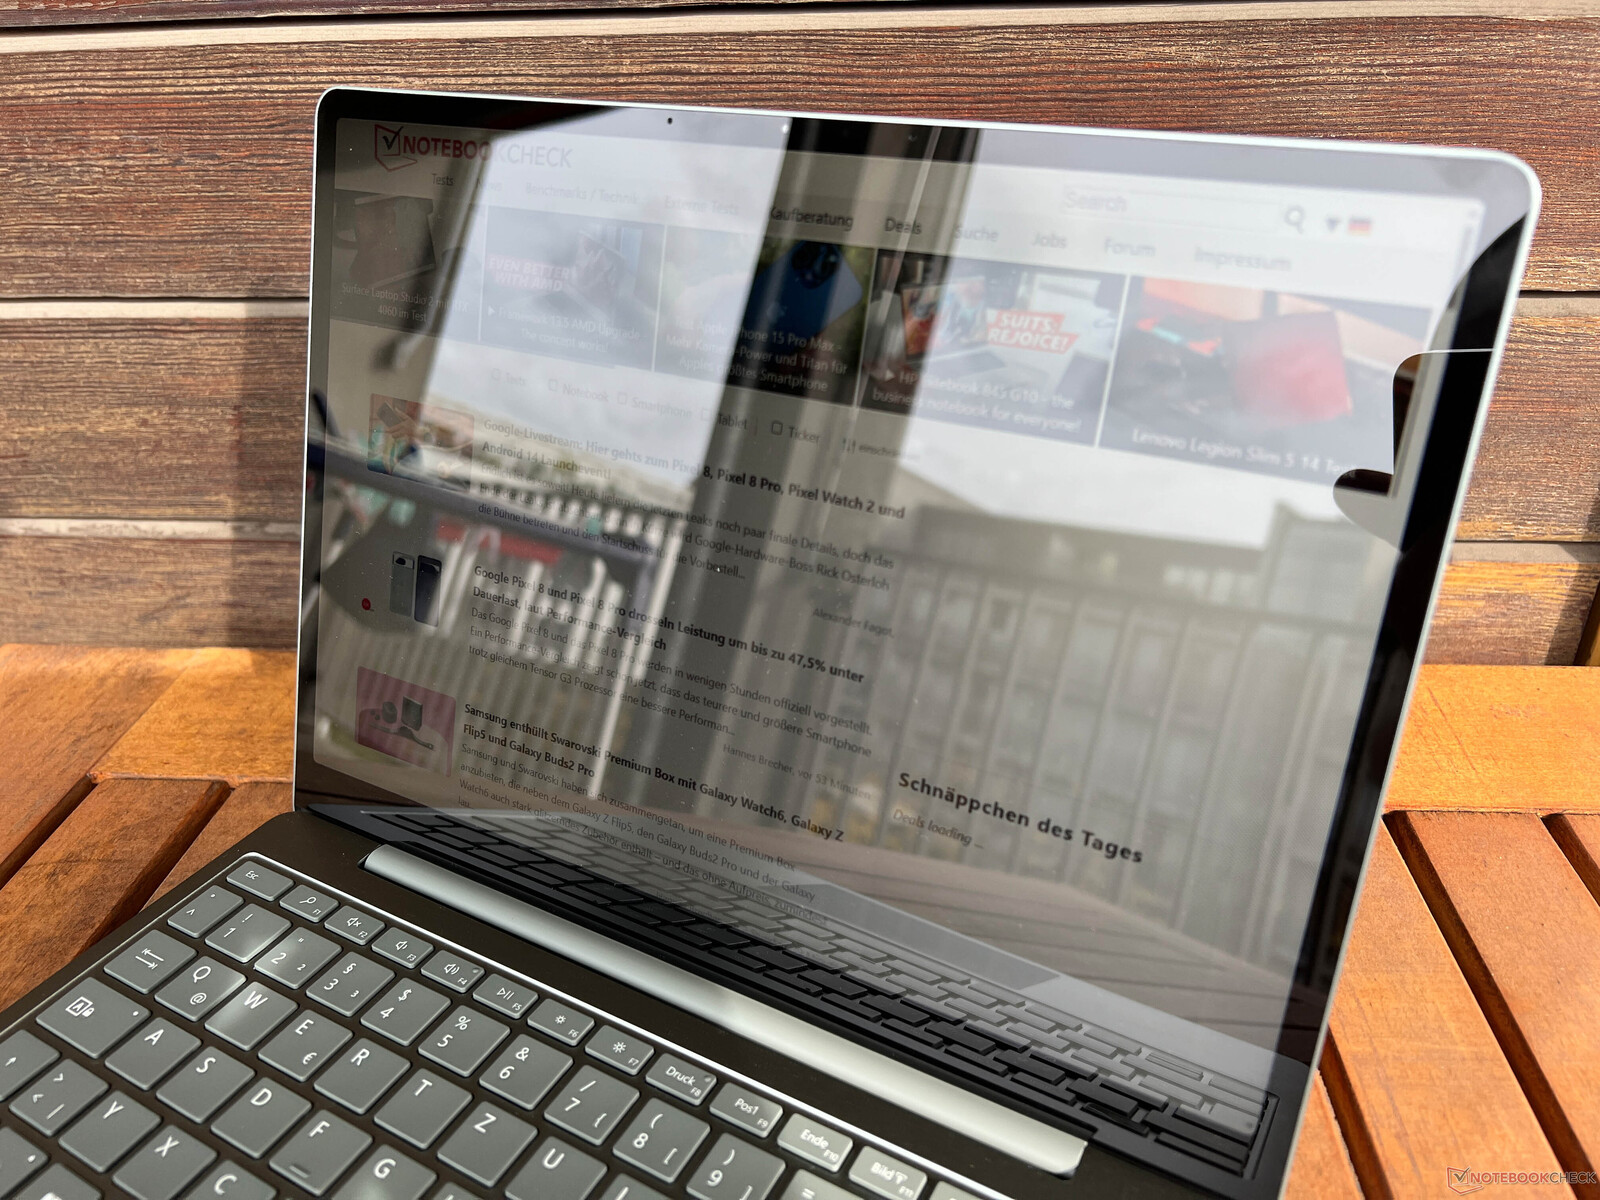
Na zewnątrz użyteczność jest ograniczona ze względu na wysoce odblaskowy ekran dotykowy. Stabilność kąta widzenia jest jednak dobra.

Wydajność - Core i5 Alder Lake
Microsoft polega obecnie na zeszłorocznej 12. generacji Core i5-1235U Alder Lake. Następca Raptor Lake jest już dostępny, ale tak naprawdę nie oferuje większej wydajności. standardowo zainstalowane jest 8 GB pamięci RAM, ale aktualizacja do 16 GB RAM jest dostępna za 250 euro (~ 250 USD).
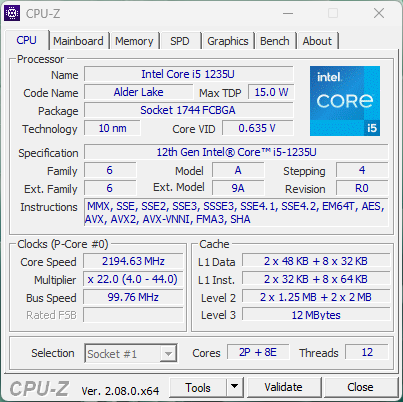
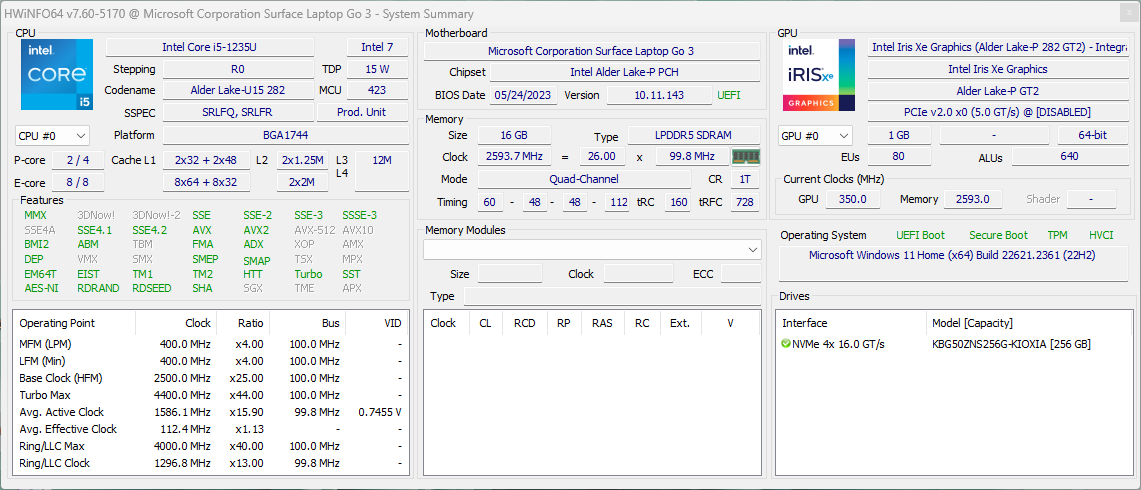
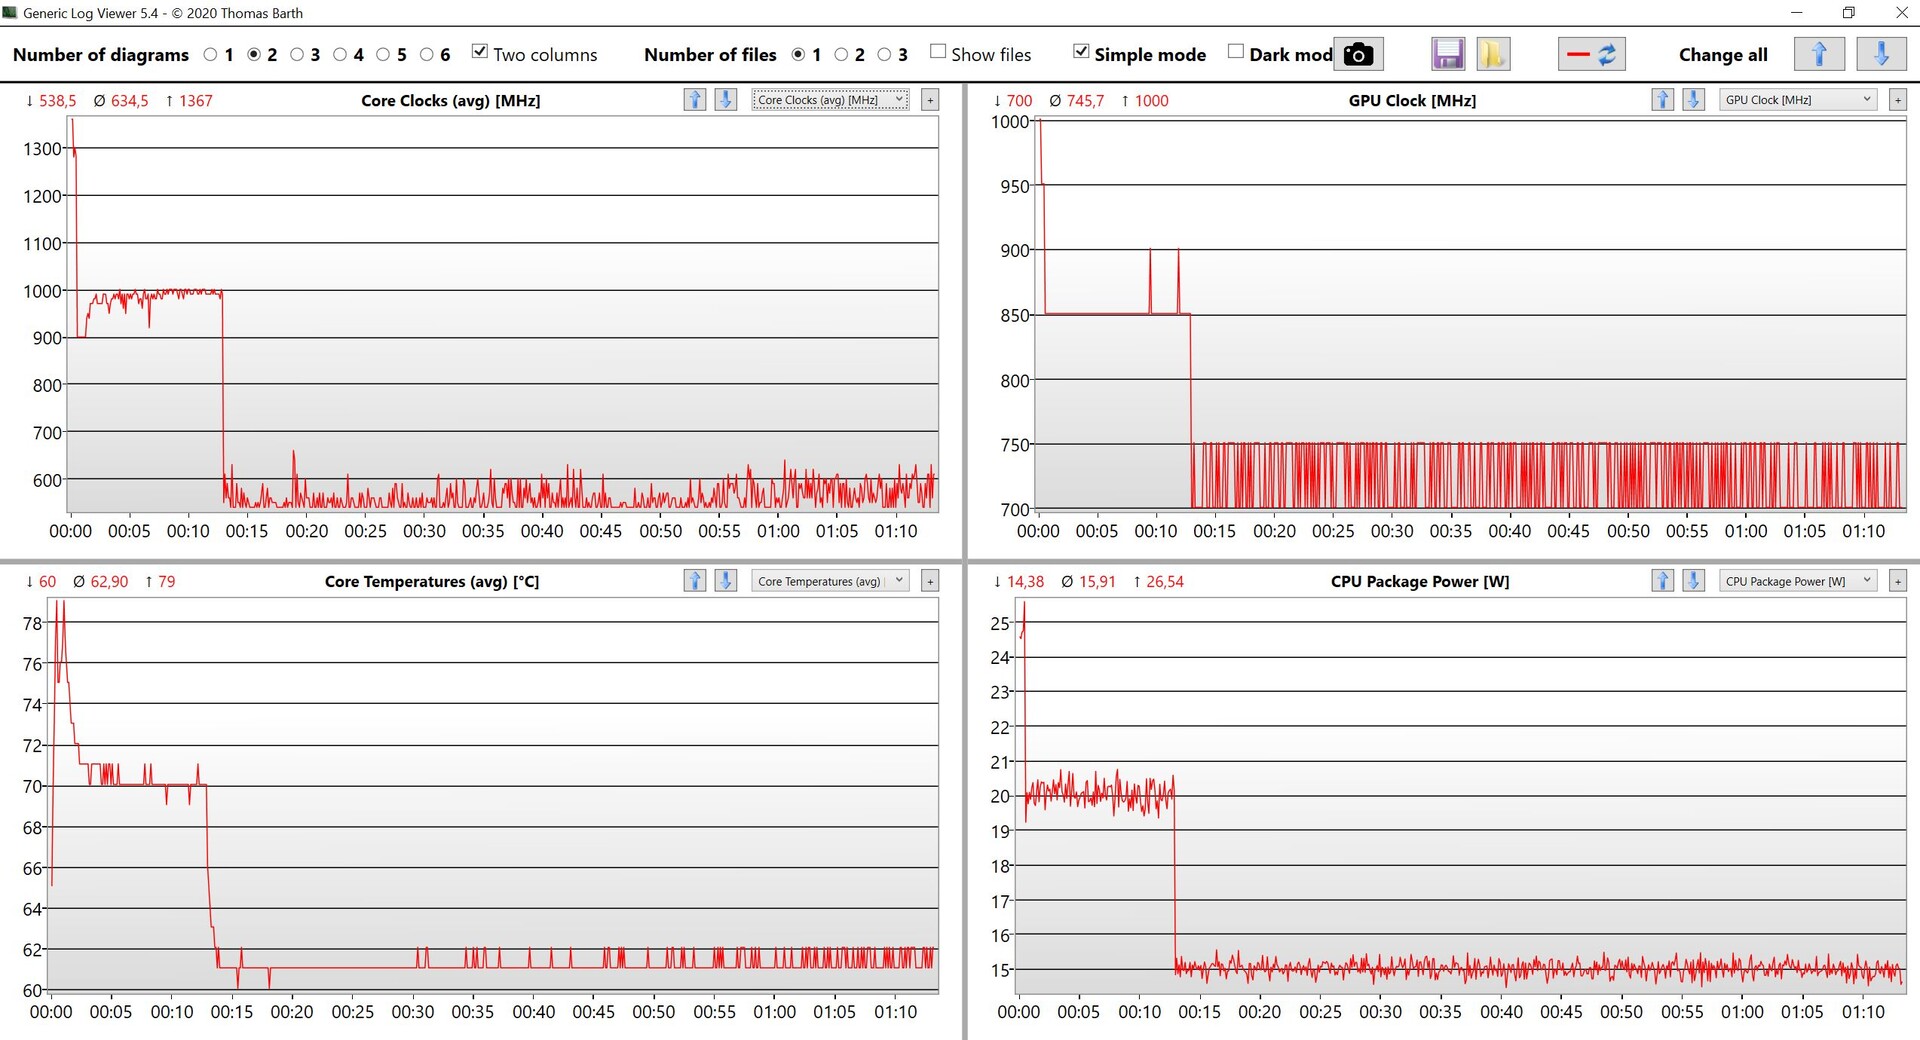
Procesor Core i5-1235U z generacji Alder Lake opiera się na architekturze hybrydowej z dwoma szybkimi rdzeniami o wysokiej wydajności i ośmioma rdzeniami o wysokiej wydajności. W Surface Laptop Go 3 procesor może zużywać 25 watów przez krótki czas, ale szybko spada do 20, a później do 15 watów. Wydajność jest zatem lepsza niż w poprzedniku. Jednak pod stałym obciążeniem oba (jak również XPS 13 9315) są do siebie bardzo zbliżone. Wydajność jest zdecydowanie wystarczająca do prostych rzeczy. Jednak pobór mocy procesora jest ograniczony do 12 watów w trybie bateryjnym, dlatego wydajność wielordzeniowa spada tutaj o ponad 50%.
Cinebench R15 Multi loop
Cinebench R20: CPU (Multi Core) | CPU (Single Core)
Cinebench R15: CPU Multi 64Bit | CPU Single 64Bit
Blender: v2.79 BMW27 CPU
7-Zip 18.03: 7z b 4 | 7z b 4 -mmt1
Geekbench 5.5: Multi-Core | Single-Core
HWBOT x265 Benchmark v2.2: 4k Preset
LibreOffice : 20 Documents To PDF
R Benchmark 2.5: Overall mean
| Cinebench R23 / Multi Core | |
| Średnia w klasie Subnotebook (1555 - 21812, n=59, ostatnie 2 lata) | |
| Apple MacBook Air 2020 M1 Entry | |
| Lenovo Yoga 6 13 83B2001SGE | |
| Przeciętny Intel Core i5-1235U (2485 - 9208, n=8) | |
| Microsoft Surface Laptop Go 3 | |
| Dell XPS 13 9315, i5-1230U | |
| Microsoft Surface Laptop Go 2 Core i5 | |
| Cinebench R23 / Single Core | |
| Średnia w klasie Subnotebook (358 - 2213, n=60, ostatnie 2 lata) | |
| Przeciętny Intel Core i5-1235U (1444 - 1698, n=8) | |
| Microsoft Surface Laptop Go 3 | |
| Apple MacBook Air 2020 M1 Entry | |
| Lenovo Yoga 6 13 83B2001SGE | |
| Microsoft Surface Laptop Go 2 Core i5 | |
| Dell XPS 13 9315, i5-1230U | |
| Cinebench R20 / CPU (Multi Core) | |
| Średnia w klasie Subnotebook (579 - 8541, n=56, ostatnie 2 lata) | |
| Lenovo Yoga 6 13 83B2001SGE | |
| Przeciętny Intel Core i5-1235U (1783 - 3537, n=8) | |
| Microsoft Surface Laptop Go 3 | |
| Apple MacBook Air 2020 M1 Entry | |
| Dell XPS 13 9315, i5-1230U | |
| Microsoft Surface Laptop Go 2 Core i5 | |
| Cinebench R20 / CPU (Single Core) | |
| Średnia w klasie Subnotebook (128 - 832, n=56, ostatnie 2 lata) | |
| Przeciętny Intel Core i5-1235U (566 - 651, n=8) | |
| Microsoft Surface Laptop Go 3 | |
| Lenovo Yoga 6 13 83B2001SGE | |
| Microsoft Surface Laptop Go 2 Core i5 | |
| Dell XPS 13 9315, i5-1230U | |
| Apple MacBook Air 2020 M1 Entry | |
| Cinebench R15 / CPU Multi 64Bit | |
| Średnia w klasie Subnotebook (327 - 3345, n=56, ostatnie 2 lata) | |
| Lenovo Yoga 6 13 83B2001SGE | |
| Przeciętny Intel Core i5-1235U (785 - 1587, n=8) | |
| Apple MacBook Air 2020 M1 Entry | |
| Microsoft Surface Laptop Go 3 | |
| Microsoft Surface Laptop Go 2 Core i5 | |
| Dell XPS 13 9315, i5-1230U | |
| Cinebench R15 / CPU Single 64Bit | |
| Średnia w klasie Subnotebook (72.4 - 322, n=56, ostatnie 2 lata) | |
| Lenovo Yoga 6 13 83B2001SGE | |
| Microsoft Surface Laptop Go 3 | |
| Przeciętny Intel Core i5-1235U (151.5 - 242, n=8) | |
| Apple MacBook Air 2020 M1 Entry | |
| Microsoft Surface Laptop Go 2 Core i5 | |
| Dell XPS 13 9315, i5-1230U | |
| Blender / v2.79 BMW27 CPU | |
| Microsoft Surface Laptop Go 2 Core i5 | |
| Apple MacBook Air 2020 M1 Entry | |
| Microsoft Surface Laptop Go 3 | |
| Przeciętny Intel Core i5-1235U (366 - 662, n=8) | |
| Średnia w klasie Subnotebook (159 - 2271, n=57, ostatnie 2 lata) | |
| Lenovo Yoga 6 13 83B2001SGE | |
| 7-Zip 18.03 / 7z b 4 | |
| Średnia w klasie Subnotebook (11668 - 77867, n=56, ostatnie 2 lata) | |
| Lenovo Yoga 6 13 83B2001SGE | |
| Apple MacBook Air 2020 M1 Entry | |
| Przeciętny Intel Core i5-1235U (20166 - 38643, n=8) | |
| Microsoft Surface Laptop Go 3 | |
| Dell XPS 13 9315, i5-1230U | |
| Microsoft Surface Laptop Go 2 Core i5 | |
| 7-Zip 18.03 / 7z b 4 -mmt1 | |
| Średnia w klasie Subnotebook (2643 - 6699, n=58, ostatnie 2 lata) | |
| Apple MacBook Air 2020 M1 Entry | |
| Lenovo Yoga 6 13 83B2001SGE | |
| Przeciętny Intel Core i5-1235U (4371 - 5233, n=8) | |
| Microsoft Surface Laptop Go 3 | |
| Microsoft Surface Laptop Go 2 Core i5 | |
| Dell XPS 13 9315, i5-1230U | |
| Geekbench 5.5 / Multi-Core | |
| Średnia w klasie Subnotebook (2557 - 17218, n=48, ostatnie 2 lata) | |
| Apple MacBook Air 2020 M1 Entry | |
| Lenovo Yoga 6 13 83B2001SGE | |
| Przeciętny Intel Core i5-1235U (5528 - 8571, n=10) | |
| Dell XPS 13 9315, i5-1230U | |
| Microsoft Surface Laptop Go 3 | |
| Microsoft Surface Laptop Go 2 Core i5 | |
| Geekbench 5.5 / Single-Core | |
| Średnia w klasie Subnotebook (726 - 2224, n=48, ostatnie 2 lata) | |
| Apple MacBook Air 2020 M1 Entry | |
| Dell XPS 13 9315, i5-1230U | |
| Microsoft Surface Laptop Go 3 | |
| Przeciętny Intel Core i5-1235U (1426 - 1643, n=10) | |
| Lenovo Yoga 6 13 83B2001SGE | |
| Microsoft Surface Laptop Go 2 Core i5 | |
| HWBOT x265 Benchmark v2.2 / 4k Preset | |
| Średnia w klasie Subnotebook (0.97 - 25.1, n=56, ostatnie 2 lata) | |
| Lenovo Yoga 6 13 83B2001SGE | |
| Przeciętny Intel Core i5-1235U (4.99 - 9.43, n=8) | |
| Microsoft Surface Laptop Go 3 | |
| Microsoft Surface Laptop Go 2 Core i5 | |
| LibreOffice / 20 Documents To PDF | |
| Microsoft Surface Laptop Go 2 Core i5 | |
| Średnia w klasie Subnotebook (39.9 - 220, n=55, ostatnie 2 lata) | |
| Microsoft Surface Laptop Go 3 | |
| Przeciętny Intel Core i5-1235U (42.4 - 65.5, n=8) | |
| Lenovo Yoga 6 13 83B2001SGE | |
| Apple MacBook Air 2020 M1 Entry | |
| R Benchmark 2.5 / Overall mean | |
| Apple MacBook Air 2020 M1 Entry | |
| Microsoft Surface Laptop Go 2 Core i5 | |
| Lenovo Yoga 6 13 83B2001SGE | |
| Microsoft Surface Laptop Go 3 | |
| Średnia w klasie Subnotebook (0.4024 - 1.456, n=57, ostatnie 2 lata) | |
| Przeciętny Intel Core i5-1235U (0.4986 - 0.603, n=8) | |
* ... im mniej tym lepiej
AIDA64: FP32 Ray-Trace | FPU Julia | CPU SHA3 | CPU Queen | FPU SinJulia | FPU Mandel | CPU AES | CPU ZLib | FP64 Ray-Trace | CPU PhotoWorxx
| Performance rating | |
| Średnia w klasie Subnotebook | |
| Lenovo Yoga 6 13 83B2001SGE | |
| Przeciętny Intel Core i5-1235U | |
| Microsoft Surface Laptop Go 3 | |
| Microsoft Surface Laptop Go 2 Core i5 | |
| Dell XPS 13 9315, i5-1230U | |
| AIDA64 / FP32 Ray-Trace | |
| Średnia w klasie Subnotebook (1135 - 32888, n=57, ostatnie 2 lata) | |
| Lenovo Yoga 6 13 83B2001SGE | |
| Przeciętny Intel Core i5-1235U (3078 - 7457, n=8) | |
| Microsoft Surface Laptop Go 2 Core i5 | |
| Microsoft Surface Laptop Go 3 | |
| Dell XPS 13 9315, i5-1230U | |
| AIDA64 / FPU Julia | |
| Lenovo Yoga 6 13 83B2001SGE | |
| Średnia w klasie Subnotebook (5218 - 123315, n=57, ostatnie 2 lata) | |
| Przeciętny Intel Core i5-1235U (15838 - 37760, n=8) | |
| Microsoft Surface Laptop Go 3 | |
| Microsoft Surface Laptop Go 2 Core i5 | |
| Dell XPS 13 9315, i5-1230U | |
| AIDA64 / CPU SHA3 | |
| Średnia w klasie Subnotebook (444 - 5287, n=57, ostatnie 2 lata) | |
| Lenovo Yoga 6 13 83B2001SGE | |
| Przeciętny Intel Core i5-1235U (978 - 2072, n=8) | |
| Microsoft Surface Laptop Go 2 Core i5 | |
| Microsoft Surface Laptop Go 3 | |
| Dell XPS 13 9315, i5-1230U | |
| AIDA64 / CPU Queen | |
| Lenovo Yoga 6 13 83B2001SGE | |
| Średnia w klasie Subnotebook (10579 - 95002, n=50, ostatnie 2 lata) | |
| Przeciętny Intel Core i5-1235U (45680 - 62404, n=8) | |
| Microsoft Surface Laptop Go 3 | |
| Dell XPS 13 9315, i5-1230U | |
| Microsoft Surface Laptop Go 2 Core i5 | |
| AIDA64 / FPU SinJulia | |
| Lenovo Yoga 6 13 83B2001SGE | |
| Średnia w klasie Subnotebook (744 - 18418, n=57, ostatnie 2 lata) | |
| Przeciętny Intel Core i5-1235U (3099 - 4644, n=8) | |
| Microsoft Surface Laptop Go 2 Core i5 | |
| Microsoft Surface Laptop Go 3 | |
| Dell XPS 13 9315, i5-1230U | |
| AIDA64 / FPU Mandel | |
| Lenovo Yoga 6 13 83B2001SGE | |
| Średnia w klasie Subnotebook (3341 - 65433, n=57, ostatnie 2 lata) | |
| Przeciętny Intel Core i5-1235U (8046 - 18819, n=8) | |
| Microsoft Surface Laptop Go 2 Core i5 | |
| Microsoft Surface Laptop Go 3 | |
| Dell XPS 13 9315, i5-1230U | |
| AIDA64 / CPU AES | |
| Średnia w klasie Subnotebook (638 - 96917, n=57, ostatnie 2 lata) | |
| Lenovo Yoga 6 13 83B2001SGE | |
| Przeciętny Intel Core i5-1235U (23386 - 67140, n=8) | |
| Microsoft Surface Laptop Go 2 Core i5 | |
| Microsoft Surface Laptop Go 3 | |
| Dell XPS 13 9315, i5-1230U | |
| AIDA64 / CPU ZLib | |
| Średnia w klasie Subnotebook (164.9 - 1379, n=57, ostatnie 2 lata) | |
| Lenovo Yoga 6 13 83B2001SGE | |
| Przeciętny Intel Core i5-1235U (329 - 633, n=8) | |
| Microsoft Surface Laptop Go 3 | |
| Microsoft Surface Laptop Go 2 Core i5 | |
| Dell XPS 13 9315, i5-1230U | |
| AIDA64 / FP64 Ray-Trace | |
| Średnia w klasie Subnotebook (610 - 17495, n=57, ostatnie 2 lata) | |
| Lenovo Yoga 6 13 83B2001SGE | |
| Przeciętny Intel Core i5-1235U (1670 - 3928, n=8) | |
| Microsoft Surface Laptop Go 2 Core i5 | |
| Microsoft Surface Laptop Go 3 | |
| Dell XPS 13 9315, i5-1230U | |
| AIDA64 / CPU PhotoWorxx | |
| Średnia w klasie Subnotebook (6569 - 85600, n=57, ostatnie 2 lata) | |
| Microsoft Surface Laptop Go 3 | |
| Microsoft Surface Laptop Go 2 Core i5 | |
| Przeciętny Intel Core i5-1235U (15933 - 41909, n=8) | |
| Dell XPS 13 9315, i5-1230U | |
| Lenovo Yoga 6 13 83B2001SGE | |
Wydajność systemu
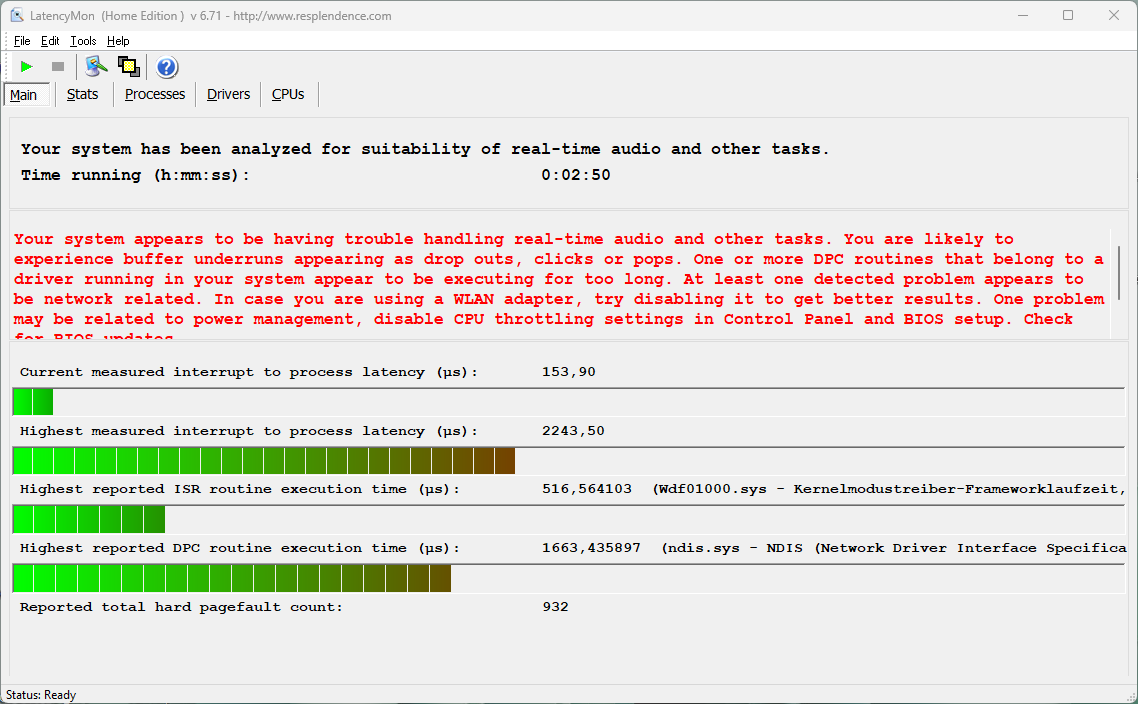
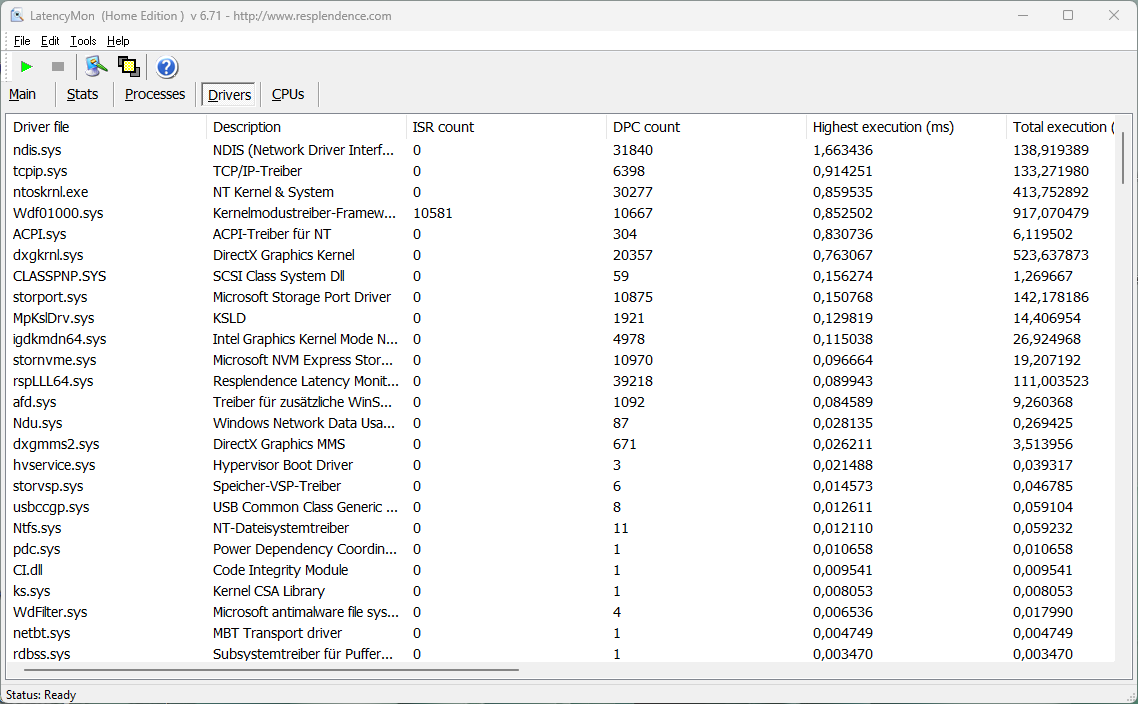
Ogólnie rzecz biorąc, subiektywna wydajność jest dobra, co jest również zasługą dysku SSD NVMe. Nie należy on do najszybszych, ale jest wystarczający do codziennego użytku. W naszym teście opóźnień próbka testowa z aktualną wersją BIOS-u wykazuje jednak ograniczenia w korzystaniu z aplikacji audio w czasie rzeczywistym.
CrossMark: Overall | Productivity | Creativity | Responsiveness
| PCMark 10 / Score | |
| Średnia w klasie Subnotebook (4920 - 9939, n=44, ostatnie 2 lata) | |
| Lenovo Yoga 6 13 83B2001SGE | |
| Przeciętny Intel Core i5-1235U, Intel Iris Xe Graphics G7 80EUs (4528 - 5543, n=8) | |
| Microsoft Surface Laptop Go 3 | |
| Dell XPS 13 9315, i5-1230U | |
| Microsoft Surface Laptop Go 2 Core i5 | |
| PCMark 10 / Essentials | |
| Średnia w klasie Subnotebook (8552 - 11646, n=44, ostatnie 2 lata) | |
| Lenovo Yoga 6 13 83B2001SGE | |
| Przeciętny Intel Core i5-1235U, Intel Iris Xe Graphics G7 80EUs (9143 - 11273, n=8) | |
| Microsoft Surface Laptop Go 3 | |
| Dell XPS 13 9315, i5-1230U | |
| Microsoft Surface Laptop Go 2 Core i5 | |
| PCMark 10 / Productivity | |
| Średnia w klasie Subnotebook (5435 - 16606, n=44, ostatnie 2 lata) | |
| Lenovo Yoga 6 13 83B2001SGE | |
| Przeciętny Intel Core i5-1235U, Intel Iris Xe Graphics G7 80EUs (6440 - 7354, n=8) | |
| Dell XPS 13 9315, i5-1230U | |
| Microsoft Surface Laptop Go 3 | |
| Microsoft Surface Laptop Go 2 Core i5 | |
| PCMark 10 / Digital Content Creation | |
| Średnia w klasie Subnotebook (5722 - 13779, n=44, ostatnie 2 lata) | |
| Microsoft Surface Laptop Go 3 | |
| Przeciętny Intel Core i5-1235U, Intel Iris Xe Graphics G7 80EUs (4220 - 5839, n=8) | |
| Lenovo Yoga 6 13 83B2001SGE | |
| Dell XPS 13 9315, i5-1230U | |
| Microsoft Surface Laptop Go 2 Core i5 | |
| CrossMark / Overall | |
| Średnia w klasie Subnotebook (365 - 2356, n=59, ostatnie 2 lata) | |
| Przeciętny Intel Core i5-1235U, Intel Iris Xe Graphics G7 80EUs (983 - 1644, n=8) | |
| Apple MacBook Air 2020 M1 Entry | |
| Lenovo Yoga 6 13 83B2001SGE | |
| Dell XPS 13 9315, i5-1230U | |
| Microsoft Surface Laptop Go 3 | |
| Microsoft Surface Laptop Go 2 Core i5 | |
| CrossMark / Productivity | |
| Średnia w klasie Subnotebook (364 - 2277, n=59, ostatnie 2 lata) | |
| Przeciętny Intel Core i5-1235U, Intel Iris Xe Graphics G7 80EUs (1026 - 1676, n=8) | |
| Lenovo Yoga 6 13 83B2001SGE | |
| Dell XPS 13 9315, i5-1230U | |
| Microsoft Surface Laptop Go 3 | |
| Apple MacBook Air 2020 M1 Entry | |
| Microsoft Surface Laptop Go 2 Core i5 | |
| CrossMark / Creativity | |
| Średnia w klasie Subnotebook (372 - 2743, n=59, ostatnie 2 lata) | |
| Apple MacBook Air 2020 M1 Entry | |
| Przeciętny Intel Core i5-1235U, Intel Iris Xe Graphics G7 80EUs (1032 - 1618, n=8) | |
| Lenovo Yoga 6 13 83B2001SGE | |
| Microsoft Surface Laptop Go 3 | |
| Dell XPS 13 9315, i5-1230U | |
| Microsoft Surface Laptop Go 2 Core i5 | |
| CrossMark / Responsiveness | |
| Średnia w klasie Subnotebook (312 - 1854, n=59, ostatnie 2 lata) | |
| Przeciętny Intel Core i5-1235U, Intel Iris Xe Graphics G7 80EUs (746 - 1867, n=8) | |
| Dell XPS 13 9315, i5-1230U | |
| Lenovo Yoga 6 13 83B2001SGE | |
| Microsoft Surface Laptop Go 3 | |
| Microsoft Surface Laptop Go 2 Core i5 | |
| Apple MacBook Air 2020 M1 Entry | |
| PCMark 10 Score | 4993 pkt. | |
Pomoc | ||
| AIDA64 / Memory Copy | |
| Średnia w klasie Subnotebook (14554 - 131023, n=57, ostatnie 2 lata) | |
| Microsoft Surface Laptop Go 3 | |
| Dell XPS 13 9315, i5-1230U | |
| Microsoft Surface Laptop Go 2 Core i5 | |
| Przeciętny Intel Core i5-1235U (24653 - 61921, n=8) | |
| Lenovo Yoga 6 13 83B2001SGE | |
| AIDA64 / Memory Read | |
| Średnia w klasie Subnotebook (15948 - 127174, n=57, ostatnie 2 lata) | |
| Microsoft Surface Laptop Go 3 | |
| Dell XPS 13 9315, i5-1230U | |
| Microsoft Surface Laptop Go 2 Core i5 | |
| Przeciętny Intel Core i5-1235U (24441 - 66108, n=8) | |
| Lenovo Yoga 6 13 83B2001SGE | |
| AIDA64 / Memory Write | |
| Średnia w klasie Subnotebook (15709 - 135141, n=57, ostatnie 2 lata) | |
| Microsoft Surface Laptop Go 3 | |
| Dell XPS 13 9315, i5-1230U | |
| Microsoft Surface Laptop Go 2 Core i5 | |
| Przeciętny Intel Core i5-1235U (25156 - 75808, n=8) | |
| Lenovo Yoga 6 13 83B2001SGE | |
| AIDA64 / Memory Latency | |
| Lenovo Yoga 6 13 83B2001SGE | |
| Microsoft Surface Laptop Go 3 | |
| Microsoft Surface Laptop Go 2 Core i5 | |
| Średnia w klasie Subnotebook (6.1 - 159.9, n=55, ostatnie 2 lata) | |
| Przeciętny Intel Core i5-1235U (76.3 - 119, n=8) | |
| Dell XPS 13 9315, i5-1230U | |
* ... im mniej tym lepiej
| DPC Latencies / LatencyMon - interrupt to process latency (max), Web, Youtube, Prime95 | |
| Dell XPS 13 9315, i5-1230U | |
| Microsoft Surface Laptop Go 3 | |
| Lenovo Yoga 6 13 83B2001SGE | |
| Microsoft Surface Laptop Go 2 Core i5 | |
* ... im mniej tym lepiej

| Drive Performance rating - Percent | |
| Lenovo Yoga 6 13 83B2001SGE | |
| Średnia w klasie Subnotebook | |
| Przeciętny Kioxia BG5 KBG50ZNS256G | |
| Microsoft Surface Laptop Go 3 | |
| Dell XPS 13 9315, i5-1230U | |
| Microsoft Surface Laptop Go 2 Core i5 | |
* ... im mniej tym lepiej
Dauerleistung Lesen: DiskSpd Read Loop, Queue Depth 8
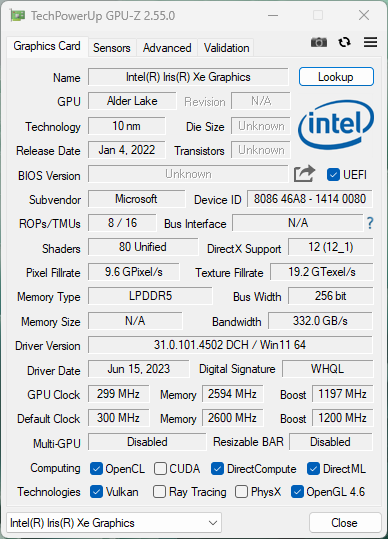
Pod względem wydajności graficznej nic się nie zmieniło, ponieważ zintegrowany układ Iris Xe Graphics G7 z 80 jednostkami EU zajmuje się obliczeniami graficznymi. Tym samym ogólna wydajność pozostaje na bardzo niskim poziomie. Odtwarzanie filmów w wysokiej rozdzielczości działa płynnie dzięki dekoderowi wideo, ale kompaktowy subnotebook szybko osiąga swoje granice podczas grania. Nawet przy niskich rozdzielczościach zazwyczaj trzeba zadowolić się minimalnymi detalami. Wydajność jest o około 30% niższa na zasilaniu bateryjnym.
| 3DMark 11 - 1280x720 Performance GPU | |
| Średnia w klasie Subnotebook (995 - 18489, n=54, ostatnie 2 lata) | |
| Lenovo Yoga 6 13 83B2001SGE | |
| Przeciętny Intel Iris Xe Graphics G7 80EUs (2246 - 6579, n=112) | |
| Microsoft Surface Laptop Go 3 | |
| Microsoft Surface Laptop Go 2 Core i5 | |
| Dell XPS 13 9315, i5-1230U | |
| 3DMark | |
| 1920x1080 Fire Strike Graphics | |
| Średnia w klasie Subnotebook (832 - 16347, n=55, ostatnie 2 lata) | |
| Microsoft Surface Laptop Go 3 | |
| Lenovo Yoga 6 13 83B2001SGE | |
| Przeciętny Intel Iris Xe Graphics G7 80EUs (1560 - 5398, n=114) | |
| Microsoft Surface Laptop Go 2 Core i5 | |
| Dell XPS 13 9315, i5-1230U | |
| 2560x1440 Time Spy Graphics | |
| Średnia w klasie Subnotebook (804 - 6288, n=54, ostatnie 2 lata) | |
| Lenovo Yoga 6 13 83B2001SGE | |
| Microsoft Surface Laptop Go 3 | |
| Przeciętny Intel Iris Xe Graphics G7 80EUs (561 - 1576, n=111) | |
| Microsoft Surface Laptop Go 2 Core i5 | |
| Dell XPS 13 9315, i5-1230U | |
| Wild Life Extreme Unlimited | |
| Średnia w klasie Subnotebook (3225 - 9092, n=14, ostatnie 2 lata) | |
| Apple MacBook Air 2020 M1 Entry | |
| Microsoft Surface Laptop Go 3 | |
| Przeciętny Intel Iris Xe Graphics G7 80EUs (1257 - 3830, n=15) | |
| Microsoft Surface Laptop Go 2 Core i5 | |
| 3DMark 11 Performance | 5282 pkt. | |
| 3DMark Fire Strike Score | 3938 pkt. | |
| 3DMark Time Spy Score | 1371 pkt. | |
Pomoc | ||
| Blender / v3.3 Classroom METAL | |
| Apple MacBook Air 2020 M1 Entry | |
| Średnia w klasie Subnotebook (76.3 - 227, n=5, ostatnie 2 lata) | |
| Blender / v3.3 Classroom HIP/AMD | |
| Lenovo Yoga 6 13 83B2001SGE | |
| Blender / v3.3 Classroom CPU | |
| Microsoft Surface Laptop Go 2 Core i5 | |
| Microsoft Surface Laptop Go 3 | |
| Apple MacBook Air 2020 M1 Entry | |
| Przeciętny Intel Iris Xe Graphics G7 80EUs (463 - 3047, n=53) | |
| Lenovo Yoga 6 13 83B2001SGE | |
| Średnia w klasie Subnotebook (241 - 861, n=59, ostatnie 2 lata) | |
* ... im mniej tym lepiej
| Performance rating - Percent | |
| Średnia w klasie Subnotebook | |
| Lenovo Yoga 6 13 83B2001SGE | |
| Microsoft Surface Laptop Go 2 Core i5 -3! | |
| Microsoft Surface Laptop Go 3 | |
| Dell XPS 13 9315, i5-1230U -4! | |
| The Witcher 3 - 1920x1080 Ultra Graphics & Postprocessing (HBAO+) | |
| Średnia w klasie Subnotebook (13.9 - 34.6, n=13, ostatnie 2 lata) | |
| Lenovo Yoga 6 13 83B2001SGE | |
| Microsoft Surface Laptop Go 3 | |
| Dell XPS 13 9315, i5-1230U | |
| GTA V - 1920x1080 Highest AA:4xMSAA + FX AF:16x | |
| Średnia w klasie Subnotebook (10.7 - 43.7, n=55, ostatnie 2 lata) | |
| Lenovo Yoga 6 13 83B2001SGE | |
| Microsoft Surface Laptop Go 3 | |
| Final Fantasy XV Benchmark - 1920x1080 High Quality | |
| Średnia w klasie Subnotebook (11.6 - 54.5, n=53, ostatnie 2 lata) | |
| Lenovo Yoga 6 13 83B2001SGE | |
| Microsoft Surface Laptop Go 3 | |
| Microsoft Surface Laptop Go 2 Core i5 | |
| Dell XPS 13 9315, i5-1230U | |
| Strange Brigade - 1920x1080 ultra AA:ultra AF:16 | |
| Średnia w klasie Subnotebook (19 - 101.3, n=49, ostatnie 2 lata) | |
| Lenovo Yoga 6 13 83B2001SGE | |
| Microsoft Surface Laptop Go 3 | |
| Dota 2 Reborn - 1920x1080 ultra (3/3) best looking | |
| Średnia w klasie Subnotebook (13 - 97, n=60, ostatnie 2 lata) | |
| Lenovo Yoga 6 13 83B2001SGE | |
| Microsoft Surface Laptop Go 3 | |
| Microsoft Surface Laptop Go 2 Core i5 | |
| X-Plane 11.11 - 1920x1080 high (fps_test=3) | |
| Średnia w klasie Subnotebook (20.7 - 50.5, n=51, ostatnie 2 lata) | |
| Lenovo Yoga 6 13 83B2001SGE | |
| Microsoft Surface Laptop Go 2 Core i5 | |
| Microsoft Surface Laptop Go 3 | |
| low | med. | high | ultra | |
|---|---|---|---|---|
| GTA V (2015) | 63.8 | 64.4 | 17.7 | 8.38 |
| The Witcher 3 (2015) | 74 | 48 | 17 | 9.83 |
| Dota 2 Reborn (2015) | 93.1 | 59.5 | 45.9 | 40.2 |
| Final Fantasy XV Benchmark (2018) | 29.9 | 16.3 | 11.9 | |
| X-Plane 11.11 (2018) | 38.6 | 28.8 | 26.4 | |
| Strange Brigade (2018) | 69.6 | 32.8 | 25.5 | 19.8 |
| F1 2021 (2021) | 77 | 34.3 | 26.5 | 18.8 |
Emisje i energia
Emisja hałasu
Surface Laptop Go 3 nadal ma niewielki wentylator, ale jest on zwykle dezaktywowany w codziennym użytkowaniu. Staje się jednak zauważalny, gdy tylko system zostanie poddany większemu obciążeniu, a także ma dość wysoką częstotliwość. Przy prawie 40 dB(A) pod stałym obciążeniem, kompaktowe urządzenie jest zbyt głośne, biorąc pod uwagę niską wydajność. W tym przypadku MacBook Air z pasywnym chłodzeniem zdecydowanie ma dużą przewagę. Nie słyszeliśmy żadnych innych szumów elektronicznych.
Hałas
| luz |
| 22.5 / 22.5 / 22.5 dB |
| obciążenie |
| 31.3 / 39.1 dB |
 | ||
30 dB cichy 40 dB(A) słyszalny 50 dB(A) irytujący |
||
min: | ||
| Microsoft Surface Laptop Go 3 Iris Xe G7 80EUs, i5-1235U, Kioxia BG5 KBG50ZNS256G | Dell XPS 13 9315, i5-1230U Iris Xe G7 80EUs, i5-1230U, Micron 3460 256 GB Soldered | Lenovo Yoga 6 13 83B2001SGE Vega 8, R7 7730U, WD PC SN740 512GB SDDPMQD-512G-1101 | Microsoft Surface Laptop Go 2 Core i5 Iris Xe G7 80EUs, i5-1135G7, Toshiba KBG40ZNS256G NVMe | |
|---|---|---|---|---|
| Noise | -15% | -16% | -6% | |
| wyłączone / środowisko * (dB) | 22.5 | 26 -16% | 27 -20% | 24.3 -8% |
| Idle Minimum * (dB) | 22.5 | 26 -16% | 27 -20% | 24.3 -8% |
| Idle Average * (dB) | 22.5 | 26 -16% | 27 -20% | 24.3 -8% |
| Idle Maximum * (dB) | 22.5 | 27.5 -22% | 27 -20% | 24.3 -8% |
| Load Average * (dB) | 31.3 | 39.5 -26% | 37.6 -20% | 33.1 -6% |
| Witcher 3 ultra * (dB) | 37.8 | 39.6 -5% | 36.7 3% | |
| Load Maximum * (dB) | 39.1 | 39.6 -1% | 37.6 4% | 41.8 -7% |
* ... im mniej tym lepiej
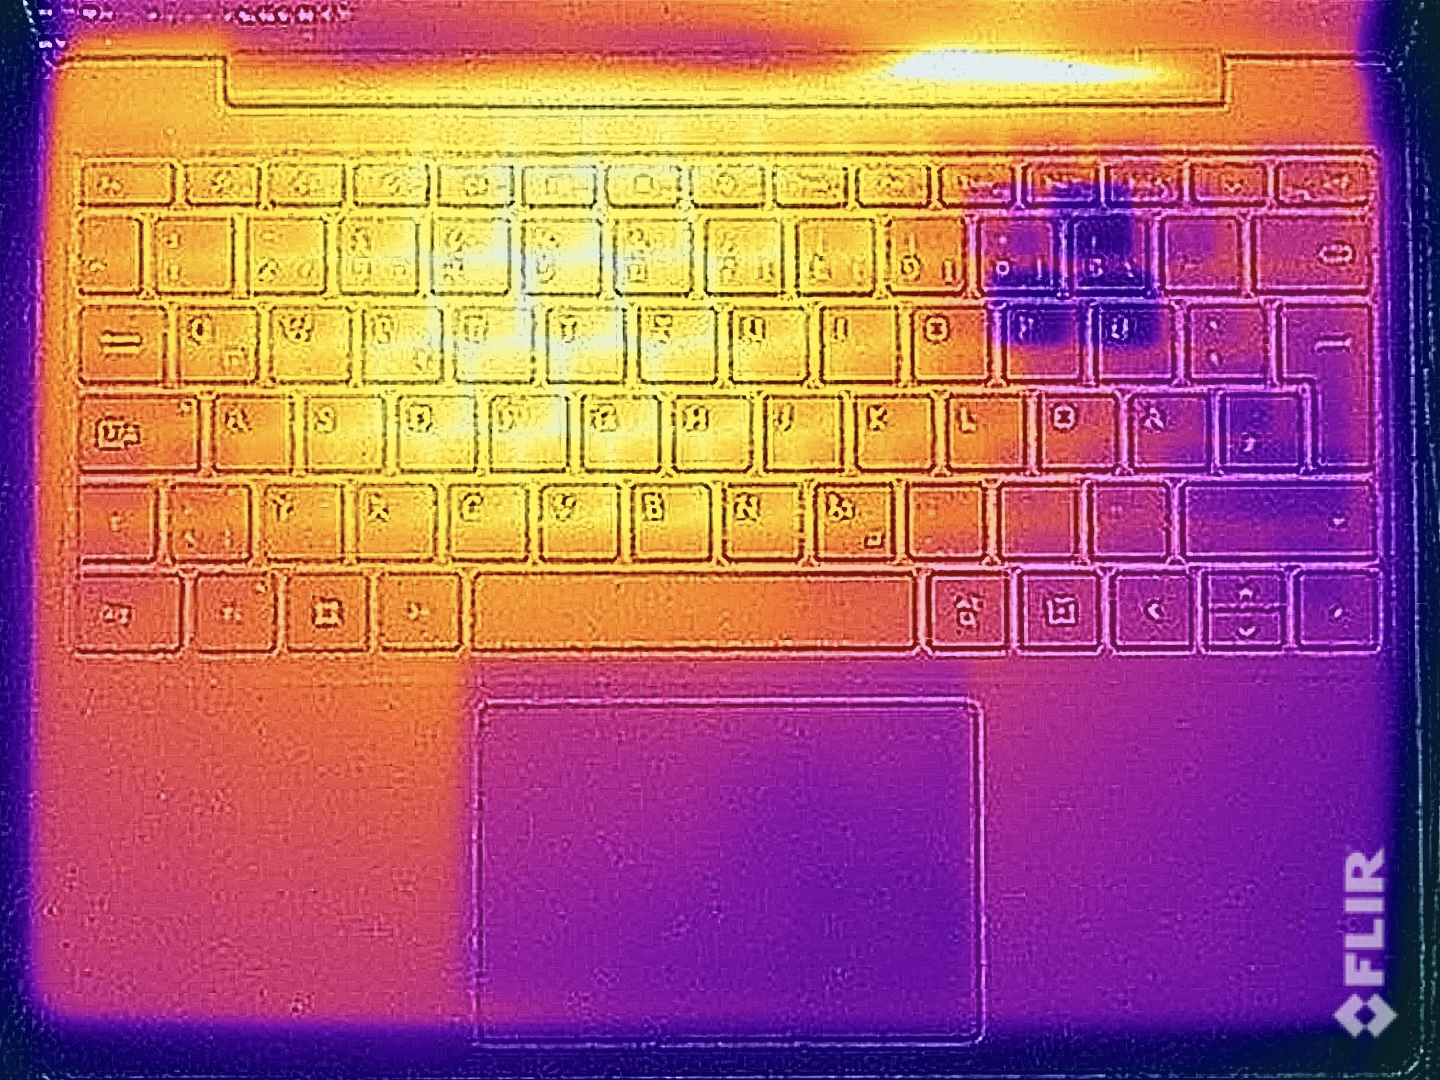
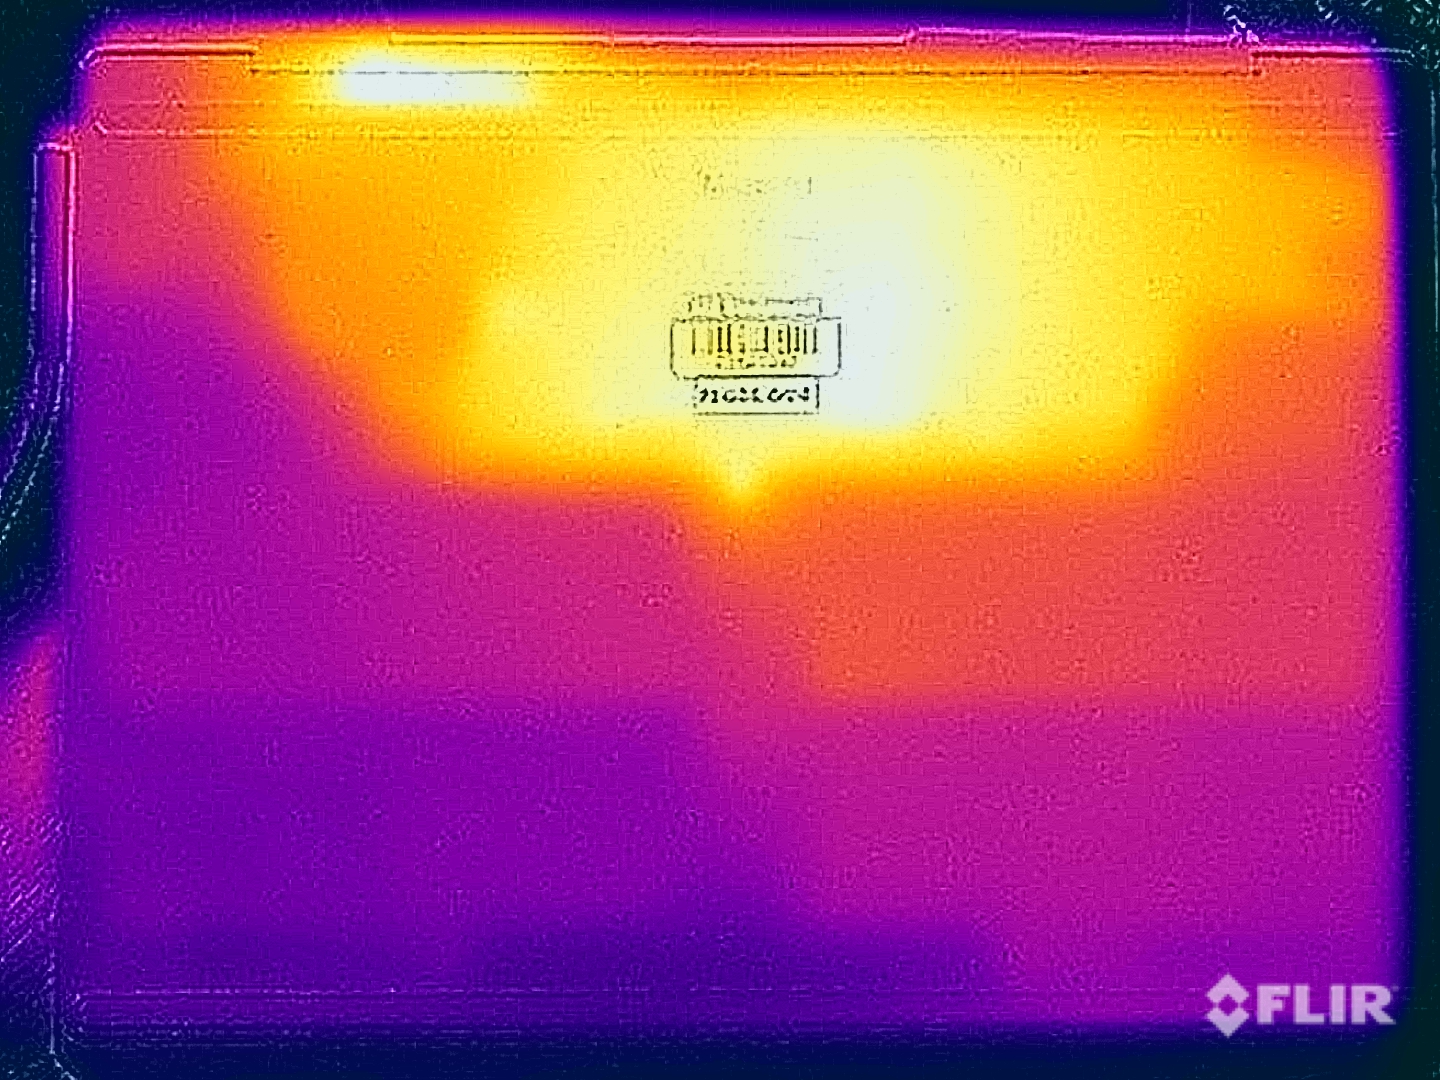
Kompaktowe urządzenie pozostaje przyjemnie chłodne w codziennym użytkowaniu, ale zmierzyliśmy do 47 °C w tylnej części spodu pod obciążeniem. W teście obciążeniowym TDP procesora najpierw ustaliło się na poziomie 20 watów, a kilka minut później na poziomie 15 watów.
(±) Maksymalna temperatura w górnej części wynosi 40.9 °C / 106 F, w porównaniu do średniej 35.9 °C / 97 F , począwszy od 21.4 do 59 °C dla klasy Subnotebook.
(-) Dno nagrzewa się maksymalnie do 47.2 °C / 117 F, w porównaniu do średniej 39.2 °C / 103 F
(+) W stanie bezczynności średnia temperatura górnej części wynosi 24.1 °C / 75 F, w porównaniu ze średnią temperaturą urządzenia wynoszącą 30.8 °C / ### class_avg_f### F.
(+) Podpórki pod nadgarstki i touchpad są chłodniejsze niż temperatura skóry i maksymalnie 31.8 °C / 89.2 F i dlatego są chłodne w dotyku.
(-) Średnia temperatura obszaru podparcia dłoni w podobnych urządzeniach wynosiła 28.2 °C / 82.8 F (-3.6 °C / -6.4 F).
| Microsoft Surface Laptop Go 3 Intel Core i5-1235U, Intel Iris Xe Graphics G7 80EUs | Apple MacBook Air 2020 M1 Entry Apple M1, Apple M1 7-Core GPU | Dell XPS 13 9315, i5-1230U Intel Core i5-1230U, Intel Iris Xe Graphics G7 80EUs | Lenovo Yoga 6 13 83B2001SGE AMD Ryzen 7 7730U, AMD Radeon RX Vega 8 (Ryzen 4000/5000) | Microsoft Surface Laptop Go 2 Core i5 Intel Core i5-1135G7, Intel Iris Xe Graphics G7 80EUs | |
|---|---|---|---|---|---|
| Heat | -3% | -19% | -18% | -9% | |
| Maximum Upper Side * (°C) | 40.9 | 44 -8% | 42.3 -3% | 43.8 -7% | 41.4 -1% |
| Maximum Bottom * (°C) | 47.2 | 44 7% | 44.9 5% | 48.2 -2% | 46.7 1% |
| Idle Upper Side * (°C) | 24.9 | 27 -8% | 32.5 -31% | 32.9 -32% | 28.5 -14% |
| Idle Bottom * (°C) | 25.9 | 27 -4% | 38.2 -47% | 34.1 -32% | 31.5 -22% |
* ... im mniej tym lepiej
Głośnik
Głośniki nadal oferują przyzwoitą wydajność, ale pozostają w tyle za MacBook Air M1.
Microsoft Surface Laptop Go 3 analiza dźwięku
(±) | głośność głośnika jest średnia, ale dobra (79 dB)
Bas 100 - 315 Hz
(-) | prawie brak basu - średnio 18.7% niższa od mediany
(±) | liniowość basu jest średnia (9.8% delta do poprzedniej częstotliwości)
Średnie 400 - 2000 Hz
(+) | zbalansowane środki średnie - tylko 4.8% od mediany
(+) | średnie są liniowe (5.2% delta do poprzedniej częstotliwości)
Wysokie 2–16 kHz
(+) | zrównoważone maksima - tylko 1.1% od mediany
(+) | wzloty są liniowe (2.7% delta do poprzedniej częstotliwości)
Ogólnie 100 - 16.000 Hz
(±) | liniowość ogólnego dźwięku jest średnia (15.4% różnicy w stosunku do mediany)
W porównaniu do tej samej klasy
» 35% wszystkich testowanych urządzeń w tej klasie było lepszych, 6% podobnych, 60% gorszych
» Najlepszy miał deltę 5%, średnia wynosiła ###średnia###%, najgorsza wynosiła 53%
W porównaniu do wszystkich testowanych urządzeń
» 22% wszystkich testowanych urządzeń było lepszych, 4% podobnych, 73% gorszych
» Najlepszy miał deltę 4%, średnia wynosiła ###średnia###%, najgorsza wynosiła 134%
Apple MacBook Air 2020 M1 Entry analiza dźwięku
(±) | głośność głośnika jest średnia, ale dobra (79.6 dB)
Bas 100 - 315 Hz
(±) | zredukowany bas - średnio 7.1% niższy od mediany
(±) | liniowość basu jest średnia (9.5% delta do poprzedniej częstotliwości)
Średnie 400 - 2000 Hz
(+) | zbalansowane środki średnie - tylko 2.2% od mediany
(+) | średnie są liniowe (5.3% delta do poprzedniej częstotliwości)
Wysokie 2–16 kHz
(+) | zrównoważone maksima - tylko 2.3% od mediany
(+) | wzloty są liniowe (4% delta do poprzedniej częstotliwości)
Ogólnie 100 - 16.000 Hz
(+) | ogólny dźwięk jest liniowy (8.7% różnicy w stosunku do mediany)
W porównaniu do tej samej klasy
» 3% wszystkich testowanych urządzeń w tej klasie było lepszych, 1% podobnych, 96% gorszych
» Najlepszy miał deltę 5%, średnia wynosiła ###średnia###%, najgorsza wynosiła 53%
W porównaniu do wszystkich testowanych urządzeń
» 3% wszystkich testowanych urządzeń było lepszych, 1% podobnych, 97% gorszych
» Najlepszy miał deltę 4%, średnia wynosiła ###średnia###%, najgorsza wynosiła 134%
| wyłączony / stan wstrzymania | |
| luz | |
| obciążenie |
|
Legenda:
min: | |
Power consumption Witcher 3 / Stresstest
Power consumption with external monitor
Żywotność baterii
Pojemność akumulatora 41 Wh nie uległa zmianie i widać poprawę w stosunku do starego modelu. W teście WLAN przy 150 cd/m² (odpowiada 70% maksymalnej jasności w testowanym urządzeniu) jest to teraz nieco poniżej 8 godzin i nieco ponad 5,5 godziny przy pełnej jasności. Nie są to złe wyniki same w sobie, ale nie są to najlepsze wskaźniki biorąc pod uwagę niską jasność ekranu. Co więcej, wszyscy rywale oferują znacznie większą wytrzymałość.
| Battery Runtime | |
| WiFi Websurfing | |
| Apple MacBook Air 2020 M1 Entry | |
| Apple MacBook Air 2020 M1 Entry (Fullscreen) | |
| Dell XPS 13 9315, i5-1230U | |
| Średnia w klasie Subnotebook (7.25 - 26.4, n=59, ostatnie 2 lata) | |
| Lenovo Yoga 6 13 83B2001SGE | |
| Microsoft Surface Laptop Go 3 (Edge 117) | |
| Microsoft Surface Laptop Go 2 Core i5 (Edge 101) | |
| WiFi Websurfing max. Brightness | |
| Dell XPS 13 9315, i5-1230U | |
| Średnia w klasie Subnotebook (4.82 - 15.8, n=32, ostatnie 2 lata) | |
| Apple MacBook Air 2020 M1 Entry | |
| Lenovo Yoga 6 13 83B2001SGE | |
| Microsoft Surface Laptop Go 3 (Edge 117) | |
| Microsoft Surface Laptop Go 2 Core i5 (Edge 101) | |
Za
Przeciw
Werdykt - Surface Laptop Go 3 jest przestarzały i zdecydowanie za drogi
Zasadniczo możemy potwierdzić wnioski z naszej recenzji Surface Laptop Go 2 ponieważ w trzeciej generacji nie ma żadnych realnych zmian. Nowy procesor Alder Lake oferuje nieco większą wydajność przez krótki czas, a czasy pracy na baterii są nieco lepsze, ale konkurencja po prostu oferuje więcej pod względem wytrzymałości.
Jednocześnie kompaktowe urządzenie ma też wyraźnie pozytywne cechy: przede wszystkim wysokiej jakości metalową obudowę i dobrą klawiaturę. Odczucia podczas pisania są bardzo dobre, ale nie może być tak, że Microsoft wciąż nie oferuje tutaj podświetlenia klawiatury. Ekran dotykowy o przekątnej 3:2 cala oferuje również przyzwoitą jakość obrazu i jest już bardzo dokładnie skalibrowany fabrycznie, ale odbija również bardzo mocno, a jasność jest niższa niż w poprzedniku poprzednikaco utrudnia użytkowanie na zewnątrz. Chłodzenie jest również problematyczne, ponieważ mały wentylator ma wiele do zrobienia pomimo niskiej wydajności, a powierzchnie nagrzewają się, gdy urządzenie jest nieco mocniej naciskane.
Nowy Microsoft Surface Laptop Go 3 stał się nieco szybszy i jest teraz opcjonalnie dostępny z 16 GB pamięci RAM, ale jego cena wzrosła w tym samym czasie. Kompaktowy laptop jest zdecydowanie za drogi i kosztuje 1149 euro, a konkurencja oferuje znacznie lepsze pakiety.
Teraz jednak dochodzimy do faktycznego problemu - ceny. Krytykowaliśmy ją już w poprzednim modelu, a teraz jest jeszcze wyższa. Ponadto Microsoft całkowicie wyeliminował tańsze (a przez to bardziej interesujące dla wielu klientów) konfiguracje. Za 500-600 euro z pewnością można by przeboleć pewne braki, ale na rynku są już naprawdę dobre urządzenia za ponad 1000 euro, które jednak są też nieco większe. Jeśli niekoniecznie potrzebujesz systemu Windows i szukasz urządzenia do codziennych zadań, powinieneś rzucić okiem na Apple MacBook Air M1 który jest już dostępny za około 900 euro i jest lepszy praktycznie pod każdym względem, z wyjątkiem ekranu dotykowego (jeśli jest używany) i braku portu USB-A.
Cena i dostępność
W chwili pisania tego tekstu Microsoft Surface Laptop Go 3 jest dostępny u różnych sprzedawców detalicznych. W Stanach Zjednoczonych użytkownicy mogą zamówić model za pośrednictwem Amazon.
Microsoft Surface Laptop Go 3
- 09/10/2023 v7 (old)
Andreas Osthoff
Przezroczystość
Wyboru urządzeń do recenzji dokonuje nasza redakcja. Próbka testowa została udostępniona autorowi jako pożyczka od producenta lub sprzedawcy detalicznego na potrzeby tej recenzji. Pożyczkodawca nie miał wpływu na tę recenzję, producent nie otrzymał też kopii tej recenzji przed publikacją. Nie było obowiązku publikowania tej recenzji. Jako niezależna firma medialna, Notebookcheck nie podlega władzy producentów, sprzedawców detalicznych ani wydawców.
Tak testuje Notebookcheck
Każdego roku Notebookcheck niezależnie sprawdza setki laptopów i smartfonów, stosując standardowe procedury, aby zapewnić porównywalność wszystkich wyników. Od około 20 lat stale rozwijamy nasze metody badawcze, ustanawiając przy tym standardy branżowe. W naszych laboratoriach testowych doświadczeni technicy i redaktorzy korzystają z wysokiej jakości sprzętu pomiarowego. Testy te obejmują wieloetapowy proces walidacji. Nasz kompleksowy system ocen opiera się na setkach uzasadnionych pomiarów i benchmarków, co pozwala zachować obiektywizm.Price comparison
