Test laptopa MSI Alpha 15
Tekst i zdjęcia: Klaus Hinum, J. Simon Leitner
Tłumaczenie: Sylwester Cyba
14/01/2020
Firma AMD wróciła na dobre na rynek procesorów do laptopów już jakiś czas temu. Teraz przyszedł czas na odebranie Nvidii kawałka tortu, jakim jest rynek kart grafiki do laptopów. W testowanym MSI Alpha 15 mieliśmy do czynienia z Radeonem RX 5500M, kartą opartą na nowej architekturze Navi (7 nm).
Obudowa
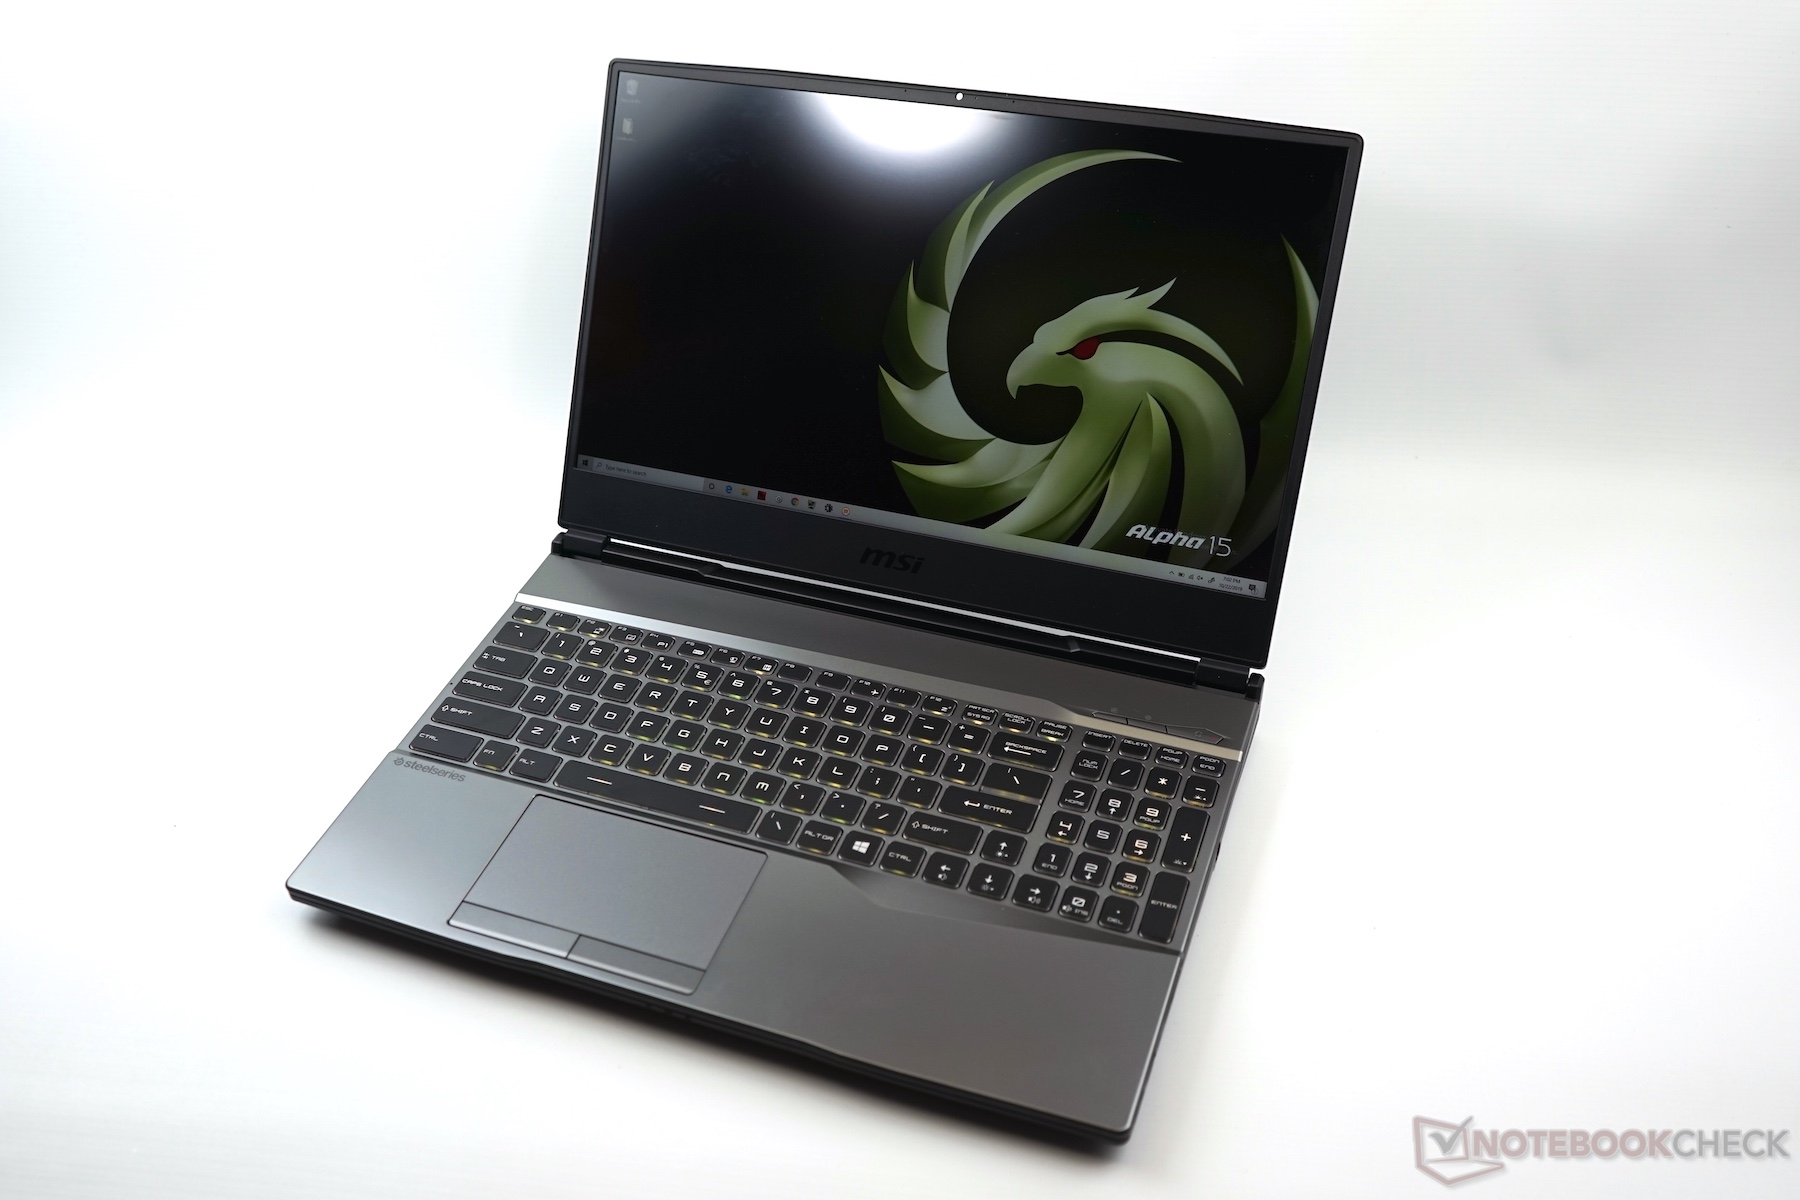
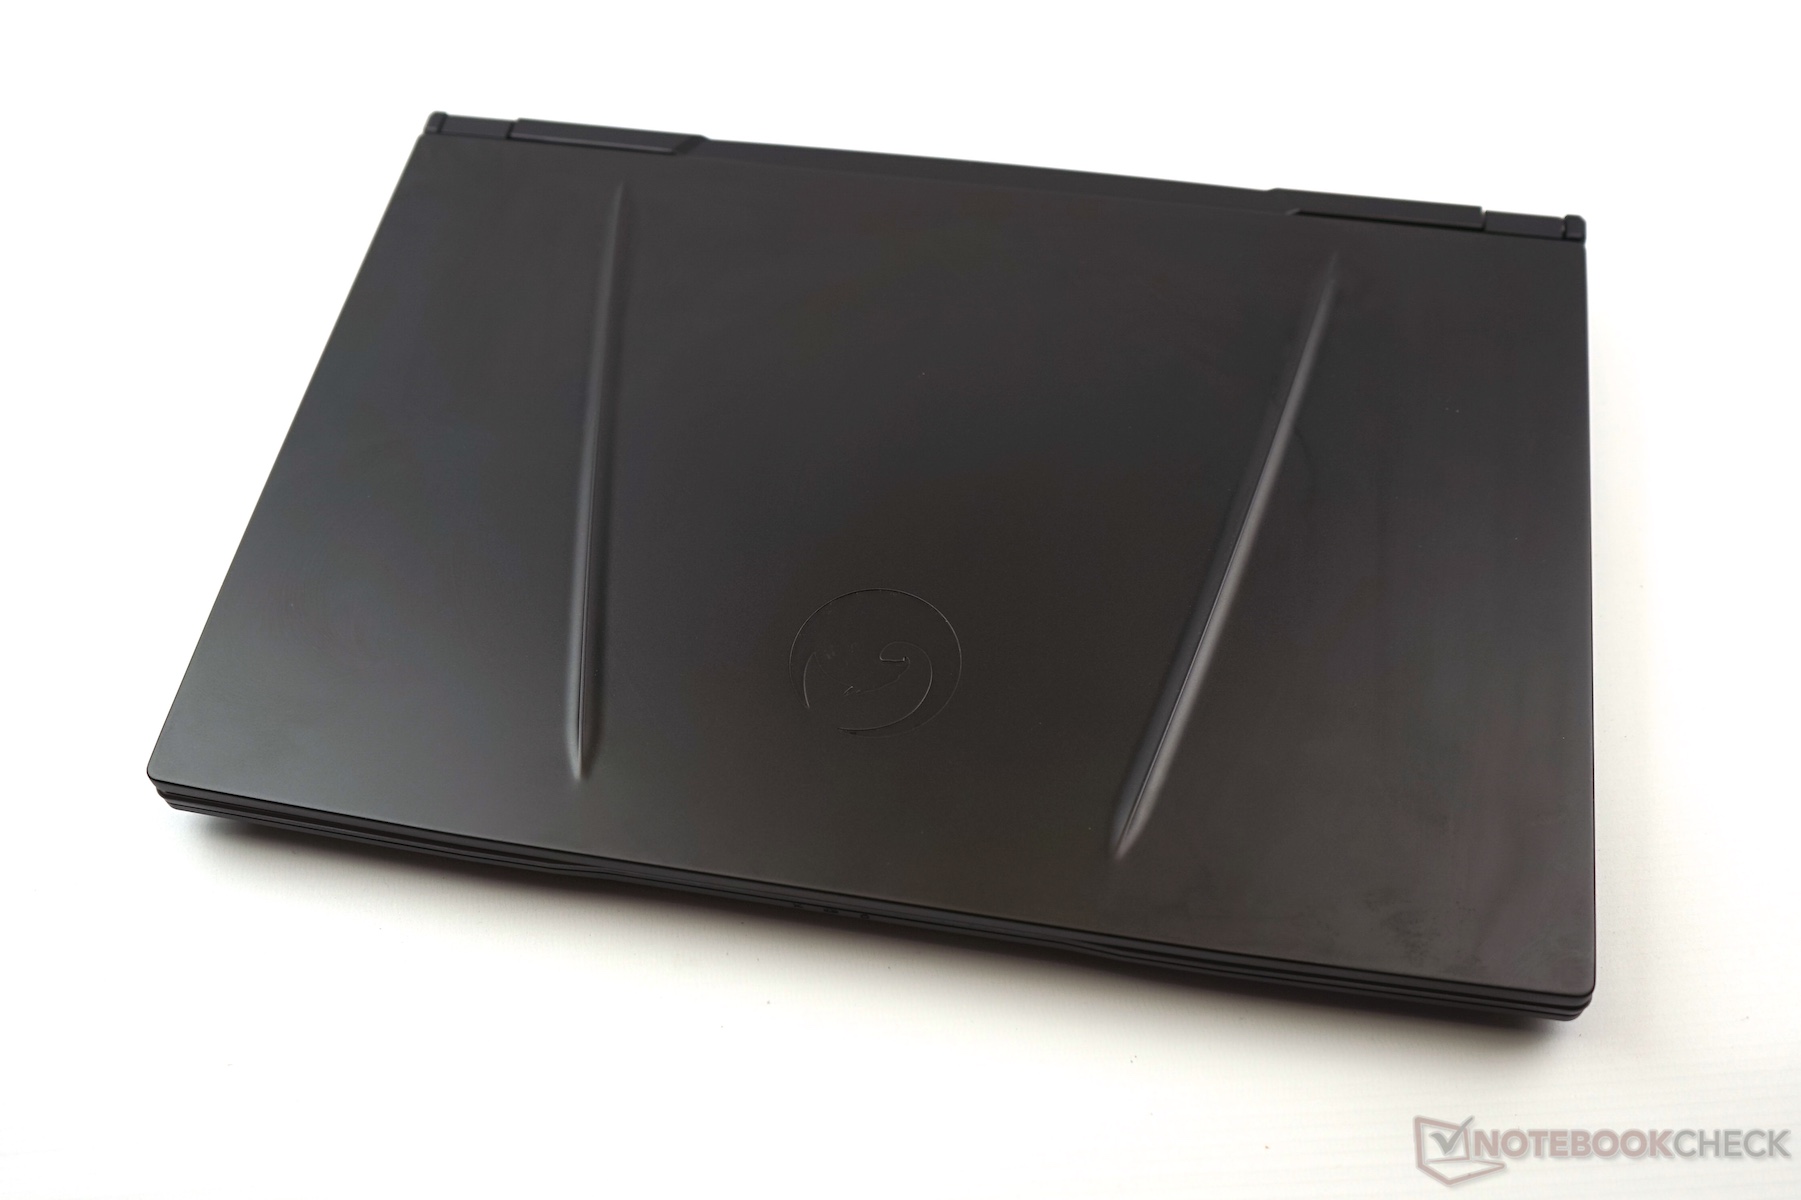
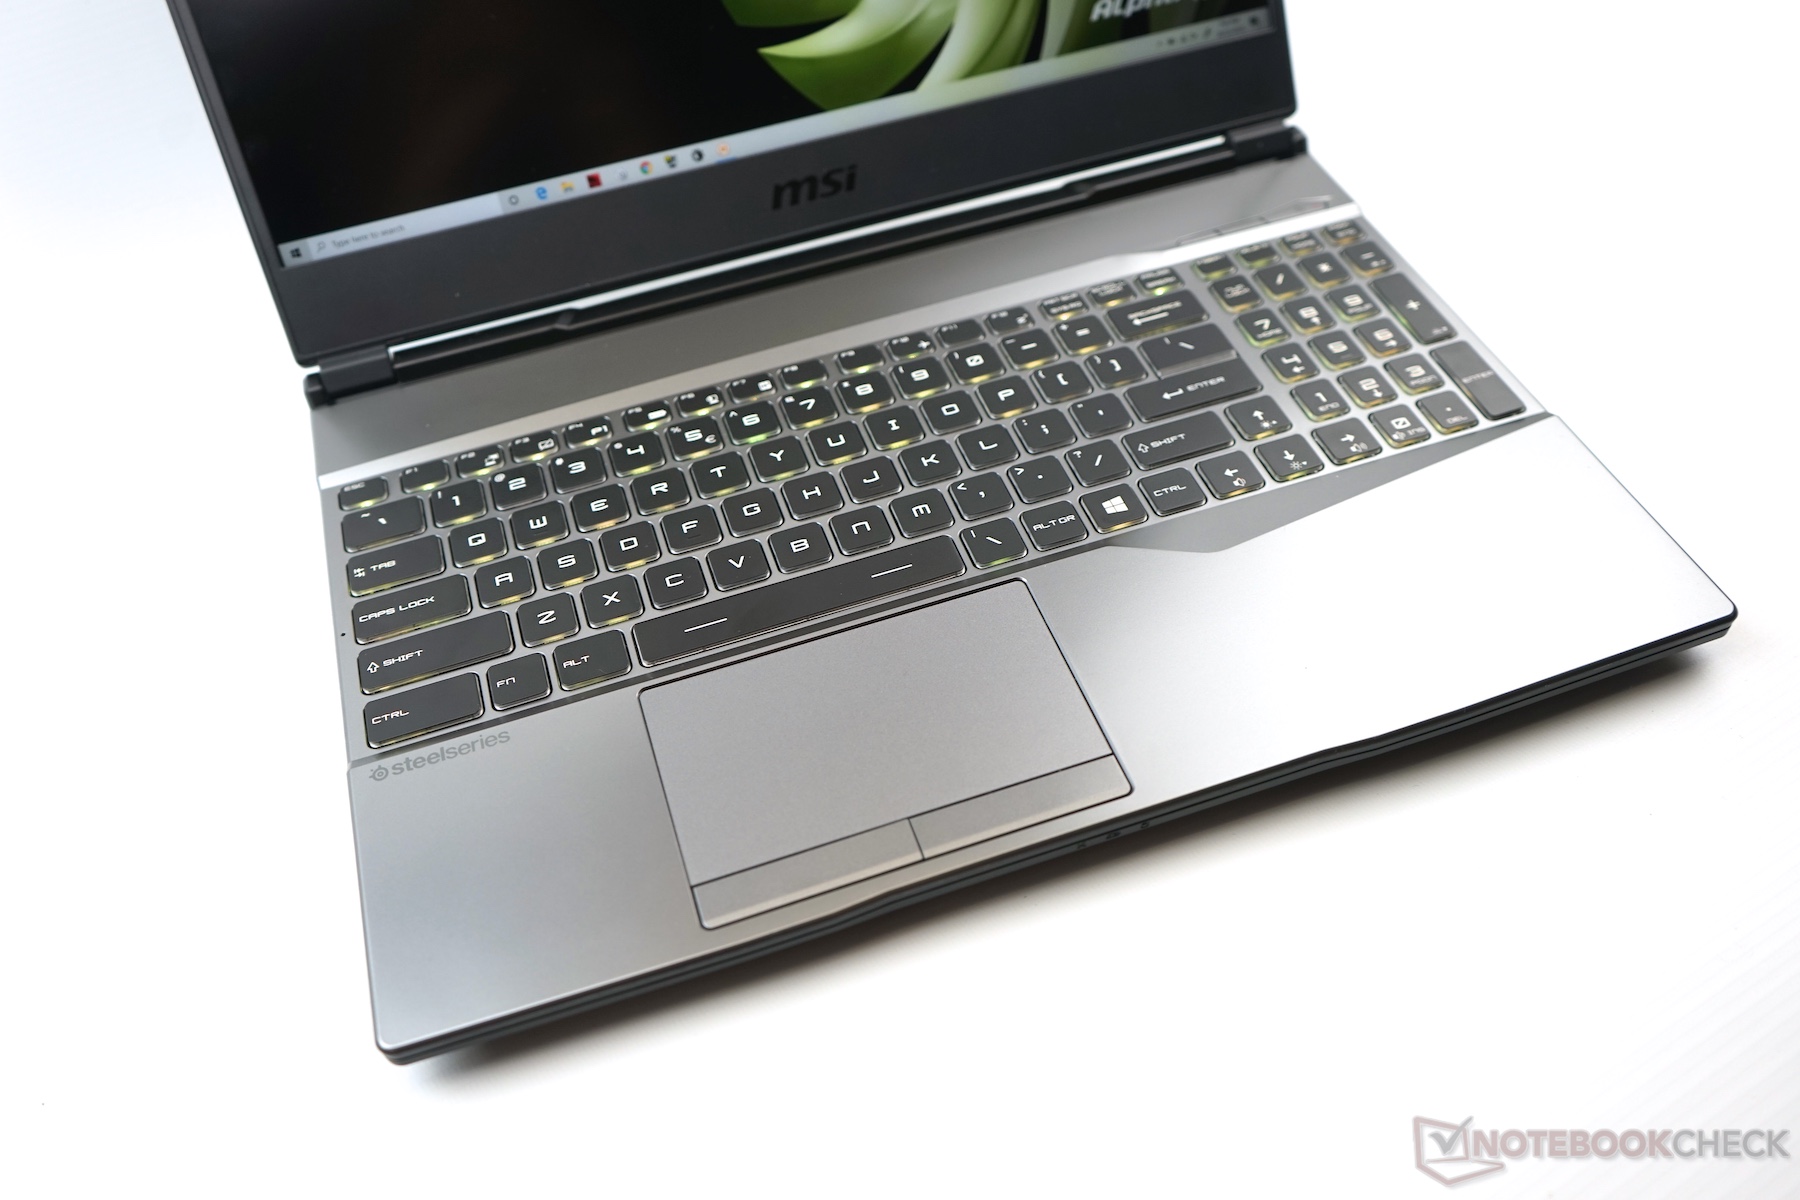
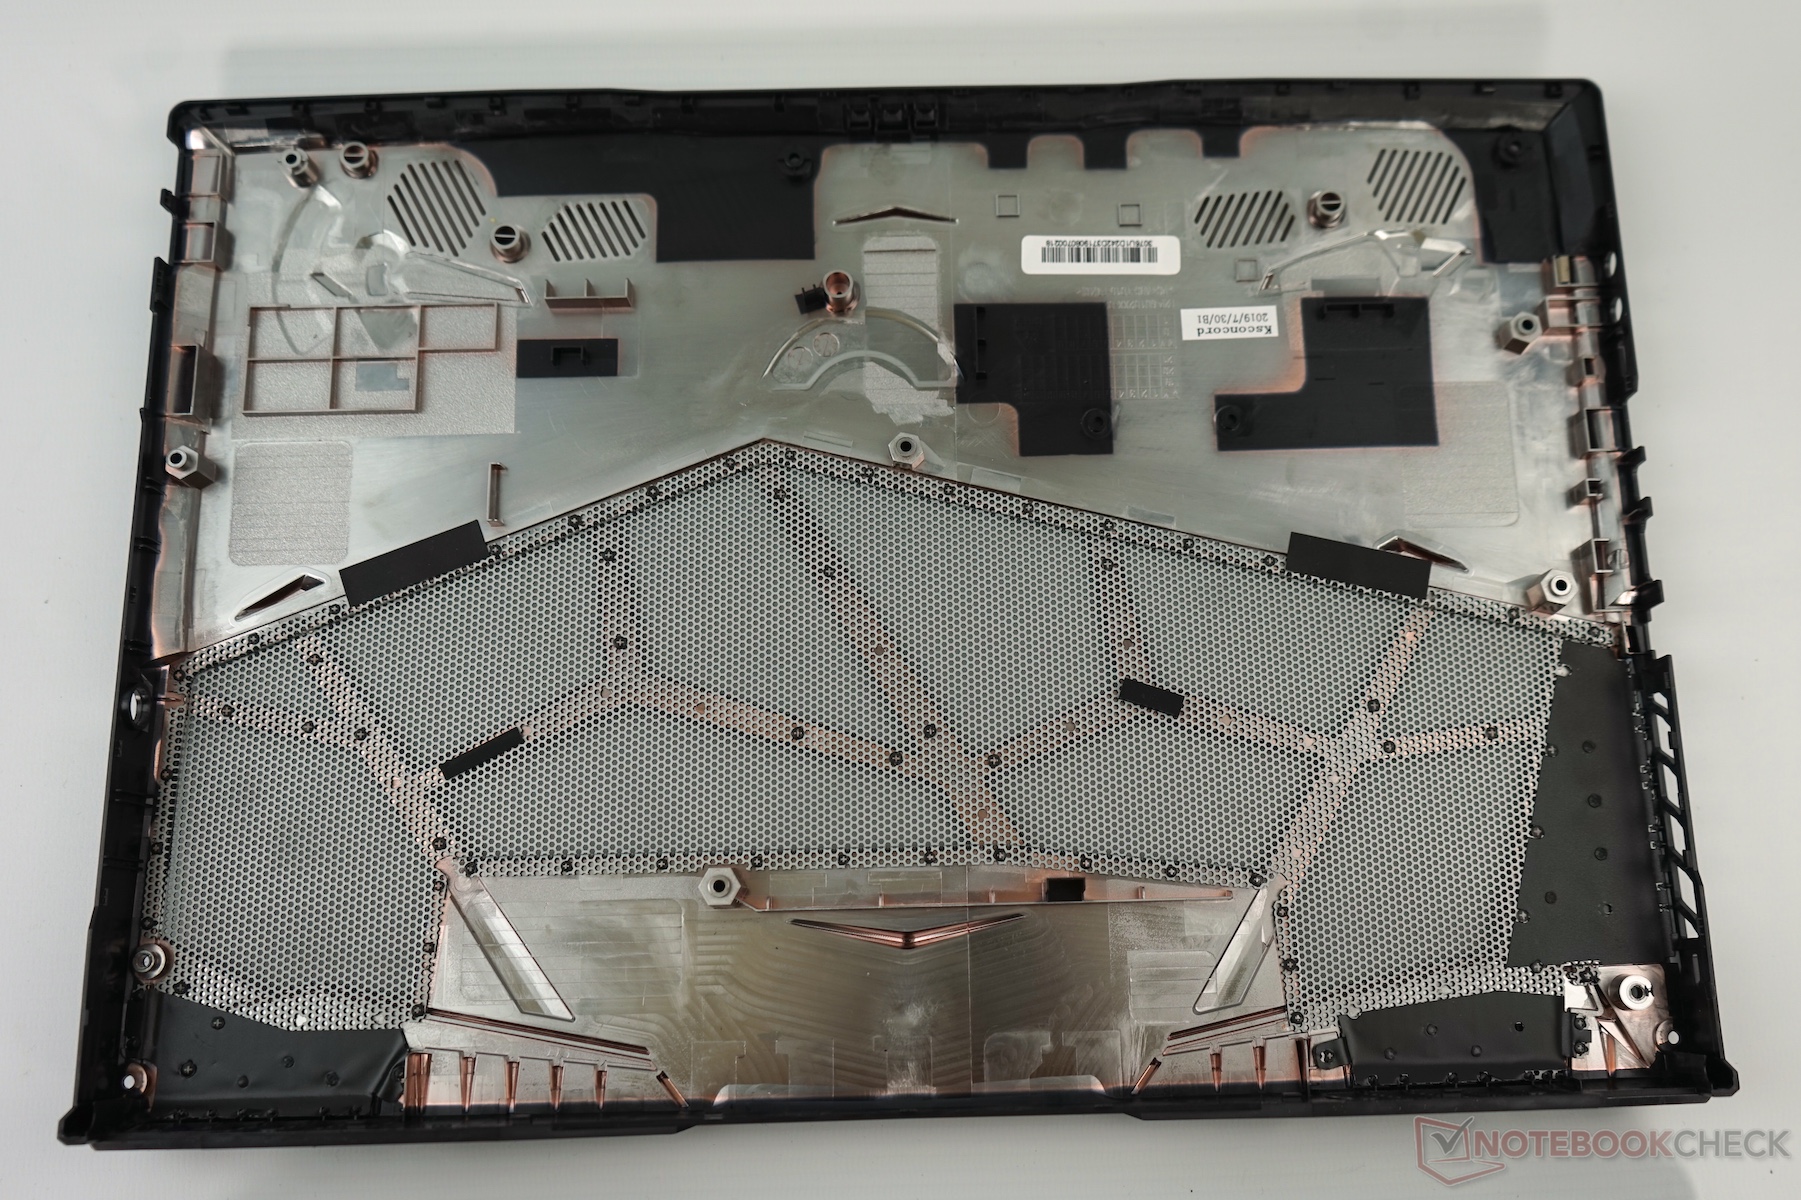
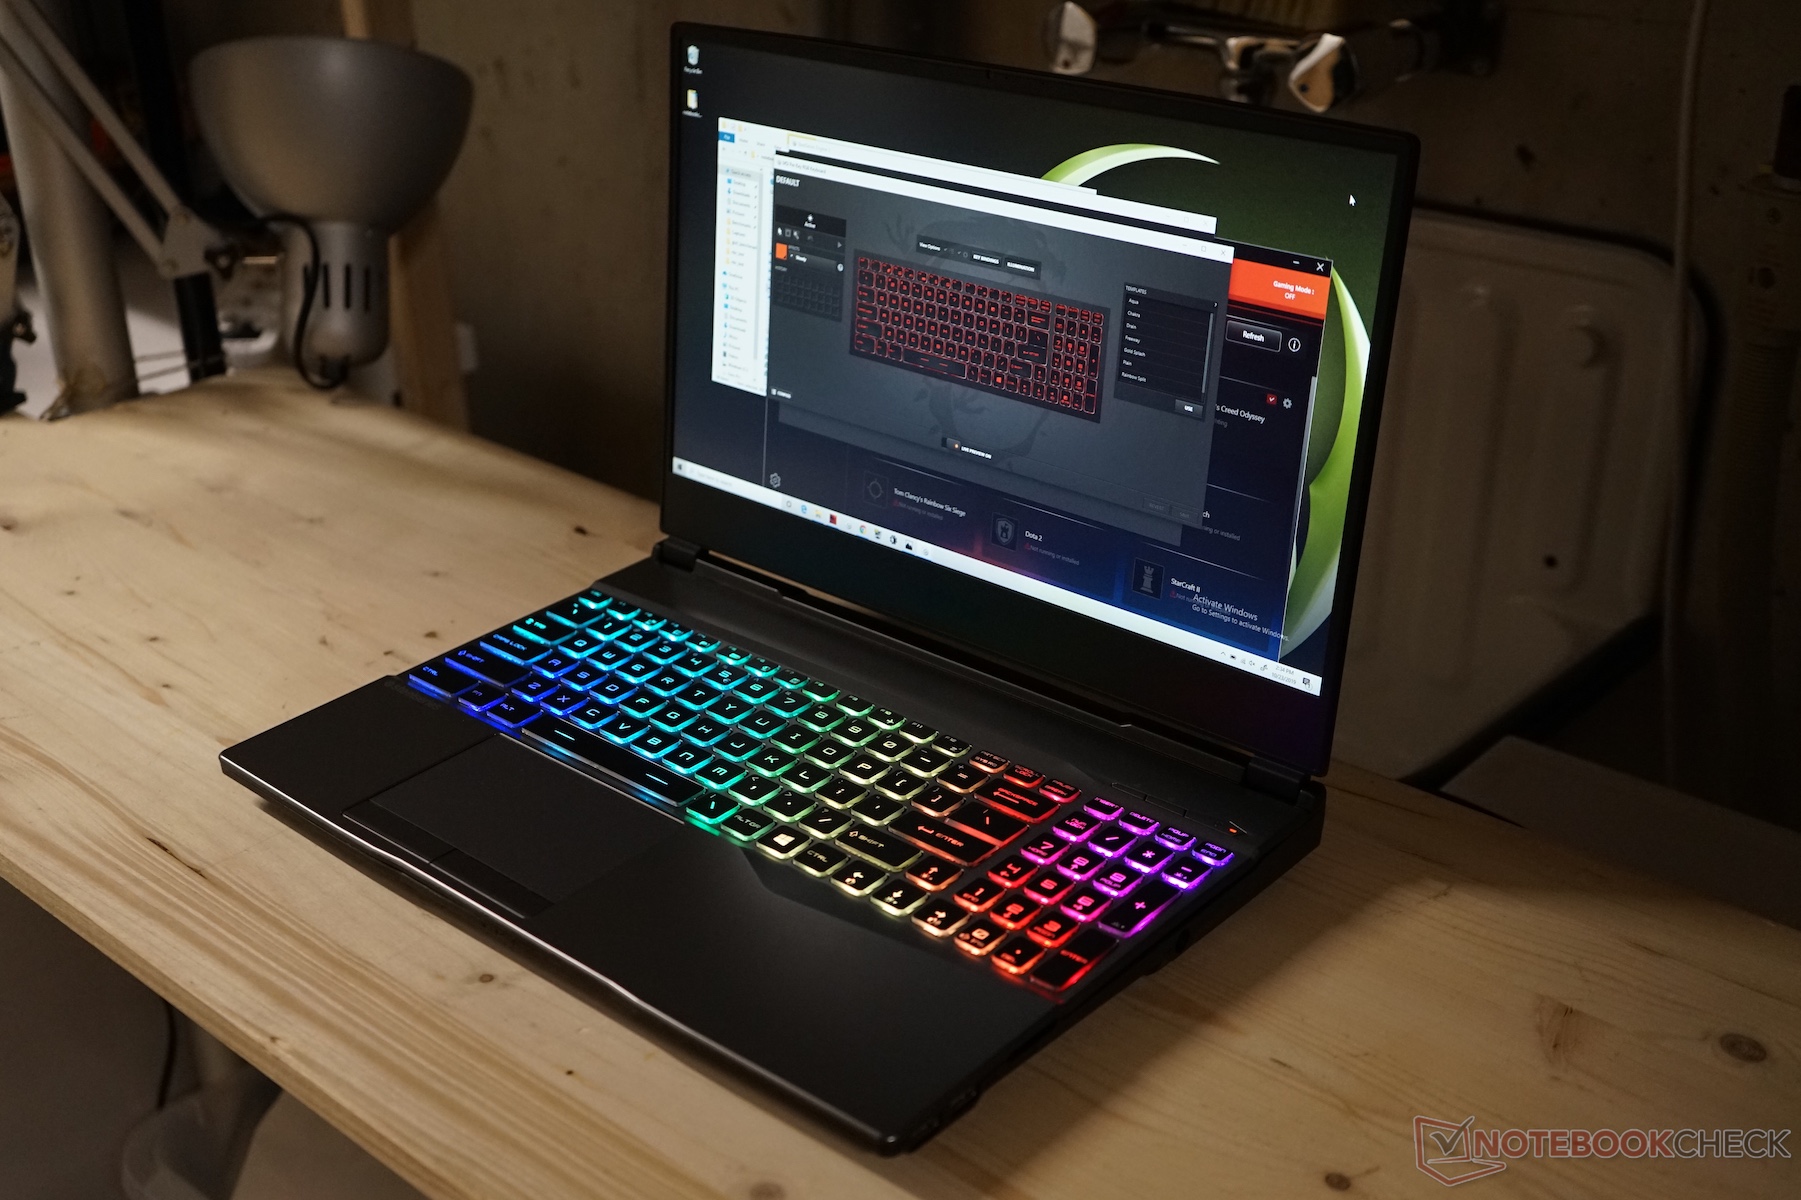
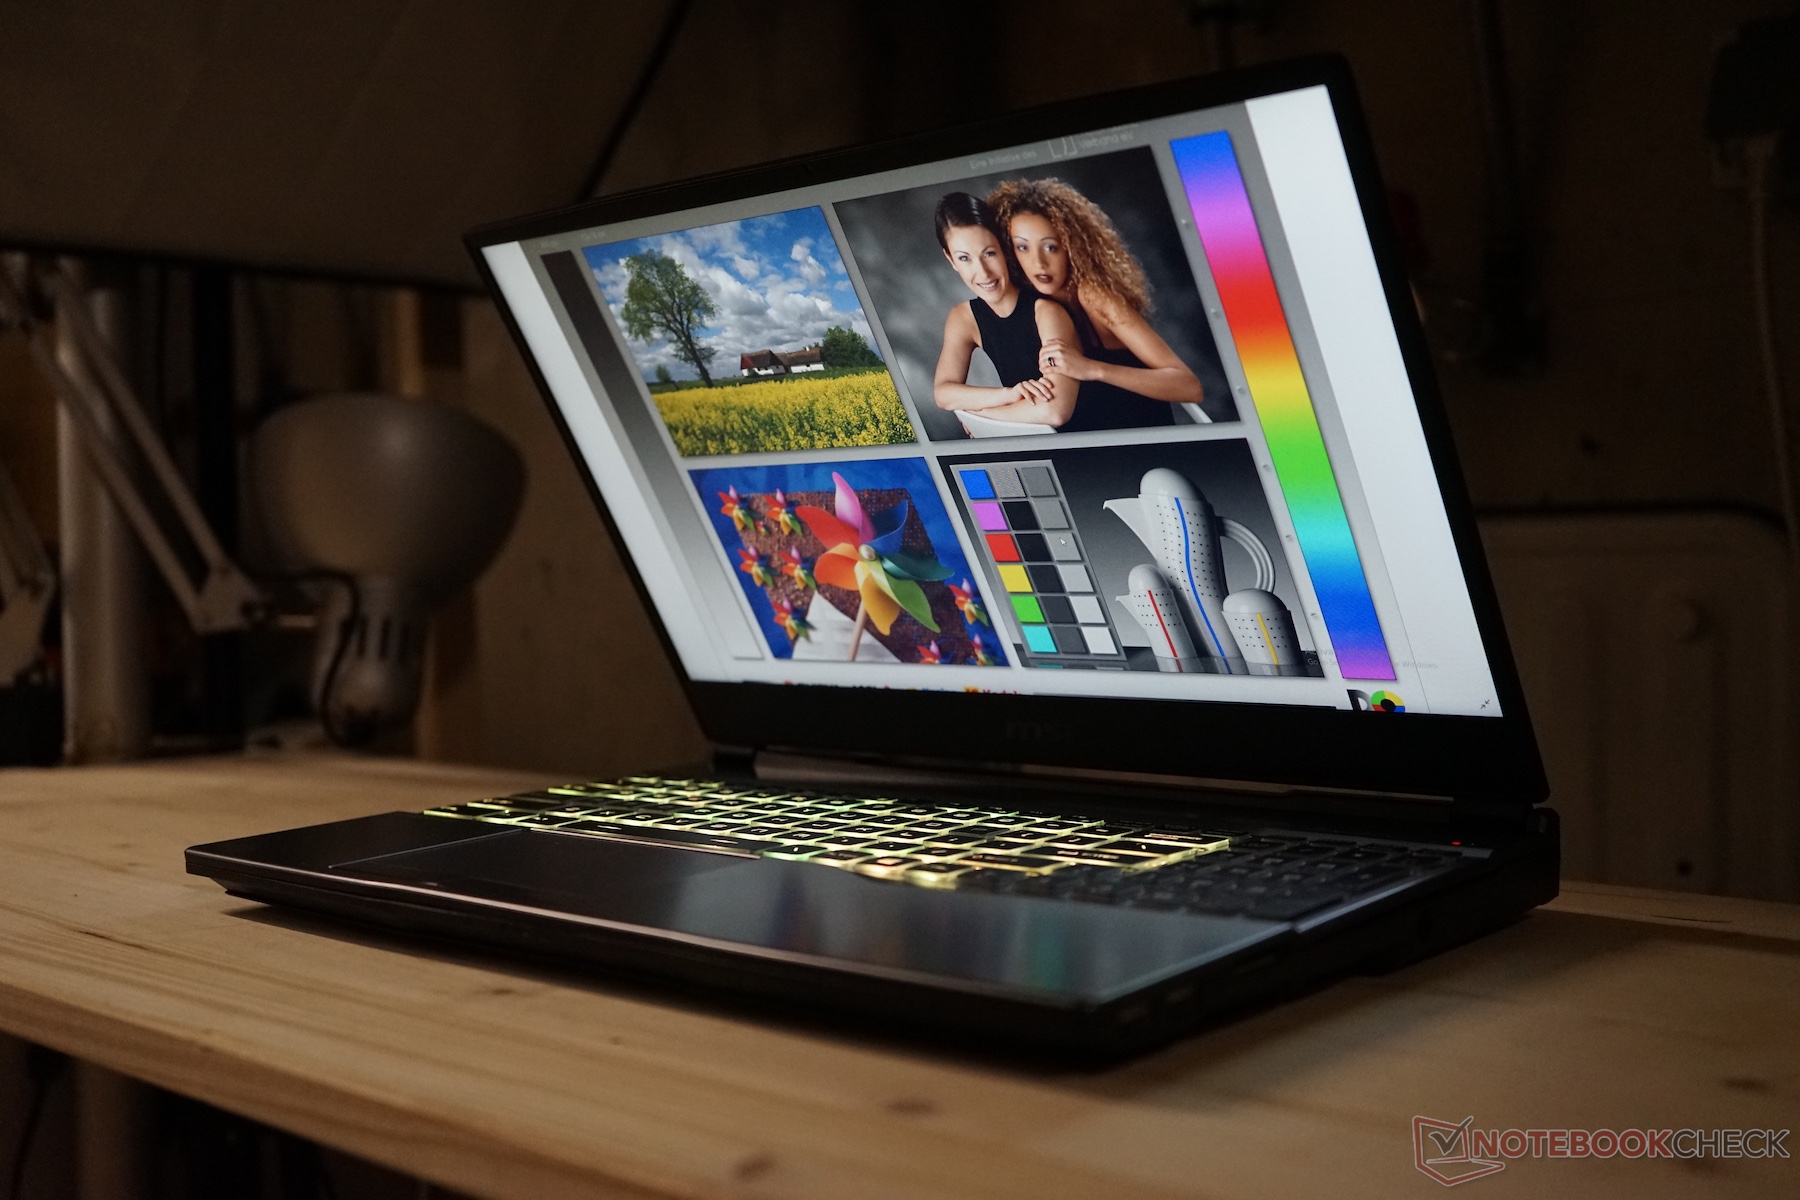
Proste wzornictwo to coś, co wyróżnia laptop MSI Alpha 15. Ten wizerunek jest przełamany przez ozdoby na spodzie i z tyłu urządzenia. Widać też, że próbowano ograniczyć koszty, by zmieścić się w niskiej cenie końcowej. Na szczęście nie wszędzie dominuje plastik. Klapa została wzmocniona elementami z aluminium, co nadaje jej pożądanej stabilności. Obudowa MSI Alpha 15 do złudzenia przypomina tę zastosowaną w modelu MSI GL65.
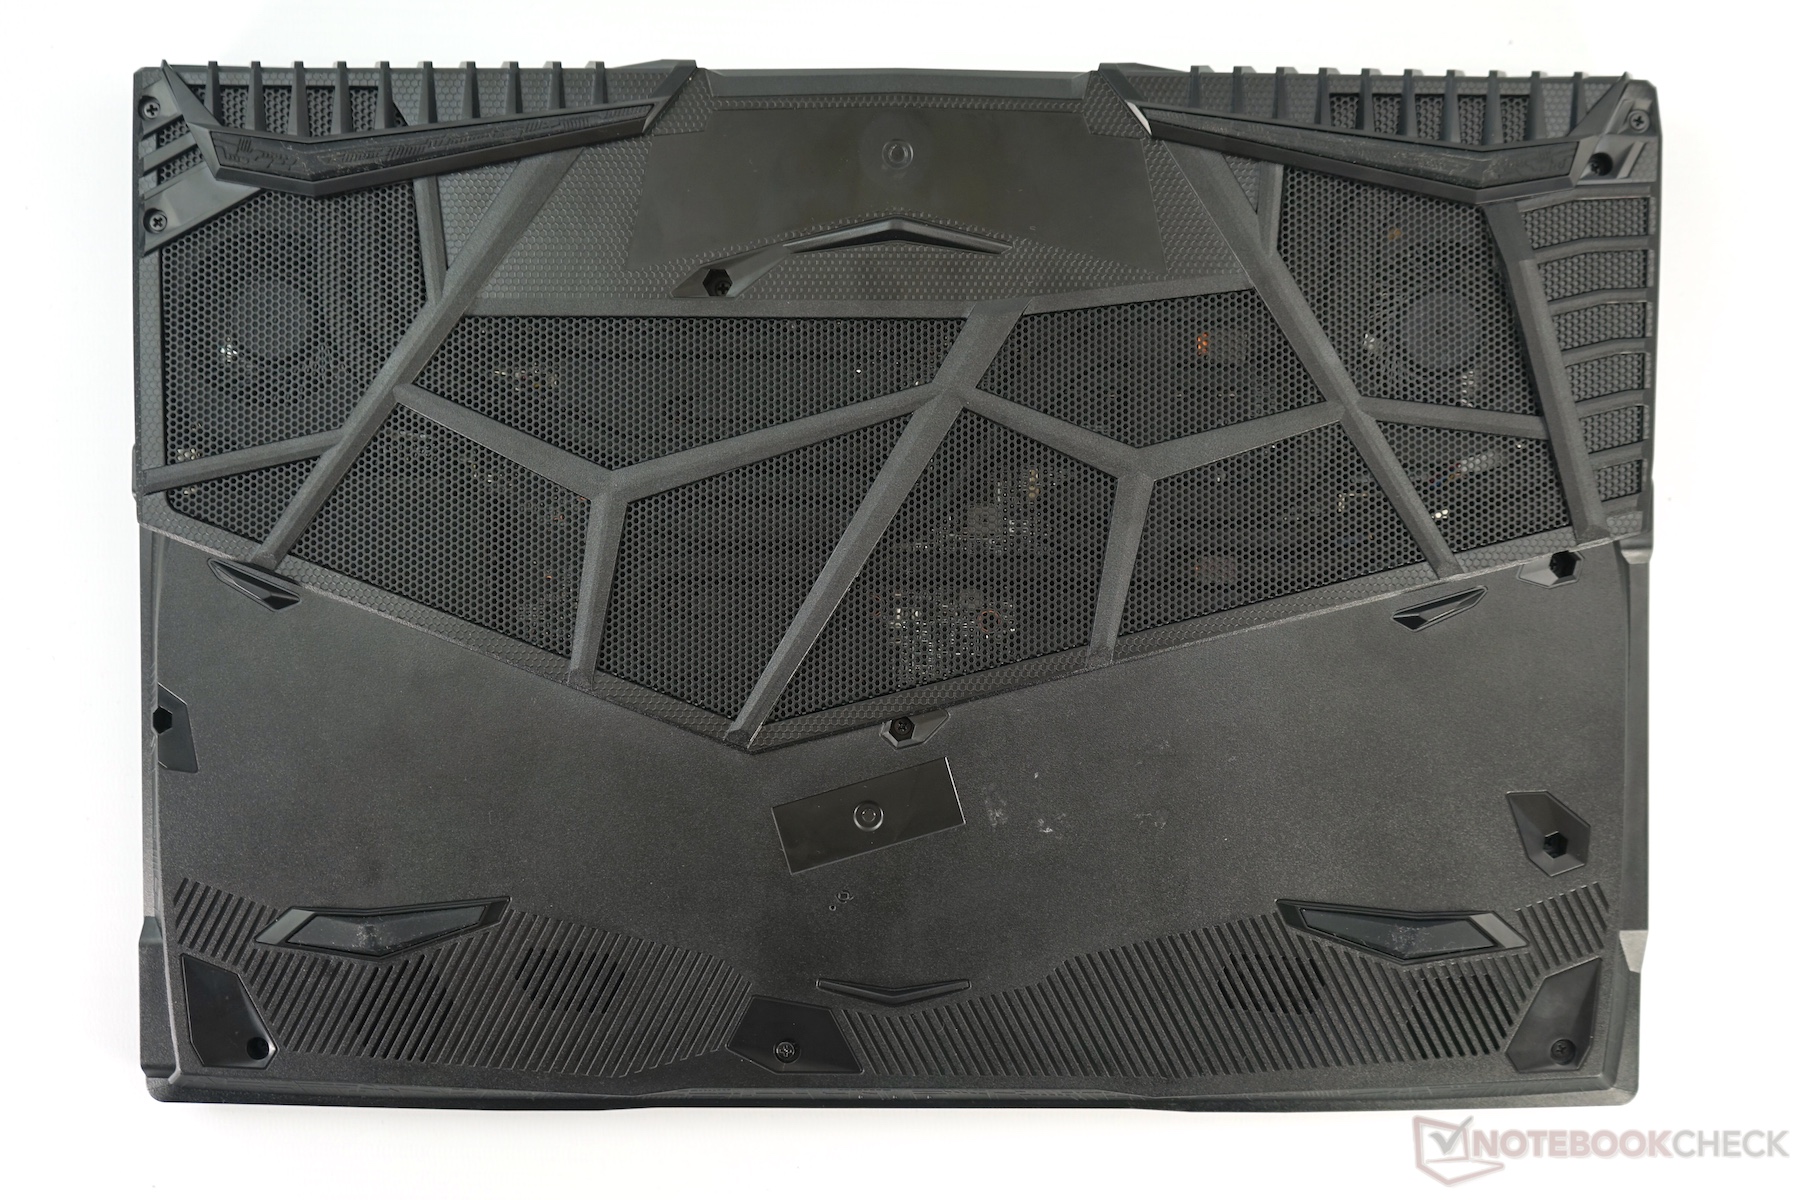
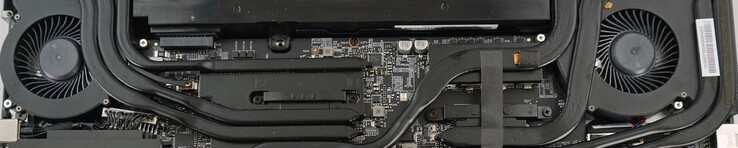
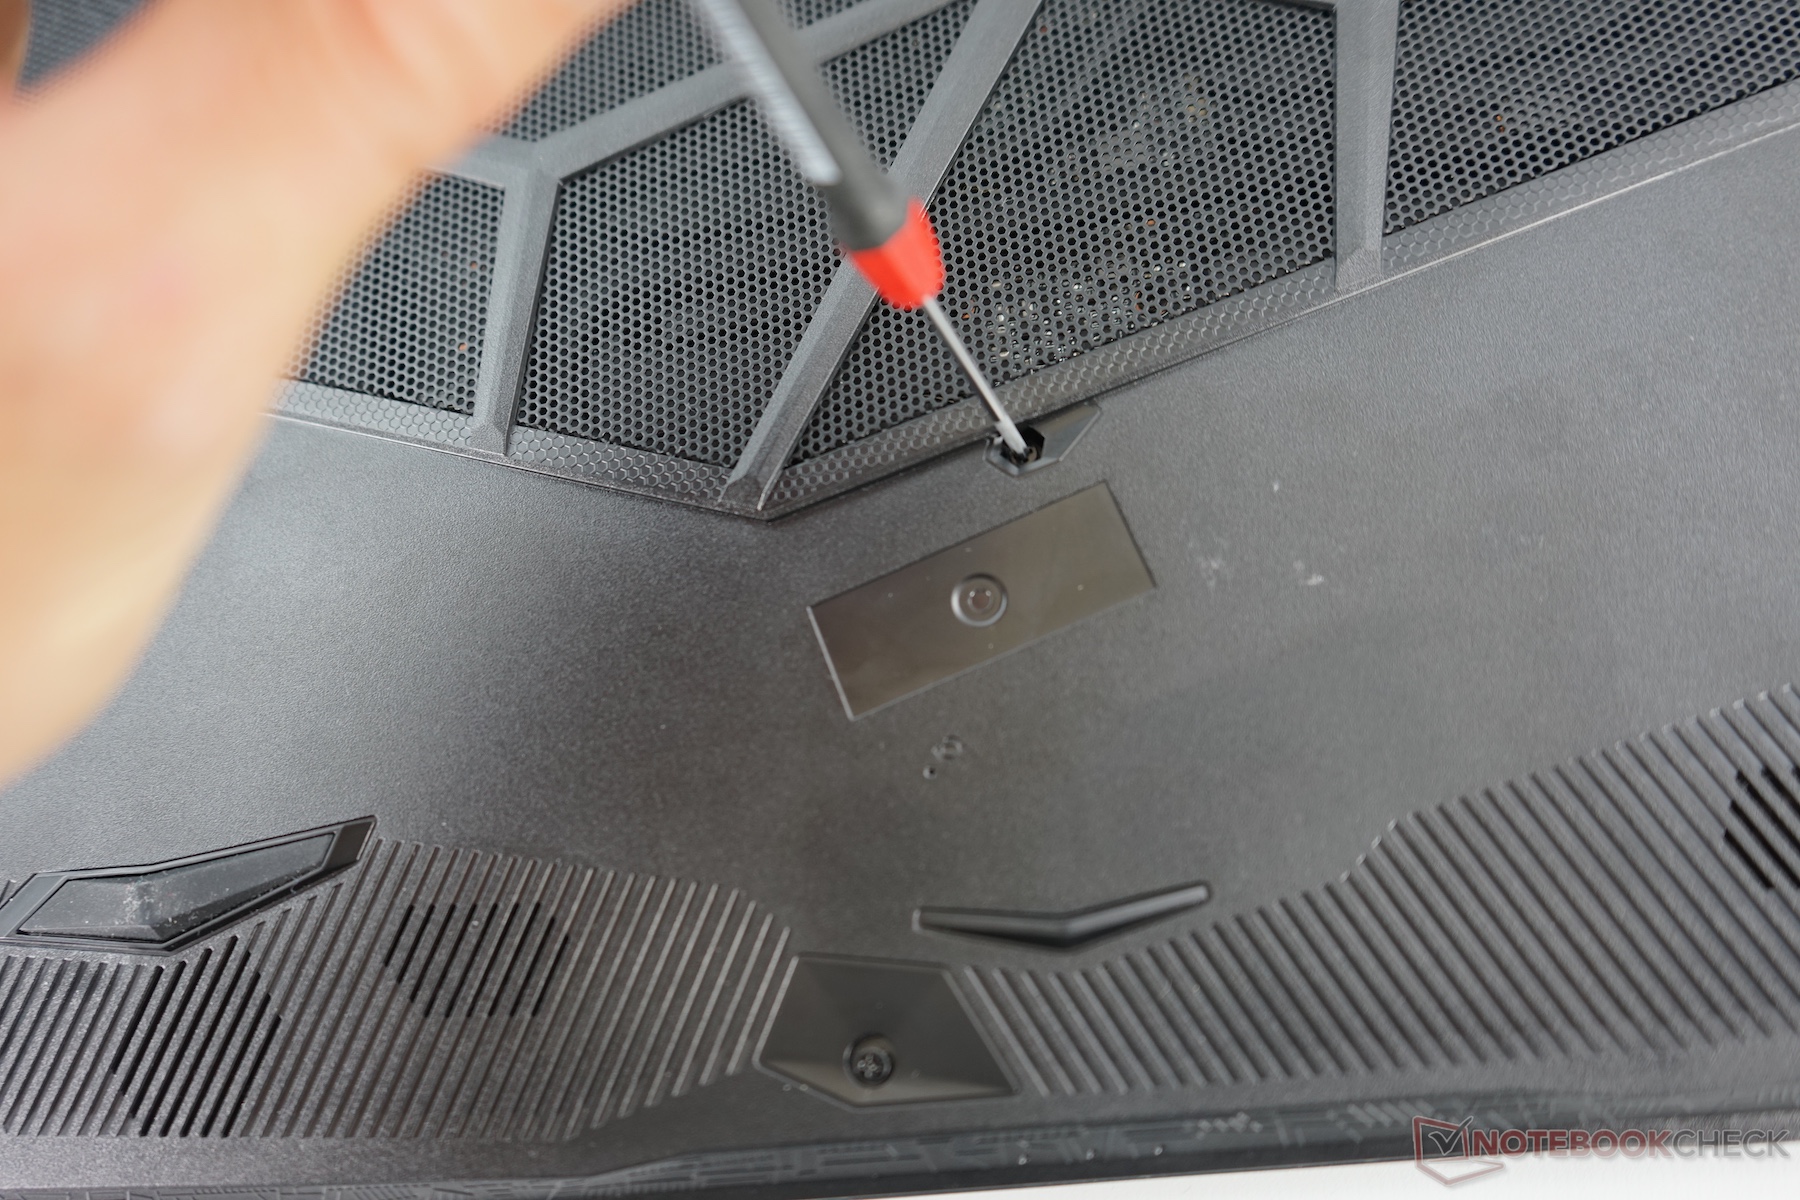
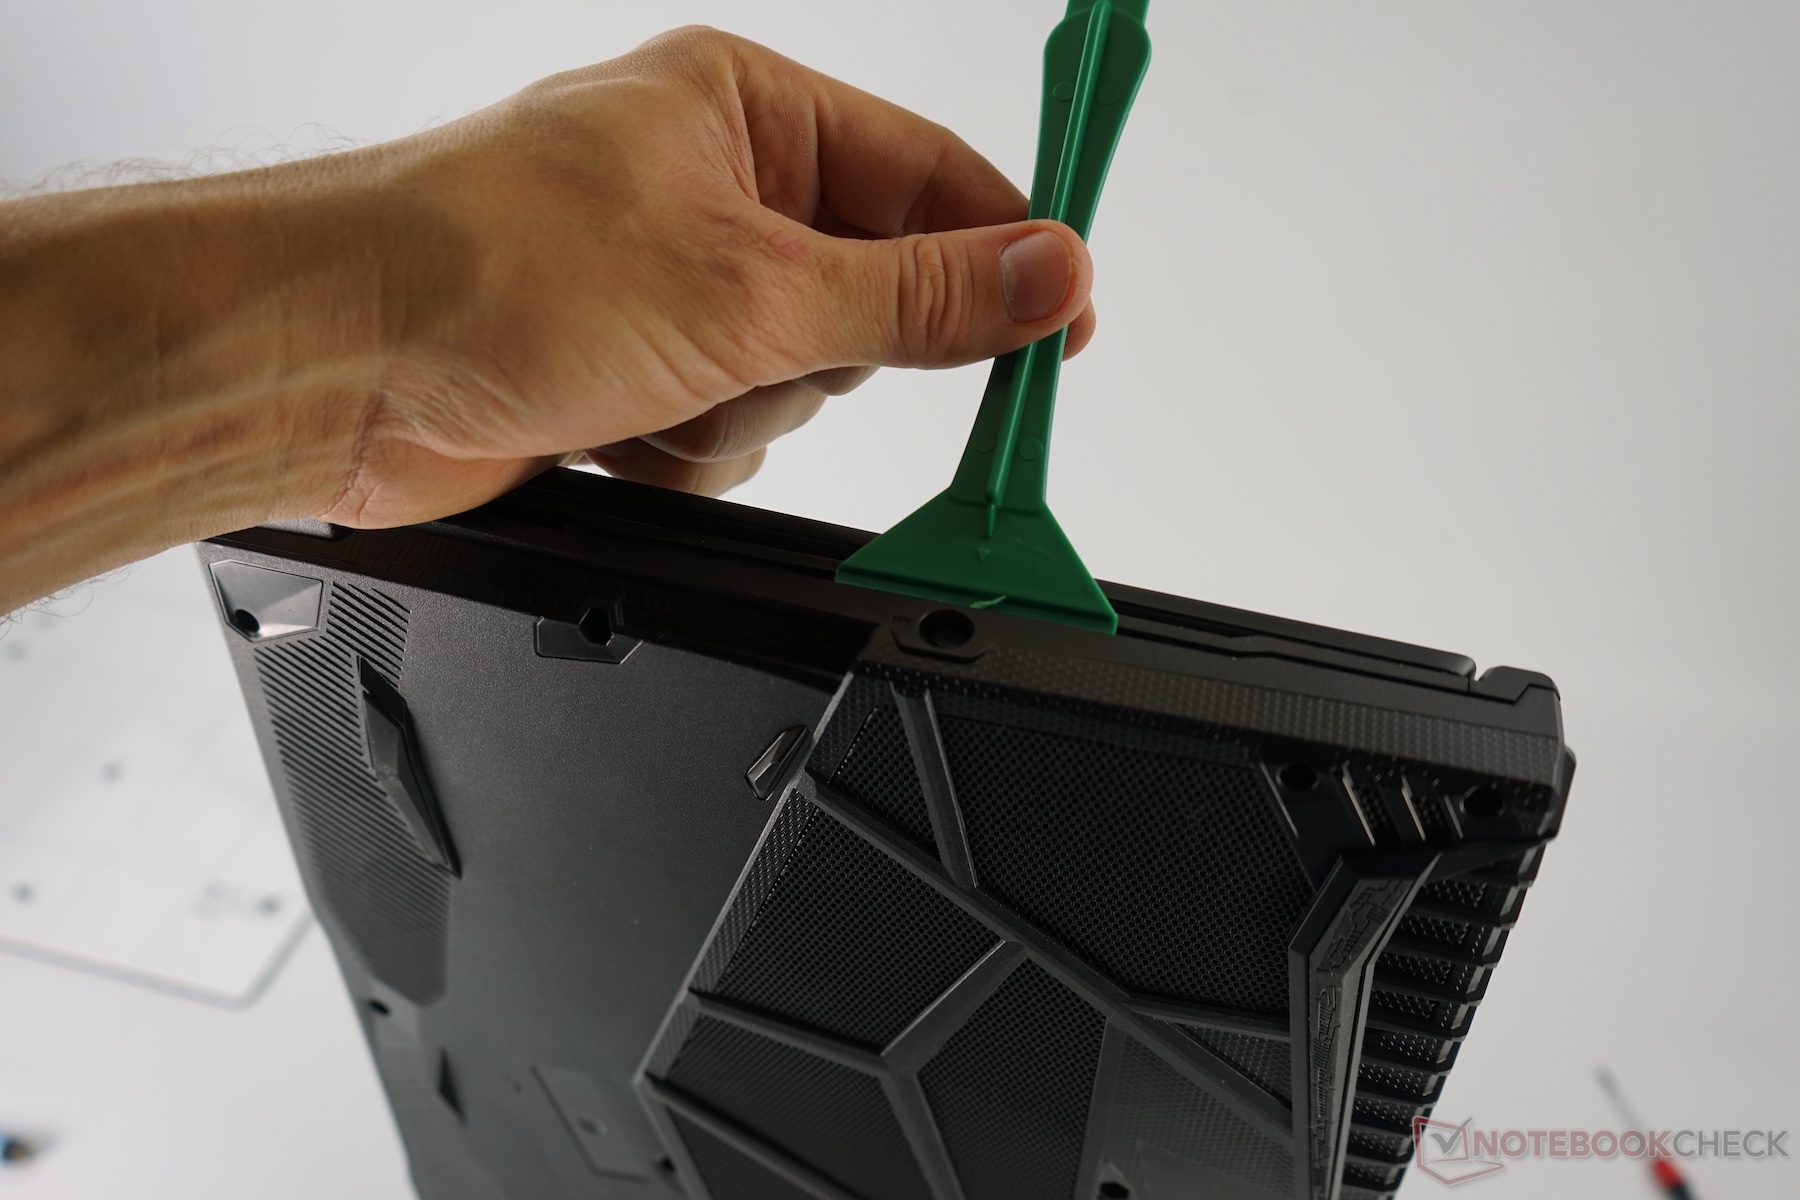
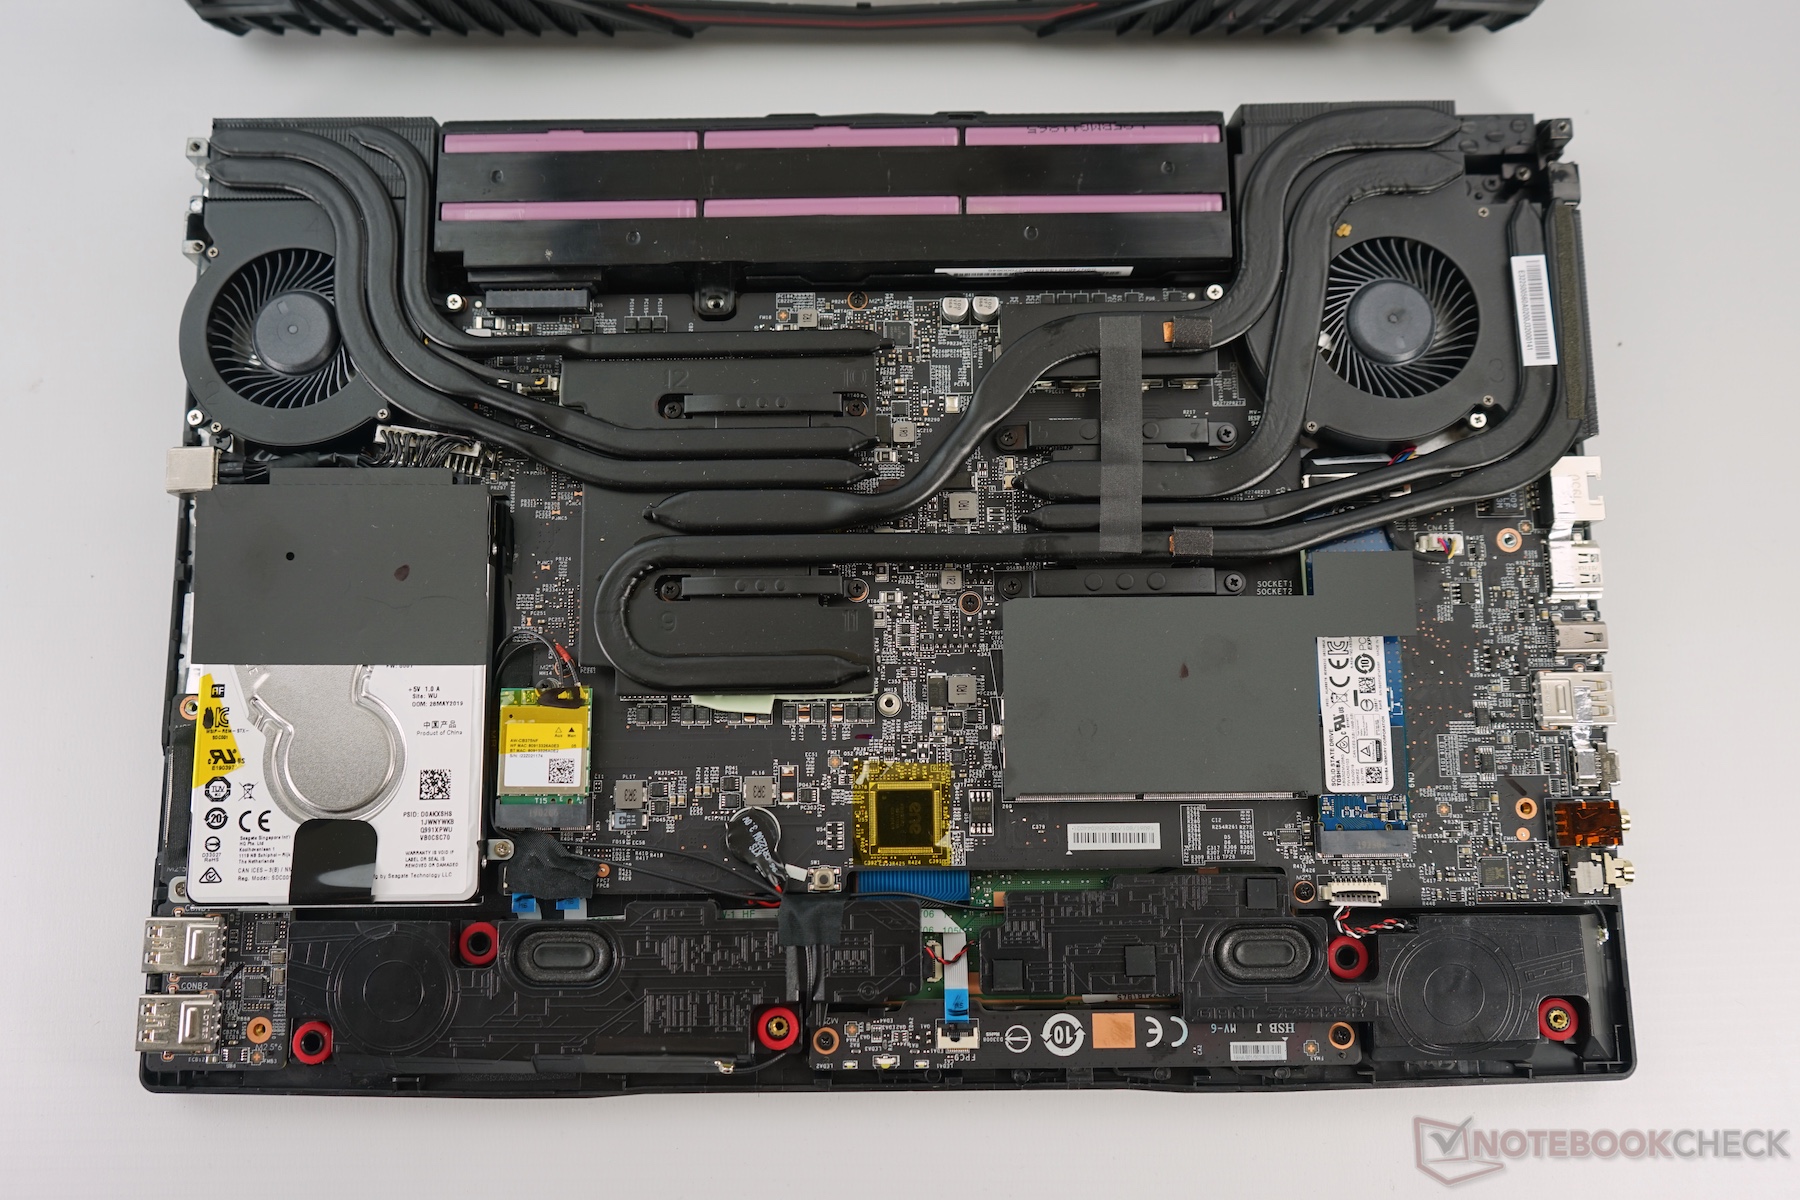
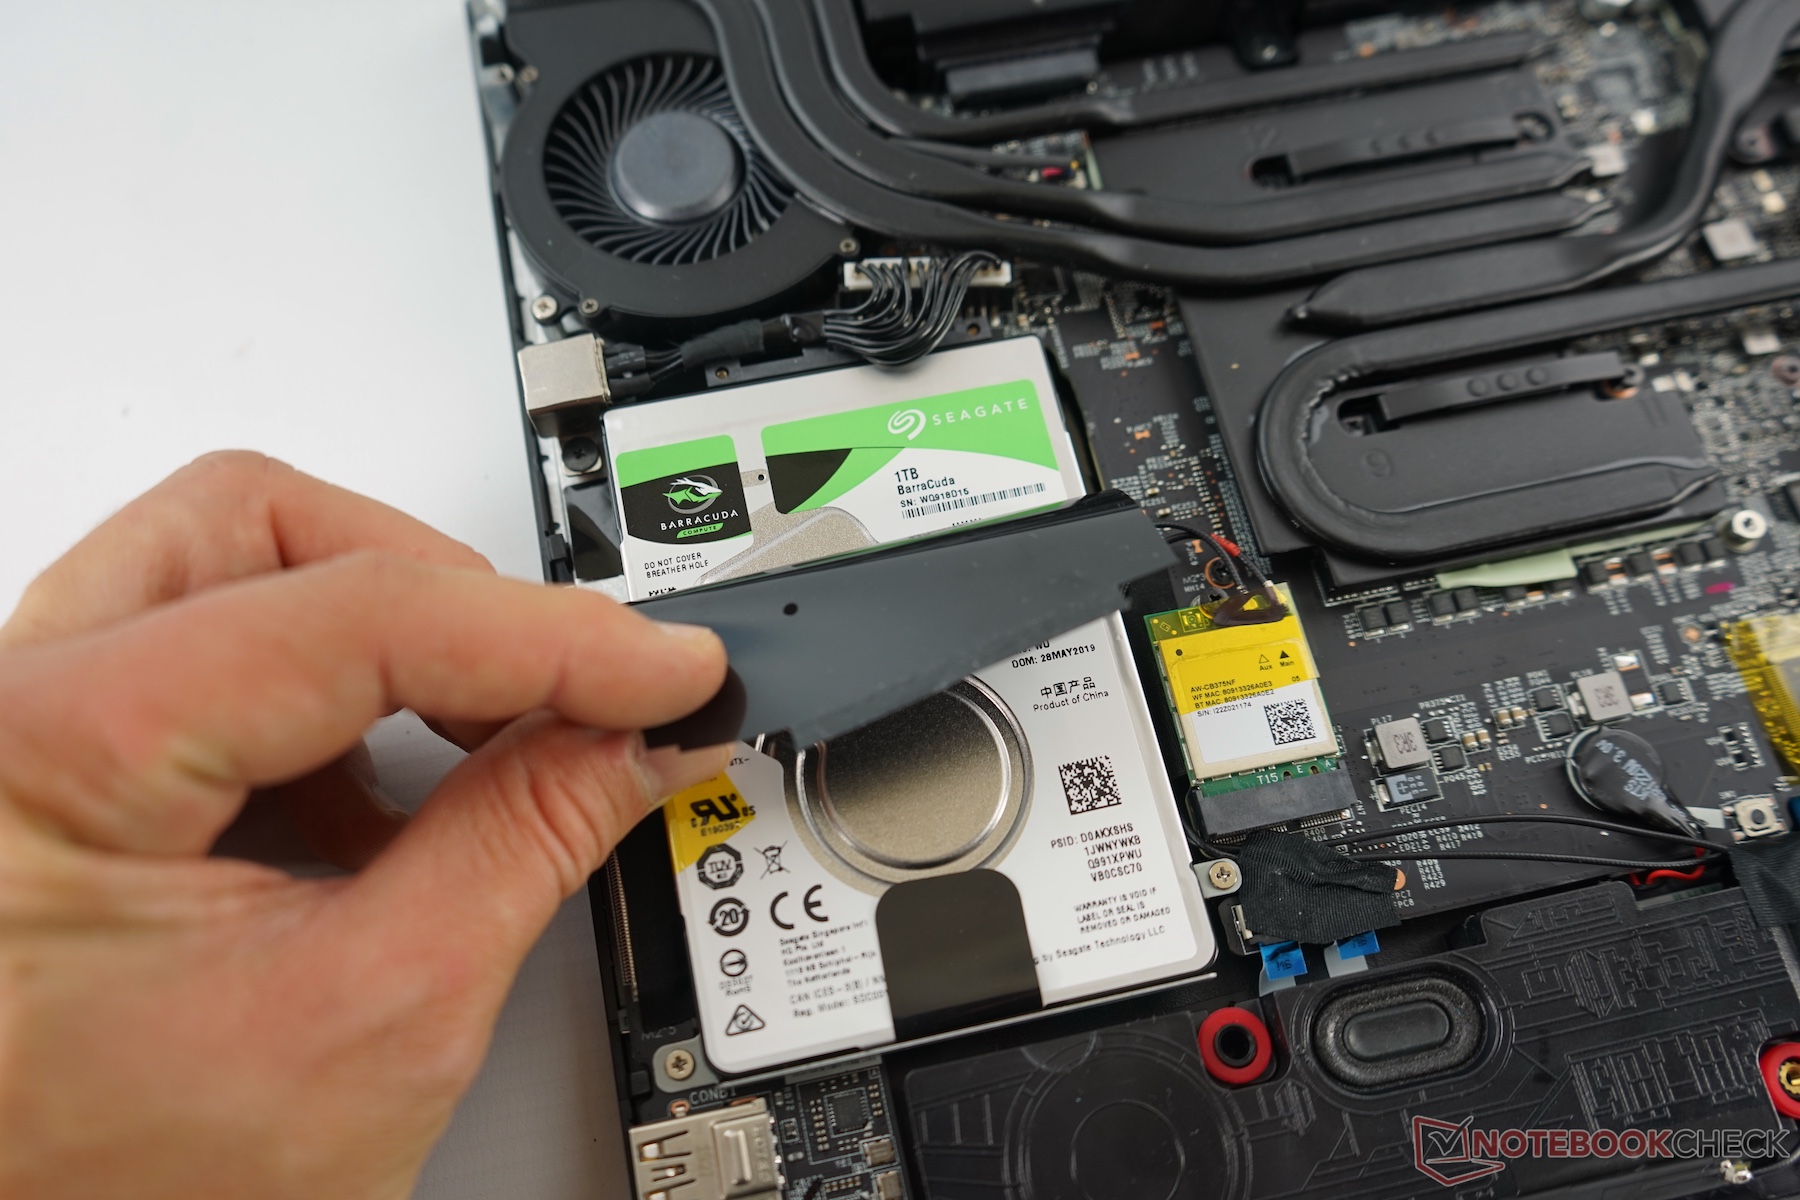
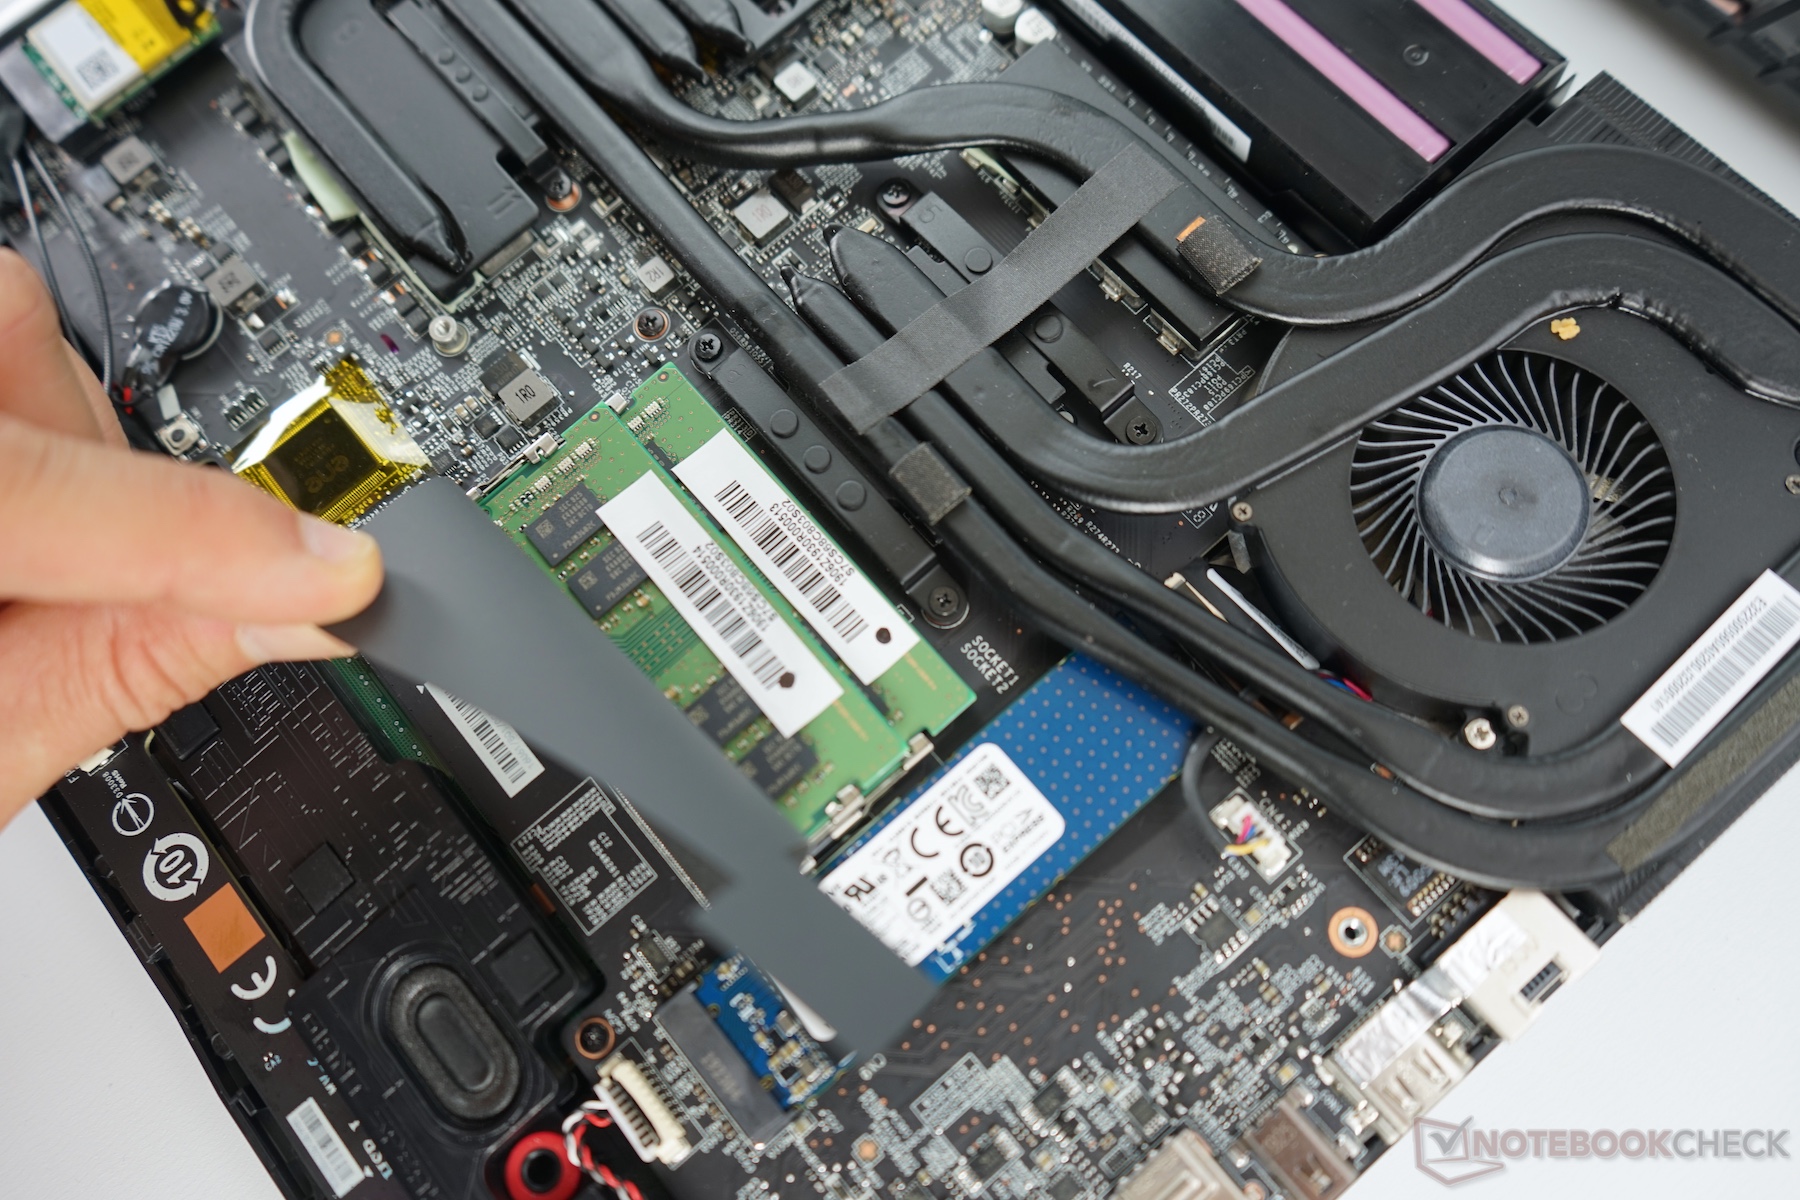
Dostęp do podzespołów jest dość prosty. Jedynie dostęp do dysku SSD formatu M.2 2280 został utrudniony, gdyż śrubka, którym jest przykręcony, znajduje się pod radiatorem. Cała reszta, jak dysk 2,5", pamięć RAM a nawet wentylatory, jest prosta do wymiany czy oczyszczenia.
Urządzenia wejścia
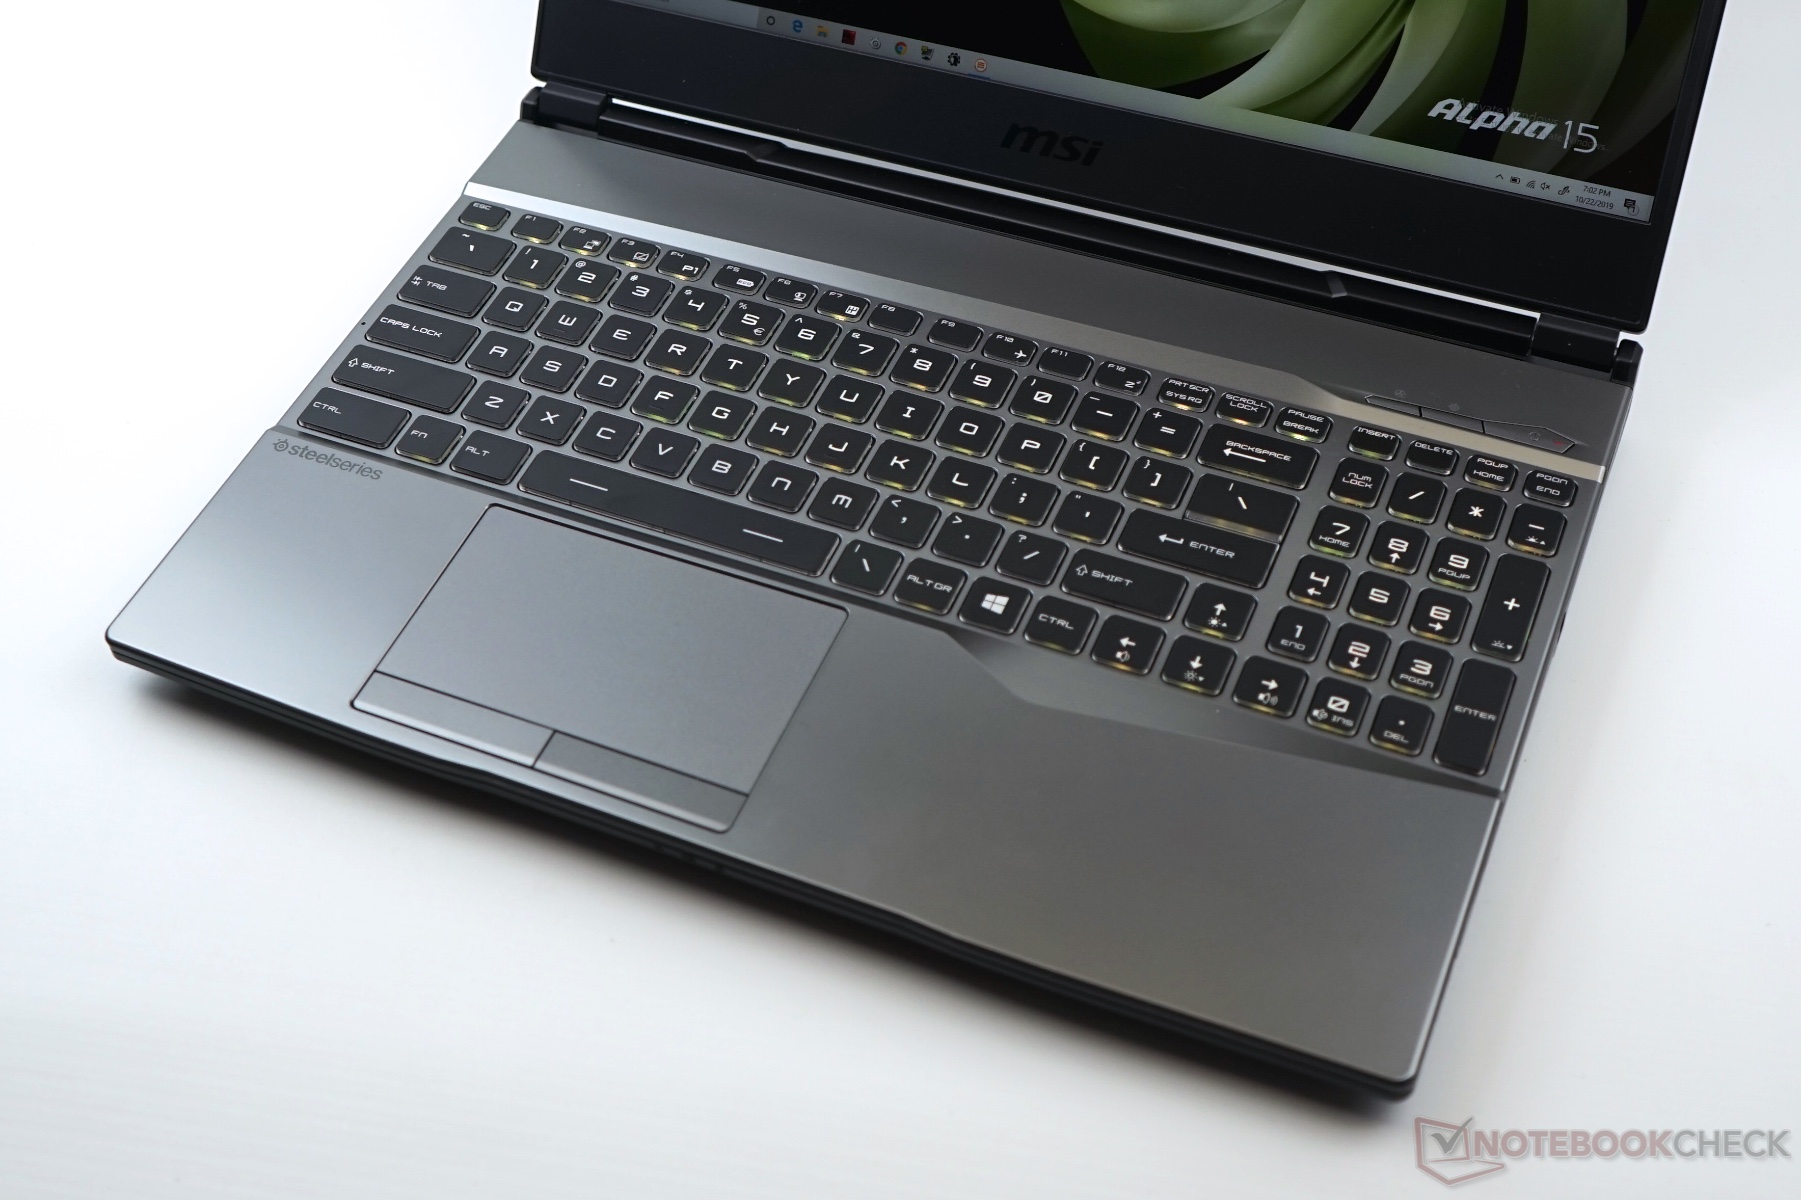
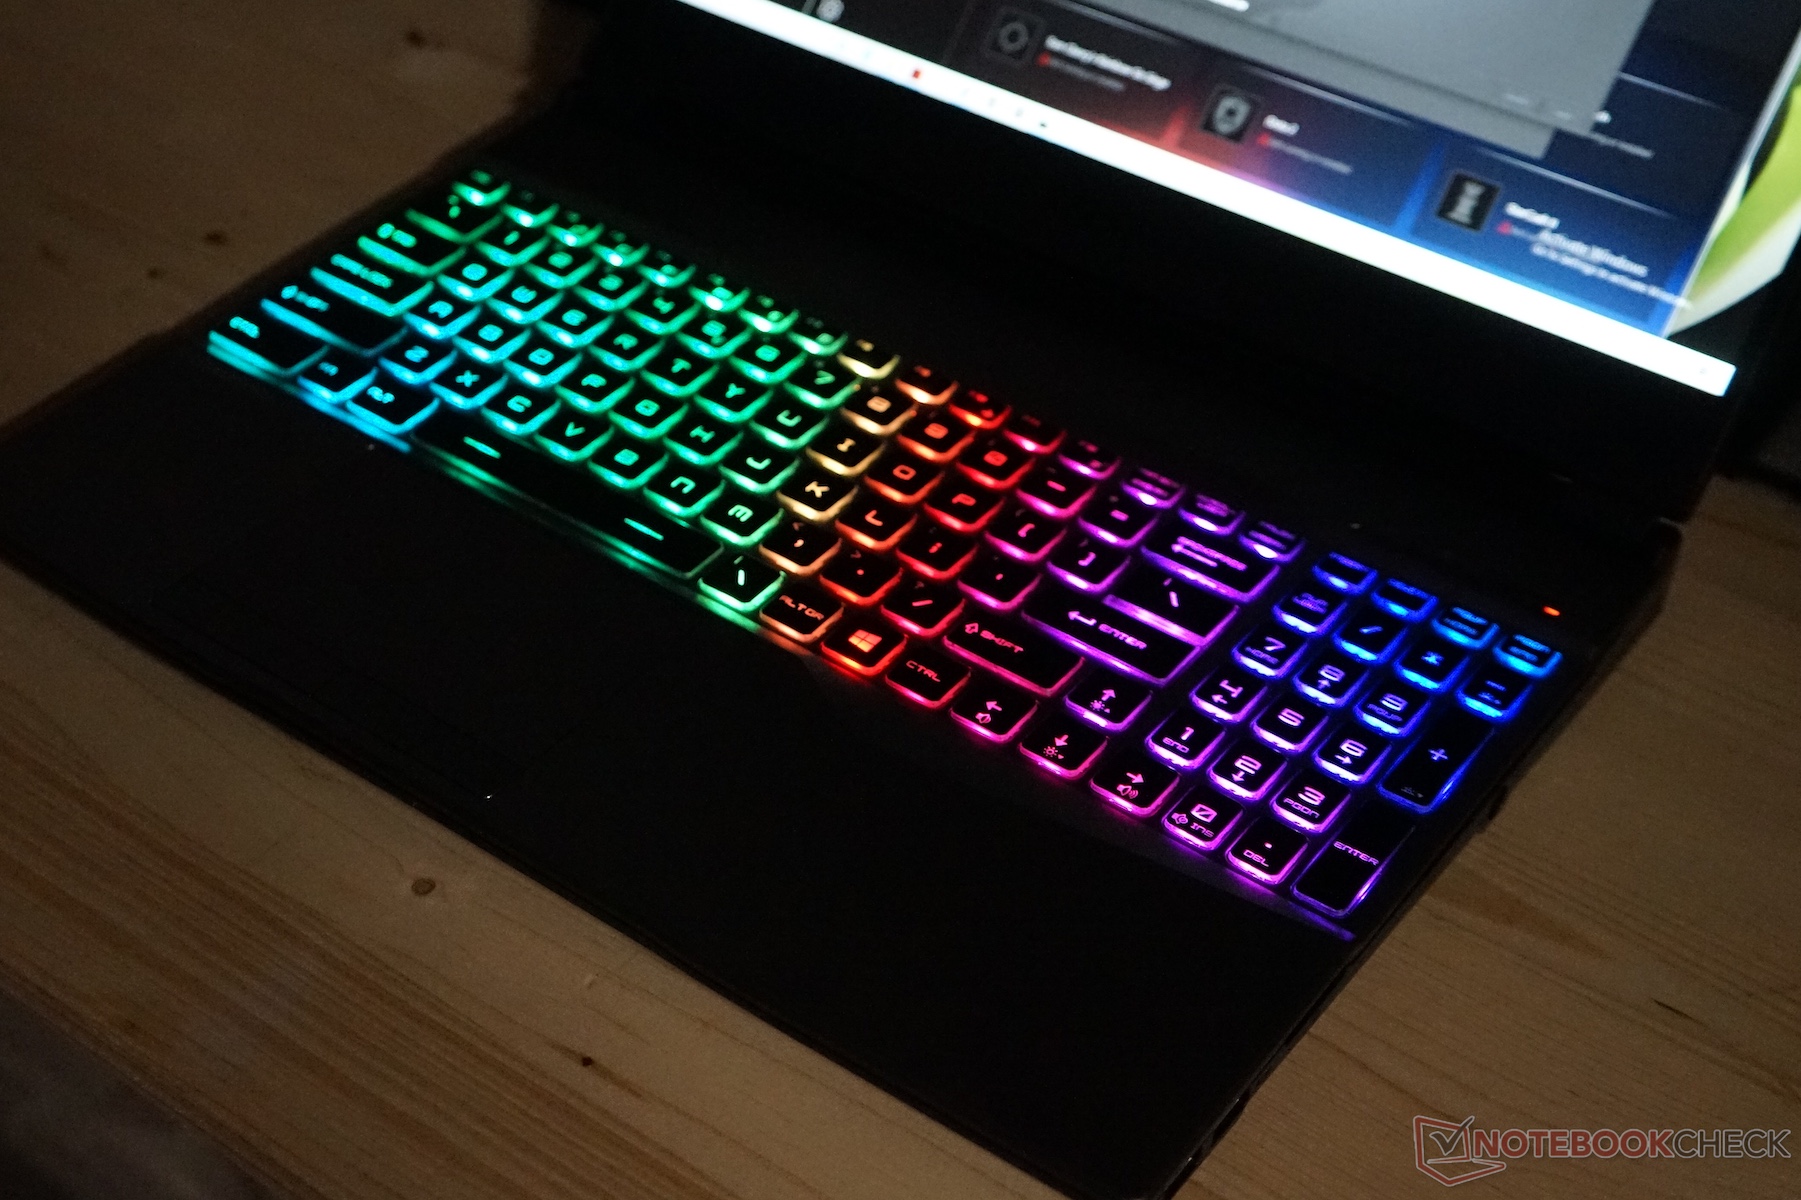
Klawiatura w egzemplarzu przedprodukcyjnym miała podświetlanie RGB dla każdego przycisku z oddzielna. Pisanie na niej było przyjemnym doświadczeniem. Gładzik też dawał radę.

Obraz
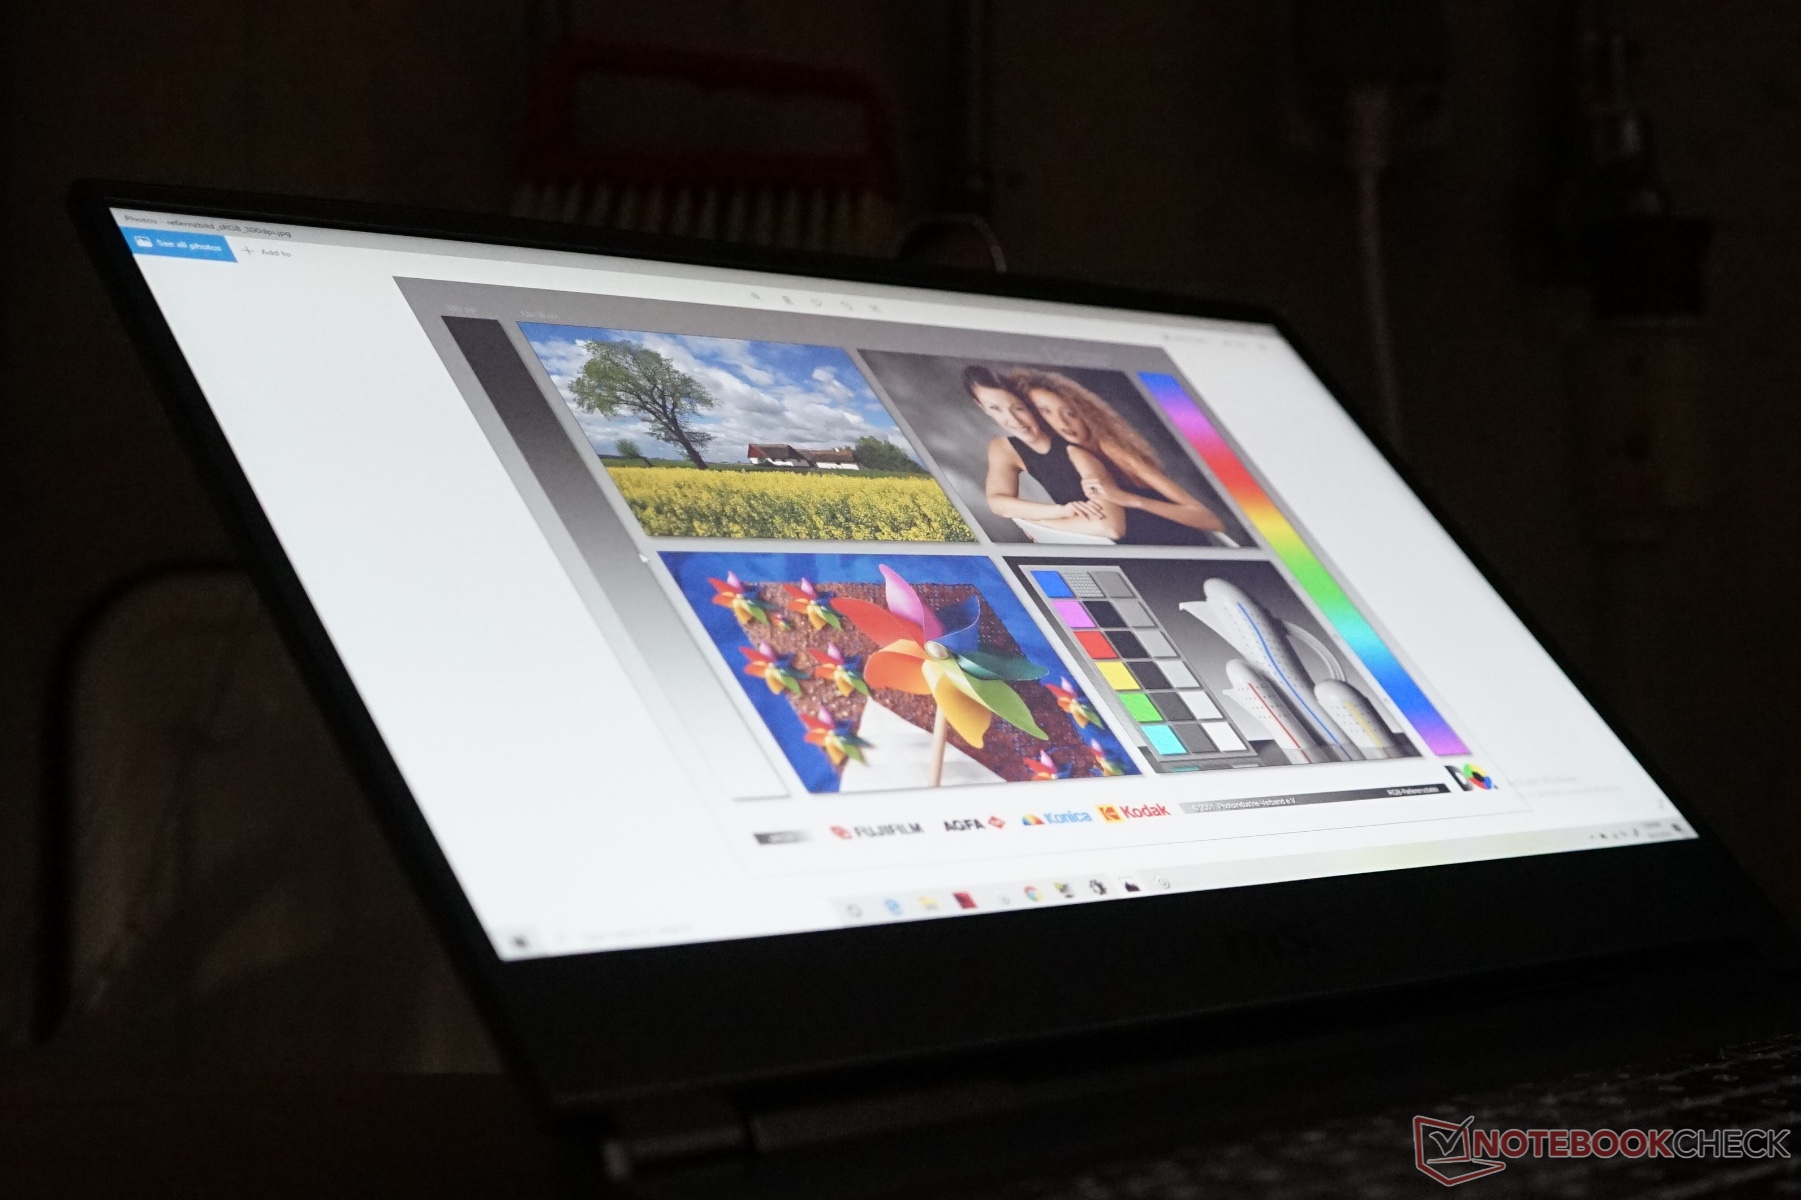
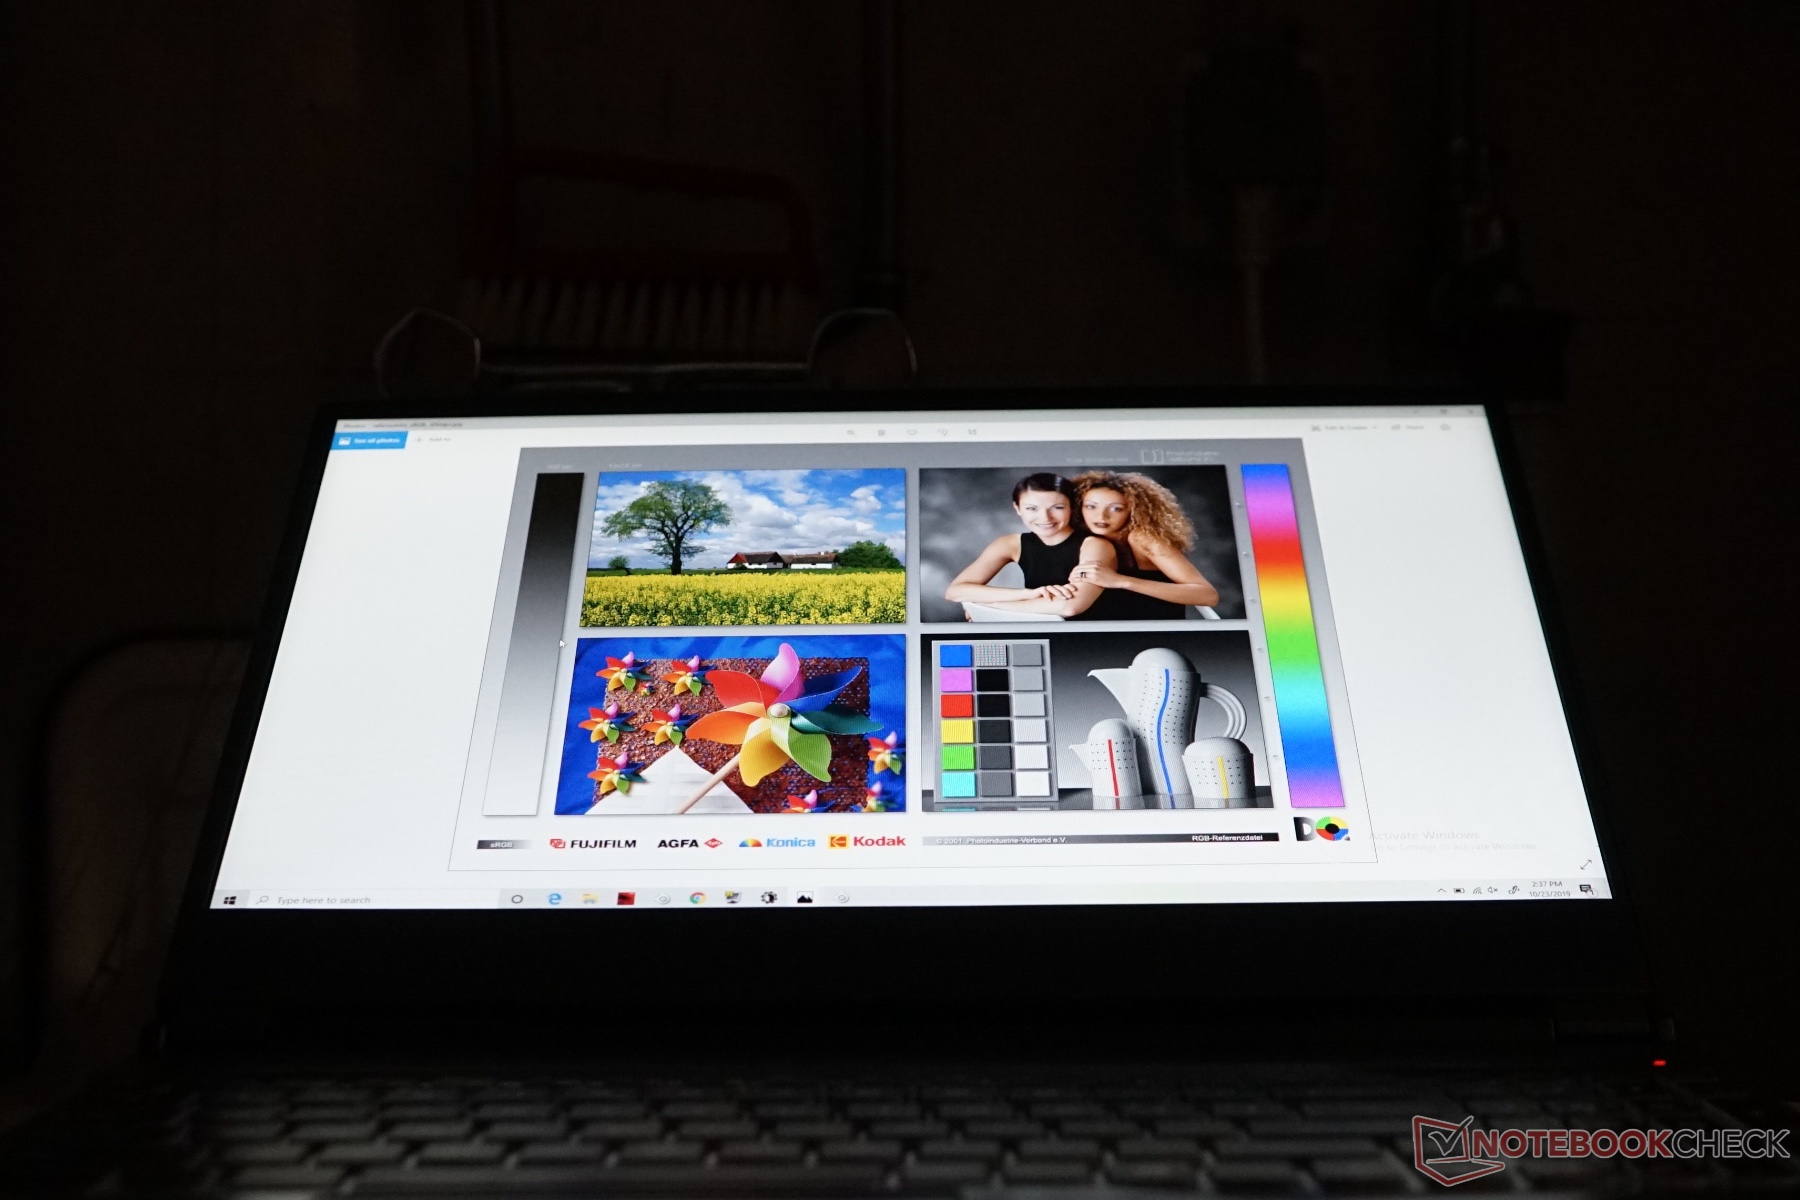
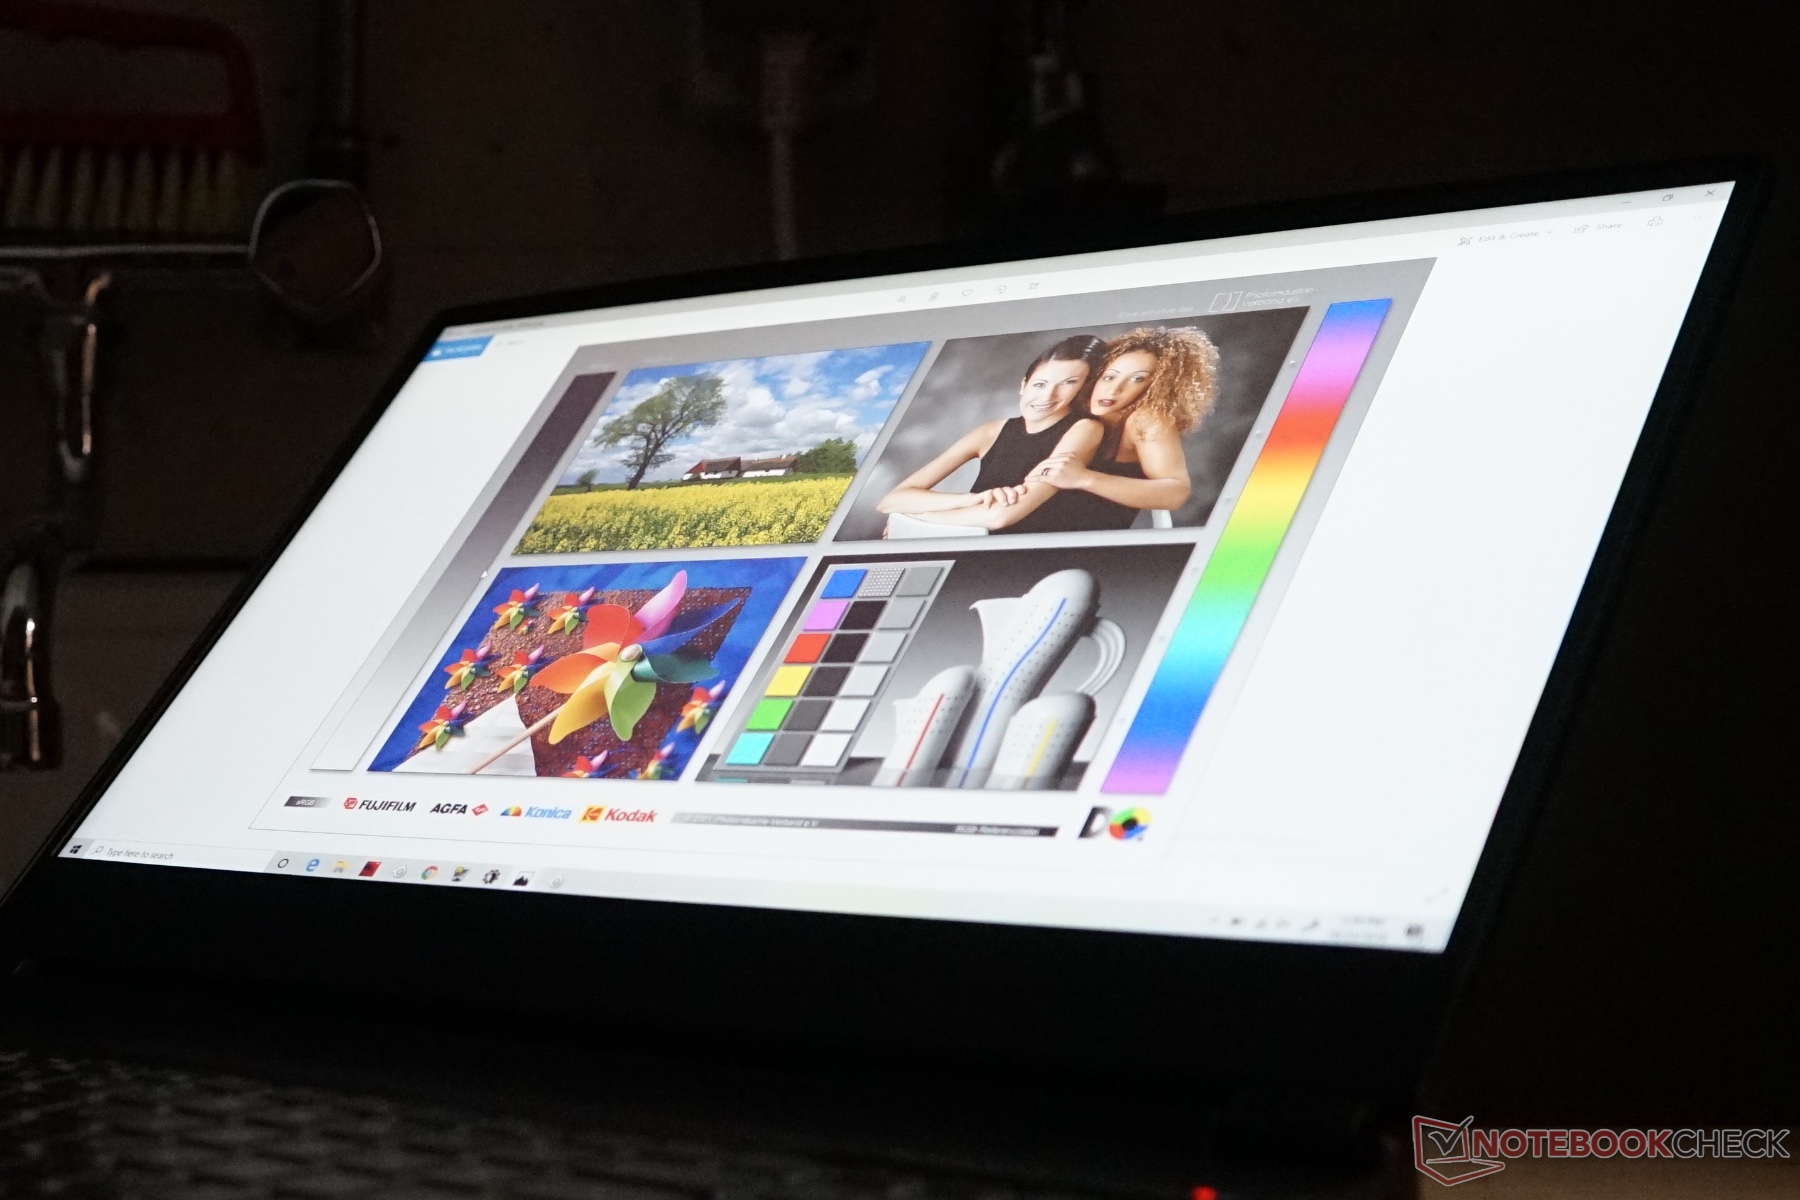
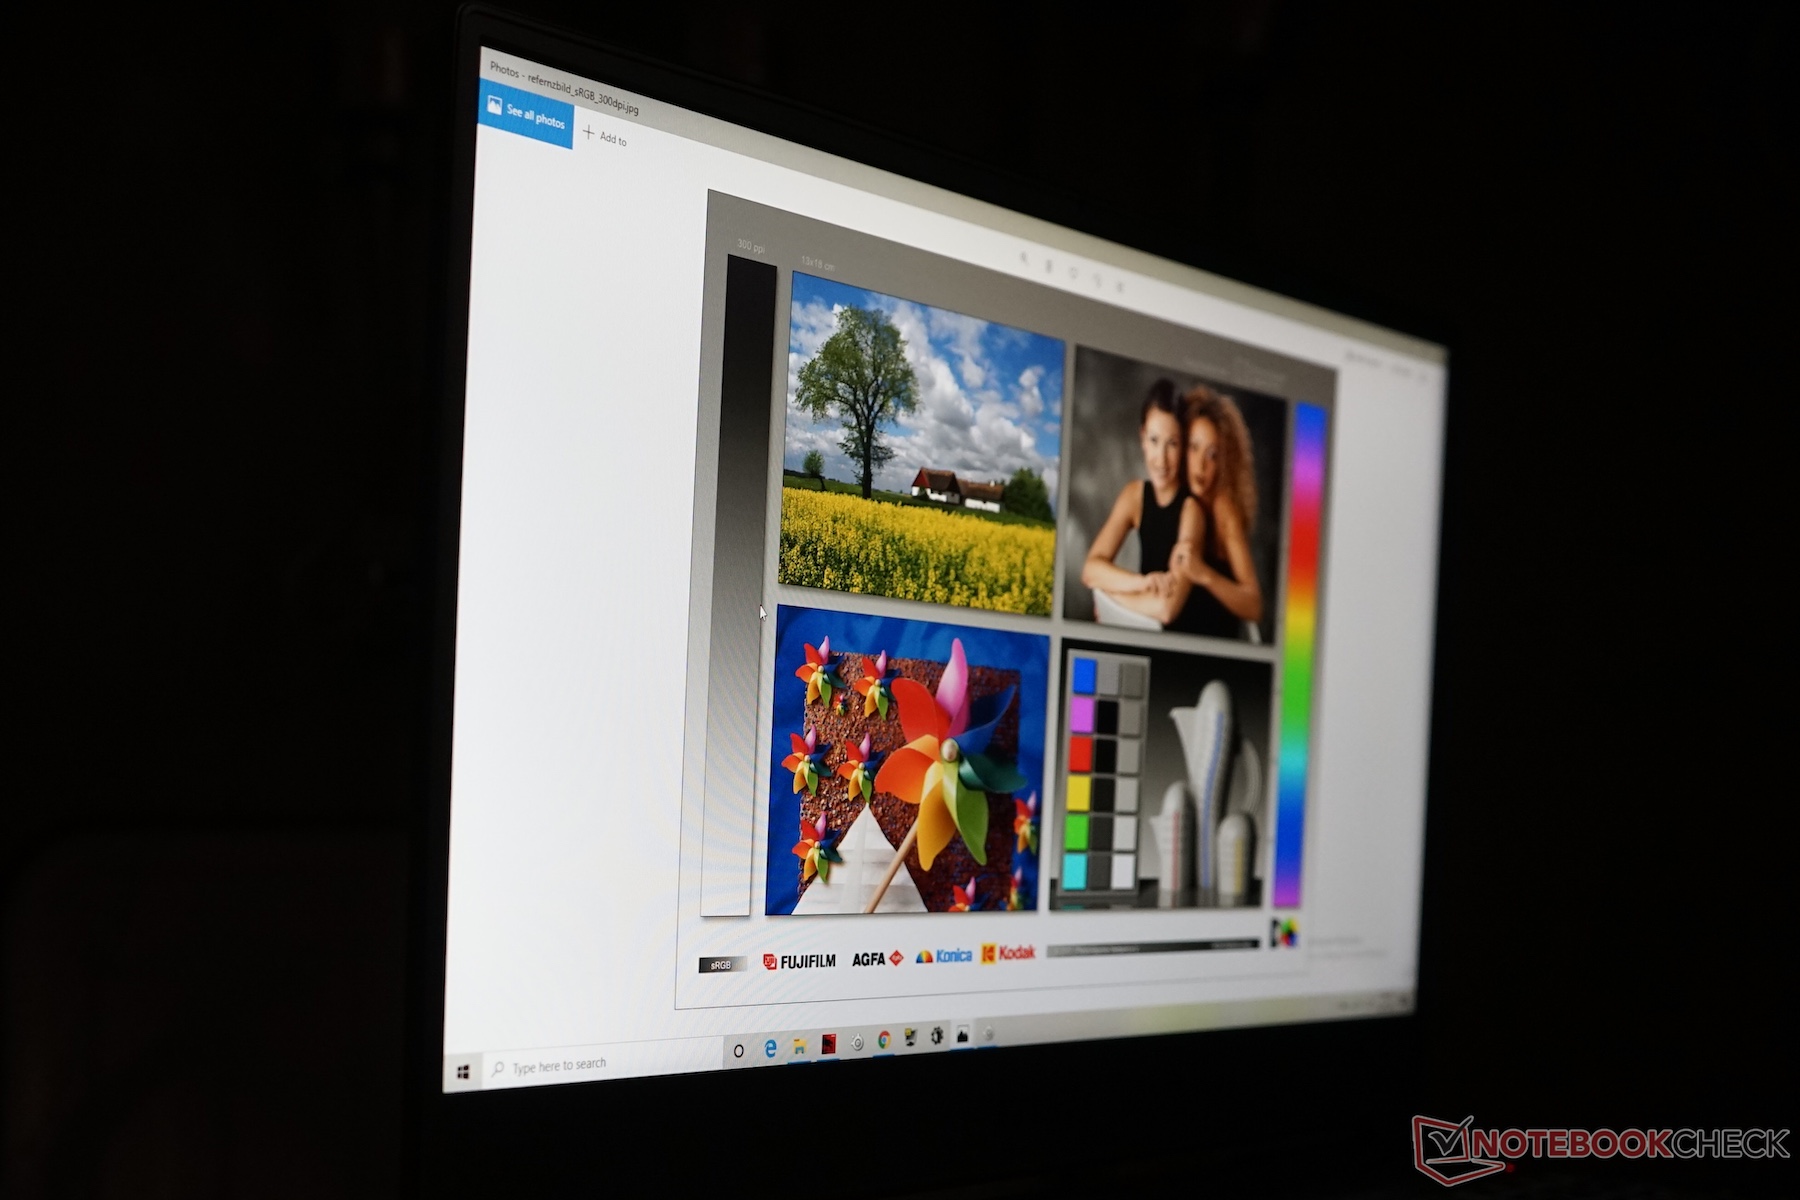
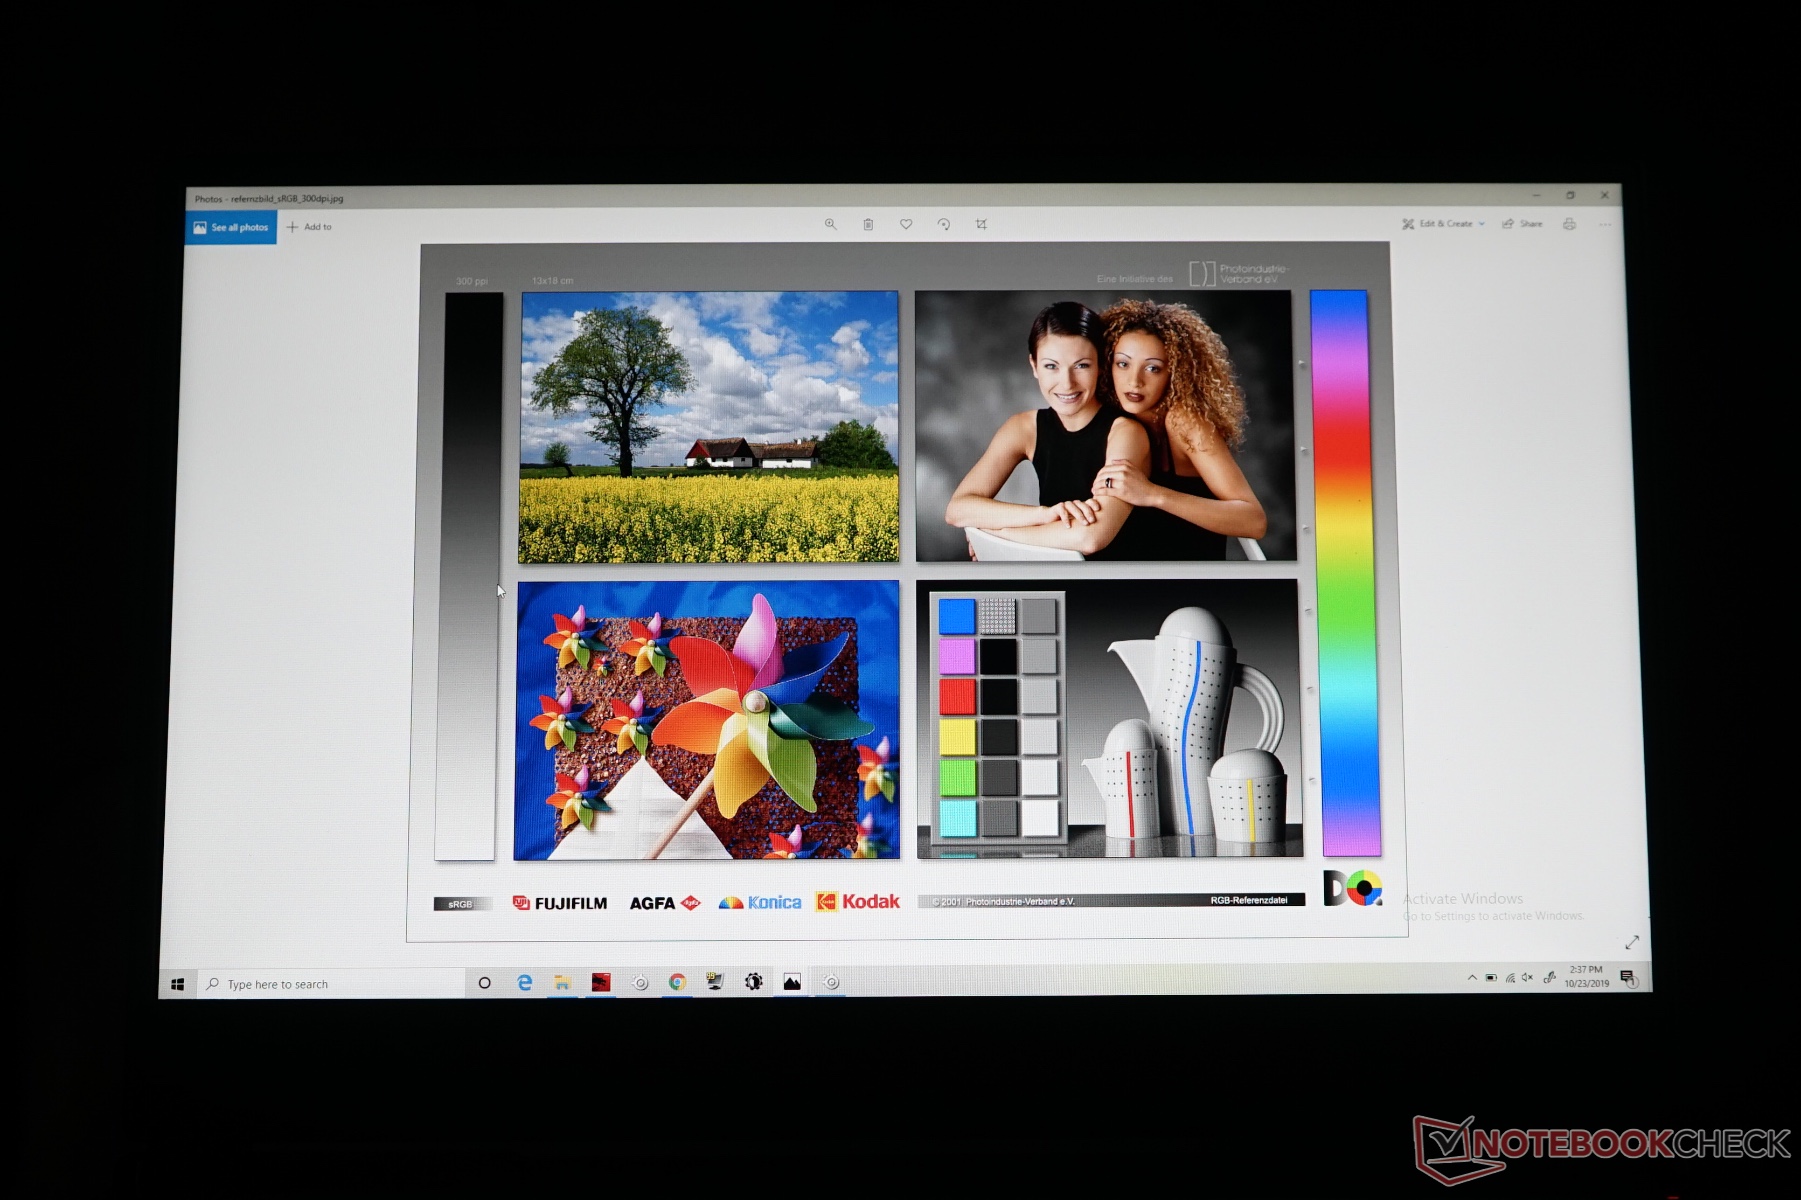
Wczesne informacje nt. dostępnych konfiguracji laptopa MSI Alpha 15 mówiły o wyświetlaczach z odświeżaniem 120 Hz i 144 Hz. Na testy trafił egzemplarz z tańszym ekranem – jest to podstawowy wyświetlacz 1080p z odświeżaniem 120 Hz wyprodukowany przez firmę AU Optronics. Jego oznaczenie to AUOD0ED
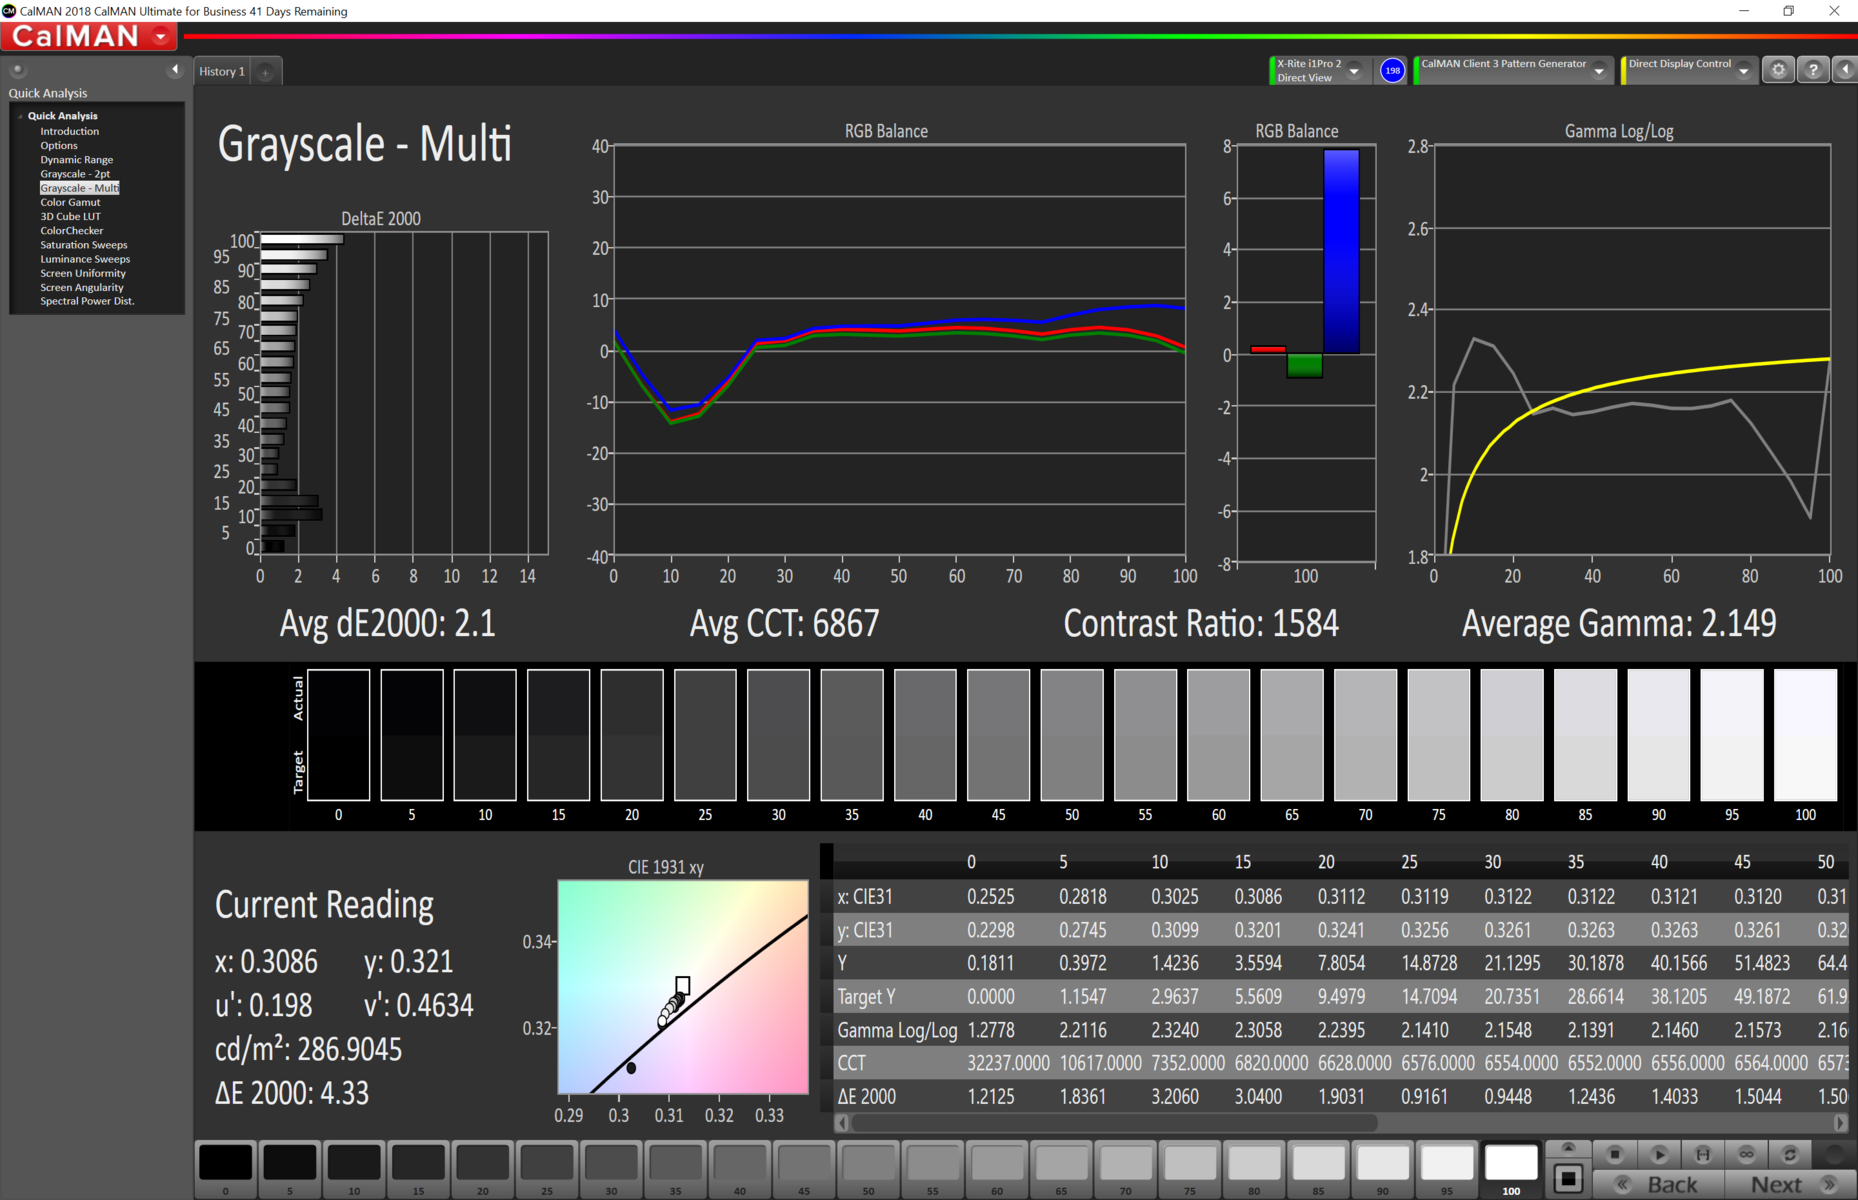
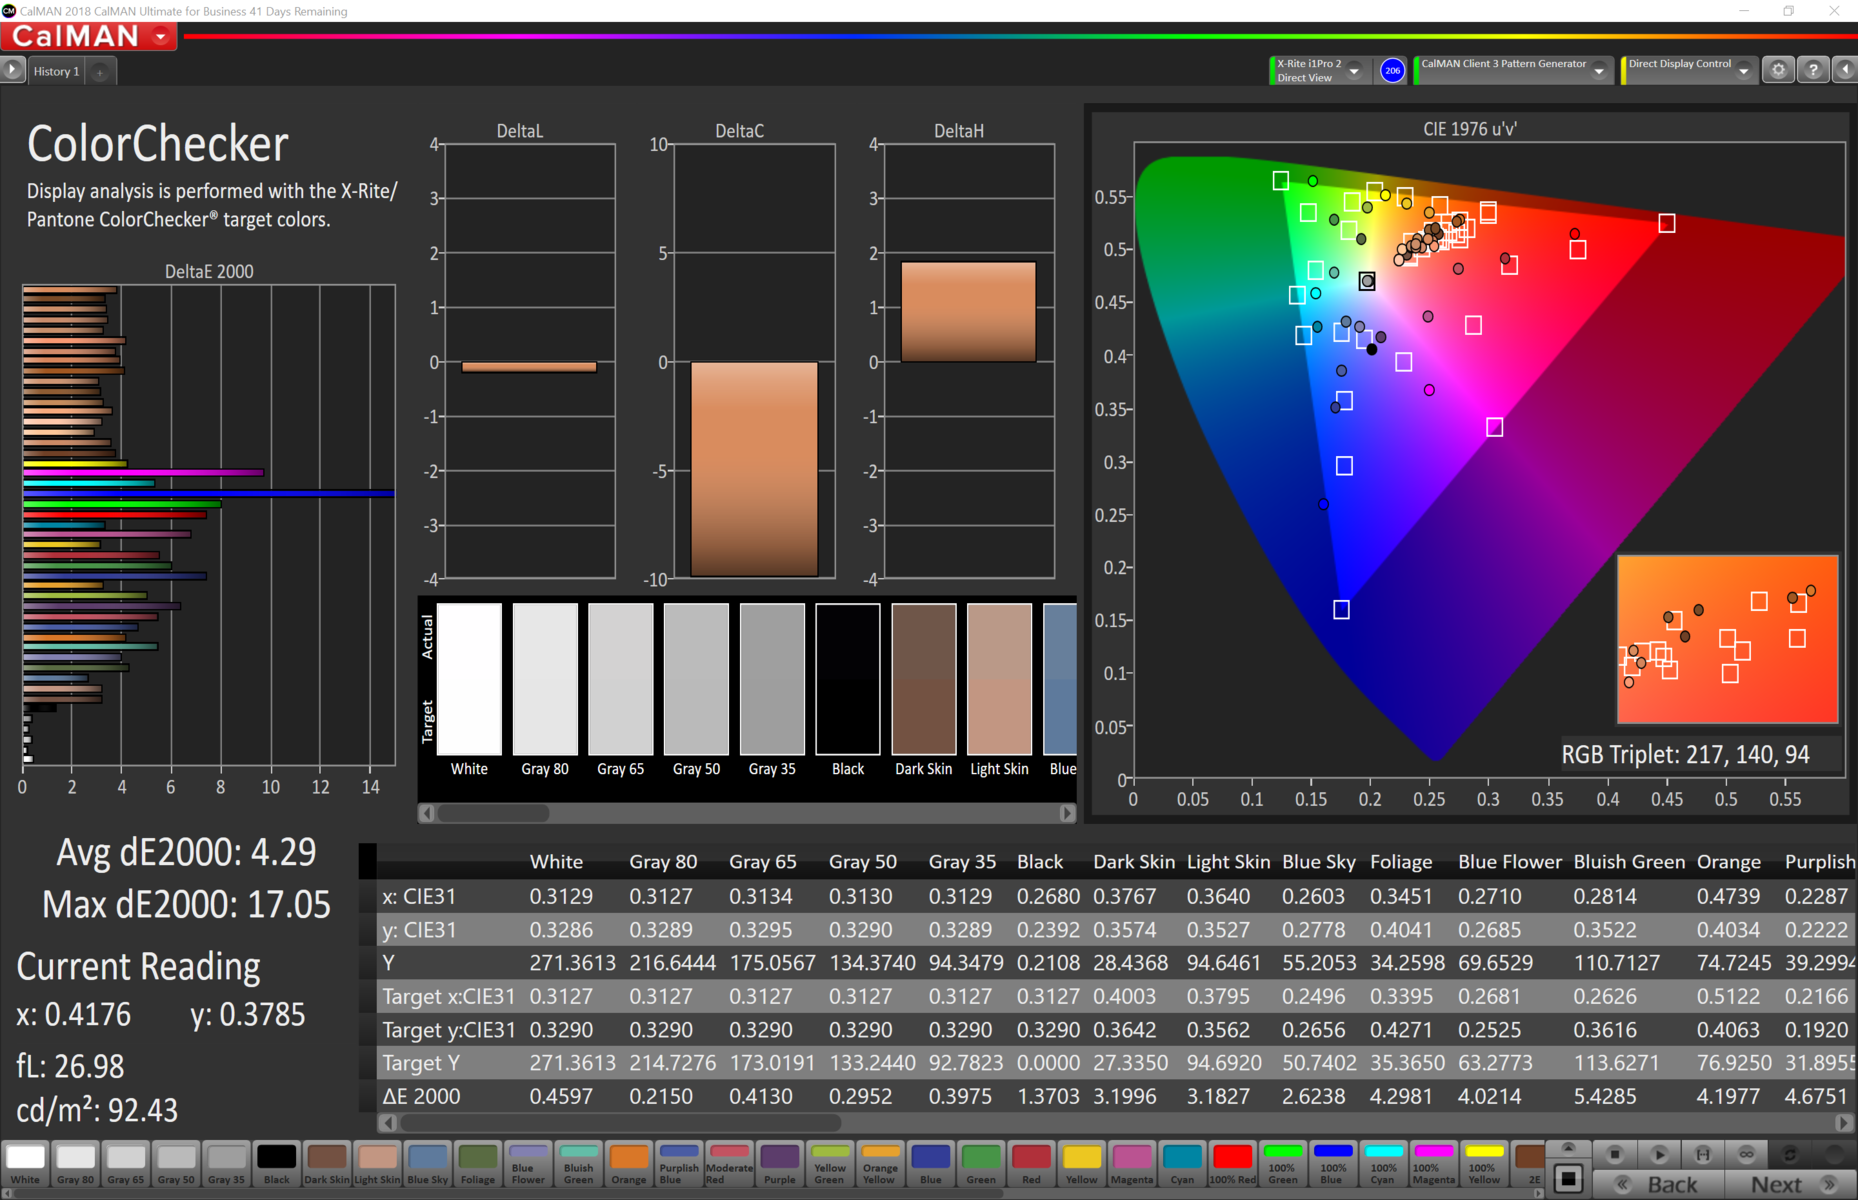
Wyżej wymieniona matryca nie bryluje w wynikach testów kalibratorem X-Rite i1Pro 2. Średnia jasność obrazu przy maksymalnej intensywności podświetlenia wyniosła 266 cd/m² a odczytany poziom czerni to 0,18 cd/m². Przekłada się to na poziom kontrastu wynoszący 1506:1.

| |||||||||||||||||||||||||
rozświetlenie: 91 %
na akumulatorze: 266 cd/m²
kontrast: 1506:1 (czerń: 0.18 cd/m²)
ΔE ColorChecker Calman: 4.38 | ∀{0.5-29.43 Ø4.73}
calibrated: 4.29
ΔE Greyscale Calman: 2.1 | ∀{0.09-98 Ø4.97}
36.74% AdobeRGB 1998 (Argyll 3D)
53.5% sRGB (Argyll 3D)
35.56% Display P3 (Argyll 3D)
Gamma: 2.15
CCT: 6867 K
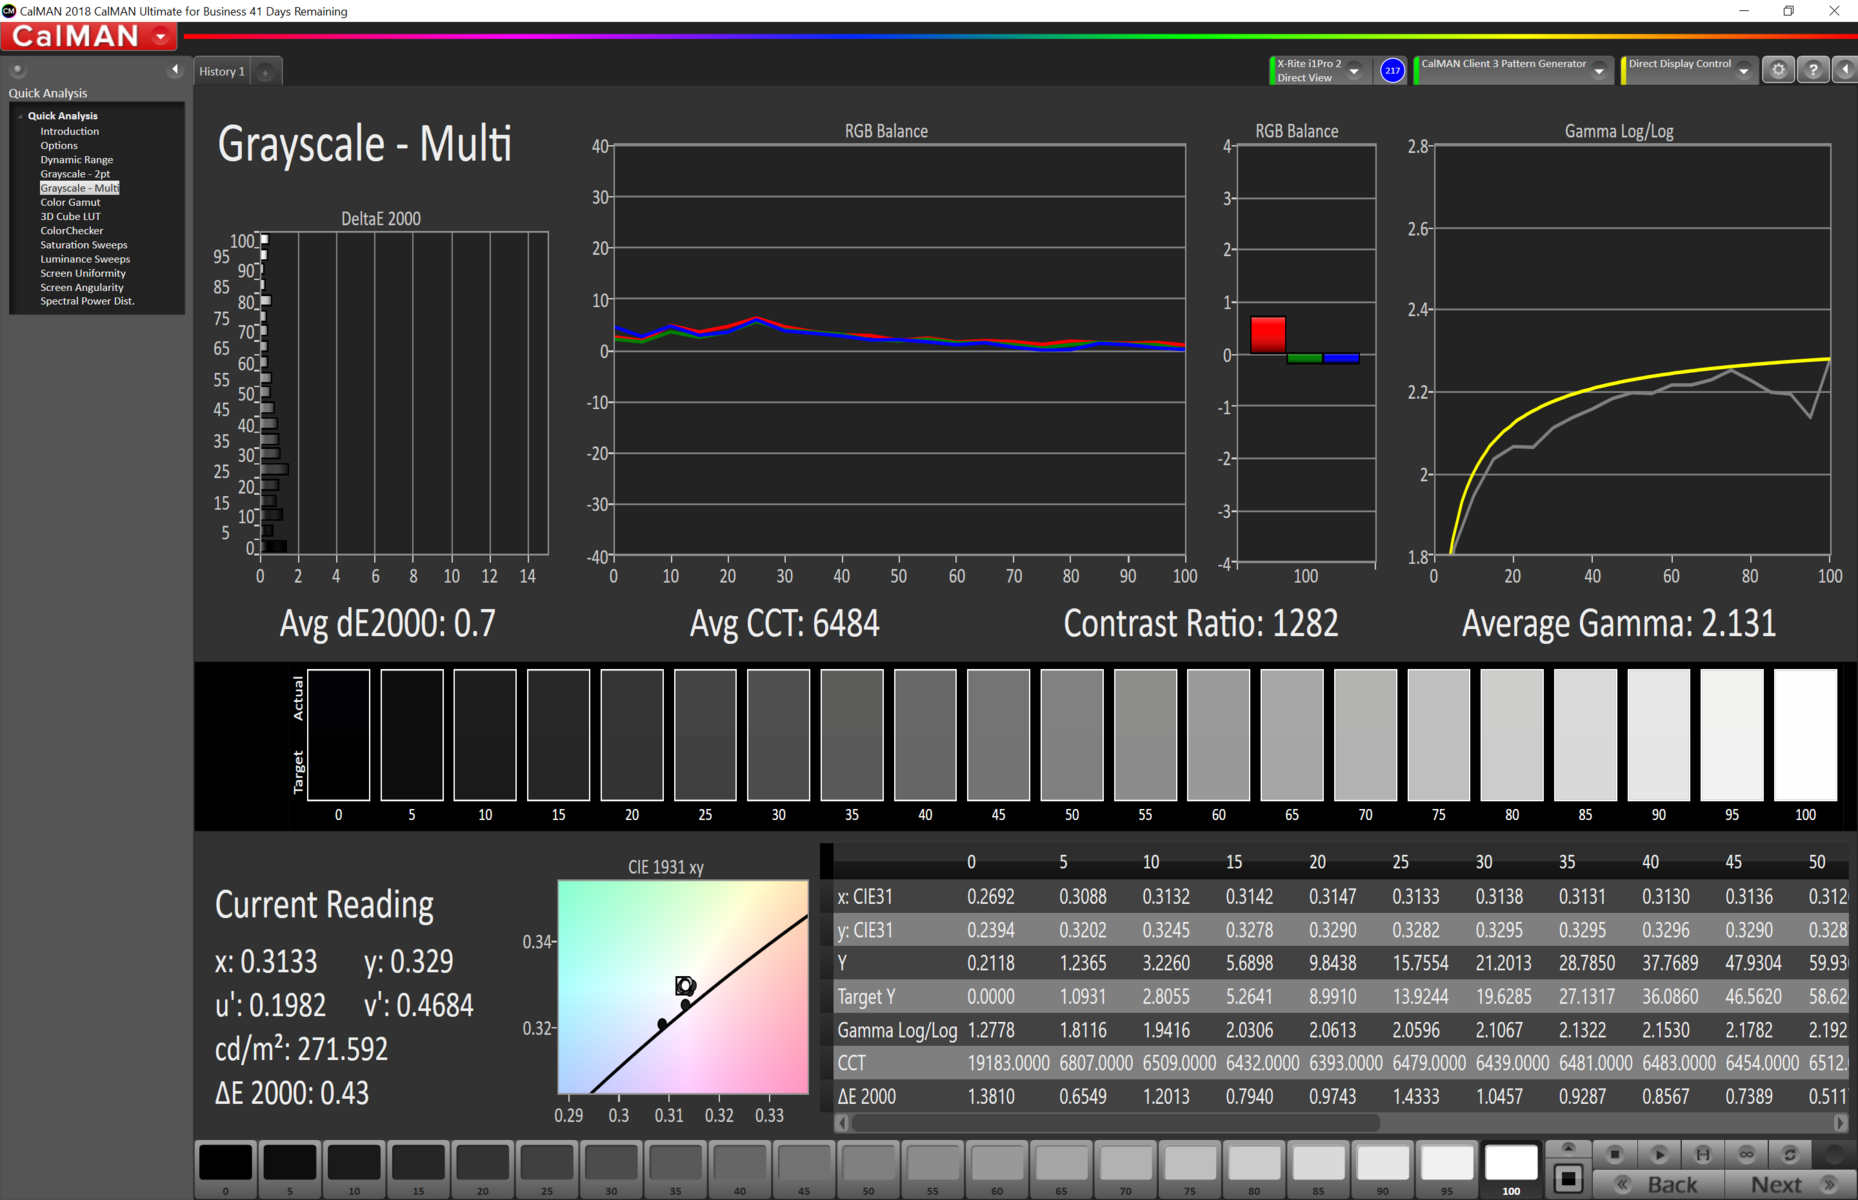
Reprodukcja kolorów jest przyzwoita. Średni błąd dla kolorów i dla odcieni szarości znacznie przekroczyły 1 – odpowiednio 4,38 i 2,1. Kalibracja ekranu poprawiła głównie punkt bieli.
Matryca w dostarczonym na testy laptopie miała czas reakcji 26,4 ms (od czerni do bieli) i 36,1 ms (od 50% do 80% w odcieniach szarości). To wyraźnie gorsze wyniki od tych, które zanotowano w laptopach Lenovo Legion Y540 i HP Pavilion Gaming 15 z matrycami 144 Hz. Tu należy podkreślić, że do MSI Alpha 15 też można zamówić tego typu szybszy wyświetlacz (144 Hz).
Wyświetl czasy reakcji
| ↔ Czas reakcji od czerni do bieli | ||
|---|---|---|
| 26.4 ms ... wzrost ↗ i spadek ↘ łącznie | ↗ ms wzrost | 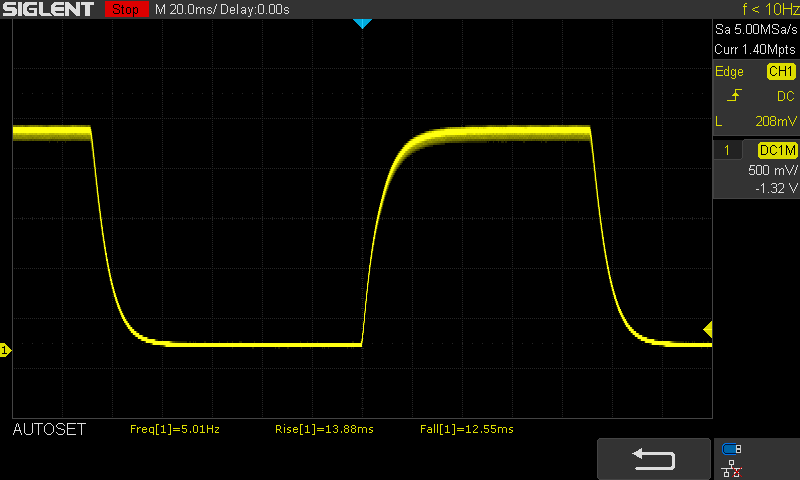 |
| ↘ ms upadek | ||
| W naszych testach ekran wykazuje stosunkowo powolne tempo reakcji i może być zbyt wolny dla graczy. Dla porównania, wszystkie testowane urządzenia wahają się od 0.1 (minimum) do 240 (maksimum) ms. » 66 % wszystkich urządzeń jest lepszych. Oznacza to, że zmierzony czas reakcji jest gorszy od średniej wszystkich testowanych urządzeń (19.9 ms). | ||
| ↔ Czas reakcji 50% szarości do 80% szarości | ||
| 36.1 ms ... wzrost ↗ i spadek ↘ łącznie | ↗ ms wzrost | 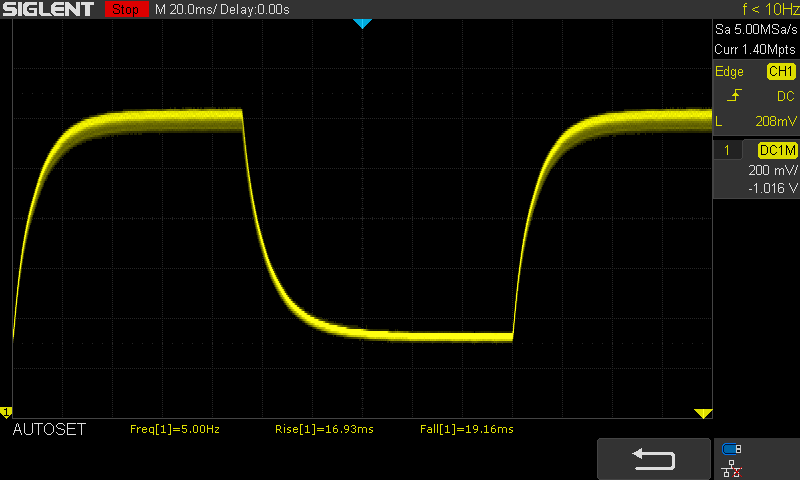 |
| ↘ ms upadek | ||
| W naszych testach ekran wykazuje powolne tempo reakcji, co będzie niezadowalające dla graczy. Dla porównania, wszystkie testowane urządzenia wahają się od 0.165 (minimum) do 636 (maksimum) ms. » 52 % wszystkich urządzeń jest lepszych. Oznacza to, że zmierzony czas reakcji jest gorszy od średniej wszystkich testowanych urządzeń (31.1 ms). | ||
Migotanie ekranu / PWM (modulacja szerokości impulsu)
| Migotanie ekranu/nie wykryto PWM | 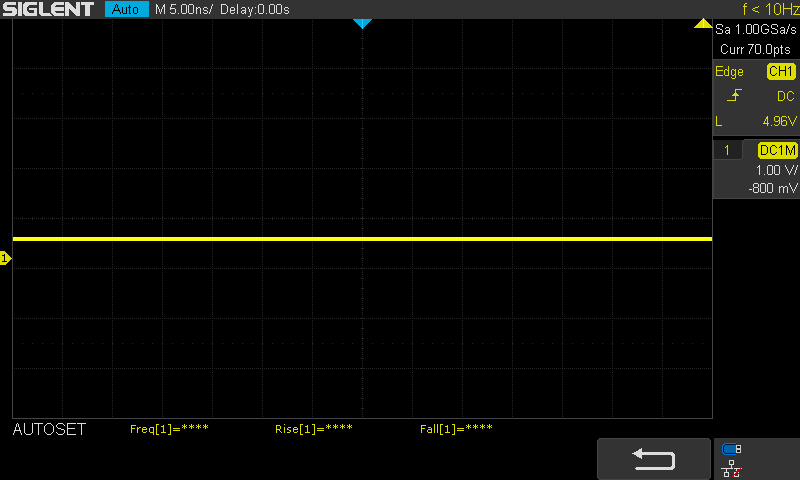 | ||
Dla porównania: 52 % wszystkich testowanych urządzeń nie używa PWM do przyciemniania wyświetlacza. Jeśli wykryto PWM, zmierzono średnio 7784 (minimum: 5 - maksimum: 343500) Hz. | |||

Osiągi
Procesor AMD Ryzen 7 3750H to dobrze znany czterordzeniowiec z początku 2019 roku. Przewinął się już w wielu testach przeprowadzonych przez Notebookcheck. W testach syntetycznych osiąga zbliżone wyniki do jednostki Intel Core i5-9300H, co czyni go dobrym CPU do stosowania w tanich laptopach do gier.
Oczywiście sam fakt zastosowania procesora Ryzen 7 3750H nie oznacza, że osiągnie on te same wyniki, co w innych laptopach. W przedprodukcyjnym MSI Alpha 15 było to o około 5% mniej punktów zbieranych na tle wcześniej zebranych wyników z innych laptopów z tym procesorem. Był też w tyle wobec komputerów z Core i5-9300H. Dochodzi jeszcze kwestia obniżania osiągów wykazanego w powtarzanych w kółko testach renderowania wielowątkowego Cinebench R15 (o około 4%).
Podsumowując: z procesora AMD Ryzen 7 3750H można wycisnąć więcej, jeśli idzie o zadania wielowątkowe. Laptop Asus GA502DU z tym samym procesorem uzyskał w teście wielowątkowym Cinebench R15 wynik o 10% lepszy od rezultatu MSI Alpha 15.
| Cinebench R15 | |
| CPU Single 64Bit | |
| Średnia w klasie Gaming (188.8 - 343, n=109, ostatnie 2 lata) | |
| Acer Aspire Nitro 5 AN515-54-53Z2 | |
| Lenovo IdeaPad L340-15IRH 81LK00BMGE | |
| Dell G3 3590 | |
| HP Omen 15-dc1020ng | |
| Asus TUF FX505DT-EB73 | |
| MSI Alpha 15 A3DDK | |
| Asus ROG Zephyrus G15 GA502DU | |
| Przeciętny AMD Ryzen 7 3750H (135 - 157, n=7) | |
| CPU Multi 64Bit | |
| Średnia w klasie Gaming (1578 - 6271, n=109, ostatnie 2 lata) | |
| Asus ROG Zephyrus G15 GA502DU | |
| Lenovo IdeaPad L340-15IRH 81LK00BMGE | |
| Asus TUF FX505DT-EB73 | |
| Dell G3 3590 | |
| HP Omen 15-dc1020ng | |
| Acer Aspire Nitro 5 AN515-54-53Z2 | |
| Przeciętny AMD Ryzen 7 3750H (672 - 805, n=7) | |
| MSI Alpha 15 A3DDK | |
| PCMark 10 - Score | |
| Średnia w klasie Gaming (5828 - 11574, n=94, ostatnie 2 lata) | |
| HP Omen 15-dc1020ng | |
| Acer Aspire Nitro 5 AN515-54-53Z2 | |
| HP Omen 15-dc1020ng | |
| Dell G3 3590 | |
| MSI Alpha 15 A3DDK | |
| MSI Alpha 15 A3DDK | |
| Asus TUF FX505DT-EB73 | |
| Przeciętny AMD Ryzen 7 3750H (3818 - 4733, n=7) | |
| Lenovo IdeaPad L340-15IRH 81LK00BMGE | |
| Asus ROG Zephyrus G15 GA502DU | |
| PCMark 8 Home Score Accelerated v2 | 4800 pkt. | |
| PCMark 8 Creative Score Accelerated v2 | 6613 pkt. | |
| PCMark 8 Work Score Accelerated v2 | 5167 pkt. | |
| PCMark 10 Score | 4733 pkt. | |
Pomoc | ||
Procesor to jedno a jest jeszcze karta grafiki. W tym laptopie była to nowość rynkowa, czyli AMD Radeon RX 5500M. To ze względu na nią laptop MSI Alpha 15 jest godny uwagi. Takie hasła jak AMD RDNA, Navi 14 czy litografia 7 nm budzą zaciekawienie. Tym bardziej, że karty Nvidia Turing są wytwarzane w litografii 12 nm.
W praktyce układ AMD Radeon RX 5500M (Navi 14) prezentuje wyższą wydajność od karty Radeon RX580 (Polaris). Za jakiś czas powinny pojawić się także laptopy z mniej wydajną grafiką AMD Radeon RX 5300M.
Na papierze AMD Radeon RX 5500M był pozycjonowany między układy GeForce GTX 1650 i GeForce GTX 1660 Ti Max-Q. Pierwsze testy wydają się to potwierdzać, bo wynik 3DMark Fire Strike Graphics okazał się o 20% gorszy od średniego wyniku laptopów z kartą GTX 1660 Ti i o 11% gorszy od średniego wyniku modeli z układem GTX 1660 Ti Max-Q, a o 27% lepszy od średniego wyniku modeli z GTX-em 1650.
| Performance rating - Percent | |
| Średnia w klasie Gaming | |
| Przeciętny NVIDIA GeForce GTX 1660 Ti Mobile | |
| Lenovo Legion Y540-15IRH-81SX00B2GE -1! | |
| Przeciętny NVIDIA GeForce GTX 1660 Ti Max-Q | |
| Asus ROG Zephyrus G15 GA502DU | |
| HP Gaming Pavilion 15-dk0009ng | |
| MSI Alpha 15 A3DDK | |
| Acer Aspire Nitro 5 AN515-54-53Z2 -1! | |
| Asus TUF FX505DT-EB73 | |
| HP Omen 15-dc1020ng | |
| HP Omen 15-dc1020ng | |
| Dell G3 3590 | |
| Lenovo IdeaPad L340-15IRH 81LK00BMGE | |
| Przeciętny NVIDIA GeForce GTX 1650 Mobile | |
| 3DMark 11 - 1280x720 Performance GPU | |
| Średnia w klasie Gaming (21841 - 80022, n=106, ostatnie 2 lata) | |
| Przeciętny NVIDIA GeForce GTX 1660 Ti Mobile (18610 - 22670, n=24) | |
| Lenovo Legion Y540-15IRH-81SX00B2GE | |
| Przeciętny NVIDIA GeForce GTX 1660 Ti Max-Q (17010 - 18653, n=8) | |
| MSI Alpha 15 A3DDK | |
| MSI Alpha 15 A3DDK | |
| HP Gaming Pavilion 15-dk0009ng | |
| Asus ROG Zephyrus G15 GA502DU | |
| Asus TUF FX505DT-EB73 | |
| HP Omen 15-dc1020ng | |
| HP Omen 15-dc1020ng | |
| Lenovo IdeaPad L340-15IRH 81LK00BMGE | |
| Dell G3 3590 | |
| Acer Aspire Nitro 5 AN515-54-53Z2 | |
| Przeciętny NVIDIA GeForce GTX 1650 Mobile (10885 - 13575, n=30) | |
| 3DMark 06 Standard Score | 26559 pkt. | |
| 3DMark 11 Performance | 13344 pkt. | |
| 3DMark Cloud Gate Standard Score | 22627 pkt. | |
| 3DMark Fire Strike Score | 10080 pkt. | |
| 3DMark Time Spy Score | 4024 pkt. | |
Pomoc | ||
Testy gier
Oczywiście testy syntetyczne potrafią być mylące. Chcąc mieć wiedzę o osiągach, trzeba jeszcze sprawdzić gry komputerowe. Tu Radeon RX 5500M potrafił wykręcić np. 43,6 kl/s (średnio) w grze Wiedźmin 3 (ustawienia Ultra, rozdzielczość 1080p). Średni wynik laptopów z kartą GTX 1650 to 35,3 kl/s (o 19% mniej) a średni wynik modeli z GTX-em 1660 Ti Max-Q to 50,7 kl/s (o 16% więcej).
W grze Shadow of the Tomb Raider układ Radeon RX 5500M wypadł nawet lepiej w porównaniu z konkurencyjnymi rozwiązaniami. Przewaga nad laptopami z kartą GTX 1650 wyniosła 26% (ich wynik okazał się o 20% gorszy) a modele z kartą GTX 1660 Ti Max-Q okazały się o tylko 2% lepsze od bohatera niniejszej recenzji.
Bywają też odstępstwa od normy, jak gra Dota 2 Reborn, gdzie reguła zarysowana wyżej się nie powtórzyła. W wielu innych grach jest jednak wciąż tak samo (rezultat Radeona RX 5500M plasuje się między osiągnięciami wspomnianych kart Nvidii). Mowa m.in. o Anno 1800, F1 2019 i Rage 2. W teście gry BioShock Infinite było nawet lepiej i karta firmy AMD wypadła niewiele gorzej od układu GeForce GTX 1660 Ti.
Podsumowując: AMD Radeon RX 5500M to karta grafiki, która oferuje osiągi na poziomie między kartą GTX 1650 a kartą GTX 1660 Ti Max-Q. Czasami dobija nawet do pułapu wyznaczonego przez układ GTX 1660 Ti. Jak to bywa, zdarzają się i spadki do poziomu karty GeForce GTX 1650.
| The Witcher 3 - 1920x1080 Ultra Graphics & Postprocessing (HBAO+) | |
| Przeciętny NVIDIA GeForce GTX 1660 Ti Mobile (51.6 - 65.1, n=21) | |
| Asus ROG Zephyrus M15 GU502GU-XB74 | |
| HP Gaming Pavilion 15-dk0009ng | |
| Lenovo Legion Y540-15IRH-81SX00B2GE | |
| HP Pavilion Gaming 15-ec0017ng | |
| Przeciętny NVIDIA GeForce GTX 1660 Ti Max-Q (44.8 - 53.2, n=7) | |
| Asus ROG Zephyrus G15 GA502DU | |
| MSI Alpha 15 A3DDK | |
| HP Omen 15-dc1020ng | |
| Asus TUF FX505DT-EB73 | |
| Dell G3 3590 | |
| Przeciętny NVIDIA GeForce GTX 1650 Mobile (29.9 - 40.3, n=31) | |
| Acer Aspire Nitro 5 AN515-54-53Z2 | |
| Lenovo IdeaPad L340-15IRH 81LK00BMGE | |
| Dell G5 15 5590-PCNJJ | |
| Shadow of the Tomb Raider - 1920x1080 Highest Preset AA:T | |
| Przeciętny NVIDIA GeForce GTX 1660 Ti Mobile (62 - 73, n=8) | |
| Asus ROG Zephyrus M15 GU502GU-XB74 | |
| Przeciętny NVIDIA GeForce GTX 1660 Ti Max-Q (49 - 67, n=4) | |
| MSI Alpha 15 A3DDK | |
| Asus ROG Zephyrus G15 GA502DU | |
| HP Pavilion Gaming 15-ec0017ng | |
| Acer Aspire Nitro 5 AN515-54-53Z2 | |
| Przeciętny NVIDIA GeForce GTX 1650 Mobile (34 - 47, n=15) | |
| Dell G5 15 5590-PCNJJ | |
| Asus TUF FX505DT-EB73 | |
| Dota 2 Reborn - 1920x1080 ultra (3/3) best looking | |
| Lenovo Legion Y540-15IRH-81SX00B2GE | |
| Lenovo Legion Y540-15IRH-81SX00B2GE | |
| Przeciętny NVIDIA GeForce GTX 1660 Ti Mobile (94.6 - 125, n=11) | |
| Przeciętny NVIDIA GeForce GTX 1650 Mobile (58.5 - 119, n=20) | |
| HP Omen 15-dc1020ng | |
| Przeciętny NVIDIA GeForce GTX 1660 Ti Max-Q (75.7 - 103, n=3) | |
| HP Omen 15-dc1020ng | |
| HP Pavilion Gaming 15-ec0017ng | |
| Lenovo IdeaPad L340-15IRH 81LK00BMGE | |
| MSI Alpha 15 A3DDK | |
| BioShock Infinite - 1920x1080 Ultra Preset, DX11 (DDOF) | |
| Lenovo Legion Y540-15IRH-81SX00B2GE | |
| Przeciętny NVIDIA GeForce GTX 1660 Ti Mobile (121.6 - 144.2, n=14) | |
| HP Gaming Pavilion 15-dk0009ng | |
| MSI Alpha 15 A3DDK | |
| Asus ROG Zephyrus M15 GU502GU-XB74 | |
| Przeciętny NVIDIA GeForce GTX 1660 Ti Max-Q (102.3 - 130, n=5) | |
| HP Pavilion Gaming 15-ec0017ng | |
| Asus ROG Zephyrus G15 GA502DU | |
| HP Omen 15-dc1020ng | |
| HP Omen 15-dc1020ng | |
| Przeciętny NVIDIA GeForce GTX 1650 Mobile (68.5 - 99.4, n=18) | |
| Dell G5 15 5590-PCNJJ | |
| Dell G3 3590 | |
| Lenovo IdeaPad L340-15IRH 81LK00BMGE | |
| Asus TUF FX505DT-EB73 | |
| F1 2019 - 1920x1080 Ultra High Preset AA:T AF:16x | |
| Przeciętny NVIDIA GeForce GTX 1660 Ti Mobile (91 - 99, n=4) | |
| HP Pavilion Gaming 15-ec0017ng | |
| Przeciętny NVIDIA GeForce GTX 1660 Ti Max-Q (71 - 77, n=2) | |
| HP Gaming Pavilion 15-dk0009ng | |
| MSI Alpha 15 A3DDK | |
| HP Omen 15-dc1020ng | |
| Przeciętny NVIDIA GeForce GTX 1650 Mobile (59 - 65, n=5) | |
| HP Omen 15-dc1020ng | |
| Dell G5 15 5590-PCNJJ | |
| Rage 2 - 1920x1080 Ultra Preset (Resolution Scale Off) | |
| Przeciętny NVIDIA GeForce GTX 1660 Ti Mobile (67.9 - 68.8, n=2) | |
| HP Pavilion Gaming 15-ec0017ng | |
| Przeciętny NVIDIA GeForce GTX 1660 Ti Max-Q (58.2 - 64.8, n=2) | |
| HP Omen 15-dc1020ng | |
| HP Gaming Pavilion 15-dk0009ng | |
| MSI Alpha 15 A3DDK | |
| Przeciętny NVIDIA GeForce GTX 1650 Mobile (45.1 - 60, n=3) | |
| HP Omen 15-dc1020ng | |
| Dell G5 15 5590-PCNJJ | |
| Anno 1800 - 1920x1080 Ultra Graphics Quality (DX11) | |
| Lenovo Legion Y540-15IRH-81SX00B2GE | |
| Przeciętny NVIDIA GeForce GTX 1660 Ti Mobile (31.1 - 54, n=4) | |
| HP Gaming Pavilion 15-dk0009ng | |
| Przeciętny NVIDIA GeForce GTX 1660 Ti Max-Q (26 - 33.2, n=2) | |
| HP Pavilion Gaming 15-ec0017ng | |
| MSI Alpha 15 A3DDK | |
| Przeciętny NVIDIA GeForce GTX 1650 Mobile (17.4 - 22.7, n=5) | |
| Dell G5 15 5590-PCNJJ | |
| Lenovo IdeaPad L340-15IRH 81LK00BMGE | |
| Rocket League - 1920x1080 High Quality AA:High FX | |
| Przeciętny NVIDIA GeForce GTX 1660 Ti Mobile (209 - 221, n=2) | |
| MSI Alpha 15 A3DDK | |
| HP Pavilion Gaming 15-ec0017ng | |
| Przeciętny NVIDIA GeForce GTX 1660 Ti Max-Q (141.7 - 173.7, n=2) | |
| Asus ROG Zephyrus G15 GA502DU | |
| Dell G3 3590 | |
| Dell G5 15 5590-PCNJJ | |
| Przeciętny NVIDIA GeForce GTX 1650 Mobile (96.4 - 162.2, n=6) | |
| Asus TUF FX505DT-EB73 | |
| GRID 2019 - 1920x1080 Ultra High Preset | |
| Przeciętny NVIDIA GeForce GTX 1660 Ti Mobile (61.7 - 64.1, n=2) | |
| HP Pavilion Gaming 15-ec0017ng | |
| Przeciętny NVIDIA GeForce GTX 1660 Ti Max-Q (n=1) | |
| Dell G5 15 5590-PCNJJ | |
| Przeciętny NVIDIA GeForce GTX 1650 Mobile (34.3 - 44.4, n=3) | |
| MSI Alpha 15 A3DDK | |
| Ghost Recon Breakpoint - 1920x1080 Ultra Preset AA:T | |
| Przeciętny NVIDIA GeForce GTX 1660 Ti Mobile (51 - 55, n=2) | |
| Przeciętny NVIDIA GeForce GTX 1660 Ti Max-Q (48 - 51, n=2) | |
| HP Pavilion Gaming 15-ec0017ng | |
| Przeciętny NVIDIA GeForce GTX 1650 Mobile (30 - 37, n=2) | |
| Dell G5 15 5590-PCNJJ | |
| MSI Alpha 15 A3DDK | |
| FIFA 20 - 1920x1080 Ultra Preset AA:4xMS | |
| Przeciętny NVIDIA GeForce GTX 1660 Ti Mobile (179 - 237, n=2) | |
| Przeciętny NVIDIA GeForce GTX 1650 Mobile (137 - 159, n=2) | |
| HP Pavilion Gaming 15-ec0017ng | |
| Przeciętny NVIDIA GeForce GTX 1660 Ti Max-Q (n=1) | |
| Dell G5 15 5590-PCNJJ | |
| MSI Alpha 15 A3DDK | |
| Borderlands 3 - 1920x1080 Badass Overall Quality (DX11) | |
| Przeciętny NVIDIA GeForce GTX 1660 Ti Mobile (46.6 - 48.6, n=3) | |
| Przeciętny NVIDIA GeForce GTX 1660 Ti Max-Q (41.5 - 42.3, n=2) | |
| HP Pavilion Gaming 15-ec0017ng | |
| MSI Alpha 15 A3DDK | |
| Przeciętny NVIDIA GeForce GTX 1650 Mobile (29 - 34.6, n=5) | |
| Dell G5 15 5590-PCNJJ | |
| Control - 1920x1080 High Quality Preset | |
| Przeciętny NVIDIA GeForce GTX 1660 Ti Mobile (50.7 - 52.8, n=2) | |
| HP Pavilion Gaming 15-ec0017ng | |
| Przeciętny NVIDIA GeForce GTX 1660 Ti Max-Q (n=1) | |
| MSI Alpha 15 A3DDK | |
| Przeciętny NVIDIA GeForce GTX 1650 Mobile (32.1 - 33.5, n=5) | |
| Dell G5 15 5590-PCNJJ | |
| Total War: Three Kingdoms - 1920x1080 Ultra (incl textures) | |
| Przeciętny NVIDIA GeForce GTX 1660 Ti Mobile (n=1) | |
| HP Gaming Pavilion 15-dk0009ng | |
| Przeciętny NVIDIA GeForce GTX 1660 Ti Max-Q (41.1 - 41.6, n=2) | |
| HP Pavilion Gaming 15-ec0017ng | |
| MSI Alpha 15 A3DDK | |
| Przeciętny NVIDIA GeForce GTX 1650 Mobile (24.4 - 26.9, n=4) | |
| Dell G5 15 5590-PCNJJ | |
| The Division 2 - 1920x1080 Ultra Preset | |
| Przeciętny NVIDIA GeForce GTX 1660 Ti Mobile (57 - 63, n=2) | |
| HP Gaming Pavilion 15-dk0009ng | |
| Przeciętny NVIDIA GeForce GTX 1660 Ti Max-Q (49 - 50, n=2) | |
| HP Pavilion Gaming 15-ec0017ng | |
| MSI Alpha 15 A3DDK | |
| Przeciętny NVIDIA GeForce GTX 1650 Mobile (35 - 43, n=3) | |
| Dell G5 15 5590-PCNJJ | |
| Dirt Rally 2.0 - 1920x1080 Ultra Preset AA:T AF:16x | |
| Przeciętny NVIDIA GeForce GTX 1660 Ti Mobile (62.3 - 65.6, n=2) | |
| HP Gaming Pavilion 15-dk0009ng | |
| MSI Alpha 15 A3DDK | |
| Przeciętny NVIDIA GeForce GTX 1660 Ti Max-Q (57.3 - 59.2, n=2) | |
| HP Pavilion Gaming 15-ec0017ng | |
| Przeciętny NVIDIA GeForce GTX 1650 Mobile (41.8 - 44.1, n=3) | |
| Dell G5 15 5590-PCNJJ | |
| Assassin´s Creed Odyssey - 1920x1080 Ultra High Preset | |
| Przeciętny NVIDIA GeForce GTX 1660 Ti Mobile (47 - 59, n=2) | |
| HP Gaming Pavilion 15-dk0009ng | |
| HP Pavilion Gaming 15-ec0017ng | |
| Przeciętny NVIDIA GeForce GTX 1660 Ti Max-Q (33 - 44, n=3) | |
| Asus ROG Zephyrus G15 GA502DU | |
| Przeciętny NVIDIA GeForce GTX 1650 Mobile (22 - 43, n=5) | |
| MSI Alpha 15 A3DDK | |
| Dell G5 15 5590-PCNJJ | |
| low | med. | high | ultra | QHD | 4K | |
|---|---|---|---|---|---|---|
| Counter-Strike: GO (2012) | 191 | 137 | 76.3 | |||
| BioShock Infinite (2013) | 201 | 169 | 123 | |||
| GTA V (2015) | 93 | 48.6 | 20.2 | |||
| The Witcher 3 (2015) | 165 | 72 | 43.6 | |||
| Dota 2 Reborn (2015) | 93 | 86 | 81 | 72 | 53 | |
| World of Warships (2015) | 93 | 54.9 | ||||
| Rainbow Six Siege (2015) | 151 | 143 | 59.6 | |||
| Overwatch (2016) | 124 | 109 | 74 | |||
| Rocket League (2017) | 175 | 175 | 72 | |||
| Playerunknown's Battlegrounds (PUBG) (2017) | 59.4 | |||||
| Middle-earth: Shadow of War (2017) | 70 | 24 | ||||
| Assassin´s Creed Origins (2017) | 41 | 35 | ||||
| Fortnite (2018) | 65 | |||||
| Far Cry 5 (2018) | 62 | 59 | 48 | |||
| Shadow of the Tomb Raider (2018) | 59 | 53 | 32 | 15 | ||
| Assassin´s Creed Odyssey (2018) | 48 | 43 | 40 | 31 | ||
| Call of Duty Black Ops 4 (2018) | 67.5 | 53.9 | 28.8 | |||
| Battlefield V (2018) | 61 | 43.7 | 16.2 | |||
| Farming Simulator 19 (2018) | 70 | 49.1 | 32.8 | |||
| Apex Legends (2019) | 72 | 51.7 | 28.4 | |||
| Far Cry New Dawn (2019) | 51 | 47 | 25 | |||
| Metro Exodus (2019) | 92.3 | 45.4 | 38.1 | 32.2 | 25 | |
| Anthem (2019) | 48 (stuttering) | 47 (stuttering) | 44 (stuttering) | 32 (stuttering) | ||
| Dirt Rally 2.0 (2019) | 58.4 | 38.1 | 22.8 | |||
| The Division 2 (2019) | 51 | 42 | ||||
| Anno 1800 (2019) | 60 | 46.3 | 23.9 | |||
| Rage 2 (2019) | 67 | 55.7 | 53.4 | 15.4 | ||
| Total War: Three Kingdoms (2019) | 134 | 69.1 | 48.7 | 35.8 | 19.4 | 6.9 |
| F1 2019 (2019) | 79 | 74 | 64 | 64 | 49.1 | 33.3 |
| Control (2019) | 119 | 47.5 | 34.2 | |||
| Borderlands 3 (2019) | 76 | 66 | 47.2 | 35.6 | 23.9 | 6.7 |
| FIFA 20 (2019) | 122 | 122 | 96 | |||
| Ghost Recon Breakpoint (2019) | 58 | 53 | 48 | 26 | ||
| GRID 2019 (2019) | 81 | 67 | 36.7 | 29.9 | 15.2 | |
| Call of Duty Modern Warfare 2019 (2019) | 112 | 94 | 81 | 64 | 35.4 | 20.1 |
| Need for Speed Heat (2019) | 63 | 57.7 | 52.3 | 45.8 | 41 | 14.1 |
| Star Wars Jedi Fallen Order (2019) | 58.6 | 40.1 | 19.8 | |||
| Red Dead Redemption 2 (2019) | 92 | 63 | 40.5 | 23.8 | ||
| God of War (2022) | 36.1 | 36 | 33 | 9.06 | ||
| Rainbow Six Extraction (2022) | 95 | 78 | 76 | 36 | ||
| GRID Legends (2022) | 81 | 71.8 | 71.1 | 59.2 | ||
| Elden Ring (2022) | 37 | 35.8 | 35.2 | 35.2 | ||
| Cyberpunk 2077 1.6 (2022) | 55.9 | 44.9 | 34.4 | 27.7 | ||
| Elex 2 (2022) | 20.1 | 19.3 | 19.4 | 18.8 | ||
| Ghostwire Tokyo (2022) | 56 | 56 | 55.7 | 54.9 | ||
| Tiny Tina's Wonderlands (2022) | 88.5 | 71.2 | 38.6 | 28.3 | ||
| Vampire Bloodhunt (2022) | 93.8 | 82.1 | 78.7 | 77.3 | ||
| F1 22 (2022) | 95 | 92 | 78 | 66 | ||
| The Quarry (2022) | 65.5 | 47 | 40.3 | 23.8 | ||
| FIFA 23 (2022) | 46.6 | 38.4 | 33.3 | 33.2 | ||
| A Plague Tale Requiem (2022) | 47.2 | 36.9 | 26.9 | 20.7 | ||
| Uncharted Legacy of Thieves Collection (2022) | 36.6 | 32.3 | 20.6 | 18.6 | ||
| Call of Duty Modern Warfare 2 2022 (2022) | 70 | 66 | 56 | 43 | ||
| Spider-Man Miles Morales (2022) | 48 | 43.3 | 30.6 | 26 | ||
| The Callisto Protocol (2022) | 57.7 | 47.4 | 29.8 | 28.6 | ||
| Need for Speed Unbound (2022) | 43.2 | 41 | 34.7 | 27.3 |
Wpływ na otoczenie
Hałas
W laptopie MSI Alpha 15 użytkownik może wybierać różne ustawienia pracy układu chłodzenia. Do wyboru są tryby Silence Mode, Balanced Mode i Extreme Performance. Trzeba podkreślić, że ich zmiana ma rzeczywisty wpływ na pracę wentylatorów. W szczególności kiedy laptop jest pod umiarkowanym obciążeniem. Testy zostały przeprowadzone w trybie Balanced Mode wraz ze zmianami dokonanymi w Windows Power Mode.
W teście bez obciążenia szum osiągnął maksymalnie 35,5 dB(A). Podczas grania było głośniej. Bardzo głośno zrobiło się w teście pełnego obciążenia, w którym zmierzono 53,6 dB(A).
Hałas
| luz |
| 31.1 / 34.8 / 35.5 dB |
| obciążenie |
| 43 / 53.6 dB |
 | ||
30 dB cichy 40 dB(A) słyszalny 50 dB(A) irytujący |
||
min: | ||
Temperatury
Temperatury obudowy nie były wysokie. W najcieplejszym miejscu zmierzono 45°C w teście pełnego obciążenia i 44°C w teście gry Wiedźmin 3.
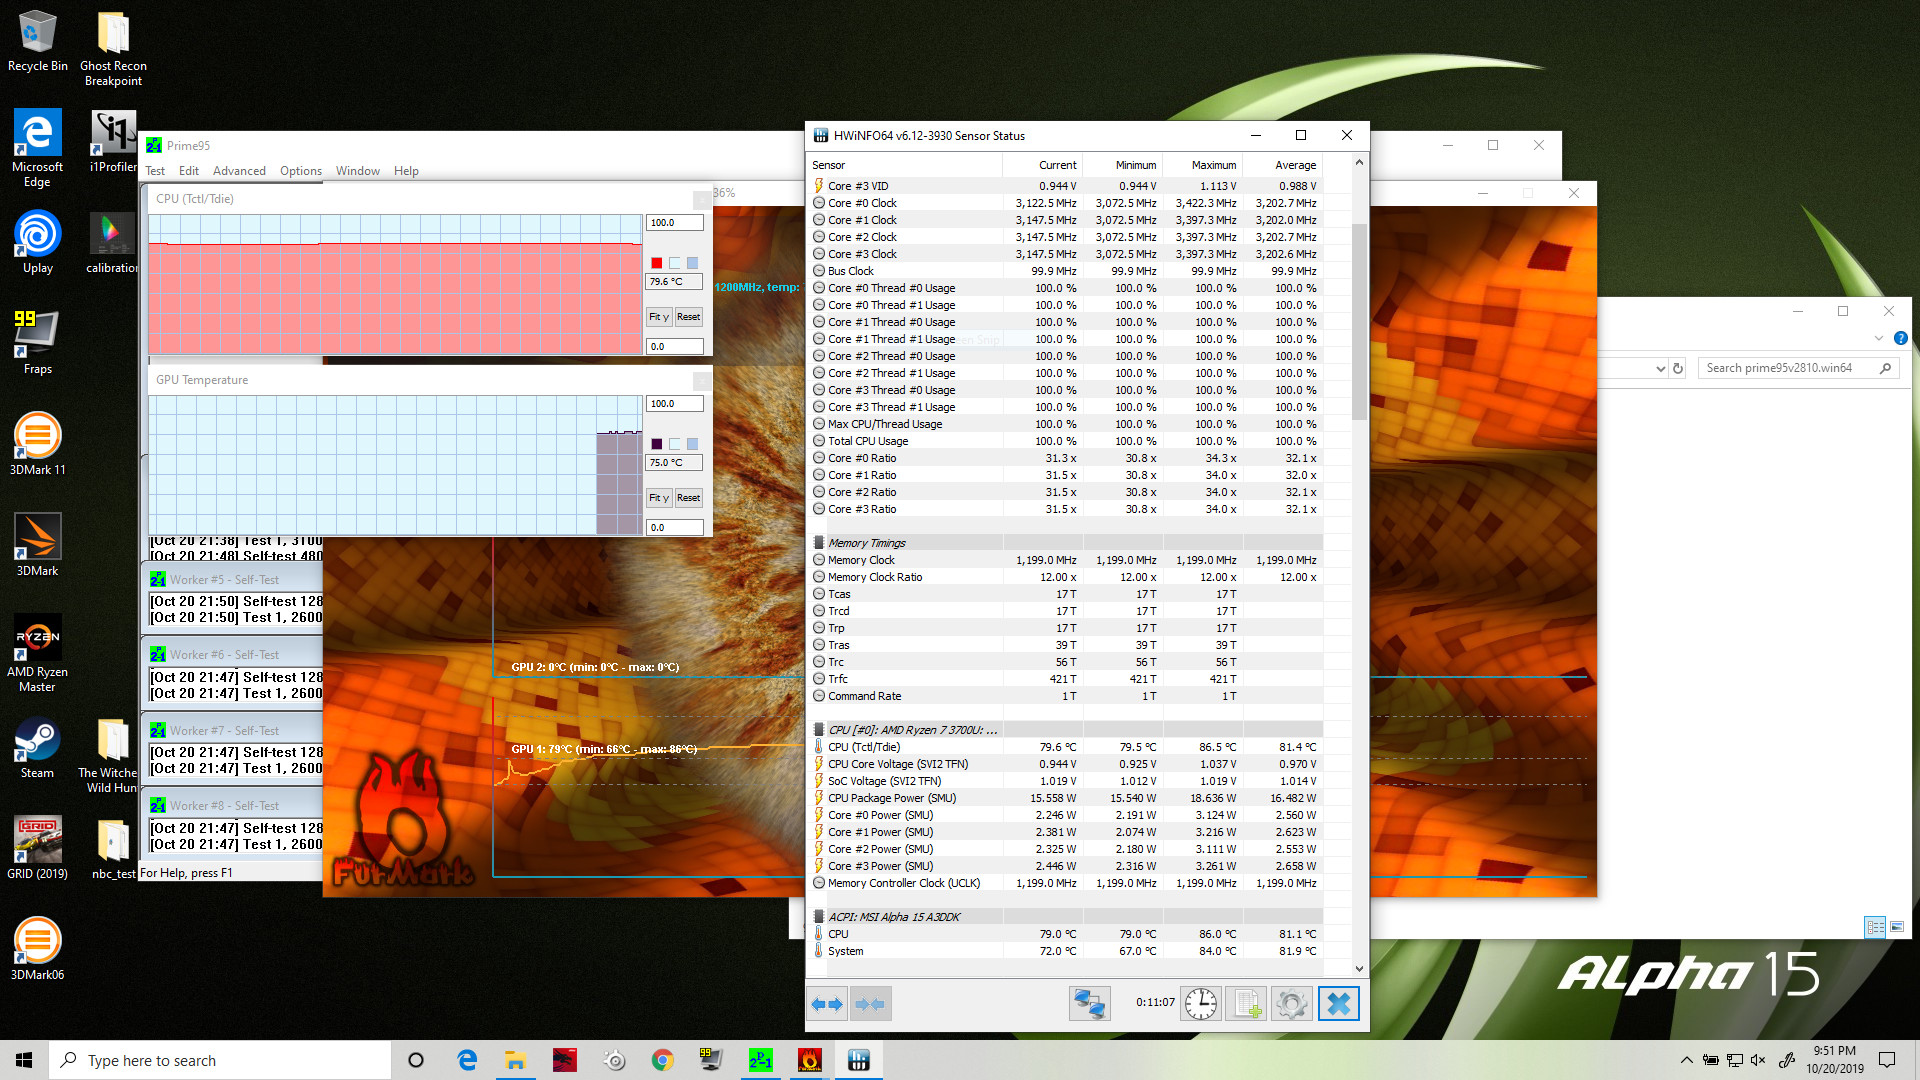
W laptopie MSI Alpha 15 nie wystąpił efekt dławienia taktowania CPU powodowanego przegrzewaniem przy pełnym obciążeniu. Temperatury CPU i GPU osiągnęły maksymalnie 86°C.
(±) Maksymalna temperatura w górnej części wynosi 42 °C / 108 F, w porównaniu do średniej 40.4 °C / 105 F , począwszy od 21.2 do 68.8 °C dla klasy Gaming.
(±) Dno nagrzewa się maksymalnie do 45 °C / 113 F, w porównaniu do średniej 43.2 °C / 110 F
(+) W stanie bezczynności średnia temperatura górnej części wynosi 29.1 °C / 84 F, w porównaniu ze średnią temperaturą urządzenia wynoszącą 33.9 °C / ### class_avg_f### F.
(+) Podczas gry w Wiedźmina 3 średnia temperatura górnej części wynosi 31.3 °C / 88 F, w porównaniu do średniej temperatury urządzenia wynoszącej 33.9 °C / ## #class_avg_f### F.
(+) Podparcia dłoni i touchpad osiągają maksymalną temperaturę skóry (32 °C / 89.6 F) i dlatego nie są gorące.
(-) Średnia temperatura obszaru podparcia dłoni w podobnych urządzeniach wynosiła 28.8 °C / 83.8 F (-3.2 °C / -5.8 F).
Wydajność akumulatora
| wyłączony / stan wstrzymania | |
| luz | |
| obciążenie |
|
Legenda:
min: | |
| MSI Alpha 15 A3DDK R7 3750H, Radeon RX 5500M, Toshiba KBG30ZMV256G, IPS, 1920x1080, 15.6" | Asus TUF FX505DT-EB73 R7 3750H, GeForce GTX 1650 Mobile, Intel SSD 660p SSDPEKNW512G8, IPS, 1920x1080, 15.6" | Dell G3 3590 i5-9300H, GeForce GTX 1650 Mobile, Toshiba BG4 KBG40ZNS128G, IPS, 1920x1080, 15.6" | Acer Aspire Nitro 5 AN515-54-53Z2 i5-9300H, GeForce GTX 1650 Mobile, WDC PC SN520 SDAPNUW-512G, IPS, 1920x1080, 15.6" | Asus ROG Zephyrus G15 GA502DU R7 3750H, GeForce GTX 1660 Ti Max-Q, Intel SSD 660p SSDPEKNW512G8, IPS, 1920x1080, 15.6" | Lenovo IdeaPad L340-15IRH 81LK00BMGE i5-9300H, GeForce GTX 1650 Mobile, WDC PC SN520 SDAPMUW-512, IPS, 1920x1080, 15.6" | HP Omen 15-dc1020ng i5-9300H, GeForce GTX 1650 Mobile, WDC PC SN720 SDAQNTW-512G, IPS, 1920x1080, 15.6" | Dell G5 15 5590-PCNJJ i5-9300H, GeForce GTX 1650 Mobile, KBG30ZMS128G, IPS, 1920x1080, 15.6" | HP Pavilion Gaming 15-ec0017ng R7 3750H, GeForce GTX 1660 Ti Max-Q, WDC PC SN720 SDAPNTW-256G, IPS, 1920x1080, 15.6" | |
|---|---|---|---|---|---|---|---|---|---|
| Power Consumption | 32% | 18% | 35% | 11% | 43% | 36% | 34% | 38% | |
| Idle Minimum * (Watt) | 11.7 | 7 40% | 6.2 47% | 5 57% | 7.4 37% | 3.8 68% | 4.04 65% | 4 66% | 3.4 71% |
| Idle Average * (Watt) | 15.7 | 9.9 37% | 8.4 46% | 7 55% | 8.6 45% | 6.6 58% | 7.2 54% | 7 55% | 7.6 52% |
| Idle Maximum * (Watt) | 22.4 | 12 46% | 27.7 -24% | 11 51% | 39.1 -75% | 8.9 60% | 11.4 49% | 12 46% | 10.2 54% |
| Load Average * (Watt) | 70.7 | 68.4 3% | 91 -29% | 89 -26% | 65.9 7% | 78.4 -11% | 80.8 -14% | 95 -34% | 73 -3% |
| Witcher 3 ultra * (Watt) | 148 | 94.9 36% | 94.4 36% | 90 39% | 106.9 28% | 82 45% | 93.6 37% | 86 42% | 107 28% |
| Load Maximum * (Watt) | 191 | 130.9 31% | 131.5 31% | 132 31% | 141.3 26% | 124 35% | 144.5 24% | 135 29% | 140.5 26% |
* ... im mniej tym lepiej
Podsumowanie
MSI Alpha 15 nie jest laptopem, który może zagrozić modelom z najwyższej półki wydajnościowej. Stanowi jednak symptom tego, że procesory i karty grafiki AMD mogą podważyć dotychczasową dominację rozwiązań Intela i Nvidii w średnim segmencie wydajnościowym.
Laptop MSI Alpha 15 jest ciekawy przede wszystkim ze względu na kartę grafiki Radeon RX 5500M opartą na architekturze Navi (7 nm). Zapewnia osiągi na poziomie pośrednim między układami GeForce GTX 1650 i GTX 1660 Ti Max-Q. Są jednak takie gry, gdzie RX 5500M notuje wyniki na poziomie GTX-a 1650, a w innych grach dobija do pułapu osiąganego przez kartę GTX 1660 Ti.
