Test procesorów Intel Core i7-6700HQ i Core i7-6820HK (Skylake-H)
23/09/2015
Laptopy z procesorami Skylake już są w produkcji, a może nawet już jadą do nas z Chin. Najwyższa pora wziąć na warsztat te CPU i sprawdzić, co one oferują. Tym razem redaktor naszego serwisu miał utrudnione zadanie, gdyż wszystkie czterordzeniowe Skylake'i są wlutowane, więc nie można ich było przekładać w ramach jednego laptopa. Coś jednak się z testów Core i7-6700HQ i Core i7-6820HK urodziło.

Model |
Rdzenie/Wątki | Zegar bazowy | Turbo 1C/2C/4C | GPU | TDP |
|---|---|---|---|---|---|
| Skylake-H | |||||
| i7-6920HQ | 4/8 | 2,9 GHz | 3,8/3,6/3,4 GHz | HD Graphics 530 (350-1050 MHz) | 45 W |
| i7-6820HQ | 4/8 | 2,7 GHz | 3,6/3,4/3,2 GHz | HD Graphics 530 (350-1050 MHz) | 45 W |
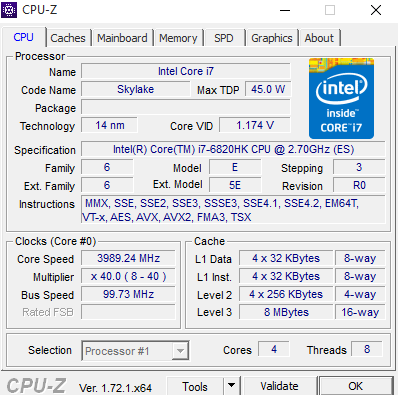
| i7-6820HK | 4/8 | 2,7 GHz | 3,6/3,4/3,2 GHz | HD Graphics 530 (350-1050 MHz) | 45 W |
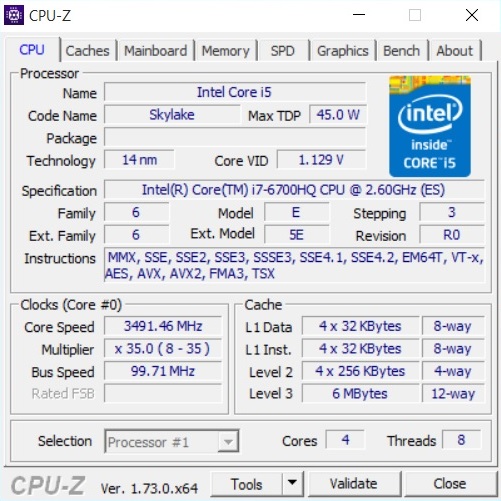
| i7-6700HQ | 4/8 | 2,6 GHz | 3,5/3,3/3,1 GHz | HD Graphics 530 (350-1050 MHz) | 45 W |
| Broadwell (wybór) | |||||
| i7-5700HQ | 4/8 | 2,7 GHz | 3,5/3,5/3,5 GHz | HD Graphics 5600 (300-1050 MHz) | 47 W |
| Haswell (wybór) | |||||
| i7-4940MX | 4/8 | 3,1 GHz | 4,0/3,9/3,8 GHz | HD Graphics 4600 (400-1350 MHz) | 57 W |
| i7-4910MQ | 4/8 | 2,9 GHz | 3,9/3,8/3,7 GHz | HD Graphics 4600 (400-1300 MHz) | 47 W |
| i7-4810MQ | 4/8 | 2,8 GHz | 3,8/3,7/3,6 GHz | HD Graphics 4600 (400-1300 MHz) | 47 W |
| i7-4720HQ | 4/8 | 2,6 GHz | 3,6/3,5/3,4 GHz | HD Graphics 4600 (400-1200 MHz) | 47 W |
Porównanie modeli
W ramach premiery procesorów Skylake do laptopów Intel zaprezentował osiem jednostek czterordzeniowych, w tym dwa modele Xeon oraz dwa procesory Core i5, które nie mają funkcji Hyper-Threading. Pozostałe to Core i7, tj. i7-6820HQ, i7-6920HQ oraz przetestowane przez nas i7-6700HQ i i7-6820HK.
W specyfikacjach tych procesorów rzuca się w oczy taktowanie niższe, niż w procesorach Haswell i Broadwell, zwłaszcza przy obciążeniu wszystkich rdzeni. W przypadku Core i7-6700HQ jest to 3,1 GHz, podczas gdy w przypadku Core i7-4720HQ (Haswell) mieliśmy 3,4 GHz a w przypadku Core i7-5700HQ (Broadwell) - 3,5 GHz. Nawet zakładając, że zwiększyła się wydajność na MHz, raczej trudno więc liczyć na skokowy wzrok bezwzględnej wydajności.
Warto jeszcze zwrócić uwagę na fakt, że zniknęły procesory ekstremalne. Zamiast nich mamy tylko jeden model z odblokowanym mnożnikiem, tj. Core i7-6820HK. W wewnętrznych testach Intelowi udało się go podkręcić do 4,2 GHz, a więc powinien on być godnym następcą Core i7-4940MX.
Platforma testowa
Testy [wlutowanych, a więc nie dało się ich wymieniać, co miało miejsce w testach Notebookcheck procesorów starszych generacji - przyp. tłum.] procesorów Core i7-6700HQ i Core i7-6820HK zostały przeprowadzone na laptopach Clevo, których oznaczeń nie możemy niestety podać z powodu umowy o zachowaniu poufności. Miały one dwa moduły po 8 GB pamięci RAM DDR4-2400 każdy a także posiadały dysk SSD Samsunga pod PCIe. Systemem operacyjnym był w obu przypadkach Windows 10 Pro. Wykorzystany sterownik grafiki Intela to 10.18.15.4256.
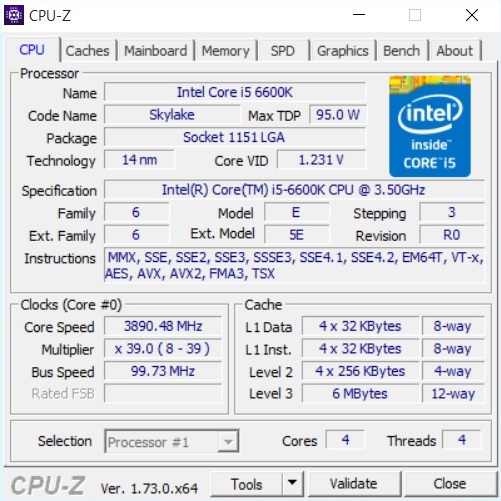
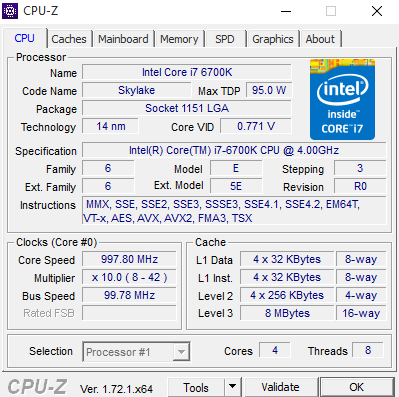
Do porównania z nimi posłużyły przeznaczone zasadniczo do komputerów stacjonarnych procesory Core i7-6700K i Core i5-6600K zamontowane w laptopach Clevo P771DM i P751DM. One także miały po dwa moduły pamięci RAM 8 GB DDR4-2400 oraz dysk SSD pod PCIe.
Pozostałe wyniki do porównań zaczerpnięto ze starszych recenzji laptopów wyposażonych w procesory Broadwell i Haswell (miały one inne pozostałe podzespoły i inne oprogramowanie, toteż rezultaty te nie są do końca porównywalne).
Testy CPU
Uśredniając wszystkie wyniki, przy takim samym taktowaniu Skylake liczy o około 10% szybciej od Haswella a o około 5% szybciej od Broadwella. To, że niepodkręcony Core i7-6820HK nie jest w stanie zdecydowanie wysunąć się na czoło stawki porównywanych CPU, wynika z wspomnianego dość niskiego taktowania. W testach wielowątkowych Core i7-5700HQ był od niego lepszy (dzięki o 300 MHz wyższemu taktowaniu dla wszystkich rdzeni). W testach jednowątkowych najlepsze osiągi spośród procesorów do laptopów zaprezentował zaś osiągający do 4 GHz Core i7-4940MX. W większości przypadków różnice między procesorami Haswell, Broadwell i Skylake o podobnym taktowaniu są na tyle nieduże, że nie byłyby odczuwalne.
Przy obciążeniu tylko rdzeni CPU TDP procesorów i7-6700HQ i i7-6820HK było niższe od granicznej wartości 45 W. Nawet przy pełnym obciążeniu stabilnie utrzymywały one swoje zegary.
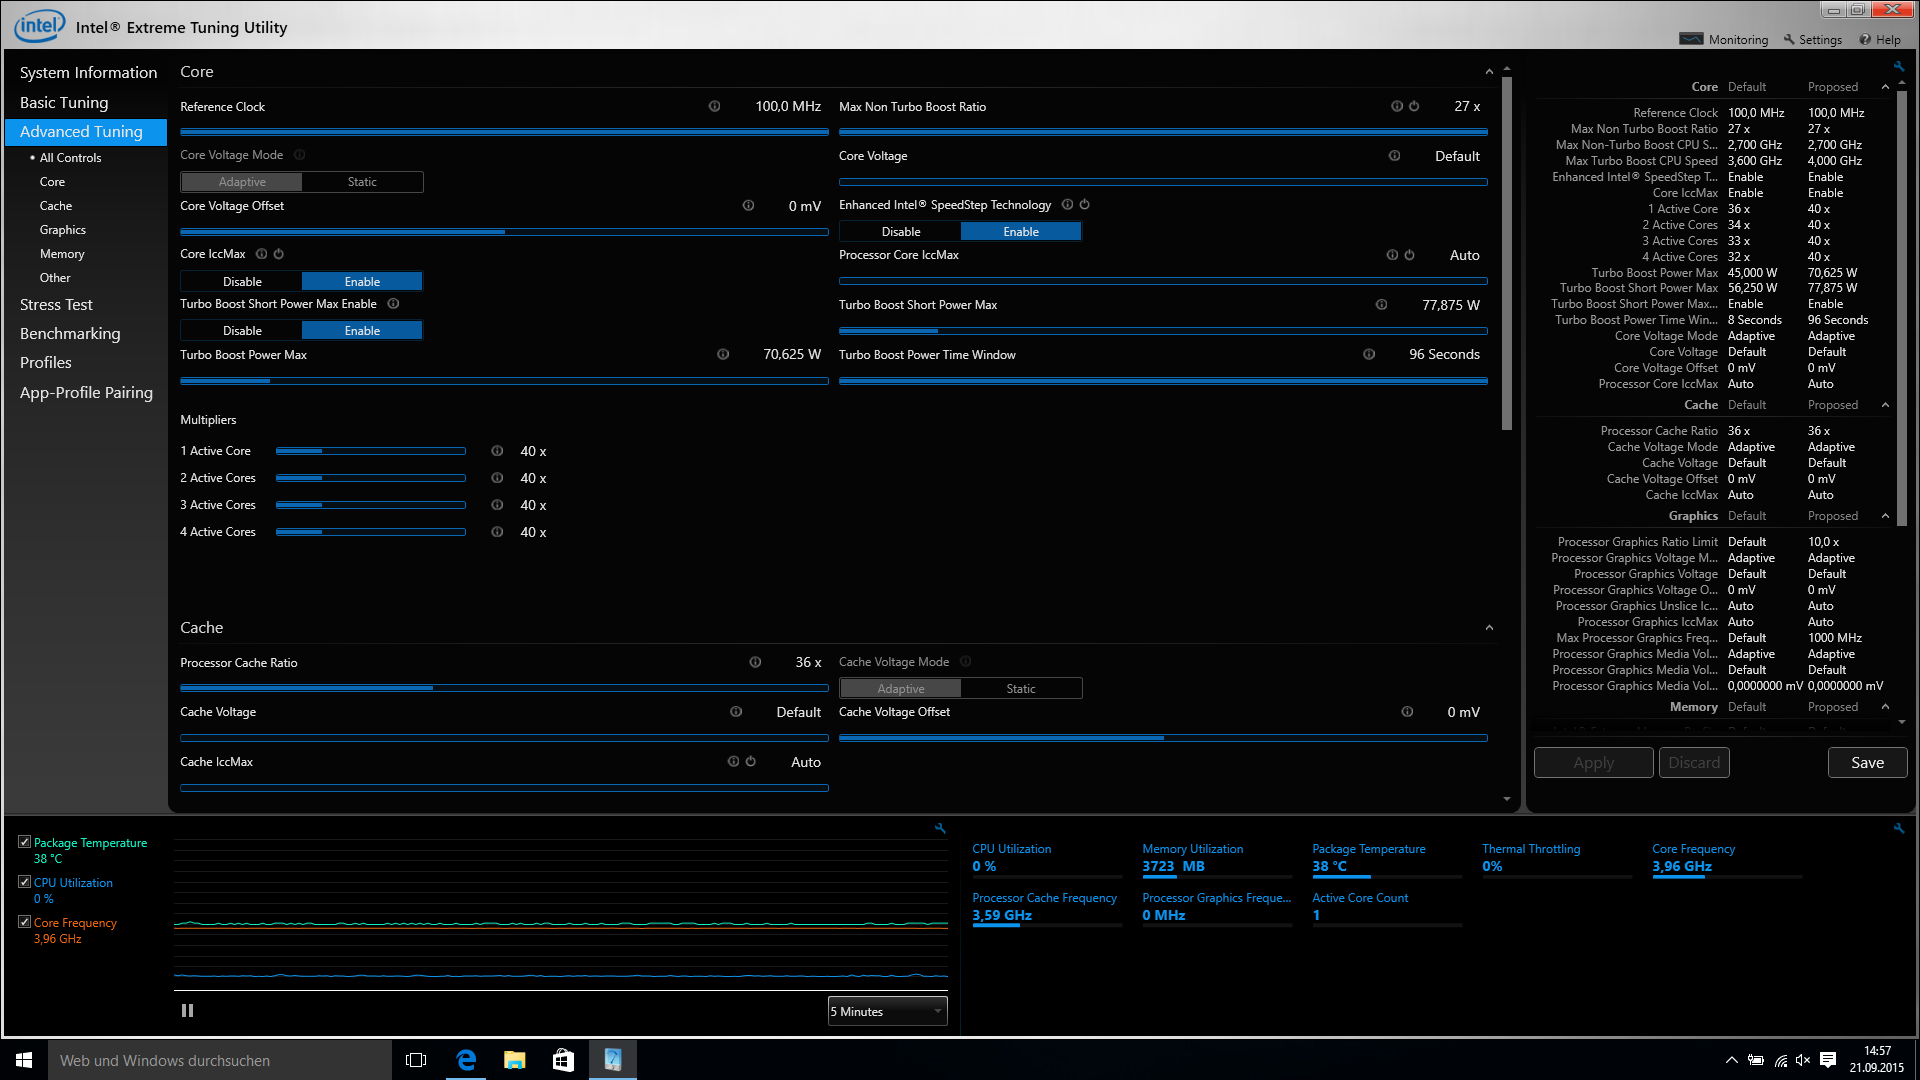
Autor sprawdził też oczywiście, co daje OC procesora Core i7-6820HK. Przy wykorzystaniu aplikacji Intel XTU został on podkręcony do 4 GHz. Jego wydajność zwiększyła się w ten sposób o 10-20%. To już poziom modelu Core i7-6700K do komputerów stacjonarnych (4,0-4,2 GHz).
| Cinebench R11.5 | |
| CPU Single 64Bit (sortuj wg wyników) | |
| Intel Core i7-6820HK @ 4 GHz | |
| Intel Core i7-6820HK | |
| Intel Core i7-6700HQ | |
| Intel Core i7-5700HQ | |
| Intel Core i7-4940MX | |
| Intel Core i7-4930MX | |
| Intel Core i7-4800MQ | |
| Intel Core i7-4720HQ | |
| Intel Core i7-6700K | |
| Intel Core i5-6600K | |
| CPU Multi 64Bit (sortuj wg wyników) | |
| Intel Core i7-6820HK @ 4 GHz | |
| Intel Core i7-6820HK | |
| Intel Core i7-6700HQ | |
| Intel Core i7-5700HQ | |
| Intel Core i7-4940MX | |
| Intel Core i7-4930MX | |
| Intel Core i7-4800MQ | |
| Intel Core i7-4720HQ | |
| Intel Core i7-6700K | |
| Intel Core i5-6600K | |
| Cinebench R15 | |
| CPU Single 64Bit (sortuj wg wyników) | |
| Intel Core i7-6820HK @ 4 GHz | |
| Intel Core i7-6820HK | |
| Intel Core i7-6700HQ | |
| Intel Core i7-5700HQ | |
| Intel Core i7-4940MX | |
| Intel Core i7-4720HQ | |
| Intel Core i7-6700K | |
| Intel Core i5-6600K | |
| CPU Multi 64Bit (sortuj wg wyników) | |
| Intel Core i7-6820HK @ 4 GHz | |
| Intel Core i7-6820HK | |
| Intel Core i7-6700HQ | |
| Intel Core i7-5700HQ | |
| Intel Core i7-4940MX | |
| Intel Core i7-4720HQ | |
| Intel Core i7-6700K | |
| Intel Core i5-6600K | |
| X264 HD Benchmark 4.0 | |
| Pass 1 (sortuj wg wyników) | |
| Intel Core i7-6820HK @ 4 GHz | |
| Intel Core i7-6820HK | |
| Intel Core i7-6700HQ | |
| Intel Core i7-5700HQ | |
| Intel Core i7-4940MX | |
| Intel Core i7-4930MX | |
| Intel Core i7-4800MQ | |
| Intel Core i7-4720HQ | |
| Intel Core i7-6700K | |
| Intel Core i5-6600K | |
| Pass 2 (sortuj wg wyników) | |
| Intel Core i7-6820HK @ 4 GHz | |
| Intel Core i7-6820HK | |
| Intel Core i7-6700HQ | |
| Intel Core i7-5700HQ | |
| Intel Core i7-4940MX | |
| Intel Core i7-4930MX | |
| Intel Core i7-4800MQ | |
| Intel Core i7-4720HQ | |
| Intel Core i7-6700K | |
| Intel Core i5-6600K | |
| TrueCrypt | |
| AES Mean 100MB (sortuj wg wyników) | |
| Intel Core i7-6820HK @ 4 GHz | |
| Intel Core i7-6820HK | |
| Intel Core i7-6700HQ | |
| Intel Core i7-5700HQ | |
| Intel Core i7-4940MX | |
| Intel Core i7-4930MX | |
| Intel Core i7-4800MQ | |
| Intel Core i7-4720HQ | |
| Intel Core i7-6700K | |
| Intel Core i5-6600K | |
| Twofish Mean 100MB (sortuj wg wyników) | |
| Intel Core i7-6820HK @ 4 GHz | |
| Intel Core i7-6820HK | |
| Intel Core i7-6700HQ | |
| Intel Core i7-5700HQ | |
| Intel Core i7-4940MX | |
| Intel Core i7-4930MX | |
| Intel Core i7-4800MQ | |
| Intel Core i7-4720HQ | |
| Intel Core i7-6700K | |
| Intel Core i5-6600K | |
| Serpent Mean 100MB (sortuj wg wyników) | |
| Intel Core i7-6820HK @ 4 GHz | |
| Intel Core i7-6820HK | |
| Intel Core i7-6700HQ | |
| Intel Core i7-5700HQ | |
| Intel Core i7-4940MX | |
| Intel Core i7-4930MX | |
| Intel Core i7-4800MQ | |
| Intel Core i7-4720HQ | |
| Intel Core i7-6700K | |
| Intel Core i5-6600K | |
| WinRAR - Result (sortuj wg wyników) | |
| Intel Core i7-6820HK @ 4 GHz | |
| Intel Core i7-6820HK | |
| Intel Core i7-6700HQ | |
| Intel Core i7-4930MX | |
| Intel Core i7-6700K | |
| Intel Core i5-6600K | |
| Super Pi Mod 1.5 XS 32M - 32M (sortuj wg wyników) | |
| Intel Core i7-6820HK @ 4 GHz | |
| Intel Core i7-6820HK | |
| Intel Core i7-6700HQ | |
| Intel Core i7-5700HQ | |
| Intel Core i7-4940MX | |
| Intel Core i7-4930MX | |
| Intel Core i7-4800MQ | |
| Intel Core i7-4720HQ | |
| Intel Core i7-6700K | |
| Intel Core i5-6600K | |
| 3DMark 06 - CPU - CPU Score (sortuj wg wyników) | |
| Intel Core i7-6820HK @ 4 GHz | |
| Intel Core i7-6820HK | |
| Intel Core i7-6700HQ | |
| Intel Core i7-5700HQ | |
| Intel Core i7-4940MX | |
| Intel Core i7-4930MX | |
| Intel Core i7-4800MQ | |
| Intel Core i7-4720HQ | |
| Intel Core i7-6700K | |
| Intel Core i5-6600K | |
| Geekbench 3 | |
| 64 Bit Single-Core Score (sortuj wg wyników) | |
| Intel Core i7-6820HK @ 4 GHz | |
| Intel Core i7-6820HK | |
| Intel Core i7-6700HQ | |
| Intel Core i7-6700K | |
| Intel Core i5-6600K | |
| 64 Bit Multi-Core Score (sortuj wg wyników) | |
| Intel Core i7-6820HK @ 4 GHz | |
| Intel Core i7-6820HK | |
| Intel Core i7-6700HQ | |
| Intel Core i7-6700K | |
| Intel Core i5-6600K | |
| Mozilla Kraken 1.1 - Total (sortuj wg wyników) | |
| Intel Core i7-6820HK @ 4 GHz | |
| Intel Core i7-6820HK | |
| Intel Core i7-6700HQ | |
| Intel Core i7-6700K | |
| Intel Core i5-6600K | |
| Octane V2 - Total Score (sortuj wg wyników) | |
| Intel Core i7-6820HK @ 4 GHz | |
| Intel Core i7-6820HK | |
| Intel Core i7-6700HQ | |
| Intel Core i7-6700K | |
| Intel Core i5-6600K | |
* ... im mniej tym lepiej
Testy GPU
W procesorach Intel Skylake znajdziemy kilka różnych układów grafiki:
- HD Graphics 510 (GT1, 12 EU, brak eDRAM),
- HD Graphics 515, HD Graphics 520, HD Graphics 530 (GT2, 24 EU, brak eDRAM),
- Iris Graphics 540, Iris Graphics 550 (GT3e, 48 EU, 64 MB eDRAM),
- Iris Pro Graphics 580? (GT4e, 72 EU, 128 MB eDRAM).
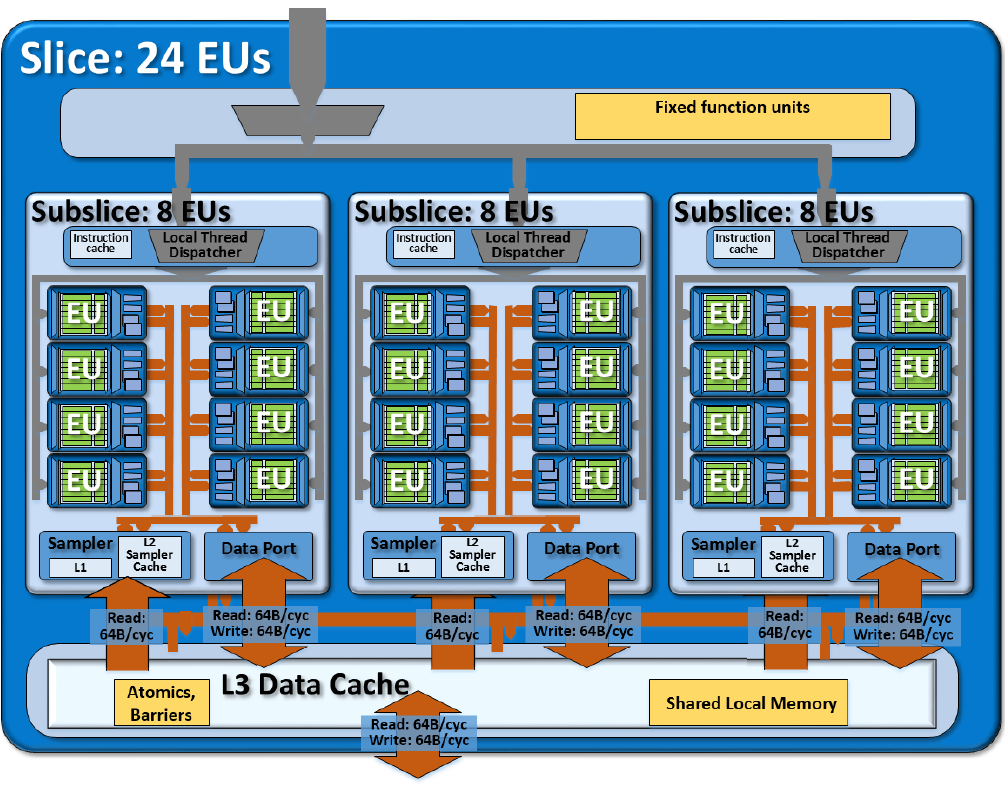
W przetestowanych procesorach czterordzeniowych był to HD Graphics 530, który jest następcą układów HD Graphics 4600 (Haswell, 20 EU) i HD Graphics 5600 (Brodwell, 24 EU).
Wzrost wydajności względem HD Graphics 4600 sięga nawet 25-30%. W porównaniu z HD Graphics 5600 jest to natomiast tylko około 5%. W grach HD Graphics 530 zapewnia podobne osiągi, co karta grafiki GeForce 920M. Na mocno obniżonych ustawieniach można pograć w wiele nowych produkcji.
W testach niektórych gier wystąpiły pewne problemy. W niektórych tytułach stwierdzono dziwnie słabe wyniki (Counter-Strike: GO, GTA V, Watch Dogs). W przypadku Call of Duty: Advanced Warfare gra się co rusz zawieszała. Przypuszczalnie winny był sterownik grafiki.
| 3DMark 11 - 1280x720 Performance GPU (sortuj wg wyników) | |
| Intel HD Graphics 530 | |
| Intel HD Graphics 530 | |
| Intel Iris Pro Graphics 5200 | |
| Intel HD Graphics 5600 | |
| Intel HD Graphics 4600 | |
| Intel HD Graphics 4600 | |
| NVIDIA GeForce 940M | |
| NVIDIA GeForce 940M | |
| NVIDIA GeForce 930M | |
| NVIDIA GeForce 930M | |
| NVIDIA GeForce 920M | |
| NVIDIA GeForce 920M | |
| 3DMark - 1920x1080 Fire Strike Graphics (sortuj wg wyników) | |
| Intel HD Graphics 530 | |
| Intel HD Graphics 530 | |
| Intel Iris Pro Graphics 5200 | |
| Intel HD Graphics 5600 | |
| Intel HD Graphics 4600 | |
| Intel HD Graphics 4600 | |
| NVIDIA GeForce 940M | |
| NVIDIA GeForce 940M | |
| NVIDIA GeForce 930M | |
| NVIDIA GeForce 930M | |
| NVIDIA GeForce 920M | |
| NVIDIA GeForce 920M | |
| NVIDIA GeForce 920M | |
| Fifa 15 | |
| 1280x720 Low Preset (sortuj wg wyników) | |
| Intel HD Graphics 530 | |
| Intel Iris Pro Graphics 5200 | |
| Intel HD Graphics 5600 | |
| Intel HD Graphics 4600 | |
| NVIDIA GeForce 920M | |
| NVIDIA GeForce 920M | |
| AMD Radeon R7 (Kaveri) | |
| 1366x768 High Preset AA:2x MS (sortuj wg wyników) | |
| Intel HD Graphics 530 | |
| Intel Iris Pro Graphics 5200 | |
| Intel HD Graphics 5600 | |
| Intel HD Graphics 4600 | |
| NVIDIA GeForce 940M | |
| NVIDIA GeForce 930M | |
| NVIDIA GeForce 930M | |
| NVIDIA GeForce 920M | |
| NVIDIA GeForce 920M | |
| AMD Radeon R7 (Kaveri) | |
| Sims 4 | |
| 1366x768 Medium Preset (sortuj wg wyników) | |
| Intel HD Graphics 530 | |
| Intel Iris Pro Graphics 5200 | |
| Intel HD Graphics 5600 | |
| Intel HD Graphics 4600 | |
| NVIDIA GeForce 920M | |
| NVIDIA GeForce 920M | |
| AMD Radeon R7 (Kaveri) | |
| 1920x1080 High Preset (sortuj wg wyników) | |
| Intel HD Graphics 530 | |
| Intel Iris Pro Graphics 5200 | |
| Intel HD Graphics 5600 | |
| Intel HD Graphics 4600 | |
| NVIDIA GeForce 920M | |
| NVIDIA GeForce 920M | |
| AMD Radeon R7 (Kaveri) | |
| GRID: Autosport | |
| 1366x768 Medium Preset (sortuj wg wyników) | |
| Intel HD Graphics 530 | |
| Intel Iris Pro Graphics 5200 | |
| Intel HD Graphics 5600 | |
| Intel HD Graphics 4600 | |
| NVIDIA GeForce 940M | |
| NVIDIA GeForce 940M | |
| NVIDIA GeForce 930M | |
| NVIDIA GeForce 930M | |
| NVIDIA GeForce 920M | |
| 1920x1080 High Preset (sortuj wg wyników) | |
| Intel HD Graphics 530 | |
| Intel Iris Pro Graphics 5200 | |
| Intel HD Graphics 5600 | |
| Intel HD Graphics 4600 | |
| NVIDIA GeForce 940M | |
| NVIDIA GeForce 940M | |
| NVIDIA GeForce 930M | |
| NVIDIA GeForce 930M | |
| NVIDIA GeForce 920M | |
| BioShock Infinite | |
| 1280x720 Very Low Preset (sortuj wg wyników) | |
| Intel HD Graphics 530 | |
| Intel HD Graphics 530 | |
| Intel Iris Pro Graphics 5200 | |
| Intel HD Graphics 5600 | |
| Intel HD Graphics 4600 | |
| NVIDIA GeForce 940M | |
| NVIDIA GeForce 930M | |
| NVIDIA GeForce 920M | |
| AMD Radeon R7 (Kaveri) | |
| 1366x768 Medium Preset (sortuj wg wyników) | |
| Intel HD Graphics 530 | |
| Intel HD Graphics 530 | |
| Intel Iris Pro Graphics 5200 | |
| Intel HD Graphics 5600 | |
| Intel HD Graphics 4600 | |
| NVIDIA GeForce 940M | |
| NVIDIA GeForce 940M | |
| NVIDIA GeForce 930M | |
| NVIDIA GeForce 930M | |
| NVIDIA GeForce 920M | |
| AMD Radeon R7 (Kaveri) | |
| 1366x768 High Preset (sortuj wg wyników) | |
| Intel HD Graphics 530 | |
| Intel HD Graphics 530 | |
| Intel Iris Pro Graphics 5200 | |
| Intel HD Graphics 5600 | |
| Intel HD Graphics 4600 | |
| NVIDIA GeForce 940M | |
| NVIDIA GeForce 940M | |
| NVIDIA GeForce 930M | |
| NVIDIA GeForce 930M | |
| NVIDIA GeForce 920M | |
| AMD Radeon R7 (Kaveri) | |
| Tomb Raider | |
| 1024x768 Low Preset (sortuj wg wyników) | |
| Intel HD Graphics 530 | |
| Intel HD Graphics 530 | |
| Intel Iris Pro Graphics 5200 | |
| Intel HD Graphics 5600 | |
| Intel HD Graphics 4600 | |
| NVIDIA GeForce 930M | |
| NVIDIA GeForce 920M | |
| NVIDIA GeForce 920M | |
| AMD Radeon R7 (Kaveri) | |
| 1366x768 Normal Preset AA:FX AF:4x (sortuj wg wyników) | |
| Intel HD Graphics 530 | |
| Intel HD Graphics 530 | |
| Intel Iris Pro Graphics 5200 | |
| Intel HD Graphics 5600 | |
| Intel HD Graphics 4600 | |
| NVIDIA GeForce 940M | |
| NVIDIA GeForce 930M | |
| NVIDIA GeForce 930M | |
| NVIDIA GeForce 920M | |
| NVIDIA GeForce 920M | |
| AMD Radeon R7 (Kaveri) | |
| 1366x768 High Preset AA:FX AF:8x (sortuj wg wyników) | |
| Intel HD Graphics 530 | |
| Intel HD Graphics 530 | |
| Intel Iris Pro Graphics 5200 | |
| Intel HD Graphics 5600 | |
| Intel HD Graphics 4600 | |
| NVIDIA GeForce 940M | |
| NVIDIA GeForce 930M | |
| NVIDIA GeForce 930M | |
| NVIDIA GeForce 920M | |
| NVIDIA GeForce 920M | |
| AMD Radeon R7 (Kaveri) | |
| Diablo III | |
| 1024x768 Low / off (sortuj wg wyników) | |
| Intel HD Graphics 530 | |
| Intel Iris Pro Graphics 5200 | |
| Intel HD Graphics 4600 | |
| NVIDIA GeForce 920M | |
| NVIDIA GeForce 920M | |
| 1366x768 Medium / low (sortuj wg wyników) | |
| Intel HD Graphics 530 | |
| Intel Iris Pro Graphics 5200 | |
| Intel HD Graphics 4600 | |
| NVIDIA GeForce 920M | |
| NVIDIA GeForce 920M | |
| 1366x768 High AA:on (sortuj wg wyników) | |
| Intel HD Graphics 530 | |
| Intel Iris Pro Graphics 5200 | |
| Intel HD Graphics 4600 | |
| NVIDIA GeForce 920M | |
| NVIDIA GeForce 920M | |
| Crysis 3 | |
| 1024x768 Low Preset (sortuj wg wyników) | |
| Intel HD Graphics 530 | |
| Intel Iris Pro Graphics 5200 | |
| Intel HD Graphics 5600 | |
| Intel HD Graphics 4600 | |
| NVIDIA GeForce 940M | |
| NVIDIA GeForce 930M | |
| NVIDIA GeForce 930M | |
| AMD Radeon R7 (Kaveri) | |
| 1366x768 Medium Preset AF:16x (sortuj wg wyników) | |
| Intel HD Graphics 530 | |
| Intel Iris Pro Graphics 5200 | |
| Intel HD Graphics 5600 | |
| Intel HD Graphics 4600 | |
| NVIDIA GeForce 940M | |
| NVIDIA GeForce 930M | |
| NVIDIA GeForce 930M | |
| AMD Radeon R7 (Kaveri) | |
| 1366x768 High Preset AA:FX AF:16x (sortuj wg wyników) | |
| Intel HD Graphics 530 | |
| Intel Iris Pro Graphics 5200 | |
| Intel HD Graphics 5600 | |
| Intel HD Graphics 4600 | |
| AMD Radeon R7 (Kaveri) | |
| Metro: Last Light | |
| 1024x768 Low (DX10) AF:4x (sortuj wg wyników) | |
| Intel HD Graphics 530 | |
| Intel Iris Pro Graphics 5200 | |
| Intel HD Graphics 5600 | |
| Intel HD Graphics 4600 | |
| NVIDIA GeForce 940M | |
| NVIDIA GeForce 930M | |
| NVIDIA GeForce 930M | |
| AMD Radeon R7 (Kaveri) | |
| 1366x768 Medium (DX10) AF:4x (sortuj wg wyników) | |
| Intel HD Graphics 530 | |
| Intel Iris Pro Graphics 5200 | |
| Intel HD Graphics 5600 | |
| Intel HD Graphics 4600 | |
| NVIDIA GeForce 940M | |
| NVIDIA GeForce 930M | |
| NVIDIA GeForce 930M | |
| AMD Radeon R7 (Kaveri) | |
| 1366x768 High (DX11) AF:16x (sortuj wg wyników) | |
| Intel HD Graphics 530 | |
| Intel Iris Pro Graphics 5200 | |
| Intel HD Graphics 5600 | |
| Intel HD Graphics 4600 | |
| NVIDIA GeForce 940M | |
| NVIDIA GeForce 930M | |
| NVIDIA GeForce 930M | |
| AMD Radeon R7 (Kaveri) | |
| Thief | |
| 1024x768 Very Low Preset (sortuj wg wyników) | |
| Intel HD Graphics 530 | |
| Intel HD Graphics 5600 | |
| Intel HD Graphics 4600 | |
| NVIDIA GeForce 940M | |
| NVIDIA GeForce 930M | |
| NVIDIA GeForce 930M | |
| NVIDIA GeForce 920M | |
| AMD Radeon R7 (Kaveri) | |
| 1366x768 Normal Preset AA:FX (sortuj wg wyników) | |
| Intel HD Graphics 530 | |
| Intel HD Graphics 5600 | |
| Intel HD Graphics 4600 | |
| NVIDIA GeForce 940M | |
| NVIDIA GeForce 930M | |
| NVIDIA GeForce 930M | |
| NVIDIA GeForce 920M | |
| AMD Radeon R7 (Kaveri) | |
| 1366x768 High Preset AA:FXAA & Low SS AF:4x (sortuj wg wyników) | |
| Intel HD Graphics 530 | |
| Intel HD Graphics 5600 | |
| Intel HD Graphics 4600 | |
| NVIDIA GeForce 930M | |
| NVIDIA GeForce 930M | |
| NVIDIA GeForce 920M | |
| AMD Radeon R7 (Kaveri) | |
| Evolve | |
| 1024x768 Low Graphics Quality (sortuj wg wyników) | |
| Intel HD Graphics 530 | |
| Intel Iris Pro Graphics 5200 | |
| Intel HD Graphics 5600 | |
| Intel HD Graphics 4600 | |
| NVIDIA GeForce 940M | |
| NVIDIA GeForce 930M | |
| NVIDIA GeForce 930M | |
| NVIDIA GeForce 920M | |
| NVIDIA GeForce 920M | |
| NVIDIA GeForce 920M | |
| AMD Radeon R7 (Kaveri) | |
| 1366x768 Medium Graphics Quality (sortuj wg wyników) | |
| Intel HD Graphics 530 | |
| Intel Iris Pro Graphics 5200 | |
| Intel HD Graphics 5600 | |
| Intel HD Graphics 4600 | |
| NVIDIA GeForce 940M | |
| NVIDIA GeForce 930M | |
| NVIDIA GeForce 930M | |
| NVIDIA GeForce 920M | |
| NVIDIA GeForce 920M | |
| NVIDIA GeForce 920M | |
| AMD Radeon R7 (Kaveri) | |
| 1920x1080 High Graphics Quality AA:FX (sortuj wg wyników) | |
| Intel HD Graphics 530 | |
| Intel Iris Pro Graphics 5200 | |
| Intel HD Graphics 5600 | |
| NVIDIA GeForce 920M | |
| NVIDIA GeForce 920M | |
| NVIDIA GeForce 920M | |
| AMD Radeon R7 (Kaveri) | |
| Battlefield Hardline | |
| 1024x768 Low Graphics Quality (DX11) (sortuj wg wyników) | |
| Intel HD Graphics 530 | |
| Intel Iris Pro Graphics 5200 | |
| Intel HD Graphics 5600 | |
| Intel HD Graphics 4600 | |
| NVIDIA GeForce 940M | |
| NVIDIA GeForce 930M | |
| NVIDIA GeForce 930M | |
| NVIDIA GeForce 920M | |
| NVIDIA GeForce 920M | |
| NVIDIA GeForce 920M | |
| AMD Radeon R7 (Kaveri) | |
| 1366x768 Medium Graphics Quality (DX11) (sortuj wg wyników) | |
| Intel HD Graphics 530 | |
| Intel Iris Pro Graphics 5200 | |
| Intel HD Graphics 5600 | |
| Intel HD Graphics 4600 | |
| NVIDIA GeForce 940M | |
| NVIDIA GeForce 930M | |
| NVIDIA GeForce 930M | |
| NVIDIA GeForce 920M | |
| NVIDIA GeForce 920M | |
| NVIDIA GeForce 920M | |
| AMD Radeon R7 (Kaveri) | |
| 1920x1080 High Graphics Quality (DX11) (sortuj wg wyników) | |
| Intel HD Graphics 530 | |
| Intel Iris Pro Graphics 5200 | |
| Intel HD Graphics 5600 | |
| Intel HD Graphics 4600 | |
| NVIDIA GeForce 940M | |
| NVIDIA GeForce 930M | |
| NVIDIA GeForce 930M | |
| NVIDIA GeForce 920M | |
| NVIDIA GeForce 920M | |
| NVIDIA GeForce 920M | |
| AMD Radeon R7 (Kaveri) | |
| Dirt Rally | |
| 1024x768 Ultra Low Preset (sortuj wg wyników) | |
| Intel HD Graphics 530 | |
| Intel Iris Pro Graphics 5200 | |
| Intel HD Graphics 5600 | |
| Intel HD Graphics 4600 | |
| NVIDIA GeForce 930M | |
| NVIDIA GeForce 920M | |
| NVIDIA GeForce 920M | |
| NVIDIA GeForce 920M | |
| AMD Radeon R7 (Kaveri) | |
| 1366x768 Medium Preset (sortuj wg wyników) | |
| Intel HD Graphics 530 | |
| Intel Iris Pro Graphics 5200 | |
| Intel HD Graphics 5600 | |
| Intel HD Graphics 4600 | |
| NVIDIA GeForce 930M | |
| NVIDIA GeForce 930M | |
| NVIDIA GeForce 920M | |
| NVIDIA GeForce 920M | |
| NVIDIA GeForce 920M | |
| AMD Radeon R7 (Kaveri) | |
| 1920x1080 High Preset (sortuj wg wyników) | |
| Intel HD Graphics 530 | |
| Intel Iris Pro Graphics 5200 | |
| Intel HD Graphics 5600 | |
| Intel HD Graphics 4600 | |
| NVIDIA GeForce 930M | |
| NVIDIA GeForce 930M | |
| NVIDIA GeForce 920M | |
| NVIDIA GeForce 920M | |
| NVIDIA GeForce 920M | |
| AMD Radeon R7 (Kaveri) | |
| Civilization: Beyond Earth | |
| 1024x768 Minimum Preset (sortuj wg wyników) | |
| Intel HD Graphics 530 | |
| Intel Iris Pro Graphics 5200 | |
| Intel HD Graphics 4600 | |
| NVIDIA GeForce 940M | |
| NVIDIA GeForce 930M | |
| AMD Radeon R7 (Kaveri) | |
| 1366x768 Medium Preset (sortuj wg wyników) | |
| Intel HD Graphics 530 | |
| Intel Iris Pro Graphics 5200 | |
| Intel HD Graphics 4600 | |
| NVIDIA GeForce 940M | |
| NVIDIA GeForce 930M | |
| NVIDIA GeForce 930M | |
| AMD Radeon R7 (Kaveri) | |
| 1920x1080 High Preset (sortuj wg wyników) | |
| Intel HD Graphics 530 | |
| Intel Iris Pro Graphics 5200 | |
| Intel HD Graphics 4600 | |
| NVIDIA GeForce 940M | |
| NVIDIA GeForce 930M | |
| AMD Radeon R7 (Kaveri) | |
| Battlefield 4 | |
| 1024x768 Low Preset (sortuj wg wyników) | |
| Intel HD Graphics 530 | |
| Intel HD Graphics 5600 | |
| NVIDIA GeForce 940M | |
| NVIDIA GeForce 940M | |
| NVIDIA GeForce 930M | |
| NVIDIA GeForce 930M | |
| AMD Radeon R7 (Kaveri) | |
| 1366x768 Medium Preset (sortuj wg wyników) | |
| Intel HD Graphics 530 | |
| Intel HD Graphics 5600 | |
| NVIDIA GeForce 940M | |
| NVIDIA GeForce 940M | |
| NVIDIA GeForce 930M | |
| NVIDIA GeForce 930M | |
| AMD Radeon R7 (Kaveri) | |
| 1366x768 High Preset (sortuj wg wyników) | |
| Intel HD Graphics 530 | |
| Intel HD Graphics 5600 | |
| NVIDIA GeForce 940M | |
| NVIDIA GeForce 940M | |
| NVIDIA GeForce 930M | |
| NVIDIA GeForce 930M | |
| AMD Radeon R7 (Kaveri) | |
| Watch Dogs | |
| 1024x768 Low Overall Quality, Medium Textures (sortuj wg wyników) | |
| Intel HD Graphics 530 | |
| Intel HD Graphics 5600 | |
| Intel HD Graphics 4600 | |
| NVIDIA GeForce 920M | |
| AMD Radeon R7 (Kaveri) | |
| 1366x768 Medium Overall Quality, Medium Textures (sortuj wg wyników) | |
| Intel HD Graphics 530 | |
| Intel HD Graphics 5600 | |
| Intel HD Graphics 4600 | |
| NVIDIA GeForce 920M | |
| AMD Radeon R7 (Kaveri) | |
| 1920x1080 High Overall Quality, High Textures AA:2x MS (sortuj wg wyników) | |
| Intel HD Graphics 530 | |
| Intel HD Graphics 5600 | |
| Intel HD Graphics 4600 | |
| NVIDIA GeForce 920M | |
| AMD Radeon R7 (Kaveri) | |
| Alien: Isolation | |
| 1024x768 (Very) Low, Off, Shadow Map 512 AF:1x (sortuj wg wyników) | |
| Intel HD Graphics 530 | |
| Intel Iris Pro Graphics 5200 | |
| Intel HD Graphics 5600 | |
| Intel HD Graphics 4600 | |
| NVIDIA GeForce 940M | |
| NVIDIA GeForce 930M | |
| NVIDIA GeForce 930M | |
| NVIDIA GeForce 920M | |
| NVIDIA GeForce 920M | |
| AMD Radeon R7 (Kaveri) | |
| 1366x768 Medium, On (AA & SSAO Off), Shadow Map 1024 AF:4x (sortuj wg wyników) | |
| Intel HD Graphics 530 | |
| Intel Iris Pro Graphics 5200 | |
| Intel HD Graphics 5600 | |
| Intel HD Graphics 4600 | |
| NVIDIA GeForce 940M | |
| NVIDIA GeForce 930M | |
| NVIDIA GeForce 930M | |
| NVIDIA GeForce 920M | |
| NVIDIA GeForce 920M | |
| AMD Radeon R7 (Kaveri) | |
| 1920x1080 High, On, Shadow Map 1536, Standard SSAO AA:FX AF:8x (sortuj wg wyników) | |
| Intel HD Graphics 530 | |
| Intel Iris Pro Graphics 5200 | |
| Intel HD Graphics 5600 | |
| Intel HD Graphics 4600 | |
| NVIDIA GeForce 940M | |
| NVIDIA GeForce 930M | |
| NVIDIA GeForce 930M | |
| NVIDIA GeForce 920M | |
| NVIDIA GeForce 920M | |
| AMD Radeon R7 (Kaveri) | |
| Middle-earth: Shadow of Mordor | |
| 1280x720 Lowest Preset (sortuj wg wyników) | |
| Intel HD Graphics 530 | |
| Intel Iris Pro Graphics 5200 | |
| Intel HD Graphics 5600 | |
| Intel HD Graphics 4600 | |
| NVIDIA GeForce 940M | |
| NVIDIA GeForce 940M | |
| NVIDIA GeForce 930M | |
| NVIDIA GeForce 930M | |
| NVIDIA GeForce 920M | |
| NVIDIA GeForce 920M | |
| AMD Radeon R7 (Kaveri) | |
| 1344x756 Medium Preset (sortuj wg wyników) | |
| Intel HD Graphics 530 | |
| Intel Iris Pro Graphics 5200 | |
| Intel HD Graphics 5600 | |
| Intel HD Graphics 4600 | |
| NVIDIA GeForce 940M | |
| NVIDIA GeForce 940M | |
| NVIDIA GeForce 930M | |
| NVIDIA GeForce 930M | |
| NVIDIA GeForce 920M | |
| NVIDIA GeForce 920M | |
| AMD Radeon R7 (Kaveri) | |
| 1920x1080 High Preset (sortuj wg wyników) | |
| Intel HD Graphics 530 | |
| Intel Iris Pro Graphics 5200 | |
| Intel HD Graphics 5600 | |
| NVIDIA GeForce 940M | |
| NVIDIA GeForce 940M | |
| NVIDIA GeForce 920M | |
| NVIDIA GeForce 920M | |
| AMD Radeon R7 (Kaveri) | |
| Far Cry 4 | |
| 1024x768 Low Graphics Quality (sortuj wg wyników) | |
| Intel HD Graphics 530 | |
| Intel Iris Pro Graphics 5200 | |
| Intel HD Graphics 5600 | |
| Intel HD Graphics 4600 | |
| NVIDIA GeForce 940M | |
| NVIDIA GeForce 930M | |
| NVIDIA GeForce 930M | |
| NVIDIA GeForce 920M | |
| NVIDIA GeForce 920M | |
| AMD Radeon R7 (Kaveri) | |
| 1366x768 Medium Graphics Quality (sortuj wg wyników) | |
| Intel HD Graphics 530 | |
| Intel Iris Pro Graphics 5200 | |
| Intel HD Graphics 5600 | |
| Intel HD Graphics 4600 | |
| NVIDIA GeForce 940M | |
| NVIDIA GeForce 930M | |
| NVIDIA GeForce 930M | |
| NVIDIA GeForce 920M | |
| NVIDIA GeForce 920M | |
| AMD Radeon R7 (Kaveri) | |
| 1920x1080 High Graphics Quality AA:SM (sortuj wg wyników) | |
| Intel HD Graphics 530 | |
| Intel Iris Pro Graphics 5200 | |
| Intel HD Graphics 5600 | |
| Intel HD Graphics 4600 | |
| NVIDIA GeForce 940M | |
| NVIDIA GeForce 920M | |
| NVIDIA GeForce 920M | |
| AMD Radeon R7 (Kaveri) | |
| Dragon Age: Inquisition | |
| 1024x768 Low Graphics Quality (sortuj wg wyników) | |
| Intel HD Graphics 530 | |
| Intel HD Graphics 5600 | |
| Intel HD Graphics 4600 | |
| NVIDIA GeForce 940M | |
| NVIDIA GeForce 930M | |
| NVIDIA GeForce 930M | |
| NVIDIA GeForce 920M | |
| NVIDIA GeForce 920M | |
| NVIDIA GeForce 920M | |
| AMD Radeon R7 (Kaveri) | |
| 1366x768 Medium Graphics Quality (sortuj wg wyników) | |
| Intel HD Graphics 530 | |
| Intel HD Graphics 5600 | |
| Intel HD Graphics 4600 | |
| NVIDIA GeForce 940M | |
| NVIDIA GeForce 930M | |
| NVIDIA GeForce 930M | |
| NVIDIA GeForce 920M | |
| NVIDIA GeForce 920M | |
| NVIDIA GeForce 920M | |
| AMD Radeon R7 (Kaveri) | |
| 1920x1080 High Graphics Quality (sortuj wg wyników) | |
| Intel HD Graphics 530 | |
| Intel HD Graphics 5600 | |
| Intel HD Graphics 4600 | |
| NVIDIA GeForce 940M | |
| NVIDIA GeForce 930M | |
| NVIDIA GeForce 920M | |
| NVIDIA GeForce 920M | |
| NVIDIA GeForce 920M | |
| AMD Radeon R7 (Kaveri) | |
| The Witcher 3 | |
| 1024x768 Low Graphics & Postprocessing (sortuj wg wyników) | |
| Intel HD Graphics 530 | |
| Intel Iris Pro Graphics 5200 | |
| Intel HD Graphics 5600 | |
| Intel HD Graphics 4600 | |
| NVIDIA GeForce 930M | |
| NVIDIA GeForce 920M | |
| NVIDIA GeForce 920M | |
| NVIDIA GeForce 920M | |
| AMD Radeon R7 (Kaveri) | |
| 1366x768 Medium Graphics & Postprocessing (sortuj wg wyników) | |
| Intel HD Graphics 530 | |
| Intel HD Graphics 5600 | |
| Intel HD Graphics 4600 | |
| NVIDIA GeForce 920M | |
| NVIDIA GeForce 920M | |
| NVIDIA GeForce 920M | |
| AMD Radeon R7 (Kaveri) | |
| 1920x1080 High Graphics & Postprocessing (Nvidia HairWorks Off) (sortuj wg wyników) | |
| Intel HD Graphics 530 | |
| Intel HD Graphics 5600 | |
| NVIDIA GeForce 920M | |
| NVIDIA GeForce 920M | |
| NVIDIA GeForce 920M | |
| AMD Radeon R7 (Kaveri) | |
| Batman: Arkham Knight | |
| 1280x720 Low / Off AF:Trilinear (sortuj wg wyników) | |
| Intel HD Graphics 530 | |
| Intel Iris Pro Graphics 5200 | |
| Intel HD Graphics 4600 | |
| NVIDIA GeForce 920M | |
| NVIDIA GeForce 920M | |
| AMD Radeon R7 (Kaveri) | |
| 1366x768 Normal / Off AF:4x (sortuj wg wyników) | |
| Intel HD Graphics 530 | |
| Intel Iris Pro Graphics 5200 | |
| Intel HD Graphics 4600 | |
| NVIDIA GeForce 920M | |
| NVIDIA GeForce 920M | |
| AMD Radeon R7 (Kaveri) | |
| 1920x1080 High / On (Interactive Smoke & Paper Debris Off) AA:SM AF:8x (sortuj wg wyników) | |
| Intel HD Graphics 530 | |
| NVIDIA GeForce 920M | |
| NVIDIA GeForce 920M | |
| AMD Radeon R7 (Kaveri) | |
| Metal Gear Solid V | |
| 1024x768 Low / Off (sortuj wg wyników) | |
| Intel HD Graphics 530 | |
| Intel Iris Pro Graphics 5200 | |
| Intel HD Graphics 4600 | |
| AMD Radeon R7 (Kaveri) | |
| 1366x768 Medium / Off (sortuj wg wyników) | |
| Intel HD Graphics 530 | |
| Intel Iris Pro Graphics 5200 | |
| Intel HD Graphics 4600 | |
| AMD Radeon R7 (Kaveri) | |
| 1920x1080 High / On (sortuj wg wyników) | |
| Intel HD Graphics 530 | |
| Intel Iris Pro Graphics 5200 | |
| Intel HD Graphics 4600 | |
| AMD Radeon R7 (Kaveri) | |
| Mad Max | |
| 1366x768 Normal Preset AF:2x (sortuj wg wyników) | |
| Intel HD Graphics 530 | |
| Intel Iris Pro Graphics 5200 | |
| Intel HD Graphics 4600 | |
| AMD Radeon R7 (Kaveri) | |
| 1920x1080 High Preset AF:6x (sortuj wg wyników) | |
| Intel HD Graphics 530 | |
| Intel Iris Pro Graphics 5200 | |
| Intel HD Graphics 4600 | |
Pobór mocy i efektywność energetyczna
Do analizy poboru mocy wybrano odczytywany przez narzędzie HWiNFO parametr "CPU Package Power". Pokazuje on pobór mocy procesora i służy do obserwowania TDP.
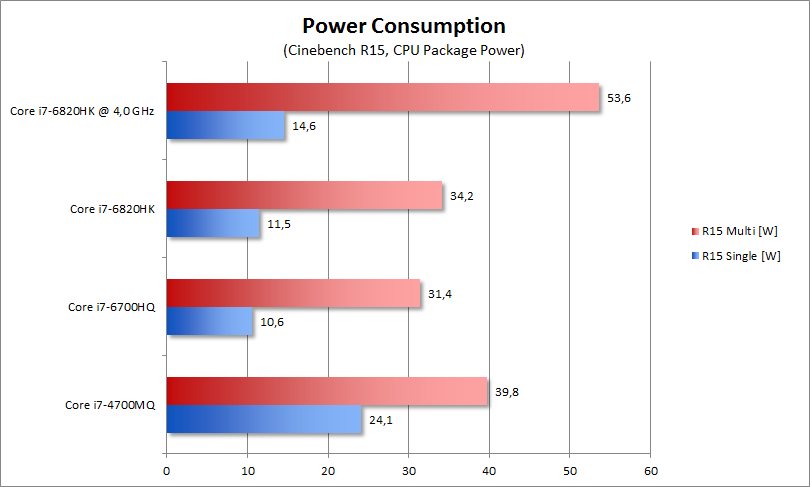
W teście wielowątkowym aplikacji Cinebench R15 procesory i7-6700HQ i i7-6820HK wykazały się niższym TDP od i7-4700MQ (Haswell), przy czym różnice wynosiły około 6-8 W. Po podkręceniu do 4 GHz (realnie 3,8-3,9 GHz) TDP i7-6820HK osiągnęło prawie 54 W.
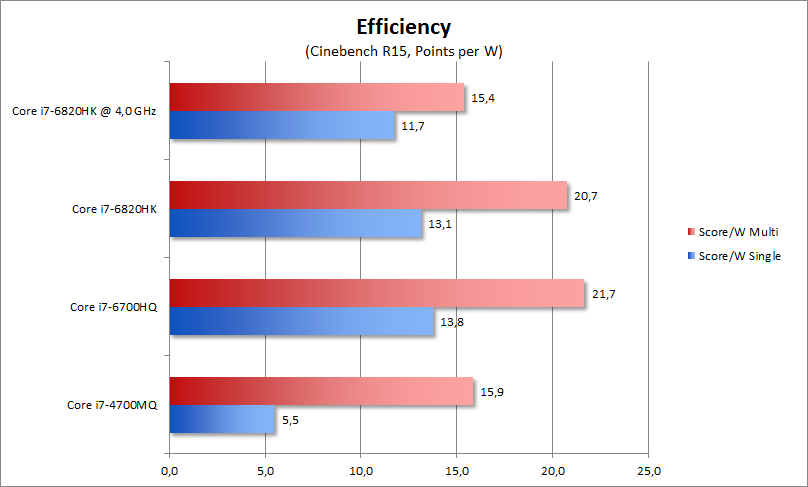
Prawdziwym zaskoczeniem była jednak różnica w poborze mocy w teście jednowątkowym. Tutaj i7-6700HQ potrzebował aż o 13,5 W mniej od i7-4700MQ. Efektywność energetyczna w tym teście (mierzona w punktach na wat) obu procesorów Skylake okazała się w teście jednowątkowym ponad dwukrotnie lepsza, niż w przypadku i7-4700MQ (13,8 dla i7-6700HQ, 13,1 w przypadku i7-6820HK, 5,5 w przypadku i7-4700MQ). Oznacza to m.in., że laptopy z tymi procesorami będą dłużej działać na akumulatorze podczas normalnej pracy.
Podsumowanie
Jeżeli ktoś wiązał z procesorami Skylake nadzieję na znaczący wzrost wydajności obliczeniowej, może być zawiedziony. Pod tym względem postęp w porównaniu z jednostkami Haswell i Broadwell o analogicznym TDP jest znikomy. Z tego powodu nie należy jednak nazywać nowej mikroarchitektury Intela porażką. Zamiast wzrostu wydajności dostaliśmy bowiem poprawę efektywności energetycznej. Bardzo dobrze wygląda to zwłaszcza przy obliczeniach jednowątkowych.
Testy wykazały także pewien wzrost wydajności zintegrowanego układu grafiki, widoczny głównie w porównaniu z HD Graphics 4600 z procesorów Intel Haswell. Wystarcza to do konkurowania z niezależną kartą grafiki GeForce 920M i pozwala myśleć o pograniu w przynajmniej mniej wymagające gry.
Autor: Till Schönborn
Wstęp i tłumaczenie: Tomasz Cyba
