Recenzja Schenker Work 14 Base - niedrogi laptop biurowy z dużą liczbą portów i jasnym wyświetlaczem IPS
Work 14 Base firmy Schenker to kompaktowy laptop biurowy, który oprócz jasnego i matowego wyświetlacza IPS, oferuje bardzo dobre opcje rozbudowy i szeroką gamę portów, w tym Ethernet, co nie jest już oczywiste nawet w przypadku laptopów biurowych lub biznesowych. Ceny Work 14 zaczynają się od 750 USD, a nasze testowe urządzenie z 16 GB pamięci RAM można obecnie znaleźć za około 770 USD.
Potencjalni konkurenci w porównaniu
Ocena | Data | Model | Waga | Wysokość | Rozmiar | Rezolucja | Cena |
|---|---|---|---|---|---|---|---|
| 82 % v7 (old) | 05/2024 | Schenker Work 14 Base i5-1235U, Iris Xe G7 80EUs | 1.3 kg | 20.2 mm | 14.00" | 1920x1080 | |
| 85.6 % v7 (old) | 11/2023 | Acer Swift Go 14 SFG14-71 i5-1335U, Iris Xe G7 80EUs | 1.3 kg | 14.9 mm | 14.00" | 2880x1800 | |
| 84.6 % v7 (old) | 10/2023 | HP ProBook 445 G10 R5 7530U, Vega 7 | 1.3 kg | 20 mm | 14.00" | 1920x1080 | |
| 85.3 % v7 (old) | 06/2023 | Dell Latitude 3440 i5-1345U, Iris Xe G7 80EUs | 1.5 kg | 19.4 mm | 14.00" | 1920x1080 | |
| 88.6 % v7 (old) | 08/2023 | Lenovo ThinkPad L14 G4 21H6S00900 R5 7530U, Vega 7 | 1.5 kg | 19.83 mm | 14.00" | 1920x1080 |
Obudowa i łączność
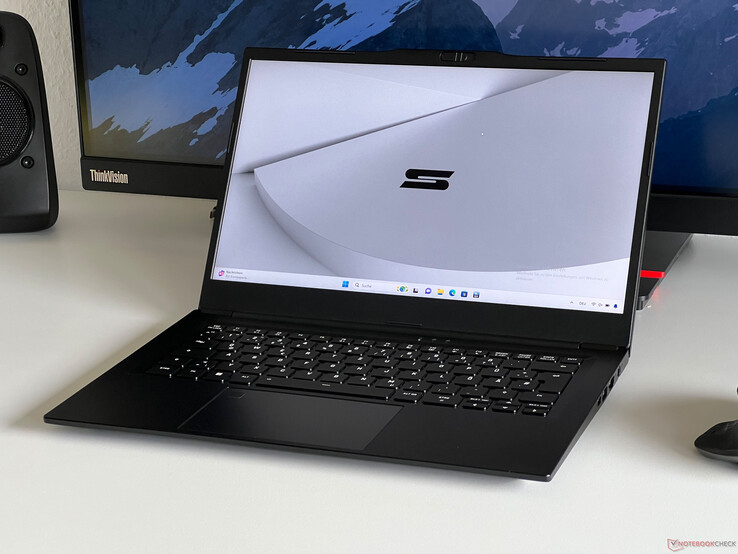
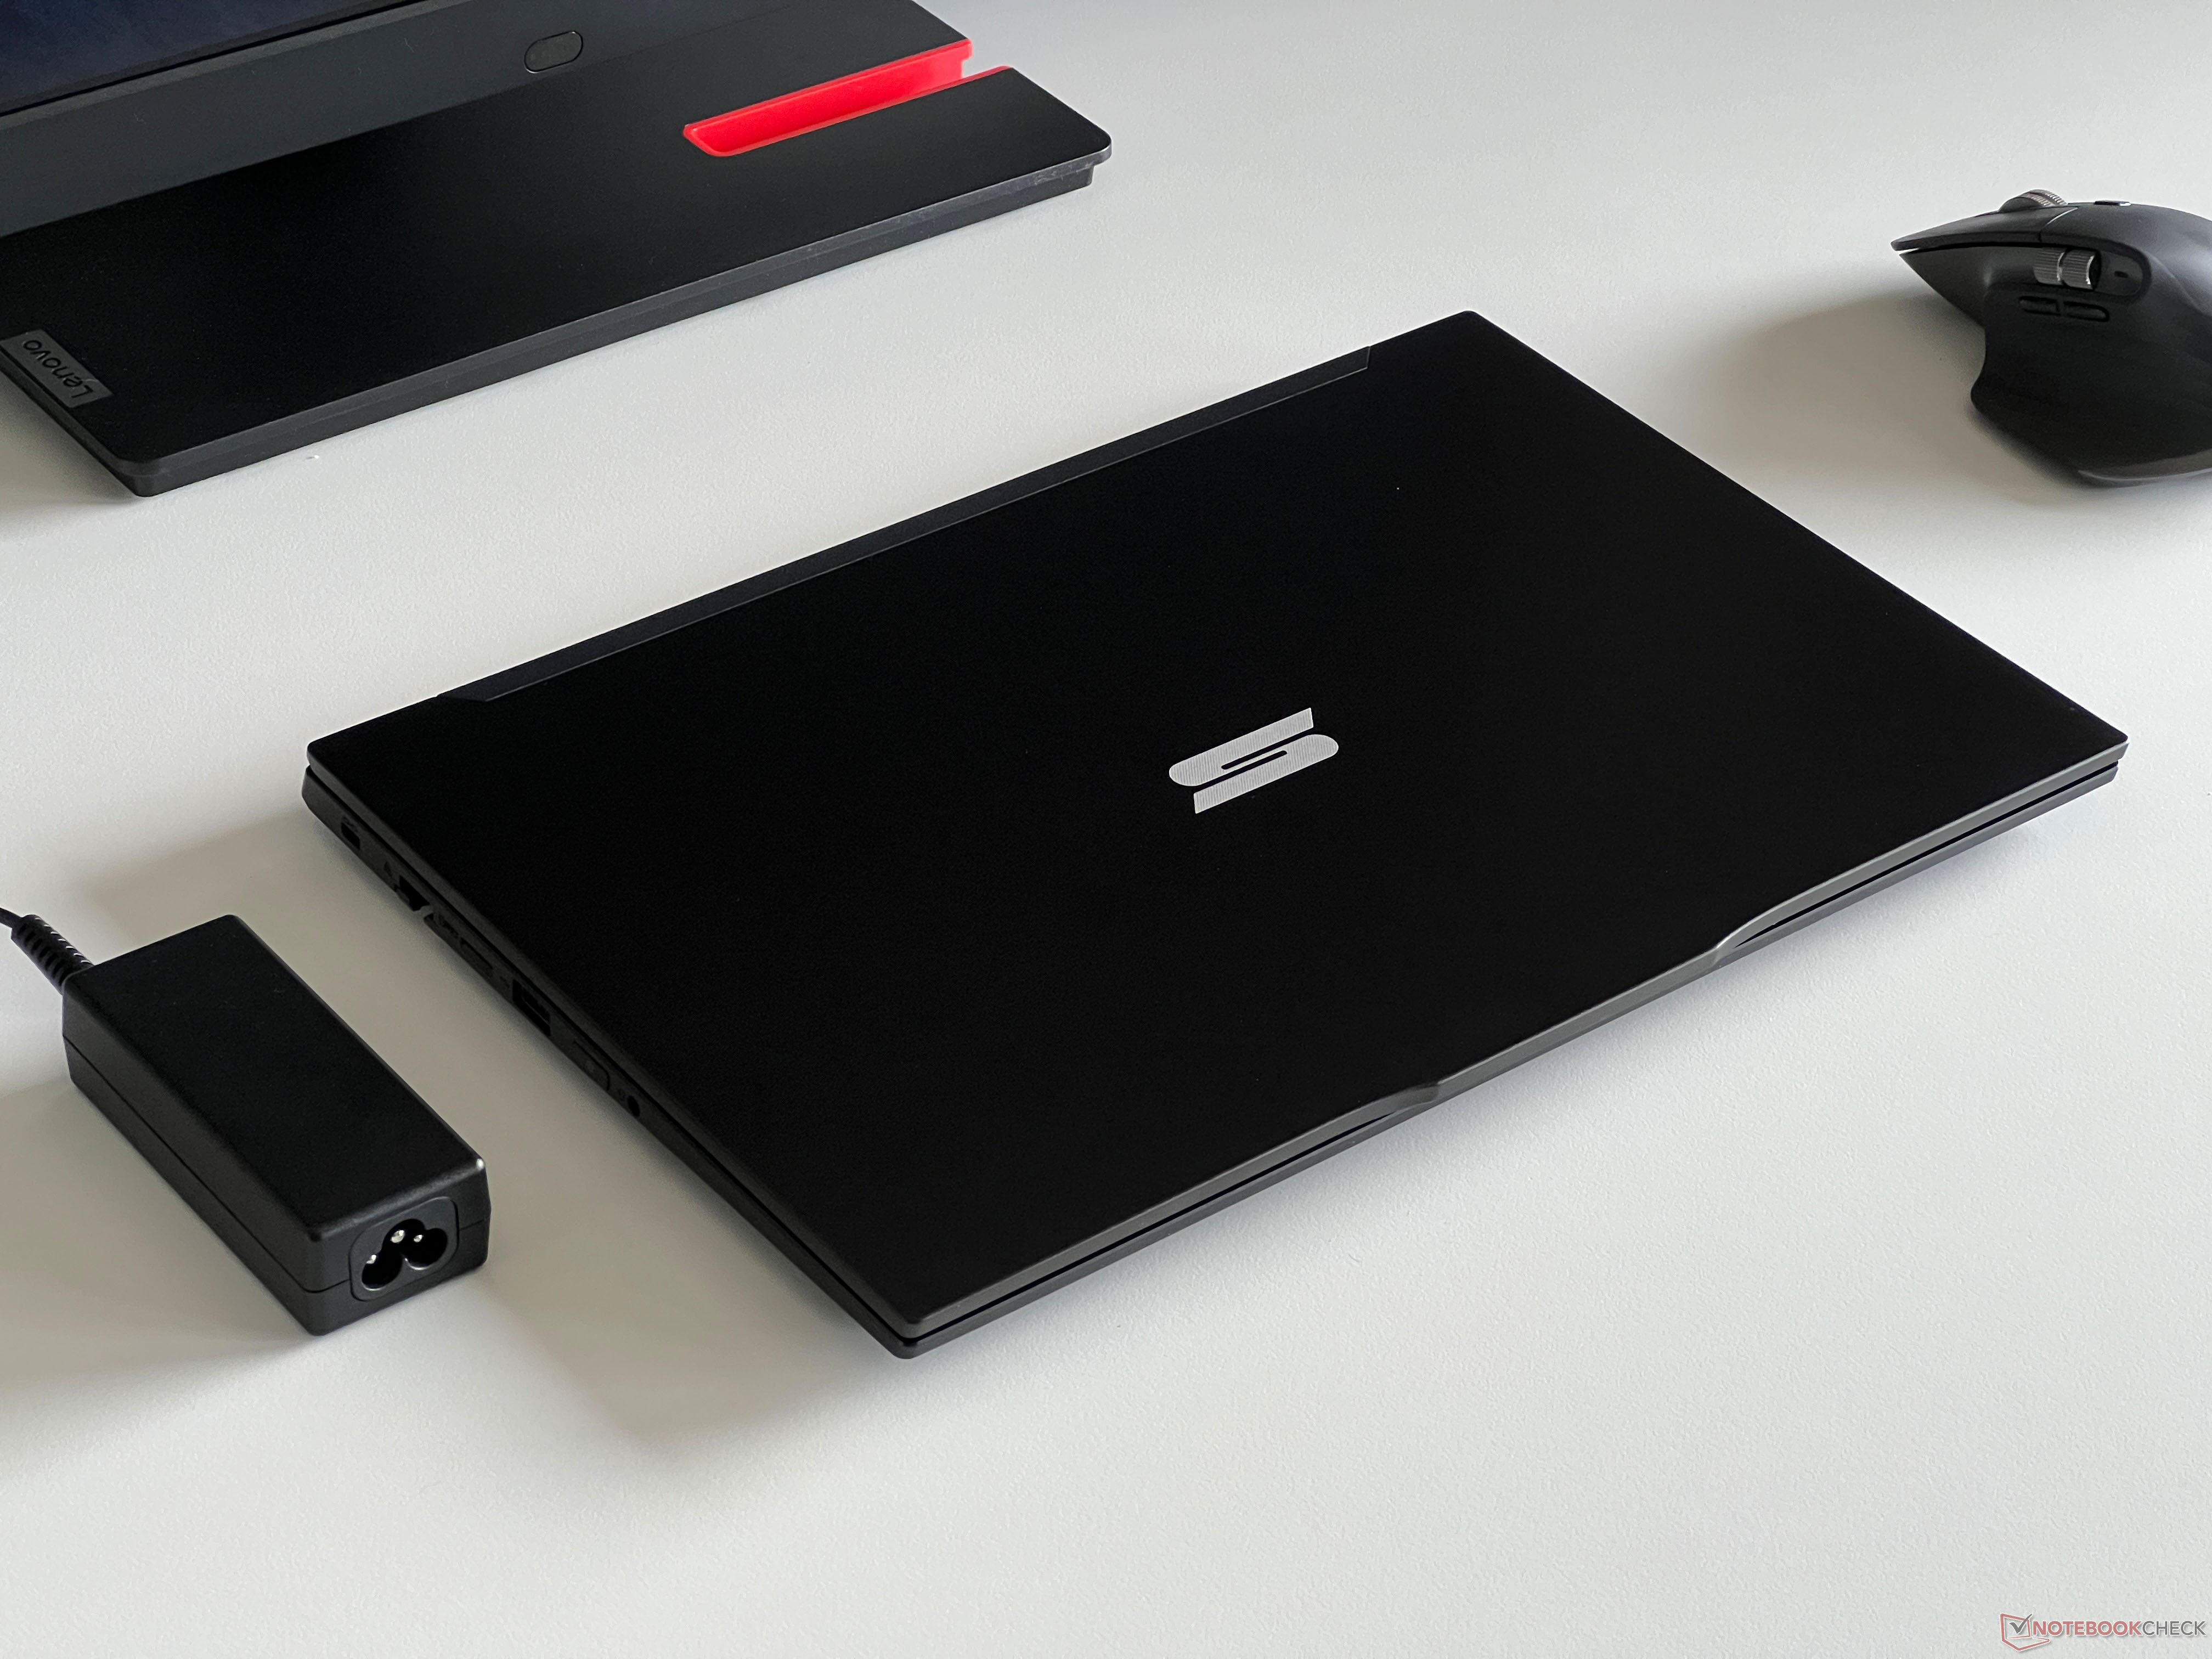
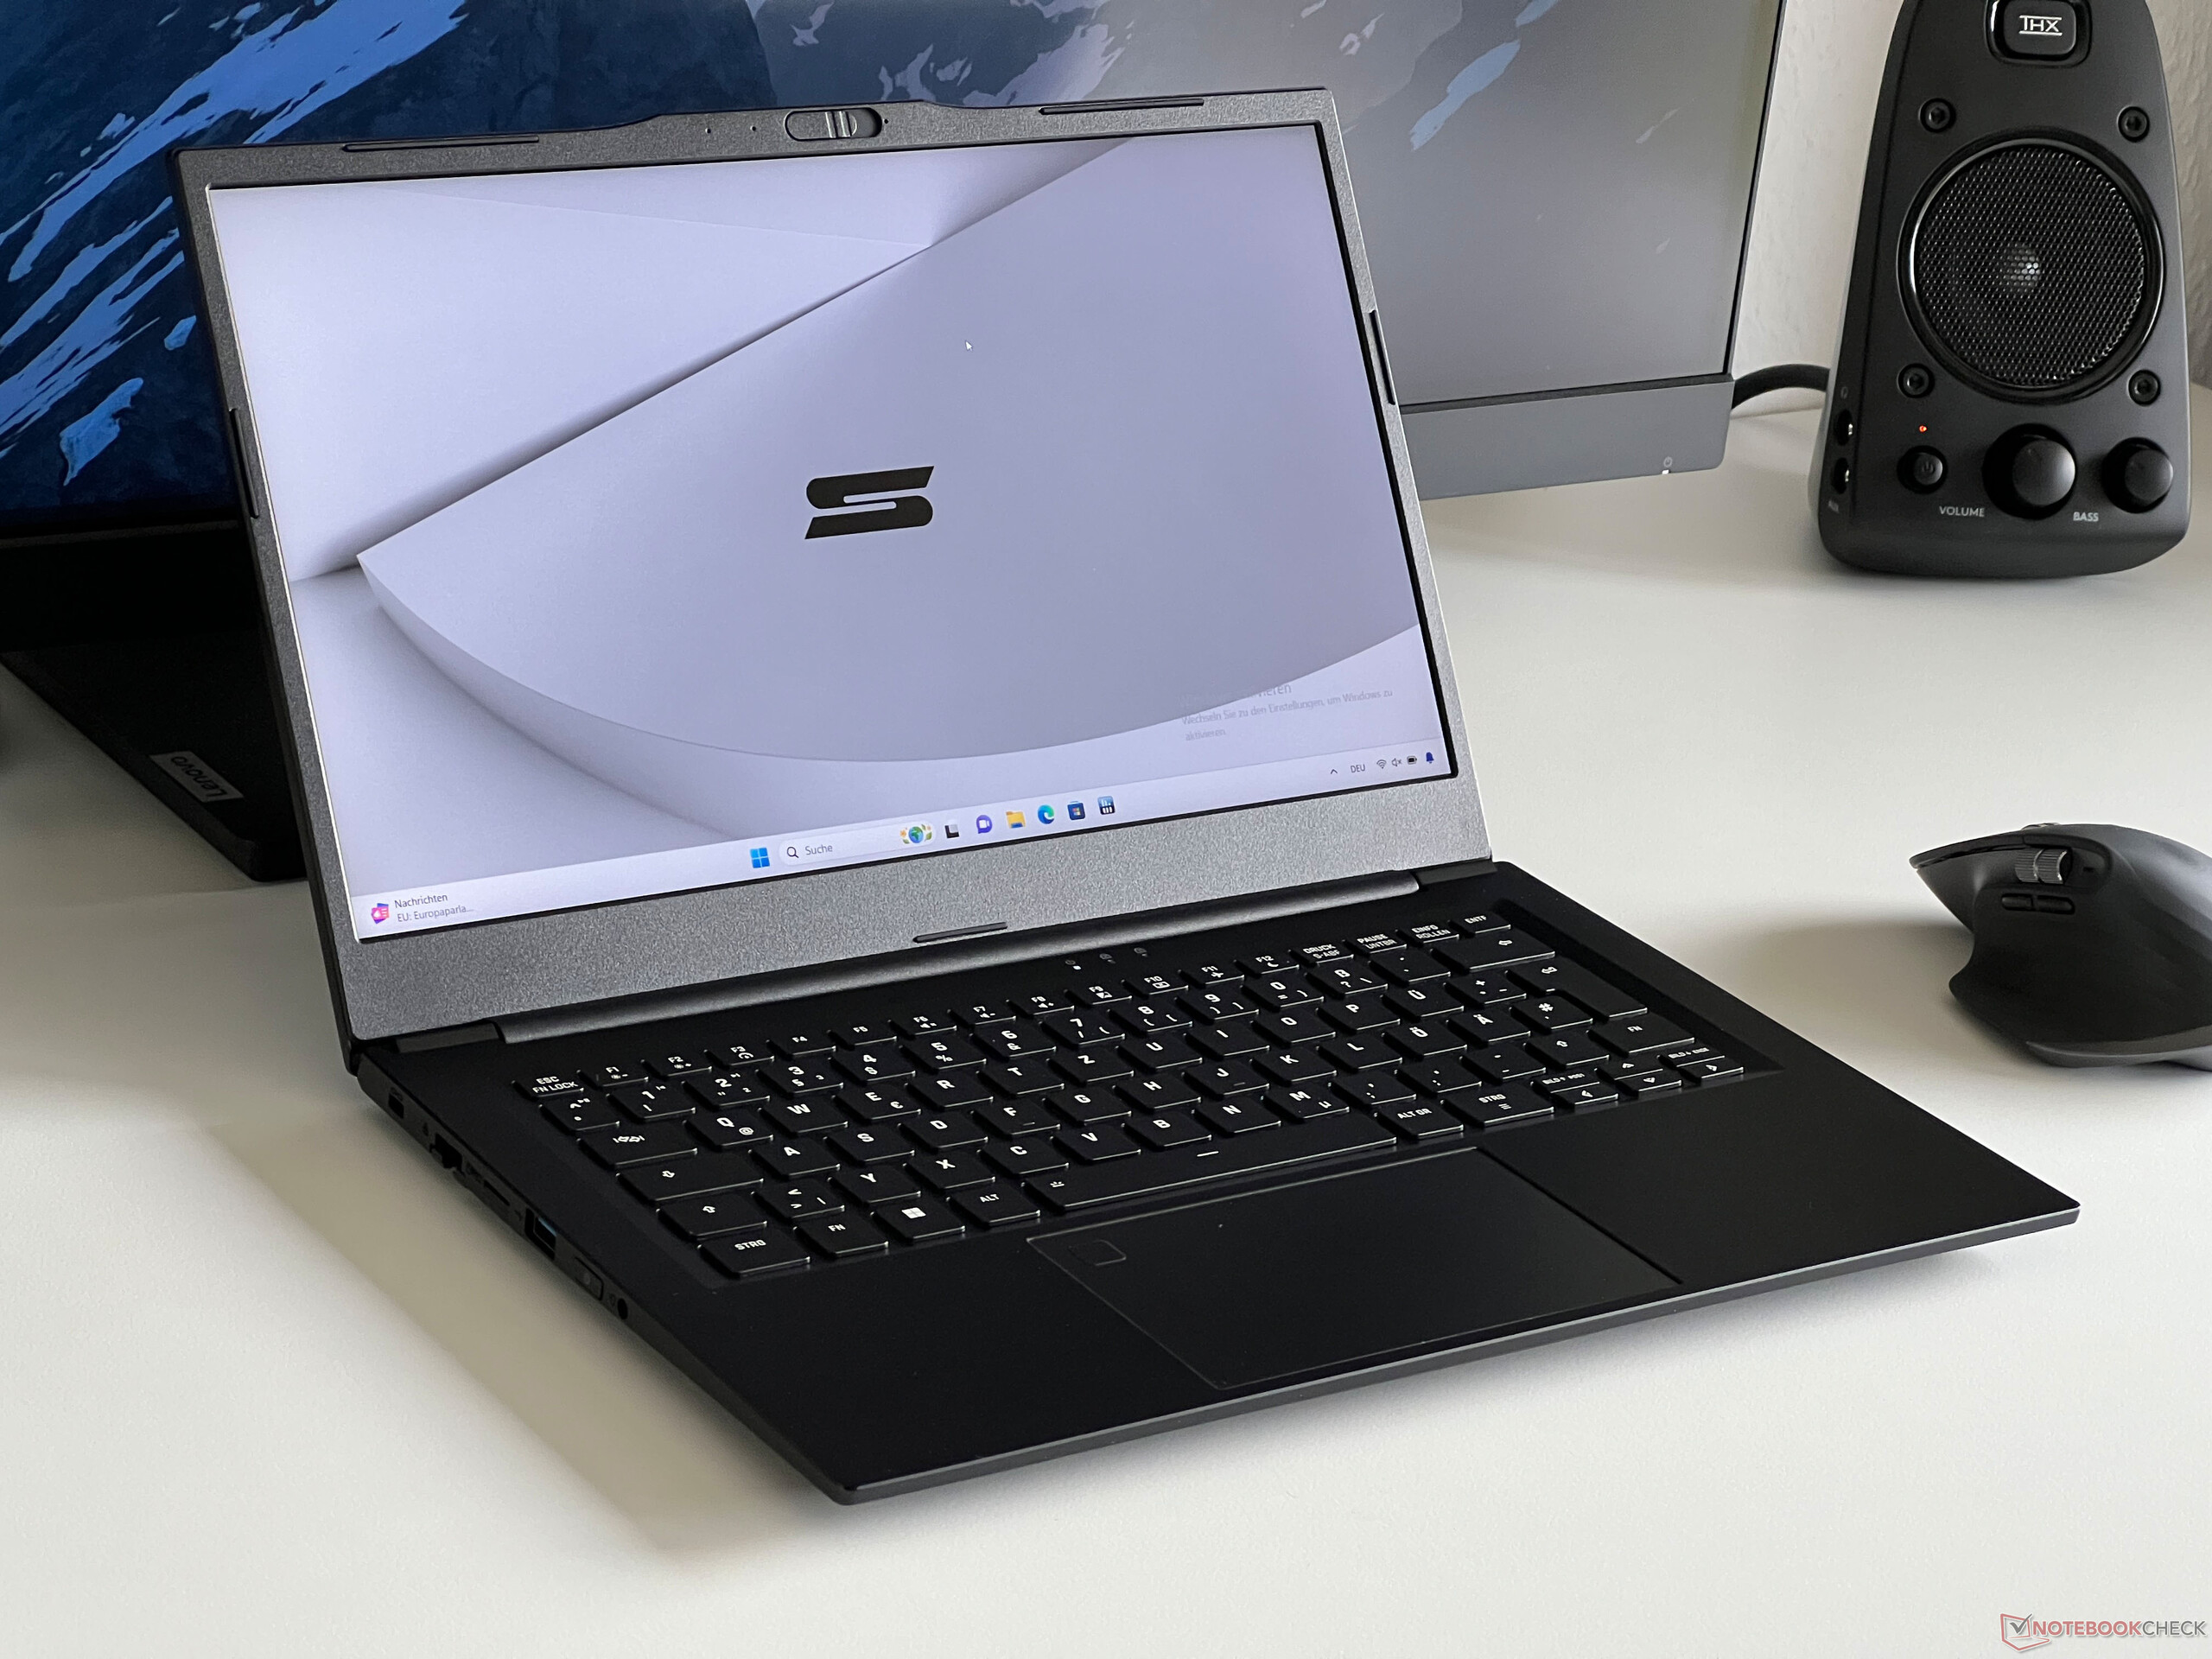
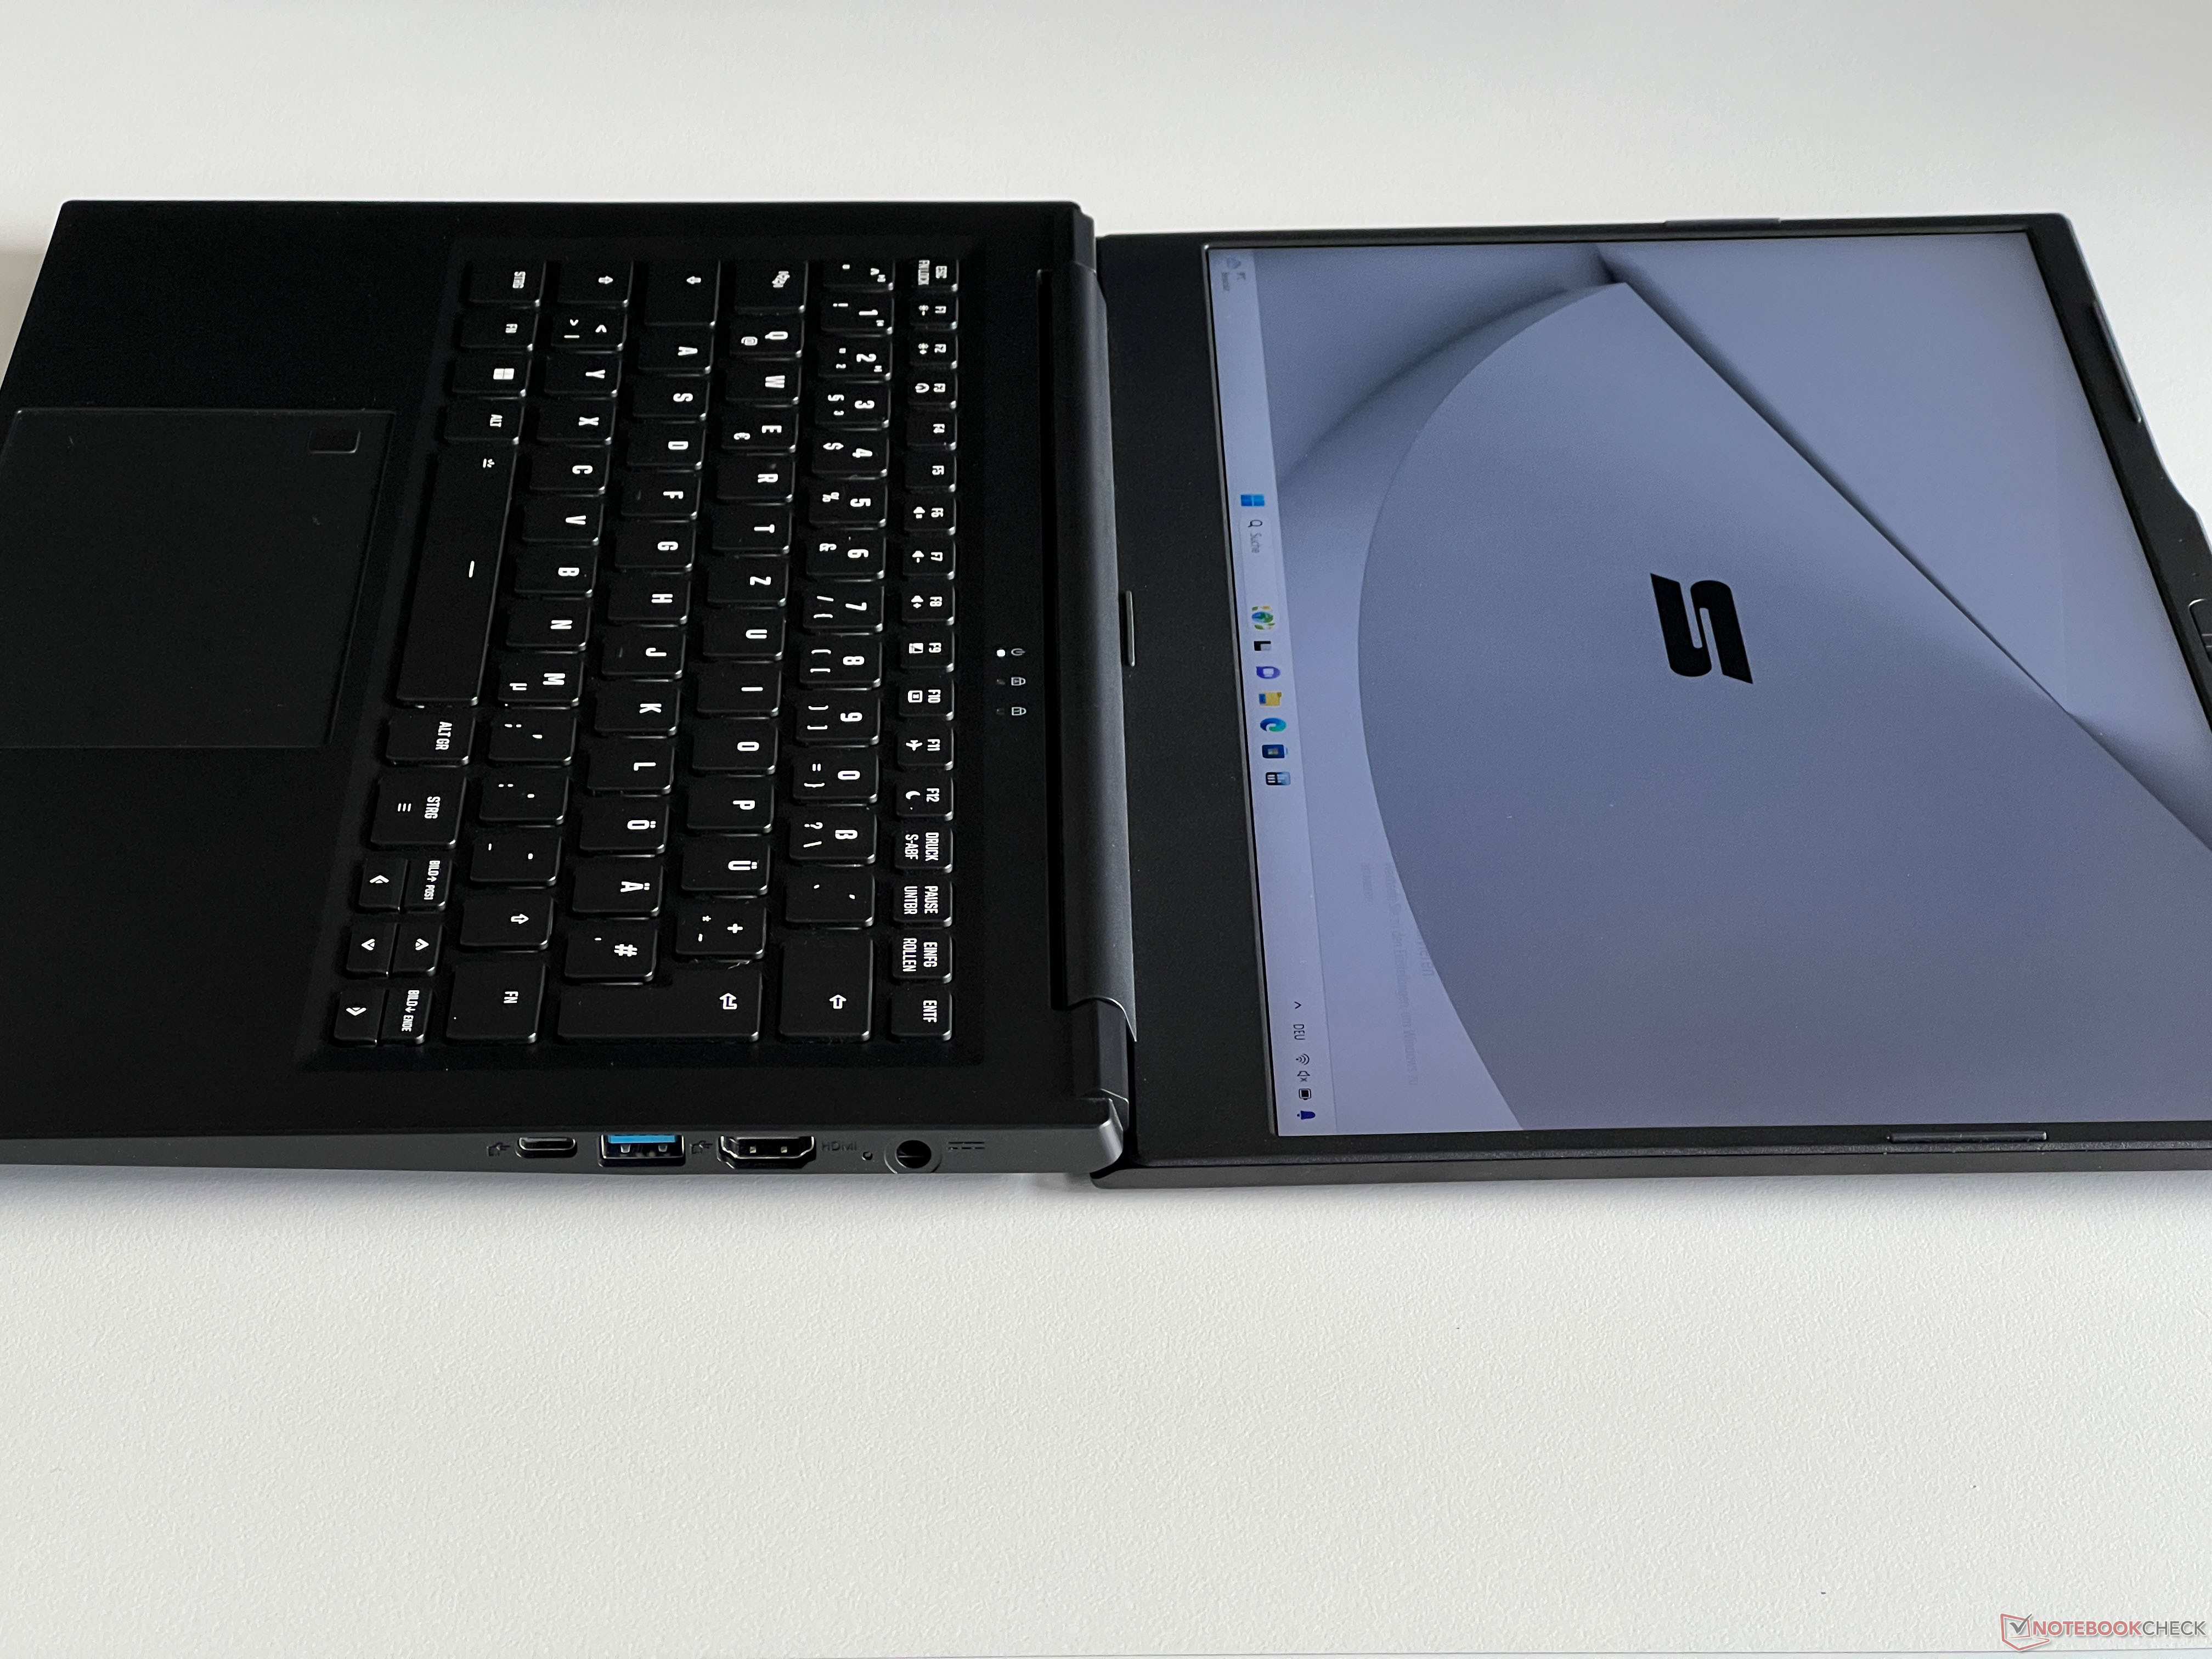
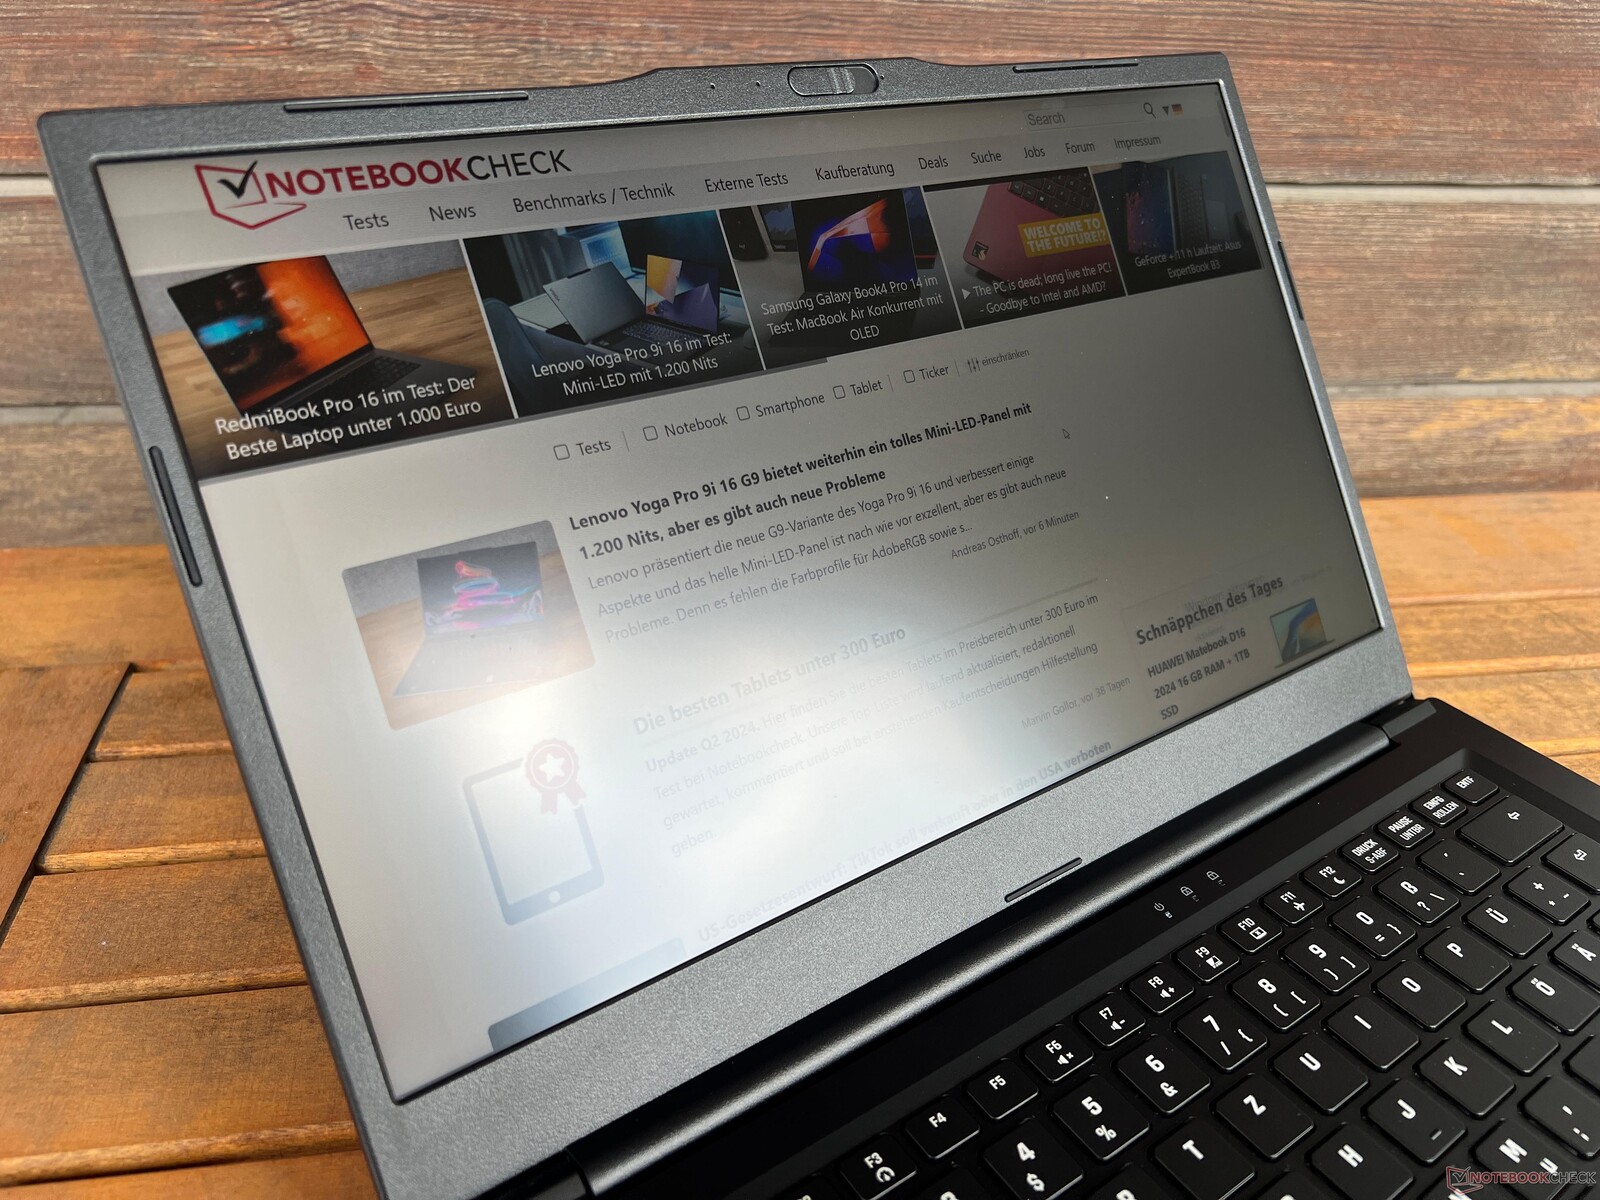
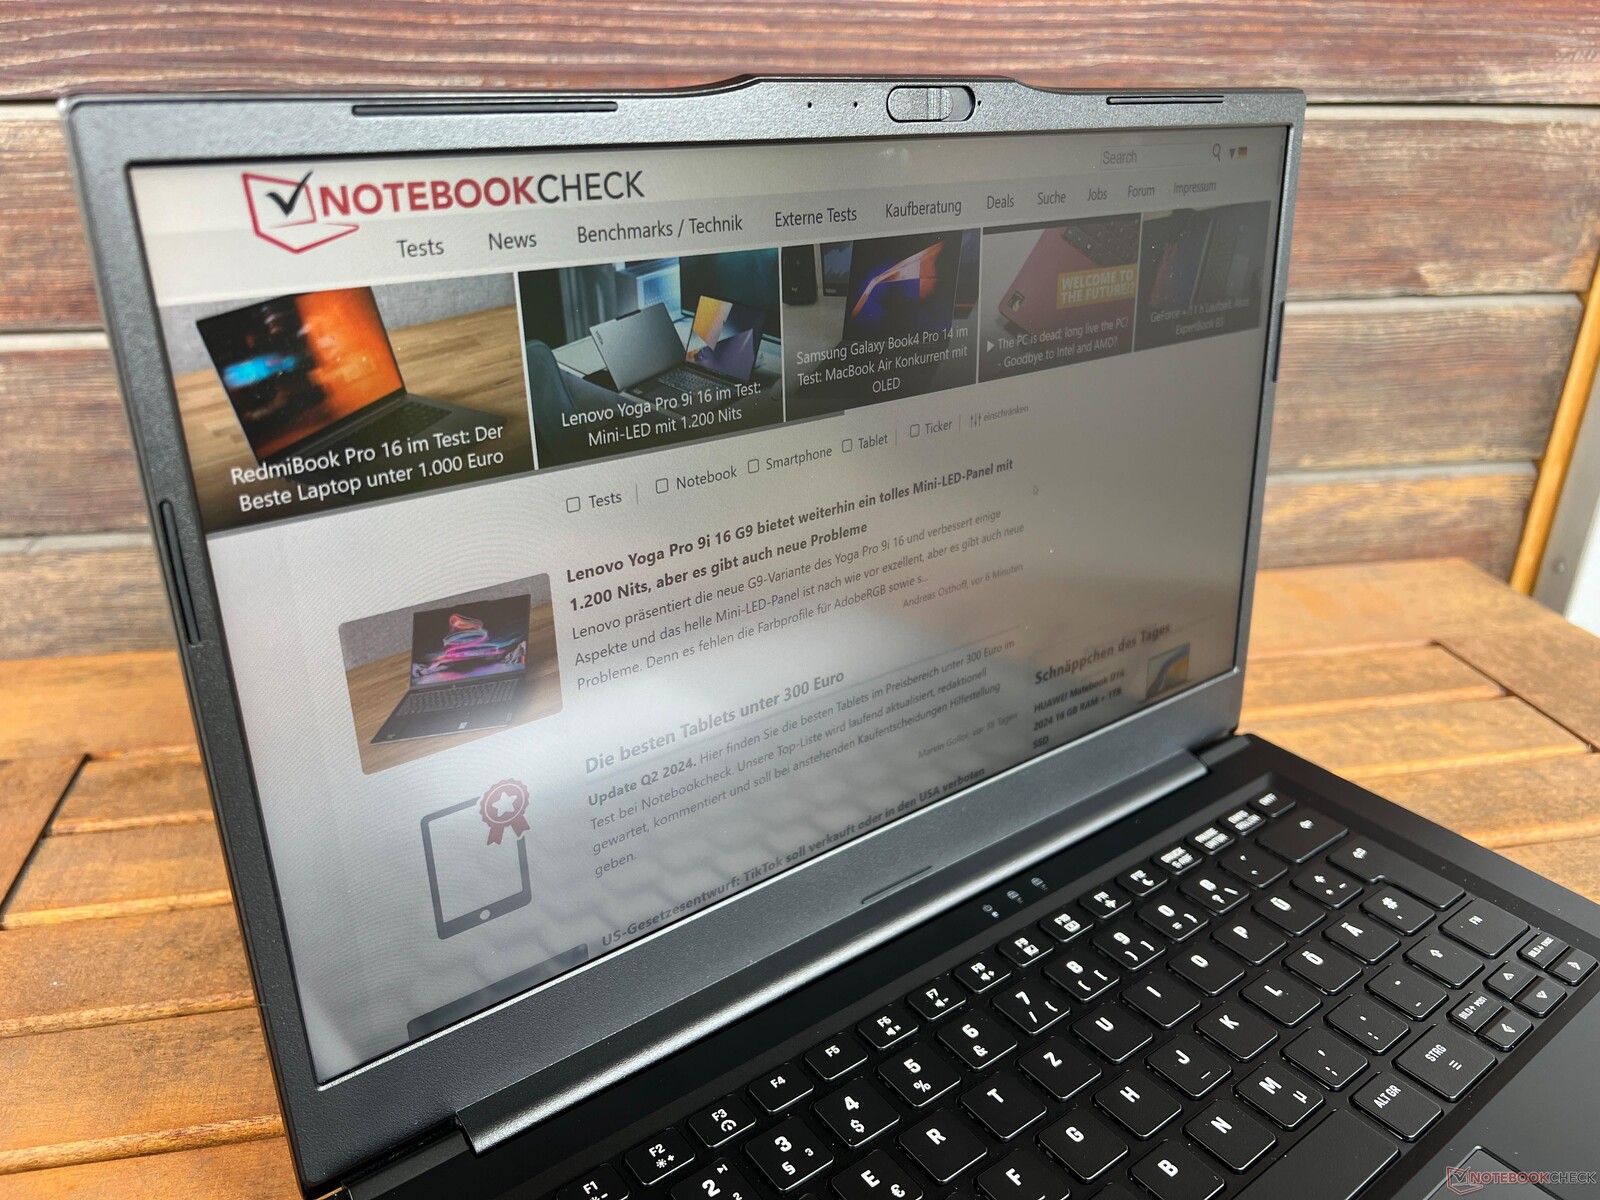
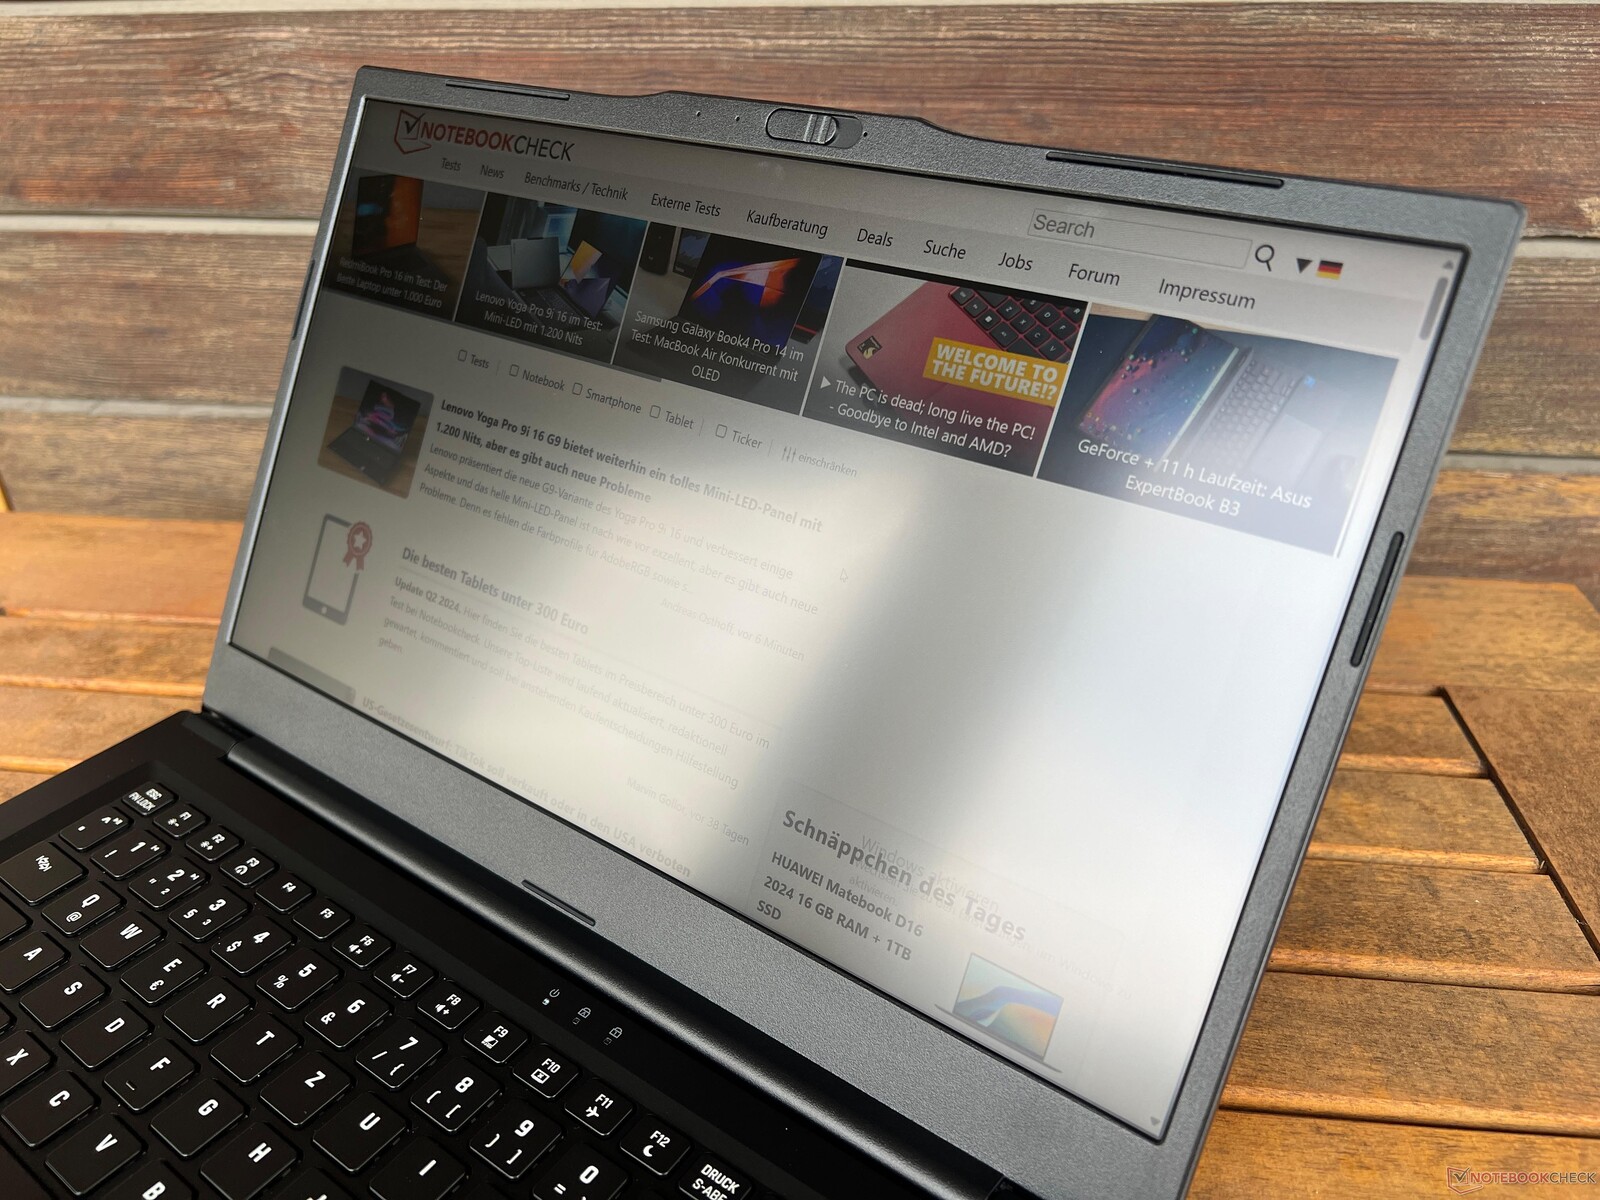
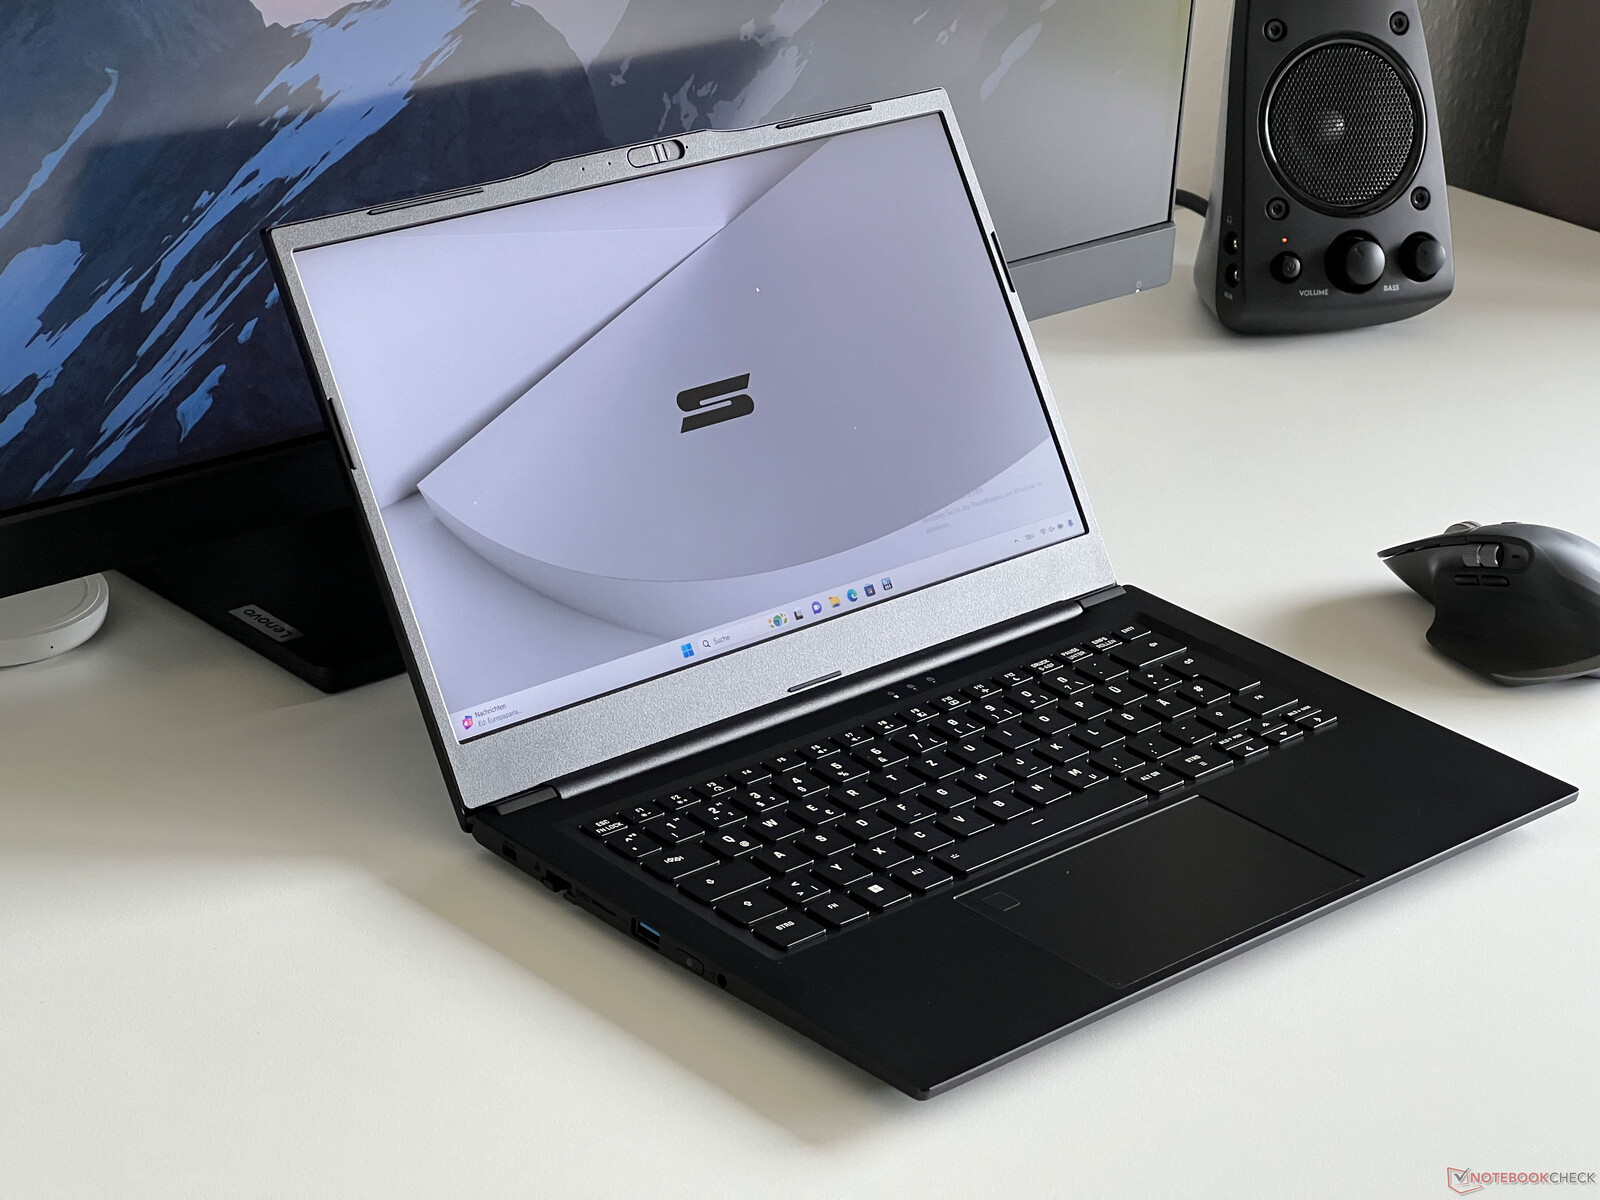
Work 14 Base posiada czarną aluminiową obudowę i na pierwszy rzut oka sprawia wrażenie wysokiej jakości. Jej gładkie powierzchnie są jednak magnesem na odciski palców i wymagają częstego czyszczenia. Za dopłatą można nabyć laptopa bez logo Schenker na pokrywie. Gdy tylko otworzymy pokrywę, co działa bardzo łatwo dzięki niezbyt atrakcyjnemu garbowi kamery, wita nas panel 16:9 z szeroką ramką wzdłuż dolnej części, która jest wykonana z szorstkiego plastiku. Nie wygląda to już szczególnie nowocześnie. Jego stabilność jest w porządku, jednak zauważyliśmy lekkie skrzypienie podczas obracania laptopa, a zwłaszcza podczas otwierania wyświetlacza (maksymalny kąt otwarcia 180 stopni).
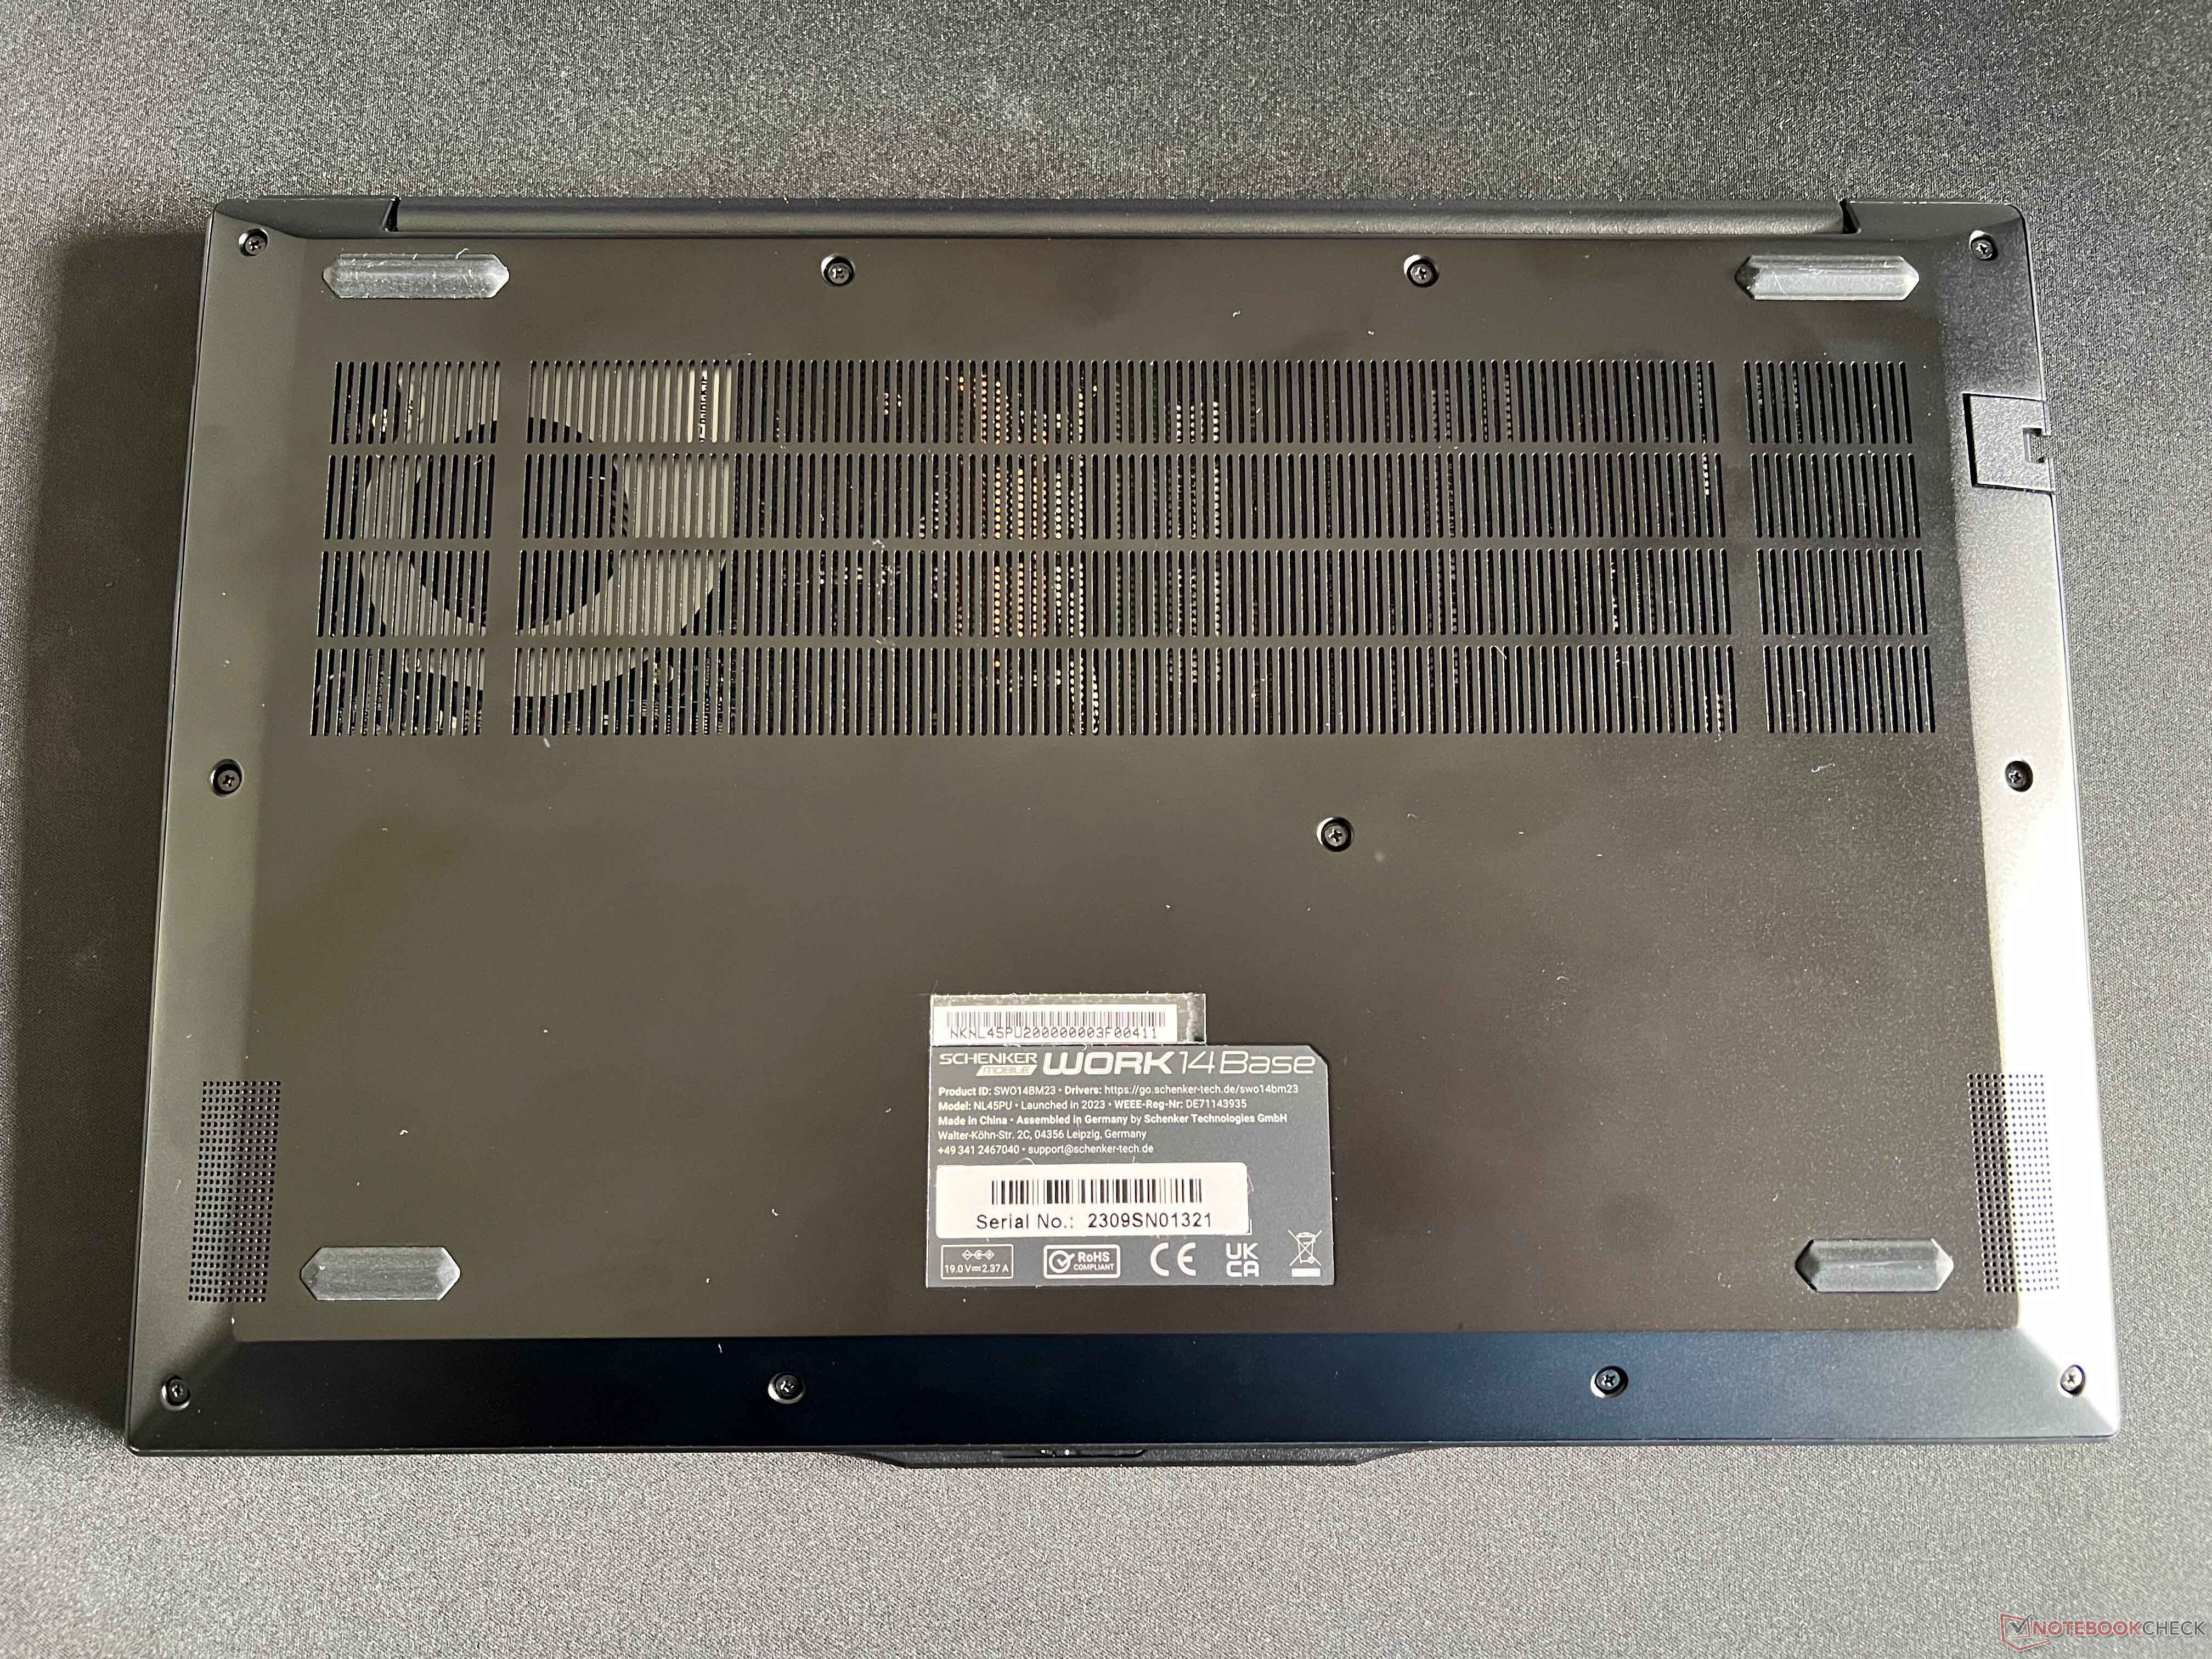
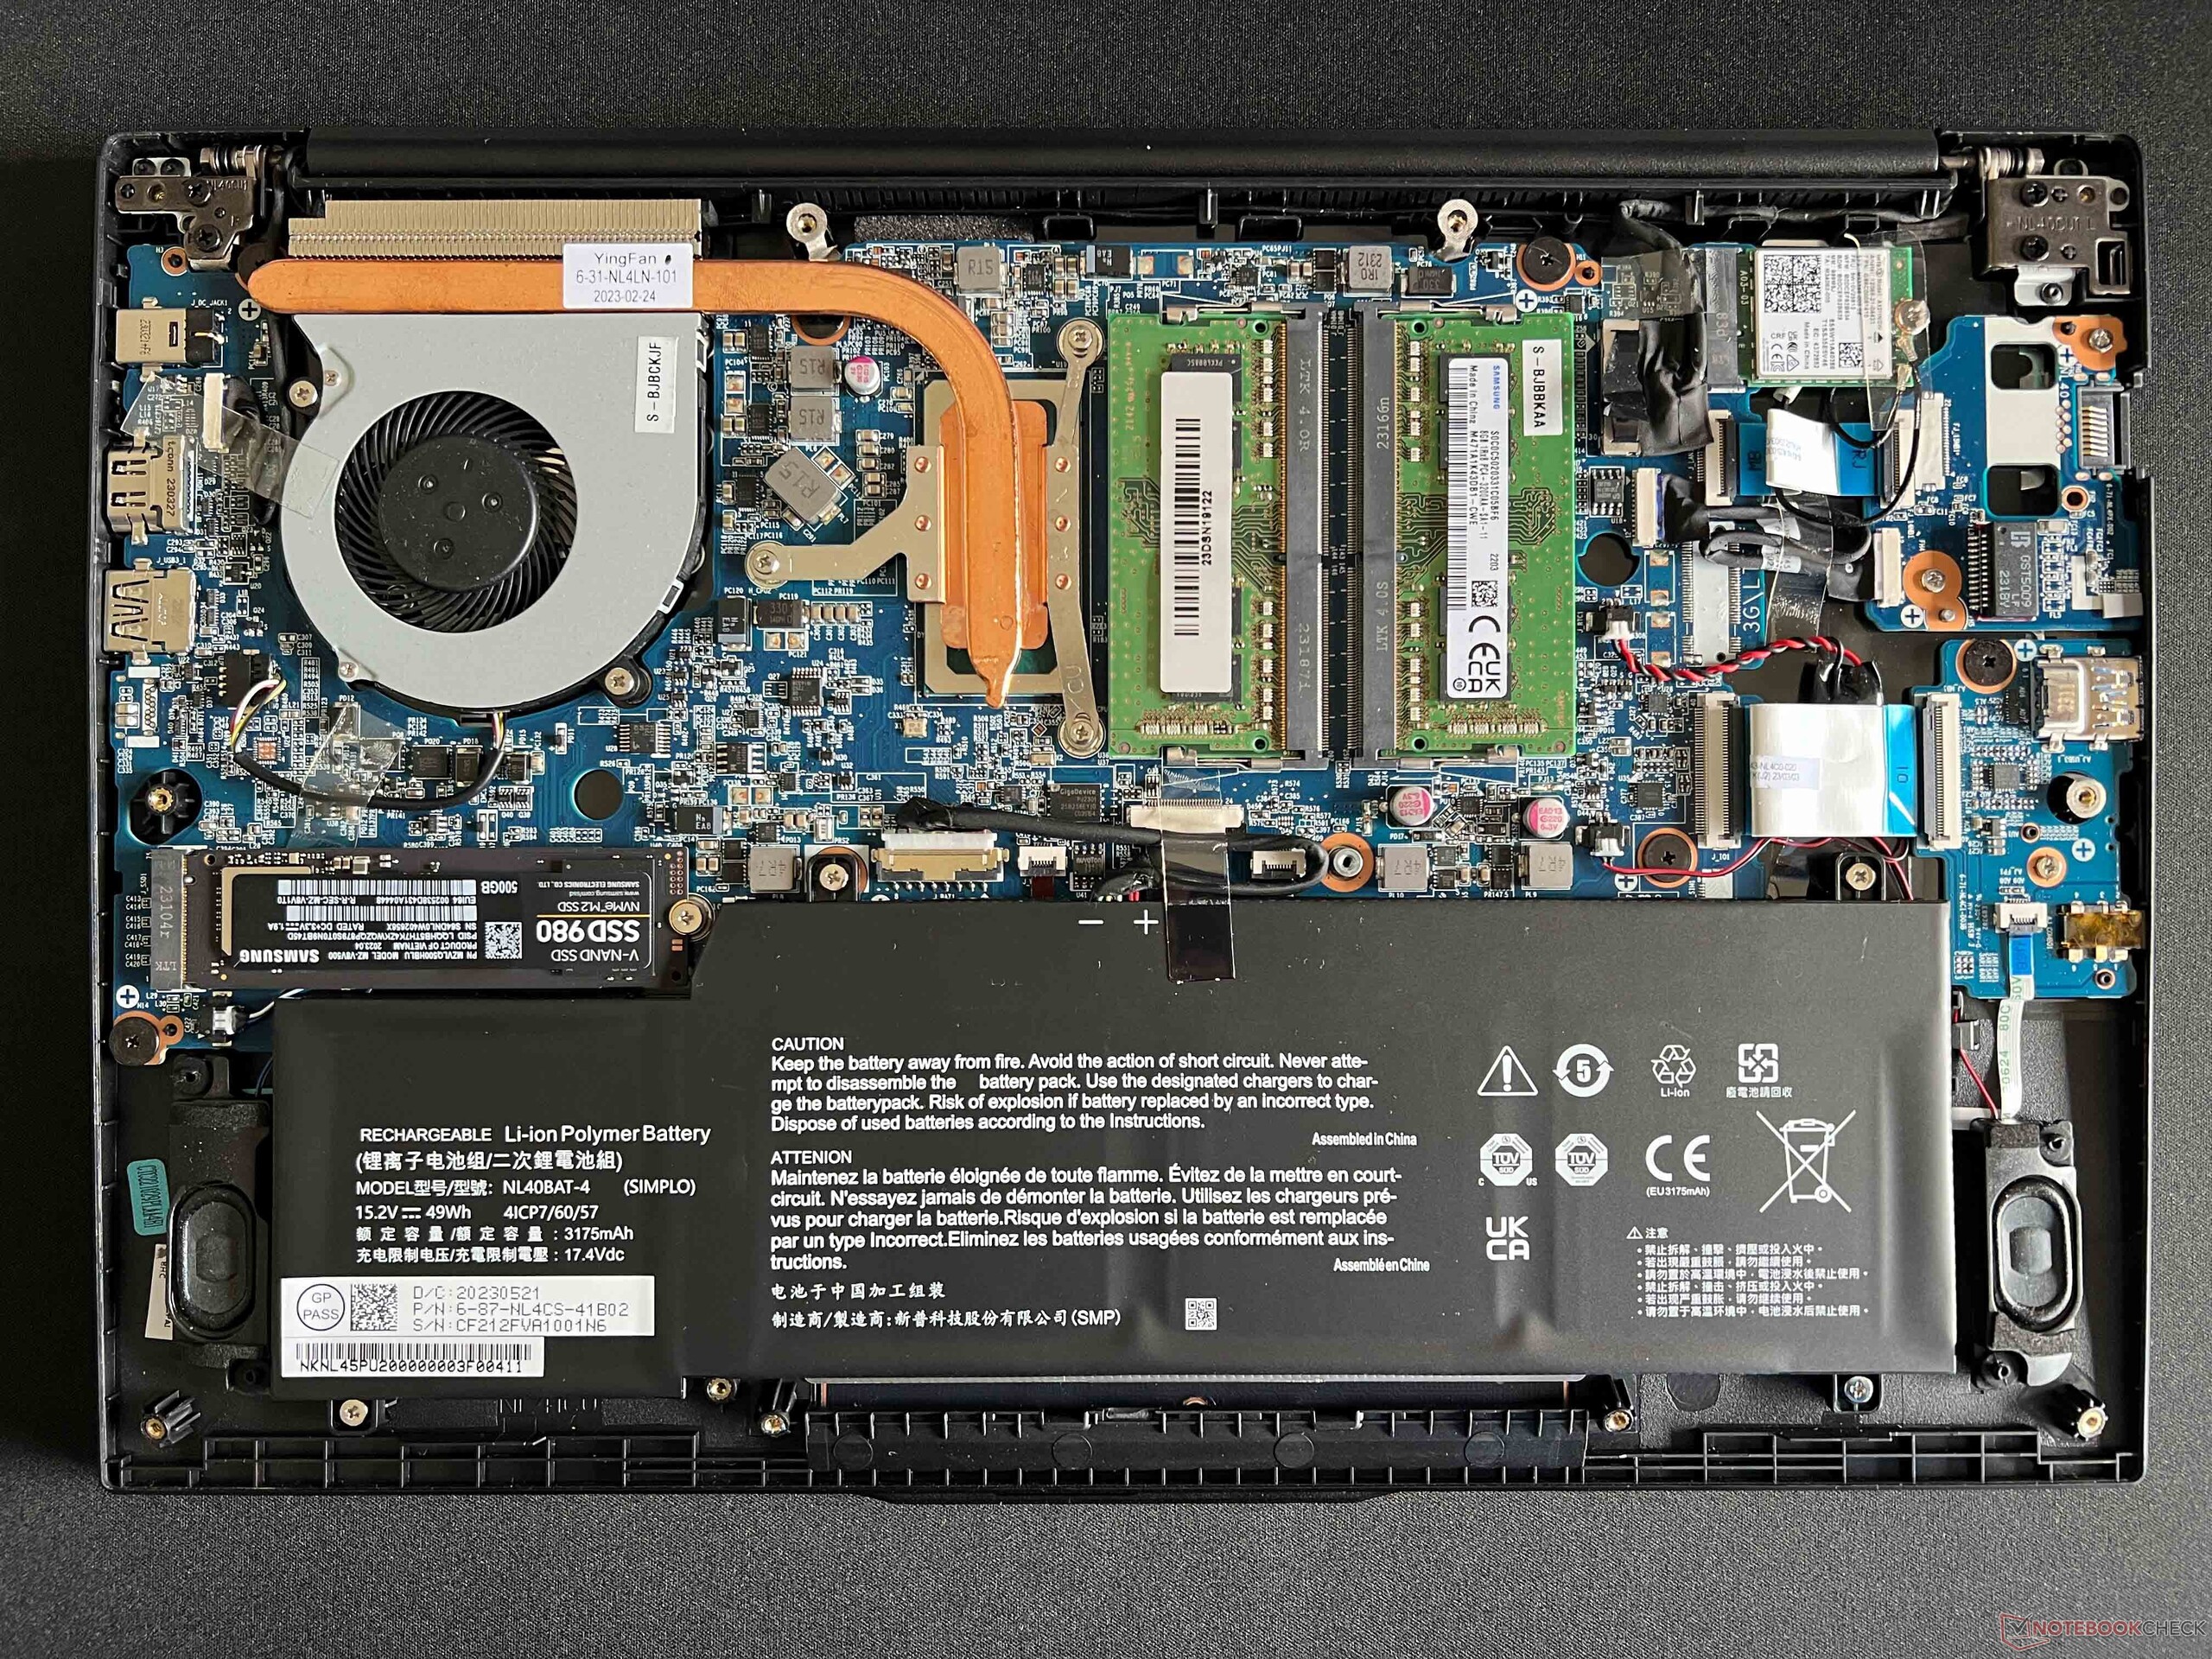
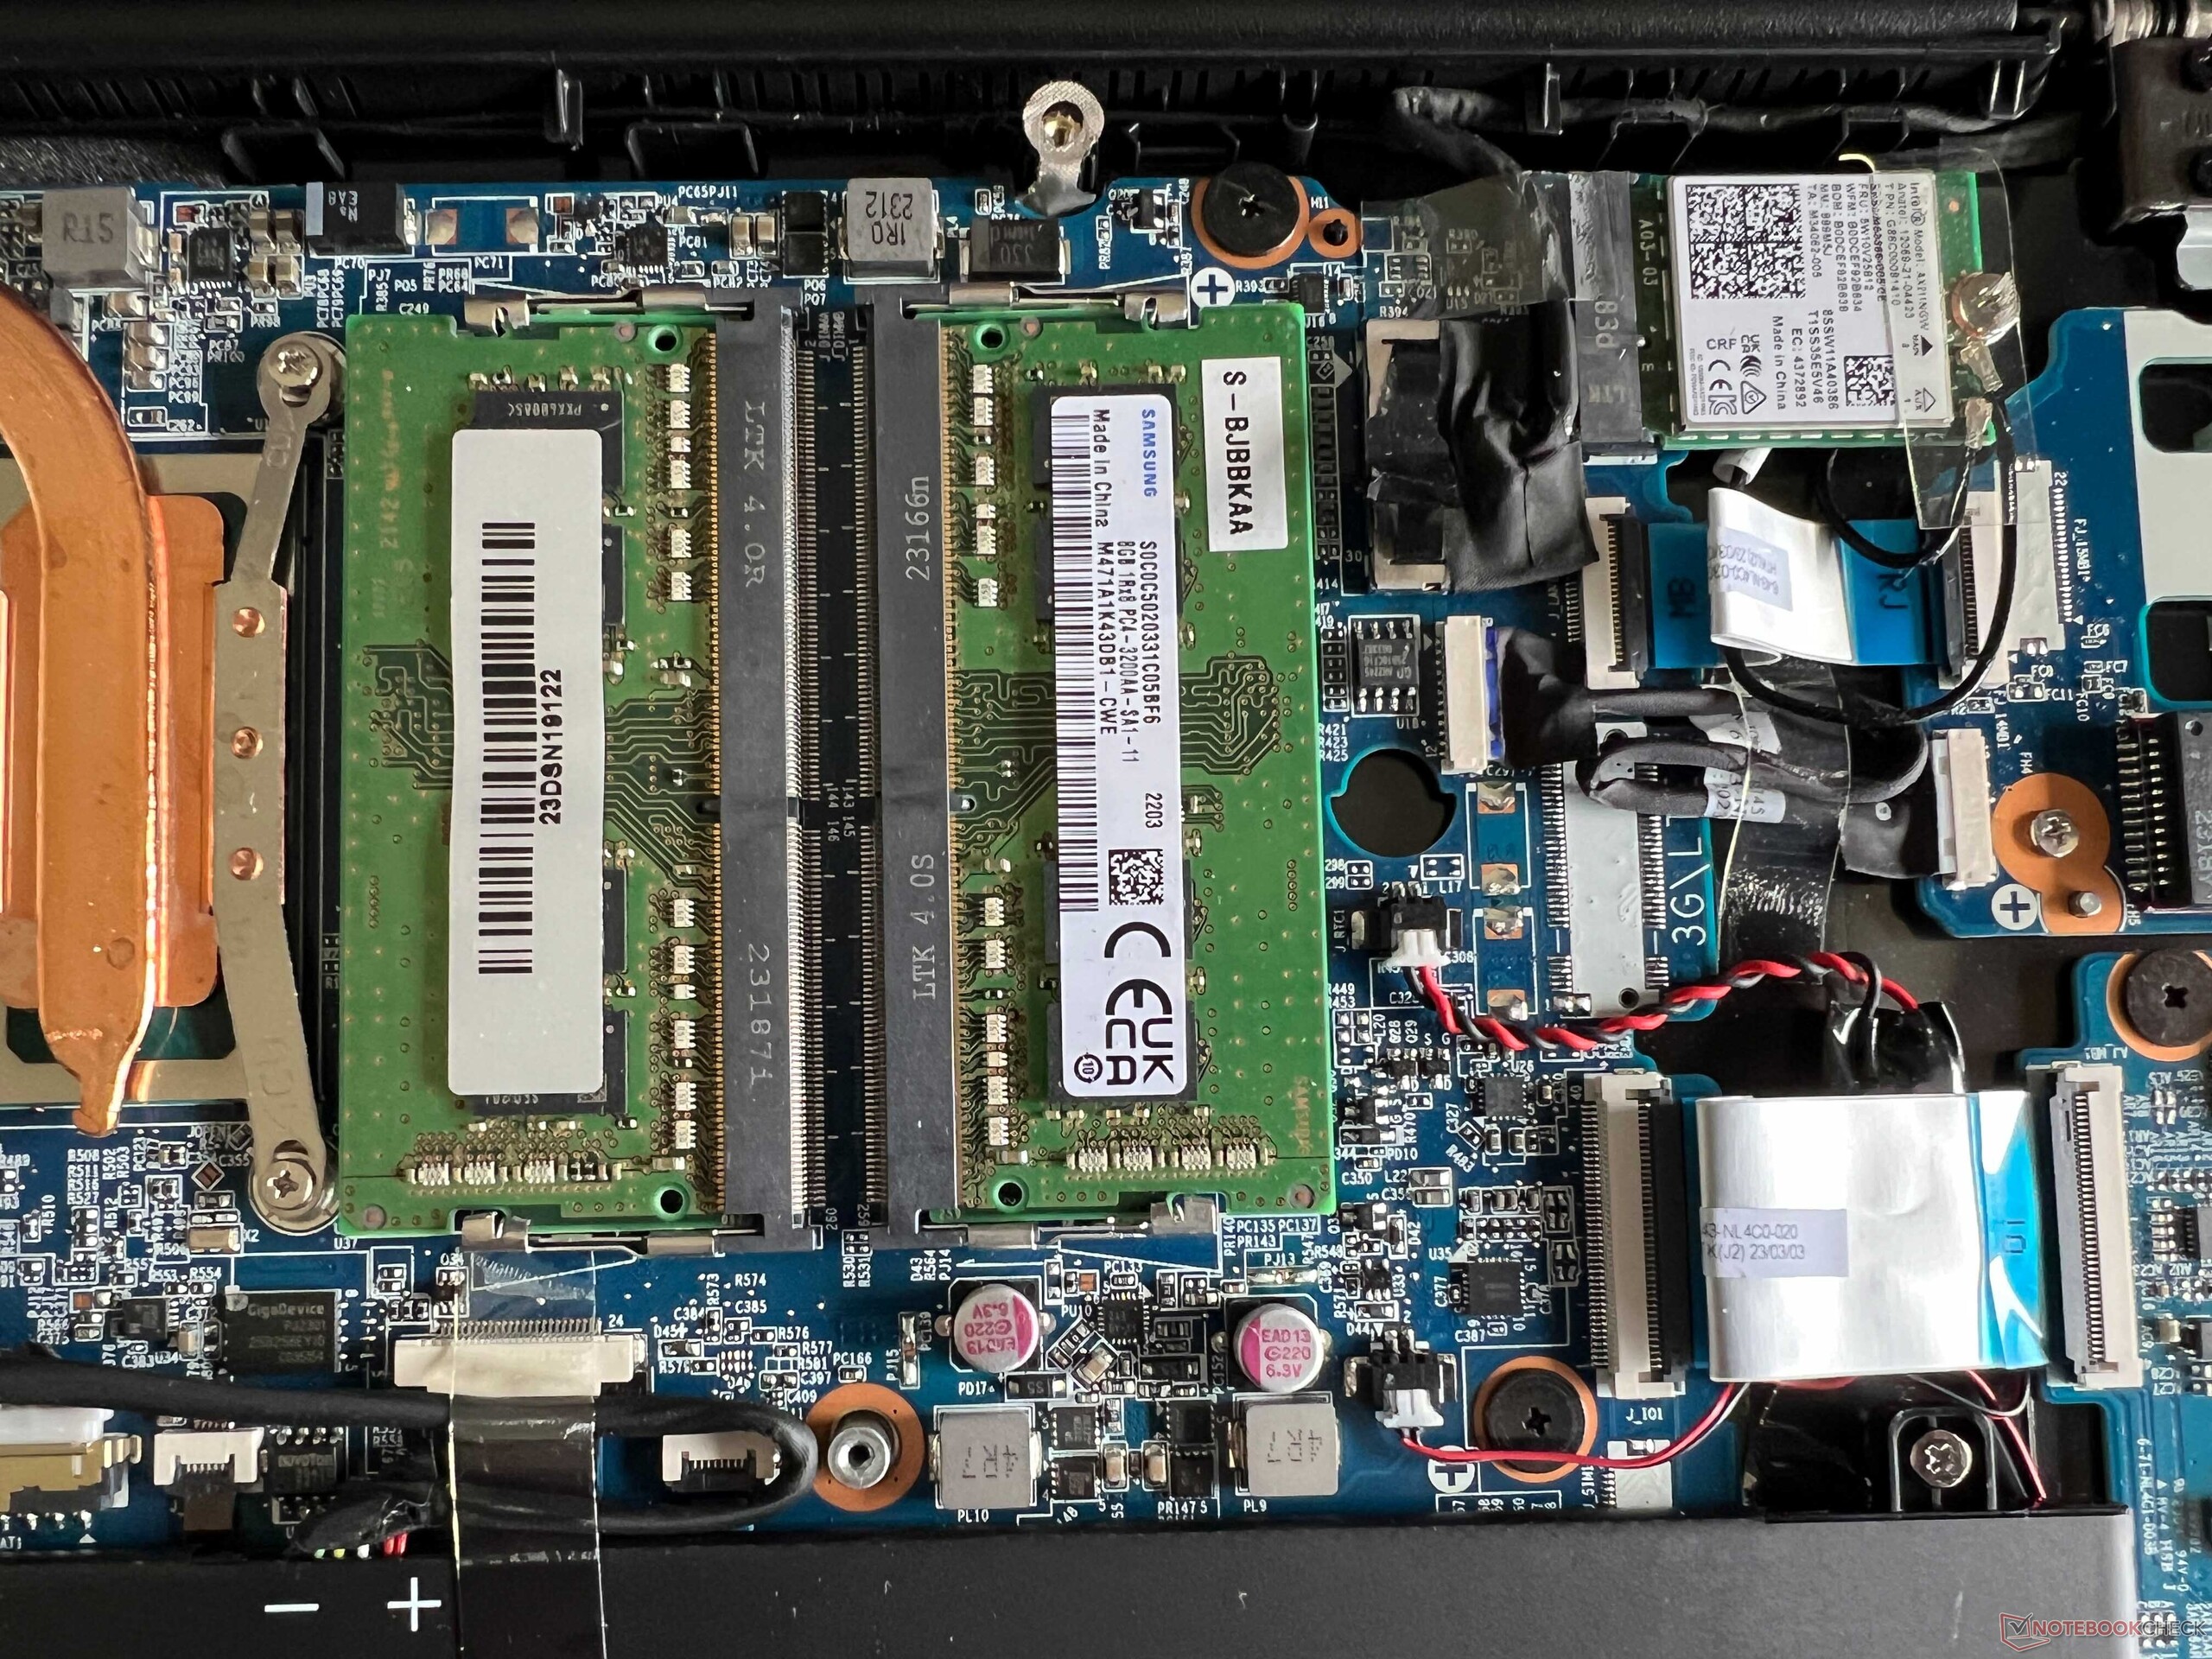
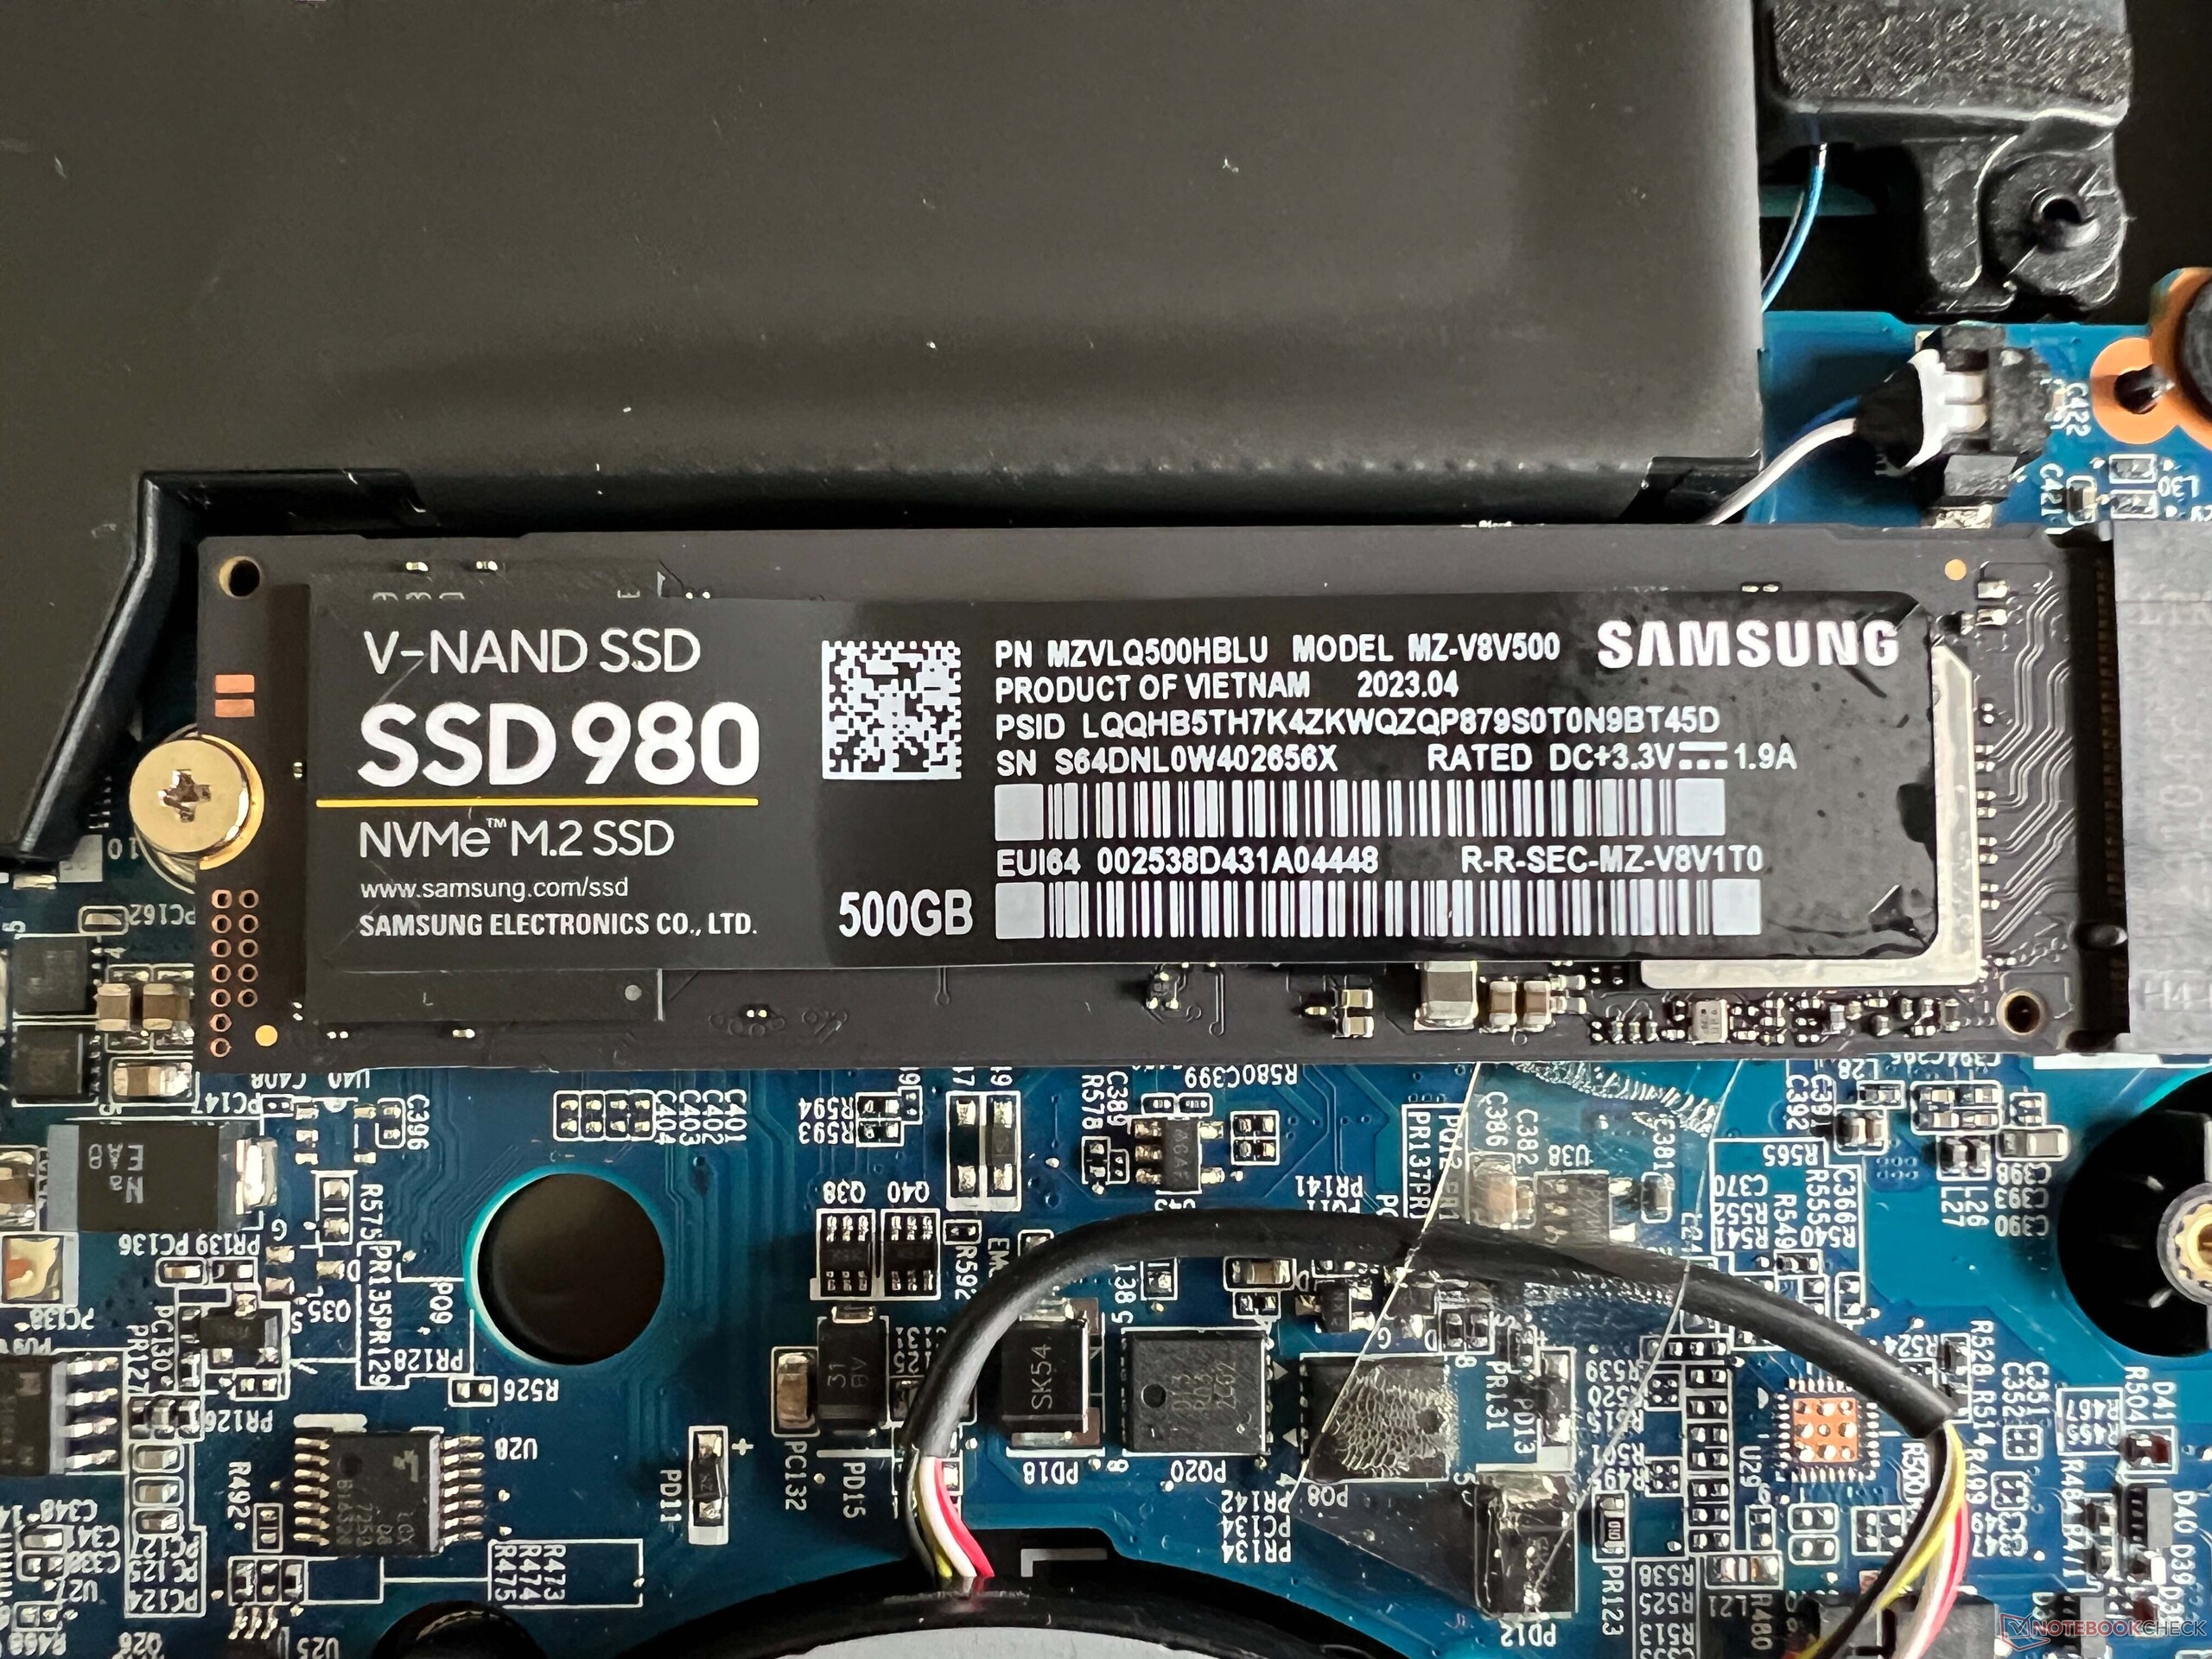
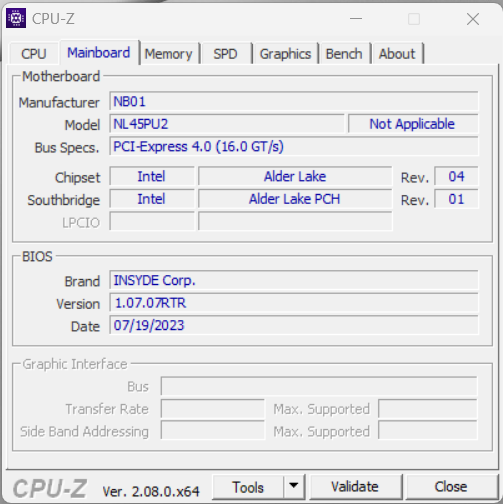
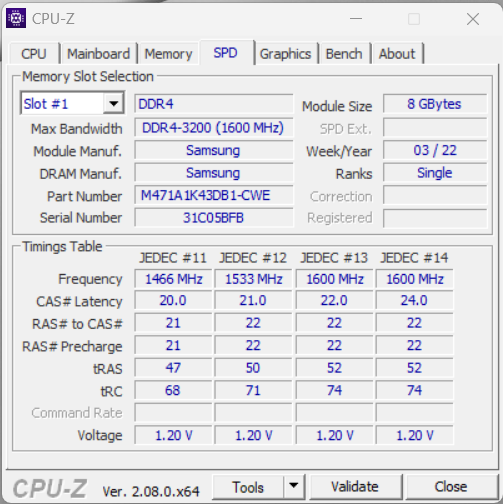
Dolna pokrywa jest zabezpieczona zwykłymi śrubami Philipsa i można ją łatwo zdjąć. Opcje rozbudowy laptopa są doskonałe, ponieważ dostępne są dwa gniazda pamięci RAM i oczywiście można również ulepszyć modele SSD i WLAN. To urządzenie jest już wyposażone w całkiem nowoczesny moduł WLAN od Intela (AX211), a jego prędkości transferu są również świetne.
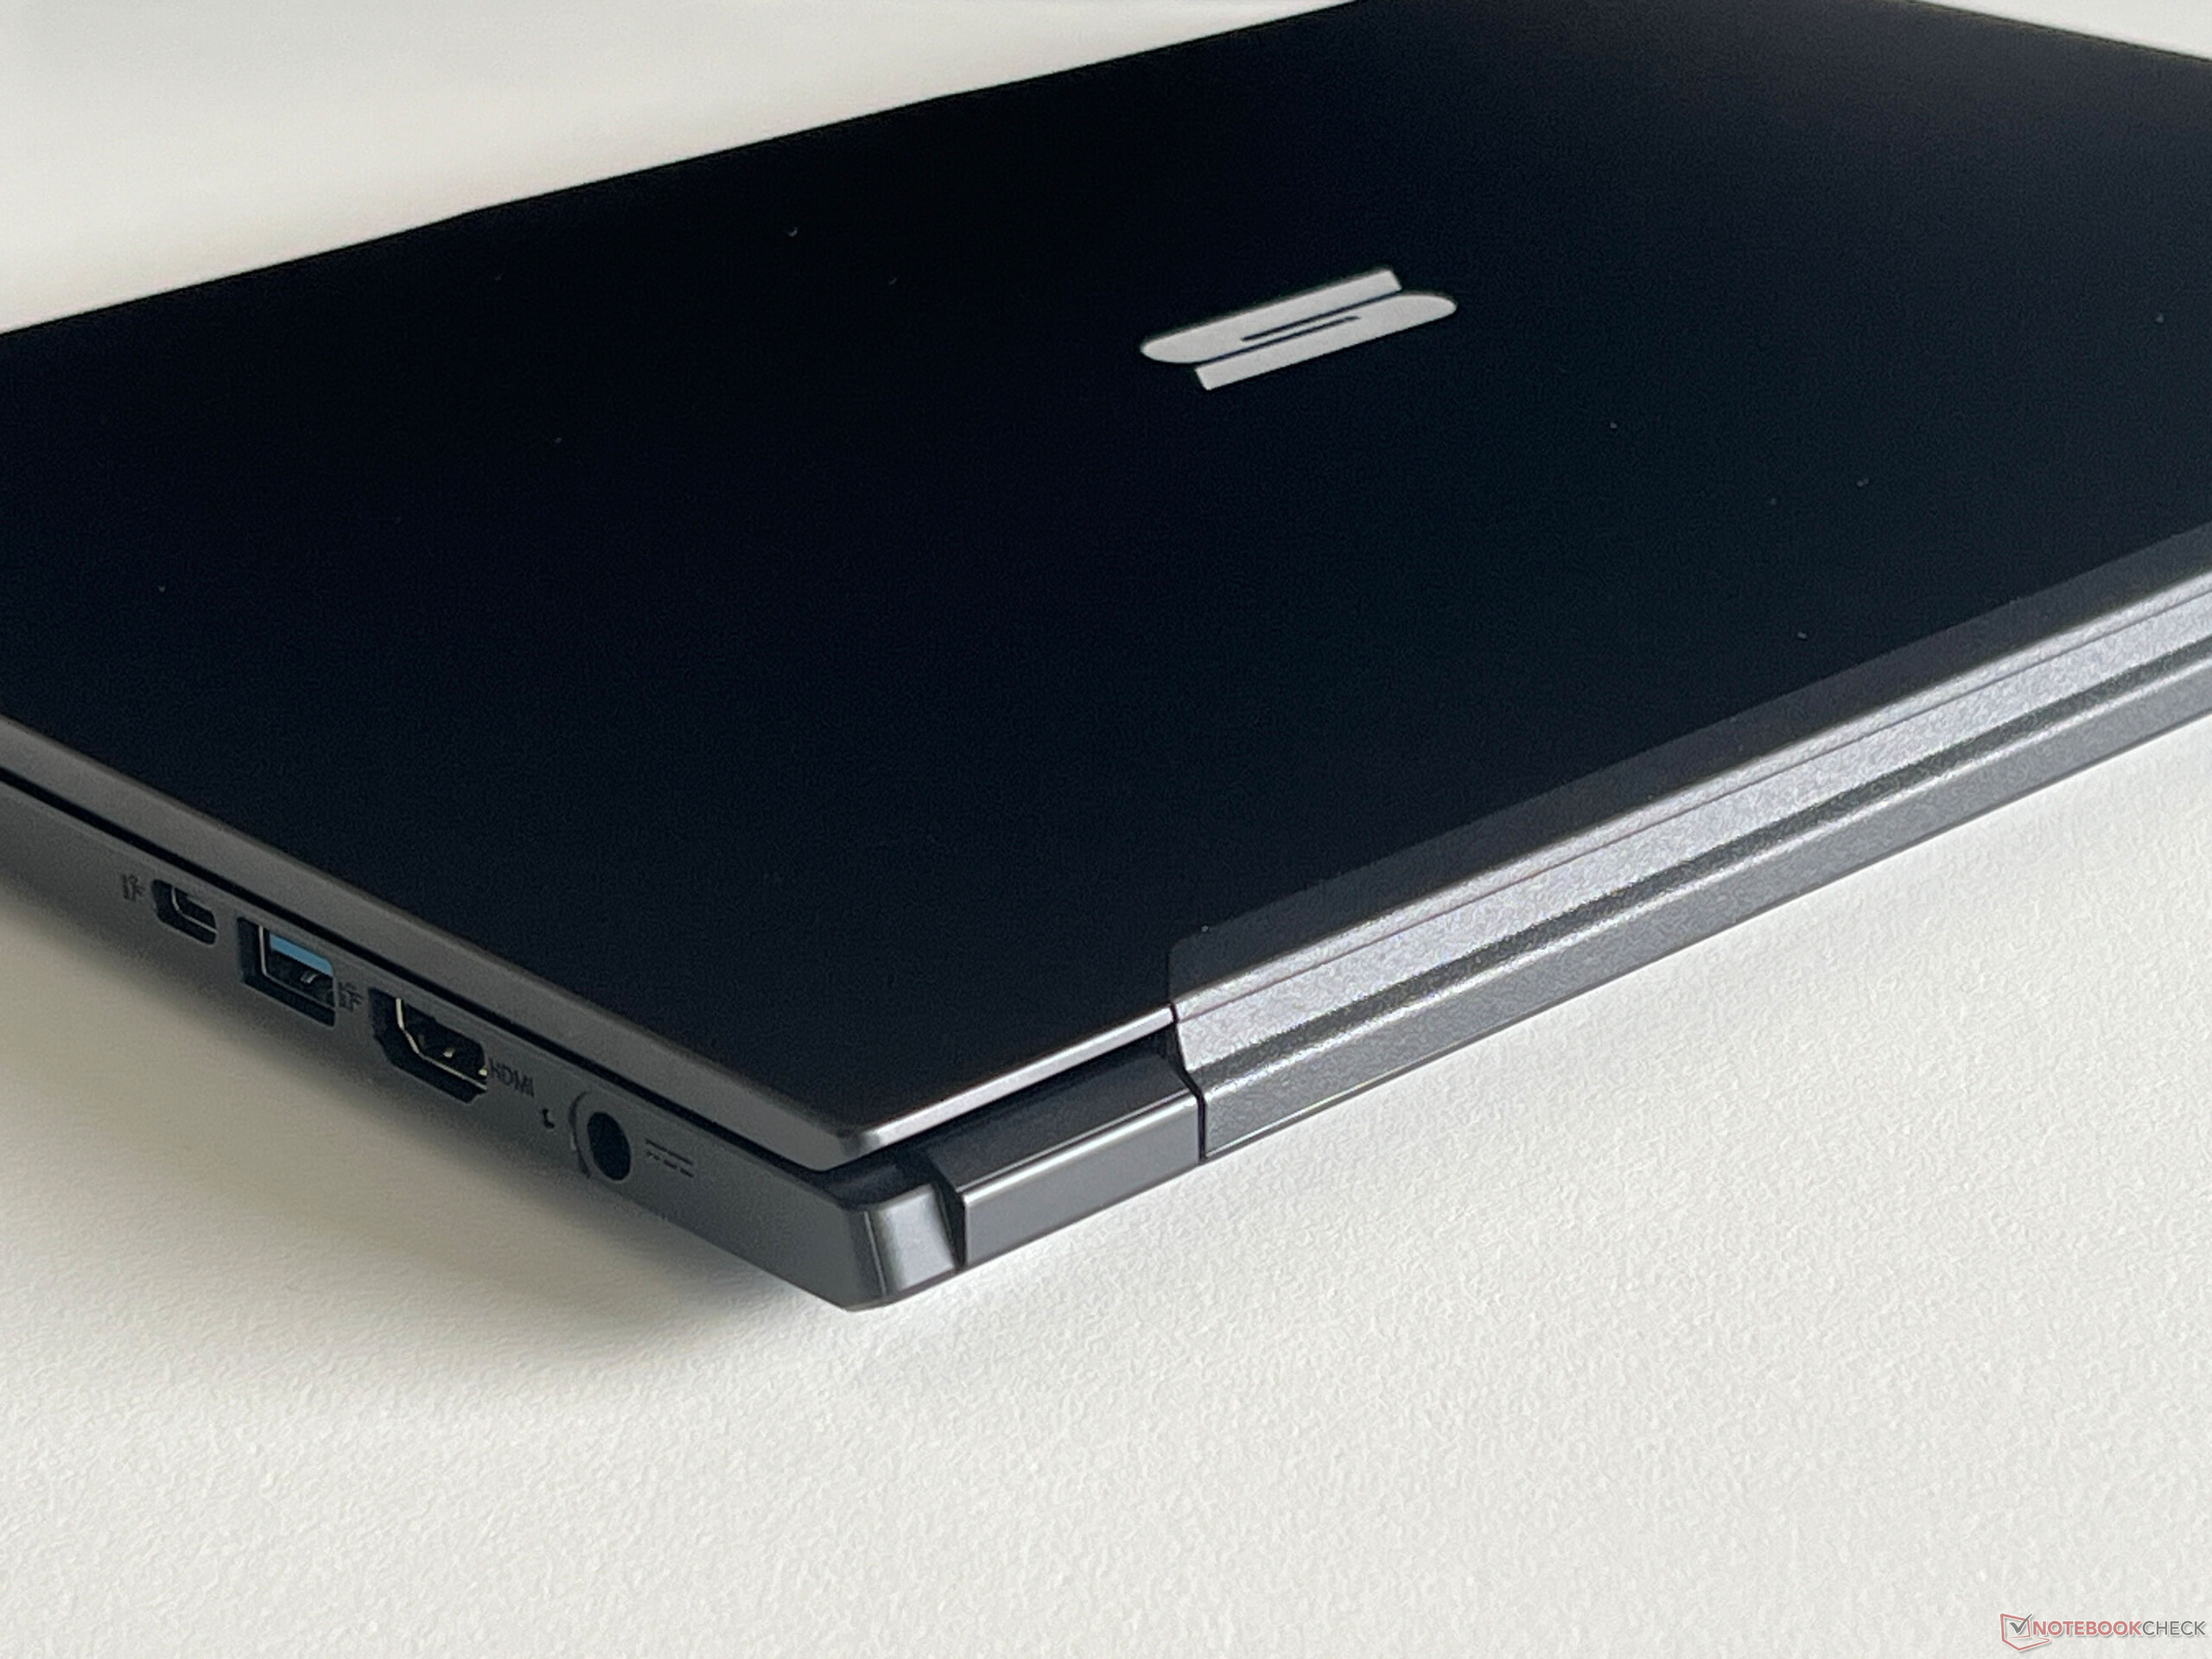
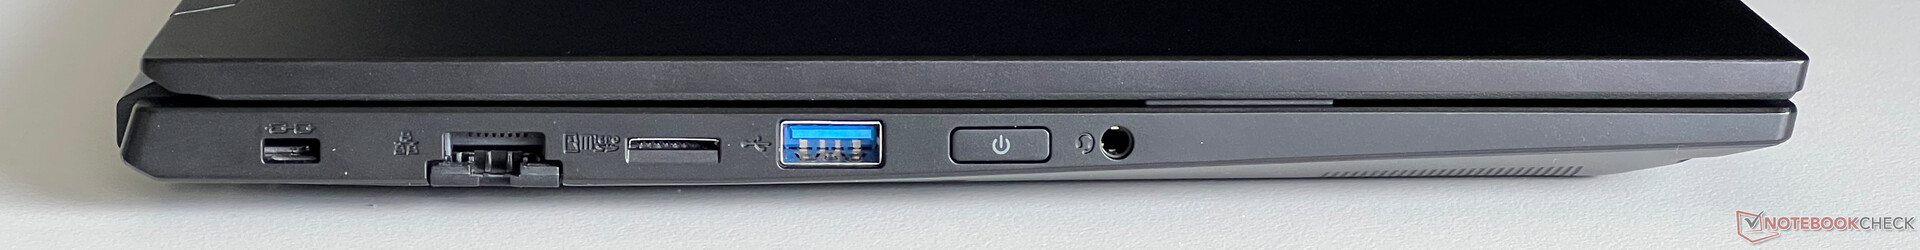
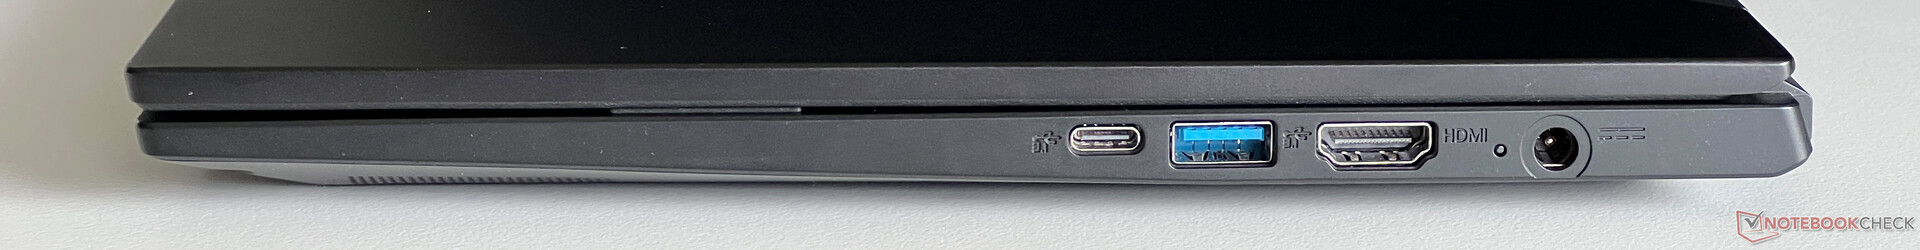
Opcje łączności to kolejna mocna strona Work 14. Co prawda trzeba będzie obejść się bez USB 4.0 i Thunderbolt, ale posiada on wystarczającą liczbę złączy USB i można bez problemu korzystać ze stacji dokujących USB-C. Ponadto posiada port Gigabit Ethernet. Jego kamera internetowa 1080p z mechaniczną osłoną robi przeciętnie wyglądające zdjęcia.
| SD Card Reader | |
| average JPG Copy Test (av. of 3 runs) | |
| Schenker Work 14 Base (Angelbird AV Pro V60) | |
| Lenovo ThinkPad L14 G4 21H6S00900 | |
| Średnia w klasie Office (19.8 - 198.5, n=22, ostatnie 2 lata) | |
| Acer Swift Go 14 SFG14-71 | |
| maximum AS SSD Seq Read Test (1GB) | |
| Lenovo ThinkPad L14 G4 21H6S00900 (AV Pro V60) | |
| Schenker Work 14 Base (Angelbird AV Pro V60) | |
| Średnia w klasie Office (27.4 - 249, n=21, ostatnie 2 lata) | |
| Acer Swift Go 14 SFG14-71 (AV Pro SD microSD 128 GB V60) | |
| Networking | |
| Schenker Work 14 Base | |
| iperf3 transmit AXE11000 | |
| iperf3 receive AXE11000 | |
| Acer Swift Go 14 SFG14-71 | |
| iperf3 transmit AXE11000 | |
| iperf3 receive AXE11000 | |
| iperf3 transmit AXE11000 6GHz | |
| iperf3 receive AXE11000 6GHz | |
| HP ProBook 445 G10 | |
| iperf3 transmit AXE11000 | |
| iperf3 receive AXE11000 | |
| Dell Latitude 3440 | |
| iperf3 transmit AXE11000 | |
| iperf3 receive AXE11000 | |
| iperf3 transmit AXE11000 6GHz | |
| iperf3 receive AXE11000 6GHz | |
| Lenovo ThinkPad L14 G4 21H6S00900 | |
| iperf3 transmit AXE11000 | |
| iperf3 receive AXE11000 | |
| iperf3 transmit AXE11000 6GHz | |
| iperf3 receive AXE11000 6GHz | |

")
")
Urządzenia wejściowe
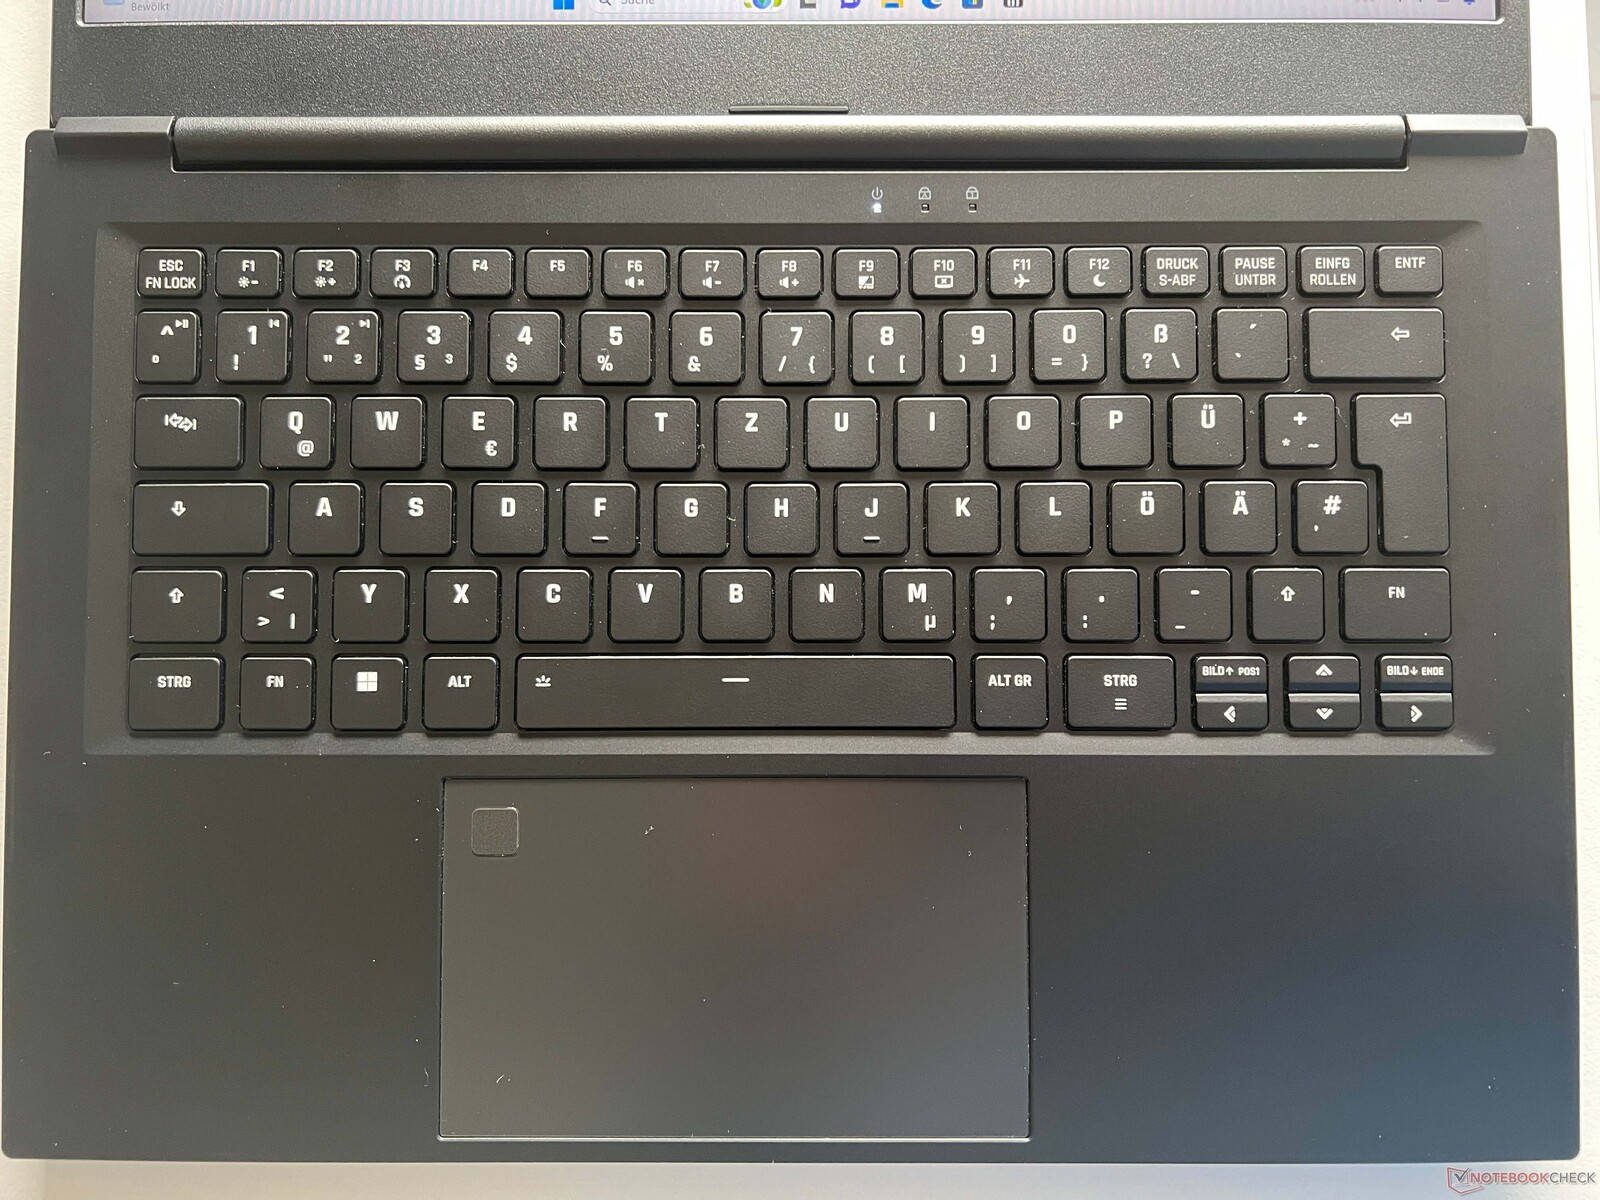
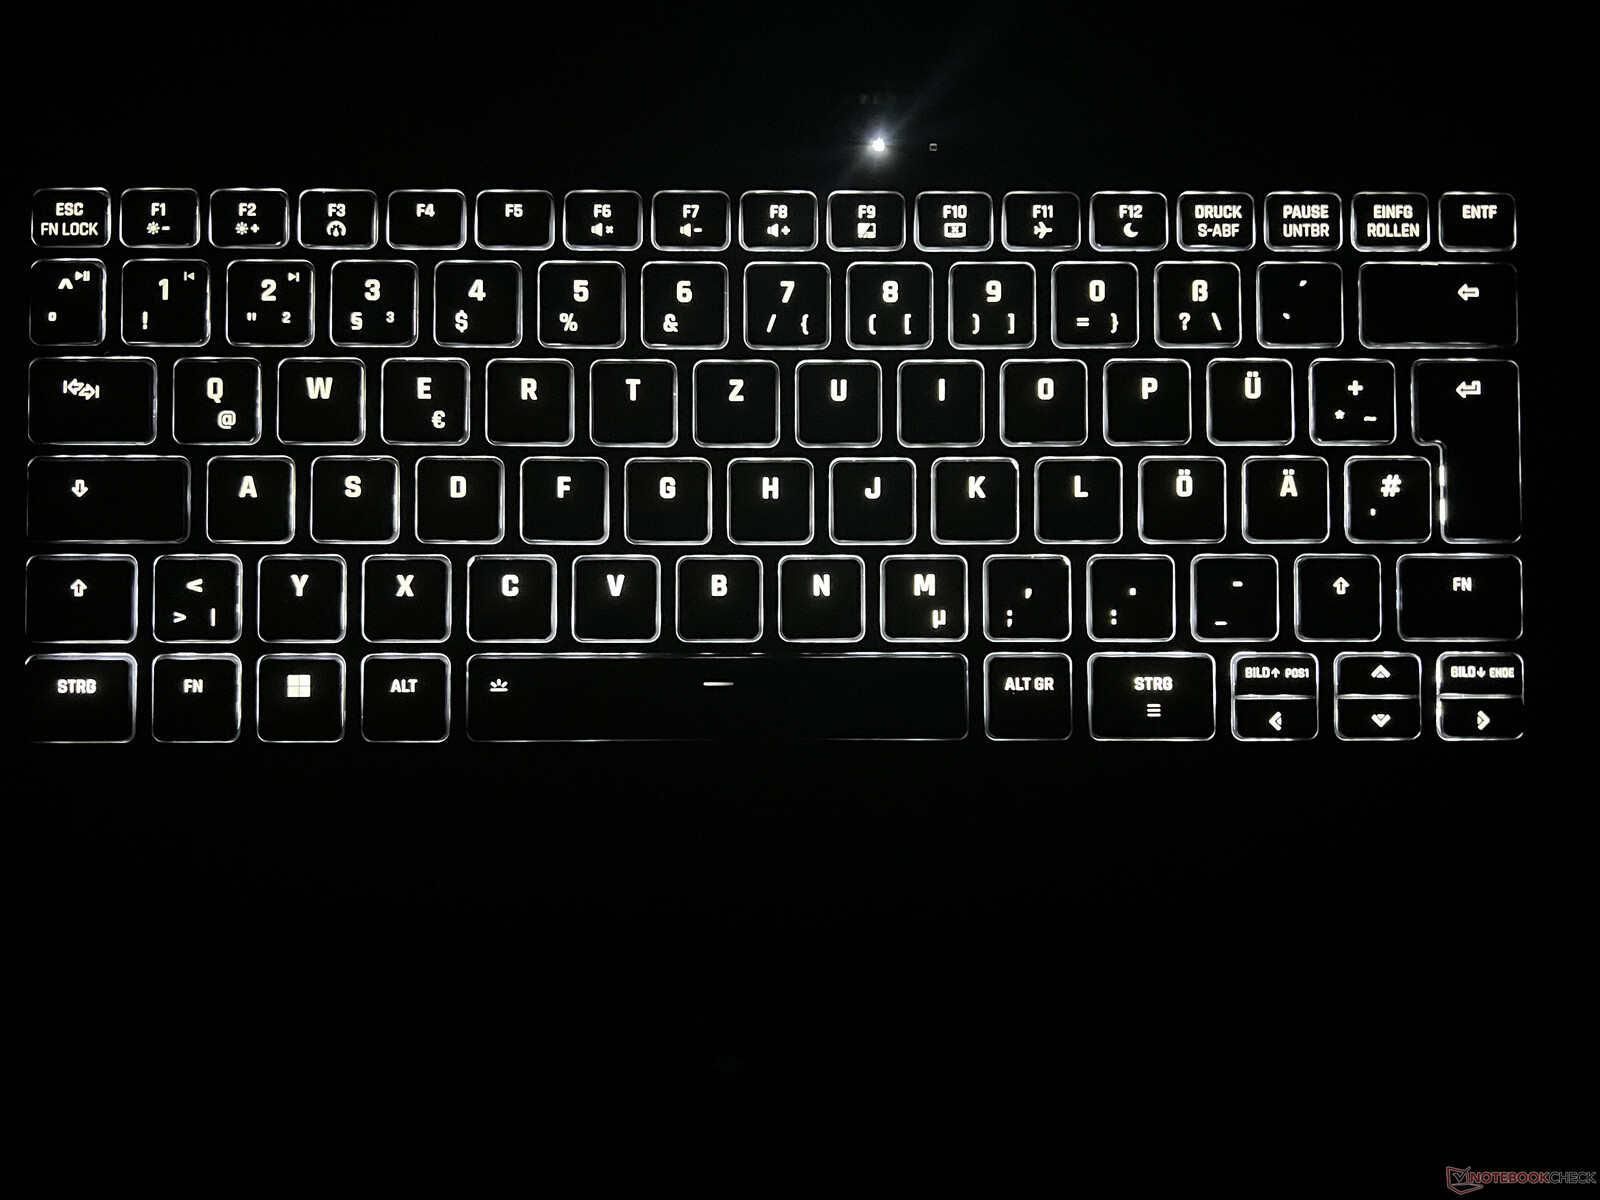
Czarna klawiatura chiclet laptopa jest podświetlana i wygodnie się na niej pisze, jednak klawisze są nieco cieńsze niż zwykle i ogólnie są dość małe. Klawisze strzałek są w rzeczywistości jeszcze mniejsze, ale są przynajmniej dedykowane klawisze obrazu w górę / obrazu w dół. Touchpad Microsoft Precision jest wystarczająco duży, aby wygodnie z niego korzystać (12,1 x 7,3 cm) i jest wyposażony w skaner linii papilarnych w lewym górnym rogu. Z drugiej strony, nie jest on całkowicie gładki i podczas użytkowania można zauważyć lekki opór. Co więcej, odgłosy kliknięć brzmią bardzo głośno i tanio, co oznacza, że zalecamy jedynie stukanie pada w celu wprowadzania danych zamiast naciskania.
Wyświetlacz - matowy panel IPS
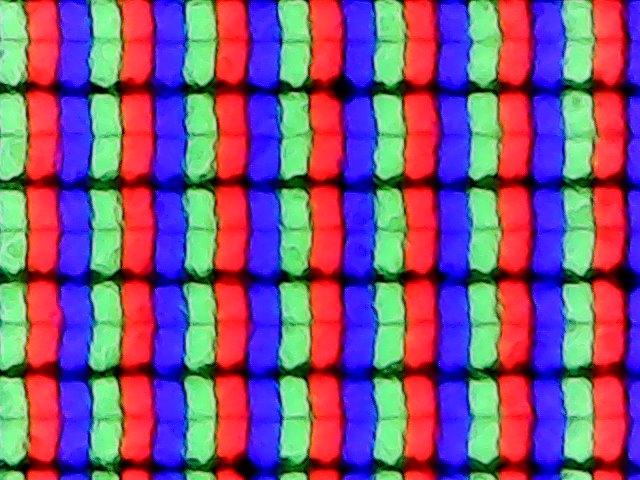
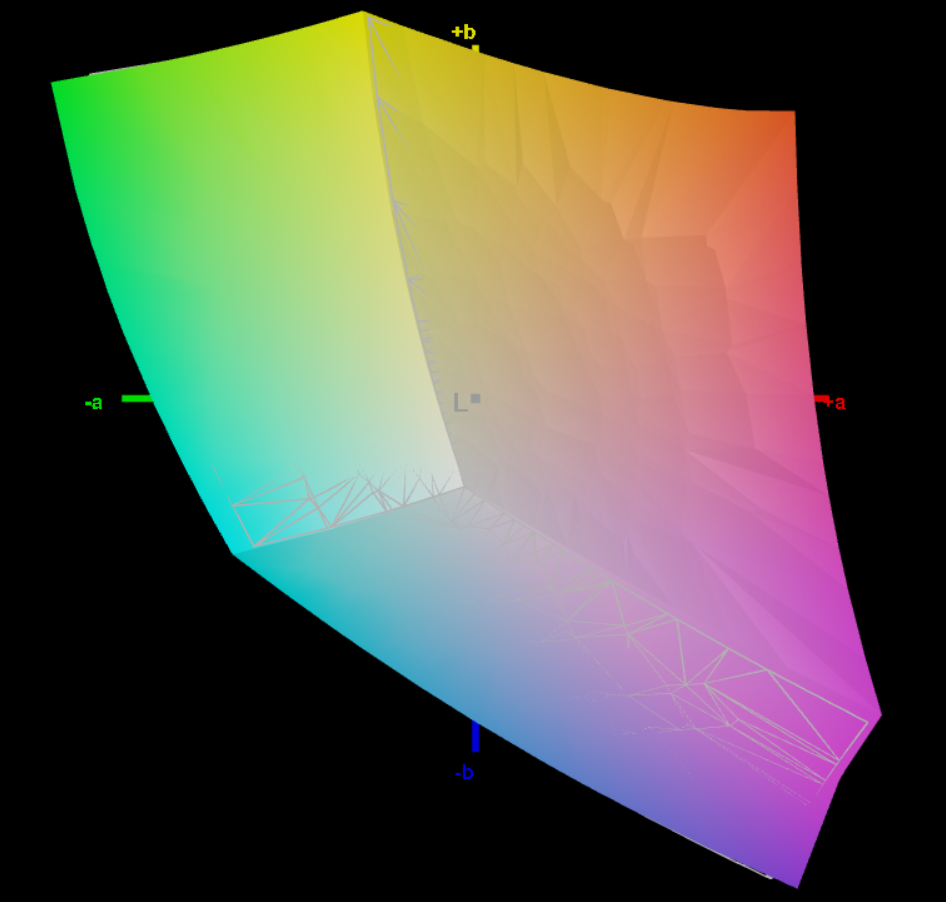
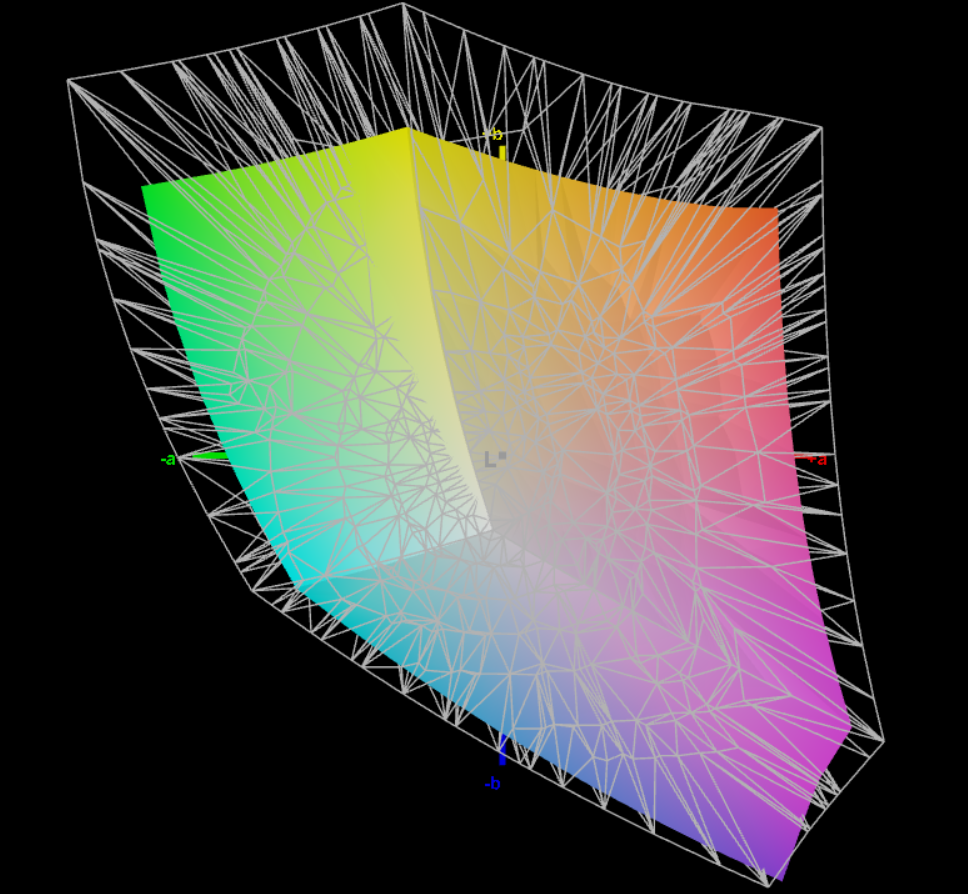
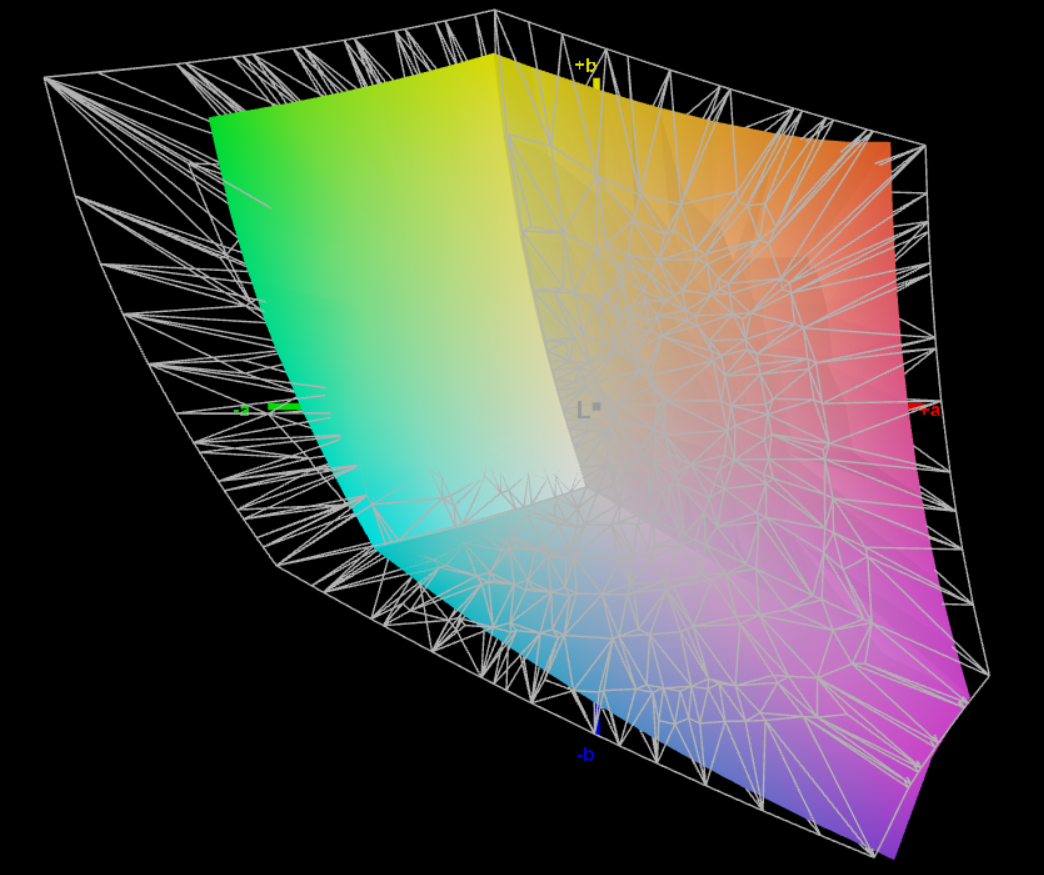
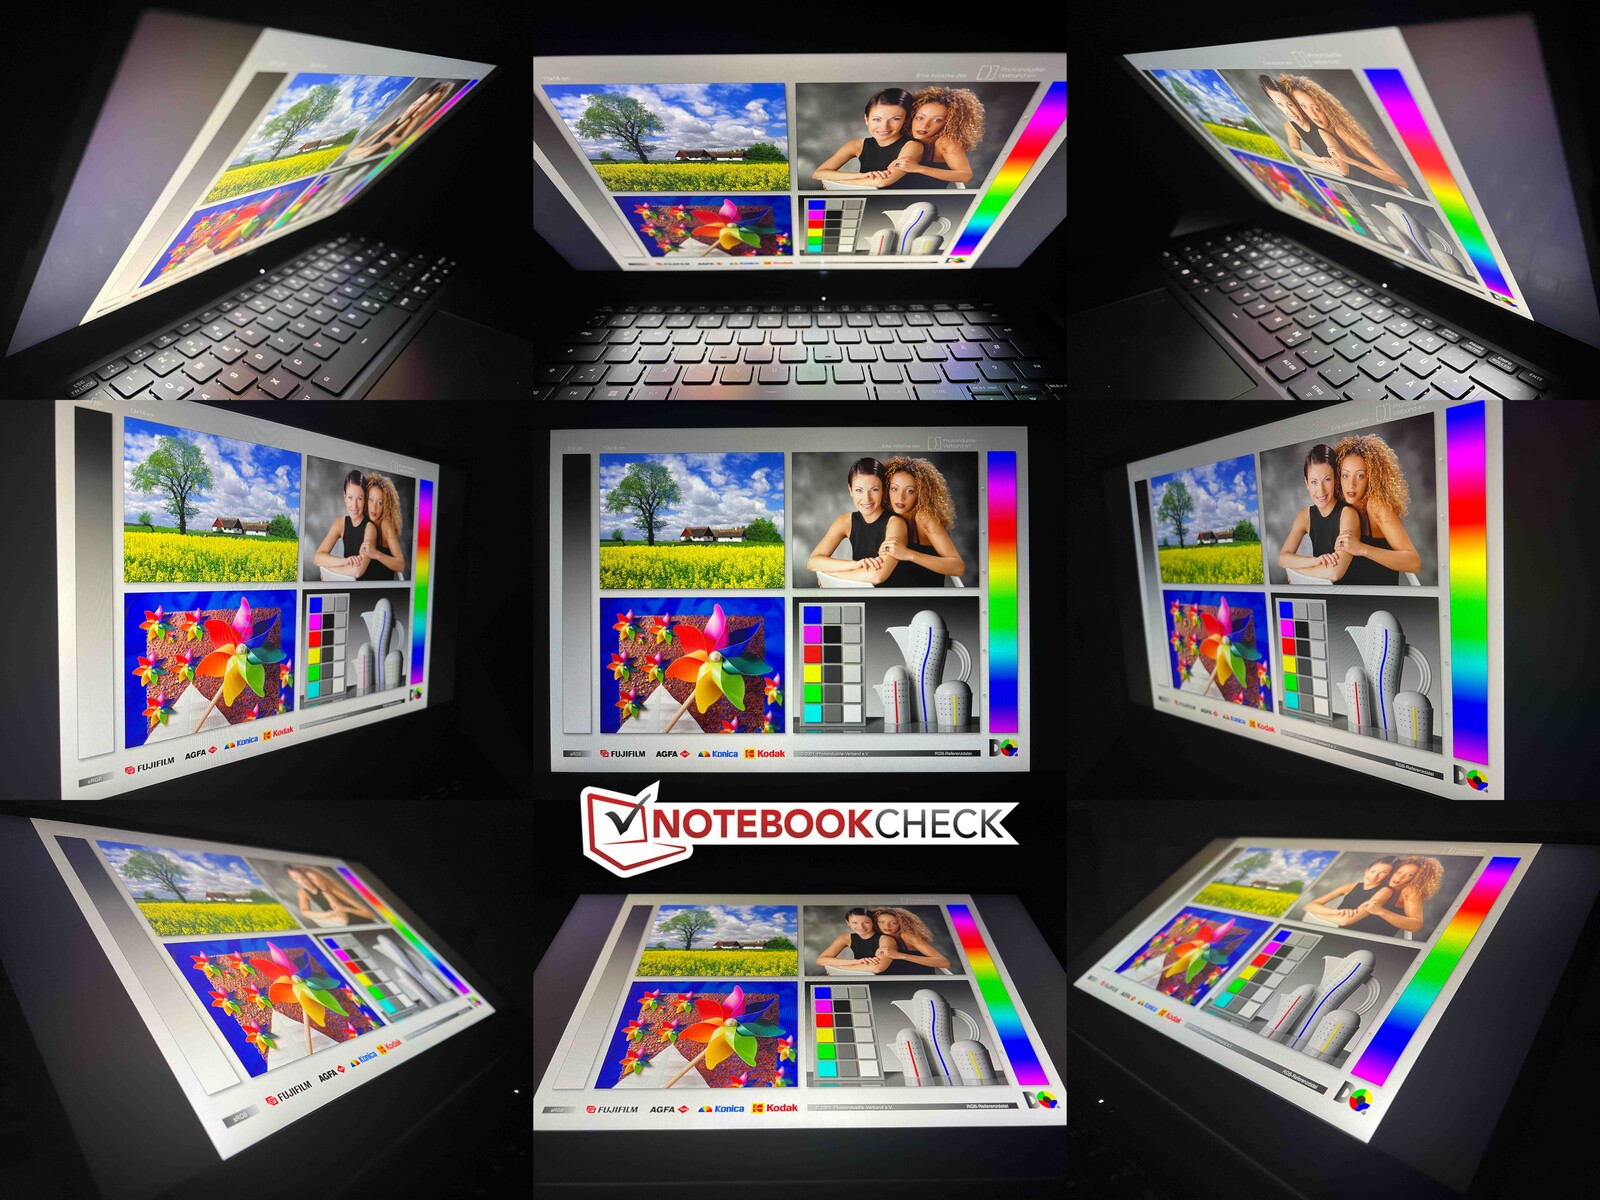
Work 14 wyposażony został w matowy panel IPS (60 Hz) od AU Optronics, który charakteryzuje się rozdzielczością 1,920 x 1,080 pikseli. Oznacza to, że nadal jest to panel 16:9, ale większość ekranów konkurencji ma takie same proporcje. Subiektywnie, jakość obrazu cierpi nieco z powodu jego ziarnistego wyglądu, jednak treść jest wystarczająco ostra, a ekran nie korzysta z PWM. Krwawienie podświetlenia nie jest problemem, ale czas reakcji jest bardzo wolny i zauważyliśmy znaczne ilości smużenia. W bezpośrednim porównaniu, Acer Swift Go oferuje znacznie lepszą subiektywną jakość obrazu dzięki panelowi OLED, ale z kolei użytkownicy muszą radzić sobie z ciągłym migotaniem PWM.
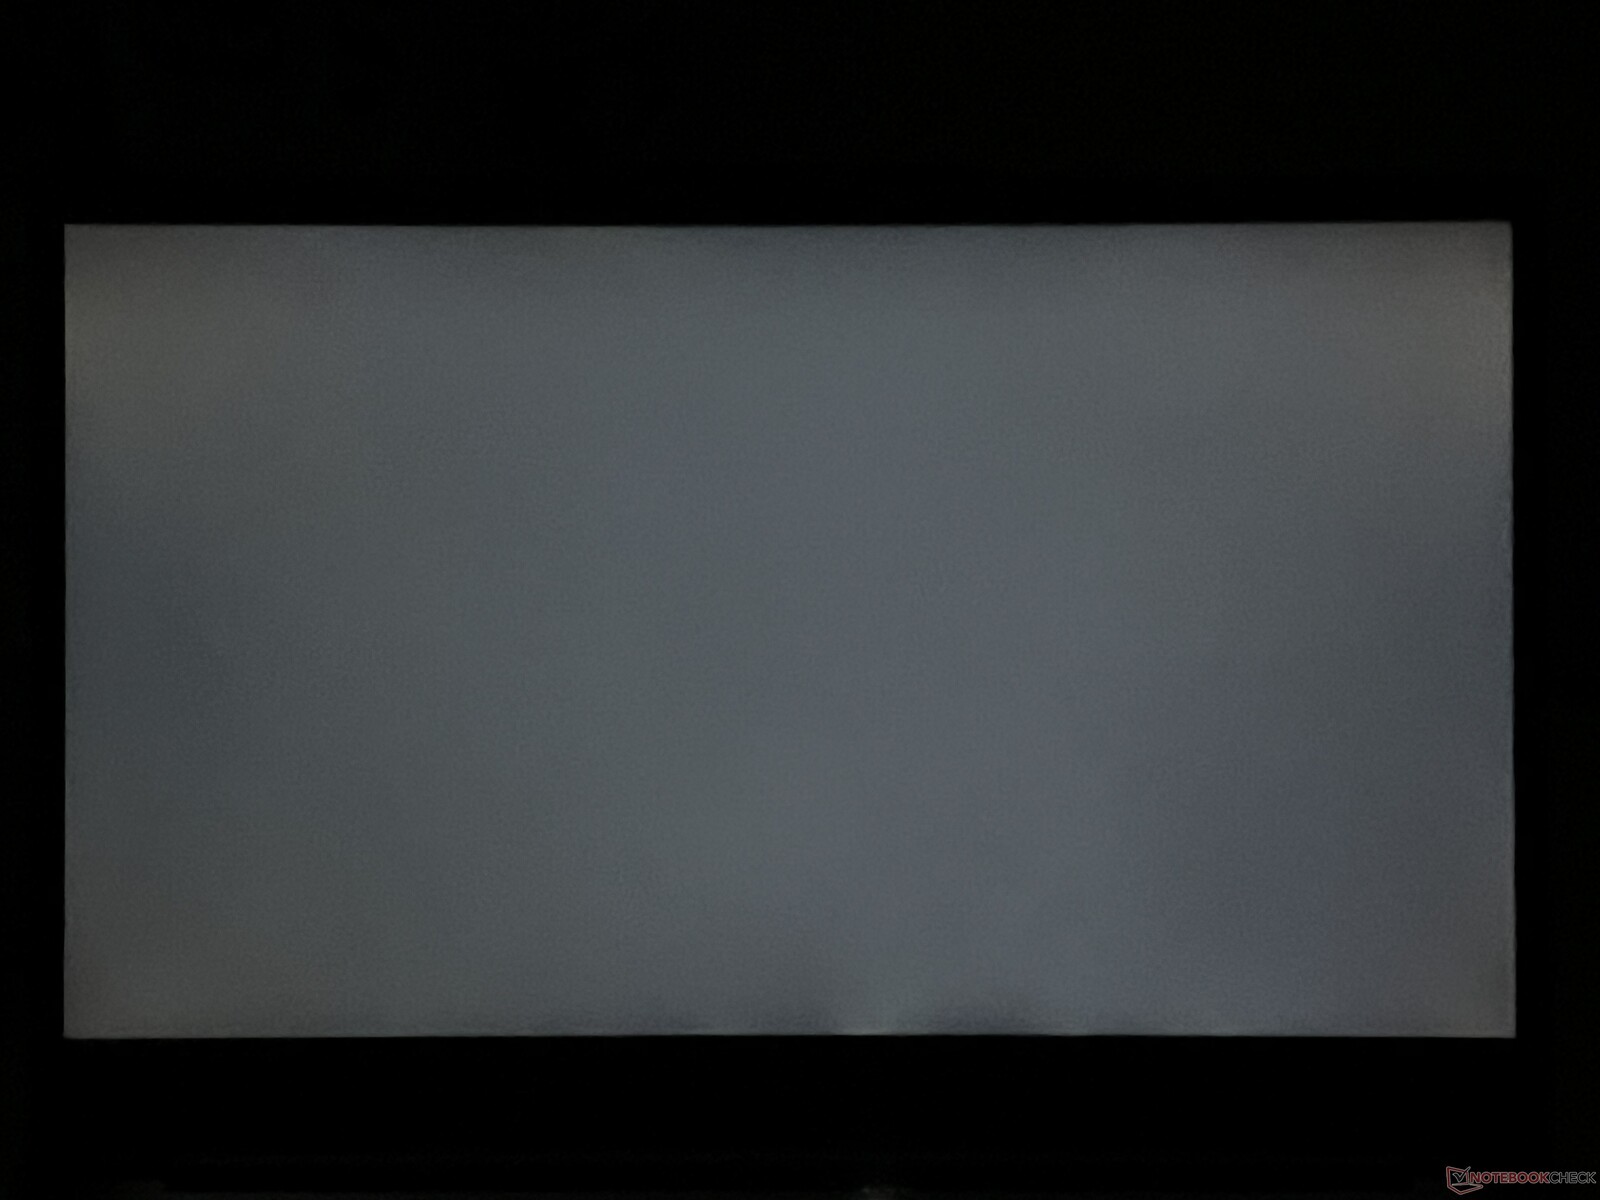
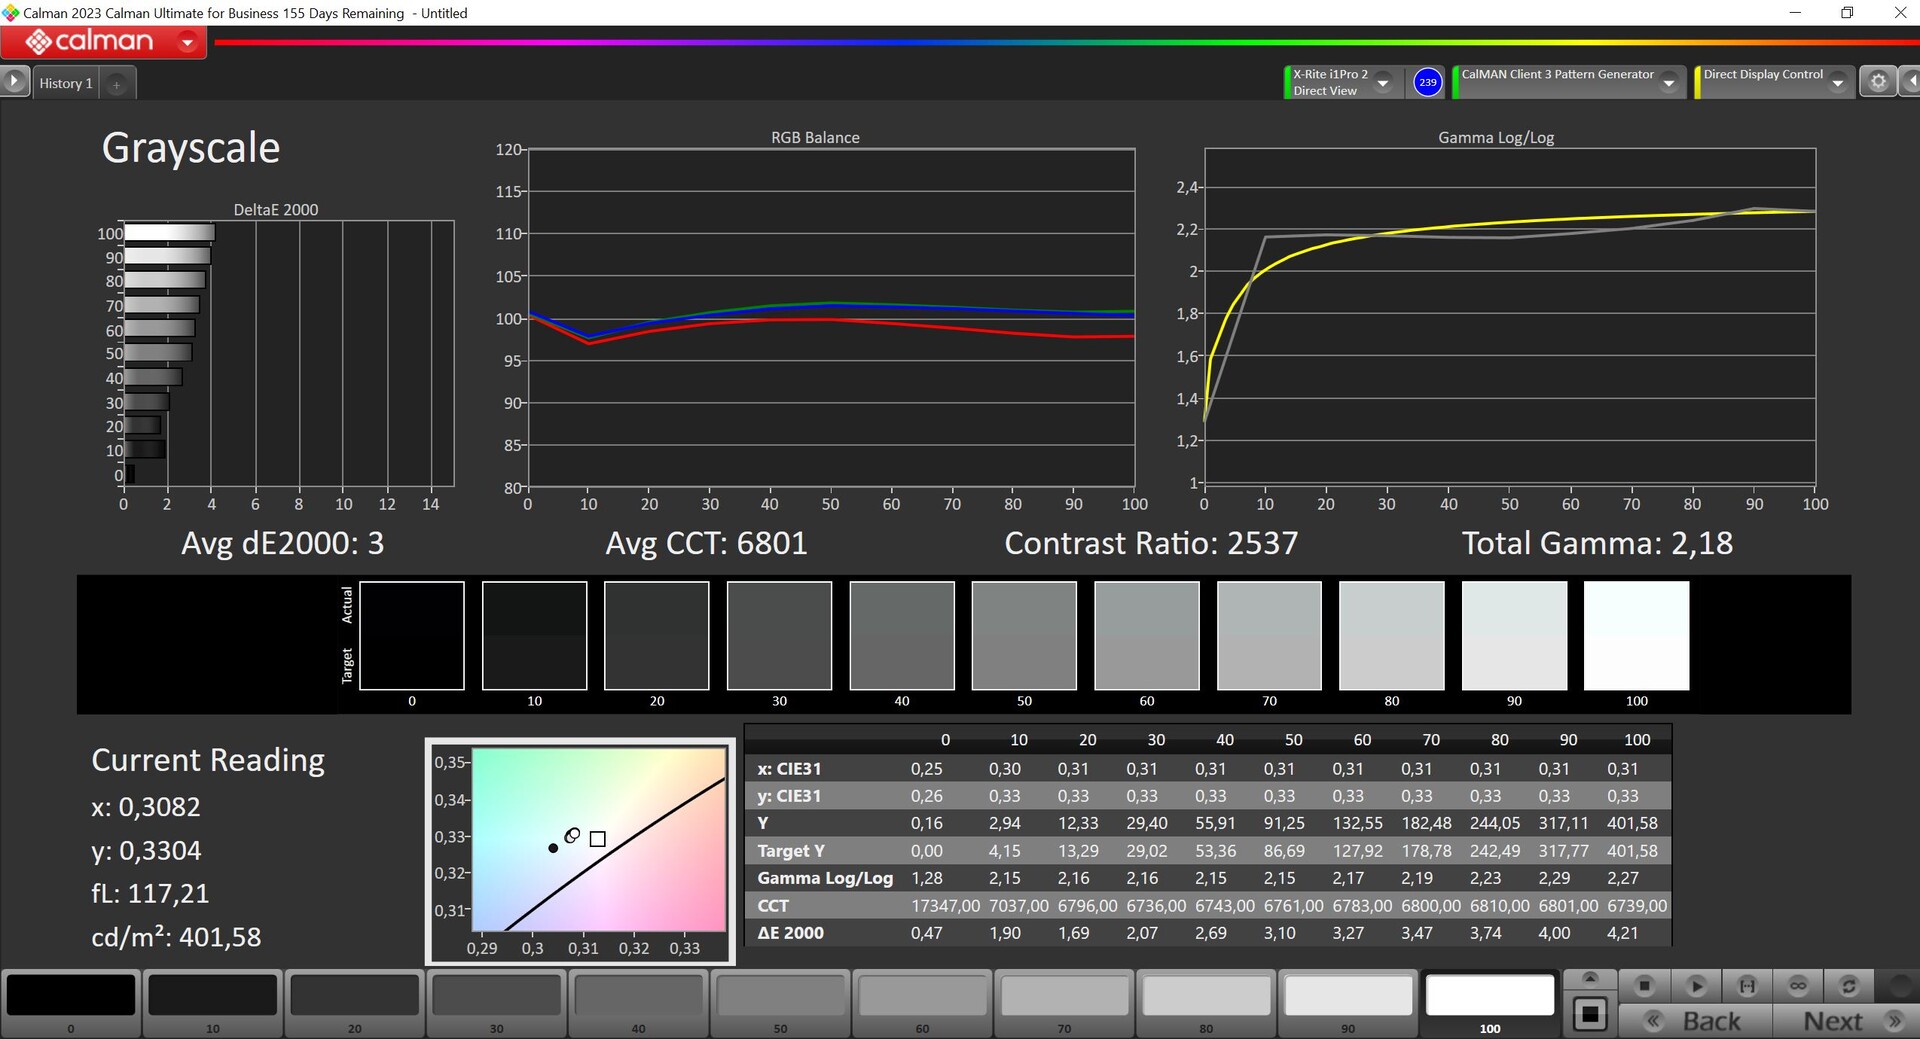
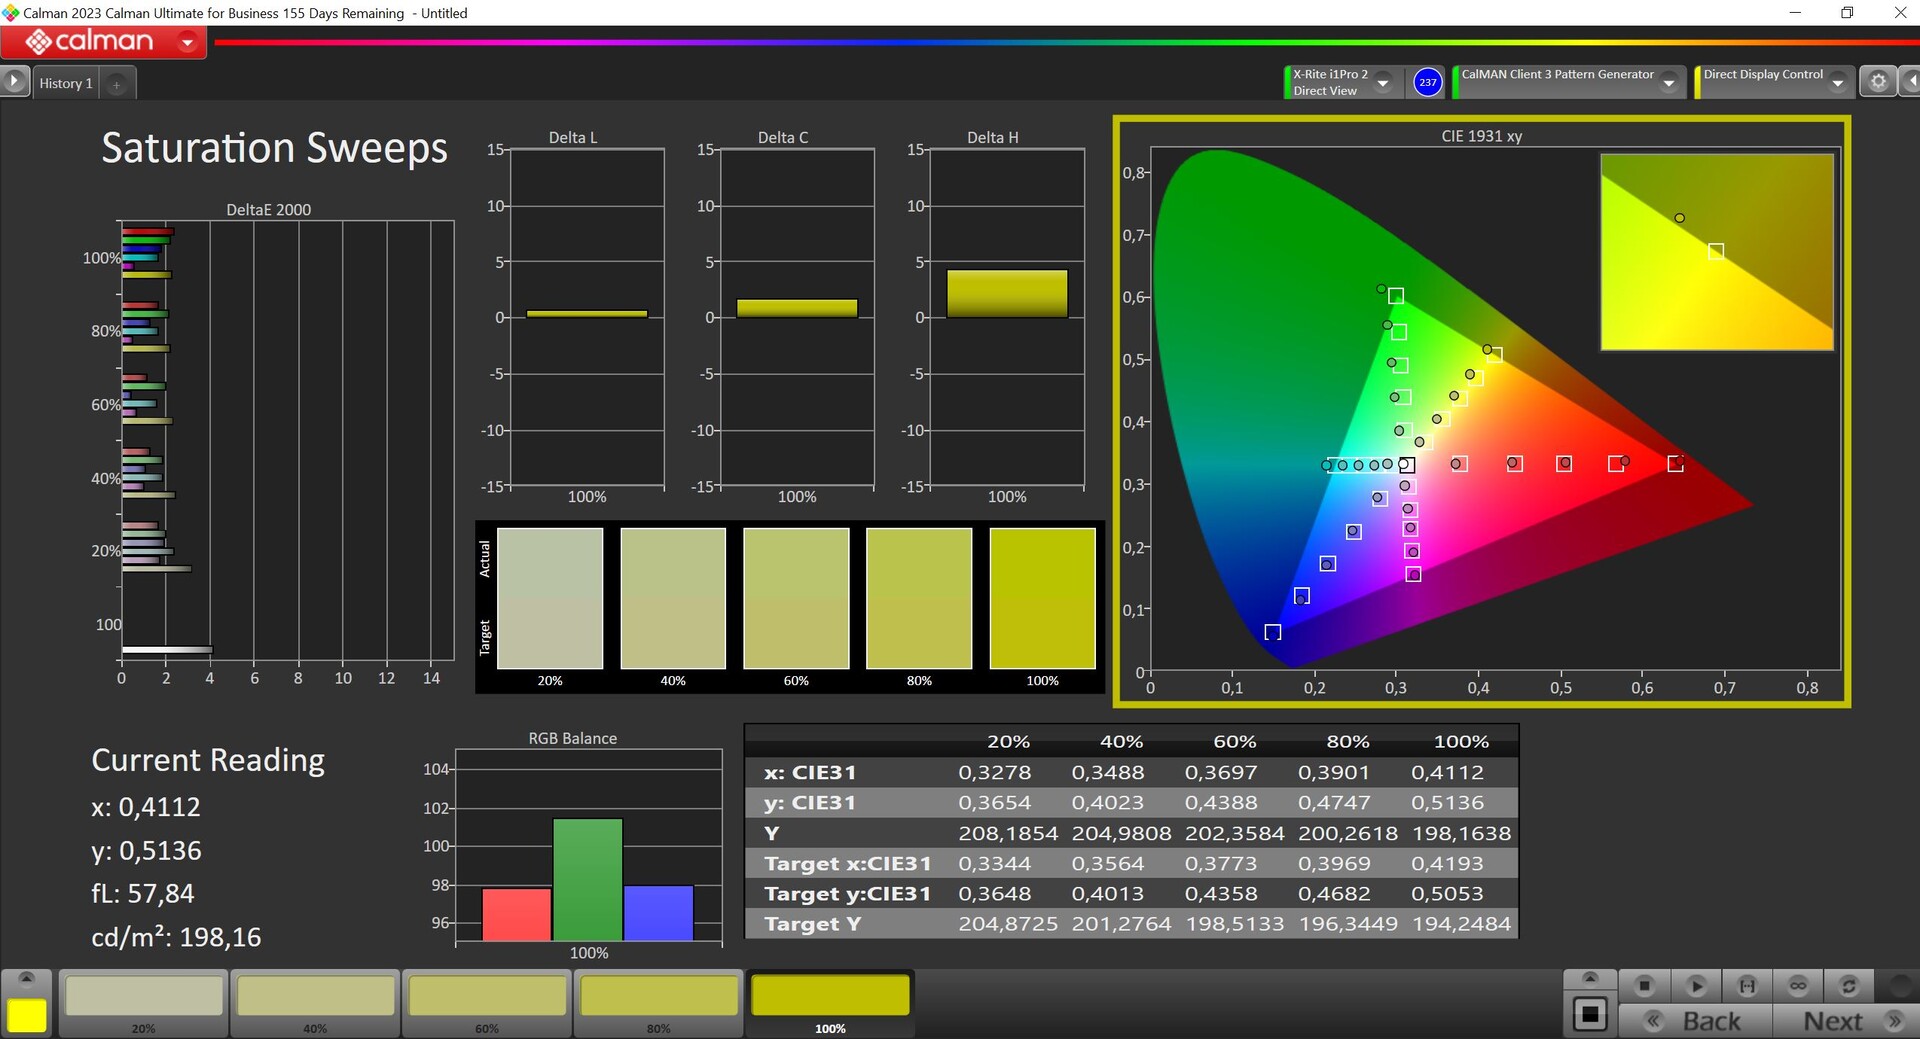
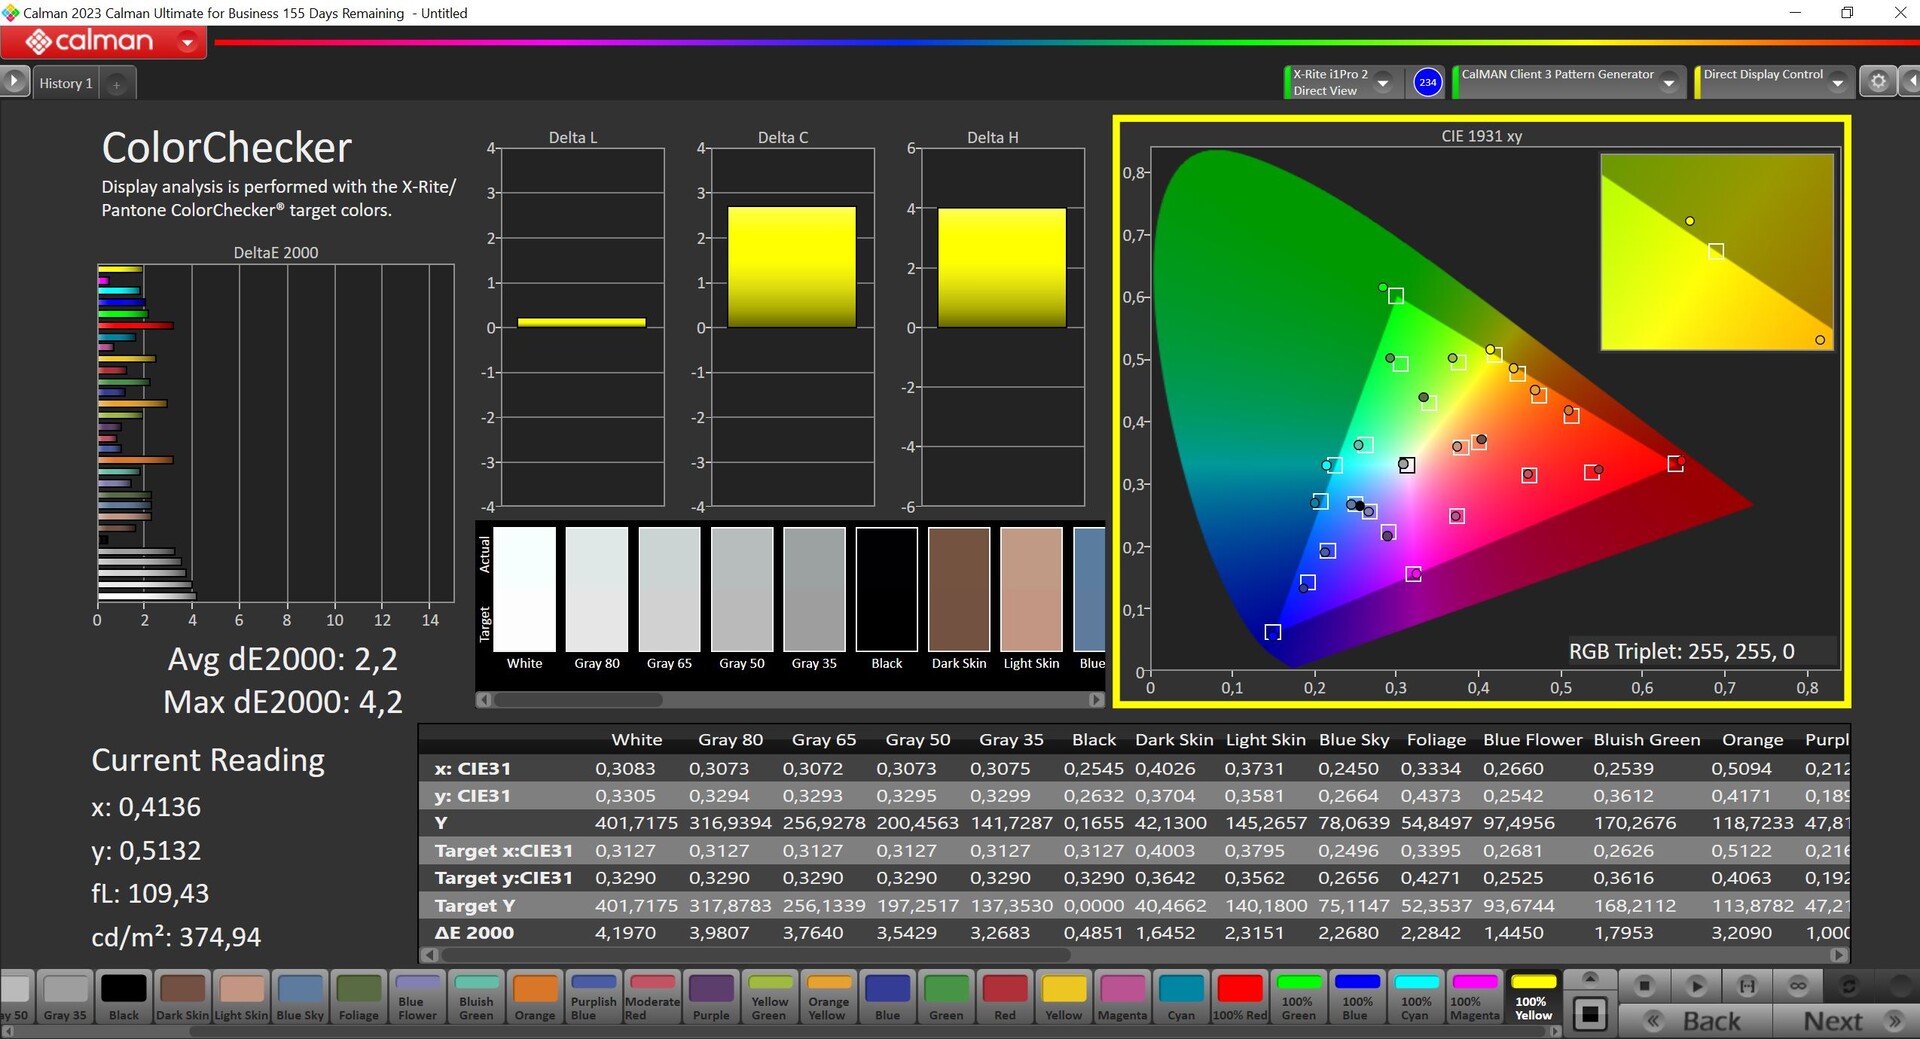
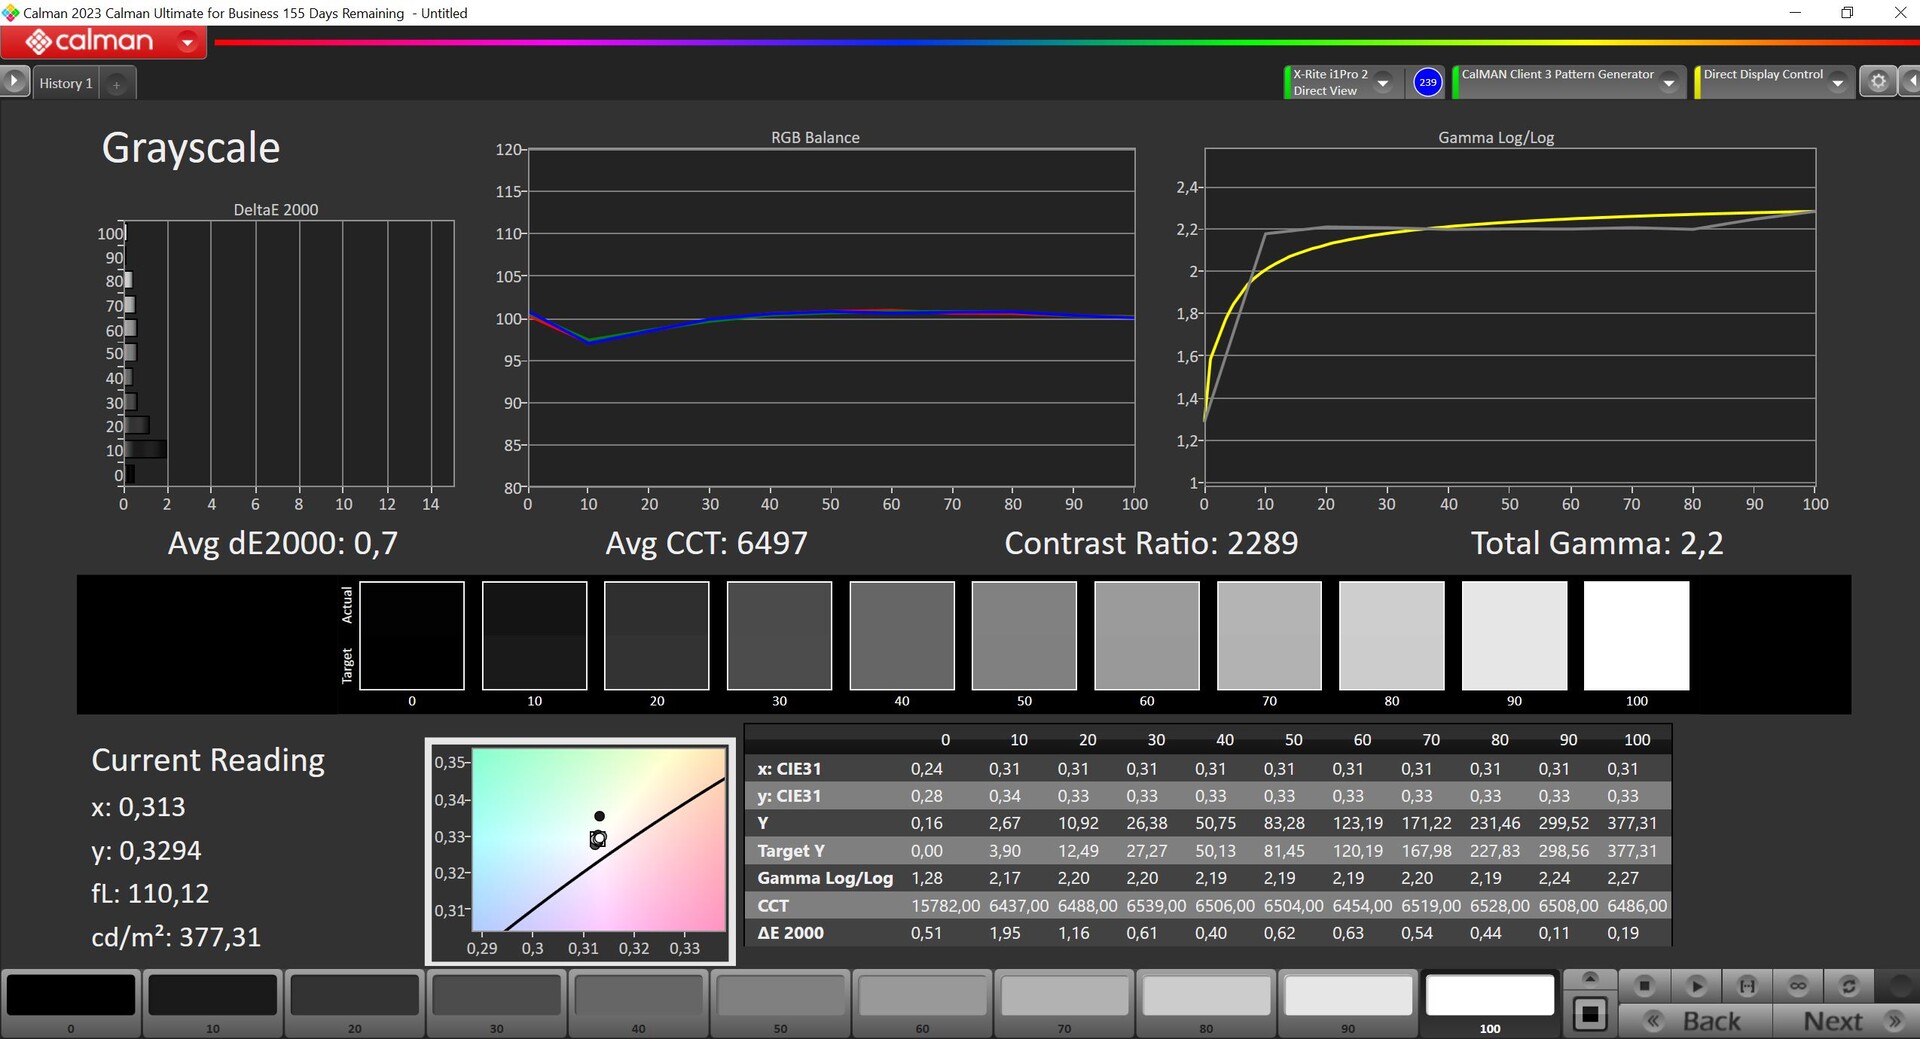
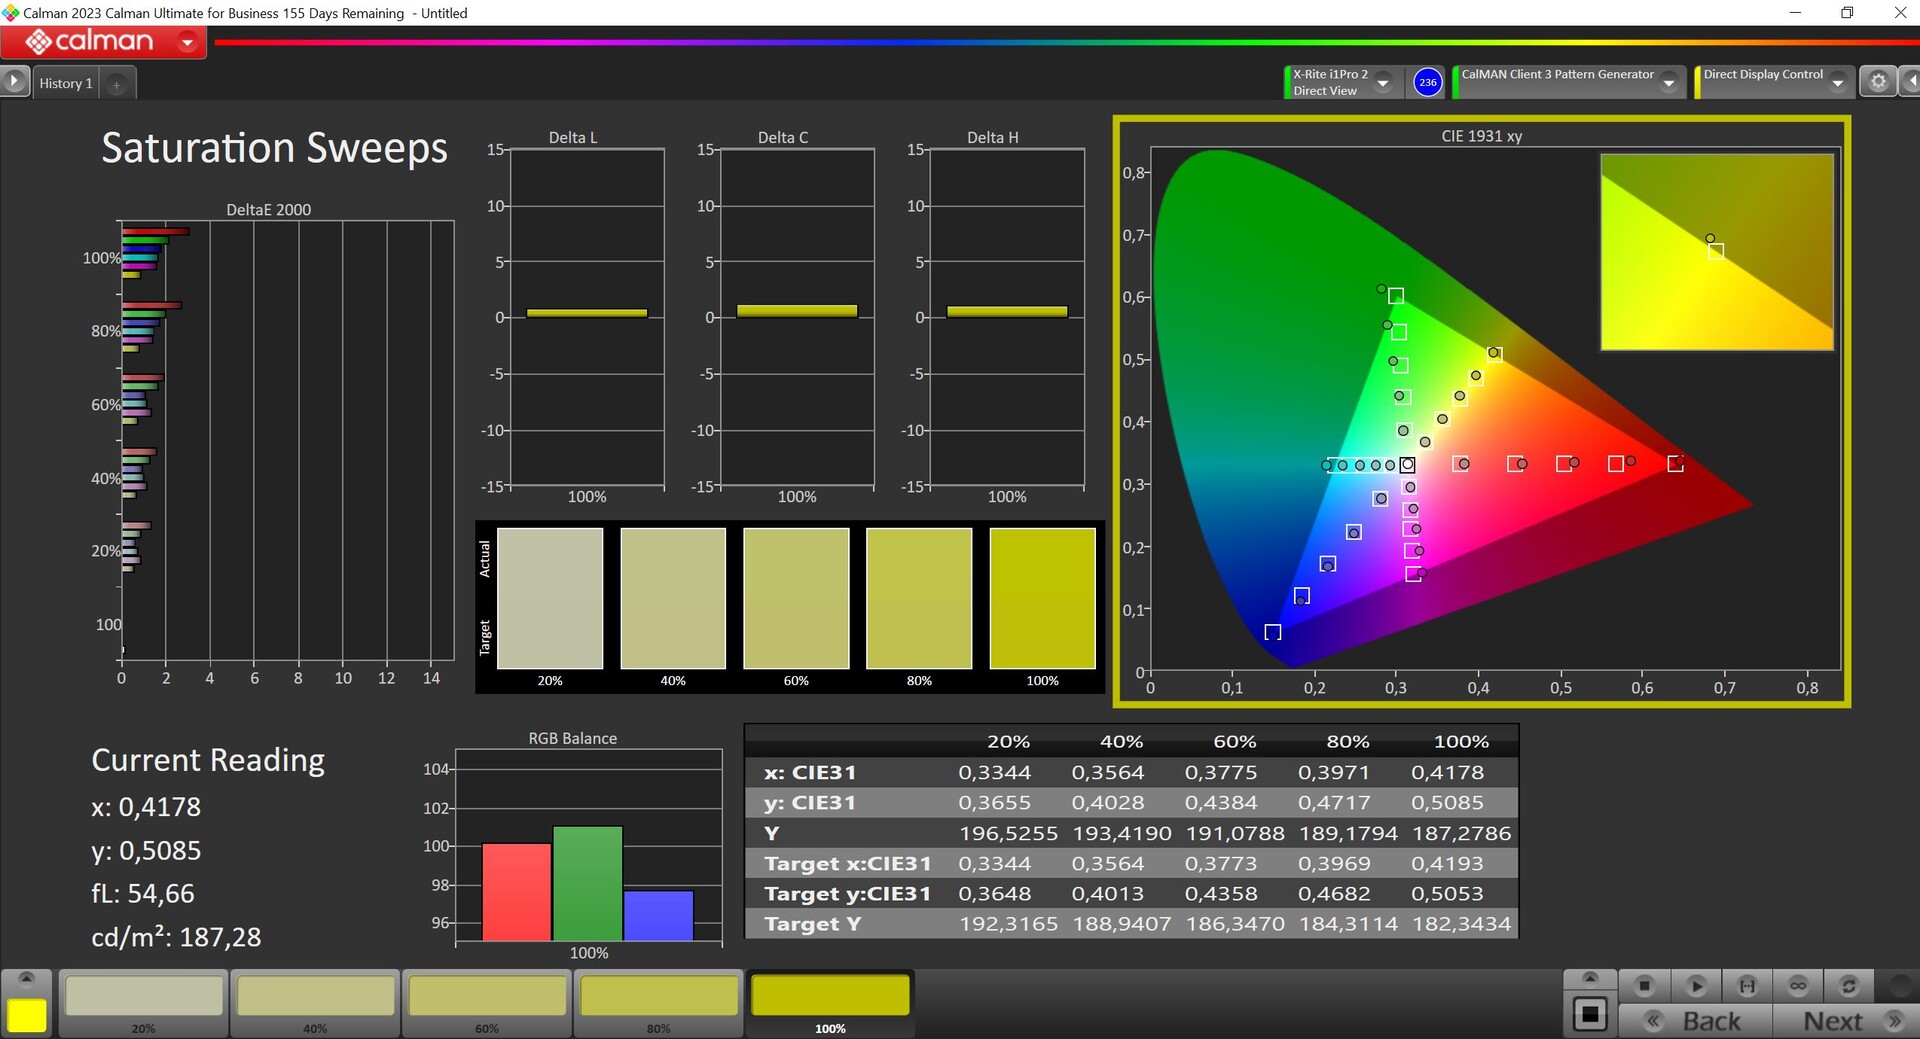
Producent podaje typową jasność na poziomie 300 cd/m², a nasze urządzenie testowe wykazało nawet znacznie lepsze wyniki średnio, a mianowicie ponad 400 cd/m². Co więcej, jego wartość czerni jest bardzo niska i wynosi 0,16 cd/m², co prowadzi do wysokiego maksymalnego współczynnika kontrastu. Jego kalibracja jest przyzwoita od razu po wyjęciu z pudełka i nie powinno to prowadzić do żadnych problemów w codziennym użytkowaniu. W przypadku samodzielnej kalibracji ekranu, można nieznacznie poprawić jego odwzorowanie, ale odbywa się to kosztem pewnej utraty jasności. Pokrywa on mniejszą przestrzeń kolorów sRGB niemal w całości. Na zewnątrz panel sprawia całkiem dobre wrażenie, a stabilność kąta widzenia jest w porządku.
| |||||||||||||||||||||||||
rozświetlenie: 89 %
na akumulatorze: 402 cd/m²
kontrast: 2513:1 (czerń: 0.16 cd/m²)
ΔE ColorChecker Calman: 2.2 | ∀{0.5-29.43 Ø4.72}
calibrated: 1.3
ΔE Greyscale Calman: 3 | ∀{0.09-98 Ø4.97}
73.8% AdobeRGB 1998 (Argyll 3D)
99.8% sRGB (Argyll 3D)
72.4% Display P3 (Argyll 3D)
Gamma: 2.18
CCT: 6801 K
| Schenker Work 14 Base B140HAN06.8, IPS, 1920x1080, 14" | Acer Swift Go 14 SFG14-71 Samsung ATNA40YK11-0, OLED, 2880x1800, 14" | HP ProBook 445 G10 AUO2FA6, IPS, 1920x1080, 14" | Dell Latitude 3440 BOE NE140FH, IPS, 1920x1080, 14" | Lenovo ThinkPad L14 G4 21H6S00900 B140HAN06.9, IPS LED, 1920x1080, 14" | |
|---|---|---|---|---|---|
| Display | 22% | -5% | -42% | 0% | |
| Display P3 Coverage (%) | 72.4 | 99.9 38% | 68.4 -6% | 40.4 -44% | 73.2 1% |
| sRGB Coverage (%) | 99.8 | 100 0% | 95.2 -5% | 60.7 -39% | 98.9 -1% |
| AdobeRGB 1998 Coverage (%) | 73.8 | 95.4 29% | 70.6 -4% | 41.8 -43% | 73.9 0% |
| Response Times | 96% | 24% | 28% | 5% | |
| Response Time Grey 50% / Grey 80% * (ms) | 60 ? | 1.85 ? 97% | 53.4 ? 11% | 35.3 ? 41% | 58.1 ? 3% |
| Response Time Black / White * (ms) | 34.7 ? | 2 ? 94% | 21.8 ? 37% | 29.8 ? 14% | 32.7 ? 6% |
| PWM Frequency (Hz) | 357 ? | ||||
| Screen | -8% | -15% | -67% | -18% | |
| Brightness middle (cd/m²) | 402 | 278 -31% | 501 25% | 292.6 -27% | 430 7% |
| Brightness (cd/m²) | 404 | 279 -31% | 464 15% | 270 -33% | 409 1% |
| Brightness Distribution (%) | 89 | 96 8% | 87 -2% | 88 -1% | 88 -1% |
| Black Level * (cd/m²) | 0.16 | 0.04 75% | 0.26 -63% | 0.19 -19% | 0.31 -94% |
| Contrast (:1) | 2513 | 6950 177% | 1927 -23% | 1540 -39% | 1387 -45% |
| Colorchecker dE 2000 * | 2.2 | 3.01 -37% | 2.64 -20% | 4.63 -110% | 2.4 -9% |
| Colorchecker dE 2000 max. * | 4.2 | 4.43 -5% | 5.06 -20% | 17.1 -307% | 4.7 -12% |
| Colorchecker dE 2000 calibrated * | 1.3 | 4.14 -218% | 1.57 -21% | 2.13 -64% | 1.4 -8% |
| Greyscale dE 2000 * | 3 | 3.2 -7% | 3.8 -27% | 3.2 -7% | 3 -0% |
| Gamma | 2.18 101% | 2.194 100% | 2.103 105% | 2.34 94% | 2.3 96% |
| CCT | 6801 96% | 6126 106% | 6562 99% | 7184 90% | 6489 100% |
| Całkowita średnia (program / ustawienia) | 37% /
14% | 1% /
-7% | -27% /
-48% | -4% /
-11% |
* ... im mniej tym lepiej

Wyświetl czasy reakcji
| ↔ Czas reakcji od czerni do bieli | ||
|---|---|---|
| 34.7 ms ... wzrost ↗ i spadek ↘ łącznie | ↗ 17 ms wzrost | 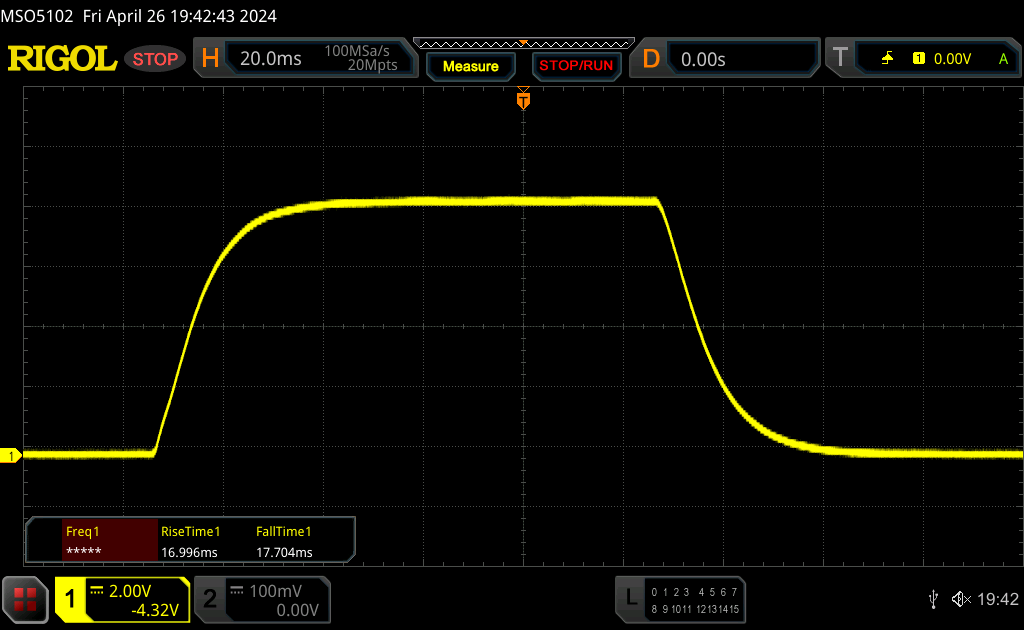 |
| ↘ 17.7 ms upadek | ||
| W naszych testach ekran wykazuje powolne tempo reakcji, co będzie niezadowalające dla graczy. Dla porównania, wszystkie testowane urządzenia wahają się od 0.1 (minimum) do 240 (maksimum) ms. » 92 % wszystkich urządzeń jest lepszych. Oznacza to, że zmierzony czas reakcji jest gorszy od średniej wszystkich testowanych urządzeń (19.8 ms). | ||
| ↔ Czas reakcji 50% szarości do 80% szarości | ||
| 60 ms ... wzrost ↗ i spadek ↘ łącznie | ↗ 27.5 ms wzrost | 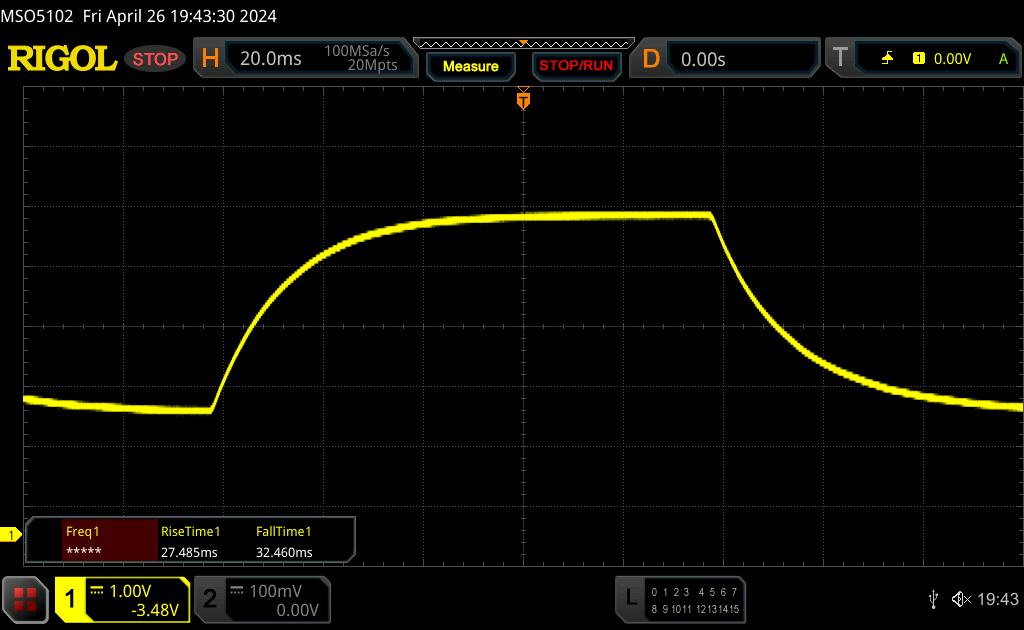 |
| ↘ 32.5 ms upadek | ||
| W naszych testach ekran wykazuje powolne tempo reakcji, co będzie niezadowalające dla graczy. Dla porównania, wszystkie testowane urządzenia wahają się od 0.165 (minimum) do 636 (maksimum) ms. » 96 % wszystkich urządzeń jest lepszych. Oznacza to, że zmierzony czas reakcji jest gorszy od średniej wszystkich testowanych urządzeń (31 ms). | ||
Migotanie ekranu / PWM (modulacja szerokości impulsu)
| Migotanie ekranu/nie wykryto PWM | 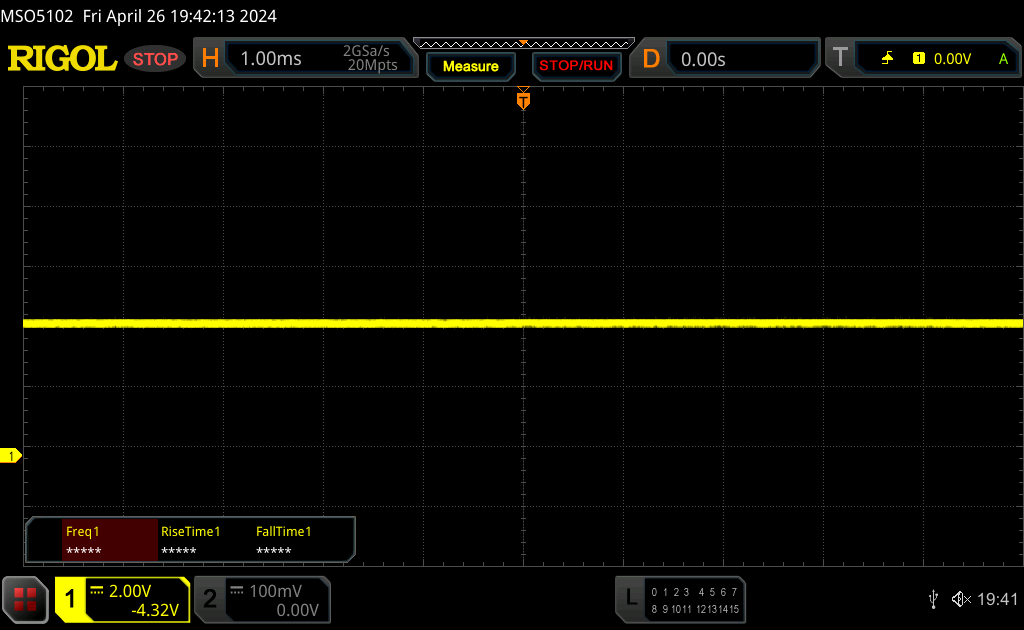 | ||
Dla porównania: 52 % wszystkich testowanych urządzeń nie używa PWM do przyciemniania wyświetlacza. Jeśli wykryto PWM, zmierzono średnio 7769 (minimum: 5 - maksimum: 343500) Hz. | |||
Występ - The Work 14 z Alder Lake
Warunki testowania
Schenker oferuje różne profile wydajności. Przeprowadziliśmy następujące testy porównawcze i pomiary w trybie rozrywki, który jest domyślnie aktywny.
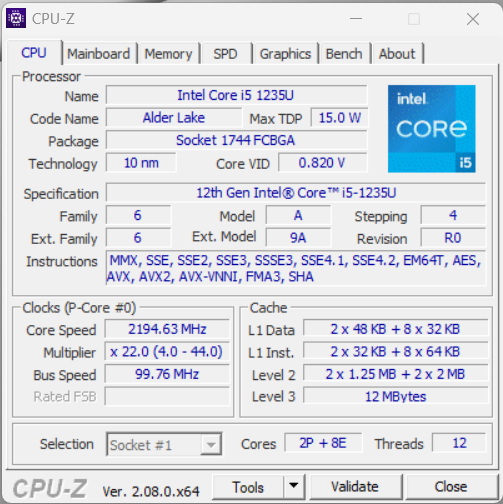
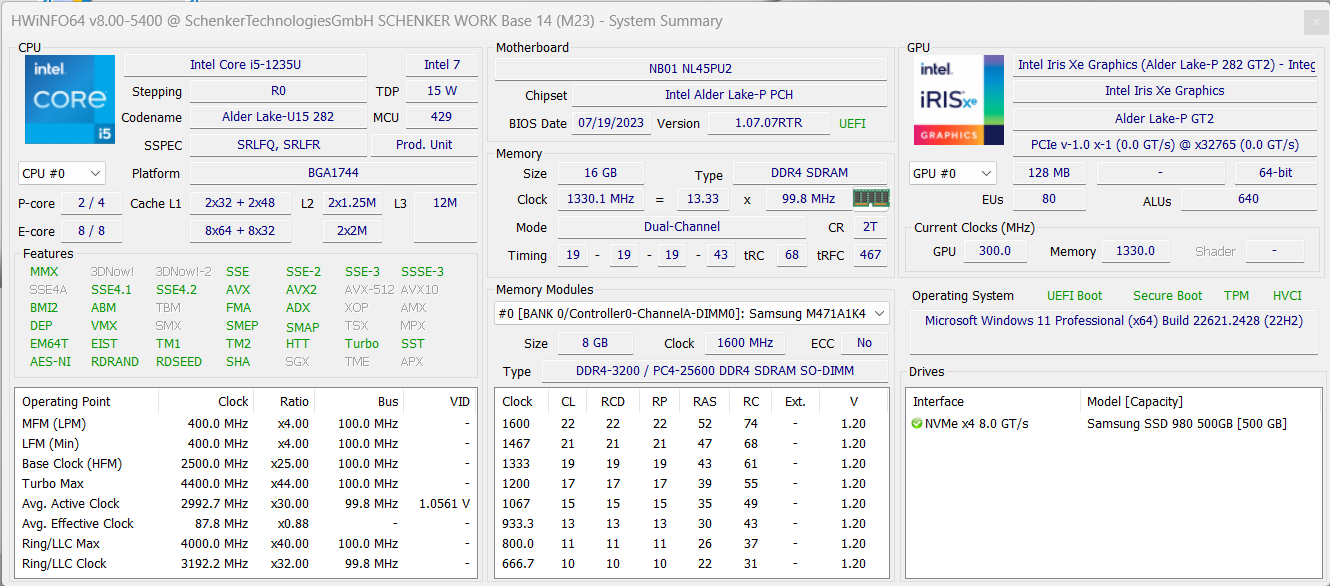
Procesor - Core i5-1235U
Procesor Core i5-1235U pochodzi z generacji Alder Lake Intela, posiada 10 rdzeni (2x wydajność, 8x efektywność) i pracuje z mocą 25/20 W w ramach Work 14. Oczywiście nie należy oczekiwać cudów wydajności, jednak jego ogólna wydajność jest porównywalna z Core i5-1345U wewnątrz Dell Latitude 14. Wydajność procesora jest zdecydowanie wystarczająca do prostych codziennych zadań podczas pracy w domu lub w biurze, a ponadto laptop nie wydaje się zbyt wolny. Z kolei w przypadku aplikacji AI trzeba będzie obejść się bez NPU. Podczas pracy na baterii procesor może zużywać maksymalnie 15 watów, dlatego też jego wydajność jest wtedy o 20% niższa. Więcej testów porównawczych procesora można znaleźć tutaj.
Cinebench R15 Multi continuous test
Cinebench R23: Multi Core | Single Core
Cinebench R20: CPU (Multi Core) | CPU (Single Core)
Cinebench R15: CPU Multi 64Bit | CPU Single 64Bit
Blender: v2.79 BMW27 CPU
7-Zip 18.03: 7z b 4 | 7z b 4 -mmt1
Geekbench 6.7: Multi-Core | Single-Core
Geekbench 5.5: Multi-Core | Single-Core
HWBOT x265 Benchmark v2.2: 4k Preset
LibreOffice : 20 Documents To PDF
R Benchmark 2.5: Overall mean
| CPU Performance rating | |
| Średnia w klasie Office | |
| Acer Swift Go 14 SFG14-71 | |
| Dell Latitude 3440 -2! | |
| Lenovo ThinkPad L14 G4 21H6S00900 -2! | |
| HP ProBook 445 G10 | |
| Schenker Work 14 Base | |
| Przeciętny Intel Core i5-1235U | |
| Cinebench R23 / Multi Core | |
| Średnia w klasie Office (1673 - 22808, n=74, ostatnie 2 lata) | |
| Lenovo ThinkPad L14 G4 21H6S00900 | |
| HP ProBook 445 G10 | |
| Acer Swift Go 14 SFG14-71 | |
| Dell Latitude 3440 | |
| Schenker Work 14 Base | |
| Przeciętny Intel Core i5-1235U (2485 - 9208, n=8) | |
| Cinebench R23 / Single Core | |
| Dell Latitude 3440 | |
| Średnia w klasie Office (708 - 2130, n=74, ostatnie 2 lata) | |
| Przeciętny Intel Core i5-1235U (1444 - 1698, n=8) | |
| Schenker Work 14 Base | |
| Acer Swift Go 14 SFG14-71 | |
| HP ProBook 445 G10 | |
| Lenovo ThinkPad L14 G4 21H6S00900 | |
| Cinebench R20 / CPU (Multi Core) | |
| Średnia w klasie Office (648 - 8840, n=73, ostatnie 2 lata) | |
| Lenovo ThinkPad L14 G4 21H6S00900 | |
| HP ProBook 445 G10 | |
| Acer Swift Go 14 SFG14-71 | |
| Dell Latitude 3440 | |
| Schenker Work 14 Base | |
| Przeciętny Intel Core i5-1235U (1783 - 3537, n=8) | |
| Cinebench R20 / CPU (Single Core) | |
| Dell Latitude 3440 | |
| Średnia w klasie Office (345 - 816, n=73, ostatnie 2 lata) | |
| Schenker Work 14 Base | |
| Przeciętny Intel Core i5-1235U (566 - 651, n=8) | |
| Acer Swift Go 14 SFG14-71 | |
| HP ProBook 445 G10 | |
| Lenovo ThinkPad L14 G4 21H6S00900 | |
| Cinebench R15 / CPU Multi 64Bit | |
| Średnia w klasie Office (250 - 3380, n=75, ostatnie 2 lata) | |
| Lenovo ThinkPad L14 G4 21H6S00900 | |
| Acer Swift Go 14 SFG14-71 | |
| HP ProBook 445 G10 | |
| Dell Latitude 3440 | |
| Przeciętny Intel Core i5-1235U (785 - 1587, n=8) | |
| Schenker Work 14 Base | |
| Cinebench R15 / CPU Single 64Bit | |
| Średnia w klasie Office (99.5 - 312, n=75, ostatnie 2 lata) | |
| Dell Latitude 3440 | |
| Acer Swift Go 14 SFG14-71 | |
| HP ProBook 445 G10 | |
| Lenovo ThinkPad L14 G4 21H6S00900 | |
| Schenker Work 14 Base | |
| Przeciętny Intel Core i5-1235U (151.5 - 242, n=8) | |
| Blender / v2.79 BMW27 CPU | |
| Schenker Work 14 Base | |
| Przeciętny Intel Core i5-1235U (366 - 662, n=8) | |
| Dell Latitude 3440 | |
| Acer Swift Go 14 SFG14-71 | |
| Lenovo ThinkPad L14 G4 21H6S00900 | |
| HP ProBook 445 G10 | |
| Średnia w klasie Office (158 - 1940, n=74, ostatnie 2 lata) | |
| 7-Zip 18.03 / 7z b 4 | |
| Średnia w klasie Office (7098 - 76886, n=75, ostatnie 2 lata) | |
| HP ProBook 445 G10 | |
| Lenovo ThinkPad L14 G4 21H6S00900 | |
| Dell Latitude 3440 | |
| Acer Swift Go 14 SFG14-71 | |
| Przeciętny Intel Core i5-1235U (20166 - 38643, n=8) | |
| Schenker Work 14 Base | |
| 7-Zip 18.03 / 7z b 4 -mmt1 | |
| Dell Latitude 3440 | |
| HP ProBook 445 G10 | |
| Średnia w klasie Office (3387 - 6469, n=75, ostatnie 2 lata) | |
| Lenovo ThinkPad L14 G4 21H6S00900 | |
| Schenker Work 14 Base | |
| Acer Swift Go 14 SFG14-71 | |
| Przeciętny Intel Core i5-1235U (4371 - 5233, n=8) | |
| Geekbench 6.7 / Multi-Core | |
| Średnia w klasie Office (757 - 17846, n=82, ostatnie 2 lata) | |
| Acer Swift Go 14 SFG14-71 | |
| Przeciętny Intel Core i5-1235U (6703 - 7046, n=2) | |
| Schenker Work 14 Base | |
| HP ProBook 445 G10 | |
| Geekbench 6.7 / Single-Core | |
| Średnia w klasie Office (462 - 2894, n=83, ostatnie 2 lata) | |
| Acer Swift Go 14 SFG14-71 | |
| Przeciętny Intel Core i5-1235U (1981 - 2208, n=2) | |
| Schenker Work 14 Base | |
| HP ProBook 445 G10 | |
| Geekbench 5.5 / Multi-Core | |
| Średnia w klasie Office (1483 - 16999, n=71, ostatnie 2 lata) | |
| Acer Swift Go 14 SFG14-71 | |
| Przeciętny Intel Core i5-1235U (5528 - 8571, n=10) | |
| Dell Latitude 3440 | |
| Schenker Work 14 Base | |
| HP ProBook 445 G10 | |
| Lenovo ThinkPad L14 G4 21H6S00900 | |
| Geekbench 5.5 / Single-Core | |
| Średnia w klasie Office (811 - 2128, n=71, ostatnie 2 lata) | |
| Dell Latitude 3440 | |
| Acer Swift Go 14 SFG14-71 | |
| Schenker Work 14 Base | |
| Przeciętny Intel Core i5-1235U (1426 - 1643, n=10) | |
| HP ProBook 445 G10 | |
| Lenovo ThinkPad L14 G4 21H6S00900 | |
| HWBOT x265 Benchmark v2.2 / 4k Preset | |
| Średnia w klasie Office (2.21 - 26, n=74, ostatnie 2 lata) | |
| Lenovo ThinkPad L14 G4 21H6S00900 | |
| HP ProBook 445 G10 | |
| Acer Swift Go 14 SFG14-71 | |
| Dell Latitude 3440 | |
| Schenker Work 14 Base | |
| Przeciętny Intel Core i5-1235U (4.99 - 9.43, n=8) | |
| LibreOffice / 20 Documents To PDF | |
| Acer Swift Go 14 SFG14-71 | |
| Średnia w klasie Office (39.9 - 102.3, n=74, ostatnie 2 lata) | |
| HP ProBook 445 G10 | |
| Przeciętny Intel Core i5-1235U (42.4 - 65.5, n=8) | |
| Dell Latitude 3440 | |
| Schenker Work 14 Base | |
| Lenovo ThinkPad L14 G4 21H6S00900 | |
| R Benchmark 2.5 / Overall mean | |
| Lenovo ThinkPad L14 G4 21H6S00900 | |
| Średnia w klasie Office (0.4098 - 0.888, n=74, ostatnie 2 lata) | |
| HP ProBook 445 G10 | |
| Przeciętny Intel Core i5-1235U (0.4986 - 0.603, n=8) | |
| Acer Swift Go 14 SFG14-71 | |
| Schenker Work 14 Base | |
| Dell Latitude 3440 | |
* ... im mniej tym lepiej
AIDA64: FP32 Ray-Trace | FPU Julia | CPU SHA3 | CPU Queen | FPU SinJulia | FPU Mandel | CPU AES | CPU ZLib | FP64 Ray-Trace | CPU PhotoWorxx
| Performance rating | |
| Średnia w klasie Office | |
| Lenovo ThinkPad L14 G4 21H6S00900 | |
| HP ProBook 445 G10 | |
| Dell Latitude 3440 | |
| Acer Swift Go 14 SFG14-71 | |
| Przeciętny Intel Core i5-1235U | |
| Schenker Work 14 Base | |
| AIDA64 / FP32 Ray-Trace | |
| Średnia w klasie Office (2083 - 31245, n=80, ostatnie 2 lata) | |
| HP ProBook 445 G10 | |
| Lenovo ThinkPad L14 G4 21H6S00900 | |
| Dell Latitude 3440 | |
| Acer Swift Go 14 SFG14-71 | |
| Schenker Work 14 Base | |
| Przeciętny Intel Core i5-1235U (3078 - 7457, n=8) | |
| AIDA64 / FPU Julia | |
| Średnia w klasie Office (8191 - 125394, n=80, ostatnie 2 lata) | |
| Lenovo ThinkPad L14 G4 21H6S00900 | |
| HP ProBook 445 G10 | |
| Dell Latitude 3440 | |
| Acer Swift Go 14 SFG14-71 | |
| Schenker Work 14 Base | |
| Przeciętny Intel Core i5-1235U (15838 - 37760, n=8) | |
| AIDA64 / CPU SHA3 | |
| Średnia w klasie Office (433 - 5755, n=80, ostatnie 2 lata) | |
| Lenovo ThinkPad L14 G4 21H6S00900 | |
| HP ProBook 445 G10 | |
| Dell Latitude 3440 | |
| Schenker Work 14 Base | |
| Acer Swift Go 14 SFG14-71 | |
| Przeciętny Intel Core i5-1235U (978 - 2072, n=8) | |
| AIDA64 / CPU Queen | |
| Lenovo ThinkPad L14 G4 21H6S00900 | |
| HP ProBook 445 G10 | |
| Średnia w klasie Office (22784 - 115197, n=69, ostatnie 2 lata) | |
| Dell Latitude 3440 | |
| Przeciętny Intel Core i5-1235U (45680 - 62404, n=8) | |
| Acer Swift Go 14 SFG14-71 | |
| Schenker Work 14 Base | |
| AIDA64 / FPU SinJulia | |
| HP ProBook 445 G10 | |
| Lenovo ThinkPad L14 G4 21H6S00900 | |
| Średnia w klasie Office (1378 - 18321, n=80, ostatnie 2 lata) | |
| Dell Latitude 3440 | |
| Przeciętny Intel Core i5-1235U (3099 - 4644, n=8) | |
| Acer Swift Go 14 SFG14-71 | |
| Schenker Work 14 Base | |
| AIDA64 / FPU Mandel | |
| Lenovo ThinkPad L14 G4 21H6S00900 | |
| HP ProBook 445 G10 | |
| Średnia w klasie Office (4601 - 66922, n=80, ostatnie 2 lata) | |
| Dell Latitude 3440 | |
| Acer Swift Go 14 SFG14-71 | |
| Schenker Work 14 Base | |
| Przeciętny Intel Core i5-1235U (8046 - 18819, n=8) | |
| AIDA64 / CPU AES | |
| Lenovo ThinkPad L14 G4 21H6S00900 | |
| Średnia w klasie Office (4854 - 155900, n=80, ostatnie 2 lata) | |
| Dell Latitude 3440 | |
| Przeciętny Intel Core i5-1235U (23386 - 67140, n=8) | |
| Acer Swift Go 14 SFG14-71 | |
| HP ProBook 445 G10 | |
| Schenker Work 14 Base | |
| AIDA64 / CPU ZLib | |
| Średnia w klasie Office (114.6 - 1366, n=80, ostatnie 2 lata) | |
| Dell Latitude 3440 | |
| HP ProBook 445 G10 | |
| Lenovo ThinkPad L14 G4 21H6S00900 | |
| Schenker Work 14 Base | |
| Przeciętny Intel Core i5-1235U (329 - 633, n=8) | |
| Acer Swift Go 14 SFG14-71 | |
| AIDA64 / FP64 Ray-Trace | |
| Średnia w klasie Office (1109 - 17834, n=80, ostatnie 2 lata) | |
| HP ProBook 445 G10 | |
| Lenovo ThinkPad L14 G4 21H6S00900 | |
| Dell Latitude 3440 | |
| Schenker Work 14 Base | |
| Acer Swift Go 14 SFG14-71 | |
| Przeciętny Intel Core i5-1235U (1670 - 3928, n=8) | |
| AIDA64 / CPU PhotoWorxx | |
| Średnia w klasie Office (11090 - 65229, n=80, ostatnie 2 lata) | |
| Acer Swift Go 14 SFG14-71 | |
| Przeciętny Intel Core i5-1235U (15933 - 41909, n=8) | |
| Schenker Work 14 Base | |
| Dell Latitude 3440 | |
| HP ProBook 445 G10 | |
| Lenovo ThinkPad L14 G4 21H6S00900 | |
Wydajność systemu
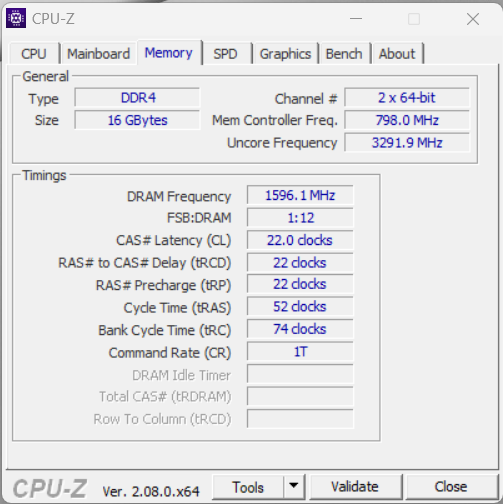
W codziennym użytkowaniu wydajność laptopa jest przyzwoita, choć dysk SSD PCIe również odgrywa tu swoją rolę. Podczas naszych testów nie odnotowaliśmy żadnych problemów ze stabilnością systemu, a w razie potrzeby pamięć RAM urządzenia można rozszerzyć do 64 GB.
CrossMark: Overall | Productivity | Creativity | Responsiveness
WebXPRT 3: Overall
WebXPRT 4: Overall
Mozilla Kraken 1.1: Total
| PCMark 10 / Score | |
| Średnia w klasie Office (2601 - 9298, n=64, ostatnie 2 lata) | |
| Lenovo ThinkPad L14 G4 21H6S00900 | |
| HP ProBook 445 G10 | |
| Acer Swift Go 14 SFG14-71 | |
| Dell Latitude 3440 | |
| Przeciętny Intel Core i5-1235U, Intel Iris Xe Graphics G7 80EUs (4528 - 5543, n=8) | |
| Schenker Work 14 Base | |
| PCMark 10 / Essentials | |
| Lenovo ThinkPad L14 G4 21H6S00900 | |
| Dell Latitude 3440 | |
| HP ProBook 445 G10 | |
| Acer Swift Go 14 SFG14-71 | |
| Średnia w klasie Office (3245 - 11594, n=64, ostatnie 2 lata) | |
| Przeciętny Intel Core i5-1235U, Intel Iris Xe Graphics G7 80EUs (9143 - 11273, n=8) | |
| Schenker Work 14 Base | |
| PCMark 10 / Productivity | |
| HP ProBook 445 G10 | |
| Średnia w klasie Office (5336 - 17243, n=64, ostatnie 2 lata) | |
| Lenovo ThinkPad L14 G4 21H6S00900 | |
| Acer Swift Go 14 SFG14-71 | |
| Dell Latitude 3440 | |
| Przeciętny Intel Core i5-1235U, Intel Iris Xe Graphics G7 80EUs (6440 - 7354, n=8) | |
| Schenker Work 14 Base | |
| PCMark 10 / Digital Content Creation | |
| Średnia w klasie Office (2049 - 13541, n=64, ostatnie 2 lata) | |
| Acer Swift Go 14 SFG14-71 | |
| Dell Latitude 3440 | |
| Schenker Work 14 Base | |
| Lenovo ThinkPad L14 G4 21H6S00900 | |
| Przeciętny Intel Core i5-1235U, Intel Iris Xe Graphics G7 80EUs (4220 - 5839, n=8) | |
| HP ProBook 445 G10 | |
| CrossMark / Overall | |
| Średnia w klasie Office (381 - 2010, n=73, ostatnie 2 lata) | |
| Acer Swift Go 14 SFG14-71 | |
| Dell Latitude 3440 | |
| Przeciętny Intel Core i5-1235U, Intel Iris Xe Graphics G7 80EUs (983 - 1644, n=8) | |
| Schenker Work 14 Base | |
| Lenovo ThinkPad L14 G4 21H6S00900 | |
| CrossMark / Productivity | |
| Acer Swift Go 14 SFG14-71 | |
| Średnia w klasie Office (464 - 1880, n=73, ostatnie 2 lata) | |
| Dell Latitude 3440 | |
| Przeciętny Intel Core i5-1235U, Intel Iris Xe Graphics G7 80EUs (1026 - 1676, n=8) | |
| Schenker Work 14 Base | |
| Lenovo ThinkPad L14 G4 21H6S00900 | |
| CrossMark / Creativity | |
| Średnia w klasie Office (319 - 2361, n=73, ostatnie 2 lata) | |
| Dell Latitude 3440 | |
| Acer Swift Go 14 SFG14-71 | |
| Przeciętny Intel Core i5-1235U, Intel Iris Xe Graphics G7 80EUs (1032 - 1618, n=8) | |
| Schenker Work 14 Base | |
| Lenovo ThinkPad L14 G4 21H6S00900 | |
| CrossMark / Responsiveness | |
| Acer Swift Go 14 SFG14-71 | |
| Średnia w klasie Office (360 - 1690, n=73, ostatnie 2 lata) | |
| Przeciętny Intel Core i5-1235U, Intel Iris Xe Graphics G7 80EUs (746 - 1867, n=8) | |
| Dell Latitude 3440 | |
| Schenker Work 14 Base | |
| Lenovo ThinkPad L14 G4 21H6S00900 | |
| WebXPRT 3 / Overall | |
| Średnia w klasie Office (129.9 - 455, n=74, ostatnie 2 lata) | |
| Dell Latitude 3440 | |
| Przeciętny Intel Core i5-1235U, Intel Iris Xe Graphics G7 80EUs (233 - 305, n=11) | |
| Lenovo ThinkPad L14 G4 21H6S00900 | |
| Acer Swift Go 14 SFG14-71 | |
| Schenker Work 14 Base | |
| WebXPRT 4 / Overall | |
| Dell Latitude 3440 | |
| Średnia w klasie Office (104.2 - 313, n=75, ostatnie 2 lata) | |
| Przeciętny Intel Core i5-1235U, Intel Iris Xe Graphics G7 80EUs (206 - 236, n=10) | |
| Schenker Work 14 Base | |
| Lenovo ThinkPad L14 G4 21H6S00900 | |
| Mozilla Kraken 1.1 / Total | |
| Lenovo ThinkPad L14 G4 21H6S00900 | |
| Schenker Work 14 Base | |
| Przeciętny Intel Core i5-1235U, Intel Iris Xe Graphics G7 80EUs (486 - 634, n=11) | |
| Średnia w klasie Office (391 - 1297, n=76, ostatnie 2 lata) | |
| Acer Swift Go 14 SFG14-71 | |
| Acer Swift Go 14 SFG14-71 | |
| Dell Latitude 3440 | |
* ... im mniej tym lepiej
| PCMark 10 Score | 4873 pkt. | |
Pomoc | ||
| AIDA64 / Memory Copy | |
| Średnia w klasie Office (20075 - 110930, n=77, ostatnie 2 lata) | |
| Acer Swift Go 14 SFG14-71 | |
| Przeciętny Intel Core i5-1235U (24653 - 61921, n=8) | |
| Schenker Work 14 Base | |
| Dell Latitude 3440 | |
| HP ProBook 445 G10 | |
| Lenovo ThinkPad L14 G4 21H6S00900 | |
| AIDA64 / Memory Read | |
| Średnia w klasie Office (10084 - 128030, n=78, ostatnie 2 lata) | |
| Przeciętny Intel Core i5-1235U (24441 - 66108, n=8) | |
| Schenker Work 14 Base | |
| Acer Swift Go 14 SFG14-71 | |
| Dell Latitude 3440 | |
| HP ProBook 445 G10 | |
| Lenovo ThinkPad L14 G4 21H6S00900 | |
| AIDA64 / Memory Write | |
| Średnia w klasie Office (20073 - 119858, n=78, ostatnie 2 lata) | |
| Acer Swift Go 14 SFG14-71 | |
| Przeciętny Intel Core i5-1235U (25156 - 75808, n=8) | |
| Schenker Work 14 Base | |
| Dell Latitude 3440 | |
| HP ProBook 445 G10 | |
| Lenovo ThinkPad L14 G4 21H6S00900 | |
| AIDA64 / Memory Latency | |
| Acer Swift Go 14 SFG14-71 | |
| Średnia w klasie Office (7.6 - 162.9, n=73, ostatnie 2 lata) | |
| Lenovo ThinkPad L14 G4 21H6S00900 | |
| HP ProBook 445 G10 | |
| Przeciętny Intel Core i5-1235U (76.3 - 119, n=8) | |
| Schenker Work 14 Base | |
| Dell Latitude 3440 | |
* ... im mniej tym lepiej
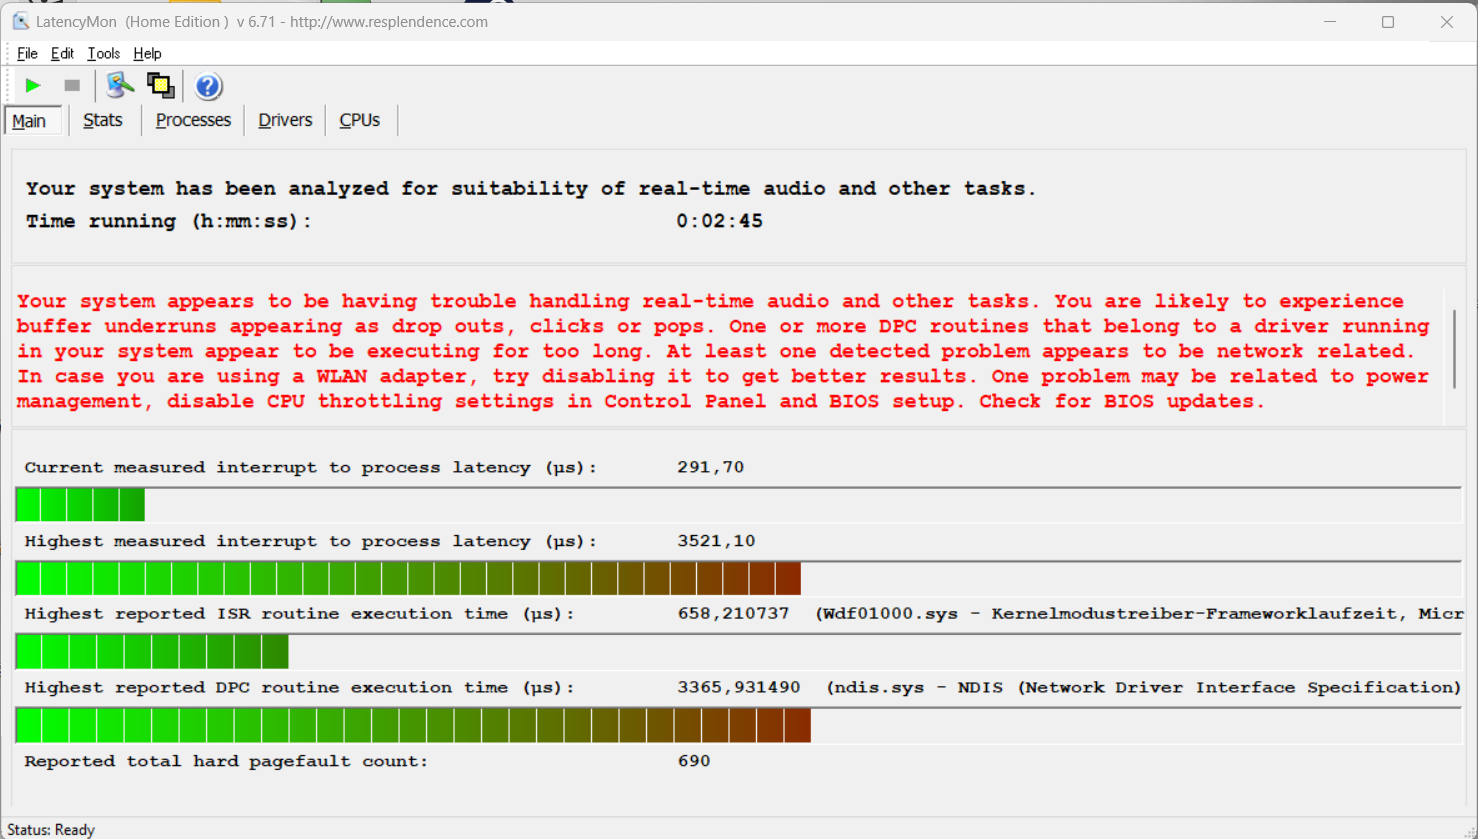
Opóźnienia DPC
Podczas naszego standardowego testu opóźnień, urządzenie testowe z aktualną wersją BIOS-u wykazywało ograniczenia podczas korzystania z aplikacji audio w czasie rzeczywistym.
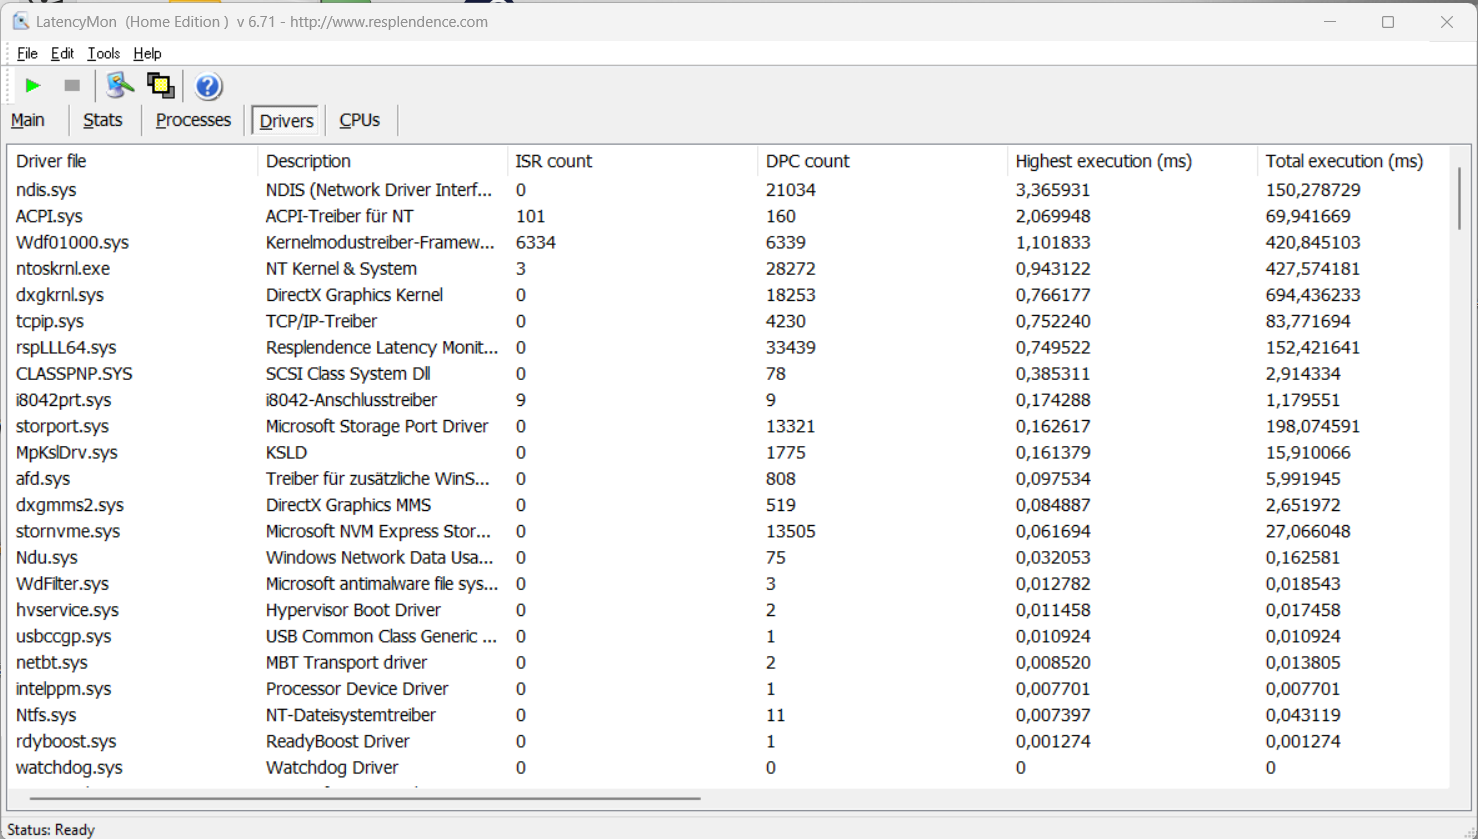
| DPC Latencies / LatencyMon - interrupt to process latency (max), Web, Youtube, Prime95 | |
| Schenker Work 14 Base | |
| Dell Latitude 3440 | |
| Lenovo ThinkPad L14 G4 21H6S00900 | |
| HP ProBook 445 G10 | |
| Acer Swift Go 14 SFG14-71 | |
* ... im mniej tym lepiej
Urządzenie pamięci masowej
Work 14 posiada szybki slot PCIe 4.0 dla dysków SSD M.2-2280. Nasze urządzenie testowe zostało wyposażone w 500-gigabajtową wersję Samsunga 980, która oferuje przyzwoite i stabilne prędkości transferu. Po pierwszym uruchomieniu laptopa użytkownicy mają do dyspozycji 422 GB. Więcej testów porównawczych dysków SSD można znaleźć tutaj.

* ... im mniej tym lepiej
Reading continuous performance: DiskSpd Read Loop, Queue Depth 8
Karta graficzna
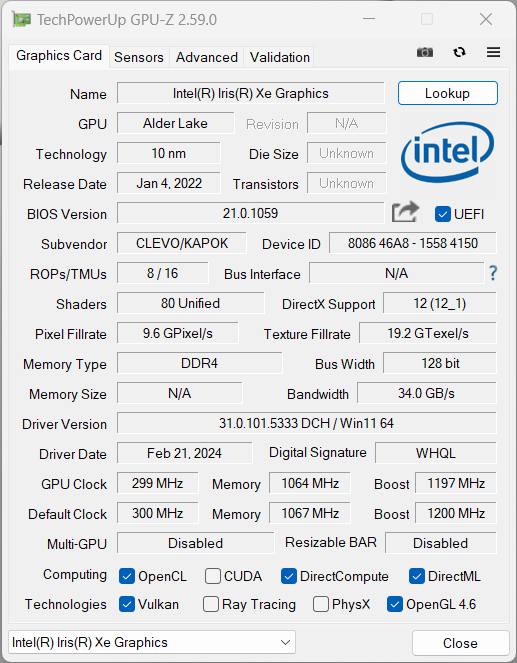
Za obliczenia graficzne odpowiada zintegrowana karta graficzna Iris Xe Graphics G7 (80 EU). Procesor iGPU dobrze radzi sobie z codziennymi zadaniami, w tym z odtwarzaniem filmów w wysokiej rozdzielczości, ale nie należy oczekiwać od niego wiele więcej. To samo można jednak powiedzieć o jego konkurentach, którzy również są wyposażeni w GPU Iris lub, w przypadku HP ProBook 445przestarzały AMD RX Vega 7.
Nasze benchmarki do gier bardzo wyraźnie pokazały, że Work 14 Base ledwo nadaje się do grania w gry. Nawet podczas uruchamiania starszych lub mniej wymagających gier, użytkownik jest zazwyczaj ograniczony do niskich poziomów szczegółowości.
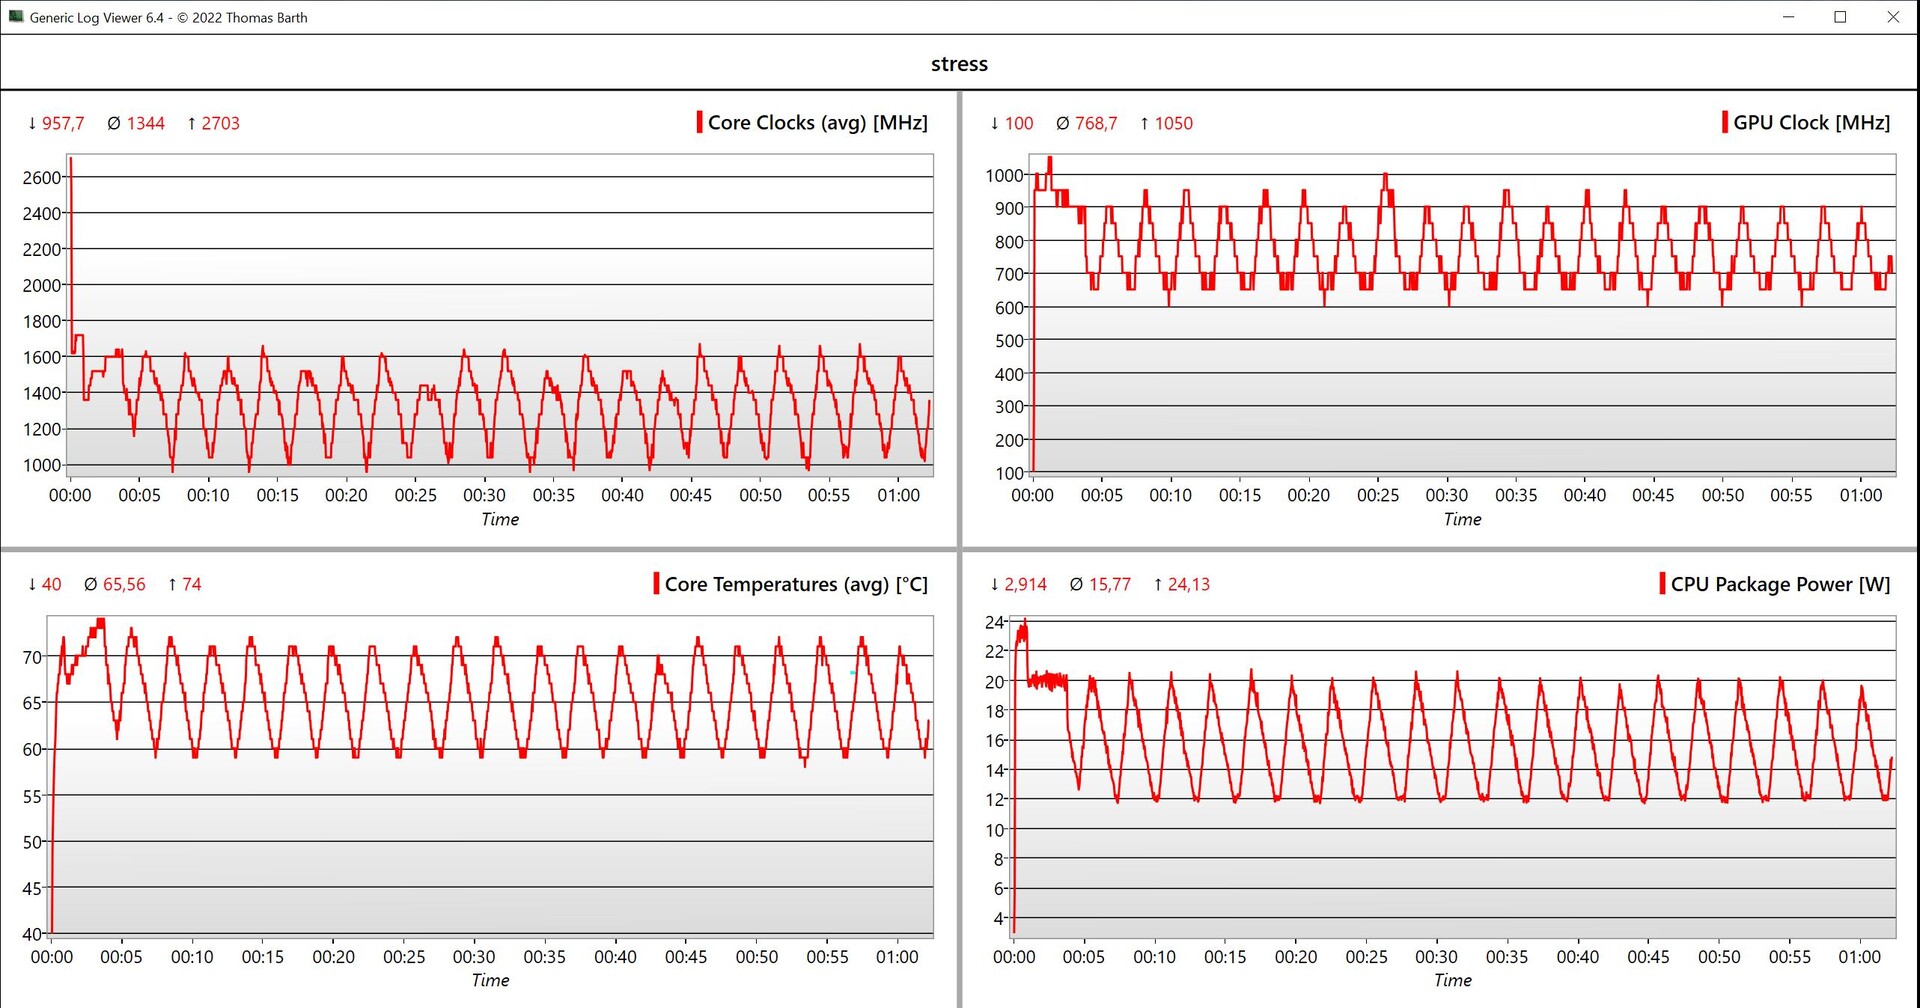
Pod stałym obciążeniem wydajność graficzna nie pozostaje całkowicie stabilna i spada o około 10%. Podczas korzystania z baterii nie odnotowaliśmy dalszego spadku wydajności. Więcej testów porównawczych GPU można znaleźć na stronie tutaj.
| 3DMark 11 Performance | 5431 pkt. | |
| 3DMark Fire Strike Score | 3537 pkt. | |
| 3DMark Time Spy Score | 1331 pkt. | |
Pomoc | ||
| Blender / v3.3 Classroom HIP/AMD | |
| Lenovo ThinkPad L14 G4 21H6S00900 | |
| HP ProBook 445 G10 | |
| Średnia w klasie Office (296 - 507, n=5, ostatnie 2 lata) | |
| Blender / v3.3 Classroom CPU | |
| Schenker Work 14 Base | |
| Przeciętny Intel Iris Xe Graphics G7 80EUs (463 - 3047, n=53) | |
| Dell Latitude 3440 | |
| Lenovo ThinkPad L14 G4 21H6S00900 | |
| Acer Swift Go 14 SFG14-71 | |
| HP ProBook 445 G10 | |
| Średnia w klasie Office (245 - 3219, n=72, ostatnie 2 lata) | |
* ... im mniej tym lepiej
| Performance rating - Percent | |
| Średnia w klasie Office | |
| Acer Swift Go 14 SFG14-71 | |
| Dell Latitude 3440 | |
| Schenker Work 14 Base | |
| HP ProBook 445 G10 | |
| Lenovo ThinkPad L14 G4 21H6S00900 | |
| The Witcher 3 - 1920x1080 Ultra Graphics & Postprocessing (HBAO+) | |
| Średnia w klasie Office (14.8 - 18.1, n=4, ostatnie 2 lata) | |
| Acer Swift Go 14 SFG14-71 | |
| HP ProBook 445 G10 | |
| Dell Latitude 3440 | |
| Schenker Work 14 Base | |
| Lenovo ThinkPad L14 G4 21H6S00900 | |
| GTA V - 1920x1080 Highest AA:4xMSAA + FX AF:16x | |
| Średnia w klasie Office (5.77 - 45.3, n=67, ostatnie 2 lata) | |
| Acer Swift Go 14 SFG14-71 | |
| Lenovo ThinkPad L14 G4 21H6S00900 | |
| Schenker Work 14 Base | |
| HP ProBook 445 G10 | |
| Dell Latitude 3440 | |
| Final Fantasy XV Benchmark - 1920x1080 High Quality | |
| Średnia w klasie Office (8.09 - 79.5, n=69, ostatnie 2 lata) | |
| Acer Swift Go 14 SFG14-71 | |
| Dell Latitude 3440 | |
| Schenker Work 14 Base | |
| HP ProBook 445 G10 | |
| Lenovo ThinkPad L14 G4 21H6S00900 | |
| Strange Brigade - 1920x1080 ultra AA:ultra AF:16 | |
| Średnia w klasie Office (12.9 - 142.1, n=51, ostatnie 2 lata) | |
| Acer Swift Go 14 SFG14-71 | |
| Dell Latitude 3440 | |
| Schenker Work 14 Base | |
| HP ProBook 445 G10 | |
| Lenovo ThinkPad L14 G4 21H6S00900 | |
| Dota 2 Reborn - 1920x1080 ultra (3/3) best looking | |
| Średnia w klasie Office (14.6 - 135, n=75, ostatnie 2 lata) | |
| Acer Swift Go 14 SFG14-71 | |
| Dell Latitude 3440 | |
| Schenker Work 14 Base | |
| HP ProBook 445 G10 | |
| Lenovo ThinkPad L14 G4 21H6S00900 | |
| X-Plane 11.11 - 1920x1080 high (fps_test=3) | |
| Średnia w klasie Office (12 - 82.4, n=66, ostatnie 2 lata) | |
| Dell Latitude 3440 | |
| HP ProBook 445 G10 | |
| Lenovo ThinkPad L14 G4 21H6S00900 | |
| Schenker Work 14 Base | |
| Acer Swift Go 14 SFG14-71 | |
Witcher 3 FPS diagram
| low | med. | high | ultra | |
|---|---|---|---|---|
| GTA V (2015) | 76.2 | 66.4 | 15.8 | 6.87 |
| The Witcher 3 (2015) | 66 | 43 | 23 | 9.6 |
| Dota 2 Reborn (2015) | 82.5 | 60 | 46.6 | 41.9 |
| Final Fantasy XV Benchmark (2018) | 30.2 | 17.4 | 12.1 | |
| X-Plane 11.11 (2018) | 30.2 | 23.7 | 21.8 | |
| Far Cry 5 (2018) | 36 | 20 | 19 | 17 |
| Strange Brigade (2018) | 64.6 | 28.3 | 22.4 | 17.6 |
| F1 23 (2023) | 29.3 | 26.7 | 18.3 |
Emisje i moc
Emisja hałasu
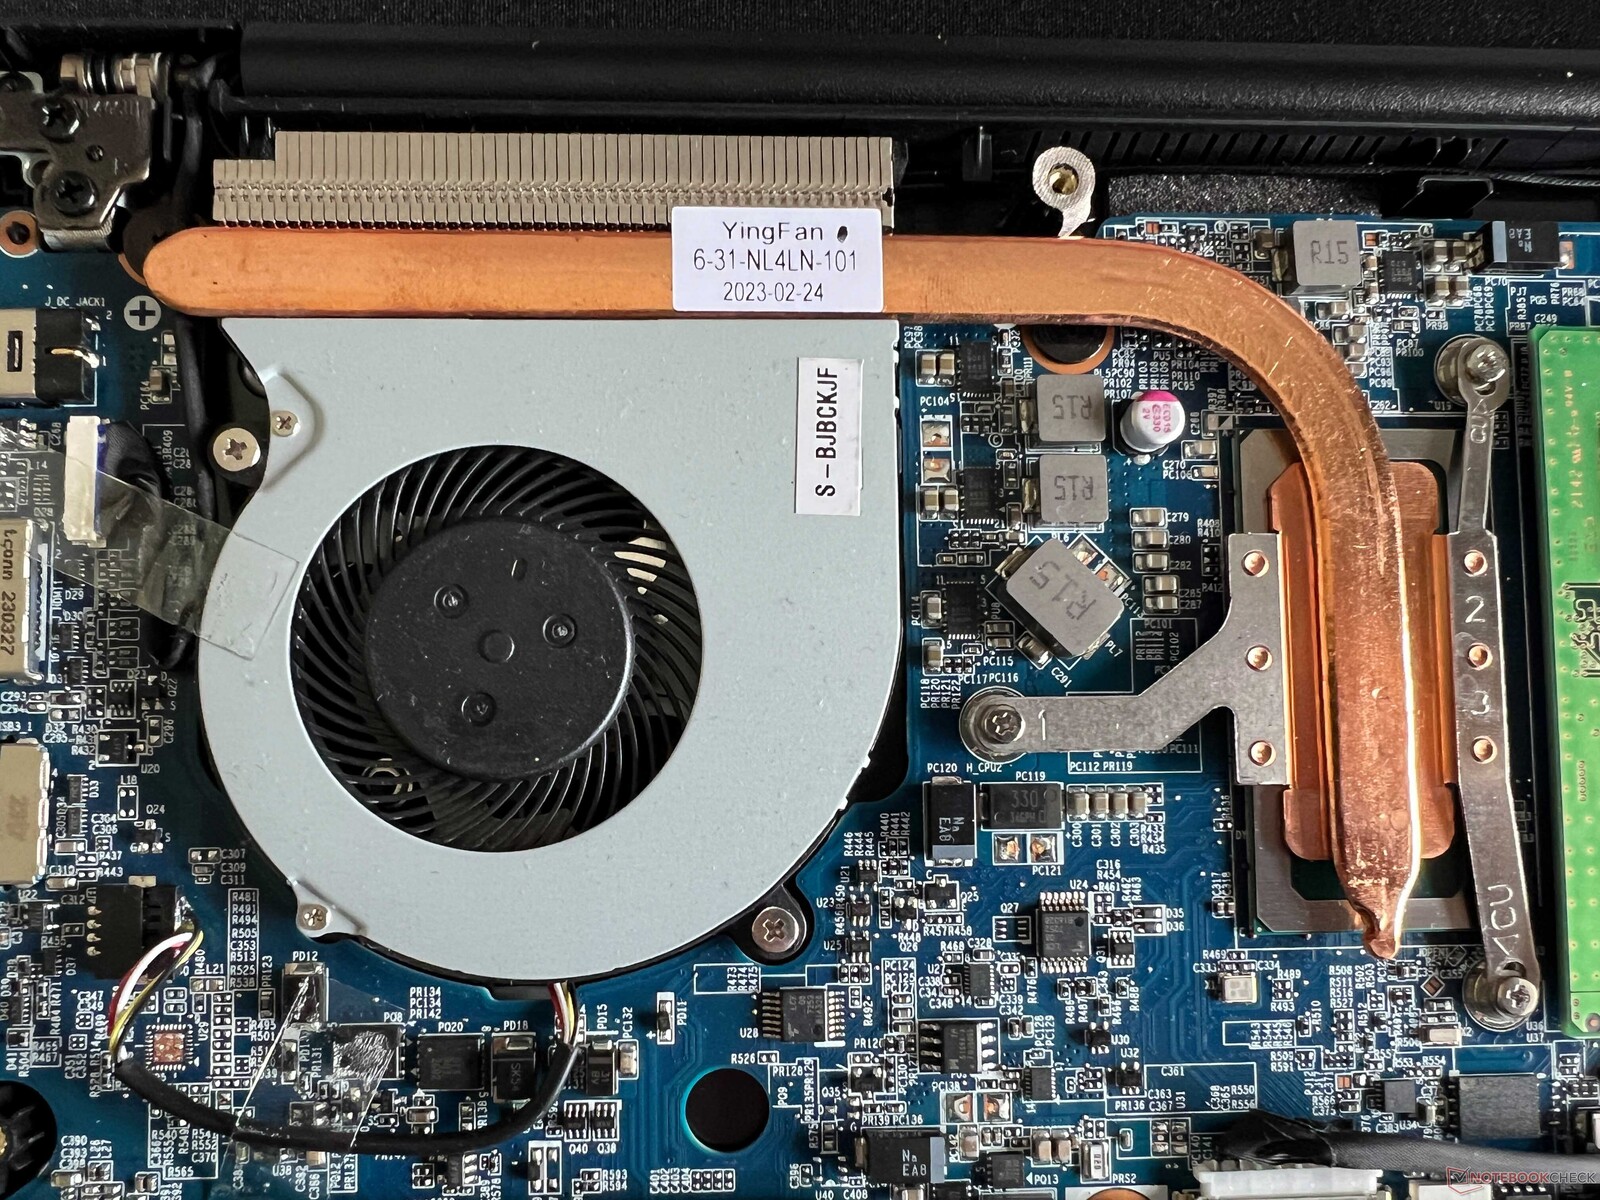
Do chłodzenia laptopa wykorzystywany jest jeden wentylator. Na biegu jałowym i przy niskim obciążeniu pozostaje on dość cichy, ale przy większym obciążeniu systemu wentylator staje się dość głośny (35 dB(A)), a dodatkowo emituje szum o wysokiej częstotliwości. W teście obciążeniowym jego 43 dB(A) to zdecydowanie za głośno - zwłaszcza biorąc pod uwagę niską wydajność laptopa. Nie odnotowaliśmy żadnych dodatkowych odgłosów elektronicznych dochodzących z naszego urządzenia testowego.
Hałas
| luz |
| 23.6 / 23.6 / 24.8 dB |
| obciążenie |
| 34.2 / 42.9 dB |
 | ||
30 dB cichy 40 dB(A) słyszalny 50 dB(A) irytujący |
||
min: | ||
| Schenker Work 14 Base Iris Xe G7 80EUs, i5-1235U, Samsung SSD 980 500GB (MZ-V8V500BW) | Acer Swift Go 14 SFG14-71 Iris Xe G7 80EUs, i5-1335U, WD PC SN740 SDDQNQD-512G-1014 | HP ProBook 445 G10 Vega 7, R5 7530U, Kioxia BG5 KBG50ZNS512G | Dell Latitude 3440 Iris Xe G7 80EUs, i5-1345U, Samsung PM9A1 MZVL2512HCJQ | Lenovo ThinkPad L14 G4 21H6S00900 Vega 7, R5 7530U, Kioxia BG5 KBG5AZNT512G | |
|---|---|---|---|---|---|
| Noise | -5% | -1% | -3% | -3% | |
| wyłączone / środowisko * (dB) | 23.6 | 24.9 -6% | 24 -2% | 23.9 -1% | 25.2 -7% |
| Idle Minimum * (dB) | 23.6 | 24.9 -6% | 24 -2% | 24.4 -3% | 25.2 -7% |
| Idle Average * (dB) | 23.6 | 24.9 -6% | 25 -6% | 24.4 -3% | 25.2 -7% |
| Idle Maximum * (dB) | 24.8 | 24.9 -0% | 28 -13% | 24.4 2% | 27.3 -10% |
| Load Average * (dB) | 34.2 | 31.9 7% | 33 4% | 37.1 -8% | 32.1 6% |
| Witcher 3 ultra * (dB) | 34.2 | 43.2 -26% | 36 -5% | 38.2 -12% | 35.7 -4% |
| Load Maximum * (dB) | 42.9 | 43.2 -1% | 36 16% | 40.2 6% | 38.3 11% |
* ... im mniej tym lepiej
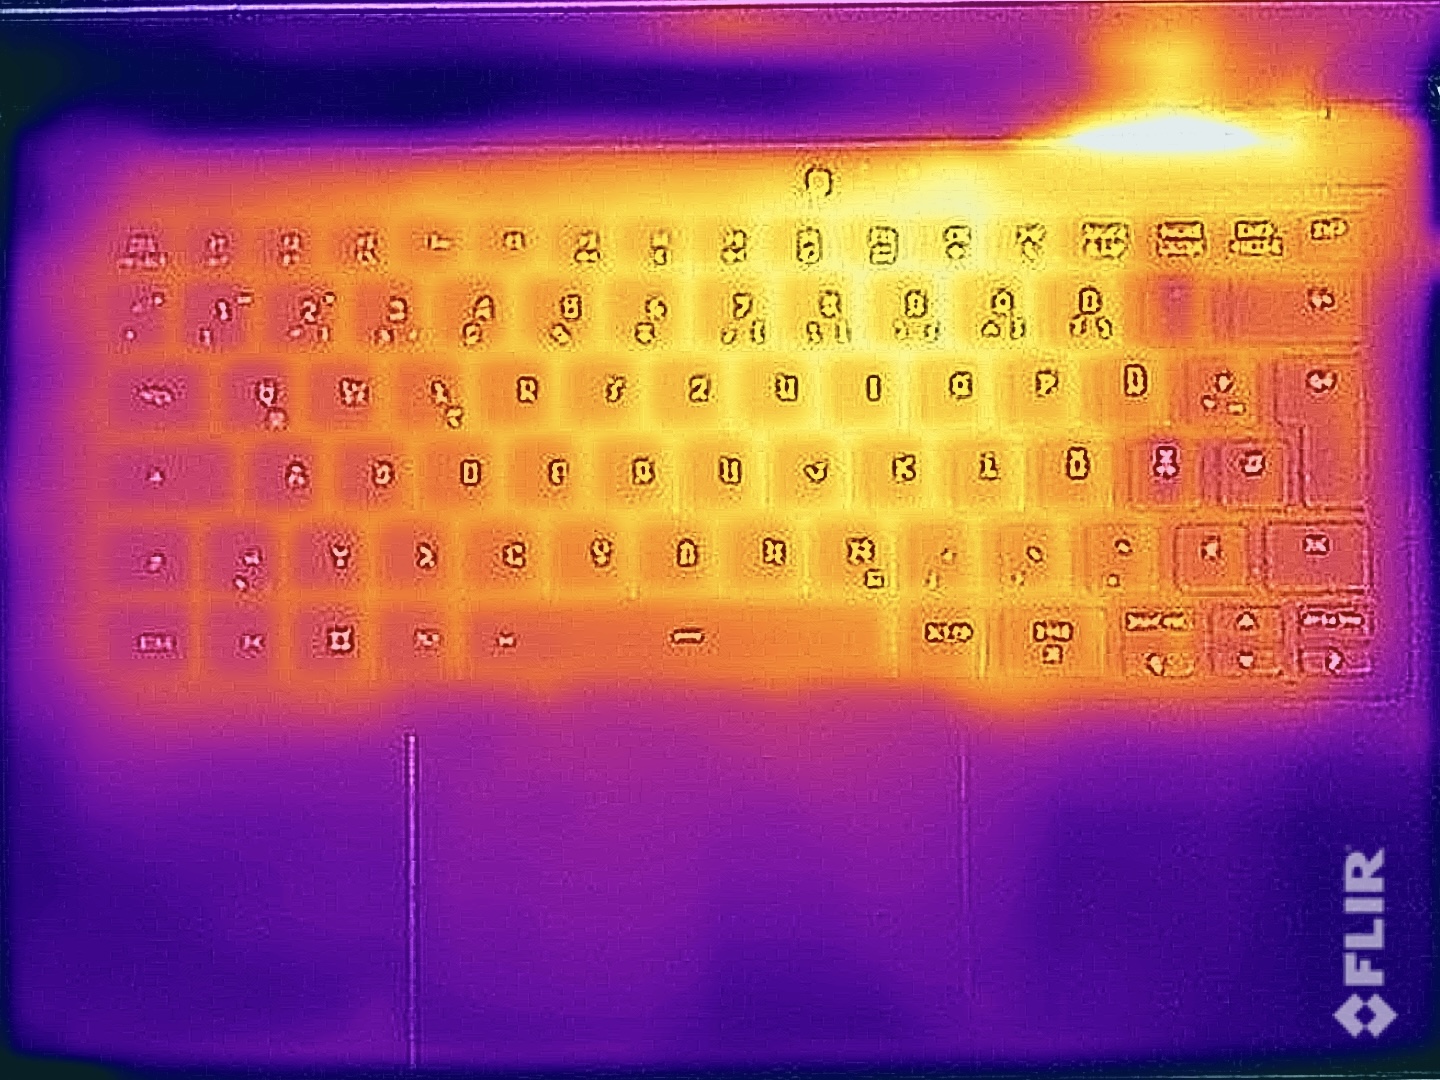
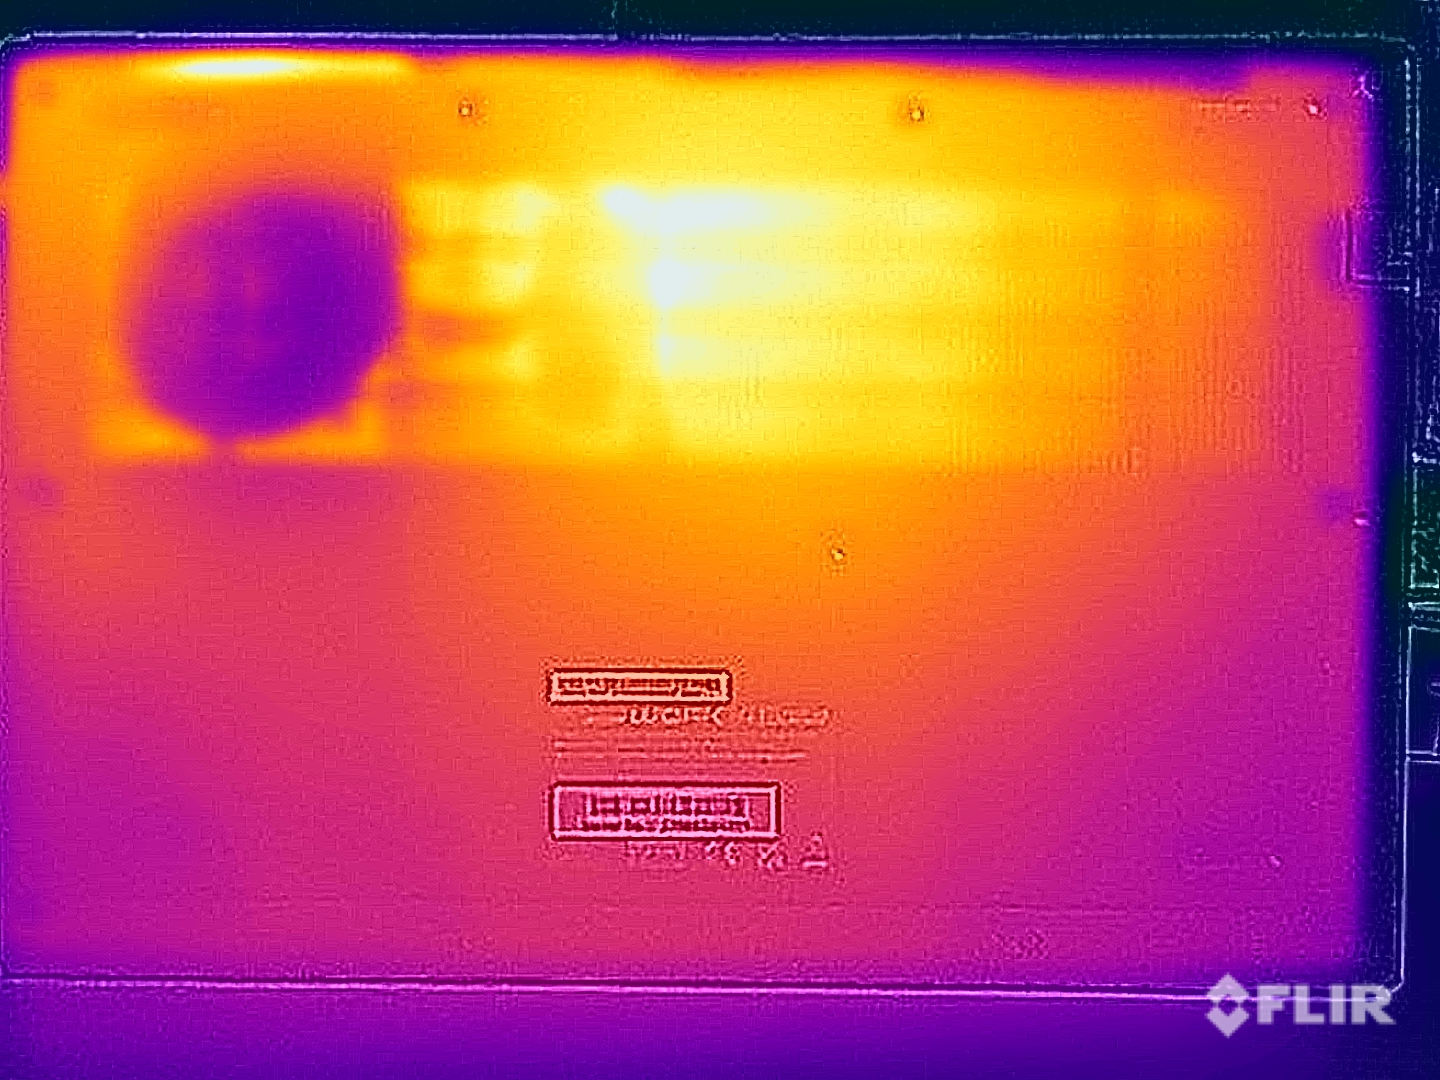
Temperatura
Temperatury jego powierzchni pozostają bezkrytyczne i nawet pod pełnym obciążeniem można bez problemu umieścić Work 14 na udach, a palce nie nagrzewają się podczas pisania. Podczas testu obciążeniowego procesor pobierał 20 watów przez dobre kilka minut, a podczas dalszego przebiegu balansował między 12 a 20 watów.
(+) Maksymalna temperatura w górnej części wynosi 39.2 °C / 103 F, w porównaniu do średniej 34.3 °C / 94 F , począwszy od 21.2 do 62.5 °C dla klasy Office.
(±) Dno nagrzewa się maksymalnie do 40.4 °C / 105 F, w porównaniu do średniej 36.8 °C / 98 F
(+) W stanie bezczynności średnia temperatura górnej części wynosi 24.4 °C / 76 F, w porównaniu ze średnią temperaturą urządzenia wynoszącą 29.5 °C / ### class_avg_f### F.
(±) Podczas gry w Wiedźmina 3 średnia temperatura górnej części wynosi 33.3 °C / 92 F, w porównaniu do średniej temperatury urządzenia wynoszącej 29.5 °C / ## #class_avg_f### F.
(+) Podpórki pod nadgarstki i touchpad są chłodniejsze niż temperatura skóry i maksymalnie 27 °C / 80.6 F i dlatego są chłodne w dotyku.
(±) Średnia temperatura obszaru podparcia dłoni w podobnych urządzeniach wynosiła 27.5 °C / 81.5 F (+0.5 °C / 0.9 F).
| Schenker Work 14 Base Intel Core i5-1235U, Intel Iris Xe Graphics G7 80EUs | Acer Swift Go 14 SFG14-71 Intel Core i5-1335U, Intel Iris Xe Graphics G7 80EUs | HP ProBook 445 G10 AMD Ryzen 5 7530U, AMD Radeon RX Vega 7 | Dell Latitude 3440 Intel Core i5-1345U, Intel Iris Xe Graphics G7 80EUs | Lenovo ThinkPad L14 G4 21H6S00900 AMD Ryzen 5 7530U, AMD Radeon RX Vega 7 | |
|---|---|---|---|---|---|
| Heat | -12% | -15% | -8% | -16% | |
| Maximum Upper Side * (°C) | 39.2 | 44.8 -14% | 43 -10% | 35.2 10% | 39 1% |
| Maximum Bottom * (°C) | 40.4 | 34.8 14% | 51 -26% | 41 -1% | 46.3 -15% |
| Idle Upper Side * (°C) | 25.3 | 30.7 -21% | 27 -7% | 29.8 -18% | 26.3 -4% |
| Idle Bottom * (°C) | 25.8 | 32.5 -26% | 30 -16% | 32 -24% | 37.5 -45% |
* ... im mniej tym lepiej
Głośniki
Dwa głośniki stereo laptopa mogą osiągać wysoką maksymalną głośność, jednak ich ogólna jakość jest wyjątkowo słaba i jest to jedna z głównych słabości Work 14. Chociaż niedrogie laptopy biurowe nigdy nie słynęły z imponującego dźwięku, Dell Latitude 14 pokazuje, że można zrobić więcej. Reszta konkurencji również ma przewagę w tym aspekcie.
Schenker Work 14 Base analiza dźwięku
(+) | głośniki mogą odtwarzać stosunkowo głośno (84.4 dB)
Bas 100 - 315 Hz
(-) | prawie brak basu - średnio 22.8% niższa od mediany
(±) | liniowość basu jest średnia (8.6% delta do poprzedniej częstotliwości)
Średnie 400 - 2000 Hz
(±) | wyższe średnie - średnio 9.7% wyższe niż mediana
(±) | liniowość środka jest średnia (11.7% delta do poprzedniej częstotliwości)
Wysokie 2–16 kHz
(+) | zrównoważone maksima - tylko 4.6% od mediany
(±) | liniowość wysokich wartości jest średnia (8.5% delta do poprzedniej częstotliwości)
Ogólnie 100 - 16.000 Hz
(±) | liniowość ogólnego dźwięku jest średnia (25.9% różnicy w stosunku do mediany)
W porównaniu do tej samej klasy
» 79% wszystkich testowanych urządzeń w tej klasie było lepszych, 7% podobnych, 14% gorszych
» Najlepszy miał deltę 7%, średnia wynosiła ###średnia###%, najgorsza wynosiła 53%
W porównaniu do wszystkich testowanych urządzeń
» 80% wszystkich testowanych urządzeń było lepszych, 4% podobnych, 16% gorszych
» Najlepszy miał deltę 4%, średnia wynosiła ###średnia###%, najgorsza wynosiła 134%
Dell Latitude 3440 analiza dźwięku
(+) | głośniki mogą odtwarzać stosunkowo głośno (85.8 dB)
Bas 100 - 315 Hz
(±) | zredukowany bas - średnio 14.6% niższy od mediany
(±) | liniowość basu jest średnia (9.8% delta do poprzedniej częstotliwości)
Średnie 400 - 2000 Hz
(+) | zbalansowane środki średnie - tylko 3% od mediany
(+) | średnie są liniowe (3.5% delta do poprzedniej częstotliwości)
Wysokie 2–16 kHz
(+) | zrównoważone maksima - tylko 4.2% od mediany
(+) | wzloty są liniowe (5.9% delta do poprzedniej częstotliwości)
Ogólnie 100 - 16.000 Hz
(+) | ogólny dźwięk jest liniowy (11.6% różnicy w stosunku do mediany)
W porównaniu do tej samej klasy
» 3% wszystkich testowanych urządzeń w tej klasie było lepszych, 2% podobnych, 95% gorszych
» Najlepszy miał deltę 7%, średnia wynosiła ###średnia###%, najgorsza wynosiła 53%
W porównaniu do wszystkich testowanych urządzeń
» 8% wszystkich testowanych urządzeń było lepszych, 2% podobnych, 90% gorszych
» Najlepszy miał deltę 4%, średnia wynosiła ###średnia###%, najgorsza wynosiła 134%
Zużycie energii
Nie odnotowaliśmy żadnych niespodzianek, jeśli chodzi o wartości zużycia energii przez urządzenie, a 45-watowy zasilacz jest więcej niż wystarczająco mocny.
| wyłączony / stan wstrzymania | |
| luz | |
| obciążenie |
|
Legenda:
min: | |
Power consumption Witcher 3 / stress test
Power consumption with external monitor
Czas trwania
Work 14 posiada baterię o pojemności 49 Wh, co przekłada się na praktyczny czas pracy wynoszący 7:38 godzin przy 150 cd/m² (38% maksymalnej jasności naszego urządzenia testowego) i 5:33 godzin przy maksymalnej jasności podczas naszego testu WLAN. W rezultacie urządzenie to znalazło się w tyle za większością konkurencji, a Work 14 nie poradzi sobie z pełnym dniem pracy bez konieczności korzystania z ładowarki. Całkowite naładowanie urządzenia zajmuje około 2,5 godziny przy włączonym zasilaniu.
Za
Przeciw
Werdykt - Laptop biurowy z dobrymi opcjami konserwacji
Schenker Work 14 Base to podstawowy laptop biurowy, który oprócz aluminiowej obudowy oferuje bardzo dobre opcje konserwacji i szeroki wybór portów. Niestety, trzeba będzie obejść się bez nowoczesnych standardów, takich jak USB4 i Thunderbolt, ale z kolei ma wystarczającą liczbę portów USB i połączenie Gigabit Ethernet - co nie zawsze jest obecnie dostępne w laptopach biurowych. Jego aluminiowa obudowa wygląda na bardziej wysokiej jakości niż plastikowe obudowy konkurentów, jednak jej powierzchnie przyciągają wiele odcisków palców i zauważyliśmy lekkie skrzypienie podczas naszego testu.
Laptop jest wyposażony w przestarzały procesor Core i5-1235U wykorzystujący niskie limity mocy, dzięki czemu jego wydajność jest całkowicie wystarczająca do prostych codziennych zadań. Częściowo za to dobre subiektywne wrażenie odpowiada również dysk SSD PCIe. Z drugiej strony, jego mały wentylator staje się dość irytujący pod obciążeniem, ponieważ emituje wysoki dźwięk i ogólnie staje się zbyt głośny. Matowy wyświetlacz IPS laptopa o rozdzielczości Full HD jest bardzo jasny przy 400 cd/m².
Schenker Work 14 Base to prosty laptop biurowy z aluminiową obudową, dobrymi opcjami konserwacji i matowym wyświetlaczem IPS. Trzeba jednak pogodzić się z ziarnistym obrazem i ogólnie niskim standardem wydajności.
Work 14 Base nie ma też łatwego zadania w rywalizacji z konkurentami, którzy generalnie oferują nieco lepszą wydajność, dłuższy czas pracy i lepsze głośniki. wyświetlacze o proporcjach 16:9 są jednak nadal normą w tej klasie cenowej i ogólnie rzecz biorąc, w tym segmencie trzeba będzie pójść na pewne kompromisy, jeśli chodzi o wydajność.
Cena i dostępność
Obecnie Schenker Work 14 Base kosztuje około 750 USD, ale nie jest dostępny w sprzedaży w Stanach Zjednoczonych.
Schenker Work 14 Base
- 01/05/2024 v7 (old)
Andreas Osthoff
Przezroczystość
Wyboru urządzeń do recenzji dokonuje nasza redakcja. Próbka testowa została udostępniona autorowi jako pożyczka od producenta lub sprzedawcy detalicznego na potrzeby tej recenzji. Pożyczkodawca nie miał wpływu na tę recenzję, producent nie otrzymał też kopii tej recenzji przed publikacją. Nie było obowiązku publikowania tej recenzji. Jako niezależna firma medialna, Notebookcheck nie podlega władzy producentów, sprzedawców detalicznych ani wydawców.
Tak testuje Notebookcheck
Każdego roku Notebookcheck niezależnie sprawdza setki laptopów i smartfonów, stosując standardowe procedury, aby zapewnić porównywalność wszystkich wyników. Od około 20 lat stale rozwijamy nasze metody badawcze, ustanawiając przy tym standardy branżowe. W naszych laboratoriach testowych doświadczeni technicy i redaktorzy korzystają z wysokiej jakości sprzętu pomiarowego. Testy te obejmują wieloetapowy proces walidacji. Nasz kompleksowy system ocen opiera się na setkach uzasadnionych pomiarów i benchmarków, co pozwala zachować obiektywizm.Price comparison

