|
|
Intel Core i9-13900K
GeForce RTX 4090, i9-13900K, Samsung SSD 980 Pro 2TB MZ-V8P2T0 |
415 (291min, 220P1 - 500max) fps |
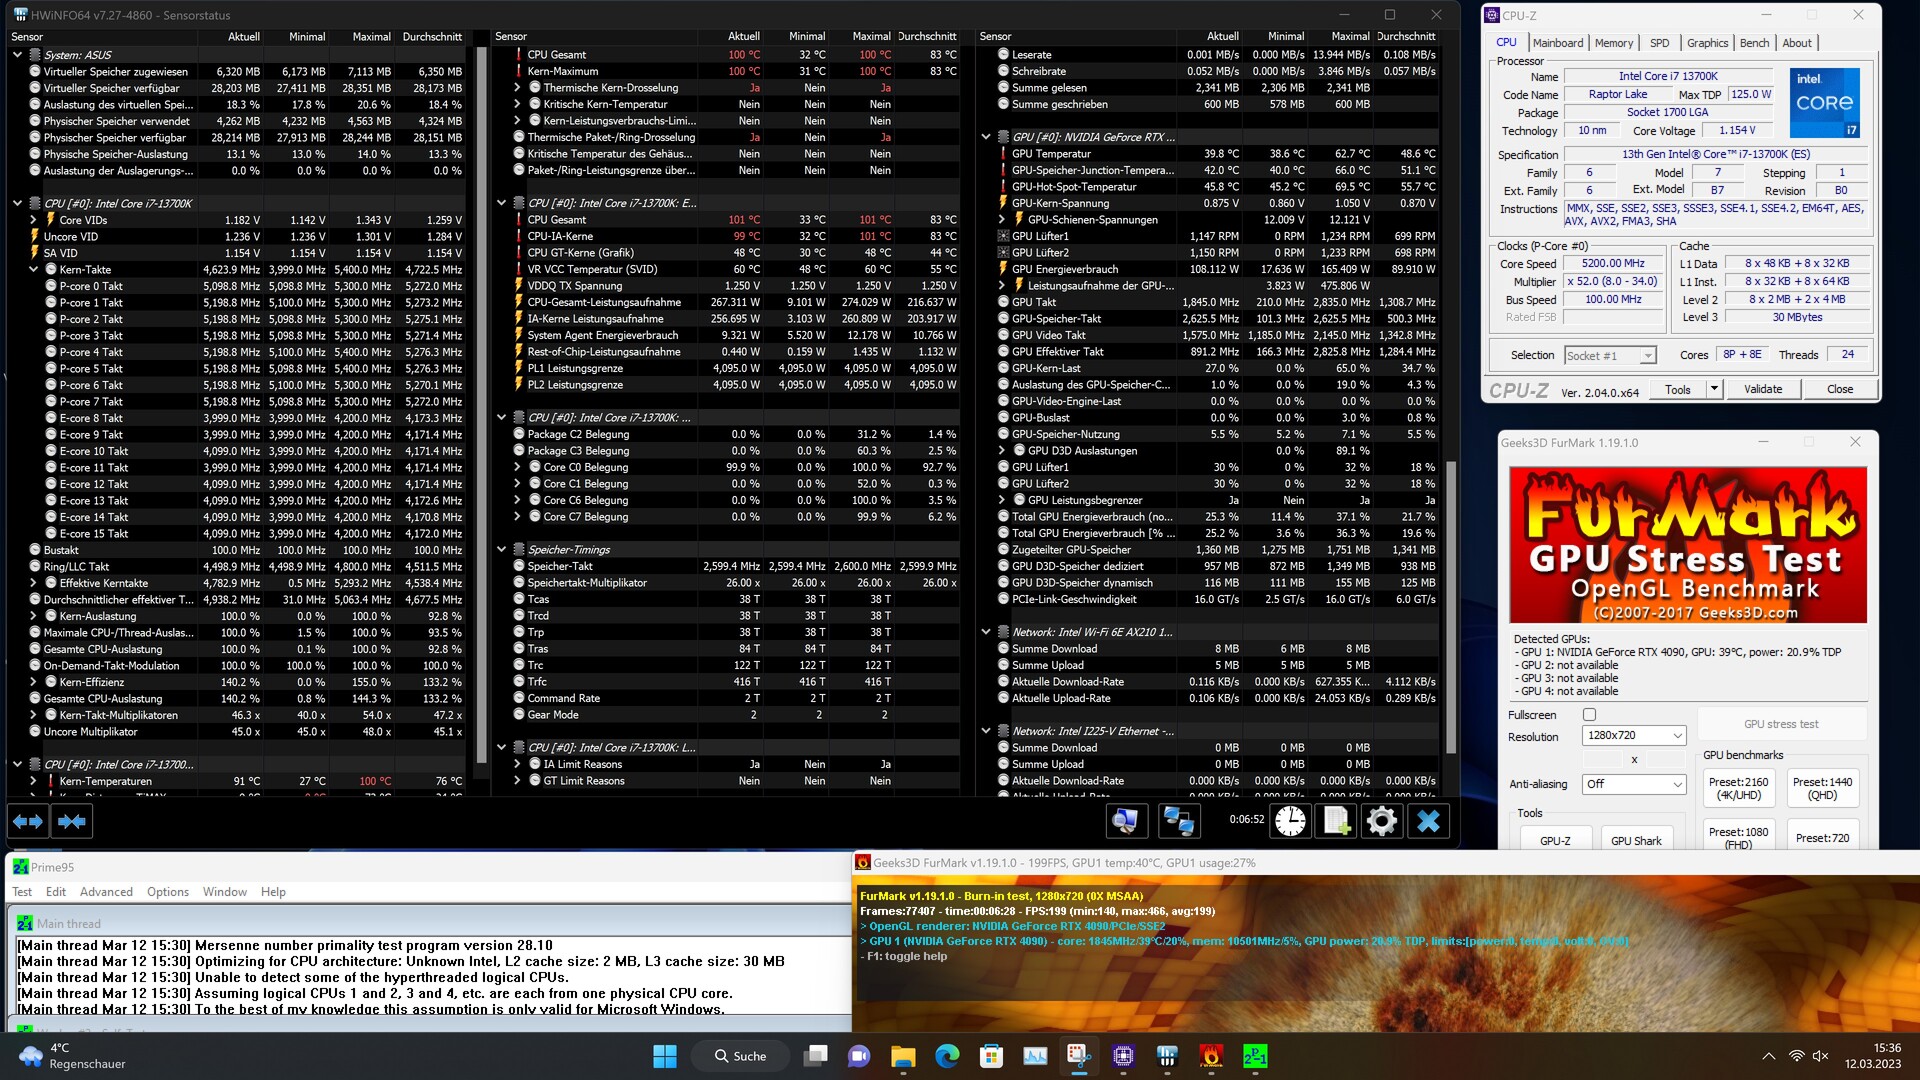
Intel Core i7-13700K
GeForce RTX 4090, i7-13700K, Intel Optane 905P 480GB 2.5 |
380 (280min, 217P1 - 437max) fps |
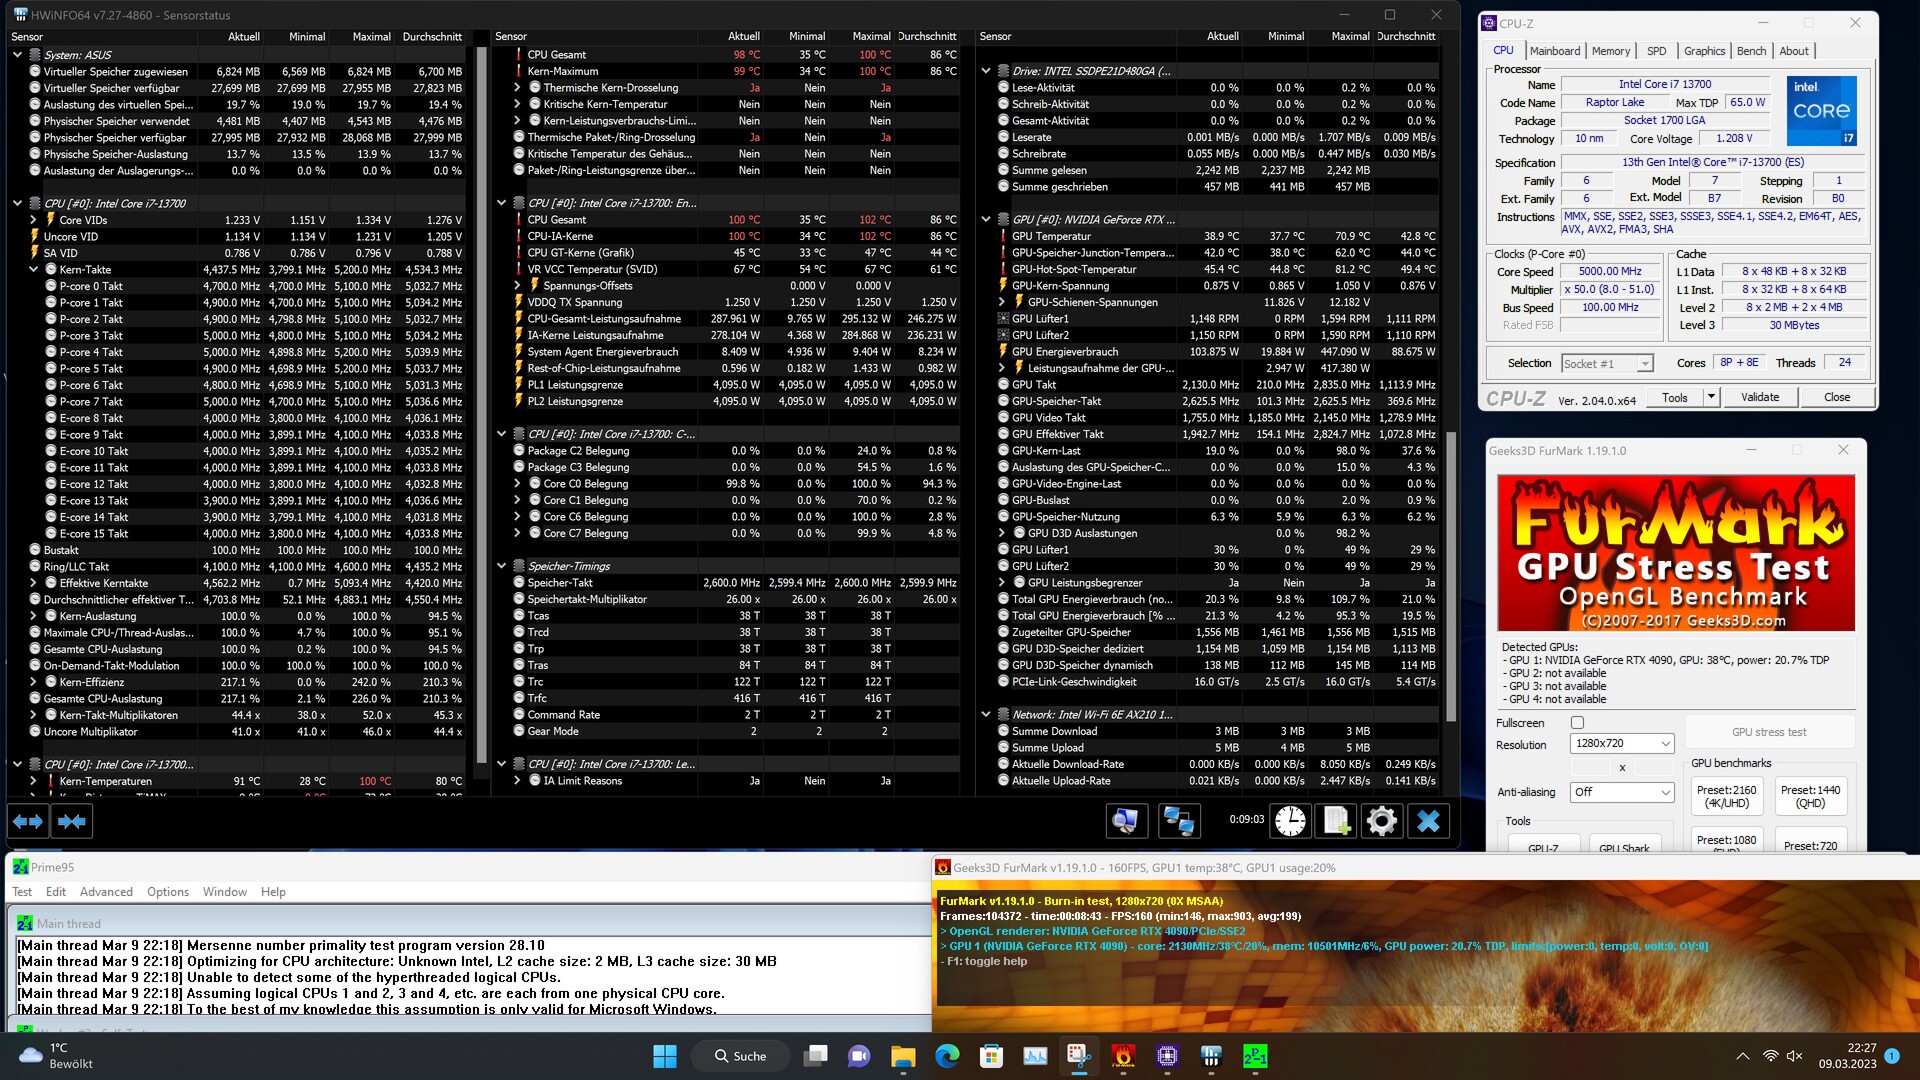
Intel Core i7-13700
GeForce RTX 4090, i7-13700, Intel Optane 905P 480GB 2.5 |
378 (244min, 212P1 - 430max) fps |
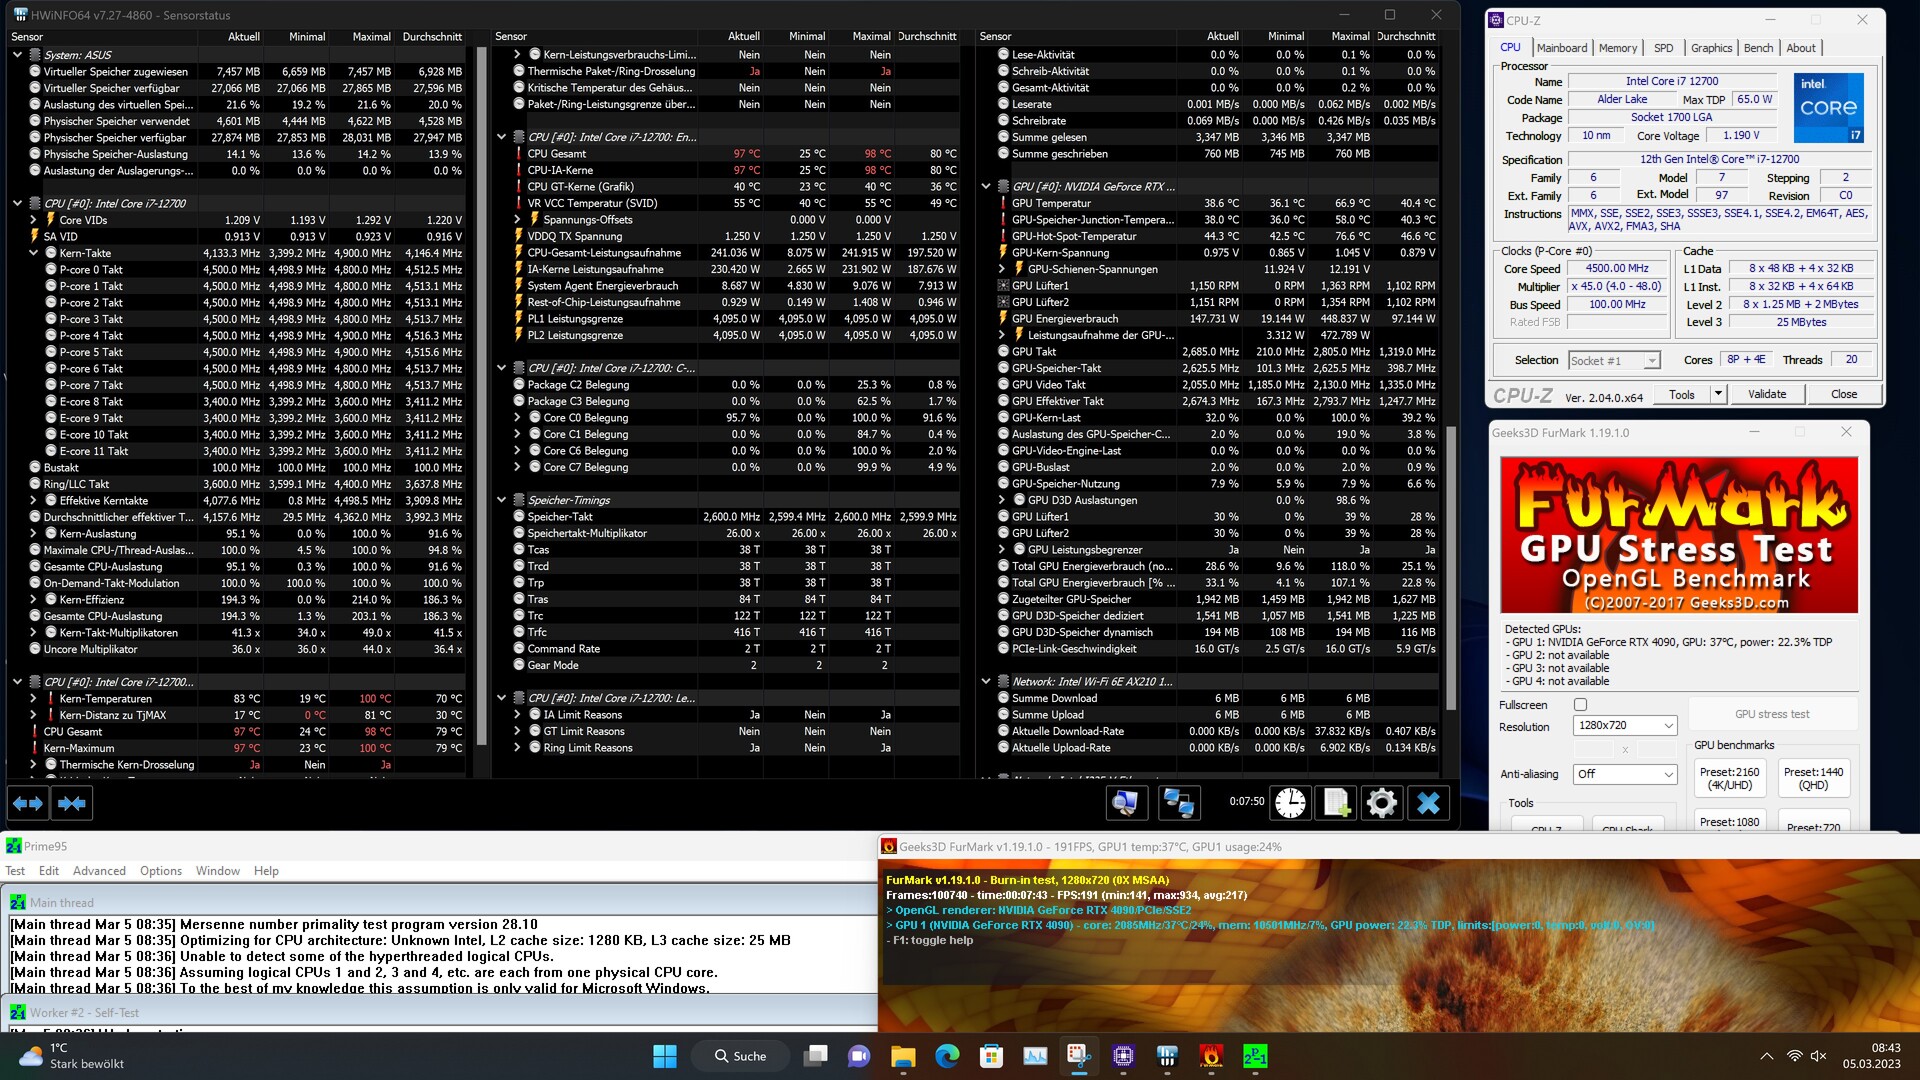
Intel Core i7-12700
GeForce RTX 4090, i7-12700, Intel Optane 905P 480GB 2.5 |
313 (235min, 185P1 - 364max) fps |
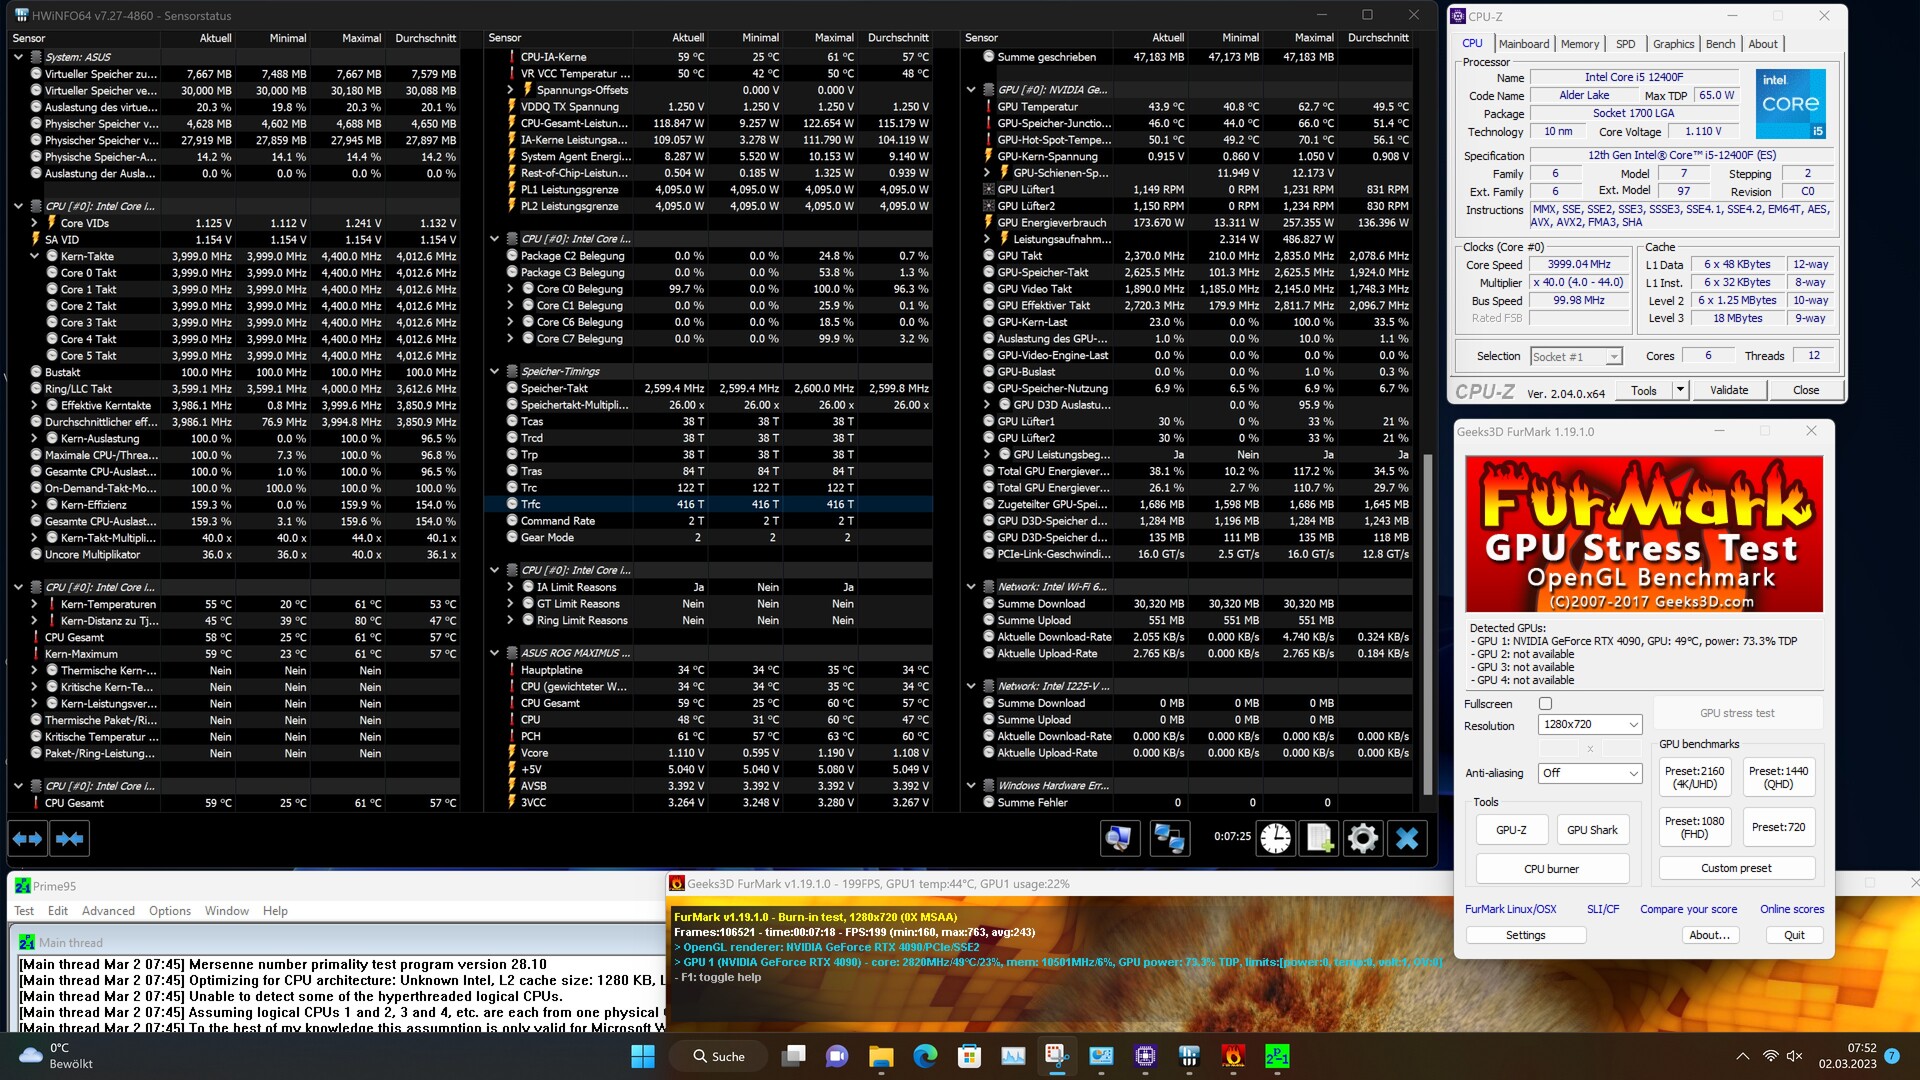
Intel Core i5-12400F
GeForce RTX 4090, i5-12400F, Intel Optane 905P 480GB 2.5 |
271 (200min, 165P1 - 305max) fps |
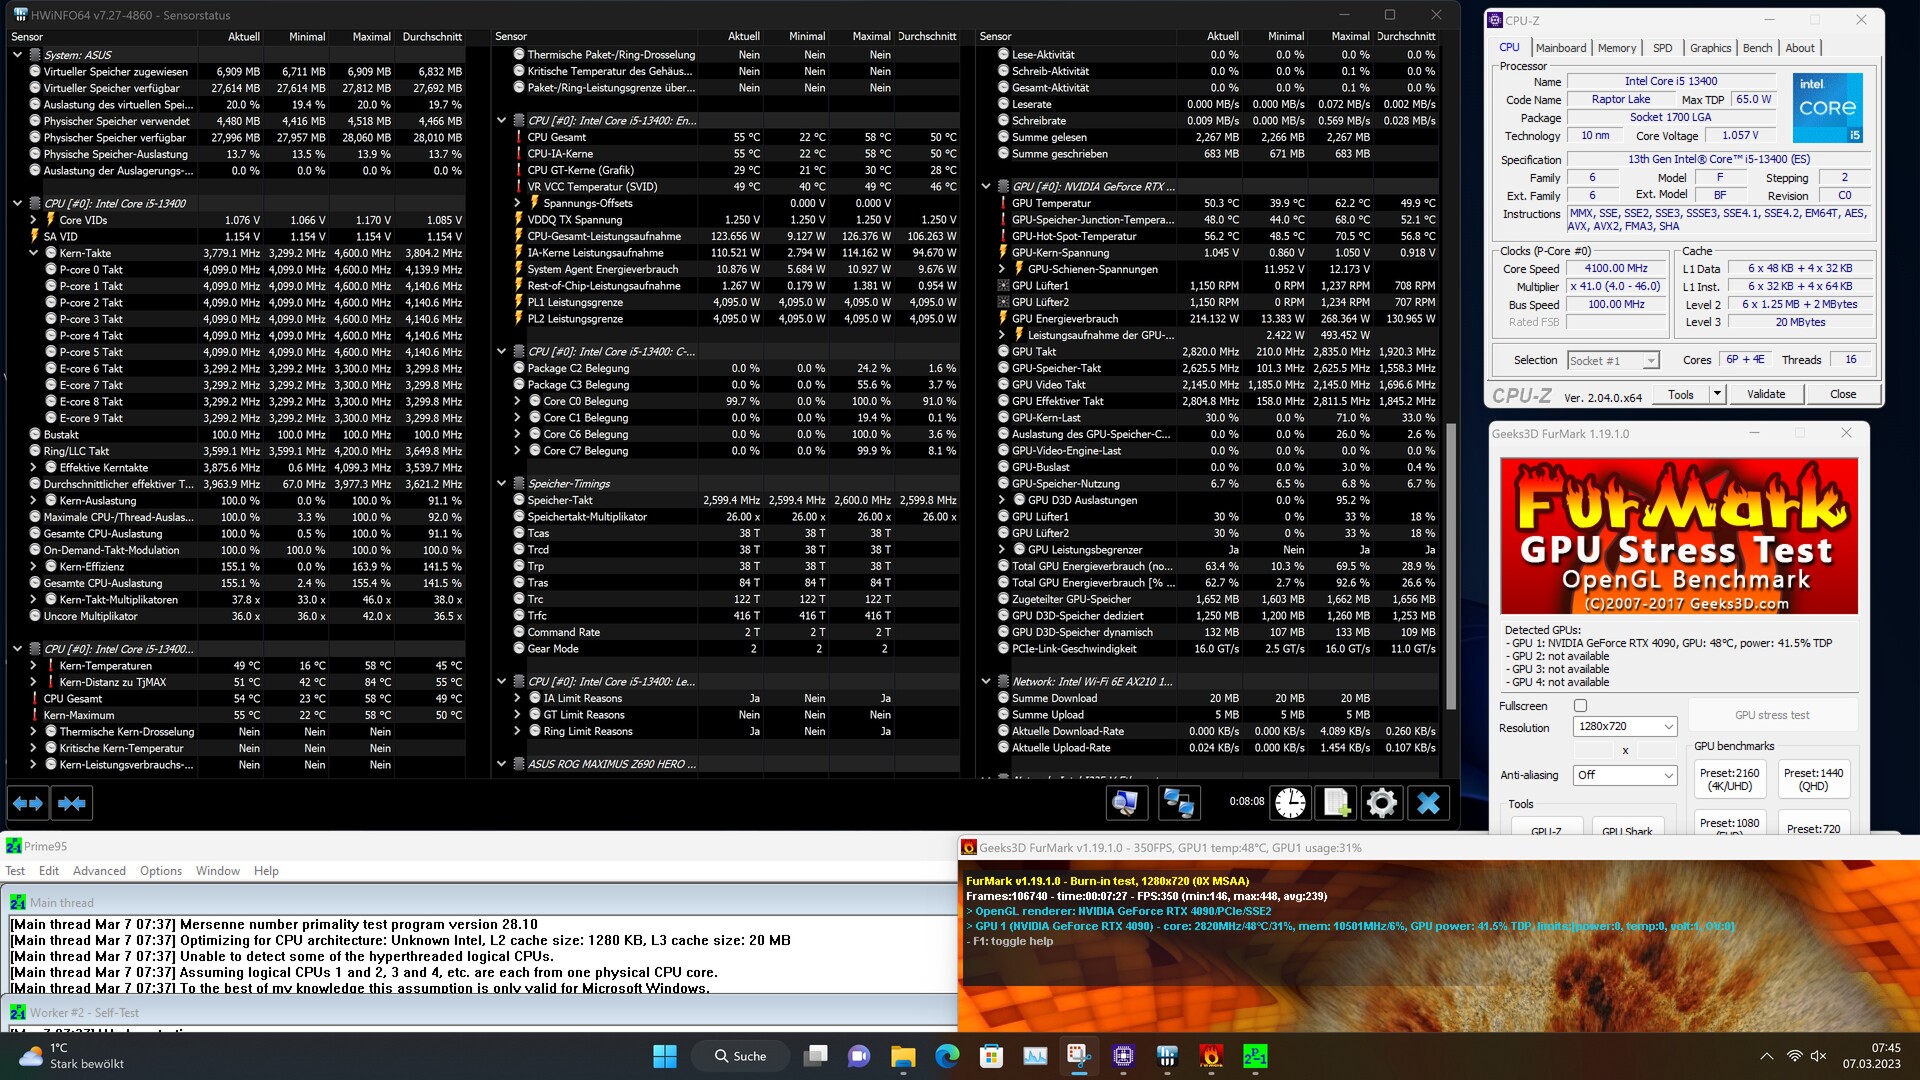
Intel Core i5-13400
GeForce RTX 4090, i5-13400, Intel Optane 905P 480GB 2.5 |
249 (197min, 152P1 - 284max) fps |
|
Intel Core i9-13900K
GeForce RTX 4090, i9-13900K, Samsung SSD 980 Pro 2TB MZ-V8P2T0 |
195.4 (165min, 131P1 - 218max) fps |
Intel Core i7-13700K
GeForce RTX 4090, i7-13700K, Intel Optane 905P 480GB 2.5 |
189.3 (155min, 125P1 - 207max) fps |
Intel Core i7-13700
GeForce RTX 4090, i7-13700, Intel Optane 905P 480GB 2.5 |
186.4 (158min, 124P1 - 208max) fps |
Intel Core i7-12700
GeForce RTX 4090, i7-12700, Intel Optane 905P 480GB 2.5 |
163.5 (135min, 106P1 - 180max) fps |
Intel Core i5-12400F
GeForce RTX 4090, i5-12400F, Intel Optane 905P 480GB 2.5 |
149 (120min, 99P1 - 165max) fps |
Intel Core i5-13400
GeForce RTX 4090, i5-13400, Intel Optane 905P 480GB 2.5 |
148.7 (114min, 95P1 - 173max) fps |
|
Intel Core i7-13700K
GeForce RTX 4090, i7-13700K, Intel Optane 905P 480GB 2.5 |
152 (128min, 105P1 - 172max) fps |
Intel Core i7-13700
GeForce RTX 4090, i7-13700, Intel Optane 905P 480GB 2.5 |
151 (129min, 105P1 - 171max) fps |
Intel Core i9-13900K
GeForce RTX 4090, i9-13900K, Samsung SSD 980 Pro 2TB MZ-V8P2T0 |
149.7 (129min, 104P1 - 173max) fps |
Intel Core i7-12700
GeForce RTX 4090, i7-12700, Intel Optane 905P 480GB 2.5 |
149.3 (121min, 98P1 - 166max) fps |
Intel Core i5-12400F
GeForce RTX 4090, i5-12400F, Intel Optane 905P 480GB 2.5 |
142.6 (115min, 94P1 - 156max) fps |
Intel Core i5-13400
GeForce RTX 4090, i5-13400, Intel Optane 905P 480GB 2.5 |
140.2 (112min, 91P1 - 152max) fps |
|
Intel Core i7-13700K
GeForce RTX 4090, i7-13700K, Intel Optane 905P 480GB 2.5 |
82.4 (72min, 71P1 - 95max) fps |
Intel Core i5-12400F
GeForce RTX 4090, i5-12400F, Intel Optane 905P 480GB 2.5 |
81.7 (71min, 70P1 - 95max) fps |
Intel Core i7-13700
GeForce RTX 4090, i7-13700, Intel Optane 905P 480GB 2.5 |
81.6 (71min, 70P1 - 93max) fps |
Intel Core i7-12700
GeForce RTX 4090, i7-12700, Intel Optane 905P 480GB 2.5 |
81.3 (71min, 68P1 - 93max) fps |
Intel Core i5-13400
GeForce RTX 4090, i5-13400, Intel Optane 905P 480GB 2.5 |
81.2 (72min, 67P1 - 93max) fps |
Intel Core i9-13900K
GeForce RTX 4090, i9-13900K, Samsung SSD 980 Pro 2TB MZ-V8P2T0 |
81.1 (71min, 70P1 - 93max) fps |
|
|
Intel Core i7-13700K
GeForce RTX 4090, i7-13700K, Intel Optane 905P 480GB 2.5 |
242 (183min - 317max) fps |
Intel Core i9-13900K
GeForce RTX 4090, i9-13900K, Samsung SSD 980 Pro 2TB MZ-V8P2T0 |
240 (184min - 302max) fps |
Intel Core i7-13700
GeForce RTX 4090, i7-13700, Intel Optane 905P 480GB 2.5 |
232 (161min - 306max) fps |
Intel Core i7-12700
GeForce RTX 4090, i7-12700, Intel Optane 905P 480GB 2.5 |
204 (156min - 270max) fps |
Intel Core i5-13400
GeForce RTX 4090, i5-13400, Intel Optane 905P 480GB 2.5 |
185 (144min - 241max) fps |
Intel Core i5-12400F
GeForce RTX 4090, i5-12400F, Intel Optane 905P 480GB 2.5 |
173 (124min - 232max) fps |
|
Intel Core i9-13900K
GeForce RTX 4090, i9-13900K, Samsung SSD 980 Pro 2TB MZ-V8P2T0 |
187 (138min - 253max) fps |
Intel Core i7-13700
GeForce RTX 4090, i7-13700, Intel Optane 905P 480GB 2.5 |
185 (139min - 251max) fps |
Intel Core i7-13700K
GeForce RTX 4090, i7-13700K, Intel Optane 905P 480GB 2.5 |
185 (144min - 254max) fps |
Intel Core i7-12700
GeForce RTX 4090, i7-12700, Intel Optane 905P 480GB 2.5 |
156 (117min - 213max) fps |
Intel Core i5-13400
GeForce RTX 4090, i5-13400, Intel Optane 905P 480GB 2.5 |
144 (109min - 202max) fps |
Intel Core i5-12400F
GeForce RTX 4090, i5-12400F, Intel Optane 905P 480GB 2.5 |
133 (103min - 180max) fps |
|
Intel Core i9-13900K
GeForce RTX 4090, i9-13900K, Samsung SSD 980 Pro 2TB MZ-V8P2T0 |
187 (143min - 253max) fps |
Intel Core i7-13700K
GeForce RTX 4090, i7-13700K, Intel Optane 905P 480GB 2.5 |
184 (139min - 248max) fps |
Intel Core i7-13700
GeForce RTX 4090, i7-13700, Intel Optane 905P 480GB 2.5 |
183 (137min - 249max) fps |
Intel Core i7-12700
GeForce RTX 4090, i7-12700, Intel Optane 905P 480GB 2.5 |
155 (119min - 210max) fps |
Intel Core i5-13400
GeForce RTX 4090, i5-13400, Intel Optane 905P 480GB 2.5 |
142 (102min - 194max) fps |
Intel Core i5-12400F
GeForce RTX 4090, i5-12400F, Intel Optane 905P 480GB 2.5 | |
|
Intel Core i9-13900K
GeForce RTX 4090, i9-13900K, Samsung SSD 980 Pro 2TB MZ-V8P2T0 |
173 (144min - 205max) fps |
Intel Core i7-13700K
GeForce RTX 4090, i7-13700K, Intel Optane 905P 480GB 2.5 |
172 (137min - 206max) fps |
Intel Core i7-13700
GeForce RTX 4090, i7-13700, Intel Optane 905P 480GB 2.5 |
171 (140min - 207max) fps |
Intel Core i7-12700
GeForce RTX 4090, i7-12700, Intel Optane 905P 480GB 2.5 |
153 (117min - 203max) fps |
Intel Core i5-13400
GeForce RTX 4090, i5-13400, Intel Optane 905P 480GB 2.5 |
142 (108min - 190max) fps |
Intel Core i5-12400F
GeForce RTX 4090, i5-12400F, Intel Optane 905P 480GB 2.5 | |
|
|
Intel Core i9-13900K
GeForce RTX 4090, i9-13900K, Samsung SSD 980 Pro 2TB MZ-V8P2T0 | |
Intel Core i7-13700K
GeForce RTX 4090, i7-13700K, Intel Optane 905P 480GB 2.5 | |
Intel Core i7-13700
GeForce RTX 4090, i7-13700, Intel Optane 905P 480GB 2.5 | |
Intel Core i7-12700
GeForce RTX 4090, i7-12700, Intel Optane 905P 480GB 2.5 | |
Intel Core i5-13400
GeForce RTX 4090, i5-13400, Intel Optane 905P 480GB 2.5 | |
Intel Core i5-12400F
GeForce RTX 4090, i5-12400F, Intel Optane 905P 480GB 2.5 | |
|
|
Intel Core i7-13700
GeForce RTX 4090, i7-13700, Intel Optane 905P 480GB 2.5 | |
Intel Core i7-13700K
GeForce RTX 4090, i7-13700K, Intel Optane 905P 480GB 2.5 | |
Intel Core i9-13900K
GeForce RTX 4090, i9-13900K, Samsung SSD 980 Pro 2TB MZ-V8P2T0 | |
Intel Core i7-12700
GeForce RTX 4090, i7-12700, Intel Optane 905P 480GB 2.5 | |
Intel Core i5-12400F
GeForce RTX 4090, i5-12400F, Intel Optane 905P 480GB 2.5 | |
Intel Core i5-13400
GeForce RTX 4090, i5-13400, Intel Optane 905P 480GB 2.5 | |
|
Intel Core i7-13700K
GeForce RTX 4090, i7-13700K, Intel Optane 905P 480GB 2.5 | |
Intel Core i9-13900K
GeForce RTX 4090, i9-13900K, Samsung SSD 980 Pro 2TB MZ-V8P2T0 | |
Intel Core i7-13700
GeForce RTX 4090, i7-13700, Intel Optane 905P 480GB 2.5 | |
Intel Core i7-12700
GeForce RTX 4090, i7-12700, Intel Optane 905P 480GB 2.5 | |
Intel Core i5-13400
GeForce RTX 4090, i5-13400, Intel Optane 905P 480GB 2.5 | |
Intel Core i5-12400F
GeForce RTX 4090, i5-12400F, Intel Optane 905P 480GB 2.5 | |
|
Intel Core i9-13900K
GeForce RTX 4090, i9-13900K, Samsung SSD 980 Pro 2TB MZ-V8P2T0 | |
Intel Core i7-13700K
GeForce RTX 4090, i7-13700K, Intel Optane 905P 480GB 2.5 | |
Intel Core i7-13700
GeForce RTX 4090, i7-13700, Intel Optane 905P 480GB 2.5 | |
Intel Core i7-12700
GeForce RTX 4090, i7-12700, Intel Optane 905P 480GB 2.5 | |
Intel Core i5-13400
GeForce RTX 4090, i5-13400, Intel Optane 905P 480GB 2.5 | |
Intel Core i5-12400F
GeForce RTX 4090, i5-12400F, Intel Optane 905P 480GB 2.5 | |
|
Intel Core i7-13700
GeForce RTX 4090, i7-13700, Intel Optane 905P 480GB 2.5 | |
Intel Core i7-13700K
GeForce RTX 4090, i7-13700K, Intel Optane 905P 480GB 2.5 | |
Intel Core i9-13900K
GeForce RTX 4090, i9-13900K, Samsung SSD 980 Pro 2TB MZ-V8P2T0 | |
Intel Core i7-12700
GeForce RTX 4090, i7-12700, Intel Optane 905P 480GB 2.5 | |
Intel Core i5-12400F
GeForce RTX 4090, i5-12400F, Intel Optane 905P 480GB 2.5 | |
Intel Core i5-13400
GeForce RTX 4090, i5-13400, Intel Optane 905P 480GB 2.5 | |
|
|
Intel Core i9-13900K
GeForce RTX 4090, i9-13900K, Samsung SSD 980 Pro 2TB MZ-V8P2T0 | |
Intel Core i7-13700K
GeForce RTX 4090, i7-13700K, Intel Optane 905P 480GB 2.5 | |
Intel Core i7-13700
GeForce RTX 4090, i7-13700, Intel Optane 905P 480GB 2.5 | |
Intel Core i7-12700
GeForce RTX 4090, i7-12700, Intel Optane 905P 480GB 2.5 | |
Intel Core i5-12400F
GeForce RTX 4090, i5-12400F, Intel Optane 905P 480GB 2.5 | |
Intel Core i5-13400
GeForce RTX 4090, i5-13400, Intel Optane 905P 480GB 2.5 | |
|
Intel Core i9-13900K
GeForce RTX 4090, i9-13900K, Samsung SSD 980 Pro 2TB MZ-V8P2T0 | |
Intel Core i7-13700K
GeForce RTX 4090, i7-13700K, Intel Optane 905P 480GB 2.5 | |
Intel Core i7-13700
GeForce RTX 4090, i7-13700, Intel Optane 905P 480GB 2.5 | |
Intel Core i7-12700
GeForce RTX 4090, i7-12700, Intel Optane 905P 480GB 2.5 | |
Intel Core i5-13400
GeForce RTX 4090, i5-13400, Intel Optane 905P 480GB 2.5 | |
Intel Core i5-12400F
GeForce RTX 4090, i5-12400F, Intel Optane 905P 480GB 2.5 | |
|
Intel Core i9-13900K
GeForce RTX 4090, i9-13900K, Samsung SSD 980 Pro 2TB MZ-V8P2T0 | |
Intel Core i7-13700K
GeForce RTX 4090, i7-13700K, Intel Optane 905P 480GB 2.5 | |
Intel Core i7-13700
GeForce RTX 4090, i7-13700, Intel Optane 905P 480GB 2.5 | |
Intel Core i7-12700
GeForce RTX 4090, i7-12700, Intel Optane 905P 480GB 2.5 | |
Intel Core i5-12400F
GeForce RTX 4090, i5-12400F, Intel Optane 905P 480GB 2.5 | |
Intel Core i5-13400
GeForce RTX 4090, i5-13400, Intel Optane 905P 480GB 2.5 | |
|
|
Intel Core i9-13900K
GeForce RTX 4090, i9-13900K, Samsung SSD 980 Pro 2TB MZ-V8P2T0 | |
Intel Core i7-13700K
GeForce RTX 4090, i7-13700K, Intel Optane 905P 480GB 2.5 | |
Intel Core i7-13700
GeForce RTX 4090, i7-13700, Intel Optane 905P 480GB 2.5 | |
Intel Core i7-12700
GeForce RTX 4090, i7-12700, Intel Optane 905P 480GB 2.5 | |
Intel Core i5-13400
GeForce RTX 4090, i5-13400, Intel Optane 905P 480GB 2.5 | |
Intel Core i5-12400F
GeForce RTX 4090, i5-12400F, Intel Optane 905P 480GB 2.5 | |
|
Intel Core i5-13400
GeForce RTX 4090, i5-13400, Intel Optane 905P 480GB 2.5 | |
Intel Core i7-13700
GeForce RTX 4090, i7-13700, Intel Optane 905P 480GB 2.5 | |
Intel Core i7-12700
GeForce RTX 4090, i7-12700, Intel Optane 905P 480GB 2.5 | |
Intel Core i9-13900K
GeForce RTX 4090, i9-13900K, Samsung SSD 980 Pro 2TB MZ-V8P2T0 | |
Intel Core i7-13700K
GeForce RTX 4090, i7-13700K, Intel Optane 905P 480GB 2.5 | |
Intel Core i5-12400F
GeForce RTX 4090, i5-12400F, Intel Optane 905P 480GB 2.5 | |
|
|
Intel Core i7-13700
GeForce RTX 4090, i7-13700, Intel Optane 905P 480GB 2.5 |
187.7 (5.01min, 200P1 - 613max) fps |
Intel Core i7-13700K
GeForce RTX 4090, i7-13700K, Intel Optane 905P 480GB 2.5 |
187.6 (3.74min, 200P1 - 607max) fps |
Intel Core i9-13900K
GeForce RTX 4090, i9-13900K, Samsung SSD 980 Pro 2TB MZ-V8P2T0 |
187.6 (4.6min, 200P1 - 623max) fps |
Intel Core i7-12700
GeForce RTX 4090, i7-12700, Intel Optane 905P 480GB 2.5 |
187.1 (2.4min, 200P1 - 499max) fps |
Intel Core i5-13400
GeForce RTX 4090, i5-13400, Intel Optane 905P 480GB 2.5 |
186.8 (1.87min, 166.7P1 - 445max) fps |
Intel Core i5-12400F
GeForce RTX 4090, i5-12400F, Intel Optane 905P 480GB 2.5 |
186.4 (2.09min, 166.7P1 - 413max) fps |
|
Intel Core i9-13900K
GeForce RTX 4090, i9-13900K, Samsung SSD 980 Pro 2TB MZ-V8P2T0 |
165.9 (13.4min, 125P1 - 295max) fps |
Intel Core i7-13700K
GeForce RTX 4090, i7-13700K, Intel Optane 905P 480GB 2.5 |
158.2 (13.6min, 125P1 - 338max) fps |
Intel Core i7-13700
GeForce RTX 4090, i7-13700, Intel Optane 905P 480GB 2.5 |
154.2 (6.9min, 111.1P1 - 312max) fps |
Intel Core i7-12700
GeForce RTX 4090, i7-12700, Intel Optane 905P 480GB 2.5 |
135.4 (13.2min, 100P1 - 202max) fps |
Intel Core i5-13400
GeForce RTX 4090, i5-13400, Intel Optane 905P 480GB 2.5 |
124.5 (13.2min, 90.9P1 - 267max) fps |
Intel Core i5-12400F
GeForce RTX 4090, i5-12400F, Intel Optane 905P 480GB 2.5 |
118.7 (4.84min, 83.3P1 - 208max) fps |
|
Intel Core i9-13900K
GeForce RTX 4090, i9-13900K, Samsung SSD 980 Pro 2TB MZ-V8P2T0 |
166.3 (2.62min, 125P1 - 372max) fps |
Intel Core i7-13700K
GeForce RTX 4090, i7-13700K, Intel Optane 905P 480GB 2.5 |
158.9 (9.12min, 125P1 - 264max) fps |
Intel Core i7-13700
GeForce RTX 4090, i7-13700, Intel Optane 905P 480GB 2.5 |
155.7 (3.67min, 111.1P1 - 316max) fps |
Intel Core i7-12700
GeForce RTX 4090, i7-12700, Intel Optane 905P 480GB 2.5 |
134.9 (6.41min, 100P1 - 204max) fps |
Intel Core i5-13400
GeForce RTX 4090, i5-13400, Intel Optane 905P 480GB 2.5 |
125.9 (8.49min, 90.9P1 - 210max) fps |
Intel Core i5-12400F
GeForce RTX 4090, i5-12400F, Intel Optane 905P 480GB 2.5 |
118.4 (12.4min, 83.3P1 - 204max) fps |
|
Intel Core i7-13700K
GeForce RTX 4090, i7-13700K, Intel Optane 905P 480GB 2.5 |
187.5 (6.22min, 200P1 - 502max) fps |
Intel Core i9-13900K
GeForce RTX 4090, i9-13900K, Samsung SSD 980 Pro 2TB MZ-V8P2T0 | |
Intel Core i7-13700
GeForce RTX 4090, i7-13700, Intel Optane 905P 480GB 2.5 |
187.2 (1.451min, 200P1 - 464max) fps |
Intel Core i7-12700
GeForce RTX 4090, i7-12700, Intel Optane 905P 480GB 2.5 |
182 (2.29min, 142.9P1 - 460max) fps |
Intel Core i5-13400
GeForce RTX 4090, i5-13400, Intel Optane 905P 480GB 2.5 |
178.2 (2.26min, 125P1 - 359max) fps |
Intel Core i5-12400F
GeForce RTX 4090, i5-12400F, Intel Optane 905P 480GB 2.5 |
175.6 (3.48min, 125P1 - 323max) fps |
|
|
Intel Core i9-13900K
GeForce RTX 4090, i9-13900K, Samsung SSD 980 Pro 2TB MZ-V8P2T0 | |
Intel Core i7-13700
GeForce RTX 4090, i7-13700, Intel Optane 905P 480GB 2.5 | |
Intel Core i7-13700K
GeForce RTX 4090, i7-13700K, Intel Optane 905P 480GB 2.5 | |
Intel Core i7-12700
GeForce RTX 4090, i7-12700, Intel Optane 905P 480GB 2.5 | |
Intel Core i5-13400
GeForce RTX 4090, i5-13400, Intel Optane 905P 480GB 2.5 | |
Intel Core i5-12400F
GeForce RTX 4090, i5-12400F, Intel Optane 905P 480GB 2.5 | |
|
Intel Core i9-13900K
GeForce RTX 4090, i9-13900K, Samsung SSD 980 Pro 2TB MZ-V8P2T0 | |
Intel Core i7-13700K
GeForce RTX 4090, i7-13700K, Intel Optane 905P 480GB 2.5 | |
Intel Core i7-13700
GeForce RTX 4090, i7-13700, Intel Optane 905P 480GB 2.5 | |
Intel Core i7-12700
GeForce RTX 4090, i7-12700, Intel Optane 905P 480GB 2.5 | |
Intel Core i5-13400
GeForce RTX 4090, i5-13400, Intel Optane 905P 480GB 2.5 | |
Intel Core i5-12400F
GeForce RTX 4090, i5-12400F, Intel Optane 905P 480GB 2.5 | |
|
Intel Core i7-13700K
GeForce RTX 4090, i7-13700K, Intel Optane 905P 480GB 2.5 | |
Intel Core i9-13900K
GeForce RTX 4090, i9-13900K, Samsung SSD 980 Pro 2TB MZ-V8P2T0 | |
Intel Core i7-13700
GeForce RTX 4090, i7-13700, Intel Optane 905P 480GB 2.5 | |
Intel Core i7-12700
GeForce RTX 4090, i7-12700, Intel Optane 905P 480GB 2.5 | |
Intel Core i5-13400
GeForce RTX 4090, i5-13400, Intel Optane 905P 480GB 2.5 | |
Intel Core i5-12400F
GeForce RTX 4090, i5-12400F, Intel Optane 905P 480GB 2.5 | |
|
|
Intel Core i9-13900K
GeForce RTX 4090, i9-13900K, Samsung SSD 980 Pro 2TB MZ-V8P2T0 |
206 (155min - 302max) fps |
Intel Core i7-13700
GeForce RTX 4090, i7-13700, Intel Optane 905P 480GB 2.5 |
203 (144min - 297max) fps |
Intel Core i7-13700K
GeForce RTX 4090, i7-13700K, Intel Optane 905P 480GB 2.5 |
203 (157min - 304max) fps |
Intel Core i7-12700
GeForce RTX 4090, i7-12700, Intel Optane 905P 480GB 2.5 |
174 (103min - 253max) fps |
Intel Core i5-13400
GeForce RTX 4090, i5-13400, Intel Optane 905P 480GB 2.5 |
159 (110min - 233max) fps |
Intel Core i5-12400F
GeForce RTX 4090, i5-12400F, Intel Optane 905P 480GB 2.5 |
147 (102min - 216max) fps |
|
Intel Core i9-13900K
GeForce RTX 4090, i9-13900K, Samsung SSD 980 Pro 2TB MZ-V8P2T0 |
161 (112min - 256max) fps |
Intel Core i7-13700K
GeForce RTX 4090, i7-13700K, Intel Optane 905P 480GB 2.5 |
153 (108min - 248max) fps |
Intel Core i7-13700
GeForce RTX 4090, i7-13700, Intel Optane 905P 480GB 2.5 |
152 (109min - 243max) fps |
Intel Core i7-12700
GeForce RTX 4090, i7-12700, Intel Optane 905P 480GB 2.5 | |
Intel Core i5-13400
GeForce RTX 4090, i5-13400, Intel Optane 905P 480GB 2.5 | |
Intel Core i5-12400F
GeForce RTX 4090, i5-12400F, Intel Optane 905P 480GB 2.5 | |
|
Intel Core i9-13900K
GeForce RTX 4090, i9-13900K, Samsung SSD 980 Pro 2TB MZ-V8P2T0 |
164 (115min - 266max) fps |
Intel Core i7-13700K
GeForce RTX 4090, i7-13700K, Intel Optane 905P 480GB 2.5 |
152 (108min - 243max) fps |
Intel Core i7-13700
GeForce RTX 4090, i7-13700, Intel Optane 905P 480GB 2.5 |
151 (107min - 241max) fps |
Intel Core i7-12700
GeForce RTX 4090, i7-12700, Intel Optane 905P 480GB 2.5 | |
Intel Core i5-13400
GeForce RTX 4090, i5-13400, Intel Optane 905P 480GB 2.5 | |
Intel Core i5-12400F
GeForce RTX 4090, i5-12400F, Intel Optane 905P 480GB 2.5 | |
|
Intel Core i9-13900K
GeForce RTX 4090, i9-13900K, Samsung SSD 980 Pro 2TB MZ-V8P2T0 |
152 (113min - 216max) fps |
Intel Core i7-13700
GeForce RTX 4090, i7-13700, Intel Optane 905P 480GB 2.5 |
145 (106min - 212max) fps |
Intel Core i7-13700K
GeForce RTX 4090, i7-13700K, Intel Optane 905P 480GB 2.5 |
145 (109min - 213max) fps |
Intel Core i7-12700
GeForce RTX 4090, i7-12700, Intel Optane 905P 480GB 2.5 | |
Intel Core i5-13400
GeForce RTX 4090, i5-13400, Intel Optane 905P 480GB 2.5 | |
Intel Core i5-12400F
GeForce RTX 4090, i5-12400F, Intel Optane 905P 480GB 2.5 | |
|
|
Intel Core i9-13900K
GeForce RTX 4090, i9-13900K, Samsung SSD 980 Pro 2TB MZ-V8P2T0 | |
Intel Core i7-13700
GeForce RTX 4090, i7-13700, Intel Optane 905P 480GB 2.5 | |
Intel Core i7-13700K
GeForce RTX 4090, i7-13700K, Intel Optane 905P 480GB 2.5 | |
Intel Core i7-12700
GeForce RTX 4090, i7-12700, Intel Optane 905P 480GB 2.5 | |
Intel Core i5-13400
GeForce RTX 4090, i5-13400, Intel Optane 905P 480GB 2.5 | |
Intel Core i5-12400F
GeForce RTX 4090, i5-12400F, Intel Optane 905P 480GB 2.5 | |
|
Intel Core i9-13900K
GeForce RTX 4090, i9-13900K, Samsung SSD 980 Pro 2TB MZ-V8P2T0 | |
Intel Core i7-13700K
GeForce RTX 4090, i7-13700K, Intel Optane 905P 480GB 2.5 | |
Intel Core i7-13700
GeForce RTX 4090, i7-13700, Intel Optane 905P 480GB 2.5 | |
Intel Core i7-12700
GeForce RTX 4090, i7-12700, Intel Optane 905P 480GB 2.5 | |
Intel Core i5-13400
GeForce RTX 4090, i5-13400, Intel Optane 905P 480GB 2.5 | |
Intel Core i5-12400F
GeForce RTX 4090, i5-12400F, Intel Optane 905P 480GB 2.5 | |
|
Intel Core i7-13700K
GeForce RTX 4090, i7-13700K, Intel Optane 905P 480GB 2.5 | |
Intel Core i7-13700
GeForce RTX 4090, i7-13700, Intel Optane 905P 480GB 2.5 | |
Intel Core i9-13900K
GeForce RTX 4090, i9-13900K, Samsung SSD 980 Pro 2TB MZ-V8P2T0 | |
Intel Core i7-12700
GeForce RTX 4090, i7-12700, Intel Optane 905P 480GB 2.5 | |
Intel Core i5-13400
GeForce RTX 4090, i5-13400, Intel Optane 905P 480GB 2.5 | |
Intel Core i5-12400F
GeForce RTX 4090, i5-12400F, Intel Optane 905P 480GB 2.5 | |
|
|
Intel Core i9-13900K
GeForce RTX 4090, i9-13900K, Samsung SSD 980 Pro 2TB MZ-V8P2T0 | |
Intel Core i7-13700
GeForce RTX 4090, i7-13700, Intel Optane 905P 480GB 2.5 | |
Intel Core i7-13700K
GeForce RTX 4090, i7-13700K, Intel Optane 905P 480GB 2.5 | |
Intel Core i7-12700
GeForce RTX 4090, i7-12700, Intel Optane 905P 480GB 2.5 | |
Intel Core i5-13400
GeForce RTX 4090, i5-13400, Intel Optane 905P 480GB 2.5 | |
Intel Core i5-12400F
GeForce RTX 4090, i5-12400F, Intel Optane 905P 480GB 2.5 | |
|
Intel Core i7-13700K
GeForce RTX 4090, i7-13700K, Intel Optane 905P 480GB 2.5 | |
Intel Core i9-13900K
GeForce RTX 4090, i9-13900K, Samsung SSD 980 Pro 2TB MZ-V8P2T0 | |
Intel Core i7-13700
GeForce RTX 4090, i7-13700, Intel Optane 905P 480GB 2.5 | |
Intel Core i7-12700
GeForce RTX 4090, i7-12700, Intel Optane 905P 480GB 2.5 | |
Intel Core i5-13400
GeForce RTX 4090, i5-13400, Intel Optane 905P 480GB 2.5 | |
Intel Core i5-12400F
GeForce RTX 4090, i5-12400F, Intel Optane 905P 480GB 2.5 | |
|
Intel Core i7-13700
GeForce RTX 4090, i7-13700, Intel Optane 905P 480GB 2.5 | |
Intel Core i7-12700
GeForce RTX 4090, i7-12700, Intel Optane 905P 480GB 2.5 | |
Intel Core i5-13400
GeForce RTX 4090, i5-13400, Intel Optane 905P 480GB 2.5 | |
Intel Core i7-13700K
GeForce RTX 4090, i7-13700K, Intel Optane 905P 480GB 2.5 | |
Intel Core i9-13900K
GeForce RTX 4090, i9-13900K, Samsung SSD 980 Pro 2TB MZ-V8P2T0 | |
Intel Core i5-12400F
GeForce RTX 4090, i5-12400F, Intel Optane 905P 480GB 2.5 | |
|
|
Intel Core i7-13700
GeForce RTX 4090, i7-13700, Intel Optane 905P 480GB 2.5 |
268 (127.73min - 445.04max) fps |
Intel Core i7-13700K
GeForce RTX 4090, i7-13700K, Intel Optane 905P 480GB 2.5 |
261 (117.16min - 442.09max) fps |
Intel Core i9-13900K
GeForce RTX 4090, i9-13900K, Samsung SSD 980 Pro 2TB MZ-V8P2T0 |
260 (113.43min - 460.83max) fps |
Intel Core i7-12700
GeForce RTX 4090, i7-12700, Intel Optane 905P 480GB 2.5 |
233 (124.52min - 364.56max) fps |
Intel Core i5-12400F
GeForce RTX 4090, i5-12400F, Intel Optane 905P 480GB 2.5 |
203 (112.65min - 299.76max) fps |
Intel Core i5-13400
GeForce RTX 4090, i5-13400, Intel Optane 905P 480GB 2.5 |
196.9 (110.05min - 286.04max) fps |
|
Intel Core i7-13700
GeForce RTX 4090, i7-13700, Intel Optane 905P 480GB 2.5 |
181.8 (91.32min - 283.37max) fps |
Intel Core i7-13700K
GeForce RTX 4090, i7-13700K, Intel Optane 905P 480GB 2.5 |
180.5 (90.82min - 282.73max) fps |
Intel Core i9-13900K
GeForce RTX 4090, i9-13900K, Samsung SSD 980 Pro 2TB MZ-V8P2T0 |
177.3 (82.92min - 288.02max) fps |
Intel Core i7-12700
GeForce RTX 4090, i7-12700, Intel Optane 905P 480GB 2.5 |
157.1 (88.03min - 235.4max) fps |
Intel Core i5-13400
GeForce RTX 4090, i5-13400, Intel Optane 905P 480GB 2.5 |
144 (81.05min - 208.64max) fps |
Intel Core i5-12400F
GeForce RTX 4090, i5-12400F, Intel Optane 905P 480GB 2.5 |
141.8 (80.39min - 206.57max) fps |
|
Intel Core i7-13700
GeForce RTX 4090, i7-13700, Intel Optane 905P 480GB 2.5 |
172.1 (81.37min - 271.89max) fps |
Intel Core i7-13700K
GeForce RTX 4090, i7-13700K, Intel Optane 905P 480GB 2.5 |
170.6 (83.63min - 271.52max) fps |
Intel Core i9-13900K
GeForce RTX 4090, i9-13900K, Samsung SSD 980 Pro 2TB MZ-V8P2T0 |
165 (77.05min - 283.77max) fps |
Intel Core i7-12700
GeForce RTX 4090, i7-12700, Intel Optane 905P 480GB 2.5 |
153.4 (86.94min - 231.48max) fps |
Intel Core i5-13400
GeForce RTX 4090, i5-13400, Intel Optane 905P 480GB 2.5 |
141 (84.07min - 206.65max) fps |
Intel Core i5-12400F
GeForce RTX 4090, i5-12400F, Intel Optane 905P 480GB 2.5 |
136.6 (79.85min - 203.29max) fps |
|
Intel Core i7-13700
GeForce RTX 4090, i7-13700, Intel Optane 905P 480GB 2.5 |
136.9 (71.43min - 234.36max) fps |
Intel Core i7-13700K
GeForce RTX 4090, i7-13700K, Intel Optane 905P 480GB 2.5 |
136.9 (72.87min - 233.59max) fps |
Intel Core i9-13900K
GeForce RTX 4090, i9-13900K, Samsung SSD 980 Pro 2TB MZ-V8P2T0 |
136.3 (72.34min - 241.96max) fps |
Intel Core i7-12700
GeForce RTX 4090, i7-12700, Intel Optane 905P 480GB 2.5 |
132.4 (68.05min - 211.86max) fps |
Intel Core i5-13400
GeForce RTX 4090, i5-13400, Intel Optane 905P 480GB 2.5 |
126.7 (68.66min - 196.97max) fps |
Intel Core i5-12400F
GeForce RTX 4090, i5-12400F, Intel Optane 905P 480GB 2.5 |
124.1 (74min - 188.01max) fps |
|
|
Intel Core i7-13700K
GeForce RTX 4090, i7-13700K, Intel Optane 905P 480GB 2.5 |
363 (71.8min, 170.6P0.1, 239P1 - 517max) fps |
Intel Core i7-13700
GeForce RTX 4090, i7-13700, Intel Optane 905P 480GB 2.5 |
358 (74.5min, 164.4P0.1, 235P1 - 522max) fps |
Intel Core i7-12700
GeForce RTX 4090, i7-12700, Intel Optane 905P 480GB 2.5 |
289 (36.6min, 132.6P0.1, 194.2P1 - 414max) fps |
Intel Core i5-13400
GeForce RTX 4090, i5-13400, Intel Optane 905P 480GB 2.5 |
259 (57.4min, 112.9P0.1, 175.7P1 - 366max) fps |
Intel Core i5-12400F
GeForce RTX 4090, i5-12400F, Intel Optane 905P 480GB 2.5 |
217 (16min, 89.8P0.1, 146.2P1 - 322max) fps |
|
Intel Core i7-13700
GeForce RTX 4090, i7-13700, Intel Optane 905P 480GB 2.5 |
245 (40.1min, 83.9P0.1, 162.6P1 - 341max) fps |
Intel Core i7-13700K
GeForce RTX 4090, i7-13700K, Intel Optane 905P 480GB 2.5 |
245 (48.8min, 97.8P0.1, 164.4P1 - 339max) fps |
Intel Core i7-12700
GeForce RTX 4090, i7-12700, Intel Optane 905P 480GB 2.5 |
227 (17.8min, 79.4P0.1, 135.8P1 - 297max) fps |
Intel Core i5-13400
GeForce RTX 4090, i5-13400, Intel Optane 905P 480GB 2.5 |
200 (21min, 69.4P0.1, 124.5P1 - 264max) fps |
Intel Core i5-12400F
GeForce RTX 4090, i5-12400F, Intel Optane 905P 480GB 2.5 |
174.3 (37.6min, 63.9P0.1, 102.6P1 - 235max) fps |
|
Intel Core i7-13700K
GeForce RTX 4090, i7-13700K, Intel Optane 905P 480GB 2.5 |
192.7 (40.5min, 71.3P0.1, 153P1 - 300max) fps |
Intel Core i7-13700
GeForce RTX 4090, i7-13700, Intel Optane 905P 480GB 2.5 |
191.7 (39.4min, 72.9P0.1, 139.9P1 - 297max) fps |
Intel Core i7-12700
GeForce RTX 4090, i7-12700, Intel Optane 905P 480GB 2.5 |
184.6 (29.9min, 68.2P0.1, 118.1P1 - 273max) fps |
Intel Core i5-13400
GeForce RTX 4090, i5-13400, Intel Optane 905P 480GB 2.5 |
181.4 (39.3min, 68.2P0.1, 117.6P1 - 252max) fps |
Intel Core i5-12400F
GeForce RTX 4090, i5-12400F, Intel Optane 905P 480GB 2.5 |
167.8 (23.7min, 54.6P0.1, 87.5P1 - 232max) fps |
|
Intel Core i7-12700
GeForce RTX 4090, i7-12700, Intel Optane 905P 480GB 2.5 |
76.5 (22.6min, 35.9P0.1, 60.6P1 - 214max) fps |
Intel Core i5-13400
GeForce RTX 4090, i5-13400, Intel Optane 905P 480GB 2.5 |
76.5 (27.1min, 38.6P0.1, 60P1 - 202max) fps |
Intel Core i7-13700
GeForce RTX 4090, i7-13700, Intel Optane 905P 480GB 2.5 |
76.4 (35.7min, 40.9P0.1, 65.1P1 - 223max) fps |
Intel Core i5-12400F
GeForce RTX 4090, i5-12400F, Intel Optane 905P 480GB 2.5 |
76.2 (24.3min, 30.3P0.1, 60.6P1 - 151.8max) fps |
Intel Core i7-13700K
GeForce RTX 4090, i7-13700K, Intel Optane 905P 480GB 2.5 |
76.2 (28.7min, 39.7P0.1, 66.4P1 - 251max) fps |
|
|
Intel Core i9-13900K
GeForce RTX 4090, i9-13900K, Samsung SSD 980 Pro 2TB MZ-V8P2T0 |
521 (418min - 584max) fps |
Intel Core i7-13700K
GeForce RTX 4090, i7-13700K, Intel Optane 905P 480GB 2.5 |
465 (325min - 539max) fps |
Intel Core i7-13700
GeForce RTX 4090, i7-13700, Intel Optane 905P 480GB 2.5 |
461 (323min - 528max) fps |
Intel Core i7-12700
GeForce RTX 4090, i7-12700, Intel Optane 905P 480GB 2.5 |
388 (314min - 434max) fps |
Intel Core i5-12400F
GeForce RTX 4090, i5-12400F, Intel Optane 905P 480GB 2.5 |
322 (266min - 345max) fps |
Intel Core i5-13400
GeForce RTX 4090, i5-13400, Intel Optane 905P 480GB 2.5 |
292 (253min - 317max) fps |
|
Intel Core i9-13900K
GeForce RTX 4090, i9-13900K, Samsung SSD 980 Pro 2TB MZ-V8P2T0 |
395 (325min - 478max) fps |
Intel Core i7-13700K
GeForce RTX 4090, i7-13700K, Intel Optane 905P 480GB 2.5 |
369 (251min - 430max) fps |
Intel Core i7-13700
GeForce RTX 4090, i7-13700, Intel Optane 905P 480GB 2.5 |
361 (300min - 429max) fps |
Intel Core i7-12700
GeForce RTX 4090, i7-12700, Intel Optane 905P 480GB 2.5 |
311 (217min - 362max) fps |
Intel Core i5-12400F
GeForce RTX 4090, i5-12400F, Intel Optane 905P 480GB 2.5 |
262 (215min - 299max) fps |
Intel Core i5-13400
GeForce RTX 4090, i5-13400, Intel Optane 905P 480GB 2.5 |
233 (192min - 268max) fps |
|
Intel Core i9-13900K
GeForce RTX 4090, i9-13900K, Samsung SSD 980 Pro 2TB MZ-V8P2T0 |
386 (302min - 456max) fps |
Intel Core i7-13700K
GeForce RTX 4090, i7-13700K, Intel Optane 905P 480GB 2.5 |
361 (279min - 437max) fps |
Intel Core i7-13700
GeForce RTX 4090, i7-13700, Intel Optane 905P 480GB 2.5 |
358 (211min - 425max) fps |
Intel Core i7-12700
GeForce RTX 4090, i7-12700, Intel Optane 905P 480GB 2.5 |
308 (246min - 362max) fps |
Intel Core i5-12400F
GeForce RTX 4090, i5-12400F, Intel Optane 905P 480GB 2.5 |
258 (204min - 299max) fps |
Intel Core i5-13400
GeForce RTX 4090, i5-13400, Intel Optane 905P 480GB 2.5 |
231 (194min - 266max) fps |
|
Intel Core i7-13700K
GeForce RTX 4090, i7-13700K, Intel Optane 905P 480GB 2.5 |
284 (242min - 329max) fps |
Intel Core i7-13700
GeForce RTX 4090, i7-13700, Intel Optane 905P 480GB 2.5 |
283 (240min - 332max) fps |
Intel Core i9-13900K
GeForce RTX 4090, i9-13900K, Samsung SSD 980 Pro 2TB MZ-V8P2T0 |
282 (194min - 330max) fps |
Intel Core i7-12700
GeForce RTX 4090, i7-12700, Intel Optane 905P 480GB 2.5 |
275 (197min - 319max) fps |
Intel Core i5-12400F
GeForce RTX 4090, i5-12400F, Intel Optane 905P 480GB 2.5 |
247 (202min - 285max) fps |
Intel Core i5-13400
GeForce RTX 4090, i5-13400, Intel Optane 905P 480GB 2.5 |
229 (184min - 265max) fps |
|
|
Intel Core i9-13900K
GeForce RTX 4090, i9-13900K, Samsung SSD 980 Pro 2TB MZ-V8P2T0 |
632 (477min, 398P1 - 685max) fps |
Intel Core i7-13700K
GeForce RTX 4090, i7-13700K, Intel Optane 905P 480GB 2.5 |
588 (466min, 371P1 - 639max) fps |
Intel Core i7-13700
GeForce RTX 4090, i7-13700, Intel Optane 905P 480GB 2.5 |
572 (447min, 359P1 - 620max) fps |
Intel Core i7-12700
GeForce RTX 4090, i7-12700, Intel Optane 905P 480GB 2.5 |
448 (363min, 297P1 - 477max) fps |
Intel Core i5-12400F
GeForce RTX 4090, i5-12400F, Intel Optane 905P 480GB 2.5 |
393 (309min, 274P1 - 416max) fps |
Intel Core i5-13400
GeForce RTX 4090, i5-13400, Intel Optane 905P 480GB 2.5 |
337 (277min, 237P1 - 358max) fps |
|
Intel Core i9-13900K
GeForce RTX 4090, i9-13900K, Samsung SSD 980 Pro 2TB MZ-V8P2T0 |
277 (237min, 209P1 - 294max) fps |
Intel Core i7-13700K
GeForce RTX 4090, i7-13700K, Intel Optane 905P 480GB 2.5 |
261 (218min, 194P1 - 278max) fps |
Intel Core i7-13700
GeForce RTX 4090, i7-13700, Intel Optane 905P 480GB 2.5 |
256 (214min, 191P1 - 272max) fps |
Intel Core i7-12700
GeForce RTX 4090, i7-12700, Intel Optane 905P 480GB 2.5 |
221 (188min, 156P1 - 233max) fps |
Intel Core i5-12400F
GeForce RTX 4090, i5-12400F, Intel Optane 905P 480GB 2.5 |
204 (166min, 150P1 - 218max) fps |
Intel Core i5-13400
GeForce RTX 4090, i5-13400, Intel Optane 905P 480GB 2.5 |
189 (158min, 136P1 - 204max) fps |
|
Intel Core i9-13900K
GeForce RTX 4090, i9-13900K, Samsung SSD 980 Pro 2TB MZ-V8P2T0 |
267 (220min, 194P1 - 286max) fps |
Intel Core i7-13700K
GeForce RTX 4090, i7-13700K, Intel Optane 905P 480GB 2.5 |
258 (216min, 193P1 - 278max) fps |
Intel Core i7-13700
GeForce RTX 4090, i7-13700, Intel Optane 905P 480GB 2.5 |
253 (200min, 182P1 - 270max) fps |
Intel Core i7-12700
GeForce RTX 4090, i7-12700, Intel Optane 905P 480GB 2.5 |
214 (168min, 143P1 - 228max) fps |
Intel Core i5-12400F
GeForce RTX 4090, i5-12400F, Intel Optane 905P 480GB 2.5 |
201 (158min, 145P1 - 215max) fps |
Intel Core i5-13400
GeForce RTX 4090, i5-13400, Intel Optane 905P 480GB 2.5 |
190.4 (159min, 137P1 - 204max) fps |
|
Intel Core i7-13700K
GeForce RTX 4090, i7-13700K, Intel Optane 905P 480GB 2.5 |
197.5 (169min, 158P1 - 222max) fps |
Intel Core i7-13700
GeForce RTX 4090, i7-13700, Intel Optane 905P 480GB 2.5 |
196.8 (166min, 156P1 - 217max) fps |
Intel Core i9-13900K
GeForce RTX 4090, i9-13900K, Samsung SSD 980 Pro 2TB MZ-V8P2T0 |
196.6 (167min, 156P1 - 219max) fps |
Intel Core i7-12700
GeForce RTX 4090, i7-12700, Intel Optane 905P 480GB 2.5 |
193.1 (162min, 137P1 - 211max) fps |
Intel Core i5-12400F
GeForce RTX 4090, i5-12400F, Intel Optane 905P 480GB 2.5 |
185 (153min, 132P1 - 197max) fps |
Intel Core i5-13400
GeForce RTX 4090, i5-13400, Intel Optane 905P 480GB 2.5 |
176.2 (144min, 127P1 - 189max) fps |